cost control measures on the performance of industries
72
COST CONTROL MEASURES ON THE PERFORMANCE OF INDUSTRIES IN KAMPALA DISTRICT, NAKA WA DIVISION: A CASE STUDY OF STEEL AND TUBE BY MUKONYEZI LUCY 1153-05014-00146 A DISSERTATION SUBMITTED TO THE COLLEGE OF ECONOMICS AND MANAGEMENT IN PARTIAL FULFILLMENT FOR THE AWARD OF BACHELORS DEGREE IN BUSINESS ADMINISTRATION (ACCOUNTING AND FINANCE) OF KAMPALA INTERNATIONAL UNIVERSITY JUNE, 2018
-
Upload
khangminh22 -
Category
Documents
-
view
1 -
download
0
Transcript of cost control measures on the performance of industries

COST CONTROL MEASURES ON THE PERFORMANCE OF INDUSTRIES
IN KAMPALA DISTRICT, NAKA WA DIVISION:
A CASE STUDY OF STEEL AND TUBE
BY
MUKONYEZI LUCY
1153-05014-00146
A DISSERTATION SUBMITTED TO THE COLLEGE OF ECONOMICS
AND MANAGEMENT IN PARTIAL FULFILLMENT FOR THE A WARD
OF BACHELORS DEGREE IN BUSINESS ADMINISTRATION
(ACCOUNTING AND FINANCE) OF KAMPALA
INTERNATIONAL UNIVERSITY
JUNE, 2018

DECLARATION I Mukonyezi Lucy declare that this research report is my original work and that it has not been
submitted for the award of a degree or another academic award or published to any university or
higher institution of learning. Where work of people has been referred to acknowledgement has
been made.
Signature -~ ·-'········· ...
MUKONYEZJ LUCY (student)
l 153-05014-00146
Date .. . :id\ l .o9 .l ~ .<. -~ -.....

APPROVAL
This research report by MUKONYEZJ LUCY titled cost control measures on the organizational
performance has been prepared under my supervision and guidance and it ' s now ready for
submission to the examination board of Kampala International University with my approval.
Signed ........ rl. .... . Date .. f?Jf vg,,/ ~ g
DR. KIRABO K. JOSEPH
(Supervisor)
ii

DEDICATION
This work is dedicated to my lovely father Mr. Abigaba Venance for your endless endeavor to
see the through school and the love you have always shown to me. You mean a lot to me and I
do not know how my life would be without you.
I also dedicate to my beloved one Mr. Nathan Twinomusuni Atwooki for his tireless and
valuable support extended to me through this course.
May God reward them for their deeds.
iii

ACKNOWLEDGEMENT
I thank the Almighty God mother Mary who have availed me with the wisdom, courage and
strength who have seen me through all the obstacles of finally complete my Bachelors degree of
Business administration in finance and accounting.
Thanks also go to my family Mr. & Mrs. Abigaba for funding me while carrying cut my
research, my beloved friends Nathan, brothers and course mates for the time company, advice
and discussions that we had together.
Special thanks go to my supervisor Dr. Kirabo k. Joseph fierei,ee and H.O.D Dr .. Kirabo
Kyeyune B. Joseph who spared their time and made special effort to provide me with the
guidance necessary to complete this study without her I would not have reached this far.
Thanks also go to the entire staff of Kampala International University especially my lecturers for
their effort in educating me, the lessons I received are so valuable to me.
I also wish to extend my sincere gratitude to the management of steel and tube industries for
granting me the chance and opportunity to collect data from the organization and all those who
filled my questionnaires.
MAY GOD BLESS YOU ALL
iv

LIST OF ACRONYMS ToC Theory of Constraints
UK United Kingdom
CVI Constructing Validity Instruments
ND Nakawa division,
KC Kampala city
V

TABLE OF CONTENT
DECLARATION ............................................................................................................................. i
APPROVAL ................................................................................................................................... ii
DEDICATION ............................................................................................................................... iii
ACKNOWLEDGEMENT ............................................................................................................. iv
LIST OF ACRONYMS ................................................................................................................... v
TABLE OF CONTENT ................................................................................................................. vi
ABSTRACT ................................................................................................................................. xii
CHAPTER ONE .............................................................................................................................. !
1.0 Introduction ................................................................................................................................ I
1.1 Background ot the study ............................................................................................................ 1
1.1.1 Historical perspective ............................................................................................................. 1
1.1.2 Theoretical perspective ........................................................................................................... 2
1.1.3 Conceptual perspective ........................................................................................................... 3
1.1.4 Contextual Perspective .......................................................................................................... .4
1.2 Statement of the problem .......................................................................................................... .4
1.3 Purpose of the study .................................................................................................................. -4
1.4 Specific objectives of the study ................................................................................................. 5
1.5 Research questions ..................................................................................................................... 5
1.6 Scope of the study ...................................................................................................................... 5
1.6.1 Content scope .......................................................................................................................... 5
1.6.2 Geographical scope ................................................................................................................. 5
1.6.3 Time scope .............................................................................................................................. 5
1.7 Significance of the study ........................................................................................................... 6
1.8. Definition ofterms .................................................................................................................... 6
vi

CHAPTER TWO ............................................................................................................................. 7
LITERATURE REVIEW ................................................................................................................ 7
2.0 Introduction ...................................................................................................................... : ......... 7
2.1 Theoretical Review .................................................................................................................... 7
2.2 Conceptual Review .................................................................................................................... 8
2.3 Review of related literature ....................................................................................................... 9
2.3.1 The relationship between cost control measures and the performance of the organization ... 9
2.3.2 Factors that affect the performance of the organization include .......................................... 11
2.4 Empirical review ...................................................................................................................... 14
2.4.1 The different cost control measures ....................................................................................... 14
2.5 Research Gaps ......................................................................................................................... 16
CHAPTER THREE ....................................................................................................................... 17
RESEARCH METHODOLOGY .................................................................................................. 17
3.0 Jntroduction .............................................................................................................................. 17
3.1 Research Design ...................................................................................................................... 17
3.1.1 Qualitative approach: ............................................................................................................ 17
3.1.2 Quantitative approach ........................................................................................................... 17
3.2 Area of Study ........................................................................................................................... 17
3.3 Population size and composition ............................................................................................. 18
3.4 Sample size and composition ................................................................................................... 18
3.3 Sapling design .......................................................................................................................... 19
3.6 Sample selection ...................................................................................................................... 19
3.7 Data collection methods and instruments ................................................................................ 19
3.7.1 Questionnaire ........................................................................................................................ 19
3.8 Sources of data ......................................................................................................................... 20
vii

3.8. l Primary Data ......................................................................................................................... 20
3.8.2 Secondary data ...................................................................................................................... 20
3.9 Procedure of data collection .................................................................................................... 20
3. l O Data processing, analysis and presentation ........................................................................... 20
3. l l Reliability and validity of data .............................................................................................. 21
3.11. I Validity ............................................................................................................................... 21
3.12 Ethical Consideration ............................................................................................................. 21
3. l 3 Limitations of the study ......................................................................................................... 21
3.14 Solutions to the problems ..................................................................................................... .22
CHAPTER FOUR ......................................................................................................................... 23
PRESENTATJON, ANAL YSJS AND INTERPRETATION OF FINDINGS ............................ .23
4.0 lntroduction .............................................................................................................................. 23
4.1 Response rate .......................................................................................................................... .23
4.2 Bio-date of the respondent. ..................................................................................................... .24
4.2.1 Gender composition of the respondents ............................................................................... 24
4.2. l Age distribution of the respondents ...................................................................................... 24
Table 4.5 Length of service ........................................................................................................... 26
4.3: To assess the different cost control measures put in place in steel and tube .......................... 27
4.4 To analyze the relationship between cost control measures and the performance of the
organization ................................................................................................................................... 34
4.5 Other factors affecting the performance of organization ........................................................ .43
CHAPTER FIVE ........................................................................................................................... 45
DISCUSSJON, SUMMARY, CONCLUSSJONS AND RECOMMENDATIONS ..................... .45
5.0 lntroduction .............................................................................................................................. 45
5. l Discussion of the findings ...................................................................................................... .45
viii

5.1.1 The different cost control measures put in place at steel and tube ...................................... .45
5.2.2 The relationship between cost control measures and the performance of steel and tube
industries ....................................................................................................................................... .46
5.2.3 Other factors affecting the performance of the organization ................................................ 47
5.2.4 Summary of the findings ..................................................................................................... .48
5.3 Conclusion to the study .......................................................................................................... .48
5.5 Area for further research ......................................................................................................... .49
REFERENCES .............................................................................................................................. 50
APPENDICES ............................................................................................................................... 53
APPENDIX I ................................................................................................................................. 53
QUESTIONNAIRE ....................................................................................................................... 53
APPENDIX 11: WORK PLAN AND TIMEFRAME .................................................................... 57
APPENDIX II[: BUDGET ............................................................................................................ 58
ix

LIST OF TABLES
Table 3.lShowing Research Population .................................................................................... 18
Table 4.1 Response rate ............................................................................................................... 23
Table 4.2 Gender composition of the respondents ................................................................... 24
Table 4.3 Age composition of the respondents ......................................................................... .24
Table 4.4 Position held in the organization ............................................................................... 25
Table 4.5 Length of service ......................................................................................................... 26
Table 4.6: showing what cost accounting is according to the organization ........................... .27
Table 4.7: Showing the response on the different classifications of costs in organizations . .28
Table 4.8: Showing what material and labor costs are in the organization ........................... 30
Table 4.9 Showing the examples of labor and material costs .................................................. 31
Table 4.10: showing the different measnres of controlling costs within the organization ... .32
Table 4.11: showing whether the organization has a costing system in place ........................ 34
Table 4.12: showing what a costing system is according to the organization ........................ 36
Table 4.13: showing the role of organizational costing systems .............................................. 38
Table 4.14: Showing how management determines the price to charge for a given product
or service ...................................................................................................................................... .39
Table 4.15: showing the factors that inhibit both time and cost control within the
organization .................................................................................................................................. 40
Table 4.16: Showing the role of costs forecast at the different levels of activities in the
organization .................................................................................................................................. 40
Table 4.17: Showing the commonly used cost control techniques within the organization . .41
Table 19: 4.18: Showing the challenges to cost controls within the organization ................. .42
Table 20: 4.19: showing the other factors affecting the performance of steel and tube ....... .43
X

LIST OF FIGURES
Figure 1.1 Conceptual frame work .............................................................................................. 9
Figure 4.1 Position held in the organization .............................................................................. 26
Figure 4.2 Showing the response on the different classifications of costs in organizations .. 29
Figure 4.3 showing the different measures of controlling costs within the organization ...... 33
Figure 4.4 showing whether the organization has a costing system in place ......................... 35
Figure 4.5 showing what a costing system is according to the organization .......................... 37
xi

1.0 Introduction
CHAPTER ONE INTRODUCTION
This chapter presents the background to the study, statement of the problem, objective of the
study, research questions and scope of the study, significance of the study and definitions of the
key terms.
1.1 Background to the study
I.I.I Historical perspective Cost control is done by the management accountant or cost accountant whose role is to provide
financial information for stock valuation purposes and also presents relevant information to
management for decision making, planning and cost control purposes.
Cost can be classified for different purposes and they include: stock valuation, profit
measurement, decision making, planning; and control. Cost control can be achieved by selecting
the right man for the right jobs, the right equipment and tools for the right work and the right
quality of materials. in the right quantity, form the right source, at the right price and delivered at
the right time (Olim. Nakachwa and Kyakula, 2008). Managers are expected to be equipped to
execute the work with due consideration to be quality of work, yet within the estimated cost and
limits. Many projects in Uganda and world over have suffered from cost and time overruns due
to factors stemming from poor cost control during the design and project implementation stages.
Research aimed at studying the cost control techniques being used in Uganda is done on the
selection of 130 contractors involved in the construction of building in Nakawa division,
Kampala city. It specifically studied the cost control techniques currently being used by
individual developers; the problems faced and proposed solutions.
The research was able to identify seven commonly used cost control techniques which include
schedules, budgets, inspection, meetings, reports, records, monitoring and evaluations. It was
noted that most projects managers and contractors in Uganda find difficulty in controlling
project costs due to problems which include delays by client to release money, delay to make a
decision, lack of materials and equipment, bad weather, overlapping of activities, unclear and
incomplete drawings, making good defective work and generally failure to control the
1

productivity of resources. Others were due to theft and vandalism, interference by clients, high
labour turnover, and insufficient knowledge on cost control techniques.
The main purpose of cost control measures is to minimize wastage in utilization so that the
overall organization costs are not affected (Chitkara, 2005). Labour productivity achieved in the
organization for a given work provides a measure of the laborer's efficiency and effectiveness
and the level of the performance in the organization.
According to Chitkara, (2005) cost control process involves accounting of actual productivity
and comparing with the standard, analyzing the courses for variations taking remedial measures
for improvement. Raina ( 1999) emphasizes the need for close supervision and good working
relationship. The relationship between time and cost is a very important aspect in the control of
cost in the organization as any variation in time has automatic implication on cost.
It is important to report and record all the works including materials, plant and labour within an
organization. This enables the management to be able to know the cost and expenses of the
resources issued in the organization and compare with the initial cost budget. Various report
techniques used include daily or weekly and monthly recording schedule control, organization
daily report and project.
1.1.2 Theoretical perspective The study I guided by the constraint theory.
The theoretical framework consists of theories explain the cost control. The theory of constraint:
According to (Otim, Nakachwa and Kyakula, 2008), the Theory of Constraints (TOC) is a
production planning and control system reported to improve manufacturing performance
surpassing both materials requirement planning and just-in-time systems. One requirement of
Theory of Constraints (TOC) is the assumption of cost accounting system that is very different
from traditional cost accounting.
This study examines the conflicts between traditional cost accounting and Theory of Constraints
(TOC) Accounting, presents a description it how the Theory of Constraints (TOC) method
operates at the Trane Company (Macon, GA) and how the cost accounting aspect of Theory of
2

Constraints (TOC) was used to evaluate the addition of a new product line proposed by
marketing.
Under this theory here is an increasing recognisation of the critical role played by an
organization's performance measurement system in achieving competitive success. The success
of an organization may well depend upon the compatibility between the performance
measurement system in operation at subordinate organizational level and the organization's
global goals. According to (Chitkara, 2005), the performance measurement systems associated
with the theory of constraints (TOC) has been advocated by researchers as mechanism for
linking operational objectives to global goals of an organization. However, empirical research is
looking to determine and test the relevance of the proposed performance measurement system
presented in Theory of Constraints (TOC). It is all accord.
1.1.3 Conceptual perspective It explains the key terms used in the research topic for example, costs, cost control, organization
performance and industries.
Cost. ls an amount that has best given or paid up in order to get something.
Cost control. This is the process of controlling costs associated with an activity process of the
organization.
Organization. Refers to an entity such as an institution that has a collective goal and it can be
linked to that external environment.
Performance. Refers to a set of financial and non-financial indicators which after information
on the degree of achievement of different goals and objectives.
An Industry: It is an economic activity concerning with the processing of raw materials and
manufacture of goods in factories
Or an industry consists of all the people and activities included in making a particular product or
providing particular services.
3

1.1.4 Contextual Perspective The study seeks to establish the factor and the extent to which the factors influence cost control
and industrial performance of steel and tube industries in Nakawa division, Kampala city. The
factors influencing performance of industries are the dependent variables which include
technological development, business reputation and image, organizational management
structures, staffing, government regulations, competition, marketing, quality of human resources,
natural factors. While performance as dependent variable will be measured due to outcome
productivity and sales. expansion of an industries and organization sustainability.
1.2 Statement of the problem
Cost control is done by the management accountant or cost accountant whose role is to provide
financial information for stock valuation purposes and also presents relevant information to
management for decision making, planning and cost control purposes.
Despite the fact that Cost control in recent years, the cost of product is manufactured in Uganda,
has been very expensive beyond the reach of common Ugandans. This cost challenges has made
many products manufactured in the country patronized by the consumers and as a result of that
expires in the hands of the sellers.
This is also a problem of poor inventory management which leads to overstocking thereby typing
down the company's working capital. Another problem facing most manufacturing industries is
installation of improper plan to reduce cost of production in order to minimize profit. Whoever
the sole aim of any business organization is to make profit and most business owners believe that
the best way to make profit is to increase sales and this brings up another conundrum. In order to
increase sales, there must be a corresponding increase in cost because of the increased amount of
work involved. This prompted the researcher to investigate more about the cost control measures
on the Performance of Industries in Kampala District, Nakawa Division. A case study of Steel
and Tube. According to Shank, Suhnk and Vi say Gorindasaran, (2011 ).
1.3 Purpose of the study The purpose of the study is to examine the cost control measure and their impacts on the impacts
in the performance of industries in Nakawa division.
4

1.4 Specific objectives of the study (i) To assess the different cost control measures put in place in industries in Nakawa division.
(ii) To analyze the relationship between the cost control measures and performance most
industries in Nakawa division.
(iii)To assess the other factors affecting the performance of different industries m Nakawa
division, Kampala.
1.5 Research questions (i) What is the different cost control measures put in place for the performance of
various industries in Nakawa division, Kampala city?
(ii) What is the relationship between the cost control measures and the performance of
such industries?
(iii) What are the factors affecting the performance of industries in Hoima district.
1.6 Scope of the study
1.6.1 Content scope The study focused on the different cost control measures, the relationship between the cost
control measures and their impacts on organizational performance, and their factors affecting the
organization's performance. The respondents of the study are mainly employees and customers
of steel & tube industries. These respondents relate with the cost control measures and
performance of industries.
1.6.2 Geographical scope They study was carried out on tube and steel industries in Nakawa division Kampala. The area
was chosen because it was accessible and reliable to the researcher and has facilities needed for
research.
1.6.3 Time scope The study considered the operations of the company from year 2018 March. All this study has
taken place in the time frame and may valuation may base on this time period. This is because
it's this period of time when tube and steel has been expanded in its operations.
The research took four months from March to June 2018 collecting analyzing, preventing and
recording data.
5

1. 7 Significance of the study. The study generated funds and increased awareness of the need to put in place cost control
measures in companies. It highlighted the advantages and disadvantage of cost control measures
to other companies, acts as an eye opener in attempt to improve on the public image of steel and
tube and increase in its performance of such industries.
The increased understanding of the weakness, strength and challenges that affected costs in
organizations was to be of a great importance to save funds and use them to improve other areas
of operations within the organization.
Nationally the findings of the study were to be of a great importance due to the fact that after
companies have established the different cost control measures and how those cost control
measures affect the organization. It would be easy to advise accordingly and put in place
strategies that would continuously reduce on the cost, increase profitability and hence
performance of the organization.
1.8. Definition of terms Cost: Is an amount that has been given or paid up in order to get something.
Cost control: This is the process or activity of controlling costs associated with an activity
process or company.
Organization: Refers to an entity such as an institution that has a collective goal and is linked to
the external environment.
Performance: Refers to a set of financial and non-financial indicators which offer information
on the degree of achievement of the objectives and results.
6

CHAPTER TWO
LITERATURE REVIEW
2.0 Introduction This chapter contains the theoretical review, conceptual review of related literature, empirical
review and research gaps.
2.1 Theoretical Review The theory it constraints (TOC) is a management philosophy which is focused on the weakest
ring (s) in the chin to improve the performance systems. Companies, whether they are in
production or service sector should be more focused on understanding their own structure in
terms of processes to survive in a global competition.
According to Goldratt (1984). In this situation, TOC becomes an important problems structuring
and solving methodology which changes the way of thinking of managers. Since the TOC first
put forth by Goldratt (1984) in his novel the goal, the theory has drawn wide attention from
practitioners and academic researchers. This study provides a review of the TOC evolution
literature by its five era; the optimized product technology era, the goal era, hay stock syndrome
era, the its not luck era and the critical chain era. The research at historical background and basic
concepts of TOC aims to see how this philosophy evolves through time and how the main point
ofTOC researchers changes. Steve, 0 (2012) and Collins D (l 998).
Improve the effectiveness of control of their projects, as expressed. According to Otim, Nakacwa
and Kyakula, (2008), the seven commonly used central techniques include schedules, budgets,
inspection, meetings, reports, records, monitoring and evaluations it was noted that most project
managers and contractors in Uganda fail difficulty in controlling project costs due to problems
which include delays by clients to release money, delay to make a decision, lack of materials
and equipment, bad weather, overlapping of activities, unclear and incomplete drawings, making
good defective works and generally failure to control the productivity of resources. Others of
paucity were due to theft and vandalism, interference by clients, high labours turnover and
insufficient knowledge on cost control techniques. The study was able to establish that the
problem was actually not the techniques to use but rather than lack of knowledge of the
7

techniques, the poor management of the cost control methodology, and the general poor site
organization and inadequate supervision, (Otim, Nakachwa and Kyakula 367)
2.2 Conceptual Review This normally defines the cost control measures used in the conceptual perspective. It talks about
the three cost control measures which include negotiation, analysis and comparison.
Cost control is defined as the regulation by executive action of the costs it operating an
understanding. Cost control aims at achieving the target of sales. Cost control involves setting
standards. The firm is expected to adhere to standards. Collins D. 1998 and Janet W (2008).
Negotiation. According to Cooper, Robin and Robert S. Kaplan (2004) Means mutual discussion
and arrangement of terms of transaction or agreement. The negotiation of a treaty between
employees and an employer. Negotiate all contracts annually for whatever reason. American
business presumes that multiple year contracts will result in lower costs.
Comparison. According to Clay (Comb, 20 I 0) comparison means comparing two activities or
outcomes that is the likely expenses and revenues that will accrue from a new investment,
purchase, hire or other major decision shows you the potential effect on profits as well as cash
flow. There is more research involved but once the estimates have been established, cost benefit
analysis is relatively straight forward. Then comparison takes place.
Discussion or analyze. It means asking renders to own their inventory and discussion will be
between two people the customers and the vendors, during discussion ask your customers,
annual planning sessions with customers have many benefits Hamilton, (2003), Naturally the
discussions primarily should focus on ways to grow the business. But too often these discussions
fail to address costs. But by discussing costs holistically up and down the supply chains,
customers often can recommend ways to reduce costs.
Cost can be classified for different purposes and they include stock valuation, profit
measurement, decision making, planning and control. Costs can be achieved by selecting the
right man for the right job, the right equipment and tools for the right work and right quality of
materials, in the right quantity from the right source, at the right price and delivered at a right
time (Otim, Nakachwa and Kyakula, 2008). And the main purpose it test control measures is to
8

minimize wastage in utilization so that the overall organization costs are not affected (Chitkara,
2005). Cost control process involves accounting of actual productivity, and comparing with the
standard, analyzing the causes for variations taking remedial measures for improvement. Rain
(1999) emphasizes the need for close supervision and good working relationship. The
relationship between time and cost is very important aspect in the control of costs in an
organization as any variation in time has automatic implication on cost.
Figure 2.1 Conceptual framework
Independent variables Dependent variables
Cost control measures Performance of
industries • Comparison
• Growth • Annual planning
• Sustainability • Negotiation
• Expansion
Source: Adopted from Chamsers ( 1995), Cosserat (1999), Ridley and Chambers (1998).
2.3 Review of related literature
2.3.1 The relationship between cost control measures and the performance of the organization. An organization is costing system is the foundation of the internal financial systems of managers.
It provides information that management needs to plan and control the organizations activities
and make decision about the fi.1ture. Examples of the types of information provided by costing
systems and the uses to which it may be put in the following:
Actual units cost for the latest period could be used for cost control by comparing with
predetermined unit standard cost, which would also be provided by the costing decision about
pricing and production levels. For example a manager cannot make a decision about the price to
9

be charged to a customer without information that tells the manager how much it costs to
produce and distribute the products to the customer. Actual costs of operating a department for
the latest period could be used for cost control by comparing a company with a predestined
budget for the department could also be used as the basis for planning future budgeted costs and
for decisions.
For example a manager may be considering the closure of the packaging depatiment and instead
outsourcing the packaging operations to another organization. In order to make this decision the
manager needs to know among other things the actual costs of operating the packaging
department.
The forecasts to be incurred at the different levels of activity could be used for planning for
decision making and as part of cost control by the comparing the actual costs with the forecasts.
For example a manager cannot make a well informed decision about the appropriate production
level for the forthcoming period unless information is available about the costs that will be
incurred of the various possible output levels. This is by no means an exhaustive list of the
information that is provided by a costing system. However it should serve to demonstrate the
organizations need costing systems that will provide basic information that management needs
for planning, control and decision making.
"Olawale 20 I 2'' in this book entitled" construction management and economics" found that the
common factors that inhibits both time and cost central during construct in period projects were
firstly identified.
Subsequently go mitigating measures have been developed for the top five leading inhibiting
factors design changes, risks/uncertainties, inaccurate evaluation of project time, complexities
and non-performance of subcontractors were recommended. These mitigating measures were
classified as: preventive, predictive, corrective and organizational measures.
These mitigating measures can be used as checklist of good practice and help project managers
to:
10

2.3.2 Factors that affect the performance of the organization include Organizational management structures, the art of management achieving extra ordinary results
through ordinary people. These are two few extra ordinary people to go around and rely on
attracting them all into your organization. At the strategic level it's concerned with setting
achievable goals for the organization and developing the competence and capability to achieve
these goals. For these goals are not matched to the organizations capability, non-amount of
employee will achieve them.
Competition with increased rate of growth and development in Ugandan industries, very many
organizations have emerged with new and better ways of doing business. Therefore this has
resulted into competition failure of which into poor quality products and services, which results
into business failure or collapse.
Government regulations, rules and regulations from the government affect the performance of
the organization. This is through its taxation policies and other regulations that limit the
performance of organizations in Uganda.
Staffing, employees have a very strong impact on the performance of an organization: this is
because most of these are directly involved in the operations of the organization. Therefore
organizations need to employ the right people for the right job to ensure that quality products are
put into the market that can attract more customers.
Business reputation and image. The reputation of business is essential to its survival. The trust
and confidence of the customer can have a direct and profound effect on a company's bottom
line. Recently, the importance of reputation has become increasingly apparent as a companies
such as BP and Toyota have had to cultivate their responses to crises in order to maintain the
reputation and standing of their business to the world. In the past business relied on word of
mouth by stakeholders in order to establish, build and maintain their reputations.
In this modern age of social networking, websites, and other methods of instant communication,
business must be conscious of their reputation on a constant basis and be responsive to any crisis
that may have an impact on their reputation.
11

Marketing; the rate of organizational performance also depends on the techniques issued in the
process of sales promotion. These methods attract new customer and improve on customer
loyalist which is done well can result into increased sales and improved organizational
performance.
Understand value drivers, the starting point understands a company's value drivers, the factors
that create stakeholders value. Once known, these factors determine which measures contribute
to long-term success and so how to translate corporate objectives into measures that guide
manager's actions. While this seems inflection, experience indicates that companies do a four job
determining and articulating these drivers. Managers tend to use one of the three methods to
identify values drivers, the most common being inflection. However, executives, rankings of
value drivers may not reflect their true importance. For example, many executives rate
environmental performance and quality as relatively unimportant drivers of long-term financial
perfor111ance.
A second method is to use standard classifications such as financial, internal business process,
customers and learning and growth categories. While these may be appropriate, other non
financial decisions 111ay be 111ore important depending on the organization's strategy, competitive
environment and objectives. However these categories do little to help determine weightings for
each dimension.
Perhaps the most sophisticated method of determining value drivers is statistical analysis of the
leading and lagging indicators of financial performance. The resulting "causal business model"
can help determine which 111easures predict future financial performance and can assist in
assigning weighting to measures based on the strength of the statistical relation. Unfortunately,
relatively few companies develop such causal business models when selecting their performance
measures.
Review consistencies, most companies track hundred, if not thousands of non-financial measures
in their day to day operations. To avoid "reinventing the wheel" an inventory of current measures
should be 111ade. Once measures have been documented, their value for perfor111ance
measurement can be assessed. The issue at this stage is the extent to which current measures are
aligned with the co111pany's strategies and value drivers. One method for assessing this alignment
12

is ''gap analysis". Gay analysis requires managers to rank performance measures at least two
dimensions their importance to strategic objectives and their importance of currently placed on
them.
2,3.3 Other factors affecting the performance of the organizations
In an article on Oct 16, 2000, in the financial times, mastering management series, Wharton
accounting Professors Christopher Ettner and David Larcker suggest that financial data have
limitations as a measure of company performance. The two note that other measures, such as
quality, may be better at forecasting, but can be difficult to implement.
Our survey of 148 US financial services companies a joint research project sponsored by the cap
Gemini Ernst 8 young center for business innovation and the Wharton Research Program on
value creation in organizations- found significant "measurement gap" for many non-financial
measures. For example, 72% of companies said customer related performance was an extremely
impo1iant driver of long-term success, against 31 % who chose shoti-term financial performance.
However the quality of short-term financial measurement is considerably better than
measurement of customer satisfaction. Similarly disparities exist for non-financial measures
related to employee performance, operational results, quality, alliances, supplier relation,
innovation, community and the environment. More important, stock market and long term
accounting performance are both higher when those measurement gaps are smaller.
According to Frankwick (20 l 0), acceptance by employee's involvement in cost control
measures. Employee involvement in the design of cost controls can increase acceptance of them,
important element in the organizational effectiveness.
According to Rotch, et al (2006), Availability of information when needed, deadlines, time
needed to complete the projects, costs associated with the project, priority needs are apparent in
these criteria costs are frequently attributed to time shortcomings or failures.
13

2.4 Empirical review
2.4.1 The different cost control measures A cost can also be referred as the cost of items. It can also be an attempt to the cost activities
when the different tasks are being taken in order to determine the cost of carrying out an activity.
Costs can be classified in different way which include; costs can be grouped as material costs,
labour costs and overhead costs.
Material costs which include those costs which are used to obtain material and receiving them
with in the organization the cost of having materials brought into the organization is called
carriage in wards.
Labour costs. These are costs incurred in the form of wages and salaries and other employment
costs. In UK there is an additional cost borne by the employer in respect of employees which is
paid to the government. It is called national insurance.
This costs are documented internally, the amount of wages and salaries are determined by the
reference to agreed rates of pay and the amount of time spent and also output produced
depending on the method of remuneration being used.
According to the purposes of different costs, they are classified as either direct or indirect costs.
Direct costs are one that can be clearly identified with the cost objects. Whereas indirect costs;
these are costs that cannot be directly attributed to a particular cost unit although it's clear that
these costs have been incurred.
However those cost controls are found in cost accounting since it is as old as human beings are
and since the financial accounting has some limitations, cost accounting has also its own
importance in accounting systems and those systems are helpful to the organization in such a
way that after you have adopted cost accounting the costs of every organization must be
analyzed so carefully and that is to say material labour and overhead costs are the main elements
of an organization. ("cost analysis @nirani sugars Ltd project report").
The cost control measures are maintained effectively using the method include:-
Total cost= Fixed cost+ variable cost x output (cost control measures).
14

Without constant supervision, companies conflict themselves in uncompetitive environment with
bloated overheads and these can damage the companies daily activities leads to its collapse.
These effort risks produce expectations on the financial statements, drive "onetime" changes, and
damage company culture.
Ways of controlling costs within an organization include renegotiate all contracts annually, use
your customers, hold head counts constantly and match terms with the turns.
Renegotiate all contracts annually for whatever case. American business presumed that multiple
year contracts will result into lower costs. A good company policy is not to have the contract
exceed are fear. This will force annual bidding or at least renewals of discussions, with current
suppliers, almost always those discussions will result into lower cost of goods. A multiple year
contract will usually favour the vendor and of course this is a lot of work but it surely pays out
(Slagrnudulder 2007).
Asking customers annual planning sessions with customer, have many benefits. Naturally these
discussions primarily should focuses on ways to develop the business. But too often these
discussions fail to address costs.
By discussing costs holistically up and down the supply chains, customers can recommend ways
to reduce such costs. For example how to take coasted step out of the process or how to plan
jointly to smooth productivity or how to change the product mix to get rid of costly sterns and
replace them with some that are more profitable. Taking to customers is not bad but talking
about how jointly the business can be improved depends on the relationship (Hamilton, 2003).
Match terms with the turns. Each stern in inventory moves at different rates. And yet suppliers
normally apply at one size fits all approach to payment forms. The working capital can be
reduced up-to zero if payment terms were matched with inventory turns in each item. By
negotiating this into your contracts if incents the suppliers only to sell the best moving stems and
to work with you to improve inventory productivity. The result will free up cash that can be
deployed elsewhere in the business and improve profits (Govinda saran, 2009).
15

2.5 Research Gaps
Ask vendors to own their inventory. Better even than matching terms with turns is to have the
vendors keep little to their inventory until sold. Normally inventory acquired from a vendor is
hold in your warehouse for use in manufacturing conversion. But why think of it as your
inventory? It has not been used yet so why it isn't their inventory? But planning results in 'just in
time" delivery so there is no inventory. But this isn't always possible for instance, in industries
like retail where the inventory is necessary for your own customers (clay comb, 2010).
According to Frankish (20 I 0), cost and benefit analysis, appraisal of the costs and benefits of
any new decision is an invaluable tool at your disposal. To perform an effective analysis, you
need as much information as possible on the decision. Any pertinent numbers that are not
available should be estimated as realistically as possible.
Comparing the likely expenses and revenues that will accrue from a new investment, purchases,
hire or other major decision shows you the potential effect on profit as well as cash flow. There
is some research involved, but once the estimated have been established, cost-benefit analysis is
relatively straight forward. Simply compare the total expenses and total revenues and make the
final decision. To estimate costs and revenues, you can use past experience, quotes from vendors.
According to Rotch Et al (2006), spending analysis you should regularly and frequently analyze
your business spending patterns. In the comi of running your business, it is very easy for
unnecessary or inefficient cost to sneak in. Each of these costs is likely to be small and not very
noticeable. But taken together, they may be costing you large amounts overtime, shaving
percentage point off profits.
16

CHAPTER THREE
RESEARCH METHODOLOGY
3.0 Introduction This chapter presented the methods that were to be used in data collections and analysis. It
sought to describe the research design, area of study, study population, sample, sampling
procedures or strategies, instruments of data collection, procedures of data collection, data
processing, analysis and presentation, control of the extraneous variables and limitations of the
study.
3.1 Research Design
The study adopted descriptive research design where qualitative and quantitative were be used to
gain an in-depth and detailed understanding of cost control measures and its impact on the
performance of steel and tube industries limited. Kothari C.R. (2014).
3.1.1 Qualitative approach: This approach gathered information based on depth understanding of human behavior and
reasons that govern behavior depending on the way and how of decision making based on
theoretical analysis and assumptions of the respondents. This was used because it dealt with
smaller populations and it put more emphasis on uncovering more about people's experiences.
This was done in a way of questioning and finding out people's experiences, views and
assumptions.
3.1.2 Quantitative approach: This is the approach that deals with numerical expression 111
figures in terms of quantity which involved measurement of quantity and amounts. However
quantitative approach was used because of the following reasons; this approach eliminates
behavioral behavioural biases whereby the behavior beliefs are done away with, the approach
leads to accuracy whereby the results are not guessed, operational risks are reduced. This
approach was used in a way of getting actual figures and taking on calculations and then getting
figures.
3.2 Area of Study The study was conducted at steel and tube, Nakawa division in Kampala district mainly focusing
in the cost control measures at the organization. The population of the study was the employees
17

and stakeholders of the organization. These include the manager, accountant, employees, support
staff and customers.
3.3 Population size and composition The study population included employees and customers of steel and tube and both top and
lower staff levels.
The organization has a population of more than 42 employees from which the respondents were
obtained.
Table: 3.1 Showing Research Population
Type of population Target Population Sample size
Managers 12 10
Accountant 10 8
Employees 20 20
Total 42 38
Source: primary data 2018
3.4 Sample size and composition
Study populations of 42 respondents were targeted by the researcher and it constituted 12
managers, 10 accountant and 20 employees. This sample was arrived by use solver's formula of
sample size computation which states that
N 11= ---
l+N(e)2
Where;
11 =
N=
e=
N n=---
1 + N (e 2)
the required sample size
the known population size
the level of significance, which is fixed at 0.05
18

N n~--1+N(el'
3.3 Sapling design
42 n = 1 + 42(0.05) 2
42 n = 1 + 42 (0.0025)
42 n=----
1 + 0.105
42 n = 1.105
n = 38
The research used purposive sampling because the techniques given the resources and time
limitation. simple random and cluster sampling methods and the findings are generalized given
the resource and time limitation.The method was also useful for scenarios where there was need
to reach a target sample quickly and likelihood to attain knowledgeable and experienced
respondents.
3.6 Sample selection Respondents were put into strata consisting of top management, the accountant support staff and
employees, customers, and human resource department and purposive sampling was conducted
in each group to get relevant information from the firm's organization and simple random
sampling was used to limit on the biasness of purpose of purposive sampling.
3. 7 Data collection methods and instruments
3.7.1 Questionnaire This method was reliable since it's cheap on the basis of finance and time. It also offers an
objective and informed view from different records that all has a great assurance of
confidentiality of data a set of structured and un-structured questions were constructed by a
researcher so as to solicit and look for specific responses from the respondents.
19

3.8 Sources of data Sources of data are classified into two;
3.8.1 Primary Data This comprises of first-hand information collected during the study primary data was collected
directly from the respondents and from the organization, for example reports and original
documents on the variable.
3.8.2 Secondary data This was comprised of second hand information. It supplement on the primary source and it was
obtained from I iterature review such as brochures, newspapers, business journals, organizational
past records, past research and other relevant reports in relation to the area of study.
3.9 Procedure of data collection The researcher got an introductory letter from the research coordinator, school of economies and
management for identification at the organization where the research was conducted. The
researcher also obtained permission from the management of steel and tube to allow her conduct
research from there. After that data was called and analyzed.
3.10 Data processing, analysis and presentation Quantitative data was checked, analyzed and edited in order to detect errors and ensure accuracy,
comprehensive and completeness of the study. Data was then subjected to statistical analysis and
will later be presented using tables, charts and graphs. The researcher used descriptive diagrams
to represent and illustrate results regarding cost control measures and its impact on steel and
tube.
Qualitative data collected will be road with the aim of having prior knowledge, love and
understanding so as to develop them while documenting the cost control measures and their
impacts on the performance of the organization.
The data was collected, organized and analyzed thoroughly to ensure and ascertain that the
question was given relevant and full response. The researchers also endeavored to extract
meaning from the data that will be collected.
20

3.11 Reliability and validity of data
3.11.1 Validity
Kimberlin et al., (2008) define validity as the "best available approximation to the truth or falsity
of a given inference, proposition or conclusion. After constructing the questionnaire, the
researcher was to contact two research experts in order to determine whether his questionnaire
tool are valid as a way of collecting information that are used in understanding the research
problem. Hence the researcher was constructing the validity of the instruments by using expert
judgment method as suggested by Gay ( 1996).
The instrument was refined based on experts' advice. The following formula was being used to
test validity index.
CVI = No. of items regarded relevant by judges
Total No. of items
36/38xl00
=95
3.12 Ethical Consideration
The following activities were to be implemented by the researcher to ensure confidentiality of
the information provided by the respondents and to ascertain the practice of ethics in this
study.
The selected organization and respondents were to be coded instead of reflecting the names.
Soliciting permission was to be done through a written request to the concerned Steel and Tube
industry owners and managers included in the steady.
Respondents were requested to sign in the informed consent form
The authors were to be acknowledged and quoted in this study.
The findings of the study were to be presented in a generalized manner.
3.13 Limitations of the study The researcher encountered some problems during her study and those include
21

The researcher faced a problem of inadequate time. Since I was given only few months, I had
also to attend to other social activities like lectures, doing course work and reading books among
others. Because of those obligations and fore went other activities which are of great impo1iance
hence a hindrance.
The researcher faced a problem of getting insufficient information. The respondents failed to
give me detailed information about their sales and others had a problem of language barrier and
as a result and relevant information was left out.
3.14 Solutions to the problems Enough time. Should be given to the researcher to solve the problem of limited time and
therefore four to six months should be given to the researcher after the last semester form only
researcher purposes.
Enough financial resource like stationary and transport to facilitate communication and easy
collection of data should be provided to the student doing researcher by the university and that
reduces the problem if limited resource funds to use.
Enough information should be provided to the researcher by the company to which the
researcher is carried out and that reduces the limited information being provided.
22

CHAPTER FOuR
PRESENTATION, ANALYSIS AND INTERPRETATION OF FINDINGS
4.0 Introduction
This chapter involves the presentation, analysis, interpretation and findings in relation to the
study objectives that include the following.
1. To assess the different cost control measures put in place at steel and tube.
11. To analyze the relationship between the cost control measures and the performance of
steel and tube.
iii. To assess the other factors affecting the performance of steel and tube.
4.1 Response rate
During the study thirty eight (38) questionnaires were issued to the organization's staff and
customers, questionnaires were returned fully answered and this represented 80% response rate
from which the data collected enabled the researcher to answer the research questions of the
study.
Table 4.1 Response rate
Questionnaires Frequency Percentage
distributed
Respondents 36 77
Non response 12 23
Total 38 100
Sonrce: primary data, 2018
The feedback received from the study showed that more respondents took time to fill in the
questionnaires and the discrepancy of23% could be caused by the respondents who failed to get
time to fill the questionnaires.
23

4.2 Bio-date of the respondent
Table 4.2 Gender composition of the respondents
Gender Frequency Percentage
Male 24 67
Female 12 33
Total 36 100
Source: primary data, 2018
4.2.1 Gender composition of the respondents
The gender of respondents was established. This aimed at knowing how males and females as
community members actively participate in local governments. The study targeted both male and
female which gave a variety of findings that were not biased making it gender sensitive.
4.2.1 Age distribution of the respondents
Table 4.3 Age composition of the respondents
Age range Frequency
18-25 12
25-35 I I
35-45 6
45 and above 7
Total 36
Source: primary data, 2018
Percentage
33
31
17
19
100
The results in table 4.3 show that the majority 33% was between the age brackets of 25-35 3 I%
were between 18-25 years, 31 % were between 35-45 years 17% and 19% above 45 years. The
research therefore shows that the study had the opportunity to sample different age brackets
giving it a chance to vary the views of different ages. The researcher was therefore able to draw a
24

conclusion that the respondents have experience and know more about the activities of the
organization thus in a better position to avail the required information.
Table 4.4 Position held in the organization
Position Frequency (f) Percentage (%)
Manager 4 11
Accountant 4 11
Employee 15 41
Customer 10 28
Others 3 9
Total 36 100
Source: Primary Data 2018
Results of the study in table 4.4 indicate that majority 41 % were employees, I I% were
managers, and I I% were accountants, 28% were customers and other people had 9%. This
implies that the employees had a lot of information and awareness of the topic being researched
about thus taking a lot of concentration on the department for more information.
25
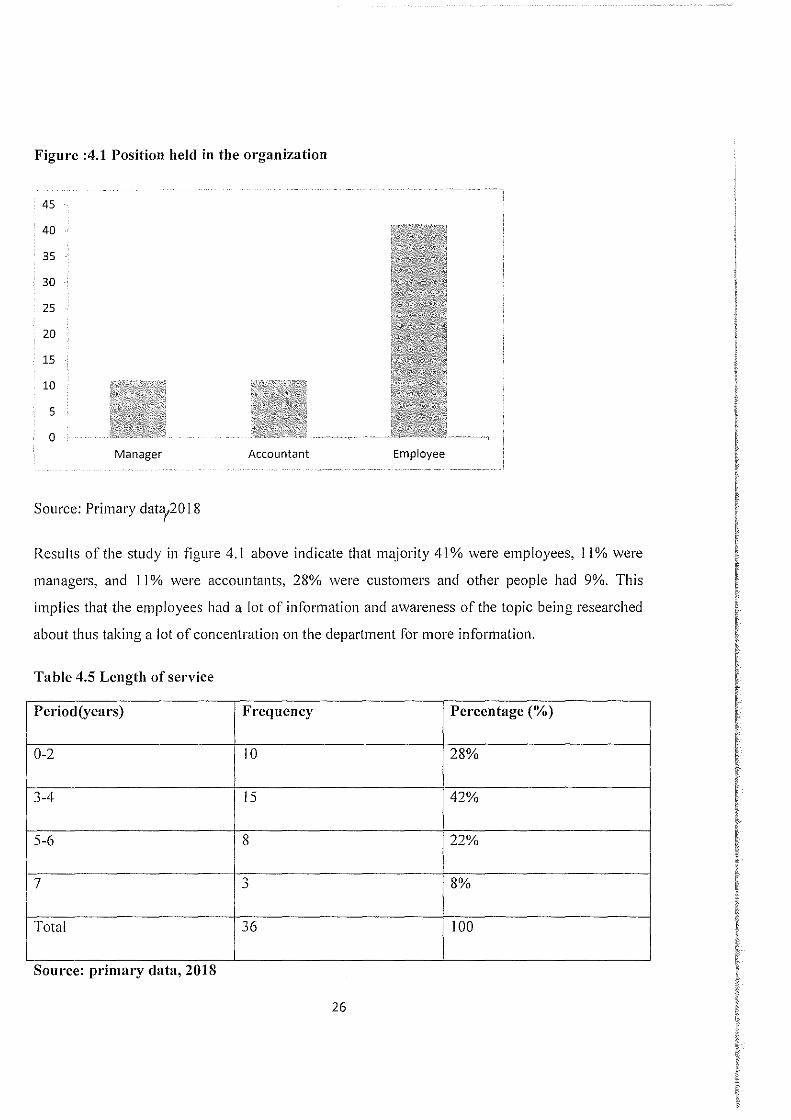
Figure :4.1 Position held in the organization
45
40
35
30
25
20
15
10
5
0 Manager
Source: Primary data12018
Accountant Employee
Results of the study in figure 4.1 above indicate that majority 41 % were employees, 11 % were
managers, and 11 % were accountants, 28% were customers and other people had 9%. This
implies that the employees had a lot of information and awareness of the topic being researched
about thus taking a lot of concentration on the department for more information.
Table 4.5 Length of service
Period(years) Frequency Percentage (%)
0-2 IO 28%
3-4 15 42%
5-6 8 22%
7 0 8% .)
Total 36 100
Source: primary data, 2018
26

According to the table 4.5, the results on the findings revealed that 8% of the employees have
served for more than 7years, 22% have served for 5-6 years, 42% have served for 3-4 years and
28% have served for 2 or less years in the organization. This implies that the study had an
opportunity of varying the ideas of the respondents that had worked for the organization for
different time frames which helped the researcher to get detailed information
about the organization and were familiar with the impact of cost control measures on
organizational performance.
4.3: To assess the different cost control measures put in place in steel and tube.
Table 4.6: showing what cost accounting is according to the organization.
Response Frequency
Attaching a cost on a product or service or operation. 15
Process of accumulating, summarizing and reporting cost data for the 10
preparation of financial reports for external parties.
A form of accounting that enables the business to be conducted more 5
efficiently and effectively.
Providing economic information to managers for achieving 6
organizational goals.
Total 36
Source: primary data, 2018
Percentage
42
28
14
16
100
According to table 4.6, majority 42% of the respondents said cost accounting is attaching a cost
on a product or service or operation, 28% said that it is a process of accumulating, summarizing
and reporting cost data for the preparation of financial reports for external parties, 14% said it is
a form of accounting that enables the business to be conducted more efficiently and effectively.
27

This therefore implies that cost accounting is the attachment of a cost on a product or service or
operation.
Table 4.7: Showing the response on the different classifications of costs in organizations.
Response Frequency Percentage (%)
Nature of expense 15 42
Function 10 28
Variability 5 13
Controllability and normality 6 17
Total 36 100
Source: primary data, 2018
Table 4.7 shows that majority or the respondents 42% classified costs by the nature of the
expense, 28%. classified costs by function, 13% classified costs by variability 17% classified
costs by controllability and normality and none confirmed to variability. This therefore implies
that the organization mainly classifies costs according to the nature of expense.
28

Figure 4.2 showing the response on the different classifications of costs in organizations.
45
40
35
30
25
20
15
10
5
0 Nature of expenses
Source: primary data, 2018
. -- ... --··-··--- -----------
Function Variability Controllability and normality
Figure 4.2 shows that majority of the respondents 42% classified costs by the nature of the
expense, 28%, classified costs by function, 13% classified costs by variability 17% classified
costs by controllability and normality and none confirmed to variability. This therefore implies
that the organization mainly classifies costs according to the nature of expense.
29

Table 4.8: Showing what material and labor costs are in the organization.
Response Percentage
Response Percentage
(Material Frequency Labor costs Frequency (%) (%)
costs)
Cost incurred in Cost of
the form of obtaining 30 83% 29 81%
materials wages and
salaries
Cost of
rece1v111g All costs
materials 6 17% related to 7 19%
within the employment
organization.
Total 36 100 Total 36 100
Source: primary data, 2018
According to table 4.8, majority, 83% responded that material costs is the cost of obtaining
materials and 81 % responded that labor costs is the cost incurred in the form of wages and
salaries, 17% responded that material costs are costs of receiving materials within the
organization; 19 % responded that labor costs are all costs related to employment. This therefore
implies that material costs are costs of obtaining materials and labor costs are costs incurred in
the form of wages and salaries.
30

Table 1: 4.9 Showing the examples of labor and material costs.
Response Frequency Percentage Response Frequency) Percentage
(labor costs) (%) (material (%
costs)
Direct 15 42 Direct 30 83
salaries material costs
Direct wages 12 "" Indirect 6 17 .).)
material costs
Indirect 5 14 - -salaries
Direct wages 4 11 - -
Total 36 100 36 100
.. Source: Researcher field data, 2018
According to the table 4.9 above. majority of the respondents said that direct salaries are the
main example of material costs with 42%, followed by direct wages with 33%, and 14% with
indirect salaries and 11 % with indirect wages. It also indicates that 83% of the respondents
pointed out direct material costs as the example of material costs and the other 17% pointed out
indirect material costs as the other example of material costs. Therefore this implies that the main
example of labor costs is direct salaries and both direct material costs and indirect material costs
are equally examples of material costs.
31

Table 2: 4.10: showing the different_measures of controlling costs within the organization.
Response Frequency Percentage(%)
Renegotiate all contracts annually for whatever reason 10 28%
Ask your customers 20 56%
Hold head count constant 0 8% ~
Match terms with turns 0 8% ~
Total 36 100
Source: Primary data 2018
According to table 4. IO above. majority of the respondents 56% of the respondents supported
asking your customers, 28% supported renegotiating contracts annually for whatever reason, 8%
hold head counts constant and 8% match terms with turns. This therefore implies that asking the
customers of the organization as the main measure of controlling costs within the organization.
32

Figure 4.3 showing the different_measures of controlling costs within the organization.
60
50
40
30
20
10
0 Revegotiate all
contracts annually for
whatever reason
Ask your customers
Hold head count constant
Match terms with turns
Series 1
i
J
According to figure 4.3, majority of the respondents 56% of the respondents supported asking
your customers. 28% supported renegotiating contracts annually for whatever reason, 8% hold
head counts constant and 8% match terms with turns. This therefore implies that asking the
customers of the organi7,ation as the main measure of controlling costs within the organization.
33

4.4 To analyze the relationship between cost control measures and the performance of the
organization.
Table 3: 4.11: showing whether the organization has a costing system in place
Response Frequency Percentage (%)
Yes 30 83%
No 6 17%
Total 36 100
Source: Researcher field data, 2018
According to table 4. I 1 above, majority of the respondents 83% confirmed that the organization
has a costing system in place. 17% of the respondents responded that there is no costing system
in the organization. This therefore implies that the organization has a costing system in place and
therefore costs incurred in the organization are systematically controlled for the performance of
the organization.
34

Figure 4.4 showiug whether the organization has a costing system iu place
Figure showing whether the organization has a costing system in place
Source: primary data, 2018
17% I
Yes
No
According to figure 4.4, majority of the respondents 83% confirmed that the organization has a
costing system in place. 17% of the respondents responded that there is no costing system in the
organization. This therefore implies that the organization has a costing system in place and
therefore costs incurred in the organization are systematically controlled for the performance of
the organization.
35

Table 4.12: showing what a costing system is according to the organization.
Response Frequency Percentage
(%)
The foundation of the internal 7 19
financial systems of managers
Process used by management to plan and control the organization's 29 81
activities and make decisions about the future.
Total 36 100
Source: primary data, 2018
According to table 4.12, majority 8 I% supported a costing system as a process used by
management to plan and control the organization's activities and make decisions about the
future. 19% supported a costing system as the foundation of the internal financial systems of
managers. This therefore implies that a costing system is a process used by management to plan
and control the organization's activities and make decisions about the future.
36

Figure 4.5 showing what a costing system is according to the organization.
90 80 70 60 so 40 30 20 10
0 The foundation of the internal
financial systems of managers
Process used by management to
plan and control the
orgasnisation's actvities and
make decisions about the future.
Source: primary data, 2018
Series 1
According to figure 4.5 majority 81 % supported a costing system as a process used by
management to plan and control the organization's activities and make decisions about the
future. 19% supported a costing system as the foundation of the internal financial systems of
managers. This therefore implies that a costing system is a process used by management to plan
and control the organization's activities and make decisions about the future.
37

Table 4.13: showing the role of organizational costing systems.
Response Frequency Percentage (%)
For cost control by
comparing with 3 8
predetermined unit standard cost
For making costing decisions I 3
For pricing and determine production levels s 81
For planning and controlling the organizations activities. 0 8 J
Total 36 100
Source: primary data, 2018
According to table 4.13, majority 81 % responded that organizational costing systems are mainly
for pricing and determine production levels, 8% responded that they are for planning and
controlling the organization·s activities, 8% responded that they are for cost control by
comparing with predetermined unit standard costs and 3% responded that they are mainly for
making decisions. This therefore implies that the main role of the organizational costing systems
is pricing and determining production levels, followed by planning and controlling the
organizations activities, cost control by comparing with predetermined unit cost and making cost
decisions.
38

Table 4.14: Showing how management determines the price to charge for a given product
or service.
Frequency Percentage
Response (%)
Determine how much it costs to produce and distribute the
product to the customer 14 39
Using prices set by competitors 4 1 I
Using the quality and quantity of the products 13 36
The status of customers to whom the goods are to be sold. 5 14
Total 36 100
Source: primary data, 2018
According to the table, 4.14 majority 39% supported that management determines price of a
product basing on how much it costs to produce and distribute the product to the customer and
also use the quality and quantity of the products. 36% supported that the organization uses the
status of customers to whom goods are being sold and using the price set by customers. This
therefore implies that the organization mainly uses how much it costs to produce and distribute a
product and its quality and quantity. 16% shows the status of customers to whom the goods are
to be sold. Thus 11 % indicates list status of customers to whom the goods are to be sold.
39

Table 4.15: showing the factors that inhibit both time and cost control within the
organization.
Response Frequency Percentage (%)
Design changes 10 28
Risks / uncertainties 13 36
Inaccurate evaluation 9 25
Complexities and non- performance of subcontractors. 4 I I
Total 36 100
Source: primary data, 2018
According to table 4.15, it indicates that majority 36% supported risks or uncertainties 28%
supported design changes, 25% also supported inaccurate evaluation and 11 % supported
complexities and nonperformance subcontractors. This therefore indicates that the leading factor
that inhibits time and cost control within the organization is risks or uncertainties.
Table 4: 4.16: Showing the role of costs forecast at the different levels of activities in the
organization.
Response Frequency Percentage (%)
To determine future sales 6 17
To estimate the organizations profits 20 55
To measure the efficiency and effectiveness of the organization 6 17
To determine the selling price 4 11
Total 36 100
Source: Primary Data 2018
According to table 4. I 6 above, it indicates that majority 55% of the respondents confirmed that
cost forecasts at the different levels of activity are to estimate the organizations profits, 17%
40
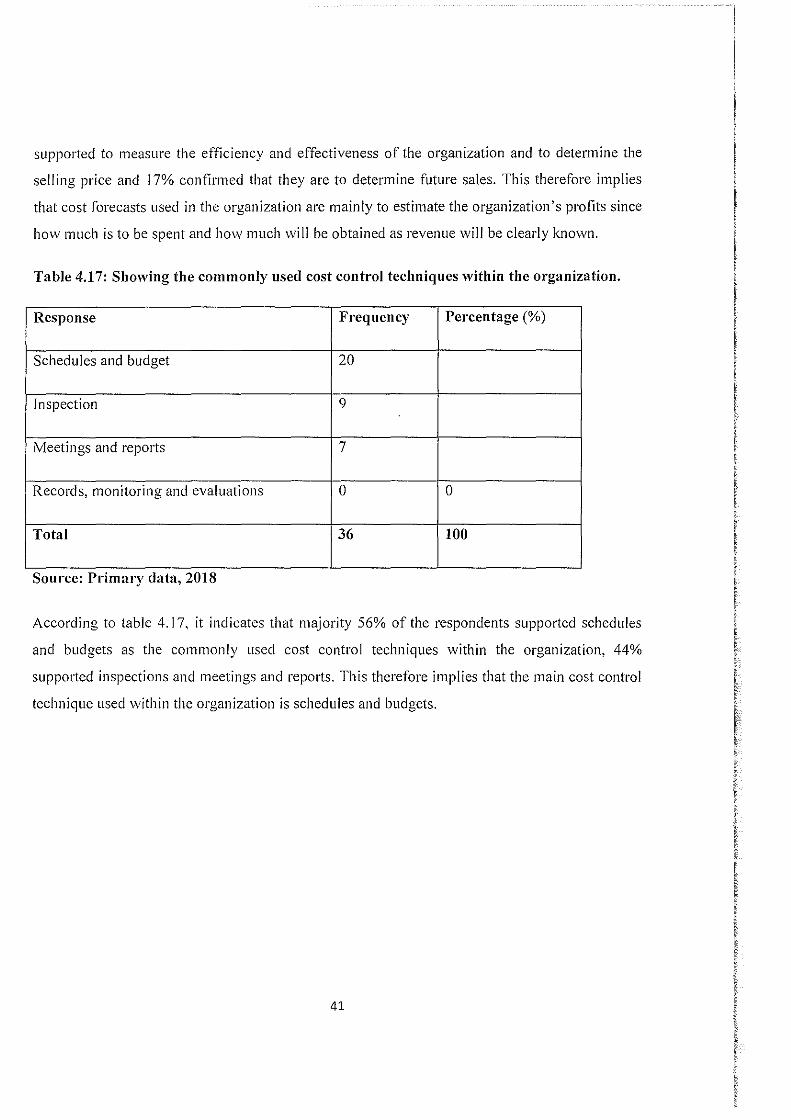
supported to measure the efficiency and effectiveness of the organization and to determine the
selling price and 17% confirmed that they are to determine future sales. This therefore implies
that cost forecasts used in the organization are mainly to estimate the organization's profits since
how much is to be spent and how much will be obtained as revenue will be clearly known.
Table 4.17: Showing the commonly used cost control techniques within the organization.
Response Frequency Percentage(%)
Schedules and budget 20
Inspection 9
Meetings and reports 7
Records, monitoring and evaluations 0 0
Total 36 100
Source: Primary data, 2018
According to table 4.17, it indicates that majority 56% of the respondents supported schedules
and budgets as the commonly used cost control techniques within the organization, 44%
supported inspections and meetings and reports. This therefore implies that the main cost control
technique used within the organization is schedules and budgets.
41

Table 4.18: Showing the challenges to cost controls within the organization.
Response Frequency Percentage(%)
Failure to control the productivity of resources 6 17
Lack of materials and equipment 0 0
Insufficient knowledge on cost control techniques 20 55
Delay to make a decision 10 28
Total 36 100
Source: primary data, 2018
According to the table above table 4.18, it indicates that majority of the respondents 55%
supported insufficient knowledge on cost control techniques as the main challenge to cost
controls within the organisation,28% supported delay in decision making, 17% supported the
failure to control the productivity of resources and none supported the lack of materials and
equipment. This therefore implies that the main challenge to cost control in the organization is
insufficient knowledge on cost control techniques. This is where management should put
emphasis in order to ensure that the cost controls in place are effective.
42

4.5 Other factors affecting the performance of organization
Table 4.19: showing the other factors affecting the performance of steel and tube.
e RESPONSE A b C d f G H i Total
6(16. 20(55.5 Business reputation & 6(16.6 - 4(1 I. I
6 % - - - - 36(100%) image %) %)
%) )
Organizational 29(8 1(2.7 3(8.3 - 3(8.3
management - - 0.5% - - 36(100%) %) %) %)
structures )
10(2 5(13.8 20(55.5 -
Staffing - - 7.7% 1(2.7) - - 36(100%) %)
) %)
Government 15(41 12(33.3 8(22.2 - 4(1 I.I
regulations .6 - - - 36(100%) %) %) %)
%)
7( I 9.4 29(80. Competition - - - - - - - 36(100
%) 5%
15(41. Understanding value 10(27.7 3(8.3 - 8(22.2 36(100
- - - - 6 drivers. %) %)
%) %) %)
Source: primary data, 2018
According to the table 4.19, majority 56% confirmed that business reputation and image result
into trust and image of the customers ,17% supported that it ensures quality products,17%
supported that it sets the limit for the organization and the other 11 % supported it attracts new
customers and improve on customer loyalty.
43

This therefore implies that business reputation affects the performance of the organization
mainly by resulting into trust and confidence of the customers.
81 % of the respondents which is the majority confirmed that organizational management
structures allow the organization to achieve extra ordinary results through ordinary people, 8%
supported resulting into trust and confidence of the customers; translate corporate objectives into
measures that guide managers' actions and assessing value for performance measurement. This
therefore implies organizational management structure affect the performance of the organization
mainly by allowing it achieve extra ordinary results through ordinary people.
56% of the respondents confirmed that staffing ensures quality products, 28% supported
achieving extra ordinary results through ordinary people, 14% suppo1ted attracting new
customers and improving on customer loyalty and 8% supported better ways of doing business.
This therefore implies that staffing affects performance of the organization mainly by ensuring
quality products.
42% of the respondents confirmed that government regulations sets the limits for the
organization, 33% supported ensuring quality products, 22% supported resulting into trust and
confidence of the customers and I I% supported assessing value for performance measurement.
This therefore implies government regulations affect the performance of the organization mainly
by setting the limits for the organization.
81 % of the respondents which is the majority confirmed that competition allows better ways of
doing business for the organization and the 19% supported ensuring quality products. This
therefore implies that competition mainly affects the performance of the organization by
allowing the organization better ways of doing business.
42% of the respondents confirmed that understanding vale drivers affects the performance of the
organization through translating corporate objectives into measures that guide manager's actions,
28% supported ensuring quality products, 22% supported assessing value for performance
measurement and 8% supported setting the limits for the organization. This therefore implies that
understanding value drivers affects the performance of the organization through translating
corporate objectives into measures that guide manager's actions.
44

CHAPTER FIVE
DISCUSSION, SUMMARY, CONCLUSSIONS AND RECOMMENDATIONS
5.0 Introduction
This chapter presents a discussion of the findings, the conclusion reached at and the
recommendations to the cost control measures and .their impact on organizational performance
in relation to steel and tube industries limited.
5.1 Discussion of the findings
5.1.1 The different cost control measures pnt in place at steel and tube.
The findings in table 4.7 indicate that majority 4 1.7% of the respondents confirmed that cost
accounting is attaching a cost on a product or service or operation. This therefore implies that
cost accounting is the attachment of a cost on a product or service or operation and this is mainly
attaching value to the product.
The findings in Table 4.8 show that majority of the respondents (50%) classified costs by the
nature of the expense, 33.3% classified costs by function, 16.7% classified costs by
controllability and normality and none confirmed to variability. This therefore implies that the
organization carries out cost classification and that costs in the organization are mainly classified
by the nature of expense.
The .findings in table 4.9 revealed that majority, 66.7% responded that material costs is the cost
of obtaining materials and 58.3% responded that labor costs is the cost incurred in the form of
wages and salaries. This therefore implies that material costs are costs of obtaining materials and
labor costs are costs incurred in the form of wages and salaries.
According to the table 4.10, majority of the respondents said that direct salaries are the main
example of material costs with 50%, followed by direct wages with 25%. It also indicates that
50% of the respondents pointed out direct material costs as the example of material costs and the
other 50% pointed out indirect material costs as the other example of material costs. Therefore
45

this implies that the main examples of labor costs are direct salaries and wages and both direct
material costs and indirect material costs are equally examples of material costs.
This is in support of their definitions above which indicate salaries and wages for labor costs and
direct material and indirect material costs for the material costs.
According to the findings in table 4.11 above, majority of the respondents 50% supported asking
your customers as the measure for controlling costs within the organization. This therefore
implies that asking the customers of the organization as the main measure of controlling costs
within the organization.
5.2.2 The relationship between cost control measures and the performance of steel and tube
industries.
The findings in table 4.12 revealed that majority of the respondents 83.3% confirmed that the
organization has a costing system in place. This therefore implies that the organization has a
costing system in place and therefore costs incurred in the organization are systematically
controlled for the performance of the organization.
According to the findings in table 4.13, it indicates that majority 66.7% supported a costing
system as a process used by management to plan and control the organization's activities and
make decisions about the future. This therefore implies that a costing system is a process used by
management to plan and control the organization's activities and make decisions about the
future.
The findings 111 table 4.14 indicate that majority 41.7% replied that organizational costing
systems are mainly for pricing and determine production levels, 25% responded that they are for
planning and controlling the organization's activities, 25% responded that they are for cost
control by comparing with predetermined unit standard costs and 8.3% responded that they are
mainly for making decisions. This therefore implies that the main role of the organizational
costing systems is pricing and determining production levels, followed by planning and
controlling the organizations activities, cost control by comparing with predetermined unit cost
and making costing decisions.
46

The findings in table 4.15 reveal that majority 33.3% supported that management determines
price of a product basing on how much it costs to produce and distribute the product to the
customer and also use the quality and quantity of the products. This therefore implies that the
organization mainly uses how much it costs to produce and distribute a product and its quality
and quantity.
According to table 4.16 above, it indicates that majority 41.7% supported risks or uncertainties
as the main factor that inhibits both time and cost control within the organization. This therefore
indicates that the leading factor that inhibits time and cost control within the organization is risks
or uncertainties.
According to table 4.17 above. it indicates that majority 33.3% of the respondents confirmed that
cost forecasts at the different levels of activity are to estimate the organizations profits. This
therefore implies that cost forecasts used in the organization are mainly to estimate the
organization's profits.
According to the findings 111 table 4. I 8, it indicates that majority 50% of the respondents
supported schedules and budgets as the commonly used cost control techniques within the
organization. This therefore implies that the main cost control technique used within the
organization is schedules and budgets.
The findings in table 4.19, it indicates that majority of the respondents 75% supported
insufficient knowledge on cost control techniques as the main challenge to cost controls within
the organization. This therefore implies that the main challenge to cost control in the
organization is insufficient knowledge on cost control techniques.
5.2.3 Other factors affecting the performance of the organization
The findings according to table 4.20, revealed that business reputation and image result into trust
and image of the customers and this was represented by a percentage of 50% , the findings also
revealed that organizational management structures allow the organization to achieve extra
ordinary results through ordinary people, this was represented by a percentage of75%, they also
revealed that staffing ensures quality products and this was revealed by a percentage of50%, the
findings revealed that 58.3% of the respondent s confirmed that government regulation sets the
47

limits for the organization, 83.3% of the respondents which is the majority confirmed that
competition allows better ways of doing business for the organization and the findings also
revealed by a percentage of 41. 7% of the respondents, that understanding vale drivers affects the
performance of the organization through translating corporate objectives into measure that guide
manager's action.
5.2.4 Summary of the findings
There was a high response rate of 80% of the issued questionnaires which were returned fully
answered while the non-response rate of20% which was a small percentage.
Majority of the respondents at 50% were between the age brackets of25-35, 8.3% were between
18-25 years, 25% were between 35-45 year and 16.7% above 45years.
59% of the respondents were male and 41 % were female.
Majority 33.3% were employees, 25% were manager, and 8.3% were accountants, 16.7% were
customers and other people had 16.7%.
Majority 68% had degrees, I 0% had certificates, 15% had diploma, 55 had masters and others
option had 2%.
Most of the respondents 4 I .7% of the employees had served for more than 7years, 33.3% have
served for 5-6 years, 16.7% have served for 3-4 years and 8.3% have served for 2 or less years in
the organization.
5.3 Conclusion to the study
Cost control measures are essential to the organization's so as to ensure that management is able
to plan and control the organizations activities and make decisions about the future, ensure
effective and efficient performance, competitively perform in the industry and ensure that the
right quality of products and services are provided to customers.
Costing system are sound in the organization with the classification of costs according to the
nature of expense and these allow the organization to determine the price for a given product in
the organization.
48

The organization uses cost control techniques such as schedules and budgets, inspection and
meetings and reports to ensure efficiency and effectiveness in their operations.
Skilled and competent accountants in the organization are responsible for controlling costs
within the organization to ensure that the available resources are used for the right cause.
5.4 Recommendations to the study
Based on the findings of this study, the following recommendations were thereby suggested:
The organization should ensure that there are stronger cost control techniques and skilled
employees in place that are able to minimize the costs by proper planning and it should also
employ new and better measures of controlling costs.
The management of the organization should ensure that there is a sound, effective and well
defined organizational structure that clearly indicates all the departments so as to ensure that the
reporting, delegation of duties are easily carried out and costs in relation to each department can
easily be ascertained.
The management should adopt the use of automated computerized accounting systems to capture
the records and transactions of the organization since they reduce on the problems of fraud,
errors and misstatements within the financial records of the organization.
The management of the organization should put in place possible solutions to the challenges to
cost controls within the organization.
5.5 Area for further research
How cost control and remuneration of employees affects the profitability of the organization.
Cost control and competitiveness of the organization.
Cost control measures and the profitability of the organization.
49

REFERENCES
"Cost analysis Qnirani sugar Ltd Project report"
Business Dictionary.comwww.businessdictionary.com/definition/cost control. Html.
Carole L. Kimberlin and Almut G. Winterstein (2008) Validity and Reliability
of Measurement
Chitkara, (2005) cost control techniques.
Clay comb (20 I 0). Strategic cost management. New York:
Free press.
Collin D. (1998) Management and cost accounting 4th edition Janet W (2008).
Collins D, (1998). Management and cost accounting 4th edition.
Cooper, D., & Schindler, P. (2004). Business Research Methods,. New Delhi:
Tata McGraw Hill.
Cooper, Robin, and Reign Slagmudler (2007) "Micro-profit -Centres'' management accounting.
Cooper. Et al (2000). ·'The design of cost management system", New York, prentice
Hall,Upper Saddle River.
Coper, Robin and Robert S. Kaplan (2004) the Design it cost management
systems.
Copper, Robin and Slagmudler (2007) ·'Micro-Profit-centers"
management accounting.
Cost control methods- Buzzlewww.buzzle.com/articles/cost-control-methods.html.
Cost control methods:- Buzzle www.buzzle.com/articles/cost-control -methods.html.
Frank wick (20 I 0). Quick insight in research methodology, Management accounting.
50

Fundamentals of management Accounting computer based assessment
Galdratt, (1984) "Cost accounting" New York, McGraw-Hill inc.
Gavinda Sarah (2009). Strategic Cost Management New York free press.
Hamilton, (2003). "Fundamental of cost accounting" India viva Books private
Ltd 5th edition.
Inhibiting factors and mitigating measure in practice. Construction management
and economics.
Instruments Used in Research. Alv!J Health-Sys/. pharm-Vo/. 65 Dec, I 2008.
Ittner C, Larckor D. (2000) Financial Times! Mastering Management series.
Ittner, C, (2000). "factory and production",London
Dp Pub I ishers.
Jarel W. (2008). Management and Cost Accounting 4th edition.
Kothari C.R. (2014). Research J'vlerhodofogy. New Age International
Publishers India Krejcie,
Larckor D. (2000) "Financial times mastering management series.
Olawale, Y.A, (20 I 0). Cost and Time control of construction project:
Otim. (2008) Cost control techniques
Otim, Nakachwa, and Kyakula (2008). Cost control techniques
Robert .I. Kaplan (2004). The Design of Cost Management System.
Upper Saddler River, N..I: Prentice Hall.
Rotch, et al, (2006). "Management control systems" Chicago,
Irwin publishers.
51

Rotch, Williams, et al (2006). Cases in Management Accounting and Control Systems.
3rd edition. Engle woodcliffs, NS: prentice Hall
Shank, Suhnk and visay Govndasaran (2011 ). "Strategic cost management.
New York:Free press.
Slagmudulder, (2007). "Micro-profit-centers" Management accounting
Stove 0, (2012). "Entrepreneurship ccommonting on business and acomomy"
By sorbes.
Williams, (2000). "Cases in Management Accounting and Control System.
52

Dear Sir/Madam.
APPENDICES
APPENDIX 1
QUESTIONNAIRE
I am Mukonyozi Lucy, a student of Kampala International University undertaking a study on the
''cost control measures and their impacts on the performance of organization" taking steel and
tube in Nakawa as the study.
l have selected you as one of my key respondents in the study. l kindly request you to spare part
of your valuable time and contribute to this study.
Your opinion will be highly confidential and will be used strictly for study purposes.
Thank you for your response.
SECTION A: BACKGROUND INFORMATION
Please put a tick where appropriate.
l. Age.
(a) l 8-25 years D
(b) 35-45 years D
2. Gender
(a) Female D
3. Position
(a) Manager
(b) Accountant
(c) Employee
( d) Customer
D D D D
(b) 25-35 years
( d) Above 45 years
(b)MaleD
(e) Others specify ............................... .
4. Highest level of education
(a) Degree D
53
D D

(b) Diploma
(c) Diploma
(d) Certificate
D D D
(e) Others specify ............................................ .
Section B: Specific questions:
To investigate the influence
5. Duration of work at steel and tube industry.
(a) 0-2 years D (b) 3-4 years D (c) 5-6 years D (d) 78 years and above D
SECTION B:
The different cost control measures
6. For each of the following statement, tick where applicable the extent to which you agree
on what cost accounting is all about place.
SA= strongly agree; A= Agree; NS= Not sure; D= Disagree and SD= Strongly Disagree.
No Statement SA A NS D SA The management Renegotiate all contracts
annually for whatever case
The industry Asks customers annual planning
sessions with customer
The management discuses costs holistically up
and down the supply chains
The management Match terms with the turns
The company Ask vendors to own their
inventory
54

C) Relationship between cost control measnres and the performance of the organization.
No Costs SA A NS D SA
Actual units cost for the latest period could be
used for cost control by comparing with
predetermined unit standard cost.
The forecasts to be incurred at the different
levels of activity could be used for planning for
decision making.
Subsequently go mitigating measures have been
developed for the leading inhibiting factors.
Improve the effectiveness of control of their
projects. as expressed.
D) Factors that affect the performance of the organization
No Costs Material Labour SA A NS D SA
cost cost
Organizational
management structures. the art of management achieving extra ordinary
results through ordinary people.
Competition with
increased rate of growth
and development in
Ugandan industries, very many organizations
have emerged with new
and better ways of doing business.
Government
55

regulations, rules and regulations from the government affect the performance of the organization.
Staffing, employees have a very strong
impact on the performance of an
organization.
The reputation of
business is essential to its survival.
The rate of organizational performance also depends on the techniques issued in the process of sales promotion.
The starting point understands a company's value drivers, the factors that
create stakeholders value.
Most companies track hundred, if not thousands of nonfinancial measures in their day to day operations.
Thank you for your valuable time
56

APPENDIX II: WORK PLAN AND TIMEFRAME
Activity Duration (days/weeks/months) Responsible
Locate Respondents Before I 5'" June 20 I 8 Researcher
Designing Pretesting data Before 22"0 June Researcher
collection tools
Data Collection Before sm July Researcher
Data Coding Before I 5'" July Researcher
Data interpretation and Before 5'" Auaust b Researcher
Reporting
Researcher
Thank you for your valuable time
57

APPENDIX III: BUDGET
Item Item Item Item
Subsistence 3 months 50,000 150,000
Allowance
Travel (Vehicle Hire) 3 months 100,000 300,000
Data Analysis 1 50,000 50,000
Secretarial Services 1 50,000 50,000
(Processing the
research instruments
and reports)
Photocopying 1 20,000 20,000
1 10,000 10,000
TOTAL 280,000 580,000
Thank you for your valuable time
58

(m KAMPALA INTERNATIONAL UNIVERSITY
Ggaba Road, Kansanga• PO SOX 20000 Kampala, Uganda Tel: +256 777 295 599, Fax: +256 (0) 41 - 501 974
E-mail: [email protected], • Website: http: //www.kiu.ac.ug
COLLEGE OF ECONOMICS AND MANAGEMENT DEPARTMENT OF ACCOUNTING AND FINANCE
May, 29th 2018
To whom it may concern
Dear Sir/Madam,
RE: INTRODUCTORY LETTER FOR MUKONYEZI LUCY REG NO 1153-05014-00146
This is to introduce to you the above named student, who is a bonafide student of Kampala International University pursuing a Bachelor's Degree in Business Administration, Third year Second ,:emester.
The purpose of this letter is to request you avail her with all the necessary assistance regarding her research.
Topic: - COST CONTROL MEASURES ON TME ?ERfORMANCE OF INDUSTRIES IN KAMPALA. DISTRICT, NAKAWA DIVISION.
Case Study: - STEEL AND TUBE.
Any information shared with her from your organization shall be treated with utmost confidentiality.

) Steel&T ube 0 Steel & Tube Industries Ltd Deals House, Jinja Road, Nakawa Industrial Area, P.0.Box 33784, l(ampala, Uganda
rll/ Inspired by innovation
To: Ms. Mukonyizi Lucy 0774099506
Dear Lucy
RE: RESEARCH STUDY AT STEEL AND TUBE INDUSTRIES
@ Tel: 0800-300 555 Email: [email protected]
@ Website: www.stil.co.ug
Date: 18th May, 2018 Ref; STIL/field study/KIU
Vve wish to inform you of management's decision to allow you conduct your two day study at Steel and Tube Industries Limited.
0
Please note that for the period indicated above you will be attached to the Finance Department at Nakawa and Namanve You will be expected to provide the company with a graduate Trainee report at the end of the two days field study.
While with us you are expected to fully abide by the company rules and regulations.
We wish to welcome you to Steel and Tube Industries Limited and trust that you will benefit from this program.
Yuurs Faithfully, For; STEEL AND TUBE INDUSTRIES LIMITED
. Kit~-J2 . Namirembe Tamasha A/H4man Resource Administrator
cc. cc.
Human Resource Manager General Manager Finance
• \/ \' 1 ',, • __ , ~ ' \ i1'j ,· • ·.'' -- ,, J ' ·1'v1' : :>~ i L1t:(