Cost-Benefit Analysis of Small-Scale Rooftop PV Systems
18
applied sciences Article Cost-Benefit Analysis of Small-Scale Rooftop PV Systems: The Case of Dragotin, Croatia Mladen Bošnjakovi´ c 1, * , Ante ˇ Ciki´ c 2 and Boris Zlatuni´ c 3 Citation: Bošnjakovi´ c, M.; ˇ Ciki´ c, A.; Zlatuni´ c, B. Cost-Benefit Analysis of Small-Scale Rooftop PV Systems: The Case of Dragotin, Croatia. Appl. Sci. 2021, 11, 9318. https://doi.org/ 10.3390/app11199318 Academic Editors: Isabel María Moreno García, Rafael López Luque and Isabel Santiago Chiquero Received: 12 September 2021 Accepted: 30 September 2021 Published: 8 October 2021 Publisher’s Note: MDPI stays neutral with regard to jurisdictional claims in published maps and institutional affil- iations. Copyright: © 2021 by the authors. Licensee MDPI, Basel, Switzerland. This article is an open access article distributed under the terms and conditions of the Creative Commons Attribution (CC BY) license (https:// creativecommons.org/licenses/by/ 4.0/). 1 Technical Department, University of Slavonski Brod, Trg Ivane Brli´ c Mažurani´ c 2, 35000 Slavonski Brod, Croatia 2 Department of Mechanical Engineering, University North, 104. Brigade 3, 42000 Varaždin, Croatia; [email protected] 3 Glavna 51, Dragotin, 31411 Trnava, Croatia; [email protected] * Correspondence: [email protected] Abstract: A large drop in prices of photovoltaic (PV) equipment, an increase in electricity prices, and increasing environmental pressure to use renewable energy sources that pollute the environment significantly less than the use of fossil fuels have led to a large increase in installed roof PV capacity in many parts of the world. In this context, this paper aims to analyze the cost-effectiveness of installing PV systems in the rural continental part of Croatia on existing family houses. A typical example is a house in Dragotin, Croatia with an annual consumption of 4211.70 kWh of electricity on which PV panels are placed facing south under the optimal slope. The calculation of the optimal size of a PV power plant with a capacity of 3.6 kW, without battery energy storage, was performed by the Homer program. The daily load curve was obtained by measuring the electricity consumption at the facility every hour during a characteristic day in the month of June. As most of the activities are related to electricity consumption, repeating during most days of the year, and taking into account seasonal activities, daily load curves were made for a characteristic day in each month of the year. Taking into account the insolation for the specified location, using the Internet platform Solargis Prospect, hourly data on the electricity production of selected PV modules for a characteristic day in each month were obtained. Based on the previous data, the electricity injected into the grid and taken from the grid was calculated. Taking into account the current tariffs for the sale and purchase of electricity, investment prices, and maintenance of equipment, the analysis shows that such a PV system can pay off in 10.5 years without government incentives. Keywords: residential photovoltaic; self-consumption; self-sufficiency; cost-effectiveness analysis 1. Introduction The use of renewable energy sources for electricity generation is in trend all over the world. However, this is not only on a large scale, with large companies for the production and distribution of electricity, but also on a small or consumer scale. In this sense, rooftop photovoltaic power plants (PVs) take a significant place. Environmental and climate change require action in all key sectors of the economy and strongly encourages the use of renewable energy sources. The European Building Fund currently emits approximately 36% of EU greenhouse gas emissions, and it is key to effectively decarbonizing the atmosphere. Emissions from the construction sector are still higher than in 2014, and the annual rate of energy renovation of buildings in the EU is only about 1%. The EU is trying to overcome these bottlenecks, and there is a new impetus towards rooftop solar installations, with a proven impact on achieving decarbonization and reducing energy demand from the electricity grid. If 90% of Europe’s roof space is known to be unused, using it to install PV systems could make a significant contribution to Europe’s energy transition. Under the moderate scenario, it is possible to install up to 570 GW roof photovoltaic capacity by 2030, which is Appl. Sci. 2021, 11, 9318. https://doi.org/10.3390/app11199318 https://www.mdpi.com/journal/applsci
-
Upload
khangminh22 -
Category
Documents
-
view
9 -
download
0
Transcript of Cost-Benefit Analysis of Small-Scale Rooftop PV Systems

applied sciences
Article
Cost-Benefit Analysis of Small-Scale Rooftop PV Systems:The Case of Dragotin, Croatia
Mladen Bošnjakovic 1,* , Ante Cikic 2 and Boris Zlatunic 3
�����������������
Citation: Bošnjakovic, M.; Cikic, A.;
Zlatunic, B. Cost-Benefit Analysis of
Small-Scale Rooftop PV Systems: The
Case of Dragotin, Croatia. Appl. Sci.
2021, 11, 9318. https://doi.org/
10.3390/app11199318
Academic Editors: Isabel
María Moreno García, Rafael
López Luque and Isabel Santiago
Chiquero
Received: 12 September 2021
Accepted: 30 September 2021
Published: 8 October 2021
Publisher’s Note: MDPI stays neutral
with regard to jurisdictional claims in
published maps and institutional affil-
iations.
Copyright: © 2021 by the authors.
Licensee MDPI, Basel, Switzerland.
This article is an open access article
distributed under the terms and
conditions of the Creative Commons
Attribution (CC BY) license (https://
creativecommons.org/licenses/by/
4.0/).
1 Technical Department, University of Slavonski Brod, Trg Ivane Brlic Mažuranic 2,35000 Slavonski Brod, Croatia
2 Department of Mechanical Engineering, University North, 104. Brigade 3, 42000 Varaždin, Croatia;[email protected]
3 Glavna 51, Dragotin, 31411 Trnava, Croatia; [email protected]* Correspondence: [email protected]
Abstract: A large drop in prices of photovoltaic (PV) equipment, an increase in electricity prices, andincreasing environmental pressure to use renewable energy sources that pollute the environmentsignificantly less than the use of fossil fuels have led to a large increase in installed roof PV capacity inmany parts of the world. In this context, this paper aims to analyze the cost-effectiveness of installingPV systems in the rural continental part of Croatia on existing family houses. A typical example isa house in Dragotin, Croatia with an annual consumption of 4211.70 kWh of electricity on whichPV panels are placed facing south under the optimal slope. The calculation of the optimal size of aPV power plant with a capacity of 3.6 kW, without battery energy storage, was performed by theHomer program. The daily load curve was obtained by measuring the electricity consumption atthe facility every hour during a characteristic day in the month of June. As most of the activities arerelated to electricity consumption, repeating during most days of the year, and taking into accountseasonal activities, daily load curves were made for a characteristic day in each month of the year.Taking into account the insolation for the specified location, using the Internet platform SolargisProspect, hourly data on the electricity production of selected PV modules for a characteristic dayin each month were obtained. Based on the previous data, the electricity injected into the grid andtaken from the grid was calculated. Taking into account the current tariffs for the sale and purchaseof electricity, investment prices, and maintenance of equipment, the analysis shows that such a PVsystem can pay off in 10.5 years without government incentives.
Keywords: residential photovoltaic; self-consumption; self-sufficiency; cost-effectiveness analysis
1. Introduction
The use of renewable energy sources for electricity generation is in trend all over theworld. However, this is not only on a large scale, with large companies for the productionand distribution of electricity, but also on a small or consumer scale. In this sense, rooftopphotovoltaic power plants (PVs) take a significant place.
Environmental and climate change require action in all key sectors of the economyand strongly encourages the use of renewable energy sources. The European BuildingFund currently emits approximately 36% of EU greenhouse gas emissions, and it is keyto effectively decarbonizing the atmosphere. Emissions from the construction sector arestill higher than in 2014, and the annual rate of energy renovation of buildings in the EU isonly about 1%. The EU is trying to overcome these bottlenecks, and there is a new impetustowards rooftop solar installations, with a proven impact on achieving decarbonizationand reducing energy demand from the electricity grid.
If 90% of Europe’s roof space is known to be unused, using it to install PV systemscould make a significant contribution to Europe’s energy transition. Under the moderatescenario, it is possible to install up to 570 GW roof photovoltaic capacity by 2030, which is
Appl. Sci. 2021, 11, 9318. https://doi.org/10.3390/app11199318 https://www.mdpi.com/journal/applsci

Appl. Sci. 2021, 11, 9318 2 of 18
a big step forward since installed 137 GW in 2020 [1]. Solar PV power plants on buildingsin the EU could produce between 680 TWh and 1300 TWh. This represents a significantuntapped potential for the growth of the solar energy market and job creation.
In order to exploit this potential of solar roofs, EU Member States need to designsupport programs for citizens and businesses wishing to install solar energy [1].
Studies specifically focused on rooftop photovoltaic power plants claim that almost25% of Europe’s electricity consumption could be generated from these facilities. Of course,the results depend on various factors, such as investment costs, electricity tariffs, subsidies,and government policies. [2,3].
In 2019, Germany had the most installed PV capacity per capita in the EU (651 W/capita),followed by the Netherlands (539 W/capita) and Belgium (466 W/capita).
Croatia has set a goal of reaching 300 MW of installed PV capacity by small consumers-producers of electricity by 2030 with a tax exemption for self-consumed electricity. Most ofthe capacity is planned for photovoltaic systems in buildings. This is only 198 W/capita,which is the lowest of all countries in the region and far lower than the EU average plannedat 758 W/capita [1].
The cumulative installed capacity of solar power plants in 2020 in Croatia is 166 MW,so we estimate that the planned increase in capacity by 2030 is very modest, and this meansa further lagging of Croatia behind neighboring countries.
The decline in the cost of solar photovoltaic systems, combined with the increase inelectricity costs, has increased the use of roof PV systems for their consumption in manyparts of the world in recent years. Own consumption, which is a completely differentsystem of production and consumption of electricity compared to the traditional system ofproduction of electricity in large power plants, allows consumers to produce and consumetheir electricity. The main advantages of this system are increased energy autonomy andreduced energy costs.
Production of electricity from renewable sources for own consumption creates im-mediate positive effects, such as a reduction of grid energy losses and reduced need formodernization of electricity infrastructure by integrating renewable distributed genera-tion into the electricity system. Green energy, thanks to the growing success of its ownconsumption, plays a strategic role in the energy transition model aimed at combiningtechnological innovation with health, environmental, and economic benefits as well as jobcreation [4].
It can also be said that self-consumption of photovoltaic (PV) energy is an economicmodel in which the building uses the produced PV electricity for its own needs, acting at thesame time as a producer and a consumer, or as a “prosumer”. The neologism “prosumer”refers to a user of electricity who produces electricity to support his own consumption(and perhaps to inject into the grid). The word was built on the association of “producer”and “consumer” and is widely used today. Two ratios are important for own consumption:self-consumption (SC) and self-sufficiency (SS).
SC is defined as the amount of locally produced and consumed electricity (Elgc) withrespect to total local electricity production (Egen) [4]:
SCx =Elgc,x
Egen,x, (1)
where x is the reference time interval for which the ratio is calculated. The interval can beone day, month, or year.
SS is the amount of consumption delivered by local production (Elgc), given the totalconsumption (Eload). Thus, it quantifies the independence of users from the grid [4] and iscalculated according to:
SSx =Elgc,x
Eload,x, (2)

Appl. Sci. 2021, 11, 9318 3 of 18
In practice, SC and SS can be from a few percent to theoretically 100%, depending onthe capacity of the photovoltaic system and the user load profile.
The question of the ratio of own consumption is deeply connected with the questionof whether to invest in the installation of a roof PV system or not. The higher the SC,the higher the profitability of the whole system, since the retail prices of electricity aresignificantly higher than the purchase prices of electricity. However, in the householdsector, the amount of PV energy produced and the amount of consumption in certain timeintervals rarely coincide, which implies that only a limited part of PV-produced electricitycan be used for own consumption. For example, Luthander et al. [5] state that the averageshare of direct own consumption is about 30%. In this context, battery-powered energystorage systems allow for increases in SC levels by storing excess solar energy producedthat will be used later (i.e., indirect own consumption). Luthander et al. also state that itis possible to increase your own consumption between 13% and 24% by using a batterysystem with a capacity of 0.5–1 kWh per installed kW PV system.
Own consumption of PV electricity assumes that the costs of photovoltaic electricityproduction are lower (at the time of capital investment or during the lifetime of the rooftopPV plant) than the cost that the consumer pays for electricity from the grid. Withoutreaching this threshold, own consumption requires state support. The indication that gridparity has been achieved could mean that the production of electricity, rather than itspurchase from the grid, is profitable. This is not the case for several reasons, which will beexplained below. It can be said that network parity is a milestone but not a guarantee ofthe competitiveness of roof PV systems.
Grid parity is actually the moment when the levelized cost of energy (LCOE) becomeslower than the retail price of electricity. If certain grid costs and fees cannot be compensated(for example, due to a higher fixed part of the grid excise duty), grid parity is not achievedwhen the price of electricity from PV becomes lower than the retail price of electricity fromthe grid. PV electricity prices need to be further reduced to reach this first measure ofcompetitiveness. Moreover, since part of the produced PV electricity is exported to thegrid and valued at a lower price than the retail price, PV LCOE must be further reduced toensure the competitiveness of PV electricity.
Most of the studies conducted were driven by promises of solar PV grid parity [6]and declining battery storage prices [7]. Despite the increase in own consumption andself-sufficiency, most papers claim that PV systems with batteries will not be profitable ifbattery prices do not fall significantly [8–12] with an increase in the price of electricity fromthe grid [13]. It should also be taken into account that the lifespan of battery systems isabout 10 years, so it is necessary to change the battery system once or twice. According tothe authors, taking into account both technological progress and rising electricity prices,battery systems will not be profitable before 2030 without government incentives.
According to Klamkaa et al. [14], the cost-effectiveness analysis suggests that most ofthe savings potential comes from direct own consumption of PV, and therefore relates tothe cost of electricity. The inclusion of a heat storage system and/or a battery system doesnot pay off when comparing savings and investment costs, at least at current prices.
An additional impetus to the development of own consumption comes from theincreasing production of electric vehicles and support for their charging, which will enablethe application of V2G technology (vehicle-to-grid). In this sense, electric vehicles willenable the storage of part of the electricity produced by their own PV system. However,one should be careful here because the working population is at work at a time when thelargest production of PV systems and cannot charge cars at that time but only on weekends.
A zero-energy building (ZEB) is a concept that is applied in buildings with a balancebetween energy production and consumption and close to zero energy or even positivein a typical year. Photovoltaic technology can play a leading role in achieving the goalof ZEB because it is one of the best-positioned technologies for increasing the energyself-sufficiency of buildings.

Appl. Sci. 2021, 11, 9318 4 of 18
The integration of PV systems into the electrical grid, in general, increases the complex-ity of grid management [15]. The variability of solar energy concerning weather conditions(along with variability on the load side) makes it difficult to manage PV production andconsumption and requires special procedures to balance the system. These difficulties canbe alleviated by the simultaneous development of:
• Energy storage system;• Smart electrical grids with optimized energy and power management;• Method of predicting renewable production and consumer consumption.
However, the volatility of energy production and variability of the load can cause anunstable power supply and high peak load [16]. Moreover, the planned mass deployment ofelectric vehicles can lead to a significant increase in the peak load of electricity demand [17]but can also be considered valuable parts of a smart grid [18].
One solution is to align consumption with solar production, as consumption in thebuilding sector is generally not synchronized with the production of the PV system. Energystorage in this sense can help a lot in solving these problems [19]. The timing of householdappliances in smart homes can be applied depending on variations in electricity prices, aswell as on consumer loads [20] or external conditions [21]. Samadi et al. [22] proposed amodel that schedules the time operation of household appliances in a system with PV pro-duction. The authors apply dynamic programming to schedule the operation of householdappliances and use game theory to sell excess energy produced. Sheraz et al. [23] proposeda house energy management system in which they incorporated a genetic algorithm, acuckoo search algorithm, and crow search algorithms. Aslam et al. [24] propose a homeenergy management system, which implements a load transfer strategy and coordinatesthe timing of household appliances.
This paper analyzes the cost-effectiveness of using a roof grid-connected PV systemwithout battery storage in the rural continental part of Croatia on an existing family housein Dragotin, Croatia. An analysis of the monthly electricity bills established that the househas an annual consumption of 4210 kWh of electricity.
2. Materials and Methods2.1. Meteorological Data for the Selected Location
The analyzed photovoltaic system was installed on the sloping roof of a residentialbuilding in Dragotin, Croatia. The PV modules are facing south and there is no shading ofthe modules. The PV modules are mounted on brackets at a roof angle of 35◦, thus enablingrear ventilation. The PV system is directly connected to the low voltage network via aninverter. The paper does not consider the storage of electricity using a battery system.Meteorological data were taken using the Solargis Prospect application [24] and are shownin Table 1 and Figures 1–3.
Table 1. Long-term annual average data for city Dragotin [24].
Feature Value Unit
Direct normal irradiation 1237.6 kWh/m2
Global horizontal irradiation 1332.7 kWh/m2
Diffuse horizontal irradiation 620.4 kWh/m2
Global tilted irradiation at the optimum angle 1549.1 kWh/m2
Annual average air temperature at height of 2 m 12.1 ◦CThe optimum tilt of PV modules 35 ◦
Terrain elevation 136 m
Appl. Sci. 2021, 11, 9318 5 of 18
Figure 1. Global tilted irradiation at the optimum angle for Dragotin [24].
Figure 2. The average GTI and average monthly temperatures for Dragotin [24].
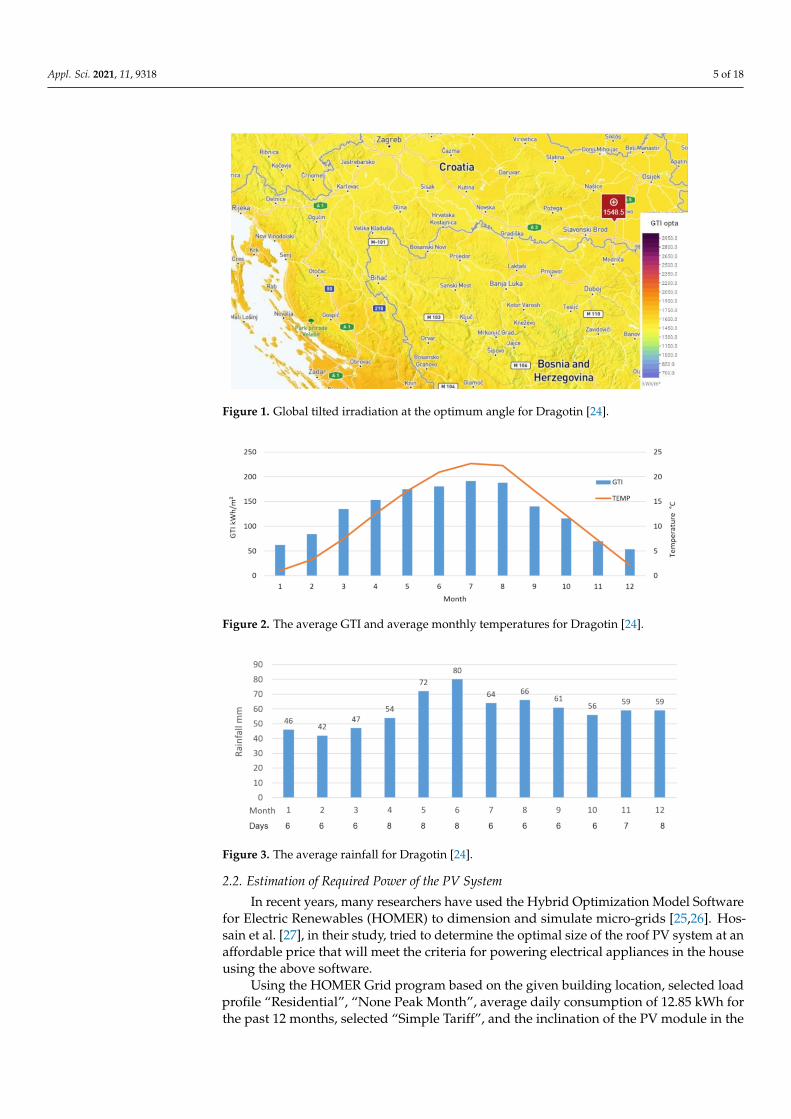
Figure 3. The average rainfall for Dragotin [24].
2.2. Estimation of Required Power of the PV System
In recent years, many researchers have used the Hybrid Optimization Model Softwarefor Electric Renewables (HOMER) to dimension and simulate micro-grids [25,26]. Hos-sain et al. [27], in their study, tried to determine the optimal size of the roof PV system at anaffordable price that will meet the criteria for powering electrical appliances in the houseusing the above software.
Using the HOMER Grid program based on the given building location, selected loadprofile “Residential”, “None Peak Month”, average daily consumption of 12.85 kWh forthe past 12 months, selected “Simple Tariff”, and the inclination of the PV module in the

Appl. Sci. 2021, 11, 9318 6 of 18
amount of 35◦ and azimuth 0◦, the simulation determined that the required power of thePV system for the selected object was 3.58 kW or approximately 3.6 kW.
2.3. Facility and Equipment
The PV power plant is placed on the roof of a courtyard building that stands at 35◦
facing south without deviation. The roof is covered with trapezoidal sheet metal and thereis no shading of the building. The courtyard building was chosen because of its southorientation and the ideal angle for placing the PV module, which is not the case with theroof of the house facing east/west. The following equipment was selected for the 3.6 kWpower plant:
Solar module Jetion 450 W JT450SGH;The power converter HUAWEI SUN2000L-3.68KTL;Installation equipment (roof racks, cables, connectors).The technical characteristics of the selected equipment are defined in Tables 2 and 3.
Table 2. Technical characteristics of the Jetion module 450 W JT450SGH [28].
Feature Label Value
Efficiency ηM 20.4%Temperature coefficient of voltage change β −0.3%/◦C
Temperature range of the module application tmin ∼ tmax −40 ◦C do 85 ◦CModule area AM 2.21 m2
Table 3. Technical characteristics of inverters HUAWEI SUN2000L-3.68KTL [29].
Feature Value
Maximum input power 4968 WRated output power 3680 W
Output voltage range 220–240 VMaximum efficiency 98.6%European efficiency 97.3%
Required number of modules for the 3.58 kW system:
n =PPV
PMPP=
3.580.45
= 8 (3)
Required surface for mounting the PV module:
APV = AM × n = 2.21 × 8 = 17.68 m2 (4)
Due to the relatively small number of modules and the shape of the roof, the modulesare installed in one row. A compatibility check determined that the selected PV modules arecompatible with the selected inverter. The roof area on which the PV modules is installed is50 m2 and meets the required area for the installation of the PV module, which is 17.68 m2.A 3-D model of the building is shown in Figure 4.

Appl. Sci. 2021, 11, 9318 7 of 18
Figure 4. Three-dimensional view of the building with installed PV modules.
2.4. Equipment Costs
According to the current market situation in the Republic of Croatia, the price for theJetion 450 W JT450SGH solar module ranges from €218 to €315 depending on the supplier,and the price for the HUAWEI SUN2000L-3.68KTL inverter ranges from €960 to €1143.The costs of the other components are shown in Table 4. The installation of a 3.6 kW PVpower plant costs €835. The price includes connection connectors, fuses with a suitablebox, and documentation required to submit a request to company HEP for the installationof electricity meters (Table 4).
Table 4. Investment costs by purchasing components at the lowest prices on the market.
Component/Service No ofPieces Length (m) Price per
Piece/m (€)Total Cost
(€)
Solar module, monocrystalline, 450 W 8 218.30 1746.40Inverter 1 960.00 960.00
Module holders 32 1.41 45.12DC cables 1 20 1.58 31.60AC cables 1 50 1.58 79.00Assembly 835.00
Installation of electricity meters 347.00Quality control with a report 200.00
Total investment cost € 4243.72Total investment cost €/kW 1178.81
Total investment costs vary significantly depending on the type of installation, thecapacity of the PV system, and the country in which the system is installed, but declinerapidly [30,31]. For example, in 2020, in Switzerland, the cost of investment of roof PVsystems was 2125 €/kW, in France 1554 €/kW, in Germany 1360 €/kW, in Italy 1180 €/kW,in India 555 €/kW, in China 630 €/kW, and in Australia 1214 €/kW [32]. The investmentcosts of large PV systems are significantly lower. In Europe, the cost ranges from € 600/kWin the Czech Republic to € 1040/kW in Ireland.
To determine the payback period, it is necessary to determine the profile of theaverage daily load for the analyzed facility and the profile of the average daily productionof electricity for the selected PV system, which is described below.
2.5. Creating a Daily Grid Load Profile
Daily load profiles were recorded on an existing building, for which a Uni-trendUT-203+ measuring instrument was used, which was used to measure current and voltagein time intervals of 30 min to obtain an hourly load curve. Figure 5 shows a typical averagedaily load curve for the month of July.

Appl. Sci. 2021, 11, 9318 8 of 18
Figure 5. Hourly load curve.
The area under the curve shows the daily electricity consumption for a household inWh. From the picture, it is possible to read the peak power of that day, which is 2169 W.
2.6. Insulation and Electricity Produced from PV Systems
Data on insolation and electricity production required for cost-effectiveness analysiswere taken from the report prepared using Solargis Prospect [24] for the Dragotin locationaccording to the given parameters. These data are shown in Table 5, taking into accountlosses in the system. Losses in the PV system that occur during energy conversion aredifficult to quantify accurately, but it is important to take them into account when designingand installing the system.
Table 5. Average daily electricity production (Wh) [24].
Hours January February March April May June July August September October November December
0–1 0 0 0 0 0 0 0 0 0 0 0 01–2 0 0 0 0 0 0 0 0 0 0 0 02–3 0 0 0 0 0 0 0 0 0 0 0 03–4 0 0 0 0 0 0 0 0 0 0 0 04–5 0 0 0 1 14 31 18 0 0 0 0 05–6 0 0 1 48 159 188 157 70 12 0 0 06–7 0 0 93 325 479 507 466 387 263 98 4 07–8 34 181 544 811 957 998 969 910 750 593 221 348–9 407 618 1042 1320 1435 1489 1479 1455 1235 1082 679 413
9–10 721 959 1448 1712 1833 1878 1878 1903 1616 1458 996 71710–11 891 1173 1688 1966 2056 2099 2131 2181 1849 1679 1163 85411–12 964 1297 1801 2047 2108 2118 2193 2280 1952 1769 1239 91412–13 1005 1330 1781 2007 2038 2086 2161 2228 1912 1713 1211 89813–14 897 1250 1623 1787 1823 1897 1967 2026 1668 1453 1029 75914–15 662 944 1270 1460 1514 1593 1690 1701 1310 1060 700 52115–16 271 603 882 1048 1118 1210 1290 1258 883 598 244 16016–17 3 193 452 600 679 774 817 742 428 87 0 017–18 0 0 46 173 275 342 363 261 40 0 0 018–19 0 0 0 4 49 123 110 20 0 0 0 019–20 0 0 0 0 0 7 3 0 0 0 0 020–21 0 0 0 0 0 0 0 0 0 0 0 021–22 0 0 0 0 0 0 0 0 0 0 0 022–23 0 0 0 0 0 0 0 0 0 0 0 023–24 0 0 0 0 0 0 0 0 0 0 0 0
Total 5856 8549 12,673 15,310 16,536 17,339 17,691 17,423 13,918 11,590 7486 5268Days inmonth 31 28 31 30 31 30 31 31 30 31 30 31
MonthlykWh 181.5 239.4 392.9 459.3 512.6 520.2 548.4 540.1 417.6 359.3 224.6 163.3
The most important losses to be considered are according to [33,34]:
(a) Losses in the inverter;(b) Ohmic losses that occur as a result of resistance to current flow from the AC side of
the inverter and in the cables;

Appl. Sci. 2021, 11, 9318 9 of 18
(c) Losses due to dust or snow on the surface of the PV module;(d) Losses of auxiliary devices.
For a given PV system and object location, theoretical losses are defined and shown inFigure 6.
Figure 6. Theoretical losses in a given PV system [24].
The average daily production and consumption of electricity for each month is calcu-lated based on the measured hourly electricity consumption and hourly electricity produc-tion (according to Table 5). The profile with 1-h time steps is most often applied [35,36].Figure 7 shows an example of the electricity consumption and production profile for themonth of January.
Figure 7. Average hourly profile of electricity consumption and production for July.
The choice of the measurement time interval has an impact on the appearance of theelectricity consumption profile, i.e., on the results of the analysis. Steps of 5 min, 15 min,and 1 h are mentioned in the literature. The longer the time step, the higher the amountsfor (SC) and (SS). The difference between (SC) for a step of 5 min and 1 h on an annual basiscan be 3.2%, while daily it can be more than 5% [4]. Accordingly, for our case of selecting atime step of 1 h, it can be assumed that the error in the analysis results does not exceed 5%.
In general, production and consumption profiles rarely match, leading to a low SS orSC value. In the case of excess electricity (production greater than consumption), unused

Appl. Sci. 2021, 11, 9318 10 of 18
electricity can be injected into the electricity grid or dissipated, resulting in low SC. Incase of insufficient production of electricity from the PV system, energy is taken from theelectricity grid, which leads to low SS. Maximizing SC along with SS is the goal of the user.
In Croatia, self-production is associated with renewable production and high-efficiencycogeneration for facilities with a capacity of <500 kW. The Renewable Energy Act obligessuppliers to purchase surplus electricity injected into the grid. In doing so, prosumers canhave one of the following two statuses:
Self-supply plant user: a final customer of electricity of the household category whohas a self-supply plant from renewable energy sources or high-efficiency cogenerationconnected within his installations, whose surplus energy within the billing period can betaken over by a supplier or market participant with a contract, provided that within thecalendar year, the amount of electricity that he delivered to the grid is less than or equal tothe electricity taken from the grid.
End customer with own production: the end customer of electricity to whose installationthe production plant for the production of electricity from renewable energy sources orhigh-efficiency cogeneration is connected, which meets the needs of the end customer andwith the possibility of delivering surplus electricity to the distribution grid. In this case,within a calendar year, the amount of electricity injected into the grid is usually higher thanthe electricity taken from the grid.
In our case, the purchase price of electricity is determined according to the principleof the customer with its own production and is calculated by the term given by thecompany HEP Ltd., i.e., according to the Renewable Energy Sources and High-EfficiencyCogeneration Act. According to the same law, the billing period is one month. In the casewhere more energy is taken from the grid than sent to the grid, expression (5) applies:
Ci = 0.9 × PKCi (5)
In the case where more energy is injected into the grid than taken from the grid,expression (6) applies:
Ci = 0.9 × PKCi ×Epi
Eii(6)
where:Ci Purchase price of electricity;PKCi The average unit price of electricity without excise duties;Epi Electricity is taken from the grid;Eii Electricity delivered to the grid.
The cost-effectiveness of PV systems is to a lesser extent affected by the decline in theefficiency of the PV module that occurs throughout the life of the system. The amountof efficiency drop is shown in Figure 8. For the first year of operation of the system, thedegradation of module properties is 0.8%, and for other years 0.5%.
Figure 8. Decrease in efficiency over the life of the PV system (%) [24].

Appl. Sci. 2021, 11, 9318 11 of 18
3. Results and Discussion
The average daily data of insolation and electricity production were calculated for eachmonth of the year using Solargis Prospect [24]. Global tilted irradiation is 1549 kWh/m2
per year and total photovoltaic power output is 4559 kWh per year.Average load values are approximately the same for each month due to routine
household activities that are the same almost every day. Even differences in electricityconsumption on Sundays and other days of the week can be ignored. Only in September,there are additional seasonal activities that affect electricity consumption and that are takeninto account. Figure 9 and Table 6 show the production and load at the average daily levelfor January for 24 h.
Figure 9. Load and energy production at the average daily level for January.
Table 6. Energy production and load at the average daily level for January.
Timeh Production Wh Load
WhFrom Grid
WhInjection to
Grid Wh
0–1 0.00 70.00 70.00 0.001–2 0.00 70.00 70.00 0.002–3 0.00 70.00 70.00 0.003–4 0.00 70.00 70.00 0.004–5 0.00 70.00 70.00 0.005–6 0.00 70.00 70.00 0.006–7 0.00 337.76 337.76 0.007–8 0.00 233.65 233.65 0.008–9 34.07 1196.55 1162.48 0.00
9–10 407.27 347.94 0.00 59.3310–11 721.39 333.32 0.00 388.0711–12 890.83 1046.32 155.49 0.0012–13 963.72 2051.42 1087.70 0.0013–14 1004.94 2169.17 1164.23 0.0014–15 897.39 698.89 0.00 198.5015–16 661.95 127.34 0.00 534.6116–17 271.23 307.60 36.37 0.0017–18 3.47 461.38 457.91 0.0018–19 0.00 280.36 280.36 0.0019–20 0.00 315.26 315.26 0.0020–21 0.00 258.62 258.62 0.0021–22 0.00 221.56 221.56 0.0022–23 0.00 70.00 70.00 0.0023–24 0.00 70.00 70.00 0.00Total 5856.26 10,947.14 6271.39 1180.51
Analogously, data can be obtained on an average daily basis for all 12 months of theyear. Below are graphical representations of data for the months of July and the month ofSeptember (Figures 10 and 11) as characteristic months.

Appl. Sci. 2021, 11, 9318 12 of 18
Figure 10. Load and energy production at the average daily level for July.
Figure 11. Load and energy production at the average daily level for September.
Based on the calculated data for all months of the year and taking into account theduration of the higher and lower tariff, summary data can be obtained for all months(Table 7) and the whole year (Table 8). Electricity meters register energy delivered tothe grid and energy taken from the grid. The amount of electricity taken from the gridor delivered to the grid is calculated for each hour as the difference between load andelectricity production. The values of daily energy generated by photovoltaic installation,daily energy imported and exported to the network (assuming current net metering),self-sufficiency (SS), and own consumption (SC) can be defined using Table 7 and Figure 7.
Table 7. Average monthly values of energy.
Month Load kWh ProductionkWh
From Grid kWhTo Grid
kWhConsumptionfrom PV kWh
SC % SS %HigherTariff
LowerTariff
January 339.36 181.54 159.71 34.70 36.60 144.95 79.8 42.7February 306.52 239.36 111.04 31.34 75.23 164.14 68.6 53.5
March 339.36 392.85 69.68 34.67 157.84 235.01 59.8 69.3April 328.41 459.29 36.88 32.12 199.87 259.42 56.5 79.0May 339.36 512.62 34.79 22.49 230.53 282.09 55.0 83.1June 328.41 520.16 28.42 20.36 240.53 279.63 53.8 85.1July 339.36 548.42 28.48 22.40 259.94 288.48 52.6 85.0
August 339.36 540.11 33.51 25.67 259.93 280.18 51.9 82.6September 544.41 417.55 128.15 115.69 116.98 300.57 72.0 55.2
October 339.36 359.30 86.56 32.03 138.54 220.77 61.4 65.1November 328.41 224.57 130.64 33.58 60.38 164.20 73.1 50.0December 339.36 163.32 169.30 34.70 27.96 135.36 82.9 39.9
Total 4211.70 4559.11 1017.16 439.75 1804.32 2754.79 60.4 65.4

Appl. Sci. 2021, 11, 9318 13 of 18
Table 8. Data on energy consumption and production on an annual basis.
Electricity With PV System No PV System
Higher tariff (kWh) 1017.16 3710.92Lower tariff (kWh) 439.75 500.13
Total 1456.91 4211.05To grid (kWh) 1804.32 −
The traditional definition of self-consumption says that photovoltaic energy is con-sumed instantly or within 15 min. Instead, net metering can be applied to dispose ofsurplus PV energy in the grid over a longer period of time (“store” in the grid), and use inperiods of insufficient PV production, thus increasing self-consumption.
The most general definition of net metering policy is the permission given to utility-related consumers to compensate for their consumption by injecting their own surpluselectricity into the grid and creating loans that can be used later. Although the generaldefinition is clear, net metering policy varies from country to country. For example,the policymaker should decide on elements, such as the policy objective (promote theadoption of a distributed grid system or guarantee the financial sustainability of utilities),compensation scheme (in energy or money), minimum technical requirements of theplant to guarantee distribution generation quality, financial mechanisms (if any) and theway it is financed, and the like. The net metering/net billing policy is essential for thecost-effectiveness of PV roofing systems.
Various net metering/net billing schemes have been analyzed in the literature, rangingfrom instantaneously net metering to 1-year net metering [37–39]. According to [37],significant compensation of electricity taken from the grid can be achieved for a period of 1day or more. If net metering is used annually, excess PV production during the summercan be injected into the grid and used in the winter months. For the object analyzed in thispaper, the results for different net measurement schemes are shown in Table 9.
Table 9. Energy injection to grid and energy consumption from grid for different net metering schemes.
Net Metering Scheme Grid Injection (kWh) Grid Consumption (kWh)
1 h 1804 14571 month 1048 5541 year 347 0
As can be seen, the longer the net metering/net billing period, the lower the valuesof energy consumed from the grid to be paid to the electricity supplier. In the case ofthe application of annual net metering, the energy consumed from the grid can be equalto zero, and this incentive scheme allows compensation of production and consumptionduring the year. This value increases as the time frame decreases, but in any case, the totalenergy injected into the grid is greater than that consumed from the grid. These resultssuggest that depending on the legislation of each country, adjusting demand to productionmay be more or less critical. In the worst case, when it is not possible to compensate forthe energy produced (instantaneously balances), the percentages of self-consumption andself-sufficiency can only be improved by some kind of consumption management. At best,the grid acts as a system for storing all the excess energy produced from the PV system [37].
Payback Time
The investment for a 3.6 kW PV power plant totals €4243.72. The PV system isconnected to the electricity grid via a home installation without incentives. From thenetwork 1456.92 kWh of energy is taken and 2754.14 kWh of energy is taken from thePV system. Into the network is injected 1804.32 kWh from the PV system. The price ofelectricity with VAT 13% [40] for a higher tariff is 0.139 €/kWh, and for a lower tariff 0.076€/kWh. The annual cost of energy in case without a PV system (acc. Table 8) is:

Appl. Sci. 2021, 11, 9318 14 of 18
Higher tariff 3710.92 × 0.139 = €515.24 (88.12%)Lower tariff 500.13 × 0.076 = €38.05 (11.88%)Total: = €553.29
The annual cost of energy in case with a PV system (acc. Table 8) is:
Higher tariff 1017.16 × 0.139 = €141.23 (69.82%)Lower tariff 439.75 × 0.076 = €33.47 (30.18%)Total: = €174.70
The time of return on investment can be significantly affected by the price of electricitythroughout the life of the PV system. Compared to the other EU Member States, the priceof electricity in Croatia is currently quite low, as can be seen from Figure 12. This impliesthat it is possible to increase prices over time, which shortens the payback time. The shareof taxes and VAT in the price of electricity (Figure 13), i.e., their changes, may also have acertain impact on the return on investment.
Figure 12. Electricity prices for household consumers, second half 2020 (EUR/kWh) [41].
Figure 13. Share of taxes and levies paid by household consumers for electricity, second half 2019 [41].
The calculation of the purchase price according to the accounting period of 1 month forthe whole year was performed according to expressions (5) or (6), and is shown in Table 10.The average unit price of electricity without excise duties (PKCi) is 0.0627 €/kWh [40]).

Appl. Sci. 2021, 11, 9318 15 of 18
Table 10. Calculation of profit for sold surplus electricity.
Month From GridkWh
To GridkWh Expression The Purchase Price
€/kWhProfit
€
January 194.41 36.60 5 0.056 2.07February 142.38 75.23 5 0.056 4.25
March 104.35 157.84 6 0.0374 5.89April 69.00 199.87 6 0.020 3.90May 57.28 230.53 6 0.0147 3.23June 48.78 240.53 6 0.012 2.75July 50.88 259.94 6 0.0107 2.87
August 59.19 259.93 6 0.0133 3.34September 243.84 116.98 5 0.056 6.61
October 118.59 138.54 6 0.048 6.70November 164.22 60.38 5 0.056 3.41December 204.00 27.96 5 0.056 1.58
Total 1456.91 1804.32 46.60
Profit for surplus electricity delivered to the grid: €46.60Annual system maintenance €20.Total annual profit: 378.60 + 46.60 − 20 = €405.20Return on investment time is calculated as the simple payback period (SPP):
SPP =Cost of investment (€)Annual profit (€/year)
(7)
SPP= 4243.72/405.20 = 10.47 years (no incentive)In case of exercising the right to incentives based on the Law on the Fund for Environ-
mental Protection and Energy Efficiency and the Statute of the Fund for Family Homes,it is possible to exercise the right to incentives up to 40% for the investment amount notexceeding €5006. The simple payback time with incentives is:
SPPi =(100 − incentives (%))
100· Cost of investment
Annual profit(8)
SPPi = (100 − 40)/100 × 4243.72/405.20 = 6.3 yearsThe main way to increase the cost-effectiveness of PV systems is to increase self-consumption.
There are two ways to improve your own consumption, namely load management and energystorage. These methods can be applied separately or in combination.
There are several definitions of load management, and common to all is the improve-ment of the energy system on the consumption side [42]. In this research, the term is usedto time-shift the load in the household, for example, the use of washing machines, heating,ventilation, and air conditioning, from periods with lower energy production from PVsystems to periods with higher production from PV systems. In this way, the periods ofinteraction with the distribution grid can be reduced. Timeshift of the load can be achievedmanually, where people turn on electrical appliances when there is excess PV production,or automatically, which requires microprocessor control, and for more advanced systems,ambient temperature, and insolation weather forecasts [43,44].
As an additional measure to improve the consumption profile, air conditioning can beinstalled, which would use the excess electricity for cooling in the summer, while it wouldbe used for space heating in spring and autumn during colder days (see Figure 14). In thisway, the cost of heating would be somewhat reduced.

Appl. Sci. 2021, 11, 9318 16 of 18
Figure 14. Degree-days of heating/cooling for Dragotin [24].
There are several different techniques for load management, such as direct load control,load limits, and smart metering and devices [45]. Most of the papers studied the PV-batterysystem with a storage capacity of 0.5–1 kWh times the installed PV capacity in kW [46–50].This means that battery systems are applied for short-term storage, usually shorter than oneday. Although battery prices are falling, PV systems with batteries are still not cost-effective,as stated in the introduction [8–12].
Dynamic power control controllers can also be purchased on the market, which con-stantly matches the amount of electricity produced by photovoltaic panels with the amountof energy consumed in the building. They do this by changing the MPPT (maximumpower point tracker) of the inverter according to the power consumption of the user. Thisguarantees that no excess energy is injected into the grid or that only a certain amount isinjected in accordance with the legislation of each country.
4. Conclusions
The paper analyzed the cost-effectiveness of applying the PV roof system on a familyhouse in the continental rural part of Croatia. For this purpose, a daily curve of electricityconsumption was recorded with a step of 1 h for the observed object and the productionof electricity from the PV system for a given location of the object was calculated. Due toroutine daily activities that are repeated throughout the year, it was possible to apply thecurves of the average daily electricity consumption for the whole month.
In general, the daily load profile and the electricity generation profile do not match,so it is necessary to calculate the SS and SC factors. For the observed object, the SC factoris in the range of 51.9% to 82.9%, which can be assessed as satisfactory. However, as thepurchase price of surplus electricity produced (in case more energy is injected into thenetwork than is taken from it) is low, the load profile needs to be further improved by usingelectricity consumers at a time when there is surplus electricity produced. However, it is notrealistic to expect that the consumption profile could be significantly improved by manualregulation and changes in inhabits. An in-house energy management system, mentionedin the introductory part, can yield much better results related to self-consumption. Theamount of SS and SC can be significantly affected by the use of battery systems for energystorage. However, such systems are still not cost-effective. The increasing use of airconditioners due to climate change has a positive effect on the daily load profile in summerbut also in spring and autumn when there are certain needs for less heating of the building,and there is surplus electricity produced in the PV system.
For the analyzed facility, with the existing electricity prices, which are among thelowest in the EU and with the existing legislation related to net metering, the roof PVsystem can be paid for in 10.5 years without government incentives.
In addition to reducing electricity bills, installing PV roofing systems provides benefits,such as energy autonomy, reduced carbon emissions, and the creation of new, local jobs.
As a continuation of this research, it would be interesting to analyze PV systems ofdifferent capacities (for example, in the range of 2 to 5 kW) for current legislation and

Appl. Sci. 2021, 11, 9318 17 of 18
determine the optimal system not only by the criterion of the payback period but also bythe total profit over the life of the PV system.
Author Contributions: M.B.: conceptualization, methodology, writing—original draft preparation,visualization; A.C.: validation, supervision; B.Z.: software, data curation. All authors have read andagreed to the published version of the manuscript.
Funding: This research received no external funding.
Institutional Review Board Statement: Not applicable.
Informed Consent Statement: Not applicable.
Data Availability Statement: Not applicable.
Conflicts of Interest: The authors declare no conflict of interest.
References1. Solar Power Europe. EU Market Outlook for Solar Power 2020–2024; Solar Power Europe: Brussels, Belgium, 2020;
ISBN 9789464073478.2. Bódisa, K.; Kougiasa, I.; Jäger-Waldau, A.; Taylor, N.; Szabó, S. A high-resolution geospatial assessment of the rooftop solar
photovoltaic potential in the European Union. Renew. Sustain. Energy Rev. 2019, 114, 109309. [CrossRef]3. Rodrigues, S.; Torabikalaki, R.; Faria, F.; Cafôfo, N.; Chen, X.; Ivaki, A.R.; Mata-Lima, H.; Morgado-Dias, F. Economic feasibility
analysis of small scale PV systems in different countries. Sol. Energy 2016, 131, 81–95. [CrossRef]4. Ciocia, A.; Amato, A.; Di Leo, P.; Fichera, S.; Malgaroli, G.; Spertino, F.; Tzanova, S. Self-Consumption and self-sufficiency in
photovoltaic systems: Effect of grid limitation and storage installation. Energies 2021, 14, 1591. [CrossRef]5. Luthander, R.; Widén, J.; Nilsson, D.; Palm, J. Photovoltaic self-consumption in buildings: A review. Appl. Energy 2015, 142, 80–94.
[CrossRef]6. López Prol, J.; Steininger, K.W. Photovoltaic self-consumption regulation in Spain: Profitability analysis and alternative regulation
schemes. Energy Policy 2017, 108, 742–754. [CrossRef]7. AECOM Australia Pty Ltd. Energy Storage Study: A Storage Market Review and Recommendations for Funding and Knowledge Sharing
Priorities; Technical Report ABN: 35 931 927 899; Australian Renewable Energy Agency: Sydney, Australia, 2015.8. Bertsch, V.; Geldermann, J.; Lühn, T. What drives the profitability of household PV investments, self-consumption and self-
sufficiency? Appl. Energy 2017, 204, 1–15. [CrossRef]9. Deotti, L.; Guedes, W.; Dias, B.; Soares, T. Technical and economic analysis of battery storage for residential solar photovoltaic
systems in the Brazilian regulatory context. Energies 2020, 13, 6517. [CrossRef]10. Mulleriyawage, U.G.K.; Shen, W.X. Optimally sizing of battery energy storage capacity by operational optimization of residential
PV-Battery systems: An Australian household case study. Renew. Energy 2020, 160, 852–864. [CrossRef]11. Vieira, F.M.; Moura, P.S.; de Almeida, A.T. Energy storage system for self-consumption of photovoltaic energy in residential zero
energy buildings. Renew. Energy 2017, 103, 308–320. [CrossRef]12. Quoilin, S.; Kavvadias, K.; Mercier, A.; Pappone, I.; Zucker, A. Quantifying self-consumption linked to solar home battery
systems: Statistical analysis and economic assessment. Appl. Energy 2016, 182, 58–67. [CrossRef]13. Pereira, L.; Cavaleiro, J.; Barros, L. Economic assessment of solar-powered residential battery energy storage systems: The case of
Madeira Island, Portugal. Appl. Sci. 2020, 10, 7366. [CrossRef]14. Klamka, J.; Wolf, A.; Ehrlich, L.G. Photovoltaic Self-Consumption after the Support Period: Will It Pay off in a Cross-Sector Perspective?
Hamburg Institute of International Economics (HWWI): Hamburg, Germany, 2018; ISSN 1861-504X.15. Notton, G. Importance of islands in renewable energy production and storage: The situation of the French islands. Renew. Sustain.
Energy Rev. 2015, 47, 260–269. [CrossRef]16. Sartori, I.; Napolitano, A.; Voss, K. Net zero energy buildings: A consistent definition framework. Energy Build. 2012, 48, 220–232.
[CrossRef]17. Langbroek, J.H.M.; Franklin, J.P.; Susilo, Y.O. When do you charge your electric vehicle? A stated adaptation approach. Energy
Policy 2017, 108, 565–573. [CrossRef]18. Cao, C.; Wu, Z.; Chen, B. Electric Vehicle—Grid Integration with voltage regulation in radial distribution networks. Energies 2020,
13, 1802. [CrossRef]19. Marczinkowski, H.M.; Østergaard, P.A. Residential versus communal combination of photovoltaic and battery in smart energy
systems. Energy 2018, 152, 466–475. [CrossRef]20. Chen, X.; Wei, T.; Hu, S. Uncertainty-aware household appliance scheduling considering dynamic electricity pricing in smart
home. IEEE Trans. Smart Grid 2013, 4, 932–941. [CrossRef]21. Missaoui, R.; Joumaa, H.; Ploix, S.; Bacha, S. Managing energy Smart Homes according to energy prices: Analysis of a building
energy management system. Energy Build. 2014, 71, 155–167. [CrossRef]

Appl. Sci. 2021, 11, 9318 18 of 18
22. Samadi, P.; Wong, V.W.S.; Schober, R. Load scheduling and power trading in systems with high penetration of renewable energyresources. IEEE Trans. Smart Grid 2016, 7, 1802–1812. [CrossRef]
23. Aslam, S.; Iqbal, Z.; Javaid, N.; Khan, Z.A.; Aurangzeb, K.; Haider, S.I. Towards efficient energy management of smart buildingsexploiting heuristic optimization with real time and critical peak pricing schemes. Energies 2017, 10, 2065. [CrossRef]
24. Jamil, A.; Alghamdi, T.A.; Khan, Z.A.; Javaid, S.; Haseeb, A.; Wadud, Z.; Javaid, N. An innovative home energy managementmodel with coordination among appliances using game theory. Sustainability 2019, 11, 6287. [CrossRef]
25. On-line Software Platform Solargis Prospect. Available online: https://apps.solargis.com/prospect/map?s=45.253882,18.312626&c=44.927863,16.641541,8&m=solargis-gti_opta&l=true (accessed on 9 August 2021).
26. Bahramara, S.; Moghaddam, M.P.; Haghifam, M.R. Optimal planning of hybrid renewable energy systems using HOMER: Areview. Renew. Sustain. Energy Rev. 2016, 62, 609–620. [CrossRef]
27. Sen, R.; Bhattacharyya, S.C. Off-grid electricity generation with renewable energy technologies in India: An application ofHOMER. Renew. Energy 2014, 62, 388–398. [CrossRef]
28. Hossain, C.A.; Chowdhury, N.; Longo, M.; Yaïci, W. System and cost analysis of stand-alone solar home system applied to adeveloping country. Sustainability 2019, 11, 1403. [CrossRef]
29. Jetion Product Catalog. Available online: http://www.jetion.com.cn/en/Down/DownList-2.html (accessed on 2 July 2021).30. Huawei Catalog. Available online: https://solar.huawei.com/en/download?p=2F2Fmedia2FSolar2Fattachment2Fpdf2Feu2
Fdatasheet2FSUN2000L.pdf (accessed on 2 July 2021).31. Bloomberg NEF. 1H 2019 LCOE Update; Bloomberg NEF: London, UK, 2019.32. Jäger-Waldau, A. PV Status Report 2019; Publications Office of the European Union: Luxembourg, 2019.33. IRENA. Renewable Power Generation Costs in 2020; International Renewable Energy Agency: Abu Dhabi, United Arab Emirates, 2021.34. Kumar, N.M.; Gupta, R.P.; Mathew, M.; Jayakumar, A.; Singh, N.K. Performance, energy loss, and degradation prediction of
roof-integrated crystalline solar PV system installed in Northern India. Case Stud. Therm. Eng. 2019, 13, 100409. [CrossRef]35. Bošnjakovic, M.; Stojkov, M.; Zlatunic, B. Experimental testing of PV module performance. Teh. Glas. 2021, 15, 127–132. [CrossRef]36. Ollas, P.; Persson, J.; Markusson, C.; Alfadel, U. Impact of battery sizing on self-consumption, self-sufficiency and peak power
demand for a low energy single-family house with PV production in Sweden. In Proceedings of the 2018 IEEE 7th WorldConference on Photovoltaic Energy Conversion (WCPEC), Waikoloa Village, HI, USA, 10–15 June 2018; pp. 0618–0623. [CrossRef]
37. Tutkun, N.; Çelebi, N.; Bozok, N. Optimum unit sizing of wind-PV-battery system components in a typical residential home.In Proceedings of the 2016 International Renewable and Sustainable Energy Conference (IRSEC), Marrakech, Morocco, 14–17November 2016; pp. 432–436. [CrossRef]
38. Ayala-Gilardón, A.; Mora-López, L.; Sidrach-de-Cardona, M. Analysis of a photovoltaic self-consumption facility with differentnet metering schemes. Int. J. Smart Grid Clean Energy 2017, 6, 47–53. [CrossRef]
39. Martín, H.; de la Hoz, J.; Aliana, A.; Coronas, S.; Matas, J. Analysis of the net metering schemes for PV self-consumption inDenmark. Energies 2021, 14, 1990. [CrossRef]
40. Mejdalani, A.N.; Chueca, J.E.; Lopez Soto, D.D.; Ji, Y.; Hallack, M. Implementing Net Metering Policies in Latin America and theCaribbean: Design, Incentives and Best Practices; Technical Note No IDB-TN-15 94; Inter-American Development Bank: Washington,DC, USA, 2018.
41. HEP Ltd. Available online: https://www.hep.hr/elektra/kucanstvo/tariPVe-stavke-cijene/1547 (accessed on 20 July 2021).42. EUROSTAT. Available online: https://ec.europa.eu/eurostat/statistics-explained/index.php?title=Electricity_price_statistics#
Electricity_prices_for_household_consumers (accessed on 20 July 2021.).43. Palensky, P.; Dietrich, D. Demand side management: Demand response, intelligent energy systems, and smart loads. IEEE Trans
Ind. Inform. 2011, 7, 381–388. [CrossRef]44. Zong, Y.; Mihet-Popa, L.; Kullmann, D.; Thavlov, A.; Gehrke, O.; Bindner, H.W. Model predictive controller for active demand
side management with PV selfconsumption in an intelligent building. In Proceedings of the IEEE PES Innovative Smart GridTechnologies Conference Europe, Berlin, Germany, 14–17 October 2012. [CrossRef]
45. Röpcke, I. From power converter to energy manager. PV Magazine, 5 June 2012.46. Strbac, G. Demand side management: Benefits and challenges. Energy Policy 2008, 36, 4419–4442. [CrossRef]47. Li, J.; Danzer, M.A. Optimal charge control strategies for stationary photovoltaic battery systems. J. Power Sour. 2014, 258, 365–373.
[CrossRef]48. Bruch, M.; Müller, M. Calculation of the cost-effectiveness of a PV battery system. Energy Proc. 2014, 46, 262–270. [CrossRef]49. Femia, N.; Toledo, D.; Zamboni, W. Storage unit and load management in photovoltaic inverters for residential application.
In Proceedings of the IECON 2013-39th Annual Conference of the IEEE Industrial Electronics Society, Vienna, Austria, 10–13November 2013; pp. 6800–6805. [CrossRef]
50. Williams, C.J.C.; Binder, J.O.; Kelm, T. Demand side management through heat pumps, thermal storage and battery storage toincrease local selfconsumption and grid compatibility of PV systems. In Proceedings of the 2012 3rd IEEE PES InternationalConference and Exhibition on Innovative Smart Grid Technologies (ISGT Europe), Berlin, Germany, 14–17 October 2012; pp. 1–6.[CrossRef]