Rooftop Solar – Garnering Support from Distribution Utilities
83
-
Upload
khangminh22 -
Category
Documents
-
view
0 -
download
0
Transcript of Rooftop Solar – Garnering Support from Distribution Utilities


Rooftop Solar – Garnering Support from Distribution Utilities
i
TABLE OF CONTENTS
Foreword……………………………………………………………………………………………………………………………. iii
Abbreviations……………………………………………………………………………………………………………………. iv
Executive Summary…………………………………………………………………………………………………………. 1
1 INTRODUCTION ....................................................................................................................................... 12
1.1 SOLAR SECTOR IN INDIA ................................................................................................................................ 12 1.2 ROOFTOP SOLAR IN INDIA ............................................................................................................................. 13 1.3 OBJECTIVE OF THE STUDY .............................................................................................................................. 15
2 OVERALL APPROACH FOR THE STUDY ..................................................................................................... 16
3 INTERNATIONAL EXPERIENCE ................................................................................................................. 18
3.1 UNITED STATES OF AMERICA ......................................................................................................................... 18 3.2 GERMANY .................................................................................................................................................. 20 3.3 UNITED KINGDOM ....................................................................................................................................... 23 3.4 JAPAN ....................................................................................................................................................... 26 3.5 CASE STUDIES - IMPACT OF ROOFTOP SOLAR ON UTILITY BUSINESS ....................................................................... 28
4 IMPACT OF ROOFTOP SOLAR ON INDIAN UTILITIES ................................................................................ 35
4.1 IMPACT ON UTILITY – KEY PARAMETERS ........................................................................................................... 35
5 STAKEHOLDER CONSULTATIONS ............................................................................................................. 48
6 RECOMMENDATIONS.............................................................................................................................. 50
6.1 REGULATORY .............................................................................................................................................. 50 6.2 OPERATIONAL ............................................................................................................................................. 52 6.3 COMMERCIAL ............................................................................................................................................. 53 6.4 IMPLEMENTATION ....................................................................................................................................... 53
7 ANNEXURE .............................................................................................................................................. 55
ANNEXURE 1: SCOPE OF WORK ................................................................................................................................ 55 ANNEXURE 2: KEY ASSUMPTIONS FOR ANALYSIS FOR EVALUATING IMPACT ON UTILITIES....................................................... 56 ANNEXURE 3: APPROACH FOR ANALYSIS ..................................................................................................................... 57 ANNEXURE 4: IMPACT ON OPERATIONAL PARAMETERS ................................................................................................. 59 ANNEXURE 5: RECOMMENDATION ANALYSIS ............................................................................................................... 64
8 REFERENCES ............................................................................................................................................ 73
LIST OF FIGURES
Figure 1: Grid connected solar projects capacity ..................................................... 12 Figure 2: Solar Growth trend in India (MW) ............................................................ 12 Figure 3: Solar Capital Cost Trend ......................................................................... 13 Figure 4: Solar Tariff Trend .................................................................................. 13 Figure 5: Capacity additions under JNNSM (in GW) .................................................. 14 Figure 6: MNRE state-wise targets for Solar Rooftops .............................................. 14 Figure 7: Overall approach ................................................................................... 16 Figure 8: Cumulative U.S. PV Installed Capacity, 2007-2017E................................... 18 Figure 9: Financing mechanism for solar projects in USA .......................................... 19 Figure 10: Popular rooftop solar business models in USA .......................................... 20 Figure 11: Growth of Solar Installed Capacity in Germany ........................................ 21 Figure 12: Modification in German FIT Program....................................................... 21 Figure 13: FIT price trend for Rooftop and ground Mounted PV in Germany ................ 23 Figure 14: Growth of Solar PV in UK ...................................................................... 24

Rooftop Solar – Garnering Support from Distribution Utilities
ii
Figure 15: Growth and Share of different schemes in total solar Capacity ................... 25 Figure 16: Growth trend in Solar Capacity with change in Policy environment ............. 26 Figure 17: Solar PV Capacity (MW) in Residential and Non Residential Segment .......... 27 Figure 18: Weekdays Peak Hour ............................................................................ 31 Figure 19: Impact of Solar on Wholesale price (base and Peak Load) ......................... 32 Figure 20: Cases and Scenarios ............................................................................ 36 Figure 21: Impact on Utility Revenue due to Solar Rooftops ..................................... 38 Figure 22: Impact of Solar Rooftops on Cross Subsidy ............................................. 39 Figure 23: Impact on utility revenue in Progressive scenario ..................................... 39 Figure 24: Impact on Utility Revenue due to solar rooftop ........................................ 40 Figure 25: Impact on Cross Subsidy due to Solar Rooftop ........................................ 41 Figure 26: Approach for estimation of hourly generation of solar rooftop in FY 2022 .... 43 Figure 27 Approach for estimation of Monthly Rooftop PV penetration for FY 2022 ....... 43 Figure 28 : Delhi - Solar rooftop & demand mapping ............................................... 44 Figure 29: Approach for Computation of Energy Credit ............................................. 45 Figure 30: De-coupling of Import and Export tariff .................................................. 65 Figure 31: Incentives Options for encouraging injections during peak time ................. 68 Figure 32: Utility driven Rooftop Model .................................................................. 70 Figure 33: Implementation Model for Aggregated solar rooftop Program .................... 72
LIST OF TABLES
Table 1: Distribution utilities covered ..................................................................... 16 Table 2: FIT rates for January 2016 to April 2016 .................................................... 25 Table 3: FIT Scheme Details ................................................................................. 28 Table 4: FiT surcharge rate for 2014 ...................................................................... 28 Table 5: Impact of PV penetration on Utility Earnings .............................................. 30 Table 6: Environmental benefits from rooftop solar.................................................. 32 Table 7: Rooftop Solar energy penetration scenario for FY 2022 ................................ 42 Table 8: Capacity Credit Limit in US and Germany ................................................... 45 Table 9: Avoided capacity for FY 2022 due to rooftop solar ....................................... 46 Table 10 : Connection/disconnection limits ............................................................. 47 Table 11: TOD tariff of Andhra Pradesh .................................................................. 60 Table 12: TOD tariff of Telangana .......................................................................... 60 Table 13: TOD tariff of Tamil Nadu ........................................................................ 61 Table 14: TOD tariff of Gujarat ............................................................................. 62 Table 15: TOD tariff of Uttar Pradesh ..................................................................... 62 Table 16: Provision of Surplus Injection and Incentive for solar rooftop ...................... 67

Rooftop Solar – Garnering Support from Distribution Utilities
iii
Foreword
Increasing energy demand, rising environmental concerns and falling cost of solar
technology are making solar power increasingly popular globally. Recognizing benefits of
our solar energy resources, Government of India has set an ambitious target of achieving
100 GW by 2022. Out of this 100 GW, 40 GW has been allocated for grid connected solar
rooftops. In support of this, 31 states/union territories have notified regulations for
net/gross-metering.
Globally, rooftop solar installations have been driven by incentives offered through various
schemes leading to faster tariff parity with utility supply. These incentives have been in
the form of direct capital subsidy, tax credits, net metering, solar specific RPOs, etc.
Similarly, in India various schemes have been launched by central and state governments
to realize the full potential of rooftop solar projects.
Solar rooftop sector has proliferated globally and is now growing in India. However,
increase in the capacity has also given rise to debates in many countries about its impacts
on utility shareholders and ratepayers, and such debates will likely become more
pronounced and widespread as solar costs continue to decline and deployment accelerates.
In India too, it is possible that distribution utilities in India may face similar commercial
and operational challenges.
Distribution utilities have an important role to play in promotion of rooftop solar projects.
Financial health of distribution utilities in India has persistently been an area of concern –
partly attributed to high levels of Aggregate Technical and Commercial (AT&C) losses as
well as inability of power tariffs to recover the cost of supply.
Rooftop solar projects offer multiple benefits including savings in T&D losses,
environmental benefits, and avoided capacity during peak solar generation. However,
given the financial and operational capabilities of Indian utilities, it is important to
understand the implications of rooftop solar on the utilities, to develop a framework that
incentivizes utilities to support large-scale deployment.
Shakti Sustainable Energy Foundation is pleased to support this report, which provides
critical insights on the implications of solar rooftop for Indian utilities. We hope that this
report will be of interest to policy makers, regulators, utilities, solar rooftop developers
and other stakeholders, and that it will help inform policy action in the solar rooftop sector.

Rooftop Solar – Garnering Support from Distribution Utilities
iv
Abbreviations
Abbreviation Description
Abbreviation Description
ABR Average Billing Rate
FY Financial Year
AC Alternating Current
GBI Generation Based Incentive
AP Andhra Pradesh
GHG Green House Gases
APPC Average Power Purchase Cost
GHI Global Horizontal Irradiation
AT&C Aggregate Technical & Commercial loss
GM Gross Metering
CAGR Compound Annual Growth Rate
GoI Government of India
CEA Central Electricity Authority
GSM Global System for Mobile
CERC Central Electricity Regulatory Commission
GW Giga Watt
CFA Central Financial Assistance
HV / HT High Voltage/ tension
CIL Coal India Limited
IEEE Institute of Electrical and Electronics Engineers
CO2 Carbon Dioxide
IEGC Indian Electricity Grid Code
COS Cost of Supply
IPP Independent Power Producers
CPUC California Public Utility Commission
IREA Intermountain Rural Electric Association
Cr Crore
IREDA Indian Renewable Energy Development Agency
CSR Corporate Social Responsibility
IRENA International Renewable Energy Agency
CSS Cross Subsidy Surcharge
IRR Internal Rate of Return
CUF Capacity Utilization Factor
ITC Investment tax Credit
DC Direct Current
JNNSM Jawaharlal Nehru National Solar Mission
DER Distributed Energy Resource
JPAC Japan Photovoltaic Expansion Center
DG Distributed Generation
kVA Kilo Volt Ampere
DOE Department of Energy
kW Kilo Watt
DT Distribution Transformer
kWp Kilo Watt Peak
EEG Erneuerbare-Energien-Gesetz
LCOE Levelized Cost of Energy
EMI Equated Monthly Installments
LV /LT Low Voltage/ Tension
EPA Environmental Protection Agency
METI Japan’s Ministry of Economy, Trade, and
Industry
EPC Energy Performance Certificate
MNRE Ministry of New and Renewable Energy,
India
EPS Electric Power Survey
MP Madhya Pradesh
FDI Foreign Direct Investment
NAPCC National Action Plan on Climate Change
FERC Federal Electricity regulatory
commission
NASA National Aeronautics and Space
Administration
FiT Feed in Tariff
NERC North American Electric Reliability Corporation

Rooftop Solar – Garnering Support from Distribution Utilities
v
Abbreviation Description
Abbreviation Description
NISE National Institute of Solar Energy
ROE Return on Equity
NM Net Metering
RPO/RPS Renewable Purchase Obligation/Standard
NPV Net Present Value
RPSSGP Rooftop PV & Small Solar Power Generation Program
NREL National Renewable Energy laboratory
SDG&E San Diego Gas and Electric
NTPC National Thermal Power Corporation
SERC State Electricity Regulatory
Commission
O&M Operation and Maintenance
SNA State Nodal Agency
PFA Power for All
StrEG Stromeinspeisungsgesetz
PFC Power Finance Corporation
SW/NW South West/ North East
PG&E Pacific Gas and Electric
Company
T&D Transmission and Distribution
PPA Power Purchase Agreement
TL Telangana
PSU Public Sector Utilities
TOD Time of Day
PTC Production Tax Credit
TOU Time of Utilization
PUC Public Utilities Commission
TSO Transmission Service Operator
PV Photovoltaics
UK United Kingdom
R&D Research and Development
UP Uttar Pradesh
RE Renewable Energy
USA United States of America
REC Renewable Energy Certificate
VGF Viability gap Funding
RESCO Renewable Energy Service Company
WACC Weighted Average Cost of Capital
Rooftop Solar – Garnering Support from Distribution Utilities
- 1 -
Executive Summary
With energy security and climate change concerns taking center stage in the policy arena,
Renewable Energy (RE) has become an important part of the agenda in India’s energy
planning process. To this effect the government has set aggressive renewable energy
targets and has put in place several policy initiatives at the Central and State levels for
both grid connected & off-grid renewable energy.
Solar energy is fast becoming the preferred options in the development of renewable
energy resources in the country. With about 250–300 sunny days in a year, around 5,000
trillion kWh of energy is incident on an annual basis over India’s land area, with most parts
receiving 4-7 kWh per sq. m per day. A study carried out by the National Institute of Solar
Energy (NISE) estimated that India has a potential of 748.9 GW of solar capacity.
To tap the solar potential in the country, India had embarked on an ambitious program
under the Jawaharlal Nehru National Solar Mission (JNNSM), targeting to achieve an
installed capacity of 20,000 MW of solar power by 2022. However, realizing the vast
potential and fast technology growth, this target has been revised to 100 GW to be
achieved by 2022. This target is proposed to be achieved through deployment of 40 GW
of rooftop solar projects and 60 GW of large and medium scale projects.
Rooftop solar installations across the globe have been driven by incentives offered through
various schemes leading to faster tariff parity with utility supply. These incentives have
been in the form of direct capital subsidy, tax credits, net metering, solar specific RPOs,
etc. In India, various schemes have been launched to realize the full potential of rooftop
solar projects. To support rooftop solar projects, many states are incentivizing rooftop
solar systems through net metering regulations.
To achieve such ambitious target of 40 GW rooftop capacity within a span of six years, it
is necessary that all the key stakeholders such as distribution utilities, consumers, solar
system installers, Regulatory Commissions etc. work together and create the ecosystem
for development of solar rooftop projects in the country. Distribution utilities have an
important role to play in the proliferation of rooftop solar projects as they will be
responsible for technical interconnections and creating the framework for various business
models to allow banking and/ or off-take of surplus power.
Globally, deployment of customer-sited rooftop solar PV projects have expanded rapidly
in recent years, driven in part by public policies premised on a range of societal benefits
that PV may provide. Table below is showing the implementation models and key drivers
for solar rooftop across the solar rich countries
Country Implementation
Model
Key Drivers Ownership of
assets
Contracting
mechanism
Germany Gross metered Feed in Tariff
(FiT)
Self-Owned -
Japan Net metered Capital Subsidy Self-Owned -
United
States
Net metered Tax rebates
(ITC/ PTC) –
RECs
Self-Owned Lease
United
States
Net metered Tax rebates
(ITC/ PTC/
Depreciation)
Third Party
Owned
PPA
India
(Gujarat)
Gross metered Feed in Tariff/
Generation
Based Incentive
(GBI)
Third Party
Owned
Rooftop Lease
Agreement
India
(Odisha)
Net metered Feed in tariff/
GBI
Third Party
Owned
Rooftop Lease
Agreement

Rooftop Solar – Garnering Support from Distribution Utilities
- 2 -
The solar rooftop segment has seen rapid proliferation in countries like USA, Germany,
United Kingdom, Japan etc. because of the factors outlined in the table above. However,
the increase in the rooftop solar capacities has also given rise to debate on its impact on
utility shareholders and ratepayers, etc. Some of the common issues faced by utilities
globally due to proliferation of solar rooftops are summarized below
• Significant reduction in sales volume due to large procurement from solar rooftops
• Difficulty in recovery of fixed cost because of distribution infrastructure and long term
purchase agreements
• Difficulty in recovery of cross-subsidy charges due to migration of high paying
consumers from the utilities to solar rooftop
• Managing variability in generation of solar rooftop for variable load
• Injection of solar power during off-peak periods and withdrawal by the consumers
during peak periods
• Treating utility grid as a backup power source by rooftop consumers
• Technical issues like phase imbalance due to solar rooftop projects, quality of utility
power, etc.
• Increase in administration burden (application processing, inspection, connectivity,
metering and billing etc.)
• Safety and security issues during operation and maintenance of grid
Impact of solar rooftop on Utility business in India
Rooftop solar development in India is currently at the initial phases of development. The
steep capacity targets would require accelerated growth in the solar rooftop projects and
it can be expected that distribution utilities in India would face several commercial and
operational challenges as has been indicated above.
Rooftop solar project offers multiple benefits in the form of savings in T&D losses,
environmental benefits (reduced GHG emission, lower water requirement & no land
requirement), and avoided capacity during peak solar generation. Depending upon the
State regulatory framework, Discoms will also be eligible for deemed Solar RPO benefit for
the solar power consumed under net-metering framework by the consumer. Given the
financial & operational capabilities of Indian utilities, it is important to understand the
extent of impact rooftop solar will make on the utilities. Some of the key issues that will
impact utilities under net metering framework are:
1. Revenue loss to Utility
The net metering model of solar rooftop development provides the consumer with an
option to self-generate & consume the solar power from the rooftop solar project. The
consumers adopting rooftop solar for self-consumption will have lower dependence on
utilities for meeting their electricity requirement, thereby reducing the electricity
consumed from utility. This shift will result in reduced sales for utilities to the solar
consumers, resulting in the revenue loss.
It can be argued that the revenue loss to utility is limited to the loss in cross-subsidy (over
and above the cost of supply). The utility will stand to lose the cross-subsidy it was getting
from the subsidizing consumers who were paying more than the cost of supply if they
chose to switch to solar. Utilities would also benefit if subsidized category of consumers
(those having tariffs below the cost of supply) adopt the rooftop solar systems.
2. Recovery of fixed costs
In India, the tariff rate design relies heavily on the volumetric sales to recover a portion
of the fixed costs. With the reduction in sales to consumers, the utilities would not be able
to recover a part of fixed cost as the rooftop solar consumer will be paying energy charges
for a lower consumption levels.

Rooftop Solar – Garnering Support from Distribution Utilities
- 3 -
Currently, the rooftop solar capacity is at a lower level and utilities have not felt the
revenue impact & related aspects. However, with increase in penetration & reduced
revenue, there can be demand from utilities to impose additional charges on net metered
rooftop solar consumers as experienced globally. Globally utility have proposed to increase
the fixed charges in the consumer bill to safeguard against the revenue drop on account
on net metering.
3. High number of tariff slabs within a consumer category
Many states have multiple tariff slabs (even up to 5) within a consumer category and
depending upon the consumption levels of the consumer, the tariff rate is applicable. The
consumers adopting the rooftop solar will be able to save on the utility electricity bill. The
impact (revenue loss) for utilities will be high in consumer categories having high number
of consumption slabs.
4. Loss in banking charges
Banking charges are not applicable on rooftop solar projects in general. However, for net
metered rooftop solar project, the gird is providing the banking facility. With the increase
in rooftop solar capacity (with target of 40GW), it can be expected that utilities need to
plan accordingly to manage high capacity under this banking arrangement. In such a
scenario, not imposing any banking charge can be considered a loss to utility. However, it
needs to be considered that only a partial amount of energy generated (which consumer
is not able to utilize) will be banked with the utility.
5. Solar consumers not covered under TOD framework
Consumers not covered under TOD have the benefit of utilizing off-peak injected solar
power during peak power. The utility is required to arrange adequate power to such
consumers during the peak time, which will get settled with the off-peak solar power
injected. With increased rooftop solar capacity addition in future, this may pose
operational/commercial challenge to utilities.
o Operational Challenges due to small & distributed nature
With proliferation of solar rooftops operational challenges such as demand balancing,
variability etc. will come in picture. Rooftop solar projects are not under the purview of
generation forecasting and given the small & distributed nature, it will be difficult of utilities
to have real time visibility on these distributed generation sources, especially at LT levels.
o Loss is fixed charges because of consumer reducing sanctioned load.
Utilities may suffer loss in fixed charges, in cases where consumers reduce their sanctioned
load because of rooftop solar capacity addition. This will also result in loss of fixed charges
which utilities were expected to recover from consumers. This case is expected to occur
only for limited capacity.
Quantification of the benefits & impact on the utilities
Net metering is considered to be important for the rooftop solar consumers to safeguard
their investments, by the solar industry as self-replication model for the retail consumers,
and by policy makers to achieve the clean energy targets. However, the utilities have a
concern about revenue erosion and reduced shareholder returns when customers with net-
metered rooftop solar systems can avoid charges for fixed infrastructure costs, as well as
potential cost-shifting between solar and non-solar customers.
This study has analyzed the commercial parameters of 17 state utilities in eight selected
states covering energy requirement, rooftop penetration, utility revenue, retail tariff, RPO
expense, environmental benefits etc. to understand the impact of solar rooftop on Indian
utilities by 2022. Several scenarios have been simulated and reviewed to understand the
impact on utilities as well as benefits from rooftop solar in case the utilities achieve the
rooftop solar capacity targets for FY 2022 proposed by MNRE. The utilities wise targets are

Rooftop Solar – Garnering Support from Distribution Utilities
- 4 -
mapped based on the projected energy requirement of the respective utility in year FY
2022.
To analyze the impact on Utility, different cases and scenarios have been developed, which
are shown in the figure
A. Scenerio-1: Highest tariff Paying Consumers Switch to Rooftop Solar
The Scenario 1 considers that rooftop solar power will replace the consumer consumption
mapped at highest tariff slab in a consumer category. The analysis below covers three
cases under Scenario 1.
o Case-1: Impact of solar Rooftop on Utility Revenue
Case 1: This assumes the highest tariff paying consumer’s switch to rooftop
solar. The impact on utility is in terms of: revenue loss, loss in fixed charges
(assuming 10% of the solar capacity will result in sanctioned load reduction),
loss in banking charges (assuming 30% of energy generated from rooftop solar
is banked and do not pay 2% banking charge @ APPC price). The benefits for
utility is Deemed RPO (@ Solar REC price of INR 3.5/kWh), environmental benefit
and savings in T&D losses.
Proliferation of Solar Rooftops will have both positive and negative impact on the Utilities’
revenue, this case explains the impact of solar rooftops on utility revenue for FY 2022
assuming that the capacity addition in rooftop segment will be as per MNRE’s target. With
increase in the retail tariff, higher number of consumers will shift to rooftop, this will result
in the reduction of sales volume and hence reduction in utility revenue. As the rooftop
capacity is expected to increase with time in view of increase in retail tariff and falling cost
of rooftop system, the loss of revenue is expected to increase with time. However, Rooftop
capacity will also have positive impact on utility revenue due to deemed RPO benefit,
environmental benefit, saving in infrastructure and reduction of technical losses etc., which
will also increase with increase in rooftop capacity.
As per the analysis the overall impact under this case for utilities will be negative.
Revenue loss to selected utilities due to solar rooftops will be in the range Rs. 7.3/kWh
to 1.2/kWh depending upon the retail supply tariff and energy requirement to be met
through solar rooftops.

Rooftop Solar – Garnering Support from Distribution Utilities
- 5 -
The overall impact (Rs/kWh) of rooftop on utility revenue in FY 2022 is shown in the
following graph. The graph also depicts the impact of rooftop on various factors of utility
revenue:
o Case-2: Impact of solar rooftop on Cross Subsidy
Case 2: This Case assumes that the highest tariff paying consumer’s will switch
to rooftop solar. The impact on utility is in terms of: cross subsidy loss, loss in
fixed charges (assuming 10% of the solar capacity will result in sanctioned load
reduction), loss in banking charges (assuming 30% of energy generated from
rooftop solar is banked and do not pay 2% banking charge @ APPC price). The
benefits for utility is environmental benefits, Deemed RPO (@ Solar REC price of
INR 3.5/kWh) and savings in T&D losses.
This case explains the impact of solar rooftops on utilities from the perspective that the
loss utility is linked with loss of cross subsidy (and not complete energy charge). With
increase in the affordability of solar rooftop system and rising retail tariff, utility consumers
are expected to go for solar rooftop. As the high tariff paying consumers will start shifting
to solar rooftop, the utility sales will start falling. This will also impact the collection of
cross-subsidy, which utility was collecting from consumer.
In addition to this utility will also lose revenue through exemption in banking charges for
solar rooftops and reduction in demand charges. However, it will also earn though deemed
RPO benefit and reduction in technical losses.
In this case, the overall impact on the revenue is positive. The impact of all the parameters
including the cross subsidy for utilities for FY 2022 is shown in the following graph. As per
the analysis, except MSEDCL, all utilities other are having positive impact of solar rooftop.
-7.30
-5.45 -5.45 -5.59-3.09
-3.04 -3.26
-2.87
-6.49
-5.75
-6.27 -6.81
-3.92
-1.29
-1.94
-1.89
-3.03
-12
-10
-8
-6
-4
-2
0
2
4
6
MS
ED
CL
BS
ES
R
BS
ES
Y
TP
DD
L
CE
SU
NE
SC
O
SO
UT
HC
O
WE
SC
O
AP
EP
DC
L
AP
SP
DC
L
TS
SP
DC
L
TS
NP
DC
L
TA
NG
ED
CO
PG
VC
L
DG
VC
L
DV
VN
L
PV
VN
L
Rs.
/kW
h
Impact on Utility Revenue - FY 22 (INR per Unit)
Revenue reduction Grid charge reduction to utitliy (10%) Banking charge loss to utility
Deemed RPO benefits T& D loss benefits Environmental benefits
Total
Utilities with low energy charge have lower negative impact. Utilities having high T&D losses will gain from rooftop solar

Rooftop Solar – Garnering Support from Distribution Utilities
- 6 -
o Impact of Solar Rooftop in progressive scenario
Case 3: This assumes the highest tariff paying consumer’s switch to rooftop
solar. It is assumed that the Cross subsidy will become zero in FY 2022 and no
environmental benefits is considered to analyze the impact. The impact on utility
is in terms of: loss in fixed charges (assuming 10% of the solar capacity will
result in sanctioned load reduction), loss in banking charges (assuming 30% of
energy generated from rooftop solar is banked and do not pay 2% banking
charge @ APPC price). The benefits for utility is only Deemed RPO (@ Solar REC
price of INR 0.5/kWh) and savings in T&D losses.
-0.10
2.46 2.13 2.213.27 3.33 3.10 3.49
0.54 1.07 0.68 1.12
3.18
5.66 5.01 5.394.24
-15
-10
-5
0
5
10
-7
-5
-3
-1
1
3
5
7
MS
ED
CL
BS
ES
R
BS
ES
Y
TP
DD
L
CE
SU
NE
SC
O
SO
UT
HC
O
WE
SC
O
AP
EP
DC
L
AP
SP
DC
L
TS
SP
DC
L
TS
NP
DC
L
TA
NG
ED
CO
PG
VC
L
DG
VC
L
DV
VN
L
PV
VN
L
Rs.
/ kW
hImpact on Utility Revenue from Cross Subsidy- FY 22 (INR per Unit)
Cross-subsidy loss Grid charge reduction to utitliy (10%) Banking charge loss to utility
Deemed RPO benefits T& D loss benefits Environmental benefits
Total
1.02 1.15 1.19 1.08 1.20 1.251.03
1.42
-0.13
0.640.14 0.28
1.021.48
1.01
2.44
1.47
-4
-3
-2
-1
0
1
2
3
4
-4
-3
-2
-1
0
1
2
3
4
Rs.
/ k
Wh
Overall Per Unit Impact FY 22 (INR per Unit)
Grid charge reduction to utitliy (10%) Banking charge loss to utility
Deemed RPO benefits T& D loss benefits
Total
Utilities with low cross subsidy levels will have lower impact. Consumer
categories having energy charge lower than COS & adopting rooftop solar will
benefit utilities.

Rooftop Solar – Garnering Support from Distribution Utilities
- 7 -
This is assumed to be a progressive case where it is assumed that the cross subsidy
component from retail tariff will become zero and utility consumers will charge consumers
as per the cost of supplying to that particular consumer. Recognizing the falling cost trend,
it is also assumed that the floor price of solar REC will drop down to Rs. 0.50/kWh from
Rs. 3.50/kWh in 2022.
In this case the impact on utility due to solar rooftop will be on the revenue loss from fixed
charges, banking charges, and benefits from deemed RPO & reduction in technical losses.
As per the analysis, the overall impact of solar rooftop on utilities will be positive in this
case.
As the reduction in power purchase cost because of reduction in technical losses will have
dominating impact on the utility revenue as compared to revenue loss on account of
reduction in demand and waiver of banking charges. The graph above is depicting the
impact of solar rooftop on utility revenue in progressive scenario.
B. Scenerio-2: Average tariff paying Consumers switch to Rooftop Solar
The Scenario 2 considers that rooftop solar power will replace the consumer consumption
mapped at average tariff slab in a particular consumer category. The analysis below
covers two cases under Scenario 2.
Case 1: This assumes the Average tariff paying consumer’s switch to rooftop
solar. The impact on utility is in terms of: revenue loss, loss in fixed charges
(assuming 10% of the solar capacity will result in sanctioned load reduction),
loss in banking charges (assuming 30% of energy generated from rooftop solar
is banked and do not pay 2% banking charge @ APPC price). The benefits for
utility is Deemed RPO (@ Solar REC price of INR 3.5/kWh) and savings in T&D
losses.
The result of the analysis is shown with the help of above graph, which represents the
behaviors of various parameters of utility revenue to be impacted due to installed solar
rooftop capacity for year FY 2022. The analysis shows that utilities will have negative
impact on revenue due to solar rooftop as due to solar rooftop, utility sales volume will
decrease and so as its revenue. However, Utility will also have saving in expenses due to
deemed RPO benefit and reduction of technical losses but the impact of sales on revenue
will be much higher than the benefits accrued from solar rooftops.
-4.81-3.89
-2.88 -3.34
-1.98 -1.93 -2.15 -1.76
-4.03 -4.11-4.92
-3.27-2.27
-1.12-1.79
0.18
-1.18
-10
-8
-6
-4
-2
0
2
4
6
8
-10
-8
-6
-4
-2
0
2
4
6
8
Rs.
/ k
Wh
Overall Per Unit Impact FY 22 (INR per unit)
Revenue reduction Grid charge reduction to utitliy (10%)
Banking charge loss to utility Deemed RPO benefits
T& D loss benefits Environmental benefits

Rooftop Solar – Garnering Support from Distribution Utilities
- 8 -
Case 2: This Case assumes that the average tariff paying consumer’s will switch
to rooftop solar. The impact on utility is in terms of: cross subsidy loss, loss in
fixed charges (assuming 10% of the solar capacity will result in sanctioned load
reduction), loss in banking charges (assuming 30% of energy generated from
rooftop solar is banked and do not pay 2% banking charge @ APPC price). The
benefits for utility is environmental benefits, Deemed RPO (@ Solar REC price of
INR 3.5/kWh) and savings in T&D losses.
This case explains the impact of solar rooftops on utilities from the perspective that the
loss utility is linked with loss of cross subsidy (and not complete energy charge). With
increase in the capacity of solar rooftops utility sales will decrease and with decrease in
the sales utility cross subsidy collections will be impacted. However, at the same time
utility will also save revenue from other benefits such as deemed RPO and reduction in
technical losses, thus the overall impact on cross subsidy will be positive in this case.
Key recommendations
Based on the analysis of the commercial and operational parameters for the utilities and
learnings from the international experience, the study has identified certain initiatives
which would support the long-term development of rooftop solar segment in India and
provide a win-win situation for both consumer and distribution utilities.
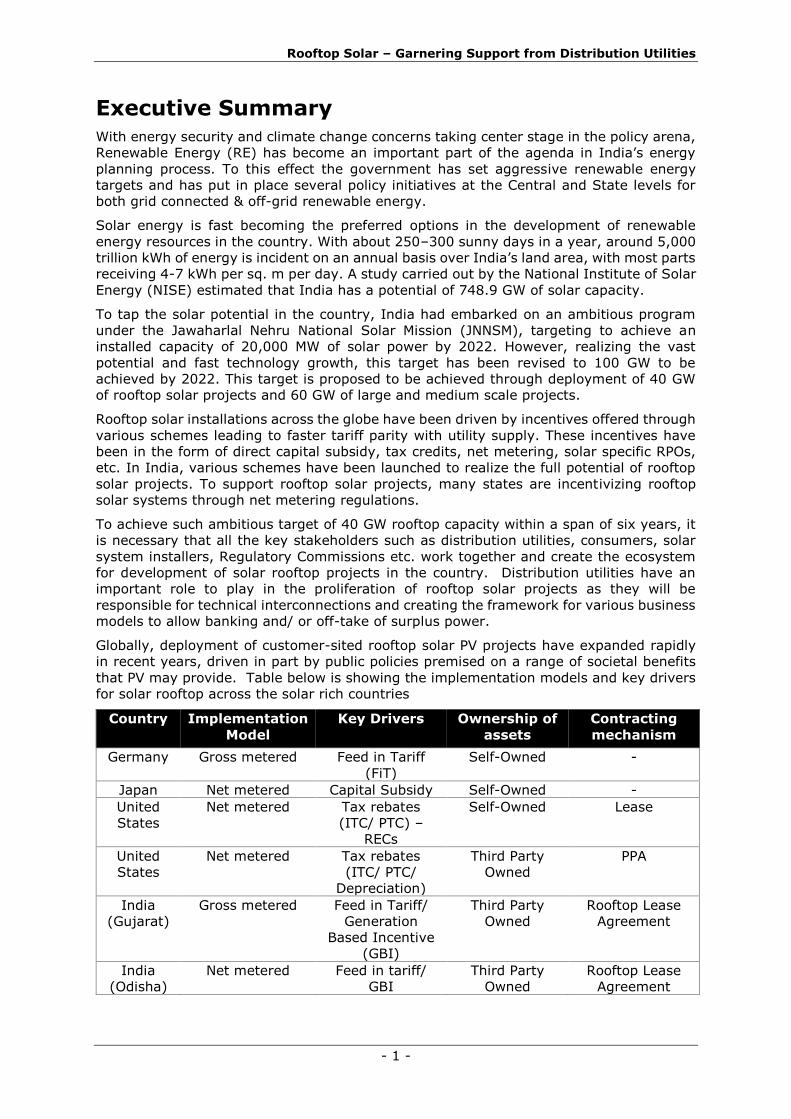
The key initiatives which could be implemented include:
Suggested Initiative Description
Rationalization of
consumer category wise
consumption slabs
• Slab rationalization should be adopted by SERCs to
protect utility interest (Short term initiative)
TOD framework on net-
metered consumers
• Rooftop solar net metered consumers can be
mandated to come under TOD framework (long term
initiative)
Allow surplus solar
power injection during
peak time
• Allow surplus power injection during peak time in an
accounting year by a net metered consumer. Limits
for surplus power injection can defined by SERCs
(Short term initiative)
2.39
4.024.70 4.46 4.38 4.44 4.21 4.60
3.00 2.712.03
4.65 4.825.83
5.16
7.466.10
-10
-8
-6
-4
-2
0
2
4
6
8
10
-10
-8
-6
-4
-2
0
2
4
6
8
10
Rs.
/ k
Wh
Overall Per Unit Impact FY 22 – (INR per unit)
Cross-subsidy loss Grid charge reduction to utitliy (10%)
Banking charge loss to utility Deemed RPO benefits
T& D loss benefits Environmental benefits
Rooftop Solar – Garnering Support from Distribution Utilities
- 9 -
Suggested Initiative Description
Promote peak-time
solar injection through
attractive tariffs/
incentives
• Providing higher level of tariff/incentive will also
encourage rooftop solar based storage options (Short
term initiative).
De-Coupling of Import
and Export tariff under
Net Metering
• As utility is providing grid infrastructure to rooftop
solar projects, to protect interest of Utility,
segregation of the import and export tariffs for net-
metered rooftop solar consumers can be considered.
• Import tariff will be energy charge and export tariff
can be capped at rooftop solar FIT, linked as % of
energy charge indicated by SERC (Long term
initiative)
Active power control on
rooftop solar systems
• Regulations to enable active power function of
advance inverter
• Utility command regulatory framework for control &
Instrumentation functions to enable advance inverter
regulations in Indian context need to be prepared and
framed.
• Compensation mechanism for loss on account of
active power curtailment (Long term Initiative)
Reactive tariff &
standards
• Advance Inverters can be used to provide voltage
regulation for improvement of tail end voltage
profiles.
• Regulations for enabling reactive power function of
advance inverter
• Incentive/tariff mechanism and level of incentives for
adopting advance inverter functionality (Short term
Initiative)
Explore utility driven
rooftop solar models
• Utilities need to play an active role in rooftop solar
capacity addition and promote utility owned/driven
models.
• Consumer should get additional incentive to
participate in utility driven models. MNRE can provide
incentive to utilities to encourage such models
Dedicated rooftop
aggregation program
• Apart of initiatives at Discom level, achieving large
capacity addition will require dedicated program from
MNRE for aggregation of rooftops. The objective of
this shall be to assist Discoms in meeting their
rooftop solar targets.
Standard documents (Contract, leasing
agreement) – this will reduce the risk of RESCOs
Consumer will get benefit from competitive
bidding & scale
Provisions for robust O&M and performance in
RESCO selection to benefit consumer

Rooftop Solar – Garnering Support from Distribution Utilities
- 10 -
Suggested Initiative Description
Support to Discoms to
facilitate
implementation of
rooftop solar
• Given the low level of rooftop solar capacity, it is
important to improve the capacity of utilities, MNRE can
provide support to utilities:
• Developing web-portal for online processing of
application
• Setting up consumer helpline center; Consumer
grievance cell
• Procurement & installation of net meters
• Organizing consumer awareness;
• Training for utility – energy accounting & billing
software, business models & net metering
• Upgradation of distribution transformers (DT) to
accommodate higher solar penetration;
• Training to ensure quality installation and O&M
• Online consumer feedback/rating for RTPV installers
Incentive scheme for
distribution utilities
• Need to develop scheme to encourage distribution
utilities to accelerate the growth of solar rooftop in the
country. The MNRE can devise a dedicated scheme for
incentivizing distribution utilities.
• Under this framework, all the distribution utilities shall
be eligible for incentive based on the rooftop solar
capacity added in their jurisdictions.
• Performance linked incentives, based on
▪ Meeting rooftop solar targets on yearly basis
▪ Number of consumers connected under net
metering arrangement
• Initiate regulatory reforms for rooftop solar capacity
addition
Conclusion
Solar rooftop is going to play an important role in meeting India’s growing energy demand
and its ambition towards becoming a global leader in solar power. With declining cost of
solar PV systems, electricity generation from rooftop solar installation is already
economically viable and, in some markets, cheaper than conventional sources of energy.
Solar rooftop has already reached grid parity in some states, for certain consumer
categories in the country.
The study indicates that solar rooftop provides several benefits to distribution utilities in
terms of meeting the day time peak demand, curbing technical losses, reducing power
purchase cost etc. While in some cases, it also affects utility business through reduction
in sales volume, reducing demand etc. Given the huge potential and limited installed
capacity of solar rooftop in the country, solar rooftop segment requires nurturing support
from key stakeholders such as policy makers, regulators, distribution licensees etc.
To achieve India’s ambitious target of 40 GW of rooftop capacity by 2022, there is a need
to devise a dedicated scheme to improve the capacity of distribution utilities by Central or
State Government. In view of this, MNRE must introduce a programme to build capacity
of discoms in specific areas such as establishing solar rooftop cell, developing

Rooftop Solar – Garnering Support from Distribution Utilities
- 11 -
interconnection framework, consumer awareness, developing web portal for online
processing, establishing consumer helpline/grievance cell, developing capacity of Discom,
SNA, SERC and Chief Electrical Inspector, Upgradation of distribution transformers etc.
Such an initiative will be a good step in the direction of bringing utilities on board. Going
forward, policy makers with support from electricity regulators will also have to devise
schemes for adoption of market models, wherein utilities plays an active role and utility
concerns associated with implementation of solar rooftops can be mitigated. Through such
measures, India will be able to meet its desired targets and meet its objective to reduce
carbon emission.
About the study
The study has been supported by Shakti Sustainable Energy Foundation and carried out
by Deloitte Touche Tohmatsu India LLP.
About Shakti Sustainable Energy Foundation
Shakti Sustainable Energy Foundation works to strengthen the energy security of the
country by aiding the design and implementation of policies that encourage energy
efficiency, renewable energy and sustainable transport solutions, with an emphasis on sub
sectors with the most energy saving potential. Working together with policy makers, civil
society, academia, industry and other partners, we take concerted action to help chart out
a sustainable energy future for India (www.shaktifoundation.in).
The views and analyses represented in this document do not necessarily reflect that of
Shakti Sustainable Energy Foundation. The Foundation accepts no liability for the content
of this document, or for the consequences of any actions taken on the basis of the
information provided.
Rooftop Solar – Garnering Support from Distribution Utilities
- 12 -
1 Introduction
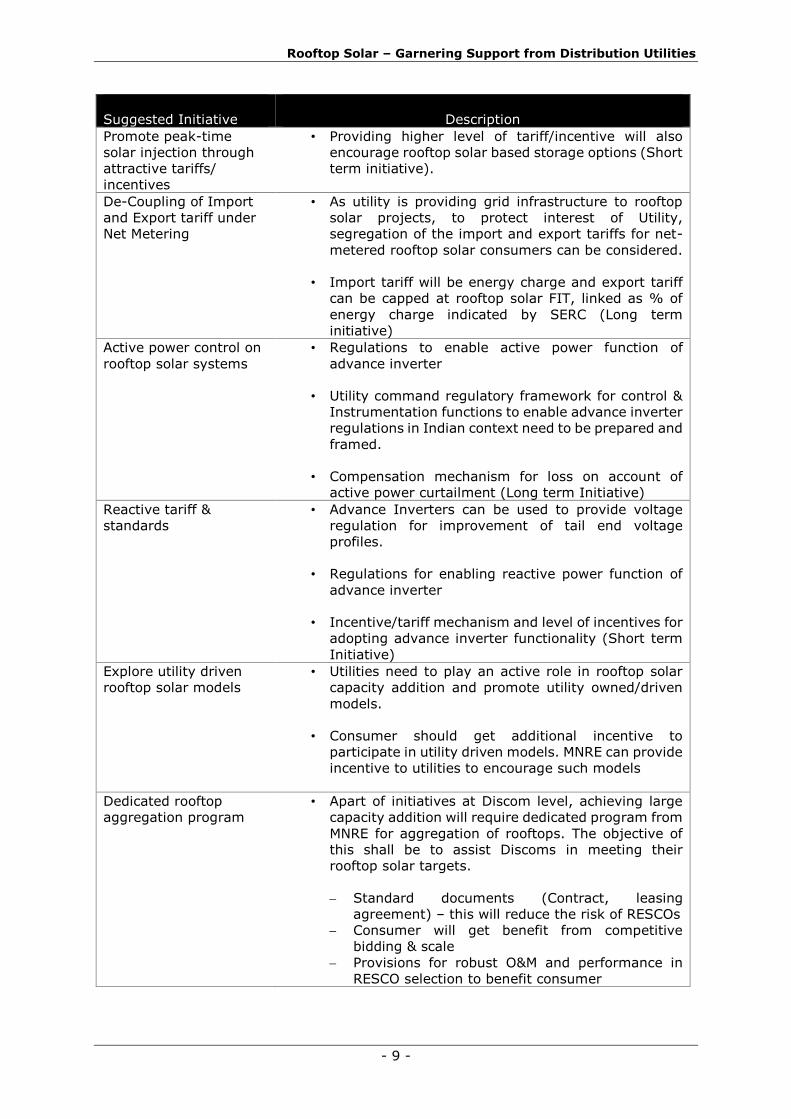
1.1 Solar sector in India
With 250–300 sunny days in a year,
about 5,000 trillion kWh of energy is
incident on an annual basis over India’s
land area with most parts receiving 4-7
kWh per sq. m per day. Recently a
study carried by National Institute of
Solar Energy (NISE) estimated that the
country has a total solar power
generation potential of 748.9 GW.
In comparison, the total installed
capacity of solar energy as on end of
July 2016 was 8,062 MW1 – a mere 1%
of the overall potential. To tap the huge
solar potential, MNRE launched the
JNNSM with a capacity addition target
of 20GW solar power by 2022. The
targets have been further revised by
five times to 100GW by 2022.
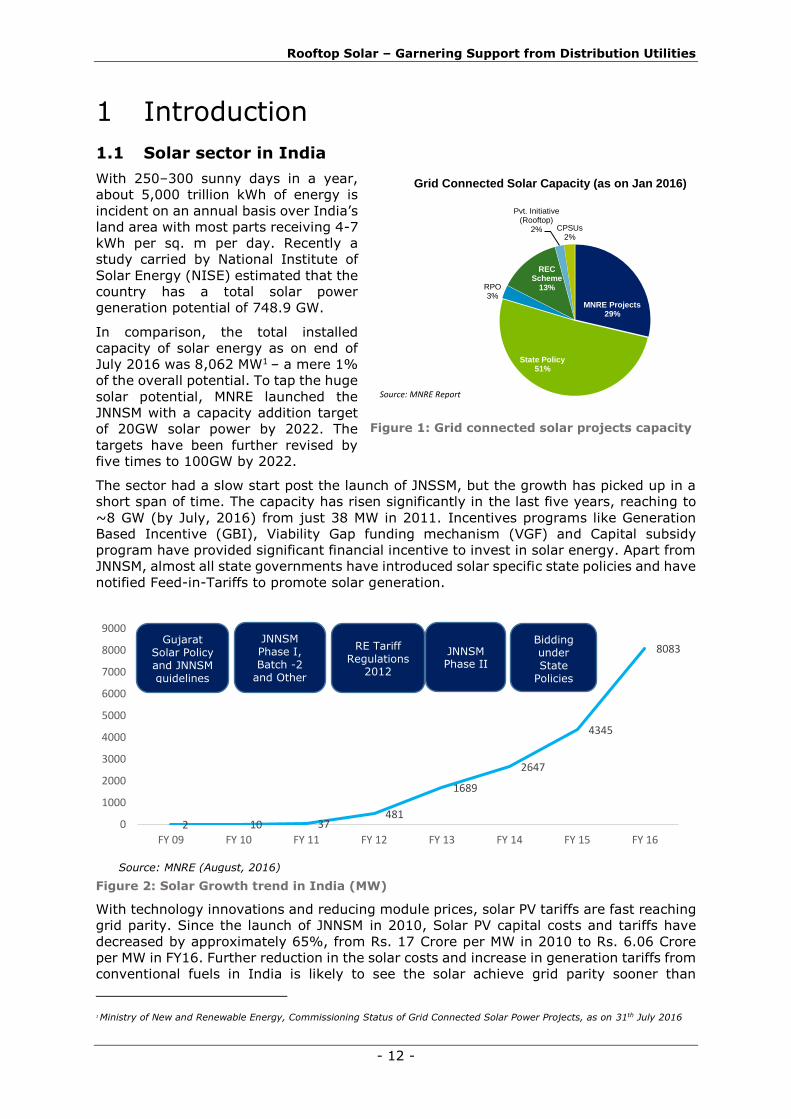
The sector had a slow start post the launch of JNSSM, but the growth has picked up in a
short span of time. The capacity has risen significantly in the last five years, reaching to
~8 GW (by July, 2016) from just 38 MW in 2011. Incentives programs like Generation
Based Incentive (GBI), Viability Gap funding mechanism (VGF) and Capital subsidy
program have provided significant financial incentive to invest in solar energy. Apart from
JNNSM, almost all state governments have introduced solar specific state policies and have
notified Feed-in-Tariffs to promote solar generation.
Figure 2: Solar Growth trend in India (MW)
With technology innovations and reducing module prices, solar PV tariffs are fast reaching
grid parity. Since the launch of JNNSM in 2010, Solar PV capital costs and tariffs have
decreased by approximately 65%, from Rs. 17 Crore per MW in 2010 to Rs. 6.06 Crore
per MW in FY16. Further reduction in the solar costs and increase in generation tariffs from
conventional fuels in India is likely to see the solar achieve grid parity sooner than
1 Ministry of New and Renewable Energy, Commissioning Status of Grid Connected Solar Power Projects, as on 31th July 2016
2 10 37481
1689
2647
4345
8083
0
1000
2000
3000
4000
5000
6000
7000
8000
9000
FY 09 FY 10 FY 11 FY 12 FY 13 FY 14 FY 15 FY 16
MNRE Projects29%
State Policy51%
RPO3%
REC Scheme
13%
Pvt. Initiative (Rooftop)
2% CPSUs2%
Grid Connected Solar Capacity (as on Jan 2016)
Source: MNRE Report
Figure 1: Grid connected solar projects capacity
Gujarat Solar Policy and JNNSM guidelines
JNNSM Phase I, Batch -2
and Other States Policies
RE Tariff Regulations
2012
JNNSM Phase II
Bidding under State
Policies
Source: MNRE (August, 2016)

Rooftop Solar – Garnering Support from Distribution Utilities
- 13 -
anticipated earlier. The trends in Solar Power benchmark Capital Cost and Tariff is
indicated below:
Figure 3: Solar Capital Cost Trend
Figure 4: Solar Tariff Trend
*Tariffs shown are for projects which are not availing accelerated depreciation benefit.
Source: Central Electricity Regulatory Commission
1.2 Rooftop Solar in India
The unutilized space on rooftops provides a large potential for generating solar power.
Small quantities of power generated by each individual household, industrial building,
commercial buildings or any other type of building can be used to fully / partially fulfil the
requirement of the building occupants and surplus, if any, can be fed into the grid. Rooftop
solar PV systems have the advantage of low installation time, providing clean, quiet and
visually unobtrusive source of energy. They can also improve the reliability of power supply
for rooftop owners, eliminate the need for long-distance transmission lines associated with
large-scale solar generation plants and save on network losses associated with large-scale
plants wheeling power to load centers.
Realizing the potential and advantages, MNRE launched a program for Generation-Based
Incentives (GBI) to incentivize the installation of Rooftop PV and Small Solar Power Plants
connected to the distribution network (at or below 33 kV level). The scheme was part of
JNNSM tail end projects under GBI scheme which is referred to as “Rooftop PV & Small
Solar Power Generation Program” (RPSSGP). A generation based incentive (GBI) was given
to the utilities to cover the difference between the tariff determined by Central Electricity
Regulatory Commission (CERC) and the base price of Rs.5.50 /kWh (FY 2010-11) with 3%
escalation per annum. In all, 71 projects have been commissioned across 12 states under
the RPSSGP scheme with total installed capacity of 90.8 MW2. However, it was observed
that this scheme garnered enthusiastic responses primarily in the ground-mounted
segment, while it received almost negligible interest in the rooftop segment.
MNRE also launched a national level ‘Grid Connected Rooftop and Small Solar Power Plants
Program’ on June 2014 which provides Central Financial Assistance (CFA) of up to 30% of
the capital cost for plants ranging from 1 kWp to 500 kWp in residential, commercial and
institutional sectors.
As per the new ambitious target of 100 GW set under the JNNSM program, MNRE has
allocated 40 GW for solar rooftops and is making concerted efforts to promote grid
connected solar rooftop projects. In a bid to achieve the same, MNRE has allocated the
targets to different states as per their energy demand and approached PSUs and other
government institutions to invest in renewable energy. Supporting the mandate, PSUs like
NTPC, CIL have already taken steps towards investments. The ministry has also introduced
a scheme for setting up of 1000 MW of Grid-connected solar PV projects by CPSUs and
Govt. of India organizations with Viability Gap funding under Batch-V of JNNSM3. The graph
2 Ministry of New and Renewable Energy, Annual Report 2014-15 3 Ministry of New & Renewable Energy, http://mnre.gov.in/file-manager/UserFiles/Scheme-1000MW-grid-connected-SPV-
batch_V-phase_II-JNNSM.pdf
17.00
6.06 13.00
12.00
0
5
10
15
20
FY10 FY11 FY12 FY13 FY14 FY15 FY16
Cap
ital
Co
st
[Rs.
cro
re/M
W]
Solar PV Solar Thermal
18.44
7.04
13.45 12.05
0
5
10
15
20
FY10 FY11 FY12 FY13 FY14 FY15 FY16
Tari
ff
[Rs.
/kW
h]
Solar PV Solar Thermal

Rooftop Solar – Garnering Support from Distribution Utilities
- 14 -
below is presenting the roadmap of MNRE for achieving the 40 GW of rooftop target by
2022
Figure 5: Capacity additions under JNNSM (in GW)
Large government institutions which have large space availability can play a pivotal role
in achieving these targets. Such institutions have high power demand and rooftop space
available with these can be utilized to meet their captive needs through a clean source. In
addition, this shall also contribute towards achieving their CSR mandate. The figure below
is presenting the targets allocated to different States by MNRE to achieve 40 GW rooftop
capacity by 2022
Figure 6: MNRE state-wise targets for Solar Rooftops
0.2
4.8 5 6 7 8 91.8
7.210
1010 9.5 8.5
2015-16 2016-17 2017-18 2018-19 2019-20 2020-21 2021-22
Rooftop Solar Projects Ground mounted ProjectsSource: MNRE
Source: MNRE

Rooftop Solar – Garnering Support from Distribution Utilities
- 15 -
While there have been some attempts under the existing policies and regulations to
promote rooftop solar PV projects, there are several barriers which continue to exist for
achieving a large-scale proliferation. A number of states are yet to specify tariff for rooftop
solar projects. Given the cost differential between MW scale solar PV projects and small
scale rooftop projects, a preferential tariff for rooftop solar PV projects needs to be
considered for the gross-metered systems. Though several states have released net-
metering regulations, there still are limiting challenges in the form of capacity and grid
integration restrictions under these regulations. In addition, there is a need to define the
technical standards for rooftop systems to ensure quality installations and operational
efficiency.
The technical limitations for the distribution networks can be one of the biggest barriers
to rooftop installations which have high potential to proliferate quickly in a favorable policy
environment. This limitation is reflected in net-metering regulations which have set project
capacity limits depending on DTR capacity. Apart from this, with increasing penetration of
rooftop solar PV, commercial interests of the utilities will need to be recognized and
managed in the choice of implementation models.
1.3 Objective of the study
India has an ambitious target to deploy 40 GW of grid-connected rooftop PV systems by
2022. However, unless the concerns of distribution utilities are addressed, a situation
similar to Tamil Nadu’s wind sector, where utility is opposing any additional wind
installations, can hit the solar rooftop sector as well. These debates have been rising even
in other countries.
Thus, with a view to bring solutions to the table, it is necessary to analyze the actual local
and aggregate impacts of rooftop systems on utilities considering actual demand and
supply profiles of the distribution areas, and tariff and cost structures. Amongst other
solutions, cost-reflective and transparent tariff design mechanisms can ensure a healthy
equation between prosumers, utilities and consumers, thus facilitating a sustained growth
of the sector.
Based on the understanding from the international experience in issues related to rooftop
solar proliferation, adoption of different market models & impact on utilities, this study
aims at devising solutions from Indian context (after considering distribution utility specific
aspects) and recommendation on changes in existing models & identifying regulatory
requirements.
The detailed scope of work is included in Annexure 1

Rooftop Solar – Garnering Support from Distribution Utilities
- 16 -
2 Overall approach for the study
To assess the impact of solar rooftop on utility business, in-depth analysis of state utilities
of eight states is carried out. Utilities Performance and Operational parameters are
analyzed based on data of past three years and projection of next five years have been
taken to analyze the future scenario. The capacity addition in rooftop segment is taken as
per MNRE’s target allocated to different states to achieve 40 GW target to analyze various
business cases in view of utility business in India.
The approach adopted for analysis and devising recommendation is shown in the following
figure
Figure 7: Overall approach
In total 17 utilities from eight (8) states have been covered for the analysis viz.
Maharashtra, Odisha, Delhi, Tamil Nadu, Andhra Pradesh, Telangana, Gujarat and Uttar
Pradesh. The utilities analysed as a part of this study are shown in the following table
Table 1: Distribution utilities covered
S
No
State Utility
1 Maharashtra Maharashtra State Electricity Distribution Company Limited
(MSEDCL)
2 Delhi BSES Rajdhani Power Ltd (BRPL)
3 BSES Yamuna Power Limited (BYPL)
Rooft
op S
ola
r U
tility
–
Opera
tion P
ara
mete
rs
Utility
- Fin
ancia
l Perf
orm
ance P
ara
mete
rs
Revenue
Tariff
Cost of Supply
Power Purchase
Rooftop Solar Capacity
targets State wise
Power Supply Profile
Power Demand Profile
Number of Consumers
Fixed Cost/ Grid Charges
T & D Loss
Year wise targets
BASE CASE ANALYSIS Base Data
Last 3 years, Projections next 3 /5 years
• Rooftop Solar energy penetration scenario by FY 2022
• Rooftop PV capacity (MW) penetration scenario for 2022 State wise mapping of hourly rooftop PV
generation and peak demand State wise mapping of monthly rooftop PV
generation and peak demand • Time of day (TOD) tariff structure across select
utility states & how it will support rooftop solar generation
• Avoided Capacity & avoided energy during peak hours
• Revenue loss to utility • Cross subsidy loss/Benefit to utility • Impact on Grid Charges collection by utility • Deemed RPO benefits to utility • Banking Charges loss to utility • Environmental benefits from rooftop solar generation
• Active & reactive power support – rooftop solar generation
States covered
1. Maharashtra 2. Delhi 3. Odisha 4. Telangana 5. Andhra Pradesh 6. Tamil Nadu 7. Gujarat 8. Uttar Pradesh
International Experience • Review of International Rooftop Solar Experience (USA, UK, Germany, Japan)

Rooftop Solar – Garnering Support from Distribution Utilities
- 17 -
S
No
State Utility
4 Tata Power Delhi Distribution Limited (TPDDL)
5 Odisha Central Electricity Supply Utility (CESU)
6 North Eastern Electricity Supply Company of Odisha Limited
(NESCO)
7 Southern Electricity Supply Company Of Odisha Limited
(SOUTHCO)
8 Western Electricity Supply Company Of Odisha Limited (WESCO)
9 Andhra
Pradesh
Eastern Power Distribution Company of Andhra Pradesh Limited
(APEPDCL)
10 Southern Power Distribution Company of Andhra Pradesh Limited
(APSPDCL)
11 Telangana Telangana State Southern Power Distribution Company Limited
(TSSPDCL)
12 Telangana State Northern Power Distribution Company of Limited
(TSNPDCL)
13 Tamil Nadu Tamil Nadu Generation and Distribution Corporation (TANGEDCO)
14 Gujarat Paschim Gujarat Vij Company Ltd. (PGVCL)
15 Dakshin Gujarat Vij Company Ltd. (DGVCL)
16 Uttar
Pradesh
Dakshinanchal Vidyut Vitran Nigam Ltd (DVVNL)
17 Paschimanchal Vidyut Vitaran Nigam Limited (PVVNL)
Various published sources of information have been relied on for collating and analyzing
the data for respective utilities. These data sources include 18th EPS report (CEA),
Performance of State Power Utilities for the years 2011-12 to 2013-14 (PFC), Tariff orders
by the State Regulatory Commissions, Power for All (PFA) reports for different states. In
addition to this data from other sources like World Bank, Asian Development Bank, IRENA,
NREL, National and International Reports have also been taken to develop the business
cases for utilities.
In the following section, the relevant international experience in the context of evolution
of rooftop solar segment has been provided.
Rooftop Solar – Garnering Support from Distribution Utilities
- 18 -
3 International Experience
3.1 United States of America
In last few years, Solar PV has seen phenomenal growth in United States and it is expected
to grow to cumulative capacity of 41 GWdc by 2016. Till Q3 2015, US solar has witnessed
addition of 1 GWdc or more in the last 8 consecutive quarters. Q3 2015 alone has 1,361
MWdc installed, bringing the market up to 4.1 GWdc through the first three quarters of
2015.
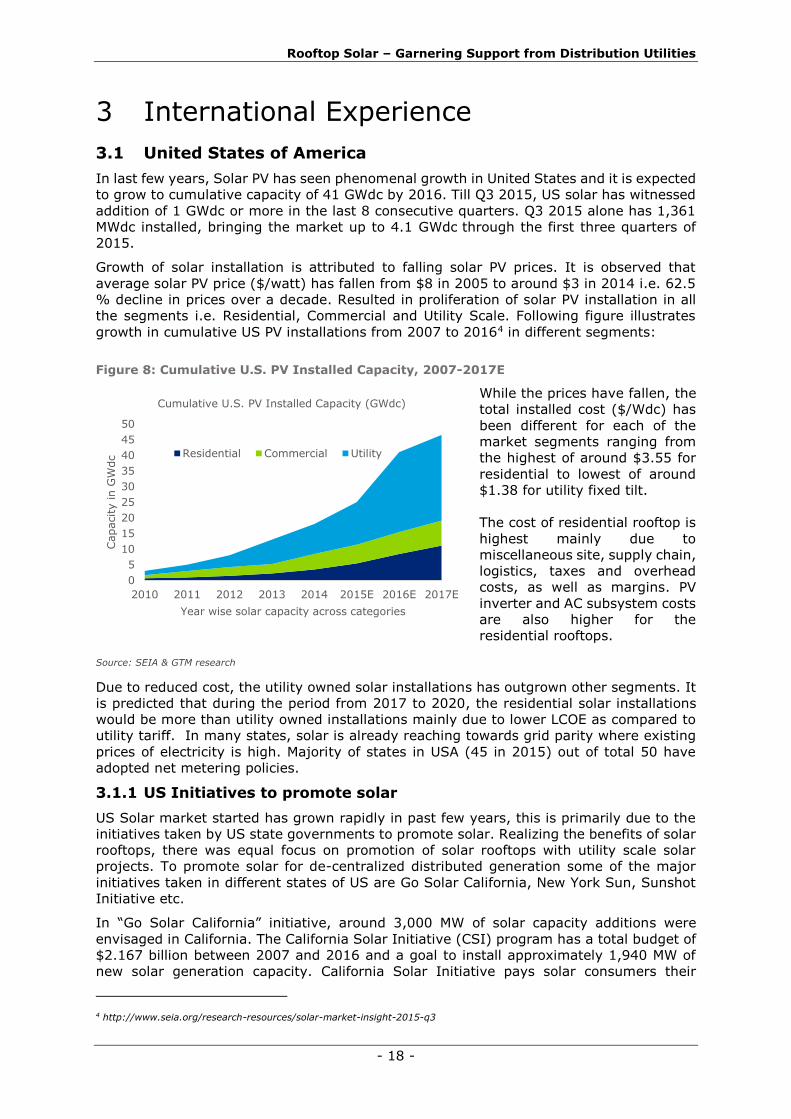
Growth of solar installation is attributed to falling solar PV prices. It is observed that
average solar PV price ($/watt) has fallen from $8 in 2005 to around $3 in 2014 i.e. 62.5
% decline in prices over a decade. Resulted in proliferation of solar PV installation in all
the segments i.e. Residential, Commercial and Utility Scale. Following figure illustrates
growth in cumulative US PV installations from 2007 to 20164 in different segments:
Figure 8: Cumulative U.S. PV Installed Capacity, 2007-2017E
While the prices have fallen, the
total installed cost ($/Wdc) has
been different for each of the
market segments ranging from
the highest of around $3.55 for
residential to lowest of around
$1.38 for utility fixed tilt.
The cost of residential rooftop is
highest mainly due to
miscellaneous site, supply chain,
logistics, taxes and overhead
costs, as well as margins. PV
inverter and AC subsystem costs
are also higher for the
residential rooftops.
Source: SEIA & GTM research
Due to reduced cost, the utility owned solar installations has outgrown other segments. It
is predicted that during the period from 2017 to 2020, the residential solar installations
would be more than utility owned installations mainly due to lower LCOE as compared to
utility tariff. In many states, solar is already reaching towards grid parity where existing
prices of electricity is high. Majority of states in USA (45 in 2015) out of total 50 have
adopted net metering policies.
3.1.1 US Initiatives to promote solar
US Solar market started has grown rapidly in past few years, this is primarily due to the
initiatives taken by US state governments to promote solar. Realizing the benefits of solar
rooftops, there was equal focus on promotion of solar rooftops with utility scale solar
projects. To promote solar for de-centralized distributed generation some of the major
initiatives taken in different states of US are Go Solar California, New York Sun, Sunshot
Initiative etc.
In “Go Solar California” initiative, around 3,000 MW of solar capacity additions were
envisaged in California. The California Solar Initiative (CSI) program has a total budget of
$2.167 billion between 2007 and 2016 and a goal to install approximately 1,940 MW of
new solar generation capacity. California Solar Initiative pays solar consumers their
4 http://www.seia.org/research-resources/solar-market-insight-2015-q3
0
5
10
15
20
25
30
35
40
45
50
2010 2011 2012 2013 2014 2015E 2016E 2017E
Capacity in G
Wdc
Year wise solar capacity across categories
Cumulative U.S. PV Installed Capacity (GWdc)
Residential Commercial Utility

Rooftop Solar – Garnering Support from Distribution Utilities
- 19 -
incentive either all-at-once for smaller systems, or over the course of five years for larger
systems.
New York-Sun was also launched in 2012 to increase solar electric installations in the
State. In April 2014, commitment of nearly $1 billion was made to NY-Sun for expanding
deployment of solar capacity throughout the State and transform New York’s solar industry
to a sustainable, subsidy-free sector. New York State Energy Research and Development
Authority (NYSERDA) has begun transitioning to the statewide NY-Sun Incentive Program,
using a Megawatt (MW) Block system, starting in August 2014 for solar electric systems
up to 200kW in capacity and in early 2015 for systems larger than 200kW in solar capacity.
In 2011, The U.S. Department of Energy (DOE) SunShot Initiative was launched with the
goal to make solar energy fully cost competitive with traditional energy sources before the
end of the decade. The SunShot works with private companies, universities, non-profit
organizations, state and local governments, and national laboratories to drive down the
cost of solar electricity to $0.06 per kilowatt-hour, without incentives, by the year 2020.
The SunShot initiative is designed to re-establish American technological leadership,
strengthen U.S. economic competitiveness in the global clean energy race, help cut carbon
pollution to combat climate change, and secure energy future.
3.1.2 Financing Mechanism
In addition to the promotional programs, there is focus also on providing finance to the
end consumers through different routes. To fund these rooftop models, there are several
financing models that emerged out in US, three broad categories to fund rooftop projects
are depicted in following figure
Under these financing mechanism, traditional financing scheme is the most common form
of solar financing wherein Cash purchase is the least expensive option in terms of total
dollars spent to acquire PV as no financing costs or solar finance company fees are
incurred. However, the upfront cost of a PV system is significant and likely a barrier for
most households. There are several financing options available to homeowners who choose
not to (or cannot) purchase a PV system with cash. The options include Home Equity Loans
or HELs (also known as second mortgages), Home Equity Line of Credit (HELOCs), and
Cash-out Mortgage Refinancing (COMRs). They are provided by banks and credit unions
across the country and therefore are likely the most available options for homeowners.
Interest rates for HELs and COMR are compound whereas HELOC interest rates are simple.
There are generally no fees (upfront or yearly) or very low fees for HELs. HELOCs and
COMR loan contracts often require upfront or yearly fees with non-interest costs tending
to be the highest for COMRs (akin to first mortgages).
Traditional self-financing tools provide homeowners with a means of purchasing a PV
system outright. However, some homeowners have additional options for procuring solar
energy via third-party ownership models, such as PPAs or solar leases, offered by multiple
local, regional, and national solar finance companies. Third party ownership enable
homeowners to benefit from commercial tax incentives available for solar—the ITC and
Traditional Self-financing
Cash Purchase
Home Equity Loan (HEL)
Home Equity Line of Credit (HELOC)
Cash-out Mortgage Refinancing (COMR)
Third-party
Ownership
Power Purchase Agreement (PPA)
Solar Lease
Utility & Public Financing
Property Assessed Clean Energy (PACE)
Utility Loans
Public Loans (Credit-Enhanced and
Revolving loans)
Figure 9: Financing mechanism for solar projects in USA

Rooftop Solar – Garnering Support from Distribution Utilities
- 20 -
the Modified Accelerated Cost Recovery System (MACRS)—by partnering with a third-party
solar provider. By making efficient use of tax incentives, third-party ownership can be cost
competitive with local retail electricity rates.
In addition to third parties, several utilities, states, and local governments also have solar
PV system financing programs for eligible residents in US. These utilities fund rooftop
systems under different schemes such as Property Assessed Clean Energy (PACE) which
is a public financing mechanism used by local governments. Similarly, utility financing is
also available to some residential and commercial customers. Utility loans are a low-cost
financing option that can either be an on-bill loan or meter-attached (i.e., secured to the
meter/electric service). However, only homeowners who are customers of utilities that
provide or participate in financing programs can access these loans. In addition to this
public loans were also available for consumers, it uses third-party capital (i.e., that of
banks or credit unions) to support lending for all or a portion of a loan. The state or local
government either provides a loan for the remaining portion of the principal or a credit
enhancement for the private-lender portion of the loan.
3.1.3 Prevalent Business Models
There are broadly three structure based on the ownership of the system relevant in US,
the first one is Self-owned wherein the rooftop system is owned and used by the end
consumer. While in case the consumer wants to go away from high initial investment, it
goes for third party or utility owned system, wherein third party or utility invests in the
rooftop system to be used by the end consumer and in return consumer pays it either in
the form of EMI for using the system or it procures the energy generated from the system
at a mutually agreed price. However, under these ownership structure there could be
difference in terms of the energy accounting and settlement. It could either be in the form
of Gross Metering, wherein the complete energy generated from the system is sold to the
grid or it could be Net Metering, wherein only the excess generation left after consumption
from solar rooftop is injected to the grid. End consumers can also choose to setup rooftop
system in off-grid mode for captive use only.
Figure 10: Popular rooftop solar business models in USA
3.2 Germany
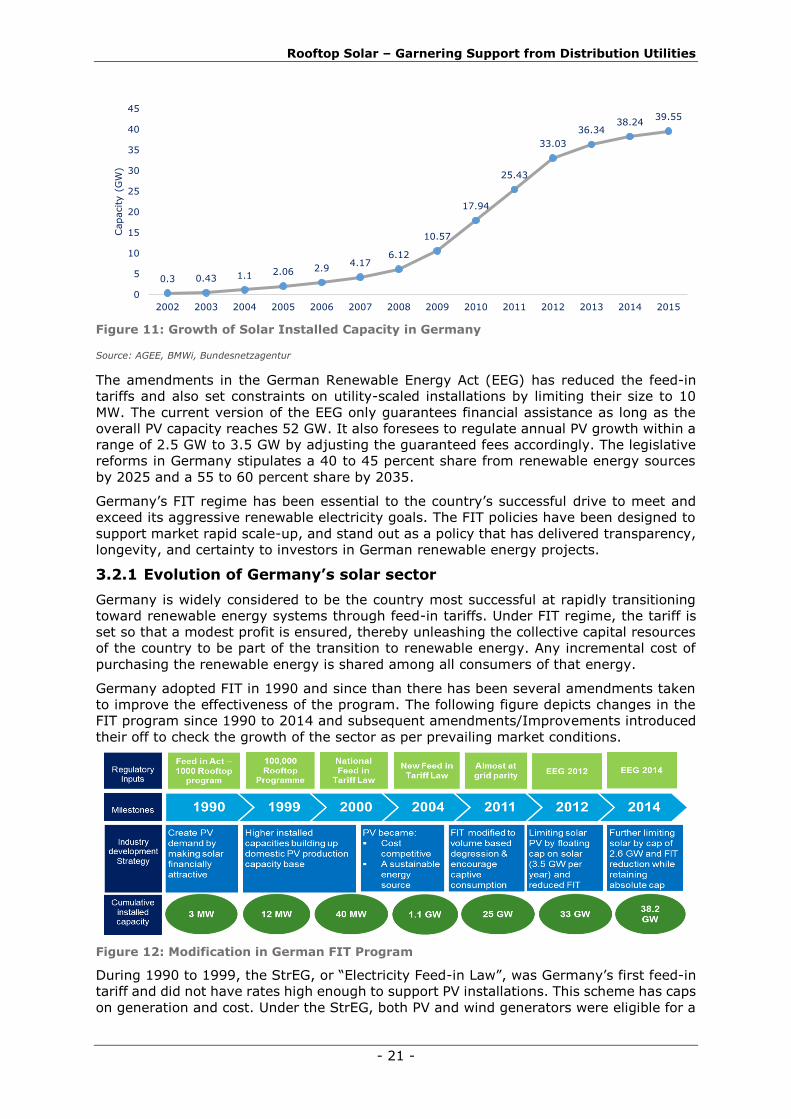
The annual capacity installation for solar PV in Germany peaked around 7 GW during the
period 2010 - 2012. Germany had the world’s highest installed solar capacity by 2015,
with more than 39 GW, ahead of US, China, Italy, UK and Japan. The capacity has grown
at a CAGR of 45.6% in the last 13 years. There has been a decline in the capacity additions
since 2013 due to changes in governmental policies.
Ownership Structure
Self Owned System
3rd Party Owned System
Utility Owned System
Metering Structure
Off-grid
Gross Metering
Net Metering
Revenue Structure
Solar Lease
PPA
Self Use
Rooftop Solar – Garnering Support from Distribution Utilities
- 21 -
Figure 11: Growth of Solar Installed Capacity in Germany
Source: AGEE, BMWi, Bundesnetzagentur
The amendments in the German Renewable Energy Act (EEG) has reduced the feed-in
tariffs and also set constraints on utility-scaled installations by limiting their size to 10
MW. The current version of the EEG only guarantees financial assistance as long as the
overall PV capacity reaches 52 GW. It also foresees to regulate annual PV growth within a
range of 2.5 GW to 3.5 GW by adjusting the guaranteed fees accordingly. The legislative
reforms in Germany stipulates a 40 to 45 percent share from renewable energy sources
by 2025 and a 55 to 60 percent share by 2035.
Germany’s FIT regime has been essential to the country’s successful drive to meet and
exceed its aggressive renewable electricity goals. The FIT policies have been designed to
support market rapid scale-up, and stand out as a policy that has delivered transparency,
longevity, and certainty to investors in German renewable energy projects.
3.2.1 Evolution of Germany’s solar sector
Germany is widely considered to be the country most successful at rapidly transitioning
toward renewable energy systems through feed-in tariffs. Under FIT regime, the tariff is
set so that a modest profit is ensured, thereby unleashing the collective capital resources
of the country to be part of the transition to renewable energy. Any incremental cost of
purchasing the renewable energy is shared among all consumers of that energy.
Germany adopted FIT in 1990 and since than there has been several amendments taken
to improve the effectiveness of the program. The following figure depicts changes in the
FIT program since 1990 to 2014 and subsequent amendments/Improvements introduced
their off to check the growth of the sector as per prevailing market conditions.
Figure 12: Modification in German FIT Program
During 1990 to 1999, the StrEG, or “Electricity Feed-in Law”, was Germany’s first feed-in
tariff and did not have rates high enough to support PV installations. This scheme has caps
on generation and cost. Under the StrEG, both PV and wind generators were eligible for a
0.3 0.43 1.1 2.06 2.94.17
6.12
10.57
17.94
25.43
33.03
36.3438.24
39.55
0
5
10
15
20
25
30
35
40
45
2002 2003 2004 2005 2006 2007 2008 2009 2010 2011 2012 2013 2014 2015
Capacity (
GW
)

Rooftop Solar – Garnering Support from Distribution Utilities
- 22 -
feed-in tariff payment set at 90% of the retail electricity rate, which meant that the FiT
rate fluctuated between 8.45-8.84 €cent/kWh over the course of the decade. Although
this rate was insufficient to drive PV markets on its own, PV generators were eligible for
rebates equal to 70% of system cost (starting in 1990) and low-interest financing under
the 100,000 roof-top program (1999). By the end of year 1999, 67 MW of PV were installed
due in large part to capital cost subsidies.
The volume management strategy during this period consisted of caps triggered by the
amount of renewable energy in each utility service area. Under the StrEG, policy costs
were recovered regionally, rather than distributed nationally. Initially, local utilities were
only required to recover policy costs from within their service territories, up to a 5%
renewable energy penetration level. Above that level, the costs would be socialized more
broadly among ratepayers served by the regional transmission system. In addition to the
generation caps, utilities were exempt from renewable energy purchases if the purchases
substantially impacted ratepayers.
In 2000, Germany passed the EEG, or “Renewable Energy Law,” which first introduced
national rates that approximated the generation cost of PV systems and proved more
effective than a direct linkage of incentives to retail rates. This program was an effort to
set cap on program and projects to control impact on ratepayers. In combination with the
100,000 Roofs Program (which offered zero-interest loans starting in 1999), the EEG drove
cumulative capacity to 435 MW by the end of 2003, or an average annual capacity addition
of ~120 MW. The EEG initially specified that a hard cap would be implemented once 350
MW of capacity was reached in order to limit policy costs. In June, 2002, however, the law
was amended to increase the capacity that would trigger the cap to 1,000 MW.
In 2003, the EEG rates were revised one year ahead of schedule when the 100,000 Roofs
Program ran out of funds. Main feature of this module was to remove the caps. The new
rates, which were established and went into effect in January 2004, were differentiated by
system size and by application type (façade mounted, roof-mounted, or free-standing),
and ranged from 46-62 €cent/kWh. Market growth accelerated under the amended EEG,
with cumulative capacity expanding to 5,979 MW by the end of 2008, or an average annual
capacity addition of ~1,100 MW. The revised EEG removed the 1000 MW program cap, as
well as the system size caps, creating the first uncapped PV market in the world.
In July 2008, the EEG was revised, and new rates went into effect in 2009. First time, the
corridor system was introduces. The new law removed rates for façade integrated PV but
introduced payments on top of the retail electricity rate for PV electricity consumed onsite.
The amendment established a “corridor” or “flexible” digression system for PV whereby
the rate would decrease each year based on the volume of MW installed during the
previous year (defined as October 2008-October 2009). The 2009 amendment projected
that 1500 MW would be installed in 2009, 1700 MW in 2010, and 1900 MW in 2011. If
the actual installations matched the projections, then the next year’s digression would be
6.5%. If actual installations were below or above the projections, the digression would
decrease or increase by an additional 1%.
In 2010, the Government introduced two “non-scheduled” decreases to reflect PV
component price declines and altered the corridor digression schedule. The rates
decreased from 2009 to 2010 by 7.5% since the amount of capacity installed exceeded
the projected 1,500 MW projection. In order to account for rapid declines in PV module
prices, the government called for additional cuts beyond the digression introduced in 2009.
In July 2010, a law was passed that immediately decreased rates for building-mounted
systems by 13%, and rates for ground mounted systems by 8-12%. The law further
decreased rates on all systems by an additional 3% in October 2010. The law also set out
a revised corridor digression system with a 3,500 MW annual installation projection. Each
GW installed in excess of the 3,500 MW baseline in 2010 would result in an additional 1%
digression in 2011, up to a maximum digression of 13%. In 2012, each GW of excess
capacity would result in a 3% decrease, for a maximum digression of 21%.

Rooftop Solar – Garnering Support from Distribution Utilities
- 23 -
In February, 2011, the German government issued a revised corridor degression schedule.
In anticipation of continued robust growth enabled by additional system cost reductions,
the revision split the potential degression for 2012 into two parts: one that would occur in
July 2011 and one that would occur on January 1, 2012. Both adjustments are to be based
on the amount of capacity installed. The total degression for 2011-2012 could be as low
as 1.5% or as high as 24%, depending on the actual PV market growth.
In 2012, the German government set a “floating cap” on solar power, limiting it to 2.5 to
3.5 gigawatt per year and reducing the feed-in remuneration of small rooftop panels
(under 10 kilowatt) from 24.43 cents per kilowatt-hour to 19.5 ct/KWh. The degression
schedules that are proposed for 2011 and between 2011-2012 can already be projected,
based on the proposals made in January.
In 2014, the new EEG retains the absolute cap of 52 gigawatt for the installed capacity of
solar power in Germany (first introduced in 2012). Installations beyond this target will not
receive any funding under the EEG. Depending on the size of the installation, new
photovoltaics will receive 9.2 to 13.1 ct/KWh. This tariff is generally set to be reduced
monthly; by how much and if at all depends on whether the addition of new solar capacity
exceeds or falls short of the prescribed target. The graph below is showing the FIT price
trend for rooftop and ground mounted solar PV from 2000 to 2016
Figure 13: FIT price trend for Rooftop and ground Mounted PV in Germany
3.3 United Kingdom
In United Kingdom, Solar PV has witnessed tremendous growth in the past 6 years. It has
reached 10,799 MW (till 2nd quarter 2016) from 32 MW installed capacity in 2010 across
892,817 installations. This is an increase of 29% (2,423 MW) compared to July 2015.
Rooftop solar industry in the UK is centered primarily in two key markets viz. small scale
and mid-size. Small scale is typically smaller than 4 kWp and up to 50 kWp in housing,
small commercial premises and community buildings. Mid-size deployment are larger than
50 kWp and up to 1 MWp, particularly on commercial and industrial buildings but also on
larger public and community buildings.
Following graph indicates year wise growth of solar PV installation and share of different
size of PV projects in the overall capacity.
0
10
20
30
40
50
60
1998 2000 2002 2004 2006 2008 2010 2012 2014 2016 2018
FIT
Pri
ce (
ct/k
Wh
)
New PV, Roof small New PV, GM Average FiT
Source: Fraunhofer Institute for Solar Energy Systems

Rooftop Solar – Garnering Support from Distribution Utilities
- 24 -
Source: Department for Business, Energy & Industrial Strategy
Figure 14: Growth of Solar PV in UK
To date, 50% (5,403 MW) of total installed solar PV capacity comes from large scale
installations greater than 5 MW, with 23% (2,450 MW) coming from small scale 0 to 4 kW
installations.
3.3.1 FIT Model
The introduction of the Feed-in-Tariff (FiT) in 2010 saw rapid growth of the UK photovoltaic
market, with many thousands of domestic installations along with numerous commercial,
community and industrial projects. By 2014, more than 650,000 solar installations had a
total capacity of over 5400 MW of solar power. In 2012, government had said that 4 million
homes across UK will be powered by sunlight, representing 22,000 MW of installed solar
power capacity by 2020.
If a household, business or community has a PV installation with a total installed capacity
of 5 MW or less, FITs pays them a tariff for the electricity they generate, and electricity
they export back to the grid. Tariff for FIT change as often as every 3 months. Once an
installation is registered for FIT, it will keep getting generation and export tariffs as long
as its installation is eligible. They will be adjusted annually for inflation based on the retail
prices index.
These installations must demonstrate that the building which they are wired to provide
electricity to has achieved an Energy Performance Certificate (EPC) rating of level D or
above in order to receive the higher tariff rate. A registered assessor can issue an EPC
indicating how energy efficient the building is. The rating band varies from A (the highest
rating) to G (the lowest rating). The energy efficiency requirement applies to solar PV
installation, with the exception of stand-alone and capacity up to 250kW.
The following graph is showing the share of different schemes in the total installed solar
PV capacity of UK
0
2
4
6
8
10
12Ja
n
Ap
r
Jul
Oct
Jan
Ap
r
Jul
Oct
Jan
Ap
r
Jul
Oct
Jan
Ap
r
Jul
Oct
Jan
Ap
r
Jul
Oct
Jan
Ap
r
Jul
Oct
Jan
Ap
r
Jul p
2010 2011 2012 2013 2014 2015 2016
UK
So
lar
Cap
acit
y (G
W)
25MW+
5-25 MW
50 kW-5 MW
10-50 kW
4-10 kW
0-4 kW

Rooftop Solar – Garnering Support from Distribution Utilities
- 25 -
Source: Department for Business, Energy & Industrial Strategy
Figure 15: Growth and Share of different schemes in total solar Capacity
3.3.2 FIT Rates
FIT rates in UK compensate for generation and export of power to grid at certain rates.
These rates are dependent on the size of the solar installment along with the energy
efficiency requirement of the buildings. Depending upon the category of the building, FIT
rates are assigned as low, medium and high to each of the building type. Export FIT is
same for all the building types but generation FIT differ depending upon the identified
class of building as low, medium or high.
Corresponding rates for each of the category is mentioned in the following table.
Table 2: FIT rates for January 2016 to April 2016
PV Installed
Capacity
(other than
stand-alone)
For eligible installations
(1 Oct 2015 to 1 Jan
2016)
(p/kWh)
For eligible installations
(1 Jan 2016 to 1 Apr
2016)
(p/kWh)
Buildin
g type
System
Capacity
Low Medium High Low Medium High
Gen
erati
on
tarif
f
0 – 4 kW 5.94 11.22 12.47 5.73 10.83 12.03
4 – 10 kW 5.94 10.17 11.30 5.73 9.81 10.90
10 – 50 kW 5.94 10.17 11.30 5.73 9.81 10.90
50 – 100 kW 5.94 8.67 9.63 5.73 8.36 9.29
100 – 150 kW 5.94 8.67 9.63 5.73 8.36 9.29
150 – 250 kW 5.94 8.29 9.21 5.73 8.00 8.89
More than 250
kW
5.94 5.73
Stand-alone 4.28 3.08
Export FIT 4.85 4.85
-
2
4
6
8
10
12Ja
n
Ap
r
Jul
Oct
Jan
Ap
r
Jul
Oct
Jan
Ap
r
Jul
Oct
Jan
Ap
r
Jul
Oct
Jan
Ap
r
Jul
Oct
Jan
Ap
r
Jul
Oct
Jan
Ap
r
2010 2011 2012 2013 2014 2015 2016
UK
So
lar
Cap
acit
y (G
W)FITs Standalone
FITs
RO Ground-mounted
RO
Unaccredited

Rooftop Solar – Garnering Support from Distribution Utilities
- 26 -
3.4 Japan
3.4.1 Evolution of Solar PV in Japan
Japan for long trusted on capital subsidy mode to encourage investment in solar PV sector
and later on it introduced RPS but the actual growth in Solar PV market was seen with the
introduction of FITs. In 1994 subsidies started at 50% of the system costs, and were then
gradually reduced to 33% in 1999. Market support on the national level, however, had
been terminated afterwards, leading to a decline in FY 2007 and 2008. Subsequently, the
government re-launched a subsidy program in 2009. In November 2009, the government
also initiated Solar FiT under which residential PV systems as well as non-residential
systems (up to 500 kW) were eligible for preferential purchasing tariffs. This led also to a
moderate growth in the non-residential solar PV market.
The Japanese Photovoltaic (PV) market has gained speed after introduction of Feed-in
Tariff (FiT) in July 2012. Prior to the start of the FiT in July 2012, the accumulated Japanese
PV capacity was 5.6 GW, 84% of which had been added by small-scale PV systems for
residential purposes. From July 2012 to June 2014 a total of 10.5 GW of new PV capacity
has been installed, 30 percent of which is residential installations. Japan Photovoltaic
Energy Association, predicts that Japan is going to install 49 GW by 2020 and 102 GW by
2030 - a capacity that would account for roughly 10 percent of Japan’s annual electricity
consumption.
The graph below is representing the growth of solar PV in Japan with change in policy
framework from 1992 to 2014.
Figure 16: Growth trend in Solar Capacity with change in Policy environment
As of now, Solar PV accounted for 10% of Japan’s electricity demand on some of the
hottest summer days, and represented 3% of total power generation in 20155. Large
volume of Capacity addition in Solar PV projects exceeded the capacity of the grid in Japan
that leads the government to revise regulation and causing utilities to refuse new
interconnection and curtail the output of existing projects without compensation.
3.4.2 Key initiatives to promote solar PV
Evolution of Japanese Solar PV market started way back in 1974 with the launch of “Sun
Shine Project”. Sun Shine project is a long term, large scale project scheduled to run from
1974 to 2000 with a goal of developing sufficient alternative energy sources to meet
considerable energy needs of Japan by 2000’s. It includes research and development
programs for solar, geothermal, coal, hydrogen energy technologies. In 1993 a re-
organization of national program was done by combining sun-shine and moon-light
5 REN 21-2016

Rooftop Solar – Garnering Support from Distribution Utilities
- 27 -
projects with the environmental issue new projects to give rise to new program called
“New Sun-Shine projects” which is scheduled up to 2020 with the estimated budget of 1.5
trillion yen6.
As a part of Sun-shine program, the
government launched Residential PV
System Program. The program was
launched in 1994 and laid a strong
foundation for the world’s largest
residential PV market. The program
ended in March, 2014 and till that time
the program is expected to solarized
over 1.5 million residential roofs and
added about 6 GW of solar PV capacity in
Japan
Between 1994 and 2005, the program
funded close to 300,000 residential PV
systems. In this period, Japan
dominated the global Solar PV market
both in terms of installation and production. The cost of average residential PV system was
greatly reduced to ¥661 per watt with an incentive rate of just ¥20 per watt (or 3% of the
system cost). During this point, the Japanese government concluded that the domestic PV
market became self-sufficient and discontinued the residential incentive program7.
During 2006 to 2008, Japan solar market faced its first market contraction due to the
inability of domestic module manufacturers to provide models. Since domestic module
makers shifted their focus to Europe for huge demand and better profits. Recognizing this,
the federal government brought back the residential PV incentive program in January 2009
with an incentive rate of ¥70 per watt. The domestic PV market was revitalized and Japan
celebrated its one million solar-roof installations in April 2012. According to data published
by the Japan Photovoltaic Expansion Center (J-PAC), the program supported 276,051
residential PV system installations during fiscal year 2012 (April 2012 to March 2013).
In order to accelerate the growth in solar PV installation, Japan shifted its focus from the
traditional residential segment to the non-residential segment with the launch of the
national FIT program in July 2012. Before the new FIT program started, Japan’s Ministry
of Economy, Trade, and Industry (METI) implemented the Purchase Program for Surplus
PV Power in November 2009.
Figure 17: Solar PV Capacity (MW) in Residential and Non Residential Segment
6 http://unesdoc.unesco.org/images/0009/000948/094830eb.pdf
7 Renewable Energy World - Japan FIT Changes Reflect End of Residential PV Program
453683 923
1143 13331533
19432743
3850
5500
7800
10000
407 449 499 566 586 611 684 875 1064 1201
5869
13409
53%
60%65% 67% 69% 72% 74% 76% 78%
82%
57%
43%
0%
10%
20%
30%
40%
50%
60%
70%
80%
90%
0
2000
4000
6000
8000
10000
12000
14000
16000
2003 2004 2005 2006 2007 2008 2009 2010 2011 2012 2013 2014
Cumulative residential capacity (MW) Cumultative non residential capacity (>10 MW) % of residential
0
500
1,000
1,500
2,000
2,500
0
100,000
200,000
300,000
Source: National Energy Foundation and J-PAC

Rooftop Solar – Garnering Support from Distribution Utilities
- 28 -
Under this law, electric utilities were obliged to purchase surplus PV power. In the case,
all the generated power from solar PV can be sold if the installed capacity of the PV system
is 10 kW as shown in the table below.
Table 3: FIT Scheme Details
Residential Non-residential
Capacity Below 10 kW Above 10 kW
Duration (in years) 10 20
Scheme Excess electricity only Total electricity produced
Purchase price
(Yen/ kWh)
2012 42 40 + tax
2013 38 36 + tax
2014 37 32 + tax
IRR 3.2% 6%
Source: METI, 2014
In order to fund FIT, Japanese government introduced Renewable Energy Surcharge per
kWh on customers with some exceptions keeping in view industry competiveness and
earthquake hit citizens. Government allowed exemption to earthquake hit customers and
80% reduction to heavy electricity consumers industries (consumption higher than higher
1,000,000 kWh) considering adverse business impact. Table 4: FiT surcharge rate for 2014
2012 2013 2014
FiT surcharge (Yen/ kWh) 0.24 0.35 0.75
Cost accrued with the purchase of
renewably produced electricity (billion
Yen) (A)
250 480 900
Administrative costs (billion Yen) (B) 1.7 2.5 2.7
Avoided costs (billion Yen) (C ) 120 167 248
D = A+B-C (billion Yen) 130.3 313.3 654.7 Source: JREF, RTS 2014
FIT provided incentives for non-residential categories and as a result the solar capacity in
non-residential category took off very quickly. The start of the FIT generated an immediate
surge of PV applications to METI and within 2 years the total capacity applied for increased
to 68.7 GW. Around 55 percent of the approved capacity after FIT introduction had been
added by large-scale projects, 41 percent by mid-size projects and only 4 percent by
residential PV projects (below 10 kW).
Thus, Japan presents a successful case for solar PV deployment by using combination of
Investment/Capital subsidy, R&D investments and RPS (2003) to promote the solar PV
industry till around 2005. Post 2005 the capital subsidy was withdrawn which led to the
fall in the market, In 2009 Japan again renewed its interest in solar PV promotion through
introduction of a FIT.
3.5 Case Studies - Impact of Rooftop Solar on Utility Business
Case-1: Impact on Tariff Structure
In Net Metering framework, rooftop consumers meets part of their energy requirement
through solar rooftop and remaining though grid. This makes grid to act as a backup power
for consumers. Further, rooftop consumers are generally exempted from wheeling and
transmission charges for the energy they procure from rooftop solar. Thus utilities sales
and revenue suffers with increase in the capacity of Distributed Generation/rooftop solar.
Due to the same reason, UniSource Energy Services (UNS), a utility serving in Arizona saw
a reduction of 8% in its annual sales. The decline in sales is due to several factors,
including:

Rooftop Solar – Garnering Support from Distribution Utilities
- 29 -
• The shutdown or curtailment of operations by certain large customers
• The commission’s EE and Distributed Generation (DG) requirements
• The slow pace of economic recovery.
UNS electric’s current rate design relies heavily on volumetric sales to recover a majority
of fixed costs. And Utility feels that this model requires adjustment at a time when usage
per customer is expected to decline, driven by increasingly successful EE programs and
growing DG usage. Moreover, without changing the current tariff structure, utilities will
not be able to recover its costs and earn an appropriate return on its investments.
In view of this, UNS proposed to increase its fixed monthly rate from $10 to $20 in its
application to Arizona Corporation Commission. The Company’s proposed to include a
mandatory three-part rate design for new residential DG users and new small commercial
DG users. The proposed rate design will allow utilities more equitable cost recovery in an
environment where overall electricity sales are declining yet the requirement of the grid
has increased. The rate design changes proposed by the company is as follows:
a) Basic Service Charge: A basic service charge to recover some fixed costs, such
as the meter, service lines, customer service and billing function, and minimum
distribution system costs.
b) Demand Charge: A demand charge to send appropriate cost-of-service price
signals and allow for recovery of fixed transmission and generation costs necessary
to satisfy a customer’s maximum electric demand over a specific period of time.
c) Rate Tiers: UNS Electric is proposing to eliminate certain upper tiers to reduce this
cost shift and enhance company’s ability to recover its fixed costs.
Moreover, the company also proposed that the three-part rate design would be mandatory
for all new DG and other partial requirements customers and would be available as an
option for non-DG customers.
Case-2: Impact on Cross Subsidy
Net Metering mechanism helps the market to grow itself but it may also burden the non-
solar consumers with rise in retail tariffs. As due to high retail tariff, cross subsiding
consumers are expected to switch to rooftop solar and leaving the burden of cross subsidy
on lower consumer bases. In order to recover the cross subsidy, utilities will be forced to
increase the tariff, thus to avoid high rates more consumers will switch to solar.
To counter this, Utilities in USA have proposed new fees and interconnection charges for
solar users. The companies say that as more customers adopt rooftop solar, fewer will be
left to pay for the upkeep of the power plants, transmission lines and substations, which
solar customers still rely on when their panels aren’t generating power. Hence Utilities
have also proposed lowering the rate at which solar customers are compensated for the
surplus electricity they generate and don’t use.
Utility’s suggestion
In view of this, Edison, which serves 130,000 homes with rooftop solar, wants to charge
future solar customers $3 per kilowatt of capacity they’ve installed on their roofs. If new
net metering rules aren’t enacted, Edison estimates non-solar customers would pay an
additional $16 billion for grid maintenance over the next decade because of cost shifting
from solar to non-solar customers. Other utilities also feel the same and meditating similar
solutions:
i) PG&E, which serves northern and central California, also has proposed a $3 per
kilowatt fee.
ii) SDG&E, wants to offer two options: Either homeowners pay a fixed, monthly curb-
to-meter fee or they opt into a system where they sell all the electricity to the utility
and buy all the electricity they need from the utility, at rates SDG&E did not specify.

Rooftop Solar – Garnering Support from Distribution Utilities
- 30 -
Recent changes
The CPUC approved a rate reform package that cuts the number of electric tiers from four
to two by 2019. That change will effectively raise electricity rates for people who use less
and lower them for people who use more. That rate-flattening makes solar less attractive
for heavy consumers of electricity, who are more likely to adopt it in the first place.
The rate reform will also stick all electrical customers with a $10 minimum bill – meaning
that no matter how little electricity a homeowner consumes, he or she will pay at least
$10 a month. (Additionally, time-of-use rates, in which electricity is more expensive when
demand is high, will become the default, though customers will be able to opt out.)
The CPUC is in process of drafting and finalizing new set of rules. The commission will
implement the new rules on July 1, 2017, or when the proportion of utilities’ generating
capacity from net metered sources hits 5 percent, whichever comes first. San Diego Gas
& Electric is expected to hit that 5 percent cap in early 2016, while Edison and Pacific Gas
& Electric are expected to hit it in late 2016.
Case-3: Impact on Utility Cash-flow/ Sales
Net Metering mechanism allows consumers to meet part of their energy requirements from
solar rooftop, thus consumption from grid comes down. Which means that the more
kilowatt-hours generated by rooftop solar, the fewer kilowatt-hours sold by utilities. And
with fewer kilowatt-hours sold, utilities have a harder time justifying investments in new
power stations, transformers and other types of capital investments that utilities earn
money from.
The loss of revenue from solar PV is not only happening in sunny states such as California
and Arizona but also in less-sunny New Jersey and others states with solar incentive
programs. PVs, electricity storage such as lithium-ion batteries, electrification of heating
and transport, energy efficiency, energy conservation and demand response, are all poised
to reduce utility revenue.
In a study carried out by Lawrence Berkley National Labs “Financial Impacts of Net-
Metered PV on Utilities and Ratepayers” revenue of utilities declines with PV penetration.
Two utilities were studied i.e. South West Utility and North East Utility. As per the study
Customer-sited PV reduces both utility revenues and costs (i.e., revenue requirements).
In the case of the SW Utility, the impacts on revenues and costs are roughly equivalent
under the 2.5% PV penetration scenario. At higher PV penetration levels, however,
revenue reductions exceed cost reductions, in part because of a declining marginal value
of PV. In the case of the NE Utility, revenue reductions exceed cost reductions across all
of the future PV penetration levels considered, and the divergence is considerably wider
than for the SW Utility. This occurs because the NE Utility has higher assumed growth in
certain fixed costs that customer-sited PV does not reduce. Following table illustrates the
impacts of customer sited PV on revenue.
Table 5: Impact of PV penetration on Utility Earnings
Earnings Impacts (NPV 20-yr)
PV Penetration 2.5% 5% 7.5% 10%
Southwest Utility -4% -4% -8% -8%
Northeast Utility -4% -9% -12% -15% Source: Lawrence Berkley National Labs
Thus, PV reduces earnings as a result of both revenue erosion and also deferred capital
investments (“lost earnings opportunity effect”).
Case-4: Impact on Market Models and Pricing Framework Solar Rooftop generates electricity during day time, however in State’s where peak
demand occurs during evening could promote storage solutions to manage the day time
excess generation by meeting peak demand during evening. In current regulatory and

Rooftop Solar – Garnering Support from Distribution Utilities
- 31 -
policy framework, such market models do not have any provisions which otherwise could
support utility at times of evening or morning peaks.
As per the California ISO (CAISO) increase in the availability of solar generation in the
early afternoons have resulted in the creation of a great deal of potential for oversupply
at some times of day during specific seasons. Based on this analysis, CAISO expects an
increasing mismatch between current design of time of utilization (TOU) rates, which
encourage a reduction in demand during afternoons in favor of evening usage, and the
likely availability of electricity over the coming years.
According to CAISO, this mismatch, in which high energy demand persists at a time when
fewer renewables are available, could threaten reliability. As a result, CAISO has proposed
to change the existing TOU periods in order to discourage electricity use during those
periods when supplies may be lower, such as weekday late afternoons in the spring and
to encourage the use of renewable distributed generation at those times. Based on its
analysis, CAISO recommends a TOU rate structure with seasonal variations in the times
for peak rates. Specifically CAISO proposes the TOU period structure as show in the
following figure:
Figure 18: Weekdays Peak Hour
Under this proposed TOU period structure, the daily peak period on both weekdays and
weekends would be from 4 p.m. to 9 p.m. daily. In summer months, July and August only,
electricity during these hours on weekdays would be at an even higher, “super- peak” rate,
with the peak rate charged for usage between 11 a.m. and 4 p.m. weekdays during those
months. The remaining time would be split between an off-peak rate applicable during
nights and mornings, and a super-off-peak rate available during weekend and certain
spring weekday afternoon. This would result in relatively lower rates during early
afternoons, with higher rates during late afternoon and early evening hours.
In general, these CAISO recommendations are consistent with recent utility proposals to
modify TOU periods. The SCE and PG&E RDW cases, in which new, later peak periods have
been approved, differ from the SDG&E RDW in at least two respects:
1) SDG&E proposed changes applicable to all customers, whereas the SCE and PG&E
proposals were limited only to some customer classes, and
2) The SCE and PG&E RDWs resulted in unopposed settlements, which are subject to
a different standard of approval than fully litigated cases.
Case-5: Impact on Power procurement cost
Germany presents a case where increase in solar installations has resulted in falling
wholesale prices. As solar tends to replace costlier source of power production. There has
been consistent falling wholesale prices with addition of solar generation. As the
renewables levy reflects the difference between FIT payments to renewable energy
producers and the market value of the produced electricity when sold on wholesale
markets.
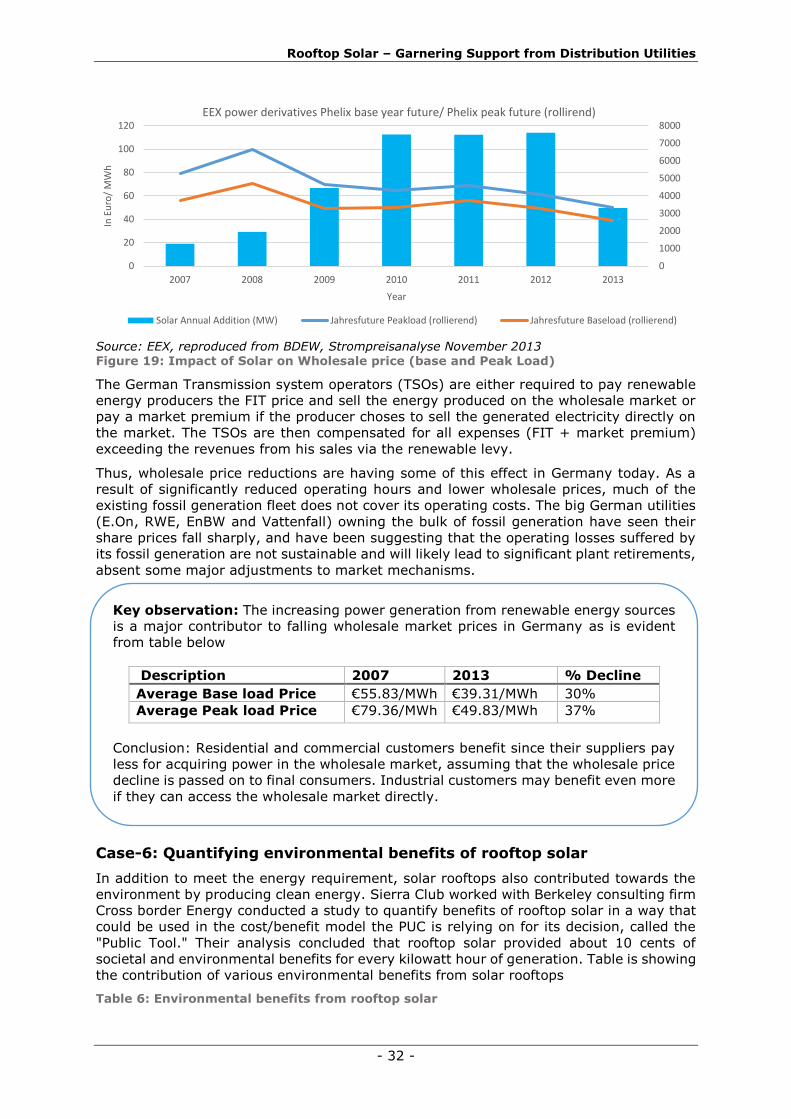
Rooftop Solar – Garnering Support from Distribution Utilities
- 32 -
Source: EEX, reproduced from BDEW, Strompreisanalyse November 2013 Figure 19: Impact of Solar on Wholesale price (base and Peak Load)
The German Transmission system operators (TSOs) are either required to pay renewable
energy producers the FIT price and sell the energy produced on the wholesale market or
pay a market premium if the producer choses to sell the generated electricity directly on
the market. The TSOs are then compensated for all expenses (FIT + market premium)
exceeding the revenues from his sales via the renewable levy.
Thus, wholesale price reductions are having some of this effect in Germany today. As a
result of significantly reduced operating hours and lower wholesale prices, much of the
existing fossil generation fleet does not cover its operating costs. The big German utilities
(E.On, RWE, EnBW and Vattenfall) owning the bulk of fossil generation have seen their
share prices fall sharply, and have been suggesting that the operating losses suffered by
its fossil generation are not sustainable and will likely lead to significant plant retirements,
absent some major adjustments to market mechanisms.
Case-6: Quantifying environmental benefits of rooftop solar
In addition to meet the energy requirement, solar rooftops also contributed towards the
environment by producing clean energy. Sierra Club worked with Berkeley consulting firm
Cross border Energy conducted a study to quantify benefits of rooftop solar in a way that
could be used in the cost/benefit model the PUC is relying on for its decision, called the
"Public Tool." Their analysis concluded that rooftop solar provided about 10 cents of
societal and environmental benefits for every kilowatt hour of generation. Table is showing
the contribution of various environmental benefits from solar rooftops
Table 6: Environmental benefits from rooftop solar
0
1000
2000
3000
4000
5000
6000
7000
8000
0
20
40
60
80
100
120
2007 2008 2009 2010 2011 2012 2013
In E
uro
/ M
Wh
Year
EEX power derivatives Phelix base year future/ Phelix peak future (rollirend)
Solar Annual Addition (MW) Jahresfuture Peakload (rollierend) Jahresfuture Baseload (rollierend)
Key observation: The increasing power generation from renewable energy sources
is a major contributor to falling wholesale market prices in Germany as is evident
from table below
Description 2007 2013 % Decline
Average Base load Price €55.83/MWh €39.31/MWh 30%
Average Peak load Price €79.36/MWh €49.83/MWh 37%
Conclusion: Residential and commercial customers benefit since their suppliers pay
less for acquiring power in the wholesale market, assuming that the wholesale price
decline is passed on to final consumers. Industrial customers may benefit even more
if they can access the wholesale market directly.
Conclusion:
Residential and commercial customers benefit since their suppliers pay less for
acquiring power in the wholesale market, assuming that the wholesale price decline
is passed on to final consumers.
Industrial customers may benefit even more if they can access the wholesale
market directly.

Rooftop Solar – Garnering Support from Distribution Utilities
- 33 -
S. No. Benefit Quantified benefit
1. Reduced Climate Impacts 3¢/kWh
2. Cleaner Air 2¢/kWh
3. Conserved Water 1¢/kWh
4. Preserved Open Space 2¢/kWh
5. More Resilient Energy System 2¢/kWh
Total 10¢/kWh Source: Sierra Club (Non Energy benefits of distributed generation)
As per their white paper Non-Energy Benefits of Distributed Generation, that ten cents
includes the value of each of these benefits:
1. Reduced climate impacts - The EPA's Social Cost of Carbon estimates that each
metric ton of carbon dioxide will cost society up to $120 in 2015 -- equivalent to
$0.03 per kilowatt hour of rooftop solar generation from avoided carbon emissions.
2. Cleaner air - Less pollution means fewer health costs borne by society in the form
of emergency room admissions, lost work days, and premature deaths. The EPA
estimates that these costs total $24 for each pound of particulate matter, and $184
for each pound of nitrous oxide, equivalent to $0.02 per kilowatt hour of rooftop
solar generation from avoided air pollution.
3. Water conservation - Generating electricity from natural gas requires a lot of
water. Analysis base estimate on the value of water on what it would cost to retrofit
existing gas plants to convert to cooling technology that uses no water, or to
desalinate ocean water. The estimate comes to about $1,600 for each acre-foot of
water saved, adding about $0.01 to the value of each kilowatt hour of renewable
generation.
4. Open space preservation - When we use the existing built environment for
energy production, we protect California's open spaces and priceless natural
heritage. Analysis base estimate on the value of agricultural land, leading us to
conservative value of $0.02 saved for each kilowatt hour of rooftop solar
generation.
5. A more resilient power system - Rooftop solar insulates against the energy
security threats to reliability by siting generation close to load. When paired with
storage and smart inverters, it will increasingly be able to provide a host of grid
services to help stabilize power flow and keep power on during grid outages. By
our estimates, this security is worth $0.02 for each kilowatt hour of rooftop solar
generation.
Case-7: Operational Initiatives
Increasing capacity of solar distributed generation will also have an impact on operational
parameters such as voltage, frequency, phase imbalance etc. of distribution utility. In
order to compensate utilities for the same, the Intermountain Rural Electric Association
(IREA) proposed a new Load Factor Adjustment Rider that would apply to new residential
customers or those installing solar after December 30, 2015 in Colarado. The charge would
apply to any residential customer who has a load factor less than or equal to the Load
Factor Threshold (9% or 10%) in a billing period.
Key observations
• The Association will measure the consumer's load factor percentage by dividing the
energy (kWh) consumed in a full billing cycle by the product of the maximum demand
(kW) and the number of hours in the billing period (kWh/kW x days x hours). For each
billing period in which the calculated load factor is less than or equal to the Load Factor
Threshold, the consumer's bill will be adjusted by an amount equal to the peak demand
times Load Factor Adjustment applicable for the rate.

Rooftop Solar – Garnering Support from Distribution Utilities
- 34 -
• Proposed Load Factor Adjustment Rate
Rate Description Load Factor
Adjustment/kW
Load Factor Threshold
Residential Service (A) $4.04 9%
Residential Incorporated
City
or Town Service (CS)
$4.13
10%
The utility (IREA) wants to ensure that the load on DT level should not fall below 10% and
proposed a penalty for customers breaching the limit thus impacting rooftop solar
customers adversely.
Case-8: Impact on T&D cost
Solar rooftops helps consumers to generate and consumer power locally, thus reduced
burden on distribution or transmission system. With increase in the capacity of these
system, utilities could avoid the cost of developing new transmission or distribution lines
for evacuating power from large utility scale projects to the end consumers.
To evaluate the saving in the cost of T&D due to solar rooftop, Cross border Energy
conducted a study “The Benefits and Costs of Solar Distributed Generation for Arizona
Public Service8”. The study pointed out the case studies which results in avoided cost in
transmission as approx. 2 cents/ kWh while for distribution the avoided cost came out to
be approximate 0.2 cents/ kWh. The Study reported that Arizona Public Service (APS)
incurs $125 million in high-voltage transmission costs for every 400 MW increase in peak
demand, and $7 million in lower-voltage sub-transmission costs per 30 MW of load growth.
It also shows $29.5 million in deferrable sub-transmission costs for a 130 MW decrease in
peak demand.
In the long-run, solar DG combines with EE and demand response (DR) resources to defer
such costs even if, over a short-term period such as a three-year transmission planning
cycle, none of these small-scale resources individually amounts to 400 MW or to the
smaller amounts in specific areas that is required to defer sub transmission projects. Given
that EE, DR, and DG resources will combine to reduce APS’s peak demands by 1,150 MW
in 2017, it seems clear that, in aggregate, these resources will avoid significant
transmission costs on the APS system.
The Study concluded that distribution capacity cost savings are possible if demand
reductions from DG exceed load growth on distribution feeders or substations, and if solar
DG can be targeted to specific locations where circuits would otherwise need an upgrade.
The study valued these reductions using a distribution avoided cost of $133,000 per MW
of DG ($133 per kW). Moreover, even on a circuit whose loading is below the 90%
threshold today, PV can reduce the peak loading and defer the future date when that
circuit’s loads exceed the 90% threshold, a date that may be beyond the current
distribution planning period but well within the lives of the installed PV systems.
8 Thomas Beach et al

Rooftop Solar – Garnering Support from Distribution Utilities
- 35 -
4 Impact of rooftop solar on Indian utilities
Deployment of customer-sited photovoltaics (rooftop solar) in countries like United States
has expanded rapidly in recent years, driven in part by public policies premised on a range
of societal benefits that PV may provide. With the success of these efforts, heated debates
have surfaced in a number of countries about the impacts of customer-sited PV on utility
shareholders and ratepayers, and such debates will likely become only more pronounced
and widespread as solar costs continue to decline and deployment accelerates.
Rooftop solar development in India is currently in a nascent phase of development.
However, with GOI targeting 40 GW of rooftop solar capacity addition and with expected
increase in rooftop solar penetration levels, it can be expected to face issues from
distribution utilities in India.
Rooftop solar project offers multiple benefits in the form of savings in T&D losses,
environmental benefits (reduced GHG emission, lower water requirement & no land
requirement), and avoided capacity during peak solar generation. Depending upon the
State regulatory framework, Discoms will also be eligible for deemed Solar RPO benefit for
the solar power consumed under net-metering framework by the consumer. Given the
financial & operational capabilities of Indian utilities, it is important to understand the
extent of impact rooftop solar will make on the utilities.
4.1 Impact on Utility – key parameters
To develop and analysis various cases and scenarios, the parameter accessed and key
assumptions taken are as follows:
• Capacity addition target for Rooftop solar (FY 2022) has been taken from MNRE in
MW. For computation of energy produced by rooftops a CUF of 16% is considered.
• State wise, year-wise Capacity addition in selected States considered as below :
State-wise MNRE Rooftop solar annual addition targets (MWp)
State FY
2016
FY
2017
FY
2018
FY
2019
FY
2020
FY
2021
FY
2022
Delhi 5 132 138 165 190 220 250
Gujarat 15 385 400 480 560 640 720
Odisha 5 120 125 150 175 200 225
Tamil Nadu 15 420 438 524 613 700 790
Maharashtra 20 565 588 704 823 940 1060
Andhra Pradesh 10 240 250 300 350 400 450
Telangana 10 240 250 300 350 400 450
Uttar Pradesh 20 510 538 650 752 860 970
• Rooftop solar capacity across category
o Total state-wise solar rooftop target is divided into utilities’ in proportion of
respective energy requirement
o Utility's solar addition is further divided into residential, commercial and
industrial categories in ratio of their respective energy consumption
assuming all capacity addition will come under Net Metering mechanism and
energy produced from rooftops shall be consumed within these three
categories
• Revenue loss to utility - Revenue loss to utility is calculated assuming that all
solar MUs would be replacing the energy sold by utility to customers in the 2
scenarios (Scenario-I and Scenario – II).

Rooftop Solar – Garnering Support from Distribution Utilities
- 36 -
o Scenario - 1: If the rooftop solar replaces the energy MUs consumed by
the existing customers and that customer falls in the highest energy slab
tariff paying category.
o Scenario -2: If the rooftop solar replaces the energy MUs consumed by the
existing customers and that customer falls in the average tariff paying
category.
• Loss of Cross Subsidy - The impact on cross subsidy is calculated as difference
b/w avg. COS (Cost of Supply) and Energy Charge/Avg. Energy Charge considered
and depending on quantum of energy replaced.
• Loss of grid Charges - Grid charges loss to utility is calculated assuming reduction
in contract demand by rooftop consumer by 10%.
• Loss of Banking Charges - Loss for utility is calculated assuming 30% of energy
generated from rooftop solar is banked and do not pay 2% banking charge
(assumed in-kind i.e. MU). Price for calculating the impact has been taken as APPC
price.
• RPO Benefit to utility - The impact of getting deemed RPO for utility is calculated
assuming Solar REC price as alternative option for meeting Solar RPO compliance.
• Benefit in T&D losses – Rooftop solar power as is generated in consumer
premises will result in utilities benefit from savings in T&D losses. The MU saved in
T&D losses due to rooftop solar is quantified using the APPC rate.
• Environmental Benefit - Various tangible impacts as reduction in water, land and
CO2 emission has been used in line with the prevailing prices for these savings to
determine total tangible benefits on account of rooftop solar generation vis-s-vis
thermal power projects.
Water Saved : Water saving is calculated based upon water required by
thermal power plants subtracting water requirements by PV plant for module
cleaning for MNRE rooftop targets FY 2022
CO2 Impact assessment: CO2 emission factor (0.82 ton CO2/MWh) assumed
(Source - CEA report). CO2 emissions reduction potential has been estimated
by multiplying total annual PV generation and emission factors.
Avoided Land Impact assessment: Land use impact data (in acres/MW) has
been collected for and thermal power plants to calculate effective land savings
(in acres) by installing rooftop PV plant. Land coverage factor of 5 acre per
MW for ground mounted PV and 1.42 acre/MW for thermal power plant has
been assumed.
4.1.1 Cases & Scenarios
The case details indicative analysis to understand the impact on utilities as well as benefits
from rooftop solar in case utilities achieve the rooftop solar capacity targets proposed by
MNRE for different states for FY 2022.
The utilities wise targets are mapped based on the projected energy requirement of the
respective utility in year FY 2022. To analyze the impact on Utility, different cases and
scenarios have been developed, which are shown in the figure
Figure 20: Cases and Scenarios

Rooftop Solar – Garnering Support from Distribution Utilities
- 37 -
C. Scenerio-1: Highest tariff Paying Consumers Switch to Rooftop Solar
The Scenario 1 considers that rooftop solar power will replace the consumer consumption
mapped at highest tariff slab in a particular consumer category. The analysis below
covers three cases under Scenario 1.
o Case-1: Impact of solar Rooftop on Utility Revenue
Case 1: This assumes the highest tariff paying consumer’s switch to rooftop
solar. The impact on utility is in terms of : revenue loss, loss in fixed charges
(assuming 10% of the solar capacity will result in sanctioned load reduction),
loss in banking charges (assuming 30% of energy generated from rooftop solar
is banked and do not pay 2% banking charge @ APPC price). The benefits for
utility is Deemed RPO (@ Solar REC price of INR 3.5/kWh), environmental benefit
and savings in T&D losses.
Proliferation of Solar Rooftops will have both positive and negative impact on the Utilities’
revenue, this case explains the impact of solar rooftops on utility revenue for FY 2022
assuming that the capacity addition in rooftop segment will be as per MNRE’s target. With
increase in the retail tariff, higher number of consumers will shift to rooftop, this will result
in the reduction of sales volume and hence reduction in utility revenue. As the rooftop
capacity is expected to increase with time in view of increase in retail tariff and falling cost
of rooftop system, the loss of revenue is expected to increase with time. However, Rooftop
capacity will also have positive impact on utility revenue due to deemed RPO benefit,
environmental benefit, saving in infrastructure and reduction of technical losses etc., which
will also increase with increase in rooftop capacity.
As per the analysis the overall impact under this case for utilities will be negative.
Revenue loss to selected utilities due to solar rooftops will be in the range Rs. 7.3/kWh
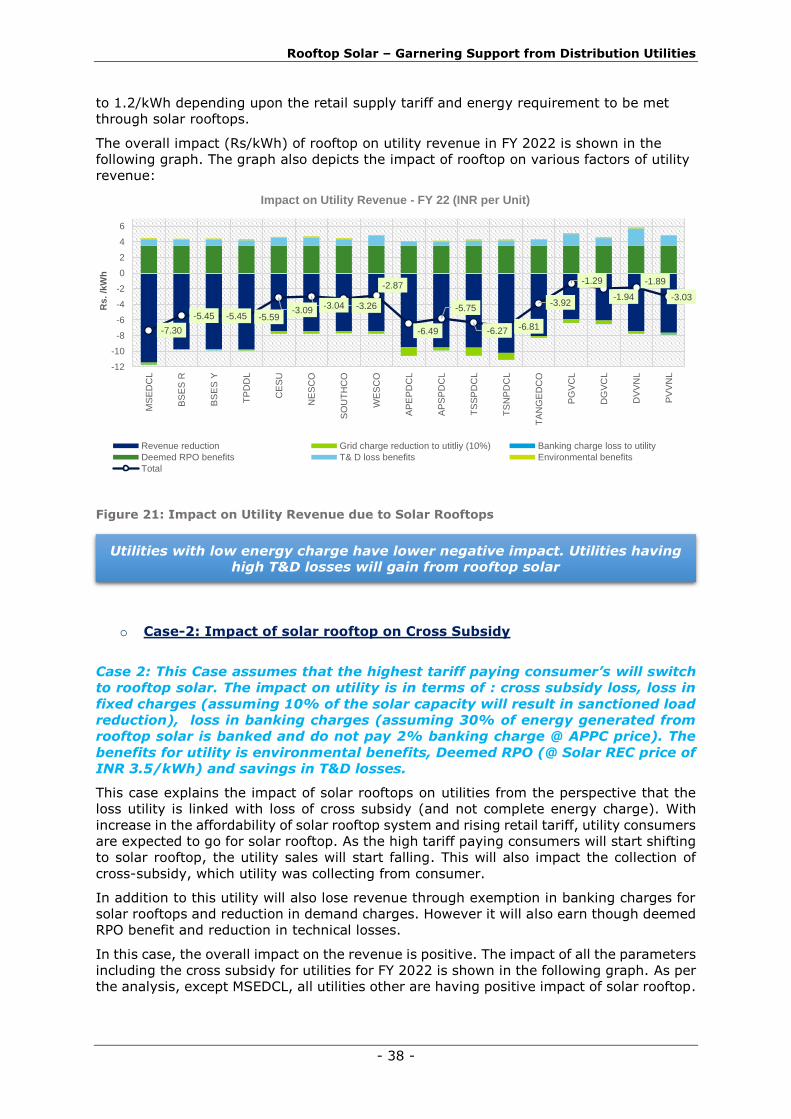
Rooftop Solar – Garnering Support from Distribution Utilities
- 38 -
to 1.2/kWh depending upon the retail supply tariff and energy requirement to be met
through solar rooftops.
The overall impact (Rs/kWh) of rooftop on utility revenue in FY 2022 is shown in the
following graph. The graph also depicts the impact of rooftop on various factors of utility
revenue:
Figure 21: Impact on Utility Revenue due to Solar Rooftops
o Case-2: Impact of solar rooftop on Cross Subsidy
Case 2: This Case assumes that the highest tariff paying consumer’s will switch
to rooftop solar. The impact on utility is in terms of : cross subsidy loss, loss in
fixed charges (assuming 10% of the solar capacity will result in sanctioned load
reduction), loss in banking charges (assuming 30% of energy generated from
rooftop solar is banked and do not pay 2% banking charge @ APPC price). The
benefits for utility is environmental benefits, Deemed RPO (@ Solar REC price of
INR 3.5/kWh) and savings in T&D losses.
This case explains the impact of solar rooftops on utilities from the perspective that the
loss utility is linked with loss of cross subsidy (and not complete energy charge). With
increase in the affordability of solar rooftop system and rising retail tariff, utility consumers
are expected to go for solar rooftop. As the high tariff paying consumers will start shifting
to solar rooftop, the utility sales will start falling. This will also impact the collection of
cross-subsidy, which utility was collecting from consumer.
In addition to this utility will also lose revenue through exemption in banking charges for
solar rooftops and reduction in demand charges. However it will also earn though deemed
RPO benefit and reduction in technical losses.
In this case, the overall impact on the revenue is positive. The impact of all the parameters
including the cross subsidy for utilities for FY 2022 is shown in the following graph. As per
the analysis, except MSEDCL, all utilities other are having positive impact of solar rooftop.
-7.30
-5.45 -5.45 -5.59-3.09
-3.04 -3.26
-2.87
-6.49
-5.75
-6.27 -6.81
-3.92
-1.29
-1.94
-1.89
-3.03
-12
-10
-8
-6
-4
-2
0
2
4
6
MS
ED
CL
BS
ES
R
BS
ES
Y
TP
DD
L
CE
SU
NE
SC
O
SO
UT
HC
O
WE
SC
O
AP
EP
DC
L
AP
SP
DC
L
TS
SP
DC
L
TS
NP
DC
L
TA
NG
ED
CO
PG
VC
L
DG
VC
L
DV
VN
L
PV
VN
L
Rs.
/kW
h
Impact on Utility Revenue - FY 22 (INR per Unit)
Revenue reduction Grid charge reduction to utitliy (10%) Banking charge loss to utility
Deemed RPO benefits T& D loss benefits Environmental benefits
Total
Utilities with low energy charge have lower negative impact. Utilities having high T&D losses will gain from rooftop solar

Rooftop Solar – Garnering Support from Distribution Utilities
- 39 -
Figure 22: Impact of Solar Rooftops on Cross Subsidy
o Impact of Solar Rooftop in progressive scenario
Case 3: This assumes the highest tariff paying consumer’s switch to rooftop
solar. It is assumed that the Cross subsidy will become zero in FY 2022 and no
environmental benefits is considered to analyze the impact. The impact on utility
is in terms of: loss in fixed charges (assuming 10% of the solar capacity will
result in sanctioned load reduction), loss in banking charges (assuming 30% of
energy generated from rooftop solar is banked and do not pay 2% banking
charge @ APPC price). The benefits for utility is only Deemed RPO (@ Solar REC
price of INR 0.5/kWh) and savings in T&D losses.
Figure 23: Impact on utility revenue in Progressive scenario
-0.10
2.46 2.13 2.213.27 3.33 3.10 3.49
0.54 1.07 0.68 1.12
3.18
5.66 5.01 5.394.24
-15
-10
-5
0
5
10
-7
-5
-3
-1
1
3
5
7
MS
ED
CL
BS
ES
R
BS
ES
Y
TP
DD
L
CE
SU
NE
SC
O
SO
UT
HC
O
WE
SC
O
AP
EP
DC
L
AP
SP
DC
L
TS
SP
DC
L
TS
NP
DC
L
TA
NG
ED
CO
PG
VC
L
DG
VC
L
DV
VN
L
PV
VN
L
Rs.
/ kW
hImpact on Utility Revenue from Cross Subsidy- FY 22 (INR per Unit)
Cross-subsidy loss Grid charge reduction to utitliy (10%) Banking charge loss to utility
Deemed RPO benefits T& D loss benefits Environmental benefits
Total
1.02 1.15 1.19 1.08 1.20 1.25 1.031.42
-0.13
0.640.14 0.28
1.021.48
1.01
2.44
1.47
-4
-3
-2
-1
0
1
2
3
4
-4
-3
-2
-1
0
1
2
3
4
Rs.
/ k
Wh
Overall Per Unit Impact FY 22 (INR per Unit)
Cross-subsidy loss Grid charge reduction to utitliy (10%)Banking charge loss to utility Deemed RPO benefitsT& D loss benefits Environmental benefitsTotal
Utilities with low cross subsidy levels will have lower impact. Consumer
categories having energy charge lower than COS & adopting rooftop solar will
benefit utilities.

Rooftop Solar – Garnering Support from Distribution Utilities
- 40 -
This is assumed to be a progressive case where it is assumed that the cross subsidy
component from retail tariff will become zero and utility consumers will charge consumers
as per the cost of supplying to that particular consumer. Recognizing the falling cost trend,
it is also assumed that the floor price of solar REC will drop down to Rs. 0.50/kWh from
Rs. 3.50/kWh in 2022.
In this case the impact on utility due to solar rooftop will be on the revenue loss from fixed
charges, banking charges, and benefits from deemed RPO & reduction in technical losses.
As per the analysis, the overall impact of solar rooftop on utilities will be positive in this
case.
As the reduction in power purchase cost on account of reduction in technical losses will
have dominating impact on the utility revenue as compared to revenue loss on account of
reduction in demand and waiver of banking charges. The graph above is depicting the
impact of solar rooftop on utility revenue in progressive scenario.
D. Scenerio-2: Average tariff Paying Consumers Switch to Rooftop Solar
The Scenario 2 considers that rooftop solar power will replace the consumer consumption
mapped at average tariff slab in a particular consumer category. The analysis below
covers two cases under Scenario 2.
Case 1: This assumes the Average tariff paying consumer’s switch to rooftop
solar. The impact on utility is in terms of : revenue loss, loss in fixed charges
(assuming 10% of the solar capacity will result in sanctioned load reduction),
loss in banking charges (assuming 30% of energy generated from rooftop solar
is banked and do not pay 2% banking charge @ APPC price). The benefits for
utility is Deemed RPO (@ Solar REC price of INR 3.5/kWh) and savings in T&D
losses. The following graph is showing the result of the analyses for FY 2022 for
selected utilities
Figure 24: Impact on Utility Revenue due to solar rooftop
-4.81-3.89
-2.88-3.34
-1.98 -1.93 -2.15 -1.76
-4.03 -4.11-4.92
-3.27-2.27
-1.12-1.79
0.18
-1.18
-10
-8
-6
-4
-2
0
2
4
6
8
-10
-8
-6
-4
-2
0
2
4
6
8
Rs.
/ k
Wh
Overall Per Unit Impact FY 22 (INR per unit)
Revenue reduction Grid charge reduction to utitliy (10%)Banking charge loss to utility Deemed RPO benefitsT& D loss benefits Environmental benefitsTotal

Rooftop Solar – Garnering Support from Distribution Utilities
- 41 -
The result of the analysis is shown with the help of above graph, which represents the
behaviors of various parameters of utility revenue to be impacted due to installed solar
rooftop capacity for year FY 2022. The analysis shows that utilities will have negative
impact on revenue due to solar rooftop as due to solar rooftop, utility sales volume will
decrease and so as its revenue. However, Utility will also have saving in expenses due to
deemed RPO benefit and reduction of technical losses but the impact of sales on revenue
will be much higher than the benefits accrued from solar rooftops.
Case 2: This Case assumes that the average tariff paying consumer’s will switch
to rooftop solar. The impact on utility is in terms of : cross subsidy loss, loss in
fixed charges (assuming 10% of the solar capacity will result in sanctioned load
reduction), loss in banking charges (assuming 30% of energy generated from
rooftop solar is banked and do not pay 2% banking charge @ APPC price). The
benefits for utility is environmental benefits, Deemed RPO (@ Solar REC price of
INR 3.5/kWh) and savings in T&D losses.
Figure 25: Impact on Cross Subsidy due to Solar Rooftop
This case explains the impact of solar rooftops on utilities from the perspective that the
loss utility is linked with loss of cross subsidy (and not complete energy charge).With
increase in the capacity of solar rooftops utility sales will decrease and with decrease in
the sales utility cross subsidy collections will be impacted. However, at the same time
utility will also save revenue from other benefits such as deemed RPO and reduction in
technical losses, thus the overall impact on cross subsidy will be positive in this case.
4.1.2 Impact on Operational Parameters
Proliferation of solar rooftop will also impact the operational parameters of utilities such
as variation in demand, variability in generation, voltage and frequency, active or reactive
power etc. this section focuses on analyzing these operational parameters & its impact on
utilities. The parameters analyzed and the outcome of the analysis is as follows
i) Rooftop Solar energy penetration scenario by FY 2022
2.39
4.024.70 4.46 4.38 4.44 4.21 4.60
3.00 2.712.03
4.65 4.825.83
5.16
7.46
6.10
-10
-8
-6
-4
-2
0
2
4
6
8
10
-10
-8
-6
-4
-2
0
2
4
6
8
10
Rs.
/ k
Wh
Overall Per Unit Impact FY 22 – (INR per unit)
Cross-subsidy loss Grid charge reduction to utitliy (10%)
Banking charge loss to utility Deemed RPO benefits
T& D loss benefits Environmental benefits

Rooftop Solar – Garnering Support from Distribution Utilities
- 42 -
This case is analyze to assess the state wise contribution of rooftop solar in the overall
energy portfolio (assuming MNRE targets are achieved). Key objective of energy
penetration analysis is to understand the energy penetration on account of MNRE rooftop
capacity as well as overall solar targets (MW) in FY2022. The approach to estimate the
energy penetration scenario for FY 2022 is as follows
Solar energy penetration is defined as the value of the solar generated electricity (MU) as
a percentage of total electricity requirement utility. Energy penetration value less than 4%
is generally referred as low penetration systems, while 4-10% penetration is referred as
medium and a value greater than 10% is referred as high penetration level. Based on the
analysis of different States of India, the rooftop solar energy penetration scenario for FY
2022 is shown below in the following table :
Table 7: Rooftop Solar energy penetration scenario for FY 2022
State
Rooftop PV target FY2022
(MW)
Annual Energy Requirement,
2022 (MU)
Solar PLF (%)
Solar Generatio
n, MU
Energy Penetratio
n,%
Maharashtra 4,700 2,20,917 16.0% 6,588 2.98
Gujarat 3,200 1,40,767 16.0% 4,485 3.19
Delhi 1,100 52,930 16.0% 1,542 2.91
Orissa 1,000 36,961 16.0% 1,402 3.79
Telangana & AP 4,000 2,05,833 16.0% 5,606 2.72
Uttar Pradesh 4,300 2,09,046 16.0% 6,027 2.88
Tamil Nadu 3,500 1,71,718 16.0% 4,906 2.86
As per the analysis, the penetration level in all the selected States is below 4% i.e. Low
penetration. Out of the eight State’s only Orissa and Gujarat have penetration level above
3%, rest all have penetration below 3% only.
ii) Rooftop PV capacity (MW) penetration scenario for FY 2022
This analysis will map State wise monthly and hourly rooftop PV generation and peak
demand. Key objective of this analysis is to estimate the instantaneous PV penetration
based on MW penetration across different hours of the day and during different months.
The approach for estimation of Rooftop Capacity (MW) penetration for FY 2022 is shown
below

Rooftop Solar – Garnering Support from Distribution Utilities
- 43 -
Figure 26: Approach for estimation of hourly generation of solar rooftop in FY 2022
Figure 27 Approach for estimation of Monthly Rooftop PV penetration for FY 2022
The analysis is carried out for eight States, the result of Delhi is described in this section,
and Analysis of other States are covered in Annexure 4. Results are explained with of
graphs plotted on Hourly and Monthly PV penetration vis-a-vis overall demand of the
state.
• Delhi – The analysis of Delhi shows that it has peak demand during the day time,
especially during the month of Jan, Feb, March where the demand rise rapidly during
early morning period and maintains during the day. The peak demand is high during
the summer months and falls during the winter months The TOD structure also
defines peak period during the day and evening time. High energy charges, along
with TOD charges, make rooftop solar a viable option in Delhi. The PV Generation
and Month wise peak rooftop demand for FY 2022 of Delhi is shown below

Rooftop Solar – Garnering Support from Distribution Utilities
- 44 -
Figure 28 : Delhi - Solar rooftop & demand mapping
iii) Time of day (TOD) Analysis across selected state utilities
The objective of mapping time of day tariff structure is to map the peak hour / off peak
hour time blocks matching with that of PV generation hours across different hours and
months in a year. This will assist in developing a case for various options for re-
structuring/defining TOD slots across consumer categories from the perspective of
supporting rooftop solar proliferation.
Mapping of the TOD tariff of different States provides that most Time of day tariffs (TOD)
are applicable for Industrial and Commercial segment and generally at higher voltage
levels HT (except Maharashtra). There is a strong superimpositions of time of day tariff
(TOD) with peak solar generation hours for Delhi, Orissa and Tamil Nadu. TOD
superimposition makes these states ideally suited for incentive mechanism / tariff deign
mechanism for rooftop solar proliferation. Mapping of TOD tariffs of different States is
covered in Annexure 4: Impact on Operational Parameters.
Surplus electricity production during peak sunny hours matching with states having TOD
during peak solar generation can incentivize solar surplus generation dispatch and hence
presents case to review banking limit designs, self-consumption and load behaviors, and
selection of consumer categories.
States observing evening peak i.e. Maharashtra, Gujarat, AP, UP and Tamil Nadu have
possibilities for off peak storage (Normal TOD or off peak TOD time storage) and peak
dispatch through electrical batteries. Storage solutions and incentive mechanism for such
scenario may provide peak demand offset by a certain percentage depending upon the
peak demand offset capacity battery dispatch limitations of the local grid.

Rooftop Solar – Garnering Support from Distribution Utilities
- 45 -
iv) Avoided Capacity and Energy benefit due to Solar Rooftop
In addition to the benefits like deemed RPO, reduction in technical losses, solar rooftops
are also beneficial for utilities in terms of avoiding additional capacity required to meet the
growing energy demand. The objective of this analysis is to compute the capacity credit
(%) for FY 2022. As per NREL Capacity credit is the actual fraction of decentralized PV
installed capacity that could reliably be used to offset conventional peaking capacity.
Capacity credit is typically measured as a percentage of name plate (STC) capacity rating
of Solar PV. The capacity credit range of different utilities in USA and Germany is shown
below in the Table
Table 8: Capacity Credit Limit in US and Germany
Country /
Subcategory
Technology LSEs
(Load Serving Entity)
Capacity credit
range, %
USA, Excluding Pacific
Northwest
Solar APS, CA IOU, Duke
Energy, NV Energy, PNM,
TEP
27% to 77%
Pacific Northwest Solar PGE, Idaho Power 5% to 36%
Germany Wind Country wide, no utility
assigned
5% to 40%
Computation of capacity credit necessary to estimate the avoided energy from solar
rooftop to displace energy that Utility generally required to procure from other sources.
Avoided energy is generally measured in terms of cost of avoided energy. For computation
of capacity credit, approach as per NREL is considered, which is explained in the following
figure :
Figure 29: Approach for Computation of Energy Credit
Higher capacity credits implies higher solar generation during peak hours, which means
higher avoided capacity and the cost of avoided energy would also be high. The result of
the analysis is shown in the table.

Rooftop Solar – Garnering Support from Distribution Utilities
- 46 -
Table 9: Avoided capacity for FY 2022 due to rooftop solar
State TOD Peak hours*
Peak hours considered
for capacity credit
Capacity credit,
FY2022 (%)
Avoided capacity,
MW
Target Rooftop
capacity, MWp
Avoided energy
FY2022, MU
Gujarat 7 AM – 11 AM 8 AM – 11 AM 37.39% 1197 3200 490
Delhi 1 PM – 5 PM 1 PM – 5 PM 36.96% 407 1100 219
Odisha 10 AM – 6 PM 10 AM – 5 PM 45.89% 459 1000 461
Tamil
Nadu
6 AM – 9 AM 7 AM – 9 AM 17.62% 617 3500 79
The analysis shows that capacity credit has much higher relevance than avoided capacity
as the avoided capacity of Gujarat is highest with 1197 MW but due to capacity credit of
37.39% its avoided energy is 490 MUs only, while the avoided capacity of Orissa is 459
MW but due to higher capacity credit its avoided energy is 461 MUs. This indicates
suitability of Orissa is higher for solar rooftops.
v) Active and Reactive Power Support
Solar rooftop systems can support utilities in controlling active and relative power with
the help of advance inverters. In order to adopt active and reactive power control there
is a need to develop voltage and frequency regulations in India.
As a part of this study, International frequency regulation practices covering countries like
USA and Germany having high penetration of rooftop solar have been analyzed. In addition
various secondary published research which includes Federal Electricity regulatory
commission (FERC), California Utility Public Commission (CPUC) orders, NERC, Germany
Utility references, and other publically available reports for mapping international rooftop
penetration so as to understand how these countries have adopted regulations, technical
standards that facilitated in proliferation for large scale deployment of rooftop PV systems
have also been reviewed which can be replicated in Indian context to support utilities in
managing the operations of solar rooftops
Germany in order to manage the high capacity of solar rooftop, in 2011 introduced a new
grid code (VDE directive) to strengthen LV grid from smart inverter functionalities and
introduced following provisions
1. Active power control (back down) for PV inverters in case grid demands for it with
compensation. Existing systems with larger than 30 kW capacity taken into service
on or after 2009 must be retrofitted with such provision to reduce active power
feeding within two years
2. Active power control by Inverter (typically in four steps 100%, 60%, 30% and 0%)
with the help of a GSM based Remote control systems
3. Reactive power support mechanism to provide power factor of range 0.9 leading to
0.9 lagging > 13.8 kVA, 0.95 lagging to 0.95 leading 3.68 kVA to 13.8 kVA and no
requirements below < 3.68 kVA inverters
4. Introduction of Hardship clause (section 15): If the feed-in of electricity generated
from renewable sources is reduced due to a grid system bottleneck , grid system
operator must compensate the operator for on account of lost electricity due to
limiting active power of the inverter
5. Retrofitting existing system for frequency response, Risk of complete black out
upon automatic shutdown of PV systems and network frequency rises above 50.2
Hz so as to make a provision that PV inverters remain connected with the grid at
preset conditions for recovering from such situations
6. On Load tap changer for MV / LV transformer, applying same can reduce cost of
distribution expansion by 60%
Similarly USA allowed reactive power injection/consumption from solar rooftop. PG&E
electric utility of USA surpassed the operational challenges by mandating use of automated

Rooftop Solar – Garnering Support from Distribution Utilities
- 47 -
inverters having added functionality of grid automation in support of voltage regulation.
Currently, PG&E utility has voltage regulation for decentralized PV inverters as an added
functionality which support the grid in case of grid demands for it by way of regulating the
reactive power (either absorb or back feed). Further, different voltage zones have been
defined in conformance to IEEE 1547a (modified Rule 21) which recommends (DER)
distributed energy resource to remain connected with the distribution grid with clearly
defined different zones voltages (must disconnect and connection zones).
Following table illustrated the provisions for connection or disconnection of DER in different
voltage zones
Table 10 : Connection/disconnection limits
Connection Limitation
Voltage level
multiplier
Stay connected
until
Disconnection Limitation
Voltage level
multiplier
Disconnection time
Above
Above >1.2 <0.16 sec
Above 1.09-1.17 12 sec Above 1.1 -1.2 13 sec 0.92-1.09 Indefinite
0.88-1.1 Do not
disconnect
Below 0.7-0.92 20 sec Below 0.6-0.88 21 sec
Below 0.5-0.7 10 sec Below 0.45-0.6 11 sec
Below 0-0.5 1.0 sec
(range
between
0.16 to 2
sec)
Below 0-0.45 2.5 sec
PG&E has mandated that solar rooftop inverters based generating facilities need to provide
reactive power (VAr) to control voltage. It shall be measured at facility side which is
generally the low voltage side of the step up transformer that connects to PG&E at point
of interconnection. In addition, Reactive power capability for interconnecting PV generation
shall be limiting from 31% to 43% of the facility watt rating into the system.
However in Indian context there are gaps in terms of managing the reactive and active
power, as per the current mandate of grid code, distributed energy resource shall cease
to energize the circuit to which it is connected in case of any fault in the system voltage
and frequency going beyond the specified limits. IEGC provides the following guidelines
for operating range of frequency and voltage in Indian electricity grid.
Voltage Band Frequency Anti-Islanding
V > 110%
or < 80% (<2s)
[49.5 – 50.2 Hz] UL 1741/
IEEE1547 <2s
The gaps in the existing regulatory framework are as follows
• Large integration of distributed energy sources such as rooftop solar requires that
these settings for voltage and frequency linking is restructured to accommodate
higher variable renewable penetration using advanced inverter functionality and
these alterations can prove to be helpful for safe/reliable operation of the grid.
• Unavailability of communication interface between DER (distributed energy resource)
and utility.
• Unavailability of H/LVRT functionality for capability of DER against temporary fault
ride through events
• Unavailability of a nationwide certification framework (0-10kW, 10 kW-100 KW &
>100 kW systems)
Source: California Public utility Commission, Smart Inverter Working Group publications
Rooftop Solar – Garnering Support from Distribution Utilities
- 48 -
To plug these gaps and makes the operations of lager capacity of solar rooftop healthy for
our grid, the study suggests following recommendation
• Regulatory intervention - Regulation facilitating advance inverter functionalities
such as reactive power feed-in for voltage support, active power control features.
• Communication with utility - Utility communication interface for advance control
features for decentralized rooftop Inverters, Compensation in case of any back-down
of active power
• Formation of a working group - Formation of a working group with clear timelines
and implementation schedule. Various stakeholders involved such as regulators,
utility, generators, private IPPs, load dispatch centers etc. should be the part of the
working group. Working group should focus on voltage support (dynamic VAR) for
improvement of tail end voltage profile, control active feed in current by the inverter
by way of a communication from the utility.
5 Stakeholder Consultations
Solar Rooftop segment is increasingly becoming popular with steep fall in the price of key
solar power components, increase in retail tariff, increasing concerns over climate etc.
Further, it provides benefits for utility in terms of reducing technical loses, managing day
time peak demand, meeting growing energy demand etc. However growing capacity of
solar rooftops can also create concerns for utilities as seen globally in terms of reduction
in revenue, increase in administration cost, affecting operational parameters etc.
For a study that is complex in nature and is to be formulated for large consumer base,
Stakeholder consultation becomes very critical. Stakeholder consultation is important to
understand the future scenario of solar rooftop segment and its impact from utilities
prospective. Further, it also helps in validating the analysis and recommendations derived
on the basis of the outcomes of the analysis. Thus as a part of this exercise our team met
with several state agencies/utilities from Rajasthan, Karnataka, Tamil Nadu, Delhi, Odisha
etc. to discuss our analysis and to know their view points on final recommendations.
As the penetration of solar rooftop is quite low in India, almost all the stakeholders
interviewed during the process specified solar rooftops as one of their focus area. Majority
of the utilities expressed their interest in development of solar rooftops in their jurisdiction
despite of the fact that it can hurt their main business i.e. supplying power to consumers.
Moreover stakeholders supported the argument by saying that solar rooftop helps utilities
to meet their day time peak demand thus reduced the power purchase cost during peak
time. Stakeholders also accepted that de-centralized generation by means of solar rooftop
is a much better way to tackle the increase energy demand in comparison to MW scale
utility projects as it requires huge infrastructure, land, O&M Cost etc. Some stakeholders
also stated that solar rooftop is going to become the mainstream power in coming future
and utilities role may only restrict to management of the distribution grid.
Some stakeholders which already have high penetration of solar rooftop, accepted the
commercial and operational challenges of it and supported the recommendations of
imposing additional charge in the form of “grid tied” charge on rooftop consumers to
recover the cost of providing backup power.
They also supported the TOD metering for solar rooftop consumers but only in commercial
and industrial category as the cost of TOD meters are too high. Some stakeholders also
supported the analysis of reduction in revenue from cross subsidy and said increasing fixed
charge or by rationalizing tariff slabs will overcome this issue. Some stakeholders were of
the view that segregating export and import tariff under net metering shall be adopted to
avoid utilities loss of cross subsidy.
Rooftop Solar – Garnering Support from Distribution Utilities
- 49 -
Majority of the stakeholders favored the recommendation of adopting utility driven models
as it is easy to implement and monitor for utilities moreover it reduced the administration
burden of utilities to deal with number of rooftop consumers. stakeholders also accepted
that utility driven model is a better approach for accelerating the growth of solar rooftop
on Indian market as it reduces the capital risks for end consumers.

Rooftop Solar – Garnering Support from Distribution Utilities
- 50 -
6 Recommendations
Deployment of customer-sited photovoltaics (rooftop solar PV) in countries like United
States has expanded rapidly in recent years, driven in part by public policies premised on
a range of societal benefits that PV may provide. With the success of these efforts, heated
debates have surfaced in a number of countries about the impacts of customer-sited PV
on utility shareholders and ratepayers, and such debates will likely become only more
pronounced and widespread as solar costs continue to decline and deployment accelerates.
Utility executives are often concerned about revenue erosion and reduced shareholder
returns when customers with net-metered PV are able to avoid charges for fixed
infrastructure costs, as well as potential cost-shifting between solar and non-solar
customers. At the same time, net metering is viewed as essential by customers with solar
PV to protect their investments, by the solar industry to grow their businesses, and by
states and environmental advocates to achieve climate or other environmental policy
goals.
Rooftop solar development in India is currently at the initial phases of development.
However, with GOI targeting 40 GW of rooftop solar capacity addition and with expected
increase in rooftop solar penetration levels, it can be expected to face issues from
distribution utilities in India.
Distribution utilities have an important role to play in promotion of rooftop solar projects,
especially keeping in mind the distributed nature of these projects and the framework of
net metering. Financial health of distribution utilities in India has persistently been an area
of concern- partly attributed to high levels of Aggregate Technical and Commercial (AT&C)
losses as well as inability of power tariffs to recover the cost of supply. However given the
impact of rooftop solar proliferation on utility business, it is important to analyze the
growth of solar rooftop vis-a-vis its impact on utility business.
Thus, based on the analysis of various state utilities, their energy requirement, financial
health, technical and operation issues, potential for solar rooftop etc. some
recommendations have been suggested to support the development of solar rooftop and
create a win-win situation for both consumer and distribution utilities. Table below is
summarizing the recommendations of the study, analysis of the same is covered under
annexure 5.
6.1 Regulatory
Sr. No Suggested
Initiative
Description
1. Rationalization
of Consumption
Slab
• Most Indian states have high number of consumption
slabs (even up-to 5) for a consumer category. This may
impact revenue realization for utilities due to net metered
solar consumption.
• Slab rationalization should be adopted by SERCs to
protect utility interest (Short term initiative)
2. TOD
framework on
net-metered
consumers
• Consumers not covered under TOD have the benefit of
utilizing off-peak injected power during peak power. With
increased rooftop solar capacity addition in future, this
may pose operational/commercial challenge to utilities.
• Rooftop solar net metered consumers can be mandated
to come under TOD framework (long term initiative)

Rooftop Solar – Garnering Support from Distribution Utilities
- 51 -
3. Allow surplus
solar power
injection
during peak
time
• Solar power generation peaks during the peak time of day
tariff (TOD) defined in states like Delhi, Orissa, and Tamil
Nadu etc.
• Allow surplus power injection during peak time for an
accounting year by a net metered consumer. Limits for
surplus power injection can defined by SERCs (Short term
initiative)
4. Promote peak-
time solar
injection
through
attractive
tariffs/
incentives
• Injection of power during peak time to assist utility
operation
• Provide higher level of tariff/incentive for power injection
by rooftop solar projects during the peak demand period
• Providing higher level of tariff/incentive will also
encourage rooftop solar based storage options (Short
term initiative).
• States such as Maharashtra, Gujarat, TL&AP, and Uttar
Pradesh, Tamil Nadu etc. having peak evening demand
can benefit from this.
5. De-Coupling of
Import and
Export tariff
under Net
Metering
• Net Metering is coupling of export and import tariff, due
to this utility may get impacted due to losses in terms of
cross subsidy, recovery in fixed charge etc.
• Net metering compensates the consumer for solar power
at the utility tariff. In certain cases, the Utility tariff may
be very high than the LCOE of solar rooftop power thereby
providing very high returns to consumers.
• As utility is providing grid infrastructure to rooftop solar
projects, to protect interest of Utility, segregation of the
import and export tariffs for net-metered rooftop solar
consumers can be considered.
• Import tariff will be energy charge and export tariff can be
capped at Solar rooftop FIT, linked as % of energy charge
indicated by SERC (Long term initiative)

Rooftop Solar – Garnering Support from Distribution Utilities
- 52 -
6.2 Operational
Sr. No Suggested
Initiative
Description
1. Active power
control on
rooftop solar
systems
• Large scale rooftop proliferation create the need for
higher utility visibility on rooftop solar generation pattern
& control of the same
• International Experience: Advance Inverters having
active power curtailment options are being used to
control the excess power in the grid (frequency
regulation).
• During high frequency events in the grid on account
of mismatched demand / supply, PV advance
inverters can be utilized to curtail a certain portion of
active power to maintain grid stability.
• Retrofit regulation mandates that all new inverters
and existing inverters shall be equipped with smart
inverter functionality by which it enables inverter to
curtail down its output base upon a signal command
from the utility(Germany)
• Regulations for enabling active power function of advance
inverter
• Utility command regulatory framework for control &
Instrumentation functions to enable advance inverter
regulations in Indian context need to be prepared and
framed.
• Compensation mechanism for loss on account of active
power curtailment (Long term Initiative)
2. Reactive tariff
&
standards
• Advance Inverters can be used to provide voltage
regulation for improvement of tail end voltage profiles.
• Germany and PG&E Rule 21, USA have specific
requirements for installing advance inverters for reactive
power support functionality.
• Advance inverter functions allow for more elaborate
monitoring and communication of the grid status. Ability
to receive operation instructions from utility and
capability to change operational parameter (reactive
power) help in maintaining grid stability, support power
quality.
• Areas with relatively low solar irradiance are ideally suited
for reactive power compensation since most of the time
inverters will be operating at lower capacity than the
rated.
• Oversized PV inverters to meet the reactive power as
required is another proposed option

Rooftop Solar – Garnering Support from Distribution Utilities
- 53 -
• Regulations for enabling reactive power function of
advance inverter
• Incentive/tariff mechanism and level of incentives for
adopting advance inverter functionality (Short term
Initiative)
6.3 Commercial
Sr. No Suggested
Initiative
Description
1. Explore utility
driven rooftop
solar models
• Utilities need to play an active role in rooftop solar
capacity addition and promote utility owned/driven
models.
• Consumer should get additional incentive to participate in
utility driven models. MNRE can provide incentive to
utilities to encourage such models.
6.4 Implementation
Sr. No Suggested
Initiative
Description
1. Dedicated
rooftop
aggregation
program
• Apart of initiatives at Discom level, achieving large
capacity addition will require dedicated program from
MNRE for aggregation of rooftops. The objective of this
shall be to assist Discoms in meeting their rooftop solar
targets.
• MNRE/SECI with the assistance of SNAs undertake
dedicated rooftop solar aggregation program
▪ Initiate consumer registration for the program
▪ MNRE to provide subsidy to participating consumers to
encourage participation
▪ Standard documents (Contract, leasing agreement) to
be in place for consumers participating in the program
– this will reduce the risk of RESCOs
▪ MNRE/SNA shall facilitate bid process for aggregated
capacity with assistance from Utility
o This will assist RESCOs in getting higher capacity &
minimize efforts in aggregation
o Consumer will get benefit from competitive bidding
& scale
o Provisions for robust O&M and performance in
RESCO selection to benefit consumer

Rooftop Solar – Garnering Support from Distribution Utilities
- 54 -
2. Support to
Discoms to
facilitate
implementation
of rooftop solar
• Given the low level of rooftop solar capacity, it is
important to improve the capacity of utilities, MNRE can
provide support to utilities :
▪ Developing web-portal for online processing of
application
▪ Setting up consumer helpline center; Consumer
grievance cell
▪ Procurement & installation of net meters
▪ Organizing consumer awareness;
▪ Training for utility – energy accounting & billing
software, business models & net metering
▪ Upgradation of distribution transformers (DT) to
accommodate higher solar penetration;
▪ Training to ensure quality installation and O&M
▪ Online consumer feedback/rating for RTPV installers
3. Incentive
scheme for
distribution
utilities
• Given the nascent phase of rooftop solar development in
India, it is important to have a clearly defined incentive
framework to encourage distribution utilities to support
rooftop solar implementation. The MNRE can devise a
dedicated scheme for incentivizing distribution
utilities.
• Under this framework, all the distribution utilities shall
be eligible for incentive based on the rooftop solar
capacity added in their jurisdictions. The incentive can
be a fixed value of INR/MW of the rooftop solar capacity
added.
• Performance linked incentives, based on
▪ Meeting rooftop solar targets on yearly basis
▪ Number of consumers connected under net
metering arrangement
▪ Avg. time taken for processing the net metering
consumer connection application
▪ Initiate regulatory reforms for rooftop solar
capacity addition

Rooftop Solar – Garnering Support from Distribution Utilities
- 55 -
7 Annexure
Annexure 1: Scope of Work
In countries where distributed energy installations are rising, the utilities have been
opposing this transformation. Their concerns stem from potential implications of such
systems on their finances and operations. Direct financial impact have been stated to
include pay-outs for surplus power fed to the grid and cost of maintaining and balancing
the grid. The latter also poses operational challenges. At the same time, there are core
systemic and legacy issues such as tariff design structures which do not reflect true costs
and thus adversely impact the distributed clean energy sector.
A counter-argument could be the value that any distributed system could offer in times
of peak load, if planned properly and market / regulatory signals are clear.
India has an ambitious target to deploy 40 GW of grid-connected rooftop PV systems by
2022. However, unless the concerns of distribution utilities are addressed, a situation
similar to Tamil Nadu’s wind sector, where utility is opposing any additional wind
installations, can hit the solar rooftop sector as well. These debates have been rising even
in other countries. For example, the United Kingdom, which to a great extent inspired the
injection of free-market principles into electric power systems, is generally not encourage
net metering.
Thus, it is necessary to analyze the actual local and aggregate impacts of rooftop systems
on utilities considering actual demand and supply profiles of the distribution areas, and
tariff and cost structures. To analyze the actual impact on solar rooftop on utility business,
this study is conducted. The terms of reference for the study are as follows
1. Review international literature to: i) Identify pros and cons of rooftop deployment models in US, UK, and
Germany, from a system-wide perspective – Gross-metering, net-
metering, self-consumption, any other
ii) Using case studies / real examples, determine direct and indirect financial
as well as operational impacts of such models on the utilities
iii) Study alternatives that have been adopted to ensure support from
utilities
2. Select a sample of Indian distribution utilities to:
i) Analyse their actual demand and supply profiles, and cost and tariff
structures
ii) Estimate the value of rooftop generation and net impact on utility
revenues and operations, if any
3. Propose mechanisms including, but not limited to, tariff design, storage solutions
(peaking power support) etc. that would ensure utility support to rooftop PV
4. Propose changes to the existing models to balance the interests of utilities,
regulators, prosumers and consumers 5. Propose regulatory provisions necessary to implement the proposed models/
alternatives 6. Consult stakeholders at appropriate stages to test the applicability of the
suggested solutions

Rooftop Solar – Garnering Support from Distribution Utilities
- 56 -
Annexure 2: Key Assumptions for analysis for
evaluating impact on utilities
S No Parameter Data Source/ Approach
1 Energy
requirement
• Upto 2016: Respective tariff orders and or PFA.
• 2017 – 2019: PFA report/EPS
• 2020 – 2022: Growth rate provided in 18th EPS report has
been applied on 2019 data
2 Peak Demand • Past data based on the PFA report and Tariff orders
• Projections based on using the projected energy requirement
for the utility and state specific load factor as provided in the
PFA or 18th EPS report
3 Energy
Consumption
• Upto 2016: Energy consumption (sale) mapped using tariff
orders of respective utilities
• 2017-19: PFA report for the state or energy requirement
reduced by T&D losses to arrive at the energy consumption
• 2020-2022: Energy requirement reduced by T&D losses to
arrive at the energy consumption values till 2022. For states
where PFA not published, 2017 onwards values till 2022.
4 Tariff rates • Both fixed and energy charges were mapped for 3 categories
(residential, commercial and industrial) for HT and LT level in
each of the categories with sub-categories as per adopted
framework by the utility
• For future, these rates forecast are based on cross subsidy
levels & growth in average billing rates.
5 Average cost
of supply
• Value for average cost of supply was taken from tariff order.
For few years if the values were not available then the same
has been taken from PFC report
• Future values were forecasted using historical trends as
reference & appropriate assumptions.
6 Average
billing rate
• Average billing rate was taken from the tariff order for
various categories and forecasted using historical trends as
well as maintaining the cross subsidy levels.
7 Cross subsidy • Cross subsidy was calculated using the category wise
differential between average billing rate and average cost of
supply
• Cross subsidy levels for different categories in year FY 2016
(based on Tariff Order/PFA) are considered as reference.
Cross subsidy levels are assumed to be constant for future
years.
8 T&D losses • Distribution and intra-state transmission losses were used for
the utilities from the tariff orders. Fur future years, it is
assumed that the values as per PFA/Tariff orders for FY
16/FY19 will remain same till FY 2022.
9 Categories
considered
• Residential, Commercial, Industrial categories were taken for
the analysis. Rest of the categories were not used for the
reason that these categories will be front runner in adoption
of rooftop solar.
10 Category-wise
allocation of
energy
consumption
• For calculating energy consumption values during 2017-22
for residential, commercial and industrial categories; total
energy consumption is divided in the ratio of energy
consumption across categories as present in year 2016.

Rooftop Solar – Garnering Support from Distribution Utilities
- 57 -
Annexure 3: Approach for analysis
S No Parameter Approach
1 Revenue
loss to
utility
Revenue loss to utility has been calculated on the assumption that
all solar MUs would be replacing the energy sold by utility to
customers in the 2 cases as described below.
• Case- 1: If the rooftop solar replaces the energy MUs
consumed by the existing customers and that customer falls
in the highest energy slab tariff paying category. This is most
likely scenario because the customers paying the highest
tariff in a category will be biggest beneficiary of solar adoption
by saving the differential.
• Case-2: If the rooftop solar replaces the energy MUs
consumed by the existing customers and that customer falls
in the average tariff paying category.
2 Cross
subsidy
loss/Benefit
to utility
• The utility will lose the cross-subsidy from the customers who
were paying more than the average cost of supply if they
chose to switch to solar. This parameters is also calculated in
both the potential cases as discussed in impact on revenue.
The impact would be worst for utility in Case-1. On the other
hand, if currently subsidized customers move to solar then
utility will benefit. But this is a low probability event.
• The Impact is calculated as difference b/w avg. CoS and
Energy Charge/Avg. Energy Charge considered and
depending on quantum of energy replaced.
3 Loss of Grid
Charges
• Utilities may lose the Grid charge (fix charge) collected from
the customers in the case the customers will reduce their
contracted demand. The chances of this happening is there
only with the customers who have demand curve coinciding
with solar generation. Else consumer will be dependent on the
grid for non-solar hour demand thus cannot reduce their
contracted demand.
• Grid charges loss to utility is calculated assuming loss in
contract demand by 10%.
4 Deemed
RPO
benefits to
utility
• If the customers who adopt solar are non-obligated entity
then the utility can retain the RPO benefits accrued. This will
help minimizing the cost for utility as in absence of this
arrangement they would have to pay higher price for
meeting RPO obligation set forth by regulation.
• The impact is assumed considering Solar REC price as
alternative option for meeting Solar RPO compliance
5 Loss of
Banking
Charges
• Banking charges are not applicable on rooftop solar projects
in general. This can be considered as a loss to utility.
• Loss for utility is calculated assuming 30% of energy
generated from rooftop solar is banked and do not pay 2%
banking charge (assumed in-kind i.e. MU). Price for
calculating the impact has been taken as APPC price.
6 Environmen
tal benefit
• Various tangible impacts as reduction in water, land and CO2
emission has been used in line with the prevailing prices for
these savings to determine total tangible benefits on
account of rooftop solar generation vis-s-vis thermal power
projects.
• MNRE rooftop PV cumulative targets for FY2022 have been
considered for estimating environmental benefit. Key
environmental benefit parameters of water, CO2 and land

Rooftop Solar – Garnering Support from Distribution Utilities
- 58 -
S No Parameter Approach
displacement has been considered for evaluating
environmental benefits.
• Water Saved: Water saving in million litre is calculated
based upon water required by thermal power plants
subtracting water requirements by PV plant for module
cleaning for MNRE rooftop targets FY 2022.
• Water savings in million litre of water has been
estimated based upon multiplying water requirements
in litre / sq m with sq m /kWp output for a crystalline
module.
• Water required for cleaning PV module assumed as
247 cu m per MW per year
• Water requirements for thermal power plant is taken
as 0.55 cu m/ h/ MW (dry cooling system - CEA)
• CO2 Impact assessment: CO2 emission factor (0.82 ton
CO2/MWh) assumed (Source - CEA report). CO2 emissions
reduction potential has been estimated by multiplying total
annual PV generation and emission factors for MNRE FY 2022
targets.
• Avoided Land Impact assessment: Land use impact data (in
acres/MW) has been collected for and thermal power plants
to calculate effective land savings (in acres) by installing
rooftop PV plant. Rationale for the calculation is that rooftop
PV plants do not use any land for installation and fully utilizes
rooftop space. Suitable factors in ratio of CUF have been
considered to account for replacement.

Rooftop Solar – Garnering Support from Distribution Utilities
- 59 -
Annexure 4: Impact on Operational Parameters
This case analyses the indicative impact of solar rooftop on operational parameters of
utility by estimating the penetration of solar rooftop vis-à-vis the monthly demand of a
particular State. The result of the analysis for different States is shown below
1. Odisha – As per the analysis, the state of Odisha does not have very high variation
in demand across different months in the year. Also, the hourly review indicates
that the peak occurs during the evening time only, when solar generation is not
available. For the targeted rooftop solar capacity, the state can have very high
instantaneous rooftop solar penetration of 17.27% during 12th hour block
(February). In view of the TOD tariff defined in the state in general are lower in the
state in comparison to other states. Hence, may not offer viable option for storage
based rooftop solar.
The above analysis implies that, the solar rooftop capacity shall be well below the
expected demand of different States in FY 2022. Moreover the generation from solar
rooftop will support utilities in managing the demand time peak demand and the
States. The States, wherein the peak demand is coming during evening hours presents
a strong case for promoting storage based rooftop system to manage the demand and
generation from solar rooftop systems.
2. Andhra Pradesh and Telangana – The analysis shows that the state witnesses high
demand during the months of Feb, March, Sept. and Oct. These months corresponds to
high solar power generation also. Hence, solar rooftop will definitely support the peak
demand requirement. Both the states combined are expected to have very high growth
in future energy requirement as per PFA plan, Hence, proper generation planning can
ensure better integration of rooftop solar power.

Rooftop Solar – Garnering Support from Distribution Utilities
- 60 -
The TOD structure of the States defines peak period during evening time. The tariff
structure provides for high tariff applicability for higher consumption slabs across
categories, including residential. Hence, rooftop solar may become viable for select
consumer category/consumption slabs. Table 11: TOD tariff of Andhra Pradesh
Table 12: TOD tariff of Telangana
3. Maharashtra - The Analysis of Maharashtra shows that Maharashtra has a peak
demand during the day time (apart from evening time) and is in line with the peak
solar power generation. Thus, solar power generation can contribute during the
peak demand period. It is assumed that the utilities will encourage solar power to
meet their solar RPO compliance. Further, Solar power can also support consumers
during evening peak time by using storage solutions, As the TOD tariff of
Maharashtra during evening for some consumer categories goes above Rs. 14
/kWh, which can be avoided using storage based solar power systems by the
consumers.
2804 2899 2806 2744 2662 2674 2694 2758 2956 2833 2818 2716
34014 3387335394
3265831152 31541 31775
33518 32899 3351330102
31619
8.2% 8.6% 7.9% 8.4% 8.5% 8.5% 8.5% 8.2% 9.0% 8.5% 9.4% 8.6%
0%
10%
20%
30%
40%
50%
60%
70%
80%
90%
100%
0
5000
10000
15000
20000
25000
30000
35000
40000
Jan Feb Mar Apr May Jun Jul Aug Sep Oct Nov Dec
% P
V P
enetr
ation
Peak d
em
and a
nd P
V s
ola
r, M
W
Monthwise peak
Month wise Peak Rooftop & Demand (mapping) in FY 2021-22: AP & TL
Peak hourly PV generation month wise Month wise peak demand, MW (FY 2016) % penetration

Rooftop Solar – Garnering Support from Distribution Utilities
- 61 -
4. Tamil Nadu – The analysis shows that the state is expected to have high demand
levels & has the potential to absorb high rooftop solar potential in absolute terms. The rooftop solar penetration (in MW) is expected to be below 11% of the peak
demand for the month across all the months. The peak period is during early
morning time or late evening time. Only during 7 am – 9am is the period where
rooftop solar will contribute towards the peak period defined under current TOD
structure (for select months). Solar generation will be negligible during the evening
time peak period as per TOD structure.
Table 13: TOD tariff of Tamil Nadu
2680 3081 2813 2769 2802 2958 2910 3026 3051 2737 2333 2479
2938528123
29975 29280 28454 29251 28413 27826 2823926710 26739
27937
9.1% 11.0% 9.4% 9.5% 9.8% 10.1% 10.2% 10.9% 10.8% 10.2% 8.7% 8.9%
0%
10%
20%
30%
40%
50%
60%
70%
80%
90%
100%
0
5000
10000
15000
20000
25000
30000
35000
Jan Feb Mar Apr May Jun Jul Aug Sep Oct Nov Dec
% P
V P
en
etr
atio
n
Pe
ak d
em
an
d a
nd
PV
so
lar,
MW
Monthwise peak
Month wise Peak Rooftop & Demand (mapping) in FY 2021-22: Tamil Nadu
Peak hourly PV generation month wise Month wise peak demand, MW (FY 2016) % penetration

Rooftop Solar – Garnering Support from Distribution Utilities
- 62 -
5. Gujarat – The State of Gujarat has high demand during the month of March which
also corresponds with the high solar generation month. The energy charges
applicable on consumer categories (in general) is low in the state in comparison to
other states. Hence, rooftop solar may not be a viable option for select categories
currently
The TOD structure also defines peak during the morning time 7 am to 11 am,
which is also a time of solar power generation. This definitely will support viability
of rooftop solar due to TOD.
Table 14: TOD tariff of Gujarat
6. Uttar Pradesh - The state witnesses’ very high variations in demand across
months, hence provides a case for evaluating incentive for feeding surplus power
generation during these months. The peak period as per the TOD structure is during
the evening time, when the solar generation is negligible. The state in general
provides for high energy charges for select consumption slabs, making rooftop solar
viable.
Table 15: TOD tariff of Uttar Pradesh
2282 2290 2309 2206 2138 2050 1915 2098 2211 2254 2200 2188
19776 20077 20864 20312 21051 2112419220 19278 19942
2171520829 21420
11.5% 11.4% 11.1% 10.9% 10.2% 9.7% 10.0% 10.9% 11.1% 10.4% 10.6% 10.2%
0%
10%
20%
30%
40%
50%
60%
70%
80%
90%
100%
0
5000
10000
15000
20000
25000
Jan Feb Mar Apr May Jun Jul Aug Sep Oct Nov Dec
% P
V P
enetr
ation
Peak d
em
and a
nd P
V s
ola
r, M
W
Monthwise peak
Month wise Peak Rooftop & Demand (mapping) in FY 2021-22: Gujarat
Peak hourly PV generation month wise Month wise peak demand, MW (FY 2016) % penetration
2694 3061 3219 2930 2618 2620 2609 2908 2935 2919 2738 2549
31981
28672 29775
3352535289 36061 35620 35289
3264230216 29555
31098
8.4% 10.7% 10.8% 8.7% 7.4% 7.3% 7.3% 8.2% 9.0% 9.7% 9.3% 8.2%
0%
10%
20%
30%
40%
50%
60%
70%
80%
90%
100%
0
5000
10000
15000
20000
25000
30000
35000
40000
Jan Feb Mar Apr May Jun Jul Aug Sep Oct Nov Dec
% P
V P
en
etr
atio
n
Pe
ak d
em
an
d a
nd
PV
so
lar,
MW
Monthwise peak
Month wise Peak Rooftop & Demand (mapping) in FY 2021-22: Uttar Pradesh
Peak hourly PV generation month wise Month wise peak demand, MW (FY 2016) % penetration

Rooftop Solar – Garnering Support from Distribution Utilities
- 63 -

Rooftop Solar – Garnering Support from Distribution Utilities
- 64 -
Annexure 5: Recommendation Analysis
Solar rooftop has several benefits for utilities however it also has some un-intended
consequences which is causing concerns for utilities. Globally utilities are proposing
additional charges on solar rooftop consumers as growing rooftop solar capacity is hurting
their business. As India is also envisaging a big solar rooftop program of 40 GW capacity,
it is expected that Indian utilities may also face similar consequences.
On the basis of through analysis of Indian energy sector, growing rooftop capacity and
learning from international experience, this study proposes some recommendations, which
can help Indian utilities to support development of solar rooftop while also saving their
interest. This annexure details supporting analysis for the recommendations provided in
the report.
1. Reduction of Consumer Tariff Slab
Solar rooftops under net metering framework allows consumers to meet their captive
energy requirements and at the same time provides backup supply though grid when solar
energy is not available. This helps consumer to reduce their utility bill by meeting the base
demand through rooftop and using utility grid to meet their peak demand.
By doing this, consumers falling in higher tariff slabs before installing rooftop system can
move to lower tariff slabs and thus impacting utility revenue. To elaborate this case
further, case of MSEDCL, Maharashtra has been considered. For domestic consumer,
MSEDCL has five tariff slabs. For a domestic consumer having monthly energy requirement
of 2000 units, its energy bill can come out as Rs. 21,963/- before installing the rooftop
system.
Once the consumer installs rooftop system under Net Metering arrangement, its energy
requirement from the grid will reduce. Assuming it is procuring 700 units from rooftop and
1300 units from grid its energy will reduce to Rs. 13,213/- under five tariff slabs. However,
if the number of slabs are reduced, the utility revenues can be increased to certain extent.
The following graph is representing an indicative impact of reduction in tariff slabs on
utility energy bill.
The analysis shows that the weighted average of grid tariff is improving with reduction in
number of slabs while the weighted average of solar tariff is reducing, thus utility revenue
will increase with reduction in tariff slabs.
Reduction of consumer tariff slabs, could help utilities in improving the
average tariff to be charged from the net Metered consumers

Rooftop Solar – Garnering Support from Distribution Utilities
- 65 -
2. Decoupling of Import and Export tariff under Net Metering The net metering mechanism couples Import and Export tariff, due to this utility may
suffer losses in terms of cross subsidy, reduction in sales volume, reduction in demand
etc.
Figure 30: De-coupling of Import and Export tariff
In order to create sustainable market for
Net Metering in long run, there can be a
possible modification in existing net
metering framework.
A simple approach could be to segregate
import and export tariff as explained in
the figure.
De-coupling should be done above a
specified level of rate, i.e. export tariff
shall be applicable if the energy charge
applicable is above the export tariff
• the rate can be linked as % of energy
charge indicated by SERC
• solar FIT plus incentive
• Solar FIT
As long as the retail tariff is above export tariff fixed by SERCs, consumers will go for net
metering. However, it is important to maintain balance between the interests of utility as
well as solar consumers.
3. Imposing Additional Charge on Net Metering Consumers In Indian electricity market, retail electricity tariff relies heavily on volumetric sales to
recover a part of utility fixed cost. However with increase in the capacity of net Metering
based rooftop systems utility sales volume will drop and utilities may not be able to recover
the share of fixed cost which is a part of retail tariff, under the current framework.
The table below is showing the share of Power purchase cost and other costs for Tamil
Nadu and its revenue realization though energy charge, demand charge and other charges
Tamil Nadu
Approved ARR (2013-14) Actual Revenue Recovery
PPC 79.1% Energy Charges 89.91%
Others 20.9% Demand 7.46%
Others 3%
As of now utilities have only a handful of net-metered customers, so they have not yet felt
the need to consider alternative rate designs. However, with increase in penetration &
reduced revenue, there can be huge demand from utilities to impose additional charges
on Net Metered Consumers as experienced globally. However there are some key issues
in increasing the fixed charges
1. Voltage wise asset mapping not undertaken by utilities – important for rationalizing
fixed charges across consumer categories
2. Certain states do not have fixed charge for select category consumers. Concept of
Minimum Monthly Charge is adopted by select states
De-coupling of Export and Import tariff for Net Metering based solar rooftops
to safeguard utilities interest in long run.

Rooftop Solar – Garnering Support from Distribution Utilities
- 66 -
3. Select States have fixed changes on per connection basis for residential category
consumers (not per kW basis)
Globally utility have proposed to increase the fixed charges on the consumer bill so as to
safeguard against the revenue drop on account on net metering.
4. Applicability of TOD framework on Rooftop Consumer In India, Generally time of Day tariff is applicable only on consumers connected at higher
voltage levels. While the rooftop consumers typically are not covered under the TOD
framework have the benefit of utilizing off-peak injected power during peak time. This can
impact utilities operationally as well as commercially and may become an issue with large
scale proliferation of rooftop solar capacity, at later stages.
The possible solution to this issues could be mandating TOD for rooftop consumers so that
energy injected during off-peak can only be adjusted against energy consumed at off-peak
or Utilities need to provide banked power to consumers during peak power – may be at
high cost of purchase at retail tariff pegged with normal rates.
5. Allowing surplus power from rooftop projects during peak time Some State in India have peak during day time and solar rooftop also generate power
during day time. In States like Delhi, Orissa and Tamil Nadu, Solar rooftop generation
peaks during the peak time of day tariff (TOD) defined in the states. Thus solar rooftop
generation is in line with the demand curve and supporting utilities in meeting the demand
during peak time.
Hence in such States, Net-metered rooftop solar systems should be encourages to inject
surplus power during peak time by providing an additional incentive/tariff to them. To
illustrate this, case of Delhi is explained with the help of following graph (different scale
used in graph)
Analysis on typical hourly
demand for Delhi state shows
maximum rooftop penetration in
the peak sunny hour which
exactly matches with the peak
demand of the utility. Hence,
corresponding rooftop capacity
addition have possibility for
demand reduction of utility
during peak hours or providing
surplus power.
Analysis is based on the hourly
values for the month of March
where MW penetration of PV is
highest
Analysis shows that peak generation from solar rooftop is in line with the day time peak
demand of the State. Thus, State where solar generation follows the demand curve should
incentives rooftop consumers to inject during peak demand so as to avoid costlier power
purchase by utilities from short term market to meet the peak demand. Table below is
showing the provision of surplus injection and incentive for excess generation from solar
rooftop for selected States.
To recover the utility fixed cost from Net Metering consumers, there is a need
to impose Grid tied charge or increase fixed charges on Net metered
consumer

Rooftop Solar – Garnering Support from Distribution Utilities
- 67 -
Table 16: Provision of Surplus Injection and Incentive for solar rooftop
Sr.
No.
State Capacity
cap on
rooftop
Surplus
allowed
(Yes/No)
Separate
incentive
for peak
injection
Incentive for net
exported energy at end
of each Financial year
1 Maharashtra Sanctioned
load, ±5%
variation
Yes No DISCOM to purchase net
exported energy at APPC
2 Delhi Sanctioned
load
Yes Yes, not
quantified
DISCOM to purchase net
exported energy at APPC
(provision for incentive is
mentioned for consumers
injecting solar power
during peak demand of
utility)
3 Odisha Sanctioned
load
No No Net energy credit
maximum limit upto 90%,
no financial incentive
4 Andhra
Pradesh
Applicable for 3 ɸ
connection
Yes No No financial incentive
(free)
5 Uttar
Pradesh
Sanctioned
load
Yes No Net energy credit @ 0.5
Rs/kWh
6 Tamil Nadu Sanctioned
load
No No Net energy credit
maximum limit upto 90%,
no financial incentive
The table shows that States like Odisha and Tamil Nadu which have peak demand, during
day time, have not allowed surplus injection and also have limitations on the upper cap of
capacity / energy injection up to a certain limit.
The state of Delhi unlike others have differentiated incentive provision for excess
generation between peaks / off peak solar injection. State of Delhi have mentioned a
clause on the incentive for the rooftop consumer but not clearly quantified the same. Even
States incentivizing net energy credit, are not provide attractive tariffs to rooftop
customers. Some states have the provision of buying energy credit remained un-utilized
at the end of financial year at APPC while in some states, energy credit remained un-
utilized at the end of the year will be consider free. Thus discouraging consumers to
generate excess energy.
6. Encourage storage solutions through attractive tariff States having evening peak can also encourage surplus generation by providing attractive
tariff during peak time. This can be done with the help of storage based rooftop systems.
Consumers will opt for storage based systems if they will get attractive tariff for injection
during peak time.
States such as Maharashtra, Gujarat, TL&AP, and Uttar Pradesh, Tamil Nadu have peak
evening demand and Solar with battery storage could be a potential solution to bring down
the peak evening demand of these utility states. Vehicle batteries after a certain period of
charging- discharging cycles, become inefficient for vehicular application, while same can
be used for power applications (grid power balancing).
Solar rooftop under Net metering arrangement should be encouraged by
attractive incentive or tariff to inject surplus power during peak time to
support utilities in meeting peak load.

Rooftop Solar – Garnering Support from Distribution Utilities
- 68 -
The possible options for providing incentive could be as shown in the following figure.
Figure 31: Incentives Options for encouraging injections during peak time
7. Utilities role in controlling Active Power
Large scale rooftop proliferation create the need for higher utility visibility on rooftop solar
generation pattern & control of the same. Currently it is not an issue because the capacity
of solar rooftop is very low in the country but soon it may become an issue due to large
scale replication. Due to this, utilities can face various issues such as
1. Voltage imbalance issue due to lack of visibility and control on distributed solar
generation
2. Operational challenges in distribution grid management and control in balancing
the supply and demand with such large scale rooftop feeding into distribution grid
3. Utilities have limited visibility at LT levels
In order to tackle these issues, Utility control is desirable in following identified areas.
• Curtailment – Active power curtailment requirements for advance inverters if grid
demands
• Communication interface - Control and communication protocol by which Utility
could manage the large scale rooftop proliferation in most optimum scenarios.
• System Retrofits – Retrofit requirements in current inverter technologies.
• Accurate RE forecasting – Ramp up requirements under variable solar
generation and ways to handle the intermittent nature of solar generation.
For this, utilities will have to adopt advanced inverter, which will facilitate utility in
controlling active power. In order to adopt advance inverter, the study proposed following
recommendations.
Sr. No Recommendation Responsible
Agency
1 Regulatory recommendations:
a) Regulations for enabling active power
function of advance inverter
• H /L FRT function enabling
framework and regulation
CERC / SERCs

Rooftop Solar – Garnering Support from Distribution Utilities
- 69 -
b) Utility command regulatory framework for
control & Instrumentation functions to
enable advance inverter regulations in
Indian context need to be prepared and
framed.
c) Compensation mechanism for loss on
account of active power curtailment
2 Grid connectivity standard
a) Implement Active power control support
(Frequency regulation)
b) Model regulation for enabling framework for
active power controls
CEA/ FOR
8. Reactive Power - Determination of tariff and changes in standards Adoption of smart inverters can provide reactive power support to utilities. Advance
Inverters can be used to provide voltage regulation for improvement of tail end voltage
profiles. Germany and PG&E Rule 21, USA have specific requirements for installing
advance inverters for reactive power support functionality. Advance inverter functions
allow for more elaborate monitoring and communication of the grid status. The ability to
receive operation instructions from utility and capability to change operational parameter
(reactive power) help in maintaining grid stability, support power quality. In order to adopt
advanced inverters, following aspects needs to be considered
• Determination of compensation structure and level of compensation to generators
for grid services provided
• System disconnect and operation standards, changes and requirements of grid
connect standards (IEEE 1547)
• Communication protocols and requirements for availability of grid services by
inverter based systems
Globally regulatory considerations include compensation on account of making these
reactive power services available and estimated based upon the payment for reactive
power generated. Areas with relatively low solar irradiance are ideally suited for reactive
power compensation since most of the time inverters will be operating at lower capacity
than the rated. Oversized PV inverters can also be used to meet the reactive power but it
will cost higher due to the oversize designs.
For reactive power control following recommendations are proposed
Sr. No. Recommendation Responsible
Agency
1 a) Regulations for enabling reactive power function
of advance inverter
b) Utility command regulatory framework for control
& Instrumentation functions to enable advance
inverter regulations in Indian context need to be
prepared and framed.
c) H / L VRT function enabling framework and
regulation
CERC / SERCs
2 Grid connectivity standard – changes in the existing
grid standard so as to take advantages of advance
inverter functionality – Reactive power support
(voltage regulation)
CEA

Rooftop Solar – Garnering Support from Distribution Utilities
- 70 -
9. Encourage utility Driven Solar Rooftop Models. Net Metering framework help market to grow itself, but it also has some limitations like
coupling of import and export tariff, higher profitability for Consumers with high retail
tariff, reduction of utility revenue etc.
While determining the retail supply tariff, SERCs generally set supply tariff higher than the
ACOS of utility to recover other costs linked with supplying consumers such as cross
subsidy, infrastructure cost, fixed charges etc. However with net metering system in place,
utility loses sales and thus revenue. In order to safeguard utilities interest, utilities would
intend to increase the retail tariff, which will encourage more consumers to shift to Net
Metering and hence higher loss in revenue.
Thus, there is a need to encourage business models which are driven by utilities rather
than customer driven. The benefits and implementation framework of utility driven model
is illustrated in the figure below
Figure 32: Utility driven Rooftop Model
Under utility driven model, RESCO will setup the rooftop system on consumer’s roof but it
has power purchase agreement with utility instead of consumer. Utility buys all the power
generated from the rooftop system (which gets passed through in ARR). Consumer pays
to utility based on its consumption from the grid and rooftop. In order to encourage
consumers to take part in this scheme Utility offers discount on retail tariff.
In this arrangement, consumer gets the benefit of discounted tariff and lease rent from
the RESCO, while RESCO gets assured payment though PPA with the utility. While utilities
have the benefit in terms of RPO, reduction in T&D loss etc. Moreover this arrangement
does not impacts utility sales as consumer are still buying from utility, thus there is no
loss of revenue for utility.
To illustrate the benefit of utility driven model, two cases have been developed
3 Incentive mechanism and level of incentives for
adopting advance inverter functionality.
Incentives could be derived from cost associated with
maintaining voltage profiles across voltage levels
(LT/HT)
CERC/SERC
4 Model Regulation need to be framed for Reactive
Power Compensation
FOR

Rooftop Solar – Garnering Support from Distribution Utilities
- 71 -
• Case-1: Consumer Owned Net Metering
• Case-2: RESCO Owned Net Metering (Utility driven Model)
The comparison of both the cases is show below
The analysis shows that in case-1 (Consumer driven Net Metering) the energy bill of
consumers for monthly requirement of 1500 units is Rs. 1818/- as it is meeting its majority
of the requirement though its own solar rooftop system. While in Case-2 (Utility Driven
Net Metering) the energy bill is in the range of Rs. 12,000/- to Rs. 15,000, as in this case
consumer is buying total energy from the utility (either from the grid or from solar
rooftop).
10. Encouraging dedicated rooftop aggregation program
Dedicated solar rooftop aggregated programs should be adopted to encourage utilities to
support implementation of solar rooftop program. The benefit of these programs is that it
allows utilities to implement rooftop programs and at the same time it also safeguard them
against the danger or losing business as in the case of traditional consumer owned net
metering arrangement. The proposed implementation model for rooftop aggregation
program is shown in the following figure

Rooftop Solar – Garnering Support from Distribution Utilities
- 72 -
Figure 33: Implementation Model for Aggregated solar rooftop Program
The Roles and responsibilities of different parties under this model is given below

Rooftop Solar – Garnering Support from Distribution Utilities
- 73 -
8 References
1. IEA PVPS Trends 2015
2. Current and future cost of photovoltaics of Fraunhofer Institute for Solar Energy
Systems ISE
3. The Japanese solar PV market and Industry by Minerva, EU-Japan Fellowship
4. Photovoltaics business models by NREL
5. Renewables 2015, Global Status report by REN21
6. Solar photovoltaic financing: residential sector deployment by NREL
7. Residential solar photovoltaics: comparison of financing benefits innovations and
options by NREL
8. The 50 states of solar (Q3 2015) by NC Clean Energy Technology Center
9. Homeowners guide to solar financing by SunShot, U. S. Department of Energy
10. California solar initiative annual program assessment (June 2015) by California
Public utilities Commission
11. U.S. Solar market insight by GTM research and SEIA (December 2015)
12. UK solar PV Strategy Part 1 and Part 2: Roadmap to a brighter future by
Department of Energy and Climate Change, UK
13. Government response to consultation on changes to financial support for solar PV
by Department of Energy and Climate Change, UK
14. Feed in Tariff payment rate table for PV eligible installations (Jan 2016 to March
2016) by Ofgem e-serve
15. The German Feed-in-tariff: recent policy changes by DB Research
16. The development of the German Solar (PV) market: Success, shortcomings and
challenges for the future.
17. Renewable Energy World - Japan FIT Changes Reflect End of Residential PV
Program and Delay in Non-residential Projects

Rooftop Solar – Garnering Support from Distribution Utilities
- 74 -
Deloitte refers to one or more of Deloitte Touche Tohmatsu Limited, a UK private company limited by guarantee (“DTTL”), its network of member firms, and their related entities. DTTL and each of its member firms are legally separate and independent entities. DTTL (also referred to as “Deloitte Global”) does not provide services to clients. Please see www.deloitte.com/about for a more detailed description of DTTL and its member firms.
This material has been prepared by Deloitte Touche Tohmatsu India LLP (“DTTILLP”), a member of Deloitte Touche Tohmatsu Limited, on a specific request from you and contains proprietary and confidential information. This material may contain information sourced from publicly available information or other third party sources. DTTILLP does not independently verify any such sources and is not responsible for any loss whatsoever caused due to reliance placed on information sourced from such sources. The information contained in this material is intended solely for you. Any disclosure, copying or further distribution of this material or its contents is strictly prohibited.

Rooftop Solar – Garnering Support from Distribution Utilities
- 75 -
Nothing in this material creates any contractual relationship between DTTILLP and you. Any mutually binding legal obligations or rights may only be created between you and DTTILLP upon execution of a legally binding contract. By using this material and any information contained in it, the user accepts this entire notice and terms of use.
©2016 Deloitte Touche Tohmatsu India LLP. Member of Deloitte Touche Tohmatsu Limited
Deloitte Touche Tohmatsu India Private Limited (U74140MH199 5PTC093339), a private company limited by shares, was converted into Deloitte Touche Tohmatsu India LLP, a limited liability partnership (LLP Identification No. AAE-8458),with effect from October 1, 2015.
About the study
The study has been supported by Shakti Sustainable Energy Foundation and carried out
by Deloitte Touche Tohmatsu India LLP.
About Shakti Sustainable Energy Foundation
Shakti Sustainable Energy Foundation works to strengthen the energy security of the
country by aiding the design and implementation of policies that encourage energy
efficiency, renewable energy and sustainable transport solutions, with an emphasis on sub
sectors with the most energy saving potential. Working together with policy makers, civil
society, academia, industry and other partners, we take concerted action to help chart out
a sustainable energy future for India (www.shaktifoundation.in).
The views and analyses represented in this document do not necessarily reflect that of
Shakti Sustainable Energy Foundation. The Foundation accepts no liability for the content
of this document, or for the consequences of any actions taken on the basis of the
information provided.
December 2016
For private circulation only

Rooftop Solar – Garnering Support from Distribution Utilities
- 76 -