2022 General Rate Case - Liberty Utilities
176
{00546823;6} Application No.: A.21- Exhibit No.: Liberty-09 Witnesses: Thomas J. Bourassa (U 933-E) 2022 General Rate Case Before the California Public Utilities Commission Chapter 9: Cost of Capital Tahoe Vista, California May 28, 2021
-
Upload
khangminh22 -
Category
Documents
-
view
1 -
download
0
Transcript of 2022 General Rate Case - Liberty Utilities

{00546823;6}
Application No.: A.21- Exhibit No.: Liberty-09 Witnesses: Thomas J. Bourassa
(U 933-E)
2022 General Rate Case Before the California Public Utilities Commission
Chapter 9: Cost of Capital
Tahoe Vista, California
May 28, 2021

Liberty-09: Cost of Capital Table Of Contents
Section Page Witness
{00546823;6} -i-
I. INTRODUCTION AND SUMMARY 1 Bourassa
II. THE MEANING OF “JUST AND REASONABLE” RATE OF RETURN. 6
III. OVERVIEW OF THE RELATIONSHIP BETWEEN RISK AND THE EXPECTED RETURN ON AN INVESTMENT 9
IV. THE PUBLICLY TRADED UTILITIES THAT COMPRISE THE SAMPLE GROUP USED TO ESTIMATE THE COST OF EQUITY 21
V. OVERVIEW OF THE DCF AND RISK PREMIUM METHODS 30
VI. REQUIRED RISK PREMIUM FOR CALPECO 55
VII. SUMMARY AND CONCLUSIONS 59
List of Exhibits
Exhibit TJB -1 – Thomas J. Bourassa’s Education Background and Regulatory Experience
Exhibit TJB -2 – Blue Chip Financial Forecasts and The Value Line Investment Survey Selection and Opinion Quarterly Forecast
Exhibit TJB -3 – Value Line Report on Electric Utility Industry
Exhibit TJB-4 – Cost of Capital Analysis (containing Tables 1 through 11)
Exhibit TJB-5 – Comparative Risk Study and Capital Asset Pricing Model (CAPM)
Exhibit TJB-6 – Risk Premium Size Study
Exhibit TJB-7 – Comparable Earnings Analysis

Liberty-09: Cost of Capital List of Tables Table Page
{00546823;6} -ii-
Exhibit TJB-4 contains cost of capital analysis (Tables 1 through 11). The cost of capital tables in exhibit TJB-4 are described throughout the testimony.

Liberty-09: Cost of Capital List of Figures Figure Page
{00546823;6} -iii-
Figure 9-1 The Capital Market Line (CML) ............................................................................................. 10
Figure 9-2 Risk Co-efficients and Operating Leverage ............................................................................ 26
Figure 9-3 Business Risk Co-efficients between Western Electric Group and Central/Eastern Electric Group ................................................................................................................. 57

{00546823;6} -1-
I. 1
INTRODUCTION AND SUMMARY 2
Q. PLEASE STATE YOUR NAME AND ADDRESS. 3
A. My name is Thomas J. Bourassa. My business address is 139 W. Wood Drive, Phoenix, 4
Arizona 85029. I am an independent certified public accountant licensed in the State of 5
Arizona and my principal business activity is providing consulting services to regulated 6
utilities in the areas of cost of service, rate design, and cost of capital. I am testifying on 7
behalf of Liberty Utilities (CalPeco Electric) LLC (“CalPeco” or the “Company”). 8
Q. PLEASE DESCRIBE YOUR EDUCATION BACKGROUND. 9
A. I hold a Bachelor degree from the Northern Arizona University with a major in 10
Chemistry and a minor in Accounting. I also hold an MBA from the University of 11
Phoenix with an emphasis in Finance. 12
Q. HAVE YOU PREVIOUSLY TESTIFIED BEFORE UTILITY REGULATORY 13
COMMISSIONS? 14
A. Yes. I have testified in several states including Arizona, Alaska, Arkansas, Montana, 15
California, and Texas. I have testified previously before the California Public Utility 16
Commission (“CPUC” or “Commission”) on cost of capital in Application No. A.09-05-17
0002 (Valencia Electric Company), Liberty Utilities (Park Water) Corp. in Application 18
No. A.18.05.001, et. al and Liberty Utilities (CalPeco Electric, LLC) Corp. in 19
Application No. A. 18-12-001. Exhibit TJB-1 provides details of my participation in 20
regulatory proceedings. 21
Q. WHAT IS THE PURPOSE OF THIS PORTION OF YOUR DIRECT 22
TESTIMONY? 23

{00546823;6} -2-
A. The purpose of my testimony is to provide a recommended minimum return on common 1
equity (“ROE”) for CalPeco’s electric distribution assets regulated by the CPUC. My 2
analysis is based upon information available in early March 2021. 3
Q. PLEASE BREIFLY DESCRIBE THE EXHIBITS ACCOMPANYING YOUR 4
TESTIMONY. 5
A. I have attached Exhibits TJB-1 through TJB-7. Exhibit TJB-1 contains the details of my 6
education background and regulatory experience. Exhibit TJB-2 contains the recent Blue 7
Chip Financial Forecasts (December 2020) and Value Line Selection and Opinion 8
Quarterly Forecast (February 26, 2021). A copy of the most recent Value Line report on 9
the electric industry along with each electric utility in my proxy group is attached as 10
Exhibit TJB-3. Exhibit TJB-4 contains my cost of capital analysis (Tables 1 through 11). 11
The cost of capital tables in Exhibit TJB-4 are described in further detail in my testimony. 12
Exhibit TJB-5 contains my risk study I prepared for CalPeco. Exhibit TJB-6 contains my 13
size study for the electric proxy group and CalPeco. Exhibit TJB-7 contains my 14
comparable earnings analysis. 15
Q. PLEASE DESCRIBE HOW YOUR TESTIMONY IS ORGANIZED. 16
A. In this Section I, a summary of my analysis and my approach is presented. In Section II, I 17
discuss the meaning of just and reasonable rates. In Section III, I provide an overview of 18
the risk and expected return on investment. In Section IV, I discuss the sample of 19
twenty-eight publicly traded electric utilities in my sample group and provide a 20
comparison to CalPeco. I then discuss recent developments in the electric utility industry 21
and their impact on investments. In Section V, I provide an overview of each of the 22
methods (Discounted Cash Flow and Risk Premium) that I employ in my analysis. In 23

{00546823;6} -3-
Section VI, I discuss the additional business risks faced by CalPeco, my comparative risk 1
study, and my recommended risk premium for CalPeco. Finally, in Section VII, I 2
summarize my testimony and present a summary of the equity costs of the proxy group 3
and CalPeco. 4
Q. PLEASE SUMMARIZE YOUR FINDINGS CONCERNING CALPECO’S COST 5
OF COMMON EQUITY. 6
A. I have determined that the cost of equity for the publicly traded electric utilities falls in 7
the range of 8.8 percent to 9.9 percent with the midpoint of the range at 9.3 percent. 8
After considering differences in financial risk and business risk between CalPeco and the 9
publicly traded electric utilities, I am recommending the adoption of an ROE of 10.5 10
percent for CalPeco. 11
My recommendation is based on consideration of cost of equity estimates using 12
the Discounted Cash Flow (“DCF”) and three Risk Premium (“RP”) approaches, 13
including the Capital Asset Pricing Model (“CAPM”). All three are market-based 14
methodologies and are designed to estimate the return required by investors on the 15
common equity capital committed to Liberty Utilities. I have applied the aforementioned 16
methodologies to a sample group of publicly traded electric utilities. Further, my analysis 17
considers (i) my review of the economic conditions expected to prevail during the period 18
in which new rates will be in effect, (ii) my judgments about the risks associated with 19
relatively small utilities like CalPeco that are not captured by the market data of publicly-20
traded electric utilities, (iii) the financial risk associated with the level of debt in 21
CalPeco’s capital structure, and (iv) additional specific business and operational risks 22
faced by CalPeco. 23

{00546823;6} -4-
In reaching my recommendation, I have applied various cost of capital 1
methodologies to a proxy group of electric utilities consisting of Value Line Western, 2
Central and Eastern electric utilities. The results of these methodologies were adjusted 3
upward by 120 basis points to account for CalPeco’s higher than average business risk 4
compared to the proxy group. My recommended ROE is based upon the Commission 5
adoption of a 52.5 percent common equity ratio for ratemaking purposes. 6
Q. WHY DID YOU USE MORE THAN ONE APPROACH FOR ESTIMATING THE 7
COST OF EQUITY? 8
A. Because no single method provides the necessary level of precision for determining a fair 9
rate of return. As Dr. Morin states: 10
Each methodology requires the exercise of considerable judgment 11 on the reasonableness of the assumptions underlying the 12 methodology and on the reasonableness of the proxies used to 13 validate a theory. The inability of the DCF model to account for 14 changes in relative market valuation, discussed below, is a vivid 15 example of the potential shortcomings of the DCF model when 16 applied to a given company. Similarly, the inability of the CAPM 17 to account for variables that affect security returns other than beta 18 tarnishes its use. 19
No one individual method provides the necessary level of precision 20 for determining a fair return, but each method provides useful 21 evidence to facilitate the exercise of an informed judgment. 22 Reliance on any single method or preset formula is inappropriate 23 when dealing with investor expectations because of possible 24 measurement difficulties and vagaries in individual companies’ 25 market data 26
When measuring equity costs, which essentially deals with the 27 measurement of investor expectations, no single methodology 28 provides a foolproof panacea. Each methodology requires the 29 exercise of considerable judgment on the reasonableness of the 30 assumptions underlying the methodology and on the 31 reasonableness of the proxies used to validate the theory. It 32 follows that more than one methodology should be employed in 33 arriving at a judgment on the cost of equity and that these 34
{00546823;6} -5-
methodologies should be applied across a series of comparable risk 1 companies. 1 2
Q. PLEASE SUMMARIZE THE APPROACH YOU USED TO ESTIMATE THE 3
COST OF EQUITY FOR THE COMPANY. 4
A. The cost of equity for CalPeco cannot be estimated directly because the Company’s 5
equity is not in the form of a publicly traded security so there is no market data for 6
CalPeco. Consequently, I have assessed the market-based common equity cost rates of 7
companies of similar, but not necessarily identical risk for insight into a recommended 8
common equity cost rate applicable to CalPeco. The DCF, Risk Premium, and CAPM 9
methodologies use data from a sample of publicly traded electric utilities, or proxy group, 10
selected from the Value Line Investment Survey serve as starting point in my analysis. 11
Analysis of a proxy group serves as a starting point because no proxy group can be 12
selected to be identical in risk to CalPeco. Therefore, the proxy group's results must be 13
adjusted to reflect the unique relative financial and/or business risks of CalPeco, as I will 14
discuss in detail. 15
There are 22 electric utilities in my electric utility proxy group are included Value 16
Line’s Western, Central and Eastern electric utilities. The electric utilities in my proxy 17
group are listed in Table 2. 18
1 Roger A. Morin. New Regulatory Finance, Public Utility Reports, Inc., 2006. 428-429. (“Morin”)

{00546823;6} -6-
II. 1
THE MEANING OF “JUST AND REASONABLE” RATE OF RETURN 2
Q. HAVE THE COURTS SET FORTH ANY CRITERIA THAT GOVERN THE 3
RATE OF RETURN THAT A UTILITY’S RATES SHOULD PRODUCE? 4
A. Yes. In 1923, the U.S. Supreme Court set forth the following criteria for determining 5
whether a rate of return is reasonable in Bluefield Electric Works and Improvement Co. v. 6
Public Service Commission of West Virginia, 262 U.S. 679, 692-93 (1923): 7
A public utility is entitled to such rates as will permit it to earn a 8 return on the value of the property which it employs for the 9 convenience of the public equal to that generally being made at the 10 same time and in the same general part of the country on 11 investments in other business undertakings which are attended by 12 corresponding risks and uncertainties … The return should be 13 reasonably sufficient to assure confidence in the financial 14 soundness of the utility, and should be adequate, under efficient 15 and economical management, to maintain and support its credit 16 and enable it to raise the money necessary for the proper discharge 17 of its public duties. A rate of return may be reasonable at one time 18 and become too high or too low by changes affecting opportunities 19 for investment, the money market, and business conditions 20 generally. 21
Then, in Federal Power Commission v. Hope Natural Gas Co., 320 U.S. 591 (1944), the 22
U.S. Supreme Court stated the following regarding the return to owners of an entity: 23
[T]he return to the equity owner should be commensurate with 24 returns on investments in other enterprises having corresponding 25 risks. That return, moreover, should be sufficient to assure 26 confidence in the financial integrity of the enterprise, so as to 27 maintain its credit and to attract capital. 320 U.S. at 603. 28
In summary, under Hope and Bluefield: 29
(1) The rate of return should be similar to the return in businesses with similar or 30
comparable risks; 31

{00546823;6} -7-
(2) The return should be sufficient to ensure the confidence in the financial integrity 1
of the utility; and 2
(3) The return should be sufficient to maintain and support the utility’s credit. 3
From the Hope and Bluefield decisions, two standards emerge: a Capital 4
Attraction standard and a Comparable Earnings standard. The Capital Attraction 5
standard focuses on investor’s required returns, which are derived from market-based 6
methods such as the DCF and RP.2 The Comparable Earnings standard focuses on 7
earned returns on book equity based on an interpretation of the Hope decision that returns 8
are defined as book rates of return on equity.3 9
Q. HAVE THESE CRITERIA BEEN APPLIED IN REGULATORY 10
PROCEEDINGS? 11
A. Yes, but the application of the “reasonableness” criteria laid down by the Supreme Court 12
has resulted in controversy. The typical method of computing the overall cost of capital 13
is quite straightforward; it is the composite, weighted cost of the various classes of capital 14
(debt, preferred stock, and common equity) used by the utility. Calculating the 15
proportion that each class of capital bears to total capital does the weighting. However, 16
there is no consensus regarding the best method of estimating the cost of equity capital. 17
The increasing regulatory use of market-based finance models in equity return 18
determinations has not, at least to date, led to a universally accepted means of estimating 19
the ROE. In addition, the market-based results are too often applied to a book-value 20
investment base, which, as I will discuss later in my testimony, understates the return 21
expected by investors who invest in actual markets based on market values. 22
2 Morin p. 21. 3 Id.

{00546823;6} -8-
With respect to the Capital Attraction standard, the cost of capital is based on the 1
concept of opportunity cost, i.e., the prospective return to investors must be comparable 2
to investments of similar risk. If a utility’s return is less than the returns on investments 3
with similar risk, investors can and will invest elsewhere. As explained by Dr. Roger 4
Morin in his book, New Regulatory Finance: 5
The concept of cost of capital is firmly anchored in the opportunity 6 cost notion of economics. The cost of a specific source of capital is 7 basically determined by the riskiness of that investment in light of 8 alternative opportunities and equals investor’s current opportunity 9 cost of investing in the securities of that utility. A rational investor 10 is maximizing the performance of his or her portfolio only if 11 returns expected on investor investments of comparable risk are 12 the same. If not, the investor will switch out of those investments 13 yielding low returns at a given risk level in favor of those 14 investments offering higher returns for the same degree of risk. 15 This implies that a utility will be unable to attract capital unless it 16 can offer returns to capital suppliers comparable to those achieved 17 on alternate competing investments of similar risk.4 18
The Bluefield decision suggests that opportunity cost is an appropriate measure of the 19
actual cost of common equity for a utility. This necessarily involves the direct 20
observation of returns on equity actually earned by firms with comparable risk to ensure 21
that the authorized rate of return is equivalent to the returns those firms are earning. This 22
concept is the basis of the Comparable Earnings standard. 23
24
4 Morin pp. 21-22.

{00546823;6} -9-
III. 1
OVERVIEW OF THE RELATIONSHIP BETWEEN 2
RISK AND THE EXPECTED RETURN ON AN INVESTMENT 3
Q. HOW IS THE COST OF EQUITY TYPICALLY ANALYZED FROM A CAPITAL 4
ATTRACTION OR MARKET-BASED PERSPECTIVE? 5
A. The cost of equity is the rate of return that equity investors expect to receive on their 6
investment. Investors can choose from numerous investment options, not simply publicly 7
traded stocks. Investments have varying degrees of risk, ranging from relatively low risk 8
assets such as Treasury securities to somewhat higher risk corporate bonds to even higher 9
risk common stocks. As the level of risk increases, investors require higher returns on 10
their investment. Finance models used to estimate the cost of equity often rely on this 11
basic concept. 12
Q. CAN YOU ILLUSTRATE THE CAPITAL MARKET RISK-RETURN 13
CONCEPT? 14
A. Yes. The following graph depicts the risk-return relationship that has become widely 15
known as the Capital Market Line (“CML”). The CML illustrates in a general way the 16
risk-return relationship. 17

{00546823;6} -10-
Figure 9-1 The Capital Market Line (CML)
The CML can be viewed as a continuum of the available investment opportunities for 1
investors. Investment risk increases move upward and to the right along the CML. 2
Again, the return required by investors increases with the risk. 3
Q. HOW DOES THE RISK-RETURN TRADE OFF CONCEPT WORK IN THE 4
CAPITAL MARKET? 5
A. The allocation of capital in a free market economy is based upon the relative risk of, and 6
expected return from, an investment. In general, investors rank investment opportunities 7
in the order of their relative risks. Investment alternatives in which the expected return is 8
commensurate with the perceived risk become viable investment options. If all other 9
factors remain equal, the greater the risk, the higher the rate of return investors will 10
Expected Rate of Return
Treasury Bills
20%
15%
10%
5% Investment Grade Bonds
Common Stocks
Speculative Investments
Higher Risk
The Capital Market Line (CML)
Non-investment Grade Bonds

{00546823;6} -11-
require to compensate them for the possibility of loss of either the principal amount 1
invested or the expected annual income from such investment. 2
Short-term Treasury bills provide a high degree of certainty and in nominal terms 3
(after considering inflation) are considered virtually risk free. Long-term bonds and 4
preferred stocks, having priority claims to assets and fixed income payments, are 5
relatively low risk, but are not risk free. The market values of long-term bonds often 6
fluctuate when government policies or other factors cause interest rates to change. 7
Common stocks are higher and to the right on the CML continuum, because they have 8
greater investment risk. Common stock risk is impacted by the nature of the underlying 9
business and the financial strength of the issuing corporation and market-wide factors, 10
such as general changes in capital costs. 11
The capital markets reflect investor expectations and requirements each day 12
through market prices. Prices for stocks and bonds change to reflect investor 13
expectations and the relative attractiveness of one investment relative to others. While 14
the example provided above seems straightforward, returns on common stocks are not 15
directly observable in advance as compared to debt or preferred stocks with fixed 16
payment terms. This means that these returns must be estimated from market data. 17
Estimating the cost of equity capital should be a matter of informed judgment about the 18
relative risk of the company in question and the expected rate of return characteristics of 19
other alternative investments. 20

{00546823;6} -12-
Q. HOW IS THE COST OF EQUITY TO BE DETERMINED FOR A PARTICULAR 1
COMPANY? 2
A. Estimating a company’s cost of equity is complex. It requires an analysis of the factors 3
influencing the cost of various types of capital, such as interest on long-term debt, 4
dividends on preferred stock, and earnings on common equity. The data for such an 5
analysis comes from highly competitive capital markets, where the firm raises funds by 6
issuing common stock, selling bonds, and by borrowing (both long-term and short-term) 7
from banks and other financial institutions. In the capital markets, the cost of capital, 8
whether the capital is in the form of debt or equity, is determined by two important 9
factors: 10
1) The pure or real rate of interest, often called the risk-free rate of interest, 11
and, 12
2) The uncertainty or risk premium (or the compensation the investor 13
requires, over and above the real or pure rate of interest for subjecting his 14
or her capital to additional risk). 15
Q. PLEASE DISCUSS THESE FACTORS IN GREATER DETAIL. 16
A. The pure rate of interest essentially reflects both the time preference for and the 17
productivity of capital. From the standpoint of the individual, it is the rate of interest 18
required to induce the individual to forgo present consumption and offer the funds, thus 19
saved, to others for a specified length of time. Moreover, the pure rate of interest concept 20
is based on the assumption that no uncertainty affects the investment undertaken by the 21
individual, i.e., there is no doubt that the periodic interest payments will be made and the 22
{00546823;6} -13-
principal returned at the end of the time period. In reality, investments without any risk 1
do not exist. Every commitment of funds involves some degree of uncertainty. 2
Turning to the second factor affecting the cost of capital, it is generally accepted 3
that the higher the degree of uncertainty, the higher the cost of capital. Investors are 4
regarded as risk averse and require that the rate of return increase as the risks and 5
uncertainty associated with an investment increases. 6
Q. CAN YOU PROVIDE SOME PERSPECTIVE ON YOUR PREVIOUS 7
DISCUSSION WITH RESPECT TO RETURNS ON COMMON STOCKS? 8
A. Yes. Conceptually, the required return on common stocks can be quantified by the 9
following equation: 10
[1] Required Return for Common Stocks = Return on a risk
free asset + Risk Premium
The risk premium investors require for common stocks will be higher than the risk 11
premium they require for investment grade bonds. As I will discuss later in this 12
testimony, this concept is the basis of risk premium methods, such as the CAPM, that are 13
used to estimate the cost of equity. 14
Q. PLEASE DISCUSS IN MORE DETAIL THE IMPACT OF RISK ON CAPITAL 15
COSTS. 16
A. With reference to specific utilities, risk is often discussed as consisting of two separate 17
types of risk: business risk and financial risk. 18
Business risk, the basic risk associated with any business undertaking, is the 19
uncertainty associated with the enterprise’s day-to-day operations. In essence, it is a 20
function of the normal day-to-day business environment, both locally and nationally. 21
Business risks include the condition of the economy and capital markets, the state of 22

{00546823;6} -14-
labor markets, regional stability, government regulation, technological obsolescence, and 1
other similar factors that may impact demand for the business’ products or services and 2
its cost of production. For utilities, business risk also includes the volatility of revenues 3
arising from abnormal weather conditions, degrees of operational leverage, regulation, 4
and regulatory climate. Regulation, for example, can compound the business risk if it is 5
unpredictable in reacting to cost increases, both in terms of the time lag and magnitude 6
for recovery of such increases. 7
Financial risk, on the other hand, concerns the distribution of business risk to the 8
various capital investors in the utility. Permanent capital is normally divided into three 9
categories: long-term debt, preferred stock, and common equity. Because common 10
equity owners have only a residual claim on earnings after debt and preferred 11
stockholders are paid, financial risk tends to be concentrated in that element of the firm’s 12
capital. Thus, a decision by management to raise additional capital by issuing additional 13
debt concentrates even more of the financial risk of the utility on the common equity 14
owners. 15
Q. WHAT ARE THE DETERMINANTS OF THE RISK FREE RATE IN 16
EQUATION [1]? 17
A. The risk-free rate can be disaggregated into a “real” rate of interest and an inflation 18
premium (expected future inflation). 19
Q. WHAT ARE THE DETERMINANTS OF THE REQUIRED RISK PREMIUM 20
FROM EQUATION [1] ABOVE? 21
A. The risk premium can be disaggregated into five general components: (1) Interest Rate 22
Risk; (2) Business Risk; (3) Regulatory Risk; (4) Financial Risk; and (5) Liquidity Risk. 23

{00546823;6} -15-
Interest Rate Risk refers to the variability in return caused by subsequent changes 1
in interest rates and stems from the inverse relationship between interest rates and asset 2
prices. For example, bond prices fall when interest rates rise and vice versa. 3
Business risk, the basic risk associated with any business undertaking, is the 4
uncertainty associated with the enterprise’s day-to-day operations. In essence, it is a 5
function of the normal day-to-day business environment, both locally and nationally, that 6
increases the probability that expected future income flows accruing to investors might 7
not be realized. Business risks include the condition of the economy and capital markets, 8
the state of labor markets, regional stability, technological obsolescence, degree of 9
competition, sales volatility, government regulation, and other similar factors that may 10
impact demand for the business product and its cost of production. For utilities, business 11
risk also includes the volatility of revenues due to abnormal weather conditions and the 12
degree of operational leverage. 13
Regulatory risk refers to the quality and consistency of regulation applied to a 14
given regulated utility. Regulatory jurisdictions are evaluated on the basis of three major 15
factors: (1) earnable return on equity, (2) regulatory quality, and (3) regulatory practices. 16
Collectively, these three factors influence a utility’s ability to earn its authorized return. 17
The type of test year employed (historical or future), capital structure and rate base 18
issues, and the length of regulatory lag are among the reasons a utility may or may not 19
have a reasonable opportunity to earn its authorized return. 20
Financial risk concerns the distribution of business risk to the various capital 21
investors in the utility. It relates to the additional variability imparted to income available 22
to common shareholders stemming from the entity’s method of financing its capital 23

{00546823;6} -16-
needs. As I discussed earlier, because common equity owners have only a residual claim 1
on earnings after debt and preferred stockholders are paid, financial risk tends to be 2
concentrated in that element of the firm’s capital. 3
Construction risk is an important component of financial risk. Construction risk 4
is the risk of tying capital up in projects that are not earning returns, or not having 5
sufficient capital to build the assets needed to keep generating returns. If an entity has a 6
large construction budget relative to internally generated cash flows, it will require 7
external financing, which will result in greater financial risk. It is essential that such 8
entities have access to capital funds on reasonable terms and conditions. 9
Utilities are more susceptible to construction risk. Utilities have a mandated 10
obligation to serve, leaving less flexibility both in the timing and discretion of scheduling 11
capital projects. This is compounded by the limited ability to wait for more favorable 12
market conditions to raise the capital necessary to fund the capital projects, and then the 13
lag between when a plant can be built and when rates can be approved to provide returns 14
on and of that capital. It is imperative that the utility maintain access to needed capital 15
and on reasonable terms and conditions. The return allowed on common equity will have 16
a critical role in determining those terms and conditions. 17
Although often discussed separately, the two types of risks (business and 18
financial) are interrelated. A study by Scott and Martin found statistically significant 19
results for unregulated firms in twelve industries that “smaller equity ratios (higher 20
leverage use) are generally associated with larger companies.”5 While unregulated 21
enterprises would be expected to seek the optimal balance between debt and equity to 22
5 Scott, D.F. and Martin, J.D., “Industry Influence on Financial Structure,” Financial Management, Spring 1975, pp. 67-71.

{00546823;6} -17-
achieve the lowest overall cost of capital, the findings of Scott and Martin suggest 1
smaller firms found it prudent to offset higher business risks related to being small by 2
reducing financial risk. This evidence suggests the lowest cost equity ratio for CalPeco 3
may be higher than the average equity ratio for the benchmark proxy group. 4
Finally, Liquidity Risk refers to the ability to readily convert an investment into 5
cash without sustaining a loss. Capital market theory generally assumes that investments 6
are liquid and observations about risk and return are drawn from information about liquid 7
investments. Non-publicly traded or privately-held investments possess little liquidity. 8
Q. IS INVESTMENT RISK IMPACTED BY COMPANY SIZE? 9
A. Yes. Investment risk bears a direct relationship to size and increases as company size 10
decreases. Investment liquidity may be a significant factor explaining this relationship. 11
However, the illiquidity of smaller stocks does not capture the size effect completely. 12
Size may be a proxy for one or more true unknown factors correlated with size.6 13
Q. HOW IS THE COST OF EQUITY TYPICALLY ANALYZED FROM A 14
COMPARABLE EARNINGS OR BOOK EQUITY RETURN-BASED 15
PERSPECTIVE? 16
A. The cost of equity is the rate of return derived from the book returns of comparable firms. 17
To implement the approach, a group of companies of comparable risk to the subject 18
utility is selected and the book equity return is computed for each company. The allowed 19
return for the subject utility is set equal to the average return on book value equity.7 The 20
rationale for this method rests on the premise that regulation is a surrogate for 21
competition and that the profitability of non-regulated firms is set by the free forces of 22 6 Rolf W. Banz, “The Relationship between Return and Market Value of Common Stocks”, Journal of Financial Economics, March 1981, pp. 3-18 7 Morin p. 381.

{00546823;6} -18-
competition.8 Typically, the group of companies is made up of non-regulated firms 1
because the book equity returns of regulated firms is not determined by competitive 2
forces but rather the past decisions of regulators.9 3
Q. HAVE YOU CONDUCTED A COMPARABLE EARNINGS ANALYSIS? 4
A. Yes, I have prepared a Comparable Earnings (CE) analysis but I do not include it in my 5
cost of equity estimation at this time. Instead, I use it as a check on the reasonableness of 6
my recommendations. My CE analysis of comparable risk unregulated firms results in an 7
indicated cost of equity of 17.28 percent. My CE analysis of comparable regulated and 8
non-regulated firms results in an indicated cost of equity of 13.2 percent. By comparison, 9
my recommended cost of equity is 10.50 percent and well below comparable risk firms. 10
I have attached my CE analysis as Exhibit TJB-6. 11
Q. WHAT STEPS DID YOU TAKE TO IDENTIFY COMPARABLE RISK FIRMS 12
FOR YOUR CE ANALYSIS? 13
A. I started with the Value 1700 firms and filtered those firms based upon the following 14
criteria: 15
1) At least 10 years of financial data. 16
2) Debt percentage between 35% and 65%. 17
3) Dividend paying. 18
4) Value Line Financial Strength of B+ or better. 19
5) Projected earnings growth of 10% or less. 20
6) No negative return on equity or negative operating margin for each of the past 10 21
years. 22
8 Id. 9 Morin p. 383.

{00546823;6} -19-
7) Excluded firms in the Banking, Financial Services, and Real Estate Investment 1
Trust industries. 2
Applying these criteria (filters) narrowed the number of firms from 1,694 to 178. Next, I 3
computed the coefficient of variance (CV) for the book return on equity (CVROE) and 4
operating margin (CVOM) for each of the 178 firms based upon 10 years of data as well 5
as computed the 10-year average operating margin (OM) for each firm. I then filtered the 6
178 firms by selecting only those firms that had a CVROE equal to or less than 65% of 7
the average CVROE of the 178 firms and only those firms that had a CVOM equal to or 8
less than 65% of the average CVOM of the 178 firms. Applying these filters to the 178 9
firms narrowed the number of firms to 51. The 51 firms are comprised of 28 regulated 10
and 27 unregulated firms. 11
Q. HOW DO THE COMPARBLE RISK FIRMS COMPARE TO THE ELECTRIC 12
PROXY GROUP IN TERMS OF RISK? 13
A. The three accounting–based risk metrics (CVROE, CVOM, and OM) compare very 14
favorably. 10 The average CVROE, CVOM, and OM for the 51 firms are 0.0997, 15
0.11917, and 17.7 percent, respectively. For my electric proxy group, the average 16
CVROE, CVOM, and OM are 0.10223, 0.11352, and 18.93 percent, respectively. 17
While market beta was not used as a risk filter, the average betas of the 51 firms 18
and my electric proxy group are very comparable. The average beta of the 51 firms is 19
0.89 while the average beta for my electric proxy group of 0.85. 20
10 The coefficient of variation of return on equity (CVROE) and coefficient of variation of operating margin (CVOM) and operating margin are accounting-based risk metrics that Duff and Phelps has found to be highly correlated to firm size and market risk premiums. The operating income statistic measures profitability, and the coefficient of variation statistics measure volatility of earnings. See Duff & Phelps, LLC. 2020 Valuation Handbook; Guide to Cost of Capital. Hoboken, NJ: John Wiley and Sons, 2020 (“Duff & Phelps”), Chapter 4, p. 17. found Online at www.dpcostofcapital.com: Duff & Phelps Cost of Capital Navigator platform (“Duff &Phelps Cost of Capital Navigator”).

{00546823;6} -20-
Q. WHAT ABOUT JUST THE UNREGULATED FIRMS? 1
A. These metrics also compare favorably. The average CVROE, CVOM, and OM for the 23 2
unregulated firms are 0.11786, 0.11635, and 14.62 percent, respectively. Again, for my 3
electric proxy group, the average CVROE, CVOM, and OM are 0.10223, 0.11352, and 4
18.93 percent, respectively. 5
The average betas of the 23 unregulated firms and my electric proxy group are 6
also comparable. The average beta of the 28 unregulated firms is 0.93 while the average 7
beta for the regulated firms is 0.86. 8

{00546823;6} -21-
IV. 1
THE PUBLICLY TRADED UTILITIES THAT COMPRISE 2
THE SAMPLE GROUP USED TO ESTIMATE THE COST OF EQUITY 3
Q. WHICH COMPANIES COMPRISE YOUR ELECTRIC PROXY GROUP? 4
A. There are 22 electric distribution utilities in my sample. For the methods employed in my 5
analysis, I used data on these sample entities from a sample of publicly traded electric 6
utilities, or proxy group, selected from the Value Line Investment Survey as a starting 7
point. 8
The 22 electric distribution companies comprising the proxy group were selected 9
by meeting the following criteria: (1) they are followed by the Value Line Investment 10
Survey; (2) they have at least ten years of historical financial and market information; (3) 11
they have a Value Line adjusted beta; (4) they have not cut or omitted their common 12
dividends during the five years ending 2019 or through time of the preparation of this 13
testimony; (5) they have operating revenues primarily from regulated operations in the 14
U.S.; and (6) at the time of the preparation of this testimony, they had not publicly 15
announced that they were involved in any major merger or acquisition activity. A copy 16
of the most recent Value Line report on the electric industry along with each electric 17
utility in my proxy group is attached as Exhibit TJB-3. 18
Q. BUT THE ELECTRIC UTILITIES IN YOUR SAMPLE ARE NOT DIRECTLY 19
COMPARABLE TO CALPECO? 20
A. That is correct. They publicly traded and are much larger (e.g. revenues, plant-in-service, 21
number of connections) and in many cases more diversified (e.g. provides both gas and 22
electric service). However, they are utilities for which market data is available. All of 23

{00546823;6} -22-
them primarily provide electric distribution and their primary source of revenues is from 1
regulated services. They are also commonly used in regulatory proceedings where 2
sample companies are selected to measure the cost of equity. Therefore, they provide a 3
useful starting point for developing the cost of equity for CalPeco while recognizing that 4
the proxies are not perfectly comparable. 5
Q. BRIEFLY, WHY IS A PROXY GROUP NECESSARY FOR COMPARISON IN A 6
COST OF CAPITAL ANALYSIS? 7
A. First, a fair rate of return for a specific utility is the return required by investors to hold 8
assets with corresponding levels of risk. Market data for a sample of comparable 9
companies provides insight into the investors’ required return, and such data comports 10
with the guidance from the U.S. Supreme Court’s decisions in Bluefield and Hope, which 11
I discussed earlier. The comparable earnings standard set forth in the Hope and Bluefield 12
decisions requires that the rate of return afforded to utilities be similar to the return for 13
businesses with similar or comparable risks. It follows that a proxy group of companies 14
with comparable risk is the starting point in a cost of capital analysis. 15
Second, a primary objective of rate regulation is to determine an authorized ROE 16
that is both fair to customers and provides reasonable returns for the subject utility. The 17
best estimate of that ROE is the cost of equity for CalPeco. The cost of equity is a cost of 18
service fairly recovered from customers through rates. For investors in CalPeco, the cost 19
of equity is commensurate with returns an investor in these utilities would expect to earn 20
from investments of comparable risk. To estimate the cost of equity requires market data 21
that reveal investor-required returns. Since CalPeco is not publicly traded, there is no 22

{00546823;6} -23-
market information to determine the cost of equity. This necessitates the selection and 1
use of a proxy group. 2
Q. PLEASE PROVIDE A GENERAL DESCRIPTION OF THE ELECTRIC 3
UTILITIES IN YOUR ELECTRIC PROXY GROUP? 4
A. Yes. Table 2 lists the percentages of regulated revenues, operating revenues, net plant, 5
the number of customers or population served, Value Line Financial strength, Value Line 6
betas, market capitalization, and market size category for the eight electric utilities. 7
Comparative data for CalPeco (where available) is also shown in Table 2. The electric 8
utilities in the electric proxy group consist primarily of Mid-Cap and Large-Cap 9
companies.11 The market capitalizations range for about $2.35 billion to over $64.2 10
billion with an average of approximately $17.3 billion. Operating revenues range from 11
about $569 million to over $25.1 billion with an average of over $7.15 billion. Net plant 12
ranges from $1.64 billion to over $102.1 billion, with an average of over $26.1 billion. 13
Q. HOW DOES CALPECO COMPARE TO THE UTILITES IN YOUR PROXY 14
GROUP? 15
A. On average, the utilities in the electric proxy group are much larger and, according to the 16
empirical financial data, they are less risky than CalPeco. CalPeco is much smaller with 17
fewer customers and has far less revenues, far less net plant and a relatively small and 18
limited service territory. At the end of 2020, CalPeco had approximately 50,000 electric 19
connections as compared to the average of the electric proxy group of about 2.85 million 20
connections. CalPeco’s revenues totaled approximately $83 million and net plant-in-21 11 Based upon 2018 market data from the Center for Research in Security Prices: Micro-Cap companies are Decile 9-10 with market capitalization less than $657 million; Low-Cap companies are Decile 6-8 with market capitalization over $657 million but less than $2,760 million; Mid-Cap companies are Decile 3-5 companies with market capitalization of over $2,760 million but less than $11,979 million; and, Large-Cap companies are Decile 1 -2 companies and have market capitalization of over $11,979 million.
{00546823;6} -24-
service was approximately $362 million compared average revenues of about $7.15 1
billion and net plant-in-service of about 26.1 billion for the proxy group. The average 2
revenues of the electric proxy group are approximately 87 times greater than CalPeco, 3
and those entities have on average over 72 times the net plant of CalPeco. 4
Q. WHAT OTHER RISK FACTORS DISTINGUISH CALPECO FROM THE 5
LARGER ELECTRIC UTILITIES IN YOUR PROXY GROUP? 6
A. First, electric utilities are capital intensive and typically have large construction budgets. 7
Firms with large construction budgets face greater construction risk (a form of financial 8
risk). The size of a utility’s capital budget relative to the size of the utility itself often 9
increases construction risk. Large utilities are better able to fund their capital budgets 10
from their earnings, cash flows, and short-term borrowings. For smaller utilities, the 11
ability to fund their capital budgets from earnings, cash flows, and short-term debt is 12
difficult, if not impossible, and must rely on additional outside capital. 13
Second, smaller companies are simply less able to cope with significant events 14
that affect sales, revenues and earnings. For example, the loss of revenues from a few 15
larger customers or from trends in the reduction of usage by customers through 16
conservation or the makeup of the customer base would have a greater effect on a small 17
company than on a much larger company with a larger customer base. 18
Third, there are a number of other factors, including the differences in regulatory 19
environments, differences in the type of test year used for rate making, and differences in 20
the available regulatory mechanisms for recovery of costs outside of a rate case. The 21
large electric utilities in my electric proxy group are generally not subject to the adverse 22
impacts of an unfavorable regulatory environment of one jurisdiction. 23

{00546823;6} -25-
In summary, there are several factors that impact the ability of a smaller utility to 1
actually earn its authorized return. An inadequate opportunity to earn the revenues in a 2
rate case leads to a greater variability of earnings for entities like CalPeco when 3
compared to the proxy group. This volatility means greater risk, and the greater risk 4
requires higher returns to maintain and support the utility’s credit. 5
Q. WHAT QUANTITATIVE MEASURES THAT CAN BE USED TO HELP 6
IDENTIFY DIFFERENCES IN BUSINESS RISK? 7
A. There are a number of fundamental accounting-based business risk measures that can be 8
used to assess the relative differences between firms. Those include: (1) the co-efficient 9
of variance of ROE; (2) the co-efficient of variance of operating income; (3) the co-10
efficient of variance of operating margin; and (4) Operating Leverage. The first three 11
reflect the distributions of earnings. These are meaningful when measured against the 12
distribution of earnings of alternative investments, like the electric utilities in my electric 13
proxy group. The fourth business risk measure reflects the impact of sales fluctuations 14
and the impact of fixed operating costs on earnings. 15
The co-efficient of variance of ROE can be quantified using the following 16
equation: 17
[2] Co-efficient of Variance of ROE = Standard Deviation of ROE/Mean of ROE 18
The co-efficient of variance of operating income can be quantified using a 19
relatively simple equation: 20
[3] Co-efficient of Variance of Operating Income = Standard Deviation of 21
Operating Income/Mean of Operating Income 22

{00546823;6} -26-
The co-efficient of variance of operating margin can be quantified using the 1
following equation: 2
[4] Co-efficient of Variance of Operating Margin = Standard Deviation of 3
Operating Margin/Mean of Operating Margin 4
And, the Operating Leverage formula is expressed as: 5
[5] Operating Leverage = Percentage Change in Operating Income/Percentage 6
Change in Sales 7
Using the business risk measures expressed in equations [2], [3], [4], and [5], the 8
greater the co-efficient of variation or Operating Leverage, the greater the risk to 9
investors of not receiving expected returns.12 Figure 9-2 shows the computed co-efficient 10
of variation for ROE, Operating Income, and Operating Margin, as well as Operating 11
Leverage using the five most recent years of historical data for the electric proxy group 12
and CalPeco: These metrics show that CalPeco is 1.2 to 5.2 times more risky than the 13
average electric proxy group companies. 14
Figure 9-2 Risk Co-efficients and Operating Leverage
Company
Business Risk Co-efficient of
variance of ROE
Business Risk Co-efficient of
variance of Operating
Income
Business Risk Co-efficient of
variance of Operating
Margin Operating Leverage
Electric Proxy Group 0.1182 0.1361 0.1224 9.47 CalPeco 0.4562 0.3003 0.2946 24.02 Relative Risk of CalPeco relative to Proxy Group
3.86 2.21 2.41 2.54
12 Tuller, Lawrence W., The Small Business Valuation(Avon, MA: Adams Media Corporation, 1994), p. 89.

{00546823;6} -27-
Q. CAN METRICS LIKE A COMPANY’S CO-EFFICIENT OF VARIATION IN 1
ROE, CO-EFFICIENT OF VARIATION IN OPERATING INCOME, AND 2
OPERATING MARGIN BE USED ALONG WITH MARKET DATA TO 3
DEVELOP COMPANY SPECIFIC RISK PREMIUMS? 4
A. Yes. Duff & Phelps publishes comparative risk characteristics using market data that 5
provides a nexus between a market beta and the metrics operating margin, the coefficient 6
of variation in operating margin, and the coefficient of variation in return on equity.13 7
This information can be used to develop implied betas for CalPeco for use in the CAPM. 8
By comparing the results of the CAPM for the electric proxy group with the CAPM for 9
CalPeco using the implied betas, informed risk premiums can be developed. As one 10
would expect, the implied beta for CalPeco is higher than the beta of the electric proxy 11
group and the empirical financial data suggests a small company risk premium is 12
appropriate. A risk premium of 100 to 299 basis points over the cost of equity of the 13
electric proxy group is indicated for CalPeco. I will discuss the indicated risk premiums 14
and implied betas and small company risk premium in more detail in the CalPeco Risk 15
Premium section of this direct testimony. 16
Q. WHAT ABOUT LIQUIDITY RISK? 17
A. A rational investor would not regard an investment in CalPeco as having the same level 18
of risk as the much larger publicly traded electric utilities in the proxy group of the 19
previously mentioned small size characteristics of CalPeco and the fact that an 20
investment in CalPeco is relatively illiquid compared to the publicly traded electric 21
utilities. An investor in a publicly traded stock can sell stock in a very short period of 22 13 Duff & Phelps, LLC. 2020 Valuation Handbook; Guide to Cost of Capital. Hoboken, NJ: John Wiley and Sons, 2020 (“Duff & Phelps”) found Online at www.dpcostofcapital.com: Duff & Phelps Cost of Capital Navigator platform (“Duff &Phelps Cost of Capital Navigator”) .

{00546823;6} -28-
time if dissatisfied with the returns. An investor in a privately held stock does not have 1
this ability to sell quickly. Consequently, investors will require a greater risk premium, 2
often called liquidity risk premium. As a consequence of these differences in risk, the 3
results produced by the DCF and RP methodologies, utilizing data for the sample 4
utilities, often understate the appropriate ROE for a small, regulated electric utility such 5
as CalPeco. 6
Q. IS THERE A RELATIONSHIP BETWEEN A UTILITY’S CAPITAL 7
STRUCTURE AND ITS COST OF CAPITAL? 8
A. Yes. Generally speaking, when an entity engages in debt financing, it exposes itself to 9
greater risk. As debt grows relative to the total capital structure the risk increases in a 10
geometric fashion as compared to the linear percentage increase in the debt ratio itself. 11
This risk is illustrated by considering the effect of leverage on net earnings. For example, 12
as leverage increases the equity ratio falls creating two adverse effects. First, equity 13
earnings decline rapidly and may even disappear. Second, the “cushion” of equity 14
protection for debt falls. A decline in the protection afforded debt holders, or the 15
possibility of a serious decline in debt protection, will act to increase the cost of debt 16
financing. Therefore, one may conclude that each new financing, whether through debt 17
or equity, impacts the marginal cost of future financing by any alternative method. 18
For an entity already perceived as being over-leveraged, this additional borrowing 19
would cause the marginal costs of both equity and debt to increase. On the other hand, if 20
the same entity instead successfully employed equity funding, this could actually reduce 21
the real marginal cost of additional borrowing, even if the particular equity issuance 22
occurred at a higher unit cost than an equivalent amount of debt. 23

{00546823;6} -29-
Q. HOW DO THE CAPITAL STRUCTURES OF THE SAMPLE ELECTRIC 1
UTILITIES COMPARE TO THE PROPOSED PRO FORMA CAPITAL 2
STRUCTURES FOR CALPECO? 3
A. Table 3 shows that the debt and equity capital structure used to develop the cost of capital 4
for CalPeco. This structure contains 54 percent equity and 46 percent debt, compared to 5
the average of the electric utility sample of approximately 46.1 percent equity and 52.5 6
percent debt. Having less debt in its capital structure implies that the Company has lower 7
financial risk than those in the electric proxy group. However, CalPeco’s recommended 8
capital structure is well within the range of capital structures found in the electric proxy 9
group. Accordingly, I do not recommend a financial risk adjustment. 10

{00546823;6} -30-
V. 1
OVERVIEW OF THE DCF AND RISK PREMIUM METHODS 2
Q. PLEASE EXPLAIN THE GENERAL APPROACHES TO ESTIMATING THE 3
COST OF CAPITAL. 4
A. There are two broad approaches: 5
1) identify comparable-risk sample companies and estimate the cost of 6
capital directly, or 7
2) find the location on the CML and estimate the relative risk of the entity, 8
which jointly determines the cost of capital. 9
The DCF method falls into the first approach. It is a direct method, but uses only a subset 10
of the total capital market evidence. The DCF rests on the premise that the fundamental 11
value of an asset (i.e. stock) is its ability to generate future cash flows to the owner of that 12
asset. The DCF is simply the sum of a stock’s expected dividend yield and the expected 13
long-term growth rate. Dividend yields are readily available, but long-term growth 14
estimates are not. I will explain the DCF in greater detail later. 15
The RP methods fall into the second approach. An equity risk premium is 16
established by determining the relationship between the cost of equity and an interest rate 17
over time. The CAPM method falls into the category of RP methods. To implement, it is 18
generally assumed that the past correlation will continue on into the future. The RP 19
generally uses a small subset of the capital market evidence whereas the CAPM uses 20
information on all securities, rather than a small subset. I will explain the RP methods in 21
more detail later. For now, the RP methods reflect a risk-return relationship, often 22
depicted graphically as the CML. 23

{00546823;6} -31-
Each of these methods measures investor expectations. In the final analysis, ROE 1
estimates are subjective and should be based on sound, informed judgment and supported 2
by competent evidence. I have applied one version of the DCF and three versions of the 3
RP methods (including the CAPM as one of the RP methods.) I believe these methods 4
provide the foundation for evaluating the fair cost of equity capital for the publicly traded 5
electric utilities in my proxy group. I then add a risk premium to the results of these 6
models for the electric proxy group to account for the differences in risk (business, 7
regulatory, liquidity, size) between the electric proxy group and CalPeco. 8
Q. PLEASE EXPLAIN THE DCF METHOD OF ESTIMATING THE COST OF 9
EQUITY. 10
A. The DCF model is based on the concept that the current price of a share of stock is equal 11
to the present value of future cash flows from the purchase of the stock. In other words, 12
the DCF model seeks to replicate the market valuation process that sets the price 13
investors are willing to pay for a share of an entity’s stock. It rests on the assumption that 14
investors rely on the expected returns (i.e., cash flow they expect to receive) to set the 15
price of a security. The DCF model in its most general form is: 16
[6] P0 = CF1/(1+k) + CF2/(1+k)2 + …. + CFn/(1+k)n 17
where k is the cost of equity; n is the number of years; P0 is the current stock price; and, 18
CF1, through CFn are the expected future cash flows expected to be received in periods 1 19
through n. 20
Equation [6] can be written to show that the current price (P0) is also equal to 21
[7] P0 = CF1/(1+k) + CF2/(1+k)2 + … + Pt/(1+k)t 22

{00546823;6} -32-
where Pt is the price expected to be received at the end of the period t. If the future price 1
(Pt) included a premium (an expected increase in the stock price or capital gain), the price 2
the investor would pay today (in anticipation of receiving that premium) would increase. 3
In other words, by estimating the cash flows from the purchase of a stock in the form of 4
dividends and capital gains, we can calculate the investor’s required rate of return, i.e., 5
the rate of return an investor presumptively used in bidding the current price to the stock 6
(P0) to its current level. 7
Equation [7] is a Market Price version of the DCF model. As with the general 8
form of the DCF model in equation [6], the current stock price (P0) is the present value of 9
the expected cash inflows in the Market Price approach. The cash flows are comprised of 10
dividends and the final selling price of the stock. The estimated cost of equity (k) is the 11
rate of return investors expect if they bought the stock at today’s price, held the stock and 12
received dividends through the transition period, and then sold it for price in period t (Pt). 13
Q. CAN YOU PROVIDE AN EXAMPLE TO ILLUSTRATE THE MARKET PRICE 14
VERSION OF THE DCF MODEL? 15
A. Yes. Assume an investor buys a share of common stock for $40. If the expected 16
dividend during the coming year is $2.00, then the expected dividend yield is 5 percent 17
($2.00/$40 = 5.0 percent). If the stock price is also expected to increase to $43.00 after 18
one year, this $3.00 expected gain adds an additional 7.5 percent to the expected total rate 19
of return ($3.00/$40 = 7.5 percent). Thus, the investor buying the stock at $40 per share 20
expects a total return of 12.5 percent (5 percent dividend yield plus 7.5 percent price 21
appreciation). The total return of 12.5 percent is the appropriate measure of the cost of 22

{00546823;6} -33-
capital because this is the rate of return that caused the investor to commit $40 of his or 1
her capital by purchasing the stock. 2
Q. PLEASE CONTINUE WITH YOUR DESCRIPTION OF THE DCF MODEL. 3
A. Under the assumption that future cash flow is expected to grow at a constant rate (“g”), 4
equation [6] can be solved for k and rearranged into the simple form: 5
[8] k = CF1/P0 + g 6
where CF1/P0 is the expected dividend yield (also expressed as D0/P0) and g is the 7
expected long-term dividend (price) growth rate. The expected dividend yield is 8
computed as the ratio of next period’s expected dividend (“D0”) divided by the current 9
stock price (“P0”). 10
This form of the DCF model is known as the “constant growth” DCF model and 11
recognizes that investors expect to receive a portion of their total return in the form of 12
current dividends and the remainder through future dividends and capital (i.e. price) 13
appreciation. A key assumption of this form of the model is that investors expect that 14
same rate of return (k) every year and that market price grows at the same rate as 15
dividends. As already discussed, this has not been historically true for the electric utility 16
sample, as shown by the data in Table 4. 17
Q. ARE THERE ANY CONCERNS ABOUT APPLYING THE DCF MODEL TO 18
UTILITY STOCKS? 19
A. Yes, there are a number of reasons why caution must be used when applying the DCF 20
model to utility stocks. First, a non-publicly traded company does not have a stock 21
market price. Using the stock prices from a proxy group assumes that the stock of 22
CalPeco would be similarly priced and has a dividend yield similar to the publicly traded 23

{00546823;6} -34-
electric companies. Second, the stock price and dividend yield components may be 1
unduly influenced by structural changes in the industry, such as mergers and acquisitions, 2
which influence investor expectations. Third, the DCF model is based on a number of 3
assumptions that may not be realistic given the current capital market environment. The 4
traditional DCF model assumes that the market price per share (“MPPS”), book value per 5
share (“BVPS), earnings per share (“EPS”), and dividends per share (“DPS”), all grow at 6
the same rate. This has not been historically true for the sample electric utility 7
companies. For example, Table 4 shows than over the past 5 years the average MPPS 8
growth has exceeded the average BVPS, EPS, and DPS. 9
The electric industry stocks performed well in 2019, these stocks did not do as 10
well in 2020. As Value Line (January 22, 2021) notes: 11
The group’s underperformance in 2020 has made these equities 12 more attractive. In particular, many issues offer very healthy total 13 return potential for the 18-month period. Projected returns over the 14 3- to 5-year period aren’t nearly as high as those for the 15 intermediate term, but might well appeal to investors on a risk 16 adjusted basis. 17 18 As a group, electric utility stocks underperformed the broader 19 market averages considerably in 2020. This was inevitable to some 20 extent, following a stellar showing for most of these issues in 21 2019. The S&P 500 posted an 18.4% total return last year. By 22 contrast, an index of 39 investor-owned utilities (IOUs) compiled 23 by the Edison Electric Institute, a group representing IOUs, had a 24 total return of -1.2%. Even the generous dividends paid by most 25 utilities weren’t enough to push the industry’s total return into 26 positive territory. 27
Value Line (February 12, 2021) notes: 28
As a group, electric utility stocks underperformed the broader 29 market averages considerably in 2020. This was inevitable to some 30 extent, following a stellar showing for most of these issues in 31 2019. The S&P 500 posted an 18.4% total return last year. By 32 contrast, an index of 39 investor-owned utilities (IOUs) compiled 33 by the Edison Electric Institute, a group representing IOUs, had a 34 total return of -1.2%. Even the generous dividends paid by most 35 utilities weren’t enough to push the industry’s total return into 36 positive territory. 37

{00546823;6} -35-
1 The expected equity returns suggested by the market based DCF model may not always 2
line up with recent experience in the markets. As Dr. Morin notes: 14 3
To the extent that increases (decreases) in relative market valuation 4 are anticipated by investors, especially myopic investors with 5 short-term investment horizons, the standard DCF model will 6 understate (overstate) the cost of equity. 7
Another way of stating this point is that the DCF model does not account for the ebb and 8
flow of investor sentiments over the course of the business cycle. The problem was 9
particularly acute in the mid 1990’s and mid 2000’s where investors, faced with very low 10
returns on short-term fixed-income securities and an uncertain market outlook, sought 11
higher yields offered by utility stocks in a so-called flight to quality, boosting utility stock 12
price and lowering the dividend yield.15 The circumstances then are not so different from 13
what is occurring today. 14
Fourth, the application of the DCF model produces estimates of the cost of equity 15
that are consistent with investor expectations only when the market price of a stock and 16
the stock’s book value are approximately the same. The DCF model will understate the 17
cost of equity when the market-to-book ratio exceeds 1.0 and, conversely, the model will 18
overstate the cost of equity when the market-to-book ratio is less than 1.0. The reason for 19
this is that the market-derived return produced by the DCF is often applied to book value 20
rate base by regulators.16 21
Fifth, the assumption of a constant growth rate may be unrealistic, and there may 22
be difficulty in finding an adequate proxy for the growth rate. Historical growth rates can 23
be downward biased as a result of the impact of anemic historical growth rates in 24
14 Morin, p. 433. 15 Morin, pp. 21-22 16 Morin at 434-435.

{00546823;6} -36-
earnings, mergers and acquisitions, restructuring, unfavorable regulatory decisions, and 1
even abnormal weather patterns. Conversely historical growth rates can be upwardly 2
biased as well particularly under current market conditions as discussed previously. 3
Q. IS THE DCF A SUPERIOR METHODOLOGY? 4
A. No. Again, I concur with Dr. Morin who states: 5
While it is certainly appropriate to use the DCF methodology to 6 estimate the cost of equity, there is no proof that the DCF produces 7 a more accurate estimate of the cost of equity than other 8 methodologies. Sole reliance on the DCF model ignores the capital 9 market evidence and financial theory formalized in the CAPM and 10 other risk premium methods. The DCF model is one of many tools 11 to be employed in conjunction with other methods to estimate the 12 cost of equity. It is not a superior methodology that supplants other 13 financial theory and market evidence. The broad usage of the DCF 14 methodology in regulatory proceedings in contrast to its virtual 15 disappearance in academic textbooks does not make it superior to 16 other methods. The same is true of the Risk Premium and CAPM 17 methodologies. (emphasis added)17 18
Q. WHAT DATA HAVE YOU USED TO COMPUTE THE EXPECTED DIVIDEND 19
YIELD (D1/P0) IN YOUR DCF MODEL? 20
A. First, I computed a current dividend yield (D0/P0). The time value of money should be 21
taken into account when determining dividend yields. This adjustment is required 22
because the basic model assumes dividends are paid once a year, but investors actually 23
receive dividend payments on a quarterly basis. Prices they pay for the stock (P0), would 24
reflect the anticipated payment and potential re-investment of quarterly dividends. To 25
approximate the time value of money and the payment of quarterly dividends, I computed 26
expected dividend yield (D1/P0) as the current dividend yield (D0/P0) times one plus the 27
growth rate (g) divided by 2. I used the spot price for each of the stocks of the electric 28
17 Morin at 431.

{00546823;6} -37-
utilities in the sample group as reported by the Value Line Investment Analyzer for March 1
2, 2021 for P0. The current dividend (CF0) is the current indicated dividend as reported 2
by Value Line. In my tables, the current dividend yield is denoted as (D0/P0), where D0 is 3
the current dividend and P0 is the spot stock price. (D1/P0) is used to denote the expected 4
dividend yield in the tables. 5
Q. WHAT MEASURES OF GROWTH (“g”) HAVE YOU USED? 6
A. My projected estimate of growth is based upon analysts’ estimates of EPS growth. For 7
my forecast growth estimate, I have used the growth forecasts from Value Line, Zacks 8
Investment Research, and Yahoo Finance. I report the historical growth and analysts’ 9
forecasts of future growth in Table 4. 10
Q: DID YOU CONSIDER ANY OTHER METHOD OF ESTIMATING EXPECTED 11
GROWTH TO APPLY THE DCF MODEL? 12
A: Yes. I considered using the so-called “sustainable growth” method. According to this 13
method, future growth is estimated by multiplying the fraction of earnings expected to be 14
retained by the company, ‘b’, by the expected return on book equity, ROE, as follows: 15
[9] g = b x ROE 16
where: g = expected growth rate in earnings/dividends 17
b = expected retention ratio 18
ROE = expected return on book equity 19
Q: DO YOU HAVE ANY RESERVATIONS IN REGARDS TO THE SUSTAINABLE 20
GROWTH METHOD? 21
A: Yes, for a least two reasons. First, the sustainable method of predicting growth is 22

{00546823;6} -38-
inherently circular. 18 This is because it relies upon an expected return on book common 1
equity which is then used in a DCF analysis to establish a common equity cost rate 2
related to the market value of common stock. If this common equity cost rate is 3
authorized as the allowed return in a regulatory proceeding, it will become the expected 4
return on book common equity. Second, the empirical finance literature demonstrates 5
that the sustainable growth method of determining growth is not as significantly 6
correlated to measures of value, such as stock prices and price/earnings ratios, as 7
analysts’ growth forecasts. 19 Because of these reasons, I chose not to rely on this 8
method. 9
Q. WHY DID YOU USE FORECASTED GROWTH RATES IN YOUR GROWTH 10
ESTIMATES? 11
A. The empirical evidence indicates that analyst estimates of EPS growth are the best 12
measure of growth for use in the DCF for utility stocks.20 Further, the DCF model 13
requires estimates of growth that investors expect in the future and not past estimates of 14
growth that have already occurred. Logically, in estimating future growth, financial 15
18 Morin at 306. 19 Morin at 307. 20 Gordon, David A., Gordon, Myron J. and Gould, Lawrence I., “Choice Among Methods of Estimating Share Yield,” Journal of Portfolio Management, Spring 1989, pp. 50-55. Gordon, Gordon and Gould found that a consensus of analysts’ forecasts of earnings per share growth for the next five years provides a more accurate estimate of growth required in the DCF model than three different historical measures of growth (historical EPS, historical DPS, and historical retention growth). They explain that this result makes sense because analysts would take into account such past growth as indicators of future growth as well as any new information. Other studies confirm the superiority of analysts’ estimates such as Vander Weide, James H. and Carleton, Willard T., “Investor Growth Expectations: Analysts vs. History,” Journal of Portfolio Management, Spring 1988, pp. 78-87; Brown, Lawrence D. and Rozeff, Michael S., “The Superiority of Analyst Forecasts as Measures of Expectations: Evidence from Earnings,” Journal of Finance, March 1978, pp. 1-16; and Timme, Stephen G. and Eisemann, Peter C., “On the Use of Consensus Forecasts of Growth in the Constant Growth Model: The Case for Electric Utilities,” Journal of Financial Management, Winter 1989, pp. 23-35. A 2004 study by the Kentucky Public Service Commission Advance Research Center updated the study by Vander Weide and Carleton (1988) and confirmed the superiority of analyst estimates over historical averages.

{00546823;6} -39-
institutions and analysts have taken into account all relevant historical information on an 1
entity, as well as other more recent information.21 To the extent that past results provide 2
useful indications of future growth prospects, analysts’ forecasts would already 3
incorporate that information. In addition, the current price of a stock reflects known 4
historic information on that entity, including its past earnings history. Any further 5
recognition of the past will double count what has already occurred. Therefore, forward-6
looking growth rates should be used. 7
Q. DID YOU APPLY A REASONABLENESS TEST TO THE INDIVIDUAL 8
RESULTS THE DCF? 9
A. Yes. DCF results that are less than the forecast Baa investment grade bond yield plus 10
100 basis points or 5.3 percent are excluded. An indicated return of 5.3 percent is the 11
minimum plausible expected cost of equity. This reasonableness approach is consistent 12
with methods the Federal Energy Regulatory Commission ("FERC") adopted in the past 13
and consistent with common sense.22 In my view, the 100 basis points above Baa bonds 14
is conservative given that the 35-year average historical premium computed from annual 15
total returns on the electric proxy group and Baa investment grade bond total returns is 16
270 basis points. Investors will not invest in risky common stocks if they can earn a 17
higher return on less risky investments. 18
Q. PLEASE SUMMARIZE THE EQUITY COST ESTIMATES YOU MAKE WITH 19
THE DCF APPROACH. 20
21 Gordon, Gordon, and Gould, p.54. 22 In its 2008 Order for Southern California Edison, 122 FERC ¶61236 at page 25, the FERC lists screens which included exclusion of any company whose low-end ROE fails to exceed the average bond yield by about 100 basis points, or more.

{00546823;6} -40-
A. In Table 6, my DCF estimate for the cost of equity of the electric proxy group is 8.8 1
percent. For CalPeco my estimate is 10.0 percent. See Table 1. 2
Q. PLEASE EXPLAIN THE RP METHODOLOGY FOR ESTIMATING THE COST 3
OF EQUITY. 4
A. The RP method is sometimes referred to as the “bond yield plus risk premium method.” 5
The general approach is to determine the spread between the return on debt and the return 6
on equity, and then add this spread to the current debt yield to derive an estimate of the 7
cost of equity. To implement the RP, it is assumed that the past relationship will continue 8
into the future. The RP is widely used by analysts and investors.23 9
The RPM formula provides a formal risk-return relationship and is stated as: 10
[10] k = Kd + bond-equity spread 11
where k is the expected return on equity and Kd is the cost of debt or debt yield. 12
Q. PLEASE TURN TO YOUR RISK PREMIUM EQUITY COST ESTIMATES. 13
HOW MANY RP ANALYSES HAVE YOU PERFORMED? 14
A. I performed two risk premium analyses aside from the CAPM. My first analysis is 15
presented in Table 8. For this risk premium analysis a historical risk premium for the 16
electric utility industry was estimated with an annual time series analysis applied to the 17
utility industry as a whole over the 1963-2020 period, using Standard and Poor’s Utility 18
Index as an industry proxy. The historical risk premium was estimated by computing the 19
actual realized return on equity capital for the S&P Utility Index for each year and then 20
subtracting the long-term Treasury bond return for that year. 21
As shown on Table 8, the average risk premium over the period was 4.8 percent 22
over long-term Treasury bond yields. I adjusted upward the risk premium estimate by 23 23 Morin, p. 108.

{00546823;6} -41-
assuming the cost of equity changes by half as much as the difference in Treasury bond 1
rates. Because the long-term Treasury rate of 2.4 percent that is expected in 2022- 2024 is 2
lower than the average historical Treasury rate of 6.2 percent for the period 1963 to 2020, 3
the future risk premium is expected to be higher than the simple average RP based on 4
past data. I computed a future risk premium of 6.8 percent based upon the assumption 5
that equity cost change by 50 percent of the change interest rates. 6
My adjustment to the risk premium is consistent with the California PUC orders. 7
For example, in the past, the California PUC has determined that risk premiums vary 8
inversely with interest rates. In Decision 97-12-089, the California PUC found that costs 9
of equity for energy utilities move in the same direction as interest rates but by less. 10
More recently, in Decision 02-11-027, the California PUC confirmed that its practice was 11
to adjust returns on equity for energy utilities by one-half to two-thirds of the change in 12
the benchmark interest rate. These findings are consistent with the findings of Dr. 13
Morin.24 14
Q. HAVE OTHERS FOUND AN INVERSE RELATIONSHIP BETWEEN RISK 15
PREMIUMS AND INTEREST RATES? 16
A. Yes. Harris and Marston, “Estimating Shareholders Risk Premia Using Analysts’ Growth 17
Rates,” Financial Management, Summer 1992 found an inverse relationship. 18
Q. WHAT IS THE RESULT OF YOUR FIRST APPROACH? 19
A. Table 8 shows the indicated cost of equity for the electric proxy group is 9.2 percent. My 20
estimate for CalPeco is 10.4 percent. See Table 1. 21
24 Morin at 128-129.

{00546823;6} -42-
Q. PLEASE EXPLAIN YOUR SECOND RP APPROACH. 1
A. In the second RP analysis, I examined the historical risk premiums implied in the ROEs 2
allowed by regulatory commissions for electric utilities over the 2001-2017 period for 3
which data were available, relative to the contemporaneous level of the long-term 4
Treasury bond yield. This variation of the risk premium approach is reasonable because 5
allowed risk premiums are presumably based on the results of market-based 6
methodologies (DCF, Risk Premium, CAPM, etc.) presented to regulators in rate 7
hearings and on the actions of objective unbiased investors in a competitive marketplace. 8
This RP approach relies on authorized ROEs as proxies for the costs of equity for 9
electric utilities. Dr. Roger Morin adopted authorized returns on equity as proxies for 10
costs of equity for electric utilities to conduct one of his risk premium analyses. My 11
analysis is similar to Dr. Morin's approach and recognizes risk premiums are expected to 12
increase (decrease) as interest rates decrease (increase). At page 123 of his book, Dr. 13
Morin reports the following statistical relationship between risk premiums (RPm) and 14
Treasury rates (Yield) for the period 1987 to 2005 for electric utilities: 15
[11] RPm = 8.2049 - 0.4833 x Yield R2 = .81 16
where averages of allowed equity returns reported by Regulatory Research 17
Associates (also SNL) were adopted as the proxies for equity costs and yields are for 18
Treasury bonds. 19
To obtain a cost of equity estimate, Dr. Morin inserts a current or projected 20
Treasury bond yield in his estimated equation. He further explains, "the clear inverse 21

{00546823;6} -43-
relationship between the allowed risk premium and interest rates [is] revealed in past 1
common equity decisions."25 2
I also used information reported by SNL, but also used annual surveys from 3
Public Utility Reports (“PUR”) in my analysis in my analysis. My analysis uses 4
authorized returns from 2001 to 2017 and produces the following statistical relationship: 5
[12] RPm = 9.332 - 0.7645 x Yield R2 = .56 6
Q. WHAT IS THE RESULT OF YOUR SECOND APPROACH? 7
A. Table 9 shows the indicated cost of equity for the electric proxy group is 9.9 percent. My 8
estimate for CalPeco is 11.1 percent. See Table 1. 9
Q. DID YOU ALSO CONSIDER A RISK PREMIUM ESTIMATE USING THE 10
EQUATION ESTIMATED BY DR. MORIN? 11
A. Yes. Inserting the expected Treasury bond yield of 2.4 percent in the formula estimated 12
by Dr. Morin indicates a risk premium equity cost estimate for a typical electric utility of 13
7.04 percent and an equity cost estimate for the electric proxy group of 9.4 percent. 14
Applying Dr. Morin's result indicates my analysis provides a similar estimate of the cost 15
of equity for the electric proxy group as does my regression approach. 16
Q. SHOULD STUDIES OF HISTORICAL RISK PREMIUMS RELY ON 17
ARITHMETIC AVERAGE RETURNS OR ON GEOMETRIC AVERAGE 18
RETURNS? 19
A. Whenever relying on historical risk premiums, only arithmetic average returns over long 20
periods are appropriate for forecasting and estimating the cost of capital, and geometric 21
average returns are not. As various finance experts have explained, an arithmetic mean is 22
25 Morin at 124.

{00546823;6} -44-
the correct approach to use in estimating the cost of capital, particularly for a risk 1
premium model.26 As Dr. Morin states: 2
Because valuation is forward-looking, the appropriate average is 3 the one that most accurately approximates the expected future rate 4 of return. The best estimate of the expected returns over a future 5 holding period is the arithmetic average. Only arithmetic means 6 are correct for forecasting purposes and for estimating the cost of 7 capital. There is no theoretical or empirical justification for the 8 use of geometric rates of return as a measure of the appropriate 9 discount rate in computing the cost of capital or in computing 10 present values.27 (emphasis added) 11
The consensus among these experts makes sense. Only arithmetic mean return rates and 12
yields are appropriate for cost of capital purposes because ex-post (historical) total 13
returns and equity risk premiums differ in size and direction over time, providing insight 14
into the variance and standard deviation of returns. The geometric mean of ex-post (after 15
the fact) equity risk premiums provides no insight into the potential variance of future 16
returns because the geometric mean relates the change over many periods to a constant 17
rate of change, rather than the year-to-year fluctuations, or variance, which are critical to 18
risk analysis. In short, the conclusion of these financial experts is that, while the 19
geometric mean is useful in comparing what happened in the past, it should not be used 20
to determine estimates of expected future returns or market risk premiums. 21
Q. LETS TURN TO THE CAPM. PLEASE EXPLAIN THE CAPM 22
METHODOLOGY FOR ESTIMATING THE COST OF EQUITY. 23
A. Like all RP methods, the CAPM is the sum of a risk-free rate plus a risk premium. Like 24
the RPM, it quantifies the additional return required by investors for bearing incremental 25
26 Zvi Bode, Alex Kane, Alan J. Marcus, Investments (McGraw-Hill 6th ed., 2005) (“Bode”), pp. 864 – 865; Richard A. Brealey, Stewart C. Myers, Frankin Allen, Principles of Corporate Finance (McGraw-Hill 11th ed.) (“Brealey”), pp. 162 – 163. 27 Morin, pp. 116 – 117 (emphasis added).

{00546823;6} -45-
risk. The CAPM was developed by William Sharpe and John Lintner in the mid-1960s 1
and is a common topic in college finance textbooks. The CAPM provides a formal risk-2
return relationship premised on the idea that only market risk matters, as measured by 3
beta. The traditional version of CAPM is represented by the formula: 4
[13] k = Rf + (Rm-Rf) 5
where k is the expected return, Rf is the risk-free rate (or zero beta asset), Rm is the 6
market return, (Rm-Rf) is the market risk premium, and is beta. 7
Q. WHAT IS BETA AND WHAT DOES IT MEASURE? 8
A. Beta is a measure of the relative risk of a security in relation to the market. In other 9
words, it is a measure of the sensitivity of a security to the market as a whole. This 10
sensitivity is also known as systematic risk. It is estimated by regressing a security’s 11
excess returns against a market portfolio’s excess returns. The slope of the regression 12
line is the beta. 13
Beta for the market is 1.0. A security with a beta greater than 1.0 is considered 14
more risky than the market. A security with a beta less than 1.0 is considered less risky 15
than the market. 16
Q. ARE THERE ANY CONCERNS ABOUT APPLYING THE CAPM MODEL TO 17
UTILITY STOCKS? 18
A. Yes. I have concerns with using this model in most periods because mechanical 19
application of the model may produce unreasonable results. The traditional CAPM only 20
captures a single measure of systematic risk as measured by beta, but there are other 21
forms of systematic risk priced by the market such as company size. A size premium is 22
necessary because the empirical evidence indicates that beta alone does not measure the 23

{00546823;6} -46-
risk of smaller companies.28 Further, there are computational problems surrounding beta 1
since it depends on the return data, the time period used, its duration, the choice of the 2
market index, and whether annual, monthly, or weekly return figures are used. Betas are 3
estimated with error. Based on empirical evidence, high betas will tend to have a positive 4
error (risk is overestimated) and low betas will have a negative error (risk is 5
underestimated).29 6
Q. ARE THERE ALTERNATIVES TO THE TRADITIONAL CAPM? 7
A. Yes, alternative versions of the CAPM have been developed that provide more robust 8
explanations of returns required by investors. A version of the CAPM called the 9
Empirical CAPM or ECAPM was developed to recognize that estimations of Rf are 10
higher than the return on long-term Treasuries. Dr. Roger Morin discusses ECAPM at 11
pages 189-191 of his book, New Regulatory Finance. The ECPAM is represented as 12
follows: 13
[14] k = Rf + .25(Rm-Rf) + . 75 (Rm-Rf) 14
The ECAPM was developed from the empirical findings that show the slope of the CML 15
is flatter and the risk-free rate is at a higher point than predicted by the pure CAPM. The 16
ECAPM has been shown to do a better job at predicting market returns. 17
Duff & Phelps also suggests a version of the CAPM in which a size premium is 18
included.30 This modified CAPM or MCAPM is represented as follows: 19
[15] k = Rf + (Rm-Rf) + RPs 20
28 Duff & Phelps 2018 Valuation Handbook, Chapter 2, p. 7. 29 Fama, Eugene F. and Kenneth R. French, “The Capital Asset Pricing Model: Theory and Evidence,” Journal of Economic Perspectives, Summer 2004, pp. 25-46. 30 Duff & Phelps 2018 Valuation Handbook, Chapter 2, p. 14.

{00546823;6} -47-
where k is the expected return, Rf is the risk-free rate (or zero beta asset), Rm is the 1
market return, (Rm-Rf) is the market risk premium, is beta, and RPs is the size premium. 2
Both the ECAPM and MCAPM recognize the pure CAPM is incomplete and does not 3
fully account for the higher returns that are needed on smaller company stocks. In other 4
words, the higher risks associated with smaller firms are not fully accounted for by beta.31 5
Q. IS FIRM SIZE A UNIQUE RISK? 6
A. No, firm size is a systematic risk factor and is an adjustment to the pure CAPM.32 7
Putting aside the empirical financial data, the need for a risk premium for size makes 8
sense. Company size is a significant element of business risk for which investors expect 9
to be compensated through greater returns. As discussed earlier, smaller companies are 10
simply less able to cope with significant events that impact sales, revenues, and earnings. 11
For example, smaller companies face more risk exposure to business cycles and 12
economic conditions, both nationally and locally. Additionally, the loss of revenues from 13
a few larger customers would have a greater effect on a small entity than on a much 14
larger entity with a larger, more diverse, customer base. Moreover, smaller companies 15
are generally less diverse in their operations and have less financial flexibility. 16
Q. DID YOU EMPLOY EITHER OF THESE ALTERNATIVE CAPM METHODS 17
(EQUATIONS 11 AND 12) AS PART OF YOUR ANALYSIS? 18
A. Yes. I employed all three versions of the CAPM to estimate the cost of equity for the 19
electric proxy group, which does somewhat mitigate my concerns about the traditional 20
CAPM. 21
31 Morningstar, Ibbotson SBBI 2013 Valuation Yearbook, pp. 85-88. (“Morningstar”) 32 Pratt, Shannon P. and Roger J. Grabowski, Cost of Capital: Applications and Examples (John Wiley and Sons, 4th Ed. 2010) p. 56.

{00546823;6} -48-
Q. WHAT IS THE RISK-FREE RATE (Rf)? 1
A. It is the return on an investment with no risk. The U.S. Treasury rate serves as the basis 2
for the risk-free rate because the yields are directly observable in the market and are 3
backed by the U.S. government. Practically speaking, short-term rates are volatile, 4
fluctuate widely and are subject to more random disturbances than long-term rates. In 5
short, long-term Treasury rates are preferred for these reasons and because long-term 6
rates are more appropriately matched to securities with an indefinite life or long-term 7
investment horizon. 8
Q. WHAT DO YOU USE AS THE RISK FREE RATE (Rf)? 9
A. I used the expected U.S. Long-term Treasury rate for 2022-2024 as the basis for the risk 10
free rate. Since the cost of capital is an opportunity cost and is prospective, it necessarily 11
requires the use of a forward-looking bond yield. In recent years, interest rates have 12
dropped to very low levels when compared to interest rates for similar securities in the 13
past. From 1999 to 2007, the annual average yield for long-term Treasury bonds was 14
5.24 percent, ranging from a low of 4.84 percent in 2007 to a high of 5.94 percent in 15
2000. In 2008, and during the recent recession, that annual average dropped to 4.24 16
percent and dropped further in 2012 to 2.9 percent. The average annual rate has 17
declined from 2013 where it was 3.45 percent to 1.56 percent for 2020. 18
Long-term interest rates over the past 10 years or so have been at historic lows. 19
This drop began during the recent recession of 2008-2009. The drop in long-term 20
Treasury rates has been largely attributed to the market intervention by the Federal 21
Reserve through its quantitative easing programs and other measures in order to stimulate 22
the economy. While the Federal Reserve doesn’t directly control longer term interest 23

{00546823;6} -49-
rates, it does set monetary policy through the setting of the federal funds rate which is an 1
important benchmark in the financial markets. Beginning in late 2007 the Federal 2
Reserve began reducing the federal funds rate. By the end of 2008, the federal funds rate 3
was to a target rate of 0 percent to 0.25 percent. The target rate did not change until late 4
2015 when the target rate was increased to 0.25 percent to 0.50 percent. Several 5
increases to the target rate were made over the next several years so that by the end of 6
2018 the target rate was increased to 2.25 percent to 2.50 percent. However, to address 7
weakening in the economy in 2019 and 2020 including the adverse impact of the 8
coronavirus pandemic on the economy, the target federal funds rate was reduced to 0 9
percent to 0.25 percent by March 2020 and remains at that level today. The long-term 10
outlook is that the federal funds rate will not be raised until 2023. 11
While interest rates are currently very low by historical standards, recently they 12
have been surging over concerns of higher inflation and above the Federal Reserve target 13
of 2 percent. The opening up of the economy after a year of lockdowns and the trillions 14
in stimulus are expected to put upward pressure on inflation and the need to the Federal 15
Reserve to raise the federal funds rate to ease the inflation rate back to its target 2 16
percent. Economists expect the 30-year U.S. Treasury yields to rise to 2.4 percent in the 17
2022-2024 timeframe up from 1.67 for the month of December 2020. See Table 7. 18
Q. WHY DO YOU USE LONG-TERM U.S. TREASURY YIELDS? 19
A. The yields on long-term Treasury bonds match more closely with the perpetual nature of 20
common stock investments.33 In addition, short-term rates are more volatile, fluctuate 21
widely and are subject to more random disturbances than long-term rates. Long-term 22
33 Morin, p. 112.

{00546823;6} -50-
Treasury rates are more appropriately matched to securities with an indefinite life or 1
long-term investment horizon. For these reasons long-term rates are preferred. 2
Q. WHAT DO YOU ADOPT AS THE RETURN FOR THE RISK-FREE RATE? 3
A. I used long-term expected Treasury bond rates as the measure of the risk-free return for 4
use with CAPM cost of equity estimates from two sources: the Blue Chip Financial 5
Forecasts and the Value Line Quarterly Forecast.34 The appropriate choice for the risk-6
free rate is the expected return for long-term Treasury securities.35 Thus, when 7
determining an estimate of the risk-free rate, it is appropriate to adopt a return that is no 8
less than the expected return on the long-term Treasury bond rate. Models to determine 9
the cost of capital are prospective in nature, which require expectational inputs, such as 10
forecasted interest rates.36 The CAPM, ECAPM, and MCAPM estimates are based on 11
expected yields of the long-term Treasury rates for which average 2.4 percent over the 12
2022-2024 timeframe (from Blue Chip Financial Forecasts and Value Line Quarterly 13
Forecasts), See Table 7. 14
Q. WHAT DID YOU USE AS THE PROXY OF THE BETA IN YOUR CAPM 15
MODELS? 16
A. I used the average beta of the sample electric utility companies. These betas were 17
obtained from Value Line Investment Analyzer (weekly data as of February 24, 2021). 18
Value Line is the source for estimated betas that I regularly employ. The average Value 19
Line beta for my electric proxy group as shown on Table 2 is 0.85. 20
I should note that because CalPeco is not publicly traded, it has no beta. In my 21
expert opinion, I strongly believe CalPeco, if it were publicly traded, would have a higher 22 34 See Table 9. 35 Duff & Phelps, Chapter 3, p. 1. 36 Morin, p 172.

{00546823;6} -51-
Value Line beta than the sample electric utility companies. Morningstar reports that 1
when betas (a measure of market risk) are properly estimated, betas are greater for small 2
companies than for larger companies.37 Morningstar also finds that even after accounting 3
for differences in beta risk, small firms require an additional risk premium over and 4
above the added risk premium indicated by differences in beta risk. 5
Q. PLEASE EXPLAIN THE MARKET RISK PREMIUM. 6
A. The market-risk premium (Rm-Rf) is the return an investor expects to receive as 7
compensation for market risk. It is the expected market return minus the risk-free rate. 8
Approaches for estimating the market risk premium can be historical or prospective. 9
Since expected returns are not directly observable, historical realized returns are 10
often used as a proxy for expected returns on the basis that the historical market risk 11
premium follows what is known in statistics as a “random walk.” If the historical risk 12
premium does follow the random walk, then one should expect the risk premium to 13
remain at its historical mean. Based on this, the best estimate of the future market risk 14
premium is the historical mean. Duff & Phelps provides historical market returns for 15
various asset classes from various historical time periods. This publication also provides 16
market risk premiums over U.S. Treasury bonds, which makes it an excellent source for 17
historical market risk premiums. 18
A current market risk premium estimation approach necessarily requires 19
examining the returns expected from common equities and bonds. One method employs 20
application of the DCF model to a representative market index such as the Value Line 21
1700 stocks. The expected return from the DCF is measured for a number of periods of 22
time, and then subtracted from the prevailing risk-free rate for each period to arrive at 23 37 Morningstar, Chapter 7

{00546823;6} -52-
market risk premium for each period. The market risk premium that is subsequently 1
employed in the CAPM is the average market risk premium of the overall period. 2
Q. HOW DID YOU ESTIMATE THE MARKET RISK PREMIUMS FOR USE IN 3
THE CAPM MODELS? 4
A. For the traditional CAPM and ECAPM, I averaged two market risk premium estimates: 5
an average of an historical market risk premium (1926-2019) and a current market risk 6
premium. For the MCAPM I used an historical market risk premium (1963-2019) and a 7
current market risk premium. 8
For the historical market risk premiums I used the Duff & Phelps measure of the 9
average premium of the market over long-term treasury securities from 1926 through 10
2019 and 1963 through 2019, both of which use the S&P 500 market index (which is 11
considered a large-cap index). The average historical market risk premium over long-12
term treasury securities is 7.15 percent for the 1926 to 2019 time period and 5.3 percent 13
for the 1963 through 2019 time period. 14
For the current market risk premium, I derived a market risk premium by first 15
using the DCF model to compute an expected market return for each of the past 12 16
months using Value Line’s projections of the average dividend yield for the dividend 17
yield in the DCF and an average of the median EPS, DPS and BVPS growth on the Value 18
Line 1700 stocks. I then subtracted the historical monthly average 30-year Treasury yield 19
for each month from the expected market returns to arrive at the expected market risk 20
premiums. Finally, I averaged the computed market risk premiums to determine the 21
current market risk premium for the last 12 months, 9 months, 6 months, and 3 months. 22
The data and computations are shown on Table 10. Estimates of the current market risk 23

{00546823;6} -53-
premium have ranged from 8.36 percent to 11.83 percent over the past 12 months. My 1
recommended market risk premium is based on the recent 3-month average estimate of 2
8.48 percent well below the mid-point of the range of the past 12-months of 10.10% 3
percent and below the median over the past 12-months of 8.93 percent. 4
Q. WHY USE TWO DIFFERENT HISTORICAL RISK PREMIUM ESTIMATES? 5
A. Because long-term historical of interest rates used to estimate market risk premiums are 6
much higher than current interest rates. As a result, risk premiums are higher today than 7
the average long-term historical risk premium. Risk premiums vary inversely with 8
interest rates as I discussed earlier. The average long-term U.S. Treasury bond rate for 9
1926 to 2019 and the 1963 to 2019 time periods were 4.9 percent, and 5.5 percent 10
respectively. Current long-term U.S Treasury bond rate is around 2 percent and suggests 11
risk premiums today are higher than the historical average. 12
Q. HOW DID YOU ESTIMATE THE SIZE PREMIUM FOR THE ELECTRIC 13
PROXY GROUP FOR USE IN THE MCAPM? 14
A. Duff & Phelps’s Size Study sorts companies by eight measures of size, breaking down 15
the NYSE universe of companies into 25 size-ranked portfolios.38 The Size Study 16
provides two ways to match a company’s size (or risk) characteristics to the appropriate 17
size (or risk) premium – a guideline portfolio method and a regression equation method. 18
I used the regression equation method to find the CAPM size risk premium for each of 19
the publicly traded utilities in the proxy group for six measures of size (market value of 20
equity, book equity, market value of invested capital, 5-year average of net income, total 21
38 The size measures include: 1) Market Capitalization; 2) Book Value of Equity; 3) 5-year Average Net Income; 4) Market Value of Invested Capital; 5) Total Assets; 6) 5-year Average Earnings Before Interest, Taxes, Depreciation and Amortization (“EBITDA”); 7) Sales; and 8) Number of Employees. See 2018 Valuation Handbook, Chapter 7, p. 6.

{00546823;6} -54-
assets, and earnings before interest, taxes, depreciation and amortization).39 I determined 1
the average size premium of all size measures for the proxy group (2.63 percent) and then 2
adjusted the average size premium to reflect the lower risk of the electric proxy group 3
compared to the companies that make up the respective size-ranked portfolios. This 4
comparative risk study uses the fundamental measures of company risk (operating 5
margin, coefficient of variation in operating income, and coefficient of variation in return 6
on book equity) to gauge how alike or different the electric proxy group is compared to 7
the companies that make up the size-ranked portfolios in the Size Study. In the instant 8
case, the estimated reduction in risk is -0.42 percent. Thus, the market risk premium for 9
size for the proxy group is 2.21 percent (2.63 percent - 0.42 percent). Using the same 10
procedure, I determined the market risk premium for size for CalPeco is 5.20 percent 11
which is 299 basis points higher than the size premium for the electric proxy group. See 12
Exhibit TJB-6, page 4. 13
Q. WHAT ARE THE RESULTS OF YOUR CAPM METHODS. 14
A. In Table 11, the traditional CAPM produces an indicated cost of equity of 9.0 percent. 15
The ECAPM produces an indicated cost of equity of 9.3 percent. The MCAPM produces 16
an indicated cost of equity of 11.0 percent. The average of these three methods is 9.8 17
percent. See Table 11. My estimate for CalPeco is 11.0 percent. See Table 1. 18
39 Duff & Phelps Cost of Capital Navigator, 2018 Supplementary Size Study data and 2018 Supplementary Data Regression Equations.

{00546823;6} -55-
VI. 1
REQUIRED RISK PREMIUM FOR CALPECO 2
Q. PLEASE DISCUSS YOUR RECOMMENDED RISK PREMIUM FOR CALPECO. 3
A. As I testified earlier, CalPeco is not directly comparable to the publicly traded electric 4
utilities in my electric proxy group. The characteristics associated with small size, such 5
as the lack of diversification, limited revenue and cash flow, relatively small customer 6
base, lack of investment liquidity, and earnings volatility, increase the risk faced by 7
smaller electric utilities over the risk associated with the electric proxy group. 8
Q. PLEASE DISCUSS SIZE RISK FOR SMALL UTILITY COMPANIES. 9
A. Investment risk increases as the firm size decreases, all else remaining constant. There is 10
a great deal of empirical evidence that the firm size phenomenon exists. Morningstar’s 11
Ibbotson SBBI 2013 Valuation Yearbook (Chapter 7) reports that smaller companies have 12
experienced market higher returns that are not fully explainable by their higher betas, and 13
that beta is inversely related to firm size. In other words, smaller companies, not only 14
have higher betas, but also higher market returns than larger ones. Even after accounting 15
for differences in beta risk, small companies require an additional risk premium over and 16
above the added risk premium indicated by differences in beta risk. 17
Q. IS THERE AN INVERSE RELATIONSHIP BETWEEN SIZE AND BETA FOR 18
THE ELECTIC PROXY GROUP? 19
A. Yes. I found an inverse relationship between market capitalization and beta in the recent 20
betas measured on the week ending January 4 2021. That is, as beta increases market 21
capitalization decreases. Using regression analysis, I found the following relationship: 22
[16] Market Capitalization = 89339 - 79431 x beta R2 = .344 23

{00546823;6} -56-
I also found inverse relationships for beta using revenues, net plant, and number of 1
connections. 2
Q. BESIDES CALPECO’S RELATIVELY SMALL SIZE COMPARED TO THE 3
ELECTRIC PROXY GROUP, WHAT OTHER CONSIDERATIONS SHOULD BE 4
GIVEN AS TO THE HIGHER BUSINESS RISKS OF CALPECO? 5
A. In Chapter 10, Mr. Jackson discusses several considerations impacting risk to CalPeco 6
including financial flexibility, regulatory climate and risk, and operational risk including 7
the risk of wildfires. I will not repeat his testimony here. How these risks individually 8
impact CalPeco’s investment risk can be debated. However, it is clear that CalPeco is 9
more risky than the electric proxy group as demonstrated by the business risk metrics 10
discussed earlier on page 23 through 25. 11
That said, CapPeco is located in the west and therefore a consideration of the 12
differences in risk between the Western electric utilities and the Central and Eastern 13
electric utilities in the electric proxy group can provide meaningful insights. For 14
example, the average beta of the Western electric utilities is 0.89 while that for the 15
Central and Eastern utilities is 0.82. This difference in beta would suggest a risk 16
premium over the Central and Eastern utilities of about 50 basis points.40 The indicated 17
higher market risk of the Western electric utilities is consistent with the higher 18
accounting based business risk metrics developed in my size and risk Studies (Exhibits 19
TJB-5 and TJB-6). The higher beta and higher business metric of the Western group may 20
reflect increased risks due to wildfires among other operational risks. 21
40 Assuming a market risk premium of 7.8 percent from the traditional CAPM (Exhibit TJB-4, Table 11), the additional premium due to the difference in beta of 0.07 is 55 basis points (7.8 percent times 0.07).

{00546823;6} -57-
Q. PLEASE EXPLAIN YOUR COMPARATIVE RISK STUDY YOU PREPARED TO 1
DEVELOP A RISK PREMIUM FOR CALPECO TO BE ADDED TO THE 2
RESULTS FOR THE ELECTRIC PROXY GROUP? 3
A. Yes. The risk study I prepared for CalPeco is attached as Exhibit TJB-5. To conduct my 4
comparative risk study, I started by computing the 5-year historical operating margin, 5
coefficient of variation of operating margin, and coefficient of variation of ROE for 6
CalPeco. Operating margin is a measure of profitability. The co-efficient of variation of 7
operating margin and ROE are measures of earnings variability. All three of these 8
metrics are highly correlated with size and risk. 9
Q. ARE THESE THE METRICS FOR THE ELECTRIC PROXY GROUP AND 10
CALPECO YOU PRESENTED EARLIER IN YOUR TESTIMONY? 11
A. Yes, on pages 23 through 25. 12
Q. HOW DO THESE METRICS COMPARE BETWEEN THE WESTERN 13
ELECTRIC UTILTIES AND THE CENTRAL/EASTERN UTILTIES? 14
A. Referring to Exhibit TJB-5, the metrics for the Western group and the Central/Eastern 15
group appear below in Figure 9-3. 16
Figure 9-3 Business Risk Co-efficients between Western Electric Group and
Central/Eastern Electric Group
Company
Business Risk Co-efficient of
variance of ROE
Business Risk Co-efficient of variance
of Operating Income
Business Risk Co-efficient of variance of
Operating Margin
Western Electric Group 0.1528 0.1546 0.1443
Central/Eastern Group 0.0942 0.1233 0.1072 Relative Risk of Western Group to Central/Eastern Group
1.62 1.25 1.35

{00546823;6} -58-
Q. PLEASE CONTINUE. 1
A. Next, I cross-referenced these metrics with data from Duff & Phelps Cost of Capital 2
Navigator Supplementary Data Risk Study and identified the corresponding market 3
portfolio beta for the Company and for my electric proxy group.41 I then computed the 4
relative difference in beta between and the electric proxy group and CalPeco. Assuming 5
that the relative difference in the market portfolio beta for the all publicly traded 6
companies is the same for publicly traded electric utilities, I then computed implied betas 7
for CalPeco using the difference in portfolio betas.42 Finally, I used the CAPM methods 8
to compute the indicated cost of equity for each utility and compared the results to the 9
CAPM results for the electric proxy group.43 Based upon this analysis, I conclude that 10
required risk premium for CalPeco is in the range of 90 to 150 basis points. 11
Q. IS THERE ANOTHER METHOD WHICH PROVIDES USEFUL 12
INFORMATION ABOUT THE RISK PREMIUM FOR CALPECO? 13
A. Yes. Based upon my analysis of the size risk premium for use in the MCAPM, I found 14
that CalPeco’s size premium over the electric proxy group (and not dependent upon beta) 15
is 299 basis points. See Exhibit TJB-6, page 4, line 35. 16
Q. WHAT RISK PREMIUM OVER THE ELECTRIC PROXY GROUP DO YOU 17
RECOMMEND FOR CALPECO? 18
A. I recommend a minimum of 120 basis points. 19
41 Duff & Phelps Cost of Capital Navigator, Supplementary Data Risk Study. See also page 6 of Exhibit TJB-5. 42 See page 6 of Exhibit TJB-4. 43 See page 7 of Exhibit TJB-4.

{00546823;6} -59-
VII. 1
SUMMARY AND CONCLUSIONS 2
Q. PLEASE PROVIDE AN OVERVIEW OF YOUR TESTIMONY. 3
A. I recommend the Commission adopt the three-step method I presented above to 4
determine the ROE for Park. In the first step, an average of costs of equity for a sample of 5
22 electric utilities is determined with the DCF model and several RP models. I 6
determined the cost of equity for the water proxy group lies in the range of 8.8 percent to 7
9.9 percent with a mid-point of 9.3 percent. 8
In the second step, I considered differences in financial risk between CalPeco and 9
the proxy group. I determined that CalPeco’s recommended capital structure is well 10
within the range of capital structures of the proxy group and only somewhat below the 11
average of the proxy group. I concluded that a financial risk adjustment was not 12
necessary. 13
In the third step, a risk premium for Park is determined to reflect the Company’s 14
higher risks. Quantitative evidence based on differences in CalPeco’s business risk 15
metrics compared to the benchmark electric proxy group justifies a risk premium in the 16
range of 90 to 150 basis points based upon relative risk and up to 299 basis points based 17
upon size. I recommend a risk premium of 120 basis points which is at the mid-point of 18
the 90 to 150 basis point range. 19
In the final step, equity costs from step one and the risk premiums from 20
step two and three are combined to determine a fair ROE for CalPeco of 10.5 percent. I 21
recommend the Commission adopt an ROE for CalPeco of no less than 10.5 percent. 22

{00546823;6} -60-
Q. PLEASE SUMMARIZE THE EQUITY COST ESTIMATES YOU MADE IN STEP 1
ONE. 2
A. I made four equity cost estimates for the electric proxy group, which are summarized in 3
Table 1. Where data were available, the equity cost estimates were based on data for the 4
eight electric utilities listed in Table 2. The first equity cost estimates were derived with 5
the DCF model. Using the DCF model to estimate growth, the estimated equity cost for 6
the electric proxy group is 8.8 percent. Next, I determined two risk premium estimates 7
and CAPM method (a third risk premium method). 8
In the first RP approach, I determined an historical risk premium for the electric 9
utility industry estimated with an annual time series analysis applied to the utility 10
industry as a whole over the 1963-2020 period, using Standard and Poor’s Utility Index 11
as an industry proxy. The historical risk premium was estimated by computing the actual 12
realized return on equity capital for the S&P Utility Index for each year and then 13
subtracting the long-term Treasury bond return for that year. The estimated equity cost 14
for the electric proxy group is 9.2 percent using this approach. 15
In the second RP approach, I relied on authorized ROEs as proxies for the costs of 16
equity for electric utilities. I examined the historical risk premiums implied in the ROEs 17
allowed by regulatory commissions for electric utilities over the 2001-2017 period for 18
which data were available, relative to the contemporaneous level of the long-term 19
Treasury bond yield. From this data I developed a statistical relationship between risk 20
premiums (RPm) and Treasury rates (Yield). The estimated equity cost for the electric 21
proxy group is 9.9 percent using this approach. 22

{00546823;6} -61-
I also established a range of CAPM estimates using long-horizon estimates of the 1
market risk premium as well as a current of the market risk premium which produced a 2
cost of equity for the electric proxy group of 9.0 percent to 11.0 percent with an average 3
of 9.8 percent. 4
I selected the mid-point of the range of my DCF and RP estimates including the 5
CAPM to establish a cost of equity for the electric proxy group of 9.3 percent. 6
Q. PLEASE SUMMARIZE YOUR ESTIMATE OF THE RISK PREMIUM YOU 7
DETERMINED IN STEP 3. 8
A. I prepared a comparative risk study use commonly used business risk metrics and data 9
from Duff & Phelps Cost of Capital Navigator 2020 Supplementary Data Risk Study. 10
Based upon this study, I conclude that risk premium for CalPeco is in the range of 90 to 11
150 basis points. I also examined differences in the size premium between CalPeco and 12
the electric proxy group based upon the Duff & Phelps Cost of Capital Navigator 2020 13
Supplementary Data Size Study and Risk Study. Based upon this analysis, I conclude 14
that the risk premium for CalPeco is 299 basis points. Based on my consideration of that 15
testimony and my judgment, I recommend a risk premium for CalPeco of no less than 16
120 basis points at this time. 17
Q. GIVEN THE RESULTS OF YOUR EQUITY COST ANALYSES, IS AN ROE OF 18
10.5 PERCENT FOR CALPECO REASONABLE? 19
A. Yes. 20
Q. DOES THIS COMPLETE YOUR TESTIMONY? 21
A. Yes.22

{00546823;6}
Exhibit TJB-1: Thomas J. Bourassa’s Education Background and Regulatory Experience.


Grimmelmann, et. al. v. Pulte Home Corporation, et. al.
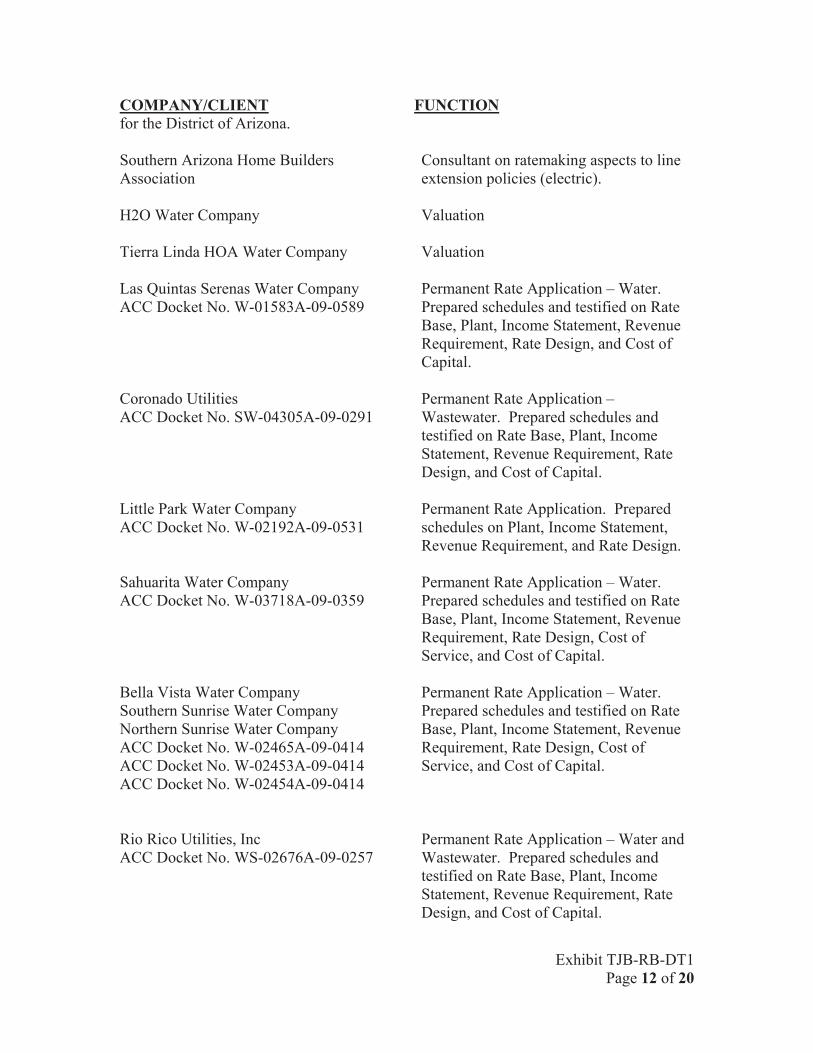

Town of Thatcher v. City of Safford


State of Arizona v. Far West Water and Sewer


{00546823;6}
Exhibit TJB-2: Blue Chip Financial Forecasts® (Vol. 39, No. 12, December 2020) and
The Value Line Investment Survey Selection and Opinion Quarterly Forecast
(Issue 3, pp. 597-608, February 26, 2021).

Blue Chip Financial Forecasts® Top Analysts’ Forecasts Of U.S. And Foreign Interest Rates, Currency Values And The Factors That Influence Them Vol. 39, No. 12, December 1, 2020 Wolters Kluwer

BLUE CHIP FINANCIAL FORECASTS® Executive Editor: Joseph Aguinaldo Director of Data Research & Analytics Haver Analytics 60 East 42nd Street New York, NY 10165 Phone (212) 986-9300 E-mail: [email protected] Robert J. Eggert, Founder Randell E. Moore, Editor Emeritus Dom Cervi, Publisher Blue Chip Financial Forecasts® (ISSN: 0741-8345) is published monthly by CCH Incorpo-rated, 28 Liberty St., 44th Floor New York, NY 10005-1400. Printed in the U.S.A. Subscriptions: For information on annual sub-scriptions, format options (PDF, Excel, online), multiple-copy rates and/or site-license agree-ments please contact Peggy Hayner at: [email protected]. Permission requests: For information on how to obtain permission to reproduce content, please visit the Wolters Kluwer website at: https://lrus.wolterskluwer.com/policies/permissions-reprints-and-licensing/ Purchasing reprints: For customized article re-prints, please contact Wright’s Media at 1-877-652-5295 or go to the Wright’s Media website at www.wrightsmedia.com. Customer Service: 1-800-234-1660 To Order: 1-800-638-8437 Customer Service Fax: 1-800-901-9075 Email: [email protected] Web Site: https://lrus.wolterskluwer.com/corporate/blue-chip/ Blue Chip Financial Forecasts® is a general cir-culation news monthly. No statement in this issue is to be construed as a recommendation to buy or sell securities or to provide investment advice. The editor and CCH Incorporated, while consid-ering the contents to be reliable, take no respon-sibility for the information contained herein. Copyright © 2020 CCH Incorporated. All Rights Reserved. This material may not be used, published, broadcast, rewritten, copied, redistrib-uted or used to create any derivative works with-out written permission from the publisher.
TABLE OF CONTENTS
Domestic Commentary p. 1
Domestic Summary Table – Table of consensus forecasts of
U.S. interest rates and key economic assumptions p. 2
International Summary Table – Table of consensus forecasts of
international interest rates and foreign exchange values p. 3
International Commentary (by Sandy Batten) p. 3
Individual Panel Member’s U.S. Forecasts – Of interest rates and
key assumptions for the next six quarters p. 4-9
Individual Panel Member’s International Forecasts – Of
international interest rates and foreign exchange values p. 10-11
Viewpoints – A sampling of views on the economy and government
policy excerpted from recent reports issued by our panel members p. 12-13
Long-Range Survey – Results of twice annual long-range survey
forecasts for the five years 2022 through 2026 and the five-year
period 2027-2031 p. 14
Databank – Monthly historical data on many key indicators of
economic activity p. 15
Calendar – Release dates for important upcoming economic
data, FOMC meetings, etc. p. 16
List of Contributing Economists – To Domestic and International
Survey inside of back cover

.
COVID-19 Slows Near-Term Growth; Vaccines Can Help Growth Recover Forecast Growth Slowed Due to COVID Resurgence. COVID-19 arguably remains the most potent force in the world economy and in the associated financial markets. As of November 27, data published by Oxford University show that there were 580,896 new cases (according to the so-called “smoothed” series), almost exactly double the number two months ago. However, in the US, this comparison was mark-edly more severe: the number of cases as of November 27 was 166,123, which was almost quadruple the number two months before. Governments have been imposing restrictions on pub-lic activities to try to curb the spread of the disease, and Ox-ford calculates indexes of the force of these restrictions, called “stringency indexes” to help gauge the impact on economies over all. These cover such activities and events as school closures, workplace closures and travel bans, scaled to a value from 0 to 100, where 100 is the strictest response. For the US, this gauge hit a new high of 75.46 on November 16. Since each country’s response is unique in content, the indexes can-not be combined to a broad world total, but one can get a sense of their relative movement through time. During November, the stringency index has been 64.81 for Germany and 75.00 for France, both up from 49.54 in September while for the UK it has been 63.89, down from 67.59 in September. But Vaccine Release Would Support Firmer Growth in 2021. For the overall US economic outlook, then, it is not sur-prising that GDP forecasts eased somewhat over the last month. With COVID cases expected to increase still more in the days ahead, the Blue Chip Financial Forecasts panel now projects 3.7% GDP growth (SAAR) in the current quarter, down from 3.9% estimated in the November forecast, and 2.6% in Q1 2021, down from 4.0% estimated last month. While these are more sluggish forecasts for this quarter and next, the differences are not dramatic and, in fact, by Q2 2021, the comparison switches, so that the 4.0% growth now seen in that quarter is slightly higher than the 3.8% projected in early November. We’d guess that low inflation and low interest rates and – perhaps more significantly – the impending release and distribution of vaccines will provide noticeable support to demand and supply in the US economy. Fed Continues to Strive toward Inflation Higher than 2% for “Some Time.” Indeed, the low inflation expectations can evidently be seen as a brake on interest rate movements, ac-cording to the Federal Reserve’s current monetary policy stance. As Fed Chair Powell and other Fed Governors have described the last couple of months, not only does inflation have to achieve a 2% annualized pace in the months ahead, but it also has to sustain a pace somewhat above 2% before the Federal Open Market Committee would tighten policy. The idea is that the policy goal is an average inflation pace of 2% over time, indicating that inflation needs to exceed 2% for “some time,” according to these officials, to offset the periods below 2% and convince investors, business leader and con-sumers that inflation is being sustained at an average of 2%. The result for the Blue Chip Financial Forecasts is that the Fed will not adjust the federal funds rate until at least 2023. Hope-
fully, the upcoming FOMC meeting on December 15-16 will yield more forward guidance, as it is one of those meetings with the quarterly “Summary of Economic Projections.” In the meantime, monetary policy has continued to concentrate on asset purchases and specialized credit support programs. The Fed has added to its holdings of Treasuries and mortgage-backed bonds an average of $23.3 billion a week for the last three months. The Fed also manages several other kinds of assets to ensure credit is available for various other kinds of financing, notably auto loans, student loans, small and medi-um-sized businesses and others. Since these are not govern-ment-backed loans, the Fed and the Treasury made an ar-rangement for the Treasury to guarantee the associated loans so the Fed could buy notes collateralized by those loans. However, Treasury Secretary Mnuchin announced on Novem-ber 19 that the Treasury would discontinue a specific group of these loan guarantees, thus blocking the Fed’s participation. Notably, though, little actual lending will be affected by these discontinuations, since there was little outright use of the spe-cific loan programs; however, their mere existence has meant that credit availability has been assured for the relevant bor-rowers and this has supported their general financing. Long-Term Outlook: Fed May Not Raise Fed Funds Rate until 2023. Finally, this month, we have the semiannual Blue Chip Financial Forecasts long-range outlook. The previous look out into the mid-2020s took place in the June 1 edition of BCFF. Growth then was seen at an average annual rate of 2.4% out to 2026 and then 2.1% during the 2027-2031 period. Growth projections now look the same. Inflation forecasts back in June showed the consumer price index advancing 2.1% per year in 2022-2026 and 2.2% in the second half of this long forecast range. In the new outlook, CPI is seen at the same pace, and we have added the PCE price index, which the panel estimates with marginally lower inflation of 2.1% and 2.0% for the two five-year periods. Fed Funds Rate Rises More Slowly with Symmetric Infla-tion Targeting. The fact that the panel sees the PCE price index sustaining a pace just above 2% does mean that eventu-ally, the Fed can indeed be expected to raise the fed funds rate to encourage the inflation rate to ease back toward settling in at 2%. The Blue Chip panel looks for a modest uptrend in the funds rate to begin with one tightening move in 2023, a little more tightening the next year and eventually reaching an aver-age of 1.5% for the year 2026. The main item of note in this new outlook is that the funds rate is seen to be modestly lower through this five-year stretch, since there’s now the new re-quirement for inflation to sustain a moderately higher pace before the Fed acts to restrain it. So overall, the fed funds rate is projected to be lower than in the prior forecast, that is, it would average 0.8% in 2022-2026 versus 1.4% in last June’s set of projections. For 2027-2031, the prior projection was an average of 2.3%. but now it is 1.8%.
Carol Stone, CBE (Haver Analytics, New York, NY)

2 BLUE CHIP FINANCIAL FORECASTS DECEMBER 1, 2020 Consensus Forecasts of U.S. Interest Rates and Key Assumptions
-------------------------------------History----------------------------------------- Consensus Forecasts-Quarterly Avg. -------Average For Week Ending------ ----Average For Month--- Latest Qtr 4Q 1Q 2Q 3Q 4Q 1Q Interest Rates Nov 20 Nov 13 Nov 6 Oct 30 Oct Sep Aug 3Q 2020 2020 2021 2021 2021 2021 2022 Federal Funds Rate 0.09 0.09 0.09 0.09 0.09 0.09 0.10 0.09 0.1 0.1 0.1 0.1 0.1 0.1 Prime Rate 3.25 3.25 3.25 3.25 3.25 3.25 3.25 3.25 3.3 3.3 3.3 3.3 3.3 3.3 LIBOR, 3-mo. 0.22 0.22 0.22 0.22 0.22 0.24 0.25 0.25 0.3 0.3 0.3 0.3 0.3 0.3 Commercial Paper, 1-mo. 0.10 0.10 0.09 0.10 0.09 0.09 0.09 0.10 0.2 0.2 0.2 0.2 0.2 0.2 Treasury bill, 3-mo. 0.08 0.10 0.10 0.10 0.10 0.11 0.10 0.11 0.1 0.1 0.1 0.1 0.1 0.2 Treasury bill, 6-mo. 0.10 0.11 0.11 0.11 0.11 0.12 0.12 0.13 0.1 0.1 0.1 0.2 0.2 0.2 Treasury bill, 1 yr. 0.11 0.12 0.13 0.12 0.13 0.13 0.13 0.14 0.1 0.2 0.2 0.2 0.2 0.3 Treasury note, 2 yr. 0.17 0.18 0.15 0.16 0.15 0.13 0.14 0.14 0.2 0.2 0.2 0.3 0.3 0.4 Treasury note, 5 yr. 0.39 0.43 0.36 0.36 0.34 0.27 0.27 0.27 0.4 0.4 0.5 0.6 0.6 0.7 Treasury note, 10 yr. 0.87 0.93 0.83 0.82 0.79 0.68 0.65 0.65 0.8 0.9 1.0 1.1 1.2 1.2 Treasury note, 30 yr. 1.60 1.69 1.60 1.60 1.57 1.42 1.36 1.36 1.6 1.6 1.8 1.8 1.9 2.0 Corporate Aaa bond 2.53 2.66 2.64 2.68 2.65 2.56 2.48 2.49 2.5 2.5 2.6 2.7 2.8 2.8 Corporate Baa bond 3.08 3.20 3.22 3.27 3.27 3.20 3.09 3.14 3.5 3.6 3.7 3.7 3.8 3.8 State & Local bonds 2.78 2.85 2.89 2.92 2.93 2.92 2.88 2.93 2.5 2.5 2.6 2.7 2.8 2.8 Home mortgage rate 2.72 2.84 2.78 2.81 2.83 2.89 2.94 2.95 2.9 2.9 3.0 3.0 3.1 3.1 ----------------------------------------History------------------------------------------- Consensus Forecasts-Quarterly 4Q 1Q 2Q 3Q 4Q 1Q 2Q 3Q 4Q 1Q 2Q 3Q 4Q 1Q Key Assumptions 2018 2019 2019 2019 2019 2020 2020 2020 2020 2020 2020 2021 2021 2022 Fed’s AFE $ Index 109.4 109.4 110.3 110.5 110.3 111.2 112.4 107.2 106.1 106.3 106.0 105.8 105.9 105.6 Real GDP 1.3 2.9 1.5 2.6 2.4 -5.0 -31.4 33.1 3.7 2.6 4.0 4.0 3.6 3.0 GDP Price Index 1.8 1.2 2.5 1.5 1.4 1.4 -1.8 3.6 1.7 1.7 1.8 1.8 1.8 1.8 Consumer Price Index 1.3 0.9 3.0 1.8 2.4 1.2 -3.5 5.2 2.0 1.9 1.9 2.0 2.0 2.0 PCE Price Index 1.4 0.6 2.5 1.4 1.5 1.3 -1.6 3.7 1.8 1.7 1.9 1.9 1.9 1.9 Forecasts for interest rates and the Federal Reserve’s Major Currency Index represent averages for the quarter. Forecasts for Real GDP, GDP Price Index and Consumer Price Index are seasonally-adjusted annual rates of change (saar). Individual panel members’ forecasts are on pages 4 through 9. Historical data: Treasury rates from the Federal Re-serve Board’s H.15; AAA-AA and A-BBB corporate bond yields from Bank of America-Merrill Lynch and are 15+ years, yield to maturity; State and local bond yields from Bank of America-Merrill Lynch, A-rated, yield to maturity; Mortgage rates from Freddie Mac, 30-year, fixed; LIBOR quotes from Intercontinental Exchange. All interest rate data are sourced from Haver Analytics. Historical data for Fed’s Major Currency Index are from FRSR H.10. Historical data for Real GDP and GDP/PCE Chained Price Indexes are from the Bureau of Economic Analysis (BEA). Consumer Price Index (CPI) history is from the Department of Labor’s Bureau of Labor Statistics (BLS).
0.000.250.500.751.001.251.501.752.002.252.502.753.00
0.000.250.500.751.001.251.501.752.002.252.502.753.00
3mo 6mo 1yr 2yr 5yr 10yr 30yr
Perce
nt
Maturities
U.S. Treasury Yield CurveWeek ended November 20, 2020 & Year Ago vs.
4Q 2020 & 1Q 2022Consensus Forecasts
Year Ago
Week e nded 11/20 /2020
Conse nsus 1Q 2022
Conse nsus 4Q 2020
0.00
0.50
1.00
1.50
2.00
2.50
3.00
3.50
4.00
0.00
0.50
1.00
1.50
2.00
2.50
3.00
3.50
4.00
1Q'09 1Q'11 1Q'13 1Q'15 1Q'17 1Q'19 1Q'21
Perce
nt
U.S. 3-Mo. T-Bills & 10-Yr. T-Note Yield (Quarterly Average) Forecast
3-Month T-Bill Yield
Consensus
Consensus
10-Yr. T-Note Yield.
050100150200250300350400450500550600650700
050
100150200250300350400450500550600650700
2012 2013 2014 2015 2016 2017 2018 2019 2020
Basis
Poi
nts
Corporate Bond SpreadsAs of week ended November 20, 2020
Baa Corporate Bond Yield minus 10-Year T-Note Yield
-50
0
50
100
150
200
250
300
350
400
-50
0
50
100
150
200
250
300
350
400
2011 2012 2013 2014 2015 2016 2017 2018 2019 2020
Basis
Poi
nts
U.S. Treasury Yield CurveAs of week ended November 20 2020
10-Year T-Note minus 3-Month T-Bill(Constant Maturity Yields)
Aaa Corporate Bond Yield
minus 10-Year T-Note Yield

DECEMBER 1, 2020 BLUE CHIP FINANCIAL FORECASTS 3
-------------Policy Rates1----------------- -----------History---------- Consensus Forecasts Month Year Months From Now: Latest: Ago: Ago: 3 6 12 U.S. 0.13 0.13 1.63 0.12 0.12 0.12 Japan -0.10 -0.10 -0.10 -0.09 -0.09 -0.09 U.K. 0.10 0.10 0.75 0.10 0.10 0.10 Switzerland -0.75 -0.75 -0.75 -0.75 -0.75 -0.75 Canada 0.25 0.25 1.75 0.25 0.25 0.25 Australia 0.10 0.25 0.75 0.13 0.13 0.14 Euro area 0.00 0.00 0.00 0.00 0.00 0.00
-----------10-Yr. Government Bond Yields2------ -----------History---------- Consensus Forecasts Month Year Months From Now: Latest: Ago: Ago: 3 6 12 U.S. 0.83 0.85 1.77 0.86 0.99 1.20 Germany -0.59 -0.58 -0.36 -0.54 -0.46 -0.31 Japan 0.02 0.04 -0.08 0.00 0.01 0.03 U.K. 0.43 0.33 0.80 0.29 0.34 0.46 France -0.35 -0.30 -0.05 -0.32 -0.24 -0.10 Italy 0.60 0.76 1.30 0.68 0.75 0.89 Switzerland -0.47 -0.49 -0.52 -0.65 -0.63 -0.58 Canada 0.65 0.64 1.47 0.75 0.86 1.04 Australia 0.86 0.86 1.10 0.89 0.91 1.04 Spain 0.07 0.17 0.44 0.12 0.20 0.34
----------------Foreign Exchange Rates3----------- -----------History---------- Consensus Forecasts Month Year Months From Now: Latest: Ago: Ago: 3 6 12 U.S. 105.34 105.96 110.83 106.1 105.3 104.3 Japan 103.81 104.78 108.67 104.5 104.3 104.1 U.K. 1.33 1.30 1.28 1.32 1.32 1.36 Switzerland 0.91 0.91 1.00 0.91 0.91 0.91 Canada 1.31 1.31 1.33 1.32 1.32 1.30 Australia 0.73 0.71 0.68 0.72 0.72 0.73 Euro 1.19 1.18 1.10 1.18 1.19 1.21 Consensus Consensus Policy Rates
vs. US Rate 10-Year Gov’t
Yields vs. U.S. Yield Now In 12 Mo. Now In 12 Japan -0.23 -0.21 Germany -1.42 -1.51 U.K. -0.03 -0.02 Japan -0.81 -1.18 Switzerland -0.88 -0.87 U.K. -0.40 -0.74 Canada 0.13 0.13 France -1.18 -1.30 Australia -0.03 0.02 Italy -0.23 -0.31 Euro area -0.13 -0.12 Switzerland -1.30 -1.79 Canada -0.17 -0.16 Australia 0.03 -0.16 Spain -0.76 -0.87 Forecasts of panel members are on pages 10 and 11. Definitions of vari-ables are as follows: 1Monetary policy rates. 2Government bonds are yields to maturity. 3Foreign exchange rate forecasts for U.K., Australia and the Euro are U.S. dollars per currency unit. For the U.S dollar, forecasts are of the U.S. Federal Reserve Board’s AFE Dollar Index.
International As accelerating new COVID cases generate lockdowns across Europe and numerous localized restrictions in much of the US, concerns over the near-term economic outlook are intensifying. Fore-casts of the pace of economic activity in Q4 2020 and Q1 2021 are starting to be marked down with some forecasters fearing a contrac-tion in some countries in either Q4 or Q1. PMIs have already moved into contraction territory in Europe and have remained there in Japan. Moreover, the latest restrictions will likely intensify an already di-chotomized sectoral impact in these economies. The rebound thus far has mainly reflected a revival of goods production with goods output in many countries already back above levels prior to the pandemic. In contrast, service-producing sectors, which are more dependent on interpersonal contact, are still reeling from the first lockdown and the continued restraint from widespread self-imposed social distancing. These already appear to be getting hit by the new round of restrictions. Indeed, the recent drop in composite PMIs was due mostly to declines in service-producing sectors.
However, global financial markets, at least so far, appear to be looking through the expected near-term economic hit from new restrictions, likely reflecting the string of extremely positive reports on vaccines. To be sure, specific issues remain about likely efficacy, but the num-bers of vaccines that are yielding positive results undeniably point to some light at the end of the pandemic tunnel. Global financial markets have certainly welcomed the recent news with equity prices in all ma-jor economies ending November considerably higher than where they started the month. On the flip side, a “risk on” attitude may lead some investors to shy away from fixed income assets, thereby putting up-ward pressure on longer-term interest rates. Our forecasters look for yields on 10-year government debt in North America and Europe to rise modestly over the twelve-month forecast horizon. But they expect little change in the 10-year yield in Japan, likely reflecting continua-tion of the Bank of Japan’s current policy of yield curve control.
The Bank of England and the Reserve Bank of Australia each held monetary policy meetings in November and each made significant moves to more accommodation. The BoE increased the size of its target for asset purchases by £150 billion to £895 billion (about 40% of GDP), extended its purchases until the end of 2021, and still left open the possibility of moving to a negative policy interest rate. At its early November meeting, the RBA was even more aggressive. It low-ered its policy cash rate, cut its target for the yield on the three-year government bond, each by 15 basis points to 0.10%, and introduced a purely quantitative easing policy by announcing that over the next six months it would purchase A$100 billion (about 5% of GDP) in gov-ernment bonds with maturities between five and ten years in addition to the bond purchases required to achieve its three-year yield target. Since it established a three-year yield target in March, the RBA has already purchased more than A$150 billion in securities. Elsewhere, European Central Bank President Lagarde’s remarks in the middle of November echoed the indications that the ECB provided at its October meeting that more accommodation was likely at its December meeting (it did not meet in November). Markets generally expect this to entail an increase in its PEPP asset purchases and more generous terms for its TLTROs.
Despite the sharp acceleration in COVID cases, there has been little change in fiscal policy over the past month. US policymakers were consumed by the nationwide election though by the end of November there were press accounts that negotiations were about to resume on new legislation to support the parts of the US economy most adversely impacted by COVID. In Europe, markets are mostly waiting for loans and grants from the EU recovery fund, which are expected to begin next spring. In Japan, the government had already announced a third supplemental budget in October. On a more active note, in announc-ing a new nationwide lockdown in November, the UK government extended several of its programs designed to ease the impact of the pandemic.

4 BLUE CHIP FINANCIAL FORECASTS DECEMBER 1, 2020
Fourth Quarter 2020 Interest Rate Forecasts
------------------------------------------------------------Percent Per Annum -- Average For Quarter------------------------------------------------------- Blue Chip ------------------------------Short-Term------------------------------ ---Intermediate-Term--- ---------------------Long-Term---------------------
Financial Forecasts 2 3 4 5 6 7 8 9 10 11 12 13 14 15 B. C. D. E.Panel Members Com. Treas. Treas. Treas. Treas. Treas. Treas. Treas. Aaa Baa State & Home GDP Cons. PCE
Bank Rate Paper Bills Bills Bills Notes Notes Notes Bond Corp. Corp. Local Mtg. Real Price Price PriceRate Rate 3-Mo. 1-Mo. 3-Mo. 6-Mo. 1-Yr. 2-Yr. 5-Yr. 10-Yr. 30-Yr. Bond Bond Bonds Rate GDP Index Index Index
Action Economics 0.1 H 3.3 H 0.3 0.1 L 0.1 L 0.1 L 0.1 L 0.2 0.4 0.8 1.6 2.4 3.5 2.9 3.1 H 107.2 H 6.4 2.2 1.9 1.3AIG 0.1 H 3.3 H 0.4 na 0.1 L 0.1 L 0.1 L 0.2 0.3 0.7 L 1.4 L na 3.3 na 3.0 na 4.0 1.7 2.6 4.3 HAmherst Pierpont Securities 0.1 H 3.3 H 0.2 L 0.1 L 0.1 L 0.1 L 0.1 L 0.2 0.3 0.8 1.6 2.3 3.3 2.3 2.8 105.8 8.1 H 2.2 2.1 1.7Bank of America 0.1 H na 0.3 na na na na 0.2 0.4 0.9 1.7 na na na na na 4.0 1.7 1.9 1.9Barclays 0.1 H 3.3 H na na na na na na na na na na na na na na 5.0 1.8 1.9 1.4BMO Capital Markets 0.1 H 3.3 H 0.2 L na 0.1 L 0.1 L 0.2 0.2 0.4 0.9 1.7 na na na 2.9 na 4.0 1.6 1.8 1.5BNP Paribas Americas 0.1 H na na na na na na 0.2 na 0.9 na na na na na na 3.3 na 2.3 2.1Chan Economics 0.1 H 3.3 H 0.3 0.2 0.1 L 0.1 L 0.2 0.2 0.4 0.9 1.6 2.5 3.6 2.5 2.9 105.5 3.0 1.6 2.1 2.0Chmura Economics & Analytics 0.1 H 3.3 H 0.2 L 0.1 L 0.1 L 0.1 L 0.1 L 0.2 0.4 0.8 1.6 2.4 na na 2.8 na 1.5 0.6 0.5 L naComerica Bank 0.1 H 3.2 0.2 L na 0.1 L 0.1 L 0.1 L 0.2 0.4 0.8 1.6 na na na 2.8 na 3.5 1.9 1.4 1.5Daiwa Capital Markets America 0.1 H 3.3 H 0.2 L 0.1 L 0.1 L 0.1 L 0.1 L 0.2 0.4 0.9 1.6 2.4 3.4 na 2.8 106.0 4.6 2.0 2.0 1.9DePrince & Assoc. 0.1 H 3.2 0.3 0.2 0.1 L 0.1 L 0.2 0.2 0.3 0.8 1.6 2.4 3.5 2.3 2.8 106.6 5.1 1.4 1.8 naEconomist Intelligence Unit 0.1 H 3.3 H na 0.1 L 0.1 L 0.1 L 0.1 L 0.2 0.3 0.7 L 1.5 na na na 2.8 na 4.2 na 1.5 naFannie Mae 0.1 H 3.3 H na na 0.1 L 0.1 L 0.1 L 0.2 0.4 0.8 1.6 na na na 2.8 na 4.3 2.0 2.3 1.7Georgia State University 0.1 H 3.3 H na na 0.1 L 0.1 L 0.1 L 0.2 0.3 0.9 1.7 2.5 3.6 na 2.9 na 3.2 1.8 2.3 1.7GLC Financial Economics 0.1 H 3.3 H 0.3 0.2 0.1 L 0.1 L 0.2 0.3 H 0.5 H 0.8 1.4 L 2.9 H 4.2 2.8 2.8 106.4 6.4 2.1 2.3 2.3Goldman Sachs & Co. 0.1 H na 0.5 H na 0.3 H na na 0.2 0.4 0.8 1.5 na na na na na 3.5 0.4 1.3 1.5Grant Thornton/Diane Swonk 0.1 H 3.3 H 0.4 0.6 H 0.1 L 0.1 L 0.1 L 0.2 0.2 L 0.8 1.7 2.2 L 3.2 na 2.8 na -0.7 2.4 H 2.7 2.1ING 0.1 H na 0.3 na na na na 0.2 0.3 0.8 1.6 na na na na na 1.6 na na naJ.P. Morgan Chase 0.1 H na 0.2 L na na na na 0.2 0.3 0.8 1.6 na na na na na 2.8 1.9 1.9 1.8Loomis, Sayles & Company 0.1 H 3.3 H 0.2 L 0.1 L 0.1 L 0.1 L 0.1 L 0.2 0.3 0.9 1.6 2.4 3.3 2.9 2.9 106.5 4.0 2.1 2.0 1.8MacroFin Analytics & Rutgers Bus School 0.1 H 3.3 H 0.2 L 0.1 L 0.1 L 0.1 L 0.1 L 0.2 0.4 0.9 1.6 2.6 3.1 L 2.8 2.8 105.4 3.8 1.5 1.9 1.6Mizuho Research Institute 0.1 H na na na na na na na na 0.9 na na na na na na na na na naMoody's Analytics 0.1 H 3.2 0.2 L 0.1 L 0.1 L 0.1 L 0.2 0.2 0.4 0.7 L 1.6 2.4 3.6 2.1 2.9 na 3.0 1.9 1.6 2.2Moody's Capital Markets Group 0.1 H 3.3 H 0.2 L 0.2 0.1 L 0.1 L 0.1 L 0.2 0.4 0.8 1.6 2.6 3.2 2.9 2.8 105.9 4.9 1.7 2.4 1.9MUFG Union Bank 0.1 H 3.3 H 0.2 L na 0.1 L 0.1 L 0.2 0.2 0.3 0.8 1.5 2.3 3.4 2.7 2.9 106.0 5.0 1.5 2.2 2.6Naroff Economic Advisors 0.1 H 3.3 H 0.3 0.2 0.1 L 0.1 L 0.2 0.2 0.4 0.8 1.5 2.2 L 4.0 2.3 2.9 106.8 4.6 2.0 1.7 1.0NatWest Markets 0.1 H 3.3 H 0.2 L 0.3 0.1 L 0.2 H 0.3 H 0.2 0.5 H 1.0 H 1.8 H 2.9 H 3.9 3.1 H 3.1 H 106.3 3.5 1.5 2.1 1.6Nomura Securities, Inc. 0.1 H 3.3 H na na na na na 0.2 0.4 0.9 na na na na na na 3.5 1.9 2.1 1.7Oxford Economics 0.1 H 3.3 H 0.2 L na 0.1 L 0.1 L 0.1 L 0.2 0.3 0.8 1.4 L na na na 2.8 107.0 3.1 1.2 1.7 1.6PNC Financial Services Corp. 0.1 H 3.3 H 0.2 L na 0.1 L 0.1 L 0.1 L 0.2 0.4 0.8 1.6 na 3.4 1.1 L 2.8 na 4.4 2.3 1.6 2.1RDQ Economics 0.1 H 3.3 H 0.2 L 0.1 L 0.1 L 0.1 L 0.2 0.2 0.5 H 0.8 1.5 2.3 3.1 L 2.9 2.8 105.8 6.5 2.3 2.5 2.3Regions Financial Corporation 0.1 H 3.3 H 0.2 L 0.1 L 0.1 L 0.1 L 0.1 L 0.2 0.4 0.8 1.6 2.4 3.6 2.5 2.9 106.3 3.9 1.9 2.4 1.5Scotiabank Group 0.1 H 3.3 H na na 0.1 L na na 0.2 0.4 0.8 1.6 na na na na na 1.9 0.7 1.8 1.6Swiss Re 0.1 H 3.3 H 0.3 0.2 0.1 L 0.2 H 0.2 0.2 0.4 0.9 1.5 2.9 H 4.3 H na 2.5 L na 1.3 0.3 L 0.7 0.7 LThe Northern Trust Company 0.1 H 3.3 H 0.2 L 0.1 L 0.1 L 0.1 L 0.1 L 0.2 0.4 0.8 1.6 2.5 3.4 3.0 2.9 106.0 3.7 2.0 1.8 1.7TS Lombard 0.1 H 3.2 0.4 0.2 0.2 0.2 H 0.2 0.1 L 0.3 0.9 1.6 2.4 3.3 1.5 2.9 105.0 L 3.0 2.0 2.0 2.5Via Nova Investment Mgt. 0.1 H 3.3 H 0.2 L 0.1 L 0.1 L 0.1 L 0.1 L 0.1 L 0.3 0.7 L 1.5 2.6 3.2 2.9 2.9 106.2 5.0 1.5 1.7 1.5Wells Fargo 0.1 H 3.3 H 0.3 0.1 L 0.1 L 0.1 L 0.2 0.1 L 0.3 0.8 1.6 2.5 3.3 2.9 2.8 na 4.5 1.9 2.2 1.7ACIMA Private Wealth 0.0 L 3.1 L 0.2 L 0.3 0.1 L 0.1 L 0.1 L 0.1 L 0.3 0.7 L 1.4 L 2.4 4.0 1.6 2.9 105.0 L -3.0 L 1.0 3.9 H 0.7 L
December Consensus 0.1 3.3 0.3 0.2 0.1 0.1 0.1 0.2 0.4 0.8 1.6 2.5 3.5 2.5 2.9 106.1 3.7 1.7 2.0 1.8
Top 10 Avg. 0.1 3.3 0.4 0.3 0.1 0.1 0.2 0.2 0.4 0.9 1.7 2.7 3.8 2.9 3.0 106.5 5.7 2.2 2.6 2.5
Bottom 10 Avg. 0.1 3.2 0.2 0.1 0.1 0.1 0.1 0.2 0.3 0.8 1.5 2.3 3.2 2.1 2.8 105.6 1.4 1.0 1.4 1.3
November Consensus 0.1 3.3 0.3 0.2 0.1 0.1 0.2 0.2 0.4 0.8 1.5 2.4 3.6 2.5 2.9 106.8 3.9 1.6 2.1 1.8
Number of Forecasts Changed From A Month Ago:
Down 0 1 5 1 2 2 6 4 4 3 5 5 7 6 14 12 15 7 13 12
Same 39 30 26 20 30 28 22 30 27 24 17 11 11 10 14 5 10 14 14 9
Up 1 2 1 2 1 1 3 4 6 12 14 8 7 4 3 2 13 14 10 12
Diffusion Index 51% 52% 44% 52% 48% 48% 45% 50% 53% 62% 63% 56% 50% 45% 32% 24% 47% 60% 46% 50%
$ Index
Avg. For ---Qtr.---
A. Fed's Adv
-------------(Q-Q % Change)--------------------------------(SAAR)-------------------
Fgn Econ
1FederalFunds
Prime LIBOR
Key Assumptions

DECEMBER 1, 2020 BLUE CHIP FINANCIAL FORECASTS 5
First Quarter 2021 Interest Rate Forecasts
------------------------------------------------------------Percent Per Annum -- Average For Quarter------------------------------------------------------- Blue Chip ------------------------------Short-Term------------------------------ ---Intermediate-Term--- ---------------------Long-Term---------------------
Financial Forecasts 2 3 4 5 6 7 8 9 10 11 12 13 14 15 B. C. D. E.Panel Members Com. Treas. Treas. Treas. Treas. Treas. Treas. Treas. Aaa Baa State & Home GDP Cons. PCE
Bank Rate Paper Bills Bills Bills Notes Notes Notes Bond Corp. Corp. Local Mtg. Real Price Price PriceRate Rate 3-Mo. 1-Mo. 3-Mo. 6-Mo. 1-Yr. 2-Yr. 5-Yr. 10-Yr. 30-Yr. Bond Bond Bonds Rate GDP Index Index Index
Action Economics 0.1 H 3.3 H 0.3 0.1 L 0.1 L 0.1 L 0.2 0.3 0.5 0.8 1.6 2.5 3.3 2.9 3.1 106.6 5.4 2.6 H 2.2 1.6AIG 0.1 H 3.3 H 0.3 na 0.1 L 0.1 L 0.2 0.2 0.4 0.8 1.5 na 3.2 na 3.1 na 4.0 1.5 3.0 H 4.2 HAmherst Pierpont Securities 0.1 H 3.3 H 0.2 L 0.1 L 0.1 L 0.1 L 0.2 0.2 0.5 1.1 H 1.9 H 2.7 3.7 2.4 3.0 106.4 5.6 2.4 2.8 2.5Bank of America 0.1 H na 0.2 L na na na na 0.2 0.4 1.0 1.8 na na na na na 1.0 1.5 1.7 1.6Barclays 0.1 H 3.3 H na na na na na 0.2 0.5 1.0 1.7 na na na na na 0.0 1.7 1.6 1.3BMO Capital Markets 0.1 H 3.3 H 0.2 L na 0.1 L 0.1 L 0.2 0.2 0.5 1.1 H 1.8 na na na 3.1 na 1.5 1.7 1.9 1.7BNP Paribas Americas 0.1 H na na na na na na 0.2 na 1.1 H na na na na na na 1.1 na 1.5 1.3Chan Economics 0.1 H 3.3 H 0.3 0.2 0.1 L 0.1 L 0.2 0.2 0.4 0.9 1.6 2.5 3.6 2.5 2.9 105.4 0.5 1.8 2.0 2.2Chmura Economics & Analytics 0.1 H 3.3 H 0.2 L 0.1 L 0.1 L 0.1 L 0.1 0.2 0.4 0.9 1.6 2.4 na na 2.8 na 1.2 0.8 L 0.6 L naComerica Bank 0.1 H 3.2 0.2 L na 0.1 L 0.1 L 0.2 0.2 0.4 0.9 1.7 na na na 2.9 na 2.8 1.9 1.6 1.6Daiwa Capital Markets America 0.1 H 3.3 H 0.2 L 0.1 L 0.1 L 0.1 L 0.1 0.2 0.5 1.0 1.7 2.5 3.5 na 2.9 106.0 2.3 1.8 2.1 1.9DePrince & Assoc. 0.1 H 3.2 0.4 0.3 0.1 L 0.2 H 0.2 0.2 0.4 0.9 1.6 2.7 3.8 2.4 2.9 106.7 4.7 1.7 1.8 naEconomist Intelligence Unit 0.1 H 3.3 H na 0.1 L 0.1 L 0.1 L 0.2 0.2 0.4 0.8 1.5 na na na 2.8 na 3.4 na 0.9 naFannie Mae 0.1 H 3.3 H na na 0.1 L 0.1 L 0.1 0.2 0.4 0.9 1.6 na na na 2.7 L na 2.7 1.8 1.7 1.5Georgia State University 0.1 H 3.3 H na na 0.1 L 0.1 L 0.0 L 0.1 L 0.4 0.9 1.7 2.4 3.7 na 3.1 na 1.3 1.7 1.6 1.4GLC Financial Economics 0.1 H 3.3 H 0.4 0.2 0.1 L 0.2 H 0.2 0.3 0.5 0.8 1.2 L 2.7 3.9 2.7 3.0 106.6 4.5 1.8 2.0 2.0Goldman Sachs & Co. 0.1 H na 0.5 H na 0.3 H na na 0.2 0.4 0.9 1.6 na na na na na 1.0 1.6 2.1 1.8Grant Thornton/Diane Swonk 0.1 H 3.3 H 0.4 0.6 H 0.1 L 0.1 L 0.1 0.1 L 0.3 0.9 1.8 2.4 3.6 na 2.9 na 2.3 1.6 1.4 1.2ING 0.1 H na 0.3 na na na na 0.3 0.6 1.0 1.9 H na na na na na -1.5 na na naJ.P. Morgan Chase 0.1 H na 0.2 L na na na na 0.2 0.3 0.8 1.7 na na na na na -1.0 1.2 1.4 1.0Loomis, Sayles & Company 0.1 H 3.3 H 0.2 L 0.1 L 0.1 L 0.1 L 0.2 0.2 0.3 0.9 1.7 2.4 3.3 2.8 2.9 105.9 1.4 1.8 1.8 1.5MacroFin Analytics & Rutgers Bus School 0.1 H 3.3 H 0.2 L 0.1 L 0.1 L 0.1 L 0.2 0.2 0.4 0.9 1.6 2.6 3.3 2.9 2.8 105.9 1.9 1.6 2.3 1.8Mizuho Research Institute 0.1 H na na na na na na na na 0.9 na na na na na na na na na naMoody's Analytics 0.1 H 3.2 0.3 0.1 L 0.1 L 0.2 H 0.3 H 0.4 H 0.5 0.8 1.8 2.2 L 3.3 2.1 3.1 na 3.6 1.1 1.1 1.4Moody's Capital Markets Group 0.1 H 3.3 H 0.2 L 0.2 0.1 L 0.1 L 0.1 0.2 0.3 0.8 1.5 2.5 3.2 2.8 2.7 L 106.3 2.5 1.8 2.0 2.0MUFG Union Bank 0.1 H 3.3 H 0.2 L na 0.1 L 0.1 L 0.2 0.2 0.3 0.8 1.5 2.4 3.5 2.7 2.9 107.0 3.5 1.5 2.3 2.2Naroff Economic Advisors 0.1 H 3.3 H 0.3 0.2 0.1 L 0.2 H 0.2 0.3 0.4 0.9 1.6 2.2 L 4.0 2.4 3.0 107.4 3.3 1.7 1.9 1.4NatWest Markets 0.1 H 3.3 H 0.4 0.2 0.1 L 0.2 H 0.3 H 0.3 0.6 1.1 H 1.9 H 2.7 3.7 3.0 2.9 107.0 -3.4 L 2.4 2.1 2.0Nomura Securities, Inc. 0.1 H 3.3 H na na na na na 0.2 0.4 0.8 na na na na na na 0.5 2.0 2.5 2.1Oxford Economics 0.1 H 3.3 H 0.3 na 0.2 0.2 H 0.2 0.2 0.4 0.9 1.5 na na na 2.9 107.4 2.8 2.0 1.9 1.8PNC Financial Services Corp. 0.1 H 3.3 H 0.2 L na 0.1 L 0.1 L 0.1 0.2 0.4 0.8 1.5 na 3.2 1.0 L 2.7 L na 3.7 2.0 1.4 1.2RDQ Economics 0.1 H 3.3 H 0.2 L 0.2 0.1 L 0.1 L 0.2 0.2 0.7 H 1.1 H 1.9 H 2.6 3.4 3.4 H 3.2 H 106.7 5.5 2.6 H 2.5 2.4Regions Financial Corporation 0.1 H 3.3 H 0.3 0.2 0.1 L 0.1 L 0.1 0.3 0.5 0.9 1.7 2.5 3.6 2.6 3.0 105.6 3.6 1.1 2.0 0.7Scotiabank Group 0.1 H 3.3 H na na 0.1 L na na 0.3 0.5 0.9 1.6 na na na na na 5.6 0.8 L 1.9 1.7Swiss Re 0.1 H 3.3 H 0.4 0.3 0.2 0.2 H 0.3 H 0.4 H 0.6 1.0 1.6 3.3 H 4.7 H na 2.7 L na 5.6 1.4 1.2 0.7The Northern Trust Company 0.1 H 3.3 H 0.3 0.1 L 0.1 L 0.1 L 0.2 0.2 0.4 0.8 1.7 2.6 3.5 3.2 2.8 105.5 3.6 2.1 2.0 1.9TS Lombard 0.1 H 3.2 0.4 0.2 0.2 0.2 H 0.2 0.2 0.2 L 0.8 1.5 2.3 3.1 L 1.4 2.8 108.0 H 1.8 1.5 1.5 1.5Via Nova Investment Mgt. 0.1 H 3.3 H 0.2 L 0.1 L 0.1 L 0.1 L 0.1 0.1 L 0.3 0.7 L 1.4 2.5 3.2 2.9 2.9 105.0 4.0 1.5 1.8 1.5Wells Fargo 0.1 H 3.3 H 0.3 0.1 L 0.1 L 0.1 L 0.2 0.1 L 0.4 0.9 1.7 2.6 3.4 2.9 2.8 na 4.0 1.6 1.5 1.5ACIMA Private Wealth -0.1 L 3.0 L 0.2 L 0.3 0.1 L 0.1 L 0.1 0.1 L 0.3 0.7 L 1.4 2.6 4.3 1.6 2.9 104.0 L 6.5 H 1.0 2.7 0.3 L
December Consensus 0.1 3.3 0.3 0.2 0.1 0.1 0.2 0.2 0.4 0.9 1.6 2.5 3.6 2.5 2.9 106.3 2.6 1.7 1.9 1.7
Top 10 Avg. 0.1 3.3 0.4 0.3 0.2 0.2 0.2 0.3 0.6 1.1 1.8 2.7 3.9 3.0 3.1 107.0 5.1 2.2 2.5 2.4
Bottom 10 Avg. 0.1 3.2 0.2 0.1 0.1 0.1 0.1 0.2 0.3 0.8 1.5 2.4 3.3 2.1 2.8 105.6 -0.1 1.2 1.3 1.1
November Consensus 0.1 3.3 0.3 0.2 0.1 0.1 0.2 0.2 0.4 0.9 1.6 2.5 3.6 2.5 3.0 107.0 4.0 1.7 1.9 1.7
Number of Forecasts Changed From A Month Ago:
Down 0 1 5 0 0 5 4 6 6 4 7 5 8 7 13 12 22 9 9 10
Same 39 30 26 22 32 25 23 31 23 22 18 13 12 8 16 5 9 15 13 13
Up 1 2 1 1 1 1 4 2 9 14 12 6 5 5 2 2 7 11 15 10
Diffusion Index 51% 52% 44% 52% 52% 44% 50% 45% 54% 63% 57% 52% 44% 45% 32% 24% 30% 53% 58% 50%
$ Index
Avg. For ---Qtr.---
A. Fed's AdvFgn Econ
1FederalFunds
Prime LIBOR
Key Assumptions-------------(Q-Q % Change)--------------------------------(SAAR)-------------------

6 BLUE CHIP FINANCIAL FORECASTS DECEMBER 1, 2020
Second Quarter 2021 Interest Rate Forecasts
------------------------------------------------------------Percent Per Annum -- Average For Quarter------------------------------------------------------- Blue Chip ------------------------------Short-Term------------------------------ ---Intermediate-Term--- ---------------------Long-Term---------------------
Financial Forecasts 2 3 4 5 6 7 8 9 10 11 12 13 14 15 B. C. D. E.Panel Members Com. Treas. Treas. Treas. Treas. Treas. Treas. Treas. Aaa Baa State & Home GDP Cons. PCE
Bank Rate Paper Bills Bills Bills Notes Notes Notes Bond Corp. Corp. Local Mtg. Real Price Price PriceRate Rate 3-Mo. 1-Mo. 3-Mo. 6-Mo. 1-Yr. 2-Yr. 5-Yr. 10-Yr. 30-Yr. Bond Bond Bonds Rate GDP Index Index Index
Action Economics 0.1 H 3.3 H 0.3 0.1 L 0.1 L 0.2 H 0.2 0.3 0.6 0.8 1.6 2.5 3.3 2.9 3.1 106.5 4.8 2.1 2.0 1.8AIG 0.1 H 3.3 H 0.3 na 0.1 L 0.1 L 0.2 0.2 0.4 0.8 1.6 na 3.3 na 3.1 na 3.5 1.0 2.2 5.6 HAmherst Pierpont Securities 0.1 H 3.3 H 0.3 0.1 L 0.1 L 0.2 H 0.2 0.3 0.7 1.4 H 2.3 H 3.1 H 4.1 2.7 3.3 107.0 4.6 2.3 2.7 2.4Bank of America 0.1 H na 0.2 L na na na na 0.3 0.4 1.2 2.0 na na na na na 7.0 1.5 1.9 1.7Barclays 0.1 H 3.3 H na na na na na 0.2 0.5 1.1 1.8 na na na na na 5.0 1.7 1.4 1.3BMO Capital Markets 0.1 H 3.3 H 0.2 L na 0.1 L 0.1 L 0.2 0.2 0.6 1.1 1.8 na na na 3.1 na 4.8 1.5 1.6 1.3BNP Paribas Americas 0.1 H na na na na na na 0.2 na 1.2 na na na na na na 3.6 na 1.7 1.5Chan Economics 0.1 H 3.3 H 0.3 0.2 0.1 L 0.1 L 0.2 0.2 0.4 1.0 1.7 2.6 3.7 2.6 3.0 105.3 3.0 1.6 1.9 1.9Chmura Economics & Analytics 0.1 H 3.3 H 0.3 0.2 0.1 L 0.1 L 0.1 L 0.2 0.4 0.9 1.6 2.4 na na 2.9 na 5.2 1.7 1.8 naComerica Bank 0.1 H 3.2 0.2 L na 0.1 L 0.2 H 0.2 0.4 0.5 1.1 1.8 na na na 2.8 na 3.5 2.0 1.8 1.8Daiwa Capital Markets America 0.1 H 3.3 H 0.3 0.1 L 0.1 L 0.1 L 0.1 L 0.2 0.6 1.1 1.8 2.6 3.6 na 3.0 107.0 3.3 1.9 2.2 2.0DePrince & Assoc. 0.1 H 3.2 0.4 0.3 0.2 0.2 H 0.2 0.3 0.5 1.0 1.7 2.9 4.0 2.5 3.0 106.9 4.2 1.7 1.8 naEconomist Intelligence Unit 0.1 H 3.3 H na 0.1 L 0.1 L 0.1 L 0.2 0.2 0.4 0.8 1.6 na na na 2.9 na 4.8 na 1.7 naFannie Mae 0.1 H 3.3 H na na 0.1 L 0.1 L 0.2 0.2 0.5 0.9 1.6 na na na 2.7 L na 2.9 2.2 2.6 2.2Georgia State University 0.1 H 3.3 H na na 0.1 L 0.1 L 0.1 L 0.2 0.5 1.1 1.9 2.4 3.9 na 3.1 na 0.4 L 2.1 2.6 2.2GLC Financial Economics 0.1 H 3.3 H 0.4 0.2 0.1 L 0.1 L 0.2 0.3 0.5 0.8 1.2 L 2.5 3.8 2.6 3.1 106.8 3.9 1.5 1.9 1.9Goldman Sachs & Co. 0.1 H na 0.5 H na 0.3 H na na na na 1.0 na na na na na na 9.5 1.8 1.9 1.9Grant Thornton/Diane Swonk 0.1 H 3.3 H 0.4 0.3 0.1 L 0.1 L 0.2 0.2 0.5 1.0 1.9 2.5 3.5 na 3.0 na 3.9 1.9 2.2 1.9ING 0.1 H na 0.3 na na na na 0.3 0.6 1.0 2.0 na na na na na 9.8 H na na naJ.P. Morgan Chase 0.1 H na 0.2 L na na na na 0.2 0.3 L 0.9 1.7 na na na na na 4.5 1.6 1.9 1.3Loomis, Sayles & Company 0.1 H 3.3 H 0.2 L 0.1 L 0.1 L 0.2 H 0.2 0.2 0.4 1.0 1.7 2.3 L 3.1 L 2.7 2.9 105.6 3.5 1.9 1.8 1.7MacroFin Analytics & Rutgers Bus School 0.1 H 3.3 H 0.2 L 0.1 L 0.2 0.2 H 0.2 0.2 0.5 1.0 1.7 2.7 3.4 2.9 2.9 106.1 2.2 1.8 2.1 2.0Mizuho Research Institute 0.1 H na na na na na na na na 0.9 na na na na na na na na na naMoody's Analytics 0.1 H 3.2 0.3 0.1 L 0.2 0.2 H 0.4 H 0.6 H 0.7 0.9 2.1 2.5 3.6 2.3 3.0 na 3.8 1.4 1.9 2.0Moody's Capital Markets Group 0.1 H 3.3 H 0.2 L 0.2 0.1 L 0.1 L 0.2 0.2 0.4 0.9 1.6 2.6 3.3 2.9 2.8 107.1 3.7 1.8 1.9 2.0MUFG Union Bank 0.1 H 3.3 H 0.2 L na 0.1 L 0.1 L 0.2 0.2 0.3 L 0.8 1.6 2.5 3.7 2.8 3.0 106.0 2.5 1.5 2.3 2.1Naroff Economic Advisors 0.1 H 3.3 H 0.3 0.2 0.2 0.2 H 0.2 0.3 0.5 0.9 1.8 2.3 L 4.1 2.6 3.1 108.3 H 2.4 1.9 2.0 1.6NatWest Markets 0.1 H 3.3 H 0.3 0.2 0.1 L 0.2 H 0.3 0.2 0.5 1.1 2.0 2.9 3.9 2.9 2.9 106.0 4.2 2.3 1.8 2.2Nomura Securities, Inc. 0.1 H 3.3 H na na na na na 0.2 0.4 0.8 na na na na na na 1.6 2.0 1.3 1.2Oxford Economics 0.1 H 3.3 H 0.3 na 0.2 0.2 H 0.2 0.2 0.4 1.0 1.7 na na na 3.0 107.8 3.3 2.3 1.7 1.7PNC Financial Services Corp. 0.1 H 3.3 H 0.2 L na 0.1 L 0.1 L 0.1 L 0.2 0.5 0.9 1.7 na 3.4 1.2 L 2.8 na 3.4 2.2 1.8 1.4RDQ Economics 0.1 H 3.3 H 0.3 0.2 0.1 L 0.1 L 0.2 0.2 0.8 H 1.4 H 2.3 H 2.8 3.8 3.7 H 3.5 H 106.7 4.2 2.7 2.6 2.5Regions Financial Corporation 0.1 H 3.3 H 0.3 0.2 0.1 L 0.1 L 0.2 0.3 0.5 1.0 1.8 2.6 3.7 2.6 3.1 105.2 3.2 1.7 1.9 1.5Scotiabank Group 0.1 H 3.3 H na na 0.1 L na na 0.4 0.7 1.1 1.7 na na na na na 3.4 1.1 2.1 1.9Swiss Re 0.1 H 3.3 H 0.4 0.3 0.2 0.2 H 0.3 0.4 0.6 1.0 1.6 3.1 H 4.3 na 2.7 L na 5.3 4.5 H 2.8 H 2.3The Northern Trust Company 0.1 H 3.3 H 0.3 0.1 L 0.1 L 0.1 L 0.2 0.2 0.5 0.9 1.9 2.7 3.7 3.5 2.9 104.5 4.1 2.0 1.7 1.7TS Lombard 0.1 H 3.2 0.4 0.2 0.2 0.2 H 0.2 0.2 0.3 L 1.0 1.7 2.5 3.3 1.6 3.0 105.0 3.0 0.8 L 0.8 L 0.8 LVia Nova Investment Mgt. 0.1 H 3.3 H 0.2 L 0.1 L 0.1 L 0.1 L 0.1 L 0.1 L 0.3 L 0.7 1.4 2.5 3.2 2.9 2.9 105.0 3.5 1.6 1.9 1.6Wells Fargo 0.1 H 3.3 H 0.3 0.1 L 0.1 L 0.1 L 0.2 0.2 0.4 1.0 1.8 2.5 3.4 3.0 2.9 na 3.1 1.7 1.5 1.6ACIMA Private Wealth -0.1 L 3.0 L 0.3 0.4 H 0.1 L 0.1 L 0.1 L 0.1 L 0.3 L 0.6 L 1.4 2.8 4.5 H 1.7 2.8 102.0 L 2.5 0.9 1.3 0.8 L
December Consensus 0.1 3.3 0.3 0.2 0.1 0.1 0.2 0.2 0.5 1.0 1.8 2.6 3.7 2.6 3.0 106.0 4.0 1.8 1.9 1.9
Top 10 Avg. 0.1 3.3 0.4 0.3 0.2 0.2 0.2 0.4 0.6 1.2 2.0 2.8 4.0 3.0 3.2 107.0 6.1 2.5 2.4 2.6
Bottom 10 Avg. 0.1 3.2 0.2 0.1 0.1 0.1 0.1 0.2 0.4 0.8 1.5 2.4 3.3 2.2 2.8 105.1 2.4 1.3 1.5 1.3
November Consensus 0.1 3.3 0.3 0.2 0.1 0.2 0.2 0.3 0.5 0.9 1.7 2.6 3.7 2.6 3.0 106.7 3.8 1.5 1.8 1.7
Number of Forecasts Changed From A Month Ago:
Down 0 1 6 2 1 4 5 6 4 6 3 3 6 6 9 10 13 0 9 8
Same 39 30 25 20 30 25 23 27 23 21 22 14 14 9 19 5 13 19 15 15
Up 1 2 1 1 2 2 3 5 10 13 11 7 5 5 3 4 12 16 13 10
Diffusion Index 51% 52% 42% 48% 52% 47% 47% 49% 58% 59% 61% 58% 48% 48% 40% 34% 49% 73% 55% 53%
$ Index
Avg. For ---Qtr.---
A. Fed's Adv
-------------(Q-Q % Change)--------------------------------(SAAR)-------------------
Fgn Econ
1FederalFunds
Prime LIBOR
Key Assumptions

DECEMBER 1, 2020 BLUE CHIP FINANCIAL FORECASTS 7
Third Quarter 2021 Interest Rate Forecasts
------------------------------------------------------------Percent Per Annum -- Average For Quarter------------------------------------------------------- Blue Chip ------------------------------Short-Term------------------------------ ---Intermediate-Term--- ---------------------Long-Term---------------------
Financial Forecasts 2 3 4 5 6 7 8 9 10 11 12 13 14 15 B. C. D. E.Panel Members Com. Treas. Treas. Treas. Treas. Treas. Treas. Treas. Aaa Baa State & Home GDP Cons. PCE
Bank Rate Paper Bills Bills Bills Notes Notes Notes Bond Corp. Corp. Local Mtg. Real Price Price PriceRate Rate 3-Mo. 1-Mo. 3-Mo. 6-Mo. 1-Yr. 2-Yr. 5-Yr. 10-Yr. 30-Yr. Bond Bond Bonds Rate GDP Index Index Index
Action Economics 0.1 H 3.3 H 0.3 0.1 L 0.1 L 0.2 H 0.2 0.3 0.6 0.9 1.7 2.5 3.4 2.9 3.2 106.4 na na 2.2 1.9AIG 0.1 H 3.3 H 0.3 na 0.1 L 0.1 L 0.2 0.3 0.5 0.9 1.7 na 3.4 na 3.1 na 3.0 1.3 2.1 4.1 HAmherst Pierpont Securities 0.1 H 3.3 H 0.3 0.2 0.2 0.2 H 0.3 0.4 0.9 H 1.7 H 2.6 H 3.4 H 4.4 3.0 3.5 107.5 4.6 2.4 2.8 2.5Bank of America 0.1 H na 0.2 L na na na na 0.3 0.5 1.4 2.3 na na na na na 5.0 1.7 1.8 1.6Barclays 0.1 H 3.3 H na na na na na 0.2 0.6 1.2 1.9 na na na na na 6.0 2.2 2.4 1.9BMO Capital Markets 0.1 H 3.3 H 0.2 L na 0.1 L 0.1 L 0.2 0.3 0.6 1.2 1.9 na na na 3.1 na 4.3 2.1 2.4 2.2BNP Paribas Americas 0.1 H na na na na na na 0.3 na 1.3 na na na na na na 5.0 na 1.6 1.5Chan Economics 0.1 H 3.3 H 0.3 0.2 0.1 L 0.1 L 0.2 0.2 0.4 1.0 1.7 2.6 3.7 2.6 3.0 105.5 4.5 1.8 2.1 1.9Chmura Economics & Analytics 0.1 H 3.3 H 0.3 0.2 0.1 L 0.1 L 0.2 0.2 0.4 0.9 1.7 2.4 na na 2.9 na 4.0 1.6 1.7 naComerica Bank 0.1 H 3.2 0.3 na 0.1 L 0.2 H 0.3 0.4 0.6 1.2 1.9 na na na 2.8 na 3.1 2.0 2.1 1.9Daiwa Capital Markets America 0.1 H 3.3 H 0.3 0.1 L 0.1 L 0.1 L 0.2 0.3 0.7 1.2 2.0 2.7 3.7 na 3.2 107.0 3.1 2.0 2.2 2.0DePrince & Assoc. 0.1 H 3.2 0.4 0.3 0.2 0.2 H 0.2 0.3 0.6 1.1 1.8 3.0 4.0 2.7 3.0 107.1 3.7 1.8 1.9 naEconomist Intelligence Unit 0.1 H 3.3 H na 0.1 L 0.2 0.2 H 0.2 0.2 0.4 0.9 1.6 na na na 3.0 na 5.5 na 1.9 naFannie Mae 0.1 H 3.3 H na na 0.1 L 0.2 H 0.2 0.3 0.5 1.0 1.6 na na na 2.8 na 3.9 1.9 2.9 H 2.2Georgia State University 0.1 H 3.3 H na na 0.1 L 0.1 L 0.1 L 0.2 0.6 1.3 2.1 2.4 3.9 na 3.3 na 1.3 L 1.8 2.8 2.1GLC Financial Economics 0.1 H 3.3 H 0.4 0.2 0.1 L 0.1 L 0.2 0.3 0.5 0.7 1.0 L 2.1 L 3.3 2.4 3.0 106.9 3.2 1.7 2.1 2.1Goldman Sachs & Co. 0.1 H na 0.5 H na 0.3 H na na na na 1.2 na na na na na na 7.0 H 1.3 1.4 1.4Grant Thornton/Diane Swonk 0.1 H 3.3 H 0.4 0.4 H 0.1 L 0.1 L 0.1 L 0.2 0.5 1.0 2.0 2.5 3.5 na 3.0 na 5.6 1.6 2.4 1.7ING 0.1 H na 0.3 na na na na 0.3 0.6 1.0 2.0 na na na na na 4.0 na na naJ.P. Morgan Chase 0.1 H na 0.2 L na na na na 0.2 0.4 0.9 1.8 na na na na na 6.5 1.7 1.9 1.5Loomis, Sayles & Company 0.1 H 3.3 H 0.3 0.1 L 0.1 L 0.2 H 0.2 0.3 0.5 1.1 1.9 2.3 3.1 L 2.6 2.9 105.4 3.1 1.8 1.8 1.7MacroFin Analytics & Rutgers Bus School 0.1 H 3.3 H 0.2 L 0.2 0.2 0.2 H 0.2 0.3 0.5 1.0 1.7 2.7 3.4 2.9 2.9 106.5 2.0 2.0 2.1 2.1Mizuho Research Institute 0.1 H na na na na na na na na 0.9 na na na na na na na na na naMoody's Analytics 0.1 H 3.2 0.3 0.1 L 0.2 0.2 H 0.5 H 0.7 H 0.9 H 1.1 2.3 2.6 3.7 2.4 3.2 na 3.1 2.3 2.7 2.8Moody's Capital Markets Group 0.1 H 3.3 H 0.2 L 0.2 0.1 L 0.1 L 0.2 0.2 0.4 0.9 1.6 2.6 3.3 2.9 2.8 107.3 2.8 1.8 1.9 2.0MUFG Union Bank 0.1 H 3.3 H 0.2 L na 0.1 L 0.2 H 0.2 0.2 0.4 0.8 1.6 2.5 3.8 2.8 3.0 104.0 2.5 1.5 2.3 1.9Naroff Economic Advisors 0.1 H 3.3 H 0.3 0.2 0.2 0.2 H 0.3 0.4 0.6 1.0 1.8 2.3 4.1 2.7 3.2 109.0 H 2.1 2.0 2.1 1.9NatWest Markets 0.1 H 3.3 H 0.3 0.2 0.1 L 0.2 H 0.3 0.3 0.5 1.1 2.1 2.9 3.9 2.8 3.0 105.0 6.0 1.9 1.8 2.0Nomura Securities, Inc. 0.1 H 3.3 H na na na na na 0.2 0.5 0.9 na na na na na na 2.9 2.4 1.6 1.5Oxford Economics 0.1 H 3.3 H 0.3 na 0.2 0.2 H 0.2 0.2 0.5 1.2 1.8 na na na 3.1 107.9 3.3 2.0 1.7 1.7PNC Financial Services Corp. 0.1 H 3.3 H 0.2 L na 0.1 L 0.1 L 0.1 L 0.2 0.6 1.1 1.8 na 3.5 1.3 L 2.9 na 3.2 2.2 2.2 2.2RDQ Economics 0.1 H 3.3 H 0.3 0.2 0.1 L 0.1 L 0.2 0.2 0.9 H 1.6 2.5 3.0 4.1 3.8 H 3.6 H 107.3 3.9 2.9 H 2.6 2.5Regions Financial Corporation 0.1 H 3.3 H 0.3 0.2 0.2 0.2 H 0.2 0.4 0.6 1.1 1.9 2.7 3.8 2.7 3.2 105.2 4.0 2.0 1.9 2.3Scotiabank Group 0.1 H 3.3 H na na 0.1 L na na 0.5 0.9 H 1.3 1.8 na na na na na 4.2 1.3 2.1 1.9Swiss Re 0.1 H 3.3 H 0.4 0.3 0.2 0.2 H 0.3 0.4 0.6 1.0 1.6 3.1 4.3 na 2.7 L na 6.0 0.3 L 1.9 1.3The Northern Trust Company 0.1 H 3.3 H 0.3 0.1 L 0.1 L 0.2 H 0.2 0.2 0.6 1.0 2.0 2.8 3.8 3.6 3.0 103.0 3.8 1.8 1.7 1.7TS Lombard 0.1 H 3.2 0.4 0.2 0.2 0.2 H 0.2 0.3 0.4 1.1 1.8 2.6 3.4 1.7 3.1 104.0 5.5 0.8 0.8 L 0.8 LVia Nova Investment Mgt. 0.1 H 3.3 H 0.2 L 0.1 L 0.1 L 0.1 L 0.1 L 0.1 L 0.3 L 0.7 1.4 2.5 3.2 2.9 2.9 105.0 3.0 1.7 2.0 1.6Wells Fargo 0.1 H 3.3 H 0.3 0.1 L 0.1 L 0.1 L 0.2 0.2 0.5 1.1 1.9 2.6 3.5 3.1 3.0 na 2.9 1.7 1.8 1.7ACIMA Private Wealth -0.1 L 3.0 L 0.3 0.4 H 0.1 L 0.1 L 0.1 L 0.1 L 0.3 L 0.6 L 1.3 3.0 4.8 H 1.7 2.8 100.0 L 3.0 0.9 1.0 1.2
December Consensus 0.1 3.3 0.3 0.2 0.1 0.2 0.2 0.3 0.6 1.1 1.8 2.7 3.7 2.7 3.0 105.8 4.0 1.8 2.0 1.9
Top 10 Avg. 0.1 3.3 0.4 0.3 0.2 0.2 0.3 0.4 0.7 1.3 2.2 2.9 4.1 3.1 3.3 107.3 5.8 2.3 2.6 2.5
Bottom 10 Avg. 0.1 3.2 0.2 0.1 0.1 0.1 0.2 0.2 0.4 0.8 1.5 2.4 3.4 2.3 2.8 104.4 2.6 1.2 1.5 1.4
November Consensus 0.1 3.3 0.3 0.2 0.2 0.2 0.2 0.3 0.5 1.0 1.8 2.6 3.7 2.6 3.0 106.2 3.3 1.7 2.1 1.9
Number of Forecasts Changed From A Month Ago:
Down 0 1 5 1 4 6 5 6 4 6 3 5 9 5 9 8 7 6 8 6
Same 39 30 26 21 28 24 24 26 24 22 22 14 11 10 16 7 12 17 18 15
Up 1 2 1 1 1 1 2 6 9 12 11 5 5 5 6 4 18 11 11 12
Diffusion Index 51% 52% 44% 50% 45% 42% 45% 50% 57% 58% 61% 50% 42% 50% 45% 39% 65% 57% 54% 59%
$ Index
Avg. For ---Qtr.---
A. Fed's Adv
-------------(Q-Q % Change)--------------------------------(SAAR)-------------------
Fgn Econ
1FederalFunds
Prime LIBOR
Key Assumptions

8 BLUE CHIP FINANCIAL FORECASTS DECEMBER 1, 2020
Fourth Quarter 2021 Interest Rate Forecasts
---------------------------------------------------------Percent Per Annum -- Average For Quarter--------------------------------------------------------- Blue Chip ------------------------------Short-Term------------------------------ ---Intermediate-Term--- ---------------------Long-Term---------------------
Financial Forecasts 2 3 4 5 6 7 8 9 10 11 12 13 14 15 B. C. D. E.Panel Members Com. Treas. Treas. Treas. Treas. Treas. Treas. Treas. Aaa Baa State & Home GDP Cons. PCE
Bank Rate Paper Bills Bills Bills Notes Notes Notes Bond Corp. Corp. Local Mtg. Real Price Price PriceRate Rate 3-Mo. 1-Mo. 3-Mo. 6-Mo. 1-Yr. 2-Yr. 5-Yr. 10-Yr. 30-Yr. Bond Bond Bonds Rate GDP Index Index Index
Action Economics 0.1 H 3.3 H 0.3 0.1 L 0.1 L 0.2 0.2 0.3 0.6 0.9 1.7 2.5 3.4 2.9 3.2 106.2 na na na naAIG 0.1 H 3.3 H 0.3 na 0.1 L 0.1 L 0.2 0.3 0.5 1.0 1.8 na 3.4 na 3.1 na 2.8 2.3 3.5 H 3.2 HAmherst Pierpont Securities 0.1 H 3.3 H 0.3 0.2 0.2 0.3 H 0.3 0.5 1.1 H 1.9 H 2.9 H 3.7 H 4.6 H 3.3 3.8 H 108.5 3.9 2.4 2.8 2.5Bank of America 0.1 H na na na na na na na na na na na na na na na 5.0 1.4 1.7 1.4Barclays 0.1 H 3.3 H na na na na na 0.2 0.6 1.3 1.9 na na na na na 4.5 2.0 2.0 1.7BMO Capital Markets 0.1 H 3.3 H 0.2 L na 0.1 L 0.1 L 0.2 0.3 0.7 1.3 1.9 na na na 3.2 na 3.3 1.9 2.2 1.9BNP Paribas Americas 0.1 H na na na na na na 0.3 na 1.4 na na na na na na 4.3 na 1.3 1.1Chan Economics 0.1 H 3.3 H 0.3 0.2 0.2 0.2 0.2 0.3 0.5 1.0 1.8 2.7 3.8 2.7 3.0 105.4 3.0 1.8 2.0 1.9Chmura Economics & Analytics 0.1 H 3.3 H 0.4 0.2 0.1 L 0.2 0.2 0.2 0.5 0.9 1.7 2.4 na na 2.9 na 3.1 1.5 1.9 naComerica Bank 0.1 H 3.2 0.3 na 0.1 L 0.2 0.3 0.5 0.7 1.2 1.9 na na na 2.8 na 3.2 2.1 2.3 2.2Daiwa Capital Markets America 0.1 H 3.3 H 0.3 0.1 L 0.1 L 0.1 L 0.2 0.4 0.8 1.4 2.1 2.9 3.9 na 3.3 108.0 2.7 2.1 2.3 2.1DePrince & Assoc. 0.1 H 3.2 0.5 H 0.3 0.2 0.2 0.2 0.4 0.7 1.2 1.9 3.2 4.0 2.8 3.1 107.3 3.2 1.7 1.9 naEconomist Intelligence Unit 0.1 H 3.3 H na 0.2 0.2 0.2 0.2 0.2 0.4 1.0 1.6 na na na 3.0 na 5.8 H na 2.2 naFannie Mae 0.1 H 3.3 H na na 0.2 0.2 0.2 0.3 0.6 1.0 1.6 na na na 2.8 na 3.8 2.1 2.9 2.4Georgia State University 0.1 H 3.3 H na na 0.1 L 0.1 L 0.1 L 0.3 0.8 1.4 2.3 2.5 4.0 na 3.5 na 2.1 1.8 2.8 2.2GLC Financial Economics 0.1 H 3.3 H 0.4 0.2 0.1 L 0.1 L 0.2 0.3 0.5 0.8 1.0 L 2.2 L 3.4 2.5 2.7 L 107.0 4.2 1.9 2.3 2.3Goldman Sachs & Co. 0.1 H na 0.5 H na 0.3 H na na na na 1.3 na na na na na na 4.5 1.3 1.8 1.4Grant Thornton/Diane Swonk 0.1 H 3.3 H 0.4 0.5 H 0.1 L 0.1 L 0.2 0.3 0.5 1.1 2.1 2.6 3.6 na 3.1 na 4.3 1.9 2.8 2.2ING 0.1 H na 0.3 na na na na 0.4 0.8 1.3 2.2 na na na na na 3.5 na na naJ.P. Morgan Chase 0.1 H na na na na na na na na na na na na na na na 3.8 1.8 1.9 1.6Loomis, Sayles & Company 0.1 H 3.3 H 0.3 0.2 0.2 0.2 0.2 0.3 0.5 1.3 2.0 2.4 3.2 L 2.6 3.0 105.2 3.0 1.8 1.9 1.8MacroFin Analytics & Rutgers Bus School 0.1 H 3.3 H 0.3 0.2 0.2 0.2 0.2 0.3 0.5 1.0 1.7 2.7 3.4 3.0 2.9 107.0 2.0 L 1.7 2.0 2.2Mizuho Research Institute 0.1 H na na na na na na na na 0.9 na na na na na na na na na naMoody's Analytics 0.1 H 3.2 0.3 0.1 L 0.2 0.3 H 0.6 H 0.8 H 1.1 H 1.4 2.5 2.9 4.0 2.7 3.4 na 5.8 H 2.5 2.9 2.7Moody's Capital Markets Group 0.1 H 3.3 H 0.2 L 0.2 0.1 L 0.2 0.2 0.2 0.4 1.0 1.6 2.6 3.3 2.9 2.8 107.4 3.5 1.8 2.0 2.1MUFG Union Bank 0.1 H 3.3 H 0.2 L na 0.1 L 0.2 0.2 0.2 0.4 0.8 1.6 2.5 3.9 2.9 3.1 104.0 2.3 1.5 2.3 2.0Naroff Economic Advisors 0.1 H 3.3 H 0.3 0.2 0.2 0.3 H 0.4 0.5 0.7 1.1 2.0 2.5 4.2 2.8 3.3 109.8 H 2.3 2.2 2.2 2.2NatWest Markets 0.1 H 3.3 H 0.3 0.2 0.1 L 0.2 0.3 0.3 0.6 1.2 2.1 2.9 3.8 2.7 3.0 105.0 5.7 0.5 L 1.1 1.7Nomura Securities, Inc. 0.1 H 3.3 H na na na na na 0.2 0.7 1.0 na na na na na na 3.1 2.2 1.2 1.3Oxford Economics 0.1 H 3.3 H 0.3 na 0.2 0.2 0.2 0.2 0.5 1.4 2.0 na na na 3.1 107.8 3.2 2.0 1.7 1.7PNC Financial Services Corp. 0.1 H 3.3 H 0.2 L na 0.1 L 0.1 L 0.2 0.2 0.7 1.2 2.0 na 3.7 1.5 L 3.0 na 3.0 2.0 2.0 2.0RDQ Economics 0.1 H 3.3 H 0.3 0.2 0.1 L 0.1 L 0.2 0.2 1.0 1.7 2.6 3.1 4.2 3.9 H 3.7 107.3 3.6 3.1 H 2.6 2.5Regions Financial Corporation 0.1 H 3.3 H 0.4 0.3 0.2 0.2 0.2 0.5 0.6 1.2 2.0 2.8 3.8 2.7 3.2 105.6 4.2 1.9 1.9 2.3Scotiabank Group 0.1 H 3.3 H na na 0.1 L na na 0.6 1.0 1.5 2.0 na na na na na 3.2 1.6 2.2 2.0Swiss Re 0.1 H 3.3 H 0.4 0.3 0.2 0.2 0.3 0.4 0.6 1.0 1.6 3.1 4.3 na 2.7 L na 3.8 0.6 1.0 L 1.4The Northern Trust Company 0.1 H 3.2 0.3 0.1 L 0.1 L 0.2 0.2 0.3 0.7 1.1 2.1 2.9 3.9 3.7 3.1 102.0 3.5 1.8 1.7 1.7TS Lombard 0.1 H 3.2 0.4 0.2 0.2 0.2 0.3 0.4 0.5 1.3 2.0 2.7 3.6 1.9 3.3 104.0 4.5 1.0 1.0 L 1.0 LVia Nova Investment Mgt. 0.1 H 3.3 H 0.2 L 0.1 L 0.1 L 0.1 L 0.1 L 0.1 L 0.3 L 0.7 1.4 2.5 3.2 L 2.9 2.9 105.0 2.5 1.8 2.0 1.7Wells Fargo 0.1 H 3.3 H 0.3 0.1 L 0.1 L 0.1 L 0.2 0.2 0.6 1.2 2.0 2.7 3.6 3.2 3.0 na 2.8 1.8 2.4 1.7ACIMA Private Wealth -0.1 L 3.0 L 0.3 0.4 0.1 L 0.1 L 0.1 L 0.1 L 0.3 L 0.6 L 1.2 3.0 4.5 1.8 2.9 100.0 L 2.0 L 0.8 1.0 L 1.3
December Consensus 0.1 3.3 0.3 0.2 0.1 0.2 0.2 0.3 0.6 1.2 1.9 2.8 3.8 2.8 3.1 105.9 3.6 1.8 2.0 1.9
Top 10 Avg. 0.1 3.3 0.4 0.3 0.2 0.2 0.3 0.5 0.9 1.5 2.3 3.1 4.2 3.2 3.4 107.6 4.9 2.3 2.7 2.5
Bottom 10 Avg. 0.1 3.2 0.3 0.1 0.1 0.1 0.2 0.2 0.4 0.9 1.5 2.5 3.4 2.4 2.8 104.2 2.5 1.2 1.4 1.4
November Consensus 0.1 3.3 0.3 0.2 0.2 0.2 0.2 0.3 0.6 1.1 1.9 2.7 3.8 2.7 3.1 106.1 3.2 1.7 2.0 1.8
Number of Forecasts Changed From A Month Ago:
Down 1 2 6 0 2 3 4 6 6 4 4 5 8 5 8 6 7 7 5 3
Same 38 29 23 22 30 27 25 24 22 21 17 12 11 9 16 6 14 16 17 16
Up 1 2 1 1 1 1 2 5 6 12 12 7 6 6 7 7 16 11 14 13
Diffusion Index 50% 50% 42% 52% 48% 47% 47% 49% 50% 61% 62% 54% 46% 53% 48% 53% 62% 56% 63% 66%
$ Index
Avg. For ---Qtr.---
A. Fed's AdvFgn Econ
1FederalFunds
Prime LIBOR
Key Assumptions-------------(Q-Q % Change)--------------------------------(SAAR)-------------------

DECEMBER 1, 2020 BLUE CHIP FINANCIAL FORECASTS 9
First Quarter 2022 Interest Rate Forecasts
------------------------------------------------------------Percent Per Annum -- Average For Quarter------------------------------------------------------- Blue Chip ------------------------------Short-Term------------------------------ ---Intermediate-Term--- ---------------------Long-Term---------------------
Financial Forecasts 2 3 4 5 6 7 8 9 10 11 12 13 14 15 B. C. D. E.Panel Members Com. Treas. Treas. Treas. Treas. Treas. Treas. Treas. Aaa Baa State & Home GDP Cons. PCE
Bank Rate Paper Bills Bills Bills Notes Notes Notes Bond Corp. Corp. Local Mtg. Real Price Price PriceRate Rate 3-Mo. 1-Mo. 3-Mo. 6-Mo. 1-Yr. 2-Yr. 5-Yr. 10-Yr. 30-Yr. Bond Bond Bonds Rate GDP Index Index Index
Amherst Pierpont Securities 0.2 H 3.3 H 0.5 H 0.3 0.4 H 0.5 H 0.6 0.7 1.4 H 2.1 H 3.1 H 3.9 H 4.8 H 3.5 4.0 H 109.5 H 3.5 2.5 H 2.8 2.5 HRegions Financial Corporation 0.2 H 3.3 H 0.4 0.3 0.2 0.3 0.3 0.5 0.7 1.3 2.1 2.8 3.9 2.7 3.3 106.0 2.1 1.7 1.8 1.6Action Economics 0.1 3.3 H 0.3 0.1 L 0.1 L 0.2 0.2 0.3 0.6 0.9 1.7 2.5 3.4 2.9 3.2 106.0 na na na naAIG 0.1 3.3 H 0.3 na 0.1 L 0.1 L 0.2 0.3 0.6 1.1 1.9 na 3.4 na 3.1 na 3.2 1.7 2.0 1.5BMO Capital Markets 0.1 3.3 H 0.2 L na 0.1 L 0.1 L 0.2 0.3 0.8 1.3 2.0 na na na 3.2 na 2.6 1.8 2.0 1.8BNP Paribas Americas 0.1 na na na na na na na na na na na na na na na 3.2 na 2.1 1.9Chan Economics 0.1 3.3 H 0.4 0.3 0.2 0.2 0.3 0.4 0.6 1.1 1.9 2.8 3.9 2.8 3.1 105.7 2.0 1.9 2.0 2.0Chmura Economics & Analytics 0.1 3.3 H 0.4 0.2 0.1 L 0.2 0.2 0.2 0.5 0.9 1.7 2.5 na na 2.9 na 2.3 2.0 1.2 naComerica Bank 0.1 3.2 0.3 na 0.1 L 0.2 0.3 0.5 0.7 1.3 2.0 na na na 2.8 na 2.9 2.0 1.8 1.8Daiwa Capital Markets America 0.1 3.3 H 0.3 0.1 L 0.1 L 0.1 L 0.2 0.5 1.0 1.6 2.3 3.1 4.1 na 3.5 108.0 2.5 2.1 2.4 2.2DePrince & Assoc. 0.1 3.2 0.5 H 0.4 H 0.2 0.2 0.3 0.4 0.8 1.3 1.9 3.3 4.0 2.7 3.2 107.5 3.2 1.7 2.1 naEconomist Intelligence Unit 0.1 3.3 H na 0.2 0.2 0.2 0.2 0.2 0.5 1.1 1.7 na na na 3.1 na 0.8 L na 2.1 naFannie Mae 0.1 3.3 H na na 0.2 0.2 0.3 0.3 0.7 1.0 1.7 na na na 2.8 na 3.6 2.1 2.6 2.3Georgia State University 0.1 3.3 H na na 0.1 L 0.1 L 0.1 L 0.4 0.9 1.6 2.4 2.5 4.0 na 3.5 na 5.0 1.5 2.3 1.9GLC Financial Economics 0.1 3.3 H 0.4 0.2 0.1 L 0.1 L 0.2 0.3 0.4 1.0 1.5 3.2 4.4 3.0 2.8 107.1 4.0 1.7 1.7 1.7Goldman Sachs & Co. 0.1 na 0.5 H na 0.3 na na na na 1.4 na na na na na na 3.0 1.7 2.0 1.8Grant Thornton/Diane Swonk 0.1 3.3 H 0.4 0.4 H 0.1 L 0.1 L 0.2 0.3 0.6 1.2 2.1 2.7 3.6 na 3.1 na 1.9 2.2 2.9 H 2.5 HING 0.1 na 0.3 na na na na 0.4 0.8 1.3 2.2 na na na na na 3.2 na na naLoomis, Sayles & Company 0.1 3.3 H 0.3 0.2 0.2 0.2 0.2 0.3 0.6 1.3 2.0 2.4 L 3.2 L 2.4 2.9 105.2 3.0 1.9 1.9 1.8MacroFin Analytics & Rutgers Bus School 0.1 3.3 H 0.3 0.2 0.2 0.2 0.3 0.3 0.5 1.0 1.7 2.7 3.4 3.0 3.0 107.5 1.8 2.1 2.2 2.2Mizuho Research Institute 0.1 na na na na na na na na 0.9 na na na na na na na na na naMoody's Analytics 0.1 3.2 0.4 0.1 L 0.2 0.3 0.7 H 0.9 H 1.3 1.6 2.7 3.0 4.1 2.7 3.6 na 5.2 H 2.3 2.8 2.5 HMoody's Capital Markets Group 0.1 3.3 H 0.2 L 0.2 0.2 0.2 0.3 0.3 0.5 1.1 1.7 2.6 3.3 3.0 2.9 107.6 3.9 1.8 1.9 1.9MUFG Union Bank 0.1 3.3 H 0.2 L na 0.1 L 0.2 0.2 0.2 0.4 0.8 1.6 2.5 3.9 2.9 3.1 103.0 2.0 1.5 2.3 2.1Naroff Economic Advisors 0.1 3.3 H 0.4 0.2 0.3 0.3 0.4 0.6 0.9 1.2 2.1 2.7 4.4 2.9 3.5 109.0 2.5 1.7 2.4 2.4NatWest Markets 0.1 3.3 H 0.3 0.2 0.1 L 0.2 0.3 0.3 0.7 1.2 2.1 2.9 3.8 2.7 3.0 105.0 4.2 1.7 2.2 1.7Nomura Securities, Inc. 0.1 3.3 H na na na na na 0.2 0.9 1.1 na na na na na na 3.9 2.3 1.5 1.4Oxford Economics 0.1 3.3 H 0.3 na 0.2 0.2 0.2 0.2 0.6 1.4 2.1 na na na 3.1 107.6 3.0 2.0 1.8 1.8PNC Financial Services Corp. 0.1 3.3 H 0.2 L na 0.1 L 0.1 L 0.2 0.2 0.8 1.3 2.2 na 3.8 1.6 L 3.1 na 2.4 2.1 2.1 2.1Scotiabank Group 0.1 3.3 H na na 0.1 L na na 0.6 1.0 1.5 2.0 na na na na na 3.0 1.8 2.1 1.9Swiss Re 0.1 3.3 H 0.4 0.3 0.2 0.2 0.3 0.4 0.6 1.0 1.6 3.1 3.9 na 2.7 L na 2.3 na 1.1 naThe Northern Trust Company 0.1 3.2 0.3 0.1 L 0.1 L 0.2 0.3 0.3 0.8 1.3 2.3 3.1 4.1 3.9 H 3.3 101.0 3.2 1.9 1.8 1.8TS Lombard 0.1 3.2 0.4 0.2 0.2 0.2 0.4 0.6 0.7 1.3 2.0 2.7 3.6 1.9 3.3 100.0 L 4.0 1.2 1.2 1.2 LVia Nova Investment Mgt. 0.1 3.3 H 0.2 L 0.1 L 0.1 L 0.1 L 0.1 L 0.1 L 0.3 L 0.7 1.4 2.5 3.2 L 2.9 2.9 105.0 2.5 1.8 2.0 1.8Wells Fargo 0.1 3.3 H 0.3 0.1 L 0.1 L 0.1 L 0.2 0.3 0.7 1.3 2.1 2.7 3.6 3.3 3.1 na 2.8 1.8 2.3 1.7ACIMA Private Wealth -0.1 L 3.0 L 0.3 0.4 H 0.1 L 0.1 L 0.1 L 0.1 L 0.3 L 0.5 L 1.2 L 3.0 4.5 1.8 3.0 100.0 L 3.0 0.9 L 1.0 L 1.2 L
December Consensus 0.1 3.3 0.3 0.2 0.2 0.2 0.3 0.4 0.7 1.2 2.0 2.8 3.8 2.8 3.1 105.6 3.0 1.8 2.0 1.9
Top 10 Avg. 0.1 3.3 0.4 0.3 0.2 0.3 0.4 0.6 1.0 1.5 2.4 3.1 4.2 3.1 3.4 107.6 4.1 2.2 2.5 2.3
Bottom 10 Avg. 0.1 3.2 0.3 0.1 0.1 0.1 0.2 0.2 0.5 0.9 1.6 2.6 3.5 2.4 2.9 103.7 1.9 1.5 1.5 1.6
November Consensus 0.1 3.3 0.3 0.2 0.2 0.2 0.3 0.4 0.7 1.2 2.0 2.8 3.9 2.7 3.2 106.4 2.9 1.8 2.0 1.9
Number of Forecasts Changed From A Month Ago:
Down 0 2 5 0 2 5 4 7 4 5 5 5 7 4 5 6 5 5 5 8
Same 34 25 23 20 28 23 22 20 21 20 16 11 10 11 18 9 13 18 15 11
Up 2 4 1 2 2 2 4 6 8 10 11 7 7 4 7 3 16 7 12 8
Diffusion Index 53% 53% 43% 55% 50% 45% 50% 48% 56% 57% 59% 54% 50% 50% 53% 42% 66% 53% 61% 50%
$ Index
Avg. For ---Qtr.---
A. Fed's Adv
-------------(Q-Q % Change)--------------------------------(SAAR)-------------------
Fgn Econ
1FederalFunds
Prime LIBOR
Key Assumptions

10 BLUE CHIP FINANCIAL FORECASTS DECEMBER 1, 2020 International Interest Rate And Foreign Exchange Rate Forecasts
United StatesFed Fund Target Rate 10 Yr. Gov't Bond Yield % Fed's AFE $ Index
Blue Chip Forecasters In 3 Mo. In 6 Mo. In 12 Mo. In 3 Mo. In 6 Mo. In 12 Mo. In 3 Mo. In 6 Mo. In 12 Mo.Barclays 0.13 0.13 -- 1.00 1.10 -- -- -- --BMO Capital Markets 0.13 0.13 0.13 1.05 1.10 1.25 105.5 105.0 104.2IHSMarkit -- -- -- 0.88 0.93 1.06 -- -- --ING Financial Markets 0.13 0.13 0.13 0.75 1.00 1.25 104.5 102.6 101.0Mizuho Research Institute -- -- -- 0.85 0.85 0.85 -- -- --Moody's Analytics 0.08 0.07 0.07 0.79 0.90 1.37 -- -- --Moody's Capital Markets 0.13 0.13 0.13 0.80 0.85 1.00 105.9 107.0 107.4Northern Trust 0.08 0.08 0.08 0.80 0.90 1.10 106.0 104.5 102.0Oxford Economics 0.13 0.13 0.13 0.95 1.12 1.39 107.4 107.8 107.8Scotiabank 0.13 0.13 0.13 0.85 1.10 1.50 -- -- --TS Lombard 0.13 0.13 0.13 0.80 1.00 1.25 108.0 105.0 104.0Wells Fargo 0.13 0.13 0.13 0.85 1.00 1.20 105.5 105.0 103.8December Consensus 0.12 0.12 0.12 0.86 0.99 1.20 106.1 105.3 104.3High 0.13 0.13 0.13 1.05 1.12 1.50 108.0 107.8 107.8Low 0.08 0.07 0.07 0.75 0.85 0.85 104.5 102.6 101.0Last Months Avg. 0.12 0.12 0.12 0.78 0.88 1.12 106.9 106.7 104.5
JapanPolicy-Rate Balance Rate 10 Yr. Gov't Bond Yield % Yen per US$
Blue Chip Forecasters In 3 Mo. In 6 Mo. In 12 Mo. In 3 Mo. In 6 Mo. In 12 Mo. In 3 Mo. In 6 Mo. In 12 Mo.Barclays -0.10 -0.10 -- 0.05 0.05 -- 103.0 104.0 --BMO Capital Markets -0.10 -0.10 -0.10 -0.05 -0.05 -0.05 105.0 106.0 107.0IHSMarkit -- -- -- -- -- -- 105.1 104.9 104.3ING Financial Markets -0.10 -0.10 -0.10 0.00 0.00 0.00 102.0 102.0 102.0Mizuho Research Institute -0.10 -0.10 -0.10 0.00 0.00 0.00 107.0 107.0 108.0Moody's Analytics -0.10 -0.10 -0.10 -0.01 0.00 0.01 102.2 99.6 97.3Moody's Capital Markets -0.10 -0.10 -0.10 0.00 0.00 0.12 104.6 104.7 104.8Nomura Securities -- -- -- -- -- -- 105.0 106.0 108.0Northern Trust -0.10 -0.10 -0.10 0.00 0.00 0.00 104.0 103.0 102.0Oxford Economics -0.05 -0.05 -0.05 0.00 0.00 0.00 105.5 105.5 105.5Scotiabank -0.10 -0.10 -0.10 -- -- -- 104.0 104.0 102.0TS Lombard -0.06 -0.06 -0.06 0.00 0.00 0.00 106.0 103.0 100.0Wells Fargo -0.10 -0.10 -0.10 0.05 0.10 0.15 105.0 106.0 108.0December Consensus -0.09 -0.09 -0.09 0.00 0.01 0.03 104.5 104.3 104.1High -0.05 -0.05 -0.05 0.05 0.10 0.15 107.0 107.0 108.0Low -0.10 -0.10 -0.10 -0.05 -0.05 -0.05 102.0 99.6 97.3Last Months Avg. -0.08 -0.08 -0.08 0.01 0.01 0.01 104.8 104.8 104.6
United KingdomOfficial Bank Rate 10 Yr. Gilt Yields % US$ per Pound Sterling
Blue Chip Forecasters In 3 Mo. In 6 Mo. In 12 Mo. In 3 Mo. In 6 Mo. In 12 Mo. In 3 Mo. In 6 Mo. In 12 Mo.Barclays 0.10 0.10 -- 0.40 0.40 -- 1.30 1.30 --BMO Capital Markets 0.10 0.10 0.10 0.50 0.60 0.75 1.31 1.31 1.33IHSMarkit -- -- -- -- -- -- 1.34 1.35 1.37ING Financial Markets 0.10 0.10 0.10 0.20 0.30 0.50 1.36 1.39 1.42Moody's Analytics 0.10 0.10 0.10 0.10 0.14 0.39 1.33 1.38 1.63Moody's Capital Markets 0.10 0.10 0.10 0.25 0.30 0.45 1.32 1.31 1.30Nomura Securities -- -- -- -- -- -- 1.35 1.37 1.42Northern Trust 0.10 0.10 0.10 0.30 0.40 0.50 1.28 1.27 1.29Oxford Economics 0.10 0.10 0.10 0.34 0.31 0.31 1.32 1.32 1.33Scotiabank 0.10 0.10 0.10 -- -- -- 1.30 1.31 1.33TS Lombard 0.10 0.10 0.10 0.19 0.25 0.30 1.25 1.20 1.24Wells Fargo 0.10 0.10 0.10 0.30 0.40 0.50 1.32 1.33 1.35December Consensus 0.10 0.10 0.10 0.29 0.34 0.46 1.32 1.32 1.36High 0.10 0.10 0.10 0.50 0.60 0.75 1.36 1.39 1.63Low 0.10 0.10 0.10 0.10 0.14 0.30 1.25 1.20 1.24Last Months Avg. 0.10 0.10 0.10 0.28 0.34 0.46 1.29 1.30 1.35
SwitzerlandSNB Policy Rate 10 Yr. Gov't Bond Yield % CHF per US$
Blue Chip Forecasters In 3 Mo. In 6 Mo. In 12 Mo. In 3 Mo. In 6 Mo. In 12 Mo. In 3 Mo. In 6 Mo. In 12 Mo.Barclays -0.75 -0.75 -- -- -- -- 0.90 0.92 --IHSMarkit -- -- -- -- -- -- 0.93 0.93 0.94ING Financial Markets -0.75 -0.75 -0.75 -0.55 -0.40 -0.30 0.90 0.90 0.92Moody's Analytics -0.75 -0.75 -0.75 -1.17 -1.25 -1.23 0.87 0.84 0.82Moody's Capital Markets -0.75 -0.75 -0.75 -0.60 -0.55 -0.41 0.92 0.92 0.93Nomura Securities -- -- -- -- -- -- 0.87 0.87 0.87Northern Trust -0.75 -0.75 -0.75 -0.50 -0.50 -0.50 0.91 0.90 0.89Oxford Economics -0.75 -0.75 -0.75 -0.59 -0.58 -0.56 0.91 0.93 0.95Scotiabank -- -- -- -- -- -- 0.91 0.91 0.91TS Lombard -0.75 -0.75 -0.75 -0.50 -0.50 -0.50 0.97 0.97 0.97Wells Fargo -- -- -- -- -- -- 0.92 0.92 0.91December Consensus -0.75 -0.75 -0.75 -0.65 -0.63 -0.58 0.91 0.91 0.91High -0.75 -0.75 -0.75 -0.50 -0.40 -0.30 0.97 0.97 0.97Low -0.75 -0.75 -0.75 -1.17 -1.25 -1.23 0.87 0.84 0.82Last Months Avg. -0.75 -0.75 -0.75 -0.59 -0.57 -0.53 0.91 0.91 0.91
CanadaO/N MMkt Financing Rate 10 Yr. Gov't Bond Yield % C$ per US$
Blue Chip Forecasters In 3 Mo. In 6 Mo. In 12 Mo. In 3 Mo. In 6 Mo. In 12 Mo. In 3 Mo. In 6 Mo. In 12 Mo.Barclays 0.25 0.25 -- -- -- -- 1.31 1.30 --BMO Capital Markets 0.25 0.25 0.25 0.85 0.95 1.10 1.30 1.30 1.29IHSMarkit -- -- -- -- -- -- 1.33 1.31 1.30ING Financial Markets 0.25 0.25 0.25 0.75 1.00 1.25 1.29 1.25 1.23Moody's Analytics 0.25 0.25 0.25 0.79 0.96 1.38 1.33 1.32 1.29Moody's Capital Markets 0.25 0.25 0.25 0.62 0.68 0.83 1.31 1.32 1.32Nomura Securities -- -- -- -- -- -- 1.34 1.33 1.30Northern Trust 0.25 0.25 0.25 0.70 0.80 0.90 1.31 1.29 1.28Oxford Economics 0.25 0.25 0.25 1.02 1.15 1.33 1.39 1.40 1.40Scotiabank 0.25 0.25 0.25 -- -- -- 1.30 1.30 1.28TS Lombard 0.25 0.25 0.25 0.53 0.43 0.50 1.38 1.38 1.38Wells Fargo 0.25 0.25 0.25 0.75 0.90 1.05 1.30 1.28 1.25December Consensus 0.25 0.25 0.25 0.75 0.86 1.04 1.32 1.32 1.30High 0.25 0.25 0.25 1.02 1.15 1.38 1.39 1.40 1.40Low 0.25 0.25 0.25 0.53 0.43 0.50 1.29 1.25 1.23Last Months Avg. 0.25 0.25 0.25 0.71 0.83 1.04 1.33 1.32 1.31

DECEMBER 1, 2020 BLUE CHIP FINANCIAL FORECASTS 11
AustraliaOfficial Cash Rate 10 Yr. Gov't Bond Yield % US$ per A$
Blue Chip Forecasters In 3 Mo. In 6 Mo. In 12 Mo. In 3 Mo. In 6 Mo. In 12 Mo. In 3 Mo. In 6 Mo. In 12 Mo.Barclays 0.10 0.10 -- -- -- -- 0.72 0.71 --IHSMarkit -- -- -- -- -- -- 0.72 0.71 0.69ING Financial Markets 0.10 0.10 0.10 1.00 1.10 1.40 0.74 0.76 0.77Moody's Analytics 0.10 0.10 0.10 0.82 0.80 1.21 0.68 0.71 0.71Moody's Capital Markets 0.10 0.10 0.10 0.80 0.85 1.00 0.73 0.74 0.74Nomura Securities -- -- -- -- -- -- 0.72 0.73 0.75Northern Trust 0.10 0.10 0.10 0.90 0.95 1.00 0.72 0.73 0.75Oxford Economics 0.07 0.07 0.09 0.93 0.94 0.95 0.72 0.72 0.73Scotiabank 0.25 0.25 0.25 -- -- -- 0.73 0.73 0.75TS Lombard 0.25 0.25 0.25 0.90 0.80 0.70 0.66 0.66 0.66Wells Fargo -- -- -- -- -- -- 0.73 0.75 0.78December Consensus 0.13 0.13 0.14 0.89 0.91 1.04 0.72 0.72 0.73High 0.25 0.25 0.25 1.00 1.10 1.40 0.74 0.76 0.78Low 0.07 0.07 0.09 0.80 0.80 0.70 0.66 0.66 0.66Last Months Avg. 0.22 0.22 0.23 0.90 0.92 1.01 0.71 0.72 0.72
Euro areaMain Refinancing Rate US$ per Euro
Blue Chip Forecasters In 3 Mo. In 6 Mo. In 12 Mo. In 3 Mo. In 6 Mo. In 12 Mo.Barclays 0.00 0.00 -- 1.18 1.16 --BMO Capital Markets 0.00 0.00 0.00 1.19 1.20 1.22IHSMarkit -- -- -- 1.16 1.16 1.16ING Financial Markets 0.00 0.00 0.00 1.20 1.22 1.25Moody's Analytics 0.00 0.00 0.00 1.20 1.24 1.28Moody's Capital Markets 0.00 0.00 0.00 1.18 1.17 1.16Nomura Securities -- -- -- 1.21 1.23 1.25Northern Trust 0.00 0.00 0.00 1.18 1.20 1.23Oxford Economics 0.00 0.00 0.00 1.18 1.18 1.19Scotiabank 0.00 0.00 0.00 1.20 1.20 1.21TS Lombard 0.00 0.00 0.00 1.15 1.12 1.20Wells Fargo 0.00 0.00 0.00 1.18 1.18 1.20December Consensus 0.00 0.00 0.00 1.18 1.19 1.21High 0.00 0.00 0.00 1.21 1.24 1.28Low 0.00 0.00 0.00 1.15 1.12 1.16Last Months Avg. 0.00 0.00 0.00 1.18 1.19 1.21
Blue Chip Forecasters In 3 Mo. In 6 Mo. In 12 Mo. In 3 Mo. In 6 Mo. In 12 Mo. In 3 Mo. In 6 Mo. In 12 Mo. In 3 Mo. In 6 Mo. In 12 Mo.Barclays -0.50 -0.45 -- -- -- -- -- -- -- -- -- --BMO Capital Markets -0.40 -0.30 -0.15 -- -- -- -- -- -- -- -- --ING Financial Markets -0.55 -0.40 -0.25 -0.35 -0.20 -0.05 0.55 0.60 0.65 0.10 0.20 0.35Moody's Analytics -0.58 -0.53 -0.31 -0.29 -0.25 -0.05 0.89 0.88 1.03 0.17 0.23 0.36Moody's Capital Markets -0.62 -0.58 -0.42 -0.37 -0.33 -0.17 0.55 0.61 0.75 0.01 0.04 0.18Northern Trust -0.55 -0.45 -0.35 -0.30 -0.20 -0.10 0.70 0.80 0.90 0.20 0.30 0.40Oxford Economics -0.62 -0.60 -0.57 -0.33 -0.30 -0.25 0.80 0.92 1.15 0.19 0.25 0.36TS Lombard -0.50 -0.40 -0.20 -0.25 -0.15 0.05 0.57 0.67 0.87 0.07 0.17 0.37Wells Fargo -0.55 -0.40 -0.20 -- -- -- -- -- -- -- -- --December Consensus -0.54 -0.46 -0.31 -0.32 -0.24 -0.10 0.68 0.75 0.89 0.12 0.20 0.34High -0.40 -0.30 -0.15 -0.25 -0.15 0.05 0.89 0.92 1.15 0.20 0.30 0.40Low -0.62 -0.60 -0.57 -0.37 -0.33 -0.25 0.55 0.60 0.65 0.01 0.04 0.18Last Months Avg. -0.48 -0.42 -0.28 -0.20 -0.14 0.04 0.95 1.02 1.24 0.35 0.45 0.66
International Interest Rate And Foreign Exchange Rate Forecasts
10 Yr. Gov't Bond Yields %Germany France Italy Spain
Japan -0.81 -0.86 -0.98 -1.18 Japan -0.23 -0.21 -0.03 -0.21United Kingdom -0.40 -0.58 -0.64 -0.74 United Kingdom -0.03 -0.02 -0.02 -0.02Switzerland -1.30 -1.52 -1.62 -1.79 Switzerland -0.88 -0.87 -0.87 -0.87Canada -0.17 -0.11 -0.13 -0.16 Canada 0.13 0.13 0.13 0.13Australia 0.03 0.03 -0.08 -0.16 Australia -0.03 0.01 0.01 0.02Germany -1.42 -1.41 -1.44 -1.51 Euro area -0.13 -0.12 -0.12 -0.12France -1.18 -1.18 -1.23 -1.30Italy -0.23 -0.19 -0.24 -0.31Spain -0.76 -0.74 -0.79 -0.87
In 6 Mo. In 12 Mo.
Consensus Forecasts Consensus Forecasts10-year Bond Yields vs U.S. Yield Policy Rates vs U.S. Target Rate
Current In 3 Mo. In 6 Mo. In 12 Mo. Current In 3 Mo.

12 BLUE CHIP FINANCIAL FORECASTS DECEMBER 1, 2020
Viewpoints: Can U.S. Consumers Cope Without More Fiscal Aid? Apart from war-time rebuilding, America’s fiscal response to the pan-demic was unparalleled, and explains the perky recovery even in the face of renewed restrictions. With households driving the economy, this note focuses on the fiscal impact on personal income and spending— how much the support measures have helped, and how much it will hurt when they expire. We also discuss postelection prospects for more stimulus. According to the Congressional Budget Office, the four pan-demic relief bills passed so far lifted the budget deficit by $2.3 trillion in fiscal 2020 and by $0.6 trillion in 2021. Without this support, the CBO estimates that U.S. GDP would have been 4.7% lower in 2020. In other words, the economy would have contracted by more than 8% this year instead of 3.5%, our current tally. Together with forgivable loans to companies via the Paycheck Protection Program (funded at $660 billion), which indirectly helped workers, much of the fiscal aid was in the form of direct payments to households. This included $1,200 in recovery rebate cheques to most taxpayers (and $500 to children), and an expansion, extension and supplementation of UI benefits. The rebate cheques, which were distributed mostly in April, added around $270 billion to 2020 personal income, or 1.4%. The extra UI benefits included a $600 weekly federal top-up to regular state benefits (Federal Pandemic Unemployment Compensation), an expansion of benefits to the self-employed and contract workers (Pandemic Unem-ployment Assistance or PUA), and a 13-week extension of regular state benefits (Pandemic Emergency Unemployment Compensation or PEUC). Between April and September, the extra UI benefits added more than $360 billion to 2020 income, or 1.8%. The CBO figures that 1.1 ppts of the 4.7% fiscal lift to GDP this year stemmed from the extra UI support, 0.8 ppts came from the Paycheck Protection Program (mostly by limiting business insolvencies and per-manent layoffs), and 0.6 ppts was from the rebate cheques. Increased federal funding for state and local governments, to help cover the costs of combatting the pandemic and minimize job layoffs owing to bal-anced budget requirements, added 0.5 ppts of support. All remaining spending and revenue provisions added 1.7 ppts, and many indirectly supported workers and households. According to the IMF, the U.S. government ranked second among major economies (after Canada) in providing direct pandemic relief. The $600 federal U.I. top-up expired on July 31 and the payout was halved to $300 per week via executive action with funding provided by FEMA’s Disaster Relief Fund. This contributed to a 2.5% drop in per-sonal income in August. Because of the earlier boost in government transfer payments to individuals, income was still 3.5% higher in Sep-tember than in February. That’s despite the labour market recovering just 52% of the earlier 22 million job losses. While worker compensa-tion fell 2.6% between February and September, transfers to individuals jumped 29%. In dollar terms, the increase in transfers was three times greater than the decrease in compensation. A wide gap between higher income and softer spending —with nominal consumption still down 2% since February after plunging 19% in the spring—has sent household saving skyward. Though more than halving since peaking above 33% in April, the 14.3% personal saving rate in September is still about double the prepandemic norm. Compared to the flow of saving in February, an extra $1.2 trillion (or more than 6% of GDP) has piled up for households and this figure will continue to rise in the near term, albeit at an ebbing clip. Boosted by still-elevated transfer payments and rebounding small business income, personal income con-
tinues to flow faster than outlays, as spending on services remains con-strained. Importantly, it isn't just tax rebates and extra UI payments that have countered the collapse in worker earnings and padded personal saving. As the Fed cut policy rates to near zero and began buying large amounts of debt securities, 30-year mortgage rates tumbled below 3% for the first time and continue to hover near record lows. This caused mortgage refinancing to surge. The Mortgage Bankers Association’s index hit its highest level in nearly 12 years in March and has stayed elevated. For many homeowners, refinancing is freeing up cash flow that would otherwise be devoted to loan payments and, for others, it is generating lump-sum cash payments. Total cash-out volume was just under $60 billion in Q3, the most in over 13 years. To put this in perspective, at about an annualized $240 billion, cashout volume represents more than three-quarters of the current $312 billion shortfall in employee compen-sation from its pre-pandemic peak. However, only homeowners benefit from the refinancing lift to income. Renters incurred much of the loss in compensation, though they are currently protected against eviction under federal, state or local laws until year-end. Many homeowners are taking advantage of the CARES Act’s forbearance program, which also expires at year-end. Still, it should be noted that the average credit (FICO) score has in-creased as income-support programs allowed borrowers to stay current on payments, and forbearance measures (also including the CARES Act’s program for student loans) did not tarnish credit ratings. Credit card debt also dropped sharply, as this is where some rebate cheques were put to work. According to the New York Fed, households used a third (35%) of the rebates to reduce debt, while 29% was spent and 36% was saved. Turning to what this means for consumer spending, note that, despite a 2.5% decline in personal income in August owing to the $300 reduction in weekly supplemental UI payments, spending actually rose 1.0% that month. The saving flow absorbed the hit to income, and still ran above its pre-pandemic pace. Funding for the $300 supplemental payment ran out in October, likely resulting in a modest decline in personal income. However, consumer spending still looks to have risen last month. Of course, it helps that steady job growth has cut the ranks of those collect-ing some form of UI benefits (20 million in late October versus 28 mil-lion in late July). Importantly, excess saving is primed to also absorb the December 26 expiry of the PUA and PEUC programs. As of Octo-ber 31, some 13 million persons relied on these programs. Assuming the number of recipients falls to about 12 million at year-end, it should result in a smaller drag on personal income (of less than $200 billion annualized) than the hit caused by either of the two top-up reductions. While excess saving affords a thick cushion of support against expiring government transfers, this is cold comfort for the millions of households with little or no savings who are about to exhaust UI benefits. Many worked in industries hammered by the pandemic. Moreover, the expiry of eviction moratoriums, along with mortgage and student loan forbear-ance, will likely lead to higher defaults, magnifying the hit to spending. Some extension of these programs is likely needed to avoid putting the recovery on a rocky footing now that the pandemic has caught a second wind.
A Sampling of Views on the Economy, Financial Markets and Government Policy Excerpted from Recent Reports Issued by our Blue Chip Panel Members and Others

DECEMBER 1, 2020 BLUE CHIP FINANCIAL FORECASTS 13 The seven-day average of new COVID-19 infections has topped 165,000 as of November 19, causing more state and local governments to renew restrictions on business activity, albeit in a targeted fashion. If there is no return to widespread lockdowns, the fact that businesses are more accustomed to operating under COVID protocols and that the weakest firms have already succumbed to the first wave suggests a less negative impact on the economy this time around. And, even business confidence should prove more resilient with major progress being made towards an effective, safe and widely distributed vaccine. Nevertheless, a re-opened and extra-funded Paycheck Protection Pro-gram (PPP) will likely be required to keep the potential second wave of job layoffs and business closures to a minimum. Many businesses are still facing a sharp decline in sales, and previous PPP loan proceeds have already been used to pay wages and other costs to fulfill for-giveness requirements. The PPP closed on August 8 after backing 5.2 million loans worth $525 billion, and the undisbursed $134 billion of funds went back into Treasury’s coffers. More direct federal support for state and local governments is also needed to keep schools open (critical to keeping people in the labour force) and to cover higher healthcare expenses at a time when financial resources are depleted by the first wave—and major cutbacks are re-quired to balance budgets. For states, the Wall Street Journal calls this the “biggest cash crisis since the Great Depression”. There have already been bipartisan appeals for $500 billion from the National Governors Association and $250 billion from The United States Conference of Mayors. While direct income support for households was a key feature of the first wave’s relief bills, we judge indirect support via measures designed to further assist small businesses and municipal governments will likely be key measures in the second wave’s relief package. Assuming Con-gress remains divided after the January 5 run-offs in two senate seats in Georgia, our working assumption is a stimulus deal worth up to $1.0 trillion, or about 5% of GDP. If the Democrats end up controlling the Senate, we could easily see double this figure. Bottom Line: Expected further fiscal aid underpins our outlook for 4% GDP growth in 2021, assuming the second wave doesn't trigger a tsu-nami of restrictions. Consumer spending will still downshift in coming months, as a new fiscal deal could be seriously delayed. However, the slowing will stem more from waning pent-up demand and lingering virus anxiety than from the end of income-support programs. Past relief measures have effectively boosted aggregate saving, giving consumers some backbone. This means that even if Congress remains gridlocked and no further relief bill is passed, the recovery will be dented but likely not derailed.
Michael Gregory and Sal Guatieri (BMO Capital Markets Economics) A Winter of Economic Discontent Yes, we’re getting closer to an effective, safe and widely-available COVID-19 vaccine. Over the past couple of weeks, news on the first criterion has excited even the scientists, let alone the stock market. The second criterion seems to be getting satisfied, but longer-term safety assessment, like longer-term efficacy evaluation, does require the pas-sage of time. The third criterion remains at the wait-and-see stage. However, even if these three vaccine criteria are adequately addressed, there’s the fourth issue of whether the public has the confidence to will-ingly get jabbed. Thus, for the U.S. and global economies, a pandemic-liberating vaccine is not yet as close. Meanwhile, the virus’ second wave continues to surge, with the people-gathering prone-Thanksgiving and other holidays fast approaching. The
seven-day average of new U.S. infections has now topped 165,000 (No-vember 19), doubling in the past 2½ weeks and causing more states and local governments to increase restrictions. As long as there’s no return to widespread lockdowns, the second wave should have less negative influence on the economy than the first wave. Businesses are now more accustomed to operating under COVID protocols, the weakest firms already closed amid the first wave and business confidence should prove more resilient given the progress towards a vaccine. But there will still be some negative economic impact, with the risks surrounding the near-term outlook skewed decidedly to the downside. A prudent risk management approach to economic policy dictates that if you can’t do anything that mitigates the risks, at least don’t magnify them. But, in post-election, now-even-more-partisan Washington, the politi-cians’ paucity of prudence is in full display. In 41 days, 13.1 million Americans will lose their federally funded unemployment insurance benefits, unless Congress extends them in the final 14 scheduled days of its lame-duck session. And, there’s an even wider swath of the popula-tion potentially impacted by the contemporaneous expiries of federal student loan and mortgage forbearance programs along with the pan-jurisdictional moratoriums on renter evictions. The new Congress and the Administration (Trump’s until it’s Biden’s on January 20) could still address these issues retroactively, but the 2021 political environ-ment could remain as toxic as 2020’s. And, even retroactive resolution might not prevent a permanent scar on consumer confidence from going hungry and homeless, even if just for a few days or weeks. Enter Treasury Secretary Mnuchin, who appeared to play nice with the Fed in the sandbox at the start of the pandemic; now, he wants his ball back before heading home. The CARES Act authorized $500 billion for the Exchange Stabilization Fund (ESF), which is controlled by the Treasury Secretary (how the funds are ‘invested’) under approval of the President. The Act allowed $46 billion to be direct loans to companies in passenger and cargo air transportation and other businesses vital to national security: the remaining $454 billion was earmarked as capital to support the Fed’s lending programs. The latter was in addition to the $40 billion (from the ESF) Mr. Mnuchin gave the Fed before the CARES Act to start setting up the facilities. The Fed has already allo-cated $205 billion of the total $494 billion to the Commercial Paper Funding Facility, the Corporate Credit Facility, the Main Street Lending Programs, the Municipal Liquidity Facility and the Term Asset-Backed Securities Loan Facility (TALF). Combined, these facilities have the capacity to lend up to $2.05 trillion (an average capital ratio of 10%). As at November 18, however, total lending was a lacklustre $126 bil-lion. There are many reasons cited for the low take-up. For example, the facilities’ criteria were considered too stringent by some lenders and borrowers, and the ‘announcement effect’ of the facilities alone caused credit markets to improve and become relatively more attractive for some companies to tap. However, the facilities remained in place as a backstop to the credit creation process, with the potential to become more accommodative if need be (via relaxing the rules while upping the capital coverage). These facilities were scheduled to be closed on De-cember 31. Chair Powell and other Fed officials argued that they should be extended, given the pandemic-related risks to the economic outlook. Instead, Mr. Mnuchin has requested that the unused capital and remain-ing unallocated funds ($455 billion in total) be returned to Congress to be reappropriated, thus closing the facilities as scheduled. The facilities could be re-opened by the new Treasury Secretary, but Congress would then have to re-authorize their capital funding (good luck with that). The risks to the near-term economic outlook are rising rapidly, not only because of the pandemic’s second wave, but because of political parti-sanship and policy imprudence.
Michael Gregory (BMO Capital Markets Economics)

14 BLUE CHIP FINANCIAL FORECASTS DECEMBER 1, 2020
Long-Range Survey:
The table below contains the results of our twice-annual long-range CONSENSUS survey. There are also Top 10 and Bottom 10 averages for each variable. Shown are consensus estimates for the years 2022 through 2026 and averages for the five-year periods 2022-2026 and 2027-2031. Apply these projections cautiously. Few if any economic, demographic and political forces can be evaluated accurately over such long time spans.
2022 2023 2024 2025 2026 2022-2026 2027-20311. Federal Funds Rate CONSENSUS 0.1 0.3 0.7 1.2 1.5 0.8 1.8
Top 10 Average 0.2 0.7 1.4 2.0 2.4 1.3 2.5 Bottom 10 Average 0.1 0.1 0.2 0.4 0.6 0.3 1.2
2. Prime Rate CONSENSUS 3.3 3.5 3.9 4.3 4.6 3.9 4.9 Top 10 Average 3.4 3.7 4.4 5.0 5.4 4.4 5.4 Bottom 10 Average 3.2 3.2 3.3 3.5 3.8 3.4 4.5
3. LIBOR, 3-Mo. CONSENSUS 0.4 0.6 1.1 1.5 1.8 1.1 2.2 Top 10 Average 0.5 1.0 1.7 2.2 2.6 1.6 2.7 Bottom 10 Average 0.3 0.3 0.5 0.8 1.1 0.6 1.6
4. Commercial Paper, 1-Mo CONSENSUS 0.3 0.7 1.2 1.6 1.9 1.1 2.1 Top 10 Average 0.4 0.9 1.6 2.1 2.4 1.5 2.5 Bottom 10 Average 0.2 0.4 0.8 1.2 1.5 0.8 1.7
5. Treasury Bill Yield, 3-Mo CONSENSUS 0.2 0.4 0.8 1.2 1.5 0.8 1.9 Top 10 Average 0.3 0.7 1.5 2.0 2.4 1.4 2.5 Bottom 10 Average 0.1 0.1 0.2 0.5 0.7 0.3 1.3
6. Treasury Bill Yield, 6-Mo CONSENSUS 0.2 0.5 0.9 1.3 1.6 0.9 2.0 Top 10 Average 0.3 0.8 1.6 2.1 2.5 1.5 2.6 Bottom 10 Average 0.1 0.2 0.3 0.5 0.8 0.4 1.4
7. Treasury Bill Yield, 1-Yr CONSENSUS 0.3 0.6 1.0 1.4 1.8 1.0 2.1 Top 10 Average 0.5 1.0 1.7 2.3 2.6 1.6 2.7 Bottom 10 Average 0.2 0.3 0.4 0.7 0.9 0.5 1.6
8. Treasury Note Yield, 2-Yr CONSENSUS 0.4 0.8 1.2 1.6 1.9 1.2 2.3 Top 10 Average 0.7 1.2 1.9 2.4 2.8 1.8 2.9 Bottom 10 Average 0.2 0.3 0.6 0.8 1.1 0.6 1.7
9. Treasury Note Yield, 5-Yr CONSENSUS 0.8 1.2 1.6 2.0 2.3 1.5 2.5 Top 10 Average 1.1 1.6 2.3 2.8 3.1 2.1 3.1 Bottom 10 Average 0.5 0.7 1.0 1.2 1.4 1.0 1.9
10. Treasury Note Yield, 10-Yr CONSENSUS 1.3 1.7 2.0 2.4 2.6 2.0 2.8 Top 10 Average 1.7 2.2 2.7 3.1 3.4 2.6 3.5 Bottom 10 Average 0.9 1.2 1.4 1.7 1.8 1.4 2.2
11. Treasury Bond Yield, 30-Yr CONSENSUS 2.1 2.4 2.8 3.1 3.4 2.8 3.6 Top 10 Average 2.5 3.0 3.5 4.0 4.2 3.4 4.3 Bottom 10 Average 1.6 1.9 2.2 2.4 2.6 2.1 2.9
12. Corporate Aaa Bond Yield CONSENSUS 2.8 3.2 3.6 4.0 4.2 3.6 4.5 Top 10 Average 3.1 3.6 4.2 4.6 4.9 4.1 5.0 Bottom 10 Average 2.4 2.8 3.0 3.3 3.6 3.0 3.9
13. Corporate Baa Bond Yield CONSENSUS 3.9 4.3 4.7 5.0 5.2 4.6 5.4 Top 10 Average 4.3 4.7 5.2 5.6 5.9 5.1 6.0 Bottom 10 Average 3.5 3.9 4.1 4.3 4.5 4.1 4.9
14. State & Local Bonds Yield CONSENSUS 2.8 3.1 3.4 3.6 3.8 3.3 3.9 Top 10 Average 3.1 3.5 3.8 4.1 4.3 3.8 4.3 Bottom 10 Average 2.5 2.8 2.9 3.2 3.4 2.9 3.6
15. Home Mortgage Rate CONSENSUS 3.2 3.5 3.9 4.2 4.5 3.9 4.7 Top 10 Average 3.5 3.9 4.4 4.9 5.2 4.4 5.2 Bottom 10 Average 2.9 3.2 3.4 3.6 3.8 3.4 4.2
A. Fed's AFE Nominal $ Index CONSENSUS 107.2 107.0 106.5 106.4 106.6 106.7 106.7 Top 10 Average 109.0 108.9 108.8 108.9 109.5 109.0 110.2 Bottom 10 Average 105.4 105.2 104.4 103.8 103.7 104.5 103.0
2022 2023 2024 2025 2026 2022-2026 2027-2031B. Real GDP CONSENSUS 3.2 2.5 2.3 2.2 2.1 2.4 2.1
Top 10 Average 3.8 3.0 2.6 2.5 2.4 2.9 2.4 Bottom 10 Average 2.6 2.1 1.9 1.9 1.8 2.1 1.8
C. GDP Chained Price Index CONSENSUS 1.9 2.0 2.1 2.1 2.1 2.0 2.1 Top 10 Average 2.2 2.3 2.3 2.3 2.3 2.3 2.3 Bottom 10 Average 1.7 1.8 1.9 1.9 1.9 1.8 1.9
D. Consumer Price Index CONSENSUS 2.1 2.2 2.2 2.1 2.2 2.1 2.2 Top 10 Average 2.4 2.4 2.4 2.4 2.4 2.4 2.4 Bottom 10 Average 1.8 1.9 1.9 1.9 1.9 1.9 1.9
E. PCE Price Index CONSENSUS 1.9 2.0 2.1 2.1 2.1 2.0 2.1 Top 10 Average 2.2 2.2 2.2 2.2 2.3 2.2 2.4 Bottom 10 Average 1.7 1.8 1.9 1.9 1.9 1.8 1.9
Five-Year Averages
Five-Year Averages
------------------------- Average For The Year -------------------------
---------------------- Year-Over-Year, % Change ----------------------

DECEMBER 1, 2020 BLUE CHIP FINANCIAL FORECASTS 15
Databank: 2020 Historical Data Monthly Indicator Jan Feb Mar Apr May Jun Jul Aug Sep Oct Nov Dec Retail and Food Service Sales (a) 0.8 -0.4 -8.2 -14.7 18.3 8.6 1.1 1.4 1.6 0.3 ···· ···· Auto & Light Truck Sales (b) 16.87 16.77 11.36 8.72 12.11 13.01 14.58 15.13 16.29 16.21 ···· ···· Personal Income (a, current $) 0.9 0.8 -1.8 12.4 -4.0 -1.1 0.9 -2.5 0.7 -0.7 ···· ···· Personal Consumption (a, current $) 0.6 0.0 -6.7 -12.7 8.7 6.5 1.5 1.2 1.2 0.5 ···· ···· Consumer Credit (e) 2.8 5.5 -5.3 -18.5 -3.9 5.7 4.3 -2.0 4.7 ···· ···· ···· Consumer Sentiment (U. of Mich.) 99.8 101.0 89.1 71.8 72.3 78.1 72.5 74.1 80.4 81.8 76.9 ···· Household Employment (c) -89 45 -2987 -22369 3839 4940 1350 3756 275 2243 ···· ···· Nonfarm Payroll Employment (c) 214 251 -1373 -20787 2725 4781 1761 1493 672 638 ···· ···· Unemployment Rate (%) 3.6 3.5 4.4 14.7 13.3 11.1 10.2 8.4 7.9 6.9 ···· ···· Average Hourly Earnings (All, cur. $) 28.43 28.52 28.69 30.03 29.70 29.32 29.35 29.45 29.46 29.50 ···· ···· Average Workweek (All, hrs.) 34.3 34.4 34.1 34.2 34.7 34.6 34.6 34.7 34.8 34.8 ···· ···· Industrial Production (d) -0.8 -0.2 -4.7 -16.3 -15.7 -10.7 -6.7 -6.7 -6.7 -5.3 ···· ···· Capacity Utilization (%) 76.9 76.9 73.6 64.2 64.8 68.7 71.7 72.2 72.0 72.8 ···· ···· ISM Manufacturing Index (g) 50.9 50.1 49.1 41.5 43.1 52.6 54.2 56.0 55.4 59.3 ···· ···· ISM Nonmanufacturing Index (g) 55.5 57.3 52.5 41.8 45.4 57.1 58.1 56.9 57.8 56.6 ···· ···· Housing Starts (b) 1.617 1.567 1.269 0.934 1.038 1.265 1.487 1.373 1.459 1.530 ···· ···· Housing Permits (b) 1.536 1.438 1.356 1.066 1.216 1.258 1.483 1.476 1.545 1.544 ···· ···· New Home Sales (1-family, c) 774 716 612 570 698 840 979 1001 1002 999 ···· ···· Construction Expenditures (a) 1.9 0.2 -0.3 -3.4 -1.3 1.0 1.1 0.8 0.3 ···· ···· ···· Consumer Price Index (nsa, d) 2.5 2.3 1.5 0.3 0.1 0.6 1.0 1.3 1.4 1.2 ···· ···· CPI ex. Food and Energy (nsa, d) 2.3 2.4 2.1 1.4 1.2 1.2 1.6 1.7 1.7 1.6 ···· ···· Producer Price Index (nsa, d) 2.0 1.1 0.3 -1.5 -1.1 -0.7 -0.4 -0.2 0.4 0.5 ···· ···· Durable Goods Orders (a) -0.2 2.0 -16.7 -18.3 15.0 7.7 11.8 0.4 2.1 1.3 ···· ···· Leading Economic Indicators (a) 0.5 -0.2 -7.4 -6.4 3.0 3.1 2.0 1.6 0.7 0.7 ···· ···· Balance of Trade & Services (f) -43.4 -37.0 -46.1 -53.6 -57.9 -53.5 -63.4 -67.0 -63.9 ···· ···· ···· Federal Funds Rate (%) 1.55 1.58 0.65 0.05 0.05 0.08 0.09 0.10 0.09 0.09 ···· ···· 3-Mo. Treasury Bill Rate (%) 1.55 1.54 0.30 0.14 0.13 0.16 0.13 0.10 0.11 0.10 ···· ···· 10-Year Treasury Note Yield (%) 1.76 1.50 0.87 0.66 0.67 0.73 0.62 0.65 0.68 0.79 ···· ····
2019 Historical Data Monthly Indicator Jan Feb Mar Apr May Jun Jul Aug Sep Oct Nov Dec Retail and Food Service Sales (a) 1.5 -0.1 1.6 0.5 0.4 0.3 0.7 0.5 -0.7 0.5 0.3 0.1 Auto & Light Truck Sales (b) 16.77 16.60 17.30 16.59 17.31 17.21 16.97 17.07 17.08 16.76 16.97 16.81 Personal Income (a, current $) 0.2 0.4 0.3 0.2 0.1 0.2 0.1 0.5 0.2 0.3 0.5 0.1 Personal Consumption (a, current $) 0.7 0.1 0.9 0.5 0.3 0.4 0.4 0.3 0.2 0.4 0.2 0.3 Consumer Credit (e) 5.2 4.9 3.7 5.2 4.4 3.5 6.6 4.3 3.7 3.7 1.9 6.6 Consumer Sentiment (U. of Mich.) 91.2 93.8 98.4 97.2 100.0 98.2 98.4 89.8 93.2 95.5 96.8 99.3 Household Employment (c) -198 239 -125 -45 148 304 198 549 403 246 -8 267 Nonfarm Payroll Employment (c) 269 1 147 210 85 182 194 207 208 185 261 184 Unemployment Rate (%) 4.0 3.8 3.8 3.6 3.6 3.7 3.7 3.7 3.5 3.6 3.5 3.5 Average Hourly Earnings (All, cur. $) 27.58 27.69 27.76 27.81 27.87 27.96 28.05 28.16 28.16 28.24 28.34 28.37 Average Workweek (All, hrs.) 34.5 34.4 34.5 34.4 34.4 34.4 34.3 34.4 34.4 34.4 34.3 34.3 Industrial Production (d) 3.6 2.7 2.3 0.7 1.7 1.0 0.4 0.3 -0.2 -0.8 -0.4 -0.8 Capacity Utilization (%) 79.0 78.5 78.4 77.8 77.8 77.7 77.4 77.8 77.4 77.0 77.6 77.2 ISM Manufacturing Index (g) 55.5 54.1 54.6 53.4 52.3 51.6 51.3 48.8 48.2 48.5 48.1 47.8 ISM Nonmanufacturing Index (g) 56.0 58.5 56.3 55.7 56.3 55.4 54.8 56.0 53.5 54.4 53.9 54.9 Housing Starts (b) 1.272 1.137 1.203 1.267 1.268 1.235 1.212 1.377 1.274 1.340 1.371 1.587 Housing Permits (b) 1.316 1.305 1.327 1.330 1.338 1.273 1.366 1.471 1.437 1.503 1.510 1.457 New Home Sales (1-family, c) 637 665 700 664 600 726 661 706 726 706 696 731 Construction Expenditures (a) 1.9 0.7 1.0 1.4 -0.2 0.1 0.9 0.9 1.0 -0.5 1.3 0.3 Consumer Price Index (nsa, d) 1.6 1.5 1.9 2.0 1.8 1.6 1.8 1.7 1.7 1.8 2.1 2.3 CPI ex. Food and Energy (nsa, d) 2.2 2.1 2.0 2.1 2.0 2.1 2.2 2.4 2.4 2.3 2.3 2.3 Producer Price Index (nsa, d) 1.9 1.9 2.0 2.4 2.1 1.6 1.6 1.9 1.5 1.0 1.0 1.4 Durable Goods Orders (a) 0.2 -3.3 4.0 -4.7 -1.5 0.1 2.5 0.5 -0.9 -0.1 -2.6 2.8 Leading Economic Indicators (a) 0.0 0.2 0.2 0.1 0.0 0.0 0.4 -0.2 -0.2 -0.2 0.2 -0.2 Balance of Trade & Services (f) -49.0 -47.3 -48.9 -49.2 -51.3 -51.7 -51.0 -50.8 -47.8 -43.0 -41.1 -45.7 Federal Funds Rate (%) 2.40 2.40 2.41 2.42 2.39 2.38 2.40 2.13 2.04 1.83 1.55 1.55 3-Mo. Treasury Bill Rate (%) 2.42 2.44 2.45 2.43 2.40 2.22 2.15 1.99 1.93 1.68 1.57 1.57 10-Year Treasury Note Yield (%) 2.71 2.68 2.57 2.53 2.40 2.07 2.06 1.63 1.70 1.71 1.81 1.86 (a) month-over-month % change; (b) millions, saar; (c) month-over-month change, thousands; (d) year-over-year % change; (e) annualized % change; (f) $ billions; (g) level; (h) thousands. Most series are subject to frequent government revisions. Use with care.

16 BLUE CHIP FINANCIAL FORECASTS DECEMBER 1, 2020
Calendar of Upcoming Economic Data Releases
Monday Tuesday Wednesday Thursday Friday December 1
ISM Manufacturing (Nov) IHS Markit Mfg PMI (Nov) Construction (Oct) Texas Service Sector Outlook Survey (Nov)
2 ADP Employment Report (Nov) ISM New York (Nov) EIA Crude Oil Stocks
Mortgage Applications
3 ISM Services PMI (Nov) IHS Markit Services PMI(Nov) Challenger Employment Report (Nov) Weekly Jobless Claims Weekly Money Supply
4 Employment Situation (Nov) Intl Trade (Oct) MSIO (Oct) Public Debt (Nov)
7 Treasury Auction Allotments (Nov) Consumer Credit (Oct) NABE Outlook (Q4)
8 Productivity & Costs (Q3) QFR (Q3) Manpower Survey (Q1) NFIB (Nov)
9 Transportation Services Index (Oct) JOLTS (Oct) Wholesale Trade (Oct) Kansas City Financial Stress Index (Nov)
EIA Crude Oil Stocks Mortgage Applications
10 CPI (Nov) QSS (Q3) Financial Accounts (Q3) Monthly Treas Statement (Nov) Cleveland Fed Med CPI (Nov) Kansas City Fed Labor Market Conditions Indicators (Nov) Weekly Jobless Claims Weekly Money Supply
11 Producer Prices (Nov) Consumer Sentiment (Dec, Preliminary)
14
15 Import & Export Prices (Nov) Industrial Production (Nov) Empire State Mfg Survey (Dec) TIC Data (Oct) FOMC Meeting
16 Advance Retail Sales (Nov) MTIS (Oct) Business Leaders Survey (Dec) Home Builders (Dec) FOMC Meeting EIA Crude Oil Stocks
Mortgage Applications
17 New Residential Construction (Nov) ECEC (Q3) Philadelphia Fed Mfg Bus Outlook Survey (Dec) Kansas City Fed Mfg Survey (Dec) Weekly Jobless Claims Weekly Money Supply
18 International Transactions (Q3) Livingston Survey (Dec) Composite Indexes (Nov)
21 Chicago Fed National Activity Index (Nov)
22 GDP (Q3, 3rd Estimate) GDP by Industry (Q3) Consumer Confidence (Dec) Treas Auction Allotments (Dec) Existing Home Sales (Nov) Philadelphia Fed Nonmfg Business Outlook (Dec) Richmond Fed Mfg and Service Sector Surveys (Dec)
23 Personal Income (Nov) FHFA HPI (Oct) New Residential Sales (Nov) Dallas Fed Trimmed-Mean PCE (Nov) Final Building Permits (Nov) Consumer Sentiment (Dec) FRB Philadelphia Coincident Economic Activity (Nov)
24 Advance Durable Goods (Nov) Weekly Jobless Claims Weekly Money Supply
25
CHRISTMAS DAY All Markets Closed
28 Texas Manufacturing Outlook Survey (Dec)
29 IIP (Q3) Case Shiller HPI (Oct) Texas Service Sector Outlook Survey (Dec)
30 Advance Trade & Inventories (Nov) Chicago PMI (Dec) Agriculture Prices (Nov) EIA Crude Oil Stocks Mortgage Applications
31 Weekly Jobless Claims Weekly Money Supply
January 1
NEW YEAR’S DAY All Markets Closed
4
5 ISM Manufacturing (Dec) IHS Markit Mfg PMI (Dec)
6 ADP Employment Report (Dec) EIA Crude Oil Stocks Mortgage Applications
7 ISM Services PMI (Dec) IHS Markit Services PMI(Dec) Challenger Employment Report (Dec) Weekly Jobless Claims Weekly Money Supply
8 Employment Situation (Dec)

. BLUE CHIP FORECASTERS
CONTRIBUTORS TO DOMESTIC SURVEY ACIMA Private Wealth, Richmond, VA Ardavan Mobasheri Action Economics, LLC, Boulder, CO Michael Englund AIG, New York, NY Henry Mo and Jerry Cai Amherst Pierpont Securities, Stamford, CT Stephen Stanley Bank of America, New York, NY Ethan Harris Barclays, New York, NY Michael Gapen BMO Capital Markets Economics, Toronto, Canada Douglas Porter BNP Paribas North America, New York, NY Bricklin Dwyer Chan Economics, New York, NY Anthony Chan Chmura Economics & Analytics, Richmond, VA Christine Chmura and Xiaobing Shuai Comerica, Dallas, TX Robert A. Dye Daiwa Capital Markets America, New York, NY Michael Moran DePrince & Associates, Murfreesburo, TN Albert E. DePrince Jr. Economist Intelligence Unit, New York, NY Leo Abruzzese and Jan Friederich Fannie Mae, Washington, DC Douglas Duncan Georgia State University, Atlanta, GA Rajeev Dhawan GLC Financial Economics, Providence, RI Gary L. Ciminero Goldman, Sachs & Co., New York, NY Jan Hatzius Grant Thornton, Chicago, IL Diane Swonk ING Financial Markets, London, England James Knightley J.P. Morgan Chase, New York, NY Bruce Kasman Loomis, Sayles & Company, L.P., Boston, MA Brian Horrigan MacroFin Analytics & Rutgers Business School, Wayne, NJ Parul Jain Mizuho Research Institute, Tokyo, Japan Takehiro Noguchi Moody’s Analytics, West Chester, PA Mark M. Zandi Moody’s Capital Markets Group, New York, NY John Lonski MUFG Union Bank, New York, NY Christopher S. Rupkey Naroff Economic Advisors, Philadelphia, PA Joel L. Naroff
NatWest Markets, Greenwich, CT Michelle Girard and Kevin Cummins Nomura Securities International, Inc., New York, NY Lewis Alexander Northern Trust Company, Chicago, IL Carl Tannenbaum Oxford Economics, New York, NY Gregory Daco PNC Financial Services Group, Pittsburgh, PA Gus Faucher RDQ Economics, New York, NY John Ryding and Conrad de Quadros Regions Financial Corporation, Birmingham, AL Richard F. Moody Scotiabank Group, Toronto, Canada Jean-Francois Perrault and Brett House Societe Generale, NY, New York Stephen W. Gallagher S&P Global, New York, NY Beth Ann Bovino Swiss Re, New York, NY Jerome Haegeli TS Lombard, London, UK Steven Blitz Via Nova Investment Management, Fredericksburg, VA Alan Gayle Wells Fargo, Charlotte, NC Jay Bryson and Mark Vitner CONTRIBUTORS TO INTERNATIONAL SURVEY Barclays Capital, New York, NY BMO Capital Markets Economics, Toronto, Canada IHS Markit, London, England ING Financial Markets, London, England Mizuho Research Institute, Tokyo, Japan Moody’s Analytics, West Chester, PA Moody’s Capital Markets Group, New York, NY Nomura Securities International, Inc., New York, NY Northern Trust Company, Chicago, IL Oxford Economics, Wayne, PA Scotiabank Group, Toronto, Canada S&P Global, New York, NY TS Lombard, London, UK Wells Fargo, Charlotte, NC

February 26, 2021
ISSUE 3Pages 597-608
The Selection & Opinion Index appears in the Febaruary 19, 2021 issue on page 628.
In Three Parts: Part 1 is the Summary & Index. This is Part 2, Selection & Opinion. Part 3 is Ratings & Reports. Volume LXXVI, Number 29.
Dear Subscribers,
As part of our ongoing efforts to keep The Value Line Investment Survey the most valuable investment resource for our subscribers, all updated Ranks are now being released on the Value Line Web Site by 8:00 A.M. Eastern Time on Mondays. You can access all the Ranks each week at www.valueline.com by entering your user name and password. We look forward to continuing to provide you with accurate and timely investment research. Thank you.
The Quarterly Economic Review 597Value Line Forecast for the U.S. Economy 598Model Portfolios: Recent Developments 602Selected Yields 605Federal Reserve Data 605Closing Stock Market Averages as of Press Time 606Major Insider Transactions 606Market Monitor 607Value Line Asset Allocation Model 607Industry Price Performance 607Changes in Financial Strength Ratings 607Stock Market Averages 608
VALUE LINE ECONOMIC AND STOCK MARKET COMMENTARY
It has been an unprecedented 12 months. True, 2020 started out routinely enough with just an orderly deceleration in busi-ness activity during the winter. But a dif-ficult close to the first quarter followed, with COVID-19 spreading across Asia, Europe, and the new world. The bot-tom would subsequently fall out of our economy, with GDP plunging 31.4% in the second quarter. Then, as parts of the nation reopened and new incidences of the disease subsided briefly, the economy saw a dramatic, if partial, recovery over the sum-mer, with GDP growth soaring by more than 33% in the third quarter.
Unfortunately, a second and then third wave of the disease, numerous business closures, and a frustratingly slow rollout of approved vaccines from Pfizer and Mod-erna followed and took much of the steam from the nascent recovery, limiting GDP growth to 4.0% in last year’s final period. In all, the nation saw its first 12-month decline in the economy in more than a decade. Worse, at 3.5%, the contraction was the largest since 1946 when the United
States was starting to demobilize after World War II. Now, 2021 is under way, with changing hands in Washington and new challenges awaiting a shaken nation.
Our sense is that 2021 will be more settled than 2020. First, recent trends in COVID-19 are less ominous, overall, as new cases, hospitalizations, and now deaths are all declining. Also, after an ago-nizingly slow rollout, vaccines are getting into the arms of Americans at a faster pace. All told, significant progress in fighting COVID-19 should be in place by midyear and the relief these steps bring should well outweigh the impact of variants developing in the virus. That would give a boost to the second-half economy with the Congres-sional Budget Office projecting that busi-ness activity could return to pre-pandemic levels by that time. For now, however,
Economic trends are less than vibrant. For example, manufacturing activity is better, but hardly eye-catching; job growth is list-
VALUE LINE FORECAST FOR THE U.S. ECONOMY
Statistical Summary for 2020-2022
2020:4 2021:1 2021:2 2021:3 2021:4 2022:1 2022:2 2021 2022GDP And Other Key MeasuresReal Gross Domestic Product 18777 18971 19204 19531 19818 20013 20162 19381 20218Total Light Vehicle Sales (Mill. Units)
16.1 16.2 16.1 16.3 16.5 16.5 16.5 16.3 16.5
Housing Starts (Million Units) 1.59 1.55 1.50 1.45 1.45 1.40 1.35 1.49 1.35After-Tax Profits ($Bill.) 1897 1913 1868 2034 1935 1951 1831 1938 1963
Annualized Rates of ChangeGross Domestic Product (Real) 4.0 4.2 5.0 7.0 6.0 4.0 3.0 5.2 4.3GDP Deflator 2.0 2.0 1.5 1.7 2.0 2.0 2.0 1.8 2.0CPI-All Urban Consumers 2.2 2.7 2.2 2.2 2.3 2.3 2.3 2.4 2.2
Average For The PeriodNational Unemployment Rate 6.7 6.3 6.0 5.8 5.6 5.3 5.0 5.9 4.9Prime Rate 3.3 3.3 3.3 3.3 3.3 3.3 3.3 3.3 3.310-Year Treasury Note Rate 0.9 1.2 1.3 1.3 1.4 1.5 1.6 1.3 1.6
Continued on page 600
The Quarterly Economic Review
In This Issue
Published weekly by VALUE LINE PUBLISHING LLC 551 Fifth Avenue, New York, NY 10176
© 2021 Value Line, Inc. All rights reserved. Factual material is obtained from sources believed to be reliable and is provided without warranties of any kind. THE PUBLISHER IS NOT RESPONSIBLE FOR ANY ERRORS OR OMISSIONS HEREIN. This publication is strictly for each subscriber’s own, non-commercial, internal use. No part of this publication may be reproduced, resold, stored or transmitted in any printed, electronic or other form, or used for generating or marketing any printed or electronic publication, service or product. Officers, directors, employees and affiliates of Value Line, Inc. (“VLI”) and EULAV Asset Management, LLC (“EULAV”), may own stocks that are reviewed or recommended in this publication. Nothing herein should be construed as an offer to buy or sell securities or to give individual investment advice.See back cover for important disclosures.

5 9 8 VALUE LINE SELECTION & OPINION F E B R U A R Y 2 6 , 2 0 2 1
© 2021 Value Line, Inc. All rights reserved. Factual material is obtained from sources believed to be reliable and is provided without warranties of any kind. THE PUBLISHER IS NOT RESPONSIBLE FOR ANY ERRORS OR OMISSIONS HEREIN. This publication is strictly for subscriber’s own, non-commercial, internal use. No part of it may be reproduced, resold, stored or transmitted in any printed, electronic or other form, or used for generating or marketing any printed or electronic publication, service or product.
To subscribe call 1-800-VALUELINE
Value Line Forecast for the U.S. Economy
Actual Estimated
2020:3 2020:4 2021:1 2021:2 2021:3 2021:4 2022:1 2022:2
Gross Domestic Product and its Components (2012 Chain Weighted $) Billions of DollarsFinal Sales 18689 18827 19058 19246 19482 19674 19820 19967Total Consumption 12920 13000 13253 13432 13661 13861 14031 14170Nonresidential Fixed Investment 2660 2747 2800 2828 2896 2952 2996 3032
Structures 465 468 473 481 483 483 485 486Equipment & Software 1230 1301 1326 1332 1352 1378 1398 1412
Residential Fixed Investment 645 694 717 720 713 704 695 686Exports 2166 2276 2372 2418 2465 2519 2568 2612Imports 3186 3398 3557 3626 3688 3751 3778 3788Federal Government 1336 1334 1350 1442 1483 1476 1437 1400State & Local Governments 1994 1985 1990 1995 2005 2020 2030 2040
Gross Domestic Product 21165 21479 21809 22159 22632 23078 23421 23712Real GDP (2012 Chain Weighted $) 18594 18777 18971 19204 19531 19818 20013 20162
Prices and Wages — Annual Rates of ChangeGDP Deflator 3.5 2.0 2.0 1.5 1.7 2.0 2.0 2.0CPI-All Urban Consumers 5.2 2.2 2.7 2.2 2.2 2.3 2.3 2.3PPI-Finished Goods 6.9 5.0 5.0 2.5 2.5 3.0 2.5 2.3Employment Cost Index—Total Comp. 2.0 3.5 2.8 2.5 2.0 2.3 2.8 3.0Productivity 5.1 -4.8 2.0 2.5 3.0 2.0 1.0 1.0
Production and Other Key MeasuresIndustrial Prod. (% Change, Annualized) 42.5 8.4 7.0 5.0 5.0 4.0 4.0 3.5Factory Operating Rate (%) 70.8 72.7 74.0 74.5 75.0 75.5 76.0 76.0Nonfarm Inven. Change (2012 Chain Weighted $) -6.8 38.6 25.0 50.0 100.0 120.0 150.0 160.0Housing Starts (Mill. Units) 1.43 1.59 1.55 1.50 1.45 1.45 1.40 1.35Existing House Sales (Mill. Units) 6.14 6.78 6.50 6.30 6.25 6.20 6.20 6.10Total Light Vehicle Sales (Mill. Units) 15.4 16.1 16.2 16.1 16.3 16.5 16.5 16.5National Unemployment Rate (%) 8.8 6.7 6.3 6.0 5.8 5.6 5.3 5.0Federal Budget Surplus (Unified, FY, $Bill) -388 -573 -800 -1000 -600 -400 -400 -100Price of Oil ($Bbl., U.S. Refiners’ Cost) 40.77 42.16 55.00 56.00 55.00 54.00 55.00 56.00
Money and Interest Rates3-Month Treasury Bill Rate (%) 0.1 0.1 0.1 0.1 0.1 0.1 0.1 0.1Federal Funds Rate (%) 0.1 0.1 0.1 0.1 0.1 0.1 0.1 0.110-Year Treasury Note Rate (%) 0.7 0.9 1.2 1.3 1.3 1.4 1.5 1.6Long-Term Treasury Bond Rate (%) 1.4 1.6 1.9 2.0 2.0 2.1 2.2 2.2AAA Corporate Bond Rate (%) 2.2 2.3 2.3 2.3 2.3 2.3 2.4 2.4Prime Rate (%) 3.3 3.3 3.3 3.3 3.3 3.3 3.3 3.3
IncomesPersonal Income (Annualized % Change) -10.2 -6.7 12.0 14.0 -10.0 -3.0 4.0 4.0Real Disp. Inc. (Annualized % Change) -16.3 -9.5 12.0 14.0 -12.0 -5.0 2.0 2.0Personal Savings Rate (%) 16.0 13.4 14.0 16.0 10.0 8.0 8.0 8.0After-Tax Profits (Annualized $Bill) 2119 1897 1913 1868 2034 1935 1951 1831
Yr-to-Yr % Change 10.3 -5.2 10.0 20.0 -4.0 2.0 2.0 -2.0
Composition of Real GDP-Annual Rates of ChangeGross Domestic Product 33.4 4.0 4.2 5.0 7.0 6.0 4.0 3.0Final Sales 25.9 3.0 5.0 4.0 5.0 4.0 3.0 3.0Total Consumption 41.0 2.5 8.0 5.5 7.0 6.0 5.0 4.0Nonresidential Fixed Investment 22.9 13.8 8.0 4.0 10.0 8.0 6.0 5.0
Structures -17.4 3.0 4.0 7.0 2.0 0.0 1.0 1.5Equipment & Software 68.2 24.9 8.0 2.0 6.0 8.0 6.0 4.0
Residential Fixed Investment 63.0 33.5 14.0 2.0 -4.0 -5.0 -5.0 -5.0Exports 59.6 22.0 18.0 8.0 8.0 9.0 8.0 7.0Imports 93.1 29.5 20.0 8.0 7.0 7.0 3.0 1.0Federal Government -6.2 -0.5 5.0 30.0 12.0 -2.0 -10.0 -10.0State & Local Governments -3.9 -1.7 1.0 1.0 2.0 3.0 2.0 2.0

F E B R U A R Y 2 6 , 2 0 2 1 VALUE LINE SELECTION & OPINION 5 9 9
© 2021 Value Line, Inc. All rights reserved. Factual material is obtained from sources believed to be reliable and is provided without warranties of any kind. THE PUBLISHER IS NOT RESPONSIBLE FOR ANY ERRORS OR OMISSIONS HEREIN. This publication is strictly for subscriber’s own, non-commercial, internal use. No part of it may be reproduced, resold, stored or transmitted in any printed, electronic or other form, or used for generating or marketing any printed or electronic publication, service or product.
To subscribe call 1-800-VALUELINE
Value Line Forecast for the U.S. Economy
Actual
2016 2017 2018 2019 2020 2021 2022 2023 2024 2025
Gross Domestic Product and its Components (2012 Chain Weighted $) Billions of DollarsFinal Sales 17659 18051 18566 19129 18580 19365 20023 20524 21057 21605Total Consumption 12248 12567 12945 13238 12723 13552 14201 14556 14949 15368Nonresidential Fixed Investment 2425 2531 2692 2777 2667 2869 3046 3183 3332 3476
Structures 496 520 541 548 490 480 488 502 523 538Equipment & Software 1122 1176 1255 1268 1205 1347 1417 1466 1525 1586
Residential Fixed Investment 591 612 603 602 637 714 683 663 669 676Exports 2376 2459 2533 2546 2216 2444 2628 2759 2870 3013Imports 3160 3309 3453 3464 3142 3655 3788 3826 3940 4137Federal Government 1188 1197 1232 1277 1333 1438 1387 1318 1291 1291State & Local Governments 1958 1971 1990 2026 2009 2003 2041 2062 2082 2103
Gross Domestic Product 18707 19485 20612 21440 20930 22420 23856 24966 26179 27423Real GDP (2012 Chain Weighted $) 17659 18051 18688 19092 18421 19381 20218 20724 21263 21794
Prices and Wages — Annual Rates of ChangeGDP Deflator 1.0 1.9 2.4 1.7 1.3 1.8 2.0 2.1 2.2 2.2CPI-All Urban Consumers 1.3 2.1 2.4 2.0 1.3 2.4 2.2 2.2 2.3 2.3PPI-Finished Goods -1.0 3.2 3.0 1.0 -0.7 3.3 2.3 2.0 1.9 2.0Employment Cost Index—Total Comp. 2.1 2.5 2.9 2.7 2.6 2.4 3.3 3.5 3.5 3.4Productivity 0.3 1.3 1.5 1.9 2.7 2.4 1.0 1.5 2.0 2.2
Production and Other Key MeasuresIndustrial Prod. (% Change, Annualized) -2.0 2.3 3.9 -0.7 0.4 5.3 3.0 2.5 2.3 2.2Factory Operating Rate (%) 74.2 75.1 76.6 75.6 70.2 74.8 75.8 75.5 75.3 75.0Nonfarm Inven. Change (2012 Chain Weighted $) 28.5 35.3 59.3 62.2 -80.0 73.8 142.5 100.0 105.0 110.0Housing Starts (Mill. Units) 1.18 1.21 1.25 1.30 1.40 1.49 1.35 1.25 1.23 1.20Existing House Sales (Mill. Units) 5.44 5.53 5.33 5.33 5.68 6.31 6.05 5.60 5.50 5.40Total Light Vehicle Sales (Mill. Units) 17.5 17.1 17.2 17.0 14.5 16.3 16.5 16.3 16.2 16.0National Unemployment Rate (%) 4.9 4.4 3.9 3.7 8.1 5.9 4.9 4.5 4.2 4.0Federal Budget Surplus (Unified, FY, $Bill) -587 -666 -779 -1022 -3349 -2800 -1100 -1000 -950 -900Price of Oil ($Bbl., U.S. Refiners’ Cost) 40.60 50.69 64.46 59.36 39.23 55.00 56.00 58.00 60.00 62.00
Money and Interest Rates3-Month Treasury Bill Rate (%) 0.3 0.9 1.9 2.1 0.4 0.1 0.1 0.1 0.2 0.5Federal Funds Rate (%) 0.4 1.0 1.8 2.2 0.4 0.1 0.1 0.1 0.3 0.510-Year Treasury Note Rate (%) 1.9 2.3 2.9 2.2 0.9 1.3 1.6 2.0 2.3 2.5Long-Term Treasury Bond Rate (%) 2.6 2.9 3.1 2.6 1.6 2.0 2.3 2.3 2.5 2.7AAA Corporate Bond Rate (%) 3.7 3.8 3.9 3.4 2.5 2.3 2.4 2.8 3.1 3.3Prime Rate (%) 3.5 4.1 4.9 5.3 3.6 3.3 3.3 3.4 3.7 4.2
IncomesPersonal Income (Annualized % Change) 2.6 4.7 5.3 3.5 5.8 3.3 3.8 4.4 4.8 5.0Real Disp. Inc. (Annualized % Change) 1.8 2.9 3.6 1.6 6.4 2.3 2.0 2.6 2.8 3.0Personal Savings Rate (%) 6.8 7.0 7.9 7.6 16.3 12.0 7.5 7.5 7.4 7.2After-Tax Profits (Annualized $Bill) 1740 1814 1904 1939 1828 1938 1963 2100 2268 2427
Yr-to-Yr % Change 0.0 4.2 1.7 1.8 -5.7 6.0 1.3 7.0 8.0 7.0
Composition of Real GDP-Annual Rates of ChangeGross Domestic Product 1.6 2.4 3.0 2.2 -3.5 5.2 4.3 2.5 2.6 2.5Final Sales 2.2 2.3 2.8 3.0 -2.9 4.2 3.4 2.5 2.6 2.6Total Consumption 2.7 2.6 2.7 2.3 -3.9 6.5 4.8 2.5 2.7 2.8Nonresidential Fixed Investment 0.2 4.4 6.9 3.2 -4.0 7.6 6.2 4.5 4.7 4.3
Structures -5.0 4.7 3.7 1.3 -10.5 -2.1 1.6 3.0 4.0 3.0Equipment & Software -1.3 4.7 8.0 1.0 -5.0 11.8 5.2 3.5 4.0 4.0
Residential Fixed Investment 6.5 3.5 -0.6 -0.2 5.9 12.0 -4.3 -3.0 1.0 1.0Exports 0.0 3.5 3.0 0.5 -13.0 10.3 7.5 5.0 4.0 5.0Imports 2.0 4.7 4.1 0.3 -9.3 16.3 3.6 1.0 3.0 5.0Federal Government 0.4 0.8 2.8 3.7 4.4 7.8 -3.5 -5.0 -2.0 0.0State & Local Governments 2.6 0.6 1.2 1.8 -0.8 -0.3 1.9 1.0 1.0 1.0
Estimated

6 0 0 VALUE LINE SELECTION & OPINION F E B R U A R Y 2 6 , 2 0 2 1
© 2021 Value Line, Inc. All rights reserved. Factual material is obtained from sources believed to be reliable and is provided without warranties of any kind. THE PUBLISHER IS NOT RESPONSIBLE FOR ANY ERRORS OR OMISSIONS HEREIN. This publication is strictly for subscriber’s own, non-commercial, internal use. No part of it may be reproduced, resold, stored or transmitted in any printed, electronic or other form, or used for generating or marketing any printed or electronic publication, service or product.
To subscribe call 1-800-VALUELINE
less; and weekly jobless filings remain stub-bornly high. In fact, even with further gains in homebuilding (as supply is inadequate to meet demand); a vigorous projected early 2021 recovery in consumer spending; improving vehicle sales; accelerating busi-ness re-openings (as the fight against this pandemic gains traction); likely stimulus and relief payments from Washington; and strong monetary support from the Federal Reserve, it is likely the economy will still face headwinds in the first quarter. Things should go a little more smoothly in the second three months, with more signifi-cant strides likely after midyear, especially if relief payments aimed at putting food on the table and avoiding evictions and foreclosures, approach the levels advocated by the Biden Administration.
Meantime, after last year’s severe recession, inflation is likely to remain under control and interest rates seem poised to stay near historic low levels through 2024. As such, it is possible the nation may sidestep a business downturn in our 3- to 5-year projection period. Of course, that scenario isn’t etched in stone. Making long-range forecasts is always a risky exercise, as 2020’s unpredictable path clearly showed. In the past, we’ve warned of exogenous shocks that could upset even the most carefully balanced investment program or business plan. While the pandemic is still in prog-ress additional risks still include, but are not be limited to, droughts, international conflicts, oil embargoes (which wouldn’t have the impact they did in the 1970’s when OPEC’s influence was greater), and, as recent history has shown, future pandemics. Absent such shocks and with monetary and fiscal support likely to con-tinue, the road to 2024-2026 should be comparatively uneventful.
SOME SPECIFICSEconomic Growth: As the foregoing indicated, 2020 was a turbulent year, with a record decline in GDP in the second quarter, but an unprecedented revival in the July-through-September period. The
The Quarterly Economic Review
Continued from front cover lead story throughout the year, of course, was COVID-19 and the giant human and financial toll it exacted on the Ameri-can people. For the year as a whole, the economy contracted by 3.5%—the largest drop since just after World War II. Even the so-called Great Recession of 2008-2009 did not see anything approaching the collapse in business activity suffered in the first half of 2020. This hopefully was a once in a century phenomenon. What brought about these gyrations (e.g., the plunge in GDP in the second quarter, the record rebound in the economy over the summer, and the deceleration in activity late in 2020) were the early, unsuccessful efforts (through business closures and the like) to fight the pandemic, the subsequent re-opening of the economy, the arrival of two approved vaccines, and the resurgence in COVID-19 infections and deaths during the winter.
Meanwhile, the fight against this disease persists. At first, moves to close down the economy last spring in order to dull the impact of the virus contributed to raising the financial costs of the outbreak. As vac-cines are now getting into the arms of more Americans, governments took less drastic measures during the disease’s latest surge. It also helps that recent weeks have seen a lessening in the pandemic’s toll. Also encouraging are the better trends in the ser-vices sector, auto demand, and most hous-ing categories. So, further modest GDP growth is likely this quarter and during the following three months (Chart 1). Holding things back figures to be a weak outlook on the jobs front, where January saw just 49,000 positions added. Not surprisingly, Fed Chair Jerome Powell has opined that the jobs picture has remained bleak (Chart 2). In all, GDP likely will rise by 4%-5% in the first two quarters of this year.
Looking ahead to the second half, the projected positive impact of the fiscal measures being sought by President Biden, the low interest-rate policies of the Federal Reserve, a projected further increase in consumer spending, ongoing strength in housing, and at least a partial victory over COVID-19 (as more Americans
get vaccinated), should combine to lift GDP somewhat more strongly. A further, if slower, recovery is likely in 2022 and through mid-decade, absent debilitating exogenous shocks to the system.
Inflation: Recently, there has been specu-lation that inflation, largely dormant for decades, would soon start to push higher. To be sure, few are calling for a surge in prices over our projection period. There is simply too much underutilized capacity and labor availability, as well as few short-ages in raw materials in place to strain our pricing structure. But there also is little doubt that years of record low interest rates, fiscal support in fighting the pandemic, and a shortage in housing stock will have an impact on inflation. To date, reports suggest little sustained upward pressure on prices. Indeed, the Consumer Price Index (CPI) for January rose 0.3% as generally forecast. Also, the index was up just 1.4% for the past 12 months. And if we exclude the volatile food and energy components, to get the so-called core rate of CPI change, we find the index was unchanged in January and likewise up 1.4% in the past year. In all, signs point to modestly higher prices in the next 3 to 5 years, as yields on U.S. Treasuries are edging upward, but not to the extent needed to make inflation the headline item it was in the 1970s (Chart 3).
Interest Rates: Here, as well, stability has been the rule. Specifically, hints of a slow-ing economy in 2019 led the Fed to lower the federal funds rate several times. When the lead bank was finished, rates were near zero, where they remain. Such historically low borrowing costs proved timely when the economy collapsed last spring and the availability of attractive credit was pivotal. Now, even with the worst of the economic turmoil behind us, low interest rates are helping to support the tenuous business upturn. That should be the case for some time. The Federal Reserve, in fact, has suggested it will keep interest rates at their present levels until 2024 (Chart 4).
Corporate Profits: Following a difficult COVID-19-impacted 2020, Corporate

F E B R U A R Y 2 6 , 2 0 2 1 VALUE LINE SELECTION & OPINION 6 0 1
© 2021 Value Line, Inc. All rights reserved. Factual material is obtained from sources believed to be reliable and is provided without warranties of any kind. THE PUBLISHER IS NOT RESPONSIBLE FOR ANY ERRORS OR OMISSIONS HEREIN. This publication is strictly for subscriber’s own, non-commercial, internal use. No part of it may be reproduced, resold, stored or transmitted in any printed, electronic or other form, or used for generating or marketing any printed or electronic publication, service or product.
To subscribe call 1-800-VALUELINE
The Quarterly Economic Review
Gross Domestic Product
06
1218243036
0- 6
- 1 2- 1 8- 2 4- 3 0- 3 6
Source:U.S.Dept.ofCom m erce
RealAnnualized PercentChange -2012 Chain-W eighted Dollars
2020 20212015 2016 2017 2018 2019
Chart1
Nonagricultural Employment
128
132
136
140
144
148
152
156
160
Source:Bureau ofLaborStatistics
(In M illions-Seasonally Adjusted)
2019 2020 20212015 2016 20182017
Chart2
Consumer and Producer Price Indexes
0%
3%
6%
9%
0%
-3 %
-6 %
-9 %
Source:Bureau ofLaborStatistics
Consum erPriceIndex ProducerPriceIndex
2020 20212015 2016 2017
Year-to-YearPercentChange
2018 2019
Chart3
Selected Interest Rates
0
2
4
6
FederalFunds 10-Yr.Treasury Note 3-M o.Treasury Bill
Source:FederalReserveBoard
(In Percent)
20162015 202120202017 2018 2019
Chart4
America should give a much better account of itself during the current 12 months. Behind this projected improvement figure to be firming demand and better cost-con-tainment. In all, companies in the S&P 500 continue to outperform expectations, with some 80% of the components in that index having exceeded their revenue and profit targets in last year’s fourth quarter. Further, more S&P members than not are signaling that the current three months will see out-performance once again. Higher earnings, in fact, should be the rule for 2021 as a whole. Notwithstanding such projected strength, price-earnings ratios remain stubbornly high. For example, at more than 21 times earnings, the recent market P/E is expensive when compared with the average for the past decade (15.8) and the last half decade (17.7). This suggests some overvaluation and a rise in risk. At a minimum, the market would seem to be priced for near perfection.
THE STOCK MARKETWhereas inflation and interest rates have woven comparatively stable paths in the past year, the stock market, in line with
the economy, has gyrated wildly. Prior to 2020, however, equities generally moved in sync with the economy by largely press-ing higher and doing so with a degree of consistency.
That all changed in a flash in 2020, as COVID-19 proved too much for the economy or Wall Street, and both would quickly collapse as winter turned to spring and the disease toll mounted. Once the massive selling dried up on the Street, a sharp market rally ensued in the spring and for much of the summer. The economy also revived. Here, however, for all the noise sounded by a 33.4% third-quarter surge in GDP, the comeback undid just a portion of the damage inflicted by the shuttering of so many businesses and schools during the early weeks of the April-through-June quarter. Then, following a late-summer selloff in stocks as new virus worries sur-faced, stocks roared back on optimism cre-ated by the aforementioned vaccines. That upbeat sentiment has continued into 2021. As for the economy, it is still struggling, with improvement in certain business
categories being countered by sloppiness on the employment front.
As to the outlook for equities, recent action has pushed an already pricey market even higher, leaving little room for missteps on the economic, earnings, monetary, or fiscal fronts. This should not suggest that stocks cannot go higher. Clearly, they can and for a time might well do so, as it always is hard to fight the tape. It is just that a good deal might have to go right to keep P/E’s where they are, especially as recent frenetic trad-ing activity in risky and generally unsuit-able stocks such as GameStop, AMC Entertainment, Virgin Galactic Holdings, and Tilray have persisted in unchecked fashion for weeks.
Conclusion: We think the bull market is sustainable, but likely to face challenges in the coming months, particularly if yields on fixed-income securities (e.g., Treasury notes) rise much further. Please refer to the inside back cover of Selection & Opinion for our statistically-based Asset Allocation Model’s current reading. ■

6 0 2 VALUE LINE SELECTION & OPINION F E B R U A R Y 2 6 , 2 0 2 1
© 2021 Value Line, Inc. All rights reserved. Factual material is obtained from sources believed to be reliable and is provided without warranties of any kind. THE PUBLISHER IS NOT RESPONSIBLE FOR ANY ERRORS OR OMISSIONS HEREIN. This publication is strictly for subscriber’s own, non-commercial, internal use. No part of it may be reproduced, resold, stored or transmitted in any printed, electronic or other form, or used for generating or marketing any printed or electronic publication, service or product.
To subscribe call 1-800-VALUELINE
PORTFOLIO IThe broader market averages are trading near all-time highs. Equities may well continue to rise in the months ahead, but we remain cautious. The valuations of many stocks appear to be on the expensive side, which increases investment risk. Indeed, unfavorable macroeconomic or geopolitical developments could spark a selloff, especially in high-flying stocks. In this environment, we believe it is of paramount importance to select equities of high quality that are trading at a reason-able valuation. These stocks should afford greater downside protection in a choppy or declining market. We also continue to seek equities with attractive growth prospects for inclusion in Portfolio I.
Meanwhile, Portfolio I selection Arthur J. Gallagher has acquired Air-Sur Inc. Air-Sur is a retail insurance broker based in Florida and serves clients in the aviation and aerospace industry. This move expands the company’s aerospace capabilities across Florida and the southeastern United States. This addition follows the purchase of specialist U.K. insurance broker The Bollington Wilson Group.
Elsewhere, Progressive Corporation has agreed to acquire Protective Insurance for $338 million. The deal, which is expected to close by the end of the third quarter, would allow Progressive to expand its com-mercial lines offerings. We are making no changes to Portfolio I this week.
PORTFOLIO IIWe are making two changes to Portfolio II this week. Mondelez and Pinnacle West are being removed to make room for two stocks that appear to offer superior growth and income potential at the moment. Our first selection is Conagra Brands, a branded food producer that sells to mass merchants and grocers throughout the United States. The COVID-19 pandemic has increased demand for stay-at-home food products and provided a boost to earnings over the past three quarters. Although earnings comparisons will likely turn negative in the May quarter, we think the stock offers value. The relative P/E ratio remains low
Model Portfolios: Recent Developments
compared to this equity’s history. Too, from an operating standpoint, the company appears to be executing better and has suc-cessfully integrated the 2018 acquisition of Pinnacle Foods. The recent 29% hike in the dividend is a vote of confidence, as well.
Our second selection is Nexstar Media Group, the largest television station owner in the United States. Its roughly 200 sta-tions obviously benefited from last year’s political campaign. However, Nexstar should enjoy solid advertising demand as an economic recovery takes hold in the ensuing quarters. Separately, though its bargaining position isn’t as great as it once was, Nexstar still gets significant retrans-mission fees from pay TV broadcasters. All in all, we think NXST stock represents a good risk-reward tradeoff for the com-ing year.
PORTFOLIO IIIPortfolio III remains in good shape. Profit-taking in some of last year’s high flyers, such as Starbucks, Disney, FedEx, Intuitive Surgical, and PVH Corp., has dampened the group’s performance a bit in recent weeks. And rising bond yields may be a headwind going forward, since they’re apt to weigh on valuations (especially in the tech sector) and render equities less attrac-tive on a relative basis.
But we like the portfolio’s current mix of growth and value names, and expect the diversity to garner nice benefits as we progress through 2021. Indeed, even if our growth issues continue to take a slight breather, we see strength in our value plays, including tobacco maker Altria Group and semiconductor maker Intel, acting as an offset. These stocks, trading at historically low P/E multiples, remain very attractive and feature healthy dividend yields that should appeal to investors looking for a little extra income.
In the meantime, we are making a change to the portfolio this week, finally selling our stake in Southwest Airlines, which has staged an impressive recovery since being hard hit at the height of the COVID-19 market panic. In its place, we are adding
shares of AutoZone, a well-managed auto-parts retailer that appears undervalued. The company seems to have the wind at its back, given strong used-car sales and America’s aging fleet of vehicles (that are more likely to be in need of repair). Mean-while, its excellent customer service should help to keep Amazon at bay. And AutoZone generates ample free cash flow that it has been using to expand internationally and aggressively repurchase stock.
PORTFOLIO IVThe U.S. stock market continues to advance. Investors seem optimistic that another relief package will be approved soon and that a stepped up vaccine cam-paign can bring the pandemic to a close. Meanwhile, most large corporations have released fourth-quarter results, and the majority have posted better-than-anticipated numbers. At Portfolio IV, Coca-Cola wrapped up 2020 with a respect-able report. Although pandemic-related restrictions continue to pressure the away-from-home business (restaurants, arenas, institutions, etc.), there have been signs of gradual improvement. In addition, cost-cutting initiatives have aided the bot-tom line. Looking to 2021, we anticipate measured progress, thanks to a better envi-ronment and product innovation. Man-agement’s willingness to reinstate guidance also is a positive indicator. We are holding onto neutrally ranked Coca-Cola stock for the stability it adds to our portfolio and for its attractive dividend yield.
Elsewhere, United Parcel Service posted impressive top- and bottom-line num-bers for the fourth quarter. The domestic segment performed well, with notable strength in the small and midsized busi-ness category. The ongoing expansion of the e-commerce sector has been a plus for package carriers and should help business in the year ahead. Meanwhile, plans are in place to control costs and revamp the network. We think the outlook for 2021 remains favorable, and are holding timely UPS shares, for now.
We are not making any trades in Portfolio IV this week. ■

F E B R U A R Y 2 6 , 2 0 2 1 VALUE LINE SELECTION & OPINION 6 0 3
© 2021 Value Line, Inc. All rights reserved. Factual material is obtained from sources believed to be reliable and is provided without warranties of any kind. THE PUBLISHER IS NOT RESPONSIBLE FOR ANY ERRORS OR OMISSIONS HEREIN. This publication is strictly for subscriber’s own, non-commercial, internal use. No part of it may be reproduced, resold, stored or transmitted in any printed, electronic or other form, or used for generating or marketing any printed or electronic publication, service or product.
To subscribe call 1-800-VALUELINE
PORTFOLIO I: STOCKS WITH ABOVE-AVERAGE YEAR-AHEAD PRICE POTENTIALPrimarily suitable for more aggressive investors
Ratings & Reports
Page Ticker CompanyRecent Price Timeliness Safety P/E Yield%
18-Month % Apprec. Potential
Financial Strength Industry Name
1555 AFL Aflac Inc. 46.92 1 2 8.8 2.9 35 A Insurance (Life)
753 ALL Allstate Corp. 104.43 3 1 8.2 2.1 25 A++ Insurance (Prop/Cas.)
830 AMGN Amgen 237.21 3 1 14.4 3.0 15 A++ Biotechnology
172 BDX Becton, Dickinson 256.32 3 1 20.1 1.3 10 A++ Med Supp Invasive
1612 BIIB Biogen 278.03 1 3 12.5 Nil 5 A Drug
2608 CACI CACI Int’l 236.73 3 3 15.8 Nil 25 B+ IT Services
1799 CBOE Cboe Global Markets 89.39 3 2 19.9 1.9 35 A Brokers & Exchanges
791 CNC Centene Corp. 59.20 2 3 11.9 Nil 45 B++ Medical Services
178 EW Edwards Lifesciences 87.65 2 2 42.8 Nil 25 A+ Med Supp Invasive
2551 AJG Gallagher (Arthur J.) 116.68 3 1 26.6 1.6 25 A Financial Svcs. (Div.)
710 GD Gen’l Dynamics 164.83 1 1 14.3 2.7 10 A++ Aerospace/Defense
1194 KMB Kimberly-Clark 132.13 3 1 16.5 3.5 15 A+ Household Products
716 LMT Lockheed Martin 337.73 3 1 13.1 3.1 25 A++ Aerospace/Defense
1623 MRK Merck & Co. 75.00 2 1 11.9 3.5 40 A++ Drug
719 NOC Northrop Grumman 297.36 3 1 12.5 2.0 15 A++ Aerospace/Defense
1979 PEP PepsiCo, Inc. 133.87 3 1 22.6 3.1 15 A++ Beverage
128 PKI PerkinElmer Inc. 150.57 1 2 13.7 0.2 20 B++ Precision Instrument
768 PGR Progressive Corp. 86.27 2 1 14.7 0.5 20 A Insurance (Prop/Cas.)
410 RSG Republic Services 91.26 3 2 24.5 1.9 20 B++ Environmental
2602 VMW VMware, Inc. 145.13 3 3 21.1 Nil 20 A+ Computer Software
To qualify for purchase in the above portfolio, a stock must have a Timeliness Rank of 1 or 2, and a Financial Strength Rating of at least B+. The stock also has to offer above-median 18-month appreciation potential. If a stock’s Timeliness Rank falls below 3 or its 18-month appreciation potential drops to zero or becomes negative, it will be automatically removed. Stocks in the above portfolio are selected and monitored by Michael F. Napoli, Senior Analyst.
PORTFOLIO II: STOCKS FOR INCOME AND POTENTIAL PRICE APPRECIATIONPrimarily suitable for more conservative investors
Ratings & Reports
Page Ticker CompanyRecent Price Timeliness Safety P/E Yield% Beta
Financial Strength Industry Name
2138 CVS CVS Health 74.21 1 2 10.8 2.7 0.95 A+ Retail Store
2509 CM.TO Can. Imperial Bank 113.43 3 2 12.8 5.1 0.95 B++ Bank
946 CSCO Cisco Systems 47.29 1 1 14.6 3.1 0.95 A++ Telecom. Equipment
1969 KO Coca-Cola 50.69 3 1 24.6 3.3 0.90 A++ Beverage
1007 CMCSA Comcast Corp. 53.23 1 1 20.2 1.9 0.80 A+ Cable TV
1909 CAG Conagra Brands 34.55 2 3 13.9 3.3 0.70 A Food Processing
1600 DOW Dow Inc. 58.15 NR 2 22.7 5.2 NMF A Chemical (Basic)
2517 JPM JPMorgan Chase 141.25 2 1 12.8 2.5 1.15 A Bank
221 JNJ Johnson & Johnson 166.58 3 1 18.4 2.4 0.85 A++ Med Supp Non-Invasive
716 LMT Lockheed Martin 337.73 3 1 13.1 3.1 0.95 A++ Aerospace/Defense
1623 MRK Merck & Co. 75.00 2 1 11.9 3.5 0.85 A++ Drug
1220 NRG NRG Energy 43.04 4 3 12.8 3.0 1.20 B+ Power
2342 NXST Nexstar Media Group 129.05 3 3 7.8 2.2 1.55 B+ Entertainment
1630 PFE Pfizer, Inc. 34.72 NR 1 13.8 4.5 0.85 A++ Drug
365 QSR Restaurant Brands Int’l 59.05 4 3 23.9 3.6 1.20 B+ Restaurant
1777 RCIB.TO Rogers Commns. 57.50 3 2 15.5 3.7 0.80 B++ Diversified Co.
1938 SJM Smucker (J.M.) 115.10 2 1 17.8 3.2 0.65 A+ Food Processing
1380 TXN Texas Instruments 179.64 3 1 31.6 2.3 0.85 A++ Semiconductor
316 UPS United Parcel Serv. 163.39 2 1 18.1 2.6 0.80 A+ Air Transport
934 VZ Verizon Commns. 54.20 3 1 10.8 4.6 0.65 A++ Telecom. Services
To qualify for purchase in the above portfolio, a stock must have a yield that is in the top half of the Value Line universe and a Safety Rank of 3 or better. Stocks are monitored by Charles Moran, Senior Analyst.

6 0 4 VALUE LINE SELECTION & OPINION F E B R U A R Y 2 6 , 2 0 2 1
© 2021 Value Line, Inc. All rights reserved. Factual material is obtained from sources believed to be reliable and is provided without warranties of any kind. THE PUBLISHER IS NOT RESPONSIBLE FOR ANY ERRORS OR OMISSIONS HEREIN. This publication is strictly for subscriber’s own, non-commercial, internal use. No part of it may be reproduced, resold, stored or transmitted in any printed, electronic or other form, or used for generating or marketing any printed or electronic publication, service or product.
To subscribe call 1-800-VALUELINE
PORTFOLIO III: STOCKS WITH LONG-TERM PRICE GROWTH POTENTIALPrimarily suitable for investors with a 3- to 5-year horizon
Ratings & Reports
Page Ticker CompanyRecent Price Timeliness Safety P/E Yield% Beta
3- to 5-Yr. Apprec.
Potential Industry Name
2574 ADBE Adobe Inc. 498.84 3 2 45.0 Nil 0.75 15-60% Computer Software
753 ALL Allstate Corp. 104.43 3 1 8.2 2.1 1.00 55-90 Insurance (Prop/Cas.)
1990 MO Altria Group 43.40 2 3 9.6 7.9 0.90 75-165 Tobacco
1399 AAPL Apple Inc. 135.37 2 1 33.0 0.6 0.90 5-30 Computers/Peripherals
2120 AN AutoNation, Inc. 78.39 3 3 10.8 Nil 1.10 15-70 Retail Automotive
2121 AZO AutoZone Inc. 1146.65 3 3 15.2 Nil 0.95 30-95 Retail Automotive
2507 BK Bank of NY Mellon 41.93 3 2 10.8 3.0 1.15 90-150 Bank
434 CSGP CoStar Group 939.76 3 2 83.5 Nil 0.90 0-30 Information Services
2332 DIS Disney (Walt) 187.67 1 2 93.8 Nil 0.95 -20-5 Entertainment
2008 EA Electronic Arts 147.74 3 2 46.6 0.5 0.60 -5-25 Entertainment Tech
2640 FB Facebook Inc. 270.50 3 2 22.8 Nil 0.90 55-110 Internet
308 FDX FedEx Corp. 263.00 1 2 14.9 1.0 1.10 25-70 Air Transport
1917 HRL Hormel Foods 48.24 3 1 27.6 2.0 0.55 15-45 Food Processing
1360 INTC Intel Corp. 61.81 1 1 12.0 2.2 0.80 55-85 Semiconductor
186 ISRG Intuitive Surgical 807.81 2 2 70.1 Nil 1.20 10-45 Med Supp Invasive
2112 PVH PVH Corp. 96.15 3 3 20.8 Nil 1.80 45-110 Apparel
410 RSG Republic Services 91.26 3 2 24.5 1.9 0.90 5-40 Environmental
367 SBUX Starbucks Corp. 105.30 3 1 36.9 1.8 1.00 15-40 Restaurant
815 UNH UnitedHealth Group 328.24 3 1 20.5 1.5 1.10 15-40 Medical Services
2569 V Visa Inc. 209.96 2 1 35.9 0.6 1.00 5-30 Financial Svcs. (Div.)
To qualify for purchase in the above portfolio, a stock must have above-average 3- to 5-year price-appreciation potential. As the price of a stock in this Portfolio rises, the computed appreciation potential may fall; it may still be held. This portfolio is most appropriate for investors focused on long-term capital gains. Stocks in the above portfolio are selected and monitored by Justin Hellman, Editorial Analyst.
PORTFOLIO IV: STOCKS WITH ABOVE-AVERAGE DIVIDEND YIELDSPrimarily suitable for investors interested in current income
Ratings & Reports
Page Ticker CompanyRecent Price Timeliness Safety P/E Yield% Beta
Financial Strength Industry Name
917 T AT&T Inc. 28.80 3 1 8.9 7.4 0.85 A++ Telecom. Services
903 LNT Alliant Energy 48.29 3 2 20.1 3.3 0.85 A Electric Util. (Central)
2443 BX Blackstone Group 70.21 3 3 21.3 5.5 1.15 B++ Public/Private Equity
1991 BTI Brit. Am. Tobacco ADR 38.03 2 3 7.8 7.1 0.95 B++ Tobacco
151 CAT Caterpillar Inc. 197.99 1 2 25.3 2.1 1.10 A+ Heavy Truck & Equip
1969 KO Coca-Cola 50.69 3 1 24.6 3.3 0.90 A++ Beverage
136 ED Consol. Edison 71.06 4 1 17.0 4.4 0.75 A+ Electric Utility (East)
974 ETN Eaton Corp. plc 123.98 2 3 25.4 2.4 1.30 B++ Auto Parts
1360 INTC Intel Corp. 61.81 1 1 12.0 2.2 0.80 A++ Semiconductor
1194 KMB Kimberly-Clark 132.13 3 1 16.5 3.5 0.70 A+ Household Products
573 LYB LyondellBasell Inds. 96.14 4 3 12.1 4.4 1.35 A Chemical (Specialty)
362 MCD McDonald’s Corp. 213.90 3 1 27.2 2.4 0.95 A++ Restaurant
1623 MRK Merck & Co. 75.00 2 1 11.9 3.5 0.85 A++ Drug
2623 PAYX Paychex, Inc. 89.40 2 2 29.2 3.0 1.15 A IT Services
1630 PFE Pfizer, Inc. 34.72 NR 1 13.8 4.5 0.85 A++ Drug
1562 PRU Prudential Fin’l 80.86 4 3 7.2 5.7 1.55 B++ Insurance (Life)
145 SO Southern Co. 60.10 3 2 18.4 4.4 0.95 A Electric Utility (East)
316 UPS United Parcel Serv. 163.39 2 1 18.1 2.6 0.80 A+ Air Transport
934 VZ Verizon Communic. 54.20 3 1 10.8 4.6 0.65 A++ Telecom. Services
415 WM Waste Management 113.25 3 1 25.7 1.9 0.80 A Environmental
To qualify for purchase in the above portfolio, a stock must have a yield that is at least 1% above the median for the Value Line universe, and a Financial Strength Rating of at least B+. Stocks are selected and monitored by Adam Rosner, Editorial Analyst.

F E B R U A R Y 2 6 , 2 0 2 1 VALUE LINE SELECTION & OPINION 6 0 5
© 2021 Value Line, Inc. All rights reserved. Factual material is obtained from sources believed to be reliable and is provided without warranties of any kind. THE PUBLISHER IS NOT RESPONSIBLE FOR ANY ERRORS OR OMISSIONS HEREIN. This publication is strictly for subscriber’s own, non-commercial, internal use. No part of it may be reproduced, resold, stored or transmitted in any printed, electronic or other form, or used for generating or marketing any printed or electronic publication, service or product.
To subscribe call 1-800-VALUELINE
Selected Yields
TAXABLERecent
(2/12/21)3 Months Ago
(11/16/20)Year Ago (2/19/20)
Market RatesDiscount Rate 0.25 0.25 2.25
Federal Funds 0.00-0.25 0.00-0.25 1.50-1.75
Prime Rate 3.25 3.25 4.75
30-day CP (A1/P1) 0.06 0.11 1.61
3-month LIBOR 0.19 0.22 1.69
U.S. Treasury Securities3-month 0.04 0.09 1.57
6-month 0.05 0.12 1.54
1-year 0.06 0.12 1.47
5-year 0.50 0.41 1.41
10-year 1.20 0.91 1.57
10-year (inflation-protected) -1.01 -0.81 -0.06
30-year 2.01 1.66 2.01
30-year Zero N/A N/A 2.04
Common StocksVL Stocks (Median) 1.90 2.00 2.20
DJ Industrials (12-mo. est.) 1.90 2.00 2.30
VL Utilities 3.80 3.40 2.90
TAXABLERecent
(2/12/21)3 Months Ago
(11/16/20)Year Ago (2/19/20)
Corporate BondsFinancial (10-year) A 1.93 1.80 2.38
Industrial (25/30-year) A 2.92 2.65 3.06
Utility (25/30-year) A 3.05 2.82 3.14
Utility (25/30-year) Baa/BBB 3.34 3.11 3.47
S&P 500 High Yield Corp. Bond Index 3.40 3.87 3.77
Foreign Bonds (10-Year)Canada 1.04 0.74 1.36
Germany -0.42 -0.54 -0.42
Japan 0.08 0.02 -0.05
United Kingdom 0.57 0.35 0.60
Mortgage-Backed SecuritiesGNMA 5.5% 2.38 2.39 3.42
FHLMC 5.5% (Gold) 1.83 2.31 3.62
FNMA 5.5% 2.06 2.70 3.55
Preferred StockUtility A 6.36 6.25 6.03
Financial BBB 5.53 5.26 5.43
Financial Adjustable A N/A N/A 5.52
0.00%
1.00%
2.00%
3.00%
4.00%
5.00%
6.00%Current
Year-Ago
Treasury Security Yield Curve
3 5 10 306 2 31M os. Years
Federal Reserve Data
BANK RESERVES (One-Month Period; in Billions, Not Seasonally Adjusted)
Recent Levels Average Level Over the Last...
1/21 12/20 Change 3 Mos. 6 Mos. 12 Mos.Total Reserves 3153.6 3135.0 18.6 3107.8 2975.4 2801.0
Borrowed Reserves 52.6 58.7 -6.1 59.3 68.9 73.4
Non-Borrowed Reserves 3101.0 3076.3 24.7 3048.5 2906.5 2727.6
MONEY SUPPLY (One-Week Period; in Billions, Seasonally Adjusted)
Recent Levels Annual Growth Rates Over the Last...
2/1/21 1/25/21 Change 3 Mos. 6 Mos. 12 Mos.M1 (Currency+demand deposits) 6748.2 6707.6 40.6 117.4% 58.0% 69.0%
M2 (M1+savings+small time deposits) 19414.9 19411.9 3.0 13.0% 13.2% 25.7%
Source: United States Federal Reserve Bank
TAX-EXEMPT
Bond Buyer Indexes20-Bond Index (GOs) 2.10 2.28 2.51
25-Bond Index (Revs) 2.47 2.70 3.01
General Obligation Bonds (GOs)1-year AAA 0.06 0.14 0.83
1-year A 0.60 0.40 1.14
5-year AAA 0.17 0.25 0.84
5-year A 0.83 0.59 1.22
10-year AAA 0.68 0.79 1.17
10-year A 1.32 1.15 1.55
25/30-year AAA 1.32 1.50 1.72
25/30-year A 1.93 1.91 2.14
Revenue Bonds (Revs) (15 Years)Education AA 1.11 1.44 1.64
Electric AA 1.05 1.25 1.61
Water/Sewer AA 1.02 1.29 1.56
Hospital AA 1.20 1.74 1.71
Toll Road AA 1.29 1.61 1.55
Source: Bloomberg Finance L.P.

6 0 6 VALUE LINE SELECTION & OPINION F E B R U A R Y 2 6 , 2 0 2 1
© 2021 Value Line, Inc. All rights reserved. Factual material is obtained from sources believed to be reliable and is provided without warranties of any kind. THE PUBLISHER IS NOT RESPONSIBLE FOR ANY ERRORS OR OMISSIONS HEREIN. This publication is strictly for subscriber’s own, non-commercial, internal use. No part of it may be reproduced, resold, stored or transmitted in any printed, electronic or other form, or used for generating or marketing any printed or electronic publication, service or product.
To subscribe call 1-800-VALUELINE
Closing Stock Market Averages as of Press Time
2/9/2021 2/16/2021 1 week 12 months
Dow Jones Industrial Average 31375.83 31522.75 +0.5% +7.2%
Standard & Poor’s 500 3911.23 3932.59 +0.5% +16.3%
N.Y. Stock Exchange Composite 15244.40 15423.02 +1.2% +9.4%
NASDAQ Composite 14007.70 14047.50 +0.3% +44.4%
NASDAQ 100 13687.08 13773.77 +0.6% +43.1%
Amex Major Market Index 2602.40 2656.79 +2.1% +10.5%
Value Line (Geometric) 626.04 629.94 +0.6% +14.8%
Value Line (Arithmetic) 8786.80 8854.26 +0.8% +33.0%
London (FT-SE 100) 6531.56 6748.86 +3.3% -9.2%
Tokyo (Nikkei) 29505.93 30467.75 +3.3% +29.5%
Russell 2000 2299.00 2272.89 -1.1% +34.7%
* Beneficial owner of more than 10% of common stock † Includes only large transactions in U.S.-traded stocks; excludes shares held in the form of limited partnerships, excludes options & family trusts
Major Insider Transactions†
PURCHASES
Latest Full-Page Report Company Insider, Title Date Shares Traded Shares Held Price Range Recent Price
2223 Affiliated Managers J. C. Horgen, Pres. 2/9/2021 4,000 136,026 $136.23 147.90
2223 Affiliated Managers R. Jeffery III, Dir. 2/10/2021 2,500 17,500 $145.53 147.90
790 Anthem, Inc. R. M. Schneider, Dir. 2/4/2021 1,700 2,921 $296.03 290.68
2612 DXC Technology R. J. Fernandez, Dir. 2/9/21-2/10/21 11,443 26,968 $25.76-$26.28 25.79
342 Greenbrier (The) Cos. W. A. Furman, Chair. 2/9/21-2/10/21 50,000 512,518 $43.06-$43.78 45.98
549 UGI Corp. T. A. Dosch, Dir. 2/9/2021 10,000 22,000 $37.46 38.88
815 UnitedHealth Group T. P. Flynn, Dir. 2/5/2021 1,500 6,972 $332.68 328.24
SALES
Latest Full-Page Report Company Insider, Title Date Shares Traded Shares Held Price Range Recent Price
203 Align Techn. G. J. Morrow, Dir. 2/8/2021 15,000 16,478 $622.19-$628.52 609.58
203 Align Techn. W. S. Thaler, Dir. 2/8/2021 14,206 13,615 $610.63-$62195. 609.58
753 Allstate Corp. D. Civgin, Officer 2/5/2021 100,000 66,408 $107.09-$107.74 104.43
797 Guardant Health A. Talasaz, Chair. 2/5/21-2/11/21 656,235 1,725,422 $156.11-$169.03 179.10
1801 Interactive Brokers T. A. Frank, Officer 2/5/21-2/10/21 131,947 1,057,393 $69.81-$73.69 72.67
1801 Interactive Brokers T. Peterffy, Chair. 2/4/21-2/11/21 120,000 8,947,511 $68.86-$73.73 72.67
1395 Onto Innovation B. C. Rhine, Dir. 2/9/21-2/11/21 200,000 281,038 $59.26-$61.60 62.41

F E B R U A R Y 2 6 , 2 0 2 1 VALUE LINE SELECTION & OPINION 6 0 7
© 2021 Value Line, Inc. All rights reserved. Factual material is obtained from sources believed to be reliable and is provided without warranties of any kind. THE PUBLISHER IS NOT RESPONSIBLE FOR ANY ERRORS OR OMISSIONS HEREIN. This publication is strictly for subscriber’s own, non-commercial, internal use. No part of it may be reproduced, resold, stored or transmitted in any printed, electronic or other form, or used for generating or marketing any printed or electronic publication, service or product.
To subscribe call 1-800-VALUELINE
Market Monitor
Valuations and Yields 2/16 2/9 13-week range 50-week rangeLast market top
(1-25-2021)Last market bottom
(3-23-2020)Median price-earnings ratio of VL stocks 21.3 21.4 20.5 - 21.7 11.0 - 22.0 21.7 11.0
P/E (using 12-mo. est’d EPS) of DJ Industrials 22.6 22.5 22.0 - 22.9 13.2 - 25.8 22.0 14.1
Median dividend yield of VL stocks 1.9% 1.9% 1.9 - 2.1% 1.9 - 3.7% 1.9% 3.7%
Div’d yld. (12-mo. est.) of DJ Industrials 1.9% 1.9% 1.9 - 2.0% 1.9 - 3.4% 2.0% 3.0%
Prime Rate 3.3% 3.3% 3.3 - 3.3% 3.3 - 4.3% 3.3% 3.3%
Fed Funds 0.1% 0.1% 0.1 - 0.1% 0.0 - 1.1% 0.1% 0.2%
91-day T-bill rate 0.0% 0.1% 0.0 - 0.1% 0.0 - 0.3% 0.1% 0.0%
AAA Corporate bond yield 2.7% 2.6% 2.2 - 2.7% 2.0 - 3.6% 2.5% 3.6%
30-year Treasury bond yield 2.0% 2.0% 1.6 - 2.0% 1.2 - 2.0% 1.8% 1.3%
Bond yield minus average earnings yield -2.0% -2.0% -2.6 - -2.0% -5.5 - -2.0% -2.1% -5.5%
Short interest/avg. daily volume (5 weeks)Short interest/avg. daily volume (5 weeks) 9.8 10.6 9.8 - 12.0 8.3 - 15.3 11.4 9.0
CBOE put volume/call volume .78 .72 .69 - .84 .67 - 1.41 .71 1.05
VALUE LINE ASSET ALLOCATION MODEL (Based only on economic and financial factors)
Current (last adjusted at market open 10/12/20)
Previous (before 10/12/20)
Common Stocks 55%-65% 60%-70%
Cash and Treasury Issues 45%-35% 40%-30%
INDUSTRY PRICE PERFORMANCE LAST SIX WEEKS ENDING 2/12/2021
7 Best Performing IndustriesCannabis +85.0%
Healthcare Information +37.5%
Semiconductor Equip. +28.6%
Natural Gas (Div.) +27.8%
Retail (Softlines) +25.4%
Retail (Hardlines) +25.0%
Power +23.6%
7 Worst Performing IndustriesPrecious Metals -9.7%
Electric Util. (Central) -1.8%
Electric Utility (West) -1.6%
Metals & Mining (Div.) +0.1%
Natural Gas Utility +2.4%
Electric Utility (East) +2.8%
Information Services +2.9%
The corresponding change in the Value Line Arithmetic Average* is +13.2%
INTEREST RATES
RecentPrevious
WeekPrime Rate 3.3% 3.3%
30-Yr. Treasury 2.0% 2.0%
Fed Funds 0.1% 0.1%
VALUE LINE UNIVERSE
RecentPrevious
WeekNew Highs 494 544
New Lows 0 0
VALUE LINE UNIVERSE
RecentPrevious
WeekAdvances 981 1478
Declines 714 216
Issues Covered 1699 1696
Market Value ($ Trillion)
48.208 47.758
Q1 2021Q4 2020Q1 2020 Q2 2020 Q3 20200%
5%
7%
8%
6%
4%
3%
2%
1%
Q1 2021Q4 2020Q1 2020 Q2 2020 Q3 2020
155
165
Index: 12/30/1988 = 100180
140
Q1 2021Q4 2020Q1 2020 Q2 2020 Q3 2020
800
1200
1000
0
400
200
600
Prime Rate
30-Yr. Treasury
Fed Funds
New Highs
New Lows
CHANGES IN FINANCIAL STRENGTH RATINGS
Company Prior Rating
New Rating
Ratings & Reports
PageCenovus Energy C+ C++ 504
Kronos Worldwide C++ B 571
Linde plc B++ A 572
Westlake Chemical A B++ 583

6 0 8 VALUE LINE SELECTION & OPINION F E B R U A R Y 2 6 , 2 0 2 1
© 2021 Value Line, Inc. All rights reserved. Factual material is obtained from sources believed to be reliable and is provided without warranties of any kind. THE PUBLISHER IS NOT RESPONSIBLE FOR ANY ERRORS OR OMISSIONS HEREIN. This publication is strictly for subscriber’s own, non-commercial, internal use. No part of it may be reproduced, resold, stored or transmitted in any printed, electronic or other form, or used for generating or marketing any printed or electronic publication, service or product.
To subscribe call 1-800-VALUELINE
Stock Market Averages
1
64
2
10
6040
20
100
200
2005 20172007 2009 2011 2013 2015 2019 2021
Dow Jones Industrials(RightScale)
Estimated P/E(LeftScale)
Estimated Appreciation Potential(LeftScale)
Estimated Yield(LeftScale)
66004200
24001800
3200050000
18000
050
100150200250300350400450500550600650700750800
Composite
Q1 2020 Q4 2020 Q1 2021Q2 2020 Q3 2020
0
50
100
150
200
250
300
350
400
450
500
550
600
Industrials
Q1 2021Q3 2020 Q4 2020Q1 2020 Q2 2020
5200
6000
6800
7600
8400
9200
10000
10800
11600
12400
13200
14000
14800
15600
Rails
Q1 2021Q3 2020 Q4 2020Q1 2020 Q2 2020
0
40
80
120
160
200
240
280
320
360
400
440
480
Utilities
Q1 2021Q3 2020 Q4 2020Q1 2020 Q2 2020
VALUE LINE ESTIMATED P/E, YIELD, APPRECIATION POTENTIAL VERSUS DOW JONES INDUSTRIALS (January 3, 2005–February 12, 2021)
WEEKLY VALUE LINE GEOMETRIC AVERAGES* (January 2, 2020–February 16, 2021)
THE VALUE LINE GEOMETRIC AVERAGES THE DOW JONES AVERAGES
Composite 1661 stocks
Industrials 1589 stocks
Rails 10 stocks
Utilities 62 stocks
Arithmetic* Composite 1661 stocks
Composite 65 stocks
Industrials 30 stocks
Transportation 20 stocks
Utilities 15 stocks
2/10/2021 626.72 474.59 14225.84 363.54 8799.34 10377.77 31437.80 12954.53 871.21
2/11/2021 626.88 474.81 14266.98 361.61 8805.99 10365.44 31430.70 12953.73 864.79
2/12/2021 629.77 477.15 14582.93 359.37 8848.59 10404.83 31458.40 13175.09 857.10
2/15/2021
2/16/2021 629.94 477.35 14641.59 358.13 8854.26 10408.78 31522.75 13180.74 851.20
% Change last 4 weeks +4.5% +4.6% +4.9% +0.2% +5.1% +1.6% +1.9% +2.2% -0.7%
Officers, directors, employees and affiliates of Value Line, Inc. (“VLI”), the parent company of Value Line Publishing LLC (“VLP”) and EULAV Asset Management (“EULAV”), may hold stocks that are reviewed or recommended in this publication. EULAV also manages investment com-panies and other accounts that use the rankings and recommendations in this publication as part of their investment strategies. These accounts, as well as the officers, directors, employees and affiliates of VLI, may dispose of a security notwithstanding the fact that The Value Line Investment Survey (the “Survey”) ranks the issuer favorably; conversely, such accounts or persons may purchase or hold a security that is poorly ranked by the Survey. Some of the investment companies managed by EULAV only hold securities with a specified minimum Timeliness Rank by the Survey and dispose of those positions when the Timeliness Rank declines or is suspended. Subscribers to the Survey and its related publications as well as some institutional customers of VLP will have access to all updated Ranks in the Survey by 8:00 AM each Monday. At the same time, portfolio managers for EULAV will receive reports providing Timeliness Ranking information. EULAV’s portfolio managers also may have access to publicly available information that may ultimately result in or influence a change in rankings or recommendations, such as earnings releases, changes in market value or disclosure of corporate transactions. The investment companies or accounts may trade upon such information prior to a change in ranking. While the rankings in the Survey are intended to be predictive of future relative performance of an issuer’s securities, the Survey is not intended to constitute a recommendation of any specific security. Any investment decision with respect to any issuer covered by the Survey should be made as part of a diversified portfolio of equity securities and in light of an investor’s particular investment objectives and circumstances. Value Line, Value Line logo, The Value Line Investment Survey, Timeliness are trademarks of Value Line, Inc. *Value Line Arithmetic & Geometric Indices calculated by Thomson Reuters. Information supplied by Thomson Reuters.
HOLIDAY HOLIDAYHOLIDAY

{00546823;6}
Exhibit TJB-3: Value Line Report on Electric Utility Industry

Electric Utility
Index: June, 1967 = 100
15
30
45
60
75
90
120
150RELATIVE STRENGTH (Ratio of Industry to Value Line Comp.)
2019 20202014 2015 2016 2017 2018
INDUSTRY TIMELINESS: 43 (of 96)
December 11, 2020 ELECTRIC UTILITY (CENTRAL) INDUSTRY 901All of the major electric utilities located in the
central region of the United States are reviewed inthis Issue; eastern electrics, in Issue 1; and theremaining utilities, in Issue 11.
In this Issue, we present our rankings of states’regulatory climates. The latest rankings includeone change.
Electric utility stocks have fared better in re-cent weeks, but the prices of a majority of issuesare down for the year—by more than 10%, for someequities. The group’s dividend yield compares fa-vorably with that of the market, but is still low, byhistorical standards.
Ranking The Regulators
A state’s regulatory climate is an important factor forelectric utilities. Every utility files rate cases from timeto time. Companies also need regulatory approval forthings such as large capital projects, mergers or acqui-sitions, and asset purchases. This is becoming even moreimportant for companies that are making moves thatwill increase the proportion of income that comes fromthe regulated utility business. For example, DTE Energyplans to spin off its midstream natural gas division, andEntergy is selling or closing its nonregulated nuclearplants.
Investors should note that a state’s regulatory climatedoes not only reflect the commission but the governor,legislature, and courts as well. Even so, the commissionis clearly the most important factor.
Below, we show each state’s regulatory climate, alongwith that of Washington, DC and the Federal EnergyRegulatory Commission (FERC). Several states are notincluded: Nebraska, Nevada, Rhode Island, Tennessee,Utah, and Vermont. These states either are little-servedby investor-owned utilities or do not have an electriccompany that is covered in The Value Line InvestmentSurvey.
• Above Average: Alabama, Alaska, Colorado, Florida,Georgia, Idaho, Indiana, Massachusetts, Michigan,Ohio, Wisconsin, FERC.
• Average: Arizona, California, Delaware, Iowa, Kansas,Kentucky, Louisiana, Maine, Minnesota, Mississippi,Missouri, New Hampshire, New Jersey, North Carolina,North Dakota, Oklahoma, Oregon, Pennsylvania, SouthCarolina, South Dakota, Texas, Virginia, Wyoming.
• Below Average: Arkansas, Connecticut, District ofColumbia, Hawaii, Illinois, Maryland, Montana, NewMexico, New York, Washington, West Virginia.
Since our last review of regulatory climates, we havelowered South Carolina from Above Average to Average.Duke Energy (reviewed in Issue 1) received a disap-pointing order in its last rate case. In addition, we areconsidering lowering Colorado to Average, lowering Vir-ginia to Below Average, and raising Arkansas to Aver-age. Black Hills Corporation has had poor outcomes inrecent regulatory matters in Colorado. The company’sutility in Colorado has a rate case pending there, and we
want to see the outcome before making a change. Also,Public Service of Colorado, a subsidiary of Xcel Energy,has fared better than Black Hills in the state in recentrate cases. Appalachian Power, a subsidiary of AmericanElectric Power, just received a disappointing rate orderthat the utility appealed to the state Supreme Court.Utilities in Arkansas have benefited from the state’sformula rate plan, which provides rate relief annually, inrecent years. Entergy, American Electric Power, andOGE Energy have subsidiaries that serve the state.Entergy is asking for an extension of this regulatoryplan. California bears watching, too, because of attitudesagainst fossil fuels that are growing in the Golden State.The treatment of wildfire-related costs is another causefor concern. At this time, though, we see no reason tomake a change.
Conclusion
This has been a difficult year for most stocks in theElectric Utility Industry. Considering how well thegroup performed in 2019, a reversion to the mean wouldnot have been surprising at all, even if 2020 wasn’t suchan unusual year. Although the industry is known for itsdefensive characteristics, these equities got caught up inthe market plunge that began in late February. Therecession caused some companies to cut their earningsguidance upon reporting first-quarter results. Somecompanies are also incurring costs directly or indirectlyrelated to the coronavirus pandemic, such as increasedbad-debt expense. ALLETE temporarily suspended itsguidance, and has been once of the worst-performingstocks in the Electric Utility Industry in 2020. Mostutility equities have recovered in price since then, butnot as much as the broader market. Most of the utilityissues reviewed in Issue 5 have risen in price since ourSeptember report, led by gains of 10% or more byCenterPoint Energy and Entergy. In an era of extremelylow interest rates, electric utility stocks appeal toincome-oriented investors for their generous dividendyields, along with the potential for dividend growth. Theindustry’s average yield of 3.7% is well above the medianof 2.1% for dividend-paying equities reviewed in TheValue Line Investment Survey. However, many of thesestocks are not cheap, and are trading within their2023-2025 Target Price Range.
Paul E. Debbas, CFA
© 2020 Value Line, Inc. All rights reserved. Factual material is obtained from sources believed to be reliable and is provided without warranties of any kind.THE PUBLISHER IS NOT RESPONSIBLE FOR ANY ERRORS OR OMISSIONS HEREIN. This publication is strictly for subscriber’s own, non-commercial, internal use. No partof it may be reproduced, resold, stored or transmitted in any printed, electronic or other form, or used for generating or marketing any printed or electronic publication, service or product.
To subscribe call 1-800-VALUELINE

1601201008060504030
2015
Percentsharestraded
302010
Target Price Range2023 2024 2025
AMEREN NYSE-AEE 77.78 22.7 22.717.0 1.09 2.7%
TIMELINESS 2 Lowered 11/20/20
SAFETY 2 Raised 6/20/14
TECHNICAL 2 Raised 12/11/20BETA .85 (1.00 = Market)
18-Month Target Price RangeLow-High Midpoint (% to Mid)
$63-$127 $95 (20%)
2023-25 PROJECTIONSAnn’l Total
Price Gain ReturnHigh 85 (+10%) 5%Low 60 (-25%) -3%Institutional Decisions
4Q2019 1Q2020 2Q2020to Buy 266 242 220to Sell 265 273 301Hld’s(000) 186367 187833 196379
High: 35.3 29.9 34.1 35.3 37.3 48.1 46.8 54.1 64.9 70.9 80.9 87.7Low: 19.5 23.1 25.5 28.4 30.6 35.2 37.3 41.5 51.4 51.9 63.1 58.7
% TOT. RETURN 11/20THIS VL ARITH.*
STOCK INDEX1 yr. 6.7 15.73 yr. 31.2 23.55 yr. 105.3 64.0
CAPITAL STRUCTURE as of 9/30/20Total Debt $10801 mill. Due in 5 Yrs $2317 mill.LT Debt $10172 mill. LT Interest $456 mill.(LT interest earned: 3.3x)Leases, Uncapitalized Annual rentals $8 mill.Pension Assets-12/19 $4564 mill.
Oblig $4967 mill.Pfd Stock $142 mill. Pfd Div’d $6 mill.807,595 sh. $3.50 to $5.50 cum. (no par), $100stated val., redeem. $102.176-$110/sh.; 616,323sh. 4.00% to 6.625%, $100 par, redeem. $100-$104/sh.Common Stock 247,206,978 shs. as of 10/30/20MARKET CAP: $19 billion (Large Cap)
ELECTRIC OPERATING STATISTICS2017 2018 2019
% Change Retail Sales (KWH) -3.4 +5.6 -3.5Avg. Indust. Use (MWH) NA NA NAAvg. Indust. Revs. per KWH (¢) NA NA NACapacity at Peak (Mw) NA NA NAPeak Load, Summer (Mw) NA NA NAAnnual Load Factor (%) NA NA NA% Change Customers (yr-end) NA NA NA
Fixed Charge Cov. (%) 350 313 307ANNUAL RATES Past Past Est’d ’17-’19of change (per sh) 10 Yrs. 5 Yrs. to ’23-’25Revenues -3.0% -.5% .5%‘‘Cash Flow’’ 1.5% 5.5% 6.0%Earnings 1.0% 6.5% 6.0%Dividends -2.0% 3.0% 5.0%Book Value -.5% 2.5% 6.0%
Cal- Fullendar Year
QUARTERLY REVENUES ($ mill.)Mar.31 Jun.30 Sep.30 Dec.31
2017 1514 1538 1723 1402 6177.02018 1585 1563 1724 1419 6291.02019 1556 1379 1659 1316 5910.02020 1440 1398 1628 1284 57502021 1600 1450 1700 1350 6100Cal- Full
endar YearEARNINGS PER SHARE A
Mar.31 Jun.30 Sep.30 Dec.312017 .42 .79 1.18 .39 2.772018 .62 .97 1.45 .28 3.322019 .78 .72 1.47 .38 3.352020 .59 .98 1.47 .41 3.452021 .65 .90 1.70 .45 3.70Cal- Full
endar YearQUARTERLY DIVIDENDS PAID B ■
Mar.31 Jun.30 Sep.30 Dec.312016 .425 .425 .425 .44 1.722017 .44 .44 .44 .4575 1.782018 .4575 .4575 .4575 .475 1.852019 .475 .475 .475 .495 1.922020 .495 .495 .495 .515
2004 2005 2006 2007 2008 2009 2010 2011 2012 2013 2014 2015 2016 201726.43 33.12 33.30 36.23 36.92 29.87 31.77 31.04 28.14 24.06 24.95 25.13 25.04 25.465.57 6.10 6.02 6.76 6.44 6.06 6.33 5.87 5.87 5.25 5.77 6.08 6.59 6.802.82 3.13 2.66 2.98 2.88 2.78 2.77 2.47 2.41 2.10 2.40 2.38 2.68 2.772.54 2.54 2.54 2.54 2.54 1.54 1.54 1.56 1.60 1.60 1.61 1.66 1.72 1.784.13 4.63 4.99 6.96 9.75 7.51 4.66 4.50 5.49 5.87 7.66 8.12 8.78 9.05
29.71 31.09 31.86 32.41 32.80 33.08 32.15 32.64 27.27 26.97 27.67 28.63 29.27 29.61195.20 204.70 206.60 208.30 212.30 237.40 240.40 242.60 242.63 242.63 242.63 242.63 242.63 242.63
16.3 16.7 19.4 17.4 14.2 9.3 9.7 11.9 13.4 16.5 16.7 17.5 18.3 20.6.86 .89 1.05 .92 .85 .62 .62 .75 .85 .93 .88 .88 .96 1.04
5.5% 4.9% 4.9% 4.9% 6.2% 6.0% 5.8% 5.3% 5.0% 4.6% 4.0% 4.0% 3.5% 3.1%
7638.0 7531.0 6828.0 5838.0 6053.0 6098.0 6076.0 6177.0669.0 602.0 589.0 518.0 593.0 585.0 659.0 683.0
36.8% 37.3% 36.9% 37.5% 38.9% 38.3% 36.7% 38.2%7.8% 5.6% 6.1% 7.1% 5.7% 5.1% 4.1% 5.6%
48.2% 45.3% 49.5% 45.2% 47.2% 49.3% 47.7% 49.2%50.9% 53.7% 49.4% 53.7% 51.7% 49.7% 51.3% 49.8%15185 14738 13384 12190 12975 13968 13840 1442017853 18127 16096 16205 17424 18799 20113 214666.0% 5.6% 6.0% 5.6% 5.8% 5.3% 6.0% 6.0%8.5% 7.5% 8.7% 7.7% 8.7% 8.3% 9.1% 9.3%8.6% 7.5% 8.8% 7.8% 8.7% 8.3% 9.2% 9.4%3.8% 2.8% 3.0% 1.9% 2.9% 2.5% 3.3% 3.4%56% 63% 66% 76% 67% 70% 64% 64%
2018 2019 2020 2021 © VALUE LINE PUB. LLC 23-2525.73 24.00 22.65 23.65 Revenues per sh 25.507.64 7.83 8.15 8.80 ‘‘Cash Flow’’ per sh 10.503.32 3.35 3.45 3.70 Earnings per sh A 4.501.85 1.92 2.00 2.09 Div’d Decl’d per sh B ■ 2.459.56 9.92 15.85 11.65 Cap’l Spending per sh 11.00
31.21 32.73 35.70 37.75 Book Value per sh C 44.50244.50 246.20 254.00 258.00 Common Shs Outst’g D 270.00
18.3 22.1 Bold figures areValue Lineestimates
Avg Ann’l P/E Ratio 16.0.99 1.18 Relative P/E Ratio .90
3.0% 2.6% Avg Ann’l Div’d Yield 3.4%
6291.0 5910.0 5750 6100 Revenues ($mill) 6900821.0 834.0 870 965 Net Profit ($mill) 1220
22.4% 17.9% 15.5% 12.5% Income Tax Rate 12.5%6.9% 5.8% 6.0% 5.0% AFUDC % to Net Profit 4.0%
50.3% 52.1% 54.5% 53.0% Long-Term Debt Ratio 51.0%48.8% 47.1% 44.5% 46.5% Common Equity Ratio 48.5%15632 17116 20325 20975 Total Capital ($mill) 2480022810 24376 27200 28900 Net Plant ($mill) 333006.4% 6.0% 5.5% 5.5% Return on Total Cap’l 6.0%
10.6% 10.2% 9.5% 10.0% Return on Shr. Equity 10.0%10.7% 10.3% 9.5% 10.0% Return on Com Equity E 10.0%4.8% 4.4% 4.0% 4.0% Retained to Com Eq 4.5%56% 57% 58% 56% All Div’ds to Net Prof 54%
Company’s Financial Strength AStock’s Price Stability 95Price Growth Persistence 80Earnings Predictability 90
(A) Dil. EPS. Excl. nonrec. gain (losses): ’05,(11¢); ’10, ($2.19); ’11, (32¢); ’12, ($6.42); ’17,(63¢); gain (loss) from disc. ops.: ’13, (92¢);’15, 21¢. ’17 EPS don’t sum due to rounding.
Next egs. report due mid-Feb. (B) Div’ds pd.late Mar., June, Sept., & Dec. ■ Div’d reinv.plan avail. (C) Incl. intang. In ’19: $5.70/sh.(D) In mill. (E) Rate base: Orig. cost depr. Rate
all’d on com. eq. in MO in ’20: elec., none; in’11: gas, none; in IL in ’14: elec., 8.7%, in ’18:gas, 9.87%; earned on avg. com. eq., ’19:10.5%. Reg. Climate: MO, Avg.; IL, Below Avg.
BUSINESS: Ameren Corporation is a holding company formedthrough the merger of Union Electric and CIPSCO. Has 1.2 millionelectric and 127,000 gas customers in Missouri; 1.2 million electricand 813,000 gas customers in Illinois. Discontinued nonregulatedpower-generation operation in ’13. Electric revenue breakdown:residential, 43%; commercial, 32%; industrial, 8%; other, 17%.
Generating sources: coal, 63%; nuclear, 23%; hydro & other, 6%;purchased, 8%. Fuel costs: 24% of revenues. ’19 reported deprec.rates: 3%-4%. Has 9,300 employees. Chairman, President & CEO:Warner L. Baxter. Inc.: Missouri. Address: One Ameren Plaza, 1901Chouteau Ave., P.O. Box 66149, St. Louis, Missouri 63166-6149.Tel.: 314-621-3222. Internet: www.ameren.com.
We trimmed our 2020 earnings esti-mate for Ameren by $0.05 a share, to$3.45. Third-quarter profits were slightlybelow our expectation. Even so, earningsshould still wind up above the 2019 tally,despite the negative effects of the reces-sion on kilowatt-hour sales in Missouri,and coronavirus-related expenses.(Ameren Illinois operates under a regu-latory mechanism that decouples revenuesand volume.) Among the positive factorsare an electric rate hike that took effect inMissouri on April 1st and investments inthe electric transmission business. Our re-vised estimate is within Ameren’s targetedrange of $3.40-$3.55 a share, which wasadjusted from $3.40-$3.60 when third-period results were reported in November.A rate case is pending in Illinois.Ameren is seeking a gas increase of $97million (including $46 million that wouldotherwise be recovered through riders oncustomers’ bills), based on a 10.5% returnon equity and a common-equity ratio of54.1%. The staff of the Illinois CommerceCommission recommended a $69 millionincrease, based on a 9.32% ROE and a50.4% common-equity ratio, and other in-
tervenors proposed a hike that was slight-ly less favorable than the staff recom-mendation. An order is due by January,with new tariffs taking effect in February.This, along with a better economy, shouldproduce higher profits in 2021.Ameren is building a wind project.The company will add 700 megawatts ofcapacity at a cost of $1.2 billion. Most ofthis will be completed by yearend, but aportion of the spending ($200 million) willslip into the first quarter of 2021.The board of directors raised the divi-dend in the fourth quarter. The in-crease was two cents a share (4.0%) quar-terly, the same as last year. Ameren’s goalfor the payout ratio is 55%-70%, and thisfigure remains near the lower end.This timely stock has been one of thetop performers among utilities in2020. The price has risen slightly in whathas been a bad year for most electric utili-ty issues, as investors like Ameren’sstability. The dividend yield is a percent-age point below the utility mean. Total re-turn potential has appeal for the 18-monthspan, but is low for the 2023-2025 period.Paul E. Debbas, CFA December 11, 2020
LEGENDS0.64 x Dividends p shdivided by Interest Rate. . . . Relative Price Strength
Options: YesShaded area indicates recession
© 2020 Value Line, Inc. All rights reserved. Factual material is obtained from sources believed to be reliable and is provided without warranties of any kind.THE PUBLISHER IS NOT RESPONSIBLE FOR ANY ERRORS OR OMISSIONS HEREIN. This publication is strictly for subscriber’s own, non-commercial, internal use. No partof it may be reproduced, resold, stored or transmitted in any printed, electronic or other form, or used for generating or marketing any printed or electronic publication, service or product.
To subscribe call 1-800-VALUELINE
RECENTPRICE
P/ERATIO
RELATIVEP/E RATIO
DIV’DYLD( )Trailing:
Median:VALUELINE

1601201008060504030
2015
Percentsharestraded
24168
Target Price Range2023 2024 2025
AMERICAN ELEC. PWR. NDQ-AEP 84.89 18.9 20.915.0 0.90 3.5%
TIMELINESS 3 Lowered 9/6/19
SAFETY 1 Raised 3/17/17
TECHNICAL 3 Raised 11/27/20BETA .75 (1.00 = Market)
18-Month Target Price RangeLow-High Midpoint (% to Mid)
$70-$143 $107 (25%)
2023-25 PROJECTIONSAnn’l Total
Price Gain ReturnHigh 105 (+25%) 9%Low 85 (Nil) 4%Institutional Decisions
4Q2019 1Q2020 2Q2020to Buy 549 483 496to Sell 459 594 508Hld’s(000) 370323 370792 366307
High: 36.5 37.9 41.7 45.4 51.6 63.2 65.4 71.3 78.1 81.1 96.2 105.0Low: 24.0 28.2 33.1 37.0 41.8 45.8 52.3 56.8 61.8 62.7 72.3 65.1
% TOT. RETURN 11/20THIS VL ARITH.*
STOCK INDEX1 yr. -4.7 15.73 yr. 20.1 23.55 yr. 78.4 64.0
CAPITAL STRUCTURE as of 9/30/20Total Debt $30553 mill. Due in 5 Yrs $11460 mill.LT Debt $28156 mill. LT Interest $1154 mill.Incl. $918 mill. securitized bonds. Incl. $307 mill.capitalized leases.(LT interest earned: 2.4x)Leases, Uncapitalized Annual rentals $269.9 mill.Pension Assets-12/19 $5015.4 mill.
Oblig $5236.8 mill.Pfd Stock None
Common Stock 496,386,252 shs.as of 10/22/20MARKET CAP: $42 billion (Large Cap)
ELECTRIC OPERATING STATISTICS2017 2018 2019
% Change Retail Sales (KWH) -1.6 +3.0 -2.2Avg. Indust. Use (MWH) NA NA NAAvg. Indust. Revs. per KWH (¢) NA NA NACapacity at Peak (Mw) NA NA NAPeak Load (Mw) NA NA NAAnnual Load Factor (%) NA NA NA% Change Customers (yr-end) NA NA +.3
Fixed Charge Cov. (%) 354 254 234ANNUAL RATES Past Past Est’d ’17-’19of change (per sh) 10 Yrs. 5 Yrs. to ’23-’25Revenues - - -.5% .5%‘‘Cash Flow’’ 2.5% 4.0% 5.0%Earnings 3.0% 4.0% 6.0%Dividends 4.5% 5.5% 5.5%Book Value 4.0% 3.0% 5.5%
Cal- Fullendar Year
QUARTERLY REVENUES ($ mill.)Mar.31 Jun.30 Sep.30 Dec.31
2017 3933 3576 4104 3810 154242018 4048 4013 4333 3801 161952019 4056 3573 4315 3616 155612020 3748 3494 4066 3492 148002021 4100 3600 4300 3600 15600Cal- Full
endar YearEARNINGS PER SHARE A
Mar.31 Jun.30 Sep.30 Dec.312017 .94 .76 1.11 .81 3.622018 .92 1.07 1.17 .74 3.902019 1.16 .93 1.48 .51 4.082020 1.00 1.05 1.50 .75 4.302021 1.15 1.10 1.60 .80 4.65Cal- Full
endar YearQUARTERLY DIVIDENDS PAID B ■
Mar.31 Jun.30 Sep.30 Dec.312016 .56 .56 .56 .59 2.272017 .59 .59 .59 .62 2.392018 .62 .62 .62 .67 2.532019 .67 .67 .67 .70 2.712020 .70 .70 .70 .74
2004 2005 2006 2007 2008 2009 2010 2011 2012 2013 2014 2015 2016 201735.51 30.76 31.82 33.41 35.56 28.22 30.01 31.27 30.77 31.48 34.78 33.51 33.31 31.355.89 5.96 6.67 6.80 6.84 6.32 6.29 6.83 6.92 7.02 7.57 7.98 8.47 7.952.61 2.64 2.86 2.86 2.99 2.97 2.60 3.13 2.98 3.18 3.34 3.59 4.23 3.621.40 1.42 1.50 1.58 1.64 1.64 1.71 1.85 1.88 1.95 2.03 2.15 2.27 2.394.28 6.11 8.89 8.88 9.83 6.19 5.07 5.74 6.45 7.75 8.68 9.37 9.98 11.79
21.32 23.08 23.73 25.17 26.33 27.49 28.33 30.33 31.37 32.98 34.37 36.44 35.38 37.17395.86 393.72 396.67 400.43 406.07 478.05 480.81 483.42 485.67 487.78 489.40 491.05 491.71 492.01
12.4 13.7 12.9 16.3 13.1 10.0 13.4 11.9 13.8 14.5 15.9 15.8 15.2 19.3.66 .73 .70 .87 .79 .67 .85 .75 .88 .81 .84 .80 .80 .97
4.3% 3.9% 4.1% 3.4% 4.2% 5.5% 4.9% 5.0% 4.6% 4.2% 3.8% 3.8% 3.5% 3.4%
14427 15116 14945 15357 17020 16453 16380 154251248.0 1513.0 1443.0 1549.0 1634.0 1763.4 2073.6 1783.234.8% 31.7% 33.9% 36.2% 37.8% 35.1% 26.8% 33.7%10.4% 10.6% 11.2% 7.3% 9.0% 11.0% 8.0% 8.0%53.1% 50.7% 50.6% 51.1% 49.0% 49.8% 50.0% 51.5%46.7% 49.3% 49.4% 48.9% 51.0% 50.2% 50.0% 48.5%29184 29747 30823 32913 33001 35633 34775 3770735674 36971 38763 40997 44117 46133 45639 502625.7% 6.6% 6.1% 6.0% 6.3% 6.1% 7.2% 5.9%9.1% 10.3% 9.5% 9.6% 9.7% 9.9% 11.9% 9.8%9.1% 10.3% 9.5% 9.6% 9.7% 9.9% 11.9% 9.8%3.1% 4.2% 3.5% 3.7% 3.8% 3.9% 5.5% 3.2%66% 60% 63% 62% 61% 60% 54% 67%
2018 2019 2020 2021 © VALUE LINE PUB. LLC 23-2532.84 31.49 29.80 30.95 Revenues per sh 32.508.77 9.35 9.75 10.40 ‘‘Cash Flow’’ per sh 11.753.90 4.08 4.30 4.65 Earnings per sh A 5.502.53 2.71 2.84 3.00 Div’d Decl’d per sh B ■ 3.55
12.89 12.43 12.40 15.35 Cap’l Spending per sh 13.2538.58 39.73 41.40 43.65 Book Value per sh C 52.50
493.25 494.17 497.00 504.00 Common Shs Outst’g D 540.0018.0 21.4 Bold figures are
Value Lineestimates
Avg Ann’l P/E Ratio 17.5.97 1.14 Relative P/E Ratio .95
3.6% 3.1% Avg Ann’l Div’d Yield 3.7%
16196 15561 14800 15600 Revenues ($mill) 175001923.8 2019.0 2125 2335 Net Profit ($mill) 3000
5.8% .7% 2.0% 2.0% Income Tax Rate 2.0%10.7% 12.7% 12.0% 12.0% AFUDC % to Net Profit 9.0%53.2% 56.1% 58.5% 59.5% Long-Term Debt Ratio 60.5%46.8% 43.9% 41.5% 40.5% Common Equity Ratio 39.5%40677 44759 49325 54500 Total Capital ($mill) 7190055099 60138 63575 68400 Net Plant ($mill) 814005.9% 5.6% 5.5% 5.5% Return on Total Cap’l 5.5%
10.1% 10.3% 10.5% 10.5% Return on Shr. Equity 10.5%10.1% 10.3% 10.5% 10.5% Return on Com Equity E 10.5%3.5% 3.4% 3.5% 4.0% Retained to Com Eq 4.0%65% 67% 69% 67% All Div’ds to Net Prof 65%
Company’s Financial Strength A+Stock’s Price Stability 100Price Growth Persistence 75Earnings Predictability 95
(A) Diluted EPS. Excl. nonrec. gains (losses):’04, 24¢; ’05, (62¢); ’06, (20¢); ’07, (20¢); ’08,40¢; ’10, (7¢); ’11, 89¢; ’12, (38¢); ’13, (14¢);’16, ($2.99); ’17, 26¢; ’19, (20¢); disc. ops.: ’04,
15¢; ’05, 7¢; ’06, 2¢; ’08, 3¢; ’15, 58¢; ’16,(1¢). Next earnings report due late Feb.(B) Div’ds paid early Mar., June, Sept., & Dec.■ Div’d reinvestment plan avail. (C) Incl. intang.
In ’19: $13.39/sh. (D) In mill. (E) Rate base:various. Rates allowed on com. eq.: 9.3%-10.9%; earned on avg. com. eq., ’19: 10.4%.Regulatory Climate: Average.
BUSINESS: American Electric Power Company Inc. (AEP), through10 operating utilities, serves 5.5 million customers in Arkansas,Kentucky, Indiana, Louisiana, Michigan, Ohio, Oklahoma, Tennes-see, Texas, Virginia, & West Virginia. Has a transmission subsidi-ary. Electric revenue breakdown: residential, 42%; commercial,24%; industrial, 19%; wholesale, 11%; other, 4%. Sold Houston
Pipeline ’05; commercial barge operation in ’15. Generatingsources not available. Fuel costs: 33% of revenues. ’19 reporteddepreciation rates (utility): 1.8%-9.5%. Has 16,900 employees.Chairman, President & CEO: Nicholas K. Akins. Incorporated: NewYork. Address: 1 Riverside Plaza, Columbus, Ohio 43215-2373.Telephone: 614-716-1000. Internet: www.aep.com.
American Electric Power should postsolid earnings growth in 2020 and2021. Rate relief and increased investmentin electric transmission are two key fac-tors. The company’s utilities frequentlyhave rate cases pending (see below). AEPalso spends significant sums on transmis-sion, some of which is recovered through aforward-looking regulatory mechanism. Infact, the company’s capital budget calls forover $16 billion of spending on electrictransmission from 2021 through 2025. Our2020 and 2021 share-net estimates arewithin management’s targeted ranges of$4.25-$4.45 and $4.51-$4.71, respectively.The company received a rate order inVirginia, and applications are pend-ing in three states. Appalachian Powerfiled for $65 million, based on a 9.9% re-turn on equity and a 50% common-equityratio. The regulators granted no increase,based on a 9.2% ROE and the samecommon-equity ratio. The utility promptlyappealed the decision to the Virginia Su-preme Court. AEP is trying to reach asettlement in Ohio, where is filed for $36million, based on a 10.15% ROE and a54.4% common-equity ratio. Kentucky
Power requested a $65 million hike, basedon a 10% ROE and a 43.3% common-equity ratio. New tariffs are expected totake effect in January. SWEPCO askedthe Texas commission to raise rates by $90million (excluding $15 million currentlybeing recovered through riders on custom-ers’ bills), based on a 10.35% ROE and a49.4% common-equity ratio. The companyexpects an order by the end of 2021, withnew rates taking effect shortly after thedecision.The board of directors raised the divi-dend in the fourth quarter. This is theusual timing of increases for AEP. As wehad estimated, the board boosted the quar-terly disbursement $0.04 a share (5.7%).The company’s goals for the dividend are agrowth rate of 5%-7% (in line with profitgrowth) and a payout ratio of 60%-70%.This top-quality equity has a dividendyield that is about equal to the utilityaverage. Total return potential is attrac-tive for the 18-month period, but unspec-tacular for the pull to 2023-2025. Therecent price is near the lower end of our2023-2025 Target Price Range.Paul E. Debbas, CFA December 11, 2020
LEGENDS0.67 x Dividends p shdivided by Interest Rate. . . . Relative Price Strength
Options: YesShaded area indicates recession
© 2020 Value Line, Inc. All rights reserved. Factual material is obtained from sources believed to be reliable and is provided without warranties of any kind.THE PUBLISHER IS NOT RESPONSIBLE FOR ANY ERRORS OR OMISSIONS HEREIN. This publication is strictly for subscriber’s own, non-commercial, internal use. No partof it may be reproduced, resold, stored or transmitted in any printed, electronic or other form, or used for generating or marketing any printed or electronic publication, service or product.
To subscribe call 1-800-VALUELINE
RECENTPRICE
P/ERATIO
RELATIVEP/E RATIO
DIV’DYLD( )Trailing:
Median:VALUELINE

1601201008060504030
2015
Percentsharestraded
15105
Target Price Range2023 2024 2025
ALLETE NYSE-ALE 56.24 16.4 16.718.0 0.78 4.6%
TIMELINESS 3 Raised 12/11/20
SAFETY 2 New 10/1/04
TECHNICAL 4 Raised 11/27/20BETA .85 (1.00 = Market)
18-Month Target Price RangeLow-High Midpoint (% to Mid)
$44-$107 $76 (35%)
2023-25 PROJECTIONSAnn’l Total
Price Gain ReturnHigh 85 (+50%) 14%Low 65 (+15%) 8%Institutional Decisions
4Q2019 1Q2020 2Q2020to Buy 158 124 141to Sell 120 154 136Hld’s(000) 38235 38410 37540
High: 35.3 37.9 42.5 42.7 54.1 58.0 59.7 66.9 81.2 82.8 88.6 84.7Low: 23.3 30.0 35.1 37.7 41.4 44.2 45.3 48.3 61.6 66.6 72.5 48.2
% TOT. RETURN 11/20THIS VL ARITH.*
STOCK INDEX1 yr. -27.4 15.73 yr. -23.3 23.55 yr. 29.4 64.0
CAPITAL STRUCTURE as of 9/30/20Total Debt $2012.5 mill. Due in 5 Yrs $712.6 mill.LT Debt $1608.0 mill. LT Interest $65.6 mill.(LT interest earned: 3.4x)
Leases, Uncapitalized Annual rentals $6.6 mill.
Pension Assets-12/19 $699.6 mill.Oblig $854.0 mill.
Pfd Stock None
Common Stock 51,974,885 shs.
MARKET CAP: $2.9 billion (Mid Cap)
ELECTRIC OPERATING STATISTICS2017 2018 2019
% Change Retail Sales (KWH) +8.4 -.2 -1.5Avg. Indust. Use (MWH) NA NA NAAvg. Indust. Revs. per KWH (¢) NA NA NACapacity at Peak (Mw) NA NA NAPeak Load, Winter (Mw) 1599 1589 1573Annual Load Factor (%) NA NA NA% Change Customers (avg.) NA NA NA
Fixed Charge Cov. (%) 339 296 277ANNUAL RATES Past Past Est’d ’17-’19of change (per sh) 10 Yrs. 5 Yrs. to ’23-’25Revenues 1.0% 2.0% -1.0%‘‘Cash Flow’’ 5.5% 6.0% 4.5%Earnings 2.5% 4.0% 4.5%Dividends 3.0% 3.5% 4.0%Book Value 5.0% 5.0% 3.5%
Cal- Fullendar Year
QUARTERLY REVENUES ($ mill.)Mar.31 Jun. 30 Sep. 30 Dec. 31
2017 365.6 353.3 362.5 337.9 1419.32018 358.2 344.1 348.0 448.3 1498.62019 357.2 290.4 288.3 304.6 1240.52020 311.6 243.2 293.9 306.3 11552021 325 285 305 325 1240Cal- Full
endar YearEARNINGS PER SHARE A
Mar.31 Jun. 30 Sep. 30 Dec. 312017 .97 .72 .88 .56 3.132018 .99 .61 .59 1.18 3.382019 1.18 .64 .60 .92 3.332020 1.28 .39 .78 .75 3.202021 1.20 .70 .75 .85 3.50Cal- Full
endar YearQUARTERLY DIVIDENDS PAID B ■ †
Mar.31 Jun.30 Sep.30 Dec.312016 .52 .52 .52 .52 2.082017 .535 .535 .535 .535 2.142018 .56 .56 .56 .56 2.242019 .5875 .5875 .5875 .5875 2.352020 .6175 .6175 .6175 .6175
2004 2005 2006 2007 2008 2009 2010 2011 2012 2013 2014 2015 2016 201725.30 24.50 25.23 27.33 24.57 21.57 25.34 24.75 24.40 24.60 24.77 30.27 27.01 27.782.97 3.85 4.14 4.42 4.23 3.57 4.35 4.91 5.01 5.35 5.68 6.79 7.08 6.591.35 2.48 2.77 3.08 2.82 1.89 2.19 2.65 2.58 2.63 2.90 3.38 3.14 3.13.30 1.25 1.45 1.64 1.72 1.76 1.76 1.78 1.84 1.90 1.96 2.02 2.08 2.14
2.12 1.95 3.37 6.82 9.24 9.05 6.95 6.38 10.30 7.93 12.48 5.84 5.35 4.0821.23 20.03 21.90 24.11 25.37 26.41 27.26 28.78 30.48 32.44 35.06 37.07 38.17 40.4729.70 30.10 30.40 30.80 32.60 35.20 35.80 37.50 39.40 41.40 45.90 49.10 49.60 51.1025.2 17.9 16.5 14.8 13.9 16.1 16.0 14.7 15.9 18.6 17.2 15.1 18.6 23.01.33 .95 .89 .79 .84 1.07 1.02 .92 1.01 1.05 .91 .76 .98 1.16.9% 2.8% 3.2% 3.6% 4.4% 5.8% 5.0% 4.6% 4.5% 3.9% 3.9% 4.0% 3.6% 3.0%
907.0 928.2 961.2 1018.4 1136.8 1486.4 1339.7 1419.375.3 93.8 97.1 104.7 124.8 163.4 155.3 159.2
37.2% 27.6% 28.1% 21.5% 22.6% 19.4% 11.3% 14.8%8.9% 2.7% 5.3% 4.4% 6.3% 2.0% 1.4% .8%
44.2% 44.3% 43.7% 44.6% 44.2% 46.3% 42.0% 41.0%55.8% 55.7% 56.3% 55.4% 55.8% 53.7% 58.0% 59.0%1747.6 1937.2 2134.6 2425.9 2882.2 3388.9 3263.4 3507.41805.6 1982.7 2347.6 2576.5 3286.4 3669.1 3741.2 3822.4
5.4% 6.0% 5.6% 5.3% 5.2% 5.8% 5.8% 5.5%7.7% 8.7% 8.1% 7.8% 7.8% 9.0% 8.2% 7.7%7.7% 8.7% 8.1% 7.8% 7.8% 9.0% 8.2% 7.7%1.5% 2.9% 2.3% 2.2% 2.5% 3.6% 2.8% 2.4%81% 66% 71% 72% 67% 60% 66% 68%
2018 2019 2020 2021 © VALUE LINE PUB. LLC 23-2529.10 23.99 22.20 23.60 Revenues per sh 25.757.37 7.24 7.25 7.75 ‘‘Cash Flow’’ per sh 9.253.38 3.33 3.20 3.50 Earnings per sh A 4.252.24 2.35 2.47 2.56 Div’d Decl’d per sh B ■ † 2.806.07 11.55 14.80 9.45 Cap’l Spending per sh 4.75
41.86 43.17 45.95 46.80 Book Value per sh C 51.2551.50 51.70 52.00 52.50 Common Shs Outst’g D 54.2522.2 24.7 Bold figures are
Value Lineestimates
Avg Ann’l P/E Ratio 18.01.20 1.32 Relative P/E Ratio 1.00
3.0% 2.9% Avg Ann’l Div’d Yield 3.7%
1498.6 1240.5 1155 1240 Revenues ($mill) 1350174.1 172.4 165 185 Net Profit ($mill) 230
14.8% NMF NMF NMF Income Tax Rate NMF.7% 1.3% 2.0% 2.0% AFUDC % to Net Profit 1.0%
39.9% 38.6% 41.5% 41.0% Long-Term Debt Ratio 41.0%60.1% 61.4% 58.5% 59.0% Common Equity Ratio 59.0%3584.3 3632.8 4080 4150 Total Capital ($mill) 47253904.4 4377.0 4935 5205 Net Plant ($mill) 5350
5.8% 5.6% 5.0% 5.5% Return on Total Cap’l 6.0%8.1% 7.7% 7.0% 7.5% Return on Shr. Equity 8.5%8.1% 7.7% 7.0% 7.5% Return on Com Equity E 8.5%2.7% 2.3% 1.5% 2.0% Retained to Com Eq 3.0%66% 70% 77% 73% All Div’ds to Net Prof 65%
Company’s Financial Strength AStock’s Price Stability 95Price Growth Persistence 60Earnings Predictability 85
(A) Diluted EPS. Excl. nonrec. gains (losses):’04, (25¢); ’05, ($1.84); ’15, (46¢); ’17, 25¢; ’19,26¢; gain (losses) on disc. ops.: ’04, $2.57, ’05,(16¢); ’06, (2¢). ’18 & ’19 EPS don’t sum due
to rounding. Next earnings report due earlyFeb. (B) Div’ds historically paid in early Mar.,June, Sept. and Dec. ■ Div’d reinvest. planavail. † Shareholder invest. plan avail. (C) Incl.
deferred charges. In ’19: $8.15/sh. (D) In mill.(E) Rate base: Orig. cost depr. Rate allowed inMN on com. eq. in ’18: 9.25%; earned on avg.com. eq., ’19: 7.9%. Regulatory Climate: Avg.
BUSINESS: ALLETE, Inc. is the parent of Minnesota Power, whichsupplies electricity to 146,000 customers in northeastern MN, & Su-perior Water, Light & Power in northwestern WI. Electric rev. break-down: taconite mining/processing, 26%; paper/wood products, 9%;other industrial, 8%; residential, 12%; commercial, 13%; wholesale,16% other, 16%. ALLETE Clean Energy (ACE) owns renewable en-
ergy projects. Acq’d U.S. Water Services 2/15; sold it 3/19. Genera-ting sources: coal & lignite, 30%; wind, 11%; other, 5%; purchased,54%. Fuel costs: 31% of revs. ’19 deprec. rate: 3.3%. Has 1,400employees. Chairman: Alan R. Hodnik. President & CEO: BethanyM. Owen. Inc.: MN. Address: 30 West Superior St., Duluth, MN55802-2093. Tel.: 218-279-5000. Internet: www.allete.com.
ALLETE is facing a challenging oper-ating environment. The recession andthe coronavirus problems have hurt thecompany’s primary utility subsidiary, Min-nesota Power, more than most electriccompanies because the utility has a small-er residential sector and a larger industri-al sector. One of its industrial customersjust restarted its facility this month, butanother customer’s plant remains shut.ALLETE Clean Energy (ACE), which in-vests in wind projects, is experiencing in-creased competition and pricing pressure.Profits are likely to decline in 2020 due inpart to a $0.16-a-share charge the compa-ny took in the second quarter for the re-fund of previously collected revenues. Weinclude this in our earnings presentationeven though management is excluding itfrom its guidance of $3.25-$3.45 a share.Considering all of these factors, the stockprice has declined 31% in 2020, makingthis one of the worst-performing equitiesin this industry.We expect much higher earnings in2021. The second-quarter comparison willbe easy due to the revenue refund in 2020.Most of Minnesota Power’s taconite cus-
tomers have submitted demand nomina-tions (telling the utility how much electri-city they expect to need) for full power forthe first four months of 2021. ACE shouldbenefit from a 303-megawatt project inOklahoma that should be completed byyearend 2020 at a cost of $450 million.Rate cases are likely upcoming in2021. Filings were postponed from 2020due to the effects of the weak economy.Minnesota Power expects to apply in No-vember, and Superior Water, Light &Power will probably file sometime nextyear. These applications should raise AL-LETE’s earning power in 2022.We expect a dividend increase in thefirst quarter of 2021. This is the usualtiming of a hike. We estimate a boost of$0.09 a share (3.6%) in the annual dis-bursement. This would be smaller than in2020 because the payout ratio is above AL-LETE’s targeted range of 60%-65%.The equity’s dividend yield is aboutone percentage point above the utilityaverage. Total return potential is aboveaverage for the next 18 months and decentfor the 3- to 5-year period.Paul E. Debbas, CFA December 11, 2020
LEGENDS0.73 x Dividends p shdivided by Interest Rate. . . . Relative Price Strength
Options: YesShaded area indicates recession
© 2020 Value Line, Inc. All rights reserved. Factual material is obtained from sources believed to be reliable and is provided without warranties of any kind.THE PUBLISHER IS NOT RESPONSIBLE FOR ANY ERRORS OR OMISSIONS HEREIN. This publication is strictly for subscriber’s own, non-commercial, internal use. No partof it may be reproduced, resold, stored or transmitted in any printed, electronic or other form, or used for generating or marketing any printed or electronic publication, service or product.
To subscribe call 1-800-VALUELINE
RECENTPRICE
P/ERATIO
RELATIVEP/E RATIO
DIV’DYLD( )Trailing:
Median:VALUELINE

1601201008060504030
2015
Percentsharestraded
302010
Target Price Range2023 2024 2025
CMS ENERGY CORP. NYSE-CMS 61.54 22.2 23.018.0 1.06 2.8%
TIMELINESS 2 Raised 11/13/20
SAFETY 2 Raised 3/21/14
TECHNICAL 2 Raised 12/4/20BETA .80 (1.00 = Market)
18-Month Target Price RangeLow-High Midpoint (% to Mid)
$51-$105 $78 (25%)
2023-25 PROJECTIONSAnn’l Total
Price Gain ReturnHigh 75 (+20%) 8%Low 55 (-10%) 1%Institutional Decisions
4Q2019 1Q2020 2Q2020to Buy 295 252 238to Sell 247 301 291Hld’s(000) 264207 265297 267271
High: 16.1 19.3 22.4 25.0 30.0 36.9 38.7 46.3 50.8 53.8 65.3 69.2Low: 10.0 14.1 17.0 21.1 24.6 26.0 31.2 35.0 41.1 40.5 48.0 46.0
% TOT. RETURN 11/20THIS VL ARITH.*
STOCK INDEX1 yr. 2.5 15.73 yr. 33.3 23.55 yr. 101.5 64.0
CAPITAL STRUCTURE as of 9/30/20Total Debt $15135 mill. Due in 5 Yrs $4549 mill.LT Debt $13336 mill. LT Interest $573 mill.Incl. $61 mill. capitalized leases.(LT interest earned: 2.9x)Leases, Uncapitalized Annual rentals $11 mill.Pension Assets-12/19 $2546 mill.
Oblig $2973 mill.Pfd Stock $37 mill. Pfd Div’d $2 mill.Incl. 373,148 shs. $4.50 $100 par, cum., callable at$110.00.Common Stock 286,334,466 shs.as of 10/8/20MARKET CAP: $18 billion (Large Cap)
ELECTRIC OPERATING STATISTICS2017 2018 2019
% Change Retail Sales (KWH) -1.4 +2.2 -3,7Avg. Indust. Use (MWH) NA NA NAAvg. Indust. Revs. per KWH (¢) 8.26 7.63 7.94Capacity at Peak (Mw) NA NA NAPeak Load, Summer (Mw) 7634 8084 8039Annual Load Factor (%) NA NA NA% Change Customers (yr-end) +1.2 +.3 +.9
Fixed Charge Cov. (%) 301 250 235ANNUAL RATES Past Past Est’d ’17-’19of change (per sh) 10 Yrs. 5 Yrs. to ’23-’25Revenues -2.0% -1.0% 1.0%‘‘Cash Flow’’ 5.0% 7.0% 5.5%Earnings 9.5% 7.0% 7.5%Dividends 15.0% 7.0% 7.0%Book Value 4.5% 5.5% 7.5%
Cal- Fullendar Year
QUARTERLY REVENUES ($ mill.)Mar.31 Jun.30 Sep.30 Dec.31
2017 1829 1449 1527 1778 6583.02018 1953 1492 1599 1829 6873.02019 2059 1445 1546 1795 6845.02020 1864 1443 1575 1668 65502021 1950 1550 1600 1700 6800Cal- Full
endar YearEARNINGS PER SHARE A
Mar.31 Jun.30 Sep.30 Dec.312017 .71 .33 .61 .52 2.172018 .86 .49 .59 .38 2.322019 .75 .33 .73 .58 2.392020 .85 .48 .76 .56 2.652021 .90 .55 .80 .60 2.85Cal- Full
endar YearQUARTERLY DIVIDENDS PAID B ■
Mar.31 Jun.30 Sep.30 Dec. 312016 .31 .31 .31 .31 1.242017 .3325 .3325 .3325 .3325 1.332018 .3575 .3575 .3575 .3575 1.432019 .3825 .3825 .3825 .3825 1.532020 .4075 .4075 .4075 .4075
2004 2005 2006 2007 2008 2009 2010 2011 2012 2013 2014 2015 2016 201728.06 28.52 30.57 28.95 30.13 27.23 25.77 25.59 23.90 24.68 26.09 23.29 22.92 23.372.87 3.43 3.22 3.08 3.88 3.47 3.70 3.65 3.82 4.06 4.22 4.59 4.88 5.29.74 1.10 .64 .64 1.23 .93 1.33 1.45 1.53 1.66 1.74 1.89 1.98 2.17- - - - - - .20 .36 .50 .66 .84 .96 1.02 1.08 1.16 1.24 1.33
2.69 2.69 3.01 5.61 3.50 3.59 3.29 3.47 4.65 4.98 5.73 5.64 5.99 5.9110.63 10.53 10.03 9.46 10.88 11.42 11.19 11.92 12.09 12.98 13.34 14.21 15.23 15.77
195.00 220.50 222.78 225.15 226.41 227.89 249.60 254.10 264.10 266.10 275.20 277.16 279.21 281.6512.4 12.6 22.2 26.8 10.9 13.6 12.5 13.6 15.1 16.3 17.3 18.3 20.9 21.3.66 .67 1.20 1.42 .66 .91 .80 .85 .96 .92 .91 .92 1.10 1.07- - - - - - 1.2% 2.7% 4.0% 4.0% 4.3% 4.2% 3.8% 3.6% 3.4% 3.0% 2.9%
6432.0 6503.0 6312.0 6566.0 7179.0 6456.0 6399.0 6583.0356.0 384.0 413.0 454.0 479.0 525.0 553.0 610.0
38.1% 36.8% 39.4% 39.9% 34.3% 34.0% 33.1% 31.2%2.2% 2.6% 2.9% 2.0% 2.3% 2.7% 3.1% 1.1%
70.1% 66.9% 67.9% 67.5% 68.7% 68.3% 67.1% 67.3%29.5% 32.6% 31.6% 32.2% 31.0% 31.4% 32.6% 32.4%9473.0 9279.0 10101 10730 11846 12534 13040 1369210069 10633 11551 12246 13412 14705 15715 167615.8% 6.3% 5.9% 6.0% 5.7% 5.7% 5.8% 5.9%
12.5% 12.5% 12.8% 13.0% 12.9% 13.2% 12.9% 13.6%12.5% 12.6% 12.9% 13.1% 13.0% 13.3% 13.0% 13.7%6.9% 5.6% 5.0% 5.2% 5.0% 5.2% 4.8% 5.2%46% 55% 61% 60% 62% 61% 63% 62%
2018 2019 2020 2021 © VALUE LINE PUB. LLC 23-2524.25 24.11 22.80 23.45 Revenues per sh 25.255.61 5.89 6.30 6.65 ‘‘Cash Flow’’ per sh 8.002.32 2.39 2.65 2.85 Earnings per sh A 3.501.43 1.53 1.63 1.74 Div’d Decl’d per sh B ■ 2.157.32 7.41 8.20 9.85 Cap’l Spending per sh 8.75
16.78 17.68 19.40 20.85 Book Value per sh C 25.75283.37 283.86 287.00 290.00 Common Shs Outst’g D 300.00
20.3 24.3 Bold figures areValue Lineestimates
Avg Ann’l P/E Ratio 18.01.10 1.30 Relative P/E Ratio 1.00
3.0% 2.6% Avg Ann’l Div’d Yield 3.4%
6873.0 6845.0 6550 6800 Revenues ($mill) 7550659.0 682.0 765 830 Net Profit ($mill) 1070
14.9% 17.7% 16.0% 16.0% Income Tax Rate 16.0%1.4% 2.1% 2.0% 2.0% AFUDC % to Net Profit 1.0%
69.0% 70.4% 69.5% 69.0% Long-Term Debt Ratio 67.0%30.7% 29.4% 30.0% 31.0% Common Equity Ratio 32.5%15476 17082 18400 19575 Total Capital ($mill) 2370018126 18926 20225 21975 Net Plant ($mill) 260005.6% 5.3% 5.5% 5.5% Return on Total Cap’l 6.0%
13.8% 13.5% 13.5% 13.5% Return on Shr. Equity 14.0%13.8% 13.6% 13.5% 13.5% Return on Com Equity E 14.0%
5.3% 4.9% 5.5% 5.5% Retained to Com Eq 5.5%62% 64% 61% 61% All Div’ds to Net Prof 60%
Company’s Financial Strength B++Stock’s Price Stability 95Price Growth Persistence 70Earnings Predictability 85
(A) Diluted EPS. Excl. nonrec. gains (losses):’05, ($1.61); ’06, ($1.08); ’07, ($1.26); ’09, (7¢);’10, 3¢; ’11, 12¢; ’12, (14¢); ’17, (53¢); gains(losses) on discont. ops.: ’05, 7¢; ’06, 3¢; ’07,
(40¢); ’09, 8¢; ’10, (8¢); ’11, 1¢; ’12, 3¢. Nextearnings report due early Feb. (B) Div’ds his-torically paid late Feb., May, Aug., & Nov. ■
Div’d reinvestment plan avail. (C) Incl. intang.
In ’19: $8.77/sh. (D) In mill. (E) Rate base: Netorig. cost. Rate allowed on com. eq. in ’18:10% elec.; in ’19: 9.9% gas; earned on avg.com. eq., ’19: 13.9%. Regul. Clim.: Above Avg.
BUSINESS: CMS Energy Corporation is a holding company forConsumers Energy, which supplies electricity and gas to lowerMichigan (excluding Detroit). Has 1.8 million electric, 1.8 million gascustomers. Has 1,234 megawatts of nonregulated generating capa-city. Owns EnerBank. Sold Palisades nuclear plant in ’07. Electricrevenue breakdown: residential, 45%; commercial, 34%; industrial,
15%; other, 6%. Generating sources: coal, 27%; gas, 18%; other,3%; purchased, 52%. Fuel costs: 41% of revenues. ’19 reporteddeprec. rates: 3.9% electric, 2.9% gas, 10.0% other. Has 8,100 full-time employees. Chairman: John G. Russell. President & CEO:Garrick Rochow. Inc.: MI. Address: One Energy Plaza, Jackson, MI49201. Tel.: 517-788-0550. Internet: www.cmsenergy.com.
CMS Energy’s utility subsidiaryreceived a gas rate increase. The Mich-igan Public Service Commission (MPSC)approved a settlement granting Con-sumers Energy a rate hike of $144 million,based on a 9.9% return on equity and a52% common-equity ratio. New tariffs tookeffect on October 1st. The settlement in-cluded a stay-out provision under whichthe utility will not file its next gas applica-tion before December 1, 2021. To compen-sate for this delay, the company will beable to amortize into income tax liabilities(estimated at $84.5 million) from Octoberof 2020 through September of 2021.Consumers Energy is awaiting an or-der on its electric rate case. The utilityis seeking an increase of $230 million,based on a 10.5% ROE. The MPSC’s staffproposed a $149 million hike, based on a9.75% ROE. Consumers Energy expects toput forth its next general rate case in thefirst quarter of 2021. Frequent filings arenecessary because the company has alarge system that has a lot of old equip-ment that must be replaced.The utility asked the MPSC to ap-prove the issuance of securitized
bonds. This would allow Consumers Ener-gy to recover the undepreciated ownershipof its Karn coal-fired plant, which the util-ity plans to close by 2023. The companyestimates it would issue $703 million.We raised our 2020 and 2021 share-earnings estimates by $0.05 and $0.10,respectively. Our revised estimates arewithin CMS Energy’s targeted ranges of$2.64-$2.68 and $2.82-$2.86, respectively.The effects of strong residential kilowatt-hour sales have largely offset weakness incommercial and industrial volume. Man-agement has controlled costs effectively,too. The profit growth we expect in 2021,helped by rate relief, is near the top end ofCMS Energy’s goal of 6%-8% annually.A dividend increase is likely in thefirst quarter of 2021. We estimate a hikeof $0.11 a share (6.7%) annually. The com-pany’s goal is 6%-8% yearly growth.This timely stock’s dividend yield isbelow the utility average. The stockprice has fallen 2% this year, far less thanmost utility issues. Total return potentialis appealing for the 18-month span but lowfor the 2023-2025 period.Paul E. Debbas, CFA December 11, 2020
LEGENDS0.83 x Dividends p shdivided by Interest Rate. . . . Relative Price Strength
Options: YesShaded area indicates recession
© 2020 Value Line, Inc. All rights reserved. Factual material is obtained from sources believed to be reliable and is provided without warranties of any kind.THE PUBLISHER IS NOT RESPONSIBLE FOR ANY ERRORS OR OMISSIONS HEREIN. This publication is strictly for subscriber’s own, non-commercial, internal use. No partof it may be reproduced, resold, stored or transmitted in any printed, electronic or other form, or used for generating or marketing any printed or electronic publication, service or product.
To subscribe call 1-800-VALUELINE
RECENTPRICE
P/ERATIO
RELATIVEP/E RATIO
DIV’DYLD( )Trailing:
Median:VALUELINE

200160
1008060504030
20
Percentsharestraded
21147
Target Price Range2023 2024 2025
DTE ENERGY CO. NYSE-DTE 125.81 17.6 17.817.0 0.84 3.4%
TIMELINESS 2 Raised 11/6/20
SAFETY 2 Raised 12/21/12
TECHNICAL 3 Raised 11/27/20BETA .95 (1.00 = Market)
18-Month Target Price RangeLow-High Midpoint (% to Mid)
$87-$201 $144 (15%)
2023-25 PROJECTIONSAnn’l Total
Price Gain ReturnHigh 165 (+30%) 10%Low 120 (-5%) 3%Institutional Decisions
4Q2019 1Q2020 2Q2020to Buy 355 279 261to Sell 245 345 318Hld’s(000) 140654 140354 141501
High: 45.0 49.1 55.3 62.6 73.3 90.8 92.3 100.4 116.7 121.0 134.4 135.7Low: 23.3 41.3 43.2 52.5 60.3 64.8 73.2 78.0 96.6 94.3 107.3 71.2
% TOT. RETURN 11/20THIS VL ARITH.*
STOCK INDEX1 yr. 4.5 15.73 yr. 20.4 23.55 yr. 84.4 64.0
CAPITAL STRUCTURE as of 9/30/20Total Debt $19674 mill. Due in 5 Yrs $8261 mill.LT Debt $18219 mill. LT Interest $694 mill.
(LT interest earned: 3.1x)
Leases, Uncapitalized Annual rentals $38 mill.
Pension Assets-12/19 $4993 mill.Oblig $5810 mill.
Pfd Stock NoneCommon Stock 193,559,593 shs.
MARKET CAP: $24 billion (Large Cap)
ELECTRIC OPERATING STATISTICS2017 2018 2019
% Change Retail Sales (KWH) -3.1 +3.5 -3.9Avg. Indust. Use (MWH) NA NA NAAvg. Indust. Revs. per KWH (¢) NMF NMF NMFCapacity at Peak (Mw) NA NA NAPeak Load, Summer (Mw) NA NA NAAnnual Load Factor (%) NA NA NA% Change Customers (yr-end) NA NA NA
Fixed Charge Cov. (%) 300 278 260ANNUAL RATES Past Past Est’d ’17-’19of change (per sh) 10 Yrs. 5 Yrs. to ’23-’25Revenues 3.0% 4.0% -.5%‘‘Cash Flow’’ 3.5% 3.5% 6.0%Earnings 8.0% 7.5% 6.0%Dividends 5.5% 7.0% 6.5%Book Value 4.5% 5.0% 5.5%
Cal- Fullendar Year
QUARTERLY REVENUES ($ mill.)Mar.31 Jun.30 Sep.30 Dec.31
2017 3236 2855 3245 3271 126072018 3753 3159 3550 3750 142122019 3514 2888 3119 3148 126692020 3022 2583 3284 3111 120002021 3300 2700 3350 3250 12600Cal- Full
endar YearEARNINGS PER SHARE A
Mar.31 Jun.30 Sep.30 Dec.312017 2.23 .99 1.51 1.00 5.732018 2.00 1.29 1.84 1.05 6.172019 2.19 .99 1.73 1.40 6.312020 1.76 1.44 2.46 1.14 6.802021 2.00 1.55 2.20 1.40 7.15Cal- Full
endar YearQUARTERLY DIVIDENDS PAID B ■
Mar.31 Jun.30 Sep.30 Dec.312017 .825 .825 .825 .825 3.302018 .8825 .8825 .8825 .8825 3.532019 .945 .945 .945 .945 3.782020 1.0125 1.0125 1.0125 1.01252021 1.085
2004 2005 2006 2007 2008 2009 2010 2011 2012 2013 2014 2015 2016 201740.84 50.74 50.93 54.28 57.23 48.45 50.51 52.57 51.01 54.56 69.50 57.60 59.24 70.286.81 8.14 8.19 8.48 8.26 9.38 9.78 9.57 9.77 10.13 11.85 9.44 10.60 11.772.55 3.27 2.45 2.66 2.73 3.24 3.74 3.67 3.88 3.76 5.10 4.44 4.83 5.732.06 2.06 2.08 2.12 2.12 2.12 2.18 2.32 2.42 2.59 2.69 2.84 3.06 3.365.19 5.99 7.92 7.96 8.42 6.26 6.49 8.77 10.56 10.59 11.58 11.26 11.40 12.54
31.85 32.44 33.02 35.86 36.77 37.96 39.67 41.41 42.78 44.73 47.05 48.88 50.22 53.03174.21 177.81 177.14 163.23 163.02 165.40 169.43 169.25 172.35 177.09 176.99 179.47 179.43 179.39
16.0 13.8 17.4 18.3 14.8 10.4 12.3 13.5 14.9 17.9 14.9 18.1 19.0 18.6.85 .73 .94 .97 .89 .69 .78 .85 .95 1.01 .78 .91 1.00 .94
5.0% 4.6% 4.9% 4.4% 5.2% 6.3% 4.8% 4.7% 4.2% 3.8% 3.5% 3.5% 3.3% 3.2%
8557.0 8897.0 8791.0 9661.0 12301 10337 10630 12607630.0 624.0 666.0 661.0 905.0 796.0 868.0 1029.0
32.7% 35.9% 29.8% 27.5% 28.5% 25.6% 24.5% 21.8%1.6% 1.6% 3.0% 3.5% 4.1% 4.3% 3.6% 3.5%
51.3% 50.6% 48.8% 47.7% 50.0% 50.2% 55.6% 56.2%48.7% 49.4% 51.2% 52.3% 50.0% 49.8% 44.4% 43.8%13811 14196 14387 15135 16670 17607 20280 2169712992 13746 14684 15800 16820 18034 19730 207216.3% 5.9% 6.1% 5.7% 6.6% 5.7% 5.3% 5.9%9.4% 8.9% 9.0% 8.3% 10.9% 9.1% 9.6% 10.8%9.4% 8.9% 9.0% 8.3% 10.9% 9.1% 9.6% 10.8%4.0% 3.4% 3.5% 2.7% 5.2% 3.4% 3.7% 4.6%57% 62% 61% 67% 52% 63% 61% 58%
2018 2019 2020 2021 © VALUE LINE PUB. LLC 23-2578.12 65.91 62.20 64.95 Revenues per sh 70.2512.58 12.97 14.40 15.15 ‘‘Cash Flow’’ per sh 17.75
6.17 6.31 6.80 7.15 Earnings per sh A 8.503.59 3.85 4.12 4.41 Div’d Decl’d per sh B ■ 5.20
14.91 15.59 19.95 18.55 Cap’l Spending per sh 13.5056.27 60.73 63.65 66.70 Book Value per sh C 79.00
181.93 192.21 193.00 194.00 Common Shs Outst’g D 205.0017.4 19.9 Bold figures are
Value Lineestimates
Avg Ann’l P/E Ratio 16.5.94 1.06 Relative P/E Ratio .90
3.3% 3.1% Avg Ann’l Div’d Yield 3.7%
14212 12669 12000 12600 Revenues ($mill) 140001120.0 1169.0 1310 1380 Net Profit ($mill) 1755
8.1% 11.5% 10.0% 10.0% Income Tax Rate 8.0%3.8% 3.3% 3.0% 3.0% AFUDC % to Net Profit 2.0%
54.2% 57.7% 60.5% 61.0% Long-Term Debt Ratio 58.5%45.8% 42.3% 39.5% 39.0% Common Equity Ratio 41.5%22371 27607 31250 33000 Total Capital ($mill) 3980021650 25317 28300 30325 Net Plant ($mill) 336006.1% 5.3% 5.5% 5.5% Return on Total Cap’l 5.5%
10.9% 10.0% 10.5% 10.5% Return on Shr. Equity 11.0%10.9% 10.0% 10.5% 10.5% Return on Com Equity E 11.0%4.9% 4.1% 4.0% 4.0% Retained to Com Eq 4.0%55% 59% 61% 62% All Div’ds to Net Prof 61%
Company’s Financial Strength AStock’s Price Stability 95Price Growth Persistence 75Earnings Predictability 85
(A) Diluted EPS. Excl. nonrec. gains (losses):’05, (2¢); ’07, $1.96; ’08, 50¢; ’11, 51¢; ’15,(39¢); ’17, 59¢; gains (losses) on disc. ops.:’04, (6¢); ’05, (20¢); ’06, (2¢); ’07, $1.20; ’08,
13¢; ’12, (33¢). ’17-’18 EPS don’t sum due torounding. Next earnings report due early Feb.(B) Div’ds pd. mid-Jan., Apr., July & Oct. ■
Div’d reinvest. plan avail. (C) Incl. intang. In
’19: $47.33/sh. (D) In mill. (E) Rate base: Netorig. cost. Rate all’d on com. eq. in ’20: 9.9%elec.; in ’20: 9.9% gas; earned on avg. com.eq., ’19: 10.8%. Regulat. Climate: Above Avg.
BUSINESS: DTE Energy Company is a holding company for DTEElectric (formerly Detroit Edison), which supplies electricity in De-troit and a 7,600-square-mile area in southeastern Michigan, andDTE Gas (formerly Michigan Consolidated Gas). Customers: 2.2mill. electric, 1.3 mill. gas. Has various nonutility operations. Electricrevenue breakdown: residential, 46%; commercial, 34%; industrial,
13%; other, 7%. Generating sources: coal, 67%; nuclear, 17%; gas,1%; purchased, 15%. Fuel costs: 54% of revenues. ’19 reporteddeprec. rates: 4.0% electric, 2.7% gas. Has 10,700 employees.Chairman: Gerard M. Anderson. President & CEO: Jerry Norcia.Inc.: MI. Address: One Energy Plaza, Detroit, MI 48226-1279. Tel.:313-235-4000. Internet: www.dteenergy.com.
DTE Energy plans to spin off its mid-stream gas business into a separatecompany. Once management has come upwith the details (including the ratio of howmany new-company shares stockholderswould receive for each DTE Energy share),the board of directors would have to ap-prove the plan. This would be tax free forDTE Energy stockholders. After the spin-off, DTE Energy would derive a greaterproportion of its income from its regulatedelectric and gas operations (90%, versus70% today). DTE Energy would retain itsEnergy Trading division and its Power &Industrial Projects segment, which pro-vides projects such as cogeneration to in-dustrial customers. After the spinoff, DTEexpects to raise the dividend 8%-10% from2021 to 2022, versus 6% otherwise. Thecompany expects the corporate separationwill be completed in mid-2021. Based onthe midpoints of DTE Energy’s original2020 guidance and its 2021 early outlook,the company states that its theoreticalshare net without midstream gas would be$5.13 in 2020 and $5.51 in 2021.We raised our 2020 earnings estimateby $0.10 a share, to $6.80. DTE Electric
benefited from favorable weather patternsin the third quarter. However, the compa-ny will use this income to give customers a$30 million revenue refund, which will re-sult in a negative year-to-year earningscomparison in the fourth quarter. Even so,profits should wind up much higher for thefull year. DTE Electric and DTE Gas re-ceived rate hikes. Cost cutting and better-than-expected residential kilowatt-hoursales have offset the effects of the reces-sion on commercial and industrial volume.The nonutility businesses have performedwell, too. A full year of rate relief shouldproduce higher profits in 2021.The board of directors raised the divi-dend, effective with the January pay-ment. The annual increase was $0.29 ashare (7.2%). DTE Energy stockholderswould also receive dividends of the newmidstream gas company after the spinoff.This timely stock has a dividend yieldthat is average for a utility. The equitydoes not stand out for long-term total re-turn potential, but this is based on DTEEnergy’s current configuration. The spin-off might well enhance shareholder value.Paul E. Debbas, CFA December 11, 2020
LEGENDS0.67 x Dividends p shdivided by Interest Rate. . . . Relative Price Strength
Options: YesShaded area indicates recession
© 2020 Value Line, Inc. All rights reserved. Factual material is obtained from sources believed to be reliable and is provided without warranties of any kind.THE PUBLISHER IS NOT RESPONSIBLE FOR ANY ERRORS OR OMISSIONS HEREIN. This publication is strictly for subscriber’s own, non-commercial, internal use. No partof it may be reproduced, resold, stored or transmitted in any printed, electronic or other form, or used for generating or marketing any printed or electronic publication, service or product.
To subscribe call 1-800-VALUELINE
RECENTPRICE
P/ERATIO
RELATIVEP/E RATIO
DIV’DYLD( )Trailing:
Median:VALUELINE

200160
1008060504030
20
Percentsharestraded
302010
Target Price Range2023 2024 2025
ENTERGY CORP. NYSE-ETR 108.85 18.4 15.813.0 0.88 3.5%
TIMELINESS 3 Raised 10/26/18
SAFETY 2 Raised 12/13/19
TECHNICAL 3 Raised 12/11/20BETA .95 (1.00 = Market)
18-Month Target Price RangeLow-High Midpoint (% to Mid)
$82-$181 $132 (20%)
2023-25 PROJECTIONSAnn’l Total
Price Gain ReturnHigh 140 (+30%) 10%Low 105 (-5%) 3%Institutional Decisions
4Q2019 1Q2020 2Q2020to Buy 348 281 283to Sell 242 349 315Hld’s(000) 176392 172217 173722
High: 86.6 84.3 74.5 74.5 72.6 92.0 90.3 82.1 87.9 90.8 122.1 135.5Low: 59.9 68.7 57.6 61.6 60.2 60.4 61.3 65.4 69.6 71.9 83.2 75.2
% TOT. RETURN 11/20THIS VL ARITH.*
STOCK INDEX1 yr. -3.8 15.73 yr. 40.3 23.55 yr. 99.5 64.0
CAPITAL STRUCTURE as of 9/30/20Total Debt $22060 mill. Due in 5 Yrs $8573.8 mill.LT Debt $19613 mill. LT Interest $831.0 mill.Incl. $209.2 mill. of securitization bonds.(LT interest earned: 2.2x)Leases, Uncapitalized Annual rentals $62.1 mill.Pension Assets-12/19 $6271.2 mill.
Oblig $8406.2 mill.Pfd Stock $254.4 mill. Pfd Div’d $18.3 mill.200,000 shs. 6.25%-7.5%, $100 par; 250,000 shs.8.75%, 1.4 mill. shs. 5.375%; all cum., without sink-ing fund.Common Stock 200,232,522 shs. as of 10/30/20MARKET CAP: $22 billion (Large Cap)
ELECTRIC OPERATING STATISTICS2017 2018 2019
% Change Retail Sales (KWH) +.2 +4.1 -1.4Avg. Indust. Use (MWH) 1034 946 1070Avg. Indust. Revs. per KWH(¢) 5.41 5.16 5.24Capacity at Peak (Mw) 24279 23121 23887Peak Load, Summer (Mw) 21671 21587 21598Annual Load Factor (%) 62 65 64% Change Customers (yr-end) +.6 +.6 +.8
Fixed Charge Cov. (%) 169 95 165ANNUAL RATES Past Past Est’d ’17-’19of change (per sh) 10 Yrs. 5 Yrs. to ’23-’25Revenues -.5% -2.0% -2.5%‘‘Cash Flow’’ 3.0% - - 4.0%Earnings -.5% .5% 3.0%Dividends 2.5% 1.5% 4.0%Book Value 1.0% -2.5% 5.0%
Cal- Fullendar Year
QUARTERLY REVENUES ($ mill.)Mar.31 Jun.30 Sep.30 Dec.31
2017 2588 2618 3244 2624 110742018 2724 2669 3104 2512 110092019 2610 2666 3141 2462 108792020 2427 2413 2904 2406 101502021 2600 2500 2900 2300 10300Cal- Full
endar YearEARNINGS PER SHARE A
Mar.31 Jun.30 Sep.30 Dec.312017 .46 2.27 2.21 .25 5.192018 .73 1.34 3.42 .39 5.882019 1.32 1.22 1.82 1.94 6.302020 .59 1.79 2.59 .68 5.652021 1.15 1.50 2.60 .70 5.95Cal- Full
endar YearQUARTERLY DIVIDENDS PAID B ■ †
Mar.31 Jun.30 Sep.30 Dec.312016 .85 .85 .85 .87 3.422017 .87 .87 .87 .89 3.502018 .89 .89 .89 .91 3.582019 .91 .91 .91 .93 3.662020 .93 .93 .93 .95
2004 2005 2006 2007 2008 2009 2010 2011 2012 2013 2014 2015 2016 201746.69 46.61 53.94 59.47 69.15 56.82 64.27 63.67 57.94 63.86 69.71 64.54 60.55 61.358.33 8.18 10.69 11.73 12.89 13.29 16.54 17.53 15.98 16.25 17.68 17.71 18.72 16.703.93 4.40 5.36 5.60 6.20 6.30 6.66 7.55 6.02 4.96 5.77 5.81 6.88 5.191.89 2.16 2.16 2.58 3.00 3.00 3.24 3.32 3.32 3.32 3.32 3.34 3.42 3.506.51 6.72 9.44 10.29 13.92 12.99 13.33 15.21 18.18 15.73 14.82 16.79 17.28 22.07
38.26 35.71 40.45 40.71 42.07 45.54 47.53 50.81 51.73 54.00 55.83 51.89 45.12 44.28216.83 216.83 202.67 193.12 189.36 189.12 178.75 176.36 177.81 178.37 179.24 178.39 179.13 180.52
15.1 16.3 14.3 19.3 16.6 12.0 11.6 9.1 11.2 13.2 12.9 12.5 10.9 15.0.80 .87 .77 1.02 1.00 .80 .74 .57 .71 .74 .68 .63 .57 .75
3.2% 3.0% 2.8% 2.4% 2.9% 4.0% 4.2% 4.9% 4.9% 5.1% 4.5% 4.6% 4.6% 4.5%
11488 11229 10302 11391 12495 11513 10846 110741270.3 1367.4 1091.9 904.5 1060.0 1061.2 1249.8 950.732.7% 17.3% 13.0% 26.7% 37.8% 2.2% 11.3% 1.8%7.4% 8.9% 11.9% 10.1% 9.3% 7.4% 8.1% 14.7%
56.3% 52.2% 55.8% 55.1% 54.9% 57.8% 63.6% 63.6%42.1% 46.4% 42.9% 43.6% 43.8% 40.8% 35.5% 35.5%20166 19324 21432 22109 22842 22714 22777 2252823848 25609 27299 27882 28723 27824 27921 296647.7% 8.5% 6.4% 5.4% 6.0% 6.0% 6.9% 5.7%
14.4% 14.8% 11.5% 9.1% 10.3% 11.1% 15.1% 11.6%14.7% 15.0% 11.6% 9.2% 10.4% 11.2% 15.2% 11.7%7.6% 8.4% 5.2% 3.0% 4.4% 4.8% 7.7% 3.9%49% 45% 56% 68% 58% 58% 50% 68%
2018 2019 2020 2021 © VALUE LINE PUB. LLC 23-2558.23 54.63 50.50 50.50 Revenues per sh 50.5016.50 17.19 17.10 18.05 ‘‘Cash Flow’’ per sh 21.00
5.88 6.30 5.65 5.95 Earnings per sh A 7.003.58 3.66 3.74 3.86 Div’d Decl’d per sh B ■ † 4.55
22.45 21.72 20.60 18.70 Cap’l Spending per sh 19.0046.78 51.34 53.55 56.30 Book Value per sh C 64.50
189.06 199.15 201.00 204.00 Common Shs Outst’g D 210.0013.8 16.5 Bold figures are
Value Lineestimates
Avg Ann’l P/E Ratio 17.5.75 .88 Relative P/E Ratio .95
4.4% 3.5% Avg Ann’l Div’d Yield 3.7%
11009 10879 10150 10300 Revenues ($mill) 106001092.1 1258.2 1155 1225 Net Profit ($mill) 1480
1.8% NMF 14.0% 22.0% Income Tax Rate 22.0%17.5% 16.7% 18.0% 14.0% AFUDC % to Net Profit 12.0%63.2% 62.0% 64.5% 64.0% Long-Term Debt Ratio 60.5%35.9% 37.1% 35.0% 35.0% Common Equity Ratio 38.5%24602 27557 30900 32725 Total Capital ($mill) 3510031974 35183 37075 38475 Net Plant ($mill) 424005.8% 5.9% 5.0% 5.0% Return on Total Cap’l 5.5%
12.0% 12.0% 10.5% 10.5% Return on Shr. Equity 10.5%12.2% 12.1% 10.5% 10.5% Return on Com Equity E 11.0%4.9% 5.2% 3.5% 3.5% Retained to Com Eq 4.0%61% 58% 66% 65% All Div’ds to Net Prof 66%
Company’s Financial Strength B++Stock’s Price Stability 90Price Growth Persistence 35Earnings Predictability 65
(A) Diluted EPS. Excl. nonrec. losses: ’05, 21¢;’12, $1.26; ’13, $1.14; ’14, 56¢; ’15, $6.99; ’16,$10.14; ’17, $2.91; ’18, $1.25. Next earningsreport due early Feb. (B) Div’ds historically
paid in early Mar., June, Sept., & Dec. ■ Div’dreinvestment plan avail. † Shareholder invest-ment plan avail. (C) Incl. def’d charges. In ’19:$29.67/sh. (D) In millions. (E) Rate base: Net
original cost. Allowed ROE (blended): 9.95%;earned on avg. com. eq., ’19: 13.0%. Regula-tory Climate: Average.
BUSINESS: Entergy Corporation supplies electricity to 2.9 millioncustomers through subsidiaries in Arkansas, Louisiana, Mississippi,Texas, and New Orleans (regulated separately from Louisiana).Distributes gas to 202,000 customers in Louisiana. Has a nonutilitysubsidiary that owns four nuclear units (two no longer operating).Electric revenue breakdown: residential, 38%; commercial, 26%; in-
dustrial, 27%; other, 9%. Generating sources: gas, 40%; nuclear,28%; coal, 6%; purchased, 26%. Fuel costs: 30% of revenues. ’19reported depreciation rate: 2.8%. Has 13,600 employees. Chairman& CEO: Leo P. Denault. Incorporated: Delaware. Address: 639 Loy-ola Avenue, P.O. Box 61000, New Orleans, Louisiana 70161. Tele-phone: 504-576-4000. Internet: www.entergy.com.
We raised our 2020 share-earnings es-timate for Entergy from $5.00 to $5.65.Third-quarter results were better than weexpected because Entergy’s nonregulatedsubsidiary turned a small profit. This busi-ness has been hurt by unfavorable condi-tions in the power markets, so Entergyhas been selling or shutting its nuclearplants. Two units are still operating, butare scheduled for closing in 2021 and2022. Management has cut expenses effec-tively to offset the effects of the weak econ-omy and the coronavirus. Note that we in-clude the results of the nonutility busi-ness, even though Entergy excludes itfrom its definition of operating earnings.The service area was hit by hurri-canes in August and October. Theworst of these caused an estimated $1.5billion-$1.7 billion of damage. Two otherhurricanes raised the total to $2.2 billion-$2.5 billion. Entergy is deferring thesecosts for future recovery. The companymight eventually recoup these coststhrough the issuance of bonds securitizedby payments on customers’ bills. HoweverEntergy recovers the hurricane-relatedcosts, the method of recovery will require
regulatory approval.Some regulatory matters are pending.Entergy Arkansas is seeking a $73 millionrate hike under the state’s Formula RatePlan (FRP). The utility also wants torenew the FRP. Entergy Louisiana wantsto review that state’s FRP, as well. Enter-gy Texas filed for increases totaling $38.4million under regulatory mechanisms forthe recovery of transmission and distribu-tion costs. Rate relief and a stronger econ-omy should enable earnings to increase in2021. However, there is a potentially nega-tive matter before federal regulators. Stateregulators allege that the federally grant-ed allowed return on equity on certain as-sets is too high.The board of directors raised the divi-dend in the fourth quarter. The in-crease was two cents a share (2.2%) quar-terly, the same as in recent years. Entergyhas stated that it expects dividend growthto accelerate in late 2021.The dividend yield is about averagefor a utility. Total return potential is at-tractive for the 18-month period, but lowfor the next 3 to 5 years.Paul E. Debbas, CFA December 11, 2020
LEGENDS0.54 x Dividends p shdivided by Interest Rate. . . . Relative Price Strength
Options: YesShaded area indicates recession
© 2020 Value Line, Inc. All rights reserved. Factual material is obtained from sources believed to be reliable and is provided without warranties of any kind.THE PUBLISHER IS NOT RESPONSIBLE FOR ANY ERRORS OR OMISSIONS HEREIN. This publication is strictly for subscriber’s own, non-commercial, internal use. No partof it may be reproduced, resold, stored or transmitted in any printed, electronic or other form, or used for generating or marketing any printed or electronic publication, service or product.
To subscribe call 1-800-VALUELINE
RECENTPRICE
P/ERATIO
RELATIVEP/E RATIO
DIV’DYLD( )Trailing:
Median:VALUELINE

1601201008060504030
2015
Percentsharestraded
1284
Target Price Range2023 2024 2025
FORTIS INC. TSE-FTS.TO A 52.29 20.3 19.719.0 0.97 3.9%
TIMELINESS 3 Lowered 11/13/20
SAFETY 2 Raised 7/17/15
TECHNICAL 1 Raised 12/11/20BETA .80 (1.00 = Market)
18-Month Target Price RangeLow-High Midpoint (% to Mid)
$43-$86 $65 (25%)
2023-25 PROJECTIONSAnn’l Total
Price Gain ReturnHigh 80 (+55%) 14%Low 55 (+5%) 6%Institutional Decisions
4Q2019 1Q2020 2Q2020to Buy 133 120 120to Sell 118 131 125Hld’s(000) 245710 238041 224494
High: 29.2 34.5 35.4 40.7 35.1 40.5 42.1 45.1 48.7 47.4 56.9 59.3Low: 21.5 21.6 28.2 30.5 29.6 29.8 34.5 36.0 40.6 39.4 44.0 41.6
% TOT. RETURN 11/20THIS VL ARITH.*
STOCK INDEX1 yr. 3.3 15.73 yr. 22.1 23.55 yr. 69.4 64.0
CAPITAL STRUCTURE as of 9/30/20Total Debt $25236 mill. Due in 5 Yrs $5512 mill.LT Debt $24147 mill. LT Interest $978 mill.Incl. $334 mill. capitalized leases.(LT interest earned: 2.7x)Leases, Uncapitalized Annual rentals $10 mill.
Pension Assets-12/19 $3208 mill.Oblig $3632 mill.
Pfd Stock $1623 mill. Pfd Div’d $67 mill.
Common Stock 465,000,000 shs.as of 10/30/20MARKET CAP: $24 billion (Large Cap)
ELECTRIC OPERATING STATISTICS2017 2018 2019
% Change Retail Sales (KWH) NA NA NAAvg. Indust. Use (MWH) NA NA NAAvg. Indust. Revs. per KWH (¢) NA NA NACapacity at Peak (Mw) NA NA NAPeak Load, Summer (Mw) NA NA NAAnnual Load Factor (%) NA NA NA% Change Customers (yr-end) NA NA NA
Fixed Charge Cov. (%) 231 208 204ANNUAL RATES Past Past Est’d ’17-’19of change (per sh) 10 Yrs. 5 Yrs. to ’23-’25Revenues -.5% - - 1.5%‘‘Cash Flow’’ 5.0% 6.5% 4.5%Earnings 6.0% 11.0% 2.5%Dividends 6.5% 7.0% 6.0%Book Value 7.0% 8.5% 4.0%
Cal- Fullendar Year
QUARTERLY REVENUES ($ mill.)Mar.31 Jun.30 Sep.30 Dec.31
2017 2274 2015 1901 2111 83012018 2197 1947 2040 2206 83902019 2436 1970 2051 2326 87832020 2391 2077 2121 2311 89002021 2500 2100 2200 2400 9200Cal- Full
endar YearEARNINGS PER SHARE B
Mar.31 Jun.30 Sep.30 Dec.312017 .72 .62 .66 .66 2.662018 .69 .57 .65 .61 2.522019 .72 .54 .63 .77 2.682020 .67 .59 .63 .61 2.502021 .72 .61 .65 .62 2.60Cal- Full
endar YearQUARTERLY DIVIDENDS PAID C ■
Mar.31 Jun.30 Sep.30 Dec.312016 .375 .375 .375 .40 1.532017 .40 .40 .40 .425 1.632018 .425 .425 .425 .45 1.732019 .45 .45 .45 .4775 1.832020 .4775 .4775 .4775 .505
2004 2005 2006 2007 2008 2009 2010 2011 2012 2013 2014 2015 2016 201711.99 13.86 14.14 17.48 23.07 21.24 21.01 19.84 19.07 18.99 19.57 23.89 17.03 19.712.23 2.73 3.05 2.96 3.51 3.66 3.99 3.90 4.10 4.10 3.62 5.21 3.91 5.431.01 1.19 1.36 1.29 1.52 1.51 1.62 1.74 1.65 1.63 1.38 2.11 1.89 2.66.54 .59 .67 .82 1.00 1.04 1.12 1.17 1.21 1.25 1.30 1.43 1.55 1.65
2.92 4.93 4.80 5.16 5.34 5.79 5.89 5.91 5.68 5.32 6.00 7.97 5.13 7.1810.47 11.76 12.26 16.72 18.00 18.57 18.95 20.53 20.84 22.39 24.90 28.63 32.32 31.7795.53 103.20 104.09 155.52 169.19 171.26 174.39 188.83 191.57 213.17 276.00 281.56 401.49 421.1015.3 17.2 17.7 21.1 17.5 16.4 18.2 18.8 20.1 20.0 24.3 18.0 21.6 16.8.81 .92 .96 1.12 1.05 1.09 1.16 1.18 1.28 1.12 1.28 .91 1.13 .84
3.5% 2.9% 2.8% 3.0% 3.8% 4.2% 3.8% 3.6% 3.6% 3.8% 3.9% 3.8% 3.8% 3.7%
3664.0 3747.0 3654.0 4047.0 5401.0 6727.0 6838.0 8301.0313.0 347.0 362.0 390.0 374.0 672.0 660.0 1174.0
17.2% 18.3% 14.1% 7.4% 14.6% 21.3% 16.9% 25.8%4.2% 5.5% 5.0% 5.9% 7.2% 7.4% 10.0% 9.5%
60.5% 57.5% 55.1% 53.5% 54.8% 53.3% 59.3% 58.4%33.5% 36.9% 35.1% 37.0% 35.7% 38.1% 36.2% 37.1%9868.0 10513 11358 12892 19235 21151 35874 361088762.0 9281.0 10249 12267 17816 19595 29337 29668
5.0% 5.0% 4.8% 4.6% 3.4% 4.5% 2.8% 4.5%8.0% 7.8% 7.1% 6.5% 4.3% 6.8% 4.5% 7.8%8.6% 8.2% 7.9% 7.0% 4.5% 7.4% 4.5% 8.3%2.8% 4.3% 3.7% 3.2% 1.7% 4.5% 2.1% 5.2%71% 52% 60% 61% 68% 46% 59% 41%
2018 2019 2020 2021 © VALUE LINE PUB. LLC 23-2519.58 18.96 19.10 19.55 Revenues per sh 21.255.40 5.44 5.60 5.90 ‘‘Cash Flow’’ per sh 7.002.52 2.68 2.50 2.60 Earnings per sh B 3.001.75 1.86 1.97 2.08 Div’d Decl’d per sh C ■ 2.507.51 8.03 9.30 8.10 Cap’l Spending per sh 8.25
34.80 36.49 37.85 39.25 Book Value per sh D 43.75428.50 463.30 466.00 470.00 Common Shs Outst’g E 482.00
17.1 19.2 Bold figures areValue Lineestimates
Avg Ann’l P/E Ratio 22.5.92 1.03 Relative P/E Ratio 1.25
4.1% 3.6% Avg Ann’l Div’d Yield 3.7%
8390.0 8783.0 8900 9200 Revenues ($mill) 102001136.0 1238.0 1350 1425 Net Profit ($mill) 168013.4% 12.5% 14.0% 14.0% Income Tax Rate 14.0%8.4% 9.2% 9.0% 8.0% AFUDC % to Net Profit 7.0%
58.8% 54.2% 54.5% 54.5% Long-Term Debt Ratio 53.0%37.2% 41.8% 41.5% 41.5% Common Equity Ratio 43.5%40082 40445 42450 44125 Total Capital ($mill) 4830032654 33988 36875 39125 Net Plant ($mill) 456004.1% 4.4% 4.5% 4.5% Return on Total Cap’l 4.5%6.9% 6.7% 6.5% 6.5% Return on Shr. Equity 7.0%7.2% 6.9% 6.5% 6.5% Return on Com Equity F 7.0%4.1% 4.0% 3.0% 3.0% Retained to Com Eq 3.5%46% 45% 49% 49% All Div’ds to Net Prof G 50%
Company’s Financial Strength B++Stock’s Price Stability 100Price Growth Persistence 45Earnings Predictability 75
(A) Also trades on NYSE under the symbolFTS. All data in Canadian $. (B) Dil. egs. Excl.nonrecur. gains (loss): ’07, 3¢; ’14, 2¢; ’15,48¢; ’17, (35¢); ’18, 7¢. ’19, $1.12. ’19 EPS
don’t sum due to chng. in shs. Next egs. reportdue mid-Feb. (C) Div’ds histor. pd. early Mar.,June, Sept., and Dec. ■ Div’d reinv. plan avail.(2% disc.). (D) Incl. intang. In ’19: $35.01/sh.
(E) In mill. (F) Rates all’d on com. eq.: 8.3%-10.32%; earn. on avg. com. eq., ’19: 7.6%.Regul. Clim.: FERC, Above Avg.; AZ, Avg.; NY,Below Avg. (G) Excl. div’ds pd. via reinv. plan.
BUSINESS: Fortis Inc.’s main focus is electricity, hydroelectric, andgas utility operations (both regulated and nonregulated) in theUnited States, Canada, and the Caribbean. Has 2 mill. electric, 1.3mill. gas customers. Owns UNS Energy (Arizona), Central Hudson(New York), FortisBC Energy (British Columbia), FortisAlberta(Central Alberta), and Eastern Canada (Newfoundland). Sold com-
mercial real estate and hotel property assets in 2015. Acquired ITCHoldings 10/16. Fuel costs: 29% of revenues. ’19 reported deprec.rate: 2.6%. Has 9,000 employees. Chairman: Douglas J. Haughey.President & CEO: Barry V. Perry. Inc.: Canada. Address: FortisPlace, Suite 1100, 5 Springdale St., PO Box 8837, St. John’s, NL,Canada, A1B 3T2. Tel.: 709-737-2800. Internet: www.fortisinc.com.
Fortis’ share earnings will probablywind up lower in 2020. The December-quarter comparison is difficult because thecompany recorded income of $0.19 a sharein the fourth quarter of 2019 for the rever-sal of a reserve that its ITC transmissionsubsidiary took for a possible revenue re-fund. In addition, the average share countis up significantly due to stock Fortisissued in late 2019. The coronavirus andweak economy have had a mild negativeeffect on income. A delay in receiving raterelief in Arizona is another factor.Rate cases are pending in Arizonaand New York. Tucson Electric Power re-quested an increase of $99 million, basedon a 10% return on equity and a 53%common-equity ratio. The staff of the Ari-zona commission proposed a $61 millionhike based on a 9.3% ROE, and an admin-istrative law judge recommended $69 mil-lion, based on a 9.35% ROE. A decisionwas expected shortly after our report wentto press. Central Hudson filed for electricand gas increases of US$33 million andUS$14 million, respectively, based on a9.1% ROE. An order is expected in mid-2021. Also, ITC benefits from a forward-
looking regulatory mechanism that ena-bles it to earn a return on its capitalspending and recover most costs each year.Beyond next year, Fortis’ capital planshould lead to solid growth in the ratebase, and thus earnings. The companyprojects spending of $19.6 billion from2021 through 2025, leading to 6% averageannual rate base growth over that timeframe.The board of directors raised the divi-dend, effective with the payment inDecember. The yearly increase was $0.11a share (5.8%). Fortis’ goal is 6% averageannual growth in the disbursementthrough 2025. Note that the company hasreinstated a 2% discount on shares pur-chased through the dividend reinvestmentplan. Fortis expects participation in theDRIP to rise from 5% to 20% as a result.The dividend yield of Fortis stock is acut above the utility average. The equi-ty has outperformed most utility issues in2020, down just 3% since the start of theyear. Total return potential is attractivefor the next 18 months and decent for the3- to 5-year period.Paul E. Debbas, CFA December 11, 2020
LEGENDS0.74 x Dividends p shdivided by Interest Rate. . . . Relative Price Strength
Options: YesShaded area indicates recession
© 2020 Value Line, Inc. All rights reserved. Factual material is obtained from sources believed to be reliable and is provided without warranties of any kind.THE PUBLISHER IS NOT RESPONSIBLE FOR ANY ERRORS OR OMISSIONS HEREIN. This publication is strictly for subscriber’s own, non-commercial, internal use. No partof it may be reproduced, resold, stored or transmitted in any printed, electronic or other form, or used for generating or marketing any printed or electronic publication, service or product.
To subscribe call 1-800-VALUELINE
RECENTPRICE
P/ERATIO
RELATIVEP/E RATIO
DIV’DYLD( )Trailing:
Median:VALUELINE

8060504030252015
107.5
2-for-1
Percentsharestraded
24168
Target Price Range2023 2024 2025
ALLIANT ENERGY NDQ-LNT 52.60 22.5 19.817.0 1.08 2.9%
TIMELINESS 3 Lowered 7/3/20
SAFETY 2 Raised 9/28/07
TECHNICAL 1 Raised 12/11/20BETA .85 (1.00 = Market)
18-Month Target Price RangeLow-High Midpoint (% to Mid)
$43-$91 $67 (25%)
2023-25 PROJECTIONSAnn’l Total
Price Gain ReturnHigh 55 (+5%) 4%Low 40 (-25%) -3%Institutional Decisions
4Q2019 1Q2020 2Q2020to Buy 272 236 227to Sell 209 272 258Hld’s(000) 188011 182284 186056
High: 15.8 18.8 22.2 23.8 27.1 34.9 35.4 41.0 45.6 46.6 55.4 60.3Low: 10.2 14.6 17.0 20.9 21.9 25.0 27.1 30.4 36.6 36.8 40.8 37.7
% TOT. RETURN 11/20THIS VL ARITH.*
STOCK INDEX1 yr. 1.4 15.73 yr. 26.7 23.55 yr. 102.6 64.0
Alliant Energy, formerly called Interstate En-ergy Corporation, was formed on April 21,1998 through the merger of WPL Holdings,IES Industries, and Interstate Power. WPLstockholders received one share of Inter-state Energy stock for each WPL share, IESstockholders received 1.14 Interstate Ener-gy shares for each IES share, and InterstatePower stockholders received 1.11 InterstateEnergy shares for each Interstate Powershare.CAPITAL STRUCTURE as of 9/30/20Total Debt $7003.0 mill. Due in 5 Yrs $1500.0 mill.LT Debt $6574.0 mill. LT Interest $240.0 mill.(LT interest earned: 2.9x)
Pension Assets-12/19 $930.4 mill. Oblig. $1279.7mill.Pfd Stock $400.0 mill. Pfd Div’d $10.2 mill.16,000,000 shs.
Common Stock 249,760,663 shs.
MARKET CAP: $13.1 billion (Large Cap)
ELECTRIC OPERATING STATISTICS2017 2018 2019
% Change Retail Sales (KWH) -1.0 +2.0 -2.2Avg. Indust. Use (MWH) 11769 11830 11448Avg. Indust. Revs. per KWH (¢) 7.16 7.25 6.98Capacity at Peak (Mw) 5375 5459 5626Peak Load, Summer (Mw) 5375 5459 5626Annual Load Factor (%) NA NA NA% Change Customers (yr-end) +.4 +.4 +.6
Fixed Charge Cov. (%) 319 322 324ANNUAL RATES Past Past Est’d ’17-’19of change (per sh) 10 Yrs. 5 Yrs. to ’23-’25Revenues -.5% -.5% 1.0%‘‘Cash Flow’’ 4.5% 3.5% 4.5%Earnings 5.0% 5.0% 5.5%Dividends 7.0% 7.0% 7.0%Book Value 4.0% 5.0% 6.5%
Cal- Fullendar Year
QUARTERLY REVENUES ($ mill.)Mar.31 Jun.30 Sep.30 Dec.31
2017 853.9 765.3 906.9 856.1 3382.22018 916.3 816.1 928.6 873.5 3534.52019 987.2 790.2 990.2 880.1 3647.72020 915.7 763.1 920.0 1051.2 36502021 1000 890 970 940 3800Cal- Full
endar YearEARNINGS PER SHARE A
Mar.31 Jun.30 Sep.30 Dec.312017 .44 .41 .73 .41 1.992018 .52 .43 .87 .37 2.192019 .53 .40 .94 .46 2.332020 .72 .54 .94 .25 2.452021 .62 .53 1.00 .45 2.60Cal- Full
endar YearQUARTERLY DIVIDENDS PAID B ■†
Mar.31 Jun.30 Sep.30 Dec.312016 .295 .295 .295 .295 1.182017 .315 .315 .315 .315 1.262018 .335 .335 .335 .335 1.342019 .355 .355 .355 .355 1.422020 .38 .38 .38 .38
2010 2011 2012 2013 2014 2015 2016 201715.40 16.51 13.94 14.77 15.10 14.34 14.58 14.622.60 2.75 2.95 3.34 3.44 3.45 3.45 3.101.38 1.38 1.53 1.65 1.74 1.69 1.65 1.99.79 .85 .90 .94 1.02 1.10 1.18 1.26
3.91 3.03 5.22 3.32 3.78 4.25 5.26 6.3413.05 13.57 14.12 14.79 15.54 16.41 16.96 17.21
221.79 222.04 221.97 221.89 221.87 226.92 227.67 231.3512.5 14.5 14.5 15.3 16.6 18.1 22.3 20.6.80 .91 .92 .86 .87 .91 1.17 1.04
4.6% 4.3% 4.1% 3.7% 3.5% 3.6% 3.2% 3.1%
3416.1 3665.3 3094.5 3276.8 3350.3 3253.6 3320.0 3382.2303.9 304.4 337.8 382.1 385.5 380.7 373.8 455.9
30.1% 19.0% 21.5% 12.4% 10.1% 15.3% 13.4% 12.5%- - - - - - - - - - 6.5% 7.0% 7.6%
46.3% 45.7% 48.4% 46.1% 49.7% 48.6% 52.8% 49.0%49.5% 50.9% 48.4% 50.8% 47.5% 51.4% 47.2% 48.6%5840.8 5921.2 6476.6 6461.0 7257.2 7246.3 8177.6 8192.86730.6 7037.1 7838.0 7147.3 6442.0 8970.2 9809.9 10798
6.6% 6.4% 6.3% 7.0% 6.3% 6.3% 5.6% 6.8%9.7% 9.5% 10.1% 11.0% 10.6% 10.2% 9.7% 10.9%9.9% 9.5% 10.3% 11.3% 10.9% 10.2% 9.7% 6.4%3.8% 3.3% 3.9% 4.9% 4.3% 3.6% 2.8% 4.0%64% 67% 64% 57% 61% 65% 71% 63%
2018 2019 2020 2021 © VALUE LINE PUB. LLC 23-2514.97 14.89 14.60 14.90 Revenues per sh 15.654.32 4.59 4.75 4.95 ‘‘Cash Flow’’ per sh 5.252.19 2.33 2.45 2.60 Earnings per sh A 3.001.34 1.42 1.52 1.61 Div’d Decl’d per sh B ■ † 1.966.34 6.28 5.50 5.05 Cap’l Spending per sh 5.15
19.43 21.24 23.60 24.35 Book Value per sh C 28.45236.06 245.02 250.00 255.00 Common Shs Outst’g D 265.00
19.1 21.2 Bold figures areValue Lineestimates
Avg Ann’l P/E Ratio 16.01.03 1.19 Relative P/E Ratio .90
3.2% 2.9% Avg Ann’l Div’d Yield 4.1%
3534.5 3647.7 3650 3800 Revenues ($mill) 4150512.1 557.2 610 655 Net Profit ($mill) 7908.4% 10.8% NMF NMF Income Tax Rate 11.0%7.8% 7.6% 7.5% 7.5% AFUDC % to Net Profit 7.5%
53.4% 51.5% 52.0% 52.0% Long-Term Debt Ratio 52.0%46.6% 48.5% 48.0% 48.0% Common Equity Ratio 48.0%9832.0 10226 10500 11000 Total Capital ($mill) 1250012031 13527 14000 15000 Net Plant ($mill) 180006.3% 4.1% 6.0% 6.0% Return on Total Cap’l 6.5%
11.2% 10.7% 10.5% 10.5% Return on Shr. Equity 10.5%11.2% 10.7% 10.5% 10.5% Return on Com Equity E 10.5%4.4% 4.2% 4.0% 4.0% Retained to Com Eq 3.5%61% 61% 62% 63% All Div’ds to Net Prof 65%
Company’s Financial Strength AStock’s Price Stability 95Price Growth Persistence 75Earnings Predictability 90
(A) Diluted EPS. Excl. nonrecur. gains (losses):’10, (8¢); ’11, (1¢); ’12, (8¢). Next earnings rpt.due mid-February. (B) Dividends historicallypaid in mid-Feb., May, Aug., and Nov. ■ Div’d
reinvest. plan avail. † Shareholder invest. planavail. (C) Incl. deferred chgs. In ’19: $72.0 mill.,$0.29/sh. (D) In millions, adjusted for split. (E)Rate base: Orig. cost. Rates all’d on com. eq.
in IA in ’19: 10.0%; in WI in ’19 Regul. Clim.:WI, Above Avg.; IA, Avg.
BUSINESS: Alliant Energy Corp., formerly named Interstate Ener-gy, is a holding company formed through the merger of WPL Hold-ings, IES Industries, and Interstate Power. Supplies electricity, gas,and other services in Wisconsin, Iowa, and Minnesota. Elect. revs.by state: WI, 42%; IA, 57%; MN, 1%. Elect. rev.: residential, 34%;commercial, 29%; industrial, 28%; wholesale, 7%; other, 2%. Fuel
sources, 2019: coal, 27%; gas, 34%; other, 39%. Fuel costs: 41%of revs. 2019 depreciation rate: 5.9%. Estimated plant age: 17years. Has approximately 3,597 employees. Chairman & Chief Ex-ecutive Officer: John O. Larsen. Incorporated: Wisconsin. Address:4902 N. Biltmore Lane, Madison, Wisconsin 53718. Telephone:608-458-3311. Internet: www.alliantenergy.com.
Alliant Energy raised its 2020 earn-ings outlook. The utility now expectsshare net to be between $2.40 and $2.46,versus its previous guidance range of$2.34-$2.48. The midpoint of the forecastwas increased by $0.02 a share, primarilydue to higher earnings from temperatureimpacts on retail electric and gas salesduring the first nine months of the year.The company provided 2021 earningsguidance for the first time. Leadershipexpects share net to be between $2.50 and$2.64, representing growth of 2%-8% fromour 2020 estimate of $2.45. The projectionassumes, among other things, a stableeconomy and continued negative impactfrom the COVID-19 health crisis. In addi-tion, due to production tax credits fromwind projects being placed into service, Al-liant expects to have a consolidated effec-tive tax rate of negative 14% in 2021.The Iowa Service Area was hit by aDerecho in late August. The wind stormcaused considerable damage to the compa-ny’s electric distribution system, resultingin over 250,000 customers losing power.Repair and restoration efforts are current-ly ongoing, and LNT’s estimate of the total
cost of the weather event stands at ap-proximately $140 million. Although thiswill mostly impact 2020 figures (earningsguidance incorporated expected Derecho-related costs), leadership is anticipating amodest sales headwind in the affectedareas through the first half of 2021.The board of directors raised the divi-dend in November. This has been thepattern in recent years. The increase was$0.0225 a share (6%) quarterly, slightlyless than last year’s expansion. Alliant istargeting a payout ratio of 60%-70%.Alliant continues to bet big on renew-ables. In 2020, the company will generateapproximately 34% of its energy from re-newables, with much of that coming fromwind power. Coal-fired generation current-ly stands at 25%, though management in-tends to reduce that number to the lowsingle digits by 2030. Natural gas, at 41%of the energy mix, is expected to stayroughly the same over the next five years.This stock does not stand out. The divi-dend yield is below average for an electricutility, and capital appreciation potentialout to 2023-2025 is flat to negative.Daniel Henigson, CFA December 11, 2020
LEGENDS0.90 x Dividends p shdivided by Interest Rate. . . . Relative Price Strength
2-for-1 split 5/16Options: YesShaded area indicates recession
© 2020 Value Line, Inc. All rights reserved. Factual material is obtained from sources believed to be reliable and is provided without warranties of any kind.THE PUBLISHER IS NOT RESPONSIBLE FOR ANY ERRORS OR OMISSIONS HEREIN. This publication is strictly for subscriber’s own, non-commercial, internal use. No partof it may be reproduced, resold, stored or transmitted in any printed, electronic or other form, or used for generating or marketing any printed or electronic publication, service or product.
To subscribe call 1-800-VALUELINE
RECENTPRICE
P/ERATIO
RELATIVEP/E RATIO
DIV’DYLD( )Trailing:
Median:VALUELINE

1601201008060504030
2015
3-for-2
Percentsharestraded
642
Target Price Range2023 2024 2025
MGE ENERGY INC. NDQ-MGEE 68.67 25.9 26.020.0 1.24 2.2%
TIMELINESS 4 Lowered 12/4/20
SAFETY 1 New 1/3/03
TECHNICAL 3 Raised 12/11/20BETA .70 (1.00 = Market)
18-Month Target Price RangeLow-High Midpoint (% to Mid)
$59-$119 $89 (30%)
2023-25 PROJECTIONSAnn’l Total
Price Gain ReturnHigh 80 (+15%) 6%Low 65 (-5%) 1%Institutional Decisions
4Q2019 1Q2020 2Q2020to Buy 75 61 70to Sell 76 83 78Hld’s(000) 15965 15334 16890
High: 25.5 29.1 31.9 37.4 40.5 48.0 48.0 66.9 68.7 68.9 80.8 83.3Low: 18.2 21.4 24.7 28.7 33.4 35.7 36.5 44.8 60.3 51.1 56.7 47.2
% TOT. RETURN 11/20THIS VL ARITH.*
STOCK INDEX1 yr. -9.5 15.73 yr. 10.7 23.55 yr. 75.3 64.0
CAPITAL STRUCTURE as of 9/30/20Total Debt $540.1 mill. Due in 5 Yrs $91.8 mill.LT Debt $520.4 mill. LT Interest $23.6 mill.(LT interest earned: 5.8x)
Leases, Uncapitalized Annual rentals $1.9 mill.
Pension Assets-12/19 $386.0 mill.Obligation $410.6 mill.
Pfd Stock None
Common Stock 36,163,370 shs.as of 10/31/20MARKET CAP: $2.5 billion (Mid Cap)
ELECTRIC OPERATING STATISTICS2017 2018 2019
% Change Retail Sales (KWH) -2.6 +1.6 -2.3Avg. Indust. Use (MWH) 1966 1802 NAAvg. Indust. Revs. per KWH (¢) 8.23 7.70 7.43Capacity at Peak (Mw) NA NA NAPeak Load, Summer (Mw) 670 686 NAAnnual Load Factor (%) NA NA NA% Change Customers (avg.) NA NA NA
Fixed Charge Cov. (%) 750 645 465ANNUAL RATES Past Past Est’d ’17-’19of change (per sh) 10 Yrs. 5 Yrs. to ’23-’25Revenues - - -.5% 1.0%‘‘Cash Flow’’ 4.5% 5.0% 5.0%Earnings 4.5% 2.5% 4.0%Dividends 3.5% 4.0% 5.5%Book Value 5.5% 5.5% 5.0%
Cal- Fullendar Year
QUARTERLY REVENUES ($ mill.)Mar.31 Jun.30 Sep.30 Dec.31
2017 156.8 126.5 139.5 140.3 563.12018 157.6 124.3 137.8 140.1 559.82019 167.6 122.2 138.2 140.9 568.92020 149.9 117.0 135.2 137.9 5402021 160 120 140 140 560Cal- Full
endar YearEARNINGS PER SHARE A
Mar.31 Jun.30 Sep.30 Dec.312017 .56 .45 .77 .42 2.202018 .58 .53 .85 .47 2.432019 .69 .45 .88 .48 2.512020 .75 .53 .88 .49 2.652021 .78 .50 .95 .52 2.75Cal- Full
endar YearQUARTERLY DIVIDENDS PAID B ■ †
Mar.31 Jun.30 Sep.30 Dec.312016 .295 .295 .3075 .3075 1.212017 .3075 .3075 .3225 .3225 1.262018 .3225 .3225 .3375 .3375 1.322019 .3375 .3375 .3525 .3525 1.382020 .3525 .3525 .37
2004 2005 2006 2007 2008 2009 2010 2011 2012 2013 2014 2015 2016 201713.89 16.73 16.13 16.33 17.35 15.40 15.36 15.76 15.61 17.04 17.88 16.27 15.71 16.241.92 2.00 2.34 2.46 2.68 2.66 2.76 2.94 2.98 3.28 3.49 3.33 3.47 3.731.18 1.05 1.37 1.51 1.59 1.47 1.67 1.76 1.86 2.16 2.32 2.06 2.18 2.20.91 .92 .93 .94 .96 .97 .99 1.01 1.04 1.07 1.11 1.16 1.21 1.26
3.13 2.80 2.94 4.14 3.08 2.35 1.76 1.88 2.84 3.43 2.67 2.08 2.41 3.1211.06 11.21 11.93 12.99 13.92 14.47 15.14 15.89 16.71 17.81 19.02 19.92 20.89 22.4530.59 30.68 31.46 32.93 34.36 34.67 34.67 34.67 34.67 34.67 34.67 34.67 34.67 34.6718.0 22.4 15.9 15.0 14.2 15.1 15.0 15.8 17.2 17.0 17.2 20.3 24.9 29.4.95 1.19 .86 .80 .85 1.01 .95 .99 1.09 .96 .91 1.02 1.31 1.48
4.3% 3.9% 4.3% 4.1% 4.2% 4.4% 4.0% 3.6% 3.2% 2.9% 2.8% 2.8% 2.2% 2.0%
532.6 546.4 541.3 590.9 619.9 564.0 544.7 563.157.7 60.9 64.4 74.9 80.3 71.3 75.6 76.1
36.9% 37.1% 37.7% 37.5% 37.5% 36.7% 36.0% 36.4%- - - - - - 5.6% 5.7% 1.3% 2.1% 2.1%
38.9% 39.6% 38.2% 39.3% 37.5% 36.2% 34.6% 33.8%61.1% 60.4% 61.8% 60.7% 62.5% 63.8% 65.4% 66.2%859.4 911.9 937.9 1016.9 1054.7 1081.5 1106.9 1176.3968.0 995.6 1073.5 1160.2 1208.1 1243.4 1282.1 1341.47.6% 7.8% 7.9% 8.3% 8.6% 7.5% 7.7% 7.3%
11.0% 11.1% 11.1% 12.1% 12.2% 10.3% 10.4% 9.8%11.0% 11.1% 11.1% 12.1% 12.2% 10.3% 10.4% 9.8%4.4% 4.7% 4.9% 6.1% 6.4% 4.5% 4.7% 4.2%60% 57% 56% 50% 48% 56% 55% 57%
2018 2019 2020 2021 © VALUE LINE PUB. LLC 23-2516.15 16.41 14.95 15.50 Revenues per sh 17.254.06 4.57 4.70 4.95 ‘‘Cash Flow’’ per sh 5.502.43 2.51 2.65 2.75 Earnings per sh A 3.001.32 1.38 1.45 1.52 Div’d Decl’d per sh B ■ † 1.806.12 4.73 6.10 4.55 Cap’l Spending per sh 4.50
23.56 24.68 27.15 28.40 Book Value per sh C 32.0034.67 34.67 36.16 36.16 Common Shs Outst’g D 36.1625.1 28.4 Bold figures are
Value Lineestimates
Avg Ann’l P/E Ratio 24.01.36 1.52 Relative P/E Ratio 1.50
2.2% 1.9% Avg Ann’l Div’d Yield 2.5%
559.8 568.9 540 560 Revenues ($mill) 62584.2 86.9 95.0 100 Net Profit ($mill) 110
24.6% 18.5% 16.5% 16.5% Income Tax Rate 16.5%5.2% 3.6% 5.0% 6.0% AFUDC % to Net Profit 3.0%
37.7% 38.0% 35.0% 35.0% Long-Term Debt Ratio 37.5%62.3% 62.0% 65.0% 65.0% Common Equity Ratio 62.5%1310.0 1379.4 1505 1575 Total Capital ($mill) 18501509.4 1642.7 1790 1875 Net Plant ($mill) 2150
7.2% 7.1% 7.0% 7.0% Return on Total Cap’l 6.5%10.3% 10.2% 9.5% 9.5% Return on Shr. Equity 9.5%10.3% 10.2% 9.5% 9.5% Return on Com Equity D 9.5%4.7% 4.6% 4.5% 4.5% Retained to Com Eq 4.0%54% 55% 54% 55% All Div’ds to Net Prof 60%
Company’s Financial Strength A+Stock’s Price Stability 95Price Growth Persistence 75Earnings Predictability 100
(A) Diluted earnings. Excludes nonrecurringgain: ’17, 62¢. ’19 earnings don’t sum due torounding. Next earnings report due late Feb.(B) Dividends historically paid in mid-March,
June, September, and December. ■ Dividendreinvestment plan available. † Shareholder in-vestment plan available. (C) Includes regu-latory assets. In ’19: $167.0 mill., $4.82/sh.
(D) In millions, adjusted for split. (E) Rate al-lowed on common equity in ’19: 9.8%; earnedon common equity, ’19: 10.4%. RegulatoryClimate: Above Average.
BUSINESS: MGE Energy, Inc. is a holding company for MadisonGas and Electric Company (MGE), which provides electric serviceto 155,000 customers in Dane County and gas service to 163,000customers in seven counties in Wisconsin. Electric revenue break-down, ’19: residential, 35%; commercial, 53%; industrial, 3%; other,9%. Generating sources, ’19: coal, 50%; gas, 14%; renewables,
14%; purchased power, 22%. Fuel costs: 34% of revenues. ’19reported depreciation rates: electric, 3.6%; gas, 2.1%; nonregu-lated, 2.3%. Has about 700 employees. Chairman, President &CEO: Jeffrey M. Keebler. Incorporated: Wisconsin. Address: 133South Blair Street, P.O. Box 1231, Madison, Wisconsin 53701-1231. Telephone: 608-252-7000. Internet: www.mgeenergy.com.
MGE Energy’s utility subsidiary isawaiting an order on its regulatorysettlement. Madison Gas and Electricreached a settlement calling for no changein electric rates and a $6.7 million (4%)rise in gas rates. The earning power of theelectric business would increase, despitethe lack of rate hike, because capitalspending would be placed in the rate base.Declines in costs, which are being passedthrough to customers, are the reason forno change in electric prices. The allowedreturn on equity would be 9.8%, and thecommon-equity ratio would be 55.85%. Anorder is expected by yearend, with newtariffs taking effect at the start of 2021.Earnings are likely to rise in 2020 and2021, despite the weak economy. MGEbenefited from favorable weather patternsin the first six months of 2020. The utili-ty’s service area was better able to recoverfrom the lockdown earlier this year be-cause it does not have a large industrialsector, and the state government was notsubject to the lockdown. Moreover, MGE isable to defer for future recovery of ex-penses associated with the coronavirus.We assume in our 2021 estimate that the
aforementioned regulatory settlement isapproved.A solar project was completed in earlyNovember, and others will be built inthe next two years. MGE has a one-thirdstake (50 megawatts) in this project, whichcost $65 million. Two similar projects arescheduled for commercial operation inApril of 2021 and December of 2022. A 20-mw project is scheduled for completion inmid-2021 at a cost of $32 million. This willbe used to serve commercial customerswho choose a renewable-energy tariff.Finances are sound. The common-equityratio and fixed-charge coverage are wellabove the utility norms. Earned returns onequity are healthy. MGE Energy merits aFinancial Strength rating of A+.This high-quality stock is untimelyand its dividend yield is low, by utili-ty standards. In fact, this is only aboutequal to the median of all dividend-payingissues under our coverage. Total returnpotential is appealing for the 18-monthspan, but not for the 3- to 5-year period.The recent quotation is well within our2023-2025 Target Price Range.Paul E. Debbas, CFA December 11, 2020
LEGENDS1.20 x Dividends p shdivided by Interest Rate. . . . Relative Price Strength
3-for-2 split 2/14Options: YesShaded area indicates recession
© 2020 Value Line, Inc. All rights reserved. Factual material is obtained from sources believed to be reliable and is provided without warranties of any kind.THE PUBLISHER IS NOT RESPONSIBLE FOR ANY ERRORS OR OMISSIONS HEREIN. This publication is strictly for subscriber’s own, non-commercial, internal use. No partof it may be reproduced, resold, stored or transmitted in any printed, electronic or other form, or used for generating or marketing any printed or electronic publication, service or product.
To subscribe call 1-800-VALUELINE
RECENTPRICE
P/ERATIO
RELATIVEP/E RATIO
DIV’DYLD( )Trailing:
Median:VALUELINE

1601201008060504030
2015
Percentsharestraded
302010
Target Price Range2023 2024 2025
WEC ENERGY GROUP NYSE-WEC 94.95 24.6 25.018.0 1.18 2.8%
TIMELINESS 2 Raised 11/13/20
SAFETY 1 Raised 3/23/12
TECHNICAL 2 Raised 12/11/20BETA .80 (1.00 = Market)
18-Month Target Price RangeLow-High Midpoint (% to Mid)
$74-$162 $118 (25%)
2023-25 PROJECTIONSAnn’l Total
Price Gain ReturnHigh 105 (+10%) 6%Low 85 (-10%) 1%Institutional Decisions
4Q2019 1Q2020 2Q2020to Buy 403 383 334to Sell 361 426 453Hld’s(000) 246035 234743 231336
High: 25.3 30.5 35.4 41.5 45.0 55.4 58.0 66.1 70.1 75.5 98.2 109.5Low: 18.2 23.4 27.0 33.6 37.0 40.2 44.9 50.4 56.1 58.5 67.2 68.0
% TOT. RETURN 11/20THIS VL ARITH.*
STOCK INDEX1 yr. 9.3 15.73 yr. 48.5 23.55 yr. 123.6 64.0
CAPITAL STRUCTURE as of 9/30/20Total Debt $13020 mill. Due in 5 Yrs $5069.2 mill.LT Debt $11653 mill. LT Interest $517.7 mill.Incl. $12.1 mill. capitalized leases.(LT interest earned: 3.8x)Leases, Uncapitalized Annual rentals $6.8 mill.Pension Assets-12/19 $3007.0 mill.
Oblig $3123.7 mill.Pfd Stock $30.4 mill. Pfd Div’d $1.2 mill.260,000 shs. 3.60%, $100 par, callable. $101;44,498 shs. 6%, $100 par.Common Stock 315,434,531 shs.
MARKET CAP: $30 billion (Large Cap)
ELECTRIC OPERATING STATISTICS2017 2018 2019
% Change Retail Sales (KWH) -3.0 +2.5 -2.5Avg. Indust. Use (MWH) NA NA NAAvg. Lg. C&I Revs. per KWH (¢) 7.13 7.05 7.25Capacity at Peak (Mw) NA NA NAPeak Load, Summer (Mw) NA NA NAAnnual Load Factor (%) NA NA NA% Change Customers (yr-end) +.7 +.7 +.6
Fixed Charge Cov. (%) 422 323 300ANNUAL RATES Past Past Est’d ’17-’19of change (per sh) 10 Yrs. 5 Yrs. to ’23-’25Revenues 3.0% 3.5% 2.0%‘‘Cash Flow’’ 7.5% 7.5% 6.5%Earnings 8.5% 6.0% 6.0%Dividends 14.5% 9.5% 6.5%Book Value 8.0% 10.5% 3.5%
Cal- Fullendar Year
QUARTERLY REVENUES ($ mill.)Mar.31 Jun.30 Sep.30 Dec.31
2017 2304 1631 1657 2055 7648.52018 2286 1672 1643 2076 7679.52019 2377 1590 1608 1947 7523.12020 2109 1549 1651 1891 72002021 2250 1600 1700 1950 7500Cal- Full
endar YearEARNINGS PER SHARE A
Mar.31 Jun.30 Sep.30 Dec.312017 1.12 .63 .68 .71 3.142018 1.23 .73 .74 .65 3.342019 1.33 .74 .74 .77 3.582020 1.43 .76 .84 .72 3.752021 1.50 .80 .85 .80 3.95Cal- Full
endar YearQUARTERLY DIVIDENDS PAID B ■
Mar.31 Jun.30 Sep.30 Dec.312016 .495 .495 .495 .495 1.982017 .52 .52 .52 .52 2.082018 .5525 .5525 .5525 .5525 2.212019 .59 .59 .59 .59 2.362020 .6325 .6325 .6325 .6325
2004 2005 2006 2007 2008 2009 2010 2011 2012 2013 2014 2015 2016 201714.66 16.31 17.08 18.12 18.95 17.65 17.98 19.46 18.54 20.00 22.16 18.77 23.68 24.242.58 2.89 2.90 2.98 2.95 3.11 3.30 3.68 4.01 4.33 4.47 3.87 5.39 5.69.93 1.28 1.32 1.42 1.52 1.60 1.92 2.18 2.35 2.51 2.59 2.34 2.96 3.14.42 .44 .46 .50 .54 .68 .80 1.04 1.20 1.45 1.56 1.74 1.98 2.08
2.85 3.40 4.17 5.28 4.86 3.50 3.41 3.60 3.09 3.04 3.26 4.01 4.51 6.2110.65 11.46 12.35 13.25 14.27 15.26 16.26 17.20 18.05 18.73 19.60 27.42 28.29 29.98
233.97 233.96 233.94 233.89 233.84 233.82 233.77 230.49 229.04 225.96 225.52 315.68 315.62 315.5717.5 14.5 16.0 16.5 14.8 13.3 14.0 14.2 15.8 16.5 17.7 21.3 19.9 20.0.92 .77 .86 .88 .89 .89 .89 .89 1.01 .93 .93 1.07 1.04 1.01
2.6% 2.4% 2.2% 2.1% 2.4% 3.2% 3.0% 3.3% 3.2% 3.5% 3.4% 3.5% 3.4% 3.3%
4202.5 4486.4 4246.4 4519.0 4997.1 5926.1 7472.3 7648.5455.6 514.0 547.5 578.6 589.5 640.3 940.2 998.2
35.4% 33.9% 35.9% 36.9% 38.0% 40.4% 37.6% 37.2%18.6% 16.8% 9.4% 4.5% 1.3% 4.5% 3.8% 1.6%50.6% 53.6% 51.7% 50.6% 48.5% 51.2% 50.5% 48.0%49.0% 46.0% 48.0% 49.1% 51.2% 48.6% 49.3% 51.9%7764.5 8608.0 8619.3 8626.6 8636.5 17809 18118 182389601.5 10160 10572 10907 11258 19190 19916 21347
7.5% 7.5% 7.9% 8.1% 8.1% 4.5% 6.3% 6.6%11.9% 12.9% 13.1% 13.6% 13.2% 7.4% 10.5% 10.5%12.0% 12.9% 13.2% 13.6% 13.3% 7.4% 10.5% 10.5%7.0% 6.8% 6.5% 5.9% 5.3% 2.1% 3.5% 3.6%41% 47% 51% 57% 60% 71% 67% 66%
2018 2019 2020 2021 © VALUE LINE PUB. LLC 23-2524.34 23.85 22.85 23.80 Revenues per sh 27.006.04 6.53 6.85 7.35 ‘‘Cash Flow’’ per sh 9.003.34 3.58 3.75 3.95 Earnings per sh A 4.752.21 2.36 2.53 2.70 Div’d Decl’d per sh B ■ 3.206.71 7.17 9.50 9.90 Cap’l Spending per sh 9.25
31.02 32.06 33.15 34.25 Book Value per sh C 38.00315.52 315.43 315.43 315.43 Common Shs Outst’g D 315.43
19.6 23.5 Bold figures areValue Lineestimates
Avg Ann’l P/E Ratio 20.01.06 1.26 Relative P/E Ratio 1.10
3.4% 2.8% Avg Ann’l Div’d Yield 3.4%
7679.5 7523.1 7200 7500 Revenues ($mill) 85001060.5 1134.2 1190 1260 Net Profit ($mill) 150013.8% 9.9% 16.5% 16.5% Income Tax Rate 16.5%2.1% 1.8% 2.0% 2.0% AFUDC % to Net Profit 2.0%
50.4% 52.5% 52.5% 54.5% Long-Term Debt Ratio 53.0%49.4% 47.4% 47.5% 45.5% Common Equity Ratio 46.5%19813 21355 22075 23775 Total Capital ($mill) 2570022001 23620 25650 27700 Net Plant ($mill) 332006.5% 6.5% 6.5% 6.5% Return on Total Cap’l 7.0%
10.8% 11.2% 11.5% 11.5% Return on Shr. Equity 12.5%10.8% 11.2% 11.5% 11.5% Return on Com Equity E 12.5%
3.7% 3.8% 3.5% 3.5% Retained to Com Eq 4.0%66% 66% 67% 68% All Div’ds to Net Prof 67%
Company’s Financial Strength A+Stock’s Price Stability 85Price Growth Persistence 70Earnings Predictability 95
(A) Diluted EPS. Excl. gains on discont. ops.:’04, 77¢; ’11, 6¢; nonrecurring gain: ’17, 65¢.’18 EPS don’t sum due to rounding. Nextearnings report due early Feb. (B) Div’ds paid
in early Mar., June, Sept. & Dec. ■ Div’d reinv-est. plan avail. (C) Incl. intang. In ’19:$20.80/sh. (D) In mill., adj. for split. (E) Ratebase: Net orig. cost. Rates all’d on com. eq. in
WI in ’15: 10.0%-10.3%; in IL in ’15: 9.05%; inMN in ’19: 9.7%; in MI in ’16: 9.9%; earned onavg. com. eq., ’19: 11.4%. Regulatory Climate:WI, Above Avg.; IL, Below Avg.; MN & MI, Avg.
BUSINESS: WEC Energy Group, Inc. (formerly Wisconsin Energy)is a holding company for utilities that provide electric, gas & steamservice in WI & gas service in IL, MN, & MI. Customers: 1.6 mill.elec., 2.9 mill. gas. Acq’d Integrys Energy 6/15. Sold Point Beachnuclear plant in ’07. Electric revenue breakdown: residential, 35%;small commercial & industrial, 32%; large commercial & industrial,
21%; other, 12%. Generating sources: coal, 36%; gas, 29%; re-newables, 4%; purchased, 31%. Fuel costs: 36% of revenues. ’19reported deprec. rates: 2.3%-3.2%. Has 7,500 employees. Chair-man: Gale E. Klappa. President & CEO: Kevin Fletcher. Inc.: WI.Address: 231 W. Michigan St., P.O. Box 1331, Milwaukee, WI53201. Tel.: 414-221-2345. Internet: www.wecenergygroup.com.
WEC Energy Group is about to wrapup another solid year. The company hasrealized consistent earnings growth in re-cent years (with 2015 being an exceptiondue to the effects of an acquisition), andthis almost certainly happened again in2020, despite the recession. Managementhas cut costs to offset the effects of de-clines in kilowatt-hour sales, and the com-pany has received authorization to deferfor future recovery most of its coronavirus-related expenses. Peoples Gas in Chicagobenefits from a regulatory mechanism thatenables it to recover the $280 million-$300million it spends annually to replace gasmains. Increased investment in nonutilitywind projects (see below) are also con-tributing to profit growth. Our 2020 earn-ings estimate is at the midpoint of WECEnergy’s guidance of $3.74-$3.76 a share.A continuation of these factors and a bet-ter economy should produce profit growthin 2021 in line with with the company’sannual target of 5%-7%.A dividend announcement probablycame shortly after our report went topress. This has been WEC’s practice inrecent years. We estimate an increase of
$0.17 a share (6.7%) annually. The compa-ny’s goals for the dividend are a growthrate of 5%-7% and a payout ratio of 65%-70%. The announcement isn’t official untilthe declaration from the board of directors.A nonutility subsidiary is expandingits investment in wind energy. Threeprojects will be for 428 megawatts of ca-pacity at a cost of $618 million. Threeothers (705 mw at a cost of $1 billion) areunder construction. WEC Energy expectsto spend $2.2 billion on this business from2021 through 2025. This should providehigher returns on investment than theregulated utilities earn.North Shore Gas filed a rate case. Theutility asked the Illinois regulators for a$7.6 million (8.5%) hike, based on a 10%return on equity and a 52.5% common-equity ratio. New tariffs are expected totake effect in September.This top-quality stock is timely, buthas a high valuation. The price hasrisen 3% in what has been a bad year formost utility issues. The dividend yield iswell below average for a utility, and 3- to5-year total return potential is low.Paul E. Debbas, CFA December 11, 2020
LEGENDS0.81 x Dividends p shdivided by Interest Rate. . . . Relative Price Strength
2-for-1 split 3/11Options: YesShaded area indicates recession
© 2020 Value Line, Inc. All rights reserved. Factual material is obtained from sources believed to be reliable and is provided without warranties of any kind.THE PUBLISHER IS NOT RESPONSIBLE FOR ANY ERRORS OR OMISSIONS HEREIN. This publication is strictly for subscriber’s own, non-commercial, internal use. No partof it may be reproduced, resold, stored or transmitted in any printed, electronic or other form, or used for generating or marketing any printed or electronic publication, service or product.
To subscribe call 1-800-VALUELINE
RECENTPRICE
P/ERATIO
RELATIVEP/E RATIO
DIV’DYLD( )Trailing:
Median:VALUELINE

Electric Utility
Index: June, 1967 = 100
15
30
45
60
75
90
RELATIVE STRENGTH (Ratio of Industry to Value Line Comp.)
120105
150
2019 2020 20212015 2016 2017 2018
INDUSTRY TIMELINESS: 17 (of 96)
February 12, 2021 ELECTRIC UTILITY (EAST) INDUSTRY 134All of the major electric utilities located in the
eastern region of the United States are reviewedin this Issue; western electrics, in Issue 11; and theremaining utilities, in Issue 5.
There has been a lot of dealmaking activityamong utilities reviewed in this Issue. They areinvolved in transactions, are attempting to do adeal, or have completed one within the past 12months.
Some utilities are getting involved in offshorewind, with one noteworthy exception.
Electric utility stocks, as a group, underper-formed the broader market averages by a widemargin in 2020. The underperformance has con-tinued in early 2021.
Electric Utility Dealmaking
Several electric companies are involved in pendingtransactions, are trying to sell assets, or have completedone within the past 12 months. A deal doesn’t necessarilymean a merger or acquisition between two companies.This can be an asset sale or purchase, or a corporateseparation. Companies can be motivated by a desire forfaster growth, a reduction in business risk, or a need toraise cash.
Only one utility in Issue 1 is involved in a traditionalmerger or acquisition. AVANGRID has agreed to acquirePNM Resources (covered in Issue 11), which owns elec-tric companies in New Mexico and Texas, for $4.3 billionin cash. The companies expect to complete the takeoverin the fourth quarter. NextEra Energy, which has beentrying to acquire utilities (usually unsuccessfully) formany years, made a bid for Santee Cooper (a municipalutility in South Carolina) and reportedly approachedDuke Energy about effecting a combination. Duke En-ergy announced a deal in January. The company willraise over $2 billion (in two phases) through the sale ofa 19.9% stake in its utility subsidiary in Indiana. Thiswill eliminate its equity needs and fund capital spend-ing. Dominion Energy has sold most of its midstreamnatural gas operations and used most of the $4 billion incash to repurchase stock. Exelon is contemplating acorporate separation of its nonregulated businesses.Public Service Enterprise Group is attempting to sell itsnon-nuclear generating assets. PPL Corporation is at-tempting to sell (or swap for U.S. utilities) its utilityoperations in the United Kingdom. For Exelon, PSEG,and PPL, the aim is to reduce the company’s businessrisk. Finally, Eversource completed the purchase of a gasutility in Massachusetts last month for $1.1 billion.
Offshore Wind
Last month, President Biden signed an executiveorder to double offshore wind by 2030 by increasingfederal leases. Even before this happened, some compa-nies reviewed in this Issue have been investing inoffshore wind. Many states have renewable-energy man-dates. Some customers have expressed interest in buy-ing electricity from renewable sources, even if this turnsout to be more costly. Through a joint venture, AVAN-GRID has two projects under development. These are
scheduled to come on line in 2024 and 2025. Eversourcehas joint ventures for three projects that are underdevelopment. One is scheduled to begin operating byyear-end 2023. The other two are unlikely to achievetheir original in-service dates of year-end 2023 andyear-end 2024, however. Dominion Resources has thelargest project in the planning stages, which would addmore than 2,640 megawatts of capacity upon completionin 2026. PSEG has agreed to take a 25% stake in aproject, but this has not closed. Offshore wind comeswith profit potential, but also entails significant con-struction risk. The experience of Eversource, which hasundergone delays in two projects, illustrates this. Wenote that NextEra Energy, the leader in onshore wind,has not shown interest in offshore wind due to theconstruction risk and the high cost of this power forcustomers.
Conclusion
As a group, electric utility stocks underperformed thebroader market averages considerably in 2020. This wasinevitable to some extent, following a stellar showing formost of these issues in 2019. The S&P 500 posted an18.4% total return last year. By contrast, an index of 39investor-owned utilities (IOUs) compiled by the EdisonElectric Institute, a group representing IOUs, had atotal return of -1.2%. Even the generous dividends paidby most utilities weren’t enough to push the industry’stotal return into positive territory.
During the first month of 2021, most power equitiescontinued to decline in price. The group’s average divi-dend yield, at 3.8%, is about twice the median ofdividend-paying stocks reviewed in The Value Line In-vestment Survey. The board of directors of most utilitiesincrease the payout annually, with an average growthrate of 5% for this industry. What’s more, most of theseissues offer 18-month total return potential that is wellabove the market median, and 3- to 5-year projectedtotal returns for many stocks compare favorably withthe market median, especially on a risk-adjusted basis.
Paul E. Debbas, CFA
© 2021 Value Line, Inc. All rights reserved. Factual material is obtained from sources believed to be reliable and is provided without warranties of any kind.THE PUBLISHER IS NOT RESPONSIBLE FOR ANY ERRORS OR OMISSIONS HEREIN. This publication is strictly for subscriber’s own, non-commercial, internal use. No partof it may be reproduced, resold, stored or transmitted in any printed, electronic or other form, or used for generating or marketing any printed or electronic publication, service or product.
To subscribe call 1-800-VALUELINE

320
2001601201008060
40
18Percentsharestraded
15105
Target Price Range2024 2025 2026
DUKE ENERGY NYSE-DUK 93.16 22.5 18.818.0 1.10 4.2%
TIMELINESS 3 New 2/12/21
SAFETY 2 New 6/1/07
TECHNICAL 4 New 2/12/21BETA .85 (1.00 = Market)
18-Month Target Price RangeLow-High Midpoint (% to Mid)
$64-$142 $103 (10%)
2024-26 PROJECTIONSAnn’l Total
Price Gain ReturnHigh 120 (+30%) 10%Low 90 (-5%) 4%Institutional Decisions
1Q2020 2Q2020 3Q2020to Buy 682 699 686to Sell 723 666 702Hld’s(000) 473369 471851 464090
High: 55.8 66.4 71.1 75.5 87.3 90.0 87.8 91.8 91.4 97.4 103.8 94.6Low: 46.4 50.6 59.6 64.2 67.1 65.5 70.2 76.1 72.0 82.5 62.1 87.6
% TOT. RETURN 1/21THIS VL ARITH.*
STOCK INDEX1 yr. -0.5 26.63 yr. 35.2 29.45 yr. 53.3 99.1
CAPITAL STRUCTURE as of 9/30/20Total Debt $64143 mill. Due in 5 Yrs $21030 mill.LT Debt $56049 mill. LT Interest $2186 mill.Incl. $969 mill. capitalized leases.(LT interest earned: 2.7x)Leases, Uncapitalized Annual rentals $268 mill.Pension Assets-12/19 $8910 mill.
Oblig $8231 mill.Pfd Stock $1962 mill. Pfd Div’d $58 mill.40 mill. shs. 5.75%, cum., $25 liq. value,redeemable at $25.50 prior to 6/15/24; 1 mill. shs.4.875%, cum., $1000 liq. value.Common Stock 735,958,560 shs. as of 10/31/20MARKET CAP: $69 billion (Large Cap)
ELECTRIC OPERATING STATISTICS2017 2018 2019
% Change Retail Sales (KWH) -2.0 +3.9 -.9Avg. Indust. Use (MWH) 2914 2953 2934Avg. Indust. Revs. per KWH (¢) NA NA NACapacity at Peak (Mw) NA NA NAPeak Load, Summer (Mw) NA NA NAAnnual Load Factor (%) NA NA NA% Change Customers (avg.) +1.3 +1.4 +1.5
Fixed Charge Cov. (%) 272 218 233ANNUAL RATES Past Past Est’d ’17-’19of change (per sh) 10 Yrs. 5 Yrs. to ’24-’26Revenues 1.0% 1.0% 1.0%‘‘Cash Flow’’ 3.5% 6.0% 5.0%Earnings 3.0% 2.5% 5.0%Dividends 3.0% 3.0% 2.5%Book Value 2.0% 1.0% 2.0%
Cal- Fullendar Year
QUARTERLY REVENUES ($ mill.)Mar.31 Jun.30 Sep.30 Dec.31
2018 6135 5643 6628 6115 245212019 6163 5873 6940 6103 250792020 5949 5421 6721 5909 240002021 6200 5650 6850 6050 247502022 6350 5800 7100 6200 25450Cal- Full
endar YearEARNINGS PER SHARE A
Mar.31 Jun.30 Sep.30 Dec.312018 1.17 .71 1.63 .61 4.132019 1.24 1.12 1.82 .89 5.072020 1.24 1.08 1.74 d.01 4.052021 1.25 1.10 1.80 1.00 5.152022 1.35 1.15 1.90 1.05 5.45Cal- Full
endar YearQUARTERLY DIVIDENDS PAID B ■
Mar.31 Jun.30 Sep.30 Dec.312017 .855 .855 .89 .89 3.492018 .89 .89 .9275 .9275 3.642019 .9275 .9275 .945 .945 3.752020 .945 .945 .965 .965 3.822021 .965
2005 2006 2007 2008 2009 2010 2011 2012 2013 2014 2015 2016 2017 2018- - 25.32 30.24 31.15 29.18 32.22 32.63 27.88 34.84 33.84 34.10 32.49 33.66 33.73- - 7.86 8.11 7.34 7.58 8.49 8.68 6.80 8.56 9.11 9.40 9.20 10.01 10.49- - 2.76 3.60 3.03 3.39 4.02 4.14 3.71 3.98 4.13 4.10 3.71 4.22 4.13- - - - 2.58 2.70 2.82 2.91 2.97 3.03 3.09 3.15 3.24 3.36 3.49 3.64- - 8.07 7.43 10.35 9.85 10.84 9.80 7.81 7.83 7.62 9.83 11.29 11.50 12.91- - 62.30 50.40 49.51 49.85 50.84 51.14 58.04 58.54 57.81 57.74 58.62 59.63 60.27- - 418.96 420.62 423.96 436.29 442.96 445.29 704.00 706.00 707.00 688.00 700.00 700.00 727.00- - - - 16.1 17.3 13.3 12.7 13.8 17.5 17.4 17.9 18.2 21.3 19.9 19.4- - - - .85 1.04 .89 .81 .87 1.11 .98 .94 .92 1.12 1.00 1.05- - - - 4.4% 5.2% 6.2% 5.7% 5.2% 4.7% 4.4% 4.3% 4.3% 4.3% 4.2% 4.5%
14529 19624 24598 23925 23459 22743 23565 245211839.0 2136.0 2813.0 2934.0 2854.0 2560.0 2963.0 2928.031.3% 30.2% 32.6% 30.6% 32.2% 31.0% 30.4% 14.2%23.2% 22.3% 8.8% 7.2% 9.2% 11.7% 12.3% 13.0%45.1% 47.0% 48.0% 47.7% 48.6% 52.6% 54.0% 53.8%54.9% 52.9% 52.0% 52.3% 51.4% 47.4% 46.0% 46.2%41451 77307 79482 78088 77222 86609 90774 9494042661 68558 69490 70046 75709 82520 86391 916945.6% 3.6% 4.6% 4.8% 4.8% 4.0% 4.3% 4.2%8.1% 5.2% 6.8% 7.2% 7.2% 6.2% 7.1% 6.7%8.1% 5.2% 6.8% 7.2% 7.2% 6.2% 7.1% 6.7%2.2% .9% 1.5% 1.7% 1.5% .6% 1.2% 1.0%72% 82% 78% 76% 79% 91% 83% 84%
2019 2020 2021 2022 © VALUE LINE PUB. LLC 24-2634.21 31.40 32.40 33.30 Revenues per sh 36.5012.13 11.05 12.70 13.35 ‘‘Cash Flow’’ per sh 15.50
5.07 4.05 5.15 5.45 Earnings per sh A 6.253.75 3.82 3.90 3.98 Div’d Decl’d per sh B ■ 4.25
15.17 15.50 14.80 14.60 Cap’l Spending per sh 14.0061.20 60.65 61.95 63.40 Book Value per sh C 68.75
733.00 764.00 764.00 764.00 Common Shs Outst’g D 764.0017.7 21.7 Bold figures are
Value Lineestimates
Avg Ann’l P/E Ratio 17.0.94 1.10 Relative P/E Ratio .95
4.2% 4.4% Avg Ann’l Div’d Yield 4.0%
25079 24000 24750 25450 Revenues ($mill) 278003755.0 3080 4065 4255 Net Profit ($mill) 488012.7% 9.0% 12.0% 12.0% Income Tax Rate 12.0%7.9% 11.0% 8.0% 8.0% AFUDC % to Net Profit 8.0%
54.0% 53.5% 54.0% 54.5% Long-Term Debt Ratio 55.0%44.1% 44.5% 44.5% 44.0% Common Equity Ratio 43.5%
101807 103825 106900 110225 Total Capital ($mill) 121600102127 108475 114050 119175 Net Plant ($mill) 132200
4.8% 4.5% 5.0% 5.0% Return on Total Cap’l 5.0%8.0% 8.0% 8.0% 8.0% Return on Shr. Equity 8.5%8.3% 8.0% 8.0% 8.5% Return on Com Equity E 8.5%2.4% 2.0% 2.0% 2.0% Retained to Com Eq 2.5%71% 77% 76% 74% All Div’ds to Net Prof 70%
Company’s Financial Strength AStock’s Price Stability 95Price Growth Persistence 40Earnings Predictability 95
(A) Dil. EPS. Excl. nonrec. losses: ’12, 70¢;’13, 24¢; ’14, 67¢; ’17, 15¢; ’18, 41¢; ’20,$2.21; losses on disc. ops.: ’14, 80¢; ’16, 60¢;’18 EPS don’t sum due to rounding. Next egs.
report due early May. (B) Div’ds paid mid-Mar.,June, Sept., & Dec. ■ Div’d reinv. plan avail.(C) Incl. intang. In ’19: $44.37/sh. (D) In mill.,adj. for rev. split. (E) Rate base: Net orig. cost.
Rate all’d on com. eq. in ’18 in NC: 9.9%; in ’19in SC: 9.5%; in ’20 in FL: 9.5%-11.5%; in ’20 inIN: 9.7%; earn. on avg. com. eq., ’19: 8.3%.Reg. Clim.: NC, SC Avg.; OH, IN Above Avg.
BUSINESS: Duke Energy Corporation is a holding company for util-ities with 7.6 mill. elec. customers in NC, FL, IN, SC, OH, & KY, and1.6 mill. gas customers in OH, KY, NC, SC, and TN. Owns inde-pendent power plants & has 25% stake in National Methanol inSaudi Arabia. Acq’d Progress Energy 7/12; Piedmont Natural Gas10/16; discontinued most int’l ops. in ’16. Elec. rev. breakdown:
residential, 44%; commercial, 28%; industrial, 14%; other, 14%.Generating sources: gas, 29%; nuclear, 29%; coal, 22%; other, 1%;purchased, 19%. Fuel costs: 30% of revs. ’19 reported deprec. rate:3.1%. Has 28,800 employees. Chairman, President & CEO: Lynn J.Good. Inc.: DE. Address: 550 South Tryon St., Charlotte, NC28202-1803. Tel.: 704-382-3853. Internet: www.duke-energy.com.
We have reinstated the Timelinessrank of Duke Energy stock. In Novem-ber, we suspended the rank due to take-over speculation stemming from a reportin The Wall Street Journal that NextEraEnergy had approached Duke about adeal. This led to a 7% rise in the stockprice that day, but since no transactionhas emerged, we reinstated the rank.Duke has announced an asset sale.The company agreed to sell a 19.9% stakein its Indiana utility for $2.05 billion incash in two phases, in the second quarterof 2021 and by January of 2023. This re-quires approval of the Federal EnergyRegulatory Commission. The proceedswould replace the $1 billion of equity Dukeplanned to add in 2021 and 2022 and beused for capital spending. Duke expects itslong-term average annual earnings growthrate to rise from 4%-6% to 5%-7%.The company reached a settlement re-garding the regulatory treatment ofcoal ash remediation costs. If this is ap-proved by the North Carolina commission,Duke will write off $1 billion of thesecosts, and will earn a return on equity thatis 1.5 percentage points below its allowed
ROE for the remainder. The company ex-pects to take a $1 billion pretax chargeagainst fourth-quarter results, which is in-cluded in our earnings presentation.Profits should return to a more-typical level in 2021 and 2022. Withoutthis item, we figure Duke would haveearned $5.10 a share last year. In 2021,the company should benefit from rate re-lief and the absence of the coal ash charge.However, dilution from a $2.5 billion for-ward equity sale, which was settled in late2020, will be a negative factor. Additionalrate relief should produce bottom-linegrowth in 2022. Our figures do not reflectthe pending deal with Duke Indiana.Duke reached a settlement in Florida.If approved by the regulators, rates will beraised by $67 million, $49 million, and $79million in 2022, 2023, and 2024, respec-tively, based on a 9.85% ROE and a 53%common-equity ratio. A ruling is expectedin the second quarter.The stock has an above-average divi-dend yield for a utility. However, divi-dend growth potential through 2024-2026is half the industry norm.Paul E. Debbas, CFA February 12, 2021
LEGENDS0.54 x Dividends p shdivided by Interest Rate. . . . Relative Price Strength
1-for-3 Rev split 7/12Options: YesShaded area indicates recession
© 2021 Value Line, Inc. All rights reserved. Factual material is obtained from sources believed to be reliable and is provided without warranties of any kind.THE PUBLISHER IS NOT RESPONSIBLE FOR ANY ERRORS OR OMISSIONS HEREIN. This publication is strictly for subscriber’s own, non-commercial, internal use. No partof it may be reproduced, resold, stored or transmitted in any printed, electronic or other form, or used for generating or marketing any printed or electronic publication, service or product.
To subscribe call 1-800-VALUELINE
RECENTPRICE
P/ERATIO
RELATIVEP/E RATIO
DIV’DYLD( )Trailing:
Median:VALUELINE

320
2001601201008060
40
18Percentsharestraded
21147
Target Price Range2024 2025 2026
CON. EDISON NYSE-ED 70.75 16.9 17.516.0 0.82 4.4%
TIMELINESS 4 Lowered 2/12/21
SAFETY 1 New 7/27/90
TECHNICAL 4 Lowered 2/5/21BETA .75 (1.00 = Market)
18-Month Target Price RangeLow-High Midpoint (% to Mid)
$62-$136 $99 (40%)
2024-26 PROJECTIONSAnn’l Total
Price Gain ReturnHigh 105 (+50%) 14%Low 85 (+20%) 9%Institutional Decisions
1Q2020 2Q2020 3Q2020to Buy 372 355 398to Sell 464 437 380Hld’s(000) 200493 198319 209716
High: 51.0 62.7 66.0 64.0 68.9 72.3 81.9 89.7 84.9 95.0 95.1 73.1Low: 41.5 48.6 53.6 54.2 52.2 56.9 63.5 72.1 71.1 73.3 62.0 66.9
% TOT. RETURN 1/21THIS VL ARITH.*
STOCK INDEX1 yr. -22.4 26.63 yr. -2.4 29.45 yr. 21.3 99.1
CAPITAL STRUCTURE as of 9/30/20Total Debt $23000 mill. Due in 5 Yrs $6380 mill.LT Debt $19206 mill. LT Interest $855 mill.(LT interest earned: 2.8x)
Leases, Uncapitalized Annual rentals $78 mill.
Pension Assets-12/19 $15608 mill.Oblig $16792 mill.
Pfd Stock None
Common Stock 334,858,832 shs.as of 10/31/20MARKET CAP: $24 billion (Large Cap)
ELECTRIC OPERATING STATISTICS2017 2018 2019
% Change Retail Sales (KWH) -2.8 +2.8 -2.9Avg. Indust. Use (MWH) NA NA NAAvg. Indust. Revs. per KWH (¢) NA NA NACapacity at Peak (Mw) NA NA NAPeak Load, Summer (Mw) 13731 14156 13835Annual Load Factor (%) NMF NMF NMF% Change Customers (yr-end) NA NA NA
Fixed Charge Cov. (%) 354 306 267ANNUAL RATES Past Past Est’d ’17-’19of change (per sh) 10 Yrs. 5 Yrs. to ’24-’26Revenues -2.0% -2.0% Nil‘‘Cash Flow’’ 4.0% 4.0% 4.0%Earnings 2.5% 2.0% 2.5%Dividends 2.0% 3.0% 3.0%Book Value 4.0% 4.5% 3.0%
Cal- Fullendar Year
QUARTERLY REVENUES ($ mill.)Mar.31 Jun.30 Sep.30 Dec.31
2018 3364 2696 3328 2949 123372019 3514 2744 3365 2951 125742020 3234 2719 3333 2964 122502021 3450 2750 3400 3000 126002022 3550 2850 3500 3100 13000Cal- Full
endar YearEARNINGS PER SHARE A
Mar.31 Jun.30 Sep.30 Dec.312018 1.37 .60 1.52 1.06 4.552019 1.31 .46 1.42 .88 4.082020 1.13 .57 1.47 .73 3.902021 1.35 .55 1.55 .80 4.252022 1.40 .60 1.60 .85 4.45Cal- Full
endar YearQUARTERLY DIVIDENDS PAID B ■
Mar.31 Jun.30 Sep.30 Dec.312017 .69 .69 .69 .69 2.762018 .715 .715 .715 .715 2.862019 .74 .74 .74 .74 2.962020 .765 .765 .765 .765 3.062021 .775
2005 2006 2007 2008 2009 2010 2011 2012 2013 2014 2015 2016 2017 201847.66 47.14 48.23 49.62 46.36 45.69 44.17 41.62 42.27 44.11 42.85 39.59 38.82 38.435.27 5.28 5.77 5.99 5.86 6.24 6.61 7.15 7.45 7.30 7.93 7.89 8.41 8.922.99 2.95 3.48 3.36 3.14 3.47 3.57 3.86 3.93 3.62 4.05 3.94 4.10 4.552.28 2.30 2.32 2.34 2.36 2.38 2.40 2.42 2.46 2.52 2.60 2.68 2.76 2.866.59 7.17 7.09 8.50 7.80 6.96 6.72 7.06 8.67 8.26 10.42 12.07 11.11 10.89
29.80 31.09 32.58 35.43 36.46 37.93 39.05 40.53 41.81 42.94 44.55 46.88 49.74 52.11245.29 257.46 272.02 273.72 281.12 291.62 292.89 292.87 292.87 292.88 293.00 305.00 310.00 321.00
15.1 15.5 13.8 12.3 12.5 13.3 15.1 15.4 14.7 15.9 15.6 18.8 19.8 17.1.80 .84 .73 .74 .83 .85 .95 .98 .83 .84 .79 .99 1.00 .92
5.0% 5.0% 4.8% 5.7% 6.0% 5.2% 4.5% 4.1% 4.3% 4.4% 4.1% 3.6% 3.4% 3.7%
12938 12188 12381 12919 12554 12075 12033 123371062.0 1141.0 1157.0 1066.0 1193.0 1189.0 1266.0 1424.036.1% 34.5% 31.8% 34.0% 33.6% 35.3% 36.6% 20.1%1.6% .5% .5% .3% .7% 1.3% 1.5% 1.5%
46.5% 45.9% 46.1% 48.0% 47.9% 50.8% 48.9% 51.1%52.5% 54.1% 53.9% 52.0% 52.1% 49.2% 51.1% 48.9%21794 21933 22735 24207 25058 29033 30149 3422125093 26939 28436 29827 32209 35216 37600 417496.2% 6.5% 6.4% 5.6% 6.0% 5.3% 5.4% 5.3%9.1% 9.6% 9.4% 8.5% 9.1% 8.3% 8.2% 8.5%9.2% 9.6% 9.4% 8.5% 9.1% 8.3% 8.2% 8.5%3.1% 3.6% 3.6% 2.6% 3.5% 3.0% 3.0% 3.5%66% 62% 62% 69% 61% 64% 63% 59%
2019 2020 2021 2022 © VALUE LINE PUB. LLC 24-2637.76 35.70 35.80 36.10 Revenues per sh 38.509.09 9.50 10.05 10.40 ‘‘Cash Flow’’ per sh 11.754.08 3.90 4.25 4.45 Earnings per sh A 5.002.96 3.06 3.10 3.20 Div’d Decl’d per sh B ■ 3.50
10.47 11.50 11.20 10.55 Cap’l Spending per sh 11.0054.12 55.45 57.15 58.75 Book Value per sh C 63.75
333.00 343.00 352.00 360.00 Common Shs Outst’g D 370.0021.1 20.3 Bold figures are
Value Lineestimates
Avg Ann’l P/E Ratio 19.01.12 1.05 Relative P/E Ratio 1.05
3.4% 3.9% Avg Ann’l Div’d Yield 3.7%
12574 12250 12600 13000 Revenues ($mill) 142501343.0 1320 1490 1590 Net Profit ($mill) 187517.1% 20.0% 17.0% 17.0% Income Tax Rate 17.0%2.0% 2.0% 2.0% 2.0% AFUDC % to Net Profit 2.0%
50.7% 49.5% 51.0% 50.5% Long-Term Debt Ratio 51.0%49.3% 50.5% 49.0% 49.5% Common Equity Ratio 49.0%36549 37575 41250 42600 Total Capital ($mill) 4820043889 45900 47775 49425 Net Plant ($mill) 543004.9% 4.5% 5.0% 5.0% Return on Total Cap’l 5.5%7.5% 7.0% 7.5% 7.5% Return on Shr. Equity 8.0%7.5% 7.0% 7.5% 7.5% Return on Com Equity E 8.0%2.3% 1.5% 2.0% 2.0% Retained to Com Eq 2.5%69% 76% 70% 69% All Div’ds to Net Prof 67%
Company’s Financial Strength A+Stock’s Price Stability 85Price Growth Persistence 40Earnings Predictability 100
(A) Diluted EPS. Excl. nonrec. gains (losses):’13, (32¢); ’14, 9¢; ’16, 15¢; ’17, 84¢; ’18,(13¢); gain on discontinued operations: ’08,$1.01. ’19 EPS don’t sum due to rounding.
Next earnings report due mid-Feb. (B) Div’dshistorically paid in mid-Mar., June, Sept., andDec. ■ Div’d reinvestment plan avail. (C) Incl.intangibles. In ’19: $21.01/sh. (D) In mill.
(E) Rate base: net orig. cost. Rate allowed oncom. eq. for CECONY in ’20: 8.8%; O&R in’19: 9.0%; earned on avg. com. eq., ’19: 8.2%.Regulatory Climate: Below Average.
BUSINESS: Consolidated Edison, Inc. is a holding company forConsolidated Edison Company of New York, Inc. (CECONY), whichsells electricity, gas, and steam in most of New York City andWestchester County. Also owns Orange and Rockland Utilities(O&R), which operates in New York and New Jersey. Has 3.7 mil-lion electric, 1.2 million gas customers. Pursues competitive energy
opportunities through three wholly owned subsidiaries. Entered intomidstream gas joint venture 6/16. Purchases most of its power.Fuel costs: 21% of revenues. ’19 reported depreciation rates: 3.0%-3.2%. Has 14,900 employees. Chairman: John McAvoy. President& CEO: Timothy Cawley. Inc.: NY. Address: 4 Irving Place, NewYork, NY 10003. Tel.: 212-460-4600. Internet: www.conedison.com.
We estimate that ConsolidatedEdison’s earnings will advance in2021 and 2022. The company’s primaryutility subsidiary, Consolidated EdisonCompany of New York, will benefit fromthe second and third phases of electric andgas rate increases this year and next. Thecomparison in 2021 will be made easier bymark-to-market accounting losses andcharges associated with a renewable-energy acquisition, which lowered shareprofits by $0.26 in the first three quarterslast year. ConEd’s renewable-energy sub-sidiary should boost its income as projectsnow under development are completed.Note that bad-debt expense associatedwith the weak economy and coronavirus-related costs have hurt earnings modestly,but the slump in kilowatt-hour sales is nota factor because the utilities operate undera regulatory mechanism that decouplesrevenues and volume. However . . .There is a source of uncertainty. TheNew York State Public Service Commis-sion has issued a show-cause order to thecompany requesting that it show why itsutilities should not be fined for its per-formance for outages in 2019 and 2020.
ConEd’s utilities might be fined as muchas $146 million. We have not assumed anyfine in our 2021 estimate. When this mat-ter will be resolved is undetermined.There is the potential for sharp in-creases in capital spending. The com-pany estimates that steps needed to ad-dress climate change would amount to$1.8 billion-$5.2 billion of capital spending.Presumably, any such spending would beplaced in the rate base through generalrate applications.The board of directors raised the divi-dend in the current quarter. The in-crease was one cent a share (1.3%) quar-terly. The hike was well below those inrecent years because ConEd expects to in-cur coronavirus-related costs (most notab-ly bad-debt expense) in 2021. The compa-ny’s goal is a payout ratio in a range of60%-70%.The dividend yield is above the utilityaverage. The stock is untimely, butstands out for its 18-month prospects, andhas appeal for its 3- to 5-year total returnpotential. The deceleration in the dividendgrowth rate is a drawback, however.Paul E. Debbas, CFA February 12, 2021
LEGENDS0.63 x Dividends p shdivided by Interest Rate. . . . Relative Price Strength
Options: YesShaded area indicates recession
© 2021 Value Line, Inc. All rights reserved. Factual material is obtained from sources believed to be reliable and is provided without warranties of any kind.THE PUBLISHER IS NOT RESPONSIBLE FOR ANY ERRORS OR OMISSIONS HEREIN. This publication is strictly for subscriber’s own, non-commercial, internal use. No partof it may be reproduced, resold, stored or transmitted in any printed, electronic or other form, or used for generating or marketing any printed or electronic publication, service or product.
To subscribe call 1-800-VALUELINE
RECENTPRICE
P/ERATIO
RELATIVEP/E RATIO
DIV’DYLD( )Trailing:
Median:VALUELINE

200160
1008060504030
20
Percentsharestraded
302010
Target Price Range2024 2025 2026
P.S. ENTERPRISE GP. NYSE-PEG 57.15 15.7 15.814.0 0.77 3.6%
TIMELINESS 2 Raised 11/13/20
SAFETY 1 Raised 11/23/12
TECHNICAL 3 Lowered 1/29/21BETA .90 (1.00 = Market)
18-Month Target Price RangeLow-High Midpoint (% to Mid)
$43-$89 $66 (15%)
2024-26 PROJECTIONSAnn’l Total
Price Gain ReturnHigh 70 (+20%) 9%Low 60 (+5%) 5%Institutional Decisions
1Q2020 2Q2020 3Q2020to Buy 352 360 361to Sell 423 368 364Hld’s(000) 339220 345831 351963
High: 34.9 35.5 34.1 37.0 43.8 44.4 47.4 53.3 56.7 63.9 62.2 59.6Low: 29.0 28.0 28.9 29.7 31.3 36.8 37.8 41.7 46.2 50.0 34.8 55.0
% TOT. RETURN 1/21THIS VL ARITH.*
STOCK INDEX1 yr. -2.1 26.63 yr. 19.5 29.45 yr. 61.7 99.1
CAPITAL STRUCTURE as of 9/30/20Total Debt $17185 mill. Due in 5 Yrs $7918 mill.LT Debt $14792 mill. LT Interest $514 mill.(LT interest earned: 5.2x)
Leases, Uncapitalized Annual rentals $44 mill.
Pension Assets-12/19 $5929 mill.Oblig $6892 mill.
Pfd Stock None
Common Stock 505,847,992 shs.as of 10/20/20MARKET CAP: $29 billion (Large Cap)
ELECTRIC OPERATING STATISTICS2017 2018 2019
% Change Retail Sales (KWH) -2.0 +2.8 -2.9Avg. Indust. Use (MWH) NA NA NAAvg. Indust. Revs. per KWH(¢) NA NA NACapacity at Peak (Mw) NA NA NAPeak Load, Summer (Mw) 9567 9978 9753Annual Load Factor (%) NA NA NA% Change Customers (avg.) NA NA NA
Fixed Charge Cov. (%) 503 413 361ANNUAL RATES Past Past Est’d ’17-’19of change (per sh) 10 Yrs. 5 Yrs. to ’24-’26Revenues -3.0% -1.0% 3.0%‘‘Cash Flow’’ 2.0% 2.0% 4.5%Earnings 1.0% 4.0% 5.0%Dividends 3.5% 4.5% 4.0%Book Value 6.0% 4.5% 5.0%
Cal- Fullendar Year
QUARTERLY REVENUES ($ mill.)Mar.31 Jun.30 Sep.30 Dec.31
2018 2818 2016 2394 2468 9696.02019 2980 2316 2302 2478 100762020 2781 2050 2370 2399 96002021 2900 2050 2500 2500 100002022 3050 2150 2600 2600 10450Cal- Full
endar YearEARNINGS PER SHARE A
Mar.31 Jun.30 Sep.30 Dec.312018 1.10 .53 .81 .32 2.762019 1.38 .86 .80 .86 3.902020 .88 .89 .98 .65 3.402021 1.15 .85 1.00 .65 3.652022 1.20 .90 1.05 .70 3.85Cal- Full
endar YearQUARTERLY DIVIDENDS PAID B ■ †
Mar.31 Jun.30 Sep.30 Dec.312017 .43 .43 .43 .43 1.722018 .45 .45 .45 .45 1.802019 .47 .47 .47 .47 1.882020 .49 .49 .49 .49 1.962021
2005 2006 2007 2008 2009 2010 2011 2012 2013 2014 2015 2016 2017 201824.74 24.07 25.28 27.94 24.57 23.31 22.42 19.33 19.71 21.52 20.61 18.22 18.14 19.243.42 3.91 4.36 4.68 4.98 5.27 5.36 4.87 5.17 5.82 6.15 5.07 5.30 5.441.79 1.85 2.59 2.90 3.08 3.07 3.11 2.44 2.45 2.99 3.30 2.83 2.82 2.761.12 1.14 1.17 1.29 1.33 1.37 1.37 1.42 1.44 1.48 1.56 1.64 1.72 1.802.04 2.01 2.65 3.50 3.55 4.27 4.12 5.09 5.56 5.58 7.65 8.32 8.30 7.76
11.99 13.35 14.35 15.36 17.37 19.04 20.30 21.31 22.95 24.09 25.86 26.01 27.42 28.53502.33 505.29 508.52 506.02 505.99 505.97 505.95 505.89 505.86 505.84 505.28 504.87 505.00 504.00
16.5 17.8 16.5 13.6 10.0 10.4 10.4 12.8 13.5 12.6 12.4 15.3 16.3 18.7.88 .96 .88 .82 .67 .66 .65 .81 .76 .66 .62 .80 .82 1.01
3.8% 3.5% 2.7% 3.3% 4.3% 4.3% 4.2% 4.6% 4.4% 3.9% 3.8% 3.8% 3.7% 3.5%
11343 9781.0 9968.0 10886 10415 9198.0 9161.0 9696.01577.0 1239.0 1243.0 1518.0 1679.0 1436.0 1431.0 1399.040.4% 36.2% 39.5% 38.2% 37.4% 31.7% 37.3% 22.3%2.7% 4.8% 4.6% 4.5% 5.5% 8.4% 10.6% 9.8%
42.1% 38.3% 40.4% 40.4% 40.3% 45.3% 46.6% 47.8%57.9% 61.7% 59.6% 59.6% 59.7% 54.7% 53.4% 52.2%17731 17467 19470 20446 21900 24025 25915 2754517849 19736 21645 23589 26539 29286 31797 3436310.2% 8.1% 7.5% 8.4% 8.6% 6.8% 6.4% 6.0%15.4% 11.5% 10.7% 12.5% 12.9% 10.9% 10.3% 9.7%15.4% 11.5% 10.7% 12.5% 12.9% 10.9% 10.3% 9.7%8.6% 4.8% 4.4% 6.3% 6.8% 4.6% 4.1% 3.4%44% 58% 59% 49% 47% 58% 61% 65%
2019 2020 2021 2022 © VALUE LINE PUB. LLC 24-2619.99 19.00 19.80 20.70 Revenues per sh 23.256.76 6.35 6.65 7.00 ‘‘Cash Flow’’ per sh 8.003.90 3.40 3.65 3.85 Earnings per sh A 4.501.88 1.96 2.04 2.12 Div’d Decl’d per sh B ■† 2.406.28 5.65 5.25 5.55 Cap’l Spending per sh 7.00
29.94 31.50 33.10 34.85 Book Value per sh C 40.75504.00 505.00 505.00 505.00 Common Shs Outst’g D 505.00
15.1 15.8 Bold figures areValue Lineestimates
Avg Ann’l P/E Ratio 14.5.80 .80 Relative P/E Ratio .80
3.2% 3.6% Avg Ann’l Div’d Yield 3.7%
10076 9600 10000 10450 Revenues ($mill) 118001979.0 1730 1845 1950 Net Profit ($mill) 224515.9% 14.5% 14.5% 14.5% Income Tax Rate 14.5%5.5% 8.0% 7.0% 7.0% AFUDC % to Net Profit 6.0%
47.7% 48.0% 48.5% 48.5% Long-Term Debt Ratio 50.0%52.3% 52.0% 51.5% 51.5% Common Equity Ratio 50.0%28832 30550 32375 34350 Total Capital ($mill) 4120035844 37300 38825 40075 Net Plant ($mill) 456007.8% 6.5% 6.5% 6.5% Return on Total Cap’l 6.5%
13.1% 11.0% 11.0% 11.0% Return on Shr. Equity 11.0%13.1% 11.0% 11.0% 11.0% Return on Com Equity E 11.0%
6.8% 4.5% 5.0% 5.0% Retained to Com Eq 5.0%48% 57% 56% 55% All Div’ds to Net Prof 54%
Company’s Financial Strength A++Stock’s Price Stability 95Price Growth Persistence 60Earnings Predictability 75
(A) Diluted EPS. Excl. nonrec. gains (losses):’06, (35¢); ’08, (96¢); ’09, 6¢; ’11, (34¢); ’12,7¢; ’16, (30¢); ’17, 28¢ (net); ’18, 8¢; ’19,(62¢); ’20, (15¢); gains (loss) from disc. ops.:
’05, (33¢); ’06, 12¢; ’07, 3¢; ’08, 40¢; ’11, 13¢.Next earnings report due late Feb. (B) Div’dshistorically paid in late Mar., June, Sept., &Dec. ■ Div’d reinvestment plan avail. (C) Incl.
intang. In ’19: $7.59/sh. (D) In mill., adj. forsplit. (E) Rate base: Net orig. cost. Rate all’don com. eq. in ’18: 9.6%; earned on avg. com.eq., ’19: 13.2%. Regulatory Climate: Average.
BUSINESS: Public Service Enterprise Group Incorporated is aholding company for Public Service Electric and Gas Company(PSE&G), which serves 2.3 million electric and 1.9 million gas cus-tomers in New Jersey, and PSEG Power LLC, a nonregulatedpower generator with nuclear, gas, and coal-fired plants in theNortheast. PSEG Energy Holdings is involved in renewable energy.
The company no longer breaks out data on electric and gas operat-ing statistics. Fuel costs: 33% of revenues. ’19 reported deprecia-tion rates (utility): 1.9%-2.5%. Has 13,000 employees. Chairman,President & Chief Executive Officer: Dr. Ralph Izzo. Inc.: New Jer-sey. Address: 80 Park Plaza, P.O. Box 1171, Newark, New Jersey07101-1171. Telephone: 973-430-7000. Internet: www.pseg.com.
Public Service Enterprise Group istrying to sell its non-nuclear generat-ing assets. These nonregulated facilitiesconsist of 6,750 megawatts of fossil-fueledcapacity and 467 mw of solar capacity.PSEG will retain its nuclear units. Thecompany wants to reduce its business riskby increasing the proportion of incomethat comes from its regulated utility, Pub-lic Service Electric and Gas. Managementexpects to complete the sales this year anduse the proceeds to reduce debt.Growth at PSE&G points to higherprofits in 2021 and 2022. The utility hasprograms to make its system more resili-ent to storms and increase energy ef-ficiency. Most of these expenditures arerecovered contemporaneously. Anotherprogram will see PSE&G spend $700 mil-lion from 2021 through 2024 to install ad-vanced meters. Most of this will occur inthe latter two years, and the utility ex-pects to place this spending in the ratebase through a rate case that will be filedin 2023 and resolved in 2024.PSEG Power is seeking additionalsupport for its nuclear facilities. Evenwith subsidies from New Jersey’s Zero
Emission Certificates. However, these as-sets are still unprofitable, so the companyis asking the state for additional subsidies,and for the program to be extended from2022 through 2025. A ruling is expected inApril.PSEG plans to invest in offshorewind. The company has agreed to take a25% stake in a 1,100 megawatt project,subject to regulatory approval. The deal isexpected to close in mid-2021. The capitalinvestment has not been disclosed. Notethat offshore wind comes with significantconstruction risk.We think the board of directors willraise the dividend this month. We ex-pect an increase of two cents a share(4.1%), the same as in recent years. Notethat the possible sale of generating assetsis not expected to have a negative effect onthe company’s dividend policy.This timely and high-quality stock hasa dividend yield that is about equal tothe industry average. Total return pros-pects are appealing for the next 18months, but are unspectacular for the 3- to5-year period.Paul E. Debbas, CFA February 12, 2021
LEGENDS0.72 x Dividends p shdivided by Interest Rate. . . . Relative Price Strength
2-for-1 split 2/08Options: YesShaded area indicates recession
© 2021 Value Line, Inc. All rights reserved. Factual material is obtained from sources believed to be reliable and is provided without warranties of any kind.THE PUBLISHER IS NOT RESPONSIBLE FOR ANY ERRORS OR OMISSIONS HEREIN. This publication is strictly for subscriber’s own, non-commercial, internal use. No partof it may be reproduced, resold, stored or transmitted in any printed, electronic or other form, or used for generating or marketing any printed or electronic publication, service or product.
To subscribe call 1-800-VALUELINE
RECENTPRICE
P/ERATIO
RELATIVEP/E RATIO
DIV’DYLD( )Trailing:
Median:VALUELINE
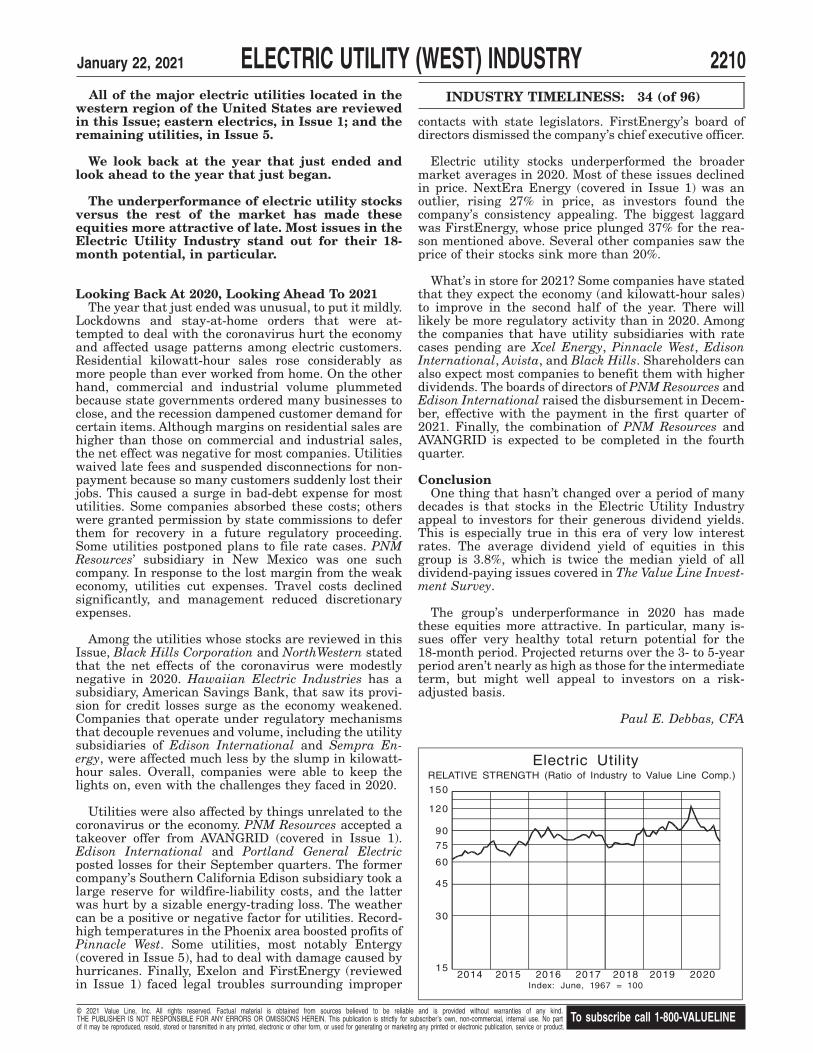
Electric Utility
Index: June, 1967 = 100
15
30
45
60
75
90
RELATIVE STRENGTH (Ratio of Industry to Value Line Comp.)
120
150
2018 20202014 2015 2016 2017 2019
INDUSTRY TIMELINESS: 34 (of 96)
January 22, 2021 ELECTRIC UTILITY (WEST) INDUSTRY 2210All of the major electric utilities located in the
western region of the United States are reviewedin this Issue; eastern electrics, in Issue 1; and theremaining utilities, in Issue 5.
We look back at the year that just ended andlook ahead to the year that just began.
The underperformance of electric utility stocksversus the rest of the market has made theseequities more attractive of late. Most issues in theElectric Utility Industry stand out for their 18-month potential, in particular.
Looking Back At 2020, Looking Ahead To 2021The year that just ended was unusual, to put it mildly.
Lockdowns and stay-at-home orders that were at-tempted to deal with the coronavirus hurt the economyand affected usage patterns among electric customers.Residential kilowatt-hour sales rose considerably asmore people than ever worked from home. On the otherhand, commercial and industrial volume plummetedbecause state governments ordered many businesses toclose, and the recession dampened customer demand forcertain items. Although margins on residential sales arehigher than those on commercial and industrial sales,the net effect was negative for most companies. Utilitieswaived late fees and suspended disconnections for non-payment because so many customers suddenly lost theirjobs. This caused a surge in bad-debt expense for mostutilities. Some companies absorbed these costs; otherswere granted permission by state commissions to deferthem for recovery in a future regulatory proceeding.Some utilities postponed plans to file rate cases. PNMResources’ subsidiary in New Mexico was one suchcompany. In response to the lost margin from the weakeconomy, utilities cut expenses. Travel costs declinedsignificantly, and management reduced discretionaryexpenses.
Among the utilities whose stocks are reviewed in thisIssue, Black Hills Corporation and NorthWestern statedthat the net effects of the coronavirus were modestlynegative in 2020. Hawaiian Electric Industries has asubsidiary, American Savings Bank, that saw its provi-sion for credit losses surge as the economy weakened.Companies that operate under regulatory mechanismsthat decouple revenues and volume, including the utilitysubsidiaries of Edison International and Sempra En-ergy, were affected much less by the slump in kilowatt-hour sales. Overall, companies were able to keep thelights on, even with the challenges they faced in 2020.
Utilities were also affected by things unrelated to thecoronavirus or the economy. PNM Resources accepted atakeover offer from AVANGRID (covered in Issue 1).Edison International and Portland General Electricposted losses for their September quarters. The formercompany’s Southern California Edison subsidiary took alarge reserve for wildfire-liability costs, and the latterwas hurt by a sizable energy-trading loss. The weathercan be a positive or negative factor for utilities. Record-high temperatures in the Phoenix area boosted profits ofPinnacle West. Some utilities, most notably Entergy(covered in Issue 5), had to deal with damage caused byhurricanes. Finally, Exelon and FirstEnergy (reviewedin Issue 1) faced legal troubles surrounding improper
contacts with state legislators. FirstEnergy’s board ofdirectors dismissed the company’s chief executive officer.
Electric utility stocks underperformed the broadermarket averages in 2020. Most of these issues declinedin price. NextEra Energy (covered in Issue 1) was anoutlier, rising 27% in price, as investors found thecompany’s consistency appealing. The biggest laggardwas FirstEnergy, whose price plunged 37% for the rea-son mentioned above. Several other companies saw theprice of their stocks sink more than 20%.
What’s in store for 2021? Some companies have statedthat they expect the economy (and kilowatt-hour sales)to improve in the second half of the year. There willlikely be more regulatory activity than in 2020. Amongthe companies that have utility subsidiaries with ratecases pending are Xcel Energy, Pinnacle West, EdisonInternational, Avista, and Black Hills. Shareholders canalso expect most companies to benefit them with higherdividends. The boards of directors of PNM Resources andEdison International raised the disbursement in Decem-ber, effective with the payment in the first quarter of2021. Finally, the combination of PNM Resources andAVANGRID is expected to be completed in the fourthquarter.
ConclusionOne thing that hasn’t changed over a period of many
decades is that stocks in the Electric Utility Industryappeal to investors for their generous dividend yields.This is especially true in this era of very low interestrates. The average dividend yield of equities in thisgroup is 3.8%, which is twice the median yield of alldividend-paying issues covered in The Value Line Invest-ment Survey.
The group’s underperformance in 2020 has madethese equities more attractive. In particular, many is-sues offer very healthy total return potential for the18-month period. Projected returns over the 3- to 5-yearperiod aren’t nearly as high as those for the intermediateterm, but might well appeal to investors on a risk-adjusted basis.
Paul E. Debbas, CFA
© 2021 Value Line, Inc. All rights reserved. Factual material is obtained from sources believed to be reliable and is provided without warranties of any kind.THE PUBLISHER IS NOT RESPONSIBLE FOR ANY ERRORS OR OMISSIONS HEREIN. This publication is strictly for subscriber’s own, non-commercial, internal use. No partof it may be reproduced, resold, stored or transmitted in any printed, electronic or other form, or used for generating or marketing any printed or electronic publication, service or product.
To subscribe call 1-800-VALUELINE

12896806448403224
1612
Percentsharestraded
18126
Target Price Range2023 2024 2025
AVISTA CORP. NYSE-AVA 39.97 19.3 22.217.0 0.89 4.2%
TIMELINESS 4 Lowered 11/6/20
SAFETY 2 Raised 5/7/10
TECHNICAL 5 Lowered 1/15/21BETA .95 (1.00 = Market)
18-Month Target Price RangeLow-High Midpoint (% to Mid)
$26-$66 $46 (15%)
2023-25 PROJECTIONSAnn’l Total
Price Gain ReturnHigh 60 (+50%) 14%Low 45 (+15%) 7%Institutional Decisions
1Q2020 2Q2020 3Q2020to Buy 122 109 105to Sell 128 130 119Hld’s(000) 53448 51645 57100
High: 22.4 22.8 26.5 28.0 29.3 37.4 38.3 45.2 52.8 52.9 49.5 53.0Low: 12.7 18.5 21.1 22.8 24.1 27.7 29.8 34.3 37.8 41.9 39.8 32.1
% TOT. RETURN 12/20THIS VL ARITH.*
STOCK INDEX1 yr. -13.8 18.83 yr. -14.2 29.95 yr. 33.5 81.5
CAPITAL STRUCTURE as of 9/30/20Total Debt $2262.8 mill. Due in 5 Yrs $480.5 mill.LT Debt $2060.8 mill. LT Interest $92.3 mill.Incl. $51.5 mill. debt to affiliated trusts; $54.5 mill.capitalized leases.(LT interest earned: 2.4x)Leases, Uncapitalized Annual rentals $4.4 mill.Pension Assets-12/19 $642.1 mill.
Oblig $742.4 mill.Pfd Stock None
Common Stock 68,735,948 shs.as of 10/30/20MARKET CAP: $2.7 billion (Mid Cap)
ELECTRIC OPERATING STATISTICS2017 2018 2019
% Change Retail Sales (KWH) +4.7 -3.7 +.2Avg. Indust. Use (MWH) 1367 1344 1296Avg. Indust. Revs. per KWH (¢) 6.11 6.20 6.26Capacity at Peak (Mw) NA NA NAPeak Load, Summer (Mw) F 1681 1716 1656Annual Load Factor (%) NA NA NA% Change Customers (yr-end) +1.2 +1.4 +1.3
Fixed Charge Cov. (%) 296 259 202ANNUAL RATES Past Past Est’d ’17-’19of change (per sh) 10 Yrs. 5 Yrs. to ’23-’25Revenues -3.0% -3.5% -.5%‘‘Cash Flow’’ 3.5% 5.0% 2.5%Earnings 6.5% 7.0% 1.0%Dividends 8.0% 4.0% 4.0%Book Value 4.0% 4.5% 2.5%
Cal- Fullendar Year
QUARTERLY REVENUES ($ mill.)Mar.31 Jun.30 Sep.30 Dec.31
2017 436.5 314.5 297.1 397.8 1445.92018 409.4 319.3 296.0 372.2 1396.92019 396.5 300.8 283.8 364.5 1345.62020 390.2 278.6 272.6 358.6 13002021 400 300 280 370 1350Cal- Full
endar YearEARNINGS PER SHARE A
Mar.31 Jun.30 Sep.30 Dec.312017 .96 .34 .07 .58 1.952018 .83 .39 .15 .70 2.072019 1.76 .38 .08 .76 2.972020 .72 .26 .07 .80 1.852021 .80 .40 .10 .80 2.10Cal- Full
endar YearQUARTERLY DIVIDENDS PAID B ■
Mar.31 Jun.30 Sep.30 Dec.312017 .3575 .3575 .3575 .3575 1.432018 .3725 .3725 .3725 .3725 1.492019 .3875 .3875 .388 .3875 1.552020 .405 .405 .405 .405 1.622021
2004 2005 2006 2007 2008 2009 2010 2011 2012 2013 2014 2015 2016 201723.76 27.98 28.68 26.80 30.77 27.58 27.29 27.73 25.86 26.94 23.66 23.83 22.47 22.082.35 2.72 4.27 2.93 3.98 4.45 3.62 3.78 3.70 4.36 4.36 4.92 5.30 4.87.73 .92 1.47 .72 1.36 1.58 1.65 1.72 1.32 1.85 1.84 1.89 2.15 1.95.52 .55 .57 .60 .69 .81 1.00 1.10 1.16 1.22 1.27 1.32 1.37 1.43
2.47 3.23 3.14 4.04 4.09 3.86 3.64 4.20 4.61 5.05 5.47 6.46 6.34 6.3015.54 15.87 17.46 17.27 18.30 19.17 19.71 20.30 21.06 21.61 23.84 24.53 25.69 26.4148.47 48.59 52.51 52.91 54.49 54.84 57.12 58.42 59.81 60.08 62.24 62.31 64.19 65.4924.4 19.4 15.4 30.9 15.0 11.4 12.7 14.1 19.3 14.6 17.3 17.6 18.8 23.41.29 1.03 .83 1.64 .90 .76 .81 .88 1.23 .82 .91 .89 .99 1.18
2.9% 3.0% 2.5% 2.7% 3.4% 4.5% 4.8% 4.5% 4.6% 4.5% 4.0% 4.0% 3.4% 3.1%
1558.7 1619.8 1547.0 1618.5 1472.6 1484.8 1442.5 1445.992.4 100.2 78.2 111.1 114.2 118.1 137.2 126.1
35.0% 35.4% 34.4% 36.0% 37.6% 36.3% 36.3% 36.5%4.0% 5.2% 8.3% 8.8% 11.1% 10.1% 8.1% 7.9%
51.6% 51.4% 50.8% 51.4% 51.0% 50.0% 51.2% 47.2%48.4% 48.6% 49.2% 48.6% 49.0% 50.0% 48.8% 52.8%2325.3 2439.9 2561.2 2669.7 3027.3 3060.3 3379.0 3273.22714.2 2860.8 3023.7 3202.4 3620.0 3898.6 4147.5 4398.8
5.4% 5.5% 4.3% 5.4% 4.9% 5.1% 5.3% 5.0%8.2% 8.5% 6.2% 8.6% 7.7% 7.7% 8.3% 7.3%8.2% 8.5% 6.2% 8.6% 7.7% 7.7% 8.3% 7.3%3.3% 3.1% .8% 2.9% 2.4% 2.3% 3.0% 1.9%60% 64% 88% 66% 69% 70% 64% 73%
2018 2019 2020 2021 © VALUE LINE PUB. LLC 23-2521.27 20.03 18.85 19.30 Revenues per sh 20.505.01 6.06 5.10 5.40 ‘‘Cash Flow’’ per sh 6.252.07 2.97 1.85 2.10 Earnings per sh A 2.501.49 1.55 1.62 1.68 Div’d Decl’d per sh B ■ 1.906.46 6.59 6.15 6.05 Cap’l Spending per sh 6.00
26.99 28.87 29.35 29.95 Book Value per sh C 32.2565.69 67.18 69.00 70.00 Common Shs Outst’g D 73.0024.5 15.0 21.7 Avg Ann’l P/E Ratio 20.51.32 .80 1.10 Relative P/E Ratio 1.15
2.9% 3.5% 4.0% Avg Ann’l Div’d Yield 3.7%
1396.9 1345.6 1300 1350 Revenues ($mill) 1500136.4 197.0 125 145 Net Profit ($mill) 185
16.0% 13.8% 8.0% 14.0% Income Tax Rate 14.0%7.7% 5.5% 9.0% 8.0% AFUDC % to Net Profit 6.0%
50.5% 49.4% 50.5% 49.5% Long-Term Debt Ratio 50.5%49.5% 50.6% 49.5% 50.5% Common Equity Ratio 49.5%3580.3 3834.6 4085 4135 Total Capital ($mill) 47504648.9 4797.0 4995 5185 Net Plant ($mill) 5700
4.8% 6.2% 4.0% 4.5% Return on Total Cap’l 5.0%7.7% 10.2% 6.0% 7.0% Return on Shr. Equity 8.0%7.7% 10.2% 6.0% 7.0% Return on Com Equity E 8.0%2.2% 4.9% .5% 1.5% Retained to Com Eq 2.0%72% 52% 88% 79% All Div’ds to Net Prof 75%
Company’s Financial Strength B++Stock’s Price Stability 70Price Growth Persistence 60Earnings Predictability 60
(A) Diluted EPS. Excl. nonrec. gain (loss): ’14,9¢; ’17, (16¢); gains on disc. ops.: ’14, $1.17;’15, 8¢. ’19 EPS don’t sum due to rounding.Next earnings report due early Feb. (B) Div’ds
paid in mid-Mar., June, Sept. & Dec. ■ Div’dreinvestment plan avail. (C) Incl. deferred chgs.In ’19: $10.77/sh. (D) In mill. (E) Rate base:Net orig. cost. Rate all’d on com. eq. in WA in
’20: 9.4%; in ID in ’17: 9.5%; in OR in ’21:9.4%; earned on avg. com. eq., ’19: 10.6%.Regulatory Climate: WA, Below Average; ID,Above Average. (F) Winter peak in ’17.
BUSINESS: Avista Corporation (formerly The Washington WaterPower Company) supplies electricity & gas in eastern Washington& northern Idaho. Supplies electricity to part of Alaska & gas to partof Oregon. Customers: 410,000 electric, 361,000 gas. Acq’d AlaskaElectric Light and Power 7/14. Sold Ecova energy-managementsub. 6/14. Electric rev. breakdown: residential, 39%; commercial,
33%; industrial, 11%; wholesale, 8%; other, 9%. Generatingsources: gas & coal, 34%; hydro, 30%; purch., 36%. Fuel costs:33% of revs. ’19 reported depr. rate (Avista Utilities): 3.3%. Has1,900 employees. Chairman: Scott L. Morris. Pres. & CEO: DennisVermillion. Inc.: WA. Address: 1411 E. Mission Ave., Spokane, WA99202-2600. Tel.: 509-489-0500. Internet: www.avistacorp.com.
Avista filed a general rate case inWashington. The utility is seeking elec-tric and gas rate increases of $44.2 million(8.3%) and $12.8 million (7.9%), respec-tively, based on a return on equity of 9.9%and a common-equity ratio of 50%. Avistais proposing to offset the effects of the baserate hike on customers by accelerating thepass-through of tax benefits, but any tariffincrease would boost the company’s earn-ing power. An order is expected in time fornew rates to take effect on October 1st.The utility plans to file for electric and gashikes in Idaho in the current quarter, andan application in Alaska is under consider-ation. An order in Idaho is due sevenmonths after the filing. Avista needs raterelief because its utilities, as a group, areunderearning their allowed ROE consider-ably. Regulatory lag has been a problem inrecent years.The utility received a gas rate hike inOregon. The commission approved a set-tlement calling for an increase of $4.4 mil-lion (6.3%), based on an ROE of 9.4% anda common-equity ratio of 50%. New tariffstook effect on January 15th. Another ap-plication is possible this year.
We expect higher earnings in 2021.Our 2020 estimate is at the midpoint ofmanagement’s targeted range of $1.75-$1.95 a share, which was affected by anunfavorable regulatory order in the Marchquarter, some coronavirus-related costs,and losses from the company’s nonutilityactivities. A $1.01-a-share merger-breakupfee that was paid to Avista in the firstquarter of 2019 made the year-to-yearcomparison difficult. Avista should benefitfrom rate relief and a better economy. Thecompany hasn’t yet provided earningsguidance for 2021, but will do so when itreports earnings in February.We think the board of directors willraise the dividend in February. This isthe usual timing of a boost. We estimatean increase of $0.06 a share (3.7%). This isslightly below the hike of a year ago be-cause the payout ratio is high. Avista’sgoal is a payout ratio of 65%-75% by 2023.This equity is untimely, but has a divi-dend yield that is slightly above theutility average. Total return potential isabove average for the next 18 months andthe 2023-2025 period.Paul E. Debbas, CFA January 22, 2021
LEGENDS0.71 x Dividends p shdivided by Interest Rate. . . . Relative Price Strength
Options: YesShaded area indicates recession
© 2021 Value Line, Inc. All rights reserved. Factual material is obtained from sources believed to be reliable and is provided without warranties of any kind.THE PUBLISHER IS NOT RESPONSIBLE FOR ANY ERRORS OR OMISSIONS HEREIN. This publication is strictly for subscriber’s own, non-commercial, internal use. No partof it may be reproduced, resold, stored or transmitted in any printed, electronic or other form, or used for generating or marketing any printed or electronic publication, service or product.
To subscribe call 1-800-VALUELINE
RECENTPRICE
P/ERATIO
RELATIVEP/E RATIO
DIV’DYLD( )Trailing:
Median:VALUELINE

200160
1008060504030
20
Percentsharestraded
302010
Target Price Range2023 2024 2025
BLACK HILLS CORP. NYSE-BKH 59.45 15.3 16.419.0 0.71 3.9%
TIMELINESS 3 Raised 11/27/20
SAFETY 2 Raised 5/1/15
TECHNICAL 4 Lowered 1/15/21BETA 1.00 (1.00 = Market)
18-Month Target Price RangeLow-High Midpoint (% to Mid)
$47-$119 $83 (40%)
2023-25 PROJECTIONSAnn’l Total
Price Gain ReturnHigh 95 (+60%) 16%Low 70 (+20%) 8%Institutional Decisions
1Q2020 2Q2020 3Q2020to Buy 139 142 130to Sell 143 129 136Hld’s(000) 54065 54025 53467
High: 28.0 34.5 34.8 37.0 55.1 62.1 53.4 64.6 72.0 68.2 82.0 87.1Low: 14.5 25.7 25.8 30.3 36.9 47.1 36.8 44.7 57.0 50.5 60.8 48.1
% TOT. RETURN 12/20THIS VL ARITH.*
STOCK INDEX1 yr. -19.6 18.83 yr. 11.6 29.95 yr. 53.1 81.5
CAPITAL STRUCTURE as of 9/30/20Total Debt $3621.1 mill. Due in 5 Yrs $626.3 mill.LT Debt $3526.9 mill. LT Interest $141.1 mill.(LT interest earned: 3.3x)Leases, Uncapitalized Annual rentals $1.0 mill.
Pension Assets-12/19 $434.3 mill.Oblig $485.4 mill.
Pfd Stock None
Common Stock 62,746,692 shs.as of 10/31/20
MARKET CAP: $3.7 billion (Mid Cap)
ELECTRIC OPERATING STATISTICS2017 2018 2019
% Change Retail Sales (KWH) +.9 +2.7 +2.1Avg. Indust. Use (MWH) 18376 19789 21406Avg. Indust. Revs. per KWH (¢) 7.69 7.41 7.38Capacity at Yearend (Mw) NA NA NAPeak Load, Summer (Mw) 1094 1104 1022Annual Load Factor (%) NA NA NA% Change Customers (yr-end) +.8 +.8 +1.1
Fixed Charge Cov. (%) 296 276 278ANNUAL RATES Past Past Est’d ’17-’19of change (per sh) 10 Yrs. 5 Yrs. to ’23-’25Revenues 1.5% .5% -.5%‘‘Cash Flow’’ 4.5% 3.0% 4.0%Earnings 7.0% 7.0% 3.5%Dividends 3.5% 5.0% 6.0%Book Value 3.0% 4.0% 5.0%
Cal- Fullendar Year
QUARTERLY REVENUES ($ mill.)Mar.31 Jun.30 Sep.30 Dec.31
2017 547.5 341.9 335.6 455.3 1680.32018 575.4 355.7 322.0 501.2 1754.32019 597.8 333.9 325.5 477.7 1734.92020 537.1 326.9 346.6 464.4 16752021 565 355 340 490 1750Cal- Full
endar YearEARNINGS PER SHARE A
Mar.31 Jun.30 Sep.30 Dec.312017 1.42 .41 .52 1.03 3.382018 1.59 .45 .32 1.11 3.472019 1.73 .24 .44 1.13 3.532020 1.59 .33 .58 1.15 3.652021 1.75 .40 .50 1.15 3.80Cal- Full
endar YearQUARTERLY DIVIDENDS PAID B ■
Mar.31 Jun.30 Sep.30 Dec.312017 .445 .445 .445 .475 1.812018 .475 .475 .475 .505 1.932019 .505 .505 .505 .535 2.052020 .535 .535 .535 .565 2.172021
2004 2005 2006 2007 2008 2009 2010 2011 2012 2013 2014 2015 2016 201734.54 41.97 19.69 18.41 26.03 32.58 33.29 28.96 26.55 28.67 31.20 25.48 29.47 31.384.46 4.81 5.04 5.29 2.95 5.41 4.88 4.01 5.59 5.93 6.25 5.67 6.28 7.151.74 2.11 2.21 2.68 .18 2.32 1.66 1.01 1.97 2.61 2.89 2.83 2.63 3.381.24 1.28 1.32 1.37 1.40 1.42 1.44 1.46 1.48 1.52 1.56 1.62 1.68 1.812.80 4.18 9.24 6.92 8.51 8.90 12.04 10.03 7.90 7.97 8.92 8.90 8.89 6.09
22.43 22.29 23.68 25.66 27.19 27.84 28.02 27.53 27.88 29.39 30.80 28.63 30.25 31.9232.48 33.16 33.37 37.80 38.64 38.97 39.27 43.92 44.21 44.50 44.67 51.19 53.38 53.5417.1 17.3 15.8 15.0 NMF 9.9 18.1 31.1 17.1 18.2 19.0 16.1 22.3 19.5.90 .92 .85 .80 NMF .66 1.15 1.95 1.09 1.02 1.00 .81 1.17 .98
4.2% 3.5% 3.8% 3.4% 4.2% 6.2% 4.8% 4.6% 4.4% 3.2% 2.8% 3.5% 2.9% 2.7%
1307.3 1272.2 1173.9 1275.9 1393.6 1304.6 1573.0 1680.364.6 40.4 86.9 115.8 128.8 128.3 140.3 186.5
26.4% 31.1% 35.5% 34.7% 33.7% 35.8% 25.1% 28.7%28.0% 65.0% 5.4% 2.4% 2.4% 2.7% 5.3% 2.7%51.9% 51.4% 43.2% 51.6% 47.9% 56.0% 66.5% 64.5%48.1% 48.6% 56.8% 48.4% 52.1% 44.0% 33.5% 35.5%2286.3 2489.7 2171.4 2704.7 2643.6 3332.7 4825.8 4818.42495.4 2789.6 2742.7 2990.3 3239.4 3259.1 4469.0 4541.4
4.4% 3.3% 5.5% 5.5% 6.1% 4.9% 4.0% 5.2%5.9% 3.3% 7.1% 8.9% 9.4% 8.8% 8.7% 10.9%5.9% 3.3% 7.1% 8.9% 9.4% 8.8% 8.7% 10.9%
.7% NMF 1.8% 3.7% 4.3% 3.8% 3.3% 5.3%87% NMF 75% 58% 54% 57% 62% 52%
2018 2019 2020 2021 © VALUE LINE PUB. LLC 23-2529.24 28.22 26.70 27.15 Revenues per sh 29.006.61 7.02 7.30 7.60 ‘‘Cash Flow’’ per sh 8.753.47 3.53 3.65 3.80 Earnings per sh A 4.251.93 2.05 2.17 2.31 Div’d Decl’d per sh B ■ 2.757.62 13.31 11.70 9.80 Cap’l Spending per sh 7.25
36.36 38.42 40.65 42.65 Book Value per sh C 47.7560.00 61.48 62.75 64.50 Common Shs Outst’g D 65.5016.8 21.2 17.4 Avg Ann’l P/E Ratio 19.0.91 1.13 .90 Relative P/E Ratio 1.05
3.3% 2.7% 3.4% Avg Ann’l Div’d Yield 3.4%
1754.3 1734.9 1675 1750 Revenues ($mill) 1900192.5 214.5 230 245 Net Profit ($mill) 275
19.2% 13.0% 13.5% 13.5% Income Tax Rate 13.0%1.4% 3.3% 2.0% 2.0% AFUDC % to Net Profit 1.0%
57.5% 57.1% 55.0% 54.0% Long-Term Debt Ratio 51.5%42.5% 42.9% 45.0% 46.0% Common Equity Ratio 48.5%5132.4 5502.2 5690 5990 Total Capital ($mill) 64504854.9 5503.2 6005 6395 Net Plant ($mill) 7100
5.0% 4.9% 5.0% 5.0% Return on Total Cap’l 5.5%8.8% 9.1% 9.0% 9.0% Return on Shr. Equity 8.5%8.8% 9.1% 9.0% 9.0% Return on Com Equity E 8.5%3.9% 3.8% 3.5% 3.5% Retained to Com Eq 3.0%55% 58% 59% 59% All Div’ds to Net Prof 65%
Company’s Financial Strength AStock’s Price Stability 80Price Growth Persistence 60Earnings Predictability 80
(A) Dil. EPS. Excl. nonrec. gains (losses): ’08,($1.55); ’09, (28¢); ’10, 10¢; ’15, ($3.54); ’16,($1.26); ’17, 14¢; ’18, $1.31; ’19, (25¢); ’20,(8¢); discontinued ops.: ’08, $4.12; ’09, 7¢; ’11,
23¢; ’12, (16¢); ’17, (31¢); ’18, (12¢). ’19 EPSdon’t sum due to rounding. Next egs. due earlyFeb. (B) Div’ds pd. early Mar., Jun., Sept., &Dec. ■ Div’d reinv. plan avail. (C) Incl. def’d
chgs. In ’19: $25.06/sh. (D) In mill. (E) Ratebase: Net orig. cost. Rate all’d on com. eq. inSD in ’15: none; in CO in ’17: 9.37%; earn. onavg. com. eq., ’19: 9.4%. Regul. Climate: Avg.
BUSINESS: Black Hills Corporation is a holding company for BlackHills Energy, which serves 214,000 electric customers in CO, SD,WY and MT, and 1.1 million gas customers in NE, IA, KS, CO, WY,and AR. Has coal mining sub. Acq’d Cheyenne Light 1/05; utilityops. from Aquila 7/08; SourceGas 2/16. Discont. telecom in ’05; oilmarketing in ’06; gas marketing in ’11; gas & oil E&P in ’17. Electric
rev. breakdown: res’l, 30%; comm’l, 35%; ind’l, 18%; other, 17%.Generating sources: coal, 30%; other, 12%; purch., 58%. Fuelcosts: 33% of revs. ’19 deprec. rate: 3.2%. Has 2,900 employees.Chairman: David R. Emery. Pres. & CEO: Linn Evans. Inc.: SD. Ad-dress: 7001 Mount Rushmore Rd., P.O. Box 1400, Rapid City, SD57709-1400. Tel.: 605-721-1700. Internet: www.blackhillscorp.com.
Black Hills has reached a settlementof its gas rate case in Nebraska, andanother gas application is pending inColorado. In Nebraska, the utility filedfor an increase of $17.3 million, based on a10% return on equity and a 50% common-equity ratio. A settlement was reached,subject to approval from the state commis-sion, calling for a hike of $11.1 million,based on a 9.5% ROE and the same equityratio. New rates should take effect thisquarter. In Colorado, Black Hills re-quested an increase of $13.5 million, basedon a 9.95% ROE and a 50% common-equity ratio, and a five-year regulatorymechanism to recover safety and system-integrity costs through a rider (surcharge)on customers’ bills. New tariffs shouldtake effect in the second quarter.Other gas rate cases might be upcom-ing. The company’s service area in Ark-ansas is growing fast, so there is a lot ofcapital spending that is not yet reflected inthe rate base. In Iowa and Kansas, BlackHills has not received a base rate hikesince 2011 and 2015, respectively.We have raised our 2020 and 2021earnings estimates by $0.10 a share
each year. Favorable weather helped thethird-quarter comparison. Black Hills’ re-vised earnings guidance for 2020 is $3.60-$3.70 a share, so earnings probably roselast year despite the negative effects of therecession on earnings (an estimated $0.05-$0.10 a share). In 2021, this drag shouldbe gone, and the company will benefit fromrate relief, including some from riders oncustomers’ bills.A wind project was completed in De-cember. This added 52.5 megawatts of ca-pacity at a cost of $79 million. Black Hillsis recovering the cost of this projectthrough a special tariff.The board of directors raised the divi-dend in the fourth quarter. This ex-tended the company’s streak of annualhikes in the disbursement to 50 years. Theincrease was $0.03 a share (5.6%) quarter-ly. Black Hills is targeting a payout ratioof 50%-60%.The stock has a dividend yield that isabout average for a utility. Total returnpotential is attractive for the 18-monthspan and respectable for the 3- to 5-yearperiod.Paul E. Debbas, CFA January 22, 2021
LEGENDS0.77 x Dividends p shdivided by Interest Rate. . . . Relative Price Strength
Options: YesShaded area indicates recession
© 2021 Value Line, Inc. All rights reserved. Factual material is obtained from sources believed to be reliable and is provided without warranties of any kind.THE PUBLISHER IS NOT RESPONSIBLE FOR ANY ERRORS OR OMISSIONS HEREIN. This publication is strictly for subscriber’s own, non-commercial, internal use. No partof it may be reproduced, resold, stored or transmitted in any printed, electronic or other form, or used for generating or marketing any printed or electronic publication, service or product.
To subscribe call 1-800-VALUELINE
RECENTPRICE
P/ERATIO
RELATIVEP/E RATIO
DIV’DYLD( )Trailing:
Median:VALUELINE

200160
1008060504030
20
Percentsharestraded
302010
Target Price Range2023 2024 2025
EDISON INTERNAT’L NYSE-EIX 61.67 NMF NMF14.0 NMF 4.3%
TIMELINESS 3 Lowered 1/22/21
SAFETY 3 Lowered 11/23/18
TECHNICAL 4 Lowered 1/22/21BETA .95 (1.00 = Market)
18-Month Target Price RangeLow-High Midpoint (% to Mid)
$45-$116 $81 (30%)
2023-25 PROJECTIONSAnn’l Total
Price Gain ReturnHigh 95 (+55%) 14%Low 65 (+5%) 6%Institutional Decisions
1Q2020 2Q2020 3Q2020to Buy 274 294 269to Sell 304 264 264Hld’s(000) 318333 329959 334110
High: 36.7 39.4 41.6 48.0 54.2 68.7 69.6 78.7 83.4 71.0 76.4 78.9Low: 23.1 30.4 32.6 39.6 44.3 44.7 55.2 58.0 62.7 45.5 53.4 43.6
% TOT. RETURN 12/20THIS VL ARITH.*
STOCK INDEX1 yr. -12.8 18.83 yr. 12.0 29.95 yr. 26.6 81.5
CAPITAL STRUCTURE as of 9/30/20Total Debt $21738 mill. Due in 5 Yrs $6123 mill.LT Debt $18958 mill. LT Interest $891 mill.(LT interest earned: 2.0x)Leases, Uncapitalized Annual rentals $107 mill.Pens. Assets-12/19 $3755 mill. Oblig $4139 mill.Pfd Stock $2193 mill. Pfd Div’d $121 mill.4,800,198 sh. 4.08%-4.78%, $25 par, call. $25.50-$28.75/sh.; 3,250,000 sh. variable, noncum., call.$100; 1,250,000 sh. 6.5%, cum., $100 liq. value;350,000 sh. 6.25%, $1000 liq. value; 460,012 sh.5.1%-5.75%, $2500 liq. value.Common Stock 378,513,912 shs. as of 10/20/20MARKET CAP: $23 billion (Large Cap)
ELECTRIC OPERATING STATISTICS2017 2018 2019
% Change Retail Sales (KWH) +.2 -.4 -2.7Avg. Indust. Use (MWH) 643 667 657Avg. Indust. Revs. per KWH (¢) NA NA NACapacity at Peak (Mw) NA NA NAPeak Load, Summer (Mw) 23508 23766 22009Annual Load Factor (%) 48.8 48.0 49.6% Change Customers (yr-end) +.7 +.6 +.5
Fixed Charge Cov. (%) 241 NMF 172ANNUAL RATES Past Past Est’d ’17-’19of change (per sh) 10 Yrs. 5 Yrs. to ’23-’25Revenues -1.0% -1.0% 2.0%‘‘Cash Flow’’ .5% -2.5% 6.5%Earnings -3.5% -10.5% 12.0%Dividends 7.0% 11.5% 4.0%Book Value 2.0% 2.5% 4.0%
Cal- Fullendar Year
QUARTERLY REVENUES ($ mill.)Mar.31 Jun.30 Sep.30 Dec.31
2017 2463 2965 3672 3220 123202018 2564 2815 4269 3009 126572019 2824 2812 3741 2970 123472020 2790 2987 4644 3079 135002021 2900 3100 4800 3200 14000Cal- Full
endar YearEARNINGS PER SHARE A
Mar.31 Jun.30 Sep.30 Dec.312017 1.11 .85 1.43 1.12 4.512018 .82 .84 1.57 d4.49 d1.262019 .64 1.57 1.35 .45 3.982020 .50 .85 d.76 1.11 1.702021 .65 1.10 1.40 .90 4.05Cal- Full
endar YearQUARTERLY DIVIDENDS PAID B ■
Mar.31 Jun.30 Sep.30 Dec.312017 .5425 .5425 .5425 .5425 2.172018 .605 .605 .605 .605 2.422019 .6125 .6125 .6125 .6125 2.452020 .6375 .6375 .6375 .6375 2.552021 .6625
2004 2005 2006 2007 2008 2009 2010 2011 2012 2013 2014 2015 2016 201731.30 36.38 38.74 40.25 43.31 37.98 38.09 39.16 36.41 38.61 41.17 35.37 36.43 37.813.79 6.99 7.25 7.60 8.08 7.96 8.41 9.03 9.63 8.80 9.95 10.35 10.43 11.03.69 3.34 3.28 3.32 3.68 3.24 3.35 3.23 4.55 3.78 4.33 4.15 3.94 4.51.80 1.02 1.10 1.18 1.23 1.25 1.27 1.29 1.31 1.37 1.48 1.73 1.98 2.23
5.32 5.73 7.78 8.67 8.67 10.07 13.94 14.76 12.73 11.05 11.99 12.97 11.46 11.7518.57 20.30 23.66 25.92 29.21 30.20 32.44 30.86 28.95 30.50 33.64 34.89 36.82 35.82
325.81 325.81 325.81 325.81 325.81 325.81 325.81 325.81 325.81 325.81 325.81 325.81 325.81 325.8137.6 11.7 13.0 16.0 12.4 9.7 10.3 11.8 9.7 12.7 13.0 14.8 17.9 17.21.99 .62 .70 .85 .75 .65 .66 .74 .62 .71 .68 .75 .94 .87
3.1% 2.6% 2.6% 2.2% 2.7% 4.0% 3.7% 3.4% 3.0% 2.8% 2.6% 2.8% 2.8% 2.9%
12409 12760 11862 12581 13413 11524 11869 123201153.0 1112.0 1594.0 1344.0 1539.0 1480.0 1422.0 1603.032.1% 25.7% 14.3% 25.2% 22.4% 6.6% 11.1% 5.0%16.9% 14.8% 8.5% 7.8% 5.8% 8.0% 6.8% 7.2%51.8% 55.3% 45.2% 45.7% 44.1% 45.0% 41.8% 45.6%44.3% 40.6% 46.2% 46.2% 47.2% 46.7% 49.2% 45.8%23861 24773 20422 21516 23216 24352 24362 2550624778 32116 30273 30455 32981 35085 37000 390506.3% 6.0% 8.9% 7.3% 7.7% 7.1% 6.9% 7.3%
10.0% 10.0% 14.2% 11.5% 11.9% 11.1% 10.0% 11.6%10.4% 10.5% 15.9% 12.5% 13.0% 12.0% 10.8% 12.7%6.5% 6.3% 11.4% 8.1% 8.8% 7.2% 5.6% 6.6%40% 43% 32% 40% 37% 44% 53% 52%
2018 2019 2020 2021 © VALUE LINE PUB. LLC 23-2538.85 34.11 35.60 35.45 Revenues per sh 41.254.69 9.15 7.95 10.30 ‘‘Cash Flow’’ per sh 12.25
d1.26 3.98 1.70 4.05 Earnings per sh A 4.752.43 2.48 2.58 2.68 Div’d Decl’d per sh B ■ 3.00
13.84 13.47 13.20 13.65 Cap’l Spending per sh 13.7532.10 36.75 36.65 39.05 Book Value per sh C 44.00
325.81 361.99 379.00 395.00 Common Shs Outst’g D 395.00- - 16.7 NMF Avg Ann’l P/E Ratio 16.5- - .89 NMF Relative P/E Ratio .90
3.8% 3.7% 4.3% Avg Ann’l Div’d Yield 3.8%
12657 12347 13500 14000 Revenues ($mill) 16300d290.0 1477.0 755 1730 Net Profit ($mill) 2000
- - NMF NMF Nil Income Tax Rate Nil- - 11.1% 24.0% 10.0% AFUDC % to Net Profit 9.0%
53.6% 53.5% 55.5% 57.0% Long-Term Debt Ratio 59.0%38.3% 39.9% 39.5% 38.0% Common Equity Ratio 37.5%27284 33360 35125 38600 Total Capital ($mill) 4650041348 44285 46900 49800 Net Plant ($mill) 57700
.1% 5.6% 3.5% 5.5% Return on Total Cap’l 5.5%NMF 9.5% 5.0% 9.5% Return on Shr. Equity 10.5%NMF 10.2% 4.5% 10.0% Return on Com Equity E 11.0%NMF 4.1% NMF 3.5% Retained to Com Eq 4.0%NMF 63% NMF 68% All Div’ds to Net Prof 64%
Company’s Financial Strength B+Stock’s Price Stability 75Price Growth Persistence 50Earnings Predictability 5
(A) Dil. EPS. Excl. nonrec. gains (losses): ’04,$2.12; ’09, (64¢); ’10, 54¢; ’11, ($3.33); ’13,($1.12); ’15, ($1.18); ’17, ($1.37); ’18, (15¢);’19, (21¢); gains (loss) from disc. ops.: ’12,
($5.11); ’13, 11¢; ’14, 57¢; ’15, 11¢; ’18, 10¢.’19 EPS don’t sum due to chng. in shs. Nextearnings report due late Feb. (B) Div’ds paidlate Jan., Apr., July, & Oct. ■ Div’d reinv. plan
avail. (C) Incl. def’d charges. In ’19: $16.82/sh.(D) In mill. (E) Rate base: net orig. cost. Rateall’d on com. eq. in ’20: 10.3%; earned on avg.com. eq., ’19: 11.5%. Regulatory Climate: Avg.
BUSINESS: Edison International (formerly SCECorp) is a holdingcompany for Southern California Edison Company (SCE), whichsupplies electricity to 5.1 mill. customers in a 50,000-sq.-mi. area incentral, coastal, & southern CA (excl. Los Angeles & San Diego).Edison Energy is an energy svcs. co. Disc. Edison Mission Energy(independent power producer) in ’12. Elec. rev. breakdown: resi-
dential, 39%; commercial, 43%; industrial, 4%; other, 14%. Genera-ting sources: nuclear, 8%; gas, 7%; hydro, 5%; purchased, 80%.Fuel costs: 39% of revs. ’19 reported depr. rate: 3.6%. Has 12,500empls. Chairman: William P. Sullivan. Pres. & CEO: Pedro J. Piz-zaro. Inc.: CA. Address: 2244 Walnut Grove Ave., P.O. Box 976,Rosemead, CA 91770. Tel.: 626-302-2222. Web: www.edison.com.
Our 2020 earnings estimate for EdisonInternational requires an explana-tion. The bottom line fell into the red inthe third quarter due to a $2.33-a-sharecharge for expected liabilities stemmingfrom wildfires and mudslides in SouthernCalifornia Edison’s service area in 2017and 2018. We also include the effects ofamortization of SCE’s contributions to thestate’s wildfire insurance fund, which re-duces quarterly earnings by $0.16 a share.Edison International is excluding theseitems from its 2020 ‘‘core’’ earnings guid-ance of $4.47-$4.62 a share. Note that theweak economy and lockdowns in Californiadon’t have a large effect on the company’sincome because SCE operates under a reg-ulatory mechanism that decouples reve-nues and volume.The utility is awaiting an order in itsgeneral rate case. SCE is seeking rateincreases of $1.3 billion in 2021 (and ask-ing that the order be retroactive to thestart of the year), $452 million in 2022,and $524 million in 2023. Rate relief andthe absence of the wildfire-liability reservepoint to material earnings improvementthis year. The California commission will
consider the recovery of incremental wild-fire mitigation costs in two separatetracks. SCE and other parties reached asettlement that, if approved by the com-mission, would raise rates $391 million torecover incremental wildfire mitigationcosts from 2018 and 2019. A decision is ex-pected in the current quarter. In March,the utility will apply for recovery of its in-cremental costs from 2020. Separately, theregulators have allowed the company torecover incremental wildfire insurancepremium costs that were incurred throughmid-2020.An equity issuance is upcoming.Edison International expects to issue $1billion of common stock in order to fundexpected wildfire liability payments.The board of directors raised the divi-dend, effective with the January pay-ment. The increase was $0.10 a share(3.9%) annually.This stock’s dividend yield is abovethe utility average. Total return poten-tial is attractive for the next 18 monthsand a bit above average for the 2023-2025period.Paul E. Debbas, CFA January 22, 2021
LEGENDS0.80 x Dividends p shdivided by Interest Rate. . . . Relative Price Strength
Options: YesShaded area indicates recession
© 2021 Value Line, Inc. All rights reserved. Factual material is obtained from sources believed to be reliable and is provided without warranties of any kind.THE PUBLISHER IS NOT RESPONSIBLE FOR ANY ERRORS OR OMISSIONS HEREIN. This publication is strictly for subscriber’s own, non-commercial, internal use. No partof it may be reproduced, resold, stored or transmitted in any printed, electronic or other form, or used for generating or marketing any printed or electronic publication, service or product.
To subscribe call 1-800-VALUELINE
RECENTPRICE
P/ERATIO
RELATIVEP/E RATIO
DIV’DYLD( )Trailing:
Median:VALUELINE

120100806448
3224201612
8
Percentsharestraded
15105
Target Price Range2023 2024 2025
HAWAIIAN ELECTRIC NYSE-HE 34.05 18.6 17.418.0 0.86 3.9%
TIMELINESS 4 Lowered 11/13/20
SAFETY 2 Raised 11/2/12
TECHNICAL 3 Raised 1/1/21BETA .80 (1.00 = Market)
18-Month Target Price RangeLow-High Midpoint (% to Mid)
$26-$63 $45 (30%)
2023-25 PROJECTIONSAnn’l Total
Price Gain ReturnHigh 40 (+15%) 8%Low 30 (-10%) 1%Institutional Decisions
1Q2020 2Q2020 3Q2020to Buy 121 116 137to Sell 152 152 135Hld’s(000) 59896 57636 53574
High: 22.7 25.0 26.8 29.2 28.3 35.0 34.9 35.0 38.7 39.3 47.6 55.2Low: 12.1 18.6 20.6 23.7 23.8 22.7 27.0 27.3 31.7 31.7 35.1 31.8
% TOT. RETURN 12/20THIS VL ARITH.*
STOCK INDEX1 yr. -22.4 18.83 yr. 7.4 29.95 yr. 44.9 81.5
CAPITAL STRUCTURE as of 9/30/20Total Debt $2206.6 mill. Due in 5 Yrs $659.1 mill.LT Debt $2068.9 mill. LT Interest $96.2 mill.Incl. $50 mill. 6.5% oblig. pfd. sec. of trust subsid.(LT interest earned: 3.9x)Leases, Uncapitalized Annual rentals $12.0 mill.Pension Assets-12/19 $1779.2 mill.
Oblig $2278.3 mill.Pfd Stock $34.3 mill. Pfd Div’d $2.0 mill.1,114,657 shs. 41⁄4% to 51⁄4%, $20 par. call. $20 to$21; 120,000 shs. 75⁄8%, $100 par. call. $100.Sinking fund ends 2018.Common Stock 109,181,124 shs. as of 10/23/20MARKET CAP: $3.7 billion (Mid Cap)
ELECTRIC OPERATING STATISTICS2017 2018 2019
% Change Retail Sales (KWH) -1.8 - - +.6Avg. Indust. Use (MWH) 5193 5067 5225Avg. Indust. Revs. per KWH (¢) 22.56 25.76 25.52Capacity at Yearend (Mw) 2224 2256 2254Peak Load, Winter (Mw) 1584 1598 1601Annual Load Factor (%) 65.8 65.0 65.2% Change Customers (yr-end) +.4 +.2 +.5
Fixed Charge Cov. (%) 409 361 368ANNUAL RATES Past Past Est’d ’17-’19of change (per sh) 10 Yrs. 5 Yrs. to ’23-’25Revenues -2.0% -5.0% .5%‘‘Cash Flow’’ 4.0% 4.5% 4.0%Earnings 6.0% 2.0% 1.5%Dividends - - - - 2.0%Book Value 2.5% 3.5% 3.5%
Cal- Fullendar Year
QUARTERLY REVENUES ($ mill.)Mar.31 Jun.30 Sep.30 Dec.31
2017 591.5 632.3 673.2 658.6 2555.62018 645.9 685.3 768.0 761.6 2860.82019 661.6 715.5 771.5 726.0 2874.62020 677.2 608.9 641.4 622.5 25502021 650 675 700 675 2700Cal- Full
endar YearEARNINGS PER SHARE A
Mar.31 Jun.30 Sep.30 Dec.312017 .31 .36 .55 .42 1.642018 .37 .42 .60 .45 1.852019 .42 .39 .58 .61 1.992020 .31 .45 .59 .45 1.802021 .39 .40 .61 .45 1.85Cal- Full
endar YearQUARTERLY DIVIDENDS PAID B ■
Mar.31 Jun.30 Sep.30 Dec.312017 .31 .31 .31 .31 1.242018 .31 .31 .31 .31 1.242019 .32 .32 .32 .32 1.282020 .33 .33 .33 .33 1.322021
2004 2005 2006 2007 2008 2009 2010 2011 2012 2013 2014 2015 2016 201723.85 27.36 30.21 30.40 35.56 24.96 28.14 33.76 34.46 31.98 31.59 24.22 21.92 23.493.09 3.22 3.19 3.01 2.72 2.59 2.88 3.18 3.28 3.22 3.41 3.31 4.17 3.681.36 1.46 1.33 1.11 1.07 .91 1.21 1.44 1.67 1.62 1.64 1.50 2.29 1.641.24 1.24 1.24 1.24 1.24 1.24 1.24 1.24 1.24 1.24 1.24 1.24 1.24 1.242.66 2.76 2.58 2.62 3.12 3.29 1.92 2.45 3.32 3.49 3.31 3.39 3.04 4.55
15.01 15.02 13.44 15.29 15.35 15.58 15.67 15.95 16.28 17.06 17.47 17.94 19.03 19.2880.69 80.98 81.46 83.43 90.52 92.52 94.69 96.04 97.93 101.26 102.57 107.46 108.58 108.7919.2 18.3 20.3 21.6 23.2 19.8 18.6 17.1 15.8 16.2 15.9 20.4 13.6 20.71.01 .97 1.10 1.15 1.40 1.32 1.18 1.07 1.01 .91 .84 1.03 .71 1.04
4.8% 4.6% 4.6% 5.2% 5.0% 6.9% 5.5% 5.0% 4.7% 4.7% 4.8% 4.1% 4.0% 3.7%
2665.0 3242.3 3375.0 3238.5 3239.5 2603.0 2380.7 2555.6115.4 140.1 164.9 163.4 170.2 161.8 250.1 180.6
37.0% 35.1% 35.9% 34.0% 35.0% 36.5% 33.1% 34.7%7.4% 6.0% 6.9% 4.8% 5.5% 5.8% 4.6% 9.6%
44.5% 44.9% 45.7% 44.0% 45.2% 43.5% 41.6% 43.4%54.3% 53.9% 53.1% 55.0% 53.8% 55.5% 57.5% 55.7%2732.9 2841.3 3001.0 3142.9 3332.3 3473.5 3595.1 3765.53165.9 3334.5 3594.8 3858.9 4148.8 4377.7 4603.5 5025.9
5.6% 6.2% 6.7% 6.4% 6.2% 5.7% 7.9% 5.8%7.6% 8.9% 10.1% 9.3% 9.3% 8.2% 11.9% 8.5%7.7% 9.0% 10.2% 9.4% 9.4% 8.3% 12.0% 8.5%1.4% 2.1% 4.2% 3.7% 2.3% 1.5% 6.3% 2.1%82% 78% 59% 61% 75% 83% 48% 76%
2018 2019 2020 2021 © VALUE LINE PUB. LLC 23-2526.28 26.38 23.20 24.30 Revenues per sh 26.254.20 4.55 4.45 4.60 ‘‘Cash Flow’’ per sh 5.251.85 1.99 1.80 1.85 Earnings per sh A 2.001.24 1.28 1.32 1.32 Div’d Decl’d per sh B ■ 1.404.94 4.20 3.30 3.40 Cap’l Spending per sh 4.50
19.86 20.93 21.60 22.30 Book Value per sh C 24.75108.88 108.97 110.00 111.00 Common Shs Outst’g D 114.00
18.9 21.3 21.6 Avg Ann’l P/E Ratio 18.51.02 1.13 1.10 Relative P/E Ratio 1.05
3.5% 3.0% 3.4% Avg Ann’l Div’d Yield 3.8%
2860.8 2874.6 2550 2700 Revenues ($mill) 3000203.7 219.8 200 210 Net Profit ($mill) 245
20.0% 19.0% 19.0% 19.0% Income Tax Rate 19.0%7.7% 7.5% 7.0% 8.0% AFUDC % to Net Profit 8.0%
47.5% 44.6% 47.5% 45.0% Long-Term Debt Ratio 46.5%51.7% 54.6% 52.0% 54.0% Common Equity Ratio 52.5%4182.3 4176.9 4570 4565 Total Capital ($mill) 53754830.1 5109.6 5185 5260 Net Plant ($mill) 5700
5.9% 6.3% 5.5% 5.5% Return on Total Cap’l 5.5%9.3% 9.5% 8.5% 8.5% Return on Shr. Equity 8.5%9.3% 9.6% 8.5% 8.5% Return on Com Equity E 8.5%3.1% 3.4% 2.5% 2.5% Retained to Com Eq 3.0%67% 64% 73% 71% All Div’ds to Net Prof F 66%
Company’s Financial Strength AStock’s Price Stability 85Price Growth Persistence 45Earnings Predictability 65
(A) Diluted EPS. Excl. gain (loss) from disc.ops.: ’04, 2¢; ’05, (1¢); nonrec. gain (losses):’05, 11¢; ’07, (9¢); ’12, (25¢); ’17, (12¢). ’18 &’19 EPS don’t sum due to rounding. Next egs.
report due mid-Feb. (B) Div’ds pd. early Mar.,June, Sept., & Dec. ■ Div’d reinv. avail.(C) Incl. intang. In ’19: $7.03/sh. (D) In mill.,adj. for split. (E) Rate base: Orig. cost. Rate al-
lowed on com. eq. in ’18: HECO, 9.5%; in ’18:HELCO, 9.5%; in ’18: MECO, 9.5%; earned onavg. com. eq., ’19: 9.8%. Reg. Climate: BelowAvg. (F) Excl. div’ds paid through reinv. plan.
BUSINESS: Hawaiian Electric Industries, Inc. is the parent compa-ny of Hawaiian Electric Company, Inc. (HECO), American SavingsBank (ASB), and Pacific Current. HECO & its subs., Maui ElectricCo. (MECO) & Hawaii Electric Light Co. (HELCO), supply electricityto 465,000 customers on Oahu, Maui, Molokai, Lanai, & Hawaii.Operating companies’ systems are not interconnected. Elec. rev.
breakdown: residential, 31%; commercial, 33%; lg. light & power,35%; other, 1%. Generating sources: oil, 54%; purch., 46%. Fuelcosts: 47% of revs. ’19 reported deprec. rate (utility): 3.2%. Has3,800 employees. Chairman: Tom Fargo. President & CEO: Con-stance H. Lau. Inc.: HI. Address: 1001 Bishop St., Suite 2900,Honolulu, HI 96808-0730. Tel.: 808-543-5662. Web: www.hei.com.
The Public Utilities Commission ofHawaii (PUC) issued an order in late2020 that will affect the three utilitysubsidiaries of Hawaiian Electric In-dustries. Some provisions have alreadybegun, but others won’t take effect untilJune. The PUC is continuing certain regu-latory mechanisms that were already inplace, such as one that decouples revenuesand volume. Some performance-basedratemaking provisions were adjusted sothat the utilities may benefit from supe-rior performance, instead of just beingpenalized for not meeting certain stan-dards. The troubling aspect of the decisionis the PUC’s order for HEI’s utilities topass through to customers $110.8 millionof cost reductions over the five-year termof the plan, which is well above the utili-ties’ commitment of $35.4 million in sav-ings. The company has asked the PUC forclarification and/or reconsideration of theorder. When the PUC will respond is un-determined; there is no statutory timeframe. Also undetermined is how anypass-through to customers will be ac-counted for, and how this order will ul-timately affect HEI’s earning power.
Earnings probably declined in 2020,and we expect only a partial recoveryin 2021. The recession did not have alarge effect on HEI’s utilities thanks to thedecoupling mechanism. Also, the utilities’coronavirus-related expenses are being de-ferred for future recovery through a sepa-rate regulatory proceeding. However, theweak economy and a narrow interest-ratemargin are hurting the company’s Amer-ican Savings Bank subsidiary. In the firstthree quarters of 2020, ASB booked provi-sions for credit losses totaling $35.2 mil-lion, versus a typical range of $17 million-$22 million for a full year. The bank istaking steps to cut costs, such as closingsix branches.We think the dividend will be held atthe current level this year. There iseven more uncertainty than usual regard-ing HEI’s earning power. There might notbe an increase in 2022, as well.This stock is untimely, and its divi-dend yield does not stand out amongutilities. The equity has some appeal forthe 18-month span, but 3- to 5-year totalreturn potential is low.Paul E. Debbas, CFA January 22, 2021
LEGENDS0.61 x Dividends p shdivided by Interest Rate. . . . Relative Price Strength
Options: YesShaded area indicates recession
© 2021 Value Line, Inc. All rights reserved. Factual material is obtained from sources believed to be reliable and is provided without warranties of any kind.THE PUBLISHER IS NOT RESPONSIBLE FOR ANY ERRORS OR OMISSIONS HEREIN. This publication is strictly for subscriber’s own, non-commercial, internal use. No partof it may be reproduced, resold, stored or transmitted in any printed, electronic or other form, or used for generating or marketing any printed or electronic publication, service or product.
To subscribe call 1-800-VALUELINE
RECENTPRICE
P/ERATIO
RELATIVEP/E RATIO
DIV’DYLD( )Trailing:
Median:VALUELINE

200160
1008060504030
20
Percentsharestraded
15105
Target Price Range2023 2024 2025
IDACORP, INC. NYSE-IDA 90.39 19.2 18.516.0 0.88 3.2%
TIMELINESS 2 Raised 8/28/20
SAFETY 1 Raised 1/22/21
TECHNICAL 4 Lowered 12/25/20BETA .80 (1.00 = Market)
18-Month Target Price RangeLow-High Midpoint (% to Mid)
$73-$151 $112 (25%)
2023-25 PROJECTIONSAnn’l Total
Price Gain ReturnHigh 115 (+25%) 9%Low 95 (+5%) 5%Institutional Decisions
1Q2020 2Q2020 3Q2020to Buy 167 154 186to Sell 174 166 147Hld’s(000) 39043 39111 38758
High: 32.8 37.8 42.7 45.7 54.7 70.1 70.5 83.4 100.0 102.4 114.0 113.6Low: 20.9 30.0 33.9 38.2 43.1 50.2 55.4 65.0 77.5 79.6 89.3 69.1
% TOT. RETURN 12/20THIS VL ARITH.*
STOCK INDEX1 yr. -8.0 18.83 yr. 13.2 29.95 yr. 60.5 81.5
CAPITAL STRUCTURE as of 9/30/20Total Debt $2000.4 mill. Due in 5 Yrs $124.8 mill.LT Debt $2000.4 mill. LT Interest $83.4 mill.(LT interest earned: 3.8x)
Pension Assets-12/19 $763.1 mill.Oblig $1134.8 mill.
Pfd Stock None
Common Stock 50,461,885 shs.as of 10/23/20
MARKET CAP: $4.6 billion (Mid Cap)
ELECTRIC OPERATING STATISTICS2017 2018 2019
% Change Retail Sales (KWH) +2.6 +.1 -.3Avg. Indust. Use (MWH) NA NA NAAvg. Indust. Revs. per KWH (¢) 5.83 5.64 5.32Capacity at Peak (Mw) NA NA NAPeak Load, Summer (Mw) 3422 3392 3242Annual Load Factor (%) NA NA NA% Change Customers (yr-end) +2.0 +2.3 +2.5
Fixed Charge Cov. (%) 329 309 307ANNUAL RATES Past Past Est’d ’17-’19of change (per sh) 10 Yrs. 5 Yrs. to ’23-’25Revenues 2.5% 2.5% 2.0%‘‘Cash Flow’’ 5.5% 4.5% 4.0%Earnings 7.0% 4.0% 4.5%Dividends 7.0% 9.0% 6.5%Book Value 5.5% 5.0% 4.0%
Cal- Fullendar Year
QUARTERLY REVENUES($ mill.)Mar.31 Jun.30 Sep.30 Dec.31
2017 302.6 333.0 408.3 305.6 1349.52018 310.1 340.0 408.8 311.9 1370.82019 350.3 316.9 386.3 292.9 1346.42020 291.0 318.8 425.3 289.9 13252021 305 330 440 300 1375Cal- Full
endar YearEARNINGS PER SHARE A
Mar.31 Jun.30 Sep.30 Dec.312017 .66 .99 1.80 .76 4.212018 .72 1.23 2.02 .52 4.492019 .84 1.05 1.78 .93 4.612020 .74 1.19 2.02 .70 4.652021 .85 1.15 2.00 .80 4.80Cal- Full
endar YearQUARTERLY DIVIDENDS PAID B ■ †
Mar.31 Jun.30 Sep.30 Dec.312017 .55 .55 .55 .59 2.242018 .59 .59 .59 .63 2.402019 .63 .63 .63 .67 2.562020 .67 .67 .67 .71 2.722021
2004 2005 2006 2007 2008 2009 2010 2011 2012 2013 2014 2015 2016 201720.00 20.15 21.23 19.51 20.47 21.92 20.97 20.55 21.55 24.81 25.51 25.23 25.04 26.764.12 3.87 4.58 4.11 4.27 5.07 5.35 5.84 5.93 6.29 6.58 6.70 6.86 7.501.90 1.75 2.35 1.86 2.18 2.64 2.95 3.36 3.37 3.64 3.85 3.87 3.94 4.211.20 1.20 1.20 1.20 1.20 1.20 1.20 1.20 1.37 1.57 1.76 1.92 2.08 2.244.73 4.53 5.16 6.39 5.19 5.26 6.85 6.76 4.78 4.68 5.45 5.84 5.89 5.66
23.88 24.04 25.77 26.79 27.76 29.17 31.01 33.19 35.07 36.84 38.85 40.88 42.74 44.6542.22 42.66 43.63 45.06 46.92 47.90 49.41 49.95 50.16 50.23 50.27 50.34 50.40 50.4215.5 16.7 15.1 18.2 13.9 10.2 11.8 11.5 12.4 13.4 14.7 16.2 19.1 20.6.82 .89 .82 .97 .84 .68 .75 .72 .79 .75 .77 .82 1.00 1.04
4.1% 4.1% 3.4% 3.5% 4.0% 4.5% 3.4% 3.1% 3.3% 3.2% 3.1% 3.1% 2.8% 2.6%
1036.0 1026.8 1080.7 1246.2 1282.5 1270.3 1262.0 1349.5142.5 166.9 168.9 182.4 193.5 194.7 198.3 212.4
- - - - 13.4% 28.3% 8.0% 19.0% 15.5% 18.6%19.1% 23.3% 20.3% 12.3% 13.6% 16.3% 16.3% 13.9%49.3% 45.6% 45.5% 46.6% 45.3% 45.6% 44.8% 43.7%50.7% 54.4% 54.5% 53.4% 54.7% 54.4% 55.2% 56.3%3020.4 3045.2 3225.4 3465.9 3567.6 3783.3 3898.5 3997.53161.4 3406.6 3536.0 3665.0 3833.5 3992.4 4172.0 4283.9
6.0% 6.8% 6.5% 6.4% 6.6% 6.2% 6.1% 6.3%9.3% 10.1% 9.6% 9.9% 9.9% 9.5% 9.2% 9.4%9.3% 10.1% 9.6% 9.9% 9.9% 9.5% 9.2% 9.4%5.5% 6.5% 5.7% 5.6% 5.4% 4.8% 4.3% 4.4%41% 36% 41% 43% 46% 50% 53% 53%
2018 2019 2020 2021 © VALUE LINE PUB. LLC 23-2527.19 26.70 26.25 27.25 Revenues per sh 30.257.85 8.07 8.20 8.40 ‘‘Cash Flow’’ per sh 9.754.49 4.61 4.65 4.80 Earnings per sh A 5.752.40 2.56 2.72 2.89 Div’d Decl’d per sh B ■ † 3.505.51 5.53 6.80 6.95 Cap’l Spending per sh 7.00
47.01 48.88 50.70 52.55 Book Value per sh C 58.7550.42 50.42 50.45 50.45 Common Shs Outst’g D 50.4520.5 22.3 20.0 Avg Ann’l P/E Ratio 18.01.11 1.19 1.00 Relative P/E Ratio 1.00
2.6% 2.5% 2.9% Avg Ann’l Div’d Yield 3.4%
1370.8 1346.4 1325 1375 Revenues ($mill) 1525226.8 232.9 235 240 Net Profit ($mill) 2907.1% 9.5% 10.0% 10.0% Income Tax Rate 10.0%
15.2% 16.2% 17.0% 17.0% AFUDC % to Net Profit 16.0%43.6% 41.3% 44.5% 44.5% Long-Term Debt Ratio 44.5%56.4% 58.7% 55.5% 55.5% Common Equity Ratio 55.5%4205.1 4201.3 4605 4770 Total Capital ($mill) 53754395.7 4531.5 4695 4865 Net Plant ($mill) 5325
6.4% 6.5% 6.0% 6.0% Return on Total Cap’l 6.5%9.6% 9.4% 9.0% 9.0% Return on Shr. Equity 9.5%9.6% 9.4% 9.0% 9.0% Return on Com Equity E 9.5%4.4% 4.2% 4.0% 3.5% Retained to Com Eq 4.0%54% 56% 58% 60% All Div’ds to Net Prof 61%
Company’s Financial Strength AStock’s Price Stability 100Price Growth Persistence 90Earnings Predictability 100
(A) Diluted EPS. Excl. nonrecurring gain (loss):’05, (24¢); ’06, 17¢. ’17 & ’19 earnings don’tsum due to rounding. Next earnings report duemid-Feb. (B) Dividends historically paid in late
Feb., May, Aug., and Nov. ■ Dividend reinvest-ment plan available. † Shareholder investmentplan available. (C) Incl. intangibles. In ’19:$26.31/sh. (D) In millions. (E) Rate base: Net
original cost. Rate allowed on common equityin ’12: 10% (imputed); earned on avg. com.eq., ’19: 9.6%. Regulatory Climate: AboveAverage.
BUSINESS: IDACORP, Inc. is a holding company for Idaho PowerCompany, a regulated electric utility that serves 583,000 customersthroughout a 24,000-square-mile area in southern Idaho and east-ern Oregon (population: 1.2 million). Most of the company’s reve-nues are derived from the Idaho portion of its service area. Reve-nue breakdown: residential, 39%; commercial, 22%; industrial,
13%; irrigation, 10%; other, 16%. Generating sources: hydro, 45%;coal, 16%; gas, 11%; purchased, 28%. Fuel costs: 33% of reve-nues. ’19 reported depreciation rate: 2.9%. Has 2,000 employees.Chairman: Richard J. Dahl. President & CEO: Lisa Grow. Incor-porated: Idaho. Address: 1221 W. Idaho St., Boise, Idaho 83702.Telephone: 208-388-2200. Internet: www.idacorpinc.com.
We estimate that IDACORP’s earningsrose slightly in 2020. We figure this hap-pened despite a difficult comparison in thefourth quarter. The company’s utility sub-sidiary, Idaho Power, benefited from favor-able weather conditions in its service area.Also, while the national recession hurt theeconomy in Idaho, this was less severe inthe state because of the concentration offood-processing customers, which contin-ued to operate even as some other busi-nesses were ordered to close. Other busi-nesses are expanding; for instance, Ama-zon opened a distribution center. Somecompanies have relocated from Californiato Idaho. Customer growth is rapid, andamounted to 2.6% for the 12-month periodthat ended on September 30th. Cost con-trol has been effective, and operating andmaintenance expenses likely declined.Upon reporting third-quarter results inlate October, IDACORP narrowed itsshare-earnings guidance from $4.45-$4.65to $4.55-$4.65. Our estimate remains atthe upper end of this range.We look for a modest profit increasethis year. The service area’s economyshould continue to recover. On the other
hand, a return to normal weather patternswould be a negative factor for the year-to-year comparison. Our estimate of $4.80 ashare would produce a 3% increase overour expectation for 2020. Management willissue earnings guidance for 2021 when itreports fourth-quarter results next month.Finances are solid. The fixed-charge cov-erage and common-equity ratio are com-fortably above the averages for the electricutility industry. The earned return onequity is consistently healthy. IDACORPhas not issued any common equity forseveral years, and expects no need for newequity in the next few years. The compa-ny’s Financial Strength rating is A. Wehave raised the equity’s Safety rank onenotch, to 1 (Highest).The dividend yield of this timely stockis a cut below the utility mean. The is-sue offers superior total return potentialfor the next 18 months. For the 3- to 5-year period, however, total return pros-pects are unexceptional, despite thelikelihood of strong dividend growth. Therecent quotation is near the lower end ofour 2023-2025 Target Price Range.Paul E. Debbas, CFA January 22, 2021
LEGENDS0.80 x Dividends p shdivided by Interest Rate. . . . Relative Price Strength
Options: YesShaded area indicates recession
© 2021 Value Line, Inc. All rights reserved. Factual material is obtained from sources believed to be reliable and is provided without warranties of any kind.THE PUBLISHER IS NOT RESPONSIBLE FOR ANY ERRORS OR OMISSIONS HEREIN. This publication is strictly for subscriber’s own, non-commercial, internal use. No partof it may be reproduced, resold, stored or transmitted in any printed, electronic or other form, or used for generating or marketing any printed or electronic publication, service or product.
To subscribe call 1-800-VALUELINE
RECENTPRICE
P/ERATIO
RELATIVEP/E RATIO
DIV’DYLD( )Trailing:
Median:VALUELINE

1601201008060504030
2015
Percentsharestraded
302010
Target Price Range2023 2024 2025
NORTHWESTERN NDQ-NWE 56.72 16.8 17.817.0 0.77 4.4%
TIMELINESS 3 Raised 11/6/20
SAFETY 2 Raised 7/27/18
TECHNICAL 4 Lowered 1/15/21BETA .95 (1.00 = Market)
18-Month Target Price RangeLow-High Midpoint (% to Mid)
$41-$101 $71 (25%)
2023-25 PROJECTIONSAnn’l Total
Price Gain ReturnHigh 85 (+50%) 14%Low 65 (+15%) 8%Institutional Decisions
1Q2020 2Q2020 3Q2020to Buy 127 143 134to Sell 144 137 126Hld’s(000) 48390 48127 47772
High: 26.8 30.6 36.6 38.0 47.2 58.7 59.7 63.8 64.5 65.7 76.7 80.5Low: 18.5 23.8 27.4 33.0 35.1 42.6 48.4 52.2 55.7 50.0 57.3 45.1
% TOT. RETURN 12/20THIS VL ARITH.*
STOCK INDEX1 yr. -15.1 18.83 yr. 9.4 29.95 yr. 29.0 81.5
CAPITAL STRUCTURE as of 9/30/20Total Debt $2307.0 mill. Due in 5 Yrs $548.1 mill.LT Debt $2204.4 mill. LT Interest $80.5 mill.Incl. $15.5 mill. capitalized leases.(LT interest earned: 2.8x)
Pension Assets-12/19 $609.0 mill.Oblig $735.6 mill.
Pfd Stock None
Common Stock 50,581,973 shs.as of 10/16/20
MARKET CAP: $2.9 billion (Mid Cap)
ELECTRIC OPERATING STATISTICS2017 2018 2019
% Change Retail Sales (KWH) +3.8 +2.9 +4.6Avg. Indust. Use (MWH) 30987 34573 37808Avg. Indust. Revs. per KWH (¢) NA NA NACapacity at Peak (Mw) NA NA NAPeak Load, Winter (Mw) 2133 2173 2237Annual Load Factor (%) NA NA NA% Change Customers (yr-end) +1.3 +1.2 +1.2
Fixed Charge Cov. (%) 275 275 284ANNUAL RATES Past Past Est’d ’17-’19of change (per sh) 10 Yrs. 5 Yrs. to ’23-’25Revenues -2.5% -2.0% 1.5%‘‘Cash Flow’’ 5.0% 5.5% 3.5%Earnings 7.0% 6.0% 2.5%Dividends 5.5% 7.5% 4.0%Book Value 6.0% 7.0% 3.0%
Cal- Fullendar Year
QUARTERLY REVENUES ($ mill.)Mar.31 Jun.30 Sep.30 Dec.31
2017 367.3 283.9 309.9 344.6 1305.72018 341.5 261.8 279.9 314.9 1198.12019 384.2 270.7 274.8 328.2 1257.92020 335.3 269.4 280.6 329.7 12152021 355 285 290 335 1265Cal- Full
endar YearEARNINGS PER SHARE A
Mar.31 Jun.30 Sep.30 Dec.312017 1.17 .44 .75 .98 3.342018 1.18 .61 .56 1.06 3.402019 1.44 .49 .42 1.18 3.532020 1.00 .43 .58 1.14 3.152021 1.15 .50 .65 1.20 3.50Cal- Full
endar YearQUARTERLY DIVIDENDS PAID B ■ †
Mar.31 Jun.30 Sep.30 Dec.312017 .525 .525 .525 .525 2.102018 .55 .55 .55 .55 2.202019 .575 .575 .575 .575 2.302020 .60 .60 .60 .60 2.402021
2004 2005 2006 2007 2008 2009 2010 2011 2012 2013 2014 2015 2016 201729.18 32.57 31.49 30.79 35.09 31.72 30.66 30.80 28.76 29.80 25.68 25.21 26.01 26.453.20 4.00 3.62 3.70 4.40 4.62 4.76 5.42 5.18 5.45 5.39 5.92 6.74 6.76
d14.32 1.71 1.31 1.44 1.77 2.02 2.14 2.53 2.26 2.46 2.99 2.90 3.39 3.34- - 1.00 1.24 1.28 1.32 1.34 1.36 1.44 1.48 1.52 1.60 1.92 2.00 2.10
2.25 2.26 2.81 3.00 3.47 5.26 6.30 5.20 5.89 5.95 5.76 5.89 5.96 5.6019.92 20.60 20.65 21.12 21.25 21.86 22.64 23.68 25.09 26.60 31.50 33.22 34.68 36.4435.60 35.79 35.97 38.97 35.93 36.00 36.23 36.28 37.22 38.75 46.91 48.17 48.33 49.37
- - 17.1 26.0 21.7 13.9 11.5 12.9 12.6 15.7 16.9 16.2 18.4 17.2 17.8- - .91 1.40 1.15 .84 .77 .82 .79 1.00 .95 .85 .93 .90 .90- - 3.4% 3.6% 4.1% 5.4% 5.7% 4.9% 4.5% 4.2% 3.7% 3.3% 3.6% 3.4% 3.5%
1110.7 1117.3 1070.3 1154.5 1204.9 1214.3 1257.2 1305.777.4 92.6 83.7 94.0 120.7 138.4 164.2 162.7
25.0% 9.8% 9.6% 13.2% - - 13.7% - - 7.6%14.2% 3.3% 9.4% 8.7% 8.9% 9.8% 4.3% 5.2%57.2% 52.2% 53.8% 53.5% 53.4% 53.1% 52.0% 50.2%42.8% 47.8% 46.2% 46.5% 46.6% 46.9% 48.0% 49.8%1916.4 1797.1 2020.7 2215.7 3168.0 3408.6 3493.9 3614.52118.0 2213.3 2435.6 2690.1 3758.0 4059.5 4214.9 4358.3
5.9% 7.0% 5.5% 5.5% 4.8% 5.2% 5.9% 5.6%9.4% 10.8% 9.0% 9.1% 8.2% 8.6% 9.8% 9.0%9.4% 10.8% 9.0% 9.1% 8.2% 8.6% 9.8% 9.0%3.5% 4.7% 3.2% 3.5% 3.8% 3.0% 4.1% 3.4%63% 56% 65% 61% 54% 65% 58% 62%
2018 2019 2020 2021 © VALUE LINE PUB. LLC 23-2523.81 24.93 24.00 24.55 Revenues per sh 27.256.96 7.07 6.80 7.25 ‘‘Cash Flow’’ per sh 8.503.40 3.53 3.15 3.50 Earnings per sh A 4.002.20 2.30 2.40 2.48 Div’d Decl’d per sh B ■ † 2.755.64 6.26 7.90 8.75 Cap’l Spending per sh 7.50
38.60 40.42 41.10 42.40 Book Value per sh C 45.7550.32 50.45 50.60 51.50 Common Shs Outst’g D 53.0016.8 19.9 18.9 Avg Ann’l P/E Ratio 18.5.91 1.06 .95 Relative P/E Ratio 1.05
3.9% 3.3% 4.0% Avg Ann’l Div’d Yield 3.7%
1198.1 1257.9 1215 1265 Revenues ($mill) 1450171.1 179.3 160 180 Net Profit ($mill) 2207.6% 1.6% NMF Nil Income Tax Rate 10.0%3.4% 4.6% 6.0% 6.0% AFUDC % to Net Profit 4.0%
52.2% 52.5% 49.0% 51.5% Long-Term Debt Ratio 48.0%47.8% 47.5% 51.0% 48.5% Common Equity Ratio 52.0%4064.6 4289.8 4090 4490 Total Capital ($mill) 46754521.3 4700.9 4915 5175 Net Plant ($mill) 5800
5.2% 5.2% 5.0% 5.0% Return on Total Cap’l 5.5%8.8% 8.8% 8.0% 8.5% Return on Shr. Equity 9.0%8.8% 8.8% 8.0% 8.5% Return on Com Equity E 9.0%3.2% 3.1% 2.0% 2.5% Retained to Com Eq 3.0%64% 64% 75% 70% All Div’ds to Net Prof 66%
Company’s Financial Strength B++Stock’s Price Stability 90Price Growth Persistence 70Earnings Predictability 85
(A) Diluted EPS. Excl. gain (loss) on disc. ops.:’05, (6¢); ’06, 1¢; nonrec. gains: ’12, 39¢ net;’15, 27¢; ’18, 52¢; ’19, 45¢. ’18 EPS don’t sumdue to rounding. Next earnings report due mid-
Feb. (B) Div’ds historically paid in late Mar.,June, Sept. & Dec. ■ Div’d reinvestment planavail. (C) Incl. def’d charges. In ’19: $16.68/sh.(D) In mill. (E) Rate base: Net orig. cost. Rate
allowed on com. eq. in MT in ’19 (elec.):9.65%; in ’17 (gas): 9.55%; in SD in ’15: nonespec.; in NE in ’07: 10.4%; earned on avg.com. eq., ’19: 9.0%. Reg. Climate: Below Avg.
BUSINESS: NorthWestern Corporation (doing business as North-Western Energy) supplies electricity & gas in the Upper Midwestand Northwest, serving 443,000 electric customers in Montana andSouth Dakota and 292,000 gas customers in Montana (85% ofgross margin), South Dakota (14%), and Nebraska (1%). Electricrevenue breakdown: residential, 39%; commercial, 47%; industrial,
4%; other, 10%. Generating sources: hydro, 34%; coal, 28%; wind,5%; other, 3%; purchased, 30%. Fuel costs: 25% of revenues. ’19reported deprec. rate: 2.8%. Has 1,500 employees. Chairman:Stephen P. Adik. President & CEO: Robert C. Rowe. Inc.: Dela-ware. Address: 3010 West 69th Street, Sioux Falls, South Dakota57108. Tel.: 605-978-2900. Internet: www.northwesternenergy.com.
NorthWestern’s earnings almost cer-tainly declined in 2020. Mild weatherand unusual costs hurt the first-quartercomparison. Over the remainder of theyear, the utility was affected by the slumpin commercial and industrial kilowatt-hour sales resulting from the weak econo-my (partly offset by higher residentialvolume) and some coronavirus-relatedcosts. NorthWestern stated that it plannedto book a pretax charge of $9.5 millionagainst fourth-quarter results because theMontana commission disallowed somepurchased-power costs. We are includingthis in our earnings presentation eventhough the company is excluding it fromits targeted range of $3.30-$3.45 a share.We expect earnings in 2021 to ap-proach the 2019 tally. We figure North-Western will have a more-typical showingin the March quarter, lower coronavirus-related effects for the full-year, and nocharge for the disallowance in the Decem-ber period. Our profit estimate of $3.50 ashare is at the midpoint of the company’spreliminary guidance of $3.40-$3.60.NorthWestern is adding generatingcapacity. The company is building a 60-
megawatt gas-fired plant in South Dakotathat is scheduled to be on line in late 2021at a cost of $80 million. The utility plansto add another 30-40 mw of capacity in2023 at an expected cost of $60 million.NorthWestern canceled plans to purchasea stake in a coal-fired plant because ob-taining regulatory approval appeared un-likely. The utility has a request for propo-sals pending in Montana, and expects toannounce the winning bidder(s) in the cur-rent quarter.We think the board of directors willraise the dividend in the currentquarter. We estimate the annual dis-bursement will be hiked by $0.08 a share(3.3%). This would be a slightly smaller in-crease than in recent years. Based on ourestimates for earnings and dividends thisyear, the payout ratio would be at the up-per end of NorthWestern’s goal of 60%-70%.The dividend yield of NorthWesternstock is somewhat above the utilityaverage. Total return potential is attrac-tive for the year ahead and respectable forthe 3- to 5-year period.Paul E. Debbas, CFA January 22, 2021
LEGENDS0.71 x Dividends p shdivided by Interest Rate. . . . Relative Price Strength
Options: YesShaded area indicates recession
© 2021 Value Line, Inc. All rights reserved. Factual material is obtained from sources believed to be reliable and is provided without warranties of any kind.THE PUBLISHER IS NOT RESPONSIBLE FOR ANY ERRORS OR OMISSIONS HEREIN. This publication is strictly for subscriber’s own, non-commercial, internal use. No partof it may be reproduced, resold, stored or transmitted in any printed, electronic or other form, or used for generating or marketing any printed or electronic publication, service or product.
To subscribe call 1-800-VALUELINE
RECENTPRICE
P/ERATIO
RELATIVEP/E RATIO
DIV’DYLD( )Trailing:
Median:VALUELINE

200160
1008060504030
20
Percentsharestraded
302010
Target Price Range2023 2024 2025
PINNACLE WEST NYSE-PNW 76.69 16.1 13.616.0 0.74 4.5%
TIMELINESS 2 Lowered 11/27/20
SAFETY 1 Raised 5/3/13
TECHNICAL 3 Lowered 1/8/21BETA .90 (1.00 = Market)
18-Month Target Price RangeLow-High Midpoint (% to Mid)
$57-$134 $96 (25%)
2023-25 PROJECTIONSAnn’l Total
Price Gain ReturnHigh 120 (+55%) 15%Low 100 (+30%) 11%Institutional Decisions
1Q2020 2Q2020 3Q2020to Buy 207 229 237to Sell 277 245 229Hld’s(000) 95773 95025 93145
High: 38.0 42.7 48.9 54.7 61.9 71.1 73.3 82.8 92.5 92.6 99.8 105.5Low: 22.3 32.3 37.3 45.9 51.5 51.2 56.0 62.5 75.8 73.4 81.6 60.1
% TOT. RETURN 12/20THIS VL ARITH.*
STOCK INDEX1 yr. -8.4 18.83 yr. 3.4 29.95 yr. 46.1 81.5
CAPITAL STRUCTURE as of 9/30/20Total Debt $6374.3 mill. Due in 5 Yrs $1573.0 mill.LT Debt $6316.4 mill. LT Interest $226.5 mill.Incl. $13.4 mill. Palo Verde sale leaseback lessornotes.(LT interest earned: 3.4x)Leases, Uncapitalized Annual rentals $14.7 mill.Pension Assets-12/19 $3318.4 mill.
Oblig $3613.1 mill.Pfd Stock None
Common Stock 112,596,784 shs.as of 10/23/20MARKET CAP: $8.6 billion (Large Cap)
ELECTRIC OPERATING STATISTICS2017 2018 2019
% Change Retail Sales (KWH) - - -.3 -.3Avg. Indust. Use (MWH) 620 662 714Avg. Indust. Revs. per KWH (¢) 8.34 8.40 7.88Capacity at Peak (Mw) 8438 8643 8241Peak Load, Summer (Mw) 7363 7320 7115Annual Load Factor (%) 46.3 47.0 47.1% Change Customers (yr-end) +1.8 +2.0 +2.0
Fixed Charge Cov. (%) 425 318 286ANNUAL RATES Past Past Est’d ’17-’19of change (per sh) 10 Yrs. 5 Yrs. to ’23-’25Revenues -.5% .5% 1.5%‘‘Cash Flow’’ 2.5% 6.0% 3.5%Earnings 6.5% 5.0% 4.5%Dividends 3.0% 3.5% 6.0%Book Value 3.0% 4.0% 3.5%
Cal- Fullendar Year
QUARTERLY REVENUES ($ mill.)Mar.31 Jun.30 Sep.30 Dec.31
2017 677.7 944.6 1183.3 759.7 3565.32018 692.7 974.1 1268.0 756.4 3691.22019 740.5 869.5 1190.8 670.4 3471.22020 661.9 929.6 1254.5 729 35752021 750 900 1250 750 3650Cal- Full
endar YearEARNINGS PER SHARE A
Mar.31 Jun.30 Sep.30 Dec.312017 .21 1.49 2.46 .27 4.432018 .03 1.48 2.80 .23 4.542019 .16 1.28 2.77 .57 4.772020 .27 1.71 3.07 .05 5.102021 .15 1.50 3.15 .35 5.15Cal- Full
endar YearQUARTERLY DIVIDENDS PAID B ■
Mar.31 Jun.30 Sep.30 Dec.312017 .655 .655 .655 .695 2.662018 .695 .695 .695 .7375 2.822019 .7375 .7375 .7375 .7825 3.002020 .7825 .7825 .7825 .83 3.182021
2004 2005 2006 2007 2008 2009 2010 2011 2012 2013 2014 2015 2016 201731.59 30.16 34.03 35.07 33.37 32.50 30.01 29.67 30.09 31.35 31.58 31.50 31.42 31.906.93 5.76 9.70 9.29 8.13 8.08 6.85 7.52 7.92 8.15 8.09 9.09 9.39 9.792.58 2.24 3.17 2.96 2.12 2.26 3.08 2.99 3.50 3.66 3.58 3.92 3.95 4.431.83 1.93 2.03 2.10 2.10 2.10 2.10 2.10 2.67 2.23 2.33 2.44 2.56 2.705.86 6.39 7.59 9.37 9.46 7.64 7.03 8.26 8.24 9.36 8.38 9.84 11.64 12.80
32.14 34.57 34.48 35.15 34.16 32.69 33.86 34.98 36.20 38.07 39.50 41.30 43.15 44.8091.79 99.08 99.96 100.49 100.89 101.43 108.77 109.25 109.74 110.18 110.57 110.98 111.34 111.7515.8 19.2 13.7 14.9 16.1 13.7 12.6 14.6 14.3 15.3 15.9 16.0 18.7 19.3.83 1.02 .74 .79 .97 .91 .80 .92 .91 .86 .84 .81 .98 .97
4.5% 4.5% 4.7% 4.8% 6.2% 6.8% 5.4% 4.8% 5.3% 4.0% 4.1% 3.9% 3.5% 3.2%
3263.6 3241.4 3301.8 3454.6 3491.6 3495.4 3498.7 3565.3330.4 328.2 387.4 406.1 397.6 437.3 442.0 497.8
31.9% 34.0% 36.2% 34.4% 34.2% 34.3% 33.9% 32.5%11.7% 12.8% 9.7% 10.0% 11.6% 11.8% 14.1% 13.9%45.3% 44.1% 44.6% 40.0% 41.0% 43.0% 45.6% 48.9%54.7% 55.9% 55.4% 60.0% 59.0% 57.0% 54.4% 51.1%6729.1 6840.9 7171.9 6990.9 7398.7 8046.3 8825.4 9796.49578.8 9962.3 10396 10889 11194 11809 12714 13445
6.5% 6.4% 6.8% 7.1% 6.4% 6.4% 6.0% 6.1%9.0% 8.6% 9.8% 9.7% 9.1% 9.5% 9.2% 9.9%9.0% 8.6% 9.8% 9.7% 9.1% 9.5% 9.2% 9.9%3.1% 2.8% 4.1% 4.1% 3.5% 3.9% 3.5% 4.2%66% 68% 58% 58% 62% 59% 62% 58%
2018 2019 2020 2021 © VALUE LINE PUB. LLC 23-2532.93 30.87 31.75 32.30 Revenues per sh 34.7511.41 11.13 11.65 11.90 ‘‘Cash Flow’’ per sh 13.25
4.54 4.77 5.10 5.15 Earnings per sh A 6.002.87 3.04 3.23 3.42 Div’d Decl’d per sh B ■ 4.05
10.73 10.76 11.65 15.20 Cap’l Spending per sh 11.7546.59 48.30 50.10 51.70 Book Value per sh C 58.00
112.10 112.44 112.65 113.00 Common Shs Outst’g D 118.0017.8 19.4 16.0 Avg Ann’l P/E Ratio 18.0.96 1.03 .80 Relative P/E Ratio 1.00
3.5% 3.3% 4.0% Avg Ann’l Div’d Yield 3.7%
3691.2 3471.2 3575 3650 Revenues ($mill) 4100511.0 538.3 575 585 Net Profit ($mill) 710
20.2% 20.2% 13.0% 13.0% Income Tax Rate 13.0%15.2% 9.3% 9.0% 12.0% AFUDC % to Net Profit 7.0%47.0% 47.1% 53.0% 55.5% Long-Term Debt Ratio 57.0%53.0% 52.9% 47.0% 44.5% Common Equity Ratio 43.0%9861.1 10263 11975 13175 Total Capital ($mill) 1602514030 14523 15100 16050 Net Plant ($mill) 181006.2% 6.3% 5.5% 5.5% Return on Total Cap’l 5.5%9.8% 9.9% 10.0% 10.0% Return on Shr. Equity 10.5%9.8% 9.9% 10.0% 10.0% Return on Com Equity E 10.5%3.9% 3.8% 4.0% 3.5% Retained to Com Eq 3.5%60% 61% 63% 66% All Div’ds to Net Prof 67%
Company’s Financial Strength A+Stock’s Price Stability 90Price Growth Persistence 65Earnings Predictability 100
(A) Diluted EPS. Excl. nonrec. gain (loss): ’09,($1.45); ’17, 8¢; gains (losses) from discont.ops.: ’05, (36¢); ’06, 10¢; ’08, 28¢; ’09, (13¢);’10, 18¢; ’11, 10¢; ’12, (5¢). ’19 EPS don’t sum
due to rounding. Next earnings report due lateFeb. (B) Div’ds historically paid in early Mar.,June, Sept., & Dec. There were 5 declarationsin ’12. ■ Div’d reinvestment plan avail. (C) Incl.
deferred charges. In ’19: $14.00/sh. (D) In mill.(E) Rate base: Fair value. Rate allowed oncom. eq. in ’17: 10.0%; earned on avg. com.eq., ’19: 10.1%. Regulatory Climate: Average.
BUSINESS: Pinnacle West Capital Corporation is a holding compa-ny for Arizona Public Service Company (APS), which supplies elec-tricity to 1.3 million customers in most of Arizona, except about halfof the Phoenix metro area, the Tucson metro area, and MohaveCounty in northwestern Arizona. Discontinued SunCor real estatesubsidiary in ’10. Electric revenue breakdown: residential, 51%;
commercial, 38%; industrial, 5%; other, 6%. Generating sources:nuclear, 28%; gas & other, 28%; coal, 24%; purchased, 20%. Fuelcosts: 30% of revenues. ’19 reported deprec. rate: 2.8%. Has 6,200employees. Chairman, President & CEO: Jeffrey B. Guldner. Inc.:AZ. Address: 400 North Fifth St., P.O. Box 53999, Phoenix, AZ85072-3999. Tel.: 602-250-1000. Internet: www.pinnaclewest.com.
Pinnacle West’s utility subsidiary hasrevised its general rate case. ArizonaPublic Service originally filed for an in-crease of $184 million (5.6%), based on areturn on equity of 10.15% and a common-equity ratio of 54.7%. The utility reducedits requested hike to $169 million (5.1%),based on an ROE of 10% and the samecommon-equity ratio. APS is trying toplace capital investments in the rate baseand obtain regulatory mechanism to trackand recover certain expenses, such asproperty taxes. The staff of the ArizonaCorporation Commission recommended anincrease of $59.8 million (1.8%), based on a9.4% ROE and the same common-equityratio. There is no statutory time frame foran order, and the case has been delayedseveral months. Perhaps an increase willgo into effect as early as mid-2021. Thereis always some risk surrounding ratecases, but the fact that two of the five com-missioners are new to their positions addsuncertainty to the current proceedings.We raised our 2020 earnings estimateby $0.15 a share, to $5.10. The compa-ny’s third-quarter tally was boosted sig-nificantly by a record-hot summer in APS’
service area. In fact, upon reporting third-quarter profits, Pinnacle West raised itstargeted range by $0.20 a share, to $4.95-$5.15. The fourth-quarter comparison willalmost certainly be materially negativedue to some discretionary spending andthe acceleration of some operating ex-penses from 2021 to 2020.We look for slightly higher profits thisyear. This is based on the assumptionthat a rate increase will be in effect by thestart of the seasonally strong third quar-ter. However, APS benefited from favor-able weather conditions in the second andthird quarters of 2020, and we base our2021 estimate on normal weather.The board of directors raised the an-nual dividend $0.19 a share (6.1%) inthe fourth quarter. This has been thegrowth rate of the disbursement in recentyears. We think dividend hikes will contin-ue at that level through 2023-2025.This timely stock is attractive for con-servative income-oriented investors.The yield is above the utility average, andtotal return potential for the 18-monthspan and 3- to 5-year period are solid.Paul E. Debbas, CFA January 22, 2021
LEGENDS0.63 x Dividends p shdivided by Interest Rate. . . . Relative Price Strength
Options: YesShaded area indicates recession
© 2021 Value Line, Inc. All rights reserved. Factual material is obtained from sources believed to be reliable and is provided without warranties of any kind.THE PUBLISHER IS NOT RESPONSIBLE FOR ANY ERRORS OR OMISSIONS HEREIN. This publication is strictly for subscriber’s own, non-commercial, internal use. No partof it may be reproduced, resold, stored or transmitted in any printed, electronic or other form, or used for generating or marketing any printed or electronic publication, service or product.
To subscribe call 1-800-VALUELINE
RECENTPRICE
P/ERATIO
RELATIVEP/E RATIO
DIV’DYLD( )Trailing:
Median:VALUELINE

12896806448403224
1612
Percentsharestraded
21147
Target Price Range2023 2024 2025
PORTLAND GENERAL NYSE-POR 41.90 27.7 14.317.0 1.28 4.0%
TIMELINESS 4 Lowered 1/22/21
SAFETY 3 Lowered 9/4/20
TECHNICAL 4 Lowered 1/8/21BETA .85 (1.00 = Market)
18-Month Target Price RangeLow-High Midpoint (% to Mid)
$34-$80 $57 (35%)
2023-25 PROJECTIONSAnn’l Total
Price Gain ReturnHigh 65 (+55%) 15%Low 45 (+5%) 6%Institutional Decisions
1Q2020 2Q2020 3Q2020to Buy 132 157 147to Sell 197 158 180Hld’s(000) 86455 90761 81534
High: 21.4 22.7 26.0 28.1 33.3 40.3 41.0 45.2 50.1 50.4 58.4 63.1Low: 13.5 17.5 21.3 24.3 27.4 29.0 33.0 35.3 42.4 39.0 44.0 32.0
% TOT. RETURN 12/20THIS VL ARITH.*
STOCK INDEX1 yr. -20.3 18.83 yr. 3.7 29.95 yr. 37.9 81.5
CAPITAL STRUCTURE as of 9/30/20Total Debt $3058 mill. Due in 5 Yrs $541 mill.LT Debt $2657 mill. LT Interest $129 mill.Incl. $135 mill. capitalized leases.(LT interest earned: 2.2x)Leases, Uncapitalized Annual rentals $8 mill.Pension Assets-12/19 $695 mill.
Oblig $905 mill.Pfd Stock None
Common Stock 89,510,606 shs.as of 10/26/20
MARKET CAP: $3.8 billion (Mid Cap)
ELECTRIC OPERATING STATISTICS2017 2018 2019
% Change Retail Sales (KWH) +3.9 -2.5 +1.2Avg. Indust. Use (MWH) 16041 16207 17827Avg. Indust. Revs. per KWH (¢) 4.94 4.79 4.75Capacity at Peak (Mw) 4743 4859 NAPeak Load, Summer (Mw) 3976 3816 3765Annual Load Factor (%) NA NA NA% Change Customers (yr-end) +1.3 +1.1 +1.1
Fixed Charge Cov. (%) 298 266 265ANNUAL RATES Past Past Est’d ’17-’19of change (per sh) 10 Yrs. 5 Yrs. to ’23-’25Revenues -1.5% -1.0% 3.0%‘‘Cash Flow’’ 3.5% 4.0% 5.0%Earnings 3.5% 4.0% 4.0%Dividends 4.0% 5.5% 6.0%Book Value 3.0% 3.5% 2.5%
Cal- Fullendar Year
QUARTERLY REVENUES ($ mill.)Mar.31 Jun.30 Sep.30 Dec.31
2017 530 449 515 515 20092018 493 449 525 524 19912019 573 460 542 548 21232020 573 469 547 561 21502021 580 475 570 575 2200Cal- Full
endar YearEARNINGS PER SHARE A
Mar.31 Jun.30 Sep.30 Dec.312017 .82 .36 .44 .67 2.292018 .72 .51 .59 .55 2.372019 .82 .28 .61 .68 2.392020 .91 .43 d.19 .40 1.552021 .85 .45 .60 .75 2.65Cal- Full
endar YearQUARTERLY DIVIDENDS PAID B ■ †
Mar.31 Jun.30 Sep.30 Dec.312017 .32 .32 .34 .34 1.322018 .34 .34 .3625 .3625 1.412019 .3625 .3625 .385 .385 1.502020 .385 .385 .385 .4075 1.562021 .4075
2004 2005F 2006 2007 2008 2009 2010 2011 2012 2013 2014 2015 2016 2017- - 23.14 24.32 27.87 27.89 23.99 23.67 24.06 23.89 23.18 24.29 21.38 21.62 22.54- - 4.75 4.64 5.21 4.71 4.07 4.82 4.96 5.15 4.93 6.08 5.37 5.78 6.16- - 1.02 1.14 2.33 1.39 1.31 1.66 1.95 1.87 1.77 2.18 2.04 2.16 2.29- - - - .68 .93 .97 1.01 1.04 1.06 1.08 1.10 1.12 1.18 1.26 1.34- - 4.08 5.94 7.28 6.12 9.25 5.97 3.98 4.01 8.40 12.87 6.73 6.57 5.77- - 19.15 19.58 21.05 21.64 20.50 21.14 22.07 22.87 23.30 24.43 25.43 26.35 27.11- - 62.50 62.50 62.53 62.58 75.21 75.32 75.36 75.56 78.09 78.23 88.79 88.95 89.11- - - - 23.4 11.9 16.3 14.4 12.0 12.4 14.0 16.9 15.3 17.7 19.1 20.0- - - - 1.26 .63 .98 .96 .76 .78 .89 .95 .81 .89 1.00 1.01- - - - 2.5% 3.3% 4.3% 5.4% 5.2% 4.4% 4.1% 3.7% 3.3% 3.3% 3.1% 2.9%
1783.0 1813.0 1805.0 1810.0 1900.0 1898.0 1923.0 2009.0125.0 147.0 141.0 137.0 175.0 172.0 193.0 204.0
30.5% 28.3% 31.4% 23.2% 26.0% 20.7% 20.6% 25.3%17.6% 5.4% 7.1% 14.6% 33.7% 19.8% 16.6% 8.8%53.0% 49.6% 47.1% 51.3% 52.7% 47.8% 48.4% 50.1%47.0% 50.4% 52.9% 48.7% 47.3% 52.2% 51.6% 49.9%3390.0 3298.0 3264.0 3735.0 4037.0 4329.0 4544.0 4842.04133.0 4285.0 4392.0 4880.0 5679.0 6012.0 6434.0 6741.0
5.4% 6.2% 5.9% 5.1% 5.8% 5.4% 5.6% 5.5%7.9% 8.8% 8.2% 7.5% 9.2% 7.6% 8.2% 8.4%7.9% 8.8% 8.2% 7.5% 9.2% 7.6% 8.2% 8.4%3.0% 4.1% 3.5% 2.9% 4.6% 3.3% 3.5% 3.6%62% 54% 57% 61% 50% 56% 57% 58%
2018 2019 2020 2021 © VALUE LINE PUB. LLC 23-2522.30 23.75 24.00 24.55 Revenues per sh 27.256.65 6.97 6.25 7.50 ‘‘Cash Flow’’ per sh 8.752.37 2.39 1.55 2.65 Earnings per sh A 3.001.43 1.52 1.59 1.68 Div’d Decl’d per sh B ■ † 2.006.67 6.78 8.60 7.45 Cap’l Spending per sh 6.00
28.07 28.99 28.95 29.90 Book Value per sh C 33.0089.27 89.39 89.55 89.65 Common Shs Outst’g D 90.0018.4 22.3 29.4 Avg Ann’l P/E Ratio 18.0.99 1.19 1.50 Relative P/E Ratio 1.00
3.3% 2.8% 3.5% Avg Ann’l Div’d Yield 3.7%
1991.0 2123.0 2150 2200 Revenues ($mill) 2450212.0 214.0 140 240 Net Profit ($mill) 2757.4% 11.2% Nil 11.0% Income Tax Rate 11.0%8.0% 7.0% 14.0% 6.0% AFUDC % to Net Profit 6.0%
46.5% 51.3% 53.5% 55.0% Long-Term Debt Ratio 54.0%53.5% 48.7% 46.5% 45.0% Common Equity Ratio 46.0%4684.0 5323.0 5575 5965 Total Capital ($mill) 64756887.0 7161.0 7510 7745 Net Plant ($mill) 7875
5.8% 5.1% 3.5% 5.0% Return on Total Cap’l 5.5%8.5% 8.3% 5.5% 9.0% Return on Shr. Equity 9.5%8.5% 8.3% 5.5% 9.0% Return on Com Equity E 9.5%3.5% 3.1% NMF 3.0% Retained to Com Eq 3.0%59% 63% NMF 63% All Div’ds to Net Prof 65%
Company’s Financial Strength B++Stock’s Price Stability 90Price Growth Persistence 75Earnings Predictability 90
(A) Diluted EPS. Excl. nonrecurring losses: ’13,42¢; ’17, 19¢. Next earnings report due mid-Feb. (B) Div’ds paid mid-Jan., Apr., July, andOct. ■ Div’d reinvestment plan avail. † Share-
holder investment plan avail. (C) Incl. deferredcharges. In ’19: $483 mill., $5.40/sh. (D) In mill.(E) Rate base: Net orig. cost. Rate allowed oncom. eq. in ’19: 9.5%; earned on avg. com. eq.,
’19: 8.4%. Regulatory Climate: Average. (F) ’05per-share data are pro forma, based on shs.outstanding when stock began trading in ’06.
BUSINESS: Portland General Electric Company (PGE) provideselectricity to 901,000 customers in 52 cities in a 4,000-square-milearea of Oregon, including Portland and Salem. The company is inthe process of decommissioning the Trojan nuclear plant, which itclosed in 1993. Electric revenue breakdown: residential, 47%; com-mercial, 30%; industrial, 9%; other, 14%. Generating sources: gas,
36%; coal, 19%; wind, 8%; hydro, 6%; purchased, 31%. Fuel costs:29% of revenues. ’19 reported depreciation rate: 3.6%. Has 2,900employees. Chairman: Jack E. Davis. President and Chief Execu-tive Officer: Maria M. Pope. Incorporated: Oregon. Address: 121S.W. Salmon Street, Portland, Oregon 97204. Telephone: 503-464-8000. Internet: www.portlandgeneral.com.
Portland General Electric’s earningsalmost certainly declined sharply in2020. The reason was a large energy-trading loss in August. This hurt third-quarter and full-year profits by $1.09 ashare, and sent the September-period tallyinto the red. The company established acommittee of board members to review itsoperations, and made some changes inpersonnel and its organizational structureas a result. The costs of these changeswere not material, and PGE cut some ex-penses to offset part of the cost of the trad-ing loss. Management is guiding WallStreet to the upper half of its earnings tar-get of $1.40-$1.60 a share.We expect an earnings recovery thisyear. The energy-trading loss was limitedto the incident in the third quarter of2020, so we assume no recurrence of anysuch problems. We also expect the utilityto benefit from a better economy in itsservice area. Renewable-energy invest-ments are being recovered through a re-newable adjustment clause. PGE’s long-term goal for annual earnings growth is4%-6%, using the 2019 tally as the base.We expect a dividend increase, too, as the
company expects the trading loss will notaffect this.A noteworthy capital project wascompleted in 2020, and another is ontrack for completion in 2021. PGE hasa one-third stake in a 300-megawatt wind-farm in a joint venture with NextEra En-ergy. (In conjunction with the project, thelatter company will own 50 mw of solar ca-pacity and 30 mw of battery of storagethat are scheduled for completion by year-end.) The cost of PGE’s share of the wind-farm was $160 million. The company isbuilding an integrated operations center atan expected cost of $200 million. This isscheduled for completion by yearend.Despite the trading loss, finances aresound. Interest coverage is adequate, andthe common-equity ratio is healthy. PGEdoes not need to issue equity to finance itscapital expenditures. PGE’s FinancialStrength rating is B++.This untimely stock’s dividend yield isslightly above the utility average. Theequity is noteworthy for its 18-month pros-pects, however, and offers respectable 3- to5-year total return potential.Paul E. Debbas, CFA January 22, 2021
LEGENDS0.73 x Dividends p shdivided by Interest Rate. . . . Relative Price Strength
Options: YesShaded area indicates recession
© 2021 Value Line, Inc. All rights reserved. Factual material is obtained from sources believed to be reliable and is provided without warranties of any kind.THE PUBLISHER IS NOT RESPONSIBLE FOR ANY ERRORS OR OMISSIONS HEREIN. This publication is strictly for subscriber’s own, non-commercial, internal use. No partof it may be reproduced, resold, stored or transmitted in any printed, electronic or other form, or used for generating or marketing any printed or electronic publication, service or product.
To subscribe call 1-800-VALUELINE
RECENTPRICE
P/ERATIO
RELATIVEP/E RATIO
DIV’DYLD( )Trailing:
Median:VALUELINE

1601201008060504030
2015
Percentsharestraded
302010
Target Price Range2023 2024 2025
XCEL ENERGY NDQ-XEL 64.40 22.2 23.016.0 1.02 2.8%
TIMELINESS 1 Raised 12/4/20
SAFETY 1 Raised 5/1/15
TECHNICAL 2 Lowered 1/15/21BETA .80 (1.00 = Market)
18-Month Target Price RangeLow-High Midpoint (% to Mid)
$51-$106 $79 (20%)
2023-25 PROJECTIONSAnn’l Total
Price Gain ReturnHigh 70 (+10%) 5%Low 55 (-15%) NilInstitutional Decisions
1Q2020 2Q2020 3Q2020to Buy 365 343 356to Sell 378 366 362Hld’s(000) 407479 412864 407854
High: 21.9 24.4 27.8 29.9 31.8 37.6 38.3 45.4 52.2 54.1 66.1 76.4Low: 16.0 19.8 21.2 25.8 26.8 27.3 31.8 35.2 40.0 41.5 47.7 46.6
% TOT. RETURN 12/20THIS VL ARITH.*
STOCK INDEX1 yr. 7.8 18.83 yr. 51.1 29.95 yr. 115.7 81.5
CAPITAL STRUCTURE as of 9/30/20Total Debt $20861 mill. Due in 5 Yrs $3725 mill.LT Debt $19960 mill. LT Interest $800 mill.Incl. $77 mill. capitalized leases.(LT interest earned: 2.8x)
Leases, Uncapitalized Annual rentals $262 mill.Pension Assets-12/19 $3184 mill.
Oblig $3701 mill.Pfd Stock None
Common Stock 525,457,773 shs.as of 10/19/20MARKET CAP: $34 billion (Large Cap)
ELECTRIC OPERATING STATISTICS2017 2018 2019
% Change Retail Sales (KWH) -.7 +3.2 -1.2Large C & I Use (MWH) 22642 23004 NALarge C & I Revs. per KWH (¢) 6.36 5.91 5.96Capacity at Peak (Mw) NA NA NAPeak Load, Summer (Mw) 19591 20293 20146Annual Load Factor (%) NA NA NA% Change Customers (yr-end) +.9 +1.1 +1.0
Fixed Charge Cov. (%) 330 281 272ANNUAL RATES Past Past Est’d ’17-’19of change (per sh) 10 Yrs. 5 Yrs. to ’23-’25Revenues -.5% .5% 1.5%‘‘Cash Flow’’ 5.5% 7.5% 7.5%Earnings 5.5% 5.0% 6.0%Dividends 5.0% 6.5% 6.0%Book Value 4.5% 4.5% 5.5%
Cal- Fullendar Year
QUARTERLY REVENUES ($ mill.)Mar.31 Jun.30 Sep.30 Dec.31
2017 2946 2645 3017 2796 114042018 2951 2658 3048 2880 115372019 3141 2577 3013 2798 115292020 2811 2586 3182 2821 114002021 3100 2700 3150 3050 12000Cal- Full
endar YearEARNINGS PER SHARE A
Mar.31 Jun.30 Sep.30 Dec.312017 .47 .45 .97 .42 2.302018 .57 .52 .96 .42 2.472019 .61 .46 1.01 .56 2.642020 .56 .54 1.14 .56 2.802021 .65 .55 1.15 .60 2.95Cal- Full
endar YearQUARTERLY DIVIDENDS PAID B ■
Mar.31 Jun.30 Sep.30 Dec.312017 .34 .36 .36 .36 1.422018 .36 .38 .38 .38 1.502019 .38 .405 .405 .405 1.602020 .405 .43 .43 .43 1.702021
2004 2005 2006 2007 2008 2009 2010 2011 2012 2013 2014 2015 2016 201720.84 23.86 24.16 23.40 24.69 21.08 21.38 21.90 20.76 21.92 23.11 21.72 21.90 22.463.27 3.28 3.61 3.45 3.50 3.48 3.51 3.79 4.00 4.10 4.28 4.56 5.04 5.471.27 1.20 1.35 1.35 1.46 1.49 1.56 1.72 1.85 1.91 2.03 2.10 2.21 2.30.81 .85 .88 .91 .94 .97 1.00 1.03 1.07 1.11 1.20 1.28 1.36 1.44
3.19 3.25 4.00 4.89 4.66 3.91 4.60 4.53 5.27 6.82 6.33 7.26 6.42 6.5412.99 13.37 14.28 14.70 15.35 15.92 16.76 17.44 18.19 19.21 20.20 20.89 21.73 22.56
400.46 403.39 407.30 428.78 453.79 457.51 482.33 486.49 487.96 497.97 505.73 507.54 507.22 507.7613.6 15.4 14.8 16.7 13.7 12.7 14.1 14.2 14.8 15.0 15.4 16.5 18.5 20.2.72 .82 .80 .89 .82 .85 .90 .89 .94 .84 .81 .83 .97 1.02
4.7% 4.6% 4.4% 4.0% 4.7% 5.1% 4.5% 4.2% 3.9% 3.9% 3.8% 3.7% 3.3% 3.1%
10311 10655 10128 10915 11686 11024 11107 11404727.0 841.4 905.2 948.2 1021.3 1063.6 1123.4 1171.0
37.5% 35.8% 33.2% 33.8% 33.9% 35.8% 34.1% 30.7%11.7% 9.4% 10.8% 13.4% 12.5% 7.7% 7.8% 9.4%53.1% 51.1% 53.3% 53.3% 53.0% 54.1% 56.3% 55.9%46.3% 48.9% 46.7% 46.7% 47.0% 45.9% 43.7% 44.1%17452 17331 19018 20477 21714 23092 25216 2597520663 22353 23809 26122 28757 31206 32842 343295.7% 6.5% 6.1% 6.0% 6.0% 5.8% 5.7% 5.8%8.9% 9.9% 10.2% 9.9% 10.0% 10.0% 10.2% 10.2%8.9% 9.9% 10.2% 9.9% 10.0% 10.0% 10.2% 10.2%3.6% 4.3% 4.7% 4.5% 4.5% 4.3% 4.0% 3.9%59% 56% 54% 54% 55% 57% 61% 62%
2018 2019 2020 2021 © VALUE LINE PUB. LLC 23-2522.44 21.98 21.15 22.15 Revenues per sh 24.255.92 6.25 6.60 7.20 ‘‘Cash Flow’’ per sh 9.002.47 2.64 2.80 2.95 Earnings per sh A 3.501.52 1.62 1.72 1.82 Div’d Decl’d per sh B ■ 2.157.70 8.05 6.70 7.70 Cap’l Spending per sh 8.25
23.78 25.24 27.25 28.55 Book Value per sh C 33.25514.04 524.54 539.00 542.00 Common Shs Outst’g D 555.00
18.9 22.3 23.8 Avg Ann’l P/E Ratio 18.01.02 1.19 1.20 Relative P/E Ratio 1.00
3.3% 2.7% 2.6% Avg Ann’l Div’d Yield 3.4%
11537 11529 11400 12000 Revenues ($mill) 135001261.0 1372.0 1480 1600 Net Profit ($mill) 196012.6% 8.5% Nil NMF Income Tax Rate NMF12.4% 8.3% 11.0% 7.0% AFUDC % to Net Profit 7.0%56.4% 56.8% 57.0% 56.0% Long-Term Debt Ratio 55.5%43.6% 43.2% 43.0% 44.0% Common Equity Ratio 44.5%28025 30646 34350 35325 Total Capital ($mill) 4150036944 39483 41000 42875 Net Plant ($mill) 484005.7% 5.6% 5.5% 5.5% Return on Total Cap’l 6.0%
10.3% 10.4% 10.0% 10.5% Return on Shr. Equity 10.5%10.3% 10.4% 10.0% 10.5% Return on Com Equity E 10.5%
4.3% 4.4% 4.0% 4.0% Retained to Com Eq 4.0%58% 58% 62% 61% All Div’ds to Net Prof 61%
Company’s Financial Strength A+Stock’s Price Stability 95Price Growth Persistence 65Earnings Predictability 100
(A) Diluted EPS. Excl. nonrecurring gain(losses): ’10, 5¢; ’15, (16¢); ’17, (5¢); gains(losses) on discontinued ops.: ’04, (30¢); ’05,3¢; ’06, 1¢; ’09, (1¢); ’10, 1¢. ’17 EPS don’t
sum due to rounding. Next earnings report duelate Jan. (B) Div’ds historically paid mid-Jan.,Apr., July, and Oct. ■ Div’d reinvestment planavailable. (C) Incl. intangibles. In ’19: $5.60/sh.
(D) In mill. (E) Rate base: Varies. Rate allowedon com. eq. (blended): 9.6%; earned on avg.com. eq., ’19: 10.8%. Regulatory Climate:Average.
BUSINESS: Xcel Energy Inc. is the parent of Northern StatesPower, which supplies electricity to Minnesota, Wisconsin, NorthDakota, South Dakota & Michigan & gas to Minnesota, Wisconsin,North Dakota & Michigan; P.S. of Colorado, which supplies electri-city & gas to Colorado; & Southwestern Public Service, which sup-plies electricity to Texas & New Mexico. Customers: 3.7 mill. elec.,
2.1 mill. gas. Elec. rev. breakdown: res’l, 31%; sm. comm’l & ind’l,36%; lg. comm’l & ind’l, 18%; other, 15%. Generating sources notavail. Fuel costs: 39% of revs. ’19 reported depr. rate: 3.3%. Has11,300 empls. Chairman & CEO: Ben Fowke. President & COO:Bob Frenzel. Inc.: MN. Address: 414 Nicollet Mall, Minneapolis, MN55401. Tel.: 612-330-5500. Internet: www.xcelenergy.com.
Xcel Energy’s Northern States Powerfacility will not have a general ratecase in Minnesota in 2021. NSP hadfiled a request for a multiyear rate hikeover three years, but included an alterna-tive proposal for a continuation of mechan-isms that benefited the utility’s earningpower in 2020 by adjusting revenues forfluctuations in sales, earning a return oncertain capital expenditures, and re-couping higher property taxes. The com-mission adopted the alternative proposal,just as it did a year earlier. NSP did file atraditional rate case in North Dakota. Theutility asked for a hike of $22 million(10.8%), based on a return on equity of10.2% and a common-equity ratio of52.5%. An interim increase of $16 millionthis month, and a final order is expectedin the third quarter.The Minnesota commission approveda proposal to repower some windprojects. This will add 650 megawatts ofcapacity at a cost of $750 million. NSPplans to ask the regulators to approve theaddition of 460 mw of solar capacity at aprojected cost of $650 million. The spend-ing will occur from 2021 through 2024.
A rate filing is pending in New Mexicoand upcoming in Texas. SouthwesternPublic Service filed for an $88 million in-crease in New Mexico, based on a 10.35%ROE and a 54.7% common-equity ratio.We were expecting an application in Texasas this report went to press. The utilitywants to place a wind project in the ratebase. Orders on the cases are expectedlater in 2021, but won’t likely have mucheffect on Xcel’s earning power until nextyear.Earnings probably rose strongly in2020, and we expect another solid in-crease this year. Xcel’s utilities are bene-fiting from rate relief. Effective cost con-trol is helping, too. We have raised our2020 and 2021 share-earnings estimates$0.05 each year. These are within the com-pany’s guidance of $2.75-$2.81 and $2.90-$3.00 for 2020 and 2021, respectively.This timely and high-quality equityhas a low dividend yield for a utility.This is about a percentage point below theindustry mean. Total return potential isattractive for the 18-month span, but lowfor the 2023-2025 period.Paul E. Debbas, CFA January 22, 2021
LEGENDS0.68 x Dividends p shdivided by Interest Rate. . . . Relative Price Strength
Options: YesShaded area indicates recession
© 2021 Value Line, Inc. All rights reserved. Factual material is obtained from sources believed to be reliable and is provided without warranties of any kind.THE PUBLISHER IS NOT RESPONSIBLE FOR ANY ERRORS OR OMISSIONS HEREIN. This publication is strictly for subscriber’s own, non-commercial, internal use. No partof it may be reproduced, resold, stored or transmitted in any printed, electronic or other form, or used for generating or marketing any printed or electronic publication, service or product.
To subscribe call 1-800-VALUELINE
RECENTPRICE
P/ERATIO
RELATIVEP/E RATIO
DIV’DYLD( )Trailing:
Median:VALUELINE

{00546823;6}
Exhibit TJB-4: Cost of Capital Analysis (containing Tables 1 through 11)

Exhibit TJB-4Table 1Witness: Bourassa
LineNo.
1 DCF Constant Growth - Table 6 8.8% 10.0%
2 Risk Premium (Historical Returns)- Table 8 9.2% 10.4%
3 Risk Premium (Authorized ROEs) - Table 9 9.9% 11.1%
4 CAPM - Table 11 9.8% 11.0%
5 Mid-point 9.3% 10.5%
6 Cost of Equity Recommendation
Notes:1Estimates include an equity risk premium of 120 basis points. See Testimony.
and a financial risk adjustment of 0 basis points. See Testimony.
Liberty Utilities (Calpeco Electric) Corp.Summary of Results
Indicated Indicated Cost of Equity for
10.5%
Sample Group Company1Cost of Equity for

Exhibit TJB-4Table 2Witness: Bourassa
Operating Net Number of MarketLine Revenues Plant Customers Value Line Capitalization SizeNo. Company Symbol (millions)1 (millions)1 (thousands) Beta1 (millions)1 Category2
1 ALLETE ALE 1,169 4,841 149 0.90 3,295 Mid-Cap2 Alliant Energy LNT 3,648 13,087 1,400 0.85 11,871 Large-Cap3 Amer. Elec. Power AEP 14,919 63,902 5,400 0.75 38,288 Large-Cap4 Ameren Corp. AEE 5,794 26,807 3,350 0.80 18,086 Large-Cap5 Avista Corp. AVA 1,322 4,992 771 0.95 2,729 Mid-Cap6 Black Hills BKH 1,735 5,503 1,209 1.00 3,815 Mid-Cap7 CMS Energy Corp. CMS 6,680 21,039 3,600 0.75 15,768 Large-Cap8 Consol. Edison ED 12,246 46,555 4,900 0.75 22,814 Large-Cap9 DTE Energy DTE 12,177 27,969 3,400 0.95 24,008 Large-Cap10 Duke Energy DUK 25,079 102,127 8,900 0.85 64,282 Large-Cap11 Edison Int'l EIX 12,347 44,285 5,100 0.95 21,375 Large-Cap12 Entergy Corp. ETR 10,879 35,183 3,100 0.95 18,015 Large-Cap13 Fortis Inc. FTS.TO 8,935 35,998 3,300 0.75 23,023 Large-Cap14 Hawaiian Elec. HE 2,875 5,110 462 0.80 3,761 Mid-Cap15 IDACORP Inc. IDA 1,351 4,710 454 0.80 4,458 Mid-Cap16 MGE Energy MGEE 569 1,643 309 0.70 2,353 Low-Cap17 Northwestern Corp. NWE 1,199 4,953 735 0.95 3,050 Mid-Cap18 Pinnacle West Capital PNW 3,587 15,159 1,200 0.90 8,238 Mid-Cap19 Portland General POR 2,145 7,539 877 0.90 3,868 Mid-Cap20 Public Serv. Enterprise PEG 10,076 35,844 4,000 0.90 28,249 Large-Cap21 WEC Energy Group WEC 7,242 25,707 4,500 0.80 25,844 Large-Cap22 Xcel Energy Inc. XEL 11,526 42,950 5,500 0.80 32,359 Large-Cap
23 Average 7,159$ 26,177$ 2,846 0.85 17,252$
Indicated3
24 Liberty Utilities (Calpeco Electric) Corp. 82.6$ 361.8$ 50 1.00 N/A
Notes:1 Value Line Analyzer Data (Weekly as of Feburary 24, 2021)2 See work papers.3 See Risk Study Exhibit TJB-5, page 6.
Liberty Utilities (Calpeco Electric) Corp.Selected Characteristics of Sample Group of Water Utilities
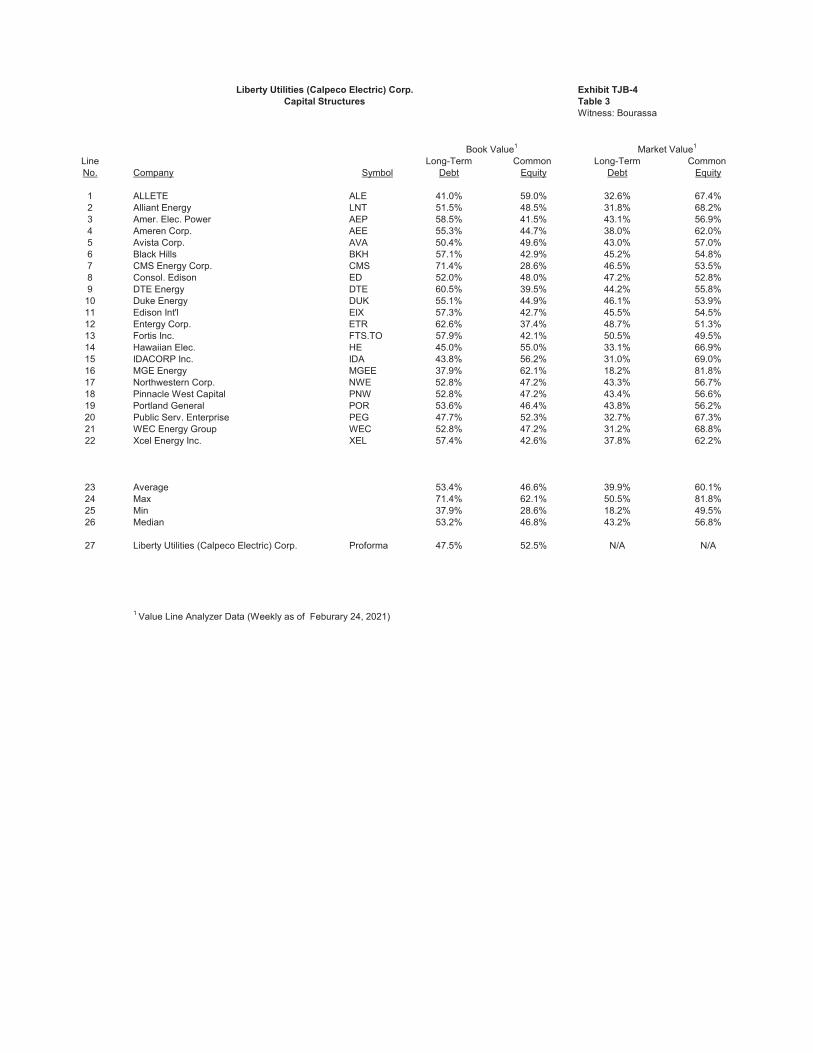
Exhibit TJB-4Table 3Witness: Bourassa
Line Long-Term Common Long-Term Common No. Company Symbol Debt Equity Debt Equity
1 ALLETE ALE 41.0% 59.0% 32.6% 67.4%2 Alliant Energy LNT 51.5% 48.5% 31.8% 68.2%3 Amer. Elec. Power AEP 58.5% 41.5% 43.1% 56.9%4 Ameren Corp. AEE 55.3% 44.7% 38.0% 62.0%5 Avista Corp. AVA 50.4% 49.6% 43.0% 57.0%6 Black Hills BKH 57.1% 42.9% 45.2% 54.8%7 CMS Energy Corp. CMS 71.4% 28.6% 46.5% 53.5%8 Consol. Edison ED 52.0% 48.0% 47.2% 52.8%9 DTE Energy DTE 60.5% 39.5% 44.2% 55.8%10 Duke Energy DUK 55.1% 44.9% 46.1% 53.9%11 Edison Int'l EIX 57.3% 42.7% 45.5% 54.5%12 Entergy Corp. ETR 62.6% 37.4% 48.7% 51.3%13 Fortis Inc. FTS.TO 57.9% 42.1% 50.5% 49.5%14 Hawaiian Elec. HE 45.0% 55.0% 33.1% 66.9%15 IDACORP Inc. IDA 43.8% 56.2% 31.0% 69.0%16 MGE Energy MGEE 37.9% 62.1% 18.2% 81.8%17 Northwestern Corp. NWE 52.8% 47.2% 43.3% 56.7%18 Pinnacle West Capital PNW 52.8% 47.2% 43.4% 56.6%19 Portland General POR 53.6% 46.4% 43.8% 56.2%20 Public Serv. Enterprise PEG 47.7% 52.3% 32.7% 67.3%21 WEC Energy Group WEC 52.8% 47.2% 31.2% 68.8%22 Xcel Energy Inc. XEL 57.4% 42.6% 37.8% 62.2%
23 Average 53.4% 46.6% 39.9% 60.1%24 Max 71.4% 62.1% 50.5% 81.8%25 Min 37.9% 28.6% 18.2% 49.5%26 Median 53.2% 46.8% 43.2% 56.8%
27 Liberty Utilities (Calpeco Electric) Corp. Proforma 47.5% 52.5% N/A N/A
1 Value Line Analyzer Data (Weekly as of Feburary 24, 2021)
Book Value1 Market Value1
Liberty Utilities (Calpeco Electric) Corp.Capital Structures

Exhibit TJB-4Table 4Witness: Bourassa
[1] [2] [3] [4] [5] [6] [7] [8] [9]Historical Value Line Zack's Yahoo Average
Line Stock Book Average Growth Projected Projected Finance ProjectedNo. Company Symbol Price1 Value2 EPS2 DPS2 Col. 1-4 Growth2 Growth3 Growth4 Growth1 ALLETE ALE 4.03% 4.50% 2.50% 3.50% 3.63% 4.50% N/A 7.00% 5.75%2 Alliant Energy LNT 10.54% 5.50% 6.00% 7.00% 7.26% 5.50% 5.89% 5.80% 5.73%3 Amer. Elec. Power AEP 7.40% 3.00% 4.00% 5.50% 4.98% 6.00% 5.29% 6.00% 5.76%4 Ameren Corp. AEE 12.55% 3.50% 8.00% 3.50% 6.89% 6.00% 6.80% 6.60% 6.47%5 Avista Corp. AVA 10.72% 4.00% 4.50% 4.00% 5.81% 1.00% 6.88% 6.00% 4.63%6 Black Hills BKH 5.77% 4.00% 7.00% 5.00% 5.44% 3.50% 5.21% 4.68% 4.46%7 CMS Energy Corp. CMS 11.08% 5.50% 7.00% 7.00% 7.64% 7.50% 6.95% 7.26% 7.24%8 Consol. Edison ED 2.37% 4.50% 1.50% 3.00% 2.84% 2.50% 2.00% 1.77% 2.09%9 DTE Energy DTE 8.65% 5.00% 8.00% 7.50% 7.29% 6.00% 5.67% 6.05% 5.91%10 Duke Energy DUK 5.10% 1.00% 2.50% 3.00% 2.90% 5.00% 5.23% 4.95% 5.06%11 Edison Int'l EIX 1.19% 2.50% 11.50% 5.06% 12.00% 3.12% NM 7.56%12 Entergy Corp. ETR -2.50% 0.50% 1.50% NEG 3.00% 5.17% 5.15% 4.44%13 Fortis Inc. FTS.TO 4.42% 7.50% 9.00% 7.00% 6.98% 2.50% 6.24% N/A 4.37%14 Hawaiian Elec. HE 4.10% 3.50% 2.00% 0.00% 2.40% 1.50% 1.27% 1.30% 1.36%15 IDACORP Inc. IDA 7.15% 4.50% 4.00% 8.00% 5.91% 4.50% 2.63% 2.60% 3.24%16 MGE Energy MGEE 8.58% 5.50% 2.50% 4.00% 5.15% 4.00% 4.71% 4.70% 4.47%17 Northwestern Corp. NWE 1.45% 5.50% 3.50% 6.50% 4.24% 2.50% 5.27% 4.66% 4.14%18 Pinnacle West Capital PNW 4.39% 4.00% 5.00% 5.50% 4.72% 4.50% 3.55% 3.70% 3.92%19 Portland General POR 3.29% 3.50% 1.50% 6.00% 3.57% 4.00% 5.48% 5.50% 4.99%20 Public Serv. Enterprise PEG 8.55% 4.50% 4.00% 4.50% 5.39% 5.00% 3.03% 3.00% 3.68%21 WEC Energy Group WEC 12.39% 8.00% 7.50% 8.50% 9.10% 6.00% 6.11% 6.14% 6.08%22 Xcel Energy Inc. XEL 13.17% 5.00% 5.50% 6.00% 7.42% 6.00% 6.08% 6.20% 6.09%
23 GROUP AVERAGE 7.00% 4.18% 4.57% 5.36% 5.46% 4.68% 4.88% 4.95% 4.88%
Notes:1 Compound annual growth in stock prices ending December 31 through 2020. Data from Yahoo Finance website.2 Value Line Analyzer, weekly as of Feburary 24, 2021.3 Zack's Investment Research website Feburary 22, 2021.4 Yahoo Finance website February 22, 2021.
Liberty Utilities (Calpeco Electric) Corp.Comparisons of Past and Future Estimates of Growth
Five-year historical annual changes

Exhibit TJB-4Table 5Witness: Bourassa
[1] [2] [3] [4]Average
Current AnnualLine Stock Current Dividend DividendNo. Company Symbol Price (P0)
1 Dividend (D0)1 Yield (D0/P0) Yield (D0/P0)
1,2
1 ALLETE ALE 61.28 2.47 4.03% 4.03%2 Alliant Energy LNT 47.11 1.42 3.01% 2.88%3 Amer. Elec. Power AEP 76.45 2.84 3.71% 3.28%4 Ameren Corp. AEE 71.91 2.00 2.78% 2.57%5 Avista Corp. AVA 39.58 1.62 4.09% 4.03%6 Black Hills BKH 59.96 2.05 3.42% 2.74%7 CMS Energy Corp. CMS 54.88 1.63 2.97% 2.65%8 Consol. Edison ED 67.08 3.06 4.56% 3.87%9 DTE Energy DTE 117.97 4.12 3.49% 3.57%10 Duke Energy DUK 87.24 3.74 4.29% 4.17%11 Edison Int'l EIX 54.90 2.47 4.50% 3.73%12 Entergy Corp. ETR 88.76 3.66 4.12% 3.52%13 Fortis Inc. FTS.TO 49.94 1.97 3.94% 3.66%14 Hawaiian Elec. HE 35.44 1.28 3.61% 3.02%15 IDACORP Inc. IDA 86.14 2.72 3.16% 2.92%16 MGE Energy MGEE 64.48 1.38 2.14% 1.94%17 Northwestern Corp. NWE 59.53 2.40 4.03% 4.02%18 Pinnacle West CapitalPNW 73.72 3.23 4.38% 3.97%19 Portland General POR 41.43 1.59 3.84% 3.47%20 Public Serv. EnterprisePEG 54.61 1.88 3.44% 3.19%21 WEC Energy Group WEC 83.03 2.53 3.05% 2.68%22 Xcel Energy Inc. XEL 58.98 1.72 2.92% 2.58%
23 GROUP AVERAGE 3.61% 3.30%
Notes:1 Stock prices as of March 2, 2021. Indicated Dividend from Value Line Analyzer weekly as of February 24, 2021.2 Average Annual Dividend is dividends declared per share for a year divided by the average annual price of the stock in the same year, expressed as a percentage. As report by Value Line Analyzer software. For comparison purposes only.
Liberty Utilities (Calpeco Electric) Corp.Current Dividend Yields for Water Utility Sample Group

Exhibit TJB-4Table 6Witness: Bourassa
[1] [2] [3] [4] [5]IndicatedCost of Adjusted
Expected Average Equity (COE) IndicatedLine Dividend Dividend Projected k=Div Yld + g Cost ofNo. Company Symbol Yield (D0/P0)
1 Yield (D1/P0)2 Growth (g)3
(Cols 2+3) Equity (COE)4
1 ALLETE ALE 4.03% 4.15% + 5.75% = 10.4% 10.4%2 Alliant Energy LNT 3.01% 3.10% + 5.73% = 8.8% 8.8%3 Amer. Elec. Power AEP 3.71% 3.82% + 5.76% = 9.6% 9.6%4 Ameren Corp. AEE 2.78% 2.87% + 6.47% = 9.3% 9.3%5 Avista Corp. AVA 4.09% 4.19% + 4.63% = 8.8% 8.8%6 Black Hills BKH 3.42% 3.50% + 4.46% = 8.0% 8.0%7 CMS Energy Corp. CMS 2.97% 3.08% + 7.24% = 10.3% 10.3%8 Consol. Edison ED 4.56% 4.61% + 2.09% = 6.7% 6.7%9 DTE Energy DTE 3.49% 3.60% + 5.91% = 9.5% 9.5%10 Duke Energy DUK 4.29% 4.40% + 5.06% = 9.5% 9.5%11 Edison Int'l EIX 4.50% 4.67% + 7.56% = 12.2% 12.2%12 Entergy Corp. ETR 4.12% 4.22% + 4.44% = 8.7% 8.7%13 Fortis Inc. FTS.TO 3.94% 4.03% + 4.37% = 8.4% 8.4%14 Hawaiian Elec. HE 3.61% 3.64% + 1.36% = 5.0%15 IDACORP Inc. IDA 3.16% 3.21% + 3.24% = 6.5% 6.5%16 MGE Energy MGEE 2.14% 2.19% + 4.47% = 6.7% 6.7%17 Northwestern Corp. NWE 4.03% 4.12% + 4.14% = 8.3% 8.3%18 Pinnacle West Capital PNW 4.38% 4.47% + 3.92% = 8.4% 8.4%19 Portland General POR 3.84% 3.93% + 4.99% = 8.9% 8.9%20 Public Serv. Enterprise PEG 3.44% 3.51% + 3.68% = 7.2% 7.2%21 WEC Energy Group WEC 3.05% 3.14% + 6.08% = 9.2% 9.2%22 Xcel Energy Inc. XEL 2.92% 3.01% + 6.09% = 9.1% 9.1%
23 Average 3.61% 3.70% + 4.88% = 8.6% 8.8%
1 Spot Dividend Yield = D0/P0. Source Table 5.2 Expected Dividend Yield = D1/P0 = D0/P0 * (1+g/2). 3 Growth (g). Source Table 4.4 Excludes results less than the forecast yield on Baa bonds plus 100 basis points. See testimony.
Liberty Utilities (Calpeco Electric) Corp.Discounted Cash Flow Analysis
DCF Constant Growth
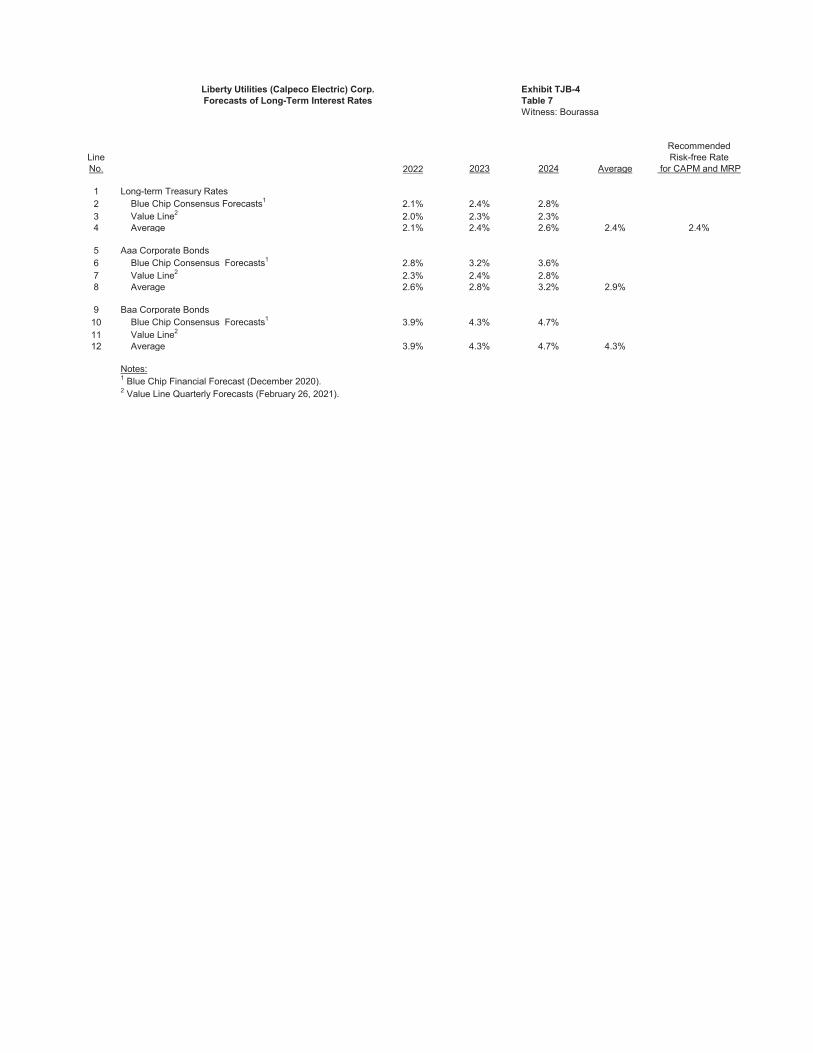
Exhibit TJB-4Table 7Witness: Bourassa
RecommendedLine Risk-free RateNo. 2022 2023 2024 Average for CAPM and MRP
1 Long-term Treasury Rates2 Blue Chip Consensus Forecasts1 2.1% 2.4% 2.8%3 Value Line2 2.0% 2.3% 2.3%4 Average 2.1% 2.4% 2.6% 2.4% 2.4%
5 Aaa Corporate Bonds6 Blue Chip Consensus Forecasts1 2.8% 3.2% 3.6%7 Value Line2 2.3% 2.4% 2.8%8 Average 2.6% 2.8% 3.2% 2.9%
9 Baa Corporate Bonds10 Blue Chip Consensus Forecasts1 3.9% 4.3% 4.7%11 Value Line2
12 Average 3.9% 4.3% 4.7% 4.3%
Notes:1 Blue Chip Financial Forecast (December 2020).2 Value Line Quarterly Forecasts (February 26, 2021).
Liberty Utilities (Calpeco Electric) Corp.Forecasts of Long-Term Interest Rates

Exhibit TJB-4Table 8Witness: Bourassa
S&PLine Utility Index LT Treasury RiskNo. Return1 Bond Yield2 Premium1 1963 12.36% 4.17% 8.41%2 1964 15.91% 4.23% 11.74%3 1965 4.67% 4.50% 0.44%4 1966 -4.48% 4.55% -8.98%5 1967 -0.63% 5.56% -5.18%6 1968 10.32% 5.98% 4.76%7 1969 -15.42% 6.87% -21.40%8 1970 16.56% 6.48% 9.69%9 1971 2.41% 5.97% -4.07%
10 1972 8.15% 5.99% 2.18%11 1973 -18.07% 7.26% -24.06%12 1974 -21.55% 7.60% -28.81%13 1975 44.49% 8.05% 36.89%14 1976 31.81% 7.21% 23.76%15 1977 8.64% 8.03% 1.43%16 1978 -3.71% 8.98% -11.74%17 1979 13.58% 10.12% 4.60%18 1980 15.08% 11.99% 4.96%19 1981 11.74% 13.34% -0.25%20 1982 26.52% 10.95% 13.18%21 1983 20.01% 11.97% 9.06%22 1984 26.04% 11.70% 14.07%23 1985 33.05% 9.56% 21.35%24 1986 28.53% 7.89% 18.97%25 1987 -2.92% 9.20% -10.81%26 1988 18.27% 9.19% 9.07%27 1989 47.80% 8.16% 38.61%28 1990 -2.57% 8.44% -10.73%29 1991 14.61% 7.30% 6.17%30 1992 8.10% 7.26% 0.80%31 1993 14.41% 6.54% 7.15%32 1994 -7.94% 7.99% -14.48%33 1995 42.15% 6.03% 34.16%34 1996 3.14% 6.73% -2.89%35 1997 24.69% 6.02% 17.96%36 1998 14.82% 5.42% 8.80%37 1999 -8.85% 6.82% -14.27%38 2000 59.70% 5.58% 52.88%39 2001 -30.41% 5.75% -35.99%40 2002 -30.04% 4.84% -35.79%41 2003 26.11% 5.11% 21.27%42 2004 24.22% 4.84% 19.11%43 2005 16.79% 4.61% 11.95%44 2006 20.95% 4.91% 16.34%45 2007 19.36% 4.50% 14.45%46 2008 -28.99% 3.03% -33.49%47 2009 11.94% 4.58% 8.91%48 2010 5.49% 4.14% 0.91%49 2011 19.91% 2.55% 15.77%50 2012 1.29% 2.46% -1.26%51 2013 13.21% 3.78% 10.75%52 2014 28.98% 2.46% 25.20%53 2015 -4.84% 2.68% -7.30%54 2016 16.28% 2.72% 13.60%55 2017 12.05% 2.89% 9.33%56 2018 4.11% 3.11% 1.22%57 2019 26.35% 2.58% 23.24%58 2020 0.49% 1.56% -2.09%
56 Average 1963 to 2020 11.1% 6.3% 4.8%
57 Expected Long-term Treasury Bond Rate3 2.4%
58 Estimate of Current Risk Premium4 6.8%
59 Projected Returns on Equity for Sample 9.2%
Notes:1 Computed Composite Proxy Group Total Returns.2 Average annual 30 Yr. U.S. Treasury Bond yields as reported by the Federal Reserve. Proxy for yields from 2003-2005 are based upon 20-year U.S. Treasury yield.3 Forecast LT U.S. Treasury Rate. Source Table 7.4 As explained in testimony, adjustment assumes equity costs change by 50% as much as interest rates.
Liberty Utilities (Calpeco Electric) Corp.Risk Premium Analysis Based on Total Returns

Exhibit TJB-4Table 9Witness: Bourassa
Formula: Risk Premium = A0 + (A1 x Treasury bond Rate)2
No. of Litigated Decisions 324Std Err of Y Est 0.0062R Squared 56.2%
Estimate of intercept (A0) 0.09332
Estimate of slope (A1) -0.7645Std Err of Coef. 0.0376t-statistic for slope -20.34
Equity Cost Predicted ExpectedEstimate for Risk Treasury
Typical Electric Utility Premium Bond Rate3
9.9% = 7.50% + 2.40%
Notes:1 Source of ROE Data: Public Utility Reports annual ROE survey by Phillip Crossprinted in various issues plus data from AUS Utility Reports various years (2001 - 2017).2 6-month lag between order dates and Treasury bond rates.3 Forecast Treasury Bond rate. Source Table 7.
Liberty Utilities (Calpeco Electric) Corp.Risk Premiums Determined by Relationship Between
Authorized ROEs and Long-term Treasury Bond Rates1
During the Period 2001-2017

Exhibit TJB-4Table 10Witness: Bourassa
Expected Expected Monthly Average ExpectedLine Dividend Dividend Expected Market 30 Year Market RiskNo. Month Yield (D0/P0)
1 Yield (D1/P0)2 + Growth (g)3 = Return (k) - Treasury Rate4 = Premium (MRP)
1 Jan 2019 2.86% 3.14% + 9.67% = 12.80% 3.04% = 9.76%2 Feb 2.71% 2.96% + 9.17% = 12.12% 3.02% = 9.10%3 Mar 2.76% 3.01% + 9.00% = 12.01% 2.98% = 9.03%4 Apr 2.71% 2.94% + 8.67% = 11.61% 2.94% = 8.67%5 May 2.90% 3.16% + 8.67% = 11.82% 2.82% = 9.00%6 Jun 2.80% 3.04% + 8.75% = 11.79% 2.57% = 9.22%7 July 2.81% 3.05% + 8.83% = 11.89% 2.57% = 9.32%8 Aug 2.94% 3.20% + 8.83% = 12.03% 2.12% = 9.91%9 Sep 2.88% 3.13% + 8.67% = 11.79% 2.16% = 9.63%10 Oct 2.82% 3.07% + 8.83% = 11.91% 2.19% = 9.72%11 Nov 2.78% 3.02% + 8.67% = 11.68% 2.28% = 9.40%12 Dec 2.70% 2.94% + 8.67% = 11.60% 2.30% = 9.30%13 Jan 2020 2.81% 3.05% + 8.67% = 11.71% 2.22% = 9.49%14 Feb 3.20% 3.48% + 8.67% = 12.14% 1.97% = 10.17%15 Mar 4.74% 5.13% + 8.17% = 13.29% 1.46% = 11.83%16 Apr 3.38% 3.64% + 7.67% = 11.30% 1.27% = 10.03%17 May 3.15% 3.38% + 7.50% = 10.88% 1.38% = 9.50%18 Jun 3.16% 3.39% + 7.17% = 10.56% 1.49% = 9.07%19 July 2.99% 3.20% + 7.00% = 10.20% 1.31% = 8.89%20 Aug 2.95% 3.16% + 7.00% = 10.16% 1.36% = 8.80%21 Sep 2.97% 3.18% + 7.17% = 10.35% 1.42% = 8.93%22 Oct 3.10% 3.33% + 7.33% = 10.66% 1.57% = 9.09%23 Nov 2.59% 2.78% + 7.33% = 10.11% 1.62% = 8.49%24 Dec 2.55% 2.74% + 7.50% = 10.24% 1.67% = 8.57%25 Jan 2021 2.50% 2.68% + 7.50% = 10.18% 1.82% = 8.36%
25 Recommended 2.55% 2.73% + 7.44% = 10.18% - 1.70% = 8.48%
26 Short-term Trends27 Recent Twelve Months Avg 3.11% 3.34% + 7.50% = 10.84% - 1.53% = 9.31%28 Recent Nine Months Avg 2.88% 3.09% + 7.28% = 10.37% - 1.52% = 8.86%29 Recent Six Months Avg 2.78% 2.98% + 7.31% = 10.28% - 1.58% = 8.71%30 Recent Three Months Avg 2.55% 2.73% + 7.44% = 10.18% - 1.70% = 8.48%
Notes:1 Average Dividend Yield (D0/P0) of dividend paying stocks. Data from Value Line Investment Analyzer Software Data - Value Line 1700 Stocks2 Expected Dividend Yield (D1/P0) equals current average dividend yield (D0/P0) times one plus growth rate(g). 3 Median of Projected EPS and Projected DPS Growth for VL 1700 stocks. Data from Value Line Investment Analyzer Software.4 Monthly average 30 year U.S. Treasury as reported by Federal Reserve.
Liberty Utilities (Calpeco Electric) Corp.Estimation of Current Market Risk Premium
Using DCF Analysis
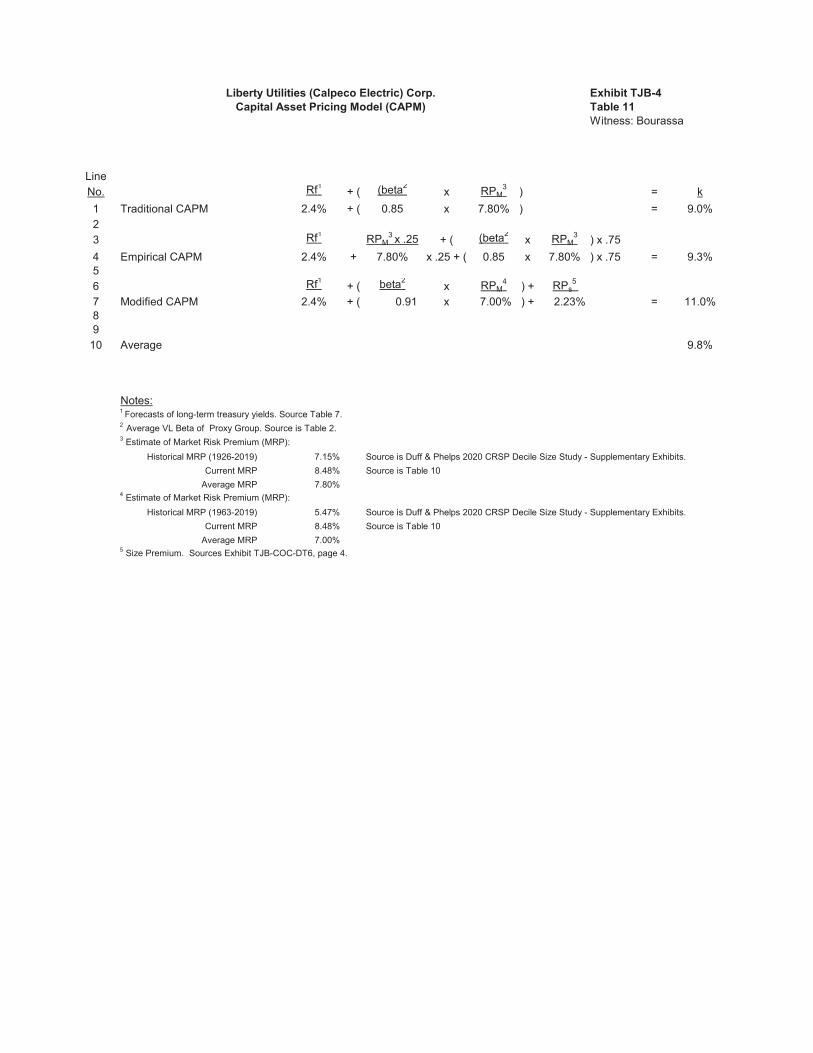
Exhibit TJB-4Table 11Witness: Bourassa
LineNo. Rf1 + ( (beta2 x RPM
3 ) = k1 Traditional CAPM 2.4% + ( 0.85 x 7.80% ) = 9.0%23 Rf1 RPM
3 x .25 + ( (beta2 x RPM3 ) x .75
4 Empirical CAPM 2.4% + 7.80% x .25 + ( 0.85 x 7.80% ) x .75 = 9.3%56 Rf1 + ( beta2 x RPM
4 ) + RPs5
7 Modified CAPM 2.4% + ( 0.91 x 7.00% ) + 2.23% = 11.0%89
10 Average 9.8%
Notes:1 Forecasts of long-term treasury yields. Source Table 7.2 Average VL Beta of Proxy Group. Source is Table 2.3 Estimate of Market Risk Premium (MRP):
Historical MRP (1926-2019) 7.15% Source is Duff & Phelps 2020 CRSP Decile Size Study - Supplementary Exhibits.Current MRP 8.48% Source is Table 10
Average MRP 7.80%4 Estimate of Market Risk Premium (MRP):
Historical MRP (1963-2019) 5.47% Source is Duff & Phelps 2020 CRSP Decile Size Study - Supplementary Exhibits.Current MRP 8.48% Source is Table 10
Average MRP 7.00%5 Size Premium. Sources Exhibit TJB-COC-DT6, page 4.
Liberty Utilities (Calpeco Electric) Corp.Capital Asset Pricing Model (CAPM)

{00546823;6}
Exhibit TJB-5: Liberty Utilities (CalPeco Electric) LLC Comparative Risk Study and Capital
Asset Pricing Model (CAPM)

Exhibit TJB-5Page 1 of 7
Co-efficientOperating Income EBIT ($ in millions) of variation
Line 5-Year Std of Operating Income CVOI CVOINo. Symbol Symbol VL Industy 2019 2018 2017 2016 2015 2014 Average Dev. (CVOI) UTILWEST OTHER1 ALLETE ALE UTILCENT 179.8$ 201.2$ 229.8$ 223.5$ 247.0$ 188.8$ 216.3$ 26.16 0.1210 0.12102 Alliant Energy LNT UTILCENT 777.7 694.4 653.4 537.0 577.0 543.6 647.90 95.35 0.1472 0.14723 Amer. Elec. Power AEP UTILCENT 2,716.3 2,682.7 3,344.1 3,474.9 3,333.5 3,232.0 3,110.30 379.31 0.1220 0.12204 Ameren Corp. AEE UTILCENT 1,267.0 1,357.0 1,458.0 1,381.0 1,259.0 1,254.0 1,344.40 83.20 0.0619 0.06195 Avista Corp. AVA UTILWEST 210.4 261.1 284.5 289.8 253.2 244.0 259.80 31.61 0.1217 0.12176 Black Hills BKH UTILWEST 406.0 397.0 416.7 329.6 279.4 260.5 365.75 59.09 0.1616 0.16167 CMS Energy Corp. CMS UTILCENT 1,239.0 1,162.0 1,338.0 1,297.0 1,163.0 1,152.0 1,239.80 78.85 0.0636 0.06368 Consol. Edison ED UTILEAST 2,676.0 2,533.0 2,609.0 2,471.0 2,427.0 2,164.0 2,543.20 100.98 0.0397 0.03979 DTE Energy DTE UTILCENT 1,707.0 1,594.0 1,646.0 1,445.0 1,350.0 1,590.0 1,548.40 147.32 0.0951 0.0951
10 Duke Energy DUK UTILEAST 5,709.0 4,926.0 5,753.0 5,314.0 5,420.0 5,344.0 5,424.40 335.26 0.0618 0.061811 Edison Int'l EIX UTILWEST 1,970.0 (496.0) 2,209.0 2,092.0 2,008.0 2,472.0 1,556.60 1,151.10 0.7395 0.739512 Entergy ETR UTILCENT 1,390.5 759.9 1,243.4 1,904.8 1,585.0 2,160.9 1,376.71 424.48 0.3083 0.308313 Fortis Inc. FTS.TO UTILCENT 2,461.0 2,365.0 2,500.0 1,483.0 1,429.0 1,023.0 2,461.0 542.62 0.2205 0.220514 Hawaiian Elec. HE UTILWEST 348.7 333.3 338.3 348.2 322.6 328.9 338.21 10.93 0.0323 0.032315 IDACORP Inc. IDA UTILWEST 298.3 296.9 304.4 271.8 282.1 253.7 290.70 13.37 0.0460 0.046016 MGE Energy MGEE UTILCENT 110.9 133.6 148.0 148.3 144.1 157.8 137.00 15.75 0.1150 0.115017 Northwestern Corp. NWE UTILWEST 276.9 258.2 261.4 245.9 245.0 178.0 257.48 13.03 0.0506 0.050618 Pinnacle West Capital PNW UTILWEST 672.0 773.7 934.4 856.0 854.6 811.2 818.13 99.54 0.1217 0.121719 Portland General POR UTILWEST 353.0 346.0 376.0 333.0 309.0 293.0 343.40 24.76 0.0721 0.072120 Public Serv. Enterprise PEG UTILEAST 2,345.0 2,244.0 2,444.0 2,382.0 2,962.0 2,623.0 2,475.40 281.53 0.1137 0.113721 WEC Energy Group WEC UTILCENT 1,531.4 1,468.4 1,785.2 1,682.1 1,250.5 1,112.1 1,543.52 205.71 0.1333 0.133322 Xcel Energy Inc. XEL UTILWEST 2,104.0 1,965.0 2,190.0 2,213.8 2,130.0 1,948.1 2,120.56 97.58 0.0460 0.0460
23 Proxy Group 0.1361 0.1546 0.1233
24 Risk relative of UTILWEST to OTHER utilities 1.25
Co-efficientStd of variation
2019 2018 2017 2016 2015 2014 Average Dev. of Operating Income25 Company 13.79 22.18 10.73 18.49 11.40 12.97 14.92 4.48 0.3003
26 Risk relative to the average risk of the proxy group and OTHER 2.21 2.44
Liberty Utilities (Calpeco Electric) Corp.Comparative Risk Study

Exhibit TJB-5Page 2 of 7
Line Sales ($ in millions) 5-YearNo. Company Symbol VL Industy 2019 2018 2017 2016 2015 2014 Average1 ALLETE ALE UTILCENT 1,241$ 1,499$ 1,419$ 1,340$ 1,486$ 1,137$ 1,397$2 Alliant Energy LNT UTILCENT 3,648 3,535 3,382 3,320 3,254 3,350 3,4283 Amer. Elec. Power AEP UTILCENT 15,561 16,196 15,425 16,380 16,453 17,020 16,0034 Ameren Corp. AEE UTILCENT 5,910 6,291 6,177 6,076 6,098 6,053 6,1105 Avista Corp. AVA UTILWEST 1,346 1,397 1,446 1,442 1,485 1,473 1,4236 Black Hills BKH UTILWEST 1,735 1,754 1,680 1,573 1,305 1,394 1,6097 CMS Energy Corp. CMS UTILCENT 6,845 6,873 6,583 6,399 6,456 7,179 6,6318 Consol. Edison ED UTILEAST 12,574 12,337 12,033 12,075 12,554 12,919 12,3159 DTE Energy DTE UTILCENT 12,669 14,212 12,607 10,630 10,337 12,301 12,091
10 Duke Energy DUK UTILEAST 25,079 24,521 23,565 22,743 23,459 23,925 23,87311 Edison Int'l EIX UTILWEST 12,347 12,657 12,320 11,869 11,524 13,413 12,14312 Entergy ETR UTILCENT 10,879 11,009 11,074 10,846 11,513 12,495 11,06413 Fortis Inc. FTS.TO UTILCENT 8,783 8,390 8,301 6,838 6,727 5,401 7,80814 Hawaiian Elec. HE UTILWEST 2,875 2,861 2,556 2,381 2,603 3,240 2,65515 IDACORP Inc. IDA UTILWEST 1,346 1,371 1,349 1,262 1,270 1,283 1,32016 MGE Energy MGEE UTILCENT 569 560 563 545 564 620 56017 Northwestern Corp. NWE UTILWEST 1,258 1,198 1,306 1,257 1,214 1,205 1,24718 Pinnacle West Capital PNW UTILWEST 3,471 3,691 3,565 3,499 3,495 3,492 3,54419 Portland General POR UTILWEST 2,123 1,991 2,009 1,923 1,898 1,900 1,98920 Public Serv. Enterprise PEG UTILEAST 10,076 9,696 9,161 9,198 10,415 10,886 9,70921 WEC Energy Group WEC UTILCENT 7,523 7,680 7,649 7,472 5,926 4,997 7,25022 Xcel Energy Inc. XEL UTILWEST 11,529 11,537 11,404 11,107 11,024 11,686 11,320
5-Year2019 2018 2017 2016 2015 2014 Average
23 Company 82.63 83.87 85.33 83.74 73.99 73.23 81.91
Liberty Utilities (Calpeco Electric) Corp.Comparative Risk Study

Exhibit TJB-5Page 3 of 7
Co-efficientof variation
Line Operating Margin (%) 5-Year Std of Operating Margin CVOM CVOMNo. Company Symbol VL Industy 2019 2018 2017 2016 2015 2014 Average Dev. (CVOM) UTILWEST OTHER1 ALLETE ALE UTILCENT 14.49% 13.43% 16.19% 16.68% 16.62% 16.61% 15.48% 0.0145 0.0938 0.09382 Alliant Energy LNT UTILCENT 21.32% 19.65% 19.32% 16.17% 17.73% 16.23% 18.84% 0.0196 0.1040 0.10403 Amer. Elec. Power AEP UTILCENT 17.46% 16.56% 21.68% 21.21% 20.26% 18.99% 19.43% 0.0229 0.1180 0.11804 Ameren Corp. AEE UTILCENT 21.44% 21.57% 23.60% 22.73% 20.65% 20.72% 22.00% 0.0117 0.0530 0.05305 Avista Corp. AVA UTILWEST 15.64% 18.69% 19.68% 20.09% 17.05% 16.57% 18.23% 0.0186 0.1022 0.10226 Black Hills BKH UTILWEST 23.40% 22.63% 24.80% 20.95% 21.42% 18.70% 22.64% 0.0155 0.0684 0.06847 CMS Energy Corp. CMS UTILCENT 18.10% 16.91% 20.33% 20.27% 18.01% 16.05% 18.72% 0.0151 0.0808 0.08088 Consol. Edison ED UTILEAST 21.28% 20.53% 21.68% 20.46% 19.33% 16.75% 20.66% 0.0090 0.0436 0.04369 DTE Energy DTE UTILCENT 13.47% 11.22% 13.06% 13.59% 13.06% 12.93% 12.88% 0.0096 0.0746 0.0746
10 Duke Energy DUK UTILEAST 22.76% 20.09% 24.41% 23.37% 23.10% 22.34% 22.75% 0.0161 0.0707 0.070711 Edison Int'l EIX UTILWEST 15.96% -3.92% 17.93% 17.63% 17.42% 18.43% 13.00% 0.0949 0.7298 0.729812 Entergy ETR UTILCENT 12.78% 6.90% 11.23% 17.56% 13.77% 17.29% 12.78% 0.0388 0.3037 0.303713 Fortis Inc. FTS.TO UTILCENT 28.02% 28.19% 30.12% 21.69% 21.24% 18.94% 25.85% 0.0409 0.1582 0.158214 Hawaiian Elec. HE UTILWEST 12.13% 11.65% 13.24% 14.62% 12.39% 10.15% 12.81% 0.0117 0.0912 0.091215 IDACORP Inc. IDA UTILWEST 22.16% 21.66% 22.55% 21.54% 22.21% 19.78% 22.02% 0.0042 0.0190 0.019016 MGE Energy MGEE UTILCENT 19.50% 23.87% 26.29% 27.22% 25.56% 25.45% 24.49% 0.0305 0.1244 0.124417 Northwestern Corp. NWE UTILWEST 22.01% 21.55% 20.02% 19.56% 20.18% 14.78% 20.66% 0.0105 0.0511 0.051118 Pinnacle West Capital PNW UTILWEST 19.36% 20.96% 26.21% 24.47% 24.45% 23.23% 23.09% 0.0283 0.1224 0.122419 Portland General POR UTILWEST 16.63% 17.38% 18.72% 17.32% 16.28% 15.42% 17.26% 0.0093 0.0542 0.054220 Public Serv. Enterprise PEG UTILEAST 23.27% 23.14% 26.68% 25.90% 28.44% 24.10% 25.49% 0.0227 0.0893 0.089321 WEC Energy Group WEC UTILCENT 20.36% 19.12% 23.34% 22.51% 21.10% 22.25% 21.29% 0.0168 0.0790 0.079022 Xcel Energy Inc. XEL UTILWEST 18.25% 17.03% 19.20% 19.93% 19.32% 16.67% 18.75% 0.0113 0.0604 0.0604
23 Proxy Group 19.08% 17.67% 20.92% 20.25% 19.53% 18.29% 19.51% 0.0215 0.1224 0.1443 0.1072
24 Risk relative of UTILWEST to OTHER utilities 1.35
Co-efficientStd of variation
2019 2018 2017 2016 2015 2014 Average Dev. of Operating Margin25 Company 16.68% 26.44% 12.57% 22.08% 15.41% 17.70% 18.64% 0.05 0.2946
26 Risk relative to the average risk of the proxy group and OTHER 2.41 2.75
Liberty Utilities (Calpeco Electric) Corp.Comparative Risk Study

Exhibit TJB-5Page 4 of 7
Return on Equity (ROE) Co-efficientLine Std of variation CVROE CVROENo. Company Symbol VL Industy 2019 2018 2017 2016 2015 2014 Average Dev. of ROE (CVROE) UTILWEST OTHER1 ALLETE ALE UTILCENT 7.7% 8.1% 7.7% 8.2% 9.0% 7.8% 8.1% 0.0052 0.0638 0.06382 Alliant Energy LNT UTILCENT 10.7% 11.2% 11.4% 9.7% 10.2% 10.9% 10.6% 0.0072 0.0678 0.06783 Amer. Elec. Power AEP UTILCENT 10.3% 10.1% 9.8% 11.9% 9.9% 9.7% 10.4% 0.0088 0.0851 0.08514 Ameren Corp. AEE UTILCENT 10.3% 10.7% 9.4% 9.2% 8.3% 8.7% 9.6% 0.0092 0.0964 0.09645 Avista Corp. AVA UTILWEST 10.2% 7.7% 7.3% 8.3% 7.7% 7.7% 8.2% 0.0113 0.1377 0.13776 Black Hills BKH UTILWEST 9.1% 8.8% 10.9% 8.7% 8.8% 9.4% 9.3% 0.0094 0.1018 0.10187 CMS Energy Corp. CMS UTILCENT 13.6% 13.8% 13.7% 13.0% 13.3% 13.0% 13.5% 0.0034 0.0256 0.02568 Consol. Edison ED UTILEAST 7.5% 8.5% 8.2% 8.3% 9.1% 8.5% 8.3% 0.0061 0.0729 0.07299 DTE Energy DTE UTILCENT 10.0% 10.9% 10.8% 9.6% 9.1% 10.9% 10.1% 0.0079 0.0783 0.0783
10 Duke Energy DUK UTILEAST 8.3% 6.7% 7.1% 6.2% 7.2% 7.2% 7.1% 0.0076 0.1072 0.107211 Edison Int'l EIX UTILWEST 10.2% -3.9% 12.7% 10.8% 12.0% 13.0% 8.4% 0.0694 0.8301 0.830112 Entergy ETR UTILCENT 12.1% 12.2% 11.7% 15.2% 11.2% 10.4% 12.5% 0.0157 0.1254 0.125413 Fortis Inc. FTS.TO UTILCENT 6.9% 7.2% 8.3% 4.5% 7.4% 4.5% 6.9% 0.0141 0.2055 0.205514 Hawaiian Elec. HE UTILWEST 9.6% 9.3% 8.5% 12.0% 8.3% 9.4% 9.5% 0.0148 0.1550 0.155015 IDACORP Inc. IDA UTILWEST 9.4% 9.6% 9.4% 9.2% 9.5% 9.9% 9.4% 0.0013 0.0141 0.014116 MGE Energy MGEE UTILCENT 10.2% 10.3% 9.8% 10.4% 10.3% 12.2% 10.2% 0.0026 0.0252 0.025217 Northwestern Corp. NWE UTILWEST 8.8% 8.8% 9.0% 9.8% 8.6% 8.2% 9.0% 0.0046 0.0506 0.050618 Pinnacle West Capital PNW UTILWEST 9.9% 9.8% 9.9% 9.2% 9.5% 9.1% 9.7% 0.0031 0.0319 0.031919 Portland General POR UTILWEST 8.3% 8.5% 8.4% 8.2% 7.6% 9.2% 8.2% 0.0034 0.0418 0.041820 Public Serv. Enterprise PEG UTILEAST 13.1% 9.7% 10.3% 10.9% 12.9% 12.5% 11.4% 0.0135 0.1183 0.118321 WEC Energy Group WEC UTILCENT 11.2% 10.8% 10.5% 10.5% 7.4% 13.3% 10.1% 0.0154 0.1528 0.152822 Xcel Energy Inc. XEL UTILWEST 10.4% 10.3% 10.2% 10.2% 10.0% 10.0% 10.2% 0.0013 0.0125 0.0125
23 Proxy Group 9.9% 9.0% 9.8% 9.7% 9.4% 9.8% 9.6% 0.0107 0.1182 0.1528 0.0942
24 Risk relative of UTILWEST to OTHER utilities 1.62
Co-efficient5-Year Std of variation
2019 2018 2017 2016 2015 2014 Average Dev. of ROE25 Company 5.7% 8.9% 3.9% 13.8% 9.0% 11.5% 8.26% 0.04 0.4562
26 Risk relative to the average risk of the proxy group and OTHER 3.86 4.84
Comparative Risk StudyLiberty Utilities (Calpeco Electric) Corp.

Exhibit TJB-5Page 5 of 7
Operating Leverage = Percent Change in Operating Income/Percent Change in Sales(also a measure of business risk) 5-Year
Line 2019 2018 2017 2016 2015 AverageNo. Company Symbol1 ALLETE ALE 0.62 2.23 0.47 0.96 1.00 1.062 Alliant Energy LNT 3.75 1.39 11.57 3.40 2.13 4.453 Amer. Elec. Power AEP 0.32 3.96 0.65 9.55 0.94 3.084 Ameren Corp. AEE 1.10 3.75 3.35 26.86 0.54 7.125 Avista Corp. AVA 5.29 2.43 7.63 5.07 4.56 5.006 Black Hills BKH 2.05 1.07 3.88 0.87 1.14 1.807 CMS Energy Corp. CMS 16.27 2.99 1.10 13.05 0.09 6.708 Consol. Edison ED 2.94 1.15 16.06 0.48 4.30 4.989 DTE Energy DTE 0.65 0.25 0.75 2.48 0.95 1.02
10 Duke Energy DUK 6.99 3.54 2.29 0.64 0.73 2.8411 Edison Int'l EIX 202.99 44.77 1.47 1.40 1.33 50.3912 Entergy ETR 69.87 66.23 16.46 3.48 3.39 31.8813 Fortis, Inc. FTS.TO 0.87 5.04 3.21 2.29 1.62 2.6014 Hawaiian Elec. HE 9.57 0.12 0.39 0.93 0.10 2.2215 IDACORP Inc. IDA 0.27 1.55 1.73 5.62 11.74 4.1816 MGE Energy MGEE 10.48 16.46 0.05 0.84 0.96 5.7617 Northwestern Corp. NWE 1.45 0.15 1.63 0.11 48.04 10.2818 Pinnacle West Capital PNW 2.21 4.87 4.81 1.74 48.99 12.5219 Portland General POR 0.31 8.91 2.89 5.90 51.88 13.9720 Public Serv. Enterprise PEG 1.15 1.40 6.47 1.68 2.99 2.7421 WEC Energy Group WEC 2.11 43.78 2.60 1.32 0.67 10.1022 Xcel Energy Inc. XEL 102.01 8.81 0.40 5.27 1.65 23.63
23 Average 20.15 10.22 4.08 4.27 8.62 9.47
2019 2018 2017 2016 2015 Average
24 Liberty Utilities (Calpeco Electric) Corp. 25.53 62.54 22.24 4.72 5.10 24.02
25 Risk relative to the average risk of the proxy group 2.54
Liberty Utilities (Calpeco Electric) Corp.Comparative Risk Study

Liberty Utilities (Calpeco Electric) Corp. Exhibit TJB-5Page 6 of 7
LineNo.
A. Beta Estimates for Proxy Group and Company`
Portfolio Operating Margin1 Portfolio CV (Operating Margin)1 Portfolio CV (ROE)1
1 Company 20 18.64% 21 29.46% 15 45.62%
2 Proxy Group 21 19.51% 12 12.24% 3 11.82%
Portfolio Sum Beta2 Portfolio Sum Beta3 Portfolio Sum Beta4 Average
3 Company 1.03 1.28 1.17
4 Proxy Group 0.99 1.11 0.87
5 Percentage Difference 4.4% 15.6% 34.2% 18.1%
B. Assume percentage difference is the same for electric utilities as companies in general
Value Line Beta6 Proxy Group5 0.85
7 Implied Beta for Company6 1.00
Notes:1 CV stands for Coefficient of Variation,2 Source is Duff & Phelps 2020 Valuation Handbook, Risk Study, Exhibit D-1, Companies Ranked by Operating Margin.3 Source is Duff & Phelps 2020 Valuation Handbook, Risk Study, Exhibit D-2, Companies Ranked by CV (Operating Margin).4 Source is Duff & Phelps 2020 Valuation Handbook, Risk Study, Exhibit D-3, Companies Ranked by CV (Operating Margin).5 Source is Table 2.6 Calculated by multiplying (1+ percentage difference in risk study betas) times average beta for the proxy group.
Comparative Risk StudyBeta Estimate Using Duff and Phelps Risk Study Portfolio Information

Exhibit TJB-5Page 7 of 7Witness: Bourassa
CAPMResults
Line FromNo. Rf1 + ( (beta2
x RPM4 ) = k Table 11 Difference
1 Traditional CAPM 2.4% + ( 1.00 x 7.80% ) = 10.2% 9.0% 1.2%23 Rf1 RPM
4 x .25 + ( (beta2x RPM
3 ) x .754 Empirical CAPM 2.4% + 7.80% x .25 + ( 1.00 x 7.80% ) x .75 = 10.2% 9.3% 0.9%56 Rf1 + ( beta3
x RPM4 ) + RPs
5
7 Modified CAPM 2.4% + ( 1.00 x 7.80% ) + 2.23% = 12.5% 11.0% 1.5%89
10 Average 11.0% 9.8% 1.2%11 High 1.5%12 Low 0.9%
Notes:1 Forecasts of long-term treasury yields. Source Table 7.2 Average VL Beta of Water Proxy Group. Source is Table 2.3 Estimate of Market Risk Premium (MRP):
Historical MRP (1926-2017) 7.10% Source is Duff & Phelps 2020 CRSP Decile Size Study - Supplementary Exhibits.Current MRP 10.03% Source is Table 11
Average MRP 8.60%4 Estimate of Market Risk Premium (MRP):
Historical MRP (1963-2017) 5.47% Source is Duff & Phelps 2020 CRSP Decile Size Study - Supplementary Exhibits.Current MRP 10.03% Source is Table 11
Average MRP 7.80%5 Size Premium. Sources Exhibit TJB-COC-DT2, page 1.
Liberty Utilities (Calpeco Electric) Corp.Capital Asset Pricing Model (CAPM)

{00546823;6}
Exhibit TJB-6: Risk Premium Size Study for Electric Proxy Group and Liberty Utilities
(CalPeco Electric) LLC

Liberty Utilities (Calpeco Electric) Corp. Exhibit TJB-6Risk Premium- Size (RPs) Estimates Size PremiumBased on Duff and Phelps 2020 Valuation Handbook (Risk Premium Study Data) Page 1 of 9
Line MV Book 5 Yr Avg. Total 5 Yr Avg.No. Company Symbol Equity1 Equity1 MVIC1 Net Income1 Assets1 EBITDA1 Sales1 ALLETE ALE 3,295$ 2,294$ 4,888$ 165$ 6,085$ 406$ 1,499$2 Alliant Energy LNT 11,871$ 5,204$ 17,404$ 456$ 16,701$ 1,118$ 3,535$3 Amer. Elec. Power AEP 38,288$ 20,549$ 67,275$ 1,913$ 80,757$ 5,386$ 16,196$4 Ameren Corp. AEE 18,086$ 8,939$ 29,164$ 716$ 32,030$ 2,338$ 6,291$5 Avista Corp. AVA 2,729$ 2,029$ 4,789$ 143$ 6,402$ 457$ 1,397$6 Black Hills BKH 3,815$ 2,363$ 6,955$ 172$ 7,559$ 561$ 1,754$7 CMS Energy Corp. CMS 15,768$ 5,495$ 29,458$ 606$ 29,666$ 2,113$ 6,873$8 Consol. Edison ED 22,814$ 18,847$ 43,196$ 1,283$ 62,895$ 3,905$ 12,337$9 DTE Energy DTE 24,008$ 12,426$ 43,009$ 996$ 45,496$ 2,650$ 14,212$
10 Duke Energy DUK 64,282$ 44,860$ 119,267$ 3,012$ 158,838$ 9,707$ 24,521$11 Edison Int'l EIX 21,375$ 13,304$ 39,239$ 1,138$ 64,382$ 3,579$ 12,657$12 Entergy ETR 18,015$ 10,222$ 35,094$ 1,122$ 51,724$ 3,485$ 11,009$13 Fortis Inc. FTS.TO 23,023$ 17,076$ 46,467$ 976$ 55,481$ 3,022$ 8,390$14 Hawaiian Elec. HE 3,761$ 2,280$ 5,624$ 203$ 13,745$ 569$ 2,861$15 IDACORP Inc. IDA 4,458$ 2,562$ 6,459$ 213$ 7,095$ 450$ 1,371$16 MGE Energy MGEE 2,353$ 856$ 2,877$ 79$ 2,082$ 191$ 560$17 Northwestern Corp. NWE 3,050$ 2,080$ 5,380$ 13$ 6,389$ 34$ 1,198$18 Pinnacle West Capital PNW 8,238$ 5,635$ 14,553$ 485$ 20,020$ 1,469$ 3,691$19 Portland General POR 3,868$ 2,612$ 6,883$ 199$ 9,069$ 696$ 1,991$20 Public Serv. Enterprise PEG 28,249$ 15,090$ 41,992$ 1,585$ 47,730$ 3,789$ 9,696$21 WEC Energy Group WEC 25,844$ 10,468$ 37,572$ 955$ 37,028$ 2,327$ 7,680$22 Xcel Energy Inc. XEL 32,359$ 14,574$ 52,004$ 1,198$ 53,957$ 3,715$ 11,537$
23 Liberty Utilities (Calpeco Electric) Corp. N/A 242.2$ N/A 14.3$ 302.0$ 25.8$ 83.7$
1 From Yahoo Finance, 10K, or Value Line Analyzer
Measures of size (Millions)

Risk Premium- Size (RPs) Estimates Exhibit TJB-6Based on Duff and Phelps 2020 Valuation Handbook (Risk Premium Study Data) Size Premium
Page 2 of 9
Line Net Income Data ($ millions) 5-YearNo. Company Symbol 2019 2018 2017 2016 2015 Average1 ALLETE ALE 172.4$ 174.1$ 159.2$ 155.3$ 163.4$ 164.9$2 Alliant Energy LNT 557.2$ 512.1$ 455.9$ 373.8$ 380.7$ 455.9$3 Amer. Elec. Power AEP 2,019.0$ 1,923.8$ 1,783.2$ 2,073.6$ 1,763.4$ 1,912.6$4 Ameren Corp. AEE 834.0$ 821.0$ 683.0$ 659.0$ 585.0$ 716.4$5 Avista Corp. AVA 197.0$ 136.4$ 126.1$ 137.2$ 118.1$ 143.0$6 Black Hills BKH 214.5$ 192.5$ 186.5$ 140.3$ 128.3$ 172.4$7 CMS Energy Corp. CMS 682.0$ 659.0$ 610.0$ 553.0$ 525.0$ 605.8$8 Consol. Edison ED 1,343.0$ 1,424.0$ 1,266.0$ 1,189.0$ 1,193.0$ 1,283.0$9 DTE Energy DTE 1,169.0$ 1,120.0$ 1,029.0$ 868.0$ 796.0$ 996.4$
10 Duke Energy DUK 3,755.0$ 2,928.0$ 2,963.0$ 2,560.0$ 2,854.0$ 3,012.0$11 Edison Int'l EIX 1,477.0$ (290.0)$ 1,603.0$ 1,422.0$ 1,480.0$ 1,138.4$12 Entergy ETR 1,258.2$ 1,092.1$ 950.7$ 1,249.8$ 1,061.2$ 1,122.4$13 Fortis Inc. FTS.TO 1,238.0$ 1,136.0$ 1,174.0$ 660.0$ 672.0$ 976.0$14 Hawaiian Elec. HE 219.8$ 203.7$ 180.6$ 250.1$ 161.8$ 203.2$15 IDACORP Inc. IDA 232.9$ 226.8$ 212.4$ 198.3$ 194.7$ 213.0$16 MGE Energy MGEE 86.9$ 84.2$ 76.1$ 75.6$ 71.3$ 78.8$17 Northwestern Corp. NWE 14.3$ 14.3$ 12.5$ 13.1$ 11.4$ 13.1$18 Pinnacle West Capital PNW 538.3$ 511.0$ 497.8$ 442.0$ 437.3$ 485.3$19 Portland General POR 214.0$ 212.0$ 204.0$ 193.0$ 172.0$ 199.0$20 Public Serv. Enterprise PEG 1,979.0$ 1,399.0$ 1,431.0$ 1,436.0$ 1,679.0$ 1,584.8$21 WEC Energy Group WEC 1,134.2$ 1,060.5$ 998.2$ 940.2$ 640.3$ 954.7$22 Xcel Energy Inc. XEL 1,372.0$ 1,261.0$ 1,171.0$ 1,123.4$ 1,063.6$ 1,198.2$
23 Liberty Utilities (Calpeco Electric) Corp. 13.8$ 19.8$ 7.8$ 15.9$ 9.0$ 14.3$
Net Income data for publicly traded water utilities from Value Line, Zacks Investment Research, 10K, and/or Yahoo Finance

Risk Premium- Size (RPs) Estimates Exhibit TJB-6Based on Duff and Phelps 2020 Valuation Handbook (Risk Premium Study Data) Size Premium
Page 3 of 9
Line EBITDA Data ($ millions) 5-YearNo. Company Symbol 2019 2018 2017 2016 2015 Average1 ALLETE ALE 382$ 407$ 407$ 419$ 417$ 406$2 Alliant Energy LNT 1,345$ 1,201$ 1,115$ 949$ 978$ 1,118$3 Amer. Elec. Power AEP 5,320$ 5,083$ 5,470$ 5,566$ 5,488$ 5,386$4 Ameren Corp. AEE 2,367$ 2,410$ 2,432$ 2,326$ 2,155$ 2,338$5 Avista Corp. AVA 421$ 454$ 478$ 492$ 442$ 457$6 Black Hills BKH 623$ 601$ 613$ 525$ 441$ 561$7 CMS Energy Corp. CMS 2,231$ 2,095$ 2,219$ 2,108$ 1,913$ 2,113$8 Consol. Edison ED 4,360$ 3,971$ 3,950$ 3,687$ 3,557$ 3,905$9 DTE Energy DTE 3,030$ 2,763$ 2,729$ 2,479$ 2,248$ 2,650$
10 Duke Energy DUK 10,885$ 9,622$ 9,799$ 9,194$ 9,033$ 9,707$11 Edison Int'l EIX 3,925$ 1,444$ 4,324$ 4,190$ 4,013$ 3,579$12 Entergy ETR 3,573$ 2,800$ 3,322$ 4,028$ 3,702$ 3,485$13 Fortis Inc. FTS.TO 3,811$ 3,608$ 3,679$ 2,302$ 1,711$ 3,022$14 Hawaiian Elec. HE 627$ 589$ 560$ 553$ 518$ 569$15 IDACORP Inc. IDA 472$ 466$ 470$ 419$ 425$ 450$16 MGE Energy MGEE 182$ 190$ 201$ 193$ 188$ 191$17 Northwestern Corp. NWE 36$ 37$ 33$ 32$ 32$ 34$18 Pinnacle West Capital PNW 1,386$ 1,541$ 1,530$ 1,459$ 1,426$ 1,469$19 Portland General POR 762$ 728$ 721$ 654$ 614$ 696$20 Public Serv. Enterprise PEG 3,771$ 3,589$ 3,691$ 3,506$ 4,389$ 3,789$21 WEC Energy Group WEC 2,458$ 2,314$ 2,584$ 2,445$ 1,834$ 2,327$22 Xcel Energy Inc. XEL 4,008$ 3,746$ 3,794$ 3,648$ 3,379$ 3,715$
23 Liberty Utilities (Calpeco Electric) Corp. 30.7$ 34.0$ 21.5$ 25.1$ 17.6$ 25.8$
Earnings before Interest, Taxes, Depreciation and Amortization (EBITDA). From Value Line, Yahoo Finance, 10K, or Zacks Investment Research.

Risk Premium- Size (RPs) Estimates Exhibit TJB-6Data Smoothing with Regression Analysis Size PremiumSmoothed Premium (RP s ) = Constant + X Coefficients * Log(Relevent Metric) Page 4 of 9
MV Book 5 Yr Avg. Total 5 Yr Avg.Line Equity Equity MVIC Net Income Assets EBITDA SalesNo. (Table B-1)1 (Table B-2)1 (Table B-4)1 (Table B-3)1 (Table B-5)1 (Table B-6)1 (Table B-7)12 Constant 10.822% 7.164% 10.421% 6.750% 8.596% 7.440% 8.794%3 X Coefficient(s) -2.128% -1.203% -1.934% -1.424% -1.437% -1.446% -1.459%456 MV Book 5 Yr Avg. Total 5 Yr Avg.7 Company Symbol Equity Equity MVIC Net Income Assets EBITDA Sales Average8 ALLETE ALE 3.34% 3.12% 3.29% 3.59% 3.16% 3.67% 4.16% 3.47%9 Alliant Energy LNT 2.15% 2.69% 2.22% 2.96% 2.53% 3.03% 3.62% 2.74%
10 Amer. Elec. Power AEP 1.07% 1.98% 1.08% 2.08% 1.54% 2.04% 2.65% 1.78%11 Ameren Corp. AEE 1.76% 2.41% 1.79% 2.68% 2.12% 2.57% 3.25% 2.37%12 Avista Corp. AVA 3.51% 3.19% 3.30% 3.68% 3.13% 3.59% 4.21% 3.51%13 Black Hills BKH 3.20% 3.11% 2.99% 3.57% 3.02% 3.47% 4.06% 3.34%14 CMS Energy Corp. CMS 1.89% 2.66% 1.78% 2.79% 2.17% 2.63% 3.20% 2.45%15 Consol. Edison ED 1.55% 2.02% 1.46% 2.32% 1.70% 2.25% 2.82% 2.02%16 DTE Energy DTE 1.50% 2.24% 1.46% 2.48% 1.90% 2.49% 2.74% 2.12%17 Duke Energy DUK 0.59% 1.57% 0.60% 1.80% 1.12% 1.67% 2.39% 1.39%18 Edison Int'l EIX 1.61% 2.20% 1.54% 2.40% 1.69% 2.30% 2.81% 2.08%19 Entergy ETR 1.77% 2.34% 1.63% 2.41% 1.82% 2.32% 2.90% 2.17%20 Fortis Inc. FTS.TO 1.54% 2.07% 1.39% 2.49% 1.78% 2.41% 3.07% 2.11%21 Hawaiian Elec. HE 3.21% 3.12% 3.17% 3.46% 2.65% 3.46% 3.75% 3.26%22 IDACORP Inc. IDA 3.06% 3.06% 3.05% 3.43% 3.06% 3.60% 4.22% 3.36%23 MGE Energy MGEE 3.65% 3.64% 3.73% 4.05% 3.83% 4.14% 4.78% 3.97%24 Northwestern Corp. NWE 3.41% 3.17% 3.21% 5.16% 3.13% 5.22% 4.30% 3.94%25 Pinnacle West Capital PNW 2.49% 2.65% 2.37% 2.93% 2.41% 2.86% 3.59% 2.76%26 Portland General POR 3.19% 3.05% 3.00% 3.48% 2.91% 3.33% 3.98% 3.28%27 Public Serv. Enterprise PEG 1.35% 2.14% 1.48% 2.19% 1.87% 2.27% 2.98% 2.04%28 WEC Energy Group WEC 1.43% 2.33% 1.57% 2.51% 2.03% 2.57% 3.13% 2.22%29 Xcel Energy Inc. XEL 1.22% 2.16% 1.30% 2.37% 1.80% 2.28% 2.87% 2.00%
29 Average 2.20% 2.59% 2.15% 2.95% 2.34% 2.92% 3.43% 2.65%30 Comparative Risk Study Risk Premium Adjustment (see Comparative Risk Study Adjustment to Size Premium) -0.42%31 Proxy Group Adjusted Risk Premium - Size (RPS). 2.23%
32 Liberty Utilities (Calpeco Electric) Corp. N/A 4.30% N/A 5.10% 5.03% 5.40% 5.99% 5.16%33 Comparative Risk Study Risk Premium Adjustment (see Comparative Risk Study Adjustment to Size Premium) 0.04%34 Adjusted Risk Premium - Size (RPS) 5.20%
35 Difference in Adjusted Risk Premium Between Proxy Group and Company 2.97%
1 Source: Duff & Phelps 2020 Valuation Handbook Supplementary Data Exhibits (Regression Equations)
RPs (levered)

Liberty Utilities (Calpeco Electric) Corp.Comparative Risk Study - Adjustment to Size PremiumBased on Duff and Phelps 2020 Size Study Data
Adjustment to Size PremiumPage 5 of 9
Line MV Book 5 Yr Avg. Total 5 Yr Avg.No. Company Symbol Equity1 Equity1 MVIC1 Net Income1 Assets1 EBITDA1 Sales1 ALLETE ALE 3,295$ 2,294$ 4,888$ 165$ 6,085$ 406$ 1,499$ 2 Alliant Energy LNT 11,871$ 5,204$ 17,404$ 456$ 16,701$ 1,118$ 3,535$ 3 Amer. Elec. Power AEP 38,288$ 20,549$ 67,275$ 1,913$ 80,757$ 5,386$ 16,196$ 4 Ameren Corp. AEE 18,086$ 8,939$ 29,164$ 716$ 32,030$ 2,338$ 6,291$ 5 Avista Corp. AVA 2,729$ 2,029$ 4,789$ 143$ 6,402$ 457$ 1,397$ 6 Black Hills BKH 3,815$ 2,363$ 6,955$ 172$ 7,559$ 561$ 1,754$ 7 CMS Energy Corp. CMS 15,768$ 5,495$ 29,458$ 606$ 29,666$ 2,113$ 6,873$ 8 Consol. Edison ED 22,814$ 18,847$ 43,196$ 1,283$ 62,895$ 3,905$ 12,337$ 9 DTE Energy DTE 24,008$ 12,426$ 43,009$ 996$ 45,496$ 2,650$ 14,212$ 10 Duke Energy DUK 64,282$ 44,860$ 119,267$ 3,012$ 158,838$ 9,707$ 24,521$ 11 Edison Int'l EIX 21,375$ 13,304$ 39,239$ 1,138$ 64,382$ 3,579$ 12,657$ 12 Entergy ETR 18,015$ 10,222$ 35,094$ 1,122$ 51,724$ 3,485$ 11,009$ 13 Fortis Inc. FTS.TO 23,023$ 17,076$ 46,467$ 976$ 55,481$ 3,022$ 8,390$ 14 Hawaiian Elec. HE 3,761$ 2,280$ 5,624$ 203$ 13,745$ 569$ 2,861$ 15 IDACORP Inc. IDA 4,458$ 2,562$ 6,459$ 213$ 7,095$ 450$ 1,371$ 16 MGE Energy MGEE 2,353$ 856$ 2,877$ 79$ 2,082$ 191$ 560$ 17 Northwestern Corp. NWE 3,050$ 2,080$ 5,380$ 13$ 6,389$ 34$ 1,198$ 18 Pinnacle West Capital PNW 8,238$ 5,635$ 14,553$ 485$ 20,020$ 1,469$ 3,691$ 19 Portland General POR 3,868$ 2,612$ 6,883$ 199$ 9,069$ 696$ 1,991$ 20 Public Serv. Enterprise PEG 28,249$ 15,090$ 41,992$ 1,585$ 47,730$ 3,789$ 9,696$ 21 WEC Energy Group WEC 25,844$ 10,468$ 37,572$ 955$ 37,028$ 2,327$ 7,680$ 22 Xcel Energy Inc. XEL 32,359$ 14,574$ 52,004$ 1,198$ 53,957$ 3,715$ 11,537$
1 From Value Line Analyzer
Step 1 - Identify the equivalent C exhibit for the B exhibits used to compute the size premium.Step 2 - Indentify the fundamental risk characteristics of the companies of the equivalent portfolio in Step 3 - Indentify the guideline portfolio in the D exhibit which has the most simliar fundamental risk characteristic found in Step 2 and find the smoothed average risk premium.Step 4 - Indentify the guideline portfolio in the D exhibit which has the most simliar fundamental risk characteristic to the Company and find the smoothed average risk premium.Step 5 - The diffence in smoothed average risk premiums is the maxmium indicated risk adjustment. The range of adjustments may be 0 or at the maximum depending on the circumstances.
Measures of size (Millions)

Liberty Utilities (Calpeco Electric) Corp.Comparative Risk Study - Adjustment to Size PremiumBased on Duff and Phelps 2020 Size Study Data
Adjustment to Size PremiumPage 6 of 9
Equivalent C Exhibit Portfolio Operating MarginMV Book 5 Yr Avg. Total 5 Yr Avg.
Line Equity Equity MVIC Net Income Assets EBITDA Sales VL Average AverageNo. Company Symbol (Table C-1) (Table C-2) (Table C-4) (Table C-3) (Table C-5) (Table C-6) (Table C-7) Industry UTILWEST OTHER1 ALLETE ALE 10.88% 11.55% 10.61% 11.04% 11.56% 10.64% 9.43% UTILCENT 11.05%2 Alliant Energy LNT 12.69% 12.21% 12.74% 12.59% 12.03% 11.93% 9.80% UTILCENT 12.37%3 Amer. Elec. Power AEP 13.50% 13.97% 14.51% 13.35% 14.01% 13.57% 10.83% UTILCENT 13.82%4 Ameren Corp. AEE 12.72% 12.17% 12.44% 12.51% 12.49% 11.99% 9.79% UTILCENT 12.39%5 Avista Corp. AVA 10.57% 11.66% 10.52% 10.71% 11.61% 10.75% 9.54% UTILWEST 10.77%6 Black Hills BKH 10.97% 11.51% 11.84% 11.12% 11.48% 11.38% 9.95% UTILWEST 11.18%7 CMS Energy Corp. CMS 12.85% 12.29% 12.46% 12.67% 12.51% 12.05% 10.05% UTILCENT 12.47%8 Consol. Edison ED 12.68% 13.94% 13.32% 13.01% 13.92% 12.90% 9.89% UTILEAST 13.29%9 DTE Energy DTE 12.84% 12.54% 13.30% 12.76% 12.82% 12.10% 10.09% UTILCENT 12.73%
10 Duke Energy DUK 13.81% 14.20% 15.63% 14.54% 14.43% 14.34% 10.37% UTILEAST 14.49%11 Edison Int'l EIX 12.50% 12.73% 13.05% 12.97% 13.93% 12.66% 9.82% UTILWEST 12.52%12 Entergy ETR 12.72% 12.24% 12.80% 12.96% 13.26% 12.59% 9.79% UTILCENT 12.76%13 Fortis Inc. FTS.TO 12.71% 13.55% 13.53% 12.73% 13.53% 12.24% 9.79% UTILCENT 13.05%14 Hawaiian Elec. HE 10.93% 11.56% 11.21% 11.28% 11.99% 11.44% 9.27% UTILWEST 11.10%15 IDACORP Inc. IDA 11.43% 11.66% 11.70% 11.34% 11.64% 10.73% 9.01% UTILWEST 11.07%16 MGE Energy MGEE 10.23% 10.08% 9.76% 10.02% 9.70% 9.68% 8.68% UTILCENT 9.91%17 Northwestern Corp. NWE 10.80% 11.67% 11.04% 7.11% 11.60% 7.34% 8.62% UTILWEST 9.74%18 Pinnacle West Capital PNW 12.36% 12.33% 12.56% 12.65% 11.69% 12.36% 9.47% UTILWEST 11.92%19 Portland General POR 11.00% 11.70% 11.82% 11.25% 11.30% 11.59% 9.39% UTILWEST 11.15%20 Public Serv. Enterprise PEG 13.38% 13.12% 13.24% 13.11% 12.97% 12.81% 9.90% UTILEAST 13.11%21 WEC Energy Group WEC 13.07% 12.25% 12.95% 12.70% 12.46% 11.98% 10.30% UTILCENT 12.57%22 Xcel Energy Inc. XEL 13.45% 13.01% 13.90% 12.99% 13.42% 12.76% 9.87% UTILWEST 12.77%
23 Proxy Group Average 12.19% 12.36% 12.50% 12.06% 12.47% 11.81% 9.71% 11.87% 11.36% 12.61%
24 Equivalent C Exhbit Smoothed Average Risk Premium based upon OM 10.10% 10.22% 9.93%

Liberty Utilities (Calpeco Electric) Corp.Comparative Risk Study - Adjustment to Size PremiumBased on Duff and Phelps 2020 Size Study Data
Adjustment to Size PremiumPage 7 of 9
Equivalent C Exhibit Portfolio CV(Operating Margin)MV Book 5 Yr Avg. Total 5 Yr Avg.
Line Equity Equity MVIC Net Income Assets EBITDA Sales VL Average AverageNo. Company Symbol (Table C-1) (Table C-2) (Table C-4) (Table C-3) (Table C-5) (Table C-6) (Table C-7) Industry UTILWEST OTHER1 ALLETE ALE 17.15% 14.77% 16.72% 14.60% 15.25% 16.07% 21.11% UTILCENT 15.76%2 Alliant Energy LNT 13.70% 13.99% 14.03% 13.57% 13.53% 14.47% 17.14% UTILCENT 13.88%3 Amer. Elec. Power AEP 11.90% 13.10% 11.96% 11.77% 14.63% 11.96% 12.74% UTILCENT 12.55%4 Ameren Corp. AEE 13.36% 13.73% 12.52% 12.97% 12.62% 13.01% 15.46% UTILCENT 13.03%5 Avista Corp. AVA 17.92% 14.93% 16.87% 15.56% 15.27% 16.29% 21.04% UTILWEST 16.84%6 Black Hills BKH 16.73% 14.72% 14.73% 14.58% 15.24% 15.50% 19.51% UTILWEST 15.86%7 CMS Energy Corp. CMS 13.62% 13.78% 12.51% 12.79% 12.45% 13.11% 17.90% UTILCENT 13.04%8 Consol. Edison ED 12.86% 13.13% 12.16% 11.82% 13.76% 11.72% 16.64% UTILEAST 12.57%9 DTE Energy DTE 12.79% 13.06% 12.16% 12.31% 13.32% 12.63% 17.57% UTILCENT 12.71%
10 Duke Energy DUK 11.26% 12.67% 11.46% 10.65% 18.44% 12.44% 14.48% UTILEAST 12.82%11 Edison Int'l EIX 12.93% 13.07% 12.18% 11.78% 13.83% 11.89% 17.08% UTILWEST 13.25%12 Entergy ETR 13.37% 13.11% 12.14% 12.39% 13.54% 12.17% 17.75% UTILCENT 12.79%13 Fortis Inc. FTS.TO 12.84% 13.11% 12.14% 12.39% 13.54% 12.17% 17.75% UTILCENT 12.70%14 Hawaiian Elec. HE 16.86% 14.78% 15.90% 15.64% 14.39% 15.44% 25.68% UTILWEST 16.95%15 IDACORP Inc. IDA 15.36% 14.61% 15.31% 15.43% 15.28% 16.29% 27.41% UTILWEST 17.10%16 MGE Energy MGEE 18.90% 18.79% 19.22% 18.86% 18.41% 19.07% 38.65% UTILCENT 18.88%17 Northwestern Corp. NWE 17.35% 14.92% 16.03% 37.95% 15.27% 37.96% 41.03% UTILWEST 25.79%18 Pinnacle West Capital PNW 14.32% 13.68% 13.77% 13.27% 12.59% 13.22% 21.09% UTILWEST 14.56%19 Portland General POR 16.60% 14.59% 14.82% 15.73% 14.95% 15.01% 100.39% UTILWEST 27.44%20 Public Serv. Enterprise PEG 12.57% 13.09% 12.16% 11.90% 13.37% 11.78% 16.83% UTILEAST 12.48%21 WEC Energy Group WEC 12.69% 13.29% 12.22% 12.48% 12.97% 13.02% 17.34% UTILCENT 12.78%22 Xcel Energy Inc. XEL 12.30% 13.08% 12.11% 11.80% 13.51% 11.82% 16.92% UTILWEST 13.08%
23 Proxy Group Average 14.43% 14.00% 13.78% 14.56% 14.37% 14.87% 24.16% 15.74% 17.87% 13.54%
24 Equivalent C Exhbit Smoothed Average Risk Premium based upon CV (OM) 10.49% 10.66% 10.28%

Liberty Utilities (Calpeco Electric) Corp.Comparative Risk Study - Adjustment to Size PremiumBased on Duff and Phelps 2020 Size Study Data
Adjustment to Size PremiumPage 8 of 9
Equivalent C Exhibit Portfolio CV(ROE)MV Book 5 Yr Avg. Total 5 Yr Avg.
Line Equity Equity MVIC Net Income Assets EBITDA Sales VL Average AverageNo. Company Symbol (Table C-1) (Table C-2) (Table C-4) (Table C-3) (Table C-5) (Table C-6) (Table C-7) Industry UTILWEST OTHER1 ALLETE ALE 27.18% 25.43% 27.45% 23.45% 26.36% 26.41% 35.52% UTILCENT 26.05%2 Alliant Energy LNT 23.22% 25.95% 23.98% 23.63% 26.84% 25.76% 27.90% UTILCENT 24.90%3 Amer. Elec. Power AEP 22.35% 22.05% 22.18% 20.87% 24.48% 22.72% 23.86% UTILCENT 22.44%4 Ameren Corp. AEE 23.19% 25.06% 24.32% 14.91% 23.89% 25.62% 27.47% UTILCENT 22.83%5 Avista Corp. AVA 28.94% 26.22% 27.75% 25.23% 26.90% 26.55% 34.46% UTILWEST 28.01%6 Black Hills BKH 26.77% 25.05% 25.38% 23.25% 28.07% 25.91% 32.72% UTILWEST 26.73%7 CMS Energy Corp. CMS 23.72% 25.84% 24.28% 18.02% 23.66% 25.66% 29.94% UTILCENT 23.53%8 Consol. Edison ED 22.47% 22.06% 22.95% 20.46% 24.86% 22.21% 27.25% UTILEAST 22.50%9 DTE Energy DTE 22.65% 24.26% 22.96% 21.61% 24.76% 24.70% 28.06% UTILCENT 23.49%
10 Duke Energy DUK 22.30% 22.12% 21.85% 19.62% 22.85% 23.89% 26.72% UTILEAST 22.10%11 Edison Int'l EIX 22.26% 23.96% 23.17% 20.27% 24.83% 22.72% 27.77% UTILWEST 23.57%12 Entergy ETR 23.21% 24.83% 23.62% 20.25% 24.82% 22.87% 28.04% UTILCENT 23.27%13 Fortis Inc. FTS.TO 22.50% 22.67% 22.76% 21.83% 24.85% 23.60% 29.11% UTILCENT 23.04%14 Hawaiian Elec. HE 26.90% 25.52% 26.28% 24.24% 27.74% 25.63% 40.06% UTILWEST 28.05%15 IDACORP Inc. IDA 25.29% 25.02% 26.22% 24.27% 27.88% 26.51% 41.96% UTILWEST 28.16%16 MGE Energy MGEE 29.92% 30.60% 30.48% 28.86% 30.05% 30.04% 53.67% UTILCENT 29.99%17 Northwestern Corp. NWE 29.92% 30.60% 30.48% 28.86% 30.05% 30.04% 53.67% UTILWEST 33.37%18 Pinnacle West Capital PNW 24.88% 25.78% 23.77% 23.19% 25.66% 24.11% 35.21% UTILWEST 26.09%19 Portland General POR 26.63% 25.01% 25.50% 24.22% 27.81% 26.05% 38.27% UTILWEST 27.64%20 Public Serv. Enterprise PEG 23.27% 23.35% 23.02% 20.84% 24.78% 22.39% 27.18% UTILEAST 22.94%21 WEC Energy Group WEC 22.92% 24.79% 23.33% 22.07% 24.39% 25.65% 28.60% UTILCENT 23.86%22 Xcel Energy Inc. XEL 22.94% 23.53% 22.45% 20.35% 24.84% 22.51% 27.39% 22.77%
23 Proxy Group Average 24.70% 24.99% 24.74% 22.29% 25.93% 25.07% 32.95% 25.81% 27.70% 23.84%
24 Equivalent C Exhbit Smoothed Average Risk Premium based upon CV (ROE) 9.84% 9.91% 9.75%

Liberty Utilities (Calpeco Electric) Corp.Comparative Risk Study - Adjustment to Size PremiumBased on Duff and Phelps 2020 Size Study DataEstimate of Risk Premium Adjustment Adjustment to Size Premium
Page 9 of 9
Line VLNo. Company Symbol OM CV (OM) CV(ROE) Industry OM CV (OM) CV(ROE) OM CV (OM) CV(ROE)1 ALLETE ALE 15.48% 9.38% 6.38% UTILCENT 15.48% 9.38% 6.38%2 Alliant Energy LNT 18.84% 10.40% 6.78% UTILCENT 18.84% 10.40% 6.78%3 Amer. Elec. Power AEP 19.43% 11.80% 8.51% UTILCENT 19.43% 11.80% 8.51%4 Ameren Corp. AEE 22.00% 5.30% 9.64% UTILCENT 22.00% 5.30% 9.64%5 Avista Corp. AVA 18.23% 10.22% 13.77% UTILWEST 18.23% 10.22% 13.77%6 Black Hills BKH 22.64% 6.84% 10.18% UTILWEST 22.64% 6.84% 10.18%7 CMS Energy Corp. CMS 18.72% 8.08% 2.56% UTILCENT 18.72% 8.08% 2.56%8 Consol. Edison ED 20.66% 4.36% 7.29% UTILEAST 20.66% 4.36% 7.29%9 DTE Energy DTE 12.88% 7.46% 7.83% UTILCENT 12.88% 7.46% 7.83%
10 Duke Energy DUK 22.75% 7.07% 10.72% UTILEAST 22.75% 7.07% 10.72%11 Edison Int'l EIX 13.00% 72.98% 83.01% UTILWEST 13.00% 72.98% 83.01%12 Entergy ETR 12.78% 30.37% 12.54% UTILCENT 12.78% 30.37% 12.54%13 Fortis Inc. FTS.TO 25.85% 15.82% 20.55% UTILCENT 25.85% 15.82% 20.55%14 Hawaiian Elec. HE 12.81% 9.12% 15.50% UTILWEST 12.81% 9.12% 15.50%15 IDACORP Inc. IDA 22.02% 1.90% 1.41% UTILWEST 22.02% 1.90% 1.41%16 MGE Energy MGEE 24.49% 12.44% 2.52% UTILCENT 24.49% 12.44% 2.52%17 Northwestern Corp. NWE 20.66% 5.11% 5.06% UTILWEST 20.66% 5.11% 5.06%18 Pinnacle West Capital PNW 23.09% 12.24% 3.19% UTILWEST 23.09% 12.24% 3.19%19 Portland General POR 17.26% 5.42% 4.18% UTILWEST 17.26% 5.42% 4.18%20 Public Serv. Enterprise PEG 25.49% 8.93% 11.83% UTILEAST 25.49% 8.93% 11.83%21 Xcel Energy Inc. XEL 18.75% 6.04% 1.25% UTILWEST 18.75% 6.04% 1.25%
22 Proxy Group Average 19.42% 12.44% 11.65% 18.72% 14.43% 15.28% 19.95% 10.95% 8.93%
Proxy Group Risk DifferencesAverage Average Average
23 Smoothed Average Risk Premium From Equivalent D 8.74% 10.16% 9.00% 9.30% 8.84% 10.37% 9.29% 9.50% 8.66% 9.99% 8.72% 9.12%24 Smoothed Average Risk Premium From Equivalent C 10.10% 10.49% 9.84% 10.14% 10.22% 10.66% 9.91% 10.26% 9.93% 10.28% 9.75% 9.99%25 Indicated Risk Adjustment -1.36% -0.32% -0.84% -0.84% -1.38% -0.29% -0.63% -0.77% -1.27% -0.29% -1.04% -0.86%
Mid-point Mid-point Mid-point26 Possible Adjustment to Risk Premium 0.00% to -0.84% -0.42% 0.00% to -0.77% -0.38% 0.00% to -0.86% -0.43%
OM CV (OM) CV(ROE)27 Liberty Utilities (Calpeco Electric) Corp. 18.64% 29.46% 45.62%
Average28 Smoothed Average Risk Premium From Equivalent D 8.85% 11.35% 10.44% 10.21%29 Smoothed Average Risk Premium From Equivalent C 10.10% 10.49% 9.84% 10.14%30 Indicated Risk Adjustment -1.25% 0.86% 0.60% 0.07%
Mid-point31 Possible Adjustment to Risk Premium 0.00% to 0.07% 0.04%
1 Source: Duff & Phelps 2020 Valuation Handbook Supplementary Data Exhibits (Regression Equations)
OTHER5 -Year Historical5 -Year Historical
5 -Year Historical
5 -Year HistoricalUTILWEST

{00546823;6}
Exhibit TJB-7: Comparable Earnings Analysis

Liberty Utilities (Calpeco Electric) Corp. Exhibit TJB-6Comparable Earnings (CE) Analysis
10-Year CV 10-Year CV Debt VL Safety VL Financial Reg. UnReg. Reg. UnReg. Reg. UnReg. Reg. UnReg. Reg. UnReg.Company Tikcer Industry Beta Avg. ROE ROE Avg. OM OM Percent Rank Strength R U R U R U R U R UALLETE ALE UTILCENT 0.85 8.07% 0.05236 15.64% 0.06622 38.56 2 A 8.07% 0.85 0.05236 15.64% 0.06622Alliant Energy LNT UTILCENT 0.85 10.35% 0.05533 18.54% 0.09861 51.53 2 A 10.35% 0.85 0.05533 18.54% 0.09861Amer. Elec. Power AEP UTILCENT 0.75 10.02% 0.07218 19.39% 0.07701 56.14 1 A+ 10.02% 0.75 0.07218 19.39% 0.07701Amer. States Water AWR WATER 0.65 12.16% 0.08577 25.23% 0.10087 44.43 2 A 12.16% 0.65 0.08577 25.23% 0.10087Amer. Water Works AWK WATER 0.85 8.48% 0.1282 32.47% 0.07154 58.53 3 B++ 8.48% 0.85 0.1282 32.47% 0.07154Ameren Corp. AEE UTILCENT 0.85 8.85% 0.10482 20.84% 0.07208 52.09 2 A 8.85% 0.85 0.10482 20.84% 0.07208AptarGroup ATR PACKAGE 0.9 15.17% 0.13586 12.71% 0.0688 40.85 2 B++ 15.17% 0.9 0.13586 12.71% 0.0688AT&T Inc. T TELESERV 0.85 13.64% 0.07681 17.12% 0.17849 45.1 1 A++ 13.64% 0.85 0.07681 17.12% 0.17849Atmos Energy ATO GASDISTR 0.8 9.26% 0.0598 23.13% 0.33985 38.03 1 A+ 9.26% 0.8 0.0598 23.13% 0.33985Avista Corp. AVA UTILWEST 0.95 8.03% 0.12002 16.44% 0.143 49.43 2 B++ 8.03% 0.95 0.12002 16.44% 0.143BCE Inc. BCE TELUTIL 0.9 16.19% 0.12252 22.62% 0.06766 51.54 2 B++ 16.19% 0.9 0.12252 22.62% 0.06766California Water CWT WATER 0.65 8.38% 0.09488 18.12% 0.10452 50.22 3 B++ 8.38% 0.65 0.09488 18.12% 0.10452Can. National Railway CNI RAILROAD 0.85 22.08% 0.09347 38.84% 0.0665 39.68 1 A 22.08% 0.85 0.09347 38.84% 0.0665Chesapeake Utilities CPK GASDISTR 0.8 11.01% 0.07689 17.50% 0.18858 43.95 2 A 11.01% 0.8 0.07689 17.50% 0.18858Consol. Edison ED UTILEAST 0.75 8.71% 0.07079 19.08% 0.09784 50.69 1 A+ 8.71% 0.75 0.07079 19.08% 0.09784Crane Co. CR DIVERSIF 1.4 21.70% 0.1145 13.63% 0.09564 36.36 3 B++ 21.70% 1.4 0.1145 13.63% 0.09564DTE Energy DTE UTILCENT 0.95 9.70% 0.09038 13.74% 0.11905 57.72 2 A 9.70% 0.95 0.09038 13.74% 0.11905Duke Energy DUK UTILEAST 0.85 7.04% 0.11773 21.83% 0.07263 54.01 2 A 7.04% 0.85 0.11773 21.83% 0.07263Emerson Electric EMR ELECEQ 1.25 22.19% 0.12685 17.10% 0.09398 42.94 1 A++ 22.19% 1.25 0.12685 17.10% 0.09398Equifax Inc. EFX INFOSER 1.05 21.59% 0.13617 28.93% 0.07765 56.72 3 A 21.59% 1.05 0.13617 28.93% 0.07765Eversource Energy ES UTILEAST 0.9 8.50% 0.12552 20.68% 0.1269 52.81 1 A 8.50% 0.9 0.12552 20.68% 0.1269Flowers Foods FLO FOODPROC 0.6 16.43% 0.10739 8.01% 0.24031 41.12 3 B++ 16.43% 0.6 0.10739 8.01% 0.24031Fresenius Medical ADR FMS MEDSERV 0.9 12.38% 0.15173 14.40% 0.09381 35.07 2 B++ 12.38% 0.9 0.15173 14.40% 0.09381Genuine Parts GPC AUTOPRTS 1.25 21.10% 0.08921 6.97% 0.08827 43.26 3 B++ 21.10% 1.25 0.08921 6.97% 0.08827Hawaiian Elec. HE UTILWEST 0.8 9.27% 0.11994 11.21% 0.15908 44.59 2 A 9.27% 0.8 0.11994 11.21% 0.15908Hill-Rom Hldgs. HRC MEDICNON 1.05 17.60% 0.14083 14.03% 0.17575 53.13 3 B++ 17.60% 1.05 0.14083 14.03% 0.17575Hubbell Inc. HUB/B ELECEQ 1.25 18.74% 0.12919 14.73% 0.04592 43.61 2 A 18.74% 1.25 0.12919 14.73% 0.04592IDACORP Inc. IDA UTILWEST 0.8 9.59% 0.02747 21.09% 0.09895 41.34 1 A 9.59% 0.8 0.02747 21.09% 0.09895Ingredion Inc. INGR FOODPROC 0.9 17.84% 0.12747 11.35% 0.18575 39.37 2 B++ 17.84% 0.9 0.12747 11.35% 0.18575McCormick & Co. MKC FOODPROC 0.85 23.71% 0.11503 15.37% 0.08746 51.28 1 A+ 23.71% 0.85 0.11503 15.37% 0.08746MGE Energy MGEE UTILCENT 0.7 10.85% 0.07085 23.14% 0.13405 37.97 1 A+ 10.85% 0.7 0.07085 23.14% 0.13405New Jersey Resources NJR GASDISTR 0.95 13.87% 0.15202 7.67% 0.30786 49.77 2 A+ 13.87% 0.95 0.15202 7.67% 0.30786NextEra Energy NEE UTILEAST 0.9 11.65% 0.1093 24.81% 0.08645 50.36 1 A+ 11.65% 0.9 0.1093 24.81% 0.08645NorthWestern Corp. NWE UTILWEST 0.95 9.15% 0.07421 17.67% 0.17377 52.47 2 B++ 9.15% 0.95 0.07421 17.67% 0.17377OGE Energy OGE UTILCENT 1.1 11.55% 0.11439 20.30% 0.11915 43.56 2 A 11.55% 1.1 0.11439 20.30% 0.11915Penske Auto PAG RETAUTO 1.55 16.21% 0.1513 2.87% 0.07945 44.69 3 B+ 16.21% 1.55 0.1513 2.87% 0.07945Pinnacle West Capital PNW UTILWEST 0.9 9.45% 0.04574 23.42% 0.0865 47.09 1 A+ 9.45% 0.9 0.04574 23.42% 0.0865Portland General POR UTILWEST 0.85 8.26% 0.0586 16.47% 0.0752 51.32 3 B++ 8.26% 0.85 0.0586 16.47% 0.0752Raytheon Technologies RTX DEFENSE 0 19.07% 0.09783 12.96% 0.12554 47.5 1 A++ 19.07% 0 0.09783 12.96% 0.12554Smucker (J.M.) SJM FOODPROC 0.7 10.20% 0.10369 16.17% 0.06976 39.61 1 A+ 10.20% 0.7 0.10369 16.17% 0.06976Sonoco Products SON PACKAGE 1 16.98% 0.1004 8.62% 0.06592 39.83 2 A 16.98% 1 0.1004 8.62% 0.06592Southern Co. SO UTILEAST 0.9 12.07% 0.05903 24.81% 0.06165 60.06 2 A 12.07% 0.9 0.05903 24.81% 0.06165Southwest Gas SWX GASDISTR 0.95 9.21% 0.07219 13.04% 0.07693 47.86 3 A 9.21% 0.95 0.07219 13.04% 0.07693SYNNEX Corp. SNX INDUSRV 1.1 13.66% 0.14079 3.05% 0.22477 41.78 3 B+ 13.66% 1.1 0.14079 3.05% 0.22477TELUS Corporation T.TO TELESERV 0.7 16.44% 0.10299 19.33% 0.04622 61.91 2 B++ 16.44% 0.7 0.10299 19.33% 0.04622UGI Corp. UGI GASDISTR 1.05 12.15% 0.11923 11.82% 0.23708 60.22 2 B++ 12.15% 1.05 0.11923 11.82% 0.23708Walmart Inc. WMT RETAIL 0.55 19.93% 0.0946 5.20% 0.13936 39.14 1 A++ 19.93% 0.55 0.0946 5.20% 0.13936Weston (George) WN.TO GROCERY 0.65 10.88% 0.15073 5.35% 0.20588 62.56 1 A 10.88% 0.65 0.15073 5.35% 0.20588Xcel Energy Inc. XEL UTILWEST 0.8 10.00% 0.04031 17.78% 0.07379 56.8 1 A+ 10.00% 0.8 0.04031 17.78% 0.07379York Water Co. (The) YORW WATER 0.8 10.30% 0.06963 50.70% 0.03261 41.32 3 B+ 10.30% 0.8 0.06963 50.70% 0.03261Zimmer Biomet Hldgs. ZBH MEDICINV 1.15 13.66% 0.10132 27.00% 0.15311 35.17 2 A 13.66% 1.15 0.10132 27.00% 0.15311
Average 0.89 13.20% 0.09997 17.70% 0.11917 47.35 9.85% 17.28% 0.85 0.93 0.08527 0.11786 20.23% 14.62% 0.12149 0.11635
Sample CountsRegulated (R) 28Unregulated (U) 23
Proxy Group 0.86 9.67% 0.10223 18.93% 0.11352 51.80
Average ROE Beta CVROE OM CVOM