Correspondence of executive function related functional and anatomical alterations in aging brain
10
Correspondence of executive function related functional and anatomical alterations in aging brain Xin Di a, ⁎, Bart Rypma b , Bharat B. Biswal a a Department of Biomedical Engineering, New Jersey Institute of Technology, Newark, NJ 07101, USA b School of Behavioral and Brain Sciences, University of Texas at Dallas, Richardson, TX 75080, USA abstract article info Article history: Received 25 June 2013 Received in revised form 19 August 2013 Accepted 3 September 2013 Available online 12 September 2013 Keywords: Aging Dorsolateral prefrontal cortex Efficiency Executive function Meta-analysis Plasticity Neurocognitive aging studies have focused on age-related changes in neural activity or neural structure but few studies have focused on relationships between the two. The present study quantitatively reviewed 24 studies of age-related changes in fMRI activation across a broad spectrum of executive function tasks using activation likelihood estimation (ALE) and 22 separate studies of age-related changes in gray matter using voxel-based morphometry (VBM). Conjunction analyses between functional and structural alteration maps were constructed. Overlaps were only observed in the conjunction of dorsolateral prefrontal cortex (DLPFC) gray matter reduction and functional hyperactivation but not hypoactivation. It was not evident that the conjunctions between gray matter and activation were related to task performance. Theoretical implications of these results are discussed. © 2013 Elsevier Inc. All rights reserved. 1. Introduction As individuals age, many aspects of cognitive function become less efficient most notably working memory, inhibitory function, and long- term memory (e.g., Craik and McDowd, 1987; Gazzaley et al., 2008; Hasher et al., 1991; Nyberg et al., 2003; Rypma et al., 2007; see Nyberg and Backman, 2010). Gray matter (GM) reductions have been reported in regions associated with these functions most notably prefrontal cortex, caudate, cerebellum, and hippocampus (Dennis and Cabeza, 2008; Raz and Rodrigue, 2006). To confront these increased endogenous challenges (i.e., those brought on by changes to neural anatomy and physiology), as well as exogenous challenges (i.e., those brought on by changes to the environment), older adults must flexibly adapt. Changes in neural activity associated with neuroanatomic changes could be thought of as manifestations of this “neural plasticity” (i.e., adaptation-related skill reacquisition; Greenwood, 2007; Park and Bischoff, 2010; Park and Reuter-Lorenz, 2009; Reuter-Lorenz and Park, 2010; Schneider-Garces et al., 2010) if it were observed (1) that age- related GM changes corresponded spatially with age-related neural activation (as measured by fMRI) and (2) that these age-related struc- ture–function changes corresponded to improvements in performance (Grady, 2012; Rypma and D'Esposito, 2001). Studies of brain function in older adults using positron emission tomography (PET) and functional magnetic resonance imaging (fMRI) have demonstrated consistent patterns of neural activity alterations (Davis et al., 2008; Spreng et al., 2010. but see Nyberg et al., 2010). These alterations generally take the form of age-related increases in frontal activity (i.e., hyperactivation). These hyperactivations have been interpreted as reflecting compensation, (i.e., adaptation to the decline of some cognitive functions; Grady, 1998), de-differentiation of cognitive processes (Baltes and Lindenberger, 1997), and reduced efficiency of cognitive processes (Motes et al., 2010; Rypma and D'Esposito, 2000; Rypma et al., 2005). Age-related neural increases in activity might be related to anatomic degeneration (e.g., Bennett et al., 2012). Specifically, it might be that local anatomic deficits lead to neural inefficiency as reflected by enhanced functional responses (e.g., Bennett et al., 2012; Greenwood, 2007). Structural alterations have been extensively investigated in previous work using manual volumetric measurement (e.g., Raz et al., 2005), voxel-based morphometry (VBM; Good et al., 2001), and cortical thickness techniques (e.g., Salat et al., 2004). Age-related gray matter reductions occur over the entire cortex, but disproportionately in regions associated with age-related functional deficits (i.e., prefrontal cortex, caudate, cerebellum, and hippocampus, Dennis and Cabeza, 2008; Raz and Rodrigue, 2006). Progress in Neuro-Psychopharmacology & Biological Psychiatry 48 (2014) 41–50 Abbreviations: ALE, activation likelihood estimation; CBF, cerebral blood flow; CMRO 2 , cerebral-metabolic oxygen rate of oxygen; DLPFC, dorsolateral prefrontal cortex; FDR, false discovery rate; fMRI, functional magnetic resonance imaging; FWHM, full width at half maximum; GM, gray matter; IPL, inferior parietal lobule; MNI, Montreal Neurological Institute; PET, positron emission tomography; SMA, supplementary motor area; VBM, voxel-based morphometry; VLPFC, ventrolateral prefrontal cortex. ⁎ Corresponding author at: Department of Biomedical Engineering, New Jersey Institute of Technology, Fenster Hall, University Heights, Newark, NJ 07102, USA. Tel.: +1 201 628 5188. E-mail address: [email protected] (X. Di). 0278-5846/$ – see front matter © 2013 Elsevier Inc. All rights reserved. http://dx.doi.org/10.1016/j.pnpbp.2013.09.001 Contents lists available at ScienceDirect Progress in Neuro-Psychopharmacology & Biological Psychiatry journal homepage: www.elsevier.com/locate/pnp
Transcript of Correspondence of executive function related functional and anatomical alterations in aging brain
Progress in Neuro-Psychopharmacology & Biological Psychiatry 48 (2014) 41–50
Contents lists available at ScienceDirect
Progress in Neuro-Psychopharmacology & BiologicalPsychiatry
j ourna l homepage: www.e lsev ie r .com/ locate /pnp
Correspondence of executive function related functional and anatomicalalterations in aging brain
Xin Di a,⁎, Bart Rypma b, Bharat B. Biswal a
a Department of Biomedical Engineering, New Jersey Institute of Technology, Newark, NJ 07101, USAb School of Behavioral and Brain Sciences, University of Texas at Dallas, Richardson, TX 75080, USA
Abbreviations:ALE, activation likelihood estimation; Ccerebral-metabolic oxygen rate of oxygen; DLPFC, dorsofalse discovery rate; fMRI, functional magnetic resonancehalf maximum; GM, gray matter; IPL, inferior paNeurological Institute; PET, positron emission tomographarea; VBM, voxel-based morphometry; VLPFC, ventrolater⁎ Corresponding author at: Department of Biomedical E
of Technology, Fenster Hall, University Heights, Newark, N5188.
E-mail address: [email protected] (X. Di).
0278-5846/$ – see front matter © 2013 Elsevier Inc. All rihttp://dx.doi.org/10.1016/j.pnpbp.2013.09.001
a b s t r a c t
a r t i c l e i n f oArticle history:Received 25 June 2013Received in revised form 19 August 2013Accepted 3 September 2013Available online 12 September 2013
Keywords:AgingDorsolateral prefrontal cortexEfficiencyExecutive functionMeta-analysisPlasticity
Neurocognitive aging studies have focused on age-related changes in neural activity or neural structure but fewstudies have focused on relationships between the two. The present study quantitatively reviewed 24 studies ofage-related changes in fMRI activation across a broad spectrum of executive function tasks using activationlikelihood estimation (ALE) and 22 separate studies of age-related changes in gray matter using voxel-basedmorphometry (VBM). Conjunction analyses between functional and structural alterationmapswere constructed.Overlaps were only observed in the conjunction of dorsolateral prefrontal cortex (DLPFC) graymatter reductionand functional hyperactivation but not hypoactivation. It was not evident that the conjunctions between graymatter and activation were related to task performance. Theoretical implications of these results are discussed.
© 2013 Elsevier Inc. All rights reserved.
1. Introduction
As individuals age, many aspects of cognitive function become lessefficient most notably working memory, inhibitory function, and long-term memory (e.g., Craik and McDowd, 1987; Gazzaley et al., 2008;Hasher et al., 1991; Nyberg et al., 2003; Rypma et al., 2007; seeNyberg and Backman, 2010). Gray matter (GM) reductions have beenreported in regions associated with these functions most notablyprefrontal cortex, caudate, cerebellum, and hippocampus (Dennis andCabeza, 2008; Raz and Rodrigue, 2006). To confront these increasedendogenous challenges (i.e., those brought on by changes to neuralanatomy and physiology), as well as exogenous challenges (i.e., thosebrought on by changes to the environment), older adults must flexiblyadapt. Changes in neural activity associated with neuroanatomicchanges could be thought of asmanifestations of this “neural plasticity”(i.e., adaptation-related skill reacquisition; Greenwood, 2007; Park andBischoff, 2010; Park and Reuter-Lorenz, 2009; Reuter-Lorenz and Park,
BF, cerebral blood flow; CMRO2,lateral prefrontal cortex; FDR,imaging; FWHM, full width at
rietal lobule; MNI, Montrealy; SMA, supplementary motoral prefrontal cortex.ngineering, New Jersey InstituteJ 07102, USA. Tel.: +1 201 628
ghts reserved.
2010; Schneider-Garces et al., 2010) if it were observed (1) that age-related GM changes corresponded spatially with age-related neuralactivation (as measured by fMRI) and (2) that these age-related struc-ture–function changes corresponded to improvements in performance(Grady, 2012; Rypma and D'Esposito, 2001).
Studies of brain function in older adults using positron emissiontomography (PET) and functional magnetic resonance imaging (fMRI)have demonstrated consistent patterns of neural activity alterations(Davis et al., 2008; Spreng et al., 2010. but see Nyberg et al., 2010).These alterations generally take the form of age-related increases infrontal activity (i.e., hyperactivation). These hyperactivations havebeen interpreted as reflecting compensation, (i.e., adaptation to thedecline of some cognitive functions; Grady, 1998), de-differentiationof cognitive processes (Baltes and Lindenberger, 1997), and reducedefficiency of cognitive processes (Motes et al., 2010; Rypma andD'Esposito, 2000; Rypma et al., 2005).
Age-related neural increases in activitymight be related to anatomicdegeneration (e.g., Bennett et al., 2012). Specifically, it might be thatlocal anatomic deficits lead to neural inefficiency as reflected byenhanced functional responses (e.g., Bennett et al., 2012; Greenwood,2007). Structural alterations have been extensively investigated inprevious work using manual volumetric measurement (e.g., Raz et al.,2005), voxel-basedmorphometry (VBM; Good et al., 2001), and corticalthickness techniques (e.g., Salat et al., 2004). Age-related gray matterreductions occur over the entire cortex, but disproportionately inregions associated with age-related functional deficits (i.e., prefrontalcortex, caudate, cerebellum, and hippocampus, Dennis and Cabeza,2008; Raz and Rodrigue, 2006).
42 X. Di et al. / Progress in Neuro-Psychopharmacology & Biological Psychiatry 48 (2014) 41–50
In the present study we sought to characterize relationshipsbetween age-related neuroanatomic changes and functional activitychanges. We focused on age-related activation changes related to gen-eral cognitive processes of executive function drawn from studies inthe literature. Activation likelihood estimation (ALE, Turkeltaub et al.,2002) was used to identify age-related activation changes over arange of different types of executive function tasks (e.g. workingmemory, executive control, and delayed response task). Based on simi-lar consideration, Spreng et al. (2010) quantitatively reviewed 77neuroimaging studies of aging effects using the ALE technique. Theirresults showed age-related increases in prefrontal activity andperformance-dependent age differences in activation laterality. Incontrast, we analyzed data only from articles that directly comparedactivity differences between older and younger groups. In addition,another ALE analysis was conducted to examine consistent anatomicalalterations using VBM analysis (Ashburner and Friston, 2000; Chanet al., 2011; Di et al., 2009). Conjunction analyses were then conductedto examine age-related structural and functional correspondence.
Four patterns of structure–function associations could be expected.First, age-related GM decreases would correspond with reductions infunctional activity. This result would suggest that, with aging, neuralloss is associated with reductions in the neural metabolic activity thatgives rise to the BOLD signal. Second, age-related GM decreases wouldbe associated with increases in functional activity. This result wouldsuggest that neural loss is associated with increases in neural metabolicactivity. Third, GM preservation would be associated with decreases infunctional activity. Finally, age-related GM preservation might be asso-ciatedwith increases in functional activity. These latter outcomeswouldsuggest more complex relationships between age-related GM changeand changes in neural metabolic activity. Interpretation of these resultswould be contingent upon their relationships to performance. Based onplasticity theories of neurocognitive aging (Greenwood, 2007; Park andReuter-Lorenz, 2009),we predicted that regions that showed consistenthyperactivation but not hypoactivation in older group would overlapwith regions that showed consistent GM reductions. In addition, obser-vations of overlap between age-related activation changes and GMchanges would be associated with age-related changes in performance.
2. Methods
2.1. Article selection
2.1.1. Functional imaging studiesStudies were searched in the PubMed database using “aging” com-
bined with task keywords and imaging modality keywords (functionalmagnetic resonance imaging, fMRI or PET). The task keywords includeddelayed match-to-sample, delayed response, go/no-go, mental arith-metic, N-back, oddball, sequence recall, Stroop, Wisconsin Card Sort,and word generation task, which was consistent with a previousmeta-analysis on executive function of patients with schizophrenia(Minzenberg et al., 2009). In addition, we searched the reference listsof the studies identified and recent ALE studies (Spreng et al., 2010;Turner and Spreng, 2012) for potential inclusion. The inclusion criteriawere as follows: 1) they were research articles; 2) they studied linearcorrelations between the age and task related activations, or compareddifferences in activations between a group of older subjects and a groupof younger subjects; 3) the results were normalized to a stereotacticstandardized space such as the Montreal Neurological Institute (MNI)space or Talairach space (Talairach and Tournoux, 1988), and thecoordinates of the activation areas were explicitly reported.
Twenty four articles with a total of 860 subjects were included in thefMRI meta-analysis (Table 1). Paxton et al. (2008) reported two exper-imentswith independent subject samples, so the two experimentsweretreated as independent. Esposito et al. (1999) and Nagels et al. (2012)examined linear correlation between task related activation and age,while the other experiments directly compared the task related
activations between the older and younger groups. All of the includedstudies but Prakash et al. (2012) reported hyperactivation for theolder group, and fifteen studies also reported hypoactivation. The taskused in each experiment was listed in Table 1. Task performance wasdetermined based on accuracy but not reaction time, consistent with aprevious meta-analysis (Spreng et al., 2010). Equivalent performancedescribes experiments where the accuracy of a given task performancewas not statistically significant between young and old group. Twelveexperiments did not report significant different performance betweenyoung and old groups (denoted as ‘=’ in Table 1), whereas 13 experi-ments reported significantly poorer performance in old adults (denotedas ‘≠’ in Table 1).
2.1.2. VBM studiesPubMed search used the key words “Voxel Based Morphometry” and
“aging,” or “VBM” and “aging,” respectively. In addition, we searched thereference lists of the studies identified for potential inclusion. From theabout 150 resultant articles, we included the studies considering the fol-lowing criteria: 1) they were empirical articles; 2) they used the voxel-based morphometry analysis to investigate the GM concentration or vol-ume changes of MRI dataset; 3) they studied linear correlations betweenthe GM alterations and age, or compared GM differences between theolder and younger individuals; 4) the resultswere normalized to a stereo-tactic standardized space such as the MNI space or Talairach space(Talairach and Tournoux, 1988), and the coordinates of the activationareas were explicitly reported.
Twenty-two articleswith a total of 2657 subjectswere included in theVBM meta-analysis (Table 2). One paper by Takahashi et al. (2011) re-ported separately the male and female results, so the two results weretreated as two independent experiments. These studies used differentsoftware such as (SPM99, SPM2, SPM5, and SPM8. http://www.fil.ion.ucl.ac.uk/spm/), FSL (http://fsl.fmrib.ox.ac.uk/fsl/fslwiki/), and in housesoftware (Tisserand et al., 2002, 2004) to conduct VBM analyses. Inaddition, different algorithms were used, including traditional VBM(Ashburner and Friston, 2000), optimized segmentation (Good et al.,2001), unified segmentation (Ashburner and Friston, 2005), andDARTEL (Ashburner, 2007). Sixteen studies compared age-related differ-ences usingmodulated GM images (i.e. GMV, graymatter volume), whileseven studies used unmodulated GM images (i.e., GMC gray matter con-centration). Good et al. (2001) used both GMV and GMC images, but weonly included the GMV results in the current analysis. All of the includedstudies reported a GM reduction across aging, while ten studies alsoreported relative GM preservation after controlling for global GM loss.Seventeen studies examined the linear correlation between the GMvolume/concentration and age, and the other six studies directly compareGM measures between older and younger groups. There was no overlapof subject samples between the fMRI meta-analysis and the VBM meta-analysis.
2.2. Activation likelihood estimation analysis
Because most of the studies reported results in MNI space, the ALEanalyses were also conducted in MNI space. For papers whose resultshad been converted fromMNI to Talairach space using Brett's transfor-mation (Brett, 1999), or a simple affine transformation (e.g. in Lamaret al., 2004), results were converted back to MNI space using the corre-sponding method. For the studies whose results were originally inTalairach space, anatomical coordinates were converted into MNIspace using the Lancaster transform (Lancaster et al., 2007).
The activation likelihood estimationmeta-analysis (Turkeltaub et al.,2002) was carried out using GingerALE 2.1.1 software with revised ran-dom effect algorithm (Eickhoff et al., 2009), and non-additive method(Turkeltaub et al., 2012). The idea behind ALE analysis is that the peakcoordinates reported in VBM studies should be viewed as probabilitydistributions around these coordinates (Turkeltaub et al., 2002). Ac-cordingly, the coordinates were convolved with a three-dimensional
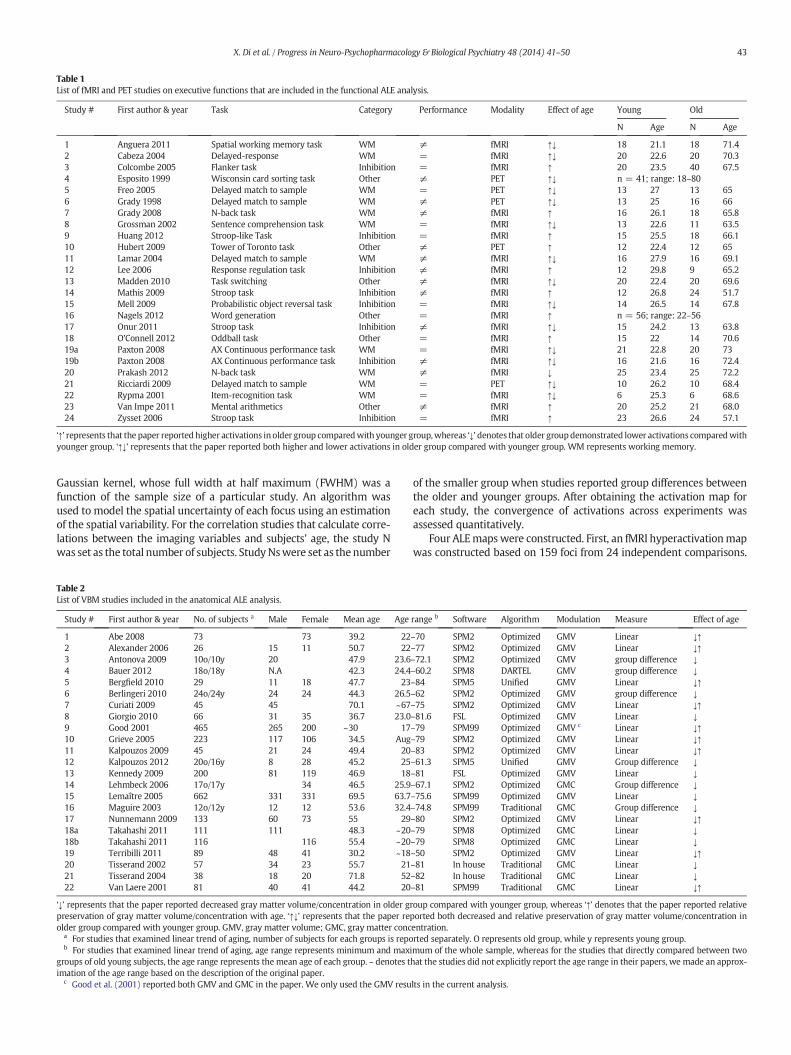
Table 1List of fMRI and PET studies on executive functions that are included in the functional ALE analysis.
Study # First author & year Task Category Performance Modality Effect of age Young Old
N Age N Age
1 Anguera 2011 Spatial working memory task WM ≠ fMRI ↑↓ 18 21.1 18 71.42 Cabeza 2004 Delayed-response WM = fMRI ↑↓ 20 22.6 20 70.33 Colcombe 2005 Flanker task Inhibition = fMRI ↑ 20 23.5 40 67.54 Esposito 1999 Wisconsin card sorting task Other ≠ PET ↑↓ n = 41; range: 18–805 Freo 2005 Delayed match to sample WM = PET ↑↓ 13 27 13 656 Grady 1998 Delayed match to sample WM ≠ PET ↑↓ 13 25 16 667 Grady 2008 N-back task WM ≠ fMRI ↑ 16 26.1 18 65.88 Grossman 2002 Sentence comprehension task WM = fMRI ↑↓ 13 22.6 11 63.59 Huang 2012 Stroop-like Task Inhibition = fMRI ↑ 15 25.5 18 66.110 Hubert 2009 Tower of Toronto task Other ≠ PET ↑ 12 22.4 12 6511 Lamar 2004 Delayed match to sample WM ≠ fMRI ↑↓ 16 27.9 16 69.112 Lee 2006 Response regulation task Inhibition ≠ fMRI ↑ 12 29.8 9 65.213 Madden 2010 Task switching Other ≠ fMRI ↑↓ 20 22.4 20 69.614 Mathis 2009 Stroop task Inhibition ≠ fMRI ↑ 12 26.8 24 51.715 Mell 2009 Probabilistic object reversal task Inhibition = fMRI ↑↓ 14 26.5 14 67.816 Nagels 2012 Word generation Other = fMRI ↑ n = 56; range: 22–5617 Onur 2011 Stroop task Inhibition ≠ fMRI ↑↓ 15 24.2 13 63.818 O'Connell 2012 Oddball task Other = fMRI ↑ 15 22 14 70.619a Paxton 2008 AX Continuous performance task WM = fMRI ↑↓ 21 22.8 20 7319b Paxton 2008 AX Continuous performance task Inhibition ≠ fMRI ↑↓ 16 21.6 16 72.420 Prakash 2012 N-back task WM ≠ fMRI ↓ 25 23.4 25 72.221 Ricciardi 2009 Delayed match to sample WM = PET ↑↓ 10 26.2 10 68.422 Rypma 2001 Item-recognition task WM = fMRI ↑↓ 6 25.3 6 68.623 Van Impe 2011 Mental arithmetics Other ≠ fMRI ↑ 20 25.2 21 68.024 Zysset 2006 Stroop task Inhibition = fMRI ↑ 23 26.6 24 57.1
‘↑’ represents that the paper reported higher activations in older group comparedwith younger group,whereas ‘↓’ denotes that older groupdemonstrated lower activations comparedwithyounger group. ‘↑↓’ represents that the paper reported both higher and lower activations in older group compared with younger group. WM represents working memory.
43X. Di et al. / Progress in Neuro-Psychopharmacology & Biological Psychiatry 48 (2014) 41–50
Gaussian kernel, whose full width at half maximum (FWHM) was afunction of the sample size of a particular study. An algorithm wasused to model the spatial uncertainty of each focus using an estimationof the spatial variability. For the correlation studies that calculate corre-lations between the imaging variables and subjects' age, the study Nwas set as the total number of subjects. StudyNswere set as the number
Table 2List of VBM studies included in the anatomical ALE analysis.
Study # First author & year No. of subjects a Male Female Mean age Age
1 Abe 2008 73 73 39.2 222 Alexander 2006 26 15 11 50.7 223 Antonova 2009 10o/10y 20 47.9 23.64 Bauer 2012 18o/18y N.A 42.3 24.45 Bergfield 2010 29 11 18 47.7 236 Berlingeri 2010 24o/24y 24 24 44.3 26.57 Curiati 2009 45 45 70.1 ~678 Giorgio 2010 66 31 35 36.7 23.09 Good 2001 465 265 200 ~30 1710 Grieve 2005 223 117 106 34.5 Aug11 Kalpouzos 2009 45 21 24 49.4 2012 Kalpouzos 2012 20o/16y 8 28 45.2 2513 Kennedy 2009 200 81 119 46.9 1814 Lehmbeck 2006 17o/17y 34 46.5 25.915 Lemaître 2005 662 331 331 69.5 63.716 Maguire 2003 12o/12y 12 12 53.6 32.417 Nunnemann 2009 133 60 73 55 2918a Takahashi 2011 111 111 48.3 ~2018b Takahashi 2011 116 116 55.4 ~2019 Terribilli 2011 89 48 41 30.2 ~1820 Tisserand 2002 57 34 23 55.7 2121 Tisserand 2004 38 18 20 71.8 5222 Van Laere 2001 81 40 41 44.2 20
‘↓’ represents that the paper reported decreased gray matter volume/concentration in older gpreservation of gray matter volume/concentration with age. ‘↑↓’ represents that the paper reolder group compared with younger group. GMV, gray matter volume; GMC, gray matter conc
a For studies that examined linear trend of aging, number of subjects for each groups is repob For studies that examined linear trend of aging, age range represents minimum and max
groups of old young subjects, the age range represents the mean age of each group. ~ denotes timation of the age range based on the description of the original paper.
c Good et al. (2001) reported both GMV and GMC in the paper. We only used the GMV resu
of the smaller group when studies reported group differences betweenthe older and younger groups. After obtaining the activation map foreach study, the convergence of activations across experiments wasassessed quantitatively.
Four ALEmapswere constructed. First, an fMRI hyperactivationmapwas constructed based on 159 foci from 24 independent comparisons.
range b Software Algorithm Modulation Measure Effect of age
–70 SPM2 Optimized GMV Linear ↓↑–77 SPM2 Optimized GMV Linear ↓↑–72.1 SPM2 Optimized GMV group difference ↓–60.2 SPM8 DARTEL GMV group difference ↓–84 SPM5 Unified GMV Linear ↓↑–62 SPM2 Optimized GMV group difference ↓–75 SPM2 Optimized GMV Linear ↓↑–81.6 FSL Optimized GMV Linear ↓–79 SPM99 Optimized GMV c Linear ↓↑–79 SPM2 Optimized GMV Linear ↓↑–83 SPM2 Optimized GMV Linear ↓↑–61.3 SPM5 Unified GMV Group difference ↓–81 FSL Optimized GMV Linear ↓–67.1 SPM2 Optimized GMC Group difference ↓–75.6 SPM99 Optimized GMV Linear ↓–74.8 SPM99 Traditional GMC Group difference ↓–80 SPM2 Optimized GMV Linear ↓↑–79 SPM8 Optimized GMC Linear ↓–79 SPM8 Optimized GMC Linear ↓–50 SPM2 Optimized GMV Linear ↓↑–81 In house Traditional GMC Linear ↓–82 In house Traditional GMC Linear ↓–81 SPM99 Traditional GMC Linear ↓↑
roup compared with younger group, whereas ‘↑’ denotes that the paper reported relativeported both decreased and relative preservation of gray matter volume/concentration inentration.rted separately. O represents old group, while y represents young group.imum of the whole sample, whereas for the studies that directly compared between twohat the studies did not explicitly report the age range in their papers, we made an approx-
lts in the current analysis.
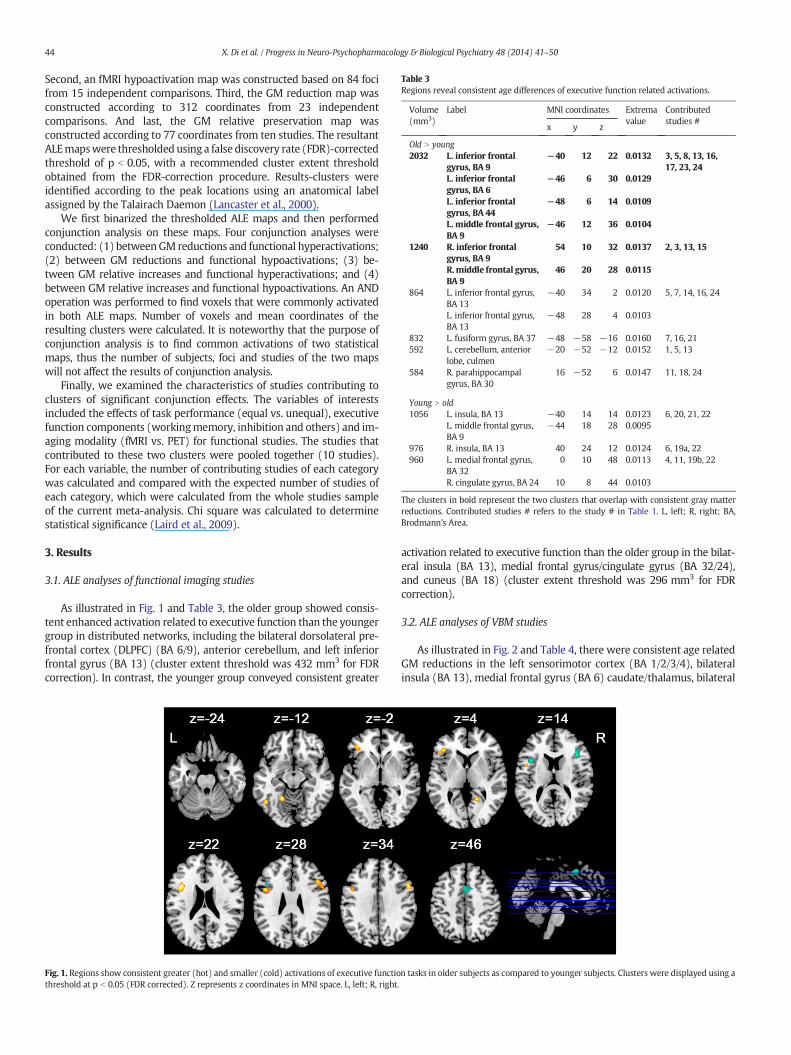
Table 3Regions reveal consistent age differences of executive function related activations.
Volume(mm3)
Label MNI coordinates Extremavalue
Contributedstudies #
x y z
Old N young2032 L. inferior frontal
gyrus, BA 9−40 12 22 0.0132 3, 5, 8, 13, 16,
17, 23, 24L. inferior frontalgyrus, BA 6
−46 6 30 0.0129
L. inferior frontalgyrus, BA 44
−48 6 14 0.0109
L. middle frontal gyrus,BA 9
−46 12 36 0.0104
1240 R. inferior frontalgyrus, BA 9
54 10 32 0.0137 2, 3, 13, 15
R.middle frontal gyrus,BA 9
46 20 28 0.0115
864 L. inferior frontal gyrus,BA 13
−40 34 2 0.0120 5, 7, 14, 16, 24
L. inferior frontal gyrus,BA 13
−48 28 4 0.0103
832 L. fusiform gyrus, BA 37 −48 −58 −16 0.0160 7, 16, 21592 L. cerebellum, anterior
lobe, culmen−20 −52 −12 0.0152 1, 5, 13
584 R. parahippocampalgyrus, BA 30
16 −52 6 0.0147 11, 18, 24
Young N old1056 L. insula, BA 13 −40 14 14 0.0123 6, 20, 21, 22
L. middle frontal gyrus,BA 9
−44 18 28 0.0095
976 R. insula, BA 13 40 24 12 0.0124 6, 19a, 22960 L. medial frontal gyrus,
BA 320 10 48 0.0113 4, 11, 19b, 22
R. cingulate gyrus, BA 24 10 8 44 0.0103
The clusters in bold represent the two clusters that overlap with consistent gray matterreductions. Contributed studies # refers to the study # in Table 1. L, left; R, right; BA,Brodmann's Area.
44 X. Di et al. / Progress in Neuro-Psychopharmacology & Biological Psychiatry 48 (2014) 41–50
Second, an fMRI hypoactivation map was constructed based on 84 focifrom 15 independent comparisons. Third, the GM reduction map wasconstructed according to 312 coordinates from 23 independentcomparisons. And last, the GM relative preservation map wasconstructed according to 77 coordinates from ten studies. The resultantALEmapswere thresholded using a false discovery rate (FDR)-correctedthreshold of p b 0.05, with a recommended cluster extent thresholdobtained from the FDR-correction procedure. Results-clusters wereidentified according to the peak locations using an anatomical labelassigned by the Talairach Daemon (Lancaster et al., 2000).
We first binarized the thresholded ALE maps and then performedconjunction analysis on these maps. Four conjunction analyses wereconducted: (1) betweenGM reductions and functional hyperactivations;(2) between GM reductions and functional hypoactivations; (3) be-tween GM relative increases and functional hyperactivations; and (4)between GM relative increases and functional hypoactivations. An ANDoperation was performed to find voxels that were commonly activatedin both ALE maps. Number of voxels and mean coordinates of theresulting clusters were calculated. It is noteworthy that the purpose ofconjunction analysis is to find common activations of two statisticalmaps, thus the number of subjects, foci and studies of the two mapswill not affect the results of conjunction analysis.
Finally, we examined the characteristics of studies contributing toclusters of significant conjunction effects. The variables of interestsincluded the effects of task performance (equal vs. unequal), executivefunction components (workingmemory, inhibition and others) and im-aging modality (fMRI vs. PET) for functional studies. The studies thatcontributed to these two clusters were pooled together (10 studies).For each variable, the number of contributing studies of each categorywas calculated and compared with the expected number of studies ofeach category, which were calculated from the whole studies sampleof the current meta-analysis. Chi square was calculated to determinestatistical significance (Laird et al., 2009).
3. Results
3.1. ALE analyses of functional imaging studies
As illustrated in Fig. 1 and Table 3, the older group showed consis-tent enhanced activation related to executive function than the youngergroup in distributed networks, including the bilateral dorsolateral pre-frontal cortex (DLPFC) (BA 6/9), anterior cerebellum, and left inferiorfrontal gyrus (BA 13) (cluster extent threshold was 432 mm3 for FDRcorrection). In contrast, the younger group conveyed consistent greater
Fig. 1. Regions show consistent greater (hot) and smaller (cold) activations of executive functiothreshold at p b 0.05 (FDR corrected). Z represents z coordinates in MNI space. L, left; R, right.
activation related to executive function than the older group in the bilat-eral insula (BA 13), medial frontal gyrus/cingulate gyrus (BA 32/24),and cuneus (BA 18) (cluster extent threshold was 296 mm3 for FDRcorrection).
3.2. ALE analyses of VBM studies
As illustrated in Fig. 2 and Table 4, there were consistent age relatedGM reductions in the left sensorimotor cortex (BA 1/2/3/4), bilateralinsula (BA 13), medial frontal gyrus (BA 6) caudate/thalamus, bilateral
n tasks in older subjects as compared to younger subjects. Clusters were displayed using a
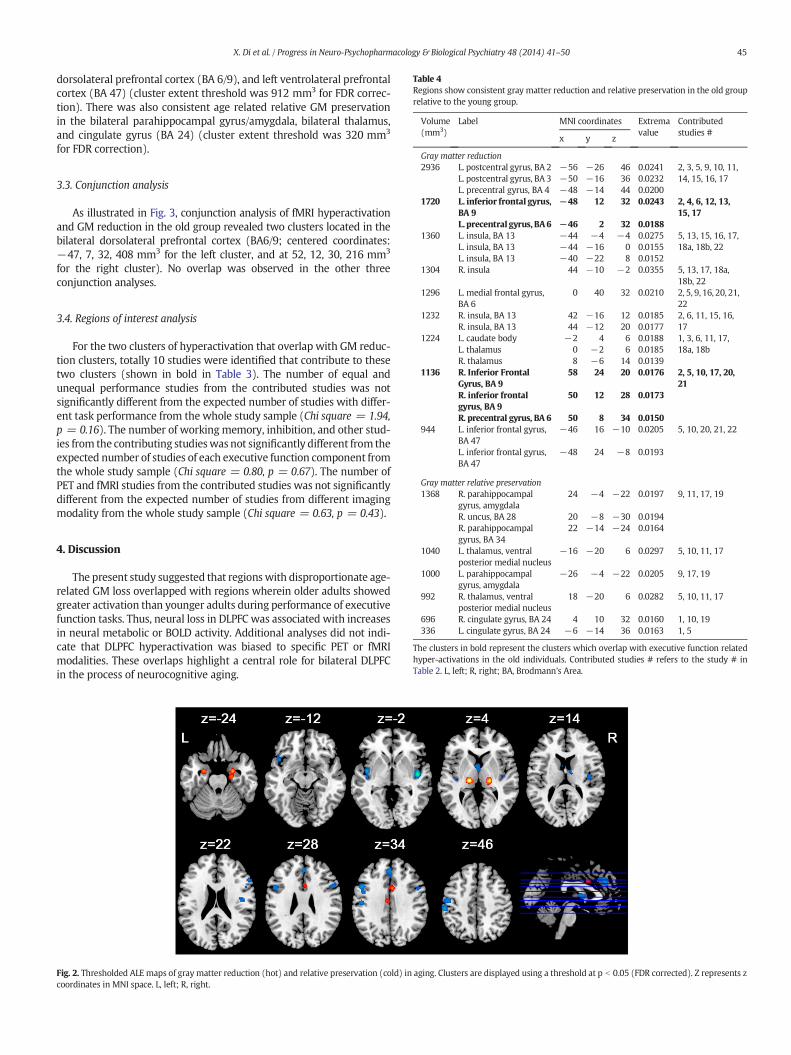
Table 4Regions show consistent gray matter reduction and relative preservation in the old grouprelative to the young group.
Volume(mm3)
Label MNI coordinates Extremavalue
Contributedstudies #
x y z
Gray matter reduction
45X. Di et al. / Progress in Neuro-Psychopharmacology & Biological Psychiatry 48 (2014) 41–50
dorsolateral prefrontal cortex (BA 6/9), and left ventrolateral prefrontalcortex (BA 47) (cluster extent threshold was 912 mm3 for FDR correc-tion). There was also consistent age related relative GM preservationin the bilateral parahippocampal gyrus/amygdala, bilateral thalamus,and cingulate gyrus (BA 24) (cluster extent threshold was 320 mm3
for FDR correction).
2936 L. postcentral gyrus, BA 2 −56 −26 46 0.0241 2, 3, 5, 9, 10, 11,14, 15, 16, 17L. postcentral gyrus, BA 3 −50 −16 36 0.0232
L. precentral gyrus, BA 4 −48 −14 44 0.02001720 L. inferior frontal gyrus,
BA 9−48 12 32 0.0243 2, 4, 6, 12, 13,
15, 17L. precentral gyrus, BA6 −46 2 32 0.0188
1360 L. insula, BA 13 −44 −4 −4 0.0275 5, 13, 15, 16, 17,18a, 18b, 22L. insula, BA 13 −44 −16 0 0.0155
L. insula, BA 13 −40 −22 8 0.01521304 R. insula 44 −10 −2 0.0355 5, 13, 17, 18a,
18b, 22
3.3. Conjunction analysis
As illustrated in Fig. 3, conjunction analysis of fMRI hyperactivationand GM reduction in the old group revealed two clusters located in thebilateral dorsolateral prefrontal cortex (BA6/9; centered coordinates:−47, 7, 32, 408 mm3 for the left cluster, and at 52, 12, 30, 216 mm3
for the right cluster). No overlap was observed in the other threeconjunction analyses.
1296 L. medial frontal gyrus,BA 6
0 40 32 0.0210 2, 5, 9, 16, 20, 21,22
1232 R. insula, BA 13 42 −16 12 0.0185 2, 6, 11, 15, 16,17R. insula, BA 13 44 −12 20 0.0177
1224 L. caudate body −2 4 6 0.0188 1, 3, 6, 11, 17,18a, 18bL. thalamus 0 −2 6 0.0185
R. thalamus 8 −6 14 0.01391136 R. Inferior Frontal
Gyrus, BA 958 24 20 0.0176 2, 5, 10, 17, 20,
21R. inferior frontalgyrus, BA 9
50 12 28 0.0173
R. precentral gyrus, BA 6 50 8 34 0.0150944 L. inferior frontal gyrus,
BA 47−46 16 −10 0.0205 5, 10, 20, 21, 22
L. inferior frontal gyrus,BA 47
−48 24 −8 0.0193
Gray matter relative preservation1368 R. parahippocampal
gyrus, amygdala24 −4 −22 0.0197 9, 11, 17, 19
R. uncus, BA 28 20 −8 −30 0.0194
3.4. Regions of interest analysis
For the two clusters of hyperactivation that overlap with GM reduc-tion clusters, totally 10 studies were identified that contribute to thesetwo clusters (shown in bold in Table 3). The number of equal andunequal performance studies from the contributed studies was notsignificantly different from the expected number of studies with differ-ent task performance from the whole study sample (Chi square = 1.94,p = 0.16). The number of workingmemory, inhibition, and other stud-ies from the contributing studieswas not significantly different from theexpected number of studies of each executive function component fromthe whole study sample (Chi square = 0.80, p = 0.67). The number ofPET and fMRI studies from the contributed studies was not significantlydifferent from the expected number of studies from different imagingmodality from the whole study sample (Chi square = 0.63, p = 0.43).
R. parahippocampalgyrus, BA 34
22 −14 −24 0.0164
1040 L. thalamus, ventralposterior medial nucleus
−16 −20 6 0.0297 5, 10, 11, 17
1000 L. parahippocampalgyrus, amygdala
−26 −4 −22 0.0205 9, 17, 19
992 R. thalamus, ventralposterior medial nucleus
18 −20 6 0.0282 5, 10, 11, 17
696 R. cingulate gyrus, BA 24 4 10 32 0.0160 1, 10, 19336 L. cingulate gyrus, BA 24 −6 −14 36 0.0163 1, 5
The clusters in bold represent the clusters which overlap with executive function relatedhyper-activations in the old individuals. Contributed studies # refers to the study # inTable 2. L, left; R, right; BA, Brodmann's Area.
4. Discussion
The present study suggested that regionswith disproportionate age-related GM loss overlapped with regions wherein older adults showedgreater activation than younger adults during performance of executivefunction tasks. Thus, neural loss in DLPFC was associated with increasesin neural metabolic or BOLD activity. Additional analyses did not indi-cate that DLPFC hyperactivation was biased to specific PET or fMRImodalities. These overlaps highlight a central role for bilateral DLPFCin the process of neurocognitive aging.
Fig. 2. Thresholded ALEmaps of graymatter reduction (hot) and relative preservation (cold) in aging. Clusters are displayed using a threshold at p b 0.05 (FDR corrected). Z represents zcoordinates in MNI space. L, left; R, right.
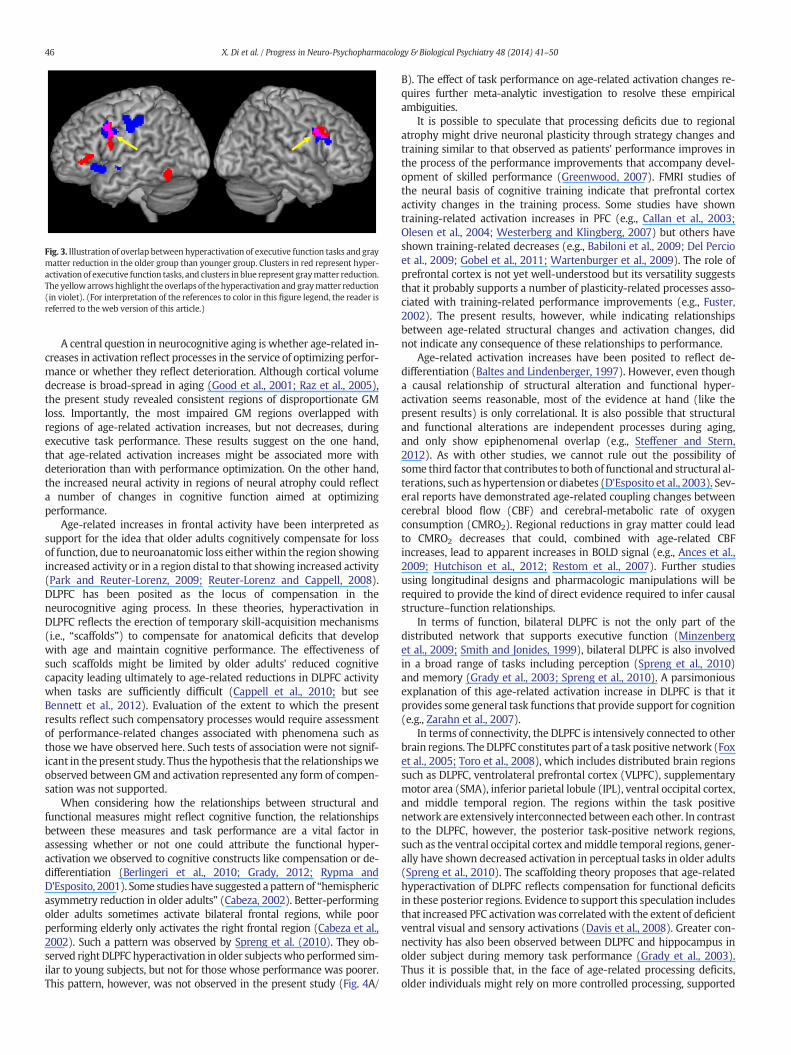
Fig. 3. Illustration of overlap between hyperactivation of executive function tasks and graymatter reduction in the older group than younger group. Clusters in red represent hyper-activation of executive function tasks, and clusters in blue represent graymatter reduction.The yellowarrowshighlight the overlaps of thehyperactivation and graymatter reduction(in violet). (For interpretation of the references to color in this figure legend, the reader isreferred to the web version of this article.)
46 X. Di et al. / Progress in Neuro-Psychopharmacology & Biological Psychiatry 48 (2014) 41–50
A central question in neurocognitive aging is whether age-related in-creases in activation reflect processes in the service of optimizing perfor-mance or whether they reflect deterioration. Although cortical volumedecrease is broad-spread in aging (Good et al., 2001; Raz et al., 2005),the present study revealed consistent regions of disproportionate GMloss. Importantly, the most impaired GM regions overlapped withregions of age-related activation increases, but not decreases, duringexecutive task performance. These results suggest on the one hand,that age-related activation increases might be associated more withdeterioration than with performance optimization. On the other hand,the increased neural activity in regions of neural atrophy could reflecta number of changes in cognitive function aimed at optimizingperformance.
Age-related increases in frontal activity have been interpreted assupport for the idea that older adults cognitively compensate for lossof function, due to neuroanatomic loss eitherwithin the region showingincreased activity or in a region distal to that showing increased activity(Park and Reuter-Lorenz, 2009; Reuter-Lorenz and Cappell, 2008).DLPFC has been posited as the locus of compensation in theneurocognitive aging process. In these theories, hyperactivation inDLPFC reflects the erection of temporary skill-acquisition mechanisms(i.e., “scaffolds”) to compensate for anatomical deficits that developwith age and maintain cognitive performance. The effectiveness ofsuch scaffolds might be limited by older adults' reduced cognitivecapacity leading ultimately to age-related reductions in DLPFC activitywhen tasks are sufficiently difficult (Cappell et al., 2010; but seeBennett et al., 2012). Evaluation of the extent to which the presentresults reflect such compensatory processes would require assessmentof performance-related changes associated with phenomena such asthose we have observed here. Such tests of association were not signif-icant in the present study. Thus the hypothesis that the relationshipsweobserved between GM and activation represented any form of compen-sation was not supported.
When considering how the relationships between structural andfunctional measures might reflect cognitive function, the relationshipsbetween these measures and task performance are a vital factor inassessing whether or not one could attribute the functional hyper-activation we observed to cognitive constructs like compensation or de-differentiation (Berlingeri et al., 2010; Grady, 2012; Rypma andD'Esposito, 2001). Some studies have suggested apattern of “hemisphericasymmetry reduction in older adults” (Cabeza, 2002). Better-performingolder adults sometimes activate bilateral frontal regions, while poorperforming elderly only activates the right frontal region (Cabeza et al.,2002). Such a pattern was observed by Spreng et al. (2010). They ob-served right DLPFC hyperactivation in older subjectswhoperformed sim-ilar to young subjects, but not for those whose performance was poorer.This pattern, however, was not observed in the present study (Fig. 4A/
B). The effect of task performance on age-related activation changes re-quires further meta-analytic investigation to resolve these empiricalambiguities.
It is possible to speculate that processing deficits due to regionalatrophy might drive neuronal plasticity through strategy changes andtraining similar to that observed as patients' performance improves inthe process of the performance improvements that accompany devel-opment of skilled performance (Greenwood, 2007). FMRI studies ofthe neural basis of cognitive training indicate that prefrontal cortexactivity changes in the training process. Some studies have showntraining-related activation increases in PFC (e.g., Callan et al., 2003;Olesen et al., 2004; Westerberg and Klingberg, 2007) but others haveshown training-related decreases (e.g., Babiloni et al., 2009; Del Percioet al., 2009; Gobel et al., 2011; Wartenburger et al., 2009). The role ofprefrontal cortex is not yet well-understood but its versatility suggeststhat it probably supports a number of plasticity-related processes asso-ciated with training-related performance improvements (e.g., Fuster,2002). The present results, however, while indicating relationshipsbetween age-related structural changes and activation changes, didnot indicate any consequence of these relationships to performance.
Age-related activation increases have been posited to reflect de-differentiation (Baltes and Lindenberger, 1997). However, even thougha causal relationship of structural alteration and functional hyper-activation seems reasonable, most of the evidence at hand (like thepresent results) is only correlational. It is also possible that structuraland functional alterations are independent processes during aging,and only show epiphenomenal overlap (e.g., Steffener and Stern,2012). As with other studies, we cannot rule out the possibility ofsome third factor that contributes to both of functional and structural al-terations, such as hypertension or diabetes (D'Esposito et al., 2003). Sev-eral reports have demonstrated age-related coupling changes betweencerebral blood flow (CBF) and cerebral-metabolic rate of oxygenconsumption (CMRO2). Regional reductions in gray matter could leadto CMRO2 decreases that could, combined with age-related CBFincreases, lead to apparent increases in BOLD signal (e.g., Ances et al.,2009; Hutchison et al., 2012; Restom et al., 2007). Further studiesusing longitudinal designs and pharmacologic manipulations will berequired to provide the kind of direct evidence required to infer causalstructure–function relationships.
In terms of function, bilateral DLPFC is not the only part of thedistributed network that supports executive function (Minzenberget al., 2009; Smith and Jonides, 1999), bilateral DLPFC is also involvedin a broad range of tasks including perception (Spreng et al., 2010)and memory (Grady et al., 2003; Spreng et al., 2010). A parsimoniousexplanation of this age-related activation increase in DLPFC is that itprovides some general task functions that provide support for cognition(e.g., Zarahn et al., 2007).
In terms of connectivity, the DLPFC is intensively connected to otherbrain regions. TheDLPFC constitutes part of a task positive network (Foxet al., 2005; Toro et al., 2008), which includes distributed brain regionssuch as DLPFC, ventrolateral prefrontal cortex (VLPFC), supplementarymotor area (SMA), inferior parietal lobule (IPL), ventral occipital cortex,and middle temporal region. The regions within the task positivenetwork are extensively interconnected between each other. In contrastto the DLPFC, however, the posterior task-positive network regions,such as the ventral occipital cortex andmiddle temporal regions, gener-ally have shown decreased activation in perceptual tasks in older adults(Spreng et al., 2010). The scaffolding theory proposes that age-relatedhyperactivation of DLPFC reflects compensation for functional deficitsin these posterior regions. Evidence to support this speculation includesthat increased PFC activationwas correlatedwith the extent of deficientventral visual and sensory activations (Davis et al., 2008). Greater con-nectivity has also been observed between DLPFC and hippocampus inolder subject during memory task performance (Grady et al., 2003).Thus it is possible that, in the face of age-related processing deficits,older individuals might rely on more controlled processing, supported
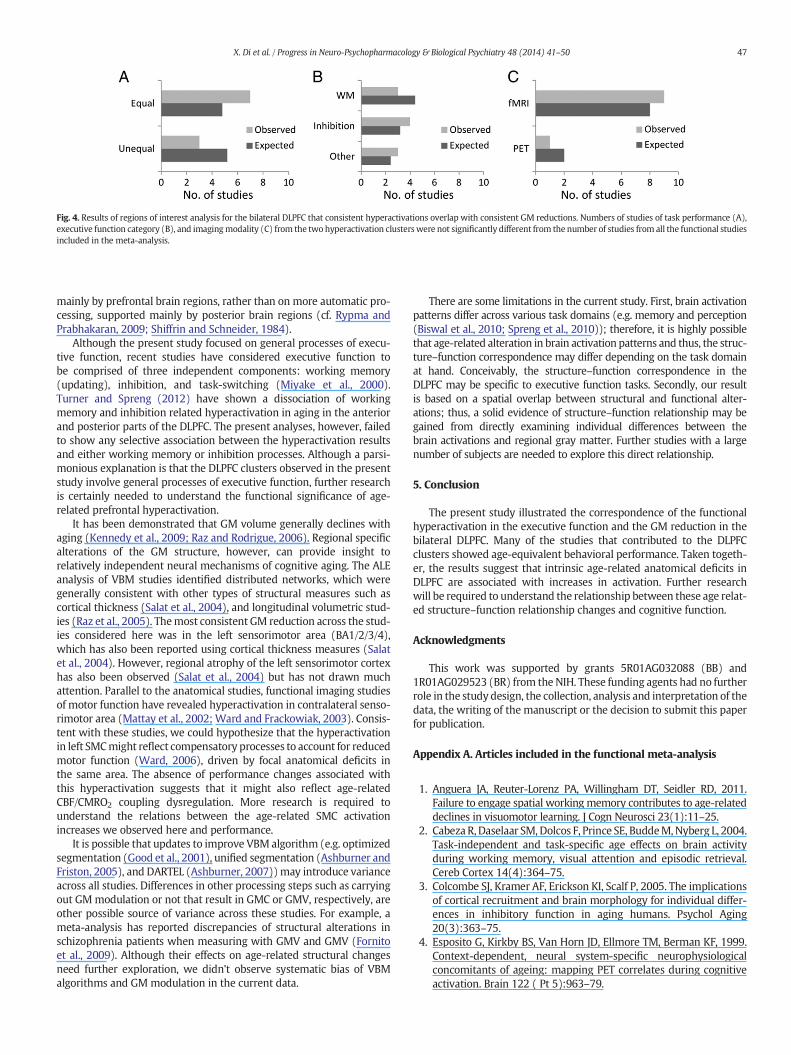
Fig. 4. Results of regions of interest analysis for the bilateral DLPFC that consistent hyperactivations overlap with consistent GM reductions. Numbers of studies of task performance (A),executive function category (B), and imagingmodality (C) from the two hyperactivation clusters were not significantly different from the number of studies from all the functional studiesincluded in the meta-analysis.
47X. Di et al. / Progress in Neuro-Psychopharmacology & Biological Psychiatry 48 (2014) 41–50
mainly by prefrontal brain regions, rather than on more automatic pro-cessing, supported mainly by posterior brain regions (cf. Rypma andPrabhakaran, 2009; Shiffrin and Schneider, 1984).
Although the present study focused on general processes of execu-tive function, recent studies have considered executive function tobe comprised of three independent components: working memory(updating), inhibition, and task-switching (Miyake et al., 2000).Turner and Spreng (2012) have shown a dissociation of workingmemory and inhibition related hyperactivation in aging in the anteriorand posterior parts of the DLPFC. The present analyses, however, failedto show any selective association between the hyperactivation resultsand either working memory or inhibition processes. Although a parsi-monious explanation is that the DLPFC clusters observed in the presentstudy involve general processes of executive function, further researchis certainly needed to understand the functional significance of age-related prefrontal hyperactivation.
It has been demonstrated that GM volume generally declines withaging (Kennedy et al., 2009; Raz and Rodrigue, 2006). Regional specificalterations of the GM structure, however, can provide insight torelatively independent neural mechanisms of cognitive aging. The ALEanalysis of VBM studies identified distributed networks, which weregenerally consistent with other types of structural measures such ascortical thickness (Salat et al., 2004), and longitudinal volumetric stud-ies (Raz et al., 2005). Themost consistent GM reduction across the stud-ies considered here was in the left sensorimotor area (BA1/2/3/4),which has also been reported using cortical thickness measures (Salatet al., 2004). However, regional atrophy of the left sensorimotor cortexhas also been observed (Salat et al., 2004) but has not drawn muchattention. Parallel to the anatomical studies, functional imaging studiesof motor function have revealed hyperactivation in contralateral senso-rimotor area (Mattay et al., 2002; Ward and Frackowiak, 2003). Consis-tent with these studies, we could hypothesize that the hyperactivationin left SMCmight reflect compensatory processes to account for reducedmotor function (Ward, 2006), driven by focal anatomical deficits inthe same area. The absence of performance changes associated withthis hyperactivation suggests that it might also reflect age-relatedCBF/CMRO2 coupling dysregulation. More research is required tounderstand the relations between the age-related SMC activationincreases we observed here and performance.
It is possible that updates to improve VBM algorithm (e.g. optimizedsegmentation (Good et al., 2001), unified segmentation (Ashburner andFriston, 2005), and DARTEL (Ashburner, 2007))may introduce varianceacross all studies. Differences in other processing steps such as carryingout GMmodulation or not that result in GMC or GMV, respectively, areother possible source of variance across these studies. For example, ameta-analysis has reported discrepancies of structural alterations inschizophrenia patients when measuring with GMV and GMV (Fornitoet al., 2009). Although their effects on age-related structural changesneed further exploration, we didn't observe systematic bias of VBMalgorithms and GM modulation in the current data.
There are some limitations in the current study. First, brain activationpatterns differ across various task domains (e.g. memory and perception(Biswal et al., 2010; Spreng et al., 2010)); therefore, it is highly possiblethat age-related alteration in brain activation patterns and thus, the struc-ture–function correspondence may differ depending on the task domainat hand. Conceivably, the structure–function correspondence in theDLPFC may be specific to executive function tasks. Secondly, our resultis based on a spatial overlap between structural and functional alter-ations; thus, a solid evidence of structure–function relationship may begained from directly examining individual differences between thebrain activations and regional gray matter. Further studies with a largenumber of subjects are needed to explore this direct relationship.
5. Conclusion
The present study illustrated the correspondence of the functionalhyperactivation in the executive function and the GM reduction in thebilateral DLPFC. Many of the studies that contributed to the DLPFCclusters showed age-equivalent behavioral performance. Taken togeth-er, the results suggest that intrinsic age-related anatomical deficits inDLPFC are associated with increases in activation. Further researchwill be required to understand the relationship between these age relat-ed structure–function relationship changes and cognitive function.
Acknowledgments
This work was supported by grants 5R01AG032088 (BB) and1R01AG029523 (BR) from the NIH. These funding agents had no furtherrole in the study design, the collection, analysis and interpretation of thedata, the writing of the manuscript or the decision to submit this paperfor publication.
Appendix A. Articles included in the functional meta-analysis
1. Anguera JA, Reuter-Lorenz PA, Willingham DT, Seidler RD, 2011.Failure to engage spatial working memory contributes to age-relateddeclines in visuomotor learning. J Cogn Neurosci 23(1):11–25.
2. Cabeza R, Daselaar SM,Dolcos F, Prince SE, BuddeM,Nyberg L, 2004.Task-independent and task-specific age effects on brain activityduring working memory, visual attention and episodic retrieval.Cereb Cortex 14(4):364–75.
3. Colcombe SJ, Kramer AF, Erickson KI, Scalf P, 2005. The implicationsof cortical recruitment and brain morphology for individual differ-ences in inhibitory function in aging humans. Psychol Aging20(3):363–75.
4. Esposito G, Kirkby BS, Van Horn JD, Ellmore TM, Berman KF, 1999.Context-dependent, neural system-specific neurophysiologicalconcomitants of ageing: mapping PET correlates during cognitiveactivation. Brain 122 ( Pt 5):963–79.
48 X. Di et al. / Progress in Neuro-Psychopharmacology & Biological Psychiatry 48 (2014) 41–50
5. Freo U, Ricciardi E, Pietrini P, Schapiro MB, Rapoport SI, Furey ML,2005. Pharmacological modulation of prefrontal cortical activityduring a working memory task in young and older humans: a PETstudy with physostigmine. Am J Psychiatry 162(11):2061–70.
6. Grady CL, McIntosh AR, Bookstein F, Horwitz B, Rapoport SI, HaxbyJV, 1998. Age-related changes in regional cerebral blood flowduringworking memory for faces. Neuroimage 8(4):409–25.
7. Grady CL, Yu H, Alain C, 2008. Age-related differences in brain activ-ity underlying workingmemory for spatial and nonspatial auditoryinformation. Cereb Cortex 18(1):189–99.
8. Grossman M, Cooke A, DeVita C, Alsop D, Detre J, Chen W, Gee J,2002. Age-related changes in working memory during sentencecomprehension: an fMRI study. Neuroimage 15(2):302–17.
9. Huang CM, Polk TA, Goh JO, Park DC, 2012. Both left and right pos-terior parietal activations contribute to compensatory processes innormal aging. Neuropsychologia 50(1):55–66.
10. Hubert V, Beaunieux H, Chételat G, Platel H, Landeau B, Viader F,Desgranges B, Eustache F, 2009. Age-related changes in the cerebralsubstrates of cognitive procedural learning. Hum Brain Mapp30(4):1374–86.
11. Lamar M, Yousem DM, Resnick SM, 2004. Age differences inorbitofrontal activation: an fMRI investigation of delayed matchand nonmatch to sample. Neuroimage: 21(4):1368–76.
12. Lee TM, Zhang JX, Chan CC, Yuen KS, Chu LW, Cheung RT, Chan YS,Fox PT, Gao JH, 2006. Age-related differences in response regulationas revealed by functional MRI. Brain Res 1076(1):171–6.
13. Madden DJ, Costello MC, Dennis NA, Davis SW, Shepler AM, SpaniolJ, Bucur B, Cabeza R, 2010. Adult age differences in functional con-nectivity during executive control. Neuroimage 52(2):643–57.
14. Mathis A, Schunck T, Erb G, Namer IJ, Luthringer R, 2009. The effectof aging on the inhibitory function in middle-aged subjects: a func-tional MRI study coupled with a color-matched Stroop task. Int JGeriatr Psychiatry 24(10):1062–71.
15. Mell T, Wartenburger I, Marschner A, Villringer A, Reischies FM,Heekeren HR, 2009. Altered function of ventral striatum duringreward-based decisionmaking in old age. FrontHumNeurosci 3:34.
16. Nagels A, Kircher T, Dietsche B, Backes H, Marquetand J, Krug A,2012. Neural processing of overt word generation in healthy indi-viduals: the effect of age and word knowledge. Neuroimage61(4):832–40.
17. Onur OA, Piefke M, Lie CH, Thiel CM, Fink GR, 2011. ModulatoryEffects of Levodopa on Cognitive Control in Young, but not inOlder Subjects: A Pharmacological fMRI Study. J Cogn Neurosci23(10):2797–810.
18. O'Connell RG, Balsters JH, Kilcullen SM, Campbell W, Bokde AW, LaiR, UptonN, Robertson IH, 2012. A simultaneous ERP/fMRI investiga-tion of the P300 aging effect. Neurobiol Aging 33(10):2448–61.
19. Paxton JL, Barch DM, Racine CA, Braver TS, 2008. Cognitive control,goal maintenance, and prefrontal function in healthy aging. CerebCortex 18(5):1010–28.
20. Prakash RS, Heo S, Voss MW, Patterson B, Kramer AF, 2012. Age-related differences in cortical recruitment and suppression: implica-tions for cognitive performance. Behav Brain Res 230(1):192–200.
21. Ricciardi E, Pietrini P, Schapiro MB, Rapoport SI, Furey ML, 2009.Cholinergic modulation of visual working memory during aging: aparametric PET study. Brain Res Bull 79(5):322–32.
22. Rypma B, Prabhakaran V, Desmond JE, Gabrieli JD, 2001. Age differ-ences in prefrontal cortical activity in working memory. PsycholAging 16(3):371–84.
23. Van Impe A, Coxon JP, Goble DJ, Wenderoth N, Swinnen SP, 2011.Age-related changes in brain activation underlying single- anddual-task performance: Visuomanual drawing and mental arith-metic. Neuropsychologia 49(9):2400–9.
24. Zysset S, SchroeterML,Neumann J, Yves von CramonD, 2006 Stroopinterference, hemodynamic response and aging. An event-relatedfMRI study. Neurobiol Aging 28:937–946.
Appendix B. Articles included in the VBM meta-analysis
1. Abe O, Yamasue H, Aoki S, Suga M, Yamada H, Kasai K, Masutani Y,Kato N, Kato N, Ohtomo K, 2008. Aging in the CNS: comparison ofgray/white matter volume and diffusion tensor data. NeurobiolAging 29(1):102–16.
2. Alexander GE, Chen K, Merkley TL, Reiman EM, Caselli RJ,Aschenbrenner M, Santerre-Lemmon L, Lewis DJ, Pietrini P, TeipelSJ, Hampel H, Rapoport SI, Moeller JR, 2006. Regional network ofmagnetic resonance imaging gray matter volume in healthy aging.Neuroreport 17(10):951–6.
3. Antonova E, ParslowD, BrammerM, DawsonGR, Jackson SH,MorrisRG, 2009. Age-related neural activity during allocentric spatialmemory. Memory 17(2):125–43.
4. Bauer E, Gebhardt H, Gruppe H, Gallhofer B, Sammer G, 2012. Al-tered negative priming in older subjects: first evidence from behav-ioral and neural level. Front Hum Neurosci 6:270.
5. Bergfield KL, Hanson KD, Chen K, Teipel SJ, Hampel H, Rapoport SI,Moeller JR, Alexander GE, 2010. Age-related networks of regionalcovariance in MRI gray matter: reproducible multivariate patternsin healthy aging. Neuroimage 49(2):1750–9.
6. Berlingeri M, Bottini G, Danelli L, Ferri F, Traficante D, Sacheli L, Co-lomboN, SbernaM, Sterzi R, Scialfa G, Paulesu E, 2010.With timeonour side? Task-dependent compensatory processes in gracefulaging. Exp Brain Res 205(3):307–24.
7. Curiati PK, Tamashiro JH, Squarzoni P, Duran FL, Santos LC,WajngartenM, Leite CC, ValladaH,Menezes PR, ScazufcaM, BusattoGF, Alves TC, 2009. Brain structural variability due to aging and gen-der in cognitively healthy Elders: results from the Sao Paulo Ageingand Health study. AJNR Am J Neuroradiol 30(10):1850–6.
8. Giorgio A, Santelli L, Tomassini V, Bosnell R, Smith S, De Stefano N,Johansen-Berg H, 2010. Age-related changes in grey andwhitemat-ter structure throughout adulthood. Neuroimage 51(3):943–51.
9. Good CD, Johnsrude IS, Ashburner J, Henson RN, Friston KJ,Frackowiak RS, 2001. A voxel-based morphometric study of age-ing in 465 normal adult human brains. Neuroimage 14(1 Pt1):21–36.
10. Grieve SM, Clark CR, Williams LM, Peduto AJ, Gordon E, 2005. Pres-ervation of limbic and paralimbic structures in aging. Hum BrainMapp 25(4):391–401.
11. Kalpouzos G, Chételat G, Baron JC, Landeau B, Mevel K, Godeau C,Barré L, Constans JM, Viader F, Eustache F, Desgranges B, 2009.Voxel-basedmapping of brain graymatter volume and glucoseme-tabolism profiles in normal aging. Neurobiol Aging 30(1):112–24.
12. Kalpouzos G, Persson J, Nyberg L, 2012. Local brain atrophy accountsfor functional activity differences in normal aging. Neurobiol Aging33(3):623.e1-623.e13.
13. Kennedy KM, Erickson KI, Rodrigue KM, Voss MW, Colcombe SJ,Kramer AF, Acker JD, Raz N, 2009. Age-related differences in region-al brain volumes: a comparison of optimized voxel-based mor-phometry to manual volumetry. Neurobiol Aging 30(10):1657–76.
14. Lehmbeck JT, Brassen S, Weber-FahrW, Braus DF, 2006. Combiningvoxel-based morphometry and diffusion tensor imaging to detectage-related brain changes. Neuroreport 17(5):467–70.
15. Lemaître H, Crivello F, Grassiot B, Alpérovitch A, Tzourio C, MazoyerB, 2005. Age- and sex-related effects on the neuroanatomy ofhealthy elderly. Neuroimage 26(3):900–11.
16. Maguire EA, Frith CD, 2003. Aging affects the engagement of thehippocampus during autobiographical memory retrieval. Brain126(Pt 7):1511–23.
17. Nunnemann S, Wohlschläger AM, Ilg R, Gaser C, Etgen T, Conrad B,Zimmer C, Mühlau M, 2009. Accelerated aging of the putamen inmen but not in women. Neurobiol Aging 30(1):147–51.
18. Takahashi R, Ishii K, Kakigi T, Yokoyama K, 2011. Gender and agedifferences in normal adult human brain: Voxel-basedmorphomet-ric study. Hum Brain Mapp 32(7):1050–8.
49X. Di et al. / Progress in Neuro-Psychopharmacology & Biological Psychiatry 48 (2014) 41–50
19. Terribilli D, Schaufelberger MS, Duran FL, Zanetti MV, Curiati PK,Menezes PR, Scazufca M, Amaro E Jr, Leite CC, Busatto GF, 2011.Age-related gray matter volume changes in the brain during non-elderly adulthood. Neurobiol Aging 32(2):354–68.
20. Tisserand DJ, Pruessner JC, Sanz Arigita EJ, van Boxtel MP, Evans AC,Jolles J, Uylings HB, 2002. Regional frontal cortical volumes decreasedifferentially in aging: an MRI study to compare volumetric ap-proaches and voxel-basedmorphometry. Neuroimage 17(2):657–69.
21. Tisserand DJ, van Boxtel MP, Pruessner JC, Hofman P, Evans AC,Jolles J, 2004. A voxel-basedmorphometric study to determine indi-vidual differences in gray matter density associated with age andcognitive change over time. Cereb Cortex 14(9):966–73.
22. Van Laere KJ, Dierckx RA, 2001. Brain perfusion SPECT: age- andsex-related effects correlatedwith voxel-basedmorphometric find-ings in healthy adults. Radiology 221(3):810–7.
ReferencesAnces BM, Liang CL, Leontiev O, Perthen JE, Fleisher AS, Lansing AE, et al. Effects of aging
on cerebral blood flow, oxygen metabolism, and blood oxygenation level dependentresponses to visual stimulation. Hum Brain Mapp 2009;30:1120–32.
Ashburner J. A fast diffeomorphic image registration algorithm. Neuroimage 2007;38(1):95–113.
Ashburner J, Friston KJ. Voxel-based morphometry—the methods. Neuroimage2000;11(6 Pt 1):805–21.
Ashburner J, Friston KJ. Unified segmentation. Neuroimage 2005;26(3):839–51.Babiloni C, Del Percio C, Rossini PM, Marzano N, Iacoboni M, Infarinato F, et al. Judgment
of actions in experts: a high-resolution EEG study in elite athletes. Neuroimage2009;45:512–21.
Baltes PB, Lindenberger U. Emergence of a powerful connection between sensory andcognitive functions across the adult life span: a newwindow to the study of cognitiveaging? Psychol Aging 1997;12(1):12–21.
Bennett IJ, MotesMA, RaoNK, RypmaB.Whitematter tract integrity predicts visual searchperformance in young and older adults. Neurobiol Aging 2012;33(2):433. [e21-31].
Berlingeri M, Bottini G, Danelli L, Ferri F, Traficante D, Sacheli L, et al. With time on ourside? Task-dependent compensatory processes in graceful aging. Exp Brain Res2010;205(3):307–24.
Biswal BB, Eldreth DA, Motes MA, Rypma B. Task-dependent individual differences inprefrontal connectivity. Cereb Cortex 2010;20(9):2188–97.
Brett M. The MNI brain and the Talairach atlas, Cambridge Imagers. http://imaging.mrc-cbu.cam.ac.uk/imaging/MniTalairach, 1999. [Last visit on May 8th, 2013].
Cabeza R. Hemispheric asymmetry reduction in older adults: the HAROLDmodel. PsycholAging 2002;17(1):85–100.
Cabeza R, Anderson ND, Locantore JK, McIntosh AR. Aging gracefully: compensatory brainactivity in high-performing older adults. Neuroimage 2002;17(3):1394–402.
Callan DE, Tajima K, Callan AM, Kubo R, Masaki S, Akahane-Yamada R. Learning-inducedneural plasticity associated with improved identification performance after trainingof a difficult second-language phonetic contrast. Neuroimage 2003;19(1):113–24.
Cappell KA, Gmeindl L, Reuter-Lorenz PA. Age differences in prefrontal recruitmentduring verbal working memory maintenance depend on memory load. Cortex2010;46(4):462–73.
Chan RC, Di X, McAlonan GM, Gong QY. Brain anatomical abnormalities in high-risk indi-viduals, first-episode, and chronic schizophrenia: an activation likelihood estimationmeta-analysis of illness progression. Schizophr Bull 2011;37(1):177–88.
Craik FI, McDowd JM. Age differences in recall and recognition. J Exp Psychol Learn MemCogn 1987;13(3):474–9.
Davis SW, Dennis NA, Daselaar SM, FleckMS, Cabeza R. Que PASA? The posterior–anteriorshift in aging. Cereb Cortex 2008;18(5):1201–9.
Del Percio C, Babiloni C, Bertollo M, Rossini P, Marzano N, Iacobini M, et al.Visuo-attentional and sensorimotor alpha rhythms are related to visuo-motor perfor-mance in athletes. Hum Brain Mapp 2009;30:3527–40.
Dennis NA, Cabeza R. Neuroimaging of healthy cognitive aging. In: Craik FIM, Salthouse TA,editors. Handbook of aging and cognition. 3rd ed. Mahwah, NJ: Erlbaum; 2008. p. 1–54.
D'Esposito M, Deouell LY, Gazzaley A. Alterations in the BOLD fMRI signal with ageing anddisease: a challenge for neuroimaging. Nat Rev Neurosci 2003;4(11):863–72.
Di X, Chan RC, Gong QY. White matter reduction in patients with schizophrenia asrevealed by voxel-based morphometry: an activation likelihood estimation meta-analysis. Prog Neuropsychopharmacol Biol Psychiatry 2009;33(8):1390–4.
Eickhoff SB, Laird AR, Grefkes C, Wang LE, Zilles K, Fox PT. Coordinate-based activationlikelihood estimation meta-analysis of neuroimaging data: a random-effects ap-proach based on empirical estimates of spatial uncertainty. Hum Brain Mapp2009;30:2907–26.
Esposito G, Kirkby BS, Van Horn JD, Ellmore TM, Berman KF. Context-dependent, neuralsystem-specific neurophysiological concomitants of ageing: mapping PET correlatesduring cognitive activation. Brain 1999;122(Pt 5):963–79.
Fornito A, Yücel M, Patti J, Wood SJ, Pantelis C. Mapping grey matter reductions in schizo-phrenia: an anatomical likelihood estimation analysis of voxel-based morphometrystudies. Schizophr Res 2009;108(1–3):104–13.
Fox MD, Snyder AZ, Vincent JL, Corbetta M, Van Essen DC, Raichle ME. The human brain isintrinsically organized into dynamic, anticorrelated functional networks. Proc NatlAcad Sci U S A 2005;102:9673–8.
Fuster JM. Frontal lobe and cognitive development. J Neurocytol 2002;31(3–5):373–85.Gazzaley A, Clapp W, Kelley J, McEvoy K, Knight RT, D'Esposito M. Age-related top-down
suppression deficit in the early stages of cortical visual memory processing. Proc NatlAcad Sci U S A 2008;105(35):13122–6.
Gobel EW, Parrish TB, Reber PJ. Neural correlates of skill acquisition: decreased corticalactivity during a serial interception sequence learning task. Neuroimage 2011;58:1150–7.
Good CD, Johnsrude IS, Ashburner J, Henson RN, Friston KJ, Frackowiak RS. A voxel-basedmorphometric study of ageing in 465 normal adult human brains. Neuroimage2001;14(1 Pt 1):21–36.
GradyCL. Brain imaging and age-related changes in cognition. ExpGerontol 1998;33(7–8):661–73.
Grady CL. The cognitive neuroscience of aging. Nat Rev Neurosci 2012;13:491–505.Grady CL, McIntosh AR, Craik FI. Age-related differences in the functional connectiv-
ity of the hippocampus during memory encoding. Hippocampus 2003;13(5):572–86.
Greenwood PM. Functional plasticity in cognitive aging: review and hypothesis. Neuro-psychology 2007;21(6):657–73.
Hasher L, Stoltzfus ER, Zacks RT, Rypma B. Age and inhibition. J Exp Psychol Learn MemCogn 1991;17(1):163–9.
Hutchison JL, Lu H, Rypma B. Neural mechanisms of age-related slowing: theΔCBF/ΔCMRO2 ratio mediates age-differences in BOLD signal and human perfor-mance. Cereb Cortex 2012. http://dx.doi.org/10.1093/cercor/bhs233.
Kennedy KM, Erickson KI, Rodrigue KM, Voss MW, Colcombe SJ, Kramer AF, et al.Age-related differences in regional brain volumes: a comparison of optimizedvoxel-based morphometry to manual volumetry. Neurobiol Aging 2009;30(10):1657–76.
Laird AR, Eickhoff SB, Li K, Robin DA, Glahn DC, Fox PT. Investigating the functional het-erogeneity of the default mode network using coordinate-based meta-analyticmodeling. J Neurosci 2009;29(46):14496–505.
Lamar M, Yousem DM, Resnick SM. Age differences in orbitofrontal activation: an fMRI in-vestigation of delayed match and nonmatch to sample. Neuroimage 2004;21(4):1368–76.
Lancaster JL, Woldorff MG, Parsons LM, Liotti M, Freitas CS, Rainey L, et al. AutomatedTalairach atlas labels for functional brain mapping. Hum Brain Mapp 2000;10(3):120–31.
Lancaster JL, Tordesillas-Gutiérrez D, Martinez M, Salinas F, Evans A, Zilles K, et al. Bias be-tween MNI and Talairach coordinates analyzed using the ICBM-152 brain template.Hum Brain Mapp 2007;28(11):1194–205.
Mattay VS, Fera F, Tessitore A, Hariri AR, Das S, Callicott JH, et al. Neurophysiological cor-relates of age-related changes in human motor function. Neurology 2002;58(4):630–5.
Minzenberg MJ, Laird AR, Thelen S, Carter CS, Glahn DC. Meta-analysis of 41 functionalneuroimaging studies of executive function in schizophrenia. Arch Gen Psychiatry2009;66(8):811–22.
Miyake A, Friedman NP, Emerson MJ, Witzki AH, Howerter A, Wager TD. The unity anddiversity of executive functions and their contributions to complex “frontal lobe”tasks: a latent variable analysis. Cogn Psychol 2000;41(1):49–100.
Motes MA, Biswal BB, Rypma B. Age-dependent relationships between prefrontal cortexactivation and processing efficiency. Cogn Neurosci 2010;2(1):1–10.
Nagels A, Kircher T, Dietsche B, Backes H, Marquetand J, Krug A. Neural processing ofovert word generation in healthy individuals: the effect of age and word knowledge.Neuroimage 2012;61(4):832–40.
Nyberg L, Bäckman L. Memory changes and the aging brain: a multimodal imaging ap-proach. In: Schaie KW, Willis SL, editors. Handbook of the psychology of aging. SanDiego, CA: Academic Press; 2010. p. 121–32.
Nyberg L, Maitland SB, RönnlundM, Bäckman L, Dixon RA,Wahlin Å, et al. Selective adultage differences in an age-invariant multifactor model of declarative memory. PsycholAging 2003;18(1):149–60.
Nyberg L, Salami A, Andersson M, Eriksson J, Kalpouzos G, Kauppi K, et al. Longitudinalevidence for diminished frontal cortex function in aging. Proc Natl Acad Sci U S A2010;107(52):22682–6.
Olesen PJ,Westerberg H, Klingberg T. Increased prefrontal and parietal activity after train-ing of working memory. Nat Neurosci 2004;7(1):75–9.
Park DC, Bischof GN. Neuroplasticity, aging, and cognitive function. In: Schaie KW, WillisSL, editors. Handbook of the psychology of aging. San Diego, CA: Academic Press;2010. p. 109–19.
Park DC, Reuter-Lorenz P. The adaptive brain: aging and neurocognitive scaffolding. AnnuRev Psychol 2009;60:173–96.
Paxton JL, Barch DM, Racine CA, Braver TS. Cognitive control, goal maintenance, andprefrontal function in healthy aging. Cereb Cortex 2008;18(5):1010–28.
Prakash RS, Heo S, Voss MW, Patterson B, Kramer AF. Age-related differences in corticalrecruitment and suppression: implications for cognitive performance. Behav BrainRes 2012;230(1):192–200.
Raz N, Rodrigue KM. Differential aging of the brain: patterns, cognitive correlates andmodifiers. Neurosci Biobehav Rev 2006;30(6):730–48.
Raz N, Lindenberger U, Rodrigue KM, Kennedy KM, Head D, Williamson A, et al. Regionalbrain changes in aging healthy adults: general trends, individual differences andmodifiers. Cereb Cortex 2005;15(11):1676–89.
Restom K, Bangen KJ, Bondi MW, Perthen JE, Liu TT. Cerebral blood flow and BOLD re-sponses to amemory encoding task: a comparison between healthy young and elder-ly adults. Neuroimage 2007;37:430–9.
Reuter-Lorenz PA, Cappell KA. Neurocognitive aging and the compensation hypothesis.Curr Dir Psychol Sci 2008;17(3):177–82. [June].
Reuter-Lorenz PA, Park DC. Human neuroscience and the aging mind: a new look at oldproblems. J Gerontol B Psychol Sci Soc Sci 2010;65(4):405–15.
50 X. Di et al. / Progress in Neuro-Psychopharmacology & Biological Psychiatry 48 (2014) 41–50
Rypma B, D'Esposito M. Isolating the neural mechanisms of age-related changes in humanworking memory. Nat Neurosci 2000;3(5):509–15.
Rypma B, D'Esposito M. Age-related changes in brain–behaviour relationships:evidence from event-related functional MRI studies. Eur J Cogn Psychol2001;13(1–2):235–56.
Rypma B, Prabhakaran V. When less is more and when more is more: the mediating rolesof capacity and speed in brain–behavior efficiency. Intelligence 2009;37(2):207–22.
Rypma B, Berger JS, Genova HM, Rebbechi D, D'Esposito M. Dissociating age-relatedchanges in cognitive strategy and neural efficiency using event-related fMRI. Cortex2005;41(4):582–94.
Rypma B, Eldreth DA, Rebbechi D. Age-related differences in activation–performance rela-tions in delayed-response tasks: a multiple component analysis. Cortex 2007;43(1):65–76.
Salat DH, Buckner RL, Snyder AZ, Greve DN, Desikan RS, Busa E, et al. Thinning of the ce-rebral cortex in aging. Cereb Cortex 2004;14(7):721–30.
Schneider-Garces NJ, Gordon BA, Brumback-Peltz CR, Shin E, Lee Y, Sutton BP, et al. Span,CRUNCH, and beyond: working memory capacity and the aging brain. J Cogn Neurosci2010;22(4):655–69.
Shiffrin RM, Schneider W. Automatic and controlled processing revisited. Psychol Rev1984;91(2):269–76.
Smith EE, Jonides J. Storage and executive processes in the frontal lobes. Science1999;283(5408):1657–61.
Spreng RN, Wojtowicz M, Grady CL. Reliable differences in brain activity between youngand old adults: a quantitative meta-analysis across multiple cognitive domains.Neurosci Biobehav Rev 2010;34(8):1178–94.
Steffener J, Stern Y. Exploring the neural basis of cognitive reserve in aging. BiochimBiophys Acta 2012;1822(3):467–73.
Takahashi R, Ishii K, Kakigi T, Yokoyama K. Gender and age differences in normal adulthuman brain: voxel-based morphometric study. Hum Brain Mapp 2011;32(7):1050–8.
Talairach J, Tournoux P. Co-planar stereotactic atlas of the human brain: 3-dimensionalproportional system—an approach to cerebral imaging. New York, NY: Thieme Med-ical Publishers; 1988.
Tisserand DJ, Pruessner JC, Sanz Arigita EJ, van Boxtel MP, Evans AC, Jolles J, et al. Regionalfrontal cortical volumes decrease differentially in aging: an MRI study to compare volu-metric approaches and voxel-based morphometry. Neuroimage 2002;17(2):657–69.
Tisserand DJ, van Boxtel MP, Pruessner JC, Hofman P, Evans AC, Jolles J. A voxel-basedmorphometric study to determine individual differences in gray matter density asso-ciated with age and cognitive change over time. Cereb Cortex 2004;14(9):966–73.
Toro R, Fox PT, Paus T. Functional coactivation map of the human brain. Cereb Cortex2008;18:2553–9.
Turkeltaub PE, Eden GF, Jones KM, Zeffiro TA. Meta-analysis of the functional neuro-anatomy of single-word reading: method and validation. Neuroimage 2002;16:765–80.
Turkeltaub PE, Eickhoff SB, Laird AR, Fox M, Wiener M, Fox P. Minimizingwithin-experiment and within-group effects in activation likelihood estimationmeta-analyses. Hum Brain Mapp 2012;33(1):1–13.
Turner GR, Spreng RN. Executive functions and neurocognitive aging: dissociable patternsof brain activity. Neurobiol Aging 2012;33(4):826. [e1-13].
Ward NS. Compensatory mechanisms in the aging motor system. Ageing Res Rev2006;5(3):239–54.
Ward NS, Frackowiak RS. Age-related changes in the neural correlates of motor perfor-mance. Brain 2003;126(Pt 4):873–88.
Wartenburger I, HeekerenHR, Preusse F, Kramer J, van deMeer E. Cerebral correlates of analog-ical processing and their modulation by training. Neuroimage 2009;48:291–302.
Westerberg H, Klingberg T. Changes in cortical activity after training of working memory—a single-subject analysis. Physiol Behav 2007;92(1–2):186–92.
Zarahn E, Rakitin B, Abela D, Flynn J, Stern Y. Age-related changes in brain activation dur-ing a delayed item recognition task. Neurobiol Aging 2007;28(5):784–98.