
Correlation structures in short-term variabilities of stock indices and exchange rates
6
Physica A 383 (2007) 96–101 Correlation structures in short-term variabilities of stock indices and exchange rates Tomomichi Nakamura a,b, , Michael Small b a Sony Computer Science Laboratories Inc., 3-14-13 Higashigotanda, Shinagawa-ku, Tokyo 141-0022, Japan b Department of Electronic and Information Engineering, The Hong Kong Polytechnic University, Hung Hom, Kowloon, Hong Kong Available online 10 May 2007 Abstract Financial data usually show irregular fluctuations and some trends. We investigate whether there are correlation structures in short-term variabilities (irregular fluctuations) among financial data from the viewpoint of deterministic dynamical systems. Our method is based on the small-shuffle surrogate method. The data we use are daily closing price of Standard & Poor’s 500 and the volume, and daily foreign exchange rates, Euro/US Dollar (USD), British Pound/USD and Japanese Yen/USD. We found that these data are not independent. r 2007 Elsevier B.V. All rights reserved. Keywords: Correlations structures; Econophysics; Financial data; Surrogate data 1. Introduction It is usually considered that market prices are interconnected or interrelated in some way or another to varying degrees. That is (for example), change of Euro/US Dollar (USD) exchange rate may influence Japanese Yen/USD exchange rate. The aim of this paper is to examine whether there are correlation structures in short-term variabilities (irregular fluctuations) of stock indices and foreign exchange rates, where all of these data show irregular fluctuations and some trends (See Figs. 1 and 2 in Section 4). Recently to investigate correlations of price changes, random matrix theory (RMT) is often applied [1–3]. RMT predictions represent an average over all possible interactions [1]. In the approach of RMT the distribution of the eigenvalues of a cross correlation matrix is compared with that of relevant ensemble of the random matrix. Broadly speaking, when there are eigenvalues that are outside the RMT predictions, it is considered that the deviations might suggest the presence of information of the marketwise effects [1]. This result shows that there are correlations among data used in the matrix. This information is useful, but also rather limited, because it does not specifically indicate which data exhibits the correlation. That is, we still do not know which data are related to one another. Moreover, to apply RMT we need to use very large matrices [3]. ARTICLE IN PRESS www.elsevier.com/locate/physa 0378-4371/$ - see front matter r 2007 Elsevier B.V. All rights reserved. doi:10.1016/j.physa.2007.04.103 Corresponding author. Current address: Sony Computer Science Laboratories Inc., 3-14-13 Higashigotanda, Shinagawa-ku, Tokyo 141-0022, Japan. E-mail addresses: [email protected] (T. Nakamura), [email protected] (M. Small).
-
Upload
independent -
Category
Documents
-
view
1 -
download
0
Transcript of Correlation structures in short-term variabilities of stock indices and exchange rates
ARTICLE IN PRESS
0378-4371/$ - se
doi:10.1016/j.ph
�Correspond141-0022, Japa
E-mail addr
Physica A 383 (2007) 96–101
www.elsevier.com/locate/physa
Correlation structures in short-term variabilities of stock indicesand exchange rates
Tomomichi Nakamuraa,b,�, Michael Smallb
aSony Computer Science Laboratories Inc., 3-14-13 Higashigotanda, Shinagawa-ku, Tokyo 141-0022, JapanbDepartment of Electronic and Information Engineering, The Hong Kong Polytechnic University, Hung Hom, Kowloon, Hong Kong
Available online 10 May 2007
Abstract
Financial data usually show irregular fluctuations and some trends. We investigate whether there are correlation
structures in short-term variabilities (irregular fluctuations) among financial data from the viewpoint of deterministic
dynamical systems. Our method is based on the small-shuffle surrogate method. The data we use are daily closing price of
Standard & Poor’s 500 and the volume, and daily foreign exchange rates, Euro/US Dollar (USD), British Pound/USD and
Japanese Yen/USD. We found that these data are not independent.
r 2007 Elsevier B.V. All rights reserved.
Keywords: Correlations structures; Econophysics; Financial data; Surrogate data
1. Introduction
It is usually considered that market prices are interconnected or interrelated in some way or another tovarying degrees. That is (for example), change of Euro/US Dollar (USD) exchange rate may influenceJapanese Yen/USD exchange rate. The aim of this paper is to examine whether there are correlation structuresin short-term variabilities (irregular fluctuations) of stock indices and foreign exchange rates, where all of thesedata show irregular fluctuations and some trends (See Figs. 1 and 2 in Section 4).
Recently to investigate correlations of price changes, random matrix theory (RMT) is often applied [1–3].RMT predictions represent an average over all possible interactions [1]. In the approach of RMT thedistribution of the eigenvalues of a cross correlation matrix is compared with that of relevant ensemble of therandom matrix. Broadly speaking, when there are eigenvalues that are outside the RMT predictions, it isconsidered that the deviations might suggest the presence of information of the marketwise effects [1]. Thisresult shows that there are correlations among data used in the matrix. This information is useful, butalso rather limited, because it does not specifically indicate which data exhibits the correlation. That is, westill do not know which data are related to one another. Moreover, to apply RMT we need to use very largematrices [3].
e front matter r 2007 Elsevier B.V. All rights reserved.
ysa.2007.04.103
ing author. Current address: Sony Computer Science Laboratories Inc., 3-14-13 Higashigotanda, Shinagawa-ku, Tokyo
n.
esses: [email protected] (T. Nakamura), [email protected] (M. Small).
ARTICLE IN PRESST. Nakamura, M. Small / Physica A 383 (2007) 96–101 97
One of the useful statistics that can directly investigate some kind of relations among data and do not needvery large matrices is the cross-correlation function (CC). This statistic can investigate correlations in short-term variabilities of two signals. However, the statistic is also restrictive because correlation is only a usefulmeasure of linear similarity [4]. That is to say, even when two signals are not similar, there are still possibilitiesthat these systems have some kind of correlation structures (that is, the systems are interconnected orinterrelated). This means that it is not enough to use only statistics such as CC in all cases. To investigatecorrelation structures more reliably, an approach from the viewpoint of a deterministic dynamical system isuseful and necessary. However, such an approach is not easy because it is difficult to treat data which exhibitshort-term variabilities and some trends. Financial data usually have such features.
To accomplish this, we apply a method based on the small-shuffle surrogate (SSS) method [4]. We apply ourmethod to daily closing price of Standard & Poor’s 500 (S&P500) and the volume, and to daily exchange rates,Euro (EUR)/US dollar (USD), British Pound (GBP)/USD and Japanese Yen (JPY)/USD. The analysis ofthese data is the major novel contribution of this paper.
In Section 2 the SSS algorithm and the hypothesis will be discussed. Our method is based on this algorithm.In Section 3 we present our choice of discriminating statistics and describe how to test our null hypothesis. InSection 4 we apply the method to financial data.
2. The small-shuffle surrogate method
To investigate whether temporal correlations in data are absent or data are independently distributed (ID)random variables even if it exhibits trends, the SSS method is useful [5]. Moreover, the SSS method does notdepend on the specific data distribution. The SSS method has proven to be effective for tackling dataexhibiting short-term variabilities and long-term trends [5–8].
SSS data are generated as follows; Let the original data be xðtÞ, let iðtÞ be the index of xðtÞ (that is, iðtÞ ¼ t,and so xðiðtÞÞ ¼ xðtÞ), let gðtÞ be Gaussian random numbers and sðtÞ will be the surrogate data.
(i)
Obtain i0ðtÞ ¼ iðtÞ þ AgðtÞ, where A is an amplitude. (ii) Sort i0ðtÞ by the rank-order and let the index of i0ðtÞ be iðtÞ. (iii) Obtain the surrogate data sðtÞ ¼ xðiðtÞÞ.We have found that choosing A ¼ 1:0 is adequate for nearly all purposes. In the SSS data, local structures orcorrelations in irregular fluctuations (short-term variabilities) are destroyed and the global behaviors (trends)are preserved. Further details of the method and the mechanism are provided in Refs. [4–7]. The nullhypothesis (NH) addressed by this algorithm is that irregular fluctuations (short-term variabilities) are IDrandom variables or time-varying random variables (in other words, there is no short-term dynamics ordeterminism) [4–7]. The SSS method also can be applied to multivariate data, irrespective of whether the datahave similar or different long-term trends. The NH is that there is no short-term correlation structure amongdata or that the irregular fluctuations are independent [4].
3. When to reject a null hypothesis
Discriminating statistics are necessary for surrogate data hypothesis testing. The SSS method changes theflow of information in the data. Hence, we choose to use the cross-correlation function (CC) and the averagemutual information (AMI) as discriminating statistics. These statistics can determine, on average, how muchone learns about one signal by observing the other [9].
After the calculation of these statistics, we need to inspect whether a NH shall be rejected. We employMonte Carlo hypothesis testing and inspect whether the estimated statistics of the original data fall within oroutside the statistical distribution of the surrogate data [10]. When the statistics fall within the distributions ofthe surrogate data, we conclude that the hypothesis may not be rejected. In this paper, we generate 99 SSSdata and hence the significance level is between 0.01 and 0.02 for a one-sided test with two non-independentstatistics [4].
ARTICLE IN PRESST. Nakamura, M. Small / Physica A 383 (2007) 96–10198
It should be noted that although the multiple comparison problem is common in surrogate dataapplications, we use the CC and the AMI as complementary statistics. This is because some of the test systemsare robust to one or the other of our two primary statistical test (the CC and the AMI). Also, although weshow plots of both the CC and the AMI as a function of time lag, the hypothesis testing is robustly conductedfor a fixed small value of lag (for example, we use only lag ¼ 1 or� 1). The plots of the CC and the AMI as afunction of lag are provided for information only. For more details see Refs. [4,7].
4. Applications
We apply our method to financial data in different markets: (1) daily closing price of S&P500 and thevolume from 3 January 1950 to 30 December 2005, and (2) daily foreign exchange rates, EUR/USD, GBP/USD and JPY/USD from 5 July 1995 to 30 June 2006. We use A ¼ 1:0 and generate 99 SSS data in all cases asmentioned above.
It is generally believed that these are not independent but rather interconnected or interrelated. For stockmarkets, it is said that the volume is a good reference indicator to know the market force. As a general trend,stock participants have the following four expectations: (1) when stock prices rise and the volume increases orabounds, as the buying pressure is strong, expectation for the higher quotation becomes strong, (2) when stockprices rise and the volume decreases or is few, as the buying pressure is weak, uncertainty over the higherquotation is fomented or the end of the higher quotation is expected, (3) when stock prices fall and the volumeincreases or abounds, as the selling pressure is strong, uncertainty over the lower quotation becomes strong,and (4) when stock prices fall and the volume decreases or is few, as downward trend for the quotation isweak, expectation for the end of the lower quotation is fomented or the market upturn is expected. Forexchange rate markets, it is shown that there is triangular arbitrage opportunities in foreign exchange marketand that these generate an interaction among foreign exchange rates [11]. Furthermore, a hierarchicaltaxonomy of various currencies is derived [12]. The above mentioned examples indicate that financial data arenot independent.
As a preliminary test, we investigate whether temporal correlations of the first difference data of the closingprices and three exchange rates are absent. If so, we consider that the dynamics is essentially the same as
0 5000 10000 15000 0 5000 10000 15000
13900 14000 14100 13900 14000 14100
a b
c d
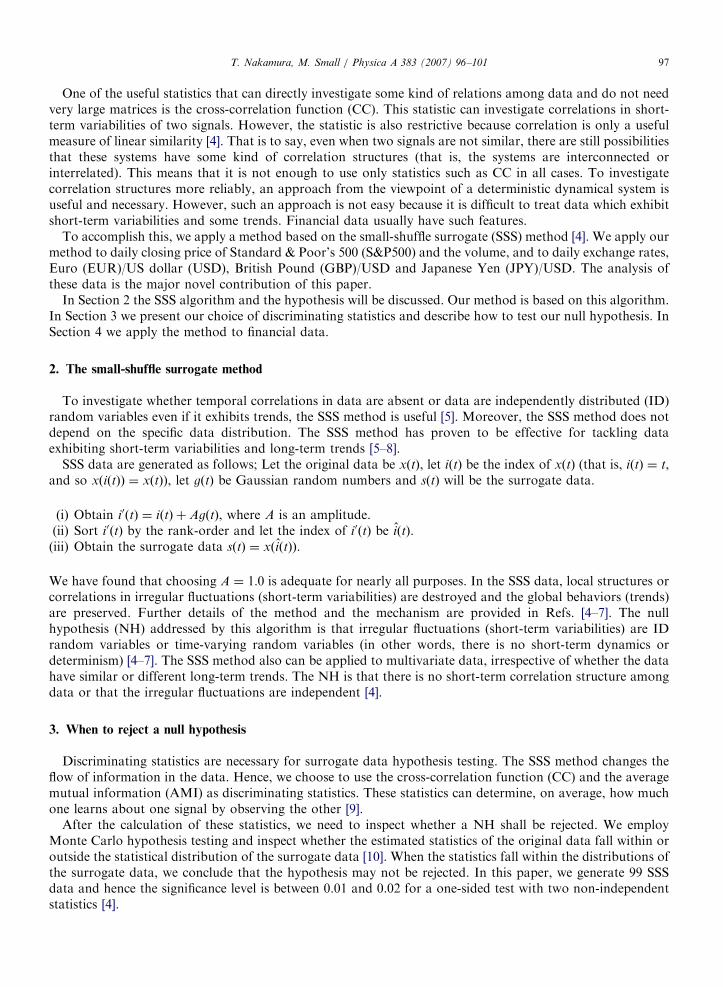
Fig. 1. Daily closing price of S&P500 and the volume: (a) and (c) show the first difference data, and (b) and (d) the volume, where (c) and
(d) show an enlargement of (a) and (b). The horizontal axis shows the trading day and the ordinate axis is arbitrary in (a)–(d). For the
purposes of this study, physical units carry no significant meaning. Hence, we use arbitrary unit for the ordinate axis.
ARTICLE IN PRESST. Nakamura, M. Small / Physica A 383 (2007) 96–101 99
random walk (RW), and the essence of the data is the first difference data (return). Further details areprovided in Ref. [8]. We found that the first differences are ID random variables or time-varying randomvariables, and then we could not reject the RW hypothesis [8]. Hence, we decided to use the first differencedata except the volume of stock data.
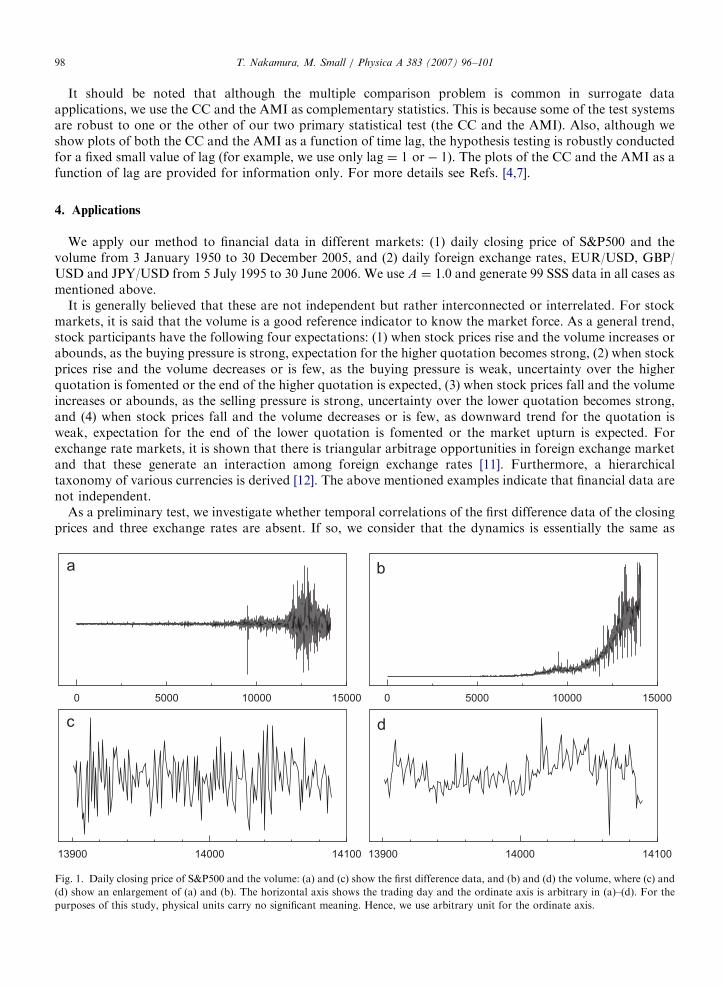
Fig. 1 shows the return of daily closing price of S&P500 and the volume. Figs. 1(a) and (b) show that whenthe volatility is large the volume is also large. From this, we expect that there are long-term correlationsbetween them. However, we cannot find clear similarities in short-term variabilities (irregular fluctuations) inFigs. 1(c) and (d). Fig. 2 shows the return of EUR/USD, GBP/USD and JPY/USD. In Fig. 2 we find neitherlong- nor short-term similarities among them.
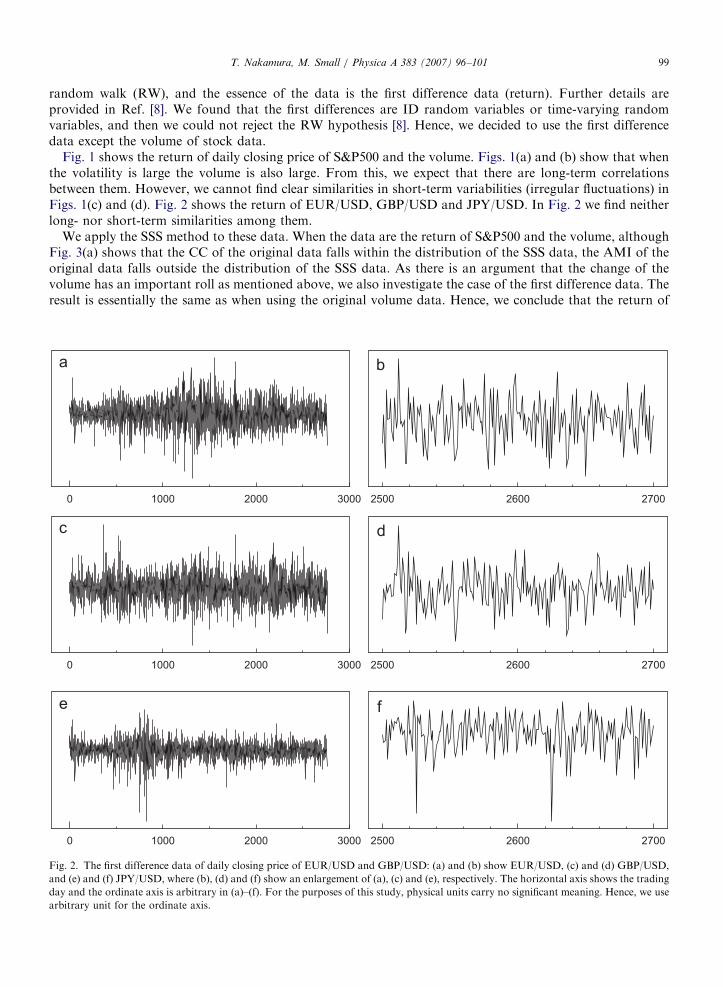
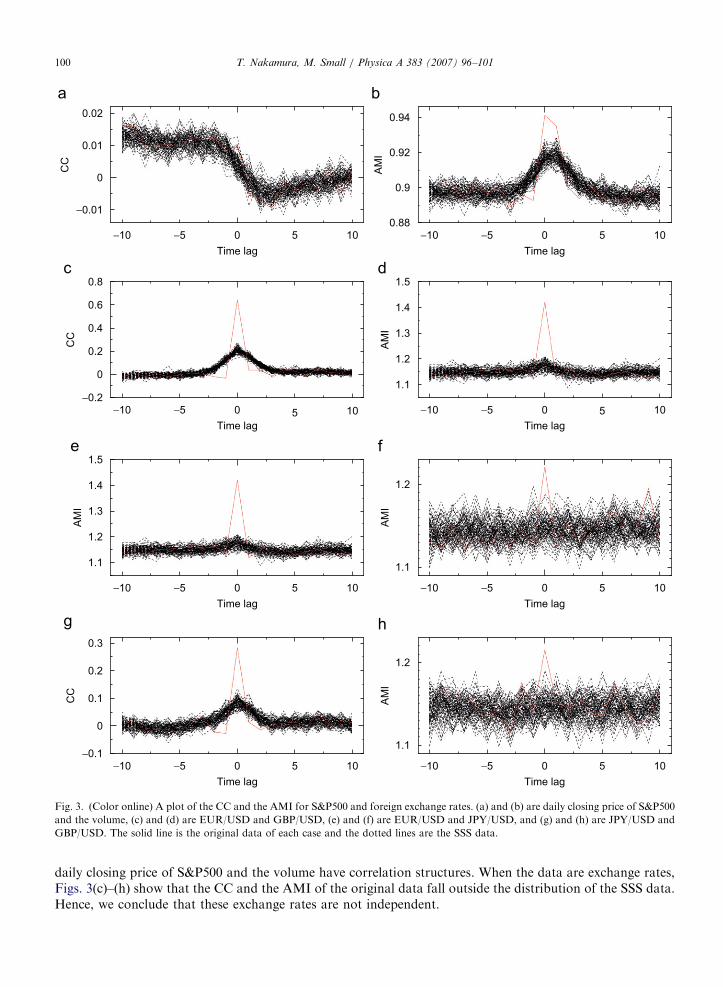
We apply the SSS method to these data. When the data are the return of S&P500 and the volume, althoughFig. 3(a) shows that the CC of the original data falls within the distribution of the SSS data, the AMI of theoriginal data falls outside the distribution of the SSS data. As there is an argument that the change of thevolume has an important roll as mentioned above, we also investigate the case of the first difference data. Theresult is essentially the same as when using the original volume data. Hence, we conclude that the return of
0 1000 2000 3000 2500 2600 2700
0 1000 2000 3000 2500 2600 2700
0 1000 2000 3000 2500 2600 2700
Fig. 2. The first difference data of daily closing price of EUR/USD and GBP/USD: (a) and (b) show EUR/USD, (c) and (d) GBP/USD,
and (e) and (f) JPY/USD, where (b), (d) and (f) show an enlargement of (a), (c) and (e), respectively. The horizontal axis shows the trading
day and the ordinate axis is arbitrary in (a)–(f). For the purposes of this study, physical units carry no significant meaning. Hence, we use
arbitrary unit for the ordinate axis.
ARTICLE IN PRESS
−10 −5 0 10
−0.01
0
0.01
0.02
Time lag
CC
−10 −5 0 100.88
0.9
0.92
0.94
Time lag
AM
I
−10 −5 0 10
−0.2
0
0.2
0.4
0.6
0.8
Time lag
CC
−10 −5 0 10
1.1
1.2
1.3
1.4
1.5
Time lag
AM
I
−10 −5 0 10
1.1
1.2
1.3
1.4
1.5
Time lag
AM
I
−10 −5 0 10
1.1
1.2
Time lag
AM
I
−10 −5 0 10−0.1
0
0.1
0.2
0.3
Time lag
CC
−10 −5 0 10
1.1
1.2
Time lag
AM
I
5 5
55
5 5
5 5
Fig. 3. (Color online) A plot of the CC and the AMI for S&P500 and foreign exchange rates. (a) and (b) are daily closing price of S&P500
and the volume, (c) and (d) are EUR/USD and GBP/USD, (e) and (f) are EUR/USD and JPY/USD, and (g) and (h) are JPY/USD and
GBP/USD. The solid line is the original data of each case and the dotted lines are the SSS data.
T. Nakamura, M. Small / Physica A 383 (2007) 96–101100
daily closing price of S&P500 and the volume have correlation structures. When the data are exchange rates,Figs. 3(c)–(h) show that the CC and the AMI of the original data fall outside the distribution of the SSS data.Hence, we conclude that these exchange rates are not independent.
ARTICLE IN PRESST. Nakamura, M. Small / Physica A 383 (2007) 96–101 101
5. Conclusion
We have applied an algorithm based on the small-shuffle surrogate method to multivariate financial data toinvestigate whether there are correlation structures in the irregular fluctuations. Applying our method, we findthat all financial data examined in this paper are not independent.
Acknowledgments
Tomo Nakamura would like to thank Managing Director Y. Ibuki (Ichiyoshi International (Hong Kong)Ltd) for his fruitful discussions. This research is supported by a Hong Kong University Grants CouncilCompetitive Earmarked Research Grant (CERG) No. PolyU 5235/03E.
References
[1] V. Plerou, P. Gopikrishnan, B. Rosenowm, L.A.N. Amaral, H.E. Stanley, Phys. Rev. Lett. 83 (1999) 1471.
[2] V. Plerou, P. Gopikrishnan, B. Rosenow, L.A.N. Amaral, H.E. Stanley, Physica A 287 (2000) 374.
[3] A. Utsugi, K. Ino, M. Oshikawa, Phys. Rev. E 70 (2004) 026110.
[4] T. Nakamura, Y. Hirata, M. Small, Phys. Rev. E 74 (2006) 041114.
[5] T. Nakamura, M. Small, Phys. Rev. E 72 (2005) 056216.
[6] T. Nakamura, M. Small, Physica A 366 (2006) 377.
[7] T. Nakamura, M. Small, Int. J. Bifurcation Chaos Appl. Sci. Eng. 16 (2006) 3581.
[8] T. Nakamura, M. Small, Phys. Lett. A 362 (2007) 189.
[9] H.D.I. Abarbanel, Analysis of Observed Chaotic Data, Springer, New York, 1996.
[10] J. Theiler, D. Prichard, Physica D 94 (1996) 221.
[11] Y. Aiba, N. Hatano, H. Takayasu, K. Marumo, T. Shimizu, Physica A 310 (2002) 467.
[12] T. Mizuno, H. Takayasu, M. Takayasu, Physica A 364 (2006) 336.