CORRELATION BETWEEN GROWTH FORM AND MOVEMENT AND THEIR DEPENDENCE ON NEURONAL AGE1
12
0270.6474//&34/0412-3051$02.00/O The Journal of Neuroscience Copyright 0 Society for Neuroscience Vol. 4, No. 12, pp. 3051-3062 Printed in U.S.A. December 1984 CORRELATION BETWEEN GROWTH FORM AND MOVEMENT AND THEIR DEPENDENCE ON NEURONAL AGE1 VINCENT ARGIRO,’ MARY BARTLETT BUNGE, AND MARY I. JOHNSON*T~ Department of Anatomy and Neurobiology and *Departments of Pediatrics and Neurology, Washington University School of Medicine, St. Louis, Missouri 63110 Received March 21, 1984; Revised May 24, 1984; Accepted May 30, 1984 Abstract Neurites of superior cervical ganglion neurons from embryonic, perinatal, and adult rats extended at different rates when placed in tissue culture on similar collagen substrata. Using high resolution cinematography and a time-lapse video recording system, we concluded that these differences arise from variations in individual growth cone .behavior. Growth cones of embryonic and perinatal neuronal origin exhibited high peak rates of advance and filopodial and lamellipodial excresences. Perinatal cones differed from embryonic ones in that they were somewhat larger, advanced in straighter paths, and retracted less, consequently translocating at 14 to 29 pm/hr compared with 8 to 22 pm/hr for embryonic cones (ranges of 4-hr means). The growth cones of neurons obtained from adult rats had scant cytoplasm and short branched filopodia, lacked definitive lamelli- podia, and traversed the terrain at 4 to 13 wm/hr due to lack of high peak rates of advance and more time spent in stationary or minimal advance phases. Periodic pauses lasting 10 to 20 min, occurring every 20 to 90 min, interrupted the forward advance of growth cones of all ages. During pauses or slow forward movement, the growth cone displayed numerous filopodia whereas, during brief episodes when embryonic and perinatal growth cones moved at peak rates of 200 pm/hr or more, the cone periphery was predominantly lamellipodial. We conclude that the predominance of a lamellipodial or filopodial conformation correlates with the rate of growth cone advance and that age-dependent variations in neurite extension rates are related to differences in growth cone form and pattern of translocation. This is the first documentation of differing behavior of single growth cones of neurons of varying developmental ages in culture. Our previous study of cultured rat superior cervical ganglion (SCG) explants demonstrated a marked dependence of neurite extension on the stage of neuronal development in the first weeks in culture (Argiro and Johnson, 1982). Neurons obtained from perinatal animals extended neurites at rates of 370 to 660 pm/day. In contrast, younger neurons, up to 1 week earlier in embryonic development, initially extended neurites at rates of 150 to 300 pm/day, and older neurons, from adolescent and 1We wish to thank Drs. Richard P. Bunge and Dikla G. Roufa for helpful comments and Dr. Dale Purves for suggestions to improve the manuscript. We are grateful for the technical assistance of Artree James, Steven Rapp, and Barbara Scott and for the secretarial expertise of Susan Mantia. Elements of the microscope used in the study were generously provided by Dr. L. Tolmach of our department. This work comprises part of a dissertation by V. A. to fulfill the requirements for the degree of Doctor of Philosophy at Washington University and was supported by Grants NS 14416 (M. I. J.) and NS 15070 (M. B. B.) from the National Institutes of Health. V. A. was supported for most of this work by National Institutes of Health Predoctoral Training Grant 5 T32 GM 07564. Preliminary reports of this work have appeared (Argiro et al., 1981, 1983). ’ Present address: Physiology Section, Biological Sciences Group, University of Connecticut, Storrs, CT 06268. ’ To whom correspondence should be addressed, at Department of Anatomy and Neurobiology, Washington University School of Medi- cine, 660 South Euclid Avenue, Box 8108, St. Louis, MO 63110. adult rats, extended neurites at much lower initial rates of 70 to 176 pm/day. This study of rat sympathetic neurons confirmed and ex- panded, with additional quantitation, findings of age-dependent neurite growth from cultured chick sympathetic neurons (Eben- dal, 1979). Tissue culture evidence of the age dependence of maximal neurite growth has also been obtained for other neu- ronal types and species under several culture conditions. Neu- rite growth from ciliary ganglion, cultured in either an explant or a dissociated cell mode, is best when ganglia are from 6- to II-day chick embryos (Ebendal, 1979; McLennan and Hendry, 1980; Collins and Lee, 1982). It is during this period of time in vivo that the ciliary neurons are contacting their targets. After this stage, i.e., by Hamburger-Hamilton stage 40 or embryonic day 14, the ability of the ciliary neurons to extend neurites is markedly diminished. Similarly, chick spinal ganglion neurons show maximal growth of neurites when taken from 7- to 13- day embryos, a stage at which they also appear to be most responsive to nerve growth factor (NGF) (Winick and Green- berg, 1965; Herrup and Shooter, 1975; Ebendal, 1979). In stud- ies of amphibian (Xenopus laevis) eye or retina in culture, neuritic outgrowth is again more vigorous from younger embry- onic animals as opposed to older larval animals (Agranoff et al., 1976). In vivo studies have also concluded that neurite growth is age dependent. Axons of the rat primary corticospinal tract initially grow at 1.2 mm/day through the diencephalon and 3051
Transcript of CORRELATION BETWEEN GROWTH FORM AND MOVEMENT AND THEIR DEPENDENCE ON NEURONAL AGE1
0270.6474//&34/0412-3051$02.00/O The Journal of Neuroscience Copyright 0 Society for Neuroscience Vol. 4, No. 12, pp. 3051-3062 Printed in U.S.A. December 1984
CORRELATION BETWEEN GROWTH FORM AND MOVEMENT AND THEIR DEPENDENCE ON NEURONAL AGE1
VINCENT ARGIRO,’ MARY BARTLETT BUNGE, AND MARY I. JOHNSON*T~
Department of Anatomy and Neurobiology and *Departments of Pediatrics and Neurology, Washington University School of Medicine, St. Louis, Missouri 63110
Received March 21, 1984; Revised May 24, 1984; Accepted May 30, 1984
Abstract
Neurites of superior cervical ganglion neurons from embryonic, perinatal, and adult rats extended at different rates when placed in tissue culture on similar collagen substrata. Using high resolution cinematography and a time-lapse video recording system, we concluded that these differences arise from variations in individual growth cone .behavior. Growth cones of embryonic and perinatal neuronal origin exhibited high peak rates of advance and filopodial and lamellipodial excresences. Perinatal cones differed from embryonic ones in that they were somewhat larger, advanced in straighter paths, and retracted less, consequently translocating at 14 to 29 pm/hr compared with 8 to 22 pm/hr for embryonic cones (ranges of 4-hr means). The growth cones of neurons obtained from adult rats had scant cytoplasm and short branched filopodia, lacked definitive lamelli- podia, and traversed the terrain at 4 to 13 wm/hr due to lack of high peak rates of advance and more time spent in stationary or minimal advance phases. Periodic pauses lasting 10 to 20 min, occurring every 20 to 90 min, interrupted the forward advance of growth cones of all ages. During pauses or slow forward movement, the growth cone displayed numerous filopodia whereas, during brief episodes when embryonic and perinatal growth cones moved at peak rates of 200 pm/hr or more, the cone periphery was predominantly lamellipodial. We conclude that the predominance of a lamellipodial or filopodial conformation correlates with the rate of growth cone advance and that age-dependent variations in neurite extension rates are related to differences in growth cone form and pattern of translocation. This is the first documentation of differing behavior of single growth cones of neurons of varying developmental ages in culture.
Our previous study of cultured rat superior cervical ganglion (SCG) explants demonstrated a marked dependence of neurite extension on the stage of neuronal development in the first weeks in culture (Argiro and Johnson, 1982). Neurons obtained from perinatal animals extended neurites at rates of 370 to 660 pm/day. In contrast, younger neurons, up to 1 week earlier in embryonic development, initially extended neurites at rates of 150 to 300 pm/day, and older neurons, from adolescent and
1 We wish to thank Drs. Richard P. Bunge and Dikla G. Roufa for helpful comments and Dr. Dale Purves for suggestions to improve the manuscript. We are grateful for the technical assistance of Artree James, Steven Rapp, and Barbara Scott and for the secretarial expertise of Susan Mantia. Elements of the microscope used in the study were generously provided by Dr. L. Tolmach of our department. This work comprises part of a dissertation by V. A. to fulfill the requirements for the degree of Doctor of Philosophy at Washington University and was supported by Grants NS 14416 (M. I. J.) and NS 15070 (M. B. B.) from the National Institutes of Health. V. A. was supported for most of this work by National Institutes of Health Predoctoral Training Grant 5 T32 GM 07564. Preliminary reports of this work have appeared (Argiro et al., 1981, 1983).
’ Present address: Physiology Section, Biological Sciences Group, University of Connecticut, Storrs, CT 06268.
’ To whom correspondence should be addressed, at Department of Anatomy and Neurobiology, Washington University School of Medi- cine, 660 South Euclid Avenue, Box 8108, St. Louis, MO 63110.
adult rats, extended neurites at much lower initial rates of 70 to 176 pm/day.
This study of rat sympathetic neurons confirmed and ex- panded, with additional quantitation, findings of age-dependent neurite growth from cultured chick sympathetic neurons (Eben- dal, 1979). Tissue culture evidence of the age dependence of maximal neurite growth has also been obtained for other neu- ronal types and species under several culture conditions. Neu- rite growth from ciliary ganglion, cultured in either an explant or a dissociated cell mode, is best when ganglia are from 6- to II-day chick embryos (Ebendal, 1979; McLennan and Hendry, 1980; Collins and Lee, 1982). It is during this period of time in vivo that the ciliary neurons are contacting their targets. After this stage, i.e., by Hamburger-Hamilton stage 40 or embryonic day 14, the ability of the ciliary neurons to extend neurites is markedly diminished. Similarly, chick spinal ganglion neurons show maximal growth of neurites when taken from 7- to 13- day embryos, a stage at which they also appear to be most responsive to nerve growth factor (NGF) (Winick and Green- berg, 1965; Herrup and Shooter, 1975; Ebendal, 1979). In stud- ies of amphibian (Xenopus laevis) eye or retina in culture, neuritic outgrowth is again more vigorous from younger embry- onic animals as opposed to older larval animals (Agranoff et al., 1976).
In vivo studies have also concluded that neurite growth is age dependent. Axons of the rat primary corticospinal tract initially grow at 1.2 mm/day through the diencephalon and
3051
3052 Argiro et al. Vol. 4, No. 12, Dec. 1984
midbrain (embryonic day 17.5 (E17.5 to E19.5) but accelerate to approximately 7.5 mm/day as they reach the thoracic levels of the cord (postnatal day 3 (P3 and P4) (Schreyer and Jones, 1982). In a study of regeneration of peripheral nerve (as opposed to the above study of initial growth of central neurons), Black and Lasek (1979) showed that the rate of regrowth of rat sciatic nerve fibers following a crush injury decreases with increasing postnatal age.
These studies raise the question of whether the differences in neurite outgrowth rates reflect individual growth cone activ- ity. Differences in the behavior of individual growth cones at different stages of development would strengthen the hypoth- esis that the maximum capacity for neurite extension is linked to a specific stage of neuronal differentiation. The purpose of this investigation was to compare growth cones of embryonic, perinatal, and adult neurons and to determine whether differ- ences found could explain age-dependent neurite outgrowth rates.
Materials and Methods
Tissue culture. SCG were removed from rats and rat embryos as described previously (Argiro and Johnson, 1982). Briefly, three age groups, E17, E21 or Pl, and PlO to P40 were selected as representative of late embryonic, perinatal, and postnatal developmental stages, re- spectively. Cultures were prepared either as explants (0.3 to 0.5 mm in diameter) or dissociated single cells. Dissociated neurons were obtained from all three age groups by incubation in 0.25% trypsin (type III, no. 8253, Sigma Chemical Co., St. Louis, MO) in Leibovitz’s L-15 medium (Grand Island Biological Co., Grand Island, NY) at 35°C for 20 min, followed by extensive washing in L-15 and trituration with a reduced bore (-1 mm) pipette. Whereas cultures of dissociated neurons from El7 or E21 animals could be routinely established, more difficulty was encountered in preparing cultures of dissociated neurons from postna- tal rats. Viable dissociated neurons were obtained using ganglia from adolescent rats (PlO) instead of the older P30 to P40 animals used to establish the explant cultures. The progressive development of connec- tive tissue and closer association of neurons and non-neuronal cells make separation of the cells increasingly difficult with advancing age.
Cultures were grown on 25.mm glass coverslips coated with approx- imately 20 ~1 of acid-solubilized rat tendon collagen (Johnson and Argiro, 1983) which was gelled by air-drying for 10 to 30 min at room temperature. Rehydration yielded a lattice of fibrillar collagen (Roufa et al., 1983) approximately 10 to 50 pm in thickness (as determined by focusing through the layer). Because this layer was applied directly to the coverslip without the intervening layer of ammoniated collagen used previously (Argiro and Johnson, 1982), the substratum was thin- ner and thus restricted the growth of extending neurites to a narrower plane of focus. The thinner substratum was mechanically stable up to 5 days, after which it would tend to detach from the coverslip.
The culture medium was changed from that used earlier (Argiro and Johnson, 1982) by utilizing a formula of Eagle’s minimal essential medium with Hanks’ salts and 25 mM HEPES (no. 380-2370: Grand Island Biological Co.) in order to maintain a pH of 7.3 under an ambient air atmosphere. To this basal medium we added 10% human placental serum, 2% chick embryo extract, 0.6% glucose, 1% L-gluta- mine (200 mM), and 10 biological units/ml of 7 S NGF.
The coverslips with tissue were sealed into Sykes-Moore chambers (Sykes and Moore, 1960; Bellco, Inc., Vineland, NJ) with approximately 0.3 ml of the above medium. The balance of the chamber volume, approximately 2 ml, was filled with air. The chambers were sufficiently well sealed to permit observation on the microscope stage without risk of dehydration or microbial contamination. Exchange of the culture medium was unnecessary as it contained sufficient nutrients to support the small amounts of tissue for at least 5 days.
Time-lapse cinematography. Growth cone activity was observed with a Nikon M inverted microscope adapted to use Zeiss phase contrast optics (Neofluar X 63/1.25 and X 100/1.30 objectives). A tungsten lamp with heat filter provided illumination. We detected no heat-induced deterioration of growth cone form under this illumination up to 1 hr of exposure. Exposure of cell bodies for more than 10 to 15 min, however, resulted in membrane blebbing. A thermostatic air-curtain incubator of our own construction maintaned the temperature on the stage at 35 & 1°C. A Nikon CFMA automatic exposure 16mm time-lapse tine
camera was mounted on the microscope. Recordak Datapak AHU film 3460 (Eastman Kodak Co., Rochester, NY), a very fine grain, high resolution, high contrast film of moderate speed, was used. The Nikon camera was set for an IS0 (ASA) exposure index of 80. A shutter speed of 0.5 set proved sufficient to resolve all but the most rapid filopodial movements. Each growth cone was filmed for 10 to 30 min at 1 frame/ sec. Films were projected at x 16 real time. All micrographs were enlarged and printed directly from the 16mm negatives.
Growth cone tracking system. We chose not to use time-lapse film records for measuring the translocational behavior of individual growth cones. Collecting precise positional information at low magnification from such film records is slow and tedious and subject to registration errors introduced by the mechanical frame advance mechanism. Ana- logue video recording has problems with the geometric stability of the image and cannot provide time-lapse ratios sufficiently high for long- term tracking.
As an alternative approach, we designed a microcomputer-controlled time-lapse digital video recording system. A high resolution (800 lines) monochrome video camera (model ITC-56, Ikegami Television Corp., Maywood, NJ) was mounted on the phototube of the microscope in place of the time-lapse tine camera. A microcomputer based on the Zilog Z80A microprocessor with IEEE-696 architecture (model DPS-1, Ithaca InterSystems Inc., Ithaca, NY), incorporating an integrated video processor (model CAT-loo, Digital Graphics Systems, Palo Alto, CA) and interfaced to two 1.2 megabyte 8-inch floppy disk drives and a graphics tablet (HIPAD, Houston Instruments, Houston, TX), was used to collect and analyze precisely timed and registered sequences of images of the living culture. The system functions in two phases, a fully automatic recording phase and an operator-assisted analysis phase.
In the recording phase, a culture was positioned on the microscope stage and a field containing two to seven extending neurites was imaged with a X 25 or X 40 phase contrast objective. A video digitizer captured a video frame as 277 X 227 picture elements of 16 grey levels in the computer memory during one standard frame period (16.7 msec). The digital image information (32 kilobytes) was then stored on a floppy disk. A timer internal to the computer triggered a digitization-storage event every 10 min. Twenty-six images were collected in this manner over a 250.min period. Once in thermal equilibrium with the incubator, the microscope maintained constant focus, permitting unattended op- eration for the recording period.
In the analysis phase, digitized images of the group of extending neurites were recalled from the floppy disk. Each image was displayed on the computer video monitor along with a superimposed cross-hair cursor whose position on the image could be set by moving the physical cursor device to a corresponding location on the graphics tablet. The cursor was used to mark the location of the growth cone at the tip of each neurite. The two-dimensional trajectories of two to seven growth cones were constructed from each 4-hr sequence. Figure 1 shows the appearance of the computer display halfway through one such analysis session.
The first two points on the trajectory established a vector represent- ing the initial direction of growth cone translocation. As motion con- tinued away from the tip of this vector (the second recorded position), the distance from this point to the tip of the growing neurite was calculated. The component of this distance vector parallel with the initial direction vector was the measure of forward advance. Negative values represented retraction behind the origin.
The average rate of forward movement was calculated by linear regression of the forward advance distance values over the entire 4-hr measurement epoch. Changes in advance rate were sampled by applying linear regression to overlapping sets of three forward distance meas- urements. Instances of retraction were counted by noting when the advance rate fell below -5 pm/hr; that is, when the growth cone slipped backward. The threshold of -5 rm/hr, rather than zero, was chosen to avoid counting very small backward movements generated by inaccu- racy in determining the position of the growth cone when it was moving very slowly. Similarly, the three-point linear regression was used in- stead of simple differentiation for computing the lo-min rate values to smooth out small errors in the forward advance measurements. This improves the confidence level of the computed rates at the cost of attenuating extreme maxima and minima. Peak rates are underesti- mated by this method (see below).
The Journal of Neuroscience Correlation between Growth Cone Form and Movement 3053
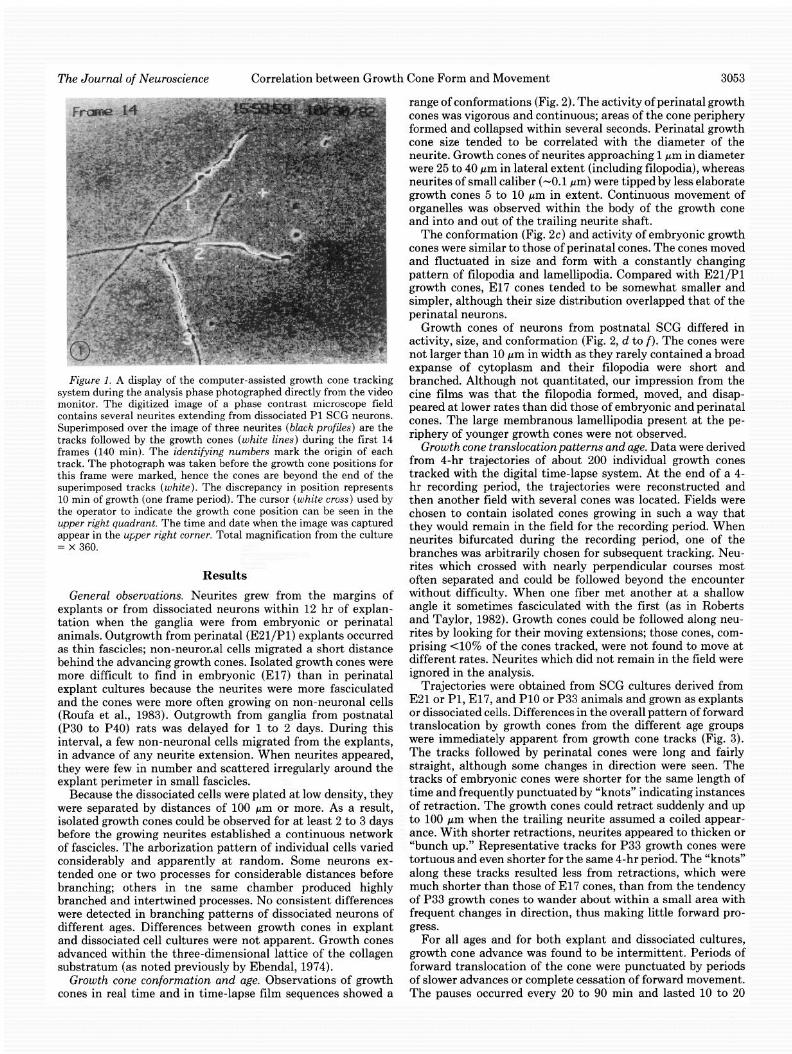
Figure 1. A display of the computer-assisted growth cone tracking system during the analysis phase photographed directly from the video monitor. The digitized image of a phase contrast microscope field contains several neurites extending from dissociated Pl SCG neurons. Superimposed over the image of three neurites (black profiles) are the tracks followed by the growth cones (white lines) during the first 14 frames (140 min). The ident$yying numbers mark the origin of each track. The photograph was taken before the growth cone positions for this frame were marked, hence the cones are beyond the end of the superimposed tracks (white). The discrepancy in position represents 10 min of growth (one frame period). The,cursor (white cross) used by the operator to indicate the growth cone position can be seen in the upper right quadrant. The time and date when the image was captured appear in the upper right corner. Total magnification from the culture = x 360.
Results
General observations. Neurites grew from the margins of explants or from dissociated neurons within 12 hr of explan- tation when the ganglia were from embryonic or perinatal animals. Outgrowth from perinatal (E21/Pl) explants occurred as thin fascicles; non-neuronal cells migrated a short distance behind the advancing growth cones. Isolated growth cones were more difficult to find in embryonic (E17) than in perinatal explant cultures because the neurites were more fasciculated and the cones were more often growing on non-neuronal cells (Roufa et al., 1983). Outgrowth from ganglia from postnatal (P30 to P40) rats was delayed for 1 to 2 days. During this interval, a few non-neuronal cells migrated from the explants, in advance of any neurite extension. When neurites appeared, they were few in number and scattered irregularly around the explant perimeter in small fascicles.
Because the dissociated cells were plated at low density, they were separated by distances of 100 pm or more. As a result, isolated growth cones could be observed for at least 2 to 3 days before the growing neurites established a continuous network of fascicles. The arborization pattern of individual cells varied considerably and apparently at random. Some neurons ex- tended one or two processes for considerable distances before branching; others in tne same chamber produced highly branched and intertwined processes. No consistent differences were detected in branching patterns of dissociated neurons of different ages. Differences between growth cones in explant and dissociated cell cultures were not apparent. Growth cones advanced within the three-dimensional lattice of the collagen substratum (as noted previously by Ebendal, 1974).
Growth cone conformation and age. Observations of growth cones in real time and in time-lapse film sequences showed a
range of conformations (Fig. 2). The activity of perinatal growth cones was vigorous and continuous; areas of the cone periphery formed and collapsed within several seconds. Perinatal growth cone size tended to be correlated with the diameter of the neurite. Growth cones of neurites approaching 1 pm in diameter were 25 to 40 pm in lateral extent (including filopodia), whereas neurites of small caliber (-0.1 pm) were tipped by less elaborate growth cones 5 to 10 pm in extent. Continuous movement of organelles was observed within the body of the growth cone and into and out of the trailing neurite shaft.
The conformation (Fig. PC) and activity of embryonic growth cones were similar to those of perinatal cones. The cones moved and fluctuated in size and form with a constantly changing pattern of filopodia and lamellipodia. Compared with E21/Pl growth cones, El7 cones tended to be somewhat smaller and simpler, although their size distribution overlapped that of the perinatal neurons.
Growth cones of neurons from postnatal SCG differed in activity, size, and conformation (Fig. 2, d to f). The cones were not larger than 10 pm in width as they rarely contained a broad expanse of cytoplasm and their filopodia were short and branched. Although not quantitated, our impression from the tine films was that the filopodia formed, moved, and disap- peared at lower rates than did those of embryonic and perinatal cones. The large membranous lamellipodia present at the pe- riphery of younger growth cones were not observed.
Growth cone translocationpatterns and age. Data were derived from 4-hr trajectories of about 200 individual growth cones tracked with the digital time-lapse system. At the end of a 4- hr recording period, the trajectories were reconstructed and then another field with several cones was located. Fields were chosen to contain isolated cones growing in such a way that they would remain in the field for the recording period. When neurites bifurcated during the recording period, one of the branches was arbitrarily chosen for subsequent tracking. Neu- rites which crossed with nearly perpendicular courses most often separated and could be followed beyond the encounter without difficulty. When one fiber met another at a shallow angle it sometimes fasciculated with the first (as in Roberts and Taylor, 1982). Growth cones could be followed along neu- rites by looking for their moving extensions; those cones, com- prising <lo% of the cones tracked, were not found to move at different rates. Neurites which did not remain in the field were ignored in the analysis.
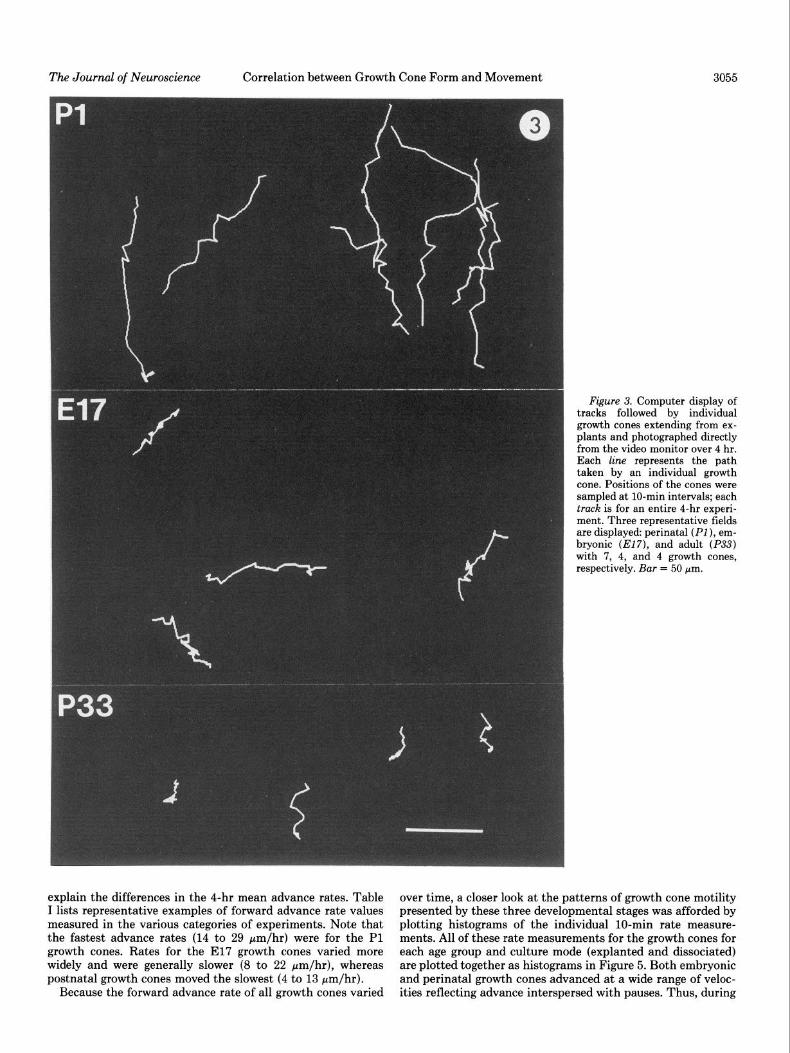
Trajectories were obtained from SCG cultures derived from E21 or Pl, E17, and PlO or P33 animals and grown as explants or dissociated cells. Differences in the overall pattern of forward translocation by growth cones from the different age groups were immediately apparent from growth cone tracks (Fig. 3). The tracks followed by perinatal cones were long and fairly straight, although some changes in direction were seen. The tracks of embryonic cones were shorter for the same length of time and frequently punctuated by “knots” indicating instances of retraction. The growth cones could retract suddenly and up to 100 pm when the trailing neurite assumed a coiled appear- ance. With shorter retractions, neurites appeared to thicken or “bunch up.” Representative tracks for P33 growth cones were tortuous and even shorter for the same 4-hr period. The “knots” along these tracks resulted less from retractions, which were much shorter than those of El7 cones, than from the tendency of P33 growth cones to wander about within a small area with frequent changes in direction, thus making little forward pro- gress.
For all ages and for both explant and dissociated cultures, growth cone advance was found to be intermittent. Periods of forward translocation of the cone were punctuated by periods of slower advances or complete cessation of forward movement. The pauses occurred every 20 to 90 min and lasted 10 to 20
3054 Argiro et al. Vol. 4, No. 12, Dec. 1984
/ /
I
I
I I
I
k
L I / I 1
a
I
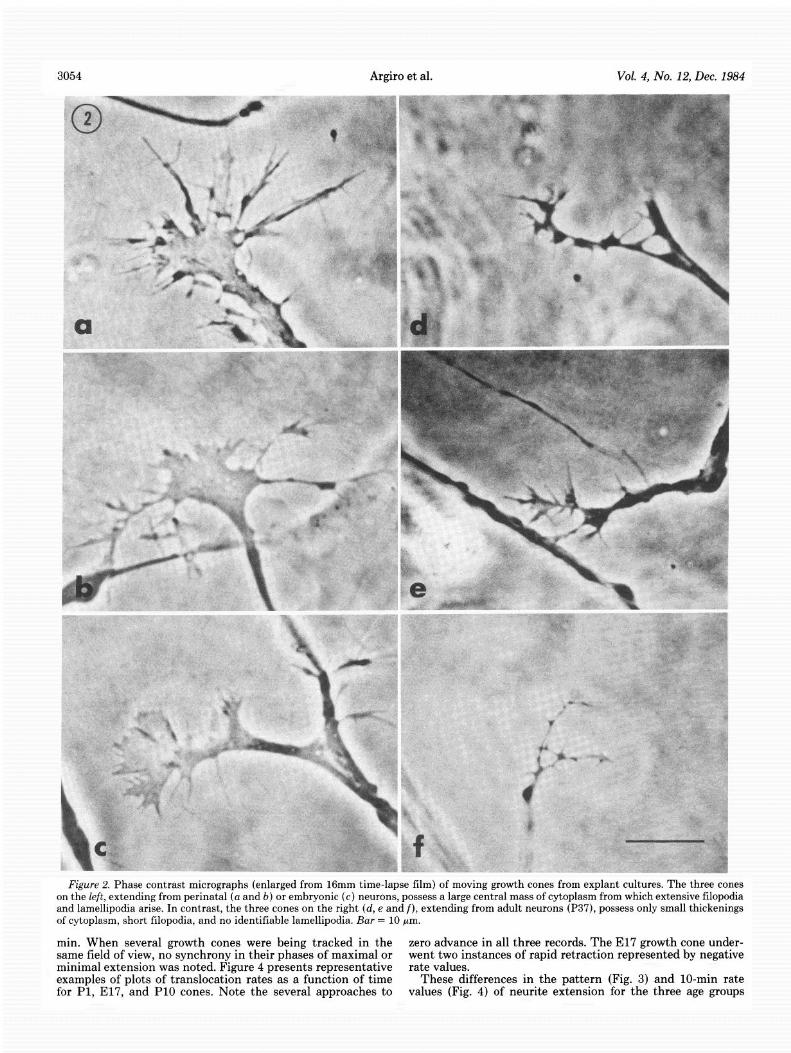
I Figure 2. Phase contrast micrographs (enlarged from 16mm time-lapse film) of moving growth cones from explant cultures. The three cones
on the left, extending from perinatal (a and b) or embryonic (c) neurons, possess a large central mass of cytoplasm from which extensive filopodia and lamellipodia arise. In contrast, the three cones on the right (d, e and f), extending from adult neurons (P37), possess only small thickenings of cytoplasm, short filopodia, and no identifiable lamellipodia. Bar = 10 pm.
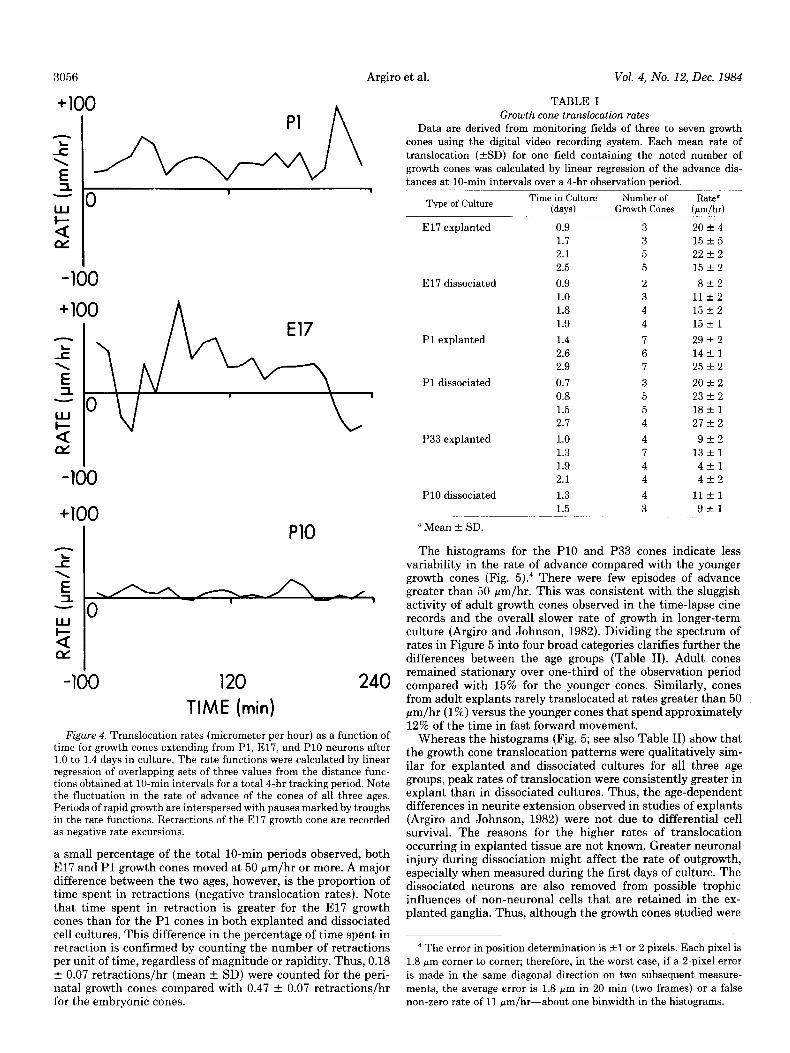
min. When several growth cones were being tracked in the zero advance in all three records. The El7 growth cone under- same field of view, no synchrony in their phases of maximal or went two instances of rapid retraction represented by negative minimal extension was noted. Figure 4 presents representative rate values. examples of plots of translocation rates as a function of time These differences in the pattern (Fig. 3) and lo-min rate for Pl, E17, and PlO cones. Note the several approaches to values (Fig. 4) of neurite extension for the three age groups
The Journal of Neuroscience Correlation between Growth Cone Form and Movement 3055
Figure 3. Computer display of tracks followed by individual growth cones extending from ex- plants and photographed directly from the video monitor over 4 hr. Each line represents the path taken by an individual growth cone. Positions of the cones were sampled at lo-min intervals; each truck is for an entire 4-hr experi- ment. Three representative fields are displayed: perinatal (PI), em- bryonic (El7), and adult (P33) with 7, 4, and 4 growth cones, respectively. Bar = 50 pm.
explain the differences in the 4-hr mean advance rates. Table I lists representative examples of forward advance rate values measured in the various categories of experiments. Note that the fastest advance rates (14 to 29 pm/hr) were for the Pl growth cones. Rates for the El7 growth cones varied more widely and were generally slower (8 to 22 pm/hr), whereas postnatal growth cones moved the slowest (4 to 13 pm/hr).
Because the forward advance rate of all growth cones varied
over time, a closer look at the patterns of growth cone motility presented by these three developmental stages was afforded by plotting histograms of the individual lo-min rate measure- ments. All of these rate measurements for the growth cones for each age group and culture mode (explanted and dissociated) are plotted together as histograms in Figure 5. Both embryonic and perinatal growth cones advanced at a wide range of veloc- ities reflecting advance interspersed with pauses. Thus, during
3056 Argiro et al.
- 2
-2 1 -
iii Q: QL
PlO
/
-100 120 240 TIME (min)
Figure 4. Translocation rates (micrometer per hour) as a function of time for growth cones extending from Pl, E17, and PlO neurons after 1.0 to 1.4 days in culture. The rate functions were calculated by linear regression of overlapping sets of three values from the distance func- tions obtained at lo-min intervals for a total 4-hr tracking period. Note the fluctuation in the rate of advance of the cones of all three ages. Periods of rapid growth are interspersed with pauses marked by troughs in the rate functions. Retractions of the El7 growth cone are recorded as negative rate excursions.
a small percentage of the total lo-min periods observed, both El7 and Pl growth cones moved at 50 pm/hr or more. A major difference between the two ages, however, is the proportion of time spent in retractions (negative translocation rates). Note that time spent in retraction is greater for the El7 growth cones than for the Pl cones in both explanted and dissociated cell cultures. This difference in the percentage of time spent in retraction is confirmed by counting the number of retractions per unit of time, regardless of magnitude or rapidity. Thus, 0.18 f 0.07 retractions/hr (mean + SD) were counted for the peri- natal growth cones compared with 0.47 f 0.07 retractions/hr for the embryonic cones.
Vol. 4, No. 12, Dec. 1984
TABLE I
Growth cone translocation rates Data are derived from monitoring fields of three to seven growth
cones using the digital video recording system. Each mean rate of translocation (SD) for one field containing the noted number of growth cones was calculated by linear regression of the advance dis- tances at lo-min intervals over a 4-hr observation neriod.
Type of Culture Time in Culture
(days) Number of RaW
Growth Cones h.dhr)
El7 explanted
El7 dissociated
Pl explanted
Pl dissociated
P33 explanted
PlO dissociated
0.9 1.7 2.1 2.5
0.9 1.0
1.8 1.9
1.4 2.6
2.9
0.7 0.8 1.5
2.7
1.0 1.3 1.9 2.1
1.3 1.5
o Mean f SD.
3 20 + 4 3 15 -t 5 5 22 -+ 2 5 15 f 2
2 8+2 3 I1 -c 2 4 15 f 2 4 15 + 1
7 29 + 2 6 14 It 1 7 25 f 2
3 20 f 2 5 23 f 2 5 18 f 1
4 27 zk 2
4 9f2 7 13 f 1 4 4fl 4 4f2
4 11 + 1 3 9a1
The histograms for the PI0 and P33 cones indicate less variability in the rate of advance compared with the younger growth cones (Fig. 5).” There were few episodes of advance greater than 50 pm/hr. This was consistent with the sluggish activity of adult growth cones observed in the time-lapse tine records and the overall slower rate of growth in longer-term culture (Argiro and Johnson, 1982). Dividing the spectrum of rates in Figure 5 into four broad categories clarifies further the differences between the age groups (Table II). Adult cones remained stationary over one-third of the observation period compared with 15% for the younger cones. Similarly, cones from adult explants rarely translocated at rates greater than 50 pm/hr (1%) versus the younger cones that spend approximately 12% of the time in fast forward movement.
Whereas the histograms (Fig. 5; see also Table II) show that the growth cone translocation patterns were qualitatively sim- ilar for explanted and dissociated cultures for all three age groups, peak rates of translocation were consistently greater in explant than in dissociated cultures. Thus, the age-dependent differences in neurite extension observed in studies of explants (Argiro and Johnson, 1982) were not due to differential cell survival. The reasons for the higher rates of translocation occurring in explanted tissue are not known. Greater neuronal injury during dissociation might affect the rate of outgrowth, especially when measured during the first days of culture. The dissociated neurons are also removed from possible trophic influences of non-neuronal cells that are retained in the ex- planted ganglia. Thus, although the growth cones studied were
4 The error in position determination is +1 or 2 pixels. Each pixel is 1.8 pm corner to corner; therefore, in the worst case, if a 2-pixel error is made in the same diagonal direction on two subsequent measure-
ments, the average error is 1.8 pm in 20 min (two frames) or a false non-zero rate of 11 wm/hr-about one binwidth in the histograms.
The Journal of Neuroscience Correlation between Growth Cone Form and Movement
cl P33
50 100
3057
I Pl II El7
cl PlO
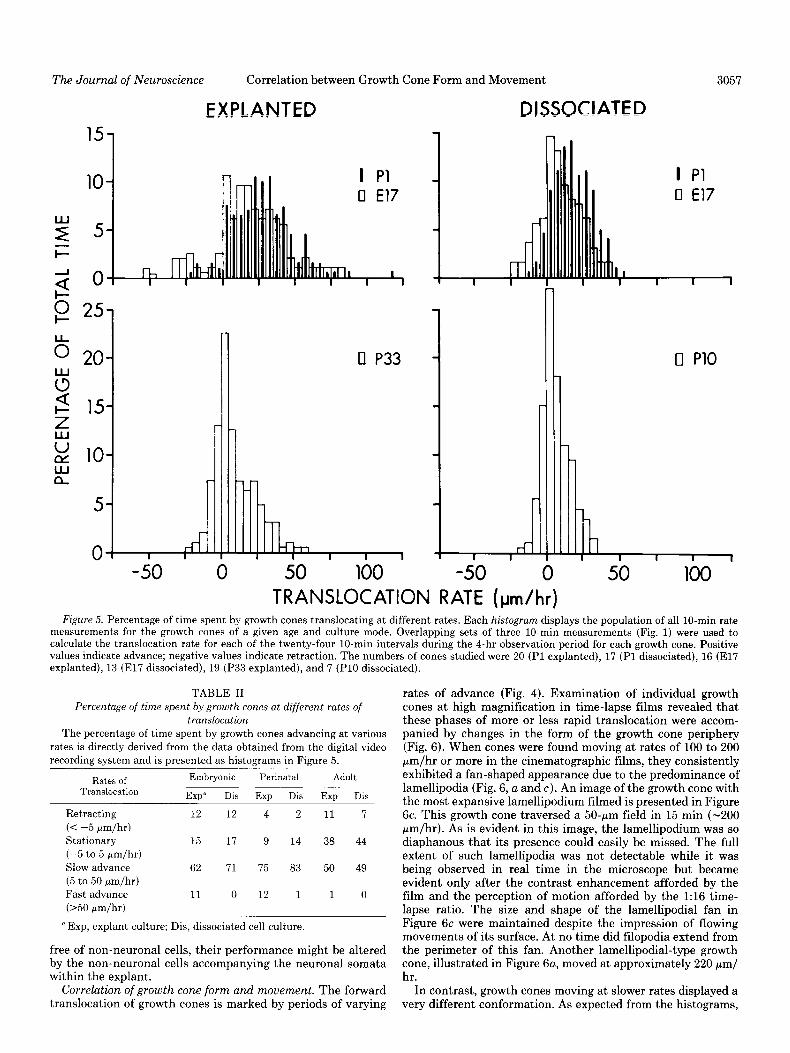
TRANSLOCATION RATE (pm/hr) Figure 5. Percentage of time spent by growth cones translocating at different rates. Each histogram displays the population of all lo-min rate
measurements for the growth cones of a given age and culture mode. Overlapping sets of three 10.min measurements (Fig. 1) were used to calculate the translocation rate for each of the twenty-four 10.min intervals during the 4-hr observation period for each growth cone. Positive values indicate advance; negative values indicate retraction. The numbers of cones studied were 20 (Pl explanted), 17 (Pl dissociated), 16 (El7 explanted), 13 (El7 dissociated), 19 (P33 explanted), and 7 (PlO dissociated).
TABLE II
Percentage of time spent by growth cones at different rates of translocation
The percentage of time spent by growth cones advancing at various rates is directly derived from the data obtained from the digital video
recording system and is presented as histograms in Figure 5.
Rates of Translocation
Embryonic Perinatal Adult
Exp” Dis ~ EXP Dis EXP Dis
Retracting (C -5 pm/hi-)
Stationary (-5 to 5 rm/hr)
Slow advance (5 to 50 pm/hr)
Fast advance (X0 umlhr)
12 12 4 2 11 7
15 17 9 14 38 44
62 71 75 83 50 49
11 0 12 1 1 0
a Exp, explant culture; Dis, dissociated cell culture.
free of non-neuronal cells, their performance might be altered by the non-neuronal cells accompanying the neuronal somata within the explant.
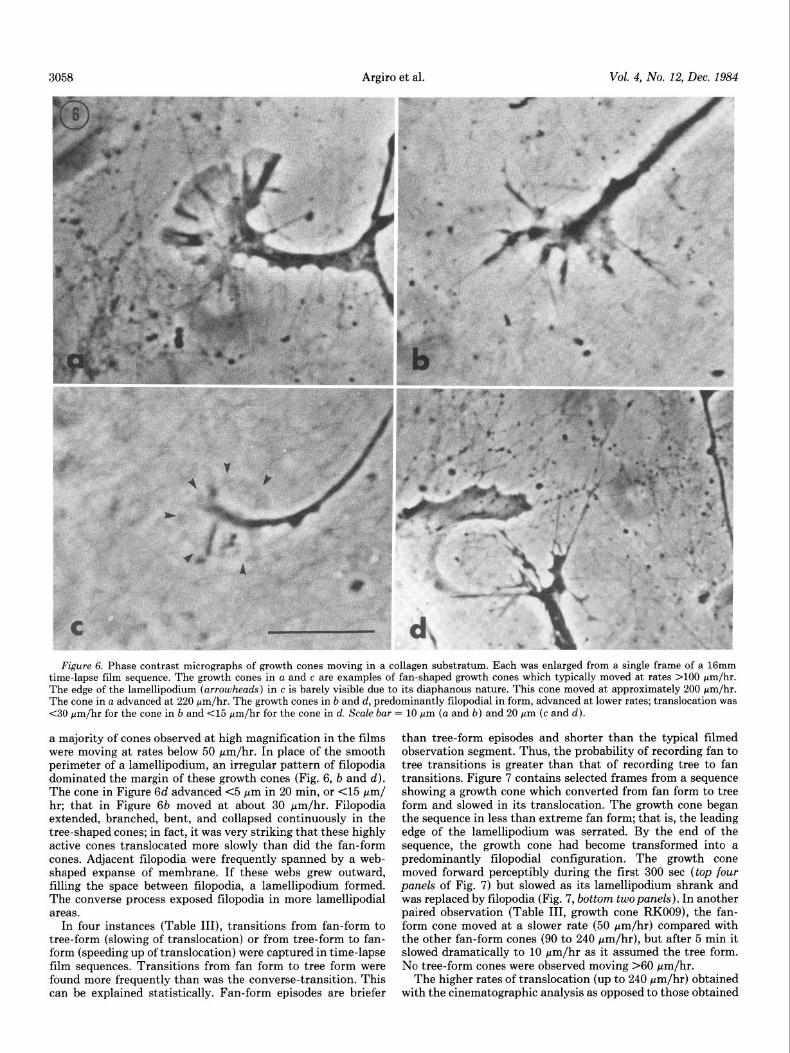
rates of advance (Fig. 4). Examination of individual growth cones at high magnification in time-lapse films revealed that these phases of more or less rapid translocation were accom- panied by changes in the form of the growth cone periphery (Fig. 6). When cones were found moving at rates of 100 to 200 pm/hr or more in the cinematographic films, they consistently exhibited a fan-shaped appearance due to the predominance of lamellipodia (Fig. 6, a and c). An image of the growth cone with the most expansive lamellipodium filmed is presented in Figure 6c. This growth cone traversed a 50-pm field in 15 min (-200 pm/hr). As is evident in this image, the lamellipodium was so diaphanous that its presence could easily be missed. The full extent of such lamellipodia was not detectable while it was being observed in real time in the microscope but became evident only after the contrast enhancement afforded by the film and the perception of motion afforded by the 1:16 time- lapse ratio. The size and shape of the lamellipodial fan in Figure 6c were maintained despite the impression of flowing movements of its surface. At no time did filopodia extend from the perimeter of this fan. Another lamellipodial-type growth cone, illustrated in Figure 6a, moved at approximately 220 pm/ hr.
Correlation of growth cone form and movement. The forward In contrast, growth cones moving at slower rates displayed a translocation of growth cones is marked by periods of varying very different conformation. As expected from the histograms,
3058 Argiro et al. Vol. 4, No. 12, Dec. 1984
Figure 6. Phase contrast micrographs of growth cones moving in a collagen substratum. Each was enlarged from a single frame of a 16mm time-lapse film sequence. The growth cones in a and c are examples of fan-shaped growth cones which typically moved at rates >lOO Nm/hr. The edge of the lamellipodium (arrowheads) in c is barely visible due to its diaphanous nature. This cone moved at approximately 200 rm/hr. The cone in a advanced at 220 pm/hr. The growth cones in b and d, predominantly filopodial in form, advanced at lower rates; translocation was <30 Fm/hr for the cone in b and <15 Fm/hr for the cone in d. Scale bar = 10 pm (a and b) and 20 pm (c and cl).
a majority of cones observed at high magnification in the films were moving at rates below 50 pm/hr. In place of the smooth perimeter of a lamellipodium, an irregular pattern of filopodia dominated the margin of these growth cones (Fig. 6, b and d). The cone in Figure 6d advanced <5 pm in 20 min, or (15 pm/ hr; that in Figure 66 moved at about 30 pm/hr. Filopodia extended, branched, bent, and collapsed continuously in the tree-shaped cones; in fact, it was very striking that these highly active cones translocated more slowly than did the fan-form cones. Adjacent filopodia were frequently spanned by a web- shaped expanse of membrane. If these webs grew outward, filling the space between filopodia, a lamellipodium formed. The converse process exposed filopodia in more lamellipodial areas.
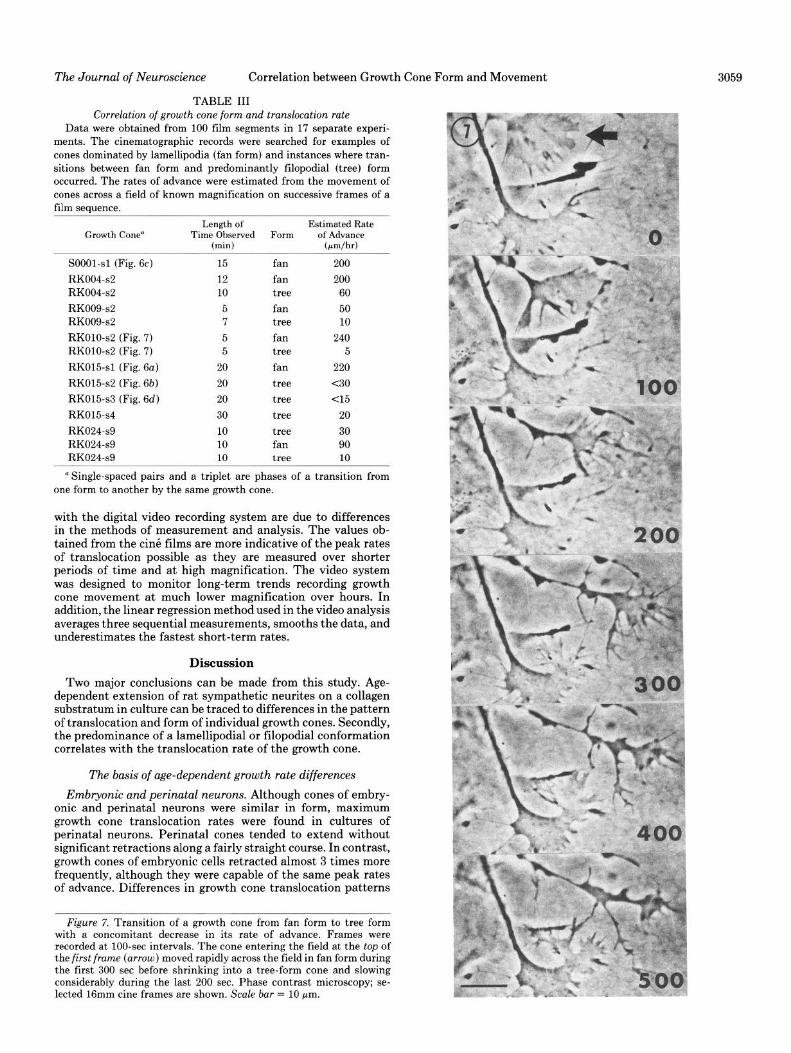
In four instances (Table III), transitions from fan-form to tree-form (slowing of translocation) or from tree-form to fan- form (speeding up of translocation) were captured in time-lapse film sequences. Transitions from fan form to tree form were found more frequently than was the converse-transition. This can be explained statistically. Fan-form episodes are briefer
than tree-form episodes and shorter than the typical filmed observation segment. Thus, the probability of recording fan to tree transitions is greater than that of recording tree to fan transitions. Figure 7 contains selected frames from a sequence showing a growth cone which converted from fan form to tree form and slowed in its translocation. The growth cone began the sequence in less than extreme fan form; that is, the leading edge of the lamellipodium was serrated. By the end of the sequence, the growth cone had become transformed into a predominantly filopodial configuration. The growth cone moved forward perceptibly during the first 300 set (top four panels of Fig. 7) but slowed as its lamellipodium shrank and was replaced by filopodia (Fig. 7, bottom two panels). In another paired observation (Table III, growth cone RK009), the fan- form cone moved at a slower rate (50 pm/hr) compared with the other fan-form cones (90 to 240 pm/hr), but after 5 min it slowed dramatically to 10 rm/hr as it assumed the tree form. No tree-form cones were observed moving >60 pm/hr.
The higher rates of translocation (up to 240 pm/hr) obtained with the cinematographic analysis as opposed to those obtained
The Journal of Neuroscience Correlation between Growth Cone Form and Movement 3059
TABLE III
Correlation of growth cone form and translocation rate Data were obtained from 100 film segments in 17 separate experi-
ments. The cinematographic records were searched for examples of
cones dominated by lamellipodia (fan form) and instances where tran- sitions between fan form and predominantly filopodial (tree) form occurred. The rates of advance were estimated from the movement of
cones across a field of known magnification on successive frames of a film sequence.
Length of Estimated Rate Growth Cone” Time Observed Form of Advance
(mm) (w/h4
SOOOl-sl (Fig. 6c) 15 fan 200
RK004-s2 12 fan 200
RK004s2 10 tree 60
RK009-s2 5 fan 50
RK009s2 7 tree 10
RKOlO-s2 (Fig. 7) 5 fan 240 RKOlO-s2 (Fig. 7) 5 tree 5
RK015-sl (Fig. 6a) 20 fan 220
RK015s2 (Fig. 6b) 20 tree <30
RK015s3 (Fig. 6d) 20 tree <15
RK015-s4 30 tree 20
RK024-s9 10 tree 30 RK024-s9 10 fan 90
RK024-s9 10 tree 10
a Single-spaced pairs and a triplet are phases of a transition from
one form to another by the same growth cone.
with the digital video recording system are due to differences in the methods of measurement and analysis. The values ob- tained from the tine films are more indicative of the peak rates of translocation possible as they are measured over shorter periods of time and at high magnification. The video system was designed to monitor long-term trends recording growth cone movement at much lower magnification over hours. In addition, the linear regression method used in the video analysis averages three sequential measurements, smooths the data, and underestimates the fastest short-term rates.
Discussion
Two major conclusions can be made from this study. Age- dependent extension of rat sympathetic neurites on a collagen substratum in culture can be traced to differences in the pattern of translocation and form of individual growth cones. Secondly, the predominance of a lamellipodial or filopodial conformation correlates with the translocation rate of the growth cone.
The basis of age-dependent growth rate differences
Embryonic and perinatal neurons. Although cones of embry- onic and perinatal neurons were similar in form, maximum growth cone translocation rates were found in cultures of perinatal neurons. Perinatal cones tended to extend without significant retractions along a fairly straight course. In contrast, growth cones of embryonic cells retracted almost 3 times more frequently, although they were capable of the same peak rates of advance. Differences in growth cone translocation patterns
Figure 7. Transition of a growth cone from fan form to tree form with a concomitant decrease in its rate of advance. Frames were recorded at 100~set intervals. The cone entering the field at the top of the first frame (arrow) moved rapidly across the field in fan form during the first 300 set before shrinking into a tree-form cone and slowing considerably during the last 200 sec. Phase contrast microscopy; se- lected 16mm tine frames are shown. Scale bar = 10 pm.
3060 Argiro et al. Vol. 4, No. 12, Dec. 1984
were observed independent of interactions with non-neuronal cells and patterns of fasciculation, both of which can influence neurite outgrowth (Ruthishauser and Edelman, 1980; Roufa et al., 1983). Although non-neuronal cells were present in these cultures, care was taken to ensure that the growth cones tracked were isolated from such cells. In >90% of the cases, the cones were also separated from other neurites.
More rapid rates of embryonic growth cone advance than those observed in this study can occur under conditions per- mitting the rapid migration of non-neuronal cells, with which the neurite tips are associated (Roufa et al., 1983). Thus, the slower rate of advance of El7 cones in the absence of associated non-neuronal cells which we report here may not be due to an intrinsic deficiency in growth cone formation. The difference in neurite extension rates between the embryonic and perinatal neurons results from an increased frequency of retraction of growth cones of the younger cells; a reason for this more frequent retraction may be that the embryonic cones do not adhere as strongly to the collagen. Growth cone adhesion is key to neurite extension because, depending upon the culture con- ditions, neurites are anchored to the substratum primarily in the growth cone regions (Bray, 1973).
This suggested difference in substratum adhesion of perinatal versus embryonic cones may be due to variations in growth cone surface membrane. That there may be some modification in the cultured growth cone surface with maturation, as judged by changing preferences for non-neuronal cells or neighboring neurites (fasciculation), has been discussed earlier (Argiro and Johnson, 1982). The potential for substantial change in growth cone surface characteristics clearly exists because of continuing addition of membrane constituents (Bray, 1970; Pfenninger and Maylie-Pfenninger, 1981; see also review by Landis, 1983) and removal of membrane during endocytosis (reviewed by Bunge et al., 1983). The composition of the constituents des- tined for the growth cone surface membrane could vary in embryonic and perinatal neurons.
The strength of attachment to the substratum strongly influ- ences growth cone morphology (size, conformation, and inter- nal organization), rate and direction of elongation, and degree of branching. Cones are more expanded and contain more and longer filopodia when they contact a more adhesive surface (Luduena, 1973b; Letourneau, 1979). Areas of close adhesion coincide with microfilament (actin) bundles, suggesting that contact influences the positioning of organelles within the cone (Letourneau 1979, 1981). Cones prefer to grow on a substratum to which they adhere best (Letourneau, 1975). Neurites are under tension, and the amount of this tension, which depends upon the degree of adhesion, influences the degree of branching (Bray, 1979). From all this and additional work, the concept has arisen that suitable adhesion of the cone is necessary for its advance. If adhesion is inadequate, the tension that is required for advance results in retraction and the cone fails to move ahead (see Johnston and Wessells, 1980; Bray, 1982; Letourneau, 1982, 1983b; Wessells, 1982; Bunge, et al., 1983, for additional review).
Adult neurons. The growth cones of older neurons did not advance as rapidly as those from embryonic and perinatal neurons in the first few days of culture. The major reasons for this difference include the lack of rates of translocation of >50 pm/hr and increased time in which little forward advance occurred. The cones from older neurons were diminished in size, exhibited fewer filopodia, and lacked definitive lamellipo- dia. These morphological and advance rate differences from younger cones suggest that the sluggish advance of cones from older neurons may be related to deficiencies in neuritelcone assembly instead of, or in addition to, possible lessened adhe- sion to the substratum.
Possible reasons for slower neurite extension from older
neurons are diminished synthesis in the cell body, reduced axonal transport of components that support motility, and paucity of specific growth-associated proteins. Luduena (1973a) found that chick sensory neurons with processes lengthening at twice a given rate synthesized twice as much protein in the cell body region.
The slower elongation of neurites and reduced cone size and activity could also result from the slower transport of the “axonal motile complex,” the actin and associated proteins traveling together in slow component b (Wujek and Lasek, 1983). Comparing the rates of slow (component b) axonal transport and axonal regeneration in the centrally and periph- erally directed processes of the rat sensory ganglion cell, Wujek and Lasek (1983) found that both regeneration and slow trans- port were about 2 times faster in the peripheral than in the central process. Because the rates of regeneration and slow component b transport were similar, the authors hypothesized that this actin-containing complex is a rate-limiting factor in regeneration because of its role in providing substances directly involved in growth cone advance (see also Black and Lasek, 1979). In fact, Lasek (1981) has proposed “that the growth cone is an expression of the continuous anterograde march of (slow component b) within the axon.”
Slower advance of adult cones could also possibly result from decreased amounts of rapidly transported proteins known to be associated with axonal growth, the “growth-associated pro- teins” (see references in Willard and Skene, 1982). Willard and Skene (1982) found that “GAP 43” increases 50 times during axonal regrowth of mammalian PNS neurons and is elevated in mammalian CNS neurons during initial growth but greatly diminished with maturation. They also discovered that GAP 43 is not reinduced when adult CNS neurons (which do not regrow axons successfully) are injured. Thus, this correlation between the elevation of GAP 43 and the onset of axonal growth and the failure of induction in a neuron that does not regenerate an axon has led to the concept that GAPS are necessary for axon growth and, moreover, that an alteration in neuronal gene expression is required for their increase in re- generation. Changing levels of GAPS could explain some of the observed changes in neurite extension rates with time in culture reported earlier (Argiro and Johnson, 1982). The initially higher rate of neurite extension from perinatal ganglia (from animals in which the neurites had been growing rapidly), the subsequent decline to half the rate in culture, the initially lower rate of extension from ganglia removed from older animals, and the subsequent gradual doubling of this rate in culture could be explained by the concept advanced by Willard and Skene (1982).
Lamellipodial versus filopodial function
A constant finding in tissue culture studies has been that the moving parts of the growth cone take the form of ruffling lamellipodia (veils) and dynamic filopodia (microspikes) (e.g., Pomerat et al., 1967). A single growth cone may extend both types of protrusions, simultaneously or at different times (Lu- duena and Wessells, 1973). Serial thin sectioning has divulged that lamellipodia and filopodia exist at the leading tips of neurites growing in the animal (Tennyson, 1970; Skoff and Hamburger, 1974; Tosney and Landmesser, 1983; K. W. Tosney and L. T. Landmesser, personal communication). To what extent these conformations differ in function during neurite extension is not yet understood. In animal studies, lamellipodia have more often been associated with axonal than with dendri- tic tips (Skoff and Hamburger, 1974). Our study shows for the first time that the rate of growth cone advance varies depending upon the predominance of lamellipodia or filopodia and that a shift from one form to the other is accompanied by a change in this rate.
The Journal of Neuroscience Correlation between Growth Cone Form and Movement 3061
The question arises, why, on the substratum we used, cones in a predominantly lamellipodial phase advanced faster (up to 240 pm/hr) than cones projecting filopodia (5 to 60 pm/hr). The motile periphery of the growth cone consists chiefly of microfilaments, and intense anti-actin immunofluorescence has been observed in this region (reviewed by Johnston and Wessells, 1980; Bunge et al., 1983; Landis, 1983; Letourneau, 1983a; Tosney and Wessells, 1983). In a recent high voltage electron microscopic study comparing expanding lamellipodia and unattached (moving) and attached filopodia, lamellipodia and unattached filopodia contained a cortical meshwork of filaments whereas attached filopodia contained aligned fila- ments that extended as bundles into the body of the cone (Tosney and Wessells, 1983). (Lamellipodia close to the sub- stratum could contain bundles of filaments which always ex- tended from attached filopodia.) That the protrusion of the leading edge is mediated by a filamentous meshwork whereas bundles of filaments are present in relation to an area of adhesion is in agreement with results obtained with a variety of non-neuronal cells. For example, Herman et al. (1981), comparing anti-actin immunofluorescence with phase contrast images in HeLa, embryonic chick, neural crest, and blood cells, found that stationary cells possessed prominent filament bun- dles (stress fibers) which stained intensely for actin, whereas migrating cells showed intense but diffuse anti-actin staining, particularly in the areas of ruffling membrane.
Our films revealed that the more slowly translocating, pre- dominantly filopodial E17/E21 cones are nonetheless highly active; because the filopodia were observed to move constantly, the difference did not appear to result from lessened motility of the cone periphery. Differences in advance rates could result from differences in substratum adhesion of the leading margin of lamellipodia versus the tips of filopodia. Letourneau (1979) found by means of interference reflection optics that the leading margin of lamellipodia is nonadherent in contrast to the central and lateral regions. In other words, a lamellipodium may be partly attached, a requirement for extension, and yet have a free margin that continues to extend (similar to fibroblasts; Izzard and Lochner, 1980). Filopodia, on the other hand, may extend and attach to the substratum along their length. These linearly adherent filopodia may stabilize portions of the cone margin and influence the organization of microfilament bundles but do not promote protrusive activity (Letourneau, 1979).
The unattached leading margin of lamellipodia may therefore be a more favorable site for the addition of components needed to expand the plasmalemma (as it may also be for fibroblasts; Abercrombie et al., 1977). Filopodial plasmalemma contains newly added lectin receptors (Pfenninger and Maylie-Pfennin- ger, 1981), but it is not known whether these are added in lamellipodial or filopodial phases. In some of the sequences we viewed (as in Fig. 7), an extended lamellipodium shrank to leave behind a predominantly filopodial “skeleton” (which then slowed in translocation). A difference between lamellipodial and filopodial function is also implied in work by Seeley and Greene (1983). These authors stated that, upon replacement of NGF in the culture medium after withdrawal for a few hours, filopodial activity was seen within 2 min but neither lamelli- podial spreading nor neurite extension reappeared until 20 min later. A better understanding of lamellipodial versus filopodial differences is important for study of adult nerve fiber regener- ation because the slowly extending neurites of adult neurons were found in our study to lack definitive lamellipodia.
References
Abercrombie, M., G. A. Dunn, and J. P. Heath (1977) The shape and movement of fibroblasts in culture. In Cell and Tissue Interactions, J. W. Lash and M. M. Burger, eds., Vol. 32, pp. 57-70, Raven Press, New York.
Agranoff, B. W., P. Field, and R. M. Gaze (1976) Neurite outgrowth from explanted Xenopus retina: An effect of prior optic nerve section. Brain Res. 113: 225-234.
Argiro, V. (1983) Neurite extension in tissue culture: An analysis of growth kinetics and the conformation and motility of growth cones. Ph.D. dissertation, Washington University, St. Louis.
Argiro, V., and M. I. Johnson (1982) Patterns and kinetics of neurite extension from sympathetic neurons in culture are age dependent. J. Neurosci. 2: 503-512.
Argiro, V., M. B. Bunge, and M. Johnson (1981) Quantitative time- lapse analysis of growth cone motility of cultured rat autonomic neurons. J. Cell Biol. 91: 92a.
Argiro, V., M. B. Bunge, and M. I. Johnson (1983) Predominance of filopodia or lamellipodia is correlated with rate of growth cone translocation. J. Cell Biol. 97: 248a.
Black, M. M., and R. J. Lasek (1979) Slowing of the rate of axonal regeneration during growth and maturation. Exp. Neurol. 63: 108 119.
Bray, D. (1970) Surface movements during the growth of single ex- planted neurons. Proc. Natl. Acad. Sci. U. S. A. 65: 4516-4519.
Bray, D. (1973) Branching patterns of individual sympathetic neurons in culture. J. Cell Biol. 56: 702-712.
Bray, D. (1979) Mechanical tension produced by nerve cells in tissue culture. J. Cell Sci. 37: 391-410.
Bray, D. (1982) Filopodial contraction and growth cone guidance. In Cell Behauiour, R. Bellairs, A. Curtis, and G. Dunn, eds., pp. 299- 317, Cambridge University Press, Cambridge, England.
Bunge, M. B., M. I. Johnson, and V. J. Argiro (1983) Studies of regenerating nerve fibers and growth cones. In Spinal Cord Recon- struction, C. C. Kao, R. P. Bunge, and P. J. Reier, eds., pp. 999120, Raven Press, New York.
Collins, F., and M. R. Lee (1982) A reversible developmental change in the ability of ciliary ganglion neurons to extend neurites in culture. J. Neurosci. 2: 424-430.
Ebendal, T. (1974) Scanning electron microscopy of chick embryo nerve fibers and heart fibroblasts on collagen substrata in uitro. Zoon 2: 99-104.
Ebendal, T. (1979) Stage-dependent stimulation of neurite outgrowth exerted by nerve growth factor and chick heart in cultured embryonic ganglia. Dev. Biol. 72: 276-290.
Herman, I. M., N. J. Crisona, and T. D. Pollard (1981) Relation between cell activity and the distribution of cytoplasmic actin and myosin. J. Cell Biol. 90: 84-91.
Herrup, K., and E. M. Shooter (1975) Properties of the p-nerve growth factor receptor in development. J. Cell Biol. 67: 118-125.
Izzard, C. S., and L. R. Lochner (1980) Formation of cell-to-substrate contacts during fibroblast motility: An interference-reflexion study. J. Cell Sci. 42: 81-116.
Johnson, M. I., and V. A. Argiro (1983) Techniques in the tissue culture of rat sympathetic neurons. Methods Enzymol. 103: 334-347.
Johnston. R. N.. and N. K. Wessells (1980) Reeulation of the elongating nerve fiber. Curr. Top. Dev. Biol. >S: 165-206.
- -
Landis, S. C. (1983) Neuronal growth cones. Annu. Rev. Physiol. 45: 5677580.
Lasek, R. J. (1981) Dynamic properties of cytoskeletons. The dynamic ordering of neuronal cytoskeletons. Neurosci. Res. Program. Bull. 19: 7-32.
Letourneau, P. C. (1975) Cell-to-substratum adhesion and guidance of axonal elongation. Dev. Biol. 44: 922101.
Letourneau, P. C. (1979) Cell-substratum adhesion of neurite growth cones, and its role in neurite elongation. Exp. Cell Res. 124: 127-138.
Letourneau, P. C. (1981) Immunocytochemical evidence for colocali- zation in neurite growth cones of actin and myosin and their rela- tionship to cell-substratum adhesions. Dev. Biol. 85: 113-122.
Letourneau, P. C. (1982) Nerve fiber growth and its regulation by extrinsic factors. In Neuronal Deuelopment, N. Spitzer, ed., pp. 213- 254, Plenum Press, New York.
Letourneau, P. C. (1983a) Differences in the organization of actin in the growth cones compared with the neurites of cultured neurons from chick embryos. J. Cell Biol. 97: 963-973.
Letourneau, P. C. (1983b) Axonal growth and guidance. Trends Neu- rosci. 6: 451-455.
Luduena, M. A. (1973a) Nerve cell differentiation in uitro. Dev. Biol. 33: 268-284.
3062 Argiro et al. Vol. 4, No. 12, Dec. 1984
Luduena, M. A. (197313) The growth of spinal ganglion neurons in serum-free medium. Dev. Biol. 33: 470-476.
Luduena, M. A., and N. K. Wessells (1973) Cell locomotion, nerve elongation, and microfilaments. Dev. Biol. 30: 427-440.
McLennan, I. S., and I. A. Hendry (1980) Influence of cardiac extracts on cultured ciliary ganglia. Dev. Neurosci. 3: l-10.
Pfenninger, K. H., and M. -F. Maylie-Pfenninger (1981) Lectin labeling of sprouting neurons. II. Relative movement and appearance of glycoconjugates during plasmalemmal expansion. J. Cell Biol. 89: 547-559.
Pomerat, C. M., W. J. Hendelman, C. W. Raiborn, and J. F. Massey (1967) Dynamic activities of nervous tissue in uitro. In The Neuron, H. Hyden, ed., pp. 119-178, Elsevier-North Holland Publishing Co., Amsterdam.
Roberts, A., and J. S. H. Taylor (1982) A scanning electron microscope study of the development of a peripheral sensory neurite network. J. Embryol. Exp. Morphol. 69: 237-250.
Roufa, D. G., M. I. Johnson, and M. B. Bunge (1983) Influence of ganglion age, nonneuronal cells and substratum on neurite outgrowth in culture. Dev. Biol. 99; 225-239.
Rutishauser, U., and G. M. Edelman (1980) Effects of fasciculation on the outgrowth of neurites from spinal ganglia in culture. J. Cell Biol. 87: 370-378.
Schreyer, D. J., and E. G. Jones (1982) Growth and target finding by axons of the corticospinal tract in prenatal and postnatal rats. Neuroscience 7: 1837-1853.
Seeley, P. J., and L. A. Greene (1983) Short-latency local actions of nerve growth factor at the growth cone. Proc. Natl. Acad. Sci. U. S. A. 80: 2789-2793.
Skoff, R., and V. Hamburger (1974) Fine structure of dendritic and axonal growth cones in embryonic chick spinal cord. J. Comp. Neurol. 153: 107-148.
Sykes, J. A., and E. B. Moore (1960) A simple tissue culture chamber. Tex. Rep. Biol. Med. 18: 288-297.
Tennyson, V. (1970) The fine structure of the axon and growth cone of the dorsal root neuroblast of the rabbit embryo. J. Cell Biol. 44: 62-79.
Tosney, K. W., and L. T. Landmesser (1983) Growth cone guidance in the chick hindlimb. Sot. Neurosci. Abstr. 9: 210.
Tosney, K. W., and N. K. Wessells (1983) Neuronal motility: The ultrastructure of veils and microspikes correlates with their motile activities. J. Cell Sci. 61: 389-411.
Wessells, N. K. (1982) Axon elongation: A special case of cell locomo- tion. In Cell Behauiour, R. Bellairs, A. Curtis, and G. Dunn, eds., pp. 225-246, Cambridge University Press, Cambridge, England.
Willard, M., and J. H. P. Skene (1982) Molecular events in axonal regeneration. In Repair and Regeneration of the Nervous System, J. G. Nicholls, ed., pp. 71-89, Springer-Verlag, New York.
Winick, M., and R. E. Greenberg (1965) Chemical control of sensory ganglia during a critical period of development. Nature 205: 180-181.
Wujek, J. R., and R. J. Lasek (1983) Correlation of axonal regeneration and slow component b in two branches of a single axon. J. Neurosci. 3: 243-251.