Coordination and Miss-Coordination in Market Entry Games with an Application to Congestion...
27
1 Coordination and Miss-Coordination in Market Entry Games with an Application to Congestion Externalities. Hernán Bejarano 1 James Shortle The Pennsylvania State University ** preliminary and incomplete please do not cite** Selected Paper prepared for presentation at the Agricultural & Applied Economics Association’s 2011 AAEA & NAREA Joint Annual Meeting, Pittsburgh, Pennsylvania, July 24-26, 2011 1 Contact Author: PhD Candidate Agricultural, Environmental and Regional Economics at Penn State,. Armsby Building , University Park , PA 16802-5600. email: [email protected] . We are really thankful with the International Foundation for Research in Experimental Economics IFREE, that funded the current experiment. All the judgments and mistakes are own responsibility of the authors and do not reflect those of IFREE.
Transcript of Coordination and Miss-Coordination in Market Entry Games with an Application to Congestion...

1
Coordination and Miss-Coordination in Market Entry Games with an Application to Congestion Externalities.
Hernán Bejarano 1 James Shortle
The Pennsylvania State University
** preliminary and incomplete please do not cite**
Selected Paper prepared for presentation at the Agricultural & Applied Economics Association’s 2011 AAEA & NAREA Joint Annual Meeting, Pittsburgh, Pennsylvania, July
24-26, 2011 1 Contact Author: PhD Candidate Agricultural, Environmental and Regional Economics at Penn State,. Armsby Building , University Park , PA 16802-5600. email: [email protected]. We are really thankful with the International Foundation for Research in Experimental Economics IFREE, that funded the current experiment. All the judgments and mistakes are own responsibility of the authors and do not reflect those of IFREE.

2
Coordination and Miss-Coordination in Market Entry Games with an Application to Congestion Externalities. Introduction
An important classes of externalities are those involving congestion. The costs of congestion are
not trivial. For example, the 2005 Urban Mobility Report by the Texas Transportation Institute
estimated that the cost of traffic congestion at 63 billion per year in the United States.
Congestion can be viewed in some instances as a result of coordination failures among those
using a congestible resource. In these cases, congestion costs can be reduced if market
participants can learn to coordinate. This papers reports the results of experiments on the ability
of students to tacitly coordinate in the use of a congestible good. Treatments examine how
uncertainty and entry fees influence the outcomes.
We use the Market Entry Game (MEG), originally studied in experiments by Kahneman
(1988), as the starting point for our analysis. The MEG models static binary decision problems in
environments with many participants and where the entry of any participant creates a negative
externality for all who choose the same action.2 MEG experiments place subjects in interactive
environments with similar characteristics to those observed in congestion problems (e.g., traffic
congestion). In contrast to many coordination games, experiments based on the MEG often find
a high degree of coordination3 (Van Huyck et al. (1990 & 1991) and (Cooper et al. 1992)).
2 Minority Games have been studied in the fields of computational social sciences. Examples of minority games are "El Farol" problem (Arthur 1994, Manuca et. al 1998 , Bottazzi and Devetag. 2007,, Kets 2007} these games have similar strategic interactions than those one of the MEG but the literature analyzed these two similar problems have remained mostly disconnected. 3 Kahneman’s words about the MEG in his Nobel price laureates ceremony: “The results, although not surprising to an economist, struck me as magical. Within very few trials, a pattern emerged in which the number of entrants, N, was within 1 or 2 of N*, with no obvious systematic tendency to be higher or lower than N*. The group was doing the right thing collectively, although conversations with the participants and the obvious statistical analyses did not reveal any consistent strategies that made sense. It took me some time to realize that the magic we were observing was an equilibrium: the pattern we saw existed because no other pattern could be sustained. This idea had not been in my intellectual bag of tools. We never formally published the N* game - I described it informally in Kahneman (1987) - but it has been taken up by others (Erev & Rapoport, 1998)”.

3
. These environments usually have multiple equilibria making difficult to achieve either
of them without a mechanism to tacitly coordinate. Failure to achieve equilibrium behavior is
costly. The aggregated profit of those participants in a MEG depends on the capability of the
agents to tacitly coordinate. Failures to co-ordinate or over entry cause costs to the entrants but
also under entry might generate costs given the it will imply that there is investment in slack
capacity. To understand what policies can work. First we need to understand how the existence
of relationships between system capacities potential users and entry fees affect the number of
entrants..
This study focuses on the following questions:
1. How does the capacity affect tacit coordination?
2. How does uncertainty regarding system capacity affect market outcomes?
3. How effective and efficient are entry fees (a classic mechanism for managing congestion)
to induce changes in entry?
In section I the theoretical model of the market entry game is developed, and the individual
problem and the market designer problem are described. The section illustrates how the policy
maker can maximize social welfare and deduce the optimal entry fee that aligns social and
individual incentives. Section II describes how the experimental design. Section III presents
the results.
I. Theoretical Framework The market entry game is a simple simultaneous decision one-shot game; subjects’ strategy
space has two possible actions; stay-out or enter.
If an individual chooses to stay out, then their payoff is certain. If they choose to enter, then
their payoff depends on the number of agents who also choose this option. The MEG payoff
function, where the payoffs for the action of entering are linearly decreasing by the number of
entrants, can be described as:

4
Where v is the value of the outside option. The parameters b,r,c,t and f characterize a market.
Where b is the intrinsic value of the market, r is the market profit multiplier, c represents the
market capacity, t is the entry cost and f is the entry.
The MEG has asymmetric equilibria in pure strategy Nash Equilibria where h players enter
and n-h stay out. In equilibrium each agent has to be indifferent between entering and staying
out. Hence,
where x is the equilibrium number of entrants. The equilibrium number of entrants is determined
by the parameters of the market (c,t,r,f), and is given by
(1)
In this game there are also mixed strategy equilibria. When players are symmetric, then
there is unique symmetric mixed strategy equilibrium where agents enter with probability
(2)
There are multiple asymmetric mixed strategy equilibria where one agent or a subset of agents
decides to enter with different probabilities.
It is important to notice the effects of the implementation that an entry fee has on the
individual incentives and the market entry. First, individual payoff function, a positive entry fee

5
( ) decreases the intrinsic value of the market option. No matter what the other subjects do
for each possible level of entrance, the market is less attractive now than what it was without the
entry fee. Equation (1) implies that the fee reduces the number of entrants in equilibrium.
Second, it might make the subject change his beliefs about the others possible behavior4
The problem of the market designer (MD) is to design a fee that induces optimal entry. The
optimal entry level is the solution to the following problem
(3)
Where C is an arbitrary the social cost faced by the society when the goal of satisfying the
demand or capacity of the market c is not achieved. Here, in contrast to previous market entry
research, we assume that the market designer is interested in meeting a demand of size c.
The optimal fee makes the first order condition of the individual problem to the first order
conditions of the MD designer at the socially optimal level. The optimal fees satisfies:
(4)
When this condition is satisfied any individual deviating from the social optimum cannot
improve his payoff. From the last two equations we can observe that both the social optimal
social level of entrance xso=x(v,k,c,r,C) and the optimal entry fee f*=f (v,k,c,r,C) are both
functions of the fundamental characteristics of the market as (v,k,c,r,C). We use these
relationships to build our experimental design.
4 Notice that theoretically if we assume that all the individuals have the same degree of rationality and homogenous preferences regarding strategic risk aversion and traditional risk aversion, then they should form consistent beliefs before and after the imposition of the entry fee and nothing should change except the number of entrants. If individuals believe that there are heterogeneous preferences regarding risk aversions then the imposition of an entry fee might change individuals’ expectation regarding future action profiles to be observed

6
II. Experimental Design
The canonical MEG was modified in two ways for this study. First, in the canonical game, the
capacity of the market (e.g., the number of cars the road can handle) is fixed and known.
However, in real world settings, the capacity may be uncertain. To study the consequences of
uncertainty, we consider two types of treatments in our baseline treatments capacity is known.
The capacity of the market is a random variable with publicly known distribution defines the
Expected Market Entry Game (EMEG) treatment.. In the EMEG, the expected capacity for each
sub-treatment is the same that the correspondent in the baseline treatment.
Second, in the canonical MEG the only cost of entry is the strategic risk. In this study we
introduce entry fees. This introduction separates the number of entrants in equilibrium from the
capacity of the market by numbers that are more than one.5 Two types of entry fees are
introduced, one type that should theoretically induce the social optimum and the other that does
not. The only prior study that considered the MEG with entry fees was Anderson et al. (2008).
This was a classroom experiment without actual monetary payment. We introduce monetary
payoffs and multiple treatments to test response to entry fees, and capacity uncertainty.
In each session subjects either face a MEG or EMEG. Twelve subjects per session
participate in a sequence of rounds that entail different pairs of capacity (or expected capacity)
and entry fees. The baseline treatments of the design addressed to answer those questions related
to the feasibility of entry fees as optimal policies in environments with possible multiple
equilibra in pure strategies. The expected treatments are conducted with the aim of observing
how additional uncertainty affects the behavior for the different parameters that characterize the
sub-treatments treatments.
The payoff function we implement in our experiment is a representation of the payoff
function in 1. In each sub-treatment of our experiment, the subjects will face the following
payoff function.
5 This means that when we create treatments where the number of entrants in equilibrium is a real small proportion of all the potential entrants, then these environments are more competitive but also riskier. They are more competitive because few numbers of participants should choose only the risky action in any equilibrium profile. In the search for some extra payoff, that is only possible when the number of entrants is below the equilibrium number, those willing to enter are facing the possibility of the over entry and

7
If you choose Option A, your payoff will be: 17
If you choose Option B, your payoff will be determined in the following way
Individual Payoffs= 15+2 {ct-(# of participants choosing Option B)} –ft
The canonical MEG (Rapport 1995) experiments presented symmetric players with b=v and fix
cost of entry c=0 or entry fee f=0.
Camerer (2003) remarked that the number of asymmetric pure strategy Nash Equilibria is
usually increased in experimental implementations of the MEG. This happens since the capacity
is an integer number and the number of participants is an integer too, then h, the number of
participants choosing Option B in any equilibrium profile can take usually more than one value.
In the canonical MEG experiments without entry fees the number of entrants in any equilibrium
profile was equal to c or c-1. It is usually the case that the marginal c entrant might be indifferent
between entering or not, the number h of entrants will depend on the parameters of payoff
function.
Our experimental design we fixed most of the fundamental characteristics of the market for all
the treatments (v,c,r,C) have the values displayed in Table I.
Table I
Sub-treatment
k v r c f
1 15 17 2 4 -1
2 15 17 2 4 0
3 15 17 2 4 2
4 15 17 2 8 0
5 15 17 2 8 2
6 15 17 2 8 4

8
Introducing Aggregated Uncertainty of the Market Capacity the Expected MEG treatment
The introduction of the EMEG treatment in our experimental design is motivated by our second
research question. The goal behind the study of this treatment is to understand and quantify the
consequences of introducing capacity risk in a Market Entry Game environment. Traditionally in
the MEG subjects always face strategic risk. This type of risk is implicit in any simultaneous
decision game when participants do not know the action that the other players would take. The
interaction of strategic risk and risk regarding the capacity value makes the EMEG treatment a
highly uncertain environment.
In the Market entry Game treatment the market capacity ct=(4,8) is a deterministic value. In the
EMEG, ct is a random variable, with expected value E(ct ). We have EMEG sub-treatments with
expected values of ) 4 and 8. For each sub-treatment, the capacity can take values that are equal
to the expected value or 2 units above or below to them. These three possible values of the
capacity are equally likely and independent of what the players play.
Each treatment can be analyzed as a 2 by 3 experiment. For the sub-treatments with each
possible level of market capacity, we design sub-reatments with 3 different possible levels of
entry fee. We fixed the value of two variables for all the sub-treatments v=17, k=15 and r=2 in
order to focus on the effects of the changes in capacity and entry fees. On the other hand, this
payoff function differs from the one used by (Rapoport et al. 1998) where v=k=1, in our case
v>k implying that there exists an implicit cost by entering Option B. In this case by deciding to
take the riskier action subject are already paying something in order to achieve those possible
higher payoffs. We still maintain some of the features of the cited work r=2, N=12 and more
importantly one of the two variables that we modify in our sub-treatments, the market capacity
ct=(4,8) is also the one used by the cited work. The fact that we keep these variables fixed has the
important implication that departing from the fix cost of choosing the option B or the imposition
of the entry fee.

9
Entry Fee
In our experiment we fixed arbitrarily the outside cost at C=6. Then for market capacity of c=4,
then optimal social level of entry are 2 and 36. For this level of capacity then the optimal entry
fee is zero. For treatments with c=8, then exist a positive optimal entry fee that is equal to four.
The numbers of entrants that characterize the Nash equilibria and mixed strategy probabilities of
each sub-treatment are expressed in Table II
Table II
Treatment 1 2 3 4 5 6
Capacity (c)
4 4 4 8 8 8
Entry Fee (f)
-1 0 2 0 2 4
xRNNE 3.5 & 2.5 2 & 3 1 & 2 6 & 7 5 & 6 4 & 5
Testable Hypothesis
In this paper we are interested in analyzing entry levels. Answers to our research questions can
be provided through testing the following hypothesis,
H1.
Where is the observed average number of entrants in the treatment l, MEG or EMEG, and j is
the sub-treatment ranging from 1 to 6.
H1 test if aggregated behavior is consistent with that of predicted RNNE for each one of our
experimental treatments and sub-treatments. Also at the same time because xtRNNE=f(c,f) is a
function of the parameters that characterize that sub-treatment market H! is directly related to our
6 If the aggregated number of entrants is more or less two of the equilibria levels, then the cost of a unit generated by the market is 4. This means that for markets that are close to the equilibrium the cost (utility) of providing a unit then an exogenous cost of 6 (opportunity cost).

10
first research question. Given that each observed is a measure that summarize how the
different monetary incentives induced by the sub-treatment affect the aggregated behavior of the
participants.
Understanding how accurate theoretical predictions are is a fundamental for policy makers as
well as for applied economist interested in environments where first best are not the expected
outcome. Because the MD in this a market entry game like situation can not control some of the
characteristics of the market as c, C and the outside options but can control f . Then
understanding the differences induced by the entry fee for a given set of characteristics provides
the MD important knowledge for their proposals.
The assumptions of risk neutrality and homogenous agents have had important implications for
market design. Particularly in environments like the market entry game if agent are risk neutral
then any new market option that present greater expected utility should induce a higher level of
entrance. The argument works also in the opposite way when the market is dominated. The
equilibrium conditions of the MEG are satisfied when a subject is indifferent between the market
and the outside option. Our EMEG treatments modify the distribution of possible payoffs of a
market but they do not modify the expected payoff of it in equilibria. Therefore even when the
EMEG has implicit more risk than the MEG treatment given that the capacity is a random
variable. The expected returns in equilibria are the same. Then risk neutral subjects assuming
equilibria behavior should behave in the same in the EMEG sub-treatments that in their
compared MEG ones. If the assumptions of risk neutrality, induce value theory and expected
equilibria behavior hold then H2 should hold.
H2.
III. Experiment
We conducted 7 experimental sessions where 84 undergraduate and graduate students
participated as subjects at the Interdisciplinary Center for Economic Sciences at George Mason
University. In each session participants either faced MEG or EMEG environment, Upon arrival

11
to the laboratory the subjects were seated at one of the 12-computer terminal separated by
partitions. The experiment was programmed and conducted with the software z-Tree
(Fischbacher 2007). Communication between subjects was prohibited. Written instructions and a
series of record sheet were given to each participant. The participants first read the instructions in
private. After they read the instructions the lab coordinator come back and read the instructions
out loud. A short practice example was then presented and followed by a quiz. The experiment
started after reviewing the quiz.
.
The experiment consisted on 125 rounds of a binary decision environment. The rounds were
divided in six blocks of 25 rounds. For each block the market parameters remain constant and are
those displayed in Table I. We conducted sessions with two different order of the sub-treatments
blocks. This implementation was taken to control for possible order effects7.
Each trial consisted of two parts. In the first part, a screen with the relevant information was
displayed. The entry fee and the market capacity or expected market capacity for that round
were displayed with buttons for the participants to choose between entering to the market or
staying out. After the subjects choose their preferred action a new screen was presented with
information on their last decision, the number of entrants in the last round, and their payoff. The
subjects were to record their decisions and profits for each round.
To reduce burden of computation faced by the students we provided them with record
sheets that have as a header tables that computed all the possible payoffs for all the different
possible number of entrants ranging between 0 and 12.
After all the 125 decisions were conducted the lab coordinator randomly selected number
between 1 and 125. The subjects were paid individually the earnings for the selected round at an
exchange rate of one dollar per experimental dollar, plus the $5 show up fee.
The experimental sessions lasted approximately two hours. Subjects earned an average of 16.5
dollars in addition to 5 dollars show up fee.
7 In addition to the experimental treatment the subjects also completed a personality test. The analysis of this data and its correlation with the behavior on the experiment it is outside the scope of this paper. In order to control for possible influence of the additional task the personality task was conducted previous to the experimental task for some sessions and posterior to this one for another sessions. There is not evidence of influence of the order of the task on the subjects behavior in the experimental task.

12
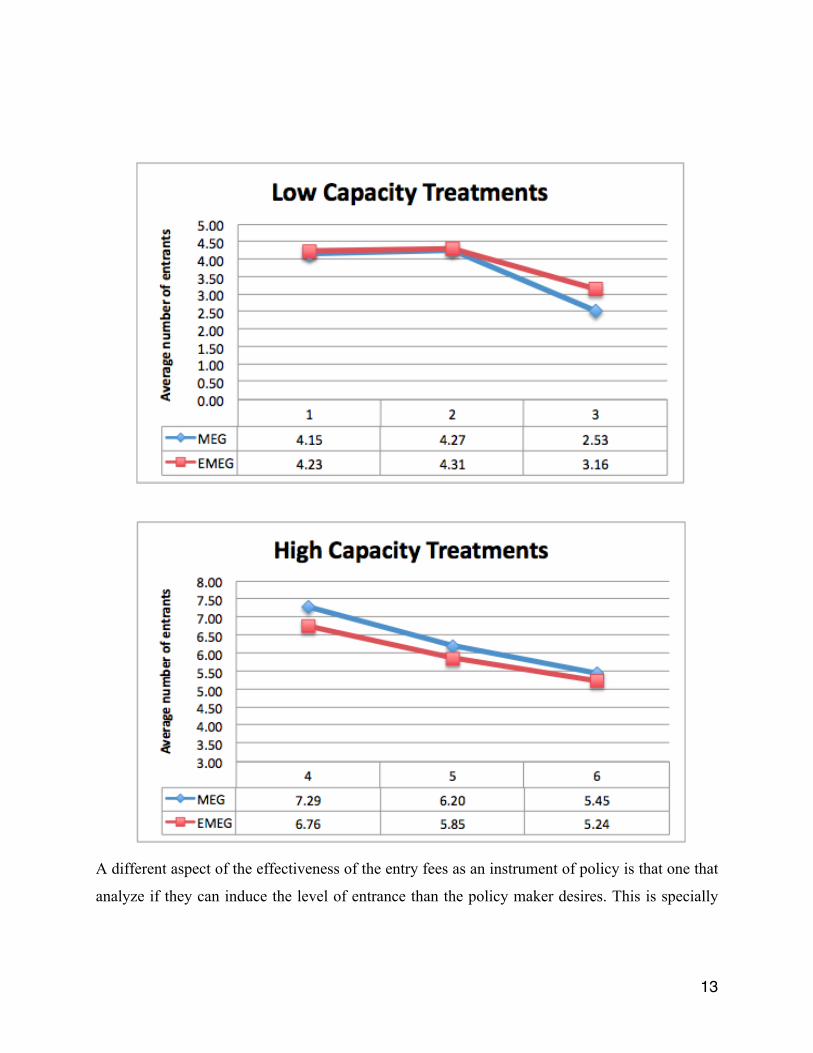
IV. Results In this paper we focus on the population behavior. We tested H1 and H2 but more importantly in this section we describe preliminary qualitative findings that we aim to complement with the analysis of the individual data and with the addition of new experimental sessions. Each session provide us with one observation of the aggregated measures. The data set contain three observations of MEG sessions and four observations of the EMEG sessions8. Entry Fees Finding I. Entry Fees Partially Work at Implementing Social Optimal We would expect The average number of entrants to be inversely related to the entry fee. The
observed entry is consistent with this expectation. For the sub-treatments with capacity 4, we
have three conditions, subsidy, no fee and positive fee. It is also clear that the offered subsidy of
sub-treatments does not constitute enough incentive to induce a much higher level of entrance.
The extra 1 unit of earnings is lower than what those entrants can obtain if one of them would
have decided not to enter. on the other hand all the other increases in the entry fees have an
effect on the payoffs of the entrants of the same magnitude of a change in one entrant. For
similar markets with capacity of 8 we have an increasing entry fee that goes from no entry fee, to
four passing by sub0treatments 5 with f=2.
Figures 1 present the average number of entrants per treatment and sub-treatment.
8 Appendix Table I provides a more detailed description of the number of individual choices and sessions.
13
A different aspect of the effectiveness of the entry fees as an instrument of policy is that one that
analyze if they can induce the level of entrance than the policy maker desires. This is specially
14
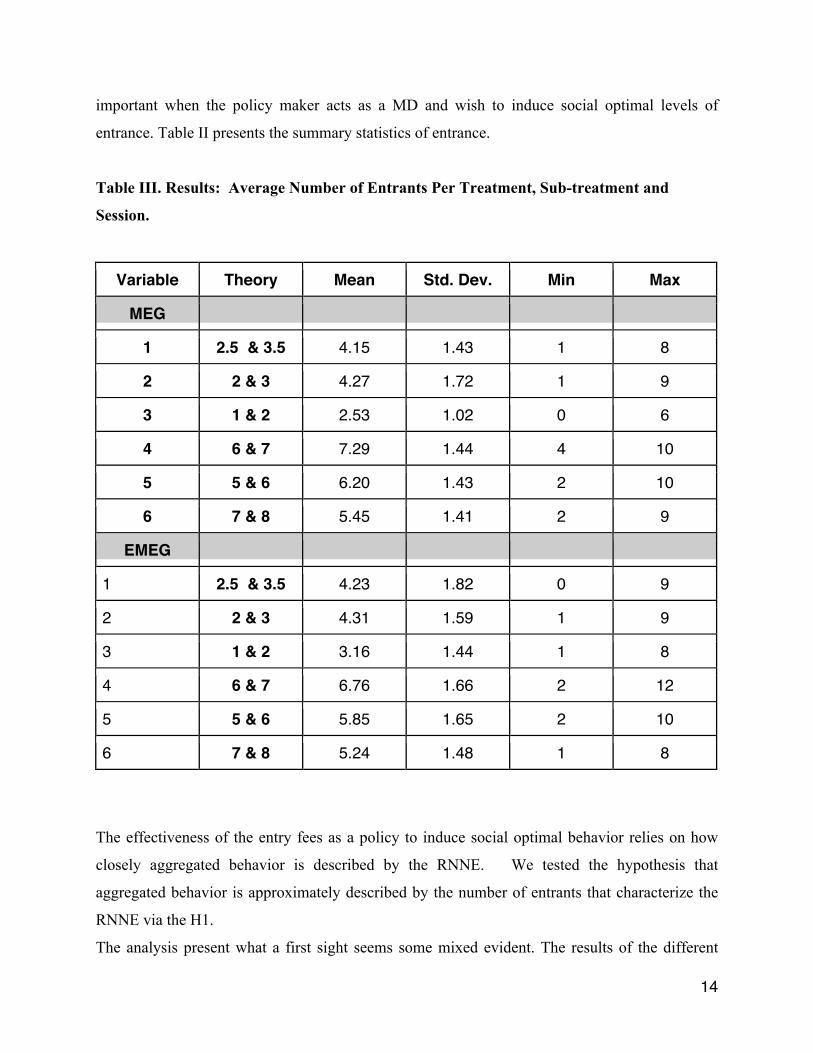
important when the policy maker acts as a MD and wish to induce social optimal levels of
entrance. Table II presents the summary statistics of entrance.
Table III. Results: Average Number of Entrants Per Treatment, Sub-treatment and
Session.
Variable Theory Mean Std. Dev. Min Max
MEG
1 2.5 & 3.5 4.15 1.43 1 8
2 2 & 3 4.27 1.72 1 9
3 1 & 2 2.53 1.02 0 6
4 6 & 7 7.29 1.44 4 10
5 5 & 6 6.20 1.43 2 10
6 7 & 8 5.45 1.41 2 9
EMEG
1 2.5 & 3.5 4.23 1.82 0 9
2 2 & 3 4.31 1.59 1 9
3 1 & 2 3.16 1.44 1 8
4 6 & 7 6.76 1.66 2 12
5 5 & 6 5.85 1.65 2 10
6 7 & 8 5.24 1.48 1 8
The effectiveness of the entry fees as a policy to induce social optimal behavior relies on how
closely aggregated behavior is described by the RNNE. We tested the hypothesis that
aggregated behavior is approximately described by the number of entrants that characterize the
RNNE via the H1.
The analysis present what a first sight seems some mixed evident. The results of the different

15
Chi-Square goodness of fit tests rejected the hypothesis H1 for all the sub-treatments. We
conducted the tests for any possible distribution that distribute most of their mass between the
two possible values that characterize the RNNE predictions. The rejection of these hypothesis
implies that the observed entry levels where generated by a different generating distribution that
those that would be generated when most of subjects behave as they are expected to do if they
are playing according to the pure strategy Nash equilibria profiles9. Figures 2 presents the same
than Figures 1 but added the two possible numbers of entrants that are characterized by the
RNNE. When we decompose the analysis in those sub-treatments with capacity level c=4 and
those with c=8. We are able to first appreciate that those treatments where the possibility of over
entry is higher, i.e. c=4, usually presented over-entry.
Figures 2 present the average number of entrants and Number of NE entrants per treatment and sub-treatment
9 These rejections are all significative at 1% level. Additionally we tested the hypothesis that all the difference between observed choices and their theoretical predictions for any round of each sub-treatments has a mean located at zero. Those hypotheses are all also rejected at 1 % significant level.

16
These figures make clear that for the groups is more difficult to tacitly coordinates in those
environments (similar markets) where the capacity of the market is low related to the number o f
potential entrants. In our experiment sub-treatments 1, 2 and 3 have a capacity of one third of the
potential entrants. With homogenous payoff functions then the potential entrants do not seem to
have a signal that help them to tacitly coordinate. It seems that in order to achieve coordination
around the Nash equilibria levels of entrance they do really need to perform some kind of magic.
On the other hand for treatments 4, 5 and 6 in certain treatments the observed mean of the
number of entrance seems to fell between the values that characterize the two possible profiles of
single strategy Nash equilibria and more or less one. We believe that evidence like this is the
reason that leaded Kahneman to make his famous comment. Then the magic of coordination
seems to work pretty well for environments were congestion is not highly likely.
After understanding the difficulties of the task we evaluate the predictive power of the theory
with a non-strict bar. We estimated what percentage of the observed rounds fell within
Kahneman’s prediction, this is the number of rounds where the observed number of entrants is

17
between the low Nash equilibria number of entrants -1 and the high Nash equilibria number of
entrants +1. This provides each sub0treatment with an interval where three possible levels of
entrance satisfy the condition. Providing room for some non-observable variables, other
regarding preferences, learning and a really broad set of variables that can be accounting for the
failure of the accuracy of the predictive power of the theory to still be included under this
criteria. Therefore under this analysis there is room for errors to still not to produce the failure of
the hypothesis that the theoretical prediction works.
The results of the quantifications of the percentage of observations that fell between the
Kahneman’s intervals is presented in Table of Results II.
Table Results II. Proportions of Observed Entrants on the Kahneman’s Interval
Sub-treatment
1 2 3 4 5 6
MEG 0.35 0.61 0.87 0.27 0.79 0.75
session_1 0.32 0.56 0.88 0.24 0.80 0.68
session_2 0.32 0.56 1.00 0.20 0.72 0.76
session_3 0.40 0.72 0.72 0.36 0.84 0.80
EMEG 0.36 0.54 0.81 0.42 0.78 0.74
session_1 0.40 0.44 0.72 0.32 0.84 0.68
session_2 0.48 0.40 0.80 0.28 0.69 0.80
session_3 0.32 0.80 0.92 0.72 0.68 0.72
session_4 0.24 0.52 0.80 0.36 0.88 0.76
It is straightforward to see that the proportion of rounds where the observed number of entrants
fell outside the Kahneman’s interval varies considerably between the different sub-treatments.
This can be between approximately 64% of the round in sub treatments 1 to only approximately
13% of the rounds on the sub-treatments 3. It is interesting to notice that the same variance on
the probability of being located around the aggregated equilibrium behavior is given for both

18
types of treatments. The last table seems to signalize a relationship between the level of the
entry and the ability of a group to tacitly coordinate. This is surprising specially for treatments
like treatment 3, where subjects face a low capacity and a high entry fee letting really small
room to coordinate and a lot of chance to be out of the equilibria.
By decomposing the analysis in these two types of treatments we recognize the limitations of the
theoretical framework based on Nash equilibria to explain the observed human behavior. We are
not the first ones to recognize this limitation Goree and Holt (2000) recognize the presence of
anomalous behavior in binary choice environments. They also recognize that the Nash
equilibrium concept is not able to fully explain the observed behavior. They propose to use
quantal response equilibria (McKelvey and Palfrey 1995) as a better concept to understand the
behavior of the experimental subjects in these environments. Goree and Holt proposition 2,
claims:
“In the quantal response equilibrium for the entry game, there is over-entry resulting in negative net expected payoffs when the mixed-strategy Nash equilibrium is less than 1/2. The reverse effect, under-entry, occurs when the mixed Nash equilibrium is greater than 1/2.”
based on this proposition and the fact that we can estimate the probability of entering given a
mixed strategy Nash equilibria by equation 2. Then we can compare the predictions generated by
applying this proposition with our observations for each one of our experimental sub-treatments.
This analysis is presented in the following table
Table II. Gore and Holt Predictions Based on QRE
Treatment 1 2 3 4 5 6
State Over Entry
Over Entry
Over Entry
Under Entry
Over Entry
Over Entry
Observed Over Entry
Over Entry
Over Entry
Over Entry
Over Entry
Over Entry
In this table we can observe that qualitative the QRE concept do a much better job in predicting
the direction of the observed behavior that the Nash equilibria. Still the practical implication in
terms of policy design are limited as it is expressed by Haile et. al (2008). Therefore we
observed that the Nash equilibria has limited utility to induce the desired level of entrance in our
experimental treatments. Further research in terms of theoretical concepts and their implications

19
as guidance of policy design should be conducted but these goals are outside the scope of this
paper.
Corollary Finding I. Entry Fees Reduced the Observed Over Entry The influence over derived result of the partial efficacy of the entry fee seems that the economic
incentives generated by the entry fee are more important that the strategic uncertainty that it can
generates by changing subjects belief regarding how the others will react to the entry fee and
leading them to play more strategically. The fact that entry fees reduce over entry is displayed in
the following table.
Table Results III. Proportions of Over-Entry
Sub-treatment MEG EMEG
1 0.89 0.87
2 0.63 0.65
3 0.03 0.17
4 0.89 0.76
5 0.40 0.34
6 0.05 0.07
The analysis deduced from the Kahneman’s interval to the over-entry analysis given the intrinsic
asymmetries those environments plausible of congestion present. As Anderson et al. (2008)
highlighted these asymmetries are present in the market entry game. Under entry in this game
produce extraordinary profits for those potential participants that decided to enter without
harming the non-entrant ones. Therefore in under-entry rounds the average payoff is above the
status quo value. On the other hand over entry generates that the entrants are obtaining
extraordinary losses making the average payoff of the players lower that those that would have
been obtained if the market was not an option.

20
Finally we will be interested in understanding the cost of disequilibria. We understand this as the
differences between the status quo average payments generated by disequilibrium behavior. The
analysis of this cost present a greater complexity than the analysis of the entry behavior given
that this cost is a function not only of the subjects behavior but also of the parameters that
characterize each sub-treatment. In the case of the EMEG the individual profits are also
influenced by the realization of the random variable and the incentives that they generate on the
participants. The analysis of this cost is outside the scope of this paper.
We present the of average individual profits per sub-treatment and experimental session in the
appendix. the remarkable feature of the experiment is the failure of the individuals to tacitly
coordinate. If we desired to analyze from an evolutionary point of view the chances that a new
market or institute or option with voluntary open entry or participation
Stochastic Capacity Finding II. The Aggregated Behavior Does Not Reject the Possibility of Risk Neutrality. H2, test idea of risk neutral behavior over all the 125 experimental rounds, 6 sub-treatments by testing: H2.
But H2 tests constitutes joint hypothesis of risk aversion and stability of risk aversion over all
sub-treatments. A Mann Whitney test of H2 can not reject H2 (z = 1.739 and Prob > |z| =
0.0821).
When instead of H2. We test sub0treament by sub-treatment.
H3.
Then H3 is rejected for al test sub-treatment per sub-treatment we rejected the hypothesis of
equality of the means for each sub-treatment at 1% level of significance. These results are
reflected in Figures 1. The average number of entrants for sub-treatments with low capacity
(1,2,3) is greater for the EMEG treatment than for the MEG. On the other hand for treatments
with larger capacity the opposite result is observed.

21
Conclusion This paper examines how capacity characteristics and entry fees affect entrance and co-
ordination in a market entry game. The analysis is based on lab experiments implementing
modifications to the market entry game.
One modification entailed the introduction of an entry fee. The fees induced changes in the
behavior in the direction predicted by the theoretical model. Tacit coordination was poorly
achieved for the groups, for most of the rounds they failed to co-ordinate. Only in 3 sessions in 3
scenarios where the expected capacity was eight the subjects were able to obtain an average
profit greater than if they stay out10. These preliminary results are consistent with literature that
has found excess entry can be based on over confidence. Camerer and Lovallo (1999) observed
that over confidence subjects trend to ignore what other players behavior and rationality
increasing their beliefs to perform well lead them to take entry in a careless way A better
instrument to induce a better tacit coordination therefore might be achieved just by improving the
ability of players to form coherent beliefs regarding other actions.
A second modification entailed the introduction of capacity risk. Subjects decision to enter react
differently to the introduction of this uncertainty to different levels of capacity. For low capacity
treatments the introduction of risk induced higher entry levels. The opposite was observed for
sub-treatments with large capacity.
10 This is shown I the appendix table A5. To test the ability to perform better than the outside option in cases with random capacity more sessions are needed. The current result are preliminary and they might have been influenced by the random draws in those specific sessions.
22
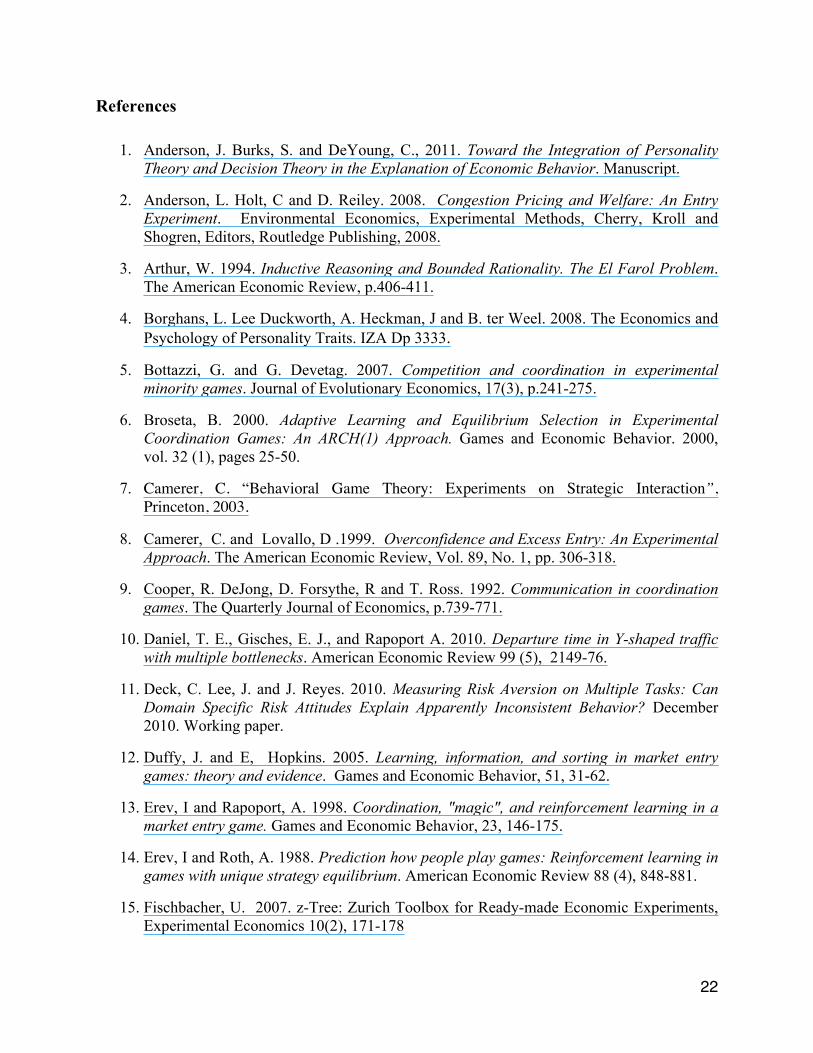
References
1. Anderson, J. Burks, S. and DeYoung, C., 2011. Toward the Integration of Personality Theory and Decision Theory in the Explanation of Economic Behavior. Manuscript.
2. Anderson, L. Holt, C and D. Reiley. 2008. Congestion Pricing and Welfare: An Entry Experiment. Environmental Economics, Experimental Methods, Cherry, Kroll and Shogren, Editors, Routledge Publishing, 2008.
3. Arthur, W. 1994. Inductive Reasoning and Bounded Rationality. The El Farol Problem. The American Economic Review, p.406-411.
4. Borghans, L. Lee Duckworth, A. Heckman, J and B. ter Weel. 2008. The Economics and Psychology of Personality Traits. IZA Dp 3333.
5. Bottazzi, G. and G. Devetag. 2007. Competition and coordination in experimental minority games. Journal of Evolutionary Economics, 17(3), p.241-275.
6. Broseta, B. 2000. Adaptive Learning and Equilibrium Selection in Experimental Coordination Games: An ARCH(1) Approach. Games and Economic Behavior. 2000, vol. 32 (1), pages 25-50.
7. Camerer, C. “Behavioral Game Theory: Experiments on Strategic Interaction”, Princeton, 2003.
8. Camerer, C. and Lovallo, D .1999. Overconfidence and Excess Entry: An Experimental Approach. The American Economic Review, Vol. 89, No. 1, pp. 306-318.
9. Cooper, R. DeJong, D. Forsythe, R and T. Ross. 1992. Communication in coordination games. The Quarterly Journal of Economics, p.739-771.
10. Daniel, T. E., Gisches, E. J., and Rapoport A. 2010. Departure time in Y-shaped traffic with multiple bottlenecks. American Economic Review 99 (5), 2149-76.
11. Deck, C. Lee, J. and J. Reyes. 2010. Measuring Risk Aversion on Multiple Tasks: Can Domain Specific Risk Attitudes Explain Apparently Inconsistent Behavior? December 2010. Working paper.
12. Duffy, J. and E, Hopkins. 2005. Learning, information, and sorting in market entry games: theory and evidence. Games and Economic Behavior, 51, 31-62.
13. Erev, I and Rapoport, A. 1998. Coordination, "magic", and reinforcement learning in a market entry game. Games and Economic Behavior, 23, 146-175.
14. Erev, I and Roth, A. 1988. Prediction how people play games: Reinforcement learning in games with unique strategy equilibrium. American Economic Review 88 (4), 848-881.
15. Fischbacher, U. 2007. z-Tree: Zurich Toolbox for Ready-made Economic Experiments, Experimental Economics 10(2), 171-178

23
16. Goeree, J. and Holt, C. 2000. An explanation of anomalous behavior in binary-‐choice games: entry, voting, public goods and the volunteers’ dilemma. Unpublised manuscript. University of Virginia.
17. Haile, P. Hortaçsu, A. and G. Kosenok, 2008. On the empirical content of quantal response equilibrium. American Economic Review 98 (1), 180-200.
18. Hartman, J., 2006. A Route Choice Experiment Involving Monetary Payouts and Actual Waiting Times. mimeo.
19. Heinemann, F. and Nagel, R. 2009. Measuring strategic uncertainty in coordination games. Review of Economic Studies, (76), pages 181-221.
20. Kets, W. and M, Voorneveld. 2007. Congestion, equilibrium and learning: The minority game. Mimeo.
21. McKelvey, R. and Palfrey, T., 1995. Quantal response equilibria for normal form games. Games and Economic Behavior, 10, 6-38.
22. Rapoport, A. 1995. Individual strategies in a market entry game. Group Decision and Negotiation (4), 117-133.
23. Salmon, T., 2001. An evaluation of econometric models of adaptive learning. Econometrica.
24. Selten, R. Schreckenberg, M. Pitz, T. Chmura, T and Kube, S. 2002. Experiments and Simulations on Day-to-Day Route Choice-Behaviour. Discussion Paper 35/2002. Bonn Discussion Papers.
25. Sundali, J., Rapoport, A. Seale, D. A. 1995. "Coordination in market entry games with symmetric players." Organizational Behavior and Human Decision Processes, 64, 203-218
26. Stigler, G., and Becker, G., 1977. De Gustibus Non Est Disputandum. American Economic Review 67, 76–90

24
Appendix
AI. Table of Number of Observed Choices Per Treatment, Sub-treatment and Session
Sessions\sub-treatment
1 2 3 4 5 6
MEG 900 900 900 900 900 900
904241129 300 300 300 300 300 300
904271143 300 300 300 300 300 300
911191148 300 300 300 300 300 300
EMEG 1200 1200 1200 1200 1056 1200
904271422 300 300 300 300 300 300
909241018 300 300 300 300 156* 300
1011191021 300 300 300 300 300 300
1102281430 300 300 300 300 300 300 * This session had software problems when the subjects were participating in the round 114 of the task.

25
A2. Table of Average Number of Entrants Per Treatment and Sub-treatment and Session
Sessions\sub-treatment
1 2 3 4 5 6
MEG 4.15 4.27 2.53 7.29 6.20 5.45
904241129 4.2 4.8 2.6 7.28 6.48 5.56
904271143 4.48 4.24 2.96 7.72 6.2 5.48
911191148 3.76 3.76 2.04 6.88 5.92 5.32
EMEG 4.23 4.31 3.16 6.76 5.85 5.24
904271422 3.92 4.56 3.36 7.04 6.16 4.92
909241018 3.8 5.12 3.64 7.2 6.15 5.52
1011191021 4.48 3.36 2.72 5.92 5.36 5.08
1102281430 4.72 4.2 2.92 6.88 5.88 5.44 A3.Table of Mann-Whitney Test of Equality of Average of Number of Entrants
sub treatment
1 2 3 4 5 6
z -1.494 -1.104 -9.846 8.131 5.930 2.531
Prob > |z| 0.1351 0.2695 0.0000 0.0000 0.0000 0.0114
Reject No No Yes Yes Yes Yes

26
A4. Table Standard Deviation of Average Number of Entrants Per Treatment and Sub-treatment and Session
Sessions\sub-treatment
1 2 3 4 5 6
MEG 1.43 1.72 1.02 1.44 1.43 1.41
904241129 1.27 1.96 1.06 1.15 1.21 1.75
904271143 1.48 1.40 0.72 1.43 1.75 1.27
911191148 1.45 1.58 1.04 1.59 1.23 1.12
EMEG 1.82 1.59 1.44 1.66 1.65 1.48
904271422 1.60 1.27 1.55 1.56 1.49 1.50
909241018 1.70 1.82 1.65 2.19 2.08 1.48
1011191021 1.90 1.20 0.87 1.23 1.79 1.06
1102281430 1.91 1.47 1.39 1.14 1.25 1.73

27
A5. Table of Average Individual Profit Per Treatment and Sub-treatment
Row Labels 1 2 3 4 5 6
MEG 16.21 15.61 16.60 16.30 16.45 16.26
904241129 16.24 14.92 16.55 16.44 16.24 15.97
904271143 15.91 15.80 16.44 15.73 16.29 16.29
911191148 16.49 16.11 16.81 16.72 16.83 16.51
EMEG 15.77 15.76 16.03 16.85 16.72 16.31
904271422 15.89 15.41 15.73 16.49 16.60 16.32
909241018 15.86 15.23 15.74 15.93 15.74 16.45
1011191021 15.81 16.49 16.56 17.88 16.55 16.37
1102281430 15.51 15.89 16.09 17.09 17.51 16.08 A6. Table of Mann-Whitney Test of Equality of Average of Individual Profits
sub treatment
1 2 3 4 5 6
z 0.265 -2.585 2.563 -5.046 5.930 -1.743
Prob > |z| 0.7912 0.0097 0.0104 0.0000 0.0000 0.0813
Reject No Yes Yes Yes Yes No