Dutch Systems of International Development Cooperation and Aspects of Educational Cooperation
Upload
independentCategory
view
5download
0
www.elsevier.com/locate/ynimg
NeuroImage 23 (2004) 25–34
Cooperation of different neuronal systems during hand sign
recognition
Akinori Nakamura,* Burkhard Maess, Thomas R. Knosche, Thomas C. Gunter,Patric Bach, and Angela D. Friederici
Max Planck Institute for Human Cognitive and Brain Sciences, Leipzig, Germany
Received 19 June 2003; revised 9 March 2004; accepted 28 April 2004
Hand signs with symbolic meaning can often be utilized more
successfully than words to communicate an intention; however, the
underlying brain mechanisms are undefined. The present study using
magnetoencephalography (MEG) demonstrates that the primary visual,
mirror neuron, social recognition and object recognition systems are
involved in hand sign recognition. MEG detected well-orchestrated
multiple brain regional electrical activity among these neuronal systems.
During the assessment of themeaning of hand signs, the inferior parietal,
superior temporal sulcus (STS) and inferior occipitotemporal regions
were simultaneously activated. These three regions showed similar time
courses in their electrical activity, suggesting that they work together
during hand sign recognition by integrating information in the ventral
and dorsal pathways through the STS. The results also demonstrated
marked right hemispheric predominance, suggesting that hand expres-
sion is processed in amanner similar to that in which social signs, such as
facial expressions, are processed.
D 2004 Elsevier Inc. All right reserved.
Keywords: Hand signs; Superior temporal sulcus; Magnetoencephalography
Introduction
In our daily communication, we use many ‘‘hand signs’’, which
have strong symbolic meanings without verbalization. These sym-
bolic hand signs are a unique type of gesture because they are
different from object-oriented actions, can substitute for parts of
speech and are independent of any sign language which has
linguistic structure (Goldin-Meadow, 1999). Symbolic hand signs
can transmit meaning alone (independent of speech) and are there-
fore classified as emblematic gestures (McNeill, 1992). How do we
recognize the hand owner’s intention/meaning from the hand signs?
Humans have an inherent ability to understand the intentions of
others (Carruthers and Smith, 1996). In the case of action perception,
it is postulated that an actor’s intention can be understood whenever
1053-8119/$ - see front matter D 2004 Elsevier Inc. All right reserved.
doi:10.1016/j.neuroimage.2004.04.034
* Corresponding author. Max Planck Institute for Human Cognitive and
Brain Sciences, Stephanstrasse 1a, 04103, Leipzig, Germany. Fax: +49-
3425-8875-11.
E-mail address: [email protected] (A. Nakamura).
Available online on ScienceDirect (www.sciencedirect.com.)
the observed action is mapped onto internal representations of the
observer’s intentions (Decety and Grezes, 1999; Rizzolatti et al.,
2001). Studies in monkeys have found ‘‘mirror neurons’’, which
discharge during both observation and execution of actions, in the
inferior frontal (Rizzolatti et al., 1996a) and inferior parietal cortices
(Fogassi et al., 1998). There are also neurons that respond to goal-
directed hand actions in the superior temporal sulcus (STS) (Perrett
et al., 1989). Several functional neuroimaging studies have shown
that homologous brain regions in humans are activated by action
observation, and should have identical neuronal properties as those
in monkeys (Decety et al., 1997; Grafton et al., 1996; Iacoboni et al.,
1999, 2001; Nishitani andHari, 2000; Rizzolatti et al., 1996b). Thus,
the inferior frontal, inferior parietal and STS regions are considered
to play an essential role in action understanding by functioning as the
observation–execution matching system (mirror neuron system).
On the other hand, an individual’s intention is also inferable from
other nonverbal cues including facial expression, eye gaze and
behavior. Such information is thought to be processed by the social
recognition system (Adolphs, 1999; Allison et al., 2000). The STS
region is also considered to be a component of the social recognition
system because neurons in the STS react to biological motions
(Grossman et al., 2000; Oram and Perrett, 1994) that convey social
signals, including eye gaze, mouth and lipmovements (Calvert et al.,
1997; Nishitani and Hari, 2002; Perrett et al., 1985; Puce et al., 1998;
Wicker et al., 1998). Besides the STS, the amygdala and orbito-
frontal cortex, both of which have reciprocal connections with the
STS, and the right somatosensory cortex are involved in the social
recognition system (Adolphs, 1999; Allison et al., 2000). In addi-
tion, the object recognition system, which involves the ventral
occipitotemporal regions (Ungerleider and Haxby, 1994), may also
play an important role in analyzing symbolic hand shapes.
As hand signs contain all aspects related to action, social and
shape information, one could expect that the three neuronal systems
described above should work together during hand sign recognition.
If so, the next question is how do these neuronal systems cooperate
across anatomically distinct cortical areas? For example, the mirror
neuron and object recognition systems are located mainly in the
dorsal and ventral pathways, respectively. It is widely accepted that in
the ventral and dorsal pathways, different aspects of visual informa-
tion (‘‘what’’ and ‘‘where/how’’) are processed in parallel (Living-
stone and Hubel, 1988; Ungerleider and Haxby, 1994). Therefore, the

A. Nakamura et al. / NeuroImage 23 (2004) 25–3426
question appears to involve the so-called ‘‘binding problem’’ (Wolfe
and Cave, 1999); that is, how do we finally achieve unified
perception/recognition from separately processed information?
To answer these questions, we analyzed the detailed temporal
structure of multiple sites of cortical electric activation during hand
sign recognition using magnetoencephalography (MEG). We re-
fined MEG data analytic methods to achieve reliable spatiotempo-
ral multiple source estimation. The method, briefly, is as follows:
First, individual brain current source density maps (Hamalainen
and Ilmoniemi, 1984, 1994; Knosche et al., 1996) (CSD), reflect-
ing electrical activity in the cortical surface, were calculated.
Second, CSD data from each individual were spatially normalized
to allow group analyses. Third, a principal component analysis
(Dien, 1998; Maess et al., 2002) (PCA) was applied to the CSD
data to extract spatiotemporally separable independent factors in
the time series. Fourth, using spatial information from the PCA
factors, a region of interest (ROI) analysis was applied to the CSD
data (PCA-based ROI analysis) to obtain time courses of specific
brain regional electrical activity. Using these methods, we show
orchestrated multiple brain activity, well structured in time, during
understanding the hand signs.
Methods
Subjects
Twenty right-handed German volunteers (mean age 25.3 years,
10 males) participated in the MEG recordings. All participants had
natural or corrected visual acuity greater than 25/25, and none of
them understood any sign language. Written informed consent was
obtained before the experiment. Seven subjects were omitted from
data analysis because of low signal to noise ratio in the MEG signal
or other technical problems such as large head motions during the
measurements. Data sets from 13 subjects were further analyzed.
Ten of these subjects participated in an additional reaction time
study.
Stimuli and tasks
Before the MEG experiment, a psychological questionnaire was
administered to a separate group of participants to select commonly
acceptable meaningful and meaningless hand signs. The question-
naire consisted of 66 images of various hand postures. Forty-seven
German native speakers rated the meaningfulness of each hand
posture subjectively from 1 (definitely meaningless) to 5 (definitely
meaningful). Note that the hand postures were recorded indepen-
dent of speech and were presented in isolation. Finally, we selected
11 meaningful and 11 meaningless hand signs (Fig. 1). Pictures in
Fig. 1. All 11 meaningful hand signs (HM+) an
the two categories were counterbalanced in shape as far as possible.
Rating scores for the hand signs are presented in Table 1.
Visual stimuli were 132 digitized gray-scaled photos (400 �400 pixels) containing 11 meaningful and 11 meaningless hand
signs each taken from six adults. Sixty-six different gray-scaled
face images (A.M. Martinez and R. Benavente. The AR Face
Database. CVC Technical Report #24, June 1998) were also
prepared. The experiments were controlled by ERTS-VIPL (Beri-
Soft Co., Frankfurt, Germany) and projected onto a screen using a
liquid crystal video projector. The visual angle was 13j � 13j and
the viewing distance was 70 cm. A small fixation point was placed
at the center of the screen.
We measured visual event-related MEG responses to meaning-
ful (HM+) and meaningless (HM�) hand signs while participants
assessed the meaningfulness of hand postures (meaning task). We
also measured MEG responses to hands (HC) (using the same
images as HM+) and faces (FC) during their categorization
(categorization task). The meaning task was performed to allow
detection of brain regions responsible for meaning/recognition
processes, and the categorization task was intended to allow
analysis of top-down effects, which are influenced by task-depen-
dent cognitive strategies.
The meaning task, which was to judge the meaningfulness of
the hand signs, consisted of following steps: at first, the hand
pictures were randomly presented (700 ms) and followed by a
blank screen (300 ms). Then a go signal appeared, after which the
participant had to press button 1 (meaningful) or 2 (meaningless)
using the right hand. Finally, a blank screen was presented for a
random time interval (1000 F 300 ms). Then the next trial started.
The assignment of response buttons was counterbalanced across
participants. In the categorization task, hand (all meaningful) or
face pictures were presented in random order. The participants
were asked to discriminate face and hand, and to press button 1 or
2. The other conditions (trial timing, imperative stimulus, etc.)
were the same as in the meaning task.
MEG recordings
Magnetic responses were measured using a 148-channel whole-
head system (WHS2500, 4D-Neuroimaging, San Diego, CA,
USA). Vertical and horizontal EOG were recorded simultaneously.
Signals were recorded with a bandwidth of 0.1–100 Hz and
digitized using a sample rate of 508.6 Hz. The continuous MEG
data were filtered off-line with a 0.5- to 30-Hz band-pass filter. In
each session, about 400 epochs were collected and averaged in a
time window between �100 ms and +700 ms relative to stimulus
onset. Epochs with motion or eye movement artifacts (more than
30 AV in horizontal or 50 AV in vertical eye movements), or with
incorrect responses were excluded from averaging. If a subject had
d their meaningless counterparts (HM�).
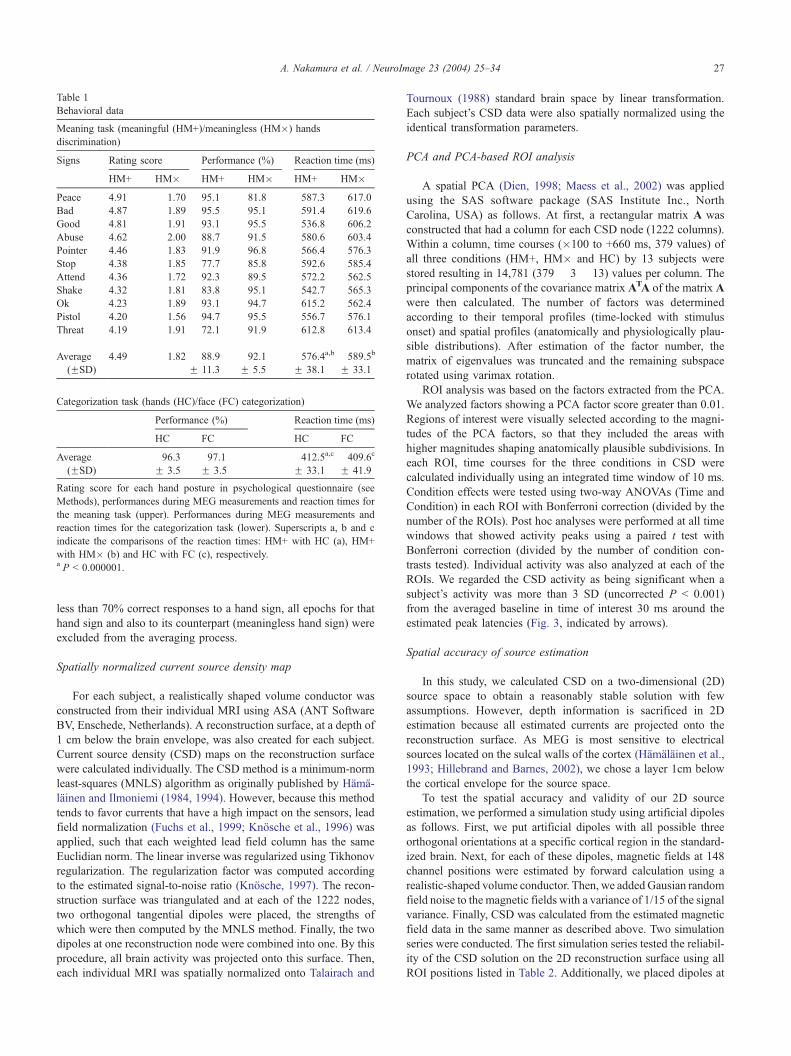
Table 1
Behavioral data
Meaning task (meaningful (HM+)/meaningless (HM�) hands
discrimination)
Signs Rating score Performance (%) Reaction time (ms)
HM+ HM� HM+ HM� HM+ HM�Peace 4.91 1.70 95.1 81.8 587.3 617.0
Bad 4.87 1.89 95.5 95.1 591.4 619.6
Good 4.81 1.91 93.1 95.5 536.8 606.2
Abuse 4.62 2.00 88.7 91.5 580.6 603.4
Pointer 4.46 1.83 91.9 96.8 566.4 576.3
Stop 4.38 1.85 77.7 85.8 592.6 585.4
Attend 4.36 1.72 92.3 89.5 572.2 562.5
Shake 4.32 1.81 83.8 95.1 542.7 565.3
Ok 4.23 1.89 93.1 94.7 615.2 562.4
Pistol 4.20 1.56 94.7 95.5 556.7 576.1
Threat 4.19 1.91 72.1 91.9 612.8 613.4
Average 4.49 1.82 88.9 92.1 576.4a,b 589.5b
(FSD) F 11.3 F 5.5 F 38.1 F 33.1
Categorization task (hands (HC)/face (FC) categorization)
Performance (%) Reaction time (ms)
HC FC HC FC
Average 96.3 97.1 412.5a,c 409.6c
(FSD) F 3.5 F 3.5 F 33.1 F 41.9
Rating score for each hand posture in psychological questionnaire (see
Methods), performances during MEG measurements and reaction times for
the meaning task (upper). Performances during MEG measurements and
reaction times for the categorization task (lower). Superscripts a, b and c
indicate the comparisons of the reaction times: HM+ with HC (a), HM+
with HM� (b) and HC with FC (c), respectively.a P < 0.000001.
A. Nakamura et al. / NeuroImage 23 (2004) 25–34 27
less than 70% correct responses to a hand sign, all epochs for that
hand sign and also to its counterpart (meaningless hand sign) were
excluded from the averaging process.
Spatially normalized current source density map
For each subject, a realistically shaped volume conductor was
constructed from their individual MRI using ASA (ANT Software
BV, Enschede, Netherlands). A reconstruction surface, at a depth of
1 cm below the brain envelope, was also created for each subject.
Current source density (CSD) maps on the reconstruction surface
were calculated individually. The CSD method is a minimum-norm
least-squares (MNLS) algorithm as originally published by Hama-
lainen and Ilmoniemi (1984, 1994). However, because this method
tends to favor currents that have a high impact on the sensors, lead
field normalization (Fuchs et al., 1999; Knosche et al., 1996) was
applied, such that each weighted lead field column has the same
Euclidian norm. The linear inverse was regularized using Tikhonov
regularization. The regularization factor was computed according
to the estimated signal-to-noise ratio (Knosche, 1997). The recon-
struction surface was triangulated and at each of the 1222 nodes,
two orthogonal tangential dipoles were placed, the strengths of
which were then computed by the MNLS method. Finally, the two
dipoles at one reconstruction node were combined into one. By this
procedure, all brain activity was projected onto this surface. Then,
each individual MRI was spatially normalized onto Talairach and
Tournoux (1988) standard brain space by linear transformation.
Each subject’s CSD data were also spatially normalized using the
identical transformation parameters.
PCA and PCA-based ROI analysis
A spatial PCA (Dien, 1998; Maess et al., 2002) was applied
using the SAS software package (SAS Institute Inc., North
Carolina, USA) as follows. At first, a rectangular matrix A was
constructed that had a column for each CSD node (1222 columns).
Within a column, time courses (�100 to +660 ms, 379 values) of
all three conditions (HM+, HM� and HC) by 13 subjects were
stored resulting in 14,781 (379 � 3 � 13) values per column. The
principal components of the covariance matrix ATA of the matrix A
were then calculated. The number of factors was determined
according to their temporal profiles (time-locked with stimulus
onset) and spatial profiles (anatomically and physiologically plau-
sible distributions). After estimation of the factor number, the
matrix of eigenvalues was truncated and the remaining subspace
rotated using varimax rotation.
ROI analysis was based on the factors extracted from the PCA.
We analyzed factors showing a PCA factor score greater than 0.01.
Regions of interest were visually selected according to the magni-
tudes of the PCA factors, so that they included the areas with
higher magnitudes shaping anatomically plausible subdivisions. In
each ROI, time courses for the three conditions in CSD were
calculated individually using an integrated time window of 10 ms.
Condition effects were tested using two-way ANOVAs (Time and
Condition) in each ROI with Bonferroni correction (divided by the
number of the ROIs). Post hoc analyses were performed at all time
windows that showed activity peaks using a paired t test with
Bonferroni correction (divided by the number of condition con-
trasts tested). Individual activity was also analyzed at each of the
ROIs. We regarded the CSD activity as being significant when a
subject’s activity was more than 3 SD (uncorrected P < 0.001)
from the averaged baseline in time of interest 30 ms around the
estimated peak latencies (Fig. 3, indicated by arrows).
Spatial accuracy of source estimation
In this study, we calculated CSD on a two-dimensional (2D)
source space to obtain a reasonably stable solution with few
assumptions. However, depth information is sacrificed in 2D
estimation because all estimated currents are projected onto the
reconstruction surface. As MEG is most sensitive to electrical
sources located on the sulcal walls of the cortex (Hamalainen et al.,
1993; Hillebrand and Barnes, 2002), we chose a layer 1cm below
the cortical envelope for the source space.
To test the spatial accuracy and validity of our 2D source
estimation, we performed a simulation study using artificial dipoles
as follows. First, we put artificial dipoles with all possible three
orthogonal orientations at a specific cortical region in the standard-
ized brain. Next, for each of these dipoles, magnetic fields at 148
channel positions were estimated by forward calculation using a
realistic-shaped volume conductor. Then, we added Gausian random
field noise to the magnetic fields with a variance of 1/15 of the signal
variance. Finally, CSD was calculated from the estimated magnetic
field data in the same manner as described above. Two simulation
series were conducted. The first simulation series tested the reliabil-
ity of the CSD solution on the 2D reconstruction surface using all
ROI positions listed in Table 2. Additionally, we placed dipoles at
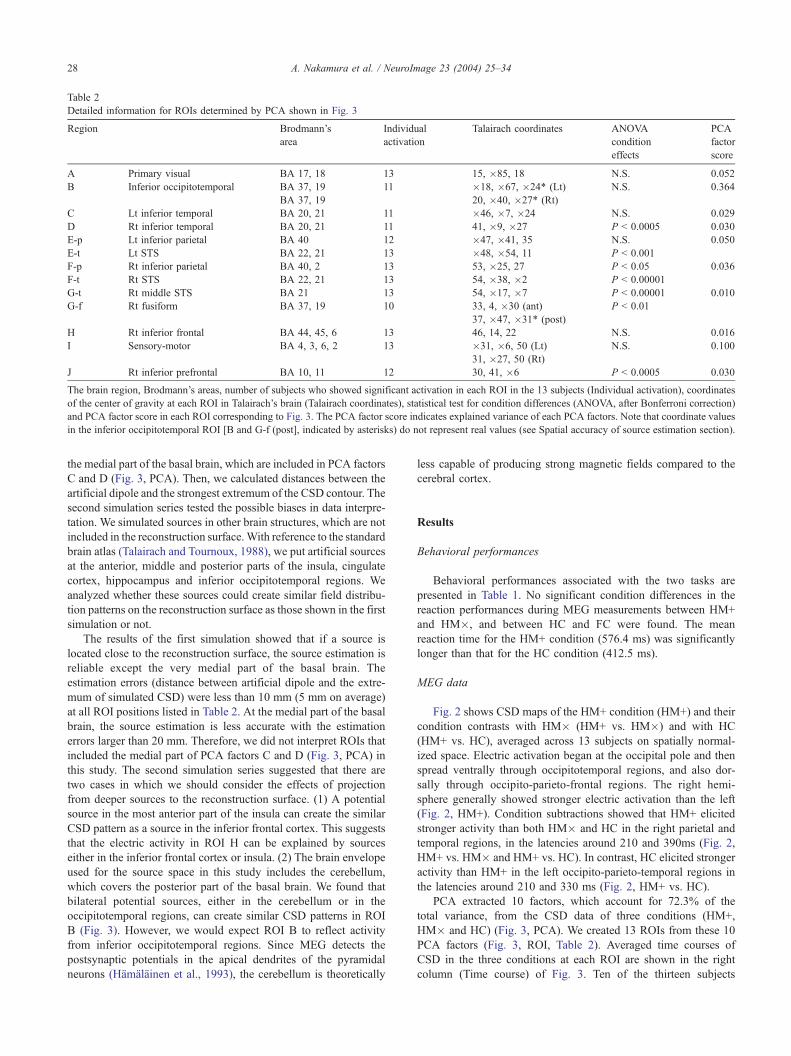
Table 2
Detailed information for ROIs determined by PCA shown in Fig. 3
Region Brodmann’s
area
Individual
activation
Talairach coordinates ANOVA
condition
effects
PCA
factor
score
A Primary visual BA 17, 18 13 15, �85, 18 N.S. 0.052
B Inferior occipitotemporal BA 37, 19 11 �18, �67, �24* (Lt) N.S. 0.364
BA 37, 19 20, �40, �27* (Rt)
C Lt inferior temporal BA 20, 21 11 �46, �7, �24 N.S. 0.029
D Rt inferior temporal BA 20, 21 11 41, �9, �27 P < 0.0005 0.030
E-p Lt inferior parietal BA 40 12 �47, �41, 35 N.S. 0.050
E-t Lt STS BA 22, 21 13 �48, �54, 11 P < 0.001
F-p Rt inferior parietal BA 40, 2 13 53, �25, 27 P < 0.05 0.036
F-t Rt STS BA 22, 21 13 54, �38, �2 P < 0.00001
G-t Rt middle STS BA 21 13 54, �17, �7 P < 0.00001 0.010
G-f Rt fusiform BA 37, 19 10 33, 4, �30 (ant) P < 0.01
37, �47, �31* (post)
H Rt inferior frontal BA 44, 45, 6 13 46, 14, 22 N.S. 0.016
I Sensory-motor BA 4, 3, 6, 2 13 �31, �6, 50 (Lt) N.S. 0.100
31, �27, 50 (Rt)
J Rt inferior prefrontal BA 10, 11 12 30, 41, �6 P < 0.0005 0.030
The brain region, Brodmann’s areas, number of subjects who showed significant activation in each ROI in the 13 subjects (Individual activation), coordinates
of the center of gravity at each ROI in Talairach’s brain (Talairach coordinates), statistical test for condition differences (ANOVA, after Bonferroni correction)
and PCA factor score in each ROI corresponding to Fig. 3. The PCA factor score indicates explained variance of each PCA factors. Note that coordinate values
in the inferior occipitotemporal ROI [B and G-f (post], indicated by asterisks) do not represent real values (see Spatial accuracy of source estimation section).
A. Nakamura et al. / NeuroImage 23 (2004) 25–3428
the medial part of the basal brain, which are included in PCA factors
C and D (Fig. 3, PCA). Then, we calculated distances between the
artificial dipole and the strongest extremum of the CSD contour. The
second simulation series tested the possible biases in data interpre-
tation. We simulated sources in other brain structures, which are not
included in the reconstruction surface.With reference to the standard
brain atlas (Talairach and Tournoux, 1988), we put artificial sources
at the anterior, middle and posterior parts of the insula, cingulate
cortex, hippocampus and inferior occipitotemporal regions. We
analyzed whether these sources could create similar field distribu-
tion patterns on the reconstruction surface as those shown in the first
simulation or not.
The results of the first simulation showed that if a source is
located close to the reconstruction surface, the source estimation is
reliable except the very medial part of the basal brain. The
estimation errors (distance between artificial dipole and the extre-
mum of simulated CSD) were less than 10 mm (5 mm on average)
at all ROI positions listed in Table 2. At the medial part of the basal
brain, the source estimation is less accurate with the estimation
errors larger than 20 mm. Therefore, we did not interpret ROIs that
included the medial part of PCA factors C and D (Fig. 3, PCA) in
this study. The second simulation series suggested that there are
two cases in which we should consider the effects of projection
from deeper sources to the reconstruction surface. (1) A potential
source in the most anterior part of the insula can create the similar
CSD pattern as a source in the inferior frontal cortex. This suggests
that the electric activity in ROI H can be explained by sources
either in the inferior frontal cortex or insula. (2) The brain envelope
used for the source space in this study includes the cerebellum,
which covers the posterior part of the basal brain. We found that
bilateral potential sources, either in the cerebellum or in the
occipitotemporal regions, can create similar CSD patterns in ROI
B (Fig. 3). However, we would expect ROI B to reflect activity
from inferior occipitotemporal regions. Since MEG detects the
postsynaptic potentials in the apical dendrites of the pyramidal
neurons (Hamalainen et al., 1993), the cerebellum is theoretically
less capable of producing strong magnetic fields compared to the
cerebral cortex.
Results
Behavioral performances
Behavioral performances associated with the two tasks are
presented in Table 1. No significant condition differences in the
reaction performances during MEG measurements between HM+
and HM�, and between HC and FC were found. The mean
reaction time for the HM+ condition (576.4 ms) was significantly
longer than that for the HC condition (412.5 ms).
MEG data
Fig. 2 shows CSD maps of the HM+ condition (HM+) and their
condition contrasts with HM� (HM+ vs. HM�) and with HC
(HM+ vs. HC), averaged across 13 subjects on spatially normal-
ized space. Electric activation began at the occipital pole and then
spread ventrally through occipitotemporal regions, and also dor-
sally through occipito-parieto-frontal regions. The right hemi-
sphere generally showed stronger electric activation than the left
(Fig. 2, HM+). Condition subtractions showed that HM+ elicited
stronger activity than both HM� and HC in the right parietal and
temporal regions, in the latencies around 210 and 390ms (Fig. 2,
HM+ vs. HM� and HM+ vs. HC). In contrast, HC elicited stronger
activity than HM+ in the left occipito-parieto-temporal regions in
the latencies around 210 and 330 ms (Fig. 2, HM+ vs. HC).
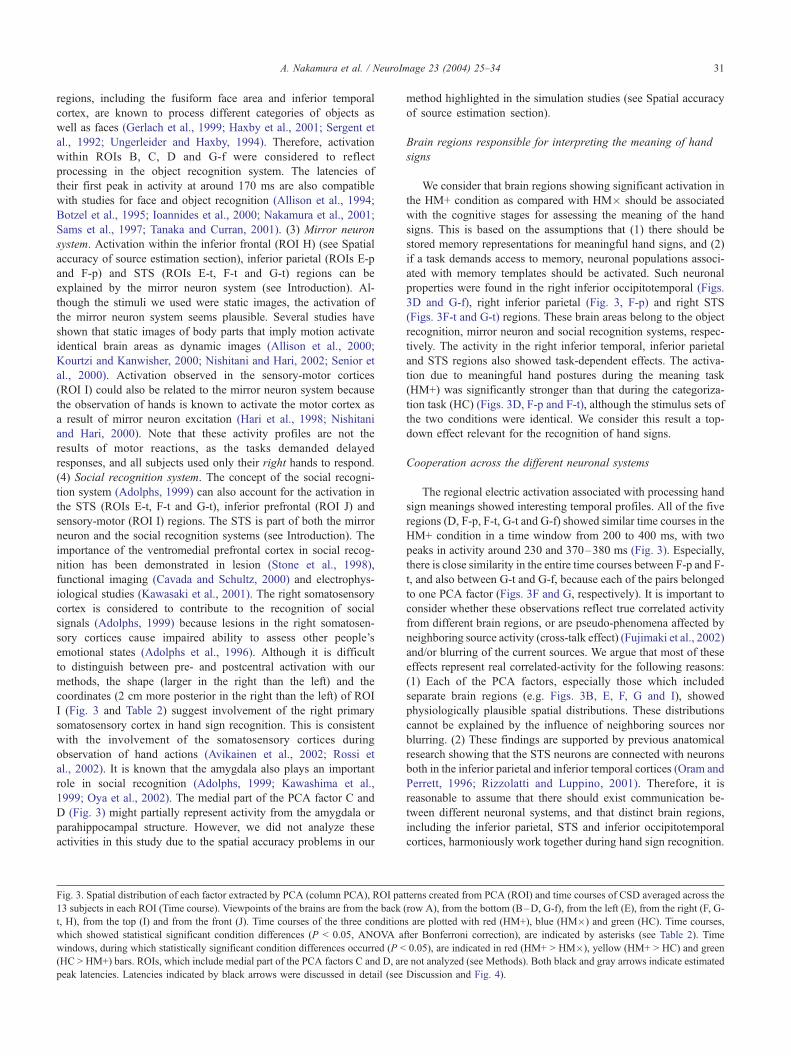
PCA extracted 10 factors, which account for 72.3% of the
total variance, from the CSD data of three conditions (HM+,
HM� and HC) (Fig. 3, PCA). We created 13 ROIs from these 10
PCA factors (Fig. 3, ROI, Table 2). Averaged time courses of
CSD in the three conditions at each ROI are shown in the right
column (Time course) of Fig. 3. Ten of the thirteen subjects

Fig. 2. Spatially normalized CSD maps and their condition contrasts. Each two columns show CSD in the HM+ condition (left), condition subtraction between
HM+ and HM� (middle), and between HM+ and HC (right). Each row indicates time windows in which the CSD was calculated.
A. Nakamura et al. / NeuroImage 23 (2004) 25–34 29
showed significant activation in all 13 ROIs, and all 13 subjects
showed significant activation in a subset of seven ROIs (A, E-t,
F-p, F-t, G-t, H and I) (Table 2). Each ROI showed characteristic
time courses in averaged regional electrical activity (Fig. 3, Time
course). ROI A displayed monophasic time courses, which
peaked in the latency around 120 ms. ROIs B, C, D and G-f
showed the first activity peaking at around 170 ms. Moreover,
both ROIs D and G-f had two additional peaks around 230 and
380 ms in the HM condition. E-p and E-t showed biphasic
activity, which were most prominent in the HC condition. Both
pairs of peaks in E-p and E-t were around 200 and 340 ms, and
180 and 330 ms, respectively. F-p, F-t, G-t and H displayed
similar biphasic time courses in the HM+ condition, with a pair
of peaks around 230 and 370 ms. ROI I showed a large peak
around 340 ms with a smaller peak around 200 ms. ROI J
showed sustained activity from 150 ms, which lasted until the
end of the analyzed time window except the HC condition.
Significant condition effects in time courses were found in 7 of
13 ROIs (Table 2, ANOVA condition effects, Fig. 3). Post hoc
analyses also detected significant condition differences in seven
ROIs at their peak activation latencies (Fig. 3). Significant activa-
tion in HM+ compared with HM� was found in ROIs D, F-p, F-t,
G-t and G-f. Moreover, ROIs D, F-p and F-t also showed
significantly stronger activity in HM+ than HC. Those five ROIs
showed similar activation patterns having two peaks around 230
and 370–380 ms. ROI E-t showed significant activation in HC
compared with HM+ (Fig. 3).
Discussion
Involvement of multiple neuronal systems in hand sign recognition
The CSD maps showed widely distributed electrical activity,
which spread to occipital, temporal, parietal and frontal lobes,
following hand sign presentation (Fig. 2). The application of the
PCA appeared to successfully extract spatiotemporally separable
electrical activity from the CSD data because each PCA factor
showed a physiologically plausible distribution (Fig. 3, PCA).
There were at least 10 independent factors, which contained
anatomically distinct subdivisions (Fig. 3, ROI, Table 2), in-
volved in hand sign recognition. We consider that most of these
multiple brain regional activation can be explained by processing
within the following four neuronal systems: (1) Primary visual
system. The effects in ROI A should mainly reflect the activation
of the primary visual cortices. The time courses of the effects,
which indicated increased activity around 50 ms with a peak at
about 120 ms after stimulus onset, are compatible with previous
electrophysiological studies (Nakamura et al., 1997; Yoneda et
al., 1995). (2) Object recognition system. Ventral occipitotemporal

A. Nakamura et al. / NeuroImage 23 (2004) 25–3430
A. Nakamura et al. / NeuroImage 23 (2004) 25–34 31
regions, including the fusiform face area and inferior temporal
cortex, are known to process different categories of objects as
well as faces (Gerlach et al., 1999; Haxby et al., 2001; Sergent et
al., 1992; Ungerleider and Haxby, 1994). Therefore, activation
within ROIs B, C, D and G-f were considered to reflect
processing in the object recognition system. The latencies of
their first peak in activity at around 170 ms are also compatible
with studies for face and object recognition (Allison et al., 1994;
Botzel et al., 1995; Ioannides et al., 2000; Nakamura et al., 2001;
Sams et al., 1997; Tanaka and Curran, 2001). (3) Mirror neuron
system. Activation within the inferior frontal (ROI H) (see Spatial
accuracy of source estimation section), inferior parietal (ROIs E-p
and F-p) and STS (ROIs E-t, F-t and G-t) regions can be
explained by the mirror neuron system (see Introduction). Al-
though the stimuli we used were static images, the activation of
the mirror neuron system seems plausible. Several studies have
shown that static images of body parts that imply motion activate
identical brain areas as dynamic images (Allison et al., 2000;
Kourtzi and Kanwisher, 2000; Nishitani and Hari, 2002; Senior et
al., 2000). Activation observed in the sensory-motor cortices
(ROI I) could also be related to the mirror neuron system because
the observation of hands is known to activate the motor cortex as
a result of mirror neuron excitation (Hari et al., 1998; Nishitani
and Hari, 2000). Note that these activity profiles are not the
results of motor reactions, as the tasks demanded delayed
responses, and all subjects used only their right hands to respond.
(4) Social recognition system. The concept of the social recogni-
tion system (Adolphs, 1999) can also account for the activation in
the STS (ROIs E-t, F-t and G-t), inferior prefrontal (ROI J) and
sensory-motor (ROI I) regions. The STS is part of both the mirror
neuron and the social recognition systems (see Introduction). The
importance of the ventromedial prefrontal cortex in social recog-
nition has been demonstrated in lesion (Stone et al., 1998),
functional imaging (Cavada and Schultz, 2000) and electrophys-
iological studies (Kawasaki et al., 2001). The right somatosensory
cortex is considered to contribute to the recognition of social
signals (Adolphs, 1999) because lesions in the right somatosen-
sory cortices cause impaired ability to assess other people’s
emotional states (Adolphs et al., 1996). Although it is difficult
to distinguish between pre- and postcentral activation with our
methods, the shape (larger in the right than the left) and the
coordinates (2 cm more posterior in the right than the left) of ROI
I (Fig. 3 and Table 2) suggest involvement of the right primary
somatosensory cortex in hand sign recognition. This is consistent
with the involvement of the somatosensory cortices during
observation of hand actions (Avikainen et al., 2002; Rossi et
al., 2002). It is known that the amygdala also plays an important
role in social recognition (Adolphs, 1999; Kawashima et al.,
1999; Oya et al., 2002). The medial part of the PCA factor C and
D (Fig. 3) might partially represent activity from the amygdala or
parahippocampal structure. However, we did not analyze these
activities in this study due to the spatial accuracy problems in our
Fig. 3. Spatial distribution of each factor extracted by PCA (column PCA), ROI pa
13 subjects in each ROI (Time course). Viewpoints of the brains are from the back
t, H), from the top (I) and from the front (J). Time courses of the three condition
which showed statistical significant condition differences (P < 0.05, ANOVA a
windows, during which statistically significant condition differences occurred (P <
(HC > HM+) bars. ROIs, which include medial part of the PCA factors C and D, ar
peak latencies. Latencies indicated by black arrows were discussed in detail (see
method highlighted in the simulation studies (see Spatial accuracy
of source estimation section).
Brain regions responsible for interpreting the meaning of hand
signs
We consider that brain regions showing significant activation in
the HM+ condition as compared with HM� should be associated
with the cognitive stages for assessing the meaning of the hand
signs. This is based on the assumptions that (1) there should be
stored memory representations for meaningful hand signs, and (2)
if a task demands access to memory, neuronal populations associ-
ated with memory templates should be activated. Such neuronal
properties were found in the right inferior occipitotemporal (Figs.
3D and G-f), right inferior parietal (Fig. 3, F-p) and right STS
(Figs. 3F-t and G-t) regions. These brain areas belong to the object
recognition, mirror neuron and social recognition systems, respec-
tively. The activity in the right inferior temporal, inferior parietal
and STS regions also showed task-dependent effects. The activa-
tion due to meaningful hand postures during the meaning task
(HM+) was significantly stronger than that during the categoriza-
tion task (HC) (Figs. 3D, F-p and F-t), although the stimulus sets of
the two conditions were identical. We consider this result a top-
down effect relevant for the recognition of hand signs.
Cooperation across the different neuronal systems
The regional electric activation associated with processing hand
sign meanings showed interesting temporal profiles. All of the five
regions (D, F-p, F-t, G-t and G-f) showed similar time courses in the
HM+ condition in a time window from 200 to 400 ms, with two
peaks in activity around 230 and 370–380 ms (Fig. 3). Especially,
there is close similarity in the entire time courses between F-p and F-
t, and also between G-t and G-f, because each of the pairs belonged
to one PCA factor (Figs. 3F and G, respectively). It is important to
consider whether these observations reflect true correlated activity
from different brain regions, or are pseudo-phenomena affected by
neighboring source activity (cross-talk effect) (Fujimaki et al., 2002)
and/or blurring of the current sources. We argue that most of these
effects represent real correlated-activity for the following reasons:
(1) Each of the PCA factors, especially those which included
separate brain regions (e.g. Figs. 3B, E, F, G and I), showed
physiologically plausible spatial distributions. These distributions
cannot be explained by the influence of neighboring sources nor
blurring. (2) These findings are supported by previous anatomical
research showing that the STS neurons are connected with neurons
both in the inferior parietal and inferior temporal cortices (Oram and
Perrett, 1996; Rizzolatti and Luppino, 2001). Therefore, it is
reasonable to assume that there should exist communication be-
tween different neuronal systems, and that distinct brain regions,
including the inferior parietal, STS and inferior occipitotemporal
cortices, harmoniously work together during hand sign recognition.
tterns created from PCA (ROI) and time courses of CSD averaged across the
(row A), from the bottom (B–D, G-f), from the left (E), from the right (F, G-
s are plotted with red (HM+), blue (HM�) and green (HC). Time courses,
fter Bonferroni correction), are indicated by asterisks (see Table 2). Time
0.05), are indicated in red (HM+ > HM�), yellow (HM+ > HC) and green
e not analyzed (see Methods). Both black and gray arrows indicate estimated
Discussion and Fig. 4).

A. Nakamura et al. / NeuroIm32
Oram and Perrett (1996) have suggested that information from both
ventral and dorsal pathways should be integrated through the STS.
Such integration processes might play an important role in solving
the binding problem.
Interhemispheric differences in hand sign processing
One of the most striking results was the marked hemispheric
asymmetry, in that most of the regions associated with processing
the meaningful hand signs were in the right hemisphere. By
contrast, in the studies investigating action perception, meaningful
actions mainly activated regions in the left hemisphere (Decety et
al., 1997; Grafton et al., 1996; Rizzolatti et al., 1996b). Decety and
Grezes (1999) considered that the left hemispheric predominance
in meaningful action perception could be interpreted as the
activation of semantic representations related to language, a
conclusion that is consistent with the left-hemispheric specializa-
tion for language and motor control. On the other hand, the right
hemispheric predominance has been suggested by the literature on
emotional and social recognition (Adolphs, 1999; Adolphs et al.,
1996; Happe et al., 1999; Nakamura et al., 1999). Similar to facial
expression (Adolphs et al., 1996; Nakamura et al., 1999), ‘‘hand
expression’’ appears to be processed predominantly in the right
hemisphere as one type of social signal.
Fig. 4. Schematic presentation of possible brain mechanisms used to recognize ha
the primary visual (color coded in yellow), mirror neuron (green), social recog
horizontally according to the peak latencies in ROI activation. Latencies of interest
arrows). Brain regions, which showed similar condition effects and time courses,
same anatomical subdivisions and also showed similar time courses, are projected o
3) are projected onto one brain picture (social recognition system, 230 and 370–38
and ROIs D and G-f (object recognition system, 230 and 370–380 ms) are also
Roles of the left parietotemporal regions
Activation of the parietotemporal regions was also found in
the left hemisphere (Figs. 3E-p and E-t). The largest effects in
these regions were elicited by the HC condition and peaked
around 180–200 ms, whereas the right counterparts, which
peaked about 40 ms later, reacted strongest to the HM+ condi-
tion. The earlier activation in the left hemisphere compared with
the right suggests that the left regions have a more primary role
for visuo-somatic analysis of hand postures. This concept is
consistent with various patient studies, showing that lesions
involving the parietotemporal regions in the dominant hemisphere
cause several types of apraxia (Leiguarda and Marsden, 2000).
The strongest activation in the HC condition suggests that the left
parietotemporal regions also have an important function associ-
ated with hand categorization.
A spatiotemporal structure of information processes in hand sign
recognition
The present study enabled us to depict global aspects of
information processing in the spatiotemporal domain during hand
sign recognition. Fig. 4 shows our hand sign recognition model
consists of processes in four neuronal systems. After the primary
age 23 (2004) 25–34
nd signs. Brain pictures with ROIs are grouped into four neuronal systems:
nition (orange) and object recognition (blue) systems. They are arranged
were determined from estimated peak latencies in Fig. 3 (indicated by black
are surrounded by black dotted lines. Note that ROIs, which belong to the
nto one brain picture; for example, both ROIs in the STS (F-t and G-t in Fig.
0 ms). Similarly, ROIs B, C, D and G-f (object recognition system, 170 ms),
combined.
A. Nakamura et al. / NeuroImage 23 (2004) 25–34 33
visual processes peaking around 120 ms, different aspects of
information are processed in parallel in anatomically distinct brain
areas. The first peak activation of these parallel processes occur at
about 170–200 ms. Thereafter, distinct brain areas are simulta-
neously activated suggesting cooperation across different neuronal
systems (230 ms). At around 340 ms, the somatomotor cortices are
maximally active. Finally, the different brain regions are again
activated in concert (370–380 ms). The right inferior prefrontal
region showed interesting time courses (Fig. 3J), in that it is
activated quite early (150 ms), and continuously active through
the task except in the HC condition (indicated by broken orange
line). This time course suggests that the right inferior prefrontal
cortex might have a function associated with top-down and/or
supervisory (monitoring) processes throughout the entire process
of hand sign recognition.
We estimated the timing of the cognitive events by combining
MEG data with the behavioral results from the reaction time study.
It took about 160 ms longer to judge meaningful or meaningless
hands than to judge hands or faces (Table 1). If we assume the
timing of categorization to be around 180 ms, during which HC
showed the largest condition effect (Fig. 3E), the time required to
recognize the meaningfulness of hand signs should be around 340
ms (180 + 160 ms = 340 ms). This estimate is consistent with the
‘‘simulation theory’’ that we understand other individual’s mind by
representing his/her state in our own brain. It is postulated that an
actor’s intention is understood when the observed action is mapped
onto our motor representations (Decety and Grezes, 1999). Anal-
ogously, it is also proposed that we infer another person’s emo-
tional and social status from the facial expression by generating
somatosensory images internally (Adolphs, 1999). Therefore, it
appears to be plausible that the effects with latencies of around 340
ms, during which the somatomotor cortices showed activity peaks,
might be associated with recognizing the ‘‘meaningfulness’’ of
hand signs. We also speculate that the concrete ‘‘meaning’’ of each
hand sign can be recognized within about 380 ms for the following
reasons. There were two activation peaks in HM+ with significant
condition effects, which perhaps reflect processes associated with
the interpretation of meaning (230 and 370–380 ms). The two
processing stages appeared to be comparable with two stages of
processing analogously proposed for word recognitions (Marslen-
Wilson, 1987): the first peak might correspond to meaning activa-
tion (lexical access) and the second might correspond to meaning
selection (recognition).
Acknowledgments
We are grateful to J. Haxby, S. Pollmann, M. Blass, A.
Anwander, P. Sivonen, S. Rueschemeyer, G. Barnes, T. Penney, T.
Kato and S. Kawatsu for helpful comments, and to Y. Wolff for
technical assistance.
References
Adolphs, R., 1999. Social cognition and the human brain. Trends Cogn.
Sci. 3, 469–479.
Adolphs, R., Damasio, H., Tranel, D., Damasio, A.R., 1996. Cortical sys-
tems for the recognition of emotion in facial expressions. J. Neurosci.
16, 7678–7687.
Allison, T., Ginter, H., McCarthy, G., Nobre, A.C., Puce, A., Luby, M.,
Spencer, D.D., 1994. Face recognition in human extrastriate cortex.
J. Neurophysiol. 71, 821–825.
Allison, T., Puce, A., McCarthy, G., 2000. Social perception from visual
cues: role of the STS region. Trends Cogn. Sci. 4, 267–278.
Avikainen, S., Forss, N., Hari, R., 2002. Modulated activation of the human
SI and SII cortices during observation of hand actions. NeuroImage 15,
640–646.
Botzel, K., Schulze, S., Stodieck, S.R., 1995. Scalp topography and analy-
sis of intracranial sources of face-evoked potentials. Exp. Brain Res.
104, 135–143.
Calvert, G.A., Bullmore, E.T., Brammer, M.J., Campbell, R., Williams,
S.C.R., McGuire, P.K., Woodruff, P.W.R., Iverson, S.D., David, A.S.,
1997. Activation of auditory cortex during silent lipreading. Science
276, 593–596.
Carruthers, P., Smith, P.K. (Eds.), 1996. Theories of Theories of Mind.
Cambridge Univ. Press, Cambridge, UK.
Cavada, C., Schultz, W., 2000. The mysterious orbitofrontal cortex. Fore-
word. Cereb. Cortex 10, 205.
Decety, J., Grezes, J., 1999. Neural mechanisms subserving the perception
of human actions. Trends Cogn. Sci. 3, 172–178.
Decety, J., Grezes, J., Costes, N., Perani, D., Jeannerod, M., Procyk, E.,
Grassi, F., Fazio, F., 1997. Brain activity during observation of
actions-Influence of action content and subject’s strategy. Brain 120,
1763–1777.
Dien, J., 1998. Addressing misallocation of variance in principal compo-
nents analysis of event-related potentials. Brain Topogr. 11, 43–55.
Fogassi, L., Gallese, V., Fadiga, L., Rizzolatti, G., 1998. Neurons respon-
ding to the sight of goal directed hand/arm actions in the parietal area
PF (7b of the macaque monkey. Abstr. - Soc. Neurosci. 24, 257.
Fuchs, M., Wagner, M., Kohler, T., Wischmann, H.A., 1999. Linear and
nonlinear current density reconstructions. J. Clin. Neurophysiol. 16,
267–295.
Fujimaki, N., Hayakawa, T., Nielsen, M., Knosche, T.R., Miyauchi, S.,
2002. An fMRI-Constrained MEG source analysis with procedures
for dividing and grouping activation. NeuroImage 17, 324–343.
Gerlach, C., Law, I., Gade, A., Paulson, O.B., 1999. Perceptual differentia-
tion and category effects in normal object recognition—A PET study.
Brain 122, 2159–2170.
Goldin-Meadow, S., 1999. The role of gesture in communication and
thinking. Trends Cogn. Sci. 3, 419–429.
Grafton, S.T., Arbib, M.A., Fadiga, L., Rizzolatti, G., 1996. Localization
of grasp representations in humans by positron emission tomography.
2. Observation compared with imagination. Exp. Brain Res. 112,
103–111.
Grossman, E., Donnelly, M., Price, R., Pickens, D., Morgan, V., Neighbor,
G., Blake, R., 2000. Brain areas involved in perception of biological
motion. J. Cogn. Neurosci. 12, 711–720.
Hamalainen, M., Ilmoniemi, R.J., 1984. Interpreting measured magnetic
fields of the brain: estimates of current distributions. Technical Report
TKK-F-A559, Helsinki University of Technology, Helsinki.
Hamalainen, M.S., Ilmoniemi, R.J., 1994. Interpreting magnetic—Fields of
the brain—Minimum norm estimates. Med. Biol. Eng. Comput. 32,
35–42.
Hamalainen, M., Hari, R., Ilmoniemi, R.J., Knuutila, J., Lounasmaa, O.V.,
1993. Magnetoencephalography. Rev. Mod. Phys. 65, 413–496.
Happe, F., Brownell, H., Winner, E., 1999. Acquired ‘theory of mind’
impairments following stroke. Cognition 70, 211–240.
Hari, R., Forss, N., Avikainen, S., Kirveskari, E., Salenius, S., Rizzolatti,
G., 1998. Activation of human primary motor cortex during action
observation: a neuromagnetic study. Proc. Natl. Acad. Sci. U. S. A.
95, 15061–15065.
Haxby, J.V., Gobbini, M.I., Furey, M.L., Ishai, A., Schouten, J.L., Pietrini,
P., 2001. Distributed and overlapping representations of faces and
objects in ventral temporal cortex. Science 293, 2425–2430.
Hillebrand, A., Barnes, G.R., 2002. A quantitative assessment of the sen-
sitivity of whole-head MEG to activity in the adult human cortex.
NeuroImage 16, 638–650.

A. Nakamura et al. / NeuroImage 23 (2004) 25–3434
Iacoboni, M., Woods, R.P., Brass, M., Bekkering, H., Mazziotta, J.C.,
Rizzolatti, G., 1999. Cortical mechanisms of human imitation. Science
286, 2526–2528.
Iacoboni, M., Koski, L.M., Brass, M., Bekkering, H., Woods, R.P., Dubeau,
M.C., Mazziotta, J.C., Rizzolatti, G., 2001. Reafferent copies of imitat-
ed actions in the right superior temporal cortex. Proc. Natl. Acad. Sci.
98, 13995–13999.
Ioannides, A.A., Liu, L.C., Kwapien, J., Drozdz, S., Streit, M., 2000.
Coupling of regional activations in a human brain during an object
and face affect recognition task. Hum. Brain Mapp. 11, 77–92.
Kawasaki, H., Adolphs, R., Kaufman, O., Damasio, H., Damasio, A.R.,
Granner, M., Bakken, H., Hori, T., Howard, M.A., 2001. Single-neuron
responses to emotional visual stimuli recorded in human ventral pre-
frontal cortex. Nat. Neurosci. 4, 15–16.
Kawashima, R., Sugiura, M., Kato, T., Nakamura, A., Hatano, K., Ito, K.,
Fukuda, H., Kojima, S., Nakamura, K., 1999. The human amygdala
plays an important role in gaze monitoring—A PET study. Brain 122,
779–783.
Knosche, T.R., 1997. Solutions of the neuroelectromagnetic inverse
problem—An evaluation study. PhD thesis, University of Twente, The
Netherlands.
Knosche, T., Praamstra, P., Stegeman, D., Peters, M., 1996. Linear estima-
tion discriminates midline sources and a motor cortex contribution to
the readiness potential. Electroencephalogr. Clin. Neurophysiol. 99,
183–190.
Kourtzi, Z., Kanwisher, N., 2000. Activation in human MT/MST by static
images with implied motion. J. Cogn. Neurosci. 12, 48–55.
Leiguarda, R.C., Marsden, C.D., 2000. Limb apraxias—Higher-order dis-
orders of sensorimotor integration. Brain 123, 860–879.
Livingstone, M., Hubel, D., 1988. Segregation of form, color, movement,
and depth-anatomy, physiology, and perception. Science 240, 740–749.
McNeill, D., 1992. Hand and Mind: What Gestures Reveal about Thought
Univ. of Chicago Press, Chicago.
Maess, B., Friederici, A.D., Damian, M., Meyer, A.S., Levelt, W.J.M., 2002.
Semantic category interference in overt picture naming: sharpening cur-
rent density localization by PCA. J. Cogn. Neurosci. 14, 455–462.
MarslenWilson, W.D., 1987. Functional parallelism in spoken word-recog-
nition. Cognition 25, 71–102.
Nakamura, A., Kakigi, R., Hoshiyama, M., Koyama, S., Kitamura, Y.,
Shimojo, M., 1997. Visual evoked cortical magnetic fields to pattern
reversal stimulation. Cogn. Brain Res. 6, 9–22.
Nakamura, K., Kawashima, R., Ito, K., Sugiura, M., Kato, T., Nakamura,
A., Hatano, K., Nagumo, S., Kubota, K., Fukuda, H., Kojima, S., 1999.
Activation of the right inferior frontal cortex during assessment of facial
emotion. J. Neurophysiol. 82, 1610–1614.
Nakamura, A., Yamada, T., Abe, Y., Nakamura, K., Sato, N., Horibe, K.,
Kato, T., Kachi, T., Ito, K., 2001. Age-related changes in brain neuro-
magnetic responses to face perception in humans. Neurosci. Lett. 312,
13–16.
Nishitani, N., Hari, R., 2000. Temporal dynamics of cortical representation
for action. Proc. Natl. Acad. Sci. U. S. A. 97, 913–918.
Nishitani, N., Hari, R., 2002. Viewing lip forms: cortical dynamics. Neuron
36, 1211–1220.
Oram, M.W., Perrett, D.I., 1994. Responses of anterior superior temporal
polysensory (STPA) neurons to biological motion stimuli. J. Cogn.
Neurosci. 6, 99–116.
Oram, M.W., Perrett, D.I., 1996. Integration of form and motion in the
anterior superior temporal polysensory area (STPa) of the macaque
monkey. J. Neurophysiol. 76, 109–129.
Oya, H., Kawasaki, H., Howard, M.A., Adolphs, R., 2002. Electrophysio-
logical responses in the human amygdala discriminate emotion catego-
ries of complex visual stimuli. J. Neurosci. 22, 9502–9512.
Perrett, D.I., Smith, P.A.J., Potter, D.D., Mistlin, A.J., Head, A.S., Milner,
A.D., Jeeves, M.A., 1985. Visual cells in the temporal cortex sensitive
to face view and gaze direction. Proc. R. Soc. Lond., Ser. B Biol. Sci.
223, 293–317.
Perrett, D.I., Harries, M.H., Bevan, R., Thomas, S., Benson, P.J., Mistlin,
A.J., Chitty, A.J., Hietanen, J.K., Ortega, J.E., 1989. Frameworks of
analysis for the neural representation of animate objects and actions.
J. Exp. Biol. 146, 87–113.
Puce, A., Allison, T., Bentin, S., Gore, J.C., McCarthy, G., 1998. Temporal
cortex activation in humans viewing eye and mouth movements.
J. Neurosci. 18, 2188–2199.
Rizzolatti, G., Luppino, G., 2001. The cortical motor system. Neuron 31,
889–901.
Rizzolatti, G., Fadiga, L., Gallese, V., Fogassi, L., 1996a. Premotor cortex
and the recognition of motor actions. Cogn. Brain Res. 3, 131–141.
Rizzolatti, G., Fadiga, L., Matelli, M., Bettinardi, V., Paulesu, E., Perani,
D., Fazio, F., 1996b. Localization of grasp representations in humans by
PET. 1. Observation versus execution. Exp. Brain Res. 111, 246–252.
Rizzolatti, G., Fogassi, L., Gallese, V., 2001. Neurophysiological mecha-
nisms underlying the understanding and imitation of action. Nat. Rev.,
Neurosci. 2, 661–670.
Rossi, S., Tecchio, F., Pasqualetti, P., Ulivelli, M., Pizzella, V., Romani,
G.L., Passero, S., Battistini, N., Rossini, P.M., 2002. Somatosensory
processing during movement observation in humans. Clin. Neurophy-
siol. 113, 16–24.
Sams, M., Hietanen, J.K., Hari, R., Ilmoniemi, R.J., Lounasmaa, O.V.,
1997. Face-specific responses from the human inferior occipito-tempo-
ral cortex. Neuroscience 77, 49–55.
Senior, C., Barnes, J., Giampietro, V., Simmons, A., Bullmore, E.T.,
Brammer, M., David, A.S., 2000. The functional neuroanatomy of
implicit-motion perception or ‘representational momentum’. Curr.
Biol. 10, 16–22.
Sergent, J., Ohta, S., Macdonald, B., 1992. Functional neuroanatomy of
face and object processing—A positron emission tomography study.
Brain 115, 15–36.
Stone, V.E., Baron-Cohen, S., Knight, R.T., 1998. Frontal lobe contribu-
tions to theory of mind. J. Cogn. Neurosci. 10, 640–656.
Talairach, J., Tournoux, P., 1988. Co-planar Stereotaxic Atlas of the Human
Brain: 3-Dimentional Proportional System: An Approach to Cerebral
Imaging Thime, Stuttgart.
Tanaka, J.W., Curran, T., 2001. A neural basis for expert object recognition.
Psychol. Sci. 12, 43–47.
Ungerleider, L.G., Haxby, J.V., 1994. ‘What’ and ‘where’ in the human
brain. Curr. Opin. Neurobiol. 4, 157–165.
Wicker, B., Michel, F., Henaff, M.A., Decety, J., 1998. Brain regions
involved in the perception of gaze: a PET study. NeuroImage 8,
221–227.
Wolfe, J.M., Cave, K.R., 1999. The psychophysical evidence for a binding
problem in human vision. Neuron 24, 11–17.
Yoneda, K., Sekimoto, S., Yumoto, M., Sugishita, M., 1995. The early
component of the visual-evoked magnetic-field. NeuroReport 6,
797–800.
Copyright © 2022 FDOKUMEN