The Process of Strategic Management in Viyellatex Interfab Shirt Manufacturing Limited Bangladesh
Upload
khangminh22Category
view
3download
0
Page 1 of 265
Cooling It! No Hair Shirt Solutions to Global WarmingBy
Gar W. LipowOlympia, WA [GarLpublic AT Comcast DOT net]
Cooling It: No Hair Shirt Solutions to Global Warming by Gar W. Lipow GarLpublic AT Comcast DOT net
Page 2 of 265
Dedication
Sometimes harsh criticism is an act of true friendship; this book is dedicated to all thenew friends it will make me.
Acknowledgements
Thanks to Rob Knapp, who spent enormous amounts of time to make extensive anduseful suggestions. Thanks to beta readers Peter Dorman, Peter Bohmer, Michael Albertand my mother Ruth Lipow. Thanks to Robin Hahnel and Frederick Peters whosecritiques of my original article on which this was based inspired me to expand into abook. Thanks to all the Buffistas whose amazing collective knowledge contributedenormously. Thanks to Tom Gray and everyone on the AWEA’s renewable energy listfor their help. Thanks to Brian Tokar for his willingness to provide answers onsustainable agriculture. While the credit for anything I got right goes to these andhundreds of other sources, blame for anything wrong is mine alone.
Special thanks to Barry Commoner for writing “The Poverty of Power” – the seed ofmost work on eco-efficiency.
CopyrightCopyright Oct. 2004 Creative Commons Attribution-Noncommercial 3.0 Unported(http://creativecommons.org/licenses/by-nc/3.0/legalcode).(Translation from legal code into human readable English: http://creativecommons.org/licenses/by-nc/3.0/ )
"If Heaven" lyric used with permission from songwriter Gretchen Peters, and copyright holder Sony/ATV Music Publishing. This isNOT licensed under a Creative Commons license, but is under standard copyright protection, meaning separate permissions arerequired for each use. In other words, don't use the quote in derivative works; it may only be included in substantially unalteredcopies.
Cooling It: No Hair Shirt Solutions to Global Warming by Gar W. Lipow GarLpublic AT Comcast DOT net
Page 3 of 265
Table of ContentsA Real Fine Place to Start: Introduction .......................................................................... 5
The Love You Save: Improving Energy Efficiency .......................................................... 9
Here Today, Gone Tomorrow: Nothing Lasts Forever and a Day........................................ 9
Saving Grace: Industrial Efficiency ....................................................................................... 11Lightening Up: Reducing Material Intensity........................................................................................ 11
Sticks N’ Stones N’ Straw N’ Steel: Material Intensity in Building Construction ........................... 13Fields of Barley, Fields of Gold: Material Intensity in Agriculture.................................................. 16Water is More Precious than Gold: Material Intensity in Water Use ............................................... 24Working for the Weekend: Material Intensity in Appliances & Office Equipment ......................... 26Can’t Hide Your Lying Eyes: Material Intensity in Packaging........................................................ 28Paper in Fire: Material Intensity in Paper Use.................................................................................. 31Bed of Roses: Material Intensity in Furniture................................................................................... 39Dress You Up in My Love: Material Intensity in Fibers.................................................................. 40Big Wheels Keep On Turning: Material Intensity in Transportation ............................................... 48Clean Sweep: Reducing Material Intensity by Lowering Pollution.................................................. 55Every Story Has an End: Recycling ................................................................................................. 63
“Let's make it, don't waste it”: Direct Energy Savings in Industry....................................................... 65
Love the Way You Move: Energy Savings in Transportation............................................. 70
A Very, Very Fine House: Saving Energy in Residential Buildings .................................... 79
Doing it in the Suites: Saving Energy in Commercial Buildings ......................................... 85
All Together Now: Total Savings ........................................................................................... 88
Earth, Sun, Sky and Sea: Sources................................................................................... 92
I’ll Let These Sparks Fly Out: Electricity ............................................................................. 92Free as Running Water: Hydro-electricity ............................................................................................ 93Where the Hot Springs Blow: Geothermal Electricity ......................................................................... 94Restless Power of the Wind: Wind Electricity .................................................................................... 95Heat of the Sun: Solar Thermal Electricity........................................................................................... 97Mixed Sources and Storage .................................................................................................................. 97Paying the Price: Costs of Transmitting, storing and Producing Electricity......................................... 99The Hydrogen Path............................................................................................................................. 100Photovoltaics ...................................................................................................................................... 102Shades of Grey: Electricity and Environmental Questions................................................................. 103Hotter than the Sun: The Mandatory Section on Nuclear Electricity ................................................. 107One and One Still is One: Cogeneration............................................................................................. 108
Warmth of the Sun: Active Solar Thermal for Low and Mid Temperature Heat .......... 109
The Sun is Burning: High Temperature Active Solar ........................................................ 111
Fields of Fire: Land Based Biomass ..................................................................................... 112
Putting it together: Grand Total .......................................................................................... 117
Higher: The Mandatory Peak Oil Chapter ................................................................... 118
Don’t Stop Thinking About Tomorrow: Research & Development............................. 119
Mañana is now: R&D and Per Capita Economic Growth ................................................. 119
Hello Tomorrow: R&D II - Adapting to the Greenhouse .................................................. 129
Cooling It: No Hair Shirt Solutions to Global Warming by Gar W. Lipow GarLpublic AT Comcast DOT net
Page 4 of 265
If Tomorrow Never Comes: R&D III – Ignoring the Greenhouse.................................... 131
Objections ....................................................................................................................... 134
Answer at the End of the Line: Technical Conclusion ................................................ 135
Politics and Economics of the Transition ..................................................................... 136
Appendixes ..................................................................................................................... 140Hot Lies and Cold Facts: Global Warming Deniers vs. Climate Science........................................... 140How CyberTran May Replace Short Domestic Flights ...................................................................... 148The Hawthorne Effect ........................................................................................................................ 149Accounting for Resource Flows ......................................................................................................... 151Phasing Out Other Greenhouse Forcings ........................................................................................... 153Timing: Can Emissions Reductions be Frontloaded?......................................................................... 155What about the Rest of the World?..................................................................................................... 159Miscellaneous Points on Sources, Style and Assumptions................................................................. 162
End Notes ....................................................................................................................... 164
Bibliography................................................................................................................... 209
Cooling It: No Hair Shirt Solutions to Global Warming by Gar W. Lipow GarLpublic AT Comcast DOT net
Page 5 of 265
A Real Fine Place to Start: Introduction
This is an optimistic book about a gloomy subject - the need to reduce fossil fuel use tofight global warming. It argues that we have technological substitutes available for oil,gas and coal now - at market prices comparable to those we currently pay. Neither costnor technical barriers prevent drastic and speedy reductions in greenhouse emissions;slowing global warming is no longer a technical problem (if it ever was). It is structural,institutional, social, and political.
Why cover this particular topic? The carbon lobby1 has mostly (not entirely) given updisputing that global warming is occurring. They know that they won't be able toconfuse the public on its human-caused nature much longer. ( ~75% of the U.S. publicunderstands global warming is a real problem2. If you are one of the remaining ~25%,please read the appendix Hot Lies and Cold Facts. ) But a final stalling tactic is open todeniers - to pretend that nothing can be done, or at least nothing that most people arewilling to live with. There is an old engineering saying: "no solution, no problem".
Converging with this, there is a small, but unfortunately influential primitivist movement.In their belief that technology itself is totalitarian, they also contribute to the idea that theonly solution to global warming is a drastic reduction in the technical level of civilization- perhaps down to the hunter-gatherer level. Many well-meaning, intelligent peoplepromote a less extreme version of this trope - the conviction that we need to impoverishworking people in rich nations to solve our environmental crisis, and deal justly with thepoorer countries.
The primary purpose of this book is to ensure that energy efficiency and renewableenergy technologies become known as inexpensive fossil fuel substitutes available today,rather than a high priced vision of tomorrow. The U.S. needs to understand that continueduse of fossil fuel is a political decision, rather than a technical one. It argues against thebelief that the only choices are destructive, expensive, continued burning of fossil fuels,or dramatic cuts in the standard of living. It tries to accomplish this by gathering in oneplace information that has been widely scattered; it also tries to organize the informationand clearly separate what we can do cheaply now, what we can do expensively now, andwhat we may be able to do in the future.
The argument that more and more global warming deniers will rely on is that it is tooexpensive to phase out most fossil fuel use.
There is a certain absurdity to spending the bulk of a book refuting the idea that savingthe world is too expensive. But this absurd task is also a necessary one. If the methodsoffered to stop global warming are too costly or too unpleasant, many people will preferto wait and hope that technology provides some magical painless solution.
Cooling It: No Hair Shirt Solutions to Global Warming by Gar W. Lipow GarLpublic AT Comcast DOT net
Page 6 of 265
Other popularizers have written about efficiency and renewables. This book differs in notassuming major technical breakthroughs, or drastic price drops in prices of existingtechnology; while these are both likely and desirable, we have cost-effective solutionsavailable now.
Also what if the breakthroughs that are only six months away are still only six monthsaway twenty years from now? It is not exactly unknown in the renewable energy field.This book will not argue against any of the “Gosh! Wow!” stuff; more serious R&Dwould probably produce exactly what many predict. But it seems urgent, absolutelyessential to show that we can phase out most fossil fuels at an equal or lower cost thancontinuing to use them – even if there is no hydrogen path, no cheap solar cells, and noinexpensive carbon fiber.
Once that is done, the book will deal with R&D agendas - near term, long term and bluesky, but in the form of a sample research program, rather than a core requirement of thetransition to a carbon neutral future.
To begin with, we need to explain how we can we make the switch at the same or lowerprices than we pay now. Mostly, renewable energy costs more (at market prices) thanfossil fuels.
No one uses kilowatts of electricity, or BTUs of heat, or gallons of gasoline for their ownsake; energy provides service--comfort, cooked food, hot water and so on. If we caninvest a tiny amount of money to drastically reduce energy needed to get the same results,more expensive renewable power can supply that reduced consumption at total costcomparable to what we spend now--including capital costs for increased efficiency. Forexample: we can inexpensively insulate a house so that it needs only a small portion ofthe heating and cooling energy of the average US home. Buy high-priced solar thermalpanels to supply most of that remaining climate control demand, and we still have anoverall heating/cooling bill less than before (including the cost of insulation). The bulkof the book will specify how to institute this type of efficiency in all areas - buildings,transportation and industry. We can reduce our energy consumption to a fraction of whatwe consume now, without reducing our standard of living, and then supply that fractionwith small amounts of expensive renewable energy. Thus, renewable energy can supplyall the services fossil fuel provides now – warm toes, cold beer, fast transportation--at acomparable cost. We will be dividing the money differently – more for capitalexpenditures, less for fuel and operating costs – but spend the same or a bit less than atpresent.
Through increased efficiency we can phase out a high percentage of fossil fuel useessentially for free. Again, energy is almost never consumed for its own sake. We usepower to accomplish goals. If your new car can get you where you want to go as quickly,safely, and pleasurably as your old one, you don’t mind that it runs of a battery chargedby wind, generated in the U.S. rather than overseas.
Cooling It: No Hair Shirt Solutions to Global Warming by Gar W. Lipow GarLpublic AT Comcast DOT net
Page 7 of 265
(If we did not care about global warming, air pollution, and human health, this would notbe our lowest priced alternative. Excluding such effects, it would be cheapest to installthe least expensive of the efficiency and renewable measures, and use fossil fuels tosupply most remaining needs. But we care how long we live, and how much of our liveswe spend healthy rather than sick. Most of us would prefer to switch to renewable powerat the same total price as we pay now for fossil fuels, rather than lower our energy billand continue to use oil, coal and natural gas.)
The first chapter will document that almost our entire energy consuming infrastructurehas a lifespan of thirty years or fewer. This is important to improving energy efficiencyat low cost. If you have to replace a perfectly good (but inefficient) car with a new highmileage model, then the cost of that fuel saving is the entire cost of the car. But if youwait until you have a buy a new car in any case, then the prices of saving gas is only thedifference between the cost of more and less efficient models. We will document thatcost can be very low indeed.
The next two chapters will show that industrial infrastructure may be upgraded over thecourse of thirty years to use about 75% less energy per unit of output--at very littleadditional cost. They will cover Material Intensity, indirect savings through producingless intensive types of material goods. For example they will document constructionmethods that reduce consumption of metal, cement, lumber, plastic and other buildingmaterials; these save the energy needed to make metal, cement, lumber and plastic beforeone factory is made more efficient. Once this is covered for a variety of areas, directsavings through making factories more efficient are documented.
Similar savings will be documented in transportation, and on residential and commercialbuildings.
A total savings chapter will total these percentage reductions, incorporating populationgrowth projections and dealing with questions of per person economic growth as well.That will allow the projection of likely consumption in 2040 if efficiency measures areadapted – and calculate major additional savings in converting primary energy to usefulpower.
Right now a great deal of primary energy is used to produce an especially important formof secondary energy – electricity. Nearly three units of fossil fuel are burned for each unitof electricity delivered from fossil fuel plants. Total efficiency measures documented willprovide a large enough absolute savings to allow all electricity to be produced via non-combustion sources – wind, hydroelectricity, geothermal, solar thermal and so forth.Thus, not having to burn fuel (either fossil or from renewable sources) to produceelectricity will provide a significant additional savings.
The chapters on sources will provide much less detail than the efficiency sections –because the glamour of various renewable sources receives a great deal of publicity inany case. Instead they will focus on costs of large scale implementation, total resourcesavailable at that cost, and environmental consequences of deployment.
Cooling It: No Hair Shirt Solutions to Global Warming by Gar W. Lipow GarLpublic AT Comcast DOT net
Page 8 of 265
Chapters on electricity will deal with existing hydroelectricity, geothermal electricity,wind electricity, and solar thermal electricity. They will also cover storage for wind andsolar thermal electricity. While some of these sources are comparable in price to thatgenerated by fossil fuels, the total dollar figures including storage and expansion of theelectric grid to make renewable electricity full available and fully dispatchable (therewhen you want it) will be significantly higher than the market price of fossil fuelgenerated electricity. This is why the main chapters dealt with efficiency; smalleramounts of more expensive electricity will provide the same services thanks to greaterefficiency in using that electricity; total costs won’t go up.
One area we will spend some time on is biomass (plant matter grown and harvested forfuel use). We won’t drill down much into forms (biodiesel, ethanol and so forth); insteadwe will concentrate on how to sustainably grow enough biomass to convert. Producingusable fuel from biomass is not the primary challenge; sustainably growing enoughbiomass to run even greatly reduced demand by transport, industry and climate controlwithout compromising food or fiber production is the more difficult challenge.
The final chapter hints at the economic, political, social and institutional barriers toimplementing these solutions, and tentatively explores the politics of overcoming thesebarriers.
From here forward, this book will be fairly number-heavy. In Hollywood, when a plotstarts dragging, writers often add a powerful visual image, to hang on to audienceattention. At any time in the discussion, please feel free to mentally insert a butterfly-laden sunrise, a chase scene, or two girls kissing.
Cooling It: No Hair Shirt Solutions to Global Warming by Gar W. Lipow GarLpublic AT Comcast DOT net
Page 9 of 265
The Love You Save: Improving Energy Efficiency
Here Today, Gone Tomorrow: Nothing Lasts Forever and a Day
As promised in the introduction, this chapter deals with the question of whetherinfrastructure improvements will work in existing buildings and equipments. After all itis one thing to document that we can build radically new types of homes and cars. But,what about all the homes that already exist? What of the cars people already drive? Arewe going to just throw them away and build new ones? Even if efficiency improvementswere free, that kind of premature depreciation and discarding capital goods would beexpensive indeed. How are we to increase efficiency with this rock solid infrastructure inplace?
Of course, that is a trick question, whose answer is implied by the chapter title. Theinfrastructure of modern industrial society is not rock solid at all.
“I’ve been thinking” says a farmer, in conversation with a city bumpkin, looking proudlyat his acres of ripening wheat, “I might put in a new variety next year – one that shouldget my yield way up.”
“Hang on” says the city bumpkin. “You already planted your fields. Are you going topull them all up, and replant?”
And of course the farmer explains that he does that every year anyway. He is going toharvest every blade of wheat he planted; planting something new only costs thedifferences between varieties.
The same thing is true of almost our entire infrastructure - on a time scale of thirty yearsor less.
Let's start with residential buildings – which can easily last over 100 years3. But, look atmajor components, not only the whole building, and your home is anything but static.According to Freddie Mac4 the average life of most types of roof is 12-20 yearsdepending upon materials. Dishwashers and disposals last 5-12 years, clothes washers,dryers, water heaters, warm air furnaces, heat pumps, and air conditioner compressorsfrom 8-12 years, refrigerators and stoves from 15-20 years. Modern residential windowstypically have 25 year life spans5. Wood, vinyl, fiberglass, and most metal siding lastbetween twenty and thirty years6. As homes age, bits and pieces break down or sufferdamage.
Similarly, most commercial buildings need a major rehab after 25 years7. Individualcomponents such as roof, exterior, HVAC, and plumbing tend to wear out in thirty yearsor less8 .
Cooling It: No Hair Shirt Solutions to Global Warming by Gar W. Lipow GarLpublic AT Comcast DOT net
Page 10 of 265
According to the OECD, Deutsche Bundesbank, and U.S. economists, industrial andmanufacturing equipment wears out within an average of twenty years at most9. Thiscovers a huge variety of lifespans. The most energy intensive equipment often tends tolast longest and dying industries will sometimes continue to use equipment long after itsnormal effective lifespan has passed. For example, PCs, which cost little compared tomost capital equipment, and use very little energy in operations (though they require a lotto manufacture), have an estimated average lifespan of around two years10. On the otherhand, the effective lifespan of coke ovens (which are very energy intensive pieces ofequipment) is normally taken to be about 25-30 years11.
There are exceptions of course. Infrastructure such as bridges, dams, sewage plants,pipelines, and water purification plants tend to last a great deal longer – forty, fifty even100 years. But maintenance for such infrastructure has been neglected for decades in thename of “cutting fat”. The American Society of Civil Engineers says America’sinfrastructure is deteriorating rapidly - report card style they give it an average grade ofD+ 12.
Transportation changes ceaselessly too. The single largest component of U.S.transportation consumption, the automobile, has an average lifespan of about 20 years13;but most are driven very lightly after their first thirteen years of life. Many are used solightly as not to constitute a significant emissions source; those which do producesignificant emissions could be bought out cheaply, in programs similar to those used toretire the worst junk cars in many European nations. Freightliner gives the lifespan of abus chassis as about ten years14, though I suspect many bus companies manage to golonger between major overhauls. Under optimistic assumptions average heavy truckengines last about 21 years between major overhauls15 . Airplane bodies last fiftythousand cycles or more (which can translate into fifty+ years); but engines seldom lastmore than thirty years16, and usually need major service of some type every ten years orso17. On average, freight train locomotive engines need overhauls every six years18
during their 40 year lifespan19 . Large scale freight ships (container, bulk cargo, andtanker ships) need to overhaul their engines every ten years or so20. The upper limit forthe latest generation of ship engines appears to be 25-30 years21 .
So, with minor exceptions, we will replace virtually our entire energy consuminginfrastructure within the next thirty years. The bulk of this book will show that as partsof our human built world break down, much more efficient replacements will cost aroundthe same as less efficient ones – making up for the higher prices of renewable sources torun them. Thus the U.S. can drop net greenhouse gas emissions to zero over thirty yearsat essentially no net cost - even without dramatic technical breakthroughs or drasticlowering of renewable energy costs.
Cooling It: No Hair Shirt Solutions to Global Warming by Gar W. Lipow GarLpublic AT Comcast DOT net
Page 11 of 265
Saving Grace: Industrial Efficiency
Lightening Up: Reducing Material Intensity
Most products ultimately provide some sort of service; we own them because they dosomething for us. If we can get the same service out of fewer goods, or use less energyand material to make the same goods, no sacrifice is involved. Keeping food cold orfrozen is the goal of owning a refrigerator; surrounding that food with a quarter ton ofmetal is a side effect, not a goal.
90% of the material by weight that humans extract from the environment is discardedbefore final products reach the consumer. 90% of finished products are discarded withinsix months, Real thermodynamic efficiency of material output over input is not 94%, noteven 15%, but around 1%22. 99% of all material extracted is discarded within six months.If we multiplied our efficiency in material use by ten - we would still discard 90% of allmaterial used within six months - nowhere close to the limits physics set.
Increasing eco-efficiency by lowering material intensity saves energy as a side effect.
Reduce the amount of concrete, metal, wood, and plastic used to construct buildings, andwe save energy in cement plants, foundries, lumber mills, chemical refineries before wemake one factory more efficient. Reduce the use of heavy farm machinery, nitrogenfertilizer, pesticides and herbicides (without increasing labor costs or reducing foodproduction) and we save energy use in agriculture and support industries before we makeone tractor more energy efficient.
Lowering material intensity does not save energy in linear proportion. A tentative rule ofthumb is that you cut energy use by about half the factor by which you reduce totalmaterial displacement and environmental impact. That is, a factor ten reduction inmaterial use per unit of service results in a factor five reduction in energy use23. (I.E.reducing environmental impact by ten (a 90% reduction) results in reducing energy useby five (an 80% reduction). Similarly, reducing material use by a factor of four (a 75%reduction) reduces energy use by a factor of two (a 50% reduction).
What exactly do we mean by saving material? We are not talking about the weight ofmaterials used, but of total environmental impact per unit of service. We are concernedabout organic and inorganic material displaced, about water used, about toxins added tothe air and to the water table.
The basic methods used to accomplish these savings include the following:
1) Look at the actual service the goods provide. Take a holistic approach, a systemsapproach and find out if there is a better way to accomplish the same service.
Cooling It: No Hair Shirt Solutions to Global Warming by Gar W. Lipow GarLpublic AT Comcast DOT net
Page 12 of 265
2) Look at the lifespan you can gain for the product. Very seldom does doubling thelifespan of a product require coming close to doubling either the cost, or the impact ofmaterials involved. However beware of increasing lifespan past the point where agood will be discarded regardless of condition.
3) Reduce the total impact of material used in constructing a good. This can meandrastically reducing the weight, but it can mean the extreme opposite. In most casesthis can be done in a way that contributes rather than detracts from increasinglifespan.
4) Reduce the amount of waste created while producing the good, the amount ofmaterial scrapped. Quite often something as simple as reducing defect rates can payboth economically and ecologically.
5) Try to make the good recyclable on as high a level as possible. That is if possible,make it repairable, so that when worn out it can simply be refurbished into like newcondition (again though not to the point where it is repairable in obsolescence). Makeit modular, so that parts that may be repaired and reused. Make parts of material thatmay be recycled into itself - so that waste from a product can be turned into rawmaterial for that same product. Only as a last step, do conventional recycling whereyou recycle scrap into lower quality goods, such as using old tires for foundation, andturning old cars into scrap metal.
6) Use the principles of environmental ecology. Try to find another industry that canaccept any waste you cannot avoid producing as an input for their process. Similarlytry and find industries that discard waste products you can use as inputs.
Note that while in some cases you can do all of the above, often you will have to choose,and balance one against another for maximum economically feasible saving. The objectin all this is biomimicry. Create industrial ecosystems that work like biologicalecosystems - cycling material from cradle to grave back to cradle again - using sunlightas the main outside input, pulling in very small amounts of minerals and water fromoutside the system, and for the most part circulating the same material over and overagain within the industrial system.
As we move to specifics, we won’t cumulate savings for industry sectors. Mostinformation available on reducing MI is not structured in such a way as to allow reliabledrawing of boundaries. We look at fibers, at fabric made from fiber, at clothes, furniture,and buildings that include some fabric, at transportation infrastructure that includes somebuildings and fabric. We look at paper (including paper packaging) and packaging (muchof which is made from paper). In short there would be a huge double counting problem ifwe cumulated, and avoiding it would be the work of a major study in itself. What isobvious is that when you look at the topics – buildings , food, water, appliances andoffice equipment, packaging, paper, furniture, fiber, and transportation infrastructureyou are covering 70%-90% of all consumer goods. It is reasonable to take this as at leasta rough sample of the whole.
Cooling It: No Hair Shirt Solutions to Global Warming by Gar W. Lipow GarLpublic AT Comcast DOT net
Page 13 of 265
Sticks N’ Stones N’ Straw N’ Steel: Material Intensity in Building Construction
Building construction worldwide uses about 40% of mineral and metal products, and25% of forest products24
One example of how to reduce this is the "Super-block" or "Super-adobe" constructiontechnique Nader Khalili25, California architect/author and founder of the Hesperia,California based CalEarth Institute26 invented that is very similar to rammed earth. Wetsoil under pressure (mixed with a little cement) turns into a sturdy and long lastingbuilding material. Khalili’s innovation is to pump the soil into bags that are continuouscoils, and bind them with barbed wire.
These small changes accomplish big things. The bags and steel reinforcement make theresults proof against earthquakes, a way to avoid devastation such as regularly occur inIran. The steel wire adds tremendous amounts of tensional and shear strength - somethinglacking in many traditional forms of earth based construction. Because the bags are acontinuous loop, you may fill them by machine instead of by hand, reducing constructionlabor to something comparable to traditional stick built construction. The steel in thebarbed wire is less than the steel in nails used for traditional wood frame buildings. Thereis less plastic in the sandbags than in the vapor barriers often used in conventionalconstruction. There is less cement mixed in with the sub-soil dirt than is typically used innormal foundations, probably less than is often used in internal plastering alone. Andsince the bulk of the home is built from on-site dirt, you don't need to truck in hugeamounts of construction material. Further, the only machinery used for foundation andshell phase of construction is digging out the subsoil dirt and pumping it into the bags.This technique can be used for the entire rough shell - foundation, floor, walls, roof, evenrough cabinetry and built-in furniture. It can then be insulated and finished byconventional or low impact techniques, as you please.
Super adobe is sturdy and durable – an earthquake safe variation on a technique that hasbeen know to last centuries in Iran. How sturdy? In Hesperia, the consultants who testedone for earthquake safety still don't know the limits of super-bloc strength. They intendedto test one to destruction, but their bulldozer was not powerful enough to actually destroyit, no matter how hard they tried.
That Khalili is a poet as well as an architect probably influenced his choice of materials.He himself has said that he likes the fact that sandbags and barbed wire, often instrumentsof war, are used to create beautiful spaces for people to live in.
Think about the embedded energy saved by this technique – reductions in steel, andplastic, and cement and wood boards. It saves the power needed to transport these things- and construction electricity and fuel too. Durability means you replace buildings lessoften – more conservation; all this occurs before you have made one mill, factory or plantmore efficient.
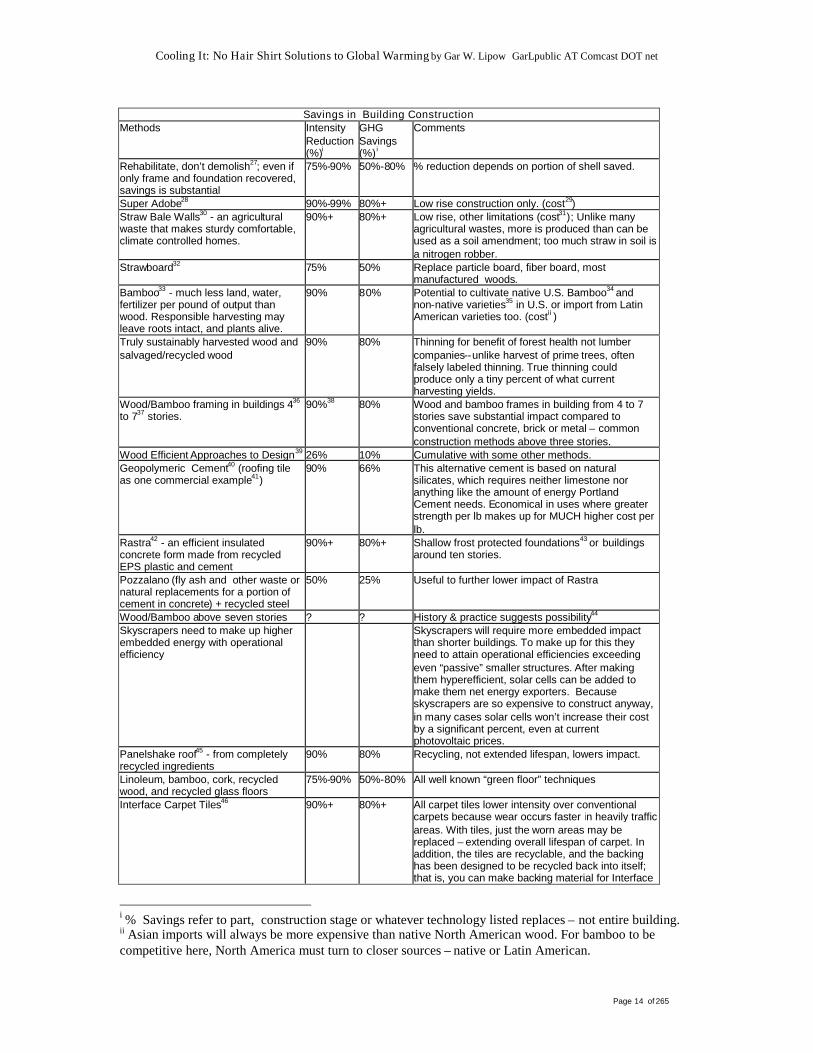
A brief survey of material intensity lowering building techniques follows in tabular form:
Cooling It: No Hair Shirt Solutions to Global Warming by Gar W. Lipow GarLpublic AT Comcast DOT net
Page 14 of 265
Savings in Building ConstructionMethods Intensity
Reduction(%)i
GHGSavings(%) i
Comments
Rehabilitate, don’t demolish27; even ifonly frame and foundation recovered,savings is substantial
75%-90% 50%-80% % reduction depends on portion of shell saved.
Super Adobe28 90%-99% 80%+ Low rise construction only. (cost29)Straw Bale Walls30 - an agriculturalwaste that makes sturdy comfortable,climate controlled homes.
90%+ 80%+ Low rise, other limitations (cost31); Unlike manyagricultural wastes, more is produced than can beused as a soil amendment; too much straw in soil isa nitrogen robber.
Strawboard32 75% 50% Replace particle board, fiber board, mostmanufactured woods.
Bamboo33 - much less land, water,fertilizer per pound of output thanwood. Responsible harvesting mayleave roots intact, and plants alive.
90% 80% Potential to cultivate native U.S. Bamboo34 andnon-native varieties35 in U.S. or import from LatinAmerican varieties too. (costii )
Truly sustainably harvested wood andsalvaged/recycled wood
90% 80% Thinning for benefit of forest health not lumbercompanies--unlike harvest of prime trees, oftenfalsely labeled thinning. True thinning couldproduce only a tiny percent of what currentharvesting yields.
Wood/Bamboo framing in buildings 436
to 737 stories.90%38 80% Wood and bamboo frames in building from 4 to 7
stories save substantial impact compared toconventional concrete, brick or metal – commonconstruction methods above three stories.
Wood Efficient Approaches to Design39 26% 10% Cumulative with some other methods.Geopolymeric Cement40 (roofing tileas one commercial example41)
90% 66% This alternative cement is based on naturalsilicates, which requires neither limestone noranything like the amount of energy PortlandCement needs. Economical in uses where greaterstrength per lb makes up for MUCH higher cost perlb.
Rastra42 - an efficient insulatedconcrete form made from recycledEPS plastic and cement
90%+ 80%+ Shallow frost protected foundations43 or buildingsaround ten stories.
Pozzalano (fly ash and other waste ornatural replacements for a portion ofcement in concrete) + recycled steel
50% 25% Useful to further lower impact of Rastra
Wood/Bamboo above seven stories ? ? History & practice suggests possibility44
Skyscrapers need to make up higherembedded energy with operationalefficiency
Skyscrapers will require more embedded impactthan shorter buildings. To make up for this theyneed to attain operational efficiencies exceedingeven “passive” smaller structures. After makingthem hyperefficient, solar cells can be added tomake them net energy exporters. Becauseskyscrapers are so expensive to construct anyway,in many cases solar cells won’t increase their costby a significant percent, even at currentphotovoltaic prices.
Panelshake roof45 - from completelyrecycled ingredients
90% 80% Recycling, not extended lifespan, lowers impact.
Linoleum, bamboo, cork, recycledwood, and recycled glass floors
75%-90% 50%-80% All well known “green floor” techniques
Interface Carpet Tiles46 90%+ 80%+ All carpet tiles lower intensity over conventionalcarpets because wear occurs faster in heavily trafficareas. With tiles, just the worn areas may bereplaced – extending overall lifespan of carpet. Inaddition, the tiles are recyclable, and the backinghas been designed to be recycled back into itself;that is, you can make backing material for Interface
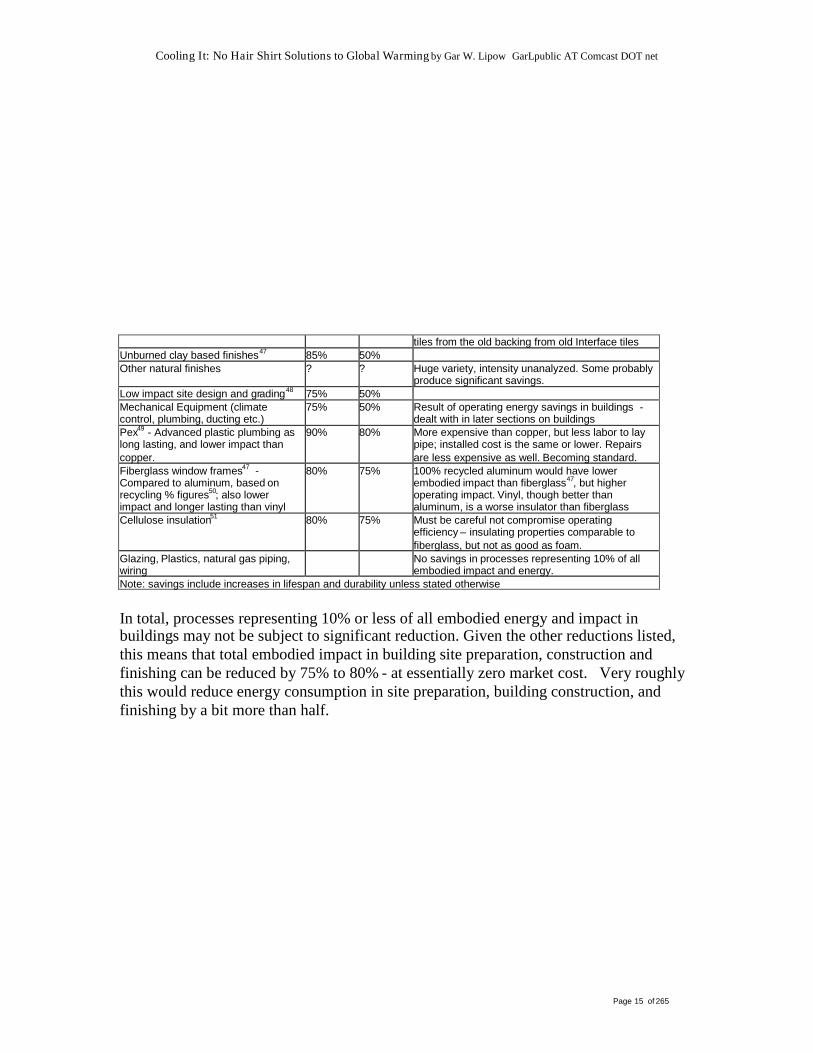
i % Savings refer to part, construction stage or whatever technology listed replaces – not entire building.ii Asian imports will always be more expensive than native North American wood. For bamboo to becompetitive here, North America must turn to closer sources – native or Latin American.
Cooling It: No Hair Shirt Solutions to Global Warming by Gar W. Lipow GarLpublic AT Comcast DOT net
Page 15 of 265
tiles from the old backing from old Interface tilesUnburned clay based finishes47 85% 50%Other natural finishes ? ? Huge variety, intensity unanalyzed. Some probably
produce significant savings.Low impact site design and grading48 75% 50%Mechanical Equipment (climatecontrol, plumbing, ducting etc.)
75% 50% Result of operating energy savings in buildings -dealt with in later sections on buildings
Pex49 - Advanced plastic plumbing aslong lasting, and lower impact thancopper.
90% 80% More expensive than copper, but less labor to laypipe; installed cost is the same or lower. Repairsare less expensive as well. Becoming standard.
Fiberglass window frames47 -Compared to aluminum, based onrecycling % figures50; also lowerimpact and longer lasting than vinyl
80% 75% 100% recycled aluminum would have lowerembodied impact than fiberglass47, but higheroperating impact. Vinyl, though better thanaluminum, is a worse insulator than fiberglass
Cellulose insulation51 80% 75% Must be careful not compromise operatingefficiency – insulating properties comparable tofiberglass, but not as good as foam.
Glazing, Plastics, natural gas piping,wiring
No savings in processes representing 10% of allembodied impact and energy.
Note: savings include increases in lifespan and durability unless stated otherwise
In total, processes representing 10% or less of all embodied energy and impact inbuildings may not be subject to significant reduction. Given the other reductions listed,this means that total embodied impact in building site preparation, construction andfinishing can be reduced by 75% to 80% - at essentially zero market cost. Very roughlythis would reduce energy consumption in site preparation, building construction, andfinishing by a bit more than half.
Cooling It: No Hair Shirt Solutions to Global Warming by Gar W. Lipow GarLpublic AT Comcast DOT net
Page 16 of 265
Fields of Barley, Fields of Gold: Material Intensity in Agriculture
If heaven was a pie it would be cherryCool and sweet and heavy on your tongueAnd just one bite would satisfy your hungerAnd there’d always be enough for everyoneGretchen Peters – ‘If Heaven’i
Agriculture for food and fiber represents another significant category of environmentalimpact. Before we worry about how to farm, we should consider how much agriculturewe need. If you read the technical news, when this subject comes up, it always discusseshow to increase food production for a hungry world.
This is completely misleading. If you look at the total food produced world wide, there isenough food produced (including meat and fish) worldwide not just to feed everyone onearth, not just to make everyone fat, but to make everybody morbidly obese. Countinggrain, beans, roots, fruits, vegetables, nuts and other plants and fungi (not includinganimal feed), plus livestock, dairy, fish, eggs and other animal products raised for humanconsumption we produced nearly 2,800 calories per person per year in 200152 - including75 grams of protein. 2,200 calories per day are generally accepted, as the average neededto keep a person healthy -neither losing nor gaining weight53 . 56 grams of protein is theU.S. RDA for adult men54.
Many people have higher requirements than this – most grown men, pregnant andlactating women for example - as well as athletic women. (As one instance, LucyLawless used to perform gymnastics and horseback riding in fairly heavy armor ten ormore hours per day while starring in "Xena - Warrior Princess", and probably burned6,000+ calories daily at the peak of her schedule.) Children, and median height adultwomen mostly need less. Below 2,200 calories, and 56 grams on average is considered anabsolute shortage; if we allow a comfort and safety margin that would mean we want atleast 2,300 calories on average per person available worldwide.
How big an increase do we need to keep up with population growth? According to theU.S. Census55, if you assume the same production with projected increases in populationwe will still average ~2,500 calories per person per day in 2010, ~2300 per day in 2020.Without cultivation of more acreage or an increase in production per acre, we thenapproach absolutely scarcity, falling to 1,900 in 2050. We need no increase in total foodproduction before 2020, and only a 21% increase by 2050.
i"If Heaven" lyric used with permission from songwriter Gretchen Peters, and copyright holder Sony/ATV Music Publishing.
Cooling It: No Hair Shirt Solutions to Global Warming by Gar W. Lipow GarLpublic AT Comcast DOT net
Page 17 of 265
Moreover, in a sense the problem of getting that increase is solved. I'm going to suggestreasons to go beyond plain old organic farming in a moment. But it turns that evenconventional organic farming could feed more people than our current industrialsystem56. Normally when people measure land use for organic farming, they look at therich nations, see that rich nations on average can grow less per acre via organic meansthan with conventional ones. (It turns out that the difference is smaller than we thought,though - about 20 %.) However, it is a different story in the developing nations.According the Brian Halweil in World Watch Magazine:
…scientists from the University ofMichigan tried to estimate how much food couldbe raised following a global shift to organic farming. The team combed through theliterature for any and all studies comparing crop yields on organic farms withthose on nonorganic farms. Based on 293 examples, they came up with a globaldataset of yield ratios for the world’s major crop for the developed and thedeveloping world. As expected,organic farming yielded less than conventionalfarming in the developed world for most food categories, while studies from thedeveloping world showed organic farming boosting yields. The team then ran twomodels. The first was conservative in the sense that it applied the yield ratio for thedeveloped world to the entire planet, i.e., they assumed that every farm regardlessof location would get only the lower developed-country yields. The second appliedthe yield ratio for the developed world to wealthy nations and the yield ratio for thedeveloping world to those countries.
<…>
…The second model [the realistic model - Gar] yielded 4,381 calories per personper day, 75 percent greater than current availability—and a quantity that couldtheoretically sustain a much larger human population than is currently supportedon the world’s farmland.
So our problem is NOT how to massively increase food production. We need to makesure everyone has access to the plenty that already exists. Hunger in the world today isdue to injustice, not shortagesi. That doesn't mean that injustice is the only problem withthe international food system.
Current agricultural production consumes far too much water and contaminates far toomany clean water sources. Water is a renewable resource, but not in unlimited quantities.If we contaminate enough of the water cycle, we will have less water available at anygiven moment. Future clean water does us no good when we need it in the present. If wedon't drastically lower agricultural consumption and contamination of water sources, wewill eventually suffer a genuine food shortage.
iAs confirmation, most nations with hungry people produce enough for everyone; it is just that not everyonecan buy what is produced. Many hungry nations are net food exporters. And many hungry nations devote alarge percentage of their agricultural land to producing coffee, flowers, and other non-food or luxuryproducts for export; in others most farmland is owned by a few large families who keep a large portion of itout of production for purposes of real estate speculation.
Cooling It: No Hair Shirt Solutions to Global Warming by Gar W. Lipow GarLpublic AT Comcast DOT net
Page 18 of 265
Similarly, worldwide we erode topsoil every year. Again, we need to reverse this tomaintain the ability to feed everybody. There are some questions about mineral sourcesand soil micronutrients as well.
In addition, the IPCC has pointed out the some of the global warming that is alreadylocked in will decrease food production in some of the worlds poorest nations. But if wecan confine the damage to less than a 2 degree centigrade warming we will actually havean overall 20% increase. Of course this increase won't do people in the poorer nationsany good if they are not given access to this food. That is a critical problem, probably themost critical problem -- but the point is it is not a technical obstacle to feeding the world.
The technical problem is to maintain food production for the next ten+ years, thenincrease it slowly, while using far less water, far less energy, eroding less soil, usingfewer mineral resources, and releasing fewer toxins into the water table. Conventionalorganic agriculture is not the limit of how we do this.
A good start would be to reverse the currently trend of destroying farmland that continuesevery year. This both takes the form of converting croplands to urban uses (roads,buildings and so forth) and destroying suitability of land for farming by erosion,destruction of water sources, mining, and toxic contamination.
Meat production is another example. In 2000 the U.S. used ~27%57 of it's cropland togrow grain for animal feed; the world used ~18.5% of it's production for the samepurpose58. Yet it turns out that feeding grain to cattle, sheep, goats and other ruminants isnot particularly healthy for them or for people who eat them. Forcing animals to spendup to half their lives confined in feedlots causes all sorts of problems. They needhormones to handle grain--far richer food than they are designed to digest. They needantibiotics to stave off the diseases that come from close confinement, and overfeeding -which creates antibiotic resistant strains of bacteria. (Meanwhile hospitals try to minimizeantibiotic prescriptions for people.) This still results in occasional e-coli scares. Further,in an effort to increase weight gain, until quite recently we fed animal byproducts to cowsand steers - which are really not well designed to be carnivores. This contributed to casesof mad cow in the United States, just as it did in the UK previously.
There is an alternative. Cattle evolved over a long period of time to eat grass. Eventoday, meat cattle are grass fed in pastures or ranges for around half their lives - andconfined to feed lots only during their final months. But there are farmers out there who"grass-finish" their cattle - raise them to their final slaughter weight on plain grass, andproduce healthier lower fat, better tasting beef.
Doesn't that lower the tons of beef you raise per acre? It certainly would seem logical. Ifyou pack cattle as tightly as if already dead in steel and concrete feedlots, you can raisemore cattle per acre than on pasture. But it takes land to raise the corn and grain andsoybeans upon which feedlot cattle subsist. Count this, and grazed cattle have about thesame production per acre as feedlot beef59 .
Cooling It: No Hair Shirt Solutions to Global Warming by Gar W. Lipow GarLpublic AT Comcast DOT net
Page 19 of 265
Will this lead to range and pasture erosion from overgrazing? It won't if we use greengrazing (intensively managed rotational grazing) which has a long and honorable history.Instead of eroding pasture or range, land intensively grazed for a short time, then rested,gains topsoil and fertility - just as the Great Plains did when grazed by buffalo instead ofcattle. So we can produce as much beef per acre via grazing as we can with feed-lots,without the soil erosion of conventional pasture or range, let alone that of row crops59 .(Note - we may not produce quite as many pounds of meat, since grass-fed cattle movemore, and build muscle. But the protein is likely to be the same, and the taste is better. )
Grass finished beef require between a fifth and a third of the fossil fuel energy needed byfeedlot cattle60. (Substituting other ruminants - bison, beefalo, sheep and goats canreduce this further.)
How do the economics of this work out? Given an equal playing field, the costs of grass-finished beef (and milk as well) are lower than conventional ranching61 .
Grass-fed beef currently sells for more than feedlot beef. Demand is high relative tosupply. Because ranchers who grass-finish cattle tend to raise small herds, they don't haveaccess to the economies of scale that larger ranchers have--facing higher transportation,slaughter and marketing costs per cow than the big guys. Also, regulations tend to favorthe giants. For instance, health regulations very strictly enforce exactly what equipment isused in slaughter, whereas actual bacteria present tends not be measured. An oppositeapproach, one that specified results rather than the means to obtain them would give thelittle guy a better chance to compete, while protecting consumers better than presentrules.
(In one recent case, John Stewart of Creekstone Farms Premium Beef Co., wished to testevery animal his company slaughtered for mad cow disease; permission was refused outof fear that if one processor did this, others would be pressured to do the same62. [Note:he won his case, and gained the right to test.)
How does green grazing preserve the soil? It avoids root damage; disturbing rootsdisrupts the growth of key soil micro-organisms--especially the fungi that produceglomalin (one key glue that holds soil in place). Grazing seldom pulls roots; normalgrazing weakens plant health by returning to the same spot too often; managementintensive grazing gives plants time to heal--and thus completely preserves root structures.The difference compares to that between an annoying cousin who drops by for dinner afew times weekly, and an irritating one who stays over one holiday weekend per year, butleaves you alone the rest of time.
Cooling It: No Hair Shirt Solutions to Global Warming by Gar W. Lipow GarLpublic AT Comcast DOT net
Page 20 of 265
Just as with animal husbandry, we can grow row crops by means that don’t disrupt rootstructure. No-till farming with crop rotation is a first step in this direction. In no-tillfarming, roots are left undisturbed, and any part of the crop not actually harvested isreturned to the soil. This not only cultivates glomalin, but retains soil nutrients. If alegume and a green manure are both included in the rotation, no-till can completelyeliminate any need for nitrogen fertilizer, and greatly reduce other fertilizers as well--usually producing slightly greater output than ploughed soil63 .
From a global warming perspective, a critical additional factor is that glomalin accountsfor 27% of carbon stored in soil64; cultivating glomalin actually serve as a significantcarbon sink.
The Rodale Institute makes an important point; often, those who promote no-till simplyseem to be encouraging the use of Roundup (the world's leading herbicide). Withouttilling, weed control appears at first glance to require more herbicide. With all the extrauncomposted plant matter in the soil, it is difficult to avoid attracting insect pests thatrequire pesticide as well. A great deal of grain in the U.S. is grown by no-till methodswithout crop rotation; this actually increases chemical use. But with proper rotation,cover crops and the use of a chop stalker or roller to convert agricultural residues to anin-place no till mulch, it is possible to reduce herbicide and pesticides by half to twothirds, and water use by 30% to 50%65. Because, in a no-till field, pesticides andherbicides remain in the soil until they decompose, pesticide and herbicide run-off isreduced by 90% or more.
Biointensive integrated pest management can reduce chemical pesticides and herbicidesfurther. This includes early pest detection and monitoring, use of predator insects andother biological controls, and least toxic, targeted pesticide and herbicides specific toparticular pests as last resorts. This in combination with well designed rotation lets moreor less conventional no-till reduce chemical herbicide and pesticides by three quarters. Insome case it even allows completely organic methods. For example, Rodale hasdeveloped a new cover crop roller that may make no-till without herbicides competitivewith herbicide production in yield in per acre66 . Thus no-till can increase yield per acre,preserve the soil, and reduce or eliminate pesticide, herbicide and artificial fertilizer use -without increasing costs.
How are the economics of no-till farming? Generally you get more production per acre,lower labor costs, and lower capital costs as well. (Thus, while conventional organicagriculture decreases production per acre in rich nations, low input biodiverse no-tillincreases crops harvested.) There are transition costs. Converting ploughed land to a no-till system takes between three and five years to build the soil enough for increasedproduction. (Lower costs normally increase net profitability even during the transitionperiod.) No-till with fiber crops such as kenaf or hemp can lead to increased compaction- though it has been found that improved drainage, combined with crop rotation willsolve this problem.
Cooling It: No Hair Shirt Solutions to Global Warming by Gar W. Lipow GarLpublic AT Comcast DOT net
Page 21 of 265
How much energy does this save? Nitrogen fertilizer use (eliminated in no-till), and farmequipment operations (drastically reduced) are the two biggest energy consumers in row-crop cultivation. Drastic reductions in, (or elimination of), other fertilizers, herbicides andpesticides cut energy use further. So again lowering material intensity indirectly savesenergy – in this case by half. Carbon emissions are reduced even more. As withmanagement intensive grazing, building soil structure transforms agriculture from acarbon source to a small carbon sink – providing minor amounts of sequestration.
Beyond this, recent work on charcoal as soil amendments may allow us to go further -sequestering significant amounts of carbon and building soil to a far greater extent67.However, there are significant limitations we need to watch out for here, Just asconventional chemical fertilizers add nutrients without building soil structure, charcoalagriculture build soil structure without adding nutrients. So you want to limit the percentand type of agricultural waste you convert to charcoal for this purpose--especiallyavoiding nitrogen rich materials. Additionally, charcoal making is usually very airpolluting. There are charcoal making methods this is not true of, but they are expensive,especially on the small scale you want to use for conversion of agricultural wastes. Noneof this is insurmountable. Rodale is working on incorporating charcoal agriculture into itsno-till farms. It just should not be seen as a quick fix that can avoid the need foremissions reduction.
Cooling It: No Hair Shirt Solutions to Global Warming by Gar W. Lipow GarLpublic AT Comcast DOT net
Page 22 of 265
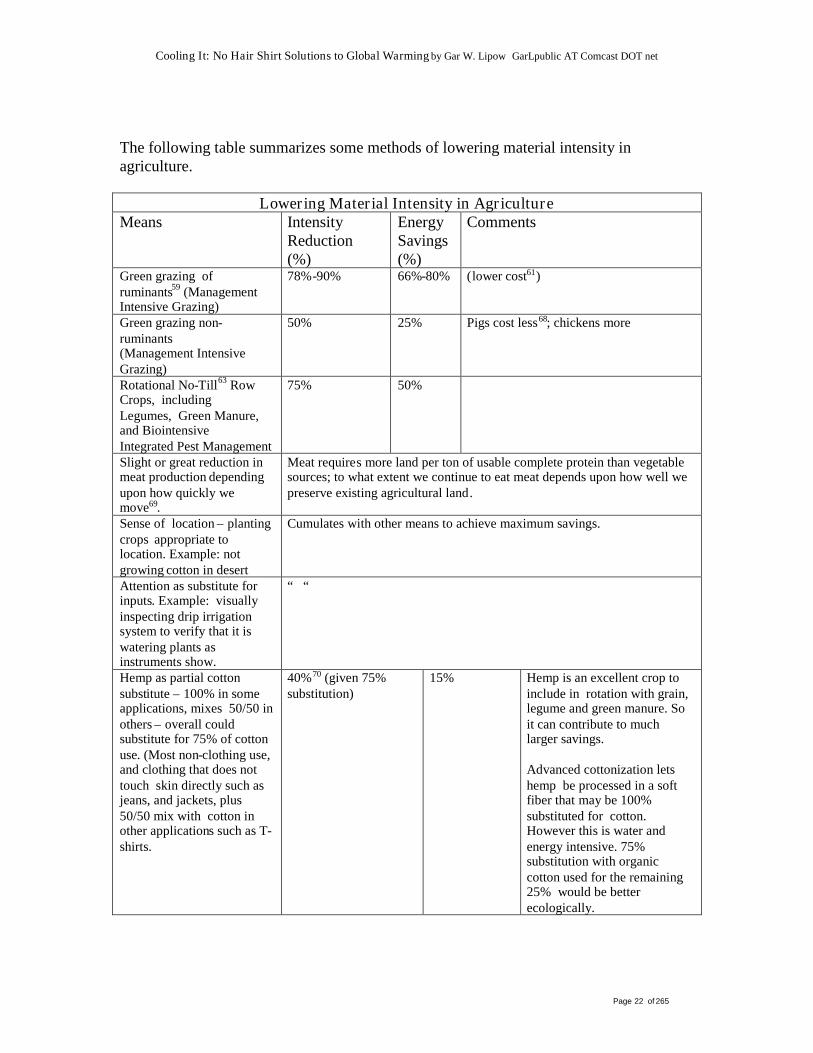
The following table summarizes some methods of lowering material intensity inagriculture.
Lowering Material Intensity in AgricultureMeans Intensity
Reduction(%)
EnergySavings(%)
Comments
Green grazing ofruminants59 (ManagementIntensive Grazing)
78%-90% 66%-80% (lower cost61)
Green grazing non-ruminants(Management IntensiveGrazing)
50% 25% Pigs cost less68; chickens more
Rotational No-Till63 RowCrops, includingLegumes, Green Manure,and BiointensiveIntegrated Pest Management
75% 50%
Slight or great reduction inmeat production dependingupon how quickly wemove69.
Meat requires more land per ton of usable complete protein than vegetablesources; to what extent we continue to eat meat depends upon how well wepreserve existing agricultural land.
Sense of location – plantingcrops appropriate tolocation. Example: notgrowing cotton in desert
Cumulates with other means to achieve maximum savings.
Attention as substitute forinputs. Example: visuallyinspecting drip irrigationsystem to verify that it iswatering plants asinstruments show.
“ “
Hemp as partial cottonsubstitute – 100% in someapplications, mixes 50/50 inothers – overall couldsubstitute for 75% of cottonuse. (Most non-clothing use,and clothing that does nottouch skin directly such asjeans, and jackets, plus50/50 mix with cotton inother applications such as T-shirts.
40%70 (given 75%substitution)
15% Hemp is an excellent crop toinclude in rotation with grain,legume and green manure. Soit can contribute to muchlarger savings.
Advanced cottonization letshemp be processed in a softfiber that may be 100%substituted for cotton.However this is water andenergy intensive. 75%substitution with organiccotton used for the remaining25% would be betterecologically.
Cooling It: No Hair Shirt Solutions to Global Warming by Gar W. Lipow GarLpublic AT Comcast DOT net
Page 23 of 265
Because ruminants and row crops account for overwhelming majority of agriculturalimpact and energy use, very roughly we could expect a 60% reduction in agriculturalenergy consumption from this. The key point is that we could increase production - peracre and per hour from various near organic techniques, while lowering ecologicalimpacts more than pure organic production can. This is sometimes described as a"middle path", though the non-organic inputs are fairly trivial.
Before we leave the subject of agriculture we may want to examine the current outer limitof low input cultivation.
Biointensive farming is many steps beyond no-till. Generally through double digging andthe use of compost, aerated soil is provided to a depth of 24 inches, either in raised orsunken beds. A variety of crops, not just one or two plants but a multiplicity, are grownclosely spaced. The close spacing shuts out weeds, as does the filling of all availableniches by multiple crop plants. The biodiversity also discourages pests, since very fewinsects, diseases or fungi are generalist enough to attack all the species grown.
It produces far more food per acre than other form of agriculture, excluding some formsof hydroponics. It is so land efficient that 100% of a vegan diet may be produced on lessthan 3,200 square feet - fertilized only by compost from the person the garden feeds71 .
Now this is also a very labor intensive form of agriculture, perhaps slightly less laborintensive than the traditional pre-industrial farming, but much harder work than modernno-till farming. It is not something to implement on a large scale, in its present form, inthe long run. But a large part of the world lives on less than two dollars a day; this type ofsystem certainly makes sense in places where people are starving and without work. It isundesirable, though, that people stay poor. Hopefully any nation poor enough that thismakes sense for a large part of it's people would use it as a stepping stone to improvetheir lives, and not leave them with subsistence agriculture (no matter how ecologicallycorrect the type) as all that held off starvation.
The main point of bringing it up in the context of the U.S., where we don't live on twodollars a day, and hopefully won't in the future, is to show that we have by no meansbegun to tap the potential of what sustainable agriculture will do. While currentsustainable low-labor no-till techniques will meet our needs in the long run it is importantto gain resource efficiency in agriculture comparable to that of biointensive techniqueswithout the waste of valuable human labor.
Cooling It: No Hair Shirt Solutions to Global Warming by Gar W. Lipow GarLpublic AT Comcast DOT net
Page 24 of 265
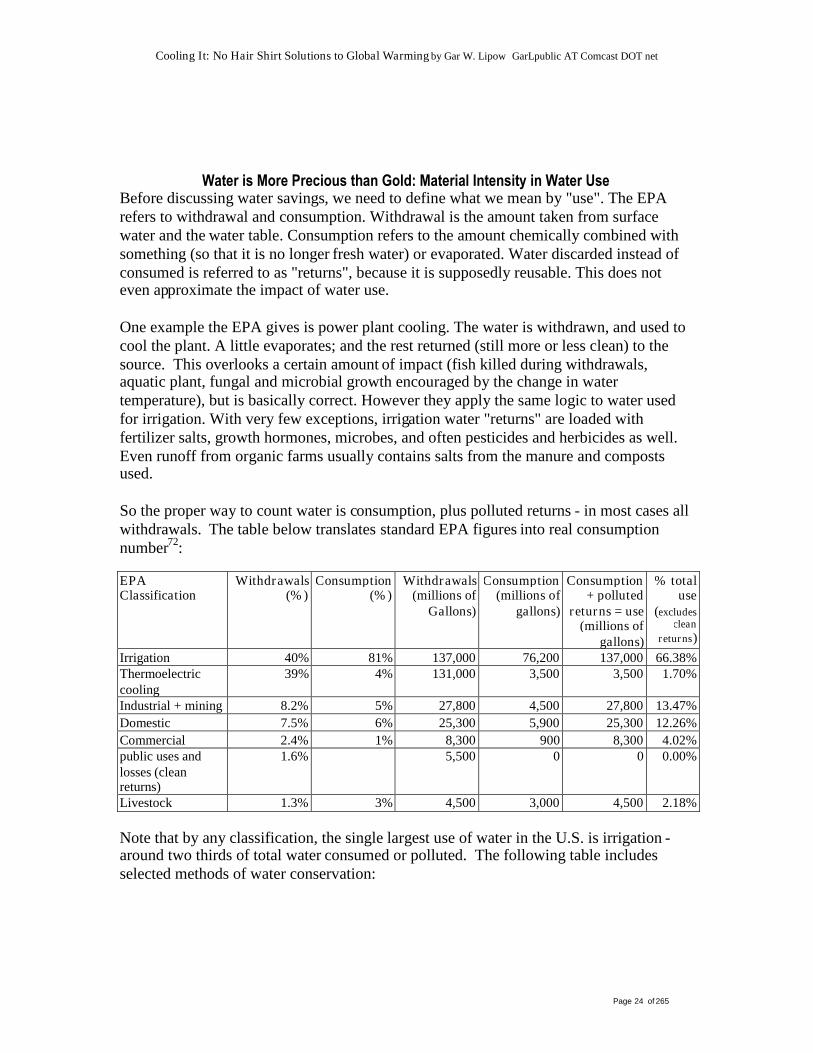
Water is More Precious than Gold: Material Intensity in Water UseBefore discussing water savings, we need to define what we mean by "use". The EPArefers to withdrawal and consumption. Withdrawal is the amount taken from surfacewater and the water table. Consumption refers to the amount chemically combined withsomething (so that it is no longer fresh water) or evaporated. Water discarded instead ofconsumed is referred to as "returns", because it is supposedly reusable. This does noteven approximate the impact of water use.
One example the EPA gives is power plant cooling. The water is withdrawn, and used tocool the plant. A little evaporates; and the rest returned (still more or less clean) to thesource. This overlooks a certain amount of impact (fish killed during withdrawals,aquatic plant, fungal and microbial growth encouraged by the change in watertemperature), but is basically correct. However they apply the same logic to water usedfor irrigation. With very few exceptions, irrigation water "returns" are loaded withfertilizer salts, growth hormones, microbes, and often pesticides and herbicides as well.Even runoff from organic farms usually contains salts from the manure and compostsused.
So the proper way to count water is consumption, plus polluted returns - in most cases allwithdrawals. The table below translates standard EPA figures into real consumptionnumber72:
EPAClassification
Withdrawals(%)
Consumption(%)
Withdrawals(millions of
Gallons)
Consumption(millions of
gallons)
Consumption+ polluted
returns = use(millions of
gallons)
% totaluse
(excludesclean
returns)Irrigation 40% 81% 137,000 76,200 137,000 66.38%Thermoelectriccooling
39% 4% 131,000 3,500 3,500 1.70%
Industrial + mining 8.2% 5% 27,800 4,500 27,800 13.47%Domestic 7.5% 6% 25,300 5,900 25,300 12.26%Commercial 2.4% 1% 8,300 900 8,300 4.02%public uses andlosses (cleanreturns)
1.6% 5,500 0 0 0.00%
Livestock 1.3% 3% 4,500 3,000 4,500 2.18%
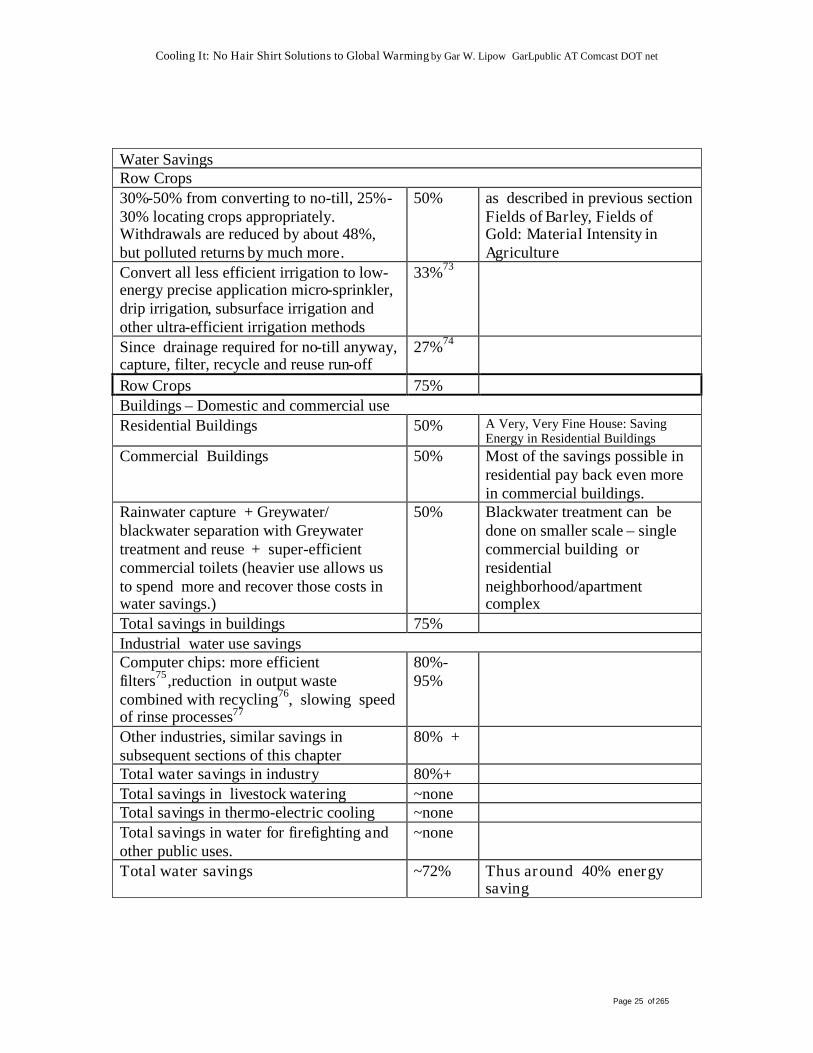
Note that by any classification, the single largest use of water in the U.S. is irrigation -around two thirds of total water consumed or polluted. The following table includesselected methods of water conservation:
Cooling It: No Hair Shirt Solutions to Global Warming by Gar W. Lipow GarLpublic AT Comcast DOT net
Page 25 of 265
Water SavingsRow Crops30%-50% from converting to no-till, 25%-30% locating crops appropriately.Withdrawals are reduced by about 48%,but polluted returns by much more.
50% as described in previous sectionFields of Barley, Fields ofGold: Material Intensity inAgriculture
Convert all less efficient irrigation to low-energy precise application micro-sprinkler,drip irrigation, subsurface irrigation andother ultra-efficient irrigation methods
33%73
Since drainage required for no-till anyway,capture, filter, recycle and reuse run-off
27%74
Row Crops 75%Buildings – Domestic and commercial useResidential Buildings 50% A Very, Very Fine House: Saving
Energy in Residential BuildingsCommercial Buildings 50% Most of the savings possible in
residential pay back even morein commercial buildings.
Rainwater capture + Greywater/blackwater separation with Greywatertreatment and reuse + super-efficientcommercial toilets (heavier use allows usto spend more and recover those costs inwater savings.)
50% Blackwater treatment can bedone on smaller scale – singlecommercial building orresidentialneighborhood/apartmentcomplex
Total savings in buildings 75%Industrial water use savingsComputer chips: more efficientfilters75 ,reduction in output wastecombined with recycling76, slowing speedof rinse processes77
80%-95%
Other industries, similar savings insubsequent sections of this chapter
80% +
Total water savings in industry 80%+Total savings in livestock watering ~noneTotal savings in thermo-electric cooling ~noneTotal savings in water for firefighting andother public uses.
~none
Total water savings ~72% Thus around 40% energysaving
Cooling It: No Hair Shirt Solutions to Global Warming by Gar W. Lipow GarLpublic AT Comcast DOT net
Page 26 of 265
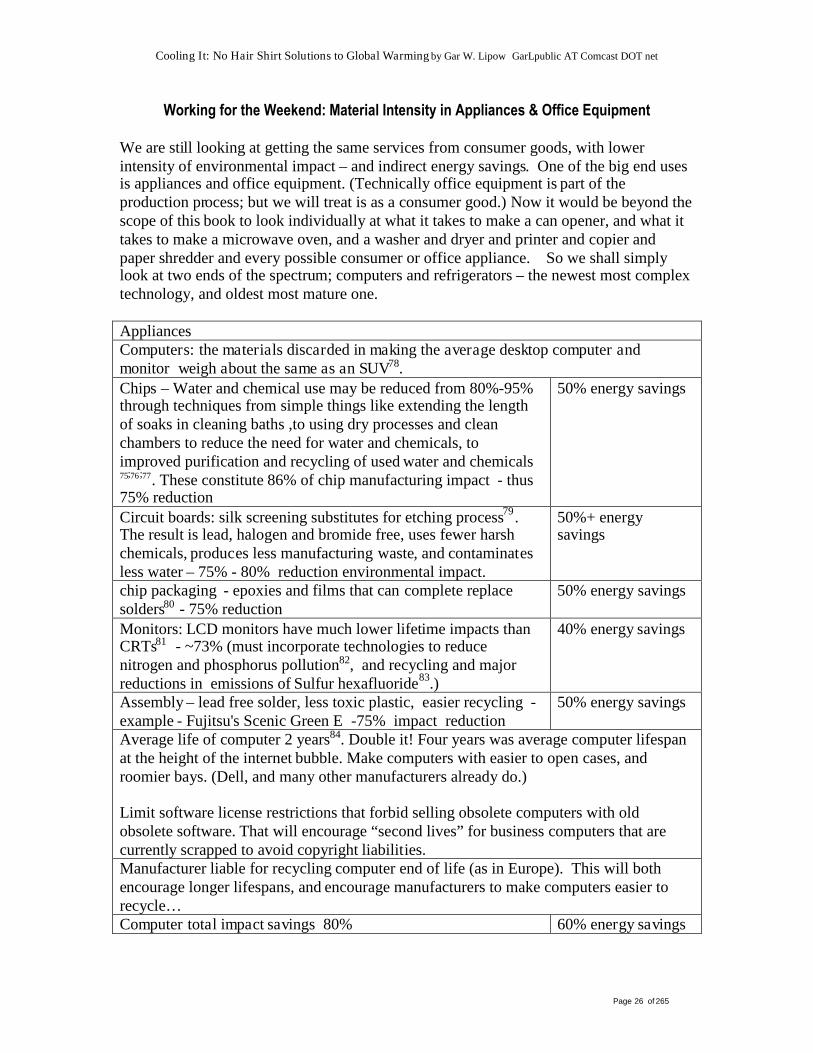
Working for the Weekend: Material Intensity in Appliances & Office Equipment
We are still looking at getting the same services from consumer goods, with lowerintensity of environmental impact – and indirect energy savings. One of the big end usesis appliances and office equipment. (Technically office equipment is part of theproduction process; but we will treat is as a consumer good.) Now it would be beyond thescope of this book to look individually at what it takes to make a can opener, and what ittakes to make a microwave oven, and a washer and dryer and printer and copier andpaper shredder and every possible consumer or office appliance. So we shall simplylook at two ends of the spectrum; computers and refrigerators – the newest most complextechnology, and oldest most mature one.
AppliancesComputers: the materials discarded in making the average desktop computer andmonitor weigh about the same as an SUV78.Chips – Water and chemical use may be reduced from 80%-95%through techniques from simple things like extending the lengthof soaks in cleaning baths ,to using dry processes and cleanchambers to reduce the need for water and chemicals, toimproved purification and recycling of used water and chemicals75;76;77. These constitute 86% of chip manufacturing impact - thus75% reduction
50% energy savings
Circuit boards: silk screening substitutes for etching process79 .The result is lead, halogen and bromide free, uses fewer harshchemicals, produces less manufacturing waste, and contaminatesless water – 75% - 80% reduction environmental impact.
50%+ energysavings
chip packaging - epoxies and films that can complete replacesolders80 - 75% reduction
50% energy savings
Monitors: LCD monitors have much lower lifetime impacts thanCRTs81 - ~73% (must incorporate technologies to reducenitrogen and phosphorus pollution82, and recycling and majorreductions in emissions of Sulfur hexafluoride83.)
40% energy savings
Assembly – lead free solder, less toxic plastic, easier recycling -example - Fujitsu's Scenic Green E -75% impact reduction
50% energy savings
Average life of computer 2 years84. Double it! Four years was average computer lifespanat the height of the internet bubble. Make computers with easier to open cases, androomier bays. (Dell, and many other manufacturers already do.)
Limit software license restrictions that forbid selling obsolete computers with oldobsolete software. That will encourage “second lives” for business computers that arecurrently scrapped to avoid copyright liabilities.Manufacturer liable for recycling computer end of life (as in Europe). This will bothencourage longer lifespans, and encourage manufacturers to make computers easier torecycle…Computer total impact savings 80% 60% energy savings
Cooling It: No Hair Shirt Solutions to Global Warming by Gar W. Lipow GarLpublic AT Comcast DOT net
Page 27 of 265
If computers are leading edge appliances, refrigerators are perhaps the oldest, mostmature technology. Heat pump based cooling was invented and commercialized in thelate 19th century, mostly to make ice for distribution. Can we lower the intensity of themanufacture of heat pump refrigeration, and improve efficiency too?
The Wuppertal institute proposed (and built an example of) an alternative85, based onlooking at refrigeration in a new light. What services exactly does it provide?
...produce or groceries should be kept cool and dark so that they will not spoil; thestorage space should be located in immediate proximity to where food is prepared;it should be hygienic, able to accommodate the usual containers, as well as meetthe reigning aesthetic standards, and it should be easily accessible....
...why should a refrigerator not be a part of the house similar to our grandmother'sroot cellar or pantry? … The doors, seals, control technology, as well as theseparately incorporated refrigeration unit, should be exchangeable....
So instead of building what amounts to a cupboard, and transporting it to the home, buildit in place like any other cabinet and add a high quality thermostat, heat pump, vent andinsulation. In operation, it uses around 145 kWh per year - about a tenth of the averageU.S. household refrigerator. (In fairness new U.S. refrigerators consume a great deal lessthan average U.S. consumption.) At the time the analysis was done they simply noted thatthey used around the same weight of material, but designed it to last the life of the houseinstead of the usual refrigerator lifespan. Their material substitutions, greatly reducingsteel (and other metals), glass, and plastic, replacing them with wood and cork or paperwill reduce material intensity even of manufacture by a factor of four or greater - beforeyou consider the greater lifespan – four or five time the U.S. average. So you end up witha factor 16 to 20 reduction in embedded impact, a 90% or better reduction in embeddedenergy over the life of the refrigerator (not counting operational savings.)
That defines a spectrum - but what about appliances in between? There may well besome room for material substitution and rethinking of the same type we saw inrefrigerators, or drastic changes at the manufacturing level as we saw with computers, ora combination of both. Microwaves are closer to the computer end of the spectrum,dishwashers, washers and dryers closer to the refrigerator. Really small appliances, likecan openers, and toasters could probably reduce impact in a third way - by a drasticincrease in lifespan. A 21st century slice toaster does little a 1965 slice toaster did not do.A 21st century can opener does little a 1978 can opener did not do. There is no reason notto manufacturer such very small appliances with sufficient durability to multiply theiryears of service four times or more. In many cases increased durability can combine withlower impact materials.
In total we can reduce major appliance impact by 80% to 90%, minor appliance impactby 50% to 75%. A factor four to five reduction in total impact would be reasonableestimate – a 50% energy savings or a bit more.
Cooling It: No Hair Shirt Solutions to Global Warming by Gar W. Lipow GarLpublic AT Comcast DOT net
Page 28 of 265
Can’t Hide Your Lying Eyes: Material Intensity in PackagingOf course there is another way to reduce the impact of can openers - eliminate cans! No,we don’t need to give up the convenience of modern packaging; rather there areimprovements in packaging that make cans obsolete; we can also eliminate wastefuloveruse.
Packaging fulfills three purposes, but is only needed for one. It helps preserve goodsduring storage, shipping, and in the consumer's home - fair enough. Packaging alsoprovides security - often packages are designed larger than preservation requires to makestealing more awkward. But there are plenty of other means to prevent or reduce theft -including a less predatory social atmosphere. Finally packaging is a marketing tool - usedto persuade people to buy goods and services. In a modern U.S. supermarket, the floorsnow compete with ceilings for what can hold the most advertising. Dividers used bycustomers to separate orders each carry a one line slogan. Conveniently placed at eyelevel above the urinals in the men's restrooms you find more paid advertising. Do wereally need to make packaging two to four times the size protection against spoiling andshipping damage requires, to grab shelf space, and take one last chance to grab thecustomer's attention?
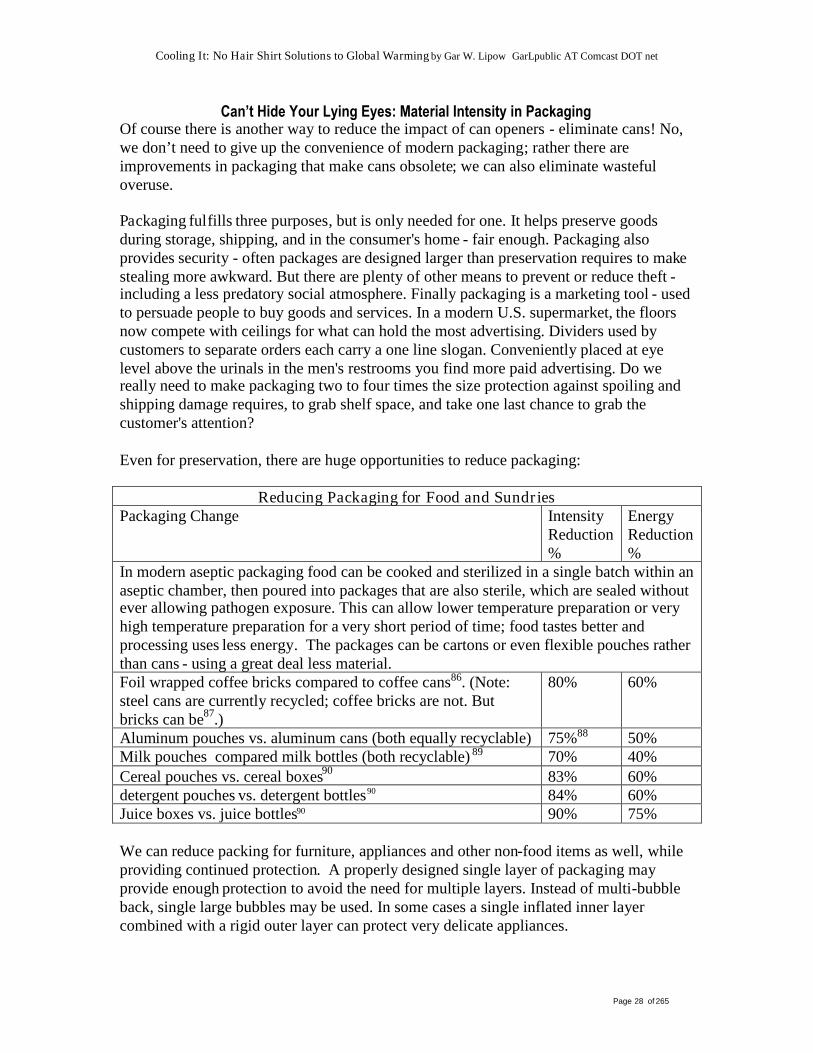
Even for preservation, there are huge opportunities to reduce packaging:
Reducing Packaging for Food and SundriesPackaging Change Intensity
Reduction%
EnergyReduction%
In modern aseptic packaging food can be cooked and sterilized in a single batch within anaseptic chamber, then poured into packages that are also sterile, which are sealed withoutever allowing pathogen exposure. This can allow lower temperature preparation or veryhigh temperature preparation for a very short period of time; food tastes better andprocessing uses less energy. The packages can be cartons or even flexible pouches ratherthan cans - using a great deal less material.Foil wrapped coffee bricks compared to coffee cans86. (Note:steel cans are currently recycled; coffee bricks are not. Butbricks can be87.)
80% 60%
Aluminum pouches vs. aluminum cans (both equally recyclable) 75%88 50%Milk pouches compared milk bottles (both recyclable) 89 70% 40%Cereal pouches vs. cereal boxes90 83% 60%detergent pouches vs. detergent bottles90 84% 60%Juice boxes vs. juice bottles90 90% 75%
We can reduce packing for furniture, appliances and other non-food items as well, whileproviding continued protection. A properly designed single layer of packaging mayprovide enough protection to avoid the need for multiple layers. Instead of multi-bubbleback, single large bubbles may be used. In some cases a single inflated inner layercombined with a rigid outer layer can protect very delicate appliances.

Cooling It: No Hair Shirt Solutions to Global Warming by Gar W. Lipow GarLpublic AT Comcast DOT net
Page 29 of 265
We also need to consider pre-consumer packaging. Consumer goods, package and all areusually stored in other packages to protect them during various shipping stages. Likeconsumer packages these can often be lightened. But in addition there is a lot of potentialin something difficult at the consumer end - reuse. Quite often a mutually beneficialagreement between retailer and wholesaler or manufacturer can result in return ofpackages, for use in future shipments. Unlike consumers, both parties know preciselywhat they stand to save in such arrangements, and the exact cost of additional labor inmaking them.
Cooling It: No Hair Shirt Solutions to Global Warming by Gar W. Lipow GarLpublic AT Comcast DOT net
Page 30 of 265
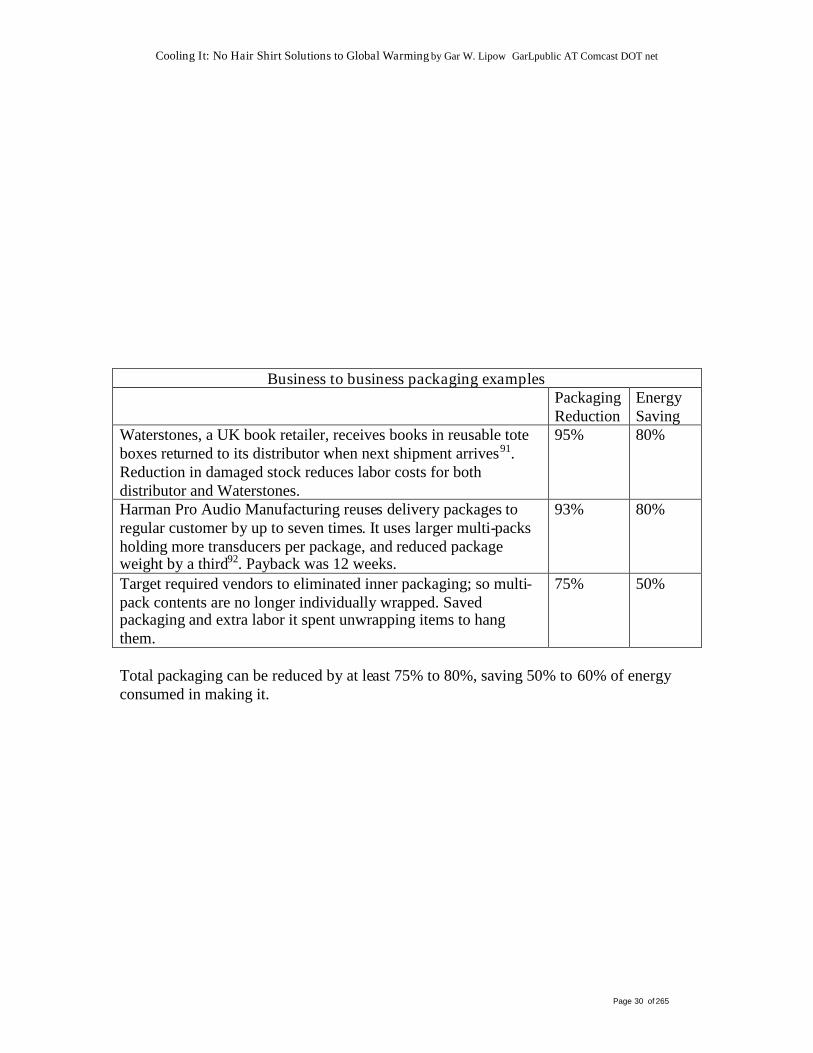
Business to business packaging examplesPackagingReduction
EnergySaving
Waterstones, a UK book retailer, receives books in reusable toteboxes returned to its distributor when next shipment arrives91.Reduction in damaged stock reduces labor costs for bothdistributor and Waterstones.
95% 80%
Harman Pro Audio Manufacturing reuses delivery packages toregular customer by up to seven times. It uses larger multi-packsholding more transducers per package, and reduced packageweight by a third92. Payback was 12 weeks.
93% 80%
Target required vendors to eliminated inner packaging; so multi-pack contents are no longer individually wrapped. Savedpackaging and extra labor it spent unwrapping items to hangthem.
75% 50%
Total packaging can be reduced by at least 75% to 80%, saving 50% to 60% of energyconsumed in making it.
Cooling It: No Hair Shirt Solutions to Global Warming by Gar W. Lipow GarLpublic AT Comcast DOT net
Page 31 of 265
Paper in Fire: Material Intensity in Paper UseWhen cardboard and paperboard are included, packaging and shipping constitute aroundhalf of paper use93, which packaging reductions discussed in the section immediatelyprior to this one can reduce by 75%-80%.
Another 12.5% is used for newsprint93- mostly to be read once, and then thrown away.The major potential for reducing newsprint size lies in reading daily newspapers onscreens rather than on printed pages. This does not refer to current fuzzy monitors, noteven LCD types. Comparatively new technology exists that allows electronic printingonto extremely thin laminates at resolutions better than that of newsprint. This is nolonger experimental. Sony now sells the 160 dpi Librie EBR-1000EP e-reader - whosesix inch screen has (as promised) a better resolution than a newspaper94 . I don't expect theLibrie to prove a great success. On initial release, it accepted documents only in aproprietary formati. The controls are unresponsive. And, as befits a bleeding edgeproduct, it is expensive - over $400 for a machine with computing power exceeded bysome calculators.
But none of this is inherent in the technology. According to Reuters, the cost of thescreen itself is in the "tens of dollars"95. So there is no reason a decent e-ink reader aboutthe size and weight of a thick trade paperback could not sell for $120 dollars or under,probably less than the cost of printing a typical U.S. daily newspaper for two years96. Itwould have no keyboard, only the minimum controls for navigating documents; thescreen would be easier to read than most paper pages.
What about the manufacturing and operating impacts of such readers? E-book readersnormally use much smaller screens than desktop LCD monitors. Smaller sizes are moreconvenient, and higher resolution screens don't need to be as big. And even for a givensize, e-ink type screens have about a third less impact than LCD monitors97. Similarly, inoperation e-ink readers use drastically less energy even than a typical PDA. Energy todownload and read is probably around a tenth that required to make and deliver the paperto the printer, print the paper, then distribute and deliver it to the reader. And you don'tneed the fastest chips or memory for this purposeii. While reading on a full size desktopwith a CRT has a similar impact to a paper periodical, an e-ink style reader has between atenth and quarter of the impact of real paper – even allowing for the "clipping" of articles,ads and coupons by printing. There is no reason e-ink could not eventually completelyreplace printed newspapers. It is absurd to use enormous amounts of material to producenewspapers which are almost never completely read, mostly read only once, and thendiscarded the next day. And with a properly designed newsreader, there is no reasonthere should be any loss of convenience.
i Remember Sony is the same company whose marketing geniuses chose to keep the superior Betamaxformat proprietary - which is why the technically inferior VHS was the standard video format until DVDreplaced itii Because screen refreshes really are done by printing to the screen, they take a noticeable fraction of asecond. So fast chips and memory would not be useful in any case; they would still run into a screenrefresh bottleneck. That is also why this technology is only useful in niche applications such as e-readers.The screen refresh rate is too low for normal computing.
Cooling It: No Hair Shirt Solutions to Global Warming by Gar W. Lipow GarLpublic AT Comcast DOT net
Page 32 of 265
There are plenty of other publications the same reasoning applies to. Many popularperiodicals are read a limited number of times and then discarded. So is a great deal ofpopular fiction. And even a lot of periodicals or papers that are kept over the long run andintensively studied don't need to be written in. E-ink, at its current stage of development,can be used to created inexpensive readers, suitable for any publication or document thatdoes not need significant markup. There is no reason this should not apply to at least 80%of books and periodicals. So a three quarters intensity reduction in 80% of publishedwork is a 60% reduction.
Office paper (including home offices) is another major portion of use. (Remember thatalong with magazines and books it constitutes about 30% of the total.) There are fairlylow tech means that can cut paper use in offices by 60%-90%. These include:
1) Replace all non-duplex printers as they wear out with duplex ones - then instituting apolicy of using both sides of all paper when practical.
2) Keep a reuse bin, and use the back side of paper printed on only one side for in-housework.
3) Making minor correction on in-house work and preliminary drafts in pen withoutreprinting the document.
4) Don’t print e-mail and other electronic documents unnecessarily.5) Make a practice of reducing margins for in-house work,
For example British Petroleum's Melbourne office reduced paper use 61% by thesemethods98. One office of Innovative Management Solutions, a Canadian environmentalcompany operating out of Ottawa managed to reduce paper consumption by 84% in aseven month pilot program99.
There are also some high tech ways to reduce paper use. An old idea from decades agohas justifiably fallen into disrepute – the hypothesis that computers and electronics wouldeliminate the need for paper. In point of fact, by making more documents accessible foreasy printing, information technology has increased paper use. Abigail J. Sellen andRichard Harper's wrote an entire book about this - "The Myth of the Paperless Office" 100.
There are several ways in which electronic documents are inferior to paper - printresolution, readability, and multi-document interfaces. Paper has higher resolution thannormal screens, better portability, and is easier to position. Multiple paper documents ona desktop handle more simply than multiple electronic documents on a screen. Paper iseasier to mark than electronic documents of any sort. Compare the use of a red pen tousing Microsoft's Word's "Track Changes" feature.
Cooling It: No Hair Shirt Solutions to Global Warming by Gar W. Lipow GarLpublic AT Comcast DOT net
Page 33 of 265
But this does not mean electronic storage does not have strengths too. If you don't alreadyknow exactly where your information is, it is a whole lot faster and easier to searchproperly indexed electronic files than thumb through paper archives. Similarly,electronics can store large amounts of information more easily than paper. A red pen maybe convenient for one person to make simple changes - but electronic change trackingsystems make collaborations among many people easier than paper. This is especiallytrue if some are in remote locations.
By working with the strengths of electronic storage, while not trying to make it replacepaper for the things paper does well, you can create an office that is not paper-less, butuses less paper.
O’Driscoll O’Neill , a Dublin a major Irish insurance brokerage operating out of Dublin,switched from a paper to an electronic document management and paper handling systemin January of 2003101. I can't find information on the exact amount of paper reduction, butpaper files have been reduced in number by at least 90%, and file clerks eliminated, alongwith 1,200 square feet of file rooms. Mail is processed faster than in the old system, andall documents are available electronically from any desk with appropriate securityauthorization. Because of this, people are spending 60% more time at their desks. "Lostdocuments" have been almost eliminated. As is normal in such system the gains inproductivity and customer service are the main point, paper savings being a minorsecondary effect.
KAF financial group, an accounting and consulting company reduced paper by 75% -again as a side effect of productivity increases102. The same article discusses even largergains Nevada County in California made by automating its system, and essentiallyputting all public documents on line.
It seems like a combination of "less paper" technology, common sense paper savingtechniques, ought to easily save 75% - 90% of paper used in offices. The cost forcommon sense techniques is low enough to more than pay for itself in paper saved.Electronic document interfaces are normally installed to produce productivity gains;paper saved is a side effect. The cost is better than free – a side effect of something that isalready producing a net gain.
Another "business use" of paper is junk mail - unsolicited advertisements. It is oftenargued that these "subsidize" the U.S. postal service - paying for first class mail. Even iftrue, such subsides are not really free. Obviously these, like all advertising and publicrelation costs, are incorporated into the price of products sold. If junk mail waseliminated or reduced the U.S. postal service could be subsidized in some other way. Butthe claim that this is a subsidy depends upon how post office accounting proceduresmatch costs and revenues. It is at least possible that first class customers are paying a bitmore than their fair share, and influential large mailers a bit less.
We won't discuss the 6.5% of paper used for tissues - paper towels, Kleenex, napkins andsuch, assuming no substantial saving there.
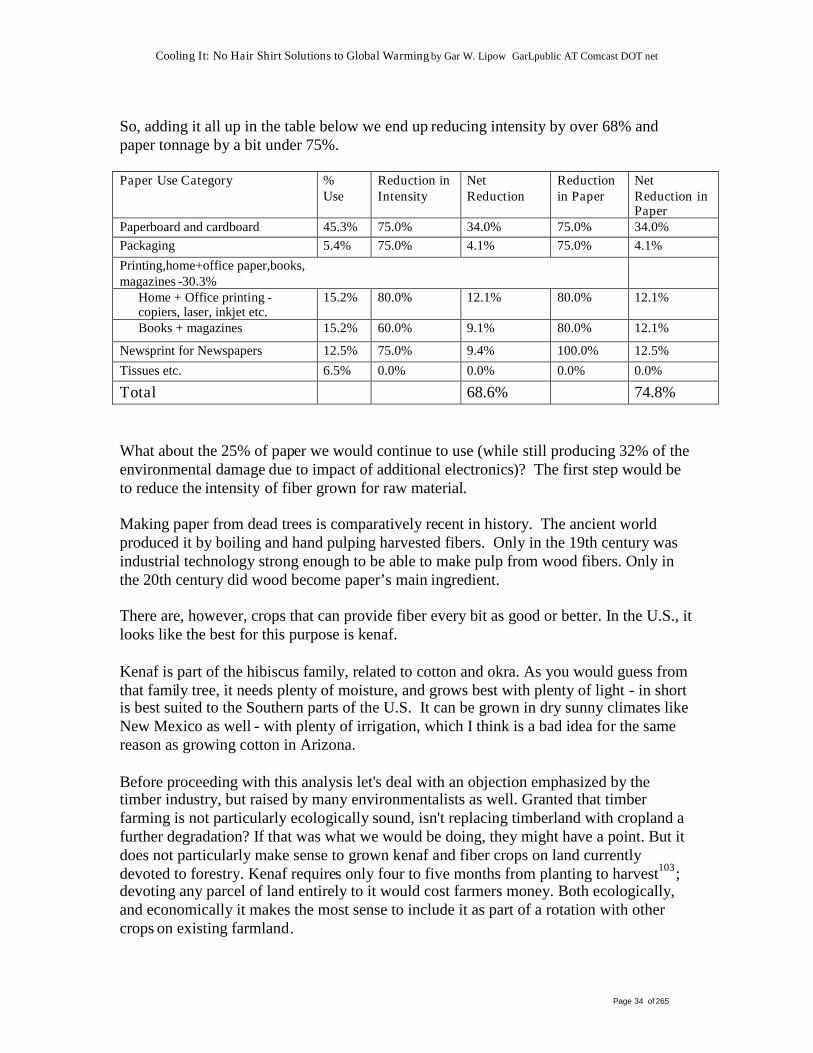
Cooling It: No Hair Shirt Solutions to Global Warming by Gar W. Lipow GarLpublic AT Comcast DOT net
Page 34 of 265
So, adding it all up in the table below we end up reducing intensity by over 68% andpaper tonnage by a bit under 75%.
Paper Use Category %Use
Reduction inIntensity
NetReduction
Reductionin Paper
NetReduction inPaper
Paperboard and cardboard 45.3% 75.0% 34.0% 75.0% 34.0%Packaging 5.4% 75.0% 4.1% 75.0% 4.1%Printing,home+office paper,books,magazines -30.3%
Home + Office printing -copiers, laser, inkjet etc.
15.2% 80.0% 12.1% 80.0% 12.1%
Books + magazines 15.2% 60.0% 9.1% 80.0% 12.1%
Newsprint for Newspapers 12.5% 75.0% 9.4% 100.0% 12.5%Tissues etc. 6.5% 0.0% 0.0% 0.0% 0.0%
Total 68.6% 74.8%
What about the 25% of paper we would continue to use (while still producing 32% of theenvironmental damage due to impact of additional electronics)? The first step would beto reduce the intensity of fiber grown for raw material.
Making paper from dead trees is comparatively recent in history. The ancient worldproduced it by boiling and hand pulping harvested fibers. Only in the 19th century wasindustrial technology strong enough to be able to make pulp from wood fibers. Only inthe 20th century did wood become paper’s main ingredient.
There are, however, crops that can provide fiber every bit as good or better. In the U.S., itlooks like the best for this purpose is kenaf.
Kenaf is part of the hibiscus family, related to cotton and okra. As you would guess fromthat family tree, it needs plenty of moisture, and grows best with plenty of light - in shortis best suited to the Southern parts of the U.S. It can be grown in dry sunny climates likeNew Mexico as well - with plenty of irrigation, which I think is a bad idea for the samereason as growing cotton in Arizona.
Before proceeding with this analysis let's deal with an objection emphasized by thetimber industry, but raised by many environmentalists as well. Granted that timberfarming is not particularly ecologically sound, isn't replacing timberland with cropland afurther degradation? If that was what we would be doing, they might have a point. But itdoes not particularly make sense to grown kenaf and fiber crops on land currentlydevoted to forestry. Kenaf requires only four to five months from planting to harvest103;devoting any parcel of land entirely to it would cost farmers money. Both ecologically,and economically it makes the most sense to include it as part of a rotation with othercrops on existing farmland.
Cooling It: No Hair Shirt Solutions to Global Warming by Gar W. Lipow GarLpublic AT Comcast DOT net
Page 35 of 265
Now this doesn't mean we don’t lower the yield of other cultivars; adding a fiber crop toa rotation does reduce total food produced on average per acre per year. Not every pieceof land used to grow food will convert to a kenaf rotation, of course. Still we are going tohave to increase the total acreage of land under cultivation to accommodate the kenafi.
A significant amount of cropland held out of production is in economic reserve or as apart of a soil erosion program – without being used for wildlife preservation or convertedto non-farm uses.
Converting some of this to no-till rotational agriculture could increase total acres undercultivation - while (as we have already shown) building the soilii; cropping this acreageby such means would help rather than harm the environment.
Further, shifting some production from timber to agriculture could help provide moreincome to farmers – contributing toward reducing the single greatest threat to long termfood production - loss of agricultural land.
Intensive industrially farmed kenaf production uses about one half the water thatintensive production short rotation timber does104, erodes soil at about half the rate, usesabout a third less fertilizer, and slightly few pesticides and herbicides, and produces aboutthree times the fiber per acre once credit is given for soybean production in rotation onthe same land.
Kenaf could also be produced more sustainably via a system similar to "the old rotation",the longest running experiment in rotational agriculture in U.S. (run by AuburnUniversity College of Agriculture), which began in the late 19th century105. The oldrotation grows cotton (no nitrogen), crimson clover or hairy vetch as green manure (nonitrogen), corn (no nitrogen), rye as cover crop (60 pound nitrogen), soybeans (nonitrogen) in a three year rotation. Given that Kenaf can mature from planting to harvest intwo months shorter time than cotton, you could probably get the same effect with a twoyear rotation, alternating between soybean/corn, and kenaf/corn and putting in clover orvetch every year. The annual use of a leguminous green manure would eliminate the needfor nitrogen fertilizer. The variety of crops and crop types would allow farmer to use trueno-till farming, as the old rotation does for cotton106.
i Just a reminder - this is a long run problem. In the short run we grow more food than the world needs.World hunger is entirely due to injustice and stupidity. There is no food shortage.ii Other conservation tillage alternatives can do this to some extent too. But any level of plowing disruptsglomalin completely; soil without glomalin will never hold together as well, or be as fertile, or as good acarbon sink as untilled land.
Cooling It: No Hair Shirt Solutions to Global Warming by Gar W. Lipow GarLpublic AT Comcast DOT net
Page 36 of 265
Kenaf farmed in a modified “old rotation” system would consume about one fifth thewater, fertilizer, and land area of long rotation tree farms (where trees grow 45-75 yearsbefore being clear cut), and build soil instead of eroding it, and need fewer herbicides andpesticides as well. Because we are doing no-till with green manure we are building soilat the fastest rate possible - and offering the greatest carbon sink harvested plants arecapable of. We are going beyond carbon neutrality to do a very small amount ofgreenhouse gas mitigation.
The superiority of kenaf to timber is even greater than a comparison to timber farmsalone would suggest. More than half of new (as opposed to recycled source) pulp comesfrom clear cut natural second growth timber107; an additional ~15% is logged fromnatural old growth forest.
408 Million acres are classified as timberlands, not including any lands removed fromproduction, in the U.S108. Around 29% of this is used to produce paper109, so 118 millionacres are currently devoted to paper. If we institute a 74.75% paper reduction, thenaround 30 million acres will still be needed for that purpose with conventional timberharvesting. Population growth will increase that to ~44 million acres by 2050. Kenaftends to range from 3 times more production per acre (comparing most intense to mostintense) to 7 times more production per acre (comparing longest pulp-farm rotations tolowest impact form of kenaf rotation). Halfway between those two would be five, to beconservative, let us model kenaf as producing 4 times as much per acre. (Remember thisgives credit for the fact that kenaf rotates with food, and thus does not use 100% of thecapacity of the land.) We would need 7.5 million acres of kenaf to replace wood pulp forpaper with today's U.S. population, and a bit over 11 million to replace timber needed toserve reduced paper needs by the projected U.S. population of 2050. In 2002 57 millionacres of cropland was idled according to the 2002 U.S. Department of Agriculture'sNatural Resource Inventory110. Even given that much of this would be wildlife reserveland, or otherwise not suited for cropping, there should still be a lot more than 11 millionacres we can use. Most of it would probably not be good land for kenaf. But more than11 million acres would be suitable for some type of food, to replace the food productionkenaf would displace when put into rotation with existing food crops.
Obviously, not one acre of timber farm has to be converted to kenaf farm to grow kenaffor paper. But let's confront for a moment the worst nightmare the timber industry uses toscare us from considering kenaf - that timber land would be directly converted to kenafproduction. Currently 118 million acres of land is used to grow timber for paper.Suppose we gradually replaced 11 million acres of that with kenaf farms, as it washarvested for pulpwood anyway, then moved the rest out of production into wildlifepreserves. That is still many times better than what we are doing now. As will be seen inlater sections, we probably will have to do something on these lines – not to producepaper, but for energy farms.
Cooling It: No Hair Shirt Solutions to Global Warming by Gar W. Lipow GarLpublic AT Comcast DOT net
Page 37 of 265
Why not used waste straw, and other fiber waste - rather than cultivating crops onpurpose for paper production? There are two reasons. One is that straw is a great buildingmaterial. As previously pointed out it makes a board superior to particle board, and it canbe directly used in home construction. Paper is rather a waste for it - especially sincekenaf makes a much higher quality paper than straw. Most fiber waste is high in silica -making it more difficult to recycle than paper pulp. Kenaf in contrast is low silica, buthas sturdier fiber that can be recycled more often. Kenaf is actually more recyclable thanwood pulp as a paper ingredient. And the silica in straw is a plus for building applications- strawboard and such. Incidentally there are similar reasons for not using hemp forpaper. The extremely high quality fiber in hemp is more difficult to process than kenafinto paper, and has more important uses. Hemp bast can replace a great deal of cotton;hemp hurd can produce a plaster substitute for building facings.
Now obviously we should not be wedded to agricultural fibers for paper. If the timberindustry wants to propose a wood pulp source that has even less environmental impactthan kenaf - more power to their elbows. But that certainly does not include anything theyare doing now.
Kenaf based paper currently costs about double that of wood pulp based. Even if thatremains the price, with a 75% reduction in use at a cost of "better than free" we wouldend up spending a lower portion of our GDP on paper than we do now. Thomas A.Rymsza, the founder and President of Vision Paper (a kenaf based paper manufacturer)claims that if can get the capital to open a pulp mill suitable to processing kenaf, the costwill be 20% lower than conventional paper111. Of course Rymsza is a successfulentrepreneur, and therefore an optimist by definition. The case he makes is plausible, butthat is part of the definition too.
Raising and harvesting fiber is only one part of the impact paper has. Just as, or probablyfar more, important is the conversion of fiber to pulp and pulp to paper.
Probably the single most significant part of the process in terms of environmental impactis manufacturing. A dedicated kenaf mill would provide a bit of a head start in thisrespect. It would use 15% less water, 25% less energy, and be totally chlorine and sulfurfree. But the best of breed commercially successful pulping mills can do much better.According to the World Watch institute, the most efficient technology produces 80% lesseffluent than the least efficient112. In the same report, one mill using 100% recycled inputmanaged to produce zero effluent of any type, and use 98% of the fiber input. They alsonoted that mills using the environmentally soundest technology tend to be the mostprofitable - since they make more efficient use of labor, and also depreciate theirequipment more slowly. Not exposing your equipment to highly volatile toxins lengthensits lifespan - something it also does for the plant's workers, and the local community.
The European Commission's Integrated Pollution Prevention and Control produced anextremely detailed report on this in December of 2002113.
Techniques recommended in this document include:
Cooling It: No Hair Shirt Solutions to Global Warming by Gar W. Lipow GarLpublic AT Comcast DOT net
Page 38 of 265
1) better training of workers, and better maintenance of equipment,2) large enough equipment and buffer areas to minimize spills, and to capture them
when they occur,3) mills that use trees as input should debark them by dry methods to avoid wet
processing of bark4) Where bleach process are used, delignification before bleaching by extended or
modified cooking and additional oxygenation, followed by chlorine free bleachingor elemental chlorine free bleaching
5) Highly efficient closed cycle brown stock for Kraft and Sulphite mills.6) Effective spill monitoring and containment.7) Closed water cycles where possible, water reuse, and recycling where not.8) Counter current washing (water from cleanest process used as wash water for the
next cleanest, and so on).9) Separation of various water cycles to avoid contaminating one another.10) Primary and biological treatment of wastewater, sometimes followed by
flocculation or chemical treatment, and sometimes followed by recycling oftreated wastewater.
11) Efficient processes for mechanical mills that spot potential rejects beforeprocessing
12) Avoidance of production of excessive emissions to air through precisemonitoring, temperature oxygen and chemical controls,
13) Filtering, scrubbing, recovery, and in some cases incineration of noxious gases.
The next major impact is end of life. Currently around half of all paper in the U.S. iscollected for recovery114. The Germans manage to collect around 70%115 of theirconsumption for the same purpose. There is no reason the U.S. should not match that.Given reduced paper use, and thus easier management of paper burdens, we should beable to exceed it and reach an 80% or better collection rate. Also, with the use of kenaf,the longer fibers may be recycled more times than wood. So we get a higher percent ofusable fiber from recycling kenaf than we do with recycling paper based pulp. The twocombined mean we can reduce end of life impact by around three times. And, of course,increased recycling reduces the amount of kenaf we have to grow, and makes it slightlyeasier to run lower impact mills. But note that of all the steps we as a society can take toreduce paper impact, recycling (though significant) is the least important..So what are we looking at in total impact? We can reduce paper consumption by around75%, lowering impact by about 68%. We can reduce the impact of growing the remainderby about 80%, and manufacturing it by a similar amount. Growing and harvesting fiberfor paper, and manufacturing it are overwhelmingly where paper impact lies. At the endof life, through increased recycling, and the ability to recycle fibers more times, we canreduce end-of-life impact by around another two to three times. This totals better than80% - a factor five reduction+ i - at rough estimate leading to a 60% or better reduction inenergy use for paper manufacturing.
i Let us underestimate growing, harvesting fiber and manufacturing paper as jointly accounting for half ofpaper's impact. Use reduction saves ~75% of paper use (though only ~69% of impact). So if we were able
Cooling It: No Hair Shirt Solutions to Global Warming by Gar W. Lipow GarLpublic AT Comcast DOT net
Page 39 of 265
Bed of Roses: Material Intensity in Furniture
Furniture also consumes significant quantities of material, whose impact we may lowerdrastically. One example is office chairs, where "...visible and structural elements aremade separately. Foot, leg mechanism, and seat are optimized for comfort ergonomics,robustness durability and easy repair. Cushions and covers and cloth changeable - bothmoney and ecological costs are minor compared to the main parts of the chair - stilldematerialized and recyclable -an 80%-95% reduction in materials116."
Eames, and Le Corbusier designed chairs on long these lines. Sedus, Wilkhahn andGrammer have actually added such lines to their collections. Similarly, the Chaos/GEAsolid wood shelves are designed to combine minimal construction material use with along lifespan117. And of course some of the same means that save materials in buildingscan save them in furniture. Strawboard panel can substitute for particle board, fiber andcomposite boards, and even extremely low grades of plywood. Bamboo and Rattanframes can substitute for wood and metal. Hemp can substitute for plastic mixtures infurniture coverings. So we end up with a factor five reduction just from making longerlifespan furniture from lower impact material (and in many cases less material). This isanother example of a 60% reduction in energy use before we increase efficiency in asingle manufacturing plant.
to eliminate 100% of remaining paper consumption at zero cost or environmental impact that would stillleave ~6% of intensity that could not be eliminated. That leaves ~25% of paper whose manufacturing wecan impact, with maximum arithmetically possible savings of 19%.
We can eliminate 80% growing, harvesting and manufacturing impacts of production of this remaining~25%, and reduce end-of-life impact by 2/3rds. Since end-of-life is where the least savings are possible,we will be conservative and assume it represents half of total environmental costs. So, by theseconservative and in fact extremely pessimistic assumptions:Net Paper Reduction 74.8%Net Reduction in Intensity 68.6%Intensity that cannot be eliminate, due to environmental costs of use reduction 6.2%Maximum Arithmetically possible remaining reduction 19.1%Allocate 50/50 between growth/harvest/manufacture and end-of-life 50.0%savings in growth, harvest and manufacturing 80.0%savings in end of life 66.7%net savings growth, harvest and manufacturing 7.6%net savings end of life 6.4%net savings in paper cycle (as opposed to use reduction) 14.0%Intensity reduction from use reduction and savings in paper cycle combined 82.6%
Cooling It: No Hair Shirt Solutions to Global Warming by Gar W. Lipow GarLpublic AT Comcast DOT net
Page 40 of 265
Dress You Up in My Love: Material Intensity in FibersThis leads to the question of fibers in general. We have already documented that wastestraw, used in quantities that do not compromise soil fertility or structure, can supply100% of low-grade manufactured board needs - particle board, and such. Strawobviously won't work for fabrics - for clothing, furniture covers, and many industrialuses.
One critical trick in textiles in general is the same as the one we discussed in furniture -make the lifespan longer, so we get more year of use out of whatever inputs go intomaking them. A fabric example we have already discussed is Interface carpets whichreduced material intensity by 90%+46. Because much clothing tends to go out of fashionbefore its current lifespan is exhausted, clothing is an especially good example. There arenatural fabric fashion lines based upon classic lines and color schemes to stay in stylelonger - Natura Linea for example117. (Think of little black dresses, classic cut suits, orjeans, and t-shirts.)
In clothing at least, the single biggest consumer of resource in fabrics is the cleaning118.(This probably applies to towels, and sheets too - not so much to other fabrics which arecleaned less often and less intensively.)
There are two technologies (really three) that might greatly reduce the intensity oflaundering - if properly combined. Today you can find at least two brands of "soap free"clothes washers on the market119. Daewoo manufactures the Midas, which combinesozonation with a small amount of catalyst to wash clothes without need for detergent.Sanyo does not require the catalyst, but boosts ozonation with ultrasound instead. Bothwork extremely well at sterilizing the clothes and water. Neither actually cleans all thatwell. In fact the Sanyo recommends soapless washing only for marginally soiled loads,and detergent and warm water for heavily soiled loads. However, for light loads wheredetergent and stain remover is not used, output from the Sanyo is free enough of bothmicroorganism and toxics that waste water from it could safely be used to water a garden.(This would be illegal almost everywhere in the U.S. - but it would be safe, and youmight be able to obtain permission in some areas.)
Now there is another technology out there - resin cleaners. A team of designers hasdeveloped the EcoSafe washing machine120. One small resin tablet will clean clothesthoroughly, without soap for about 50 loads. There is some sort of enzymatic action;demonstration models get clothes as clean (in fact significantly cleaner) than detergent -and sweet smelling too. There is so little resin released in a single load that no rinse cycleis needed. And, from a cleaning point of view, there is no reason ever to use warm or hotwaters. Cold works just fine on everything. So if you take a normal front loading watersaving washer, run it only on cold water, and eliminate the rinse cycle you havemaximized both water and energy savings. And the water you do use comes out lesspolluted because of the not needing to use soap.
Cooling It: No Hair Shirt Solutions to Global Warming by Gar W. Lipow GarLpublic AT Comcast DOT net
Page 41 of 265
So, unlike ozone ions, why has this not been commercialized? Resin, from all accounts,does a marvelous cleaning job - but has no sterilization or antiseptic properties at all.Normal detergent does a fair job at sterilizing clothes, especially when hot water is used.Commercial detergent free washers are far superior at sterilization, even though actualcleaning power is not great. No manufacturer wants the liability of selling a washingmachine that has fewer anti-bacterial properties than a normal washing machine. Sure,you can use hot water to make up for some of it - but then you lose many of theadvantages of the detergent free model.
Of course the solution is obvious. Combine the resin washer with ozonation or ultrasoundor both. Then you have cleaning and sterilization properties combined. You never have touse detergent or hot water. You can use normal water saving technologies (make themachine front loading etc) and eliminate the rinse cycle, except for loads requiring staintreatment. Most energy in washers is used to heat water - so eliminating the need to everuse anything but cold water takes already energy savings washers and saves even more.The elimination of most rinse cycles saves a good bit of the remaining energy and water,and will combine well with normal conservation practices. In terms of water, you notonly decrease use, but decrease pollution of water that is used – reducing total impact bya great deal more than normal water saving washers. Energy use is cut 80% or more.Water use is probably not lowered quite by that, but water impact by a great deal morethan 80%. Because of resin and stain removal, not quite something to use on your garden,but nonetheless 99%+ less polluted than output from a normal wash load.
So we can reduce the environmental impact of laundering fabrics by 80% or more. Canwe do something similar with dry cleaning? Greenpeace favors two technologies121 thatcan save 80% or more of the impact over conventional perc based methods. Some drycleaners have begun to use wet cleaning techniques first imported from Germany in 1991,that get clothes as clean, wrinkle free, and do as little damage as dry cleanings122. Othersuse carbon dioxide based cleaning that save water, energy and avoid toxic chemicals123.Other alternative dry cleaning methods, though better than PERC, are not so highlyrecommended.
Outside of clothing, sheets, towels, and other such items than need weekly cleaning,maintenance is probably not quite so large a part of environmental impact. In such itemsthough, sturdier and easier to clean textiles will reduce such costs. We will return to thisin a bit.
Cooling It: No Hair Shirt Solutions to Global Warming by Gar W. Lipow GarLpublic AT Comcast DOT net
Page 42 of 265
For most non-clothing textiles, the manufacturing process is probably the single greatestpart of the environmental impact. Textile manufacturing is by nature an extremely dirtyprocess. The steps vary from textile to textile but include texturizing human-made fibersor preparing and spinning natural fibers. They including warping, bleaching, weaving,scouring, more preparation, dyeing (and/or printing), finishing, cutting, sewing. Justabout every step involves washing and rinsing. You need chemicals to help the fabricsurvive mechanical and thermal processes, to add special properties to the fabric, to speedup the absorption of other chemicals, to counteract the effects of other chemicals, to helpclean out other chemicals. Huge amounts of water are used throughout. Large amountsof energy are used to heat that water to the proper temperature for various chemicalprocesses. This is historically part of textiles - not merely of the modern industry. Lookat the ancient Roman dyeing industry, or how leather was traditionally tanned, or howwool was traditionally cleaned and treated. The material intensity of fiber manufacturingis another area with tremendous economically feasible potential for reduction -conservatively 80%.
Shell can make Polytrimethylene terephthalate (PTT) cost comparable to PETpolyester fabrics124 PTT, unlike normal polyesters can absorb dye without carriers attemperatures as low 100 degrees centigrade.Use wool, cotton, flax, hemp, and other natural fabrics raised without pesticides.None end in processing baths.Standard setting for purchases125, to avoid processing unacceptable material,reducing reworks, seconds, and discards.Testing/pre-screening raw materials126
Implement simple operations and housekeeping improvements. Spills and wastagefrom poor housekeeping can be responsible for between 10% and 50% of a mill'stotal effluent load127
Schedule dyeing to minimize cleaning.Dye each color separately; or schedule similar colors together, dying lighter todarker colors, and brighter to duller chromas. (The first is occasionally practical, thesecond fairly frequently.)Automatic stops on washing processes to stop when the processes they are rinsing orwashing do. Install valves and spill prevention devices to prevent overflows.Replace toxic chemical processes with thermal or mechanical processes, and lesstoxic chemicals. For example, J.P. Stevens substituted ultraviolet light for chemicalbiocides in air washers and cooling towers128.Dutch General Assessment Methodology in Netherlands (RIZA-concept) SCORE-System in Denmark, BEWAG-concept in Switzerland, and TEGEWA system inGermany.

Cooling It: No Hair Shirt Solutions to Global Warming by Gar W. Lipow GarLpublic AT Comcast DOT net
Page 43 of 265
Examples of substitution include hydrogen peroxide in desizing starch, copper freedyes, high temperature reactive dyes that can be loaded at same time as dispersivedyes - normally applied in a separate stage129. (This saves time, water and energy byeliminating a stage, and also eliminates the caustic bath dispersives normallyrequire.) Use surfactants biodegradable, or bioeliminable in wastewater treatmentinstead of alkylphenol ethoxylates such as alcohol ethoxylates130. Bathless air jetscan avoid or minimize the use of anti-foaming agents; to the extent they still must beused there are alternatives to conventional mineral oil based agents131.
Avoid pre-treatment and dyeing complexing agents by softening water to removeiron cations.
Use dry processes to remove iron from fabrics.
Remove iron inside fabrics by non-hazardous reactive agents.
Minimize use of sizing agents by prewetting yarn. (There is still a net reduction inwater use, because of reduction in washing requirements131 :253.)
Compact cotton spinning can cut sizing chemicals by half, completely eliminateingparaffin, and greatly reduce water use131:254.
Ultra-low chrome wool dyeing via stoichiometrical and substoichiometrical dosage.(Stoichiometical dyeing means dyeing until all molecules in the wool that can reactwith the chrome have been exhausted, lowering the chrome residue.Substoichchiometical dosage means stopping before all sites on the wool areexhausted - using up even more of the chrome.
Urea in reactive dye printing paste may be eliminated, or in the worst case reducedby 73%, by foaming or spraying fabric to be printed with a trivial a mount of water.[Trivial compared to water contamination ended by elimination or reduction inurea.] Foaming works in every case - spraying for all except silk or viscosefabrics131:357.
There are techniques to reduce printing paste volumes131:362, and simple methods ofrecovering printing paste131 :364, of which between half and 75% can normally bereused.
Use a lower ratio of water to fabric (thus lowering the energy needed to move andheat the water, and the amount of chemicals in the water). For example, theLumberton, North Carolina plant of Almanac Knits lowered the water ratio of jetdyeing machines - reducing dye chemical use by 60% to 70%132.
Similarly, pad batch dyeing can drastically reduce chemical use for certain fabrics(mainly cotton, rayon and other natural fabrics - even then depending largely on thefinish desired). In it fabric impregnated with water and dyes mixed, the excess
Cooling It: No Hair Shirt Solutions to Global Warming by Gar W. Lipow GarLpublic AT Comcast DOT net
Page 44 of 265
squeezed out by mangles. It is rolled or boxed, and covered with plastic film andkept until dye is absorbed - then machine washed. It can eliminate salt and manyspecialty chemicals, and reduce water use by an average of 90%133 Where it can beused it also saves energy, production time, and labor. Like many environmentallysound techniques it pays for itself in labor savings and quality improvements, withenvironmental gains being essentially "free".
Automated dosing systems can deliver chemicals in the right amounts at the righttime. They reduce chemical and water use, make result more reproducible134 (This isan important benefit in the textile industry - allowing delivery of exactly the resultsthe customer ordered.) It also reduces process time (improving productivity) andreduces reworks and redoes. Bloomsburg Mills introduced automating dosing in itsdyeing process, and saved 28% of water use as a side effect. In the best such systemsfor normal commercial use, "dosing and monitoring equipment meter exact amountof chemicals and auxiliaries ,which are delivered to machines and vessels withouthuman intervention in exact right amounts. Wash water for vessels and supply pipestaken into consideration in preparation and dosing. Chemicals are delivered inseparate streams so that no premixing takes place before delivery."135 So cleaning isrequired only after completion of the final step.
Another alternative is single rope dyeing machines. According to the EuropeanCommission136: (note: paraphrased for brevity rather than quoted exactly)
Only one fabric rope passes through all flow groups and components return tothe first compartment after each lap is completed. High uniformity results,because fabric passes through all nozzles and troughs at each lap. Speeds,nozzle flows and operating conditions don’t vary in different compartments –conditions remain homogenous throughout. Baths reach uniformity morequickly when conditions change; this provides faster chemical injection, andsteeper temperature gradient without damage to fiber. The numbers of laps,rather than hold times, are the means of measuring process. (Exception -fixatives still time dependent - but all other chemical applications as well asmechanical and temperature dependent one may be measured in laps.) Thisgives very high repeatability. Time saving devices are also incorporated -power filling and draining, full volume heated tank, advance rinsing programsetc. can obtain constant liquor ratio with 60% of nominal capacity.
We already gave examples of possible savings in conventional printing, in the listsof chemical reduction. Much greater reductions are possible in extremely highvolume printing (such as carpets). Digital printing can provide very exact, veryprecise results - with dyes shot directly into the carpet. 80% of water, and similarsavings in dyes are made137 There are tremendous labor savings - carpet is printed ina direct WYSIWYG process from design. Patterns are stored electronically. Samplesare minimized or (occasionally) eliminated. These are very capital intensivemachines, and only pay for themselves in extremely high volume processes. Butwhere they pay, they really pay. It is rather a step function; it does not come close to
Cooling It: No Hair Shirt Solutions to Global Warming by Gar W. Lipow GarLpublic AT Comcast DOT net
Page 45 of 265
paying or you have really big savings - not much in between.
At the other end of the spectrum, extremely low volume textile printing may be donevia inkjet. You gain similar savings to any other digital printing. But because speedis low it only pays for extremely short runs - 100 meters or fewer138.
The greatest use of water in textile processing is in various rinsing and washingstages. One simple housekeeping step is to ensure rinsing and washing processes areturned off when the process they are rinsing and washing does. (It is usually worthputting in automated stops to ensure this.) Minimize wet cleaning through meanslike scraping machinery before wet cleaning it.
One way to greatly reduce this is via countercurrent washing. The least dirty waterfrom the final states in used for the next to the last stage, and so forth - until the firststate where water is discharged or processed. Savings vary, but typically, in a twostage process, wash water use is cut in half; in a five stage process water use isreduced by 80%139.
Savings almost as great can be obtained by optimizing and combining processes.One manufacturer reduced chemical use by a minimum of 20% by extending thetime fabrics were dyed by 15 minutes. Some of the worst pollutants were reduced by60% and 98%140. (Similarly several stages may be combined - for example de-sizing, scouring and bleaching. )
Lastly you can recycle and reuse water; most common is the reuse of dyebaths -which can be analyzed, replenished and reused141 Amital reduced water use by twothirds via dye bath and cooling water reuse142 . Similar savings have been reportedfrom rinse water reuse. In addition to the counterflow washing already mentioned,there are also continuous horizontal washers - where water is sprayed on top offabric as it travels upwards on the machine. Similarly, for bleaching there arecontinuous knit bleach ranges that use built in counterflow and controlled dosing toreduce water, chemical and energy consumption. The water from rinsing cleaningbelts also tends not to be extremely dirty and may be used for many purposes143.
In total every stage of textile processing there are multiple means that can reducewater and chemical consumption by between half and 90% each. While some ofthese are mutually exclusive, the vast majority can be simultaneously applied. Thereare additional multiple steps each one of which may save 10% to 33% of waterchemicals, and other steps that can reduce or eliminate a specific chemical or seriesof chemicals. Again most of these are not mutually exclusive. It would not beunreasonable to conclude that total water and chemical use in textile processing maybe reduced by 90% from the average. (Because of the combination of multiple stepsthat are cumulative). It would be conservative to conclude that this can be done bywell over 80%.
Cooling It: No Hair Shirt Solutions to Global Warming by Gar W. Lipow GarLpublic AT Comcast DOT net
Page 46 of 265
Lastly there is the question of natural fibers. Of all the natural fibers, cotton is the mostintensive - using more water, pesticides, eroding more soil, and covering more land perunit of production than any other natural fiber source; it is worse than many plastic fibersas well47. Hemp requires about the same water and fertilizer per acre to grow as cotton,but produces about two to three times the bast fiber per acre144. Hemp seed oil is asuperior substitute for cotton seed oil, containing much healthier fats. As a byproduct ofprocessing the oil out of hemp seed, you end up with high protein meal, superiornutritionally to soy meal and useful for almost every purpose soy meal has. (You don'tend up with as much of it per acre as soy; it remains a byproduct, not the main crop.) It iseasier than cotton to grow without pesticides or herbicides, and where they have to beused requires less. It requires significantly more processing than cotton, but alsoproduces huge amounts of hurd which have their own uses. So the net environmentalimpact of hemp per unit of output remains about one half to one third that of cotton,perhaps less depending upon how one weighs the high protein meal, and the higherquality oils.
Hemp can substitute for cotton in many applications. For example Levi's original bluejeans were made from hemp, and you can substitute hemp 100% for cotton in all denimapplications, as well as in most furniture fabric. Even in applications where you need touse cotton, you can substitute hemp for a percentage of fabric - producing a more robustshrink resistant fabric. (Recently some hemp clothing manufactures have beeneliminating cotton mixtures from their lines. New air finishing processes apparently makethe hemp soft enough to make cotton an unneeded addition.) In clothing applications wecan substitute hemp for 100% of about half the uses, and around 50% for the other half.In non-clothing applications, there is no reason not to substitute hemp 100% for cotton.So we can substitute hemp of 75% or more of cotton use. The cost will be about twicethat of cotton, but hemp fabrics also last longer than cotton fabrics, and require less care.For bed sheets, and rugs, and furniture covers and most non-clothing textile uses, thiswould more than make up for the difference.
For clothing, advanced cottonization that makes 100% hemp as comfortable as cottonincreases energy and water consumption at any rate. As pointed out in the section onagriculture, mixing hemp 50/50 with organic cotton is ecologically sounder in thesecases. In the case of clothing, increased physical lifespan may or may not translate intolonger actual lifespan, depending on how successful designers are in developing linesthat don’t go out of style. Regardless, lower production impact remains significant.
Another alternative that produces extremely soft strong fiber is bamboo – which requireseven less land than hemp, though comparable water per unit of output.

Cooling It: No Hair Shirt Solutions to Global Warming by Gar W. Lipow GarLpublic AT Comcast DOT net
Page 47 of 265
Natural fibers are only one part of textile manufacturing. Polyester, nylon, and othersynthetics play a substantial role - and in the U.S. constitute the overwhelming majorityof fabric. Hemp may reverse this to a modest degree. It is sturdier than cotton, moredurable, more water resistant, tends to shrink less. But it has no stretch, and is exceededin water resistance, and dry strength by a number of synthetics. As previously pointedout, there are lower impact synthetic fibers such as PPT that can substitute for higherimpact one.
So between better processes, longer lifespans and lower impact materials we can reducethe impact of fibers by three quarters – resulting very roughly in a 50% reduction inenergy use.
Cooling It: No Hair Shirt Solutions to Global Warming by Gar W. Lipow GarLpublic AT Comcast DOT net
Page 48 of 265
Big Wheels Keep On Turning: Material Intensity in Transportation
Transportation infrastructure manufacture also uses tremendous amounts of industrialenergy. Cars, trains, buses, planes, ships, boats, roads, parking areas, rail stations, busstations, switching stations, ports, harbors, airports, and so on all require energy to make.
We will start with the automobile, which is the single largest energy and infrastructureconsumer within transportation. Although people who really love automobiles will stillbe free to own them, we are talking about drastically reducing their use and ownership.So let's make this clear that we won't be asking for any sacrifice.
Automobile owners can be divided into two classes. For one group, either a smallmajority or a large minority, automobile ownership is a practical matter - the fastest, mostflexible and most reliable way to get the work on time, the most convenient way to goshopping. Offer this group an alternative that is just as practical - that does not involvethe inconveniences, delays, and inflexibility of most existing bus and train systems, thatis not only cheaper but more convenient than cars, with the same freedom, and they willgladly use it.
For a second group, cars are not just a mode of transportation; cars are a thing of beauty,something to love. However, very few people love driving on the Santa Monica Freewayat rush hour. Only very unusual individuals enjoy crawling along at four miles an hoursurrounded by incipient cases of road rage. Most car lovers prefer to drive when not toomany others are on the road, or at least in traffic that actually moves. Given the chance,most dedicated car lovers would probably save their driving for occasions when itactually is a pleasure, and use a decent transit system to avoid roads that have beentransformed into giant parking lots
Before continuing, let's emphasize we are not talking about eliminating all individual carownership. As a practical matter there are alternatives that make sense for cities andsuburbs. For truly rural areas, individually owned cars will remain the most practical andenvironmentally sound alternative. And, as we pointed out, there are people withemotional attachments to their cars that go beyond pure pragmatism. There is no reasonthey shouldn't own cars if they wish to.
So what is this alternative that is more convenient than individual ownership? It is acombination of an automated ultra-light rail and car sharing. Let's take them one at atime.
Cooling It: No Hair Shirt Solutions to Global Warming by Gar W. Lipow GarLpublic AT Comcast DOT net
Page 49 of 265
CyberTran145 light rail uses small cars carrying 20 passengers. (The same sized carscould actually be configured to carry anywhere from 6 to 30 passenger.) Small light carsrun on cheaper tracks. The total capital cost of a CyberTran urban system (including railand guideways) is about a tenth or less of the per cost per passenger mile of conventionallight rail146. CyberTran is an automated driverless system; so while fixed routes would beused during rush hour, (a series of CT cars following one another would mimic aconventional multi-car train) at all other times it would be an on demand system.Regardless, you would never have to wait more than five minutes or so for a car - usuallyless. In-system transfers should take even less time, because when you bought a ticket,the system would know you needed to transfer and when. And because of the highdegree of computerization (each car would have an on-board computer, plus the systemwould have a bank of central computers as well) routing would be optimized. Transferswould be avoided when possible; when transfers were needed the routes would still bedirect enough you would never go around Robin Hood's barn to get to your destination.
Given the small numbers of passengers per car (and the fact that stops would be made atoffline sidings, without blocking the main track) travel would also be optimized tominimize the number of stops a given car made. That is passengers would be sorted ontocars by destination. During off-peak hours this would result in virtual expresses with fewstops between a passenger and her destination. Rush hour might or might not allow this;but at minimum the number of stops made would be reduced; you would never have tostop at every, or almost every, station.
And there will be a lot of stations available. Stops are offline from main guideways - oneCyberTran car stopping does not delay others. CyberTran stations can be as frequent asbus stops. Because of automation you can afford more surplus cars, since unused capacityis parked, not rolling, not consuming labor or energy. And you can also afford not to haveto fill the cars. So in most cases you will have a stop within easy walking distance of bothends of your journey. In addition, even major stops don't have to be major multi-acre lotslike the BART Park n' Rides in San Francisco; Park n' Rides can consist of many smallparking lots; not giant branches of the night auto supply. If you live in a nightmarishsuburban development, with acre after acre of housing and no shops or suitable areas fora transit stop within walking distance, you will still find a (comparatively) small, pleasantCyberTran stop with parking a short drive from your home.
Also CyberTran is not designed for people to stand in the aisles. The cost, as mentioned,is about 10% that of conventional rails and most of that is in guideways, not the cars. Soit won't need to be overloaded during peak hours to pay for off-peak travel. You areguaranteed a seat. You only stand if you want to stretch your legs - an option you don'thave while driving an auto.
To summarize: you have 24 hour availability; journey time is about the same as a car;your railcar is ready when you are; you always have a seat; stops are nearby; and you canread the paper on your commute.
Cooling It: No Hair Shirt Solutions to Global Warming by Gar W. Lipow GarLpublic AT Comcast DOT net
Page 50 of 265
You have the comfort of a car, probably more - and unlike buses every car is fullywheelchair and disabled accessible; there is plenty of room for luggage - more carry-onbaggage space than pre-deregulation planes. (And, depending on local policy, they mayeasily be designed to accommodate baby carriages and bicycles as well.)
CyberTran is safer than auto travel, with a lower probability of accidents, better crashresistance, and built-in airbags.
CyberTran is better than normal transit both in terms of protection from crime andprotection from harassment. Unlike normal transit, it provides a low penalty inconvenience for following human instinct in choosing transit companion. A CyberTrancar is divided into compartments of between two and five seats each. So upon enteringyou can avoid compartments with anyone you feel uncomfortable with, or wait a fewminutes and order a new train if the whole car feels wrong.
In addition there are special security features; every seat has a phone that connectsdirectly to security. and there are pull cords like old trolleys have that automaticallyoverrides all programming and pulls to nearest secure destination, notifying security.Since you can tell which cord was pulled; and there are not many passengers to acompartment, identifying anyone responsible for "prank" stops or false alarms should bepossible in almost all cases.
The question arises as to how to put CyberTran (or other new generation of transit) inplace. An obvious place to start is with the fact that U.S. city and commuter buses getfewer passenger miles per gallon than cars or even light trucks/ SUVs147. Vehicles burn alot more fuel stopping and starting than traveling. A bus has to deal with normal stop andgo traffic and all the stops to pick up and drop off passengers besides. If they were fullyloaded all the time, that might make up for it. But according to DOT in the source justmentioned, even with standing room only during peak periods, city and commuter buseson average carry only nine passengers. Buses do reduce congestion, but not by much; onebus replaces many cars that would otherwise be on the road; but buses turning andchanging lanes in city traffic and especially buses at stops cause congestion as well.
Most city and commuter buses are miserable to ride. Bus trips take longer than car tripsto the same destination; further, trip time can be unpredictable. Passengers breathe fumes,often have to stand, and depending on the route may suffer harassment while traveling.Buses also perform an essential function. In the U.S., city and commuter buses are theonly means by which poor people or people who can't drive for any reason can getaround inexpensively. (Very few U.S. cities are exceptions to this.)
To replace this with a form of transit that is less expensive, more convenient and morecomfortable would be a kindness to city and commuter bus riders, and to the cars thatcurrently share the streets with them. Replace the busiest most crowded bus routes withCyberTran first, then the next, and so on until you replace all routes with three or moreruns daily. Put a transit stop at every former bus stop on these routes. The bus riders willbe much better off; and the streets will be less crowded and congested.

Cooling It: No Hair Shirt Solutions to Global Warming by Gar W. Lipow GarLpublic AT Comcast DOT net
Page 51 of 265
Ridership won't be limited to former bus riders. A lot of people will decide it is better toread a paper or nap on new generation transit than spend the same or more time stuck intraffic in a commute. Many will decide it is better not to fight traffic and parking whenvisiting friends and relations, or eating (and especially drinking) out. Givenaccommodations for luggage and packages, some may even use it for shopping.
And that will lead to demand for transit on other routes. Transit routes will becomeselling points in real estate. Developers will build along them, and demand them nearexisting tracts. In short you will get the same kind of feedback cycle that currently leadsto more auto use. CyberTran runs about 30 cents per passenger mile (cheaper than autotransportation) in a system with ten thousand users or over - something achievable infairly low-density areas. (In other words if 25,000 people live within ten miles of you(taking all directions into consideration) your area could support a CyberTran system. Inshort, it is practical wherever population density (living and working combined) exceeds81 people per square mile – something that is true for most of the population of the U.S.)
So how much infrastructure are we saving? For the same passenger capacity, aCyberTran consumes about less than a fifth of a land a comparable highway needs148, andthus probably the same in concrete and steel. When stations, maintenance outbuildings,electric power generation and administrative buildings are considered compared toparking, garages, gas stations, and auto repair required for cars trucks and buses, this landdifference probably is greater. Because it rest more lightly on the land (it is alwayselevated by at least a foot, and is quite literally lighter) CyberTran disrupts the land muchless during construction. Most of the time leveling and grading can be eliminatedentirely, and always greatly reduced. Further true elevation is comparatively inexpensive- thus allowing CyberTran tracks to raised above existing roads, parking lots andbuilding, on highway or freeway medians. Because CyberTran can handle steeper gradesthan conventional rail, it can sometimes climb mountains and hills rather than tunnelingthrough them. So overall it is reasonable to assume that fixed infrastructure impact isabout a tenth that required for automobiles, light trucks and buses.
As extra-long electric cars, leaving their motors behind, CyberTran train cars will takeless energy to build than three single family SUVs (which they are equivalent to in bothlength and passenger capacity). But they will be shared by about ten times the number ofpeople. Overall they have about 1/42nd as large a rolling infrastructure as automobiles orbuses per passenger mile149.
While super-light rails is not quite door to door, there is no reason everyone in an areasuper-light rail serves can't have a stop within a few short blocks of their home -anywhere a bus stop could go. Unlike conventional light rail, super-light rail does notrequire high-density development. Although it will fit quite nicely into new urbanism, oreven old urbanism, it also will work well in suburbs.
Cooling It: No Hair Shirt Solutions to Global Warming by Gar W. Lipow GarLpublic AT Comcast DOT net
Page 52 of 265
But there are times when a car will still be more convenient; two examples that spring tomind are transporting heavy or bulky items, and trips to rural areas. Instead of owningcars, people may subscribe to a commercial service that stores cars near where they live.This way they can rent the car just when they need it - without having to pay insurance,storage, maintenance and all the costs of owning a car full time while using it part time.Car sharing services already exist worldwide. There are even a number that have sprungup in parts of the U.S. Zipcar may be found in Boston, New York, New Jersey,Washington D.C. and Chapel Hill150. FlexCar may be found in greater San Francisco, LosAngeles, San Diego, Denver, Chicago, greater Washington D.C., Portland Oregon,Seattle and other smaller cities.151. Car sharing companies often inflate estimates as tohow much car ownership is reduced. But the European commission financed a study thatmeasured actual reduction in ownership and usage with such a service in Bremen152.They estimate that their 100 car fleet, reduced ownership for 2,200 participants by 500 to700 cars. So each car in the shared fleet replaced five to seven individual cars. Further itis worth noting that while Europe has first rate transit - far superior to any public transitin the USA - nobody anywhere has anything like CyberTran. A 24 hour automateddemand driven transit system without a significant wait time day or night – even outsideurban areas - would be something new.
The combination of such a transit system with a shared car system should make carownership truly optional for many people - where people outside of rural areas own carsonly because they like them, not out of practical necessity. If people really had thischoice - where car ownership was truly optional, not an economic necessity, how muchwould it reduce car ownership in the U.S.?
There is an example that provides a good indication. Manhattan in New York Citycombines the best public transit system in the U.S., with what is probably some of theworst traffic and parking. There is very little practical incentive to own a car inManhattan. I'm sure there are exceptions, people who really need cars. But overall, Iwould say that the rate of car ownership in Manhattan is an example of truly voluntarydriving - reflecting the number of people who buy automobiles because they enjoy andappreciate them. According to the New York Metropolitan Transportation Council(NYMTC) survey conducted in 1997 and 1998, the average number of vehicles perManhattan household was .38 - in other words slightly more than one car per threehouseholds153. This compares to the USA average of 1.7 vehicles per household in 1995,and 1.9 vehicles per household in 2001154.
So total car ownership in areas with a combination of decent public transport and someform of car sharing can be reduced by between a factor of 4.5 and a factor of 5. Thepublic transportation this requires (as opposed to existing systems) is equivalent to about1/20th of the impact of the remaining cars displaced, and the impact of shared cars isequivalent to another fifth to seventh. Infrastructure (vehicles, tracks, roads, parking,stations and so forth may be reduced to about 3/10ths of normal U.S. use. When the 3%or so of the USA population who live in areas that will not support automated super-lightrail are included, this is almost exactly a two/thirds reduction - so a reduction by factorthree.
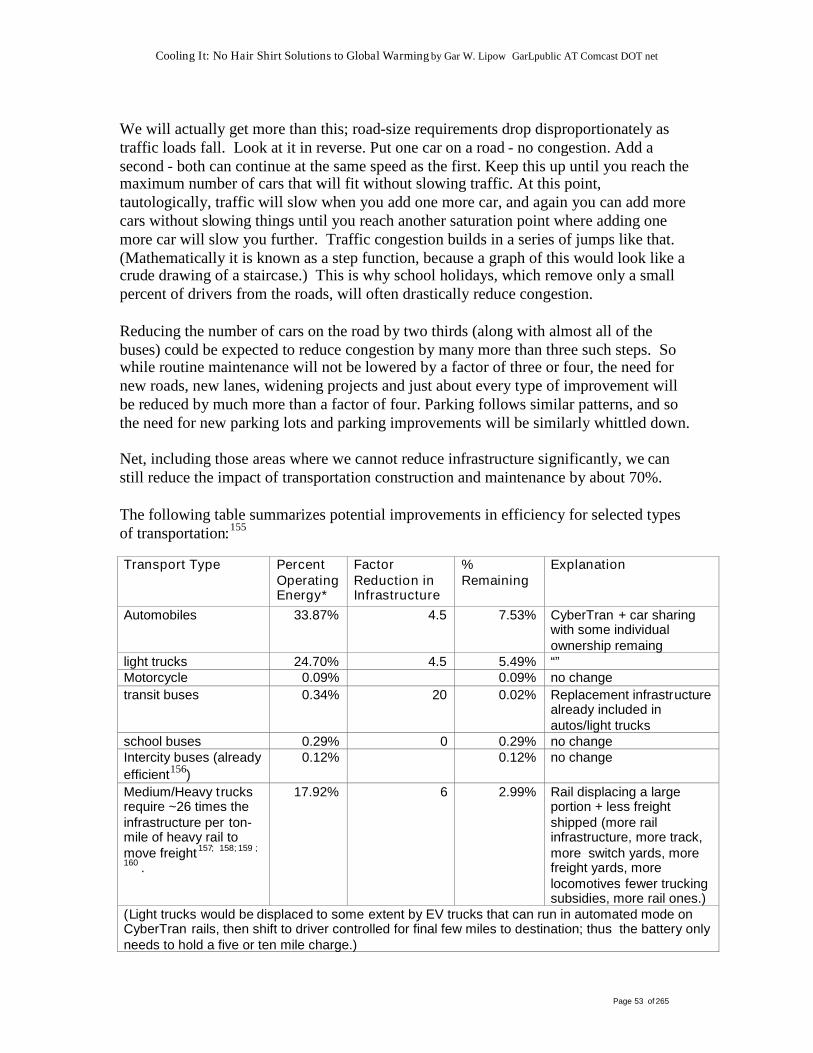
Cooling It: No Hair Shirt Solutions to Global Warming by Gar W. Lipow GarLpublic AT Comcast DOT net
Page 53 of 265
We will actually get more than this; road-size requirements drop disproportionately astraffic loads fall. Look at it in reverse. Put one car on a road - no congestion. Add asecond - both can continue at the same speed as the first. Keep this up until you reach themaximum number of cars that will fit without slowing traffic. At this point,tautologically, traffic will slow when you add one more car, and again you can add morecars without slowing things until you reach another saturation point where adding onemore car will slow you further. Traffic congestion builds in a series of jumps like that.(Mathematically it is known as a step function, because a graph of this would look like acrude drawing of a staircase.) This is why school holidays, which remove only a smallpercent of drivers from the roads, will often drastically reduce congestion.
Reducing the number of cars on the road by two thirds (along with almost all of thebuses) could be expected to reduce congestion by many more than three such steps. Sowhile routine maintenance will not be lowered by a factor of three or four, the need fornew roads, new lanes, widening projects and just about every type of improvement willbe reduced by much more than a factor of four. Parking follows similar patterns, and sothe need for new parking lots and parking improvements will be similarly whittled down.
Net, including those areas where we cannot reduce infrastructure significantly, we canstill reduce the impact of transportation construction and maintenance by about 70%.
The following table summarizes potential improvements in efficiency for selected typesof transportation:155
Transport Type PercentOperatingEnergy*
FactorReduction inInfrastructure
%Remaining
Explanation
Automobiles 33.87% 4.5 7.53% CyberTran + car sharingwith some individualownership remaing
light trucks 24.70% 4.5 5.49% “”Motorcycle 0.09% 0.09% no changetransit buses 0.34% 20 0.02% Replacement infrastructure
already included inautos/light trucks
school buses 0.29% 0 0.29% no changeIntercity buses (alreadyefficient156)
0.12% 0.12% no change
Medium/Heavy trucksrequire ~26 times theinfrastructure per ton-mile of heavy rail tomove freight157; 158; 159 ;
160 .
17.92% 6 2.99% Rail displacing a largeportion + less freightshipped (more railinfrastructure, more track,more switch yards, morefreight yards, morelocomotives fewer truckingsubsidies, more rail ones.)
(Light trucks would be displaced to some extent by EV trucks that can run in automated mode onCyberTran rails, then shift to driver controlled for final few miles to destination; thus the battery onlyneeds to hold a five or ten mile charge.)
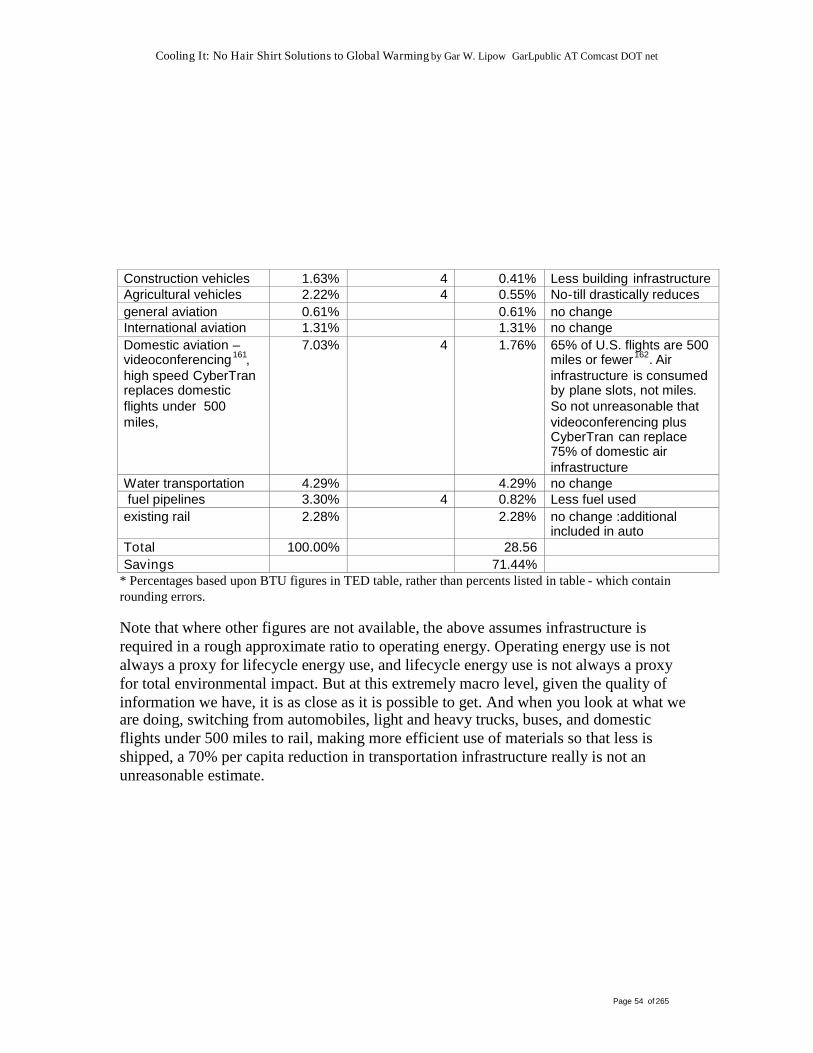
Cooling It: No Hair Shirt Solutions to Global Warming by Gar W. Lipow GarLpublic AT Comcast DOT net
Page 54 of 265
Construction vehicles 1.63% 4 0.41% Less building infrastructureAgricultural vehicles 2.22% 4 0.55% No-till drastically reducesgeneral aviation 0.61% 0.61% no changeInternational aviation 1.31% 1.31% no changeDomestic aviation –videoconferencing161,high speed CyberTranreplaces domesticflights under 500miles,
7.03% 4 1.76% 65% of U.S. flights are 500miles or fewer162. Airinfrastructure is consumedby plane slots, not miles.So not unreasonable thatvideoconferencing plusCyberTran can replace75% of domestic airinfrastructure
Water transportation 4.29% 4.29% no changefuel pipelines 3.30% 4 0.82% Less fuel used
existing rail 2.28% 2.28% no change :additionalincluded in auto
Total 100.00% 28.56Savings 71.44%
* Percentages based upon BTU figures in TED table, rather than percents listed in table - which containrounding errors.
Note that where other figures are not available, the above assumes infrastructure isrequired in a rough approximate ratio to operating energy. Operating energy use is notalways a proxy for lifecycle energy use, and lifecycle energy use is not always a proxyfor total environmental impact. But at this extremely macro level, given the quality ofinformation we have, it is as close as it is possible to get. And when you look at what weare doing, switching from automobiles, light and heavy trucks, buses, and domesticflights under 500 miles to rail, making more efficient use of materials so that less isshipped, a 70% per capita reduction in transportation infrastructure really is not anunreasonable estimate.
Cooling It: No Hair Shirt Solutions to Global Warming by Gar W. Lipow GarLpublic AT Comcast DOT net
Page 55 of 265
Clean Sweep: Reducing Material Intensity by Lowering PollutionWe have covered enough types of consumer goods to know we can spot ways to reducematerial intensity by close to factor four just through analysis by end use classification. Insome areas we can reduce by much more than factor four, in some a great deal less. It isclose enough that we cannot be sure they balance out. But there is one other step; so farwe have examined reduced pollution just as we examined reduced industrial energy use –as a side effect of overall reductions in material intensity.
Pollution reduction, though, is desirable for its own sake. Particulate emissions frompower plants kill 30,000 people in the U.S. every year163. Non-particulate emissionsfrom power plants and other sources, toxic wastes, water pollution and other pollutionsources may kill a great many more than this. And as with other material intensityreductions, pollution reduction reduces energy consumption as a by-product. Not everypollution reduction technique does this of course. Some means of filtering air and wateremissions decrease energy efficiency – as do lower temperature combustion processes toreduce NOx production. But overall a broad program of pollution reduction reducesenergy use.
For example, a great deal of toxic waste is generated simply by leaks and spills ofexpensive useful chemicals. Reducing such leaks, and reducing or recovering the spillssaves those same substances for input into processes and finished goods; this usuallysaves money over older more wasteful industrial processes, and saves the energy thatwould have been used to manufacture replace chemicals for what was spilled. Similarly,recovering used chemicals for reuse accomplishes the same thing. Reducing waterpollution often involves decreasing total use of water, lowers the amount of energyrequired to heat and pump that water. Reducing air pollution often involves burningwaste gas, and using the heat generated for industrial processes. A small net energysaving is pretty clear. (By some measures it provides a large one; but that is becauseincreasing energy efficiency is one way to lower pollution. Since the bulk of this study isdevoted to detailing means of increasing energy efficiency, to include this would bedouble counting with a vengeance. Leaving direct energy savings aside, consideringpollution reduction to provide a small net energy savings is more reasonable.)
There are a great many low tech, low cost methods that produce savings. One of the firstis bureaucracy - horrible old fashioned red tape. Yes, excessive un-needed bureaucracyhas a well-earned reputation for preventing work; but bureaucracy, in the right place, isalso a way of getting things done. Think of the flight list pilots have to go over beforetakeoff. A paper checklist increases the odds they will perform the proper procedure eachtime – without failures of human or electronic memory causing them to skip a step.There a lot of points in industrial operation where the same principles apply. A far fromexhaustive list:
Documenting startup and shutdown procedures; doing either improperly may leadto anything from a major accident to a minor wastage of material
Documenting operational procedures; most industries have turnover; it is fairlycommon in industries that don’t document procedures properly to run into thingslike failing to turn off the water when a rinsing procedure is complete.
Cooling It: No Hair Shirt Solutions to Global Warming by Gar W. Lipow GarLpublic AT Comcast DOT net
Page 56 of 265
Documenting emergency procedures; it may seem silly to keep a manual of whatto do in an emergency; but if the person who knows what to do is not immediatelyavailable you may find the manual faster than you find the person. And if theperson who knows leaves, having procedures documented increases the odds thatthe next person to do the job will be trained properly.
Documenting inventory on hand someplace outside the physical location; helpfulto firefighters and emergency crews in the event of an accident.
Documenting all spills and accidents – helpful in managing sites post-shutdown.
Red tape, every bit of that list; but which item would want an oil refinery or chemicalfactory in your neighborhood to omit? And while the emergency documentation isusually required by law, the operational documentation, lack of which is most likely tolead to accidents, is often omitted.
Returning to the “pilot’s list” analogy for the moment, this entire section on pollutionprevention is an example of that principle. Most individual paragraphs in it are somethingcommon sense might suggest; but as you go through paragraph after paragraph think – ifyou were doing pollution prevention for a particular plant, would you remember or thinkof every single one of these that are applicable? And this is by no means a pollutionprevention manual or text book. Serious reference works, which I will cite at the end,generally run hundreds of pages.
Depending on circumstances there are other bureaucratic processes that can help preventproblems and lead to improvements:
Regular reviews with major customers and suppliers of the way your processesand theirs interact. You never know when a change can lead to a product suppliedto you becoming less suitable, or a product you supply being less suitable for acustomer. Reworks, regardless of who pays, are a major cause of wasted material.And even if someone else pays for a problem, it is likely to come back to bite youin a future transactions. This does not just help head off problems; it can help spotopportunities too. Sometimes win-win changes can be made lowering costs orincreasing quality for both parties.
Regular reviews of standard literature to spot new processes and technologies thatmight lead to improvements. Most companies have informal networks - companygeeks or proactive managers that keep an eye out. But – especially in largerorganizations- you need a formal process or easy opportunities get missed. Thatis one of things bureaucracy was invented for – to allow large organizations toovercome the inertia that would otherwise stop them from doing some of the samethings small groups do naturally. Why not just have small groups? Because thereis stuff only large groups can do. No, turning large organizations into networks ofsmall ones does not solve that particular problem; whether a large group isstructured like a pyramid or like a web you still have cracks important things canfall into; no matter how irritating it is you need formal procedures to minimizethis.
Cooling It: No Hair Shirt Solutions to Global Warming by Gar W. Lipow GarLpublic AT Comcast DOT net
Page 57 of 265
Extending the last two a bit, regular reviews of policy from the ground up – ratherthan just looking at incremental changes, and taking all existing procedures forgranted, occasional examination of everything from top to bottom to see if someof the routine has become obsolete, or was never the optimum approach in thefirst place.
Formal training; default job training in the U.S. is often “throw her in the water,and see if she swims”. Or the previous job holder’s can spend her last dayshowing the new woman the ropes. This can lead to routine operating informationnot being conveyed properly. Almost never does it teach exception handling,shutdowns and startups, or dealing with emergency situations. You also need aclear chain of responsibility set up.
During design phases – either of new plants or major modifications, relative riskassessment can help minimize pollution and wastages both. For a given pollutant– say sulfur or dioxin – assess what source in your plant is the greatestcontributor, which is the second and so on; rank them. Now you can prioritize,find where you will get the greatest reduction for a given investment. Even if youare completely eliminating a pollutant, identifying this lets you get rid of it faster.
Similarly routine maintenance can reduce waste tremendously. For example, simplyinspecting pipes and ducts regularly for leaks, and fixing them quickly can save a greatdeal. Inspecting and (in the case of chemicals) occasionally testing raw materials andother inputs before they come in the door can save wasted material and wasted time.
Housekeeping is even more interesting, because – though the term is used metaphorically– much of what it covers is literal. For example, dusting more frequently can preventfilters from plugging so quickly, and save both material and filters - nothing metaphoricalabout that use of the term “housekeeping”. Or the point that in automated cleaningprocesses, you can start with dry processes (essentially wiping with a cloth) beforemoving on to wet cleaning. This can not only save on water; the chemicals absorbed bythe cloth (being more concentrated) may be recovered from the cloth if of sufficient valueto do so. [Note again that these are automated processes, not somebody manually wipinga vat with rags.] Further, the cleaning step can go more quickly, allowing the next stageto start sooner, and increasing labor productivity as well. There is also the point thatsupplies for dealing with spills should be stored where they are likely to occur,comparable to keeping cleaning supplies in the kitchen and bathroom.
There are other related points which, while a metaphorical use of the term, still obviouslywould have been instituted when processes were first designed if the designers hadthought like someone who did housework. For example, an important principle of designis to build vessels for liquids bigger than the minimum required to hold them - makingthem less likely to overflow. Anyone who cooks regularly knows a too small pot is morelikely to make a mess. Similarly there is the principle of “bunds” storing dangerous orvaluable material in containers held in other containers – so that if there is a leak or spill,you can catch the overflow; the same principle you use when place a coffee or tea cup ona saucer, a bowl of cereal on a plate, or use a coaster for a beer can.
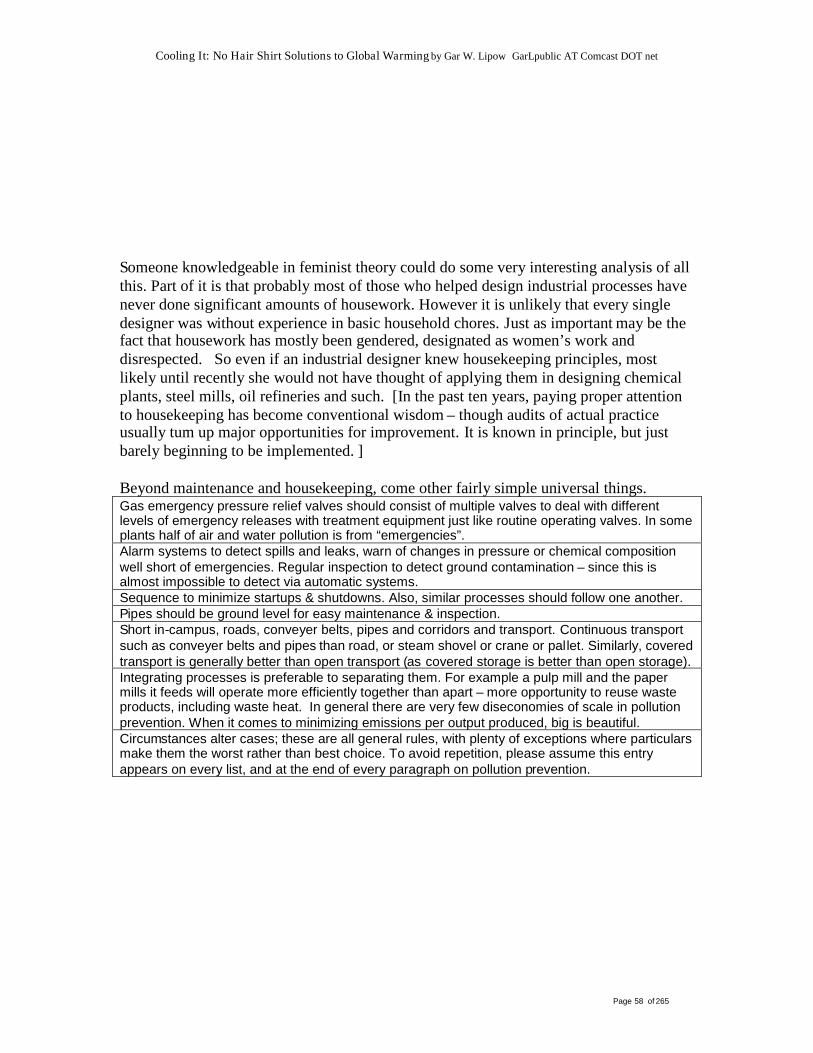
Cooling It: No Hair Shirt Solutions to Global Warming by Gar W. Lipow GarLpublic AT Comcast DOT net
Page 58 of 265
Someone knowledgeable in feminist theory could do some very interesting analysis of allthis. Part of it is that probably most of those who helped design industrial processes havenever done significant amounts of housework. However it is unlikely that every singledesigner was without experience in basic household chores. Just as important may be thefact that housework has mostly been gendered, designated as women’s work anddisrespected. So even if an industrial designer knew housekeeping principles, mostlikely until recently she would not have thought of applying them in designing chemicalplants, steel mills, oil refineries and such. [In the past ten years, paying proper attentionto housekeeping has become conventional wisdom – though audits of actual practiceusually turn up major opportunities for improvement. It is known in principle, but justbarely beginning to be implemented. ]
Beyond maintenance and housekeeping, come other fairly simple universal things.Gas emergency pressure relief valves should consist of multiple valves to deal with differentlevels of emergency releases with treatment equipment just like routine operating valves. In someplants half of air and water pollution is from “emergencies”.Alarm systems to detect spills and leaks, warn of changes in pressure or chemical compositionwell short of emergencies. Regular inspection to detect ground contamination – since this isalmost impossible to detect via automatic systems.Sequence to minimize startups & shutdowns. Also, similar processes should follow one another.Pipes should be ground level for easy maintenance & inspection.Short in-campus, roads, conveyer belts, pipes and corridors and transport. Continuous transportsuch as conveyer belts and pipes than road, or steam shovel or crane or pallet. Similarly, coveredtransport is generally better than open transport (as covered storage is better than open storage).Integrating processes is preferable to separating them. For example a pulp mill and the papermills it feeds will operate more efficiently together than apart – more opportunity to reuse wasteproducts, including waste heat. In general there are very few diseconomies of scale in pollutionprevention. When it comes to minimizing emissions per output produced, big is beautiful.Circumstances alter cases; these are all general rules, with plenty of exceptions where particularsmake them the worst rather than best choice. To avoid repetition, please assume this entryappears on every list, and at the end of every paragraph on pollution prevention.
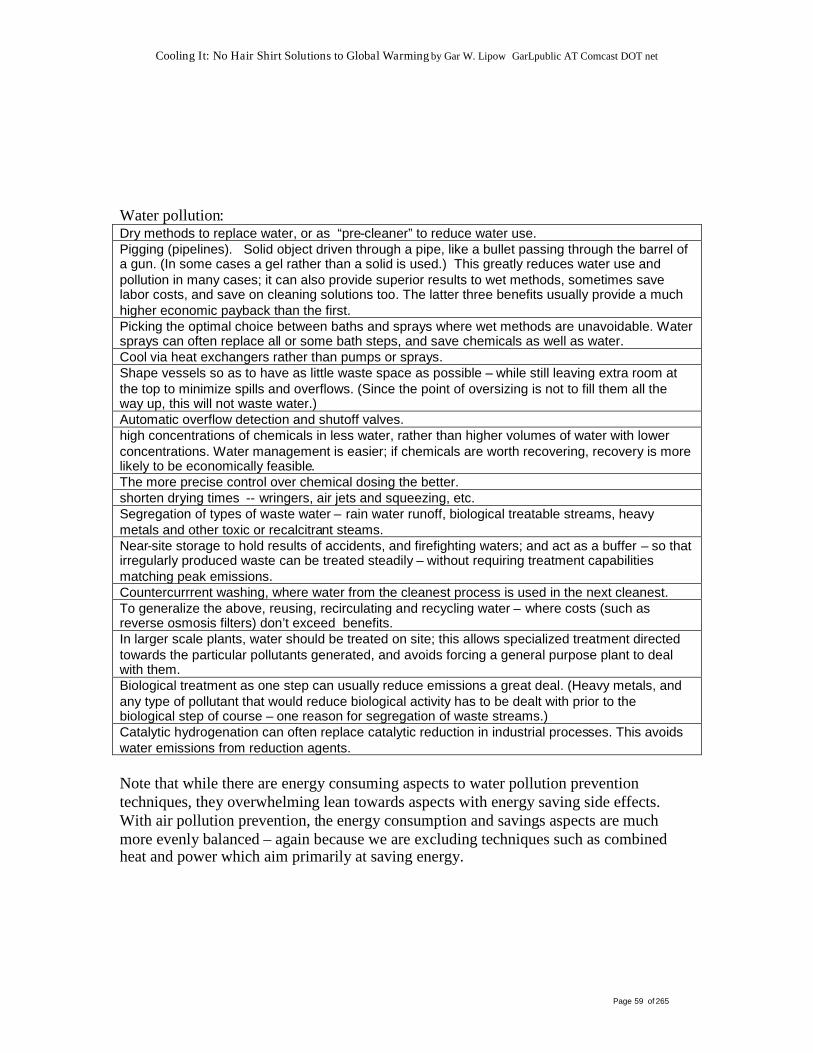
Cooling It: No Hair Shirt Solutions to Global Warming by Gar W. Lipow GarLpublic AT Comcast DOT net
Page 59 of 265
Water pollution:Dry methods to replace water, or as “pre-cleaner” to reduce water use.Pigging (pipelines). Solid object driven through a pipe, like a bullet passing through the barrel ofa gun. (In some cases a gel rather than a solid is used.) This greatly reduces water use andpollution in many cases; it can also provide superior results to wet methods, sometimes savelabor costs, and save on cleaning solutions too. The latter three benefits usually provide a muchhigher economic payback than the first.Picking the optimal choice between baths and sprays where wet methods are unavoidable. Watersprays can often replace all or some bath steps, and save chemicals as well as water.Cool via heat exchangers rather than pumps or sprays.Shape vessels so as to have as little waste space as possible – while still leaving extra room atthe top to minimize spills and overflows. (Since the point of oversizing is not to fill them all theway up, this will not waste water.)Automatic overflow detection and shutoff valves.high concentrations of chemicals in less water, rather than higher volumes of water with lowerconcentrations. Water management is easier; if chemicals are worth recovering, recovery is morelikely to be economically feasible.The more precise control over chemical dosing the better.shorten drying times -- wringers, air jets and squeezing, etc.Segregation of types of waste water – rain water runoff, biological treatable streams, heavymetals and other toxic or recalcitrant steams.Near-site storage to hold results of accidents, and firefighting waters; and act as a buffer – so thatirregularly produced waste can be treated steadily – without requiring treatment capabilitiesmatching peak emissions.Countercurrrent washing, where water from the cleanest process is used in the next cleanest.To generalize the above, reusing, recirculating and recycling water – where costs (such asreverse osmosis filters) don’t exceed benefits.In larger scale plants, water should be treated on site; this allows specialized treatment directedtowards the particular pollutants generated, and avoids forcing a general purpose plant to dealwith them.Biological treatment as one step can usually reduce emissions a great deal. (Heavy metals, andany type of pollutant that would reduce biological activity has to be dealt with prior to thebiological step of course – one reason for segregation of waste streams.)Catalytic hydrogenation can often replace catalytic reduction in industrial processes. This avoidswater emissions from reduction agents.
Note that while there are energy consuming aspects to water pollution preventiontechniques, they overwhelming lean towards aspects with energy saving side effects.With air pollution prevention, the energy consumption and savings aspects are muchmore evenly balanced – again because we are excluding techniques such as combinedheat and power which aim primarily at saving energy.
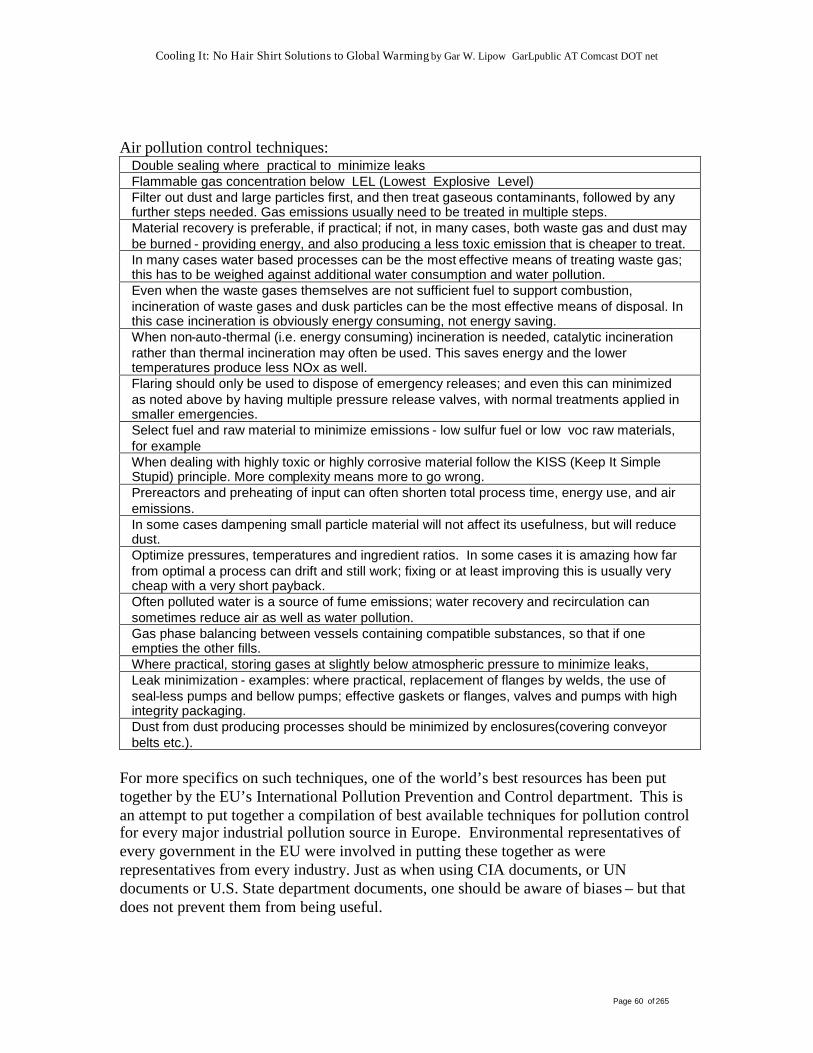
Cooling It: No Hair Shirt Solutions to Global Warming by Gar W. Lipow GarLpublic AT Comcast DOT net
Page 60 of 265
Air pollution control techniques:Double sealing where practical to minimize leaksFlammable gas concentration below LEL (Lowest Explosive Level)Filter out dust and large particles first, and then treat gaseous contaminants, followed by anyfurther steps needed. Gas emissions usually need to be treated in multiple steps.Material recovery is preferable, if practical; if not, in many cases, both waste gas and dust maybe burned - providing energy, and also producing a less toxic emission that is cheaper to treat.In many cases water based processes can be the most effective means of treating waste gas;this has to be weighed against additional water consumption and water pollution.Even when the waste gases themselves are not sufficient fuel to support combustion,incineration of waste gases and dusk particles can be the most effective means of disposal. Inthis case incineration is obviously energy consuming, not energy saving.When non-auto-thermal (i.e. energy consuming) incineration is needed, catalytic incinerationrather than thermal incineration may often be used. This saves energy and the lowertemperatures produce less NOx as well.Flaring should only be used to dispose of emergency releases; and even this can minimizedas noted above by having multiple pressure release valves, with normal treatments applied insmaller emergencies.Select fuel and raw material to minimize emissions - low sulfur fuel or low voc raw materials,for exampleWhen dealing with highly toxic or highly corrosive material follow the KISS (Keep It SimpleStupid) principle. More complexity means more to go wrong.Prereactors and preheating of input can often shorten total process time, energy use, and airemissions.In some cases dampening small particle material will not affect its usefulness, but will reducedust.Optimize pressures, temperatures and ingredient ratios. In some cases it is amazing how farfrom optimal a process can drift and still work; fixing or at least improving this is usually verycheap with a very short payback.Often polluted water is a source of fume emissions; water recovery and recirculation cansometimes reduce air as well as water pollution.Gas phase balancing between vessels containing compatible substances, so that if oneempties the other fills.Where practical, storing gases at slightly below atmospheric pressure to minimize leaks,Leak minimization - examples: where practical, replacement of flanges by welds, the use ofseal-less pumps and bellow pumps; effective gaskets or flanges, valves and pumps with highintegrity packaging.Dust from dust producing processes should be minimized by enclosures(covering conveyorbelts etc.).
For more specifics on such techniques, one of the world’s best resources has been puttogether by the EU’s International Pollution Prevention and Control department. This isan attempt to put together a compilation of best available techniques for pollution controlfor every major industrial pollution source in Europe. Environmental representatives ofevery government in the EU were involved in putting these together as wererepresentatives from every industry. Just as when using CIA documents, or UNdocuments or U.S. State department documents, one should be aware of biases – but thatdoes not prevent them from being useful.
Cooling It: No Hair Shirt Solutions to Global Warming by Gar W. Lipow GarLpublic AT Comcast DOT net
Page 61 of 265
In spite of the fact that it is probably contrary to the intentions of the technical peopleworking on them – these reference works are likely to be used to reduce environmentalprotection in Europe. Since each document states that it is simply a technical reference,without legal force, this is not obvious in reading them. But the legal structure of the EUmakes this likely for the following reasons:
1) Each document tries to determine which techniques are cost effective. In somecases, standards that have been enforced successfully in the most environmentallyaware nations are considered not to be cost effective – either by consensus or by asplit decision. In the latter case, the advocates for the more stringent position areusually in a minority.
2) In the case of court cases alleging trade barriers, the EU judges tend to be moreconcerned with trade than environmental protection; in addition they have veryfew restrictions on what evidence they can use to judge by. So they are very likelyto turn to these reference documents, and consider any standards beyond themajority opinion in them unfair or discriminatory trade barriers if applied toforeigners doing business in these nations.
3) If an EU constitution ever passes, and a European parliament starts passingenforceable environmental laws, these documents are likely to serve as thetechnical basis either for the laws themselves or for regulation created withinthese laws.
Likely future misuse of these documents does not prevent them from being superbtechnical references. While you may or may not agree with their decisions as to whatconstitutes Best Available Techniques, the detailed sections preceding them – consistingof techniques to consider in choosing Best Available Techniques – usually will tell youeverything you are likely to wish to know about available options. Brief sections onemerging technology following the BAT sections are sometimes excellent as well. A listof the most helpful BAT sources is included in the endnotes164.
One point not emphasized in the EU documents is “green” production of plastics bymaking them from biological rather than petroleum sources. It is fairly well known wecan produce plastic from recent biological sources (soybeans, cotton waste and such)rather than fossil biological ones. How much environmental impact can we save bydoing this? In some cases we can obtain a factor four or five reduction - in many as littleas a 20% savings. And, we must be careful, because in some contexts biological sourcedplastics have a higher environmental impact than petroleum based ones. An excellentover view may be found in the LCA chapter of Volume 10 of the Encyclopedia ofBiopolymers165.
Cooling It: No Hair Shirt Solutions to Global Warming by Gar W. Lipow GarLpublic AT Comcast DOT net
Page 62 of 265
We already looked at substituting waste straw, hemp and kenaf for wood as a fibersource, with an increase in agricultural land use of 11 million acres (though saving a greatdeal more than this is forest use). To produce today’s consumption of plastics fromagriculture sources as well would add another 17 million acres to this166. Given longerlasting consumer goods, more thrifty use of materials in manufacturing and increasedrecycling, it is reasonable to assume a factor four reduction in the use of plastics. So thatwould result in the use of four and quarter million acres. But we have to allow forpopulation growth. That makes a total of about 6.4 million acres through 2050.
An economy that reduced material throughput per unit of economic growth by four timesfrom the present, we could produce all our fiber and plastic needs on 17.4 millionadditional acres – out of 57 million acres that have been presently taken out of productionby set-aside programs. Given no till farming for row crops, and intensely managedrotational grazing for meat production we ought to be able to achieve up to a 20%increase in total food production we will need with the use of no additional land –possibly needing to reduce meat production by a very small percent. This also returns to apoint I made towards the beginning of this chapter. We do not face a crisis in agriculturalproduction or even in land available for agricultural production – provided we stoppaving over farmland and putting farmers out of work. We need to produce our food andfiber via more sustainable techniques. Such techniques are available, and sufficient forthe land currently in production, plus a very tiny portion of the set asides. But suchtechniques will not be sufficient if we continue to lose land to urbanization, erosion, andfarmers being put out of business by unstable and absurdly low crop prices. Every bit asurgent as other sustainability issues is the preservation of farmland, and the preservationof small farmers to keep them operating on land large agribusiness won’t touch.
Cooling It: No Hair Shirt Solutions to Global Warming by Gar W. Lipow GarLpublic AT Comcast DOT net
Page 63 of 265
Every Story Has an End: RecyclingWe’ve looked at end user goods and some of the intermediate processes in making them– including end of life recycling in specific cases. Before we sum up, we need to dealwith one thing that is getting a great deal of emphasis – the “cradle to cradle” concept.As we saw in Interface carpets, building goods that last a long time, and then can berecycled back into themselves at the end of life is very important. On occasion, so-called“down cycling” can be just as important. For example old newspapers can be made intomore old newspapers or into insulation. Newspaper to newspaper is true cradle to cradle,a discarded good being recycled back into itself. But it also takes a lot of energy andwater to recycle a newspaper back itself. Water and energy used in de-inking canapproachi that of making a newspaper from virgin pulp. On the other had old newspaperscan also be made into insulation. Some people disapprove of this on the grounds that thisuses up the best long fibers most suitable for reuse in newspaper manufacture. But longnewspaper fibers can still be recycled only a limited number of times. Fibers recycledinto newspapers could in theory be used up within days, certainly in practice withinweeks or a few months at most. Cellulose insulation, on the other hand, lasts up to fiftyyears – and saves energy every day of those fifty years. This is a lot more productive usefor those long fibers.
Some people have made a whole principle of this – turning the waste from one industryinto the raw material of another. In one preliminary study done in the greater Durham,North Carolina research triangle area, nearly half of the sites investigated had potentiallocal partners to provide raw materials or to consume waste as raw material167. Abouthalf of those actually set up relationships. There was also a famous spontaneous"industrial ecology" that arose in Kalundborg168, Denmark as a simple economy measure.
So long as its value is not overstated, this makes sense. We do need to “close the loop” sothat a great deal less of material extracted is discarded than now. But, as in the case ofnewspaper recycling, it is no cure-all. Recycling – whether via reuse, “cradle to cradle”or industrial ecology will not by itself result in anything like a factor four reduction, letalone a factor ten or twenty savings. But combined with all the other principles it can bethe final step to lead to a factor four reduction in material intensity.
i Some source claim recycling newspaper into newspaper requires more energy and water than using virginfibers. I suspect that depends on the recycling process used.
Cooling It: No Hair Shirt Solutions to Global Warming by Gar W. Lipow GarLpublic AT Comcast DOT net
Page 64 of 265
That is – provide consumer goods and services that last longer, that are easier to repair,substituting material and processes with lower ecological footprints for material andprocesses with larger ones to provide the same consumer services. Then do the samething at the factory level – use less ecologically intensive goods and processes to producethe longer lasting consumer goods that provide consumer service through less intensivematerials and processes. Reduce pollution from such production. And then recycle thegreatly reduced waste from this. You can see that a factor four reduction is fairlystraightforward technically and economically –even at current market prices, though notso easy to achieve politically. A great many things (such as buildings) can be provided ata factor five reduction even at the end user level alone. Some, such as transportation,don’t quite reach that great a level, probably end user goods and services average out tofactor four or close to it. When you add in the much more modest (but still significant)reductions possible via pollution prevention, and savings from recycling, you definitelyend up with over a factor four reduction.
Does it pass the sanity test that this results in cutting industrial energy consumption by abit more than half? We increase lifespans, reduce intensity of materials that constitutethose goods, and the intensity of processes used to manufacture them; it makes sense thatwe would end up reducing energy use by a little over half as a byproduct - before we savea single quad of industrial energy through conventional energy efficiency techniques.
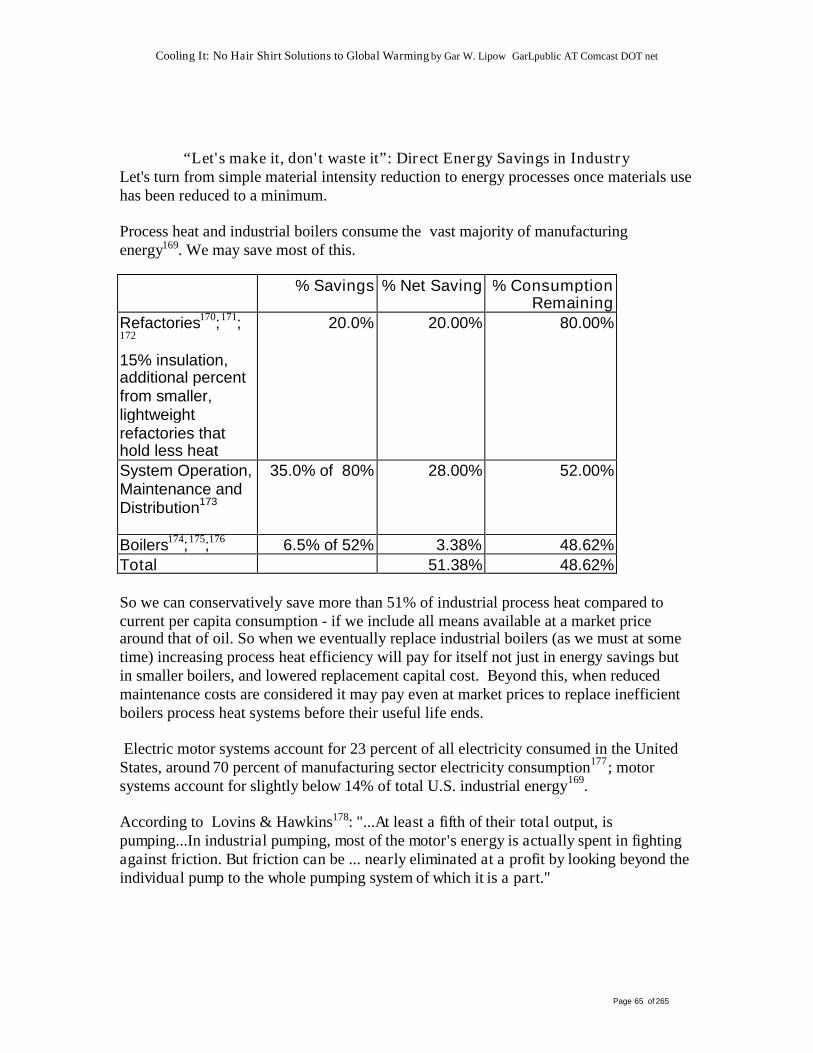
Cooling It: No Hair Shirt Solutions to Global Warming by Gar W. Lipow GarLpublic AT Comcast DOT net
Page 65 of 265
“Let's make it, don't waste it”: Direct Energy Savings in IndustryLet's turn from simple material intensity reduction to energy processes once materials usehas been reduced to a minimum.
Process heat and industrial boilers consume the vast majority of manufacturingenergy169. We may save most of this.
% Savings % Net Saving % ConsumptionRemaining
Refactories170;171;172
15% insulation,additional percentfrom smaller,lightweightrefactories thathold less heat
20.0% 20.00% 80.00%
System Operation,Maintenance andDistribution173
35.0% of 80% 28.00% 52.00%
Boilers174;175;176 6.5% of 52% 3.38% 48.62%Total 51.38% 48.62%
So we can conservatively save more than 51% of industrial process heat compared tocurrent per capita consumption - if we include all means available at a market pricearound that of oil. So when we eventually replace industrial boilers (as we must at sometime) increasing process heat efficiency will pay for itself not just in energy savings butin smaller boilers, and lowered replacement capital cost. Beyond this, when reducedmaintenance costs are considered it may pay even at market prices to replace inefficientboilers process heat systems before their useful life ends.
Electric motor systems account for 23 percent of all electricity consumed in the UnitedStates, around 70 percent of manufacturing sector electricity consumption177; motorsystems account for slightly below 14% of total U.S. industrial energy169.
According to Lovins & Hawkins178: "...At least a fifth of their total output, ispumping...In industrial pumping, most of the motor's energy is actually spent in fightingagainst friction. But friction can be ... nearly eliminated at a profit by looking beyond theindividual pump to the whole pumping system of which it is a part."
Cooling It: No Hair Shirt Solutions to Global Warming by Gar W. Lipow GarLpublic AT Comcast DOT net
Page 66 of 265
Big pipes and small pumps use a great deal less energy than large pumps and small pipes.A fifty percent fatter pipe reduces friction by 86%. In addition, extra bends put into mostpiping systems multiply friction by three to five times178. Designers normally ignore thisbecause the cost of additional piping would exceed the value of energy savings. But thesavings in energy, plus the capital savings through buying smaller pumps do in fact lowercosts as a whole.
The savings from fatter, better arranged pipes and smaller pumps should reduce pumpingenergy use by over 80% of pumping energy used179. One example is a factory carpetmaker Interface built in Shanghai. A top western specialist specified 95 horsepowerpumps; fatter, better laid out pipes reduced this to 7 horsepower - a 92% savings.178
After material savings, and after various types of throughput savings, half of motorenergy could be saved in the motors themselves. In electric motors this can be achievedby more efficient variable speed motors sized right for the job, with the right mechanicaland electrical interfaces to what is driven180. Because these new motors not only cutenergy, but maintenance costs, they will pay for themselves quickly. (The more efficientmotors run cooler and slower. Heat and motor speed both contribute to shorter motorlife.) (Note: similar savings are possible with stationary heat driven motors as well - withsimilar paybacks.)
Between cutting energy use for motors in half, and cutting energy use for pumping by80% or better, it seem we can end up with a 55% savings or better in total motor usage.
Facility heating, ventilation, lighting, air conditions and other facility support representsabout 8.7% of industrial energy169. These are the same processes we will consider incommercial buildings; we will document 70% average savings in commercial buildings;because of that, we estimate comparable potential in industrial facilities.
Uses classified as “other” and “unreported” represent about 3.4% of industrialconsumption169. It will not be unreasonable to assume this reflects industrial energy useas a whole, and that similar savings may be found.
On-site electricity generation represents 2.3% of industrial energy use, which will bediscussed under co-generation, not here.
Electrochemical processes represent about 2.1% of industrial energy169. Since these arealready pretty efficient, most of the savings here will come from savings in material use –which we have already counted.
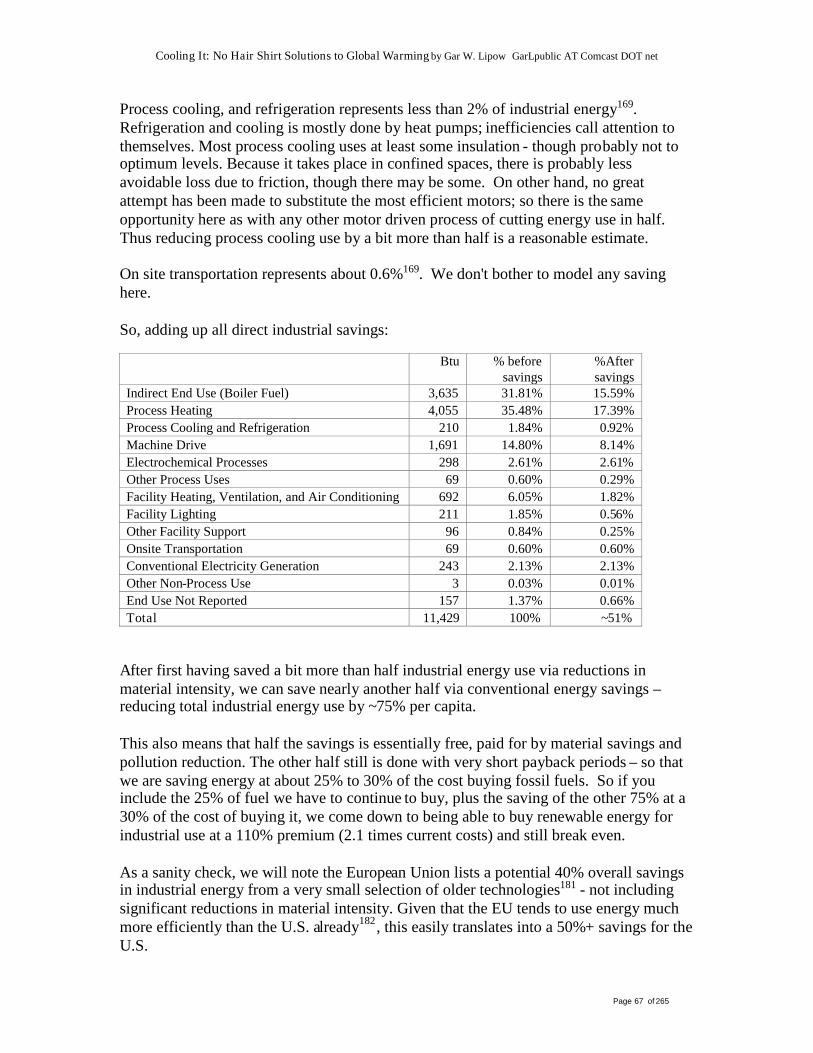
Cooling It: No Hair Shirt Solutions to Global Warming by Gar W. Lipow GarLpublic AT Comcast DOT net
Page 67 of 265
Process cooling, and refrigeration represents less than 2% of industrial energy169.Refrigeration and cooling is mostly done by heat pumps; inefficiencies call attention tothemselves. Most process cooling uses at least some insulation - though probably not tooptimum levels. Because it takes place in confined spaces, there is probably lessavoidable loss due to friction, though there may be some. On other hand, no greatattempt has been made to substitute the most efficient motors; so there is the sameopportunity here as with any other motor driven process of cutting energy use in half.Thus reducing process cooling use by a bit more than half is a reasonable estimate.
On site transportation represents about 0.6%169. We don't bother to model any savinghere.
So, adding up all direct industrial savings:
Btu % beforesavings
%Aftersavings
Indirect End Use (Boiler Fuel) 3,635 31.81% 15.59%Process Heating 4,055 35.48% 17.39%Process Cooling and Refrigeration 210 1.84% 0.92%Machine Drive 1,691 14.80% 8.14%Electrochemical Processes 298 2.61% 2.61%Other Process Uses 69 0.60% 0.29%Facility Heating, Ventilation, and Air Conditioning 692 6.05% 1.82%Facility Lighting 211 1.85% 0.56%Other Facility Support 96 0.84% 0.25%Onsite Transportation 69 0.60% 0.60%Conventional Electricity Generation 243 2.13% 2.13%Other Non-Process Use 3 0.03% 0.01%End Use Not Reported 157 1.37% 0.66%Total 11,429 100% ~51%
After first having saved a bit more than half industrial energy use via reductions inmaterial intensity, we can save nearly another half via conventional energy savings –reducing total industrial energy use by ~75% per capita.
This also means that half the savings is essentially free, paid for by material savings andpollution reduction. The other half still is done with very short payback periods – so thatwe are saving energy at about 25% to 30% of the cost buying fossil fuels. So if youinclude the 25% of fuel we have to continue to buy, plus the saving of the other 75% at a30% of the cost of buying it, we come down to being able to buy renewable energy forindustrial use at a 110% premium (2.1 times current costs) and still break even.
As a sanity check, we will note the European Union lists a potential 40% overall savingsin industrial energy from a very small selection of older technologies181 - not includingsignificant reductions in material intensity. Given that the EU tends to use energy muchmore efficiently than the U.S. already182, this easily translates into a 50%+ savings for theU.S.

Cooling It: No Hair Shirt Solutions to Global Warming by Gar W. Lipow GarLpublic AT Comcast DOT net
Page 68 of 265
This section so far has focused on a very top down approach. That is, it has looked atvery general categories, and very broad studies. So let us examine some specificexamples – many of them funded by the U.S. DOE. Most are around 50%, some a bit lessothers a great deal more.
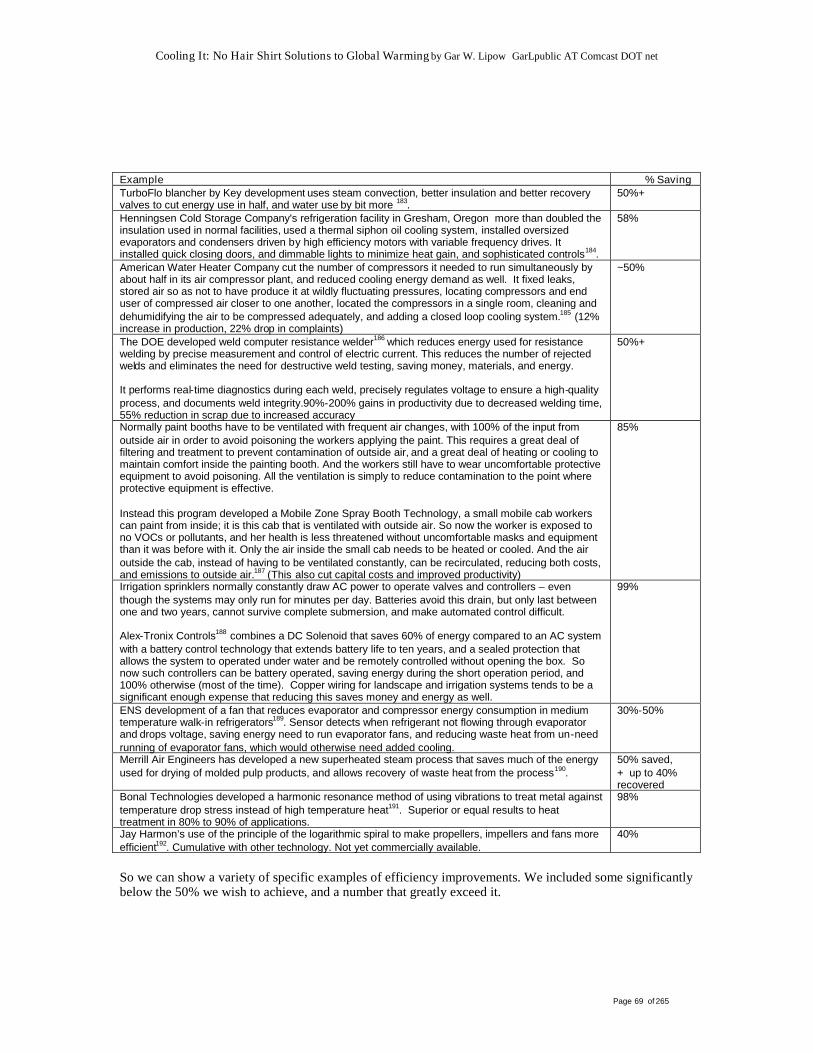
Cooling It: No Hair Shirt Solutions to Global Warming by Gar W. Lipow GarLpublic AT Comcast DOT net
Page 69 of 265
Example % SavingTurboFlo blancher by Key development uses steam convection, better insulation and better recoveryvalves to cut energy use in half, and water use by bit more 183.
50%+
Henningsen Cold Storage Company's refrigeration facility in Gresham, Oregon more than doubled theinsulation used in normal facilities, used a thermal siphon oil cooling system, installed oversizedevaporators and condensers driven by high efficiency motors with variable frequency drives. Itinstalled quick closing doors, and dimmable lights to minimize heat gain, and sophisticated controls184.
58%
American Water Heater Company cut the number of compressors it needed to run simultaneously byabout half in its air compressor plant, and reduced cooling energy demand as well. It fixed leaks,stored air so as not to have produce it at wildly fluctuating pressures, locating compressors and enduser of compressed air closer to one another, located the compressors in a single room, cleaning anddehumidifying the air to be compressed adequately, and adding a closed loop cooling system.185 (12%increase in production, 22% drop in complaints)
~50%
The DOE developed weld computer resistance welder186 which reduces energy used for resistancewelding by precise measurement and control of electric current. This reduces the number of rejectedwelds and eliminates the need for destructive weld testing, saving money, materials, and energy.
It performs real-time diagnostics during each weld, precisely regulates voltage to ensure a high-qualityprocess, and documents weld integrity.90%-200% gains in productivity due to decreased welding time,55% reduction in scrap due to increased accuracy
50%+
Normally paint booths have to be ventilated with frequent air changes, with 100% of the input fromoutside air in order to avoid poisoning the workers applying the paint. This requires a great deal offiltering and treatment to prevent contamination of outside air, and a great deal of heating or cooling tomaintain comfort inside the painting booth. And the workers still have to wear uncomfortable protectiveequipment to avoid poisoning. All the ventilation is simply to reduce contamination to the point whereprotective equipment is effective.
Instead this program developed a Mobile Zone Spray Booth Technology, a small mobile cab workerscan paint from inside; it is this cab that is ventilated with outside air. So now the worker is exposed tono VOCs or pollutants, and her health is less threatened without uncomfortable masks and equipmentthan it was before with it. Only the air inside the small cab needs to be heated or cooled. And the airoutside the cab, instead of having to be ventilated constantly, can be recirculated, reducing both costs,and emissions to outside air.187 (This also cut capital costs and improved productivity)
85%
Irrigation sprinklers normally constantly draw AC power to operate valves and controllers – eventhough the systems may only run for minutes per day. Batteries avoid this drain, but only last betweenone and two years, cannot survive complete submersion, and make automated control difficult.
Alex-Tronix Controls188 combines a DC Solenoid that saves 60% of energy compared to an AC systemwith a battery control technology that extends battery life to ten years, and a sealed protection thatallows the system to operated under water and be remotely controlled without opening the box. Sonow such controllers can be battery operated, saving energy during the short operation period, and100% otherwise (most of the time). Copper wiring for landscape and irrigation systems tends to be asignificant enough expense that reducing this saves money and energy as well.
99%
ENS development of a fan that reduces evaporator and compressor energy consumption in mediumtemperature walk-in refrigerators189. Sensor detects when refrigerant not flowing through evaporatorand drops voltage, saving energy need to run evaporator fans, and reducing waste heat from un-needrunning of evaporator fans, which would otherwise need added cooling.
30%-50%
Merrill Air Engineers has developed a new superheated steam process that saves much of the energyused for drying of molded pulp products, and allows recovery of waste heat from the process190.
50% saved,+ up to 40%recovered
Bonal Technologies developed a harmonic resonance method of using vibrations to treat metal againsttemperature drop stress instead of high temperature heat191. Superior or equal results to heattreatment in 80% to 90% of applications.
98%
Jay Harmon’s use of the principle of the logarithmic spiral to make propellers, impellers and fans moreefficient192. Cumulative with other technology. Not yet commercially available.
40%
So we can show a variety of specific examples of efficiency improvements. We included some significantlybelow the 50% we wish to achieve, and a number that greatly exceed it.
Cooling It: No Hair Shirt Solutions to Global Warming by Gar W. Lipow GarLpublic AT Comcast DOT net
Page 70 of 265
Love the Way You Move: Energy Savings in Transportation
Moving people on the ground is the single greatest use of transportation energy.
Most passenger trips in the U.S. are made by automobile. People looking for a chance tobash ordinary Americans often sneer at the "American love affair with the automobile". Ihave to admit there is an element of that; automobiles do have attractiveness beyond theirfunctionality. But in point of fact there are plenty of rational reasons Americans prefercars to other forms of passenger transport in most cases.
An overwhelming one is that journeying by transit often takes longer. For example, worktravel using public transportation takes about twice as long as private transportationthough there is only a slight difference in travel distance193.
There are comfort issues as well. Due to load management requirements the odds are youwill have to stand part of the way if traveling during rush hour. There is always thechance of harassment or criminal victimization. Incidentally, most transit buses (asopposed to long distance coach buses) get fewer passenger miles per gallon than mostautomobiles147.
We have already discussed a transit system that does not have these problems - whichoffers the convenience and comfort of automobiles at a reasonable cost – CyberTranwhich would attract a lot of the passenger miles currently spent in automobiles. Carswould still have advantages for physically heavy shopping, for work requiring significantequipment, and for certain types of recreation - among others. 75% of passenger milestraveled by auto in the U.S. are NOT subject to this limitation194. Allowing for a certainamount of pure automobile love, it would not be unreasonable to guess that a superiorpassenger transit system could attract 70% of the miles now traveled by automobile, lighttruck, van or SUV. Many of the remaining miles could be part of car sharing or otherrental arrangements.
A reminder: the small light Cybertan cars run on cheaper tracks, keeping the total capitalcost of an CyberTran urban (or suburban) system (including elevated rail and guideways)at about a tenth or less of the per seat cost of conventional light rail. The same light carsalso mean energy costs per passenger mile are better than conventional light rail as well.
CyberTran is a computer automated driverless system; routes are calculated on the fly,meaning that passengers that will travel with either no or very few stops between theirdeparture and destination, and that transfers will be uncommon, and without long waits ormissed connections. Passengers will not need to wait more than five minutes for a car,which will be available 24 hours per day, seven days a week. Seating is guaranteed;passengers never need to stand. CyberTran may easily be made bicycle, wheelchair, babystroller, and package friendly.
Cooling It: No Hair Shirt Solutions to Global Warming by Gar W. Lipow GarLpublic AT Comcast DOT net
Page 71 of 265
Given the combination of greater convenience to attract more passengers, and on the flyoptimization of routes it would not be unreasonable to assume that CyberTran cars inoperation will use a higher percent of their capacity than buses, maintaining an average offour passengers per vehicle.
CyberTran cars consume about .106 kWh per passenger mile195. If that electricity comesfrom hydropower, wind or other non-combustion sources (with a 20% loss to allow forincreased line losses), this is the equivalent of 330 passenger miles per gallon. Cars andpersonal trucks combined averaged around 32 passenger miles per gallon in 2000147 .CyberTran would transport passengers around 10 times more efficiently thanautomobiles.
The way to implement CyberTran would be to begin replacing bus routes where it wouldprovide cheaper, faster, more comfortable more convenient and more energy efficienttransport for bus riders – then lure auto riders into the now far superior mass transitsystem.
One thing that may ultimately help CyberTran succeed is its resemblance to a giant penis.Probably, painting it any type of flesh tone would be too obvious. But surely a marketingperson could do something with the fact CyberTran is bigger than a car, but can tirelesslykeep thrusting forward much longer.
Superior transit could replace all regular route city and suburban buses and about 70% ofautomobile mileage. The other 30% won't go away; there are all the functions mentionedat the beginning of this article that transit won’t work well for. There are people in ruralareas where demand is too scattered to support even the far less expensive transitCyberTran represents. And there are people who simply will prefer cars to trains.
There are two solutions for them.
A four passenger electric sedan (running at the equivalent of above 200 mpg if theelectricity had come from wind, water or other non-combustion sources with a 20%transmission loss) was demonstrated in 1997 that had a range of 210 miles at normalhighway speeds before needing recharging and could have retailed for as little as$20,000196. That is a lot of money; but it was also at the mid, rather than high end for anew car –even in 1997. There are people for whom that mile range would not be enough;but there are also plenty who would never drive more than 210 miles in a single day, noteven on vacation. Note that that battery lifespan and cost are not an obstacle to this inmass production197.
What about people who need greater range – whether in an occasional rental or for theirdaily driving needs? There is a solution for that too - the Hypercar198.
As with green buildings, this is a case where whole system thinking is the key - wheredoing several things at once works better than doing any one of them singly.
Cooling It: No Hair Shirt Solutions to Global Warming by Gar W. Lipow GarLpublic AT Comcast DOT net
Page 72 of 265
Hybrid autos gain efficiency three places.
First, a gasoline-powered generator produces electricity that in turn drives the car motor.This is more efficient than burning gasoline to drive motor directly. Heat converts intoelectricity more efficiently than high torque mechanical power if weight must be keptlow. Electricity, in turn converts, into high torque mechanical power with almost no loss.
Second, manufacturers have made slight weight reductions.
Third, some use regenerative braking to recover mechanical energy lost in stopping andslowing.
Hybrid engines alone only increase performance by 30% on average. But, thecombination of all these factors has been known to double mileage for some models.
There have also been prototypes of ultra-light cars - using carbon fiber/fiberglasscomposites to produce bodies much lighter than normal cars, with the same or betterstrength.
These are much, much more expensive than conventional autos and get double or triplethe mileage.
But if you combine the two technologies various synergies occur.
With the lighter weight the hybrid engine and batteries can be smaller and lighter -decreasing weight much more than the simple substitution of carbon and silicon for steelwould suggest. The regenerative breaking gains much more stopping power - so muchmore that manual brakes feel like, and are as responsive as power brakes, so powerbrakes are not needed. Similarly manual steering is as responsive as power steering.
This increases mileage to the point that the gas tank size can be reduced, decreasingweight more. Using electric axle motors eliminates the need for a transmission and a lotof other standard auto parts.
At this point something interesting happens to cost. Even though carbon fiber is about1000 times as expensive per pound as steel, you are using a lot fewer pounds. And muchof cost of steel parts is shaping the steel; with carbon fiber/fiberglass composites, partsare extruded pre-shaped. The car uses ten to twenty composite parts vs. hundreds of steelparts. Paint is baked in, so the painting step that can represent as much as 15% of themanufacturing cost of a car is eliminated.
As a result, this ultra-light weight, ultra-efficient car costs less to manufacture than acomparable conventional car. Savings in labor, capital equipment, and manufacturingenergy more than make up the increased material cost.
Cooling It: No Hair Shirt Solutions to Global Warming by Gar W. Lipow GarLpublic AT Comcast DOT net
Page 73 of 265
You end up with a better car too. Safety in even a small hyper-car far exceeds that of thebest SUVs. Carbon fiber (and passengers enclosed by it) will survive collisions a lotbetter than steel. (This doesn't mean that you can't make a hypercar SUV as well.) AHypercar can be expected to last much longer than a conventional car. (Carbon fiber lastslonger than steel -even when diluted with fiberglass.) Fewer parts mean that maintenanceis simpler - both diagnosis of problems and their repair are easier.
They can have any feature any other car has - air conditioning, power windows, sunroofsor whatever.
No one has actually built one commercially for a number of reasons - including the factthat it would make every existing auto manufacturing plant obsolete, and cannibalizesales of existing models - forcing the write-off of unamortized capital equipment. U.S.auto makers might have done it anyway as a blow against their competition, but theAmerican auto industry does not sacrifice short-term profits to gain market share. Themanufacturers of other nations might have considered it. But US free trade principlestend to be for other nations to follow. There are already informal (but enforced) quotas onJapanese automobiles. A foreign manufacture making a radically better car than U.S.manufacturers would face significant risks of exclusion from the U.S. market.
Someone in another industry might have considered it. But there is more to the autoindustry than making a good product. You need distributors, suppliers, and a unique typeof marketing. So for someone other than an auto company to take this on would require adeep-pocketed risk taker with an appetite for a fight - not the world’s most commonanimal. In short there are plenty of reasons besides practicality for auto makers to resistHypercars.
Gasoline powered hypercars would use around one third the energy per mile compared toconventional automobiles. Battery powered hypercars would do better; the SolectriaSunrise discussed above was essentially a hypercar EV; the 210 MPG efficiency wasbetter than a hydrogen car driven by fuel cells.
All of these, CyberTran, electric cars and Hypercars will take time to implement. Is theresomething that may be done immediately? Hybrid cars are growing in sales, and alreadyrun to some extent off batteries. Increase that battery capacity, and add a plug so that youcan charge them from the grid; the result is PHEV (Plugin Hybrid Electric Vehicle). Youcan get much of the thermodynamic efficiency improvement you could get with a 100%electric car, and still have the range of gasoline engine. You don’t have the improvementyou would get with a true Hypercar or electric car, because you don’t have the ultra-lightweight, the other improvements such as good aerodynamics and low rolling resistance,and you have the mass and complexity of both a larger battery and a fuel tank. But carbon(and other) emissions are half of those generated by a conventional car199, and they are aminor modification of automobiles on the market now. We could build them now in ourcurrent factories. In fact conventional hybrids have been customized into PHEVs200.
Cooling It: No Hair Shirt Solutions to Global Warming by Gar W. Lipow GarLpublic AT Comcast DOT net
Page 74 of 265
This another way take advantage of batteries that may be superior to a pure electrichypercar - plugin hybrid hypercars. The could give us almost the efficiency of electriccars, all the carbon reductions we need, and the convenience of a conventional range anda 400 mile range with instant refills.
Imagine a hypercar PHEV70 with a seventy mile battery - in the Solectria Sunrise thatwould have been ten kWh. You have saved 2/3rds of the weight of the batteries, so youcan spend them on a tank and engine to drive the electric motors when the battery isdischarged the maximum that is safe for it, enough to get about 70 miles. Usually it isconsidered that 85% of miles driven by Americans are driven on trips of less than 60miles in a day, so it is safe to assume that a 70 mile range will let at least than much ofthe mileage be driven by batteries. A hypercar should get 75 miles to the gallon, so afour gallon tank will extend your range to 375 miles, with the ability to refill in any gasstation - reasonable even on long trips. If the grid you charge from is mainly wind, waterand sun charged , you are getting 200 MPG for 85% of your driving, 75 MPG for 15%and ending up with 181 MPG in energy efficiency (better incidentally that the 5Xefficiency Lovin's claims for hydrogen based hypercars). With a low carbon grid, youare getting the same carbon reduction an all gasoline car would get at 300 MPG. But ifwe can really produce sustainable, carbon neutral biomass, we can do better. Fill thattank up with 85% biofuel and 15% fossil fuel. The lowest energy biofuels have abouthalf the BTU value of gasoline or diesel, so as a worst case scenario we need double ourtank size to 8 gallons. But we do have 15% dead dinosaurs in the mix - reduce it back to6.8 gallons. Also, the lowest energy density biofuels can also generate 30% more powerper Btu in than fossil fuels, because they can be burned more completely. So reduce thetank back to under five gallons. We have not increased the auto weight substantially, butif the biofuel came from truly carbon neutral (or carbon negative) biological sources, wehave reduced carbon by another ~74% - due to fossil fuel displacement (more for energydenser fuels). Carbon emissions and oil use have been reduced 98% per mile compared toa 25 MPG gasoline car.
There is one last possible efficiency gain in transportation. Assuming that heavy grocerytrips would continue to be done by automobile, there is one other already existingtechnology that could greatly reduce energy for this purpose – internet ordering ofgroceries to be delivered from local suppliers. A Finnish study showed that if people hadrefrigerated reception boxes to hold the groceries such deliveries (so they could bedelivered with an eight hour window, and stores could optimize their delivery schedules)this would save around 76% of energy use compared to individual trips to the grocerystore201.
Cooling It: No Hair Shirt Solutions to Global Warming by Gar W. Lipow GarLpublic AT Comcast DOT net
Page 75 of 265
Aside from technology, there is a policy that could win us occasional drops in emissions.A percentage of the automobiles on the road are old beater cars, worth from $400-$1,800.They are near or past the end of a conventional automobile lifetime, kept alive as the onlytransportation alternative for many of the poor. They mostly get very poor mileage, andgenerate high emissions. Periodically, offer the owners of such cars even trades of themfor new or decent used cars with better mileage, lower emissions; most will be glad toaccept them. Or, for a lower cost option, Europe has found that a straight buy-out (at apremium) of junk cars a very effective way to increase average mileage, and reduceemissions for the actual on-the-road fleet.
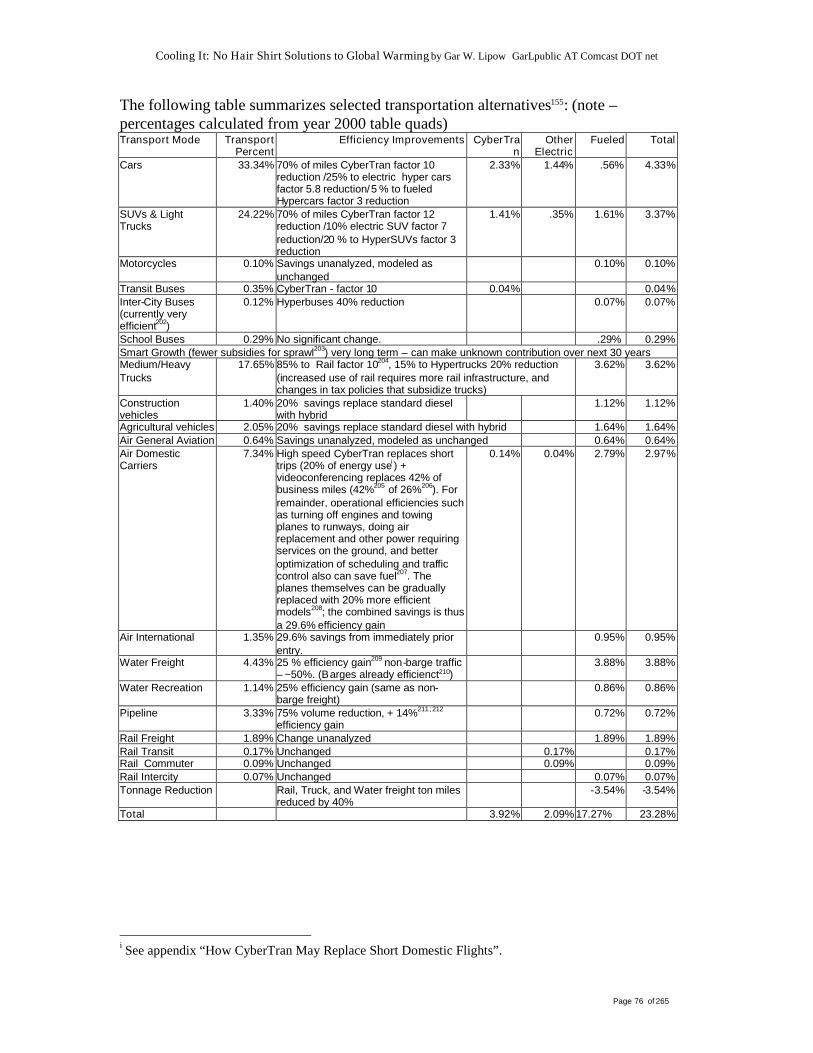
Cooling It: No Hair Shirt Solutions to Global Warming by Gar W. Lipow GarLpublic AT Comcast DOT net
Page 76 of 265
The following table summarizes selected transportation alternatives155: (note –percentages calculated from year 2000 table quads)Transport Mode Transport
PercentEfficiency Improvements CyberTra
nOther
ElectricFueled Total
Cars 33.34% 70% of miles CyberTran factor 10reduction /25% to electric hyper carsfactor 5.8 reduction/5 % to fueledHypercars factor 3 reduction
2.33% 1.44% .56% 4.33%
SUVs & LightTrucks
24.22% 70% of miles CyberTran factor 12reduction /10% electric SUV factor 7reduction/20 % to HyperSUVs factor 3reduction
1.41% .35% 1.61% 3.37%
Motorcycles 0.10% Savings unanalyzed, modeled asunchanged
0.10% 0.10%
Transit Buses 0.35% CyberTran - factor 10 0.04% 0.04%Inter-City Buses(currently veryefficient202)
0.12% Hyperbuses 40% reduction 0.07% 0.07%
School Buses 0.29% No significant change. .29% 0.29%Smart Growth (fewer subsidies for sprawl203) very long term – can make unknown contribution over next 30 yearsMedium/HeavyTrucks
17.65% 85% to Rail factor 10204, 15% to Hypertrucks 20% reduction(increased use of rail requires more rail infrastructure, andchanges in tax policies that subsidize trucks)
3.62% 3.62%
Constructionvehicles
1.40% 20% savings replace standard dieselwith hybrid
1.12% 1.12%
Agricultural vehicles 2.05% 20% savings replace standard diesel with hybrid 1.64% 1.64%Air General Aviation 0.64% Savings unanalyzed, modeled as unchanged 0.64% 0.64%Air DomesticCarriers
7.34% High speed CyberTran replaces shorttrips (20% of energy usei ) +videoconferencing replaces 42% ofbusiness miles (42%205 of 26%206). Forremainder, operational efficiencies suchas turning off engines and towingplanes to runways, doing airreplacement and other power requiringservices on the ground, and betteroptimization of scheduling and trafficcontrol also can save fuel207. Theplanes themselves can be graduallyreplaced with 20% more efficientmodels208; the combined savings is thusa 29.6% efficiency gain
0.14% 0.04% 2.79% 2.97%
Air International 1.35% 29.6% savings from immediately priorentry.
0.95% 0.95%
Water Freight 4.43% 25 % efficiency gain209 non-barge traffic– ~50%. (Barges already efficienct210)
3.88% 3.88%
Water Recreation 1.14% 25% efficiency gain (same as non-barge freight)
0.86% 0.86%
Pipeline 3.33% 75% volume reduction, + 14%211 ;212
efficiency gain0.72% 0.72%
Rail Freight 1.89% Change unanalyzed 1.89% 1.89%Rail Transit 0.17% Unchanged 0.17% 0.17%Rail Commuter 0.09% Unchanged 0.09% 0.09%Rail Intercity 0.07% Unchanged 0.07% 0.07%Tonnage Reduction Rail, Truck, and Water freight ton miles
reduced by 40%-3.54% -3.54%
Total 3.92% 2.09% 17.27% 23.28%
i See appendix “How CyberTran May Replace Short Domestic Flights”.
Cooling It: No Hair Shirt Solutions to Global Warming by Gar W. Lipow GarLpublic AT Comcast DOT net
Page 77 of 265
We have an 77% per capita reduction in transit energy – at somewhere between noadditional costs and a saving - a slightly higher percentage of which is electricity than atpresent. CyberTran is cheaper than cars, light trucks, SUVS and planes even beforeenergy cost is taken into consideration. Hypercars are about the same cost or a bit cheaperthan normal cars – ditto hypertrucks and Hyperbuses. Electric cars, if mass produced,would be comparable in cost to conventional cars, though with a more limited range.Heavy rail freight capital costs and maintenance are lower per ton-mile than roads andtrucks, even before energy savings are considered. Telecommuting pays for itself manytimes over in fuel costs. Improved water shipping efficiency, and more efficient airplanesare pretty much break even propositions when it comes to fuel cost.
Logically it would seem that the substantial capital savings in ground transit, groundfreight, short term air flights, and substantial fuel savings from telecommutingsubstituting for some air travel, will more than make up for the small capital costs ofslightly improved shipping and planes. That the 77% per capita transportation energysavings is free, rather than a net capital savings is a highly conservative assumption. Theconservative assumption that the 77% savings is free, that the costs of the savings arecompletely paid for by other capital savings, means we can afford to pay five times thecurrent cost of fossil fuel to run transportation on renewables.
One note on all this: unfortunately one assumption that is normally good falls down badlyhere - that fossil fuel consumption roughly tracks emissions. Airplanes, sadly, producewarming far out of proportion to their carbon emissions. The problem here is watervapor.
Normally, water vapor causes greenhouse heating only in response to increases in othergreenhouse gases. The troposphere (where we live) mostly is saturated with all the waterit can hold. Put more water in the air and it will precipitate out within a short time -maybe a great distance from where it was absorbed. However, if we add carbon dioxideequivalents to the air, that heats it just a little. The small temperature rise lets theatmosphere absorb water vapor in greater amounts. In other words, while carbon dioxideforces the temperature up words, water vapor increases temperature as feedbackmechanism. The way climate scientists often put this is that "water vapor is a feedback,not a forcing".
Cooling It: No Hair Shirt Solutions to Global Warming by Gar W. Lipow GarLpublic AT Comcast DOT net
Page 78 of 265
The trouble with jet airplanes is that they emit water in the lower stratosphere, not thetroposphere. They fly above the clouds, where the air is NOT saturated with water. Wateremitted at the level is a forcing, not a feedback. If airplanes were infrequent this wouldnot matter. Water, even at that level, is not a long term feedback. As a one time thing, itwould soon mix with the troposphere and precipitate out quickly. Unfortunately, airlineschedule are pretty regular from day to day. So jet planes add water to the stratospherefaster than nature regulatory mechanism can keep up with. We won't have a choice but toreducing flying even after all "no regrets" reductions are made. This is not a terriblething. A luxury configured CyberTran (six people per car - configured with bathrooms,water, drinks and snacks) could get you 3,000 miles in under two days. (It could actuallytravel that distance in 20 hours, but we are assuming stops for meals , stretch breaks, andan overnight stop for sleeping.) For long journeys like this, if we can get Maglev or othervery highs speed electric trains to work, we could end up coming close to airplane speed,and simply eliminate air travel for any trip that does not cross large bodies of water. Ultrahigh speed trains are not particularly energy efficient. (Maglev is especially egregiousdue to the embedded energy in Maglev tracks.) But energy efficiency is not (for achange) the point; even if high speed rail consumes more energy than planes, the globalwarming effect is still lower. And if the electricity for this purpose comes from solar orwind energy than the global warming effect is near zero.
At any rate flying won't have to be zero. We may, due to having delayed so long to tacklea problem that was widely foreseen in the 1970's, have to drastically reduce it for a while.There will be more replacement of international travel with long distance communication.Most long distance travel over land will be by trains. Most long distance travel over waterwill be by ship. We will find higher speed versions of both trains and ships; but overalllong distance travel will be slower. The world won't be quite as small for a while. But inthe long run, if we survive otherwise, we will find a solution to this as well.
Cooling It: No Hair Shirt Solutions to Global Warming by Gar W. Lipow GarLpublic AT Comcast DOT net
Page 79 of 265
A Very, Very Fine House: Saving Energy in Residential Buildings
Residential savings may be the best known, and are certainly the most mature renewableenergy technologies.
Climate control in new homes can easily be reduced from the average U.S. standardthrough high levels of insulation without thermal bridges, tight seals, high-quality singlepass ventilation, and high efficiency windows. In Germany, Jürgen Schnieders conducteda study of various "Passivhuas" (passive house) buildings213 in Germany, documentingthat on average they saved 90% of heating and cooling costs compared to U.S. averages,while adding about 10% to construction costs. That is easily recovered (with interest)over the course of a 15 year mortgage or by slightly higher rents that will still savetenants money in lower utility bills.
In existing homes we can save less, around 60%, by weather sealing to one air changeper hour, insulating attics, floors, and ducting, and installing modest window forms ofwindow insulation – such as window insulation kits, tinting or insulated drapes.
On average in the U.S. a 60% reduction would save about $400 per year214 . Capital costsfor the saving will run between $1,000 and $3,000. So energy savings provide an eightyear simple (interest free) payback; add interest to provide a 6.5% real rate of return, andthis stretches out to twelve years. You can shave a bit off this by timing such remodelingclose to the time you have to replace your furnace, (and air conditioner if you use one).After insulation, you can buy a 30% to 50% smaller furnacei, at 15% to 20% less -another$200 savings; price differences between larger and smaller air conditioners will result insimilar savings.
You can go further, retrofitting anything you would install in a new home, but while itmay improve your home air quality, and show social responsibility, it won’t pay for itselfin money.
This is not just something that can be done; it is something that has been done.
The NAHB Research Center, Inc. did a study for the National Renewable EnergyLaboratory documenting a gut rehab that saved over 80% of heating and cooling energycost effectively215.
When it comes to new homes, more than 5,000 such homes have been built in the EU -including some in areas of Finland well north of Alaska.
iYou have to size your furnace for peak not average usage –so can’t cut by as much as your total energysavings.
Cooling It: No Hair Shirt Solutions to Global Warming by Gar W. Lipow GarLpublic AT Comcast DOT net
Page 80 of 265
Professor Soontorn Boonyatikarn in hot humid Bangkok, Thailand built a home that uses1/15th the overall energy of a normal upper middle class Thai home216. Its airconditioner is one quarter the tonnage of a normal Bangkok air conditioner for a homethis size. This home cost about $124,000 to build, normal for a Thai home of it's size inhis neighborhood. Amory Lovins claims that total cooling requirements are about 10% ofaverage217.
In the same book, Amory and Hunter Lovins and Paul Hawken suggest theheadquarters/residence of the organization the Lovins run and live in as an example:
Rocky Mountain Institute headquarters in Colorado is at an elevation of 7,100 feet. It getsas cold as -47 degrees F in this location. Amory Lovins claims they saved 99% of spaceheating energy, and used 92 percent efficient heat recovering ventilators, and that theysaved construction costs over conventional techniques.
We can demonstrate similar savings for domestic water-heating - after climate control thenext largest energy consumer in the home - 17.28% of residential use218, adding $207 perto the average yearly bill219. A systems approach to water energy savings will includewater savings as well; in 2002, the average annual price of water and other publicservices was $326220. Estimating $25 a month of this as trash removal cost means thatwater & sewer charges ran about $300 per year. So, combined water, sewage, and water-heating dollars total around $507 annually.
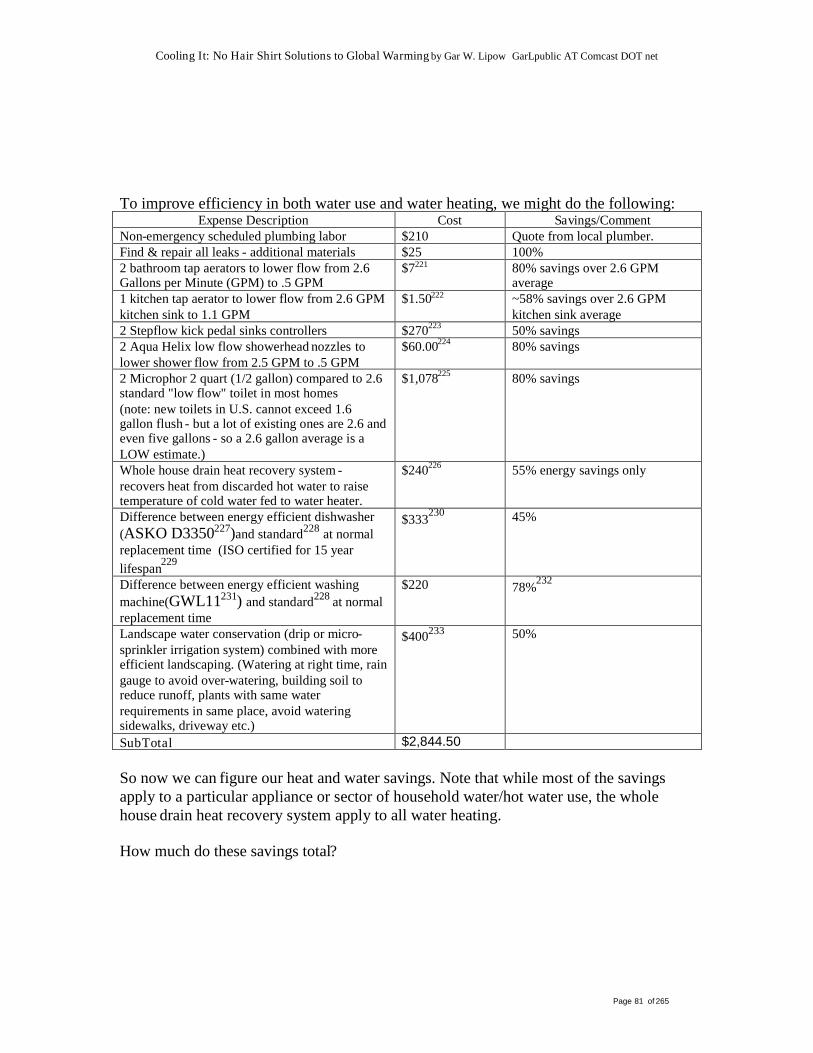
Cooling It: No Hair Shirt Solutions to Global Warming by Gar W. Lipow GarLpublic AT Comcast DOT net
Page 81 of 265
To improve efficiency in both water use and water heating, we might do the following:Expense Description Cost Savings/Comment
Non-emergency scheduled plumbing labor $210 Quote from local plumber.Find & repair all leaks - additional materials $25 100%2 bathroom tap aerators to lower flow from 2.6Gallons per Minute (GPM) to .5 GPM
$7221 80% savings over 2.6 GPMaverage
1 kitchen tap aerator to lower flow from 2.6 GPMkitchen sink to 1.1 GPM
$1.50222 ~58% savings over 2.6 GPMkitchen sink average
2 Stepflow kick pedal sinks controllers $270223 50% savings2 Aqua Helix low flow showerhead nozzles tolower shower flow from 2.5 GPM to .5 GPM
$60.00224 80% savings
2 Microphor 2 quart (1/2 gallon) compared to 2.6standard "low flow" toilet in most homes(note: new toilets in U.S. cannot exceed 1.6gallon flush - but a lot of existing ones are 2.6 andeven five gallons - so a 2.6 gallon average is aLOW estimate.)
$1,078225 80% savings
Whole house drain heat recovery system -recovers heat from discarded hot water to raisetemperature of cold water fed to water heater.
$240226 55% energy savings only
Difference between energy efficient dishwasher(ASKO D3350227)and standard228 at normalreplacement time (ISO certified for 15 yearlifespan229
$333230 45%
Difference between energy efficient washingmachine(GWL11231) and standard228 at normalreplacement time
$220 78%232
Landscape water conservation (drip or micro-sprinkler irrigation system) combined with moreefficient landscaping. (Watering at right time, raingauge to avoid over-watering, building soil toreduce runoff, plants with same waterrequirements in same place, avoid wateringsidewalks, driveway etc.)
$400233 50%
SubTotal $2,844.50
So now we can figure our heat and water savings. Note that while most of the savingsapply to a particular appliance or sector of household water/hot water use, the wholehouse drain heat recovery system apply to all water heating.
How much do these savings total?
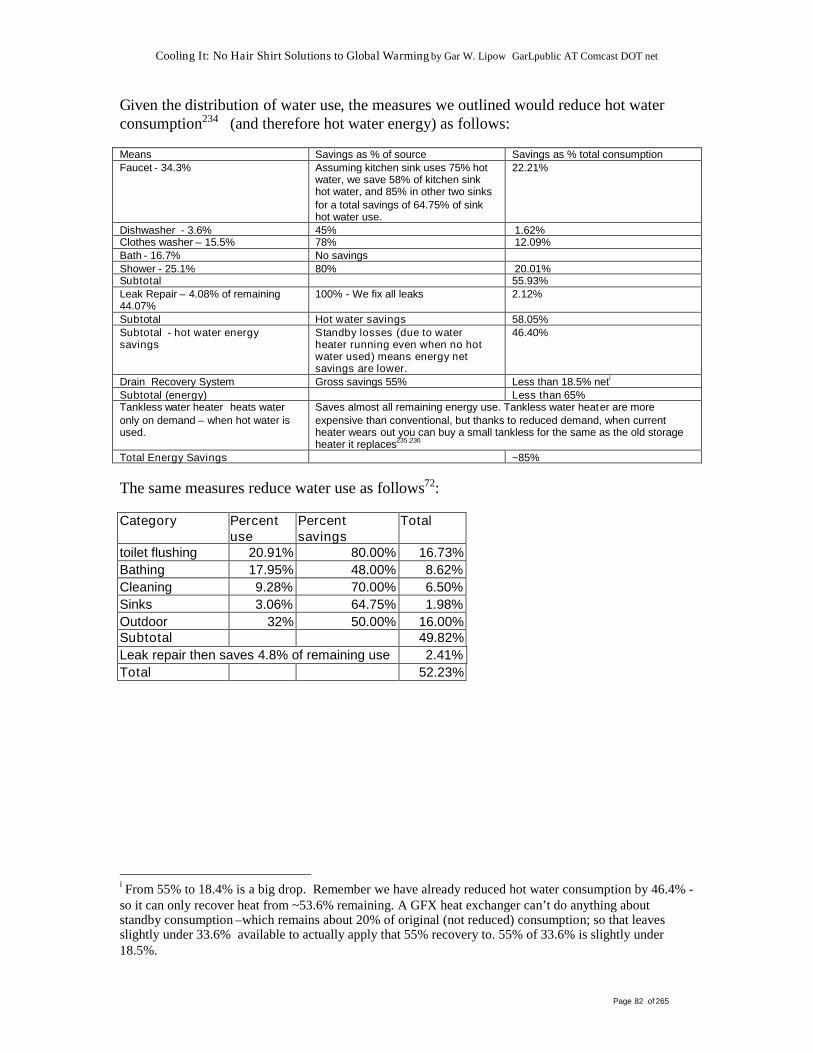
Cooling It: No Hair Shirt Solutions to Global Warming by Gar W. Lipow GarLpublic AT Comcast DOT net
Page 82 of 265
Given the distribution of water use, the measures we outlined would reduce hot waterconsumption234 (and therefore hot water energy) as follows:
Means Savings as % of source Savings as % total consumptionFaucet - 34.3% Assuming kitchen sink uses 75% hot
water, we save 58% of kitchen sinkhot water, and 85% in other two sinksfor a total savings of 64.75% of sinkhot water use.
22.21%
Dishwasher - 3.6% 45% 1.62%Clothes washer – 15.5% 78% 12.09%Bath - 16.7% No savingsShower - 25.1% 80% 20.01%Subtotal 55.93%Leak Repair – 4.08% of remaining44.07%
100% - We fix all leaks 2.12%
Subtotal Hot water savings 58.05%Subtotal - hot water energysavings
Standby losses (due to waterheater running even when no hotwater used) means energy netsavings are lower.
46.40%
Drain Recovery System Gross savings 55% Less than 18.5% neti
Subtotal (energy) Less than 65%Tankless water heater heats wateronly on demand – when hot water isused.
Saves almost all remaining energy use. Tankless water heater are moreexpensive than conventional, but thanks to reduced demand, when currentheater wears out you can buy a small tankless for the same as the old storageheater it replaces235 ;236
Total Energy Savings ~85%
The same measures reduce water use as follows72:
Category Percentuse
Percentsavings
Total
toilet flushing 20.91% 80.00% 16.73%Bathing 17.95% 48.00% 8.62%Cleaning 9.28% 70.00% 6.50%Sinks 3.06% 64.75% 1.98%Outdoor 32% 50.00% 16.00%Subtotal 49.82%Leak repair then saves 4.8% of remaining use 2.41%Total 52.23%
i From 55% to 18.4% is a big drop. Remember we have already reduced hot water consumption by 46.4% -so it can only recover heat from ~53.6% remaining. A GFX heat exchanger can’t do anything aboutstandby consumption –which remains about 20% of original (not reduced) consumption; so that leavesslightly under 33.6% available to actually apply that 55% recovery to. 55% of 33.6% is slightly under18.5%.

Cooling It: No Hair Shirt Solutions to Global Warming by Gar W. Lipow GarLpublic AT Comcast DOT net
Page 83 of 265
So we save 52.23% of water inflow and sewage outflow, and 85% of water heatingenergy use. Given the values we looked at for costs ($207 for heating, $300 for water andsewer), at a 6.5% discount rate, the present value of these savings over a thirteen yearperiod is around ~$2,860 - a trivial gain over $2,845. Thus, we can save ~85% of hotwater cost, and around half of water consumption at around zero costs, or a veryminiscule gain. Aside from the social benefits we do have some additional personalbenefits as well. Water saving dishwashers and washing machines also save soap. Ultralow flush toilets actually tend to have fewer jams, need fewer double flushes, and havefewer plumbing problems in general than standard low flush ones. Tankless waterheaters occupy less space than standard ones, last longer, and are easier to repair. Kickpedal sink controls help slow disease transmission within the home, and also provideconvenience when your hands are full. (In fact most kick pedal sink controls installedwithin homes are installed for these reasons and not for the purposes of water savings.)
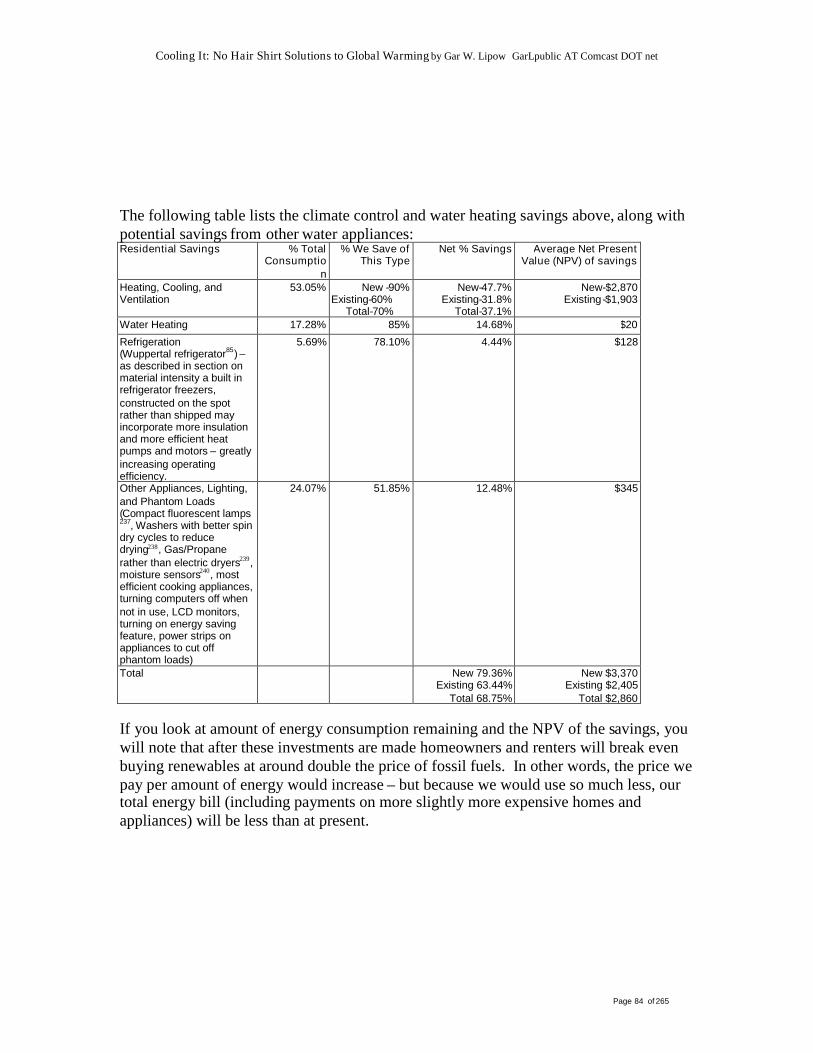
Cooling It: No Hair Shirt Solutions to Global Warming by Gar W. Lipow GarLpublic AT Comcast DOT net
Page 84 of 265
The following table lists the climate control and water heating savings above, along withpotential savings from other water appliances:Residential Savings % Total
Consumption
% We Save ofThis Type
Net % Savings Average Net PresentValue (NPV) of savings
Heating, Cooling, andVentilation
53.05% New -90%Existing-60%
Total-70%
New-47.7%Existing-31.8%
Total-37.1%
New-$2,870Existing-$1,903
Water Heating 17.28% 85% 14.68% $20
Refrigeration(Wuppertal refrigerator85) –as described in section onmaterial intensity a built inrefrigerator freezers,constructed on the spotrather than shipped mayincorporate more insulationand more efficient heatpumps and motors – greatlyincreasing operatingefficiency.
5.69% 78.10% 4.44% $128
Other Appliances, Lighting,and Phantom Loads(Compact fluorescent lamps237, Washers with better spindry cycles to reducedrying238, Gas/Propanerather than electric dryers239,moisture sensors240, mostefficient cooking appliances,turning computers off whennot in use, LCD monitors,turning on energy savingfeature, power strips onappliances to cut offphantom loads)
24.07% 51.85% 12.48% $345
Total New 79.36%Existing 63.44%
Total 68.75%
New $3,370Existing $2,405
Total $2,860
If you look at amount of energy consumption remaining and the NPV of the savings, youwill note that after these investments are made homeowners and renters will break evenbuying renewables at around double the price of fossil fuels. In other words, the price wepay per amount of energy would increase – but because we would use so much less, ourtotal energy bill (including payments on more slightly more expensive homes andappliances) will be less than at present.
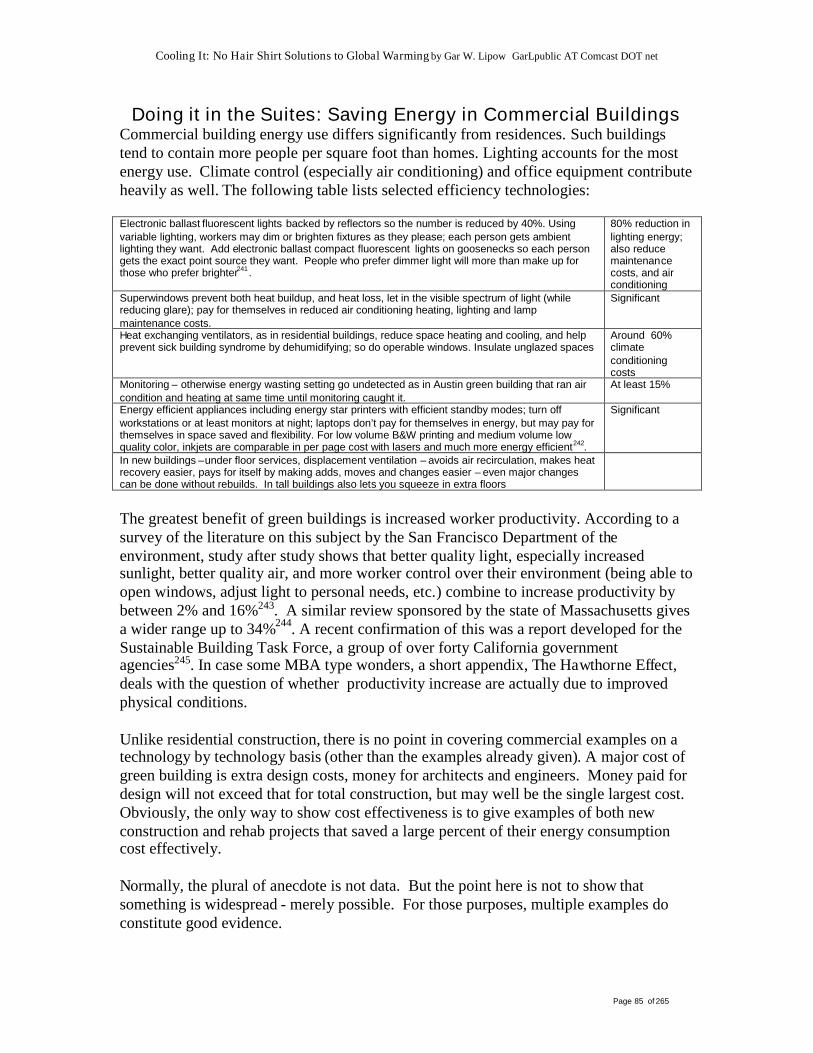
Cooling It: No Hair Shirt Solutions to Global Warming by Gar W. Lipow GarLpublic AT Comcast DOT net
Page 85 of 265
Doing it in the Suites: Saving Energy in Commercial BuildingsCommercial building energy use differs significantly from residences. Such buildingstend to contain more people per square foot than homes. Lighting accounts for the mostenergy use. Climate control (especially air conditioning) and office equipment contributeheavily as well. The following table lists selected efficiency technologies:
Electronic ballast fluorescent lights backed by reflectors so the number is reduced by 40%. Usingvariable lighting, workers may dim or brighten fixtures as they please; each person gets ambientlighting they want. Add electronic ballast compact fluorescent lights on goosenecks so each persongets the exact point source they want. People who prefer dimmer light will more than make up forthose who prefer brighter241 .
80% reduction inlighting energy;also reducemaintenancecosts, and airconditioning
Superwindows prevent both heat buildup, and heat loss, let in the visible spectrum of light (whilereducing glare); pay for themselves in reduced air conditioning heating, lighting and lampmaintenance costs.
Significant
Heat exchanging ventilators, as in residential buildings, reduce space heating and cooling, and helpprevent sick building syndrome by dehumidifying; so do operable windows. Insulate unglazed spaces
Around 60%climateconditioningcosts
Monitoring – otherwise energy wasting setting go undetected as in Austin green building that ran aircondition and heating at same time until monitoring caught it.
At least 15%
Energy efficient appliances including energy star printers with efficient standby modes; turn offworkstations or at least monitors at night; laptops don’t pay for themselves in energy, but may pay forthemselves in space saved and flexibility. For low volume B&W printing and medium volume lowquality color, inkjets are comparable in per page cost with lasers and much more energy efficient242.
Significant
In new buildings –under floor services, displacement ventilation – avoids air recirculation, makes heatrecovery easier, pays for itself by making adds, moves and changes easier – even major changescan be done without rebuilds. In tall buildings also lets you squeeze in extra floors
The greatest benefit of green buildings is increased worker productivity. According to asurvey of the literature on this subject by the San Francisco Department of theenvironment, study after study shows that better quality light, especially increasedsunlight, better quality air, and more worker control over their environment (being able toopen windows, adjust light to personal needs, etc.) combine to increase productivity bybetween 2% and 16%243. A similar review sponsored by the state of Massachusetts givesa wider range up to 34%244. A recent confirmation of this was a report developed for theSustainable Building Task Force, a group of over forty California governmentagencies245. In case some MBA type wonders, a short appendix, The Hawthorne Effect,deals with the question of whether productivity increase are actually due to improvedphysical conditions.
Unlike residential construction, there is no point in covering commercial examples on atechnology by technology basis (other than the examples already given). A major cost ofgreen building is extra design costs, money for architects and engineers. Money paid fordesign will not exceed that for total construction, but may well be the single largest cost.Obviously, the only way to show cost effectiveness is to give examples of both newconstruction and rehab projects that saved a large percent of their energy consumptioncost effectively.
Normally, the plural of anecdote is not data. But the point here is not to show thatsomething is widespread - merely possible. For those purposes, multiple examples doconstitute good evidence.
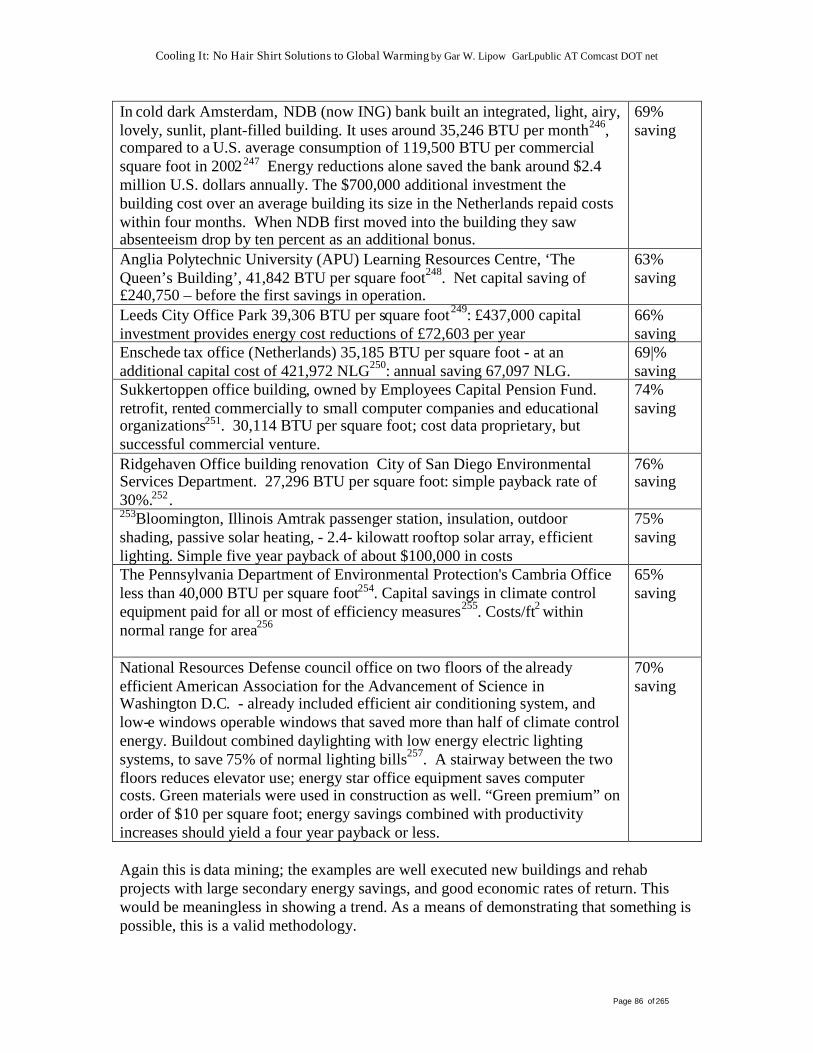
Cooling It: No Hair Shirt Solutions to Global Warming by Gar W. Lipow GarLpublic AT Comcast DOT net
Page 86 of 265
In cold dark Amsterdam, NDB (now ING) bank built an integrated, light, airy,lovely, sunlit, plant-filled building. It uses around 35,246 BTU per month246,compared to a U.S. average consumption of 119,500 BTU per commercialsquare foot in 2002247 Energy reductions alone saved the bank around $2.4million U.S. dollars annually. The $700,000 additional investment thebuilding cost over an average building its size in the Netherlands repaid costswithin four months. When NDB first moved into the building they sawabsenteeism drop by ten percent as an additional bonus.
69%saving
Anglia Polytechnic University (APU) Learning Resources Centre, ‘TheQueen’s Building’, 41,842 BTU per square foot248. Net capital saving of£240,750 – before the first savings in operation.
63%saving
Leeds City Office Park 39,306 BTU per square foot249: £437,000 capitalinvestment provides energy cost reductions of £72,603 per year
66%saving
Enschede tax office (Netherlands) 35,185 BTU per square foot - at anadditional capital cost of 421,972 NLG250: annual saving 67,097 NLG.
69|%saving
Sukkertoppen office building, owned by Employees Capital Pension Fund.retrofit, rented commercially to small computer companies and educationalorganizations251. 30,114 BTU per square foot; cost data proprietary, butsuccessful commercial venture.
74%saving
Ridgehaven Office building renovation City of San Diego EnvironmentalServices Department. 27,296 BTU per square foot: simple payback rate of30%.252.
76%saving
253Bloomington, Illinois Amtrak passenger station, insulation, outdoorshading, passive solar heating, - 2.4- kilowatt rooftop solar array, efficientlighting. Simple five year payback of about $100,000 in costs
75%saving
The Pennsylvania Department of Environmental Protection's Cambria Officeless than 40,000 BTU per square foot254. Capital savings in climate controlequipment paid for all or most of efficiency measures255. Costs/ft2 withinnormal range for area256
65%saving
National Resources Defense council office on two floors of the alreadyefficient American Association for the Advancement of Science inWashington D.C. - already included efficient air conditioning system, andlow-e windows operable windows that saved more than half of climate controlenergy. Buildout combined daylighting with low energy electric lightingsystems, to save 75% of normal lighting bills257. A stairway between the twofloors reduces elevator use; energy star office equipment saves computercosts. Green materials were used in construction as well. “Green premium” onorder of $10 per square foot; energy savings combined with productivityincreases should yield a four year payback or less.
70%saving
Again this is data mining; the examples are well executed new buildings and rehabprojects with large secondary energy savings, and good economic rates of return. Thiswould be meaningless in showing a trend. As a means of demonstrating that something ispossible, this is a valid methodology.
Cooling It: No Hair Shirt Solutions to Global Warming by Gar W. Lipow GarLpublic AT Comcast DOT net
Page 87 of 265
We have demonstrated we can save between two-thirds and three-quarters of the energyin both existing and new commercial buildings (compared to the current average) with asimple payback ranging from less than no time (energy saving techniques lower capitalcosts) to seven years. Longer payback periods typically do not include gains inproductivity, which is the major economic benefit in both new construction andrehabilitation.
Therefore, it is a conservative assumption that average payback will be five years or lessif productivity gains are included, probably a pessimistic one. Similarly, a seventy-percent or more savings at this payback rate is most likely pessimistic. Again, it ispessimistic not in terms of what is usually done (which it greatly exceeds), but in terms ofwhat it is possible to do.
Given a 70% energy savings, a productivity gain at least equal in value to that savings,and a five year simple payback, and a 6.5% discount rate, this means we can pay ~2.84times current cost for the remaining energy used and still break even.
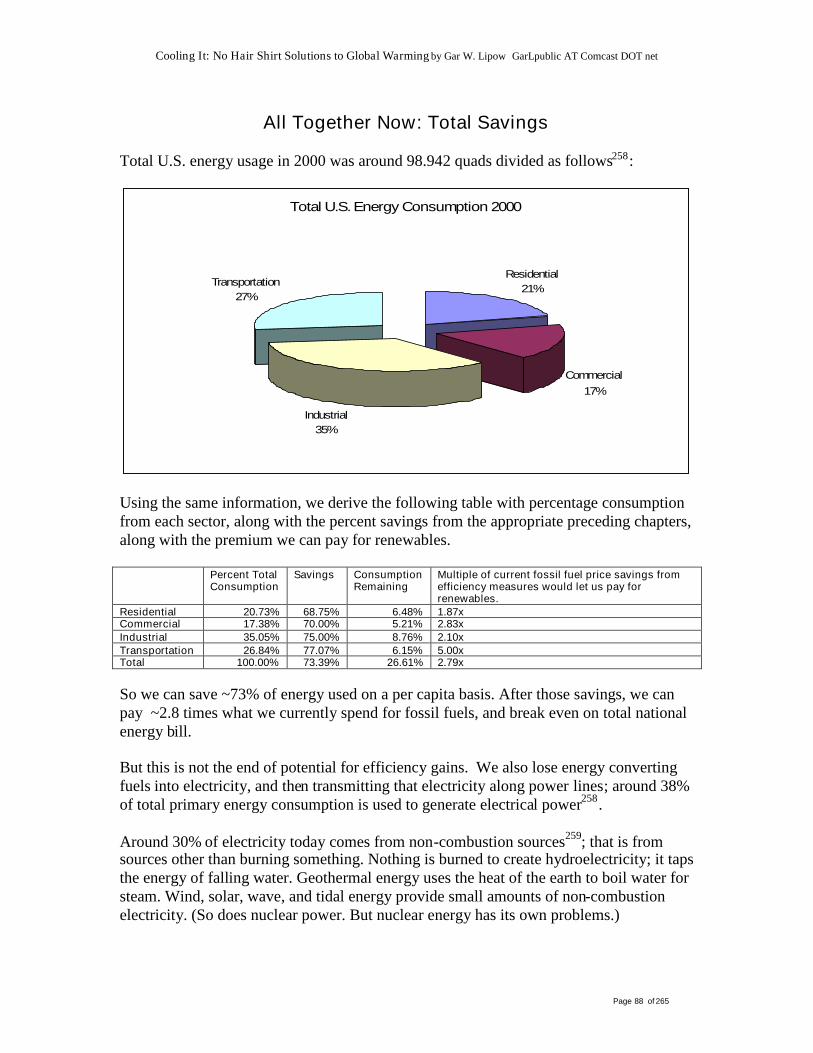
Cooling It: No Hair Shirt Solutions to Global Warming by Gar W. Lipow GarLpublic AT Comcast DOT net
Page 88 of 265
All Together Now: Total Savings
Total U.S. energy usage in 2000 was around 98.942 quads divided as follows258:
TotalU.S.EnergyConsumption2000
Residential21%
Commercial17%
Industrial35%
Transportation27%
Using the same information, we derive the following table with percentage consumptionfrom each sector, along with the percent savings from the appropriate preceding chapters,along with the premium we can pay for renewables.
Percent TotalConsumption
Savings ConsumptionRemaining
Multiple of current fossil fuel price savings fromefficiency measures would let us pay forrenewables.
Residential 20.73% 68.75% 6.48% 1.87xCommercial 17.38% 70.00% 5.21% 2.83xIndustrial 35.05% 75.00% 8.76% 2.10xTransportation 26.84% 77.07% 6.15% 5.00xTotal 100.00% 73.39% 26.61% 2.79x
So we can save ~73% of energy used on a per capita basis. After those savings, we canpay ~2.8 times what we currently spend for fossil fuels, and break even on total nationalenergy bill.
But this is not the end of potential for efficiency gains. We also lose energy convertingfuels into electricity, and then transmitting that electricity along power lines; around 38%of total primary energy consumption is used to generate electrical power258.
Around 30% of electricity today comes from non-combustion sources259; that is fromsources other than burning something. Nothing is burned to create hydroelectricity; it tapsthe energy of falling water. Geothermal energy uses the heat of the earth to boil water forsteam. Wind, solar, wave, and tidal energy provide small amounts of non-combustionelectricity. (So does nuclear power. But nuclear energy has its own problems.)
Cooling It: No Hair Shirt Solutions to Global Warming by Gar W. Lipow GarLpublic AT Comcast DOT net
Page 89 of 265
Burning fuel produces the rest - around 70%. This requires a bit less than three units offuel to produce one unit of electricity. In the year 2000, according to the InternationalEnergy Agency, the U.S. produced about 36.7 BTUs of electricity for each 100 BTUsburned to generate it239. (This included line losses of around 10%260, as well as thermalconversion losses.)
Given the efficiencies we are looking at, the total drop in electricity use, we should beable to supply all our electricity entirely from sources that don’t involve combustion offuel – hydroelectricity, wind and geothermal plus solar thermal. So after countervailingfactors, (small additional amounts of electricity used in transportation, and additional linelosses from sending power longer distances), we should have a net savings of anadditional ~9.6% of remaining energy consumptioni. Including that, we can save a totalof 83% of energy use per capita, without lifestyle reductions or shrinking our economy..Remember that, though our target date for a complete switch to renewable sources is2040, we want to meet the energy needs of 2050 by that date. That is because we don’twant to supply most energy from renewables in 2040, and then run short the next year.
iWe calculate this as follows. Current line losses, as mentioned, are about 10%. But if we are goinggenerate electricity renewably without assuming breakthroughs – without assuming cheap solar cells,inexpensive fuel cells, inexpensive electrolysis, we will have ship electricity from where inexpensiverenewable sources may be found – a lot of it a long distance from where consumed. So that we means wewill need longer distance transmission lines, and greater losses from transmission – maybe as much as 10%greater (bringing total line losses to 20%).
Current losses are ~63% (current net conversion) of 70% (the percent of our electricity we generate fromfossil fuel) of 38% (primary energy used to generate electricity) – equals ~16.76%. Instead we would lose~20% of ~70% of ~38% - equals a ~5.3% loss. This is about an 11% gross saving.
However the 30% we currently generate from non-combustion sources will also have to be shipped further,doubling our 10% transmission loss there to 20%. So instead of 10% of 30% of 38% (~1%), we will lose20% of 30% of 38% (~2%), another ~1%.
Lastly, about ~2% of total energy will be additional electricity used for transportation currently powered byfuel. This will be a tremendous savings over IC and jet engines; but we will still have a 20% transmissionloss - an additional ~0.4%. Subtracting that 1% and .4% from the 11% gross saving still lets us save ~9.6%of total energy remaining.
These saving are economic, and environmental. A hydroelectric turbine does not convert the power offalling water to electricity with 100% efficiency (though it can come surprisingly close). Neither do windgenerators, nor geothermal power stations.
The environmental differences are obvious; a solar thermal power plant emits no greenhouse gases inoperation. The economic difference is important too. If you burn natural gas to produce electricity youcould have used that same natural gas somewhere else – to heat homes, to drive high temperature industrialprocesses, to use as a raw feedstock. When we tap the power of the wind to generate electricity or pumpwater, that is the first stage at which the natural resource has been converted to an economic one. Theopportunity costs are of a different order. (They are not zero of course; resources go into building a windgenerator. But your operating input is not something that otherwise would have gone to a differenteconomic purpose.)
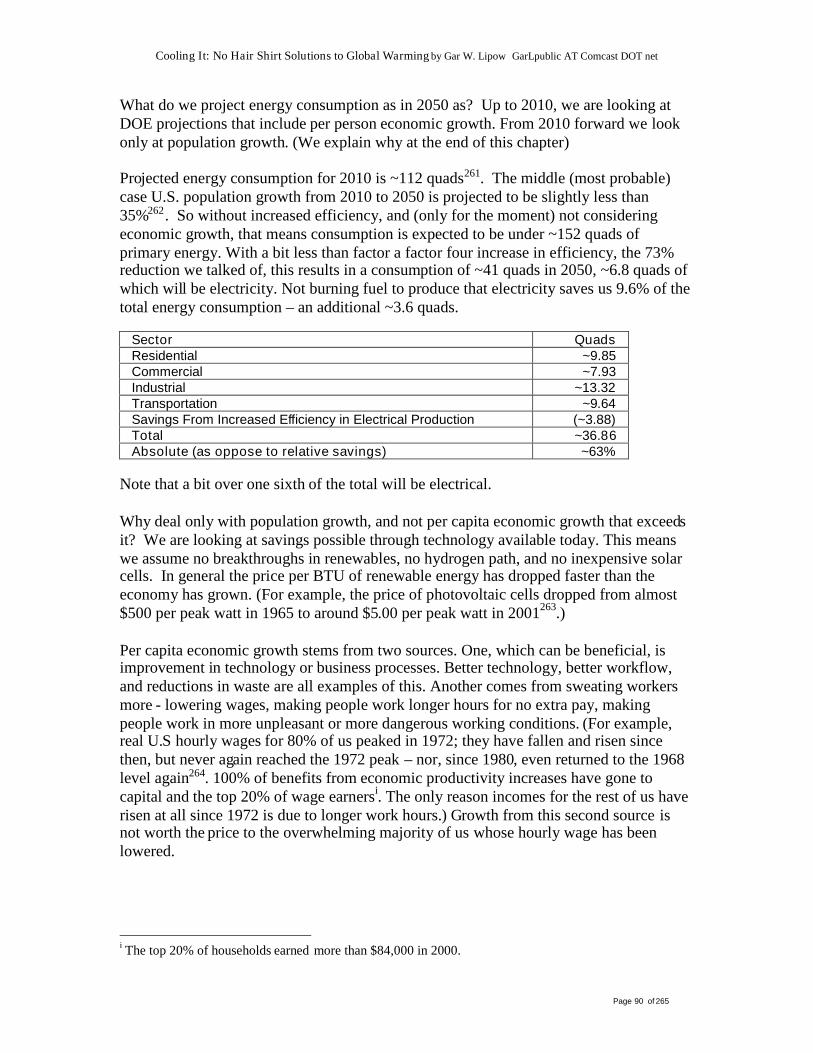
Cooling It: No Hair Shirt Solutions to Global Warming by Gar W. Lipow GarLpublic AT Comcast DOT net
Page 90 of 265
What do we project energy consumption as in 2050 as? Up to 2010, we are looking atDOE projections that include per person economic growth. From 2010 forward we lookonly at population growth. (We explain why at the end of this chapter)
Projected energy consumption for 2010 is ~112 quads261. The middle (most probable)case U.S. population growth from 2010 to 2050 is projected to be slightly less than35%262. So without increased efficiency, and (only for the moment) not consideringeconomic growth, that means consumption is expected to be under ~152 quads ofprimary energy. With a bit less than factor a factor four increase in efficiency, the 73%reduction we talked of, this results in a consumption of ~41 quads in 2050, ~6.8 quads ofwhich will be electricity. Not burning fuel to produce that electricity saves us 9.6% of thetotal energy consumption – an additional ~3.6 quads.
Sector QuadsResidential ~9.85Commercial ~7.93Industrial ~13.32Transportation ~9.64Savings From Increased Efficiency in Electrical Production (~3.88)Total ~36.86Absolute (as oppose to relative savings) ~63%
Note that a bit over one sixth of the total will be electrical.
Why deal only with population growth, and not per capita economic growth that exceedsit? We are looking at savings possible through technology available today. This meanswe assume no breakthroughs in renewables, no hydrogen path, and no inexpensive solarcells. In general the price per BTU of renewable energy has dropped faster than theeconomy has grown. (For example, the price of photovoltaic cells dropped from almost$500 per peak watt in 1965 to around $5.00 per peak watt in 2001263.)
Per capita economic growth stems from two sources. One, which can be beneficial, isimprovement in technology or business processes. Better technology, better workflow,and reductions in waste are all examples of this. Another comes from sweating workersmore - lowering wages, making people work longer hours for no extra pay, makingpeople work in more unpleasant or more dangerous working conditions. (For example,real U.S hourly wages for 80% of us peaked in 1972; they have fallen and risen sincethen, but never again reached the 1972 peak – nor, since 1980, even returned to the 1968level again264. 100% of benefits from economic productivity increases have gone tocapital and the top 20% of wage earnersi. The only reason incomes for the rest of us haverisen at all since 1972 is due to longer work hours.) Growth from this second source isnot worth the price to the overwhelming majority of us whose hourly wage has beenlowered.
i The top 20% of households earned more than $84,000 in 2000.

Cooling It: No Hair Shirt Solutions to Global Warming by Gar W. Lipow GarLpublic AT Comcast DOT net
Page 91 of 265
So if we stick to growth from actual improvement in the way work is done, then we cancount on renewable technology to automatically keep up with it. In short we want todemonstrate that the technology we have now can maintain the 2010 U.S. per capita GDPthrough 2050. If we show that, with a transition to essentially zero emission by 2040,then we have shown (by usual economic standards anyway) that normal renewableinnovation rates will sustain economic growth over and above population increases.
(To be on the safe side though, you will note that we do have a section near the end of thebook where we specifically consider R&D areas that would cover economic growthbeyond that in population. It is speculative – but then again so are the innovations thatwill create such per capita growth. In that context we can consider things like cheap solarcells – because their uncertainty is no greater than the processes which will consume theirpower.)
Cooling It: No Hair Shirt Solutions to Global Warming by Gar W. Lipow GarLpublic AT Comcast DOT net
Page 92 of 265
Earth, Sun, Sky and Sea: Sources
I’ll Let These Sparks Fly Out: Electricity
We have more potential to produce renewable electricity than any other form ofrenewable output (other of course than efficiency). As we will see in other sections, bothwind and sun could provide enough renewable electricity to meet many times total worlddemand for all forms of power (not only electrical usage). Thus we will want tosubstitute electricity for other forms of energy whenever possible.
While efficiency and solar heat are the best ways to provide climate control and domestichot water, these means may not always be practical. So long as we use it very thriftily,there is no reason renewable electricity rather than fossil fuels can't be used in these cases- via heat pumps, for example. Again, the preferred source for these purposes are solarenergy, mid-temperature geothermal and ground-source heat pumps; but renewableelectricity can provide backup, and last-ditch none-of-these-work alternatives. Becauseheat is cheaper to store than electricity, where this is necessary, PCM or other storagemeans could allow use of wind electricity without backup or standby energy.
In industry too, we can substitute electricity for much current fuel use. Often one for onesubstitution is impossible or at least highly inefficient. But almost always, when you lookat the result you are aiming for, rather than merely focusing on the process, you can findan electrical means. For example, trying to design a resistance heater that wouldsubstitute for basic oxygen furnaces would be absurd. But electric arc furnaces processscrap metal far more effectively than coal fired furnaces - even when that electricity isproduced by coal; if the electricity the savings are immense (which is why most scrapmetal today is process in electric arc furnaces). Similarly, many of the efficiency meansmentioned in the section on industry allow electrical substitution. Alternative cleaningprocesses such as super-critical carbon dioxide or ultrasonic chambers can substitute forhigh temperature cleaning processes. Mini-reactors can allow concentrated electricalprocesses to heat tiny areas substituting for huge fossil fuel driven furnaces. And, soforth.
Cooling It: No Hair Shirt Solutions to Global Warming by Gar W. Lipow GarLpublic AT Comcast DOT net
Page 93 of 265
Free as Running Water: Hydro-electricity
The U.S. consumed 2.84 quads of hydroelectricity in 2000265, some imported fromCanada. Thanks to global warming caused droughts, and competing uses, availablehydroelectricity may not stay at that level. Also, hydroelectricity is extremely damagingecologically, disrupting critical habitats and often endangered species. However, a lot ofexisting dams are used only for flood control and water supply; some of them could addturbines without affecting these existing uses or causing additional damage. Also, smallhydro plants use canals and ditches rather than dams, and thus may do less environmentaldamage. This potential is almost untouched. We don't know what hydroelectricproduction in the U.S. will be at the end of this century. Given that the need for floodcontrol and water supply won't go away, and the potential to add turbines to existingdams, plus small hydro potential we can guess that it won't be substantially less than wehave now. Given the limiting climate and ecological factors needed we can guess it won'tbe substantially more. So a good tentative guess is that we can keep production about thesame at a reasonable economic and ecological cost. But, we need to understand that thereis a huge question mark; that is an extremely foggy number.
Most regions with hydroelectric power produce significantly less than needed just fortheir own consumption - even after the efficiency improvements recommended266. Butthe regions that produce the most hydroelectricity, the Pacific Contiguous and RockyMountain census areas, produce much more than their requirements after efficiencymeasures266. Hydroelectricity is among the most important renewable energy resources –because dams make it storable and dispatchable. Within limits we can storehydroelectricity and dispatch when we choose. (The limits are, of course, that dams arealso important for flood control, and irrigation. We can’t let them get too full, nor wastewater we need for other purposes.)
According to the California Energy Commission, the levelized production costs ofhydroelectricity are about 6.04 cents per kWh.
Cooling It: No Hair Shirt Solutions to Global Warming by Gar W. Lipow GarLpublic AT Comcast DOT net
Page 94 of 265
Where the Hot Springs Blow: Geothermal Electricity
Something like 95% of the solid mass of the earth is at a temperature of 100 centigrade ormore. So in a very hypothetical sense, we could provide all the electricity we need forthousands of years from this source. At the moment we have the technical ability toaccess a very tiny portion of that potential, and the ability to access a tiny portion of thattiny portion economically.
In the U.S., we could produce up to 22 gigawatts of capacity with today’s technology267.However, probably only about 6.5 of those gigawatts could be produced economically.This translates into slightly less than .2 quads of electrical energy.
According to the World Bank, the levelized cost of geothermal electricity produced inlarge plants from plants runs from 4 to 6 cents per kWh268. The Public RenewablesPartnership (a partnership of several DOE programs, several large utility associations,and the non-profit Center for Resource Solutions gives the price for binary plants (whichcan utilize lower temperature sources and are more environmentally sound) as around 5.8cents per kWh269. The California Energy Commission, (which tends to be very careful,working as they do in a state Enron peeled like a banana) gives the cost as 7.37 cents perkWh270, which we will use.
Cooling It: No Hair Shirt Solutions to Global Warming by Gar W. Lipow GarLpublic AT Comcast DOT net
Page 95 of 265
Restless Power of the Wind: Wind Electricity
Wind is an inexpensive source of electricity now - able to provide variable electricity at alevelized cost of ~5 cents per kWh271.
Wind potential could provide virtually any amount of electricity we would needconsidering only class 5 and better wind power available year round272. Economicallyviable sources worldwide could supply many times world demand273; economicallyviable sources within the U.S. could supply several times U.S. demand273.
Of course wind is a variable source (not intermittent – power curves from wind are fairlypredictable – but variable). Further, most energy is consumed at a fair distance from areaswhere class 5 and higher winds blow all year round. (Constant high winds don't headmost lists of preferred climates.) Even in those places the wind occasionally stopsblowing.
The variable nature of wind is not as difficult to deal with as most people think. Theproblem with wind power without storage is that you need backups for when the winddoes not blow - so you end up spending capital twice, once for the wind generator andonce for the backup plant. But all power plants need some spinning and operatingreserves. (Spinning reserves are reserves that are already on line or can come on line inless than a second – to compensate for failures where there is no notice. Operatingreserves are off-line plants that can be brought on-line in a normal step by step mannerfor a planned or predicted reduction in production from another source.) There is a levelof wind utilization at which operating and spinning reserves are no greater than thoseneeded for any other source.
The DOE says that level is 10%. But studies, (and actual experience), suggests that thatclever grid management can let you gain 20% of your power from wind and still not needa significant increase in spinning and operating reserves. If a large percent of yourelectricity is extremely reliable base generation - say hydroelectricity or geothermalenergy, wind power without storage or extra backup may provide more than that274.
But it turns out that wind could supply much higher percentages of a grid than previouslyrealized if we used HVDC electric transmission lines to connect wind farms hundreds (oreven thousands) of miles apart. Because wind tends to rise and fall at different locationsat different times, low and no power periods grow shorter and less frequent. Withsufficient interconnections, around a third of wind energy generated can compete withcoal plants for baseload needs275. (Baseload is the demand for electricity a utility mustmeet all the time, as opposed to the additional loads the vary from hour to hour above thatbase.)
Cooling It: No Hair Shirt Solutions to Global Warming by Gar W. Lipow GarLpublic AT Comcast DOT net
Page 96 of 265
However we also need to consider than once you have all these interconnections, storageneeds to turn a greater percent of power generated in into base or peak loads decreases. InMarch of 2006, Windtech International magazine published an article on Vehicle to Gridinterconnection276, which included a chart based on unpublished wind data from a studycovering eight sites dispersed hundreds of kilometers apart277. It found that with suchinterconnected wind farms, most periods of low wind lasted three hours or fewer for thecombination of interconnected farms (as opposed to a single farm). Thus the ability tostore only a few hours worth of power would allow a much higher percent of powerproduced as firm or baseload capacity.
This still does not allow wind to meet demand above that consistent base; if you want todo that you would need to be able time shift some of your output by more than threehours. Ten hours of average production for the series of wind farms would seem areasonable guess. At this point almost all the power produced could be used for base,load following, and even (to some extent) peak. That amount of reliability would let windreplace 80% or 90% of electrical use.
Average production for a wind generator represents about 30% maximum capacity. (Thatis: over the course of a year, a single generator will produce about 30% of the electricityit could create if it spun at maximum speed 24 hours per day.) So ten hours of averageproduction represents three hours of peak production; and peak production is how capitalexpenditures for wind are measured. In other words, to calculate capital costs for theadditional storage, we should price three hours of capacity compared to the power all thefarms could produce if all the generators on all of them spun at maximum speed at thesame time.
Cooling It: No Hair Shirt Solutions to Global Warming by Gar W. Lipow GarLpublic AT Comcast DOT net
Page 97 of 265
Heat of the Sun: Solar Thermal Electricity
Solar energy has even more potential than wind to produce electricity. Enough solarenergy strikes the surface of the earth every 40 minutes to produce all power consumedfor a year278.
Solar thermal power plants currently produce electricity for ~11 cents per kWh279, byusing concentrating mirrors to produce heat to drive turbines. (The principle is the sameas setting a bit of paper on fire with a magnifying glass.). Because heat is cheaper tostore than electricity, the heat from the concentrators may be stored at $35 per kWht280.16 hours storage makes the electricity fully dispatchable, allows plants to operate at about65% of nameplate capacity, and (at the price mentioned) adds around 1 cent per kWhover the first twenty years of plant life. If you assume around a half cent per kWhadditional O&M for the storage facility, this gives us a price ~12.5 cents per kWh –expensive, but less than hydrogen, flow batteries, or new nuclear plants for the samecapability.
There is a major consortium who believes that the combination of simply mass producingthe mirrors on a large scale, combined with using waste heat from the engines to producewater and air conditioning, would lower this price to between 3 and 5 cents per kWh281.Reliability is about 70%. (Solar thermal requires more storage than wind. An obviouscause is that night happens continuously 12 or so hours out of every 24. In addition,unlike wind, solar power from deserts does not provide access to widely differing sites.Extreme cloudy weather (especially multi-day extreme cloudy weather) will probablyhappen at the same time on differing sites.
Mixed Sources and Storage
Solar and wind electricity combined complement each other. Wind tends to peak inwinter and at night. Solar energy tends to peak in the summer and during the day.Absolute still windless weather tends to be sunny. Heavy clouds tend to produce morewind. With a mixed grid of mainly solar thermal electricity (with thermal storage) andwind connected by long distance transmission lines, ten hours storage compared toaverage use will go even further. As with wind solar plants average only a smallpercentage of their peak output; so we can translate that ten hours average into threehours of peak for solar as well. (That is actually conservative. Solar electricity plantsaverage more like 20% of peak than 30%. )
The least expensive way we know to store electricity is pumped storage - much less perkWh of capacity than flow batteries or flywheels. In a pumped storage plant, a reservoiris maintained at a significant elevation above a water source such as a lake or river. Whenexcess power is available, water is pumped up to that reservoir. To recover that power,the water is simply dropped through a pipe into a hydroelectric generator then dumpedback into that water source.
Cooling It: No Hair Shirt Solutions to Global Warming by Gar W. Lipow GarLpublic AT Comcast DOT net
Page 98 of 265
Conventional pumped storage is ecologically extremely damaging; in some cases it candwarf even conventional hydro for in the destruction it causes. In North America the bestconventional pumped storage sites are in use in any case. A more recent technique calledmodular pumped storage is both less ecologically harmful, and can be placed whereconventional pumped storage can't. Modular pumped storage creates two artificialreservoirs an upper and a lower one. The lower reservoir is charged only once. Water ispumped between the two in a closed cycle. Operating water is only needed on a smallscale to replace leakage and evaporation. Since such a system is not continuouslydraining rivers or lakes, it does not need to be near a major water source. You can place itanywhere you have sufficient differences in elevation, even in the desert. The priceshould be at high end of the Electricity Storage Association's estimate for a pumpedstorage cost range -- ~$150 per kWh of capacity282.
So you would need about $450 worth of pumped storage per KW of peak wind and sunelectricity. Those capital costs could add as much as 2 cents to each kWh, depending onhow it was used in practice. O&M (excluding electricity costs) adds another quarter cent.In addition, you lose about 25% to 30% of each kWh you put into storage to friction,evaporation, and leakage. One third of power would go to base load without passingthrough storage. If you balanced amounts of wind and solar sources cleverly, a significantamount would also go directly into the grid to meet some peaking and load followingneeds. Also smart-grid technology would allow some of the load to follow productionrather than requiring all of production to follow the load. If we had substantial all-electricand electric plug-in hybrid vehicles, a substantial portion of the power they used couldprobably be accepted on an as-available basis. Still, between half and 60% of productionwould probably need to come from storage. If we take the high figures (30% of 60%),that means we would lose 18% of our 5 cents per kWh electricity. We can round up toanother 1 cent per kWh. So, total costs from storage would be around 3.25 cents perkWh.
Cooling It: No Hair Shirt Solutions to Global Warming by Gar W. Lipow GarLpublic AT Comcast DOT net
Page 99 of 265
Paying the Price: Costs of Transmitting, storing and Producing Electricity
This brings up another point hinted at earlier. Most of this power has to be generatedfairly far from where it is consumed. There are various technical reasons wind farms needto be build far from cities - even when city wind speeds are suitable for turbines. Ifhydropower, geothermal, and solar thermal electricity are to mix with wind power toprovide a reliable supply, we will need a few very long lines – some possibly up to 3,000kilometers (1,864+ miles).
The longest DC lines in the world are around 1,700 or 1,800 kilometers. But mostcompanies who have looked at the issue think that lines of up 5,000 kilometers are quitefeasible if needed, let alone 3,000283.
A 3,000 kilometer 3,000 Megawatt DC line will typically have an average 13% loss283.Most of the transmission lines would be less, so the overall average would be more like11%. Wind, which is the vast majority of the proposed electricity grid, would mostlytravel less than 1000 kilometers – with a fair percent of it traveling only via the local grid.(Not always of course; if we have such an extensive grid, and wind is blowing one placeand not another, we will probably want to take advantage on occasion.) And a great dealof wind is much closer than 600 miles to where it is consumed. A 1,000 kilometer HVDCline typically suffers a 9% thermal and conversion loss. So we can average the powertraveling up to 3,000 kilometers with the half derived from wind power traveling lessthan 1,000 kilometers – resulting at most in 10.36% loss. If you add in an additional 10%from normal AC transmission, conversion and distribution losses, the total is slightly lessthan 20%i - at most.
Minor grid improvements such as voltage regulators can reduce this. (For that matterthere are small scale voltage regulators for homes and small business which can do thesame thing284.) Even before improvements, there are a lot of reasons losses don't have tobe this high. But we will assume the 20% to be on the safe side.
Aside from power losses, what are the costs of the lines themselves, and of operationsand management? The same source gives total levelized line costs and O&M of ~1 centper kWh for a 15-17 cent per kWh total.
Let’s take another approach, to double check the costs of such an increased transmissionnetwork.
The electric utility industry, projecting a huge increase in demand, currently wantsaround 100 billion dollars in grid improvements285.
i(Yes, having been asked this, the arithmetic is correct. Percentages multiply; they don’t add. Losingslightly more than 10%, followed by losing another 10% of what remains is a total loss of slightly lessthan 20%.
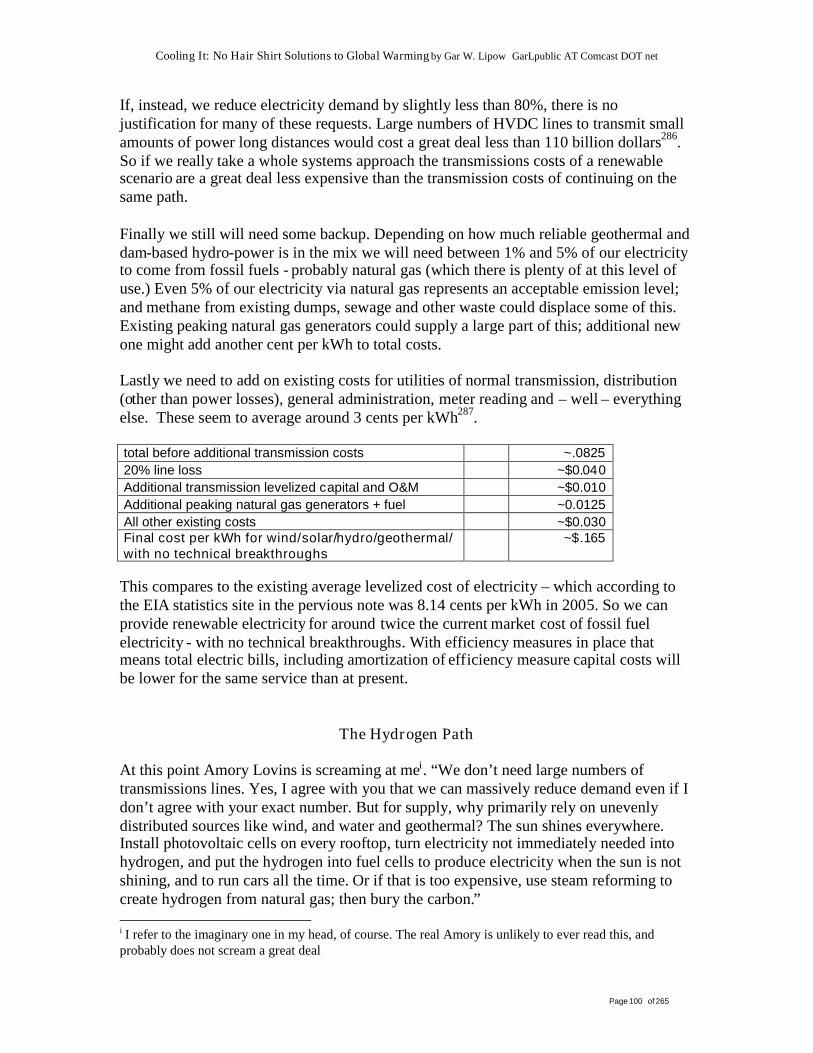
Cooling It: No Hair Shirt Solutions to Global Warming by Gar W. Lipow GarLpublic AT Comcast DOT net
Page 100 of 265
If, instead, we reduce electricity demand by slightly less than 80%, there is nojustification for many of these requests. Large numbers of HVDC lines to transmit smallamounts of power long distances would cost a great deal less than 110 billion dollars286.So if we really take a whole systems approach the transmissions costs of a renewablescenario are a great deal less expensive than the transmission costs of continuing on thesame path.
Finally we still will need some backup. Depending on how much reliable geothermal anddam-based hydro-power is in the mix we will need between 1% and 5% of our electricityto come from fossil fuels - probably natural gas (which there is plenty of at this level ofuse.) Even 5% of our electricity via natural gas represents an acceptable emission level;and methane from existing dumps, sewage and other waste could displace some of this.Existing peaking natural gas generators could supply a large part of this; additional newone might add another cent per kWh to total costs.
Lastly we need to add on existing costs for utilities of normal transmission, distribution(other than power losses), general administration, meter reading and – well – everythingelse. These seem to average around 3 cents per kWh287.
total before additional transmission costs ~.082520% line loss ~$0.040Additional transmission levelized capital and O&M ~$0.010Additional peaking natural gas generators + fuel ~0.0125All other existing costs ~$0.030Final cost per kWh for wind/solar/hydro/geothermal/with no technical breakthroughs
~$.165
This compares to the existing average levelized cost of electricity – which according tothe EIA statistics site in the pervious note was 8.14 cents per kWh in 2005. So we canprovide renewable electricity for around twice the current market cost of fossil fuelelectricity - with no technical breakthroughs. With efficiency measures in place thatmeans total electric bills, including amortization of efficiency measure capital costs willbe lower for the same service than at present.
The Hydrogen Path
At this point Amory Lovins is screaming at mei. “We don’t need large numbers oftransmissions lines. Yes, I agree with you that we can massively reduce demand even if Idon’t agree with your exact number. But for supply, why primarily rely on unevenlydistributed sources like wind, and water and geothermal? The sun shines everywhere.Install photovoltaic cells on every rooftop, turn electricity not immediately needed intohydrogen, and put the hydrogen into fuel cells to produce electricity when the sun is notshining, and to run cars all the time. Or if that is too expensive, use steam reforming tocreate hydrogen from natural gas; then bury the carbon.”
i I refer to the imaginary one in my head, of course. The real Amory is unlikely to ever read this, andprobably does not scream a great deal
Cooling It: No Hair Shirt Solutions to Global Warming by Gar W. Lipow GarLpublic AT Comcast DOT net
Page 101 of 265
Sadly, compared to geothermal and existing hydro and wind, both solar photovoltaicgeneration, and hydrogen fuel cell storage are horribly expensive – even when theavoided cost of transmission lines is taken into account. I agree that if we had cheap solarcells, and the ability to electrolyze hydrogen inexpensively from the cheap electricitythey would provide, and the ability to recover power economically from that hydrogen inreasonably priced fuel cells that would be preferable. You will agree in return, I presume,that if we had some eggs, we could have ham and eggs, if we had some ham.
In terms of steam reforming of natural gas: we certainly know how. But the cost is asleast 50% higher than the cost of the natural gas alone. The system costs of a natural gasbased hydrogen path will be high. And nature has already sequestered the carbon nicelyfor us. Leave the damn stuff in the ground and produce power from something else.
Before this book ends, I will suggest ways we might get to that hydrogen future (orsomething comparable) that does not require massive grid extension. The problem here isthat it is one thing have confidence a technical problem is solvable. It is quite another tobet the future on making a breakthrough, however small it might seem, within a specifictimeframe , with a quite literal drop dead deadline (as in a lot of people will drop dead ifwe don’t make the deadline). The best we can do on this is structure our investments insuch a manner, and order that the choice between a grid intensive and grid light path aredelayed as long possible. In practice though time is short; we will probably end having toextend and improve our electricity grid. If the hydrogen future (or flow battery future)breakthrough happens we can still make use of such a grid to minimize the use ofstorage; storing electricity (more or less by definition) is more expensive than using it asgenerated.
Now to provide 100% renewable power would require more storage than the few hoursspecified above. But a mixed wind and solar grid that includes some hydro, geothermal,modest storage and long distance transmission can provide between 99% and 95% of ourelectricity. Even if we have to get 1% to 5% of remaining power from natural gas, thatstill reduces greenhouse emissions to an acceptable level.
Cooling It: No Hair Shirt Solutions to Global Warming by Gar W. Lipow GarLpublic AT Comcast DOT net
Page 102 of 265
PhotovoltaicsSolar cells may be the flashiest source of renewable electricity. While they have some ofthe greatest long run potential, currently they also are one of the priciest. They cancurrently compete where grid connection is impractical or expensive, with peak powercosts in certain very limited locations, as replacements for extremely expensive facingson some tall buildings. Without storage, they constitute a variable source (as much lessexpensive wind power does) for all on-grid connections; even at current prices theeconomically available potential is greater than zero.
Most experts think breakthroughs will happen soon in photovoltaics. If they do, solarcells on rooftops, south walls and shading parking lots and roadways could provide mostor all of our electricity, reducing the need for huge wind farms and centralized solarthermal plants in a renewable scenario. Also because photovoltaic cells (unlikeconcentrating systems) can be reasonably productive in non-desert climates, you can getsome of the same increase reliability from interconnections you do with wind plants. Aswith concentrating systems, you gain maximum benefit from a mixed grid with both windand solar electricity.
Cooling It: No Hair Shirt Solutions to Global Warming by Gar W. Lipow GarLpublic AT Comcast DOT net
Page 103 of 265
Shades of Grey: Electricity and Environmental Questions
There are environmental questions about all these methods of generating renewableelectricity, and of transmitting. We begin with wind energy.
One objection sometime made is that wind generators kill birds. It is true that badlylocated, designed, and sited turbines may kill endangered raptors; but this is easy toavoid.
Other than that - existing wind generators kill about 6,400 birds per year. If every bit ofour current electricity demand (not reduced, but current) was met by wind about 1 millionadditional birds would die a year. In contrast, collisions with buildings kill 100 millionbirds a year; cell phone towers kill 40 million birds a year; human infrastructure andactivities in general kill from one to four million birds a day in the United States288. Feraland outdoor cats kill at least hundreds of millions annually289. Next to efficiency, wind isthe most environmentally benign energy source there is.
I will note that these objections are raised by the fossil fuel industry much more oftenthan by environmentalists. In some cases people object that wind generators spoil theirview; my reaction is "you want to burn more coal, give more miners black lung so as notto spoil your view? You want all of us to suffer more deaths from respiratory disease -including lung cancer so as not to spoil your view? You want more tornadoes, morehurricanes, more disease, more crop failures, more floods, and more droughts from globalwarming so as not to spoil your view? Get over yourself!"
There are slightly more serious objections to geothermal electricity. Hot water takenfrom sources can end up contaminating the freshwater table with salts and toxins. Hugeamounts of cooling water are often used in water cooled geothermal plants. In modernplants, such as the Mokai Geothermal plant in New Zealand290, these impacts are reducedto a negligible level:
…geothermal fluid is completely contained from production to reinjection, with theonly emissions being negligible quantities of steam emitted by the steam traps andthe non-condensable gases emitted above the air coolers.
The plant has a relatively larger footprint but a much lower profile than aconventional condensing steam turbine with an underslung condenser. The aircooler structures have a significantly lower profile than wet cooling towers andhave the advantage of never producing a visible plume. In addition to its lowprofile, the plant has no water or chemical consumption and no blow-down ofcontaminated cooling tower water…
Cooling It: No Hair Shirt Solutions to Global Warming by Gar W. Lipow GarLpublic AT Comcast DOT net
Page 104 of 265
Normally greenhouse emissions from geothermal plants are considered to be about onesixth that of natural gas per unit of power. That might not be acceptable on a large scale,but as a small percentage of electricity production should prove no problem. In the U.S.,where most feasible remaining untapped reserves are moderate temperature in any case,we will probably use close cycle air cooled binary technology almost exclusively, furtherreducing emissions.
A brief description of possible geothermal side affects and current mitigation technologycan be found at the U.S. national park service web site291.
Also, environmental effects may come from large scale HVDC transmission lines. Theseeffects, if they exist, may not be minor. The question of what effect EMF fromtransmission lines have is controversial. The majority of studies have shown no effects. Aminority, however, have shown links between exposure to powerline EMF and leukemia,brain tumors and other forms of cancer. WHO is concerned enough to classify EMF as apossible carcinogen.
The December, 2001 issue of Environmental Health Perspectives included a review ofthe literature on the subject292. Of those studies that showed effects, the most extremeseem to be in ranges increases in number of deaths from various cancer from low to hightens of people per million. One way to look at that is (according to the most pessimisticstudies) that if we exposed 50 million people to greatly increased EMF, somewherebetween zero and an additional <10,000 people per year would die. Any number abovezero is quite horrible, of course.
In contrast, fine particle pollution from coal burning electric power plants we run noware, by themselves, responsible for at least 24,000 deaths per year in the U.S293.According to the same study, all fossil fuel based power plants particulates combined kill30,000 per year. And this is particulates alone, without including NOX, Sulfur and othernon-particulate air pollution, not to mention mining, mercury and global warming affects.
So even in the very unlikely worst case – high voltage transmission lines would still do agreat deal less harm than the fossil fuel emissions they displace.
In addition, if such effects do exist, high voltage DC transmission line produce fieldsmuch more similar to the earth’s natural field than AC lines do – meaning the bodyshould be more adapted to them. So you would expect effects on the low rather than highend. Put it this way; reduce the number of large diesel trucks running through myneighborhood spewing toxins into the air, and as far as I’m concerned you may run a highvoltage DC line past my house.
Cooling It: No Hair Shirt Solutions to Global Warming by Gar W. Lipow GarLpublic AT Comcast DOT net
Page 105 of 265
This brings to an important point to consider when weighing environmental effects.There is no kilowatt fairy, no BTU bunny. Everything we do has environmental affects.Solar cells are made with highly toxic metals. Fluorescent lights contain mercury (lessthan produced by coal to produce the electricity they displace though). I’m not saying itis the absolute optimum possible; it is a compilation, and I’m sure there are wonderfultechnologies out there I’ve overlooked. But without inexpensive electricity storage(something we do not yet have) any renewable scenario is going to require someadditional high voltage lines.
“Aha!” say the primitivists. “High voltage lines aren’t acceptable. Let’s go low-techinstead, and live a simpler life.” How far back exactly do you want to go? To wood lotsfor heating and cooking, with a population that will stabilize at between 8 and 12 billion?That won’t leave you many forests or much land for growing food. “We can have solarpanels for heat” chimes in the simple lifer; “we’ll just live without electricity”. And howdo we make the glass and process the metal for your solar panel? Remember, we don’twant to use fossil fuels or wood for that either. I’m not saying it is impossible to come upwith a low tech way to support 12 billion people (depending upon how you define “lowtech”). I’m betting, though, that any low tech answer will have a higher environmentalimpact than renewable electricity – even if renewable energy requires high voltage lines.
We need to also consider hydroelectric plants. These have the most seriousconsequences. Many people question whether they are even a sustainable source. Thereare ways to mitigate various problems. Fish friendly turbines are under development, asare improvements in small hydro. But fundamentally, pulling a large percent of movingwater out of rivers, holding it in reservoirs, and then releasing it at our convenience doestremendous damage. It contributes to erosion, destroys fish and wildlife. The levees anddams that failed to protect New Orleans from hurricane Katrina also prevented thedeposit of sediment that would have built up marshlands that had diminished the fury ofhurricanes striking on previous occasions.
There are even questions about how carbon neutral hydroelectric dams are294. Byflooding areas that were previously dry, dams may help convert CO2 to methane - a farmore powerful greenhouse gas. Even where reservoirs are converted from existing lakesor wetlands, the powerful turbines may force dissolved methane out of the water thatwould otherwise have been converted by micro-organisms to CO2. How much occurs isnot established fact, but that some of it occurs is unquestionable, especially if plant matteris left in place when the dam is built. The most important variable appears to be acresflooded per watt - meaning that high head hydro where existing plant matter is removedbefore construction is probably (but not certainly) low emissions. In short, we need (asNature says repeatedly in discussing it), more data.
I will note that modular pumped storage avoids many of these problems. Recirculatingthe same water over and over again avoids destruction of rivers and lakes. And even ifthere is initially dissolved organic matter in the water that converts to methane, in aclosed cycle this will be a one time occurrence. Once the existing organic matter is usedup, there will be no significant source of new carbon to convert.

Cooling It: No Hair Shirt Solutions to Global Warming by Gar W. Lipow GarLpublic AT Comcast DOT net
Page 106 of 265
Cooling It: No Hair Shirt Solutions to Global Warming by Gar W. Lipow GarLpublic AT Comcast DOT net
Page 107 of 265
Hotter than the Sun: The Mandatory Section on Nuclear Electricity
Inexpensive sustained net-energy fusion would be wonderful if we had it; but we don’t.
The last time we built nuclear power plants in the U.S. their capital costs averaged over$3,000 per KW in mid-80s dollars295.
The nuclear industry insists that modern plants could be built more quickly and wouldcost much less; they promise their plants won’t end up costing four to seven times budgetas they have in the past.
The pebble bed reactor is one example often promoted of a new generation technologyfor producing less expensive, safer fission reactors. The consortium building a pebble bedreaction in South Africa has finally revealed the cost – just short of $9,800+ per KW incapital costs296; that cost has no chance of falling, but may yet increase.
We can build solar thermal with storage at two thirds of that price, fully dispatchablewind at one third – and not have to worry about uranium mining, waste transport andstorage, and the liability issues (which in the U.S. are dealt with through the specialprivileges of the Price/Anderson act not given to any other power source).
Cooling It: No Hair Shirt Solutions to Global Warming by Gar W. Lipow GarLpublic AT Comcast DOT net
Page 108 of 265
One and One Still is One: CogenerationThere is a well known way to increase the efficiency of electricity generation –combined heat and power or cogeneration. You can use waste heat from a power plant forlower temperature uses, such as industrial process heat or water heating or spaceconditioning. Or you can use waste heat from industrial processes to produce electricity.As a transitional strategy for say the next ten or fifteen years this would make sense in theU.S. But now that we have added up the numbers above, you can see once fossil fuelsare phased out we won’t be able to afford to use sparse biofuels to generate electricity.Using waste heat from industrial processes is more promising – so long as it does notincrease the fuel used for those processes. In the latter case though, cogenerationbecomes a variable process just like wind. Combined heat and power in such casesdisplaces wind and other variable sources, but does not provide either a base or loadfollowing source. And if you have an industrial process with enough high temperaturewaste heat to power an electrical turbine, you may be better off using that waste heat foranother industrial process – possibly by co-locating another industrial plant near it.These limitations make co-generation an excellent means of reducing fossil fuel duringthe transition, but not a significant source of ways to eliminate it. The only exceptionwould be if we have a breakthrough in cheap hydrogen production from electricity, butnot in fuel cells. A combined cycle hydrogen burning turbine, where the waste heat isused for non-electrical purposes could match or exceed fuel cells in the hydrogen-useefficiency.
Cooling It: No Hair Shirt Solutions to Global Warming by Gar W. Lipow GarLpublic AT Comcast DOT net
Page 109 of 265
Warmth of the Sun: Active Solar Thermal for Low and MidTemperature Heat
Electricity represents only about 18% of our end use consumption needs -although wecan and must greatly increase this in a renewable scenario. A large portion of the restmay be supplied via active solar. Solar energy can supply space heat and hot water forresidential use. (Single family residential cooling is on too small a scale for active solar tobe economical, unless someone could integrate it into a solar heating unit without a greatdeal of additional cost). It can supply space heat, cooling and hot water in commercialbuildings. (Commercial air conditioning is definitely done on a large enough scale to besupplied by solar thermal air conditioning.) Similarly the small portion of industrialconsumption used for space conditioning could be supplied by solar thermal. Providingup 65% of climate control and hot water is considered normal today; but we are lookingat fossil fuel free future where fuel is more expensive than at present. So our goal will beto see that active solar thermal will supply about 85% of all space heating, 85% ofcommercial and industrial space cooling, and 85% of hot water requirements belowboiling temperature - beyond that provided by passive solar. (Note also that these areaverages; the best technology can do better than this in California or Arizona, and worsein the Yukon. [Yes, you can get significant amounts of solar thermal energy in Alaska;just don’t rely on it as your primary space or water heating source.])
Note that with seasonal storage, this works quite well in cloudy climates with short days.Yes you need more solar panels; but demand is higher, so they usually pay for themselvesin almost as short a time as in sunnier climates with lower demand. Active solar can varyfrom low temperature low cost systems without moving parts (near passive systems) suchas the solar wall297, to sophisticated selectively coated flat plate systems.
While this is a worthwhile goal, and theoretically possible, it is not one we are likely toachieve. There are densely populated areas where buildings shade one another andbuildings where walls are shaded and roofs have the wrong orientation for solar. Theseare especially discouraging in cold cloudy climates where you need a lot of heat, anddon't get that much direct sunlight in any case. As we mentioned in the section onelectricity, electric heat, is our backup plan - with ground source heat pumps usedwhenever possible. (A recent discovery is that ground source heat pumps can draw onspace under streets; with cooperation from local governments these can be installed forentire neighborhoods during road repair.)
Now one last point before we add up the numbers on this. Because we incorporatedpassive solar already into our efficiency scenario, we have saved more in space heatingand cooling than other areas. And because hot water uses comparatively low temperatureheat, we were able to save more there as well. So it would be reasonable to lower theshare of such use as a percent of total energy, thus reducing the amount of lowtemperature solar thermal we can use. (In other words we will assume less solar thermalthan if the shares were the same, to avoid counting the same saving twice.)
Quadrillion BTU Energy in 2050 (not including the additional electricity storagelosses)
~36.86
Cooling It: No Hair Shirt Solutions to Global Warming by Gar W. Lipow GarLpublic AT Comcast DOT net
Page 110 of 265
Commercial space heating as a percent of total energy 2000298 6.96%Commercial water heating as a percent of total energy 2000 298 1.04%Commercial space cooling as a percent of total energy 2000298 2.63%Residential space heating as percent of total energy 2000299 9.69%Residential water heating as percent of total energy 2000218 3.58%Industrial space conditioning as a percent of total energy 2000169 2.12%Subtotal 26.02%However, more intense efficiency savings are possible with space heating andcooling than other sectors due to the use of passive solar. So we reduce thistotal as a percent of total consumption by 20%
20.82%
Active solar can save about 85% of that at a price less than twice conventionallow temperature applications
17.70%
Quadrillion BTU from active thermal solar in 2050 6.47Shares of total energy are computed as follows. Share of each usage type as percent of the particular sector(in the sources referenced by endnotes in the table) is multiplied by each sectors share of all energy used258.
Low temperature solar is almost competitive with natural gas now when supplying from45%-65% of needs. At 2X the cost of fossil fuel we may be able to supply 85%. To theextent we can't, we can use un-stored, un-backed-up cheap wind electricity to drive heatpumps (ground source where practical, air-to-air where not). When temperatures droptoo low for heat pumps to be practical we can rely on high efficiency resistance heating,powered by off-peak renewable electricity, and stored as heat.
Cooling It: No Hair Shirt Solutions to Global Warming by Gar W. Lipow GarLpublic AT Comcast DOT net
Page 111 of 265
The Sun is Burning: High Temperature Active Solar
The same concentrating solar mirrors that can drive electrical turbines can also provideheat for industrial processes. Reasonably priced rooftop parabolic collectors have beendeveloped that can reach temperatures suitable for many industrial processes300.However the potential is more limited than with electricity. When it comes to electricityproduction you can locate plants to sunny climates (such as the clearest parts of thedesert) and transmit the electricity where it is needed via high voltage lines. There are alot of reasons for not relocating massive amounts of industry to the fragile desertecosystems – for instance lack of water. (Industry needs lots of water.)
While evacuated tube collectors can produce low temperature heat on cloudy days,concentrating collectors produce high temperature heat only in direct sunlight. Also thepractical maximum means these concentrators could only serve about 35% of the processheat and industrial boiler fuel market (though they might increase that a bit by acting aspre-heaters). It seems reasonable that we could provide 45% of that 35% - less in someareas of course, but more in others. That comes to nearly 16% of the industrial energy inour high efficiency scenario, or ~2 quads.
Cooling It: No Hair Shirt Solutions to Global Warming by Gar W. Lipow GarLpublic AT Comcast DOT net
Page 112 of 265
Fields of Fire: Land Based BiomassBiomass may be produced from crops grown especially for that purpose and convertedinto biogas or liquid biofuel range from 1.5 to 4 times the price per BTU of comparablefossil fuels301; as an average say three times the cost. Biowaste as a fuel source rangesfrom one quarter the cost of comparable fossil fuel to 1.5 time that same cost301 . You canmake natural gas or syngas from biomass, convert it into charcoal as a coal replacement,or produce various liquid products (ethanol, methanol, biodiesel ) to replace petroleumproducts.
How much land based biofuel could we use? We currently obtain a bit over 3% (~3.3quads) of our energy from biomass in the United States302. Much of this is producedunsustainably. Some of it is not even biomass (waste plastic and such). But we discard agreat deal more organic material than we use, and as already shown in the materialintensity section, we know how to grow crops much more sustainably than we actuallydo. So it would be reasonable to assume we could continue to generate that sustainablyrather than unsustainably, (without compromising the ability to use as much of it asneeded for fertilizer or fiber purposes).
One example is corn. If we could use some of the stover from corn we produce anyway,either to produce additional ethanol or methanol or if we dried it and burned it directly asa coal substitute, we could obtain a small sustainable energy yield from such farmswithout increasing the land used or robbing it of fertility. (Removing between 40% and50% of corn stover from a field costs it neither structure nor nutrients. In fact we have totake some of it. Too much corn stover on the soil is a nitrogen robber, and can lead toexcess soil compaction.)
And corn stover is among the biomass least suited for fiber applications, so we are notcompeting with fiber either. (Though, stover is a good source for cellulosistic chemicals.)The enzymes required to produce ethanol from cellulose are still extremely expensive;but bio-methanol is around double the cost of fossil fuels, as is direct burning – whichcan be done comparatively cleanly in fluidized bed combustion plants. So we can extract3.3 quads from existing cultivated cropland and biowaste.
Is there any way we can increase biomass from croplands? Fuel crops other than cornmay be grown through rotational no-till organic methods just as crops for food, fiber andchemical may. In fact certain organic techniques (such as mixing crops) are easier if theproduct is harvested for fuel than for other purposes. There are a huge variety of cropssuitable for energy purposes including switchgrass, hemp, elephant grass, leucana,Eucalyptus Grandis, alfalfa, hybrid poplar, coppice willow. Many of these are nitrogenfixers. Other are tree crops and can be use for soil conservation – mixed with other cropsand thus NOT clear cut on harvest.
Cooling It: No Hair Shirt Solutions to Global Warming by Gar W. Lipow GarLpublic AT Comcast DOT net
Page 113 of 265
Of the 57 million acres that have been taken out of production, we already suggestedusing 17.7 million to produce fiber and chemical needs. Assuming that half should beleft completely wild rather used for any agricultural purpose, that would still leave uswith 10.8 million acres we could use for such purposes. (Again, as with kenaf andchemical crops, we don’t necessarily have to dedicate land only to energy crops – thoughsome areas may be suited to exactly that. We can increase the total crop lands by thatamount and in many cases include fuel crops in rotation with other crops. The wider thevariety of crops you include in a rotation the more resistance you have to disease andpests. )
Additionally, we are not utilizing most waste straw for fertilizer or fiber. In the short runwe could probably generate up to 8 quads from that, giving us a 12.5 quad total. As away of saving farms (thus making the biggest possible longer term contributionagricultural sustainability – preventing the loss of farmland) it may even be a wisechoice. But energy really is not the optimum use for waste straw, given that some of itcan help build soil structure, and the rest replace much of the wood used as buildingmaterial. So we should not count on most of this being available for energy purposes inthe long run.
What about unconventional sources? Ecologist David Tilman, at the University ofMinnesota has discovered a way to get more net energy out of a hectare of mixed prairiegrasses (the more variety the better) than best energy crops303, about 28.4 GJ/HA ondegraded land, about 42.6 GJ/HA on fertile ground. (This means that on eroded land theyget about 50% more net energy per acre than corn ethanol, 75% more on good soil.) Partof this increased energy yield is due to the process suggested to convert biomass toenergy - Fischer-Tropsch hydrocarbon synthesis - which produces diesel fuel, gasoline,and electricity. The diesel or gasoline is around 2¼ times more expensive than gasolinefrom fossil oil304. (It converts biomass with around 47% efficiency. If energy needed togrow, harvest and transport grasses also comes from this process, this nets 41% of theBTU's that were in the original biomass.) For diesel, which rail and trucking dependupon, this may be the best choice. Two alternatives to Fischer Tropsch could yield thesame or better results less expensively - where the products could be used.
Conventional pyrolysis can convert biomass to methanol with around a 50% efficiency -sometimes better305. (You can gain another 5%-8% in the form of electricity generatedfrom waste steam.) Methanol can substitute for gasoline, and many other liquid fuels atcost around double gasoline (per BTU). Methanol has a fuel value about half that ofgasoline per gallon; many cars can't run on it; but we could put flex-fuel requirements onall new automobiles, so that we could phase in its use over the course of 13 years.Transport tankers and gas station storage tanks have to install special liners and newvalves to handle it - again something that could be done over a 13 year period.
Cooling It: No Hair Shirt Solutions to Global Warming by Gar W. Lipow GarLpublic AT Comcast DOT net
Page 114 of 265
There are also environmental, health and safety concerns - all of which can be addressed.Methanol is toxic and dangerous - like gasoline. Unlike both MTBE and gasoline, it is anaturally occurring substance that many organisms have evolved to predate on. If anunderground methanol tank leaks, it will seep into the water table where it will be dilutedand broken down into less dangerous forms quickly306 - nothing like the year that is theminimum for MTBE. In the case of surface spills, the same thing will happen even faster.That does not make spills trivial; like gasoline we want to keep the stuff out of theenvironment and especially out of our water supplies. If really heavy concentrationsoccur, then (again like) gasoline it can be cleaned up, though via different methods (hightemperature steam oxidation, bioremediation or both). In terms of fire safety, puremethanol is indeed more dangerous to store - due to differences in vapors, colorlessness,and tastelessness. However, in practice, the maximum concentration usually advocated is85% methanol and 15% gasoline (which can come from FT). This takes care of all thoseproblems; so long as transport and storage have been modified to resist corrosion bymethanol, the fire safety is equivalent to gasoline307. Note that methanol substitutes forgasoline308. While diesel engines can be modified to use methanol with efficienciesapproaching or exceeding the best conventional diesels309, maintenance and engine life todate have proven miserable compared to real diesel or biodiesel310. There is some workbeing done on making gasoline engines comparable in efficiency and reliability to diesel.If that was successful then methanol could replace diesel as well.
Biomass can also be converted to charcoal with around 50% efficiency; there may bewaste gas not used up by the process to make electricity, as well as waste heat to be usedfor the same purpose. However it may be that process waste heat either from charcoal ormethanol making will be needed for drying the grasses before conversion. Charcoal ismuch cheaper to make than other alternatives, but it also has more limited uses. Theelectricity coal and natural gas make can be better replaced by wind, sun and water. 5-7% of coal in the U.S. is used in industrially, over and above electricity making. There issome use of charcoal, as charcoal. Charcoal is an extraordinarily useful soil amendment,building soil structure permanently. And we can probably find some cases wherecharcoal can substitute for other fuels without compromising efficiency, though mostlypeople switch from coal to other fuels for process efficiency sake - since coal is thecheapest fossil fuel there is.
Overall the mix would be mostly methanol for gasoline, FT for diesel and gasoline to mixwith the methanol, with some percent of charcoal production.
Is there any additional land we could use for bioproduction?
There are about 4 million hectares of land degraded by mining311 we could produce fuelfrom by the Tilman method.
We also convert some grazing and rangeland. It is well known that Americans eat moremeat that is good for us312. While I'm a great believer in small luxuries, could convert15% of grazed land to energy production (concentrating on cattle land). The landcurrently devoted to growing grain to "finish" that beef could provide grain and legumes
Cooling It: No Hair Shirt Solutions to Global Warming by Gar W. Lipow GarLpublic AT Comcast DOT net
Page 115 of 265
to replace the protein those cattle would have provided, plus. And it would not have to bea hardship, or even require vegetarian meals. Chile and beans , red beans and rice (withsausage if you wish) , split pea (with ham or bacon if you like), much Thai, Chinese,Vietnamese or Indian food, minestrone, Italian wedding soup, and bean burritos are allexamples of luxury or comfort foods that get most of their protein from vegetables, butcan still include a little meat or cheese for flavor. Eating a few meals like that a week,while still having the rest be heavily meat based would be no great hardship, unless yougot tired of all that meat! 15% of range land is about 50.4 million hectares, and could beconfined to overgrazed, eroded land, where we should probably stop grazing cattle in anycase. This will probably reduce meat production by a great deal less than 15%.
However, there is one other major source for sustainable land based biomass – existingtimberlands. If you remember, in the industrial section we suggested ways to reduce toone quarter the use of timberlands for paper, and also suggested ways to reduce wooddemand to almost nothing, for a slightly below 93% per capita reduction in timberharvesting. Before the reduction this would have been 408 million acres108 devoted totree farming rather than wilderness. After the reduction, that would have meant a bit lessthen 31 million acres still in tree farms increasing to around 44 million acres by 2050 tomatch population growth.
That leaves 364 million acres that are either tree farms, or virgin timber scheduled forharvesting; we have made proposals to save all those acres. In the absence of technicalbreakthroughs in energy storage or cheap renewable electricity, we can use up to another100 million acres of that for energy production, confining ourselves to short and mediumrotation mono-cultures, and leaving 100% of old growth, and natural second growthforest and woodlands untouched.
Ok so how much energy does this add up to? The NDRC thinks we could get nearly 17quads of energy from biomass313. However this assumes greatly increased per acre cropyields, and also use of all waste fiber not needed for soil building. However we haveprojected saving much more energy by replacing much of wood, and even some plasticand metal with the same waste fiber. Also it assumes greatly increased crop yields peracre - which may be done sustainably or may not. So, cutting this in half to 8.5 quadwould be more reasonable.
As a double check a study by the University of Tennessee Biobased Energy AnalysisGroup projects about 15.5 quads with both increased yield, and massive conversion ofexisting grazing and timberland to biofuels, about 10 quad with almost no landconversion, but with greatly increased yield314. So a projection of 8.5 quads withsignificant conversion of land, but no increased yields is conservative.
Between crops, grazing land and timberland we are looking at potential of around 8.5quads of energy from biomass. The only reason we can produce such a high amount ofbiomass sustainably is because we are phasing out a small portion of meat production,and because we have freed a great deal of land currently devoted to timber and paperproduction.
Cooling It: No Hair Shirt Solutions to Global Warming by Gar W. Lipow GarLpublic AT Comcast DOT net
Page 116 of 265
I would add that there are a wide variety of ways to process and use biofuels, and thatobviously best practices should be adapted. In general corn based ethanol is a farmsubsidy, not an energy program; a way of processing natural gas or coal through corn-fields into liquid fuel with either a net loss or a modest BTU boost from solar energy. Thebest way to convert biomass into usable fuel is FT, methanol, cellulosistic ethanol,biodiesel, and the creation of both charcoal and syngas. In all cases, electricity should beco-produced with the conversion of raw biomass to fuel. In all cases energy input shouldeither be from the biomass itself, or from nearby renewable electricity without longdistance transmission or fossil fuel backup.
While all this is technically possible in a very narrow sense there are social issue toconsider. For example replacing some food crops with fuel crops may not need toincrease hunger look at in the abstract; but in a globalized world market, reducing foodproduction significantly anywhere increases food prices. Look how U.S. ethanolproduction from corn has increased food prices in both the U.S. and in Mexico. Fuelcrops are also replacing food crops in nations in a number of poor nations, driving foodprices up in areas where many people are already living on a dollar a day.
Further, in many cases fuel crops are actually increasing rather than reducinggreenhouse emissions. In the U.S., extremely low to negative net energy corn ethanol isoften distilled in coal powered processes. In Indonesia, palm and other fuel oil cropswhich do produce net energy also replace old growth rainforest, thus releasing far moreemissions than the fossil fuel they replace.
To implement biofuels sustainably on a large scale would require a transformation of theentire international economy. In the absence of such change, we should probably beextremely modest in our use of them.
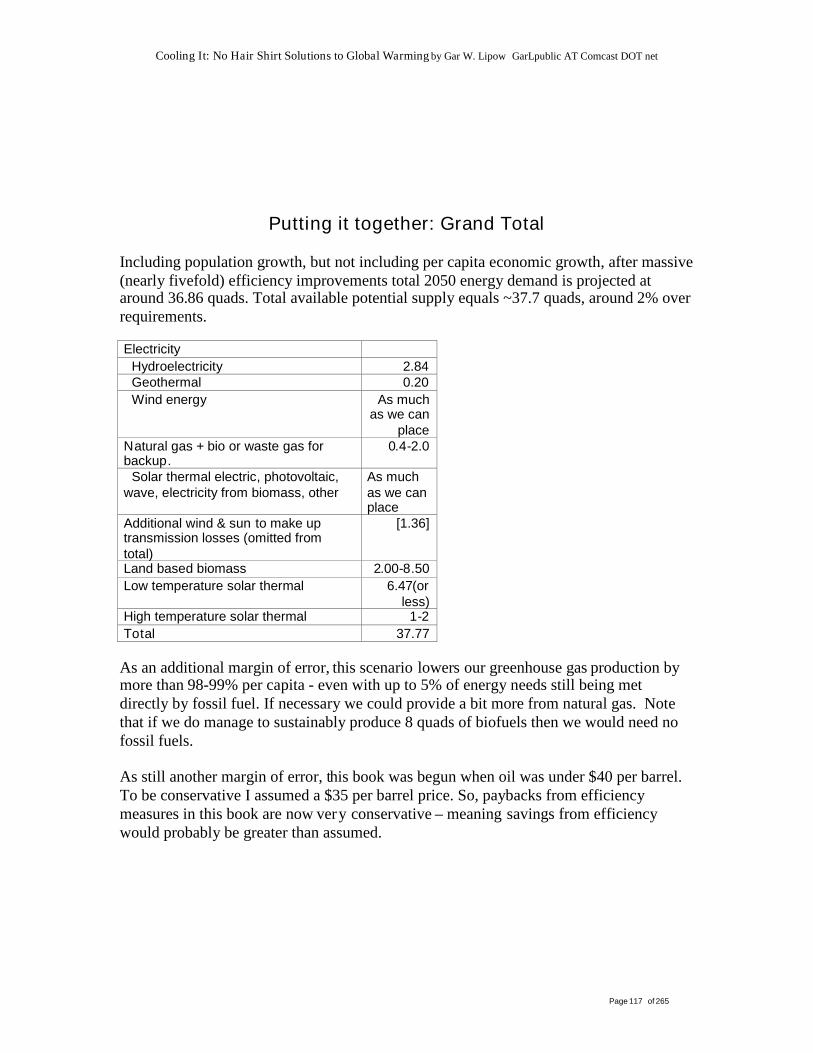
Cooling It: No Hair Shirt Solutions to Global Warming by Gar W. Lipow GarLpublic AT Comcast DOT net
Page 117 of 265
Putting it together: Grand Total
Including population growth, but not including per capita economic growth, after massive(nearly fivefold) efficiency improvements total 2050 energy demand is projected ataround 36.86 quads. Total available potential supply equals ~37.7 quads, around 2% overrequirements.
ElectricityHydroelectricity 2.84Geothermal 0.20Wind energy As much
as we canplace
Natural gas + bio or waste gas forbackup.
0.4-2.0
Solar thermal electric, photovoltaic,wave, electricity from biomass, other
As muchas we canplace
Additional wind & sun to make uptransmission losses (omitted fromtotal)
[1.36]
Land based biomass 2.00-8.50Low temperature solar thermal 6.47(or
less)High temperature solar thermal 1-2Total 37.77
As an additional margin of error, this scenario lowers our greenhouse gas production bymore than 98-99% per capita - even with up to 5% of energy needs still being metdirectly by fossil fuel. If necessary we could provide a bit more from natural gas. Notethat if we do manage to sustainably produce 8 quads of biofuels then we would need nofossil fuels.
As still another margin of error, this book was begun when oil was under $40 per barrel.To be conservative I assumed a $35 per barrel price. So, paybacks from efficiencymeasures in this book are now very conservative – meaning savings from efficiencywould probably be greater than assumed.
Cooling It: No Hair Shirt Solutions to Global Warming by Gar W. Lipow GarLpublic AT Comcast DOT net
Page 118 of 265
Higher: The Mandatory Peak Oil ChapterIt is quite true that there is a finite amount of oil in the ground. We have to run out of itsometime, and before that happens production has to peak and decline.
The oil industry normally estimates that this will happen around 2030. Daniel Yegin putsthat date closer to 2020. A number of analysts, including prominent ones in Bush’s WhiteHouse, and leading environmentalists think it may have already happened, or at least islikely to occur by 2010. There is at least some evidence that this view may be right.
The same efficiency measures and renewable alternatives that will solve global warmingwill phase out oil faster than the worse case peak oil projections require. U.S. domesticoil production peaked in the mid 70s. ~30 years later we still produce 40% of that peak.To solve global warming we need to phase out all fossil fuels almost completely – a 98%or better reduction over a thirty year period. We can’t solve global warming withoutdecreasing fossil fuel use faster than oil production drops - just as a side effect.
Cooling It: No Hair Shirt Solutions to Global Warming by Gar W. Lipow GarLpublic AT Comcast DOT net
Page 119 of 265
Don’t Stop Thinking About Tomorrow: Research &Development
Mañana is now: R&D and Per Capita Economic Growth
So far we have dealt strictly with what we know how to do now. Current technologycould allow us to phase out fossil fuels over the course of 30 years, along with drasticallyreducing timber harvesting, Portland cement manufacture, and other greenhouse emittingactivities at essentially zero cost, while allowing normal economic growth through 2010,and keeping up with population growth thereafter.
There are a number of reasons we want to do better than this. To start with, we do wantper capita economic growth, so long as it does not come about at apocalyptic costs, andgenuinely benefits the people of this planet. For another, while a 30 year phase out givesus a decent chance avoiding the loss of our industrial civilization or worse, we would likebetter odds than that. (Think about how you would feel if as the result of a medical visitthe doctor were to say in a cheery tone “congratulations – you have a 75% chance ofsurviving the year.”) For a third, relying strictly on renewable and efficiency technologynear the current price of fossil fuel requires us to make choices we’d rather not make –such as continued use of hydroelectricity, the use of a larger quantity of biomass than isstrictly preferable, and the creation of a fairly extensive additional high voltagetransmission network.
As I mentioned before, when we talk about economic growth beyond population, (percapita economic growth) it is reasonable to talk about breakthroughs that are not here yet;the technology to provide that growth, also, is not here yet. Imagine as a thoughtexperiment that technological innovation ceased. You would continue to get per capitagrowth in developed nations for a while, based upon stuff “in the pipeline” that is not yetimplemented. Past that, growth would stop, other than with population - assuming youdid not simply force people to work longer or under harsher conditions. So if we aretalking about growth all the way through 2050 it is reasonable to assume sometechnological innovation. Will it necessarily occur in the renewable energy sector? Italways has in the past. Besides this kind of thing is a choice not a prediction. If weintelligently fund research and development in a large number of promising renewablesectors, we will get results - not in everything we fund, but in a high enough percentageto repay multiples of total investment. Here are some examples we might consider. Thisis not a research program, just a very incomplete list of projects worth furtherinvestigation.
Cooling It: No Hair Shirt Solutions to Global Warming by Gar W. Lipow GarLpublic AT Comcast DOT net
Page 120 of 265
The single most desirable breakthrough would be the development of inexpensivephotovoltaic cells. This alone could bring about a hydrogen present – even without thefuel cell breakthrough usually paired with it. If we could bring down the price of PVdown to the point where it produced power for a cent per kWh, (instead of the 25 cents ofpresent), we could produce solar hydrogen for around $13 per mmbtu with existingcommercial electroyzers – about 2.3 times the cost of natural gas – within the price wecould afford for renewables in the efficiency scenario. This could displace biofuels forindustrial, commercial and residential uses. How about transportation? Withoutinexpensive fuel cells hydrogen is not a particularly suitable transportation fuel. But sincewe are already looking at drastically reducing transportation energy demand, with asignificant portion of that electricity we end up with no more than around 8 quadsrequired for liquid transportation fuel – something we can produce from waste,agriculture and genuine tree thinning that does not take live healthy mature trees, andmodest energy farming on existing timberlands - leaving most of our remaining forestsuntouched.
How hard would such a breakthrough be to make? After all we’ve been hoping for thisfor at least 30 years. Well there are never any guarantees. But there is one approachBarry Commoner suggested back in the 70’s that a Danish consulting group recentlyrevived. The theory is that the price of solar cells is a chicken/ egg problem. Becausedemand is low we never get large factories with full economies of scale to bring down theprice of solar cells. Because the price is high demand stays low.
The usual suggestion for breaking the deadlock is demand pull – increasing orders to thepoint where large scale factories could be built. However, the Danish study suggests alarge scale supply side approach – building a giant large scale PV factory accompaniedby a large scale plant to manufacture solar grade silicon315. Currently PV factories buycomputer grade silicon, or process computer chip scrap.
The cost would be well below a billion, with a high probability of success and hugepotential payouts.
If it succeeded, we could eliminate the need for a huge network of high voltagetransmission lines. With cheap enough solar cells you can produce cheap inexpensiveelectricity almost everywhere – from Southern California to Northern Massachusets. Thefew places where this is not the case, like Alaska, have low population densities andnearby access to wind, water, geothermal or biomass. With $0.01/kWh electricity, youcan mix in large amounts of storage without overall electrical price being outrageous.
Cooling It: No Hair Shirt Solutions to Global Warming by Gar W. Lipow GarLpublic AT Comcast DOT net
Page 121 of 265
Is the building of such a pair of factories really likely to bring the price that low? Initially,the answer is no. Cells produced from such a factory are likely to produce electricity nocheaper than a nickel per kWh – about the same price as fossil fuel based electricity, butnot cheap enough for a no fuel cell/cheap electrolyzer hydrogen future. But if solar cellsreally are a chicken/egg problem then the virtuous cycle does not end with theconstruction of a pair of factories. Once the demand is there, other manufacturers willcompete for the new market, applying some of the research that has been completed butnot applied to produce PV at a lower cost. And others will compete with them, and soforth. So we have a very good chance of getting $0.01 kWh electricity out of it.
Even if not, merely producing solar cells through true mass production, and providing adedicated source of solar grade silicon, thus lowering solar electrical costs to ~five centsper kWh is worthwhile in itself. And frankly I think at least 2 cents to be likely, and 3cents almost certain.
This does not mean there is no research left to do on PV. The European Commissionsuggests the following316:
1) Low-cost and high-quality silicon feedstock;2) Optimisation of crystalline silicon process technologies with particular emphasis
on cost and efficiency of wafer cell production;3) Thin-film technologies: highly efficient mass production plus an understanding of
material limitations, aimed at reducing costs;4) Innovative PV concepts for PV cells and modules which have a potential for large
cost reductions (such as tandem and concentrator cells, new materials).5) Research on reducing the cost of other new and innovative components and
systems
There is another path to a solar future besides PV, one that may be easier to reach. Solarthermal electricity runs 11 cents per kWh, and $40 per thermal equivalent of a kWh ofstorage.
However, the National Renewable Energy Laboratory believes they can lower storagecost from the current ~$40/kWht to around $15/kWht280 - which would lower storagecosts to about a cent per kWh over the lifetime of a plant. There is probably room tolower the cost of solar thermal electricity further as well. If we can do these two things,we can phase out hydropower and avoid most biomass use increase without needing ahydrogen path- though hydrogen remains desirable.
Cooling It: No Hair Shirt Solutions to Global Warming by Gar W. Lipow GarLpublic AT Comcast DOT net
Page 122 of 265
The most critical lack preventing a hydrogen present is not fuel cells but inexpensiveelectrolyzers. Currently Stuart Energy can provide 75% efficient electrolyzers for arund$400 per KW in 5 megawatt sizes and higher. If we could lower this to $100 per KWthen hydrogen could be brought down to around double the price of natural gas even at 3cents per kilowatt hour (probably attainable via wind in the near future). This is in partanother chicken/egg problem. Demand for electrolyzers is not high. A well designedmass purchase program might by itself bring down prices to that level. If not, it would bewell worth an R&D program.
What about fuel cells? I’m not as convinced of the centrality of fuel cells as many. Wecan use a combination of efficiency and other renewables to meet our needs withoutthem. With the appropriate use of electric trains to substitute both for many auto andplane journeys, heavy rail for freight instead of trucks, electric autos, and non-hydrogenhyper car technology, we can run that part of transport requiring fuel on a comfortablysustainable amount of biofuel –so long as hydrogen or cheap renewable electricity isavailable for industry. (Otherwise we keep hydro for electricity, and end keeping anuncomfortably large portion of tree plantations continuing to operate as such, rather thanconverting them into forest.) Still having inexpensive fuel cells available would behighly desirable. They would help increase the efficiency of Hypercars, just as AmoryLovins suggests. Without cheap hydrogen they could still cut carbon emissions duringthe transition to a renewable society. With cheap hydrogen, that is cheap renewableelectricity and cheap electrolyzers, they constitute an inexpensive source of massiveamounts of reliable renewable electricity.
They are not as mature a technology as solar cells or electrolyzers, and I’m notcompletely convinced that fuel cells are a chicken/egg problem rather than somethingrequiring more research. But such research would pay in a number of ways. For onething, developing an inexpensive fuel cell would almost certainly develop an inexpensivePEM electrolyzer (the most efficient and currently the most expensive type ofelectrolyzer) because they are by definition the same problem. Extracting most of theavailable energy from hydrogen in the process of chemically converting it back water(rather than simply burning it) is a lot more difficult and complicated problem than usingelectrical energy to convert water into hydrogen and oxygen. If you can do the firstinexpensively, you can do the second even more economically.
Hydrogen’s main potential value is not for transportation, though that is often suggested,but as one possible means of electricity storage, and as a source for high temperatureindustrial processes.
Cooling It: No Hair Shirt Solutions to Global Warming by Gar W. Lipow GarLpublic AT Comcast DOT net
Page 123 of 265
As we saw in earlier sections hydrogen is not the only potential means of storingelectricity. Today’s flow batteries offer lower costs than hydrogen as a means ofelectricity storage, and a higher round trip efficiency than hydrogen is ever likely to have.Research and development can lower the cost of hydrogen storage – but this is true forflow batteries as well. And even more than with fuel cells; research is definitely needed,it is not a simple chicken/egg problem. I contacted a leading flow battery manufacturer(VRB associates) to ask them how much larger batteries could lower the cost. They toldme that they thought $225 per kWh was their current limit, that beyond that you run intodiseconomies of scale. No doubt mass production could also bring costs down. Butmulti-megawatt batteries are not like automobiles. There are limits to how many you willever produce in a year. In short to bring flow battery costs down will require majorresearch investments, not merely demand pull – just as with fuel cells.
In terms of automobiles, lithium ion batteries for electrical vehicles are much closer tocommercialization than fuel cells. It would not take much to bring them down to areasonable price for auto use – making hybrid EVs or plug-in hybrids possible. A hybridEV or plug-in hybrid relies entirely on stored grid power for short journeys, fuel forlonger ones.
We also need greatly increased research into reversible chemical reactions for storingthermal energy – high temperature heat, low temperature heat and cold. A lot of effortshave focused on phase change, and they remain promising, but such reactions as metalhydrides and zeolites deserve more attention. Low quality natural zeolites may be aseffective as high quality synthetic ones for storing thermal energy below the boiling pointof water - which might make solar energy practical for close to 100% of low temperatureneeds.
In addition to solar energy, there is a tremendous untapped in potential in wind class 4and below, probably accessible only via small wind. Right now small wind is much moreexpensive than utility scale wind farms (per kWh), but if the price can be brought down ithas about 20 times of potential of wind farms – another possible path to a hydrogenfuture (which requires electricity cheaper than fossil fuels rather than merely competitivewith them). So far efforts at small scale wind have focused either on conventionalhorizontal turbines, or on unconventional vertical ones – with neither resulting in the costreductions we need. The Selsam wind turbine uses multiple horizontal style turbines on atilted tower – getting some of the low capital costs of vertical wind, and some of thehigher efficiency of horizontal ones317. (It has potential for utility scale wind too.) As inany R&D there are no guarantees, but basically we have a cost/output curve of whichonly the extreme ends have been tested. This turbine explores the whole area of the curvein between. It is at least possible that this will discover a “sweet spot” – a compromisewith a lower cost per kWh hour than either extreme. Any R&D funding trying to lead to arenewable future should seriously consider this project.
Cooling It: No Hair Shirt Solutions to Global Warming by Gar W. Lipow GarLpublic AT Comcast DOT net
Page 124 of 265
Of course we should not just turn to small scale. Utility scale wind is already competitivewith fossil fuels, and the potential, (though not as great as small wind) is more than weneed. There is no reason to think we have come to end of the potential for lower largescale wind costs, and we need continuing research in this area as well. One possibility isgyromills (essentially tethered helicopters with wind generators attached) A gyromillcan reach much higher than a tower, accessing high altitude rather than surface winds.Significant wind power can be tapped almost anywhere through this means. Unlikesurface mills, gyromills can approach 80% of nameplate capacity. The power required tokeep the mill in the air is a tiny portion of that generated. This has been demonstrated ona small scale. One major problem, stability, has been solved recently by adding morerotors – since unlike a helicopter, a gyromill does not actually need to travel. There iseven one company who thinks gyromills are ready for commercial deployment, and couldproduce wind electricity at an unsubsidized cost of less two cents per kWh318. Thoughentrepreneurs are optimists by nature (at least in public), it sounds like financing a pilotproject would be a worthwhile use of public funds, followed by encouraging deploymentif the cost and output projections proved anywhere near accurate.
Although wind power is environmentally benign compared to any other means ofgenerating electricity, this does not mean it can’t be improved. We do need to continueto study bat, bird and insect protection.
Related to wind is wave power. It is not yet commercially priced, and the near termpotential quantity is not nearly equal to that of wind or solar. But it has one advantagethat makes it very promising indeed. Wave power is extremely reliable – not up to that ofhydropower or geothermal, but very much greater than that of wind or solar withoutstorage. Inexpensive wave power added to a renewable mix would significantly reducethe amount of expensive stored electricity needed. So bringing its price down is importanteven if it could supply only a small portion of total electricity needs.
We need a great deal more research in biomass as well. This includes: less expensiveenzymes for less expensive production of cellulosistic ethanol, along with better and lessexpensive enzymes in general for biomass production, better gasification processes,better bio-refineries to co-produce chemical, pharmaceutical, food byproducts and energyproduction, integrated biomass production and processing facilities. We also need moreresearch on more sustainable ways to generate biomass – low impact and especially lowwater; we need lower impact ways to process biomass as well.
Related to this, we need to find out if the high energy, resource, and land efficiency ofbiointensive agriculture can be duplicated or even approached without the high laborcosts. Because of my background, my instinct is to look at robotics, cybernetic,computerization and data processing technology. But, as with no-till agriculture, thebreakthroughs there are just as likely to occur via simple common sense questioning ofassumptions. Approaching the problem from the other end, hydroponics is already anextremely water and labor efficient technology; we need research to lower its high capitaland energy costs.
Cooling It: No Hair Shirt Solutions to Global Warming by Gar W. Lipow GarLpublic AT Comcast DOT net
Page 125 of 265
There is a related study that would be worth doing – a cultivatable and recoverable landsurvey. In many poor nations cultivatable land is simply held out of cultivation, to driveup the future price for purposes of real estate speculation. (In the rich nations this is notas common – the land already is valuable and there are usually short term ways to exploitland for which you have other long term plans.) Secondly, while a great deal of lostfarmland is truly lost, some of it may have been eroded or damaged in other ways withouthaving been permanently converted to other uses. There are well know ways to rebuildthe soil on eroded land; sometimes even poisoned land can be recovered – and land that istoo toxic to grow food on might still be suitable for energy biomass. Lastly a great deal ofland in nations with hungry people is used to grown coffee and flowers and other non-food luxury crops – though in absolute terms the FAO figures do not seem to suggestthey account for a large percent of world crop acreage319.
We also need more investigation of kelp and algae and other ocean and water basedbiomass. Right now it is way too expensive to be a source for anything but chemicals,pharmaceuticals and luxury foods – products that sell at high prices per kilogram. But ifthe price could be lowered the sustainable potential is much greater than that for landbased biomass. And to the extent that such material is grown in polluted water rather thanfertilized it actually helps reduce eutrophication and clean the oceans of some of thedamage we have done to them. Deliberate fertilization, as sometimes proposed, isprobably not sound.
We need more research in high temperature solar applications for process heat. Dishconcentrators can produce heat above 750 Fahrenheit degrees, but very expensively. If itcould be done cheaply, that is another large portion of industrial needs that could be metby high temperature solar. Related to this, inexpensive long term storage of hightemperature heat is an area that needs more funding.
While we already know how to make huge efficiency increases, the potential forimprovements there is high also. We need more research on enzymes and catalysts thatallow the huge number of chemicals involved in industrial production to take place atlower temperatures and for shorter times.
A great many production facilities include a few steps out of many that require energy ormaterial intensive processes - ultra clean environments, highly toxic solvents, very hightemperatures. More development of mini-reactors which isolate these steps from othersin small tightly controlled environment could save huge amounts of energy, water andmaterials - especially in the chemical and electronics industries.
In these same industries (and many others) super-critical carbon dioxide might providehuge savings as well. It can substitute for toxic solvents in a great many contexts, and ismuch easier to keep ultra-pure than water – whose ultra-purification requires substantialenergy.
Cooling It: No Hair Shirt Solutions to Global Warming by Gar W. Lipow GarLpublic AT Comcast DOT net
Page 126 of 265
Currently high strength carbon fibers are very expensive to produce in both money andenvironmental damage. Lowering both costs could allow them to widely substitute forsteel and other metals – providing a huge energy and environmental savings.
We need to continue research into high temperature superconductors (of course) to lowertransmission costs and risk for electricity. They are currently commercially competitivein certain limited instances; if their costs could be lowered and efficiency improved theyhave a great deal of potential.
Similarly we need more research into electroactive polymers, which might allow us toliterally print lightbulbs, computer monitors and other electronics where nano-secondresponse times are not required.
All of the above are comparatively short term. But we have seen in the past that “bluesky” research based on a large scale vision often pays off. So let’s include a couple of“big picture” long term projects just to show that they fit in as well.
One field we are already putting a great deal into is nanotech - and we should. We haveevery reason to expect this field to produce low cost solar cells, low cost environmentallysound electronics, low cost electrolyzers for hydrogen and possibly low cost fuel cells.However there is one aspect of nanotech we are not putting enough effort into – howdangerous the waste is and what needs to be done about it. The current and near futureversions of nanotech, unlike portrayals in some of my favorite science fiction, mainlyfocuses not on bacteria and virus sized machines, but on how materials act whenprocessed into very tiny fibers, crystals, tubes and other nanostructures. Carbon, silicon,glass and metals (just to name a few examples) behave in very different and often usefulways when formed into such structures, compared to their normal forms.
Now any manufacturing process produces some waste; nanotechnology usually results inscrap nanomaterial. We are talking about scrap carbon, glass, metal or silicon – all prettyharmless sounding stuff. And maybe it is just as harmless as it sounds. But just ascommon materials behave differently in useful ways, when formed into nanostructures,they may behave differently in harmful ways as well. The point is, we don’t know.Nanotech has so much potential; we do not want this infant industry to make the samemistake other high tech industries have, and smugly assume their waste products areharmless or that the problem of waste disposal will be solved without effort on their part.Test your material now; find out how harmless it really is; if it is not harmless find outhow to turn into something that is. Apply the old business cliché and be proactive.
Cooling It: No Hair Shirt Solutions to Global Warming by Gar W. Lipow GarLpublic AT Comcast DOT net
Page 127 of 265
Is this a real concern? Well bear in mind we see many harmless materials turn dangerouseven at the macro level when formed into ordinary small fibers. Cellulose and glass areamong the least toxic non-food substances known. But when turned into cellulose fiberfor insulation, and fiberglass for many purposes, you do not want to breathe them.Cellulose and fiberglass insulation are always sealed off from building air when properlyinstalled. Workers who install the stuff wear masks and protect themselves in other ways,or they do if their employer cares about their health, or if they have the leverage to forcetheir employer to care. Note that we have not stopped using either material. As a societywe investigated what the dangers are, and know how to take appropriate precautions.
That I’m sure is all we need to do with nanotech - find out what the problems are. Insome cases there probably won’t be any. In others only simple fixes will be required.Some substances may require elaborate precautions or complex post processing. Andisn’t it better to know that in time not to kill a lot of people and ruin the reputation of anindustry that could save us all? Spend the effort now to find out what problems it mightcreate and how to solve them.
Another place I think we need to put some research money is into the space program.One possibility that requires trivial funding compared to the benefits is the space elevatoror beanstalk. An elevator to space could get us there and back again a lot less expensivelythan space shuttles – if it worked. Admittedly that is a big if. There are many problems tobe solved – developing the nanotubes to make that large a structure self-supporting,protecting against micro-meteors and space debris, protecting against differential winds,and corrosion from exposure to various levels of the atmosphere, find ways to ensureultra-long fibers can be free of flaws. But some very serious people think it could bedone.
And cheap access to space could provide a lot of benefits even with our 30 year timeframe – solar energy that is reliable and predictable, cheap vacuum, a place to produceexotic materials without a biological environment to disrupt. What if it fails and you can’tbuild a beanstalk? Well even then the research needed to make a serious attempt wouldprobably give you nanotubes and a number of useful results. The potential spin-offs, evenfrom failure, and the spectacular rewards of success might make this a project with a verygood potential risk/reward ratio.
But I also think it is important to our growth as a species; it will help to make us betterpeople. When I was very small and humankind made it into space for the first time, mylate father wrote some verses on the subject. I still think it expresses something veryimportant:
I can hear the planets ring!I find joy in everything!And there’s no more room in living for tears!I am glad for every breath!Life was never meant for death!And I want to live a million more years! I want to live a million more years!
Cooling It: No Hair Shirt Solutions to Global Warming by Gar W. Lipow GarLpublic AT Comcast DOT net
Page 128 of 265
The whole human race is my family.I have brothers and sisters wherever I roam.This little green globe is just too small for me!So I count the great wide universe as my home!
We have lost that joy somewhere along the way, replaced it with an ecstasy of hate. Ithink it is time the human race make another attempt to become space people.
Now again, none of the above is a research agenda. It is simply some examples worthconsidering. A real research agenda would be laid out by experts in various fields tomaximize results. But the principles, I think, are the ones a real research agenda wouldfollow. Invest intelligently in a variety of promising approaches, and you will get goodenough results from the successes to outweigh by many times what is lost to the failures.(It is rather like oil drilling, where the successful finds make up for the dry holes and theproductive but uneconomic wells.) Mix short term practical projects with visionary bluesky possibilities – sometimes the low hanging fruit is as sweet as it looks; sometimes thewild and crazy big ideas produce the best results.
Cooling It: No Hair Shirt Solutions to Global Warming by Gar W. Lipow GarLpublic AT Comcast DOT net
Page 129 of 265
Hello Tomorrow: R&D II - Adapting to the Greenhouse
So far we have dealt with preventing global warming. But of course nearly one degreecentigrade of it has already occurred. Even if we start comparatively soon, it is unlikelywe will muster the political will anytime before 2010, and by the time we phase out fossilfuels, it is nearly certain that a second degree will have occurred. A feedback cycle mayhave already begun that will take us beyond that. And if the carbon lobby has its way wewon’t start anywhere near as soon as 2010.
I’m optimistic. I don’t think the feedback cycles are so great as to be uncontrollable, and Ithink starting by 2010 will hold our losses down to a level our species and civilizationcan survive. But we will lose a lot, and we need work out how to adapt to it.
One of the big losses has already begun – water. We have less fresh water availablewhere it is needed worldwide each year. Not of all this is due to global warming. Weover tap aquifers, and recklessly contaminate freshwater sources with toxins. But we arealso getting less snow pack in mountains, less rain where it would recharge aquifers inclimates that need water mosti. (We also get more rain in humid climates where there isno shortage of water. Of course some cities in rainy climates still depend on snow packfor fresh water. So, to take an example near where I live, Seattle may someday suffer aflood and a drought simultaneously.)
The material intensity section outlined some techniques to greatly increase production perliter of water. After all we have plenty of water for drinking, cooking and washing.(There are people without any of this of course, but they could be provided it at anabsurdly low price. That anyone in the world goes without clean drinking, cooking orwash water is an example of hideous cruelty and injustice; for these purposes there is noshortage - only deprivation.) We may run short of water for agriculture and industry –even with a factor four productivity increase in its use.
There is a technique that is well known, and actually in fairly widespread commercial use- reverse osmosis desalination. It is very expensive, but a mature technology. It is verywell suited to wind-power, since it essentially consists of pumping water through veryfine filters which filter out the salt and let the water through. This might be a prime usefor offshore wind – a market for the electricity right at the point of production. Similarlyif wave power became practical, this would be an obvious application for it as well. (Infact most wave research assumes co-production of water and electricity, rather thanproducing either singly.)
iRainfall and snow pack have natural long term cycles. So we don’t know how much of the current drop isdue to global warming, and how much is due to the end of a peak.

Cooling It: No Hair Shirt Solutions to Global Warming by Gar W. Lipow GarLpublic AT Comcast DOT net
Page 130 of 265
Of course there is more research needed on reverse osmosis. While energy is one majorcost of converting sea water into fresh water, it is not the only significant cost. Reverseosmosis filters are expensive, and don’t last long. We need to improve this as much aspossible, either by making the filters cheaper, making them last longer, or making themrecyclable, or better yet, regeneratable. All of those at once would be nice of course.They have already improved a great deal. As energy efficiency improves for reverseosmosis, we not only save energy costs, but capital costs in the huge pumps they requireas well.
Other adaptations are more development than research; we need better public health tomake up for increased exposure to exotic disease; we need to restore wetlands, build uplevees, and generally learn to prevent, mitigate and recover from the increased numbersof natural disasters .
One consequence we have already talked about of global warming is increased energy inthe atmosphere. While in most respects this is bad news (very few climates will beimproved by higher winds) it is good news for wind energy; many areas that are currentlynot suitable for wind power will become suitable as class 3 wind areas become class 4wind areas, and class 4 wind areas class 5 wind areas. This is not an unmixed blessingeven for the wind industry; you can’t run a wind generator in a hurricane or even windsof above a certain the speed (what that speed is depending on the wind generator). Still,overall, commercially exploitable wind resources will increase.
Cooling It: No Hair Shirt Solutions to Global Warming by Gar W. Lipow GarLpublic AT Comcast DOT net
Page 131 of 265
If Tomorrow Never Comes: R&D III – Ignoring the Greenhouse
Much of the carbon lobby suggests that it would be less expensive and more humane todo nothing about reducing global warming - simply switch to coal (of which we haveplenty) and adapt to the changes that would come.
Obviously I don’t favor this approach, but I thought I’d be helpful to the other side, andput forward some specific proposals.
To start with in an unmitigated planet greenhouse you would have weather more thanclimate. It would tend to be much warmer on average, but would still get frosts andsnowstorms unpredictably – some of them in places you currently don’t get snow. Youwould get more droughts in dry climate, more floods in wet places (with an occasionalswitch just to keep things interesting). Insects would flourish on a warmer planet andpests of all types would migrate. And of course storms would be worse than at present,and the average wind speed would be significantly higher. This has interestingimplications for agriculture. Finding crops that are simultaneously drought and floodresistant, adapted to high temperatures, but able to survive low temperatures, and that areusable by humans as sources of complete protein and moderately concentratedcarbohydrates (comparable to grain or roots) makes for a fascinating challenge.
One possibility is to learn how to grow most of our crops indoors. Some parts ofScandinavia grow a large part of their fruits and vegetables in glass houses, but I don’tknow if any nation has ever tried to raise a significant amount of its grain and animalsthat way. For at least half a century, there have been proposals for geodesic andinflatable domes miles in diameter, but no one could ever come up with a good enoughreason to build one; ignore global warming long enough and we may get one. I’m surethe people of this country won’t mind having a quarter of it domed over. At any rate if wereally intend to do nothing towards prevention, we need to investigate more seriously thecheapest way to deploy this well-known technology, and the cheapest way to climatecondition these farm bubbles. We can research means to improve our hydroponicstechnology too, since hydroponics minimizes water consumption.
In case this fails, an alternative possibility is leaf protein. With a centrifuge you canextract protein from just about any kind of leaf on any kind plant. So we could simplyplant “farms” with whatever kind of biomass we can get to grow and use wind poweredcentrifuges to extract the protein which we would then treat and store. Currently leafprotein is extremely expensive compared to meat; we need a way to bring the price down.
Cooling It: No Hair Shirt Solutions to Global Warming by Gar W. Lipow GarLpublic AT Comcast DOT net
Page 132 of 265
Also leaf protein is currently extracted from crops planted for just this purpose. Anoutdoor “farm” adapted to a greenhouse climate would consist of mixed plants. Thesewould not be separate rows or beds or even in the more complex arrangements we find inpermaculture and biointensive gardening. This would be a variety of species completelymixed; suitable for differing climates. The idea is that some varieties would flourish andothers fail depending on what the weather that year was suited to grow. Any wildvolunteers would be welcomed; in a planet greenhouse farm there would be no such thingas a weed.
Now leaf protein is already expensive compared to animal protein, since it requires moreextensive processing than normal vegetable protein. Extracting the protein from mixedleaves of a semi-random variety will require some additional research.
If eating leaves does not appeal, there are other possibilities. Blue green algae –(spirulina) is both a protein and a carbohydrate source that can be produced in a widevariety of climates while requiring less water than conventional agriculture. It is stillfairly expensive compared to normal animal and vegetable protein sources, and wouldrequire more research to bring those costs down.
There is one possible protein source that will actually increase on planet greenhouse –insects. We even know how to prepare them; there are organizations devoted to insecteating already in existence that have developed extensive recipes; some are reputed to bequite tasty. The trick here is harvesting. Most technology we have for dealing withinsects involves killing or discouraging them. We need to learn how to capture them un-poisoned in large lots, if we really intend to live on unmitigated planet greenhouse.Possibly worms would be easier to do this with than flying insects; and snails are alreadywell known as a gourmet treat. So that is good news for people who don’t want to live onleaves and pond-scum; we can eat bugs instead.
Ah, but there is one other thing we should consider. What if the same people who opposedoing anything to prevent the worst effects of global warming from happening don’t wantto spend the money to learn to live with it? What a surprise that would be! Well there isstill one area they would still desperately need to research.
If nothing is done to prevent the worst global warming, and no serious research is madein adapting to it, then you will eventually have the world food supply cut by at least onehalf, probably three quarters and possibly 90%. Of course the industrial infrastructurewill also be seriously impacted. The remaining people will be pretty busy improvisingadaptations without a lot of preparation via prior research. So you will not have a lot ofpeople available with free time to dispose of the dead – no more than one per thousandcorpses, probably as few as one per ten thousand corpses.

Cooling It: No Hair Shirt Solutions to Global Warming by Gar W. Lipow GarLpublic AT Comcast DOT net
Page 133 of 265
Now this will be a serious health hazard to the living, (presumably those who favor doingnothing to prevent global warming). In that case we need to develop techniques wherebyone person may find and permanently dispose of a thousand or more widely scatteredcorpses per day unassisted. This may bring up thoughts of Soylent Green, but large scaleexo-cannibalism is not actually a practical disposal method. Cannibalism tends toproduce all sorts of exotic diseases to begin with. But eating corpses that have died ofnatural causes, especially when they are not fresh would be an extremely unsafealternative. Because this is addressed to the carbon lobby, mentioning these practicalconsiderations is important. I’ve never seen signs of ethical standards that would rule outtheir eating human flesh.
I do hope those who oppose mitigation of the global warming, and support simplyadapting to it, find these suggestions helpful.
Cooling It: No Hair Shirt Solutions to Global Warming by Gar W. Lipow GarLpublic AT Comcast DOT net
Page 134 of 265
Objections
One thermodynamic criticism is often made of renewable sources – by anti-environmentalists, and even environmentalists such as George Monbiot. Renewableenergy can never match the economy of concentrated hydrocarbons they argue; there maybe a lot of it, but it is too sparsely distributed. This overlooks the fact that a great deal ofeffort in our society is spent to distribute them in non-concentrated, decentralized forms.
For example the electric grid is used to take the output of large electric plants anddistribute them a few kilowatt-hours a time to multiple users. Similarly gas utilitiesdistribute gas for heating and cooling. Filling stations distribute refined petroleum in theform of gasoline and diesel fuel to multiple cars and trucks. It would be a lot easier toproduce energy in a distributed manner for distributed use, and concentrate it for the few(mostly industrial) cases where we need huge quantities of energy in a small space.
Renewable critics also point out how many square miles would have to be covered withsolar cells to supply all our electricity, let alone all of our energy. There are a lot ofreasons PV cells may not be presently able to supply a large percent of our energy - butlack of land to put them on is not one of them. Solar cells on rooftops, south walls, andparking lots alone could supply a lot more electricity than the U.S. uses. So could U.S.roads. There are some arguments worth considering against doing this (yet). Lack ofenvironmentally sound places to put solar cells is not one of them.
In general land use arguments against renewables don't make sense. For one thing solarand wind don't actually use more land than many of our other sources. For instance,according to the DOE, a concentrating solar thermal plant would require less than 10% ofthe land consumed by the Grand Coulee Dam to produce the same amount ofelectricity320 . Similarly, if land destroyed by mining is taken into consideration, CSPalso uses around the same amount of land that coal plants do321. PV, even when notinstalled on rooftops and other existing human built structures consumes less land thanCSP. Wind uses more land than solar, but uses it more lightly. Overall it does not seemthat there is a reasonable land density argument to be made against solar and wind.
What about storage techniques such as pumped storage? Pumped storage to hold tenhours average consumption at today's rate would require less than 4,000 square milescompared to the 43,600 miles currently used to generate hydroelectricity, or the 92,600consumed by all the dams in the NID inventory322.
Another argument is that a lot of the proposals are already being carried out to someextent without solving the problem; that does not invalidate the fact that if carriedthrough completely they can save or produce a great deal of energy. What we need toexceed is not our best current operating procedures, but our current average efficiency. Ifcomprehensive adaptation of a widely used technique can raise that average high enough,then so much the better.

Cooling It: No Hair Shirt Solutions to Global Warming by Gar W. Lipow GarLpublic AT Comcast DOT net
Page 135 of 265
Answer at the End of the Line: Technical Conclusion
We could power the U.S., the most carbon intensive society on the planet, via carbonneutral techniques at a lower price than energy is provided now - allowing for populationgrowth, and using existing technology. For economic growth over and above populationincreases, R&D potential in the field of alternate energy can more than match potentialtechnical changes in other area.
Cooling It: No Hair Shirt Solutions to Global Warming by Gar W. Lipow GarLpublic AT Comcast DOT net
Page 136 of 265
Politics and Economics of the Transition
Two questions arise: if efficiency measures and renewable energy can replace fossil fuelsat comparable prices, what is stopping us from doing it now, and what needs to change?A full answer would require a book in itself; in fact I’ve written it - the companionvolume to this one No Hair Shirts: Money and Politics in the Fight against GlobalWarming. But it would be unfair to end without at least a hint of economic and politicalsolutions to match the technical ones. For brevities sake, I’m simply going sketch a smallpart of the economic and political arguments – without proof, and without even muchevidence. For such evidence, as well as a lot more detail on the political economy of boththe problem and the solution read No Hair Shirts.
The conventional wisdom about things like global warming and air pollution is that agood part of it is caused by a lack of full social pricing. That is, coal plants owners hurtpeople other than the owners; and the owners don’t have to pay for any of that damage.After all, if someone else is picking up certain expenses for you, you have no incentive tominimize those expenses, and in fact have every reason to incur more of those expenses ifyou can trade them for others which you do pay. Like a lot of conventional wisdom, thisis quite true.
But a something else must be preventing a lot of the savings in this book from beingrealized; because a great many of the efficiency measures outline are less expensive thanconventional alternatives, right now, and were less expensive even when oil was $35 perbarrel. Lack of full social pricing, is not the reason savings with payback periods as shortas two weeks are sometimes omitted.
In economic jargon, we would say that energy demand has low elasticity in response toprice signals. Translated into English, this means that when the price of energy rises,demand drops but not by as much as you would reasonably expect.
Most economists who pay attention to energy economics do recognize that energydemand does in fact have low elasticity in response to price increases. And the reason forthis in the short run is uncontroversial. While there are immediate things people can do tosave a small percent of their consumption in response to price increases, major reductionsrequire either capital investment or major sacrifices. For example, while we can turndown the thermostat up to a point, in sub-freezing weather we can only turn it down sofar. If we want to save energy past that point we either make an investment in insulation,or take the risk of freezing to death.
What there is more argument about is why even in the very long elasticity seems too low.Why, when making capital investments, do investors overlook opportunities forincrementally tiny additional expenditures which have very high rates of return?
Cooling It: No Hair Shirt Solutions to Global Warming by Gar W. Lipow GarLpublic AT Comcast DOT net
Page 137 of 265
A number of reasons are suggested; for example there are split incentives – such asinsulation in rental units. A renter has strong disincentives to insulate, because she maynot be in the same unit to take advantage of the investments, and does not wish to simplymake a present of a capital improvement to her landlord. A landlord paying for insulationwill be saving the tenant money, not herself.
There is differential access to capital. For example a homeowner borrowing to insulateher attic is drawing down on a much more limited stock of credit than a utility borrowingto build a power plant or gas pipeline.
Most cost accounting systems (even ABC cost accounting systems which are still not thedominant accounting method) don’t allocate flow costs such as energy properly – whichmeans the people who actually control the costs won’t necessarily get credit for anysavings they produce. Essentially, we have split incentives within firms.
In all fairness there is a small minority who insist that there is no problem; they claim thata number of factors justify low investment in energy savings. One is that since energy isa comparatively small percentage of costs for most companies and individuals (eventhough high in absolute terms), high transaction costs for such savings lower their value.Another is a claim that energy efficiency techniques don’t really provide equivalentservices – that energy saving bulbs provide worse light, and that in general efficiencytechniques make up in lowered quality what they save in energy. Lastly they point outthat energy savings often translate into lower dollar savings than you would expect;energy bills include fixed costs that don’t drop with energy consumption; so cuttingenergy use by half lowers energy bills by less than half.
However a large number of companies have instituted energy saving programs that payback all costs (including additional administrative costs – the “transaction costs”) manytimes over in a very short time – so for the most part the transaction cost argument doesnot wash.
Most of the time energy efficiency techniques improves rather than lowers quality. Forexample, it is true than many people find compact fluorescent bulbs provide worsequality light than incandescent. But the single biggest potential for efficiency in lightingis not in residential, but commercial buildings. And most commercial light already isfluorescent. Savings there are through using better grades of fluorescent bulbs, reflectors,dimmer switches to allow employees to adjust the brightness of ambient lighting to theirown taste, the provision of desk lamps or other spot source employees can aim wherethey want, and the use of day-lighting – letting in natural sunlight. Every one of thesesteps is pretty universally agreed to improve lighting quality, and the human comfortcompared to conventional fluorescents.
Cooling It: No Hair Shirt Solutions to Global Warming by Gar W. Lipow GarLpublic AT Comcast DOT net
Page 138 of 265
Lastly, fixed utility costs are real – but significant efficiency improvements still providesubstantial payback, because electricity and fuel use charges are significant over andabove fixed costs. Also many energy efficiency techniques provide more non-energypayback than energy payback. For example, better light in commercial buildings providesmuch more payback in productivity increases and reduced maintenance labor than inlighting energy.
For these reasons the majority of economists agree with engineers and energy experts,there are real energy saving opportunities being missed without justification. In the wordsof Amory Lovins, industry is leaving “$10,000 bills on the floor”.
So what is the policy answer here? And what are the politics?
Well the usual suggestions are various forms of green taxes - driving energy prices upwith carbon taxes, or the failed Kyoto style tradable permits. A price on carbon will haveto be part of the solution, but in the face of demand inelasticity it cannot be the mainapproach. Raising prices and doing nothing else does not prevent leaving $10,000 billson the floor; it just increases their number. Serious policy to solve global warming willhave to include significant and public works components and regulatory components.
Public works are required because a lot choices required are NOT ones individuals canmake. No amount of green taxes or regulation will provide light rail to transport people,or heavy rail to transport freight. A regulatory component is needed because we don’twant to simply provide every kind of good and service publicly, but still face the problemof demand inelasticity – which leaves the only choice in such cases regulations thatspecify ends, while leaving means to individuals. If we seriously want to tackle theproblem, significant regulation and public works will have to be part of the solution;paradoxically there the regulatory aspect may often prove the least coercive component.
At any rate regardless of what policy is used, phasing out U.S. fossil fuels will not befree. Oh the net cost will be zero; we will save more than we will spend. But, theexpenditures will largely be capital expenditure, while the savings will be operational; wewill have to invest money up front in order to gain a continuing flow of savings overmany years – a lot of it public money.
How much money will this take? The New Apollo Alliance suggests spending $30 billiondollars per year the course of ten years on wind generators, solar roofs, and efficiencymeasures. But their goal is modest – focused mainly on oil. To almost completely phaseout fossil fuels in the U.S. would probably cost around $150 billion dollar - $300 billionper year – for thirty years not ten. Now that is a lot of money; but aside from the fact thatwe would get it back, it is also something we can easily afford. For example, it is muchless than we spend on the military each year. It is a tiny fraction of the cost of tax cuts wehave given to millionaires and billionaires. It is less than a third of 2005 energyexpenditures.
Cooling It: No Hair Shirt Solutions to Global Warming by Gar W. Lipow GarLpublic AT Comcast DOT net
Page 139 of 265
Five years into such a program, the annual value of energy saved will exceed annualpublic investment – though some of the savings will be a result of regulation andincentives rather than only public spending. Fifteen years from the beginning, total valueof energy saved by public spending alone will exceed the cost of that public spending.Twenty years on, it will have paid back all costs including interest. And that assumes$35/barrel oil (which we will never see again) and no increases in other fossil fuel costs.
Now comes the hard part; politically given that conservatives are currently the dominantforce in U.S. politics how are we going win this? $150 billion dollars a year in domesticpublic spending is not going to be popular with any conservative movement, nor areenergy efficiency regulations.
Authors Michael Shellenberger and Ted Nordhaus, who helped found the ApolloAlliance give a hint as to how to approach this in their famous essay “The Death ofEnvironmentalism: Global warming politics in a post-environmental world”323
Without agreeing with everything they say, I think they make one key point. The changesneeded are too big to deal with as just an environmental view. But a lot of othermovements to make this nation better are in a similar situation. Women’s rights, endingracism, saving and expanding union rights, equality for GLBT and for the disabled allrequire changes that are too big for the individual movements to win by themselves.Further, none of these movements can win in an America moving ever further to theright. Every one of them requires stronger democracy, and strong state intervention onthe side of the little guy against large private institutions. Most require significantamounts of public spending.
So this redefines the problem; it is not how the environmental movement gains supportfor technical and political solutions to global warming, but how some sort of alliance orcoalition between labor, feminists, GLBT, anti-racists, the disability rights movement,and environmentalists combine agendas to win on broader progressive issues. In otherwords we need a progressive movement; a climate coalition will be able to makesignificant contributions to such a movement and make significant demands on it – butboth the contributions and demands will be as one group among many other equalgroups, not as a keystone. Climate disruption will not be THE central issue.
In “No Hair Shirts” I argue that the very size of this challenge gives us a shot at winning.People from every movement are realizing the need for some type of coalition. In thatbook, I compare it to baboon troops moving closer together in the face of predatorpressure.
Cooling It: No Hair Shirt Solutions to Global Warming by Gar W. Lipow GarLpublic AT Comcast DOT net
Page 140 of 265
AppendixesHot Lies and Cold Facts: Global Warming Deniers vs. Climate Science
Powerful interests, cranks, and honest dupes continue to dispute the mainstream scientificconsensus about global warming. Unfortunately we have to take the time to counter theirpropaganda - a victory for the carbon lobby. It is as though we were in the midst oftrying to seriously improve public education, and suddenly had to stop and fight anattempt to remove the theory of evolution from biology text – oh wait…
Usually on catastrophic environmental issues, you consider the precautionary principle -weighing very small chances of catastrophe against great harm if they occur. Globalwarming is on the same scale, but with overwhelming rather than tiny odds of disaster ifunchecked. It is rather as though a group of small children found a loaded gun - one withtwelve chambers, eleven of which contain bullets. They decide to play Russian Rouletteanyway; after all they might get lucky and pick the chamber without ammunition.
The greenhouse effect exists. As a bumper sticker says about the speed of light "186,000miles per second; it's not just a good idea; it's the law." Most sunlight penetrating theearth's atmosphere to reach the surface does so in the form of visible short wave light.When it reaches the surface, much of it is converted into longer wavelength thermalenergy - infrared. It tries to bounce back out into space again, but some of the longerwavelength energy cannot penetrate the carbon dioxide and other greenhouse gases in theatmosphere; thus solar energy is trapped and helps heat the planet. If greenhouse gasesdid not produce global warming the surface temperature of the planet would be too coldfor humans to survive. The average surface temperature would slightly less than zeroFahrenheit degrees, instead of the nearly sixty Fahrenheit degrees it actually is324. Thegreenhouse effect is about as controversial as the round earth hypothesis.
Deniers seem confused about where the burden of proof lies. Basic meteorology tells usthat increased levels of greenhouse gases lead to increased global warming. Fossil fueluse increases greenhouse gas levels in the atmosphere. All data available, including someof extremely high quality, shows that greenhouse gas levels and temperatures are rising.If deniers want to argue that warming is not occurring, or that something other thangreenhouse gas level increases is the primary cause, the burden of proof is on them tosuggest a plausible explanation and provide evidence for it. It is not the responsibility ofmainstream science to take the time to demolish every evidence-free wild speculationthey invent - although so far this has been done.
Not only the Intergovernmental Panel on Climate Change of the World MeteorologicalOrganization and the United Nations Environmental Programme expressed consensus onthe dangers of human caused global warming325. So has every scientific society in theU.S. with climate science expertise325 including National Academy of Sciences, TheAmerican Meteorological Society, the American Geophysical Union, and AmericanAssociation for the Advancement of Science. Further, between 1993 and 2003 the ISIdatabase lists not one paper disputing global warming published in English languagescientific peer reviewed literature325. (I’m sure a few have sneaked into obscurepublications with careless editors.)
Cooling It: No Hair Shirt Solutions to Global Warming by Gar W. Lipow GarLpublic AT Comcast DOT net
Page 141 of 265
Global warming denial is a propaganda ploy, not a scientific position.
For example, deniers argue that an increase in greenhouse gases from fossil fuels will notsignificantly warm our climate. After all, atmospheric water vapor is directly responsiblefor far more of the greenhouse effect than carbon dioxide, methane, and other extractionand combustion products. Sadly, when such gases warm the air just a little, theatmosphere absorbs more water vapor - multiplying the effect into a significant one. Inshort, it is the other greenhouse gases that determine how much water vapor theatmosphere holds.
Deniers also claim that plants will absorb the extra carbon through normal processes ofphotosynthesis. Plants breathe carbon dioxide the way we breathe oxygen; increasedcarbon dioxide, in the absence of other changes does increase growth. Many commercialgreenhouses use this principle. Unfortunately, exposure to temperatures they are notadapted to, more violent storms, and disruptions in water supplies, and increased insectpopulations higher average temperatures encourage, will destroy far more plant life thanincreased CO2 can encourage. There is also evidence that prolonged unbroken CO2increases may limit the ability of most plants to use micronutrients, leading to an actualdecrease in plant growth326.
Let's compare theory to data. From the same NASA page cited earlier324:According to the Intergovernmental Panel on Climate Change (IPCC), since theindustrial revolution, carbon dioxide levels have increased 31 percent andmethane levels have increased 151 percent. Paleoclimate readings taken fromice cores and fossil records show that these gases, two of the most abundantgreenhouse gases, are at their highest levels in the past 420,000 years.
So we've added significantly to the amount of carbon dioxide (and methane and NO2) inthe atmosphere. Theory says this should have increased water vapor in the atmosphereand therefore temperature.
Cooling It: No Hair Shirt Solutions to Global Warming by Gar W. Lipow GarLpublic AT Comcast DOT net
Page 142 of 265
Citing NASA again324:Temperature data gathered from many different sources all across the globeshow that the surface temperature of the Earth, which includes the loweratmosphere and the surface of the ocean, has risen dramatically over the pastcentury. The IPCC estimates the increase has been between 0.4°C and 0.8°C.Worldwide measurements of sea level show a rise of 0.1 to 0.2 meters over thelast century. Readings gathered from glaciers reveal a steady recession of theworld’s continental glaciers. Taken together, all of these data suggest that overthe last century the planet has experienced the largest increase in surfacetemperature in 1,000 years.
Some deniers still fight a last ditch battle against admitting that warming is taking place -for example citing satellite data that seems to indicate less global warming than measuredon the surface.
Satellite data measures different layers of the atmosphere than surface temperature; soyou would expect results to be different than on the surface. Unlike surface data (thatgoes back to the 19th century), satellite results mostly cover the very short period from1979 forward. That period includes both the Mount St. Helens volcanic eruption andozone depletion - both of which could be expected to lower temperatures in the upperatmosphere. It also turns out there were measurement errors - including heating on theradiation sensor itself and satellite drift.
A new study by scientists from the National Center for Atmospheric Research and theLawrence Livermore National Laboratory, supported by the U.S. Department of Energyand the National Oceanic and Atmospheric Administration, with contributions from theNational Science Foundation corrected for all these factors327:
The group found a warming trend of 0.16°F per decade in the layer betweenabout 1.5 and 7.5 miles high, compared to a trend of 0.02°F in the previouslypublished UAH analysis. Both estimates have a margin of error of nearly 0.2°F(plus or minus). [my interpolation: since the study covered 1979-1999 the totalwarming trend was 0.32°F - greater than the margin of error.] According to theauthors, the new results are a closer match with surface warming, as well aswith four computer-model simulations of 20th-century climate produced byNCAR and Los Alamos National Laboratory.
As a further check on the new satellite data set, the team examined regionalpatterns. Using a statistical technique, the group analyzed the 20th-centurysimulations and searched for an underlying "fingerprint" of climate change. Forinstance, the rates of warming in the satellite-monitored data vary by latitudefrom north to south. The authors found that the overall fingerprint of climatechange in the models resembled this and other regional patterns found in thenew satellite data set.
Cooling It: No Hair Shirt Solutions to Global Warming by Gar W. Lipow GarLpublic AT Comcast DOT net
Page 143 of 265
In other words, allowing for the effects of ozone depletion and volcanic eruptions, andcorrecting for undisputed measurement errors, actual measurements approximate thosepredicted. Data confirms the theory.
Remember that if we were to decide that satellite data and standard meteorologicalrecords are unreliable, we would still have the glacier ice core results and measuredincreases in sea level324 – plus measured warming of the oceans328.
Deniers also like to claim the global warming (that they say isn't happening) is not humancaused. In the past they argued that data show less warming than climate models predict.Currently, between cooling due to ozone destruction, and the corrected satellite datamentioned above, that dog not only won't hunt - it wants to lie very still in a corner andwhine.
Instead they now argue that the peak of a long-term sun cycle329, rather than greenhousegases, causes rising temperatures. This long-term peak, however, is in magnetic flux -which has not been linked to temperature variations. Other deniers ascribe risingtemperatures to the Milankovitch cycles - predictable variations in solar warming due tolong term changes in earth's orbital distance from the sun. These cycles take place overmany centuries, however, and cannot explain the size of the changes that took placewithin a single hundred years (the 20th century) - let alone the warming that occurred inthe last two decades of that century. What about the shorter-term eleven-year and twenty-two year irradiance cycles - in which natural variations occur in the amount of solarenergy reaching the earth's surface? According to the National Oceanic and AtmosphericAdministration330 "... the trend in solar irradiance is estimated at ~0.09 W/m2 comparedto 0.4 W/m2 from well-mixed greenhouse gases". So, increases in greenhouse gasproduction explain at least four times as much of the warming trend as the irradiancecycle does - most analysts say much more.
Another denier position is that global warming will be mild and benign. Canada willgrow oranges; Kansas will raise bananas; vineyards will cover England - and everyonewill do the "Happy! Happy! Joy! Joy!" dance.
The overwhelming weight of the evidence goes against this rosy scenario. TheIntergovernmental Panel on Climate Change projects that without drastic reductions inhuman caused greenhouse emissions, the Earth's average surface temperature willincrease between 2.5° and 10.4°F (1.4°-5.8°C) between 1990 and 2100331. This may notseem like much. After all, night and daytime temperatures often differ by more than thisrange. Unfortunately this small average variation will cause much greater swings day today. One way to understand the magnitude of such a change is the following quote fromthe Union of Concerned Scientists website332. "Temperatures only 5°-9°F cooler thanthose today prevailed at the end of the last Ice Age, in which the Northeast United Stateswas covered by more than 3,000 feet of ice."
Cooling It: No Hair Shirt Solutions to Global Warming by Gar W. Lipow GarLpublic AT Comcast DOT net
Page 144 of 265
The IPCC report puts it more cautiously331: "The projected rate of warming is muchlarger than the observed changes during the 20th century and is very likely to be withoutprecedent during at least the last 10,000 years, based on palaeoclimate data."
When it comes to the consequences the IPCC predicts331:15:
Higher maximum temperatures and more hot days, Higher minimumtemperatures, fewer cold days and frost days, reduced diurnal temperaturerange over most land areas, increase of heat index over land areas, moreintense precipitation events, increased summer continental drying over mostmid-latitude continental land , associated risk of drought interiors, increase intropical cyclone peak wind, increase in tropical cyclone mean and peakprecipitation intensities
This is expected to be worse in the global south, which will see more heat waves, morefloods more droughts, more intense rain, more and stronger cyclones and topical storms.Food production there will drop precipitately; the greater number and intensity ofcyclones, floods and storms, punctuated by the occasional drought, combined withdecreased capability to deal with them will drastically enlarge the number of famines andglobal refugees. There will be more extinction, and more endangered species. This alsomeans more species changing habitats - thus an increase in pests and the spread ofdisease (which will be encouraged to begin with by the warmer climate).
Growth in the more spectacular forms of poverty will increase the quieter forms that arejust as deadly. Absolute hunger, and malnutrition, lack of access to clean water or tomedical care will grow. Unchecked global warming will probably kill more in the poornations than an unending major war would.
The same thing will happen on a smaller scale in the richer north; it too may expect moredisease, more pests, and more extinction. If warming is not too severe, the rich nationsmay avoid famines and massive population displacement. But northern agriculture is notlikely to flourish on planet greenhouse.
Aside from simple lower production, there are also questions of instability. Suppose, forexample, that a wheat-growing region becomes suitable for banana production. Oneinteresting question this raises is, will raising a luxury crop (bananas) instead of a staple(wheat) necessarily be equally profitable in a world where demand for staples vs. luxuryfood is increasing? More to the point - when does this hypothetical farmer make theswitch? Temperatures will rise gradually but not steadily; there is no predicting exactlywhat year to plough up the wheat, and put in the banana trees. Worse, because of theinstability mentioned, a year suitable for wheat may follow a year suitable for bananas.The poor farmer, aside from the usual problem of how well her crop will do, now has todecide what crop to plant. And of course she faces other problems from global warming -more storms, more high winds, more tornadoes and hurricanes if she plants in an area thatsuffers from them. She may yet face more droughts and floods. She will certainly facemore insects, other crop pests, and more (and probably exotic) plant diseases.
Cooling It: No Hair Shirt Solutions to Global Warming by Gar W. Lipow GarLpublic AT Comcast DOT net
Page 145 of 265
I suspect a lot of global warming deniers have never talked to an actual farmer. I don’tthink they understand how much very small changes in climate from the optimum for aparticular crop can affect yield. Farmers have enough problems weather and pestcommon to the areas they cultivate. Floods in areas that never flooded, heat waves onland which suffered only from frosts, attacks by entirely unfamiliar pests are notinconveniences to farmers – they are catastrophes. Deniers overlook, too, the role coldplays in the lifecycle of many plants. There are crops that only reproduce when subjectto frosts, others that reproduce better in cold temperatures than hot ones. It has alreadybeen documented that higher night temperatures result in lower rice production333, andpossibly in lower production of other grains such as wheat and corn.
The suffering of the poorer countries will combine with direct effects to harm the richnations. More refugees will drive down wages - either through immigration into thewealthy nations or by providing cheaper labor outside it. The diseases and pests arelikely to travel northward and mingle with the newly flourishing native ones. Especiallyif combined with a growing refugee population, this will put additional strain on thehealth care system - so health care will be more expensive. Less food will be available;food prices will rise. Damage at home (and probably refugees from abroad) will combineto increase housing demand and costs. Without assuming more inequality, crime, and lesssocial spending (all of which seem likely in a world that allows all this) even the rich partof planet greenhouse sounds like a miserable place to be poor, working class, or middleclass compared to our current world.
History supplies a useful comparison. Fossil fuel burning and massive forest destruction,the two major contributors to both human caused air pollution and human caused globalwarming both escalated drastically around 1750 - the beginning of the industrialrevolution. The consequences of escalating air pollution were felt from the start. We areonly beginning to feel the consequences of global warming now. In 1995, the WorldHealth Organization estimated that air pollution from fossil fuel killed more than 460,000people annually334. A 1997 Lancet study suggested that number would rise to 700,000 ayear by 2020335. This number is ~250 years after the industrial revolution, followingdecades of effort at mitigation. The carbon balance only altered enough to have majorconsequences for humans in the last few decades. Actual measurable harm began muchmore recently than that. We are in, essentially, the same position when it comes to globalwarming that we were with air pollution in 1750. Change occurs more rapidly than it didin the 18th century. If left unchecked we can expect greenhouse damage to escalateduring this century as rapidly as damage from air pollution did in London between the19th and 20th centuries. In 1873, 268 excess deaths were reported from a "pea-souper" ina period of a few days336. In 1954 the worst smog ever recorded in London killed around4,000 people within one four day period337. A recent study suggests that current globalwarming killed around 160,000 people in 2000338 due to increases in disease, heat waves,flooding, drought, hurricanes and tornadoes. By historical analogy (and not by scientificanalysis) we could expect this to escalate to a bit less than 2.4 million annually by 2050(if unchecked). This proves nothing - but provides a good sanity check on the previousnumbers, showing that they make sense historically.
Cooling It: No Hair Shirt Solutions to Global Warming by Gar W. Lipow GarLpublic AT Comcast DOT net
Page 146 of 265
This leads to another point raised by global warming deniers. Global warming, which isnot happening, and due to natural causes, and good for you, is too far advanced to doanything about. (Denier debating tactics resemble a story the Talmud tells. It seems thatone family was accused of borrowing a jar from another, then taking it back cracked. Theaccused family offered three defenses: they never got the jar; it was already broken whenthey received it; and they returned it undamaged. ) And it is not longer only denierssaying this. A number of climatologists and environmentalists are starting to panic, tofear that it is too late that we are doomed, doomed, doomed.
What they fear is that emissions must, just by virtue of how long change will take at thispoint rise well above the point where an irreversible feedback cycle begins, and thatwarming then continues regardless of what human beings do about emissions.
However leading climate scientists argue that the odds are still against catastrophe(though worse than we would like) if we start in time – by around 2010. Two facts giveus this chance:
1) Climate change has thermal lag; it takes time after greenhouse gases are in theatmosphere for them to produce warming.
2) Many of the greenhouse gases other than CO2 – methane and so forth have muchshorter lifespans in the atmosphere than carbon dioxide.
So if we start reducing emissions by 2010, we will still overshoot the safe level of 400PPM, maybe even reaching 475 PPM of CO2 equivalent. If, at that time, we have beenreducing emissions steadily since 2010, the drop in methane and other non-CO2greenhouse gas may drop concentrations back to a safe level before the atmospherereacts.
Malte Meinshausen, Reto Knutti and Dave Frame provide a useful analogy339: it wouldbe as if we turned on our oven, and then just as the dial hit 475, noticed the cat hadwandered inside. If we reacted quickly enough, and turned the oven off before it actuallyreached that temperature. the cat might survive. Right now climatologists think our oddsare lot better than those of the cat in oven; around 75%. A one in four chance of disasteris not happy news of course; but people get those kind of odds in hospitals every day, andstill survive.
Now it is true that significant global warming that has already occurred. But, IPCCdocuments show that if we drastically reduce greenhouse emissions, we probably stillhave time to prevent the worst consequences. Human beings are adaptable. If we canprevent the greenhouse effect escalating drastically, we will find a way to adjust to thechanges that have already happened, or are too late to prevent. Worst case scenarios donot have to happen.
Cooling It: No Hair Shirt Solutions to Global Warming by Gar W. Lipow GarLpublic AT Comcast DOT net
Page 147 of 265
Readers who know something about global warming may wonder why, when looking atthe consequences of not acting, I chose this particular scenario. It is after all, the mildest,most optimistic of the plausible “business as usual” projections. If Pollyanna, Pangloss,Anne of Green Gables, Mr. Micawber, and Rebecca of Sunnybrook Farm were climatescientists this is the example they would pick. Why not describe some of the moreprobable and horrible possibilities?
Because the least harm we can expect from unchecked global warming is enough reasonto put enormous efforts into stopping it. The most optimistic plausible case is theequivalent of a major war, year after year for hundreds of years. I don't think that lookingat worse possibilities than this gains us anything. Depression and terror aren't energizing;they don't help us fight better.
Imagine for a moment that you needed to walk on a two by four supported a few inchesoff the ground a distance of a several yards. Depending on your balance you might findthis easy, difficult, or impossible. Now imagine that instead of a few inches off theground it was set at a great height to bridge a chasm across jagged rocks. I don't knowabout you, but for me the challenge just got much harder. Now imagine trying to cross itwhile someone shouted over and over again: "If you fall you die. If you fall you die."Constant reminders of the stakes do not contribute to solving the problem.
I considered adding a second appendix titled "The Plural of Apocalypse" that dealt withgenuine worst case scenarios. But I decided the demands of honesty are met by simplypointing out that these are real possibilities and (unfortunately) not simply wildspeculation.
It is, after all, pretty clear that phasing out fossil fuels over the course of 30 years givesbetter than even odds. Further because the scenario I’ve outline phases in efficiency asexisting infrastructure is retired emission reductions are slightly better than linear –meaning that we would probably reduce them by 70% or better within 20 years, andcomplete a total or near total phase out within thirty. That is actually better than mostoptimists currently think possible.
If that was not sufficient, we could phase in some of the carbon sequestration techniquesthat have been developed – powering them by wind generators, or other inexpensiveforms of variable renewable energy as they are developed. Because we don’t care whattime of day or year carbon is sequestered as long as it is sequestered we would not needto worry about electricity storage issues; we could use the power as it came. Note thatthis is not a substitute for reducing emissions. (For one thing reducing emissions is muchcheaper.) But once emissions are at (or near) zero this would be a way of reducing thedamage that has been done. And if that is not fast enough, we can phase out fossil fuelsmuch faster and more expensively either by retiring inefficient infrastructure fast or byphasing in expensive renewables. But we should take no longer than 30 years to reduceemissions to close to zero; there is even a good chance it will be enough.
In short we need to follow the first law of holes: when you are in one, stop digging.
Cooling It: No Hair Shirt Solutions to Global Warming by Gar W. Lipow GarLpublic AT Comcast DOT net
Page 148 of 265
How CyberTran May Replace Short Domestic Flights
We can replace a portion of domestic air travel with CyberTran. CyberTran, in additionto being a commuter transit vehicle, has a high-speed version that can reach 150 mph. A150-mph train can match planes for travel speed on flights of up to 500 miles. (Variousfactors let a 150-mph train compete against much faster planes. Check in time at theairport; security, time in the airplane waiting for a runway before takeoff, time in the airbefore landing waiting for a landing strip, time after landing taxing to the terminal. In aconnecting flight CyberTran loses the check and security in advantages; you are alreadychecked in. But it retains the others and adds a certain security; if your flight is late, aCyberTran will still be available five minutes after you land; a connecting flight won'twait for you. And CyberTran is a lot less likely to be weather delayed than an airplane.)
What percent of infrastructure for U.S. domestic air service can CyberTran replace? Thedata is not available for a direct answer, but comparison to Europe, for which data isavailable, gives a good estimate. About 70% of European domestic flights are 621 milesor fewer340. Given that Europe has an excellent rail system, and has already switchedsome travel from plane to rail, and the U.S. has a generally poor rail system, it would notbe unreasonable to assume that the percent for the U.S. is higher. It is conservative toassume that the U.S. percentage is the same. About 60% of U.S. flights are 400 miles orfewer341. So making the conservative assumption that 70% of U.S. flights are fewer than621 miles, it is an equally conservative interpolation that 65% of U.S. Domestic flightsare 500 miles or fewer.
Again it is estimated in Europe that only about half these miles could be replaced by rail,either because some are connecting flights, or because physical obstacles are in the way.But, as pointed out above, plane-to-plane connections are good candidates for CyberTranreplacements. Mountains and bodies of water between two metropolitan areas 500 milesapart or fewer, both big enough to have airports with scheduled domestic airlines arelikely to already be tunneled or bridged for auto traffic in the U.S. and thus available forCyberTran. So we could reasonably expect to replace 90% of these with CyberTran. Andsince we can credit such high speed rail for the ground traffic it will replace, we maycount that as the next net savings for air travel.
Note that this refers to passenger miles, not routes. A fair number of short routes arebetween very minor airports, and carry very tiny numbers of passengers a day on a veryfew flights. Obviously, if fifty passengers a day fly three hundred miles from Podunk toBoondock, we are not going to build three hundred miles of track to save those flights.But, more or less by definition, most passenger miles on short flights will be over routesthat have lots of passengers, where putting in track is worthwhile.
Cooling It: No Hair Shirt Solutions to Global Warming by Gar W. Lipow GarLpublic AT Comcast DOT net
Page 149 of 265
The Hawthorne EffectIn his excellent collection of energy saving examples "Cool Companies", Joseph J.Romm effectively compiles in one place data demolishing the whole idea of a"Hawthorne Effect".342 (The Hawthorne Effect hypothesis claims that comfort, andphysical working conditions have little affect on productivity; productivity increases stemfrom workers knowing manager are paying them attention.) He starts by quoting, VivianLoftness head of Carnegie Mellon school of architecture on the bad results of this belief."Executives constantly cite Hawthorne effect as clear disproof of any real linkage ofproductivity to the physical workplace - all that matters is management method. Thisallows workers to be put into increasingly poorer work environments, smallerworkstations, cheaper furniture, less work surface, less storage, no daylight or view, nocontrol of air, temperature or light."
According to Romm the "Hawthorne Effect" has never been replicated in anyexperiments. He cites two major reviews of the literature.
A 1967 study by U.S. Office of Education conducted new field research aimed atreproducing the Hawthorne Effect and also included a review of published educationstudies. The field research could not replicate the effect; nor did the literature review findany evidence343
In 1989, a more comprehensive review of the literature examined every journal article,unpublished paper or dissertation included in three major databases and previousHawthorne reviews. This found 38 studies that included Hawthorne control groups inaddition to normal control groups. The review found no evidence of an overallHawthorne Effect. "Mean effect associated with Hawthorne manipulation was non-significant and such groups could essentially be regarded as no different from no-treatment controls344."
Omitting details, even the original two Hawthorne experiments do not support theconclusion drawn from them. In both experiments, there was greatly increased incentivefor higher production, a promotion of small-group solidarity, and much greater feedbackon performance than in the normal shop floor. In addition, in the second (and main)experiment, these workers had greatly increased control over their environment than onthe normal shop floor. So these were actually experiments in feedback, incentive, andpartial workers self-management!
Contrary to the usual descriptions, productivity did not constantly increase regardless ofworking conditions. Although the overall trend was steeply up, productivity fell almost asoften as it rose. Modern statistical analysis shows zero correlation between "attention"and productivity in either Hawthorne experiment. However the second experiment'sresults do closely resemble a learning curve.

Cooling It: No Hair Shirt Solutions to Global Warming by Gar W. Lipow GarLpublic AT Comcast DOT net
Page 150 of 265
Given the studies cited that show that better lighting, ventilation and worker control oftheir own environment can improve productivity, the refutation of studies claiming thatthere is no such link, I think we can reasonably include productivity gains in the benefitsof green building.
Cooling It: No Hair Shirt Solutions to Global Warming by Gar W. Lipow GarLpublic AT Comcast DOT net
Page 151 of 265
Accounting for Resource Flows
In recent decades business has begun to realize that so called standard accountingoverlooks and misallocates costs, and costs them money. About 25% of accounting in theU.S. is now done via Activity Based Accounting; however ABC accounting is verysensitive to what drivers are used to allocate costs; energy, water and other flow costs stilltend to be assigned to labor drivers – which perpetuates the problems we have covered.There are some further steps, which are still in their infancy.
One, which is not widely used, is RCA (Resource Consumption Accounting) whichassigns costs to resources, not merely activities345. I don’t know if the approach as awhole provides results superior enough to ABC accounting to be worth the additionaleffort. However, there is one area in which it which takes a vital step; it uses the solutionof simultaneous equations to allocate costs. Whole systems thinking is always iterative,always requires simultaneous solutions, because optimizing parts separately almost neveroptimizes the whole. Accounting (other than projections forward) has always stuck tosimple arithmetic for good reason; the resources to use anything more complex on aroutine basis were not there. However with computers, the use of simultaneous solutionsis no more difficult than simply double entry booking. Like ABC, there is extra data entry– which is where the question of effort vs. results has to be evaluated. But if you areusing a system such as ABC where the data needs to be entered in any case, then it makesno sense to avoid computer time (but not human time) it would take to allocate properly.
More widely used, at least in larger EU companies is Environmental ManagementAccounting. EMA is not a case of corporations suddenly caring about more than theirbottom line. It is based on the recognition that some environmental mistakes can costcompanies money. The International Body UK, provides a decent explanation of this346.EMA is actually an ad-hoc collection of many techniques. However it almost alwaysincludes flow accounting, a measurement of the physical flow of materials and resourcesthrough the company – with cost allocation taking place only after knowing where thematerial is physically and who is responsible for it. It also includes better accounting forcontingent liabilities, placing a value on the risk taken both of monetary liability and lossof reputation if a company is proven responsible for severe environmental damage. Betteraccounting is not a fundamental solution; but it can provide some marginal improvement,and has a role to play.
Note that green accounting tends to have very high transaction costs; it pays for itself inthe narrow sense of increasing profits only in intensively polluting or resource intensiveindustries. For light and service industries more informal means, such as periodic greenaudits given better results for each dollar spent.
Cooling It: No Hair Shirt Solutions to Global Warming by Gar W. Lipow GarLpublic AT Comcast DOT net
Page 152 of 265
A strong example of how flow costs tend to get misallocated is the issue of occupationalsafety. Of course the primary “misallocation” here is a misallocation of power that leadsto callousness and indifference to human suffering. Here I’m making a narrower point –that many costs to the owner, which you would expect to be tracked out of self interest,are hidden347. The paper cited gives examples of indirect costs which are often allocatedto general overhead, rather than a specific accident:Interruption in production immediately following the accidentMorale effects on coworkersPersonnel allocated to investigating and writing up the accidentRecruitment and training costs for replacement workersReduced quality of recruitment poolDamage to equipment and materials (if not identified and allocated through routineaccounting procedures)Reduction in product quality following the accidentReduced productivity of injured workers on light dutyOverhead cost of spare capacity maintained in order to absorb the cost of accidentsNot every firm will miss every one of these costs; but most will miss some. These are realdollar and cents costs to the owner. Estimates of how many of these costs are missed varyfrom a bit less than half to as high as 20 to 1. In other words, almost half the cost ofworker injury being missed is the low estimate.
Cooling It: No Hair Shirt Solutions to Global Warming by Gar W. Lipow GarLpublic AT Comcast DOT net
Page 153 of 265
Phasing Out Other Greenhouse Forcings
Throughout this book we have concentrated on phasing out fossil fuels. But between aquarter and a third of human caused global warming is due to other greenhouse gases andthe destruction of sinks. When examined closely we will see that most of either can becontrolled by actions required to control fossil fuels or fit naturally with that actions weare taking to do so:
1) Methane. A great deal of methane is released into the atmosphere by coal miningwhich this book proposes phasing out or reducing drastically. (To the extent wecontinue to mine coal we can burn most of the methane released - reducing itsimpact.) Obviously natural gas production releases methane as well, since naturalgas is methane. Much of the remaining methane is due to agriculture; no-tillrotational cropping can reduce this is in row cropping. Intensively managedrotational grazing provides some reduction on the livestock side; carbonsequestration from soil building more than makes up for methane emissions; bothlivestock raising and row cropping become modest greenhouse gas sinks, ratherthan significant sources.
2) Nitrous oxide (N2O) – mostly a product of artificial nitrogen fertilizer – whoseuse we propose eliminating (without lowering food or fiber production).
3) SF6 - probably the highest impact greenhouse gas per gram of material; wedescribed how to deal with it in the material impact subsection on computermonitors.
4) Perfluoro Compounds – can be dealt with an a manner similar to SF6 the use ofsubstitutes where possible, the capture and recycling where they must be used,and the development of replacements in the long run to let them be phased out.
5) Hydrofluorocarbons - used in refrigeration and air conditioning. They are beingphased out in any case for the sake of the ozone layer. Although many advancedsubstitutes have been developed, probably ammonia and carbon dioxide are thebest gases to use for these purposes in the long run. (Yes both greenhouse gases,but in the small quantity used in refrigeration and air conditioning will not be aproblem compared to other refrigerants. Yes ammonia is poisonous – butammonia water refrigerators contained it safely for decades; using ammoniasafely as a refrigerant is a mature technology.)
6) NOx – not a greenhouse gas, but a sometime precursor of greenhouse gases.Produced from any type of combustion in the presence of nitrogen. Production ofelectricity completely from non-combustion sources, along with reductions inmaterial intensity and greater industrial efficiency will reduce this a great deal.Methods specific to reducing NOx are dealt with to some extent in the pollutionprevention section of the material intensity chapter.
7) Deforestation – we dealt with reducing this by ~60% overall in various sections ofthe material intensity chapter (Paper, “green” chemistry and biomass energy).
8) Cement production – we dealt with that in the material intensity chaptersubsection on buildings.

Cooling It: No Hair Shirt Solutions to Global Warming by Gar W. Lipow GarLpublic AT Comcast DOT net
Page 154 of 265
9) Soil erosion – a fair amount of carbon is stored in healthy soil. No-till agriculture,and soil conservation tillage, can help turn agriculture from a carbon source to acarbon sink. We dealt with that in the material intensity section on food.
Cooling It: No Hair Shirt Solutions to Global Warming by Gar W. Lipow GarLpublic AT Comcast DOT net
Page 155 of 265
Timing: Can Emissions Reductions be Frontloaded?Becoming carbon neutral over the course of thirty years is a vital goal; but reducingemission by only 33% during the first ten years may not be fast enough. Fortunately,because much of the infrastructure being replaced lasts much less than thirty years, thebulk of emissions reduction will occur towards the beginning. Renewable sources may bephased in a bit faster as well. And a few inexpensive additional steps may frontload theprocess further.
The First Ten Years
How much can we cut in the first ten years? (For the sake of the calculation, we assume aperiod from 2010 to the beginning of 2020.)
Transportation accounts for 27% of energy used. One third of the way into the transitionwe could cut a surprisingly large amount. Electric and Hypercars can be prototyped veryrapidly once a decision is made to build commercial models; Electric and Hypercarfactories are also faster to build than normal automobile plants. So you might actuallyhave cars rolling off the factory floor within five years of deciding to start. Certainlyregulators could insist that all new hybrids be plug-in hybrids. Possibly they would insistthat plug-in hybrid efficiency was the minimum standard that would be accepted for anynew car made or sold. Ideally that standard would increase to Plugin Electric Hypercarslevels as quickly as possible.
CyberTran, and various Personal Rapid Transit (PRT) schemes have been alpha tested.You need to do competitive beta testing by setting up small commercial lines of each, tosee which works best in day-to-day operations. During beta testing, you couldsimultaneously plan sign track locations in each major urban and suburban area, evenobtaining easements and buying property, waiting until a system passed all real worldtests to create final designs for each location. Still it would be four to six years beforelaying of track for major ultra-light rail systems could begin; once begun ultra-light railcan be constructed much faster than normal light rail. But most likely CyberTran (orsome PRT if that proved better in practice) would be just beginning operation in yeareight or nine of the transition. We would also have done a buyback of the worst fuel-hogjunkers on the road, providing efficient automobiles to people who currently get 17 mpgor worse in things that barely run.
Autos have a twenty year life cycle; but they are usually down to traveling a fewthousand miles a year or less by the end of thirteen years. So we would have replacedabout 40% of the ones traveling the longest distances by the end of ten years. Many ofthose replacements would be electric cars that get eight times the mileage equivalent ofconventional cars; some would be plugin hyper cars that get seven times the mileage. Buteven before this we would have begun phasing in plug-in hybrids which produce halfconventional emissions.
Cooling It: No Hair Shirt Solutions to Global Warming by Gar W. Lipow GarLpublic AT Comcast DOT net
Page 156 of 265
When it comes to heavy trucks we can do even better. Freight trains need no Beta testing.And there is no reason to take 30 years to encourage a switch from truck to rail. Lay thetracks; put in the switchyards; build freight yards. Containers that can travel equally wellby rail or truck are pretty routine, so if rail can get it most of the way, trucks can handlethe first and last fifty miles. Put some of the 150 billion a year we have proposedallocating into this, and there is no reason we can’t come close to eliminating longdistance heavy trucking by the end of ten years. The same applies to savings in watertransport as well; the potential is modest, but given that ships are one of great unregulatedsources of air pollutants, there is no reason the modest savings there can’t be phased inpretty quickly - paid for by air pollution reductions.
We can incorporate a modest portion of airline improvements too. We won’t haveCyberTran operating to replace short flights yet. But, there is no reason we can’t put intoplace the operational efficiencies or the more advanced telecommuting.
Reductions in material intensity and energy use through the tenth year should lower thevolume of freight shipped, and of fossil fuels pumped through pipelines by one third inthe first ten years. In addition there is no reason the full 14% savings via operationalefficiencies in pipelines should not be implemented within the first decade.
So we should end up with about a 39% per capita reduction in transportation emissionsjust from efficiency improvements. After allowing for population growth, that meanstotal consumption would be down to 20 quads. Not bad for the first ten years of a thirtyyear program in a sector where a slow ramp up is unavoidable.
What about residential buildings, which account for about 21% of energy use? There isno reason adequate insulation and weather sealing should not be complete for every homein the U.S. in ten years. Windows and appliances will be replaced as they wear out; butlifespans imply that in ten years we will have replaced two thirds or more of these. Newbuildings will have to meet standards from day one. On average we should be over 70%through the efficiency cycle in residential buildings – which means per capitaconsumption in residences should be down 48%+. Allowing for population growth thismeans at the end of ten years, in 2020, residential consumption will be a bit over 13quads.
Commercial buildings undergo full rehabs at least every 25 years. So a bit less than halfof existing commercial buildings will have undergone full efficiency upgrades; 100% ofnew buildings will have to meet the new standards; so commercial buildings can be about50% of the way through their possible savings in 10 years. Since total savings forcommercial buildings is 70%, that means a reduction of 35% per capita; allowing forpopulation growth, consumption will be 13.4~ quads.
Cooling It: No Hair Shirt Solutions to Global Warming by Gar W. Lipow GarLpublic AT Comcast DOT net
Page 157 of 265
However we could also develop about 50% of low temperature active solar potential bythen, giving us another 3.3 quads – reducing combined consumption in commercialbuildings to around 10.1 quads. (If some of the low temperature solar thermal provesimpractical, we could put in additional wind without storage, and let the buildings usethis "off-peak" wind energy to produce heat they would store in PCM, natural zeolites, orplain old thermal mass.)
Industrial equipment has an average lifespan of 20 years. In spite of the exceptions thatare longer, the weighted average is much lower than that, because of the huge numberwith shorter lifespans. So when it comes to direct energy savings, there is no reason atleast half should not be instituted within ten years. Changes in material intensity shouldbe able to take place as fast or faster. So per capita industrial consumption should bereduced by 37.5 % over a ten year period; net industrial consumption should be less than27 quads.
Total emissions in the three sectors combined will be about 70% of what was released in2000. Energy consumption will be a bit higher than that of course, due to active solar.
But we can lower this a bit further. Around 35% of carbon equivalent emissions aregenerated from electricity production. (These, of course, are already included in sectorialreductions; we can’t count them again.). But we could speed up decarbonization of ourelectrical grid -- massively deploying wind and solar and long distance transmission andstorage, so that we phase out anther 25% or 30% of 2000 consumption. That would cutfossil fuel use for electricity production by more than half, and (if we phased out coalbefore phasing out other fossil fuels) about 60% of total electrical emissions. That wouldrepresent another ~10 quads over the savings from efficiency alone. That would bringtotal emissions reduction to around 40% - during the first ten years.
In addition we might get some reduction from carbon sequestration in the soil from"energy prairies", cultivation of glomalin in no-till agriculture, and the use of charcoalsoil amendment. I'm very suspicious of counting soil sequestration in the long run; wedon't know how long carbon in the soil stays in the soil. But if this works the way a lot ofvery smart people think it will, we could get another 2%
The Second Decade
Cooling It: No Hair Shirt Solutions to Global Warming by Gar W. Lipow GarLpublic AT Comcast DOT net
Page 158 of 265
How about the second ten years? CyberTran (or some electrified light or ultra-light railsystem) will be complete; pre-efficiency standard autos will be 17 or older; most will bedriven fewer than 1,200 miles a year. So transportation efficiency improvements will be99%+ complete. The same will be true in residential buildings. 80% of existingcommercial buildings will have finished their rehab cycle, and the remaining ones willhave five years left at most; a short enough time to economically justify a prematurerehab on grounds of energy savings and efficiency improvements, given higher energyprices at the time. Industry will similarly be through its 20 year equipment replacementcycle. Since this is an average, significant equipment will remain. But it is unlikely thatthis will represent a great deal of energy. Material intensity improvements should becomplete – at least to the factor-four level we projected, though there are good reasons tosupport further ones. There is no reason 95% of efficiency improvements can't be inplace.
What about supply? With only a few efficiency improvements remaining, all the supplyimprovements should be phased in as well. The saving from efficiency improvementswill be more than enough to justify developing 100% of the renewable potential outlined.So we will have reduced fossil fuel consumption to about five quads or fewer at the endof 20 years. This is around a 94% reduction in absolute total. Since consumption will besmall enough to consist entirely of natural gas, that should be better than 95% reductionin net emissions - especially since glomalin cultivation combined with low input farmingshould convert agriculture to a small carbon sink. Since population will be greater, theper capita reduction will be better than this.
The final five quads of fossil fuel consumption, or as much of it as necessary, could beeliminated over the remaining ten years, as additional efficiency savings and increasedrenewables reduce the need for natural gas.
Somewhere in this thirty year process we will get some sort of breakthrough. That is notspeculation. It is certainly. While it is speculation to guess what that improvement willbe, will either find cheaper renewable methods to generate some of this energy, cheapermethods to store this energy, or cheaper methods to save even more energy. Probably wewill find all three. But note that even ignoring this we have the means to get off fossilfuel.
Cooling It: No Hair Shirt Solutions to Global Warming by Gar W. Lipow GarLpublic AT Comcast DOT net
Page 159 of 265
What about the Rest of the World?
So far this book has been extremely USAcentric – and for good reason. The United Statesis the most carbon intensive nation on this planet, and highly influential. Its ability tophase out fossil fuels strongly indicates the rest of the planet may as well; actually doingso instead of blocking international progress would influence many others.
However it is not quite as simple as “we can do it, so anyone could”. The U.S. may be acarbon intensive society, but we also have an unusually low population density comparedto natural resource. We have more biomass available per person than Europe and most ofAsia. If we believe the Stanford study, we have a quarter of the world’s wind resources.Still efficiency is pretty much a matter of access to capital and the sun shines everywhere.If the rich world provides capital for renewable developments to the poor ones, the samenumbers add up for the world as for the U.S.
The U.S. in 2000 used around 100 quads to supply a population of ~282 million. Worldpopulation in 2050 is projected to be ~9.25 billion. So if world GDP per capita in 2050were to be equal to U.S. GDP per capita in 2000, and it squeezed five times the GDPfrom each unit of energy the U.S. did in 2000, world energy use would be around ~656quads, ~22 terawatts, about 50% more than at present. Though rich nations, such as theU.S. could make absolute reductions in energy consumption, poor nations will needabsolute increases if they are to stop being poor.
Efficiency increases means the world would get more benefit, more GDP from eachenergy unit used it afford to pay BTU for energy. Thus increases in potential efficiencymean the ability to pay more for clean renewable energy, and still get an increase in GDP,about 2.8 times more as we have already shown in the U.S. analysis.
For example, according to the Congressional Budget Office, on average the cost ofelectricity production in the U.S. is 8 cents per kWh, so with proper efficiencyimprovements, both it and the world could afford to pay 19.6 cents per kWh. Natural gasruns at minimum $6 per MCF, so efficiency increases would let the world pay theequivalent of $16.80 per MCF – and so on.
Cooling It: No Hair Shirt Solutions to Global Warming by Gar W. Lipow GarLpublic AT Comcast DOT net
Page 160 of 265
Let us start with low temperature heat, space heating, water heating, and air conditioning.With modern evacuated collectors, solar energy can provide heat at about the boilingpoint of water in almost any climate . With natural zeolites, which can store thisindefinitely in very compact spaces there is no reason that almost any climate can’t getmuch of its space, hot water, and air conditioning from solar energy at a price well below$16.80 per MCF equivalent. Buildings with roofs and south walls shaded by otherbuildings could get power from their neighbors. The only exceptions are climates inextreme latitudes, and climates with long lasting fogs. (Rain, clouds and morning fogwon’t prevent 100% solar low temperature power in these circumstances – just make itimpractical.. Even in Alaska seasonal storage would make it possible to supply allclimate control and hot water from the direct solar energy; just not feasible.) So, that is abit over 7.33 TW right there. Let us allow for climates don’t support this due to latitudeor really extreme fog, subtract power to run the solar systems and say 7 TW. Bear inmind that we could provide 65% of that at prices competitive with 1998 natural gas, sonearly 100% at much higher prices is not unreasonable.
We might get about 3.4 terawatts of biomass from the following sources:
1) Energy crops included on expanded land base provided by inclusion of reserveland , as in the U.S.2) Biodiverse energy plantations on overgrazed, strip mined or otherwise humandamaged land. Almost any kind of crop can serve as an energy source. There are hardyperennials suited to most types of damaged land. There are grasses and herbaceousspecies that will grow in arid, cold climate, others that will grow in arid, warm climates,and a much wider variety that will grow in cold or warm wet climates. Once youreestablish soil, you may be able mix crops, get your biodiversity by combining multiplespecies in the same place rather than over time. Or you may use more conventionalrotations – whatever suits your eco-system.3) Replacement of timber farms with energy plantations as timber for buildings andpaper is replaced by paper reduction, use of agricultural fiber for paper, and use of wastestraw for building materials. Remember that up to half of straw and stove not only maybut must be removed from the soil in sustainable agriculture.4) Alternatively if the culture is already paper efficient, or if for some other reasonwaste straw and stover cannot be used as a manufacturing input, waste straw may itselfbe used as an energy source via gasification, F-T, or ultra-clean burning methods.
So biomass could produce a very important 15% of world-wide energy demand; it couldprovide hydrocarbon chemical stocks and gaseous and liquid fuels for processes that musthave them. But again, for this not to be a disaster in practice would require an immensetransformation in social context. Given a globalized market, extreme inequality bothwithin and between nations, extreme corporate influence, and outright dictatorships inmany nations in practice this would likely come at the expense of food production andthe livelihoods of the poor, and often be a net emitter of greenhouse gases, and disruptboth natural and social ecologies in ways aside from greenhouse issues.
Cooling It: No Hair Shirt Solutions to Global Warming by Gar W. Lipow GarLpublic AT Comcast DOT net
Page 161 of 265
Fortunately, renewable electrical potential is far greater than any reasonable forecast forthe poor nations as well as the rich. There is no significant demand for electricity that isnot within 5,000 kilometers of a major potential dispatchable source – large amounts ofgeothermal or hydroelectric in rare cases, but mostly solar thermal and wind.(Remember, 5,000 kilometers is probably the practical limit for high voltage DCtransmission.)
Take an especially knotty case – the United Kingdom. London has plenty of wind, butalso is less than 2,400 kilometers from Tripoli as the crow flies. Transmission from NorthAfrica to London via continental Europe and across the Chunnel would (of course) not beas the crow flies; but it could certainly be kept with that 5,000 kilometer limits.
Of course if Sky Windpower’s gyromills prove practical, we could definitely get all weever want. If they really can provide 2 cents per kWh electricity even more reliably thanland based systems, total price for a 95% wind grid including storage could be providedat a cost comparable to fossil fuels today.
There are rare case where hydropower or geothermal may provide a significant percent ofa nations electricity; in most nations there is at least enough of one, the other or both tocomplement wind power.
Cooling It: No Hair Shirt Solutions to Global Warming by Gar W. Lipow GarLpublic AT Comcast DOT net
Page 162 of 265
Miscellaneous Points on Sources, Style and Assumptions
1) There is no such thing as half a suspension bridge. Sometimes we have had tolook forward to future chapters to calculate what is happening in current chapters.(If you remember high school algebra, you could think of this as solvingsimultaneous equations.)
2) I try to use gender neutral language whenever possible; but sometimes I find itunbearably awkward. When that happens I use “she”, “her” and “woman” asgeneric terms referring to both male and female humans.
3) Discount rates are a reflection of the fact that even an absolutely iron-cladguarantee of one hundred dollars a year for ten years is not worth the same as onethousand dollars today. (At a 6.5% discount rate, that cash flow is worth a bit lessthan $719.) By an odd coincidence, 6.5% is the discount rate used throughout thisbooki.
4) A lot of the proposals are already being carried out to some extent; that does notinvalidate the fact that if carried through completely they can save or produce agreat deal of energy. What we need to exceed is not our best current operatingprocedures, but our current average efficiency. If comprehensive adaptation of awidely used technique can raise that average high enough, then so much thebetter.
5) If you are reading this in one of the rich nations other than the U.S. you maynotice that a number of recommendations are routinely followed already whereyou live; the reality is that in many sectors the U.S. has fallen technologicallybehind the rest of the rich world.
i Many bottom-up energy studies use extremely high discount rates - commonly 30% and up. This isbecause the people making these studies are focused on what the industries involved can be coaxed intodoing either through simple persuasion, or through very mild tax incentives and regulations. There arevarious reasons industry demands such high rates of return on energy savings, which we will delve intoafter the technical sections.
It is tempting to go to the opposite extreme, and use the social discount rate, (the rate of growth in theeconomy). This is typically around 3 or 4 percent. After all, to the extent that capital as a whole (notindividual firms, but all firms put together) earn a real rate of return greater than economic growth it mustbe extracted from somewhere else within the economy. I give an example on the next page that, for 80% ofus, real wages have been frozen in the U.S. since 1968, while the per capita economy nearly doubled3. Sousing a social discount rate would make a great deal of sense.
But our definition of "zero cost" precludes this. We are going to bundle measures we predict to save lessthan our discount rate together with measures we predict to save more. We will start with savingsexceeding our discount rate; then we will use that savings to pay for expensive renewable supplies - endingup with zero market cost compared to current trends or a bit less. With this kind of juggling we have tobuild in some risk premium as a margin of error. We will not end up with a return exceeding our discountrate by much; very small miscalculations could lead to yields that are lower. Mainstream social discountshover around 5%. As a precaution, we will use a real discount rate of 6.5% - substantially higher than mostvariable mortgage rates as of the time of writing this book. It should be no lower than those rates even ifthey rise by the time it is published. Given that risks in energy saving investments are substantially lowerin risk than private-mortgages backed bonds, that energy prices tend to keep up with inflation, and thatgreenhouse gas reducing investments have tremendous social benefits, this is still a conservative choice.
Cooling It: No Hair Shirt Solutions to Global Warming by Gar W. Lipow GarLpublic AT Comcast DOT net
Page 163 of 265
6) I use a variety of types of sources in this book; but I think if you pay attention tothe type of information being documented you will find the sources appropriate.For example I get statistical information from large governmental or quasi-governmental agencies, or major think tanks, non-profits and academic andprofessional sources respected across the political spectrum. For cost averages(and comparable points), I sometimes use respected commercial sources or tradeassociations. For examples, and specific data points (such as the per square footcost of a particular house) I will sometimes use general periodicals such as theNY Times.
7) I will occasionally cite advertising, partisan or viewpoint organizations or otherhighly biased, not necessarily respected sources in certain circumstances:
a. For data where they would be the best source – for example price quotesfrom manufacturers or distributors
b. Concessions that go against their bias, especially if reinforced by arespected source
c. For quotation, when they make a point in an especially articulate or wellreasoned way – though in such cases I always try to document the factsbehind their argument from other sources.
8) Whenever possible I provide a URL to make cites easier to check, though ofcourse a high percentage will have expired or become otherwise obsolete. Whenthis happens Google is your friend. So are libraries.
9) I'm using a personal variation on end-of-manuscript Chicago style endnotes.Instead of dividing them into sections corresponding to chapters, and restartingnumbering in each section, I simply number them consecutively from beginningto end. That way, when skipping past other notes to find the one you aresearching for, it is always obvious approximately how far away your goal is.

Cooling It: No Hair Shirt Solutions to Global Warming by Gar W. Lipow GarLpublic AT Comcast DOT net
Page 164 of 265
End Notes1 Fossil fuel companies, auto industry, many oil producing nations, and a variety of right wing think tanks.
The leading journalist covering this is Ross Gelbspan. In 1995, he was briefly fooled by dishonest workfrom “global warming skeptics” Pat Michaels, S. Fred Singer and Richard Lindzen; when a look at theactual science showed him he had been lied to, he was angry enough to write the book “The Heat is On” toexpose both their junk science, and the cranks and liars behind it He has probably been the leadingjournalist exposing the carbon lobby since then, and has essentially given up the rest of his career to focusfulltime on the global warming and the carbon lobby.
Ross Gelbspan, The Heat Is on: The Climate Crisis, the Cover-Up, the Prescription (New York: PerseusBook Group,1997). (Still an excellent source for history of the Carbon Lobby.)
Ross Gelbspan, Boiling Point: How Politicians, Big Oil and Coal, Journalists and Activists Have Fueledthe Climate Crisis - and What We Can Do to Avert Disaster (New York: Perseus Book Group - BasicBooks, 2004). (Focuses more on his view of solution – but also brings Carbon Lobby history up to date.)
Ross Gelbspan, "Snowed,". Mother Jones May/Jun 2005, The Foundation for National Progress,10/Jun/2005 <http://www.motherjones.com/news/feature/2005/05/snowed.html>. (Part of excellent May2005 issue of Mother Jones, which contains a good survey of the current state of the Carbon Lobby.)
Another good source for current state of the Carbon Lobby is the Union of Concerned Scientists.Union of Concerned Scientists, Global Warming - Skeptic Organizations. 2005, Union of ConcernedScientists, 30/Sep/2005 <http://www.ucsusa.org/global_warming/science/skeptic-organizations.html>.
To find out more about individual organizations, I recommend SourceWatch published online by TheCenter For Media and Democracy. You will that along with groups devoted primarily to global warmingdenial, much Carbon Lobby funding goes to general right wing groups that include it as one activity amongmany.
Center for Media and Democracy, SourceWatch - SourceWatch. SourceWatch Applies It's Standards toItself - Reveals Own Funding Just as It Does Others, 2005, Center for Media and Democracy, 10/Jun/2005<http://www.sourcewatch.org/index.php?title=SourceWatch>.
2 Just about every public opinion survey by respectable sources shows about 75% of the public convincedthat global warming is a real and serious problem, and about 25% convinced of the opposite or uncertain.
The Gallup poll for March 2005 shows nearly 80% of the population now believes human caused globalwarming is real.Gallup Poll, Environment: The Gallup Poll March 7-10 2005. 01/07 2005, The Polling Report, 02/07/2005<< http://www.pollingreport.com/enviro.htm>>.
A series of public opinion polls regarding global warming compiled by the highly regarded Program onInternational Policy Attitudes:
"The Reality and Urgency of Global Warming," Americans & the World, Program on International PolicyAttitudes - Jointly Established by the Center on Policy Attitudes (COPA) and the Center for Internationaland Security Studies at Maryland (CISSM), School of Public Affairs, University of Maryland, 20/03 2005,01/01/2005 <http://www.americans-world.org/digest/global_issues/global_warming/gw1.cfm>.

Cooling It: No Hair Shirt Solutions to Global Warming by Gar W. Lipow GarLpublic AT Comcast DOT net
Page 165 of 265
These include the following:
In September 2002, 74% said they "believe the theory that increased carbon dioxide and other gasesreleased into the atmosphere will, if unchecked, lead to global warming and an increase in averagetemperatures" “Majorities Continue to Believe in Global Warming and Support Kyoto Treaty”, TheHarris Poll, Harris Interactive #56 , October-23-2002<http://www.harrisinteractive.com/harris_poll/index.asp?PID=335> ((January 2, 2005)
--In March 2001, 64% said they "believe that emissions of gases like carbon dioxide are causingglobal temperature increases"; 23% did not (Time/CNN).
--In an August 2000 Harris poll, 72% said they "believe[d] the theory" of global warming, while20% said they did not--up from December 1997 when in response to the same question 67% saidthey believed it and 21% said they did not.
--In a July 1999 NBC News/Wall Street Journal poll, only 11% took the position that "concernabout global climate change is unwarranted."
--In a September 1998 Wirthlin poll, 74% embraced the belief that "global warming is real" evenwhen the belief was defined in terms of global warming having "catastrophic consequences," whilejust 22% said they did not believe in it.
--An October 1997 Ohio State University survey asked about "the idea that the world's temperaturemay have been going up slowly over the last 100 years" and found that 77% thought "this hasprobably been happening," while 20% thought "it probably hasn't been happening." Likewise, 74%thought the world's average temperature would go up in the future, while 22% thought it would not.
The Pew Research Center for People and the Press, Americans Support Action on Global Warming:Progress Seen On AIDS, Jobs, Crime and the Deficit. 21/11 1997, 02/07/2005 <http://people-press.org/reports/display.php3?ReportID=100>.
3Jennifer O’Connor, Survey on Actual Service Lives for North American Buildings, Oct 2004). Sep 2004.Presented at Woodframe Housing Durability and Disaster Issues Conference, 16/Jun/2006<http://www.northernrockies.org/Departments/Fire/Wood_Buildings/Wood%2520Buildings%2520Service_Life_E.pdf>.
A good indicator is that the Australian government thinks that most Australian homes (which have to meettougher standards than U.S. ones do) have a lifespan of around 50 years.
Chris Reardon, Your Home Technical Manual - Design for Lifestyle and the Future - 3.0 Materials UseIntroduction. 1/Mar/2004, Commonwealth of Australia/Joint Initiative of the Australian Government andthe Design and Construction Industries, 9/Jan/2005<http://www.greenhouse.gov.au/yourhome/technical/fs30.htm>.
4 The Old House Web, Schedule of Normal Life. 1995, 1/Jan/2005<http://www.oldhouseweb.net/stories/Detailed/267.shtml>.
5Hawkins, Dominique M., Saving Wood Windows. 24/Sep 2004, State of New Jersey Department ofEnvironmental Protection Division of Parks & Forestry Natural & Historic Resources HistoricPreservation Office, 2/Jan/2005 <http://www.state.nj.us/dep/hpo/4sustain/windowsave.pdf>.
6The Minnesota Green Affordable Housing Guide, published by University of Minnesota College ofArchitecture and Landscape Architecture cites a 25 year lifespan

Cooling It: No Hair Shirt Solutions to Global Warming by Gar W. Lipow GarLpublic AT Comcast DOT net
Page 166 of 265
Regents of the University of Minnesota, The Minnesota Green Affordable Housing Guide - Components:Cladding (Siding), 30/June 2004, 2004 Regents of the University of Minnesota, 09/Jan/2005<http://www.greenhousing.umn.edu/comp_cladding.html>.
So does the Commonwealth of Massachusetts Historical CommissionCarol DiNinno and Ann Lattinville, "Technical Assistance Tips: Vinyl Siding,". Preservation Advocate, no.Spring 2003 (2003), Commonwealth of Massachusetts Historical Commission, 06/Jul/2005<http://www.sec.state.ma.us/mhc/mhcpdf/pasp03.pdf>. P5.
Jim Cory, "Siding Replacement", Remodeling Magazine, no. November 2002 November 2002: 2002 Costvs. Value Report, Hanley Wood, 10/Mar/2004<http://www.remodeling.hw.net/pages/remodelingonline/Story.nsp?story_id=1000027503&ID=newsreal&scategory=Computers&type=break>.
Note that many “authoritative” sources give longer, life spans, based upon exaggerated manufacturersclaims, rather than real life experience. For instance, one of the sources most commonly cited for lifespansis the September 2002, Baseline Measures for Improving Housing Durability, published by the U.S.Department of Housing and Urban Development
Robert E. Chapman and Christine A. Izzo, Baseline Measures for Improving Housing Durability, NISTIR6870. September 2002. US. Department of Commerce National Institute of Standards and TechnologyBuilding and Fire Research Laboratory/U.S. Department of Housing and Urban Development Office ofPolicy Development and Research, 06/Jul/2005 <http://fire.nist.gov/bfrlpubs/build02/PDF/b02159.pdf>.
If you look at footnote 26 at the bottom of page 38 of that article, it turns out that average (as opposed tominimum) lifetimes are based on “Life Expectancy of Housing Components” published by Ahluwalia,Gopal, and Angela Shackford. in the August 1993 Housing Economics pp. 5-9 – based on surveys ofmanufacturers, trade industry associations and researchers. Given that at least two thirds of the sourceswould tend to be biased towards optimism, I would expect lifespans from such a source to be wildlyexaggerated. Let’s test this by focusing in on one example – vinyl siding.
The 50 year average estimated lifespan for vinyl siding is widely cited. The Housing Economics is not thesole source of course. The Vinyl Institute promotes this figure as much as possible. But does it make sensecompared to environmental and remodeling sources?
Most vinyl siding offers a 50+ year warranty. That appears devastating until you look at what kind ofwarranty is offered. Many of the warranties are prorated. Those that are not usually have a kicker: they areinvalidated or become prorated when the home is sold. Because most people do not stay in the samehouse for 25 year, the vast majority of these warranties will expose the seller to no significant liability pastafter a couple of decade. (I know there are exceptions. But, looking at it from the point of view of howmuch money a warranty will cost the issuer, the exceptions are not significant.
Let’s look at one vinyl siding warranty (http://www.mastic.com/warrantyvs.asp) a warranty for MasticVinyl Siding from Alcoa, downloaded February 2, 2005 – one that advertises itself as non-pro-rated,transferable. That sounds good – except that as soon as it is transferred it becomes very heavily proratedindeed.
For a second owner, by the time 14 years have passed the warranty covers only 20% of the original cost ofthe siding. Bear in mind that decently installed, well maintained vinyl siding will last 25-30 years. Soimagine every most (non-original owners have problems and try to collect on the warranty 20 years fromnow. That means the manufacturer will have to pay out 20% of siding sales price in 20 years. But having topay a dollar twenty years from now does not cost the same as having to pay it now. Using a discount rate of6.5% that 20% 20 years from now is worth only 3.5% of the current sales dollar. In other words, themanufacturer (knowing that most homes will be occupied by a second (or third or fourth owner)) needsonly add 3.5% to the selling price to cover the cost of this 50 year warranty. Actually that is overstating; in
Cooling It: No Hair Shirt Solutions to Global Warming by Gar W. Lipow GarLpublic AT Comcast DOT net
Page 167 of 265
practice by the time the home has passed through a number of hands, a lot of people won’t even think ofchecking to see whether there is a warranty out on siding 20+ years old. What about siding that goes badsooner? Well remember this particular warranty hits that 20% mark after 14 years. Even badly installed andmaintained siding tends to last for 15. But if the siding was improperly installed or poorly maintained thatinvalidates the warranty in any case. In other words offering a 50 year warranty under those particularterms is a worthwhile investment in marketing terms, even if the siding does not in fact last 50 years. So theexistence of such a warranty does not tell you very much.
Also by the time the manufacturers face a significant number of people trying to collect on the warranty,whoever made the recommendation to offer it will be working for a different company or retired.
Fundamentally vinyl (as it is normally installed) just is not sturdy enough to last more than 30 years in theconditions house siding normally faces. It becomes brittle with age, and also brittle in extremely cold (andsometimes in extremely hot) weather. You can harmlessly bounce a hammer off newly installed vinylsiding; try it ten years later and you will shatter your vinyl. The same thing is true in really cold weather.Hit vinyl siding with a snow-blower or lawnmower and it won’t hold up very well. As it grows older, youcan damage vinyl siding by leaning a ladder against it to repair a roof or a window. Top quality vinylsiding, perfectly installed and maintained might well last fifty years or longer. But that is not the averagecase – especially the perfect installation and maintenance.
7Robin Suttell, "Intelligent and Integrated Buildings: Technologies and Current Market Conditions BreakDown Conventional Barriers,". Buildings Magazine November 2002, Statmats Business Media, 5/Jan/2005<http://www.buildings.com/Articles/detail.asp?ArticleID=1095>.
8OUS Capital Construction, The Oregon University System Sustainable Renewal Program for FailingAssets. 19/Jul 2004, 02/Jan/2005 <<http://www.ous.edu/board/dockets/ddoc040716-DM.pdf>>.
9. Engelbert Westkämper, director of the Institute of Manufacturing and Factory Operation at the Universityof Stuttgart says "... A factory building normally lasts 30 years, but it doesn't stay the same for 30 years.Machines and systems have an average life span of ten years; in some cases only five years..."
"Prof. Engelbert Westkämper, 56, is a leading expert in the field of manufacturing engineering. Since 1995he has served as Director of the Fraunhofer Institute for Production Engineering and Automation inStuttgart, Germany and as Director of the Institute of Manufacturing and Factory Operation at theUniversity of Stuttgart. A mechanical engineer, Westkämper also has a hands-on industrial background,including positions as Manager of Manufacturing Engineering and Technology at MBB in Munich and asManager of Production Engineering at AEG in Frankfurt. He was also responsible for manufacturingtechnology at Airbus in Hamburg and Bremen.
"Visualizing Tomorrow's Industrial Environments: Interview with Engelbert Westkämper,". SiemensWebzine, no. Pictures of the Future - Fall 2002 (2002), Siemen, 02/Jan/2005<http://w4.siemens.de/FuI/en/archiv/pof/heft2_02/artikel08/>.
The OECD gives the average service life for capital equipment (weighted by value) as 15 years - not thesame as in the U.S., but indicative.
Paul Schreyer, Capital Stocks, Capital Services, and Multi-Factor Prodductivity Measures. EconomicStudies, Draft. 3/Nov 2003, OECD Statistics Directorate, 3/Jan/2005<http://www.oecd.org/dataoecd/30/46/29877839.pdf>. P10.
According to the Deutsche Bundesbank , U.S. capital equipment generally lasted about 25 years in 1987,and the rate of depreciation has risen drastically every one of the 18 years that followed (meaning lifespanhas fallen).

Cooling It: No Hair Shirt Solutions to Global Warming by Gar W. Lipow GarLpublic AT Comcast DOT net
Page 168 of 265
Ulf von Kalckreuth and Jurgen Schröder, Monetary Transmission in the New Economy: Service Life ofCapital, Transmission Channels and the Speed of Adjustment, Discussion Paper 16/02. 16/June 2002,Economic Research Centre of the Deutsche Bundesbank,p2, 03/Jan/2005<http://www.bundesbank.de/download/volkswirtschaft/dkp/2002/200216dkp.pdf>.
Some U.S. economists calculate an average 5.9% depreciation rate for U.S. physical capital, which isconsistent with a 20 year lifespan:
M. Ishaq Nadiri and Ingmar R. Prucha, "Estimation of the Depreciation Rate of Physical and R&D Capitalin the U.S. Total Manufacturing Sector,". Economic Inquiry XXXIV January 1996: 43-56, WesternEconomic Association International, 03/Jan/2005 <http://www.econ.nyu.edu/user/nadiri/pub86.PDF>.
10Region 2 United States Environmental Protection Agency, Life Cycle of Old Computers - ProblemContinued. 15/October 2002, U.S. EPA, 3/July/2005 <http://www.epa.gov/region02/r3/problem.htm>.
11 “The generally accepted standard for the normal effective lifespan of a coke oven is 25 to 30 years.”
Office Technology Assessment, "Technology and Raw Materials Problems - Chapter 7," Technology andSteel Industry Competitiveness, June 1980), NTIS Order #PB80-208200. 1996, 223. Office TechnologyAssessment, Princeton University, 02/Jan/2005 <http://www.wws.princeton.edu/cgi-bin/byteserv.prl/~ota/disk3/1980/8019/801909.PDF>.
12American Society Civil Engineers, ASCE Report Card for America’s Future: 2003 Progress Report AndUpdate to the 2001 Progress Report. September 2003, 1, ASCE, 10/Jan/2005<http://www.asce.org/reportcard/pdf/fullreport03.pdf>.
The EPA sponsored a study that focused on water infrastructure, and concluded the ASCE was toogenerous.
American Water Works Service Co. Inc. Engineering Department, Deteriorating Buried InfrastructureManagement Challenges and Strategies. May 2002. Environmental Protection Agency, 10/Jan/2005<http://www.epa.gov/safewater/tcr/pdf/infrastructure.pdf>.
13S. Lu, VEHICLE SURVIVABILITY AND TRAVEL MILEAGE SCHEDULES, DOT HS809 952. Jan 2006, : NHTSA’s National Center for Statistics and Analysis NCSA,12/Jan/2007 <http://www-nrd.nhtsa.dot.gov/pdf/nrd-30/NCSA/Rpts/2006/809952.pdf>.
Florida Department of Highway Safety and Motor Vehicles, How to Buy a Used Car. 21/May 2004,3/July/2005 <http://www.hsmv.state.fl.us/dmv/usedcar.html>.
14 Freightline Custom Chassis, Commericial Bus Chassis: Frequently Asked Questions. 03/Jan/2005<http://www.freightlinerchassis.com/cb_default.asp?page=cb_faqs&nav=mb>.
2nd source:Research and Special Programs Administration John A. Volpe National Transportation Systems Center,Transit Security Design Considerations: Final Report. November 2004, 7-8. Federal Transit Authority ofthe U.S. Department of Transportation, 05/Jul/2005<http://transit-safety.volpe.dot.gov/security/SecurityInitiatives/DesignConsiderations/CD/ftasesc.pdf>.
15 We have to combine two figures here, average number of miles traveled annually by heavy trucks, andengine life in miles. The Department of Transportation suggests that heavy trucks average 47,022 milesannually in the U.S.

Cooling It: No Hair Shirt Solutions to Global Warming by Gar W. Lipow GarLpublic AT Comcast DOT net
Page 169 of 265
Stacey C. Davis and Susan W. Diegel, TRANSPORTATION ENERGY DATA BOOK: - Edition 23, ORNL-697(Edition 23 of ORNL-5198). October 2003, Chapter 5: Heavy Vehicles and Characteristics, Page 5-7,Table 5-Truck Statistics by Size - 1997. Oak Ridge National Laboratory for the U.S. Department ofEnergy Office of Planning, Budget Formulation and Analysis Energy Efficiency and Renewable Energy,24/Feb/2003 <http://www-cta.ornl.gov/data/tedb23/Full_Doc_TEDB23.pdf>.
The Pacific Northwest National Laboratory suggest that a heavy truck, on average, needs a major overhaulat between 400,000 and one million miles. (A truck that is used a lot, but run at a low mileage, spending alot of time idling or in stop and go traffic, or turning around in narrow streets and parking lots will wearout in a lot fewer miles, so the range makes sense.) Therefore if we assume that million miles, divide the47,022 miles traveled annually into it and calculate a 21 year life span, we are projecting an optimisticlength of time between major overhauls for an “average” heavy truck.
PNNL, "Need For Transportation Technologies Heads Into Overdrive,". PNNL Breakthroughs Magazine:Science, Technology, Innovation Fall 2002, Pacific Northwest National U.S. Department of EnergyMultiprogram National Laboratory - Richland WA, 3/Jan/2005<http://www.pnl.gov/breakthroughs/fall02/special.stm>.
16"When Should Part-Life Engines Be Built?" Engine Yearbook 2005. 2005. Aviation Industry Press Ltd.,London, 11/Jan/2005 < http://www.aviation-industry.com/atem/newpages/eyb2003pdfs/E2005_TES.pdf>.P30.
17 "Commercial Aero-Engine MRO Outlook - a New Dawn?" Engine Yearbook 2005. 2005. AviationIndustry Press Ltd, 11/Jan/2005 <http://www.aviation-industry.com/atem/newpages/eyb2003pdfs/E2005_aerostrat.pdf>.p4.
18Charles River Associates for Diesel Technology Forum, Diesel Technology and the American Economy,Report D02378-00. October 2000, 12/Jan/2005 <http://www.dieselforum.org/enews/downloads/DTF-Economic-Study.PDF>. p2.
For rail transport in general the same figure seems to be 12 years (ibid 14:Volpe above)
19 “Locomotive engines are expected to last for at least 40 years, which placesgreater emphasis on durability. This low turnover rate also limits thepenetration rate of new technologies; however, locomotives undergo manyoverhauls, providing opportunities for modifications throughout their lives.”
Frank Stodolsky, Railroad and Locomotive Technology Roadmap, ANL/ESD/02-6. December 2002.Center for Transportation Research, Energy Systems Division - Argonne National Laboratory, 11/Jan/2005<http://www.transportation.anl.gov/pdfs/RR/261.pdf>.p13.
20Yes, this is a press release – a press release boasting about an extraordinary example of product life – withno claim that it represents typical results. The estimate is likely to be high rather than low; and highernumbers are less favorable to the case we are making.
Torben Klingenberg, Press Release: Heading for 30 000 Operating Hours with HFO GenSets. October2003. MAN B&W Diesel A/S, 17/Jan/2005<http://www.manbw.com/files/news/filesof3003/CP_ships_pr_nov.pdf>.
21As previously noted, the following press release is more likely to give a high than a low lifespanestimate.
Vesa Tompuri, "Wärtsilä’s New Medium-Speed Diesel Engine Has the Lowest Emissions on the Market,"WATTSON:Wärtsilä’s Investor Magazine. 2004. Sanoma Magazines Custom Publishing Division for
Cooling It: No Hair Shirt Solutions to Global Warming by Gar W. Lipow GarLpublic AT Comcast DOT net
Page 170 of 265
Wärtsilä Corporation, 13/Jan/2005<http://www.wartsila.com/Wartsila/docs/en/investors/English_lowres.pdf>.p13.
2nd source: a 1999 study was pessimistic about reducing greenhouse gas emissions in ships, because theyhave lifespans of 20 years or more.
Bronson Consulting Group CPCS Transcom Ltd. for Marine Sub-Group of the Transportation Table onClimate Change, Marine Summary:Transportation &Climate Change : Assessment of Opportunities toReduce GHG Emissions in the Marine Transportation Industry. July 1999, 18/Nov/2003<http://www.tc.gc.ca/programs/environment/climatechange/subgroups1/marine/Exec_Summary/English/Marine.htm>.
22"..Only one percent of total material flow ends up in, and is still being used within, products six monthsafter their sale..."Paul Hawken, Amory Lovins, and L.Hunter Lovins, Natural Capitalism: Creating the Next IndustrialRevolution (Boston: Little, Brown and Company/Back Bay, 2000). p81. Page citations are to the Back Baypaperback edition. Along with Barry Commoner, Amory Lovins is one of the key popularizers of the ideathat increased efficiency and more use of renewables could supply most of our energy.
23 Friedrich Bio Schmidt-Bleek, "Energy," Factor 10 Manifesto, Jan 2000). May 2000. Factor 10 Institute,2/Feb/2004 <http://www.factor10-institute.org/pdf/F10Manif.pdf>.p5.
24David Malin Roodman and Nicholas Lenssen, Worldwatch Paper #124: A Building Revolution: HowEcology and Health Concerns Are Transforming Construction. Single Page Summary of Book, March1995, Worldwatch Institute, 22/Aug/2005 <http://www.worldwatch.org/pubs/paper/124>.(note one page summary, not entire 67 page paper)
25 California Institute of Earth Art and Architecture, Nader Khalili. Jan 2004, California Institute of EarthArt and Architecture, 23/Aug/2005 <http://www.calearth.org/khalili.htm>.
26California Institute of Earth Art and Architecture, CalEarth Forum. July 2005, California Institute ofEarth Art and Architecture, 23/Aug/2005 <http://www.calearth.org/>.
27Ernst von Weizsacker, Amory B. Lovins, and L. Hunter Lovins, Factor Four - Doubling Wealth, HalvingResource Use - The New Report to the Club of Rome (London: Earthscan, 1997).
Wayne Trusty and Jamie Meil, The Environmental Implications of Building New Versus Renovating anExisting Structure. Jan 2001. ATHENA™ Sustainable Materials Institute, 23/Aug/2005<http://www.athenasmi.ca/papers/down_papers/SB2000_paper.pdf>.
28Ernst von Weizsacker, Amory B. Lovins, and L. Hunter Lovins, Factor Four - Doubling Wealth, HalvingResource Use - The New Report to the Club of Rome (London: Earthscan, 1997).
Wayne Trusty and Jamie Meil, The Environmental Implications of Building New Versus Renovating anExisting Structure. Jan 2001. ATHENA™ Sustainable Materials Institute, 23/Aug/2005<http://www.athenasmi.ca/papers/down_papers/SB2000_paper.pdf>.
29 Amazon Nails, Information Guide to Straw Bale Building for Self-Builders and the ConstructionIndustry, 2001). 2003. Amazon Nails, 23/Dec/2003<http://www.strawbalefutures.org.uk/pdf/strawbaleguide.pdf>.p2.
30Canadian Architect, "Measures of Sustainability - Embodied Energy," Measures of Sustainability, 2002,Canadian Architect, 02/Feb/2003
Cooling It: No Hair Shirt Solutions to Global Warming by Gar W. Lipow GarLpublic AT Comcast DOT net
Page 171 of 265
<http://www.cdnarchitect.com/asf/perspectives_sustainibility/measures_of_sustainablity/measures_of_sustainablity_embodied.htm>.
31 Amazon Nails, Information Guide to Straw Bale Building for Self-Builders and the ConstructionIndustry, 2001). 2003. Amazon Nails, 23/Dec/2003<http://www.strawbalefutures.org.uk/pdf/strawbaleguide.pdf>.p2.
32 4, "Wheat-Straw Particleboard,". Environmental Building News, no. 6 Nov/Dec 1995: Product Review,BuildingGreen.Com, 23/Aug/2005<http://www.buildinggreen.com/auth/article.cfm?fileName=040608a.xml>.
33 International Bamboo Foundation, Bamboo Technologies | About Bamboo. 15/May 2004, InternationalBamboo Foundation, 26/Oct/2005 <http://www.bambootechnologies.com/allabout.htm>.
International Network for Bamboo and Rattan, International Network for Bamboo and Rattan (INBAR) |Bamboo and Rattan Facts. 2005, International Network for Bamboo and Rattan, 26/Oct/2005<http://www.inbar.int/facts.htm>.
International Fund for Agricultural Development, Agricultural Research Grants | Programme forDevelopment and Diffusion of Technologies for Smallholder Bamboo- and Rattan-Based Producers –Phase II. 2005, International Fund for Agricultural Development, 26/Oct/2005<http://www.ifad.org/grants/tags/518.htm>.
34 United States Department of Agriculture Natural Resources Conservation Service, PLANTS NationalDatabase Reports and Topics - Arundinaria Gigantea . 22/Aug 2005, United States Department ofAgriculture Natural Resources Conservation Service <http://plants.usda.gov/cgi_bin/plant_profile.cgi?symbol=ARGI>.
35 David Linvill, Frank Linton, and Michael Hotchkiss, Growing Bamboo in Georgia. 9/May 2001,Cooperative Extension Service - The University of Georgia College of Agricultural and EnvironmentalSciences, 23/Aug/2005 <http://pubs.caes.uga.edu/caespubs/horticulture/GrowingBamboo.htm>.
Carol A. Miles, Chuhe Chen, and Tamera Flores, Washington State University Bamboo Research Report2000 - On-Farm Bamboo Production in the Pacific Northwest, 2000). May 2001. Extension AgriculturalSystems Program, Washington State University Research and Extension Center, 23/Aug/2005<http://agsyst.wsu.edu/BambooReport2000.pdf>.
36Kevin K. C. Cheung, Multi-Storey, Multi-Family Wood-Frame Construction in the USA, 27/Sep/2000).International Conference on the Seismic Performance of Traditional Buildings:Istanbul, Turkey, Nov.16-18, 2000. 15/Nov 2001. International Council on Monuments and Sites: International Wood Committee,23/Aug/2005 <http://www.icomos.org/iiwc/seismic/Cheung-K.pdf>.
37Laura Soullière Harrison, "National Park Service: Architecture in the Parks (Old Faithful Inn),"Architecture in the Parks: Excerpts from a National Historic Landmark Theme Study, Nov 1986). 26/Feb2001. National Park Service - Department of the Interior, 23/Aug/2005<http://www.cr.nps.gov/history/online_books/harrison/harrison3.htm>.
Chateau at the Oregon Caves, Oregon Caves Outfitters - An In-Depth Description of the Chateau. 2003,Chateau at the Oregon Caves, 23/Aug/2005<http://www.oregoncavesoutfitters.com/AbouttheChateau.asp>.
38Jamie Meil et al., CORRIM: Phase I Final Report - Module J: Environmental Impacts of a Single FamilyBuilding Shell - From Harvest to Construction (Review Draft). 23/Aug 2004. Consortium for Research onRenewable Industrial Materials (CORRIM), 23/Aug/2005<http://www.corrim.org/reports/final_report_2004/Module%2520J_%2520August%252023.pdf>.

Cooling It: No Hair Shirt Solutions to Global Warming by Gar W. Lipow GarLpublic AT Comcast DOT net
Page 172 of 265
39 Ann Edminster and Sami Yassa, Efficient Wood Use in Residential Construction: A Practical Guide toSaving Wood, Money, and Forests, 1998). Natural Resources Defense Council, 19/Feb/2006<http://www.nrdc.org/cities/building/rwoodus.asp>.
40Zongjin Li, Ding.Zhu, and Yunsheng Zhang, Development of Sustainable Cementitious Materials.International Workshop on Sustainable Development and Concrete Technology: Beijing, May 20–21,2004. 25/Mar 2004, 23/Aug/2005 <http://www.ctre.iastate.edu/pubs/sustainable/lisustainable.pdf>.p57.
41Siloxo Pty Ltd, Siloxo -Melbourne Australia. Siloxo -Products and Services, 15/Aug 2003, Siloxo PtyLtd, 18/Aug/2004 <http://www.siloxo.com/products.htm>.
42Rastra Found., What is RASTRA®. 16/Mar 2005, Rastra Found., 4/Sep/2005<http://rastra.net/rastracom/web-site/wi_ra.htm>.
43 Rastra Found., What is RASTRA®. 16/Mar 2005, Rastra Found., 4/Sep/2005<http://rastra.net/rastracom/web-site/wi_ra.htm>.pp1-2.
44 Wooden pagodas the height of small skyscrapers have been documented historically.China Internet Information Center, "Introduction," China Through a Lens, 25/Sep 2002, China InternetInformation Center - Authorized Government Portal Site to China, 4/Sep/2005 <http://www.china.org.cn/english/TR-e/43461.htm>.
Edwin Karmiol, Mysteries of Japanese Pagodas Unlocked. 17/Aug 2002, Asia Times, 4/Sep/2005<http://www.atimes.com/atimes/Japan/DH17Dh01.html>.
Bamboo is used as scaffolding in building skyscrapers today.Mark Landler, "Foreign Desk: Hong Kong Journal; For Raising Skyscrapers, Bamboo Does Nicely(Abstract),". NY Times, no. Late Edition - Final 27/Mar 2002: Section A, Page 4, Column 3, 23/Aug/2005<http://query.nytimes.com/gst/abstract.html?res=FB0917F9385F0C748EDDAA0894DA404482>.
Now there was one huge problem with traditional pagodas. While they were sturdy, and wonderfully insectand earthquake resistant, when exposed to fire they went up like, well, tinder. Fortunately, today there areall sorts of fire barriers you can wrap wood in. In point of fact, protected wood, guarded by a multi-hourgraded fire barrier can be more fire safe than steel - because wood does not have the huge thermalconductivity steel has; it simply does not have the capability of growing as hot. How far beyond sevenstories wood (and possibly bamboo construction) can grow safely is hard to guess. But seven stories isprobably not the limit.
45Michelle Clark Hucal, "Recycled Roofing,". Environmental Design and Construction, no. Cool Roofing -May 2003 Supplement 1/May 2003, BNP Media, 5/Sep/2005<http://www.edcmag.com/CDA/ArticleInformation/features/BNP__Features__Item/0,4120,97795,00.html>.
46 Ibid 22 “Chapter 7, Muda, Service and Flow” pp.139-141.
47Wuppertal Institute for Climate, Environment and Energy, Material Intensity of Materials, Fuels,Transport Services, Version 2;28.10.2003. May 2004. Wuppertal Institute for Climate, Environment andEnergy, Wuppertal Institute for Climate, Environment and Energy, 5/Sep/2005<http://www.wupperinst.org/Projekte/mipsonline/download/MIT_v2.pdf>.p3(clay),p8(cement).
American Clay Enterprises, American Clay Finishes™ Clay Veneer Plaster Product Specifications. 18/Dec2003. American Clay Enterprises, 5/Sep/2005 <http://www.americanclay.com/pdfs/ProductSpecs.pdf>.
Cooling It: No Hair Shirt Solutions to Global Warming by Gar W. Lipow GarLpublic AT Comcast DOT net
Page 173 of 265
Athena Swentzell Steen and Bill Steen, Artistry in Clay & Lime. 3/Jun 2005, The Canelo Project,5/Sep/2005 < http://www.caneloproject.com/pages/workshops/clayartistry.html>.
48Michael Clar, Buckeye Development, LLC - Pembrook Woods Low Impact Development. Feb 2000,Buckeye Development, LLC, 5/Sep/2005<http://www.buckeyedevelopment.net/lowimpactdevelopment.htm>.
49U.S. Department of Housing and Urban Development Partnership for Advancing Technology in Housing,Affordability and Value Through Housing Technology Program and Services Guide. 20/Jun 2002. U.S.Department of Housing and Urban Development Partnership for Advancing Technology in Housing,5/Sep/2005 <http://www.huduser.org/publications/pdf/guidetoserv.pdf>.p3.
50The Aluminum Association, Inc., Aluminum Association | Climate Change. 2004, Environment andClimate Change - Conservation, Preservation, and Recycling, The Aluminum Association, Inc., 5/Sep/2005<http://www.aluminum.org/Content/NavigationMenu/The_Industry/Government_Policy/Climate_Change/Climate_Change.htm>.
51 Alex Wilson, "Insulation Materials: Environmental Comparisons,". Environmental Building News 4, no.1 Jan/Feb 1995, BuildingGreen.Com, 5/Sep/2005<http://www.buildinggreen.com/auth/article.cfm?fileName=040101a.xml>.
More recent data from the United States National Institute of Standards and Technology suggestsessentially the same thing.Barbara C. Lippiatt, BEES 2.0 -Building for Environmental and Economic Sustainability Technical Manualand User Guide, Jun/2000). June 2000. Office of Applied Economics, Building and Fire ResearchLaboratory, National Institute of Standards and Technology, 5/Sep/2005<http://museum.nist.gov/exhibits/timeline/PDF/BEES.PDF>.pp 62,65.
A contractor for the EPA analyzed the same BEES database and came to the opposite conclusion:United States Environmental Protection Agency Office of Research and Development, Framework forResponsible Environmental Decision Making (FRED): Using Life Cycle Assessment to EvaluatePreferability of Products, Oct 2000), EPA/600/R-00/095. June 2001. United States EnvironmentalProtection Agency Office of Research and Development, 5/Sep/2005<http://www.lcacenter.org/library/pdf/fred.pdf>.pB-5.
Their conclusion does not seem to match the data. Where BEES database, as added up in manual site showscellulose requiring about one fifth the energy input (for manufacturing and raw materials combined) asfiberglass, the FRED example shows cellulose requiring more than 20 times the energy per kilogram.Since this varies from every other analysis ever done to be believed it would have to more specific as towhere the difference came from.
For example the Minnesota Building Database shows about one tenth the global warming impact forcellulose as fiberglassUniversity of Minnesota College of Architecture and Landscape Architecture Center for SustainableBuilding Research, "Minnesota Building Materials Database - Generic Fiberglass Batt," MinnesotaBuilding Materials Database, 26/May 2004, University of Minnesota College of Architecture andLandscape Architecture Center for Sustainable Building Research, 5/Sep/2005<http://www.buildingmaterials.umn.edu/07211_batt_bees.html>.
University of Minnesota College of Architecture and Landscape Architecture Center for SustainableBuilding Research, "Minnesota Building Materials Database - Blown Cellulose," Minnesota BuildingMaterials Database, 26/May 2004, University of Minnesota College of Architecture and LandscapeArchitecture Center for Sustainable Building Research, 5/Sep/2005<http://www.buildingmaterials.umn.edu/07210_blown_bees.html>.

Cooling It: No Hair Shirt Solutions to Global Warming by Gar W. Lipow GarLpublic AT Comcast DOT net
Page 174 of 265
52 Food and Agriculture Organization of the United Nations (FAO)., "Food Balance Sheet," FAOSTATOnline Database 2004. Commodity Balances Database - Production. Aug 2004, Food and AgricultureOrganization of the United Nations (FAO)., 10/Sep/2005<http://faostat.fao.org/faostat/servlet/XteServlet3?OutputLanguage=english&Areas=ALL&Items=2901&Years=2001&Years=2000&Domain=FBS&ItemTypes=FBS&language=EN&Codes=ShowCodes>.
53Economic Research Unit United States Department of Agriculture, ERS/USDA Briefing Room - GlobalFood Security: Questions and Answers. 11/May 2005, Economic Research Unit United States Departmentof Agriculture, 10/Sep/2005 <http://www.ers.usda.gov/Briefing/GlobalFoodSecurity/questions/>.
54Institute of Medicine of the National Academies, Dietary Reference Intakes: Macronutrients. May 2005,National Academy of Sciences, 10/Sep/2005 <http://www.iom.edu/Object.File/Master/7/300/0.pdf>.p4.
55 U.S. Census Bureau, "World Population: Total Midyear Population," Intenational Data Base, 30/April2004, U.S. Census Bureau, 25/May/2004 <http://www.census.gov/ipc/www/worldpop.html>.
56 Brian Halweil, "Can Organic Farming Feed Us All?". World Watch Magazine 19, no. 3 May/Jun2006The Organic Center, Worldwatch Institute, Jan-03-2007 <http://www.organic-center.org/reportfiles/EP193A.Halweil.pdf>.
57 Food and Agriculture Organization of the United Nations (FAO)., FAOSTAT Online Database 2004 -Crops Primary. Aug 2004, Food and Agriculture Organization of the United Nations (FAO)., 10/Sep/2005<http://faostat.fao.org/faostat/servlet/XteServlet3?Areas=231&Items=%3E1714&Elements=31&Years=2000&Format=Table&Xaxis=Countries&Yaxis=Items&Aggregate=&Calculate=&Domain=SUA&ItemTypes=Production.Crops.Primary&language=EN>.U.S. Grain harvest in 2000 in hectares equal 58,497,083U.S. agricultural harvest from cropland in 2000 equals 136,057,883So ~43% of total cropland harvested in 2000 was grain.
World Resources Institute, "Meat Consumption: Grain Fed to Livestock as a Percent of Total GrainConsumed," EarthTrends Environmental Portal - Environmental Information Database, 2004, WorldResources Institute, 10/Sep/2005 <http://earthtrends.wri.org/searchable_db/results.cfm?years=1999-2000,2000-2001,2001-2002,2002-2003,2003-2004&variable_ID=348&theme=8&cID=190&ccID=0>.From 60% to 65% of U.S. grain is fed to animals,So around 27% of U.S. cropland used to grow food for animals
58 Food and Agriculture Organization of the United Nations (FAO)., FAOSTAT Online Database 2003 -Crops Primary. Aug 2004, Food and Agriculture Organization of the United Nations (FAO)., 10/Sep/2005<http://faostat.fao.org/faostat/servlet/XteServlet3?Areas=862&Items=%3E1714&Elements=31&Years=2000&Format=Table&Xaxis=Years&Yaxis=Countries&Aggregate=&Calculate=&Domain=SUA&ItemTypes=Production.Crops.Primary&language=EN>.Total Crops Worldwide 2000 (Ha) 1,348,840,594Total Crops World Wide Grain (Ha) 674,247,980So ~50% of harvested primary crop acreage used for grain in 2000
World Resources Institute, "Meat Consumption: Grain Fed to Livestock as a Percent of Total GrainConsumed," EarthTrends Environmental Portal - Environmental Information Database, 2004, WorldResources Institute, 10/Sep/2005 < http://earthtrends.wri.org/searchable_db/results.cfm?years=1999-2000,2000-2001,2001-2002,2002-2003,2003-2004&variable_ID=348&theme=8&cID=190&ccID=0 >.Around 37% of grain crops worldwide fed to animals.~37% of ~50%=~18.5% of total cropland worldwide used to grow grain for animals.
59Joel Salatin, a grass-fed beef pioneer and author makes the point from a stockman's viewpoint:
Cooling It: No Hair Shirt Solutions to Global Warming by Gar W. Lipow GarLpublic AT Comcast DOT net
Page 175 of 265
Roughly speaking, land that will produce 100 bushel-per-acre corn, will produce 400 cow-day[s]forage (one cow day is what one cow will eat in one day--cow-days are to graziers what inches areto carpenters and board-feet are to lumberjacks). If 100 bushels (average 60 pounds per bushel,weight 6,000 pounds), that will produce about 857 pounds of beef.
At 400 cow-days we can carry 600 stocker calves (400-800 lb.) gaining at least 1.5 pounds per day,yielding 900 lbs. (600 X 1.5 = 900) of beef per acre.
….... The point is to move the stock to mimic grazing patterns of native herbivores…
... Under good controlled grazing, we allow the grass to recuperate through its "blaze of growth"period before being regrazed… …By keeping 98% of the farm at rest and in the fast growth period,not letting the forage get grazed too early or too late after growth slows down, we can seetremendous increases in forage growth…
…. Most parasites lose strength dramatically after being denied a host for three weeks. Since mostpaddock shifts occur at least three weeks apart…, this depletes parasite virility and reduces theneed for wormers..
.... Because the animals lounge in different paddocks every day, they spread their manure moreevenly over the pasture…
Joel Salatin, "Joel Salatin Introduces Livestock Grazing... 'Salad Bar Beef,". Acres USA - A Voice for Eco-Agriculture March 1996Eco-Friendly Foods, 10/Sep/2005<http://www.ecofriendly.com/index.cfm?section=4&page=20>.
60Cutler J. Cleveland and Charles A. S. Hall, "Climate Change Human Driving Forces, Biophysical Basis,and Likely Impacts," Climate Change - Socioeconomic Dimensions and Consequences of Mitigation, ed.Pentti Vartia, 2000). Oct 1999. Fortum, Boston Univerisity, 11/Sep/2005<http://www.bu.edu/cees/research/workingp/pdfs/9910.pdf>.p9.
61Jimmy Henning et al., Rotational Grazing, 2000), ID-143. 2000. Cooperative Extension Service -University of Kentucky, Department of Agriculture, 13/Sep/2005<http://www.ca.uky.edu/agc/pubs/id/id143/id143.pdf>.
State of Illinois Department of Agriculture IIllinois Sustainable Agriculture Committee, "S/A 98-18Sustainable Beef Production - Management Intensive Grazing Vs Corn Silage Program for Beef StockerCalves.," Sustainable Agriculture Grant Review Committee C2000 Sustainable Agriculture Grant Projects- ON-FARM RESEARCH AND DEMONSTRATION. Oct 2001. State of Illinois Department of AgricultureIIllinois Sustainable Agriculture Committee, State of Illinois Department of Agriculture IIllinoisSustainable Agriculture Committee, 13/Sep/2005<http://www.agr.state.il.us/C2000/fy00/FY00Report.pdf>.pp6-17(*Note: total beef production over the three year period was about one third the per acre production fromcorn.. However this was an experimental program grazing basically two forages - alfalfa /orchard grassduring warm weather, and small grain cereal rye during cool. A more experienced grazer with a widervariety of forages could expect better results - especially if drough resistant varieties were used. Also thecattle tested were largely bred as feedlot animals. Forage animals in pasture compared to feedlot breeds ongrain would be a better test. However, even with the lower production per acre, cost per pound of beef,and especially labor per pound of beef was lower with grass raised.)
Center for Integrated Agricultural Systems of the University of Wisconsin's College of Agricultural andLife Sciences, CIAS: Management Intensive Rotational Grazing's Sense..and Dollars. April 1996, Centerfor Integrated Agricultural Systems of the University of Wisconsin's College of Agricultural and LifeSciences, 13/Sep/2005
Cooling It: No Hair Shirt Solutions to Global Warming by Gar W. Lipow GarLpublic AT Comcast DOT net
Page 176 of 265
<http://www.cias.wisc.edu/archives/2000/01/04/dairy_grazing_can_provide_good_financial_return/index.php>.(The milk per acre is slightly lower, but labor costs are MUCH lower, as are feed costs and capital costs. Soeven with no price premium the farmer would make higher profits.)
Also, Ibid 59
62Richard Cowan, "U.S. Group Blasts Creekstone Mad Cow Testing Plan,". Reuters Via Forbes.Com19/Apr 2004, Forbes, 14/May/2004<http://www.forbes.com/markets/newswire/2004/04/19/rtr1336959.html>.
63Donald Lobb, "No-Till Success Hinges on Developing a Complete Crop Production 'System,'".Sustainable Farming, no. Winter 94 (1994)Ecological Agriculture Projects, McGill University (MacdonaldCampus), Resource Efficient Agricultural Production - Canada (REAP-CANADA), 17/Sep/2005<http://www.eap.mcgill.ca/MagRack/SF/Winter%2094%20I.htm>.
64Sara Wright, Glomalin: A Manageable Soil Glue. 2004, USDA Sustainable Agricultural SystemsLaboratory, 26/May/2004 < http://www.ba.ars.usda.gov/sasl/research/glomalin/brochure.pdf>.
65Preston Sullivan, Conservation Tillage, Jul-2003). Appropriate Technology Transfer For Rural Areas.Aug 2003. National Center for Appropriate Technology, 26/May/2004 <http://attra.ncat.org/attra-pub/PDF/consertill.pdf>.Pp2-3.
Corliss Karasov, "No-Till Farming on Comeback Trail,". Environmental Health Perspectives 110, no. 2Feb 2002, 1/Jun/2004 <http://www.greennature.com/article833.html>.
66Laura Sayre, "New Farm Research: Cover Crop Roller," The New Farm, 20/Nov 2003, The RodaleInstitute, 7/May/2005 <http://www.newfarm.org/depts/NFfield_trials/1103/notillroller.shtml>.
67 Emma Marris, "Black is the New Green,". Nature 442, no. 10 Aug 2006, Charcoal Sequestering Carbonin Soil, Nature Publishing Group, Jan-03-2007<http://www.bestenergies.com/downloads/naturemag_200604.pdf>.
68Greg Gunthorp and Lei Gunthorp, Grassfarmer.Com - PASTURED PIGS ON THE GUNTHORP FARM.24/Feb 2004, American Farmland Trust, 13/Sep/2005 <http://grassfarmer.com/pigs/gun1.html>.
Sustainable Agriculture Network, Profitable Pork:Strategies for Hog Producers. Livestock Alternatives. Jul2003. Sustainable Agriculture Network, Sustainable Agriculture Research and Education Program,31/May/2004 <http://www.sare.org/publications/hogs/profpork.pdf>.
69Roger Segelken (ED), "U.S. Could Feed 800 Million People with Grain That Livestock Eat, CornellEcologist Advises Animal Scientists," Conrnell University Science News, 7/Aug 1997, Cornell University,13/Sep/2005 < http://www.news.cornell.edu/science/Aug97/livestock.hrs.html>.
70Hempopotamus, All About Hemp. 2004, Industrial Hemp, Hempopotamus, 22/Jun/2004<http://www.hemphouse.com/docs/hempinfo.html>.
71John Jeavons, "Cultivating Our Garden: Biointensive Farming Uses Less Water, Land, Machinery, andFertilizer - and More Human Labor,". In Context, no. 42/Fall 1995 - A Good Harvest (1995), ContextInstitute, 17/Sep/2005 < http://www.context.org/ICLIB/IC42/Jeavons.htm>.p34.
Cooling It: No Hair Shirt Solutions to Global Warming by Gar W. Lipow GarLpublic AT Comcast DOT net
Page 177 of 265
72 United States Environmental Protection Agency, How We Use Water In These United States. 18/March2003, United States Environmental Protection Agency, 06/Jul/2005<http://www.epa.gov/watrhome/you/chap1.html>.
73Micro-irrigation system (drip + sprinkler) about 5.7% of total irrigated acreageVarious gravity forms (at 50%) are about 43.9% of total irrigated acreageOther sprinklers irrigate about 51.2% of total irrigated acreage
United States Department of Agriculture National Agricultural Statistics Department, 2003 Farm & RanchIrrigation Survey (2002 Census of Agriculture| Volume 3, Special Studies, Part 1). Nov 2004. United StatesDepartment of Agriculture National Agricultural Statistics Department, 28/Oct/2005<http://www.nass.usda.gov/census/census02/fris/fris03.pdf>.p8.Table 4. Land Irrigated by Method of Water Distribution: 2003 and 1998
Micro irrigation systems average around 82.5% irrigation efficiencyGravity irrigation systems average around 50% irrigation efficiencyOther sprinkler average around 70% irrigation efficiency
Michael D. Dukes, Types and Efficiency of Florida Irrigation Systems, (Note: Data Used Was fromNational Sources). Dec 2002. University of Florida - Agricultural and Biological Engineering Dept,28/Oct/2005<http://www.agen.ufl.edu/~mdukes/publications/Types_and_Efficiency_of_Florida_Irrigation_Systems.pdf>..p8.
So applying the efficiency numbers from the second source to the acreage in the first, we can calculate thatcurrent average irrigation efficiency is around 62%. If that average efficiency was upgrade to micro-irrigation levels we would reduce water use for irrigation nationally by an average of one third.
74I. Broner, Irrigation: Tailwater Recovery for Surface Irrigation. Crop Series, 4.709. 1998. Colorado StateUniversity Cooperative Extension, 17/Sep/2005 <http://www.ext.colostate.edu/pubs/crops/04709.PDF>.
75Pacific Northwest Pollution Prevention Resource Center, "Topical Reports -Energy and Water Efficiencyfor Semiconductor Manufacturing," Pollution Prevention (P2) Pays - N.C. Division of Pollution Preventionand Environmental Assistance, Feb 2000, Pacific Northwest Pollution Prevention Resource Center,17/Sep/2005 <http://www.p2pays.org/ref/04/03271/>.
76Hidetoshi Wakamatsu, Akira Mayuzumi, and Norio Tanaka, "Effective Utilization Technology for UltraPurewater, Chemical Liquids and Waste Materials on Semiconductor Manufacturing Plant,". OKITechnical Review 68, no. 188: Special Edition on the Environment Dec 2001, Oki Industry Co. Ltd -Environment Division, 23/May/2004 <http://www.oki.com/en/otr/downloads/otr-188-06.pdf>.pp23 – 27.
77 Stanford University News Service, Can Computer Chip Makers Reduce Environmental Impact? 5/Jun1996, Stanford University News Service, 4/Jun/2004 <http://www.stanford.edu/dept/news/pr/96/960605chipsenvir.html>.
78Eric Williams, "Energy Intensity of Computer Manufacturing: Hybrid Assessment Combining Processand Economic Input-Output Methods,". Environmental Science & Technology 38, no. 22 15/Nov 2004,American Chemical Society, 18/Sep/2005 <http://www.it-environment.org/publications/hybrid%20PC%20LCA%20abstract.pdf or full version(paid)http://pubs.acs.org/cgi-bin/article.cgi/esthag/2004/38/i22/pdf/es035152j.pdf>.pp6166 – 6174.
79EECO - A Transico Company, EECO-Greenä SILVER-THROUGH-HOLE DOUBLE-SIDED PRINTEDCIRCUIT BOARDS PRODUCT OVERVIEW DESIGN CONSIDERATIONS FAQ’s. Dec 2003, EECO - ATransico Company, 22/May/2004 < http://www.eecoswitch.com/PDF%20Files/STH%20FAQs.PDF>.

Cooling It: No Hair Shirt Solutions to Global Warming by Gar W. Lipow GarLpublic AT Comcast DOT net
Page 178 of 265
80Sumitomo Bakelite Co. Ltd., Products That Provide Environmental Solutions. Jan 2004. SumitomoBakelite Co. Ltd., 4/Jun/2004 <http://www.sumibe.co.jp/english/kankyou/pdf/rc2003_E06.pdf>.
81 Jonathan G. Overly, Lori E. Kincaid, and Jack R. Geibig, "Chapter 3: LIFE-CYCLE IMPACTASSESSMENT," Desktop Computer Displays: A Life-Cycle Assessment, EPA-744-R-01-004a. Dec 2001.Environmental Protection Agency, 18/Mar/2005 <http://www.epa.gov/dfe/pubs/comp-dic/lca/Ch3.pdf>.pp3-30.Table 3-10. Baseline life-cycle impact category indicators
82Sharp Corporation, Sharp Environmental Report 2002, April 2001 - March 2002. December 2002. SharpCorporation, 20/Mar/2005 <http://sharp-world.com/corporate/eco/report/2002pdf/report_2002.pdf>.p9.
83Richard T. Carson and Nadja Marinova, Running on Air, Sep-1999). Institute on Global Conflict andCooperation IGCC Policy Briefs, ISSN 1089-8352 Policy Brief Number 13. 21/Feb 2005. Institute onGlobal Conflict and Cooperation (IGCC), 18/Mar/2005<http://repositories.cdlib.org/cgi/viewcontent.cgi?article=1088&context=igcc>.
84Keirsten Scanlon, Poison PCs and Toxic TVs:California's Biggest Environmental Crisis That You'veNever Heard of. Jun 2001. Silicon Valley Toxics Coalition; Californians Against Waste; Materials for theFuture, 6/Jun/2004 <http://www.cawrecycles.org/Ewaste/PPCs%20and%20TTVs/ppc-ttv.pdf>.Citing: the Electronic Product Recovery and Recycling Baseline Report, published in May, 1999 by the USNational Safety Council
85Friedrich Bio Schmidt-Bleek, MIPSBOOK or The Fossil Makers -Factor 10 and More, ed.Reuben(Trans) Deumling, 1994), ISBN 3-7643-2959-9. Birkhäuser: Basel, Boston, Berlin, WuppertalInstitute for Climate, Environment, Energy, 3/Aug/2004 <http://prog2000.casaccia.enea.it/nuovo/documenti/427.doc>.
86 "Steel Producers Target Canned Foods,". Packaging World Magazine July 1995Packaging WorldMagazine Online, Summit Publishing, 9/Jun/2004 <http://www.packworld.com/articles/Features/1064.html>.
Note: this is an article favoring steel cans over foil packs for coffee. I analyzed information from this articleso as to make to make sure I was not being over-optimistic. So again I repeat - this is information fromsteel can makers - people who favor steel cans over foil packs.
Modern steel cans for coffee weigh 17 pounds vs. 3 pounds for a steel brick. This is still an 80%+reduction.
Here are the invalid arguments:
1) The most popular can quantity is 13 pounds not 17 pounds. Right, but a 13 pound can holds fewerservings than a 3 pound brick. A 17 pound can remains the correct comparison. If you insist on using13 pound cans as a comparison then you have to take a fraction of the weight of a second 13 pound canand allocate it - which would result in a less favorable result for steel than a single 17 pound can.
2) The second argument is one from recycling. About 64% of steel cans are recycled, whereas foil packcurrently are not. The problem with this is that recycling a steel can does not cut its impact in half. Itwould not even if the steel cans were simple rinsed out and had a new lid put on them. But in fact thatis not how steel cans are recycled. They are melted down and used as sources to make new steel from.That new steel does have about 1/2 the material intensity of steel from raw ore, but then the energyand impacts of shaping the steel and making the cans are about the same. So long as the foil pack is notrecycled we end up with about a 65% reduction - still significant. However we are not looking just atcurrent practices, but at what practices we need to adapt. So we could theoretically recycle close to100% of steel cans (those cans being used in households to hold nails and such making up for those notrecycled). So that ends up as only a 60% reduction using foil wrap - still better than coffee cans. But if

Cooling It: No Hair Shirt Solutions to Global Warming by Gar W. Lipow GarLpublic AT Comcast DOT net
Page 179 of 265
we are looking at this, it is not impossible to recycle this kind of wrap. If you reduce the variety ofplastic, using only one metal and one plastic, as we shall see later on it is possible to separate out themetal and plastic. Or you can use the combination to make plastic lumber. So if you recycle both youend up with an 80% net reduction again.
87Association of Cities and Regions for Recycling, Good Practices Guide on Waste Plastics Recycling: AGuide by and For Local and Regional Authorities - 2004, ed. Jean-Pierre Hannequart. Feb 2004.Association of Cities and Regions for Recycling, 10/May/2005<http://www.ecvm.org/img/db/ACRRReport.pdf>.p83.
88Azom.com Pty Ltd, Aluminium Packaging (Focus on Europe). 2002, Azom.Com Pty Ltd, 9/Jun/2004<http://www.azom.com/details.asp?ArticleID=1396#_Advantages_of_Aluminium>.
89Environment and Plastics Industry Council (EPIC), Plastics and Source Reduction. Sep 2001.Environment and Plastics Industry Council (EPIC), 9/Jun/2004 <http://www.cpia.ca/epic/docs/factsheets/Source%20Reduction.PDF>.
90Flexible Packaging Association, Examples of Source Reduction. Flexible Packaging Association,9/Jun/2004 <http://www.flexpack.org/enviro/09srexamples.htm>.
91Envirowise, Retail Supply Chain Distributes Cost Savings from Improved Packaging - A Case Study fromthe Book Industry. Envirowise Case Studies, CS332. Mar 2002. Envirowise, 14/May/2004<http://www.envirowise.gov.uk/envirowisev3.nsf/0/EAE528C70CD5852480256CE5004C7095/$File/CS332.pdf>.
92Envirowise, Packaging Rethink Boosts Profits: A Good Practice Case Study At Harman Pro AudioManufacturing. Environmental Technology Best Practice Programme, GC275 Final Results. Oct 2000.Envirowise, 14/May/2004 <http://www.envirowise.gov.uk/envirowisev3.nsf/0/17A681225D041DE080256CE5004C71EC/$File/GC275.pdf>.
93Figures for 1999, but without packaging, and with a total for 1998(not 1999) that excludes building paper:Peter J. Ince and Irene Durbak, "Pulpwood Supply and Demand: Development in the South, Little GrowthElsewhere,". Journal of Forestry 100, no. 2 1/Mar 2002, Society of American Foresters, 18/Sep/2005<http://www.fpl.fs.fed.us/documnts/pdf2002/ince02b.pdf>.pp20-21.
Totals for 1998 and 1999 paperboard – which is the bulk of paper products not including building paper.James L. Howard, U.S. Timber Production, Trade, Consumption, and Price Statistics 1965-1999, FPL-RP-595. April 2001. United States Department of Agriculture Forest Service Forest Products Laboratory,18/Sep/2005 <http://www.fpl.fs.fed.us/documnts/fplrp/fplrp595.pdf>.p71.Table 45—Paperboard production, imports, exports, and consumption, 1965–1999
Using the growth consumption between 1998 and 1999 from the above I was able to take the 1998 totalfrom the first source and estimate the 1999 total consumption. Given 1999 total consumption and everyother category, 1999 packaging may then be calculated by subtraction.
94Mark J Lytle, "Library Without Books,". The Guardian (Guardian Unlimited) 22/Apr 2004, 11/Jun/2004< http://www.guardian.co.uk/online/story/0,3605,1197495,00.html>.
95Reuters, Let’s Make Reading Better! 9/Feb 2004, IT supplement of The Tribune, The Tribune of India,20/Sep/2005 <http://www.tribuneindia.com/2004/20040209/login/main3.htm>.
96Advertising accounts for around 65% of daily revenues, circulation for 35%, while newsprint accounts forabout one third of total costs. Allowing for profit (so that one third of revenues does not equal one third of

Cooling It: No Hair Shirt Solutions to Global Warming by Gar W. Lipow GarLpublic AT Comcast DOT net
Page 180 of 265
costs), this means printing a typical daily U.S. newspaper costs well over half, and perhaps as much as 90%of the subscription price.
"Newspaper," Microsoft® Encarta® Online Encyclopedia. 2004, 11/Jun/2004 <http://encarta.msn.com/text_761564853___62/Newspaper.html>.
97Lyad Atuan et al., Life-Cycle Assessment of Desktop Computer Display. Mar 2004. None - Term Projectin Masters Level Class, 6/Jun/2004 <http://s93889521.onlinehome.us/docs/mie415.pdf>.
(Please note that this is only student project in a masters program. However it tracks quite closely to theEPA result for CRT and LED monitors, using differing sources. So it is not an unreasonable source for thesaving for e-ink – especially since we are not talking about a big difference in any case.)
98 2002 paper consumption was 21.4 kg per personClare Walker, Melbourne Central Green Office 2002 Performance Report. Jul 2003. BP Australia,11/Jun/2004 <http://www.bp.com.au/environmental_social/green_office_2002_report.pdf>.p6.
According to the 2001 report, the 1997 bench was 55 kg per person. So that was indeed a 61% reduction.Also there were layoffs and hours per person increased - so this may understate the saving.Kerryn Schrank, Melbourne Central Green Office 2001 Performance Report. Aug 2002. BP Australia,11/Jun/2004 <http://www.bp.com.au/environmental_social/green_office_2001_report.pdf>.p4.
99Brad Wallace, "Paper Reduction Program Saves Money And The Environment," Knowledge BankArticles, 28/Sep 2004, Innovative Management Systems, 20/Sep/2004<http://www.solutions.ca/Knowledge_Bank/Articles/article.asp?doc_id=158>.
100Abigail J. Sellen and Richard Harper, The Myth of the Paperless Office (Cambridge MA USA: MITPress, 2001).
101David Stewart, "Ensuring Effective Insurance Thanks to Paperless Office,". SiliconRepublic.Com -Ireland's Technology News Service 19/Apr 2004Case Studies, Silcon Republic - Dublin, 11/Jun/2004<http://www.siliconrepublic.com/news/news.nv?uid=lipowg&sid=C5mmenoD&storyid=single3087>.
102 Mike Martin, "Paperless Office: Case Studies Show How and Why,". Computer Bits 14, no. 1 Jan 2004,Bitwise Productions Portland Oregon, 14/Jun/2004 <http://www.computerbits.com/archive/2004/0100/paperless.html (if no longer good cache at:http://66.102.7.104/search?q=cache:IrULwCmYYXYJ:www.computerbits.com/archive/2004/0100/paperless.html)>.
103 KP Products, About The Kenaf Plant. 14/Jan 2005, KP Products, 20/Sep/2005 <http://www.visionpaper.com/kenaf2.html>.
104Jame A. Rydelius, Growing Eucalyptus for Pulp and Energy. Mechanization in Short Rotation, IntensiveCulture Forestry Conference, Mobile, AL, March 1-3, 1994. Mar 1994, Short Rotation Woody CropsOperations Working Group (Established by DOE ORNL, USDA and EPRI), 14/Jun/2004 <http://www.woodycrops.org/mechconf/rydeliu.html>.
105 Gene Stevenson, 90 Years' Results Say Yes to Winter Legumes, Crop Rotations. 9/Feb 1989, College ofAgriculture: Auburn University Alabama Agricultural Experiment Station, 15/Jun/2004 <http://www.ag.auburn.edu/aaes/webpress/1989/rotations.htm>.
106Charles Mitchell, Wayne Reeves, and Dennis Delany, "Breaking Records: Sensible Management HelpsAlabama's Long Term Experiments Net Record Yields,". Online Highlights: A Magazine of Research fromthe Alabama Agricultural Research Station at Auburn University 48, no. 3 Fall 2001, College of

Cooling It: No Hair Shirt Solutions to Global Warming by Gar W. Lipow GarLpublic AT Comcast DOT net
Page 181 of 265
Agriculture: Auburn University Alabama Agricultural Experiment Station, 15/Jun/2004 <http://www.ag.auburn.edu/aaes/communications/highlightsonline/fall01/fall-mitchell.html>.
107 Jane N. Abramovitz and Ashley T. Mattoon, Paper Cuts:: Recovering the Paper Landscape, ed. Jane A.Peterson, WorldWatch Paper 149. Dec 1999. Worldwatch Institute, 16/Jun/2004<http://www.worldwatch.org/pubs/download/EWP149/>.p21.Figure 5
108David R. Darr, U.S. Forest Resources. 28/Sep 2000, U.S. Forest Service, 15/Jun/2004<http://biology.usgs.gov/s+t/noframe/m1103.htm>.
109 Jim Motavalli, "Beyond Wood | Tree-Free and Chlorine-Free Papers Offer Sound Alternatives to ForestDestruction,". E, The Environmental Magazine IX, no. 1 Jan-Feb 1998, Earth Action Network, Inc.,1/Oct/2005 <http://www.emagazine.com/view/?41>.
110U.S. Department of Agriculture’s Natural Resources Conservation Service (NRCS);Iowa StateUniversity’s Center for Survey Statistics and Methodology, 2002 Annual Natural Resources Inventory:Land Use. April 2004. U.S. Department of Agriculture’s Natural Resources Conservation Service(NRCS);Iowa State University’s Center for Survey Statistics and Methodology, 15/Jun/2004<http://www.nrcs.usda.gov/technical/land/nri02/landuse.pdf>.p2.
111Thomas A. Rymsza, "Firm Profile: Vision Paper,". Journal of Industrial Ecology 7, no. 3-4 May 2004,Massachusetts Institute of Technology and Yale University, 16/Jun/2004<http://www.visionpaper.com/speeches_papers/jiec_7_3-4_215_0.pdf>.p217.
112 Ibid 107 p49.
113European Commission, Integrated Pollution Prevention and Control (IPPC) Reference Document onBest Available Techniques in the Pulp and Paper Industry. Dec 2001. European Commission, 20/Sep/2005<ftp://ftp.jrc.es/pub/eippcb/doc/ppm_bref_1201.pdf>.
114“In 2003 the U.S. paper recovery rate achieved an all-time high of 50.3%. Paper recovery has increasedsteadily from 33.5% in 1990, to its present level of 50.3%.” (Note that not all of the 50.3% recovered canbe used. So, the actual recycling rate is less than 50%.)
American Forest and Paper Association, "Recycling," Environment and Recycling, 2005, American Forestand Paper Association, 21/Jun/2005<http://www.afandpa.org/Content/NavigationMenu/Environment_and_Recycling/Recycling/Recycling.htm>.
115European Recovered Paper Council;Confederation of European Paper Industries, The EuropeanDeclaration on Paper Recovery Annual Report 2000. 14/Sep 2001, European Recovered PaperCouncil;Confederation of European Paper Industries, 21/Jun/2005<http://www.paperrecovery.org/files/ERPC%20AR%202000_2.pdf>.p17.
Table 2-2 - CEPI – European Paper and Board and Recovered Statistic by Country in 2000 – 1000 tonnes
116 Ibid 27
117 Austrian Federal Ministry of Transport, Innovation and Technology (BMVIT) - Austrian IndustrialResearch Promotion Fund, Forschungsforum 1/1998 - Development of Evaluation Fields for Ecodesign.2002, Austrian Federal Ministry of Transport, Innovation and Technology (BMVIT) - Austrian IndustrialResearch Promotion Fund, 22/Jun/2004<http://www.nachhaltigwirtschaften.at/(print)/publikationen/forschungsforum/981/teil2.en.html>.

Cooling It: No Hair Shirt Solutions to Global Warming by Gar W. Lipow GarLpublic AT Comcast DOT net
Page 182 of 265
118Franklin Associates, LTD, Life Cycle Analysis (LCA): Woman's Knit Polyester Blouse -Final Report.June 1993, American Fiber Manufacturers Association, 22/Jun/2004 < http://www.fibersource.com/f-tutor/LCA-Page.htm>.
119Richard Way, "Soap-Free Washers Explained: Soap-Free Washers Have Become a Reality. Richard WayLooks at Their Potential,". Electrical Retailing Weekly 20/Jun 2002, DMG World Media (UK) Ltd\,22/Jun/2004 <http://www.findarticles.com/p/articles/mi_m0KZC/is_2002_June_20/ai_88579178>.
120Katherine Noble-Goodman, "Washing Machine to Reduce Water Use, Eliminate Detergent,". U.S. WaterNews Online Oct 2001, U.S. Water News Inc., 22/Jun/2004<http://www.uswaternews.com/archives/arcconserv/1wasmac10.html>.
121Greenpeace USA, A Rating Of Dry Cleaning Methods Currently In Use In The U.S. Jul 2001,Greenpeace USA, 23/Sep/2005 <http://www.greenpeace.org/raw/content/usa/press/reports/what-s-in-what-s-out-a-ratin.pdf>.
122South Coast Air Quality Management District, Noh Says Yes to Wet Cleaning: Orange County DryCleaner Converts to Non-Toxic Process. 19/Dec 2001, South Coast Air Quality Management District,22/Jun/2004 < http://www.aqmd.gov/news1/2001/OC_Wet_Cleaner.htm>.
123Hangers America, Hangers America: Liquid CO2: The Benefits to Hangers Owners. 16/Mar 2005,Hangers America, 23/Sep/2005 <http://www.hangersdrycleaners.com/co2_4.html>.
124European Commission, Integrated Pollution Prevention and Control (IPPC) Reference Document onBest Available Techniques for the Textiles Industry. Jul 2003. European Commission, 2/Oct/2005<ftp://ftp.jrc.es/pub/eippcb/doc/txt_bref_0703.pdf>.p304.Section 4.6.1
125United States Environmental Protection Agency - Office of Compliance, Profile of the Textile Industry.Sector Notebook Project, EPN3 10-R-97-009. Sep 1997, United States Environmental Protection Agency -Office of Compliance, 23/Ju/2004<http://www.epa.gov/compliance/resources/publications/assistance/sectors/notebooks/textilsn.pdf>.p75.
126Ibid 125 p77.
127 Ibid 125 p100.
128 Ibid 125 p79.
129 Ibid 125 p78.
130 Ibid 124 p265.Section 4.3.3
131 Ibid 124 pp267-268.Section 4.3.4
132Ibid 125 p79.
133 Ibid 125 p80.
134 Ibid 125 p.85.
135 Ibid 124 p446.Section 5.1

Cooling It: No Hair Shirt Solutions to Global Warming by Gar W. Lipow GarLpublic AT Comcast DOT net
Page 183 of 265
136 Ibid 124 p353.Section 4.6.21.3
137 Ibid 124 p370.Section 4.7.8
138 Ibid 124 p371.Section 4.7.9
139Ibid 125 p81.
140Ibid 125 p82.
141Ibid 125 p82.
142 Ibid 125 p93.
143 Ibid 124 p368.Section 4.7.7
144Hempopotamus, All About Hemp. 2004, Industrial Hemp, Hempopotamus, 22/Jun/2004<http://www.hemphouse.com/docs/hempinfo.html>.
145John A. Dearien, Struthers Richard D., and Kent D. McCarthy, CyberTran: A Systems Analysis Solutionto the High Cost and Low Passenger Appeal of Conventional Rail Transportation Systems. Nov 2001,CyberTran International, Inc, 22/Jun/2004 <http://www.cybertran.com/ctpaper.pdf>.
146 Ibid 145 P.5 (Note the cost per seat in examples given is five to ten times less. But once you includegreater utilization from computation or routes on the one tenth the cost becomes a conservative estimate.)
147 Stacey C. Davis and Susan W. Diegel, TRANSPORTATION ENERGY DATA BOOK: - Edition 22,ORNL-6967 (Edition 22 of ORNL-5198). Sep 2002. Center for Transportation Analysis Science andTechnology Division of the Oak Ridge National Laboratory for the U.S. DOE, 23/Sep/2005 < www-cta.ornl.gov/cta/Publications/Reports/ORNL-6967.pdf >.Page 2-14 Table 2.11 Passenger Travel and Energy Use in the United States, 2000
148Dylan Saloner and Neil Garcia-Sinclair, "Environmental Impact of Ultra Light Rail Transit: Lesseningthe External Costs of Transportation," Alameda, California, 9/October 2006.pp 20-21.
149 Ibid 148 p 5.150Zipcar, Inc, Get a Zipcard. 2005, Zipcar, Inc, 23/Sep/2005 <http://www.zipcar.com/apply/>.
151Flexcar. 2005, Flexcar, 23/Sep/2005 <http://www.flexcar.com/>.
152Nina Borweger et al., Car Sharing in Practice: The Tosca Takeup Guide. Information SocietyProgramme, Project Number: 1st-1999-20856. 24/Jan 2002. Rupprecht Consult;European Comission <http://www.atc.bo.it/progetti/tosca/Take%20Up%20Guide%20Final.pdf>.
153Parsons Brinckerhoff Quade & Douglas; Cambridge Systematics, Inc.;NuStats International, RT-HISRegional Travel -Household Interview Survey GENERAL FINAL REPORT. Feb 2000. New YorkMetropolitan Transportation Council (NYMTC); North Jersey Transportation Planning Authority(NJTPA), 24/Feb/2004 <http://www.nymtc.org/files/fr00321.pdf>.p83.Table 51
Cooling It: No Hair Shirt Solutions to Global Warming by Gar W. Lipow GarLpublic AT Comcast DOT net
Page 184 of 265
154 Ibid 15 p8-6.Table 8.5: Demographic Statistics from the 1969, 1977, 1983, 1990, 1995 NPTS and 2001 NHTS
155 Ibid 15 p2-7.Table 2.5 - Transportation Energy Use by Mode, 2000–2001
156 Ibid 147Table 2.11 Passenger Travel and Energy Use in the United States, 2000
157Ibid 15Table 2.14 - Intercity Freight Movement and Energy Use in the United States, 2001
158 For number of class I freight cars and locomotivesU.S. Census Bureau, "Section 23 - Transportation," Statistical Abstract of the United States, 2002. 2002,U.S. Census Bureau, 22/Jun/2004 <http://www.census.gov/prod/2003pubs/02statab/trans.pdf>.p689.Section 23 - Table No.1089.Railroads,Class I —Summary:1990 to 2000 (for number of class I freight cars& locomotives)
Ibid 15 for number of trucks
159 Ibid 158 p669.No.1053.Highway Mileage —Functional Systems and Urban/Rural:2000
160 Ibid 158
161Cathy Keefe, "Business and Convention Travelers' Habits Tracked in New Survey," Press Releases,8/Feb 2005, Travel Industry Association of America (TIA), 23/Sep/2005<http://www.tia.org/pressmedia/pressrec.asp?Item=359>.
16260% of air trips are 400 miles or fewer.Joe Sharkey, "Rail Projects Are Sign of a Quiet Revolution in Short-Haul Trips," EcoCity Cleveland -Transportation Choices, 4/Jun 2002, New York Times Inc., 23/Sep/2005 <http://www.ecocitycleveland.org/transportation/rail/nytimes_rail_article.html>.
70% of European domestic flights are 621 miles or underCaroline Dr. Lucas, The Future of Aviation: The Government's Consultation Document on Air TransportPolicy - Submission from Dr Caroline Lucas, MEP, Green Party, and Member of the EuropeanParliament's Transport Committee. 2001. European Parliment, Green Party UK, 23/Sep/2005 <http://archive.greenparty.org.uk/reports/2001/aviation/av_fut_mep_resp.pdf>.
Since Europe has much better long distance passenger rail infrastructure than the U.S., it would bereasonable to assume that at least 60% of U.S. domestic flights are same length. Thus 500 miles is areasonable interpolation between the two data points. Even if the second is thrown out, it is a conservativeextrapolation of the first data point alone.
163Conrad Schneider, Power Plant Emissions: Particulate Matter-Related Health Damages and the Benefitsof Alternative Emission Reduction Scenarios. Jun 2004. Clean Air Task Force Abt Associates Inc,24/Aug/2004 <http://cta.policy.net/dirtypower/docs/abt_powerplant_whitepaper.pdf>.
164 Note the following are the document versions I downloaded. Point your ftp enabled browser toftp://ftp.jrc.es/pub/eippcb/doc/ for the latest versions – since these documents are revised often, and theparticular FTP documents will probably have been replaced by more recent versions.
Cooling It: No Hair Shirt Solutions to Global Warming by Gar W. Lipow GarLpublic AT Comcast DOT net
Page 185 of 265
European Commission Directorate-General Joint Research Centre (JRC) Institute for ProspectiveTechnological Studies Sustainability in Industry, Energy and Transport European - IPPC Bureau,Integrated Pollution Prevention and Control Draft Reference Document on Best Available Techniques inthe Large Volume Inorganic Chemicals - Solid and Others Industry, Draft August 2004. Aug 2004,European Commission Directorate-General Joint Research Centre (JRC) Institute for ProspectiveTechnological Studies Sustainability in Industry, Energy and Transport European - IPPC Bureau,17/May/2005 <ftp://ftp.jrc.es/pub/eippcb/doc/lvic-s_d1_0804.pdf>.
European Commission Directorate-General Joint Research Centre (JRC) Institute for ProspectiveTechnological Studies Sustainability in Industry, Energy and Transport European - IPPC Bureau,Integrated Pollution Prevention and Control (IPPC) Reference Document on Best Available Techniques forMineral Oil and Gas Refineries, Final. Feb 2003, European Commission Directorate-General JointResearch Centre (JRC) Institute for Prospective Technological Studies Sustainability in Industry, Energyand Transport European - IPPC Bureau, 18/May/2005 <ftp://ftp.jrc.es/pub/eippcb/doc/ref_final_0203.pdf>.
European Commission Directorate-General Joint Research Centre (JRC) Institute for ProspectiveTechnological Studies Sustainability in Industry, Energy and Transport European - IPPC Bureau,Integrated Pollution Prevention and Control (IPPC) Reference Document on Best Available Techniques inthe Large Volume Organic Chemical Industry. Feb 2003, European Commission Directorate-General JointResearch Centre (JRC) Institute for Prospective Technological Studies Sustainability in Industry, Energyand Transport European - IPPC Bureau, 24/Sep/2005 <ftp://ftp.jrc.es/pub/eippcb/doc/lvo_bref_0203.pdf>.
European Commission Directorate-General Joint Research Centre (JRC) Institute for ProspectiveTechnological Studies Sustainability in Industry, Energy and Transport European - IPPC Bureau, ReferenceDocument on Best Available Techniques for Management of Tailings and Waste-Rock in Mining Activities,Final. Jul 2004, European Commission Directorate-General Joint Research Centre (JRC) Institute forProspective Technological Studies Sustainability in Industry, Energy and Transport European - IPPCBureau, 18/May/2005 <ftp://ftp.jrc.es/pub/eippcb/doc/mmr_bref_0704.pdf>.
European Commission Directorate-General Joint Research Centre (JRC) Institute for ProspectiveTechnological Studies Sustainability in Industry, Energy and Transport European - IPPC Bureau,Integrated Pollution Prevention and Control Reference Document on Best Available Techniques in theSmitheries and Foundries Industry. Jul 2004, European Commission Directorate-General Joint ResearchCentre (JRC) Institute for Prospective Technological Studies Sustainability in Industry, Energy andTransport European - IPPC Bureau, 18/May/2005 <ftp://ftp.jrc.es/pub/eippcb/doc/sfo_bref_0704.pdf>.
European Commission Directorate-General Joint Research Centre (JRC) Institute for ProspectiveTechnological Studies Sustainability in Industry, Energy and Transport European - IPPC Bureau,Integrated Pollution Prevention and Control Reference Document on Best Available Techniques onEmissions from Storage. Jan 2005, European Commission Directorate-General Joint Research Centre (JRC)Institute for Prospective Technological Studies Sustainability in Industry, Energy and Transport European -IPPC Bureau, 18/May/2005 <ftp://ftp.jrc.es/pub/eippcb/doc/esb_final_0105.pdf>.
European Commission Directorate-General Joint Research Centre (JRC) Institute for ProspectiveTechnological Studies Sustainability in Industry, Energy and Transport European - IPPC Bureau,Integrated Pollution Prevention and Control Reference Document on Best Available Techniques inCommon Waste Water and Waste Gas Treatment/Management Systems in the Chemical Sector. Feb 2003,European Commission Directorate-General Joint Research Centre (JRC) Institute for ProspectiveTechnological Studies Sustainability in Industry, Energy and Transport European - IPPC Bureau,18/May/2005 <ftp://ftp.jrc.es/pub/eippcb/doc/cww_final_0203.pdf>.
European Commission Directorate-General Joint Research Centre (JRC) Institute for ProspectiveTechnological Studies Sustainability in Industry, Energy and Transport European - IPPC Bureau,Integrated Pollution Prevention and Control Draft Reference Document on Best Available Techniques inthe Production of Polymers, Draft. April 2005, European Commission Directorate-General Joint Research
Cooling It: No Hair Shirt Solutions to Global Warming by Gar W. Lipow GarLpublic AT Comcast DOT net
Page 186 of 265
Centre (JRC) Institute for Prospective Technological Studies Sustainability in Industry, Energy andTransport European - IPPC Bureau, 18/May/2005 <ftp://ftp.jrc.es/pub/eippcb/doc/pol_d2_0405.pdf>.
European Commission Directorate-General Joint Research Centre (JRC) Institute for ProspectiveTechnological Studies Sustainability in Industry, Energy and Transport European - IPPC Bureau,Integrated Pollution Prevention and Control Draft Reference Document on Best Available Techniques inthe Food, Drink and Milk Industry, Draft. May 2003, European Commission Directorate-General JointResearch Centre (JRC) Institute for Prospective Technological Studies Sustainability in Industry, Energyand Transport European - IPPC Bureau, 18/May/2005 <ftp://ftp.jrc.es/pub/eippcb/doc/fdm_d2_0503.pdf>.
European Commission Directorate-General Joint Research Centre (JRC) Institute for ProspectiveTechnological Studies Sustainability in Industry, Energy and Transport European - IPPC Bureau,Integrated Pollution Prevention and Control Draft Reference Document on Best Available Techniques inthe Ceramic Manufacturing Industry, Draft. Oct 2004, European Commission Directorate-General JointResearch Centre (JRC) Institute for Prospective Technological Studies Sustainability in Industry, Energyand Transport European - IPPC Bureau, 18/May/2005 <ftp://ftp.jrc.es/pub/eippcb/doc/cer_d1_1004.pdf>.
European Commission Directorate-General Joint Research Centre (JRC) Institute for ProspectiveTechnological Studies Sustainability in Industry, Energy and Transport European - IPPC Bureau,Integrated Pollution Prevention and Control Draft Reference Document on Best Available Techniques forthe Surface Treatment of Metals and Plastics, Draft. Apr 2004, European Commission Directorate-GeneralJoint Research Centre (JRC) Institute for Prospective Technological Studies Sustainability in Industry,Energy and Transport European - IPPC Bureau, 18/May/2005<ftp://ftp.jrc.es/pub/eippcb/doc/stm_d2_0404.pdf>.
European Commission Directorate-General Joint Research Centre (JRC) Institute for ProspectiveTechnological Studies Sustainability in Industry, Energy and Transport European - IPPC Bureau,Integrated Pollution Prevention and Control Draft Reference Document on Best Available Techniques forthe Surface Treatment Using Organic Solvents, Draft. May 2004, European Commission Directorate-General Joint Research Centre (JRC) Institute for Prospective Technological Studies Sustainability inIndustry, Energy and Transport European - IPPC Bureau, 18/May/2005<ftp://ftp.jrc.es/pub/eippcb/doc/sts_d1_0504.pdf>.
European Commission Directorate-General Joint Research Centre (JRC) Institute for ProspectiveTechnological Studies Sustainability in Industry, Energy and Transport European - IPPC Bureau,Integrated Pollution Prevention and Control (IPPC) Reference Document on Best Available Techniques inthe Ferrous Metals Processing. Dec 2001, European Commission Directorate-General Joint ResearchCentre (JRC) Institute for Prospective Technological Studies Sustainability in Industry, Energy andTransport European - IPPC Bureau, 18/May/2005 <ftp://ftp.jrc.es/pub/eippcb/doc/fmp_bref_1201.pdf>.
European Commission Directorate-General Joint Research Centre (JRC) Institute for ProspectiveTechnological Studies Sustainability in Industry, Energy and Transport European - IPPC Bureau,Integrated Pollution Prevention and Control (IPPC) Best Available Techniques Reference Document onthe Production of Iron and Steel. Dec 2001, European Commission Directorate-General Joint ResearchCentre (JRC) Institute for Prospective Technological Studies Sustainability in Industry, Energy andTransport European - IPPC Bureau, 18/May/2005 <ftp://ftp.jrc.es/pub/eippcb/doc/isp_bref_1201.pdf>.
European Commission Directorate-General Joint Research Centre (JRC) Institute for ProspectiveTechnological Studies Sustainability in Industry, Energy and Transport European - IPPC Bureau,Integrated Pollution Prevention and Control (IPPC) Best Available Techniques Draft Reference Documentfor Large Combustion Plants, Draft. Nov 2004, European Commission Directorate-General Joint ResearchCentre (JRC) Institute for Prospective Technological Studies Sustainability in Industry, Energy andTransport European - IPPC Bureau, 18/May/2005 <ftp://ftp.jrc.es/pub/eippcb/doc/lcp_d3_1104.pdf>.
Cooling It: No Hair Shirt Solutions to Global Warming by Gar W. Lipow GarLpublic AT Comcast DOT net
Page 187 of 265
European Commission Directorate-General Joint Research Centre (JRC) Institute for ProspectiveTechnological Studies Sustainability in Industry, Energy and Transport European - IPPC Bureau,Integrated Pollution Prevention and Control (IPPC) Reference Document on Best Available Techniques inthe Chlor-Alkali Manufacturing Industry. Dec 2001, European Commission Directorate-General JointResearch Centre (JRC) Institute for Prospective Technological Studies Sustainability in Industry, Energyand Transport European - IPPC Bureau, 18/May/2005 <ftp://ftp.jrc.es/pub/eippcb/doc/cak_bref_1201.pdf>.
165Martin Patel et al., "Chapter 14 Life-Cycle Assessment of Bio-Based Polymers and Natural FiberComposites," Biopolymers, Volume 10, General Aspects and Special Applications. Biopolymers, 10Volumes with Index, ed. Alexander Steinbüchel. April 2003. Wiley, 11/Jun/2004<http://www.chem.uu.nl/nws/www/general/personal/Biopoly.pdf>.p409.(Summarized in Section 5)
166Committee on Biobased Industrial Products, National Research Council, Biobased Industrial Products:Research and Commercialization Priorities - Executive Summary. 2000. National Academy of Sciences,24/Sep/2005 <http://books.nap.edu/execsumm_pdf/5295.pdf>.
167 Judy Kincaid, Industrial Ecosystem Development Project Report. May 1999. Triangle J Council ofGovernments, 23/Sep/2005 <ftp://ftp.tjcog.org/pub/solidwst/ieprept.pdf>.
168The Kalundborg Centre for Industrial Symbiosis, Kalundborg Municipality;Asnæs Power Station;TheStatoil Refinery;BPB Gyproc A/S; Soilrem A/S;Novo Nordisk A/S;Novozymes A/S;Noveren I/S;IndustrialDevelopment Council - Kalundborg Region, 14/Aug/2004 <http://www.symbiosis.dk/>.
169Energy Information Administration Office of Energy Markets and End Use - U.S. Department of Energy,Annual Energy Review 2001, DOE/EIA-0384(2001). Nov 2002, Energy Information Administration Officeof Energy Markets and End Use - U.S. Department of Energy, 25/Sep/2005<http://tonto.eia.doe.gov/FTPROOT/multifuel/038401.pdf>.p51.Table 2.4 Manufacturing Inputs for Heat, Power, and Electricity Generation by End Use, 1998
170Arvind C. Thekdi, "Guest Column: Energy Savings in Industry Through Use of Insulation andRefractories,". Energy Matters May/Jun 2000: Best Practices, U.S. Department of Energy Office of EnergyEfficiency and Renewable Energy Industrial Technologies Program, 25/Sep/2005<http://www.eere.energy.gov/industry/bestpractices/may2000_guest.htm>.
171U.S. Department of Energy Office of Energy Efficiency and Renewable Energy Industrial TechnologiesProgram, Energy-Saving Lightweight Refractory: New Refractory Material Allows For Thinner, Lighter,And More Cost-Effective Manufacturing Of Kiln Furniture. Inventions and Innovation Project Fact Sheet,DOE/GO-102001-1037. Feb 2001, U.S. Department of Energy Office of Energy Efficiency and RenewableEnergy Industrial Technologies Program, 5/Sep/2004<http://www.eere.energy.gov/inventions/pdfs/silicar.pdf>.
172h Christine L. Grahl, "Saving Energy with Raw Materials,". Ceramic Industry 1/Jul 2002, BNP Media,25/Sep/2005<http://www.ceramicindustry.com/CDA/ArticleInformation/coverstory/BNPCoverStoryItem/0,2708,80846,00.html>.
173 Tourism and Resources Australia Department of Industry, "Steam Leaks,". Australian Energy News, no.16 June 2000, Australia Department of Industry, Tourism and Resources, 25/Sep/2005<http://www1.industry.gov.au/archive/pubs/aen/aen16/34steam.html (Same info as old ASE site pagehttp://www.ase.org/programs/industrial/steam.htm#Table%201 which has disappeared)>.
174

Cooling It: No Hair Shirt Solutions to Global Warming by Gar W. Lipow GarLpublic AT Comcast DOT net
Page 188 of 265
Weil-McLain, Straight Talk About Boiler Efficiency. 21/Jan 2005, Weil-McLain, 25/Sep/2005<http://www.weil-mclain.com/netdocs/straighttalk.htm>.
Weil-McLain calculates that single (non-adjustable) boilers tend to run at around 65% average efficiency ,whereas multiple (or adjustable) boilers tend to run at around 80% average efficiency. This translates intoslightly less than a 20% savings from the more efficient to the less efficient boiler.
Note that this is talking commercial boilers – used for space and hot water heating. But the same principalsapply to industrial boilers; a boiler operates much less efficiently when used at less than capacity. Somultiple boilers turned on as needed, so that all running boiler operate near maximum efficiency are moreefficient than one big boiler running at less than maximum efficiency most of the time. Note there are twomajor limits to this. One is cost: many small boilers cost more that a few big ones. The second is thatwarming up and cooling down a boiler also costs energy. If you have too many boilers and spend a lot oftime turning them on and off, you will waste more energy than you save. But the optimum is fairly easy tocalculate on a plant by plant basis, and we are nowhere near it.
175Office of Industrial Technologies - Energy Efficiency and Renewable Energy • U.S. Department ofEnergy, Minimize Boiler Short Cycling Losses. Tip Sheets, Tip Sheet 16. Dec 2000. Office of IndustrialTechnologies - Energy Efficiency and Renewable Energy • U.S. Department of Energy, 8/Oct/2005<http://www.eere.energy.gov/industry/bestpractices/pdfs/boil_cycl.pdf>.
Pacific Gas & Electric Company, Energy Efficient Operations and Maintenance Strategies for IndustrialGas Burners. PG&E Energy Efficiency Information© “Industrial Gas Boiler O&M Strategies”. 25/Apr1997, Pacific Gas & Electric Company, 8/Oct/2005<http://www.pge.com/003_save_energy/003c_edu_train/pec/info_resource/pdf/GASBOILR.PDF>.
CANMET Energy Technology Centre, Natural Resources Canada, "Chapter 2: Getting the Most For YourFuel Bill," An Energy Efficiency and Environment Primer for Boiler and Heaters. 22/Jan 2003, CANMETEnergy Technology Centre, Natural Resources Canada, 8/Oct/2005<http://www.energysolutionscenter.org/BoilerBurner/Resources/Primer/Primer_Chap2.pdf>.
176The Delta Institute, Sector-Based Pollution Prevention: Toxic Reductions Through Energy Efficiencyand Conservation Among Industrial Boilers: A Report to the United States EPA Great Lakes NationalProgram Office, GL97514402. July 2002. The Delta Institute, 25/Sep/2005 <http://delta-institute.org/publications/boilers/SectorBasedP2.pdf>.p16. (8.5X11 Pages)Table 3-3(Note: recommendation 3 in table 3-3 appears to have a multi-century payback because a period wassubstituted for a comma. The same number appears in table 3-2 in the document http://www.delta-institute.org/publications/boilers/Table3-2.pdf with comma in the proper place.)
177Consortium for Energy Efficiency, Inc, Motor Decisions Matter Energy Efficiency/Usage Fact Sheet.~2002, Consortium for Energy Efficiency, Inc (Consortium of Motor Industry Manufacturers and ServiceCenters, Trade Associations, Electric Utilities and Government Agencies), 25/Sep/2005 <http://www.motorsmatter.org/press/press_kit/energry_facts.html>.
178 Ibid 22 p115.Chapter 6, Tunneling through the Cost Barrier | Integrating Design to Capture multiple Benefits
179 U.S. Department of Energy Office of Energy Efficiency and Renewable Energy Industrial TechnologiesProgram, Energy Tips: Reduce Pumping Costs Through Optimum Pipe Sizing: Motor Tip Sheet # 1,DOE/GO-10099-879. Dec 1999. U.S. Department of Energy Office of Energy Efficiency and RenewableEnergy Industrial Technologies Program, 16/Aug/2004<http://www.energystar.gov/ia/business/industry/motor1.pdf>.

Cooling It: No Hair Shirt Solutions to Global Warming by Gar W. Lipow GarLpublic AT Comcast DOT net
Page 189 of 265
180Paul Hawken, Amory Lovins, and L.Hunter Lovins, "Additional Book Material -Appendix 5-D,"Natural Capitalism, Additional Material for Hawkens, Lovins&Lovins "Natural Capitalism" - On-LineOnly, 1999, Rocky Mountain Institute, 25/Sep/2005<http://www.natcap.org/sitepages/art58.php?pageName=Additional%20Book%20Material&article_refresh=%2Fsitepages%2Fpid27.php%3FpageId%3D27>.
181The Atlas Project of the European Commission, Estimated Long Term Technical Energy SavingsPotential. 7/Mar 2002, The Atlas Project of the European Commission, 17/Aug/2004<http://europa.eu.int/comm/energy_transport/atlas/htmlu/ioeneffa.html>.
182U.S. Department of Energy - Energy Information Administration, E.1g World Energy Intensity (TotalPrimary Energy Consumption Per Dollar of Gross Domestic Product),1980-2002 (Btu Per 1995 U.S.Dollars Using Market Exchange Rates). 25/Jun 2004, U.S. Department of Energy - Energy InformationAdministration, 18/Aug/2004 < http://www.eia.doe.gov/pub/international/iealf/tablee1c.xls>.
183Office of Industrial Technologies - Energy Efficiency and Renewable Energy • U.S. Department ofEnergy, Energy-Efficient Food-Blanching System: New Blanching System Increases Productivity WhileSaving Energy. NICE 3 - National Industrial Competitiveness Through Energy, Environment, andEconomics. Mar 2002, Office of Industrial Technologies - Energy Efficiency and Renewable Energy • U.S.Department of Energy <http://www.oit.doe.gov/nice3/factsheets/key.pdf (Note:removed from web alongwith a lot of other federal energy information. I kept a copy; substitute URL on book site.)>.
184 Joseph J. Romm, Cool Companies: Proven Results - Cool Buildings. 2005, Romm,Joseph J.,22/Aug/2005 <http://www.cool-companies.com/proven/buildings.cfm>.
185 Industrial Technologies Program - Energy Efficiency and Renewable Energy • U.S. Department ofEnergy, American Water Heater Company: Compressed Air System Optimization Project Saves Energyand Improves Production at Water Heater Plant. BestPractices Case Study, DOE/GO-102003-1716. Nov2003, Industrial Technologies Program - Energy Efficiency and Renewable Energy • U.S. Department ofEnergy, 26/Sep/2005 <http://www.nrel.gov/docs/fy04osti/33648.pdf>.
186Office of Industrial Technologies - Energy Efficiency and Renewable Energy • U.S. Department ofEnergy, Weldcomputer® Resistance Welder Adaptive Control: Sophisticated Welding Control SystemSaves Energy, Improves Quality, and is Affordable for General Industrial Use. Inventions and InnovationSuccess Story, I-OT-588. Jan 2002, Fice of Industrial Technologies - Energy Efficiency and RenewableEnergy • U.S. Department of Energy, 4/Sep/2005<http://www.eere.energy.gov/inventions/pdfs/weldcomp.pdf>.
187Office of Industrial Technologies - Energy Efficiency and Renewable Energy • U.S. Department ofEnergy, Mobile Zone Spray Booth Technology For Ultra-Efficient Surface Coating Operations: NewTechnology Saves Energy And Reduces Pollution During Surface Coating Operations. Inventions &Innovation, I-OT-489. Dec 2001, Office of Industrial Technologies - Energy Efficiency and RenewableEnergy • U.S. Department of Energy, 5/Sep/2004<http://www.eere.energy.gov/inventions/pdfs/clydesmith.pdf>.
188Office of Industrial Technologies - Energy Efficiency and Renewable Energy • U.S. Department ofEnergy, Irrigation Valve Solenoid Energy Saver • New Battery-Powered Controllers Save Energy inIrrigation Applications. Agriculture Success Story, I-OT-698. Sep 2001, Office of Industrial Technologies- Energy Efficiency and Renewable Energy • U.S. Department of Energy, 5/Sep/2004<http://www.eere.energy.gov/inventions/pdfs/alextronix.pdf>.
189Office of Industrial Technologies - Energy Efficiency and Renewable Energy • U.S. Department ofEnergy, ENS Fan Saver For Medium-Temperature Walk-In Refrigerators • New Fan Saver Reduces EnergyConsumption up to 50%. Inventions & Innovation, I-OT-670. Oct 2001, Office of Industrial Technologies -

Cooling It: No Hair Shirt Solutions to Global Warming by Gar W. Lipow GarLpublic AT Comcast DOT net
Page 190 of 265
Energy Efficiency and Renewable Energy • U.S. Department of Energy, 6/Sep/2004<http://www.eere.energy.gov/inventions/pdfs/ensfansaver.pdf>.
190Office of Industrial Technologies - Energy Efficiency and Renewable Energy • U.S. Department ofEnergy, Thermodyne™ Evaporator - A Molded Pulp Products Dryer • New Technology RevolutionizesPulp Product Drying. Forest Products Success Story, I-FP-529. Apr 2002, Office of IndustrialTechnologies - Energy Efficiency and Renewable Energy • U.S. Department of Energy, 6/Sep/2004<http://www.eere.energy.gov/inventions/pdfs/merrillaireng.pdf>.
191Office of Industrial Technologies - Energy Efficiency and Renewable Energy • U.S. Department ofEnergy, Meta-Lax® Stress Relief Process - Greatly Reduces Energy Consumption and EliminatesPollution. Metal Success Story, I-MC-412. Aug 2002, Office of Industrial Technologies - EnergyEfficiency and Renewable Energy • U.S. Department of Energy, 6/Sep/2004<http://www.eere.energy.gov/inventions/pdfs/bonaltech.pdf>.
192Ross A. Leventhal, "Sustainable in Seattle,". Architecture Week, no. 101 5/Jun 2002: Environment,Artifice Inc., 6/Sep/2004 <http://www.architectureweek.com/2002/0605/environment_2-2.html>.pE2.2.
193"Journeys-to-work using public transportation continued to take twice as long as private transportation,though there is only a slight difference in travel distance."Ibid 147 p11-15.
194Ibid 147 p11-12.
195 John A. Dearien (Junior), "Ultralight Rail and Energy Use," in Encyclopedia of Energy, ed. Cutler J.Cleveland (Elsevier Publishing, March 2004), 255-66.
196 Energy Conversion Devices, Inc., Energy Conversion Devices, Inc. 1997 Letter to Stockholders -Commercializing Technologies That Enable the Information and Energy Industries. Dec 1997, EnergyConversion Devices, Inc., 26/Sep/2005 <http://www.ovonic.com/PDFs/LtrstoShldrs/ecd97ltr.pdf>.p3.
197Mark Duvall et al., Advanced Batteries for Electric-Drive Vehicles : A Technology and Cost-Effectiveness Assessment for Battery Electric, Power Assist Hybrid Electric, and Plug-in Hybrid ElectricVehicles, Preprint Report, Version 16. 25/March 2003, Electric Power Research Institute (EPRI), 03-Jan-2007 <http://www.epri.com/corporate/discover_epri/news/downloads/EPRI_AdvBatEV.pdf>.Page v. - Battery cycles are over 2,000 cycles with almost no loss of capacity with deep discharge, evenbetter with shallow discharge in actual use. So we can conservatively estimate 1,000 cycles, which wouldlast longer than the lifetime of the car.
Page vi - NiMH cost can reach $320 per kWh capacity in volumes of 100,000 or more. (Remember that anautomobile needs more than one)
So battery cost, interest, and electricity at 14 cents per kWh will still cost less than $2.50 per gallon gas.
198Rocky Mountain Institute, "The Hypercar® Concept," Transportation, 2004, Rocky Mountain Institute,19/Aug/2004 <http://www.rmi.org/sitepages/pid386.php>.
199 IAGS-Institute for the Analysis of Global Security, Plug-in Hybrid Vehicles. 14/Jan 2006, IAGS-Institute for the Analysis of Global Security, 17/Mar/2006 <http://www.iags.org/pih.htm>.
200 CalCars - The California Cars Initiative - 100 MPG Hybrids, Plug-In Hybrids: State Of Play, History &Players. 17/Mar 2006, 17/Mar/2006 <http://www.calcars.org/history.html>.
201Hanne Siikavirta et al., "Effects of E-Commerce on Greenhouse Gas Emissions: A Case Study ofGrocery Home Delivery in Finland,". Journal of Industrial Ecology 6, no. 2 - E-commerce, the Internet,
Cooling It: No Hair Shirt Solutions to Global Warming by Gar W. Lipow GarLpublic AT Comcast DOT net
Page 191 of 265
and the Environment Spring 2002, MIT Press, 19/Aug/2004<http://mitpress.mit.edu/journals/jiec/v6n2/jie_v6n2_83_0.pdf>.Pp 83-97.
202Ibid 147Table 2.11 Passenger Travel and Energy Use in the United States, 2000
203Gerrit Knaap et al., Government Policy and Urban Sprawl. 2000. Illinois Department of NaturalResources, University of Illinois at Urbana-Champaign, 29/Jun/2005<http://dnr.state.il.us/orep/c2000/balancedgrowth/pdfs/government.pdf>.
204Ibid 147 p2-19.Table 2.14 - Intercity Freight Movement and Energy in the United States, 2000
205Cathy Keefe, "Business and Convention Travelers' Habits Tracked in New Survey," Press Releases,8/Feb 2005, Travel Industry Association of America (TIA), 23/Sep/2005<http://www.tia.org/pressmedia/pressrec.asp?Item=359>.
206Charles River Associates Incorporated;Polaris Research & Development, "A Summary of Key StatisticsAcross Airports," AIR PASSENGERS FROM THE BAY AREA’S AIRPORTS, 2001 & 2002 - Final ReportVolume 1:OVERVIEW AND METHODS, CRA No. D03144-00. Sept 2003. Metropolitan TransportationCommission, 23/Sep/2005<http://www.mtc.ca.gov/maps_and_data/datamart/survey/APS_report_volume_1.pdf>.p7.(Note statistics are bay area statistics only.)
Inbound International travel 26%-30% primarily for business purposes. So 26% remains a conservativeestimate at international level.Bureau of Transportation Statistics, BTS - U.S. International Travel and Transportation Trends - OverseasTravel Trends. 2004, Inbound Overseas Travel;, Bureau of Transportation Statistics, 23/Sep/2005<http://www.bts.gov/publications/us_international_travel_and_transportation_trends/overtrends.html>.
21% of RPM business and first class. Since an increasing percent of business air travel is economy, that isconsistent with 26% estimate.Jim Corridore, "Industry Profiles - Industry Trends," Standar & Poor's Industry Surveys: Airlines. 25/Nov2004. Standards & Poor's Division of McGraw Hill, 23/Sep/2005<http://libsys.uah.edu/library/mgt301/spairline.pdf>.p11.
207D. Dimitriu et al., Aviation and the Global Atmosphere -(Chapter 8) Air Transport Operations andRelations to Emissions - Executive Summary. Apr 1999, GRID-Arendal Official United NationsEnvironment Programme (UNEP) Centre, 19/Aug/2004<http://www.grida.no/climate/ipcc/aviation/119.htm>.
208Boeing World Headquarters, Boeing 787-3 Dreamliner Facts. 2003, Boeing Company, 21/Aug/2004<http://www.boeing.com/commercial/7e7/facts_sr.html>.
209William R. Moomaw et al., Climate Change 2001 - Mitigation -Working Group III: Mitigation - 3.4.4.8Waterborne Transport. 2001, Intergovernmental Panel on Climate Change, 19/Aug/2005<http://www.grida.no/climate/ipcc_tar/wg3/103.htm>.
210U.S. Army Corp of Engineers | Rock Island District | Mississippi Valley Division, Transportation ModeComparison - Energy Environment- Efficiency. Jan 2002. U.S. Army Corp of Engineers | Rock IslandDistrict | Mississippi Valley Division, 26/Sep/2005 <http://www2.mvr.usace.army.mil/UMR-IWWSNS/documents/tr-comp.pdf>.p1.
Cooling It: No Hair Shirt Solutions to Global Warming by Gar W. Lipow GarLpublic AT Comcast DOT net
Page 192 of 265
211I’m conservatively estimating compressor change potential to be only a 1% savings though moreprobably between 2% and 4% of compressor energy could be saved in the U.S. through such means.
Compresser efficiency can vary from 50% to over 90% in natural gas pipelines.Southwest Research Institute (SwRI), 18-Services for the Pipeline Industry Brochure. 2005, SouthwestResearch Institute (SwRI), 27/Sep/2005 <http://www.swri.edu/3pubs/brochure/d18/pipeline/pipeline.htm>.
We have an aging fleet of compressors 20-50 years old. While most the efficient gas compressors areabout 91%, new electric compressor 92-95% efficient. (Note: these percents are comparisons to thethermodynamic limit, not to a theormodynamically impossible 100% efficiency. And yes, the gas used togenerate the electricity for the electric compressors is taken into consideration; it is like hybrid cars; insome cases using heat to generate electricity to produce mechanical power can be more efficient that usingheat directly to generate mechanical power ).
Michael Crowley and Prem Bansal, Development of an Integrated Electric Motor Compression System.3/Oct 2004, Gas Machinery Research Council | DOE NETL Research Review, 27/Sep/2005<http://www.gmrc.org/gmrc/2004finalpapers/Development%20of%20an%20Integrated%20Electric%20Motor%20Driven%20Compressor.pdf>.
Although older less efficient compressors were more rugged and lasted up to 50 years, more typically apipeline compressor lasts 30 years. Most U.S. compressors are under 90% efficiency, and almost none areabove 91%. So even if the “compressor fleet” was new we could expect just about every compressor to bereplaced over the next 30 years with one that is a percent or two more efficient. But in fact, as documentedabove we have a lot of old compressors, which are probably more in 75%-80% efficiency range. They willneed to be replaced soon; replacing them with the most efficient compressors will save a lot more than afew percent. So actually 4% savings from compressor improvements would still be a conservativeestimate. 1% leaves a huge margin of error.
212Phil Ferber et al., Gas Pipeline Optimization. 31st Annual Meeting - October 20-22, 1999 | St. Louis,Missouri. Oct 1999, Pipeline Simulation Interest Group, 27/Sep/2005<http://www.psig.org/papers/1990/9905.pdf>.p16.
This documents a 13.26% savings from just better (and very simple) software control. That cumulated witha 1% savings from improved compressors gives you better that 14% savings. And that does not evenconsider leaks: better controls can detect leaks more quickly and pinpoint them more accurately. Moremodern compressors cause fewer leaks to begin with. (Compressors are a major cause of leaks.) So thatgives you an additional margin of error in an already very conservative estimate.
213Jürgen Schnieders, CEPHEUS - Measurement Results from More Than 100 Dwelling Units in PassiveHouses. May 2003. Passive House Institute, 23/Dec/2003<http://www.passiv.de/07_eng/news/CEPHEUS_ECEEE.pdf>.
(Note: he documented an 80% reduction compared to German standards. But Germans use about half theenergy per capita as the U.S.
States Census Bureau, "Section 19 - Energy and Utilities," Statistical Abstract of the United States 2002.December 2002. United States Census Bureau<http://www.census.gov/prod/2003pubs/02statab/energy.pdf>.p847Table No. 1350. Energy Consumption and Production by Country: 1990 and 2000
So this is a 90% savings, compared to U.S. standards. Actually it is a bit more, because the 80% savingscompares to tougher requirements for new German homes, not average use.
214U.S. Department of Energy - Energy Information Administration, "2001 Consumption and ExpendituresTables - Space-Heating Expenditures Tables," A Look at Residential Energy Consumption in 2001.
Cooling It: No Hair Shirt Solutions to Global Warming by Gar W. Lipow GarLpublic AT Comcast DOT net
Page 193 of 265
23/October 2003, 23/Dec/2003<ftp://ftp.eia.doe.gov/pub/consumption/residential/2001ce_tables/spaceheat_expend.pdf>
Table CE2-9e. Space-Heating Energy Expenditures in U.S. Households by Northeast Census Region, 2001- Preliminary Data
Table CE2-12e. Space-Heating Energy Expenditures in U.S. Households by West Census Region, 2001 -Preliminary Data
U.S. Department of Energy - Energy Information Administration, "2001 Consumption and ExpendituresTables - Electric Air-Conditioning Expenditures Tables," A Look at Residential Energy Consumption in2001. 23/October 2003, 23/Dec/2003<ftp://ftp.eia.doe.gov/pub/consumption/residential/2001ce_tables/ac_expend.pdf>.
Table CE3-9e. Electric Air-Conditioning Energy Expenditures in U.S. Households by Northeast CensusRegion, 2001 - Preliminary Data
Table CE3-12e. Electric Air-Conditioning Energy Expenditures in U.S. Households by West CensusRegion, 2001 - Preliminary Data
215Joe Wiehagen and Craig Drumhelle, Strategies for Energy Efficient Remodeling | Seer 2003 |Case StudyReport, 2004). 30/Mar 2004. National Renewable Energy Laboratory, 1/Oct/2005<http://www.toolbase.org/docs/MainNav/Remodeling/4564_SEERCaseStudyReport.pdf>.
216 Agence France-Presse, Thai Architect Hits on Blueprint for Sustainable Living in the Tropics.28/September 2003, Terra Daily, 06/Jul/2005<http://www.terradaily.com/2003/030928033742.6azaxajn.html>.
Maria Cheng and Julian Gearing, "Green Seeds,". Asia Week 27-18 11/May 2001, Asia Week, 05/Jul/2005<http://www.asiaweek.com/asiaweek/magazine/nations/0,8782,108626,00.html>.
217And according to Amory Lovins this was larger than he needed.Paul Hawken, Amory Lovins, and L.Hunter Lovins, Natural Capitalism: Creating the Next IndustrialRevolution (Boston: Little, Brown and Company/Back Bay, 2000).Chapter 5:Building Blocks. p103.
218U.S. Department of Energy - Energy Information Administration, "2001 Consumption and ExpendituresTables - Total Energy Consumption," A Look at Residential Energy Consumption in 2001. 23/October2003, 23/Dec/2003<ftp://ftp.eia.doe.gov/pub/consumption/residential/2001ce_tables/enduse_consump.pdf>.
Table CE1-9c. Total Energy Consumption in U.S. Households by Northeast Census Region, 2001 -Preliminary Data
U.S. Department of Energy - Energy Information Administration, "2001 Consumption and ExpendituresTables - Water-Heating Consumption Tables," A Look at Residential Energy Consumption in 2001.23/October 2003, 23/Dec/2003<ftp://ftp.eia.doe.gov/pub/consumption/residential/2001ce_tables/waterheat_consump.pdf>.
Table CE4-9c. Water-Heating Energy Consumption in U.S. Households by Northeast Census Region, 2001- Preliminary
219U.S. Department of Energy - Energy Information Administration, "2001 Consumption and ExpendituresTables - Water-Heating Expenditures," A Look at Residential Energy Consumption in 2001. 23/October

Cooling It: No Hair Shirt Solutions to Global Warming by Gar W. Lipow GarLpublic AT Comcast DOT net
Page 194 of 265
2003, 23/Dec/2003<ftp://ftp.eia.doe.gov/pub/consumption/residential/2001ce_tables/waterheat_expend.pdf>
Table CE4-9e. Water-Heating Energy Expenditures in U.S. Households by Northeast Census Region, 2001- Preliminary Data
Table CE4-10e. Water-Heating Energy Expenditures in U.S. Households by Midwest Census Region, 2001- Preliminary Data
220U.S. Department of Labor Bureau of Labor Statistics, "Table 8. Region of Residence: Average AnnualExpenditures and Characteristics," Consumer Expenditure Survey 2002. 13/Nov 2003. U.S. Department ofLabor Bureau of Labor Statistics, 06/Jul/2005 < http://www.bls.gov/cex/2002/Standard/region.pdf>.
Table 8. Region of residence: Average annual expenditures and characteristics, Consumer ExpenditureSurvey, 2002
221Whedon 0.5 GPM Ultra SaverAerator - US$3.50Energy Federation Incorporated, EFI Internet Division Residential Catalogue | Bath Faucet Aerators. July2005, Energy Federation Incorporated, 13/Jul/2005<http://www.energyfederation.org/consumer/default.php/cPath/27_52>.
similar product to above for $2.15Conserv-A-Store, Conserv-A-Store :: Recycling Supplies, Solar Lighting, Electrical, Plumbing & WaterConservation Products-Economical & Eco-Friendly! Part Number: 01-0104. July 2005, Conserv-A-Store,13/Jul/2005 <http://www.conservastore.com/productdetail.php?p=23>.
222Conserv-A-Store, Conserv-A-Store :: Recycling Supplies, Solar Lighting, Electrical, Plumbing & WaterConservation Products-Economical & Eco-Friendly!. July 2005, Conserv-A-Store, 13/Jul/2005<http://www.conservastore.com/index_plumbing.htm>.
223According to the Handyman Club the Stepflow Kick Pedal should be discounted to $129Tom Sweeney, Handyman Club of America - Hands Free - Pedal Valve Makes Sink Faucets Convenientand Clean. February 1999, Handyman Club of America (Publishers of Handy Magazine), 13/Jul/2005<http://www.handymanclub.com/document.asp?cID=57&dID=777>.
And here it is on-line for $120.00 with shipping and such probably around $129 .Professional Piercing Information Systems, Products: Step-Flow Operated Sink Valve. 16/June 2005,Professional Piercing Information Systems, 13/Jul/2005 <http://www.propiercing.com/products.html>.
224Priced at $27.00 without shipping at sustainable village. Assuming six bucks in shipping charges total of$60. Since sustainable village ships this only to developing nations, I've given the URL of manufacturerwho should be able to tell where we in the U.S. can actually buy it.
Sustainable Village, Sustainable Village - Products - Aqua Helix . 2005, Sustainable Village, 13/Jul/2005<http://www.thesustainablevillage.com/servlet/display/product/detail/22602>.
Jet Blast Industrial Services, Aqua Helix Home. 18/Feb 1999, Jet Blast Industrial Services, 13/Jul/2005<http://www.jetblast.net/ahhome.html>.
225Microphor LF-210 $539.00Dean Petrich, Toilet Prices. 16/July 2005, Ultra-Low Water-Flush toilets, Aqua Alternatives, 20/Jul/2005<http://www.enviroalternatives.com/toiletprices.html#ULTRA-LOW%20WATER-FLUSH>.

Cooling It: No Hair Shirt Solutions to Global Warming by Gar W. Lipow GarLpublic AT Comcast DOT net
Page 195 of 265
226WaterFilm Energy Inc., GFX 40% Off. GFX Heat Exchanger, 25/May 2005, WaterFilm Energy Inc.,20/Jul/2005 < http://www.gfxtechnology.com/sale.html>.
Carmine Dr. Vasile, International Data on Successfully Demonstrated Energy Efficiency Projects -Residential Waste Water Heat-Recovery System: GFX. April 2000, Centre for the Analysis andDissemination of Demonstrated Energy Technologies, 20/Jul/2005<http://gfxtechnology.com/CADDET.PDF>.
Note where showers are not the main hot water consumer in the household storage recovery systems areavailable in the same price range:
National Association of Home Builders Research Center, Drainwater Heat Recovery. 2004, NationalAssociation of Home Builders Research Center, 08/Aug/2005<http://www.toolbase.org/tertiaryT.asp?DocumentID=2134&CategoryID=1402>.
227EnergyStar Dishwasher product rating - in this case 85% better than average new model (so divide by185).(Note: this does not quite double efficiency of what is currently for sale, which means it is probably doubleor better that currently in use - but we will use EnergyStar rating as conservative estimate of savings)
Energy Star Program of the EPA and DOE, Energy Star Qualified Dishwashers, List of Energy StarDishwashers with Efficiency Ratings. 14/June 2004, Energy Start Program of the EPA and DOE,10/Jul/2005 <http://www.energystar.gov/ia/products/prod_lists/dishwash_prod_list.pdf>.p1
228Average Energystar & regular appliance prices 2000
The NPD Group, Inc., NPD INTELECT REPORTS SIGNIFICANT GROWTH FOR ENERGY-EFFICIENTAPPLIANCES. Average Appliance Prices: Energystar Vs. Non-Energystar, 18/October 2000, The NPDGroup, Inc., 10/Jul/2005 < http://www.npd.com/press/releases/press_001018.htm>.
(Note: A market survey is a legitimate source for pricing information).
229ASKO, D3350. 204, ASKO, 05/Jul/2005<http://www.asko.se/ASKO/brandsite/main.cfm?moduleID=10&productID=2814#>.
230Universal Appliance and Kitchen Center, 24" ASKO Dishwasher, D3121. Quote July 10 for AskoD3121, July 2005, Universal Appliance and Kitchen Center, 10/Jul/2005 <http://store.universal-akb.net/24asdid3.html>. (Note this was for a particular day – the key is that you can get a dishwasher thatconsumes around 250 kWh per year for around $333 more than a non-Energy Star model.)
231Liz Madison, Kitchen Tools, Kitchen Electrics, Cookware, Tableware - LizMadison.Com -GWL11.GWL11 Clothes Washer, July 2005, Liz Madison, 10/Ju<http://www.lizmadison.com/housewares/Product.asp_X_SKU_Y_GWL11_Z_REF_Y_SHLIZ>.
No doubt the particular page will have expired by the time you read this. The main point is that you can geta washing machine that saves nearly 80% of the energy a non-Energy Star model would use for about $220more.
232Energy Star Program of the EPA and DOE, ENERGY STAR® Qualified Clothes Washers, ENERGYSTAR® Qualified Clothes Washers with Effiiciencies and Projected Yearly KWh Consumption. 21/June2004. Energy Star Program of the EPA and DOE, 11/Jul/2005<http://www.energystar.gov/ia/products/prod_lists/clotheswash_prod_list.pdf>.
(Again this rates against average new available, so efficiency compared to installed home clothes washersis probably slightly better.)

Cooling It: No Hair Shirt Solutions to Global Warming by Gar W. Lipow GarLpublic AT Comcast DOT net
Page 196 of 265
233Mark Hutchinson, Trickle Irrigation: Using and Conserving Water in the Home Garden - University ofMaine Cooperative Extension Bulletin #2280. April 2005, University of Maine Cooperative Extension,13/Jul/2005 < http://www.umext.maine.edu/onlinepubs/htmpubs/2160.htm>.
234William B. DeOreo, David M. Lewis, and Peter W. Mayer, Seattle Home Water Conservation Study:The Impacts of High Efficiency Plumbing Fixture Retrofits in Single-Family Homes. December 2000.Aquacraft, Inc. Water Engineering and Management, 08/Aug/2005<http://www.cuwcc.org/Uploads/product/Seattle-Final-Report.pdf>.p54.
235Madison Gas & Electric Company, Water Heaters. Feb/25 2005. Madison Gas and Electric Company,Madison Gas and Electric Company, 08/Aug/2005<http://www.mge.com/images/PDF/Brochures/Residential/WaterHeaters.pdf>.p3.
236Low Energy Systems, Inc, Infinion with Battery Spark Ignition. August 2005, Low Energy Systems, Inc,08/Aug/2005 <http://www.tanklesswaterheaters.com/infinion2.html>.
237 U.S. Department of Energy Office of Energy Efficiency and Renewable Energy, "Energy Savers:Compact Fluorescent Lamps," Energy Savers: A Consumer Guide to Renewable Energy and EnergyEfficiency, 21/June 2004, 19/Aug/2005 <http://www.eere.energy.gov/consumerinfo/factsheets/ef2.html>.
238Fisher & Paykel, Washers . August 2005, Fisher & Paykel, 19/Aug/2005<http://usa.fisherpaykel.com/laundry/washers/washers.cfm>.
239Secondary (end use) consumption is 4 kWh per load for the electric dryer, plus .23 kWh per load plus.22 therms per load for the gas dryer. If you convert therms to kWh at 100% efficiency this comes out thegas dryer actually using 67% more energy than an electric dryer.
Energy Star Program of the EPA and DOE, "About the HES Appliance Module," The Home Energy Saver,Table 3: Other Appliances and Miscellaneous Energy Usages, 06/June 2001, Energy Star Program of theEPA and DOE, 20/Aug/2005 < http://homeenergysaver.lbl.gov/hes/aboutapps.html>.
However, on average heat driven power plants convert only 36.47% of heat energy into electricity.
International Energy Agency, Electricity Information 2002 Edition, Electricity Information, vol. 2002Edition, no. ISBN 9264197931 (Paris: OECD - Organisation for Economic Co-operation and Development,2002).p.II.706Part II Table 9 United State Electricity Production From Combustible Fuels in Electricity Plants"
So dividing the electricity consumption in both gas and electric dryers by 36.47, and then converting bothto therms or both to kWh as you please, you end up with a 35.47% savings.
240California Energy Commission, "Dryers," Consumer Energy Center - Inside Your Home, August 2005,California Energy Commission, 20/Aug/2005<http://www.consumerenergycenter.org/homeandwork/homes/inside/appliances/dryers.html>.
241Amory B. Lovins and William D. Browning, Negawatts for Buildings, Jul/1992). 15/Nov 2000. UrbanLand Institute, 21/Jan/2004 <http://www.rmi.org/images/other/GDS-Negawatts4Bldgs.pdf>.pp4-5
242 Sarah Goorskey, Andy Smith, and Katherine Wang, Home Energy Briefs #7 - Electronics, 2004). 3/Dec2004. Rocky Mountain Institute, 20/Aug/2005 <http://www.rmi.org/images/other/Energy/E04-17_HEB7Electronics.pdf>.p3.
Cooling It: No Hair Shirt Solutions to Global Warming by Gar W. Lipow GarLpublic AT Comcast DOT net
Page 197 of 265
243Mark Palmer and Alicia Mariscal, Green Buildings and Worker Productivity: A Review of the Literature,Aug 2001). Aug 2001. San Francisco Department of the Environment, 22/Aug/2005<http://www.sfenvironment.com/aboutus/innovative/greenbldg/gb_productivity.pdf>.
244Gregory H. Kats, Green Building Costs and Financial Benefits. October 2003. MassachusettsTechnology Collaborative State Development Agency for Renewable Energy and the Innovation Economy.,23/Jan/2004 < http://www.mtpc.org/RenewableEnergy/green_buildings/GreenBuildingspaper.pdf>.p6.
245Gregory H. Kats et al., The Costs and Financial Benefits of Green Buildings: A Report to California’sSustainable Building Task Force, Oct 2003). Oct 2003. California Sustainable Building Task Force,29/Jan/2004 < http://www.usgbc.org/Docs/News/News477.pdf>.p ix.
246William Browning, NMB Bank Headquarters: The Impressive Performance of a Green Building, June1992). 24/Feb 2003. The Urban Land Institute, Rocky Mountain Institute, 22/Aug/2005<http://www.rmi.org/images/other/GDS/D92-21_NMBBankHQ.pdf>.p24.
247U.S. Department of Energy Office of Energy Efficiency and Renewable Energy, 2004 Buildings EnergyDatabook, Jan 2005). Jan 2005. U.S. Department of Energy Office of Energy Efficiency and RenewableEnergy, 22/Aug/2005 <http://buildingsdatabook.eren.doe.gov/docs/2004bedb-0105.pdf>.p1-9.Table 1.3.4 - Commercial Delivered and Primary Energy Consumption Intensities, by Year
248 http://erg.ucd.ie/EC2000/EC2000_PDFs/dossier_1011.pdfCommission of the European Communities, Energy Consumption and Cost Effectiveness of EC2000Buildings, Jan 2000). Energy Comfort 2000, European Commission Thermie Project to Reduce Energy andImprove Comfort and Environment, Information Dossier Number 10/11. January 2004. Commission of theEuropean Communities, Energy Research Group - University College, 22/Aug/2005<http://erg.ucd.ie/EC2000/EC2000_PDFs/dossier_1011.pdf>.pp1-2.
249
Ibid 248 pp2-3.
250Ibid 248 pp3-4.
251Energy Research Group - University College, Case Study Module C - Sukkertoppen - Copenhagen DK.Mid Career Education: Solar Energy in European Office Buildings. Nov 1997. Energy Research Group -University College, 22/Aug/2005 <http://erg.ucd.ie/mid_career/pdfs/case_study_C.pdf>.p15.
252 Joseph J. Romm, Cool Companies: How the Best Businesses Boost Profits and Productivity by CuttingGreenhouse Gas Emissions (Washington D.C. & Covelo CA: Island Press, 1999).p51.Chapter 3: Buildings.
253 Joseph J. Romm, Cool Companies: Proven Results - Cool Buildings. 2005, Romm,Joseph J.,22/Aug/2005 <http://www.cool-companies.com/proven/buildings.cfm>.
254Green Building Council, USGBC - LEED Case Study - Energy - DEP Cambria. 2003, Green BuildingCouncil, 22/Aug/2005 <http://leedcasestudies.usgbc.org/energy.cfm?ProjectID=47>.
255Green Building Council, USGBC - LEED Case Study - Finance - DEP Cambria. 2003, Green BuildingCouncil, 22/Aug/2005 <http://leedcasestudies.usgbc.org/finance.cfm?ProjectID=47>.
256U.S. Department of Energy Office of Energy Efficiency and Renewable Energy, Department ofEnvironmental Protection, Cambria Office Building, Ebensberg Pennsylvania - Highlighting HighPerformance, Nov 2001), DOE/GO-102001-1353. Jan 2002. U.S. Department of Energy Office of EnergyEfficiency and Renewable Energy, 22/Aug/2005<http://www.eere.energy.gov/buildings/info/documents/pdfs/29941.pdf>.p3.
Cooling It: No Hair Shirt Solutions to Global Warming by Gar W. Lipow GarLpublic AT Comcast DOT net
Page 198 of 265
257Buy Recycled Business Alliance, Natural Resources Defense Council, 2004). 17/Sep 2004. Buy RecycledBusiness Alliance, 22/Aug/2005 <http://www.brba-epp.org/brba-epp.org/pdfs/Natural%20Resou%E2%80%A6ces%20Defense%20C.pdf>.p2.
258United States Department of Energy, Energy Information Administration, "Table 2.1a EnergyConsumption by Sector, 1949-2002," Annual Energy Review, 2004, United States Department of Energy,Energy Information Administration, 20/Aug/2004 <http://www.eia.doe.gov/emeu/aer/txt/ptb0201a.html>.Table 2.1a Energy Consumption by Sector, 1949-2002 (Trillion Btu)
259States Census Bureau, "Section 19 - Energy and Utilities," Statistical Abstract of the United States 2002 .December 2002. United States Census Bureau<http://www.census.gov/prod/2003pubs/02statab/energy.pdf>.p572.Energy and Utilities - Table No.892. Electric Power IndustryCapability,and Consumption of Fuels:1990 to 2000 [Net generation for calendar years; capability as ofDecember 31]
260Los Alamos National Laboratory, Los Alamos--Energy Security Overview. 2003, Los Alamos NationalLaboratory, 31/Aug/2004 <http://www.lanl.gov/energy/overview.html>.
261United States Department of Energy, Energy Information Administration, Annual Energy Outlook 2004with Projections to 2025, DOE/EIA-0383(2004. January 2004, Table 2. Energy Consumption by Sectorand Source, United States Department of Energy, Energy Information Administration, 21/Aug/2004<http://www.eia.doe.gov/oiaf/aeo/excel/aeotab_2.xls>.
Table 2. Energy Consumption by Sector and Source (Quadrillion Btu per Year, Unless Otherwise Noted)
262 U.S. Census Bureau, Table 1a. Projected Population of the United States, by Race and Hispanic Origin:2000 to 2050. 18/March 2004, 16/March/2005 <http://www.census.gov/ipc/www/usinterimproj/>.
263 Brian A. Toal, "Renewables:Future Shock,". Oil & Gas Investor October 2001, Chemical WeekAssociates Inc., National Renewable Energy Laboratory, 2/Jul/2005<http://www.nrel.gov/docs/gen/fy02/31353.pdf>. p2
264 U.S. Bureau of Labor Statistics Series Reports. 2/Jul/2005 <http://data.bls.gov/cgi-bin/srgate>. SeriesCEU0500000049 [Employment, Hours, and Earnings from the Current Employment Statistics survey(National)] All Years, Not Seasonally Adjusted, Super Sector - Total Private, Industry -Total Private, DataType - AVERAGE HOURLY EARNINGS, 1982 DOLLARS
“Production and nonsupervisory workers account for about 80 percent of all employment measured by theCES survey.”
Bureau of Labor Statistics, "Planned Changes to the Current Employment Survey," Employment, Hours,and Earnings from the Current Employment Statistics Survey (National), 18/April 2005, 12/06/2005<http://www.bls.gov/ces/cesww.htm>.
265 Stacey C. Davis and Susan W. Diegel, TRANSPORTATION ENERGY DATA BOOK: - Edition 22,ORNL-6967 (Edition 22 of ORNL-5198). Sep 2002. Center for Transportation Analysis Science andTechnology Division of the Oak Ridge National Laboratory for the U.S. DOE, 23/Sep/2005 <http://www-cta.ornl.gov/cta/Publications/pdf/ORNL-6967.pdf>. p563. Energy and Utilities - Table No. 877. EnergySupply and Disposition by Type of Fuel: 1960 to 2000[ In quadrillion British thermal units (Btu). For Btu conversion factors, see source]
266Hydroelectricity:
Cooling It: No Hair Shirt Solutions to Global Warming by Gar W. Lipow GarLpublic AT Comcast DOT net
Page 199 of 265
United States Department of Energy, Energy Information Administration, Table E2. Existing Capacity atU.S. Electric Utilities by Census Division, State, and Prime Mover, 2000. 24/Sep 2002, United StatesDepartment of Energy, Energy Information Administration, 22/Aug/2004<http://www.eia.doe.gov/cneaf/electricity/ipp/html1/ippv1te2p1.html>.
Estimates for power consumption by State:United States Department of Energy, Energy Information Administration, State Energy Data 2000:Consumption Estimates for Power Consumption by State. 2003, United States Department of Energy,Energy Information Administration, 22/Aug/2004<http://www.eia.doe.gov/emeu/states/sep_use/total/csv/use_all_btu.csv>.
267 Geothermal Energy Association, Geothermal Electric Production Potential. 2004, Geothermal EnergyAssociation, 22/Aug/2004 <http://www.geo-energy.org/UsResources.htm>.
268World Bank, Geothermal Energy: Assessment. 7/Sep 2000, World Bank, 22/Aug/2004<http://www.worldbank.org/html/fpd/energy/geothermal/assessment.htm>.
269Roger Hill, Public Renewables Partnership, About PRP - Geothermal:Geothermal Costs. 10/Jun 2004,The Public Renewables Partnership, 22/Aug/2004 <http://www.repartners.org/geothermal/geocosts.htm>.
270California Energy Commission, Levelized Cost of Electricity Production<. Jan 2004, California EnergyCommission, 7/Jun/2004 <http://www.energy.ca.gov/electricity/levelized_cost.html>.
271Federal Energy Regulatory Commission, Staff Briefing Paper: ASSESSING THE STATE OF WINDENERGY IN WHOLESALE ELECTRICITY MARKETS, ADO0 13 000. Nov 2004. Federal EnergyRegulatory Commission, 1/Oct/2005 < http://www.ferc.gov/legal/maj-ord-reg/land-docs/11-04-wind-report.pdf>.p11.
New Mexico Energy, Minerals, and Natural Resources Departments - Energy Conservation andManagement Division, Wind Energy. 1/Nov 2005, New Mexico Energy, Minerals, and Natural ResourcesDepartments - Energy Conservation and Management Division, 1/Oct/2005<http://www.emnrd.state.nm.us/emnrd/ecmd/Wind/wind.htm>.
U.S. Department of Energy Office of Energy Efficiency and Renewable Energy, Wind and HydropowerTechnologies Program: Wind Energy Research. 30/Aug 2005, U.S. Department of Energy Office ofEnergy Efficiency and Renewable Energy, 1/Oct/2005<http://www.eere.energy.gov/windandhydro/wind_research.html>.
272Renewable Resource Data Center, Wind Energy Resource Atlas of the United States - Map 2-14 SummerWind Resource Estimates in the Contiguous United States. Feb 2002, U.S. Department of Energy Office ofEnergy Efficiency and Renewable Energy, 27/Sep/2005 <Http://rredc.nrel.gov/wind/pubs/atlas/maps/chap2/2-14m.html>.
273 Cristina L. Archer and Mark Z. Jacobson, "Evaluation of Global Wind Power,". Journal of Geophysical Research -Atmospheres 110, no. D12 30-Jun 2005, American Geophysical Union, 20-Jan-2008<http://www.stanford.edu/group/efmh/winds/2004jd005462.pdf>, D12110 DOI:10.1029/2004JD005462.
274 Julie Osborn et al., A Sensitivity Analysis of the Treatment of Wind Energy in the Aeo99 Version ofNEMS, LBNL-44070 / TP-28529. Jan 2001. Ernest Orlando Lawrence Berkeley National Laboratory -University of California; National Renewable Energy Laboratory, 12/Jun/2004<http://enduse.lbl.gov/info/LBNL-44070.pdf>.
275 Cristina L. Archer and Mark Z. Jacobson, "Supplying Baseload Power and Reducing Transmission Requirements byInterconnecting Wind Farms,". JOURNAL OF APPLIED METEOROLOGY AND CLIMATOLOGY 46, no. 11 Nov 2007:1701-17, American Meteorological Society, 18/Jan/2008 <http://www.stanford.edu/group/efmh/winds/aj07_jamc.pdf>.

Cooling It: No Hair Shirt Solutions to Global Warming by Gar W. Lipow GarLpublic AT Comcast DOT net
Page 200 of 265
276Willet Kempton and Amardeep Dhanju, "Electric Vehicles with V2G Storage for Large-Scale WindPower,". Windtech International Mar 2006, (accessed 27/Dec/2004)<http://www.udel.edu/V2G/docs/KemptonDhanju06-V2G-Wind.pdf>. Figure 2.
277 ]Cristina L. Archer and Mark Z. Jacobson, "Spatial and Temporal Distributions of U.S. Winds and WindPower at 80 m Derived from Measurements,". JOURNAL OF GEOPHYSICAL RESEARCH 108, no. D916/May 2003, (accessed 27/Dec/2006)<http://www.stanford.edu/group/efmh/winds/2002JD002076.pdf>.Previously unpublished data in the V2Garticle had been compiled for this study.
278 Ken Zweibel, James Mason, and Vasilis Fthenakis, "A Solar Grand Plan,". Scientific American Jan 2008, By 2050Solar Power Could End U.S. Dependence on Foreign Oil and Slash Greenhouse Gas Emissions, 18/Jan/2008<http://www.sciam.com/article.cfm?id=a-solar-grand-plan>.
279Otis Port, "Power From The Sunbaked Desert | Solar Generators May Be a Hot Source of PlentifulElectricity,". Business Week 12/Sep 2005: SCIENCE & TECHNOLOGY, The McGraw-Hill CompaniesInc, 14/Oct/2005 <http://www.businessweek.com/magazine/content/05_37/b3950067_mz018.htm>.
280National Renewable Energy Laboratory (NREL), NREL: Concentrating Solar Power Research -Parabolic-Trough Thermal Energy Storage Technology. National Renewable Energy Laboratory (NREL),26/Mar/2005 <http://www.nrel.gov/csp/thermal_storage_tech.html>.
281Gerhard Knies, Deserts as Sustainable Powerhouses and Inexhaustible Waterworks for the World, Sep-2006). Sep 2006. Trans-Mediterranean Renewable Energy Cooperation - (Formed by The Club of Rome,The Hamburg Climate Protection Foundation, and the National Energy Research Center of Jordan),3/Jan/2007 <http://www.trecers.net/downloads/GCREADER.pdf>.
282 Electricity Storage Association, Electricity Storage Association - Technology Comparisons - Capital Cost. 27-Oct2005, Electricity Storage Association, 20-Jan-2008<http://electricitystorage.org/tech/technologies_comparisons_capitalcost.htm>.
283Alessandro Clerici and Andrea Longhi, Competitive Electricity Transmission as an Alternative toPipeline Gas Transport for Electricity Delivery. 17th World Energy Council Congress, Houston, Texas,USA, 13-18 September 1998 . Sep 1998. World Energy Council, 23/Aug/2004<http://www.worldenergy.org/wec-geis/publications/default/tech_papers/17th_congress/2_2_08.asp>.
Also: American Wind Energy Association, FAQ: Cost of Wind Energy. 2000, American Wind EnergyAssociation, 22/Aug/2004 <http://www.awea.org/faq/cost.html>.
Also:Shimon Awerbuch, "Determining the Real Cost: Why Renewable Power is More Cost-CompetitiveThan Previously Believed,". Renewable Energy World, no. March-April 2003 Mar 2003, James & James,27/Sep/2005 <http://www.earthscan.co.uk/news/article/mps/UAN/71/v/3/sp/332149698573342662256>.
284Energy Ideas Clearinghouse, Product Technology & Review | Home Voltage Regulator (HVR)™,Enterprise Voltage Regulator (EVR)™. 2004. Washington State University Extension Energy Program(Manages Energy Ideas Clearinghuse for Northwest Energy Efficiency Alliance in Portland Oregon),26/Mar/2005 <http://www.nwalliance.org/resources/documents/PTR/EI_PTR200407Microplanet.pdf>.
285“The scale of deploying the technology, and doing the detailed systems engineering to make it work as aseamless network, will require significant levels of investment, estimated at $100 billion over a decade.”
T.J. Glauthier, Testimony of T.J. Glauthier President & CEO, Electricity Innovation Institute Affiliate ofEPRI (Electric Power Research Institute) House Committee on Energy and Commerce Hearing on
Cooling It: No Hair Shirt Solutions to Global Warming by Gar W. Lipow GarLpublic AT Comcast DOT net
Page 201 of 265
“Blackout 2003: How Did It Happen and Why?” Sep 2003, Electric Power Research Institute (EPRI),27/Sep/2005 <http://www.epri.com/corporate/discover_epri/news/testimony_TJ-090403.pdf>.p5.
If they really mean what they say in the study, they are talking about a number closer to $200 billion perdecade plus:
“..investment deficit is now on the order of $20 billion per year and must be accounted for over andabove the investment levels of the 1990s if service demands are to be confidently met.”
Electric Power Research Institute (EPRI), Electricity Sector Framework for the Future | Volume I |Achieving the 21st Century Transformation. 6/Aug 2003, Electric Power Research Institute (EPRI),27/Sep/2005 <http://www.epri.com/corporate/esff/ESFF_volume1.pdf>.p16.
So this is $100 billion every five years, plus however many years of “deficit” they propose to make up for.
286Eric Hirst and Brendan Kirby, Transmission Planning and the Need for New Capacity. NationalTransmisson Grid Study - Issue Studies, Issue 4. May 2002, U.S. Department of Energy, 27/Sep/2005<http://www.eh.doe.gov/ntgs/issuepapers/ISSUE_4.PDF>.pD-19.Table 3. Typical costs, thermal capacities, and corridor widths of transmission lines(Note: The table was reformatted by me to fit this document, some of the units converted, and a computedcolumn added to the end.)
Voltage (kV) Capital cost Capacity Cost Width (feet) Cost for 3000 KM$/mile (MW) (Million $/GW-Mile) (1865 mile) Line
230 480,000 350 1.37 100 895,200,000345 900,000 900 1 125 1,678,500,000500 1,200,000 2000 0.6 175 2,238,000,000765 1,800,000 4000 0.45 200 3,357,000,000
287
Generation, Distribution and various administrative, sales and miscellaneous expenses ran around 36.5% oftotal expenses in 2005.Energy Information Administration, Revenue and Expense Statistics for Major U.S. Investor-OwnedElectric Utilities (Electric Power Annual with data for 2005) - Published October 2006.<http://www.eia.doe.gov/cneaf/electricity/epa/epat8p1.html>
Electricity costs per kWh in 2005 averaged 8.14 cents per kWh.Table 7.4. Average Retail Price of Electricity to Ultimate Customers by End-Use Sector, 1994 through2005 - (Electric Power Annual with data for 2005) - Published October 2006<http://www.eia.doe.gov/cneaf/electricity/epa/epat7p4.html>
Hence 2.9697 or ~3.0 cents per kWh288Mick Sagrillo, "Advice from an Expert -Putting Wind Power's Effect on Birds in Perspective,"Frequently Asked Questions, 2003, American Wind Energy Association, 24/Jun/2005 <http://www.awea.org/faq/sagrillo/swbirds.html>.
289John S. Coleman, Stanley A. Temple, and Scott R. Craven, Cats and Wildlife - A Conservation Dilemma.1997, U.S. Department of Agriculture, University of Wisconsin-Extension, Cooperative Extension,24/Jun/2005 <http://wildlife.wisc.edu/extension/catfly3.htm>.
290 Power Technology, Power Technology - Mokai Geothermal Power Plantl, New Zealand. 26/Aug 2003,SPG Media Limited/SPG Media Group, 23/Aug/2004 <http://www.power-technology.com/projects/mokai/>.
Cooling It: No Hair Shirt Solutions to Global Warming by Gar W. Lipow GarLpublic AT Comcast DOT net
Page 202 of 265
291 National Park Service - U.S. Department of the Interior - Geologic Resources Division, GeothermalEnergy Overview. NPS Western Energy Summit Jan 21 - 23. Jan 2003, National Park Service - U.S.Department of the Interior - Geologic Resources Division, 24/Aug/2004<http://www2.nature.nps.gov/geology/adjacent_minerals/EnergySummit/Geothermal/geothermal%20factsheet.pdf>.p2.
292Anders Ahlbom et al., "Review of the Epidemiologic Literature on EMF and Health,". EnvironmentalHealth Perspectives 109, no. SUPPLEMENT 6 Dec 2001, ICNIRP (International Commission for Non-Ionizing Radiation Protection) Standing Committee on Epidemiology, National Institute of EnvironmentalHealth Sciences of the U.S. Department of Health and Human Services, 24/Aug/2004<http://www.icnirp.de/documents/epireview1.pdf ; http://ehp.niehs.nih.gov/members/2001/suppl-6/911-933ahlbom/ahlbom-full.html>.pp911-933.
293Ibid 163 p6-2. - Table 6.1
294 Jim Giles, "Methane quashes green credentials of hydropower", Nature, November 30 2006,444:7119.p.524295American Society of Civil Engineers, 2001 Report Card for America's Infrastructure - Report CardASCE - Energy. 2001, American Society of Civil Engineers, 8/May/2003<http://www.asce.org/reportcard/index.cfm?reaction=factsheet&page=12>.
296Steve Thomas, "Government Needs to Take a Brave Decision Now | Crunch Time for Pebble Bed Plan,".Cape Times 18/Sep 2003: Insight, The Cape Times & Independent Online (Pty) Ltd, 10/Apr/2005<http://www.capetimes.co.za/index.php?fSectionId=332&fArticleId=238104>.
297U.S. Department of Energy Office of Energy Efficiency and Renewable Energy, Combustion SuccessStory: Solarwall© Air Preheating System | Elegantly Simple System Uses Solar Energy to Heat VentilationAir or Preheat Combustion Air. Office of Industrial Technology Inventions & Innovations Program, I-CO-563. December 2001, U.S. Department of Energy Office of Energy Efficiency and Renewable Energy,5/Sep/2004 <http://www.eere.energy.gov/inventions/pdfs/conserval.pdf>.
298United States Department of Energy, Energy Information Administration, Preliminary CBECS End-UseEstimates - Preliminary End-Use Energy Consumption Estimates for Commercial Buildings in 1999 Basedon Data from the 1999 Commercial Buildings Energy Survey. 1999, United States Department of Energy,Energy Information Administration, 25/Aug/2004<http://www.eia.doe.gov/emeu/cbecs/enduse_consumption/intro.html>.Detailed Tables - Table 1. End-Use Consumption for Natural Gas, Electricity, and Fuel Oil, 1999(Preliminary Estimates)
299These are preliminary numbers released in late 2003, and may change slightly by the time you read this.
U.S. Department of Energy - Energy Information Administration, "2001 Consumption and ExpendituresTables – Total Energy Consumption" A Look at Residential Energy Consumption in 2001. 23/October2003, 23/Dec/2003<ftp://ftp.eia.doe.gov/pub/consumption/residential/2001ce_tables/enduse_consump.pdf>.Table CE1-9c. Total Energy Consumption in U.S. Households by Northeast Census Region, 2001 -Preliminary DataTable CE1-10c. Total Energy Consumption in U.S. Households by Midwest Census Region, 2001 -Preliminary DataTable CE1-11c. Total Energy Consumption in U.S. Households by South Census Region, 2001 -Preliminary DataTable CE1-12c. Total Energy Consumption in U.S. Households by West Census Region, 2001 -Preliminary Data
Cooling It: No Hair Shirt Solutions to Global Warming by Gar W. Lipow GarLpublic AT Comcast DOT net
Page 203 of 265
U.S. Department of Energy - Energy Information Administration, "2001 Consumption and ExpendituresTables - Space-Heating Energy Consumption," A Look at Residential Energy Consumption in 2001.23/October 2003, 23/Dec/2003<ftp://ftp.eia.doe.gov/pub/consumption/residential/2001ce_tables/spaceheat_consump.pdf>.Table CE2-9c. Space-Heating Energy Consumption in U.S. Households by Northeast Census Region, 2001-Preliminary DataTable CE2-10c. Space-Heating Energy Consumption in U.S. Households by Midwest Census Region, 2001- Preliminary DataTable CE2-11c. Space-Heating Energy Consumption in U.S. Households by South Census Region, 2001 -Preliminary DataTable CE2-12c. Space-Heating Energy Consumption in U.S. Households by West Census Region, 2001 -Preliminary Data
U.S. Department of Energy - Energy Information Administration, "2001 Consumption and ExpendituresTables - Electric Air-Conditioning Consumption Tables," A Look at Residential Energy Consumption in2001. 23/October 2003, 23/Dec/2003<ftp://ftp.eia.doe.gov/pub/consumption/residential/2001ce_tables/ac_consump.pdf>.Table CE3-9c. Electric Air-Conditioning Energy Consumption in U.S. Households by Northeast CensusRegion, 2001 - Preliminary DataTable CE3-10c. Electric Air-Conditioning Energy Consumption in U.S. Households by Midwest CensusRegion, 2001 - Preliminary DataTable CE3-11c. Electric Air-Conditioning Energy Consumption in U.S. Households by South CensusRegion, - Preliminary DataTable CE3-12c. Electric Air-Conditioning Energy Consumption in U.S. Households by West CensusRegion, - Preliminary Data
300Solargenix Energy LLC, Solargenix Energy - Formerly Duke Solar Energy - The Natural Power ForGood. 2005, Solargenix Energy LLC, 28/Mar/2005 <http://www.solargenix.com/powerRoof.cfm>.
301Rober C. Brown, Colletti, Joe, and Arne Hallam, "Factors Influencing the Adoption of Biomass EnergySystems: An Evaluation for Iowa," Fifth World Congress of Chemical Engineering, San Diego, CA, July14-18, 1996 (Ames Iowa USA: Iowa State University, 1996), Obsolete URL(http://webbook2.ameslab.gov/Summary%20Biomass.doc).
302 Donal L. Klass, "Biomass for Renewable Energy And Fuels," Encyclopedia of Energy. 2004. Elsevier,Inc, Biomass Energy Research Association ( BERA) Washington D.C., 28/Sep/2005<http://www.bera1.org/cyclopediaofEnergy.pdf>.p196.
303 David Tilman, Jason Hill, and Clarence Lehman, "Carbon-Negative Biofuels from Low-Input High-Diversity Grassland Biomass,". Science 314, no. 5805 8/Dec 2006, American Association for theAdvancement of Science, 01/01/2007<http://www.ce.cmu.edu/~gdrg/readings/2006/12/12/Tilman_CNegativeBiofuelsFromLowInputHighDiversityGrasslandBiomass.pdf>.
304Biopact [Summarizing Report from German Energy Agency], Bioenergy Pact Between Europe andAfrica: German Energy Agency: Biomass-to-Liquids Can Meet up to 35% of Germany's Fuel Needs by2030. 15/December 2006, Biopact, 28/Dec/2006 <http://biopact.com/2006/12/german-energy-agency-biomass-to.html [summary of orginal report in German:http://www.dena.de/fileadmin/user_upload/Download/Dokumente/Publikationen/mobilitaet/BtL_Realisierungsstudie.pdf]>.
Note that this price assumes biomass imported by ship or rail into German - so probably more than withbiomass grown within 50 miles.. The price given is $3.98/ gallon, which is for refined product. At the pumpprice tends to be 42% higher than refined product - so at the pump price of $5.65 (including taxes), around2.2 X current price of $2.50/gallon.
Cooling It: No Hair Shirt Solutions to Global Warming by Gar W. Lipow GarLpublic AT Comcast DOT net
Page 204 of 265
305 Stefan Unnasch and Louis Browning, Fuel Cycle Energy Conversion Efficiency Analysis Status Report.25/May 2000. California Energy Commission Transportation Technology and Fuels Office ARCADISGeraghty & Miller, Inc, 01/03/2007<http://www.arb.ca.gov/msprog/zevprog/2000review/efficiency.doc>.p7.Table 6.three specific cases:It was considered feasible to produce Methanol with nearly 53% thermal efficiency back in 1981:L.K. Mudge et al., Investigations on Catalyzed Steam Gasification of Biomass. Appendix B: FeasibilityStudy of Methanol Production Via Catalytic Gasification of 2000 Tons of Wood Per Day, Jan-1981), On-Line Abstract. 2001. U.S. Department of Energy, 03-Jan-2007<http://www.osti.gov/energycitations/product.biblio.jsp?osti_id=6711590>.
More recently, non-bleeding-edge technology was considered able to convert biomass into methanol whichhad 57% of the original BTU content. If the plant generated its own electricity that would reduce thermalefficiency to 475-49%. However, this is not the proper accounting of net energy, because even withcombined heat and power, methanol combustion is not an efficient way to generate electricity. Ifefficiently generated electricity had been used, provided by (say) a 55% efficient combined cycle turbinethat managed to place some waste heat, the range would have more like 50% - 52%, even more if theelectricity was provided by wind.Nycomb Synergetics and Ecotraffic R&D AB, Biomass-Derived Alcohols for Automotive and IndustrialUses, Apr 1999). May 1999, European Union Program Altener and the Swedish National Board forIndustrial and Technical Development, Jan-03-2007 <http://www.nykomb.se/pdf/methanol.pdf>.
Lastly, Mitsubishi recently demonstrated bleeding edge technology extracted 65% of energy from biomassin the form of methanol in a pilot project. They claim that, on a large scale, 75% would be possible.Obviously this should be taken with great circulatory system threatening sacks of salt. Also, Mitsubishisays nothing about cost. But it certainly is indicative that Methanol conversion efficiency limit is wellabove 50%.
Mitsubishi Power Sysems, New Product New Technology: Biomass Gasification Methanol SynthesisSystem. 29/Sep 2005, Mitsubishi Power Sysems, Jan-03-2007<http://www.mhi.co.jp/power/e_power/techno/biomass/index.html>.306 Doctor L. Fishbein, ENVIRONMENTAL HEALTH CRITERIA 196: Methanol, 1997). INTERNATIONALPROGRAMME ON CHEMICAL SAFETY. 1997. UNITED NATIONS ENVIRONMENT PROGRAMME;INTERNATIONAL LABOUR ORGANISATION;WORLD HEALTH ORGANIZATION, 03/Jan/2007<http://www.inchem.org/documents/ehc/ehc/ehc196.htm>.
307 John A. Volpe National Transportation Systems Center of the U.S. Department of TransportationResearch and Special Programs Administration, CLEAN AIR PROGRAM SUMMARY OF ASSESSMENTOF THE SAFETY, HEALTH, ENVIRONMENTALAND SYSTEM RISKS OF ALTERNATIVE FUELS - Aug1995 Final Report, Aug 1995), FTA-MA-90-7007-95-1 ;DOT-VNTSC-FTA-95-5. Mar 1999. FederalTransit Administration, 01/03/2007 <http://transit-safety.volpe.dot.gov/Publications/CleanAir/Alt_Fuel/alt_fuel.pdf>.p3-5.308B.H. West et al., Federal Methanol Fleet Project Final Report, Mar-1993), ORNL/TM -12278. 2003.Oak Ridge Natonal Laboratory;U.S. Department of Energy Office of Transportation Systems, Jan-03-2007<http://www.ornl.gov/info/reports/1993/3445603700029.pdf>.An important note on maintenance: if you look at the chapter on this subject, especially the summary tableson page 21, you will see that engine wear, and maintenance were if fact worse than with gasoline, but not agreat deal worse. Given that these were retrofits rather than designed from scratch for M85, had originalparts ripped out and replaced, there is little doubt that a built-from-scratch methanol car would have hadreliability comparable to gasoline.

Cooling It: No Hair Shirt Solutions to Global Warming by Gar W. Lipow GarLpublic AT Comcast DOT net
Page 205 of 265
309 Howard ED Lentzner, "Glow-Plug-Assisted Ignition and Combustion of Methanol Studied in a Direct-Injection Diesel Engine,". Combustion Research Facility News 23, no. No 1 Jan/Feb 2001, Sandia NationalLaboratories, 03-Jan-2007 <http://www.ca.sandia.gov/crf/newspubs/CRFnews/news_pdf/CRFV23N1.pdf>.
310Biomass Energy Research Association (BERA), Additional Commentary Submitted by D.L. Klass for theRecord: Los Angeles Evaluation of Methanol- and Ethanol-Fueled Buses. 29/May 1998, Biomass EnergyResearch Association (BERA), Jan-03-2007 <http://www.bera1.org/LA-buses.html>.
311 R. Lal, R. F. Follett, and J. M. Kimble, "ACHIEVING SOIL CARBON SEQUESTRATION IN THEUNITED STATES: A CHALLENGE TO THE POLICY MAKERS.,". Soil Science: An InterdisciplinaryApproach to Soil Resarch 168, no. 12 Dec 2003, Walters Kluwer | Lippincott Williams & Wilkins, 01-Jan-2007 <http://cat.inist.fr/?aModele=afficheN&cpsidt=15361224>.312 Jim Dryden, "Does Too Much Protein in the Diet Increase Cancer Risk?" School of Medicine News &Information, 7/Dec 2006, Washington Univeristy in St. Louis School of Medicine, Jan-03-2007<http://mednews.wustl.edu/news/page/normal/8388.html>.
313Nathanael Greene et al., Growing Energy: How Biofuels Can Help End America’s Oil Dependence, Dec-2004). Dec 2004. Natural Resources Defense Council, 01-Jan-2007<http://www.nrdc.org/air/energy/biofuels/biofuels.pdf>.p5.
314Burton C. English et al., 25% Renewable Energy for the United States By 2025: Agricultural andEconomic Impacts, Nov 2006). Nov 2006, 4.1 Renewable Production. The University of TennesseeDepartment of Agricultural Economics Biobased Energy Economics Analysis Group, 03/Jan/2007<http://www.agpolicy.org/ppap/REPORT%2025x25.pdf>. p31.Table 11.
315KPMG Bureau voor Economische Argumentatie; Steins Bisschop Meijburg & Co Advocaten, SolarEnergy: From Perennial Promise to Competitive Alternative - Final Report, Project Number: 2562. Aug1999. Greenpeace - Nederlands, 24/Sep/2004<http://archive.greenpeace.org/~climate/renewables/reports/kpmg8.pdf>.
316 European Commission, EUROPA - Research - Energy - - R&D Topics . Jul 2005, EuropeanCommission, 28/Sep/2005 <http://europa.eu.int/comm/research/energy/nn/nn_rt/nn_rt_pv/article_1108_en.htm>.
317Doug Selsam, The Selsam SUPERTURBINE. Sep 2005, Superturbine Inc., 28/Sep/2005<http://www.speakerfactory.net/wind.htm>.
California Energy Commission, Notice of Awards EISG Program, Solicitation 02-01. 19/Feb 2003,California Energy Commission, 18/Sep/2004 <http://www.energy.ca.gov/contracts/smallgrant/2003-02-21_awards_02-02.html>.
318 Sky WindPower Corporation, Sky WindPower Corporation. 6/June 2005, Sky WindPower Corporation,123/Feb/2006 <http://www.skywindpower.com/ww/index.htm>.
319(For example wheat accounted for 20 times the acreage harvested compared to coffee worldwide in2004)
United Nations Food and Agriculture Organization of the United Nations Statistical Service, FAOSTATDatabase Results. 2004, United Nations Food and Agriculture Organization of the United NationsStatistical Service, 13/Jul/2005<http://faostat.fao.org/faostat/servlet/XteServlet3?Areas=862&Items=656&Items=15&Elements=31&Year

Cooling It: No Hair Shirt Solutions to Global Warming by Gar W. Lipow GarLpublic AT Comcast DOT net
Page 206 of 265
s=2004&Format=Table&Xaxis=Years&Yaxis=Countries&Aggregate=&Calculate=&Domain=SUA&ItemTypes=Production.Crops.Primary&language=EN>.
320U.S. Department of Energy - Energy Efficiency and Renewable Energy, Solar FAQs — Concentrating Solar Power— ALL. 8/Feb 2007, 18/Jan/2008http://www.eere.energy.gov/solar/cfm/faqs/third_level.cfm/name=Concentrating%20Solar%20Power/cat=ALL#Q84
321 According to the DOE, coal plants consume slightly more land than CSP.Ibid 320
According to an in depth 1984 study, CSP uses slightly more land than coa.Byron A. Miller and Martin J. Pasqualetti, "Land Requirements for the Solar and Coal Options," TheGeographical Journal 150, no. 2 (Jul 1984): 192-212.
Given that solar energy has made a lot of progress since 1984, it seems likely that Miller and Pasqualettiwere right when their study was complete, and the DOE is correct today.
322 U.S. Army Corps of Engineers, "National Inventory of Dams", Feb 2005, 27-Jun-2007<http://edcftp.cr.usgs.gov/pub/data/nationalatlas/dams00x020.tar.gz>.
323 Michael Shellenberger and Ted Nordhaus, "The Death of Environmentalism: Global Warming Politicsin a Post-Environmental World,". Grist Magazine 13/Jan 2005: Main Dish, Grist Magazine - Seattle,15/Oct/2005 <http://grist.org/news/maindish/2005/01/13/doe-reprint/>.
324John Weir, Global Warming. 8/Apr 2002, NASA Earth Observatory, 10/Jun/2005 <http://earthobservatory.nasa.gov/Library/GlobalWarming/printall.php>.
325Naomi Oreskes, "Beyond the Ivory Tower: The Scientific Consensus on Climate Change,". Science 306,no. Issue 5702, 1686 ; 3/Dec 2004: Essays on Science and Society, The American Association for theAdvancement of Science (AAAS), 30/Dec/2004<http://www.sciencemag.org/cgi/content/full/306/5702/1686>.
326Bruce A. Hungate et al., "CO2 Elicits Long-Term Decline in Nitrogen Fixation,". Science 304, no. 5675,1291 28/May 2004, The American Association for the Advancement of Science (AAAS), 1/Sep/2004<http://www.sciencemag.org/cgi/content/full/304/5675/1291>, (Brevia: Requires free registration andLogin).Brevia: Page 1291
327National Center for Atmospheric Research, New Look at Satellite Data Supports Global Warming Trend.1/May 2003, National Center for Atmospheric Research, 10/Jun/2004<http://www.ucar.edu/communications/newsreleases/2003/wigley2.html>.
328Sydney Levitus et al., "Warming of the World Ocean,". Science 287, no. 5461 24/Mar 2000, TheAmerican Association for the Advancement of Science (AAAS), 31/Dec/2004<http://www.atmos.ucla.edu/~gruber/teaching/papers_to_read/levitus_sci_00.pdf>.
329Sami K. Solanki, The Sun is More Active Now Than Over the Last 8000 Years. 28/Oct 2004, Max PlanckInstitute for Solar System Research, 1/Oct/2005<http://www.mpg.de/english/illustrationsDocumentation/documentation/pressReleases/2004/pressRelease20041028/>.
330 National Oceanic and Atmospheric Administration, NCDC: Global Warming - Frequently AskedQuestions -Can the Observed Changes Be Explained by Natural Variability, Including Changes in Solar

Cooling It: No Hair Shirt Solutions to Global Warming by Gar W. Lipow GarLpublic AT Comcast DOT net
Page 207 of 265
Output? 27/May 2005, National Oceanic and Atmospheric Administration, 1/Oct/2005 <http://lwf.ncdc.noaa.gov/oa/climate/globalwarming.html#Q10>.
331Daniel L. Albritton et al., Summary for Policymakers: A Report of Working Group I of theIntergovernmental Panel on Climate Change. Jan 2001, Intergovernmental Panel on Climate Change,31/Dec/2004 <http://www.ipcc.ch/pub/spm22-01.pdf>.p13.
332Union of Concerned Scientists, Global Warming FAQ. 10/Aug 2005, Union of Concerned Scientists,1/Oct/2005 <http://www.ucsusa.org/global_warming/science/global-warming-faq.html>.
333Shaobing Peng et al., "Rice Yields Decline with Higher Night Temperature from Global Warming,".Journal of the Proceedings of the National Academy of Sciences 101, no. 7 6/Jul 2004, National Academyof Sciences, 31/Dec/2004 <http://www.pnas.org/cgi/reprint/101/27/9971.pdf>.pp9971-9975.
334Luis Cifuentes et al., "Climate Change: Hidden Health Benefits of Greenhouse Gas Mitigation,". Science293, no. 5533 17/Aug 2001When Smoke Ran Like Water, The American Association for the Advancementof Science (AAAS), 4/Jun/2004 <http://www.whensmokeranlikewater.com/publications/scientific/Science2.html>.
335World Resources Institute, Greenhouse Gas Emissions Endanger the Public's Health Today. Nov 1997,World Resources Institute - Citing November 7 1997 Lancet Article, 1/Oct/2005<http://population.wri.org/newsrelease_text.cfm?NewsReleaseID=104>.
336David Urbinato, "London's Historic "Pea-Soupers,"". EPA Journal Summer 1994, U.S. EPA, 9/Jan/2005<http://www.epa.gov/history/topics/perspect/london.htm>.
337Chirag Trivedi, "The Great Smog of London,". BBC News Online 5/Dec 2002, BBC News Online,9/Jan/2005 <http://news.bbc.co.uk/1/hi/england/2545759.stm>.
Ken Livingstone, 50 Years On: The Struggle for Air Quality in London Since the Great Smog of December1952. Dec 2002. Greater London Authority, 9/Jan/2005<http://www.london.gov.uk/mayor/environment/air_quality/docs/50_years_on.pdf>.p1.
Regulatory Services - The Lambeth Council, Lambeth 2002 Annual Air Quality Report - ActiveMonitoring Summary. 2002. Regulatory Services - The Lambeth Council, 9/Jan/2005<http://www.lambeth.gov.uk/intradoc/groups/public/documents/report/029068.pdf>.p10.
338Shaoni Bhattacharya, "Global Warming 'Kills 160,000 a Year,'". New Scientist (NewScientist.ComOnline News Journal) Oct 2003, 9/Jan/2005 <http://www.newscientist.com/article.ns?id=dn4223>.
339Dave Frame, Reto Knutti, and Malte Meinshausen, RealClimate - Can 2°C Warming Be Avoided?Climate Science from Climate Scientists, 31/Jan 2006, Real Climate, 12/Feb/2006<http://www.realclimate.org/index.php?p=246#more-246>..340Caroline Dr. Lucas, The Future of Aviation: The Government's Consultation Document on Air TransportPolicy - Submission from Dr Caroline Lucas, MEP, Green Party, and Member of the EuropeanParliament's Transport Committee. 2001. European Parliment, Green Party UK, 23/Sep/2005 <http://archive.greenparty.org.uk/reports/2001/aviation/av_fut_mep_resp.pdf>.
341 Joe Sharkey, "Rail Projects Are Sign of a Quiet Revolution in Short-Haul Trips," EcoCity Cleveland -Transportation Choices, 4/Jun 2002, New York Times Inc., 23/Sep/2005 <http://www.ecocitycleveland.org/transportation/rail/nytimes_rail_article.html>.
342Ibid 252Appendix :"There Is No Such Thing As the "Hawthorne Effect"
Cooling It: No Hair Shirt Solutions to Global Warming by Gar W. Lipow GarLpublic AT Comcast DOT net
Page 208 of 265
343The Impact of the Hawthorne Effect in Experiment Designs in Educational Research,Final Report P1757, U.S. Office of EducationDesmond Cook, 1967 - as cited by Cool Companies (252)
344 Hawthorne Control Procedures in Educational Experiments: A Reconsideration of Their Use andEffectiveness," Review of Educational Research Summer 1989 Vol 59 No 2 pp 215-228John G. Adair, Donal Sharpe, and Cam-Loi Huynthas cited in Cool Companies (252)
345B. Douglas Clinton and David E. Keys, "Resource Consumption Accounting: The Next Generation ofCost Management Systems,". Focus Magazine: For the Performance Management Professional 5, no.2002 (2002), Focused Management Inc., 2/Apr/2005<http://www.focusmag.com/back_issues/issue_05/pages/rca.htm>.
346Shane Johnson, Environmental Management Accounting. 13/Jan 2004, Association of CharteredCertified Accountants, 2/Apr/2005 <http://www.acca.co.uk/publications/studentaccountant/1073480>.
347Peter Dorman, The Economics of Safety, Health, and Well-Being at Work: An Overview. InFocusProgram on SafeWork. May 2000, International Labour Organization (ILO) of the United Nations,2/Apr/2005 <http://www.ilo.org/public/english/protection/safework/papers/ecoanal/ecoview.pdf>.p17.
Cooling It: No Hair Shirt Solutions to Global Warming by Gar W. Lipow GarLpublic AT Comcast DOT net
Page 209 of 265
Bibliography
U.S. Department of Labor Bureau of Labor Statistics. Bureau of Labor Statistics Data.BLS Online Series Database. 2005. U.S. Department of Labor Bureau of Labor Statistics.http://data.bls.gov/cgi-bin/srgate. Accessed 22/Aug/2005.
United States Environmental Protection Agency. How We Use Water In These UnitedStates. 18/March 2003. United States Environmental Protection Agency.http://www.epa.gov/watrhome/you/chap1.html. Accessed 06/Jul/2005.
Sherman Oaks, CA. 12.2 Cu. Ft. Crosley ® Chest Freezer WCC12/E. August 2005.Universal Appliance and Kitchen Center. http://www.universal-akb.com/crchfrwc2.html#. Accessed 16/Aug/2005.
Southwest Research Institute (SwRI). 18-Services for the Pipeline Industry Brochure.2005. Southwest Research Institute (SwRI).http://www.swri.edu/3pubs/brochure/d18/pipeline/pipeline.htm. Accessed 27/Sep/2005.
American Society of Civil Engineers. 2001 Report Card for America's Infrastructure -Report Card ASCE - Energy. 2001. American Society of Civil Engineers.http://www.asce.org/reportcard/index.cfm?reaction=factsheet&page=12. Accessed8/May/2003.
U.S. Department of Agriculture’s Natural Resources Conservation Service (NRCS);IowaState University’s Center for Survey Statistics and Methodology. 2002 Annual NaturalResources Inventory: Land Use. April 2004. U.S. Department of Agriculture’s NaturalResources Conservation Service (NRCS);Iowa State University’s Center for SurveyStatistics and Methodology. http://www.nrcs.usda.gov/technical/land/nri02/landuse.pdf.Accessed 15/Jun/2004.
United States Department of Agriculture National Agricultural Statistics Department.2003 Farm & Ranch Irrigation Survey (2002 Census of Agriculture| Volume 3, SpecialStudies, Part 1). Nov 2004. United States Department of Agriculture NationalAgricultural Statistics Department.http://www.nass.usda.gov/census/census02/fris/fris03.pdf. Accessed 28/Oct/2005.
U.S. Department of Energy Office of Energy Efficiency and Renewable Energy. 2004Buildings Energy Databook. U.S. Department of Energy Office of Energy Efficiency andRenewable Energy: Washington D.C., Jan 2005. Jan 2005.http://buildingsdatabook.eren.doe.gov/docs/2004bedb-0105.pdf. Accessed 22/Aug/2005.
Universal Appliance and Kitchen Center. 24" ASKO Dishwasher, D3121. Quote July 10for Asko D3121. July 2005. Itchen Tools, Kitchen Electrics, Cookware, Tableware |LizMadison.Com. http://store.universal-akb.net/24asdid3.html. Accessed 10/Jul/2005.
Cooling It: No Hair Shirt Solutions to Global Warming by Gar W. Lipow GarLpublic AT Comcast DOT net
Page 210 of 265
Energy Star Program of the EPA and DOE. "About the HES Appliance Module." In TheHome Energy Saver. Table 3: Other Appliances and Miscellaneous Energy Usages.06/June 2001. Energy Star Program of the EPA and DOE.http://homeenergysaver.lbl.gov/hes/aboutapps.html. Accessed 20/Aug/2005.
KP Products. About The Kenaf Plant. 14/Jan 2005. KP Products.http://www.visionpaper.com/kenaf2.html. Accessed 20/Sep/2005.
Abramovitz, Jane N., and Ashley T. Mattoon. Paper Cuts:: Recovering the PaperLandscape. Edited by Jane A. Peterson. WorldWatch Paper 149. Dec 1999. WorldwatchInstitute. http://www.worldwatch.org/pubs/download/EWP149/. Accessed 16/Jun/2004.
Adler, Mike. The Box Book. Clinton Ct USA: Adler/Barbour(Kenyon) - InternationalMarine, 1985.
U.S. Department of Housing and Urban Development Partnership for AdvancingTechnology in Housing. Affordability and Value Through Housing Technology Programand Services Guide. 20/Jun 2002. U.S. Department of Housing and Urban DevelopmentPartnership for Advancing Technology in Housing.http://www.huduser.org/publications/pdf/guidetoserv.pdf. Accessed 5/Sep/2005.
U.S. Department of State, Office to Monitor and Combat Trafficking in Persons."AFGHANISTAN (TIER 2)." In Victims of Trafficking and Violence Protection Act of2000: Trafficking in Persons 2005 Report. U.S. DEPARTMENT OF STATEPUBLICATION 11252. Jun 2005. 51. U.S. Department of State, Office to Monitor andCombat Trafficking in Persons. http://www.state.gov/documents/organization/47255.pdf.Accessed 3/Oct/2005.
Agence France-Presse. "Carbon Dioxide Spike Renews Global Warming Fears."Australian Broadcasting Corporation Online 12/Oct 2004. Australian BroadcastingCorporation. http://www.abc.net.au/news/newsitems/200410/s1217958.htm. Accessed1/Jan/2005.
———. Thai Architect Hits on Blueprint for Sustainable Living in the Tropics.28/September 2003. Terra Daily.http://www.terradaily.com/2003/030928033742.6azaxajn.html. Accessed 06/Jul/2005.
International Fund for Agricultural Development. Agricultural Research Grants |Programme for Development and Diffusion of Technologies for Smallholder Bamboo-and Rattan-Based Producers – Phase II. 2005. International Fund for AgriculturalDevelopment. http://www.ifad.org/grants/tags/518.htm. Accessed 26/Oct/2005.
Ahlbom, Anders et al. "Review of the Epidemiologic Literature on EMF and Health."Environmental Health Perspectives 109, no. SUPPLEMENT 6 Dec 2001. ICNIRP(International Commission for Non-Ionizing Radiation Protection) Standing Committeeon Epidemiology. National Institute of Environmental Health Sciences of the U.S.
Cooling It: No Hair Shirt Solutions to Global Warming by Gar W. Lipow GarLpublic AT Comcast DOT net
Page 211 of 265
Department of Health and Human Services.http://www.icnirp.de/documents/epireview1.pdf ;http://ehp.niehs.nih.gov/members/2001/suppl-6/911-933ahlbom/ahlbom-full.html.Accessed 24/Aug/2004.
Air Krete: A CEMENTIOUS FOAM INSULATION. 19/May 2005. Air Krete Inc.http://www.airkrete.com/. Accessed 06/Jul/2005.
Los Alamos National Laboratory. Los Alamos--Energy Security Overview. 2003. LosAlamos National Laboratory. http://www.lanl.gov/energy/overview.html. Accessed31/Aug/2004.
Albritton, Daniel L. et al. Summary for Policymakers: A Report of Working Group I ofthe Intergovernmental Panel on Climate Change. Jan 2001. Intergovernmental Panel onClimate Change. http://www.ipcc.ch/pub/spm22-01.pdf. Accessed 31/Dec/2004.
Alfano, Sal. Cost Vs. Value 2003 - Window Replacement. 1/Nov 2003. Hanley WoodLLC. http://www.remodeling.hw.net/industry-news.asp?articleID=60872§ionID=173. Accessed 2/Oct/2005.
ALINA JSC. ALINA JSC. - Frequently Asked Questions (FAQ). 2003. ALINA JSC.http://www.moydom.ru/eng/izodom/faq.html. Accessed 4/Jun/2004.
Hempopotamus. All About Hemp. 2004. Industrial Hemp. Hempopotamus.http://www.hemphouse.com/docs/hempinfo.html. Accessed 22/Jun/2004.
Azom.com Pty Ltd. Aluminium Packaging (Focus on Europe). 2002. Azom.Com PtyLtd. http://www.azom.com/details.asp?ArticleID=1396#_Advantages_of_Aluminium.Accessed 9/Jun/2004.
The Aluminum Association, Inc. Aluminum Association | Climate Change. 2004.Environment and Climate Change - Conservation, Preservation, and Recycling. TheAluminum Association, Inc.http://www.aluminum.org/Content/NavigationMenu/The_Industry/Government_Policy/Climate_Change/Climate_Change.htm. Accessed 5/Sep/2005.
American Clay Enterprises. American Clay Finishes™Clay Veneer Plaster ProductSpecifications. 18/Dec 2003. American Clay Enterprises.http://www.americanclay.com/pdfs/ProductSpecs.pdf. Accessed 5/Sep/2005.
American Society Civil Engineers. ASCE Report Card for America’s Future: 2003Progress Report and Update to the 2001 Progress Report. September 2003. 1. ASCE.http://www.asce.org/reportcard/pdf/fullreport03.pdf. Accessed 10/Jan/2005.
Industrial Technologies Program - Energy Efficiency and Renewable Energy • U.S.Department of Energy. American Water Heater Company: Compressed Air System
Cooling It: No Hair Shirt Solutions to Global Warming by Gar W. Lipow GarLpublic AT Comcast DOT net
Page 212 of 265
Optimization Project Saves Energy and Improves Production at Water Heater Plant. InBestPractices Case Study. DOE/GO-102003-1716. Nov 2003. Industrial TechnologiesProgram - Energy Efficiency and Renewable Energy • U.S. Department of Energy.http://www.nrel.gov/docs/fy04osti/33648.pdf. Accessed 26/Sep/2005.
American Water Works Service Co. Inc. Engineering Department. Deteriorating BuriedInfrastructure Management Challenges and Strategies. May 2002. EnvironmentalProtection Agency. http://www.epa.gov/safewater/tcr/pdf/infrastructure.pdf. Accessed10/Jan/2005.
Anderton, Frances. "Shelter Made of the Earth's Own Dust." NY Times 15/April 1999:Design Notebook. http://www.calearth.org/nyt1.htm. Accessed 23/Aug/2005.
United States Department of Energy, Energy Information Administration. Annual EnergyOutlook 2004 with Projections to 2025. DOE/EIA-0383(2004. January 2004. Table 2.Energy Consumption by Sector and Source. United States Department of Energy, EnergyInformation Administration. http://www.eia.doe.gov/oiaf/aeo/excel/aeotab_2.xls.Accessed 21/Aug/2004.
United States Department of Energy, Energy Information Administration. Annual EnergyOutlook 2005 with Projections to 2025. Report #: DOE/EIA-0383(2005). January 2005.Table 2. Energy Consumption by Sector and Source. National Energy InformationCenter, EI-30. http://www.eia.doe.gov/oiaf/aeo/excel/aeotab_2.xls. Accessed 2/Jul/2005.
Energy Information Administration Office of Energy Markets and End Use - U.S.Department of Energy. Annual Energy Review 2001. DOE/EIA-0384(2001). Nov 2002.Energy Information Administration Office of Energy Markets and End Use - U.S.Department of Energy. http://tonto.eia.doe.gov/FTPROOT/multifuel/038401.pdf.Accessed 25/Sep/2005.
United States Department of Energy, Energy Information Administration. Annual EnergyReview 2003. DOE/EIA-0384(2003). United States Department of Energy Office ofEnergy Markets and End Use: Washington D.C., September 2004. September 2004. 38(76). http://www.eia.doe.gov/emeu/aer/pdf/aer.pdf. Accessed 2/Jul/2005.
Montana Department of Environmental Quality. Appliances: Selection and OperatingTips on Energy Efficient Appliances. January 2003. Montana Department ofEnvironmental Quality. http://www.deq.state.mt.us/Energy/EEHome/appliances.pdf.Accessed 19/Aug/2005.
Jet Blast Industrial Services. Aqua Helix Home. 18/Feb 1999. Jet Blast IndustrialServices. http://www.jetblast.net/ahhome.html. Accessed 13/Jul/2005.
Archer, Cristina L., and Mark Z. Jacobson. "Evaluation of Global Wind Power." Journalof Geophysical Research - Atmospheres 110, no. D12 30-Jun 2005. American
Cooling It: No Hair Shirt Solutions to Global Warming by Gar W. Lipow GarLpublic AT Comcast DOT net
Page 213 of 265
Geophysical Union. http://www.stanford.edu/group/efmh/winds/2004jd005462.pdf.D12110 DOI:10.1029/2004JD005462. Accessed 20-Jan-2008.
———. "Supplying Baseload Power and Reducing Transmission Requirements byInterconnecting Wind Farms." JOURNAL OF APPLIED METEOROLOGY ANDCLIMATOLOGY 46, no. 11 Nov 2007: 1701-17. American Meteorological Society.http://www.stanford.edu/group/efmh/winds/aj07_jamc.pdf. Accessed 18/Jan/2008.
Arias, Elizabeth. "United States Life Tables, 2000." National Vital Statistics Reports 51,no. 3 19/Dec 2002. National Center for Health Statistics.http://www.cdc.gov/nchs/data/nvsr/nvsr51/nvsr51_03.pdf. Accessed 2/Oct/2004.
Associated Press. "In Global Warming Fight, Trees not Always Best Answer." USAToday 7/Aug 2002: Health and Behavior. Gannett Co. Inc.http://www.usatoday.com/news/science/2002-08-07-global-warming_x.htm. Accessed4/Jaun/2004.
Athanasiou, Tom, and Paul Baer. Dead Heat: Global Justice and Global Warming. NewYork: Seven Stories Press, 2002.
Atuan, Lyad et al. Life-Cycle Assessment of Desktop Computer Display. Mar 2004. None- Term Project in Masters Level Class.http://s93889521.onlinehome.us/docs/mie415.pdf. Accessed 6/Jun/2004.
Australia Department of Industry, Tourism and Resources. "Steam Leaks." AustralianEnergy News No. 16 June 2000. Australia Department of Industry, Tourism andResources. http://www1.industry.gov.au/archive/pubs/aen/aen16/34steam.html (Sameinfo as old ASE site page http://www.ase.org/programs/industrial/steam.htm#Table%201which has disappeared). Accessed 25/Sep/2005.
Houston Automated Shade and Drapery. Automated Shades - Motorized Shades, SolarShades and Drapery Systems - Exterior Solor Shades. Houston Automated Shade andDrapery. http://www.automatedshade.com/exterior.php. Accessed 05/Jul/2005.
Awerbuch, Shimon. "Determining the Real Cost: Why Renewable Power is More Cost-Competitive Than Previously Believed." Renewable Energy World No. March-April2003 Mar 2003. James & James.http://www.earthscan.co.uk/news/article/mps/UAN/71/v/3/sp/332149698573342662256.Accessed 27/Sep/2005.
Backwoods Solar Electric Systems. Backwoods Solar Electric Systems -The CatalogPages - Refrigeration. 19/Jul 2005. Backwoods Solar Electric Systems.http://www.backwoodssolar.com/Catalogpages2/refriger2.htm. Accessed 16/Aug/2005.
Cooling It: No Hair Shirt Solutions to Global Warming by Gar W. Lipow GarLpublic AT Comcast DOT net
Page 214 of 265
Baldwin, J. WNET: Bucky Fuller Dymaxion Car. ~1996. WNET (PBS TristateArea/Internet Collaberation). http://www.thirteen.org/bucky/car.html. Accessed7/Oct/2005.
International Bamboo Foundation. Bamboo Technologies | About Bamboo. 15/May 2004.International Bamboo Foundation. http://www.bambootechnologies.com/allabout.htm.Accessed 26/Oct/2005.
Bell, Jeffrey. "Auto Makers Juggle Substance, Style To Do Their Part For TheEnvironment." In. Wall Street Journal 15/May 2004The Aluminum Association. DowJones & Company.http://www.aluminum.org/Template.cfm?Section=Home&template=/ContentManagement/ContentDisplay.cfm&ContentID=1444. Accessed 6/Jun/2004.
Bentur, Arnon, Sidney Diamond, and Neal Steven Berke. Steel Corrosion in Concrete:Fundamentals and Civil Engineering Practice. London: E&FN Spon, 1997.
Beyn, Edgar J. THE PERFECT BOX, 39 Ways to Improve Your Boat's Ice Box.Annapolis: Spa Creek Instruments Co, 1982.
Bhattacharya, Shaoni. "Global Warming 'Kills 160,000 a Year.'." New Scientist(NewScientist.Com Online News Journal) Oct 2003.http://www.newscientist.com/article.ns?id=dn4223. Accessed 9/Jan/2005.
Committee on Biobased Industrial Products, National Research Council. BiobasedIndustrial Products: Research and Commercialization Priorities - Executive Summary.2000. National Academy of Sciences. http://books.nap.edu/execsumm_pdf/5295.pdf.Accessed 24/Sep/2005.
Bluestone, Irving. "Time 100: Builders and Titans: Walter Reuther." Time Magazine7/Dec 1998. Time Inc. http://www.time.com/time/time100/builder/profile/reuther3.html.Accessed 17/Apr/2005.
Boeing World Headquarters. Boeing 787-3 Dreamliner Facts. 2003. Boeing Company.http://www.boeing.com/commercial/7e7/facts_sr.html. Accessed 21/Aug/2004.
Borweger, Nina et al. Car Sharing in Practice: The Tosca Takeup Guide. In InformationSociety Programme. Project Number: 1st-1999-20856. 24/Jan 2002. RupprechtConsult;European Comission.http://www.atc.bo.it/progetti/tosca/Take%20Up%20Guide%20Final.pdf.
Brand, Steward. How Buildings Learn: What Happens After They’re Built. New York:Viking Penguin, 1994.
Cooling It: No Hair Shirt Solutions to Global Warming by Gar W. Lipow GarLpublic AT Comcast DOT net
Page 215 of 265
Broner, I. Irrigation: Tailwater Recovery for Surface Irrigation. In Crop Series. 4.709.1998. Colorado State University Cooperative Extension.http://www.ext.colostate.edu/pubs/crops/04709.PDF. Accessed 17/Sep/2005.
Bronson Consulting Group CPCS Transcom Ltd. for Marine Sub-Group of theTransportation Table on Climate Change. Marine Summary:Transportation &ClimateChange : Assessment of Opportunities to Reduce GHG Emissions in the MarineTransportation Industry. July 1999.http://www.tc.gc.ca/programs/environment/climatechange/subgroups1/marine/Exec_Summary/English/Marine.htm. Accessed 18/Nov/2003.
Brown, Rober C., Colletti, Joe, and Arne Hallam. "Factors Influencing the Adoption ofBiomass Energy Systems: An Evaluation for Iowa." Fifth World Congress of ChemicalEngineering, San Diego, CA, July 14-18, 1996. Ames Iowa USA: Iowa State University,1996.
Browning, William. NMB Bank Headquarters: The Impressive Performance of a GreenBuilding. The Urban Land Institute: Washington D.C., June 1992. 24/Feb 2003. RockyMountain Institute. http://www.rmi.org/images/other/GDS/D92-21_NMBBankHQ.pdf.Accessed 22/Aug/2005.
Bureau of Transportation Statistics. BTS - U.S. International Travel and TransportationTrends - Overseas Travel Trends. 2004. Inbound Overseas Travel;. Bureau ofTransportation Statistics.http://www.bts.gov/publications/us_international_travel_and_transportation_trends/overtrends.html. Accessed 23/Sep/2005.
U.S. Office of Management & Budget. Budget of the United States Government:Historical Tables Fiscal Year 2005 | Section 3 - Federal Government Outlays byFunction | Table 3.1 - Outlays by Superfunction and Function: 1940-2010. 2005. U.S.Government Printing Office.http://www.gpoaccess.gov/usbudget/fy06/sheets/hist03z1.xls. Accessed 4/Apr/2005.
Bureau of Labor Statistics. "Planned Changes to the Current Employment Survey." InEmployment, Hours, and Earnings from the Current Employment Statistics Survey(National). 18/April 2005. http://www.bls.gov/ces/cesww.htm. Accessed 12/06/2005.
CalCars - The California Cars Initiative - 100 MPG Hybrids. Plug-In Hybrids: State OfPlay, History & Players. 17/Mar 2006. http://www.calcars.org/history.html. Accessed17/Mar/2006.
Calder, Nigel. Refrigeration for Pleasure Boats: Installation, Maintenance, and Repair.Camden ME USA: International Marine, 1991.
California Institute of Earth Art and Architecture. CalEarth Forum. July 2005. CaliforniaInstitute of Earth Art and Architecture. http://www.calearth.org/. Accessed 23/Aug/2005.
Cooling It: No Hair Shirt Solutions to Global Warming by Gar W. Lipow GarLpublic AT Comcast DOT net
Page 216 of 265
Stanford University News Service. Can Computer Chip Makers Reduce EnvironmentalImpact? 5/Jun 1996. Stanford University News Service.http://www.stanford.edu/dept/news/pr/96/960605chipsenvir.html. Accessed 4/Jun/2004.
Carson, Richard T., and Nadja Marinova. Running on Air. In Institute on Global Conflictand Cooperation IGCC Policy Briefs. Sep-1999. ISSN 1089-8352 Policy Brief Number13. 21/Feb 2005. Institute on Global Conflict and Cooperation (IGCC).http://repositories.cdlib.org/cgi/viewcontent.cgi?article=1088&context=igcc. Accessed18/Mar/2005.
Carvelli, Peter. RenewableEnergyAccess.Com | California Victory: Solar Exit FeeDefeated. 4/Apr 2003. Renewable Energy Access.http://www.renewableenergyaccess.com/rea/news/story?id=8485. Accessed 28/Sep/2005.
Envirowise. Case Studies- All Industries - Envirowise. Practical Environmental Advicefor Business, a Government Programme Managed by Momenta, an Operating Division ofAEA Technology Plc, and Technology Transfer and Innovation Ltd. Sep/28 2005.Momenta. http://www.envirowise.gov.uk/page.aspx?o=168584. Accessed 28/Sep/2005.
Energy Research Group - University College. Case Study Module C - Sukkertoppen -Copenhagen DK. In Mid Career Education: Solar Energy in European Office Buildings.Nov 1997. Energy Research Group - University College.http://erg.ucd.ie/mid_career/pdfs/case_study_C.pdf. Accessed 22/Aug/2005.
Cement Association of Canada. "Cement Association of Canada - Geopolymer Cement."In Cement Association of Canada - Advanced Search. 21/Dec 2003. Cement Associationof Canada.http://www.cement.ca/cement.nsf/searchFinal/DB64D50A9B5CD72D85256D48005EBCA5?OpenDocument. Accessed 04/Sep/2005.
Chapman, Robert E., and Christine A. Izzo. Baseline Measures for Improving HousingDurability. NISTIR 6870. September 2002. US. Department of Commerce NationalInstitute of Standards and Technology Building and Fire Research Laboratory/U.S.Department of Housing and Urban Development Office of Policy Development andResearch. http://fire.nist.gov/bfrlpubs/build02/PDF/b02159.pdf. Accessed 06/Jul/2005.
CANMET Energy Technology Centre, Natural Resources Canada. "Chapter 2: Gettingthe Most For Your Fuel Bill." In An Energy Efficiency and Environment Primer forBoiler and Heaters. 22/Jan 2003. CANMET Energy Technology Centre, NaturalResources Canada.http://www.energysolutionscenter.org/BoilerBurner/Resources/Primer/Primer_Chap2.pdf. Accessed 8/Oct/2005.
Charles River Associates for Diesel Technology Forum. Diesel Technology and theAmerican Economy. Report D02378-00. October 2000.
Cooling It: No Hair Shirt Solutions to Global Warming by Gar W. Lipow GarLpublic AT Comcast DOT net
Page 217 of 265
http://www.dieselforum.org/enews/downloads/DTF-Economic-Study.PDF. Accessed12/Jan/2005.
Cheng, Maria, and Julian Gearing. "Green Seeds." Asia Week 27-18 11/May 2001. AsiaWeek. http://www.asiaweek.com/asiaweek/magazine/nations/0,8782,108626,00.html.Accessed 05/Jul/2005.
Cheung, Kevin K. C. Multi-Storey, Multi-Family Wood-Frame Construction in the USA.In International Conference on the Seismic Performance of TraditionalBuildings:Istanbul, Turkey, Nov.16-18, 2000. 27/Sep/2000. 15/Nov 2001. InternationalCouncil on Monuments and Sites: International Wood Committee.http://www.icomos.org/iiwc/seismic/Cheung-K.pdf. Accessed 23/Aug/2005.
Center for Integrated Agricultural Systems of the University of Wisconsin's College ofAgricultural and Life Sciences. CIAS: Management Intensive Rotational Grazing'sSense.and Dollars. April 1996. Center for Integrated Agricultural Systems of theUniversity of Wisconsin's College of Agricultural and Life Sciences.http://www.cias.wisc.edu/archives/2000/01/04/dairy_grazing_can_provide_good_financial_return/index.php. Accessed 13/Sep/2005.
Cifuentes, Luis et al. "Climate Change: Hidden Health Benefits of Greenhouse GasMitigation." In. Science 293, no. 5533 17/Aug 2001When Smoke Ran Like Water. TheAmerican Association for the Advancement of Science (AAAS).http://www.whensmokeranlikewater.com/publications/scientific/Science2.html. Accessed4/Jun/2004.
Clar, Michael. Buckeye Development, LLC - Pembrook Woods Low Impact Development.Feb 2000. Buckeye Development, LLC.http://www.buckeyedevelopment.net/lowimpactdevelopment.htm. Accessed 5/Sep/2005.
Clark, Sean, and Michael Panciera. "Cover Crop Roll-Down for Weed Suppression inNo-Till Crop Production." In 2002 Fruit and Vegetable Crops Research Report. Editedby Brent Rowell, and John C Snyder. PR470. Dec 2002. University of Kentucky Collegeof Agriculture Agricultural Experiment Station.http://www.ca.uky.edu/agc/pubs/pr/pr470/PR470.PDF. Accessed 17/Sep/2005.
Clerici, Alessandro, and Andrea Longhi. Competitive Electricity Transmission as anAlternative to Pipeline Gas Transport for Electricity Delivery. In 17th World EnergyCouncil Congress, Houston, Texas, USA, 13-18 September 1998. Sep 1998. WorldEnergy Council. http://www.worldenergy.org/wec-geis/publications/default/tech_papers/17th_congress/2_2_08.asp. Accessed 23/Aug/2004.
Cleveland, Cutler J., and Charles A. S. Hall. "Climate Change Human Driving Forces,Biophysical Basis, and Likely Impacts." In Climate Change - Socioeconomic Dimensionsand Consequences of Mitigation. Edited by Pentti Vartia. Fortum: Helsinki, 2000. Oct
Cooling It: No Hair Shirt Solutions to Global Warming by Gar W. Lipow GarLpublic AT Comcast DOT net
Page 218 of 265
1999. Boston Univerisity. http://www.bu.edu/cees/research/workingp/pdfs/9910.pdf.Accessed 11/Sep/2005.
Clinton, B. Douglas, and David E. Keys. "Resource Consumption Accounting: The NextGeneration of Cost Management Systems." Focus Magazine: For the PerformanceManagement Professional 5, no. 2002 (2002). Focused Management Inc.http://www.focusmag.com/back_issues/issue_05/pages/rca.htm. Accessed 2/Apr/2005.
Coleman, John S., Stanley A. Temple, and Scott R. Craven. Cats and Wildlife - AConservation Dilemma. 1997. U.S. Department of Agriculture, University of Wisconsin-Extension, Cooperative Extension. http://wildlife.wisc.edu/extension/catfly3.htm.Accessed 24/Jun/2005.
U.S. Department of Energy Office of Energy Efficiency and Renewable Energy.Combustion Success Story: Solarwall© Air Preheating System | Elegantly Simple SystemUses Solar Energy to Heat Ventilation Air or Preheat Combustion Air. In Office ofIndustrial Technology Inventions & Innovations Program. I-CO-563. December 2001.U.S. Department of Energy Office of Energy Efficiency and Renewable Energy.http://www.eere.energy.gov/inventions/pdfs/conserval.pdf. Accessed 5/Sep/2004.
"Commercial Aero-Engine MRO Outlook - a New Dawn?" In Engine Yearbook 2005.2005. Aviation Industry Press Ltd. http://www.aviation-industry.com/atem/newpages/eyb2003pdfs/E2005_aerostrat.pdf. Accessed 11/Jan/2005.
Commoner, Barry. The Poverty of Power: Energy and the Economic Crisis. New York:Alfred A. Knopf, 1976.
Cement Association of Canada. Concrete Thinking for a Sustainable Future. Jan 2004.Cement Association of Canada.http://www.cement.ca/cement.nsf/48ee3f6971d16bad8525693b004d616f/6abdcde126a87a6c85256d2e005cc53b/$FILE/Sustainable%20Development.pdf. Accessed 2/Oct/2005.
O’Connor, Jennifer. Survey on Actual Service Lives for North American Buildings.Presented at Woodframe Housing Durability and Disaster Issues conference,: Las Vegas,Oct 2004. Sep 2004.http://www.northernrockies.org/Departments/Fire/Wood_Buildings/Wood%2520Buildings%2520Service_Life_E.pdf. Accessed 16/Jun/2006.
Conserv-A-Store. Conserv-A-Store :: Recycling Supplies, Solar Lighting, Electrical,Plumbing & Water Conservation Products-Economical & Eco-Friendly! Part Number:01-0104. July 2005. Conserv-A-Store.http://www.conservastore.com/productdetail.php?p=23. Accessed 13/Jul/2005.
Corridore, Jim. "Industry Profiles - Industry Trends." In Standar & Poor's IndustrySurveys: Airlines. 25/Nov 2004. Standards & Poor's Division of McGraw Hill.http://libsys.uah.edu/library/mgt301/spairline.pdf. Accessed 23/Sep/2005.
Cooling It: No Hair Shirt Solutions to Global Warming by Gar W. Lipow GarLpublic AT Comcast DOT net
Page 219 of 265
Cory, Jim. "Siding Replacement." Remodeling Magazine No. November 2002 November2002: 2002 Cost vs. Value Report. Hanley Wood.http://www.remodeling.hw.net/pages/remodelingonline/Story.nsp?story_id=1000027503&ID=newsreal&scategory=Computers&type=break. Accessed 10/Mar/2004.
NAHB Research Center, Inc. Costs and Benefits of Insulating Concrete Forms forResidential Construction. In PATH (Partnership for Advancing Technology in Housing).HUD Contract H-21172CA. Nov 2001. U.S.Department of Housing and UrbanDevelopment Office of Policy Development and Research.http://www.huduser.org/Publications/PDF/icfbenefit.pdf. Accessed 4/Jun/2004.
Cowan, Richard. "U.S. Group Blasts Creekstone Mad Cow Testing Plan." Reuters ViaForbes.Com 19/Apr 2004. Forbes.http://www.forbes.com/markets/newswire/2004/04/19/rtr1336959.html. Accessed14/May/2004.
Cowen, Robert C. "Global Warming's Surprising Fallout." The Christian Science Monitor19/Aug 2004. The First Church of Christ, Scientist.http://www.csmonitor.com/2004/0819/p16s01-sten.html. Accessed 1/Sep/2004.
Crowley, Michael, and Prem Bansal. Development of an Integrated Electric MotorCompression System. 3/Oct 2004. Gas Machinery Research Council | DOE NETLResearch Review.http://www.gmrc.org/gmrc/2004finalpapers/Development%20of%20an%20Integrated%20Electric%20Motor%20Driven%20Compressor.pdf. Accessed 27/Sep/2005.
ASKO. D3350. 204. ASKO.http://www.asko.se/ASKO/brandsite/main.cfm?moduleID=10&productID=2814#.Accessed 05/Jul/2005.
Darr, David R. U.S. Forest Resources. 28/Sep 2000. U.S. Forest Service.http://biology.usgs.gov/s+t/noframe/m1103.htm. Accessed 15/Jun/2004.
Davis, Stacey C., and Susan W. Diegel. TRANSPORTATION ENERGY DATA BOOK: -Edition 22. ORNL-6967 (Edition 22 of ORNL-5198). Sep 2002. Center forTransportation Analysis Science and Technology Division of the Oak Ridge NationalLaboratory for the U.S. DOE. http://www-cta.ornl.gov/cta/Publications/pdf/ORNL-6967.pdf. Accessed 23/Sep/2005.
———. TRANSPORTATION ENERGY DATA BOOK: - Edition 23. ORNL-697(Edition23 of ORNL-5198). October 2003. Chapter 5: Heavy Vehicles and Characteristics, Page5-7, Table 5-Truck Statistics by Size - 1997. Center for Transportation Analysis Scienceand Technology Division of the Oak Ridge National Laboratory for the U.S. DOE.http://www-cta.ornl.gov/data/tedb23/Full_Doc_TEDB23.pdf. Accessed 24/Feb/2003.
Cooling It: No Hair Shirt Solutions to Global Warming by Gar W. Lipow GarLpublic AT Comcast DOT net
Page 220 of 265
Davis, Todd. "Tour Time - Color Spot -Adios Runoff, Hello Quality." In The GreenBeam - The Online Channel for Horticulture Business Solutions. Dec 2002.Branch/Smith Publishing. http://www.greenbeam.com/features/tour120202.stm.Accessed 3/Jun/2004.
Dearien, John A., Struthers Richard D., and Kent D. McCarthy. CyberTran: A SystemsAnalysis Solution to the High Cost and Low Passenger Appeal of Conventional RailTransportation Systems. Nov 2001. CyberTran International, Inc.http://www.cybertran.com/ctpaper.pdf. Accessed 22/Jun/2004.
Dearien, John A. (Junior). "CyberTran -Future Progress, Efficiency and Statistics." 4/Dec2003. Accessed 4/Dec/2003.
United States Department of Energy, Energy Information Administration. DeliveredEnergy Consumption Projection by Industry in the Annual Energy Outlook 2002-Table 4.30/Jul 2002. United States Department of Energy, Energy Information Administration.http://www.eia.doe.gov/oiaf/analysispaper/industry/tbl4.html. Accessed 22/Aug/2005.
DeOreo, William B., David M. Lewis, and Peter W. Mayer. Seattle Home WaterConservation Study: The Impacts of High Efficiency Plumbing Fixture Retrofits inSingle-Family Homes. December 2000. Aquacraft, Inc. Water Engineering andManagement. http://www.cuwcc.org/Uploads/product/Seattle-Final-Report.pdf. Accessed08/Aug/2005.
U.S. Department of Energy Office of Energy Efficiency and Renewable Energy.Department of Environmental Protection, Cambria Office Building, EbensbergPennsylvania - Highlighting High Performance. Nov 2001. DOE/GO-102001-1353. Jan2002. U.S. Department of Energy Office of Energy Efficiency and Renewable Energy.http://www.eere.energy.gov/buildings/info/documents/pdfs/29941.pdf. Accessed22/Aug/2005.
Dias De Oliveira, Marcelo E., Burton E. Vaughan, and Edward J. Rykiel. " Ethanol asFuel: Energy, Carbon Dioxide Balances, and Ecological Footprint." BioScience(Publisher: American Institute of Biological Sciences) 55, no. 7 (Jul 2005): 593-602.
Institute of Medicine of the National Academies. Dietary Reference Intakes:Macronutrients. May 2005. National Academy of Sciences.http://www.iom.edu/Object.File/Master/7/300/0.pdf. Accessed 10/Sep/2005.
Digiacomo, Gigi et al. Sustainable Farming Systems: Demonstrating Environmental andEconomic Performance. Jun-2001. Nov 2001. Minnesota Project; Minnesota Institute forSustainable Agriculture; University of Minnsota.http://www.misa.umn.edu/publications/SFSreport.pdf. Accessed 11/Sep/2005.
Dimitriu, D. et al. Aviation and the Global Atmosphere -(Chapter 8) Air TransportOperations and Relations to Emissions - Executive Summary. Apr 1999. GRID-Arendal
Cooling It: No Hair Shirt Solutions to Global Warming by Gar W. Lipow GarLpublic AT Comcast DOT net
Page 221 of 265
Official United Nations Environment Programme (UNEP) Centre.http://www.grida.no/climate/ipcc/aviation/119.htm. Accessed 19/Aug/2004.
———. Aviation and the Global Atmosphere -(Chapter 8) Air Transport Operations andRelations to Emissions - Other Factors to Reduce Emissions. Apr 1999. 8.3.1.1. AircraftCapacity Utilization. GRID-Arendal Official United Nations Environment Programme(UNEP) Centre. http://www.grida.no/climate/ipcc/aviation/124.htm. Accessed19/Aug/2004.
DiNinno, Carol, and Ann Lattinville. "Technical Assistance Tips: Vinyl Siding."Preservation Advocate No. Spring 2003 (2003). Commonwealth of MassachusettsHistorical Commission. http://www.sec.state.ma.us/mhc/mhcpdf/pasp03.pdf. Accessed06/Jul/2005.
National Association of Home Builders Research Center. Drainwater Heat Recovery.2004. National Association of Home Builders Research Center.http://www.toolbase.org/tertiaryT.asp?DocumentID=2134&CategoryID=1402. Accessed08/Aug/2005.
California Energy Commission. "Dryers." In Consumer Energy Center - Inside YourHome. August 2005. California Energy Commission.http://www.consumerenergycenter.org/homeandwork/homes/inside/appliances/dryers.html. Accessed 20/Aug/2005.
Dearien, John A. (Junior). "Ultralight Rail and Energy Use." In Encyclopedia of Energy,edited by Cutler J. Cleveland, 255-66. Elsevier Publishing, 2004.
Dukes, Michael D. Types and Efficiency of Florida Irrigation Systems. (Note: Data UsedWas from National Sources). Dec 2002. University of Florida - Agricultural andBiological Engineering Dept.http://www.agen.ufl.edu/~mdukes/publications/Types_and_Efficiency_of_Florida_Irrigation_Systems.pdf. Accessed 28/Oct/2005.
Duxton Windows and Door. Special Feature: The Airdrie Project. April 2003.http://www.duxtonwindows.com/Pages/airdrie.html. Accessed 06/Jul/2005.
Edminster, Ann, and Sami Yassa. Efficient Wood Use in Residential Construction: APractical Guide to Saving Wood, Money, and Forests. Natural Resources DefenseCouncil: New York, 1998. http://www.nrdc.org/cities/building/rwoodus.asp. Accessed19/Feb/2006.
U.S. Department of Energy - Energy Information Administration. E.1g World EnergyIntensity (Total Primary Energy Consumption Per Dollar of Gross DomesticProduct),1980-2002 (Btu Per 1995 U.S. Dollars Using Market Exchange Rates). 25/Jun2004. U.S. Department of Energy - Energy Information Administration.http://www.eia.doe.gov/pub/international/iealf/tablee1c.xls. Accessed 18/Aug/2004.
Cooling It: No Hair Shirt Solutions to Global Warming by Gar W. Lipow GarLpublic AT Comcast DOT net
Page 222 of 265
EECO - A Transico Company. EECO-Greenä SILVER-THROUGH-HOLE DOUBLE-SIDED PRINTED CIRCUIT BOARDS PRODUCT OVERVIEW DESIGNCONSIDERATIONS FAQ’s. Dec 2003. EECO - A Transico Company.http://www.eecoswitch.com/PDF%20Files/STH%20FAQs.PDF. Accessed 22/May/2004.
Energy Federation Incorporated. EFI Internet Division Residential Catalogue | BathFaucet Aerators. July 2005. Energy Federation Incorporated.http://www.energyfederation.org/consumer/default.php/cPath/27_52. Accessed13/Jul/2005.
Eisenberg, Carolyn W, Drawing the Line: The American Decision to Divide Germany,1944-1949. New York: Cambridge University Press, 1996.
Eisenberg, David. Historic Straw-Bale Structures -An Eye-Witness Account. 25/Mar2004. California Straw Building Association.http://www.strawbuilding.org/sb/reading/historic.htm. Accessed 23/Aug/2005.
Elderkin, Phil. "Down-to-Earth Houses." The Christian Science Mo 2/Oct 2002: Living.http://www.csmonitor.com/2002/1002/p11s02-lign.html. Accessed 23/Aug/2005.
Seattle City Light. Electric Industry Restructuring and Seattle City Light. Feb 2004.Seattle City Light.http://www.cityofseattle.net/light/news/advisory/Docs/presnotes_06_03_03.pdf.Accessed 28/Mar/2005.
U.S. Department of Energy - Energy Information Administration. Electric PowerMonthly - Table 5.6.A. Average Retail Price of Electricity to Ultimate Customers. 9/Aug2005. U.S. Department of Energy - Energy Information Administration.http://www.eia.doe.gov/cneaf/electricity/epm/table5_6_a.html. Accessed 20/Aug/2005.
Electricity Storage Association. Electricity Storage Association - TechnologyComparisons - Capital Cost. 27-Oct 2005. Electricity Storage Association.http://electricitystorage.org/tech/technologies_comparisons_capitalcost.htm. Accessed20-Jan-2008.
Electric Power Research Institute (EPRI). Electricity Sector Framework for the Future |Volume I | Achieving the 21st Century Transformation. 6/Aug 2003. Electric PowerResearch Institute (EPRI). http://www.epri.com/corporate/esff/ESFF_volume1.pdf.Accessed 27/Sep/2005.
Commission of the European Communities. Energy Consumption and Cost Effectivenessof EC2000 Buildings. In Energy Comfort 2000. Jan 2000. European CommissionThermie Project to Reduce Energy and Improve Comfort and Environment. InformationDossier Number 10/11. January 2004. Commission of the European Communities.Energy Research Group - University College.http://erg.ucd.ie/EC2000/EC2000_PDFs/dossier_1011.pdf. Accessed 22/Aug/2005.
Cooling It: No Hair Shirt Solutions to Global Warming by Gar W. Lipow GarLpublic AT Comcast DOT net
Page 223 of 265
Energy Conversion Devices, Inc. Energy Conversion Devices, Inc. 1997 Letter toStockholders -Commercializing Technologies That Enable the Information and EnergyIndustries. Dec 1997. Energy Conversion Devices, Inc.http://www.ovonic.com/PDFs/LtrstoShldrs/ecd97ltr.pdf. Accessed 26/Sep/2005.
The Energy Doctor. The Energy Doctor Free/No Risk Offer. 22/Mar 2002. The EnergyDoctor. http://www.energydr.com/Free_Offers/Free_Service/free_service.html. Accessed12/Mar/2005.
Orange & Rockland ConEdison. Energy Efficiency - Ranges and Ovens. August 2005.Orange & Rockland ConEdison.http://www.oru.com/energyandsafety/energyefficiency/rangesandovens.html. Accessed20/Aug/2005.
Pacific Gas & Electric Company. Energy Efficient Operations and MaintenanceStrategies for Industrial Gas Burners. In PG&E Energy Efficiency Information©“Industrial Gas Boiler O&M Strategies”. 25/Apr 1997. Pacific Gas & Electric Company.http://www.pge.com/003_save_energy/003c_edu_train/pec/info_resource/pdf/GASBOILR.PDF. Accessed 8/Oct/2005.
U.S. Department of Energy Office of Energy Efficiency and Renewable Energy. "EnergySavers: Compact Fluorescent Lamps." In Energy Savers: A Consumer Guide toRenewable Energy and Energy Efficiency. 21/June 2004.http://www.eere.energy.gov/consumerinfo/factsheets/ef2.html. Accessed 19/Aug/2005.
U.S. Department of Energy Office of Energy Efficiency and Renewable Energy. EnergySavers: Demand (Tankless or Instantaneous) Water Heaters. Washington D.C. 03/Jan2005. U.S. Department of Energy Office of Energy Efficiency and Renewable Energy.http://www.eere.energy.gov/consumerinfo/factsheets/bc1.html. Accessed 08/Aug/2005.
U.S. Department of Energy Office of Energy Efficiency and Renewable Energy. "EnergySavers: Energy Use of Some Typical Home Appliances." In Energy Savers: A ConsumerGuide to Renewable Energy and Energy Efficiency. 28/Jun 2004. U.S. Department ofEnergy Office of Energy Efficiency and Renewable Energy.http://www.eere.energy.gov/consumerinfo/factsheets/ec7.html. Accessed 20/Aug/2005.
U.S. Department of Energy Office of Energy Efficiency and Renewable Energy. EnergySavers: Loose-Fill Insulations. 04/May 2004. U.S. Department of Energy Office ofEnergy Efficiency and Renewable Energy.http://www.eere.energy.gov/consumerinfo/factsheets/insulate.html. Accessed12/Mar/2005.
Salem Electric. Energy Saving Ideas - Ovens & Ranges. 2005. Small But Significant.Salem Electric. http://www.salemelectric.com/info/ideas/ovens_ranges.aspx. Accessed20/Aug/2005.
Cooling It: No Hair Shirt Solutions to Global Warming by Gar W. Lipow GarLpublic AT Comcast DOT net
Page 224 of 265
Energy Star Program of the EPA and DOE. Energy Star Qualified Dishwashers. List ofEnergy Star Dishwashers with Efficiency Ratings. 14/June 2004. Energy Start Programof the EPA and DOE.http://www.energystar.gov/ia/products/prod_lists/dishwash_prod_list.pdf. Accessed10/Jul/2005.
Energy Star Program of the EPA and DOE. ENERGY STAR® Qualified ClothesWashers. ENERGY STAR® Qualified Clothes Washers with Effiiciencies and ProjectedYearly KWh Consumption. 21/June 2004. Energy Star Program of the EPA and DOE.http://www.energystar.gov/ia/products/prod_lists/clotheswash_prod_list.pdf. Accessed11/Jul/2005.
Energy Star Program of the EPA and DOE. ENERGY STAR® Qualified Refrigerators.15/Jun 2004. Energy Star Program of the EPA and DOE.http://www.energystar.gov/ia/products/prod_lists/refrig_prod_list.pdf. Accessed08/Aug/2005.
U.S. Department of Energy Office of Energy Efficiency and Renewable EnergyIndustrial Technologies Program. Energy Tips: Reduce Pumping Costs ThroughOptimum Pipe Sizing: Motor Tip Sheet # 1. DOE/GO-10099-879. Dec 1999. U.S.Department of Energy Office of Energy Efficiency and Renewable Energy IndustrialTechnologies Program. http://www.energystar.gov/ia/business/industry/motor1.pdf.Accessed 16/Aug/2004.
Office of Industrial Technologies - Energy Efficiency and Renewable Energy • U.S.Department of Energy. Energy-Efficient Food-Blanching System: New Blanching SystemIncreases Productivity While Saving Energy. In NICE 3 - National IndustrialCompetitiveness Through Energy, Environment, and Economics. Mar 2002. Office ofIndustrial Technologies - Energy Efficiency and Renewable Energy • U.S. Departmentof Energy. http://www.oit.doe.gov/nice3/factsheets/key.pdf (Note:removed from webalong with a lot of other federal energy information. I kept a copy; substitute URL onbook site.).
U.S. Department of Energy Office of Energy Efficiency and Renewable EnergyIndustrial Technologies Program. Energy-Saving Lightweight Refractory: NewRefractory Material Allows For Thinner, Lighter, And More Cost-EffectiveManufacturing Of Kiln Furniture. In Inventions and Innovation Project Fact Sheet.DOE/GO-102001-1037. Feb 2001. U.S. Department of Energy Office of EnergyEfficiency and Renewable Energy Industrial Technologies Program.http://www.eere.energy.gov/inventions/pdfs/silicar.pdf. Accessed 5/Sep/2004.
Office of Industrial Technologies - Energy Efficiency and Renewable Energy • U.S.Department of Energy. ENS Fan Saver For Medium-Temperature Walk-In Refrigerators• New Fan Saver Reduces Energy Consumption up to 50%. In Inventions & Innovation. I-OT-670. Oct 2001. Office of Industrial Technologies - Energy Efficiency and Renewable
Cooling It: No Hair Shirt Solutions to Global Warming by Gar W. Lipow GarLpublic AT Comcast DOT net
Page 225 of 265
Energy • U.S. Department of Energy.http://www.eere.energy.gov/inventions/pdfs/ensfansaver.pdf. Accessed 6/Sep/2004.
Gallup Poll. Environment: The Gallup Poll March 7-10 2005. 01/07 2005. The PollingReport. <http://www.pollingreport.com/enviro.htm>. Accessed 02/07/2005.
United States Environmental Protection Agency. EPA Global Warming Site: Inside theGreenhouse - Making a Sink, Not a Stink. 123/Sep 2000. United States EnvironmentalProtection Agency.http://www.epa.gov/globalwarming/greenhouse/greenhouse11/sink.html. Accessed12/Jan/2004.
Economic Research Unit United States Department of Agriculture. ERS/USDA BriefingRoom - Global Food Security: Questions and Answers. 11/May 2005. EconomicResearch Unit United States Department of Agriculture.http://www.ers.usda.gov/Briefing/GlobalFoodSecurity/questions/. Accessed 10/Sep/2005.
The Atlas Project of the European Commission. Estimated Long Term Technical EnergySavings Potential. 7/Mar 2002. The Atlas Project of the European Commission.http://europa.eu.int/comm/energy_transport/atlas/htmlu/ioeneffa.html. Accessed17/Aug/2004.
Eto, J., D. Arasteh, and S. Selkowitz. Transforming the Market for Residential Windows:Design Considerations for DOE’s Efficient Window Collaborative. 1996. LawrenceBerkeley National Laboratory. http://eetd.lbl.gov/btp/papers/42254.pdf. Accessed4/Jun/2004.
European Commission. EUROPA - Research - Energy - - R&D Topics. Jul 2005.European Commission.http://europa.eu.int/comm/research/energy/nn/nn_rt/nn_rt_pv/article_1108_en.htm.Accessed 28/Sep/2005.
European Recovered Paper Council;Confederation of European Paper Industries. TheEuropean Declaration on Paper Recovery Annual Report 2000. 14/Sep 2001. EuropeanRecovered Paper Council;Confederation of European Paper Industries.http://www.paperrecovery.org/files/ERPC%20AR%202000_2.pdf. Accessed21/Jun/2005.
Flexible Packaging Association. Examples of Source Reduction. Flexible PackagingAssociation. http://www.flexpack.org/enviro/09srexamples.htm. Accessed 9/Jun/2004.
Food and Agriculture Organization of the United Nations (FAO). FAOSTAT OnlineDatabase 2003 - Crops Primary. Aug 2004. Food and Agriculture Organization of theUnited Nations (FAO).http://faostat.fao.org/faostat/servlet/XteServlet3?Areas=862&Items=%3E1714&Elements=31&Years=2000&Format=Table&Xaxis=Years&Yaxis=Countries&Aggregate=&Calcu
Cooling It: No Hair Shirt Solutions to Global Warming by Gar W. Lipow GarLpublic AT Comcast DOT net
Page 226 of 265
late=&Domain=SUA&ItemTypes=Production.Crops.Primary&language=EN. Accessed10/Sep/2005.
Food and Agriculture Organization of the United Nations (FAO). FAOSTAT OnlineDatabase 2004 - Crops Primary. Aug 2004. Food and Agriculture Organization of theUnited Nations (FAO).http://faostat.fao.org/faostat/servlet/XteServlet3?Areas=231&Items=%3E1714&Elements=31&Years=2000&Format=Table&Xaxis=Countries&Yaxis=Items&Aggregate=&Calculate=&Domain=SUA&ItemTypes=Production.Crops.Primary&language=EN. Accessed10/Sep/2005.
United Nations Food and Agriculture Organization of the United Nations StatisticalService. FAOSTAT Database Results. 2004. United Nations Food and AgricultureOrganization of the United Nations Statistical Service.http://faostat.fao.org/faostat/servlet/XteServlet3?Areas=862&Items=656&Items=15&Elements=31&Years=2004&Format=Table&Xaxis=Years&Yaxis=Countries&Aggregate=&Calculate=&Domain=SUA&ItemTypes=Production.Crops.Primary&language=EN.Accessed 13/Jul/2005.
American Wind Energy Association. FAQ: Cost of Wind Energy. 2000. American WindEnergy Association. http://www.awea.org/faq/cost.html. Accessed 22/Aug/2004.
California Straw Building Association. FAQs About Straw Building. 25/Mar 2004.California Straw Building Association. http://www.strawbuilding.org/sb/faq.html.Accessed 23/Aug/2005.
VRB Power Systems Inc. FAQ…Vanadium Redox Battery Energy Storage System….2004. VRB Power Systems Inc. http://www.vrbpower.com/vanadiumredoxbattery.html.Accessed 1/Oct/2005.
Ferber, Phil et al. Gas Pipeline Optimization. In 31st Annual Meeting - October 20-22,1999 | St. Louis, Missouri. Oct 1999. Pipeline Simulation Interest Group.http://www.psig.org/papers/1990/9905.pdf. Accessed 27/Sep/2005.
Ferreira, Anton. Sandbag Homes May Be Shelter Breakthrough. 30/Jul 2001. Reuters ViaAlertNet. http://www.alertnet.org/thefacts/reliefresources/245466.htm. Accessed23/Aug/2005.
Flexcar. 2005. Flexcar. http://www.flexcar.com/. Accessed 23/Sep/2005.
Florida Department of Highway Safety and Motor Vehicles. How to Buy a Used Car.21/May 2004. http://www.hsmv.state.fl.us/dmv/usedcar.html. Accessed 3/July/2005.
FOAM-TECH Products - SUPERGREEN FOAM. 2005. Building Envelope Solutions -Thetford VT. http://www.foam-tech.com/products/supergreen.htm. Accessed05/Jul/2005.
Cooling It: No Hair Shirt Solutions to Global Warming by Gar W. Lipow GarLpublic AT Comcast DOT net
Page 227 of 265
Food and Agriculture Organization of the United Nations (FAO). "Food Balance Sheet."In FAOSTAT Online Database 2004. Commodity Balances Database - Production. Aug2004. Food and Agriculture Organization of the United Nations (FAO).http://faostat.fao.org/faostat/servlet/XteServlet3?OutputLanguage=english&Areas=ALL&Items=2901&Years=2001&Years=2000&Domain=FBS&ItemTypes=FBS&language=EN&Codes=ShowCodes. Accessed 10/Sep/2005.
Austrian Federal Ministry of Transport, Innovation and Technology (BMVIT) - AustrianIndustrial Research Promotion Fund. Forschungsforum 1/1998 - Development ofEvaluation Fields for Ecodesign. 2002. Austrian Federal Ministry of Transport,Innovation and Technology (BMVIT) - Austrian Industrial Research Promotion Fund.http://www.nachhaltigwirtschaften.at/(print)/publikationen/forschungsforum/981/teil2.en.html. Accessed 22/Jun/2004.
Fox, Jonathan W., and David R Cramer. Hypercars: A Market-Oriented Approach toMeeting Lifecycle Environmental Goals. Reprinted from SAE PAPER 971096 as RMIT97-05. 1997. Rocky Mountain Institute. http://www.rmi.org/images/other/Trans/T97-05_MarketApproach.pdf. Accessed 2/Oct/2005.
Frame, Dave, Reto Knutti, and Malte Meinshausen. RealClimate - Can 2°C Warming BeAvoided? Climate Science from Climate Scientists. 31/Jan 2006. Real Climate.http://www.realclimate.org/index.php?p=246#more-246. Accessed 12/Feb/2006.
United States Environmental Protection Agency Office of Research and Development.Framework for Responsible Environmental Decision Making (FRED): Using Life CycleAssessment to Evaluate Preferability of Products. EPA/600/R-00/095. United StatesEnvironmental Protection Agency Office of Research and Development: WashingtonD.C., Oct 2000. June 2001. http://www.lcacenter.org/library/pdf/fred.pdf. Accessed5/Sep/2005.
Freightline Custom Chassis. Commericial Bus Chassis: Frequently Asked Questions. .http://www.freightlinerchassis.com/cb_default.asp?page=cb_faqs&nav=mb. Accessed03/Jan/2005.
GATT. GATT, United States - Taxes on Automobiles (DS31/R), Report of the Panel, Oct.11, 1994. 11/Oct 1994. GATT. WorldTradeLaw.Net.http://www.worldtradelaw.net/reports/gattpanels/us-autotaxes.pdf. Accessed30/Sep/2005.
Gelbspan, Ross. Boiling Point: How Politicians, Big Oil and Coal, Journalists andActivists Have Fueled the Climate Crisis - and What We Can Do to Avert Disaster. NewYork: Perseus Book Group - Basic Books, 2004.
———. "Snowed." Mother Jones May/Jun 2005. The Foundation for National Progress.http://www.motherjones.com/news/feature/2005/05/snowed.html. Accessed 10/Jun/2005.
Cooling It: No Hair Shirt Solutions to Global Warming by Gar W. Lipow GarLpublic AT Comcast DOT net
Page 228 of 265
Geothermal Energy Association. Geothermal Electric Production Potential. 2004.Geothermal Energy Association. http://www.geo-energy.org/UsResources.htm. Accessed22/Aug/2004.
National Park Service - U.S. Department of the Interior - Geologic Resources Division.Geothermal Energy Overview. In NPS Western Energy Summit Jan 21 - 23. Jan 2003.National Park Service - U.S. Department of the Interior - Geologic Resources Division.http://www2.nature.nps.gov/geology/adjacent_minerals/EnergySummit/Geothermal/geothermal%20factsheet.pdf. Accessed 24/Aug/2004.
World Bank. Geothermal Energy: Assessment. 7/Sep 2000. World Bank.http://www.worldbank.org/html/fpd/energy/geothermal/assessment.htm. Accessed22/Aug/2004.
Zipcar, Inc. Get a Zipcard. 2005. Zipcar, Inc. http://www.zipcar.com/apply/. Accessed23/Sep/2005.
Mazatlan On line Tour Operator and Travel Services Ticket Master. Getting To and FromMazatlan by Bus - Mazatlan, Mexico. Jul 2004. Mazatlan On Line Tour Operator andTravel Services Ticket Master.http://www.mazatlan.com.mx/tipsandadvice/by_bus_getting_to_maz.htm. Accessed19/Aug/2004.
WaterFilm Energy Inc. GFX 40% Off. GFX Heat Exchanger. 25/May 2005. WaterFilmEnergy Inc. http://www.gfxtechnology.com/sale.html. Accessed 20/Jul/2005.
Gielen, D.J. Technology Characterisation for Ceramic and Inorganic Materials. In InputData for Western European Markal. Sep-1997. ECN-C--97-064. 8/Oct 1998. TheNetherlands Energy Research Foundation.http://www.ecn.nl/docs/library/report/1997/c97064.pdf. Accessed 23/Aug/2005.
Glauthier, T.J. Testimony of T.J. Glauthier President & CEO, Electricity InnovationInstitute Affiliate of EPRI (Electric Power Research Institute) House Committee onEnergy and Commerce Hearing on “Blackout 2003: How Did It Happen and Why?” Sep2003. Electric Power Research Institute (EPRI).http://www.epri.com/corporate/discover_epri/news/testimony_TJ-090403.pdf. Accessed27/Sep/2005.
The World Bank. Global Development Finance (GDF) Online Sample Database. 2003.The World Bank. http://publications.worldbank.org/subscriptions/GDF-trial/. Accessed7/May/2005.
Union of Concerned Scientists. Global Warming - Skeptic Organizations. 2005. Union ofConcerned Scientists. http://www.ucsusa.org/global_warming/science/skeptic-organizations.html. Accessed 30/Sep/2005.
Cooling It: No Hair Shirt Solutions to Global Warming by Gar W. Lipow GarLpublic AT Comcast DOT net
Page 229 of 265
Union of Concerned Scientists. Global Warming FAQ. 10/Aug 2005. Union ofConcerned Scientists. http://www.ucsusa.org/global_warming/science/global-warming-faq.html. Accessed 1/Oct/2005.
Goett, Andrew, and Richard Farmer. Prospects for Distributed Electricity Generation.Sep 2003. Congress of the United States Congressional Budget Office (CBO).http://www.cbo.gov/ftpdocs/45xx/doc4552/09-16-Electricity.pdf. Accessed 27/Sep/2005.
Association of Cities and Regions for Recycling. Good Practices Guide on WastePlastics Recycling: A Guide by and For Local and Regional Authorities - 2004. Edited byJean-Pierre Hannequart. Feb 2004. Association of Cities and Regions for Recycling.http://www.ecvm.org/img/db/ACRRReport.pdf. Accessed 10/May/2005.
Goorskey, Sarah, Andy Smith, and Katherine Wang. Home Energy Briefs #7 -Electronics. Rocky Mountain Institute: Snowmass CO, 2004. 3/Dec 2004.http://www.rmi.org/images/other/Energy/E04-17_HEB7Electronics.pdf. Accessed20/Aug/2005.
Graham, R.L., and M.E. Downing. "Results Discussion, Conclusions -3.1 Yields,Production Costs, and Farm-Gate Prices." In Potential Supply and Cost of Biomass FromEnergy Crops in the TVA Region. ORNL-6858. Apr 1995. Oak Ridge NationalLaboratory (ORNL). http://bioenergy.ornl.gov/reports/tvareg/supply3.html. Accessed24/Aug/2004.
Grahl, Christine L. "Saving Energy with Raw Materials." Ceramic Industry 1/Jul 2002.BNP Media.http://www.ceramicindustry.com/CDA/ArticleInformation/coverstory/BNPCoverStoryItem/0,2708,80846,00.html. Accessed 25/Sep/2005.
Consumers Union. GreenerChoices.Org | Washers/Dryers. August 2005. ConsumersUnion. http://www.eco-labels.org/greenconsumers/products.cfm?product=washer&page=RightChoices.Accessed 20/Aug/2005.
World Resources Institute. Greenhouse Gas Emissions Endanger the Public's HealthToday. Nov 1997. World Resources Institute - Citing November 7 1997 Lancet Article.http://population.wri.org/newsrelease_text.cfm?NewsReleaseID=104. Accessed1/Oct/2005.
Gunthorp, Greg, and Lei Gunthorp. Grassfarmer.Com - PASTURED PIGS ON THEGUNTHORP FARM. 24/Feb 2004. American Farmland Trust.http://grassfarmer.com/pigs/gun1.html. Accessed 13/Sep/2005.
Cooling It: No Hair Shirt Solutions to Global Warming by Gar W. Lipow GarLpublic AT Comcast DOT net
Page 230 of 265
Hangers America. Hangers America: Liquid CO2: The Benefits to Hangers Owners.16/Mar 2005. Hangers America. http://www.hangersdrycleaners.com/co2_4.html.Accessed 23/Sep/2005.
Harris, J.C., B.H. Rumack, and F.D. Aldrich. "Toxicology of Urea Formaldehyde andPolyurethane Foam Insulation - Abstract." Journal of the American Medical AssociationVol. 245 No. 3 16/January 1981. http://jama.ama-assn.org/cgi/content/abstract/245/3/243.Accessed 05/Jul/2005.
Harrison, Laura Soullière. "National Park Service: Architecture in the Parks (Old FaithfulInn)." In Architecture in the Parks: Excerpts from a National Historic Landmark ThemeStudy. National Park Service - Department of the Interior: Washington D.C., Nov 1986.26/Feb 2001. http://www.cr.nps.gov/history/online_books/harrison/harrison3.htm.Accessed 23/Aug/2005.
Hawken, Paul, Amory Lovins, and L.Hunter Lovins. "Additional Book Material -Appendix 5-D." In Natural Capitalism. Additional Material for Hawkens,Lovins&Lovins "Natural Capitalism" - On-Line Only. 1999. Rocky Mountain Institute.http://www.natcap.org/sitepages/art58.php?pageName=Additional%20Book%20Material&article_refresh=%2Fsitepages%2Fpid27.php%3FpageId%3D27. Accessed25/Sep/2005.
———. Natural Capitalism: Creating the Next Industrial Revolution. Boston: Little,Brown and Company/Back Bay, 2000.
Hawthorne, Christopher. "Turning Down the Global Thermostat." Metropolis MagazineNo. October 2003 Oct 2003.http://www.metropolismag.com/html/content_1003/glo/index.html. Accessed22/Aug/2005.
Henning, Jimmy et al. Rotational Grazing. ID-143. Cooperative Extension Service -University of Kentucky, Department of Agriculture: Lexington Kentucky USA, 2000.2000. http://www.ca.uky.edu/agc/pubs/id/id143/id143.pdf. Accessed 13/Sep/2005.
Herzog, Howard J. "What Future for Carbon Capture and Sequestration?" EnvironmentalScience and Technology 35, no. 7 1/Apr 2001: Pp. 148 A - 153 A. American ChemicalSociety. http://sequestration.mit.edu/pdf/EST_web_article.pdf. Accessed 9/Jan/2005.
Hill, Roger. Public Renewables Partnership, About PRP - Geothermal:GeothermalCosts. 10/Jun 2004. The Public Renewables Partnership.http://www.repartners.org/geothermal/geocosts.htm. Accessed 22/Aug/2004.
Hirst, Eric, and Brendan Kirby. Transmission Planning and the Need for New Capacity.In National Transmisson Grid Study - Issue Studies. Issue 4. May 2002. U.S. Departmentof Energy. http://www.eh.doe.gov/ntgs/issuepapers/ISSUE_4.PDF. Accessed27/Sep/2005.
Cooling It: No Hair Shirt Solutions to Global Warming by Gar W. Lipow GarLpublic AT Comcast DOT net
Page 231 of 265
Holigan, Michael. Michael Holigan’s Your New House Television Show - How-To-Library, Blower Door Test. 2004. MichaelHoligan.Com.http://www.michaelholigan.com/Departments/HowTo/HowToPage.asp?ts_id=ath192.Accessed 12/Mar/2005.
Honeywell Ventilation Systems - Fresh Air Year Round. 50-8170 RL 5/05. May 2005.Honeywell International Inc. http://customer.honeywell.com/Techlit/Pdf/50-0000s/50-8170.pdf. Accessed 05/Jul/2005.
HopTech Homebrewing Supplies. HopTech Homebrewing Supplies - Home Brewing,Beer Kits, Brewing Equipment - Temperature Control. August 2005. HopTechHomebrewing Supplies.<http://www.hoptech.com/cart/cart.php?target=category&category_id=282>. Accessed16/Aug/2005.
Horton, George. The Blight of Asia. Indianapolis Indiana USA: Bobbs-Merrill, 1926.
Mayo Town Council & European Comission. HOUSEHOLD COOKING APPLIANCES:How to Save Energy and Stop Your Money Going Down the Drain. 12/10 2003. MayoEnergy Agency. http://www.mayoenergy.ie/publications/New_FactSheets/Factsheet6.pdf.Accessed 20/Aug/2005.
Howard, James L. U.S. Timber Production, Trade, Consumption, and Price Statistics1965-1999. FPL-RP-595. April 2001. United States Department of Agriculture ForestService Forest Products Laboratory.http://www.fpl.fs.fed.us/documnts/fplrp/fplrp595.pdf. Accessed 18/Sep/2005.
Factor 10 Institute. 2005. http://www.factor10-institute.org/. Accessed 22/Aug/2005.
Regents of the University of Minnesota. The Minnesota Green Affordable Housing Guide- Components: Cladding (Siding). 30/June 2004. 2004 Regents of the University ofMinnesota. http://www.greenhousing.umn.edu/comp_cladding.html. Accessed09/Jan/2005.
The Kalundborg Centre for Industrial Symbiosis. Kalundborg Municipality;Asnæs PowerStation;The Statoil Refinery;BPB Gyproc A/S; Soilrem A/S;Novo NordiskA/S;Novozymes A/S;Noveren I/S;Industrial Development Council - Kalundborg Region.http://www.symbiosis.dk/. Accessed 14/Aug/2004.
Wuppertal Institute for Climate, Environment and Energy. 2005.http://www.wupperinst.org/. Accessed 22/Aug/2005.
Hucal, Michelle Clark. "Recycled Roofing." Environmental Design and Construction No.Cool Roofing - May 2003 Supplement 1/May 2003. BNP Media.
Cooling It: No Hair Shirt Solutions to Global Warming by Gar W. Lipow GarLpublic AT Comcast DOT net
Page 232 of 265
http://www.edcmag.com/CDA/ArticleInformation/features/BNP__Features__Item/0,4120,97795,00.html. Accessed 5/Sep/2005.
Huelman, Pat, and Wanda Olson. Common Questions About Heat and Energy RecoveryVentilators (FO-07284 ). 1999. University of Minnesota Extension Service.http://www.extension.umn.edu/distribution/housingandclothing/DK7284.html. Accessed2/Oct/2005.
Hungate, Bruce A. et al. "CO2 Elicits Long-Term Decline in Nitrogen Fixation." Science304, no. 5675, 1291 28/May 2004. The American Association for the Advancement ofScience (AAAS). http://www.sciencemag.org/cgi/content/full/304/5675/1291. (Brevia:Requires free registration and Login). Accessed 1/Sep/2004.
Hutchinson, Mark. Trickle Irrigation: Using and Conserving Water in the Home Garden- University of Maine Cooperative Extension Bulletin #2280. April 2005. University ofMaine Cooperative Extension.http://www.umext.maine.edu/onlinepubs/htmpubs/2160.htm. Accessed 13/Jul/2005.
IAGS-Institute for the Analysis of Global Security. Plug-in Hybrid Vehicles. 14/Jan2006. IAGS-Institute for the Analysis of Global Security. http://www.iags.org/pih.htm.Accessed 17/Mar/2006.
Rocky Mountain Institute. "The Hypercar® Concept." In Transportation. 2004. RockyMountain Institute. http://www.rmi.org/sitepages/pid386.php. Accessed 19/Aug/2004.
U.S. Census Bureau. IDB Data Access--Spreadsheet. 2004. U.S. Census Bureau.http://www.census.gov/ipc/www/idbsprd.html. Accessed 3/Sep/2004.
Ince, Peter J., and Irene Durbak. "Pulpwood Supply and Demand: Development in theSouth, Little Growth Elsewhere." Journal of Forestry 100, no. 2 1/Mar 2002. Society ofAmerican Foresters. http://www.fpl.fs.fed.us/documnts/pdf2002/ince02b.pdf. Accessed18/Sep/2005.
Low Energy Systems, Inc. Infinion with Battery Spark Ignition . August 2005. LowEnergy Systems, Inc. http://www.tanklesswaterheaters.com/infinion2.html. Accessed08/Aug/2005.
Amazon Nails. Information Guide to Straw Bale Building for Self-Builders and theConstruction Industry. Amazon Nails: Todmorden UK, 2001. 2003.http://www.strawbalefutures.org.uk/pdf/strawbaleguide.pdf. Accessed 23/Dec/2003.
Insolroll Inc. Insolroll 2800 Exterior Retractable Solar Screen Shade System. June 2003.Insolroll Inc. http://www.insolroll.com/solarblackout/exterior.html. Accessed05/Jul/2005.
Cooling It: No Hair Shirt Solutions to Global Warming by Gar W. Lipow GarLpublic AT Comcast DOT net
Page 233 of 265
SolarShade Systems Inc. Instant Relief from the Sun’s Heat! April 2002. SolarShadeSystems Inc. http://www.solarshade.ca/solarshade.pdf. Accessed 05/Jul/2005.
European Commission Directorate-General Joint Research Centre (JRC) Institute forProspective Technological Studies Sustainability in Industry, Energy and TransportEuropean - IPPC Bureau. Integrated Pollution Prevention and Control (IPPC) BestAvailable Techniques Draft Reference Document for Large Combustion Plants. Draft.Nov 2004. European Commission Directorate-General Joint Research Centre (JRC)Institute for Prospective Technological Studies Sustainability in Industry, Energy andTransport European - IPPC Bureau. ftp://ftp.jrc.es/pub/eippcb/doc/lcp_d3_1104.pdf.Accessed 18/May/2005.
European Commission Directorate-General Joint Research Centre (JRC) Institute forProspective Technological Studies Sustainability in Industry, Energy and TransportEuropean - IPPC Bureau. Integrated Pollution Prevention and Control (IPPC) BestAvailable Techniques Reference Document on the Production of Iron and Steel. Dec2001. European Commission Directorate-General Joint Research Centre (JRC) Institutefor Prospective Technological Studies Sustainability in Industry, Energy and TransportEuropean - IPPC Bureau. ftp://ftp.jrc.es/pub/eippcb/doc/isp_bref_1201.pdf. Accessed18/May/2005.
European Commission Directorate-General Joint Research Centre (JRC) Institute forProspective Technological Studies Sustainability in Industry, Energy and TransportEuropean - IPPC Bureau. Integrated Pollution Prevention and Control (IPPC) ReferenceDocument on Best Available Techniques for Mineral Oil and Gas Refineries. Final. Feb2003. European Commission Directorate-General Joint Research Centre (JRC) Institutefor Prospective Technological Studies Sustainability in Industry, Energy and TransportEuropean - IPPC Bureau. ftp://ftp.jrc.es/pub/eippcb/doc/ref_final_0203.pdf. Accessed18/May/2005.
European Commission. Integrated Pollution Prevention and Control (IPPC) ReferenceDocument on Best Available Techniques for the Textiles Industry. Jul 2003. EuropeanCommission. ftp://ftp.jrc.es/pub/eippcb/doc/txt_bref_0703.pdf. Accessed 2/Oct/2005.
European Commission Directorate-General Joint Research Centre (JRC) Institute forProspective Technological Studies Sustainability in Industry, Energy and TransportEuropean - IPPC Bureau. Integrated Pollution Prevention and Control (IPPC) ReferenceDocument on Best Available Techniques in the Chlor-Alkali Manufacturing Industry. Dec2001. European Commission Directorate-General Joint Research Centre (JRC) Institutefor Prospective Technological Studies Sustainability in Industry, Energy and TransportEuropean - IPPC Bureau. ftp://ftp.jrc.es/pub/eippcb/doc/cak_bref_1201.pdf. Accessed18/May/2005.
European Commission Directorate-General Joint Research Centre (JRC) Institute forProspective Technological Studies Sustainability in Industry, Energy and TransportEuropean - IPPC Bureau. Integrated Pollution Prevention and Control (IPPC) Reference
Cooling It: No Hair Shirt Solutions to Global Warming by Gar W. Lipow GarLpublic AT Comcast DOT net
Page 234 of 265
Document on Best Available Techniques in the Ferrous Metals Processing. Dec 2001.European Commission Directorate-General Joint Research Centre (JRC) Institute forProspective Technological Studies Sustainability in Industry, Energy and TransportEuropean - IPPC Bureau. ftp://ftp.jrc.es/pub/eippcb/doc/fmp_bref_1201.pdf. Accessed18/May/2005.
European Commission Directorate-General Joint Research Centre (JRC) Institute forProspective Technological Studies Sustainability in Industry, Energy and TransportEuropean - IPPC Bureau. Integrated Pollution Prevention and Control (IPPC) ReferenceDocument on Best Available Techniques in the Large Volume Organic ChemicalIndustry. Feb 2003. European Commission Directorate-General Joint Research Centre(JRC) Institute for Prospective Technological Studies Sustainability in Industry, Energyand Transport European - IPPC Bureau.ftp://ftp.jrc.es/pub/eippcb/doc/lvo_bref_0203.pdf. Accessed 24/Sep/2005.
European Commission. Integrated Pollution Prevention and Control (IPPC) ReferenceDocument on Best Available Techniques in the Pulp and Paper Industry. Dec 2001.European Commission. ftp://ftp.jrc.es/pub/eippcb/doc/ppm_bref_1201.pdf. Accessed20/Sep/2005.
European Commission Directorate-General Joint Research Centre (JRC) Institute forProspective Technological Studies Sustainability in Industry, Energy and TransportEuropean - IPPC Bureau. Integrated Pollution Prevention and Control Draft ReferenceDocument on Best Available Techniques for the Surface Treatment of Metals andPlastics. Draft. Apr 2004. European Commission Directorate-General Joint ResearchCentre (JRC) Institute for Prospective Technological Studies Sustainability in Industry,Energy and Transport European - IPPC Bureau.ftp://ftp.jrc.es/pub/eippcb/doc/stm_d2_0404.pdf. Accessed 18/May/2005.
European Commission Directorate-General Joint Research Centre (JRC) Institute forProspective Technological Studies Sustainability in Industry, Energy and TransportEuropean - IPPC Bureau. Integrated Pollution Prevention and Control Draft ReferenceDocument on Best Available Techniques for the Surface Treatment Using OrganicSolvents. Draft. May 2004. European Commission Directorate-General Joint ResearchCentre (JRC) Institute for Prospective Technological Studies Sustainability in Industry,Energy and Transport European - IPPC Bureau.ftp://ftp.jrc.es/pub/eippcb/doc/sts_d1_0504.pdf. Accessed 18/May/2005.
European Commission Directorate-General Joint Research Centre (JRC) Institute forProspective Technological Studies Sustainability in Industry, Energy and TransportEuropean - IPPC Bureau. Integrated Pollution Prevention and Control Draft ReferenceDocument on Best Available Techniques in the Ceramic Manufacturing Industry. Draft.Oct 2004. European Commission Directorate-General Joint Research Centre (JRC)Institute for Prospective Technological Studies Sustainability in Industry, Energy andTransport European - IPPC Bureau. ftp://ftp.jrc.es/pub/eippcb/doc/cer_d1_1004.pdf.Accessed 18/May/2005.
Cooling It: No Hair Shirt Solutions to Global Warming by Gar W. Lipow GarLpublic AT Comcast DOT net
Page 235 of 265
European Commission Directorate-General Joint Research Centre (JRC) Institute forProspective Technological Studies Sustainability in Industry, Energy and TransportEuropean - IPPC Bureau. Integrated Pollution Prevention and Control Draft ReferenceDocument on Best Available Techniques in the Food, Drink and Milk Industry. Draft.May 2003. European Commission Directorate-General Joint Research Centre (JRC)Institute for Prospective Technological Studies Sustainability in Industry, Energy andTransport European - IPPC Bureau. ftp://ftp.jrc.es/pub/eippcb/doc/fdm_d2_0503.pdf.Accessed 18/May/2005.
European Commission Directorate-General Joint Research Centre (JRC) Institute forProspective Technological Studies Sustainability in Industry, Energy and TransportEuropean - IPPC Bureau. Integrated Pollution Prevention and Control Draft ReferenceDocument on Best Available Techniques in the Large Volume Inorganic Chemicals -Solid and Others Industry. Draft August 2004. Aug 2004. European CommissionDirectorate-General Joint Research Centre (JRC) Institute for Prospective TechnologicalStudies Sustainability in Industry, Energy and Transport European - IPPC Bureau.ftp://ftp.jrc.es/pub/eippcb/doc/lvic-s_d1_0804.pdf. Accessed 17/May/2005.
European Commission Directorate-General Joint Research Centre (JRC) Institute forProspective Technological Studies Sustainability in Industry, Energy and TransportEuropean - IPPC Bureau. Integrated Pollution Prevention and Control Draft ReferenceDocument on Best Available Techniques in the Production of Polymers. Draft. April2005. European Commission Directorate-General Joint Research Centre (JRC) Institutefor Prospective Technological Studies Sustainability in Industry, Energy and TransportEuropean - IPPC Bureau. ftp://ftp.jrc.es/pub/eippcb/doc/pol_d2_0405.pdf. Accessed18/May/2005.
European Commission Directorate-General Joint Research Centre (JRC) Institute forProspective Technological Studies Sustainability in Industry, Energy and TransportEuropean - IPPC Bureau. Integrated Pollution Prevention and Control ReferenceDocument on Best Available Techniques in Common Waste Water and Waste GasTreatment/Management Systems in the Chemical Sector. Feb 2003. EuropeanCommission Directorate-General Joint Research Centre (JRC) Institute for ProspectiveTechnological Studies Sustainability in Industry, Energy and Transport European - IPPCBureau. ftp://ftp.jrc.es/pub/eippcb/doc/cww_final_0203.pdf. Accessed 18/May/2005.
European Commission Directorate-General Joint Research Centre (JRC) Institute forProspective Technological Studies Sustainability in Industry, Energy and TransportEuropean - IPPC Bureau. Integrated Pollution Prevention and Control ReferenceDocument on Best Available Techniques in the Smitheries and Foundries Industry. Jul2004. European Commission Directorate-General Joint Research Centre (JRC) Institutefor Prospective Technological Studies Sustainability in Industry, Energy and TransportEuropean - IPPC Bureau. ftp://ftp.jrc.es/pub/eippcb/doc/sfo_bref_0704.pdf. Accessed18/May/2005.
Cooling It: No Hair Shirt Solutions to Global Warming by Gar W. Lipow GarLpublic AT Comcast DOT net
Page 236 of 265
European Commission Directorate-General Joint Research Centre (JRC) Institute forProspective Technological Studies Sustainability in Industry, Energy and TransportEuropean - IPPC Bureau. Integrated Pollution Prevention and Control ReferenceDocument on Best Available Techniques on Emissions from Storage. Jan 2005. EuropeanCommission Directorate-General Joint Research Centre (JRC) Institute for ProspectiveTechnological Studies Sustainability in Industry, Energy and Transport European - IPPCBureau. ftp://ftp.jrc.es/pub/eippcb/doc/esb_final_0105.pdf. Accessed 18/May/2005.
International Energy Agency. Electricity Information 2002 Edition. ElectricityInformation, vol. 2002 Edition, no. ISBN 9264197931. Paris: OECD - Organisation forEconomic Co-operation and Development, 2002.
International Network for Bamboo and Rattan. International Network for Bamboo andRattan (INBAR) | Bamboo and Rattan Facts. 2005. International Network for Bambooand Rattan. http://www.inbar.int/facts.htm. Accessed 26/Oct/2005.
China Internet Information Center. "Introduction." In China Through a Lens. 25/Sep2002. China Internet Information Center - Authorized Government Portal Site to China.http://www.china.org.cn/english/TR-e/43461.htm. Accessed 4/Sep/2005.
IronStraw Group. IronStraw Straw Bale Photo Gallery. 5/Jul 2005. IronStraw Group.http://www.ironstraw.org/gallery.htm. Accessed 23/Aug/2005.
Office of Industrial Technologies - Energy Efficiency and Renewable Energy • U.S.Department of Energy. Irrigation Valve Solenoid Energy Saver • New Battery-PoweredControllers Save Energy in Irrigation Applications. In Agriculture Success Story. I-OT-698. Sep 2001. Office of Industrial Technologies - Energy Efficiency and RenewableEnergy • U.S. Department of Energy.http://www.eere.energy.gov/inventions/pdfs/alextronix.pdf. Accessed 5/Sep/2004.
Jeavons, John. "Cultivating Our Garden: Biointensive Farming Uses Less Water, Land,Machinery, and Fertilizer - and More Human Labor." In Context No. 42/Fall 1995 - AGood Harvest (1995). Context Institute.http://www.context.org/ICLIB/IC42/Jeavons.htm. Accessed 17/Sep/2005.
Johnson, Shane. Environmental Management Accounting. 13/Jan 2004. Association ofChartered Certified Accountants.http://www.acca.co.uk/publications/studentaccountant/1073480. Accessed 2/Apr/2005.Kalckreuth, Ulf von, and Jurgen Schröder. Monetary Transmission in the New Economy:Service Life of Capital, Transmission Channels and the Speed of Adjustment. DiscussionPaper 16/02. 16/June 2002. Economic Research Centre of the Deutsche Bundesbank.http://www.bundesbank.de/download/volkswirtschaft/dkp/2002/200216dkp.pdf.Accessed 03/Jan/2005.
Cooling It: No Hair Shirt Solutions to Global Warming by Gar W. Lipow GarLpublic AT Comcast DOT net
Page 237 of 265
Karasov, Corliss. "No-Till Farming on Comeback Trail." Environmental HealthPerspectives 110, no. 2 Feb 2002. http://www.greennature.com/article833.html. Accessed1/Jun/2004.
Karmiol, Edwin. Mysteries of Japanese Pagodas Unlocked. 17/Aug 2002. Asia Times.http://www.atimes.com/atimes/Japan/DH17Dh01.html. Accessed 4/Sep/2005.
Kats, Gregory H. Green Building Costs and Financial Benefits. October 2003.Massachusetts Technology Collaborative State Development Agency for RenewableEnergy and the Innovation Economy.http://www.mtpc.org/RenewableEnergy/green_buildings/GreenBuildingspaper.pdf.Accessed 23/Jan/2004.
Kats, Gregory H. et al. The Costs and Financial Benefits of Green Buildings: A Report toCalifornia’s Sustainable Building Task Force. California Sustainable Building TaskForce: Sacramento CA, Oct 2003. Oct 2003.http://www.usgbc.org/Docs/News/News477.pdf. Accessed 29/Jan/2004.
Keefe, Cathy. "Business and Convention Travelers' Habits Tracked in New Survey." InPress Releases. 8/Feb 2005. Travel Industry Association of America (TIA).http://www.tia.org/pressmedia/pressrec.asp?Item=359. Accessed 23/Sep/2005.
University of Wisconsin -Extension; Cooperative Extension University of Minnesota:Center for Alternative Plant & Animal Products and the Minnesota Extension Service."Kenaf." In Alternative Field Crops Manual. Wisconsin, Minnesota, 1992. 2000.University of Wisconsin -Extension; Cooperative Extension University of Minnesota:Center for Alternative Plant & Animal Products and the Minnesota Extension Service.http://www.hort.purdue.edu/newcrop/afcm/kenaf.html.
Kennedy, Joeseph F. Natural Building Colloquium - Building with Earthbags. June 1997.Materials. Network Productions.http://www.networkearth.org/naturalbuilding/earthbags.html. Accessed 23/Aug/2005.
Economic and Social Data Servicer (ESDS) International. KILM 18. Labour Productivityand Unit Labour Costs. University of Essex;University of Manchester.http://www.esds.ac.uk/international/support/user_guides/ilo/kilm18EN.pdf. Accessed29/Mar/2005.
Kincaid, Judy. Industrial Ecosystem Development Project Report. May 1999. Triangle JCouncil of Governments. ftp://ftp.tjcog.org/pub/solidwst/ieprept.pdf. Accessed23/Sep/2005.
Kirby, Alex. BBC News | SCI/TECH | Tree Planting Warning Over Global Warming.23/May 2001. BBC News Online. http://news.bbc.co.uk/2/hi/science/nature/1347068.stm.Accessed 4/Jun/2004.
Cooling It: No Hair Shirt Solutions to Global Warming by Gar W. Lipow GarLpublic AT Comcast DOT net
Page 238 of 265
Liz Madison. Kitchen Tools, Kitchen Electrics, Cookware, Tableware - LizMadison.Com-GWL11. GWL11 Clothes Washer. July 2005. Liz Madison.http://www.lizmadison.com/housewares/Product.asp_X_SKU_Y_GWL11_Z_REF_Y_SHLIZ. Accessed 10/Ju.
Klass, Donal L. "Biomass for Renewable Energy And Fuels." In Encyclopedia of Energy.2004. Elsevier, Inc. Biomass Energy Research Association ( BERA) Washington D.C.http://www.bera1.org/cyclopediaofEnergy.pdf. Accessed 28/Sep/2005.
Knaap, Gerrit et al. Government Policy and Urban Sprawl. 2000. Illinois Department ofNatural Resources. University of Illinois at Urbana-Champaign.http://dnr.state.il.us/orep/c2000/balancedgrowth/pdfs/government.pdf. Accessed29/Jun/2005.
Koegel, R.G., and R.J. Straub. " Wet Fractionation of Alfalfa Juice for Value-AddedProducts." In Research Summaries. 1995. U.S. Dairy Forage Research Center.http://www.dfrc.wisc.edu/RS95_pdfs/fh2.pdf. Accessed 24/Aug/2004.
Regulatory Services - The Lambeth Council. Lambeth 2002 Annual Air Quality Report -Active Monitoring Summary. 2002. Regulatory Services - The Lambeth Council.http://www.lambeth.gov.uk/intradoc/groups/public/documents/report/029068.pdf.Accessed 9/Jan/2005.
Landler, Mark. "Foreign Desk: Hong Kong Journal; For Raising Skyscrapers, BambooDoes Nicely (Abstract)." NY Times No. Late Edition - Final 27/Mar 2002: Section A,Page 4, Column 3.http://query.nytimes.com/gst/abstract.html?res=FB0917F9385F0C748EDDAA0894DA404482. Accessed 23/Aug/2005.
Leggett, Jeremy. "Global Warming: The Worst Case.. The Feedback Factor." Bulletin ofthe Atomic Scientists 48, no. 5 (June 1992): Cover.
Reuters. Let’s Make Reading Better! 9/Feb 2004. IT supplement of The Tribune. TheTribune of India. http://www.tribuneindia.com/2004/20040209/login/main3.htm.Accessed 20/Sep/2005.
California Energy Commission. Levelized Cost of Electricity Production<. Jan 2004.California Energy Commission.http://www.energy.ca.gov/electricity/levelized_cost.html. Accessed 7/Jun/2004.
Leventhal, Ross A. "Sustainable in Seattle." Architecture Week No. 101 5/Jun 2002:Environment. Artifice Inc. http://www.architectureweek.com/2002/0605/environment_2-2.html. Accessed 6/Sep/2004.
Levitus, Sydney et al. "Warming of the World Ocean." Science 287, no. 5461 24/Mar2000. The American Association for the Advancement of Science (AAAS).
Cooling It: No Hair Shirt Solutions to Global Warming by Gar W. Lipow GarLpublic AT Comcast DOT net
Page 239 of 265
http://www.atmos.ucla.edu/~gruber/teaching/papers_to_read/levitus_sci_00.pdf.Accessed 31/Dec/2004.
Li, Zongjin, Ding.Zhu, and Yunsheng Zhang. Development of Sustainable CementitiousMaterials. In International Workshop on Sustainable Development and ConcreteTechnology: Beijing, May 20–21, 2004. 25/Mar 2004.http://www.ctre.iastate.edu/pubs/sustainable/lisustainable.pdf. Accessed 23/Aug/2005.
Franklin Associates, LTD. Life Cycle Analysis (LCA): Woman's Knit Polyester Blouse -Final Report. June 1993. American Fiber Manufacturers Association.http://www.fibersource.com/f-tutor/LCA-Page.htm. Accessed 22/Jun/2004.
Linvill, David, Frank Linton, and Michael Hotchkiss. Growing Bamboo in Georgia.9/May 2001. Cooperative Extension Service - The University of Georgia College ofAgricultural and Environmental Sciences.http://pubs.caes.uga.edu/caespubs/horticulture/GrowingBamboo.htm. Accessed23/Aug/2005.
Lippiatt, Barbara C. BEES 2.0 -Building for Environmental and Economic SustainabilityTechnical Manual and User Guide. Office of Applied Economics, Building and FireResearch Laboratory, National Institute of Standards and Technology: Washington D.C.,Jun/2000. June 2000. http://museum.nist.gov/exhibits/timeline/PDF/BEES.PDF.Accessed 5/Sep/2005.
Livingstone, Ken. 50 Years On: The Struggle for Air Quality in London Since the GreatSmog of December 1952. Dec 2002. Greater London Authority.http://www.london.gov.uk/mayor/environment/air_quality/docs/50_years_on.pdf.Accessed 9/Jan/2005.
Lobb, Donald. "No-Till Success Hinges on Developing a Complete Crop Production'System.'." In. Sustainable Farming No. Winter 94 (1994)Ecological AgricultureProjects, McGill University (Macdonald Campus). Resource Efficient AgriculturalProduction - Canada (REAP-CANADA).http://www.eap.mcgill.ca/MagRack/SF/Winter%2094%20I.htm. Accessed 17/Sep/2005.
Lovins, Amory B., and William D. Browning. Negawatts for Buildings. Urban LandInstitute: Washington D.C., Jul/1992. 15/Nov 2000.http://www.rmi.org/images/other/GDS-Negawatts4Bldgs.pdf. Accessed 21/Jan/2004.
Lovins, Amory, Donella Meadows, and Marc Rosenbaum. The Furnace Free HouseDiscussion: He Furnace-Free House in Vermont. July - November 1998. Building Green.http://www.buildinggreen.com/elists/furnacefree.cfm. Accessed 05/Jul/2005.
Lucas, Caroline Dr. The Future of Aviation: The Government's Consultation Documenton Air Transport Policy - Submission from Dr Caroline Lucas, MEP, Green Party, andMember of the European Parliament's Transport Committee. 2001. European Parliment.
Cooling It: No Hair Shirt Solutions to Global Warming by Gar W. Lipow GarLpublic AT Comcast DOT net
Page 240 of 265
Green Party UK.http://archive.greenparty.org.uk/reports/2001/aviation/av_fut_mep_resp.pdf. Accessed23/Sep/2005.
Lukey, Grant C. (General Manager Siloxo Pty. Ltd), [email protected]. Email. Reply toquestion on corrosion of steel reinforcing in geopolymeric cement. Abbotsford, VictoriaAustralia, 21/Oct, 2004.
Lytle, Mark J. "Library Without Books." The Guardian (Guardian Unlimited) 22/Apr2004. http://www.guardian.co.uk/online/story/0,3605,1197495,00.html. Accessed11/Jun/2004.
Marland, Gregg, Tom Boden, and Robert J. Andres. National CO2 Emissions fromFossil-Fuel Burning, Cement Manufacture, and Gas Flaring: 1751-2000. Aug 2003. OakRidge National Laboratory (ORNL) -Carbon Dioxide Information Analysis Center.http://cdiac.esd.ornl.gov/ftp/trends/emissions/ban.dat. Accessed 1/Jan/2004.
Martin, Mike. "Paperless Office: Case Studies Show How and Why." Computer Bits 14,no. 1 Jan 2004. Bitwise Productions Portland Oregon.http://www.computerbits.com/archive/2004/0100/paperless.html (if no longer goodcache at:http://66.102.7.104/search?q=cache:IrULwCmYYXYJ:www.computerbits.com/archive/2004/0100/paperless.html). Accessed 14/Jun/2004.
Wuppertal Institute for Climate, Environment and Energy. Material Intensity ofMaterials, Fuels, Transport Services. Version 2;28.10.2003. May 2004. WuppertalInstitute for Climate, Environment and Energy. Wuppertal Institute for Climate,Environment and Energy.http://www.wupperinst.org/Projekte/mipsonline/download/MIT_v2.pdf. Accessed5/Sep/2005.
McMaster University Sustainable Communities Research Group. SustainableCommunities Research Group: Windows and Doors. June 2000.http://www.eng.mcmaster.ca/civil/sustain/building/Windows%20and%20Doors.pdf.Accessed 06/Jul/2005.
McNarie, Alan D. "Home Grown Homes: Can Bamboo's Promise Be Fulfilled? It'sCheap, Easy to Grow, and Stronger Than Wood. So Why Aren't Homes Made of BambooLegal?" Hawaii Island Journal 19/Feb 2003.http://www.hawaiiislandjournal.com/stories/1b03c.html. Accessed 23/Aug/2005.
Canadian Architect. "Measures of Sustainability - Embodied Energy." In Measures ofSustainability. 2002. Canadian Architect.http://www.cdnarchitect.com/asf/perspectives_sustainibility/measures_of_sustainablity/measures_of_sustainablity_embodied.htm. Accessed 02/Feb/2003.
Cooling It: No Hair Shirt Solutions to Global Warming by Gar W. Lipow GarLpublic AT Comcast DOT net
Page 241 of 265
World Resources Institute. "Meat Consumption: Grain Fed to Livestock as a Percent ofTotal Grain Consumed." In EarthTrends Environmental Portal - EnvironmentalInformation Database. 2004. World Resources Institute.http://earthtrends.wri.org/searchable_db/results.cfm?years=1999-2000,2000-2001,2001-2002,2002-2003,2003-2004&variable_ID=348&theme=8&cID=190&ccID=0. Accessed10/Sep/2005.
Meil, Jamie et al. CORRIM: Phase I Final Report - Module J: Environmental Impacts ofa Single Family Building Shell - From Harvest to Construction (Review Draft). 23/Aug2004. Consortium for Research on Renewable Industrial Materials (CORRIM).http://www.corrim.org/reports/final_report_2004/Module%2520J_%2520August%252023.pdf. Accessed 23/Aug/2005.
Melo, Frederick, and Kevin Dennehy. "Windmill Opponents Added to 'Dirty' List |Toxics Action Center Joins Public Policy Fracas with Its Roster of EnvironmentalOffenders." Cape Cod Times 4/Dec 2002. Cape Cod Times.http://www.capecodonline.com/special/windfarm/windmillopponents4.htm. Accessed6/Jun/2005.
Office of Industrial Technologies - Energy Efficiency and Renewable Energy • U.S.Department of Energy. Meta-Lax® Stress Relief Process - Greatly Reduces EnergyConsumption and Eliminates Pollution. In Metal Success Story. I-MC-412. Aug 2002.Office of Industrial Technologies - Energy Efficiency and Renewable Energy • U.S.Department of Energy. http://www.eere.energy.gov/inventions/pdfs/bonaltech.pdf.Accessed 6/Sep/2004.
Michka. Building with Hemp. 3/Sep 1999.http://www.hempfood.com/IHA/iha01209.html. Accessed 1/Oct/2005.
Miles, Carol A., Chuhe Chen, and Tamera Flores. Washington State University BambooResearch Report 2000 - On-Farm Bamboo Production in the Pacific Northwest .Extension Agricultural Systems Program, Washington State University Research andExtension Center: Vancouver Washington, 2000. May 2001.http://agsyst.wsu.edu/BambooReport2000.pdf. Accessed 23/Aug/2005.
Miller, Byron A., and Martin J. Pasqualetti. "Land Requirements for the Solar and CoalOptions." The Geographical Journal 150, no. 2 (Jul 1984): 192-212.
Office of Industrial Technologies - Energy Efficiency and Renewable Energy • U.S.Department of Energy. Minimize Boiler Short Cycling Losses. In Tip Sheets. Tip Sheet16. Dec 2000. Office of Industrial Technologies - Energy Efficiency and RenewableEnergy • U.S. Department of Energy.http://www.eere.energy.gov/industry/bestpractices/pdfs/boil_cycl.pdf. Accessed8/Oct/2005.
Cooling It: No Hair Shirt Solutions to Global Warming by Gar W. Lipow GarLpublic AT Comcast DOT net
Page 242 of 265
University of Minnesota College of Architecture and Landscape Architecture Center forSustainable Building Research. "Minnesota Building Materials Database - BlownCellulose." In Minnesota Building Materials Database. 26/May 2004. University ofMinnesota College of Architecture and Landscape Architecture Center for SustainableBuilding Research. http://www.buildingmaterials.umn.edu/07210_blown_bees.html.Accessed 5/Sep/2005.
University of Minnesota College of Architecture and Landscape Architecture Center forSustainable Building Research. "Minnesota Building Materials Database - GenericFiberglass Batt." In Minnesota Building Materials Database. 26/May 2004. University ofMinnesota College of Architecture and Landscape Architecture Center for SustainableBuilding Research. http://www.buildingmaterials.umn.edu/07211_batt_bees.html.Accessed 5/Sep/2005.
Mitchell, Charles, Wayne Reeves, and Dennis Delany. "Breaking Records: SensibleManagement Helps Alabama's Long Term Experiments Net Record Yields." OnlineHighlights: A Magazine of Research from the Alabama Agricultural Research Station atAuburn University 48, no. 3 Fall 2001. College of Agriculture: Auburn UniversityAlabama Agricultural Experiment Station.http://www.ag.auburn.edu/aaes/communications/highlightsonline/fall01/fall-mitchell.html. Accessed 15/Jun/2004.
Office of Industrial Technologies - Energy Efficiency and Renewable Energy • U.S.Department of Energy. Mobile Zone Spray Booth Technology For Ultra-Efficient SurfaceCoating Operations: New Technology Saves Energy And Reduces Pollution DuringSurface Coating Operations. In Inventions & Innovation. I-OT-489. Dec 2001. Office ofIndustrial Technologies - Energy Efficiency and Renewable Energy • U.S. Departmentof Energy. http://www.eere.energy.gov/inventions/pdfs/clydesmith.pdf. Accessed5/Sep/2004.
Moomaw, William R. et al. Climate Change 2001 - Mitigation -Working Group III:Mitigation - 3.4.4.8 Waterborne Transport. 2001. Intergovernmental Panel on ClimateChange. http://www.grida.no/climate/ipcc_tar/wg3/103.htm. Accessed 19/Aug/2005.
Mooney, Chris. "Put a Tiger In Your Think Tank." Mother Jones May/Jun 2005. TheFoundation for National Progress.http://www.motherjones.com/news/featurex/2005/05/exxon_chart.html. Accessed10/Jun/2005.
Morse, Ronald D. No-Herbicide, No-Till Summer Broccoli-Quantity of Rye and HairyVetch Mulch on Weed Suppression and Crop Yield. In Southern Conservation TillageConference for Sustainable Agriculture - Conservation Tillage: Benefiting Farmers,Society, and the Environment - 9-11 July, 2001, Oklahoma City, Oklahoma. Jul 2002.Auburn University College of Agriculture.http://www.ag.auburn.edu/aux/nsdl/sctcsa/Proceedings/2001/Morse.pdf.
Cooling It: No Hair Shirt Solutions to Global Warming by Gar W. Lipow GarLpublic AT Comcast DOT net
Page 243 of 265
Motavalli, Jim. "Beyond Wood | Tree-Free and Chlorine-Free Papers Offer SoundAlternatives to Forest Destruction." E, The Environmental Magazine IX, no. 1 Jan-Feb1998. Earth Action Network, Inc. http://www.emagazine.com/view/?41. Accessed1/Oct/2005.
Consortium for Energy Efficiency, Inc. Motor Decisions Matter Energy Efficiency/UsageFact Sheet. ~2002. Consortium for Energy Efficiency, Inc (Consortium of Motor IndustryManufacturers and Service Centers, Trade Associations, Electric Utilities andGovernment Agencies).http://www.motorsmatter.org/press/press_kit/energry_facts.html. Accessed 25/Sep/2005.
California Institute of Earth Art and Architecture. Nader Khalili. Jan 2004. CaliforniaInstitute of Earth Art and Architecture. http://www.calearth.org/khalili.htm. Accessed23/Aug/2005.
Nadiri, M. Ishaq, and Ingmar R. Prucha. "Estimation of the Depreciation Rate of Physicaland R&D Capital in the U.S. Total Manufacturing Sector." Economic Inquiry XXXIVJanuary 1996: 43-56. Western Economic Association International.http://www.econ.nyu.edu/user/nadiri/pub86.PDF. Accessed 03/Jan/2005.
National Organization on Disability (NOD). The National Organization on Disability |2004 N.O.D./Harris Survey Documents Trends Impacting 54 Million Americans. 25/Jun2004. National Organization on Disability (NOD).http://www.nod.org/index.cfm?fuseaction=page.viewPage&pageID=1430&nodeID=1&FeatureID=1422&redirected=1&CFID=3341450&CFTOKEN=13810219. Accessed7/Jun/2005.
Buy Recycled Business Alliance. Natural Resources Defense Council. Buy RecycledBusiness Alliance: Washington D.C., 2004. 17/Sep 2004. http://www.brba-epp.org/brba-epp.org/pdfs/Natural%20Resou%E2%80%A6ces%20Defense%20C.pdf. Accessed22/Aug/2005.
National Oceanic and Atmospheric Administration. NCDC: Global Warming -Frequently Asked Questions -Can the Observed Changes Be Explained by NaturalVariability, Including Changes in Solar Output? 27/May 2005. National Oceanic andAtmospheric Administration.http://lwf.ncdc.noaa.gov/oa/climate/globalwarming.html#Q10. Accessed 1/Oct/2005.
The National Renewable EnergyLaboratory (NREL). "How Much Land Will PV Need toSupply Our Electricity?" In PV FAQs. Feb/2004. DOE/GO-102004-1835. Feb 2004. U.S.Department of Energy Office of Energy Efficiency and Renewable Energy. NREL.http://www.nrel.gov/docs/fy04osti/35097.pdf. Accessed 18/Jan/2008.
Nelson, Arthur C. TOWARD A NEW METROPOLIS: THE OPPORTUNITY TOREBUILD AMERICA. December 2004. The Brookings Institution.
Cooling It: No Hair Shirt Solutions to Global Warming by Gar W. Lipow GarLpublic AT Comcast DOT net
Page 244 of 265
http://www.brookings.edu/metro/pubs/20041213_RebuildAmerica.pdf. Accessed14/Mar/2005.
The Institute for America’s Future;Center On Wisconsin Strategy. New Energy forAmerica - The Apollo Jobs Report: For Good Jobs & Energy Independence -A Report tothe Apollo Alliance. January 2004. The Apollo Alliance.http://www.apolloalliance.org/docUploads/ApolloReport%5F022404%5F122748%2Epdf(http://www.apolloalliance.org/document.cfm?documentID=18 ). Accessed 30/Aug/2004.
B4UBUILD.COM. New House Square Foot Residential Construction Costs -B4UBUILD.COM. 18/Feb 2002. B4UBUILD.COM.http://www.b4ubuild.com/faq/faq_0002.shtml. Accessed 23/Aug/2005.
"New ILO Study Highlights Labour Trends Worldwide: US Productivity up, EuropeImproves Ability to Create Jobs." World of Work -The Magazine of the ILO No. 48 Sep2003. Department of Communications of The International Labor Office of the UnitedNations - Geneva.http://www.ilo.org/public/english/bureau/inf/download/magazine/pdf/mag48.pdf or(http://www.ilo.org/public/english/bureau/inf/magazine/48/kilm.htm). Accessed28/Sep/2005.
National Center for Atmospheric Research. New Look at Satellite Data Supports GlobalWarming Trend. 1/May 2003. National Center for Atmospheric Research.http://www.ucar.edu/communications/newsreleases/2003/wigley2.html. Accessed10/Jun/2004.
"Newspaper." In Microsoft® Encarta® Online Encyclopedia. 2004.http://encarta.msn.com/text_761564853___62/Newspaper.html. Accessed 11/Jun/2004.
Newton, John, and Nigel Westaway. Sustainable Homes: Embodied Energy inResidential Property Development -A Guide for Registered Social Landlords. 28/Jul2000. Sustainable Homes (Hastoe Housing Association).http://www.sustainablehomes.co.uk/EMBENG.PDF. Accessed 22/Aug/2005.
Noble-Goodman, Katherine. "Washing Machine to Reduce Water Use, EliminateDetergent." U.S. Water News Online Oct 2001. U.S. Water News Inc.http://www.uswaternews.com/archives/arcconserv/1wasmac10.html. Accessed22/Jun/2004.
South Coast Air Quality Management District. Noh Says Yes to Wet Cleaning: OrangeCounty Dry Cleaner Converts to Non-Toxic Process. 19/Dec 2001. South Coast AirQuality Management District. http://www.aqmd.gov/news1/2001/OC_Wet_Cleaner.htm.Accessed 22/Jun/2004.
California Energy Commission. Notice of Awards EISG Program, Solicitation 02-01.19/Feb 2003. California Energy Commission.
Cooling It: No Hair Shirt Solutions to Global Warming by Gar W. Lipow GarLpublic AT Comcast DOT net
Page 245 of 265
http://www.energy.ca.gov/contracts/smallgrant/2003-02-21_awards_02-02.html.Accessed 18/Sep/2004.
The NPD Group, Inc. NPD INTELECT REPORTS SIGNIFICANT GROWTH FORENERGY-EFFICIENT APPLIANCES. Average Appliance Prices: Energystar Vs. Non-Energystar. 18/October 2000. The NPD Group, Inc.http://www.npd.com/press/releases/press_001018.htm. Accessed 10/Jul/2005.
National Renewable Energy Laboratory (NREL). NREL: Concentrating Solar PowerResearch - Parabolic-Trough Thermal Energy Storage Technology. National RenewableEnergy Laboratory (NREL). http://www.nrel.gov/csp/thermal_storage_tech.html.Accessed 26/Mar/2005.
Office Technology Assessment. "Technology and Raw Materials Problems - Chapter 7."In Technology and Steel Industry Competitiveness. NTIS order #PB80-208200. OfficeTechnology Assessment: Washington D.C., June 1980. 1996. 223. Princeton University.http://www.wws.princeton.edu/cgi-bin/byteserv.prl/~ota/disk3/1980/8019/801909.PDF.Accessed 02/Jan/2005.
Chateau at the Oregon Caves. Oregon Caves Outfitters - An In-Depth Description of theChateau. 2003. Chateau at the Oregon Caves.http://www.oregoncavesoutfitters.com/AbouttheChateau.asp. Accessed 23/Aug/2005.
Oreskes, Naomi. "Beyond the Ivory Tower: The Scientific Consensus on ClimateChange." Science 306, no. Issue 5702, 1686 ; 3/Dec 2004: Essays on Science andSociety. The American Association for the Advancement of Science (AAAS).http://www.sciencemag.org/cgi/content/full/306/5702/1686. Accessed 30/Dec/2004.
Osborn, Julie et al. A Sensitivity Analysis of the Treatment of Wind Energy in the Aeo99Version of NEMS. LBNL-44070 / TP-28529. Jan 2001. Ernest Orlando LawrenceBerkeley National Laboratory -University of California; National Renewable EnergyLaboratory. http://enduse.lbl.gov/info/LBNL-44070.pdf. Accessed 12/Jun/2004.
Ottinger, Richard L., and Mindy Jayne. "Global Climate Change Kyoto Implementation:Legal Frameworks for Implementing Clean Energy Solutions." In. Pace EnvironmentalLaw Review 18, no. 1 Winter 2000Temple Law School Institute for International Law andPublic Policy. Pace Law School.http://www.temple.edu/iilpp/EnvironmentalRoundtableResearchDocs/Ottinger%20-%20Global%20Climate%20Change.pdf. Accessed 11/Jun/2005.
OUS Capital Construction. The Oregon University System Sustainable RenewalProgram for Failing Assets. 19/Jul 2004.<http://www.ous.edu/board/dockets/ddoc040716-DM.pdf>. Accessed 02/Jan/2005.
Overly, Jonathan G., Lori E. Kincaid, and Jack R. Geibig. "Chapter 3: LIFE-CYCLEIMPACT ASSESSMENT." In Desktop Computer Displays: A Life-Cycle Assessment.
Cooling It: No Hair Shirt Solutions to Global Warming by Gar W. Lipow GarLpublic AT Comcast DOT net
Page 246 of 265
EPA-744-R-01-004a. Dec 2001. Environmental Protection Agency.http://www.epa.gov/dfe/pubs/comp-dic/lca/Ch3.pdf. Accessed 18/Mar/2005.
Envirowise. Packaging Rethink Boosts Profits: A Good Practice Case Study At HarmanPro Audio Manufacturing. In Environmental Technology Best Practice Programme.GC275 Final Results. Oct 2000. Envirowise.http://www.envirowise.gov.uk/envirowisev3.nsf/0/17A681225D041DE080256CE5004C71EC/$File/GC275.pdf. Accessed 14/May/2004.
Palmer, Mark, and Alicia Mariscal. Green Buildings and Worker Productivity: A Reviewof the Literature. San Francisco Department of the Environment: San Francisco, Aug2001. Aug 2001.http://www.sfenvironment.com/aboutus/innovative/greenbldg/gb_productivity.pdf.Accessed 22/Aug/2005.
Pank, Will, Herbert Girardet, and Greg Cox. Tall Buildings and Sustainability Report.Corporation of London ( the London municipal government): London, Feb/2002. Feb2002. http://www.cityoflondon.gov.uk/NR/rdonlyres/DE3830FE-D52D-4B10-B8B6-AB8EEB001404/0/BC_RS_tallbuild_0202_FR.pdf. Accessed 5/Sep/2005.
Patel, Martin et al. "Chapter 14 Life-Cycle Assessment of Bio-Based Polymers andNatural Fiber Composites." In Biopolymers, Volume 10, General Aspects and SpecialApplications. Biopolymers, 10 Volumes with Index. Edited by Alexander Steinbüchel.April 2003. Wiley. http://www.chem.uu.nl/nws/www/general/personal/Biopoly.pdf.Accessed 11/Jun/2004.
Peng, Shaobing et al. "Rice Yields Decline with Higher Night Temperature from GlobalWarming." Journal of the Proceedings of the National Academy of Sciences 101, no. 76/Jul 2004. National Academy of Sciences.http://www.pnas.org/cgi/reprint/101/27/9971.pdf. Accessed 31/Dec/2004.
Pearson Education publishing as Infoplease. Percent of U.S. Households with a Computerand Internet Connections. Aug 2005. Pearson Education Publishing as Infoplease.http://www.infoplease.com/ipa/A0902841.html. Accessed 20/Aug/2005.
Perelman, Michael. Class Warfare in the Information Age. New York: PalgraveMacmillan, 2000.
Perez, Richard et al. Update: Effective Load-Carrying Capability of Photovoltaics in theUnited States: Conference Paper Preprint. NREL/CP-620-40068. U.S. Department ofEnergy Office of Scientific and Technical Information;U.S. Department of CommerceNational Technical Information Service: Oakridge, Tennesee;Springfield, VA, Jun-2006.To Be Presented at Solar 2006 Conference Denver, ColoradoJuly 8–13, 2006. June 2006.National Renewable Energy Laboratory (NREL). http://www.nrel.gov/pv/pdfs/40068.pdf.Accessed 18/Jan/2008.
Cooling It: No Hair Shirt Solutions to Global Warming by Gar W. Lipow GarLpublic AT Comcast DOT net
Page 247 of 265
March of Dimes. Peristats - March of Dimes. 2005. March of Dimes.http://www.marchofdimes.com/peristats/tlanding.aspx?reg=99&lev=0&top=5&sle.Accessed 6/Jun/2005.
Pershing, Jonathan, and Jim Mackenzie. Removing Subsidies: Leveling the Playing Fieldfor Renewable Energy Technologies - Thematic Background Paper. 'This is One of 12Thematic Background Papers (TBP) That Have Been Prepared as Thematic Backgroundfor the. Conference.' Mar 2004. International Conference for Renewable Energies, Bonn2004. http://www.renewables2004.de/pdf/tbp/TBP04-LevelField.pdf. Accessed11/Jun/2005.
National Intelligence Council. "Pervasive Insecurity." In Mapping the Global Future |Report of the National Intelligence Council’s 2020 Project |Based on Consultations WithNongovernmental Experts Around the World. Dec 2004. Transmuting InternationalTerrorism pp 93-94. http://www.foia.cia.gov/2020/2020.pdf. Accessed 6/May/2005.
Petrich, Dean. Toilet Prices. 16/July 2005. Ultra-Low Water-Flush toilets. AquaAlternatives. http://www.enviroalternatives.com/toiletprices.html#ULTRA-LOW%20WATER-FLUSH. Accessed 20/Jul/2005.
Pfafferott, Jens. "Evaluation of Earth-to-Air Heat Exchangers with a StandardizedMethod to Calculate Energy Efficiency." In. Energy and Buildings 35(2003 - 971 -983)10/March 2003Science Direct. Elsevier.http://www.ise.fhg.de/german/fields/field1/mb5/publications/tos/querschnittsanalysen/science_e2a_pfafferott.pdf. Accessed 05/Jul/2005.
News-Medical.Net Medical News. "Pharmaceutical Reproductive Rights in the UnitedStates." In Pharmaceutical News. 29/Mar 2005. News-Medical.Net Medical News.http://www.news-medical.net/print_article.asp?id=8785. Accessed 6/Jun/2005.
Pimentel, David, and Tad W. Patzek. "Ethanol Production Using Corn, Switchgrass, andWood; Biodiesel Production Using Soybean and Sunflower." Natural ResourcesResearch (Publisher: Science+Business Media B.V.) 14, no. 1 (Mar 2005): 65-76.
United States Department of Agriculture Natural Resources Conservation Service.PLANTS National Database Reports and Topics - Arundinaria Gigantea. 22/Aug 2005.United States Department of Agriculture Natural Resources Conservation Service.http://plants.usda.gov/cgi_bin/plant_profile.cgi?symbol=ARGI.
Environment and Plastics Industry Council (EPIC). Plastics and Source Reduction. Sep2001. Environment and Plastics Industry Council (EPIC).http://www.cpia.ca/epic/docs/factsheets/Source%20Reduction.PDF. Accessed9/Jun/2004.
PNNL. "Need For Transportation Technologies Heads Into Overdrive." PNNLBreakthroughs Magazine: Science, Technology, Innovation Fall 2002. Pacific
Cooling It: No Hair Shirt Solutions to Global Warming by Gar W. Lipow GarLpublic AT Comcast DOT net
Page 248 of 265
Northwest National U.S. Department of Energy Multiprogram National Laboratory -Richland WA. http://www.pnl.gov/breakthroughs/fall02/special.stm. Accessed3/Jan/2005.
Pollack, James A. Soy Vs. Petro Polyols A Life-Cycle Comparison. "Early" 2003. OmniTech International, Ltd (Technical Consultants). United Soybean Board.http://www.unitedsoybean.org/newuses/targets_soybased_plastics_LCA.pdf. Accessed24/Sep/2005.
Port, Otis. "Power From The Sunbaked Desert | Solar Generators May Be a Hot Sourceof Plentiful Electricity." Business Week 12/Sep 2005: SCIENCE & TECHNOLOGY. TheMcGraw-Hill Companies Inc.http://www.businessweek.com/magazine/content/05_37/b3950067_mz018.htm. Accessed14/Oct/2005.
Abt Associates Inc. Power Plant Emissions: Particulate Matter-Related Health Damagesand the Benefits of Alternative Emission Reduction Scenarios. Jun 2004. Clean Air TaskForce. http://cta.policy.net/dirtypower/docs/abt_powerplant_whitepaper.pdf. Accessed24/Aug/2004.
Power Technology. Power Technology - Mokai Geothermal Power Plantl, New Zealand.26/Aug 2003. SPG Media Limited/SPG Media Group. http://www.power-technology.com/projects/mokai/. Accessed 23/Aug/2004.
United States Department of Energy, Energy Information Administration. PreliminaryCBECS End-Use Estimates - Preliminary End-Use Energy Consumption Estimates forCommercial Buildings in 1999 Based on Data from the 1999 Commercial BuildingsEnergy Survey. 1999. United States Department of Energy, Energy InformationAdministration. http://www.eia.doe.gov/emeu/cbecs/enduse_consumption/intro.html.Accessed 25/Aug/2004.
Price, Henry W., and Stephen Carpenter. The Potential for Low-Cost ConcentratingSolar Power Systems. In Intersociety Energy Conversion Engineering ConferenceVancouver, British Columbia, Canada August 1-5, 1999. May 1999. National RenewableEnergy Laboratory. http://www.nrel.gov/docs/fy99osti/26649.pdf. Accessed 9/Jan/2005.
Energy Ideas Clearinghouse. Product Technology & Review | Home Voltage Regulator(HVR)™, Enterprise Voltage Regulator (EVR)™. 2004. Washington State UniversityExtension Energy Program (Manages Energy Ideas Clearinghuse for Northwest EnergyEfficiency Alliance in Portland Oregon).http://www.nwalliance.org/resources/documents/PTR/EI_PTR200407Microplanet.pdf.Accessed 26/Mar/2005.
Sumitomo Bakelite Co. Ltd. Products That Provide Environmental Solutions. Jan 2004.Sumitomo Bakelite Co. Ltd.http://www.sumibe.co.jp/english/kankyou/pdf/rc2003_E06.pdf. Accessed 4/Jun/2004.
Cooling It: No Hair Shirt Solutions to Global Warming by Gar W. Lipow GarLpublic AT Comcast DOT net
Page 249 of 265
Professional Piercing Information Systems. Products: Step-Flow Operated Sink Valve.16/June 2005. Professional Piercing Information Systems.http://www.propiercing.com/products.html. Accessed 13/Jul/2005.
United States Environmental Protection Agency - Office of Compliance. Profile of theTextile Industry. In Sector Notebook Project. EPN3 10-R-97-009. Sep 1997. UnitedStates Environmental Protection Agency - Office of Compliance.http://www.epa.gov/compliance/resources/publications/assistance/sectors/notebooks/textilsn.pdf. Accessed 23/Ju/2004.
Sustainable Agriculture Network. Profitable Pork:Strategies for Hog Producers. InLivestock Alternatives. Jul 2003. Sustainable Agriculture Network. SustainableAgriculture Research and Education Program.http://www.sare.org/publications/hogs/profpork.pdf. Accessed 31/May/2004.
7. "R-Value of Straw Bales Lower Than Previously Reported." Environmental BuildingNews No. 9 Oct 1998: What's Happening. BuildingGreen.Com.http://www.buildinggreen.com/auth/article.cfm?fileName=070902b.xml. Accessed23/Aug/2005.
Rangwala, Glen. Hussein Kamel. 27/Feb 2003. MiddleEastReference.Org.Uk.http://middleeastreference.org.uk/kamel.html. Accessed 20/Apr/2005.
Greenpeace USA. A Rating Of Dry Cleaning Methods Currently In Use In The U.S. Jul2001. Greenpeace USA. http://www.greenpeace.org/raw/content/usa/press/reports/what-s-in-what-s-out-a-ratin.pdf. Accessed 23/Sep/2005.
Raucher, Margaret. Walter P. Reuther Library/Personal Collections. 2002. Housing.Walter P. Reuther Library of Wayne State University.http://www.reuther.wayne.edu/use/marg.html. Accessed 17/Apr/2005.
"The Reality and Urgency of Global Warming." In Americans & the World. Program onInternational Policy Attitudes - Jointly Established by the Center on Policy Attitudes(COPA) and the Center for International and Security Studies at Maryland (CISSM),School of Public Affairs, University of Maryland. 20/03 2005. http://www.americans-world.org/digest/global_issues/global_warming/gw1.cfm. Accessed 01/01/2005.
Realty Times. "Builders Researching Energy Efficient Homes." Realty Times (2000).Realty Times. http://realtytimes.com/rtcpages/20000619_energy.htm. Accessed4/Jun/2004.
Reardon, Chris. Your Home Technical Manual - Design for Lifestyle and the Future - 3.0Materials Use Introduction. 1/March 2004. Commonwealth of Australia/Joint Initiativeof the Australian Government and the Design and Construction Industries.http://www.greenhouse.gov.au/yourhome/technical/fs30.htm. Accessed 9/Jan/2005.
Cooling It: No Hair Shirt Solutions to Global Warming by Gar W. Lipow GarLpublic AT Comcast DOT net
Page 250 of 265
10. "Recycled-Content EPS Insulation from Polar Industries." Environmental BuildingNews No. 2 Feb 2001: Product Review -. BuildingGreen.Com.http://www.buildinggreen.com/auth/article.cfm?fileName=100209a.xml. Accessed5/Sep/2005.
American Forest and Paper Association. "Recycling." In Environment and Recycling.2005. American Forest and Paper Association.http://www.afandpa.org/Content/NavigationMenu/Environment_and_Recycling/Recycling/Recycling.htm. Accessed 21/Jun/2005.
European Commission Directorate-General Joint Research Centre (JRC) Institute forProspective Technological Studies Sustainability in Industry, Energy and TransportEuropean - IPPC Bureau. Reference Document on Best Available Techniques forManagement of Tailings and Waste-Rock in Mining Activities. Final. Jul 2004. EuropeanCommission Directorate-General Joint Research Centre (JRC) Institute for ProspectiveTechnological Studies Sustainability in Industry, Energy and Transport European - IPPCBureau. ftp://ftp.jrc.es/pub/eippcb/doc/mmr_bref_0704.pdf. Accessed 18/May/2005.
International Monetary Fund. Report for Selected WEO Aggregates and Subjects |World Economic Outlook Database - September 2004. Sep 2004.
International Monetary Fund.http://www.imf.org/external/pubs/ft/weo/2004/02/data/dbaoutm.cfm?SD=2001&ED=2005&R1=1&R2=1&CS=5&SS=2&OS=C&DD=0&OUT=1&C=001&S=BM-BX&CMP=0&x=42&y=3. Accessed 15/Jun/2005.
Research and Special Programs Administration John A. Volpe National TransportationSystems Center. Transit Security Design Considerations: Final Report. November 2004.7-8. Federal Transit Authority of the U.S. Department of Transportation. http://transit-safety.volpe.dot.gov/security/SecurityInitiatives/DesignConsiderations/CD/ftasesc.pdf.Accessed 05/Jul/2005.
Envirowise. Retail Supply Chain Distributes Cost Savings from Improved Packaging - ACase Study from the Book Industry. In Envirowise Case Studies. CS332. Mar 2002.Envirowise.http://www.envirowise.gov.uk/envirowisev3.nsf/0/EAE528C70CD5852480256CE5004C7095/$File/CS332.pdf. Accessed 14/May/2004.
National Association of Home Builders Research Center. Revised Builder’s Guide toFrost Protected Shallow Foundations. In Toolbase. Sep-2004. 14/11 2004. NationalAssociation of Home Builders Research Center.http://www.toolbase.org/docs/SubsystemNav/Foundations/4495_RevisedFPSFGu.Accessed 4/Sep/2005.
Rocky Mountain Institute. Rocky Mountain Institute's Home Energy Briefs #8 -KITCHEN APPLIANCES. 03/12 2004. Rocky Mountain Institute.
Cooling It: No Hair Shirt Solutions to Global Warming by Gar W. Lipow GarLpublic AT Comcast DOT net
Page 251 of 265
http://www.rmi.org/images/other/Energy/E04-18_HEB8KitchenApps.pdf. Accessed20/Aug/2005.
Romm, Joe. Cool Companies - Proven Results: Cool Buildings. ~2004. Center for Energyand Climate Solutions. http://www.cool-companies.com/proven/buildings.cfm. Accessed19/Aug/2004.
Romm, Joseph J. Cool Companies: How the Best Businesses Boost Profits andProductivity by Cutting Greenhouse Gas Emissions. Washington D.C. & Covelo CA:Island Press, 1999.
———. Cool Companies: Proven Results - Cool Buildings. 2005. Romm,Joseph J.http://www.cool-companies.com/proven/buildings.cfm. Accessed 22/Aug/2005.
Roodman, David Malin, and Nicholas Lenssen. Worldwatch Paper #124: A BuildingRevolution: How Ecology and Health Concerns Are Transforming Construction. SinglePage Summary of Book. March 1995. Worldwatch Institute.http://www.worldwatch.org/pubs/paper/124. Accessed 22/Aug/2005.
Parsons Brinckerhoff Quade & Douglas; Cambridge Systematics, Inc.;NuStatsInternational. RT-HIS Regional Travel -Household Interview Survey GENERAL FINALREPORT. Feb 2000. New York Metropolitan Transportation Council (NYMTC); NorthJersey Transportation Planning Authority (NJTPA).http://www.nymtc.org/files/fr00321.pdf. Accessed 24/Feb/2004.
Rydelius, Jame A. Growing Eucalyptus for Pulp and Energy. In Mechanization in ShortRotation, Intensive Culture Forestry Conference, Mobile, AL, March 1-3, 1994. Mar1994. Short Rotation Woody Crops Operations Working Group (Established by DOEORNL, USDA and EPRI). http://www.woodycrops.org/mechconf/rydeliu.html.Accessed 14/Jun/2004.
Rymsza, Thomas A. "Firm Profile: Vision Paper." Journal of Industrial Ecology 7, no. 3-4 May 2004. Massachusetts Institute of Technology and Yale University.http://www.visionpaper.com/speeches_papers/jiec_7_3-4_215_0.pdf. Accessed16/Jun/2004.
State of Illinois Department of Agriculture IIllinois Sustainable Agriculture Committee."S/A 98-18 Sustainable Beef Production - Management Intensive Grazing Vs Corn SilageProgram for Beef Stocker Calves." In Sustainable Agriculture Grant Review CommitteeC2000 Sustainable Agriculture Grant Projects - ON-FARM RESEARCH ANDDEMONSTRATION. Oct 2001. State of Illinois Department of Agriculture IIllinoisSustainable Agriculture Committee. State of Illinois Department of Agriculture IIllinoisSustainable Agriculture Committee.http://www.agr.state.il.us/C2000/fy00/FY00Report.pdf. Accessed 13/Sep/2005.
Cooling It: No Hair Shirt Solutions to Global Warming by Gar W. Lipow GarLpublic AT Comcast DOT net
Page 252 of 265
Sagrillo, Mick. "Advice from an Expert -Putting Wind Power's Effect on Birds inPerspective." In Frequently Asked Questions. 2003. American Wind Energy Association.http://www.awea.org/faq/sagrillo/swbirds.html. Accessed 24/Jun/2005.
Salatin, Joel. "Joel Salatin Introduces Livestock Grazing.. 'Salad Bar Beef." In. AcresUSA - A Voice for Eco-Agriculture March 1996Eco-Friendly Foods.http://www.ecofriendly.com/index.cfm?section=4&page=20. Accessed 10/Sep/2005.
Saloner, Dylan, and Neil Garcia-Sinclair. "Environmental Impact of Ultra Light RailTransit: Lessening the External Costs of Transportation." Alameda, California, 9/October2006 (Unpublished version).
The Gas Company, LLC. Saving Energy At Home. 26/Jul 2005. The Gas Company, LLC.http://www.hawaiigas.com/saving/. Accessed 20/Aug/2005.
Hawkins, Dominique M. Saving Wood Windows. 24/Sep 2004. State of New JerseyDepartment of Environmental Protection Division of Parks & Forestry Natural &Historic Resources Historic Preservation Office.http://www.state.nj.us/dep/hpo/4sustain/windowsave.pdf. Accessed 2/Jan/2005.
Sayre, Laura. "New Farm Research: Cover Crop Roller." In The New Farm. 20/Nov2003. The Rodale Institute.http://www.newfarm.org/depts/NFfield_trials/1103/notillroller.shtml. Accessed7/May/2005.
Scanlon, Keirsten. Poison PCs and Toxic TVs:California's Biggest Environmental CrisisThat You've Never Heard of. Jun 2001. Silicon Valley Toxics Coalition; CaliforniansAgainst Waste; Materials for the Future.http://www.cawrecycles.org/Ewaste/PPCs%20and%20TTVs/ppc-ttv.pdf. Accessed6/Jun/2004.
Schmidt-Bleek, Friedrich Bio. "Energy." In Factor 10 Manifesto. Factor 10 Institute:Provence France, Jan 2000. May 2000. http://www.factor10-institute.org/pdf/F10Manif.pdf. Accessed 2/Feb/2004.
———. MIPSBOOK or The Fossil Makers -Factor 10 and More. Edited byReuben(Trans) Deumling. 1994. ISBN 3-7643-2959-9. Birkhäuser: Basel, Boston,Berlin. Wuppertal Institute for Climate, Environment, Energy.http://prog2000.casaccia.enea.it/nuovo/documenti/427.doc. Accessed 3/Aug/2004.
Schneider, Conrad. Power Plant Emissions: Particulate Matter-Related Health Damagesand the Benefits of Alternative Emission Reduction Scenarios. Jun 2004. Clean Air TaskForce Abt Associates Inc.http://cta.policy.net/dirtypower/docs/abt_powerplant_whitepaper.pdf. Accessed24/Aug/2004.
Cooling It: No Hair Shirt Solutions to Global Warming by Gar W. Lipow GarLpublic AT Comcast DOT net
Page 253 of 265
Schnieders, Jürgen. CEPHEUS - Measurement Results from More Than 100 DwellingUnits in Passive Houses. May 2003. Passive House Institute.http://www.passiv.de/07_eng/news/CEPHEUS_ECEEE.pdf. Accessed 23/Dec/2003.
Schrank, Kerryn. Melbourne Central Green Office 2001 Performance Report. Aug2002. BP Australia.http://www.bp.com.au/environmental_social/green_office_2001_report.pdf. Accessed11/Jun/2004.
Schreyer, Paul. Capital Stocks, Capital Services, and Multi-Factor ProdductivityMeasures. In Economic Studies. Draft. 3/Nov 2003. OECD Statistics Directorate.http://www.oecd.org/dataoecd/30/46/29877839.pdf. Accessed 3/Jan/2005.
Schuyler, David. "Target Works with Vendors to Reduce Packaging, Save Millions." TheBusiness Journal of Milwaukee 21/Jul 2000: In Depth: Environmental Issues. AmericanCity Business Journals Inc.http://www.bizjournals.com/milwaukee/stories/2000/07/24/focus1.html?t=printable.Accessed 10/Jun/2004.
European Commission Directorate General Environment. "Screen Computers: CathodesRay Tubes Desktop Vs. Liquid Crystal Display." In Study on External EnvironmentalEffects Related to the Life Cycle of Products and Services - Appendix 2: Case Studies.Feb-2003. Jul 2003. European Commission Directorate General Environment.http://www.tecnologieefficienti.it/tecnologie/LCD%5CLCD_vs_CRT_LCA.pdf.Accessed 20/Mar/2005.
United States Census Bureau. "Section 19 - Energy and Utilities." In Statistical Abstractof the United States 2002. December 2002. United States Census Bureau.http://www.census.gov/prod/2003pubs/02statab/energy.pdf.
United States Department of Energy, Energy Information Administration. "Section 2 -Energy Consumption by Sector." In Annual Energy Review 2004. DOE/EIA-0384(2004).United States Department of Energy, Energy Information Administration: WashingtonD.C., Aug 2005. 10/Aug 2005. http://www.eia.doe.gov/emeu/aer/pdf/pages/sec2.pdf.Accessed 22/Aug/2005.
U.S. Census Bureau. "Section 23 - Transportation." In Statistical Abstract of the UnitedStates. 2002. 2002. U.S. Census Bureau.http://www.census.gov/prod/2003pubs/02statab/trans.pdf. Accessed 22/Jun/2004.
United States Census Bureau. "Section 30 - Comparative International Statistics." InStatistical Abstract of the United States 2002. December 2002. Page 823 Table 1305.United States Census Bureau.http://www.census.gov/prod/2003pubs/02statab/intlstat.pdf. Accessed 1/Jan/2004.
Cooling It: No Hair Shirt Solutions to Global Warming by Gar W. Lipow GarLpublic AT Comcast DOT net
Page 254 of 265
The Delta Institute. Sector-Based Pollution Prevention: Toxic Reductions ThroughEnergy Efficiency and Conservation Among Industrial Boilers: A Report to the UnitedStates EPA Great Lakes National Program Office. GL97514402. July 2002. The DeltaInstitute. http://delta-institute.org/publications/boilers/SectorBasedP2.pdf. Accessed25/Sep/2005.
Segelken, Roger(ED). "U.S. Could Feed 800 Million People with Grain That LivestockEat, Cornell Ecologist Advises Animal Scientists." In Conrnell University Science News.7/Aug 1997. Cornell University.http://www.news.cornell.edu/science/Aug97/livestock.hrs.html. Accessed 13/Sep/2005.
Segrest, S. A. et al. Biomass Co-Firing With Coal at Lakeland, Florida, Utilities. 4-8/Oct1998. BioEnergy’98: Expanding BioEnergy Partnerships. Madison, WI. October 4-8.http://trees.ifas.ufl.edu/BioEnergy98%20Paper.pdf. Accessed 24/Aug/2004.
Sellen, Abigail J., and Richard Harper. The Myth of the Paperless Office. Cambridge MAUSA: MIT Press, 2001.
Selsam, Doug. The Selsam SUPERTURBINE. Sep 2005. Superturbine Inc.http://www.speakerfactory.net/wind.htm. Accessed 28/Sep/2005.
Sharkey, Joe. "Rail Projects Are Sign of a Quiet Revolution in Short-Haul Trips." InEcoCity Cleveland - Transportation Choices. 4/Jun 2002. New York Times Inc.http://www.ecocitycleveland.org/transportation/rail/nytimes_rail_article.html. Accessed23/Sep/2005.
Sharp Corporation. Sharp Environmental Report 2002. April 2001 - March 2002.December 2002. Sharp Corporation. http://sharp-world.com/corporate/eco/report/2002pdf/report_2002.pdf. Accessed 20/Mar/2005.
Shellenberger, Michael, and Ted Nordhaus. "The Death of Environmentalism: GlobalWarming Politics in a Post-Environmental World." Grist Magazine 13/Jan 2005: MainDish. Grist Magazine - Seattle. http://grist.org/news/maindish/2005/01/13/doe-reprint/.Accessed 15/Oct/2005.
Siikavirta, Hanne et al. "Effects of E-Commerce on Greenhouse Gas Emissions: A CaseStudy of Grocery Home Delivery in Finland." Journal of Industrial Ecology 6, no. 2 - E-commerce, the Internet, and the Environment Spring 2002. MIT Press.http://mitpress.mit.edu/journals/jiec/v6n2/jie_v6n2_83_0.pdf. Accessed 19/Aug/2004.
Siloxo Pty Ltd. Siloxo -Melbourne Australia. Company Site for Leading GeopolymericCement Manufacturer. 15/Aug 2003. Siloxo Pty Ltd.<http://www.siloxo.com/index_siloxo.htm>. Accessed 18/Aug/2004.
Cooling It: No Hair Shirt Solutions to Global Warming by Gar W. Lipow GarLpublic AT Comcast DOT net
Page 255 of 265
Sky WindPower Corporation. Sky WindPower Corporation. 6/June 2005. SkyWindPower Corporation. http://www.skywindpower.com/ww/index.htm. Accessed123/Feb/2006.
Taxi 2000 Corporation. SkyWeb Express Personal Rapid Transit - A Revolution inUrban Transportation: Home. June 2004. Taxi 2000 Corporation.<http://www.skywebexpress.com/>. Accessed 22/Jun/2004.
United States Department of Energy Smart Communities Network. Smart CommunitiesNetwork: Green Buildings Introduction. 2003. United States Department of Energy SmartCommunities Network. http://www.sustainable.doe.gov/buildings/gbintro.shtml.Accessed 15/Feb/2004.
Smith, Jenni. "Turn Out the Heat | Customizing Heating and Cooling Products to Meet aParticular Home's Need Can Dramatically Cut Down on Energy Costs as Well asInstallation Time." In HousingZone: Building Materials. 7/Mar 2000. Reed BusinessInformation. http://www.housingzone.com/topics/pr/cmaterials/pr00ca602.asp. Accessed4/Jun/2004.
Solanki, Sami K. The Sun is More Active Now Than Over the Last 8000 Years. 28/Oct2004. Max Planck Institute for Solar System Research.http://www.mpg.de/english/illustrationsDocumentation/documentation/pressReleases/2004/pressRelease20041028/. Accessed 1/Oct/2005.
KPMG Bureau voor Economische Argumentatie; Steins Bisschop Meijburg & CoAdvocaten. Solar Energy: From Perennial Promise to Competitive Alternative - FinalReport. Project Number: 2562. Aug 1999. Greenpeace - Nederlands.http://archive.greenpeace.org/~climate/renewables/reports/kpmg8.pdf. Accessed24/Sep/2004.
SeeSawUsa.com. Solar Shades Instantly Reduce Heat, Glare and Fading - TransparentMylar® Solar Shades. May 2005. SeeSawUsa.Com.http://www.seesawusa.com/KoolVueInfo.htm. Accessed 06/Jul/2005.
Solargenix Energy LLC. Solargenix Energy - Formerly Duke Solar Energy - The NaturalPower For Good. 2005. Solargenix Energy LLC.http://www.solargenix.com/powerRoof.cfm. Accessed 28/Mar/2005.
Sorrell, Charles E. Project Fact Sheet: Glass Development Of Advanced RefractoriesFor The Glass Manufacturing Industry. Feb 1999. U.S. Department of Energy Office ofEnergy Efficiency and Renewable Energy Industrial Technologies Program. ORNL.http://www.ms.ornl.gov/programs/energyeff/aim/factsheets/glass.pdf. Accessed22/Sep/2004.
Federal Energy Regulatory Commission. Staff Briefing Paper: ASSESSING THE STATEOF WIND ENERGY IN WHOLESALE ELECTRICITY MARKETS. ADO0 13 000. Nov
Cooling It: No Hair Shirt Solutions to Global Warming by Gar W. Lipow GarLpublic AT Comcast DOT net
Page 256 of 265
2004. Federal Energy Regulatory Commission. http://www.ferc.gov/legal/maj-ord-reg/land-docs/11-04-wind-report.pdf. Accessed 1/Oct/2005.
United States Department of Energy, Energy Information Administration. State EnergyData 2000: Consumption Estimates for Power Consumption by State. 2003. United StatesDepartment of Energy, Energy Information Administration.http://www.eia.doe.gov/emeu/states/sep_use/total/csv/use_all_btu.csv. Accessed22/Aug/2004.
"Steel Producers Target Canned Foods." In. Packaging World Magazine July1995Packaging World Magazine Online. Summit Publishing.http://www.packworld.com/articles/Features/1064.html. Accessed 9/Jun/2004.
Steen, Athena Swentzell, and Bill Steen. Artistry in Clay & Lime. 3/Jun 2005. TheCanelo Project. http://www.caneloproject.com/pages/workshops/clayartistry.html.Accessed 5/Sep/2005.
Stevenson, Gene. 90 Years' Results Say Yes to Winter Legumes, Crop Rotations. 9/Feb1989. College of Agriculture: Auburn University Alabama Agricultural ExperimentStation. http://www.ag.auburn.edu/aaes/webpress/1989/rotations.htm. Accessed15/Jun/2004.
Stewart, David. "Ensuring Effective Insurance Thanks to Paperless Office." In.SiliconRepublic.Com - Ireland's Technology News Service 19/Apr 2004Case Studies.Silcon Republic - Dublin.http://www.siliconrepublic.com/news/news.nv?uid=lipowg&sid=C5mmenoD&storyid=single3087. Accessed 11/Jun/2004.
Stodolsky, Frank. Railroad and Locomotive Technology Roadmap. ANL/ESD/02-6.December 2002. Center for Transportation Research, Energy Systems Division - ArgonneNational Laboratory. http://www.transportation.anl.gov/pdfs/RR/261.pdf. Accessed11/Jan/2005.
Weil-McLain. Straight Talk About Boiler Efficiency. 21/Jan 2005. Weil-McLain.http://www.weil-mclain.com/netdocs/straighttalk.htm. Accessed 25/Sep/2005.
Sullivan, Preston. Conservation Tillage. In Appropriate Technology Transfer For RuralAreas. Jul-2003. Aug 2003. National Center for Appropriate Technology.http://attra.ncat.org/attra-pub/PDF/consertill.pdf. Accessed 26/May/2004.
Charles River Associates Incorporated;Polaris Research & Development. "A Summary ofKey Statistics Across Airports." In AIR PASSENGERS FROM THE BAY AREA’SAIRPORTS, 2001 & 2002 - Final Report Volume 1:OVERVIEW AND METHODS. CRANo. D03144-00. Sept 2003. Metropolitan Transportation Commission.http://www.mtc.ca.gov/maps_and_data/datamart/survey/APS_report_volume_1.pdf.Accessed 23/Sep/2005.
Cooling It: No Hair Shirt Solutions to Global Warming by Gar W. Lipow GarLpublic AT Comcast DOT net
Page 257 of 265
EcoChoices EcoKitchen. Sun Frost Refigerators And Freezers - Models Available.23/Jun 2005. Prices. EcoChoices EcoKitchen.http://www.ecokitchen.com/shop/refrigerator/models.html#RF19. Accessed08/Aug/2005.
Sustainable Village. Sustainable Village - Products - Aqua Helix. 2005. SustainableVillage. http://www.thesustainablevillage.com/servlet/display/product/detail/22602.Accessed 13/Jul/2005.
Suttell, Robin. "Ntelligent and Integrated Buildings: Technologies and Current MarketConditions Break Down Conventional Barriers." Buildings Magazine November 2002.Statmats Business Media. http://www.buildings.com/Articles/detail.asp?ArticleID=1095.Accessed 5/Jan/2005.
Sweeney, Tom. Handyman Club of America - Hands Free - Pedal Valve Makes SinkFaucets Convenient and Clean. February 1999. Handyman Club of America (Publishersof Handy Magazine). ttp://www.handymanclub.com/document.asp?cID=57&dID=777.Accessed 13/Jul/2005.
United States Census Bureau. Table 001. Total Midyear Population. April 2004. UnitedStates Census Bureau. http://www.census.gov/cgi-bin/ipc/idbagg. Accessed 1/Jan/2005.
United States Department of Energy, Energy Information Administration. "Table 2.1aEnergy Consumption by Sector, 1949-2002." In Annual Energy Review. 2004. UnitedStates Department of Energy, Energy Information Administration.http://www.eia.doe.gov/emeu/aer/txt/ptb0201a.html. Accessed 20/Aug/2004.
U.S. Department of Labor Bureau of Labor Statistics. "Table 8. Region of Residence:Average Annual Expenditures and Characteristics." In Consumer Expenditure Survey2002. 13/Nov 2003. U.S. Department of Labor Bureau of Labor Statistics.http://www.bls.gov/cex/2002/Standard/region.pdf. Accessed 06/Jul/2005.
United States Department of Energy, Energy Information Administration. Table E2.Existing Capacity at U.S. Electric Utilities by Census Division, State, and Prime Mover,2000. 24/Sep 2002. United States Department of Energy, Energy InformationAdministration. http://www.eia.doe.gov/cneaf/electricity/ipp/html1/ippv1te2p1.html.Accessed 22/Aug/2004.
Taracena Arriola, Arturo. "Liberalismo y Poder Político en Centroamérica (1870-1929)."In Historia General de Centroamérica Volume 4, 167-254;403-412. San José de CostaRica: FLACSO, 1994.
Tax Policy Center: A Joint Venture of the Urban Institute and Brookings Institution.Taxes as a Percent of GDP, 2000. 29/Apr 2002. Tax Policy Center: A Joint Venture ofthe Urban Institute and Brookings Institution.
Cooling It: No Hair Shirt Solutions to Global Warming by Gar W. Lipow GarLpublic AT Comcast DOT net
Page 258 of 265
http://www.taxpolicycenter.org/TaxFacts/TFDB/Content/Excel/oecd_tax_GDP_2000.xls.Accessed 4/Apr/2005.
The Old House Web. Schedule of Normal Life. 1995.http://www.oldhouseweb.net/stories/Detailed/267.shtml. Accessed 1/Jan/2005.
The Pew Research Center for People and the Press. Americans Support Action on GlobalWarming: Progress Seen On AIDS, Jobs, Crime and the Deficit. 21/11 1997.http://people-press.org/reports/display.php3?ReportID=100. Accessed 02/07/2005.
Thekdi, Arvind C. "Guest Column: Energy Savings in Industry Through Use ofInsulation and Refractories." Energy Matters May/Jun 2000: Best Practices. U.S.Department of Energy Office of Energy Efficiency and Renewable Energy IndustrialTechnologies Program.http://www.eere.energy.gov/industry/bestpractices/may2000_guest.htm. Accessed25/Sep/2005.
Office of Industrial Technologies - Energy Efficiency and Renewable Energy • U.S.Department of Energy. Thermodyne™Evaporator - A Molded Pulp Products Dryer •New Technology Revolutionizes Pulp Product Drying. In Forest Products Success Story.I-FP-529. Apr 2002. Office of Industrial Technologies - Energy Efficiency andRenewable Energy • U.S. Department of Energy.http://www.eere.energy.gov/inventions/pdfs/merrillaireng.pdf. Accessed 6/Sep/2004.
Thermomax Industries Ltd. Thermomax Industries, Solar Thermal, Home Solar Power,Commercial Solar Power, Radiant Heating Methods. 2005. Thermomax Industries Ltd.http://www.solarthermal.com/. Accessed 28/Sep/2005.
Thomas, Steve. "Government Needs to Take a Brave Decision Now | Crunch Time forPebble Bed Plan." Cape Times 18/Sep 2003: Insight. The Cape Times & IndependentOnline (Pty) Ltd.http://www.capetimes.co.za/index.php?fSectionId=332&fArticleId=238104. Accessed10/Apr/2005.
Toal, Brian A. "Renewables:Future Shock." Oil & Gas Investor October 2001. ChemicalWeek Associates Inc./ National Renewable Energy Laboratory.<http://www.nrel.gov/docs/gen/fy02/31353.pdf>. Accessed 2/Jul/2005.
Tompuri, Vesa. "Wärtsilä’s New Medium-Speed Diesel Engine Has the LowestEmissions on the Market." In WATTSON:Wärtsilä’s Investor Magazine. 2004. SanomaMagazines Custom Publishing Division for Wärtsilä Corporation.http://www.wartsila.com/Wartsila/docs/en/investors/English_lowres.pdf. Accessed13/Jan/2005.
Pacific Northwest Pollution Prevention Resource Center. "Topical Reports -Energy andWater Efficiency for Semiconductor Manufacturing." In Pollution Prevention (P2) Pays -
Cooling It: No Hair Shirt Solutions to Global Warming by Gar W. Lipow GarLpublic AT Comcast DOT net
Page 259 of 265
N.C. Division of Pollution Prevention and Environmental Assistance. Feb 2000. PacificNorthwest Pollution Prevention Resource Center. http://www.p2pays.org/ref/04/03271/.Accessed 17/Sep/2005.
United States Census Bureau. Total Midyear Population for the World: 1950-2050.26/Apr 2005. United States Census Bureau.http://www.census.gov/ipc/www/worldpop.html. Accessed 1/Oct/2005.
U.S. Army Corp of Engineers | Rock Island District | Mississippi Valley Division.Transportation Mode Comparison - Energy Environment- Efficiency. Jan 2002. U.S.Army Corp of Engineers | Rock Island District | Mississippi Valley Division.http://www2.mvr.usace.army.mil/UMR-IWWSNS/documents/tr-comp.pdf. Accessed26/Sep/2005.
Trivedi, Chirag. "The Great Smog of London." BBC News Online 5/Dec 2002. BBCNews Online. http://news.bbc.co.uk/1/hi/england/2545759.stm. Accessed 9/Jan/2005.
Trusty, W. B., and J. K. Meil. "Building Life Cycle Assessment: Residential CaseStudy." Presented at the Proceedings: Mainstreaming Green: Sustainable Design forBuildings and Communities, October 1999. Chattanooga TN USA: He American Instituteof Architect;U.S. Green Building Council, 1999.
Trusty, Wayne, and Jamie Meil. The Environmental Implications of Building New VersusRenovating an Existing Structure. Jan 2001. ATHENA™ Sustainable Materials Institute.http://www.athenasmi.ca/papers/down_papers/SB2000_paper.pdf. Accessed23/Aug/2005.
Tujague, Amy C. "Waterborne Commerce Statistics Center Ton Miles by Vessel Typefor Calendar Year 2001." 20/Aug 2004. Accessed 21/Aug/2004.
U.S. Army Corps of Engineers. "National Inventory of Dams". Feb 2005.http://edcftp.cr.usgs.gov/pub/data/nationalatlas/dams00x020.tar.gz. Accessed 27-Jun-2007.
U.S. Bureau of Labor Statistics Series Reports. . http://data.bls.gov/cgi-bin/srgate.Accessed 2/Jul/2005.
U.S. Census Bureau. Table 1a. Projected Population of the United States, by Race andHispanic Origin: 2000 to 2050. 18/March 2004.http://www.census.gov/ipc/www/usinterimproj/. Accessed 16/March/2005.
U.S. Department of Energy - Energy Efficiency and Renewable Energy. Solar FAQs —Concentrating Solar Power — ALL. 8/Feb 2007.http://www.eere.energy.gov/solar/cfm/faqs/third_level.cfm/name=Concentrating%20Solar%20Power/cat=ALL#Q84. Accessed 18/Jan/2008.
Cooling It: No Hair Shirt Solutions to Global Warming by Gar W. Lipow GarLpublic AT Comcast DOT net
Page 260 of 265
U.S. Department of Energy - Energy Information Administration. "2001 Consumptionand Expenditures Tables - 2001 Appliances Consumption Tables." In A Look atResidential Energy Consumption in 2001 . 23/October 2003.ftp://ftp.eia.doe.gov/pub/consumption/residential/2001ce_tables/appl_consump.pdf.Accessed 23/Dec/2003.
———. "2001 Consumption and Expenditures Tables - 2001 Appliances ExpendituresTables." In A Look at Residential Energy Consumption in 2001. 23/October 2003.ftp://ftp.eia.doe.gov/pub/consumption/residential/2001ce_tables/appl_expend.pdf.Accessed 23/Dec/2003.
———. "2001 Consumption and Expenditures Tables - Electric Air-ConditioningConsumption Tables." In A Look at Residential Energy Consumption in 2001. 23/October2003. ftp://ftp.eia.doe.gov/pub/consumption/residential/2001ce_tables/ac_consump.pdf.Accessed 23/Dec/2003.
———. "2001 Consumption and Expenditures Tables - Electric Air-ConditioningExpenditures Tables." In A Look at Residential Energy Consumption in 2001. 23/October2003. ftp://ftp.eia.doe.gov/pub/consumption/residential/2001ce_tables/ac_expend.pdf.Accessed 23/Dec/2003.
———. "2001 Consumption and Expenditures Tables - Space-Heating ExpendituresTables." In A Look at Residential Energy Consumption in 2001. 23/October 2003.ftp://ftp.eia.doe.gov/pub/consumption/residential/2001ce_tables/spaceheat_expend.pdf.Accessed 23/Dec/2003.
———. "2001 Consumption and Expenditures Tables - Space-Heatingl EnergyConsumption." In A Look at Residential Energy Consumption in 2001. 23/October 2003.ftp://ftp.eia.doe.gov/pub/consumption/residential/2001ce_tables/spaceheat_consump.pdf.Accessed 23/Dec/2003.
———. "2001 Consumption and Expenditures Tables - Total Energy Consumption." InA Look at Residential Energy Consumption in 2001. 23/October 2003.ftp://ftp.eia.doe.gov/pub/consumption/residential/2001ce_tables/enduse_consump.pdf.Accessed 23/Dec/2003.
———. "2001 Consumption and Expenditures Tables - Water-Heating ConsumptionTables." In A Look at Residential Energy Consumption in 2001. 23/October 2003.ftp://ftp.eia.doe.gov/pub/consumption/residential/2001ce_tables/waterheat_consump.pdf.Accessed 23/Dec/2003.
———. "2001 Consumption and Expenditures Tables - Water-Heating Expenditures." InA Look at Residential Energy Consumption in 2001. 23/October 2003.ftp://ftp.eia.doe.gov/pub/consumption/residential/2001ce_tables/waterheat_expend.pdf.Accessed 23/Dec/2003.
Cooling It: No Hair Shirt Solutions to Global Warming by Gar W. Lipow GarLpublic AT Comcast DOT net
Page 261 of 265
———. "2001 Housing Characteristics Tables -Appliances Tables." In A Look atResidential Energy Consumption in 2001. 23/October 2003.ftp://ftp.eia.doe.gov/pub/consumption/residential/2001hc_tables/appl_percent.pdf.Accessed 23/Dec/2003.
U.S. Department of Labor Bureau of Labor Statistics. United States Department ofLabor: Frequently Asked Questions - Women - Pregnancy. 2005. U.S. Department ofLabor Bureau of Labor Statistics. http://www.dol-union-reports.gov/dolfaq/go-dol-faq.asp?faqid=46&faqsub=Pregnancy&faqtop=Women&topicid=13. Accessed6/Jun/2005.
United States Environmental Protection Agency, Region 2. Life Cycle of Old Computers -Problem Continued. 15/October 2002. U.S. EPA.http://www.epa.gov/region02/r3/problem.htm. Accessed 3/July/2005.
Urbinato, David. "London's Historic "Pea-Soupers."." EPA Journal Summer 1994. U.S.EPA. http://www.epa.gov/history/topics/perspect/london.htm. Accessed 9/Jan/2005.
Green Building Council. USGBC - LEED Case Study - Energy - DEP Cambria. 2003.Green Building Council. http://leedcasestudies.usgbc.org/energy.cfm?ProjectID=47.Accessed 22/Aug/2005.
Green Building Council. USGBC - LEED Case Study - Finance - DEP Cambria. 2003.Green Building Council. http://leedcasestudies.usgbc.org/finance.cfm?ProjectID=47.Accessed 22/Aug/2005.
Vallette, Jim, Daphne Wysham, and Nadia Martínez. A Wrong Turn From Rio: TheWorld Bank’s Road to Climate Catastrophe. In Enth Session of the Conference ofParties, Climate Change Convention Buenos Aires, Argentina, December 2004. Dec2004. Institute for Policy Studies;Transnational Institute.http://www.seen.org/PDFs/Wrong_turn_Rio.pdf. Accessed 30/Mar/2005.
van den Reek, J.A. Reduction of CO2 Emissions by Reduction of Paper Use forPublication Applications. Oct 1999.http://www.chem.uu.nl/nws/www/publica/99048.pdf. Accessed 13/May/2004.
Vasile, Carmine Dr. International Data on Successfully Demonstrated Energy EfficiencyProjects - Residential Waste Water Heat-Recovery System: GFX. April 2000. Centre forthe Analysis and Dissemination of Demonstrated Energy Technologies.http://gfxtechnology.com/CADDET.PDF. Accessed 20/Jul/2005.
Venmar Ventilation Inc. Residential Product Group. Venmar Whole House AirExchanger. April 2004.http://venmar.ca/upload/821525852/Venmar_Whole_House_Air_Exchanger-v1.pdf.Accessed 05/Jul/2005.
Cooling It: No Hair Shirt Solutions to Global Warming by Gar W. Lipow GarLpublic AT Comcast DOT net
Page 262 of 265
"Visualizing Tomorrow's Industrial Environments: Interview with EngelbertWestkämper." Siemens Webzine No. Pictures of the Future - Fall 2002 (2002). Siemen.http://w4.siemens.de/FuI/en/archiv/pof/heft2_02/artikel08/. Accessed 02/Jan/2005.
Volk, Timothy A. Willow Biomass for Bioenergy, SUNY-ESF: Brochure. 1997. SUNYCollege of Environmental Science and Forestry.http://www.esf.edu/willow/PUBLICATIONS/brochures/brochure.htm. Accessed24/Aug/2004.
Waggener, Robert (Ed). Cooperative Extension Service - Forage-Grass ResearchHelping Northeast Wyoming Ranchers. 21/June 2005. University of WyomingCooperative Extension Service.http://www.uwyo.edu/CES/News/Forage_Grass_research.htm. Accessed 13/Sep/2005.
Wakamatsu, Hidetoshi, Akira Mayuzumi, and Norio Tanaka. "Effective UtilizationTechnology for Ultra Purewater, Chemical Liquids and Waste Materials onSemiconductor Manufacturing Plant." OKI Technical Review 68, no. 188: Special Editionon the Environment Dec 2001. Oki Industry Co. Ltd - Environment Division.http://www.oki.com/en/otr/downloads/otr-188-06.pdf. Accessed 23/May/2004.
Walker, Clare. Melbourne Central Green Office 2002 Performance Report. Jul 2003.BP Australia.http://www.bp.com.au/environmental_social/green_office_2002_report.pdf. Accessed11/Jun/2004.
Wallace, Brad. "Paper Reduction Program Saves Money And The Environment." InKnowledge Bank Articles. 28/Sep 2004. Innovative Management Systems.http://www.solutions.ca/Knowledge_Bank/Articles/article.asp?doc_id=158. Accessed20/Sep/2004.
Missouri Department of Natural Resources Land Reclamation Program. Warm-Season,Native Grasses on Reclaimed Minelands - Landowner Management Guide. In LandReclamation Program Fact Sheet. Jul 2003. Missouri Department of Natural ResourcesLand Reclamation Program. http://www.dnr.mo.gov/oac/pub2082.pdf. Accessed13/Sep/2005.
Alcoa Building Products. Warranty Information Mastic Vinyl Siding, Soffit andAccessories. 2002. Alcoa Building Products. http://www.mastic.com/warrantyvs.asp.Accessed 02/Feb/2005.
Fisher & Paykel. Washers. August 2005. Fisher & Paykel.http://usa.fisherpaykel.com/laundry/washers/washers.cfm. Accessed 19/Aug/2005.
Madison Gas & Electric Company. Water Heaters. Feb/25 2005. Madison Gas andElectric Company. Madison Gas and Electric Company.
Cooling It: No Hair Shirt Solutions to Global Warming by Gar W. Lipow GarLpublic AT Comcast DOT net
Page 263 of 265
http://www.mge.com/images/PDF/Brochures/Residential/WaterHeaters.pdf. Accessed08/Aug/2005.
Watson, Robert T., and many IPCC authors and reviewers. Climate Change 2001:Synthesis Report: Summary for Policymakers - An Assessment of the IntergovernmentalPanel on Climate Change. 2001. Intergovernmental Panel on Climate Change.http://www.ipcc.ch/pub/un/syreng/spm.pdf. Accessed 4/Jun/2004.
Way, Richard. "Soap-Free Washers Explained: Soap-Free Washers Have Become aReality. Richard Way Looks at Their Potential." Electrical Retailing Weekly 20/Jun 2002.DMG World Media (UK) Ltd\.http://www.findarticles.com/p/articles/mi_m0KZC/is_2002_June_20/ai_88579178.Accessed 22/Jun/2004.
Weir, John. Global Warming. 8/Apr 2002. NASA Earth Observatory.http://earthobservatory.nasa.gov/Library/GlobalWarming/printall.php. Accessed10/Jun/2005.
Weizsacker, Ernst von, Amory B. Lovins, and L. Hunter Lovins. Factor Four - DoublingWealth, Halving Resource Use - The New Report to the Club of Rome. London:Earthscan, 1997.
Office of Industrial Technologies - Energy Efficiency and Renewable Energy • U.S.Department of Energy. Weldcomputer® Resistance Welder Adaptive Control:Sophisticated Welding Control System Saves Energy, Improves Quality, and is Affordablefor General Industrial Use. In Inventions and Innovation Success Story. I-OT-588. Jan2002. Fice of Industrial Technologies - Energy Efficiency and Renewable Energy • U.S.Department of Energy. http://www.eere.energy.gov/inventions/pdfs/weldcomp.pdf.Accessed 4/Sep/2005.
Rastra Found. What is RASTRA®. 16/Mar 2005. Rastra Found.http://rastra.net/rastracom/web-site/wi_ra.htm. Accessed 4/Sep/2005.
4. "Wheat-Straw Particleboard." Environmental Building News No. 6 Nov/Dec 1995:Product Review. BuildingGreen.Com.http://www.buildinggreen.com/auth/article.cfm?fileName=040608a.xml. Accessed23/Aug/2005.
"When Should Part-Life Engines Be Built?" In Engine Yearbook 2005. 2005. AviationIndustry Press Ltd. http://www.aviation-industry.com/atem/newpages/eyb2003pdfs/E2005_TES.pdf. Accessed 11/Jan/2005.
Wiehagen, Joe, and Craig Drumhelle. Strategies for Energy Efficient Remodeling | Seer2003 |Case Study Report. National Renewable Energy Laboratory: Boulder CO, 2004.30/Mar 2004.
Cooling It: No Hair Shirt Solutions to Global Warming by Gar W. Lipow GarLpublic AT Comcast DOT net
Page 264 of 265
http://www.toolbase.org/docs/MainNav/Remodeling/4564_SEERCaseStudyReport.pdf.Accessed 1/Oct/2005.
Williams, Eric. "Energy Intensity of Computer Manufacturing: Hybrid AssessmentCombining Process and Economic Input-Output Methods." Environmental Science &Technology 38, no. 22 15/Nov 2004. American Chemical Society. http://www.it-environment.org/publications/hybrid%20PC%20LCA%20abstract.pdf or fullversion(paid) http://pubs.acs.org/cgi-bin/article.cgi/esthag/2004/38/i22/pdf/es035152j.pdf. Accessed 18/Sep/2005.
Williams, Eric D., Robert U. Ayres, and Miriam Heller. "The 1.7 Kilogram Microchip:Energy and Material Use in the Production of Semiconductor Devices." In.Environmental Science & Technology 36, no. 24 15/Dec 2002IT and EnvironmentInitiative. American Chemical Society. http://www.it-environment.org/publications/1.7%20kg%20microchip.pdf.
Wilson, Alex. "Insulation Materials: Environmental Comparisons." EnvironmentalBuilding News 4, no. 1 Jan/Feb 1995. BuildingGreen.Com.http://www.buildinggreen.com/auth/article.cfm?fileName=040101a.xml. Accessed5/Sep/2005.
U.S. Department of Energy Office of Energy Efficiency and Renewable Energy. Windand Hydropower Technologies Program: Wind Energy Research. 30/Aug 2005. U.S.Department of Energy Office of Energy Efficiency and Renewable Energy.http://www.eere.energy.gov/windandhydro/wind_research.html. Accessed 1/Oct/2005.
New Mexico Energy, Minerals, and Natural Resources Departments - EnergyConservation and Management Division. Wind Energy. 1/Nov 2005. New MexicoEnergy, Minerals, and Natural Resources Departments - Energy Conservation andManagement Division. http://www.emnrd.state.nm.us/emnrd/ecmd/Wind/wind.htm.Accessed 1/Oct/2005.
Region Ostfriesland e.V. Wind Energy in East Frisia. June 2004.http://www.modellregion-ostfriesland.de/contenido/cms/upload/Exel/Wind_Energy_in_East_Frisia_Folder.pdf.Accessed 7/Mar/2005.
Renewable Resource Data Center. Wind Energy Resource Atlas of the United States -Map 2-14 Summer Wind Resource Estimates in the Contiguous United States. Feb 2002.U.S. Department of Energy Office of Energy Efficiency and Renewable Energy.Http://rredc.nrel.gov/wind/pubs/atlas/maps/chap2/2-14m.html. Accessed 27/Sep/2005.
Wolff, Edward N. Working Paper No. 407: Changes in Household Wealth in the 1980sand 1990s in the U.S. May/Jun 2004. The Levy Economics Institute of Bard College.http://www.levy.org/modules/pubslib/files/wp407.pdf. Accessed 4/Jun/2005.

Cooling It: No Hair Shirt Solutions to Global Warming by Gar W. Lipow GarLpublic AT Comcast DOT net
Page 265 of 265
U.S. Census Bureau. "World Population: Total Midyear Population." In IntenationalData Base. 30/April 2004. U.S. Census Bureau.http://www.census.gov/ipc/www/worldpop.html. Accessed 25/May/2004.
Wright, Sara. Glomalin: A Manageable Soil Glue. 2004. USDA Sustainable AgriculturalSystems Laboratory. http://www.ba.ars.usda.gov/sasl/research/glomalin/brochure.pdf.Accessed 26/May/2004.
Yamaguchi, Mitsutsune. Implementing the Kyoto Protocol Target and Its Impacts onTrade: Japanese Automobile Fuel Efficiency Standards. 2003. Keio University. GlobalEnvironment & Trade Study. http://www.gets.org/pages/harmony/Yamaguchi.doc.Accessed 30/Sep/2005.
Zweibel, Ken, James Mason, and Vasilis Fthenakis. "A Solar Grand Plan." ScientificAmerican Jan 2008. By 2050 Solar Power Could End U.S. Dependence on Foreign Oiland Slash Greenhouse Gas Emissions. http://www.sciam.com/article.cfm?id=a-solar-grand-plan. Accessed 18/Jan/2008.
Copyright © 2022 FDOKUMEN