Revisiting the conversion of muscle into meat and the underlying mechanisms
Upload
khangminh22Category
view
4download
0
Department of Planning, School of Architecture and Planning, Anna University
CCP To Business Plan / TNUIFSL / September 2006 68
Conversion of CCP into
BUSINESS PLAN FOR VILLUPURAM
Draft final Report
SUBMITTED TO:
TNUIFSL
BY
Department of Planning School of Architecture and Planning
Anna University Chennai 600 025

Department of Planning, School of Architecture and Planning, Anna University
CCP To Business Plan / TNUIFSL / September 2006 69
Chapter TITLE Page No.
1. INTRODUCTION
1.1. Context Of Conversion Of CCP Into Business Plan 1
1.2. Objectives 2
1.3. Preparation Of Business Plan 2
1.4. Methodology 2
2.0 TOWN PROFILE
2.1. Location 8
2.2. Physical Features 8
2.3. Climate And Rainfall 9
2.4. The Town in History 9
2.5. Local Planning Area 9
2.6. Demographic Profile 10
2.7. Economic Base of Villupuram 13
2.8. Economic Growth 13
2.9. Occupational Pattern 13
2.10. Issues –Economic Development 14
2.11. Strategic Plan-Economic Development 15
2.12. Land use Dynamics 15
2.13. Developmental Trends of Villupuram Town 23
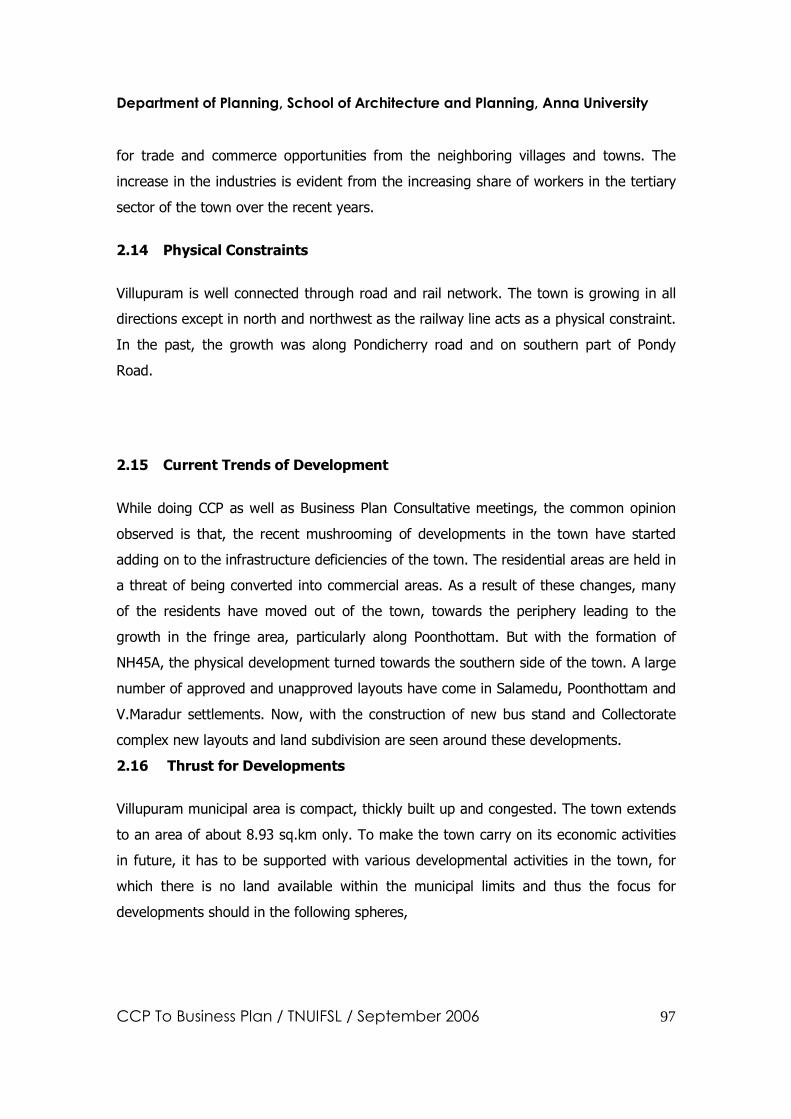
2.14. Physical Constraints 23
2.15. Current Trends of Development 23
2.16. Thrust for Developments 24
2.17. Strategy Adopted for Population Projection 24
3.0 BASIC SERVICES AND SOCIAL FACILITIES
3.1. Water Supply 29
3.2. Sewerage And Drainage 38
3.3. Solid Waste Management 47
3.4. Roads & Streets 50
3.5. Street Lighting 53
3.6. Educational Institutions 55
3.7. Medicare 56
4.0. FUTURE VISION OF VILLUPURAM AS IDENTIFIED BY CCP
4.1. Future Vision 59
4.2 Mission Statement 62
5.0 ASSET MANAGEMENT PLAN
5.1. Inventory Of Assets 63
5.2. Street Lights 64
5.3. Roads & Streets 64
5.4. Water Supply system 64
5.5. Others 65

Department of Planning, School of Architecture and Planning, Anna University
CCP To Business Plan / TNUIFSL / September 2006 70
6.0 BUSINESS PLAN – PROJECT PROFILE
6.1 Construction Of Commercial Complex @ Old Bus Stand 68
6.2 Expansion of Vegetable market 73
6.3 Underground Sewerage System 78
6.4 Solid Waste Management 86
6.5 Office cum Shopping Complex at the first floor of Kalayanamandapam
91
6.6 Energy Saving Measures – Street Lights 96
6.7 Improvement of Shops at Kamarajar Salai 102
6.8 Status of Business Plan Projects 107
7.0 VILLUPURAM MUNICIPAL FINANCE
7.1 Revenue receipts 110
7.2 Revenue Expenditure 113
7.3 Share of Income & Expenditure – Villupuram Municipality 114
7.4 Trend of Income & Expenditure – Villupuram Municipality 116
7.5 Demand Collection Balance Scenario 117
7.6 Assessment of Performance of Municipal Finance 122
7.7 Financial Operational Plan (FOP) 122
Annexure – I - Ward wise Population Density: Villupuram Municipality - 2001
Annexure – II - Ward wise House Service Coverage: Villupuram Municipality
Annexure – III - Streetwise Road Details: Villupuram Municipality - 2006
Annexure – IV - Villupuram Municipality - Buildings – 2006
Annexure –V – Villupuram Municipality - Lands – 2006
Annexure –VI – Villupuram Municipality - CULVERTS / BRIDGES - 2006
Annexure –VII – Furniture, Fixture and Office Equipments – 2006
Annexure –VI - Property Tax Assements Ward wise: Villupuram Municipality – 2006

Department of Planning, School of Architecture and Planning, Anna University
CCP To Business Plan / TNUIFSL / September 2006 71
List of Figures
Sl.
No.
Fig No.
Title Facing Page No.
1. 2.1 Location Map – Villupuram
9
2. 2.2 Villupuram Town Map 9
3 2.3 Villupuram – Ward Boundaries 9
4. 2.4 Villupuram – Population Density: 2001 census 12
5. 2.5 Trend of Development 24
6. 3.1 Water Supply System - Villupuram 32
7. 3.2 Water Supply System - Villupuram 32
8. 3.3 Drainage System - Villupuram 42
9. 3.4 Road Network - Villupuram 51

Department of Planning, School of Architecture and Planning, Anna University
CCP To Business Plan / TNUIFSL / September 2006 72
List of Tables
Sl.
No.
Table No.
Title Page No.
1. 2.1 Growth of Population – Villupuram Town 1901-2001 10
2. 2.2 Decennial Sex Ratio – Villupuram town: 1901-2001 12
3 2.3 Literacy - Villupuram Town 1991-2001 12
4. 2.4 Participation Rate and Occupational Structure: Villupuram Town 1971 – 2001 13
5. 2.5 Distribution of Industries by Type and % of Employment - Villupuram 14
6. 2.6 Existing Land Use Villupuram 1995 18
7. 2.7 Proposed land Use break Up -2011 19
8. 5.1 Roads – Types and Length 64
9. 5.2 Water Supply Appurtenances and their Numbers 64
10. 5.3 Building Of Schools, Hospitals and Parks 65
11. 6.1 Distribution of Development Components 69
12. 6.2 Repayment Schedule – Cash Inflow 70
13. 6.3 Cash Outflow 72
14. 6.4 Cash flow statement 72
15. 6.5 Distribution of Development Components 75
16. 6.6 Repayment Schedule – Cash Inflow 75
17. 6.7 Cash Outflow 77
18. 6.8 Cash flow statement 77
19. 6.9 Distribution of Development Components 80
20. 6.10 Development Components in phasing 81
21. 6.11 Repayment Schedule – Cash Inflow 83
22. 6.12 Cash Outflow 85
23. 6.13 Cash flow statement 85
24. 6.14 Distribution of Development Components 87
25. 6.15 Repayment Schedule – Cash Inflow 88

Department of Planning, School of Architecture and Planning, Anna University
CCP To Business Plan / TNUIFSL / September 2006 73
26. 6.16 Cash Outflow 90
27. 6.17 Cash flow statement 90
28. 6.18 Distribution of Development Components 92
29. 6.19 Repayment Schedule – Cash Inflow 93
30. 6.20 Cash Outflow 95
31. 6.21 Cash flow statement 95
32. 6.22 Distribution of Development Components 97
33. 6.23 Repayment Schedule – Cash Inflow 98
34. 6.24 DEBT / SAVINGS STATEMENT 99
35. 6.25 Benefits of Privatization 101
36. 6.26 Cash Outflow (implemented by the local body) 101
37. 6.27 Distribution of Development Components 103
38. 6.28 Repayment Schedule – Cash Inflow 104
39. 6.29 Cash Outflow 106
40. 6.30. Cash flow statement 106
41. 6.31. Loan Details of Business Plan Projects 107
42. 6.32. Cash Flow Statement for the Business Plan Projects 108
43. 7.1 Revenue Receipts: 2000-01 to 2005-06, Villupuram 111
44. 7.2 Revenue Receipts as percentage of Total Revenue Receipts 111
45. 7.3 Break – up of Revenue Expenditure: 1999-00 to 2003-04 113
46. 7.4 Revenue Expenditure as percentage of Total Revenue Expenses 114
47. 7.5 Loan Outstanding – Villupuram Town 114
48. 7.6 Income and Expenditure - Major heads Growth Trend 2000-01 to 2005-06 116
49. 7.7 DCB for Property Tax of Villupuram 2000-01 to 2004-05 118
50. 7.8 DCB for Professional Tax of Villupuram 2000-01 to 2004-05 120
51. 7.9 DCB of Water Charges of Villupuram 2000-01 to 2004-05 121
52. 7.10 Performance of Villupuram Municipal Finance, 2000-01 to 2004-05 122
53. 7.11 Assumptions for the Financial Projections - Property Tax 124
54. 7.12 Assumptions for the Financial Projections - Professional Tax 124
55. 7.13 Assumptions for the Financial Projections - Water Charges 125
56. 7.14 Assumptions for the Financial Projections - Other Revenue Receipts 126
57. 7.15 Assumptions for the Financial Projections – Other Revenue Expenses 127
58. 7.16 Financial Operational Plan (FOP) – Short Term Period (2006-07 to 2010-11) 129
59. 7.17 Financial Operational Plan (FOP) – Long Term Period (2006-07 to 2025-26) 130
60. 7.18 Financial Operational Plan (FOP) – Short Term Period (2006-07 to 2010-11) - (Excluding Business Plan Projects)
132
61. 7.19 Financial Operational Plan (FOP) – Long Term Period (2006-07 to 2025-26) - (Excluding Business Plan Projects)
133

Department of Planning, School of Architecture and Planning, Anna University
CCP To Business Plan / TNUIFSL / September 2006 74
PREFACE
Preparation of Business Plan was the second important step taken by
the Tamilnadu Urban Development Fund (TNUDF) under Tamilnadu Urban Development Progarmme (TNUDP – III) being sponsored by World Bank. In the earlier attempt under capacity building of urban local bodies TNUDF had sponsored to prepare CCP for number of towns. The C.C.P. has identified series of projects focusing on economic development, environmental protection, infrastructure improvement and preservation of historical monuments and heritage elements, besides formulating strategies and tasks for mobilization of resources and augmentation of municipal finance. Though the local body could implement various projects proposed in the C.C.P, the local bodies needed the guidance in implementing some of the innovative
projects especially private partnership. Therefore, it is considered pertinent to formulate a strategic plan for effective conversion of C.C.P into a Business Plan (BP).
The BP is a non-conventional and practical plan with economic viability
and sustainability. Methodically and systematically, it generates funding through “Business like” means and with the application of innovative techniques and management skills including Private Partnership and improvement of services effectively. Good Business Plans are practical in the sense that it sets concrete goals, responsibilities and deadlines. While the project is on implementation, the BP provides a platform for regular review and course of corrections. We are thankful to the Managing Director, Tamilnadu Urban Development Fund (TNUDF) for awarding this job to us. We believe this project is a practical planning exercise to us.
We are extremely thankful to the Chairperson of the Villupuram Town Council, They promptly called the consultative meetings of the Council, stakeholders, and in providing all information and discussing the issues, prospects of town’s improvement and growth. We are sure that implementation of projects of Business Plan would bring in vibration in the towns activities. Dr.V.M.Marudhachalam Project in-charge Villupuram
Dr.S.P.Sekar Project Coordinator Business Plan
Dr. V.M. Marudhachalam HOD, Department of Planning SAP, Anna University

Department of Planning, School of Architecture and Planning, Anna University
CCP To Business Plan / TNUIFSL / September 2006 75
1
INTRODUCTION
1.1 CONTEXT OF CONVERSION OF CCP INTO BUSINESS PLAN
City Corporate Plan (CCP) was prepared for Villupuram in 2004 under the Tamil Nadu
Urban Development Programme II (TNUDP-II). The unique feature of the C.C.P is that it
is a plan prepared with united efforts and involvement of stake holders- elected
representatives, public, private agencies, Non-Governmental Organizations (NGO’s) and
Community Based Organizations (CBO’s). Therefore, C.C.P. focuses on felt needs and
priorities of the city, in terms of quality of environment and municipal services. The
C.C.P has identified series of projects focusing on economic development, environmental
protection, infrastructure improvement and preservation of historical monuments and
heritage elements, besides formulating strategies and tasks for mobilization of resources
and augmentation of municipal finance. However, the local body could not implement
various projects proposed in the C.C.P due to financial constraints, lack of implementing
mechanisms, institutional capacity and lack of private investments and resources.
Therefore, it is considered pertinent to formulate a strategic plan for effective
conversion of C.C.P into a Business Plan (BP).
The BP is a non-conventional and practical plan with economic viability and
sustainability. Since the stack holders involved in identifying the developmental needs it
creates an ownership and acceptance in terms of the BP identified projects and means
of finance. Methodically and systematically, it generates funding through “Business like”
means and with the application of innovative techniques and management skills
including Private Partnership and improvement of services effectively. Good Business
Plans are practical in the sense that it sets concrete goals, responsibilities and deadlines.
BP assigns tasks to each involved in the project life cycle or departments and links to
milestones. BP also guides to breakdown one strategy to many implementable parts.
While the project is on implementation, the BP provides a platform for regular review
and course of corrections

Department of Planning, School of Architecture and Planning, Anna University
CCP To Business Plan / TNUIFSL / September 2006 76
1.2 OBJECTIVES In the above context, the following are the primary objectives of the Business Plan (BP):
1.2.1. To crystallize and prioritize bankable projects from out of the projects
identified in the CCP and newly thought Programme,
1.2.2. To confirm the so identified projects through consultative process; 1.2.3. To workout and test performance indicators to assess the services
and financial efficiency of the local body;
1.2.4. To formulate Financial Operation Plan (FOP) and design a mechanism of project implementation including identifying potential investors.
1.3 PREPARATION OF BUSINESS PLAN Business Plan is (a) to augment the financial resources and minimization of expenditure of the local body and (b) to develop Asset Management Plan (AMP) for improving the quality of basic services. These are the two prime components of the Business Plan. The approach towards BP is essentially the state of art of consultative and stakeholders involvement in preparing and implementation of the plan respectively. The method of realizing the objectives of the plan will be essentially collective and coordinated efforts of planners, local body administrators and participation of stakeholders. It is also to turn the local bodies efforts for the provision of services and facilities from conventional provider role to innovative private investments as under business like environment. This, in turn improves the municipal finance besides improve the service delivery. 1.4 METHODLOGY 1.4.1 FINANCIAL STATUS REPORT:
First step in the process of optimization of the financial system of the local body is to prepare a status report on the financial position of the local body, on one side and on improving the quality of basic services on the other. The status report dwells on sources of income and the pattern of expenditure. The main sources of finance of local bodies could be categorized as internal and external. Internal reserve, include ‘local taxes’, ‘user charges’, ‘fees’ and rent or lease amount collected from properties owned by the local body.
Following are some of the taxes collected by local bodies.
(i) Property tax
(ii) Registration fee

Department of Planning, School of Architecture and Planning, Anna University
CCP To Business Plan / TNUIFSL / September 2006 77
(iii) Fair tax
(iv) yearly tax
(v) Market tax
(vi) Profession tax
(vii) Advertisement tax
(viii) Entertainment tax
The user charges are directly connected with the services rendered by the local body.
This would include lighting tax, water tax and library cess. Fee and duties are stamp
duty and land and property registration fee. Part of this amount is made available to the
local body from out of the enhanced value of properties. Proceeds from tenants and
lessees of municipal properties constitute another source of income. Loans and grants
are important components of external source of revenue. Grant–in–aid may be of three
types.
a) An ordinary grant meant to defray administration costs;
b) Grant in lieu of octroi;
c) Special grant-in-aid for assistance in development or maintenance.
A lion’s share of the income is spent on salary to staff and pension to retired employees.
Local bodies have hardly any resource for capital investment or for rehabilitation of
existing assets. Maintenance of decaying services becomes responsibilities of municipal
councils, whereas, the entire capital input into cities fall to the share of development
authorities.
1.4.2 FINANCIAL ASSESSMENT OF THE LOCAL BODY
The purpose of this BP is to identify issues and problems in the process of augmentation
of the municipal resources.
Basis of levy of taxes: To examine the principles, in which a particular type of tax is
levied. For example, the property tax is levied based on certain principles such as
location, land and building use, housing typology, and owner/tenant occupation. This
concept will be examined with reference to all taxes and additional parameters, if any,
for any of the tax base will be proposed

Department of Planning, School of Architecture and Planning, Anna University
CCP To Business Plan / TNUIFSL / September 2006 78
(a) Rationality of revision of taxes:
Tax structure/ rate has to be periodically revised based on certain logical
reasoning. To quote an example, property tax structure has to
commensurate with the increase in rental and property value.
(b) Payment of grants and its predictability:
Grant–in-aids are mostly paid based on certain formulae as proposed by
the State Finance Commission and other concerned agencies. Therefore,
it may be possible to predict future grants and plan accordingly.
(c) Identification of issues in revenue realization:
This is to consider whether
- the methods of tax assessment is simple and the collection mode
is hassle-free;
- Transfer of grants / defrayed amounts are automatic and routine;
- Institutional mechanism for assessment and collection is
transparent and accountable.
(d) Cost- benefits analysis of projects/ assets
This method is adopted to evaluate economic and social inability of
projects. In this method, the ratio of net annual benefits to the net
annual cost is determined. The capital cost which is one time cost, is
converted into an annual cost by using the Capital Recovery Factor (CRF).
1.4.3 FINANCIAL PLAN
A Financial plan for the local body is formulated based on the outcome of the status
report and Financial Assessment.
• Optimization of Existing Resource Base: Existing resource base may be
optimized by activating the system, by plugging loopholes, by achieving perfection in
recovery, and periodical revision of tax-structures.
• Identification of benchmark cost: Benchmarking is a process of comparing and
measuring costs of various services within the local body against with that best in
class. The benchmark cost is taken for optimization.

Department of Planning, School of Architecture and Planning, Anna University
CCP To Business Plan / TNUIFSL / September 2006 79
• Institutional Mechanism for Financial Management: The existing institutional
mechanism for the financial management may have to be revamped by honing of
skills through training, motivation and by the system of incentives and disincentives.
Building Management Information System (BMIS) will help to rein accountability and
transparency.
• Resource Generation: Additional resource may be generated through non-
conventional and innovative methods such as:
i. Recycling of municipal land
ii. Land use conversion and intensification of development of
municipal property.
iii. Public- Private Partnership (PPP) for service Provision, BOT
(Build, Operate and Transfer), DBFO (Design, Build, Finance
and Operate)
iv. Higher tariff for excess consumption
v. Leasing of Air space
vi. Optimization of energy resources
1.4.3. IMPROVE THE QUALITY OF BASIC SERVICES
The quality of basic services provided by the local body is improved through the
assessment of the level of the basic services and formulation of Asset Management Plan
(AMP).
Assessment of Level of Basic Services (LBS): The level of basic services provided by the
local body is assessed by development of performance indicators. Performance
indicators provide the ‘Gauge’ to measure the level accomplishment of quality services.
The following may be various elements of performance indicators.
Coverage – including that in Economically weaker Section Area (EWSA).
Economic viability of the service vis- a- vis tariff/user charges, subsides,
Benefits Cost Ratio(BCR).
Affordability, with particular reference to Economically Weaker Sections /Slum
dwellers.

Department of Planning, School of Architecture and Planning, Anna University
CCP To Business Plan / TNUIFSL / September 2006 80
Participatory process: whether services system enables and encourages the
participation by stakeholders-end users, representation from Non-Governmental
Organizations (NGOs), Community Based Organization (CBOs), and private
investors in decision making.
Technical application in the planning, design, development and delivery
– recycling, reuse, .Application of modern techniques such as GIS and Remote
Sensing.
Environmental Impact of the Services: water- surface and ground water
Land, Air quality, Noise level, Vibrations, Dust, Soil erosion, Cutting and filling of
soil Cutting of trees.
o Institutional constraint
o Dearth of technical know-how
o Lack of accountability and transparency
o Excessive overhead charges. 1.4.4.1 COMPREHENSIVE ASSET MANAGEMENT PLAN The principal objective of Comprehensive Asset Management Plan is to prioritize projects
for capital investment and for investment for re-habilitation. Various services provided
by the local body are examined against a set of performance indicators. Depending upon
the level of different services offered by the municipal council, proposals will be
formulated to improve the quality of services.
1.4.5 FORMULATION OF BUSINESS PLAN
Financial Plan and Asset Management plan are dovetailed to have the Business Plan. The BP will be a sustainable one from economic, social, technical and institutional points of view and emulate improve the service delivery.

Department of Planning, School of Architecture and Planning, Anna University
CCP To Business Plan / TNUIFSL / September 2006 81
2
TOWN PROFILE
2.1 Location and Importance
Villupuram town having a population of 95,459 as per 2001 census is a selection Grade
Municipality and also headquarters of Villupuram District. It is the largest urban centre in
the district and is about 160 km south of Chennai at 11°57’ north latitude 79°3’ east
longitude. Villupuram is located on one of the major transportation corridors of the state
i.e. between Chennai and Madurai. The railway line, Chennai – Trichy, converted from
meter gauge to board gauge, and the road NH 45 and 45A pass through this town.
Villupuram is a railway junction and transportation nodal centre with meter gauge lines
to Pondicherry, Cuddalore and Katapadi as also the road N.H 45 A to Pondicherry
starting from here (Fig 2.1). Important urban centres around Villupuram in about
200 km radius are Cuddalore, Trichy, Salem, Vellore, Kancheepuram and Pondicherry. It
is gate way to the southern part of TamilNadu, and a Commercial centre dealing with
agricultural and food products largely meant for its hinterland.
2.2 Physical Features
The total geographical are of Municipality extends over 8.93 sq.km. The terrain of the
town though a flat one, with a falling gentle slope towards the east is having physical
constraints for development due to falling gentle slope towards the east is having
physical constraints for development due to a number of railway lines traversing the
town. The Municipality constitutes a single local planning of area. The Municipality has
plans to extend its present administrative boundary. The residential area is spread
almost throughout the municipal area except in the railway colony with sparse
development as it comes under central government’s possession. However, the major
commercial uses are mainly concentrated at the centre of the town, i.e. at the
intersection of Pondicherry Road and Gandhi Nagar Road. The weekly market, regulated
market and the whole sale markets are also located in this area.

Department of Planning, School of Architecture and Planning, Anna University
CCP To Business Plan / TNUIFSL / September 2006 82
2.3 Climate and Rainfall
The town experiences moderate temperature conditions except during severe summer
period. The normal maximum temperature is 39.9°C, and minimum 20.5°C. Though the
town gets rainfall from both the monsoons, north east monsoon contributes more than
the south –west monsoon.
2.4 The Town in History
Though the town has not played any important role historically, there are inscriptions of
the lord Krishna Devaraya period in the Shiva Temple located in Ward 6 of the town.
This temple formed the Citadel of a small fort during wars of eighteenth century. The
Fort was taken over by the British in 1952 from the French. Villupuram town which was
formed as Third Grade Municipality on 1.10.1919, was upgraded to Second Grade
Municipality on 1.10.1952, then to First Grade Municipality on 1.4.1973. It is now
functioning as a Selection Grade Municipality since 02.03.88.
2.5 Local Planning Area
The town LPA covers an area of 8.93 sq km. The Municipal limit of the Villupuram town
was declared as Local Planning Area by the Government under section 10 (4) of
TamilNadu Town and Country Planning Act 1971, in G.O. Ms. No 641/R.D. & L.A.
Department, dated 16th March 1974 , and this includes Villupuram (part), Poonthottam
(part), Marudur (part), Panampattu (part), Maharajapuram (part) and Keelperumbakkam
revenue village of Villupuram taluk. A local planning authority was constituted by
Government of Tamil Nadu under section 11(1) TamilNadu Town and Country Planning
Act 1971 in G.O. Ms .No 651 /R.D & L.A Department, dated 8th April 1979.

Department of Planning, School of Architecture and Planning, Anna University
CCP To Business Plan / TNUIFSL / September 2006 83
Decadal Growth Rate
0
10
20
30
40
50
60
1911 1921 1931 1941 1951 1961 1971 1981 1991
Year
Gro
wth
Rat
e (%
)
Decadal Growth Rate
2.6 Demographic Profile
2.6.1 Population Growth
The population of the town was just 11263 in
1901, which was gone up to 95459 in 2001,
showing more than eight fold increases during
the last 10 decades. The average growth rate
per decades during the above period was
24.83%. A maximum decadal growth of 51.1%
was registered during 1941-51 due to addition
of adjacent areas and a minimum growth rate
7.5% during 1991 -01 due mainly to exodus of
population to work centers including Chennai.
(Table 2.1).
Table 2.1: Growth of Population –
Villupuram town: 1901-2001
Year Population Growth Rate
Density / Km
1901 11263 -- --
1911 16157 43.5 --
1921 17423 7.8 --
1931 20127 16.3 --
1941 23829 18.5 --
1951 35684 51.1 --
1961 43496 21.9 5190
1971 60242 38.5 7189
1981 77091 28.0 9199
1991 88788 15.2 10595
2001 95459 7.5 10690
Source: Census of India 2001
Trend of Population Growth: 1901 - 2001
0
20000
40000
60000
80000
100000
120000
1901
1911
1921
1931
1941
1951
1961
1971
1981
1991
2001
Pop
ulat
ion
Population

Department of Planning, School of Architecture and Planning, Anna University
CCP To Business Plan / TNUIFSL / September 2006 84
2.6.2 Population Density
a) Town Level
Population density of the town as a whole shows a tremendous increase of almost three
times during 1961-2001. But during 1961-01, i.e. four decades, it doubled from 5190
persons per sq km area (1961) to 10690 persons per sq km area (2001) (Table 2.1 ). A
look at the table reveals that during every decade since 1961 excepting 1991-01 an
additional 2000 persons were added to every sq.km area of the town, and it was
stagnating during 1991-2001. A study of the physical spread of the town with additional
developments on a large scale in unapproved on a large scale in unapproved layouts
during the last 3 or 4 decades shows an accelerated phase to town development since
recently.
b) Ward Level
The town is divided in to 36 electoral wards varying in area from 4.8 ha (w: 28) to 82
(w: 18) and accommodating population from 1443 (w: 13) to 4665(w: 29) according to
1991 census. The density of population varies from 28 to 444 persons / sq.km, sparsely
populated ward being 25 and the crowded ward being 28. (Annexure- I). The following
figure reveals the population density ward wise in relation to the average population
density of the town.

Department of Planning, School of Architecture and Planning, Anna University
CCP To Business Plan / TNUIFSL / September 2006 85
2.6.3 Sex Ratio
The trend of sex ratio over the last seven decades (since 1941) Table (2.2) shows a
stable situation in the first three decades, and slight downward shift up to 1981. But
during 1981-91, the sex ratio plumbed down to remarkable low of 818 which could be
ascribed to a large scale male influx into the town due to accentuated development and
construction activities.
Table 2.2: Decenial Sex Ratio – Villupuram town: 1901-2001
S.No Year Population Males Females Sex ratio Tamil Nadu
1 1941 23829 12193 11636 954 1012
2 1951 35684 18256 17428 954 1007
3 1961 43496 22258 21238 954 992
4 1971 60242 31422 28820 917 978
5 1981 77091 39828 37263 935 977
6 1991 88788 43287 35425 818 974
7 2001 95455 48094 47361 984
Source: Census of India 2001 Compared to TamilNadu as whole, the sex ratio of Villupuram remained relatively lower
till 1991 and the decade 1991-01 indicates more male mobility in Villupuram town and
thus showing higher sex ratio i.e., 984 females per 1000 males.
2.6.4 Literacy
0
50
100
150
200
250
300
350
400
450
Den
sity
(P
PH
)
1 2 3 4 5 6 7 8 9 10 11 12 13 14 15 16 17 18 19 20 21 22 23 24 25 26 27 28 29 30 31 32 33 34 35 36
Wards

Department of Planning, School of Architecture and Planning, Anna University
CCP To Business Plan / TNUIFSL / September 2006 86
In the 1981 and 91 census years the literacy rate in the town was 65% of which was
nearly 40% constituted the male literacy and the rest, females. The town’s literacy
performance during 2001 is improved i.e., 77.32% literates to the total population.
Accordingly, the male female literacy is 53.74% and 46.26% of the total literates. By the
total males, 82% are literates while it is 72.10% for females as per 2001 census.
(Table 2.3)
Table 2.3 Literacy - Villupuram Town 1991-2001
Year Total Population Total literate
(%)
Male literate to Total
Literates (%)
Female Literate to Total
Literates (%)
1971 60242 59.42 36.39 23.03
1981 77091 65.09 38.15 26.94
1991 88788 64.51 39.9 24.61
2001 95459 77.32 53.74 46.26
Source: Census of India 2001 2.7 Economic Base of Villupuram
Villupuram is one of the major urban centers in Chennai – Trichy transport corridor.
Villupuram functions as a market center and it has large catchment area. From the
census data (2001), the town by its work force distribution among the various economic
activities, emerges as a dominant Trade and commerce centre in the region. Villupuram
was acting as one of the railway work shop centers earlier, but now, that the activity has
ceased and after electrification of the railway line, trade activities in the town have said
to have increased.
2.8 Economic Growth
The growth and decay of the settlement to large extent depends on its economic base
and its buoyancy. The data on growth of participation rate as per Table 2.4 in
Villupuram shows a Stagnation trend. Between 1961-71, the growth of main work force
was in the order of 2.75 percent per annum, which came down to 2.63 percent in the

Department of Planning, School of Architecture and Planning, Anna University
CCP To Business Plan / TNUIFSL / September 2006 87
year 1971-81 and it marginally improved to 2.72 percent per annum during the decade
1981-91. It further marginally improved to about 2.97 percent during 1991 – 01.
However, it may be noted that the growth of employment is almost in stagnation with
very marginal variation during the last 4 decades and this trend is in tune with the
growth rate of population in the town.
2.9 Occupational Pattern
As per the Table 2.4 the Primary sector is declining, Secondary sector plays a very low
role in town’s economic development compared to the standards and Service sector
comprising of trade and commerce, transportation and other services play a vital role in
the town’s economy.
Table 2.4: Participation Rate and Occupational Structure: Villupuram Town 1971 – 2001
% age to the Total Workers Year
% age of Workers to the Total Population Primary Secondary Tertiary
1971 27.59 12.38 7.02 80.60
1981 26.38 7.66 1.79 90.55
1991 27.20 8.10 20.14 71.76
2001 31.65 (29.76) 2.93 3.42 93.65
Source: Census of India 1971 - 2001 2001 census figures inclusive of marginal workers, Figures in the bracket indicates % without marginal workers The participation ratio in general is less than the normal of 30%to 33%(32.61%in TN
urban in 1991)and as it is as of 1991 , the proportion of marginal workers or the
disguised unemployment in the town is about four times more than that of the
TamilNadu urban sector, and the proportion of non –workers is also more in the town by
5.5% compared to that of the state’s urban .This only indicates that the dependent
population in the town is around 11%more than the normal according to 91 census.
2.9.1 Industrial sector
In Villupuram town and its vicinity, there are only three industries worth naming of
which two are outside the municipal limits and one is within Villupuram town limits. They
are Madras Vanaspati Factory in the town, South India Sugars and Southern Agriculture
Industries Ltd. Out side the town .All the three units together provide employment for

Department of Planning, School of Architecture and Planning, Anna University
CCP To Business Plan / TNUIFSL / September 2006 88
about 500 persons. In addition to the three units, small-scale industries provide
employment for about 1900 persons. Thus the industrial activity in Villupuram is not
very significant and as such requires strengthening.
Table 2.5: Distribution of Industries by Type and % of Employment - Villupuram
S. No Industries By Category % of Employment to
total industrial workers
1 Beverages 2.1
2 Printing & Publishing 2.0
3 Electrical Machinery 2.2
4 Clay & Ceramics 3.0
5 Metal Products 4.0
6 Wood Products 8.0
7 Transport & Equipment 14.3
8 Food Products 63.0
9 Miscellaneous 1.4
Total 100
2.10 Issues –Economic Development
i) Secondary sector’s role in the town’s economy is far low and continuation of this
trend may deteriorate the economy of the town.
ii) Industries in the town are connected to the rural feeder lines of the electricity
board, which is subjected to frequent load shedding, and hence it badly affects
industrial production and growth.
iii) Town’s proximity to Pondicherry State, which offers concessions and thus
entrepreneurs move to Pondicherry. An industrial estate is also located in
Pondicherry.

Department of Planning, School of Architecture and Planning, Anna University
CCP To Business Plan / TNUIFSL / September 2006 89
iv) Advantage of being close to Chennai , and being located on National Highways
and important Railway lines is not fully tapped
2.11 Strategic Plan-Economic Development
In view of the existing relative location and economic situation, the strategic plan for
Villupuram, in collaboration and consultation with State Industries Department, Town
and Country Planning Department, District Industries Centre, TamilNadu Electricity
Board and individuals along with the entrepreneurial skills ; who are the main stake
holders in the industrial development of Villupuram town, postulates the following
strategies aiming at achieving the vision of Villupuram as a “ Commercially strong
with industrial bias” urban centre over 2 decades:
i) Villupuram town is acting as the regional centre with a large rural hinter land,
with demand for commercial activities. Thus, the municipality is in the thinking
process of developing commercial space to meet the demand.
ii) There are agricultural markets for cotton and ground nuts. Villupuram
municipality is in touch with marketing committee to provide the necessary
infrastructure like parking yards.
iii) Villupuram municipality is willing to cooperate with EB ,DIC and state industries
department in promoting industrial activity in the town
iv) Directorate of Town and Country Planning in the light of newly formed districts
may review process of identification of least urbanized taluks. If done, it is most
probable that Villupuram will be identified as one of the backward taluks. Once
done, a special development plan for the taluk could be evolved after studying
the potentials in the taluk and the role of Villupuram as the district and taluk
head quarters.
2.12 Land use Dynamics
2.12.1 Existing land Use
Villupuram Planning Area extends over 8.93 sq.km. The town is divided in four segments
by north south Madras-Trichy Railway line, east – west Villupuram –Pondicherry
Highway. The Trichy Madras National Highway No.45 runs through the western part of

Department of Planning, School of Architecture and Planning, Anna University
CCP To Business Plan / TNUIFSL / September 2006 90
the own .The trend of development to large extent closely follows the alignment of this
transport corridor .The areas lying adjacent to the transportation arterials have come up
fast .The land area earmarked for development within the planning area measures about
441.40 ha or 73.84% of the total extent of the town as per Master plan revised and
approved (2004).
2.12.1.1 Growth Directions
The town is growing in all directions except in north and northwest as the railway line
acts as a physical constraint. In the past, the growth was along Pondicherry road and on
southern part of Pondy Road. But with the formation of NH45A, the physical
development turned towards the southern side of the town .A large number of approved
and unapproved layouts have come in Salamedu, Poonthottam and V.Maradur
settlements. Now, with the construction of new bus stand and Collectorate complex new
layouts and land subdivision are seen around these developments.
2.12.1.2 Existing Land Use: 1995
a) Residential Use
Residential area occupies 223.27 ha of land covering 50.58% of the total developed
area. The residential developments are concentrated in V.Maradur Poonthottam,
Kilperumbakkam and Kamala Nagar surroundings. Among these residential areas,
Poonthottam registers comparatively more intensive development.
b) Commercial Use
Commercial use is mainly concentrated in the heart of the town, and at ten junctions of
Pondicherry road and Mahatma Gandhi Road. The weekly market regulated markets and
whole sale trades are all located in this area. Villupuram town is an important
commercial centre dealing mainly with agriculture commodities and food products.
Commercial activity occupies 21.02 ha accounting for 4.76% of the developed area. The
retail business activities are evenly distributed in the new developed area. Commercial
activities are fast developing along Kanniyakulam road.
c) Industrial Use

Department of Planning, School of Architecture and Planning, Anna University
CCP To Business Plan / TNUIFSL / September 2006 91
There is only one large scale industry within the Villupuram planning area -viz. The
Madras Vanspathi Product Industry covering an area of 10 ha. And two other industries
are outside LPA. The automobile industrial units comprising mainly workshop and service
centers are located along Trichy -Madras National Highways. A concentration of rice and
oil mills is found along the Pondicherry road on the eastern side of the town. The area
under the industrial use occupies in all nearly 30 ha covering 6.67% of the developed
area.
d) Public and Semi Public Use
Government offices, civic buildings, religious, educational and medical institution which
are elements of public and semi public uses public uses occupy 14.11 ha i.e. 3.2% of
the developed area. These uses are found concentrated along Thiruvika Road and Trichy
–Madras National Highway.
e) Educational Institutions
There are 13 elementary schools, 14 high schools, 4 higher secondary schools and 5
technical intuitions in the town. The schools are concentrated in the developed area and
particularly the high schools are located on western and eastern sides of the railway
junction.
One Government Arts College is located in the town and it occupies an area of 16.37 ha.
There is also a Government Teachers School for secondary Grade Women Teachers, and
a Government Training School of Engineering for class –IV Railway Staff.
The educational institutions occupy in aggregate an area of 38.17 ha accounting for
8.65 % of the total developed area.
f) Medical Institutions
Government Hospital occupying an area of about 0.9 ha with bed strength of 96 is
located at the junction of the National Highway Madras- Trichy, and Pondicherry road.
There is also a railway hospital with bed strength of 26, located on eastern side of
railway junction, and along the Pondicherry Road. A part from these hospitals, the town
has one maternity home, two dispensaries and several private nursing homes and
private consulting clinics. Almost all the medical institutions are adjacent to the
Pondicherry road. The total area occupied by these institutions is about 1.22 ha.

Department of Planning, School of Architecture and Planning, Anna University
CCP To Business Plan / TNUIFSL / September 2006 92
Break Up of Developed Area
50%
7%9%
3%
26%
5%
Residential CommercialIndustrial EducationalPublic & Semi Public Transportation
g) Utilities and Services
The area occupied by this category of use is about 11.95 ha (2.7% of developed area)
comprising land under uses viz. water supply, drainage and electricity. Recreation and
open spaces cover around 6.03 ha, i.e.1.65% of the town’s developed area.
h) Housing
It may be seen that during 61-71, 71-81, & 81-91, the growth rates of houses were
34%, 54% & 32% respectively while the corresponding growth rates in households were
less being 31%, 29% & 17%. Existing land use picture is an in Table 2.6
Table 2.6: Existing Land Use Villupuram 1995
S. No Use Extent in Ha % to
Developed area
% to total
area
Developed Area
1 Residential 223.7 50.58 37.35
2 Commercial 21.02 4.76 3.52
3 Industrial 29.46 6.67 4.93
4 Public and Semi Public 14.11 3.2 2.36
5 Transport & Communications 115.37 26.14 19.3
6 Educations 28.17 8.65 6.38
Total Developed Area 441.4 100 73.84
1 Agricultural Lands 117.95 - 19.73
2 Vacant Lands 21.45 - 3.62
3 Land under Water 17.05 - 2.81
Total 156.45 - 26.16
Net Total 597.85 100 100
Source: DT&CP Records – Master plan for Villupuram 1995
Break Up of Undeveloped Area
75%
11%
14%
Agricultural LandsVacant LandsLand under water

Department of Planning, School of Architecture and Planning, Anna University
CCP To Business Plan / TNUIFSL / September 2006 93
2.12.2 Proposed Land Use and Population Projection –Master Plan.
The land use pattern of the town as proposed for a prospective period up to 2011 as in
Table 2.7
Table 2.7: Proposed land Use break Up -2011
S. No Use Extent in
Ha
% to the developed
area
% to total area
Developed Area
1 Residential 356.47 61.38 59.62
2 Commercial 23.02 3.96 3.85
3 Industrial 32.46 5.59 5.43
4 Public & Semi Public 14.11 2.43 2.36
5 Transport & Communication 116.57 20.07 19.46
6 Education 38.17 6.57 6.38
Total Developed Area 580.8 100 97.03
ll Un Developed Area
1 Land under water 17.05 - 2.97
Total Un Developed Area 17.05 - 2.97
Total For Non - DD Plan Area 597.85 100.100
DD Plan Area 295.15 - -
Net Total Area of the town 893 - -
Source: DT&CP Records – Master plan for Villupuram
a) Residential
The land under this use at present is 50.58% and this is equal to the suggested %.
Considering the existing density pattern and the projected population of 1.30 lakhs for
the year 2011 Villupuram Town will accommodate a residential use of 356.47 ha a
residential density of 364 persons per hectare in the developed area The lands now lying
vacant on the northern and eastern sides of the town are slowly emerging as residential
colonies, since these are the only available vacant lands and having sufficient
transportation facilities. The above areas are proposed as residential areas in the
proposed land use plan.
b) Commercial

Department of Planning, School of Architecture and Planning, Anna University
CCP To Business Plan / TNUIFSL / September 2006 94
The town functions as an important commercial centre. So it is proposed that about 23
ha of land be earmarked for this use covering 3.96% at the end of the planning period.
Space to depth of 30m on both the sides of Kanniakulam road and Pandit Jawaharlal
Nehru road are of commercial use. Accordingly, these road sides are designed as
commercial area in the perspective plan taking in to account the trends of development.
c) Industrial
There are no industries worth mentioning in the town except Madras Vanaspathy
Factory. Presently, about 29.46 ha of land is being utilized for industrial purpose. Scope
for establishing new industries within the town is almost nil. This is due to the lack of
motivation among the people and high cost of land in the available vacant area. Hence a
piece of vacant land available adjacent to the existing Vanaspathy factory has been
earmarked as industrial land so as to facilitate its expansion, if needed in future.
Further, a small piece of land near the existing rice mill has been earmarked as
industrial use, since it abuts the existing burial ground. The total area provided for
industrial use is 32.46 ha i.e. 5.5% of developed area for the planning period up to
2011.
d) Public and semi Public
Public offices are concentrated at CBD area and also scattered on the western side of
the town. Most of the public offices are functioning in the rented buildings. The total
area now available for public and semi public uses is 14.11 ha. Due to scarcity of vacant
government lands, it is suggested that these designated area be used intensively to
accommodate more government offices. Therefore, new areas are identified for this use
in the proposed land use plan.
e) Education
As regards the land requirements for educational use number of Higher Secondary
Schools, colleges and Higher Educational Institutions are only considered. Taking in to
account the present availability of educational facilities, no additional area has been
proposed for educational use.

Department of Planning, School of Architecture and Planning, Anna University
CCP To Business Plan / TNUIFSL / September 2006 95
f) Traffic and Transportation
Regarding traffic and transportation, a road of 600 m length and 20 m width from north
to south connecting Pondicherry road and Panambattu road has been proposed to
control the flow of traffic occurring on Pandit Jawaharlal Nehru – Pondicherry road in
future. A part from this, two by-pass roads for the National Highways N H 45 and N H
45 A passing through the town have been subsequently considered. The by-pass for
Madras-Trichy N H has been taken up and for Pondicherry road by feasibility study has
been completed by the N H Department.
2.12.3 Issues- Land Use
i) Sine economic activities are not attracted either within or outside the town,
the development of the town seems to be nil or minimal.
ii) Inadequate control on land subdivision leads to formation of un approved
layouts in which Villupuram Municipality is not able to provide good
environment conditions.
iii) Location of new functions like bus stand and district head quarters attracts
un planned haphazard developments in the vicinity of the sites. In the
absence of proper monitoring management of such developments created is
bound to be poor.
iv) Ribbon development along the national highways is likely to create problem
in future both for the town and the adjacent Village Panchayats.
v) Railway property (colony) occupies about 38 ha of prime land and it has
ceased to residential colony, any longer. The area largely is in disuse and the
few old building is dilapidated condition. Since the municipality has no control
over the area, undesirable social activities are on the increase in this railway
colony area.
2.12.4 Strategic Plan Proposals
The land and urban growth management options have to essentially direct the
physical form of the town in achieving an environmentally sound and sustaining urban
area. In order to realize the objectives, the strategies and tasks spelt out are:

Department of Planning, School of Architecture and Planning, Anna University
CCP To Business Plan / TNUIFSL / September 2006 96
i) Include the areas closer and adjacent to new bus stand as part of the
town as prepare a plan for better management of the land.
ii) Develop municipal lands as commercial propositions so as to improve the
revenue capacity of the municipality and at the same time,
encroachments of the municipal lands could also be prevented.
iii) Take steps to regularize the unapproved layouts and provide/ extend
basic services adequately which will improve the overall quality of life in
the town.
iv) Safe ground municipal lands and natural channels from encroachments.
v) Shift automobile workshop to other areas designated for industries
vi) Provide by-pass to the N H s
vii) Establish industrial activities in private and public sectors through local
economic development, entrepreneurial development skills.
viii) Improve water supply
ix) Uninterrupted power supply to be provided.
x) Provide good drainage/sewerage system
xi) Improve health care facilities.
xii) Solve the problem in the railway colonies. Concerted efforts are required
to seek NOC. So that the area could be used by the local Body, or lease
for 99 years or alienate the land of the L B, or the Railway Department to
provide facilities and a congenial living environment.
2.13 Developmental Trends of Villupuram Town
Villupuram town, having a population of 95,459 as per 2001 census, and an area of 8.36
sq.km, is a selection grade municipality. It is a Headquarters town of Villupuram District
and it is the largest urban centre in the district. It is located on one of the major
transportation corridors of the state between Chennai and Madurai. The broad gauge
and metre gauge railway lines and NH 45 and NH 45 A pass through this town.
Important urban centres around Villupuram is about 200 kms radius are Cuddalore,
Trichy, Salem, Vellore, Thiruvannamalai, Kanchipuram, Pondicherry. It is considered as a
transportation nodal centre as well as gateway to the southern districts of TamilNadu.
The town is slowly evolving as an service town and as nodal point by attracting people
Department of Planning, School of Architecture and Planning, Anna University
CCP To Business Plan / TNUIFSL / September 2006 97
for trade and commerce opportunities from the neighboring villages and towns. The
increase in the industries is evident from the increasing share of workers in the tertiary
sector of the town over the recent years.
2.14 Physical Constraints
Villupuram is well connected through road and rail network. The town is growing in all
directions except in north and northwest as the railway line acts as a physical constraint.
In the past, the growth was along Pondicherry road and on southern part of Pondy
Road.
2.15 Current Trends of Development
While doing CCP as well as Business Plan Consultative meetings, the common opinion
observed is that, the recent mushrooming of developments in the town have started
adding on to the infrastructure deficiencies of the town. The residential areas are held in
a threat of being converted into commercial areas. As a result of these changes, many
of the residents have moved out of the town, towards the periphery leading to the
growth in the fringe area, particularly along Poonthottam. But with the formation of
NH45A, the physical development turned towards the southern side of the town. A large
number of approved and unapproved layouts have come in Salamedu, Poonthottam and
V.Maradur settlements. Now, with the construction of new bus stand and Collectorate
complex new layouts and land subdivision are seen around these developments.
2.16 Thrust for Developments
Villupuram municipal area is compact, thickly built up and congested. The town extends
to an area of about 8.93 sq.km only. To make the town carry on its economic activities
in future, it has to be supported with various developmental activities in the town, for
which there is no land available within the municipal limits and thus the focus for
developments should in the following spheres,

Department of Planning, School of Architecture and Planning, Anna University
CCP To Business Plan / TNUIFSL / September 2006 98
� Enhance facilities to promote the town, Villupuram as a commercial centre laid
down with better facilities and services for both localities and also commuters
from different parts of the region.
� Improvement of the Trade facilities with in the town, like relocation or
improvement of the market areas.
� Improvement of the quality of the infrastructural facilities of the town to provide
better standard of life for the local inhabitants.
2.17 Strategy Adopted for Population Projection Population projections become indispensable in the event of envisaging development
projects for a town. Increase in population of the town is governed by 3 basic factors of
population components. They are Birth, Death, and Migration. All the 3 components are
influenced heavily by external factors which influences the town development. For e.g. a
town population may go high because of in-migration induced by employment
opportunities (or) town may decline in population size because of out-migration. This
may be a factor due to non availability of employment & facilities. Therefore estimating
population for Villupuram town is being done with the following assumptions. The BP
identified projects could attract more employment, and the proposed development could
attract more in-migrants to the town, So the estimated population may hold good
realization of the town. Considering the size in terms of the population and the land area
in one hand and the dynamic growth pattern of the town it is proposed to adopt 3
scenarios in terms of population projection 1. Based on Arithmetic Projection (assuming
Natural growth + some amount of investment attraction) 2. Geometric projection
(calculated with added project which may likely to induce some amount of employment
generation) 3.Exponential projection (Implementation of Large scale long term projects
adding on to the employment opportunities).
2.17.1 Scenario for Arithmetic Projection Method

Department of Planning, School of Architecture and Planning, Anna University
CCP To Business Plan / TNUIFSL / September 2006 99
Villupuram town, in last decades have increasing growth rate in terms of population. It
is attributed to the fact that the town experiences a much faster commercial growth
slowly influenced by the location of the town and its increasing industrial activities. By
the way of identifying projects & implementing them during the post CCP period, the
living standards of the residents could be improved and a natural check may limit the
change in the town. Projects such as Strom water drainage & sanitation improvement,
improvement of street lights, Roads improvement etc are completed / being
implemented which gives better look to the town as well as serve population better. On
conclusion of the Business plan consultative meeting and identifying potentials of
Villupuram additional projects are identified both short term and long term. Short term
projects are to be implemented in next 5 years time which is likely to improve the
services and trade opportunities of the town. This may results more in migrants and
limit people moving out of the town.
2.17.2 Scenario for Geometric Projection Method
POPULATION PROJECTION
WORKERS POPULATION PROJECTION
The scenario of population
projection based on arithmetic
projection considering the past
trend of the population growth rate
of 26%. In this scenario total
projected population for 1991-2026
is 1.3 lakhs. Workers population
forms part of the projected
population. It is aimed that workers
under tertiary sector are increased
& the estimated workers under
secondary, tertiary workers are in
0.66%, 44% respectively.
Arithmetic Progression method
-20000
0
20000
40000
60000
80000
1991 2001 2011 2021 2026 2031
Primary Secondary Tertiary
ARTHIMETIC INCREASE METHOD
0
20000
40000
60000
80000
100000
120000
140000
160000
1971 1981 1991 2001 2011 2021 2026 2031
Population

Department of Planning, School of Architecture and Planning, Anna University
CCP To Business Plan / TNUIFSL / September 2006 100
The Arithmetic projection method it is assumed that much of the secondary sector
projects need not be implemented in short term. If the town will to get attracted and
grow better projects under Trade & industrial sector has to be pushed through. Primarily
manufacturing & industries are under private sector and local body has to find means of
attracting the private people to invest. Therefore better terms and conditions for private
operators are to be explored to provide service facilities. Some of the innovative projects
such as Renovation of market Complexes and Construction of Shopping complexes do
form part of Business plan. Villupuram is having still potentials for more projects under
trade, lodging facilities, education center, industrial development, commercial
development. If such projects are implemented, Villupuram may gear up for a higher
level of population mostly attracting workers of secondary and tertiary sector.
2.17.3 Scenario for Exponential Projection Method
The experience of the consultative meetings of CCP & Business Plan highlights that
Villupuram to be a Commercial – Industrial – Sustainable town in the next 20 years.
BY Geometric projection
method the estimated
population up to 2026 is
about 1.9 lakhs and the
expanded employment
as indicated above may
result to workers such
as secondary, tertiary in
the proportion of 0.11%,
53% respectively.
Geometric Progression method -50000
0
50000
100000
150000
200000
1991 2001 2011 2021 2026 2031
Primary Secondary Tertiary
GEOMETRIC INCREASE METHOD
0
50000
100000
150000
200000
250000
1971 1981 1991 2001 2011 2021 2026 2031
Population

Department of Planning, School of Architecture and Planning, Anna University
CCP To Business Plan / TNUIFSL / September 2006 101
Being blessed with conventional industries, Villupuram has the potentiality to explore as
a industrial center at the regional level. Since it is on the National Highway connecting
important towns and also with the potentiality of workshops & service stations it could
grow in that sector as well. It is seen that If at all Villupuram has to grow better some
amount of focused activities are to be done to promote industrial development. It is
anticipated that proper political outlook added with administration thrust, Villupuram’s
population can grow in many folds.
2.17.4 Adopted Population for the Next 20 Years
It is seen a number of possibilities of population growth shifting from one trend to
another trend purely based on the kind of inducement anticipated. In order to work out
projects that includes service projects expressed by people, selected by Local body some
logical projection of population need to be adopted. Since Geometrical method demands
large scale long term heavy investment project it is likely that it may likely be suitable to
By Exponential growth
method the Villupuram town
may have accommodate
about 2.3 lakhs population
during 2026 with a
composition of 0..05% of
secondary, 115% of tertiary
sector respectively.
Exponential Projection method
0
100000
200000
300000
400000
500000
600000
1991 2001 2011 2021 2026 2031Primary Secondary Tertiary
EXPONENTIAL METHOD
0
50000
100000
150000
200000
250000
300000
1971 1981 1991 2001 2011 2021 2026 2031
Population

Department of Planning, School of Architecture and Planning, Anna University
CCP To Business Plan / TNUIFSL / September 2006 102
this municipality. Whereas Arithmetic projection may be simple to adopt the current
trend and CCP as well as Business plan anticipate some amount of inducement
practically population of Villupuram is likely to grow more than that of Arithmetic
projection. As the municipality is moderated in size having limited resource may not be
able to tap huge loans it may not also touch up to Exponential growth rate. Therefore
the population adopted to work out business plan for 2026 may be in a measured
phase. Thus the population increase may be by Geometric Projection method
fulfilling the vision of the town to be developed in Sustainable – Industrial and
Commercial Center.
Population Projection- Adopted
POPULATION PROJECTION METHOD
0
50000
100000
150000
200000
250000
300000
1971 1981 1991 2001 2011 2021 2031
YEA R
Arthimetic Increase M ethod Geometric Increase M ethod Exponetial M ethod

Department of Planning, School of Architecture and Planning, Anna University
CCP To Business Plan / TNUIFSL / September 2006 103
3
BASIC SERVICES AND INFRASTRUCTURAL FACILITIES
3.0 General Position
Provision and maintenance of basic services namely water supply, sewerage,
drainage, roads/streets, street lights and electricity constitute the obligatory
functions of the local body. The town enjoys fairly good level of services except in
the small –unapproved layouts and also railway colony, which comes under the
central railway ministry.
Sizeable development works in terms of provision of services either newly and /or as
improvement have been completed in all the wards by the local body and works are
3.BASIC SERVICES AND INFRASTRUCTURAL
FACILITIES
3.0 General Position
Provision and maintenance of basic services namely water supply, sewerage,
drainage, roads/streets, street lights and electricity constitute the obligatory
functions of the local body. The town enjoys fairly good level of services except in
the small –unapproved layouts and also railway colony, which comes under the
central railway ministry.
Sizeable development works in terms of provision of services either newly and /or as
improvement have been completed in all the wards by the local body and works are
continuing in many parts of the town as the consultant team could see during
August 2000.Enquiries from the public either in the ward level consultative meetings
or other at random, have not revealed any serious problem of service except for the
drainage system by residential developments.
3.1 Water Supply.

Department of Planning, School of Architecture and Planning, Anna University
CCP To Business Plan / TNUIFSL / September 2006 104
3.1.1 Present Status.
3.1.1.1 Surface Water Sources
i) The town is provided with protected water supply. Protected water supply system
was introduced in the year 1970 from a source 12 km away in South Pennaiar River
Basin. The scheme was designed for an ultimate population of 81,700 in the year
1996 with a supply of 12.25 lakhs gallons or 46.3 lakhs liters a day. The head works
are located down stream of Ellis Chattiram Anaicut in Pennaiar River near Kappur
Village. The existing head works consists of one well 10.4 km deep,3.66 m (12 feet)
in diameter with one 6m (20ft) diameter infiltration gallery, and three 11 m deep 2
m diameter bore wells . The water drawn from the collection well is being conveyed
through the pipes in to services reservoirs located along NH45 near travelers
bungalow and along Pondy road near the railway quarters.
ii) Another source was developed in 1990. This project comprises two deep bore
wells of 2 m diameter each sunk 123m deep at Anangur Village 8 k.m away from the
town. This water is pumped in to OHT of eastern zone.
3.1.1.2 Piped Water Supply System
For the purpose of distribution of water supply to the town limits inhabitants, the
town has been divided in to two zones namely Zone I&ll. Zone l covers the area west
of Madras –Trichy Railway line and ,Zone ll covers the area east of Madras –Trichy
Railway line.
At present 54 lpcd of water is supplied through 78.40 kms distribution water mains
and public fountains, mini power pumps and hand pumps. This covers 80% of the
town area excluding the portion occupied by railway quarters and some unapproved
layouts. There are 144 public stand points supplying water in areas where individual
house connections are rare.
The nearby village’s viz.Vazhuda reddy and Thiruppan Chavadi are also provided
with 1 lakh liters and 1.5 liters of water a day respectively from these sources. There
are two OHT zone in each water supply zone located at the junction of Jawaharlal
Nehru Road and Power House Street in the eastern zone and, another on the

Department of Planning, School of Architecture and Planning, Anna University
CCP To Business Plan / TNUIFSL / September 2006 105
hospital road south of Singara Thoppu in the western zone having storing capacities
of 9 lakh litres and 7 lakh litres respectively. The municipality supplies water
normally twice a day from two hours in the morning and, one and half –hours in the
evening. The piped water supply amounts to 35 lpcd. 5453 houses are given water
supply connections till March 2006 and 118 non domestic connections. Expect the
railway colony which is under the possession of Central Government and some of the
unapproved layouts, all other area are provided with water supply distributions
mains.
3.1.1.3 Under ground Sources
There are 205 hand pumps each with a bore well. Hand pump provide water supply to
about 4000 families. In addition there are a number of open wells / bore wells
maintained by individual families. All these sources of both surface and subsurface
supply roughly 50 lpcd on an average to the total population. This 50 lpcd include
ground water contribution of 15 lpcd . By and large, the citizens have no serious
complaints about water supply. Water charges are Rs .2 per 1000 liters or Rs 20 for
domestic supply and Rs 6 per 1000 liters of water subject to minimum of Rs 60 for
non domestic supply per mensum. Water supply distribution network and locations of
200 hand pumps are shown in the town map (Fig.3.1)
3.1.2 Issues – Water Supply
3.1.2.1 Town Level
a) Quantity inadequacy
Water supply as per month by the state government is to be 90 lpcd . The present
supply is 54 lpcd by piped supply and about 15 lpcd by sub surface sources. But the
random enquiries made in different parts of the town except unapproved colonies
revealed fair level of satisfaction among users. One of the main reasons for this being,
there are a number of private bore wells and hand pumps yielding water sufficient to
meet both drinking and non drinking requirements. However, these sources over time
cannot be depended upon as the ground water level is sinking and also, the seepage
from the “kuttais” and “kulams” which function as sewage ponds pollute the ground

Department of Planning, School of Architecture and Planning, Anna University
CCP To Business Plan / TNUIFSL / September 2006 106
water faster. As the population keeps growing faster than predicted in the Master Plan,
the problem of adequately meeting the water requirement will become a matter of
serious concern sooner than expected this requires a suitable and sustainable solution.
b) Quality Improvement
Surface water is treated to safe limits of domestic consumption. Sub surface water,
though is said to have caused no discomfort, particularly in the un-approved layouts
where citizens depend only on ground water in layouts near kuttais is said to taste
differently. These ground water require to be tested and treated.
c) Pressure
The pressure at the points of supply at eth tail end areas of supply system particularly in
the northern and western wards of the town is less. There are certain main reasons for
this inadequacy:
a. There are only over-head tanks supplying the entire town at present.
Both the tanks are located in the southern half of the town, and the
distance between the tanks is as much as three fourth of a kilometer and
each supplies area up to 650 meters distance in the northern parts of the
tank. The tanks were constructed as early as 1970 and development and
growth of the town since then has been almost double till 2001.
b. The supply is on alternate days for 2 hours (6.0 am to 8.00 am) and
effective supply time at the tail ends reduces to less than an hour.
c. The topography of the town is almost flat with gentle slope down
eastwards. The water supply distribution mains are not laid in gravity
gradient, and in certain wards there are humps in the lines resulting in
poor distribution and supply pressure.
d. At various points along the mains, the water is clandestinely sucked
through boosters by individuals disrupting the flow and quantity down
stream.
e. The design supply meant for 81700 populations in 1996 is now used for a
population more than a lakh (2006) and a little less than a lakh (2001)

Department of Planning, School of Architecture and Planning, Anna University
CCP To Business Plan / TNUIFSL / September 2006 107
and over far extended stretches, thus straining the system beyond its
effective capacity.
These problems could be taken care of if the quantum of supply is enhanced and the
locations of the main supply tanks are distributed. In certain pockets it may require to
correct the levels of the supply mains.
d) Storage Capacity- Inadequate
The water from the surface sources is stored in two OHTs and then supplied through the
distribution system. The total capacity of the two tanks is only 16 lakh litres, and if filled
twice a day , the total storage is 32 lakh litres and including the supply hours when the
water keeps flowing in to the tanks the total storage works out to nearby 36 lakh litres .
The third source is being developed to produce 16 lakh litres. One OHT of 8 lakh litres
capacity (to supply minimum 16 lakh litres in two spells) is part of development of 3rd
source. One more OHT 10 lakh litres capacity has to be created to meet the projected
requirement of 70 lpcd by 2005-06, that would supply in two spells a day including
pumping 24 lakh litres. A fourth source of 24 lakh litres supply a day has to be
developed by 2005-06.
3.1.2 .2 Issues at Ward / Street-Water Supply
i) The said weakness in the supply manifest themselves in different forms at
the micro levels as expressed by the Councilors and the public (please refer
Annexure on ward level /street level demands with specific reference to
water supply).
ii) In the recent past, due to large scale developments on the courses many of
the original drainage canals and nullahs, and also the ponds lakes, there is
large scale depletion of sub-surface water sources , and the ground water
level has gone deeper;10-15 m. Moreover, the ground water is polluted as
the as the left over portions of ponds and pools are used as sewage storage,
giving rise to nuisance of mosquito round the year, besides unsanitary and
unhygienic conditions in a number of parts of the town, affecting the living
environment.

Department of Planning, School of Architecture and Planning, Anna University
CCP To Business Plan / TNUIFSL / September 2006 108
iii) Though the situation cannot be fully retrieved to original stage, even now
provision of a proper drainage to drain the town’s waste water away and
restoring the ponds and lakes / nullahs by desilting / drudging and storm
water in the water bodies will certainly rise the ground water level and
improve its quality.
iv) Distribution lines are not laid in proper gradient in a number of streets
resulting in disturbance in supply particularly at the peripheral areas.
v) Water supply presently covers only 85% of the population , and many parts
in wards 1,2,3,18,17,14,9,7,5and 23 are not yet covered by organized water
supply.
The demand for water supply for a population of 95,455 lakhs (2001) at 70 plcd will
require an additional supply quantum of 12.8 lakh litres. Piped water supply will be
enhanced to reach 90 lpcd by 2011 by developing additional 20 lpcd for a population of
1.3 lakhs by 2011, i.e. 26 lakh litres additional supply during 2006-11. It may be noted
that in addition, the ground water sources through bore wells / hand pumps by the
municipality and private individuals will help augmenting the supply by 15 lpcd as
estimated as of 2000 A.D. and by a minimum of 90 lpcd by 2005-06.
3.1.3 Future Requirements
3.1.3.1 Town Level
a) Quantity
While reviewing the master plan for Villupuram, DT&CP has assigned a population size
of 1.10 lakhs for 2001 and 1.30 lakhs for 2011. But already according to the municipality
mid 2000 assessment the population was 1.21 lakhs. How ever, for calculation of water
demand, DTand CP’s projections were considered. Though a norm of 90 lpcd is
suggested by the state government by the state government, keeping in view the
present level of 35 lpcd through piped water supply and another 15 lpcd through hand
pumps and individual wells, it may be too difficult to hike the supply almost double in a
short span of 5 years. It is there fore suggested that the piped water supply is at the
most enhanced to reach 70 lpcd by 2005-06, in view of the fact that the satisfaction

Department of Planning, School of Architecture and Planning, Anna University
CCP To Business Plan / TNUIFSL / September 2006 109
level of the public as of 2000 AD is at 51 lpcd including hand pumps etc and there is no
valid reason that the bench mark satisfaction level will increase abruptly beyond 70 lpcd
of piped supply in the next 5 years.
e) Quality
The water from two existing surface sources are treated and supplied. How ever, water
from sub surface sources requires treatment in terms of chlorination and adding alum to
coagulate the suspended matter.
f) Supply
In order to reach, water to all and with adequate pressure , one more OHT, proposed is
to be constructed – at EB colony in the next one or two years , and one more by 2005
after development of 4th source to supply the required additional quantum of 24 lakh
litres a day during 2002-03 and 2005-06.
3.1.3.2 Requirements at Ward / Street Levels.
At ward and street levels, water supply requirements are in the form of laying or
extension of water supply distribution mains, particularly in unapproved layouts,
provision of public fountains, hand pumps and construction of over head tanks, as
expressed by the councilors and the public at the consultative meetings.
Construction of one OHT particularly will be relevant only when the supply is enhanced
as the third source and one more OHT of 10 lakh litres capacity at ward no.28 during
2002-03 and 2005-06. Simultaneous to development of fourth source of water supply for
24LL a day. Between 2006 and 2011, sources to supply 26 lakh litres a day have to be
developed.
3.1.4 Strategies – Water Supply
Strategies for an effective and efficient supply of water will include:

Department of Planning, School of Architecture and Planning, Anna University
CCP To Business Plan / TNUIFSL / September 2006 110
i) Planning and augmenting supply identifying suitable and sustainable sources
of water supply to the required level by 2005 &2011.
ii) Provision or extension of distribution network to supply water to all citizens.
iii) Creating storages i.e. OHT’s with suitable heads and capacity to meet the
quantum and pressure requirements.
iv) Planning innovative operation and maintenance mechanism to oversee and
coordinate water supply in all parts of the town efficiently.
3.1.5 Tasks 3.1.5.1 Town Level a) Augmentation of Water Supply
i) TWAD Board had already attempted a project to enhance water supply to the
town through a battery of 8 deep bore wells in Somanur village and another 3
deep wells in Arpichampalayam village. The waters from the wells were to be
stored in Salayampalayam village before it was pumped to Villupuram. It was
proposed to distribute the water from new 5 OHTs . The project was estimated
to cost Rs 12.23 crores with a running cost of RS 3 crores every year. As the
debt service burden would be beyond the repaying capacity of the local body,
the municipal council resolved in March 2000 to drop the proposal, after
assessing the economics of the project from the municipality resource capacity
side.
ii) Another project, at the instance of the Hon’ble Minister for Transport.
Government of Tamil Nadu , in a review meeting taken on 11.10.99, was decided
to be entrusted to TWAD Board , in order to enhance the water supply to
Villupuram town. This project consists of 3 deep bore wells to be sunk in the
Malattar river bed, 8 km away from the town at a rough cast estimate of Rs 175
lakhs. The project includes an OHT of 8 lakh litres capacity in Marudur area. The
town council ha resolved in its meeting held on 26.11.99 to take up the project
raising loan from the State Government, and getting the project as a deposit
work by TWAD Board.

Department of Planning, School of Architecture and Planning, Anna University
CCP To Business Plan / TNUIFSL / September 2006 111
On completion of the project interalia , 500 new connections could be given in
Marudur area. This will fetch the municipality Rs .50 lakhs in the form of deposit
at Rs 10000 per new connection Rs 1.25 lakhs as supervision charges , and
Rs2.4 lakhs as water charges . This project will help increase the supply from 35
lpcd to 51 lpcd from the organized supply system and with ground water supply,
the supply will be about 65 lpcd.
Already TWAD Board has stated the preliminary works of erecting test bores in
September 2000, and the project is expected to be completely by the end of
2002-03. Thus investigations may have to be continued to locate sources in and
around Pennaiar River which is the only near by perennial source of water supply
is enhanced to reach 70 lpcd by 2005 -06 with an additional quantum of 24 lakh
litres.
iii) As per CCP(2001), by the end of 2004-05 two over head tanks to a supply a
total quantity of 40 lakh litres will constructed at EB colony and in ward 28, and
of which one is proposed to be completed 2002-03, for on OHT of 8 lakh litres
capacity is already included in the 3rd water source project by TWAD Board .
Another OHT of 10 lakh capacity will have to be constructed in Ward no .28
vi) Water traffic has to be revised so that capital investment on water supply
improvement recovered from the users. The revision could have been effected
by the municipality from 2002-03 and in 2005-06.
v) The entire system will be computerized and geographical information System is
generated to include System Configurations In Terms Of Components, Location
Age Structure Characteristics, Traffic Structure, Collection Performance And
Related Operations.
vi) Expect Capital Works, Operation And Maintenance And Tariff Collection on water
supply may be privatized.
3.2 Sewerage and Drainage

Department of Planning, School of Architecture and Planning, Anna University
CCP To Business Plan / TNUIFSL / September 2006 112
3.2.1 Existing Status
3.2.1.1 Town level – Sewerage and Drainage
There is no separate system for carrying the sewage and storm water separately in the
town. The road side drains used for carrying both the sullage and rain water. Of the
18000 houses as of 2000 AD, only about 6500 houses have septic tanks, and 3500 leach
pits or low cost sanitary latrines. Though the conservancy system of removing the
human waste was eradicated; old houses do not have latrines and they use community
toilet or even open places.
Under ground drainage system does not exist in the town.
Open drains are available in almost all parts of the town and the road side drains total to
length of 74140 m against the road length of 54700 m. There are as many as 8 major
drainage systems draining various parts of the town. They are briefly explained in the
following paragraphs.
i) Kolianur channel running west –east over the entire length of the town for
about 4 km along the Jawaharlal Nehru Road is the main drain to carry part
of the town’s sullage and storm water. Infact, this is an irrigation channel
owned by PWD connecting Poonthottam tank on the west of the town and
Erumanthangal tank on the east of the town , finally joining a pond. This
channel located south of eth PJN road up to the railway line drains wards 15
(part),13, 17,30,29 &, east of the railways , runs north of PJN road draining
25th ward (part), 11 and 7(part). It joins Erumanthangal Eri beyond the town.
Kolianur channel is embanked except for about 700 m long stretch west of
Eills Chatram Road lying in Ward No.17 and it si considered not necessary to
embank it an another 700 m from EB Colony to the boundary along J.Nehru
Road, which is to be lined.
ii) Another channel namely Marudur Channel branching off from kolianur
channel east of the junction of Kanniya kulam road and the Kolianur channel
runs south for about 600 m to the municipal limit, draining wards 15
(part),14,27,28 and joins Marudur Eri across the boundary of teht town .
While the Kolianur Channel is lined with cut stone and rubble , and is open ,

Department of Planning, School of Architecture and Planning, Anna University
CCP To Business Plan / TNUIFSL / September 2006 113
the Marudur channel is linked with cut stone and rubble , and is open , the
Marudur channel is kutcha and due, to encroachment of the channel
poromboke , the flow course is narrwed to 1-1.5 m (from 10m) . More over,
the residents along the channel dump their wastes in the channel choking its
flow that renders stagnation along the channel show lack of civic sense and
non cooperative attitude. They complain of severe mosquito problem but at
the same time they insist on dumping the waste in to channel blocking the
flow.
iii) A small drain draining ward no.13 south wars flows in to Marudur Eri
iv) Another drain measuring about 2 km existed emanating from a pond of
Municipal office and cutting across railway colony and crossing the municipal
boundary north of Erikarai St to join a lake near the town limits. This drain
took care of storm water and sewage from the central area of the town
covering wards 31,32,33,35,36 and railway colony , government Arts College
and part of Kilperumbakkam ward 6(part). But now the drain area has been
sited and pattas issued for the initial 450 m length of the drain up to
Gurusamy road and the last 400 m length of the drain from the end of
Kannagi St to the town boundary. The rest of the channel is silted and the
portion of the channel under the railway lines is a critical portion as it
desilting is more difficult.
Since the tail of the drain within the town is blocked by the development, the
drain water forms a pool south of Erikarai St in the Government Art College
area before it squeezes out through a culvert across the boundary.
v) One more natural drain viz. Kakuppam drain, for about 1120 m long
originating from a pond at Kakuppam , north of Govindasamy layout in the
north eastern part of the town in Kilperumbakkam area, runs east to join
Erumanthangal lake. Now , the first 200 m length of the drain has come
under development and its flows across the town boundary is constrained by
development , but as narrowed drain it crosses the boundary and joins the

Department of Planning, School of Architecture and Planning, Anna University
CCP To Business Plan / TNUIFSL / September 2006 114
lake beyond the town limit . As the tail end of the drain is narrow, the flow is
slow and the rest of drain faces stagnation of sullage water.
vi) There was on more natural drain draining the North West part of the town,
emanating from a pond east of Agarampattai, running for about 800 m east
wards to cross the boundary and to flow east to Kakuppam village. There is
vent under the railway lines and the vent is choked and narrowed and the
portion of the drain for more than 200 m long east railway line has come
under residential layout. The municipality has constructed a well adjacent to
the railway lines on the east and is pumping the sewage to take it along the
roads in the Raja layout in east –west direction along the road in ward 4 and
up to Oovaiar St to join the Kakuppam drain. This pool of sewage has spread
west of the railway line to a large lake –storage, and it is a mosquito –
breeding centre. This drain serves wards 19,20,21,22, and 34 (part).Up to
the railway line for about 200m, the drain needs embankment and desilting.
vii) The north –west part of the town, east of Madras Trunk Road in ward 1&2, is
drained by an artificial drain starting from Singara Thoppu, to cross the
Gingee road and flowing northwards along the Katpadi railway line through a
culvert and run along Madras Trunk Road to Cross the boundary of the town
and join Pambai River 2 km away. An originally irrigation channel emanating
from the trunk road near Lalkhan Kuttai flows north –west up to the junction
of the trunk road and the railway line to cross it eastwards to join a Kuttai .
This drain area is not encroached and can be embanked. Area under ward
no. 18 can be drained in to Kolinur channel as the slope of the area is falling
south wards.
Viii) The Vavva Sippi Eri which existed in ward no 3 north of the railway line is
silted and residential development has come up here. This area was draining
in to part of Eri beyond the town boundary. Now that was also vanished. The
drain flows in to Ooral Kuttai at present beyond town limits.

Department of Planning, School of Architecture and Planning, Anna University
CCP To Business Plan / TNUIFSL / September 2006 115
The biggest stumbling block in draining the drainage system in the town in the Municipal
is helplessness as most of drains are under the possession of Revenue Department
Experience shows that alienation of the lands from Revenue Department to Municipality
is time taking process if at all it is agreed to alienate the land. The channels are under
ownership of PWD.
3.2.1.2 Ward / Street level: Sewerage and Drainage
Drains as said earlier, act as sewers also as the sullage water joins. Excluding the
unapproved layouts, and railway colony, in all other area in 36 wards only those streets
and cross streets which are still of mud or WBM surface, do not have drains. Even here
some of WBM street have been provided with drains. It is also rare if the BT roads not
having drains unless they are recently BT carpeted from WBM. For e.g., in wards 3& 7,
number of sit are of WBM/MR, and therefore are not yet provided with pucca drains.
On the other hand, most of the streets in wards no ,4, 5, 6, 10, 11, 13, 15, 16, 19, 21,
22, 26, 27, 28, 29, 30, 31, 35, & 36 have drains on both the sides of the roads . The
drains vary from 0.23 m -0.4m in width.
The total length of the drains accordingly to the municipality’s ledgers is 70410 m
against the total length of the roads of 54700 m. Thus only 15440 m of roads do not
drain on both sides as of Oct 2000.
3.2.1.3 Quantum of Sewage /Drain Water.
The quantum of sewage is not measured and there is no record in the local body. There
is no treatment plant also. But assuming 54 lpcd supply of water, and 80% to return as
waste water, the estimated sewage is in the order of 43 lakh litres a day.
3.2.2 Issues: Sewerage and Drainage
3.2.2.1 Town Level
i) There is no separate system of sewerage or drainage, and the existing
system is combined one.

Department of Planning, School of Architecture and Planning, Anna University
CCP To Business Plan / TNUIFSL / September 2006 116
ii) Estimated 4000-5000 families do not have sanitary provision of their own,
and use public toilets and others use open areas. Families using dry latrines
are not existent.
iii) The natural drainage system that existed two decades back in the town has
been badly tampered with. The natural flow of the waste rain water has
been blocked and built upon resulting in pools ands ponds of the waste /rain
water stagnating at number of places in the town breeding lot of mosquito’s.
iv) The stagnant waste water becomes septic and putrefaction takes place
emanating foul smell in the area besides presenting a filthy environment.
Environment health is greatly affected by these pools of pollutants.
v) Seepage of the polluted putrefied waste water pollutes the ground water
rendering it unusable for any domestic use.
vi) Most of the drain areas belong to Revenue Department, with the result, the
position of the Municipality becomes precarious in the sense that though
these drains lie within the limits of the municipal town, the municipality town,
the Municipality is not in apposition to do much including prevention of
encroachments, protection of drainage lands construction of drains along the
drain courses to provide an environmentally free living environment.
vii) The raw waste water is disposed of in areas outside the town, and it is a
nuisance to those village panchayats.
3.2.2.2 Ward / Street level issues: Sewage and Drainage
i) Unapproved layouts officially and legally are not with in purview of the
municipal Governance for provision of basic services. As such, till such time
the unapproved layouts are approved or a decision is taken about their
approval by the Government, Municipal administration can hardly help in this
regard. Even then, some facilities which the local body could help have been
provided.
ii) Roads mainly of mud or WBM surface are not yet provided with side drains.
iii) In some of the streets, the drains are not constructed with proper gradient to
facilitate a smooth flow preferably with “self cleaning velocity”. The resulted
in the waste water either stagnating particularly when the flow is thin, or

Department of Planning, School of Architecture and Planning, Anna University
CCP To Business Plan / TNUIFSL / September 2006 117
flowing partly in opposite directions from the same streets ending at wrong
destinations
iv) In some parts of the town , the drain levels are higher than the floor level,
resulting in sullage water running in to building especially at the time of rains
3.2.3 Future Requirements: Sewage and Drainage
3.2.3.1 Town Level
i) At town level, there is already a proposal to construct underground
sewerage system for which TWAD Board has under taken preparatory
works. Under this scheme the town will be dividing in to 5 sewage zones,
and finally the sewage from the 5 zones will be disposed of in the
Vadakuchipalayam and Poyyappakkam villages in sewage farm, and to
grow grass. For this purpose, the district collector has assessed the value of
acquisistion of 59.0.9.5 ha of land in Poyyappakkam at Rs 53 lakhs in 1995.
The municipal Council had resolved in August 1996 to mobilize this amount
from the government either as grants or loans . A request for this fund was
made by the commissioner Municipal Administration in August 1996 itself.
TWAD Board also followed up the proposal with the CMA to obtain the funds
. The district Revenue officer also insisted the need for acquiring the land
first, for the project to be taken up.
For the purpose of storming the waste waster in the five zones of the town
as identified by the TWAD Board, 5 ‘Kuttais’ one in each zone was chosen
and they are:
Zone Name Of Kuttai Area in Ha
1 Pappankulam Kuttai 0.63
2 Kanniakulam Kuttai 0.55
3 Eswaran Koil Kuttai 0.49
4 i)Vannan Kuttai
ii)Kulam
0.15
1.45
5 Thamarai Kulam Kuttai 0.25

Department of Planning, School of Architecture and Planning, Anna University
CCP To Business Plan / TNUIFSL / September 2006 118
On taking up the scheme, sewage will be collected separately and disposed of. Then
part of the existing system of ‘drains’ will suffice to conduct the storm water away in to
water courses outside the town. This under ground sewerage system project is
estimated by TWAD Board to cost Rs 28.15 crores.
Alternate Proposal
An alternate to the TWAD Boards proposals of underground drainage costing Rs 28
crores has been felt in evitable as the financial position of its municipality may not bear
such a large loan burden for years to come. More over, even if the municipality decided
to venture in to such proposal, the whole process as contemplated in the project will
take fairly along time by when, the cost will have escalated substantially rendering the
repaying capacity of the municipally almost to reach to reach a point of break, and this
would incidentally impose a stop on taking up other important capital works and proper
O&M of existing services in the town. Therefore an alternative comparably effective in
addressing the sewage/ drainage problem of the town has become un avoidable. The
alternate proposal is largely as described below. The town is topographically flat with a
gentle slope down eastwards and the drains as of now serve to carry waste water as
well as rain water. Though there is no no unified system of sewage or drainage, various
parts of the town are being drained out and as such as drainage pattern exists. The out
flowing drains joins water bodies such as Marudur Eri, Anangur Eri Koliyanur Eri
Chiterrikarai Kuttai Erumanthangal Eri and Kilperumbakkam Eri all outside the town
limits. These ‘Eris’ are either poromboke lands or under revenue department and they
are being used as waste waster ponds for decades now.
In these very locations, treatment plants either Activated Sullage Process (ASP) or
Tricking Filters (TF) of different sizes could be constructed, and the number of the
treatment plants can be restricted to four. The sullage that is generated as of 2000 A.D
is estimated at maximum of 5 mld as 80% of the total water consumption. As per the
scientific norms, the unit cost of per mld waste waster for ASP as well as TF is Rs 28.5
lakhs . For 10 mld capacity plant, the total cost of disinfection plant, capitalized O&M
cost for 20 years excluding land cost estimated as Rs 443.086 lakhs for ASP and
Rs415.905 lakhs for TF.

Department of Planning, School of Architecture and Planning, Anna University
CCP To Business Plan / TNUIFSL / September 2006 119
The land requirement for one mld is 0.22 ha for ASP as well as TF .In the case of
Villupuram Municipality, the land is already available and is in use. Even if to be paid for
100 mld plants, the land would cost not more than Rs 10 lakhs. The treated effluent can
be very well used for irrigation purpose, and if need be, that can fetch some revenue
also. During heavy rains, the storm water can be conducted as of now, through the
existing drains This proposal also includes isolating all the kulams and kuttais now being
used as sewerage storages in the town , and taking the waste waster in separate box by
passing these water bodies. This requires a separate study to prepare the project.
i) The existing drains will be first desilted, and sub trunks covered.
ii) At VannaKulam , a vent under the railway lines has to be desilted . Matter
has to be taken up with the railways, and the action has already been
initiated in October 2000.
iii) The municipality will take up the matter with the revenue Department and
PWD, in order to obtain no objection certificate from them or lease of their
lands for 99 years or alienation of land municipality so that the
municipality can use only for the purpose of discharging obligatory
functions of the municipality , besides checking encroachments and
protecting their lands.
iv) As the legal case against encroachments and violations take , as it is lot of
time in the court as per the present system , some legal set up at regional
or district level be established vested with powers to only deal with
violations / encroachments of lands in the municipalities for quick disposal
of these cases.
v) An intensive and extensive education campaign may be launched by the
municipal Administration to educate the public and make them fully aware
of their duties in keeping the environment hygienic and livable, and also to
solicit their co-operation with the municipality in the un keep and protection
of appurtenances provided with infrastructural facilities in the town.
3.2.3.2 Ward/ Street level requirements: Sewerage and Drainage

Department of Planning, School of Architecture and Planning, Anna University
CCP To Business Plan / TNUIFSL / September 2006 120
a) Ward level and road level requirements in respect of sewerage and drainage as
expressed by the respective councilors and general public , have been listed and
included in capital improvement programme during 5 years starting 2001-02
The priorities have been fixed on the basis of importance of the service at the specific
area and technical/economic feasibility.
3.2.4 Strategies-Sewerage and Drainage
Strategic Plan for 2001 envisages 100% population coverage by sewerage and drainage
systems, and the sewage generated will be in the order of 110 lakh litres from 90 lpcd
supply of water for a projected population of 1.6 lakhs by 2021. Sewage treatment
capacity will have to be enhanced by suitable additions of treatment units.
Strategies will include:
i) Diversion of the sewage flows from kuttais and Kulams to the sub-trunk
sewer/drainage lines.
ii) Strengthening of the sub –trunks of drains cum sewers in all the 8 major
drainage system as of now.
iii) Integrating the flow and treating to stipulated BOD limit.
iv) Use the effluents for the sewage farms and / or dispose of in to water
courses after treatment.
v) Strengthening the operation and maintenance by updating the know-how
and methods and techniques of handling waste water , and even privatizing
the O&M
vi) Educating the citizens about the need foe scientific methods of sanitary uses
and the need for environment hygiene.
vii) Covering the entire population by sanitary measures and facilities by 2011.
3.2.5 Tasks and Actions
i) Conduct ground level survey to fix the gradients in each identified drainage
area and fix the gradient of the collectors, sub trunk and trunk lines .

Department of Planning, School of Architecture and Planning, Anna University
CCP To Business Plan / TNUIFSL / September 2006 121
ii) Design suitable treatment plant units as per the capacity requirements at four
outlet points in the eri lands
iii) Initiate action to privatize operation and maintenance of the sewage /
drainage systems.
iv) Computerize the entire system and its operation for prompt attention for
maintenance and for solution for the problem.
v) Provide public toilets where ever necessary.
3.3 Solid Waste Management
3.3.1 Existing Status
a) Quantity
Though exact amount of solid waste being generated in the town is not assessed by the
local , it is estimated that about 400 gms of solid waste is being produced a day per
capita, and as such as for a population of 95,455 as per2001 census , the total
generation of solid waste is about 38.18 tones a day 27 tones or 70 % of the garbage is
being lifted every day. But the compost manure has no demand at all and as the result
the yards are spilling over, and no more dumping was possible. At present, the town’s
garbage is dumped in to 3 kuttais namely Easwaran Kuttai along Madras trunk road in
the north, Poonthottam kuttai abutting the old bus stand, and Ooral Kuttai near the
municipal Park. Nearly half of the Poonthottam Kuttai as reclaimed by dumping the
wastes for taxi stand.
b) Collection
Collection of garbage is managed by2 sanitary inspectors against 7 Sanitary inspectors,
9 health supervisors, 6 drivers, 129 permanent and 84 on consolidated basis under the
over all supervision of Municipal Health Officer . In order to provide better and effective
health service to the people, the town is dived in to 7 divisions assigning one division to
one sanitary inspector.
c) Disposal Method

Department of Planning, School of Architecture and Planning, Anna University
CCP To Business Plan / TNUIFSL / September 2006 122
To dump the wastes, the municipality is having two compost yards over 2.19 ha and
1.17 ha, one along Chennai – Trichy national highway and another along PJN Road
outside the town limits. These compost yards expected to treat 3000 tones of garbage,
but they are being used partly now.
3.3.2 Issues - Solid Waste Management
3.3.2.2 Town level –Issues
i) There is room for improvement of garbage collection performance.
ii) Compost yards outside the town are over spilling, and the manure is not
lifted by any body as the method of refill is not scientific.
iii) Recycling and separation of organic and in organic materials are not being
practiced.
iv) Garbage dumping in the kuttai’s in the town is not desirable as it is un
hygienic and is polluting the ground water and air besides being unsightly
v) The garbage contains more of inorganic matter rendering it difficult for
composting unless segregated.
3.3.2.3 Ward/ Street Level – Issues
i) Placement of dustbins is an issue, as though the residents demand dustbins
in the streets as individuals, they avoid keeping the dustbin in front of their
houses. Placement of permanent dust chamber also face the same problem
3.3.3 Future Requirements
3.3.3.1 Town Level
i) Proper sanitary refill has to be however maintained outside the town after
recycling the wastes. Organic wastes will have to be segregated and treated
in compost plants to convert the wastes in to manure.
ii) The site needs to be planned for proper treatment of eth bio–gradable
wastes and the manure has to sell at a price to make ‘Wealth from Waste’.
The use of compost yards will be reviewed.
Department of Planning, School of Architecture and Planning, Anna University
CCP To Business Plan / TNUIFSL / September 2006 123
iii) Solid waste management can also be privatized so that a clean environment
is ensured, as also it will be easy for the Municipality to administer. Here,
other town models can be adopted.
iv) The compost yards lying over –dumped out side the town will be cleared of
the dump and sanitary refill will be done in scientific method.
v) The compost yards will be protected by a compound wall and the roads in
them will be suitably raised / improved
3.3.3.2 Street/ Ward Levels
i) Collection will have to be systematized by giving each house a polythene or a
bio –gradable bag so that it can be kept at the gates on the street for easy
collection. Contrarily, the residents can also be instructed to carry their
garbage wastes to the vehicle passing through the street at fixed timings
with signals, through alarms and the like in the collection vehicles.
ii) As a first step, dust bins as required by the residents will be supplied to place
at vantage points or constructed with the consent of the residents.
3.3.4 Strategies -Solid Waste Management
i) The municipality has sufficient sites outsides the town for disposal of garbage
but for want of practicing scientific disposal method , the depression within
the town is used for dumping . This requires reviving the Solid Waste
Management system and practice by renovation of compost sites and reuse
of them.
ii) Recycling of the waste and segregation of organic / bio gradable from in
organic will be practiced
iii) In organic matter will be used to fill in the depression, which require to
reclaimed in the town.
iv) Operation and maintenance staff will be trained to handle the garbage
scientifically and as a remunerative activity.
v) Solid waste management will be privatized in a phased manner
vi) Computerizing the solid waste management in order to have effective
monitoring nod management as the issue is of great health concern.

Department of Planning, School of Architecture and Planning, Anna University
CCP To Business Plan / TNUIFSL / September 2006 124
vii) Locale will be educated and made aware through cable media and hand bills
, meetings etc about the importance of public hygiene and the methods they
have to following solid waste management , and for their cooperative
attitude.
3.3.5 Tasks- Solid Waste Management
i) The waste in its composition and characteristics will be studied , so that a
suitable method of scientifically handling it could be evolved
ii) Recycling of waste and their economic and environmental implications will be
assessed
iii) Privatization is already attempted on an experimental basis by the
municipality. If found satisfactory, the SWM will privatized
iv) The compost yards outside the town will be revived for sanitary refilling of
waste after segregating organic wastes
v) Community participation is a sprit of public service and voluntary service will
be elicited
vi) O&M will be over hauled for a better restructuring.
vii) Computerization of SWM will be under taken for simplifying the procedure
and for better monitoring
3.3.6 Sustainability Indicators
• Proportion of garbage lifted :85% to 100
• Proportion of vehicle capacity 100% of waste generated
• Spacing of dust bins :35 m
• Road Length per conservancy staff:205m
• No. of conservancy staff per 1000 persons (1991):3
3.4 Roads and Streets
3.4.1 Existing Status
Transportation and communication uses occupy 115.37 ha which works out to 26.14%
of the total developed area which is the second predominant use in the town

Department of Planning, School of Architecture and Planning, Anna University
CCP To Business Plan / TNUIFSL / September 2006 125
There are five major roads passing through this town of which two roads are National
Highways (6.4 kms) and the remaining roads are MDR and ODR, and are under the
maintenance of Highway Department. Besides, a number of inter linking and feeder
roads connecting the above major roads constitute the towns circulation pattern under
the maintenance of the local body. The mass transportation facility exists in all major
roads within the town. In the town as of 2004 – 05, about 54.861 km lengths of roads
are in existence, of which about 10 km of the roads maintained by high ways
Department, and the remaining by the municipality.
With regard to rail net work. Villupuram is railway junction having 3 m gauge and one
board gauge lines branching off in all four directions. Villupuram railway junction
handles 26 express 28 passenger and 32 goods trains daily.
S.No. Roads by surface Length in Kms % to total
1 Roads concreted 25.344 46.22
2 Tar roads 27.433 42.7
3 Gravel Roads 4.224 7.7
4 Mud roads 1.860 3.4
Total 54.861 100.00
Source :Annual report 2004-05 Villupuram Municipality
3.4.2 Issues: Roads and Streets
3.4.2.1 Town level –Issues
i) Madras –Trichy trunk road and Jawaharlal Nehru Road become highly
congested during peak hours. More over, through out the day, particularly
along distance by passable traffic make deafening noise along these roads
resulting in difficulty in transaction of business and peoples talking, and rise
in blood pressure and tension. Apart from these, the dust the traffic raises

Department of Planning, School of Architecture and Planning, Anna University
CCP To Business Plan / TNUIFSL / September 2006 126
from thick layers of articles in the vicinity of these roads. Enquires revealed
that it becomes a handicap for elders , un healthy and children to take to
take rest or to sleep in these arterial belts in the town.
ii) A few roads are of mud and WBM surfaced. How ever, the municipality has
plans to pave all the roads either by BT or cement concrete.
iii) The new bus stand has become an asset to the ULB as old bus stand was in
sufficient to the buses, both local and regional and which was also causing
heavy congestion in the centre of the town.
3.4.2.2 Ward / Street Levels: Roads
i) At peak hours, in some of the roads, traffic volume is such that two way
movements result in delays pollution and extra fuel consumption.
ii) 17 roads constituting only 3.84 are of WBM.
3.4.3 Future Requirements
3.4.3.1 Town Level
i) Two by passes to carry the by passable traffic are necessary. One from NH45
and the other NH 45A. Master plan for the town suggest a by pass road.
Alignment has been done by the National Highway department for the by
pass on NH 45. For another , the NH Department has under taken a
feasibility study , accordingly, the take off is 14 km away on pondicherry road
to join NH45 north of the town
ii) In the new bus stand, bus movement area has to be concreted. Old bus
stand has to be repaired and maintenance ensured.
iii) Parking spots to be identified for three wheelers.
3.4.3.2 Street/ Ward levels
At street levels, the following measures are suggested.
i) Speed breakers on Gingee road, KK Road
ii) Road dividers between new bus stand and siginal , PJN Road
iii) Railway over bridge across Villupuram-katpadi line south of the town

Department of Planning, School of Architecture and Planning, Anna University
CCP To Business Plan / TNUIFSL / September 2006 127
iv) One way – Kamaraj road. M G Road. TVK Road ,Kilperumbakkam main road f
v) Foot paths – along KK Road
vi) Manned Railway crossing across – railway feeder road
vii) Widening of Pondy road
3.4 Strategies – Roads and Streets
Strategic plan for 2011 for a population of 1.3 lakhs will have another 10 km of roads
and land use coverage of 116 ha as per the master plan. The aggregate road length of
more than 40 un approved layouts will be more than 10 km . Provision of by pass roads
to NH45 and NH 45A will save the town from traffic congestion and dust pollution from
by –passable traffic.
i) The municipality is proposing to cement concrete most of the roads and
bitumen surface all WBM /MR roads.
ii) Tree/ shrubs plantation on sides of major roads
iii) Provision of speed breakers and dividers on select roads as suggested by
stake holders.
iv) Provision of foot path along KK Road
v) Saving a few roads from congestion by opening them only for one way traffic
3.4.1 Tasks – Roads and Streets
i) Decongest main roads from by –passable traffic by providing by passes
ii) Decongest some roads from congestion by making them on way roads and
providing dividers
iii) Reduce danger of speeding by speed breakers
iv) Road side plantation for shade and avenue look.
3.5 Street lighting

Department of Planning, School of Architecture and Planning, Anna University
CCP To Business Plan / TNUIFSL / September 2006 128
3.5.1 Existing Status
In order to take care of providing and maintaining street lights, one electrical inspector,
3 wire men and 3 helpers are working in the municipality
As of 2004 - 05, there were 2166 Street lights
250 w- Sodium vapour lamps 350
40w- Tube lights 1719
250w- Mercury Vapour Lamps 95
High mast lamps 2
Total 1979
According to norms of one light for every 25 m of road length in 54.7 km of road/street
in the town 2188 lights would suffice. There are 242 roads with bends and curves, and
they would need extra lights. On the whole, except in un approved layouts, there are
enough number of lights.
3.5.2 Issues
i) Municipality has first provided tube lights and as the demand and need
increased the local body for sodium Vapour Lamps. Citizens now in
variably demand Sodium Vapour Lamps and mercury vapour lamps which
are costly and power intensive. How ever, the local body has decided to
replace the tube light by sodium vapour lamps over time, and mercury
vapour lamps in select area.
ii) Unapproved colonies for obvious reasons do not have adequate number
of street lights.
iii) According to norm of one street light for every 25 m of road length the
town has to have 2188 lights against 2166 available, there by a shortage
of 22 light exists (2004 - 05).
iv) Tube light pose O&M problem as they last for short time compared to
other lights replacement by Sodium Vapour lamp or Mercury Vapour
Lamp however is relatively more costly.

Department of Planning, School of Architecture and Planning, Anna University
CCP To Business Plan / TNUIFSL / September 2006 129
3.5.3 Future Requirements – Street lighting
Un approved lay outs require street lights on a priority basis and the municipality is
planning to replace the tube lights by sodium vapour lamps. As of 2004 - 05, the local
body has decided to provide additionally 75 Sodium Vapour Lamps besides attending to
repair works at the estimated cost of Rs.3.88 lakhs
3.5.4 Strategies and Task – Street Lighting
• Adequate number of street lights at least according to eth norms will be
provided
• Over time , the tube lights may be replaced by Sodium Vapour Lamps, and in
specific areas by Mercury Vapour Lamps
• Unapproved layouts will also be provided with street lights
• The municipality has installed 3 High Mast Lamps. Some more at the bus stand,
and junction of NH and at the Gandhi Statue will be provided
3.5.5 Sustainability Indicators – Street lighting
i) Spacing of Street lights 27.5m to 25m
ii) % of Tube Lights 80%-20%
iii) No of lights/ sq.km 222-245
iv) No of lights /1000 ppn 18-25
3.6 Educational Institutions
3.6.1 Existing Status
Educational institutional structures belong to the local body and are maintained by the
local body. Payment of salary for the teachers and staff is made by the state
government since April 1990. One Government College of Arts viz Perarignar Anna Arts
College is located in the town. There are 8 primary schools, 2 middle schools, 2 high
schools and 1 higher secondary schools.

Department of Planning, School of Architecture and Planning, Anna University
CCP To Business Plan / TNUIFSL / September 2006 130
3.6.2 Future Requirements-Schools
By norms, the number of primary schools which serve giving initial education to the
children should be at least one for every 1000 population , accordingly minimum four
more primary schools may have to constructed in the town . Like wise 2 more middle
schools may have to be setup. But demand for less additional schools was made at the
consultative meetings, for, there are number of private schools which meet
requirements.
3.6.3 Issues – Education
The municipality has to only build/ repair/ renovate and maintain the existing schools.
But the municipality gets no funds for this separately.
3.6.4 Strategies and Tasks
i) Literacy level will have to be improved in the town, and it was only
64.5% in 1991 against the states 77.9%.
ii) Citizens will be made aware of the poor literacy level of the town in
habitants and encourage them to send their children in variably to
schools.
iii) Due to finance crunch, there is constraint for additions to the schools or
constructions of new schools. But this can be done from government’s
grants or from people’s contributions.
3.6.5 Sustainability Indictors - Education
3.7 Medicare
3.7.1 Existing Status
a) Literacy rate (1991) 64.5%
b) No of primary Schools/ 10000 population 0.73-1
c) No Middle schools /10000 0.18

Department of Planning, School of Architecture and Planning, Anna University
CCP To Business Plan / TNUIFSL / September 2006 131
The municipality maintains three medical units: One Maternity hospital, one Allopathic
Hospital and one siddha dispensary. One lady Medical officer is in charge of the
Maternity Hospital, one Allopathic Doctor is in charge of the Allopathic dispensary and
likewise one Siddha dispensary. They are assisted by 2 compounders, 4 (maternity)
nurses, 6(maternity) ayas, one office assistant and 2 watch men. All these medical units
are located within the municipal buildings. There are a number of private clinics of
various sizes in the town
In addition, at various points of time. Health camps are organized and they are either
government sponsored or private NGOs/ Missionary sponsored. In Villupuram, the
following campus are being organized every year
i) Polio administrators camps 4-5 times a year covering all the wards.
ii) Government department of Health and Medicine sponsors Chicken pox
inoculation campus 3 -4 times a year for children up to 9 months
iii) Tests and investigators survey camps to detect leprosy cases are arranged 2-
3 times a year by the municipality.
iv) As a preventative measure , medicine for Filariasis are distributed 2-3 times
a year
v) Special camps to bring in public awareness about AIDS are arranged 2-3
times a year and people are give free advice and guidance.
vi) Under ‘jeeva jothi’ campaign , school students are medically tested to
investigate problems of health if any relating to anaemia , worms ear-nose
throat problems , dental care and the like thousands of students get the
benefit from these camps.
vii) As a regular feature , under NFCB programme , the MHO overseas mosquito
elimination through sprays and gas emissions –all over the city . Eleven
employees are working in this cell in the municipality.
viii) To prevent adulteration of food stuffs and eatables surprise raids as are
conduced to collect samples of food grains and other food items for testing.
The municipality qualified adulteration investigators for this purpose. The
samples are normally tested in Coimbatore labs.

Department of Planning, School of Architecture and Planning, Anna University
CCP To Business Plan / TNUIFSL / September 2006 132
3.7.2 Future Requirements- Medicare
Repair, maintenance, renovation and more staff, equipping the hospitals with modern
equipment and instruments and deploying specialist doctors for proper health care
priority requirements. Additional Medicare facilities in terms of Public Health Centre and
Maternity Home are required in the town. A veterinary hospital is also required in the
town. At town level, how ever a full fledged General Hospital is demanded as the town is
fast growing besides being District Head Quarters, and for emergency / complicated
surgery , the patients are to be taken to Pondicherry hospitals . An incinerator to treat
the medical wastes is a must in the town.A trauma care wing has to be attached to GH.
3.7.3 Strategies – Medicare
i) A full fledged hospital with 100-200 beds as an extension to the existing GH
necessary and the government will be approached for the purpose.
ii) Existing facilities will have to be revived and up dated in terms of equipment,
specialization medicines and branches of medi care in the GH.
iii) For other systems of medicine, full- fledged dispensaries will have to be
opened
iv) Two public Health Centers and a Maternity Home are to be set up
v) One veterinary hospital is required in the town
vi) People will have to be educated and informed about various new diseases
and the need for an awareness of them as a preventative measure and also
the remedies and precautions the people have to take to avoid contracting
the disease.
4
FUTURE VISION
4.1 Future Vision
As a foremost initial step, the ‘vision’ for the town has to be established in clear cut
terms as aspired by the people and, finally acceptable to them.

Department of Planning, School of Architecture and Planning, Anna University
CCP To Business Plan / TNUIFSL / September 2006 133
“Participation of the public, the users of the plan” is considered the essence of the
strategic plan, and in turn the business plan for the town in expressing their
aspirations and dreams about the town’s future character, form and function.
As the first priority step, a consultative process was evolved involving all the elected
councilors who are the responsible representatives of the public to reflect the
collective wish of their respective ward citizens and, the line agencies who all
contribute in their respective sectors of development to build the city. In four open
meetings, for the ward wise citizens, for the councilors and for the line agencies,
presided over by the chairman of the town council and, in the presence Municipal
Commissioner and all concerned from municipality, the participants deliberated at
length, at the instance of the consultant team, the issues relating to the town, the
town’s present status and its future. For the purpose of consolidating their considered
views, they have given in writing in the questionnaire provided for this purpose. An
analysis of views of the councilors and the line agencies wish the town to grow
“Commercially strong with an industrial bias in future in a sustainable living
environment”.
The town at present is growing commercial centre with vast agricultural hinter- land.
Commodities and food products followed by textiles and jewellery are traded in the
markets. The neighboring towns like Pondicherry are growing competitors as the
products in Villupuram are largely conventional. In order to make the products
attractive and competitive, and also to diversify the economy, setting industrial
establishments in manufacturing at house holds and other than house hold levels
become essential.
The requirements at area level expressed by the councilors and other stake holders
including the public a the series of consultative meetings at ward level mostly relate to
building a city with target of making it to fulfill the vision evolved for the city .
In brief, the importance blocks of the city building process are as follows:

Department of Planning, School of Architecture and Planning, Anna University
CCP To Business Plan / TNUIFSL / September 2006 134
i) Urban Governance
The organization has to be developed in such away that it is responsive to the
citizens’ needs with an understanding of the aspiration of the people and provide the
services and facilities to an acceptable and minimum satisfactory level in a
transparent mode of operation.
ii) Municipal Finance
The organizational resources have to be managed in a way to meet the strategic and
corporate plan capital and other requirements through an optimal assessment
method of raising resources, so that the citizens are conscious and willing to pay and
contribute as when required. This is to be done with a well through out Financial and
operating Plan Considering the short term and long term capital and O&M
requirements.
iii) Economic Development
The city is growing commercial centre with District Headquarters administrative set
up. For sustaining the town’s growth and development, an industrial input is
necessary in light of the entrepreneurial skill and potential of the town in the
regional setting.
iv) Land Use
The master plan for the town has extensively dealt the composition and disposition
of land use mosaic for the town for a perspective plan period of 20 years. The land
use plan keeps in view the growth dynamics of the town.
v) Traffic and Transportation
The town is traversed by arterial roads and railway lines, and because of its
locational advantages in the regional setting, the town’s road become increasingly
congested and polluting the town’s atmosphere. By passable traffic has to be
diverted , and the town roads will be made as far as possible dust free and less
congested , leaving the town’s environmental livable.
vi) Essential Services

Department of Planning, School of Architecture and Planning, Anna University
CCP To Business Plan / TNUIFSL / September 2006 135
Basic services such as water supply, sewerage, sanitation, street lighting, solid waste
management and roads /streets will be provided to the satisfaction of the citizen so
as to meet the social economic environmental norms and needs.
vii) Environment
The town’s land water and air will be kept environmentally acceptable through
concerted efforts to mitigate pollution and contamination of them by wastes, dust
and noise. The efforts in this direction will ensure sustainment of good environment
of the town.
viii) Privatization
For effectiveness and efficiency in managing services and commercial ventures of
sizable capital investments, private sector has to be involved, where the local body
will play a role of facilitator or enabler besides a manager.
ix) Community participation and Development
Community’s participation will be of utmost importance in the development of the
town and accordingly the efforts in planning for the town over short terms will be
oriented. The strategies for achieving these goals are clearly spelt out in the
respective sections.
4.2 Mission Statement
i) The short term mission for the town as the synthesis of corporate plan goals
will be to prepare adequate sound economic, social physical base as
foundation for building the “Vision” project in the long term. This would
mean provision of basic services to the people in an effective and efficient
manner, through an economic / financial investment programme.
ii) The long term vision for the town includes a well coordinated mission –
target-oriented effort that would include line-departments’ involvements with
the local body through a planned investment and implementation schedule.

Department of Planning, School of Architecture and Planning, Anna University
CCP To Business Plan / TNUIFSL / September 2006 136
5 ASSETS MANAGEMENT PLAN
5.0 Introduction
The local bodies like families and individuals, persons certain assert and properties. In
order to retain and strengthen the same as to earn income or provide needful service
out of them, they should maintain and preserve them at most. The exercise to maintain

Department of Planning, School of Architecture and Planning, Anna University
CCP To Business Plan / TNUIFSL / September 2006 137
and preserve them is what we may call Assert Management Plan (AMP). These assets
may be of movable and immovable items. Specifically the roads, parks, water supply
sources and river pumping stations, storm water drains, sewerage lines, street lights,
lands, buildings, markets, shopping complexes etc… are immovable assets and vehicles
and others can come under movable assets.
As to draw AMP, we need to have information on the conditions, costs, values, extent of
area in case of land or building, performance and management/ maintenance standards
if any.
5.1 Inventory of Assets
The basic aspects of the assets the AMP should have are types of assets in terms of
quantity and quality, location and locational distribution of assets, procurement age of
the assets, life cycle of the assets. Almost all assets either increase or decrease in their
values through the time and space and use. Thus the values as particularly the value
updating are yet other aspects of AMP.
Annexure III states the conditions and types of roads and length of each road street
wise. Annexure IV and V show the ward wise location and extent of various buildings
and lands of the municipality.
5.2 Street Lights
Villupuram Municipality, as of 2002 has provided 2203 streetlights in the Town.
5.3 Roads and Streets
Villupuram has roads to a length of 61,260 Kms, as asset to its credit. Of these roads,
75 percent of the roads are either BT or CC surfaced.
TABLE 5.1 Roads – Types and Length
S.No. Type of Roads Length in Kms
% to total
Highway Roads
1 National Highways 6.40 10.45

Department of Planning, School of Architecture and Planning, Anna University
CCP To Business Plan / TNUIFSL / September 2006 138
Sub Total 6.40 10.45
Municipal Roads
1 Concrete roads 25.34 41.36
2 BT roads 23.43 38.25
3 WBM roads 4.22 6.89
4 Earthen roads 1.86 3.04
Sub Total 54.85 89.55
TOTAL 61.26 100.00
5.4 Water Supply System
All the units relating to water supply systems covering Head works, Transmission Ducts,
OHT’s, Reservoirs, Supply and distribution mains, House connections, Treatment units
and other related appurtenances belong to the corporation. The distribution pipelines of
the town runs about 78.40 kms in length.
TABLE 5.2 Water Supply Appurtenances and their Numbers
S.No Type of Appurtenances No’s
1 Private Hand pumps with bore wells 200
2 Mini Power pumps 48
3 Public Fountains 144
4 OHTs 2
5 House service connections 5554
5.5 Others
The municipality owns vehicles for the officials, for lifting of garbage and in addition
owns compost yards for dumping of garbage.

Department of Planning, School of Architecture and Planning, Anna University
CCP To Business Plan / TNUIFSL / September 2006 139
Table 5.3: Building Of Schools, Hospitals and Parks
S.No Buildings No.
1 Municipal school buildings 36
2 Hospitals 4
3 Municipal Parks 3

Department of Planning, School of Architecture and Planning, Anna University
CCP To Business Plan / TNUIFSL / September 2006 140
6.1 CONSTRUCTION OF SHOPPING COMPLEX
6.1.1 INTRODUCTION
Villupuram is an important administration
centre with the population of 95,459 as per
2001 census and it is a fast growing urban
centre in the northern part of Tamilnadu. It
has got one of the important railway junction
connecting various important towns of
Tamilnadu and other states of India. The NH 45 and NH 45A runs through the town. It
is a major commercial centre famous for the wholesale trade of Paddy, Groundnut,
Sugarcane, Cotton etc., The major roads and municipal roads in the centre of the town
have large number of shops and trading activities. The Old bus stand site in centre of
the town is at present vacant and abuts the Pandit Jawaharlal Nehru Road. All these
features make the town more vibrant in recent years.
6.1.2 NEED ASSESSMENT
Due to congestion, bus stand operated within the town centre is shifted to a new
location during 2000. Total extent of the New Bus Stand is 15 acres located outside the
municipal limit along NH-45 (Trichy road) near Collectorate and Integrated Court
Complex Building with adequate facilities for handling more buses. Now Erstwhile Bus
stand site is used for parking town buses operated within the radius of 25 to 30km from
Villupuram. The total extent of old bus stand site is approximately 78,000 sq.ft along
Jawaharlal Nehru Road but only part of the land is used for bus bays rest of the land is
left vacant. Therefore Old bus stand can be utilized to develop commercial activities.
Since Villupuram is a major commercial and trading centre in the district, planned
commercial complexes are required of the time and proper spatial arrangement of the
activities. The old bus stand site is abutting the Pandit Jawaharlal Nehru Road which is a
wider and major road with commercial activities. Thus it is more situated for commercial
complex. Besides this, still some of the town buses terminate and start from this locality.
Thus the bus passengers and town population and as well as the hinterland population
Old Bus Stand Site

Department of Planning, School of Architecture and Planning, Anna University
CCP To Business Plan / TNUIFSL / September 2006 141
visiting the commercial centre will be benefited. The rental revenue and deposits of the
new shops will strengthen the revenue base of the Municipality. Already local body
owned 15 shops and rented to private people in this site. These shops yield nearly Rs.
2.50 lakhs per annum as a rent. Municipality felt that vacant land available in old bus
stand site is the prime location where shopping complex can be constructed in order to
utilize the land for mobilizing more resources for the local body.
6.1.3 COMPONENTS
It is suggested that shopping complex can be constructed in order to generate
sustainable revenue. It is proposed to construct in G+ 1 floor with all the infrastructure
facilities. It is proposed that shopping complex can be constructed at a plinth area of
29,000 sq.ft.
6.1.4 EXPENSES
Development cost for the project includes 2% of the total project cost as O&M charges
and 4% of the total project cost as inflation charges. The construction cost of Shopping
complex for a area of 58124 sq.ft in G+1 floor at a market rate of Rs. 1000 per sq.ft
comes around Rs. 581.24 lakhs. Over heads including O&M and Inflation for this project
is calculated as Rs. 34.87 lakhs. Thus the total project cost estimated is Rs. 616.11
Lakhs. The total cost is to be borrowed from TUFIDCO, TUUIFSL & Similar agencies at
the interest rate of 12.5% per annum for a repayment period of about 20yrs.
Table 6.1: Distribution of Development Components
S.No Development Component Rs. In Lakhs
1 Establishment Cost 581.24
Development costs (a) 581.24
1 O&M Charges @ 2% of (a) 11.62
2 Inflation @ 4% of (a) 23.25
Over heads (b) 34.87
GRAND TOTAL (a+b) 616.11

Department of Planning, School of Architecture and Planning, Anna University
CCP To Business Plan / TNUIFSL / September 2006 142
Table 6.2: Repayment Schedule – Cash Inflow
REPAYMENT SCHDULE - CASH INFLOW Rs. in lakhs
No. of years for Repayment: 20
Moratorium period: 5 Years
Repayment starting year: 2008
Repayment starting year: 2012
Loan Repayment
year Principal Interest Total Balance Year
Total Repayment
616.11 2007 0.00 0.00 0.00 616.11 2007 0.00
2008 32.43 77.01 109.44 583.69 2008 109.44
2009 32.43 72.96 105.39 551.26 2009 105.39
2010 32.43 68.91 101.33 518.83 2010 101.33
2011 32.43 64.85 97.28 486.41 2011 97.28
2012 32.43 60.80 93.23 453.98 2012 93.23
2013 32.43 56.75 89.17 421.55 2013 89.17
2014 32.43 52.69 85.12 389.12 2014 85.12
2015 32.43 48.64 81.07 356.70 2015 81.07
2016 32.43 44.59 77.01 324.27 2016 77.01
2017 32.43 40.53 72.96 291.84 2017 72.96
2018 32.43 36.48 68.91 259.42 2018 68.91
2019 32.43 32.43 64.85 226.99 2019 64.85
2020 32.43 28.37 60.80 194.56 2020 60.80
2021 32.43 24.32 56.75 162.14 2021 56.75
2022 32.43 20.27 52.69 129.71 2022 52.69
2023 32.43 16.21 48.64 97.28 2023 48.64
2024 32.43 12.16 44.59 64.85 2024 44.59
2025 32.43 8.11 40.53 32.43 2025 40.53
2026 32.43 4.05 36.48 0.00 2026 36.48
616.11 729.61 1386.26 1386.26
The total repayment made at the end of 2026 is about Rs.1386.26 Lakhs for a total loan
amount of Rs.616.11 Lakhs for the base year 2007.

Department of Planning, School of Architecture and Planning, Anna University
CCP To Business Plan / TNUIFSL / September 2006 143
6.1.5 REVENUE
It is proposed that shopping complex will hold 64 shops with the size of 12m x 6m and
24 shops with the size of 6m x 3m in G+1 floor. It is proposed to rent shops at a base
rate of Rs. 20 per sq.ft per month.
Therefore in a year nearly Rs. 133 Lakhs of revenue can be generated out of 88 shops.
Base rate arrived at this year will be revised on every consecutive 3 years of 10%
through out the repayment period. The total recovery arrived at 2026 out of this project
will be Rs.3325.11 Lakhs. The surplus amount out of this project at the end of 2026 is
Rs.1938.35 Lakhs.
6.1.6 DEBT SERVICES
The total project cost is carried by loan. Debt servicing will start with the interest pay in
the year 2008 (of Rs.77.01 lakhs). In 2008 repayment of loan (Principle + Interest) will
be Rs.109.44 lakhs and at the end of 2026 it reduced to Rs. 36.48 lakhs. The total debt
serving for the project works out to be Rs.1386.26 lakhs for a loan amount of Rs.616.11
Lakhs and total debt services are 616:1386(round off).
6.1.7 CASH FLOW
Throughout the repayment period the cash flow is in surplus and the Recovery &
Repayment ratio starts with 1.22 in the year 2008 and for the project is 2.40. Meanwhile
the rate of debt charges and recovery remains under 0.82 indicating the project revenue
is surplus over the debt servicing.

Department of Planning, School of Architecture and Planning, Anna University
CCP To Business Plan / TNUIFSL / September 2006 144
Table 6.3: Cash Outflow
CASH OUTFLOW Rs in lakhs
RECOVERY 2007 2008 2009 2010 2011 2012 2013 2014 2015 2016 2017 2018 2019 2020 2021 2022 2023 2024 2025 2026
Rent from Shops
0.00 133.44 133.44 133.44 146.78 146.78 146.78 161.46 161.46 161.46 177.61 177.61 177.61 195.37 195.37 195.37 214.91 214.91 214.91 236.40
TOTAL 0.00 133.44 133.44 133.44 146.78 146.78 146.78 161.46 161.46 161.46 177.61 177.61 177.61 195.37 195.37 195.37 214.91 214.91 214.91 236.40
Table 6.4: Cash flow statement
CASH- FLOW STATEMENT Rs. In Lakhs
Particulars 2007 2008 2009 2010 2011 2012 2013 2014 2015 2016 2017 2018 2019 2020 2021 2022 2023 2024 2025 2026 TOTAL
RECOVERY
Rent from Shops
0.00 133.44 133.44 133.44 146.78 146.78 146.78 161.46 161.46 161.46 177.61 177.61 177.61 195.37 195.37 195.37 214.91 214.91 214.91 236.40 3325.11
TOTAL (A) 0.00 133.44 133.44 133.44 146.78 146.78 146.78 161.46 161.46 161.46 177.61 177.61 177.61 195.37 195.37 195.37 214.91 214.91 214.91 236.40 3325.11
REPAYMENT
Debt charges 0.00 109.44 105.39 101.33 97.28 93.23 89.17 85.12 81.07 77.01 72.96 68.91 64.85 60.80 56.75 52.69 48.64 44.59 40.53 36.48 1386.26
TOTAL (B) 0.00 109.44 105.39 101.33 97.28 93.23 89.17 85.12 81.07 77.01 72.96 68.91 64.85 60.80 56.75 52.69 48.64 44.59 40.53 36.48 1386.26
Surplus /Deficit
0.00 24.00 28.05 32.11 49.50 53.56 57.61 76.34 80.39 84.45 104.65 108.70 112.75 134.57 138.62 142.68 166.27 170.32 174.37 199.92 1938.85
CUMULATIVE SURPLUS/ DEFICIT
0.00 24.00 52.05 84.16 133.66 187.21 244.82 321.17 401.56 486.01 590.66 699.36 812.11 946.68 1085.30 1227.98 1394.24 1564.56 1738.94 1938.85
Recovery /Repayment
(A/B) 0.00 1.22 1.27 1.32 1.51 1.57 1.65 1.90 1.99 2.10 2.43 2.58 2.74 3.21 3.44 3.71 4.42 4.82 5.30 6.48 2.40
Debt Charges /Devt. Charges (B/A)
0.00 0.82 0.79 0.76 0.66 0.64 0.61 0.53 0.50 0.48 0.41 0.39 0.37 0.31 0.29 0.27 0.23 0.21 0.19 0.15 0.42

Department of Planning, School of Architecture and Planning, Anna University
CCP To Business Plan / TNUIFSL / September 2006 145

Department of Planning, School of Architecture and Planning, Anna University
CCP To Business Plan / TNUIFSL / September 2006 73
6.2 VEGETABLE MARKET
6.2.1 INTRODUCTION
Villupuram Municipal Market is one of the important commercial centre, which support
the daily needs of the population residing in the surrounding rural areas and the town.
Agricultural commodity such as cereals, grains and fruits are purchased and routed
through Villupuram, having high rural commuters between villages and Villupuram. The
Municipal market is located in the central area near the Old Bus Stand and
accommodates 42 shops (both Vegetable and Non-Vegetable shops).
6.2.2 NEED ASSESSMENT
The Urban Local Body maintains one daily market, which caters to the need of
Villupuram town and surrounding rural areas. The existing market is located in ward no.
31 with T.S. No. 2 and T.S. No. 3 to 30 at a total extent of 5900 m2. The Municipal
market consists of different type of commercial activities like Vegetable Shops, Mutton
Shops, Fish Markets, Petty Shops and Provision Shops. Villupuram Municipal Market is
one of the important commercial centre and generates revenue (Rs. 1.25 lakhs per
annum), which is a source of income to local body.
At present, municipal market is located in the central area and consists of 42 Shops
(Vegetable and non-vegetable shops). Other than this, there are many shops also
functioning outside the market area. Different type of commercial activities is
concentrated along the M G Road, Baharsha Street and Kamaraj Street. Utilization of
this market and arrangement of shops as observed by the consultant’s team is not
proper and effective in tune with the town’s growth. Fish stalls and vegetable shops are
run unremuneratively according to the enquiries made with the shop keepers because
the street / pavement vendors along the commercial streets in the town do the similar
activities. The daily market shop keepers pay daily rent to the Municipality. It is
observed that this way the monthly rent per shop of vegetable and fish market may be
around Rs. 500 to Rs. 600 only. As per the survey conducted and from the interest of
Local Body in augmenting revenue, it is proposed to go in for Modernized Complex for

Department of Planning, School of Architecture and Planning, Anna University
CCP To Business Plan / TNUIFSL / September 2006 74
Market / Shops in G+1 floors in the existing vegetable Market site with all infrastructure
facilities. As to maximize the returns from the scarce urban land of this market and set
right the disorderly spatial arrangement, the present daily market complex may be
remodeled and reconstructed so that more shops are constructed in an orderly manner.
This way more revenue will add to the existing revenue base of the Villupuram
Municipality. As to run the daily market at more profitable level, the pavement / street
vendors along the commercial streets / roads need to be regulated and controlled.
Simultaneously this regulation will smoothen the traffic flow along the major roads of
the town too.
6.2.3 COMPONENTS
In existing market site, it is proposed to have Modernized Complex in G+ 1 floor with
400 shops. In that ground floor is used to sale vegetables & Grocery; first floor is for
Fruits and Flowers. Each shop is designed to have a approximate working space of
200 sq.ft at a construction cost of Rs.1000/sq.ft. Total estimated cost for the
construction of these shops is about Rs.800 Lakhs and overheads of Rs. 48 Lakhs. The
shops will be rented on monthly basis for Rs.3000 per shop and the total estimated
revenue will be Rs.144 Lakhs per annum.
6.2.4 OPERATING PARAMETERS
The total project cost has to be sourced from the finance institutions such as TUFIDCO
under the IDSMT Scheme for about Rs.848 Lakhs deducting the deposit amount of Rs.
40 lakhs at a rate of Rs. 10,000 from each shop owners. It involves the establishment
cost such as laying of staircase, construction of 400 shops. The total estimated cost
involves the operation and maintenance cost with the inflation.
6.2.5 EXPENSES
Development cost for the project includes 2% of the total project cost as O&M charges
and 4% of the total project cost as inflation charges. Thus the total project cost is
Rs.848 lakhs.

Department of Planning, School of Architecture and Planning, Anna University
CCP To Business Plan / TNUIFSL / September 2006 75
Table 6.5: Distribution of Development Components
S.No Development Component Rs. In Lakhs
1 Establishment Cost 800.00
Development costs (a) 800.00
1 O&M Charges @ 2% of (a) 16.00
2 Inflation @ 4% of (a) 32.00
Over heads (b) 48.00
GRAND TOTAL (a+b) 848.00
Deducting Rs. 40 Lakhs collected from shop owners as deposits the loan to be raised is
Rs. 808 Lakhs. The loan is to be borrowed from TUFIDCO, TUUIFSL & Similar agencies
at the interest rate of 12.5% per annum for a repayment period of about 20yrs.
Table 6.6: Repayment Schedule – Cash Inflow REPAYMENT SCHDULE - CASH INFLOW Rs in lakhs
No. of years for Repayment: 20
Moratorium period: 5 Years
Repayment starting year: 2008
Repayment starting year: 2012
Loan Repayment
year Principal Interest Total Balance Year
Total Repayment
808.00 2007 0.00 0.00 0.00 808.00 2007 0.00
2008 42.53 101.00 143.53 765.47 2008 143.53
2009 42.53 95.68 138.21 722.95 2009 138.21
2010 42.53 90.37 132.89 680.42 2010 132.89
2011 42.53 85.05 127.58 637.89 2011 127.58
2012 42.53 79.74 122.26 595.37 2012 122.26
2013 42.53 74.42 116.95 552.84 2013 116.95
2014 42.53 69.11 111.63 510.32 2014 111.63
2015 42.53 63.79 106.32 467.79 2015 106.32
2016 42.53 58.47 101.00 425.26 2016 101.00
2017 42.53 53.16 95.68 382.74 2017 95.68
2018 42.53 47.84 90.37 340.21 2018 90.37
2019 42.53 42.53 85.05 297.68 2019 85.05
2020 42.53 37.21 79.74 255.16 2020 79.74
2021 42.53 31.89 74.42 212.63 2021 74.42
2022 42.53 26.58 69.11 170.11 2022 69.11
2023 42.53 21.26 63.79 127.58 2023 63.79
2024 42.53 15.95 58.47 85.05 2024 58.47
2025 42.53 10.63 53.16 42.53 2025 53.16
2026 42.53 5.32 47.84 0.00 2026 47.84
808.00 956.84 1818.00 1818.00

Department of Planning, School of Architecture and Planning, Anna University
CCP To Business Plan / TNUIFSL / September 2006 76
The total repayment made at the end of 2026 is about Rs.1818 Lakhs for a loan amount
of Rs.808 Lakhs from the base year 2007.
6.2.6 REVENUE
The shops in the complex are left to lease on the monthly basis and the total revenue
for all the 400 shops on an average will be around Rs.12.00 lakhs / month. The total
recovery arrived at 2026 will be Rs.3588.25 Lakhs. This is assessed based on the
prevailing market rate. Base rate arrived at this year will be revised on every
consecutive 3 years of 10% through out the repayment period. The surplus amount out
of this project at the end of 2026 is Rs.1770.25 Lakhs.
6.2.7 DEBT SERVICES
Debt servicing will start with the interest in the year 2008 (of Rs.101 lakhs). In 2008
repayment of loan (Principle + Interest) will be Rs.143.53 lakhs and at the end of 2026
it reduced to Rs. 47.84 lakhs. The total interest paid for the project works out to be
Rs.1818 lakhs for a loan amount of Rs.808 Lakhs and total debt services are
808:1818(round off).
6.2.8 CASH FLOW
In this project, cash flow is in surplus through out the repayment period and the
Recovery & Repayment ratio starts with 1.00 in the year 2008 and for the project is
1.97. Meanwhile the rate of debt charges and recovery remains under 1.00 indicating
the project revenue is surplus over the debt servicing.

Department of Planning, School of Architecture and Planning, Anna University
CCP To Business Plan / TNUIFSL / September 2006 77
Table 6.7: Cash Outflow
CASH OUTFLOW Rs in lakhs
RECOVERY 2007 2008 2009 2010 2011 2012 2013 2014 2015 2016 2017 2018 2019 2020 2021 2022 2023 2024 2025 2026
Revenue from shops
0.00 144.00 144.00 144.00 158.40 158.40 158.40 174.24 174.24 174.24 191.66 191.66 191.66 210.83 210.83 210.83 231.91 231.91 231.91 255.10
TOTAL 0.00 144.00 144.00 144.00 158.40 158.40 158.40 174.24 174.24 174.24 191.66 191.66 191.66 210.83 210.83 210.83 231.91 231.91 231.91 255.10
Table 6.8: Cash flow statement
CASH- FLOW STATEMENT Rs. In Lakhs
Particulars 2007 2008 2009 2010 2011 2012 2013 2014 2015 2016 2017 2018 2019 2020 2021 2022 2023 2024 2025 2026 TOTAL
RECOVERY
Revenue from shops
0.00 144.00 144.00 144.00 158.40 158.40 158.40 174.24 174.24 174.24 191.66 191.66 191.66 210.83 210.83 210.83 231.91 231.91 231.91 255.10 3588.25
TOTAL (A) 0.00 144.00 144.00 144.00 158.40 158.40 158.40 174.24 174.24 174.24 191.66 191.66 191.66 210.83 210.83 210.83 231.91 231.91 231.91 255.10 3588.25
REPAYMENT
Debt charges
0.00 143.53 138.21 132.89 127.58 122.26 116.95 111.63 106.32 101.00 95.68 90.37 85.05 79.74 74.42 69.11 63.79 58.47 53.16 47.84 1818.00
TOTAL (B) 0.00 143.53 138.21 132.89 127.58 122.26 116.95 111.63 106.32 101.00 95.68 90.37 85.05 79.74 74.42 69.11 63.79 58.47 53.16 47.84 1818.00
Surplus /Deficit
0.00 0.47 5.79 11.11 30.82 36.14 41.45 62.61 67.92 73.24 95.98 101.30 106.61 131.09 136.41 141.73 168.12 173.44 178.76 207.26 1770.25
CUMULATIVE SURPLUS /DEFICIT
0.00 0.47 6.26 17.37 48.19 84.33 125.78 188.39 256.31 329.55 425.53 526.83 633.44 764.53 900.94 1042.67 1210.79 1384.23 1562.99 1770.25
Recovery /Repayment
(A/B) 0.00 1.00 1.04 1.08 1.24 1.30 1.35 1.56 1.64 1.73 2.00 2.12 2.25 2.64 2.83 3.05 3.64 3.97 4.36 5.33 1.97
Debt Charges /Devt. Charges (B/A)
0.00 1.00 0.96 0.92 0.81 0.77 0.74 0.64 0.61 0.58 0.50 0.47 0.44 0.38 0.35 0.33 0.28 0.25 0.23 0.19 0.51

Department of Planning, School of Architecture and Planning, Anna University
CCP To Business Plan / TNUIFSL / September 2006 78
6.3 UNDERGROUND SEWERAGE SYSTEM
6.3.1 INTRODUCTION
Contour of the town is generally flat, with a falling gentle slope from North to South and
West to East. There is no separate drainage, STWD, Sewerage system. The Natural course
of drainage system serves through out the town. It is proposed to have a UGD system
based on contour falling; the entire town is divided into 3 sewer zones with three pumping
stations at Xavier Colony, Pappan Kulam and Thamaraikulam. STPs at Poyyapakkam and
Vadakachipalayam. Zone I cover wards 1 & 18 fully and ward nos. 2, 17, 19 & 34 in western
part of the municipality. Zone II covers the central portion of the town including ward nos.
3, 13, 14, 15, 16, 19, 20, 21, 22, 23, 26, 27, 28, 29, 30, 31, 32, 33, 35 & 36 fully and 2, 17,
19 & 34 partly. Zone III covers the eastern part of the municipality includes ward 4, 5, 6, 7,
8, 9, 10, 11, 12, 24 & 25 fully.
6.3.2 NEED ASSESSMENT
Villupuram town has not been provided with an Underground Sewerage system. All the rain
water takes the natural course and drain water, storm water, sullage and sewer together.
The town is provided only with open masonry drains in most of the streets. The open drains
put up are along the sides of the roads / streets. There are 8 major drains draining various
parts of the town. Sewerage is let out directly into street drains without treatment
throughout the town. Sometimes they are let into low lying areas or ponds which act as
mosquito’s breeding grounds. Thus the performance of existing open drains system and
sewage disposal or not satisfactory. As to protect the towns population and considerable
amount of floating population visiting regularly the town. To improve the sanitary conditions
of the total town and to improve the quality of life a network of underground sewerage
system, a proper treatment and safe disposal is necessitated.
6.3.3 COMPONENTS
In order to provide under ground sewerage system involves construction of sewer lines,
house service connections, bedding, construction of main pumping station, sewage
treatment plant, Laying of pumping Mains & construction of STP. It was roughly worked out
that the total estimated cost for the project is about Rs.3380.31 Lakhs and the service

Department of Planning, School of Architecture and Planning, Anna University
CCP To Business Plan / TNUIFSL / September 2006 79
providers are asked to pay the initial deposits at a rate of Rs. 5000 for domestic and Rs.
20000 for non-domestic use. The estimated connections will be about 25000 domestic
connections and 4000 commercial connections. The total estimated deposits will be of
Rs.716.67 Lakhs.
6.3.4 OPERATING PARAMETERS
About 30% of the total Project cost is been provided as grant by TUNIFSL for the service
project. The deposits obtained for the service connections in the first & second phase is
excluded from the project cost to arrive total amount to be raised as a loan. It is proposed
to obtain Rs.840.77 Lakhs as a loan from financial institutions such as TNUIFSL at the
interest rate of 8.25% per annum for a repayment period of about 20yrs in which
moratorium period is of 5 yrs. This project is phased in two phases and the loan amount
obtained from the finance agencies are taken in phases as per the requirement.
6.3.5 EXPENSES
The core activity involved in this project are construction of sewer lines, house service
connections, bedding, construction of main pumping station, laying of main pumping station
and construction of STP. Development costs for the project involves Physical Contingency @
5 % of base cost and Price Contingency @ 10 % of the total project cost & Supervision
Charges @ 5% compounding for 3 years and Interest for 3 years. So the total project cost is
expected to be Rs.3380.15 Lakhs.
Table 6.9: Distribution of Development Components
S.No Development Component Rs. In Lakhs
Development costs
1 Sewer System (89.230 km)
Zone 1 (19.550 km) 225.000
Zone 2 (45.466 km) 533.000
Zone 3 (24.214 km) 345.320
2 House Service Connections 537.460
3 Road restoration charges for sewers, Hsc & Pumping main
301.490
4 Sewage cleaning equipment 25.000
sub total (A) 1967.270

Department of Planning, School of Architecture and Planning, Anna University
CCP To Business Plan / TNUIFSL / September 2006 80
5 Pumping Stations (3 nos.)
Zone 1 - PS1 20.500
Zone 2 -PS2 34.330
Zone 3 -PS3 25.910
Interconnection between various units 2.560
sub total (B) 83.300
6 Laying of Pumping Mains (3 nos.)
PM1 55.000
PM2 89.000
PM3 61.000
sub total (C) 205.000
7 Construction of Sewage Treatment Plant 375.000
8 Miscellaneous Items 135.000
sub total (D) 510.000
Total Base Cost (A+B+C+D) 2765.570
Over heads
9 Physical Contingency @ 5 % of base cost 138.280
sub total (E) 2903.850
10 Price Contingency @ 10 % of sub total E 290.380
sub total (F) 3194.230
11 Supervision Charges @ 5% of sub total F 159.710
sub total (G) 3353.940
Interest for 3 years 26.370
Total Project Cost 3380.315
6.3.6 PHASING
The loan is obtained in 2 phases, Phase I accounts to Rs. 1481.197 Lakhs and Phase II
accounts to Rs. 1899.118 Lakhs. For Phase I loan is obtained during 2007 and repayment of
loan ends in 2026 and for Phase II loan is obtained during 2008 and repayment ends in
2027. Phase I having a grant component of Rs. 798.67 Lakhs and deposits of Rs. 358.34
Lakhs. Phase II having a grant component of Rs. 1024.12 Lakhs and Rs. 358.34 Lakhs as
deposits. Therefore Loan amount for Phase I is Rs. 324.11 Lakhs and for
Phase II is Rs. 516.66 Lakhs.

Department of Planning, School of Architecture and Planning, Anna University
CCP To Business Plan / TNUIFSL / September 2006 81
Table 6.10: Development Components in phasing
S.No PROJECT COST Rs. In lakhs
Development costs Phase 1 Phase 2 TOTAL
1 Sewer System (89.230 km)
Zone 1 (19.550 km) 225.000 225.000
Zone 2 (45.466 km) 533.000 533.000
Zone 3 (24.214 km) 345.320 345.320
2 House Service Connections 537.460 537.460
3 Road restoration charges for sewers, Hsc & Pumping main 301.490 301.490
4 Sewage cleaning equipment 25.000 25.000
sub total (A) 758.000 1209.270 1967.270
5 Pumping Stations (3 nos.)
Zone 1 - PS1 20.500 20.500
Zone 2 -PS2 34.330 34.330
Zone 3 -PS3 25.910 25.910
Interconnection between various units 2.560 2.560
sub total (B) 54.830 28.470 83.300
6 Laying of Pumping Mains (3 nos.)
PM1 55.000 55.000
PM2 89.000 89.000
PM3 61.000 61.000
sub total (C) 144.000 61.000 205.000
7 Construction of Sewage Treatment Plant 187.5 187.5 375.000
8 Miscellaneous Items 67.5 67.5 135.000
sub total (D) 255 255 510.000
Total Base Cost (A+B+C+D) 1211.830 1553.740 2765.570
Over heads
1 Physical Contingency @ 5 % of base cost 60.592 77.687 138.279
sub total (E) 1272.422 1631.427 2903.849
2 Price Contingency @ 10 % of sub total E 127.242 163.143 290.385
sub total (F) 1399.664 1794.570 3194.233
3 Supervision Charges @ 5% of sub total F 69.983 89.728 159.712
sub total (G) 1469.647 1884.298 3353.945
Interest for 3 years 11.550 14.820 26.370
Total Project Cost 1481.197 1899.118 3380.315

Department of Planning, School of Architecture and Planning, Anna University
CCP To Business Plan / TNUIFSL / September 2006 82
6.3.7 REVENUE
The revenue generated from this project is by getting service charges at the rate of
Rs.5000/ domestic connection and Rs. 20000/ commercial connection. The total amount
obtained as deposits will be Rs.716.67 Lakhs. Revenue also includes service charges for
each connection it accounts to Rs. 396.00 Lakhs during 2010. Base rate has been arrived for
the initial 3 years by considering the prevailing market rate and it is proposed to increase
10% for the consecutive 3 years through out the repayment period. The total recovery
arrive

Department of Planning, School of Architecture and Planning, Anna University
CCP To Business Plan / TNUIFSL / September 2006 83
Table 6.11: Repayment Schedule – Cash Inflow REPAYMENT SCHDULE - CASH INFLOW Rs. in lakhs
No. of years for Repayment: 20 No. of years for Repayment: 20
Moratorium period: 5 Years Moratorium period: 5 Years
Repayment starting year: 2008 Repayment starting year: 2009
Repayment starting
year: 2008
Loan Repayment
year Principal Interest Total Balance Loan
Repayment year
Principal Interest Total Balance Year Total
Repayment
324.11 2007 0.00 0.00 0.00 324.11 2007 0.00
2008 17.06 0.00 17.06 307.05 516.66 2008 0.00 0.00 0.00 516.66 2008 17.06
2009 17.06 0.00 17.06 289.99 2009 27.19 0.00 27.19 489.47 2009 44.25
2010 17.06 0.00 17.06 272.93 2010 27.19 0.00 27.19 462.27 2010 44.25
2011 17.06 0.00 17.06 255.87 2011 27.19 0.00 27.19 435.08 2011 44.25
2012 17.06 21.11 38.17 238.82 2012 27.19 0.00 27.19 407.89 2012 65.36
2013 17.06 19.70 36.76 221.76 2013 27.19 33.65 60.84 380.70 2013 97.60
2014 17.06 18.29 35.35 204.70 2014 27.19 31.41 58.60 353.50 2014 93.95
2015 17.06 16.89 33.95 187.64 2015 27.19 29.16 56.36 326.31 2015 90.30
2016 17.06 15.48 32.54 170.58 2016 27.19 26.92 54.11 299.12 2016 86.65
2017 17.06 14.07 31.13 153.52 2017 27.19 24.68 51.87 271.93 2017 83.00
2018 17.06 12.67 29.72 136.47 2018 27.19 22.43 49.63 244.73 2018 79.35
2019 17.06 11.26 28.32 119.41 2019 27.19 20.19 47.38 217.54 2019 75.70
2020 17.06 9.85 26.91 102.35 2020 27.19 17.95 45.14 190.35 2020 72.05
2021 17.06 8.44 25.50 85.29 2021 27.19 15.70 42.90 163.16 2021 68.40
2022 17.06 7.04 24.09 68.23 2022 27.19 13.46 40.65 135.96 2022 64.75
2023 17.06 5.63 22.69 51.17 2023 27.19 11.22 38.41 108.77 2023 61.10
2024 17.06 4.22 21.28 34.12 2024 27.19 8.97 36.17 81.58 2024 57.45
2025 17.06 2.81 19.87 17.06 2025 27.19 6.73 33.92 54.39 2025 53.80
2026 17.06 1.41 18.47 0.00 2026 27.19 4.49 31.68 27.19 2026 50.14
324.11 168.88 492.98 2027 27.19 2.24 29.44 0.00 2027 29.44
516.66 269.21 785.86 1278.85
The total repayment made at the end of 2026 is about Rs.1278.85 Lakhs for a total loan amount of Rs.840.77 Lakhs for the base
year 2007.

Department of Planning, School of Architecture and Planning, Anna University
CCP To Business Plan / TNUIFSL / September 2006 84
6.3.7.1 Assumptions
It is assumed that the total deposits collected for the service connections will be added
in the principle amount in order to reduce the loan amount obtained from the finance
institutions. Thus we take only the service charges collected in each year can be
calculated as revenue. Since the installation period is 3 years the service charges will be
collected from the year 2010. The surplus amount out of this project at the end of 2027
is Rs. 9120.59 Lakhs.
6.3.8 DEBT SERVICES
The interest rate 8.25% will be calculated as per phases and in the first phase the
principle starts in the year 2008 (of Rs.17.06lakhs) the interest from 2012 will
Rs.21.11 Lakhs. The total loan amount paid for the first phase will be Rs.492.98 Lakhs.
In the second phase the principle starts at 2009 (of Rs.27.19 Lakhs) and the interest
from 2013 (of Rs.33.65 Lakhs). The total loan amount paid for the second phase will be
Rs.785.86 Lakhs. The total debt serving for the project works out at Rs.1278.85 Lakhs
for a loan amount of Rs.840.77 Lakhs (including the grants) and total debt services are
841 : 1279 (rounded off).
6.3.9 CASH FLOW
From the cash flow statement, the cash flow remains deficit till 2009 after then it is
having surplus revenue each year. At the end of 2027 project ends with the surplus
revenue of Rs. 9120.59 Lakhs at a Recovery-Repayment ration of 8.13. Meanwhile the
rate of debt charges and recovery remains under 0.20 indicating the project revenue is
surplus over the debt servicing.

Department of Planning, School of Architecture and Planning, Anna University
CCP To Business Plan / TNUIFSL / September 2006 85
Table 6.12: Cash Outflow
CASH OUTFLOW Rs in lakhs
RECOVERY 2007 2008 2009 2010 2011 2012 2013 2014 2015 2016 2017 2018 2019 2020 2021 2022 2023 2024 2025 2026 2027
Service Charges 0.00 0.00 0.00 396.00 396.00 396.00 455.40 455.40 455.40 523.71 523.71 523.71 602.27 602.27 602.27 692.61 692.61 692.61 796.50 796.50 796.50
TOTAL 0.00 0.00 0.00 396.00 396.00 396.00 455.40 455.40 455.40 523.71 523.71 523.71 602.27 602.27 602.27 692.61 692.61 692.61 796.50 796.50 796.50
Table 6.13: Cash flow statement
CASH- FLOW STATEMENT Rs. In Lakhs
Particulars 2007 2008 2009 2010 2011 2012 2013 2014 2015 2016 2017 2018 2019 2020 2021 2022 2023 2024 2025 2026 2027 TOTAL
RECOVERY
Service Charges
0.00 0.00 0.00 396.00 396.00 396.00 455.40 455.40 455.40 523.71 523.71 523.71 602.27 602.27 602.27 692.61 692.61 692.61 796.50 796.50 796.50 10399.44
TOTAL (A) 0.00 0.00 0.00 396.00 396.00 396.00 455.40 455.40 455.40 523.71 523.71 523.71 602.27 602.27 602.27 692.61 692.61 692.61 796.50 796.50 796.50 10399.44
REPAYMENT
Debt charges 0.00 17.06 44.25 44.25 44.25 65.36 97.60 93.95 90.30 86.65 83.00 79.35 75.70 72.05 68.40 64.75 61.10 57.45 53.80 50.14 29.44 1278.85
TOTAL (B) 0.00 17.06 44.25 44.25 44.25 65.36 97.60 93.95 90.30 86.65 83.00 79.35 75.70 72.05 68.40 64.75 61.10 57.45 53.80 50.14 29.44 1278.85
Surplus
/Deficit 0.00 -17.06 -44.25 351.75 351.75 330.64 357.80 361.45 365.10 437.06 440.71 444.36 526.57 530.22 533.87 627.86 631.51 635.16 742.70 746.35 767.06 9120.59
CUMULATIVE
SURPLUS/ DEFICIT
0.00 -17.06 -61.31 290.44 642.19 972.83 1330.63 1692.07 2057.17 2494.23 2934.94 3379.30 3905.86 4436.08 4969.95 5597.81 6229.32 6864.48 7607.18 8353.53 9120.59
Recovery
/Repayment (A/B)
0.00 0.00 0.00 8.95 8.95 6.06 4.67 4.85 5.04 6.04 6.31 6.60 7.96 8.36 8.81 10.70 11.34 12.06 14.81 15.88 27.06 8.13
Debt Charges
/Devt. Charges (B/A)
0.00 0.00 0.00 0.11 0.11 0.17 0.21 0.21 0.20 0.17 0.16 0.15 0.13 0.12 0.11 0.09 0.09 0.08 0.07 0.06 0.04 0.12

Department of Planning, School of Architecture and Planning, Anna University
CCP To Business Plan / TNUIFSL / September 2006 86

Department of Planning, School of Architecture and Planning, Anna University
CCP To Business Plan / TNUIFSL / September 2006 87
6.4 SOLID WASTE MANAGEMENT
6.4.1 INTRODUCTION
Villupuram is the municipality of about 8.36 sq.Km and maximum of the town is under the
urban use. As per 2001 census, the total population of the town is about 95,459 persons.
Villupuram town generates 42 MT of Solid Waste per day out of this nearly 40 MT of the
Solid Waste being collected, transported and disposed daily, which works to per capita
generation of 420 gms/ day. The efficiency of the present mechanism can able to collect
95% of the total waste generated in the town. The town is not provided with proper
disposal yard and it is required to propose a new one for the development of the town.
6.4.2 NEED ASSESSMENT
At present, there is no full-fledged compost yard facility is available for solid waste dumping
and the waste is generally disposed in the NH 45 Road Compost Yard 1KM away from the
town centre, which occupy an area of 5.42 acres. The existing compost yard is not provided
with adequate infrastructure facilities such as road, Weigh Bridge, Waste Segregation
platform, mechanical sewer and security room. Under Vision Plan
proposal under scrutiny for the purchase of 15 acres of land Kakuppam Village located 9 km
East from the necessary proposals are submitted for Pollution Board Clearance. Current
practice of Solid waste management is simply dumping in an open yard. As there are no
composting the waste remains as waste thus generating environmental Solid waste
problems as well as stinky environment. It is very close to existing residential colonies and
there is a stiff resistance from this colony people on the use of this site for composting.
Under the circumstance, the Local body was to push through to identify a new compost
yard with an extent of 15 acres at Kakuppam village.
6.4.3 COMPONENTS

Department of Planning, School of Architecture and Planning, Anna University
CCP To Business Plan / TNUIFSL / September 2006 88
The project basically involves 3 phases in which improvement of collection & Transportation
is in the first part, setting of compost plant and improvement of land fill site is in the next
consecutive level. From the current practice, no revenue is generated from the sale of
manure and sale of recyclable waste which is generated out of the solid waste collected
from the town. The proposed project cost could be equated from the revenue gained out of
sale of the compost. Thus the total revenue generated out will be around Rs.386.48 Lakhs
at the end of 2026.
6.4.4 OPERATING PARAMETERS
This project cost is calculated with the works involved such as Improvement of collection &
Transportation, setting up of compost Yard, Improvement of land fill site. The development
cost is Rs. 168.00 lakhs. This amount is proposed to be sourced from the finance institutions
such as TUFIDCO or under the IDSMT Scheme.
6.4.5 EXPENSES
This project activity has Improvement of Collection & Transportation, Setting up of Compost
plant, Improvement of land fill site are executed from the total amount of Rs.168.00 Lakhs.
Table 6.14: Distribution of Development Components
S.No PROJECT COST- in Lakhs
Development Cost TOTAL
1 Purchase of Dumper placer, dumper pins & auto tippers
47.00
2 Construction of transfer station 10.00
3 Vermi Compost Shed 8.00
4 Compost Yard 71.00
5 Information, education & communication 32.00
Total 168.00
Table 6.15: Repayment Schedule – Cash Inflow

Department of Planning, School of Architecture and Planning, Anna University
CCP To Business Plan / TNUIFSL / September 2006 89
REPAYMENT SCHDULE - CASH INFLOW Rs in lakhs
No. of years for Repayent: 20
Moratorium period: 5 Years
Repayment starting year: 2009
Repayment starting year: 2012
Loan Repayment
year Principal Interest Total Balance Year
Total Repayment
168.00 2007 0.00 0.00 0.00 168.00 2008 0.00
2008 8.84 0.00 8.84 159.16 2009 8.84
2009 8.84 0.00 8.84 150.32 2010 8.84
2010 8.84 0.00 8.84 141.47 2011 8.84
2011 8.84 0.00 8.84 132.63 2012 8.84
2012 8.84 10.94 19.78 123.79 2013 19.78
2013 8.84 10.21 19.05 114.95 2014 19.05
2014 8.84 9.48 18.33 106.11 2015 18.33
2015 8.84 8.75 17.60 97.26 2016 17.60
2016 8.84 8.02 16.87 88.42 2017 16.87
2017 8.84 7.29 16.14 79.58 2018 16.14
2018 8.84 6.57 15.41 70.74 2019 15.41
2019 8.84 5.84 14.68 61.89 2020 14.68
2020 8.84 5.11 13.95 53.05 2021 13.95
2021 8.84 4.38 13.22 44.21 2022 13.22
2022 8.84 3.65 12.49 35.37 2023 12.49
2023 8.84 2.92 11.76 26.53 2024 11.76
2024 8.84 2.19 11.03 17.68 2025 11.03
2025 8.84 1.46 10.30 8.84 2026 10.30
2026 8.84 0.73 9.57 0.00 2027 9.57
168.00 87.54 255.54 255.54
The total repayment made at the end of 2026 is about Rs.255.54 Lakhs for a total loan
amount of Rs. 168.00 Lakhs for the base year 2008.
6.4.6 REVENUE

Department of Planning, School of Architecture and Planning, Anna University
CCP To Business Plan / TNUIFSL / September 2006 90
After the project got completed the revenue can be generated by selling the manure
produced and by sale of recyclable waste. It is assumed that about 10% of the total
garbage is converted into manure i.e.1095 tons per year taking a base rate of Rs. 1000 per
ton. Also recyclable waste accounts to 5% of total garbage. For calculation purpose 0.25
tons of wastes are sold as a recyclable waste per day. Therefore revenue generated by
means of selling recyclable waste in a year is Rs. 4.56 lakhs considering Rs. 5000 per ton.
The total recovery by means of sale of manure & recyclable waste is about Rs.15.51 Lakhs
per annum. Base rate has been arrived for the initial 3 years by considering the prevailing
market rate and it is proposed to increase 10% for the consecutive 3 years through out the
repayment period.
6.4.7 DEBT SERVICES
Debt servicing for this project starts with principle in the year 2008 (of Rs.8.84 Lakhs) and
the interest from 2012 (of Rs.10.94 Lakhs). The total debt serving for the project works out
at Rs.255.54 Lakhs for a loan amount of Rs.168.00 Lakhs and total debt services are 168 :
256 (rounded).
6.4.8 CASH FLOW
In this project we have a surplus Cash flow throughout the repayment period and the
recovery vs repayment ratio starts at 1.75 in the year 2008 and those of the project it is
1.51 where as the rate of debt charges and recovery remains under 1.12 indicating the
project revenue is surplus over the debt servicing.

Department of Planning, School of Architecture and Planning, Anna University
CCP To Business Plan / TNUIFSL / September 2006 91
Table 6.16: Cash Outflow
CASH OUTFLOW Rs in lakhs
RECOVERY 2007 2008 2009 2010 2011 2012 2013 2014 2015 2016 2017 2018 2019 2020 2021 2022 2023 2024 2025 2026
sale of manure
0.00 10.95 10.95 10.95 12.05 12.05 12.05 13.25 13.25 13.25 14.57 14.57 14.57 16.03 16.03 16.03 17.64 17.64 17.64 19.40
sale of recyclable waste
0.00 4.56 4.56 4.56 5.02 5.02 5.02 5.52 5.52 5.52 6.07 6.07 6.07 6.68 6.68 6.68 7.34 7.34 7.34 8.08
TOTAL 0.00 15.51 15.51 15.51 17.06 17.06 17.06 18.77 18.77 18.77 20.64 20.64 20.64 22.71 22.71 22.71 24.98 24.98 24.98 27.48
Table 6.17: Cash flow statement
CASH- FLOW STATEMENT Rs. In Lakhs
Particulars 2007 2008 2009 2010 2011 2012 2013 2014 2015 2016 2017 2018 2019 2020 2021 2022 2023 2024 2025 2026 TOTAL
RECOVERY
Sale of manure
0.00 10.95 10.95 10.95 12.05 12.05 12.05 13.25 13.25 13.25 14.57 14.57 14.57 16.03 16.03 16.03 17.64 17.64 17.64 19.40 272.86
sale of recyclable
waste 0.00 4.56 4.56 4.56 5.02 5.02 5.02 5.52 5.52 5.52 6.07 6.07 6.07 6.68 6.68 6.68 7.34 7.34 7.34 8.08 113.63
TOTAL (A) 0.00 15.51 15.51 15.51 17.06 17.06 17.06 18.77 18.77 18.77 20.64 20.64 20.64 22.71 22.71 22.71 24.98 24.98 24.98 27.48 386.48
REPAYMENT
Debt charges 0.00 8.84 8.84 8.84 8.84 19.78 19.05 18.33 17.60 16.87 16.14 15.41 14.68 13.95 13.22 12.49 11.76 11.03 10.30 9.57 255.54
TOTAL (B) 0.00 8.84 8.84 8.84 8.84 19.78 19.05 18.33 17.60 16.87 16.14 15.41 14.68 13.95 13.22 12.49 11.76 11.03 10.30 9.57 255.54
Surplus / Deficit
0.00 6.67 6.67 6.67 8.22 -2.72 -1.99 0.44 1.17 1.90 4.51 5.24 5.97 8.76 9.49 10.22 13.22 13.95 14.68 17.91 130.95
CUMULATIVE SURPLUS /DEFICIT
0.00 6.67 13.34 20.00 28.22 25.50 23.51 23.95 25.12 27.02 31.53 36.76 42.73 51.49 60.98 71.20 84.42 98.36 113.04 130.95
Recovery / Repayment
(A/B) 0.00 1.75 1.75 1.75 1.93 0.86 0.90 1.02 1.07 1.11 1.28 1.34 1.41 1.63 1.72 1.82 2.12 2.26 2.42 2.87 1.51
Debt Charges / Devt. Charges
(B/A) 0.00 0.57 0.57 0.57 0.52 1.16 1.12 0.98 0.94 0.90 0.78 0.75 0.71 0.61 0.58 0.55 0.47 0.44 0.41 0.35 0.66

Department of Planning, School of Architecture and Planning, Anna University
CCP To Business Plan / TNUIFSL / September 2006 92
6.5 OFFICE CUM SHOPPING COMPLEX
6.5.1 INTRODUCTION
Villupuram town is a district headquarters town. It is also a major urban centre and
commercial centre for a vast hinterland of the district Villupuram. It is an important
transportation nodal centre as the broad and metre guage railway lines and NH 45 and NH
45 a pass through this town. These national highways and major municipal roads in the
centre of the town are commercially developed. The Muncipal Kalyana Mandapam situated
in Pandit Jawaharlal Nehru Road which is a major commercial road running from east to
west in southern part of the town. The location of this kalyanamandapam is a potential land
but developed as a kalyanamandapam in ground level only.
6.5.2 NEED ASSESSMENT
The site within which the municipal kalyanamandapam is put up is a prime and valuable
urban site. It can have two proposals. One proposal is on the intensification of the use of
this site. It is necessitated as it can fetch more revenue to the Municipality. Thus, the first
floor to be put, after finding out the feasibility corrective measures, will be used for
shopping cum office complex with separate entries. A Lodge, which is also an remunerative
activity in that locality can also be thought. The other proposal is on improving the
kalyanamandapam with good finishing like tiled floorings, furnishings, fittings and lighting
arrangements within and outside the buildings. The good finish and aesthetic nature of the
kalyanamandapam will attract the public to conduct the marriages, meetings, social and
public functions etc. This way the improved kalyana mandapam will fetch additional revenue
to the Municipality.
6.5.3 COMPONENTS
The existing Kalayanamandapam is proposed to improve at a cost of Rs. 15 Lakhs. It is
suggested that Office cum shopping complex with better infrastructure facilities can be
constructed in the first floor at an extent of 6,000sq.ft over the existing
Kalayanamandapam. It is proposed to construct each shop with an area of 250sq.ft at a
prevailing construction cost of Rs. 1000 per sq.ft. Approximately it is designed to have 16

Department of Planning, School of Architecture and Planning, Anna University
CCP To Business Plan / TNUIFSL / September 2006 93
numbers of shops occupy an area of 4000 sq.ft. Remaining area (2000 sq.ft) is proposed to
rent it for office purpose. It is estimated that nearly Rs. 79.50 Lakhs of capital is required to
implement this project.
6.5.4 OPERATING PARAMETERS
The total project cost has to be sourced from the financial institutions such as TUFIDCO
under the IDSMD Scheme for about Rs. 79.50 Lakhs. This cost involves the establishment
cost for office & shopping complex and improvement of existing Kalayanamandapam. The
total estimated cost involves the operation and maintenance cost with the inflation.
6.5.5 EXPENSES
Development cost for the project includes construction cost of office & shops and 2% of the
total project cost as O&M charges and 4% of the total project cost as inflation charges.
Thus the total project cost arrived is Rs.132.71 Lakhs.
Table 6.18: Distribution of Development Components
S.No Development Component Rs. In Lakhs
1 Improvement of Kalayanamandapam 15.00
2 Construction of Office cum shopping Complex 60.00
Development costs (a) 75.00
1 O&M Charges @ 2% of (a) 1.50
2 Inflation @ 4% of (a) 3.00
Over heads (b) 4.50
GRAND TOTAL (a+b) 79.50
The total cost is to be borrowed from TUFIDCO, TUUIFSL & Similar agencies at the interest
rate of 12.5% per annum for a repayment period of about 20yrs.
Table 6.19: Repayment Schedule – Cash Inflow

Department of Planning, School of Architecture and Planning, Anna University
CCP To Business Plan / TNUIFSL / September 2006 94
REPAYMENT SCHDULE - CASH INFLOW Rs. in Lakhs
No. of years for Repayment: 20
Moratorium period: 5 Years
Repayment starting year: 2008
Repayment starting
year: 2012
Loan Repayment
year Principal Interest Total Balance Year
Total
Repayment
79.50 2007 0.00 0.00 0.00 79.50 2007 0.00
2008 4.18 9.94 14.12 75.32 2008 14.12
2009 4.18 9.41 13.60 71.13 2009 13.60
2010 4.18 8.89 13.08 66.95 2010 13.08
2011 4.18 8.37 12.55 62.76 2011 12.55
2012 4.18 7.85 12.03 58.58 2012 12.03
2013 4.18 7.32 11.51 54.39 2013 11.51
2014 4.18 6.80 10.98 50.21 2014 10.98
2015 4.18 6.28 10.46 46.03 2015 10.46
2016 4.18 5.75 9.94 41.84 2016 9.94
2017 4.18 5.23 9.41 37.66 2017 9.41
2018 4.18 4.71 8.89 33.47 2018 8.89
2019 4.18 4.18 8.37 29.29 2019 8.37
2020 4.18 3.66 7.85 25.11 2020 7.85
2021 4.18 3.14 7.32 20.92 2021 7.32
2022 4.18 2.62 6.80 16.74 2022 6.80
2023 4.18 2.09 6.28 12.55 2023 6.28
2024 4.18 1.57 5.75 8.37 2024 5.75
2025 4.18 1.05 5.23 4.18 2025 5.23
2026 4.18 0.52 4.71 0.00 2026 4.71
79.50 94.14 178.88 178.88
The total repayment made at the end of 2026 is about Rs.178.88 Lakhs for a total loan
amount of Rs.79.50 Lakhs for the base year 2007.
6.5.6 REVENUE

Department of Planning, School of Architecture and Planning, Anna University
CCP To Business Plan / TNUIFSL / September 2006 95
since Kalayanamandapam is already exists there is no revenue is projected for making cash
out flow for this project Only revenue from office and shops is considered. Office cum shops
is designed for 16 nos. It is proposed to rent a shop at Rs. 20 per sq.ft per month. The
revenue generated per month by way of rent from shops is around Rs. 80,000.
Therefore annually Rs. 9.60 Lakhs of revenue can be mobilized out of 16 shops. Office is
proposed to have a working area of 2000 sq.ft and a monthly rent of Rs. 15,000 is
proposed to collect. Therefore it accounts Rs. 1.80 Lakhs per annum. Therefore annually Rs.
11.40 Lakhs of revenue can be mobilized out of this project. Base rate arrived at this year
will be revised on every consecutive 3 years of 10% through out the repayment period. The
total recovery arrived at 2026 will be Rs.284.07 Lakhs. The surplus amount out of this
project at the end of 2026 is Rs.105.19 Lakhs.
6.5.7 DEBT SERVICES
Debt servicing will start with the interest in the year 2008 (of Rs.9.94 Lakhs). The total debt
serving for the project works out to be Rs.178.88 Lakhs for a loan amount of Rs.79.50
Lakhs and total debt services are 79:179(round off).
6.5.8 CASH FLOW
In this project the cash flow is deficit till 2011 to an amount of 6.61 Lakhs. Later this project
experiences a surplus of Rs. 0.51 Lakhs during 2012. At the end of 2026 it ends to a surplus
of Rs. 15.49 Lakhs. Recovery & Repayment ratio starts with 0.81 in the year 2008 and for
the project is 1.59. Meanwhile the rate of debt charges and recovery is over 1.00 till 2011
later it remains less than 0.90 indicating the project revenue is surplus over the debt
servicing. For the entire repayment period ratio of debt charges and recovery is 0.63.

Department of Planning, School of Architecture and Planning, Anna University
CCP To Business Plan / TNUIFSL / September 2006 96

Department of Planning, School of Architecture and Planning, Anna University
CCP To Business Plan / TNUIFSL / September 2006 97
Table 6.20: Cash Outflow
CASH OUTFLOW Rs in Lakhs
RECOVERY 2007 2008 2009 2010 2011 2012 2013 2014 2015 2016 2017 2018 2019 2020 2021 2022 2023 2024 2025 2026
Revenue from Office and Shops
0.00 11.40 11.40 11.40 12.54 12.54 12.54 13.79 13.79 13.79 15.17 15.17 15.17 16.69 16.69 16.69 18.36 18.36 18.36 20.20
TOTAL 0.00 11.40 11.40 11.40 12.54 12.54 12.54 13.79 13.79 13.79 15.17 15.17 15.17 16.69 16.69 16.69 18.36 18.36 18.36 20.20
Table 6.21: Cash flow statement
CASH- FLOW STATEMENT Rs. In Lakhs
Particulars 2007 2008 2009 2010 2011 2012 2013 2014 2015 2016 2017 2018 2019 2020 2021 2022 2023 2024 2025 2026 TOTAL
RECOVERY
Revenue from Office and Shops
0.00 11.40 11.40 11.40 12.54 12.54 12.54 13.79 13.79 13.79 15.17 15.17 15.17 16.69 16.69 16.69 18.36 18.36 18.36 20.20 284.07
TOTAL (A) 0.00 11.40 11.40 11.40 12.54 12.54 12.54 13.79 13.79 13.79 15.17 15.17 15.17 16.69 16.69 16.69 18.36 18.36 18.36 20.20 284.07
REPAYMENT
Debt charges 0.00 14.12 13.60 13.08 12.55 12.03 11.51 10.98 10.46 9.94 9.41 8.89 8.37 7.85 7.32 6.80 6.28 5.75 5.23 4.71 178.88
TOTAL (B) 0.00 14.12 13.60 13.08 12.55 12.03 11.51 10.98 10.46 9.94 9.41 8.89 8.37 7.85 7.32 6.80 6.28 5.75 5.23 4.71 178.88
Surplus /Deficit
0.00 -2.72 -2.20 -1.68 -0.01 0.51 1.03 2.81 3.33 3.86 5.76 6.28 6.80 8.85 9.37 9.89 12.08 12.61 13.13 15.49 105.19
CUMULATIVE SURPLUS /DEFICIT
0.00 -2.72 -4.92 -6.60 -6.61 -6.10 -5.06 -2.25 1.08 4.94 10.69 16.98 23.78 32.63 42.00 51.89 63.97 76.58 89.71 105.19
Recovery/ Repayment
(A/B) 0.00 0.81 0.84 0.87 1.00 1.04 1.09 1.26 1.32 1.39 1.61 1.71 1.81 2.13 2.28 2.45 2.93 3.19 3.51 4.29 1.59
Debt Charges
/Devt. Charges (B/A)
0.00 1.24 1.19 1.15 1.00 0.96 0.92 0.80 0.76 0.72 0.62 0.59 0.55 0.47 0.44 0.41 0.34 0.31 0.28 0.23 0.63

Department of Planning, School of Architecture and Planning, Anna University
CCP To Business Plan / TNUIFSL / September 2006 98

Department of Planning, School of Architecture and Planning, Anna University
CCP To Business Plan / TNUIFSL / September 2006 99
6.6 STREET LIGHTS.
6.6.1 INTRODUCTION
Energy savings means energy producing. It is a well known fact and it is very much
essential for any city to reduce expenditure and generate resources. If so the resource will
be available for spend on other developmental activities. Villupuram town’s financial
situation displays that there is considerable amount of money spend on the electricity
charges. Street Lighting is one of the major consumption of energy for the Local Body. It is
a recurring activity where in the local body has to pay regular by this energy tariff to TNEB.
Conservation of energy is the national agenda, to cope with the peace of development and
conservation is the need of the hour. Increasing population in the city needs the city
authority to find means and ways to reduce the cost in supply and increase the efficiency.
The technology now had come up to reduce this tariff by altering the consumption pattern
by adopting energy saving equipments like Timmer, Dimmer and high tech Chokes. By
doing so about 40% of the consumption of energy could be saved. It requires marginal
investment of altering existing fittings. It is assessed from the records that many private
agencies shown interest to take up change over of current system to new system of install
& maintenance totally by private parties.
6.6.2 NEED ASSESSMENT
There are about 1752 tube lights in the municipality and by opting to energy saving
methods about 40% of the energy is saved by Lumen control, Energy Efficient illuminaries.
This employs specially designed low impedance circuit which reduces the running current
and voltage to an optimum level in the load circuits without ejecting the other parameters
which caused to save energy about 25% to 40% in lighting loads. Dimmer introduced in
power saving switch is most superior to other control devices. Automatic Timmer is
introduced in the municipality in order to reduce the power supply in the mornings. Thus we
could save ample amount of energy.

Department of Planning, School of Architecture and Planning, Anna University
CCP To Business Plan / TNUIFSL / September 2006 100
6.6.3 COMPONENTS
The proposed project is of installation of energy saving street lights by changing the existing
40W lights into 36W lights and also introducing dimmer option for all the sodium vapour
lamps. This project involves Switching off Alternate lamps during off Peak hour in high mask
lamps, Automation in Switching On / Off, Using Timers and replacement of the existing 40
Watts choke with energy efficient electronics choke. It is roughly worked out that the total
cost estimated for the project is Rs.6.13 Lakhs. By introducing this option, there is scope for
energy savings of almost 40 % which is quite substantial. The expected cost savings would
be around Rs.7.54 Lakhs / year and the investment needed to achieve this savings is only
Rs.6.13 Lakhs which is a one time investment.
6.6.4 OPERATING PARAMETERS
The project cost has to be sourced from the finance institutions for the total project cost of
about Rs.6.13 Lakhs. This cost is used for Establishment of Energy saving street lights.
6.6.5 EXPENSES
This project is a short term project and the inflation and O&M Charges will not be calculated
for it. So the total project cost is expected to be only Rs.6.13 Lakhs.
Table 6.22: Distribution of Development Components
S.No Development Component Rs. In Lakhs
1 Replacement of 40w tube lights to 36w tube lights 0.70
2 Fixing of Dimmer for Sodium Vapour Lamps 0.53
3 Installation of Timer 3.30
4 Replacing 40w choke into electronic choke 1.60
GRAND TOTAL 6.13
The total cost is to be borrowed from TUFIDCO, TUUIFSL & Similar agencies at the interest
rate of 8.25% per annum for a repayment period of about 20yrs in which moratorium
period is of 5 yrs.

Department of Planning, School of Architecture and Planning, Anna University
CCP To Business Plan / TNUIFSL / September 2006 101
Table 6.23: Repayment Schedule – Cash Inflow
REPAYMENT SCHDULE - CASH INFLOW Rs. in lakhs
No. of years for Repayment: 20
Moratorium period: 5 Years
Repayment starting year: 2008
Repayment starting
year: 2012
Loan Repayment
year Principal Interest Total Balance Year
Total
Repayment
6.13 2007 0.00 0.00 0.00 6.13 2007 0.00
2008 0.32 0.00 0.32 5.81 2008 0.32
2009 0.32 0.00 0.32 5.48 2009 0.32
2010 0.32 0.00 0.32 5.16 2010 0.32
2011 0.32 0.00 0.32 4.84 2011 0.32
2012 0.32 0.40 0.72 4.52 2012 0.72
2013 0.32 0.37 0.70 4.19 2013 0.70
2014 0.32 0.35 0.67 3.87 2014 0.67
2015 0.32 0.32 0.64 3.55 2015 0.64
2016 0.32 0.29 0.62 3.23 2016 0.62
2017 0.32 0.27 0.59 2.90 2017 0.59
2018 0.32 0.24 0.56 2.58 2018 0.56
2019 0.32 0.21 0.54 2.26 2019 0.54
2020 0.32 0.19 0.51 1.94 2020 0.51
2021 0.32 0.16 0.48 1.61 2021 0.48
2022 0.32 0.13 0.46 1.29 2022 0.46
2023 0.32 0.11 0.43 0.97 2023 0.43
2024 0.32 0.08 0.40 0.65 2024 0.40
2025 0.32 0.05 0.38 0.32 2025 0.38
2026 0.32 0.03 0.35 0.00 2026 0.35
6.13 3.19 9.32 9.32
The total repayment made at the end of 2026 is about Rs.9.32 Lakhs for a total loan
amount of Rs.6.13Lakhs for the base year 2007.

Department of Planning, School of Architecture and Planning, Anna University
CCP To Business Plan / TNUIFSL / September 2006 102

Department of Planning, School of Architecture and Planning, Anna University
CCP To Business Plan / TNUIFSL / September 2006 103
6.6.6 REVENUE
This project will not be having any revenue after installation of the energy saving street lights but the amount of electricity
consumed in the present situation will be less than that of the proposed option. The saved amount will be around Rs.7.54 Lakhs
which could be used for other development projects in the Municipality. So the total amount saved at the end of 2026 will be around
Rs.151.56 Lakhs i.e. the loan obtained in 2007 can be repaid by the amount saved in the project. From the Table below we can find
the savings amount per year is more than the Debt charges and the total savings gained at the end of the repayment period is
Rs.142.23 Lakhs.
Table 6.24: DEBT / SAVINGS STATEMENT
DEBT/ SAVINGS STATEMENT Rs. In Lakhs
Particulars 2007 2008 2009 2010 2011 2012 2013 2014 2015 2016 2017 2018 2019 2020 2021 2022 2023 2024 2025 2026 TOTAL
Debt charges
0.00 0.32 0.32 0.32 0.32 0.72 0.70 0.67 0.64 0.62 0.59 0.56 0.54 0.51 0.48 0.46 0.43 0.40 0.38 0.35 9.32
Savings 7.58 7.58 7.58 7.58 7.58 7.58 7.58 7.58 7.58 7.58 7.58 7.58 7.58 7.58 7.58 7.58 7.58 7.58 7.58 7.58 151.56
TOTAL (B) 7.58 7.26 7.26 7.26 7.26 6.86 6.88 6.91 6.94 6.96 6.99 7.02 7.04 7.07 7.10 7.12 7.15 7.18 7.20 7.23 142.23
So we can assume the Total surplus amount gained out of this project at the end of 2026 is Rs.142.23 Lakhs.

Department of Planning, School of Architecture and Planning, Anna University
CCP To Business Plan / TNUIFSL / September 2006 104
6.6.7 DEBT SERVICES
Debt servicing for this project starts with principle in the year 2008 (of Rs.0.32 Lakhs) and the interest from 2012 (of Rs.0.40 Lakhs).
The total debt serving for the project works out at Rs.9.32 Lakhs for a loan amount of Rs.6.13 Lakhs and total debt services are 6 : 9
(rounded of).
6.6.8 PRIVATISATION
Privatization of street light project will be cost effective for the Local body. The conditions for this project will be the total initial
investment should be done by the private person. About 50% of the total cost saved by this project should be shared with the local
body. The Private organization has the privilege to enjoy the benefits for 5 years. At the beginning of 6th year the total cost saved
will be enjoyed by the revenue to the local body. Thus the total revenue gained from 2018 till the end of 2026 will be Rs.68.20 Lakhs
without any initial investment.

Department of Planning, School of Architecture and Planning, Anna University
CCP To Business Plan / TNUIFSL / September 2006 102
6.7 IMPROVEMENT OF SHOPS
6.7.1 INTRODUCTION
Villupuram is an important administration centre with the population of 95,459 as per
2001 census and it is a fast growing urban centre in the northern part of Tamilnadu. It
has got one of the important railway junction connecting various important towns of
Tamilnadu and other states of India. The NH 45 and NH 45A runs through the town. It
is a major commercial centre famous for the wholesale trade of Paddy, Groundnut,
Sugarcane, Cotton etc., The major roads and municipal roads in the centre of the town
have large number of shops and trading activities.
6.7.2 NEED ASSESSMENT
Since Villupuram is a major commercial and trading centre in the district, planned
commercial complexes are required of the time and proper spatial arrangement of the
activities. To cater this municipality has owned some shops abutting the Kamarajar
Street. This road is a wider and major road in Villupuram with commercial activities. The
existing shops fetch some revenue to the local body by means of rents but the shops
are not potentially used. As to maximize the returns from the scarce urban land of these
shops and set right the disorderly spatial arrangement, the present shops may be
remodeled and reconstructed so that more shops are constructed in an orderly manner.
This way more revenue will add to the existing revenue base of the Villupuram
Municipality. The rental revenue and deposits of the new shops will strengthen the
revenue base of the Municipality. Already local body owned some shops and rented to
private people in this site. Municipality felt that existing shops can be renovated by
constructing shopping complex with better facilities since this site is the prime location
for mobilizing more resources to the local body by constructing shopping complex.
6.7.3 COMPONENTS
The existing Shops in the Kamarajar Street are proposed to improve at a cost of
Rs. 50 Lakhs. It is suggested that shopping complex with better infrastructure facilities
can be constructed G+1 floor at an extent of 5,000sq.ft in place of existing shops. It is

Department of Planning, School of Architecture and Planning, Anna University
CCP To Business Plan / TNUIFSL / September 2006 103
proposed to construct each shop with an area of 250sq.ft at a prevailing construction
cost of Rs. 1000 per sq.ft. Approximately it is designed to have 20 numbers of shops
occupy an area of 5000 sq.ft with 10 shops in ground floor and 10 shops in first floor. It
is estimated that nearly Rs. 53 Lakhs of capital is required to implement this project
including O&M and Inflation.
6.7.4 OPERATING PARAMETERS
The total project cost has to be sourced from the financial institutions such as TUFIDCO
under the IDSMD Scheme for about Rs. 53.00 Lakhs. This cost involves the
establishment cost for office & shopping complex and improvement of existing
Kalayanamandapam. The total estimated cost involves the operation and maintenance
cost with the inflation.
6.7.5 EXPENSES
Development cost for the project includes construction cost of office & shops and 2% of
the total project cost as O&M charges and 4% of the total project cost as inflation
charges. Thus the total project cost arrived is Rs.53.30 Lakhs.
Table 6.27: Distribution of Development Components
S.No Development Component Rs. In Lakhs
1 Improvement of shops 50.00
Development costs (a) 50.00
1 O&M Charges @ 2% of (a) 1.00
2 Inflation @ 4% of (a) 2.00
Over heads (b) 3.00
GRAND TOTAL (a+b) 53.00
The total cost is to be borrowed from TUFIDCO, TUUIFSL & Similar agencies at the
interest rate of 12.5% per annum for a repayment period of about 20yrs.

Department of Planning, School of Architecture and Planning, Anna University
CCP To Business Plan / TNUIFSL / September 2006 104
Table 6.28: Repayment Schedule – Cash Inflow
REPAYMENT SCHDULE - CASH INFLOW Rs. in lakhs
No. of years for Repayment: 20
Moratorium period: 5 Years
Repayment starting year: 2008
Repayment starting year: 2012
Loan Repayment
year Principal Interest Total Balance Year
Total
Repayment
53.00 2007 0.00 0.00 0.00 53.00 2007 0.00
2008 2.79 6.63 9.41 50.21 2008 9.41
2009 2.79 6.28 9.07 47.42 2009 9.07
2010 2.79 5.93 8.72 44.63 2010 8.72
2011 2.79 5.58 8.37 41.84 2011 8.37
2012 2.79 5.23 8.02 39.05 2012 8.02
2013 2.79 4.88 7.67 36.26 2013 7.67
2014 2.79 4.53 7.32 33.47 2014 7.32
2015 2.79 4.18 6.97 30.68 2015 6.97
2016 2.79 3.84 6.63 27.89 2016 6.63
2017 2.79 3.49 6.28 25.11 2017 6.28
2018 2.79 3.14 5.93 22.32 2018 5.93
2019 2.79 2.79 5.58 19.53 2019 5.58
2020 2.79 2.44 5.23 16.74 2020 5.23
2021 2.79 2.09 4.88 13.95 2021 4.88
2022 2.79 1.74 4.53 11.16 2022 4.53
2023 2.79 1.39 4.18 8.37 2023 4.18
2024 2.79 1.05 3.84 5.58 2024 3.84
2025 2.79 0.70 3.49 2.79 2025 3.49
2026 2.79 0.35 3.14 0.00 2026 3.14
53.00 62.76 119.25 119.25
The total repayment made at the end of 2026 is about Rs.119.25 Lakhs for a total loan
amount of Rs.53.00 Lakhs for the base year 2007.

Department of Planning, School of Architecture and Planning, Anna University
CCP To Business Plan / TNUIFSL / September 2006 105
6.7.6 REVENUE
Shops are designed for 20 nos. It is proposed to rent a shop at Rs. 20 per sq.ft per
month. The revenue generated per month by way of rent from shops is around
Rs. 1,00,000. Therefore annually Rs. 12.00 Lakhs of revenue can be mobilized out of 20
shops. Base rate arrived at this year will be revised on every consecutive 3 years of 10%
through out the repayment period. The total recovery arrived at 2026 will be
Rs.299.02 Lakhs. The surplus amount out of this project at the end of 2026 is Rs.179.77
Lakhs.
6.7.7 DEBT SERVICES
Debt servicing will start with the interest in the year 2008 (of Rs.6.63 Lakhs). The total
debt serving for the project works out to be Rs.119.25 Lakhs for a loan amount of
Rs.53.00 Lakhs and total debt services are 53:119(round off).
6.7.8 CASH FLOW
In this project the cash flow is surplus throughout the repayment period. It starts with a
surplus of Rs. 2.59 during 2008 and ends to a surplus of Rs. 18.12 Lakhs during 2026.
Recovery & Repayment ratio starts with 1.27 in the year 2008 and for the project is
2.51. Meanwhile the rate of debt charges and recovery is remains less than 1. indicating
the project revenue is surplus over the debt servicing. For the entire repayment period
ratio of debt charges and recovery is 0.40.

Department of Planning, School of Architecture and Planning, Anna University
CCP To Business Plan / TNUIFSL / September 2006 106
Table 6.29: Cash Outflow
CASH OUTFLOW Rs in Lakhs
RECOVERY 2007 2008 2009 2010 2011 2012 2013 2014 2015 2016 2017 2018 2019 2020 2021 2022 2023 2024 2025 2026
Revenue from Shops
0.00 12.00 12.00 12.00 13.20 13.20 13.20 14.52 14.52 14.52 15.97 15.97 15.97 17.57 17.57 17.57 19.33 19.33 19.33 21.26
TOTAL 0.00 12.00 12.00 12.00 13.20 13.20 13.20 14.52 14.52 14.52 15.97 15.97 15.97 17.57 17.57 17.57 19.33 19.33 19.33 21.26
Table 6.30: Cash flow statement
CASH- FLOW STATEMENT Rs. In Lakhs
Particulars 2007 2008 2009 2010 2011 2012 2013 2014 2015 2016 2017 2018 2019 2020 2021 2022 2023 2024 2025 2026 TOTAL
RECOVERY
Revenue from Shops
0.00 12.00 12.00 12.00 13.20 13.20 13.20 14.52 14.52 14.52 15.97 15.97 15.97 17.57 17.57 17.57 19.33 19.33 19.33 21.26 299.02
TOTAL (A) 0.00 12.00 12.00 12.00 13.20 13.20 13.20 14.52 14.52 14.52 15.97 15.97 15.97 17.57 17.57 17.57 19.33 19.33 19.33 21.26 299.02
REPAYMENT
Debt charges 0.00 9.41 9.07 8.72 8.37 8.02 7.67 7.32 6.97 6.63 6.28 5.93 5.58 5.23 4.88 4.53 4.18 3.84 3.49 3.14 119.25
TOTAL (B) 0.00 9.41 9.07 8.72 8.37 8.02 7.67 7.32 6.97 6.63 6.28 5.93 5.58 5.23 4.88 4.53 4.18 3.84 3.49 3.14 119.25
Surplus /Deficit
0.00 2.59 2.93 3.28 4.83 5.18 5.53 7.20 7.55 7.90 9.70 10.04 10.39 12.34 12.69 13.04 15.14 15.49 15.84 18.12 179.77
CUMULATIVE SURPLUS /DEFICIT
0.00 2.59 5.52 8.80 13.63 18.81 24.34 31.54 39.09 46.98 56.68 66.72 77.12 89.45 102.14 115.18 130.32 145.81 161.65 179.77
Recovery/ Repayment
(A/B)
0.00 1.27 1.32 1.38 1.58 1.65 1.72 1.98 2.08 2.19 2.54 2.69 2.86 3.36 3.60 3.88 4.62 5.04 5.54 6.77 2.51
Debt Charges
/Devt. Charges (B/A)
0.00 0.78 0.76 0.73 0.63 0.61 0.58 0.50 0.48 0.46 0.39 0.37 0.35 0.30 0.28 0.26 0.22 0.20 0.18 0.15 0.40

Department of Planning, School of Architecture and Planning, Anna University
CCP To Business Plan / TNUIFSL / September 2006 107
6
BUSINESS PLAN – PROJECT PROFILE Introduction: It is been clear from the vision statement collected at the instance of CCP, the stakeholders anticipated that Villupuram town could be a industrial cum transportation node and a tourist center. To achieve this, investments need to be routed at appropriate projects. As the vision statement do not directly lad to a specific project consorted efforts are to be plowed in to achieve the vision. Business Plan is one such efforts to review the projects that are identified in CCP and later implemented and yet to formulate additional innovative projects. The Business Plan looks the local body as a resource center rather than only service provider and tries to emulate projects that are feasible to attract private investments. Consultative Process:
To execute this assignment, a stakeholders meeting was called to assess the new innovative projects that are to be included in the Business Plan preparation. Meeting was held in Villupuram during 27th of July 2006. It was headed by the Municipal Chairman and Commissioner of Villupuram town and it includes the participants like Councilors of all the wards, Municipality officials, key stakeholders, NGOs and various organizations etc. The projects that are listed by the stakeholders are assessed for implementation. The consultants also went around to identify innovative projects in the market. A key decision taken by way of consultation is included in the report. The following are the workable projects proposed and that are considered under the Business Plan for the development of the town to enhance the town as an industrial town while keeping in mind achieving the quality of life of the people in the town.
• Commercial complex at old bus stand
• Expansion of Vegetable market
• Under ground Sewerage Systems
• Solid Waste Management
• Office cum Shopping complex at the first floor of Kalayanamandapam
• Energy saving Measures – Street Lights
• Improvement of shops – Kamarajar Salai
The identified projects are as basic services and specialized service for the improvement of the quality of living of the people of Villupuram town. The details of the above said projects are presented in the subsequent pages following an order in each project such as a brief introduction, need assessment, component courses, and operating parameters according to phase wise, expenses, revenue, debt services, and cash flow.

Department of Planning, School of Architecture and Planning, Anna University
CCP To Business Plan / TNUIFSL / September 2006 108
6.8. Status of Business Plan Projects
Under this assignment 7 projects are identified in Villupuram Municipality. Each project is
backed with cash flow statement describing recoveries out of the project and repayment of loan
(Principle + Interest) over a period of time is worked out elaborately considering the interest
rate and moratorium period which is applicable for obtaining loan. Table 6.32 describes the
cash flow statement worked out for this business plan. At the end of 2027, Rs. 5046.09 lakhs of
money has to be repaid including principle & interest for the loan amount Rs. 2571.51 lakhs at
8.25 % rate of interest for service and 12.5% for commercial projects including a moratorium
period of 5 years and 1 year respectively. A total recovery out of business plan projects is
Rs. 17637.43 lakhs at the end of year 2026. Therefore at the end of the repayment year
business plan projects ends at a surplus of Rs. 12620.78 lakhs.
Table. 6.31: Loan Details of Business Plan Projects
Projects Loan
Raised Recovery Debts
Surplus /
Deficit
Shopping complex - Old bus stand 616.11 3325.11 1386.26 1938.85
Market complex 808.00 3588.25 1818.00 1770.25
UGDS 840.77 9602.94 1249.41 8353.53
SWM 168.00 386.48 255.54 130.95
Office & Shops over Kalayanamandapam 79.50 284.07 178.88 105.19
Energy Saving – Street lights 6.13 151.56 9.32 142.23
Improvement of shops 53.00 299.02 119.25 179.77
Total 2571.51 17637.43 5016.66 12620.78
Share of Debts In Project
36%
25%
2%
28%
0.19%5% 4%
Shopping complex - Old bus stand
Market complex
UGD
SWM
Office & Shops over Kalayanamandapam
street light
Improvement of shops
Share of Recovery In Project
20%54%
2%
2%1%
19%2%
Shopping complex - Old bus standMarket complexUGD
SWMOffice & Shops over Kalayanamandapamstreet lightImprovement of shops

Department of Planning, School of Architecture and Planning, Anna University
CCP To Business Plan / TNUIFSL / September 2006 110
Out of seven identified projects construction of UGD takes nearly 33 percent of the total
loan amount. Improvement of Vegetable market also shares 31% of loan amount
accounts to Rs. 808 lakhs. Even then recoveries from UGD top the list by bagging
54% of total recoveries (Rs. 9602 lakhs) during the repayment period. It is followed by
market of Rs. 3588 lakhs by means of user charges during the repayment period.
Table. 6.32. Cash Flow Statement for the Business Plan Projects
Year Recovery Repayment Cumulative Surplus / Deficit
2007 7.58 0.00 7.58
2008 323.93 302.73 21.20
2009 323.93 319.68 4.25
2010 719.93 309.44 410.49
2011 751.56 299.20 452.37
2012 751.56 321.41 430.16
2013 810.96 342.65 468.31
2014 845.76 328.01 517.76
2015 845.76 313.36 532.40
2016 914.07 298.71 615.36
2017 952.35 284.06 668.29
2018 952.35 269.41 682.93
2019 1030.91 254.77 776.14
2020 1073.01 240.12 832.89
2021 1073.01 225.47 847.54
2022 1163.35 210.82 952.53
2023 1209.67 196.18 1013.49
2024 1209.67 181.53 1028.14
2025 1313.56 166.88 1146.68
2026 1364.51 152.23 1212.27
2027 796.50 29.44 767.06
TOTAL 18433.93 5046.09 13387.84
During the entire repayment period recoveries are more than the repayment for the loan
raised, maximum surplus is achieved during the year 2026 (ie. Rs. 1212.27 lakhs). In
2009 surplus of Rs. 4.25 lakhs is the least compared to a repayment period of 20 years.

Department of Planning, School of Architecture and Planning, Anna University
CCP To Business Plan / TNUIFSL / September 2006 111
Recovery Vs Repayment
0
200
400
600
800
1000
1200
1400
1600
2007 2008 2009 2010 2011 2012 2013 2014 2015 2016 2017 2018 2019 2020 2021 2022 2023 2024 2025 2026 2027
Year
Rs. in lakhs
Recovery Repayment

Department of Planning, School of Architecture and Planning, Anna University
CCP To Business Plan / TNUIFSL / September 2006 112
7 VILLUPURAM MUNICIPAL FINANCE
7.0 Villupuram Municipal Finance
The finances of ULBs are operated under the general account of “Income and
Expenditure”. Some times these accounts are classified depending on the sources as
“revenue” and “capital”. Therefore, the outgoing items relate to “revenue expenditure”
and “capital expenditure” and, the incoming to “revenue receipt” and “capital receipt”.
However, for a medium sized municipality like Villupuram, the capital expenditure is not
to be sizable, which otherwise may effect the municipal finance heavily, the “revenue”
and “capital” (receipt and expenditure) are not dealt separately. Therefore, municipal
finance is classified as “Income” and “Expenditure”.
7.1 Revenue receipts
Under this head taxes, fees, grants, income from properties and special services are
included. The amount under most of these heads is growing however their share to the
revenue receipts in respective years is unstable. Revenue receipts accounts to Rs.656
lakhs in 2000-01 grown to Rs.690 lakhs in 2005-06 with 3 percent average annual
growth rate over past 6 years.
i) Taxes - own sources - Taxes are collected by the Municipality and also by
other agencies. Municipality collects property tax and profession tax. In 2005-06, the tax
receipts accounted for Rs.231 Lakhs.
ii) Taxes - Assigned Revenue - Taxes collected by other agencies include
entertainment tax, duty on transfer of property, taxes on carts and animals which
amounted to Rs. 78 1akhs in 2005-06.

Department of Planning, School of Architecture and Planning, Anna University
CCP To Business Plan / TNUIFSL / September 2006 113
Table 7.1 Revenue Receipts: 2000-01 to 2005-06, Villupuram (Rs in lakhs)
2000-
01
2001-
02
2002-
03
2003-
04
2004-
05
2005-
06 Sl.
No. Code No.
Actuals Budget
INCOME STATEMENT
1 Property Tax 170.80 155.68 183.29 145.74 199.58 209.58
2 Other Taxes
a. Professional Tax 21.38 22.30 22.85 20.71 20.34 21.36
b. Other Taxes
(excluding Professional Tax) 0.00 0.03 0.55 0.10 0.11 0.15
3 Assigned Revenue 87.88 55.17 109.73 88.41 83.46 78.50
4 Devolution Fund 92.67 102.54 159.77 162.71 82.18 104.40
5 Service Charges and Fees
a. Water Charges 17.19 17.71 8.69 13.84 17.50 18.50
b. Service Charges and Fees (excluding Water Charges)
65.69 70.46 91.73 141.06 110.66 129.39
6 Grants and Contributions 100.68 37.03 7.69 0.00 0.00 0.00
7 Sale and Hire Charges 53.69 57.23 61.80 85.79 64.48 81.24
8 Other Income 0.96 7.77 1.37 4.01 0.25 0.30
9 Deposits & Advances 45.51 33.91 119.39 23.17 46.97 46.60
Total Income 656.45 559.83 766.86 685.54 625.53 690.02
Table 7.2 Revenue Receipts as percentage of Total Revenue Receipts (in %)
2000-
01
2001-
02
2002-
03
2003-
04
2004-
05
2005-
06 Average Sl.
No. Code No.
Actuals Budget
INCOME STATEMENT
1 Property Tax 26.02 27.81 23.90 21.26 31.91 30.37 26.88
2 Other Taxes
a. Professional Tax 3.26 3.98 2.98 3.02 3.25 3.10 3.26
b. Other Taxes
(excluding Professional Tax) 0.00 0.01 0.07 0.01 0.02 0.02 0.02
3 Assigned Revenue 13.39 9.85 14.31 12.90 13.34 11.38 12.53
4 Devolution Fund 14.12 18.32 20.83 23.73 13.14 15.13 17.54
5 Service Charges and Fees
a. Water Charges 2.62 3.16 1.13 2.02 2.80 2.68 2.40
b. Service Charges and Fees
(excluding Water Charges) 10.01 12.59 11.96 20.58 17.69 18.75 15.26
6 Grants and Contributions 15.34 6.61 1.00 0.00 0.00 0.00 3.83
7 Sale and Hire Charges 8.18 10.22 8.06 12.51 10.31 11.77 10.18
8 Other Income 0.15 1.39 0.18 0.58 0.04 0.04 0.40
9 Deposits & Advances 6.93 6.06 15.57 3.38 7.51 6.75 7.70
Total Income 100.00 100.00 100.00 100.00 100.00 100.00 100.00

Department of Planning, School of Architecture and Planning, Anna University
CCP To Business Plan / TNUIFSL / September 2006 114
0
100
200
300
400
500
600
700
2000-01 2001-02 2002-03 2003-04 2004-05 2005-06
Property Tax Other Tax Non-Tax SFC Devolution Assigned Revenue Other grants
Revenue Receipts
0
100
200
300
400
500
600
2000-01 2001-02 2002-03 2003-04 2004-05 2005-06
Salaries O&M Debt Servicing
Revenue Expenses
iii) Non-tax Revenue - This head includes income from Fees, Properties, Special
services & Miscellaneous. This head amounts to Rs. 147 lakhs in the year 2005-06.
iv) Grants & Contributions - Following 74th CAA grants in aid of revenue
expenditure got boosted, since ’97-98’; the effect of the CAA is substantially felt in ULBs
resource. It accounts to Rs. 104 lakhs during the year 2005-06 also grants and
contribution accounts for Rs. 8 Lakhs in 2002-03.

Department of Planning, School of Architecture and Planning, Anna University
CCP To Business Plan / TNUIFSL / September 2006 115
7.2 Revenue Expenditure
Villupuram municipality uses the resources for general administration, operation and
maintenance of services along with public works, obligatory, discretionary and
remunerative and education. Revenue expenditure during 2000-01 was Rs.483 lakhs
and in 2005-06 it accounts to Rs. 494 lakhs. It has grown nearly 1.5% every year.
i) Personal Cost - This constitutes one of the major components of expenditure
accounting for Rs. 251 lakhs during 2005-06. It goes on increasing from Rs. 208 lakhs
in 2000-01 to Rs. 251 lakhs in 2005-06 at a average growth of 5 percent each year.
ii) Operating Expenses - This head includes the O&M of core services and it
accounts to Rs. 79 lakhs in 2005-06 at a share of 16 percent of total expenses.
iii) Administrative Expenses – In this nearly Rs. 67 lakhs of money spend during
2005-06. It achieve a rapid pace (77% average growth) over past 6 yrs. In an average it
takes a share of 8% of total expenses.
Table 7.3 Break – up of Revenue Expenditure: 1999-00 to 2003-04 (Rs in Lakhs)
Sl. Code No. 2000-01 2001-02 2002-03 2003-04 2004-05 2005-06

Department of Planning, School of Architecture and Planning, Anna University
CCP To Business Plan / TNUIFSL / September 2006 116
No. Actuals Budget
EXPENDITURE STATEMENT
1 Personnel Cost 208.74 203.24 207.77 206.70 182.35 251.95
2 Terminal and Retirement Benefits
45.79 47.18 47.37 49.74 42.60 20.65
3 Operating Expenses 143.76 153.18 178.54 113.42 97.90 79.40
4 Administrative
Expenses 16.88 13.79 57.54 26.74 63.92 67.00
5 Finance Expenses
a. Interest on Loans 57.07 77.35 90.12 61.15 64.94 34.04
6 Deposits & Advances 10.83 25.95 27.71 8.25 40.32 41.60
Total Expenses 483.07 520.69 609.05 466.00 492.03 494.64
Table 7.4 Revenue Expenditure as percentage of Total Revenue Expenses (in %)
2000-01
2001-02
2002-03
2003-04
2004-05
2005-06
Average Sl.
No. Code No.
Actuals Budget
EXPENDITURE STATEMENT
1 Personnel Cost 43.21 39.03 34.11 44.36 37.06 50.94 41.45
2 Terminal and Retirement Benefits
9.48 9.06 7.78 10.67 8.66 4.17 8.30
3 Operating Expenses 29.76 29.42 29.31 24.34 19.90 16.05 24.80
4 Administrative
Expenses 3.49 2.65 9.45 5.74 12.99 13.55 7.98
5 Finance Expenses
a. Interest on Loans 11.81 14.86 14.80 13.12 13.20 6.88 12.44
6 Deposits & Advances 2.24 4.98 4.55 1.77 8.19 8.41 5.03
Total Expenses 100.00 100.00 100.00 100.00 100.00 100.00 100.00
The debt and overdue of the municipality in terms of outstanding Principal is from
Government of Tamil Nadu, MUDF/ TNUDF and TUFIDCO to the tune of Rs. 396 lakhs in
the year 2003-04.
Table 7.5. Loan Outstanding – Villupuram Town
(Rs. in Lakhs)

Department of Planning, School of Architecture and Planning, Anna University
CCP To Business Plan / TNUIFSL / September 2006 117
Sl. No.
Loan Particulars
Total Amount
Drawn
Loan Period
Rate of Interest
Total Principal
&
Interest Repaid
Outstanding as on March
31, 2004
All financial figures in Rs. Lakhs
1 Mudf / Tnudf 99.00 5 15.50 0.00 99.00
2 Others (Specify) - TUFIDCO 297.00 8 15.00 262.83 34.17
Total 396.00 262.83 133.17
7.3 Share of Income & Expenditure – Villupuram Municipality
When aggregated under major heads of income and expenditure it shows
(Table 7.2 & 7.4) major incomes are from property tax and devolution fund which
together accounts for about 30% of total revenue of the municipality (Table 7.4). It is
followed by Assigned revenue at a contribution of 13% to total revenue of the ULB.
Property tax is the single largest resource of the Villupuram town with the average share
of 27% to total revenue over past six years. On expenditure side about 41% spends on
personal cost and 25% on operating expenses. Interest on loans accounts to an average
of 13% of total expenses.
Share of Expenses
50.9%
4.2%
14%
8.4%
6.9%
16.1%
Personnel Cost Terminal and Retirement Benefits
Operating Expenses Administrative Expenses
Finance Expenses Deposits & Advances

Department of Planning, School of Architecture and Planning, Anna University
CCP To Business Plan / TNUIFSL / September 2006 118
Share of Resources
30.4%
3.1%
11.4%15.1%
21.4%
11.8%6.8%
Property Tax Other TaxesAssigned Revenue Devolution FundService Charges and Fees Sale and Hire ChargesDeposits & Advances

Department of Planning, School of Architecture and Planning, Anna University
CCP To Business Plan / TNUIFSL / September 2006 119
7.4 Trend of Income & Expenditure – Villupuram Municipality
Income increased at an average of 2.5% over past few years in other hand expenses
increases at a trend of 1.5 % growths during 2000-01 to 2005-06. All the revenue heads
shows a positive trend especially property tax and assigned revenue shows a trend of 6%
each over the years. Except administrative expenses and personal cost all the other
expenditure heads shows a negative trend. Income & Expenditure trend of the municipality
is shown in the following fig.
Table 7.6. Income and Expenditure under Major heads Growth Trend 2000-01 to 2005-06
( in %)
2001-02 2002-03 2003-04 2004-05 2005-06 Average Sl.
No. Code No.
Actuals Budget
INCOME STATEMENT
1 Property Tax -8.85 17.74 -20.49 36.94 5.01 6.07
2 Other Taxes
a. Professional Tax 4.30 2.47 -9.37 -1.79 5.01 0.13
b. Other Taxes
(excluding Professional Tax) -- 1733.33 -81.82 10.00 36.36 424.47
3 Assigned Revenue -37.22 98.89 -19.43 -5.60 -5.94 6.14
4 Devolution Fund 10.65 55.81 1.84 -49.49 27.04 9.17
5 Service Charges and Fees
a. Water Charges 3.03 -50.93 59.26 26.45 5.71 8.70
b. Service Charges and Fees
(excluding Water Charges) 7.26 30.19 53.78 -21.55 16.93 17.32
6 Grants and Contributions -63.22 -79.23 -100.00 -- -- -80.82
7 Sale and Hire Charges 6.59 7.99 38.82 -24.84 25.99 10.91
8 Other Income 709.38 -82.37 192.70 -93.77 20.00 149.19
9 Deposits & Advances -25.49 252.08 -80.59 102.72 -0.79 49.59
Total Income -14.72 36.98 -10.60 -8.75 10.31 2.64
EXPENDITURE STATEMENT
1 Personnel Cost -2.63 2.23 -0.51 -11.78 38.17 5.09
2 Terminal and Retirement Benefits
3.04 0.40 5.00 -14.35 -51.53 -11.49
3 Operating Expenses 6.55 16.56 -36.47 -13.68 -18.90 -9.19
4 Administrative Expenses -18.31 317.26 -53.53 139.04 4.82 77.86
5 Finance Expenses
a. Interest on Loans 35.54 16.51 -32.15 6.20 -47.58 -4.30
6 Deposits & Advances 139.61 6.78 -70.23 388.73 3.17 93.61
Total Expenses 7.79 16.97 -23.49 5.59 0.53 1.48

Department of Planning, School of Architecture and Planning, Anna University
CCP To Business Plan / TNUIFSL / September 2006 120
Percentage of Property Tax Collection
0
20
40
60
2000-01 2001-02 2002-03 2003-04 2004-05
% o
f C
olle
ctio
n
1 Current 2 Arrears
Growth of Property Tax Demand & Collection
-30
-20
-10
0
10
20
30
2001-02 2002-03 2003-04 2004-05
Gro
wth
Rat
e in
%
1 Current 2 Arrears
Growth Pattern of Revenue & Expenditure
690626686
767
560656
495
492466
609
483
521
0
100
200
300
400
500
600
700
800
900
2000-01 2001-02 2002-03 2003-04 2004-05 2005-06
Rs. in lakhs
Total Income Total Expenditure
7.5 Demand Collection Balance Scenario
It is seen from the Income and Expenditure statement that the major source of income for
the municipality is through the taxes. The DCB of major sources of incomes are from (i)
Property Taxes (ii) Professional Taxes and (iii) Water Taxes.
i) Property tax
In 2004-05, the total demand for property tax
(including arrears and current) stood at Rs.845
lakhs of which Rs. 200 lakhs has been
collected. The collection performance was 24%
and, on an average around 22% of property
tax has been collected yearly.
Coming to arrears and current demand
collection, 19% and 33% has been collected on
an average in last five years. (Table 7.6)

Department of Planning, School of Architecture and Planning, Anna University
CCP To Business Plan / TNUIFSL / September 2006 121
Prperty Tax Collection Performance
0100
200300400
500600700
800900
2000-01 2001-02 2002-03 2003-04 2004-05
Year
Rs. in lakhs
Demand Collection Balance
Table 7.6. DCB for Property Tax of Villupuram 2000-01 to 2004-05
Sl.
No.
Particulars 2000-01 2001-02 2002-03 2003-04 2004-05
Figures Rs. In lakhs
I. Property Tax - Demand, Collection and Balance
Total Number of Assessments 15248 15678 16237 16949 17730
Growth in Assessments -- 2.82 3.57 4.39 4.61
A. Demand
1. Arrears 462.84 491.99 541.31 568.97 634.15
2. Current 199.95 205.00 210.95 210.92 210.99
3. Total 662.79 696.99 752.26 779.89 845.14
B. Collection
1. Arrears 113.63 89.51 120.40 80.60 101.42
2. Current 57.17 66.17 62.89 65.14 98.16
3. Total 170.80 155.68 183.29 145.74 199.58
C. Balance
1. Arrears 349.21 402.48 420.91 488.37 532.73
2. Current 142.78 138.83 148.06 145.78 112.83
3. Total 491.99 541.31 568.97 634.15 645.56
D. Collection Analysis
1. Arrears (%) 24.55 18.19 22.24 14.17 15.99
2. Current (%) 28.59 32.28 29.81 30.88 46.52
3. Total (%) 25.77 22.34 24.37 18.69 23.62

Department of Planning, School of Architecture and Planning, Anna University
CCP To Business Plan / TNUIFSL / September 2006 122
Percentage of Profession Tax Collection
01020304050
60708090
100
2000-01 2001-02 2002-03 2003-04 2004-05
% o
f C
olle
ctio
n1 Current 2 Arrears
Growth of Profession Tax Demand & Collect ion
-20
-15
-10
-5
0
5
10
2001-02 2002-03 2003-04 2004-05
1 Current 2 Arrears
ii) Profession tax
The total demand under this item in 2004-
05 was RS. 58 lakhs and the amount
collected was only RS. 20 lakhs, with a
collection performance of 35%. On an
average nearly 38% of profession tax has
been collected. (Table 7.7).
The arrear amount in 2004-05 was Rs.37
lakhs, while the current demand was Rs.21
lakhs of which’s 0.88 lakhs and Rs.19 lakhs
have been collected by the Municipality,
which accounts for 2% and 92%
respectively. On an average, the collection
performance for arrears and current
demand is 6% and, 86% respectively.

Department of Planning, School of Architecture and Planning, Anna University
CCP To Business Plan / TNUIFSL / September 2006 123
Profession Tax Collection Performance
0
10
20
30
40
50
60
70
2000-01 2001-02 2002-03 2003-04 2004-05
Year
Rs. in lakhs
Demand Collection Balance
Table 7.7. DCB for Professional Tax of Villupuram 2000-01 to 2004-05
Sl. No.
Particulars 2000-01 2001-02 2002-03 2003-04 2004-05
Figures Rs. In lakhs
II. Profession Tax - Demand, Collection and Balance
Total Number of Assesses 8750 8312 7897 7729 7517
Growth in Assessments -- -5.01 -4.99 -2.13 -2.74
A. Demand
1. Arrears 31.62 31.83 33.33 33.21 37.05
2. Current 21.59 23.80 23.73 24.55 21.00
3. Total 53.21 55.63 57.06 57.76 58.05
B. Collection
1. Arrears 2.10 1.45 2.84 2.80 0.88
2. Current 19.28 20.85 21.01 17.91 19.46
3. Total 21.38 22.30 23.85 20.71 20.34
C. Balance
1. Arrears 29.52 30.38 30.49 30.41 36.17
2. Current 2.31 2.95 2.72 6.64 1.54
3. Total 31.83 33.33 33.21 37.05 37.71
D. Collection Analysis
1. Arrears (%) 6.64 4.56 8.52 8.43 2.38

Department of Planning, School of Architecture and Planning, Anna University
CCP To Business Plan / TNUIFSL / September 2006 124
Percentage of Water Charges Collection
0
50
100
2000-01 2001-02 2002-03 2003-04 2004-05
% o
f C
olle
ctio
n
1 Current 2 Arrears
Grow th of Water Charges Demand & Collection
-150
-100
-50
0
50
2001-02 2002-03 2003-04 2004-05
Gro
wth
Rat
e in
%
1 Current 2 Arrears
2. Current (%) 89.30 87.61 88.54 72.95 92.67
3. Total (%) 40.18 40.09 41.80 35.86 35.04
iii) Water Charges
The total demand in 2004-05 was Rs.29
lakhs and Rs.17.50 lakhs have been
collected (59% of demand) and on an
average this component has been found
to be increasing at 2% yearly.
The collection performance was at 46%
and 63% for arrears and current demand
respectively. (Table 7.8)

Department of Planning, School of Architecture and Planning, Anna University
CCP To Business Plan / TNUIFSL / September 2006 125
Water Tax Collection Performance
0
5
10
15
20
25
30
35
2000-01 2001-02 2002-03 2003-04 2004-05
Year
Rs. in lakhs
Demand Collection Balance
Table 7.8. DCB of Water Charges of Villupuram 2000-01 to 2004-05
Sl.
No. Particulars 2000-01 2001-02 2002-03 2003-04 2004-05
Figures Rs. In lakhs
III. Water Charges - Demand, Collection and Balance
Total Number of Assessments 5359 5432 5487 5487 5491
Growth in Assessments -- 1.36 1.01 0.00 0.07
A. Demand
1. Arrears 12.28 9.92 7.11 13.48 14.67
2. Current 14.83 14.90 15.06 15.03 15.03
3. Total 27.11 24.82 22.17 28.51 29.70
B. Collection
1. Arrears 6.76 6.02 1.64 5.93 7.39
2. Current 10.43 11.69 7.05 7.91 10.11
3. Total 17.19 17.71 8.69 13.84 17.50
C. Balance
1. Arrears 5.52 3.90 5.47 7.55 7.28
2. Current 4.40 3.21 8.01 7.12 4.92
3. Total 9.92 7.11 13.48 14.67 12.20
D. Collection Analysis
1. Arrears (%) 55.05 60.69 23.07 43.99 50.37
2. Current (%) 70.33 78.46 46.81 52.63 67.27
3. Total (%) 63.41 71.35 39.20 48.54 58.92

Department of Planning, School of Architecture and Planning, Anna University
CCP To Business Plan / TNUIFSL / September 2006 126
7.6 Assessment of Performance of Municipal Finance
From the actuals, Villupuram revenue account stand for about 10.94 crores in the year
2005-2006. This includes OB of about 8.98 crores and the trend shows an increasing
amount of revenue which is favorable to the municipality for any investment. The Operating
Ratio (RE / RI) shows less than 1 for all the years between 2000-01 to 2005-06 except in
2001-02 which has crossed 0.90 mark (Table 7.9). In the same year, DS to income was
13% but in rest of the years are under control and very much comfortable in the year 2005-
06 which was 4.93 percentage to income.
Table 7.9. Performance of Villupuram Municipal Finance, 2000-01 to 2004-05 (Figures Rs. In lakhs)
Account Head 2000-01 2001-02 2002-03 2003-04 2004-05 2005-06 Sl.
No. Actuals Budget
1 Revenue Account Status
(Incl. OB) 348.71 387.85 545.66 765.20 898.70 1094.08
2 Operating Ratio
(Rev. Expen./Rev. Inc.) 0.74 0.93 0.79 0.68 0.79 0.72
3 Debt Servicing –
Percentage of Income (%) 8.69 13.82 11.75 8.92 10.38 4.93
7.7 Financial Operational Plan (FOP)
The Financial Operating Plan (FOP) is essentially a multi-year forecast of finances of the
urban local body. The FOP can be generated for a short-medium term of 5-8 years and also
for a long-term for 20 years period. In this context, the FOP is envisaged with short-term
period of 5 years (2006-07 to 2010-11) and a long-term period of 20 years (2006-07 to
2025-26). A salient feature of the FOP is that all outstanding dues including debt and non-
debt liabilities have been taken into account. It needs mention that the identified
investments are phased from the year 2006-07.
The FOP is essentially a financial forecast, developed on the basis of the growth trends of
various components of income and expenditure, based on the time-series data. It is
noteworthy that several assumptions need to be made while forecasting the finances of the
ULBs. The immense care have been taken to adopt various assumptions based on the
current growth trends, contribution pattern of various revenue drivers and utilization pattern
of various expenditure drivers. In addition, various quantifiable assets and liabilities of the

Department of Planning, School of Architecture and Planning, Anna University
CCP To Business Plan / TNUIFSL / September 2006 127
ULBs were also taken into account and phased out over a period of time. The following
section provides an insight into the various assumptions made, necessary logic and
justifications for such assumptions.
7.8.1 Assumptions:
The financial forecast for the horizon period has been made based on the analysis of the
growth trend, sectoral contribution (for receipts/income) and utilization (for expenses) and
other externalities likely to impact the forecast like pay commission revisions, flow of
devolution fund, etc. The FOP is prepared for a short-term & long-term horizon periods with
sustainable level of capital investments in both the terms. Following are some of the
assumptions adopted while projecting the FOP of Villupuram town.
7.8.2 Revenue Receipts / Income: It has been projected under the following heads:
� Property Tax
� Other Taxes
o Professional Tax
o Other Taxes (excluding Professional Tax)
� Assigned Revenue
� Devolution Fund
� Service Charges and Fees
o Water Charges
o Service Charges and Fees (excluding Water Charges)
� Grants and Contributions
� Sale and Hire Charges
Property Tax:
Property tax accounts for an amount of about Rs. 209 lakhs in the year 2005-06. It
accounts on an average for about 26 percent of the total income of the municipality.
Property tax is one of the major revenue sources of the Villupuram Municipality. The
projection for future is based on the forecast demand and the current demand of year 2005-
06 is taken as the base. Its trend for the past 5 years shows at 6 percent increase and it is
assumed to grow at the rate of 2.0 percent per year for the projected period.

Department of Planning, School of Architecture and Planning, Anna University
CCP To Business Plan / TNUIFSL / September 2006 128
Further, it is also assumed that the general ARV revision (which was due last year) would be
undertaken during the year 2005-06. The other assumptions underlying projection of
revenue from property tax are presented in the table below:
Table 7.11. Assumptions for the Financial Projections - Property Tax
Sl. No. Items/Particulars Assumption Basis
1. ARV Revision � Next revision during the year 2006-07
� Increase at a rate of 30 percent per revision
� Revision once in 5-years as per the Act
2. Growth in Assessments
� Increase annually � Existing trend or maximum
of 5% p.a. for ULB
� Existing or nominal growth
3. Collection Performance
� Existing trend or maximum of 95 percent
� Average collection performance (both current & arrear demand)
� Current demand - 75-85% � Arrear demand - 50-60%
Professional Tax:
Professional tax is one of the major revenue sources among the other taxes levied by the
ULB. The projection for future is based on the forecast demand and the current demand of
year 2005-06 is taken as the base. Further, it may be noted that the last revision was done
during 2002-03 and thus the next revision is assumed after 10-12 years (2014-15). The
professional tax scored at Rs. 21.36 lakhs (2005-06) having an average growth of 3 percent.
It is assumed that this would grow at the rate of 5 percent for the projected period. The
other assumptions underlying projection of revenue from professional tax are presented in
the table below:
Table 7.12. Assumptions for the Financial Projections - Professional Tax
Sl. No. Items/Particulars Assumption Basis
1. Revision � Next revision during the year 2014-15
� Increase at a rate of 30 percent
� Revision generally once in 10-12 years
2. Growth in Assessments
� Increase annually � Existing trend or
maximum of 7 % p.a. for ULB
� Existing or nominal growth

Department of Planning, School of Architecture and Planning, Anna University
CCP To Business Plan / TNUIFSL / September 2006 129
3. Collection Performance
� Existing trend or maximum of 90 percent
� Average collection performance (both current & arrear
demand) � Current demand - 70-
80 percent � Arrear demand - 45-50
percent
Water Charges:
The projection of water charges for future is based on the forecast demand and the current
demand of year 2005-06 is taken as the base. The water charges scored at Rs. 18.50 lakhs
(2005-06) having an average growth of 2.40 percent. It is assumed that this would grow at
the rate of 2 percent for the projected period. The other assumptions underlying projection
of revenue from professional tax are presented in the table below:
Table 7.13. Assumptions for the Financial Projections - Water Charges
Sl. No. Items/Particulars Assumption Basis
1. Revision � Next revision during the year 2005-06
� Increase at a rate of 20 percent per revision
� Revision allowed once in 3 years as per the Act
2. Growth in Assessments
� Increase annually � Existing trend or
maximum of 3 % p.a. for ULB
� Existing or nominal growth
3. Collection Performance
� Existing trend or maximum of 85 percent
� Average collection performance
� Current demand - 75-85 percent
� Arrear demand - 50-55
percent
Devolution Funds:
Devolution funds are projected based on the formula adopted by the GoTN to devolve SFC
grants. The State’s official projection of Sales Tax for next 10 years is considered as the
base. As per the formula, about 8 percent of the State’s Sales ax would be devolved for the
local bodies (both urban and rural). About 42 percent of the total amount available for the

Department of Planning, School of Architecture and Planning, Anna University
CCP To Business Plan / TNUIFSL / September 2006 130
devolution would be devolved to the urban local bodies at the following rate:
� Municipal Corporations -31percent
� Municipalities - 34 percent
� Town Panchayats - 35 percent
Further, it may be observed that the base population figure considered for SFC devolution is
the latest Census figures and accordingly, the SFC devolution per capita has been calculated
for ULB, at the State level. This per capita devolution has been adopted to project the SFC
devolutions for the Villupuram town, keeping the population of the ULB as per the 2001
Census as the base.
Other Revenue Receipts / Income:
The assumptions for forecast of other revenue items are presented in the table below. The
growth rate under each item of receipt is adopted based on the average trend of all the
ULBs under different categories. In case of abnormalities in the growth trend, a nominal
growth rate has been adopted.
Table 7.14. Assumptions for the Financial Projections - Other Revenue Receipts
Sl. No.
Items/Particulars Unit Assumptions for
Forecast
1. Other Taxes (excluding Professional Tax) Percent 8.00
2. Assigned Revenue Percent 8.00
3. Service Charges and Fees (excluding Water and
Sewer Charges)
Percent 10.00
4. Grants and Contributions Percent 5.00
5. Sale and Hire Charges Percent 5.00
6. Other Income Percent 15.00
7.8.3 Revenue Expenditure: It has been projected under the following heads:
� Personnel Cost
o Salaries
o Others
� Terminal and Retirement Benefits
� Operating Expenses
� Repairs and Maintenance

Department of Planning, School of Architecture and Planning, Anna University
CCP To Business Plan / TNUIFSL / September 2006 131
� Program Expenses
� Administrative Expenses
� Finance Expenses
o Finance Expenses (excluding Interest n Loans)
o Interest on Loans
� Phasing of Non-Debt Liability
Personnel Cost (including Salaries and Other Establishment Expenditure):
The present average growth in establishment expenditure is about 1-6 percent per annum.
However, for the future, the annual growth rate in Personnel Cost is arrived based on the
increase in following sub-components:
� Net salary increase - 3 percent per annum
� Revision of DA - 4 to 5 percent per annum
� Others (new recruitments, etc) - 2 to 3 percent per annum
Accordingly, the Personnel Cost is assumed to be growing at the rate of 10 percent per
annum.
Other Expenditure:
The assumptions for forecast of other revenue expenditure items are presented in the table
below. The growth rate under each item of expenditure is adopted based on the average
trend in this local body over last five years. In case of abnormalities in the growth trend, a
nominal growth rate has been adopted.
Table 7.15. Assumptions for the Financial Projections –
Other Revenue Expenses
Sl. No.
Items/Particulars Unit Assumptions for
Forecast
1. Terminal and Retirement Benefits Percent 10.00
2. Operating Expenses Percent 10.00
3. Repairs and Maintenance Percent 8.00
4. Program Expenses Percent 10.00
5. Administrative Expenses Percent 10.00

Department of Planning, School of Architecture and Planning, Anna University
CCP To Business Plan / TNUIFSL / September 2006 132
6. Finance Expenses (excluding Interest on Loans)
Percent 10.00
It is noteworthy that the revenue expenditure item ‘Depreciation’ is not considered for
financial projection, as it is just a notional item
Finance Expenses - Debt Servicing:
Debt servicing component has been dealt separately in detail as per the terms and
conditions of the loan. The debt servicing of both existing proposed loans have been taken
into consideration. While calculating the debt servicing, the principal repayment and interest
payable on the loans have been calculated separately. The interest on loans has been
considered as the revenue expenditure item while the principal repayment has been taken
as cash-flow item. However, for calculating the Debt-Service Coverage (DSC) ratio, both
principal repayment and interest payable on the loans have been taken into account.
7.8.4. Financial Operational Plan: (Including Business Plan Projects)
Based on the above assumptions, FOP has been formulated for a short term period of 2006-
07 to 2010-11 and in that the total revenue receipt has been estimated to reach to Rs.
2031.16 lakhs in 2010-11 from Rs.690.02 lakhs in 2005-06. The total revenue expenditure
has been increased from Rs.494.64 lakhs (2005-06) to Rs. 1042.60 Lakhs (2010-11). It is
observed that in all the years operating ration (RE/RI) remains more than 0.7. But in other
hand debt serving over the total revenue is well within 15 percent indicating ease of the
municipal finance in repayment of loan (Table 7.16). For a Long term period of 2006-07 to
2025-26, total revenue receipt has been estimated to reach to Rs. 6269.16 lakhs in 2025-26
from Rs.690.02 lakhs in 2005-06. The total revenue expenditure has been increased from
Rs.494.64 lakhs (2005-06) to Rs. 3250.92 Lakhs (2025-26). In long term also Operating
ration (RE/RI) is around 0.50. The debt serving over the total revenue is well within 20
percent indicating ease of the municipal finance in repayment of loan (Table 7.17).

Department of Planning, School of Architecture and Planning, Anna University
CCP To Business Plan / TNUIFSL / September 2006 133
7.8.5. Summary Status:
Key Indicators Minimum Maximum Average
Existing (2000-01 to 2005-06)
OR (Ratio) 0.68 0.93 0.77
DSR (%) 8.42 13.82 10.33
Short-Term (2006-07 to 2010-11)
OR (Ratio) 0.51 0.65 0.58
DSR (%) 4.28 24.81 17.23
Long-Term (2006-07 to 2025-26)
OR (Ratio) 0.49 0.52 0.51
DSR (%) 2.43 14.71 7.74

Department of Planning, School of Architecture and Planning, Anna University
CCP To Business Plan / TNUIFSL / September 2006 134

Department of Planning, School of Architecture and Planning, Anna University
CCP To Business Plan / TNUIFSL / September 2006 135
Table. 7.16. Financial Operational Plan (FOP) – Short Term Period (2006-07 to 2010-11)Figures Rs. In lakhs
2000-01 2001-02 2002-03 2003-04 2004-05 2005-06 2006-07 2007-08 2008-09 2009-10 2010-11 Sl. No.
Account Head
Actuals =================================> Est. Short-term Projections ======================>
Opening Balance 175.33 348.71 387.85 545.66 765.20 898.70 1070.01 1435.90 1902.78 2374.93 3277.69
Revenue Receipts
1 Property Tax 170.80 155.68 183.29 145.74 199.58 209.58 220.67 292.60 298.45 304.42 310.51
2 Other Taxes
a. Professional Tax 21.38 22.30 22.85 20.71 20.34 21.36 16.72 17.55 18.43 19.35 20.32
b. Other Taxes (excluding Professional Tax) 0.00 0.03 0.55 0.10 0.11 0.15 0.16 0.17 0.19 0.20 0.22
3 Assigned Revenue 87.88 55.17 109.73 88.41 83.46 78.50 84.78 91.56 98.89 106.80 115.34
4 Devolution Fund 92.67 102.54 159.77 162.71 82.18 104.40 279.23 306.93 337.17 367.21 399.92
5 Service Charges and Fees
a. Water Charges 17.19 17.71 8.69 13.84 17.50 18.50 18.81 19.18 19.57 23.95 24.43
b. Service Charges and Fees (excluding Water Charges)
65.69 70.46 91.73 141.06 110.66 129.39 142.33 156.56 172.22 189.44 208.38
6 Grants and Contributions 100.68 37.03 7.69 0.00 0.00 0.00 2.02 2.12 2.23 2.34 2.45
7 Sale and Hire Charges 53.69 57.23 61.80 85.79 64.48 81.24 85.30 89.57 94.05 98.75 103.69
8 Other Income 0.96 7.77 1.37 4.01 0.25 0.30 0.35 0.40 0.46 0.52 0.60
9 Deposits & Advances 45.51 33.91 119.39 23.17 46.97 46.60 53.59 61.63 70.87 81.50 93.73
10 Recoveries from Projects 0.00 0.00 0.00 0.00 0.00 0.00 7.58 323.93 323.93 719.93 751.56
Total Revenue Receipts 656.45 559.83 766.86 685.54 625.53 690.02 911.52 1362.20 1436.44 1914.41 2031.16
Revenue Expenditure
1 Personnel Cost 208.74 203.24 207.77 206.70 182.35 251.95 277.15 304.86 335.35 368.88 405.77
2 Terminal and Retirement Benefits 45.79 47.18 47.37 49.74 42.60 20.65 22.72 24.99 27.49 30.23 33.26
3 Operating Expenses 143.76 153.18 178.54 113.42 97.90 79.40 87.34 96.07 105.68 116.25 127.87
4 Administrative Expenses 16.88 13.79 57.54 26.74 63.92 67.00 73.70 81.07 89.18 98.09 107.90
5 Finance Expenses
a. Interest on Loans 57.07 77.35 90.12 61.15 64.94 34.04 14.91 11.20 7.49 3.78 1.60
b. Debt service on new investments 0.00 0.00 0.00 0.00 0.00 0.00 0.00 302.73 319.68 309.44 299.20
6 Deposits & Advances 10.83 25.95 27.71 8.25 40.32 41.60 45.76 50.34 55.37 60.91 67.00
Total Revenue Expenditure 483.07 520.69 609.05 466.00 492.03 494.64 521.57 871.25 940.22 987.58 1042.60
Revenue Surplus / Deficit 173.38 39.14 157.81 219.54 133.50 195.38 389.96 490.95 496.22 926.83 988.56
Principle Payment (Earlier Loan) 0.00 0.00 0.00 0.00 0.00 24.07 24.07 24.07 24.07 24.07 4.27

Department of Planning, School of Architecture and Planning, Anna University
CCP To Business Plan / TNUIFSL / September 2006 136
Net Surplus / Deficit 173.38 39.14 157.81 219.54 133.50 171.31 365.89 466.88 472.15 902.76 984.29
Closing Balance 348.71 387.85 545.66 765.20 898.70 1070.01 1435.90 1902.78 2374.93 3277.69 4261.98
Key Financial Indicators
2000-01 2001-02 2002-03 2003-04 2004-05 2005-06 2006-07 2007-08 2008-09 2009-10 2010-11 Account Head Actuals =================================> Est. Short-term Projections ========================>
Status of Accounts (incl. OB, PP and CC but exc. Dep)
348.71 387.85 545.66 765.20 898.70 1070.01 1435.90 1902.78 2374.93 3277.69 4261.98
Operating Ratio (Rev. Expen./Rev. Inc.) 0.74 0.93 0.79 0.68 0.79 0.72 0.57 0.64 0.65 0.52 0.51
Cash Debt-Service Coverage Ratio (DSCR) 6.11 5.01 6.05 12.51 13.84 18.41 36.84 5.63 6.76 9.72 13.97
DS/TR (Debt Service/Total Revenue) 8.69 13.82 11.75 8.92 10.38 8.42 4.28 24.81 24.45 17.62 15.02
Table. 7.17. Financial Operational Plan (FOP) – Long Term Period (2006-07 to 2025-26)
Figures
Rs. In lakhs
2011-12 2012-13 2013-14 2014-15 2015-16 2016-17 2017-18 2018-19 2019-20 2020-21 2021-22 2022-23 2023-24 2024-25 Account Head
Long-term
Projections===============================================================================================================>
Opening Balance 4261.98 5340.52 6487.17 7713.98 8983.56 10372.97 12033.15 13748.84 15613.33 17583.27 19621.21 22041.88 24592.66 27234.29 30092.95
Revenue Receipts
Property Tax 411.74 419.97 428.37 436.94 445.68 627.91 640.47 653.27 666.34 679.67 901.24 919.26 937.65 956.40
Other Taxes
Professional Tax 21.33 22.40 23.52 24.70 25.93 38.65 41.35 44.25 47.34 50.66 54.20 58.00 62.06 66.40
b. Other Taxes (excluding Professional Tax) 0.24 0.26 0.28 0.30 0.32 0.35 0.38 0.41 0.44 0.48 0.51 0.56 0.60 0.65
Assigned Revenue 124.57 134.54 145.30 156.92 169.48 183.03 197.68 213.49 230.57 249.02 268.94 290.45 313.69 338.78
Devolution Fund 437.65 478.94 524.12 573.56 627.67 686.89 751.69 822.60 900.21 985.13 1078.07 1179.77 1291.07 1412.87

Department of Planning, School of Architecture and Planning, Anna University
CCP To Business Plan / TNUIFSL / September 2006 137
Service Charges and Fees
a. Water Charges 24.92 30.50 31.11 31.73 38.84 39.61 40.41 52.37 53.41 54.48 66.69 68.02 69.38 84.92
b. Service Charges and Fees (excluding Water Charges)
229.22 252.14 277.36 305.09 335.60 369.16 406.08 446.69 491.36 540.49 594.54 654.00 719.40 791.34
Grants and Contributions 2.58 2.71 2.84 2.98 3.13 3.29 3.45 3.63 3.81 4.00 4.20 4.41 4.63 4.86
Sale and Hire Charges 108.87 114.31 120.03 126.03 132.33 138.95 145.90 153.19 160.85 168.89 177.34 186.20 195.51 205.29
Other Income 0.69 0.80 0.92 1.06 1.21 1.40 1.61 1.85 2.12 2.44 2.81 3.23 3.71 4.27
Deposits & Advances 107.79 123.96 142.55 163.93 188.52 216.80 249.32 286.72 329.73 379.19 436.07 501.47 576.70 663.20
Recoveries from Projects 751.56 810.96 845.76 845.76 914.07 952.35 952.35 1030.91 1073.01 1073.01 1163.35 1209.67 1209.67 1313.56
Total Revenue Receipts 2221.16 2391.48 2542.15 2669.01 2882.80 3258.39 3430.67 3709.36 3959.19 4187.45 4747.95 5075.04 5384.06 5842.54
Revenue Expenditure
Personnel Cost 446.34 490.98 540.08 594.08 653.49 718.84 790.73 869.80 956.78 1052.46 1157.70 1273.47 1400.82 1540.90
Terminal and Retirement Benefits 36.58 40.24 44.27 48.69 53.56 58.92 64.81 71.29 78.42 86.26 94.89 104.37 114.81 126.29
Operating Expenses 140.66 154.73 170.20 187.22 205.94 226.54 249.19 274.11 301.52 331.67 364.84 401.32 441.46 485.60
Administrative Expenses 118.69 130.56 143.62 157.98 173.78 191.16 210.27 231.30 254.43 279.88 307.86 338.65 372.51 409.77
Finance Expenses
a. Interest on Loans 0.96 0.32 0.00 0.00 0.00 0.00 0.00 0.00 0.00 0.00 0.00 0.00 0.00 0.00
b. Debt service on new investments 321.41 342.65 328.01 313.36 298.71 284.06 269.41 254.77 240.12 225.47 210.82 196.18 181.53 166.88
Deposits & Advances 73.70 81.07 89.17 98.09 107.90 118.69 130.56 143.61 157.98 173.77 191.15 210.27 231.29 254.42
Total Revenue Expenditure 1138.35 1240.55 1315.34 1399.43 1493.39 1598.21 1714.98 1844.88 1989.25 2149.51 2327.27 2524.27 2742.43 2983.87
Revenue Surplus / Deficit 1082.81 1150.93 1226.81 1269.58 1389.41 1660.18 1715.70 1864.48 1969.94 2037.94 2420.68 2550.77 2641.63 2858.67
Principle Payment (Earlier Loan) 4.27 4.27 0.00 0.00 0.00 0.00 0.00 0.00 0.00 0.00 0.00 0.00 0.00 0.00
Net Surplus / Deficit 1078.54 1146.66 1226.81 1269.58 1389.41 1660.18 1715.70 1864.48 1969.94 2037.94 2420.68 2550.77 2641.63 2858.67
Closing Balance 5340.52 6487.17 7713.98 8983.56 10372.97 12033.15 13748.84 15613.33 17583.27 19621.21 22041.88 24592.66 27234.29 30092.95 33111.20

Department of Planning, School of Architecture and Planning, Anna University
CCP To Business Plan / TNUIFSL / September 2006 138
Key Financial Indicators
2011-12 2012-13 2013-14 2014-15 2015-16 2016-17 2017-18 2018-19 2019-20 2020-21 2021-22 2022-23 2023-24 2024-25 2025Account Head Long-term Projections=======================================================================================>
Status of Accounts (incl. OB, PP and CC but exc. Dep)
5340.52 6487.17 7713.98 8983.56 10372.97 12033.15 13748.84 15613.33 17583.27 19621.21 22041.88 24592.66 27234.29 30092.95 33111.20
Operating Ratio (Rev. Expen./Rev. Inc.) 0.51 0.52 0.52 0.52 0.52 0.49 0.50 0.50 0.50 0.51 0.49 0.50 0.51 0.51
Cash Debt-Service Coverage Ratio (DSCR) 16.35 18.68 23.52 28.67 34.73 42.36 51.03 61.28 73.23 87.02 104.55 125.36 150.03 180.33
DS/TR (Debt Service/Total Revenue) 14.71 14.52 12.90 11.74 10.36 8.72 7.85 6.87 6.06 5.38 4.44 3.87 3.37 2.86

Department of Planning, School of Architecture and Planning, Anna University
CCP To Business Plan / TNUIFSL / September 2006 139

CCP To Business Plan / TNUIFSL / September 2006 140
estimated that total revenue receipt is estimated to reach to Rs. 1279 lakhs in 2010-11 from
Rs.690 lakhs in 2005-06.
The total revenue expenditure is also increased from Rs.494 lakhs (2005-06) to Rs. 743
Lakhs (2010-11). It is observed that in all the years Operating ration (RE/RI) remains
around 0.7. The debt serving over the total revenue is well within 15 percent indicating ease
of the municipal finance in repayment of loan (Table 7.18). For a Long term period of 2006-
07 to 2025-26, total revenue receipt has been estimated to reach to Rs. 4904 lakhs in 2025-
26 from Rs.690 lakhs in 2005-06. The total revenue expenditure has been increased from
Rs.494 lakhs (2005-06) to Rs. 3098 Lakhs (2025-26). It is observed that in all the years
Operating ration (RE/RI) remains well within operating feasibility of (less than 1). The debt
serving over the total revenue is well within 1 percent indicating ease of the municipal
finance in repayment of loan (Table 7.19).
7.8.7. Summary Status:
Key Indicators Minimum Maximum Average
Existing (2000-01 to 2005-06)
OR (Ratio) 0.68 0.93 0.77
DSR (%) 8.42 13.82 10.33
Short-Term (2006-07 to 2010-11)
OR (Ratio) 0.55 0.58 0.57
DSR (%) 0.46 4.31 2.67
Long-Term (2006-07 to 2025-26)
OR (Ratio) 0.56 0.63 0.60
DSR (%) - 0.36 0.03

CCP To Business Plan / TNUIFSL / September 2006 141

Department of Planning, School of Architecture and Planning, Anna University
CCP To Business Plan / TNUIFSL /September 2006 142
Table. 7.18. Financial Operational Plan (FOP) – Short Term Period (2006-07 to 2010-11) - (Excluding Business Plan Projects)
Figures Rs. In lakhs
2000-01 2001-02 2002-03 2003-04 2004-05 2005-06 2006-07 2007-08 2008-09 2009-10 2010-11 Sl.
No.
Account Head
Actuals =================================> Est. Short-term Projections =========================>
Opening Balance 175.33 348.71 387.85 545.66 765.20 898.70 1070.01 1428.32 1874.00 2341.90 2834.17
Revenue Receipts
1 Property Tax 170.80 155.68 183.29 145.74 199.58 209.58 220.67 292.60 298.45 304.42 310.51
2 Other Taxes
a. Professional Tax 21.38 22.30 22.85 20.71 20.34 21.36 16.72 17.55 18.43 19.35 20.32
b. Other Taxes (excluding Professional Tax) 0.00 0.03 0.55 0.10 0.11 0.15 0.16 0.17 0.19 0.20 0.22
3 Assigned Revenue 87.88 55.17 109.73 88.41 83.46 78.50 84.78 91.56 98.89 106.80 115.34
4 Devolution Fund 92.67 102.54 159.77 162.71 82.18 104.40 279.23 306.93 337.17 367.21 399.92
5 Service Charges and Fees
a. Water Charges 17.19 17.71 8.69 13.84 17.50 18.50 18.81 19.18 19.57 23.95 24.43
b. Service Charges and Fees (excluding
Water Charges) 65.69 70.46 91.73 141.06 110.66 129.39 142.33 156.56 172.22 189.44 208.38
6 Grants and Contributions 100.68 37.03 7.69 0.00 0.00 0.00 2.02 2.12 2.23 2.34 2.45
7 Sale and Hire Charges 53.69 57.23 61.80 85.79 64.48 81.24 85.30 89.57 94.05 98.75 103.69
8 Other Income 0.96 7.77 1.37 4.01 0.25 0.30 0.35 0.40 0.46 0.52 0.60
9 Deposits & Advances 45.51 33.91 119.39 23.17 46.97 46.60 53.59 61.63 70.87 81.50 93.73
Total Revenue Receipts 656.45 559.83 766.86 685.54 625.53 690.02 903.95 1038.28 1112.52 1194.49 1279.60
Revenue Expenditure
1 Personnel Cost 208.74 203.24 207.77 206.70 182.35 251.95 277.15 304.86 335.35 368.88 405.77
2 Terminal and Retirement Benefits 45.79 47.18 47.37 49.74 42.60 20.65 22.72 24.99 27.49 30.23 33.26
3 Operating Expenses 143.76 153.18 178.54 113.42 97.90 79.40 87.34 96.07 105.68 116.25 127.87
4 Administrative Expenses 16.88 13.79 57.54 26.74 63.92 67.00 73.70 81.07 89.18 98.09 107.90
5 Finance Expenses
a. Interest on Loans 57.07 77.35 90.12 61.15 64.94 34.04 14.91 11.20 7.49 3.78 1.60
6 Deposits & Advances 10.83 25.95 27.71 8.25 40.32 41.60 45.76 50.34 55.37 60.91 67.00
Total Revenue Expenditure 483.07 520.69 609.05 466.00 492.03 494.64 521.57 568.52 620.55 678.14 743.40
Revenue Surplus / Deficit 173.38 39.14 157.81 219.54 133.50 195.38 382.38 469.75 491.97 516.34 536.19
Principle Payment (Earlier Loan) 0.00 0.00 0.00 0.00 0.00 24.07 24.07 24.07 24.07 24.07 4.27
Net Surplus / Deficit 173.38 39.14 157.81 219.54 133.50 171.31 358.31 445.68 467.90 492.27 531.92
Closing Balance 348.71 387.85 545.66 765.20 898.70 1070.01 1428.32 1874.00 2341.90 2834.17 3366.09
Key Financial Indicators
2000-01 2001-02 2002-03 2003-04 2004-05 2005-06 2006-07 2007-08 2008-09 2009-10 2010-11 Account Head
Actuals =================================> Est. Short-term Projections ========================>
Status of Accounts
(incl. OB, PP and CC but exc. Dep) 348.71 387.85 545.66 765.20 898.70 1070.01 1428.32 1874.00 2341.90 2834.17 3366.09
Operating Ratio (Rev. Expen./Rev. Inc.) 0.74 0.93 0.79 0.68 0.79 0.72 0.58 0.55 0.56 0.57 0.58
Cash Debt-Service Coverage Ratio (DSCR) 6.11 5.01 6.05 12.51 13.84 18.41 36.64 53.14 74.21 101.77 573.15
DS/TR (Debt Service/Total Revenue) 8.69 13.82 11.75 8.92 10.38 8.42 4.31 3.40 2.84 2.33 0.46
Table. 7.19. Financial Operational Plan (FOP) – Long Term Period (2006-07 to 2025-26) - (Excluding Business Plan Projects)

Department of Planning, School of Architecture and Planning, Anna University
CCP To Business Plan / TNUIFSL /September 2006 143
Figures Rs. In lakhs
2011-12
2012-13
2013-14
2014-15
2015-16
2016-17
2017-18
2018-19 2019-20 2020-21 2021-22 2022-23 2023-24 2024-25 2025-26 Sl. No
.
Account Head
Long-term Projections=========================================================================================================
======>
Opening Balance 3366.09
4014.48
4692.82
5401.88
6139.05
6913.10
7904.99
8937.75 10026.0
9 11163.1
4 12353.5
4 13821.6
9 15358.9
7 16972.4
6 18684.4
5
Revenue Receipts
1 Property Tax 411.74 419.97 428.37 436.94 445.68 627.91 640.47 653.27 666.34 679.67 901.24 919.26 937.65 956.40 975.53
2 Other Taxes
a. Professional Tax 21.33 22.40 23.52 24.70 25.93 38.65 41.35 44.25 47.34 50.66 54.20 58.00 62.06 66.40 71.05
b. Other Taxes (excluding Professional Tax)
0.24 0.26 0.28 0.30 0.32 0.35 0.38 0.41 0.44 0.48 0.51 0.56 0.60 0.65 0.70
3 Assigned Revenue 124.57 134.54 145.30 156.92 169.48 183.03 197.68 213.49 230.57 249.02 268.94 290.45 313.69 338.78 365.89
4 Devolution Fund 437.65 478.94 524.12 573.56 627.67 686.89 751.69 822.60 900.21 985.13 1078.07 1179.77 1291.07 1412.87 1546.16
5 Service Charges and Fees
a. Water Charges 24.92 30.50 31.11 31.73 38.84 39.61 40.41 52.37 53.41 54.48 66.69 68.02 69.38 84.92 86.62
b. Service Charges and Fees (excluding Water Charges)
229.22 252.14 277.36 305.09 335.60 369.16 406.08 446.69 491.36 540.49 594.54 654.00 719.40 791.34 870.47
6 Grants and Contributions 2.58 2.71 2.84 2.98 3.13 3.29 3.45 3.63 3.81 4.00 4.20 4.41 4.63 4.86 5.10
7 Sale and Hire Charges 108.87 114.31 120.03 126.03 132.33 138.95 145.90 153.19 160.85 168.89 177.34 186.20 195.51 205.29 215.55
8 Other Income 0.69 0.80 0.92 1.06 1.21 1.40 1.61 1.85 2.12 2.44 2.81 3.23 3.71 4.27 4.91
9 Deposits & Advances 107.79 123.96 142.55 163.93 188.52 216.80 249.32 286.72 329.73 379.19 436.07 501.47 576.70 663.20 762.68
Total Revenue Receipts 1469.60
1580.52
1696.39
1823.25
1968.72
2306.04
2478.32
2678.46 2886.18 3114.44 3584.59 3865.37 4174.39 4528.98 4904.66
Revenue Expenditure
1 Personnel Cost 446.34 490.98 540.08 594.08 653.49 718.84 790.73 869.80 956.78 1052.46 1157.70 1273.47 1400.82 1540.90 1694.99
2 Terminal and Retirement Benefits 36.58 40.24 44.27 48.69 53.56 58.92 64.81 71.29 78.42 86.26 94.89 104.37 114.81 126.29 138.92
3 Operating Expenses 140.66 154.73 170.20 187.22 205.94 226.54 249.19 274.11 301.52 331.67 364.84 401.32 441.46 485.60 534.16
4 Administrative Expenses 118.69 130.56 143.62 157.98 173.78 191.16 210.27 231.30 254.43 279.88 307.86 338.65 372.51 409.77 450.74
5 Finance Expenses
a. Interest on Loans 0.96 0.32 0.00 0.00 0.00 0.00 0.00 0.00 0.00 0.00 0.00 0.00 0.00 0.00 0.00
6 Deposits & Advances 73.70 81.07 89.17 98.09 107.90 118.69 130.56 143.61 157.98 173.77 191.15 210.27 231.29 254.42 279.86
Total Revenue Expenditure 816.94 897.90 987.34
1086.0
7
1194.6
8
1314.1
5
1445.5
6 1590.12 1749.13 1924.04 2116.44 2328.09 2560.90 2816.99 3098.69
Revenue Surplus / Deficit 652.65 682.62 709.05 737.18 774.05 991.89
1032.76
1088.34 1137.05 1190.40 1468.15 1537.28 1613.49 1711.99 1805.97
Principle Payment (Earlier Loan) 4.27 4.27 0.00 0.00 0.00 0.00 0.00 0.00 0.00 0.00 0.00 0.00 0.00 0.00 0.00
Net Surplus / Deficit 648.38 678.35 709.05 737.18 774.05 991.89
1032.76
1088.34 1137.05 1190.40 1468.15 1537.28 1613.49 1711.99 1805.97
Closing Balance 4014.48
4692.82
5401.88
6139.05
6913.10
7904.99
8937.75
10026.09
11163.14
12353.54
13821.69
15358.97
16972.46
18684.45
20490.42
Key Financial Indicators
2011-12 2012-13 2013-14 2014-15 2015-16 2016-17 2017-18 2018-19 2019-20 2020-21 2021-22 2022-23 2023-24 2024-25 2025-26 Account Head
Long-term Projections==========================================================================================================>
Status of Accounts
(incl. OB, PP and CC but exc. Dep) 4014.48 4692.82 5401.88 6139.05 6913.10 7904.99 8937.75 10026.09 11163.14 12353.54 13821.69 15358.97 16972.46 18684.45 20490.42
Operating Ratio (Rev. Expen./Rev. Inc.) 0.56 0.57 0.58 0.60 0.61 0.57 0.58 0.59 0.61 0.62 0.59 0.60 0.61 0.62 0.63
Cash Debt-Service Coverage Ratio (DSCR) 767.25 1022.05 0.00 0.00 0.00 0.00 0.00 0.00 0.00 0.00 0.00 0.00 0.00 0.00 0.00
DS/TR (Debt Service/Total Revenue) 0.36 0.29 0.00 0.00 0.00 0.00 0.00 0.00 0.00 0.00 0.00 0.00 0.00 0.00 0.00

CCP To Business Plan / TNUIFSL /September 2006
By way of implementing the suggested projects in the Business plan the local body attain a position were they could sustain their revenue
and in turn civic services could be improved by means of their own resources without getting engrossed in debts.
Copyright © 2022 FDOKUMEN