Convergence in plant traits between species within grassland communities simplifies their monitoring
10
Convergence in plant traits between species within grassland communities simplifies their monitoring Pauline Ansquer, Michel Duru *, Jean Pierre Theau, Pablo Cruz INRA, UMR1248 Agir, F-31326 Castanet Tolosan, France 1. Introduction Policy makers are interested to evaluate the effects of agri- environmental measures on land use and the environment, and advisory services want to assess the effect of farmers’ management practices on technical and economic perfor- mance (Caballero, 2007). Plant trait measurement is a promising method for assessing the effects of land-use change or environmental factors on ecosystem functioning, including productivity and nutrient cycling, in grasslands (Lavorel and Garnier, 2002). Plant traits can be considered as field indicators instead of species composition of the plant communities for monitoring the impact of environmental or management changes on their agricultural and environmental character- istics. However measurements on all the plant species at field level is very time-consuming. Thus we are studying how to ecological indicators 9 (2009) 1020–1029 article info Article history: Received 7 July 2008 Received in revised form 22 October 2008 Accepted 4 December 2008 Keywords: Managed grasslands Grazing Cutting Fertilization Specific leaf area Nitrogen Leaf dry matter content Flowering Land use Field indicator abstract Plant trait measurement is a very powerful and promising method for assessing the effects of land use change on ecosystem behavior in grasslands, but it is very time-consuming. Hence we pose the following questions for simplifying diagnosis and monitoring: (i) are plant traits (PTs) similar between plant life forms (PLF: grasses, rosettes, upright forbs, legumes) within a plant community? (ii) is it possible to define the main plant community characteristics by measuring traits on one PLF or a limited number of dominant species? Six PTs known for their ability to characterize the capacity of species to exploit resource- rich or -poor environments and for their competitive dominance in response to disturbance (specific leaf area (SLA), leaf dry matter content (LDMC), plant height (H), C and N contents, flowering time) were measured on the species of 18 plant communities located in Central Pyrenees. The experiment combined 2 fertility levels and 3 defoliation regimes (cutting, grazing). Comparisons were made between the weighted values at community, PLF and two dominant species levels. Regression analysis shows that there were significant correlations between grasses and rosettes for 4 PTs. For H, N and C:N ratio, data for both grass and rosette PLFs were close to the bisecting line. The largest difference in the intercept was observed for LDMC. On the basis of plant traits weighted for all the species, plant communities were ranked in similar ways for SLA and H (Spearman r > 0.93; p < 0.001) and to a lesser extent for LDMC (r = 0.72; p < 0.001). Convergence in weighted plant traits for different PLFs within a plant community mean that in the studied grasslands, defoliation regime and nutrient availability act as strong filters that impose, at least at PLF level, very similar PFTs. This determines a specific local community structure and composition. An application of this result in managed grasslands is the possibility of focusing on one PLF or a limited number of species for vegetation diagnosis and monitoring. # 2008 Elsevier Ltd. All rights reserved. * Corresponding author. Fax: +33 5 61 73 55 37. E-mail address: [email protected] (M. Duru). available at www.sciencedirect.com journal homepage: www.elsevier.com/locate/ecolind 1470-160X/$ – see front matter # 2008 Elsevier Ltd. All rights reserved. doi:10.1016/j.ecolind.2008.12.002
-
Upload
independent -
Category
Documents
-
view
2 -
download
0
Transcript of Convergence in plant traits between species within grassland communities simplifies their monitoring

e c o l o g i c a l i n d i c a t o r s 9 ( 2 0 0 9 ) 1 0 2 0 – 1 0 2 9
Convergence in plant traits between species within grasslandcommunities simplifies their monitoring
Pauline Ansquer, Michel Duru *, Jean Pierre Theau, Pablo Cruz
INRA, UMR1248 Agir, F-31326 Castanet Tolosan, France
a r t i c l e i n f o
Article history:
Received 7 July 2008
Received in revised form
22 October 2008
Accepted 4 December 2008
Keywords:
Managed grasslands
Grazing
Cutting
Fertilization
Specific leaf area
Nitrogen
Leaf dry matter content
Flowering
Land use
Field indicator
a b s t r a c t
Plant trait measurement is a very powerful and promising method for assessing the effects
of land use change on ecosystem behavior in grasslands, but it is very time-consuming.
Hence we pose the following questions for simplifying diagnosis and monitoring: (i) are
plant traits (PTs) similar between plant life forms (PLF: grasses, rosettes, upright forbs,
legumes) within a plant community? (ii) is it possible to define the main plant community
characteristics by measuring traits on one PLF or a limited number of dominant species?
Six PTs known for their ability to characterize the capacity of species to exploit resource-
rich or -poor environments and for their competitive dominance in response to disturbance
(specific leaf area (SLA), leaf dry matter content (LDMC), plant height (H), C and N contents,
flowering time) were measured on the species of 18 plant communities located in Central
Pyrenees. The experiment combined 2 fertility levels and 3 defoliation regimes (cutting,
grazing). Comparisons were made between the weighted values at community, PLF and two
dominant species levels. Regression analysis shows that there were significant correlations
between grasses and rosettes for 4 PTs. For H, N and C:N ratio, data for both grass and rosette
PLFs were close to the bisecting line. The largest difference in the intercept was observed for
LDMC. On the basis of plant traits weighted for all the species, plant communities were
ranked in similar ways for SLA and H (Spearman r > 0.93; p < 0.001) and to a lesser extent for
LDMC (r = 0.72; p < 0.001). Convergence in weighted plant traits for different PLFs within a
plant community mean that in the studied grasslands, defoliation regime and nutrient
availability act as strong filters that impose, at least at PLF level, very similar PFTs. This
determines a specific local community structure and composition. An application of this
result in managed grasslands is the possibility of focusing on one PLF or a limited number of
species for vegetation diagnosis and monitoring.
# 2008 Elsevier Ltd. All rights reserved.
avai lable at www.sc iencedi rec t .com
journal homepage: www.e lsev ier .com/ locate /ecol ind
1. Introduction
Policy makers are interested to evaluate the effects of agri-
environmental measures on land use and the environment,
and advisory services want to assess the effect of farmers’
management practices on technical and economic perfor-
mance (Caballero, 2007). Plant trait measurement is a
promising method for assessing the effects of land-use change
* Corresponding author. Fax: +33 5 61 73 55 37.E-mail address: [email protected] (M. Duru).
1470-160X/$ – see front matter # 2008 Elsevier Ltd. All rights reservedoi:10.1016/j.ecolind.2008.12.002
or environmental factors on ecosystem functioning, including
productivity and nutrient cycling, in grasslands (Lavorel and
Garnier, 2002). Plant traits can be considered as field indicators
instead of species composition of the plant communities for
monitoring the impact of environmental or management
changes on their agricultural and environmental character-
istics. However measurements on all the plant species at field
level is very time-consuming. Thus we are studying how to
d.

e c o l o g i c a l i n d i c a t o r s 9 ( 2 0 0 9 ) 1 0 2 0 – 1 0 2 9 1021
simplify them by making measurements on a limited number
of plant species.
It has long been recognized that predicting the response of
plant species to variation in resources requires a functional
classification of species (Grime et al., 1988; McIntyre, 1999)
based on functional parameters directly linked to growth and
developmental functions of plants, or strongly correlated to
other variables describing these functions (Weiher et al., 1999).
Most of this research is based on studying the proportion of
different plant life forms (PLFs: grasses, rosettes, uprights
forbs, legumes) in response to ecological factors. On the other
hand, a short list of key plant functional traits has been
established for grouping species independently of their
botanical family (Diaz and Cabido, 1997). The approach is
based on an analysis of the traits developed by plants growing
in communities (Garnier et al., 2004). However, applying this
approach based on the recognition of all the species within a
community, especially at a vegetative stage, is very time-
consuming and requires reliable botanical knowledge. Thus,
the approach can be regarded as a practical tool to reduce a
wide diversity of species to a small number of entities for
simplifying field diagnosis and/or monitoring.
We have considered key traits that drive the properties of
species-rich grasslands, studying those characterizing the
capacity of species to exploit resource-rich or -poor environ-
ments and the capacity for competitive dominance in
response to disturbance (Westoby, 1998; Wilson et al., 1999).
For the former, four plant traits can be considered: the specific
leaf area (SLA), the leaf dry matter content (LDMC), the leaf
nitrogen content and leaf C:N ratio. They allow species to be
located on a resource capture/use—availability axis Wilson
et al. (1999). Species adapted to poor resource availability (low-
growing species) have a low SLA and N content, and a high
LDMC and leaf C:N ratio (Louault et al., 2005). LDMC was much
less variable than the other leaf traits, being largely indepen-
dent of leaf thickness (Garnier et al., 2001), and consequently a
better predictor of location on the resource capture/use—
availability axis (Wilson et al., 1999). Plant height or specific
shoot height are considered to be the most relevant traits
indicating capacity for competitive dominance (Hodgson et al.,
1999), because they express an ability to capture light
(Hartvigsen and McNaughton, 1995; Vesk et al., 2004). They
respond to management intensity (Bello et al., 2005). Flowering
time is related to plant growth rates and the capture and use of
nutrients (Sosebee and Weibe, 1973), and these latter variables
are correlated with leaf traits (Cruz et al., 2002). It responds to
the frequency of defoliation (Louault et al., 2005), and is closely
related to herbage growth pattern (Duru et al., 2005).
In this paper we address two objectives. First we examine
the similarity in plant traits for species growing together
within a plant community. We sought evidence as to how
species gather together under contrasting management
practices, given the opportunity to evaluate the assembly
rule theory, stating that any filter imposed on a regional
species pool acts to determine local community structure and
composition (Weiher and Keddy, 1999). Environmental filter-
ing is thought to result in the formation of groups of species
with similar traits that tend to occur together more often than
expected by chance alone (Holdaway and Sparrow, 2006).
Secondly, in applied terms, we examine if focusing measure-
ments only on the grass PLF, or on the two dominant species or
two dominant grass species, provides similar results as
measurements made on the overall plant community through
comparison of rosettes and upright forbs.
For studying the similarity in plant traits between plant life
forms within grassland communities, we used a set of
grasslands having different fertility levels and defoliation
regimes. We first examined if there was an effect of manage-
ment practices considered as ecological factors upon plant
trait values for each PLF. Secondly, we compared plant traits of
grass species to those of other main PLFs (rosettes, upright
forbs). Then, for simplifying the characterization of vegeta-
tion, we compared weighted plant traits for all the species to
those of grass species or only the two dominant species or two
dominant grass species. Finally, we examined the value of
these results to highlight species assemblage rules in
temperate managed grasslands and to propose a simplified
method for vegetation diagnosis and/or monitoring at the field
level.
2. Materials and methods
2.1. Experimental design
The experiment consisted of a set of 18 grassland commu-
nities sampled on four livestock farms in the Pyrenees (lat
42851’ N, long 1817’ E, 600–1200 m a.s.l.). Soil parent material
varies from alluvium in the bottom of the valley to shale or
granite on the slopes. Mean annual temperature is 10 8C and
annual rainfall is 1080 mm (5 years’ data). Grassland commu-
nities were chosen to represent the field diversity in terms of
defoliation management (grazing and/or cutting), nutrient
availability (Ansquer et al., 2004) and the functional composi-
tion of the vegetation: the grass abundance (Fig. 1a) and the
weighted grass LDMC (Fig. 1b). There were3 defoliation regimes,
combined with 2 levels of fertility (assessed empirically through
fertilizer management and qualitative observations on botani-
cal composition in the previous year, and denoted + and�) with
3 replications: 3 meadows (M) cut twice a year then grazed in
autumn, 3 meadows (GM) grazed in spring then cut, and 3
pastures (P) which were only grazed (Appendix A). The
maximum distance between fields was 500 m.
2.2. Botanical composition
The floristic composition of each community was obtained
through the list of species and their relative specific
abundance expressed as their oven-dry mass divided by the
total sampled above-ground dry biomass. Ten samples were
cut from each community at the peak of biomass production
(at the end of spring) on subplots of 35 m2. All the biomass
samples of a given subplot were pooled and the different
species were separated and identified.
Five PLFs were distinguished. Rosettes and upright forbs
are defined respectively as dicotyledons having, at the
vegetative stage, simple leaves without stems and compound
leaves with stems and/or large petioles (Cruz et al., 2002).
Graminoids are Carex and Luzula species. Others PLFs are
grasses and legumes. In most of the plots (15/18), the most
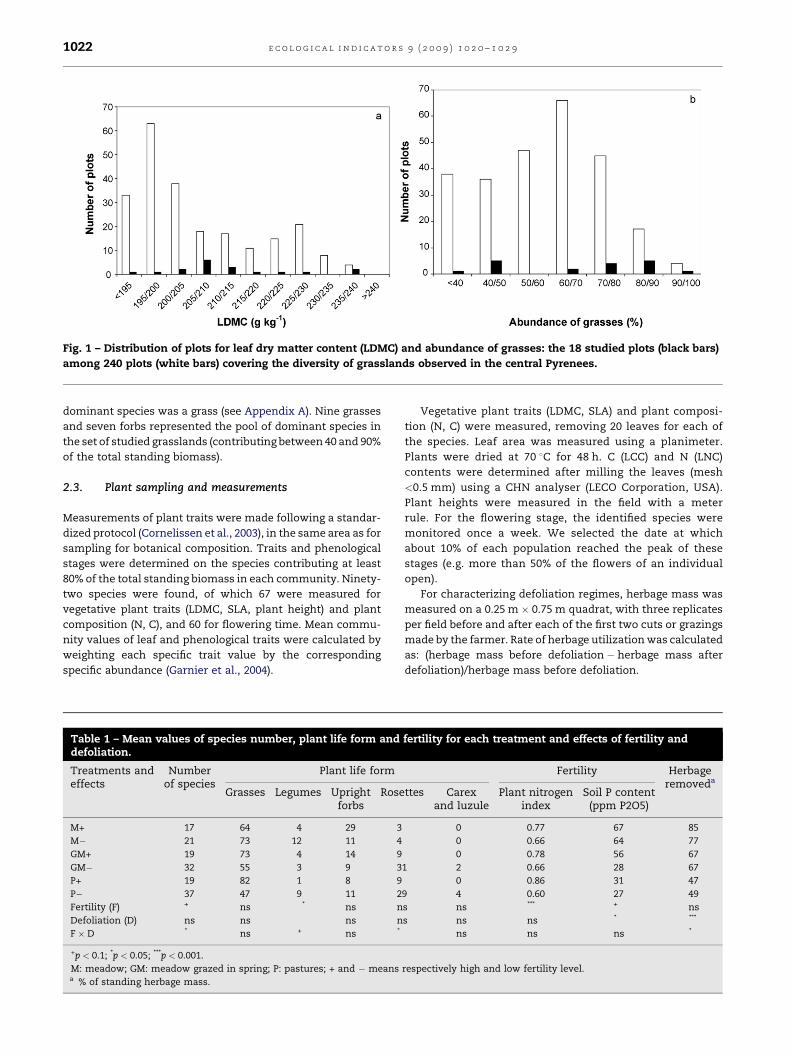
Fig. 1 – Distribution of plots for leaf dry matter content (LDMC) and abundance of grasses: the 18 studied plots (black bars)
among 240 plots (white bars) covering the diversity of grasslands observed in the central Pyrenees.
e c o l o g i c a l i n d i c a t o r s 9 ( 2 0 0 9 ) 1 0 2 0 – 1 0 2 91022
dominant species was a grass (see Appendix A). Nine grasses
and seven forbs represented the pool of dominant species in
the set of studied grasslands (contributing between 40 and 90%
of the total standing biomass).
2.3. Plant sampling and measurements
Measurements of plant traits were made following a standar-
dized protocol (Cornelissen et al., 2003), in the same area as for
sampling for botanical composition. Traits and phenological
stages were determined on the species contributing at least
80% of the total standing biomass in each community. Ninety-
two species were found, of which 67 were measured for
vegetative plant traits (LDMC, SLA, plant height) and plant
composition (N, C), and 60 for flowering time. Mean commu-
nity values of leaf and phenological traits were calculated by
weighting each specific trait value by the corresponding
specific abundance (Garnier et al., 2004).
Table 1 – Mean values of species number, plant life form anddefoliation.
Treatments andeffects
Numberof species
Plant life form
Grasses Legumes Uprightforbs
Rose
M+ 17 64 4 29 3
M� 21 73 12 11 4
GM+ 19 73 4 14 9
GM� 32 55 3 9 3
P+ 19 82 1 8 9
P� 37 47 9 11 2
Fertility (F) + ns * ns n
Defoliation (D) ns ns ns n
F � D * ns + ns *
+p < 0.1; *p < 0.05; ***p < 0.001.
M: meadow; GM: meadow grazed in spring; P: pastures; + and � meansa % of standing herbage mass.
Vegetative plant traits (LDMC, SLA) and plant composi-
tion (N, C) were measured, removing 20 leaves for each of
the species. Leaf area was measured using a planimeter.
Plants were dried at 70 8C for 48 h. C (LCC) and N (LNC)
contents were determined after milling the leaves (mesh
<0.5 mm) using a CHN analyser (LECO Corporation, USA).
Plant heights were measured in the field with a meter
rule. For the flowering stage, the identified species were
monitored once a week. We selected the date at which
about 10% of each population reached the peak of these
stages (e.g. more than 50% of the flowers of an individual
open).
For characterizing defoliation regimes, herbage mass was
measured on a 0.25 m � 0.75 m quadrat, with three replicates
per field before and after each of the first two cuts or grazings
made by the farmer. Rate of herbage utilization was calculated
as: (herbage mass before defoliation � herbage mass after
defoliation)/herbage mass before defoliation.
fertility for each treatment and effects of fertility and
Fertility Herbageremoveda
ttes Carexand luzule
Plant nitrogenindex
Soil P content(ppm P2O5)
0 0.77 67 85
0 0.66 64 77
0 0.78 56 67
1 2 0.66 28 67
0 0.86 31 47
9 4 0.60 27 49
s ns *** + ns
s ns ns * ***
ns ns ns *
respectively high and low fertility level.
e c o l o g i c a l i n d i c a t o r s 9 ( 2 0 0 9 ) 1 0 2 0 – 1 0 2 9 1023
2.4. Data analysis
For examining the variation of the plant trait (direction of
variation, order of magnitude, etc.) along an ecological gradient,
several cases can be considered: (i) strong convergence in the
direction where a trait responded whatever the plant functional
group; (ii) part convergence, one of the two forms of growth
always having higher values than the other (this can result from
an intrinsic characteristic to the growth form considered); (iii)
part convergence when the different plant functional groups
did not have the same response to the ecological gradient.
Soil fertility and nutrient availability were assessed through
soil analysis (layer 0–5 cm) for phosphorus (Olsen method) and
plant analysis for nitrogen (Table 1). For the latter, plant
nitrogen index (Ni) is calculated from N concentration and
herbage mass. It is the ratio of the actual %N (%Na) to the critical
%N (%Nc) which corresponds to: %Nc = 4.8 (DM)�0.32 reported by
Lemaire and Gastal (1997). It provides a rigorous ranking of plots
for their nitrogen limitation for herbage production A valueof Ni
of 1 means that herbage growth is not limited by nitrogen.
ANOVA, correlations and correlations (Pearson and Spear-
man) were calculated using Statistix 7.0 software. Percentages
were loge-transformed to meet ANOVA conditions.
3. Results
3.1. Characterization of the treatments for plant life formsand management practices
There was a significant effect of treatments on the proportion of
the different PLFs and numbers of species (Table 1). The rosette
PLF was most abundant on the GM- and P-treatments and least
abundant on the M treatments. Rosette forms usually increased
the most when grasses decreased (r = �0.8; p < 0.001). The
defoliation treatments resulted mainly in a difference in the
proportion of herbage removed while the difference in field
fertility corresponded to differences in nitrogen availability
(plant nitrogen index) or soil phosphorus availability (Table 1).
3.2. Plant trait variations in different plant life forms
Significant differences were observed between PLFs for the 6
plant traits, and the highest significant levels were found for
Table 2 – Comparison of the means of the six plant traits for t
Traits Significance Grasses
20a
Flowering date (Julian days) ¤ 158ab
Plant height at vegetative stage (cm) * 22.2a
SLA (m2 kg�1) * 26.0a
LDMC (g kg�1) *** 257a
LNCmass (g kg�1) *** 27.9b
Lamina C:N ratio *** 18.9ab
CL: carex and luzule.¤p < 0.1; *p < 0.05; ***p < 0.01.
Data having a different letter in the same line were significantly differena Number of species considered.
LDMC, LNC and C:N ratio (Table 2). Grass and rosette PLFs were
the most distinct. There were significant differences for plant
height, SLA, LDMC. Grass life forms were characterized by
their late flowering dates, greatest plant heights and LDMCs
(together with Carex and Luzule) and SLA (together with
legumes). Small significant differences between PLFs were due
to large variation within groups. This was especially observed
for flowering date. For example, in comparison of grass
species, some rosette species can flower early in the season,
such as Carex and Luzule (around 100 Julian days for
Taraxacum officinale L., Bellis perennis L. and Plantago lanceolata
L.) or later (around 150 Julian days for Scabiosa columbaria L.,
Knautia arvensis L., Picris hieracioides L.).
3.3. Comparison of weighted plant traits betweenrosettes, upright forbs and grasses
Plant traits measured on grasses and dicotyledons were
significantly positively correlated, except for LDMC (not
shown). Correlations were usually higher when considering
only the rosette PLF, except for SLA. This suggests that not all
dicotyledons have the same behavior, depending on the plant
trait considered. Thus for further result analysis, we distin-
guished upright and rosette forbs.
For SLA there was a significant correlation only between the
grass and the upright forbs (Fig. 2a). Furthermore, dicotyledons
have only half the range of variation in SLA as the grasses. Grass
and rosette PLFs were significantly correlated for LDMC, but
there was a significant difference in the intercept (Fig. 2b). On
the other hand, there was no significant correlation between
grasses and the upright forb PLF.
The plant height, measured at the vegetative stage, is an
almost perfect example of convergence between grass PLF and
rosette as well upright forbs (Fig. 2c). Indeed, the linear
regressions were almost identical with the bisecting line.
The leaf N content (Fig. 2d) and C:N ratio (Fig. 2e), although a
little further away from the bisecting line, behave as they do
for plant height. The nitrogen content of grass PLF tended to be
slightly higher than those of rosette PLF and lower than those
of upright forb PLFs.
For the date of flowering (Fig. 2f), the correlations between
grass PLF and rosette as well as upright forbs PLFs were
significant but weaker (p < 0.1) than for the vegetative plant
traits. Rosettes and upright forbs flowered earlier than the
he five functional groups.
Rosettes Upright forbs Legumes CL
15 22 6 4
136a 139ab 147a 99b
13.5b 18.2ab 15.8ab 9.1b
21.2b 24.1ab 27.6a 18.3b
147c 201b 213ab 271a
25.0b 31.9ab 44.8a 21.9b
21.0a 16.9ab 11.9b 24.0a
t.
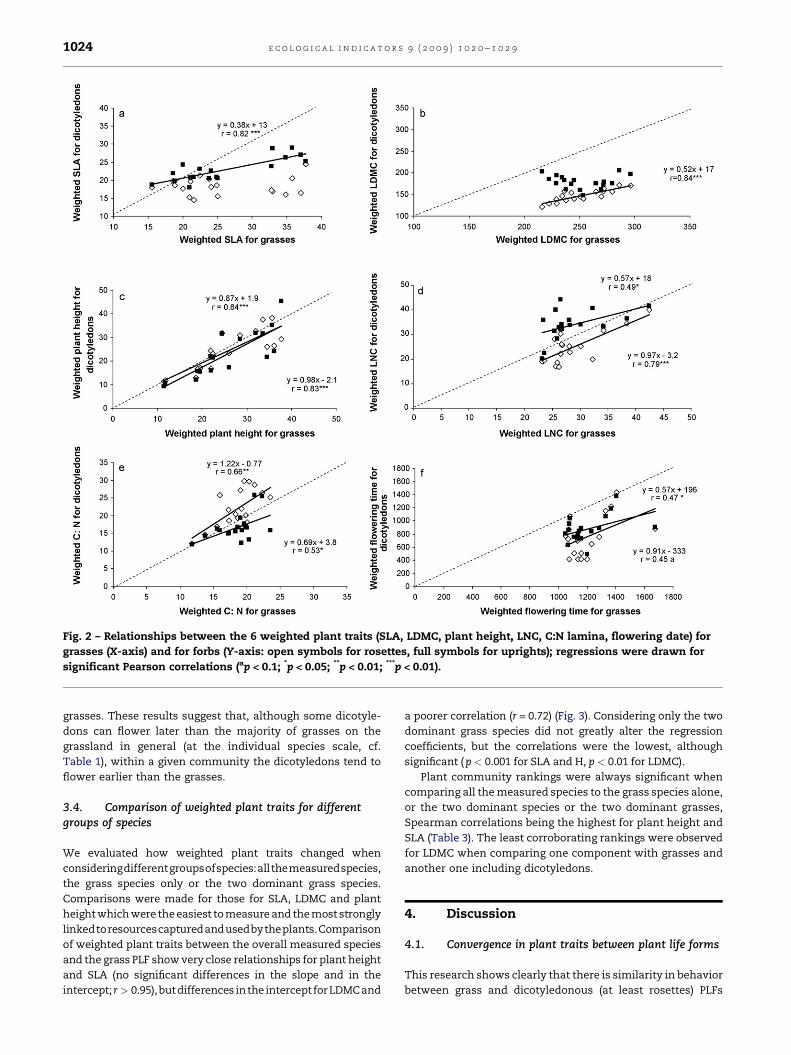
Fig. 2 – Relationships between the 6 weighted plant traits (SLA, LDMC, plant height, LNC, C:N lamina, flowering date) for
grasses (X-axis) and for forbs (Y-axis: open symbols for rosettes, full symbols for uprights); regressions were drawn for
significant Pearson correlations (ap < 0.1; *p < 0.05; **p < 0.01; ***p < 0.01).
e c o l o g i c a l i n d i c a t o r s 9 ( 2 0 0 9 ) 1 0 2 0 – 1 0 2 91024
grasses. These results suggest that, although some dicotyle-
dons can flower later than the majority of grasses on the
grassland in general (at the individual species scale, cf.
Table 1), within a given community the dicotyledons tend to
flower earlier than the grasses.
3.4. Comparison of weighted plant traits for differentgroups of species
We evaluated how weighted plant traits changed when
consideringdifferentgroupsofspecies:allthemeasuredspecies,
the grass species only or the two dominant grass species.
Comparisons were made for those for SLA, LDMC and plant
height which were the easiest to measure and the most strongly
linkedtoresourcescapturedandusedbytheplants.Comparison
of weighted plant traits between the overall measured species
and the grass PLF show very close relationships for plant height
and SLA (no significant differences in the slope and in the
intercept; r > 0.95),butdifferences inthe intercept forLDMCand
a poorer correlation (r = 0.72) (Fig. 3). Considering only the two
dominant grass species did not greatly alter the regression
coefficients, but the correlations were the lowest, although
significant (p < 0.001 for SLA and H, p < 0.01 for LDMC).
Plant community rankings were always significant when
comparing all the measured species to the grass species alone,
or the two dominant species or the two dominant grasses,
Spearman correlations being the highest for plant height and
SLA (Table 3). The least corroborating rankings were observed
for LDMC when comparing one component with grasses and
another one including dicotyledons.
4. Discussion
4.1. Convergence in plant traits between plant life forms
This research shows clearly that there is similarity in behavior
between grass and dicotyledonous (at least rosettes) PLFs

Fig. 3 – Relationships between three weighted plant traits
(SLA, LDMC, plant height) for the whole plant community
(X-axis) and the grass group (open symbols) or the two
dominant grasses (full symbols); regressions were drawn
for significant Pearson correlations (ap < 0.1; *p < 0.05;**p < 0.01; ***p < 0.01).
e c o l o g i c a l i n d i c a t o r s 9 ( 2 0 0 9 ) 1 0 2 0 – 1 0 2 9 1025
found within a given community for a set of weighted plant
traits characterizing species for the capture and use of
resources and competitiveness. These results were obtained
for a range of defoliation managements (grazing vs cutting)
Table 3 – Spearman correlation coefficients between plant traitwo dominant species; (iii) the two dominant grasses (n = 18).
Correlation between the weightedplant trait for the overall species and
Leaf dry matter
* All grass species 0.73**
* The two dominant species 0.71**
* The two dominant grass species 0.72**
** p < 0.01.*** p < 0.01.
and intensities of defoliation, as well as fertility gradients
(Table 1) which were typical of temperate managed grass-
lands. Indeed, such comparisons are usually made for more
contrasting treatments (used vs abandoned grasslands)
(Tremont, 1994) or larger spatial scales (Diaz et al., 2004). This
means that even at the spatial scale at which we worked,
defoliation regime and fertility act as strong filters that
impose, at least at PLF level, very similar plant traits
determining specific local community structure and composi-
tion (Holdaway and Sparrow, 2006). Consequently, for each
combination of environmental factors, there is a group of
species with similar traits that tend to occur together more
often than expected by chance alone. Our observations
confirm that there is a relative uniformity within the plant
community of productivity-related traits, whereas diversity is
often observed in regenerative traits (Grime, 2006).
Our results confirmed the well-known effect of manage-
ment practices, considered as ecological factors, on the
proportions of the different PLFs (see Section 2). The original
result of this study concerns the effect of management on
weighted plant traits for the different PFFs. When an
ecological factor increased (or decreased) a plant trait for
the grass PLF, it also did so for other PLFs, usually to a similar
extent. This similarity in response, especially for grass and
rosette PLFs, was observed clearly for 4 plant traits involved in
the plant strategy for resource acquisition and use (Craine
et al., 2001): LDMC, that reflects the ‘‘tissue density’’ strategy,
height, %N and C:N ratio.
Such similar behavior between grasses and dicotyledons
was also observed when comparing different PLFs within a
plant community, especially for SLA (Diaz et al., 2004). For %N,
a better correlation was found between grasses and rosettes
than between grasses and upright forbs. Litter C:N ratio, an
index of litter quality, was depended significantly of stocking
rate; it was lower at 4.0 sheep ha�1 year�1 compared with 1.3
and 5.3 sheep ha�1 year�1 (Barger et al., 2004). For the height,
Craine et al. (2001) show that along a fertility gradient, there
was a parallel pattern of growth form for both grasses and
forbs on low-fertility plots. We observed that the height of
some rosettes can equal that of grasses at medium fertility
level (Fig. 2c), because leaves that grow roughly parallel to the
ground become erect when there is competition for light. On
the other hand, there was a significant difference in the timing
of flowering between grasses and dicotyledons, as reported
previously (Negi et al., 1992), but to a lesser extent than for
other plant traits, probably because variations in flowering
time associated with nutrient availability are minor (Al Haj
ts for all species combined and (i) all grass species; (ii) the
Plant traits
content Specific leaf area Plant height
0.95*** 0.97***
0.96*** 0.96***
0.95*** 0.93***
e c o l o g i c a l i n d i c a t o r s 9 ( 2 0 0 9 ) 1 0 2 0 – 1 0 2 91026
Khaled et al., 2005). Indeed, this result strengthened the view
that phenological stages are related to these plant character-
istics, at least to LDMC (Sosebee and Weibe, 1973).
Differences and similarities between grasses and dicoty-
ledons (upright forbs, rosettes) were also observed for plants
growing in pure stands. In this way, LDMC values separated
the species into three PLFs (grass, rosette forbs and upright
forbs, p � 0.001) while this is not the case for SLA and height (Al
Haj Khaled et al., 2005). Thus, LDMC should not be measured at
plant community level without considering PLFs separately.
On the other hand, Craine et al. (2002) found that there was
more variation within C3 grasses and forbs than between the
two groups. Both were distinguished because of some
morphological and allocation traits, but not by traits asso-
ciated with growth and production. In the same experiment,
Tjoelker et al. (2005) show that the mean values of SLA
between grasses, forbs, legumes were similar (99–118 cm2 g�1)
but not significantly different. However, significant differ-
ences were found for %N and C:N ratio as regards the
proportion of grasses and legumes. Craine et al. (2001) show
that the separation of grasses and forbs in theory-based
classifications is obvious when the traits used for the
classification rely heavily on morphology. On the other hand,
they noted that there was little difference in functional traits
such as SLA, leaf longevity and growth in low-nutrient
conditions.
The similarity in traits between PLFs within a plant
community in response to ecological gradients is in agreement
with the similarity observed previously for agronomic char-
acteristics. The similarity found between grasses and dicoty-
ledons within a set of plant communities for leaf:stem ratio
(Calviere and Duru, 1999) and plant part digestibility (Duru,
1997) means that the studied plant traits are appropriate as
response and effect traits (Hooper et al., 2002).
4.2. Implications for field diagnosis and monitoring theeffect of land-use change on ecosystem behavior throughplant trait measurements
For the six plant traits known to be suitable for characterizing
the capacity of species to exploit resource-rich or -poor
environments or the capacity for competitive dominance in
response to disturbance on the one hand, and to assess
agronomic or environmental properties on the other, there is
good correlation between measurements made for the two
main species or the two main grasses and for all the species
combined. These results differ from those of Cousins and
Lindborg (2004) who found that differences in plant traits were
mainly related to a wetness gradient rather than management
intensity, but they are in agreement with Garnier’s findings
(Garnier et al., 2004). These authors show that the correlations
between leaf traits (LDMC and SLA) and environmental or
management factors (in their case, the period of abandonment
of the pasture) are more sound when one considers only the
two dominant species or the weighted plant traits at
community level rather than the actual values for each of
the species. This was due to the ‘‘mass ratio hypothesis’’
postulating that ecosystem properties should depend on
species traits and on species contribution to the whole
above-ground biomass of the community (Grime, 1998; Vile
et al., 2005). To summarize, the two dominant grasses or
species that constitute at least 18 and 29% respectively (up to
69 and 79%) of the herbage mass represent well the behavior of
the whole pasture as regards the studied plant traits. Thus,
they can be used as indicators for field diagnosis or monitoring
in order to evaluate if there are changes in land use or
management intensity and on their impacts upon environ-
ment and agriculture. However, for field diagnosis, care should
be taken to ensure that differences in plant traits are due to
differences in management intensity and not to environ-
mental gradients such as wetness (Cousins and Lindborg,
2004).
In order to use plant functional parameters for ranking
plant communities according to their response to ecological
gradients (Kleyer, 1999; Pakeman, 2004) or their effect on
agronomic characteristics (Duru et al., 2005), methods to
simplify their application in the field would be welcome. We
can distinguish methods based on trait measurements and
those based of the use of plant trait databases (Lavorel et al.,
2007). For the former, one must be able to identify species.
However, we show that it is possible to reduce dramatically the
number of species on which plant traits are measured without
toomuchchange in the plant community ranking. The choice of
the grass PLF is justified by its abundance in semi-natural
grasslands and their similar morphology (one botanical family)
which avoids having to adapt the procedure of trait measure-
ments. Furthermore, by measuring only the grass PLF, the loss
of information is small for the whole community. However, we
think that this simplified method performs better for ranking
grassland communities according to plant traits than for
providing absolute values. Another method is to list traits
chosen at random (Gaucherand et al., 2006). In this case, it is not
necessary to identify the species, but caution should be
exercised, especially for LDMC measurements, due to the big
differences which exist between PLFs.
5. Conclusion
Grasses and dicotyledonous (especially rosette) plant life
forms behaved very similarly within a set of grassland
communities differing in soil fertility and defoliation regimes
for several plant functional parameters that respond to
management (nutrient availability and defoliation regime).
The closest relationships were observed for plant height at the
vegetative stage, leaf nitrogen content and C:N ratio. On the
other hand, the dicotyledonous species have lower LDMC and
flowered on average earlier than grasses. Reducing the plant
community to the grass PLF or even to the two dominant
species did not greatly alter the ranking of the set of studied
grasslands, leading to the possibility of using a simple method
for assessing the effects of land-use change on ecosystem
behavior by monitoring the targeted plant traits.
Acknowledgment
The work was funded by the EU project VISTA (Vulnerability of
Ecosystem Services to Land Use Change in Traditional
Agricultural Landscapes) (Contract no. EVK2-2001-15 000356).
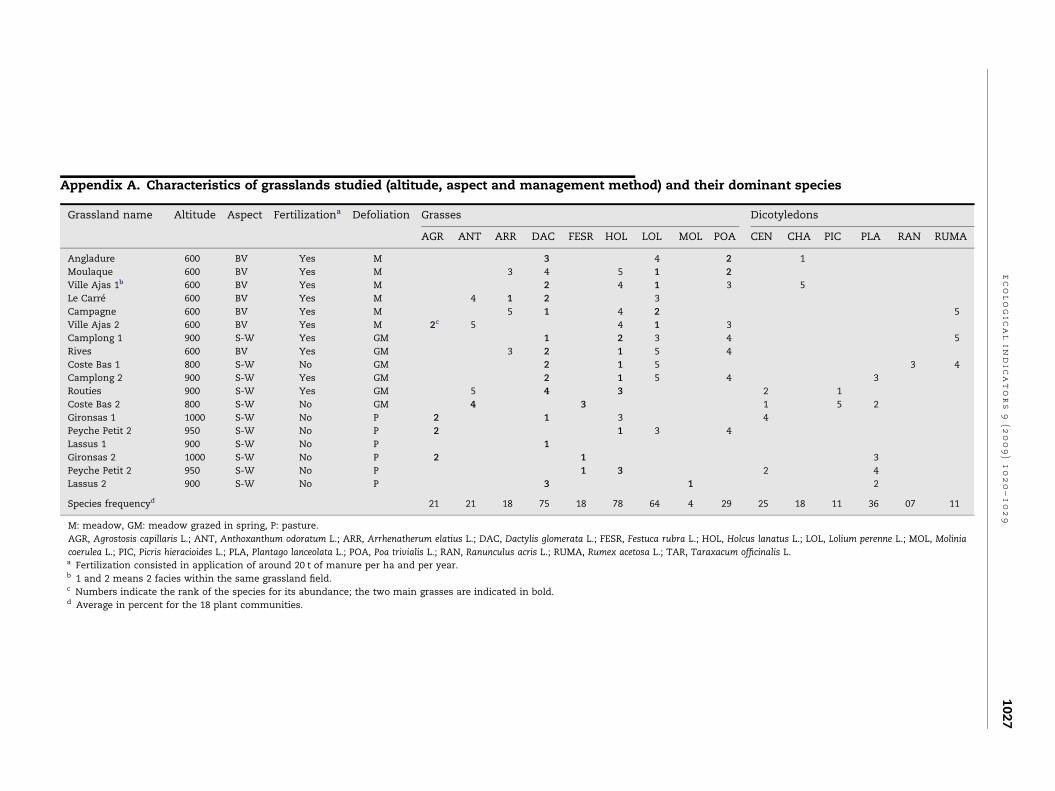
Appendix A. Characteristics of grasslands studied (altitude, aspect and management method) and their dominant species
Grassland name Altitude Aspect Fertilizationa Defoliation Grasses Dicotyledons
AGR ANT ARR DAC FESR HOL LOL MOL POA CEN CHA PIC PLA RAN RUMA
Angladure 600 BV Yes M 3 4 2 1
Moulaque 600 BV Yes M 3 4 5 1 2
Ville Ajas 1b 600 BV Yes M 2 4 1 3 5
Le Carre 600 BV Yes M 4 1 2 3
Campagne 600 BV Yes M 5 1 4 2 5
Ville Ajas 2 600 BV Yes M 2c 5 4 1 3
Camplong 1 900 S-W Yes GM 1 2 3 4 5
Rives 600 BV Yes GM 3 2 1 5 4
Coste Bas 1 800 S-W No GM 2 1 5 3 4
Camplong 2 900 S-W Yes GM 2 1 5 4 3
Routies 900 S-W Yes GM 5 4 3 2 1
Coste Bas 2 800 S-W No GM 4 3 1 5 2
Gironsas 1 1000 S-W No P 2 1 3 4
Peyche Petit 2 950 S-W No P 2 1 3 4
Lassus 1 900 S-W No P 1
Gironsas 2 1000 S-W No P 2 1 3
Peyche Petit 2 950 S-W No P 1 3 2 4
Lassus 2 900 S-W No P 3 1 2
Species frequencyd 21 21 18 75 18 78 64 4 29 25 18 11 36 07 11
M: meadow, GM: meadow grazed in spring, P: pasture.
AGR, Agrostosis capillaris L.; ANT, Anthoxanthum odoratum L.; ARR, Arrhenatherum elatius L.; DAC, Dactylis glomerata L.; FESR, Festuca rubra L.; HOL, Holcus lanatus L.; LOL, Lolium perenne L.; MOL, Molinia
coerulea L.; PIC, Picris hieracioides L.; PLA, Plantago lanceolata L.; POA, Poa trivialis L.; RAN, Ranunculus acris L.; RUMA, Rumex acetosa L.; TAR, Taraxacum officinalis L.a Fertilization consisted in application of around 20 t of manure per ha and per year.b 1 and 2 means 2 facies within the same grassland field.c Numbers indicate the rank of the species for its abundance; the two main grasses are indicated in bold.d Average in percent for the 18 plant communities.
ec
ol
og
ic
al
in
dic
at
or
s9
(2
00
9)
10
20
–1
02
91
02
7
e c o l o g i c a l i n d i c a t o r s 9 ( 2 0 0 9 ) 1 0 2 0 – 1 0 2 91028
r e f e r e n c e s
Al Haj Khaled, R., Duru, M., Theau, J.P., Plantureux, S., Cruz, P.,2005. Variation of leaf traits through seasons and N-availability levels and its consequences for rankinggrassland species. J. Veg. Sci. 16, 391–398.
Ansquer, P., Theau, J.P., Cruz, P., Viegas, J., Al Haj Khaled, R.,Duru, M., 2004. Caracterisation de la diversite fonctionnelledes prairies a flore complexe: vers la construction d’outilsde gestion. Fourrages 179, 353–368.
Barger, N.N., Ojima, D.S., Belnap, J., Shiping, W., Yanfren, W.,Chen, Z., 2004. Changes in plant functional groups, litterquality and soil carbon and nitrogen mineralization withsheep grazing in an inner Mongolian grassland. J. RangeManage. 57, 613–619.
Bello, F., Leps, J., Sebastia, M.T., 2005. Predictive value of planttraits to grazing along a climatic gradient in theMediterranean. J. Appl. Ecol. 42, 824–833.
Caballero, R., 2007. High Nature Value (HNV) Grazing Systems inEurope: a link between biodiversity and farm economics.Open Agric. J. 1, 11–19.
Calviere, I., Duru, M., 1999. The effect of N and P fertilizerapplication and botanical composition on the leaf/stemratio patterns in spring in Pyrenean meadows. Grass ForageSci. 54, 255–266.
Cornelissen, J.H.C., et al., 2003. Handbook of protocols forstandardised and easy measurement of plant functionaltraits worldwide. Aust. J. Bot. 51, 335–380.
Cousins, S.A., Lindborg, R., 2004. Assessing changes in plantdistribution patterns—indicator species versus plantfunctional types. Ecol. Indicators 4, 17–27.
Craine, J.M., Froehle, J., Tilman, D., Wedin, D.A., Chapin, F.S.,2001. The relationships among root and leaf traits of 76grassland species and relative abundance along fertility anddisturbance gradients. Oikos 93, 274–285.
Craine, J.M., Tilman, D., Wedin, D., Reich, P., Tjoelker, M., Knops,J., 2002. Functional traits, productivity and effects onnitrogen cycling of 33 grassland species. Funct. Ecol. 16,563–574.
Cruz, P., Duru, M., Therond, O., Theau, J.P., Ducourtieux, C.,Jouany, C., Al Haj Khaled, R., Ansquer, P., 2002. Une nouvelleapproche pour caracteriser les prairies naturelles et leurvaleur d’usage. A new approach to the characterization ofnatural grasslands and their use value. Fourrages 172,335–354.
Diaz, S., Cabido, M., 1997. Plant functional types and ecosystemfunctions in relation to global change. J. Veg. Sci. 8,463–474.
Diaz, S., Hodgson, J.G., Thompson, K., Cabido, M., Cornilessen,J.H.C., et al., 2004. The plant traits that drive ecosystems:evidence from three continents. J. Veg. Sci. 15, 295–304.
Duru, M., 1997. Leaf and stem in vitro digestibility for grassesand dicotyledons of meadow plant communities in spring. J.Sci. Food Agric. 74, 175–185.
Duru, M., Tallowin, J., Cruz, P., 2005. Functional diversity in low-input grassland farming systems: characterisation, effectand management. In: Lillak, R., Viiralt, R., Linke, A.,Geherman, V. (Eds.), Integrating Efficient GrasslandFarming and Biodiversity, vol. 10. EGF, Tartu, Estonia, pp.199–210.
Garnier, E., Laurent, G., Bellmann, A., Debain, S., Berthelier, P.,Ducout, B., Roumet, C., Navas, M.L., 2001. Consistency ofspecies ranking based on functional leaf traits. New Phytol.152, 69–83.
Gaucherand, S., Liancourt, P., Lavorel, S., 2006. Importance andintensity of competition along a fertility gradient and acrossspecies. J. Veg. Sci. 17, 455–464.
Garnier, E., Cortez, J., Billes, G., Navas, M.L., Roumet, C.,Debussche, M., Laurent, G., Blanchard, A., Aubry, D.,Bellmann, A., Neill, C., Toussaint, J.P., 2004. Plant functionalmarkers capture ecosystem properties during secondarysuccession. Ecology 85, 2630–2637.
Grime, J.P., 1998. Benefits of plant diversity to ecosystems:immediate, filter and founder effects. J. Ecol. 902–910.
Grime, J.P., 2006. Trait convergence and trait divergence inherbaceous plant communities: mechanisms andconsequences. J. Veg. Sci. 17, 255–260.
Grime, J.P., Hodgson, J.G., Hunt, R., 1988. Comparative plantecology. In: Unwin, H. (Ed.), Functional Approach tocommon British Species. Unwin Hyman Ltd., London, UK,pp. ix-742.
Hartvigsen, G., McNaughton, S.J., 1995. Tradeoff between heightand relative growth rate in a dominant grass from theSerengeti ecosystem. Oecologia 102, 273–276.
Hodgson, J.G., Wilson, P.J., Hunt, R., Grime, J.P., Thompson, K.,1999. Allocating C-S-R plant functional types: a softapproach to a hard problem. Oikos 85, 282–294.
Holdaway, R.J., Sparrow, A.D., 2006. Assembly rules operatingalong a primary riverbed-grassland successional sequence.J. Ecol. 94, 1092–1102.
Hooper, D.U., Solan, M., Sykes, M.T., Diaz, S., Gessner, M.O.,Buchmann, N., Degrange, V., Grime, P., Hulot, F., Mermillod-Blondin, F., Roy, J., Spehn, E.M., Peer van, L., 2002. Speciesdiversity, functional diversity, and ecosystem functioning.In: Loreau, M., Naeem, S., Inchausti, P. (Eds.). Biodiversityand ecosystem functioning—synthesis and perspectives,New York, USA, pp. 195–208.
Kleyer, M., 1999. Distribution of plant functional types alonggradients of disturbance intensity and resource supply in anagricultural landscape. J. Veg. Sci. 10, 697–708.
Lavorel, S., Garnier, E., 2002. Predicting changes in communitycomposition and ecosystem functioning from plant traits:revisiting the Holy Grail. Funct. Ecol. 16, 545–556.
Lavorel, S., Grigulis, K., McIntyre, S., Williams, N.S.G., Garden,D., Dorrough, J., Berman, S., Quetier, F., Thebault, A., Bonis,A., 2007. Assessing functional diversity in the field—methodology matters! Funct. Ecol. 22, 134–147.
Lemaire, G., Gastal, F., 1997. N uptake and distribution in plantcanopies. In: Lemaire, G. (Ed.), Diagnosis of the NitrogenStatus in the Crops. Springer Verlag, Berlin, pp. 3–44.
Louault, F., Pillar, V.D., Garnier, E., Soussana, J.F., 2005. Planttraits and functional types in response to reduceddisturbance in a semi-natural grassland. J. Veg. Sci. 16, 151–160.
McIntyre, S., 1999. Plant functional types—recent history andcurrent developments. In: International RangelandCongress, Inc. Proceedings of the VI Int. RangelandCongress, Townsville, Australia. In People and Rangelands:Building the future.
Negi, G.C.S., Rikhari, H.C., Singh, S.P., 1992. Phenologicalfeatures in relation to growth forms and biomassaccumulation in an alpine meadow of the CentralHimalaya. Vegetation 101, 161–170.
Pakeman, R.J., 2004. Consistency of plant species and traitresponses to grazing along a productivity gradient: a multi-site analysis. J. Ecol. 92, 893–905.
Sosebee, R.E., Weibe, W., 1973. Effect of phonologicaldevelopment on radio phosphorus translocationsfrom leaves in created wheat grass. Oecologia 13,103–112.
Tjoelker, M.G., Craine, J.M., Wedin, D., Reich, P.B., Tilley, J.M.A.,2005. Linking leaf and root trait syndromes among 39grassland and savannah species. New Phytol. 167, 493–508.
Tremont, R.M., 1994. Life-history attributes of plants in grazedand ungrazed grasslands on the northern tablelands of NewSouth Wales. Aust. J. Bot. 42, 511–530.

e c o l o g i c a l i n d i c a t o r s 9 ( 2 0 0 9 ) 1 0 2 0 – 1 0 2 9 1029
Vesk, P.A., Leisham, M.R., Westoby, M., 2004. Simple traits donot predict grazing response in Australian dry shrublandsand woodlands. J. Appl. Ecol. 41, 22–31.
Vile, D., Garnier, E., Shipley, B., Laurent, G., Navas, M.L., Roumet,C., Lavorel, S., Diaz, S., Hodgson, J.G., Lloret, F., Midgley, G.F.,Poorter, H., Rutheford, M.C., Wilson, P.J., Wright, I.J., 2005.Specific leaf area and dry matter content estimate thicknessin laminar leaves. Ann. Bot. 96, 1129–1136.
Weiher, E., Keddy, P.A., 1999. Relative abundance and evennesspatterns along diversity and biomass gradients. Oikos 87,355–361.
Weiher, E., Van der Werf, A., Thompson, K., Roderick, M.,Garnier, E., Eriksson, O., 1999. Challenging Theophrastus: acommon core list of plant traits for functional ecology. J.Veg. Sci. 10, 609–620.
Westoby, M., 1998. A leaf-height-seed (LHS) plant ecologystrategy scheme. Plant Soil 199, 213–227.
Wilson, P.J., Thompson, K., Hodgson, J.G., 1999. Specific leaf areaand leaf dry matter content as alternative predictors ofplant strategies. New Phytol. 143, 155–162.