CONVECTIVE TOWERS IN EYEWALLS OF TROPICAL CYCLONES OBSERVED BY THE TRMM PRECIPITATION RADAR IN...
12
CONVECTIVE TOWERS IN EYEWALLS OF TROPICAL CYCLONES OBSERVED BY THE TRMM PRECIPITATION RADAR IN 1998–2001 Owen A. Kelley * and John Stout TRMM Science Data and Information System, NASA Goddard, Greenbelt, Maryland Center for Earth Observation and Space Research, George Mason University, Fairfax, Virginia Abstract —The Precipitation Radar of the Tropical Rainfall Measuring Mission (TRMM) is the first space-borne radar that is capable of resolving the detailed vertical structure of convective towers. During 1998 to 2001, the Precipitation Radar overflew approximately one hundred tropical cyclones and observed their eyewalls. Many eyewalls had one or more convective towers in them, especially the eyewalls of intensifying cyclones. A convective tower in an eyewall is most likely to be associated with cyclone intensi- fication if the tower has a precipitation rate of 2 mm/h at or above an altitude of 14 km. Alterna- tively, the tower can have a 20 dBZ radar reflec- tivity at or above 14.5 km. Intensifying cyclones are more than twice as likely to have at least one convective tower in their eyewall than non- intensifying cyclones. 1. INTRODUCTION It is difficult to forecast the intensity of a tropical cyclone, and improving those forecasts would enhance public safety. The intensity of a tropical cyclone is often determined from an estimate of the maximum 1-minute average surface wind speed. Once a cyclone moves over land, its intensity is correlated with the damage due to wind, flooding, coastal storm surge, and any associ- ated tornadoes. A recent report asks, “Given the amount of effort that has been expended to observe, analyze, and predict hurricane intensity change, why has so little progress been made?” (USWRP 2000) Another recent study states a similar sentiment: “Intensity forecasts have little skill and have shown only slight improvement in the past 20 years” (Heymsfield et al. 2001; Demaria and Kaplan 1999). The present study suggests one indicator of cyclone intensification, based on the work of Herbert Riehl and Joanne Malkus Simpson that is described below. In the late 1950s, Riehl and Simpson proposed that most heating of the upper troposphere in the Tropics is due to towering cumulonimbus clouds rather than broad uplifting (Riehl and Malkus 1958; Malkus 1959; Houze 2003; Zipser 2003; Anthes 2003). In the early 1960s, this hypothesis was nicknamed the “hot tower hypothe- sis” (Malkus and Riehl 1960). A separate paper stated that these convective towers can exist inside tropical cyclones (Riehl and Malkus 1961). Since then, convective towers have been seen as one of the mechanisms that maintains the intensity of a tropical cyclone. In the mid-1960s, the mesoscale structure surrounding convective towers became a topic of research (Malkus and Riehl 1964). Since the 1980s, one mesoscale structure in particular has been studied: convective bursts, which include multiple convective towers (Steranka et al. 1986; Rodgers et al. 2000; Heymsfield et al. 2001). Most papers about convective towers and convective bursts are descriptive. In contrast, only a few papers attempted to be predictive, such as showing how a convective tower or burst contributes to tropical cyclone formation (Simpson et al. 1998) or intensification (Steranka et al. 1986). Before the 1997 launch of the Tropical Rainfall Measuring Mission (TRMM), no dataset existed that could show globally and definitively that the presence of a convective tower in a tropical cyclone was often associated with cyclone intensification. In particular, aircraft radar studies of individual storms lacked global coverage (Heymsfield et al. 2001; Simpson et al. 1998; Dodge et al. 1999). Global studies used passive microwave radiometers such as SSM/I (Rodgers et al. 2000, 1994) or infrared observations of cloud-top temperatures (Steranka et al. 1986). Neither of these instruments observe the exact height of convection. The horizontal and vertical resolution of the TRMM Precipitation Radar are sufficient to provide global statistics on convective towers in the eyewalls of tropical cyclones. However, Precipitation Radar overflights that observe the entire eyewall of a cyclone are rare because of the narrow width of the swath. The long duration of the TRMM mission compensates for the rarity of good overflights. So far, the Precipitation Radar has operated flawlessly for six years even though it was designed for only three years in space (Kummerow et al. 1998). Recently, several surveys were published about TRMM Precipitation Radar observations of the vertical structure of convection (Nesbitt et al. 2000; Alcala and Dessler 2002; Toracinta et al. 2002; Berg et al. 2002, Shin et al. 2000; Cecil et al. 2002). None of these surveys quantify the number of convective towers in tropical cyclone eyewalls, which is the topic of the present study. In Section 2 of this paper, we define relevant terms and state the hypothesis of this study. In Section 3, we locate approximately one hundred Precipitation Radar overflights of tropical cyclones whose eyewalls are entirely or mostly within the Precipitation Radar swath. In Section 4, we discuss different definitions of convec- tive towers. We choose a definition that locates those towers that are most often associated with tropical cyclone intensification. In Section 5, we quantify how often cyclone intensification is associated with a convective tower in the cyclone’s eyewall. * Corresponding author address: Owen Kelley, NASA Goddard, Code 902, Bld. 32, Rm. S048B, Greenbelt, MD 20771. E-mail: [email protected]. P1.43
-
Upload
independent -
Category
Documents
-
view
0 -
download
0
Transcript of CONVECTIVE TOWERS IN EYEWALLS OF TROPICAL CYCLONES OBSERVED BY THE TRMM PRECIPITATION RADAR IN...
CONVECTIVE TOWERS IN EYEWALLS OF TROPICAL CYCLONES OBSERVED BY THE TRMM PRECIPITATION RADAR IN 1998–2001
Owen A. Kelley* and John Stout
TRMM Science Data and Information System, NASA Goddard, Greenbelt, Maryland Center for Earth Observation and Space Research, George Mason University, Fairfax, Virginia
Abstract—The Precipitation Radar of the Tropical Rainfall Measuring Mission (TRMM) is the first space-borne radar that is capable of resolving the detailed vertical structure of convective towers. During 1998 to 2001, the Precipitation Radar overflew approximately one hundred tropical cyclones and observed their eyewalls. Many eyewalls had one or more convective towers in them, especially the eyewalls of intensifying cyclones. A convective tower in an eyewall is most likely to be associated with cyclone intensi-fication if the tower has a precipitation rate of 2 mm/h at or above an altitude of 14 km. Alterna-tively, the tower can have a 20 dBZ radar reflec-tivity at or above 14.5 km. Intensifying cyclones are more than twice as likely to have at least one convective tower in their eyewall than non-intensifying cyclones. 1. INTRODUCTION It is difficult to forecast the intensity of a tropical cyclone, and improving those forecasts would enhance public safety. The intensity of a tropical cyclone is often determined from an estimate of the maximum 1-minute average surface wind speed. Once a cyclone moves over land, its intensity is correlated with the damage due to wind, flooding, coastal storm surge, and any associ-ated tornadoes. A recent report asks, “Given the amount of effort that has been expended to observe, analyze, and predict hurricane intensity change, why has so little progress been made?” (USWRP 2000) Another recent study states a similar sentiment: “Intensity forecasts have little skill and have shown only slight improvement in the past 20 years” (Heymsfield et al. 2001; Demaria and Kaplan 1999). The present study suggests one indicator of cyclone intensification, based on the work of Herbert Riehl and Joanne Malkus Simpson that is described below. In the late 1950s, Riehl and Simpson proposed that most heating of the upper troposphere in the Tropics is due to towering cumulonimbus clouds rather than broad uplifting (Riehl and Malkus 1958; Malkus 1959; Houze 2003; Zipser 2003; Anthes 2003). In the early 1960s, this hypothesis was nicknamed the “hot tower hypothe-sis” (Malkus and Riehl 1960). A separate paper stated that these convective towers can exist inside tropical cyclones (Riehl and Malkus 1961). Since then, convective towers have been seen as one of the mechanisms that maintains the intensity of a tropical
cyclone. In the mid-1960s, the mesoscale structure surrounding convective towers became a topic of research (Malkus and Riehl 1964). Since the 1980s, one mesoscale structure in particular has been studied: convective bursts, which include multiple convective towers (Steranka et al. 1986; Rodgers et al. 2000; Heymsfield et al. 2001). Most papers about convective towers and convective bursts are descriptive. In contrast, only a few papers attempted to be predictive, such as showing how a convective tower or burst contributes to tropical cyclone formation (Simpson et al. 1998) or intensification (Steranka et al. 1986). Before the 1997 launch of the Tropical Rainfall Measuring Mission (TRMM), no dataset existed that could show globally and definitively that the presence of a convective tower in a tropical cyclone was often associated with cyclone intensification. In particular, aircraft radar studies of individual storms lacked global coverage (Heymsfield et al. 2001; Simpson et al. 1998; Dodge et al. 1999). Global studies used passive microwave radiometers such as SSM/I (Rodgers et al. 2000, 1994) or infrared observations of cloud-top temperatures (Steranka et al. 1986). Neither of these instruments observe the exact height of convection. The horizontal and vertical resolution of the TRMM Precipitation Radar are sufficient to provide global statistics on convective towers in the eyewalls of tropical cyclones. However, Precipitation Radar overflights that observe the entire eyewall of a cyclone are rare because of the narrow width of the swath. The long duration of the TRMM mission compensates for the rarity of good overflights. So far, the Precipitation Radar has operated flawlessly for six years even though it was designed for only three years in space (Kummerow et al. 1998). Recently, several surveys were published about TRMM Precipitation Radar observations of the vertical structure of convection (Nesbitt et al. 2000; Alcala and Dessler 2002; Toracinta et al. 2002; Berg et al. 2002, Shin et al. 2000; Cecil et al. 2002). None of these surveys quantify the number of convective towers in tropical cyclone eyewalls, which is the topic of the present study. In Section 2 of this paper, we define relevant terms and state the hypothesis of this study. In Section 3, we locate approximately one hundred Precipitation Radar overflights of tropical cyclones whose eyewalls are entirely or mostly within the Precipitation Radar swath. In Section 4, we discuss different definitions of convec-tive towers. We choose a definition that locates those towers that are most often associated with tropical cyclone intensification. In Section 5, we quantify how often cyclone intensification is associated with a convective tower in the cyclone’s eyewall.
* Corresponding author address: Owen Kelley, NASAGoddard, Code 902, Bld. 32, Rm. S048B, Greenbelt,MD 20771. E-mail: [email protected].
P1.43
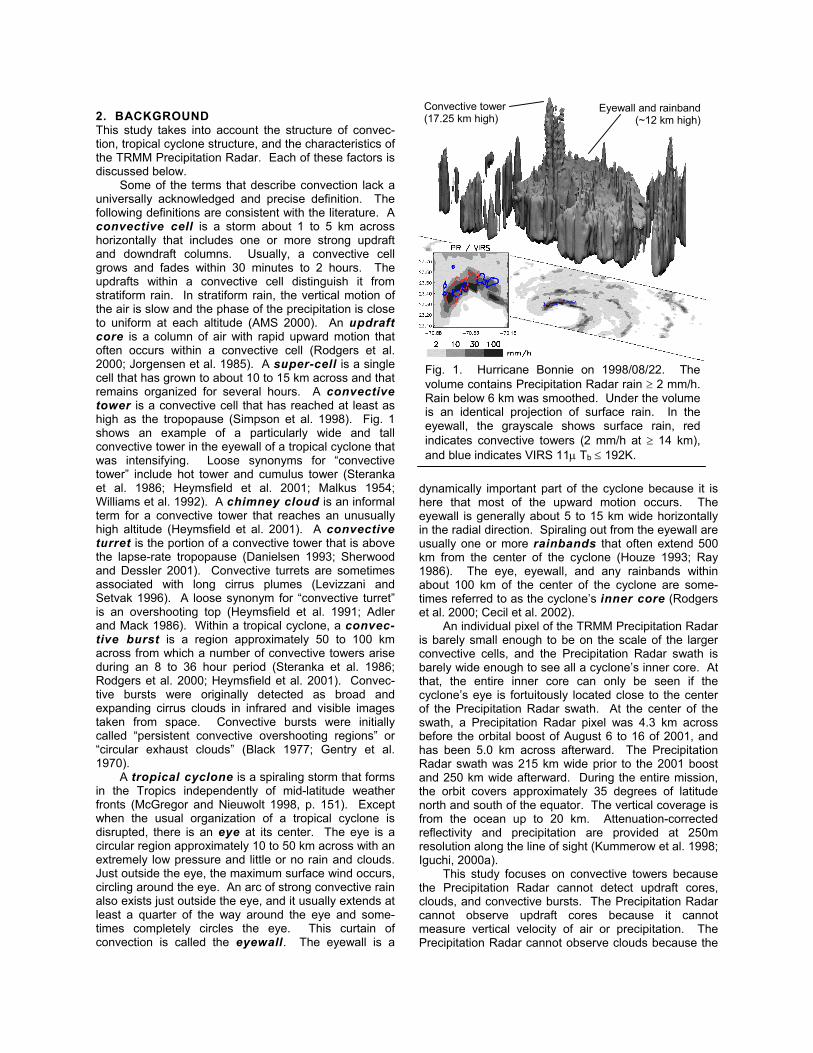
2. BACKGROUND This study takes into account the structure of convec-tion, tropical cyclone structure, and the characteristics of the TRMM Precipitation Radar. Each of these factors is discussed below. Some of the terms that describe convection lack a universally acknowledged and precise definition. The following definitions are consistent with the literature. A convective cell is a storm about 1 to 5 km across horizontally that includes one or more strong updraft and downdraft columns. Usually, a convective cell grows and fades within 30 minutes to 2 hours. The updrafts within a convective cell distinguish it from stratiform rain. In stratiform rain, the vertical motion of the air is slow and the phase of the precipitation is close to uniform at each altitude (AMS 2000). An updraft core is a column of air with rapid upward motion that often occurs within a convective cell (Rodgers et al. 2000; Jorgensen et al. 1985). A super-cell is a single cell that has grown to about 10 to 15 km across and that remains organized for several hours. A convective tower is a convective cell that has reached at least as high as the tropopause (Simpson et al. 1998). Fig. 1 shows an example of a particularly wide and tall convective tower in the eyewall of a tropical cyclone that was intensifying. Loose synonyms for “convective tower” include hot tower and cumulus tower (Steranka et al. 1986; Heymsfield et al. 2001; Malkus 1954; Williams et al. 1992). A chimney cloud is an informal term for a convective tower that reaches an unusually high altitude (Heymsfield et al. 2001). A convective turret is the portion of a convective tower that is above the lapse-rate tropopause (Danielsen 1993; Sherwood and Dessler 2001). Convective turrets are sometimes associated with long cirrus plumes (Levizzani and Setvak 1996). A loose synonym for “convective turret” is an overshooting top (Heymsfield et al. 1991; Adler and Mack 1986). Within a tropical cyclone, a convec-tive burst is a region approximately 50 to 100 km across from which a number of convective towers arise during an 8 to 36 hour period (Steranka et al. 1986; Rodgers et al. 2000; Heymsfield et al. 2001). Convec-tive bursts were originally detected as broad and expanding cirrus clouds in infrared and visible images taken from space. Convective bursts were initially called “persistent convective overshooting regions” or “circular exhaust clouds” (Black 1977; Gentry et al. 1970). A tropical cyclone is a spiraling storm that forms in the Tropics independently of mid-latitude weather fronts (McGregor and Nieuwolt 1998, p. 151). Except when the usual organization of a tropical cyclone is disrupted, there is an eye at its center. The eye is a circular region approximately 10 to 50 km across with an extremely low pressure and little or no rain and clouds. Just outside the eye, the maximum surface wind occurs, circling around the eye. An arc of strong convective rain also exists just outside the eye, and it usually extends at least a quarter of the way around the eye and some-times completely circles the eye. This curtain of convection is called the eyewall. The eyewall is a
dynamically important part of the cyclone because it is here that most of the upward motion occurs. The eyewall is generally about 5 to 15 km wide horizontally in the radial direction. Spiraling out from the eyewall are usually one or more rainbands that often extend 500 km from the center of the cyclone (Houze 1993; Ray 1986). The eye, eyewall, and any rainbands within about 100 km of the center of the cyclone are some-times referred to as the cyclone’s inner core (Rodgers et al. 2000; Cecil et al. 2002). An individual pixel of the TRMM Precipitation Radar is barely small enough to be on the scale of the larger convective cells, and the Precipitation Radar swath is barely wide enough to see all a cyclone’s inner core. At that, the entire inner core can only be seen if the cyclone’s eye is fortuitously located close to the center of the Precipitation Radar swath. At the center of the swath, a Precipitation Radar pixel was 4.3 km across before the orbital boost of August 6 to 16 of 2001, and has been 5.0 km across afterward. The Precipitation Radar swath was 215 km wide prior to the 2001 boost and 250 km wide afterward. During the entire mission, the orbit covers approximately 35 degrees of latitude north and south of the equator. The vertical coverage is from the ocean up to 20 km. Attenuation-corrected reflectivity and precipitation are provided at 250m resolution along the line of sight (Kummerow et al. 1998; Iguchi, 2000a). This study focuses on convective towers because the Precipitation Radar cannot detect updraft cores, clouds, and convective bursts. The Precipitation Radar cannot observe updraft cores because it cannot measure vertical velocity of air or precipitation. The Precipitation Radar cannot observe clouds because the
Fig. 1. Hurricane Bonnie on 1998/08/22. The volume contains Precipitation Radar rain ≥ 2 mm/h. Rain below 6 km was smoothed. Under the volume is an identical projection of surface rain. In the eyewall, the grayscale shows surface rain, red indicates convective towers (2 mm/h at ≥ 14 km), and blue indicates VIRS 11µ Tb ≤ 192K.
Convective tower (17.25 km high)
Eyewall and rainband(~12 km high)
radar scattering from cloud droplets is too weak (i.e., below the radar’s sensitivity). The radar cannot identify convective bursts because the TRMM satellite’s return period is four to five days, whereas a return period of an hour or less would be necessary. The Precipitation Radar’s ability to observe convective towers is limited by the fact that its horizontal resolution is 5 km, while convective towers can be just 2 to 3 km wide (Heymsfield et al. 2001, Fig. 10). A 5 km Precipitation Radar pixel with enough precipitation to be considered a tower could contain a 5km-wide cell of moderate precipitation, a narrower cell with stronger precipitation, or several very narrow cells. The height reported in Precipitation Radar data files is actually the distance along the line of sight, in other words, the height is “slant height.” In our study, the difference between slant height and altitude is of minor importance. At the center of the swath, slant height equals altitude. The greatest difference between slant height and altitude occurs at the edge of the swath because there the zenith observation angle reaches 17.03 degrees. At the swath edge, the height of convection is overestimated by 0.88 km if the convec-tion reaches a slant height of 20 km and slant height is equated to altitude ( 20 [1 - cos 17.03°] ). Alternatively, the height of convection could be underestimated at the swath edge due to the tilt in the pixels. The top of an edge pixel is 5.9 km closer to the center of the swath than its bottom ( 20 sin 17.03° ). An underestimation would occur if the tilt of a pixel caused the top of a convective cell to fall outside the pixel that contains the base of that cell. While the difference between altitude and slant height can affect individual pixels, we assume that most of the error averages out because we are combining observations from many tropical cyclones in this study. This study looks for convective towers only in the eyewall, not the rainbands. The first reason for this limitation is that the Precipitation Radar’s swath is too narrow to see all of the rainbands of a cyclone at the same time. The second reason is that the Precipitation Radar can resolve the eyewall unlike SSM/I and the TRMM Microwave Imager (TMI). Studies that use SSM/I or TMI data consider all of the inner core region as a unit, and do not resolve the eyewall within the inner core. The third reason to focus on the eyewall is that the eyewall is where a convective tower’s heating could have the greatest influence on tropical cyclone intensity (Simpson et al. 1998). Previous studies have shown that clusters of convective towers (i.e., convective bursts) are able to influence future intensification of cyclones. Heymsfield et al. (2001) state, “Several case studies spanning nearly 30 years point toward a relationship between the occurrence of convective bursts and sudden intensifica-tion.” Similarly, Rodgers et al. (2000) state, “The presence of either multiple inner-core convective bursts or convective rainband cycles may initiate a period of intensification.” A convective tower may be able to influence a cyclone’s development because of the large amount of latent heat released within it. Around 1 to 5 km of altitude, latent heat is released by the condensa-
tion of water vapor and is called heat of vaporization (2.2 kJ/g). Around 4 to 5 km of altitude, latent heat is released by the freezing of liquid water, and it called heat of fusion (0.34 kJ/g) (AMS 2000). Steranka et al. (1986) state that the latent heat released by convection is “the primary fuel of tropical cyclones and it has an important role in storm intensification.” What sets this present study apart from previous studies is the hypothesis that even a single convective tower may be associated with cyclone intensification. To test this hypothesis, we choose a precise definition of convective tower, in Section 4 of this paper, which differs in detail from definitions used by other research-ers. 3. SELECTING TRMM OVERFLIGHTS In this section, we describe our method of choosing which TRMM overflights to analyze. From the begin-ning, we exclude overflights of tropical storms and depressions because we are interested in cyclone intensification, not cyclone formation. The role of convective towers in tropical cyclone formation is described in Simpson et al. (1998) and Gray (1998). In this paper, we consider Precipitation Radar overflights of tropical cyclones in all oceans during in the years stated in the first row of Table 1. The ocean basins are abbreviated in the following way: Atlantic (AT), East Pacific (EP), North Indian (NI), South Indian (SI), and West Pacific (WP). The South Indian category in our table includes the southwestern Indian Ocean near Africa all the way to the south Pacific Ocean that lies east of Australia. Row two of Table 1 shows the number of tropical cyclones that would be expected in each basin for the number of years in row one. This expected value is based on the mean annual number of cyclones from 1968 to 1989 (McGregor and Nieuwolt 1998, p. 157). Row three of Table 1 includes only those storms that reach tropical cyclone strength in the given year range. Row three is based on best track data of the National Hurricane Center and the Joint Typhoon Warning Center. Best track data can be downloaded from the following URL: http://weather.unisys.com. The values in rows two and three are similar, which shows that this year range has a typical number of cyclones. Row four is the sum of the duration of all cyclones including only days during which the storm has tropical cyclone strength for at least part of the day. Row five shows the number of Precipitation Radar overflights of tropical cyclones for which the cyclone’s center in the best track data is at least 40 km from the edge of the Precipitation Radar swath, which means that the eyewall is likely to be within the swath. By dividing the total column in rows four and five, one can verify the statistic reported in the previous section that the return period of a well-centered Precipitation Radar overflight is about four to five days. The values shown in row five were obtained from an automated search that intersects the TRMM orbit with the best track data for each tropical cyclone. For two reasons, the number of overflights analyzed in this study (row six) is less than the total
number of cyclone overflights (row five). First, we exclude overflights in which the wide TMI swath indicates that the narrower Precipitation Radar swath did not observe a significant portion of the eyewall. This restriction reduces the total number of overflights from 132 to 110. Second, overflights were excluded because the cyclone’s center moves within 100 km of land within 1 day of the TRMM overflight. Intensification is very unlikely after a cyclone’s center goes over land, so land-falling cyclones cannot help us determine if convective towers are associated with intensification (Simpson et al. 1998). The second restriction further reduces the total number of overflights from 110 to 93. Were others to re-analyze this dataset, they might want to exclude additional overflights. For example, we include cyclones that enter colder water, that collide with a mid-latitude front, or that encounter increased wind sheer. Table 2 on the last page of this paper could be used to locate any of the TRMM overflights that we analyze. The overflights in row six of Table 1 represent our attempt to locate all the high-quality overflights of tropical cyclones in the given year range. The only way to increase the number of well-centered overflights would be to consider observations from later years. 4. LOCATING CONVECTIVE TOWERS There is no universally accepted and precise criterion for distinguishing a convective tower from an ordinary convective cell. The general idea is that convective towers are taller than most other convective cells and have reached or overshot the tropopause. To develop a criterion for locating convective towers that are associ-ated with cyclone intensification, we examine various
signal thresholds and height thresholds. These two kinds of thresholds answer the following questions: what radar reflectivity should be considered to be the top of a convective cell and what altitude must this reflectivity reach? Near the top of a convective cell, the radar signal weakens until it fades into the instrument noise. Some researchers consider the height of a cell to be the top of the cloud (Riehl and Malkus 1961; Malkus 1959). Cloud tops have a radar reflectivity of –50 to 10 dBZ at frequencies used in standard weather radars, which is too low to be observed by most ground radars (Doviak and Zrnic, 1993, 503–5; Meneghini and Kozu, 1990, p. 146; Hai et al. 1985). Other researchers consider the top of the tower to be the “echo top,” i.e., the height of the lowest detectable radar signal. For some aircraft radars, the echo top can be as low as –10 to 0 dBZ (Alcala and Dessler 2002). Both of these signal thresholds are too low to be used with TRMM Precipita-
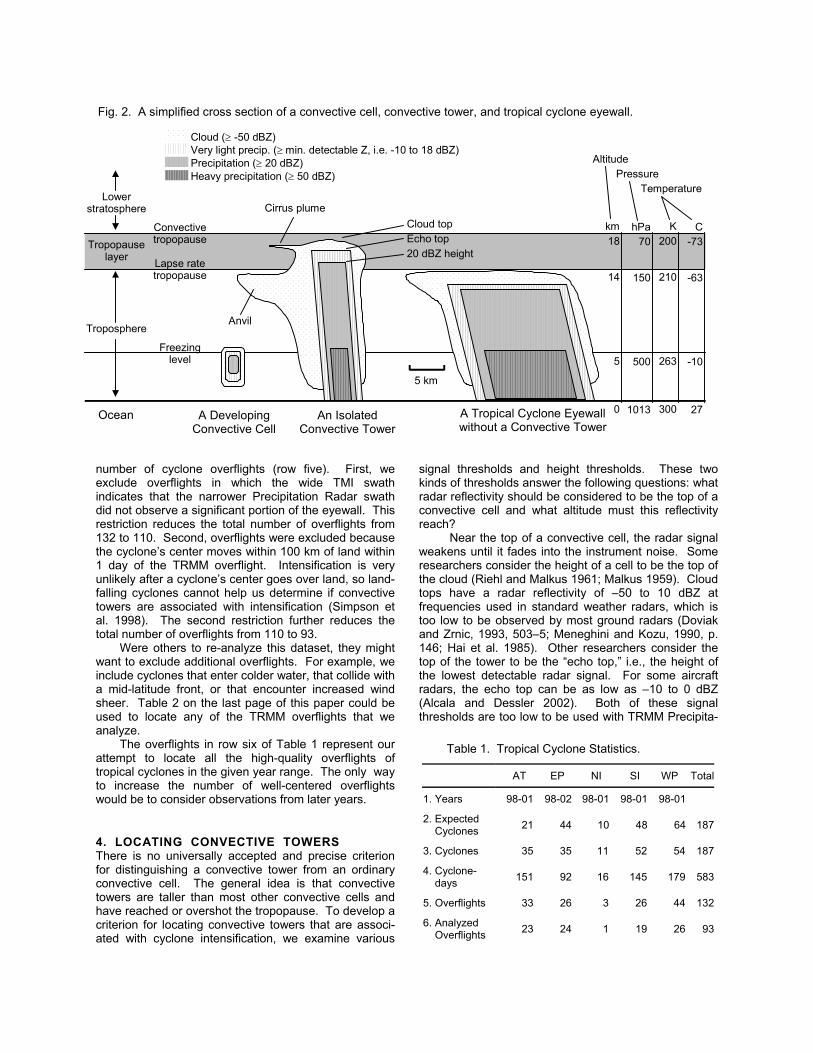
Fig. 2. A simplified cross section of a convective cell, convective tower, and tropical cyclone eyewall.
Convective tropopause
Lapse rate tropopause
Freezing level
km18
14
5
0
5 km
Cloud top Echo top 20 dBZ height
A Developing Convective Cell
An Isolated Convective Tower
A Tropical Cyclone Eyewall without a Convective Tower
Cirrus plume
hPa70
150
500
1013
K200
210
263
300
Cloud (≥ -50 dBZ) Very light precip. (≥ min. detectable Z, i.e. -10 to 18 dBZ)Precipitation (≥ 20 dBZ) Heavy precipitation (≥ 50 dBZ)
C-73
-63
-10
27
Lower stratosphere
Tropopause layer
Troposphere
Ocean
Anvil
Altitude Pressure Temperature
Table 1. Tropical Cyclone Statistics.
AT EP NI SI WP Total
1. Years 98-01 98-02 98-01 98-01 98-01
2. Expected Cyclones 21 44 10 48 64 187
3. Cyclones 35 35 11 52 54 187
4. Cyclone- days 151 92 16 145 179 583
5. Overflights 33 26 3 26 44 132
6. Analyzed Overflights 23 24 1 19 26 93
tion Radar data because the Precipitation Radar’s minimum detectable signal is around 20 dBZ. Fig. 2 shows a diagram of signal thresholds and the tropopause. Traditionally, the tropopause is defined as the altitude where the temperature stops dropping with increasing altitude (i.e., the lapse-rate tropopause). As shown in Fig. 2, we find that a recently introduced concept of a tropopause “layer” helps to describe convective towers (Alcala and Dessler 2002; Highwood and Hoskins 1998). Alcala and Dessler state, “Sher-wood and Dessler (2000, 2001) have called this region the tropical tropopause layer and define it to extend from the level of zero net radiative heating (~14 km, 150 hPa) to the highest level of overshooting convection (~18 km, 70 hPa). . . . The maximum level of neutral buoyancy of tropical deep convection is around 14 km, coincident with the base of the tropical tropopause layer.” Fig. 3 allows us to consider how effective the Precipitation Radar’s 20 dBZ reflectivity threshold is for locating convective towers. We use the attenuation-corrected reflectivity that is found in the output of the TRMM 2A25 algorithm (Iguchi et al. 2000a, 2000b; Meneghini et al. 2000). The 2A25 algorithm is run at TRMM Science Data and Information System (TSDIS), and its output can be downloaded from the Goddard Earth Sciences Distributed Active Archive Center (DAAC).
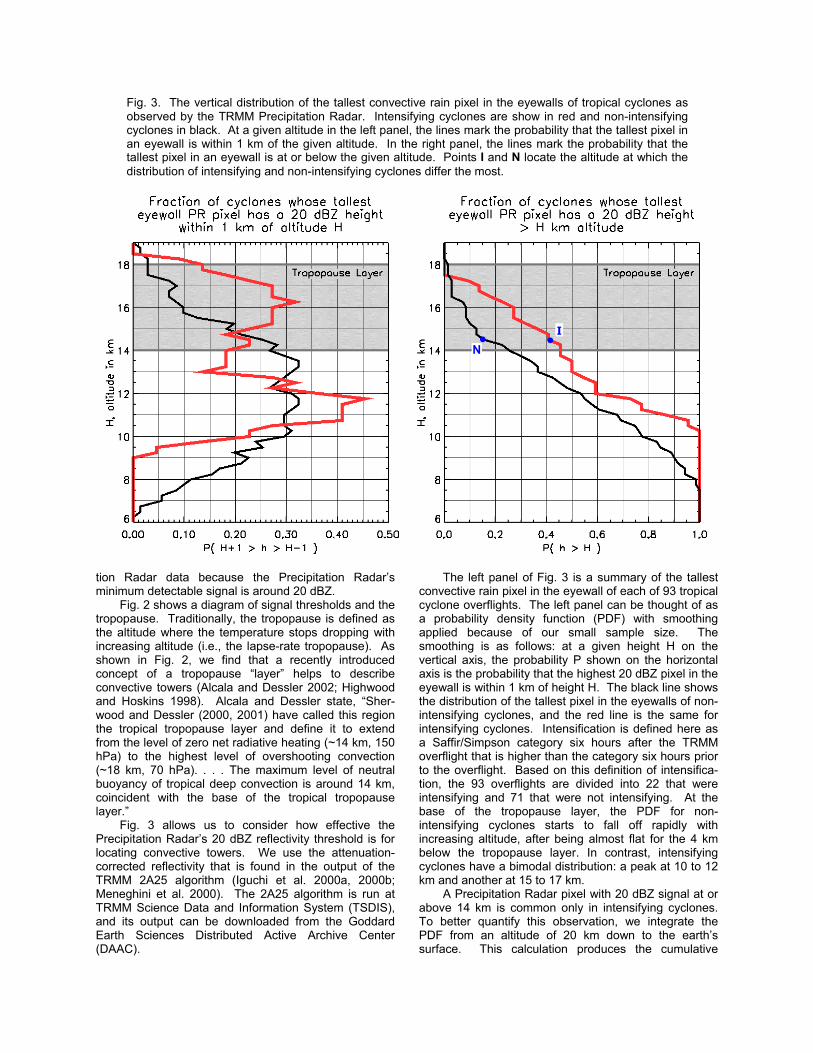
The left panel of Fig. 3 is a summary of the tallest convective rain pixel in the eyewall of each of 93 tropical cyclone overflights. The left panel can be thought of as a probability density function (PDF) with smoothing applied because of our small sample size. The smoothing is as follows: at a given height H on the vertical axis, the probability P shown on the horizontal axis is the probability that the highest 20 dBZ pixel in the eyewall is within 1 km of height H. The black line shows the distribution of the tallest pixel in the eyewalls of non-intensifying cyclones, and the red line is the same for intensifying cyclones. Intensification is defined here as a Saffir/Simpson category six hours after the TRMM overflight that is higher than the category six hours prior to the overflight. Based on this definition of intensifica-tion, the 93 overflights are divided into 22 that were intensifying and 71 that were not intensifying. At the base of the tropopause layer, the PDF for non-intensifying cyclones starts to fall off rapidly with increasing altitude, after being almost flat for the 4 km below the tropopause layer. In contrast, intensifying cyclones have a bimodal distribution: a peak at 10 to 12 km and another at 15 to 17 km. A Precipitation Radar pixel with 20 dBZ signal at or above 14 km is common only in intensifying cyclones. To better quantify this observation, we integrate the PDF from an altitude of 20 km down to the earth’s surface. This calculation produces the cumulative
Fig. 3. The vertical distribution of the tallest convective rain pixel in the eyewalls of tropical cyclones as observed by the TRMM Precipitation Radar. Intensifying cyclones are show in red and non-intensifying cyclones in black. At a given altitude in the left panel, the lines mark the probability that the tallest pixel in an eyewall is within 1 km of the given altitude. In the right panel, the lines mark the probability that the tallest pixel in an eyewall is at or below the given altitude. Points I and N locate the altitude at which the distribution of intensifying and non-intensifying cyclones differ the most.
• •N
I
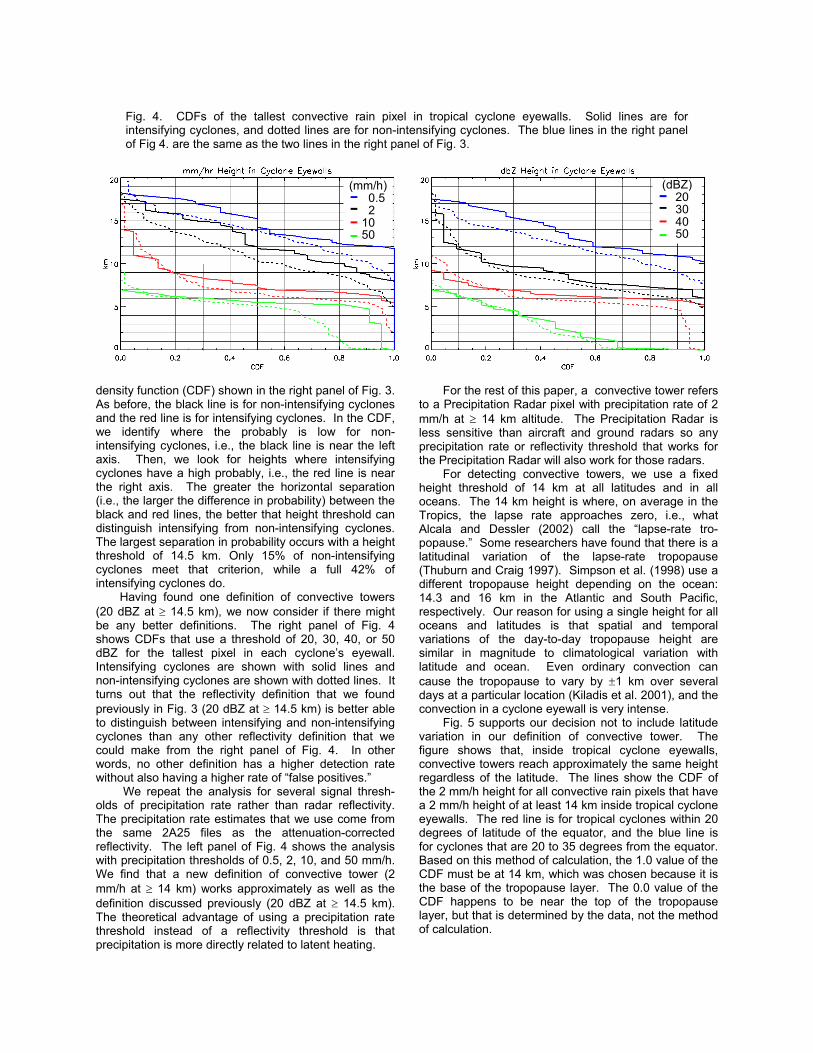
density function (CDF) shown in the right panel of Fig. 3. As before, the black line is for non-intensifying cyclones and the red line is for intensifying cyclones. In the CDF, we identify where the probably is low for non-intensifying cyclones, i.e., the black line is near the left axis. Then, we look for heights where intensifying cyclones have a high probably, i.e., the red line is near the right axis. The greater the horizontal separation (i.e., the larger the difference in probability) between the black and red lines, the better that height threshold can distinguish intensifying from non-intensifying cyclones. The largest separation in probability occurs with a height threshold of 14.5 km. Only 15% of non-intensifying cyclones meet that criterion, while a full 42% of intensifying cyclones do. Having found one definition of convective towers (20 dBZ at ≥ 14.5 km), we now consider if there might be any better definitions. The right panel of Fig. 4 shows CDFs that use a threshold of 20, 30, 40, or 50 dBZ for the tallest pixel in each cyclone’s eyewall. Intensifying cyclones are shown with solid lines and non-intensifying cyclones are shown with dotted lines. It turns out that the reflectivity definition that we found previously in Fig. 3 (20 dBZ at ≥ 14.5 km) is better able to distinguish between intensifying and non-intensifying cyclones than any other reflectivity definition that we could make from the right panel of Fig. 4. In other words, no other definition has a higher detection rate without also having a higher rate of “false positives.” We repeat the analysis for several signal thresh-olds of precipitation rate rather than radar reflectivity. The precipitation rate estimates that we use come from the same 2A25 files as the attenuation-corrected reflectivity. The left panel of Fig. 4 shows the analysis with precipitation thresholds of 0.5, 2, 10, and 50 mm/h. We find that a new definition of convective tower (2 mm/h at ≥ 14 km) works approximately as well as the definition discussed previously (20 dBZ at ≥ 14.5 km). The theoretical advantage of using a precipitation rate threshold instead of a reflectivity threshold is that precipitation is more directly related to latent heating.
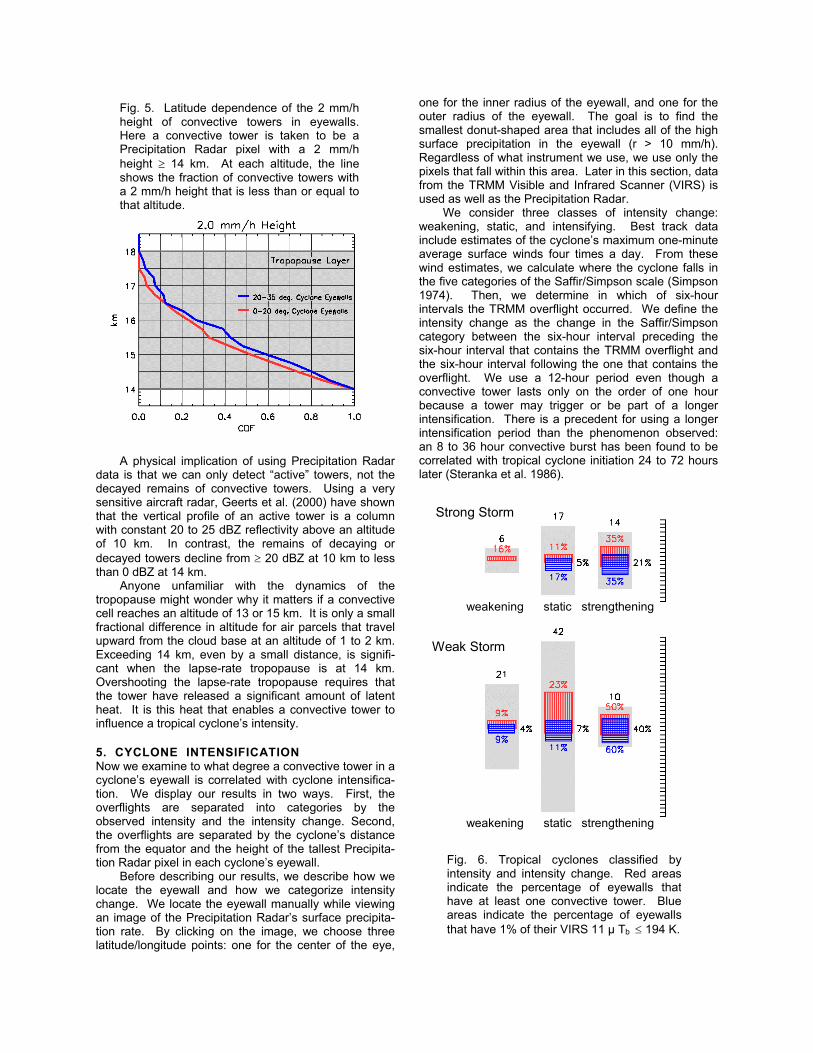
For the rest of this paper, a convective tower refers to a Precipitation Radar pixel with precipitation rate of 2 mm/h at ≥ 14 km altitude. The Precipitation Radar is less sensitive than aircraft and ground radars so any precipitation rate or reflectivity threshold that works for the Precipitation Radar will also work for those radars. For detecting convective towers, we use a fixed height threshold of 14 km at all latitudes and in all oceans. The 14 km height is where, on average in the Tropics, the lapse rate approaches zero, i.e., what Alcala and Dessler (2002) call the “lapse-rate tro-popause.” Some researchers have found that there is a latitudinal variation of the lapse-rate tropopause (Thuburn and Craig 1997). Simpson et al. (1998) use a different tropopause height depending on the ocean: 14.3 and 16 km in the Atlantic and South Pacific, respectively. Our reason for using a single height for all oceans and latitudes is that spatial and temporal variations of the day-to-day tropopause height are similar in magnitude to climatological variation with latitude and ocean. Even ordinary convection can cause the tropopause to vary by ±1 km over several days at a particular location (Kiladis et al. 2001), and the convection in a cyclone eyewall is very intense. Fig. 5 supports our decision not to include latitude variation in our definition of convective tower. The figure shows that, inside tropical cyclone eyewalls, convective towers reach approximately the same height regardless of the latitude. The lines show the CDF of the 2 mm/h height for all convective rain pixels that have a 2 mm/h height of at least 14 km inside tropical cyclone eyewalls. The red line is for tropical cyclones within 20 degrees of latitude of the equator, and the blue line is for cyclones that are 20 to 35 degrees from the equator. Based on this method of calculation, the 1.0 value of the CDF must be at 14 km, which was chosen because it is the base of the tropopause layer. The 0.0 value of the CDF happens to be near the top of the tropopause layer, but that is determined by the data, not the method of calculation.
Fig. 4. CDFs of the tallest convective rain pixel in tropical cyclone eyewalls. Solid lines are for intensifying cyclones, and dotted lines are for non-intensifying cyclones. The blue lines in the right panel of Fig 4. are the same as the two lines in the right panel of Fig. 3.
(dBZ) 20 30 40 50
(mm/h) 0.5 2 10 50
A physical implication of using Precipitation Radar data is that we can only detect “active” towers, not the decayed remains of convective towers. Using a very sensitive aircraft radar, Geerts et al. (2000) have shown that the vertical profile of an active tower is a column with constant 20 to 25 dBZ reflectivity above an altitude of 10 km. In contrast, the remains of decaying or decayed towers decline from ≥ 20 dBZ at 10 km to less than 0 dBZ at 14 km. Anyone unfamiliar with the dynamics of the tropopause might wonder why it matters if a convective cell reaches an altitude of 13 or 15 km. It is only a small fractional difference in altitude for air parcels that travel upward from the cloud base at an altitude of 1 to 2 km. Exceeding 14 km, even by a small distance, is signifi-cant when the lapse-rate tropopause is at 14 km. Overshooting the lapse-rate tropopause requires that the tower have released a significant amount of latent heat. It is this heat that enables a convective tower to influence a tropical cyclone’s intensity. 5. CYCLONE INTENSIFICATION Now we examine to what degree a convective tower in a cyclone’s eyewall is correlated with cyclone intensifica-tion. We display our results in two ways. First, the overflights are separated into categories by the observed intensity and the intensity change. Second, the overflights are separated by the cyclone’s distance from the equator and the height of the tallest Precipita-tion Radar pixel in each cyclone’s eyewall. Before describing our results, we describe how we locate the eyewall and how we categorize intensity change. We locate the eyewall manually while viewing an image of the Precipitation Radar’s surface precipita-tion rate. By clicking on the image, we choose three latitude/longitude points: one for the center of the eye,
one for the inner radius of the eyewall, and one for the outer radius of the eyewall. The goal is to find the smallest donut-shaped area that includes all of the high surface precipitation in the eyewall (r > 10 mm/h). Regardless of what instrument we use, we use only the pixels that fall within this area. Later in this section, data from the TRMM Visible and Infrared Scanner (VIRS) is used as well as the Precipitation Radar. We consider three classes of intensity change: weakening, static, and intensifying. Best track data include estimates of the cyclone’s maximum one-minute average surface winds four times a day. From these wind estimates, we calculate where the cyclone falls in the five categories of the Saffir/Simpson scale (Simpson 1974). Then, we determine in which of six-hour intervals the TRMM overflight occurred. We define the intensity change as the change in the Saffir/Simpson category between the six-hour interval preceding the six-hour interval that contains the TRMM overflight and the six-hour interval following the one that contains the overflight. We use a 12-hour period even though a convective tower lasts only on the order of one hour because a tower may trigger or be part of a longer intensification. There is a precedent for using a longer intensification period than the phenomenon observed: an 8 to 36 hour convective burst has been found to be correlated with tropical cyclone initiation 24 to 72 hours later (Steranka et al. 1986).
Fig. 5. Latitude dependence of the 2 mm/h height of convective towers in eyewalls. Here a convective tower is taken to be a Precipitation Radar pixel with a 2 mm/h height ≥ 14 km. At each altitude, the line shows the fraction of convective towers with a 2 mm/h height that is less than or equal to that altitude.
Weak Storm
Strong Storm
Fig. 6. Tropical cyclones classified by intensity and intensity change. Red areas indicate the percentage of eyewalls that have at least one convective tower. Blue areas indicate the percentage of eyewalls that have 1% of their VIRS 11 µ Tb ≤ 194 K.
weakening static strengthening
weakening static strengthening
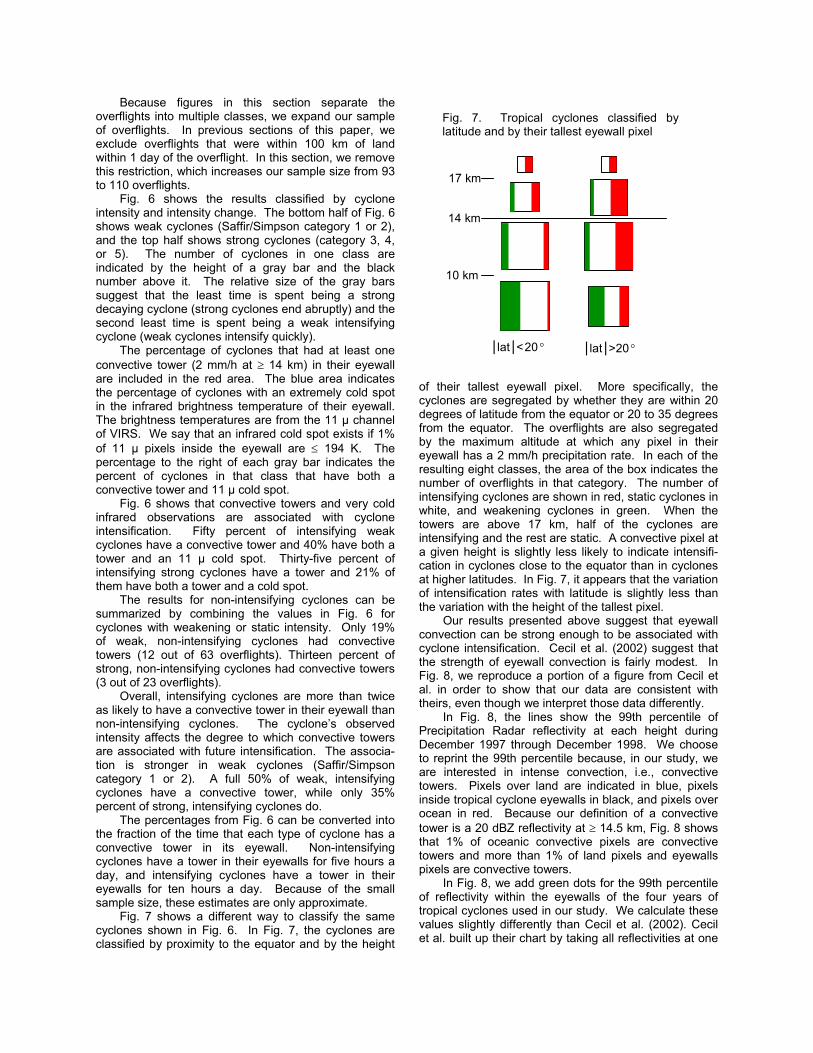
Because figures in this section separate the overflights into multiple classes, we expand our sample of overflights. In previous sections of this paper, we exclude overflights that were within 100 km of land within 1 day of the overflight. In this section, we remove this restriction, which increases our sample size from 93 to 110 overflights. Fig. 6 shows the results classified by cyclone intensity and intensity change. The bottom half of Fig. 6 shows weak cyclones (Saffir/Simpson category 1 or 2), and the top half shows strong cyclones (category 3, 4, or 5). The number of cyclones in one class are indicated by the height of a gray bar and the black number above it. The relative size of the gray bars suggest that the least time is spent being a strong decaying cyclone (strong cyclones end abruptly) and the second least time is spent being a weak intensifying cyclone (weak cyclones intensify quickly). The percentage of cyclones that had at least one convective tower (2 mm/h at ≥ 14 km) in their eyewall are included in the red area. The blue area indicates the percentage of cyclones with an extremely cold spot in the infrared brightness temperature of their eyewall. The brightness temperatures are from the 11 µ channel of VIRS. We say that an infrared cold spot exists if 1% of 11 µ pixels inside the eyewall are ≤ 194 K. The percentage to the right of each gray bar indicates the percent of cyclones in that class that have both a convective tower and 11 µ cold spot. Fig. 6 shows that convective towers and very cold infrared observations are associated with cyclone intensification. Fifty percent of intensifying weak cyclones have a convective tower and 40% have both a tower and an 11 µ cold spot. Thirty-five percent of intensifying strong cyclones have a tower and 21% of them have both a tower and a cold spot. The results for non-intensifying cyclones can be summarized by combining the values in Fig. 6 for cyclones with weakening or static intensity. Only 19% of weak, non-intensifying cyclones had convective towers (12 out of 63 overflights). Thirteen percent of strong, non-intensifying cyclones had convective towers (3 out of 23 overflights). Overall, intensifying cyclones are more than twice as likely to have a convective tower in their eyewall than non-intensifying cyclones. The cyclone’s observed intensity affects the degree to which convective towers are associated with future intensification. The associa-tion is stronger in weak cyclones (Saffir/Simpson category 1 or 2). A full 50% of weak, intensifying cyclones have a convective tower, while only 35% percent of strong, intensifying cyclones do. The percentages from Fig. 6 can be converted into the fraction of the time that each type of cyclone has a convective tower in its eyewall. Non-intensifying cyclones have a tower in their eyewalls for five hours a day, and intensifying cyclones have a tower in their eyewalls for ten hours a day. Because of the small sample size, these estimates are only approximate. Fig. 7 shows a different way to classify the same cyclones shown in Fig. 6. In Fig. 7, the cyclones are classified by proximity to the equator and by the height
of their tallest eyewall pixel. More specifically, the cyclones are segregated by whether they are within 20 degrees of latitude from the equator or 20 to 35 degrees from the equator. The overflights are also segregated by the maximum altitude at which any pixel in their eyewall has a 2 mm/h precipitation rate. In each of the resulting eight classes, the area of the box indicates the number of overflights in that category. The number of intensifying cyclones are shown in red, static cyclones in white, and weakening cyclones in green. When the towers are above 17 km, half of the cyclones are intensifying and the rest are static. A convective pixel at a given height is slightly less likely to indicate intensifi-cation in cyclones close to the equator than in cyclones at higher latitudes. In Fig. 7, it appears that the variation of intensification rates with latitude is slightly less than the variation with the height of the tallest pixel. Our results presented above suggest that eyewall convection can be strong enough to be associated with cyclone intensification. Cecil et al. (2002) suggest that the strength of eyewall convection is fairly modest. In Fig. 8, we reproduce a portion of a figure from Cecil et al. in order to show that our data are consistent with theirs, even though we interpret those data differently. In Fig. 8, the lines show the 99th percentile of Precipitation Radar reflectivity at each height during December 1997 through December 1998. We choose to reprint the 99th percentile because, in our study, we are interested in intense convection, i.e., convective towers. Pixels over land are indicated in blue, pixels inside tropical cyclone eyewalls in black, and pixels over ocean in red. Because our definition of a convective tower is a 20 dBZ reflectivity at ≥ 14.5 km, Fig. 8 shows that 1% of oceanic convective pixels are convective towers and more than 1% of land pixels and eyewalls pixels are convective towers. In Fig. 8, we add green dots for the 99th percentile of reflectivity within the eyewalls of the four years of tropical cyclones used in our study. We calculate these values slightly differently than Cecil et al. (2002). Cecil et al. built up their chart by taking all reflectivities at one
Fig. 7. Tropical cyclones classified by latitude and by their tallest eyewall pixel
17 km
14 km
10 km
| lat |<20 ° | lat |>20°
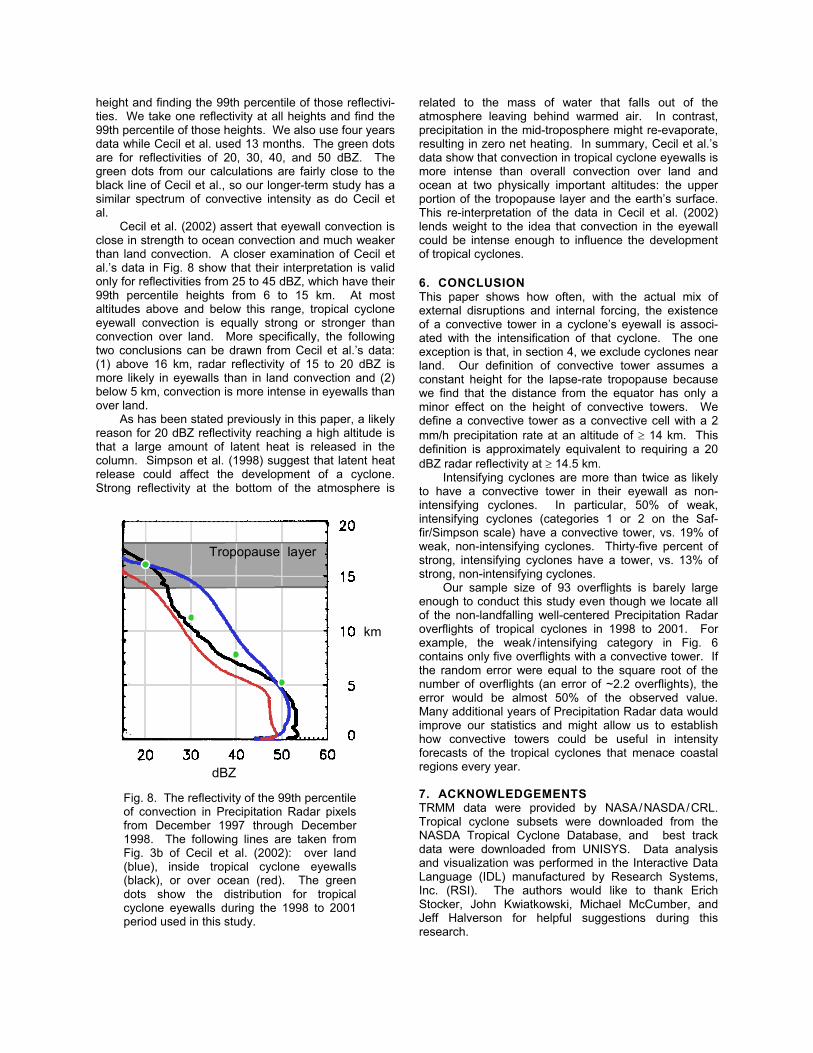
height and finding the 99th percentile of those reflectivi-ties. We take one reflectivity at all heights and find the 99th percentile of those heights. We also use four years data while Cecil et al. used 13 months. The green dots are for reflectivities of 20, 30, 40, and 50 dBZ. The green dots from our calculations are fairly close to the black line of Cecil et al., so our longer-term study has a similar spectrum of convective intensity as do Cecil et al. Cecil et al. (2002) assert that eyewall convection is close in strength to ocean convection and much weaker than land convection. A closer examination of Cecil et al.’s data in Fig. 8 show that their interpretation is valid only for reflectivities from 25 to 45 dBZ, which have their 99th percentile heights from 6 to 15 km. At most altitudes above and below this range, tropical cyclone eyewall convection is equally strong or stronger than convection over land. More specifically, the following two conclusions can be drawn from Cecil et al.’s data: (1) above 16 km, radar reflectivity of 15 to 20 dBZ is more likely in eyewalls than in land convection and (2) below 5 km, convection is more intense in eyewalls than over land. As has been stated previously in this paper, a likely reason for 20 dBZ reflectivity reaching a high altitude is that a large amount of latent heat is released in the column. Simpson et al. (1998) suggest that latent heat release could affect the development of a cyclone. Strong reflectivity at the bottom of the atmosphere is
related to the mass of water that falls out of the atmosphere leaving behind warmed air. In contrast, precipitation in the mid-troposphere might re-evaporate, resulting in zero net heating. In summary, Cecil et al.’s data show that convection in tropical cyclone eyewalls is more intense than overall convection over land and ocean at two physically important altitudes: the upper portion of the tropopause layer and the earth’s surface. This re-interpretation of the data in Cecil et al. (2002) lends weight to the idea that convection in the eyewall could be intense enough to influence the development of tropical cyclones. 6. CONCLUSION This paper shows how often, with the actual mix of external disruptions and internal forcing, the existence of a convective tower in a cyclone’s eyewall is associ-ated with the intensification of that cyclone. The one exception is that, in section 4, we exclude cyclones near land. Our definition of convective tower assumes a constant height for the lapse-rate tropopause because we find that the distance from the equator has only a minor effect on the height of convective towers. We define a convective tower as a convective cell with a 2 mm/h precipitation rate at an altitude of ≥ 14 km. This definition is approximately equivalent to requiring a 20 dBZ radar reflectivity at ≥ 14.5 km. Intensifying cyclones are more than twice as likely to have a convective tower in their eyewall as non-intensifying cyclones. In particular, 50% of weak, intensifying cyclones (categories 1 or 2 on the Saf-fir/Simpson scale) have a convective tower, vs. 19% of weak, non-intensifying cyclones. Thirty-five percent of strong, intensifying cyclones have a tower, vs. 13% of strong, non-intensifying cyclones. Our sample size of 93 overflights is barely large enough to conduct this study even though we locate all of the non-landfalling well-centered Precipitation Radar overflights of tropical cyclones in 1998 to 2001. For example, the weak/ intensifying category in Fig. 6 contains only five overflights with a convective tower. If the random error were equal to the square root of the number of overflights (an error of ~2.2 overflights), the error would be almost 50% of the observed value. Many additional years of Precipitation Radar data would improve our statistics and might allow us to establish how convective towers could be useful in intensity forecasts of the tropical cyclones that menace coastal regions every year. 7. ACKNOWLEDGEMENTS TRMM data were provided by NASA/NASDA/CRL. Tropical cyclone subsets were downloaded from the NASDA Tropical Cyclone Database, and best track data were downloaded from UNISYS. Data analysis and visualization was performed in the Interactive Data Language (IDL) manufactured by Research Systems, Inc. (RSI). The authors would like to thank Erich Stocker, John Kwiatkowski, Michael McCumber, and Jeff Halverson for helpful suggestions during this research.
Fig. 8. The reflectivity of the 99th percentile of convection in Precipitation Radar pixels from December 1997 through December 1998. The following lines are taken from Fig. 3b of Cecil et al. (2002): over land (blue), inside tropical cyclone eyewalls (black), or over ocean (red). The green dots show the distribution for tropical cyclone eyewalls during the 1998 to 2001 period used in this study.
dBZ
km
Tropopause layer
Adler, R.F., and R.A. Mack, 1986: Thunderstorm cloud top dynamics as inferred from satellite observations and a cloud top parcel model. J. Atmos. Sci., 43, 1945–60.
Alcala, C.M., and A.E. Dessler 2002: Observations of deep convection in the tropics using the tropical rainfall measuring mission (TRMM) precipitation radar. J. Geophys. Res., 107 (D24) 4792.
AMS, 2000: Glossary of Meteorology. AMS, 855 pp. Anthes, R.A., 2003: Hot towers and hurricanes: early
observations, theories and models. Cloud Systems. AMS. 139–48.
Berg, W., C. Kummerow, and C.A. Morales, 2002: Differences between east and west Pacific rainfall systems. J. Climate, 15, 3659–72.
Black, P.G., 1977: Some aspects of tropical storm structure revealed by handheld camera photographs from space. Skylab Explores the Earth. NASA John-son Space Flight Center, 417–61.
Cecil, D.J., E.J. Zipser, and S.W. Nesbitt, 2002: Reflectivity, ice scattering, and lightening characteris-tics of hurricane eyewalls and rainbands. part I: quantitative description. Mon. Wea. Rev., 130, 769–84.
Danielsen, E.F., 1993: In situ evidence of rapid, vertical, irreversible transport of lower troposphere air into the lower tropical stratosphere by convective cloud turrets and by larger-scale upwelling in tropical cyclones. J. Geophys. Res., 98, 8665–81.
Demaria, M., and J. Kaplan, 1999: An updated statistical hurricane intensity prediction scheme (SHIPS) for the Atlantic and Easter North Pacific. Wea. Forecasting, 14, 326–37.
Dodge, P., R.W. Burpee, and F.D. Marks, 1999: The kinematics structure of a hurricane with sea level pressure less than 900 mbar. Mon. Wea. Rev., 127, 987–1004.
Doviak, R.J., and D.S. Zrnic, 1993: Doppler Radar and Weather Observations. 2nd ed. Academic Press, 562.
Elsner, J.B., and A.B. Kara, 1999: Hurricanes of the North Atlantic. Oxford U. Press, 488 pp.
Geerts, B., G.M. Heymsfield, L.T. Tian, J.B. Halverson, A. Guillory, M.I. Mejia 2000: Hurricane Georges’s landfall in the Dominican Republic: detailed airborne doppler radar imagery. Bull. Amer. Meteor. Soc., 81, 999–1018.
Gentry, R.C., T.T. Fujita, and R.C. Sheets, 1970: Aircraft, spacecraft, satellite and radar observations of Hurricane Gladys, 1968. J. of App. Meteor., 9, 837–48.
Gray, W.M., 1998: The formation of tropical cyclones. Meteorol. Atmos. Phys., 67, 37–69.
Hai, L., X. Miaoxin, W. Chong, and H. Yookui, 1985: Ground-based remote sensing of LCW in cloud and rainfall by a combined dual-wavelength radar-radiometer system. Adv. Atmos. Sci., 2, 93–103.
Heymsfield, G.M., J.B. Halverson, J. Simpson, L. Tian, and T.P. Bui, 2001: ER-2 doppler radar investigation of the eyewall of Hurricane Bonnie during the convec-tion and moisture experiment-3. J. Appl. Meteor., 40, 1310–30.
Heymsfield, G.M., R. Fulton, J.D. Fulton, and J.D. Spinhirne, 1991: Aircraft overflight measurements of Midwest severe storms: implications on geosynchro-nous satellite interpretations. Mon. Wea. Rev., 119, 436–56.
Highwood, E.J., and B.J. Hoskins, 1998: The tropical tropopause. Q. J. R. Meteorol. Soc., 124, 1579–1604.
Holliday, C.R., and A.H. Thompson, 1979: Climatologi-cal characteristics of rapidly intensifying typhoons. Mon. Wea. Rev., 107, 1022–34.
Houze, R.A., 1993: Clouds in hurricanes. chapter 10 of Cloud Dynamics. Academic Press, 573 pp.
Houze, R.A., 2003: From hot towers to TRMM: Joanne Simpson and advances in tropical convection re-search. Cloud Systems. AMS. 37–48.
Iguchi, T., R. Meneghini, J. Awaka, T. Kozu, and K. Okamoto, 2000a: Rain profiling algorithm for TRMM precipitation radar data. Adv. Space. Res., 25, 973–76.
Iguchi, T., T. Kozu, R. Meneghini, J. Awaka, and K. Okamoto, 2000b: Rain-profiling algorithm for the TRMM Precipitation Radar. J. App. Meteor., 39, 2038–52.
Jorgensen, D.P., E.J. Zipser, and M.A. LeMone, 1985: Vertical motions in intense hurricanes. J. Atmos. Sci., 42, 839–55.
Kiladis, G.N., K.H. Straub, G.C. Reid, and K.S. Gage, 2001: Aspects of intraseasonal variability of the tropopause and lower stratosphere. Q. J. R. Meteor. Soc., 127, 196–83.
Kummerow, C., W. Barnes, T. Kozu, J. Shue, and J. Simpson, 1998: The Tropical Rainfall Measuring Mission (TRMM) sensor package. J. Atmos. and Oceanic Tech., 15, 809–17.
Levizzani, V., and M. Setvak, 1996: Multispectral, high-resolution satellite observations of plumes on top of convective storms. J. Atmos. Sci., 53, 361–69.
Malkus, J., and H. Riehl, 1960: On the dynamics and energy transformations in steady-state hurricanes. Tellus, 12, 1–20.
Malkus, J., and H. Riehl, 1964: Cloud Structure and Distributions over the Tropical Pacific Ocean. U. of California Press, 229 pp.
Malkus, J.S., 1954: On the structure of some cumulo-nimbus clouds which penetrated the high tropical troposphere. Tellus, 6, 351–66.
Malkus, J.S., 1959: Recent developments in studies of penetrative convection and an application to hurricane cumulonimbus towers. Cumulus Dynamics: Proceed-ings of the 1st Conference on Cumulus Convection. Pergamon Press. 65–84.
McGregor, G.R., and S. Nieuwolt, 1998: Tropical Climatology. 2nd ed. Wiley, 339 pp.
Meneghini, R., and T. Kozu, 1990: Spaceborne Weather Radar. Artech House, 201 pp.
Meneghini, R., T. Iguchi, T. Kozu, L. Liam, H. Okamoto, J.A. Jones, and J. Kwiatkowski, 2000: Use of the surface reference technique for path attenuation estimates from the TRMM Precipitation Radar. J. App. Meteor., 39, 2053–70.
Nesbitt, S.W., E.J. Zipser, and D.J. Cecil, 2000: A census of precipitation features in the tropical using

TRMM: radar, ice scattering, and lightning observa-tions. J. Climate, 13, 4087–4106.
Ray, P.S., 1986: Mesoscale structure of hurricanes. chapter 14 of Mesoscale Meteorology and Forecast-ing. AMS. 311–30.
Reid, G.C., and K.S. Gage, 1996: The tropical tro-popause over the western Pacific: wave driving, convection, and the annual cyclone. J. Geophys. Res., 101, 21233–41.
Riehl, H., and J.S. Malkus, 1958: On the heat balance in the equatorial trough zone. Geophysica (Helsinki), 6, 503–38.
Riehl, H., and J.S. Malkus, 1961: Some aspects of Hurricane Daisy, 1958. Tellus, 13, 181–213.
Rodgers, E.B., S.W. Chang, and H.F. Pierce, 1994: A satellite observational and numerical study of precipi-tation characteristics in western north-Atlantic tropical cyclones. J. App. Meteor., 33, 129–39.
Rodgers, E.B., W. Olson, J. Halverson, J. Simpson, and H. Pierce, 2000: Environmental forcing of Super Typhoon Paka (1997) latent heat structure. J. App. Meteor., 39, 1983–2006.
Sherwood, S.C., and A.E. Dessler 2001: A model for transport across the tropical tropopause. J. Atmos. Sci., 58, 765–79.
Shin, D.B., G.R. North, and K.P. Bowman, 2000: A summary of reflectivity profiles from the first year of TRMM radar data. J. Climate, 13, 4072–86.
Simpson, 1974: The hurricane disaser potential scale. Weatherwise. 169 and 186.
Simpson, J., J.B. Halverson, B.S. Ferrier, W.A. Peter-sen, R.H. Simpson, R. Blakeslee, and S.L. Durden, 1998: On the role of “hot towers” in tropical cyclone formation. Meteor. Atmos. Phys., 67, 15–35.
Steranka, J., E.B. Rodgers, and R.C. Gentry, 1986: The relationship between satellite measured convective bursts and tropical cyclone intensification. Mon. Wea. Rev., 114, 1539–46.
Thuburn, J., and G.C. Craig, 1997: GCM tests of theories for the height of the tropopause. J. Atmos. Sci., 54, 869–82.
Toracinta, E.R., D.J. Cecil, E.J. Zipser, S.W. Nesbitt, 2002: Radar, passive microwave, and lightning characteristics of precipitation systems in the tropics. Mon. Wea. Rev., 130, 802–24.
U.S. Weather Research Program, 2000: Implementation Plan-Hurricane Landfall. p. 25. http://box.mmm.ucar. edu/USWRP/implementation/download/usrp-docs /USWRP_IMPLEMENTATION_ PLAN_912.pdf.
Williams, E.R., S.A. Rutledge, S.G. Geotis, N. Renno, E. Rasmussen, and T. Rickenbach, 1992: A radar and electrical study of tropical “hot towers.” J. Atmos. Sci., 49, 1386–95.
Zipser, E.J., 2003: Some views on “hot towers” after 50 years of tropical field programs and two years of TRMM data. Cloud Systems. AMS. 49–58.
Zipser, E.J., and K.R. Lutz, 1994: The vertical profile of radar reflectivity of convective cells: a strong indicator of storm intensity and lightning probability. Mon. Wea. Rev., 122, 1751–59.
date & time orbit storm kt ∆kt km19980210.0254 1171 si.anacelle 80 20 8.0019980211.1800 1196 si.anacelle 115 -10 12.2519980608.0056 3030 ni.03a 95 10 13.5019980625.0352 3300 ep.blas 120 0 14.7519980727.0356 3805 ep.darby 100 0 11.5019980822.1806 4224 at.bonnie 85 15 17.2519980824.1050 4251 at.bonnie 100 0 9.5019980824.1215 4252 ep.howard 110 0 10.0019980827.1149 4299 ep.howard 70 -15 5.0019980830.2221 4353 wp.rex 90 0 13.25
19980918.1349 4647 wp.todd 65 -5 17.7519980919.0339 4656 at.georges 95 20 11.5019980925.1733 4760 at.karl 70 10 15.7519980927.0016 4780 at.georges 95 5 13.5019980927.1509 4790 at.jeanne 70 0 16.2519981017.0652 5100 ep.lester 80 10 8.2519981018.1519 5121 ep.madeline 75 0 12.5019981022.0536 5178 ep.lester 95 10 10.2519981209.0022 5931 si.thelma 130 -5 14.2519990118.1132 6569 si.alda 100 0 5.50
19990126.0203 6689 si.damien 65 -10 17.0019990305.1558 7298 si.davina 90 30 17.2519990311.0658 7386 si.davina 75 0 13.2519990318.0648 7497 si.elaine 100 0 14.5019990330.0157 7683 si.frederic 115 15 14.2519990331.1659 7708 si.frederic 140 -5 14.2519990426.1314 8116 wp.kate 65 15 15.7519990501.1157 8194 wp.leo 70 -20 8.7519990620.0034 8975 ep.adrian 65 10 16.0019990713.1311 9346 ep.beatriz 105 -5 11.25
19990731.1157 9629 wp.olga 65 10 10.0019990809.2350 9763 ep.eugene 95 5 15.0019990821.2245 9967 at.bret 90 40 15.0019990822.1028 9975 at.cindy 65 -5 7.7519990828.1112 10070 at.cindy 120 5 9.2519990828.1735 10074 at.dennis 90 5 14.0019990829.1136 10086 at.cindy 100 -20 8.7519990830.1201 10102 at.cindy 80 -10 6.7519990913.0932 10321 at.floyd 135 -10 11.2519990916.0736 10367 at.gert 130 -5 13.25
19990920.1004 10432 wp.bart 80 25 8.7519990922.0917 10457 at.gert 70 -10 8.5019990922.0017 10463 wp.bart 130 10 12.0019991008.0110 10710 wp.dan 90 0 10.0019991116.1619 11335 at.lenny 85 15 9.5020000128.0616 12479 si.connie 110 -10 10.5020000214.2123 12757 si.leon-eline 70 0 10.7520000215.0528 12763 si.leon-eline 65 -5 10.0020000302.1710 13023 si.norman 95 40 15.7520000305.1642 13070 si.norman 65 0 9.00
date & time orbit storm kt ∆kt km20000329.2136 13451 si.hudah 90 -5 13.5020000416.1920 13734 si.paul 125 -5 13.5020000620.1055 14753 ep.carlotta 75 20 14.7520000622.1006 14784 ep.carlotta 100 0 9.5020000729.0854 15367 ep.daniel 65 -15 11.7520000802.1151 15432 wp.jelawat 115 0 12.7520000805.1751 15483 wp.jelawat 90 0 10.0020000807.1701 15514 wp.jelawat 80 -10 7.5020000810.2221 15565 at.alberto 65 5 6.7520000815.0901 15635 wp.ewiniar 75 0 12.25
20000911.1648 16066 wp.saomai 110 -5 9.0020000916.1851 16146 wp.sonamu 70 0 16.7520000929.2143 16353 at.isaac 90 -20 13.0020001029.1519 16822 wp.xangsane 65 35 11.5020010109.1700 17958 si.bindu 90 0 12.2520010111.1612 17989 si.bindu 70 10 8.5020010528.0142 20140 ep.adolph 95 30 11.5020010530.0052 20171 ep.adolph 110 -15 9.0020010705.0656 20743 wp.utor 65 -5 6.7520010726.0057 21070 wp.kong-rey 80 0 10.50
20010727.2346 21085 wp.kong-rey 70 -15 12.2520010727.1921 21098 wp.kong-rey 70 -15 8.2520010727.2234 21100 wp.kong-rey 70 -15 8.7520010805.1944 21240 wp.man-yi 105 -15 9.0020010827.1844 21584 ep.flossie 65 10 14.7520010829.0159 21604 ep.flossie 75 10 8.5020010907.2112 21757 wp.danas 100 0 9.7520010908.0340 21761 wp.nari 65 -5 11.5020010910.2140 21798 at.erin 90 -20 7.5020010915.1230 21868 wp.nari 75 10 10.25
20010915.0619 21872 at.felix 90 0 9.2520010916.0840 21889 at.felix 80 -10 9.0020010917.0607 21903 at.felix 65 -10 10.0020010919.1635 21941 wp.vipa 65 5 10.0020010924.0424 22011 at.humberto 75 -15 14.5020010924.1225 22016 ep.juliette 100 -20 8.2520010927.0304 22057 ep.juliette 90 -10 6.0020011024.0351 22478 wp.podul 140 5 11.0020020529.0813 25863 ep.alma 75 10 15.7520020725.1747 26758 ep.elida 115 -25 11.75
20020825.1153 27237 ep.fausto 95 -20 8.0020020831.2252 27338 ep.hernan 100 30 10.0020020902.2239 27369 ep.hernan 105 -15 7.00
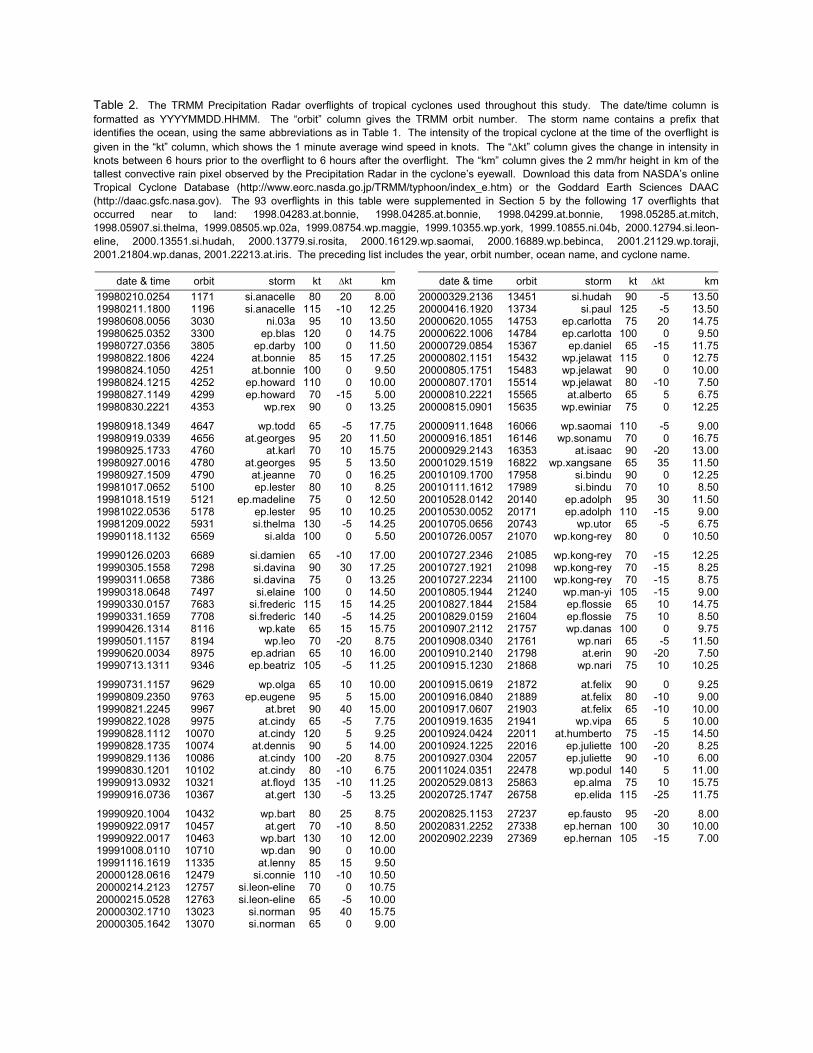
Table 2. The TRMM Precipitation Radar overflights of tropical cyclones used throughout this study. The date/time column isformatted as YYYYMMDD.HHMM. The “orbit” column gives the TRMM orbit number. The storm name contains a prefix thatidentifies the ocean, using the same abbreviations as in Table 1. The intensity of the tropical cyclone at the time of the overflight isgiven in the “kt” column, which shows the 1 minute average wind speed in knots. The “∆kt” column gives the change in intensity inknots between 6 hours prior to the overflight to 6 hours after the overflight. The “km” column gives the 2 mm/hr height in km of thetallest convective rain pixel observed by the Precipitation Radar in the cyclone’s eyewall. Download this data from NASDA’s onlineTropical Cyclone Database (http://www.eorc.nasda.go.jp/TRMM/typhoon/index_e.htm) or the Goddard Earth Sciences DAAC(http://daac.gsfc.nasa.gov). The 93 overflights in this table were supplemented in Section 5 by the following 17 overflights thatoccurred near to land: 1998.04283.at.bonnie, 1998.04285.at.bonnie, 1998.04299.at.bonnie, 1998.05285.at.mitch,1998.05907.si.thelma, 1999.08505.wp.02a, 1999.08754.wp.maggie, 1999.10355.wp.york, 1999.10855.ni.04b, 2000.12794.si.leon-eline, 2000.13551.si.hudah, 2000.13779.si.rosita, 2000.16129.wp.saomai, 2000.16889.wp.bebinca, 2001.21129.wp.toraji,2001.21804.wp.danas, 2001.22213.at.iris. The preceding list includes the year, orbit number, ocean name, and cyclone name.