
Convective systems and surface processes in Amazonia during the WETAMC/LBA
23
A case study of convective organization into precipitating lines in the Southwest Amazon during the WETAMC and TRMM-LBA M. A. F. Silva Dias, 1 W. Petersen, 2 P. L. Silva Dias, 1 R. Cifelli, 2 A. K. Betts, 3 M. Longo, 1 A. M. Gomes, 4 G. F. Fisch, 5 M. A. Lima, 4 M. A. Antonio, 4 and R. I. Albrecht 1 Received 16 January 2001; revised 3 October 2001; accepted 9 October 2001; published 27 September 2002. [1] A case study of convective development in the Southwest Amazon region during the Wet Season Atmospheric Mesoscale Campaign (WETAMC) and Tropical Rainfall Measuring Mission (TRMM)/Large-Scale Biosphere-Atmosphere (LBA) Experiment in Amazonia is presented. The convective development during 7 February 1999 is shown to occur during a period of very weak large-scale forcing in the presence of topography and deforestation. The available data include dual Doppler radar analysis, radiosonde launches, and surface and boundary layer observations. The observational analysis is complemented with a series of model simulations using the RAMS with 2-km resolution over a 300 km 300 km area forced by a morning radiosonde profile. A comparison of the observed and simulated thermodynamic transformation of the boundary layer and of the formation of convective lines, and of their kinematic and microphysical properties is presented. It is shown that only a few very deep and intense convective cells are necessary to explain the overall precipitating line formation and that discrete propagation and coupling with upper atmosphere circulations may explain the appearance of several lines. The numerical simulation indicates that topography may be the cause of initial convective development, although later on the convective line is parallel to the midlevel shear. There are indications that small-scale deforestation may have an effect on increasing rainfall in the wet season when the large-scale forcing is very weak. INDEX TERMS: 0315 Atmospheric Composition and Structure: Biosphere/atmosphere interactions; 3307 Meteorology and Atmospheric Dynamics: Boundary layer processes; 3314 Meteorology and Atmospheric Dynamics: Convective processes; 3322 Meteorology and Atmospheric Dynamics: Land/atmosphere interactions Citation: Silva Dias, M. A. F., et al., A case study of convective organization into precipitating lines in the Southwest Amazon during the WETAMC and TRMM-LBA, J. Geophys. Res., 107(D20), 8078, doi:10.1029/2001JD000375, 2002. 1. Introduction [2] A major goal of the Large-Scale Biosphere-Atmos- phere (LBA) Experiment in Amazo ˆnia is to better under- stand the coupling between atmospheric convection and land surface variability and its impact on the hydrologic cycle in Amazo ˆnia. During the Wet Season Atmospheric Mesoscale Campaign (WETAMC)/LBA and Tropical Rain- fall Measuring Mission (TRMM)/LBA, several convective lines occurred with different degrees of organization [Cifelli et al., 2002; Machado et al., 2002; Pereira Filho et al., 2002; Carvalho and Jones, 2001]. Most of the cases were observed to propagate over the WETAMC and TRMM network of observing platforms as mature systems or as systems formed by the outflow interactions of previous convection formed elsewhere. On 7 February 1999 there was a unique opportunity to observe the complete evolution of a squall line beginning with the formation of scattered clouds in the early morning and concluding with the development of an organized line of deep convective cells. Importantly, the organization of the squall line occurred well within the dual-Doppler coverage area of the S-POL and TOGA radars (see Cifelli et al. [2002] and Silva Dias et al. [2002] for locations of the radars). [3] Greco et al. [1990] classified convective systems forming in the Amazon region as Coastal Occurring Sys- tems (COS), Basin Occurring Systems (BOS) and Locally Occurring Systems (LOS). A significant fraction of the convection classified as COS represented very large squall JOURNAL OF GEOPHYSICAL RESEARCH, VOL. 107, NO. D20, 8078, doi:10.1029/2001JD000375, 2002 1 Department of Atmospheric Science, University of Sa ˜o Paulo (USP), Sa ˜o Paulo, Brazil. 2 Department of Atmospheric Science, Colorado State University (CSU), Fort Collins, Colorado, USA. 3 Atmospheric Research, Pittsford, Vermont, USA. 4 Institute of Meteorological Research, State University of Sa ˜o Paulo (UNESP), Sa ˜o Paulo, Brazil. 5 Institute of Space Activities, Aeronautics Technological Center (CTA), USA. Copyright 2002 by the American Geophysical Union. 0148-0227/02/2001JD000375$09.00 LBA 46 - 1
Transcript of Convective systems and surface processes in Amazonia during the WETAMC/LBA

A case study of convective organization into precipitating lines in the
Southwest Amazon during the WETAMC and TRMM-LBA
M. A. F. Silva Dias,1 W. Petersen,2 P. L. Silva Dias,1 R. Cifelli,2 A. K. Betts,3
M. Longo,1 A. M. Gomes,4 G. F. Fisch,5 M. A. Lima,4 M. A. Antonio,4
and R. I. Albrecht1
Received 16 January 2001; revised 3 October 2001; accepted 9 October 2001; published 27 September 2002.
[1] A case study of convective development in the Southwest Amazon region during theWet Season Atmospheric Mesoscale Campaign (WETAMC) and Tropical RainfallMeasuring Mission (TRMM)/Large-Scale Biosphere-Atmosphere (LBA) Experiment inAmazonia is presented. The convective development during 7 February 1999 is shownto occur during a period of very weak large-scale forcing in the presence of topographyand deforestation. The available data include dual Doppler radar analysis, radiosondelaunches, and surface and boundary layer observations. The observational analysis iscomplemented with a series of model simulations using the RAMS with 2-km resolutionover a 300 km� 300 km area forced by a morning radiosonde profile. A comparison of theobserved and simulated thermodynamic transformation of the boundary layer and of theformation of convective lines, and of their kinematic and microphysical properties ispresented. It is shown that only a few very deep and intense convective cells are necessaryto explain the overall precipitating line formation and that discrete propagation andcoupling with upper atmosphere circulations may explain the appearance of several lines.The numerical simulation indicates that topography may be the cause of initialconvective development, although later on the convective line is parallel to the midlevelshear. There are indications that small-scale deforestation may have an effect onincreasing rainfall in the wet season when the large-scale forcing is very weak. INDEX
TERMS: 0315 Atmospheric Composition and Structure: Biosphere/atmosphere interactions; 3307
Meteorology and Atmospheric Dynamics: Boundary layer processes; 3314 Meteorology and Atmospheric
Dynamics: Convective processes; 3322 Meteorology and Atmospheric Dynamics: Land/atmosphere
interactions
Citation: Silva Dias, M. A. F., et al., A case study of convective organization into precipitating lines in the Southwest Amazon during
the WETAMC and TRMM-LBA, J. Geophys. Res., 107(D20), 8078, doi:10.1029/2001JD000375, 2002.
1. Introduction
[2] A major goal of the Large-Scale Biosphere-Atmos-phere (LBA) Experiment in Amazonia is to better under-stand the coupling between atmospheric convection andland surface variability and its impact on the hydrologiccycle in Amazonia. During the Wet Season AtmosphericMesoscale Campaign (WETAMC)/LBA and Tropical Rain-fall Measuring Mission (TRMM)/LBA, several convective
lines occurred with different degrees of organization [Cifelliet al., 2002; Machado et al., 2002; Pereira Filho et al.,2002; Carvalho and Jones, 2001]. Most of the cases wereobserved to propagate over the WETAMC and TRMMnetwork of observing platforms as mature systems or assystems formed by the outflow interactions of previousconvection formed elsewhere. On 7 February 1999 therewas a unique opportunity to observe the complete evolutionof a squall line beginning with the formation of scatteredclouds in the early morning and concluding with thedevelopment of an organized line of deep convective cells.Importantly, the organization of the squall line occurredwell within the dual-Doppler coverage area of the S-POLand TOGA radars (see Cifelli et al. [2002] and Silva Diaset al. [2002] for locations of the radars).[3] Greco et al. [1990] classified convective systems
forming in the Amazon region as Coastal Occurring Sys-tems (COS), Basin Occurring Systems (BOS) and LocallyOccurring Systems (LOS). A significant fraction of theconvection classified as COS represented very large squall
JOURNAL OF GEOPHYSICAL RESEARCH, VOL. 107, NO. D20, 8078, doi:10.1029/2001JD000375, 2002
1Department of Atmospheric Science, University of Sao Paulo (USP),Sao Paulo, Brazil.
2Department of Atmospheric Science, Colorado State University(CSU), Fort Collins, Colorado, USA.
3Atmospheric Research, Pittsford, Vermont, USA.4Institute of Meteorological Research, State University of Sao Paulo
(UNESP), Sao Paulo, Brazil.5Institute of Space Activities, Aeronautics Technological Center (CTA),
USA.
Copyright 2002 by the American Geophysical Union.0148-0227/02/2001JD000375$09.00
LBA 46 - 1

lines that have been studied by Silva Dias and Ferreira[1992] and by Cohen et al. [1995]. These squall lines andtheir associated mesoscale boundaries are formed at thenorthern coast of South America, are triggered by the seabreeze circulation, and can propagate well into the interiorof the Amazon basin as organized entities for up to severaldays. Garstang et al. [1994] and Greco et al. [1994] studiedthe kinematic and diabatic heat and moisture transports ofseveral COS that were observed during ABLE 2B [Harrisset al., 1990] using a radiosonde and surface mesonet net-work in near Manaus.[4] BOS are convective lines that form in the basin and
also show propagation but with lifetimes of a few hours.LOS are smaller, short-lived, more isolated convectivesystems that tend to peak in phase with diurnal heating. Inthe definition of Orlanski [1975], COS, BOS, and LOSwould be classified as meso-a, meso-b and meso-g systems,respectively.[5] During the WETAMC, at least one case of COS with
a very long lifetime was observed and this case is describedby Betts et al. [2002a]. Cifelli et al. [2002] contrasted thevertical structure of two convective systems occurring indifferent low-level wind regimes (i.e., easterly versus west-erly) during WETAMC and TRMM-LBA. The ‘‘westerly’’event was a BOS while the classification of the ‘‘easterly’’case was ambiguous and may have been either BOS orCOS. Cifelli et al. found significant differences in thekinematic and microphysical characteristics of the twosystems. The convective system observed in Rondoniaduring the afternoon of 7 February 1999 can be classifiedas BOS. Unlike convection described in the previous studiesdiscussed above, the 7 February system appeared to developindependently of obvious influences from previous convec-tion or other large-scale boundary interactions.[6] This paper will build upon observations made during
the WETAMC and TRMM/LBA by several observingplatforms, and by high resolution numerical simulationsperformed with the Regional Atmospheric Modeling Sys-tem (RAMS) [Pielke et al., 1992] to describe and discussthe organization of the 7 February 1999 convection. Section2 describes both the data and methodology used in thisstudy. Section 3 presents the observed large-scale surfaceand boundary layer evolution from the early morningthrough afternoon hours and section 4 discusses kinematicand microphysical aspects of storm evolution as observedby the S-POL and TOGA radars. Results from the numer-ical simulation are presented in section 5 including adiscussion of the impact of topography and surface vegeta-tion cover in the observed development. Last, section 6summarizes the observations and presents the conclusions.
2. Data, Methodology, and Model
[7] Radar data from the NCAR S-POL (S-band, dual-polarized) and NASA TOGA radar (C-band, linear-polar-ized) were utilized to retrieve the three-dimensional windfield and to examine cloud microphysical properties for the7 February event. A description of the radar locations,scanning strategies, and parameters collected by the radarsare given by Cifelli et al. [2002].[8] A total of 15 volumes of S-POL and TOGA radar
data were analyzed for the time period 1530–1810 UTC.
These data allowed for the mesoscale structure of convec-tion to be examined at 10 min resolution with the exceptionof two time periods in which dual-Doppler could not beperformed due to missing scans from the TOGA radar(1720 and 1800 UTC). The dual-Doppler analysis proce-dure involved manually unfolding the radial velocity data,interpolating to a 103 km � 103 km � 16.5 km Cartesiangrid (1 � 1 � 0.5 km spacing) and combining the data toretrieve the three dimensional wind field. Prior to unfolding,the S-POL data were processed to eliminate ground clutterand calculate specific differential phase (KDP) from totaldifferential phase (CDP) data as described by Carey et al.[2000]. A complete description of the radar analysis proce-dure is given by Cifelli et al. [2002].[9] Surface data from weather stations at Rebio Jaru
and Rolim de Moura [Silva Dias et al., 2002, see Figure 2for locations] were obtained with 30 min resolution whilethe data from the pasture site at Fazenda Nossa Senhora,also known as the Anglo-Brazilian Amazonian ClimateObservation Study (ABRACOS) [Gash et al., 1996] site,was obtained at 5 min resolution [see Fuentes et al.,2000]. The ABRACOS site is located in a pasture area atapproximately 2 km from the TOGA radar. The surfacedata [cf. Betts et al., 2002b, for the instrumentation at thissite] have been screened for tendencies and comparedwith radiosonde first level data off the surface. For thepurpose of this case study, suspicious data have beenremoved and left as missing data. The radiosonde data hasundergone a full quality control procedure. The stations ofRebio Jaru and Rolim de Moura operated Vaisala equip-ment while ABRACOS and Rancho Grande operated VIZequipment.[10] The Rolim de Moura sounding of 1200 UTC (Local
time is UTC minus 4 hours) located at 11�4201700S and61�4603800W was used for a horizontally homogeneousinitialization of RAMS. Tests were performed also withthe 1200 UTC ABRACOS sounding but due to a veryhumid layer below 1 km, an unrealistic stratus deck formedin the simulation, hindering surface solar heating andfurther development of the mixed layer. One single gridhas been used in the model simulations with 2-km reso-lution centered close to the city of Ji-Parana at 10.87�S,61.83�W. A stretched vertical grid has been used, starting at150 m resolution just above the surface and stretchinggradually by a factor of 1.2 in successive layers untilreaching a maximum spacing of 1 km, and then keptconstant up to model top which is set at approximately25 km. The first level for wind, temperature, and mixingratios is 71 m above ground level (AGL). The simulatedgrid matrix has 151 � 149 � 31 points. Surface filesdescribing topography, vegetation and percent of landversus water in a grid cell have been obtained from anIGBP (International Geosphere Biosphere Program) 1-kmresolution data set. The full microphysics suite of RAMSversion 4.3 has been used in all simulations [Walko et al.,1995] with pristine ice having prognostic concentrationwhile the other ice have specified mean diameter. Cumulusparameterization has been turned off since clouds aresupposedly being resolved with this model resolution.Initial values of soil moisture, constant over the wholedomain at the initial time, have been used to tune thesurface fluxes to the observations as will be discussed in
LBA 46 - 2 SILVA DIAS ET AL.: PRECIPITATING LINES IN SW AMAZON

section 5. The model run with all the above mentionedoptions is referred to as the control run.
3. Large-Scale, Surface, and Boundary LayerEvolution
[11] Figure 1 shows the infrared satellite images for 7February 1999 at 1215 and 1815 UTC. The red square
indicates the study area in the SWAmazon over the Brazilianstate of Rondonia. A previous day Mesoscale ConvectiveSystem (MCS) located in SW Rondonia decayed in the earlymorning hours. At 1215 UTC the NE half of the study regionhas clear skies. By 1815 UTC Figure 1b shows the NW/SEoriented line that will be discussed in the following sections.[12] The large-scale situation over SW Amazon Basin,
specifically over the state of Rondonia, in the early morning
Figure 2. Winds from the global CPTEC analysis for 7 Feb. 1999, 1200 UTC and divergence (labels in10�6 s�1). (a) 925 hPa; (b) 100 hPa. The square is around the study area, the state of Rondonia.
Figure 1. Infrared GOES satellite images. The red square is the study area in Rondonia. (a) 7 Feb. 1999,1215 UTC; (b) 7 Feb. 1999, 1815 UTC. Colors are associated to threshold IR temperatures: yellow for230K < Tir < 210K; green for 210K < Tir < 190K.
SILVA DIAS ET AL.: PRECIPITATING LINES IN SW AMAZON LBA 46 - 3

Figure 3. Temporal evolution of the vertical profile of potential temperature (a) and specific humidity (b)and wind (shaded areas show wind speed greater than 4 m s�1) (c) from the ABRACOS site radiosondelaunch.
LBA 46 - 4 SILVA DIAS ET AL.: PRECIPITATING LINES IN SW AMAZON

of 7 February 1999 indicated very weak forcing from thelarge scale (about ± 0.4 cm s�1 at 850 hPa). The winds atthe low level shown in Figure 2a were from the NWresponding to the remains of a mid latitude frontal systemapproaching from Southern Brazil, Paraguay and SouthernBolivia (T. M. Rickenbach et al., Modulation of convectionin the western Amazon basin by extratropical baroclinicalwaves, submitted to Journal of Geophysical Research,2001, hereinafter referred to as Rickenback et al., submittedmanuscript, 2001). Actually, 7 February was an interestingday from a regime perspective, as it actually was a day oftransition from westerly to easterly regimes according toRickenbach et al. (submitted manuscript, 2001) definition:the soundings from ABRACOS in Figure 3c show low levelwinds were starting to turn by 1500 UTC. Low levelconvergence was found west of the study area in the centralpart of the Amazon Basin colocated with upper leveldifluence as may be seen in Figure 2b. Rondonia was atthe eastern edge of this pattern close to the no divergenceline.[13] The interest in this case lies in the fact that no
significant large-scale forcing was evident. Convection ini-
tiated in apparent randomness in response to diurnal heating.The convection started during the morning as small con-vective cells; a few systems grew and got organized intoseveral convective bands that were about 300–400 km long,travelling at low speeds and with a lifetime of several hours.[14] The first thunderstorms reached the ABRACOS site
by 18 UTC (14:00 LT) affecting the growth of the boundarylayer. Table 1 shows the time evolution of the height of theconvective boundary layer (CBL) for 7 February 1999.Development of the CBL depth was remarkable, extendingto a depth of 85 m higher than the average for the wholeWETAMC. Figure 3 shows a sequence of soundings at theABRACOS site: the sounding of 1800 UTC was launchedjust prior to the arrival of the first gust-front. By 2100 UTC,it was impossible to characterize the height of the CBL, asthe whole boundary layer became very stable and wasoverlayed by stratiform clouds. At 12 UTC, the convectiveavailable potential energy (CAPE) had a value of 1155 Jkg�1 (see Table 2). At 18 UTC, prior to the arrival of thegust front CAPE increased to 1365 J kg�1.[15] Figure 4 shows the detailed evolution of some sur-
face thermodynamic variables, temperature and pressure on
Figure 4. Time series of surface thermodynamic variables at the ABRACOS pasture site on 7 Feb. 1999.
Table 1. Time Evolution of the Height of CBL Over the Pasture
Site (ABRACOS)a
12 UTC 15 UTC 18 UTC 21 UTC
7 Feb. 1999 90 600 850 ???8 Feb. 1999 50 400 850Average (from Fisch et al.,submitted manuscript, 2001)
94 475 765 927
aHeights are in meters.
Table 2. Some Thermodynamics Variables for 7 February 1999
From the ABRACOS Soundings
12 UTC 15 UTC 18 UTC 21 UTC
Surface Thetae, K 348.4 352.8 352.0 348.4CAPE, J kg�1 1155 1365 1299 5LCL, hPa 963.1 884.4 882.4 951.1CIN, J kg�1 53.1 84.4 32.4 11.1Surface q, g kg�1 17.0 16.2 15.9 16.7
SILVA DIAS ET AL.: PRECIPITATING LINES IN SW AMAZON LBA 46 - 5

the upper panel, equivalent potential temperature, qE, andsurface wind speed, on the middle panel, and water vapormixing ratio q, and pressure height from surface to thelifting condensation level (LCL), �pNCL, calculated frommeasurements at 1.5 m height. From 1200 to 1500 UTC,temperature, �pLCL and qE all rise to reach roughly theirmaximum values for the day, while mixing ratio fluctuatesaround 18.5 g.kg�1. During this period, q is kept fromrising, despite the large surface evaporation, by the upwardtransport of moisture into shallow cumulus clouds. About1500 UTC the convective clouds start to organize first into
bands of congestus (cf. Figure 9) and the fluctuations of T,pLCL and qE get larger as the site is influenced by showers.The passage of the line at 1800 UTC is very distinct, and ismarked by large falls in these same three variables as thesurface gust-front reaches the site at 1759 UTC, withmaximum wind speed greater than 20 m s�1. The outflowair produces a temperature drop of about 7K and a drop inqE of 13K in about 20 min, and is nearly saturated (relativehumidity about 90%, and �pLCL falls from 110 to less than20 hPa in about 30 min).[16] The outflow air however is barely drier in mixing
ratio suggesting that the boundary layer is affected byseparate evaporative and downdraft transport processes.Figure 5 shows the data just before and after the arrival ofthe gust-front on a (q, q) plot. The cluster of points markedwith an x shows the 1 min surface fluctuations for a periodof 20 min ahead of the gust front. The data after the arrivalof the gust-front (circles) at 1759 UTC are also 1 min apartand some are labeled with their time. Initially, q falls and qrises at constant qE = 361.5K (dotted line shown), corre-sponding to a mean of the value ahead of the gust-front.This indicates high qE air modified just by the evaporationof rain. However, around 1805 UTC the trajectory changessharply on the figure, as q and q both fall steeply (and alongwith them, qE to below 350K). This change of trajectoryindicates the arrival of cooler, drier downdraft air fromabove.[17] The transition in the structure of outflow air has been
noticed in earlier studies [e.g., Betts, 1984], and recentlyTompkins [2001], from a numerical simulation, has drawnattention to the fact that the triggering of new convection bycold pool outflows over the ocean appears to involve thelifting of this cooled but high qE air, although over theocean, the surface heat flux rapidly restores the temperature.[18] The tethersonde profiles at the ABRACOS site
show the BL structure before and after the passage ofthe convective band. Figures 6a and 6b show the sequence
Figure 5. (q, q) plot, showing the arrival of the gust-frontat 1359 LST.
Figure 6. Sequence of tethersonde BL profiles of q and qE at ABRACOS site on 7 February.
LBA 46 - 6 SILVA DIAS ET AL.: PRECIPITATING LINES IN SW AMAZON

of BL profiles of q and qE with mean times at 1148, 1457,1752 and 1901 UTC. For each there is an ascent anddescent profile, but we have only distinguished them forthe ascent and descent pair just before 1800 UTC, becausethis descent profile was just at the arrival time of thefirst gust-front. Considering the sequence from 1148 to1745 UTC, we see the warming and deepening of thenearly mixed boundary layer (BL), and an increase in BLqE from values of order 354K to 359K. At 1500 UTC, themixed layer (ML) depth is about 70 hPa, consistent withpLCL in Figure 4. The 1745 UTC ascent profile is justshowing signs of cooling near the surface. About 15 minlater, the 1759 UTC descent profile (heavy dashes) is justat the time of arrival of the gust-front and it shows a largecooling, but qE has barely started to fall as the tethersondeis drawn down to the surface, because this is just ahead ofthe arrival of the low qE downdraft air, as discussed above.By the time of the following profile, near 2101 UTC, thepassage of the convective line has transformed the BL backto a cooler, more stable structure, with a lower qE verysimilar to that in the morning. In fact, the morningstructure was itself established by convection during theprevious night.[19] Figure 7a shows all radiation components measured
at the ABRACOS site. Downward shortwave irrradiance(DSW) representing solar incoming radiation has a strongdiurnal cycle. After sunrise (1100 UTC), the absolute valueof DSW starts to rise, with some variability due to somecloud cover. After a maximum absolute value (1170 Wm�2) at about 1600 UTC, DSW falls to 388 W m�2 at1700 UTC due to cloudiness. DSW recovered higher valuesat 1730 UTC (1032 W m�2) although it drops to 27 W m�2
after the convective line passage (1830 UTC), leading thenet radiation to �58 W m�2. Upward shortwave irradiance(USW) shows similar features but with smaller values.Upward longwave irradiance (ULW) represents irradianceemitted by the surface and is seen to increase by sunrise,reaching a maximum value at 1600 UTC - 511 W m�2. Aslight ULW decrease is observed at 1700 UTC, emphasizingthe passage of some convective cells, followed by anincrease. At 1800 UTC ULW was 503 W m�2 and it fellto 439 W m�2 at 1900 UTC, due to the cooling effect of thedowndrafts. Afterwards, ULW did not recover the originalvalues, remaining at 450 W m�2.
[20] Figure 7b shows sensible and latent heat fluxes (SHand LH, respectively). Both start to increase after sunrise,reaching maximum values at 1500 UTC (LH) and 1600UTC (SH), with a Bowen ratio of about 0.6 when there is arapid fall followed by an increase. At 1830 UTC, both SHand LH drop to zero and do not return to high values.Figure 8 shows the number of raingages (from a total of 40in the area) that observed 5 min rainfall rates over differentthresholds (20, 40, 60 and 80 mm.hr�1) during the after-noon. It shows that high rainfall rates occurred between1700 and 1830 UTC and a few sites observed rainfall ratesover 60 and 80 mm.hr�1.
4. Radar Observations of Storm Evolution
[21] Low-level radar CAPPI’s of reflectivity and horizon-tal wind flow were used to determine the overall trend inconvective organization during the 1530–1810 UTC anal-ysis period. For the dual-Doppler analysis, an average stormmotion vector was calculated for each radar volume in orderto perform a differential advection in the combined dual-Doppler synthesis. Inspection of successive low-levelCAPPI (Constant Altitude Plan Position Indicator) plotsshowed that the average storm motion direction remainednearly constant throughout the analysis period (motion from
Figure 7. (a) Downward and upward shortwave (left axis) and longwave (right axis) irradiance and netirradiance (left axis). (b) Sensible and Latent heat fluxes; at ABRACOS site on 7 February.
Figure 8. Number of raingages in all networks (42raingages) that measured 5 min rainfall rates above thegiven thresholds.
SILVA DIAS ET AL.: PRECIPITATING LINES IN SW AMAZON LBA 46 - 7

30� toward 210�); however, the average speed of the lineincreased from 5 m s�1 prior to 1710 UTC to approximately7 m s�1 after 1710 UTC.[22] Figure 9 shows the echo features across the
sampling domain at 1530 UTC. At this time, the echopopulation represents a mostly unorganized cumulus fieldembedded in weak northeasterly flow. The line feature isbarely discernable as a loose aggregation of cells in thenortheast segment of the plot. By 1630 UTC, this featurehad solidified into a linear band with a roughly north-west-southeast orientation. At this point, the band wasover 100 km in length, although the width barely exceededone cell (�10 km) in many places (Figure 10). Long rangesurveillance scans (not shown) revealed that a significantportion of the band extended outside (north) of the dual-Doppler domain.[23] Animation of the low-level CAPPI’s showed that the
line moved via discrete propagation during the analysis
period, at least as could be discerned from the 10-minresolution of the radar data. As the line moved toward thesouthwest, new cells formed out ahead of the line (�20–30 km) in an orientation roughly parallel to the main linearband. Between 1700 and 1730 UTC, the newer cells outahead of the line intensified and solidified into anotherlinear feature while the main portion of the band weakenedin its wake (Figure 11). The system continued toward thesouthwest, albeit at a somewhat faster speed (7 m s�1). The‘‘new’’ line contained a trailing region of decaying con-vection (the previous linear band), which broadened theoverall feature considerably in many places along the line.Also evident in Figure 11 is another linear feature withsimilar northwest-southeast orientation about 50 km to therear (northeast) of the main line band, moving in roughlythe same direction. The line continued to move toward thesouthwest and lengthened to over 200 km, mostly as aconsequence of convection along the southern margin(south of S-POL). Despite its length, the band remainedrather loosely organized, eventually breaking up into dis-crete aggregates of cells. The linear feature eventuallydecayed several hours after the dual-Doppler analysisperiod, although remnants were detectable for several morehours.
4.1. Time-Height Sections
[24] In order to examine the mesoscale evolution of theconvection in terms of kinematic and microphysical proper-ties, the line feature in each synthesis volume was isolatedby qualitative inspection of low-level radar CAPPI’s (2 km)for the entire analysis period. Composites of the u, v, and wcomponents of the wind as well as reflectivity for theisolated region were then calculated. Time-height sectionsof the composite analyses were constructed for the timeperiod 1530–1810 UTC. Because of the two missing radarvolumes mentioned above, linear interpolation was used tofill-in the missing time periods and complete the time-heightsections.[25] Throughout the sampling period, the low-level flow
(ground relative) was weak and out of the northeast (seeFigures 9–11). The CAPPI’s in Figures 9–11 show that thestrongest low-level flow was to the rear (north-northeast) of
Figure 9. Radar CAPPI of reflectivity (shaded), horizontalwind vectors (storm relative), and convergence (contours of±0.1 and 0.9 � 10�3 s�1) at 1530 UTC at a height of 1 kmAGL. The locations of the S-POL and TOGA radars areindicated in the plot.
Figure 10. Same as Figure 9 except for 1630 UTC. Figure 11. Same as Figure 9 except for 1730 UTC.
LBA 46 - 8 SILVA DIAS ET AL.: PRECIPITATING LINES IN SW AMAZON

the band throughout the sampling period and that there waslittle curvature, except in the vicinity of convective cores.Figures 12 and 13 show time-height sections of vertical airmotion and reflectivity, respectively. Inspection of themaximum vertical air motion and maximum reflectivitypanels reveal that the intensity of the system (in terms ofdepth and magnitude) generally increased over time. How-ever, the intensity modulated several times during theanalysis period with each ‘‘pulse’’ being larger than theprevious one. Specifically, both the maximum verticalvelocity and reflectivity parameters show an increase
in the contour slope at upper levels near 1540 UTC,1710 UTC, and 1750 UTC (the modulations can also beseen in the average vertical air motion plot). The latter pulseindicates the greatest overall intensity of the line featureduring the analysis period with maximum updrafts in atleast one cell exceeding 19 m s�1 near 12 km and the30 dBZ contour extending to near 11 km. Two other pulsesin maximum vertical air motion at 1610 and 1640 UTC arenot obvious in the reflectivity cross sections. In general, thereflectivity increased at upper levels over the course of thesampling period as the storm deepened.
Figure 12. Time-height cross-sections of composite vertical air motion (top panel), maximum verticalair motion (middle panel), and minimum vertical air motion (bottom panel) within the region defining thelinear band feature in each dual-Doppler synthesis volume. Contour units are m s�1. Note change incontour interval between the top and middle-bottom panels. Solid (dashed) contours indicate upward(downward) motion.
SILVA DIAS ET AL.: PRECIPITATING LINES IN SW AMAZON LBA 46 - 9

[26] Figure 14 shows the composite time-height crosssection of horizontal wind perpendicular and parallel to theline orientation. The line perpendicular section shows flowfrom front-to-rear (FTR) at nearly all heights throughout thesampling period. This plot shows that the shear in the lowerto middle troposphere decreased over time due to a combi-nation of decreasing FTR below 3 km and increasing FTRbetween 3 and 9 km. The decrease in low-level FTR isparticularly evident after about 17:30 UTC and is probablyrelated to the intensification of new cell growth, and asso-ciated convergence, ahead of the line feature (Figure 11). Inthe upper troposphere, rear-to-front (RTF) flow increasedover time, probably due to the overall intensification of thesystem and subsequent interaction of storm-generated out-flow with upper-level easterly flow in the environment.[27] The storm parallel cross section in Figure 14 shows
that the flow is toward the northwest at all heights duringthe analysis period and that there is significantly larger deepshear (0.5–10 km) parallel to the line compared to theperpendicular direction. Moreover, the storm parallel shearprofile does not change substantially over the course of thesampling period.
4.2. Microphysical and Kinematic Vertical Structureof Convection
[28] Convective cells located along the leading edge ofthe system exhibited an evolving reflectivity structure thatwas a function of both the stage of lifecycle and thelocation relative to the edge of the cold pool. During the
early stage of the convective lifecycle, cells developingalong the edge of the surging cold pools exhibited a fairlyerect vertical structure (Figures 15 and 16). During themature phase, the convective vertical structure becametilted as the cells extended to heights above the 9-km level(Figures 16 and 17). New cells (Figures 15 and 16) alwaysexhibited first precipitation echoes between the 2- and 4-kmheight levels. Not surprisingly, multiparameter radar obser-vations indicate that the primary development of rainfall inthe growing convection took place via warm-rain processes[e.g., Takahashi, 1990; Bringi et al., 1997; Petersen et al.,1999; Carey and Rutledge, 2000]. This is well illustrated inFigure 15 where a combination of significant differentialreflectivities (Zdr; e.g., >1 dB) and storm-relative velocityvectors indicate that raindrops formed along the edge of arobust new cell, adjacent to and within an updraft attemperatures well above 0�C. Combined with a 1–2 kmspatial offset of significant values of differential propaga-tion phase (Kdp; > 1�/km), the reflectivity and Zdr obser-vations1 suggest that small numbers of large raindrops
Figure 13. Composite reflectivity (top panel) and maximum reflectivity (bottom panel) in the regiondefining the linear band in each dual-Doppler synthesis. Contour units are dBZ starting at 5 dBZ andincrementing by 5 dBZ.
1Physically, Zdr is a ratio of the returned power measured at horizontalpolarization to that of vertical polarization, and is to the reflectivity-weighted mean particle aspect ratio (e.g., drop oblateness). Kdp is a measureof the difference in phase propagation of the two polarized signals throughthe medium, and is a combined measure of both liquid water content andmean mass-weighted particle aspect ratio in Rayleigh scattering regimes [cf.Doviak and Zrnic, 1993].
LBA 46 - 10 SILVA DIAS ET AL.: PRECIPITATING LINES IN SW AMAZON

continued to grow by coalescence as they descendedthrough the updraft, resulting in robust Zdr signatures(4 dB; diameter maxima of 5–6 mm) on the edge of theupdraft and reflectivity core (Figures 15 and 17). Within thereflectivity cores (Figures 15–17), Kdp and Zdr valuessuggest the accumulation of an increased rainwater contentbetween the 3 and 4 km levels associated with a largernumber of medium sized drops (3–4 mm). These medium-sized drops were also transported laterally as they fell intodowndrafts and eventually comprised the bulk of the low-level reflectivity core. Near the 2.5–3 km height level,where local reflectivity maxima were often located (Figures15–17), Kdp and Zdr values suggest a decreasing liquidwater content but slightly larger raindrop diameters (4–5 mm). Drop breakup and evaporation likely explain the
subsequent decrease in both Kdp and Zdr below the reflec-tivity core and near the surface.[29] The spatial size sorting of rainfall observed in the
cell shown in Figure 15 (reflected in the lateral offset of Kdp
and Zdr), resulted in a pronounced lateral variation of theraindrop size distribution (DSD). This variability in theDSD spanned a distance of approximately 3 km nearthe surface and was well represented for this particular cellin surface disdrometer measurements of the DSD collectedat the Ji Parana airport (not shown).[30] Representative cross-sections of reflectivity, velocity
and polarimetric variables for convective cell types in amature growth stage are shown in Figures 16 and 17. Themore mature cells in Figure 16 (located north of y = 25) aretypical of the convective intensity and draft structure
Figure 14. Storm relative horizontal wind components perpendicular (top panel) and parallel (bottompanel) to the orientation of the linear band. Units are m s�1. Solid (dashed) lines indicate positive(negative) flow. In the top (bottom) panel, flow toward the rear (southwest) is positive.
SILVA DIAS ET AL.: PRECIPITATING LINES IN SW AMAZON LBA 46 - 11

encountered in this convective system, while the crosssection presented in Figure 17 is more representative ofthe most intense convection observed. From a microphys-ical perspective, one large difference between the deepintense (typical) cells shown in Figures 16 and 17 is thepresence (lack) of strong evidence supporting a hail pro-duction process in the intense (typical) cell. For the typicalor mean cell in this case, the polarimetric radar data suggestthat Zdr columns extending to temperatures <0�C accom-panied by local enhancements in Linear Depolarization
Ratio (indicating mixed phase processes) were rarelyobserved. Based on previous polarimetric radar studies inthe tropics [e.g., Bringi et al., 1997; Carey and Rutledge,2000; Cifelli et al., 2002] this observation suggests thatmixed phase processes may not have played as dominant arole in the overall production of rainfall in the system as awhole. Indeed, cloud-to-ground lightning flash counts onthis day were at a relative minimum, further supporting thelack of robust mixed phase processes in the clouds. Con-versely, as shown in Figure 17, there were at least a few
Figure 15. 7 February 1999, 1740 UTC. North-south cross section (approximately cross-line) of radarreflectivity and storm relative velocity vectors through a growing cell. a) Radar reflectivity. Values areshaded and vector magnitude is indicated in upper right corner. The solid line indicates the approximateheight of the freezing level. b) As in (a) but Zdr (shaded) and Kdp (contoured every 1�/km beginning at1�/km).
LBA 46 - 12 SILVA DIAS ET AL.: PRECIPITATING LINES IN SW AMAZON

moderately intense convective cells embedded in the brokenline of convection. In these cells significant Zdr and Kdp
were found at temperatures near �5�C suggesting thepresence of a hail process driven by the lofting andsubsequent freezing of raindrops. While not the dominantmode of precipitation production in the convective system,it is reasonable to suggest that enhanced downdrafts asso-
ciated with the presence of enhanced ice processes in thesecells may have locally enhanced the strength and/or move-ment of the cold pool along the convective line [e.g., Trieret al., 1996].[31] From a dynamical perspective, one ubiquitous char-
acteristic of the mature cells was the presence of a disconti-nuity between low level and upper level updrafts (Figures 16
Figure 16. 7 February 1999, 1810 UTC. (a) As in Figure 15, but through a mixture of developing andmature convective cells. (b) As in Figure 15.
SILVA DIAS ET AL.: PRECIPITATING LINES IN SW AMAZON LBA 46 - 13
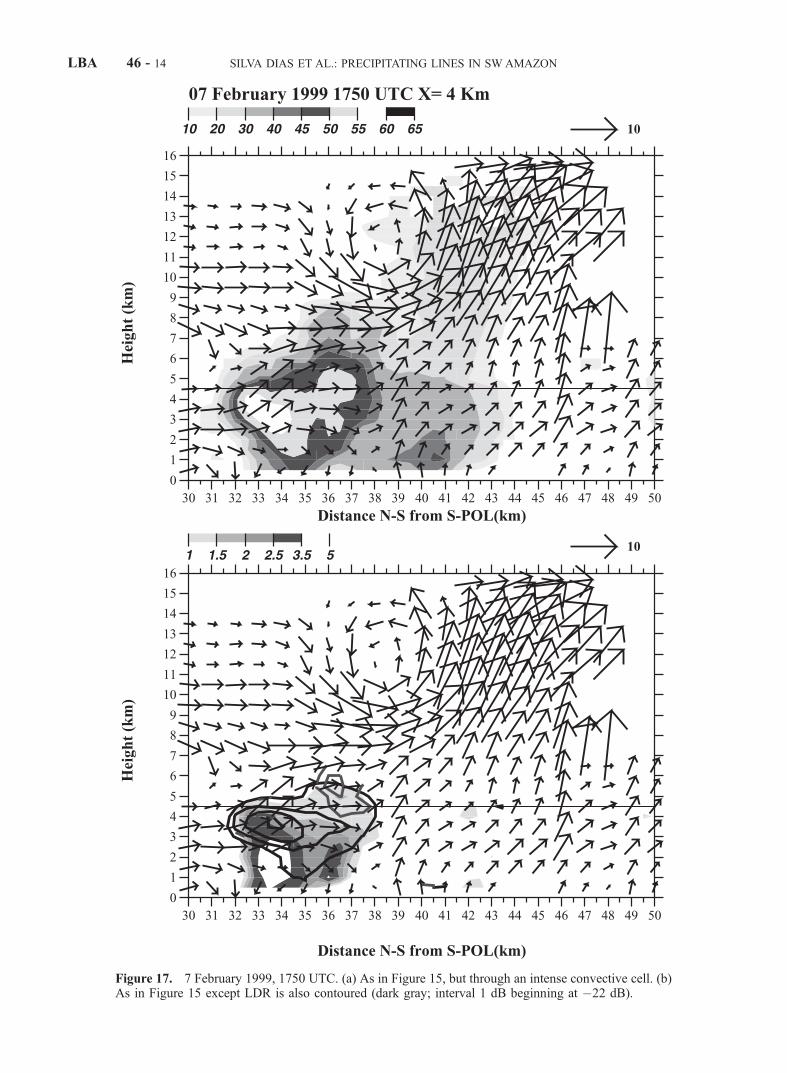
Figure 17. 7 February 1999, 1750 UTC. (a) As in Figure 15, but through an intense convective cell. (b)As in Figure 15 except LDR is also contoured (dark gray; interval 1 dB beginning at �22 dB).
LBA 46 - 14 SILVA DIAS ET AL.: PRECIPITATING LINES IN SW AMAZON
and 17). The radar data suggest that as cells developed anddeepened, updrafts at mid and upper-levels accelerated asprecipitation was unloaded. At the same time, the updraftsat mid levels were progressively displaced northward (in astorm relative sense) from the lower level core. This north-ward displacement was due to a combination of discretepropagation of the convective system (e.g., cold pool surgesthat out ran growing convection) and strong upper-levelshear. The net effect was to tilt the system rearward and toweaken the precipitation structure at upper levels as the
updraft became cutoff from its vapor/condensate source atlower levels. Enhanced convergence and entrainment ofdryer air into the updraft aloft also served to prohibit thegrowth of large precipitation particles at mid levels. Fur-ther, as the strong updrafts in the deeper cells (Figures 16and 17) impinged on the base of the tropopause, robustoverturning circulations appeared on the leading edge ofthe updraft, resulting in strong dynamically forced down-drafts at mid and upper levels that worked to suppressgrowing convective towers located along the new location
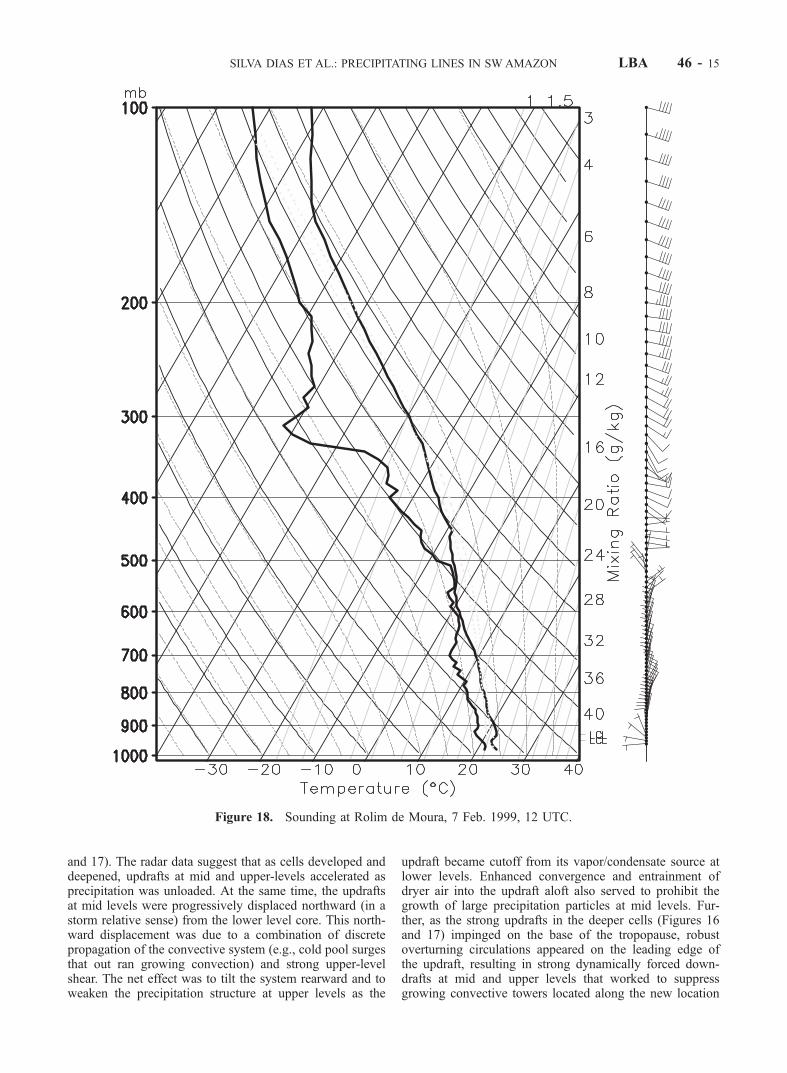
Figure 18. Sounding at Rolim de Moura, 7 Feb. 1999, 12 UTC.
SILVA DIAS ET AL.: PRECIPITATING LINES IN SW AMAZON LBA 46 - 15

of the cold pool (Figures 16 and 17). In fact, the datasuggest that downdrafts driven by the mid and upper levelconvergence associated with the overturning circulationmay have, in some instances, merged with lower leveldowndrafts to form a deep column of subsidence andassociated precipitation free zones (e.g., Figure 16) betweennew convection on the edge of the surging cold pool and theold position of the convective line (similar to the presence atupper levels of a dynamically forced transition region in asquall-line) [e.g., Biggerstaff and Houze, 1993]. Coupledwith discrete jumps in cold pool position, this processwould serve to isolate convection in old convective linesfrom the new, resulting in the appearance of multipleconvective lines.
5. Numerical Simulation
[32] A nested grid approach with nudging toward a large-scale analysis and to observed data was tried with 3 grids,with resolutions of 32, 8, and 2 km, starting several daysbefore. The main problem with this run was that simulatedclouds and rainfall were seen to develop and dissipate, andseveral persist through the morning of 7 February, givingunrealistic initial conditions for that particular day. The soilmoisture evolves according to the simulated rainfall givingalso a distribution that may be coherent with the simulationbut is not coherent with the previous day and night observedrainfall. In order to start from an initial condition morerealistic the horizontally homogeneous run presented abetter option, in this case. For the soil moisture the adjust-ment consisted in increase it until the surface temperatureevolution and the mixed layer heights in the model and inthe observations during the morning, in the pasture site,were similar. The forest site was less sensitive to theevolution of soil moisture in the upper layers since theroots remove water from deeper layers which have alwaysplenty of water. A vertical profile of soil moisture, drier atthe surface and moister at the bottom of the soil model,induces a horizontal variability in the portioning of surface
fluxes through the deeper roots of vegetation in the forestand shallow roots in deforested areas. Using a homogeneousrun may then be justified for this particular day as a meansto analyze the effect of the surface in the absence of large-
Figure 19. Topography (left) and vegetation class (blue is evergreen broadleaf trees and the other colorsare related either to grassland, shrubs, farming areas).
Figure 20. Simulated temperature T (open circles in �C)and water vapor mixing ratio (r - closed circles in g kg�1)for a deforested grid point (close to ABRACOS site) for thecontrol run.
LBA 46 - 16 SILVA DIAS ET AL.: PRECIPITATING LINES IN SW AMAZON
scale forcing and because most of the area under analysiswas actually clear during the morning.[33] The objective of the numerical simulations is to
evaluate the impact of dynamic instabilities versus surfaceforcing (topography and land cover) in the development of aconvective line. Three simulations will be discussed here: (1)control run (with all the options presented in section 2); (2)flat run with inhomogeneous vegetation and (3) homoge-neous vegetation (forest) run with real topography. The flatrun differs from the control run in the topography which isuniform throughout the model domain with an altitude of225 m. The impact of topography may be seen by comparingthe control run and the flat run. The impact of deforestationmay be addressed comparing the control run and the forestrun. Before discussing the differences between the threeruns, a brief description of the time and spatial evolution ofthe convective activity in the control run will be presented.[34] The sounding at Rolim de Moura used to initialize
the model may be seen in Figure 18. It shows a typicalmoist sounding with northwesterlies in the lower levels andeasterlies in the upper levels in accordance with the large-scale situation depicted in Figure 2. A saturated layerbetween 500 hPa and 600 hPa did not persist through themorning hours and did not seem to have an impact on themodel evolution. The topography and vegetation classesmay be seen in Figure 19 and show that the deforested area(forest is blue and other colors indicate deforested areas) liesin the diagonal of the domain mostly under heights of250 m. Most of the area with altitudes higher than 250 m
is covered by forest. In the western half the terrain height isseen to gradually increase from north to south while in theeastern half a north south mountain range with altitudesreaching 500 m is the dominant feature with well definedvalleys to the east and west. The eastern edge of thedeforested area actually reaches the bottom of the valleyat the Machado River; to the east of the river, terraingradually gets higher and is covered by forest.[35] The soil moisture has been used to tune the depth of
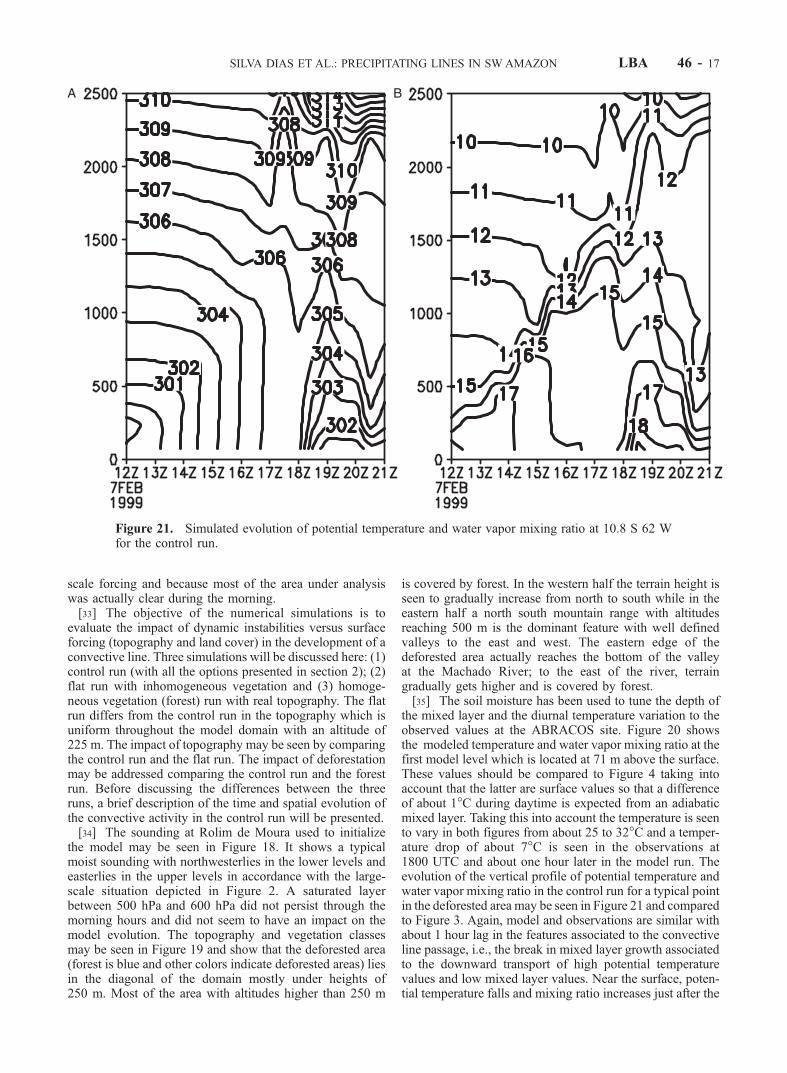
the mixed layer and the diurnal temperature variation to theobserved values at the ABRACOS site. Figure 20 showsthe modeled temperature and water vapor mixing ratio at thefirst model level which is located at 71 m above the surface.These values should be compared to Figure 4 taking intoaccount that the latter are surface values so that a differenceof about 1�C during daytime is expected from an adiabaticmixed layer. Taking this into account the temperature is seento vary in both figures from about 25 to 32�C and a temper-ature drop of about 7�C is seen in the observations at1800 UTC and about one hour later in the model run. Theevolution of the vertical profile of potential temperature andwater vapor mixing ratio in the control run for a typical pointin the deforested area may be seen in Figure 21 and comparedto Figure 3. Again, model and observations are similar withabout 1 hour lag in the features associated to the convectiveline passage, i.e., the break in mixed layer growth associatedto the downward transport of high potential temperaturevalues and low mixed layer values. Near the surface, poten-tial temperature falls and mixing ratio increases just after the
Figure 21. Simulated evolution of potential temperature and water vapor mixing ratio at 10.8 S 62 Wfor the control run.
SILVA DIAS ET AL.: PRECIPITATING LINES IN SW AMAZON LBA 46 - 17

line passage followed by a decrease in mixing ratio in asimilar fashion as described in section 4.[36] To achieve the agreement in mixed layer depth
growth during the morning the soil type used has been asandy clay loam with 5 levels from the surface to 2 m depthwith soil moisture of 39% saturation at the first level belowthe surface and increasing linearly to the deepest level to45%. Since there is no memory from the previous dayconvective activity, in the form of heterogeneous soil mois-ture at the initial time, some differences in convective
development may be expected, perhaps even explainingthe timing of the convective line development in the model.The homogeneous initialization of meteorological variablesmay also have an impact in the development of the con-vective system.
5.1. Control Run
[37] Figure 22 shows the rainwater mixing ratio and thewind fields at 71 m AGL. At 1700 UTC the first rain cells areseen over the north-south mountain range at about 61.7�W
Figure 22. Rainwater mixing ratio (g kg�1) and wind vectors at 71 m AGL (wind vectors plotted atevery 6th grid point).
LBA 46 - 18 SILVA DIAS ET AL.: PRECIPITATING LINES IN SW AMAZON

(cf. Figure 19 for the topography); it is important to note atthe southern edge of the mountain range the development ofa cell that in the next hour becomes the precursor of aconvective line. Well organized outflow boundaries origi-nated from the downdrafts are seen to gradually organize therain cells. At 1800 UTC the rain has moved west of themountain range and the cell to its south becomes larger. At1930 UTC the line to the south has a NW to SE orientationand new cells are seen again in the northern part of themountain range building up a new convective line. Compar-ing this evolution with the radar observations, it may be seenthat Figure 9, although at an earlier time (about 1 hr), showsa line of echoes around the 60-km N-S range mark thatcorresponds to the location of the mountain range. Figures 10and 11 also show the new cell in the northern part, buildingup into a new convective line.[38] Alexander and Young [1992] and LeMone et al.
[1998] analyze the evolution of tropical convective linesand found that in the case of weak low level shear the lineswere oriented parallel to the midlevel shear. Accordingly,in the present case, the mid level shear between 800 and400 hPa, from the wind profile in Figure 18, is from 122�,i.e., basically from the SE.[39] Following the convective line motion, a propagation
speed of about 10–11 m s�1 is found which is faster thanthe observed 5–7 m s�1. The vertical structure of the
convective cells may be seen in Figure 23 as a cross sectionat 11. 6�S, 10.8�S, and 10.3�S. The deepest cells reach 12–14 km with maximum condensate mixing ratio between 3and 4 g.kg�1. It is seen that the upper level updraft lagsbehind the low level updraft with a tilt similar to the oneseen for the radar profiles in Figures 16 and 17. The discretepropagation indicated in section 4 is seen also in thenumerical simulation as new cells developing ahead of thedeep ones in Figures 23a and 23b. However, just a few cellsare deep, consistent with the radar observations, most of thecondensate remains below 7000 m for most of the extensionof the line. Ice water content at 9300 m AGL may be seen inFigure 24 for several times indicating that only two cells ofthe initial line have significant ice content at this level andthat the line formed over the topography in later times alsooriginates from a deep cell with ice water content in upperlevels. Vertical speeds in the model never exceed 13 m s�1,below the radar derived vertical wind speeds (up to 19 ms�1). However, model output has been obtained for everyhalf our and larger values might be found between outputtimes. Rainfall rates of 33 mm in 30 min are seen in thesimulation at the early stages between 1730 UTC and1830 UTC. The rainfall rates in Figure 8 are 5 min ratesbut are coherent with the simulated results. Wind gustsin Figure 4 show values reaching 20 m s�1 while the windspeed in the numerical simulation does not exceed 14 m s�1.
Figure 23. Height � longitude cross section of total mixing ratio of all condensate (water and ice) andstreamlines (u,w) at 1830 UTC.
SILVA DIAS ET AL.: PRECIPITATING LINES IN SW AMAZON LBA 46 - 19

[40] As a summary, the simulated convective lines areseen as a result of convective cells that start over the N-Smountain range about one hour later than in the observa-tions, move faster and seem less vigorous than the obser-vations. On the other hand, there is a reasonable similarityin the depth, overall orientation, rainfall rates and evolutionof outflow boundaries and even on the later development ofa new line on the northern part on the mountain range. Theradar observations suggesting that only a few cells wereintense and had large ice water content in their upper half isalso obtained in the simulation. It is seen that, although notperfect, the simulation captured some basic features of theobservations and can therefore serve as a basis for thediscussion in the next section.[41] The different time of convection start might have an
impact on the strength of convection given, for example, bythe maximum simulated updrafts. The effect of the initialsounding has been only in the moisture deficit: too moistsoundings develop a stratus deck in the simulation thatprevents surface heating until dissipation thus unrealisticallypostponing the diurnal cycle of temperature and moisture atthe surface. The sounding used appears to be quite repre-sentative of the area at the initial time. Different options inthe microphysics parameterization of RAMS essentiallyreproduce the overall convective evolution with a ±20%difference in intensity. Further studies are needed, however,in order to fully explore the role of cloud condensation
nuclei in the microphysics of clouds in the Amazon regionas suggested by Silva Dias et al. [2002].
5.2. Impact of Topography and Vegetation Contrast
[42] The differences in location and intensity of surfacerainfall between 1730 and 1800 UTC may be seen inFigure 25 for the three runs. At this initial stage the cellsare more north south oriented than later (cf. Figure 22).Topography is seen as a fundamental forcing for thelocation of the first cells in the model; in the flat run,cells are randomly formed except for a line of cells in theeastern edge of the deforested area in the valley. The cellat the south end of the mountain range is more confined inthe forest run and maximum rainfall rate is seen in the flatrun. The domain average temporal evolution of precipita-tion (not shown) for the three runs indicate that the flat runhas the maximum average precipitation rate in 30 minalthough it starts later than the other two and has a shorterduration. The control run has more rainfall than the forestrun. The average over all domain precipitation total forthe duration of the simulation (12 hours) is 11.3, 9.5 and10.2 mm for the control, flat and forest runs, respectively.The average precipitation for 7 February from the rain-gages in Figure 8, is 15.7 mm.
6. Conclusion
[43] The merging picture from a combination of dataanalysis and numerical simulations for the 7 Februaryconvective development in Rondonia may be summarizedas follows. In the absence of large-scale forcing on a clearand sunny morning, shallow convective cells are seen toform all over the area and deep cells develop over the N-Smountain range where enhanced sensible heat flux [Souzaet al., 2001] favors early development. In this particularsynoptic situation of low level northwesterly flow, enhancedconvergence and more vigorous convective cells (if formed)are favored on the southern end of the north-southmountain range. The subsequent evolution is seen as aresult of spreading outflows formed by downdrafts of themore intense cells where ice processes are active andcloud tops reach the upper troposphere. Gust fronts areseen to be initially moist, but gradually become drier asdowndrafts from about 80–90 hPa above cloud base reachthe surface.[44] The radar data suggest that as cells developed and
deepened, updrafts at mid and upper-levels accelerated asprecipitation was unloaded. At the same time, the updraftsat mid levels were progressively displaced northward fromthe lower level core. The net effect was to tilt the systemrearward and to weaken the precipitation structure at upperlevels as the updraft became cutoff from its vapor/conden-sate source at lower levels. Enhanced convergence andentrainment of dryer air into the updraft aloft also servedto prohibit the growth of large precipitation particles at midlevels. Further, as the strong updrafts in the deeper cellsimpinged on the base of the tropopause, robust overturningcirculations appeared on the leading edge of the updraft,resulting in strong dynamically forced downdrafts at midand upper levels that worked to suppress growing convec-tive towers located along the new location of the cold pool.In fact, the data suggest that downdrafts driven by the mid
Figure 23. (continued)
LBA 46 - 20 SILVA DIAS ET AL.: PRECIPITATING LINES IN SW AMAZON

and upper level convergence associated with the overturn-ing circulation may have, in some instances, merged withlower level downdrafts to form a deep column of subsidenceand associated precipitation free zones between new con-vection on the edge of the surging cold pool and the oldposition of the convective line. Coupled with discrete jumpsin cold pool position, this process would serve to isolateconvection in old convective lines from the new, resulting inthe appearance of multiple convective lines.
[45] The effect of deforestation has been analyzed in thisparticular case from a numerical model perspective and isseen to enhance total rainfall over the area. Nobre et al.[1991] discussed the effect of an overall deforestation overthe Amazon region consisting of a complete change offorest into pasture areas showing that the net effect wouldbe a reduction in total rainfall and increase in surfacetemperature. Silva Dias and Regnier [1996] showed thatin the dry season, enhanced vertical motion would be
Figure 24. Total ice water content at 9300 m in g kg�1 (control run).
SILVA DIAS ET AL.: PRECIPITATING LINES IN SW AMAZON LBA 46 - 21

expected over the deforested areas in Rondonia thus explain-ing the satellite observations in Cutrim et al. [1995] thatshowed enhanced shallow cumulus clouds over deforestedareas as well as over mountain ranges, again for the dryseason.Wang et al. [2000] discuss the effect of deforestationin the rainy season in Rondonia in a situation of strong large-
scale forcing and found no impact. However, the rainyseason in Rondonia as shown by Rickenback et al. (sub-mitted manuscript, 2001) undergoes phases where the largescale dominates, convection is widespread and the diurnalcycle is not so strong as during the phase where there is nolarge-scale forcing. In the latter, the surface processes are
Figure 25. Ground precipitation (in mm/30 min) between 1730 and 1800 UTC for (a) control run; (b)flat run; (c) forest run.
LBA 46 - 22 SILVA DIAS ET AL.: PRECIPITATING LINES IN SW AMAZON

dominant. In the present case of very weak large-scaleforcing a preference for deep cloud development over themountains is suggested and deforestation may be acting asan enhancing factor for total rainfall. Clearly, there is a limitto the potential increase in rainfall in association withdeforestation since, eventually, drier air may hinder furtherconvective development.
[46] Acknowledgments. Acknowledgments are due the NASA/TRMM Program Grants NAG5-9642 and NCC5-288 and the Fundacaode Amparo a Pesquisa do Estado de Sao Paulo - FAPESP Grant 1997/9926-9. Support from the European Community (LBA-EUSTACH) and Nether-lands Research Program Global Air Pollution and Climate Change areacknowledged. The National Science Foundation partially supported theS-POL radar deployment. Many thanks to all the Brazilian, American, andEuropean participants of the field experiment. Thanks are also due toCNPq/MCT who provided scholarships for many LBA participants.
ReferencesAlexander, G. D., and G. S. Young, The relationship between EMEXmesoscale precipitation feature properties and their environmental char-acteristics, Mon. Weather Rev., 120(4), 554–564, 1992.
Betts, A. K., Boundary layer thermodynamics of a High Plains severestorm, Mon. Weather Rev., 112, 2199–2211, 1984.
Betts, A. K., J. D. Fuentes, M. Garstang, and J. H. Ball, Surface diurnalcycle and boundary layer structure over Rondonia during the rainy sea-son, J. Geophys. Res., 107, 10.1029/2000JD000356, in press, 2002a.
Betts, A. K., L. V. Gatti, A. M. Cordova, M. A. F. Silva Dias, and J. Fuentes,Transport of ozone to the surface by downdrafts at night, J. Geophys.Res., 107, 10.1029/2000JD000158, in press, 2002b.
Biggerstaff, M. I., and R. A. Houze, Kinematics and microphysics of thetransition zone of the 10–11 June 1985 squall line, J. Atmos. Sci., 50,3091–3110, 1993.
Bringi, V. N., K. Knupp, A. Detwiler, L. Liu, I. J. Caylor, and R. A. Black,Evolution of a Florida thunderstorm during the Convection and Precipi-tation/Electrification Experiment: The case of 9 August 1991, Mon.Weather Rev., 125, 2131–2160, 1997.
Carey, L. D., and S. A. Rutledge, The relationship between precipitationand lightning in tropical island convection: A C-band polarimetric radarstudy, Mon. Weather Rev., 128, 2687–2710, 2000.
Carey, L. D., S. A. Rutledge, D. A. Ahijevych, and T. D. Keenan, Correct-ing propagation effects in C-band polarimetric radar observations of tro-pical convection using differential propagation phase, J. Appl. Meteorol.,39, 1405–1433, 2000.
Carvalho, L. M. U., and C. Jones, A satellite method to identify structuralproperties of mesoscale convective systems based on the maximum spa-tial correlation tracking technique (MASCOTTE), J. Appl. Meteorol., 40,1683–1701, 2001.
Cifelli, R., W. A. Petersen, L. D. Carey, S. A. Rutledge, and M. A. F. SilvaDias, Radar observations of kinematic, microphysical, and precipitationcharacteristics of two MCSs in TRMM LBA, J. Geophys. Res., 107,10.1029/2000JD000264, in press, 2002.
Cohen, J. C. P., M. A. F. Silva Dias, and C. A. Nobre, Environmentalconditions associated with Amazonian squall lines: A case study, Mon.Weather Rev., 123(11), 3163–3174, 1995.
Cutrim, E., D. W. Martin, and R. Rabin, Enhancement of cumulus cloudsover deforested lands in Amazonia, Bull. Am. Meteorol. Soc., 76(10),1801–1805, 1995.
Doviak, R. J., and D. S. Zrnic, Doppler Radar and Weather Observations,Academic, San Diego, Calif., 562 pp., 1993.
Garstang, M., L. H. Massier Jr., J. Halverson, S. Greco, and J. Scala,Amazon coastal squall lines, Part 1, Structure and kinematics, Mon.Weather Rev., 122, 608–622, 1994.
Gash, J. H., C. A. Nobre, J. M. Roberts, and R. L. Victoria, An overview ofABRACOS, in Amazon Deforestation and Climate, edited by Gash et al.,1–14, John Wiley, New York, 1996.
Greco, S., R. Swap, M. Garstang, S. Ulanski, M. Shipham, R. C. Harriss,R. Talbolt, M. O. Andreae, and P. Artaxo, Rainfall and surface kinematicconditions over central Amazonia ABLE 2B, J. Geophys. Res., 95,17,001–17,014, 1990.
Greco, S., J. Scala, J. Halverson, H. L. Massie Jr., W. K. Tao, andM. Garstang, Amazon coastal squall lines, Part II, Heat and moisturetransports, Mon. Weather Rev., 122, 623–635, 1994.
LeMone, M. A., E. J. Zipser, and S. B. Trier, The role of environmentalshear and thermodynamic conditions in determining the structure andevolution of mesoscale convective systems during TOGA COARE,J. Atmos. Sci, 55(23), 3493–3518, 1998.
Machado, L. A. T., H. Laurent, and A. Lima, The diurnal march of theconvection observed during TRMM-WETAMC/LBA, J. Geophys. Res.,107, 10.1029/2001JD000338, in press, 2002.
Nobre, C. A., P. J. Sellers, and J. Shukla, Amazonian deforestation andregional climate change, J. Clim., 4, 957–987, 1991.
Pereira Filho, A. J., M. A. F. Silva Dias, R. I. Albrecht, L. G. P. Prereira,and O. Massambani, Multisensor analysis of a squall line in theAmazon region, J. Geophys. Res., 107, 10.1029/2001JD000305, in press,2002.
Petersen, W. A., L. D. Carey, S. A. Rutledge, J. C. Knievel, N. J. Doesken,R. H. Johnson, T. B. McKee, T. Vonder Haar, and J. F. Weaver, Mesos-cale and radar observations of the Fort Collins flash flood of 28 July1997, Bull. Am. Meteorol. Soc., 80, 191–216, 1999.
Pielke, R. A., W. R. Cotton, R. L. Walko, C. J. Tremback, W. A. Lyons,L. D. Grasso, M. E. Nicholls, M. D. Moran, D. A. Wesley, T. J. Lee, andJ. H. Copeland, A comprehensive meteorological modeling system -RAMS, Meteorol. Atmos. Phys., 49(1–4), 69–91, 1992.
Silva Dias, M. A. F., and R. N. Ferreira, Application of a linear spectralmodel to the study of Amazonian squall lines during GTE/ABLE 2B,J. Geophys. Res., 97, 20,405–20,419, 1992.
Silva Dias, M. A. F., and P. Regnier, Simulation of mesoscale circulations ina deforested area of Rondonia in the dry season, in Amazonian Defor-estation and Climate, edited by J. Gash et al., pp. 531–547, John Wiley,New York, 1996.
Silva Dias, M. A. F., et al., Clouds and rain processes in a biosphereatmosphere interaction context in the Amazon Region, J. Geophys.Res., 107, 10.1029/2001JD000335, in press, 2002.
Souza, E. P., N. O. Renno, and M. A. F. Silva Dias, Convective circula-tions induced by surface heterogeneities, J. Atmos. Sci., 57, 2915–2922,2001.
Takahashi, T., Near absence of lightning in torrential rainfall producingMicronesian thunderstorms, Geophys. Res. Lett., 17, 2381–2384, 1990.
Tompkins, A. M., Organization of tropical convection in low vertical windshears: The role of cold pools, J. Atmos. Sci., 58, 1650–1672, 2001.
Trier, S. B., W. C. Skamarock, M. A. LeMone, D. B. Parsons, and D. P.Jorgensen, Structure and evolution of the 22 February 1993 TOGACOARE squall line: Numerical simulations, J. Atmos. Sci., 53, 2861–2886, 1996.
Walko, R. L., W. R. Cotton, M. P. Meyers, and J. Y. Harrington, NewRAMS cloud microphysics parameterization, Part I, The single-momentscheme, Atmos. Res., 38, 29–62, 1995.
Wang, J. R. L. Bras, and E. A. B. Eltahir, The impact of observed defor-estation on the mesoscale distribution of rainfall and clouds in Amazonia,J. Hydrometeorol., 1, 267–286, 2000.
�����������R. I. Albrecht, M. Longo, M. A. F. Silva Dias, and P. L. Silva Dias,
Department of Atmospheric Science, University of Sao Paulo (USP), Ruado Matao, 1226, 05508-900 Sao Paulo - SP, Brazil. ([email protected])R. Cifelli and W. Petersen, Department of Atmospheric Science,
Colorado State University (CSU), Fort Collins, CO 80523 USA.A. K. Betts, Atmospheric Research, Pittsford, VT, USA.M. A. Antonio, A. M. Gomes, and M. A. Lima, Institute of
Meteorological Research, State University of Sao Paulo (UNESP), Brazil.G. F. Fisch, Institute of Space Activities, Aeronautics Technological
Center (CTA), USA.
SILVA DIAS ET AL.: PRECIPITATING LINES IN SW AMAZON LBA 46 - 23