Controls on stratification in the Rhine ROFI system
13
JOURNAL OF MARINE SYSTE:MS Journal of Marine Systems 12 (1997) 31 l-323 ELSEVIER Controls on stratification in the Rhine ROFI system Alejandro J. Souza, John H. Simpson School of Ocean Sciences, University of Wales Bangor, Menai Bridge, Gwyedd LL.59 5EY, UK Received 26 July 1995; revised 15 December 1995; accepted 7 February 1996 Abstract Stratification in the Rhine ROFI is very variable; the mean water column stability is controlled by the combined effect of tidal, wind and wave stirring which, at times, brings about complete vertical homogeneity. Control by the mixing variables has been elucidated by a regression analysis of mean stratification on the components of the windstress and significant wave height. There is strong partial correlation with all three variables which explains between 56% and 65% of the variance in two time series of observations in October 1990 and September 1992, respectively. During periods of low stirring the water column was observed to re-stratify over the whole inshore region through the relaxation of the horizontal gradients under gravity andwith the influence of rotation. Superimposed on the mean stratification there is strong semi-diurnal variation, occurring throughout the stratified region at times of reduced mixing. The amplitude of this semi-diurnal variation is of the same order as the mean stability and frequently results in conditions being mixed or nearly mixed once per tide. This semi-diurnal variation results primarily from cross-shore tidal straining which interacts with the main density gradient to induce stratification. The hypothesis that water column stability is controlled by the combination of these processes has been tested using a reduced physics model which has been successful in reproducing the main features of both the mean and semi-diurnal components of stratification. Keywords: coastal current; mixing; buoyancy: stratification; Dutch coast: North Sea 1. Introduction The Rhine has an average freshwater dischargeof 2200 m3 s- ’ which generates a major ROFI (Region Of Freshwater Influence) over a large area of the south-eastern North Sea. This ROFI covers the entire Dutch coast to the north of the Rhine sourcewith the western boundary at about 30 km from the coast and the north-eastern boundary at more than 100 km from the Rhine source (Simpson et al., 1993). The freshwater within this area is an important driving force for both the water column stability and the dynamics. In general it can be said that stratification in the Rhine ROFI system is the result of competition between the effect of stirring due to wind, waves and tides on one hand and the buoyancy input due to tidal straining and density driven currents on the other (Simpson et al., 1991). The fortnightly varia- tion in the intensity of tidal stirring tends to impose a regular cycle on the system with stratification break- ing down at, or soon after, spring tides. At the same time, the variability of wind (Van Alphe:n et al., 1988) and waves (Munchow and Garvine, 1993) as well as the fluctuations in river dischargeintroduce a more random component of variation to the stratifi- 0924-7963/97/$17.00 Copyright 0 1997 Elsevier Science B.V. All rights reserved. PII SO924-7963(96)00105-4
-
Upload
khangminh22 -
Category
Documents
-
view
1 -
download
0
Transcript of Controls on stratification in the Rhine ROFI system

JOURNAL OF
MARINE SYSTE:MS
Journal of Marine Systems 12 (1997) 31 l-323 ELSEVIER
Controls on stratification in the Rhine ROFI system
Alejandro J. Souza, John H. Simpson School of Ocean Sciences, University of Wales Bangor, Menai Bridge, Gwyedd LL.59 5EY, UK
Received 26 July 1995; revised 15 December 1995; accepted 7 February 1996
Abstract
Stratification in the Rhine ROFI is very variable; the mean water column stability is controlled by the combined effect of tidal, wind and wave stirring which, at times, brings about complete vertical homogeneity. Control by the mixing variables has been elucidated by a regression analysis of mean stratification on the components of the windstress and significant wave height. There is strong partial correlation with all three variables which explains between 56% and 65% of the variance in two time series of observations in October 1990 and September 1992, respectively. During periods of low stirring the water column was observed to re-stratify over the whole inshore region through the relaxation of the horizontal gradients under gravity and with the influence of rotation.
Superimposed on the mean stratification there is strong semi-diurnal variation, occurring throughout the stratified region at times of reduced mixing. The amplitude of this semi-diurnal variation is of the same order as the mean stability and frequently results in conditions being mixed or nearly mixed once per tide. This semi-diurnal variation results primarily from cross-shore tidal straining which interacts with the main density gradient to induce stratification.
The hypothesis that water column stability is controlled by the combination of these processes has been tested using a reduced physics model which has been successful in reproducing the main features of both the mean and semi-diurnal components of stratification.
Keywords: coastal current; mixing; buoyancy: stratification; Dutch coast: North Sea
1. Introduction
The Rhine has an average freshwater discharge of 2200 m3 s- ’ which generates a major ROFI (Region Of Freshwater Influence) over a large area of the south-eastern North Sea. This ROFI covers the entire Dutch coast to the north of the Rhine source with the western boundary at about 30 km from the coast and the north-eastern boundary at more than 100 km from the Rhine source (Simpson et al., 1993). The freshwater within this area is an important driving force for both the water column stability and the dynamics.
In general it can be said that stratification in the Rhine ROFI system is the result of competition between the effect of stirring due to wind, waves and tides on one hand and the buoyancy input due to tidal straining and density driven currents on the other (Simpson et al., 1991). The fortnightly varia- tion in the intensity of tidal stirring tends to impose a
regular cycle on the system with stratification break- ing down at, or soon after, spring tides. At the same time, the variability of wind (Van Alphe:n et al.,
1988) and waves (Munchow and Garvine, 1993) as well as the fluctuations in river discharge introduce a more random component of variation to the stratifi-
0924-7963/97/$17.00 Copyright 0 1997 Elsevier Science B.V. All rights reserved. PII SO924-7963(96)00105-4

312 A.J. Souza, J.H. Simpson/Journal of Marine Systems 12 (I997) 311-323
cation. When the combined stirring decreases the density gradients relax under gravity as in the Linden and Simpson (1988) laboratory experiments, but with the additional effect of the earth’s rotation which limits the spreading of the density current and de- flects it generating a typical coastal current.
The presence of mean water column stability modifies the tidal ellipses (Visser et al., 1994; Souza and Simpson, 1996), generating a strong off-shore component of tidal shear, which then interacts with the horizontal density gradients introducing a strong semi-diurnal component of stratification (Simpson and Souza, 1995).
In this paper we shall make use of observations and model simulations to elucidate the importance of the different processes in determining the presence of the mean stratification and show how this mean stratification introduces a strong component of tidal
shear and hence a semi-diurnal variability of stratifi- cation. Special emphasis will be given to the wind and waves controls over the stratification.
2. Observations
The observational programme in the Rhine ROFI was part of an European cooperative effort under the MAST PROFILE project which was designed to determine the structure of the water column and flow, and to measure the horizontal density gradients which form an important part of the dynamical forc- ing.
The measurements were planned to include at least one spring-neap tidal cycle, and hence to deter- mine the water column stability during conditions of high and low tidal stirring. Time series of measure-
52.25
; ’ AA F
// t NOC’RDwIlK
Longitude
1
Fig. 1. Rhine ROFI study area for the 1990 campaign. . = CTD stations, + and 0 = UCNW and RWS moorings, respectively. * =
ground CODAR stations and the square shows the HF radar coverage.

A.J. Souza, J.H. Simpson/Journal of Marine Systems 12 (1997) 311-323 313
ments were made using an array of instrumented moorings, while ship surveys were carried out to establish a spatial context.
The data were collected during two cruises on- board the RRS Challenger, the first one in Septem- ber-October 1990 and the second in September 1992. Although the basic aims of the two observational periods were practically the same, there were some significant differences between the two campaigns. During part of the 1990 survey the IFM HF radar CODAR was measuring surface velocities, while in the 1992 campaign, an undulating CTD SEAROVER was used to generate quasi-synoptic density sections.
2.1. The 1990 Experiment
This first survey (23/9/90 to 23/10/90) was a co-operative effort between the Institute fir Meereskunde Hamburg, Germany (IFM), the Rijk- waterstaat, The Netherlands (RWS), Proudman Oceanographic Lab, U.K. (POL) and the University of Wales Bangor, U.K. (UWB) and consisted of
three major elements: ship hydrographic surveys; current, temperature and conductivity tim’e series from moorings; an HF radar (CODAR) for mapping the surface currents.
Two arrays of moorings (Fig. 1) were deployed from 23 September to 18 October: (1) cross-shore from Scheveningen, with moorings at 2, 3, 5, 8, 13 and 33 km from the coast, each equipped with current meters at 4 m above the bed and 4 m below the surface to observe the transverse section of the alongshore flow field and (2) a diamond array cen- tred on the Scheveningen line 13 km from the coast. Each of the diamond moorings were equipped with three current meters, at approximate depths of 8, 12 and 16 m and the majority of instruments also recorded temperature and salinity. In addition a TS recorder and a recording transmissometer were at- tached to the toroidal marker buoy. A fifth transmis- someter was located near the bottom in mooring A.
From the 7 October to the 23 October 1990, surface currents were measured using an HF radar (CODAR) with ground stations located at Graven-
Rhine ROFI Study Area Mooring Positions and Survey Track
---+r-- Longitude
--bi--- Longitude
Fig. 2. Rhine ROFI study area for 1992. Bathymetry in metres with mooring positions (W) and SEAROVER tracks for the study period.

314 A.J. Souza, J.H. Simpson/Journal of Marine Systems I2 (1997) 311-323
zande and Noordwijk. This gave a coverage out to N 40 km, equivalent to a grid of more than 100 current meters spaced at intervals of N 3 km.
Two spatial hydrographic surveys were carried out by the RRS Challenger (Fig. 1). The timing of these surveys was chosen to coincide with the post- springs and post-neaps periods to provide a maxi- mum contrast in tidal stirring. Profiles of tempera- ture, salinity, optical beam transmittance and chloro- phyll fluorescence were recorded at each station using a NBIS Mk 3 CTD system equipped with auxiliary sensors.
2.2. The 1992 experiment
A second collaborative study, between UCNW, POL and RWS, was carried out between 2 and 17 September 1992. In this case the mooring array formed a square with a centroid, located on the Noordwijk line 16 km from the coast and with comer moorings at 13 km from each other (Fig. 2). The moorings were moved northward relative to the 1990 positions to avoid any possible effect from the near source region. As in the 1990 campaign, the moorings were designed to determine the water col- umn structure and flow and to measure the horizon- tal density gradients. For this purpose the moorings were equipped with 4 current meters (3 Aanderaa and 1 S4), at 1, 10, 13, 16 m depth; all the Aanderaa current meters were capable of measuring tempera- ture and salinity. At the same time, bottom mounted ADCPs were recording velocities throughout most of the water column. The toroid marker buoys were fitted with a TS logger, a fluorimeter and a transmis- someter, while another transmissometer was located near the bottom. From the 8 September 1992 a continuous hydrographic spatial survey was carried out by the RRS Challenger using the SEAROVER undulator.
3. Competition between density currents and stir- ring
Observations from mooring A during the 1990 campaign are shown in Fig. 3. The predicted cycle of tidal stirring using the efficiency estimates from Simpson and Bowers (1981) (Fig. 3a) indicates a
(4
210.0 1725 271.0 217.5 10.0 242s 35.0 37s NO TME(JJU4l DAYS)
Fig. 3. Time series of stirring power and stratification for 1990. (a) Tidal stirring power: instantaneous value (dashed) and daily
mean (continuous) computed from current meter velocity at moor- ing A (4 m above the bed). (b) Wind stirring power calculated using data fro Noordwijk tower. (d) Stratification Ap. density
difference between 1 m and 16 m deep for mooring A.
typical spring neaps cycle with maximum values of instantaneous mixing energy of the order of 0.2 mW rnp3 and maximum daily mean values of about 0.1 mW rnp3. This spring-neaps cycle of stirring was augmented by the stirring effect of the wind which re-inforced the mixing during the central springs period (JD 277-281), with instantaneous values of the same order of magnitude of those of the tidal mixing, in contrast with the previous and subsequent neaps when the wind mixing was reduced (Fig. 3b). The effect of these large changes in mixing is evi- dent in the water column stratification (Fig. 3c) as

A.J. Souza, J.H. Simpson/Journal of Marine Systems 12 (1997) 311-323 315
observed in the bottom-surface density difference. With strong episodes of stratification ( Ap) during the neap periods and almost complete mixing during springs.
The survey data also show a spring-neaps switch- ing between mixed and stratified conditions as ob- served in the time series. The re-stratification which occurred between the two surveys represents a relax- ation under gravity of the horizontal gradients ob- served in the strongly mixed situation. The nature of this adjustment can be seen clearly in Fig. 4 which show the contrasting density distribution on the No- ordwijk (N) section. When vertical mixing is re- duced, the pressure gradients due to the density
u, motion N First SuNev
-35 -30 -25 -20 -15 -10 -5 0
u, section N Second survey
0 !~l’~‘l’ll’l’~:.!,:,H:“““““““‘!
b
is 30 -25 -20 -15 -10 -5 0
MS- Fm)
Fig. 4. Density sections on the N (Noordwijk) transect in 1990. (a) post-springs; (b) post-neaps.
Fig. 5. Same as Fig. 3 but for 1992 and (bottom) stratification Ap,
density difference between 1 m and 16 m deep, continuous mooring A dashed mooring D.
gradients in Fig. 4a initiate a cross-shore flow like that in the laboratory experiment of Linden and Simpson (1988). The motion is then constrained by the earths rotation and the cross-shore displacement is limited to about 1.5 Rossby radii (Ou, 1983) or in this case about 5 km as observed during the neaps survey (Fig. 4b).
This alternation between stratified and mixing conditions in a time scale of the spring-neaps tidal cycle is in accord to the behaviour observed in other ROFIs (Simpson et al., 1990). In this particular case, however, because of wind and tidal stirring vary coherently, we are not able to separate their relative importance.
The relative influence of the stirring mechanisms is clearer for the 1992 campaign (Fig. 51, where the tidal and wind mixing maxima do not coincide. Fig.

316 A.J. Souza. J.H. Simpson/Journal of Marine Systems 12 (I 997) 31 l-323
Stratification Distribution Density difference (12-I m)
a
52.0 3.75 4.25 4.75 3.75 4.25 4.75
Longitude Longitude
Fig. 6. Stratification distribution from SEAROVER survey, shown as the density difference between 12 and 1 m depth (in kg mW3 ); (a) on September 11, 1992 (Julian day 255); (b) on September 12, 1992 (Julian day 256).
5a shows the spring-neaps tidal cycle with neaps at about day 249, when tidal stirring is negligible, and springs at about day 257, when tidal stirring has increases with instantaneous values of the order of 0.1 mW rne3. At times, strong bursts of wind stir- ring with energy input of up to 0.1 mW rnw3 domi- nate over the relatively smaller tidal contribution. The influence of the combined stirring power inputs is reflected by the mean stratification in (Fig. 5~): low stratification at the start of the density record corresponds to a bout of strong wind mixing after which lower winds allow strong stratification to de- velop at mooring A and D with a Ap - 2 kg me3 on days 254-255. This was followed by a period of strong wind and tidal stirring which brought the water column almost to complete homogeneity on day 256.
The control of stratification by wind stirring is also apparent in the survey data using the undulator SEAROVER on a zig-zag pattern on days 254 and 255 (Fig. 2a). Fig. 6a shows a quasi-synoptic map of density difference between surface and 12 m based on a survey over the period JD 254 21:40 to JD 255 O&046. Strong stratification is apparent out to N 20 km from the coast beyond which the density was vertically uniform. The next day (Fig. 6b), JD 256 7:58 to 17:52, after a period of strong winds of the order of 12 m s-l, we observed that the water column was vertically homogeneous over most of
the region, with the exception of some slight stratifi- cation near the coast. In the interpretation of the quasi-synoptic maps we have made the assumption that the evolution of the density field during the survey period can be neglected. In this case, it is obviously not true, as the stratification responds very quickly to tidal and wind forcing (Fig. 5). :In order to understand this rapidly changing system it is neces-
* SEAROVER
- MOORING A
254 255 256
TIME (JULIAN DAYS)
Fig. 7. Time series of stratification expressed as the density difference between 1 m and 12 m deep. Continuous line corre-
sponds to data from mooring A and the dots correspond to data from the SEAROVER inside the stratified area (1.5 km from the coast).
A.J. Souza, J.H. Simpson/Joumd ofMarine Systems I2 (1997) 311-323
sary to take in consideration both the spatial and temporal variability, i.e. we need to refer to Figs. 6 and 7 together before drawing any conclusion.
4. Tidal straining
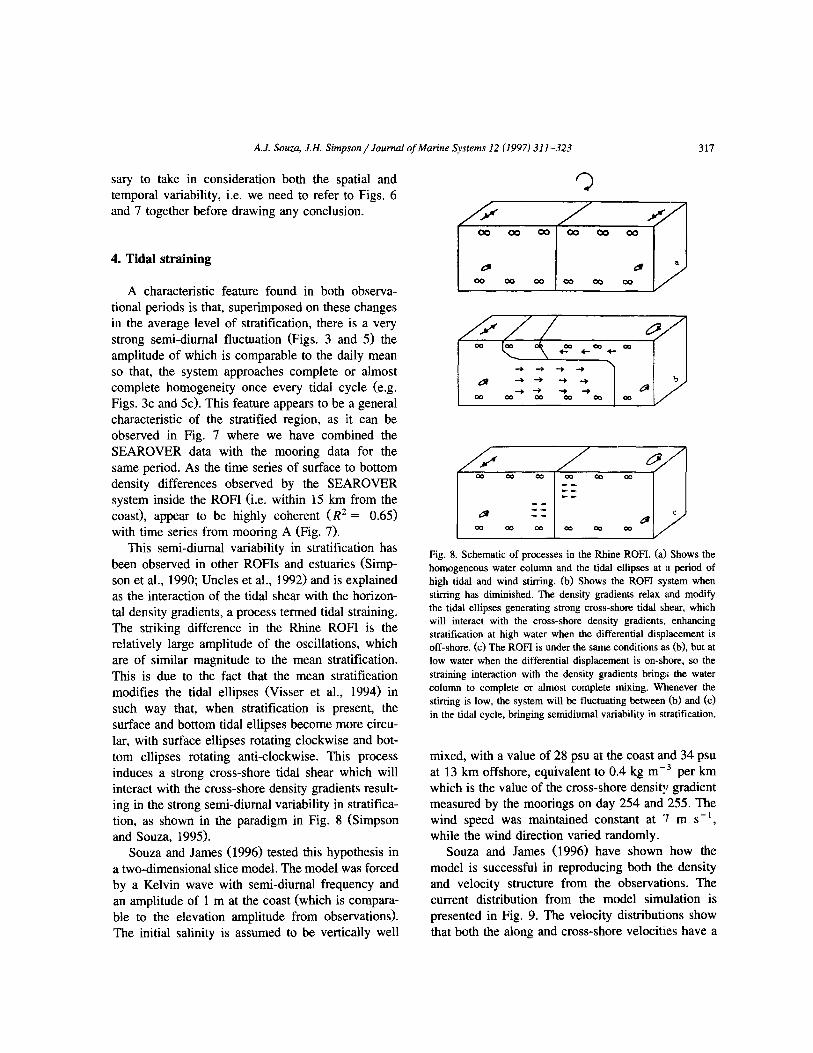
A characteristic feature found in both observa- tional periods is that, superimposed on these changes in the average level of stratification, there is a very strong semi-diurnal fluctuation (Figs. 3 and 5) the amplitude of which is comparable to the daily mean so that, the system approaches complete or almost complete homogeneity once every tidal cycle (e.g. Figs. 3c and 5~). This feature appears to be a general characteristic of the stratified region, as it can be observed in Fig. 7 where we have combined the SEAROVER data with the mooring data for the same period. As the time series of surface to bottom density differences observed by the SEAROVER system inside the ROFI (i.e. within 15 km from the coast), appear to be highly coherent (R2 = 0.65) with time series from mooring A (Fig. 7).
This semi-diurnal variability in stratification has been observed in other ROFJs and estuaries (Simp- son et al., 1990; Uncles et al., 1992) and is explained as the interaction of the tidal shear with the horizon- tal density gradients, a process termed tidal straining. The striking difference in the Rhine ROFl is the relatively large amplitude of the oscillations, which are of similar magnitude to the mean stratification. This is due to the fact that the mean stratification modifies the tidal ellipses (Visser et al., 1994) in such way that, when stratification is present, the surface and bottom tidal ellipses become more circu- lar, with surface ellipses rotating clockwise and bot- tom ellipses rotating anti-clockwise. This process induces a strong cross-shore tidal shear which will interact with the cross-shore density gradients result- ing in the strong semi-diurnal variability in stratifica- tion, as shown in the paradigm in Fig. 8 (Simpson and Souza, 1995).
Souza and James (1996) tested this hypothesis in a two-dimensional slice model. The model was forced by a Kelvin wave with semi-diurnal frequency and an amplitude of 1 m at the coast (which is compara- ble to the elevation amplitude from observations). The initial salinity is assumed to be vertically well
Fig. 8. Schematic of processes in the Rhine ROFI. (a) Shows the homogeneous water column and the tidal ellipses at a period of
high tidal and wind stirring. (b) Shows the ROFI system when stirring has diminished. The density gradients relax and modify the tidal ellipses generating strong cross-shore tidal shear, which will interact with the cross-shore density gradients, enhancing stratification at high water when the differential displacement is off-shore. (c) The ROFI is under the same conditions a5 (b), but at low water when the differential displacement is on-sbore, so the
straining interaction with the density gradients brings the water column to complete or almost complete mixing. Whenever the stirring is low, the system will be fluctuating between (b) and k)
in the tidal cycle, bringing semidiumal variability in stratification.
mixed, with a value of 28 psu at the coast and 34 psu
at 13 km offshore, equivalent to 0.4 kg me3 per km which is the value of the cross-shore density gradient measured by the moorings on day 254 and 255. The wind speed was maintained constant at ‘7 m s- ‘, while the wind direction varied randomly.
Souza and James (1996) have shown how the model is successful in reproducing both the density and velocity structure from the observations. The current distribution from the model simulation is presented in Fig. 9. The velocity distributions show that both the along and cross-shore velocities have a

318 A.J. Souz+ J.H. Simpson/Journal of Marine Systems 12 (1997) 311-323
Velocity: v contours, u, w vectors In
0.2 mnlhec 0.5 mkc ..-_--_ _ (a)
0 5 I 0 15 :20 25
km
, 1 I\, , , , , , , , / , , / I, I ( I I I / , I ,
((4
0 5 IO 15 20 25
km
Fig. 9. Velocity distribution from the slice model at different times in a tidal cycle. (a) 3 hours after high water, (b) at low water, (c) 3 hours after low water and (d) at high water. Simulation times are above each pane. Contours show the along-shore component of velocity, while the vectors show the cross-shore and vertical components, horizontal velocities are in m s-’ and vertical velocity is in mm-‘.
maximum inside the stratified area, bounded at ap- proximately 10 km. A striking result is that this stratified region shows a strong cross-shore shear, which is not apparent in the mixed region in accor- dance with the paradigm in Fig. 8. The cross-shore shear is maximum when the tidal elevation is equal to that of the mean sea level, while the maximum velocities are at high and low water Fig. 9.
5. The effect of winds and waves on stratification
The importance of wind mixing as a control of stratification is apparent in the time series from both surveys (Figs. 3 and 5). It is evident at the start of the time series in 1990 when at day 268 tidal stirring is low and wind stirring is high, which results in a period of complete vertical homogeneity, but this is even clearer in the case of the 1992 experiment,
where stratification Ap > 1 kg me3 is present even at spring tides and homogeneity only appears when the wind stirring is strong. Further evidence of the importance of wind stirring is deduced from numeri- cal model simulations in which vertical homogeneity could not be achieved unless the wind stress was introduced (Luyten et al., 1996 and Souza and James, 1996).
Another important aspect of the wind effect on stratification has been suggested by Munchow and Garvine (1993) and Visser (1992). They argue that upwelling winds enhanced stratification while down- welling winds reduce it. This is observed in Table 1 where, we show results from simulations of the slice model of Souza and James (1996), using a wind speed of ‘7 m s- ’ and different wind direction. In Joordens et al. (19961, we show how a period of strong downwelling winds, may have limited the freshwater transport and hence intensified the density

A.J. Souza, J.H. Simpson/.Ioumal of Marine Systems I2 (1997) 31 l-323 319
Table 1 Mean stratification against wind direction, with a constant wind
speed of 7 m SC’
Stratification PSU Direction (to)
0.66 North-downwelling 5.70 West-off-shore 5.92 South-upwelling 0.65 East-on-shore
gradients. When the wind relaxed the enhanced den- sity gradients will drive a stronger flow, enhancing the mean and semi-diurnal stratification.
Another potentially important wind-related mech- anism in the control of the development of stratifica- tion is that of wave stirring. In Figs. 10 and 11 a strong inverse correlation is apparent between strati- fication and cross-shore wind component and the wave height for both the 1990 and the 1992 cam- paigns. Regressions of mean stratification against the
7 (4
I I I I I I I I I I I I
(W
. [ , , ( , , , , , ( ,
$1 (c)
Fig. 10. Time series for 1990. (a) Daily mean stratification, (b) cross-shore wind velocity component, (c) wave significant height.
7 (a)
149 w) 251 Is1 253 I.54 215 256 257 us u9
lidjdMb)3)
Fig. 11. Same as Fig. 14 but for 1992.
wind components and wave height demonstrate strong partial correlations with the three variables and explain 56% and 65% of the variance at a 99% significance level for the length of the 1990 and 1992 campaigns, respectively (Table 2). The overall correlation between stratification, wind components and waves is not sensitive to either the time lag (up to 6 hrs) and the power of the wind speed and wave height.
The wind and waves regression in Table 2 sug- gests that stratification will decrease with on-shore, downwelling winds and high waves, while it will
Table 2 Regression of stratification against wind and wavesAp = a + bW, + cW.. f dH.
Year a b c d R=
1990 2.2-l -0.107 -0.0451 -0.621 56% 1992 1.41 - 0.0645 - 0.0365 -0.211 65%

320 A.J. Souza, J.H. Simpson/Journal of Marine Systems 12 (1997) 31 l-323
increase with upwelling and off-shore winds. The most favourable direction of wind for enhancing stratification, for both study periods, is at a geometri- cal angle of - 1.50” and the transfer faction is about 10%.
The above results suggest that the mean stratifica- tion in the Rhine ROFI is primarily controlled by the combined effect of wind and waves at least during these two observational periods. Unfortunately, in this study, we were not able to separate swells from local seas because of the strong correlation between the cross-shore winds and the wave orbital velocities, so we were not able to asses the independent contri- bution of wind and waves.
6. Simulations of the Rhine ROFI processes using a point model
In order to test our understanding of the processes involved in the development and fate of stratifica- tion, we have used a modified version of the level 2 turbulence closure model of Simpson and Sharples (1992) to achieve a synthesis of various processes operating in the ROFI regime. The model uses an explicit scheme to integrate the equations of motion as explained in Simpson and Souza (1995).
In the shallow waters of the Rhine ROFI the wind wave orbital velocity is nonzero at the bed, so that increased levels of turbulence are produced, enhanc- ing the bed stress and changing the value of the drag coefficient (Davies and Lawrence, 1994). We have represented this extra stress by the wave-current interaction model of Grant and Madsen (19791, as formulated by Davies and Lawrence (1994).
For a colinear flow, the combined maximum bed shear stress rT based upon the instantaneous current stress TV and maximum wave bed stress T , is given
by TT = Tc + T w
with (1)
where V, is the maximum near-bed wave orbital velocity and f, is the wave friction factor.
The near bed orbital velocity is given by
u,= Q,O sinh kh
with a, as the wave amplitude, w wave frequency and k, the wave number given by the linear disper- sion relation
o* = gk tanh kh (4) The wave friction factor f, is given by the semi-em- pirical expression of Jonsson (1967) and Jonsson and Carlsen (1976)
(5)
where k, = 302, and z, is the roughness length and A, = l&/w.
The calculation of the effective drag coefficient f, taking into account wave effects and assuming that the current does not influence the wave field is calculated following Davies and Lawrence (1994). The wave friction velocity is given by
I- \ l/2
u,,= ‘w ( I P
(6)
The initial condition for the current factor exclud- ing wind wave turbulence was determined from
K ?. f,=2 ln(30Zr/k,c ) 1
where K is the Van Karman’s COnShIt, k, = k,, for this initial calculation and z, the reference height at which the slip condition is applied.
Once we have calculated f,, U, c can be com- puted from
\ 112
The combined friction velocity U, cw for waves and currents is given by
u * cw = (u,‘, + Ufwy2
The apparent bottom roughness k, felt by the current due to the presence of wave is given by
with C, = 24.0 (Grant and Madsen, 1979) and
(10)

A.J. Soura, J.H. Simpson/ Journal of Marine Systems I2 (1997) 311-323 321
This value of k, is then used at the next time step to determine f, and hence the bed stress.
We have run this model with simplified forcing by surface slopes obtained from the POL 2-d barotropic model (Proctor and Smith, 199 1) for 1990 and tide gauge observations at the mooring positions in 1992. The time variable (predominant) cross-shore density gradient, with a mean value of 1.85 X lop4 kg mm4, were derived from temperature and salinity measurements at moorings. The meteorological data was provided by Koninklijk Nederlands Meteorolo- gisch Institute, from the Hook of Holland in 1990 and Noordwijk tower 1992 (wind speed, air tempera- ture, humidity) and Valkenburg for both years (solar radiation), with significant wave height and period from Noordwijk tower for both years.
Fig. 12 shows the time series of stratification for the observations and the model. There is a good degree of correspondence between the two with the model exhibiting the main features of the observa- tions notably the two periods of strong stratification
Mcdel
in 1990 with the strong tidal straining in them. As well as the maxima in Ap on 1992 days 254-255, which are simulated with satisfactory timing and magnitude, the near zero stability are also repro- duced by the model.
The model confirms the operation of the cross- shore straining mechanism in driving the semi-diur- nal oscillations of stability. The suppression of tidal straining by enhanced vertical mixing is clearly ap- parent, if somewhat exaggerated, in the model re- sults. The use of a wave current interaction derived bed shear stress compared with a constant be:d shear stress (Simpson and Souza, 1995), does not signifi- cantly improve the prediction of stratification in this case.
7. Conclusions
The observations confirm the existence of a ROFI regime extending northwards along the Dutch coast
MC&l
168 273 17l 274 176 178 280 2F2 2!d 286 288 2W
llLXNiidzyS)
Fig. 12. Stratifications time series from l-d model. (top left) model simulations for 1990, (top right) model simulations for 1992, (bottom left) observations for 1990, (bottom right) observations for 1992.

322 A.J. Souza, J.H. Simpson /Journal of Marine Systems 12 (1997) 31 l-323
to more than 100 km from the Rhine source and out to about 30 km from the coast.
In this ROFI, the mean stratification is the result of the relaxation of the density gradients under grav- ity and under the effect of the earth’s rotation in competition with the stirring mechanisms. When stir- ring power input is low a mean stratification devel- ops and modifies the tidal ellipses generating strong cross-shore tidal shear which then creates a pro- nounced semi-diurnal component of stratification with an amplitude of about the same size as the mean stratification.
In the Rhine ROFI the stirring is driven by tides, wind and waves. Averaged over the annual cycle tidal and wind stirring are comparable with mean values of about 3 X 10m5 W rnd3. The difference is that the wind stirring varies over a wider dynamic the range than that of the tidal currents, so that the wind appears to be the controlling factor over the stratification.
An extra wind-related effect is that of the bottom stirring due to waves, which is important in shallow regions as that of the Rhine. Unfortunately, we were not able to separate the direct effect of the waves from that of the wind. A way to do this will be to analyse the effect of swells at times when the local wind is relatively weak.
The direction of the windstress is also important in relation to stratification of the Rhine ROFI in accord with the suggestion of Munchow and Garvine (1993) and Visser (1992). We find, however, that the most favourable wind direction in the case of the Rhine ROFI is 30” south of the offshore direction and not simply coast parallel upwelling favourable wind as proposed by Munchow and Garvine (1993).
The point model has been successful in reproduc- ing the mean and semi-diurnal stratification for both observational periods. The effect of including the wave current interaction as a source of bed shear stress, does not show any significant improvement in the simulation of stratification, as represented by bottom-surface density difference. The inference is that, in this case, the effect of wave mixing is small and does not significantly enhance the overall stiring. This does not, however, exclude the possibility of substantial influence in circumstances where there are large swell waves in the absence of local wind- stress.
The success of both l-d and 2-d models in repro- ducing the stratification and the shear observed in the Rhine ROFI, strongly suggest that the system, as a first approximation, behaves in a 2-d (x-z) man- ner. In this simplified picture, the effect of the along-shore advection will only affect the system by modifying the cross-shore density gradients. Evi- dence of the above process can be observed in Fig. 5c, which shows some difference on the amplitude of stratification between mooring A and mooring D, this difference in stratification can be readily ex- plained by the difference in the cross-shore density gradient.
Although as discussed above, there is clear evi- dence of along-shore advection of cross-shore den- sity gradients, the effect of the river discharge is not apparent. During our observational periods the Rhine discharge was more or less constant at about 1300 m3 s-’ and uncorrelated to our periods of stratifica- tion.
Another possible along shore effect is that of the tidal advection, as proposed by Van Alphen et al. (1988). They suggested that the semi-diurnal vari- ability in Noordwijk tower was due to along-shore tidal advection. The fact that the maximum stratifica- tion coincides with the maximum along-shore veloc- ity, as shown in Van Alphen et al. (1988) Fig. 11, strongly suggest that the semi-diurnal variability in stratification cannot be the result of the along-shore tidal advection. If along-shore advection was respon- sible for the semi-diurnal stratification, the along- shore velocity and the stratification should be out of phase by 90”, as the stratification would be the result of the interaction of the resultant tidal displacement and the along-shore density gradients. Furthermore, De Ruijter et al. (1992) show that the mean along- shore density gradients in the Dutch coastal region are negligible in comparison with the cross-shore density gradient. In particular during our observa- tional periods the along-shore density gradients are an order of magnitude smaller than the cross-shore density gradients with the along-shore tidal displace- ment being of similar amplitude to that of the differ- ential cross-shore tidal displacement.
The recurrent idea of along-shore advection of stratified structures, “blobs”, which form in the source region, can be discarded by similar arguments to the ones explained above. If such structures are

A.J. Souza, J.H. Simpson/Journal of Marine Systems 12 (1997) 311-323 323
formed they would have a very short life span and would not reach as far as Noordwijk (M. Visser, pers. commun.). Moreover, the stratified structures observed in quasi-synoptic distributions of stratifica- tion (e.g. figs. 5 and 6 from Simpson et al., 1993) appeared to be related to the semi-diurnal stratifica- tion due to tidal straining (Fig. 7) and not to along- shore advection of stratification.
Acknowledgements
This study was supported by the EEC through the Mast program under the MAS2-CT93-0054 contract. A.J. Souza wishes to thank CONACyT, Mexico for the studentship provided. We also want to thank POL for their technical support and for allowing us to use their bottom mounted ADCPs and to IfM Hamburg for the CODAR data.
References
Davies, A.M. and Lawrence, .I., 1994. Examining the influence of wind and wind wave turbulence on tidal currents, using a three-dimensional hydrodynamic model including wave-cur-
rent interaction. J. Phys. Oceanogr., 24: 244-2460. De Ruijter, W.P.M., Van der Giessen, A. and Groendijk, F.C.,
1992. Current and density structure in the Netherlands coastal
zone. In: D. Prandle (Editor), Dynamics and Exchanges in Estuaries and the Coastal Zone (Coast. Estuar. Sci., 40). AGU, Washington, DC, pp. 255-276.
Grant, W.D. and Madsen, O.S., 1979. Combined wave and current interaction with a rough bottom. J. Geophys. Res. (Oceans), 84: 1797-1808.
Jonsson, LG., 1967. Wave boundary layers and friction factors. Proc. 10th Int. Conf. Coastal Eng. Am. Sot. Civ. Eng., Washington, pp. 127-148.
Jonsson, LG. and Carlsen, N.A., 1976. Experimental and theoreti- cal investigations in an oscillatory turbulent boundary layer. J.
Hydr. Res., 14: 45-60. Joordens, J.C.A., Souza, A.J. and Visser, A.W., 1996. The influ-
ence of tidal straining and wind on suspended matter and phytoplankton dynamics in the Rhine outflow region. Neth. J.
Sea Res., submitted. Linden, P.F. and Simpson, J.E., 1988. Modulated mixing and
frontogenesis in shallow seas and estuaries. Cont. Shelf. Res.,
8(10): 1107-l 127. Luyten, P.J., Deleersnijder, E., Ozer, .I. and Ruddick, K.G., 1996.
Presentation of a family of turbulence closure models for stratified shallow water flows and application to the Rhine
outflow region. Cont. Shelf. Res., 16: 101-103. Munchow, A. and Garvine, R.W., 1993. Buoyancy and wind
forcing of a coastal current. J. Mar. Res., 51: 293-3:!2.
Ott, H.W., 1983. Some-two layer models of shelf-slope front: Geostrophic adjustment and its maintenance. .I. Phys. Oceanogr., 13: 1798-1808.
Proctor, R. and Smith, J.A., 1991. The depth-average residual circulation on the North West European Shelf August 1988- October 1989. Proudman Oceanogr. Lab. Rep., 20.
Simpson, J.H. and Bowers, D., 1981. Models of stratification and frontal movement in the shelf seas. Deep-Sea Res., 28: 727- 738.
Simpson, J.H. and Sharples, J., 1992. Dynamically-active models
in the prediction of estuarine stratification. In: D. Prandle (Editor), Dynamics and Exchanges in Estuaries and the Coastal Zone (Coast. Estuar. Sci., 40). AGU, Washington, pp. lOl- 113.
Simpson, J.H. and Souza, A.J., 1995. Semidiumal switching of
stratification in the region of freshwater influence of the Rhine. J. Geophys. Res., 100: 7037-7044.
Simpson, J.H., Brown, J., Matthews, J.P. and Allen, G., 1990.
Tidal straining, density currents and stirring in the ‘control of estuarine stratification. Estuaries, 12: 129-132.
Simpson, J.H., Sharples, J. and Rippeth, T.P., 1991. A prescrip- tive model of stratification induced by freshwamr runoff. Estuar. Coast. Shelf. Sci., 33: 23-35.
Simpson, J.H., Bos, W.G., Schirmer, F., Souza, A.J... Rippeth, T.P., Jones, S.E. and Hydes, D., 1993. Periodic stratification in the Rhine ROFI in the North Sea. Oceanol. Acta, 16(l): 23-32.
Souza, A.J. and James, I.D., 1996. A two-dimensional model of tidal straining in the Rhine ROFI. Cont. Shelf. Res., 16:
949-966. Souza, A.J. and Simpson, J.H., 1996. The modification of the tidal
ellipses by stratification in the Rhine ROFI. Cont. Shelf Res.,
16: 997-1007. Uncles, R.J., Gong, W.K. and Ong, J.E., 1992. Intratidlal fluctua-
tions in stratification within a mangrove estuary. Hydrobiolo- gia, 247: 163-171.
Van Alphen. J.S.L.J., De Ruijter, W.P.M. and Borst, J.C., 1988. Outflow and three-dimensional spreading of Rhine river water in the Netherlands coastal zone. In: J. Dronkers and W. van Leusen (Editors), Physical Processes in Estuaries. Springer, Berlin, pp. 70-92.
Visser, A.W., Souza, A.J., Hessner, K. and Simpson, J.H., 1994. The influence of water column stratification on tidal current
profiles in a ROFI system. Oceanol. Acta, 17: 369,-381. Visser, M., 1992. On the distribution of suspended matter and
density driven circulation in the Dutch coastal area. In: D.
Prandle (Editor), Dynamics and Exchanges in Estuaries and the Coastal Zone (Coast. Estuar. Sci., 401. AGU, Washington, pp. 55 l-576.