Controlling wasteloads from point and nonpoint sources to river system by GIS-aided Epsilon Robust...
10
Research paper Controlling wasteloads from point and nonpoint sources to river system by GIS-aided Epsilon Robust Optimization model Shigeya Maeda a, * , Toshihiko Kawachi a , Koichi Unami a , Junichiro Takeuchi a , Eiji Ichion b a Graduate School of Agriculture, Kyoto University, Kitashirakawa Oiwake-cho, Sakyo-ku, Kyoto 606-8502, Japan b Faculty of Bioresources and Environmental Sciences, Ishikawa Prefectural University, 1-308 Suematsu, Nonoichi-cho, Ishikawa-gun, Ishikawa 921-8836, Japan Received 20 August 2008; revised 30 March 2009; accepted 3 April 2009 Abstract A stochastic multiobjective programming model, an 3-RO (Epsilon Robust Optimization) model as a simulationeoptimization model with an embedding approach, is developed for river water quality management under hydro-environmental uncertainty. The model is a hybrid of the 3-constraint method and the robust optimization framework, which depresses the high sensitivity of the model to the input data uncer- tainties by introducing a plausible set of scenarios. Possible pollutant sources (all kinds of point and nonpoint pollutant sources excepting forests) are treated as controllable. The finite element method is employed for approximations to COD (Chemical Oxygen Demand) and DO (Dissolved Oxygen) transport equations with convection and dispersion terms. Realizations for the in-stream CODeDO interactive events, thus described in discrete forms, are embedded as equality constraints in the model. Controlling wasteloads from a variety of sources is implemented by seeking noninferior solutions (management alternatives) that maximize total COD load to the stream while minimizing COD load deviations and in-stream water quality violations. Demonstrative operation of the model is made with its application to the Yasu River, Japan. It is shown that there is indeed an alternative management strategy to improve in-stream water quality as a whole while increasing the total allowable load to the stream. The 3-RO model developed could thus be a viable alternative to the conventional river water quality management models. Ó 2009 International Association for Hydro-environment Engineering and Research, Asia Pacific Division. Published by Elsevier B.V. All rights reserved. Keywords: Optimization; Nonpoint pollutant source; Domestic wastewater; River water quality management; Uncertainty; Geographic Information System 1. Introduction Reconciling human activities with river water quality conservation is one of the major requirements for sustainable economic and social development. As an overarching theme of this reconciliation, scientific approaches to basin-scale river water quality management problems have been made using a mathematical programming technique which is capable of harmonizing the competing goals of stakeholders under hydro- environmental, political and institutional constraints. Since rivers are the major source of water used for irrigation and drinking in Japan, river water quality control is of vital importance. Problem formulations have commonly been made to minimize wastewater treatment levels (or costs) in compliance with given in-stream water quality standards (WQSs). For example, Ejaz and Peralta (1995) proposed a simulatione optimization (S/O) model for showing the trade-off between human and bovine populations from which treated wastewater can be discharged into the river system, and solved this mul- tiobjective programming problem by use of the 3-constraint method. Uncertainty of inflow rates at the upstream end of a river was taken into account through obtaining different sets of noninferior solutions with different inflow rates. As part of the optimization constraint sets, the assimilative capacities of * Corresponding author. Tel.: þ81 75 753 6162; fax: þ81 75 753 6349. E-mail address: [email protected] (S. Maeda). 1570-6443/$ - see front matter Ó 2009 International Association for Hydro-environment Engineering and Research, Asia Pacific Division. Published by Elsevier B.V. All rights reserved. doi:10.1016/j.jher.2009.04.002 Available online at www.sciencedirect.com Journal of Hydro-environment Research 4 (2010) 27e36 www.elsevier.com/locate/jher
Transcript of Controlling wasteloads from point and nonpoint sources to river system by GIS-aided Epsilon Robust...
Available online at www.sciencedirect.com
Journal of Hydro-environment Research 4 (2010) 27e36www.elsevier.com/locate/jher
Research paper
Controlling wasteloads from point and nonpoint sources to river systemby GIS-aided Epsilon Robust Optimization model
Shigeya Maeda a,*, Toshihiko Kawachi a, Koichi Unami a, Junichiro Takeuchi a, Eiji Ichion b
a Graduate School of Agriculture, Kyoto University, Kitashirakawa Oiwake-cho, Sakyo-ku, Kyoto 606-8502, Japanb Faculty of Bioresources and Environmental Sciences, Ishikawa Prefectural University, 1-308 Suematsu, Nonoichi-cho, Ishikawa-gun, Ishikawa 921-8836, Japan
Received 20 August 2008; revised 30 March 2009; accepted 3 April 2009
Abstract
A stochastic multiobjective programming model, an 3-RO (Epsilon Robust Optimization) model as a simulationeoptimization model withan embedding approach, is developed for river water quality management under hydro-environmental uncertainty. The model is a hybrid ofthe 3-constraint method and the robust optimization framework, which depresses the high sensitivity of the model to the input data uncer-tainties by introducing a plausible set of scenarios. Possible pollutant sources (all kinds of point and nonpoint pollutant sources exceptingforests) are treated as controllable. The finite element method is employed for approximations to COD (Chemical Oxygen Demand) and DO(Dissolved Oxygen) transport equations with convection and dispersion terms. Realizations for the in-stream CODeDO interactive events,thus described in discrete forms, are embedded as equality constraints in the model. Controlling wasteloads from a variety of sources isimplemented by seeking noninferior solutions (management alternatives) that maximize total COD load to the stream while minimizing CODload deviations and in-stream water quality violations. Demonstrative operation of the model is made with its application to the Yasu River,Japan. It is shown that there is indeed an alternative management strategy to improve in-stream water quality as a whole while increasing thetotal allowable load to the stream. The 3-RO model developed could thus be a viable alternative to the conventional river water qualitymanagement models.� 2009 International Association for Hydro-environment Engineering and Research, Asia Pacific Division. Published by Elsevier B.V. Allrights reserved.
Keywords: Optimization; Nonpoint pollutant source; Domestic wastewater; River water quality management; Uncertainty; Geographic Information System
1. Introduction
Reconciling human activities with river water qualityconservation is one of the major requirements for sustainableeconomic and social development. As an overarching theme ofthis reconciliation, scientific approaches to basin-scale riverwater quality management problems have been made usinga mathematical programming technique which is capable ofharmonizing the competing goals of stakeholders under hydro-environmental, political and institutional constraints. Since
* Corresponding author. Tel.: þ81 75 753 6162; fax: þ81 75 753 6349.
E-mail address: [email protected] (S. Maeda).
1570-6443/$ - see front matter � 2009 International Association for Hydro-environment Engin
doi:10.1016/j.jher.2009.04.002
rivers are the major source of water used for irrigation anddrinking in Japan, river water quality control is of vitalimportance.
Problem formulations have commonly been made tominimize wastewater treatment levels (or costs) in compliancewith given in-stream water quality standards (WQSs). Forexample, Ejaz and Peralta (1995) proposed a simulationeoptimization (S/O) model for showing the trade-off betweenhuman and bovine populations from which treated wastewatercan be discharged into the river system, and solved this mul-tiobjective programming problem by use of the 3-constraintmethod. Uncertainty of inflow rates at the upstream end ofa river was taken into account through obtaining different setsof noninferior solutions with different inflow rates. As part ofthe optimization constraint sets, the assimilative capacities of
eering and Research, Asia Pacific Division. Published by Elsevier B.V. All rights reserved.
28 S. Maeda et al. / Journal of Hydro-environment Research 4 (2010) 27e36
a stream for a variety of water quality constituents includingBOD (Biological Oxygen Demand) were represented by theregression equations obtained from numerous external simu-lations [i.e., by a regression approach (Alley, 1986)]. Changet al. (1997) presented the interactive fuzzy interval multi-objective programming model which was capable of deter-mining wastewater treatment levels within a river basin thatwould minimize total treatment cost and yet maximize BODloading to the river while considering the uncertainties ofa decision-maker’s preference. Mass balances representingpollutant and flow continuities in streams were embedded inthe model as equality constraints (i.e., by an embeddingapproach in S/O models), the former being derived bysuccessively applying the classic StreeterePhelps equationfrom upstream to downstream river segments. Takyi and Lence(1999) developed an approach for evaluating the trade-offbetween wastewater treatment cost (for BOD removal) andreliability of achieving pollution control (i.e., DissolvedOxygen (DO) objectives) under input information uncer-tainties of stream velocity, stream temperature and reaerationrate, using a multiple-realization chance constraint method.Using the random values of the uncertainties generated byMonte Carlo simulation, the realizations associated with DOimprovements per unit waste removed by each dischargerwere produced based on the CampeDobbins modification tothe StreeterePhelps equation. This is an application of not truebut pseudo-embedding approach. Mujumdar and Sasikumar(2002) presented an approach which could consider uncer-tainties due to randomness of river flow and fuzziness in themanagement goals of simultaneously achieving as low risk aspossible of low water quality and as minimum fractional BODremoval level as possible, in order to obtain seasonal fractionalBOD removal levels in terms of which DO deficits at check-points in a river, confined within a given range, are expressedusing the StreeterePhelps equation.
Alternative formulations addressing the objective in termsof wasteload in lieu of treatment level or cost are ratherprimitive, but rare in practice. Without consideration ofuncertainties and also of mass balances for flow and waterquality constituents in streams, Hathhorn and Tung (1989)solved a bi-objective problem to maximize BOD dischargeand minimize the largest difference in equity measuresbetween various waste dischargers using fuzzy linearprogramming. Jia and Culver (2006) developed a robustoptimization model to incorporate the uncertainty of waterquality predictions and to minimize pollutant load reductions(fecal coliform bacteria) given various levels of reliability withrespect to WQSs. The water quality predictions were gener-ated and linked to the optimization algorithm using the linearresponse matrix that could be obtained from an externalhydrological simulation model which performs flow routingand simulates in-stream water quality processes. The approachemployed is categorized as a linking approach. The trueembedding approach where numerical discrete forms of flowand transport equations are included as constraints in optimi-zation models has commonly been used for groundwatermanagement (Gorelick and Remson, 1982; Gharbi and Peralta,
1994; Peralta et al., 1994). The first application to surfacewater pollutant transport was made by Kawachi and Maeda(1999) in which coupled steady-state BOD and DO transportequations of complete form were approximated by the finiteelement method to embed them as equality constraints in thedeterministic optimization model for BOD load allocations topoint sources (PSs/ industrial wastewater treatment plants)within a river basin. The coefficients of the transport equationswere also estimated by numerically solving the gradually-varying steady-state flow equation by the finite elementmethod. Building on this work, Maeda et al. (2000) andKawachi and Maeda (2000) developed scenario-basedstochastic robust optimization (RO) models within the generalframework of robust optimization theory (Mulvey et al., 1995)to produce solutions insensitive to the input data uncertaintiesas found in stream flow rate or water depth. To obtain a scalarobjective function, the prime objective of maximizing theexpected total BOD load to the river was penalized by twodifferent weighted objectives, associated with solutionrobustness and model robustness, which control the total BODload deviations and the water quality violations, respectively.This RO model was reformulated as an Epsilon RobustOptimization (3-RO) model by introducing the 3-constraintmethod which takes only the prime objective as an objectivefunction, and moves other objectives to constraints (Maedaand Kawachi, 2001). The 3-RO model has the additionaladvantages, arising from the 3-constraints, of producing onlysuch noninferior (or Pareto optimal) solutions as are worthy ofdiscussion in a multiobjective decision-making process andproviding trade-off rates among objectives of each noninferiorsolution (Chankong and Haimes, 1983). From due cognizanceof its lesser applicability to the real world, nonpoint source(NPS) pollutant loading from agriculture, assumed to beuncontrollable, was incorporated in the 3-RO model, andthereby BOD load was replaced by CODMn load (ChemicalOxygen Demand (permanganate oxidizability), hereinafternoted as COD) as a decision variable since unit area loadingfrom agricultural lands is measured by COD rather than byBOD and the water quality indicator for a river should becommensurable with that for a lake in dealing with a riverelake composite system (Kawachi and Maeda, 2004a). Themodel so modified was used for generating noninferior solu-tions against which the current water quality and pollutioncontrol policy in the Yasu River, which communicates withLake Biwa, Japan, could be appraised diagnostically (Kawachiand Maeda, 2004b).
This paper builds on the work of Kawachi and Maeda (2004b)where pollutant sources such as domestic septic tanks andcommunity wastewater treatment plants have not been treated aspollutant sources because of the difficulty of collecting associ-ated data. However, those sources are considered to seriouslyaffect river water quality as they occupy a significant portion oftotal loads from urban and residential areas. A geographicinformation system (GIS) is employed to store and managespatial data on such pollutant sources in this study, resulting inconsideration of all the PSs and NPSs. After significant modi-fications of the objective function and constraints, a modified
29S. Maeda et al. / Journal of Hydro-environment Research 4 (2010) 27e36
3-RO model is again applied to the Yasu River to demonstrate itscapability of producing significant noninferior solutions as wellas to find effective wasteload allocation alternatives forimproving in-stream water qualities.
2. COD and DO transport equations
Consider a river or a network of streams with a middle- orlarge-scale catchment. Water and pollutants are assumed toenter and leave the river laterally through outlets located alongthe river. Interaction between the stream water and ground-water is assumed negligible.
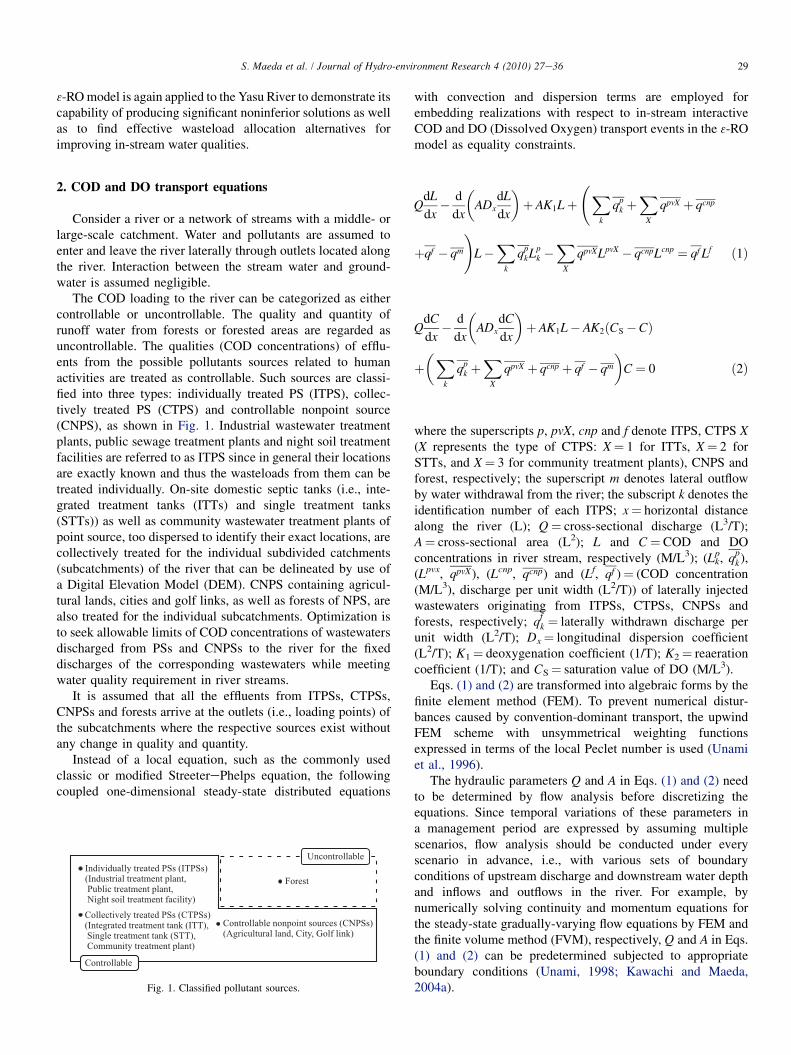
The COD loading to the river can be categorized as eithercontrollable or uncontrollable. The quality and quantity ofrunoff water from forests or forested areas are regarded asuncontrollable. The qualities (COD concentrations) of efflu-ents from the possible pollutants sources related to humanactivities are treated as controllable. Such sources are classi-fied into three types: individually treated PS (ITPS), collec-tively treated PS (CTPS) and controllable nonpoint source(CNPS), as shown in Fig. 1. Industrial wastewater treatmentplants, public sewage treatment plants and night soil treatmentfacilities are referred to as ITPS since in general their locationsare exactly known and thus the wasteloads from them can betreated individually. On-site domestic septic tanks (i.e., inte-grated treatment tanks (ITTs) and single treatment tanks(STTs)) as well as community wastewater treatment plants ofpoint source, too dispersed to identify their exact locations, arecollectively treated for the individual subdivided catchments(subcatchments) of the river that can be delineated by use ofa Digital Elevation Model (DEM). CNPS containing agricul-tural lands, cities and golf links, as well as forests of NPS, arealso treated for the individual subcatchments. Optimization isto seek allowable limits of COD concentrations of wastewatersdischarged from PSs and CNPSs to the river for the fixeddischarges of the corresponding wastewaters while meetingwater quality requirement in river streams.
It is assumed that all the effluents from ITPSs, CTPSs,CNPSs and forests arrive at the outlets (i.e., loading points) ofthe subcatchments where the respective sources exist withoutany change in quality and quantity.
Instead of a local equation, such as the commonly usedclassic or modified StreeterePhelps equation, the followingcoupled one-dimensional steady-state distributed equations
Fig. 1. Classified pollutant sources.
with convection and dispersion terms are employed forembedding realizations with respect to in-stream interactiveCOD and DO (Dissolved Oxygen) transport events in the 3-ROmodel as equality constraints.
QdL
dx� d
dx
�ADx
dL
dx
�þAK1Lþ
Xk
qpk þX
X
qpvX þ qcnp
þqf � qm
!L�
Xk
qpkLp
k �X
X
qpvXLpvX � qcnpLcnp ¼ qf Lf ð1Þ
QdC
dx� d
dx
�ADx
dC
dx
�þAK1L�AK2ðCS�CÞ
þ�X
k
qpk þX
X
qpvX þ qcnp þ qf � qm
�C¼ 0 ð2Þ
where the superscripts p, pvX, cnp and f denote ITPS, CTPS X(X represents the type of CTPS: X¼ 1 for ITTs, X¼ 2 forSTTs, and X¼ 3 for community treatment plants), CNPS andforest, respectively; the superscript m denotes lateral outflowby water withdrawal from the river; the subscript k denotes theidentification number of each ITPS; x¼ horizontal distancealong the river (L); Q¼ cross-sectional discharge (L3/T);A¼ cross-sectional area (L2); L and C¼ COD and DOconcentrations in river stream, respectively (M/L3); (Lk
p, qpk),
(Lpvx, qpvX), (Lcnp, qcnp) and (Lf, qf )¼ (COD concentration(M/L3), discharge per unit width (L2/T)) of laterally injectedwastewaters originating from ITPSs, CTPSs, CNPSs andforests, respectively; qf
k ¼ laterally withdrawn discharge perunit width (L2/T); Dx¼ longitudinal dispersion coefficient(L2/T); K1¼ deoxygenation coefficient (1/T); K2¼ reaerationcoefficient (1/T); and CS¼ saturation value of DO (M/L3).
Eqs. (1) and (2) are transformed into algebraic forms by thefinite element method (FEM). To prevent numerical distur-bances caused by convention-dominant transport, the upwindFEM scheme with unsymmetrical weighting functionsexpressed in terms of the local Peclet number is used (Unamiet al., 1996).
The hydraulic parameters Q and A in Eqs. (1) and (2) needto be determined by flow analysis before discretizing theequations. Since temporal variations of these parameters ina management period are expressed by assuming multiplescenarios, flow analysis should be conducted under everyscenario in advance, i.e., with various sets of boundaryconditions of upstream discharge and downstream water depthand inflows and outflows in the river. For example, bynumerically solving continuity and momentum equations forthe steady-state gradually-varying flow equations by FEM andthe finite volume method (FVM), respectively, Q and A in Eqs.(1) and (2) can be predetermined subjected to appropriateboundary conditions (Unami, 1998; Kawachi and Maeda,2004a).
30 S. Maeda et al. / Journal of Hydro-environment Research 4 (2010) 27e36
3. Optimization model
The 3-RO model is capable of providing a maximumallowable COD load for each controllable pollutant source orsubcatchment, developed by taking Lk
p, Lpvx and Lcnp as deci-sion variables. Hydraulic and hydrological uncertainties of theriverine environment are described by scenarios and theiroccurrence probabilities which can be provided by stochasticanalysis of the historic records concerned. Considering thatinter-monthly uncertainties over a year are of primaryimportance in the context of river water quality management,one scenario is provided for each month. The probability ofa scenario can then be defined as the ratio of the monthlynumber of days to the yearly number of days. Key componentsof the scenario are Q, L, and C at the upstream end of a river, hat the downstream end of a river, qj
cnp ( j¼ identificationnumber for subcatchments), T, K1 and K2. Employing sucha scenario-based description to produce noninferior solutionsrobust against the uncertainties and reducing a linear vector(or multiobjective) problem to a scalar (or single-objective)one by introduction of the 3-constraint method (Chankong andHaimes (1983)) yields the complete 3-RO model;
Minimize f1 ð3Þ
(i) COD and DO transport equations cast into the finiteelement versions at all scenarios
EsLsþFps Lp
s þX
X
FpvXs LpvX
s þFcnps Lcnp
s ¼ bs; cs ð4Þ
GsCsþHsLs ¼ ds; cs ð5Þ
(ii) WQSs at loading points and/or stream junctions in theriver at all scenarios
Los �Lou
s ¼ Uoþs �Uo�
s ; cs ð6Þ
Cols � Co
s ¼ Voþs � Vo�
s ; cs ð7Þ
(iii) Water quality limitations at the downstream end of theriver at all scenarios
Lds � Ldu
s ; Cds � Cdl
s ; cs ð8Þ
(iv) Effluent limitation standards for wastewaters fromITPSs and CTPSs at all scenarios
Lpls � Lp
s � Lpus ; cs ð9Þ
LpvXls � LpvX
s � LpvXus ; cs;X ð10Þ
(v) Limits for the rates of optimal to current CNPS-bornCOD loads at subcatchment outlets
rcnpl �
Ps
psqcnpjs Lcnp
js
LOcnpj
� rcnpu; cj ð11Þ
(vi) Lower limits for expected total ITPS- and CTPS-bornCOD loads
Xs
ps
Xk
qpkLp
ks
!� LOpl ð12Þ
Xs
ps
Xj
qpvXj LpvX
js
!� LOpvXl; cX ð13Þ
(vii) Lower limit for expected total CNPS-born COD load
Xs
ps
Xj
qcnpjs Lcnp
js
!� LOcnpl ð14Þ
(viii) 3-constraints
fj � 3j; j ¼ 2;3;4 ð15Þ
(ix) Supplementary constraints at all scenarios in order tomake the problem tractable
yþs � y�s ¼ xs�X
s
psxs; cs ð16Þ
ps
�yþs þ y�s
��w� 0; cs ð17Þ
(x) Nonnegativity at all scenarios
Ls;Lps ;L
pvXs ;Lcnp
s ;Los ;L
ds ;Cs;C
os ;C
ds ;w; y
þs ; y
�s ;U
oþs ;Uo�
s ;Voþs ;Vo�
s
� 0 cs;X
ð18Þ
with the definitions;
f1ð$Þ ¼ �X
s
psxs ð19Þ
f2ð$Þ ¼maxs
(ps
�����xs�X
s
psxs
�����)
ð20Þ
f3ð$Þ ¼X
s
Xi
ps
�Uoþ
is þVoþis
�ð21Þ
f4ð$Þ ¼X
s
Xi
ps
�Uo�
is þVo�is
�ð22Þ
xs ¼X
k
qpkLp
ksþX
X
Xj
qpvXj LpvX
js þX
j
qcnpjs Lcnp
js ð23Þ
where the superscripts u, l and o stand for upper limit, lowerlimit, and loading point and/or stream junction, respectively;the subscript s represents scenario; xs¼ total controllable CODload to the river (M/T); ps¼ probability of scenario s; qk
p, qjpvx
and qjscnp¼ lateral discharges to the river which transport the
loads from kth ITPS, CTPS in jth subcatchment and CNPS injth subcatchment, respectively (L3/T); Ls and Cs¼ vectors ofin-stream nodal COD and DO concentrations, Ljs (M/L3) and
31S. Maeda et al. / Journal of Hydro-environment Research 4 (2010) 27e36
Cjs (M/L3), respectively; Lsp¼ vector of COD concentration of
effluent from kth ITPS, Lksp (M/L3) (decision variable);
Lspvx¼ vector of COD concentration of collected effluent from
CTPS X flowing to the outlet of jth subcatchment, Ljspvx
(decision variable); Lscnp¼ vector of COD concentration of
effluent from CNPS flowing to the outlet of jth subcatchment,Ljs
cnp (M/L3) (decision variable); Es, Gs and Hs¼ state matricesobtained from application of the FEM; Fs
p, Fspvx and
Fscnp¼matrices associated with Ls
p, Lspvx and Ls
cnp, respec-tively; bs and ds¼ right-hand side constant vectors; Ls
o andCs
o¼ vectors of in-stream COD and DO concentrations atloading points and/or stream junctions, respectively; Ls
ou andCs
ol¼ vectors of limitations of WQSs for COD and DOconcentrations, Ls
ou and Csol, respectively; Us
oþ andVs
oþ¼ vectors of violated deviations of COD and DOconcentrations from WQSs, Uis
oþ (M/L3) and Visoþ (M/L3),
respectively; Uso� and Vs
o�¼ vectors of surplus deviations ofCOD and DO concentrations from WQSs, Uis
o� (M/L3) andVis
o� (M/L3), respectively; Lsd and Cs
d¼COD and DOconcentrations at the downstream end of the river (M/L3),respectively; Ls
du¼ upper limit for Lsd; Cs
dl¼ lower limit for Csd;
Lspl and Ls
pu¼ vectors of lower and upper COD limits foreffluent from kth ITPS, Lks
pl and Lkspu, respectively; Ls
pvxl andLs
pvxu¼ vectors of lower and upper COD limits collectedeffluent from CTPS X in jth subcatchment, Ljs
pvxl and Ljspvxu,
respectively; rcnpl and rcnpu¼ lower and upper limits for therate of optimal to current CNPS-born COD loads, respectively;LOj
cnp¼ current CNPS-born COD load arriving at the outlet ofjth subcatchment; LOpl, LOpvxl and LOcnpl¼ lower limits forexpected total COD loads from ITPSs, CTPSs X and CNPSs,
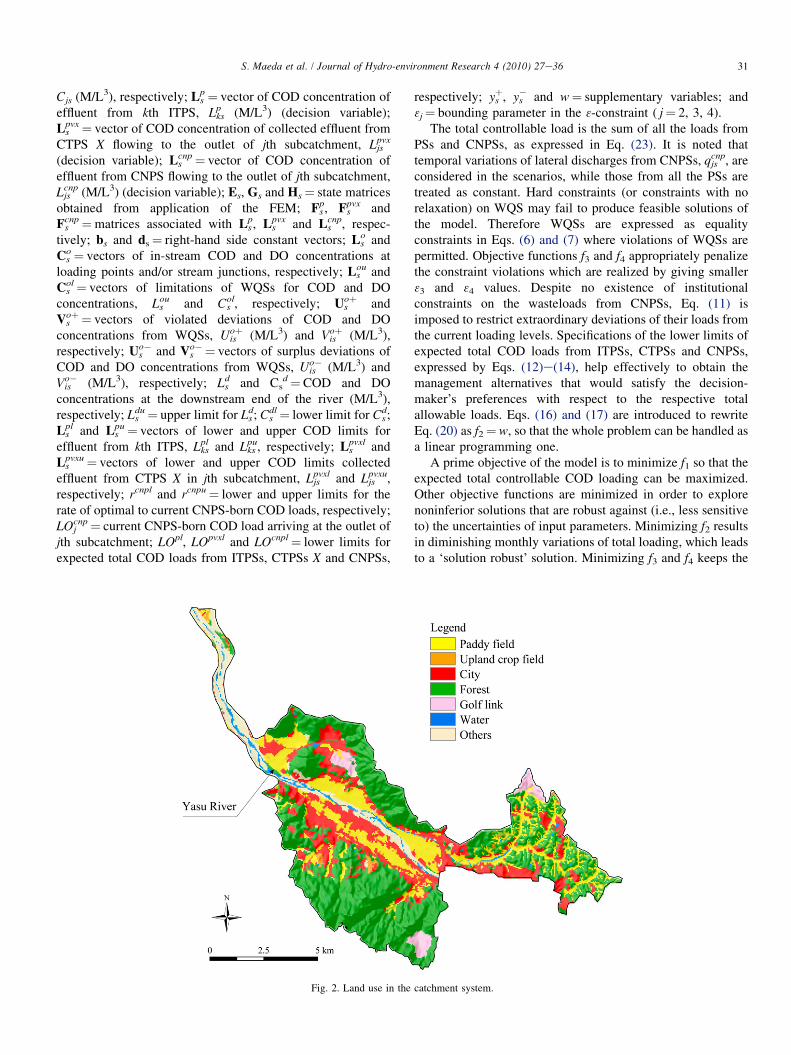
Fig. 2. Land use in the
respectively; ysþ, ys
� and w¼ supplementary variables; and3j¼ bounding parameter in the 3-constraint ( j¼ 2, 3, 4).
The total controllable load is the sum of all the loads fromPSs and CNPSs, as expressed in Eq. (23). It is noted thattemporal variations of lateral discharges from CNPSs, qjs
cnp, areconsidered in the scenarios, while those from all the PSs aretreated as constant. Hard constraints (or constraints with norelaxation) on WQS may fail to produce feasible solutions ofthe model. Therefore WQSs are expressed as equalityconstraints in Eqs. (6) and (7) where violations of WQSs arepermitted. Objective functions f3 and f4 appropriately penalizethe constraint violations which are realized by giving smaller33 and 34 values. Despite no existence of institutionalconstraints on the wasteloads from CNPSs, Eq. (11) isimposed to restrict extraordinary deviations of their loads fromthe current loading levels. Specifications of the lower limits ofexpected total COD loads from ITPSs, CTPSs and CNPSs,expressed by Eqs. (12)e(14), help effectively to obtain themanagement alternatives that would satisfy the decision-maker’s preferences with respect to the respective totalallowable loads. Eqs. (16) and (17) are introduced to rewriteEq. (20) as f2¼ w, so that the whole problem can be handled asa linear programming one.
A prime objective of the model is to minimize f1 so that theexpected total controllable COD loading can be maximized.Other objective functions are minimized in order to explorenoninferior solutions that are robust against (i.e., less sensitiveto) the uncertainties of input parameters. Minimizing f2 resultsin diminishing monthly variations of total loading, which leadsto a ‘solution robust’ solution. Minimizing f3 and f4 keeps the
catchment system.
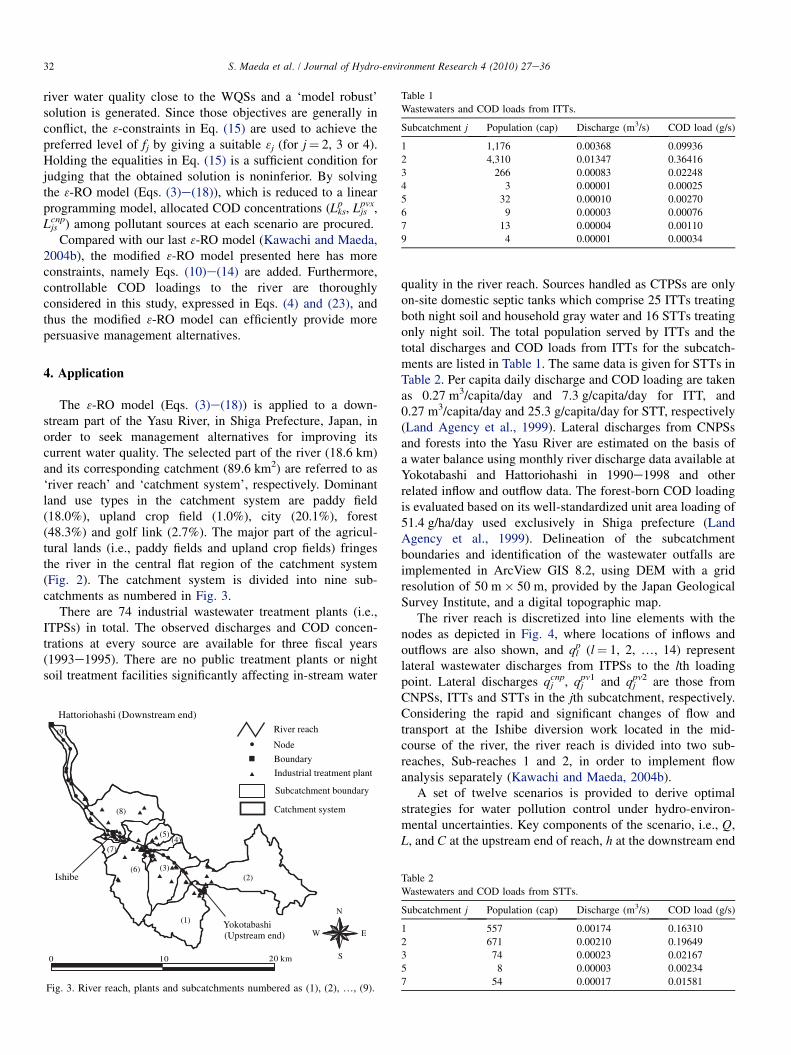
Table 1
Wastewaters and COD loads from ITTs.
Subcatchment j Population (cap) Discharge (m3/s) COD load (g/s)
1 1,176 0.00368 0.09936
2 4,310 0.01347 0.36416
3 266 0.00083 0.02248
4 3 0.00001 0.00025
5 32 0.00010 0.00270
6 9 0.00003 0.00076
7 13 0.00004 0.00110
9 4 0.00001 0.00034
32 S. Maeda et al. / Journal of Hydro-environment Research 4 (2010) 27e36
river water quality close to the WQSs and a ‘model robust’solution is generated. Since those objectives are generally inconflict, the 3-constraints in Eq. (15) are used to achieve thepreferred level of fj by giving a suitable 3j (for j¼ 2, 3 or 4).Holding the equalities in Eq. (15) is a sufficient condition forjudging that the obtained solution is noninferior. By solvingthe 3-RO model (Eqs. (3)e(18)), which is reduced to a linearprogramming model, allocated COD concentrations (Lks
p , Ljspvx,
Ljscnp) among pollutant sources at each scenario are procured.
Compared with our last 3-RO model (Kawachi and Maeda,2004b), the modified 3-RO model presented here has moreconstraints, namely Eqs. (10)e(14) are added. Furthermore,controllable COD loadings to the river are thoroughlyconsidered in this study, expressed in Eqs. (4) and (23), andthus the modified 3-RO model can efficiently provide morepersuasive management alternatives.
4. Application
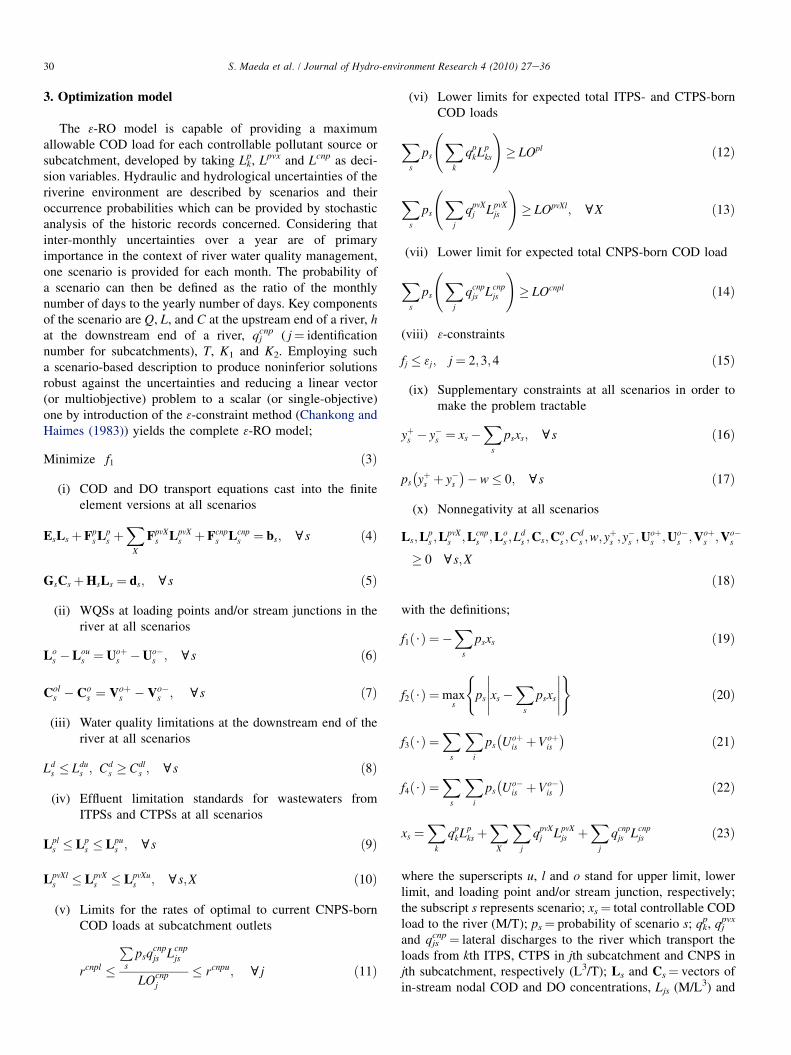
The 3-RO model (Eqs. (3)e(18)) is applied to a down-stream part of the Yasu River, in Shiga Prefecture, Japan, inorder to seek management alternatives for improving itscurrent water quality. The selected part of the river (18.6 km)and its corresponding catchment (89.6 km2) are referred to as‘river reach’ and ‘catchment system’, respectively. Dominantland use types in the catchment system are paddy field(18.0%), upland crop field (1.0%), city (20.1%), forest(48.3%) and golf link (2.7%). The major part of the agricul-tural lands (i.e., paddy fields and upland crop fields) fringesthe river in the central flat region of the catchment system(Fig. 2). The catchment system is divided into nine sub-catchments as numbered in Fig. 3.
There are 74 industrial wastewater treatment plants (i.e.,ITPSs) in total. The observed discharges and COD concen-trations at every source are available for three fiscal years(1993e1995). There are no public treatment plants or nightsoil treatment facilities significantly affecting in-stream water
0 10 20 km
N
W E
S
Node
Boundary
Industrial treatment plant
Subcatchment boundary
Catchment system
Ishibe
Yokotabashi(Upstream end)
(1)
(2)(3)
(4)(5)
(6)
(7)
(8)
(9)
Hattoriohashi (Downstream end)River reach
Fig. 3. River reach, plants and subcatchments numbered as (1), (2), ., (9).
quality in the river reach. Sources handled as CTPSs are onlyon-site domestic septic tanks which comprise 25 ITTs treatingboth night soil and household gray water and 16 STTs treatingonly night soil. The total population served by ITTs and thetotal discharges and COD loads from ITTs for the subcatch-ments are listed in Table 1. The same data is given for STTs inTable 2. Per capita daily discharge and COD loading are takenas 0.27 m3/capita/day and 7.3 g/capita/day for ITT, and0.27 m3/capita/day and 25.3 g/capita/day for STT, respectively(Land Agency et al., 1999). Lateral discharges from CNPSsand forests into the Yasu River are estimated on the basis ofa water balance using monthly river discharge data available atYokotabashi and Hattoriohashi in 1990e1998 and otherrelated inflow and outflow data. The forest-born COD loadingis evaluated based on its well-standardized unit area loading of51.4 g/ha/day used exclusively in Shiga prefecture (LandAgency et al., 1999). Delineation of the subcatchmentboundaries and identification of the wastewater outfalls areimplemented in ArcView GIS 8.2, using DEM with a gridresolution of 50 m� 50 m, provided by the Japan GeologicalSurvey Institute, and a digital topographic map.
The river reach is discretized into line elements with thenodes as depicted in Fig. 4, where locations of inflows andoutflows are also shown, and ql
p (l¼ 1, 2, ., 14) representlateral wastewater discharges from ITPSs to the lth loadingpoint. Lateral discharges qj
cnp, qjpv1 and qj
pv2 are those fromCNPSs, ITTs and STTs in the jth subcatchment, respectively.Considering the rapid and significant changes of flow andtransport at the Ishibe diversion work located in the mid-course of the river, the river reach is divided into two sub-reaches, Sub-reaches 1 and 2, in order to implement flowanalysis separately (Kawachi and Maeda, 2004b).
A set of twelve scenarios is provided to derive optimalstrategies for water pollution control under hydro-environ-mental uncertainties. Key components of the scenario, i.e., Q,L, and C at the upstream end of reach, h at the downstream end
Table 2
Wastewaters and COD loads from STTs.
Subcatchment j Population (cap) Discharge (m3/s) COD load (g/s)
1 557 0.00174 0.16310
2 671 0.00210 0.19649
3 74 0.00023 0.02167
5 8 0.00003 0.00234
7 54 0.00017 0.01581
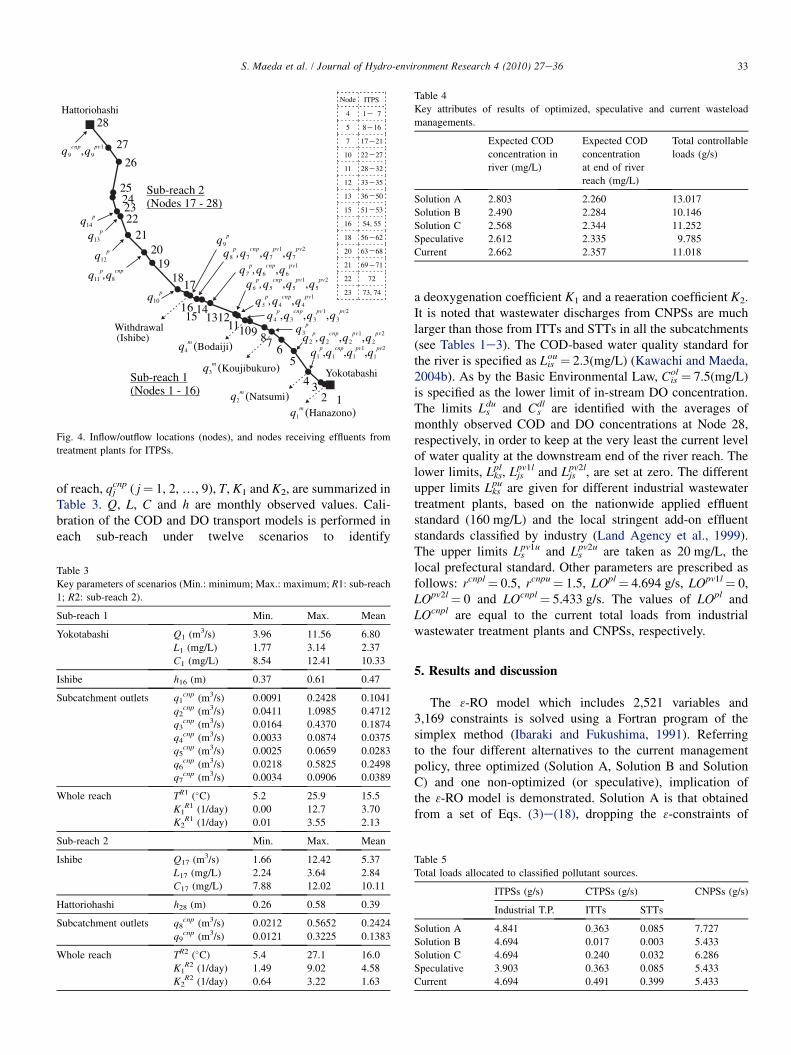
Table 4
Key attributes of results of optimized, speculative and current wasteload
managements.
Expected COD
concentration in
river (mg/L)
Expected COD
concentration
at end of river
reach (mg/L)
Total controllable
loads (g/s)
Solution A 2.803 2.260 13.017
Solution B 2.490 2.284 10.146
Solution C 2.568 2.344 11.252
Speculative 2.612 2.335 9.785
Current 2.662 2.357 11.018
1234
56
78910111213
1415
16
1718
1920
2122232425
26
27
28
Sub-reach 1(Nodes 1 - 16)
Sub-reach 2(Nodes 17 - 28)
q q q q1 1 1 1
p cnp pv pv, , ,1 2
q ,q2 2
p cnp, ,q q2 2
pv pv1 2q3
pq q4 3
p cnp, , ,q q3 3
pv pv1 2
q ,q5
p cnp
4 ,q4
pv1
q ,q6
p cnp
5 , ,q q5 5
pv pv1 2q ,q7
p cnp
6 ,q6
pv1
q ,q8 7
p cnp, ,q q7 7
pv pv1 2q9
p
q ,q11 8
p cnp
q12
p
q9
cnp,q9
pv1
Withdrawal(Ishibe)
Yokotabashi
Hattoriohashi
q10
p
q13
p
q14
p
q1
m ( )Hanazono
q2
m ( )Natsumi
q3
m ( )Koujibukuro
q4
m ( )Bodaiji
Node ITPS
4 1 7
5 8 16
7 17 21
10 22 27
11 28 32
12 33 35
13 36 50
15 51 53
16 54, 55
18 56 62
20 63 68
21 69 71
22 72
23 73, 74
Fig. 4. Inflow/outflow locations (nodes), and nodes receiving effluents from
treatment plants for ITPSs.
33S. Maeda et al. / Journal of Hydro-environment Research 4 (2010) 27e36
of reach, qjcnp ( j¼ 1, 2, ., 9), T, K1 and K2, are summarized in
Table 3. Q, L, C and h are monthly observed values. Cali-bration of the COD and DO transport models is performed ineach sub-reach under twelve scenarios to identify
Table 3
Key parameters of scenarios (Min.: minimum; Max.: maximum; R1: sub-reach
1; R2: sub-reach 2).
Sub-reach 1 Min. Max. Mean
Yokotabashi Q1 (m3/s) 3.96 11.56 6.80
L1 (mg/L) 1.77 3.14 2.37
C1 (mg/L) 8.54 12.41 10.33
Ishibe h16 (m) 0.37 0.61 0.47
Subcatchment outlets q1cnp (m3/s) 0.0091 0.2428 0.1041
q2cnp (m3/s) 0.0411 1.0985 0.4712
q3cnp (m3/s) 0.0164 0.4370 0.1874
q4cnp (m3/s) 0.0033 0.0874 0.0375
q5cnp (m3/s) 0.0025 0.0659 0.0283
q6cnp (m3/s) 0.0218 0.5825 0.2498
q7cnp (m3/s) 0.0034 0.0906 0.0389
Whole reach TR1 (�C) 5.2 25.9 15.5
K1R1 (1/day) 0.00 12.7 3.70
K2R1 (1/day) 0.01 3.55 2.13
Sub-reach 2 Min. Max. Mean
Ishibe Q17 (m3/s) 1.66 12.42 5.37
L17 (mg/L) 2.24 3.64 2.84
C17 (mg/L) 7.88 12.02 10.11
Hattoriohashi h28 (m) 0.26 0.58 0.39
Subcatchment outlets q8cnp (m3/s) 0.0212 0.5652 0.2424
q9cnp (m3/s) 0.0121 0.3225 0.1383
Whole reach TR2 (�C) 5.4 27.1 16.0
K1R2 (1/day) 1.49 9.02 4.58
K2R2 (1/day) 0.64 3.22 1.63
a deoxygenation coefficient K1 and a reaeration coefficient K2.It is noted that wastewater discharges from CNPSs are muchlarger than those from ITTs and STTs in all the subcatchments(see Tables 1e3). The COD-based water quality standard forthe river is specified as Lis
ou¼ 2.3(mg/L) (Kawachi and Maeda,2004b). As by the Basic Environmental Law, Cis
ol¼ 7.5(mg/L)is specified as the lower limit of in-stream DO concentration.The limits Ls
du and Csdl are identified with the averages of
monthly observed COD and DO concentrations at Node 28,respectively, in order to keep at the very least the current levelof water quality at the downstream end of the river reach. Thelower limits, Lks
pl, Ljspv1l and Ljs
pv2l, are set at zero. The differentupper limits Lks
pu are given for different industrial wastewatertreatment plants, based on the nationwide applied effluentstandard (160 mg/L) and the local stringent add-on effluentstandards classified by industry (Land Agency et al., 1999).The upper limits Ls
pv1u and Lspv2u are taken as 20 mg/L, the
local prefectural standard. Other parameters are prescribed asfollows: rcnpl¼ 0.5, rcnpu¼ 1.5, LOpl¼ 4.694 g/s, LOpv1l¼ 0,LOpv2l¼ 0 and LOcnpl¼ 5.433 g/s. The values of LOpl andLOcnpl are equal to the current total loads from industrialwastewater treatment plants and CNPSs, respectively.
5. Results and discussion
The 3-RO model which includes 2,521 variables and3,169 constraints is solved using a Fortran program of thesimplex method (Ibaraki and Fukushima, 1991). Referringto the four different alternatives to the current managementpolicy, three optimized (Solution A, Solution B and SolutionC) and one non-optimized (or speculative), implication ofthe 3-RO model is demonstrated. Solution A is that obtainedfrom a set of Eqs. (3)e(18), dropping the 3-constraints of
Table 5
Total loads allocated to classified pollutant sources.
ITPSs (g/s) CTPSs (g/s) CNPSs (g/s)
Industrial T.P. ITTs STTs
Solution A 4.841 0.363 0.085 7.727
Solution B 4.694 0.017 0.003 5.433
Solution C 4.694 0.240 0.032 6.286
Speculative 3.903 0.363 0.085 5.433
Current 4.694 0.491 0.399 5.433
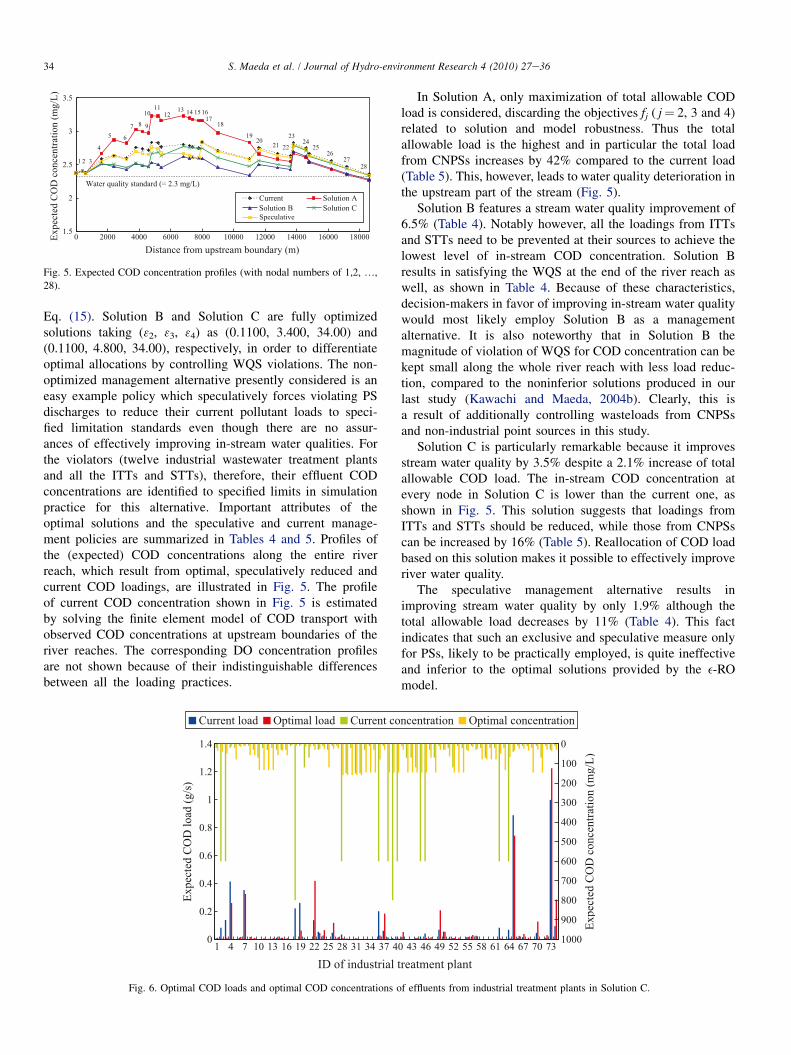
Fig. 5. Expected COD concentration profiles (with nodal numbers of 1,2, .,
28).
34 S. Maeda et al. / Journal of Hydro-environment Research 4 (2010) 27e36
Eq. (15). Solution B and Solution C are fully optimizedsolutions taking (32, 33, 34) as (0.1100, 3.400, 34.00) and(0.1100, 4.800, 34.00), respectively, in order to differentiateoptimal allocations by controlling WQS violations. The non-optimized management alternative presently considered is aneasy example policy which speculatively forces violating PSdischarges to reduce their current pollutant loads to speci-fied limitation standards even though there are no assur-ances of effectively improving in-stream water qualities. Forthe violators (twelve industrial wastewater treatment plantsand all the ITTs and STTs), therefore, their effluent CODconcentrations are identified to specified limits in simulationpractice for this alternative. Important attributes of theoptimal solutions and the speculative and current manage-ment policies are summarized in Tables 4 and 5. Profiles ofthe (expected) COD concentrations along the entire riverreach, which result from optimal, speculatively reduced andcurrent COD loadings, are illustrated in Fig. 5. The profileof current COD concentration shown in Fig. 5 is estimatedby solving the finite element model of COD transport withobserved COD concentrations at upstream boundaries of theriver reaches. The corresponding DO concentration profilesare not shown because of their indistinguishable differencesbetween all the loading practices.
Fig. 6. Optimal COD loads and optimal COD concentrations o
In Solution A, only maximization of total allowable CODload is considered, discarding the objectives fj ( j¼ 2, 3 and 4)related to solution and model robustness. Thus the totalallowable load is the highest and in particular the total loadfrom CNPSs increases by 42% compared to the current load(Table 5). This, however, leads to water quality deterioration inthe upstream part of the stream (Fig. 5).
Solution B features a stream water quality improvement of6.5% (Table 4). Notably however, all the loadings from ITTsand STTs need to be prevented at their sources to achieve thelowest level of in-stream COD concentration. Solution Bresults in satisfying the WQS at the end of the river reach aswell, as shown in Table 4. Because of these characteristics,decision-makers in favor of improving in-stream water qualitywould most likely employ Solution B as a managementalternative. It is also noteworthy that in Solution B themagnitude of violation of WQS for COD concentration can bekept small along the whole river reach with less load reduc-tion, compared to the noninferior solutions produced in ourlast study (Kawachi and Maeda, 2004b). Clearly, this isa result of additionally controlling wasteloads from CNPSsand non-industrial point sources in this study.
Solution C is particularly remarkable because it improvesstream water quality by 3.5% despite a 2.1% increase of totalallowable COD load. The in-stream COD concentration atevery node in Solution C is lower than the current one, asshown in Fig. 5. This solution suggests that loadings fromITTs and STTs should be reduced, while those from CNPSscan be increased by 16% (Table 5). Reallocation of COD loadbased on this solution makes it possible to effectively improveriver water quality.
The speculative management alternative results inimproving stream water quality by only 1.9% although thetotal allowable load decreases by 11% (Table 4). This factindicates that such an exclusive and speculative measure onlyfor PSs, likely to be practically employed, is quite ineffectiveand inferior to the optimal solutions provided by the e-ROmodel.
f effluents from industrial treatment plants in Solution C.
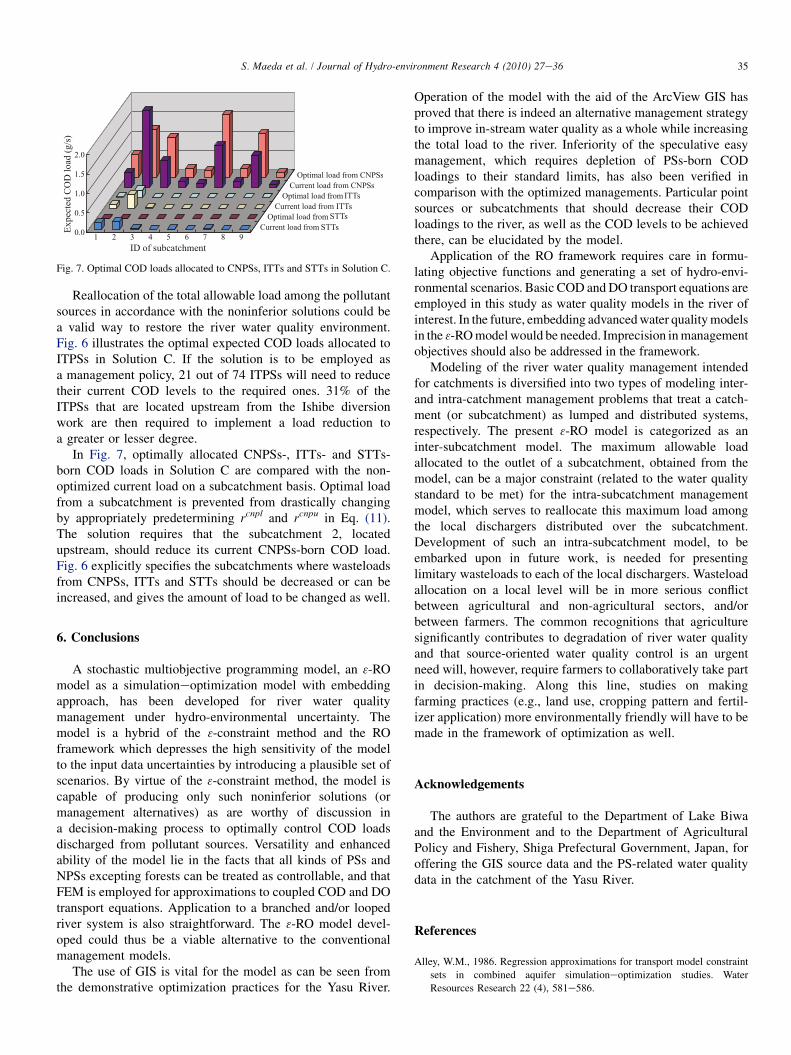
Fig. 7. Optimal COD loads allocated to CNPSs, ITTs and STTs in Solution C.
35S. Maeda et al. / Journal of Hydro-environment Research 4 (2010) 27e36
Reallocation of the total allowable load among the pollutantsources in accordance with the noninferior solutions could bea valid way to restore the river water quality environment.Fig. 6 illustrates the optimal expected COD loads allocated toITPSs in Solution C. If the solution is to be employed asa management policy, 21 out of 74 ITPSs will need to reducetheir current COD levels to the required ones. 31% of theITPSs that are located upstream from the Ishibe diversionwork are then required to implement a load reduction toa greater or lesser degree.
In Fig. 7, optimally allocated CNPSs-, ITTs- and STTs-born COD loads in Solution C are compared with the non-optimized current load on a subcatchment basis. Optimal loadfrom a subcatchment is prevented from drastically changingby appropriately predetermining rcnpl and rcnpu in Eq. (11).The solution requires that the subcatchment 2, locatedupstream, should reduce its current CNPSs-born COD load.Fig. 6 explicitly specifies the subcatchments where wasteloadsfrom CNPSs, ITTs and STTs should be decreased or can beincreased, and gives the amount of load to be changed as well.
6. Conclusions
A stochastic multiobjective programming model, an 3-ROmodel as a simulationeoptimization model with embeddingapproach, has been developed for river water qualitymanagement under hydro-environmental uncertainty. Themodel is a hybrid of the 3-constraint method and the ROframework which depresses the high sensitivity of the modelto the input data uncertainties by introducing a plausible set ofscenarios. By virtue of the 3-constraint method, the model iscapable of producing only such noninferior solutions (ormanagement alternatives) as are worthy of discussion ina decision-making process to optimally control COD loadsdischarged from pollutant sources. Versatility and enhancedability of the model lie in the facts that all kinds of PSs andNPSs excepting forests can be treated as controllable, and thatFEM is employed for approximations to coupled COD and DOtransport equations. Application to a branched and/or loopedriver system is also straightforward. The 3-RO model devel-oped could thus be a viable alternative to the conventionalmanagement models.
The use of GIS is vital for the model as can be seen fromthe demonstrative optimization practices for the Yasu River.
Operation of the model with the aid of the ArcView GIS hasproved that there is indeed an alternative management strategyto improve in-stream water quality as a whole while increasingthe total load to the river. Inferiority of the speculative easymanagement, which requires depletion of PSs-born CODloadings to their standard limits, has also been verified incomparison with the optimized managements. Particular pointsources or subcatchments that should decrease their CODloadings to the river, as well as the COD levels to be achievedthere, can be elucidated by the model.
Application of the RO framework requires care in formu-lating objective functions and generating a set of hydro-envi-ronmental scenarios. Basic COD and DO transport equations areemployed in this study as water quality models in the river ofinterest. In the future, embedding advanced water quality modelsin the 3-RO model would be needed. Imprecision in managementobjectives should also be addressed in the framework.
Modeling of the river water quality management intendedfor catchments is diversified into two types of modeling inter-and intra-catchment management problems that treat a catch-ment (or subcatchment) as lumped and distributed systems,respectively. The present 3-RO model is categorized as aninter-subcatchment model. The maximum allowable loadallocated to the outlet of a subcatchment, obtained from themodel, can be a major constraint (related to the water qualitystandard to be met) for the intra-subcatchment managementmodel, which serves to reallocate this maximum load amongthe local dischargers distributed over the subcatchment.Development of such an intra-subcatchment model, to beembarked upon in future work, is needed for presentinglimitary wasteloads to each of the local dischargers. Wasteloadallocation on a local level will be in more serious conflictbetween agricultural and non-agricultural sectors, and/orbetween farmers. The common recognitions that agriculturesignificantly contributes to degradation of river water qualityand that source-oriented water quality control is an urgentneed will, however, require farmers to collaboratively take partin decision-making. Along this line, studies on makingfarming practices (e.g., land use, cropping pattern and fertil-izer application) more environmentally friendly will have to bemade in the framework of optimization as well.
Acknowledgements
The authors are grateful to the Department of Lake Biwaand the Environment and to the Department of AgriculturalPolicy and Fishery, Shiga Prefectural Government, Japan, foroffering the GIS source data and the PS-related water qualitydata in the catchment of the Yasu River.
References
Alley, W.M., 1986. Regression approximations for transport model constraint
sets in combined aquifer simulationeoptimization studies. Water
Resources Research 22 (4), 581e586.
36 S. Maeda et al. / Journal of Hydro-environment Research 4 (2010) 27e36
Chang, N.B., Chen, H.W., Shaw, D.G., Yang, C.H., 1997. Water pollution control
in river basin by interactive fuzzy interval multiobjective programming.
Journal of Environmental Engineering, ASCE 123 (12), 1208e1216.
Chankong, V., Haimes, Y.Y., 1983. Multiobjective Decision Making: Theory
and Methodology. North Holland, New York, pp. 113-175.
Ejaz, M.S., Peralta, R.C., 1995. Modeling for optimal management of agri-
cultural and domestic wastewater loading to streams. Water Resources
Research 31 (4), 1087e1096.
Gharbi, A., Peralta, R.C., 1994. Integrated embedding optimization applied to
Salt Lake valley aquifers. Water Resources Research 30 (3), 817e832.
Gorelick, S.M., Remson, I., 1982. Optimal location and management of waste
disposal facilities affecting ground water quality. Water Resources Bulletin
18 (1), 43e51.
Hathhorn, W.E., Tung, Y.K., 1989. Bi-objective analysis of waste load allocation
using fuzzy linear programming. Water Resources Management 3, 243e257.
Ibaraki, T., Fukushima, M., 1991. Programming for Solving Optimization
Problems. Iwanami, pp. 39e58 (in Japanese).
Jia, Y., Culver, T.B., 2006. Robust optimization for total maximum daily load
allocations. Water Resources Research 42, W02412. doi:10.1029/
2005WR004079.
Kawachi, T., Maeda, S., 1999. Water pollution control in stream network by
finite element and linear programming method. Proceedings of the Japan
Academy, Series B 75 (6), 138e143.
Kawachi, T., Maeda, S., 2000. Robust optimization model for water quality
management in river systems. Proceedings of the Japan Academy, Series B
76 (8), 112e117.
Kawachi, T., Maeda, S., 2004a. Optimal management of waste loading into
a river system with nonpoint source pollutants. Proceedings of the Japan
Academy, Series B 80 (8), 392e398.
Kawachi, T., Maeda, S., 2004b. Diagnostic appraisal of water quality and pollu-
tion control realities in Yasu River using GIS-aided epsilon robust optimiza-
tion model. Proceedings of the Japan Academy, Series B 80 (8), 399e405.
Land Agency and Other Water-related Agencies/Ministries of Japan, 1999.
Comprehensive Investigations for Conservation of Lake Biwa, p. 97 (in
Japanese).
Maeda, S., Kawachi, T., 2001. 3-Constraint approach for robust optimization of
wasteload allocation in river systems. Transactions of the Japanese Society
of Irrigation, Drainage and Reclamation Engineering 215, 117e124.
Maeda, S., Kawachi, T., Okumura, H., 2000. Robust optimization of river
water quality management. Transactions of the Japanese Society of Irri-
gation, Drainage and Reclamation Engineering 207, 77e82.
Mujumdar, P.P., Sasikumar, K., 2002. A fuzzy risk approach for seasonal water
quality management of a river system. Water Resources Research 38 (1).
doi:10.1029/2000WR000126.
Mulvey, J.M., Vanderbei, R.J., Zenios, S.A., 1995. Robust optimization of
large-scale systems. Operations Research 43 (2), 264e281.
Peralta, R.C., Hegazy, M.A., Musharrafieh, G.R., 1994. Preventing pesticide
contamination of groundwater while maximizing irrigation crop yield.
Water Resources Research 30 (11), 3183e3193.
Takyi, A.K., Lence, B.J., 1999. Surface water quality management using
a multiple-realization chance constraint method. Water Resources
Research 35 (5), 1657e1670.
Unami, K., 1998. Optimization and Control of Water Conveyance/Storage
Systems. Ph. D. thesis. Kyoto University, Kyoto, pp. 14e18.
Unami, K., Kawachi, T., Okumura, H., Hiramatsu, K., 1996. Numerical model
of pseudo steady flows in estuarine open channel networks using finite
volume and finite element methods. In: Benkhaldoun, F., Vilsmeier, R.
(Eds.), Finite Volumes for Complex Applications. Hermes, pp. 563e570.