Contributions of gas flaring to a global air pollution hotspot: spatial and temporal variations,...
10
Contributions of gas flaring to a global air pollution hotspot: Spatial and temporal variations, impacts and alleviation Obinna C.D. Anejionu a, * , J. Duncan Whyatt a , G. Alan Blackburn a , Catheryn S. Price b a Lancaster Environment Centre, Gordon Manley Building, Lancaster University, Lancaster LA1 4YQ, United Kingdom b Cambridge Environmental Research Consultants (CERC), Cambridge CB2 1SJ, United Kingdom highlights Flare-related air pollution derived through combination of geospatial technologies. Extended pollution series constructed in the absence of in situ monitoring data. Impacts of air pollution on human health and natural ecosystems quantified. Inter-state contributions to pollution levels determined. Benefits of reduced flaring activity and increased flaring efficiency demonstrated. article info Article history: Received 8 February 2015 Received in revised form 30 July 2015 Accepted 3 August 2015 Available online 7 August 2015 Keywords: Gas flares Remote sensing Dispersion modelling Health impacts Environmental impacts Niger delta abstract Studies of environmental impacts of gas flaring in the Niger Delta are hindered by limited access to official flaring emissions records and a paucity of reliable ambient monitoring data. This study uses a combination of geospatial technologies and dispersion modelling techniques to evaluate air pollution impacts of gas flaring on human health and natural ecosystems in the region. Results indicate that gas flaring is a major contributor to air pollution across the region, with concentrations exceeding WHO limits in some locations over certain time periods. Due to the predominant south-westerly wind, con- centrations are higher in some states with little flaring activity than in others with significant flaring activity. Twenty million people inhabit areas of high flare-associated air pollution, which include all of the main ecological zones of the region, indicating that flaring poses a substantial threat to human health and the environment. Model scenarios demonstrated that substantial reductions in pollution could be achieved by stopping flaring at a small number of the most active sites and by improving overall flaring efficiency. © 2015 Elsevier Ltd. All rights reserved. 1. Introduction A large proportion of Nigeria's oil facilities were developed in the early 1960s and 1970s in response to increased international demand for oil (Rotty, 1974). Gas was not a popular energy source at the time and environmental standards were not as stringent as they are today (Kuranga, 2002 cited in Abdulkareem, 2005a; OGP, 2000), consequently most of the excess gas associated with crude oil production was removed through the process of flaring (Fig. 1). This combustion process has been going on for almost six decades in Nigeria, hence its global recognition as a prominent flaring nation (Elvidge et al., 2009). As there was little local awareness of the environmental impacts of gas flaring in the 1960s and because flaring technology was in its infancy, flaring efficiencies were low relative to modern day stan- dards (Leahey et al., 2001; OGP, 2000) with large volumes of gas flared at flow stations (where oil from different wells is initially gathered) and in refineries on an almost continuous basis (Marais et al., 2014). Although it is generally assumed that flares attain high flaring efficiency, producing only non-toxic carbon dioxide (CO 2 ) and water, in reality, combustion is incomplete and harmful by-products such as sulphur dioxide (SO 2 ), nitrogen oxides (NOx), hydrogen sulphide (H 2 S), volatile organic compounds (VOC), total hydrocarbons, heavy metals and particulates are released into the environment (Johnson and Coderre, 2012; Abdulkareem, 2005a). Generally, flares are thought to operate at an average efficiency of 68% ± 7% (Leahey et al., 2001). * Corresponding author. E-mail address: [email protected] (O.C.D. Anejionu). Contents lists available at ScienceDirect Atmospheric Environment journal homepage: www.elsevier.com/locate/atmosenv http://dx.doi.org/10.1016/j.atmosenv.2015.08.006 1352-2310/© 2015 Elsevier Ltd. All rights reserved. Atmospheric Environment 118 (2015) 184e193
Transcript of Contributions of gas flaring to a global air pollution hotspot: spatial and temporal variations,...

lable at ScienceDirect
Atmospheric Environment 118 (2015) 184e193
Contents lists avai
Atmospheric Environment
journal homepage: www.elsevier .com/locate/atmosenv
Contributions of gas flaring to a global air pollution hotspot: Spatialand temporal variations, impacts and alleviation
Obinna C.D. Anejionu a, *, J. Duncan Whyatt a, G. Alan Blackburn a, Catheryn S. Price b
a Lancaster Environment Centre, Gordon Manley Building, Lancaster University, Lancaster LA1 4YQ, United Kingdomb Cambridge Environmental Research Consultants (CERC), Cambridge CB2 1SJ, United Kingdom
h i g h l i g h t s
� Flare-related air pollution derived through combination of geospatial technologies.� Extended pollution series constructed in the absence of in situ monitoring data.� Impacts of air pollution on human health and natural ecosystems quantified.� Inter-state contributions to pollution levels determined.� Benefits of reduced flaring activity and increased flaring efficiency demonstrated.
a r t i c l e i n f o
Article history:Received 8 February 2015Received in revised form30 July 2015Accepted 3 August 2015Available online 7 August 2015
Keywords:Gas flaresRemote sensingDispersion modellingHealth impactsEnvironmental impactsNiger delta
* Corresponding author.E-mail address: [email protected] (O.C.D. Anejion
http://dx.doi.org/10.1016/j.atmosenv.2015.08.0061352-2310/© 2015 Elsevier Ltd. All rights reserved.
a b s t r a c t
Studies of environmental impacts of gas flaring in the Niger Delta are hindered by limited access toofficial flaring emissions records and a paucity of reliable ambient monitoring data. This study uses acombination of geospatial technologies and dispersion modelling techniques to evaluate air pollutionimpacts of gas flaring on human health and natural ecosystems in the region. Results indicate that gasflaring is a major contributor to air pollution across the region, with concentrations exceeding WHOlimits in some locations over certain time periods. Due to the predominant south-westerly wind, con-centrations are higher in some states with little flaring activity than in others with significant flaringactivity. Twenty million people inhabit areas of high flare-associated air pollution, which include all ofthe main ecological zones of the region, indicating that flaring poses a substantial threat to human healthand the environment. Model scenarios demonstrated that substantial reductions in pollution could beachieved by stopping flaring at a small number of the most active sites and by improving overall flaringefficiency.
© 2015 Elsevier Ltd. All rights reserved.
1. Introduction
A large proportion of Nigeria's oil facilities were developed inthe early 1960s and 1970s in response to increased internationaldemand for oil (Rotty, 1974). Gas was not a popular energy source atthe time and environmental standards were not as stringent as theyare today (Kuranga, 2002 cited in Abdulkareem, 2005a; OGP, 2000),consequently most of the excess gas associated with crude oilproductionwas removed through the process of flaring (Fig. 1). Thiscombustion process has been going on for almost six decades inNigeria, hence its global recognition as a prominent flaring nation(Elvidge et al., 2009).
u).
As therewas little local awareness of the environmental impactsof gas flaring in the 1960s and because flaring technology was in itsinfancy, flaring efficiencies were low relative to modern day stan-dards (Leahey et al., 2001; OGP, 2000) with large volumes of gasflared at flow stations (where oil from different wells is initiallygathered) and in refineries on an almost continuous basis (Maraiset al., 2014). Although it is generally assumed that flares attainhigh flaring efficiency, producing only non-toxic carbon dioxide(CO2) and water, in reality, combustion is incomplete and harmfulby-products such as sulphur dioxide (SO2), nitrogen oxides (NOx),hydrogen sulphide (H2S), volatile organic compounds (VOC), totalhydrocarbons, heavy metals and particulates are released into theenvironment (Johnson and Coderre, 2012; Abdulkareem, 2005a).Generally, flares are thought to operate at an average efficiency of68% ± 7% (Leahey et al., 2001).
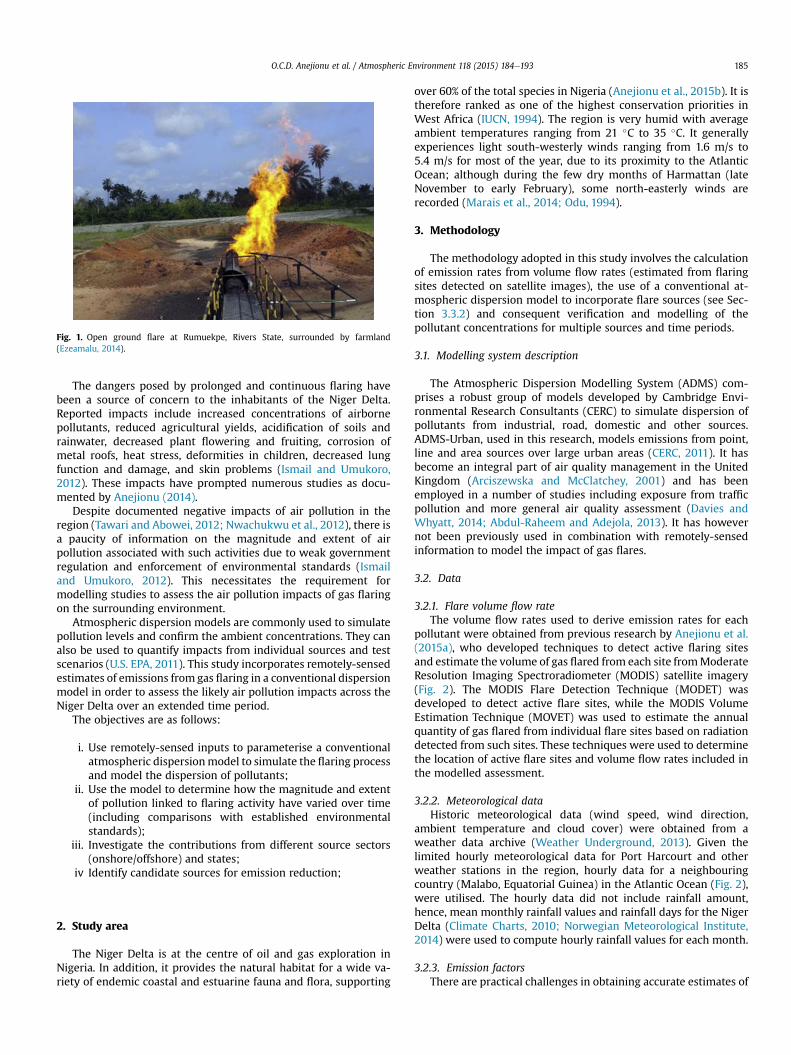
Fig. 1. Open ground flare at Rumuekpe, Rivers State, surrounded by farmland(Ezeamalu, 2014).
O.C.D. Anejionu et al. / Atmospheric Environment 118 (2015) 184e193 185
The dangers posed by prolonged and continuous flaring havebeen a source of concern to the inhabitants of the Niger Delta.Reported impacts include increased concentrations of airbornepollutants, reduced agricultural yields, acidification of soils andrainwater, decreased plant flowering and fruiting, corrosion ofmetal roofs, heat stress, deformities in children, decreased lungfunction and damage, and skin problems (Ismail and Umukoro,2012). These impacts have prompted numerous studies as docu-mented by Anejionu (2014).
Despite documented negative impacts of air pollution in theregion (Tawari and Abowei, 2012; Nwachukwu et al., 2012), there isa paucity of information on the magnitude and extent of airpollution associated with such activities due to weak governmentregulation and enforcement of environmental standards (Ismailand Umukoro, 2012). This necessitates the requirement formodelling studies to assess the air pollution impacts of gas flaringon the surrounding environment.
Atmospheric dispersion models are commonly used to simulatepollution levels and confirm the ambient concentrations. They canalso be used to quantify impacts from individual sources and testscenarios (U.S. EPA, 2011). This study incorporates remotely-sensedestimates of emissions from gas flaring in a conventional dispersionmodel in order to assess the likely air pollution impacts across theNiger Delta over an extended time period.
The objectives are as follows:
i. Use remotely-sensed inputs to parameterise a conventionalatmospheric dispersionmodel to simulate the flaring processand model the dispersion of pollutants;
ii. Use the model to determine how the magnitude and extentof pollution linked to flaring activity have varied over time(including comparisons with established environmentalstandards);
iii. Investigate the contributions from different source sectors(onshore/offshore) and states;
iv Identify candidate sources for emission reduction;
2. Study area
The Niger Delta is at the centre of oil and gas exploration inNigeria. In addition, it provides the natural habitat for a wide va-riety of endemic coastal and estuarine fauna and flora, supporting
over 60% of the total species in Nigeria (Anejionu et al., 2015b). It istherefore ranked as one of the highest conservation priorities inWest Africa (IUCN, 1994). The region is very humid with averageambient temperatures ranging from 21 �C to 35 �C. It generallyexperiences light south-westerly winds ranging from 1.6 m/s to5.4 m/s for most of the year, due to its proximity to the AtlanticOcean; although during the few dry months of Harmattan (lateNovember to early February), some north-easterly winds arerecorded (Marais et al., 2014; Odu, 1994).
3. Methodology
The methodology adopted in this study involves the calculationof emission rates from volume flow rates (estimated from flaringsites detected on satellite images), the use of a conventional at-mospheric dispersion model to incorporate flare sources (see Sec-tion 3.3.2) and consequent verification and modelling of thepollutant concentrations for multiple sources and time periods.
3.1. Modelling system description
The Atmospheric Dispersion Modelling System (ADMS) com-prises a robust group of models developed by Cambridge Envi-ronmental Research Consultants (CERC) to simulate dispersion ofpollutants from industrial, road, domestic and other sources.ADMS-Urban, used in this research, models emissions from point,line and area sources over large urban areas (CERC, 2011). It hasbecome an integral part of air quality management in the UnitedKingdom (Arciszewska and McClatchey, 2001) and has beenemployed in a number of studies including exposure from trafficpollution and more general air quality assessment (Davies andWhyatt, 2014; Abdul-Raheem and Adejola, 2013). It has howevernot been previously used in combination with remotely-sensedinformation to model the impact of gas flares.
3.2. Data
3.2.1. Flare volume flow rateThe volume flow rates used to derive emission rates for each
pollutant were obtained from previous research by Anejionu et al.(2015a), who developed techniques to detect active flaring sitesand estimate the volume of gas flared from each site fromModerateResolution Imaging Spectroradiometer (MODIS) satellite imagery(Fig. 2). The MODIS Flare Detection Technique (MODET) wasdeveloped to detect active flare sites, while the MODIS VolumeEstimation Technique (MOVET) was used to estimate the annualquantity of gas flared from individual flare sites based on radiationdetected from such sites. These techniques were used to determinethe location of active flare sites and volume flow rates included inthe modelled assessment.
3.2.2. Meteorological dataHistoric meteorological data (wind speed, wind direction,
ambient temperature and cloud cover) were obtained from aweather data archive (Weather Underground, 2013). Given thelimited hourly meteorological data for Port Harcourt and otherweather stations in the region, hourly data for a neighbouringcountry (Malabo, Equatorial Guinea) in the Atlantic Ocean (Fig. 2),were utilised. The hourly data did not include rainfall amount,hence, mean monthly rainfall values and rainfall days for the NigerDelta (Climate Charts, 2010; Norwegian Meteorological Institute,2014) were used to compute hourly rainfall values for each month.
3.2.3. Emission factorsThere are practical challenges in obtaining accurate estimates of

Fig. 2. The total volume of gas combusted at individual flare sites in the Niger Delta (2000e2014), reproduced from Anejionu et al., (2015a).
O.C.D. Anejionu et al. / Atmospheric Environment 118 (2015) 184e193186
emissions associated with flaring (OAQPS, 1984; Backshall, 2013).As a result, predetermined emission factors are typically used tocompute emission rates for flares. The emission factors relate thequantity of a pollutant released with an activity associated with therelease of that pollutant (e.g. amount of gas flared per unit time)(U.S. EPA, 2014a). The emission factors adopted in the study(Table 1) were established by the UK Department of Energy andClimate Change (EEMS, 2008) and are similar to those recom-mended by the Exploration and Production Forum (E&P Forum,1994).
3.3. Methods
3.3.1. Computing gas flare emission ratesThe following equation for estimating emission rates taken from
OAQPS (1995) and Ontario Ministry of the Environment, 2007 wasused to calculate pollutant emissions:
E ¼ A*EF*ð1� ER=100Þ (1)
Where: E is the emission rate of a pollutant (g/s), A is the activityrate (g/s) which is the mass of gas flared, EF is emission factor of a
Table 1Emission factors used in the modelling. The units for the emission factors are ‘massof pollutant per unit mass of flared gas’. (Source: EEMS, 2008; E&P Forum, 1994).
Pollutant UK EEMS E&P Tier 2
CO 0.0067 0.0087NOX 0.0012 0.0015SO2 0.0000128 0.0000128VOC 0.01 0.015
pollutant, and ER is the overall emission reduction efficiency(flaring efficiency in %). Flaring efficiency of 75% was assumed forflares in the Niger Delta based on findings of earlier studies (Leaheyet al., 2001; Sawaragi and Akashi, 1978 cited in Abdulkareem,2005a). Ismail and Umukoro (2012) stated that “on a casualobservation of the flares in the Niger Delta one sees that they aresooty and evidently burn at low efficiency.” Flaring efficiency isthus used in this context as a primary measure of the overall per-formance of the flare systems and not necessarily as the combus-tion efficiency, which relates to the percentage of the natural gasthat is completely oxidized to CO2 and water (US. EPA, 1983).
The volume of gas flared (in m3/year) from each flare site wasestimated from remote sensing (Anejionu et al., 2015a). This wasconverted to a mass flow rate (g/s) assuming that the flared gas hasthe density of methane (the dominant component of the gasextracted in the Niger Delta (Isichei and Sanford, 1976)).
3.3.2. Computation of effective diameter and heightGas is typically flared from stacks of fixed height and diameter,
however actual combustion occurs beyond the tip of the flarestacks (Fig. 3). As a result, flare stack parameters such as effectiveheight and diameter are calculated to account for this.
Effective stack height is calculated as the sum of the stack heightand the height of the flame above the stack exit point to the flametip. The effective diameter is derived from the flare buoyancy flux.To compute the effective height (Heff ) and effective diameter (Deff ),various factors such as heat release are required to compute flamebuoyancy and height increase (see section 3.3.2.1 for details).
3.3.2.1. Details of computation of flaring parameters. Heat releasedwas computed using the following expression (San Joaquin ValleyAir Pollution Control District, 2014).

Fig. 3. Effective stack height and diameter (Price, 2013).
Table 2Selected annual mean air quality standards (U.S EPA, 2014B; WHO, 2005; CERC,2011).
Pollutant UK (mg/m3) EU (mg/m3) US (mg/m3) WHO (mg/m3)
CO 10000 10000 10000 10000NO2 40 40 53 40O3 100 120 147 100SO2 20 20 80 e
O.C.D. Anejionu et al. / Atmospheric Environment 118 (2015) 184e193 187
Q ¼ ðW=3:6Þ*X
wiqi (2)
Where: Q is heat released per hour (kW), W is gas flow rate (kg/hr),wi is mass fraction of component i, and qi is heating value of gascomponent i (MJ/kg). The methane heating value of 55.53 MJ/kgwas used.
The heat released was further converted from kW to J/s, and thenet heat released in J/s (Qn) computed by assuming a 25% heat loss(recommended as default) by (Ontario Ministry of Environment2003) using:
Qn ¼ ð75=100Þ*Qj (3)
The height increase (Dh) was computed using the followingequation:
Dh ¼ 0:00456xðQcÞ0:478ðOntario Ministry of the Environment; 2003Þ (4)
Where Qc is the net heat release in units of calories/s.Subsequently, the effective height (Heff ) is computed as:
Heff ¼ Hþ Dh (5)
Where H is the measured stack height.The flare buoyancy flux (Fb) in turn was computed using the
following expression:
Fb ¼ g*Qn
p*r*Ta*Cp(6)
Where g is acceleration due to gravity (m/s2), r is air density(kg/m3), Ta is air temperature (K) and Cp is the specific heat of dryair (J/(kg K). The flare buoyancy flux was subsequently used tocompute the effective diameter (Deff ), using the followingexpression:
Deff ¼
0BB@
2
0@Fb
0@ TfðTf�TaÞ
1A1A
ðgvÞ0:5
1CCA (7)
Where Tf ¼ flare exit temperature and v ¼ the stack exit velocity.Flare exit temperature of 1273 K (1000� C), which matches those inthe region (Abdulkareem, 2005a) and exit velocity of 20 m/s (U.SEPA, 1995; Ontario Ministry of Environment (2003)) was used.
3.3.3. Pollutant concentration verificationAs noted by Marais et al. (2014), there is a paucity of monitored
air pollution data for the Niger Delta. However, we were able to usea spatially and temporally limited set of ambient monitoring data(Osuji and Avwiri, 2005) for the purposes of model verification. Themonitoring sites were used as receptors, and modelled concen-trations were compared to observed concentrations at each site.
The model input and setup were initially verified for a singlesource (flare) using lower, central and upper volume estimatesfrom the MODIS volume estimation technique (Anejionu et al.,2015a). The resulting concentration profiles were similar to thosereported by Abdulkareem (2005b), with peak concentrationsoccurring 500me600m downwind of the source (SupplementaryFigure 1). Subsequently, the verification was extended to othersites within the region.
A binary validation matrix was computed and Factor-2 analysisconducted (Supplementary Tables 1 and 2). In addition, a semi-quantitative approach using data from the satellite-based Scan-ning Imaging Absorption Spectrometer for Atmospheric Cartog-raphy (SCIAMACHY) was used to guide the verification process. Thissemi-quantitative approach, which effectively indicated an upperlimit for the modelled estimates was used in conjunction with theFactor-2 matrix to select the most appropriate modelling parame-ters including volume flow rates (low, medium and high estimates)and background ozone concentration (Vingarzan, 2004). Maraiset al. (2014) similarly used satellite (including SCIAMACHY) andaircraft observations of atmospheric and tropospheric column-integrated concentrations to verify atmospheric composition overNigeria produced by a chemical transport model. Consequently,lower estimates of flaring volumes were used with a backgroundozone concentration of 10 mg/m3 in the modelling (seeSupplementary Tables 1 and 2).
3.3.4. Modelling gas flare pollutant concentrationsHaving verified the method and determined the relevant model
parameters ADMS-Urbanwas used tomodel the dispersion of flare-related pollutants (NO2, SO2, CO and O3) across the Niger Delta forthe period 2000 to 2013 inclusive. To establish a baseline for themodelling, various scenarios representing typical and possibleconditions in the region were simulated. About half of the flares inthe region are thought to be ground flares (open and horizontally-directed flares lying about 1.5m above the ground e Fig. 1) with theremainder thought to be short stacks (10m above the ground)

Fig. 4. Modelled annual mean NO2 concentrations from flares operating in the NigerDelta in 2000. Active flare sites are also shown.
Fig. 5. Modelled time series of annual mean NO2 concentrations across the Niger Delta
O.C.D. Anejionu et al. / Atmospheric Environment 118 (2015) 184e193188
(Dung et al., 2008; Isichei and Sanford, 1976). As we have no officialinformation on flare locations and heights, sensitivity to modelstack height was tested by assuming all flares were ground-based inone scenario and released from 15m stacks in another. Pollutantconcentrations across the region did not vary significantly betweenscenarios (about 1 mg/m3 difference) hence a height of 10m wasadopted for all the flares included in the study.
A variable surface roughness file was implemented to accountfor onshore and offshore environments with values of 0.3m and0.001m adopted for land and sea areas accordingly. Chemical re-actions between the primary pollutants and the atmosphere weremodelled to obtain secondary pollutants NO2 and O3 from NOx andVOC. Wet and dry deposition was also modelled.
3.3.5. Spatial modelling and analysis of pollutant concentrationThe results of the modelling were incorporated within a
Geographical Information System (GIS). This enabled pollution es-timates to be integrated with other spatial data for the regionincluding flare locations, state boundaries, ecological zones andpopulation data. The GIS also facilitated the investigation of
(2000e2013). Areas of highest concentration exceed the WHO limit of 40 mg m�3.
O.C.D. Anejionu et al. / Atmospheric Environment 118 (2015) 184e193 189
contributions from onshore and offshore flares, as well as individ-ual states. WHO Air Quality Limits (Table 2) were used to delineateareas of risk.
4. Results
Fig. 4 illustrates the spatial distribution of modelled pollutantconcentrations across the Niger Delta region for the representativeyear 2000. This year was chosen because emissions in 2000 werehigher than present day levels but lower than those experienced in2005 and 2006. Results are presented for NO2 and O3 since theseare key pollutants that affect human and plant health. Other pol-lutants showed similar overall patterns of dispersion.
States with few (Imo and Abia) or no (Enugu and Cross River)active flare sites experienced higher levels of pollution than statescontainingmultiple active flare sites (Bayelsa, Rivers and Delta) dueto the predominant south-westerly wind in the region. Imo, AkwaIbom, Abia and some parts of Rivers State experienced the highestlevels of pollution overall with annual mean concentrations of NO2
and O3 exceeding WHO annual limits (Table 2) in some years(Fig. 5). Limits for other pollutants such as CO and SO2 were notexceeded.
Fig. 5 illustrates mean NO2 concentration across the region for
Fig. 6. Modelled annual mean NO2 concentration across the Niger Delta in 2000 revealing spof source sector contributions does not equate to modelled total concentration (all flares) d
the period 2001e2013. Concentrations (of all pollutants) increaseto a peak in 2005/2006 before declining to the present day. Thistrend is consistent with crude oil production in Nigeria over thisperiod and with increased gas flaring noted by Anejionu et al.(2014, 2015a). These findings are consistent with statements fromthe oil and gas companies in the region regarding reduced flaringactivities (SPDC, 2013).
Separate models containing only flares from onshore andoffshore sources were run in order to determine relative and ab-solute contributions on a state-by-state basis. The results revealthat the majority of air pollution is generated by onshore sources(Fig. 6) and that the impact of offshore flares is negligible. However,a significant (>30%) proportion of air pollution received by AkwaIbom State and to a lesser extent the coastal areas of Bayelsa andDelta States, originates from offshore sources, because a lot offlaring activity takes place just off the coast of Akwa Ibom (Fig. 2).
In order to determine inter-state contributions to pollutantconcentrations across the region, the model was run 8 times usingemissions from each flaring state in turn. The concentrations pro-duced from each run were aggregated for each receiving state andstatistically summarised. The resulting ‘blame matrix’ for NO2 isshown in Table 3. Analysis of the ‘blame matrix’ revealed RiversState to be the largest single contributor to air pollution in many
ecific pollution contributions from offshore and onshore source sectors. Note: The sumue to non-linearities in the NO2 chemistry.

Table 3Blame matrix using mean NO2 concentration (mg/m3) for the year 2000 data to illustrate the pollutant contribution of individual states on neighbours.
Sources Receptors
Flaring States Non-Flaring States
Abia AK Bayelsa Delta Edo Imo Ondo Rivers Anambra Benue CR Ebonyi Enugu Kogi
Abia 1 0 0 0 0 0 0 0 0 0 0 0 0 0AK 0 7 0 0 0 0 0 0 0 1 5 1 0 0Bayelsa 11 6 10 6 1 14 0 12 9 7 7 10 8 2Delta 3 1 1 9 9 4 2 1 10 6 3 5 8 6Edo 0 0 0 2 5 0 1 0 3 2 1 1 3 3Imo 2 0 0 0 0 4 0 0 5 3 2 4 5 1Ondo 0 0 0 1 3 0 2 0 1 0 1 0 1 1Rivers 19 15 1 1 0 15 0 12 5 7 12 12 7 1
Note: AK denotes Akwa Ibom, CR denotes Cross River.The bolded concentrations highlight the magnitude of pollution generated by each state that were not transported to other states.
O.C.D. Anejionu et al. / Atmospheric Environment 118 (2015) 184e193190
states, exporting more pollution to Abia, Imo and Akwa Ibom, thanit generated locally. Other states, which are not officially classed asoil-producing, such as Enugu, Anambra, Cross River and Ebonyi,
Fig. 7. Modelled impacts of NO2 and O3 on human health and natural ecosystems. Maps shoO3 concentration and (d) O3 concentration in relation to underlying ecological zones. 2005
also experienced high concentrations. Approximately 20 millionpeople live in the towns and cities of these densely populated states(Nigeria Population Commission, 2010) and are exposed to high
w: (a) NO2 concentration (b) NO2 concentration in relation to underlying population (c)results were used in this case to illustrate maximum impact.

Fig. 8. Map showing annual rates of total (wet þ dry) deposition across the NigerDelta, 2000.
O.C.D. Anejionu et al. / Atmospheric Environment 118 (2015) 184e193 191
levels of pollution from sources beyond their immediate control.Fig. 7 illustrates the potential impact of air pollution on major
population centres in and around the Niger Delta in addition toimpacts on vegetation and ecosystems. Major towns and cities suchas Enugu, Aba and Calabar all experienced high levels of pollutionin 2005/06, while others such as Port Harcourt, Benin City andWarri experienced much lower levels in comparison. Elevatedozone levels were found across the Niger Delta, suggesting signif-icant harmful impacts on plants in all ecological zones (Fig. 7c andTable 4). The rainforest was found to be the most susceptible todamage with 51% of this zone being exposed to high ozone levels(Table 4). This is important not only for the natural ecosystem, butbecause the majority of farming in the region is carried out withinthis zone, implying strong negative impacts on biodiversity andagriculture. The freshwater swamp, mangrove and savannah zoneswere also heavily impacted by secondary pollutants, withmoderateor high ozone levels being experienced over 58%, 33% and 43% oftheir areas, respectively.
Fig. 8 illustrates the spatial distribution of pollutant deposition.In contrast to the dispersion of gases such as NO2, patterns of wetand dry deposition aremuchmore localised within themain flaringareas.
To understand the extent to which present day levels of airpollution could be reduced further in the region the model was re-run using 2013 sources with assumed flaring efficiencies of 85% and95% respectively. The results are summarised in Table 5.
5. Discussion
In this study, the gas flaring process was implemented within aconventional dispersion model using emission estimates derivedfrom remotely-sensed imagery. The results suggest that gas flaringremains a major contributor to air pollution across the region withstates containing few or no active flare sites often experiencinghigher levels of pollution than states actively involved in the flaringprocess (Figs. 4 and 7). This large dispersion range may beexplained by the high momentum and buoyancy of the flareplumes. This is important because prior to this finding, it has alwaysbeen assumed that the effects of gas flaring were highly localised innature (Ovri and Iroh, 2013; Dung et al., 2008; Isichei and Sanford,1976). Consequently, fiscal intervention and compensation fromthe Federal Government of Nigeria to cushion the effects of envi-ronmental degradation resulting from oil exploration activitiessuch as gas flaring has not been extended to the non-oil-producingstates. The findings from this research provide clear evidencejustifying the need for the revision of such compensatory policies.
The pollution risk maps (Fig. 5) revealed that major towns andcities located some distance from major flaring activity haveexperienced pollutant levels in excess of WHO limits, while townsin prominent flaring states, have experienced much lower levels incomparison. It should, however, be noted that although somemajorcities (Warri and Benin City) were found not to be among the veryhigh risk areas, pollution from other sources (transport and in-dustry) could lead to exceedance of WHO limits. Analysis of themodelled deposition (Fig. 8) revealed that Rivers State was at the
Table 4Modelled impacts (km2) of ozone on main ecological zones in the Niger Delta in 2005.
Freshwater M
Very Low (<20) 0 (0%) 22Low (20e60) 4552 (42%) 12Moderate (60e100) 4812 (44%) 40High (>100) 1547 (14%) 32Zone Extent (in study area) 10911 22
greatest risk of acid deposition, followed by Akwa Ibom. This cor-roborates previous studies, where rainwater was found to be acidicaround flaring locations (Ovri and Iroh, 2013; Ekpoh and Obia,2010; Nduka et al., 2008).
Analyses of results obtained from amodel scenario of increasingflaring efficiency (Table 5), based on simple treatment of emissions(Equation (1)), suggest that significant improvements in air qualitycould be achieved by increasing the flaring efficiency of sites in theregion. Even at 85% flaring efficiency, no part of the region wouldexperience pollution levels exceeding the WHO standards.
The results obtained from modelling a hypothetical scenario inwhich emissions were suppressed at some of the most active flar-ing sites in the region revealed that the proportion of pollutiongenerated by these flares was relatively high compared to thatgenerated by the remaining flares in the region (Table 6) with 27%of the pollution in the study area (and much higher proportions insome states) generated by only 14 out of the 103 active flares. Thissuggests that air quality in the Niger Delta could be improvedfurther through targeted interventions of selected sources.
Whilst the outcomes of this research cast an interesting light onthe environmental impacts of gas flaring in the Niger Delta, itshould be acknowledged that the results presented are illustrativeas opposed to definitive, with large uncertainty bounds. In thisstudy we had limited access to hourly meteorological data from theregion, no reliable information on emission rates, limited infor-mation on flare stack heights and limited ambient monitoring datafor verification purposes. Despite these limitations, which mayaffect the absolute accuracy of our results, this study does provideimportant insights into the impacts of flaring on local and regionalair pollution. It has shown the value of combining flaring volumeestimates from remotely-sensed data with emission factors togenerate credible emission rates that can be employed in adispersionmodel. Given the lack of official information on pollutant
angrove Rainforest Savannah
89 (10%) 15051 (17%) 23972 (24%)694 (57%) 14093 (16%) 32186 (33%)66 (18%) 15002 (17%) 25020 (25%)96 (15%) 46169 (51%) 17290 (18%)345 90315 98468

Table 5Statistical summary of pollution surfaces obtained using different flaring efficiencies tested based on 2013 emissions (mg/m3). Percentage improvements were obtained bysubtracting the pollutant concentrations for 95% efficiency from the corresponding 75% efficiency, and using the difference to calculate percentage improvement from 75%concentration levels.
Maximum concentration Mean & (5th e 95th) percentile
Flaring efficiency CO NO2 SO2 O3 CO NO2 SO2 O3
75% 664 36 1 47 82 (1e241) 8 (0e19) 0 (0e1) 18 (10e31)85% 452 24 1 60 55 (1e159) 5 (0e13) 0 (0 - 0) 21 (10e38)95% 150 12 0 27 18 (0e53) 2 (2e7) 0 (0e0) 10 (14e19)75% minus 95% 514 24 1 20 62 6 0* 8Improvement (%) 77 67 70 43 76 75 81 44
*Note for SO2: mean at 75% ¼ 0.16, mean at 95% ¼ 0.03.
Table 6The impact of suppressing emissions from the 14 largest flaring sites in the region (2013). Note: the sum of concentrations from the 14 largest sites and the other sites does notequate to corresponding modelled concentrations for all flares due to non-linearities in the NO2 chemistry.
State All Flares (mg/m3) 14 Flaring Sites (mg/m3) Other sites (mg/m3) % Contribution 14 Sites % Contribution Other Sites
Abia 18 8 14 36 64Akwa Ibom 18 6 15 29 71Anambra 19 8 15 35 65Bayelsa 9 1 8 11 89Benue 13 5 11 31 69Cross River 17 6 14 30 70Delta 14 3 12 20 80Ebonyi 16 7 13 35 65Edo 12 2 11 15 85Enugu 16 7 13 35 65Imo 21 10 15 40 60Kogi 7 2 6 25 75Ondo 3 0 3 0 100Rivers 15 6 12 33 67Regional 14 5 12 27 73
O.C.D. Anejionu et al. / Atmospheric Environment 118 (2015) 184e193192
concentrations in the region, these model estimates are invaluable.We expect that our results will serve as a guide to researchers, whonow have some empirical basis with which to underpin their ob-servations of flaring impacts. It may also catalyse the release ofmonitored data bymultinational companies operating in the regionand prompt further research. The results may also result in policychanges, as state governments in the high risk areas who are notreceiving commensurate compensations from the Federal Gov-ernment could base their arguments on the findings of thisresearch. It is also our expectation that techniques developed in theresearch will play significant role in the future monitoring andmanagement of air quality in the Niger Delta. Based on themodelled time-series, we have shown that pollutant concentra-tions are now declining across the region as flaring activities arereduced, but we have also demonstrated that further improve-ments in air quality can be achieved through the adoption of moreefficient flaring technologies.
6. Conclusion
This research pioneered the use of emission information derivedfrom remotely-sensed data in estimating air pollution linked to gasflaring in the region. The results indicate the likely magnitude andextent of pollution across the region associated with the gas flaringprocess. We hope that the results from this study will prompt therelease of more flaring information, leading to better source char-acterisation and further refinement of the modelling process.
Despite limitations encountered, we conclude that the processof gas flaring has been, and continues to be, a major influence on airpollution in the region. Since flaring has been practiced for close to60 years, the environmental and health impacts are likely to havebeen significant. Looking forwards, future impacts can be
minimised with improved flaring efficiency and suppression offlaring activity from some of the larger sites.
Acknowledgements
We wish to acknowledge the Petroleum Technology Develop-ment Fund (PTDF Nigeria) who sustained the later stages of thisresearch via a scholarship, the Surveyors Council of Nigeria (SUR-CON), who partly supported the initial stages of this project with aresearch grant, and the Department of Geoinformatics andSurveying, University of Nigeria Enugu Campus, for the provision ofthe political map that was used in this research. We also thank DrDavid Carruthers (CERC) for his invaluable feedback and acknowl-edge the free use of tropospheric NO2 column data from theSCIAMACHY sensor from www.temis.nl.
Appendix A. Supplementary data
Supplementary data related to this article can be found at http://dx.doi.org/10.1016/j.atmosenv.2015.08.006.
References
Abdulkareem, A.S., 2005a. Evaluation of Ground Level Concentration of PollutantDue to Gas Flaring by Computer Simulation: a Case Study of Niger. Delta Area ofNigeria.
Abdulkareem, A.S., 2005b. Urban air pollution evaluation by computer simulation: acase study of petroleum refining company Nigeria. Leonardo J. Sci. 6, 17e28.
Abdul-Raheem, A.M.O., Adejola, F.A., 2013. Variation of source distribution of totaloxidants: contributions of oxides of nitrogen, sulphur (IV) oxide emissions andbackground ozone from Lagos-Nigeria. Int. J. Phys. Sci. 8 (11), 411e420.
Anejionu, O.C.D., 2014. Remote Survey of Gas Flares and Associated Environmentaland Health Impacts in the Niger Delta (PhD thesis submitted to the LancasterUniversity).
Anejionu, C.D.O., Blackburn, G.A., Whyatt, J.D., 2014. Satellite survey of gas flares:
O.C.D. Anejionu et al. / Atmospheric Environment 118 (2015) 184e193 193
development and application of a Landsat-based technique in the Niger delta.Int. J. Remote Sens. 35 (5), 1900e1925.
Anejionu, C.D.O., Blackburn, G.A., Whyatt, J.D., 2015a. Detecting gas flares andestimating flaring volumes at individual flow stations using MODIS data.Remote Sens. Environ. 158, 81e94.
Anejionu, O.C.D., Ahiarammunnah, P.A.N., Nri-ezedi, C.J., 2015b. Hydrocarbonpollution in the Niger delta: geographies of impacts and appraisal of lapses inextant legal framework. Resour. Policy 45, 65e77.
Arciszewska, C., McClatchey, J., 2001. The importance of meteorological data formodelling air pollution using ADMS-urban. Meteorological Appl. J. 8, 345e350.
Backshall, D., 2013. Atmospheric Dispersion Modelling of Discharges to Air from theFlaring of Fracturing Fluid. Prepared for Taranaki Regional Council by AirQuality Management Ltd. Report Number 13e008.
CERC (Cambridge Environmental Research Consultants), 2011. ADMS-urban: anUrban Air Quality Management System. User Guide -Version 3.1.
Climate Charts, 2010. Port Harcourt, Nigeria: Climate, Global Warming, and DaylightCharts and Data. http://www.climate-charts.com/Locations/n/NI65250.php(accessed 17.12.13.).
Davies, G., Whyatt, J.D., 2014. A network-based approach for estimating pedestrianjourney-time exposure to air pollution. Sci. Total Environ. 485e486, 62e70.
Dung, E.J., Bombom, L.S., Agusomu, T.D., 2008. The effects of gas flaring on crops inthe niger delta, Nigeria. GeoJournal 73, 297e305.
E&P Forum (Exploration and Production Forum), 1994. Methods for Estimation ofAtmospheric Emissions from E&P Operations. The Oil Industry InternationalExploration and Production Forum Report No 2.59/197.
EEMS (Environmental Emissions Monitoring System), 2008. Atmospheric EmissionsCalculations. https://www.gov.uk/government/uploads/system/uploads/attachment_data/file/136461/atmos-calcs.pdf (accessed 17.12.13.).
Ekpoh, I.J., Obia, A.E., 2010. .The role of gas flaring in the rapid corrosion of zincroofs in the niger delta region of Nigeria. Environmentalist 30, 347e352.
Elvidge, C.D., Ziskin, D., Baugh, K.E., Tuttle, B.T., Ghosh, T., Pack, D.W., Erwin, E.H.,Zhizhin, M., 2009. A fifteen year record of global natural gas flaring derivedfrom satellite data. Energies 2, 592e622.
Ezeamalu, B., 2014. Investigation: How Decades of Gas Flaring Is Harming Nigerians(Part 1). Premium Times Newspaper. http://www.premiumtimesng.com/news/160899-investigation-decades-gas-flaring-harming-nigerians-part-1.html(accessed 17.05.14.).
Isichei, A.O., Sanford, W.W., 1976. The effects of waste gas flares on the surroundingvegetation in South- Eastern Nigeria. J. Appl. Ecol. 13 (1), 177e187.
Ismail, O.S., Umukoro, G.E., 2012. Global impact of gas flaring. Energy Power Eng. 4,290e302.
IUCN (International Union for the Conservation of Nature), 1994. A guide to theconvention to the biological diversity. Environ. Policy Law Pap. 30. https://portals.iucn.org/library/efiles/documents/EPLP-no.030.pdf (accessed 10.12.11.).
Johnson, M.R., Coderre, A.R., 2012. Compositions and Greenhouse gas emissionfactors of flared and vented gas in the Western Canadian sedimentary basin.J. Air & Waste Manag. Assoc. 62 (9), 992e1002.
Leahey, D.M., Preston, K., Strosher, M., 2001. Theoretical and observational assess-ments of flare efficiencies. J. Air Waste Manag. Assoc. 51, 1610e1616.
Marais, E.A., Jacob, D.J., Wecht, K., Lerot, C., Zhang, L., Yu, K., Kurosu, T.P., Chance, K.,Sauvage, B., 2014. Anthropogenic emissions in Nigeria and implications foratmospheric ozone pollution: a view from space. Atmos. Environ. 99, 32e40.
Nigeria Population Commission, 2010. 2006 population and Housing Census:Population Distribution by State, LGA, and Senatorial Districts. http://www.ibenaija.org/uploads/1/0/1/2/10128027/vol_03_table_dsx_lgapop_by_sdistrict-pdf.pdf (accessed 15.06.13.).
Norwegian Meteorological Institute, 2014. Weather Statistics for Port Harcourt,Rivers (Nigeria). http://www.yr.no/place/Nigeria/Rivers/Port_Harcourt/statistics.html (accessed 17.12.13.).
Nwachukwu, A.N., Chukwuocha, E.O., Igbudu, O., 2012. A survey on the effects of airpollution on diseases of the people of Rivers state, Nigeria. Afr. J. Environ. Sci.
Technol. 6 (10), 371e379.Nduka, J.K.C., Orisakwe, O.E., Ezenweke, L.O., Ezenwa, T.E., Chendo, M.N.,
Ezeabasili, N.G., 2008. Acid rain phenomenon in Niger delta region of Nigeria:economic, biodiversity and public health concern. Sci. World J. 8, 811e818.
OAQPS (U.S. EPA Office of Air Quality Planning and Standards), 1984. Evaluation ofthe Efficiency of Industrial Flares. http://www.tceq.state.tx.us/assets/public/implementation/air/rules/Flare/Resource_2.pdf (accessed on 20.03.14.).
OAQPS (U.S. EPA Office of Air Quality Planning and Standards), 1995. Compilation ofAir Pollution Emission Factors: Volume 1 e Stationary Points and Area Sources.AP 42 Document. http://www.epa.gov/ttn/chief/ap42/index.html (accessed19.02.14.).
Odu, C.T.I., 1994. Gas flare Emissions and their Effects on the Acidity of Rain Waterin the Ebocha Area. https://www.elaw.org/system/files/Ng.GasFlares.AcidRain.Ebocha.doc (accessed 09.03.13.).
OGP (International Association of Oil and Gas Producers), 2000. Flaring and Ventingin the Oil and Gas Exploration and Production Industry: an Overview of Pur-pose, Quantities, Issues, Practices and Trends. Report No. 2.79/288. http://www.ogp.org.uk/pubs/288.pdf (accessed 14.01.14.).
Ontario Ministry of the Environment, 2003. Proposed Guidance for Air DispersionModelling. http://www.weblakes.com/products/aermod/resources/Ontario_MOE_Proposed_Air_Dispersion_Modelling_Guidance.pdf (accessed 19.02.14.).
Ontario Ministry of the Environment, 2007. Step by Step Guideline for EmissionCalculation, Record Keeping and Reporting for Airborne Contaminant Discharge(accessed 14.04.14.).
Ovri, J.E.O., Iroh, M., 2013. Corrosion Effect of Gas Flaring On Galvanized RoofingSheet in Imo State, Nigeria. Int. J. Eng. Sci 2 (1), 339e345.
Osuji, L.C., Avwiri, G.O., 2005. Flared gases and other pollutants associated with airquality in industrial areas of Nigeria: an Overview. Chem. Biodivers. 2, 1e8.
Price, C., 2013. Modelling flares in ADMS 5. In: Presented at ADMS 5 User GroupMeeting at the Assembly Rooms, Newcastle (13th November).
Rotty, R.M., 1974. First estimates of global flaring of natural gas. Atmos. Environ. 8,681e686.
San Joaquin Valley Air Pollution Control District. (2014). http://www.valleyair.org/busind/pto/Resources/Modeling/Source%20Parameters/Flare%20Modeling%20Parameters.xlsx (accessed 19.01.14.).
SPDC (Shell Petroleum Development Company of Nigeria), 2013. Shell in Nigeria:Gas Flaring. http://s02.static-shell.com/content/dam/shell-new/local/country/nga/downloads/pdf/2013bnotes/gas-flaring.pdf (accessed 09.03.14).
Tawari, C.C., Abowei, J.F.N., 2012. Air pollution in the niger delta area of Nigeria. Int.J. Fish. Aquatic Sci. 1 (2), 94e117.
U.S. EPA (United States Environmental Protection Agency), 1983. Flare efficiencystudy. EPA-600/2-83-052.
U.S. EPA (United States Environmental Protection Agency), 2011. DispersionModelling. http://www.epa.gov/air/aqmportal/management/modeling/dispersion.htm (accessed 04.10.13.).
U.S. EPA (United States Environmental Protection Agency), 1995. SCREEN3 ModelUser's Guide. Office of Air Quality Planning and Standards Emissions, Moni-toring, and Analysis Division. EPA-454/B-95e004. http://www.epa.gov/scram001/userg/screen/screen3d.pdf. accessed 19.02.14.
U.S. EPA (United States Environmental Protection Agency), 2014a. Emissions Factors& AP 42, Compilation of Air Pollutant Emission Factors. http://www.epa.gov/ttn/chief/ap42/index.html (accessed 21.02.14).
U.S. EPA (United States Environmental Protection Agency), 2014b. National AmbientAir Quality Standards (NAAQS). http://www.epa.gov/air/criteria.html.
Vingarzan, R., 2004. A review of surface ozone background levels and trends.Atmos. Environ. 38, 3431e3442.
Weather Underground, 2013. Weather History for Malabo, Equatorial Guinea.http://www.wunderground.com/history/airport/FGSL (accessed 12.12.13).
WHO (World Health Organisation), 2005. WHO Air Quality Guidelines for Particu-late Matter, Ozone, Nitrogen Dioxide and Sulfur Dioxide. Global Update. Sum-mary of Risk Assessment. WHO/SDE/PHE/OEH/06.02.