Towards a Joint Regional Agenda for the Alleviation of ...
23
CAPSA Monograph No. 50 Towards a Joint Regional Agenda for the Alleviation of Poverty through Agriculture and Secondary Crop Development Bangkok, 21-22 November 2007 Proceedings of the Regional Meeting Edited by J.W. Taco Bottema Geoff Thompson I Wayan Rusastra Robert Baldwin
-
Upload
khangminh22 -
Category
Documents
-
view
0 -
download
0
Transcript of Towards a Joint Regional Agenda for the Alleviation of ...
CAPSA Monograph No. 50
Towards a Joint Regional Agendafor the Alleviation of Poverty
through Agriculture andSecondary Crop Development
Bangkok, 21-22 November 2007
Proceedings of the Regional Meeting
Edited by
J.W. Taco BottemaGeoff Thompson
I Wayan RusastraRobert Baldwin
41
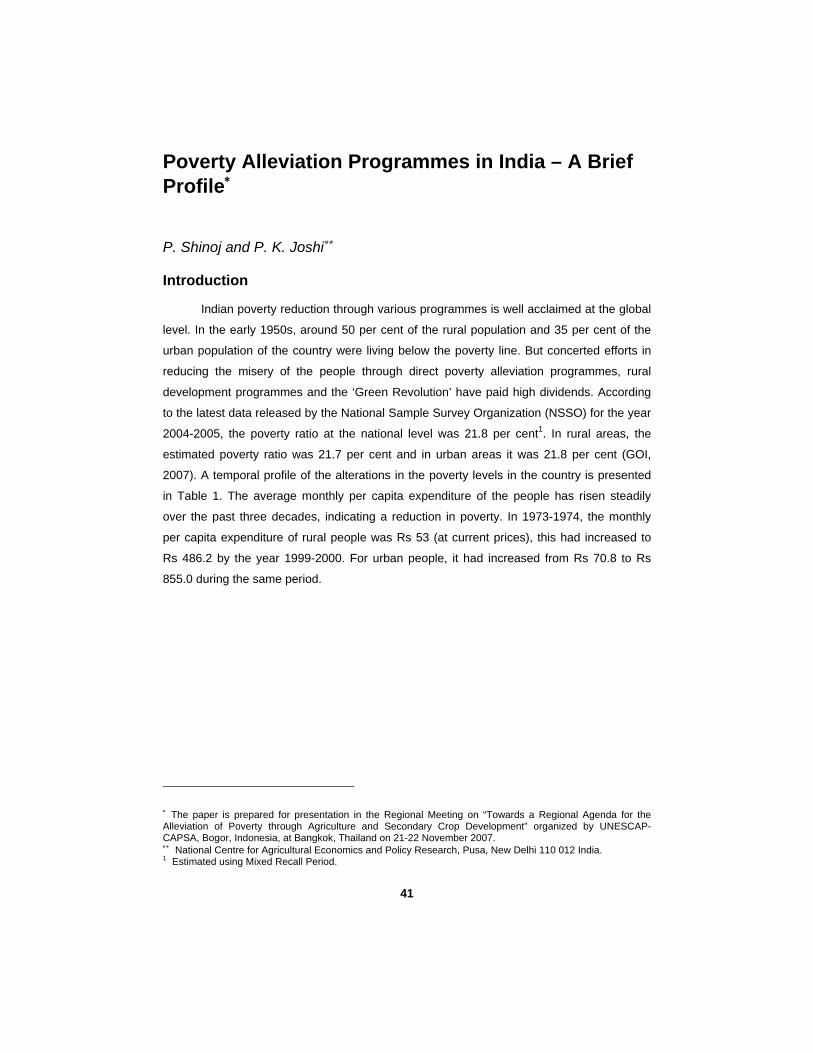
Poverty Alleviation Programmes in India – A Brief Profile∗
P. Shinoj and P. K. Joshi∗∗
Introduction
Indian poverty reduction through various programmes is well acclaimed at the global
level. In the early 1950s, around 50 per cent of the rural population and 35 per cent of the
urban population of the country were living below the poverty line. But concerted efforts in
reducing the misery of the people through direct poverty alleviation programmes, rural
development programmes and the ‘Green Revolution’ have paid high dividends. According
to the latest data released by the National Sample Survey Organization (NSSO) for the year
2004-2005, the poverty ratio at the national level was 21.8 per cent1. In rural areas, the
estimated poverty ratio was 21.7 per cent and in urban areas it was 21.8 per cent (GOI,
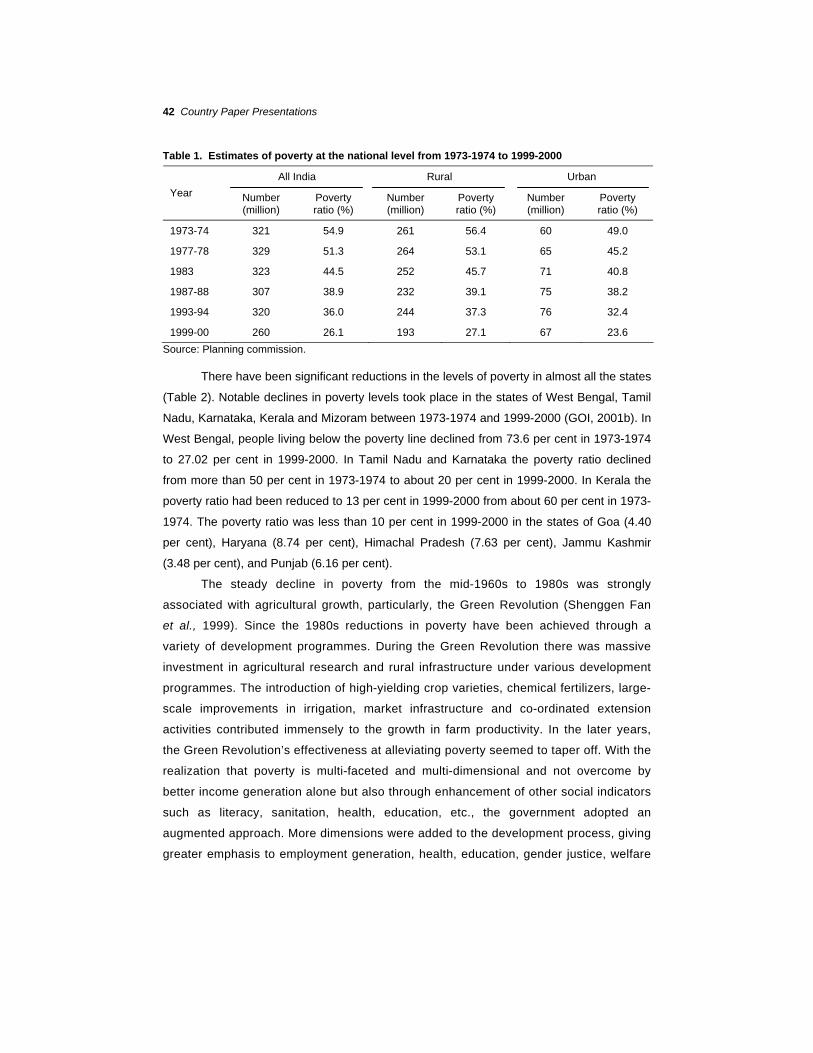
2007). A temporal profile of the alterations in the poverty levels in the country is presented
in Table 1. The average monthly per capita expenditure of the people has risen steadily
over the past three decades, indicating a reduction in poverty. In 1973-1974, the monthly
per capita expenditure of rural people was Rs 53 (at current prices), this had increased to
Rs 486.2 by the year 1999-2000. For urban people, it had increased from Rs 70.8 to Rs
855.0 during the same period.
∗ The paper is prepared for presentation in the Regional Meeting on “Towards a Regional Agenda for the Alleviation of Poverty through Agriculture and Secondary Crop Development” organized by UNESCAP-CAPSA, Bogor, Indonesia, at Bangkok, Thailand on 21-22 November 2007. ∗∗ National Centre for Agricultural Economics and Policy Research, Pusa, New Delhi 110 012 India. 1 Estimated using Mixed Recall Period.
42 Country Paper Presentations
Table 1. Estimates of poverty at the national level from 1973-1974 to 1999-2000
All India Rural Urban
Year Number (million)
Poverty ratio (%)
Number (million)
Poverty ratio (%)
Number (million)
Poverty ratio (%)
1973-74 321 54.9 261 56.4 60 49.0
1977-78 329 51.3 264 53.1 65 45.2
1983 323 44.5 252 45.7 71 40.8
1987-88 307 38.9 232 39.1 75 38.2
1993-94 320 36.0 244 37.3 76 32.4
1999-00 260 26.1 193 27.1 67 23.6
Source: Planning commission.
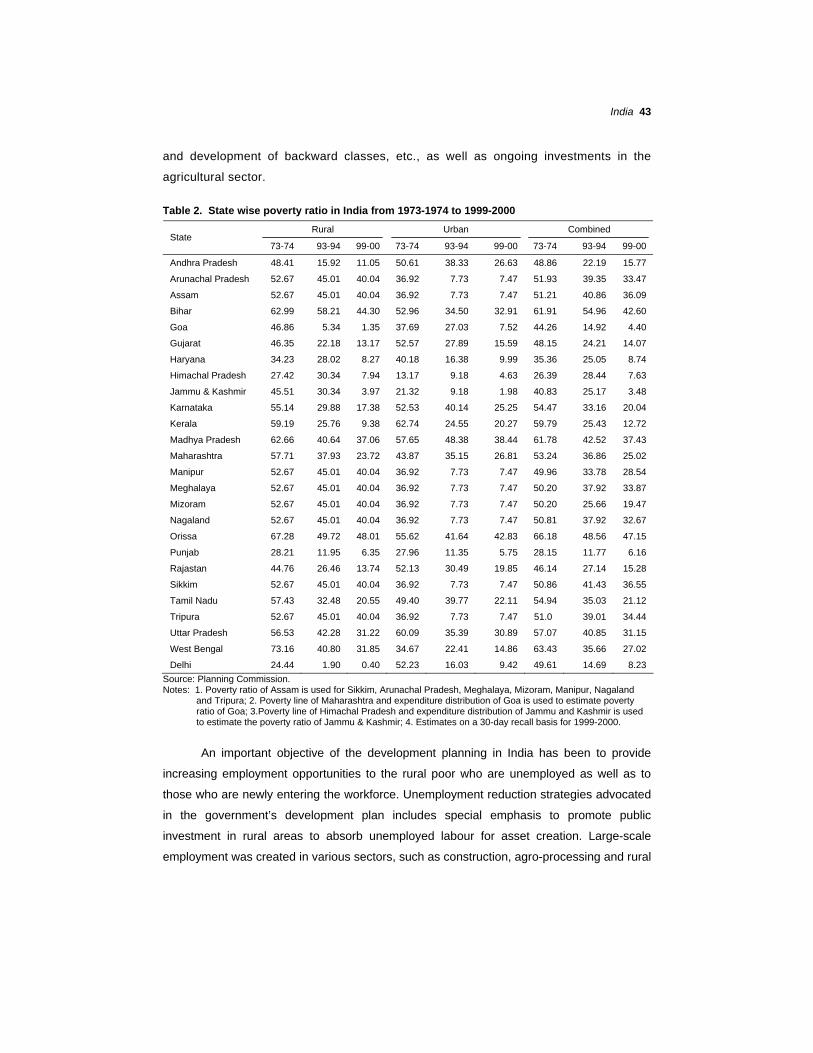
There have been significant reductions in the levels of poverty in almost all the states
(Table 2). Notable declines in poverty levels took place in the states of West Bengal, Tamil
Nadu, Karnataka, Kerala and Mizoram between 1973-1974 and 1999-2000 (GOI, 2001b). In
West Bengal, people living below the poverty line declined from 73.6 per cent in 1973-1974
to 27.02 per cent in 1999-2000. In Tamil Nadu and Karnataka the poverty ratio declined
from more than 50 per cent in 1973-1974 to about 20 per cent in 1999-2000. In Kerala the
poverty ratio had been reduced to 13 per cent in 1999-2000 from about 60 per cent in 1973-
1974. The poverty ratio was less than 10 per cent in 1999-2000 in the states of Goa (4.40
per cent), Haryana (8.74 per cent), Himachal Pradesh (7.63 per cent), Jammu Kashmir
(3.48 per cent), and Punjab (6.16 per cent).
The steady decline in poverty from the mid-1960s to 1980s was strongly
associated with agricultural growth, particularly, the Green Revolution (Shenggen Fan
et al., 1999). Since the 1980s reductions in poverty have been achieved through a
variety of development programmes. During the Green Revolution there was massive
investment in agricultural research and rural infrastructure under various development
programmes. The introduction of high-yielding crop varieties, chemical fertilizers, large-
scale improvements in irrigation, market infrastructure and co-ordinated extension
activities contributed immensely to the growth in farm productivity. In the later years,
the Green Revolution’s effectiveness at alleviating poverty seemed to taper off. With the
realization that poverty is multi-faceted and multi-dimensional and not overcome by
better income generation alone but also through enhancement of other social indicators
such as literacy, sanitation, health, education, etc., the government adopted an
augmented approach. More dimensions were added to the development process, giving
greater emphasis to employment generation, health, education, gender justice, welfare
India 43
and development of backward classes, etc., as well as ongoing investments in the
agricultural sector.
Table 2. State wise poverty ratio in India from 1973-1974 to 1999-2000
Rural Urban Combined State
73-74 93-94 99-00 73-74 93-94 99-00 73-74 93-94 99-00
Andhra Pradesh 48.41 15.92 11.05 50.61 38.33 26.63 48.86 22.19 15.77
Arunachal Pradesh 52.67 45.01 40.04 36.92 7.73 7.47 51.93 39.35 33.47
Assam 52.67 45.01 40.04 36.92 7.73 7.47 51.21 40.86 36.09
Bihar 62.99 58.21 44.30 52.96 34.50 32.91 61.91 54.96 42.60
Goa 46.86 5.34 1.35 37.69 27.03 7.52 44.26 14.92 4.40
Gujarat 46.35 22.18 13.17 52.57 27.89 15.59 48.15 24.21 14.07
Haryana 34.23 28.02 8.27 40.18 16.38 9.99 35.36 25.05 8.74
Himachal Pradesh 27.42 30.34 7.94 13.17 9.18 4.63 26.39 28.44 7.63
Jammu & Kashmir 45.51 30.34 3.97 21.32 9.18 1.98 40.83 25.17 3.48
Karnataka 55.14 29.88 17.38 52.53 40.14 25.25 54.47 33.16 20.04
Kerala 59.19 25.76 9.38 62.74 24.55 20.27 59.79 25.43 12.72
Madhya Pradesh 62.66 40.64 37.06 57.65 48.38 38.44 61.78 42.52 37.43
Maharashtra 57.71 37.93 23.72 43.87 35.15 26.81 53.24 36.86 25.02
Manipur 52.67 45.01 40.04 36.92 7.73 7.47 49.96 33.78 28.54
Meghalaya 52.67 45.01 40.04 36.92 7.73 7.47 50.20 37.92 33.87
Mizoram 52.67 45.01 40.04 36.92 7.73 7.47 50.20 25.66 19.47
Nagaland 52.67 45.01 40.04 36.92 7.73 7.47 50.81 37.92 32.67
Orissa 67.28 49.72 48.01 55.62 41.64 42.83 66.18 48.56 47.15
Punjab 28.21 11.95 6.35 27.96 11.35 5.75 28.15 11.77 6.16
Rajastan 44.76 26.46 13.74 52.13 30.49 19.85 46.14 27.14 15.28
Sikkim 52.67 45.01 40.04 36.92 7.73 7.47 50.86 41.43 36.55
Tamil Nadu 57.43 32.48 20.55 49.40 39.77 22.11 54.94 35.03 21.12
Tripura 52.67 45.01 40.04 36.92 7.73 7.47 51.0 39.01 34.44
Uttar Pradesh 56.53 42.28 31.22 60.09 35.39 30.89 57.07 40.85 31.15
West Bengal 73.16 40.80 31.85 34.67 22.41 14.86 63.43 35.66 27.02
Delhi 24.44 1.90 0.40 52.23 16.03 9.42 49.61 14.69 8.23
Source: Planning Commission. Notes: 1. Poverty ratio of Assam is used for Sikkim, Arunachal Pradesh, Meghalaya, Mizoram, Manipur, Nagaland
and Tripura; 2. Poverty line of Maharashtra and expenditure distribution of Goa is used to estimate poverty ratio of Goa; 3.Poverty line of Himachal Pradesh and expenditure distribution of Jammu and Kashmir is used to estimate the poverty ratio of Jammu & Kashmir; 4. Estimates on a 30-day recall basis for 1999-2000.
An important objective of the development planning in India has been to provide
increasing employment opportunities to the rural poor who are unemployed as well as to
those who are newly entering the workforce. Unemployment reduction strategies advocated
in the government’s development plan includes special emphasis to promote public
investment in rural areas to absorb unemployed labour for asset creation. Large-scale
employment was created in various sectors, such as construction, agro-processing and rural
44 Country Paper Presentations
services covering both skilled and unskilled people. Technical and financial assistance, low-
interest bank loans, provision of tools, training programmes, etc., were extended and
expanded to encourage self-employment for educated youths. In addition to employment
programmes, various housing development schemes, infrastructure development schemes,
crop insurance schemes, education schemes and food grain distribution programmes were
also implemented to address various needs of the rural and urban poor of the country.
There were some integrated programmes such as the Integrated Rural Development
Programme (IRDP) and Drought Prone Area Programme (DPAP) which aimed at overall
development of rural households by providing suitable income generating opportunities
through a mix of subsidies and credits to undertake farm and non-farm income generating
activities. The Public Distribution Programme (PDS) ensures food security for households in
rural and urban areas. Food distribution programmes with high subsidies under the
Antyodaya Anna Yojana and nutritional security for children under the Midday Meal scheme
continue to be important programmes contributing to food and nutritional security in
underprivileged areas and societies.
This paper collates various ongoing programmes specifically designed to alleviate
poverty. The programmes are broadly classified under six categories: (i) increasing farm
income and labour productivity; (ii) employment generation programmes; (iii) rural
development programmes; (iv) local area development programmes; (v) transfer of cash
and food grains to the poor; and (vi) reducing costs through subsidies and augmenting
prices. A list of various poverty alleviation programmes initiated in India since the inception
of planned development in the country is presented in Appendix 1.
Programmes aimed at augmenting farm income and labour productivity
Specifically designed anti-poverty programmes to generate both self-employment and
wage employment in rural areas were redesigned and restructured in 1999-2000 to enhance
their efficiency and sustainability. All these ongoing programmes have been designed with a
focus on the provision of basic services for improving the quality of life of the people, to protect
the poor from destitution, to reduce the negative impact of sharp fluctuations in employment
and incomes and social insecurity (GOI, 2001a). These projects and programmes can be
broadly grouped into different categories based on their impact channels. These cover a range
of activities like land reform, irrigation development, promotion of high-value commodities such
as horticulture, bamboo, fish, plantation crops and agricultural insurance.
India 45
Land reforms Land reforms have been viewed both as a means for achieving redistributive justice
and as a means for attaining higher levels of agricultural production and incomes in rural
areas. Access to land is still a major source of employment and income in rural areas.
Therefore, the issue of agrarian restructuring continues to receive priority. The major
components of the Land Reforms Policy include, detection and distribution of ceiling surplus
lands, tenancy reforms, consolidation of land holdings, providing access to poor to common
lands and wastelands, preventing the alienation of tribal lands and providing land rights to
women. For successful land reforms, updating of land records by traditional methods as well
as through computerization is an essential prerequisite (GOI, 2001a). Up to 1995, 3 million
hectares of land had been declared surplus, out of which 2.66 million ha of land was
distributed among 5.03 million landless labourers. Also 76.2 million ha of land have been
brought under the process of land consolidation (Pratyogita Darpan, 2007). However the
progress of this programme has been rather slow. Most of the states have stopped the
consolidation programmes and the achievements so far have not been very impressive.
Command Area Development and Water Management Programme (CADWMP)
The centrally sponsored command area development (CAD) programme was
launched in 1974-1975 with the main objective of improving utilization of created irrigation
potential and optimizing agriculture production and productivity from irrigated lands on a
sustainable basis, by integrating all functions related to irrigated agriculture through a multi-
disciplinary team under an area development authority. So far, 310 irrigation projects with a
Cultural Command Area (CCA) of 28.85 million ha have been included under the
programme, out of which 133 projects are ongoing. To further strengthen the programme,
CAD was restructured and renamed ‘Command Area Development and Water Management
Programme’ (CADWMP) in April 2004. The programme includes execution of on-farm
development works such as construction of field channels and drains, reclamation of
waterlogged areas, renovation and rehabilitation of tanks, etc. CADWMP also involves other
activities such as adaptive trials, demonstrations, training of farmers and evaluation studies
(Pratyogita Darpan, 2006).
Central scheme on micro-irrigation A centrally sponsored scheme on micro-irrigation was launched in January 2006
covering a total area of 620 thousand ha. The scheme aims to achieve greater water use
46 Country Paper Presentations
efficiency to enhance productivity and provide better quality produce. During 2006-2007, an
Annual Action Plan for 14 States has already been approved pursuant to the guidelines and
a sum of Rs 2,794 million had been released to the States up to November 2006. So far the
scheme has covered an area of 331 thousand ha (GOI, 2007).
National Horticulture Mission (NHM) National horticulture mission was launched in May 2005 as a major initiative to bring
diversification in agriculture and augment income of farmers through the cultivation of high-
value horticultural crops. The programme seeks to double horticultural production by the
year 2011, bringing an additional 540 thousand ha under horticulture as well as taking up
rejuvenation, quality planting materials, high-tech cultivation, post-harvest management,
processing and marketing programmes. Total outlay of the mission is Rs 23 billion during
the X plan period (Pratyogita Darpan, 2006). Up until December 2006, Rs 5.6 billion had
been released (GOI, 2007).
Marine Fishing Policy 2004 The national fishing policy was formulated in 2004. The major thrusts being to
augment marine fish production to a sustainable level so as to boost seafood exports and
also to increase per capita fish protein intake of the masses. It also aims to ensure the
socio-economic security of fishermen whose livelihood solely depends on this profession.
The policy ensures sustainable development of marine fisheries with due concern for
ecological integrity and bio-diversity (GOI, 2006).
National Bamboo Mission The Department of Agriculture and Co-operation has launched the National Bamboo
Mission with 100 per cent assistance from the Central Government. The total projected cost
of this programme is Rs 5.68 billion, including an outlay of Rs 900 million during 2006-2007
(Tenth Plan) and the first four years of the Eleventh Plan (GOI, 2007). The mission aims to
popularize new applications for bamboo, including use as wood substitutes and composites,
pre-fabricated housing and structures, gasification of bamboo to provide electricity to remote
and off-grid locations, and molded products. It also plans to exploit the benefits of micro-
propagation in bamboo as an economically viable and cheap method of multiplication.
National Project on Organic Farming This programme has been designed for production, promotion, and market
development of organic farming in the country with an outlay of Rs 570.5 million. It was
India 47
formally started in October 2004 with the following components (Pratyogita Darpan, 2006);
;putting in place a system of certification for organic produce ־
;building capacity of organic farming through service providers ־
providing financial support to commercial production units like fruits and vegetable ־
waste compost units, bio-fertilizer production and hatcheries for vermicompost;
.promoting organic farming for higher returns and improving soil characteristics ־
Price Stabilization Fund for Plantation Crops The Government of India approved a price stabilization fund in 2003 for controlling
fluctuations in the prices of tea, coffee, rubber and tobacco. Farmers having holdings up to
4 hectares are covered under this scheme. To stabilize prices, benchmark prices will be
determined on the basis of the seven yearly moving average of international price. If the
market price deviates from the benchmark price by more than 20 per cent, eligible
producers of plantation crops will get relief from this fund. The Central Government will
contribute Rs 3 billion for financing this fund (Pratyogita Darpan, 2006).
Action plan on enhancing production and productivity of wheat To enhance the productivity and output of wheat, the Ministry of Agriculture has
formulated a three-year rolling plan, targeting about 50 per cent of the area under wheat. A
new scheme, ‘Enhancing Sustainability of Dry Land Farming Systems’, has been formulated
keeping in view the commitment of the Government to launch a special programme for dry
land farming in the arid and semi-arid regions under the National Common Minimum
Programme (NCMP). The proposed scheme aims at addressing issues like rainwater
harvesting and its efficient utilization; in situ soil moisture conservation; use of organic
manures; alternate land use; and adoption of improved dry-land farming technologies (GOI,
2007).
Special Agriculture Production Scheme (Vishesh Krishi Upaj Yojana) The objective of this scheme is to promote export of fruits, vegetables, flowers, minor
forest produce and their value-added products by giving incentives to exporters of such
products. The exporters of such products shall be entitled for duty scrip equivalent up to 5
per cent of the FOB value of exports for each licensing year commencing from April, 2004.
The Central Government’s share of funding for the financial year 2004-2005 was Rs 6.95
billion (GOI, 2006).
48 Country Paper Presentations
National Agricultural Insurance Scheme (NAIS) This scheme has been implemented since June 1999. It was set up to meet the
demand to bring more crops under crop insurance and extend its scope to cover all farmers
and lower the unit area of insurance. The main objective of this scheme is to protect farmers
against losses suffered due to crop failures caused by natural calamities such as drought,
flood, hailstorm, cyclone, fire, pest/diseases, etc. The NAIS envisages coverage for all food
crops (cereals, millets and pulses), oilseeds and annual commercial/horticultural crops such
as sugar cane, potato, cotton, ginger, onion, turmeric, chilies, pineapple, banana, jute,
tapioca, coriander, cumin and garlic for which past data on yield is available for an adequate
number of years. Cumulatively, 7.51 crore (75.1 million) farmers have been covered under
NAIS in the last 12 seasons from Rabi 1999-2000 to Kharif 2005 (GOI, 2006).
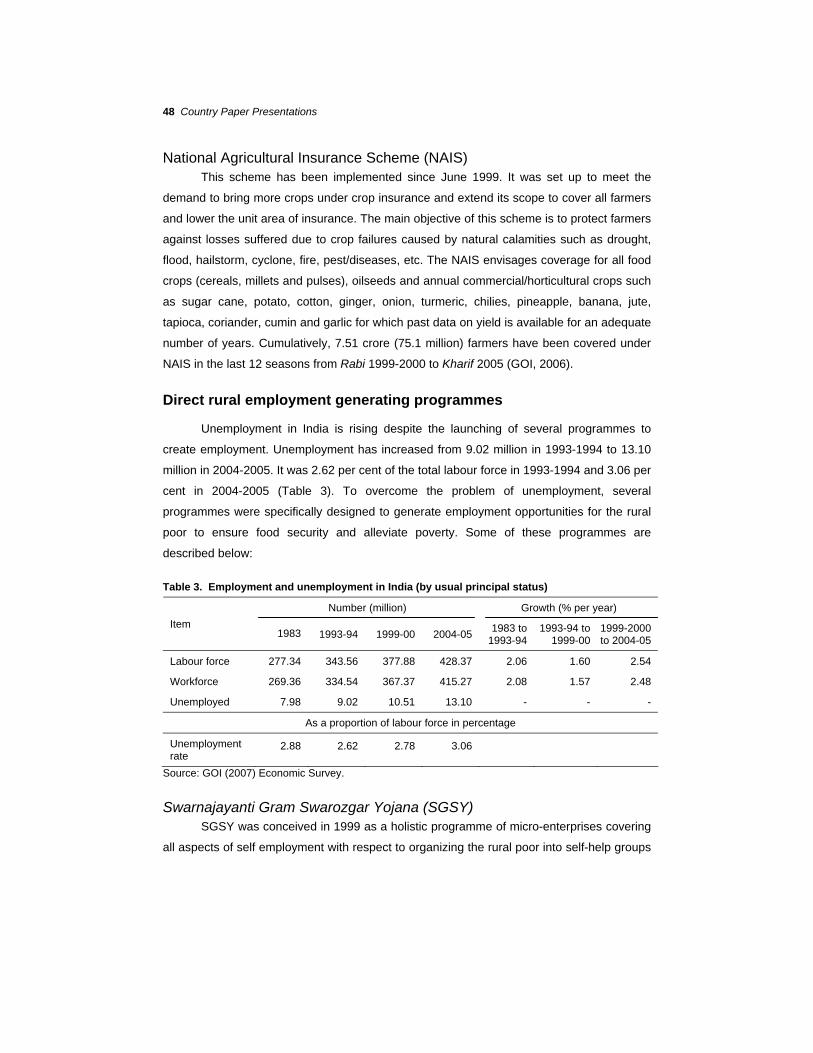
Direct rural employment generating programmes
Unemployment in India is rising despite the launching of several programmes to
create employment. Unemployment has increased from 9.02 million in 1993-1994 to 13.10
million in 2004-2005. It was 2.62 per cent of the total labour force in 1993-1994 and 3.06 per
cent in 2004-2005 (Table 3). To overcome the problem of unemployment, several
programmes were specifically designed to generate employment opportunities for the rural
poor to ensure food security and alleviate poverty. Some of these programmes are
described below:
Table 3. Employment and unemployment in India (by usual principal status)
Number (million) Growth (% per year)
Item 1983 1993-94 1999-00 2004-05
1983 to 1993-94
1993-94 to 1999-00
1999-2000 to 2004-05
Labour force 277.34 343.56 377.88 428.37 2.06 1.60 2.54
Workforce 269.36 334.54 367.37 415.27 2.08 1.57 2.48
Unemployed 7.98 9.02 10.51 13.10 - - -
As a proportion of labour force in percentage
Unemployment rate
2.88 2.62 2.78 3.06
Source: GOI (2007) Economic Survey.
Swarnajayanti Gram Swarozgar Yojana (SGSY) SGSY was conceived in 1999 as a holistic programme of micro-enterprises covering
all aspects of self employment with respect to organizing the rural poor into self-help groups
India 49
(SHGs) to improve their capacity building, planning of activity clusters, infrastructure build
up, technology, access to credit and marketing. Micro-enterprises in the rural areas are
established by building on the potential of the rural poor. The objective of the programme is
to bring the existing poor families above the poverty line. The scheme is being implemented
as a Centrally Sponsored Scheme on a cost-sharing ratio of 75:25 between the Central
Government and the States (GOI, 2002). Up to 31 December 2006, 2.44 million self-help
groups (SHGs) had been formed and 7.32 million participants had been assisted with a total
outlay of Rs164 billion (GOI, 2007).
Jawahar Gram Samridhi Yojana (JGSY) JGSY was started in 1999 with the primary objective being the creation of demand-
driven community village infrastructure, including durable assets at the village level and
assets to enable the rural poor to increase opportunities for sustained employment. The
secondary objective of this programme is to provide supplementary employment for the
unemployed poor in the rural areas. The programme is being implemented on a cost-
sharing basis of 75:25 between the Central Government and states (GOI, 2002). Wage
employment under the programme is given to Below Poverty Line (BPL) families.
National Rural Employment Guarantee Scheme (NREGS) NREGS was initiated after the notification of National Rural Employment Guarantee
Act in 2005. The programme started in February 2006. The National Food for Work
Programme (NFFWP) in which food grains and other resources were supplied in return for
manual work was integrated into NREGS from its inception. Another ongoing programme,
Sampoorna Grameen Rozgar Yojana (SGRY) was also merged into this scheme. The major
thrust of the scheme was to provide at least 100 days of guaranteed wage employment in
every financial year to every household whose adult members volunteer to do unskilled
manual work. The scheme is self-selecting in the sense that those among the poor who
need work at minimum wage would report for work under the scheme. Of the Rs 113 billion
allocated for NREGS in 2006-2007, Rs 67.15 billion was released up to 31 January 2007.
Until 31 January, 34.7 million job cards had been issued; and of the 15 million households
who had requested employment, 14.7 million households had been provided employment
(GOI, 2007).
50 Country Paper Presentations
Drought Prone Area Programme (DPAP) DPAP aims to minimize the adverse effects of drought on production of crops and
livestock and productivity of land, water and human resources ultimately leading to the
drought proofing of the affected areas. It also aims at promoting overall economic
development and improving the socio-economic conditions of the resource poor and
disadvantaged inhabiting the programme areas. This programme was initially launched in
1973-1974 but was modified in 1995 on a watershed basis. So far, up to January 31, 2007,
3,076 new projects covering 1.54 million ha have been sanctioned under DPAP (GOI,
2007).
Desert Development Programme (DDP) DDP has been envisaged as an essentially land-based activity and conceived as a
long-term measure for restoration of ecological balance by conserving, developing and
harnessing land, water, livestock and human resources. The main objectives of this
programme are: (i) combating drought and desertification; (ii) encouraging restoration of
ecological balance; (iii) mitigating the adverse effects of drought and adverse edapho-
climatic conditions on crops and livestock and productivity of land, water and human
resources; (iv) promoting economic development of village community; and (v) improving
socio-economic conditions of the resource poor and disadvantaged sections of village
community, namely, the assetless and women. Though formulated in 1977-1978, it was
modified so that implementation was on a watershed basis from 1995 onwards. Presently,
235 blocks from 40 districts in 7 states are covered under this programme (Pratyogita
Darpan, 2007).
Integrated Wastelands Development Programme (IWDP) IWDP has been carried out since 1989-1990. Under this programme wastelands are
being developed with the active participation of stakeholders i.e., user groups, self-help
groups and Panchayat Raj Institutions. The projects are implemented through the Project
Implementing Agencies (PIAs), which can be a Line Department or a reputed NGO having
sufficient experience in the field of watershed development. The primary objective of the
programme is to bring more land under productive cultivation. In 2006-2007, 463 new
projects covering 2.11 million ha were sanctioned under this scheme (GOI, 2007).
India 51
Local Rural Welfare Programmes
The Government of India initiated several welfare programmes for housing,
sanitation, rural infrastructure, education and women’s welfare activities. A brief profile of
such programmes is given below:
Bharat Nirman Yojana Accepting the policy, ‘a step towards village union’, the Government of India
launched a scheme named Bharat Nirman Yojana in 2005. The main emphasis of this
scheme is developing the rural infrastructure and thus involving the rural poor in the wider
process of economic growth. The major six sectors identified in the scheme are irrigation,
roads, housing, water supply, electrification and rural communication. The target of the
programme is to bring an additional area of 10 million ha under assured irrigation, to
connect all villages having a population of 1,000 persons or more with all weather roads, to
construct six million additional houses for the poor, to provide drinking water to all
inhabitations, to offer electricity connections to 23 million households and to give telephone
connectivity to all the villages by the year 2009 (Pratyogita Darpan, 2006).
Indira Awas Yojana (IAY) The Indira Awaas Yojana (IAY) is a major scheme for construction of houses to be
given to the poor, free of cost and upgrading of unserviceable kutcha houses to semi pucca
houses. Samagra Awaas Yojana (SAY), a similar comprehensive housing scheme was
launched in 1999-2000 on a pilot project basis with a view to ensuring integrated provision
of shelter, sanitation and drinking water. The underlying philosophy is to provide for
convergence of the existing rural housing, sanitation and water supply schemes with special
emphasis on technology transfer, human resource development and habitat improvement
with people’s participation. Up to December 2006, with cumulative expenditure of Rs 292.46
billion, 15.3 million houses had been constructed or upgraded (GOI, 2007).
Valmiki Ambedkar Awas Yojana (VAMBAY) VAMBAY was launched in 2001 and facilitates the construction and upgrading of
dwelling units for slum dwellers and provides a more healthy and enabling urban environment
through the construction community toilets. Cumulatively, up to March 2006, Rs 9.36 billion had
been released as Central Government subsidy for the construction or upgrading of 4,58,630
dwelling units and 65,331 toilets. For 2006-2007, a Central Government allocation of Rs 750
million has been made to meet the committed liabilities of ongoing projects (GOI, 2007).
52 Country Paper Presentations
Vande Mataram Scheme This scheme assists pregnant women to minimize complications during pregnancy
such as haemorrhaging, anaemia, toxaemia, obstructed labour, unsafe abortions, etc. It was
started in 2004 as a major public-private partnership initiative. The scheme provides free
outpatient services including antenatal check-up for all pregnant women and family planning
counselling to new mothers (Pratyogita Darpan, 2006).
Janani Suraksha Yojana (JSY) This programme is a safe motherhood intervention programme with an integrated
package of services and cash benefits nationwide. It aims to provide obstetric care services
to expectant mothers throughout the pregnancy period, including antenatal care, childbirth
and immediate post-partum period through a co-ordinated medical care and delivery
system. JSY is a 100 per cent centrally sponsored scheme focusing on both maternal and
child health (Pratyogita Darpan, 2006).
Rashtriya Mahila Kosh (RMK) The objective of this institution is to facilitate credit support to poor women to
improve their socio-economic status and livelihood. The support is extended through NGOs
and women development corporations. The financial assistance extended is totally security
free and does not insist on any collateral backing. Since its inception RMK has sanctioned
and disbursed loans totalling Rs 1,674 million and 1,268 million respectively benefiting 5.21
million poor women up to March 2005 (Pratyogita Darpan, 2006).
Sarva Sikha Abhiyan (SSA) Sarva Sikha Abhiyan was launched in 2001 as part of an ongoing programme to
provide all children between the ages of six and 14 with primary education. It covers the
entire country with a special focus on the education needs of girls, SC/STs and other
children in difficult circumstances. It also seeks to open new schools in locations which do
not have schooling facilities, and strengthen existing school infrastructure through provision
of additional classes, toilets, drinking water, etc. SSA addresses the needs of 194 million
children between the ages of 6 and 14 years. Up until September 2006, SSA had opened of
164,000 new schools, constructed 281,000 additional class rooms, provided 150 million
drinking water facilities, built 193 million toilets, supplied free text books to 57.8 million
children and appointed 666,000 teachers (Pratyogita Darpan, 2007).
India 53
Programmes for Transfer of Cash and Food Grains
Some programmes were also initiated to directly transfer cash as well as food grains
to poor and underprivileged groups. These aimed to ensure income security of
underprivileged groups and food security for the poor. Salient characteristics of such
programmes are given below:
National Social Assistance Programme (NSAP) The NSAP was launched on 15 August 1995 to provide social and financial
assistance to poor households in the case of old age, death of primary breadwinner and
maternity. This represents a significant step towards the fulfilment of the Directive Principles
in Articles 41 and 42 of the Constitution. The programme supplements the efforts of the
state governments with the objective of ensuring minimum national levels of well being. The
provision of central assistance seeks to ensure that social protection to beneficiaries is
uniformly available. The main features of the three components of the NSAP, (a) National
Old Age Pension Scheme (NOAPS), (b) National Family Benefit Scheme (NFBS), and (c)
National Maternity Benefit Scheme (NMBS), are given below (GOI, 2001a).
National Old Age Pension Scheme (NOAPS) In this scheme, an old age pension of Rs 75 per month, per beneficiary is provided to
persons of 65 years and above who are destitute in the sense of having little or no regular
means of subsistence from their own sources of income or through support from family
members or other sources.
National Family Benefit Scheme (NFBS) A sum of Rs 10,000 is provided in the case of death of the primary breadwinner due
to natural or accidental causes. The family benefit is paid to surviving member of the
household of the deceased who, after local enquiry, is determined to be the head of the
household. The primary breadwinner is defined as a member whose earnings contribute
substantially to the household income and who is more than 18 and less than 65 years of
age. The bereaved household should qualify as a BPL according to the criteria prescribed
by the Government of India.
National Maternity Benefit Scheme (NMBS) A lump sum cash assistance of Rs 500 is provided to pregnant women of
households below the poverty line up to the first two live births provided they are 19 years of
age and above. The maternity benefit is disbursed in one installment, 12–8 weeks prior to
54 Country Paper Presentations
the delivery. In case of delay it can be disbursed to the beneficiary even after the birth of the
child.
Public Distribution System (PDS) The Public Distribution System (PDS) of India is, perhaps, the largest distribution
network of its type in the world with a network of about 451 thousand Fair Price Shops
(FPS) distributing commodities to about 180 million households (GOI, 2001a). The system is
designed to help both the producers and consumers of food grains by linking procurement
to support prices and ensuring their distribution along with other essential commodities at
affordable prices throughout the country. It also stabilizes the prices of food grains by
rapidly responding to situations of temporary food shortage through transferring food grains
from surplus to deficit areas. PDS, therefore, continues to be a major instrument of the
government’s economic policy to enhance food security for the poor. The government
spends huge sums of money in the form of food subsidies to make food grains available at
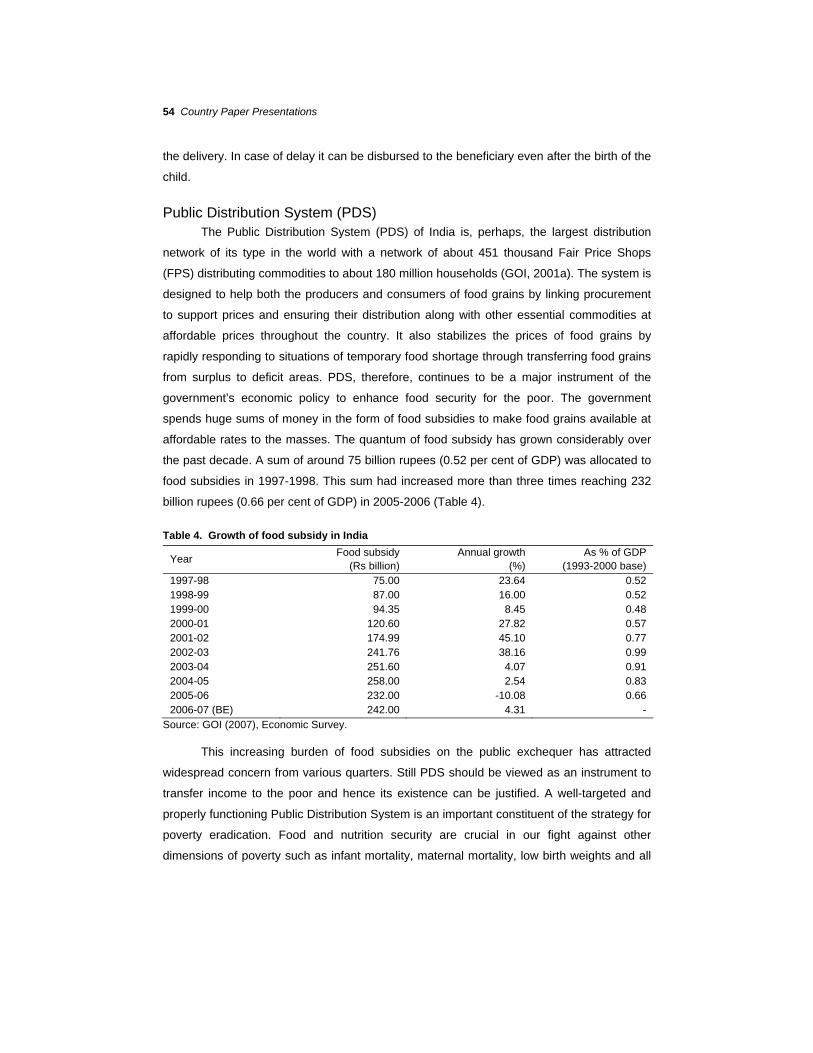
affordable rates to the masses. The quantum of food subsidy has grown considerably over
the past decade. A sum of around 75 billion rupees (0.52 per cent of GDP) was allocated to
food subsidies in 1997-1998. This sum had increased more than three times reaching 232
billion rupees (0.66 per cent of GDP) in 2005-2006 (Table 4).
Table 4. Growth of food subsidy in India
Year Food subsidy
(Rs billion) Annual growth
(%) As % of GDP
(1993-2000 base) 1997-98 75.00 23.64 0.52 1998-99 87.00 16.00 0.52 1999-00 94.35 8.45 0.48 2000-01 120.60 27.82 0.57 2001-02 174.99 45.10 0.77 2002-03 241.76 38.16 0.99 2003-04 251.60 4.07 0.91 2004-05 258.00 2.54 0.83 2005-06 232.00 -10.08 0.66 2006-07 (BE) 242.00 4.31 -
Source: GOI (2007), Economic Survey.
This increasing burden of food subsidies on the public exchequer has attracted
widespread concern from various quarters. Still PDS should be viewed as an instrument to
transfer income to the poor and hence its existence can be justified. A well-targeted and
properly functioning Public Distribution System is an important constituent of the strategy for
poverty eradication. Food and nutrition security are crucial in our fight against other
dimensions of poverty such as infant mortality, maternal mortality, low birth weights and all
India 55
other forms of deprivation. PDS was widely criticized for its lack of direction towards the
deserving section of the population, urban bias, inadequate coverage and lack of
transparent and accountable arrangements for delivery. Realizing this, since 1997 the
Government has streamlined the PDS by issuing special cards to families below poverty line
and selling food grains under PDS to them at specially subsidized prices under the modified
scheme of Targeted Public Distribution System (TPDS). The government is now planning to
introduce a food coupon system in order to discourage malpractice in TPDS and to prevent
black marketeering. The idea is to universalize the price of food grains to above the poverty
line prices and then extend food subsidies to the poor in the form of food stamps worth a
particular sum. There will be no limits on entitlements and the poor can chose what to buy.
However the planning in this direction is still at the nascent stage and more thought has to
go into it before implementation. Currently the food grains are distributed to the poor
through two major schemes as outlined below.
Annapurna Yojana This scheme was introduced in 1999 as a pilot project. It provides 10 kg of food
grains to senior citizens at subsidized rates of Rs 2 per kg for wheat and Rs 3 per kg for
rice. The scheme is operational in 25 states and five union territories. More than 608
thousand families have been identified as beneficiaries of this scheme.
Antyodaya Anna Yojana (AAY) This scheme provides food grains at a highly subsidized rate of Rs 2.00 per kg for
wheat and Rs 3.00 per kg for rice to the poor families at the rate of 35 kg per family per
month under the Targeted Public Distribution System (TPDS).
Midday meal scheme A National Programme for Nutritional Support to Primary Education (NPNSPE),
popularly known as the midday meal scheme was launched in 1995. Food grains are
supplied free of cost at the rate of 100 grams per child per school day in cooked form and
the meal is served with a minimum content of 300 calories and 8–12 grams of protein each
school day for a minimum of 200 days. Raw food grains, at a rate of 3 kg per student per
month for 9–11 months of the year, is also supplied under the scheme (Pratyogita Darpan,
2006).
56 Country Paper Presentations
Cost Reducing and Price Increasing Programmes
In India, domestic support to producers is provided mainly through input subsidies
with an objective to reduce the cost of cultivation. A minimum support prices (MSP) scheme
for basic staple commodities provides better prices to producers. These programmes have
remarkably increased food grain production that has resulted in achieving food security in
the country.
Input subsidies The three major agricultural inputs being subsidized are fertilizers, electricity and
irrigation water. Estimates of input subsidies from 1990-1991 to 2002-2003 are given in
Table 5. The Retention Price System (RPS) for fertilizers was introduced in 1977 to insulate
farmers from rising prices and to ensure the availability of fertilizers. The difference between
the ‘retention price’ or normal cost of production (plus a 12 per cent post-tax return on
investment) and the ‘notified sales price’ (minus a distribution margin) is paid to
manufacturers based on specific plants (Mullen, K. et al., 2005). Originally nitrogenous,
phosphatic and potassic fertilizers were included under the price control subsidy
programme. However, in 1992 phosphatic and potassic fertilizers were decontrolled.
Subsidies on urea during 2005-2006 were estimated at Rs 110.54 billion, and on
decontrolled phosphatic and potassic fertilizers at Rs 52 billion. The erstwhile individual unit-
oriented RPS in respect of urea had been replaced in stages by a group-based pricing
scheme under the New Pricing Scheme (NPS) with effect from April 2003 and April 2004
(GOI, 2006).
Gulati and Narayanan (2003) estimated power subsidy in agriculture on power going
to the agricultural sector by calculating the difference between cost of supplying electricity to
all sectors and the tariff charged to the agricultural sector multiplied by the quantity of
electricity that is reported to be supplied to agriculture. Using this approach, with the caveats
that agricultural use may be overstated and electricity suppliers inefficient, they found that
the estimated subsidy in 2000-2001 was around Rs 288 billion.
A major irrigation subsidy programme in India currently ongoing is the Accelerated
Irrigation Benefits Programme (AIBP) started in 1996-1997 to give loan assistance to the
States to help them complete some of the incomplete major/medium irrigation projects
which were in an advanced stage of completion. Up to March 2006, under AIBP, the State
Governments were provided Rs 194.38 billion as CLA/grant for 200 major/medium irrigation
projects and 5,562 Surface Minor Irrigation Schemes (GOI, 2007).
India 57
Another minor input subsidy includes the seed subsidy programme. The National
Seed Policy of 2001 seeks to provide farmers with superior quality seeds. Under the Seed
Bank Scheme, introduced in 1999-2000, seeds are also made available in cases of natural
calamity and seed storage infrastructure is to be developed. Grants are provided to
participating seed corporations for maintenance of certified and foundation seeds. The
government also directs a part of the input subsidy in the form of preferential bank credit to
the farmers. The ‘Farm Credit Package’ announced in June 2004 stipulated doubling the
flow of institutional credit for agriculture in the ensuing three years. The target of 30 per cent
growth in agricultural credit in 2004-2005 was surpassed by actual growth of 44 per cent in
overall credit by all agencies to Rs 1,253.09 billion in 2004-2005. To provide adequate and
timely support from the banking system to the farmers for their cultivation needs, including
purchase of all inputs in a flexible and cost effective manner, a model Kisan Credit Card
Scheme (KCC) was introduced in August 1998 (GOI, 2007).
Table 5. Estimated input subsidies 1990-1991 to 2002-2003
Fertilizer Power Irrigation Total Year
in Rs billion at current prices at 2000-01 prices
1990-91 45.6 46.2 25.7 117.5 253.0
1991-92 35.1 58.8 28.7 122.6 231.9
1992-93 32.6 73.4 32.9 138.9 241.7
1993-94 33.5 89.6 34.4 157.5 250.1
1994-95 78.9 112.0 39.5 230.4 334.3
1995-96 96.9 138.4 44.1 279.4 371.8
1996-97 96.3 155.8 44.4 296.6 367.3
1997-98 81.6 190.2 46.7 318.4 369.6
1998-99 83.1 225.0 49.4 357.5 384.5
1999-00 62.1 262.7 52.1 377.0 390.1
2000-01 72.6 288.4 54.9 415.7 415.7
2001-02 67.3 319.8 57.8 444.9 428.3
2002-03 70.0 356.8 60.6 487.3 453.4
Source: Gulati and Narayanan, 2003. Values for 2001-02 and 2002-03 are obtained through trend projections.
Price support policies The domestic price support policies pursued by the Government of India continued
to provide major assistance to the farmers. The commodities covered under this programme
58 Country Paper Presentations
include paddy, wheat, coarse cereals, maize, barley, pulses (i.e. gram, arhar moong, urad),
sugar cane, cotton, ground-nuts, jute, rapeseed/mustard, sunflower, soybean, safflower,
toria, tobacco, copra, sesamum and niger seed (GOI, 2003). The stated objectives of the
agricultural price policy are to ensure remunerative prices to farmers, even out effects of
seasonality, and promote agricultural diversification, although the guaranteed prices can be
below prevailing market prices. MSP levels are determined by the Commission for
Agricultural Costs and Prices (CACP). For horticultural and other agricultural commodities
not covered by the MSP, there is a Market Intervention Scheme (MIS) of somewhat ad hoc
support measures. Under the MIS, if the price of a commodity falls below a specific
‘economic’ level, the Government of India can intervene at the request of the state
governments, by purchasing the product at intervention prices that do not exceed the cost of
production. The MIS so far has been implemented for commodities like apples, kinnoo /
malta, garlic, oranges, galgal, grapes, mushrooms, clove, black pepper, pineapple, ginger,
red-chilies, coriander seed, isabgol, chicory, onions, potatoes, cabbage, mustard seed,
castor seed, copra, palm oil, etc. (GOI, 2001b).
Conclusions
Poverty alleviation programmes have always provided great relief to the burgeoning
millions of the poor in the country. But targeting government expenditures simply to reduce
poverty is not sufficient. Government expenditures also need to stimulate economic growth,
to help generate the resources required for future government expenditures. Such growth is
the only way of providing a permanent solution to the poverty problem and to increase the
overall welfare of rural people (Shenggen, Fan et al., 1999). Therefore the country has
resorted to a multi-dimensional approach in resolving the problem by giving emphasis to
agricultural productivity improvement, employment guarantee, women and children
development, health, infrastructure development, sanitation, insurance, subsidies, etc. While
planning the poverty alleviation programmes it has to be taken into consideration that the
process should ultimately address human poverty rather than simply addressing income
poverty. More clearly, given the structural relations, the role of per capita income in reducing
human poverty is rather limited. What matters is that higher per capita income should be
translated into higher levels of social infrastructure and government expenditure on social
services which in turn lead to a reduction in the levels of human poverty (Prabhu and
Kamdar, 2002). Thus a well-balanced strategy, taking lessons from the past, would indeed
result in placing the country in a sustainable growth path along with poverty alleviation.
India 59
References
GOI, 2001a. Annual Plan Document 2000-01, Planning Commission, New Delhi (on-line),
http://planningcommission.nic.in/.
GOI, 2001b. Union Budget 2000-01, Ministry of Finance, New Delhi, (on-line), http://india-
budget.nic.in/.
GOI, 2002. Economic Survey 2005-06, Ministry of Finance, New Delhi (on-line), http://india-
budget.nic.in/.
GOI, 2003. Agricultural Statistics at a Glance, Ministry of Agriculture, Department of Agri-
culture and Cooperation, New Delhi. [on-line], http://agricoop.nic.in/statatglance2003.
htm (04 November 2004).
GOI, 2006. Economic Survey 2005-06, Ministry of Finance, New Delhi (on-line), http://india-
budget.nic.in/.
GOI, 2007. Economic Survey 2006-07, Ministry of Finance, New Delhi (on-line), http://india-
budget.nic.in/.
Gulati, A. and Narayanan, S., 2003. Subsidy Syndrome in Indian Agriculture, New Delhi:
Oxford University Press.
Mullen, K., Orden, D. and Gulati, A., 2005. “Agricultural policies in India: producer support
estimates 1985-2002”, IFPRI Discussion paper no. 82, MTID, Washington, D.C.:
IFPRI.
Prabhu, K.S. and Kamdar, S., 2002. “Human poverty and income poverty: linkages and
implications”, in Prabhu K.S. and R. Sudarshan (eds.) Reforming India’s Social
Sector, New Delhi: Social Science Press.
Pratyogita Darpan, 2006. Indian Economy, Agra: Pratyogita Darpan Publishers.
Pratyogita Darpan, 2007. Indian Economy, Agra: Pratyogita Darpan Publishers.
Shenggen, F., Hazell, P. and Thorat, S., 1999. “Linkages between government spending,
growth and poverty in rural India”, Research report no. 110, Washington D.C.: IFPRI.
60 Country Paper Presentations
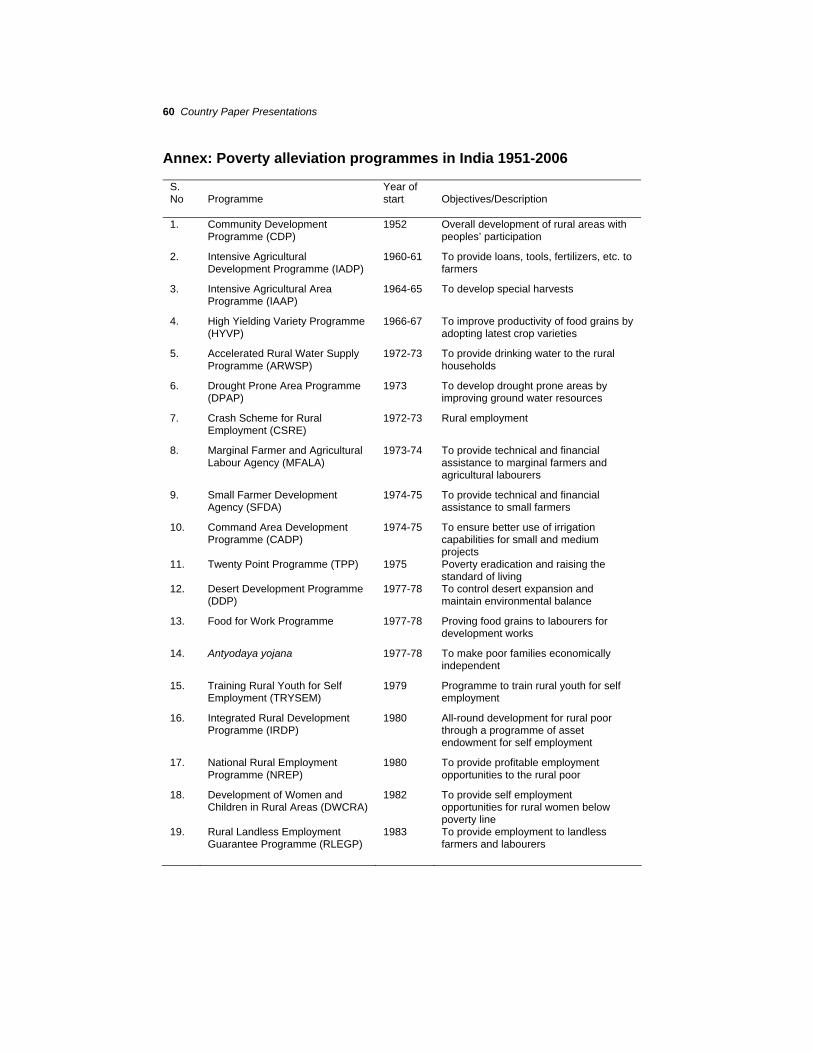
Annex: Poverty alleviation programmes in India 1951-2006
S. No Programme
Year of start
Objectives/Description
1. Community Development Programme (CDP)
1952 Overall development of rural areas with peoples’ participation
2. Intensive Agricultural Development Programme (IADP)
1960-61 To provide loans, tools, fertilizers, etc. to farmers
3. Intensive Agricultural Area Programme (IAAP)
1964-65 To develop special harvests
4. High Yielding Variety Programme (HYVP)
1966-67 To improve productivity of food grains by adopting latest crop varieties
5. Accelerated Rural Water Supply Programme (ARWSP)
1972-73 To provide drinking water to the rural households
6. Drought Prone Area Programme (DPAP)
1973 To develop drought prone areas by improving ground water resources
7. Crash Scheme for Rural Employment (CSRE)
1972-73 Rural employment
8. Marginal Farmer and Agricultural Labour Agency (MFALA)
1973-74 To provide technical and financial assistance to marginal farmers and agricultural labourers
9. Small Farmer Development Agency (SFDA)
1974-75 To provide technical and financial assistance to small farmers
10. Command Area Development Programme (CADP)
1974-75 To ensure better use of irrigation capabilities for small and medium projects
11. Twenty Point Programme (TPP) 1975 Poverty eradication and raising the standard of living
12. Desert Development Programme (DDP)
1977-78 To control desert expansion and maintain environmental balance
13. Food for Work Programme 1977-78 Proving food grains to labourers for development works
14. Antyodaya yojana 1977-78 To make poor families economically independent
15. Training Rural Youth for Self Employment (TRYSEM)
1979 Programme to train rural youth for self employment
16. Integrated Rural Development Programme (IRDP)
1980 All-round development for rural poor through a programme of asset endowment for self employment
17. National Rural Employment Programme (NREP)
1980 To provide profitable employment opportunities to the rural poor
18. Development of Women and Children in Rural Areas (DWCRA)
1982 To provide self employment opportunities for rural women below poverty line
19. Rural Landless Employment Guarantee Programme (RLEGP)
1983 To provide employment to landless farmers and labourers
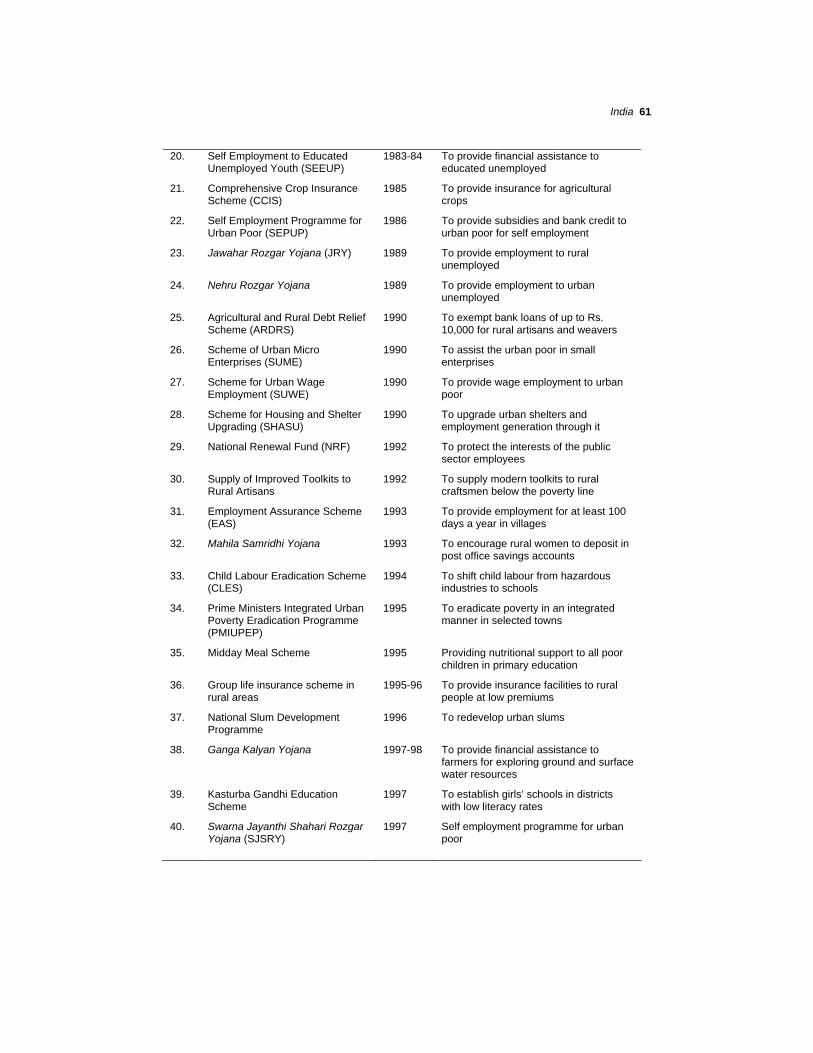
India 61
20. Self Employment to Educated Unemployed Youth (SEEUP)
1983-84 To provide financial assistance to educated unemployed
21. Comprehensive Crop Insurance Scheme (CCIS)
1985 To provide insurance for agricultural crops
22. Self Employment Programme for Urban Poor (SEPUP)
1986 To provide subsidies and bank credit to urban poor for self employment
23. Jawahar Rozgar Yojana (JRY) 1989 To provide employment to rural unemployed
24. Nehru Rozgar Yojana 1989 To provide employment to urban unemployed
25. Agricultural and Rural Debt Relief Scheme (ARDRS)
1990 To exempt bank loans of up to Rs. 10,000 for rural artisans and weavers
26. Scheme of Urban Micro Enterprises (SUME)
1990 To assist the urban poor in small enterprises
27. Scheme for Urban Wage Employment (SUWE)
1990 To provide wage employment to urban poor
28. Scheme for Housing and Shelter Upgrading (SHASU)
1990 To upgrade urban shelters and employment generation through it
29. National Renewal Fund (NRF) 1992 To protect the interests of the public sector employees
30. Supply of Improved Toolkits to Rural Artisans
1992 To supply modern toolkits to rural craftsmen below the poverty line
31. Employment Assurance Scheme (EAS)
1993 To provide employment for at least 100 days a year in villages
32. Mahila Samridhi Yojana 1993 To encourage rural women to deposit in post office savings accounts
33. Child Labour Eradication Scheme (CLES)
1994 To shift child labour from hazardous industries to schools
34. Prime Ministers Integrated Urban Poverty Eradication Programme (PMIUPEP)
1995 To eradicate poverty in an integrated manner in selected towns
35. Midday Meal Scheme 1995 Providing nutritional support to all poor children in primary education
36. Group life insurance scheme in rural areas
1995-96 To provide insurance facilities to rural people at low premiums
37. National Slum Development Programme
1996 To redevelop urban slums
38. Ganga Kalyan Yojana 1997-98 To provide financial assistance to farmers for exploring ground and surface water resources
39. Kasturba Gandhi Education Scheme
1997 To establish girls’ schools in districts with low literacy rates
40. Swarna Jayanthi Shahari Rozgar Yojana (SJSRY)
1997 Self employment programme for urban poor
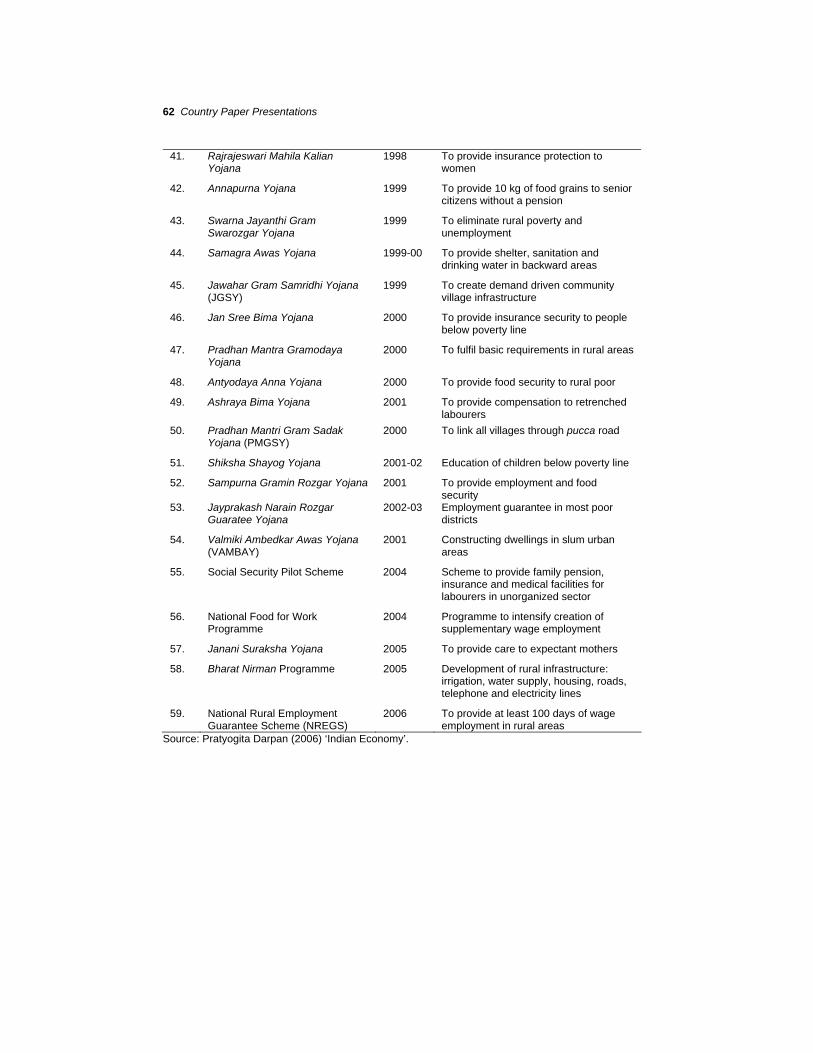
62 Country Paper Presentations
41. Rajrajeswari Mahila Kalian Yojana
1998 To provide insurance protection to women
42. Annapurna Yojana 1999 To provide 10 kg of food grains to senior citizens without a pension
43. Swarna Jayanthi Gram Swarozgar Yojana
1999 To eliminate rural poverty and unemployment
44. Samagra Awas Yojana 1999-00 To provide shelter, sanitation and drinking water in backward areas
45. Jawahar Gram Samridhi Yojana (JGSY)
1999 To create demand driven community village infrastructure
46. Jan Sree Bima Yojana 2000 To provide insurance security to people below poverty line
47. Pradhan Mantra Gramodaya Yojana
2000 To fulfil basic requirements in rural areas
48. Antyodaya Anna Yojana
2000 To provide food security to rural poor
49. Ashraya Bima Yojana 2001 To provide compensation to retrenched labourers
50. Pradhan Mantri Gram Sadak Yojana (PMGSY)
2000 To link all villages through pucca road
51. Shiksha Shayog Yojana
2001-02 Education of children below poverty line
52. Sampurna Gramin Rozgar Yojana
2001 To provide employment and food security
53. Jayprakash Narain Rozgar Guaratee Yojana
2002-03 Employment guarantee in most poor districts
54. Valmiki Ambedkar Awas Yojana (VAMBAY)
2001 Constructing dwellings in slum urban areas
55. Social Security Pilot Scheme 2004 Scheme to provide family pension, insurance and medical facilities for labourers in unorganized sector
56. National Food for Work Programme
2004 Programme to intensify creation of supplementary wage employment
57. Janani Suraksha Yojana
2005 To provide care to expectant mothers
58. Bharat Nirman Programme 2005 Development of rural infrastructure: irrigation, water supply, housing, roads, telephone and electricity lines
59. National Rural Employment Guarantee Scheme (NREGS)
2006 To provide at least 100 days of wage employment in rural areas
Source: Pratyogita Darpan (2006) ‘Indian Economy’.