2022 Global Gas Flaring Tracker Report
12
2022 Global Gas Flaring Tracker Report
-
Upload
khangminh22 -
Category
Documents
-
view
0 -
download
0
Transcript of 2022 Global Gas Flaring Tracker Report

2022 Global Gas Flaring Tracker Report

2021 was yet another turbulent year for the oil and gas industry,
with rising oil prices, tight oil and gas markets, high energy prices,
and the ongoing recovery from the Covid-19 pandemic. However,
despite these challenges, the UN Climate Change Conference
of the Parties (COP26) and Global Methane Pledge (GMP)
underscored once again the growing urgency for governments,
companies, and development organizations to accelerate
decarbonizing the global economy. This is a pressing need, brought
to the fore by the Russian invasion of Ukraine earlier this year and
its dramatic impact on energy security across the world.
In 2021, 144 billion cubic meters (bcm) of gas was needlessly
flared at upstream oil and gas facilities across the globe. We
estimate that this gas flaring resulted in approximately 400
million tonnes of carbon dioxide (CO2) equivalent emissions
globally last year. Ending this polluting practice must be central
to decarbonization efforts. Not only could the gas wasted displace
dirtier fuels and increase energy access in some of the world’s
poorest countries, but by utilizing the gas that is currently being
flared, the world could make significant progress towards much-
needed energy security. For example, the volume of gas flared
worldwide is greater than the European Union's 27 member states
gas imports from Russia.
Flaring reduction also plays a critical role in mitigating methane
emissions, by eliminating a direct source of methane released
un-combusted from flares and enabling the gas successfully
conserved through reductions in venting and fugitive emissions
to be utilized rather than flared. This raises the often-overlooked
importance of integrating the decarbonization of the oil and gas
sector into wider climate initiatives and discussions.
With this in mind, we’re keen to understand not only how much
gas was flared in 2021, but where countries have made progress
and where the greatest opportunities for flaring abatement
remain. GGFR’s 2022 Global Gas Flaring Tracker, a leading global
and independent indicator of gas flaring, found that despite
strong early progress, reductions in both absolute flare volumes
and flaring intensity have plateaued over the last decade;
impressive reductions in some countries have unfortunately been
offset by concerning increases in others.
We explore several oil-producing countries where absolute flare
volumes have decreased and some where they have increased,
despite commitments and efforts to end flaring. Unfortunately,
flaring increases are not limited to those countries highlighted in
this report. We urge all governments and operators to carefully
assess how they are producing oil and to identify and seize
opportunities for effective decarbonization.
With less than a decade to go until the global ambition of Zero
Routine Flaring by 2030, it is time for swift and determined
action. Our team at the World Bank will continue to support
this effort, especially in developing countries, and work closely
with governments and oil companies to overcome the barriers to
flaring reduction.
Zubin BamjiProgram Manager
Global Gas Flaring Reduction Partnership
World Bank
Foreword
© 2022 International Bank for Reconstruction and Development / The World Bank1818 H Street NWWashington DC 20433Telephone: 202-473-1000Internet: www.worldbank.org
This work is a product of the staff of The World Bank with external contributions. The findings, interpretations, and conclusions expressed in this work do not necessarily reflect the views of The World Bank, its Board of Executive Directors, or the governments they represent.
The World Bank does not guarantee the accuracy, completeness, or currency of the data included in this work and does not assume responsibility for any errors, omissions, or discrepancies in the information, or liability with respect to the use of or failure to use the information, methods, processes, or conclusions set forth. The boundaries, colors, denominations, and other information shown on any map in this work do not imply any judgment on the part of The World Bank concerning the legal status of any territory or the endorsement or acceptance of such boundaries.
Nothing herein shall constitute or be construed or considered to be a limitation upon or waiver of the privileges and immunities of The World Bank, all of which are specifically reserved.
Rights and Permissions
The material in this work is subject to copyright. Because The World Bank encourages dissemination of its knowledge, this work may be reproduced, in whole or in part, for noncommercial purposes as long as full attribution to this work is given.
Any queries on rights and licenses, including subsidiary rights, should be addressed to
World Bank Publications, The World Bank Group, 1818 H Street NW, Washington, DC 20433, USA
Fax: 202-522-2625; e-mail: [email protected].
Cover Photo: Leonid Ikan/ShutterstockUsed with the permission.Further permission required for reuse.
2022 Global Gas Flaring Tracker Report 32022 Global Gas Flaring Tracker Report2

Plateau at a Time for Progress
Despite strong early progress since satellite observations began in 1996, reductions in flaring have plateaued over the last decade, marking a period of disappointing progress during a time of increased international focus on the urgency of greenhouse gas emissions reduction and the energy transition.
Global gas flaring volumes have remained largely static over the last 10 years, plateauing at around 144 bcm. During this same period, global oil production levels rose slightly before dropping in 2020 due to the impacts of the Covid pandemic, averaging around 80 million barrels of oil per day. However, the global perspective obscures the significant flare reduction progress made by some countries – with the reduction achieved only to be offset by increases in flaring by others.
A similar story emerges when we consider flaring intensity, the volume of gas flared per barrel of oil produced; the initial improvements are evident, only to plateau again over the last decade.
Oil
prod
ucti
on (m
ln b
bl/d
)
Gas flaring Oil production
50
75
100
125
150
175
200
225
25
0
20
30
10
40
50
60
70
80
90
100
Flar
e vo
lum
e (b
cm)
0
1996 2001 2006 2011 2016 2021
Global gas flaring and oil production 1996 to 2021 (flaring only at upstream oil & gas and LNG plants)
Source: NOAA, Payne Institute and Colorado School of Mines, GGFR
Source: NOAA, Payne Institute and Colorado School of Mines, EIA, GGFR
1996 2001 2006 2011 2016 2021
GGFR partner countriesGlobal Non GGFR partner countries
-50%
-45%
-25%
-30%
-35%
-40%
-20%
-15%
-10%
-5%
0
-55%
Cha
nge
in fl
arin
g in
tens
ity
-60%
Percentage reductions in flaring intensity 1996 to 2021: global average, GGFR and non-GGFR partner countries
Source: NOAA, Payne Institute and Colorado School of Mines, GGFR
Increase Decrease Total
0
20
18
14
16
12
10
8
6
4
2
6.3
5.1
3.0
2.20.6
-0.7-0.7
-0.7
-1.2
-1.4
-1.4
-1.9
-2.5
-2.5
-3.0
1.3
Flar
e vo
lum
e ch
ange
20
12 -
20
21 (b
cm)
Iran
Uni
ted
Sta
tes
Iraq
Rus
sia
Mex
ico
Col
ombi
a
Bra
zil
Ang
ola
Indo
nesi
a
Kaz
akha
stan
Turk
men
ista
n
Uzb
ekis
tan
Arg
enti
na
Tota
l
Res
t of
Wor
ld
Nig
eria
Change in flare volume between 2012 and 2021 (individual countries with most significant change (+ or – 0.6 bcm) indicated, rest of world combined, overall global change of +1.3 bcm)
Phot
o cr
edit
: © B
ulat
Iskh
akov
/ S
hutt
erSt
ock
2022 Global Gas Flaring Tracker Report 52022 Global Gas Flaring Tracker Report4

Top Ten Countries Account for 75 percent of all Flaring
In 2021, the top 10 flaring countries (on an absolute volume basis)
accounted for 75 percent of all gas flaring and 50 percent of
global oil production.
Seven of the top 10 flaring countries have held this position
consistently for the last 10 years: Russia, Iraq, Iran, the United
States, Venezuela, Algeria, and Nigeria. The remaining three;
Mexico, Libya, and China, have shown significant flaring increases
in recent years.
When we consider flaring intensity, fragile, conflict-affected,
and insecure countries, such as Venezuela, Syria, and Yemen are
among the worst performers, flaring more gas per barrel of oil
produced than any other country. The intensity perspective also
suggests there are opportunities to improve flaring performance in
oil-producing countries such as Algeria, the Republic of the Congo,
Gabon, and Turkmenistan.
Considering again the top 10 flaring countries on a volume basis,
Russia, Iraq, the United States, Nigeria, and Mexico have all
committed to the World Bank’s Zero Routine Flaring by 2030 (ZRF)
Initiative, which commits governments and companies to (a) not
routinely flare gas in any new oil field development, and (b) to end
routine flaring in existing oil fields as soon as possible and no later
than 2030. However, over the past decade, only the United States
has successfully improved the flaring intensity of its oil production.
Phot
o cr
edit
: © O
psor
man
/ S
hutt
erst
ock
0.0
2016 2017 2018 2019 2020 20212012 2013 2014 2015
27,500
25,000
22,500
20,000
Flar
e vo
lum
e (b
cm) 17,500
15,000
12,500
10,000
7,500
5,000
2,500
Iraq
Uni
ted
Stat
es
Nig
eria
Liby
a
Om
an
Vene
zuel
a
Iran
Alg
eria
Mex
ico
Chi
na
Egyp
t
Saud
i Ara
bia
Ang
ola
Mal
aysi
a
Indo
nesi
a
Kaz
akha
stan
Gab
on
Can
ada
Rep
of t
he C
ongo
Indi
a
Turk
men
ista
n
Qat
ar
Ecua
dor
Arg
enti
na
Syri
a
Yem
en
UA
E
Bra
zil
Uni
ted
Kin
gdom
Rus
sia
Flare volumes for the top 30 flaring countries from 2012 to 2021 (sorted by 2021 volume, shown in red)
Source: NOAA, Payne Institute and Colorado School of Mines, GGFR
Source: NOAA, Payne Institute and Colorado School of Mines, EIA, GGFR
0
2016 2017 2018 2019 2020 20212012 2013 2014 2015
90
80
Flar
ing
inte
nsit
y (m
³/bb
l)
70
60
50
40
30
20
10
Iraq
Uni
ted
Stat
es
Nig
eria
Liby
a
Om
an
Vene
zuel
a
Iran
Alg
eria
Mex
ico
Chi
na
Egyp
t
Saud
i Ara
bia
Ang
ola
Mal
aysi
a
Indo
nesi
a
Kaz
akha
stan
Gab
on
Can
ada
Rep
of t
he C
ongo
Indi
a
Turk
men
ista
n
Qat
ar
Ecua
dor
Arg
enti
na
Syri
a
Yem
en
UA
E
Bra
zil
Uni
ted
Kin
gdom
Rus
sia
Flaring intensity for the top 30 flaring countries from 2012 to 2021 (sorted by 2021 volume, shown in red)
2022 Global Gas Flaring Tracker Report 72022 Global Gas Flaring Tracker Report6

Key Trends
Promising Reductions
In this report, we explore promising progress in a few case study
countries and connect those findings to those of our Global
Flaring and Venting Regulations: A Comparative Review of Policies
study where relevant. We also share some worrying trends in
two countries. It should be noted that these case studies are not
intended to present a comprehensive analysis of progress (or lack
thereof) in flaring reduction.
Kazakhstan has achieved the largest overall flare reduction of all
countries during the last 10 years, reducing absolute flaring from
4 bcm in 2012 to 1.5 bcm in 2021. In addition to reducing routine
flaring over these years, anecdotal evidence suggests there have
also been improvements in equipment reliability and production
efficiency leading to a reduction in non-routine flaring. This
progress has been enabled by strictly enforced regulations that
apply financial penalties for gas flaring, coupled with a well-
established domestic gas market and integrated gas value chain
to incentivize flare gas recovery. The case study for Kazakhstan
in Global Flaring and Venting Regulations: A Comparative Review of
Policies provides more details on the regulatory frameworks in
the country.
5
4
3
2
1
0
Flare volume Flare intensity
20132012 2016 2018 2019 2020 20212017201520140
1
2
3
4
5
6
7
8
Flar
ing
inte
nsit
y (m
³/bb
l)
Flar
e vo
lum
e (b
cm)
Kazakhstan flare volume versus flare intensity, 2012 to 2021
Source: NOAA, Payne Institute and Colorado School of Mines, EIA, GGFR
5
4
3
2
1
0
Flaring volume Oil production
20132012 2016 2018 2019 2020 20212017201520140
0.5
1.0
1.5
2.0
Oil
prod
ucti
on (m
ln b
bl/d
)
Flar
e vo
lum
e (b
cm)
Kazakhstan flare volume versus oil production, 2012 to 2021
Source: NOAA, Payne Institute and Colorado School of Mines, GGFR, EIA
The United States is the only one of the top 10 flaring countries to
have successfully reduced absolute flare volumes while increasing
production over the last decade—decreasing its flaring intensity
by 46 percent. However, in terms of absolute volume reductions,
the United States achieved an 8 percent reduction over the last
decade, which somewhat masks the recent progress made to
reduce flaring in the shale oil basins of the Permian, Bakken, and
Eagleford. These fields represented 89 percent of all US flaring in
2021, and flaring has reduced by 51 percent since 2019, when oil
production from these regions peaked. This reduction appears to
have been achieved by increasing domestic gas utilization and the
export of natural gas in the form of liquefied natural gas (LNG),
enabled by increased pipeline infrastructure and capacity.
Our just-released Global Flaring and Venting Regulations: A
Comparative Review of Policies study explores the regulatory
context in the main flaring regions, specifically Texas (Permian,
Eagleford) and North Dakota (Bakken). In Texas, in particular, there
has been significantly increased pressure by multiple stakeholders
to reduce flaring over recent years. While regulators made flaring
and venting regulation more stringent in 2020, there is evidence
that application and enforcement of the regulations could be more
rigorous to support the positive trend in reduced flaring.
20
15
10
5
0
Flare volume Flare intensity
20132012 2016 2018 2019 2020 20212017201520140
1
2
3
4
5
6
7
8
Flar
ing
inte
nsit
y (m
³/bb
l)
Flar
e vo
lum
e (b
cm)
United States flare volume versus flare intensity, 2012 to 2021
Source: NOAA, Payne Institute and Colorado School of Mines, EIA, GGFR
20
15
10
5
0
Flaring volume Oil production
20132012 2016 2018 2019 2020 20212017201520140
2
4
6
8
10
12
14
Oil
prod
ucti
on (m
ln b
bl/d
)
Flar
e vo
lum
e (b
cm)
United States flare volume versus oil production, 2012 to 2021
Source: NOAA, Payne Institute and Colorado School of Mines, GGFR, EIA
400
300
200
100
0
-100
-200
Imports Exports Total final consumption
19951990 2010 2020201520052000
Flar
e vo
lum
e (b
cm)
United States gas import, export and total final consumption indicting increase in both export and total final consumption over last decade (modified data, taken from IEA, 2021)
Source: IEA
Kazakhstan
2021 Flare volume rank:
2012-2021
62%reductionin flaring
2012-2021
67%reduction in
flaring intensity
18th
The United States
2021 Flare volume rank:
2012-2021
8%*reductionin flaring
2012-2021
46%reduction in
flaring intensity
4th
*51 percent reduction in Shale oil basins between 2019 and 2021 alone
2022 Global Gas Flaring Tracker Report 92022 Global Gas Flaring Tracker Report8
Despite not being a significant contributor to overall global flare
volumes, Colombia’s progress in flare reduction and its recent
leadership in developing regulation on methane emissions make
it worthy of mention. Flare volumes in Colombia reduced from 1
bcm in 2012 to 0.3 bcm in 2021, enabled by a well-established
domestic gas market for local gas utilization and strong
regulations which strictly prohibit and monetarily penalize any
unauthorized gas flaring and wasting of gas. In February of this
year, Colombia was one of the first countries worldwide to pass
regulation on flaring, venting and fugitive methane emissions,
following its signing of the GMP during COP26. In addition to
government action, the national oil company, Ecopetrol, is a
ZRF endorser and has an interim target to reduce flaring by
77 percent by 2022 from 2017 levels. Ecopetrol has linked its
targets to Colombia’s Nationally Determined Contribution
(NDC) to the Paris Agreement, which specifically calls out gas
utilization as an opportunity. In parallel, Ecopetrol has recently
initiated an aerial survey of methane emissions from its oil and
gas production facilities.
1.2
1.0
0.8
0.6
0.4
0.2
0
Flare volume Flare intensity
20132012 2016 2018 2019 2020 20212017201520140.0
0.5
1.0
1.5
2.0
2.5
3.0
3.5
Flar
ing
inte
nsit
y (m
³/bb
l)
Flar
e vo
lum
e (b
cm)
Colombia flare volume versus flare intensity, 2012 to 2021
Source: NOAA, Payne Institute and Colorado School of Mines, EIA, GGFR
1.2
1.0
0.8
0.6
0.4
0.2
0
Flaring volume Oil production
20132012 2016 2018 2019 2020 20212017201520140.0
0.2
0.4
0.6
0.8
1.0
1.2
Oil
prod
ucti
on (m
ln b
bl/d
)
Flar
e vo
lum
e (b
cm)
Colombia flare volume versus oil production, 2012 to 2021
Source: NOAA, Payne Institute and Colorado School of Mines, GGFR, EIA
4.5
4.0
3.5
3.0
2.5
2.0
1.5
1.0
0.5
0
Total final consumption
19951990 2010 2020201520052000
Flar
e vo
lum
e (b
cm)
Colombia total final gas consumption indicating increase in domestic gas consumption as Colombia does not import gas (data taken from IEA, values in petajoules (PJ) converted to bcm assuming an average natural gas heating value of 45 cubic meters per megajoule)
Source: IEA
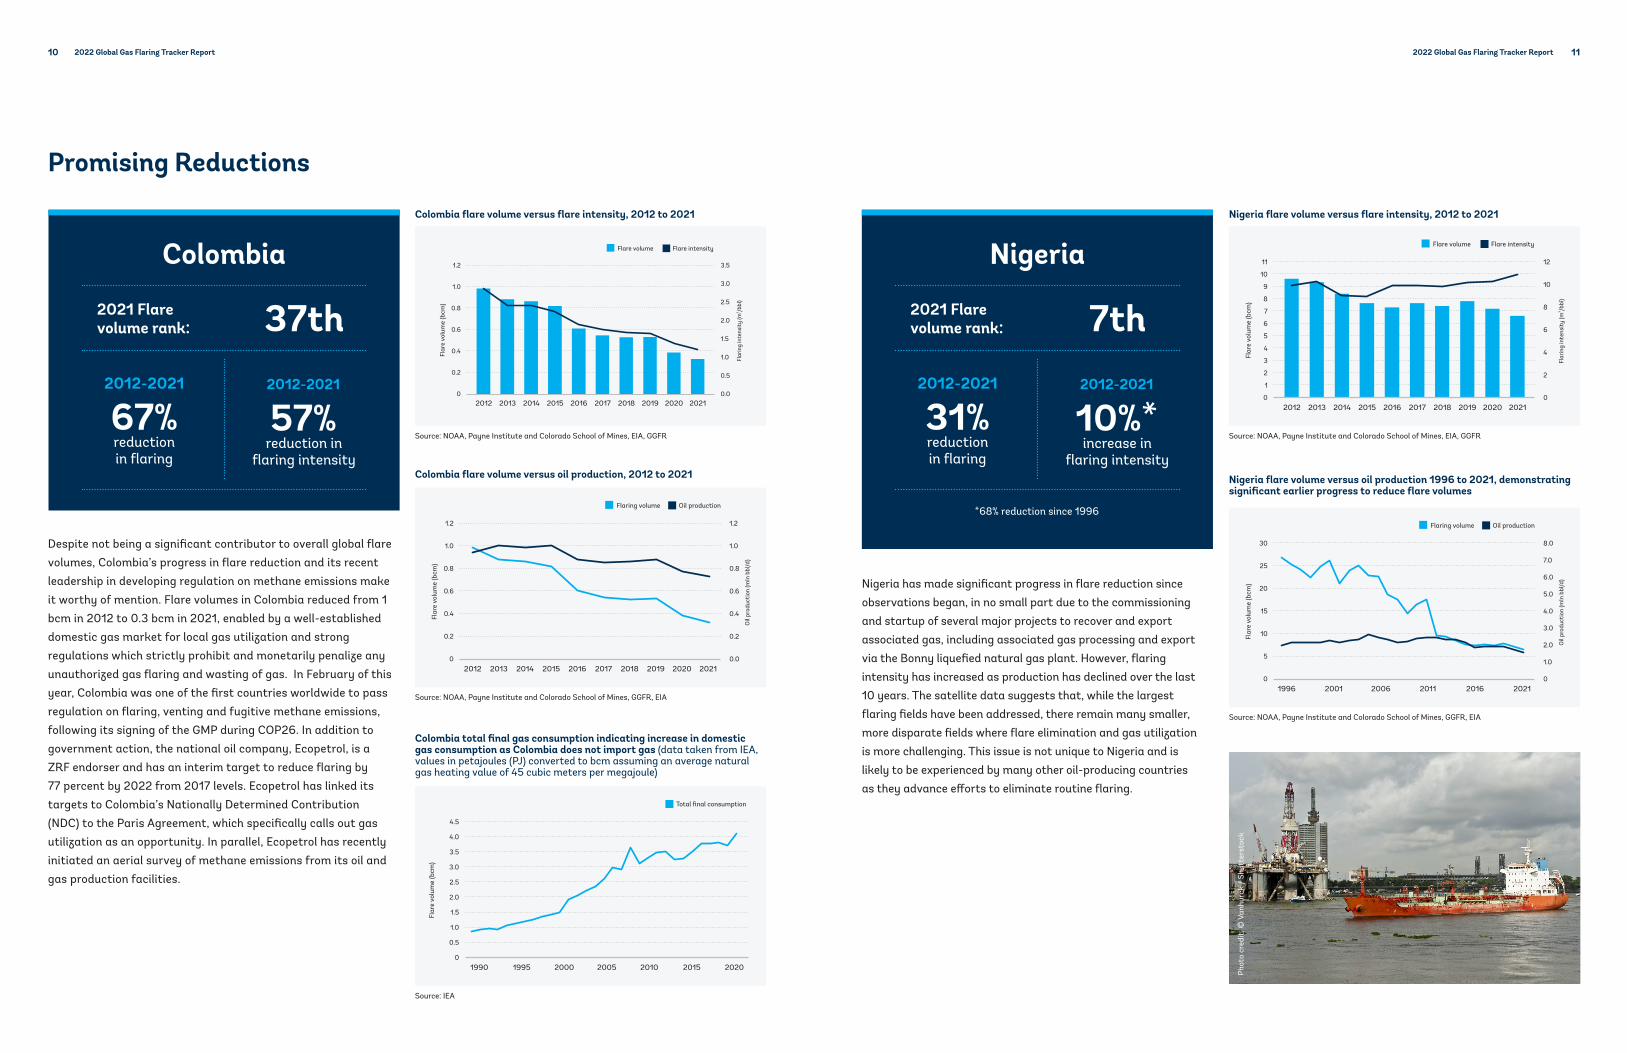
Nigeria has made significant progress in flare reduction since
observations began, in no small part due to the commissioning
and startup of several major projects to recover and export
associated gas, including associated gas processing and export
via the Bonny liquefied natural gas plant. However, flaring
intensity has increased as production has declined over the last
10 years. The satellite data suggests that, while the largest
flaring fields have been addressed, there remain many smaller,
more disparate fields where flare elimination and gas utilization
is more challenging. This issue is not unique to Nigeria and is
likely to be experienced by many other oil-producing countries
as they advance efforts to eliminate routine flaring.
11
10
9
1
2
3
4
5
6
7
8
0
Flare volume Flare intensity
20132012 2016 2018 2019 2020 20212017201520140
2
4
6
8
10
12
Flar
ing
inte
nsit
y (m
³/bb
l)
Flar
e vo
lum
e (b
cm)
Nigeria flare volume versus flare intensity, 2012 to 2021
Source: NOAA, Payne Institute and Colorado School of Mines, EIA, GGFR
30
25
20
15
10
5
0
Flaring volume Oil production
20011996 2016 2021201120060
5.0
6.0
7.0
8.0
1.0
2.0
3.0
4.0
Oil
prod
ucti
on (m
ln b
bl/d
)
Flar
e vo
lum
e (b
cm)
Nigeria flare volume versus oil production 1996 to 2021, demonstrating significant earlier progress to reduce flare volumes
Source: NOAA, Payne Institute and Colorado School of Mines, GGFR, EIA
Colombia
2021 Flare volume rank:
2012-2021
67%reductionin flaring
2012-2021
57%reduction in
flaring intensity
37th
Nigeria
2021 Flare volume rank:
2012-2021
31%reductionin flaring
2012-2021
10%*increase in
flaring intensity
7th
*68% reduction since 1996
Phot
o cr
edit
: © V
anhu
rck
/ Sh
utte
rsto
ck
Promising Reductions
2022 Global Gas Flaring Tracker Report 112022 Global Gas Flaring Tracker Report10

Worrying Increases
Despite oil production declining over the last 10 years, Mexico
has increased flaring by over 50 percent, with a sharp uptick
since 2018, rising from 3.8 bcm to 6.5 bcm in 2021. This increase
suggests oil production is occurring at wells with higher gas-
to-oil ratios and, with no outlet for the gas, the additional gas
produced is flared. Additionally, in the Marine Region, where the
highest gas volumes are flared, the use of nitrogen for artificial
lift results in the production of gas with a high nitrogen content,
which cannot be accepted in the domestic gas network. As a
result, a large amount of this gas is flared both offshore and at
onshore gas processing plants. Mexico’s focus over the last few
years has been on energy security, however the increase in gas
flaring has occurred while Mexico has also steadily increased
natural gas imports, highlighting the potential flare gas recovery
could play in its energy independence.
8
7
6
4
3
5
2
1
0
Flare volume Flare intensity
20132012 2016 2018 2019 2020 20212017201520140
2
4
6
8
10
12
Flar
ing
inte
nsit
y (m
³/bb
l)
Flar
e vo
lum
e (b
cm)
Mexico flare volume versus flare intensity, 2012 to 2021
Source: NOAA, Payne Institute and Colorado School of Mines, EIA, GGFR
7.0
6.0
5.0
4.0
3.0
2.0
1.0
0
Flaring volume Oil production
20132012 2016 2018 2019 2020 20212017201520140
0.5
1.0
1.5
2.0
2.5
3.0
Oil
prod
ucti
on (m
ln b
bl/d
)
Flar
e vo
lum
e (b
cm)
Mexico flare volume versus oil production, 2012 to 2021
Source: NOAA, Payne Institute and Colorado School of Mines, GGFR, EIA
80
70
60
50
40
30
20
10
0
Gas importsGas productionTotal gas supply
19951990 2010 2020201520052000
Nat
ural
gas
vol
ume
(bcm
)
Mexico domestic gas production, import and total final consumption 1990 to 2020, indicating increase in gas export and decrease in production (data taken from IEA, values in petajoules (PJ) converted to bcm assuming an average natural gas heating value of 45 cubic meters per megajoule, 2020 values provisional)
Source: IEA
Over the last decade, flaring has steadily increased in Iraq, with
volumes rising from 13 bcm in 2012 to almost 18 bcm in 2021,
accounting for around 12 percent of total global flaring. At the
same time, Iraq is importing natural gas; about 10 bcm in 2020.
Flare gas recovery and associated gas utilization are significant
opportunities for Iraq, which is both a GGFR partner and
endorser of the ZRF initiative and has gas utilization reduction
cited in its NDC.
20
14
16
18
8
2
10
4
12
6
0
Flare volume Flare intensity
20132012 2016 2018 2019 2020 20212017201520140
4
2
6
8
10
12
14
16
18
Flar
ing
inte
nsit
y (m
³/bb
l)
Flar
e vo
lum
e (b
cm)
Iraq flare volume versus flare intensity, 2012 to 2021
Source: NOAA, Payne Institute and Colorado School of Mines, EIA, GGFR
20
18
16
14
12
10
8
6
4
2
0
Flaring volume Oil production
20132012 2016 2018 2019 2020 20212017201520140
1.0
2.0
1.5
2.5
3.0
3.5
4.0
4.5
5.0
Oil
prod
ucti
on (m
ln b
bl/d
)
Flar
e vo
lum
e (b
cm)
Iraq flare volume versus oil production, 2012 to 2021
Source: NOAA, Payne Institute and Colorado School of Mines, GGFR, EIA
25
20
15
10
5
0
Natural gas importsDry natural gas productionDry natural gas consumption
2005 2010 20202015
Nat
ural
gas
vol
ume
(bcm
)
Iraq natural gas production, import and total consumption (data taken from bp Statistical Review of World Energy, July 2021)
Source: IEA, bp Statistical Review of World Energy, July 2021
Mexico
2021 Flare volume rank:
2012-2021
53%increasein flaring
2012-2021
126%increase in
flaring intensity
8th
Iraq
2021 Flare volume rank:
2012-2021
41%increasein flaring
2012-2021
3%increase in
flaring intensity
2nd
Phot
o cr
edit
: © G
GFR
2022 Global Gas Flaring Tracker Report 132022 Global Gas Flaring Tracker Report12

A Wasteful Practice, Crucial to Tackling Methane Emissions
Gas flaring is a wasteful practice that burns a valuable energy source that could be used to enhance economic development, provide increased energy security, and potentially displace dirtier energy sources. The 144 bcmof natural gas flared in 2021 could have potentially generated some 1,800 Terawatt hours (TWh) of energy, almost two-thirds of the European Union’s net domestic electricity generation.
Tackling gas flaring is also critical, given its role in global methane emissions. Methane is a more potent greenhouse gas than CO2 but has a shorter atmospheric lifetime. Therefore, reducing methane emissions is one of the fastest, most effective ways to slow the rate of climate change.
Gas flaring is a direct source of methane (see box below) and efforts to eliminate flaring also eliminate the associated methane emissions.
However, flare elimination efforts also support methane reductions from other sources, such as venting and fugitive releases. Without an outlet to export or utilize the gas, any methane conserved from these sources will ultimately be sent to flare and while there may be an overall emissions reduction, methane is still released, and this valuable energy source is still wasted.
This highlights the importance of flare reduction and gas management to overall oil and gas decarbonization strategies.
Why is flaring a source of methane?Methane is emitted from flares as flares do not completely combust all the hydrocarbons in the gas stream.
In our estimates, we assume:
• A flare destruction efficiency of 98 percent, assuming 2 percent methane is released uncombusted.
• The gas flared has a composition comprising 81 percent methane, with the remaining comprising heavier hydrocarbons (e.g. ethane, propane, butane).
• Methane has a global warming potential 25 times greater than CO2on a 100-year basis, consistent with the IPCC Fourth Assessment Report.
With these assumptions, we estimate that 2021 flaring resulted in 400 million tonnes of CO2 equivalent emissions (MMtCO2e), of which 361 MMtCO2e was in the form of CO2 and 39 MMtCO2e was in the form of uncombusted methane.
Methane
39
CO₂
361
Estimated emissions from gas flaring in 2021 in million tonnes of CO2 equivalants
Source: NOAA, Payne Institute and Colorado School of Mines, GGFR
Phot
o cr
edit
: © L
eoni
d Ik
an /
Shu
tter
stoc
k
2022 Global Gas Flaring Tracker Report 152022 Global Gas Flaring Tracker Report14

-50%
0%
50%
100%
-50% 0% 50% 100% 150%
% Change Flare 2016-2021
% C
hang
e Fl
are
Inte
nsit
y 20
16-2
021
ZRF endosers Non-ZRF endosers
% Change Flare 2016-2021
Argentina
Syria
China
Libya
Iran
Algeria
IndiaTurkmenistan
Mexico
Kazakhstan
Canada
Malaysia
Indonesia
Rep of the Congo
United States
Angola
Egypt
Gabon
Saudi Arabia
Nigeria
Iraq
Oman
Ecuador
Russia
Better performance to date:these countries have decreased both flare volumes and flaring intensity since 2016
Poor performance to date:these countries have increased both flare volumes and flaring intensity since 2016
Percentage change in flare volume versus flaring intensity between 2016 and 2021, top 30 flaring countries only, ZRF endorsing countries indicated. Bubble size is 2021 flare volume
Source: NOAA, Payne Institute and Colorado School of Mines, EIA, GGFR
Mixed Progress Towards Zero Routine Flaring
In 2015, the World Bank launched the ZRF initiative, which
commits endorsing governments and companies to end routine
flaring by 2030. 2022 marks an important mid-point on this
journey, so we take an opportunity to reflect on progress to date.
Although 34 governments have endorsed the ZRF initiative,
and committed to creating an enabling environment for flare
reduction investments, there has been mixed progress to date.
Some endorsing governments have successfully achieved both
a reduction in absolute flare volume and flaring intensity since
2016, which indicates that flare reductions are not solely due to
a decline in production. However, tremendous opportunities for
improvement remain for some of the largest flaring countries,
such as Russia, Iraq, and Mexico, all of whom were endorsers of
the initiative in 2016 and have since experienced an increase in
absolute flare volumes and flaring intensity.
Non-endorsingcountries
39% Endorsingcountries
61%
Percentage of 2021 flare volumes occurring in ZRF endorsing countries
Source: NOAA, Payne Institute and Colorado School of Mines, GGFR
0%
5%
10%
15%
20%
-5%
2016 2017 2018 2019 2020 2021-10%
Global ZRF endosers Non-ZRF endosers
Change in flaring intensity 2016 to 2021: global average, ZRF endorsing countries and non-ZRF endorsing countries
Source: NOAA, Payne Institute and Colorado School of Mines, EIA, GGFR
Phot
o cr
edit
: © O
psor
man
/ S
hutt
erst
ock
2022 Global Gas Flaring Tracker Report 172022 Global Gas Flaring Tracker Report16

Imported Flare Gas Index
In last year’s report, we introduced a new metric, the Imported
Flare Gas (IFG) Index, to infer the flaring associated with the
crude oil imported by various countries around the world. This
new metric highlights the flaring consequences of certain crude
imports and shares the burden of responsibility for flaring
reduction between both countries that produce and the countries
that import the crude oil. It is based on the premise that if a
country is importing crude oil from producing countries, it is also
importing the flaring intensity of these producing countries in
proportion to the amount of crude oil imported.
The IFG Index can help oil-importing countries assess where flaring
hotspots are in their fossil fuel supply chain. This should lead
to a dialogue with the countries from which they import oil and
potentially to assist in implementing flaring reduction initiatives,
thereby significantly improving the carbon emissions intensity of
the oil they consume.
Analysis of 2021 data suggests that many large crude oil-
importing countries, such as Spain, Italy, and the Netherlands,
are ‘exposed’ to high levels of gas flaring as they import crude
from countries with a high flaring intensity, such as Russia, Libya,
Algeria, Iraq, and Mexico.
Russian Federation Libya United Kingdom
Nigeria Iraq Gabon
Algeria United States Egypt
Kazakhstan Malaysia Tunisa
Mexico Cameroon Others
Esto
nia
Aus
tral
ia
Swit
zerl
and
Gre
ece
Spai
n
Slov
akia
Nor
way
Ital
y
Impo
rted
Fla
re G
as (I
FG) I
ndex
(m3/
bbl)
0
Aus
tria
Bel
arus
Rom
ania
Fran
ce
Finl
and
Lith
uani
a
Bul
gari
a
Pola
nd
Hun
gary
Cze
ch R
epub
lic
Ger
mna
y
Port
ugal
Net
herl
ands
Uni
ted
Kin
gdom
Can
ada
Uni
ted
Stat
es
Den
mar
k
Cro
atia
Swed
en
New
Zea
land
Irel
and
Japa
n
Bel
gium
Icel
and
Luxe
mbo
urg
Latv
ia
14
13
12
11
10
9
8
7
6
5
4
3
2
1
Rus
sian
Fed
erat
ion
2021 IFG Index Results
China
United States
India
Japan
South Korea
GermanyNetherlands
Thailand
France
United Kingdom
Singapore
Belgium
Poland
Greece
Italy
Spain
Canada
Sweden
0.00
1.00
2.00
3.00
4.00
5.00
6.00
7.00
8.00
9.00
10.00
0 1000 2000 3000 4000
Crude Import (Kbbl/day)
Impo
rted
Fla
re G
as (I
FG) I
ndex
(m3/
bbl)
International AverageFlaring Intensity
5000 6000 11000
Countries exposed to high flaring
IFG Index of Largest Crude Importing Countries (> 250 K bbl/day)
Source: NOAA, Payne Institute and Colorado School of Mines, EIA, UN Comtrade, GGFR
Source: NOAA, Payne Institute and Colorado School of Mines,, EIA, UN Comtrade, GGFR
Phot
o cr
edit
: © R
ed_S
hado
w /
Shu
tter
stoc
k.2022 Global Gas Flaring Tracker Report 192022 Global Gas Flaring Tracker Report18

While global flare volumes have remained largely static over the
last decade, the very significant reductions achieved by some
countries are encouraging and set an example for others.
Given the growing international focus on methane emissions and
acknowledging the important role the oil and gas industry could
play towards achieving climate goals, we call on governments
and companies to increase their focus and accelerate their
commitment to ending this wasteful industry practice by 2030.
On technology: while technology and innovation have an
important role to play, it is important to note that most flaring
is not due to a lack of available technology; it is due to a lack of
political will and leadership in developing appropriate markets and
infrastructure to recover and utilize the gas.
On regulation: effective regulation and strong enforcement
are paramount; our Global Flaring and Venting Regulations: A
Comparative Review of Policies study explores the many, and varied,
policy mechanisms that can be leveraged to both penalize gas
flaring and incentivize gas utilization.
On methane: eliminating routine flaring can offer a double win in
the shared endeavor to reduce global methane emissions by:
• eliminating a direct source of methane released un-combusted
from flares; and
• enabling the gas successfully conserved through reductions in
venting and fugitive emissions to be utilized rather than flared.
On decarbonization: the utilization of flared gas presents an
opportunity to put a valuable, wasted energy source to beneficial
use. Natural gas can help reduce the carbon intensity of the global
energy mix, with the ability to replace coal and liquid fuels quickly,
allowing time for the development and implementation of low and
no carbon sources such as renewables and green hydrogen.
On timing: Infrastructure projects needed to connect flares to
markets can take years to be developed and operational. If Zero
Routine Flaring by 2030 is to be achieved, action must be swift
and determined.
Despite the 10-year plateau in flaring, we remain hopeful that
significant progress on flaring can be made over the next few
years, but this will require strong regulation and effective
collaboration between the public and private sectors.
Concluding Reflections
Phot
o cr
edit
: © e
leon
imag
es /
Shu
tter
stoc
k.
Phot
o cr
edit
: © E
ssam
al-
Suda
ni /
Shu
tter
stoc
k.2022 Global Gas Flaring Tracker Report 212022 Global Gas Flaring Tracker Report20

Global Gas Flaring Reduction Partnership (GGFR) Multi-Donor Trust Fund
1850 I Street NW, Washington, DC 20006
MethodologyThe 2022 Global Gas Flaring Tracker Report is produced on an annual basis
by the World Bank’s GGFR, comprised of governments, oil companies,
and international institutions working to end routine gas flaring at oil
production sites around the world. GGFR, in partnership with the US NOAA
and The Payne Institute for Public Policy at the Colorado School of Mines,
has developed global gas flaring estimates based upon observations from
satellites launched in 2012 and 2017. The advanced sensors of this satellite
detect the heat emitted by gas flares as infrared emissions at global
upstream oil and gas facilities.
The Colorado School of Mines and GGFR quantify these infrared emissions
and calibrate them using country-level data collected by a third-party data
supplier, Cedigaz, to produce robust estimates of global gas flaring volumes.
The satellite data for estimating flare gas volumes is collected by NOAA’s
satellite-mounted Visual and Infrared Radiometer Suite of detectors (VIIRS).
VIIRS has a multispectral set of infrared detectors which:
• at nighttime respond only to heat emissions and hence are not affected by
sunlight, moonlight or other light sources
• respond to wavelengths where emissions from flares are at a maximum
• overfly every flare several times per night
• have excellent spatial resolution.
The ability of VIIRS to detect and discriminate hot sources, such as
gas flares, enables flares to be detected automatically with minimal
manual intervention. Emissions from non-flare hot sources (e.g. biomass
burning) can be removed from the data by selecting only emissions with
temperatures above 1100C; other hot sources burn at lower temperatures.
Indeed, flares burn hotter than any other terrestrial hot sources, including
volcanos. Since the first year of year of operation in 2012, VIIRS has
automatically detected ~10,000 flares annually around the globe.
The World Bank’s role in gas flaring reduction
The World Bank’s GGFR works closely with
governments and oil companies to help assess
technologies, develop policies and regulations,
and build capacity to end routine flaring
by 2030. We are also continuing to secure
commitments for the Zero Routine Flaring by
2030 initiative, Zero Routine Flaring by 2030
initiative, building upon the 87 government
and oil company endorsers that, together,
account for close to 60 percent of global
flaring. Ending routine gas flaring is critical
if governments and companies are to deliver
their products in the cleanest manner possible,
meet net-zero targets, and maintain their
license to operate, especially in developing
countries where millions lack access to energy.
To do this, we must test and scale innovative
approaches, while considering new solutions
that treat associated gas as an asset, not
a waste product. Such approaches must
also be tailored to the unique circumstances
and context of a particular country, or even
a specific oil production site. We need to
work collaboratively with governments and
oil companies to develop holistic policies,
considering a range of incentives and
penalties, to finally put an end to this practice.
References: Elvidge, C.D.; Zhizhin, M.; Hsu, F.-C.; Baugh, K.E. VIIRS Nightfire: Satellite Pyrometry at Night. Remote Sens. 2013, 5, 4423-4449. https://doi.org/10.3390/rs5094423 Elvidge, C.D.; Zhizhin, M.; Baugh, K.; Hsu, F.-C.; Ghosh, T. Methods for Global Survey of Natural Gas Flaring from Visible Infrared Imaging Radiometer Suite Data. Energies 2016, 9, 14. https://doi.org/10.3390/en9010014