Contrasting changes in taxonomic, phylogenetic and functional diversity during a long-term...
20
Contrasting changes in taxonomic, phylogenetic and functional diversity during a long-term succession: insights into assembly processes Oliver Purschke 1,2,3,4 *, Barbara C. Schmid 1,2 , Martin T. Sykes 1 , Peter Poschlod 5 , Stefan G. Michalski 6 , Walter Durka 6 , Ingolf K € uhn 6 , Marten Winter 3,6 and Honor C. Prentice 2 1 Department of Physical Geography and Ecosystem Science, Lund University, S€ olvegatan 12, SE-223 62 Lund, Sweden; 2 Biodiversity, Department of Biology, Lund University, S€ olvegatan 37, SE-223 62 Lund, Sweden; 3 German Centre for Integrative Biodiversity Research (iDiv) Halle-Jena-Leipzig, Deutscher Platz 5e, DE-04103 Leipzig, Germany; 4 Geobotany and Botanical Garden, Institute of Biology, Martin Luther University of Halle-Wittenberg, Am Kirchtor 1, DE-06108 Halle (Saale), Germany; 5 Institute of Botany, Faculty of Biology and Preclinical Medicine, University of Regensburg, Universit € atsstrasse 31, DE-93053 Regensburg, Germany; and 6 Department of Community Ecology, Helmholtz Centre for Environmental Research – UFZ, Theodor-Lieser-Straße 4, DE-06120 Halle (Saale), Germany Summary 1. Theory predicts that the processes generating biodiversity after disturbance will change during suc- cession. Comparisons of phylogenetic and functional (alpha and beta) diversity with taxonomic diver- sity can provide insights into the extent to which community assembly is driven by deterministic or stochastic processes, but comparative approaches have yet to be applied to successional systems. 2. We characterized taxonomic, phylogenetic and functional plant (alpha and beta) diversity within and between four successional stages in a > 270-year-long arable-to-grassland chronosequence. Null models were used to test whether functional and phylogenetic turnover differed from random expec- tations, given the levels of species diversity. 3. The three facets of diversity showed different patterns of change during succession. Between early and early-mid succession, species richness increased but there was no increase in functional or phylogenetic diversity. Higher than predicted levels of functional similarity between species within the early and early-mid successional stages, indicate that abiotic filters have selected for sets of func- tionally similar species within sites. Between late-mid and late succession, there was no further increase in species richness, but a significant increase in functional alpha diversity, suggesting that functionally redundant species were replaced by functionally more dissimilar species. Functional turnover between stages was higher than predicted, and higher than within-stage turnover, indicating that different assembly processes act at different successional stages. 4. Synthesis. Analysis of spatial and temporal turnover in different facets of diversity suggests that deterministic processes generate biodiversity during post-disturbance ecosystem development and that the relative importance of assembly processes has changed over time. Trait-mediated abiotic fil- tering appears to play an important role in community assembly during the early and early-mid stages of arable-to-grassland succession, whereas the relative importance of competitive exclusion appears to have increased towards the later successional stages. Phylogenetic diversity provided a poor reflection of functional diversity and did not contribute to inferences about underlying assembly processes. Functionally deterministic assembly suggests that it may be possible to predict future post-disturbance changes in biodiversity, and associated ecosystem attributes, on the basis of spe- cies’ functional traits but not phylogeny. Key-words: alpha diversity, arable-to-grassland succession, beta diversity, chronosequence, com- munity assembly, determinants of plant community diversity and structure, environmental filtering, null model, semi-natural grasslands, trait *Correspondence author. E-mail: [email protected] © 2013 The Authors. Journal of Ecology © 2013 British Ecological Society Journal of Ecology 2013, 101, 857–866 doi: 10.1111/1365-2745.12098
-
Upload
idiv-biodiversity -
Category
Documents
-
view
0 -
download
0
Transcript of Contrasting changes in taxonomic, phylogenetic and functional diversity during a long-term...
Contrasting changes in taxonomic, phylogenetic andfunctional diversity during a long-term succession:insights into assembly processesOliver Purschke1,2,3,4*, Barbara C. Schmid1,2, Martin T. Sykes1, Peter Poschlod5,Stefan G. Michalski6, Walter Durka6, Ingolf K€uhn6, Marten Winter3,6 and Honor C. Prentice2
1Department of Physical Geography and Ecosystem Science, Lund University, S€olvegatan 12, SE-223 62 Lund,Sweden; 2Biodiversity, Department of Biology, Lund University, S€olvegatan 37, SE-223 62 Lund, Sweden; 3GermanCentre for Integrative Biodiversity Research (iDiv) Halle-Jena-Leipzig, Deutscher Platz 5e, DE-04103 Leipzig, Germany;4Geobotany and Botanical Garden, Institute of Biology, Martin Luther University of Halle-Wittenberg, Am Kirchtor 1,DE-06108 Halle (Saale), Germany; 5Institute of Botany, Faculty of Biology and Preclinical Medicine, University ofRegensburg, Universit€atsstrasse 31, DE-93053 Regensburg, Germany; and 6Department of Community Ecology,Helmholtz Centre for Environmental Research – UFZ, Theodor-Lieser-Straße 4, DE-06120 Halle (Saale), Germany
Summary
1. Theory predicts that the processes generating biodiversity after disturbance will change during suc-cession. Comparisons of phylogenetic and functional (alpha and beta) diversity with taxonomic diver-sity can provide insights into the extent to which community assembly is driven by deterministic orstochastic processes, but comparative approaches have yet to be applied to successional systems.2. We characterized taxonomic, phylogenetic and functional plant (alpha and beta) diversity withinand between four successional stages in a > 270-year-long arable-to-grassland chronosequence. Nullmodels were used to test whether functional and phylogenetic turnover differed from random expec-tations, given the levels of species diversity.3. The three facets of diversity showed different patterns of change during succession. Betweenearly and early-mid succession, species richness increased but there was no increase in functional orphylogenetic diversity. Higher than predicted levels of functional similarity between species withinthe early and early-mid successional stages, indicate that abiotic filters have selected for sets of func-tionally similar species within sites. Between late-mid and late succession, there was no furtherincrease in species richness, but a significant increase in functional alpha diversity, suggesting thatfunctionally redundant species were replaced by functionally more dissimilar species. Functionalturnover between stages was higher than predicted, and higher than within-stage turnover, indicatingthat different assembly processes act at different successional stages.4. Synthesis. Analysis of spatial and temporal turnover in different facets of diversity suggests thatdeterministic processes generate biodiversity during post-disturbance ecosystem development andthat the relative importance of assembly processes has changed over time. Trait-mediated abiotic fil-tering appears to play an important role in community assembly during the early and early-midstages of arable-to-grassland succession, whereas the relative importance of competitive exclusionappears to have increased towards the later successional stages. Phylogenetic diversity provided apoor reflection of functional diversity and did not contribute to inferences about underlying assemblyprocesses. Functionally deterministic assembly suggests that it may be possible to predict futurepost-disturbance changes in biodiversity, and associated ecosystem attributes, on the basis of spe-cies’ functional traits but not phylogeny.
Key-words: alpha diversity, arable-to-grassland succession, beta diversity, chronosequence, com-munity assembly, determinants of plant community diversity and structure, environmental filtering,null model, semi-natural grasslands, trait
*Correspondence author. E-mail: [email protected]
© 2013 The Authors. Journal of Ecology © 2013 British Ecological Society
Journal of Ecology 2013, 101, 857–866 doi: 10.1111/1365-2745.12098
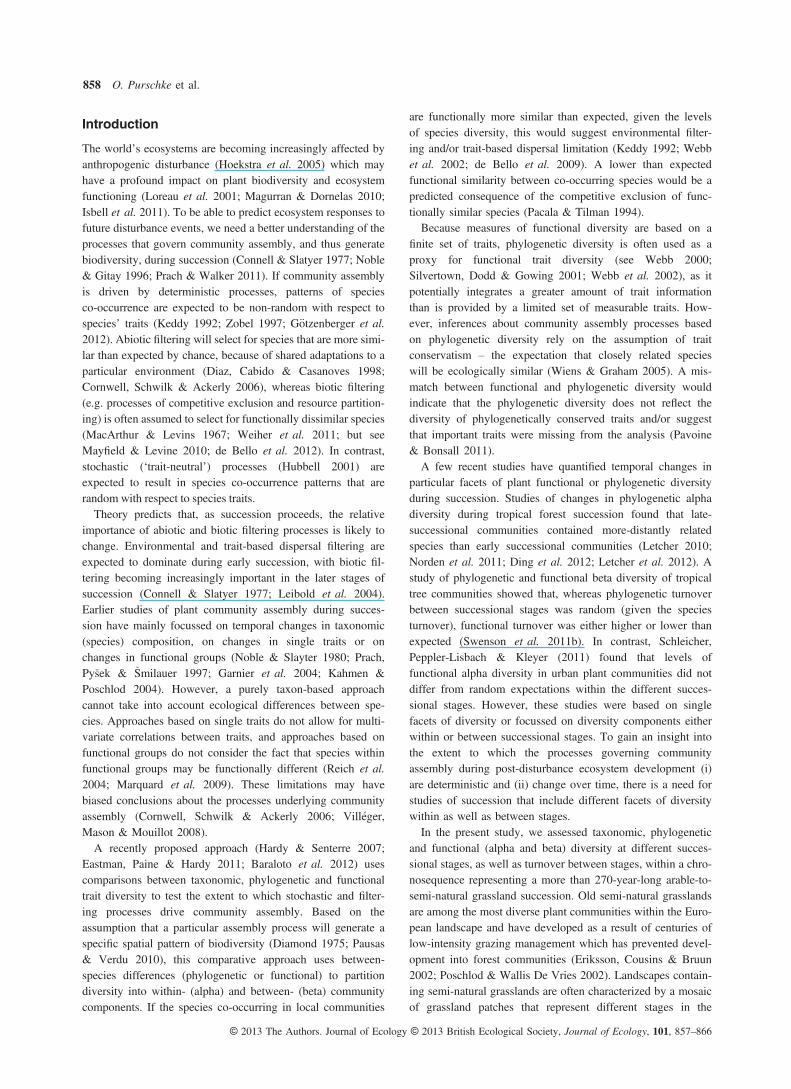
Introduction
The world’s ecosystems are becoming increasingly affected byanthropogenic disturbance (Hoekstra et al. 2005) which mayhave a profound impact on plant biodiversity and ecosystemfunctioning (Loreau et al. 2001; Magurran & Dornelas 2010;Isbell et al. 2011). To be able to predict ecosystem responses tofuture disturbance events, we need a better understanding of theprocesses that govern community assembly, and thus generatebiodiversity, during succession (Connell & Slatyer 1977; Noble& Gitay 1996; Prach & Walker 2011). If community assemblyis driven by deterministic processes, patterns of speciesco-occurrence are expected to be non-random with respect tospecies’ traits (Keddy 1992; Zobel 1997; G€otzenberger et al.2012). Abiotic filtering will select for species that are more simi-lar than expected by chance, because of shared adaptations to aparticular environment (Diaz, Cabido & Casanoves 1998;Cornwell, Schwilk & Ackerly 2006), whereas biotic filtering(e.g. processes of competitive exclusion and resource partition-ing) is often assumed to select for functionally dissimilar species(MacArthur & Levins 1967; Weiher et al. 2011; but seeMayfield & Levine 2010; de Bello et al. 2012). In contrast,stochastic (‘trait-neutral’) processes (Hubbell 2001) areexpected to result in species co-occurrence patterns that arerandom with respect to species traits.Theory predicts that, as succession proceeds, the relative
importance of abiotic and biotic filtering processes is likely tochange. Environmental and trait-based dispersal filtering areexpected to dominate during early succession, with biotic fil-tering becoming increasingly important in the later stages ofsuccession (Connell & Slatyer 1977; Leibold et al. 2004).Earlier studies of plant community assembly during succes-sion have mainly focussed on temporal changes in taxonomic(species) composition, on changes in single traits or onchanges in functional groups (Noble & Slayter 1980; Prach,Py�sek & �Smilauer 1997; Garnier et al. 2004; Kahmen &Poschlod 2004). However, a purely taxon-based approachcannot take into account ecological differences between spe-cies. Approaches based on single traits do not allow for multi-variate correlations between traits, and approaches based onfunctional groups do not consider the fact that species withinfunctional groups may be functionally different (Reich et al.2004; Marquard et al. 2009). These limitations may havebiased conclusions about the processes underlying communityassembly (Cornwell, Schwilk & Ackerly 2006; Vill�eger,Mason & Mouillot 2008).A recently proposed approach (Hardy & Senterre 2007;
Eastman, Paine & Hardy 2011; Baraloto et al. 2012) usescomparisons between taxonomic, phylogenetic and functionaltrait diversity to test the extent to which stochastic and filter-ing processes drive community assembly. Based on theassumption that a particular assembly process will generate aspecific spatial pattern of biodiversity (Diamond 1975; Pausas& Verdu 2010), this comparative approach uses between-species differences (phylogenetic or functional) to partitiondiversity into within- (alpha) and between- (beta) communitycomponents. If the species co-occurring in local communities
are functionally more similar than expected, given the levelsof species diversity, this would suggest environmental filter-ing and/or trait-based dispersal limitation (Keddy 1992; Webbet al. 2002; de Bello et al. 2009). A lower than expectedfunctional similarity between co-occurring species would be apredicted consequence of the competitive exclusion of func-tionally similar species (Pacala & Tilman 1994).Because measures of functional diversity are based on a
finite set of traits, phylogenetic diversity is often used as aproxy for functional trait diversity (see Webb 2000;Silvertown, Dodd & Gowing 2001; Webb et al. 2002), as itpotentially integrates a greater amount of trait informationthan is provided by a limited set of measurable traits. How-ever, inferences about community assembly processes basedon phylogenetic diversity rely on the assumption of traitconservatism – the expectation that closely related specieswill be ecologically similar (Wiens & Graham 2005). A mis-match between functional and phylogenetic diversity wouldindicate that the phylogenetic diversity does not reflect thediversity of phylogenetically conserved traits and/or suggestthat important traits were missing from the analysis (Pavoine& Bonsall 2011).A few recent studies have quantified temporal changes in
particular facets of plant functional or phylogenetic diversityduring succession. Studies of changes in phylogenetic alphadiversity during tropical forest succession found that late-successional communities contained more-distantly relatedspecies than early successional communities (Letcher 2010;Norden et al. 2011; Ding et al. 2012; Letcher et al. 2012). Astudy of phylogenetic and functional beta diversity of tropicaltree communities showed that, whereas phylogenetic turnoverbetween successional stages was random (given the speciesturnover), functional turnover was either higher or lower thanexpected (Swenson et al. 2011b). In contrast, Schleicher,Peppler-Lisbach & Kleyer (2011) found that levels offunctional alpha diversity in urban plant communities did notdiffer from random expectations within the different succes-sional stages. However, these studies were based on singlefacets of diversity or focussed on diversity components eitherwithin or between successional stages. To gain an insight intothe extent to which the processes governing communityassembly during post-disturbance ecosystem development (i)are deterministic and (ii) change over time, there is a need forstudies of succession that include different facets of diversitywithin as well as between stages.In the present study, we assessed taxonomic, phylogenetic
and functional (alpha and beta) diversity at different succes-sional stages, as well as turnover between stages, within a chro-nosequence representing a more than 270-year-long arable-to-semi-natural grassland succession. Old semi-natural grasslandsare among the most diverse plant communities within the Euro-pean landscape and have developed as a result of centuries oflow-intensity grazing management which has prevented devel-opment into forest communities (Eriksson, Cousins & Bruun2002; Poschlod & Wallis De Vries 2002). Landscapes contain-ing semi-natural grasslands are often characterized by a mosaicof grassland patches that represent different stages in the
© 2013 The Authors. Journal of Ecology © 2013 British Ecological Society, Journal of Ecology, 101, 857–866
858 O. Purschke et al.

succession from arable cultivation to permanent pasture. A chro-nosequence approach, in which different-aged patches of vege-tation are assumed to represent a temporal sequence of changein community composition, provides the only means of studyingthe long-term (over several centuries) dynamics of such succes-sional systems (Knops & Tilman 2000; Peltzer et al. 2010;Walker et al. 2010). Chronosequences are most suited for theanalysis of community characteristics, such as biological diver-sity, that change in a linear fashion over time, and, despitecritiques (Johnson & Miyanishi 2008), can contribute to anunderstanding of landscape processes, even in systems whereplant community trajectories do not match changes in soildevelopment (Walker et al. 2010).First, we quantified taxonomic, phylogenetic and functional
diversity within grassland communities (alpha diversity),together with the taxonomic, phylogenetic and functionalturnover between communities (beta diversity), at four succes-sional time steps.Secondly, to obtain insights into stochastic and determinis-
tic processes, we examined, for each successional time step,whether species co-occurring within sites were phylogeneti-cally or functionally more (or less) similar than expected,given the taxonomic diversity. If community assembly duringsuccession is deterministic, levels of functional similarity areexpected to be either higher or lower than predicted by anappropriate null model. If abiotic filtering is the dominantassembly process in the initial phases of succession, func-tional similarity between species co-occurring within commu-nities should be higher than expected within the earlysuccessional stages.Third, we assessed phylogenetic and functional turnover
between successional stages. If the phylogenetic or functionalturnover between sites belonging to different stages is higherthan the turnover between sites from the same successionalstage, this would indicate that there is phylogenetic and func-tional turnover, possibly caused by differential environmentalfiltering, during the course of succession.
Materials and methods
STUDY AREA AND SAMPLING
We studied grassland plant communities in a chronosequence repre-senting an arable-to-semi-natural grassland succession within a4.5 9 4.5 km landscape (centred on 56°40′49″ N, 16°33′58″ E) onthe Baltic Island of €Oland, Sweden. The overall topography in thestudy area is flat and the landscape consists of a mosaic of grasslands,arable fields and forests. €Oland has a history of grazing managementdating back to the early Neolithic (3900–3300 BC), but the proportionof grassland in the study area has declined progressively over the lastthree centuries – from 86% in 1723 to 9% at the present day (Johans-son et al. 2008). The remaining grassland fragments are still exten-sively grazed by free-ranging cattle. Younger grasslands havedeveloped on previously arable fields (Johansson et al. 2008).
All grassland fragments in the present-day landscape were classi-fied according to their grazing continuity (grassland age), with thehelp of GIS overlay analysis of land-use maps from 1730, 1959,1994 and 2005 (see Johansson et al. 2008), and assigned to one of
four successional stages (early, early-mid, late-mid and late succes-sion), representing 5–15, 16–50, 51–270 and > 270 years of grasslandcontinuity. Grassland fragments < 50 m2 were excluded from thestudy, and fragments > 2500 m2 were subdivided into smaller units(ranging from 1250 to 2500 m2), giving a total of 1335 grasslandunits with areas ranging between 56 and 2500 m2. Within each suc-cessional stage, 55 grassland units were randomly selected, withoutreplacement. Presence/absence data for all non-woody, vascular plantspecies (234 in total) were collected from a single 2 9 2-m plot(between mid-May and mid-July 2009) within each of the 55 selectedgrassland units representing each of the four successional stages (giv-ing a total of 220 plots). The amount of disturbance was characterizedby the percentage of bare ground within each plot.
TRAIT DATA
The plant species recorded in the plots were scored for 11 functionaltraits associated with their response to and/or tolerance of disturbance(Fig. S1 in Supporting Information). All traits were compiled/derivedfrom large data bases for the North-West European flora (Poschlodet al. 2003; Kleyer et al. 2008). The total set of traits consisted of: (i)five vegetative traits, mainly related to the species’ competitive ability,growth rate and ability to respond to disturbance [canopy height, plantlife-form, specific leaf area (SLA), leaf size, leaf dry matter content(LDMC)] and (b) six regenerative traits, related to species’ ability todisperse in space and time (epizoochory, wind dispersal potential,adult plant longevity, seed bank persistence, seed mass, seed produc-tion per ramet; Poschlod, Tackenberg & Bonn 2005). Qualitative dataon plant life-form (Raunkiær 1934) were coded as a quantitativevariable: cryptophytes and therophytes = 1, hemicryptophytes = 2,chamaephytes = 3 and phanerophytes = 4 (cf. Pakeman, Lennon &Brooker 2011). Wind dispersal potential, on an ordinal scale, wasderived from data on seed terminal velocity and seed release height(Tackenberg, Poschlod & Bonn 2003). Cattle are the main grazinglivestock in the study area, and cattle-coat seed retention potential,predicted from seed mass and seed morphology using the regressionmodel in R€omermann, Tackenberg & Poschlod (2005), was used asan indicator for epizoochorous dispersal potential. Adult plant longev-ity was inferred from data on plant life span and on clonal propaga-tion, using three ordinal classes ‘annual and biennial’, ‘perennial/without the ability to spread clonally’ and ‘perennial showing clonali-ty’. Seed bank persistence was characterized by the longevity index(Bekker et al. 1998), calculated as the proportion of non-transient seedbank records in the data base of Thompson, Bakker & Bekker (1997).
Because data for all 11 traits were not available for the full set ofspecies (n = 234), estimates for missing values (9.1% of the cases)were obtained by predictive mean matching based on the observedtrait values, using multivariate imputation by chained equations(MICE) as implemented in the package ‘mice’ (van Buuren &Groothuis-Oudshoorn 2011) in the R statistical package (R Develop-ment Core Team 2012).
PHYLOGENETIC DATA
We extracted a phylogenetic tree for the 234 species in the study from adated, ultrametric supertree for 4685 Central European vascular plantspecies (DAPHNE 1.0, Durka & Michalski 2012). The final tree included221 internal nodes of which 9 (4%) were polytomies. All but one of thepolytomies (families within the Malpighiales) were below the familylevel, with three polytomies involving genera in the Poaceae, and fivepolytomies involving species within different dicot genera (Fig. S1).
© 2013 The Authors. Journal of Ecology © 2013 British Ecological Society, Journal of Ecology, 101, 857–866
Diversity facets and community assembly during succession 859

DIVERSITY MEASURES
Measures of taxonomic, phylogenetic and functional alpha and betadiversity were calculated for each plot within the four successionalstages. Taxonomic alpha and beta diversity were characterized by spe-cies richness and the 1 – Jaccard index [Koleff, Gaston & Lennon2003; R-package ‘vegan’ (Oksanen et al. 2012)], respectively. Follow-ing Hardy & Senterre (2007) (see also Baraloto et al. 2012), phyloge-netic and functional diversity were estimated within a consistentframework, based on the spatial decomposition of between-speciesevolutionary relatedness or trait similarity into within- (alpha) andbetween- (beta) community components that are independent of taxo-nomic diversity.
Within the Hardy & Senterre (2007) framework, phylogenetic andfunctional alpha diversity are, respectively, equivalent to the meanphylogenetic or functional trait distance between species (MPDP
w,MPDT
w) within a community and, in the case of presence/absencedata, measure phylogenetic and functional distinctness.
Phylogenetic and functional turnover (beta diversity) were calcu-lated, respectively, using the ΠST and τST statistics (Hardy & Senterre2007): ΠST = 1�mMPDP
w/MPDPa and τST = 1�mMPDT
w/MPDTa ,
where mMPDPw and mMPDT
w are the mean within-community phylo-genetic and functional distance (MPDP
w, MPDTw), respectively, aver-
aged over all communities. MPDPa and MPDT
a are the meanphylogenetic and functional distance between distinct species sampledfrom different communities. Values of ΠST or τST > 0 indicate thatspecies within communities are phylogenetically more related, orfunctionally more similar, than species from different communities(phylogenetic or functional clustering). ΠST or τST < 0 indicate thatspecies within communities are phylogenetically less related, or func-tionally less similar, than species from different communities (phylo-genetic or functional overdispersion). In our study ΠST and τST werecalculated for each pair of plots.
Phylogenetic diversity was calculated from a phylogenetic cophe-netic distance matrix. The functional diversity indices were obtainedfrom a species distance matrix based on the 11 functional traits. Wecarried out principal component analysis (PCA) on the log-transformedand standardized (mean = 0, SD = 1) trait data to correct for domi-nance of the distance matrix by highly correlated traits (see Devictoret al. 2010; Swenson, Anglada-Cordero & Barone 2011a). The result-ing PCA axes were used to construct the interspecies functional dis-tance matrix from which the mean pairwise distances, within andbetween communities, were calculated.
Differences in mean diversity between the four successional timesteps were assessed with ANOVA and post hoc pairwise comparisonsusing a permutation approach [5000 permutations; R-package‘lmPerm’ (Wheeler 2010)]. The Benjamini & Yekutieli (2001) correc-tion for P-values was used to control for false discovery rates.
Phylogenetic and functional beta diversity (ΠST and τST) werecalculated between pairs of plots belonging to the same or to differ-ent successional time steps, to assess temporal turnover in phyloge-netic and functional diversity. The phylogenetic and functionaldiversity measures were calculated using the R-packages ‘picante’(Kembel et al. 2010) and ‘spacodiR’ (Eastman, Paine & Hardy2011).
NULL MODEL ANALYSIS
To assess whether species within communities were phylogeneticallyor functionally more (or less) similar than expected from a randomdraw from the pool of species found in each successional time step,
we compared the observed ΠST and τST values with the ΠST and τSTvalues from 999 random communities. ‘Relative’ diversity measures,such as ΠST or τST, have been shown to provide more robust tests ofphylogenetic or functional community structure than absolute mea-sures such as MPD (Hardy 2008). Random communities were gener-ated using the null model ‘1a’ in Hardy (2008), shuffling the namesof the species across the phylogenetic or functional distance matrix.Permutations were restricted to species that have similar occurrencefrequencies within the study landscape, grouping species into distinctfrequency classes characterized by a fixed ratio: maximal/minimaloccurrence frequency = 4, resulting in limits between frequency clas-ses of 1, 4, 16, 64 and 256. This type of null model is appropriatewhen overall species’ frequencies are distributed non-randomly acrossthe phylogeny or the functional trait space, as was the case in ourstudy (see Appendix S1 and Fig. S2), and maintains (i) the speciesrichness of each community, (ii) the species turnover between com-munities, (iii) the occurrence frequency of the species across the land-scape, (iv) patterns of spatial clustering (e.g. caused by dispersallimitation), (v) the species identity within each time step and (vi) thephylogenetic and functional signal in overall species frequencies. Allnull model tests were carried out on the average ΠST and τST values(global estimates) for the 2 9 2-m plots within the respective succes-sional stages. Tests on global diversity estimates have been shown tohave greater power than those based on estimates from pairs of sites(Hardy 2008).
Significant positive (or negative) values of ΠST or τST (beta diver-sity) indicate that species within plots belonging to a particular suc-cessional stage are more (or less) similar than expected by chance.Higher phylogenetic or functional turnover (ΠST, τST) between plotsbelonging to different successional stages than between plots from thesame successional stage would suggest that different filteringprocesses act at different successional stages.
PHYLOGENETIC SIGNAL IN TRAITS
To assess the extent to which the phylogenetic relatedness betweenspecies reflects ecological similarity (i.e. phylogenetic conservatism),we used Blomberg’s K-statistic (Blomberg et al. 2003) to quantify thetree-wide phylogenetic signal in each of the 11 traits [R-package ‘phy-tools’ (Revell 2012)]. K values close to zero indicate less phylogeneticsignal than expected from a Brownian motion model of trait evolution(Blomberg et al. 2003), implying that closely related species are func-tionally distinct. The significance of the phylogenetic signal wasassessed by comparing the observed K values with a null distributionof K values generated by shuffling (999 times) the species’ namesacross the tips of the phylogenetic tree. There is a significant signal ifthe observed K values are within the top 2.5% of the randomized Kvalues. We assessed node-level phylogenetic signal at different depthsin the phylogeny following the approach proposed by Moles et al.(2005) (see Appendix S2).
SHIFTS IN COMMUNITY-LEVEL MEAN TRAIT VALUES
Successional shifts in single traits were used as an aid to the interpre-tation of results from the null model analysis. Community-level meantrait values, for each of the 11 functional traits, were calculated foreach plot. Mean trait values for each successional stage were used tosummarize changes in trait values over time. Differences in mean traitvalues between successional stages were assessed on the basis of ANO-
VA and post hoc pairwise comparisons using a nonparametric permu-tational approach. P-values were obtained from randomization testing
© 2013 The Authors. Journal of Ecology © 2013 British Ecological Society, Journal of Ecology, 101, 857–866
860 O. Purschke et al.
(999 runs) and controlled for false discovery rates (Benjamini &Yekutieli 2001).
Results
CHANGES IN DIVERSITY DURING SUCCESSION
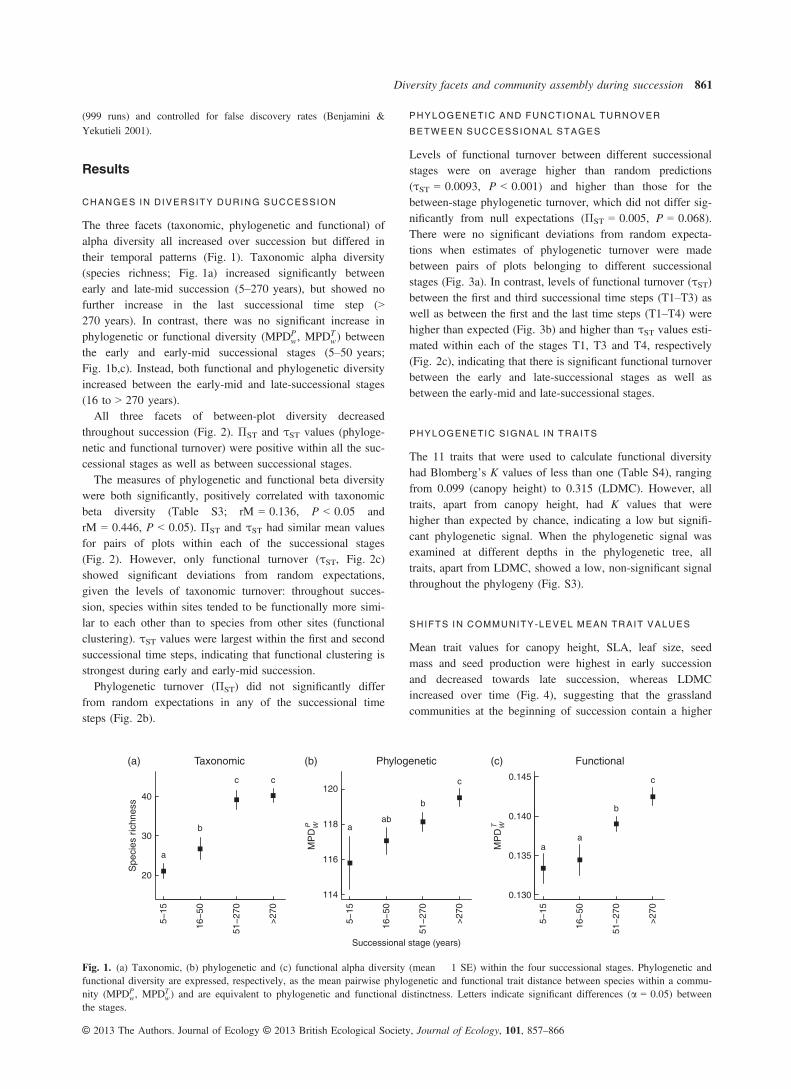
The three facets (taxonomic, phylogenetic and functional) ofalpha diversity all increased over succession but differed intheir temporal patterns (Fig. 1). Taxonomic alpha diversity(species richness; Fig. 1a) increased significantly betweenearly and late-mid succession (5–270 years), but showed nofurther increase in the last successional time step (>270 years). In contrast, there was no significant increase inphylogenetic or functional diversity (MPDP
w, MPDTw) between
the early and early-mid successional stages (5–50 years;Fig. 1b,c). Instead, both functional and phylogenetic diversityincreased between the early-mid and late-successional stages(16 to > 270 years).All three facets of between-plot diversity decreased
throughout succession (Fig. 2). ΠST and τST values (phyloge-netic and functional turnover) were positive within all the suc-cessional stages as well as between successional stages.The measures of phylogenetic and functional beta diversity
were both significantly, positively correlated with taxonomicbeta diversity (Table S3; rM = 0.136, P < 0.05 andrM = 0.446, P < 0.05). ΠST and τST had similar mean valuesfor pairs of plots within each of the successional stages(Fig. 2). However, only functional turnover (τST, Fig. 2c)showed significant deviations from random expectations,given the levels of taxonomic turnover: throughout succes-sion, species within sites tended to be functionally more simi-lar to each other than to species from other sites (functionalclustering). τST values were largest within the first and secondsuccessional time steps, indicating that functional clustering isstrongest during early and early-mid succession.Phylogenetic turnover (ΠST) did not significantly differ
from random expectations in any of the successional timesteps (Fig. 2b).
PHYLOGENETIC AND FUNCTIONAL TURNOVER
BETWEEN SUCCESSIONAL STAGES
Levels of functional turnover between different successionalstages were on average higher than random predictions(τST = 0.0093, P < 0.001) and higher than those for thebetween-stage phylogenetic turnover, which did not differ sig-nificantly from null expectations (ΠST = 0.005, P = 0.068).There were no significant deviations from random expecta-tions when estimates of phylogenetic turnover were madebetween pairs of plots belonging to different successionalstages (Fig. 3a). In contrast, levels of functional turnover (τST)between the first and third successional time steps (T1–T3) aswell as between the first and the last time steps (T1–T4) werehigher than expected (Fig. 3b) and higher than τST values esti-mated within each of the stages T1, T3 and T4, respectively(Fig. 2c), indicating that there is significant functional turnoverbetween the early and late-successional stages as well asbetween the early-mid and late-successional stages.
PHYLOGENETIC SIGNAL IN TRAITS
The 11 traits that were used to calculate functional diversityhad Blomberg’s K values of less than one (Table S4), rangingfrom 0.099 (canopy height) to 0.315 (LDMC). However, alltraits, apart from canopy height, had K values that werehigher than expected by chance, indicating a low but signifi-cant phylogenetic signal. When the phylogenetic signal wasexamined at different depths in the phylogenetic tree, alltraits, apart from LDMC, showed a low, non-significant signalthroughout the phylogeny (Fig. S3).
SHIFTS IN COMMUNITY-LEVEL MEAN TRAIT VALUES
Mean trait values for canopy height, SLA, leaf size, seedmass and seed production were highest in early successionand decreased towards late succession, whereas LDMCincreased over time (Fig. 4), suggesting that the grasslandcommunities at the beginning of succession contain a higher
Spe
cies
ric
hnes
s
a
b
c c
20
30
40
5−15
16−
50
51−
270
>27
0
MP
DWP
MP
DWTa
ab
b
c
114
116
118
120
5−15
16−
50
51−
270
>27
0
aa
b
c
0.130
0.135
0.140
0.145
5−15
16−
50
51−
270
>27
0
Successional stage (years)
FunctionalPhylogeneticTaxonomic(a) (b) (c)
Fig. 1. (a) Taxonomic, (b) phylogenetic and (c) functional alpha diversity (mean � 1 SE) within the four successional stages. Phylogenetic andfunctional diversity are expressed, respectively, as the mean pairwise phylogenetic and functional trait distance between species within a commu-nity (MPDP
w, MPDTw) and are equivalent to phylogenetic and functional distinctness. Letters indicate significant differences (a = 0.05) between
the stages.
© 2013 The Authors. Journal of Ecology © 2013 British Ecological Society, Journal of Ecology, 101, 857–866
Diversity facets and community assembly during succession 861

proportion of ruderal (fast growing and disturbance-tolerant)species than late-successional communities. Early successionalcommunities had greater wind dispersal potential, higher lev-els of epizoochory and higher seed bank persistence than late-successional communities, indicating that species that have ahigh long-distance dispersal potential and long-term persistentseed banks are more often found in the early than latersuccessional stages.
Discussion
The present study shows that taxonomic, phylogenetic andfunctional diversity show different patterns of change duringa more than 270-year-long arable-to-grassland succession.Between early and early-mid succession, there was anincrease in species richness that was not accompanied by sig-nificant increases in phylogenetic or functional alpha diver-sity. Throughout succession, species co-occurring within siteswere functionally more similar than expected by chance(functional clustering), indicating that community assembly isdeterministic with respect to species traits. High levels offunctional clustering within the early and early-mid succes-sional stages suggest that abiotic filters have selected for sets
of functionally similar species. Although there was no changein species richness between the late-mid and late-successionalstages, there was a significant increase in phylogenetic andfunctional alpha diversity, with functionally similar and clo-sely related species being replaced by functionally and phylo-genetically more distinct species. Functional turnover betweensuccessional time steps was higher than expected, and higherthan within-stage turnover, suggesting that differential envi-ronmental filtering has selected for different species traits inthe different successional stages. Phylogenetic turnover didnot differ significantly from random expectations, either withinor between successional stages, and provided no insights intothe temporal dynamics of the processes underlying communityassembly.
CONTRASTING PATTERNS OF TEMPORAL CHANGE IN
THE DIFFERENT FACETS OF DIVERSITY
Taxonomic, phylogenetic and functional alpha diversity allincreased during succession but showed different temporalpatterns of increase, indicating that the different facets ofwithin-community diversity provide complementary informa-tion on successional changes in community composition
1−Ja
ccar
da
b
c
d
0.65
0.70
0.75
0.80
5−15
16−
50
51−
270
>27
0
ΠS
T
τ ST
a
b
cd
0.000
0.005
0.010
5−15
16−
50
51−
270
>27
0
ab
cd
0.000
0.005
0.010
5−15
16−
50
51−
270
>27
0
Successional stage (years)
FunctionalPhylogeneticTaxonomic(a) (b) (c)
Fig. 2. (a) Taxonomic, (b) phylogenetic and (c) functional turnover (beta diversity), for all pairs of plots (black squares, mean � 1 SE) withineach of the four successional stages. Phylogenetic and functional turnover (ΠST or τST) are based on the partitioning of the mean pairwise phylo-genetic or functional trait distance into within- and between-community components. Letters indicate significant differences (a = 0.05), based onpermutation testing, between the stages. ΠST or τST values > 0 indicate that species co-occurring within communities are phylogenetically morerelated, or functionally more similar, to each other than to species from other sites (phylogenetic or functional clustering). The black dotted lineand the grey-shaded area represent the mean and the 95%-confidence interval for the ΠST or τST values, respectively, from the 999 random com-munities. τST values outside the interval indicate significant functional clustering.
0.000
0.005
0.010
0.015
T1−
T2
T1−
T3
T1−
T4
T2−
T3
T2−
T4
T3−
T4
T1−
T2
T1−
T3
T1−
T4
T2−
T3
T2−
T4
T3−
T4
Successional stage (years)
Phylogenetic Functional
ΠS
T
0.000
0.005
0.010
0.015
τ ST
(a) (b)
Fig. 3. Temporal (a) phylogenetic and (b)functional turnover between successionalstages (black squares, mean � 1 SE). T1–T4correspond to the four successional stages(5–15, 16–50, 51–270 and >270 yearsof grassland continuity). Between-stagefunctional, but not phylogenetic, turnover issignificantly higher than random expectations(τST values are above the grey-shaded area, i.e.above the 95% confidence interval for the τSTvalues from the 999 random communities).
© 2013 The Authors. Journal of Ecology © 2013 British Ecological Society, Journal of Ecology, 101, 857–866
862 O. Purschke et al.

(Fig. 1). The number of species increased between the earlyand early-mid successional time steps (Fig. 1a). However, theabsence of significant, concurrent increases in phylogenetic orfunctional alpha diversity (Fig. 1b,c) indicates that theincrease in species richness between the early and early-midsuccessional stage mainly reflects the entry of closely related,and functionally similar, species. In contrast, there were no
significant changes in species richness between the late-midtime step and the last successional time step. Despite the lackof change in the number of species, significant increases infunctional and phylogenetic diversity reveal that closelyrelated and/or functionally similar species are replaced byfunctionally and phylogenetically more distinct speciesbetween the late-mid and late-successional stages(R€omermann et al. 2009).
TEMPORAL CHANGES IN ASSEMBLY PROCESSES: THE
RELAT IVE IMPORTANCE OF ABIOT IC F ILTERING
DECREASES OVER TIME
Functional turnover between plots was higher than expected(functional clustering) within all successional stages, indicat-ing that species co-occurring within communities were func-tionally more similar than predicted, given the levels oftaxonomic diversity. The functional turnover between plotswithin each successional stage suggests that deterministic pro-cesses independent of the process of succession contribute tothe species turnover between plots. However, levels of func-tional clustering were highest within the early and early-midsuccessional stages (Fig. 2a,b). The fact that the specieswithin sites were functionally more similar to each other thanto species from other sites during early and early-mid succes-sion, may be explained by the effects of strong environmentalfiltering (Dinnage 2009; Helmus et al. 2010). Effects oflarge-scale disturbance and fertilization during arable cultiva-tion have been shown to persist during the early stages ofsubsequent arable-to-grassland succession (Fraterrigo et al.2005; Carbajo et al. 2011; Ceulemans et al. 2011), and thehabitats of the early and early-mid successional communitiesin the present study were still characterized by a high propor-tion of bare soil (used as an indicator for disturbance in ourstudy; Fig. S4). Previous agricultural disturbance regimes,such as ploughing, are likely to have acted as environmentalfilters which selected for ruderal (fast growing and distur-bance-tolerant) species that produce large numbers of seeds(high SLA, canopy height and high seed production; Fig. 4;Marrs 1993; Dinnage 2009). At the same time, lower levelsof interspecific competition in the less dense vegetation of theearly and early-mid successional habitats may allow the coex-istence of functionally similar species (cf. Dinnage 2009;Pakeman 2011). Our finding that the species occurring withinthe late-mid and late-successional grasslands are functionallymore distinct than those in the early and early-mid succes-sional communities suggests that, as succession proceeds, therelative importance of environmental filtering decreases. Thisfinding agrees with the theoretical prediction (Connell & Slat-yer 1977; Leibold et al. 2004) that the relative importance ofthe processes generating biodiversity after disturbance willchange over time. Competitive exclusion of functionally simi-lar species (MacArthur & Levins 1967; Grime 2006) may beexpected to play a stronger role in community assembly asthe grass sward becomes more dense and resources, such asphosphorus, become limiting in the old grasslands (Wardleet al. 2004; Lambers et al. 2008). The high levels of
Fig. 4. Community-level mean values (mean � 1 SE) for the 11plant functional traits that were used to calculate functional diversitywithin each of the four successional stages. Letters indicate significantdifferences (a = 0.05) between the stages.
© 2013 The Authors. Journal of Ecology © 2013 British Ecological Society, Journal of Ecology, 101, 857–866
Diversity facets and community assembly during succession 863
functional diversity in the older grasslands are consistent withprevious studies which conclude that, under conditions ofresource limitation, plant communities tend to be comprisedof species with complementary nutrient-acquisition strat-egies – allowing the exploitation of a wider range of theavailable resources (e.g. Tilman, Wedin & Knops 1996;Oelmann et al. 2011; MacDonald, Bennett & Taranu 2012).The fact that the functional turnover between the earlier
and late-successional stages was higher than the within-stageturnover (Fig. 3b) suggests that different environmental filter-ing processes govern community assembly at different succes-sional stages, but may also be a reflection of species filteringbased on dispersal traits (Purschke et al. 2012), with speciesthat have high long-distance dispersal potential beingfavoured during early and early-mid succession (Fig. 4).
FUNCTIONAL AND PHYLOGENETIC DIVERSITY SHOW
DIFFERENT PATTERNS OF DEVIATION FROM NULL
EXPECTATIONS
There are at least three possible explanations for the fact thatfunctional and phylogenetic diversity show different patternsof deviation from null expectations (Fig. 2). First, phyloge-netic relationships may be a poor reflection of the species’ecological similarity if the traits under consideration are notphylogenetically conserved. Although nearly all traits in ourstudy had higher than expected Blomberg’s K values, K val-ues were considerably lower than one (Table S4). The studyby Hardy & Pavoine (2012) demonstrated that values of Kcan be biased downwards if information on intraspecific traitvariation is not provided, and such data were not available inthe present study. Nevertheless, the fact that most traitsshowed weak and non-significant phylogenetic signal through-out the phylogenetic tree (Fig. S3) suggests that closelyrelated species are not functionally similar (see Fig. S1). Sec-ond, phylogenetic diversity may represent a more inclusiveoverall measure of ecological similarity than measures offunctional diversity, which are based on a limited set of traits(Cadotte et al. 2009; Meynard et al. 2011). However, the factthat (i) most traits in our study showed a low phylogeneticsignal and (ii) functional, but not phylogenetic, diversityshowed significant deviations from random expectations, sug-gests that the traits that were used in our study are involvedin the process of community assembly. Third, the finding thatΠST and τST values (phylogenetic and functional turnover)were similar within each successional stage, but ΠST valuesfor random communities had a larger confidence intervalcompared to τST (Fig. 2a,b), suggests that the power to detectsignificant community structure is higher when using data onmultiple traits than when using phylogenetic data.
Conclusions
Comparative analysis of taxonomic, phylogenetic and func-tional diversity within and between different stages duringsuccession provides insights into the temporal dynamics ofthe processes that drive post-disturbance biodiversity changes.
Our results show that changes in functional and phylogeneticdiversity over time differ from those shown by taxonomicdiversity. Non-random patterns in functional turnover (both inspace and time) indicate that, at the scale of our study, (i)ecosystem development after disturbance is driven by deter-ministic processes, and (ii) that there is a shift in the relativeimportance of filtering processes as succession proceeds, ashas been predicted theoretically. Trait-mediated filtering playsan important role in community assembly during the earlyand early-mid stages of arable-to-grassland successionwhereas the relative importance of competitive exclusionincreases towards late succession. Phylogenetic diversity,often used as a proxy of functional diversity (Winter,Devictor & Schweiger 2012), did not contribute to inferencesabout underlying assembly processes. The finding that com-munity assembly was deterministic with respect to traits, butnot phylogeny, suggests that it may be possible to predictfuture changes in biodiversity and associated alterations inecosystem functioning, based on species traits, but notphylogeny. Differences in the temporal patterns of changebetween different facets of biodiversity also suggest thatassessments of biodiversity change after disturbance may bemisleading if based on a single facet of diversity.
Acknowledgements
We would like to thank Lotten J. Johansson and Merit Kindstr€om for providingdata on landscape history, Nathan G. Swenson for discussions about phyloge-netic signal, Jonathan M. Eastman and Susan G. Letcher for statistical advice,James M. Bullock, Hans Henrik Bruun, Jacob Weiner and Torben Wittwer forcommenting on an earlier version of the manuscript and Olivier Hardy, JasonFridley and an anonymous referee whose comments substantially improved themanuscript. The ecological research station ‘Station Linn�e’ at €Olands Skogsbyprovided the working base for the fieldwork. The study was financed by grantsto M.T.S. and H.C.P. from the Swedish Research Council for Environment,Agricultural Sciences and Spatial Planning (FORMAS). O.P. and M.W. kindlyacknowledge the support by the German Centre for Integrative BiodiversityResearch (iDiv) Halle-Jena-Leipzig, funded by the German Science Foundation(FZT 118).
References
Baraloto, C., Hardy, O.J., Paine, C.E.T., Dexter, K.G., Cruaud, C., Dunning,L.T., Gonzalez, M.-A., Molino, J.-F., Sabatier, D., Savolainen, V. &Chave, J. (2012) Using functional traits and phylogenetic trees to examinethe assembly of tropical tree communities. Journal of Ecology, 100, 690–701.
Bekker, R.M., Bakker, J.P., Grandin, U., Kalamees, R., Milberg, P., Poschlod,P., Thompson, K. & Willems, J.H. (1998) Seed size, shape and vertical dis-tribution in the soil: indicators of seed longevity. Functional Ecology, 12,834–842.
de Bello, F., Thuiller, W., Lep�s, J., Choler, P., Cl�ement, J.-C., Macek, P., Se-basti�a, M.-T. & Lavorel, S. (2009) Partitioning of functional diversity revealsthe scale and extent of trait convergence and divergence. Journal of Vegeta-tion Science, 20, 475–486.
de Bello, F., Price, J.N., M€unkem€uller, T., Liira, J., Zobel, M., Thuiller, W.,Gerhold, P., G€otzenberger, L., Lavergne, S., Lep�s, J., Zobel, K. & P€artel, M.(2012) Functional species pool framework to test for biotic effects on com-munity assembly. Ecology, 93, 2263–2273.
Benjamini, Y. & Yekutieli, D. (2001) The control of the false discovery rate inmultiple testing under dependency. Annals of Statistics, 29, 1165–1188.
Blomberg, S.P., Garland, T., Ives, A.R. & Crespi, B. (2003) Testing for phylo-genetic signal in comparative data: behavioral traits are more labile. Evolu-tion, 57, 717–745.
van Buuren, S. & Groothuis-Oudshoorn, K. (2011) Mice: multivariate imputa-tion by chained equations in R. Journal of Statistical Software, 45, 1–67.
© 2013 The Authors. Journal of Ecology © 2013 British Ecological Society, Journal of Ecology, 101, 857–866
864 O. Purschke et al.

Cadotte, M.W., Cavender-Bares, J., Tilman, D. & Oakley, T.H. (2009) Usingphylogenetic, functional and trait diversity to understand patterns of plantcommunity productivity. PLoS ONE, 4, e5695.
Carbajo, V., den Braber, B., van der Putten, W.H. & De Deyn, G.B. (2011)Enhancement of late successional plants on ex-arable land by soil inocula-tions. PLoS ONE, 6, e21943.
Ceulemans, T., Merckx, R., Hens, M. & Honnay, O. (2011) A trait-based anal-ysis of the role of phosphorus vs. nitrogen enrichment in plant species lossacross North-west European grasslands. Journal of Applied Ecology, 48,1155–1163.
Connell, J.H. & Slatyer, R.O. (1977) Mechanisms of succession in natural com-munities and their role in community stability and organization. The Ameri-can Naturalist, 111, 1119–1144.
Cornwell, W.K., Schwilk, D.W. & Ackerly, D.D. (2006) A trait-based test forhabitat filtering: convex hull volume. Ecology, 87, 1465–1471.
Devictor, V., Mouillot, D., Meynard, C., Jiguet, F., Thuiller, W. & Mouquet,N. (2010) Spatial mismatch and congruence between taxonomic, phyloge-netic and functional diversity: the need for integrative conservation strategiesin a changing world. Ecology Letters, 13, 1030–1040.
Diamond, J.M. (1975) Assembly of species communities. Ecology and Evolu-tion of Communities (eds M.L. Cody & J.M. Diamond), pp. 342–444.Belknap, Cambridge, MA, USA.
Diaz, S., Cabido, M. & Casanoves, F. (1998) Plant functional traits and environ-mental filters at a regional scale. Journal of Vegetation Science, 9, 113–122.
Ding, Y., Zang, R., Letcher, S.G., Liu, S. & He, F. (2012) Disturbance regimechanges the trait distribution, phylogenetic structure and community assemblyof tropical rain forests. Oikos, 121, 1263–1270.
Dinnage, R. (2009) Disturbance alters the phylogenetic composition and struc-ture of plant communities in an old field system. PLoS ONE, 4, e7071.
Durka, W. & Michalski, S.G. (2012) DaPhnE: a dated phylogeny of a largeEuropean flora for phylogenetically informed ecological analyses. Ecology,93, 2297–2297.
Eastman, J.M., Paine, C.E.T. & Hardy, O.J. (2011) spacodiR: structuring ofphylogenetic diversity in ecological communities. Bioinformatics, 27, 2437–2438.
Eriksson, O., Cousins, S.A.O. & Bruun, H.H. (2002) Land-use history and frag-mentation of traditionally managed grasslands in Scandinavia. Journal ofVegetation Science, 13, 743–748.
Fraterrigo, J.M., Turner, M.G., Pearson, S.M. & Dixon, P. (2005) Effects ofpast land use on spatial heterogeneity of soil nutrients in southern Appala-chian forests. Ecological Monographs, 75, 215–230.
Garnier, E., Cortez, J., Bill�es, G., Navas, M.-L., Roumet, C., Debussche, M.,Laurent, G., Blanchard, A., Aubry, D., Bellmann, A., Neill, C. & Toussaint,J.-P. (2004) Plant functional markers capture ecosystem properties duringsecondary succession. Ecology, 85, 2630–2637.
G€otzenberger, L., de Bello, F., Br�athen, K.A., Davison, J., Dubuis, A., Guisan,A. et al. (2012) Ecological assembly rules in plant communities –approaches, patterns and prospects. Biological Reviews, 87, 111–127.
Grime, J.P. (2006) Trait convergence and trait divergence in herbaceous plantcommunities: mechanisms and consequences. Journal of Vegetation Science,17, 255–260.
Hardy, O.J. (2008) Testing the spatial phylogenetic structure of local communi-ties: statistical performances of different null models and test statistics on alocally neutral community. Journal of Ecology, 96, 914–926.
Hardy, O.J. & Pavoine, S. (2012) Assessing phylogenetic signal with measure-ment error: a comparison of Mantel tests, Blomberg et al’.s K, and phyloge-netic distograms. Evolution, 66, 2614–2621.
Hardy, O.J. & Senterre, B. (2007) Characterizing the phylogenetic structure ofcommunities by an additive partitioning of phylogenetic diversity. Journal ofEcology, 95, 493–506.
Helmus, M.R., Keller, W., Paterson, M.J., Yan, N.D., Cannon, C.H. & Rusak,J.A. (2010) Communities contain closely related species during ecosystemdisturbance. Ecology Letters, 13, 162–174.
Hoekstra, J.M., Boucher, T.M., Ricketts, T.H. & Roberts, C. (2005) Confront-ing a biome crisis: global disparities of habitat loss and protection. EcologyLetters, 8, 23–29.
Hubbell, S. (2001) The Unified Neutral Theory of Biodiversity and Biogeogra-phy. Princeton University Press, Princeton, NJ.
Isbell, F., Calcagno, V., Hector, A., Connolly, J., Harpole, W.S., Reich, P.B.et al. (2011) High plant diversity is needed to maintain ecosystem services.Nature, 477, 199–202.
Johansson, L.J., Hall, K., Prentice, H.C., Ihse, M., Reitalu, T., Sykes, M.T. &Kindstr€om, M. (2008) Semi-natural grassland continuity, long-term land-usechange and plant species richness in an agricultural landscape on €Oland,Sweden. Landscape and Urban Planning, 84, 200–211.
Johnson, E.A. & Miyanishi, K. (2008) Testing the assumptions of chronose-quences in succession. Ecology Letters, 11, 419–431.
Kahmen, S. & Poschlod, P. (2004) Plant functional trait responses to grasslandsuccession over 25 years. Journal of Vegetation Science, 15, 21–32.
Keddy, P.A. (1992) Assembly and response rules – 2 goals for predictive com-munity ecology. Journal of Vegetation Science, 3, 157–164.
Kembel, S.W., Cowan, P.D., Helmus, M.R., Cornwell, W.K., Morlon, H., Ack-erly, D.D., Blomberg, S.P. & Webb, C.O. (2010) Picante: R tools for inte-grating phylogenies and ecology. Bioinformatics, 26, 1463–1464.
Kleyer, M., Bekker, R., Knevel, I., Bakker, J., Thompson, K., Sonnenschein,M. et al. (2008) The LEDA Traitbase: a database of life-history traits of theNorthwest European flora. Journal of Ecology, 96, 1266–1274.
Knops, J.M.H. & Tilman, D. (2000) Dynamics of soil nitrogen and carbon accu-mulation for 61 years after agricultural abandonment. Ecology, 81, 88–98.
Koleff, P., Gaston, K.J. & Lennon, J.J. (2003) Measuring beta diversity forpresence-absence data. Journal of Animal Ecology, 72, 367–382.
Lambers, H., Raven, J.A., Shaver, G.R. & Smith, S.E. (2008) Plant nutrient-acquisition strategies change with soil age. Trends in Ecology and Evolution,23, 95–103.
Leibold, M.A., Holyoak, M., Mouquet, N., Amarasekare, P., Chase, J.M., Hoo-pes, M.F., Holt, R.D., Shurin, J.B., Law, R., Tilman, D., Loreau, M. &Gonzalez, A. (2004) The metacommunity concept: a framework for multi-scale community ecology. Ecology Letters, 7, 601–613.
Letcher, S.G. (2010) Phylogenetic structure of angiosperm communities duringtropical forest succession. Proceedings of the Royal Society B: BiologicalSciences, 277, 97–104.
Letcher, S.G., Chazdon, R.L., Andrade, A.C., Bongers, F., van Breugel, M.,Finegan, B., Laurance, S.G., Mesquita, R.C., Mart�õnez-Ramos, M. & Wil-liamson, G.B. (2012) Phylogenetic community structure during succession:evidence from three Neotropical forest sites. Perspectives in Plant Ecology,Evolution and Systematics, 14, 79–87.
Loreau, M., Naeem, S., Inchausti, P., Bengtsson, J., Grime, J.P., Hector, A.,Hooper, D.U., Huston, M.A., Raffaelli, D., Schmid, B., Tilman, D. & War-dle, D.A. (2001) Biodiversity and ecosystem functioning: current knowledgeand future challenges. Science, 294, 804–808.
MacArthur, R. & Levins, R. (1967) Limiting similarity convergence and diver-gence of coexisting species. The American Naturalist, 101, 377–385.
MacDonald, G.K., Bennett, E.M. & Taranu, Z.E. (2012) The influence of time,soil characteristics, and land-use history on soil phosphorus legacies: a globalmeta-analysis. Global Change Biology, 18, 1904–1917.
Magurran, A.E. & Dornelas, M. (2010) Biological diversity in a changingworld. Philosophical Transactions of the Royal Society. B, Biological Sci-ences, 365, 3593–3597.
Marquard, E., Weigelt, A., Temperton, V.M., Roscher, C., Schumacher, J.,Buchmann, N., Fischer, M., Weisser, W.W. & Schmid, B. (2009) Plant spe-cies richness and functional composition drive overyielding in a six-yeargrassland experiment. Ecology, 90, 3290–3302.
Marrs, R. (1993) Soil fertility and nature conservation in Europe: theoreticalconsiderations and practical management solutions. Advances in EcologicalResearch, 24, 241–300.
Mayfield, M.M. & Levine, J.M. (2010) Opposing effects of competitive exclu-sion on the phylogenetic structure of communities. Ecology Letters, 13,1085–1093.
Meynard, C.N., Devictor, V., Mouillot, D., Thuiller, W., Jiguet, F. & Mou-quet, N. (2011) Beyond taxonomic diversity patterns: how do a, b and ccomponents of bird functional and phylogenetic diversity respond to envi-ronmental gradients across France? Global Ecology and Biogeography, 20,893–903.
Moles, A.T., Ackerly, D.D., Webb, C.O., Tweddle, J.C., Dickie, J.B. & West-oby, M. (2005) A brief history of seed size. Science, 307, 576–580.
Noble, I.R. & Gitay, H. (1996) A functional classification for predicting thedynamics of landscapes. Journal of Vegetation Science, 7, 329–336.
Noble, I.R. & Slayter, R.O. (1980) The use of vital attributes to predict succes-sional changes in plant-communities subject to recurrent disturbances. Vege-tation, 43, 5–21.
Norden, N., Letcher, S.G., Boukili, V., Swenson, N.G. & Chazdon, R. (2011)Demographic drivers of successional changes in phylogenetic structure acrosslife-history stages in tropical plant communities. Ecology, 93, S70–S82.
Oelmann, Y., Richter, A.K., Roscher, C., Rosenkranz, S., Temperton, V.M.,Weisser, W.W. & Wilcke, W. (2011) Does plant diversity influence phospho-rus cycling in experimental grasslands? Geoderma, 167–68, 178–187.
Oksanen, J., Blanchet, F.G., Kindt, R., Legendre, P., Minchin, P.R., O’Hara,R.B., Simpson, G.L., Solymos, P., Stevens, M.H.H. & Wagner, H. (2012)vegan: Community Ecology Package. R package version 2.1-21. Availableat: http://r-forge.r-project.org/projects/vegan/
© 2013 The Authors. Journal of Ecology © 2013 British Ecological Society, Journal of Ecology, 101, 857–866
Diversity facets and community assembly during succession 865

Pacala, S.W. & Tilman, D. (1994) Limiting similarity in mechanistic and spa-tial models of plant competition in heterogeneous environments. The Ameri-can Naturalist, 143, 222–257.
Pakeman, R.J. (2011) Functional diversity indices reveal the impacts of landuse intensification on plant community assembly. Journal of Ecology, 99,1143–1151.
Pakeman, R., Lennon, J. & Brooker, R. (2011) Trait assembly in plant assem-blages and its modulation by productivity and disturbance. Oecologia, 167,209–218.
Pausas, J.G. & Verdu, M. (2010) The jungle of methods for evaluating pheno-typic and phylogenetic structure of communities. BioScience, 60, 614–625.
Pavoine, S. & Bonsall, M.B. (2011) Measuring biodiversity to explain commu-nity assembly: a unified approach. Biological Reviews, 86, 792–812.
Peltzer, D.A., Wardle, D.A., Allison, V.J., Baisden, W.T., Bardgett, R.D.,Chadwick, O.A. et al. (2010) Understanding ecosystem retrogression. Eco-logical Monographs, 80, 509–529.
Poschlod, P., Tackenberg, O. & Bonn, S. (2005) Plant dispersal potential andits relation to species frequency and coexistence. Vegetation Ecology (ed. E.van der Maarel), pp. 147–171. Blackwell Scientific Publications, Oxford.
Poschlod, P. & Wallis De Vries, M.F. (2002) The historical and socioeconomicperspective of calcareous grasslands – lessons from the distant and recentpast. Biological Conservation, 104, 361–376.
Poschlod, P., Kleyer, M., Jackel, A.K., Dannemann, A. & Tackenberg, O.(2003) BIOPOP – a database of plant traits and internet application for nat-ure conservation. Folia Geobotanica, 38, 263–271.
Prach, K., Py�sek, P. & �Smilauer, P. (1997) Changes in species traits duringsuccession: a search for pattern. Oikos, 79, 201–205.
Prach, K. & Walker, L.R. (2011) Four opportunities for studies of ecologicalsuccession. Trends in Ecology and Evolution, 26, 119–123.
Purschke, O., Sykes, M.T., Reitalu, T., Poschlod, P. & Prentice, H.C. (2012)Linking landscape history and dispersal traits in grassland plant communities.Oecologia, 168, 773–783.
R Development Core Team (2012) R: A Language and Environment for Statis-tical Computing. R Foundation for Statistical Computing, Vienna, Austria.
Raunkiær, C. (1934) The Life Forms of Plants and Statistical Plant Geography,Being the Collected Papers of C. Raunkiær. Oxford University Press,Oxford.
Reich, P.B., Tilman, D., Naeem, S., Ellsworth, D.S., Knops, J., Craine, J.,Wedin, D. & Trost, J. (2004) Species and functional group diversity indepen-dently influence biomass accumulation and its response to CO2 and N. Pro-ceedings of the National Academy of Sciences of the USA, 101, 10101–10106.
Revell, L.J. (2012) phytools: an R package for phylogenetic comparative biol-ogy (and other things). Methods in Ecology and Evolution, 3, 217–223.
R€omermann, C., Tackenberg, O. & Poschlod, P. (2005) How to predict attach-ment potential of seeds to sheep and cattle coat from simple morphologicalseed traits. Oikos, 110, 219–230.
R€omermann, C., Bernhardt-R€omermann, M., Kleyer, M. & Poschlod, P. (2009)Substitutes for grazing in semi-natural grasslands – do mowing or mulchingrepresent valuable alternatives to maintain vegetation dynamics? Journal ofVegetation Science, 20, 1086–1098.
Schleicher, A., Peppler-Lisbach, C. & Kleyer, M. (2011) Functional traits duringsuccession: is plant community assembly trait-driven? Preslia, 83, 347–370.
Silvertown, J., Dodd, M. & Gowing, D. (2001) Phylogeny and the niche struc-ture of meadow plant communities. Journal of Ecology, 89, 428–435.
Swenson, N.G., Anglada-Cordero, P. & Barone, J.A. (2011a) Deterministictropical tree community turnover: evidence from patterns of functional betadiversity along an elevational gradient. Proceedings of the Royal Society B:Biological Sciences, 278, 877–884.
Swenson, N.G., Stegen, J.C., Davies, S.J., Erickson, D.L., Forero-Montana, J.,Hurlbert, A.H., Kress, W.J., Thompson, J., Uriarte, M., Wright, S.J. &Zimmerman, J.K. (2011b) Temporal turnover in the composition of tropicaltree communities: functional determinism and phylogenetic stochasticity.Ecology, 93, 490–499.
Tackenberg, O., Poschlod, P. & Bonn, S. (2003) Assessment of wind dispersalpotential in plant species. Ecological Monographs, 73, 191–205.
Thompson, K., Bakker, J. & Bekker, R. (1997) The Soil Seed Banks of NorthWest Europe: Methodology, Density and Longevity. Cambridge UniversityPress, Cambridge.
Tilman, D., Wedin, D. & Knops, J. (1996) Productivity and sustainability influ-enced by biodiversity in grassland ecosystems. Nature, 379, 718–720.
Vill�eger, S., Mason, N.W.H. & Mouillot, D. (2008) New multidimensionalfunctional diversity indices for a multifaceted framework in functional ecol-ogy. Ecology, 89, 2290–2301.
Walker, L.R., Wardle, D.A., Bardgett, R.D. & Clarkson, B.D. (2010) The useof chronosequences in studies of ecological succession and soil development.Journal of Ecology, 98, 725–736.
Wardle, D.A., Bardgett, R.D., Klironomos, J.N., Set€al€a, H., van der Putten,W.H. & Wall, D.H. (2004) Ecological linkages between aboveground andbelowground biota. Science, 304, 1629–1633.
Webb, C.O. (2000) Exploring the phylogenetic structure of ecological commu-nities: an example for rain forest trees. The American Naturalist, 156, 145–155.
Webb, C.O., Ackerly, D.D., McPeek, M.A. & Donoghue, M.J. (2002) Phyloge-nies and community ecology. Annual Review of Ecology and Systematics,33, 475–505.
Weiher, E., Freund, D., Bunton, T., Stefanski, A., Lee, T. & Bentivenga, S.(2011) Advances, challenges and a developing synthesis of ecological com-munity assembly theory. Philosophical Transactions of the Royal Society. B,Biological Sciences, 366, 2403–2413.
Wheeler, B. (2010) lmPerm: Permutation Tests for Linear Models. R packageversion 1.1-2. Available at: http://cran.r-project.org/web/packages/lmPerm/
Wiens, J.J. & Graham, C.H. (2005) Niche conservatism: integrating evolution,ecology, and conservation biology. Annual Review of Ecology, Evolution,and Systematics, 36, 519–539.
Winter, M., Devictor, V. & Schweiger, O. (2012) Phylogenetic diversity andnature conservation: where are we? Trends in Ecology and Evolution, 28,199–204.
Zobel, M. (1997) The relative role of species pools in determining plant speciesrichness: an alternative explanation of species coexistence? Trends in Ecol-ogy and Evolution, 12, 266–269.
Received 6 December 2012; accepted 26 March 2013Handling Editor: Jason Fridley
Supporting Information
Additional Supporting Information may be found in the online ver-sion of this article:
Appendix S1. Non-random structure in species frequencies.
Appendix S2. Node-level phylogenetic signal.
Table S1. Pearson’s product-moment correlations (r) between theplant traits.
Table S2. Pearson’s product-moment correlations (r) between taxo-nomic, phylogenetic and functional alpha diversity.
Table S3. Mantel correlations (rM) between taxonomic, phylogeneticand functional beta diversity.
Table S4. Tree-wide phylogenetic signal (Blomberg’s K) in each ofthe traits.
Figure S1. Distribution of the plant traits across the phylogeny of the234 plant species.
Figure S2. Non-random structure in species frequencies.
Figure S3. Node-level phylogenetic signal.
Figure S4. Amount of bare soil (in %) within the four successionalstages.
© 2013 The Authors. Journal of Ecology © 2013 British Ecological Society, Journal of Ecology, 101, 857–866
866 O. Purschke et al.
Supporting Information
Appendix S1. Non-random structure in species frequencies.
We tested for non-random structure in overall species frequencies (number of sites occupied by a
species) across the phylogeny and the trait space, using the APD (abundance phylogenetic
clustering) index proposed by Hardy (2008). APD values > 0 would indicate that the most frequent
species are closely related, or functionally similar. Significance of the APD values was evaluated by
comparing the observed APD values with the APD values from 999 random communities, generated
by shuffling the species names across the phylogenetic tree or functional distance matrix. In our
study, species frequencies were significantly clustered across the trait space (Fig. S2).
Appendix S2. Node-level phylogenetic signal.
Node-level phylogenetic signal at different depths in the phylogeny was assessed following the
approach proposed by Moles et al. (2005; AOT module in Phylocom 4.2 (Webb et al. 2008), see
Fig. S3): (1) Trait values were arranged across the tips of the phylogenetic tree; (2) the standard
deviation (divergence size) of the trait values across the descendent terminal taxa was calculated for
each node; (3) divergence size values were re-calculated after permuting (999 times) trait values
across the tips of the phylogenetic tree to generate a random distribution of divergence size values;
(4) for each trait, the rank of observed divergence size within the null distribution was plotted
against node age, to assess whether, at different depths in the phylogeny, phylogenetic signal was
higher (low ranks) or lower (high ranks) than expected by chance.
References
Hardy O.J. (2008) Testing the spatial phylogenetic structure of local communities: statistical
1

performances of different null models and test statistics on a locally neutral community.
Journal of Ecology, 96, 914-926.
Moles A.T., Ackerly D.D., Webb C.O., Tweddle J.C., Dickie J.B. & Westoby M. (2005) A brief
history of seed size. Science, 307, 576-580.
Webb, C.O., Ackerly, D.D. & Kembel, S.W. (2008) Phylocom: software for the analysis of
phylogenetic community structure and trait evolution. Bioinformatics, 24, 2098-2100.
2

Table S1. Pearson's product-moment correlations (r) between the eleven plant functional traits that
were used to calculate functional diversity. Significant correlations (P < 0.05) are indicated by bold
text.
LDMC Leaf size
SLA Seed mass
Seed prod.
Plant life
form
Wind Epi-zoochory
Longevity Seed bank
Canopy height
0.13 0.43 0.04 0.32 0.19 0.05 -0.10 -0.13 0.19 -0.06
LDMC -0.09 -0.20 0.15 -0.22 0.15 -0.10 -0.03 0.29 -0.11
Leaf size 0.03 0.35 0.10 -0.04 -0,04 -0.19 0.20 -0.17
SLA -0.07 -0.08 -0.21 -0.08 0.11 -0.19 0.19
Seed mass -0.38 0.01 -0.56 -0.59 0.13 -0.46
Seed pro-duction
-0.10 0.30 0.27 -0.21 0.41
Plant life form
0.07 0.04 0.51 -0.19
Wind 0.34 0.02 0.21
Epizoochory 0.03 0.25
Longevity -0.42
3

Table S2. Pearson's product-moment correlations (r) between the taxonomic, phylogenetic and
functional alpha diversity measures. Significant correlations (P < 0.05) are indicated by bold text.
MPDPw MPDT
w
Species richness 0.380 0.520
MPDPw
0.358
Table S3. Mantel correlations (rM) between the taxonomic, phylogenetic and functional beta
diversity measures, calculated over all pairs of plots. Significant correlations (999 permutations, P <
0.05) are indicated by bold text.
ΠST τST
1-Jaccard 0.136 0.446
ΠST 0.185
4

Table S4. Tree-wide phylogenetic signal (Blomberg's K) in each of the eleven functional traits. K
values of less than 1 indicate less phylogenetic signal than expected from a Brownian motion model
of trait evolution. P values from randomization testing, shuffling (999 times) the names of the
species on the phylogenetic tree.
Trait K P
Canopy height 0.099 0.494
LDMC 0.315 0.001
Leaf size 0.204 0.001
SLA 0.139 0.012
Seed mass 0.24 0.001
Seed production 0.144 0.002
Plant life form 0.192 0.001
Wind 0.197 0.001
Epizoochory 0.153 0.009
Longevity 0.137 0.005
Seed bank 0.156 0.001
5


Figure S1. Distribution of the eleven plant functional traits across the phylogeny of the 234 plant
species. Trait values were standardized to mean = 0 and SD = 1. Large circles indicate high and
small circles low trait values, respectively. Open circles correspond to negative and filled circles to
positive values.

Figure S2. Non-random structure in species frequencies.
Observed APD values (Hardy 2008) (see Appendix S1) (vertical solid red line), measuring the
strength of phylogenetic (left panel) and functional (right panel) structure in species frequencies,
versus the null distribution of APD values (solid black line). Vertical dashed lines indicate the 95%
CI of the expected APD values. Overall species frequencies were non-randomly distributed across
the trait space (with APD values greater than 95% of the null distribution), indicating that the most
frequent species are functionally clustered, i.e. share similar traits (right panel).

Figure S3. Node-level phylogenetic signal.
The lines represent, for each trait, fitted curves from local polynomial regression (loess; smoothing
span = 0.66, polynomial degree = 1) of node age (x-axis) against the rank of the observed
divergence size (at each node) within a null distribution of expected divergence size values (y-axis;
see Appendix S2). Significant phylogenetic signal at a particular node is indicated by a lower than
expected divergence size of a trait, i.e. by rank scores less than 25. None of the eleven traits, apart
from LDMC, showed significant phylogenetic signal across the phylogeny.

Figure S4. Mean values (± 1 s.e.) of the amount of bare soil (in %) within the four successional
stages. Letters indicate significant differences (α = 0.05) between the stages.