Phage Therapy Related Microbial Succession Associated with ...
14
viruses Article Phage Therapy Related Microbial Succession Associated with Successful Clinical Outcome for a Recurrent Urinary Tract Infection Austen Terwilliger 1 , Justin Clark 1 , Maile Karris 2 , Haroldo Hernandez-Santos 1 , Sabrina Green 1 , Saima Aslam 2, * and Anthony Maresso 1, * Citation: Terwilliger, A.; Clark, J.; Karris, M.; Hernandez-Santos, H.; Green, S.; Aslam, S.; Maresso, A. Phage Therapy Related Microbial Succession Associated with Successful Clinical Outcome for a Recurrent Urinary Tract Infection. Viruses 2021, 13, 2049. https://doi.org/10.3390/v13102049 Academic Editor: Jean-Paul Pirnay Received: 25 August 2021 Accepted: 7 October 2021 Published: 12 October 2021 Publisher’s Note: MDPI stays neutral with regard to jurisdictional claims in published maps and institutional affil- iations. Copyright: © 2021 by the authors. Licensee MDPI, Basel, Switzerland. This article is an open access article distributed under the terms and conditions of the Creative Commons Attribution (CC BY) license (https:// creativecommons.org/licenses/by/ 4.0/). 1 TAILΦR Labs, Molecular Virology and Microbiology Department, Baylor College of Medicine, Houston, TX 77030, USA; [email protected] (A.T.); [email protected] (J.C.); [email protected] (H.H.-S.); [email protected] (S.G.) 2 Center for Innovative Phage Applications and Therapeutics, Division of Infectious Diseases and Global Public Health, University of California, San Diego, CA 92093, USA; [email protected] * Correspondence: [email protected] (S.A.); [email protected] (A.M.); Tel.: +1-858-657-7643 (S.A.); +1-713-798-7369 (A.M.) Abstract: We rationally designed a bacteriophage cocktail to treat a 56-year-old male liver transplant patient with complex, recurrent prostate and urinary tract infections caused by an extended-spectrum beta-lactamase (ESBL)-producing Escherichia coli (E. coli) (UCS1). We screened our library for phages that killed UCS1, with four promising candidates chosen for their virulence, mucolytic properties, and ability to reduce bacterial resistance. The patient received 2 weeks of intravenous phage cocktail with concomitant ertapenem for 6 weeks. Weekly serum and urine samples were collected to track the patient’s response. The patient tolerated the phage therapy without any adverse events with symptom resolution. The neutralization of the phage activity occurred with sera collected 1 to 4 weeks after the first phage treatment. This was consistent with immunoassays that detected the upregulation of immune stimulatory analytes. The patient developed asymptomatic recurrent bacteriuria 6 and 11 weeks following the end of phage therapy—a condition that did not require antibiotic treatment. The bacteriuria was caused by a sister strain of E. coli (UCS1.1) that remained susceptible to the original phage cocktail and possessed putative mutations in the proteins involved in adhesion and invasion compared to UCS1. This study highlights the utility of rationally designed phage cocktails with antibiotics at controlling E. coli infection and suggests that microbial succession, without complete eradication, may produce desirable clinical outcomes. Keywords: phage therapy; microbial pathogenesis; UTI; humoral response; comparative genomics 1. Introduction Bacteriophages, the viral predators of bacteria, are the most numerous and prolific bacterial killers on earth. An estimated 10 31 phages dispatch around 50% of 10 30 bac- terial cells in the world every day [1,2]. This enormous and constant genetic turnover provides near-infinite adaptive and evolutionary potential. When this landscape of possi- bility is compared to that of conventional antibiotics—with defined, rigid structures and limited chemical space—antibiotics just cannot keep pace with bacterial evolution that subverts, circumvents, and destroys them [3,4]. As the world enters the post-antibiotic era, phages—evolvableagents capable of great change—carry potential as a novel antibiotic approach and last-resort measure for persons suffering from multi-drug-resistant bacterial infections [5]. However, the application of these unique features encoded within phages have not been sufficiently explored in the scientific and medical setting with regard to efficacy and clinical outcome. Urinary tract infection (UTI) case studies employing phage therapy lack extensive mechanistic investigation or consideration for the biological context Viruses 2021, 13, 2049. https://doi.org/10.3390/v13102049 https://www.mdpi.com/journal/viruses
-
Upload
khangminh22 -
Category
Documents
-
view
5 -
download
0
Transcript of Phage Therapy Related Microbial Succession Associated with ...

viruses
Article
Phage Therapy Related Microbial Succession Associatedwith Successful Clinical Outcome for a Recurrent UrinaryTract Infection
Austen Terwilliger 1, Justin Clark 1 , Maile Karris 2, Haroldo Hernandez-Santos 1, Sabrina Green 1,Saima Aslam 2,* and Anthony Maresso 1,*
�����������������
Citation: Terwilliger, A.; Clark, J.;
Karris, M.; Hernandez-Santos, H.;
Green, S.; Aslam, S.; Maresso, A.
Phage Therapy Related Microbial
Succession Associated with
Successful Clinical Outcome for a
Recurrent Urinary Tract Infection.
Viruses 2021, 13, 2049.
https://doi.org/10.3390/v13102049
Academic Editor: Jean-Paul Pirnay
Received: 25 August 2021
Accepted: 7 October 2021
Published: 12 October 2021
Publisher’s Note: MDPI stays neutral
with regard to jurisdictional claims in
published maps and institutional affil-
iations.
Copyright: © 2021 by the authors.
Licensee MDPI, Basel, Switzerland.
This article is an open access article
distributed under the terms and
conditions of the Creative Commons
Attribution (CC BY) license (https://
creativecommons.org/licenses/by/
4.0/).
1 TAILΦR Labs, Molecular Virology and Microbiology Department, Baylor College of Medicine,Houston, TX 77030, USA; [email protected] (A.T.); [email protected] (J.C.);[email protected] (H.H.-S.); [email protected] (S.G.)
2 Center for Innovative Phage Applications and Therapeutics, Division of Infectious Diseases and GlobalPublic Health, University of California, San Diego, CA 92093, USA; [email protected]
* Correspondence: [email protected] (S.A.); [email protected] (A.M.); Tel.: +1-858-657-7643 (S.A.);+1-713-798-7369 (A.M.)
Abstract: We rationally designed a bacteriophage cocktail to treat a 56-year-old male liver transplantpatient with complex, recurrent prostate and urinary tract infections caused by an extended-spectrumbeta-lactamase (ESBL)-producing Escherichia coli (E. coli) (UCS1). We screened our library for phagesthat killed UCS1, with four promising candidates chosen for their virulence, mucolytic properties,and ability to reduce bacterial resistance. The patient received 2 weeks of intravenous phage cocktailwith concomitant ertapenem for 6 weeks. Weekly serum and urine samples were collected to trackthe patient’s response. The patient tolerated the phage therapy without any adverse events withsymptom resolution. The neutralization of the phage activity occurred with sera collected 1 to4 weeks after the first phage treatment. This was consistent with immunoassays that detectedthe upregulation of immune stimulatory analytes. The patient developed asymptomatic recurrentbacteriuria 6 and 11 weeks following the end of phage therapy—a condition that did not requireantibiotic treatment. The bacteriuria was caused by a sister strain of E. coli (UCS1.1) that remainedsusceptible to the original phage cocktail and possessed putative mutations in the proteins involvedin adhesion and invasion compared to UCS1. This study highlights the utility of rationally designedphage cocktails with antibiotics at controlling E. coli infection and suggests that microbial succession,without complete eradication, may produce desirable clinical outcomes.
Keywords: phage therapy; microbial pathogenesis; UTI; humoral response; comparative genomics
1. Introduction
Bacteriophages, the viral predators of bacteria, are the most numerous and prolificbacterial killers on earth. An estimated 1031 phages dispatch around 50% of 1030 bac-terial cells in the world every day [1,2]. This enormous and constant genetic turnoverprovides near-infinite adaptive and evolutionary potential. When this landscape of possi-bility is compared to that of conventional antibiotics—with defined, rigid structures andlimited chemical space—antibiotics just cannot keep pace with bacterial evolution thatsubverts, circumvents, and destroys them [3,4]. As the world enters the post-antibiotic era,phages—evolvableagents capable of great change—carry potential as a novel antibioticapproach and last-resort measure for persons suffering from multi-drug-resistant bacterialinfections [5]. However, the application of these unique features encoded within phageshave not been sufficiently explored in the scientific and medical setting with regard toefficacy and clinical outcome. Urinary tract infection (UTI) case studies employing phagetherapy lack extensive mechanistic investigation or consideration for the biological context
Viruses 2021, 13, 2049. https://doi.org/10.3390/v13102049 https://www.mdpi.com/journal/viruses

Viruses 2021, 13, 2049 2 of 14
of the infection [6,7]. Scientific investigation of clinical cases remains essential to under-standing the host/bacteria/phage relationship and developing effective phage therapies.
UTIs are common and frequently treated with antibiotics, with an estimated 11.3 millionantibiotic prescriptions totaling $1.6 billion in annual costs in the US [8]. As 20% of personswith UTIs present to the emergency room for treatment, there are additional significantcosts beyond the antibiotic prescription [9]. Further, a subset of persons experience compli-cated and recurrent UTIs, including pyelonephritis, sepsis, bacteremia, and prostatitis [10].Recurrent UTIs are associated with biofilm (within urothelial mucosa, urinary stones,catheters); immunosuppression; and, in the case of prostatitis, the insufficient penetrationof antibiotics [11–13]. E. coli is the most common pathogen associated with UTIs andincreasingly presents as a multi-drug resistant organism (MDRO) [10].
Here, we report the use of a four-phage cocktail to treat complicated UTI. This uniquecocktail included two phages that each bestowed a property potentially important for phagetherapy. One phage binds human polysaccharides that are present at mucosal surfaces, atrait that could place the phage at the site of the bacterial infection [14]. Another phage,attained by directed evolution, targets the major bacterial pathway of phage resistancearising from the infection with another phage in the cocktail [15]. Thus, we developed acocktail that is designed to both promote bacterial killing under physiologically relevantconditions (targeted phage localization) and reduce bacterial resistance by circumventinga common mechanism for E. coli phage evasion. Here, we report the patient’s outcome,immune response, and characteristics of the dominant residual bacterial strain that emergedfollowing the cessation of therapy.
2. Materials and Methods2.1. Human Subjects
As per the University of California San Diego’s (UCSD) Center for Innovative PhageApplications and Therapeutics (IPATH) protocol, we filed and received approval fromthe Food and Drug Administration for the emergency use of phage cocktail for the studyparticipant. The UCSD Institutional Review Board and Institutional Biosafety Committeeurgently approved use, and we obtained written informed consent from the participant.
2.2. Phage Discovery/Purification
All phages were first discovered as individual plaques on lawns of E. coli clinical iso-lates using the double agar overlay method [16]. We successively passaged each individualplaque by streaking onto fresh lawns twice, with single plaques taken each time. A singleplaque from the final streak created a clonal plate lysate [16]. All phages were purifiedvia CsCl gradient, as previously described [17], using the patient isolate UCS1 and titersdetermined by double agar overlay assay.
2.3. Phage Sequencing Analysis
Please refer to Supplemental Methods for phage genomic DNA preparation andsequencing. Raw reads were processed using FaQCs (version 2.09 with default settings,quality score cutoff of Q30, and reads less than 50 base pairs discarded) [18] and assembledusing SPAdes (version 3.5.0) [19]. For each phage, a single circular contig produced the finalassembly. Gene calling and annotation were done using the RASTtk pipeline (version 1.3.0,using default settings) [20] through PATRIC’s Genome Annotation service, [21] and tRNApredictions were done using ARAGORN (version 1.2.36.c) [22]. Coding sequences weresearched for virulence and antibiotic resistance genes by using BLAST (version 2.8.1) [23]to compare assembled genomes against the Virulence Factor Database (VFDB; version20200408) [24], the PATRIC virulence factor database [25], the Antibiotic Resistance GeneDatabase (ARDB; version 1.1) [26], and the Comprehensive Antibiotic Resistance Database(CARD; version 3.0.7) [27]. ShortBRED (version 0.9.4) [28] was used for targeted searchesof coding sequences for genes in VFDB, CARD, and the Resfam antibiotic resistance genedatabase [29]. Phage genus was predicted from sequenced relatives identified by using
Viruses 2021, 13, 2049 3 of 14
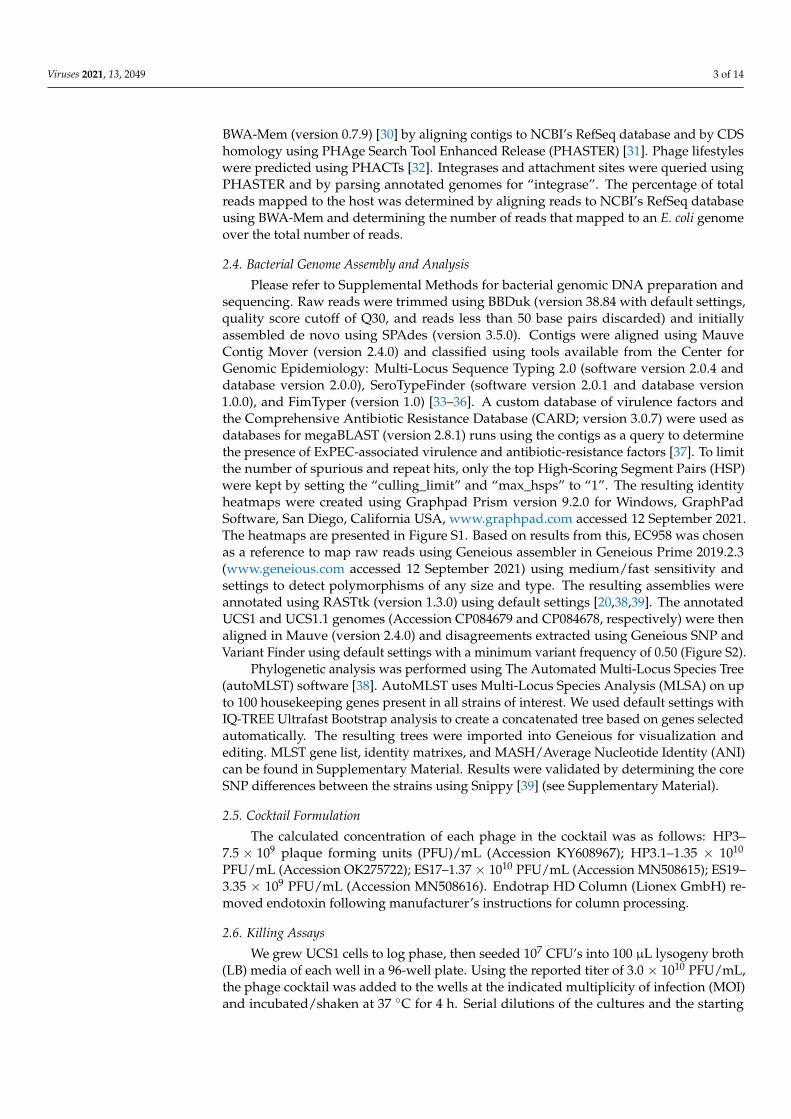
BWA-Mem (version 0.7.9) [30] by aligning contigs to NCBI’s RefSeq database and by CDShomology using PHAge Search Tool Enhanced Release (PHASTER) [31]. Phage lifestyleswere predicted using PHACTs [32]. Integrases and attachment sites were queried usingPHASTER and by parsing annotated genomes for “integrase”. The percentage of totalreads mapped to the host was determined by aligning reads to NCBI’s RefSeq databaseusing BWA-Mem and determining the number of reads that mapped to an E. coli genomeover the total number of reads.
2.4. Bacterial Genome Assembly and Analysis
Please refer to Supplemental Methods for bacterial genomic DNA preparation andsequencing. Raw reads were trimmed using BBDuk (version 38.84 with default settings,quality score cutoff of Q30, and reads less than 50 base pairs discarded) and initiallyassembled de novo using SPAdes (version 3.5.0). Contigs were aligned using MauveContig Mover (version 2.4.0) and classified using tools available from the Center forGenomic Epidemiology: Multi-Locus Sequence Typing 2.0 (software version 2.0.4 anddatabase version 2.0.0), SeroTypeFinder (software version 2.0.1 and database version1.0.0), and FimTyper (version 1.0) [33–36]. A custom database of virulence factors andthe Comprehensive Antibiotic Resistance Database (CARD; version 3.0.7) were used asdatabases for megaBLAST (version 2.8.1) runs using the contigs as a query to determinethe presence of ExPEC-associated virulence and antibiotic-resistance factors [37]. To limitthe number of spurious and repeat hits, only the top High-Scoring Segment Pairs (HSP)were kept by setting the “culling_limit” and “max_hsps” to “1”. The resulting identityheatmaps were created using Graphpad Prism version 9.2.0 for Windows, GraphPadSoftware, San Diego, California USA, www.graphpad.com accessed 12 September 2021.The heatmaps are presented in Figure S1. Based on results from this, EC958 was chosenas a reference to map raw reads using Geneious assembler in Geneious Prime 2019.2.3(www.geneious.com accessed 12 September 2021) using medium/fast sensitivity andsettings to detect polymorphisms of any size and type. The resulting assemblies wereannotated using RASTtk (version 1.3.0) using default settings [20,38,39]. The annotatedUCS1 and UCS1.1 genomes (Accession CP084679 and CP084678, respectively) were thenaligned in Mauve (version 2.4.0) and disagreements extracted using Geneious SNP andVariant Finder using default settings with a minimum variant frequency of 0.50 (Figure S2).
Phylogenetic analysis was performed using The Automated Multi-Locus Species Tree(autoMLST) software [38]. AutoMLST uses Multi-Locus Species Analysis (MLSA) on upto 100 housekeeping genes present in all strains of interest. We used default settings withIQ-TREE Ultrafast Bootstrap analysis to create a concatenated tree based on genes selectedautomatically. The resulting trees were imported into Geneious for visualization andediting. MLST gene list, identity matrixes, and MASH/Average Nucleotide Identity (ANI)can be found in Supplementary Material. Results were validated by determining the coreSNP differences between the strains using Snippy [39] (see Supplementary Material).
2.5. Cocktail Formulation
The calculated concentration of each phage in the cocktail was as follows: HP3–7.5 × 10⁹ plaque forming units (PFU)/mL (Accession KY608967); HP3.1–1.35 × 10¹⁰
PFU/mL (Accession OK275722); ES17–1.37 × 10¹⁰ PFU/mL (Accession MN508615); ES19–3.35 × 10⁹ PFU/mL (Accession MN508616). Endotrap HD Column (Lionex GmbH) re-moved endotoxin following manufacturer’s instructions for column processing.
2.6. Killing Assays
We grew UCS1 cells to log phase, then seeded 107 CFU’s into 100 µL lysogeny broth(LB) media of each well in a 96-well plate. Using the reported titer of 3.0 × 10¹⁰ PFU/mL,the phage cocktail was added to the wells at the indicated multiplicity of infection (MOI)and incubated/shaken at 37 ◦C for 4 h. Serial dilutions of the cultures and the starting

Viruses 2021, 13, 2049 4 of 14
inoculum (control) were then plated using 10 µL slants on LB agar plates. The plates wereincubated at 37 ◦C overnight and the resulting colonies counted.
2.7. Luminex Data Analysis and Heatmap Creation
Patient sera samples before, during, and after phage administration were subjectedto antibody-based quantification with a Milliplex human 48-plex cytokine panel (Cat#HCYTA-60K-PX48) according to the manufacturer’s protocol. Data were generated withLuminex xPONENT for Magpix, version 4.2 build 1324 on a Magpix instrument andanalyzed with Milliplex Analyst, version 5.1.0.0 standard, build 27 October 2012. Resultswere considered statistically significant with ≥35 counts per analyte per well. The medianfluorescent intensity for standard curves was analyzed using a 5-parameter log curve-fitting method to calculate sera concentrations. Concentrations (pg/mL) of analytes weredetermined by averaging duplicate samples and standardized to concentrations of samplestaken before phage treatment was administered (pretreatment levels). Values were base 2log transformed (log2) and processed with Heatmapper to create heat maps and hierarchalclustering [38]. Hierarchal clustering was done with average linkage clustering methodand Euclidean distance measurements.
2.8. Synography
Antibiotic-phage synograms were performed as previously described by our lab [40].Briefly, each well of a 96-well plate was inoculated with 5× 10⁷ CFU of UCS1 and subjectedto increasing concentrations of drug, phage cocktail, or both in LB and incubated/shakenat 37 ◦C for 24 h.
2.9. Serum Neutralization
A UCS1 cocktail mimic was prepared by mixing phages HP3, HP3.1, ES17, and ES19from the same stocks as the original cocktail. Serum samples were serially diluted 1:10 and1:100 in phage buffer. 100 µL each of serum and diluted samples were mixed with 1 µL ofthe cocktail mimic in a 96-well flat bottom plate and incubated/shaken at 37 ◦C for 30 min.Serial dilutions of each well were spotted onto a UCS1 lawn in a double agar overlay assayand resulting PFUs counted to determine titer.
3. Results3.1. Participant Characteristics and Phage Therapy Design Modality
The phage cocktail recipient was a 56-year-old man with well-controlled humanimmunodeficiency virus (HIV) infection and hepatitis B virus infection who was status post-liver transplant and on tacrolimus since 2014. He had symptomatic recurrent prostatitis andUTIs in the setting of kidney stones from April 2017 to January 2020 due to ESBL-producingE. coli, for which he completed multiple courses of intravenous (IV) ertapenem for varying6–8 week durations, with several courses including the concurrent use of azithromycinand trimethoprim/sulfamethoxazole based on antibiotic synergy testing and enhancedprostate tissue penetration. He also completed multiple courses of oral fosfomycin andN-acetylcysteine for biofilm dissolution. He additionally underwent the surgical removalof his kidney stones and lithotripsy, although small punctate irremovable stones remained.He did not tolerate gentamicin bladder washes and, in general, symptomatic UTI recurredwithin 2–3 weeks of antibiotic discontinuation. Phage therapy provided a last resort optionin an effort to resolve the infection.
TAILΦR (Tailored Antibacterials and Innovative Laboratories for Phage (Φ) Research)received the UCS1 ESBL-producing E. coli clinical isolate on an agar slant from IPATH.It exhibited the typical green sheen on Eosin Methylene Blue (EMB) agar, indicative oflactose fermentation (Figure S3). Our E. coli phage library was screened via spot assay andidentified that 20 of the 22 phages tested formed clearings. The details of the four selectedphages are noted in Table 1.

Viruses 2021, 13, 2049 5 of 14
Table 1. Composition, Genomic Analysis, and Properties of UCS1 Escherichia coli Phage Cocktail.
Bacteriophages HP3 HP3.1 ES17 ES19
Viruses 2021, 13, 2049 5 of 14
IPATH. It exhibited the typical green sheen on Eosin Methylene Blue (EMB) agar, indica-tive of lactose fermentation (Figure S3). Our E. coli phage library was screened via spot assay and identified that 20 of the 22 phages tested formed clearings. The details of the four selected phages are noted in Table 1.
Table 1. Composition, Genomic Analysis, and Properties of UCS1 Escherichia coli Phage Cocktail.
Bacteriophages HP3 HP3.1 ES17 ES19
Characteristics Morphology Myovirus Myovirus Podovirus Myovirus
Source Goose/Duck Feces Directed Evolution Human Sewage Human Sewage Genome Size (bp) 168,188 168,195 75,134 167,088
Coding Sequences (CDS) 264 266 124 263Hypothetical Proteins 26 26 79 24
Proteins with Functional Assign-ment 238 240 45 239
Closest Sequenced Relative Escherichia virus T40 Escherichia virus T40 Escherichia phage
Eco32 Escherichia phage
HY01 Antibiotic Resistance CDS NO NO NO NOBacterial Virulence CDS NO NO NO NO
Attachment Sites NO NO 2 NOIntegrases NO NO NO NO
Lifestyle Prediction Lytic Lytic Likely Lytic LyticTiter in Cocktail (PFU/mL) 7.5 × 10⁹ 1.35 × 10¹⁰ 1.37 × 10¹⁰ 3.35 × 10⁹
Cocktail Properties Date of Manufacture 10/23/19
Titer (PFU/mL) 3 × 10¹⁰ Endotoxin Content (EU/mL) 685
Endotoxin Units per Dose (EU) 22.83 Storage 4 °C in 2.5mL Glass Vial
USP 71 Sterility Testing No Growth Detected Acid Fast Bacteria Testing No Growth Detected Phages HP3, ES17, ES19 were imaged and their genomes analyzed in Gibson et al. [41]. HP3.1 was imaged according to those same methods. All genomes were further analyzed according to methods above. Certified testing of endotoxin, sterility, and mycobacteria were performed according to USP guidelines, and certificates of analysis are presented in Fig-ure S4.
100 nm
Viruses 2021, 13, 2049 5 of 14
IPATH. It exhibited the typical green sheen on Eosin Methylene Blue (EMB) agar, indica-tive of lactose fermentation (Figure S3). Our E. coli phage library was screened via spot assay and identified that 20 of the 22 phages tested formed clearings. The details of the four selected phages are noted in Table 1.
Table 1. Composition, Genomic Analysis, and Properties of UCS1 Escherichia coli Phage Cocktail.
Bacteriophages HP3 HP3.1 ES17 ES19
100 nm
Characteristics Morphology Myovirus Myovirus Podovirus Myovirus
Source Goose/Duck Feces Directed Evolution Human Sewage Human Sewage Genome Size (bp) 168,188 168,195 75,134 167,088
Coding Sequences (CDS) 264 266 124 263 Hypothetical Proteins 26 26 79 24
Proteins with Functional Assign-ment 238 240 45 239
Closest Sequenced Relative Escherichia virus T40 Escherichia virus T40 Escherichia phage
Eco32 Escherichia phage
HY01 Antibiotic Resistance CDS NO NO NO NO
Bacterial Virulence CDS NO NO NO NO Attachment Sites NO NO 2 NO
Integrases NO NO NO NO Lifestyle Prediction Lytic Lytic Likely Lytic Lytic
Titer in Cocktail (PFU/mL) 7.5 × 10⁹ 1.35 × 10¹⁰ 1.37 × 10¹⁰ 3.35 × 10⁹ Cocktail Properties
Date of Manufacture 10/23/19
Titer (PFU/mL) 3 × 10¹⁰
Endotoxin Content (EU/mL) 685
Endotoxin Units per Dose (EU) 22.83
Storage 4 °C in 2.5mL Glass Vial
USP 71 Sterility Testing No Growth Detected
Acid Fast Bacteria Testing No Growth Detected Phages HP3, ES17, ES19 were imaged and their genomes analyzed in Gibson et al. [41]. HP3.1 was imaged according to those same methods. All genomes were further analyzed according to methods above. Certified testing of endotoxin, sterility, and mycobacteria were performed according to USP guidelines, and certificates of analysis are presented in Fig-ure S4.
Characteristics
Morphology Myovirus Myovirus Podovirus MyovirusSource Goose/Duck Feces Directed Evolution Human Sewage Human Sewage
Genome Size (bp) 168,188 168,195 75,134 167,088Coding Sequences (CDS) 264 266 124 263
Hypothetical Proteins 26 26 79 24Proteins with Functional
Assignment 238 240 45 239
Closest Sequenced Relative Escherichia virusT40
Escherichia virusT40
Escherichia phageEco32
Escherichia phageHY01
Antibiotic Resistance CDS NO NO NO NOBacterial Virulence CDS NO NO NO NO
Attachment Sites NO NO 2 NOIntegrases NO NO NO NO
Lifestyle Prediction Lytic Lytic Likely Lytic LyticTiter in Cocktail (PFU/mL) 7.5 × 10⁹ 1.35 × 10¹⁰ 1.37 × 10¹⁰ 3.35 × 10⁹
Cocktail Properties
Date of Manufacture 10/23/19Titer (PFU/mL) 3 × 10¹⁰
Endotoxin Content (EU/mL) 685Endotoxin Units per Dose (EU) 22.83
Storage 4 ◦C in 2.5 mL Glass VialUSP 71 Sterility Testing No Growth Detected
Acid Fast Bacteria Testing No Growth Detected
Phages HP3, ES17, ES19 were imaged and their genomes analyzed in Gibson et al. [41]. HP3.1 was imaged according to those samemethods. All genomes were further analyzed according to methods above. Certified testing of endotoxin, sterility, and mycobacteria wereperformed according to USP guidelines, and certificates of analysis are presented in Figure S4.
Phages HP3, ES17, and ES19 were previously characterized by Gibson et al. [41]. Theirgenomes are devoid of undesirable elements (toxins, antibiotic resistance, and integrasegenes). ES17 was further investigated by Green et al. [14]. Through selective screening, theydiscovered that ES17 possesses mucolytic traits and binds to heparan sulfate proteoglycans(HSPGs). These features promote infection in mucoid environments, such as the gut. PhageES17 is particularly unique in that it binds to bacterial and human carbohydrates, which maypositionally target the phage to unique mucosal environments where the bacteria localize [42].
3.2. Safety and Efficacy of Phage Cocktail
Where possible, we employed consensus best practices to guide the cocktail formu-lation and characterization [43]. In vitro safety was assayed via three measures: genomicanalysis, endotoxin quantification, and sterility, with the results presented in Table 1.The concentration of endotoxin units delivered per 109 PFU was determined to be 22.83EU/dose, well within the 5 EU/kg/hr limit appropriate for the patient (weight 68.6 Kg) [44],and USP 71/AFB testing demonstrated the sterility of the final product. The final cocktailof four phages was highly lytic in both the plate and broth assessments of killing activity

Viruses 2021, 13, 2049 6 of 14
(Figure 1A,B). All the MOIs appeared to reduce the bacterial CFU burden by 4 logs whencompared to the uninfected control. We performed synography to assess the ability of thephage cocktail to synergize with the ertapenem. Slight antagonism was observed at thelowest concentrations of ertapenem (0.25 µg/mL) and phage (103–5 PFU/mL) tested, withan additive effect observed at higher phage concentrations (107–9 PFU/mL) (Figure 1C).Taken together, these data suggested that the UCS1 cocktail was virulent and suitable forthe combinatorial treatment with ertapenem.
Viruses 2021, 13, 2049 6 of 14
Phages HP3, ES17, and ES19 were previously characterized by Gibson et al. [41]. Their genomes are devoid of undesirable elements (toxins, antibiotic resistance, and inte-grase genes). ES17 was further investigated by Green et al. [14]. Through selective screen-ing, they discovered that ES17 possesses mucolytic traits and binds to heparan sulfate proteoglycans (HSPGs). These features promote infection in mucoid environments, such as the gut. Phage ES17 is particularly unique in that it binds to bacterial and human car-bohydrates, which may positionally target the phage to unique mucosal environments where the bacteria localize [42].
3.2. Safety and Efficacy of Phage Cocktail Where possible, we employed consensus best practices to guide the cocktail formu-
lation and characterization [43]. In vitro safety was assayed via three measures: genomic analysis, endotoxin quantification, and sterility, with the results presented in Table 1. The concentration of endotoxin units delivered per 109 PFU was determined to be 22.83 EU/dose, well within the 5 EU/kg/hr limit appropriate for the patient (weight 68.6 Kg) [44], and USP 71/AFB testing demonstrated the sterility of the final product. The final cocktail of four phages was highly lytic in both the plate and broth assessments of killing activity (Figure 1A,B). All the MOIs appeared to reduce the bacterial CFU burden by 4 logs when compared to the uninfected control. We performed synography to assess the ability of the phage cocktail to synergize with the ertapenem. Slight antagonism was ob-served at the lowest concentrations of ertapenem (0.25 µg/mL) and phage (103−5 PFU/mL) tested, with an additive effect observed at higher phage concentrations (107−9 PFU/mL) (Figure 1C). Taken together, these data suggested that the UCS1 cocktail was virulent and suitable for the combinatorial treatment with ertapenem.
Figure 1. Characterization of UCS1 Cocktail. (A) Serial dilution of UCS1 Cocktail onto lawn of UCS1 E. coli. Each tick mark represents 1 mm. (B) Killing Assay. 106 CFUs of UCS1 E. coli were incubated without phage or indicated MOI of UCS1 cocktail for 4 h in 100 µL LB, and resulting CFUs counted. Error bars represent mean +/− SD n = 3 technical replicates **** p < 0.001. (C) Synogram performed as described in Gu Liu et al. 2020 [39]. Each well of a 96-well plate was inoculated with
Figure 1. Characterization of UCS1 Cocktail. (A) Serial dilution of UCS1 Cocktail onto lawn of UCS1 E. coli. Each tickmark represents 1 mm. (B) Killing Assay. 106 CFUs of UCS1 E. coli were incubated without phage or indicated MOIof UCS1 cocktail for 4 h in 100 µL LB, and resulting CFUs counted. Error bars represent mean +/− SD n = 3 technicalreplicates **** p < 0.001. (C) Synogram performed as described in Gu Liu et al. 2020 [39]. Each well of a 96-well plate wasinoculated with 5 × 10⁸ CFU of UCS1 and subjected to increasing concentrations of drug, phage cocktail, or both in LB andincubated/shaken at 37 ◦C for 24 h. Optical Density 600 nM measurements were taken every 30 min. Values are reported as% reduction in growth at 24 h compared to untreated controls.
3.3. Phage Treatment: Clinical Safety and Efficacy
The patient received two weeks of intravenous (IV) phage therapy from 2/4/20 to2/18/20 as well as six weeks of IV ertapenem, ending on 3/16/20. Each dose consisted of1.0 × 109 PFU/mL of the phage cocktail every twelve hours. The once-daily ertapenemwas given two hours after the morning phage dose (Figure 2). The first dose of phage wasadministered in the inpatient setting with frequent monitoring of the vital signs. Aftertraining and with self-administration instructions, the remaining doses were administeredby the patient via a peripherally inserted central catheter at home. The patient kept a dailysymptom diary, had weekly clinic visits with blood draws for the assessment of liver andkidney function, complete blood counts, and inflammatory markers. The patient toleratedthe phage infusions well without any clinical adverse events and no concern for organrejection. The liver and kidney function and complete blood counts remained stable. TheC-reactive protein remained normal, while the sedimentation rate declined from 83 to

Viruses 2021, 13, 2049 7 of 14
48 mm/hr. We collected baseline and weekly serum trough and urine samples while onphage therapy. No bacteria were detected in the urine after the first dose of the phageand ertapenem. At the end of therapy (EOT) on 3/16/20, the patient did not have anysymptomatic recurrence of UTI in the 12 weeks of follow-up. However, the surveillanceurine cultures were positive for asymptomatic bacteriuria at weeks 8 and 13 (2 and 7 weeksfollowing EOT) for which antibiotic treatment was not needed.
Viruses 2021, 13, 2049 7 of 14
5 × 10⁸ CFU of UCS1 and subjected to increasing concentrations of drug, phage cocktail, or both in LB and incu-bated/shaken at 37 °C for 24 h. Optical Density 600 nM measurements were taken every 30 min. Values are reported as % reduction in growth at 24 h compared to untreated controls.
3.3. Phage Treatment: Clinical Safety and Efficacy The patient received two weeks of intravenous (IV) phage therapy from 2/4/20 to
2/18/20 as well as six weeks of IV ertapenem, ending on 3/16/20. Each dose consisted of 1.0 × 10⁹ PFU/mL of the phage cocktail every twelve hours. The once-daily ertapenem was given two hours after the morning phage dose (Figure 2). The first dose of phage was administered in the inpatient setting with frequent monitoring of the vital signs. After training and with self-administration instructions, the remaining doses were adminis-tered by the patient via a peripherally inserted central catheter at home. The patient kept a daily symptom diary, had weekly clinic visits with blood draws for the assessment of liver and kidney function, complete blood counts, and inflammatory markers. The patient tolerated the phage infusions well without any clinical adverse events and no concern for organ rejection. The liver and kidney function and complete blood counts remained sta-ble. The C-reactive protein remained normal, while the sedimentation rate declined from 83 to 48 mm/hr. We collected baseline and weekly serum trough and urine samples while on phage therapy. No bacteria were detected in the urine after the first dose of the phage and ertapenem. At the end of therapy (EOT) on 3/16/20, the patient did not have any symptomatic recurrence of UTI in the 12 weeks of follow-up. However, the surveillance urine cultures were positive for asymptomatic bacteriuria at weeks 8 and 13 (2 and 7 weeks following EOT) for which antibiotic treatment was not needed.
Figure 2. Treatment and clinical sampling course for patient with ESBL-producing E. coli UTI. (Top) Patient overview, administration route (PICC line, orange), and treatments (UCS1 cocktail, green; ertapenem, gray). (Bottom) Time course
Figure 2. Treatment and clinical sampling course for patient with ESBL-producing E. coli UTI. (Top)Patient overview, administration route (PICC line, orange), and treatments (UCS1 cocktail, green; er-tapenem, gray). (Bottom) Time course for dosing regimen of UCS1 cocktail (green), ertapenem (gray),and clinical sampling of urine (yellow drops) and blood (red drops). Created with BioRender.comaccessed 23 September 2021.
3.4. Longitudinal Assessment of Humoral Response
We found that the patient’s sera from weeks 1–4 led to the complete in vitro neutral-ization of the phage activity when assessed using the patient’s E. coli isolate (Figure 3). Thiseffect was rescued by serum dilution, indicating the inhibitory component was a part ofthe serum.

Viruses 2021, 13, 2049 8 of 14
Viruses 2021, 13, 2049 8 of 14
for dosing regimen of UCS1 cocktail (green), ertapenem (gray), and clinical sampling of urine (yellow drops) and blood (red drops). Created with BioRender.com accessed 23 September 2021.
3.4. Longitudinal Assessment of Humoral Response We found that the patient’s sera from weeks 1–4 led to the complete in vitro neutral-
ization of the phage activity when assessed using the patient’s E. coli isolate (Figure 3). This effect was rescued by serum dilution, indicating the inhibitory component was a part of the serum.
Figure 3. Patient humoral response to UCS1 Cocktail. (A) Equal volumes of the UCS1 cocktail mimic were mixed with phage buffer alone (No Serum), weekly patient serum samples (Neat), or dilutions in phage buffer and incubated/shaken at 37 C for 30 min. Serial dilutions from each condition were spotted onto lawns of UCS1 E. coli to determine titer. Results are reported as average +/− SD. n = 3 technical replicates. (B) Luminex assays performed on weekly sera samples. Concen-trations (pg/mL) of humoral markers were measured in duplicate, averaged, and standardized to pretreatment levels be-fore being converted to Log2 values. Heatmap and hierarchal clustering were done using HeatMapper with average link-age clustering method and Euclidean distance measurements.
When compared to serum levels prior to treatment, humoral analytes fell into four categories based on hierarchical clustering: increased, decreased, decreased following in-crease, and fluctuated (Figure 3B). Most prominently, interleukin-5 (IL-5) increased up to four-fold across weeks 1–4 (2 weeks during and 2 weeks after phage therapy). An increas-ing pattern was observed for platelet-derived growth factors A and B (PDGFA, PDGFB) and chemokine C-C motif ligand 4 (CCL4) for all 4 weeks, while IL9, IL-7, and IL-8 only increased after the completion of the phage administration (weeks 3–4). Several analytes increased in the first week of phage therapy, then decreased the following 3 weeks, in-cluding IL-12B, IL-27, IL-1a, transcription growth factor A (TGFA), CCL3, IL-2, and inter-feron gamma (IFNy). The fluctuating analytes—ones that changed weekly without a clear discernable pattern—included IL-15, IL-13, IL-6, IL-18, C-X3-C motif chemokine ligand 1 (CX3CL1), C-X-C motif ligand 9 (CXCL9), CXCL10, C-C motif ligand 7 (CCL7), and CCL2. Finally, the analytes that decreased across all 4 weeks compared to the pre-treatment
Figure 3. Patient humoral response to UCS1 Cocktail. (A) Equal volumes of the UCS1 cocktail mimic were mixed withphage buffer alone (No Serum), weekly patient serum samples (Neat), or dilutions in phage buffer and incubated/shakenat 37 ◦C for 30 min. Serial dilutions from each condition were spotted onto lawns of UCS1 E. coli to determine titer.Results are reported as average +/− SD. n = 3 technical replicates. (B) Luminex assays performed on weekly sera samples.Concentrations (pg/mL) of humoral markers were measured in duplicate, averaged, and standardized to pretreatmentlevels before being converted to Log2 values. Heatmap and hierarchal clustering were done using HeatMapper with averagelinkage clustering method and Euclidean distance measurements.
When compared to serum levels prior to treatment, humoral analytes fell into fourcategories based on hierarchical clustering: increased, decreased, decreased followingincrease, and fluctuated (Figure 3B). Most prominently, interleukin-5 (IL-5) increased upto four-fold across weeks 1–4 (2 weeks during and 2 weeks after phage therapy). Anincreasing pattern was observed for platelet-derived growth factors A and B (PDGFA,PDGFB) and chemokine C-C motif ligand 4 (CCL4) for all 4 weeks, while IL9, IL-7, andIL-8 only increased after the completion of the phage administration (weeks 3–4). Severalanalytes increased in the first week of phage therapy, then decreased the following 3 weeks,including IL-12B, IL-27, IL-1a, transcription growth factor A (TGFA), CCL3, IL-2, andinterferon gamma (IFNy). The fluctuating analytes—ones that changed weekly withouta clear discernable pattern—included IL-15, IL-13, IL-6, IL-18, C-X3-C motif chemokineligand 1 (CX3CL1), C-X-C motif ligand 9 (CXCL9), CXCL10, C-C motif ligand 7 (CCL7), andCCL2. Finally, the analytes that decreased across all 4 weeks compared to the pre-treatment(week 0) sera included IL-10, IL-4, IL-3, IL-12A, epidermal growth factor (EGF), IFNa,tumor necrosis factor alpha (TNFa), and vascular endothelial growth factor A (VEGFA).
3.5. Assessment of ESBL-Producing E. coli Strain Following Phage Therapy Treatment
The surveillance urine culture at week 8 (six weeks after phage therapy cessation, twoweeks after EOT) grew ESBL-producing E. coli (labeled here UCS1.1). The repeat urineculture at week 13 also grew ESBL-producing E. coli. Furthermore, UCS1.1 was just assusceptible to the original phage cocktail as UCS1 (EOP’s~1, Figure 4A), suggesting theUCS1.1 may be equivalent to UCS1.

Viruses 2021, 13, 2049 9 of 14
Viruses 2021, 13, 2049 9 of 14
(week 0) sera included IL-10, IL-4, IL-3, IL-12A, epidermal growth factor (EGF), IFNa, tu-mor necrosis factor alpha (TNFa), and vascular endothelial growth factor A (VEGFA).
3.5. Assessment of ESBL-Producing E. coli Strain Following Phage Therapy Treatment The surveillance urine culture at week 8 (six weeks after phage therapy cessation,
two weeks after EOT) grew ESBL-producing E. coli (labeled here UCS1.1). The repeat urine culture at week 13 also grew ESBL-producing E. coli. Furthermore, UCS1.1 was just as susceptible to the original phage cocktail as UCS1 (EOP’s~1, Figure 4A), suggesting the UCS1.1 may be equivalent to UCS1.
Figure 4. UCS1 and UCS1.1 are nearly identical ST131 strains. (A) Purified phages HP3, HP3.1, ES17, and ES19 were tit-tered onto lawns of UCS1 and UCS1.1. Efficiency of Plating (EOP) was calculated using UCS1 as the reference strain (EOP = 1). n = 3 technical replicates. (B) Phylogenetic tree was generated using autoMLST and visualized using Geneious Prime. UCS1 and UCS1.1 are shown in the context of other ST131 strains from the three major subtypes (fimH22, fimH30, and fimH41) and strains from other relevant UPEC sequence types: CFT073 (ST73) and UTI89 (ST95). Nodes are annotated with Ultrafast Bootstrap values. (C) Circular genome visualization created using BLAST Ring Image Generator (BRIG). EC958 acted as reference genome. Rings from inner to outer are as follows: (1) GC Content, (2) GC skew, (3) E. coli EC958 (Red), (4) E. coli UCS1 (Blue), (5) E. coli UCS1.1, and (6) CDS features (from EC958).
To test this hypothesis, we sequenced both UCS1 and UCS1.1 and performed com-parative genomics. The analysis revealed both are O25b:H4:K100 strains belonging to the fimH30 subgroup of the ST131 sequence type, one of the most prevalent ExPEC-causing sequence types in the world and currently responsible for the ST131 pandemic [45,46]. UCS1 and UCS1.1 contained many ExPEC-associated virulence factors, including papA, afa fimbriae, yersiniabactin (fyuA), aerobactin (iutA), iss, and iha (Figure 4B). Compared to other ST131s, the de novo assembled genomes had a serotype, fim-type, and virulence profile most similar to EC958, a UPEC strain isolated in 2005 [47]. This was the basis for using EC958 as a reference to assemble the genomes for direct comparison. The final as-semblies showed that UCS1 and UCS1.1 contained all the Genomic Islands (GI-thrW, GI-pheV, GI-selC, GI-leuX) and prophages (Phi1-7) described in EC958 (Figure 4C) [47].
There were dozens of SNPs, insertions, and deletions that distinguished the two strains, including putative mutations in the attachment, motility, and secretion system elements. These changes are listed in Table 2. The effect of these changes on the virulence of UCS1 and UCS1.1 is unclear.
Figure 4. UCS1 and UCS1.1 are nearly identical ST131 strains. (A) Purified phages HP3, HP3.1, ES17, and ES19 were titteredonto lawns of UCS1 and UCS1.1. Efficiency of Plating (EOP) was calculated using UCS1 as the reference strain (EOP = 1).n = 3 technical replicates. (B) Phylogenetic tree was generated using autoMLST and visualized using Geneious Prime. UCS1and UCS1.1 are shown in the context of other ST131 strains from the three major subtypes (fimH22, fimH30, and fimH41) andstrains from other relevant UPEC sequence types: CFT073 (ST73) and UTI89 (ST95). Nodes are annotated with UltrafastBootstrap values. (C) Circular genome visualization created using BLAST Ring Image Generator (BRIG). EC958 acted asreference genome. Rings from inner to outer are as follows: (1) GC Content, (2) GC skew, (3) E. coli EC958 (Red), (4) E. coliUCS1 (Blue), (5) E. coli UCS1.1, and (6) CDS features (from EC958).
To test this hypothesis, we sequenced both UCS1 and UCS1.1 and performed com-parative genomics. The analysis revealed both are O25b:H4:K100 strains belonging to thefimH30 subgroup of the ST131 sequence type, one of the most prevalent ExPEC-causingsequence types in the world and currently responsible for the ST131 pandemic [45,46].UCS1 and UCS1.1 contained many ExPEC-associated virulence factors, including papA,afa fimbriae, yersiniabactin (fyuA), aerobactin (iutA), iss, and iha (Figure 4B). Comparedto other ST131s, the de novo assembled genomes had a serotype, fim-type, and virulenceprofile most similar to EC958, a UPEC strain isolated in 2005 [47]. This was the basisfor using EC958 as a reference to assemble the genomes for direct comparison. The finalassemblies showed that UCS1 and UCS1.1 contained all the Genomic Islands (GI-thrW,GI-pheV, GI-selC, GI-leuX) and prophages (Phi1-7) described in EC958 (Figure 4C) [47].
There were dozens of SNPs, insertions, and deletions that distinguished the twostrains, including putative mutations in the attachment, motility, and secretion systemelements. These changes are listed in Table 2. The effect of these changes on the virulenceof UCS1 and UCS1.1 is unclear.
Table 2. Notable Mutations in UCS1.1 compared to UCS1.
Coding Sequence Locus Tag Length (bp) Type Amino AcidChange
ProteinEffect
Probable lipoprotein YPO0703 EC958_0641 3 Deletion ExtensionProphage-associated invasin-like protein EC958_1349 0 Insertion TruncationProphage-associated invasin-like protein EC958_1349 2 Deletion Frame ShiftProphage-associated invasin-like protein EC958_1349 4 Substitution Extension
Large exoproteins involved in heme utilization or adhesion, upaH EC958_1689 9 Deletion NTGT→ N DeletionGlutamate decarboxylase, gadB EC958_1756 5 Deletion Frame Shift
Putative capsular polysaccaride transport protein, YegH EC958_2403 1 SNP (transition) I→M SubstitutionGlutamate decarboxylase, gadA EC958_3921 1 Insertion ExtensionGlutamate decarboxylase, gadA EC958_3921 0 Insertion Frame Shift
SisB (ShiA homolog) EC958_4074 1 SNP (transversion) Q→ L SubstitutionUncharacterized protein YeeP EC958_4120 2 Deletion Frame Shift
Antigen 43 EC958_4121 2 Insertion N→ NAATNVT InsertionAnti-adapter protein IraM EC958_4960 7 Deletion Extension

Viruses 2021, 13, 2049 10 of 14
Table 2. Cont.
Coding Sequence Locus Tag Length (bp) Type Amino AcidChange
ProteinEffect
Antigen 43 EC958_5138 0 Insertion Frame ShiftMicrocin-E7 immunity protein EC958_5152 2 Deletion Frame Shift
Small inner membrane protein, YmgF family NA 3 Substitution V→ R Substitution
Contig assembly and genomic analysis were performed as described in Methods and Figure 4. Mutations in transposable elements wereremoved, along with genes of unknown function, or for which no protein effect was predicted. Genes that code for known and putativevirulence factors, as well as genes involved in nutrient uptake, are presented here. Gene designations are listed for strain EC958, the closestancestral strain. Deletions resulting in large protein truncations are omitted from “Amino Acid Change” for clarity.
4. Discussion
UTIs are a common cause of recurrent infection and are associated with the develop-ment of multi-drug resistance. We describe the successful resolution of a symptomatic,recurrent, and complicated ESBL-producing E. coli UTI in an immunosuppressed patienttreated with combinatorial phage cocktail and ertapenem. Our study affirms the clinicalsafety of phage therapy when administered intravenously at a dose of 109 PFUs/mL, aswell as the safety of self-administration, as noted previously [48–50]. An additional keyfinding was the onset of serum neutralization of the phages 1 week after treatment initiation,which has implications for phage therapy duration as well as the consideration of otherroutes of phage instillation, including intra-vesical for UTI. The baseline serum did notinhibit the phage infectivity; however, the sera collected at week 1 greatly reduced plaqueformation and completely abolished phage infectivity from week 2 onward. Sera inhibitionat week 1 suggests the action of an innate immune response, while the inhibition at laterweeks is consistent with an adaptive response. This result agrees with previous studiesinvestigating the presence of neutralizing antibodies in response to phage therapy [51].
We also utilized antibody-based detection assays to quantify humoral analytes before,during, and after phage administration. Most notably, IL5 exhibited the highest increaseduring and after treatment. IL5 is produced by Th2 helper cells and stimulates B-celldevelopment and IgA secretion [52]. Likewise, IL7 and growth factors PDGFA, PDGFA,and IL8 levels appeared to increase the B-cell development, and the IgA secretion wouldagree with the increased mucosal immune activity in the urinary tract and observed serumneutralization of the phage cocktail [53]. However, other B-cell-associated factors, such asIL2, IL4, IL12, and IFNγ, decreased, along with pro-inflammatory markers, such as IL1α,IL1β, TNFα, and IFNα. This may be attributable to the concurrent provision of tacrolimus,a calcineurin phosphatase inhibitor used for immunosuppression for transplant recipients.Overall, the results of the serum analysis are consistent with an induced adaptive immuneresponse to the UCS1 phage cocktail.
The patient had asymptomatic bacteriuria following EOT, unlike previous symp-tomatic recurrences requiring antibiotic courses the prior year, suggesting the presence of anon-pathogenic bacterial isolate. This bacteriuria was caused by a nearly identical strain ofESBL-producing E. coli (UCS1.1). The putative mutations noted in UCS1.1 may providepossible mechanisms for the altered pathogenicity. The prophage-associated invasin-likeprotein beta-barrel domain shares homology with the beta-barrel domain of FdeC (19%amino acid homology overall), an adhesin that mediates biofilm formation and is necessaryfor kidney colonization in the mouse urinary tract [54]. The immunization with FdeC alsoconferred protection against a murine model of UTI, making it a strong UPEC vaccinecandidate [55]. The Vgr proteins are components of the baseplate and tip structures of thetype VI secretion systems (TSS). TSS complexes mediate biofilm formation and interspeciescompetition for colonizing microbiome niches. Similarly, colicin immunity protein preventscolicin from destroying the cell’s own membrane [56]. Ultimately, UCS1.1 may have lost oraltered these factors that confer adherence, invasion, and biofilm formation abilities to UCS1.
The genomic analysis indicated that UCS1.1 originated alongside and was derivedfrom UCS1 rather than an independent infection event. Thus, it is intriguing that UCS1.1was the predominant isolate after the phage therapy. The near identity of the clinical

Viruses 2021, 13, 2049 11 of 14
isolates and continued recurrence may indicate the presence of quiescent intracellularbacterial communities [57,58], a condition that would impede complete microbial clearance.UCS1.1 could be a rare variant or simply the result of genetic drift. UCS1 was likelycleared by the phage/antibiotic combination treatment, leaving the microbial niche tobe filled by UCS1.1. A rare variant or genetic drift would also explain why UCS1.1 isjust as susceptible to the phages in the UCS1 cocktail. Rather than develop resistance tothe phage cocktail, microbial succession and expansion occurred once the predominantESBL-producing E. coli was cleared. It is also possible that the mutations in UCS1.1 do notappreciably affect virulence when compared to UCS1. In that case, the patient’s improvedclinical presentation could be due to biofilm reduction and/or alteration of the urobiome.This hypothesis is congruent with phage disruption of biofilms and dysbiosis-drivenUTI [59–61]. Such an observation is consistent with our phage selection based on anti-biofilm and anti-resistome activity. Future efforts will focus on reverse genetics and murinemodels of UTI to test potential mechanism(s) of virulence attenuation.
Due to their prevalence, penchant for multi-drug resistance, and easy access for drugdelivery, UTIs are desirable targets for phage therapy trials. The previous phage therapyfor UTI trials evaluated the defined cocktails. However, a recently initiated study [62] willevaluate pre-approved phages that are variably matched to each patient’s clinical bacterialisolate, similar to the “sur-mesure” personalized approach [63]. Our case report supportsthe use of a rationally designed phage cocktail with antibiotics to treat recurrent UTIand demonstrates that, in addition to complete bacterial eradication, favorable microbialsuccession should be considered a desirable clinical outcome.
Supplementary Materials: The following are available online at https://www.mdpi.com/article/10.3390/v13102049/s1, Supplemental methods, Figure S1. Comparative pathogenomics and resistomicsof UCS1 and UCS1.1 with other E. coli species, Figure S2: Bioinformatic pipeline for genomiccomparison between UCS1 and UCS1.1, Figure S3: Colony Morphology of UCS1 E. coli, Figure S4:Characterization of UCS1 cocktail by certified laboratories, Full mutation list.xlsx, auto MLST SnippyData.xlsx, and Concatenated autoMLST.fasta.
Author Contributions: Conceptualization, A.M. and S.A.; methodology, A.T., J.C., S.G., A.M.; formalanalysis, A.T., J.C., H.H.-S., M.K.; investigation, A.T., H.H.-S., J.C., M.K., S.G.; data curation, A.T.,J.C.; writing—original draft preparation, A.T., M.K., S.A.; writing—review and editing, A.T., M.K.,J.C., S.G., S.A., A.M.; funding acquisition, A.M. All authors have read and agreed to the publishedversion of the manuscript.
Funding: This work was supported by the National Institutes of Health (grant number U19 AI157981),the Robert and Helen Kleberg Foundation, and Baylor College of Medicine seed funds awarded toA.M. The funders had no role in the design of the study; in the collection, analyses, or interpretationof data; in the writing of the manuscript, or in the decision to publish the results.
Institutional Review Board Statement: The study was conducted according to the guidelines of theDeclaration of Helsinki, and approved by the Institutional Review Board of University of CaliforniaSan Diego Health (protocol code #200163 14 July 2020).
Informed Consent Statement: Informed consent was obtained from all subjects involved in the study.
Acknowledgments: We would like to thank the Digestive Diseases Center at the Texas MedicalCenter and Susan Venable for their help with the Luminex assays. We would also like to thankHeidi Kaplan at the University of Texas Health and Sciences Center for her help in obtaining electronmicroscopy images.
Conflicts of Interest: S.A. discloses a consultant role for Merck, Gilead, and an unpaid consultantrole for BioMx. The rest of the authors have no conflicts of interest to disclose.

Viruses 2021, 13, 2049 12 of 14
References1. Hendrix, R.W.; Smith, M.C.M.; Burns, R.N.; Ford, M.E.; Hatfull, G.F. Evolutionary Relationships among Diverse Bacteriophages
and Prophages: All the World’s a Phage. Proc. Natl. Acad. Sci. USA 1999, 96, 2192–2197. [CrossRef] [PubMed]2. Noble, R.T.; Fuhrman, J.A. Rapid Virus Production and Removal as Measured with Fluorescently Labeled Viruses as Tracers.
Appl. Environ. Microbiol. 2000, 66, 3790–3797. [CrossRef] [PubMed]3. Cooper, M.A.; Shlaes, D. Fix the Antibiotics Pipeline. Nature 2011, 472, 32. [CrossRef] [PubMed]4. Schooley, R.T.; Strathdee, S. Treat Phage like Living Antibiotics. Nat. Microbiol. 2020, 5, 391–392. [CrossRef] [PubMed]5. Green, S.; Ma, L.; Maresso, A. Phage therapy. In Reference Module in Biomedical Sciences; Elsevier: Amsterdam, The, Netherlands,
2018; p. B9780128012383662000. ISBN 978-0-12-801238-3.6. Rostkowska, O.M.; Miedzybrodzki, R.; Miszewska-Szyszkowska, D.; Górski, A.; Durlik, M. Treatment of Recurrent Urinary
Tract Infections in a 60-year-old Kidney Transplant Recipient. The Use of Phage Therapy. Transpl. Infect. Dis. 2020, 23, e13391.[CrossRef]
7. Caldwell, J.A. Bacteriophagy in urinary infections following the administration of the bacteriophage therapeutically. Arch. Intern.Med. 1928, 41, 189. [CrossRef]
8. Centers for Disease Control and Prevention (U.S.). Antibiotic Resistance Threats in the United States, 2019; Centers for DiseaseControl and Prevention (U.S.): Atalanta, GA, USA, 2019.
9. Takhar, S.S.; Moran, G.J. Diagnosis and Management of Urinary Tract Infection in the Emergency Department and OutpatientSettings. Infect. Dis. Clin. N. Am. 2014, 28, 33–48. [CrossRef]
10. Wagenlehner, F.M.E.; Bjerklund Johansen, T.E.; Cai, T.; Koves, B.; Kranz, J.; Pilatz, A.; Tandogdu, Z. Epidemiology, Definition andTreatment of Complicated Urinary Tract Infections. Nat. Rev. Urol. 2020, 17, 586–600. [CrossRef]
11. Zhao, F.; Yang, H.; Bi, D.; Khaledi, A.; Qiao, M. A Systematic Review and Meta-Analysis of Antibiotic Resistance Patterns, and theCorrelation between Biofilm Formation with Virulence Factors in Uropathogenic E. coli Isolated from Urinary Tract Infections.Microb. Pathog. 2020, 144, 104196. [CrossRef]
12. De Souza, R.M.; Olsburgh, J. Urinary Tract Infection in the Renal Transplant Patient. Nat. Rev. Nephrol. 2008, 4, 252–264. [CrossRef]13. Wagenlehner, F.M.E.; Naber, K.G. Fluoroquinolone Antimicrobial Agents in the Treatment of Prostatitis and Recurrent Urinary
Tract Infections in Men. Curr. Urology Rep. 2004, 5, 309–316. [CrossRef]14. Green, S.I.; Liu, C.G.; Yu, X.; Gibson, S.; Salmen, W.; Rajan, A.; Carter, H.E.; Clark, J.R.; Song, X.; Ramig, R.F.; et al. Targeting of
Mammalian Glycans Enhances Phage Predation in the Gastrointestinal Tract. mBio 2021, 12, e03474-20. [CrossRef]15. Salazar, K.C.; Ma, L.; Green, S.I.; Zulk, J.J.; Trautner, B.W.; Ramig, R.F.; Clark, J.R.; Terwilliger, A.L.; Maresso, A.W. Antiviral
Resistance and Phage Counter Adaptation to Antibiotic-Resistant Extraintestinal Pathogenic Escherichia Coli. mBio 2021, 12, 20.[CrossRef]
16. Clokie, M.R.J.; Kropinski, A.; Lavigne, R. (Eds.) Bacteriophages: Methods and Protocols, Volume IV; Methods in Molecular Biology;Springer: New York, NY, USA, 2019; Volume 1898, ISBN 978-1-4939-8939-3.
17. Green, S.I.; Kaelber, J.T.; Ma, L.; Trautner, B.W.; Ramig, R.F.; Maresso, A.W. Bacteriophages from ExPEC Reservoirs Kill PandemicMultidrug-Resistant Strains of Clonal Group ST131 in Animal Models of Bacteremia. Sci. Rep. 2017, 7, 46151. [CrossRef]
18. Lo, C.-C.; Chain, P.S.G. Rapid Evaluation and Quality Control of next Generation Sequencing Data with FaQCs. BMC Bioinform.2014, 15, 366. [CrossRef]
19. Bankevich, A.; Nurk, S.; Antipov, D.; Gurevich, A.A.; Dvorkin, M.; Kulikov, A.S.; Lesin, V.M.; Nikolenko, S.I.; Pham, S.; Prjibelski,A.D.; et al. SPAdes: A New Genome Assembly Algorithm and Its Applications to Single-Cell Sequencing. J. Comput. Biol. 2012,19, 455–477. [CrossRef] [PubMed]
20. Brettin, T.; Davis, J.J.; Disz, T.; Edwards, R.A.; Gerdes, S.; Olsen, G.J.; Olson, R.; Overbeek, R.; Parrello, B.; Pusch, G.D.; et al.RASTtk: A Modular and Extensible Implementation of the RAST Algorithm for Building Custom Annotation Pipelines andAnnotating Batches of Genomes. Sci. Rep. 2015, 5, 8365. [CrossRef] [PubMed]
21. Wattam, A.R.; Davis, J.J.; Assaf, R.; Boisvert, S.; Brettin, T.; Bun, C.; Conrad, N.; Dietrich, E.M.; Disz, T.; Gabbard, J.L.; et al.Improvements to PATRIC, the All-Bacterial Bioinformatics Database and Analysis Resource Center. Nucleic Acids Res. 2017, 45,D535–D542. [CrossRef] [PubMed]
22. Laslett, D. ARAGORN, a Program to Detect TRNA Genes and TmRNA Genes in Nucleotide Sequences. Nucleic Acids Res. 2004,32, 11–16. [CrossRef]
23. Johnson, M.; Zaretskaya, I.; Raytselis, Y.; Merezhuk, Y.; McGinnis, S.; Madden, T.L. NCBI BLAST: A Better Web Interface. NucleicAcids Res. 2008, 36, W5–W9. [CrossRef] [PubMed]
24. Chen, L.; Zheng, D.; Liu, B.; Yang, J.; Jin, Q. VFDB 2016: Hierarchical and Refined Dataset for Big Data Analysis—10 Years On.Nucleic Acids Res. 2016, 44, D694–D697. [CrossRef]
25. Mao, C.; Abraham, D.; Wattam, A.R.; Wilson, M.J.C.; Shukla, M.; Yoo, H.S.; Sobral, B.W. Curation, Integration and Visualizationof Bacterial Virulence Factors in PATRIC. Bioinformatics 2015, 31, 252–258. [CrossRef] [PubMed]
26. Liu, B.; Pop, M. ARDB–Antibiotic Resistance Genes Database. Nucleic Acids Res. 2009, 37, D443–D447. [CrossRef] [PubMed]27. McArthur, A.G.; Waglechner, N.; Nizam, F.; Yan, A.; Azad, M.A.; Baylay, A.J.; Bhullar, K.; Canova, M.J.; De Pascale, G.; Ejim,
L.; et al. The Comprehensive Antibiotic Resistance Database. Antimicrob. Agents Chemother. 2013, 57, 3348–3357. [CrossRef][PubMed]

Viruses 2021, 13, 2049 13 of 14
28. Kaminski, J.; Gibson, M.K.; Franzosa, E.A.; Segata, N.; Dantas, G.; Huttenhower, C. High-Specificity Targeted Functional Profilingin Microbial Communities with ShortBRED. PLoS Comput. Biol. 2015, 11, e1004557. [CrossRef]
29. Gibson, M.K.; Forsberg, K.J.; Dantas, G. Improved Annotation of Antibiotic Resistance Determinants Reveals Microbial ResistomesCluster by Ecology. ISME J. 2015, 9, 207–216. [CrossRef] [PubMed]
30. Li, H. Aligning Sequence Reads, Clone Sequences and Assembly Contigs with BWA-MEM. arXiv 2013, arXiv:1303.3997.31. Arndt, D.; Grant, J.R.; Marcu, A.; Sajed, T.; Pon, A.; Liang, Y.; Wishart, D.S. PHASTER: A Better, Faster Version of the PHAST
Phage Search Tool. Nucleic Acids Res. 2016, 44, W16–W21. [CrossRef] [PubMed]32. McNair, K.; Bailey, B.A.; Edwards, R.A. PHACTS, a Computational Approach to Classifying the Lifestyle of Phages. Bioinformatics
2012, 28, 614–618. [CrossRef] [PubMed]33. Darling, A.C.E. Mauve: Multiple Alignment of Conserved Genomic Sequence With Rearrangements. Genome Res. 2004, 14,
1394–1403. [CrossRef]34. Larsen, M.V.; Cosentino, S.; Rasmussen, S.; Friis, C.; Hasman, H.; Marvig, R.L.; Jelsbak, L.; Sicheritz-Ponten, T.; Ussery, D.W.;
Aarestrup, F.M.; et al. Multilocus Sequence Typing of Total-Genome-Sequenced Bacteria. J. Clin. Microbiol. 2012, 50, 1355–1361.[CrossRef]
35. Joensen, K.G.; Tetzschner, A.M.M.; Iguchi, A.; Aarestrup, F.M.; Scheutz, F. Rapid and Easy In Silico Serotyping of Escherichia ColiIsolates by Use of Whole-Genome Sequencing Data. J. Clin. Microbiol. 2015, 53, 2410–2426. [CrossRef]
36. Roer, L.; Tchesnokova, V.; Allesøe, R.; Muradova, M.; Chattopadhyay, S.; Ahrenfeldt, J.; Thomsen, M.C.F.; Lund, O.; Hansen, F.;Hammerum, A.M.; et al. Development of a Web Tool for Escherichia Coli Subtyping Based on FimH Alleles. J. Clin. Microbiol.2017, 55, 2538–2543. [CrossRef]
37. Clark, J.R.; Maresso, A.M. Comparative Pathogenomics of Escherichia Coli: Polyvalent Vaccine Target Identification throughVirulome Analysis. Infect Immun. 2021, 89. [CrossRef] [PubMed]
38. Alanjary, M.; Steinke, K.; Ziemert, N. AutoMLST: An Automated Web Server for Generating Multi-Locus Species Trees Highlight-ing Natural Product Potential. Nucleic Acids Res. 2019, 47, W276–W282. [CrossRef] [PubMed]
39. Seemann, Torsten Rapid Haploid Variant Calling and Core Genome Alignment. Available online: https://github.com/tseemann/snippy (accessed on 12 September 2021).
40. Gu Liu, C.; Green, S.I.; Min, L.; Clark, J.R.; Salazar, K.C.; Terwilliger, A.L.; Kaplan, H.B.; Trautner, B.W.; Ramig, R.F.; Maresso, A.W.Phage-Antibiotic Synergy Is Driven by a Unique Combination of Antibacterial Mechanism of Action and Stoichiometry. mBio2020, 11, e01462-20. [CrossRef] [PubMed]
41. Gibson, S.B.; Green, S.I.; Liu, C.G.; Salazar, K.C.; Clark, J.R.; Terwilliger, A.L.; Kaplan, H.B.; Maresso, A.W.; Trautner, B.W.; Ramig,R.F. Constructing and Characterizing Bacteriophage Libraries for Phage Therapy of Human Infections. Front. Microbiol. 2019, 10,2537. [CrossRef] [PubMed]
42. Bishop, J.R.; Schuksz, M.; Esko, J.D. Heparan Sulphate Proteoglycans Fine-Tune Mammalian Physiology. Nature 2007, 446,1030–1037. [CrossRef]
43. Pirnay, J.; Blasdel, B.G.; Bretaudeau, L.; Buckling, A.; Chanishvili, N.; Clark, J.R.; Corte-real, S.; Debarbieux, L.; Dublanchet, A.;De Vos, D.; et al. Quality and Safety Requirements for Sustainable Phage Therapy Products. Pharm. Res. 2015, 32, 2173–2179.[CrossRef]
44. Office of Regulatory Affairs Bacterial Endotoxins/Pyrogens. Available online: https://www.fda.gov/inspections-compliance-enforcement-and-criminal-investigations/inspection-technical-guides/bacterial-endotoxinspyrogens (accessed on 27 December2020).
45. Johnson, J.R.; Johnston, B.; Clabots, C.; Kuskowski, M.A.; Castanheira, M. Escherichia Coli Sequence Type ST131 as the MajorCause of Serious Multidrug-Resistant E. Coli Infections in the United States. Clin. Infect. Dis. 2010, 51, 286–294. [CrossRef]
46. Johnson, J.R.; Tchesnokova, V.; Johnston, B.; Clabots, C.; Roberts, P.L.; Billig, M.; Riddell, K.; Rogers, P.; Qin, X.; Butler-Wu, S.;et al. Abrupt Emergence of a Single Dominant Multidrug-Resistant Strain of Escherichia Coli. J. Infect. Dis. 2013, 207, 919–928.[CrossRef] [PubMed]
47. Forde, B.M.; Ben Zakour, N.L.; Stanton-Cook, M.; Phan, M.-D.; Totsika, M.; Peters, K.M.; Chan, K.G.; Schembri, M.A.; Upton, M.;Beatson, S.A. The Complete Genome Sequence of Escherichia Coli EC958: A High Quality Reference Sequence for the GloballyDisseminated Multidrug Resistant E. Coli O25b:H4-ST131 Clone. PLoS ONE 2014, 9, e104400. [CrossRef] [PubMed]
48. Speck, P.; Smithyman, A. Safety and Efficacy of Phage Therapy via the Intravenous Route. FEMS Microbiol. Lett. 2016, 363, fnv242.[CrossRef]
49. Abedon, S.T.; Kuhl, S.J.; Blasdel, B.G.; Kutter, E.M. Phage Treatment of Human Infections. Bacteriophage 2011, 1, 66–85. [CrossRef][PubMed]
50. Aslam, S.; Lampley, E.; Wooten, D.; Karris, M.; Benson, C.; Strathdee, S.; Schooley, R.T. Lessons Learned From the First 10Consecutive Cases of Intravenous Bacteriophage Therapy to Treat Multidrug-Resistant Bacterial Infections at a Single Center inthe United States. Open Forum Infect. Dis. 2020, 7, ofaa389. [CrossRef]
51. Łusiak-Szelachowska, M.; Zaczek, M.; Weber-Dabrowska, B.; Miedzybrodzki, R.; Kłak, M.; Fortuna, W.; Letkiewicz, S.; Rogóz, P.;Szufnarowski, K.; Jonczyk-Matysiak, E.; et al. Phage Neutralization by Sera of Patients Receiving Phage Therapy. Viral Immunol.2014, 27, 295–304. [CrossRef] [PubMed]
52. Moon, B.; Takaki, S.; Miyake, K.; Takatsu, K. The Role of IL-5 for Mature B-1 Cells in Homeostatic Proliferation, Cell Survival, andIg Production. J. Immunol. 2004, 172, 6020–6029. [CrossRef]

Viruses 2021, 13, 2049 14 of 14
53. Kerr, M.A. The Structure and Function of Human IgA. Biochem. J. 1990, 271, 285–296. [CrossRef]54. Easton, D.M.; Allsopp, L.P.; Phan, M.-D.; Moriel, D.G.; Goh, G.K.; Beatson, S.A.; Mahony, T.J.; Cobbold, R.N.; Schembri, M.A.
The Intimin-Like Protein FdeC Is Regulated by H-NS and Temperature in Enterohemorrhagic Escherichia Coli. Appl. Environ.Microbiol. 2014, 80, 7337–7347. [CrossRef]
55. Nesta, B.; Spraggon, G.; Alteri, C.; Moriel, D.G.; Rosini, R.; Veggi, D.; Smith, S.; Bertoldi, I.; Pastorello, I.; Ferlenghi, I.; et al.FdeC, a Novel Broadly Conserved Escherichia Coli Adhesin Eliciting Protection against Urinary Tract Infections. mBio 2012, 3, 9.[CrossRef]
56. Olschläger, T.; Braun, V. Sequence, Expression, and Localization of the Immunity Protein for Colicin M. J. Bacteriol. 1987, 169,4765–4769. [CrossRef] [PubMed]
57. Mysorekar, I.U.; Hultgren, S.J. Mechanisms of Uropathogenic Escherichia Coli Persistence and Eradication from the Urinary Tract.Proc. Natl. Acad. Sci. USA 2006, 103, 14170–14175. [CrossRef]
58. Rosen, D.A.; Hooton, T.M.; Stamm, W.E.; Humphrey, P.A.; Hultgren, S.J. Detection of Intracellular Bacterial Communities inHuman Urinary Tract Infection. PLoS Med. 2007, 4, e329. [CrossRef] [PubMed]
59. Chibeu, A.; Lingohr, E.J.; Masson, L.; Manges, A.; Harel, J.; Ackermann, H.-W.; Kropinski, A.M.; Boerlin, P. Bacteriophages withthe Ability to Degrade Uropathogenic Escherichia Coli Biofilms. Viruses 2012, 4, 471–487. [CrossRef] [PubMed]
60. Zaczek, M.; Weber-Dabrowska, B.; Miedzybrodzki, R.; Górski, A. Phage Prevalence in the Human Urinary Tract—CurrentKnowledge and Therapeutic Implications. Microorganisms 2020, 8, 1802. [CrossRef] [PubMed]
61. Garretto, A.; Miller-Ensminger, T.; Wolfe, A.J.; Putonti, C. Bacteriophages of the Lower Urinary Tract. Nat. Rev. Urol. 2019, 16,422–432. [CrossRef]
62. Adaptive Phage Therapeutics, Inc. A Phase I/II Study of Bacteriophage Therapy to Evaluate Safety, Tolerability, and Efficacy of Targeted“Personalized” Bacteriophage Treatments in Patients With Bacterial Infection of the Urinary Tract; Adaptive Phage Therapeutics, Inc.:Gaithersburg, MD, USA, 2020. Available online: clinicaltrials.gov (accessed on 28 December 2020).
63. Pirnay, J.-P.; De Vos, D.; Verbeken, G.; Merabishvili, M.; Chanishvili, N.; Vaneechoutte, M.; Zizi, M.; Laire, G.; Lavigne, R.; Huys,I.; et al. The Phage Therapy Paradigm: Prêt-à-Porter or Sur-Mesure? Pharm. Res. 2011, 28, 934–937. [CrossRef]