Contract No. W-7405-eng-26 - International Nuclear ...
298
ORNL-TM-3703 Contract No. W-7405-eng-26 METALS AND CERAMICS DIVISION FUELS AND MATERIALS DEVELOPMENT PROGRAM QUARTERLY PROGRESS REPORT FOR PERIOD ENDING DECEMBER 31, 1971 P. Patriarca MARCH 1772 OAK RIDGE NATIONAL LABORATORY Oak Ridge, Tennessee 37830 operated by UNION CARBIDE CORPORATION for the U.S. ATOMIC ENERGY COMMISSION
-
Upload
khangminh22 -
Category
Documents
-
view
3 -
download
0
Transcript of Contract No. W-7405-eng-26 - International Nuclear ...
ORNL-TM-3703
Contract No. W-7405-eng-26
METALS AND CERAMICS DIVISION
FUELS AND MATERIALS DEVELOPMENT PROGRAM QUARTERLY PROGRESS REPORT FOR PERIOD ENDING DECEMBER 31, 1971
P. Patriarca
MARCH 1772
OAK RIDGE NATIONAL LABORATORY Oak Ridge, Tennessee 37830
operated by UNION CARBIDE CORPORATION
for the U.S. ATOMIC ENERGY COMMISSION

iii
HIGHLIGHTS
PART I. FAST REACTOR TECHNOLOGY
FUELS
Two ETR instrumented capsules loaded by the Sphere-Pac process with (Uo.73»Puo.2 7)Oi.97 coarse microspheres and U02 fine microspheres to test the "U-Fine" process were prepared. (p. 5)
Three EBR-II encapsulated pins containing Sphere-Pac (U,Pu)02 fuel have attained a calculated peak bum up of 7.5% FIMA. (p. 6)
The lead (U,Pu)02 fuel pin for the 37-pin EBR-II subassembly has attained a peak burnup of 2.3% FIMA.. (p. 7)
The first capsule (MINT-1) to measure the effect of in-reactor power cycling on axial extension of both the (U,Pu)02 fuel and cladding was placed into the ORR irradiation facility. (p. 12)
Thermodynamic calculations indicate that carbon will be removed from (U,Pu)02 fuel and deposited on the inner clad surface and that hydrogen diffuses out of the fuel pin; thus, the C0tC02 and H2!H20 mechanisms are not plausible means of oxygen transport to the clad. (p.
The mechanism available for transport of the attacking component must be related to fission products or, perhaps impurities, which we have postulated not to be available in Sphere-Pac fuels, (p. 23)
Irradiation testing of two capsules each containing four (U,Pu)N pins in ETR continued. Peak burnup at present is 5% FIMA. (p. 34)
Seven fuel pins to be irradiated in EBR-II are undergoing final testing at Battelle Columbus Laboratory. (p. 35)
A process was developed for preparing (U,Pu)N pellets and powder for shipment to recovery at Hanford. (p. 35)

iv
ABSORBERS
Transmission electron microscopy of boron carbide powders and pellets irradiated in the EBR-II indicate a high density of planar defects accompanied by a complex strain field. As the fluence is increased and irradiation temperature is decreased, the defect density and strain field intensity increases. In postirradiation heat treatments, the number of defects decreasess, strain field intensity decreases, but the size of the defects become large and the material swells as the temperature is increased. Postirradiation heat treatments at 1450°C show about 2.5% Av/v. Even at irradiation temperatures as low as 500°C, the defects have been identified as crystallographically oriented cavities. We assume these cavities to be filled with htlium. At the lower irradiation temperatures the helium pressure may be in excess of that needed to balance the sur-face tension forces, thus causing the large lattice strain fields. This will be true if the helium atom diffusion coefficient is higher than the self-diffusion coefficient in boron carbide. (p. 43)
The discovery of the cavity formation at these low FTR temperatures may be very important relative to gas release, since as the density of these defects is increased, they may serve as traps for helium subsequently produced by the (n,a) reaction. These traps may result in a lower helium release rate as irradiation proceeds until some critical point is reache where the material is fractured because of the high internal strain. At this time, large bursts of helium would be released. (p. 58)
CLADDINGS
The creep-rupture properties of type 316 stainless steel have been determined after irradiation in the annealed, 20 and 50% cold-worked conditions. Irradiation temperatures were in the range 450 to about 800°C, and the maximum fast neutron fluence was 2.7 x 10²² neutrons/cm2 (>0.1 MeV). Properties were sensitive to the irradiation and test temperature. At this fluence level the most significant propert; change was the loss of ductility which was most pronounced in the temperature range 550 to 650°C. In this temperature range the fractures were
V
predominantly intergranular. Specimens irradiated in the 50% cold-worked condition were stronger (both in creep rate and rupture life) and exhibited about the same ductility as specimens irradiated in the 20% cold-worked condition. (p. 79)
The increase in lattice parameter as a function of irradiation temperature (in the range 450 to 750°C) has been determined for silicon carbide which was irradiated in the Oak Ridge Research Reactor. These results provide a calibration curve for the use of silicon carbide as a temperature monitor in EBR-II irradiation experiments. (p. 89)
Tensile tests of as-annealed and cold-worked specimens of type 316 stainless steel were carried out in aged and unaged conditions at dif-ferent temperatures and crosshead speeds. A detailed, qualitative analysis of the stress-strain behavior has been undertaken on the basis of the shape of the stress-strain curves and the serrations occurring in them. The mechanisms responsible for discontinuous yielding have been discussed and three types of serrations identified. (p. 96)
Aging has been found to affect cold-worked specimens more strongly than specimens in the as-annealed condition. A significant difference in precipitate morphology has been observed between cold-worked and as-annealed specimens after long-time aging at 650°C. Large a-phase particles occur almost exclusively in cold-worked and aged specimens, (p. 122)
Good correlation was noted between the electromagnetic response and the degree of cold work in FFTF fuel cladding within a batch of tubing. (p. 183)
Tentative results from testing of altered notches in 20% cold-worked stainless steel indicate that these type defects cause premature failure in biaxial stress rupture tests at times equal to those observed for EDM notches at the test conditions investigated to date. (p. 138)
FABRICATION DEVELOPMENT OF LMFBR COMPONENTS
Posttest examination of Alco/BLH steam generator is continuing. A full-scale model of a 180-deg segment of the lower tube sheet has signi-ficantly assisted interpretation of the crack patterns. Examination of several tube-to-tube sheet welds from the unit has revealed a relatively-high incidence of porosity, fissures, and lack-of-fusion, (p. 150)
A seventh stress-corrosion run was conducted in the chloride-injection, steam-corrosion loop using 10 ppm NaCl and 20 ppxn 0 as con-taminants. Materials which resisted stress-corrosion cracking in all surface conditions, both as-welded and nonwelded, were Inconel 625 and type 410 stainless steel. In the form of nonwelded sheet or strips, Inconel 600, Hastelloy C, Hastelloy G, and all of the various ferritic alloys of interest for LMFBR applications resisted cracking. Specimens of Incoloy 800 welded with Inconel 82 co\v;:±nued to display a moderate amount of cracking. (p. 143)
Creep-rupture tests on stainless steel submerged-arc and shielded metal-arc welds have been extended to longer rupture times. At a temperature of 650°C (1200°F) and with rupture times from 1000 to 2600 hr, the elongations of the submerged-arc welds vary between 6 and 12%; shielded metal-arc welds with controlled additions of boron, phosphorus, and ferrotitanium retain an elongation of 12% at a rupture time of over 3000 hr. (p. 158)
Special batches of types 308 and 316 stainless steel electrodes with controlled additions to improve high-temperature properties are being procured commercially. (p. 159)
The tensile and creep properties of FFTF vessel, type 308 stainless steel weldments at 566°C (1050°F) vary through the thickness of the weldment, with the material at the surface being weaker. (p. 209)
By using stainless steel filler wire containing 63Ni as a radio-active tracer, micro-segregation in welds is readily revealed. An unusual layering effect (inhomogenous bonds) was observed, (p. 164)
vii
The hot ductility of an Incoloy 800-type experimental alloy con-taining combined titanium and sulfur or an alloy containing carbon is slightly affected by a welding thermal cycle whereas the presence of all three elements in an alloy causes a distinct loss in its ability to recover ductility. These data are necessary in setting compositional limits for an optimized Incoloy 800 filler metal, (p. 168)
Charpy V-notch tests on welds in the niobium-stabilized grade of 2 1/4 Cir-1 Mo steel indicate, excellent toughness. The weld-melted toughness is in excess of 40 ft-lb at 5°C (40°F) and values as high as 125 ft-lb and 86 lateral expansion have been recorded for tests made with the notch near the fusion line. (p. 171)
Experimental measurements of eddy-current response to specimen thickness were compared with calculated results with excellent agreement. This demonstrates the accuracy with which optimum design of eddy-current tests can be performed using the analytical approach. Sensitivity to thickness changes were accurate and repeatable within about 0.1%. (p. 180)
Ultrasonic frequency analysis techniques using two transducers were shown to provide good identification and measurement of reflectors with irregular shapes ;ind contours. (p. 184)
Early problems of instrument jitters have been solved in development of closed circuit television techniques for radiographic interpretation, (p. 187)
PART II. SPACE POWER TECHNOLOGY
Six refractory-metal-clad UN pins and three U02 pins continue to operate satisfactorily in the ORR under space-reactor conditions. (p. 238)
The higher strength and increased rupture life of CVD tungsten containing 10 to 20 ppm F appears to be due to hardening of the matrix by fluorine impurities in solution or in the form of very small bubbles. Duplex deposits of CVD tungsten combine the high strength of the fluoride material with the high ductility of chloride material. (p. 241)
Electron fractography studies on CVD tungsten indicate that outgassing treatments used in the fabrication of thermionic emitters should be limited to 20 hr at 1800°C for optimum creep properties. (p. 251)
viii
Our high-temperature tungsten irradiation experiment is currently operating in EBR-II and will be withdrawn in March 1972, after receiving a peak fluence of 8 x 10²¹ neutrons/cm2 (>0.1 MeV). (p. 258)
The sensitivity of T-lll and molybdenum alloys to contaminants such as oxygen, water vapor, and other gases which are present in Pioneer radioisotope thermal generators has been determined. In general, the molybdenum alloys appear far less sensitive to these impurities than T-lll. Under conditions most representative of Pioneer generators, the ductility of T-lll was not affected by the addition of 290 ppm 0. (p. 259)
One-pound ingots of three Pt-Rh-W alloys have been fabricated into sheet by hot rolling electron beam melted ingots. Of the three, the Pt—26% Rh—8% W alloy appears to be the most fabricable. Additional Pt-Rh-W alloys with small additions of hafnium and titanium have also been fabricated into sheet. In general, these alloys exhibit superior mechanical properties particularly at elevated temperatures. (p. 275)

ix
Page
HIGHLIGHTS iii
PART I. FAST REACTOR TECHNOLOGY
FUELS
1. DEVELOPMENT OF FBR OXIDE FUELS 3 Fabrication of (U,Pu)02 Fuels 3
Replacement Fuel for the F-l Experiment 4 Fuel for GB-10 Capsule 4 Fuel for the ETR Instrumented Capsules 5
Irradiation Testing of (U,Pu)02 Fuels 5 Fast Flux Irradiation Tests 5 Uninstrumented Thermal Flux Irradiation Tests 7 ETR Instrumented Tests 10 ETR Instrumented Capsule Assembly 11 GCBR Fast Flux Test Replacement Capsule Fabrication . , 12 Tests of Mechanical Interaction of Fuel and Cladding 12
Analysis of Fuel Element Performance 13 Analysis of Oxide Fuel-Cladding Chemical Attack . . . . 13 Analysis of Oxide Fuel-Cladding Intergranular Attack Data 18 Molybdenum Concentration Distributions in Fuel Pins 23
2, ADVANCED FAST BREEDER REACTOR FUELS DEVELOPMENT 34 Irradiation Testing 34
Thermal Flux Tests 34 Fast Flux Tests 35
Synthesis, Fabrication, and Characterization of Advanced FBR Fuels 35 Passivation Treatment of Residual Nitride Fuels 35

BLANK PAGE
X
Page 3. DEVELOPMENT OF FBR NETJTRON-ABSORBER MATERIALS 38
Boron Carbide 38 Phase Studies in the Boron-Carbon System 38
Irradiation Behavior of Boron Carbide 42 Nuclear Magnetic Resonance Spectrum of 7Li in Irradiated Boron Carbide (BC-8) . . 42
Supplemental Evaluation of Powders from HEDL Experiment X042 43
Gas Release and Solid Swelling of Irradiated B 4C From ANL-EBR-II Higher-Worth Control Rods G and H . . 58
Microstructure of B<,C Pellets Irradiated in the EBR-II 62
Fabrication of EBR-II Series II Neutron Absorber Experiment 73
Alternate Materials 73 Fabrication of Tantalum Borides 73 Helium Vents for Absorber Rods 74
4. MECHANICAL PROPERTIES OF ALLOYS IN REACTOR ENVIRONMENTS AND DEVELOPMENT OF FBR CLADDING AND STRUCTURAL ALLOYS . . . . 79
Effects of Fast Neutron Irradiation on the Creep-Rupture Properties of Type 316 Stainless Steel 79
Determination of Temperatures in EBR-II Cladding and Structural Material Irradiation Experiments 89
Analysis of Stress-Strain Behavior of Unirradiated Type 316 Stainless Steel 96
The Significance and Potential of Stress-Strain Curves 97
Discontinuous Yielding 99 Classification of Serrations 99 The Effect of Different Strain Rates on Tensile Data 104
The Effect of Different Test Temperatures on Tensile Data 107
Specimens in the Cold-Worked and Aged Condition . . . . 117 The Effect of Different Amounts of Tensile Prestrain on Postaging Tensile Data 126
xi
Page 5. FABRICATION DEVELOPMENT FOR FBR CLADDING 133
Effect of Fabrication Variables 133 Biaxial Stress-Rupture Properties of Type 316 Stainless Steel Tubing 133
Studies of Defected Tubing 138 Stress-Rupture Properties of Stainless Steel Tubing with Defects 138
6. COMPATIBILITY OF STEAM GENERATOR MATERIALS 142 Steam Corrosion of Advanced Steam Generator Materials . . . 142
General Corrosion . . . . . 142 Stress-Corrosion Cracking . . 143
Examination of Alco/BLH Steam Generator 150 Thermographic Inspection of Bond Quality in Tubes . . . 150 Model of Lower Tube Sheet 152 Examination of Upper Tube Sheet 154 Tube-to-Tube Sheet Welds 154
7. JOINING OF STRUCTURAL MATERIALS 157
Austenitic Stainless Steels . . . . . 157 Welding Development for FBR Stainless Steel Components 157
Investigations of Mechanical Properties 158 Filler Metal Development for Pipe Welding 159
Use of Radioisotopes to Study Cracking 162 Selection of Radioisotopes . . . . . . 162 Welding Studies Using 6 3Ni as Tracer in Filler Metal Wire 164
Nickel-Rich Alloys 168 Inconel 600 and Incoloy 800 168 Ferritic Steels 171 Stabilized Grades 171 Low-Carbon Grades 174 Tube-to-Tube Sheet Studies 175
• « X I 1
Page 8. NONDESTRUCTIVE TESTING DEVELOPMENT 177
NDT Development for Steam Generators . 177 Radiography 177 Liquid Penetrants . . . 178 Eddy Currents 179
Electromagnetic Inspection Methods (Eddy Currents) . . . . 180 Measurement of Cold Work in Stainless Steel 183
Ultrasonic Inspection Methods 184 Ultrasonic Frequency Analysis 184 Ultrasonic Imaging . . . . . . . . . . . . . . . . . . 185
Penetrating Radiation Inspection Methods 187 9. MECHANICAL PROPERTIES OF STRUCTURAL MATERIALS 188
Mechanical Properties of Type 304 Stainless Steels . . . . 188 Analysis Phases in Type 316 Stainless Steel 206 Properties of FFTF Vessel Type 308 Stainless Steel Test Weldments 209
Procurement of FFTF Welds 209 Tensile Properties 209 Creep-Rupture . . . . . 215
Mechanical Properties of 2 1/4% Cr-1% Mb Steel 222 Annealing Studies . . . . . 223
Mechanical Properties 223 Welds 223 Base Metal 232
PART II. SPACE POWER TECHNOLOGY
10. DEVELOPMENT OF URANIUM M0N0NITRIDE FUELS 237 Thermal Simulation Tests 237 Operation of Capsules 238
xiii
Page
11. TUNGSTEN METALLURGY 241 Creep Properties of Tungsten Materials 241
Variations in the Creep Properties of Fluoride CVD Tungsten 241
Creep of Duplex Deposits of CVD Tungsten 246 Low-Stress Creep Tests on CVD Tungsten 251
Effect of Carburization on the Creep Properties of Tungsten Alloys 257
Effect of Fast-Neutron Irradiation on the Properties of Tungsten Alloys 258
12. PHYSICAL METALLURGY OF REFRACTORY ALLOYS 259 Effect of Oxygen Contamination on the Mechanical Properties of T-lll 259
Effect of Oxygen on the Mechanical Properties of 0.090-in.-thick T-lll 264
Contamination Studies of T-lll and TZM by Impurities Outgassed from Graphite and Min-K 1301 266
Contamination Studies of T-lll and TZM by Water Vapor 269
Effect of Oxygen Contamination on the Mechanical Properties of Molybdenum-Base Alleys 271
Effect of CO-Gas Contamination on the Mechanical Properties of Molybdenum^Base Alloys 273
13. CLADDING MATERIALS FOR SPACE ISOTOPIC HEAT SOURCES . . . . 275 Preparation of Pt-Rh-W Sheet 275 Development of Improved Alloys 276 Characterization of Iridium 280
PART I. FAST REACTOR TECHNOLOGY
3.
FUELS
1. DEVELOPMENT OF FBR OXIDE FUELS
P. Patriarca A. L. Lotts F. J. Homan
The purpose of this program is to advance the technology of (U,Pu)02
as a fuel for the LMFBR. The oxide, fuels studied in this program are derived from coprecipitation, mechanical blending, and sol-gel processes and are fabricated by cold pressing and sintering and Sphere-Pac. We emphasize determination of the properties and performance of oxide fuels derived from the sol-gel process and fabricated by Sphere-Pac; techniques, but we also compare these fuels with those fabricated by other processes. The main objectives of the program are (1) to establish the performance characteristics and limitations of (U,Pu)02 fuel fabricated by the differ-ent processes, (2) to obtain a fundamental Understanding of the mechanisms that are involved in the behavior of fuel elements under irradiation, (3) to develop fabrication techniques that provide both economy and a product with opcimized performance, and (4) to develop analytical methods sufficiently accurate to optimize experimental design and to predict the response of fuel elements to LMFBR service conditions.
Fabrication of (U,Pu)02 Fuels
J. D. Sease R. A. Bradley
The objective o:: our (U,Pu)02 fabrication program is to develop processes by which mixed oxide fuel of controlled density and stoichiometry can be fabricated for irradiation tests. A large portion of this program has been the development of Sphere-Pac and sol-gel pellet fabrication techniques.
During this report period we fabricated the fuel pins for two instrumented capsules to be irradiated in the ETR. Work is in progress on fuel for two irradiation experiments on the Gas-Cooled Fast Breeder Reactor Program on the replacement fuel pins for the F-l experiment and the fuel for the GB-10 experiment.
4.
Replacement Fuel for the F-l Experiment (R. A. Bradley) Eight fuel pins containing (U,Pu)02 pellets were fabricated previously
for the GCFR F-l irradiation experiment in collaboration with Gulf General Atomic.1 We have been requested to prepare the fuel for five additional pins that will be used in replacement capsules. The fuel requirements and the preparation of the fuel was discussed previously.2
We have not received the surface-roughened cladding from GGA; therefore, no additional work has been done on this project. We expect to receive the cladding and to fabricate the pins about February 1972.
Fuel for GB-10 Capsule (R. A. Bradley) The fuel pin for the GB-10 capsule will contain 8.8 in. of nominally
87.5% dense, solid, dished-end pellets with an oxygen-to-metal ratio of 1.97. The smear density of the fuel pin la required to be 84.0 ± 1.0% of theoretical. The (U0.8e,Pu©.i2)02 powder, with the uranium containing 9% 2 3 5U, was prepared by the sol-gel process.3
We performed sintering tests on the (U,Pu)C>a powder to obtain shrinkage data required to design and fabricate the pellet pressing die. This die is presently being used in sintering tests to establish pressing and sintering conditions which will yield 87.5% dense pellets. We expect to complete the fuel fabrication and characterization by about February 1, 1972. The capsule into which the fuel will be loaded is expected from GGA on about the same date.
lT. N. Washburn, J. D. Sease, R. A. Bradley, E. J. Manthos, and M. K. Preston, LMFBR Fuel Cycle Studies Progr. Rept. May 1970, No. '15, ORNL-TM-3018, pp. 57-58.
aJ. D. Sease and R. A. Bradley, Fuels and Materials Development Program Quart. Progr. Rept. for Period Ending September 30, 1971, ORNL-TM-3550, pp. 4~6.
3R. A. Bradley and J. D. Sease, GCR-TU Programs Semiannual Progr, Rept. for Period Ending September 30, 1970, ORNL-4637, p. 49.
5.
Fuel for the ETR Instrumented Capsules (R. A. Bradley) We fabricated the fuel pins for two instrumented capsules (ORNL
43-125 and 43-126) for in situ measurement of fission gas release. Each contains approximately 20 in. of mixed oxide fuel. One contains (Uo.75,Pu0.25)0i.97 pellets fabricated by WADCO from mechanically mixed powders. The other was loaded by the Sphere-Pac process with (Uo.73,Puo.2 7)0i.97 coarse microspheres and U0 2 fine microspheres to yield a nominal fuel bed composition of (U 0.bo,Pu 0.2o)O a. 9 8. The smear densities of both the Sphere-Pac and the pellet pins are 83.5 ± 1.0% of theoretical.
Irradiation Testing of (U,Pu)02 Fuels
F. J. Homan T. N. Washburn
The performance characteristics of mixed (U,Pu)02 fuels are being evaluated in a variety of irradiation tests for potential application in an LMFBR. We are now concentrating on comparative tests of fuel fabricated as pellets or as microspheres loaded by the Sphere-Pac technique. The program includes thermal-flux experiments, which permit use of instrumented capsules and continuously controlled heat rates, and fast flux experiments, in which the fission rate distribution and radiation effects on the cladding are more typical of those for operating conditions anticipated in an LMFBR.
Fast Flux Irradiation Tests (A. R. Olsen) The fast flux irradiation tests in the EBR-II are designed to
approximate conditions to be encountered in a commercial-scale LMFBR. The objective of these tests is to establish the effects of fuel fabri-cation form (Sphere-Pac or pellet), void distribution, and stoichiometry on the swelling of the fuel, mechanical and chemical interactions of fuel and cladding, release of fission gas, and distribution of fission products in a (U,Pu)02 fuel operating at typical heat rates to design levels of burnup.
6.
The five Series I encapsulated tests all contain Sphere-Pac fuels. Two of the capsules, S-l-A and S-l-E, were returned to ORNL after the initial period of irradiation in subassembly X050 which was discharged from the EBR-II at the end of run 42 on May 18, 1970. The other three capsules are continuing under irradiation in subassembly X119 with a scheduled incremental exposure of 5600 MWd of EBR-II operation. Subassembly X119 was installed in position 5F4 of the EBR-II grid on May 16, 1971. There have been several interruptions in the irradiation schedule as reported previously^ including a subassembly reconstitution. The current identification is X119A. As of December 14, the start of EBR-II run 53, the pins had been exposed to 3675 MWd or 66% of the current incremental exposure. The combined exposure in subassemblies X050 and X119 to date establish a current calculated peak burnup of 7.5% FIMA for these three encapsulated pins.
The postirradiation examination of pins S-l-A and S-l-E is continuing with all effort now being- directed toward establishing the radial distribution of fission products. This microprobe analysis has been delayed by difficulties in obtaining satisfactorily polished sections using a nonaqueous polishing medium. The results of the examination to date were reported at the last ANS meeting5 and in previous reports in this series.5 9 An ORNL report on these two pins is in preparation.
R. Olsen, Fuels and Materials Development Program Quart. Progr. Rept. for Period Ending September 30, 1971, ORNL-TM-3550, pp. 8-12-
5A. R. Olsen, "Sol-Gel Sphere-Pac (U,Pu)02 Fuel Performance In EBR-II Irradiation Tests," Trans. Am. Nucl. Soc. 1A(2), 596-97 (Oct. 1971).
6A. R. Olsen, Fuels and Materials Development Program Quart. Progr. Rept. for Period Ending September 30, 1970, ORNL-4630, pp. 27-29.
7A. R. Olsen, Fuels and Materials Development Program Quart. Progr. Rept. for Period Ending December 31, 1970. 0RNL-TM-330Q, pp. 15-19.
8A. R. Olsen, J. L. Miller, and D„ R. Cuneo, Fuels and Materials Development Program Quart. Progr. Rept. for Period Ending March 31, 1971, OHNL-TM-3416, pp. 15-20.
9A. R. Olsen, Fuels and Materials Development Program Quart. Progr. Rept. for Period Ending June 30, 1971, 0RNL-TM-354U, pp. 45-^6.
7.
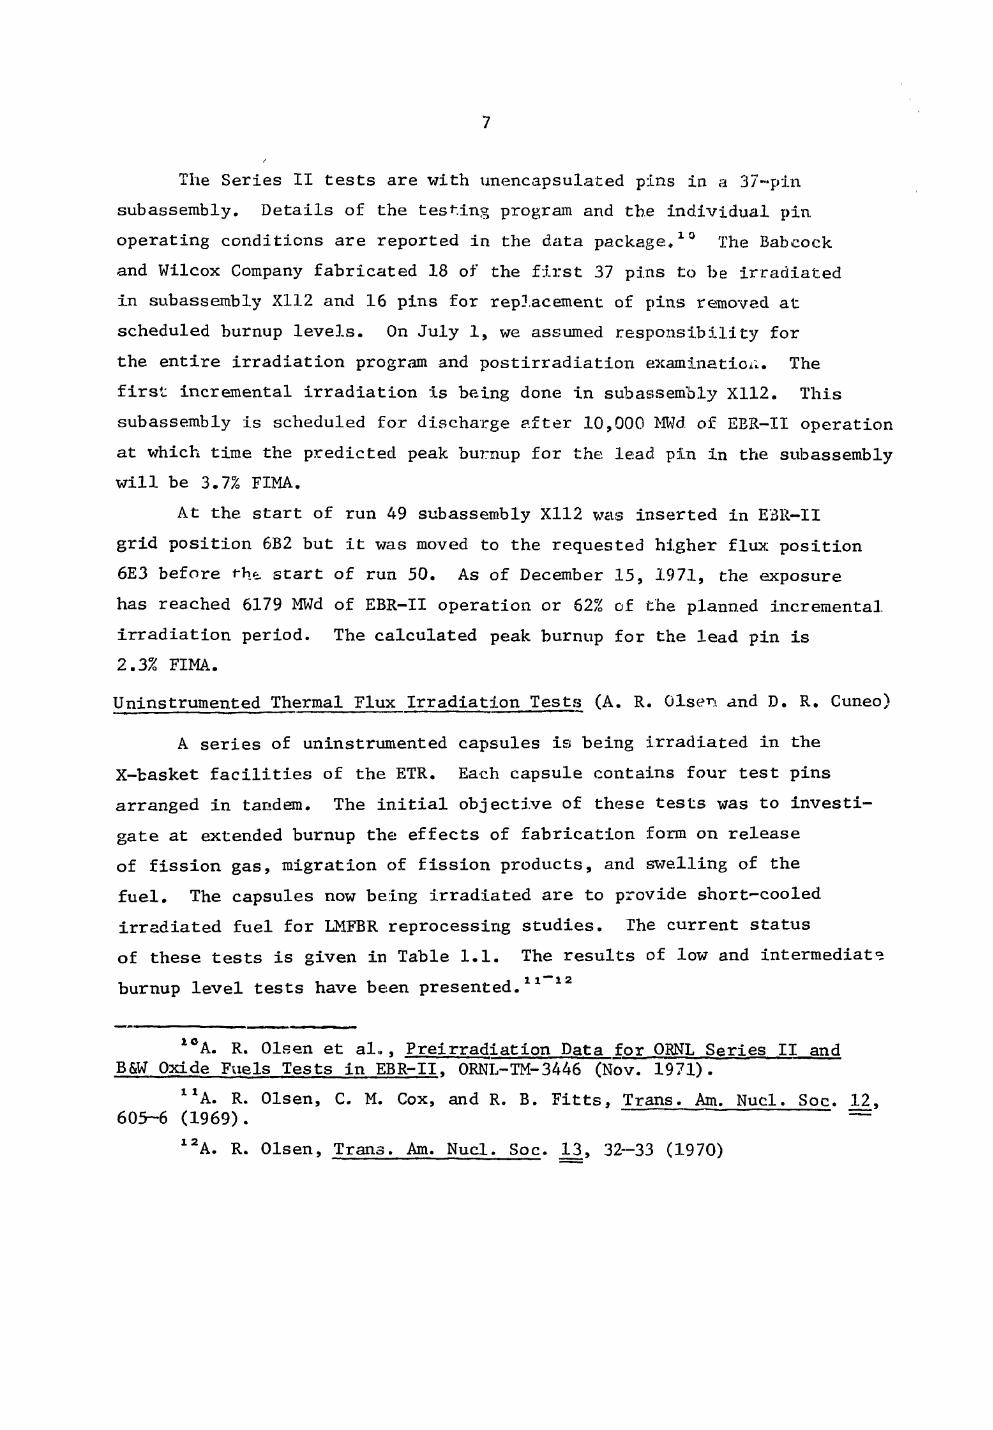
The Series II tests are with unencapsulated pins in a 37-pin subassembly. Details of the testing program arid the individual pin operating conditions are reported in the data package.10 The Babcock and Wilcox Company fabricated 18 of the first 37 piris to be irradiated in subassembly X112 and 16 pins for replacement of pins removed at scheduled burnup levels. On July 1, we assumed responsibility for the entire irradiation program and postirradiation examination. The first incremental irradiation is being done in subassembly X112. This subassembly is scheduled for discharge after 10,000 MWd of EBR-II operation at which time the predicted peak burnup for the lead pin in the subassembly will be 3.7% FIMA.
At the start of run 49 subassembly X112 was inserted in EBR-II grid position 6B2 but it was moved to the requested higher flux position 6E3 before t*ht start of run 50. As of December 15, 1971, the exposure has reached 6179 MWd of EBR-II operation or 62% of the planned incremental irradiation period. The calculated peak burnup for the lead pin is 2.3% FIMA.
Uninstrumented Thermal Flux Irradiation Tests (A. R. Qlsen. and D. R. Cuneo)
A series of uninstrumented capsules is being irradiated in the X-basket facilities of the ETR. Each capsule contains four test pins arranged in tandem. The initial objective of these tests was to investi-gate at extended burnup the effects of fabrication form on release of fission gas, migration of fission products, and swelling of the fuel. The capsules now being irradiated are to provide short-cooled irradiated fuel for LMFBR reprocessing studies. The current status of these tests is given in Table 1.1. The results of low and intermediate burnup level tests have been presented.11 1 2
1 0A. R. 01sen et al., Preirradiation Data for ORNL Series II and B&W Oxide Fuels Tests in EBR-II. ORNL-TM-3446 (Nov. 1971).
1 1 A. R. Olsen, C. M. Cox, and R. B. Fitts, Trans. Am. Nucl. Soc. 12, 605-6 (1969). —
1 2A. R. Olsen, Trans. Am. Nucl. Soc. 13, 32-33 (1970)
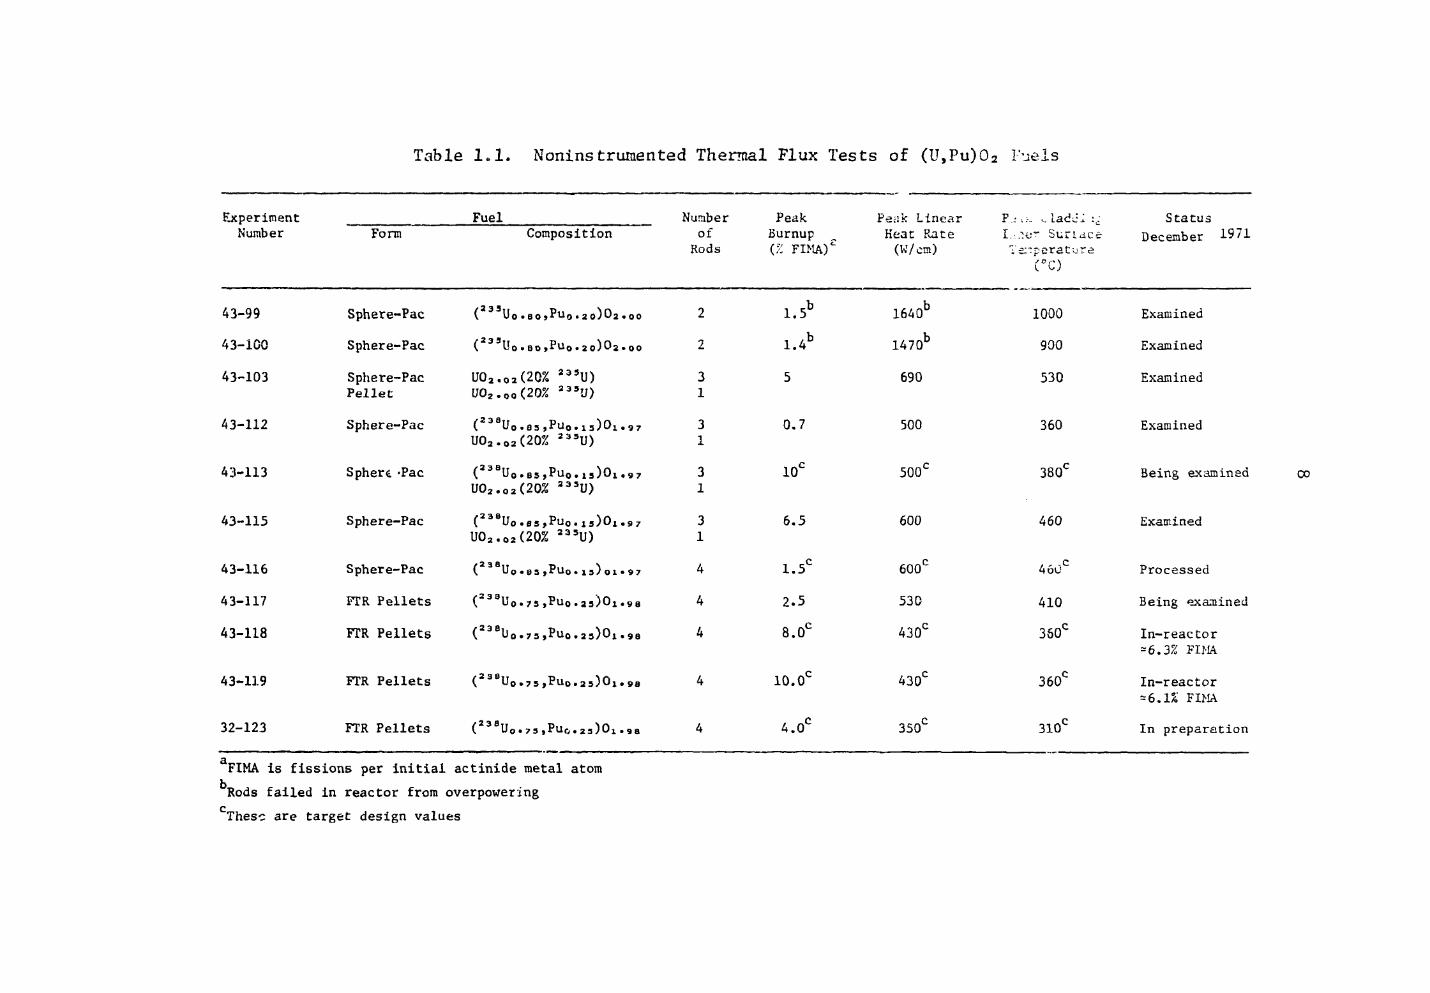
Table 1.1. Noninstrumented Thermal Flux Tests of (U,Pu)02 Fuels
Experiment Fuel Number Peak Pe;ik L i n e a r F : .. .. l a d J i : c Status Number Form Composition o f
Rods Burnup (': FIMA)c
Heat Rate (W/cm)
I . o . e - S u r i a c s T e m p e r a t u r e
C°C)
December 1971
43-99 Sphere-Pac ( a 3 3Uo .eojPu<>.20)02.00 2 1.5b 1640b 1000 Examined
43-100 Sphere-Pac ( 2 3 SUo.eo >Puo .2o)0a.oo 2 1.4b 1470b 900 Examined
43-103 Sphere-Pac Pellet
U02.02(20% 2 3 3 U ) U02.o0(20% 33»J)
3 1
5 690 530 Examined
43-112 Sphere-Pac ( 2 3 8UO . 0 S >PUO . 1 S )O I . 9 7 U02.02(20% 2 3 5 U )
3 1
0.7 500 360 Examined
43-113 Sphere -Pac ( 2 3 B U O • B S J P U O . I S ) 0 x . 9 7 U02.02(20% 2 3 S U )
3 1
10° 500c 380° Being examined
43-115 Sphere-Pac ( 2 3 8 UO»8S >PUO« i s ) 0 l « 9 7 U 0 2 . 0 2 ( 2 0 % 2 3 5 U )
3 1
6.5 600 460 Examined
43-116 Sphere-Pac ( 2 3 8 U O . B 3 » P U o • l s ) o i * 9 7 4 1.5° 600c 4 O U P r o c e s s e d
43-117 FIR Pellets ( 2 3 3 U O . 7 S , P U O . 2 S )OX . 9 8 4 2.5 530 410 Being examined
43-118 FIR Pellets ( 2 3 8 U O . 7 S » P U o . 2 S ) O i . 9 8 4 8.0C 430C 360c In-reactor = 6 . 3 % F I M A
43-119 FTR Pellets ( 2 3 B U O . 7 5 » P U O . 2 s ) 0 l * 9 8 4 10.oc 430° 360C In-reactor = 6 . 1 % F I M A
32-123 FTR Pellets ( 2 3 8 UO«73 JPUO•2 3)0L .98 4 4.0° 350° 310c In preparation
FIMA is fissions per initial actinide metal atom bRods failed in reactor from overpowering c These are target design values
9.
Postirradiation metallographic and microprobe examinations of the pins from the high burnup capsules are continuing. To date only one section from the peak burnup pin 43-113-3 has been examined for actinide distribution. The microprobe analysis indicates a gradual increase in the Pu/U ratio adjacent to the central void. This measure is most pronounced in the innermost 20% of the fuel. It is not clear whether this changing ratio is the result of actinide redistribution or represents at least in part a reduction in plutonium burnup due to self shielding in these thermal flux tests. However, the existence of a dense annular fuel ring at an R/RQ of 0.85 (approximately 0.012 in. from the fuel cladding interface) which shows a distinct dip in the Pu/U ratio suggests actinide redistribution similar to that seen in lower burnup samples.13 The Pu/U ratio is generally lower by about 15% outside of the dense annular ring. Microprobe analysis of the fuel-cladding interface region shows both U and Pu concentrations decreasing proportionately. Analyses for fission product distributions are just starting.
Capsules 43-117, 43-118, and 43-119 are the first capsules we have irradiated with mechanically mixed (U,Pu)02 pellet fuel. Only capsule 43-117 has completed its planned irradiation. Capsules 43-118 and 43-119 are continuing their irradiation to the target burnup levels indicated in Table 1.1. These capsules are primarily intended for reprocessing studies on short cooled fuel. As part of this reprocessing study the Chemical Technology Division is comparing measured fission product recovery with predicted fission product inventory. The prediction of fission product content is being made with the 0RIGEN code.1* Analytical data for the burnup analysis of the four pins in 43-117 have been received. The burnup for the peak pin in position 3 was 2.5% FIMA. This burnup indicates that the start of life linear heat rate was in excess of 16 kW/.t't or approximately 20% greater than anticipated. A depletion
1 3A. R. Olsen, R. B. Fitts, and W. J. Lackey, In-Reactor Restructuring Temperatures and Kinetics for (U,Pu)02, 0RNL-TM-3387 (July 1971).
lf*M. J. Bell; 0RIGEN, The ORNL Isotope Generation and Depletion Code, ORNL-4628, in preparation.
10.
calculation on the fuel has confirmed this value arid indicates the end of life peak heat rate was down to 13.8 kW/ft. Revised 0RIGEN calculations are being made to account actual operating conditions.
ETR Instrumented Tests (A. R. Olsen and R. A. Buhl) The ETR instrumented tests are designed to determine the performance
of mixed oxide fuel under simulated LMFBR design operating conditions. Series I consists of two capsules 43-120 and 43-121. Each capsule
contains four fuel pins with two thermocouples to measure cladding temperature at the fuel axial midplane of each pin. These tests are designed to investigate fuel swelling and fuel-cladding chemical interactions of Sphere-Pac and pelletized (U,Pu)02 fuels over a wide range of cladding temperatures up to a maximum of 650°C.
As of December 12, 1971, the Series I capsules have been irradiated approximately 307 effective full power days (EFPD) to a peak fuel burnup of 7% FIMA.
As indicated in the last report of this series1S the peak cladding inner surface temperature on experiment 43-120 had fallen to approximately 520°C while the 43-121 peak cladding inner surface temperature was approximately 550°C. Therefore, at the beginning of ETR cycle 114 capsule 43-121 was moved to a higher flux position intended to bring clad-ding inner surface temperature back up to a desired 650*C temperature. Although there has been only a limited amount of irradiation during cycle 114 it appears as though the change in location, together with other changes in the ETR core loading, have resulted in a power increase which brings the peak cladding inner surface temperature up to only 580°C. Unless continued operation shows the cladding temperature rising more than usual between the beginning and end of cycle (approximately 50°C) we will move capsule 43-120 to a higher flux position and terminate the irradiation of capsule 43-120 during the next reactor shutdown.
I SA. R. Olsen and R. A. Buhl, Fuels and Materials Development Program Progr. Rept. for Period Ending September 30, 1971, 0RNL-TM-355Q, pp. 15-17.
11.
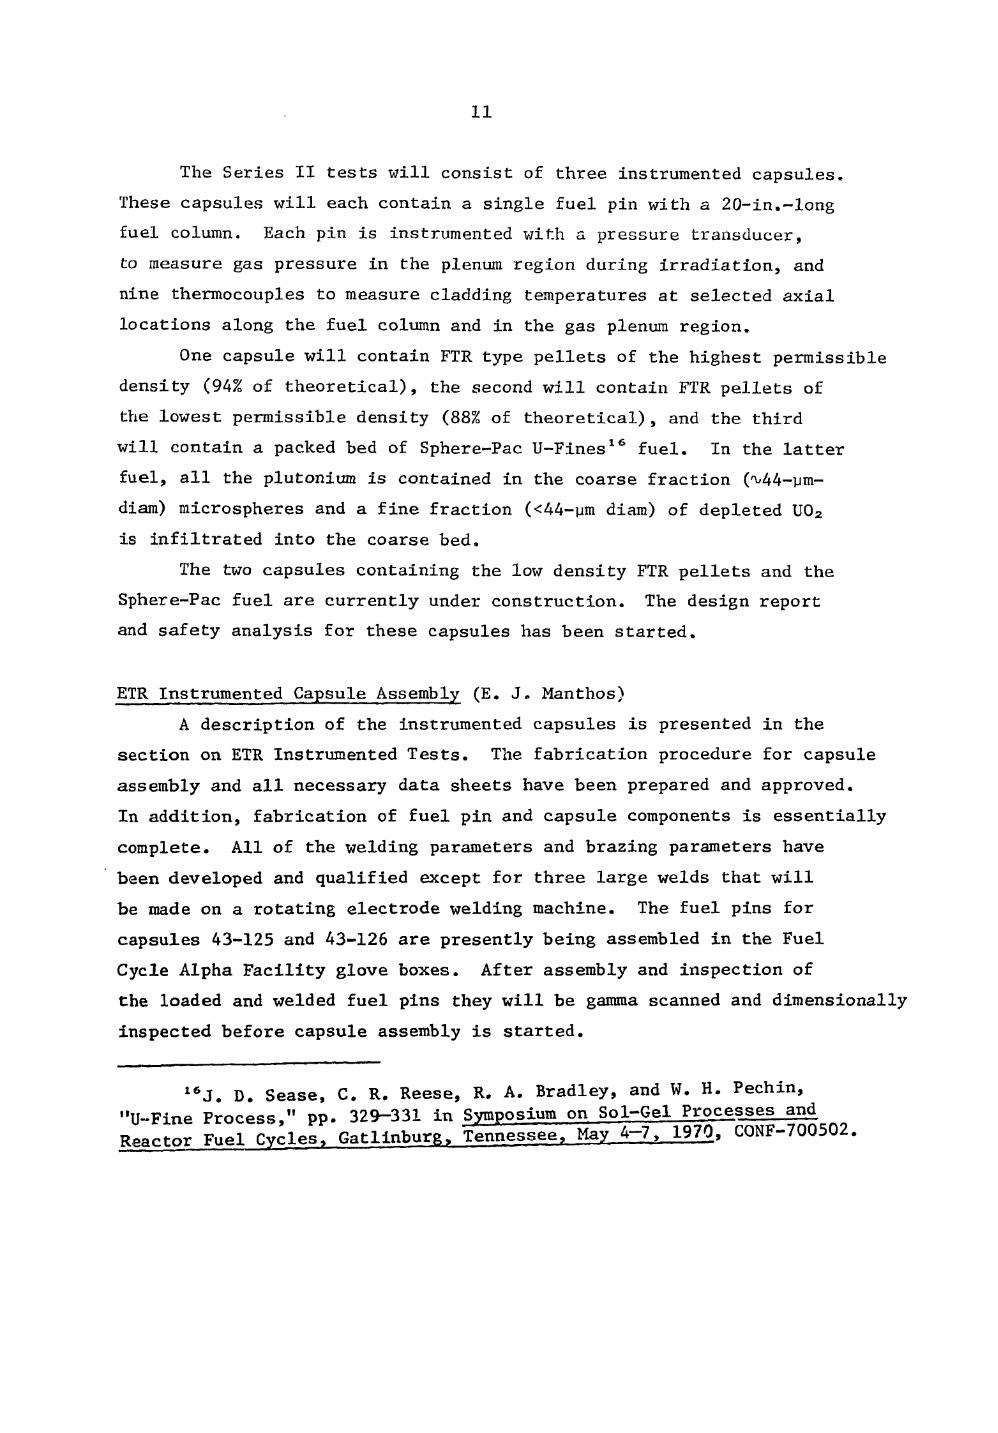
The Series II tests will consist of three instrumented capsules. These capsules will each contain a single fuel pin with a 20-in.-long fuel column. Each pin is instrumented with a pressure transducer, to measure gas pressure in the plenum region during irradiation, and nine thermocouples to measure cladding temperatures at selected axial locations along the fuel column and in the gas plenum region.
One capsule will contain FTR type pellets of the highest permissible density (94% of theoretical), the second will contain FTR pellets of the lowest permissible density (88% of theoretical), and the third will contain a packed bed of Sphere-Pac U-Fines 1 6 fuel. In the latter fuel, all the plutonium is contained in the coarse fraction (^44-ym-diam) microspheres and a fine fraction (<44-ym diam) of depleted U0 2
is infiltrated into the coarse bed.
The two capsules containing the low density FTR pellets and the Sphere-Pac fuel are currently under construction. The design report and safety analysis for these capsules has been started.
ETR Instrumented Capsule Assembly (E. J. Manthos) A description of the instrumented capsules is presented in the
section on ETR Instrumented Tests. The fabrication procedure for capsule assembly and all necessary data sheets have been prepared and approved. In addition, fabrication of fuel pin and capsule components is essentially complete. All of the welding parameters and brazing parameters have been developed and qualified except for three large welds that will be made on a rotating electrode welding machine. The fuel pins for capsules 43-125 and 43-126 are presently being assembled in the Fuel Cycle Alpha Facility glove boxes. After assembly and inspection of the loaded and welded fuel pins they will be gamma scanned and dimensionally inspected before capsule assembly is started.
1 6J. D. Sease, C. R. Reese, R. A. Bradley, and W. H. Pechin, "U-Fine Process," pp. 329-331 in Symposium on Sol-Gel Processes and Reactor Fuel Cycles. Gatlinburg, Tennessee. May 4-7, 1970, CQNF-700502.
12.
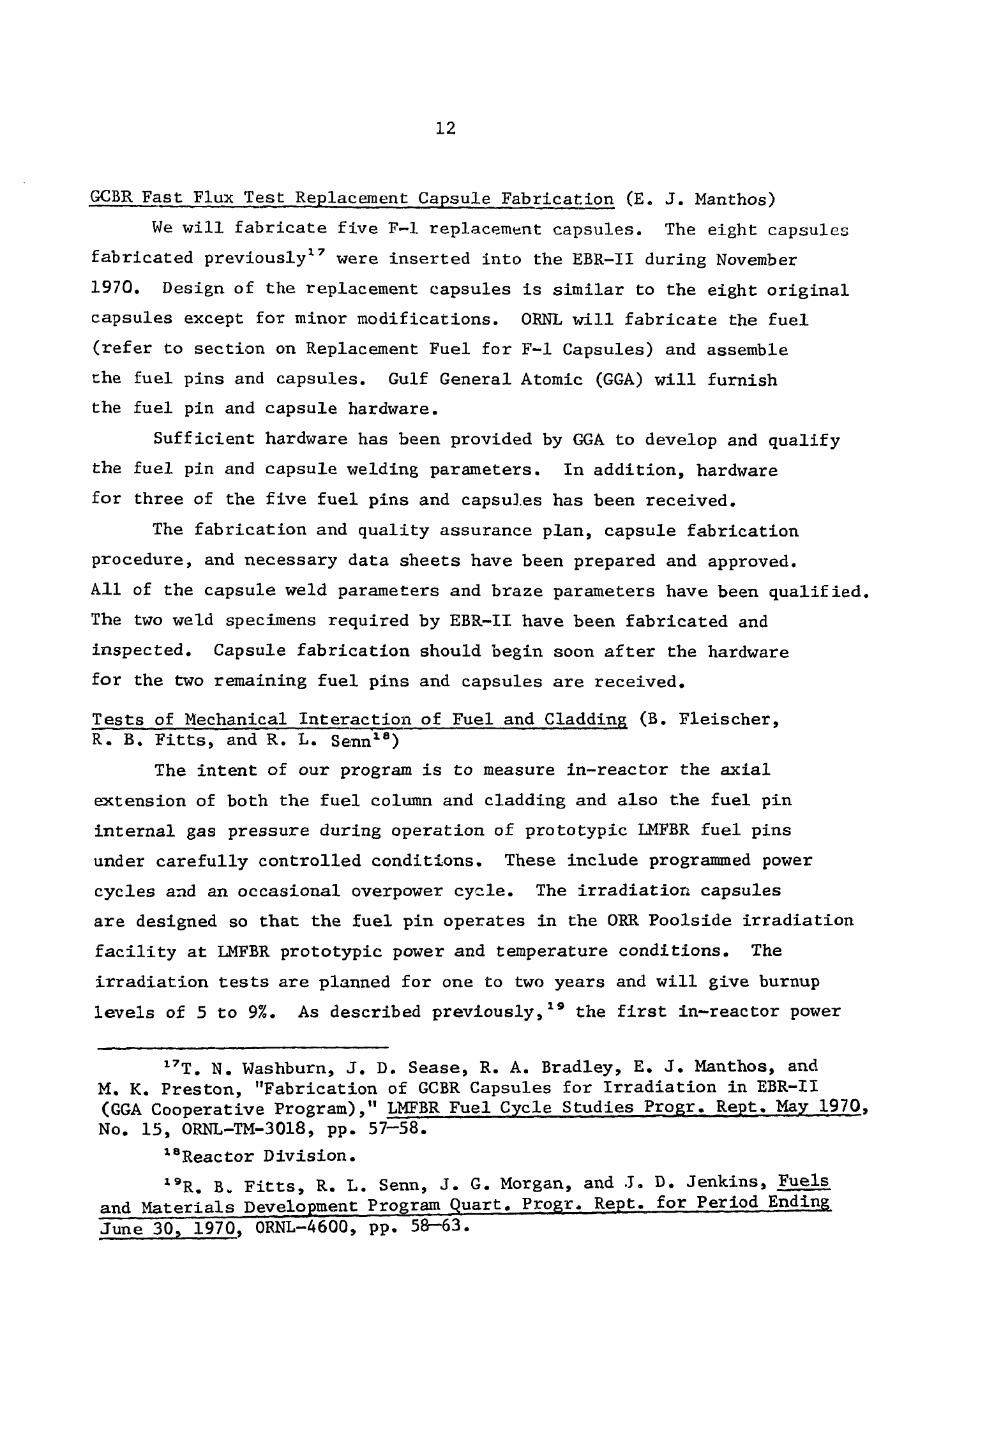
GCBR Fast Flux Test Replacement Capsule Fabrication (E. J. Manthos) We will fabricate five F-l replacement capsules. The eight capsules
fabricated previously17 were inserted into the EBR-II during November 1970. Design of the replacement capsules is similar to the eight original capsules except for minor modifications. OKNL will fabricate the fuel (refer to section on Replacement Fuel for F-l Capsules) and assemble the fuel pins and capsules. Gulf General Atomic (GGA) will furnish the fuel pin and capsule hardware.
Sufficient hardware has been provided by GGA to develop and qualify the fuel pin and capsule welding parameters. In addition, hardware for three of the five fuel pins and capsules has been received.
The fabrication and quality assurance plan, capsule fabrication procedure, and necessary data sheets have been prepared and approved. All of the capsule weld parameters and braze parameters have been qualified. The two weld specimens required by EBR-II have been fabricated and inspected. Capsule fabrication should begin soon after the hardware for the two remaining fuel pins and capsules are received.
Tests of Mechanical Interaction of Fuel and Cladding (B. Fleischer, R. B. Fitts, and R. L. Seam 1 8)
The intent of our program is to measure in-reactor the axial extension of both the fuel column and cladding and also the fuel pin internal gas pressure during operation of prototypic LMFBR fuel pins under carefully controlled conditions. These include programmed power cycles and an occasional overpower cycle. The irradiation capsules are designed so that the fuel pin operates in the ORR Poolside irradiation facility at LMFBR prototypic power and temperature conditions. The irradiation tests are planned for one to two years and will give burnup levels of 5 to 9%. As described previously,19 the first in-reactor power
1 7T. N. Washburn, J. D. Sease, R. A. Bradley, E. J. Manthos, and M. K. Preston, "Fabrication of GCBR Capsules for Irradiation in EBR-II (GGA Cooperative Program)," LMFBR Fuel Cycle Studies Progr. Rept. May 1970, No. 15, ORNL-TM-3018, pp. 57-58.
lsReactor Division. l 9R. B„ Fitts, R. L. Senn, J. G. Morgan, and J. D. Jenkins, Fuels
and Materials Development Program Quart. Progr. Rept. for Period Ending June 30, 1970, 0RNL-4600, pp. 58r-63.
13.
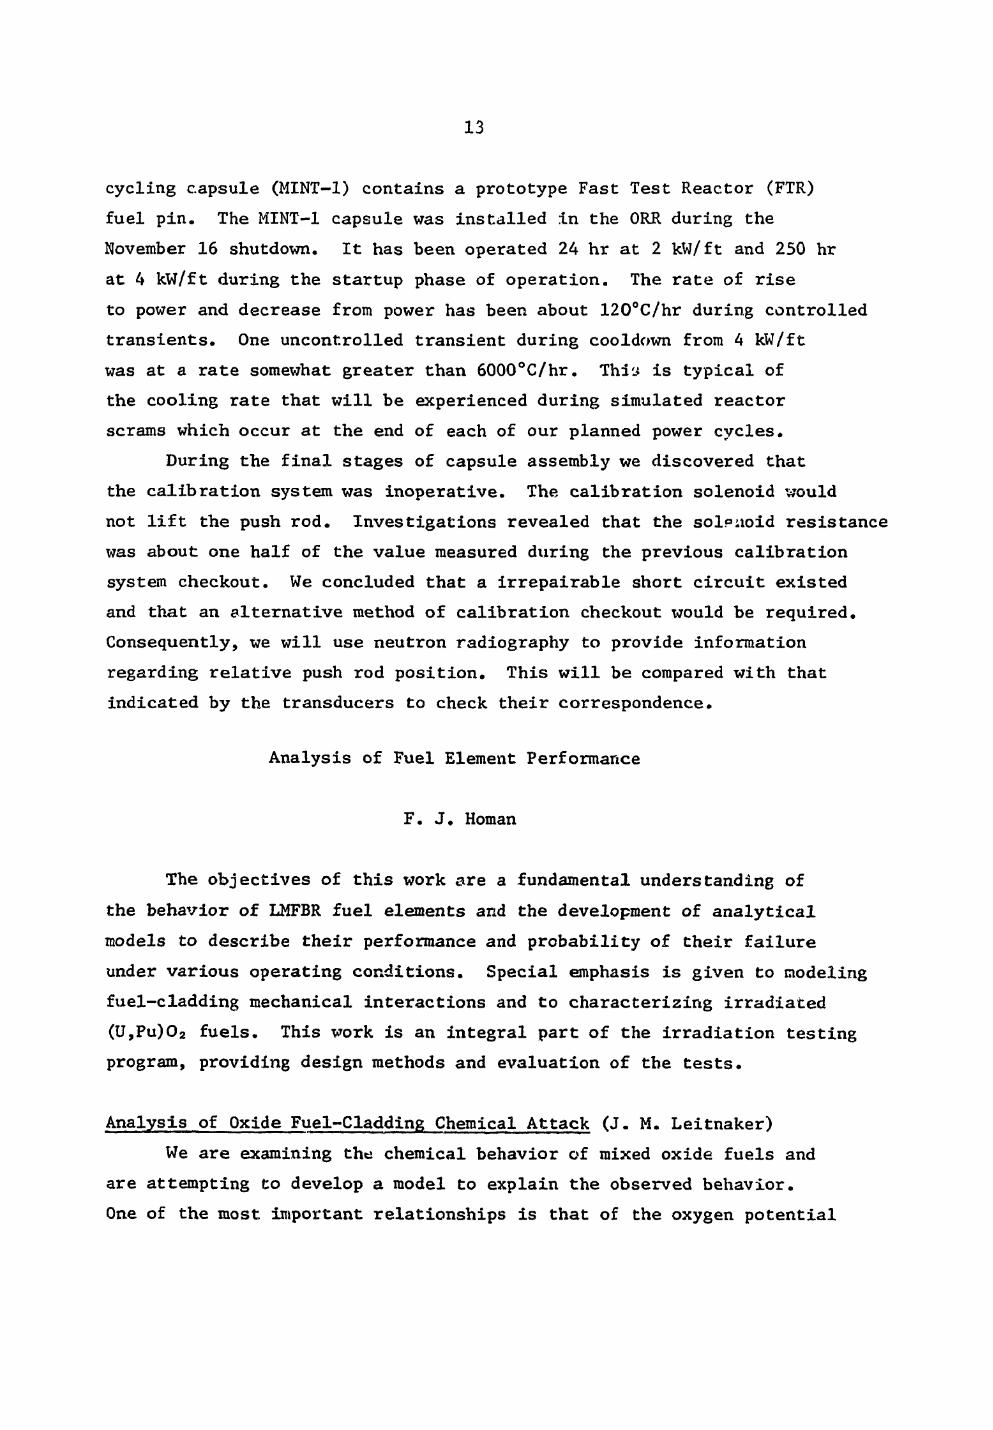
cycling capsule (MINT-1) contains a prototype Fast Test Reactor (FTR) fuel pin. The MINT-1 capsule was installed in the ORR during the November 16 shutdown. It has been operated 24 hr at 2 kW/ft and 250 hr at 4 kW/ft during the startup phase of operation. The rate of rise to power and decrease from power has been about 120°C/hr during controlled transients. One uncontrolled transient during cooldown from 4 kW/ft was at a rate somewhat greater than 6000°C/hr. Thiy is typical of the cooling rate that will be experienced during simulated reactor scrams which occur at the end of each of our planned power cycles.
During the final stages of capsule assembly we discovered that the calibration system was inoperative. The calibration solenoid would not lift the push rod. Investigations revealed that the solpitoid resistance was about one half of the value measured during the previous calibration system checkout. We concluded that a irrepairable short circuit existed and that an alternative method of calibration checkout would be required. Consequently, we will use neutron radiography to provide information regarding relative push rod position. This will be compared with that indicated by the transducers to check their correspondence.
Analysis of Fuel Element Performance
F. J. Homan
The objectives of this work are a fundamental understanding of the behavior of LMFBR fuel elements and the development of analytical models to describe their performance and probability of their failure under various operating conditions. Special emphasis is given to modeling fuel-cladding mechanical interactions and to characterizing irradiated (U,Pu)02 fuels. This work is an integral part of the irradiation testing program, providing design methods and evaluation of the tests.
Analysis of Oxide Fuel-Cladding Chemical Attack (J. M. Leitnaker) We are examining the chemical behavior of mixed oxide fuels and
are attempting to develop a model to explain the observed behavior. One of the most important relationships is that of the oxygen potential
14.
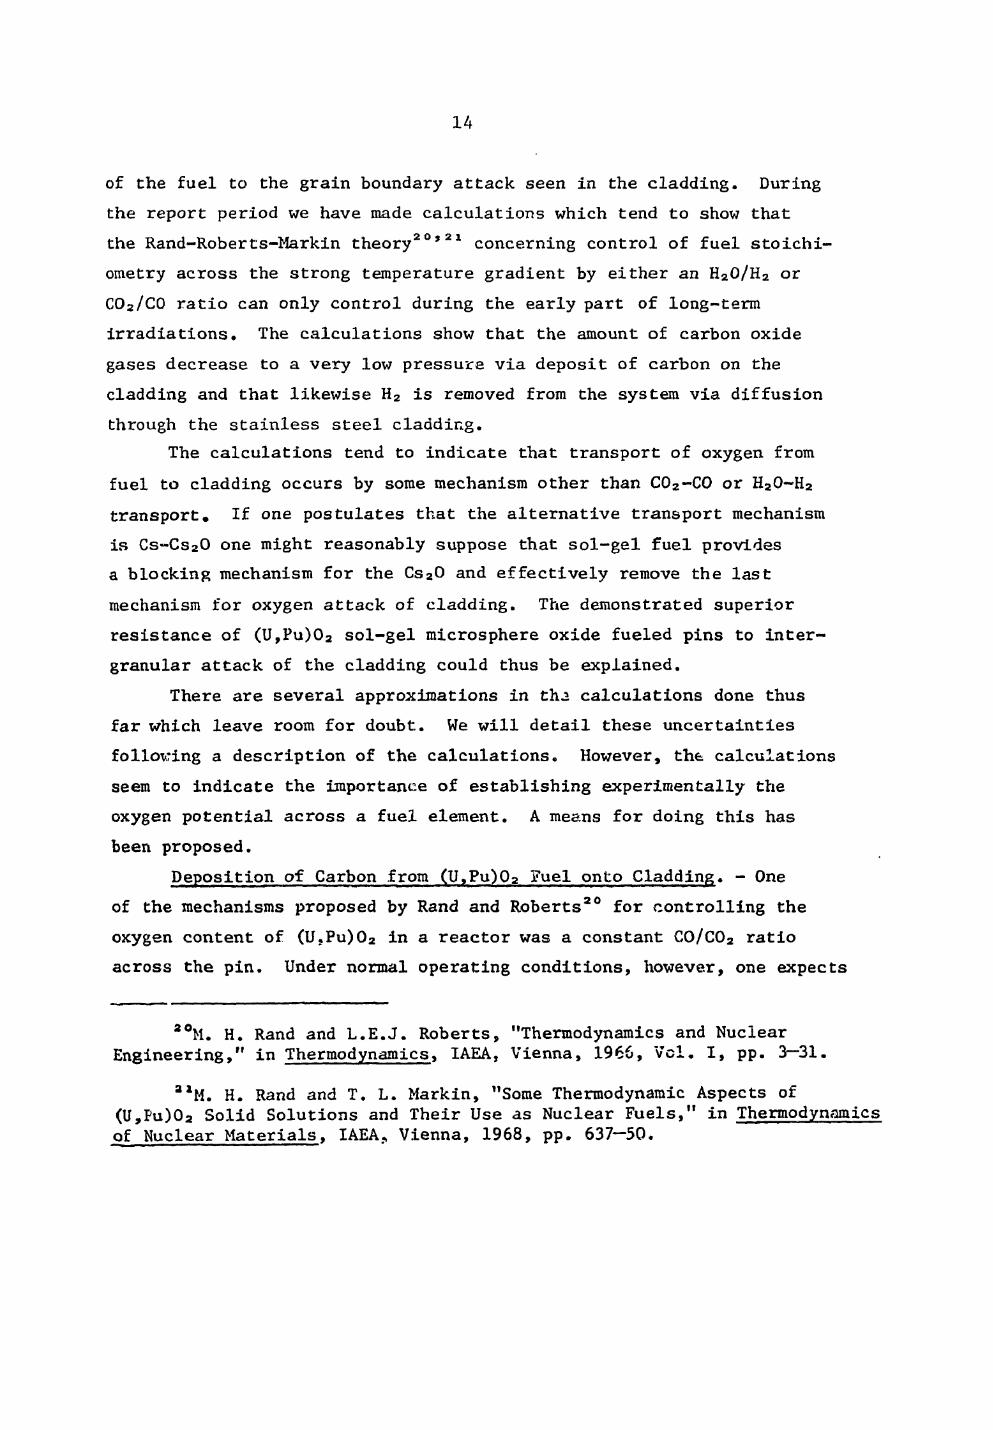
of the fuel to the grain boundary attack seen in the cladding. During the report period we have made calculations which tend to show that the Rand-Roberts-Markin theory 2 0* 2 1 concerning control of fuel stoichi-ometry across the strong temperature gradient by either an H 20/H 2 or C02/C0 ratio can only control during the early part of long-term irradiations. The calculations show that the amount of carbon oxide gases decrease to a very low pressure via deposit of carbon on the cladding and that likewise H 2 is removed from the system via diffusion through the stainless steel cladding.
The calculations tend to indicate that transport of oxygen from fuel to cladding occurs by some mechanism other than C02-C0 or H 20~H 2
transport. If one postulates that the alternative transport mechanism is Cs-Cs20 one might reasonably suppose that sol-gel fuel provides a blocking mechanism for the Cs20 and effectively remove the last mechanism for oxygen attack of cladding. The demonstrated superior resistance of (U,Pu)02 sol-gel microsphere oxide fueled pins to inter-granular attack of the cladding could thus be explained.
There are several approximations in th.2 calculations done thus far which leave room for doubt. We will detail these uncertainties following a description of the calculations. However, the calculations seem to indicate the importance of establishing experimentally the oxygen potential across a fuel element. A means for doing this has been proposed.
Deposition of Carbon from (U,Pu)02 Fuel onto Cladding. - One of the mechanisms proposed by Rand and Roberts20 for controlling the oxygen content of (U,Pu)02 in a reactor was a constant C0/C02 ratio across the pin. Under normal operating conditions, however, one expects
a 0M. H. Rand and L.E.J. Roberts, "Thermodynamics and Nuclear Engineering," in Thermodynamics, IAEA, Vienna, 1966, Vol. I, pp. 3—31.
a iM. H. Rand and T. L. Markin, "Some Thermodynamic Aspects of (U,Pu)0a Solid Solutions and Their Use as Nuclear Fuels," in Thermodynamics of Nuclear Materials, IAEA., Vienna, 1968, pp. 637—50.
15.
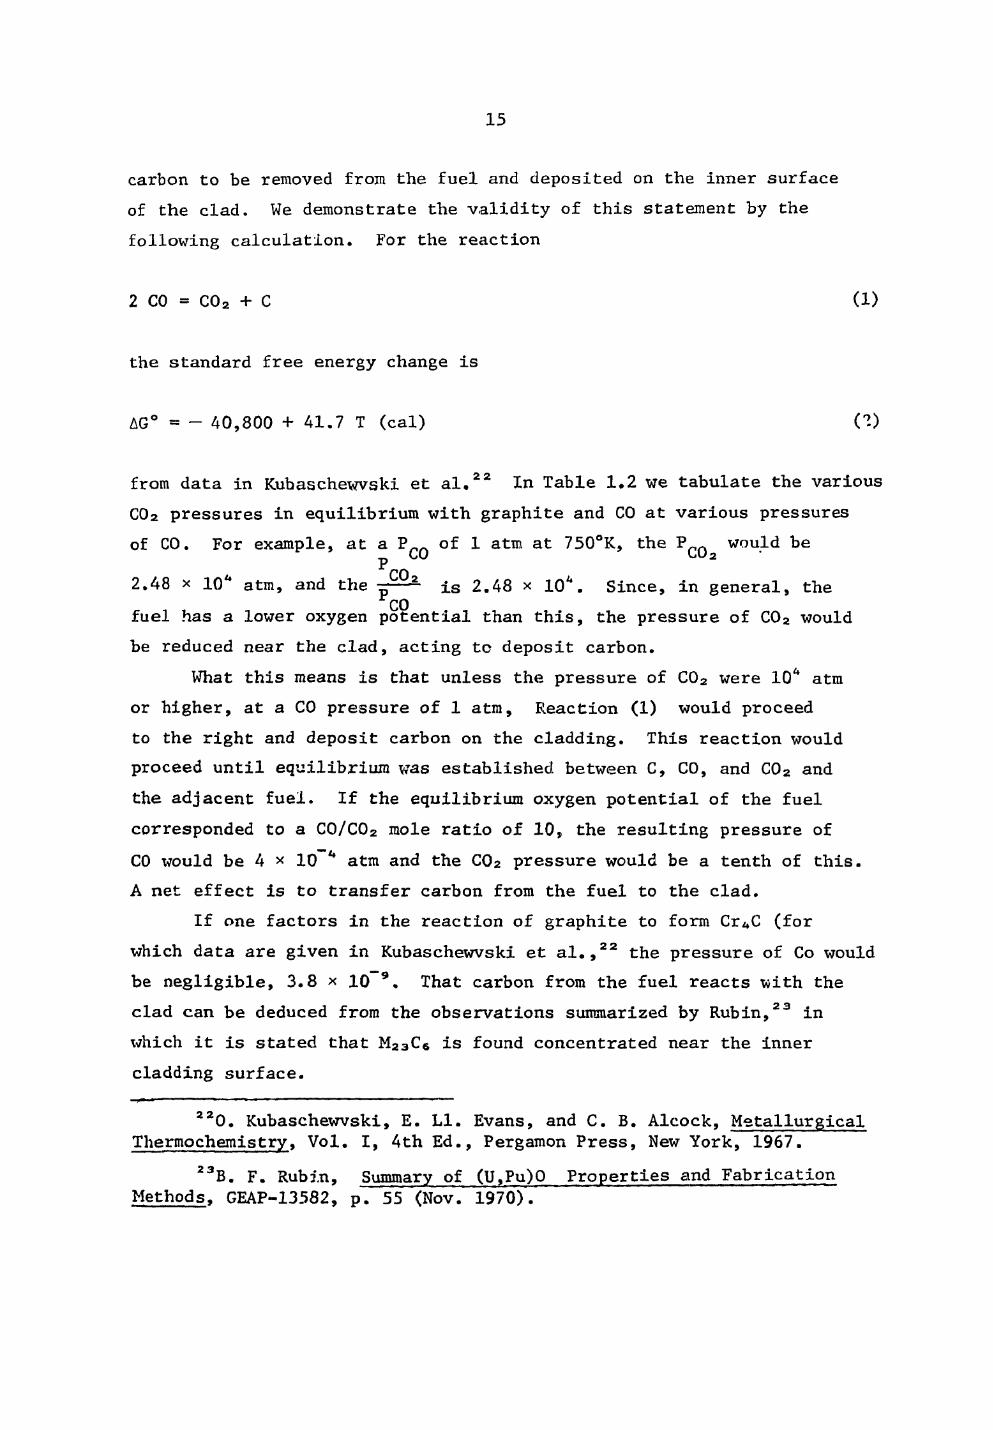
carbon to be removed from the fuel and deposited on the inner surface of the clad. We demonstrate the validity of this statement by the following calculation. For the reaction
2 CO « C0 2 + C
the standard free energy change is
AG° = - 40,800 + 41.7 T (cal)
(1)
CO
from data in Kubaschewvski et al. 2 2 In Table 1.2 we tabulate the various C02 pressures in equilibrium with graphite and CO at various pressures of CO. For example, at a of 1 atm at 750°K, the P ft would be p C U L.U2
2.48 x 10* atm, and the is 2.48 x 10 A. Since, in general, the CO
fuel has a lower oxygen potential than this, the pressure of C02 would be reduced near the clad, acting to deposit carbon.
What this means is that unless the pressure of C02 were 10* atm or higher, at a CO pressure of 1 atm, Reaction (1) would proceed to the right and deposit carbon on the cladding. This reaction would proceed until equilibrium was established between C, CO, and C02 and the adjacent fuel. If the equilibrium oxygen potential of the fuel corresponded to a C0/C02 mole ratio of 10, the resulting pressure of CO would be 4 * 10 u atm and the CO2 pressure would be a tenth of this. A net effect is to transfer carbon from the fuel to the clad.
If one factors in the reaction of graphite to form CrAC (for which data are given in Kubaschewvski et al., 2 2 the pressure of Co would be negligible, 3.8 x 10 9 . That carbon from the fuel reacts with the clad can be deduced from the observations summarized by Rubin,23 in which it is stated that M 2 3 C 6 is found concentrated near the inner cladding surface.
2 20. Kubaschewvski, E. LI. Evans, and C. B. Alcock, Metallurgical Thermochemistry, Vol. I, 4th Ed., Pergamon Press, New York, 1967.
2 3B. F. Rubin, Summary of (U,Pu)0 Properties and Fabrication Methods, GEAP-13582, p. 55 (Nov. 1970).
16.
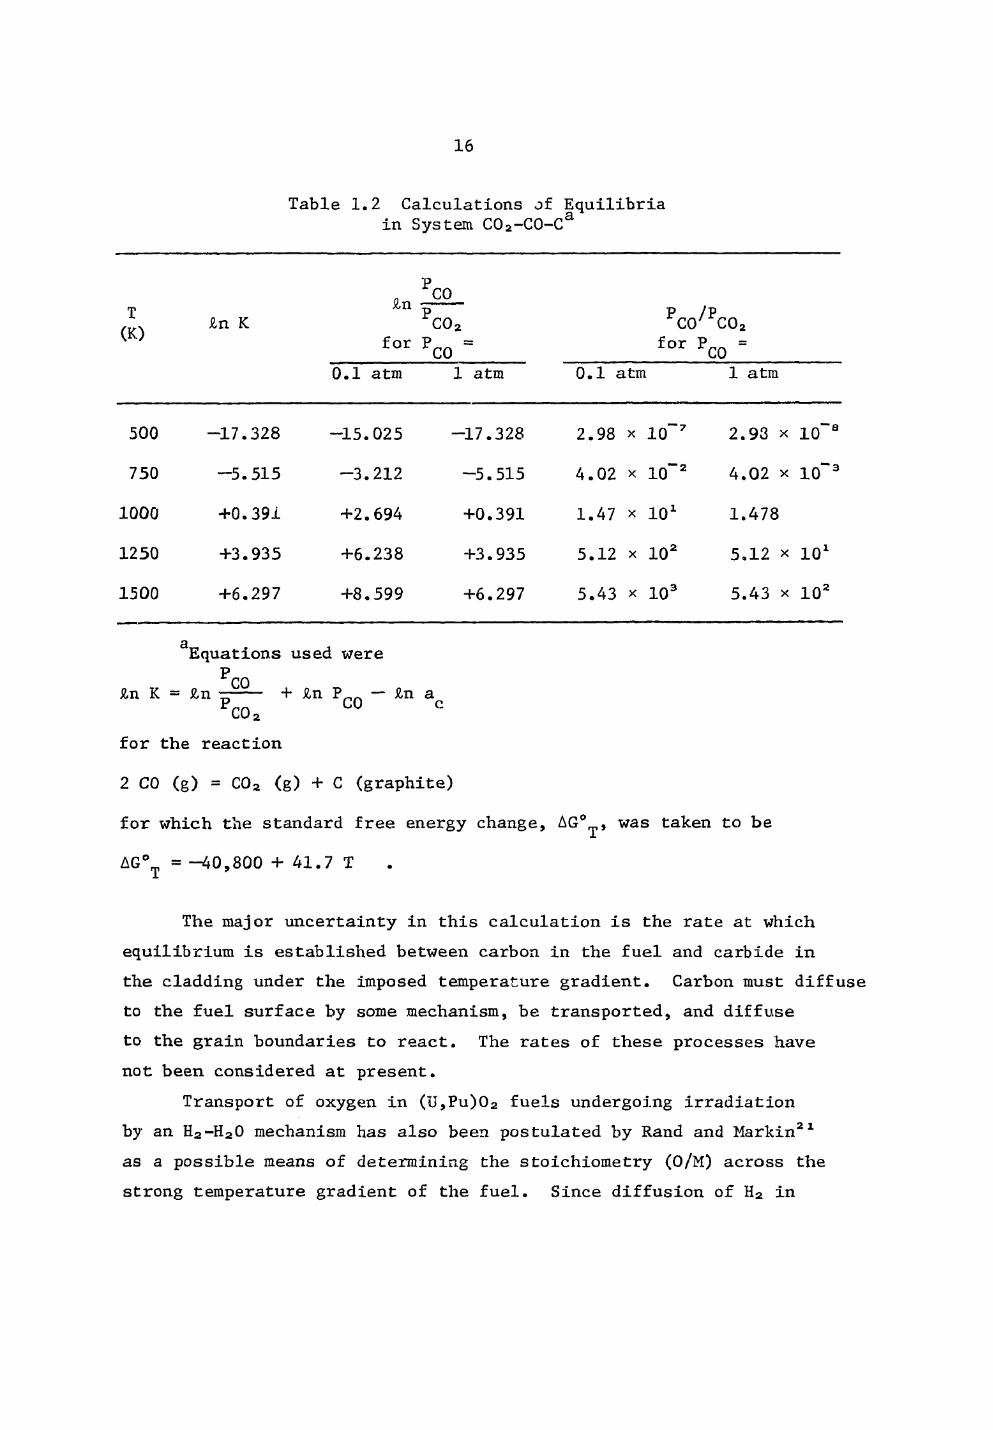
Table 1.2 Calculations jf Equilibria in System C02-C0-Ca
T OO
Jin K Jin
for P
CO 'CO; CO
P /P CO7 C02 for P CO
0.1 atm 1 atm 0.1 atm 1 atm
500 -17.328 -15.025 -17.328 2.98 x 10~7 2.93 x 10~'
750 -5.515 -3.212 -5.515 4.02 x 10"2 4.02 x 10~:
1000 +0.391 +2.694 +0.391 1.47 x 101 1.478
1250 +3.935 +6.238 +3.935 5.12 x 10² 5.12 x 101
1500 +6.297 +8.599 +6.297 5.43 x 10³ 5.43 x 10²
Equations used were PC0 Jin K = Zn + Jin — Jin a C02
c o
for the reaction
2 CO (g) = C02 (g) + C (graphite)
for which the standard free energy change, AG0^, was taken to be
AG°T = -^40,800 + 41.7 T
The major uncertainty in this calculation is the rate at which equilibrium is established between carbon in the fuel and carbide in the cladding under the imposed temperature gradient. Carbon must diffuse to the fuel surface by some mechanism, be transported, and diffuse to the grain boundaries to react. The rates of these processes have not been considered at present.
Transport of oxygen in (U,Pu)02 fuels undergoing irradiation by an H 2-H 20 mechanism has also been postulated by Rand and Markin21
as a possible means of determining the stoichiometry (O/M) across the strong temperature gradient of the fuel. Since diffusion of H 2 in
17.
stainless steels is rapid, we calculated the time required to reduce the pressure of H 2 to a low value where the rate of transport might be considered negligible by this mechanism. Since the H 2/H 20 mole ratio is assumed to be fixed by the fuel, reduction of the pressure of H2 would likewise reduce the pressure of H 20 thereby reducing the rate at which oxygen could be transported to the cladding,
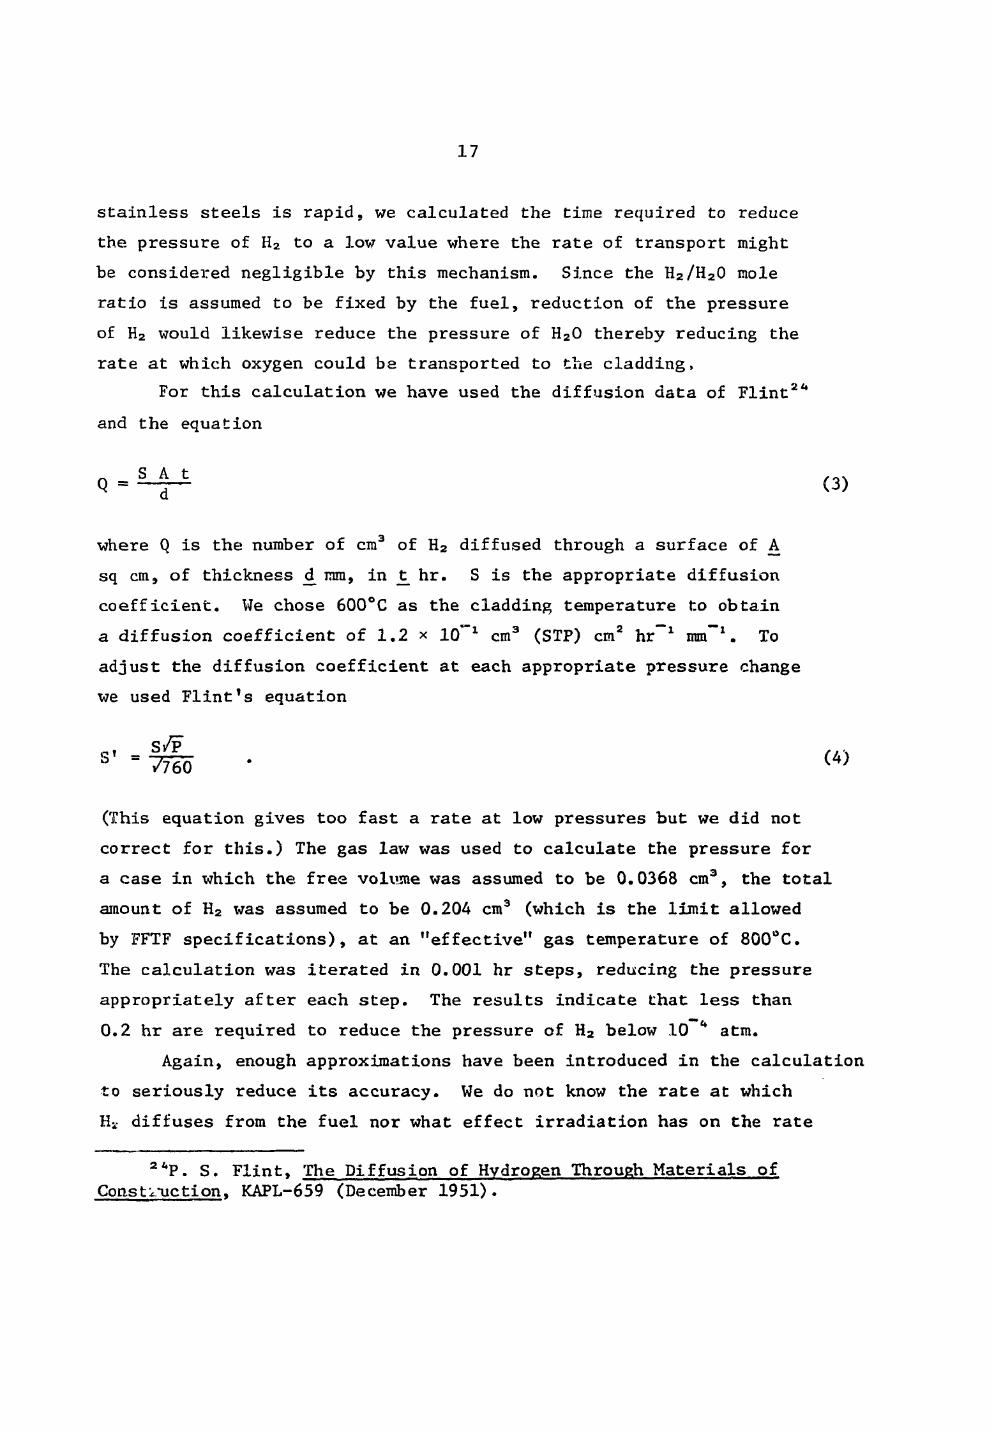
For this calculation we have used the diffusion data of Flint2* and the equation
Q = 2 - p ( 3 )
where Q is the number of cm3 of H 2 diffused through a surface of A sq cm, of thickness ci mm, in t hr. S is the appropriate diffusion coefficient. We chose 600°C as the cladding temperature to obtain a diffusion coefficient of 1.2 * 10~l cm3 (STP) cm2 hr""1 mm" 1. To adjust the diffvision coefficient at each appropriate pressure change we used Flint1s equation
n - S/F ° " 7760 (A)
(This equation gives too fast a rate at low pressures but we did not correct for this.) The gas law was used to calculate the pressure for a case in which the free volume was assumed to be 0.0368 cm3, the total amount of H 2 was assumed to be 0.204 cm3 (which is the limit allowed by FFTF specifications), at an "effective" gas temperature of 800°C. The calculation was iterated in 0.001 hr steps, reducing the pressure appropriately after each step. The results indicate that less than 0.2 hr are required to reduce the pressure of H 2 below 10 * atm.
Again, enough approximations have been introduced in the calculation to seriously reduce its accuracy. We do not know the rate at which Hi- diffuses from the fuel nor what effect irradiation has on the rate
2*P. S. Flint, The Diffusion of Hydrogen Through Materials of Consfj.-uction. KAPL-659 (December 1951) .
18.
of diffusion of H 2 through the stainless steel. However, even an error in the assumption resulting in two orders of magnitude error in the time would make the time involved only 20 hr.
If the above two mechanisms are eliminated as contenders for transport of oxygen to the clad, fission products seem to be all that remain. Most likely contenders for providing intergranular attack mechanisms are Mo and Cs. Other possibilities which cannot be excluded are Sr and Te (although probably not as an oxide mechanism). The two in greater abundance are Mo and Cs. Hence, they are favored for further study.
Experiments by Adamson25 at General Electric indicate Cs-Cs20 can affect the stoichiometry of (U,Pu)02 fuel across a temperature with a slightly different heat of transport than a C0-C02 transport. We know of no similar experiments involving Mo-Mo02.
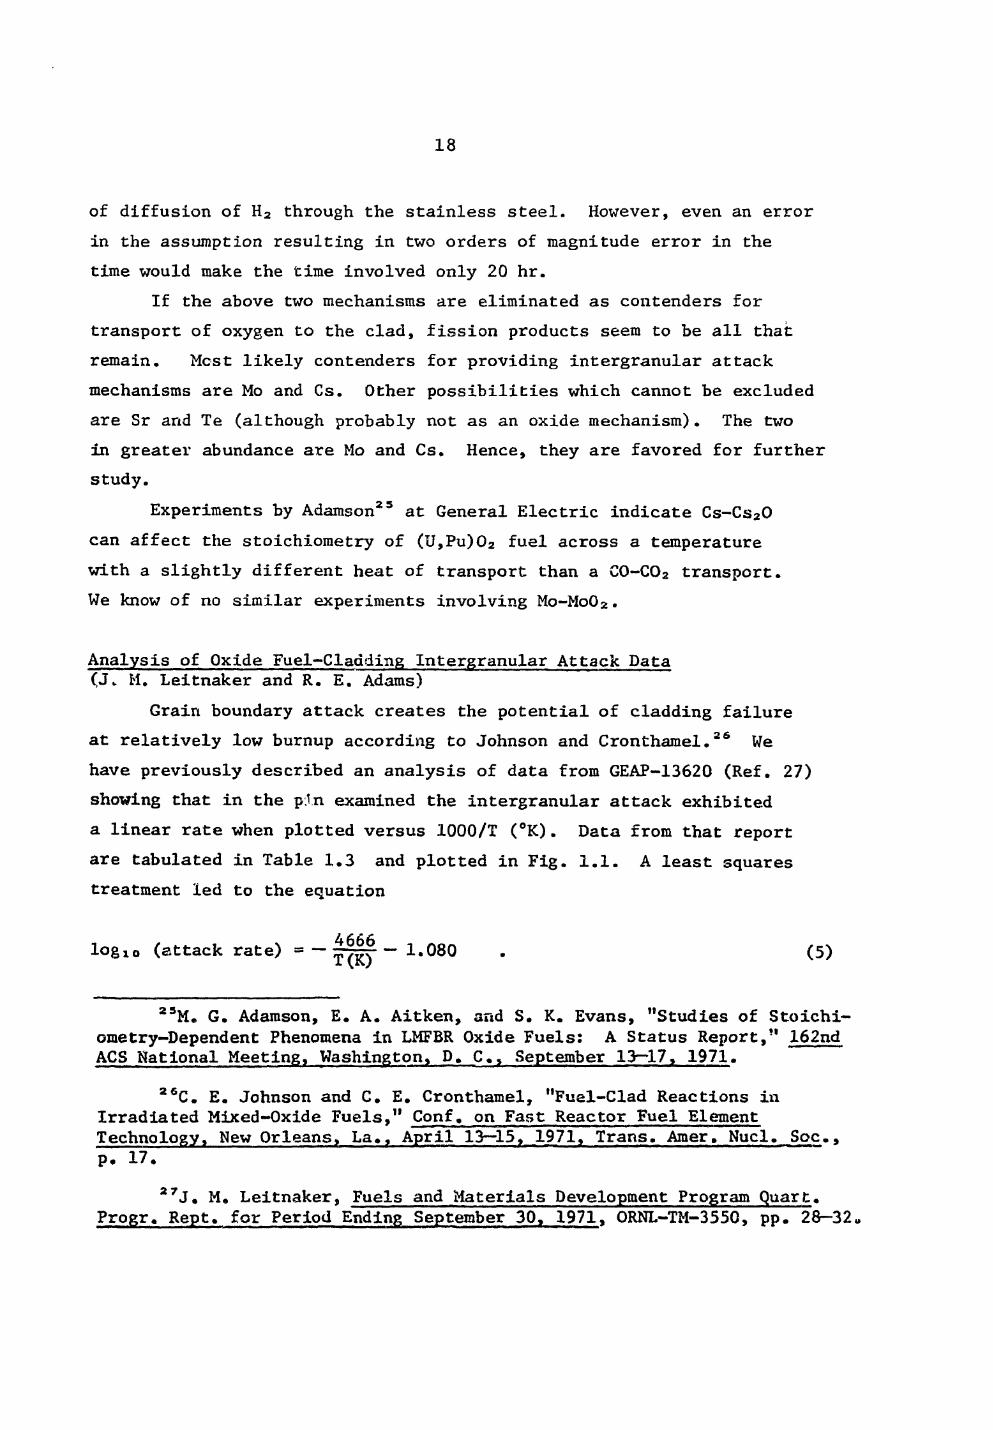
Analysis of Oxide Fuel-Cladding Intergranular Attack Data (J, M. Leitnaker and R. E. Adams)
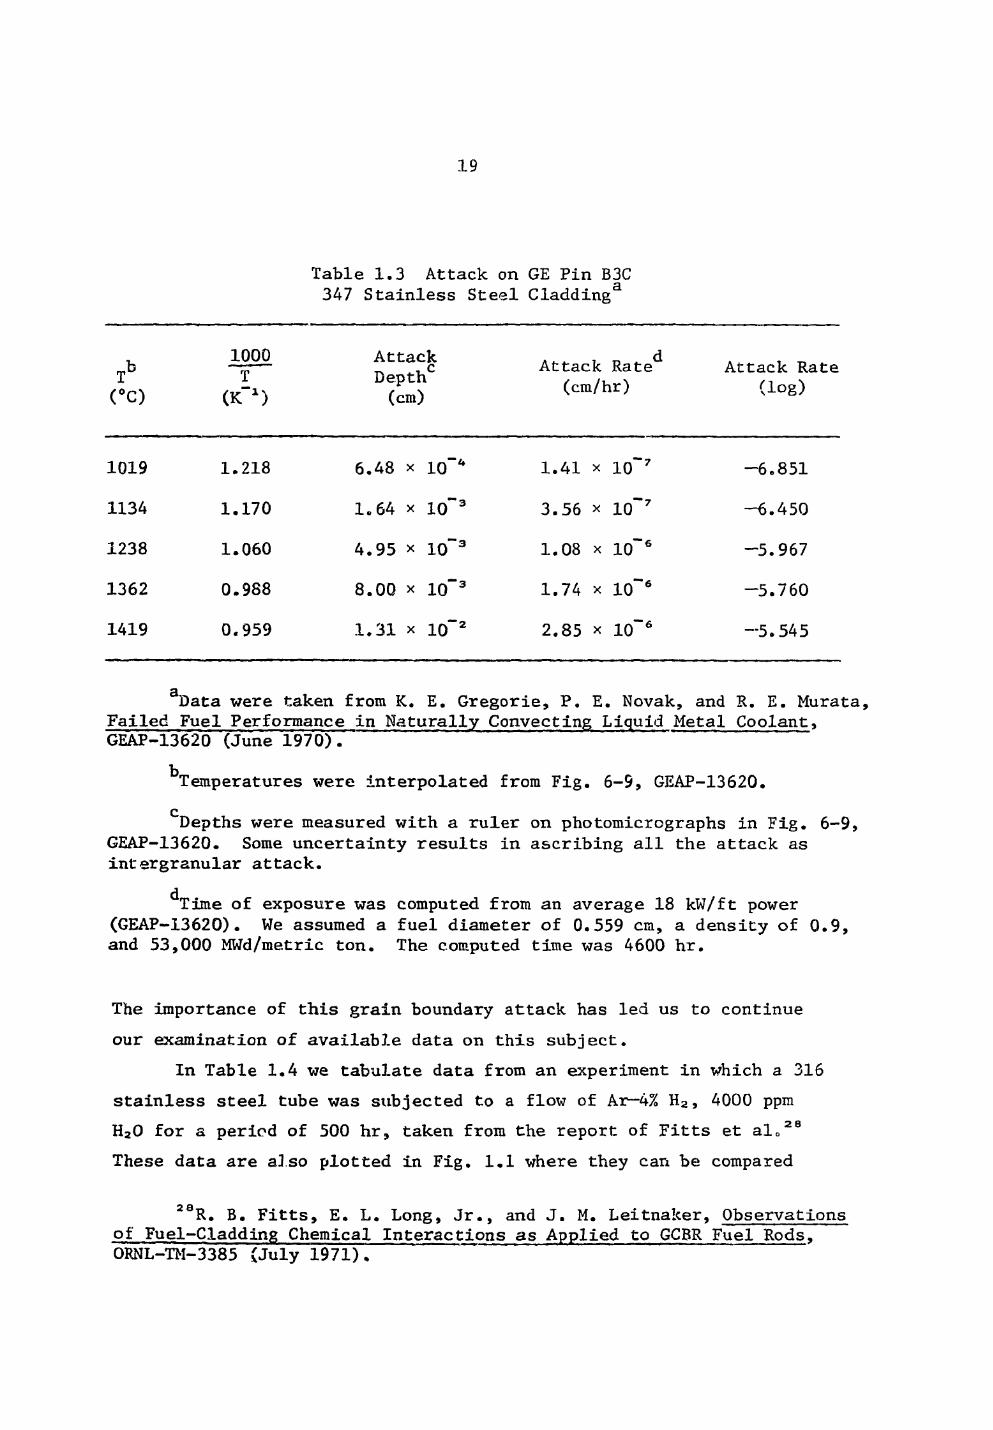
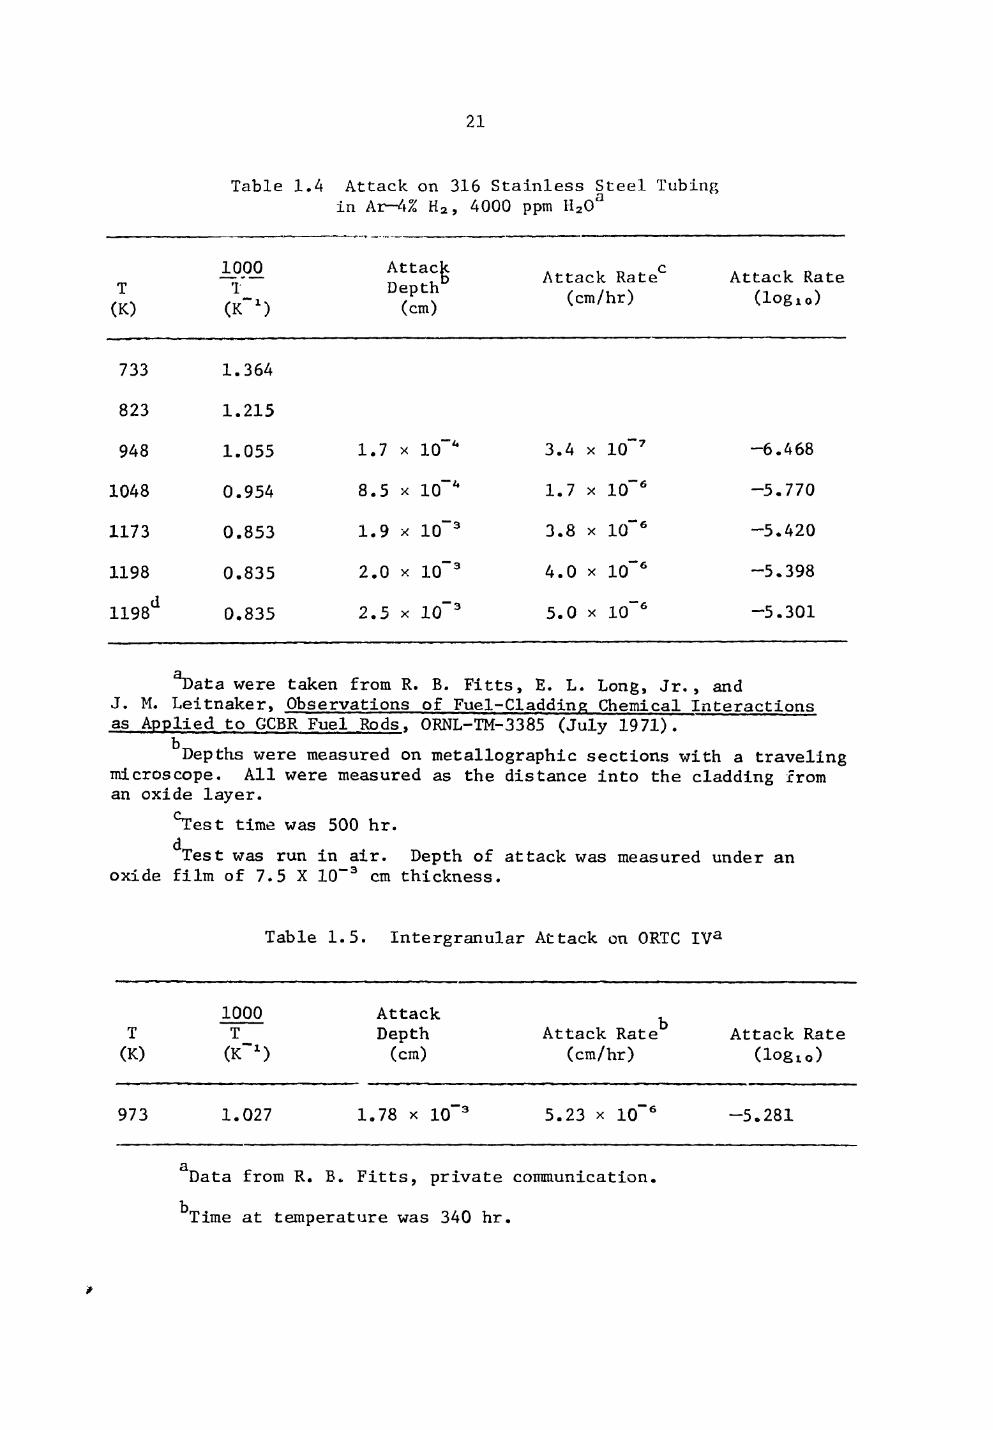
Grain boundary attack creates the potential of cladding failure at relatively low burnup according to Johnson and Cronthamel.26 We have previously described an analysis of data from GEAP-13620 (Ref. 27) showing that in the pin examined the intergranular attack exhibited a linear rate when plotted versus 1000/T (°K). Data from that report are tabulated in Table 1.3 and plotted in Fig. 1.1. A least squares treatment led to the equation
logxo (attack rate) = - - 1.080 . (5)
2 3M. G. Adamson, E. A. Aitken, and S. K. Evans, "Studies of Stoichi-ometry-Dependent Phenomena in LMFBR Oxide Fuels: A Status Report," 162nd ACS National Meeting, Washington, D. C t l September 13-17, 1971.
2 6C. E. Johnson and C. E. Cronthamel, "Fuel-Clad Reactions in Irradiated Mixed-Oxide Fuels," Conf. on Fast Reactor Fuel Element Technology, New Orleans, La., April 13—15, 1971, Trans. Amer. Nucl. Soc., p. 17.
2 7J. M. Leitnaker, Fuels and Materials Development Program Quart. Progr. Rept. for Period Ending September 30, 1971, QRNL-TM-3550, pp. 28-32*
19.
Table 1.3 Attack on GE Pin B3C 347 Stainless Steel Cladding3
T (°C)
1000 T
(K"1)
Attack Depth0
(cm) Attack Rate
(cm/hr) Attack Rate
(log)
1019
1134
1238
1362
1419
1.218
1.170
1.060
0.988
0.959
6.48 x
1.64 x 10~3
4.95 x 10"3
8.00 x io"3
1.31 x io~2
1.41 x 10~7
3.56 x lo~7
1.08 x 10~6
1.74 x 10~6
2.85 x 10~6
-6.851
-6.450
-5.967
-5.760
-5.545
g
Data were taken from K. E. Gregorie, P. E. Novak, and R. E. Murata, Failed Fuel Performance in Naturally Convecting Liquid Metal Coolant, GEAP-13620 (June 1970).
^Temperatures were interpolated from Fig. 6-9, GEAP-13620. c
Depths were measured with a ruler on photomicrographs in Fig. 6-9, GEAP-13620. Some uncertainty results in ascribing all the attack as intergranular attack.
^Time of exposure was computed from an average 18 kW/ft power (GEAP-13620). We assumed a fuel diameter of 0.559 cm, a density of 0.9, and 53,000 MWd/metric ton. The computed time was 4600 hr.
The importance of this grain boundary attack has led us to continue our examination of available data on this subject.
In Table 1.4 we tabulate data from an experiment in which a 316 stainless steel tube was subjected to a flow of Ar—4% H 2, 4000 ppm H 20 for a period of 500 hr, taken from the report of Fitts et al D
2 8
These data are also plotted in Fig. 1.1 where they can be compared
2 0R. B. Fitts, E. L. Long, Jr., and J. M. Leitnaker, Observations of Fuel-Cladding Chemical Interactions as Applied to GCBR Fuel Rods, ORNL-TM-3385 (July 1971).
20
V 0HNL-9WG 71-13321
• • < * •
a - !> 0 c. • t
• t <r o tr •CO
-f> H
to
-74
• OPfit. OuT-Of-'-fitE AIR, t "
aORW OUT-OF-PILE LOW OXYGEN, 515
• or PIN 03C-2. 347 '.,S
0 7 0 8 0 9 I O 1.1
»K) 1.2 13
.1
1.4
Fig. 1.1. Intergranular Attack Rates on Stainless Steels.
with the data from the General Electric failed pin data. A least squares treatment Jed to the equation
logio (attack rate) = — 4816 K K ) - 1.3129 (6)
The similar slopes and not-too-dissimilar ordinates of these two sets of data seem important. The plot can serve as a point of comparison for other fuel pin data.
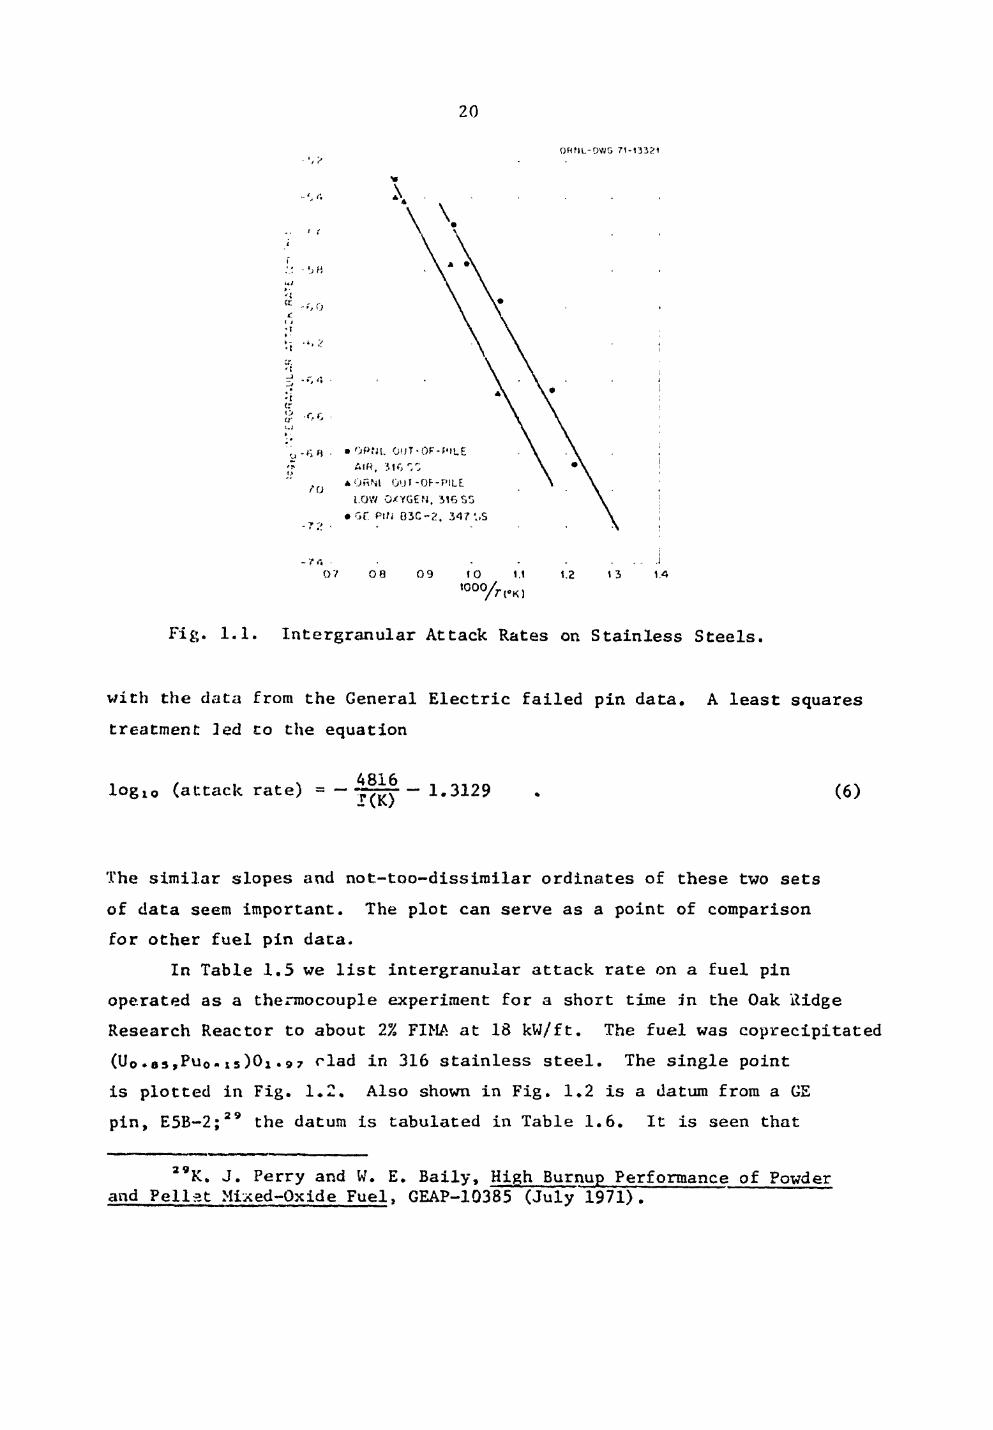
In Table 1.5 we list intergranular attack rate on a fuel pin operated as a thermocouple experiment for a short time in the Oak Ridge Research Reactor to about 2% FIMA at 18 kW/ft. The fuel was coprecipitated ( U o . a s . x s ) 0 j . 9 7 clad in 316 stainless steel. The single point is plotted in Fig. 1.2. Also shown in Fig. 1.2 is a datum from a GE pin, E5B-2;29 the datum is tabulated in Table 1.6. It is seen that
a 9K. J. Perry and W. E. Baily, High Burnup Performance of Powder and Pellet Mixed-Oxide Fuel, GEAP-10385 (July 1971).
21.
Table 1.4 Attack on 316 Stainless Steel Tubing in Ar—4% H a, 4000 ppm ll20a
c
Attack Rate Attack Rate (cm/hr) (logio)
733 1.364
823 1.215
948 1.055 1.7 X 10"" 3.4 X 10~7 -6.468
1048 0.954 8.5 X 10"" 1.7 X 10"6 -5.770
1173 0.853 1.9 X 10"3 3.8 X 1 0 " 6 -5.420
1198 0.835 2.0 X 10"3 4.0 X 10~6 -5.398
1198d 0.835 2.5 X 10" 3 5.0 X 1 0 ~ 6 -5.301
% a t a were taken from R. B. Fitts, E. L. Long, Jr., and J. M. Leitnaker, Observations of Fuel-Cladding Chemical Interactions as Applied to GCBR Fuel Rods, ORNL-TM-3385 (July 1971).
IJ
Depths were measured on metallographic sections with a traveling microscope. All were measured as the distance into the cladding from an oxide layer.
°Test time was 500 hr. ^Test was run in air. Depth of attack was measured under an
oxide film of 7.5 X 10~3 cm thickness.
Table 1.5. Intergranular Attack on ORTC IV a
1000 Attack T T Depth Attack Rate Attack Rate (K) (K"1) (cm) (cm/hr) (loglo)
973 1.027 1.78 x 10"3 5.23 x 10"6 -5.281
a
Data from R. B. Fitts, private communication.
^Time at temperature was 340 hr.
100_0 Attack T T Depth (K) (K~x) (cm)
22.
-•j ? !)l<M.-!,/i', / t - I M I ' l
•\A
1
u . - S B »
o
- G O •
-C ?. •
tr - f j £ I 2 I
o - 6 8 j r?> o
- 7 0 ! I i
- 7 . 2 )
• ORTC-IV • GE PIM E
-7 .4 0 7 0 .8 0.9 1.0 t I
«><>o/n-Kj I 2 14
Fig. 1.2. Intergranular Attack Rates. (The lower line corresponds to ORNL out-of-pile data; the upper line corresponds to GE pin B3C.)
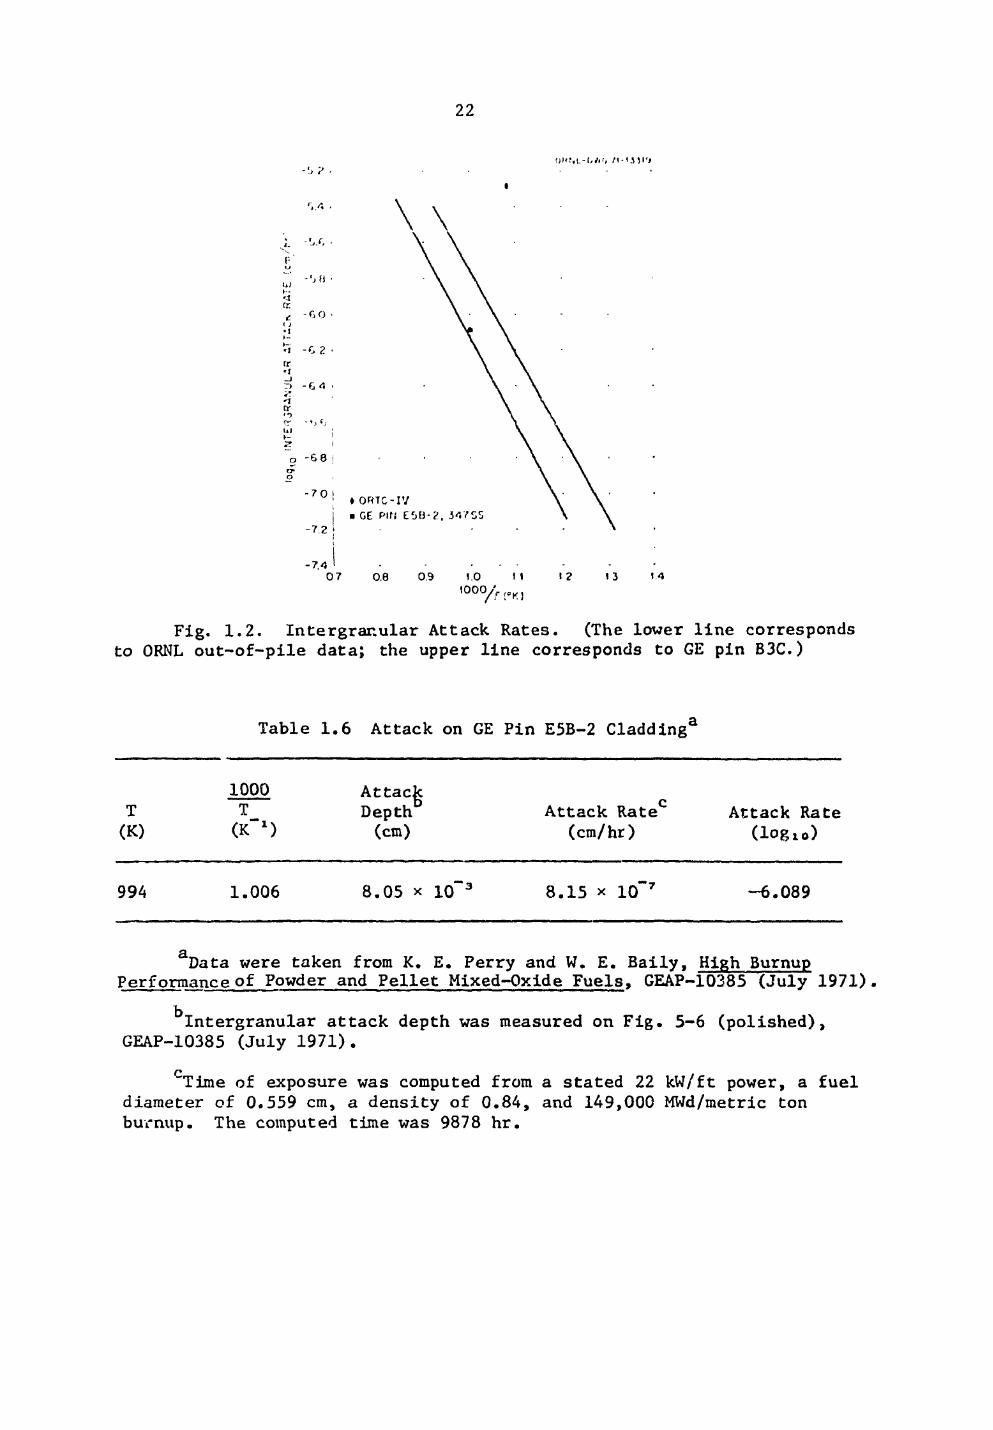
Table 1.6 Attack on GE Pin E5B-2 Cladding3
1000 Attack T T Depth Attack Rate0 Attack Rate (K) (K"1) (cm) (cm/hr) (log10)
994 1.006 8.05 * 10~3 8.15 * 10~7 -6.089
Data were taken from K. E. Perry and W. E. Baily, High Burnup Performance of Powder and Pellet Mixed-Oxide Fuels, GEAP-10385 (July 1971).
^Intergranular attack depth was measured on Fig. 5-6 (polished), GEAP-10385 (July 1971).
c Time of exposure was computed from a stated 22 kW/ft power, a fuel
diameter of 0.559 cm, a density of 0.84, and 149,000 MWd/metric ton burnup. The computed time was 9878 hr.
23.
the GE datum lies near the line corresponding to the ORNL out-of-reactor data while the ORTC attack rate is much higher than any of the other data.
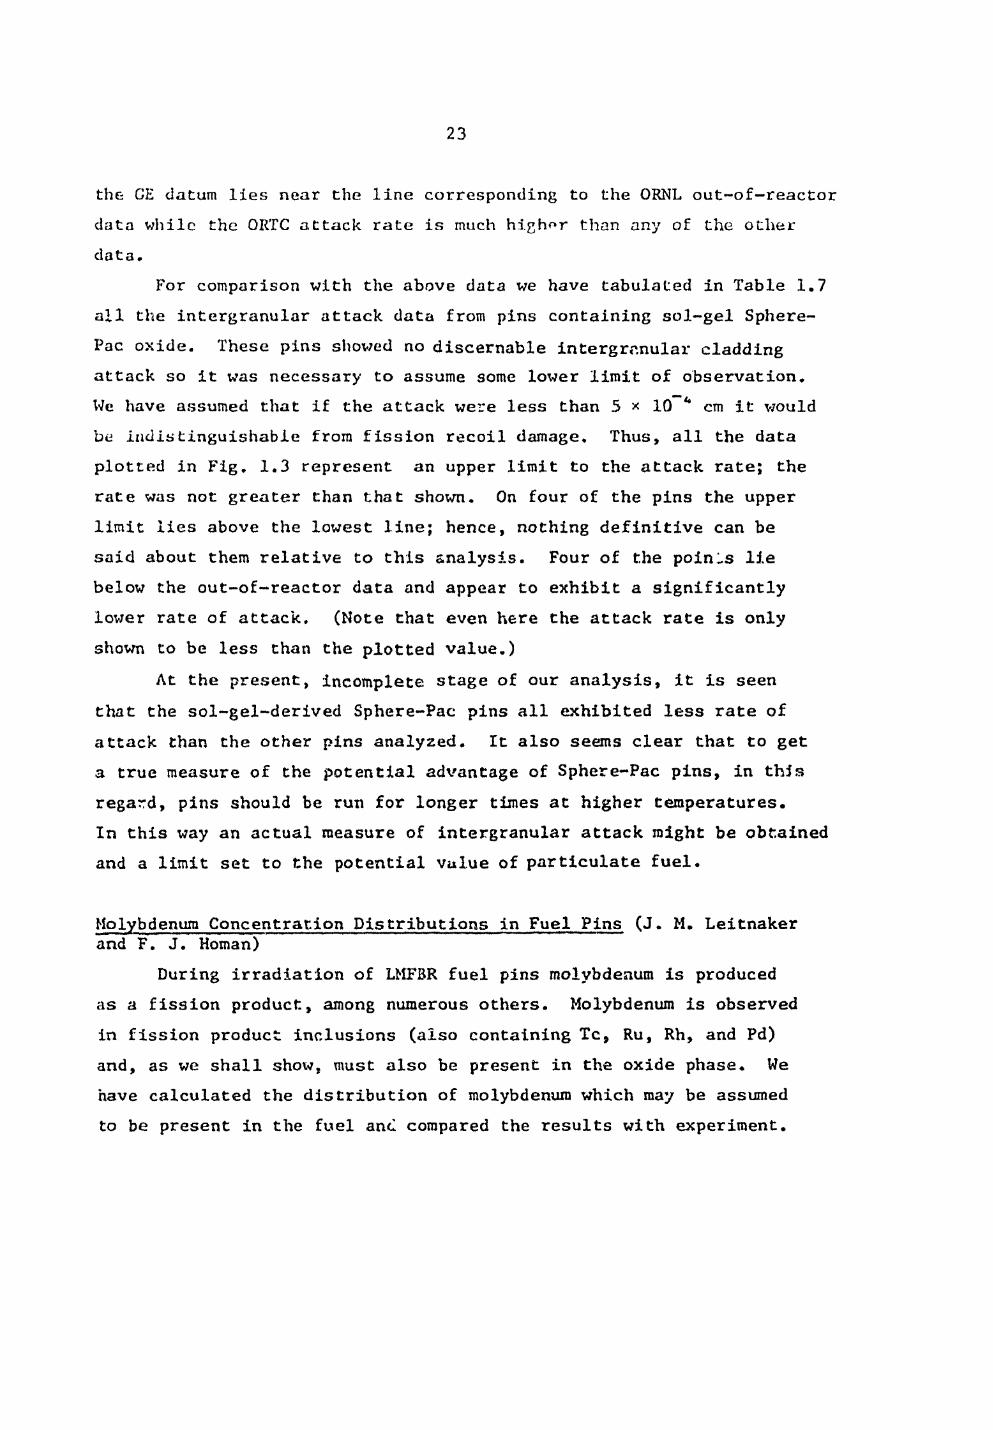
For comparison with the above data we have tabulated in Table 1.7 all the intergranular attack data from pins containing sol-gel Sphere-Pac oxide. These pins showed no discernable intergrr.nular cladding attack so it was necessary to assume some lower limit of observation. We have assumed that if the attack were less than 5 * 10 4 cm it would be indistinguishable from fission recoil damage. Thus, all the data plotted in Fig. 1.3 represent an upper limit to the attack rate; the rate was not greater than that shown. On four of the pins the upper limit lies above the lowest line; hence, nothing definitive can be said about them relative to this analysis. Four of the points lie below the out-of-reactor data and appear to exhibit a significantly lower rate of attack. (Note that even here the attack rate is only shown to be less than the plotted value.)
At the present, incomplete stage of our analysis, it is seen that the sol-gel-derived Sphere-Pac pins all exhibited less rate of attack than the other pins analyzed. It also seems clear that to get a true measure of the potential advantage of Sphere-Pac pins, in this regard, pins should be run for longer times at higher temperatures. In this way an actual measure of intergranular attack might be obtained and a limit set to the potential value of particulate fuel.
Molybdenum Concentration Distributions in Fuel Pins (J. M. Leitnaker and F. J. Homan)
During irradiation of LMFBR fuel pins molybdenum is produced as a fission product, among numerous others. Molybdenum is observed in fission product inclusions (also containing Tc, Ru, Rh, and Pd) and, as we shall show, must also be present in the oxide phase. We have calculated the distribution of molybdenum which may be assumed to be present in the fuel anc compared the results with experiment.
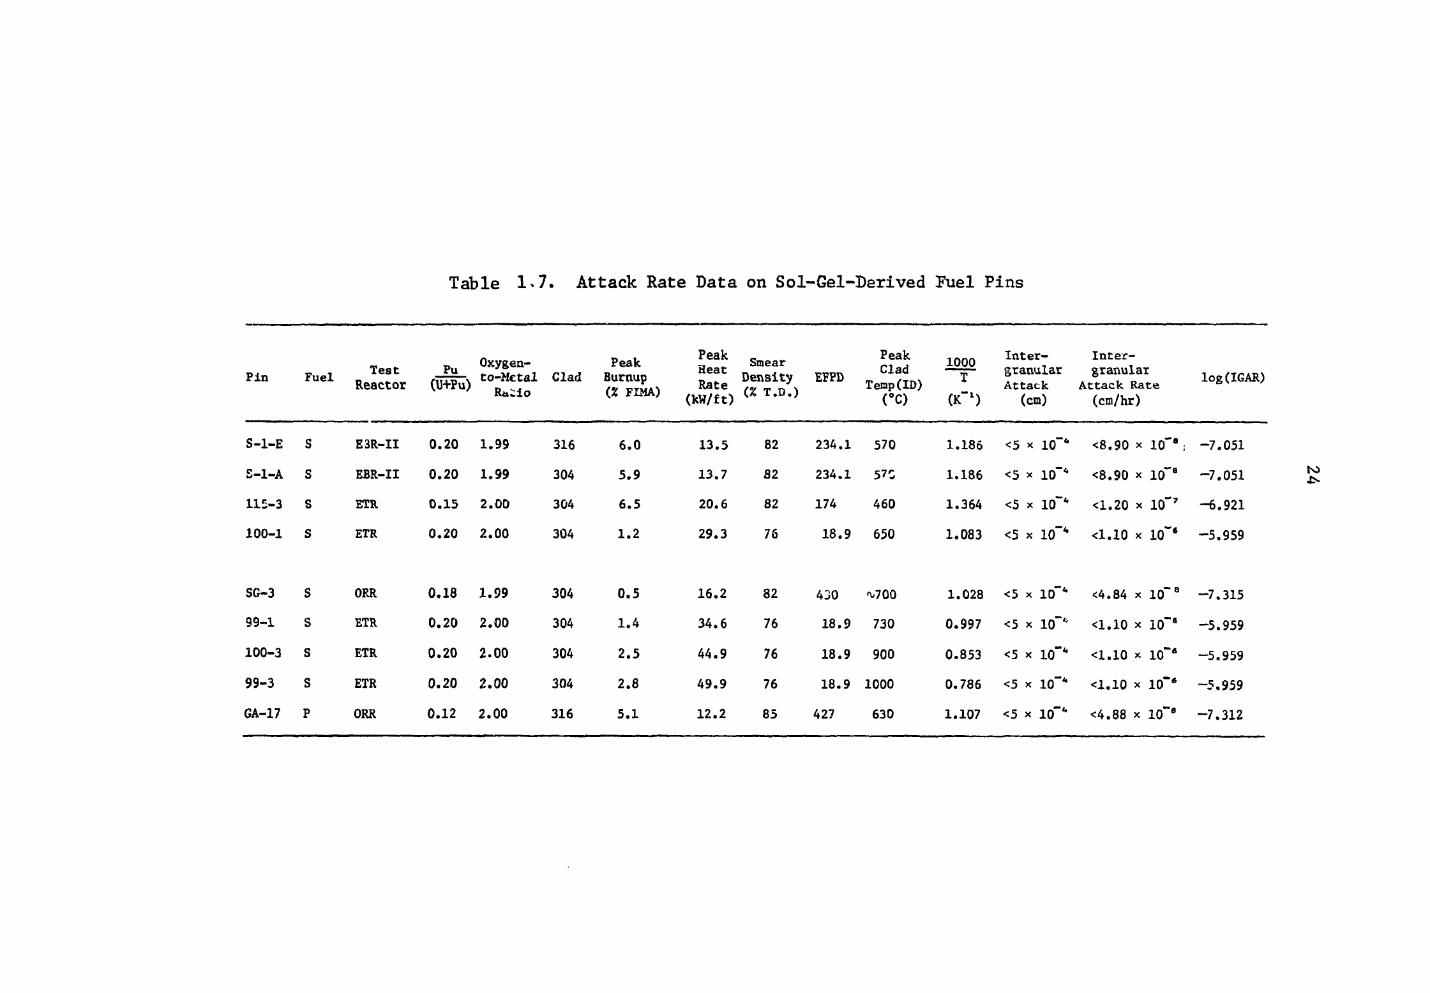
Table 1>7. Attack Rate Data on Sol-Gel-Derived Fuel Pins
Pin Fuel Test Reactor
Pu (U+Pu)
Oxygen-to-Metal Ra-io
Clad Peak
Burnup (Z FIMA)
Peak Heat Rate
(kW/ft)
Smear Density <% T.D.)
EFPD Peak Clad
Temp(ID) (°C)
1000 T
(K"1)
Inter-granular Attack
(cm)
Inter-granular
Attack Rate (cm/hr)
log (IGi
S-l-E S E3R-II 0.20 1.99 316 6.0 13.5 82 234.1 570 1.186 <5 x K f * <8.90 x 10"'j -7.051
S-l-A S EBR-II 0.20 1.99 304 5.9 13.7 82 234.1 570 1.186 <5 x 10"" <8.90 x i o " 8 -7.051
115-3 S ETR 0.15 2.00 304 6.5 20.6 82 174 460 1.364 <5 x lO-41 <1.20 x 10~7 -6.921
100-1 S ETR 0.20 2.00 304 1.2 29.3 76 18.9 650 1.083 <5 x 10"* <1.10 x 10~6 -5.959
SG-3 S ORR 0.18 1.99 304 0.5 16.2 82 430 ^700 1.028 <5 x 10"" <4.84 x 10"8 -7.315
99-1 S ETR 0.20 2.00 304 1.4 34.6 76 18.9 730 0.997 <5 x 10"' <1.10 x i(fa -5.959
100-3 S ETR 0.20 2.00 304 2.5 44.9 76 18.9 900 0.853 <5 x lcf* <1.10 x 10~6 -5.959
99-3 S ETR 0.20 2.00 304 2.8 49.9 76 18.9 1000 0.786 <5 x 10"* <1.10 x 10~6 -5.959
GA-17 P ORR 0.12 2.00 316 5.1 12.2 85 427 630 1.107 <5 x 10"* <4.88 x 10"8 -7.312
25.
ORNL-OWG 71-13320
, 0 0 0 /RT"K)
Fig. 1.3. Limit of Intergranular Attack Rate on Sol-Gel-Derived Mixed Oxide Fuel Pins. (The lower line corresponds to ORNL out-of-pile data; the upper line corresponds to GE pin B3C.)
The calculation of the distribution is straightforward. The reaction to be considered is
M o (s) + 0 2 ( g ) = M O 0 2 ( S ) (7)
for which the equilibrium constant, K, is
K QMoO>2 C 8 }
where the CPs are activities of their subscripted material, We assume
QMO02 = k a [Mo02] (9)
where kx is the Henry law constant and [Mo02] is the Mo0 2 concentration in the oxide phase. Likewise,
26.
QMo = k2[Mo] (10)
and
a o a - P 0 2 . ( I D
Then
K = k„ I M o ( M ( 1 2 ) O 2
where k3 = ki/k2. One can obtain the value of K from
AG° = —RT £n K (13)
where AG® is the standard free-energy change from Reaction (7), R is the gas constant, and T is the temperature in kelvins. The value of AG° can be obtained from Kubaschewvski et al.39
AG°(1) = - 140,500 - 4.6 T log T + 55.8 T (calories) . (14)
PC0 We can also obtain as a function of the ratio — — - as ° a CO
RT £n Pn = - 135,000 + (41.5 + 9.152 log T (calories) . (15) ° 2 \ CO /
We continue to use the P-,- /?nr, ratio as establishing oxygen potential UU 2 L>U for two reasons. First, it may represent a close approximation to the truth if only in the early part of an irradiation. Second, the transport of oxygen by a Cs20/Cs mechanism may not be too different in its effect and this procedure is at present easier. Since, from Eqs. (12) and (13),
AG°(1) ® —RT Jin k3 I 1 » (16) j" [MoQ2] 1 L[Ho]P0J
a*0. Kubaschewvski, E. LI. Evans, and C. B. Alcock, Metallurgical Thenaochemistry, Vol. I, 4th Ed., Pergamon Press, New York, 1967.
27.
one can solve for the desired quantity, log k3 ^ ,
obtaining
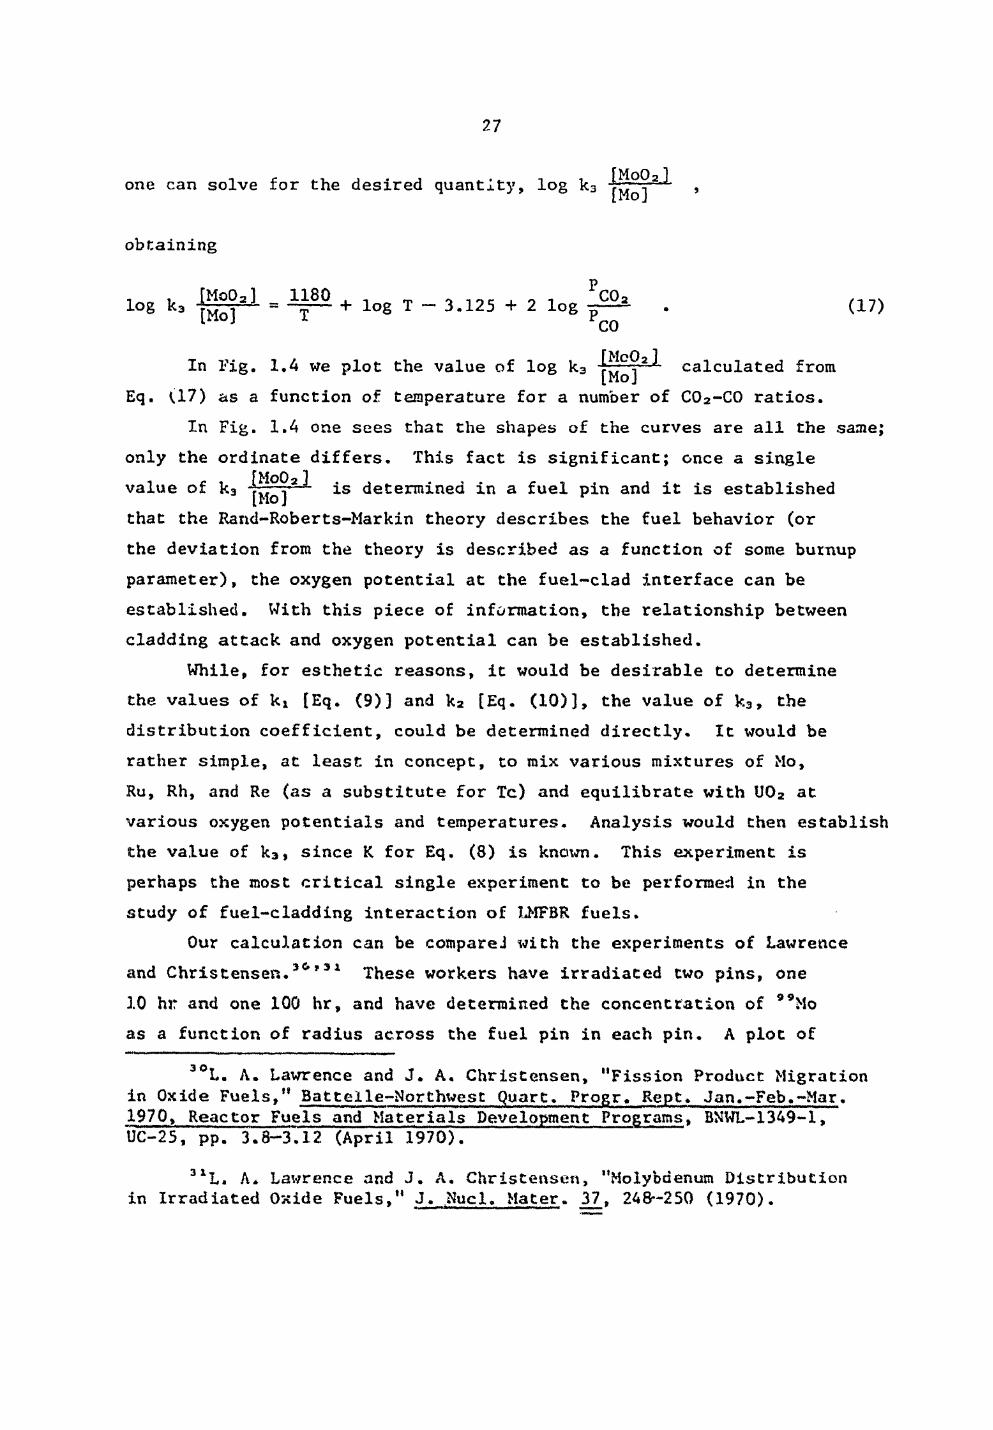
log k3 = log T - 3 . 1 2 5 + 2 l o g ^ O i . ( 1 7 ) CO
In Fig. 1.4 we plot the value of log k3 j^j*2^ calculated from Eq. (17) as a function of temperature for a number of C02-C0 ratios.
In Fig. 1.4 one sees that the shapes of the curves are all the same; only the ordinate differs. This fact is significant; once a single value of k3 jj^y2 is determined in a fuel pin and it is established that the Rand-Roberts-Markin theory describes the fuel behavior (or the deviation from the theory is described as a function of some b u m u p parameter), the oxygen potential at the fuel-clad interface can be established. With this piece of information, the relationship between cladding attack and oxygen potential can be established.
While, for esthetic reasons, it would be desirable to determine the values of kx [Eq. (9)] and k 2 [Eq. (10)3, the value of k 3, the distribution coefficient, could be determined directly. It would be rather simple, at least in concept, to mix various mixtures of Mo, Ru, Rh, and Re (as a substitute for Tc) and equilibrate with U0 2 at various oxygen potentials and temperatures. Analysis would then establish the value of k 3, since K for Eq. (8) is known. This experiment is perhaps the most critical single experiment to be performed in the study of fuel-cladding interaction of LMFBR fuels.
Our calculation can be compareJ with the experiments of Lawrence and Christensen. 3 6 , 3 1 These workers have irradiated two pins, one 10 hr and one 100 hr, and have determined the concentration of " M o as a function of radius across the fuel pin in each pin. A plot of
3°L. A. Lawrence and J. A. Christensen, "Fission Product Migration in Oxide Fuels," Battcslle-Northwest Quart. Progr. Kept. Jan.-Feb.-Mar. 1970, Reactor Fuels and Materials Development Programs, BJiWL-1349-1, UC-25, pp. 3.8-3.12 (April 1970).
3 XL. A* Lawrence and J. A. Christensen, "Molybdenum Distribution in Irradiated Oxide Fuels," J. Nucl. Mater. 37, 248-250 (1970).
28.
ORNL-DWG 7 1 - 1 3 0 9 9
Fig. 1.4. Calculated Distribution of Mo02 and Mo Across an Oxide Fuel Element.
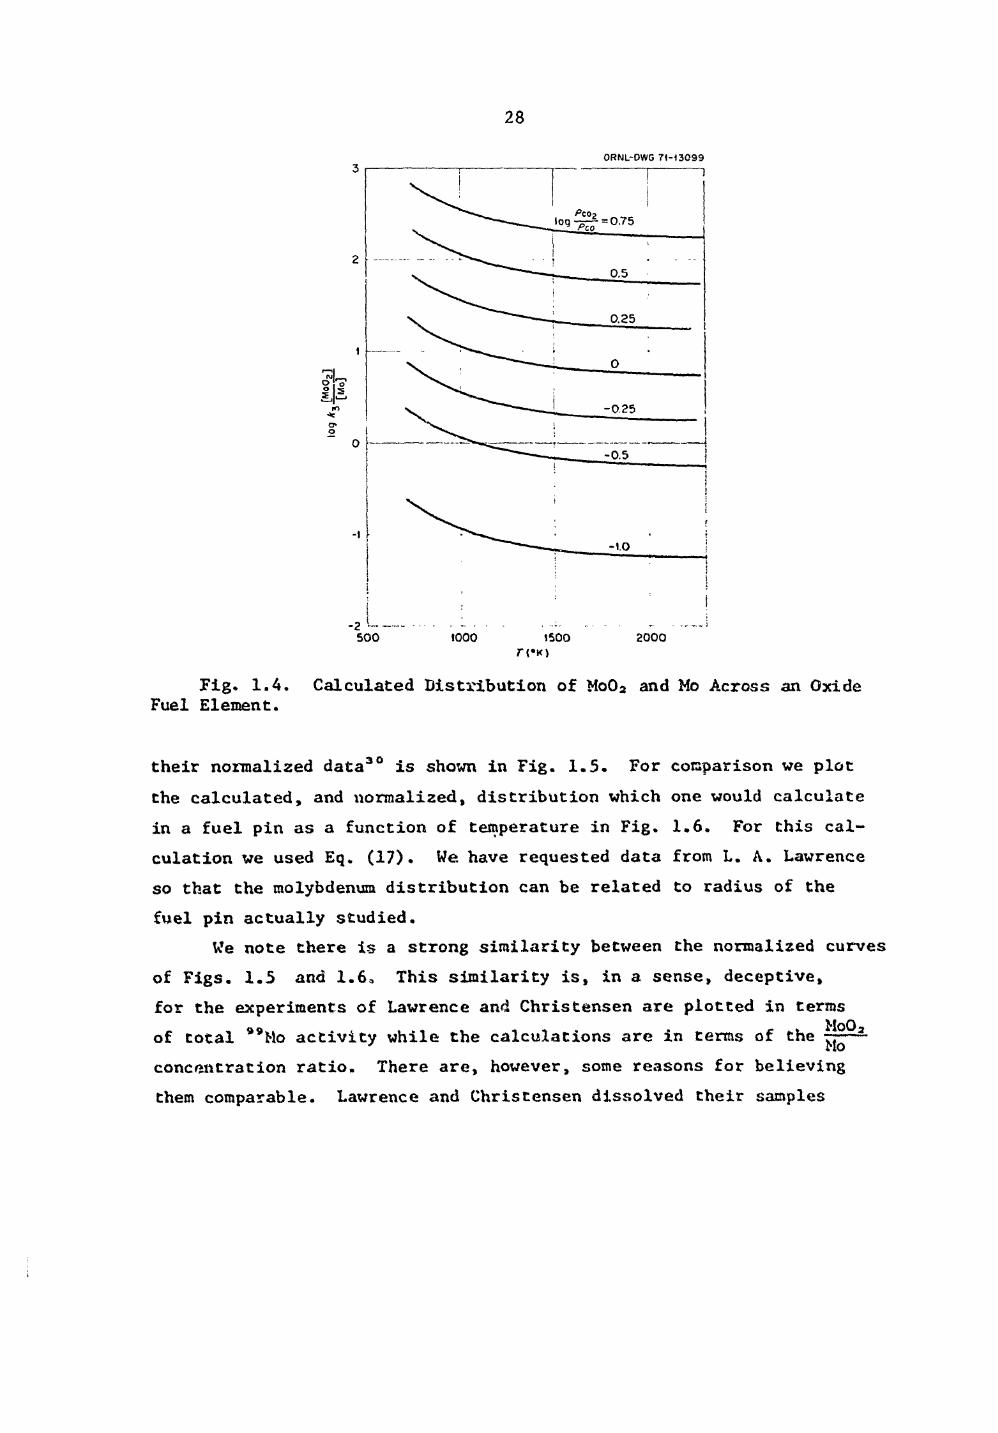
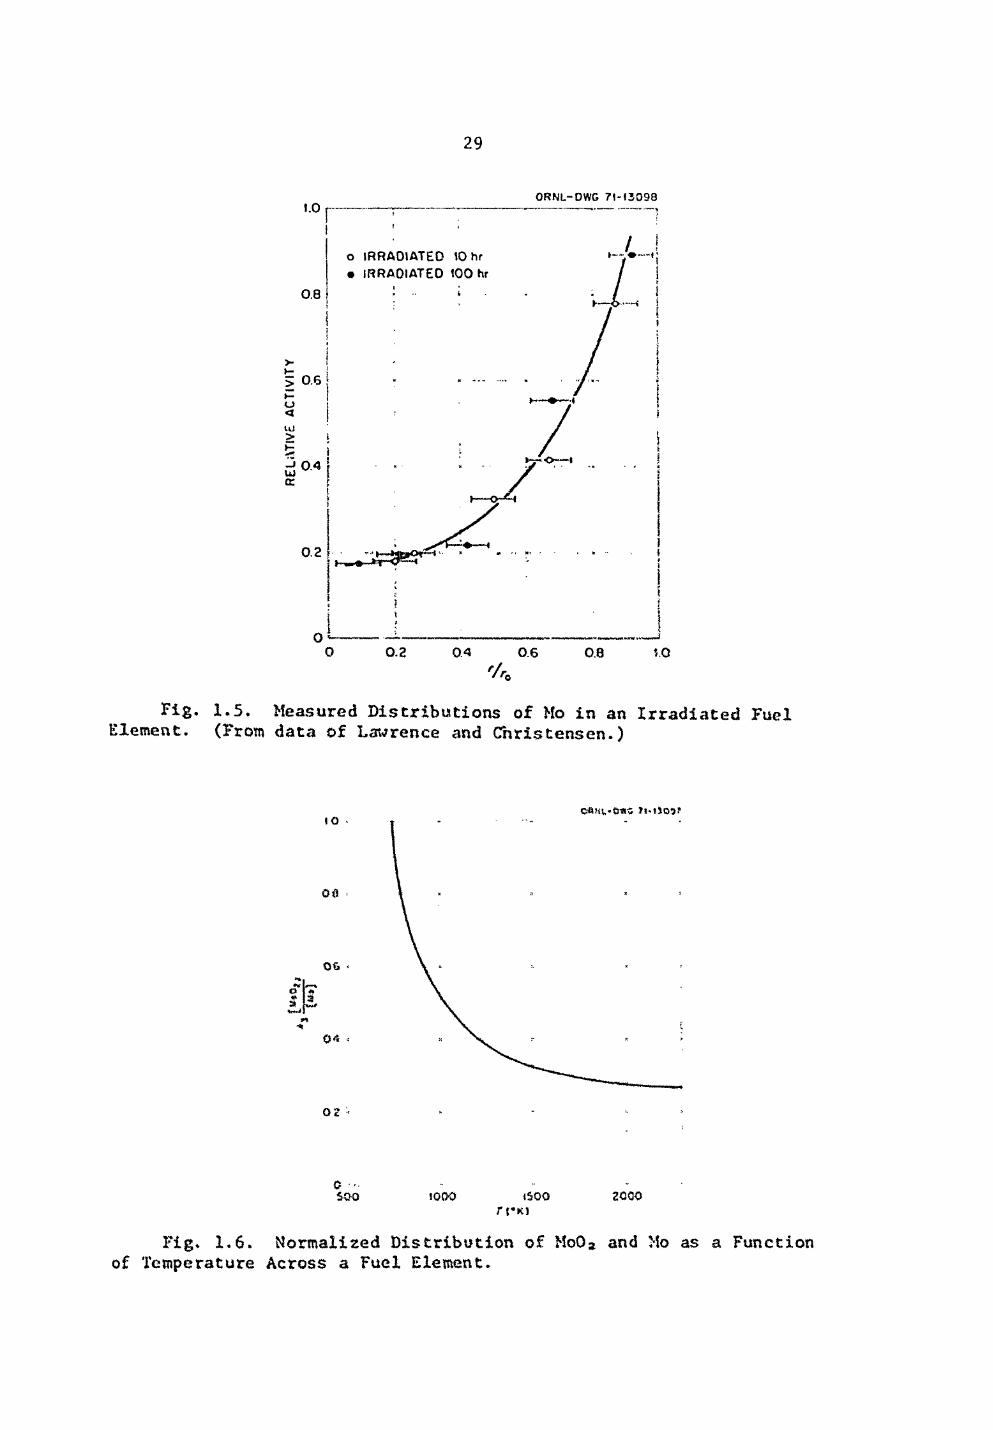
their normalized data 3 0 is shown in Fig. 1.5. For comparison we plot the calculated, and normalized, distribution which one would calculate in a fuel pin as a function of temperature in Fig. 1.6. For this cal-culation we used Eq. (17). We have requested data from L. A. Lawrence so that the molybdenum distribution can be related to radius of the fuel pin actually studied.
We note there is a strong similarity between the normalized curves of Figs. 1.5 and 1.6, This similarity is, in a sense, deceptive, for the experiments of Lawrence and Christensen are plotted in terms of total *®Mo activity while the calculations are in terms of the concentration ratio. There are, however, some reasons for believing Chem comparable. Lawrence and Christensen dissolved their samples
29.
i.o
0.8
0.6
< U J
2:
UJ ce 0.4
0.2
O R N L - D W G 7 1 - 1 3 0 9 8
o IRRADIATED 10 hr • IRRAOIATEO 100 hr
/ .!
•jfcr-v -*
i O w~
0 0.2 0 4 0 . 6 0.8 i.O
Fig. 1.5. Measured Distributions of Mo in an Irradiated Fuel Element. (From data of Lawrence and Christensen.)
JO
oa
s \
0«
Cfti i i 'OttS
0 2 -
0 ... . -SO-Q 1000 <500 2QQ0
r {*KJ
Fig. 1.6. Normalized Distribution of MoO a and Mo as a Function of Temperature Across a Fuel Element.
30.
in concentrated HNOa with a trace of HF added.32 There is good reason to believe chat any metallic .inclusions would not have dissolved with this treatment. 0'Boyle et al. 3 3 have measured molybdneum concentrations in metallic inclusions across (U,Pu)Oa.0 fuel pins to a burnup of 5.6 x 10 r o fissions-cm 3 . The amount of molybdenum present varied from a low of 20 wt % at the central void to a high of 25 wt Z at ~ = 0.7, while one would expect the ratio to vary, from Fig. 1.6, by
a factor of 4. If the molybdenum concentration is essentially constant across the pin, then Fig. 1,6 gives very nearly the [Mo02] concentration.
Although Lawrence and Christensen's experiment was in a thermal flux anc? they first concluded3* that the molybdenum did not move, a later calibration experiment32 convinced them that the molybdenum had indeed soved and there was a time dependence to the movement. There remains ."» basic uncertainty in their conclusion. Note that the calibration experiment involved using a pin irradiated at a center temperature of 1200°C, while the experimental pins had central temperatures near melting. F r w Fig. 1.4 one expects quite different molybdenum distributions at low temperatures than at high temperatures, and the calibration to account for flux depression may not be at all appropriate.
In our calculation, shown in Fig. 1.4, thermodynamic equilibrium has been assumes. Since the classical method of approaching equilibrium from two sides is impractical {although maybe not impossible), an alternative is to run the equilibration f o r i.wo times, one much longer than the other. Lawrence and Christerpen hove done this (10 hr and 100 hr) and obtained essentially constant rr-sults (see Fig. 1.5). The high correlation between the calculated ami the experimental curves seems good evidence that the oxygen potest a i s governed by something giving similar distribution as would a constant C0 2-C0 ratio.
3 2L. A. Lawrence,, private communication to J. M. Leitnaker.
3 3D. R. 0fBoyle, F. L. Brown, and J. E. Sanecki, "Solid Fission Product Behavior In Uranium-Plutonium Oxide Fuel Irradiated in a Fast Neutron Flux," J. Nucl. Mater. 29, 27-42 (1969).
31.
Some comments concerning necessary and desirable experiments are in order. First, it is obvious that a knowledge of the value of k 3 I j f f l a t a n y p 0i nt i n j- e f u ei would yield the value of the oxygen potential at any point within the fuel once (a) the mechanism controlling the oxygen distribution is established on a quantitative basis, and (b) auxiliary thermodynamic data are available; both requirements must be fulfilled. Foint (a) could be established by careful analysis of several fuel elements across several radial sections. Before the analysis is performed, during the last reactor cycle, the pins should be operated at as constant a temperature as possible and for a time of, say, 100 hr to ensure thermodynamic equilibrium. The distribution of molybdenum in oxide and in metallic inclusions could be measured either chemically or by microprobe analysis with suitable standards, preferably both.
Point (b), the need for auxiliary data, is somewhat more involved. First, there is a need for phase relationships in the U—Mo~0 system or, better, U-Pu-Mo-0 in the region near the fluorite lattice compound. These data must be obtained as a function of oxygen potential and temper-ature. Second, activity coefficients relating [Mo02] in the metallic fission product inclusions to activity as a function of temperature and composition are needed. (The determination of a distribution coefficient may be an easier experiment and it would also be desirable as a check on the second and third experiments.)
Perry and Baily3* report analysis of metallic inclusions in both the columnar grain region and in the outer fuel region of a pin operated to approximately 148,000 MWd/metric ton. The Mo/Ru ratio in the outer fuel region wan 2.5, while in the columnar grain region this ratio was approximately 1. This observation at high burnup seems at variance with predictions made on the basis of the Rand-Roberts-Markin theory 3 5' 3 6
3 aK. R. Perry and W. E. Baily, High Burnup Performance of Powder and Pellet Mixed-Oxide Fuel, GEAP-10385, p. 20 (July 1971).
3 5M. H. Rand and L„E.J. Roberts, "Thermodynamics and Nuclear Engineering," in Thermodynamics, IAEA, Vienna, 1966, Vol. I, pp. 3-31.
3 6M. H. Rand and T. L. Markin, "Some Thermodynamic Aspects of (U,Pu)0 Solid Solutions and Their Use as Nuclear Fuels," in Thermo-dynamics of Nuclear Materials, IAEA, Vienna, 1968, pp. 637—50.
32.
as follows. If one calculates the distribution of Mo and Mo02 in the fuel, one sees that the concentration ratio from center of [Mo J fuel to outside must always increase. If r.h analysis is correct and the Rand-Roberts theory correctly describes the behavior of fuel within the pin, then both the concentration of molybdenum in the metallic fission products and of MoOa in tne oxide fuel must have both increased in the outer region ox the fuel relative to the central part; the Mo02
concentration increase must, of course, be a greater increase in order that the concentration ratio 2 - also increase in the outer region. {.Mo J ° We feel that the molybdenum concentration in the metallic inclusions would tend to decrease in the outer region relative to the center, so that tho concentration would increase in the outer region. | Mo J Thxs surmise is denied by the work reported by Perry and Baily.
There are several possible conclusions. One is that a large fraction of the fission product molybdenum moves to the outer region of the fuel and thus ample Mo02 can be present to accord with the thermo-dynamic analysis. A second possibility is that even a minor modification of the Rand-Roberts theory does not describe the 2 concentration distribution. A third possibility is that local thermodynamic equilibrium does not exist. A fourth possibility is that the other metallic fission products (Tc, Rh, and Pd) may have a large effect on the activity of dissolved molybdenum.
One cannot tell from the data given how much of the molybdenum has been oxidized. We attempted to calculate an observed Mo/Ru ratio by assuming 2.5 represented the Mo/Ru ratio in all of the outer region and 1.0 represented the Mo/Ru ratio in the columnar grain region. A diameter of the columnar grain region was selected f:?:om Fig. 5-3 of xlef. 33 and checked via Fig. 5-8 of Ref. 33, A volume average gave a Mo/Ru metallic fission product ratio of 1.62. We also calculated the Mo/Ru ratio from expected fission yields, suitably correcting for fissioning of 2 3 5 U and 2 3 9Pu. This calculation yielded a Mo/Ru ratio of 1.23. The 25% discrepancy in the numbers very likely indicates our method of averaging the volumes is incorrect.
33.
We also calculated the amount of molybdenum which should have been oxidized in the pin, assuming the 0/(U+Pu) mole ratio remained constant and suitably adjusting the differing fission yields of 2 3 5U and 2 3 9Pu. Approximately 65% of the molybdenum would have been oxidized assuming no reaction with the cladding. Since an extensive interaction layer was observed we suspect the amount of molybdenum actually oxidized was much less than this; again, our calculations are too crude to yield reliable estimates of how much. If the above calculations were taken at face value they would tend to indicate that no buffering of the fuel had taken place by the molybdenum. These calculations point up the desirability of obtaining both the molybdenum concentration in the metallic fission products and the Mo0 2 concentration in the oxide fuel itself. Also pointed up is the desirability of analyzing a total segment of the fuel for molybdenum in the metallic fission products and molybdenum in the oxide. A measure of the extent of oxidization of the clad would thus be obtained. The fuel itself could be dissolved in HN0 3, leaving the metallic fission product inclusions to be analyzed separately.
34.
2. ADVANCED FAST BREEDER REACTOR FUELS DEVELOPMENT
J. L. Scott P. Patriarca
The goals of this program are to investigate the properties and behavior of those uranium- and plutonium-base ceramic fuels that -we term conductors such as the mononitrides, carbonitrides, and mono-carbides and to compare their potential as liquid-metal fast breeder reactor (LMFBR) fuel -with that of (U,!Ru)02, which by comparison is an insulator. Since the thermal conductivity of the ceramic conductors is about ten times that of (U,Pu)02, one could theoretically operate a conductor at ten times the power density with the same central temperature. In practice, heat transfer limitations, thermal stresses in the cladding, and high rates of swelling at high temperatures limit the power density to about two or three times of (U,Pu)02 — still a challenging improvement. Additionally, the margins for transient overpower are much higher in the ceramic conductors than in (U,Pu)02-
In spite of the potential benefits of advanced LMB'BR fuels, the level of effort is being reduced because of the budget crunch. For this reason this program is being phased out at ORNL and the work reported here represents an orderly phaseout.
Other work on nitride fuels is reported in Chapter 10.
Irradiation Testing
T. N. Washburn
Thermal Flux Tests
Two noninstrumented capsules of four pins each are now b e i n g
irradiated in the ETR. These "screening" tests are to determine th< performance of high purity (U,Pu)N. The peak linear h tl
30 kW/ft and peak b u m u p will be about 5$ FIMA. The fuel is ' pellets with densities from 86 to 91 $> of theoretical, - » i 1 1 i have a 0.010-in. radial gap between the fuel pellet and • 1 • id in, i P I--I with NaK-19 to enhance heat transfer.
35.
Capsules 43-Nl and 43-N2 were inserted into the ETR during the cycle 110 shutdown and the reactor went to full power on December 9, 1970. Capsule 43-WI is scheduled for removal from the reactor in January 1972 during the midcycle shutdown of cycle 114. Estimated peak burnup in each capsule at this time will be approximately 5$> FIMA. Capsule 43-N2 will remain in the reactor and 43-Wl will be shipped to LASL, as planned, for postirradiation examination.
Fast Flux Tests (E. J. Manthos)
Seven unencapsulated fuel pins described in Table 2.1 were trans-ferred to Battelle Columbus Laboratory (BCL) for eddy current inspection of the sodium bond at temperatures above the sodium melting point. Inspection of these pins has not been completed because of difficulties at BCL in fabricating a suitable inspection standard.
Synthesis, Fabrication, and Characterization of Advanced FBR Fuels
V. J. Tennery
Our effort during this quarter has been directed toward developing a process that will permit the controlled conversion of all our Pu-contaminated nitride scrap to oxide preparatory to shipping the material for recovery reprocessing and reducing our inventory to zero. This procedure must be completed before we can close down our inert atmosphere mixed-nitride facility.
Passivation Treatment of Residual Nitrj.de Fuels
E. S. Bomar
The AEC Operations Office at Richland, Washington, was contacted for information on steps to recycle our plutonium-bearing scrap material resulting from the advanced fuels work. These scrap materials are in the form nf powder and pellets of both PuN and (U,Pu)N. Present regula-1.1 •).. «.ii handling pyrophoric materials, such as nitrides, are in an unsettled state but, if possible, the nitrides should be converted to a chemically stable form such as oxide prior to shipment.
36.
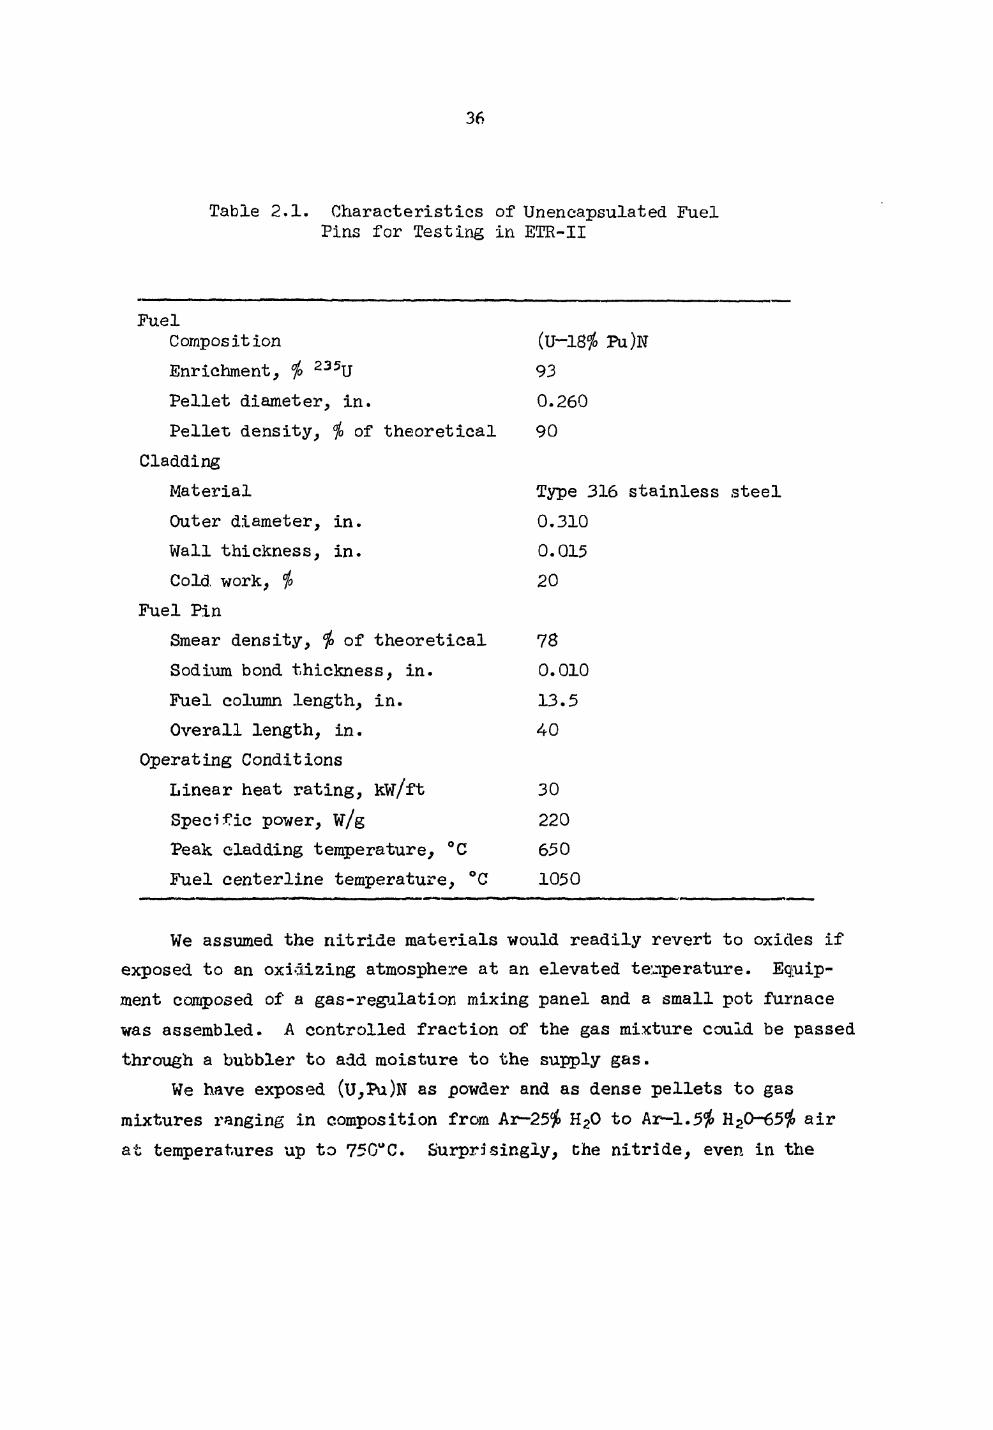
Table 2.1. Characteristics of Unencapsulated Fuel Pins for Testing in ETR-II
Fuel Composition Enrichment, $ 235U Pellet diameter, in. Pellet density, $ of theoretical
Cladding Material Outer diameter, in. Wall thickness, in. Cold work, i
Fuel Pin Smear density, $ of theoretical Sodium bond thickness, in. Fuel column length, in. Overall length, in.
Operating Conditions Linear heat rating, kw/ft Specific power, w/g Peak cladding temperature, °C Fuel centerline temperature, °C
(U-l8<?o PU)N 93 0.260 90
Type 316 stainless steel 0.310 0.Q15 20
78 0.010 13.5 40
30 220 650 1050
We assumed the nitride materials would readily revert to oxides if exposed to an oxidizing atmosphere at an elevated temperature. Equip-ment composed of a gas-regulation mixing panel and a small pot furnace was assembled. A controlled fraction of the gas mixture could be passed through a bubbler to add moisture to the supply gas.
We have exposed (U,Pu)N as powder and as dense pellets to gas mixtures ranging in composition from Ar-25# H20 to Ar-1.5$ H20-65# air at temperatures up to 750UC. Siirprisingly, the nitride, even in the
37.
form of powder, does not readily oxidize beyond a superficial degree on stepwise exposure to successively more oxidizing atmospheres.
A 30-g sample of powder oxidized to 2.6$ oxygen after incremental exposures totaling about 36 hr in Ar-2.5$ H20 followed by a similar period of exposure to Ai^-1.5$ H20-65$ air. The furnace temperature was increased in steps to a maximum of about 625°C.
A second powder charge weighing 110 g was loaded into the furnace and heated in contact with an Ar—20$ H20—172$ air atmosphere at tempera-tures to about 750°C. This material contained 0.9$ oxygen after 24 hr of treatment.
Although the fractional conversion was small the resulting powder was found to be nonpyrophoric during 11 days of exposure at room tempera-ture to air in a glove box. Samples from respectively the first and second conversion treatments gained 0.7 and 0.1$ by weight in the 11 days. A gain of this magnitude would be expected due to pickup of moisture.
The Richmond office agrees that a sufficiently stable material can be prepared by a treatment of the above type to permit shipment.
38.
3. DEVELOPMENT OF FBR NEUTRON-ABSORBER MATERIALS
G. M. Adamson, Jr. W. R. Martin R. G. Donnelly
The objective of our work is to characterize boron carbide suffi-ciently to provide measurable control parameters to properly evaluate fabrication techniques and the effects of irradiation. The irradiation studies will emphasize basic effects of materials variables in both thermal- and fast-reactor environments. A concurrent effort is to examine alternate absorber materials that are potentially better control materials for FBR service.
Boron Carbide
Phase Studies in the Boron-Carbon System (j. P. DeLuca)
This limited study of the boron-carbon phase diagram will help in the fabrication and characterization of boron carbide in several ways. By determining the true equilibrium binary system, one can determine at what level various impurities are important when considering various nuclear grade materials. This basic data will determine which boron-to-carbon ratios are expected to be stable, and also under what conditions these various ratios can be produced.
Progress was made this quarter on determining the binary phase diagram of the B-C system. Ten samples of various B/C ratios from 3.41 to 65.5 were annealed and examined by wet chemical analysis and x-rays.
The sample used to determine the B-C binary phase diagram were prepared from ultra-pure elemental boron and carbon.1 The material was analytically weighed and oblique blended for 1 hr. Pellets l/4 in. diam were prepared by pressing the blended powders in a boron carbide lined die at 40,000 psi. The initial weight of all the samples was 0.350 g.
1J. P. DeLuca, Fuels and Materials Development Program Quart. Progr. Rept. September 30, 1971, 0RNL-3550, p. 55.
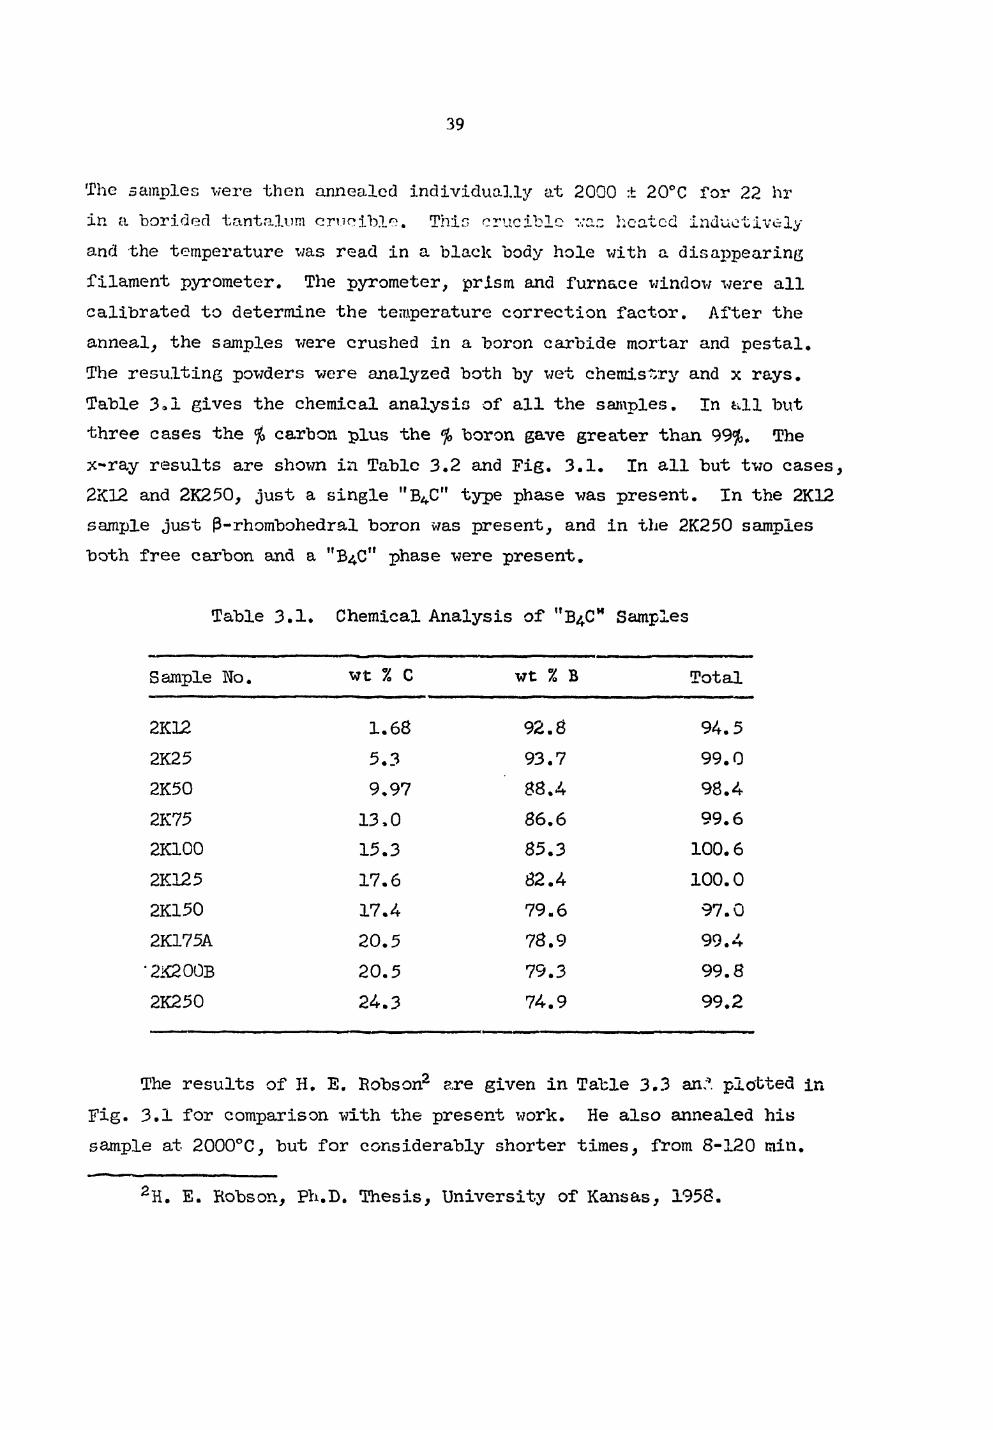
39.
The samples were then annealed individually at 2000 ± 20e,C for 22 hr in a borided tantalum crucible. Thin crucible vac heated inductively and the temperature was read in a black body hole with a disappearing filament pyrometer. The pyrometer, prism and furnace window were all calibrated to determine the temperature correction factor. After the anneal, the samples were crushed in a boron carbide mortar and pestal. The resulting powders were analyzed both by wet chemistry and x rays. Table 3.1 gives the chemical analysis of all the samples. In &11 but three cases the % carbon plus the % boron gave greater than 99$. The x-ray results are shorn in Tabic 3.2 and Fig. 3.1. In all but two cases, 2K12 and 2K250, just a single "B^C" type phase was present. In the 2K12 sample just P-rhombohedral boron was present, and in the 2K250 samples both free carbon and a UB4C" phase were present.
Table 3.1. Chemical Analysis of "B4CH Samples
Sample No. wt % C wt % B Total
2K12 1.68 92.8 94.5 2K25 5.3 93.7 99.0 2K50 9.97 88.4 98.4 2K75 13,0 86.6 99.6 2K100 15.3 85.3 100.6 2K125 17.6 82.4 100.0 2K150 17.4 79.6 97.0 2K175A 20.5 78.9 99.4 2K200B 20.5 79.3 99.8 2K250 24.3 74.9 99.2
The results of H. E. Hobs on2 are given in Table 3.3 an;' plotted in Fig. 3.1 for comparison with the present work. He also annealed his sample at 2000°C, but for considerably shorter times, from 8-120 rain.
aH. E. Bobson, Ph.D. Thesis, University of Kansas, 1958.
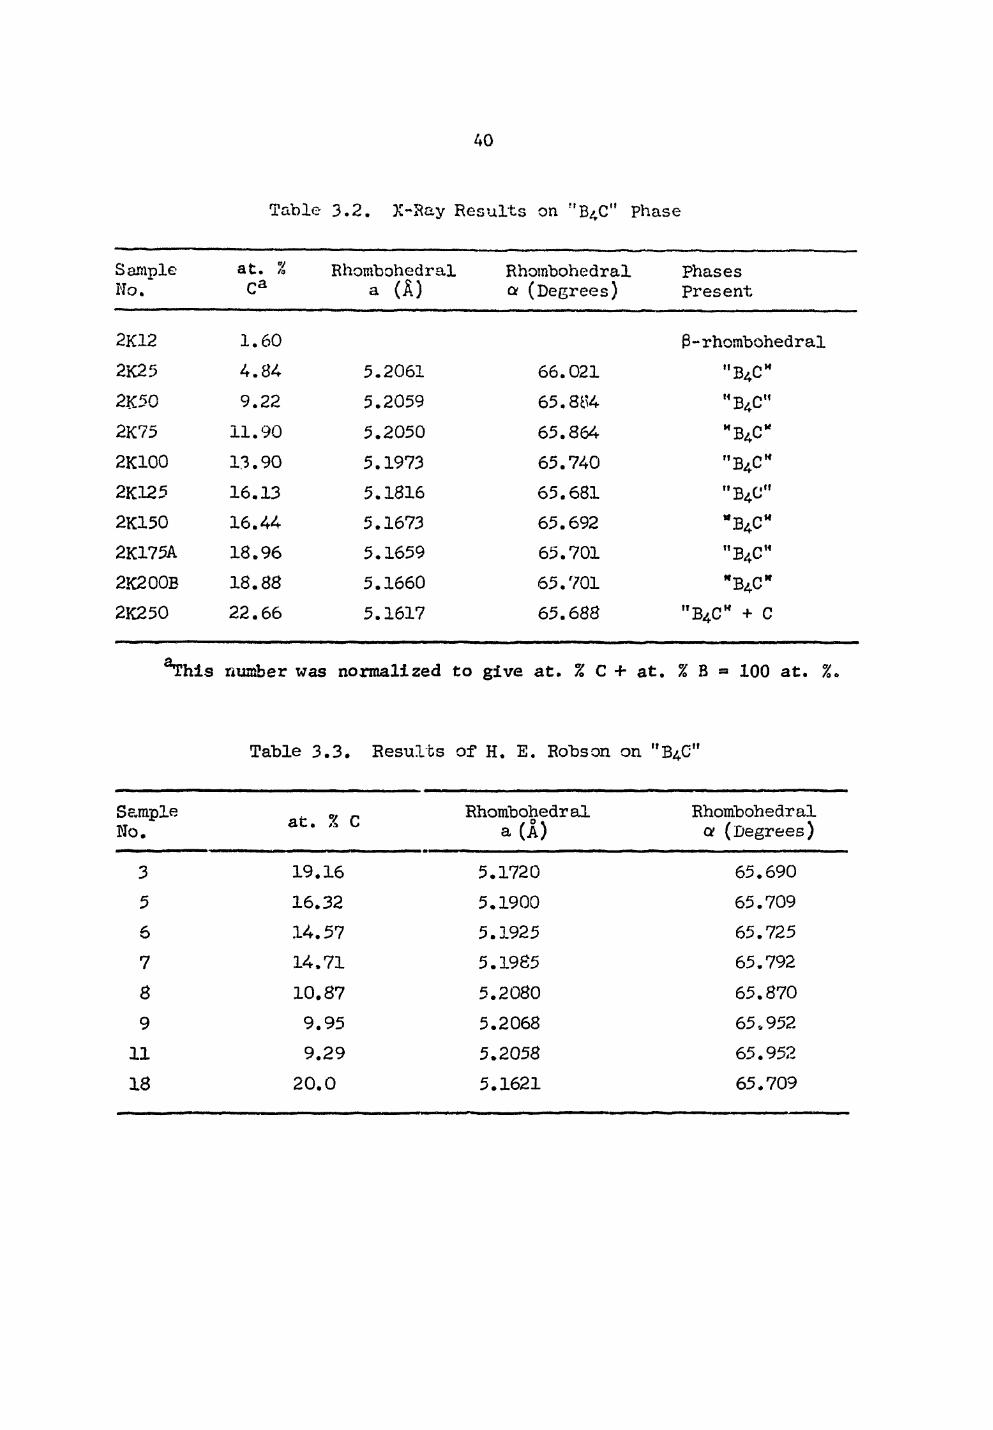
40.
Table 3.2. X-Ray Results on "B4C" Phase
Sample at. % Rhombohedral Rhombohedral Phases No. Ca a ( A ) ot (Degrees) Present
2 K 1 2 1 . 6 0 3-rhombohedral 2 K 2 5 4 . 8 4 5 . 2 0 6 1 6 6 . 0 2 1 " B 4 C M
2 K 5 0 9 . 2 2 5 . 2 0 5 9 6 5 . 8 I * 4 H B 4 C M
2 K 7 5 1 1 . 9 0 5 . 2 0 5 0 6 5 . 8 6 4 H B 4 C "
2 K 1 0 0 1 3 . 9 0 5 . 1 9 7 3 6 5 . 7 4 0 " B 4 C M
2K125 1 6 . 1 3 5 . 1 8 1 6 6 5 . 6 8 1 " B 4 C "
2 K 1 5 0 1 6 . 4 4 5 . 1 6 7 3 6 5 . 6 9 2 W B 4 C M
2 K 1 7 5 A 1 8 . 9 6 5 . 1 6 5 9 6 5 . 7 0 1 " B 4 C H
2 K 2 0 0 B 1 8 . 8 8 5 . 1 6 6 0 6 5 . 7 0 1 " B 4 C W
2 K 2 5 0 2 2 . 6 6 5 . 1 6 1 7 6 5 . 6 8 8 " B 4 C M + c
^his number was normalized to give at. % C + at . % B = 100 at. %.
Table 3 . 3 . Results of H. E. Robson on " B 4 C "
Sample No. at • « C Rhombohedral
a (I) Rhombohedral en (Degrees)
3 1 9 . 1 6 5 . 1 7 2 0 6 5 . 6 9 0
5 1 6 . 3 2 5 . 1 9 0 0 6 5 . 7 0 9
6 1 4 . 5 7 5 . 1 9 2 5 6 5 . 7 2 5
7 1 4 . 7 1 5 . 1 9 8 5 6 5 . 7 9 2
8 1 0 . 8 7 5 . 2 0 8 0 6 5 . 8 7 0
9 9 . 9 5 5 . 2 0 6 8 6 5 . 9 5 2
11 9 . 2 9 5 . 2 0 5 8 6 5 . 9 5 2
1 8 2 0 . 0 5 . 1 6 2 1 6 5 . 7 0 9
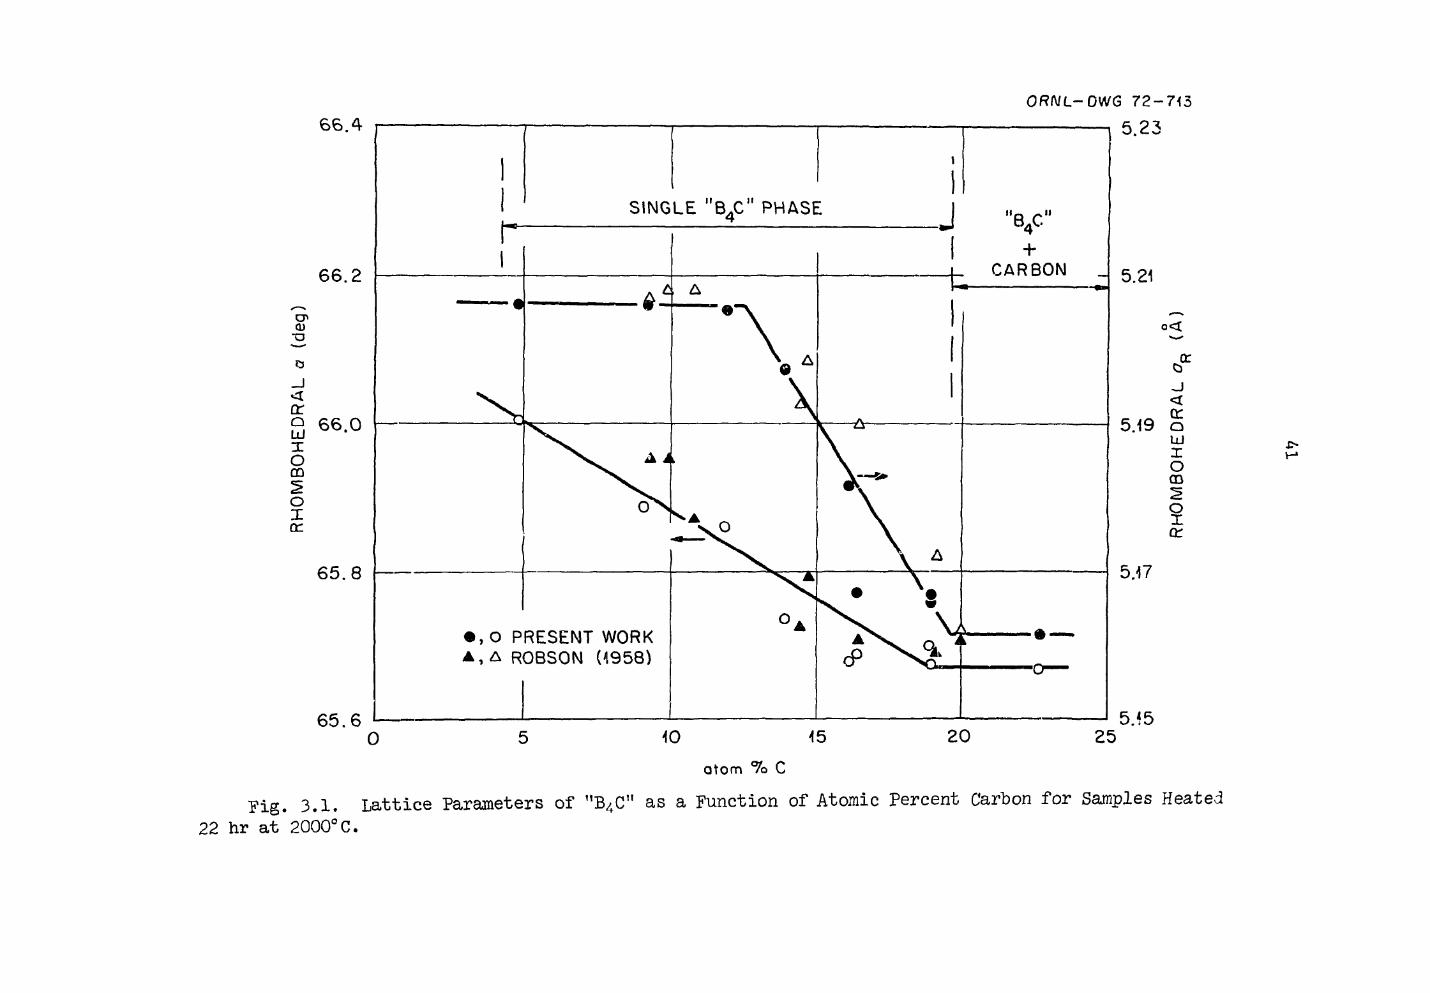
6 6 . 4 ORNL-OWG 72 — 715
5 . 2 3
6 5 . 6
Fig. 3.1. Lattice Parameters of MB4C" as a Function of Atomic Percent Carbon for Samples Heated 22 hr at 2000°C.
42.
The agreement between Robson1s work and the present work is remarkably-good. However, it was found in tliis work that annealing times as long as six hours did not give good results as indicated by B^C, B, and C. All being present in the x-ray pattern.
From Fig. 3.1 it appears as though the single phase field of nB4CM
extends from approximately 20 at. $ C to somewhere between 1.6 to 4.84 at. $ C. This is considerably wider than previously reported.3>^ More work needs to be done before the exact lower limit of the homogeneity range is fixed.
Irradiation Behavior of Boron Carbide
Nuclear Magnetic Resonance Spectrum of 7Li in Irradiated Boron Carbide (BC-8) (R. A. Tv7eeks)
In addition to disruption of the structure by fast neutrons two impurities, 7Li and 4He, which are the result of the reaction 10B(n,a)7Lij are also introduced when boron carbide is irradiated in a fission reactor. Both particles leave the 10B site at which a reaction takes place with sufficient energy to escape the site (assuming that a displacement energy of >24 eV is required). Examination of samples irradiated with 1021 neutrons cm"2 at an ambient temperature of 730°C, using various techniques including x-ray diffraction and scanning electron microscopy, has shown that a small distortion of the rhombohedral unit cell occurs and defects appear. Wo evidence of precipitated phases has been detected. Presumably 7Li occupies, randomly, interstitial sites in the structure.
3R. T. Dolloff, Research Study to Determine the Phase Equilibrium Relations of Selected Metal Carbides at High Temperatures, WAPD Tech. Rept., 60-143, pp. 12-14 (1960).
4R. P. Elliott, The Boron-Carbon System, ARF-2200-12 (1963).
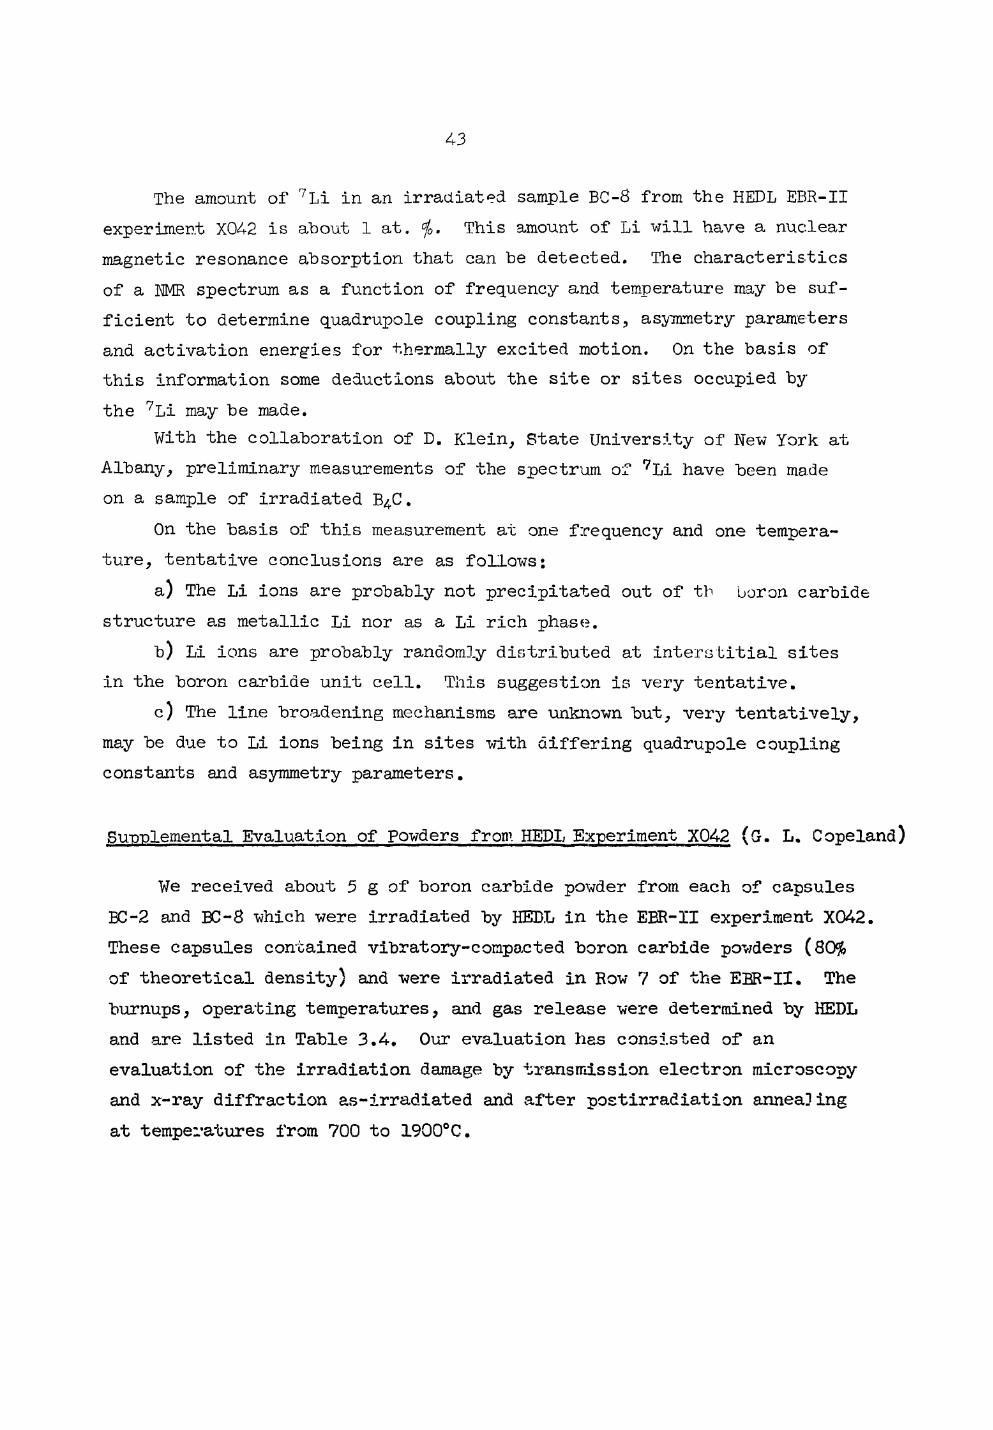
43.
The amount of 7Li in an irradiated sample BC-S from the HEDL EBR-II experiment X042 is about 1 at. This amount of Li will have a nuclear magnetic resonance absorption that can be detected. The characteristics of a NMR spectrum as a function of frequency and temperature may be suf-ficient to determine quadrupole coupling constants, asymmetry parameters and activation energies for thermally excited motion. On the basis of this information some deductions about the site or sites occupied by the 7Li may be made.
With the collaboration of D. Klein, State University of New York at Albany, preliminary measurements of the spectrum of 7Li have "been made on a sample of irradiated B4C.
On the basis of this measurement at one frequency and one tempera-ture, tentative conclusions are as follows:
a) The Li ions are probably not precipitated out of th boron carbide structure as metallic Li nor as a Li rich phase.
b) Li ions are probably randomly distributed at interstitial sites in the boron carbide unit cell. This suggestion is very tentative.
c) The line broadening mechanisms are unknown but, very tentatively, may be due to Li ions being in sites with differing quadrupole coupling constants and asymmetry parameters.
Supplemental Evaluation of Powders from HEDL Experiment XQ42 (G. L. Copeland)
We received about 5 g of boron carbide powder from each of capsules BC-2 and BC-8 which were irradiated by HEDL in the EBR-II experiment X042. These capsules contained vibratory-compacted boron carbide powders (80%
of theoretical density) and were irradiated in Row 7 of the EBR-II. The burnups, operating temperatures, and gas release were determined by HEDL and are listed in Table 3.4. Our evaluation has consisted of an evaluation of the irradiation damage by transmission electron microscopy and x-ray diffraction as-irradiated and after postirradiation annealing at temperatures from 700 to 1900°C.
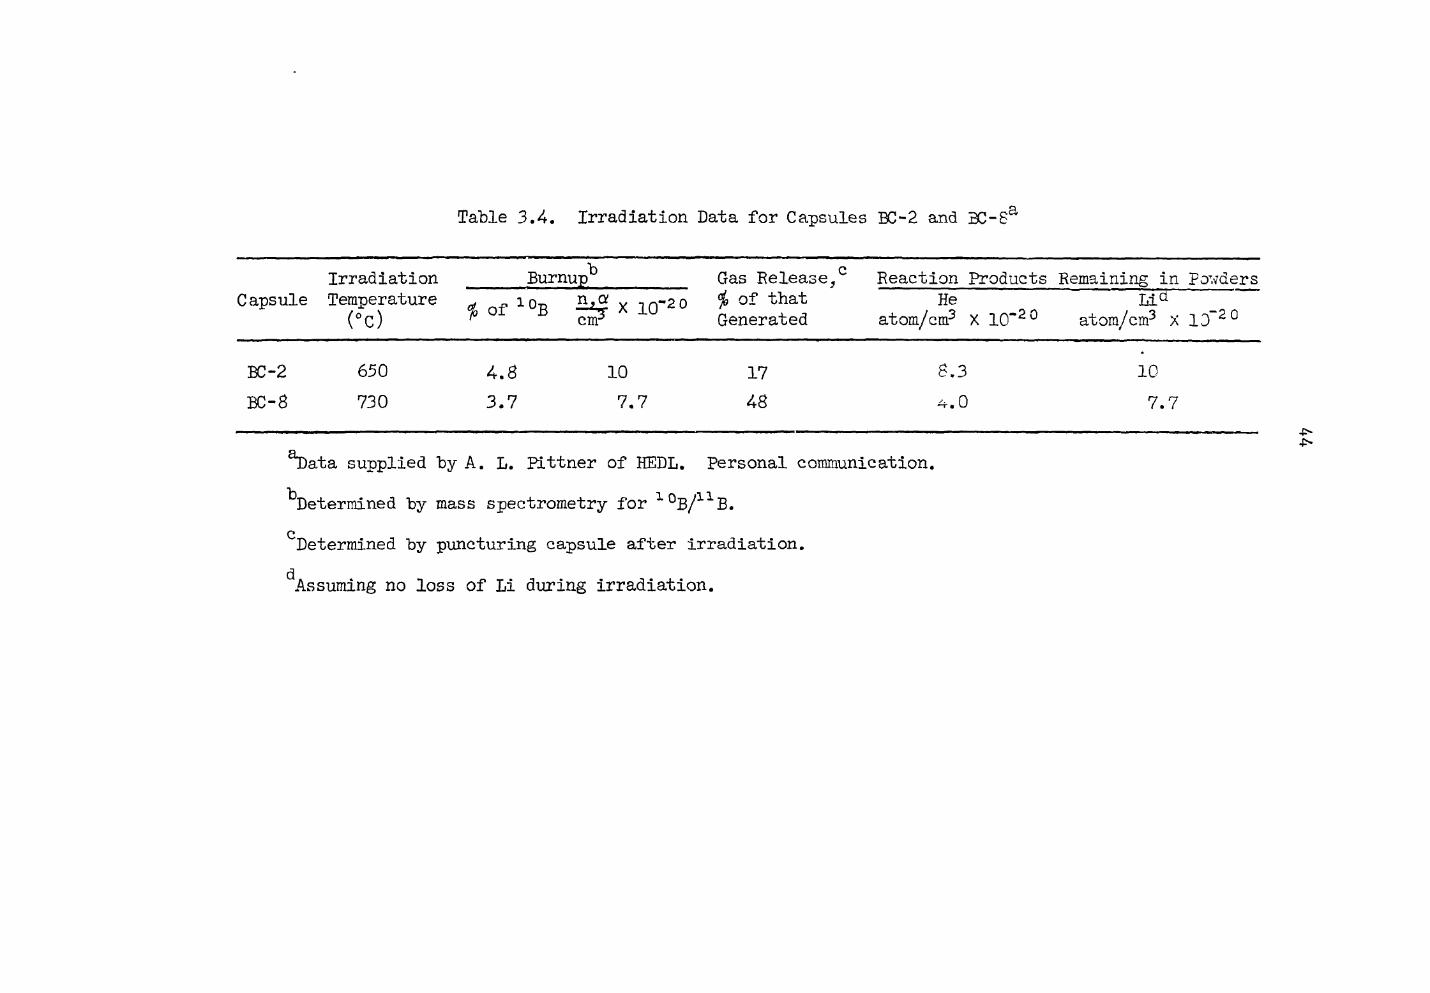
Table 3.4. Irradiation Data for Capsules BC-2 and 3>S a
Irradiation Burnup13 Gas Release,0 Reaction Products Remaining in Powders Capsule Temperature
(°c) $ of 1 °B ^ X ^ cm-3 10"2 0 $ of that Generated
He atom/cm3 X 10~20
Lid atom/cm3 X 13~20
BC-2 650 4.8 10 17 8.3 10 BC-8 730 3.7 7. 7 48 *-r . 0 7.7
^ata supplied "by A. L. Pittner of HEDL. Personal communication.
^Determined by mass spectrometry for 1°B/11B. c
Determined by puncturing capsule after irradiation.
Assuming no loss of Li during irradiation.
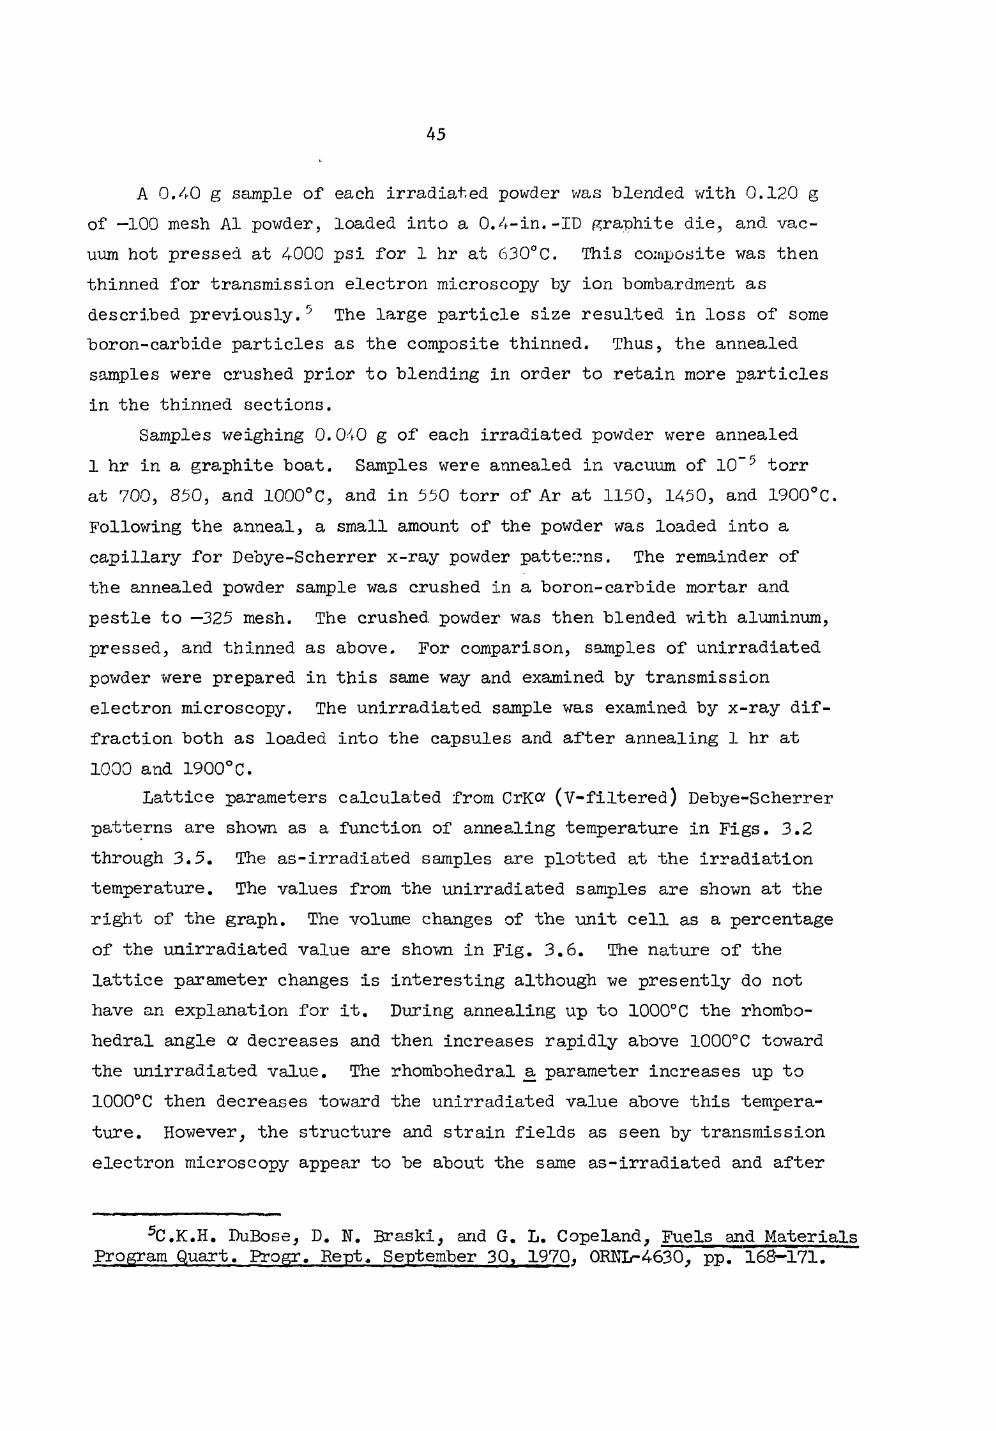
45.
A 0.40 g sample of each irradiated powder was blended with 0.120 g of —100 mesh Al powder, loaded into a 0.4-in.-ID graphite die, and. vac-uum hot pressed at 4000 psi for 1 hr at 630°C. This composite was then thinned for transmission electron microscopy by ion bombardment as described previously.5 The large particle size resulted in loss of some boron-carbide particles as the composite thinned. Thus, the annealed samples were crushed prior to blending in order to retain more particles in the thinned sections.
Samples weighing 0.040 g of each irradiated powder were annealed 1 hr in a graphite boat. Samples were annealed in vacuum of 10"5 torr at 700, 850, and 1000°C, and in 550 torr of Ar at 1150, 1450, and 1900°C. Following the anneal, a small amount of the powder was loaded into a capillary for Debye-Scherrer x-ray powder patterns. The remainder of the annealed powder sample was crushed in a boron-carbide mortar and pestle to —325 mesh. The crushed powder was then blended with aluminum, pressed, and thinned as above. For comparison, samples of unirradiated powder were prepared in this same way and examined by transmission electron microscopy. The unirradiated sample was examined by x-ray dif-fraction both as loaded into the capsules and after annealing 1 hr at 1000 and 1900°C.
Lattice parameters calculated from CrKa (V-filtered) Debye-Scherrer patterns are shown as a function of annealing temperature in Figs. 3.2 through 3.5. The as-irradiated samples are plotted at the irradiation temperature. The values from the unirradiated samples are shown at the right of the graph. The volume changes of the unit cell as a percentage of the unirradiated value are shown in Fig. 3.6. The nature of the lattice parameter changes is interesting although we presently do not have an explanation for it. During annealing up to 1000°C the rhombo-hedral angle or decreases and then increases rapidly above 1000°C toward the unirradiated value. The rhombohedral a parameter increases up to 1000°C then decreases toward the unirradiated value above this tempera-ture. However, the structure and strain fields as seen by transmission electron microscopy appear to be about the same as-irradiated and after
5C .K.H. DuBose, D. N. Braski, and G. L. Copeland, Fuels and Materials Program Quart. Progr. Kept. September 30, 1970, 0RW]>4630, pp. 168-171.
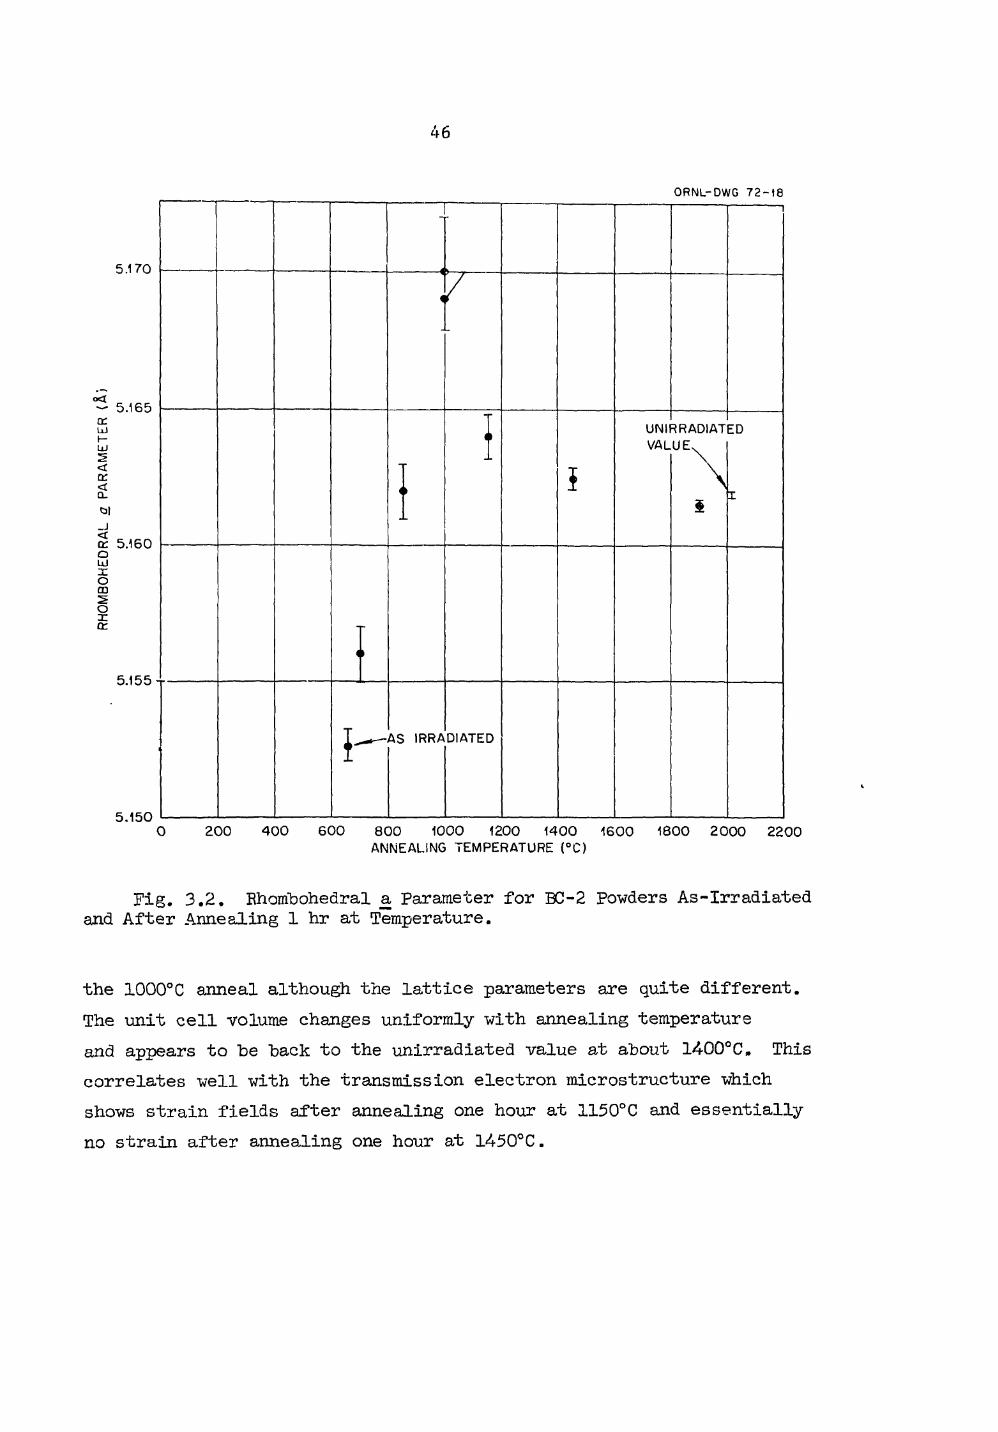
46
ORNL-DWG 7 2 - 1 8
5 . 1 7 0
5.165
5.160
5.155 t -
I
V
-AS IRRADIATED
5.150
i
UNIRRADIATED VALUE.
\ $
200 400 600 800 1000 1200 1400 ANNEALING TEMPERATURE ( °C )
1600 1800 2000 2200
Fig. 3.2. Rhombohedral a Parameter for BC-2 Povders As-Irradiated and After Annealing 1 hr at Temperature.
the 1000°C anneal although the lattice parameters are quite different. The unit cell volume changes uniformly with annealing temperature and appears to be back to the unirradiated value at about 1400°C, This correlates well with the transmission electron microstructure which shows strain fields after annealing one hour at 1150°C and essentially no strain after annealing one hour at 1450°C.
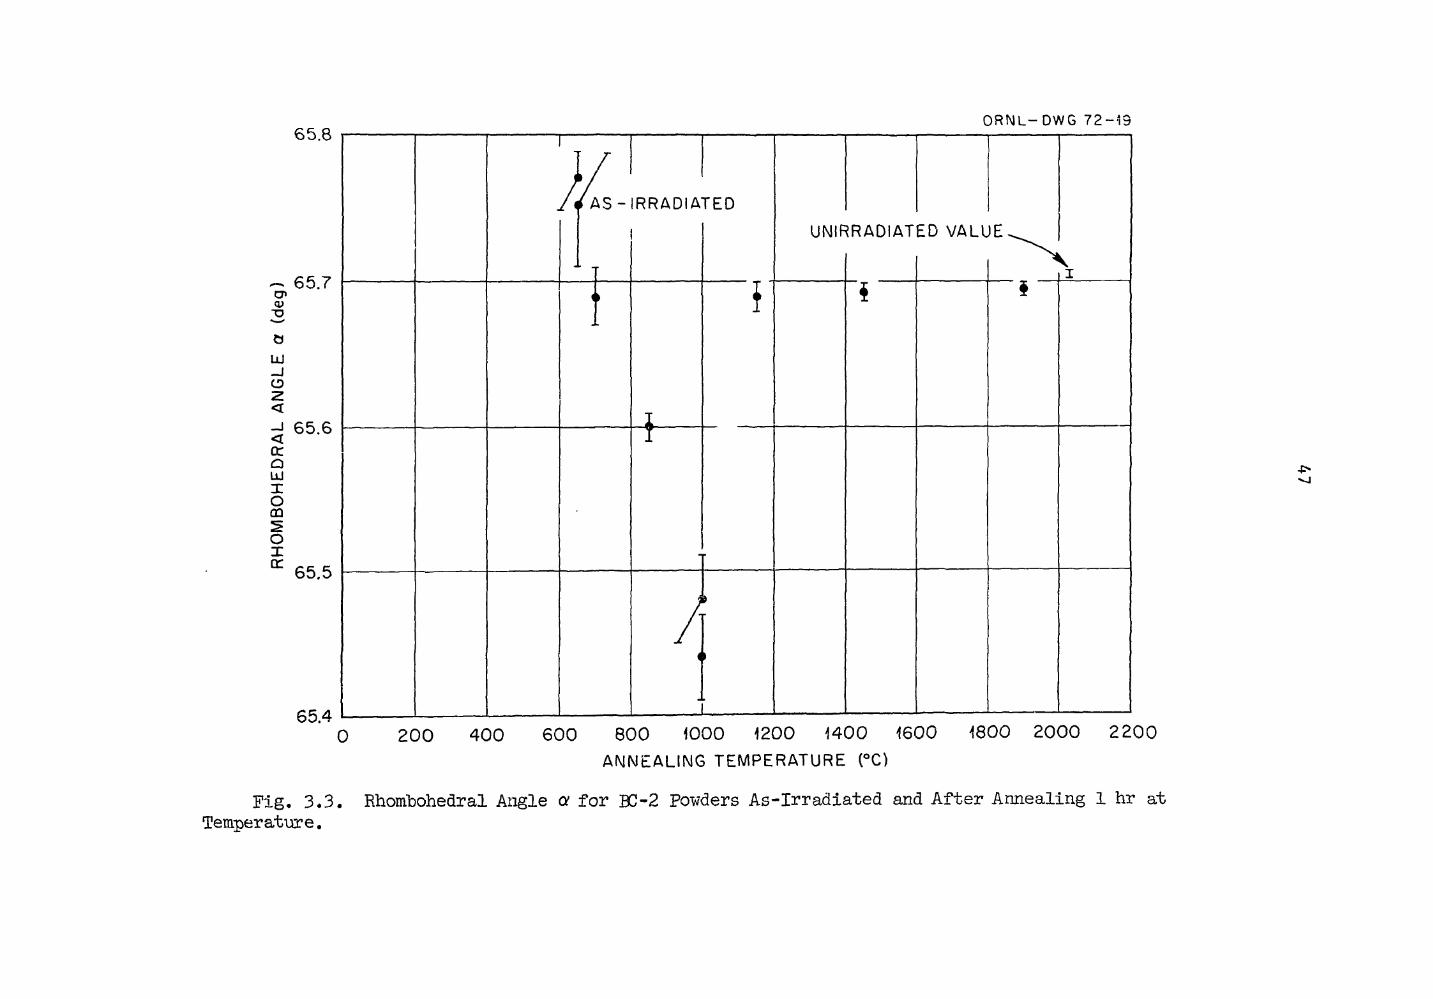
65.8
~ 6 5 . 7 CT> <D
o UJ -J 0 < -J 6 5 . 6 < cc Q UJ 1 O CD O 5 6 5 . 5
6 5 . 4 0
O R N L - DWG 7 2 - 1 3
A S - I R R A D I A T E D
i
I
U N I R R A D I A T E D V A L U E
A
200 400 600 800 1000 1200 1400 16 00 A N N E A L I N G T E M P E R A T U R E ( °C)
4800 2000 2200
Fig. 3.3. Rhombohedral Angle a for BC-2 Powders As-Irradiated and After Annealing 1 hr at Temperature.
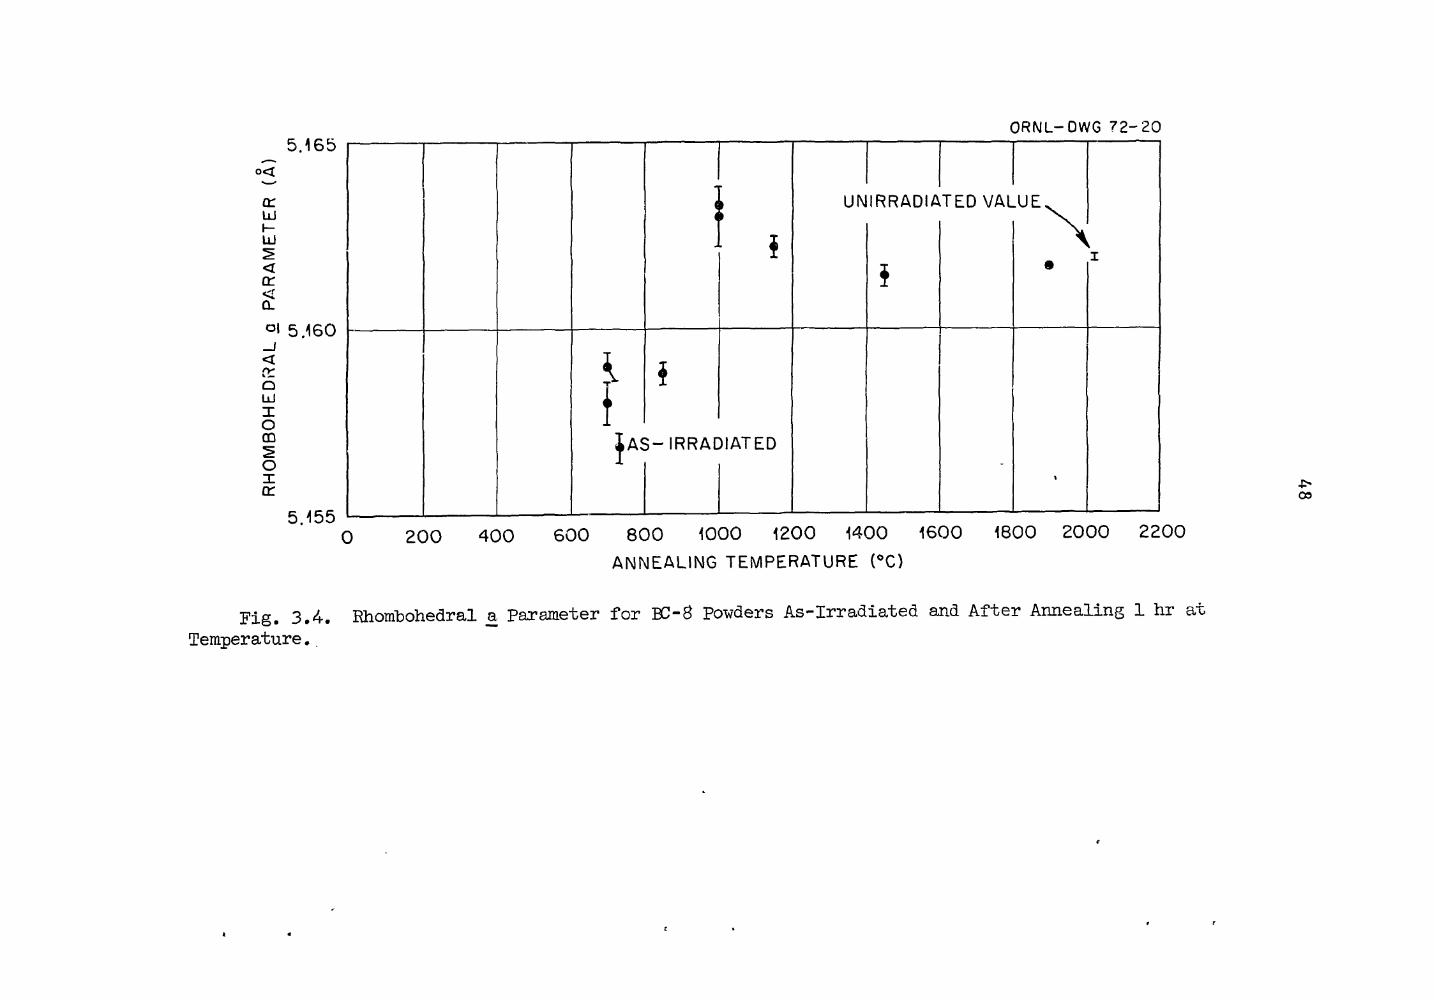
5.165 ORNL-OWG 72-20
0<
en LLJ
UJ <
en < OL
5 / 6 0
Q LLJ I o CD S O X DC
5.155
i
\ i
I
} A S - I R R A D I A T E D
U N I R R A D I A T E D V A L U E ,
i
0 2 0 0 4 0 0 6 0 0 8 0 0 1000 1200 1400 1600 1800 2 0 0 0 2 2 0 0
A N N E A L I N G T E M P E R A T U R E ( ° C )
Fig. 3.4. Rhonibohedral a Parameter for BC-8 Powders As-Irradiated and After Annealing 1 hr Temperature.
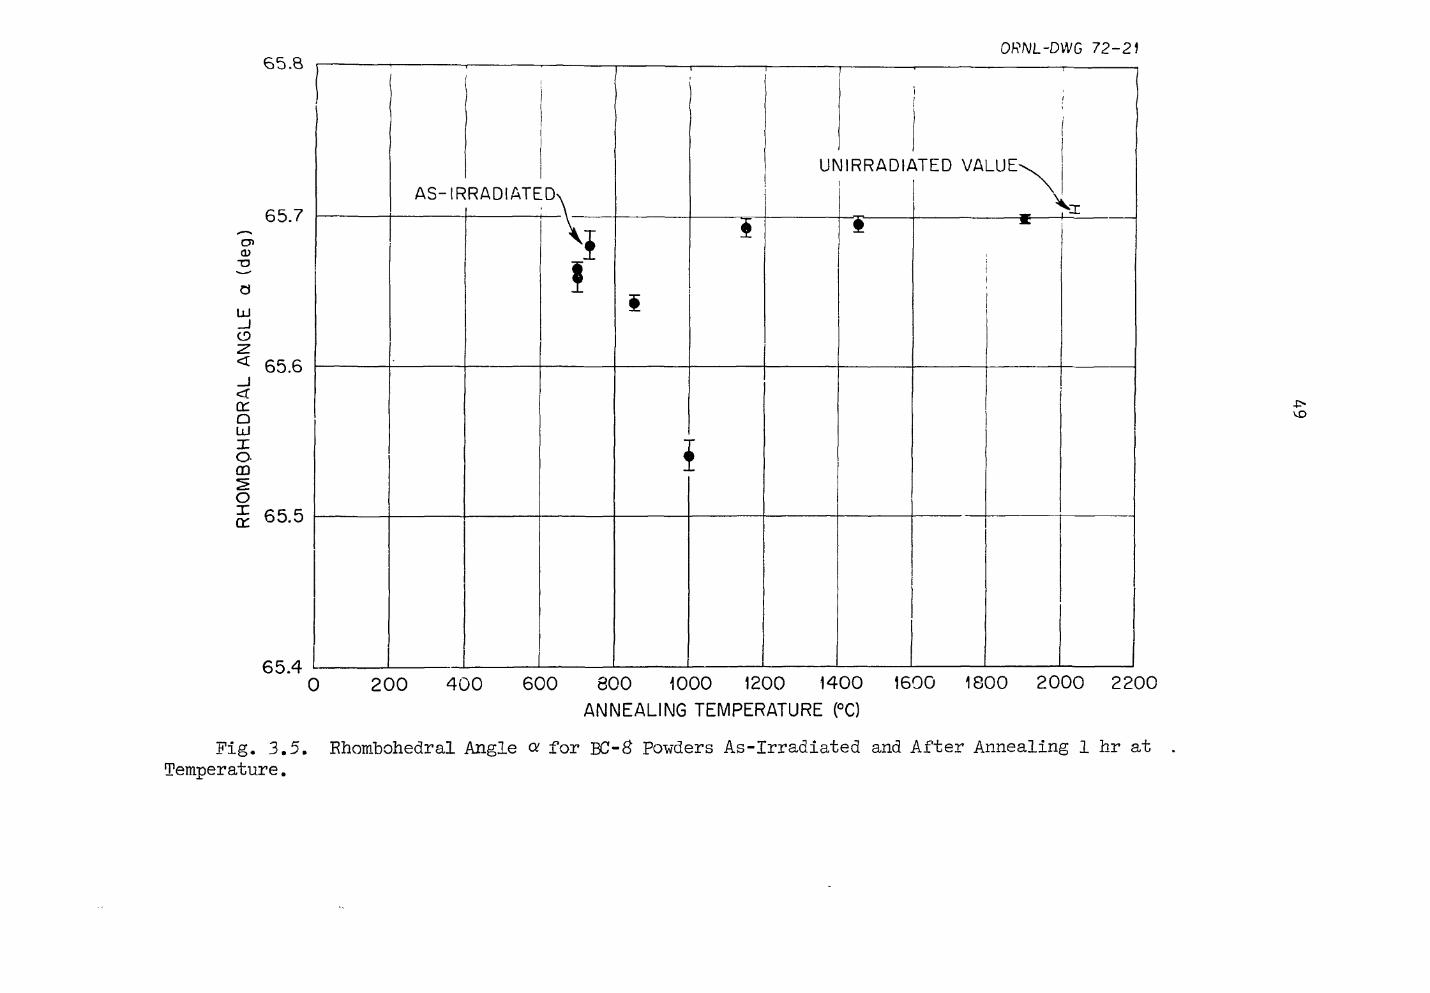
65.8 DRNL-DVUG 72-2J
65.7 cn CD
"O
LLJ _ J O
•Z. < 65.6 < cc o L J X o CD
O X cr 65.5
65.4
AS- IR
t
RADIATE
i i
Ul JIRRADI/
i i
tTED VALUE^^
1
1
! I
i i K
! i
0 200 400 600 800 1000 1200 1400 1600 1800 2000 2200 A N N E A L I N G T E M P E R A T U R E (°C)
Fig. 3.5. Rhombohedral Angle or for BC-£ Powders As-Irradiated and After Annealing 1 hr at Temperature.
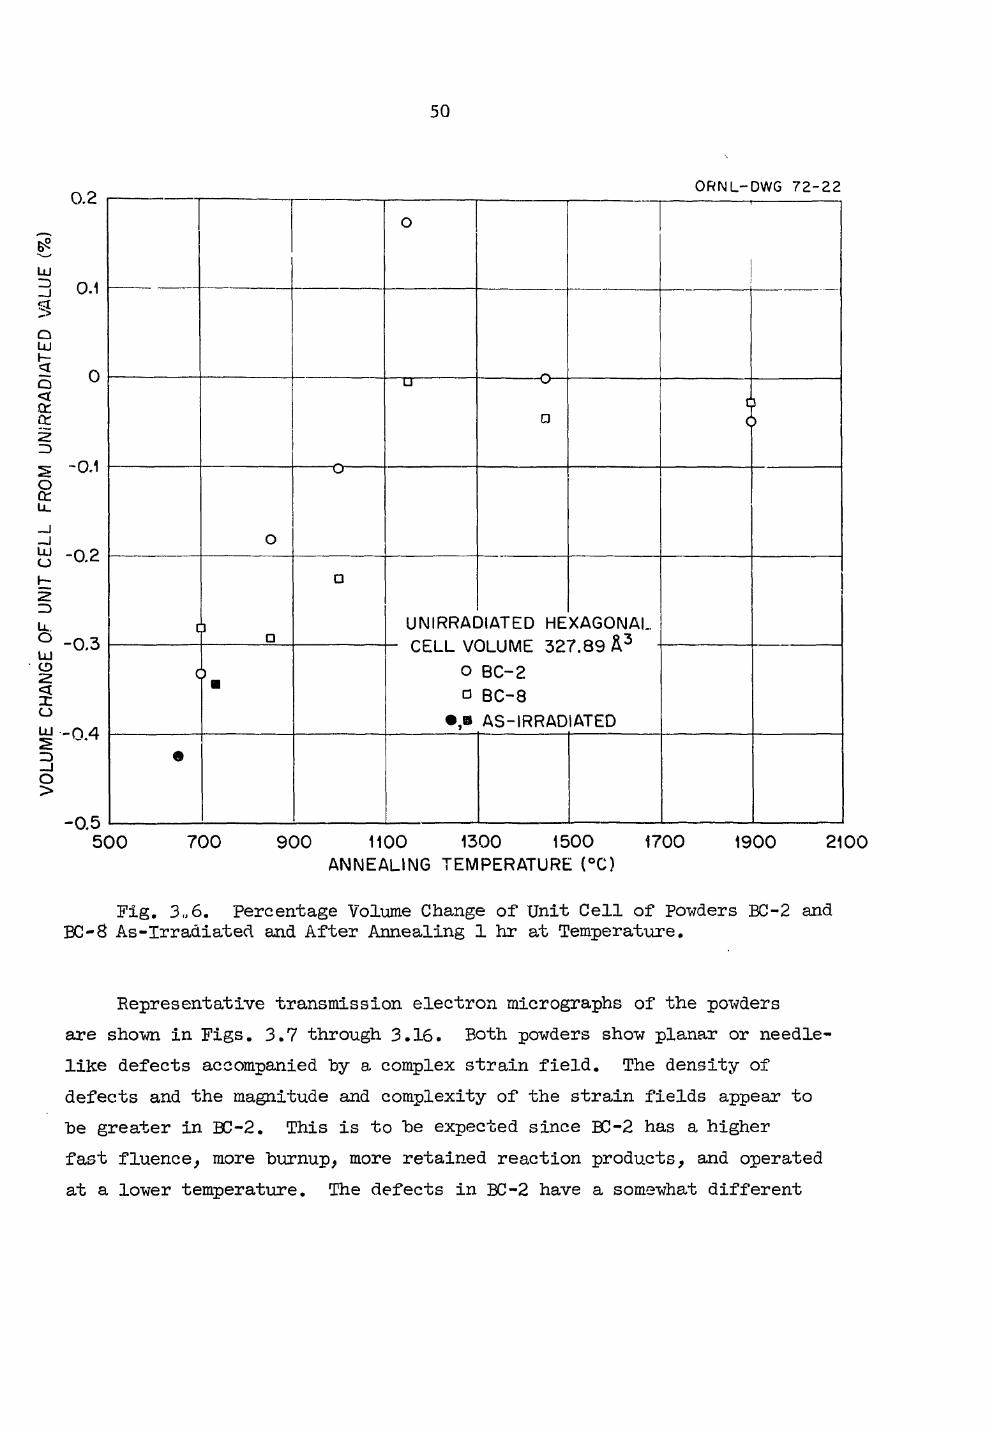
50
0.2 ORNL-DWG 7 2 - 2 2
g LU ZD - J % O LU
0.1
£ 0 2 o < a: cc
o en u.
UJ o
u . o UJ CD <t X o
-0.1
-0.2
- 0 . 3
w - 0 . 4 ID O >
- 0 . 5 5 0 0
o ,
!
U L> • 3
o
o
c ] 1 D
•
UNIRRAt r* r-1 | \ ii
3IATED HE DLUME 32 BC-2 BC-8 AS-IRRAD
XAG0NAL 7.89 & 3 •
ATED
c } •
CLLL VI 0 •
3IATED HE DLUME 32 BC-2 BC-8 AS-IRRAD
XAG0NAL 7.89 & 3 •
ATED
9
7 0 0 9 0 0 1100 1300 1500 1700 1900 2100 ANNEALING TEMPERATURE (°C)
Fig. 3,6. Percentage Volume Change of Unit Cell of Powders BC-2 and BC-8 As-Irradiatecl and After Annealing 1 hr at Temperature.
Representative transmission electron micrographs of the powders are shown in Figs. 3.7 through 3.16. Both powders show planar or needle-like defects accompanied hy a complex strain field. The density of defects and the magnitude and complexity of the strain fields appear to he greater in BC-2. This is to be expected since BC-2 has a higher fast fluence, more burnup, more retained reaction products, and operated at a lower temperature. The defects in BC-2 have a somewhat different
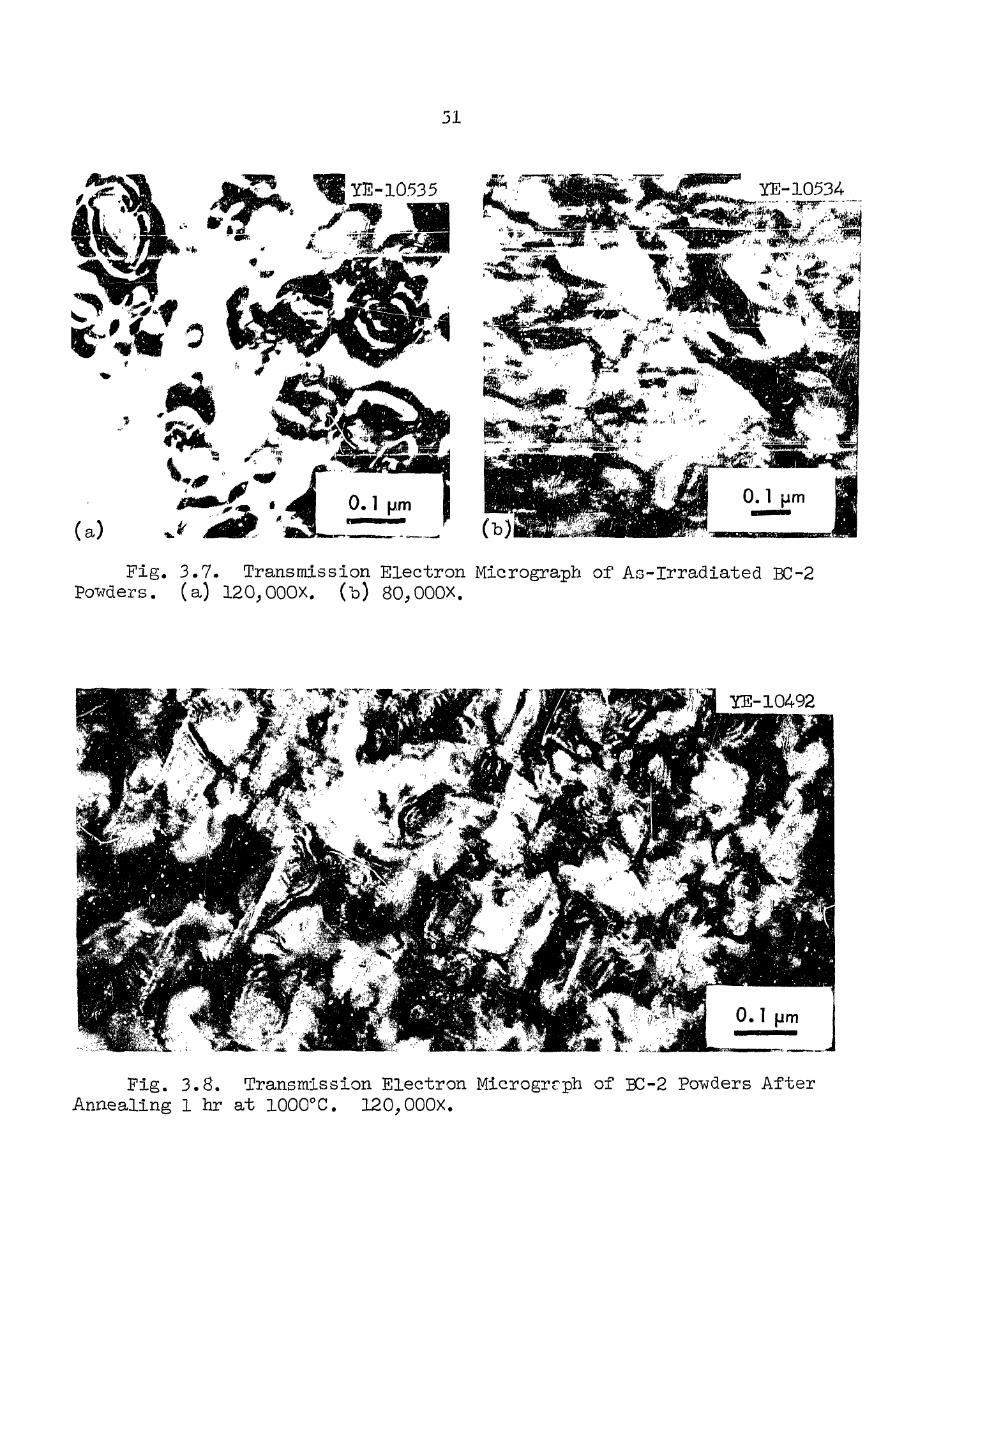
51.
Fig. 3.7. Transmission Electron Micrograph of As-Irradiated BC-2 Powders. (a) 120,000x. (b) BO^OOOX.
Fig. 3.8. Transmission Electron Microgrcph of BC-2 Powders After Annealing 1 hr at 1000°C. 120,000X.
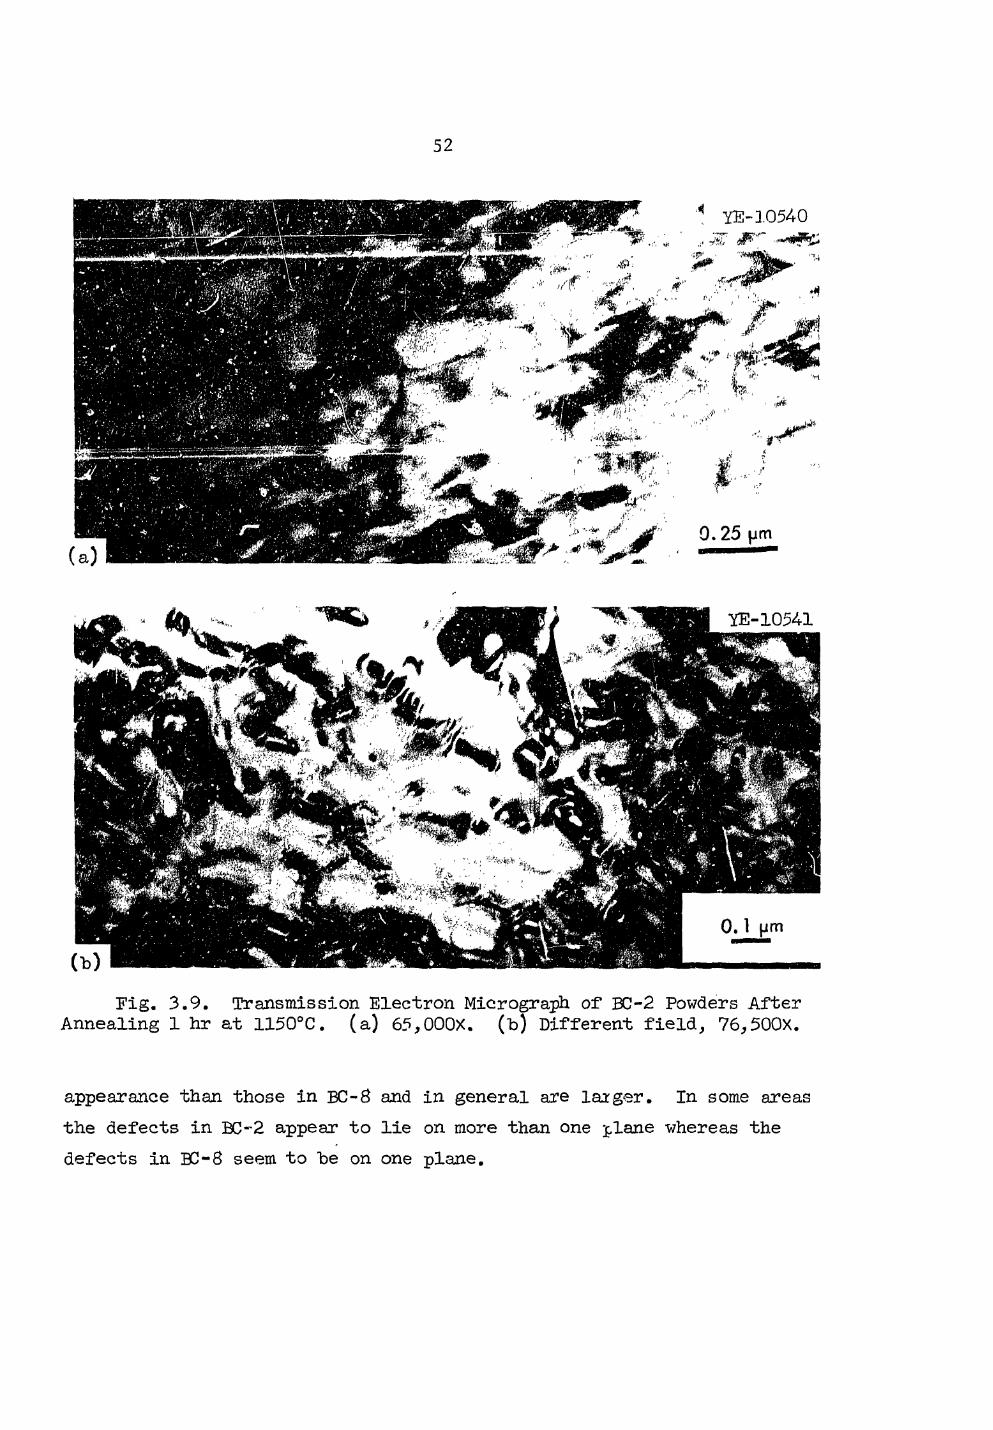
52.
Fig. 3.9. Transmission Electron Micrograph of BC-2 Powders After Annealing 1 hr at 1150°C. (a) 65,000X. (b) Different field, 76 ,500x.
appearance than those in BC-8 and in general are larger. In some areas the defects in BC-2 appear to lie on more than one j,lane whereas the defects in BC-8 seem to be on one plane.
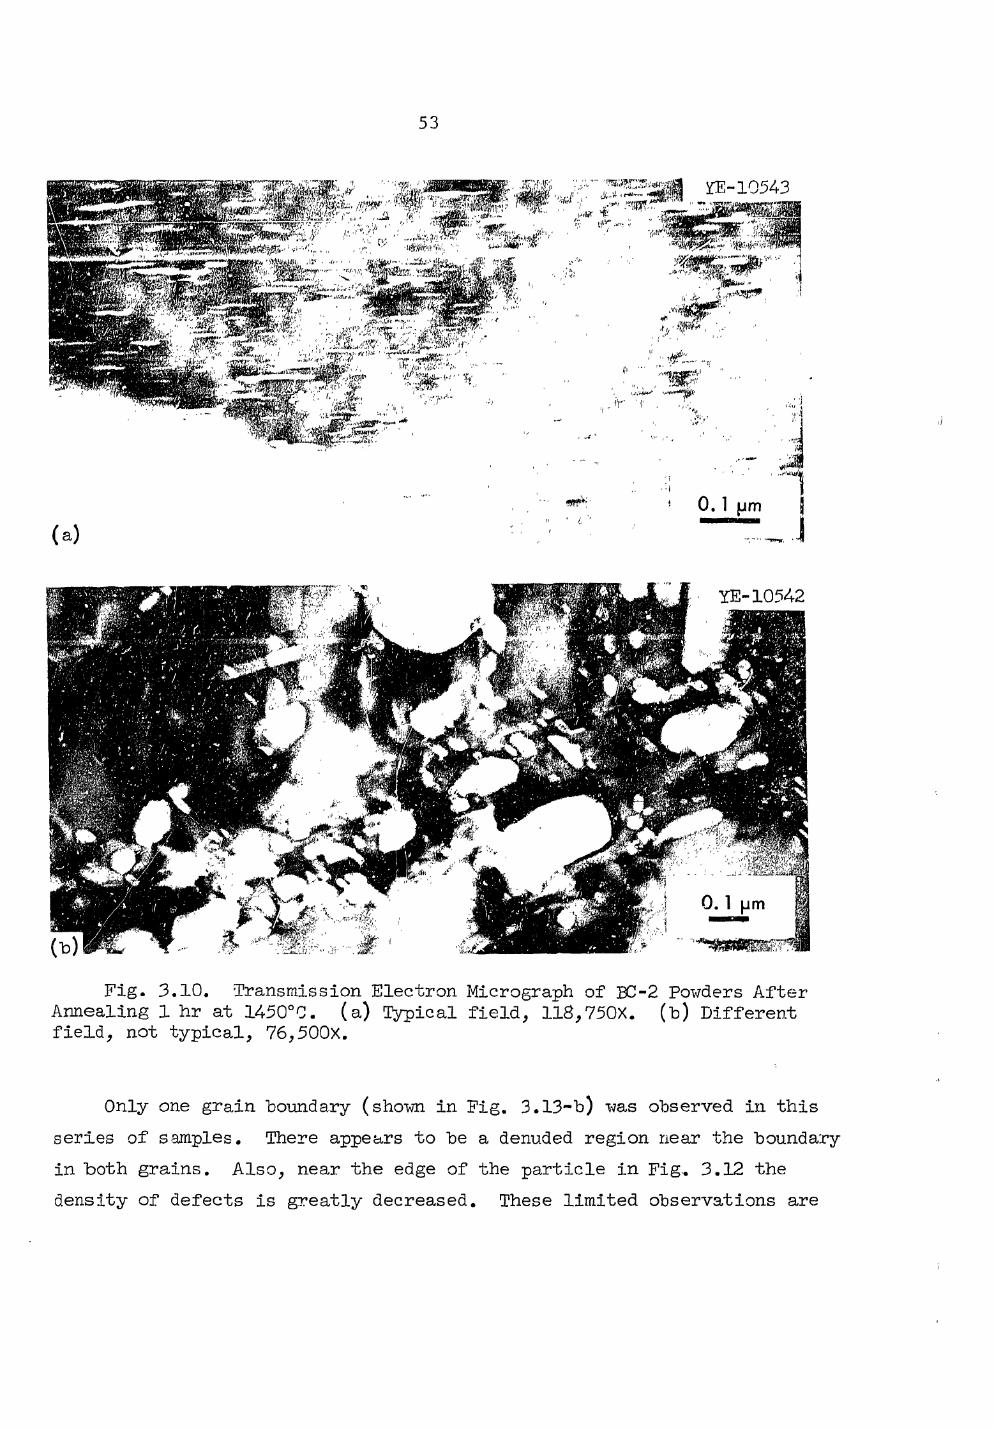
53.
Fig. 3.10. Transmission Electron Micrograph of BC-2 Powders After Annealing 1 hr at 1450°C. (a) Topical field, 118,750X. (b) Different field, not typical, 76,500x.
Only one grain boundary (shown in Fig. 3.13-b) was observed in this series of samples. There appears to be a denuded region near the boundary in both grains. Also, near the edge of the particle in Fig. 3.12 the density of defects is greatly decreased. These limited observations are
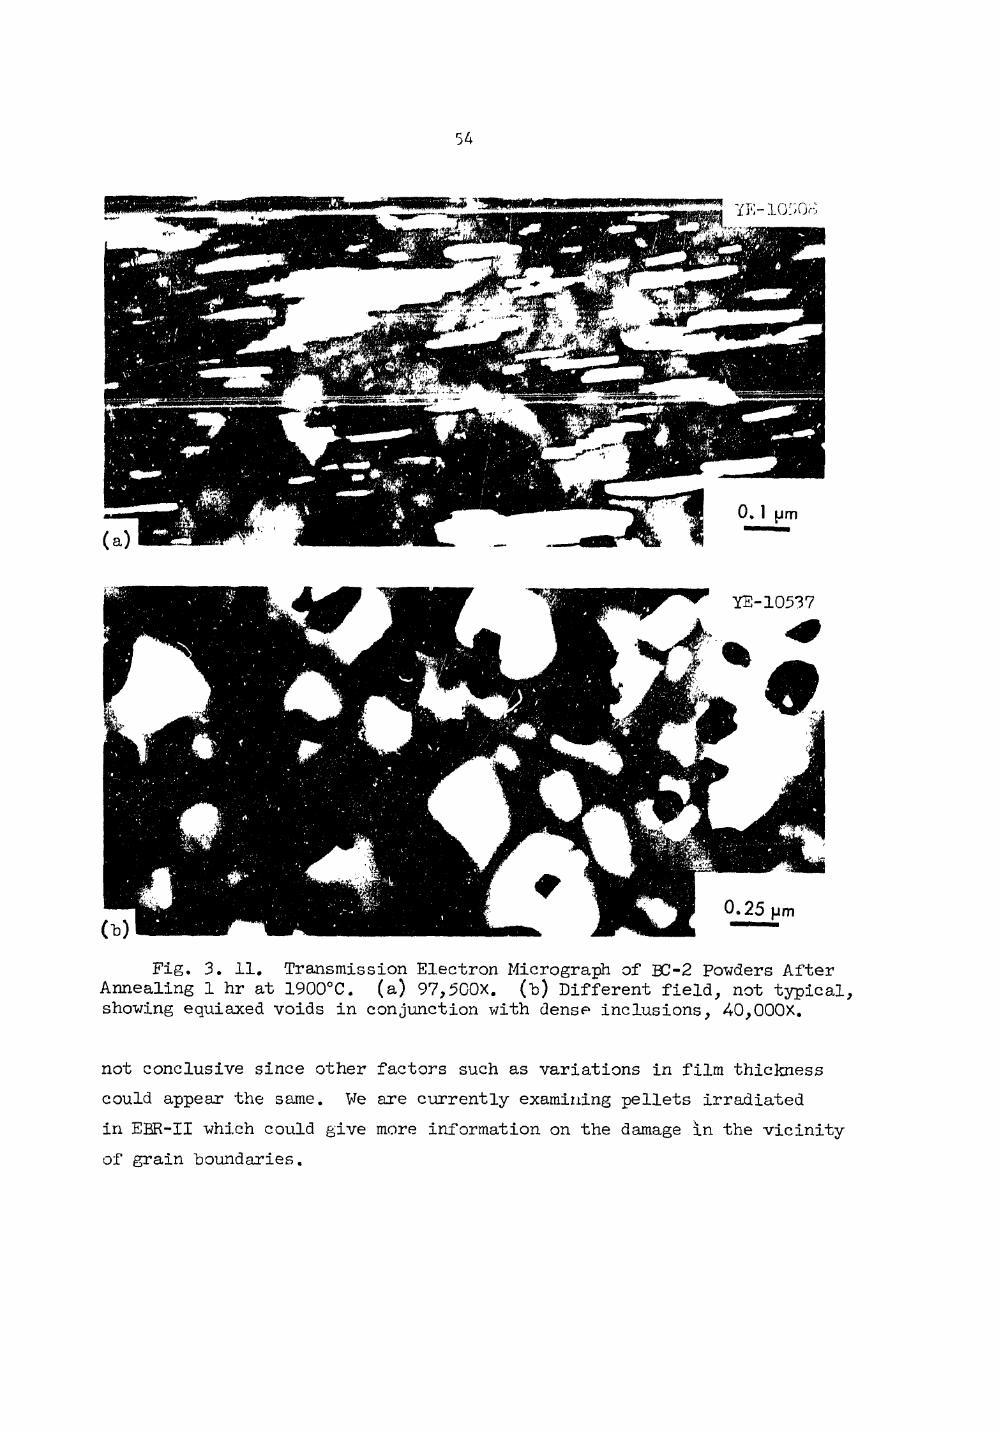
54.
Fig. 3. 11. Transmission Electron Micrograph of BC-2 Powders After Annealing 1 hr at 1900°C. (a) 97,5C0X. (h) Different field, not typical, showing equiaxed voids in conjunction with dense inclusions, 40,000X.
not conclusive since other factors such as variations in film thickness could appear the same. Ve are currently examining pellets irradiated in EBR-II which could give more information on the damage in the vicinity of grain "boundaries.
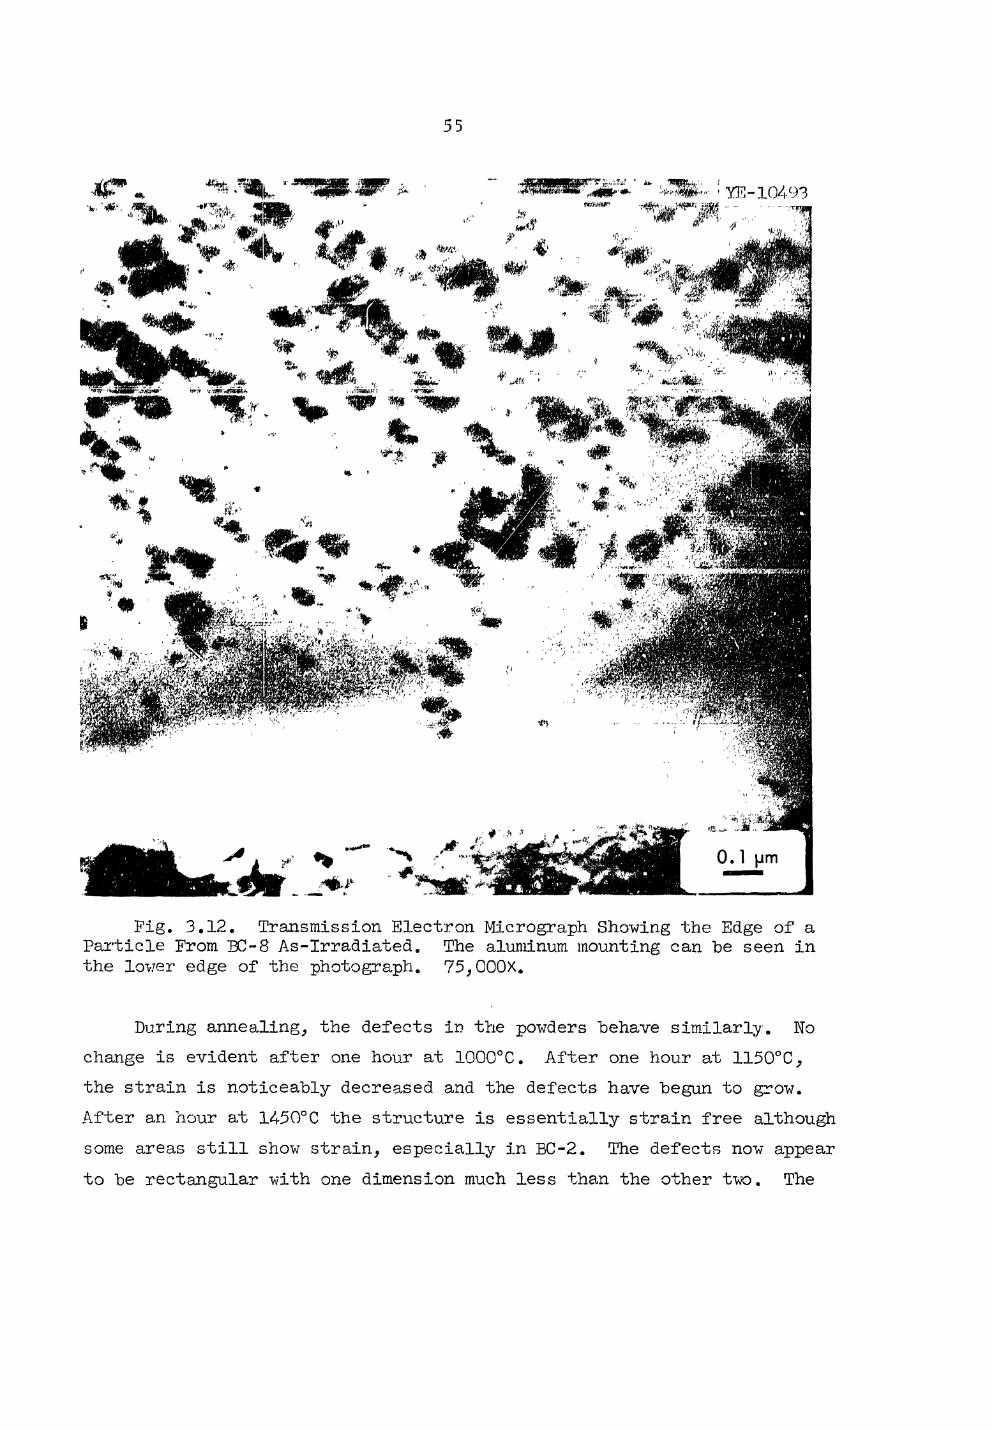
55.
Fig. 3.12. Transmission Electron Micrograph Showing the Edge of a Particle From BC-8 As-Irradiated. The aluminum mounting can he seen in the lower edge of the photograph. 75,000X.
During annealing, the defects in the powders behave similarly. No change is evident after one hour at 1000°C. After one hour at 1150°C, the strain is noticeably decreased and the defects have begun to grow. After an hour at 1450°C the structure is essentially strain free although some areas still show strain, especially in BC-2. The defects now appear to be rectangular with one dimension much less than the other two. The
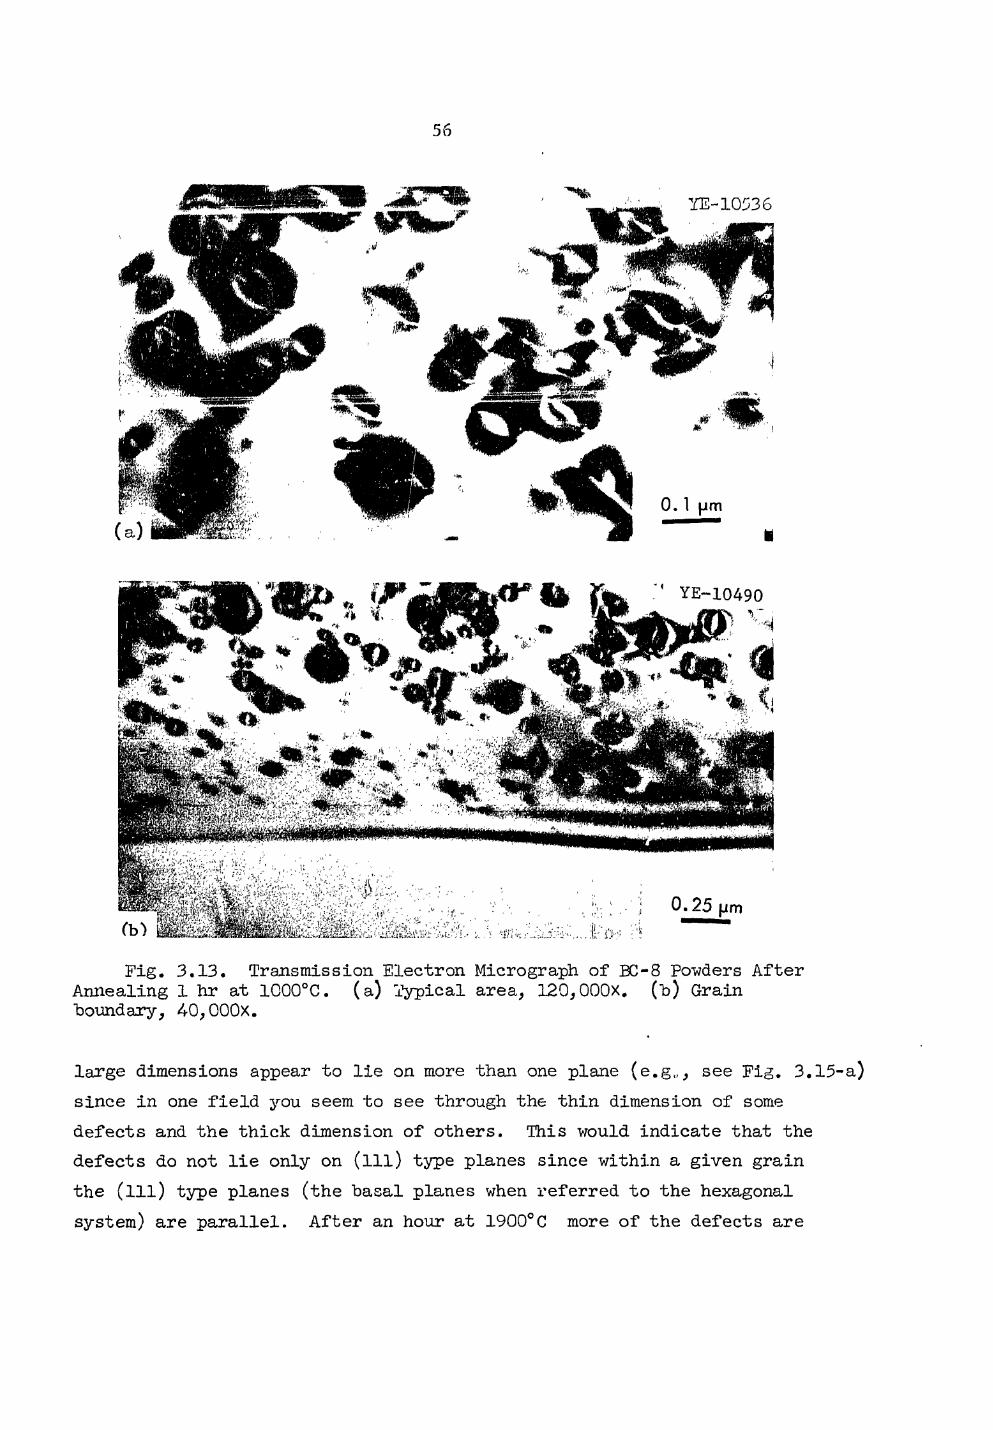
56.
YE-10536
' YE-10490
Fig. 3 .13 . Transmission Electron Micrograph of BC-8 Powders After Annealing 1 hr at 1000°C. (a) Typical area, 120,000x. (b) Grain boundary, 40,000x.
large dimensions appear to lie on more than one plane (e.g„, see Fig. 3.15-
since in one field you seem to see through the thin dimension of some defects and the thick dimension of others. This would indicate that the defects do not lie only on (ill) type planes since within a given grain the (ill) type planes (the basal planes when referred to the hexagonal system) are parallel. After an hour at 1900°C more of the defects are
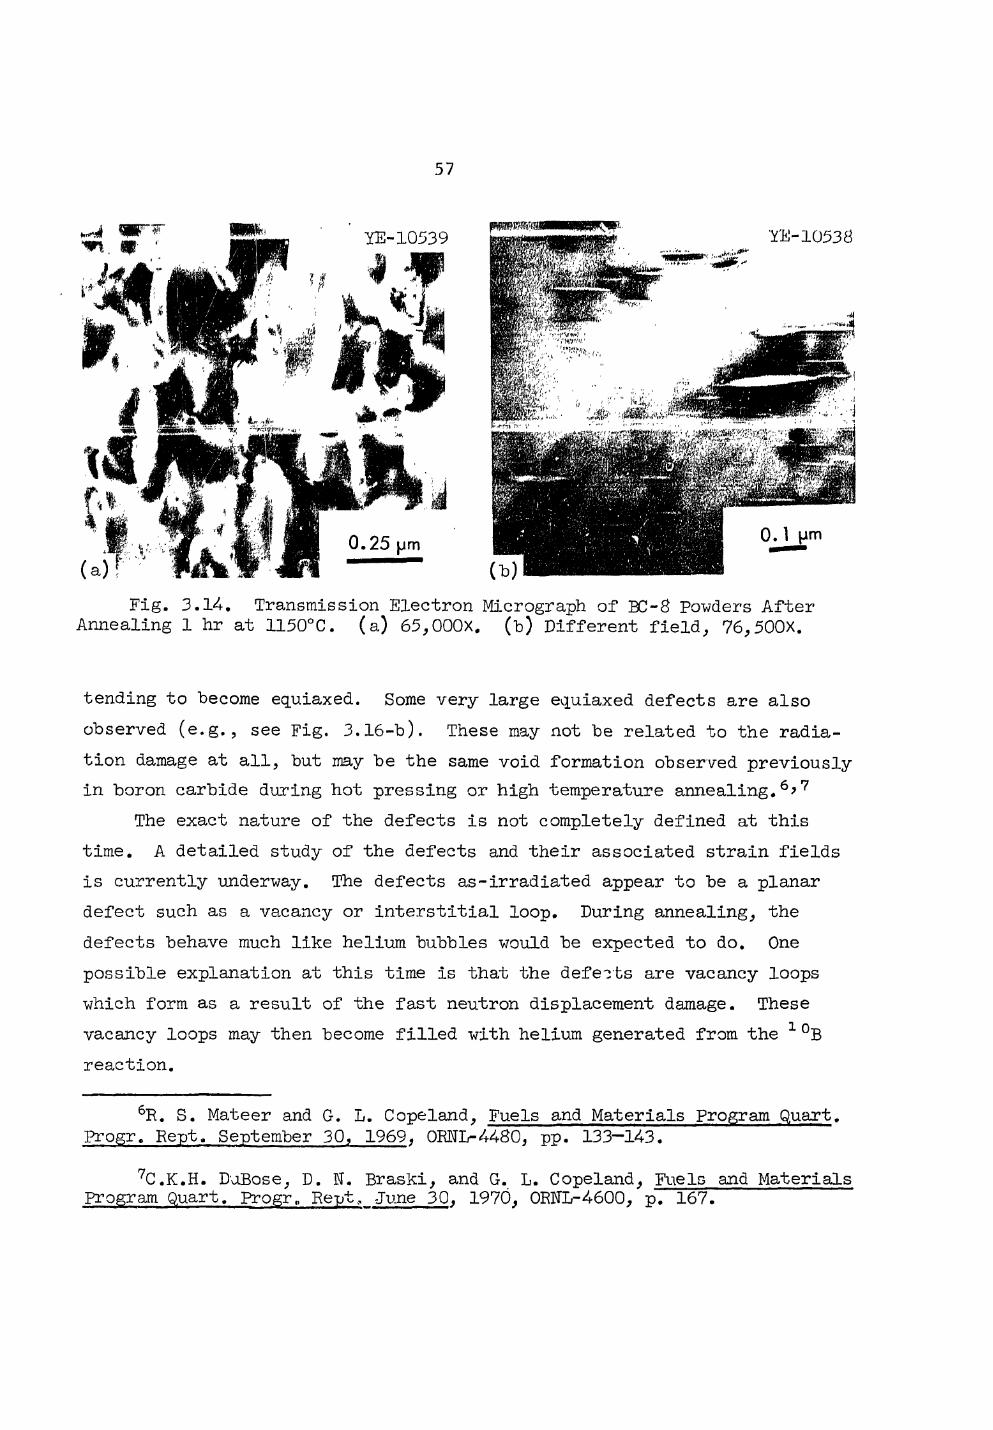
57.
Fig. 3.14. Transmission Electron Micrograph of BC-8 Powders After Annealing 1 hr at 1150°C. (a) 65,000X. (b) Different field, 76,500X.
tending to become equiaxed. Some very large equiaxed defects are also observed (e.g., see Fig. 3.16-b). These may not be related to the radia-tion damage at all, but may be the same void formation observed previously in boron carbide during hot pressing or high temperature annealing.6>7
The exact nature of the defects is not completely defined at this time. A detailed study of the defects and their associated strain fields is currently underway. The defects as-irradiated appear to be a planar defect such as a vacancy or interstitial loop. During annealing, the defects behave much like helium bubbles would be expected to do. One possible explanation at this time is that the defeats are vacancy loops which form as a result of the fast neutron displacement damage. These vacancy loops may then become filled with helium generated from the 1°B reaction.
6R. S. Mateer and G. L. Copeland, Fuels and Materials Program Quart. Progr. Kept. September 30, 1969, ORNL-4480, pp. 133-143.
7C.K.H. DoBose, D. N. Braski, and G. L. Copeland, Fuels and Materials Program Quart. Progr,, Rept, June 30, 1970, 0RNL-4600, p. 167.
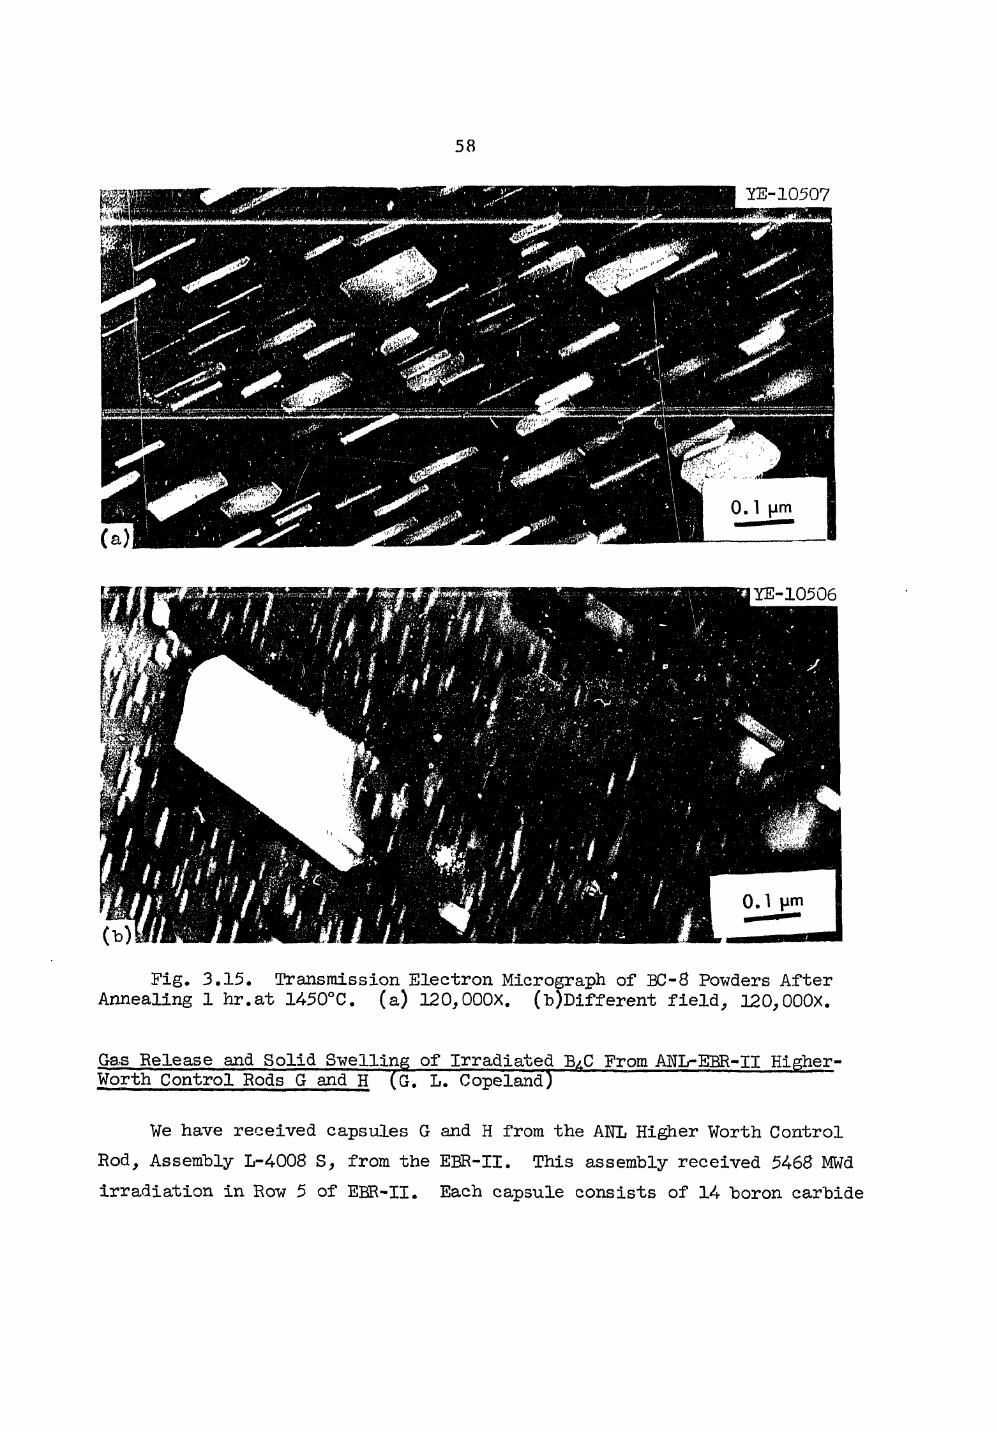
58.
Fig. 3.15. Transmission Electron Micrograph of BC-8 Powders After Annealing 1 hr.at 1450°C. (a) 120,000X. (b)Different field, 120,000X.
Gas Release and Solid Swelling of Irradiated BzC From ML-EBR-II Higher-Worth Control Rods G and H (G. L. Copeland)
We have received capsules G and H from the ANL Higher Worth Control Rod, Assembly L-4008 S, from the EBR-II. This assembly received 5468 MWd irradiation in Row 5 of EBR-II. Each capsule consists of 14 boron carbide
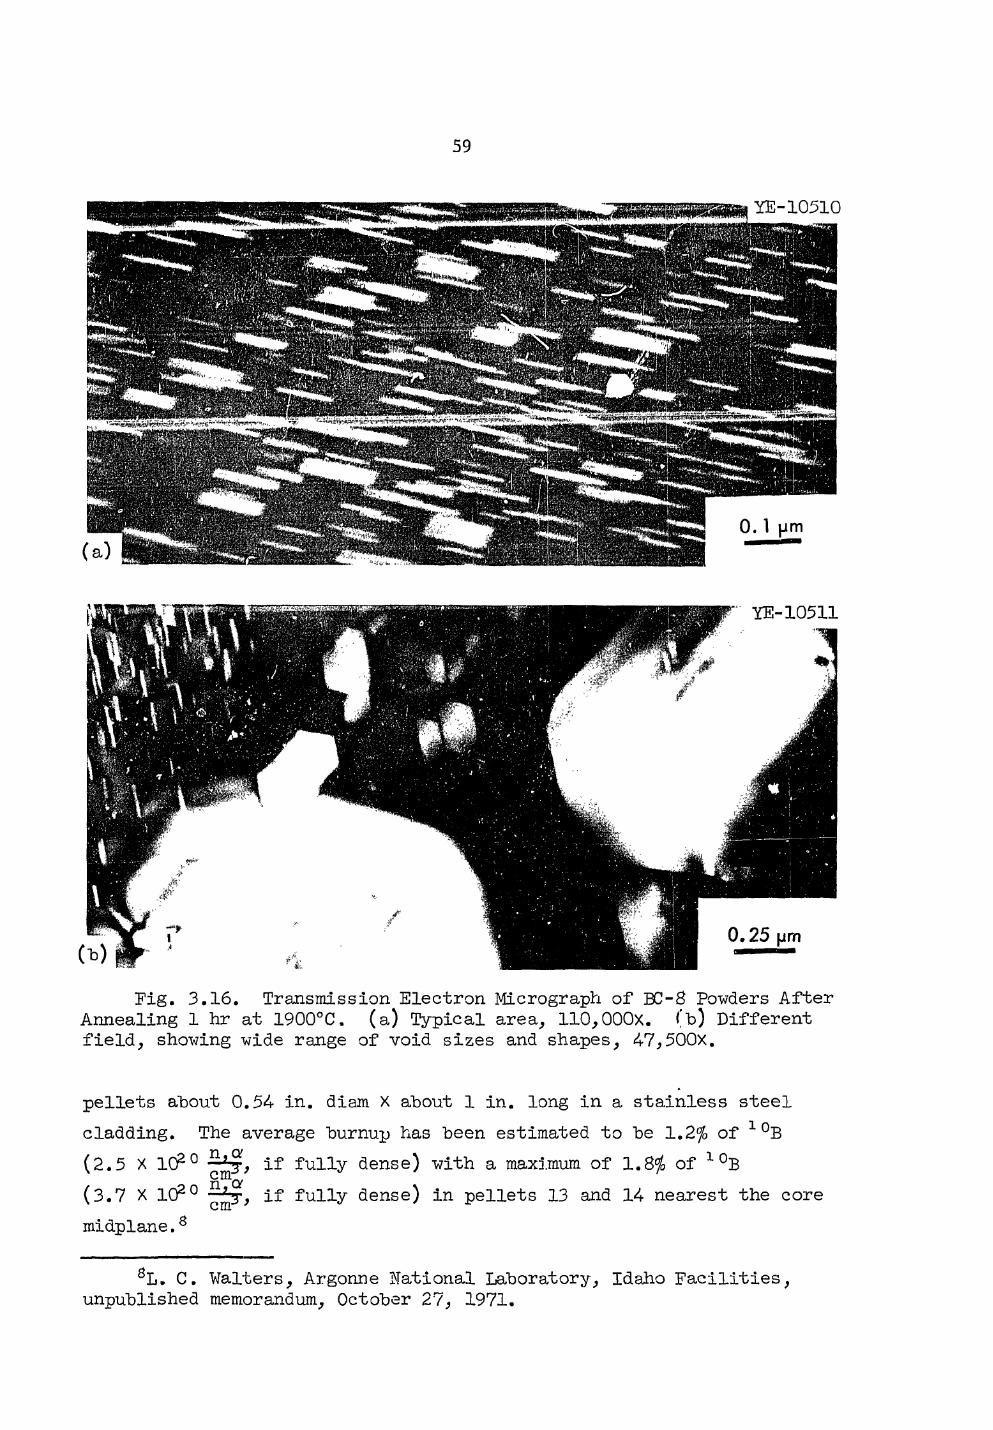
59.
Fig. 3.16. Transmission Electron Micrograph of BC-S Powders After Annealing 1 hr at 1900°C. (a) Typical area, 110,000x. (b) Different field, showing wide range of void sizes and shapes, 47,500x.
pellets about 0.54 in. diam X about 1 in. long in a stainless steel cladding. The average burnup has been estimated to be 1.2% of 1°B (2 . 5 X 10²⁰ if fully dense) with a maximum of 1.8$ of 1 °B c rn n a (3.7 X lO20 -^j, if fully dense) in pellets 13 and 14 nearest the core midplane.8
8L. C. Walters, Argonne National Laboratory, Idaho Facilities, unpublished memorandum, October 27, 1971.
60.
The evaluation at ORNL is planned to consist of; (a) Plenum gas analysis (pressure, volume, chemical analysis) (b) Visual exaniination (c) Length, diameter, and weight measurements (a)
Burnup determination by 1®B/3"'1'B isotopic analysis (e) Metallography (f) Transmission electron microscopy (g) Scanning electron microscopy of fractured surfaces (h) X-ray diffraction to determine lattice parameters (i) Measurement of retained gas by vacuum fusion analysis Examination of the pellets from the two capsules is now in progress.
Evaluations (~J) through (h) are planned in the as-irradiated condition and after heat treatment at various temperatures.
A failure in the gas sampling system during the puncture of Capsule G resulted in an incomplete analysis for this capsule. The only reliable result from this measurement is the total gas volume o:" 55.58 cm5 at STP. After this measurement the mercury from the Toepler pump flowed back through the system into the capsule. The system was completely rebuilt and checked out with standards prior to puncturing Capsule H so that confidence can be placed in the following results for Cap°ule H:
Plenum volume; 52.18 cm3. Volume gas at 1 atm and J: 64.02 cm3. Volume of gas at STP: 58.45 cm3. Pressure in capsule a;fc 24°C: 17.99 psia.
Two samples of the gas were analyzed with both showing greater than 99% helium as shown in Table 3.5.
The capsules were sealed before irradiation containing helium at 15.7 psia.9 Assuming that the capsules were welded shuc. at 24°C and using the estimated average burnup of 1.2$ of 1°B, the helium released to the plenum is calculated to be 1.65$ of that generated during irradiation.
9L. C. Walters, Argonne National Laboratory. Idaho Facilities, unpublished memorandum, November 30, 1971.
61
Table 3.5. Analysis of G-as From Capsule H
Sample L <30
Sample R (%)
He 99.1 99.5 02 0.07 0.04 H2O 0.3 0.1 H2 0.04 0.02 H 3 < 0.02 < 0.02 N 2 + CO 0.24 0.13 Argon 0.25 0.23 co2 < 0.02 < 0.02 Krypton < 0.02 < 0.02 Xenon < 0.03 < 0.03
The pellets were removed from the cladding easily after cutting off the top and "bottom of the tube. The pellets slid from the tubing easily by tapping the tubing. Mercury from the gas collection apparatus was observed on che pellets at both ends of Capsule G. A couple of small chips were removed from both capsules. The pellets were examined at 10X and appeared to be in excellent condition. No cracks or other irregularities attributable to the irradiation were observed. The cylindrical surfaces of the pellets were very rough and all edges were chipped but this appears to be the hot-pressed condition.
The activity of the pellets ranged from 30 to 200 viR/hr at 1 1/2 in. However, the pellets smeared at up to 72,000 dpm £ contamination. It was desirable to clean the pellets before evaluation to lower the P contamination. The pellets were rinsed in 50 vol % nitric acid for 30 min, ::hen rinsed in an ultrasonic bath of acetone, then alcohol. The pellets were placed in a 200°F air drying oven to dry. This cleaning procedure did not appear visually to affect the pellets. The 3 contamina-tion was lowered to less than 20,000 and in most cases to about 3000 dpm.
62
The results of length, diameter, and weight measurements are presented in Tables 3.6 and 3.7. The spread in diameter measurements on a given pellet due to the irregularity of the surfaces prevents any detection of diameter change. The lengths of the pellets in general increased "by 0.001 to 0.002 in. (about 0.1 to 0.2%) during irradiation. Neither weights nor densities were reported for the individual pellets prior to irradia-tion. The as-irradiated densities, as calculated from average diameter, length, and weight, ranged from 93 to 97$ of the theoretical density of 2.52 g/cm3. A total stack weight for the pellets was given so that an average density for the stack can be calculated using the pellet dimensions to calculate their volume. These calculations show an average stack density before irradiation of 95.1$ of 2.52 g/cm3 for Capsule G and 95.3$ of 2,52 g/cm3 for Capsule H. The average stack densities after irradiation were 94-.8 and 95.0$ of 2.52 g/cm3 for Capsules G and H, respectively. These density changes indicate an average swelling of 0.28 and 0.38$ for the pellets in Capsules G and H, respectively. Although these calculations are approximate, the swelling is about what would be expected and is consistent with the about 0.1$ length change observed.
Microstructure of B^C Pellets Irradiated in the EBR-II (A. Jostons* and C.K.H. DuBose)
Boron carbide has been used extensively as a neutron absorber in various types of nuclear reactors. Currently, B4.C is a main candidate for use in fast breeder reactors. Unfortunately, little is known about the nature of radiation damage which in B4C may arise from Frenkel defects created by displacements and by the transmutation reaction 1 °B (n,cv) 7 Li whereby a helium and one lithium atom are formed from each transmuted 1 0B atom. Recently developed techniques at 0RNL10 for preparation of thin sections suitable for transmission electron microscopy have enabled us to examine directly the radiation induced defect structure in B4C.
l0C.K.H. DuBose, G. L. Copeland, and D. N. Braski, Metallography, in press.
*0n attachment from the Australian Atomic Energy Research Commission, Research Establishment, Lucas Heights, N.S.W.
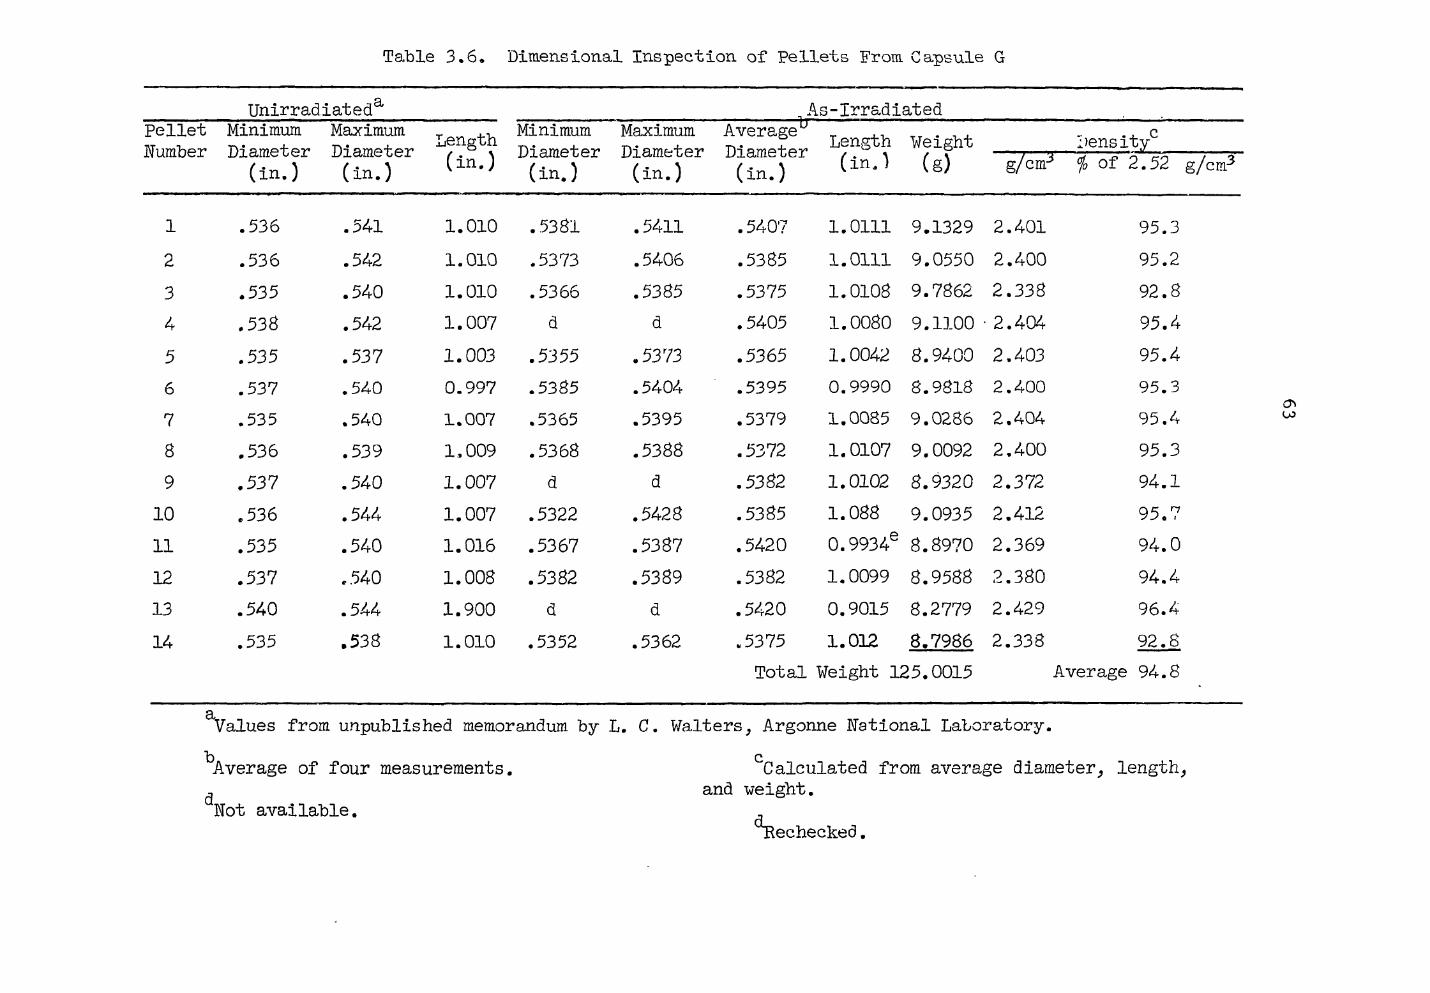
Table 3.6. Dimensional Inspection of Pellets From Capsule G
Pellet Number
Unirradiated a Minimum Diameter
(in.)
Maximum Diameter (in.)
L< ength (in.)
Minimum Diameter (in.)
Maximum Diameter (in.)
Average^ Diameter (in.)
As-Irradiated Length (in.)
Weight density (g) g/cmJ % of 2.52 g/cm-
1 .536 .541 1.010 .5381 .5411 .5407 1.0111 9.1329 2.401 95.3 2 .536 .542 1.010 .5373 .5406 .5385 1.0111 9.0550 2.400 95.2 3 .535 .540 1.010 .5366 .5385 .5375 1.0108 9.7862 2.338 92.8 4 .538 .542 1.007 d d .5405 1.0080 9.1100 • 2.404 95.4 5 .535 .537 1.003 .5355 .5373 .5365 1.0042 8.9400 2.403 95.4 6 .537 .540 0.997 .5385 .5404 .5395 0.9990 8.9818 2.400 95.3 7 .535 .540 1.007 .5365 .5395 .5379 1.0085 9.0286 2.404 95.4 8 .536 .539 1.009 .5368 .5388 .5372 1.0107 9.0092 2.400 95.3 9 .537 .540 1.007 d d .5382 1.0102 8.9320 2.372 94.1
10 .536 .544 1.007 .5322 .5428 .5385 1.088 9.0935 2.412 95.7 11 .535 .540 1.016 .5367 .5387 .5420 0.9934s 8.8970 2.369 94.0 12 .537 .540 1.008 .5382 .5389 .5382 1.0099 8.9588 2.380 94.4 13 .540 .544 1.900 d d .5420 0.9015 8.2779 2.429 96.4 14 .535 .538 1.010 .5352 .5362 .5375 1.012 8.7986 2.338 92.8
Total Weight 125.0015 Average 94-.8
SL
Values from unpublished memorandum by L. C. Walters, Argonne National Laboratory, b c Average of four measurements. Calculated from average diameter, length, ^ and weight. Not available.
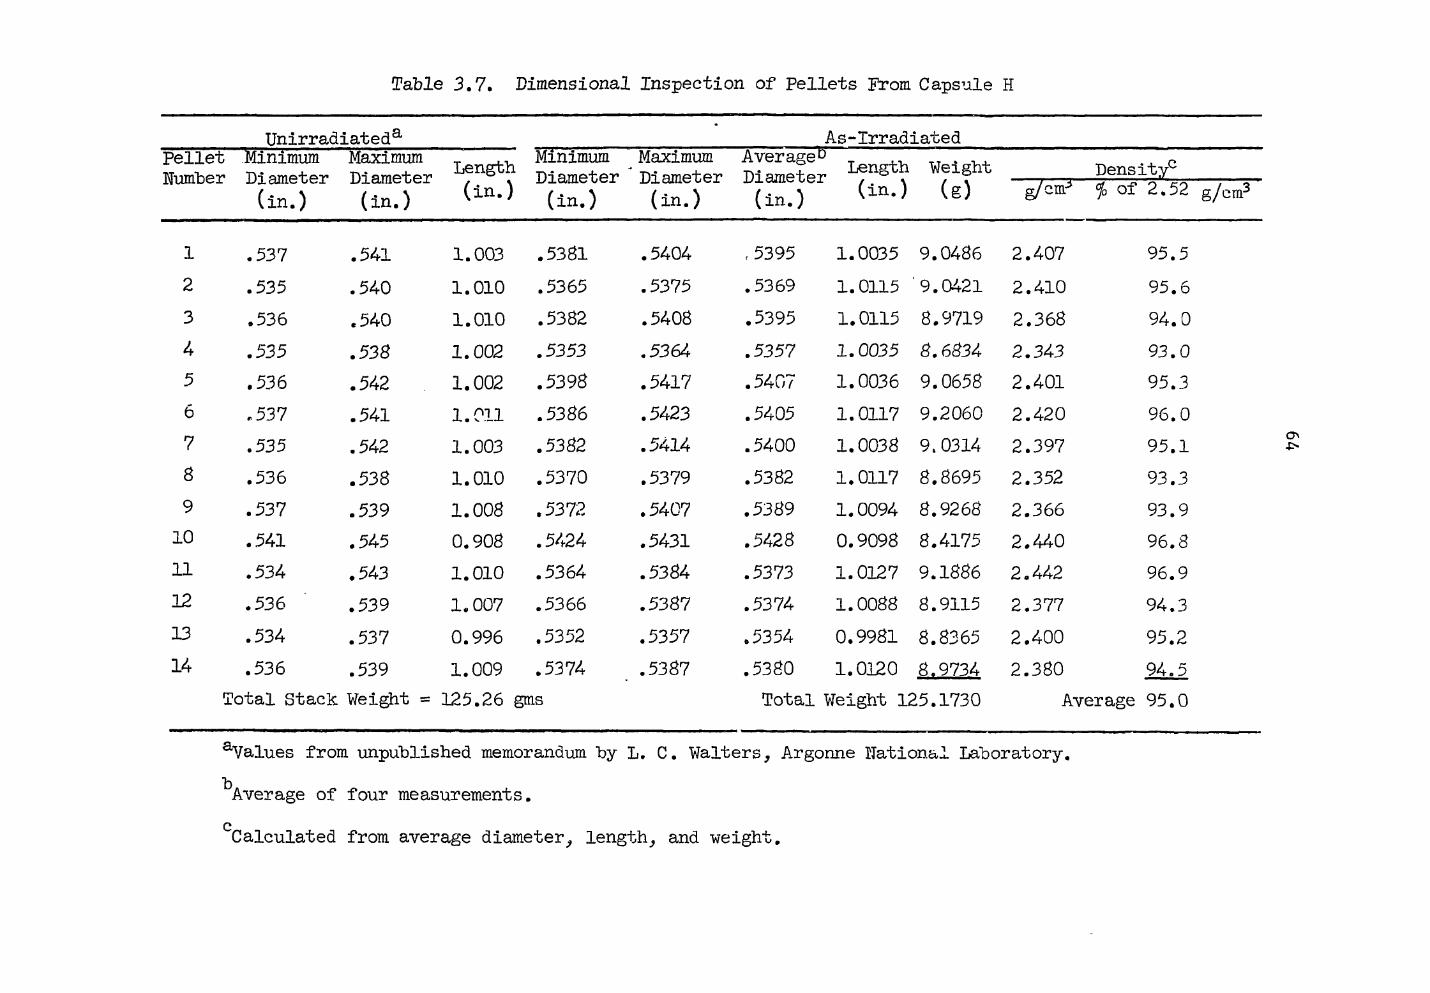
Table 3.7. Dimensional Inspection of Pellets From Capsule H
Unirradiated8, As-Irradiated Pellet Minimum Maximum T ~T7" Minimum Maximum Average0 " 77 " . , , ~ Number Diameter Diameter ^ ^ Diameter J Diameter Diameter ^ ^ ^ight , 3 S ^ K o , ,
(in.) (in.) ^ (in.) (in.) (in.) ^ g/cm^ % of 52 g/cm3
1 .537 .541 1.003 .5381 .5404 ,5395 1.0035 9.0486 2.407 95.5 2 .535 .540 1.010 .5365 .5375 .5369 1.0115 '9.0421 2.410 95.6 3 .536 .540 1.010 .5382 .5408 .5395 1.0115 8.9719 2.368 94.0 4 .535 .538 1.002 .5353 .5364 .5357 1.0035 8.6834 2.343 93.0 5 .536 .542 1.002 .5398 .5417 .5407 1.0036 9.0658 2.401 95.3 6 .537 .541 1.011 .5386 .5423 .5405 1.0117 9.2060 2.420 96.0 7 .535 .542 1.003 .5382 .5414 .5400 1.0038 9.0314 2.397 95.1 8 .536 .538 1.010 .5370 .5379 .5382 1.0117 8.8695 2.352 93.3 9 .537 .539 1.008 .5372 . 5407 .5389 1.0094 8.9268 2.366 93.9
10 .541 .545 0.908 .5424 .5431 .5428 0.9098 8.4175 2.440 96.8 11 .534 .543 1.010 .5364 .5384 .5373 1.0127 9.1886 2.442 96.9 12 .536 .539 1.007 .5366 .5387 .5374 1.0088 8.9115 2.377 94.3 13 .534 .537 0.996 .5352 .5357 .5354 0.9981 8.8365 2.400 95.2 14 .536 .539 1.009 .5374 .5387 .5380 1.0120 8.9734 2.380 94.5
Total Stack Weight = 125.26 gms Total Weight 125.1730 Average 95.0
aValues from unpublished memorandum by L. C. Walters, Argonne National Laboratory.
Average of four measurements. c Calculated from average diameter, length, and weight.
65
The observations refer to pellets from the AiTL-EBR-II Higher-Worth Control Rou G, irradiated to a burnup of 1.2# 1 °B [2 , 5 X 10²⁰ (n^J/cm3 ] at about 500°C and to boron carbide powders irradiated by HEDL in the BC-2 and BC-8 capsules to burnups of 4.8$ 1 °B [10 X 1020 (n,a)/cm3 ] and 3.7fo 1 °B [7.7 X 10²⁰ (n,a)/cm3 ] at estimated temperatures of 650 and 730°C, respectively.
The microstructure of an as-irradiated pellet, characterized by a high density of black spot defects is shown in Fig. 3.17. There is a grain boundary denuded zone of defects but twin boundaries do not exhibit denuding. The grown-in lattice defects, twins and stacking faults, are still present afti-r irradiation. Thus, to a first glance, the radiation damage structure closely resembles that in metals where defect clusters formed by the aggregation of point defects caused by displacements are the riain evidence of damage for irradiation temperatures below about 0,3 Tm, where T m is the melting point in °K. For B^C, with T m about 2450°C, the temperature range investigated, about 500-730°C, represents 0.2-8-0.36 Tm.
Diffraction contrast studies of these black spot defects show them to "be resolvable into loops which often exhibit a line of no contrast. The line of no contrast appears to be independent of the diffraction vector. Consequently, these defects do not possess a spherical strain field. Two types of defects which could explain the contrast behavior are prismatic dislocation loops or precipitates which are plate or disk like. The strain contrast pattern in Fig. 3.18 is not characteristic of dis-location loops but has been observed for thin platelike precipitates surrounded by coherency strains. Furthermore, it has not been found possible so far to find conditions under which some of the images go out of contrast as expected for dislocation loops for g>b = 0, where •g is the diffraction vector and b is the Burgers vector of the disloca-tion loop. Due to the ever present image overlap arising from the high defect density and strong strain fields,, the nature of the strain fields has not been determined at this stage. Nor can we deduce rigorously the nature of the defect responsible for the observed images in transmission electron microscopy.
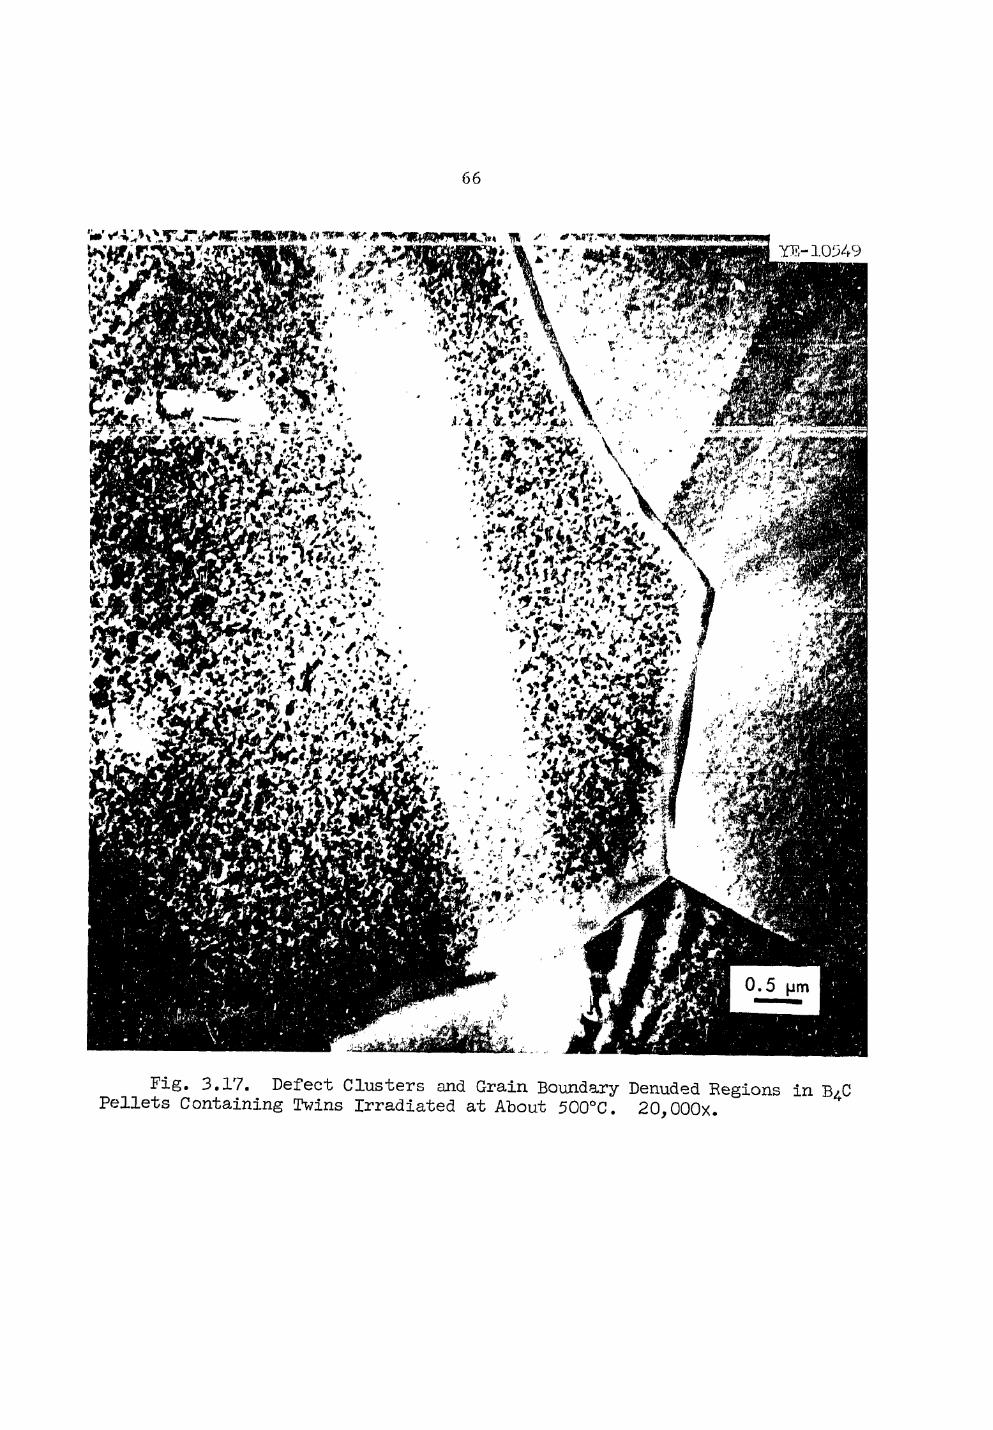
6 6
•r
YG-10549
Fig. 3.17. Defect Clusters and Grain Boundary Denuded Regions in B/C Pellets Containing [Twins Irradiated at About 500°C. 20,000x.
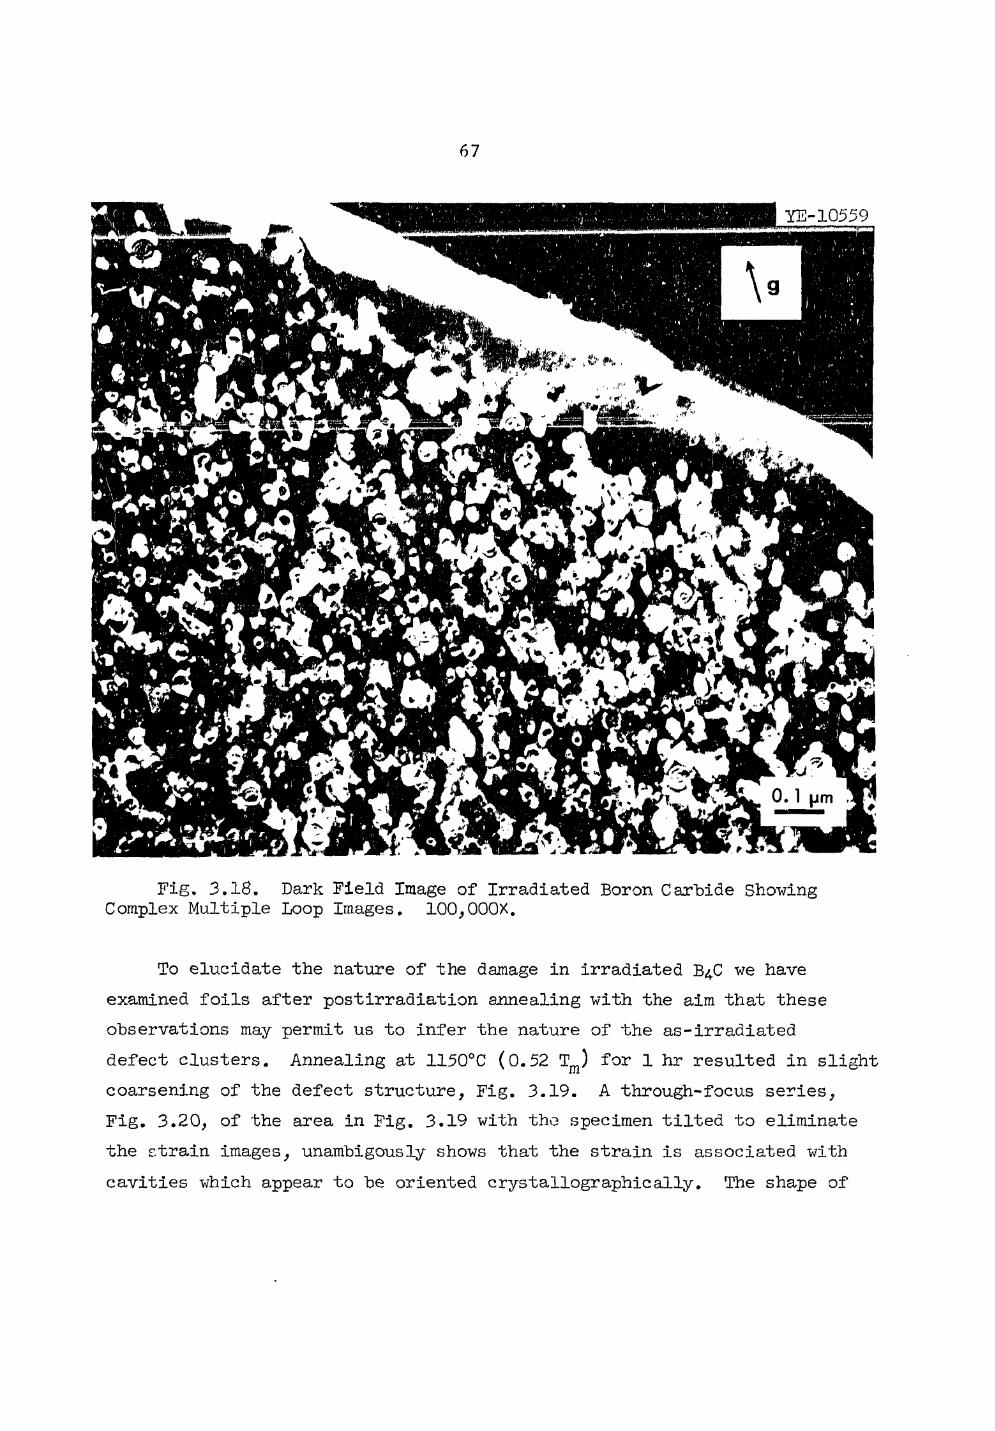
67
Fig. 3.18. Dark Field Image of Irradiated Boron Carbide Showing Complex Multiple Loop Images. 100,000X.
To elucidate the nature of the damage in irradiated B4C we have examined foils after postirradiation annealing with the aim that these observations may permit us to infer the nature of the as-irradiated defect clusters. Annealing at 1150°C (0.52 T ) for 1 hr resulted in slight coarsening of the defect structure, Fig. 3.19. A through-focus series, Fig. 3.20, of the area in Fig. 3.19 with the specimen tilted to eliminate the strain images, unambigously shows that the strain is associated with cavities which appear to be oriented crystallographically. The shape of
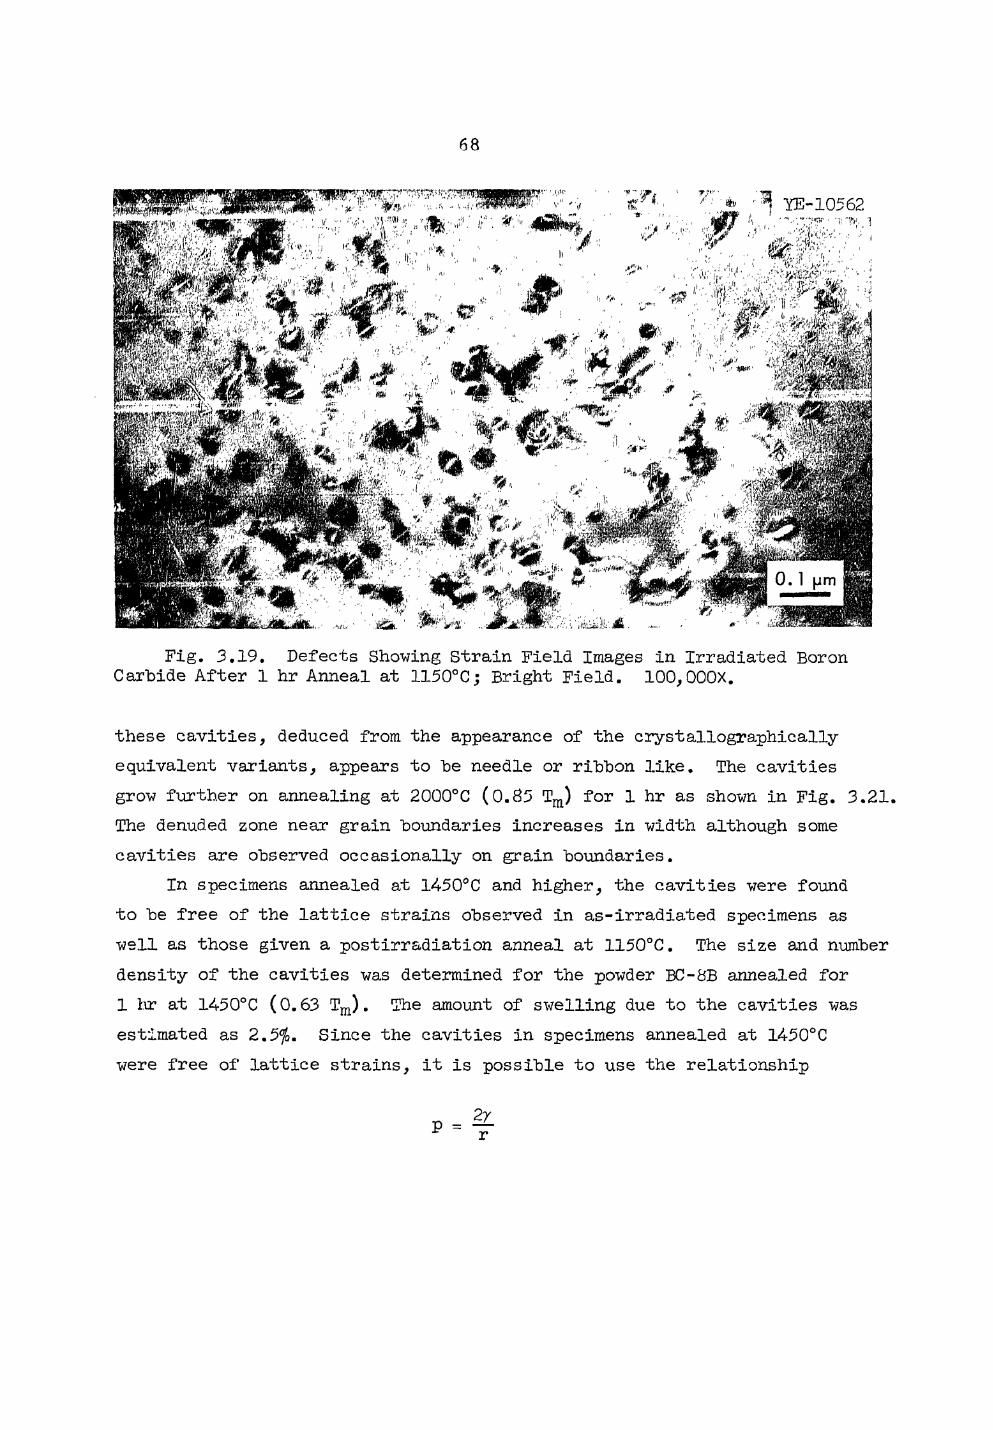
68
Fig. 3.19. Defects Shoving Strain Field Images in Irradiated Boron Carbide After 1 hr Anneal at 1150°Cj Bright Field. 100,000x.
these cavities, deduced from the appearance of the crystallographically equivalent variants, appears to be needle or ribbon like. The cavities grow further on annealing at 2000°C (0.85 Tm) for 1 hr as shown in Fig. 3.21. The denuded zone near grain boundaries increases in width although some cavities are observed occasionally on grain boundaries.
In specimens annealed at 1450°C and higher, the cavities were found to be free of the lattice strains observed in as-irradiated specimens as well as those given a postirradiation anneal at 1150°C. The size and number density of the cavities was determined for the powder BC-8B annealed for 1 hr at 1450°C (0.63 Tm). The amount of swelling due to the cavities was estimated as 2.5$. Since the cavities in specimens annealed at 1450°C were free of lattice strains, it is possible to use the relationship
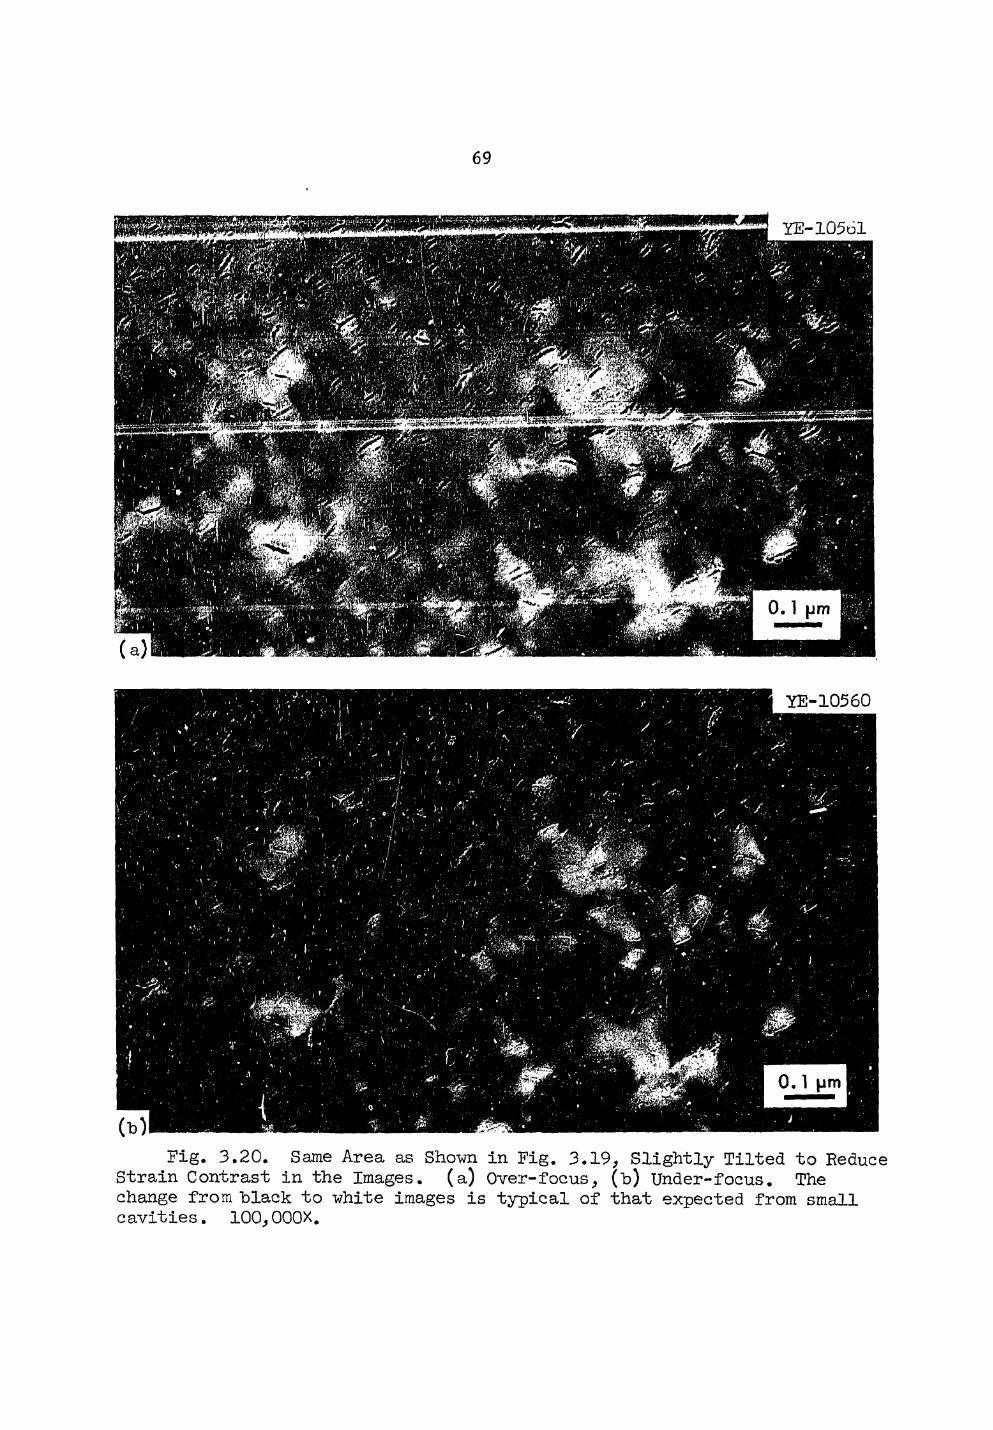
69
Fig. 3.20. Same Area as Shown in Fig. 3.19, Slightly Tilted to Reduce Strain Contrast in the Images, (a) Over-focus, (b) Under-focus. The change from "black to white images is typical of that expected from small cavities. 100,000X.
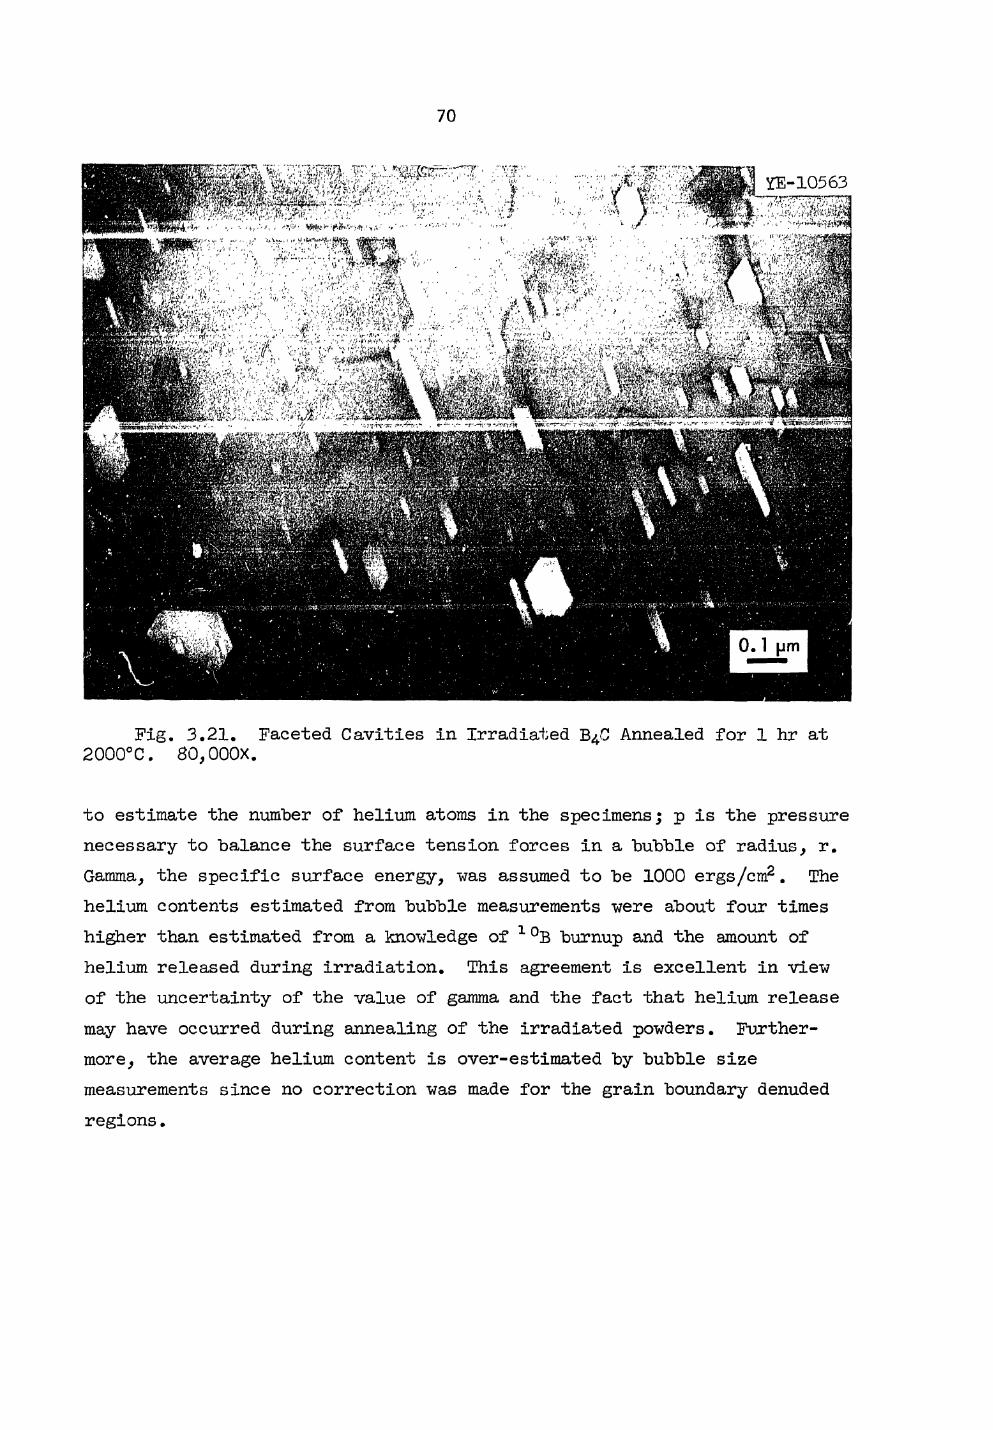
70
Fig. 3.21. Faceted Cavities in Irradiated B4C Annealed for 1 hr at 2000°C. 80,000X.
to estimate the number of helium atoms in the specimens; p is the pressure necessary to balance the surface tension forces in a bubble of radius, r. Gamma, the specific surface energy, was assumed to be 1000 ergs/cm2. The helium contents estimated from bubble measurements were about four times higher than estimated from a knowledge of 1 °B burnup and the amount of helium released during irradiation. This agreement is excellent in view of the uncertainty of the value of gamma and the fact that helium release may have occurred during annealing of the irradiated powders. Further-more, the average helium content is over-estimated by bubble size measurements since no correction was made for the grain boundary denuded regions.
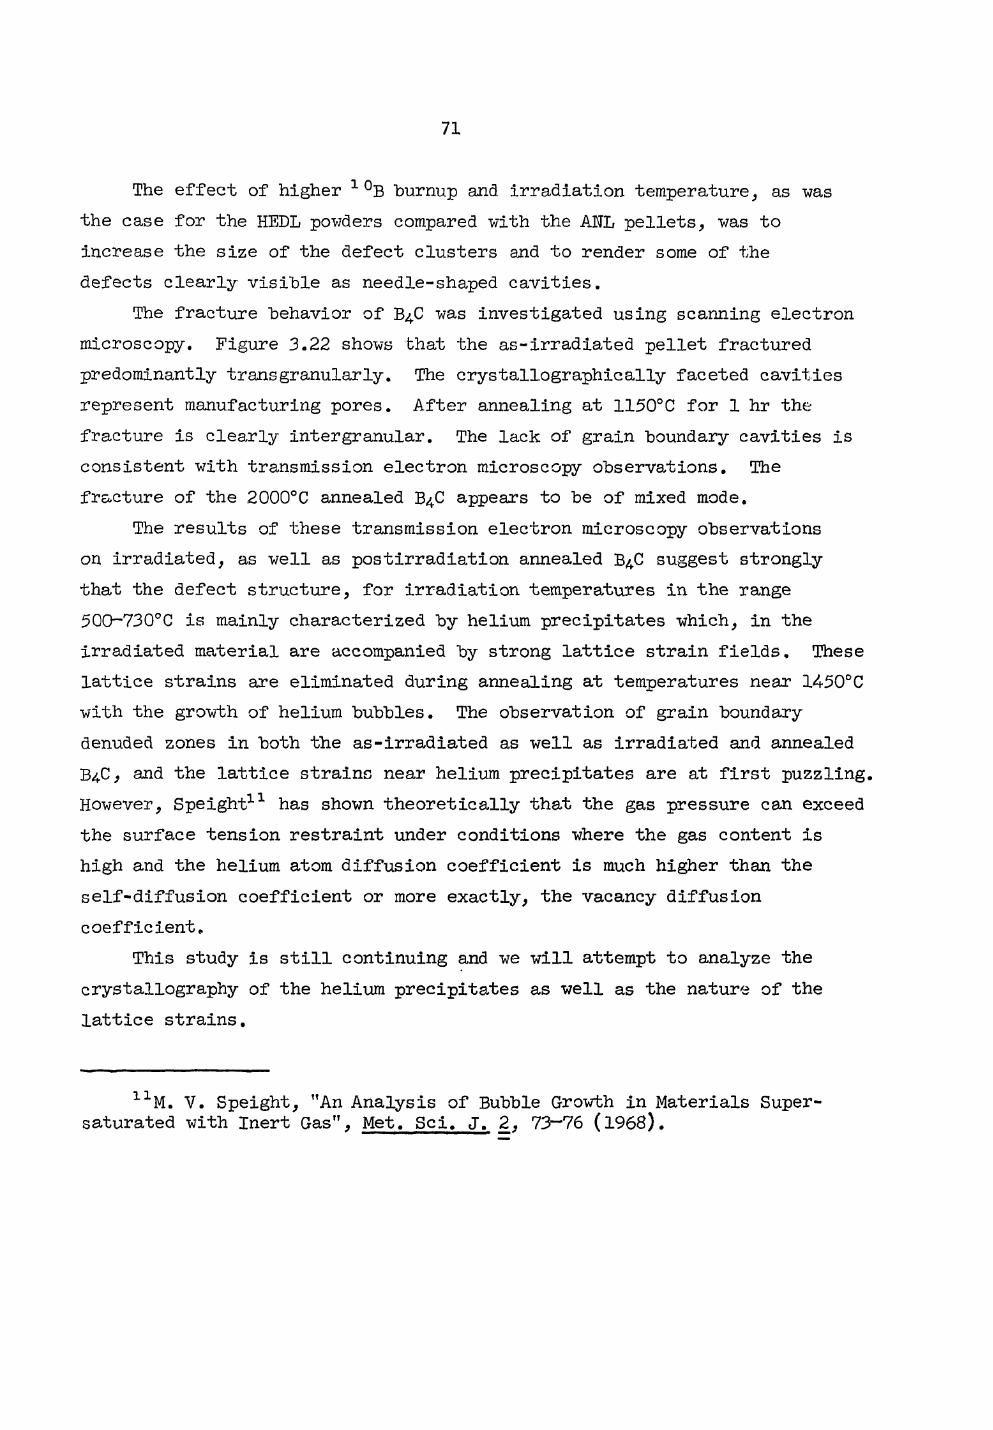
71
The effect of higher 1 °B burnup and irradiation temperature, as was the case for the HEDL powders compared with the ANL pellets, was to increase the size of the defect clusters and to render some of the defects clearly visible as needle-shaped cavities.
The fracture behavior of B4C was investigated using scanning electron microscopy. Figure 3.22 shows that the as-irradiated pellet fractured predominantly transgranularly. The crystallographically faceted cavities represent manufacturing pores. After annealing at 1150°C for 1 hr the fracture is clearly intergranular. The lack of grain boundary cavities is consistent with transmission electron microscopy observations. The fracture of the 2000°C annealed B4C appears to be of mixed mode.
The results of these transmission electron microscopy observations on irradiated, as well as postirradiation annealed B^C suggest strongly that the defect structure, for irradiation temperatures in the range 500-730°C is mainly characterized by helium precipitates which, in the irradiated material are accompanied by strong lattice strain fields. These lattice strains are eliminated during annealing at temperatures near 1450°C with the growth of helium bubbles. The observation of grain boundary denuded zones in both the as-irradiated as well as irradiated and annealed B4C, and the lattice strains near helium precipitates are at first puzzling. However, Speight11 has shown theoretically that the gas pressure can exceed the surface tension restraint under conditions where the gas content is high and the helium atom diffusion coefficient is much higher than the self-diffusion coefficient or more exactly, the vacancy diffusion coefficient.
This study is still continuing and we will attempt to analyze the crystallography of the helium precipitates as well as the nature of the lattice strains.
I:LM. V. Speight, "An Analysis of Bubble Growth in Materials Super-saturated with Inert Gas", Met. Sci. J. 2, 73-76 (1968).
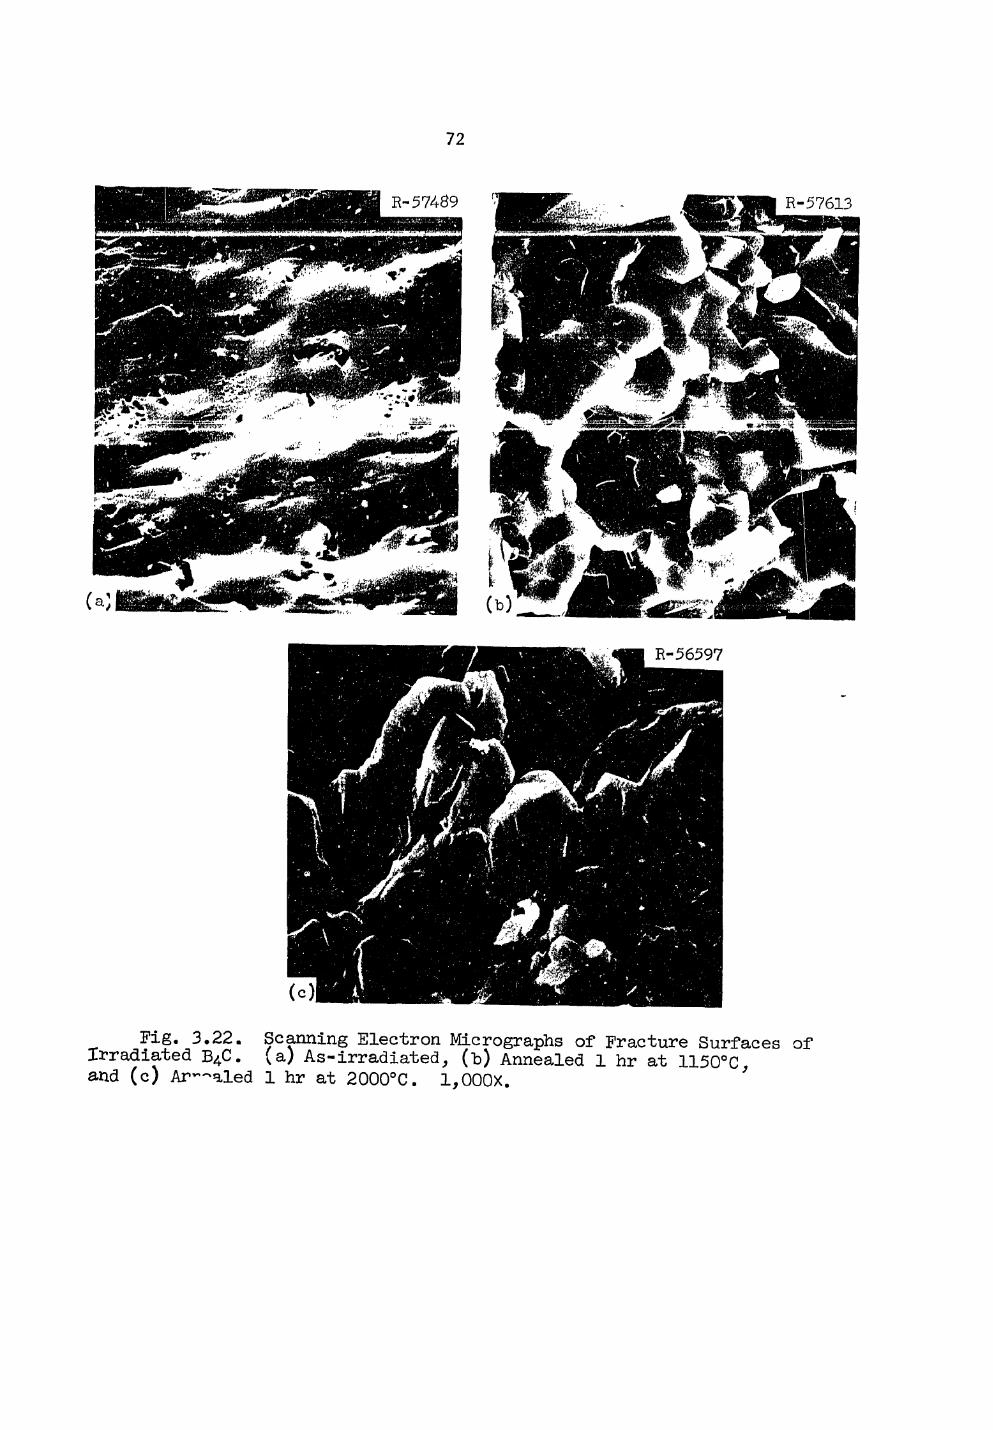
72
Fig. 3.22. Scanning Electron Micrographs of Fracture Surfaces of Irradiated B^C. (a) As-irradiated, (b) Annealed 1 hr at 1150°C and (c) Ar—aled 1 hr at 2000°C. 1,000X. '
73
Fabrication of EBR-II Series II Neutron Absorber Experiment (E. J. Manthos)
The fabrication and quality assurance plan for component fabrication and capsule assembly for capsules 0-14, 0-15, 0-16, 0-17, and 0-18 in the alpha subassembly has been prepared and approved. Fabrication of the capsules is being carried out under Quality Level II as defined in the ORNL-Q.A. Program, "Definitions of Quality Levels", (Revised April 15, 1970). Fabrication procedures, route sheets, and data sheets for the low temperature capsules 0-14, 0-15, and 0-18 have also been prepared and approved. The fabrication procedures for the high temperature capsules 0-16 and 0-17 have been prepared and are in the process of being approved.
All materials necessary for the fabrication of various capsule components have been purchased and are on hand. The Nbr-1$. Zr components required for the two pins in capsule 0-17 have been received from the vendor.
Development and qualifications of the welding and brazing parameters for all of the capsules is approximately 75$ complete. Wherever possible, partial assembly and inspection of various components and subassemblies is proceeding. Three of the low temperature pins (each capsule contains two pins), 0-14T, 0-14B, 0-15B, have been assembled and welded and are being inspected.
Alternate Materials
Fabrication of Tantalum Borides (M. M. Martin, J. P. DeLuca)
Various borides of tantalum are being studied for their application as neutron absorbers. Our objective is to determine the irradiation performance of Ta2B (Ta + Ta3B2) and TaB2 after an exposure of about 2.2 X 10²² neutrons/cm2 (of energy greater than 0.1 MeV). We selected these compounds as promising alternate absorber materials for boron carbide or tantalum control rods being considered for FBR's. Both tantalum borides are less dense than tantalum metal and possess more reactivity worth per unit volume. In fact, TaB2 has 12$ more worth per
74
cubic centimeter than B4C. Also, their total possible gas release is up to a factor of 2 less than that from boron carbide. However, they lack sufficient metallurgical characterization and irradiation experience to warrant consideration at this time. We plan to provide irradiation data to allow an evaluation of their performance in service.
Considerable progress has been made this quarter. Single phase TaB2
powder has been produced by a carbothermic reduction method.12 This powder was then hot pressed for 1 hr at 2000°C and 5000 psi, in graphite dies to form high density pellets. The pellets were then characterized. The results of this characterisation is given in Table 3.8. The large amount of carbon found by wet chemistry is thought to come from two different sources. It could have come from the carbothermic reduction step to produce the powder and/or from the carbon dies used in the hot pressing step.
Cermet pellets were also produced this quarter. In making these pellets, Ta and B powders were blended to give the desired overall composition of Ta2B. These powder blends were then hot pressed at 2100°C, 5000 psi for 1 hr. Some pellets were also lined with 2 mil Ta foil to see if this would reduce the carbon level. See Table 3.9 for the characterization of the cermet pellets.
Helium Vents for Absorber Rods
J. I. Federer
The FTR control rods may be life-limited due to the n,a reaction involving 1 °B. The pressure of helium generated by the n,a reaction would eventually cause swelling of the stainless steel, forcing early removal of the rods from the reactor. A possible solution to this prob-lem is the use of vents which allow the helium to escape from the rods into the reactor coolant. Therefore, we are studying the effects of thermal exposure, sodium corrosion, and neutron irradiation on the helium permeability of potential vent materials.
l 2J. P. DeLuca and M. M. Martin, Fuels and Materials Development Program Quart. Progr. Rept. September 30, 1971, 0RNL-TM-3550, p. 70.
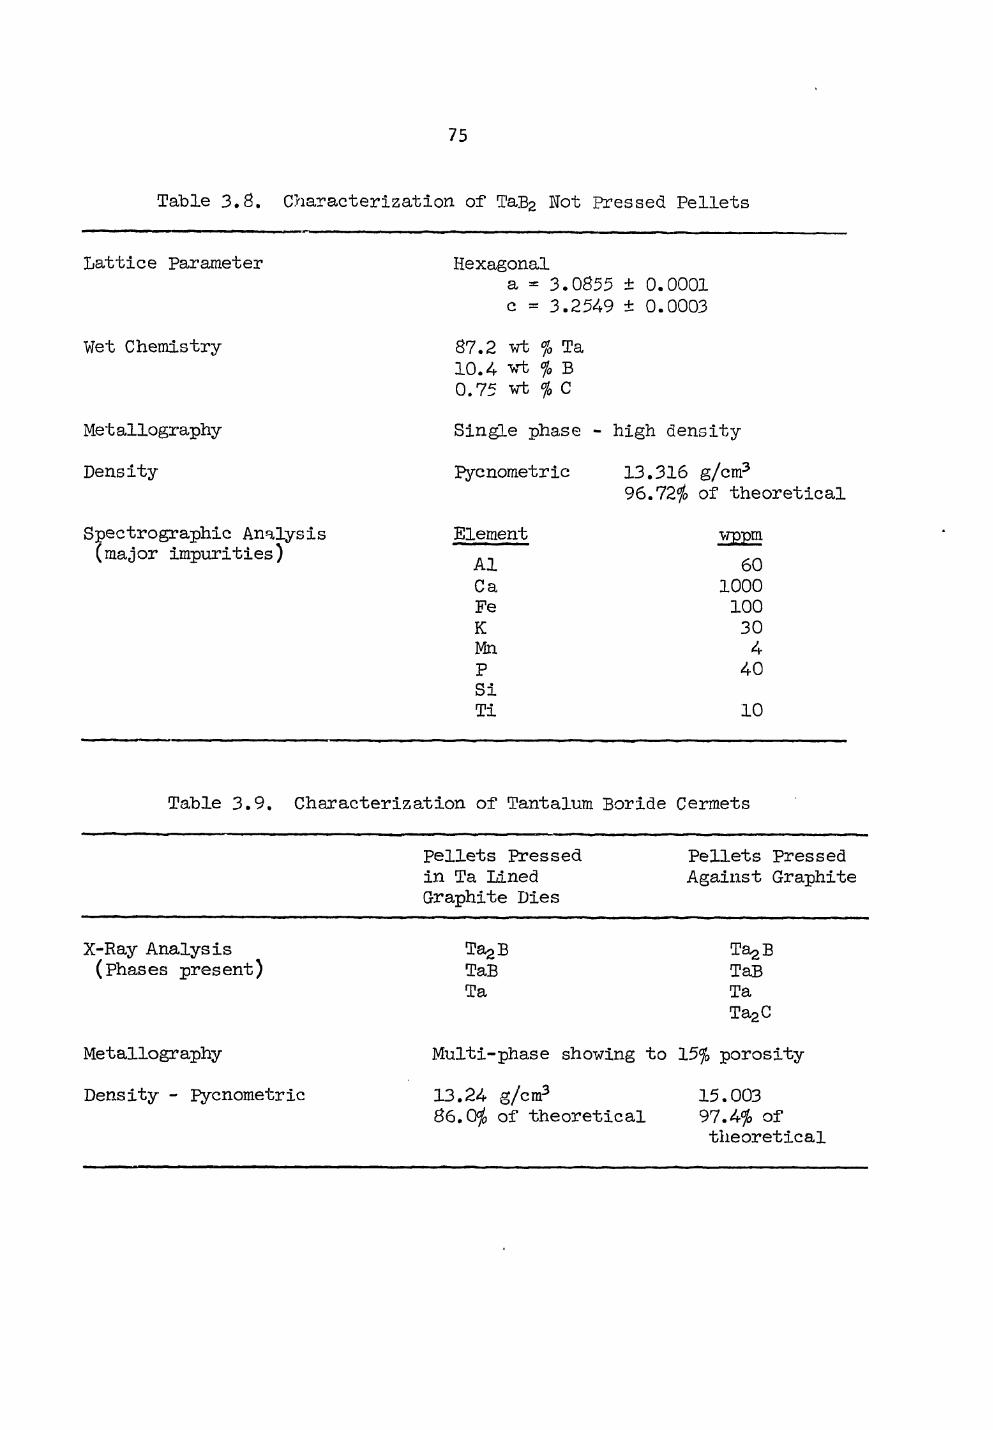
75
Table 3.8. Characterization of TaB2 Not Pressed Pellets
Lattice Parameter
Wet Chemistry
Met allography
Density
Spectrographie Analysis (major impurities)
Hexagonal a = 3.0855 ± 0.0001 c = 3.2549 ± 0.0003
87.2 -wt % Ta 10.4 vt % B 0.75 wt % C
Single phase - high density
Pycnometric 13.316 g/cm3 96.72$ of theoretical
Element wppm Al 60 Ca 1000 Fe 100 K 30 Mn 4 P 40 Si Ti 10
Table 3.9. Characterization of Tantalum Boride Cermets
Pellets Pressed in Ta Lined Graphite Dies
Pellets Pressed Against Graphite
X-Ray Analysis (Phases present)
Metallography
Density - Pycnometric
Ta^B TaB Ta
TagB TaB Ta Ta2C
Multi-phase showing to 15% porosity
13.24 g/cm3 86.0$ of theoretical
15.003 97.4$ of theoretical
76
An important task is design and installation of a vent experiment in an EBR-II capsule. The objective of this experiment is to evaluate the effects of fast neutron irradiation and sodium exposure on the permeability of candidate vent materials. The experiment consists of 14 vents stacked in Pin No. 0-19-B, Subassembly Beta. Seven of the vents •will be exposed to sodium during irradiation which will be conducted at a calculated temperature of 450°C for about one year. The vent materials to be investigated are types 304 and 316 stainless steels. The vents are porous disks of these materials fabricated by pressing and sintering powders. The disks will be metallurgically bonded to a holder to facili-tate determination of helium leak rates before and after reaction exposure. A view of the vent holder is shown in Pig. 3.23. The experiment is in the process of being fabricated.
Three disks having leak rates greater than 4 X 10""5 cm3/sec were electron-beam welded into stainless steel holders. Slight tarnishing of the disks which occurred during welding was attributed to atmospheric impurities in the pores. After welding, the helium leak rate through the disks was measured over the temperature range 25 to 500°C and at p?.-essures of 25, 35, and 45 psia. The first disk tested after welding had a leak rate of only 2 to 5 X 10"9 cm3/sec up to 300°C, and the leak rate was insensitive to pressure. As the temperature increased from 300 to 400°C, the leak rate increased to about 4 X 10"6 cm3/sec and became pressure dependent, A posttest inspection-revealed a small crack in the disk adjacent to the weld fusion zone. The crack evidently formed during heating, and was .responsible for the larger leak rates.
The other two welded disks had leak rates of only about 4 X 10"9 cm3/sec over the range 25 to 500°C. These rates were much lower than those measured at 25°C using a rubber seal. We suspected that a small gas passage in the disk holders was accidently closed by welding; however, after drilling the opening, the leak rate was still only 2 to 4 X 10"8 cm3/sec One possible reason for the low leak rate is that the heat of welding closed the pores of the disk. Another possibility is that the pores were closed by the tarnish which formed during welding. Still another possibility is that the leak rate prior to welding was actually much lower than was measured. This would imply that the disks were sintered
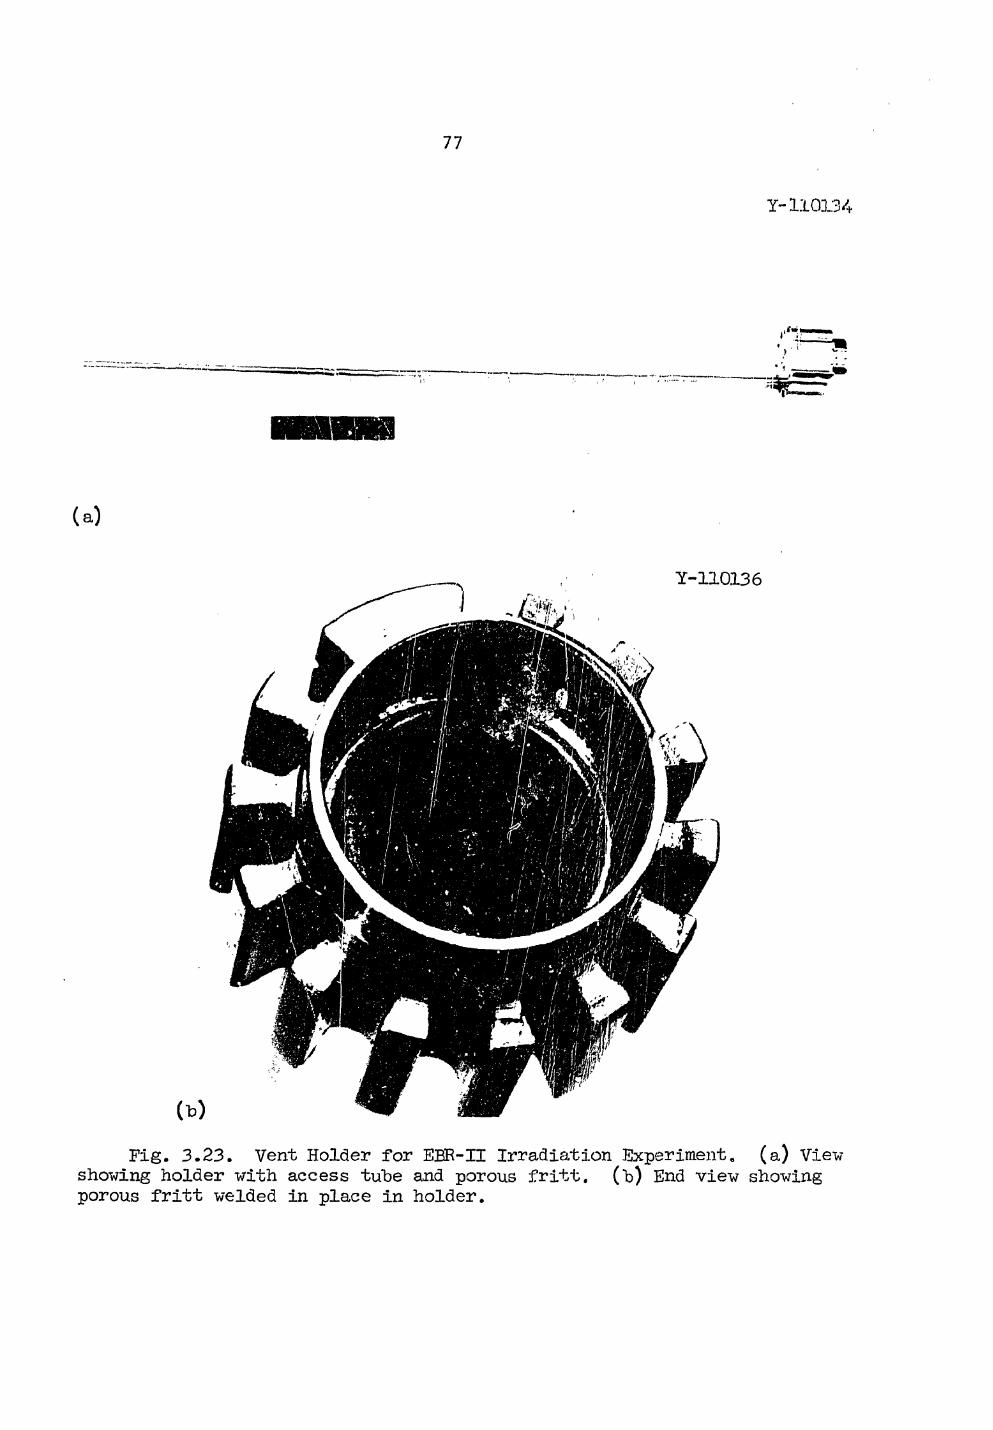
77
Y-110134
(a)
Fig. 3.23. Vent Holder for EBR-II Irradiation Experiment, (a) View showing holder with access tube and porous fritt. (b) End view showing porous fritt welded in place in holder.

78
too much, and that the measured leak rate was associated with the rubber seal. These possibilities are being evaluated.
79
4. MECHANICAL PROPERTIES OF ALLOYS IN REACTOR ENVIRONMENTS AM) DEVELOPMENT OF FBR CLADDING AND STRUCTURAL ALLOYS
J. R. Weir, Jr. H. E. McCoy, Jr. W. R. Martin
The main emphasis of this program is on austenitic stainless steels. Included in our work are types 304 and 316 stainless steel and titanium-modified types 304 and 316 stainless steel. Types 318, 19-9DL, and 12R72HV stainless steel have also been included in recent experiments inserted into the Experimental Breeder Reactor-II (EBR-Il). The irra-diation effects are determined by measurements of swelling and mechani-cal properties after irradiation. Experiments are run in three reactors: the EBR-II, the Oak Ridge Research Reactor (ORR), and the High-Flux Isotope Reactor (HFIR). Comparative results should reveal any effects of flux and reactor spectrum. Specimens of each material are irradiated in a variety of conditions so that the effects of irradiation tempera-ture, fluence, and metallurgical condition can be evaluated.
Effects of Fast Neutron Irradiation on the Creep-Rapture Properties of Type 316 Stainless Steel
E. E. Bloom J. 0. Stiegler
Type 316 stainless steel has been irradiated in the annealed, 10, 20, and 50$ cold-worked conditions at temperatures in the range 450 to about 800°C and to maximum fast neutron fluences of 2.7 x 10²² neutrons/cm2
(> 0.1 MeV). Rupture life (tj and secondary creep rate (e) as a function of K
initial applied stress for unirradiated specimens tested in the annealed and 20$ cold-worked conditions are shown in Figs. 4.1 and 4.2, respectively. In the annealed condition, the log t and the log kg can be represented as linear functions of log cr over the range of the data. An exception occurred at 650°C where sufficient data were available to show deviation from linearity. In general the properties and behavior
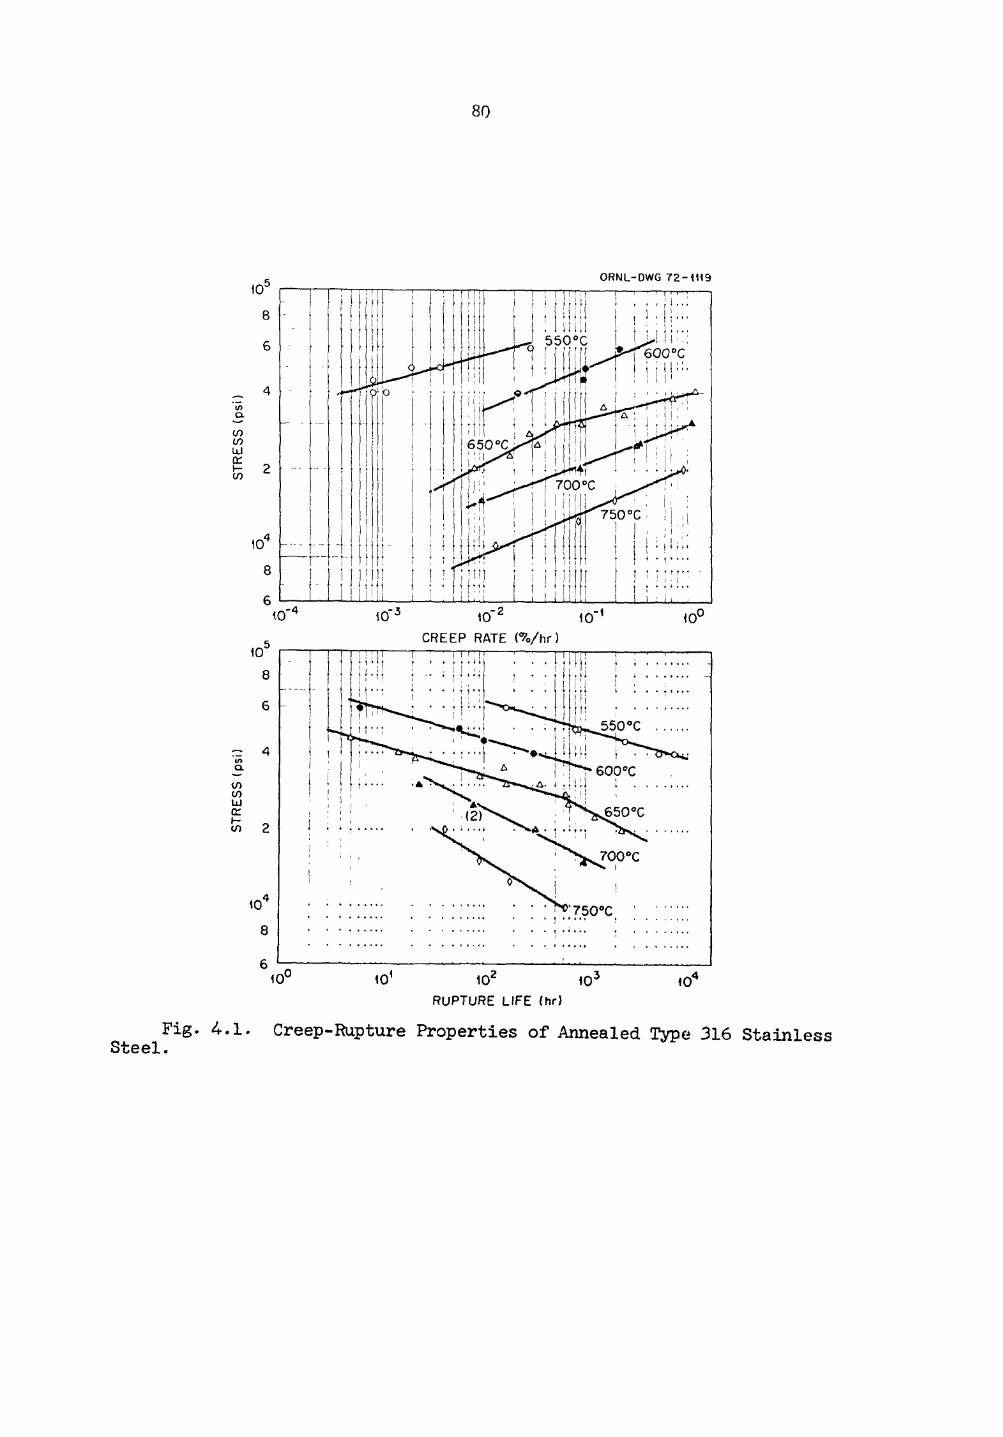
8 0
ORNL-DWG 7 2 - 1114
icr 10* RUPTURE LIFE (hr)
Steel. Fig. 4.1. Creep-Rupture Properties of Annealed Type 316 Stainless
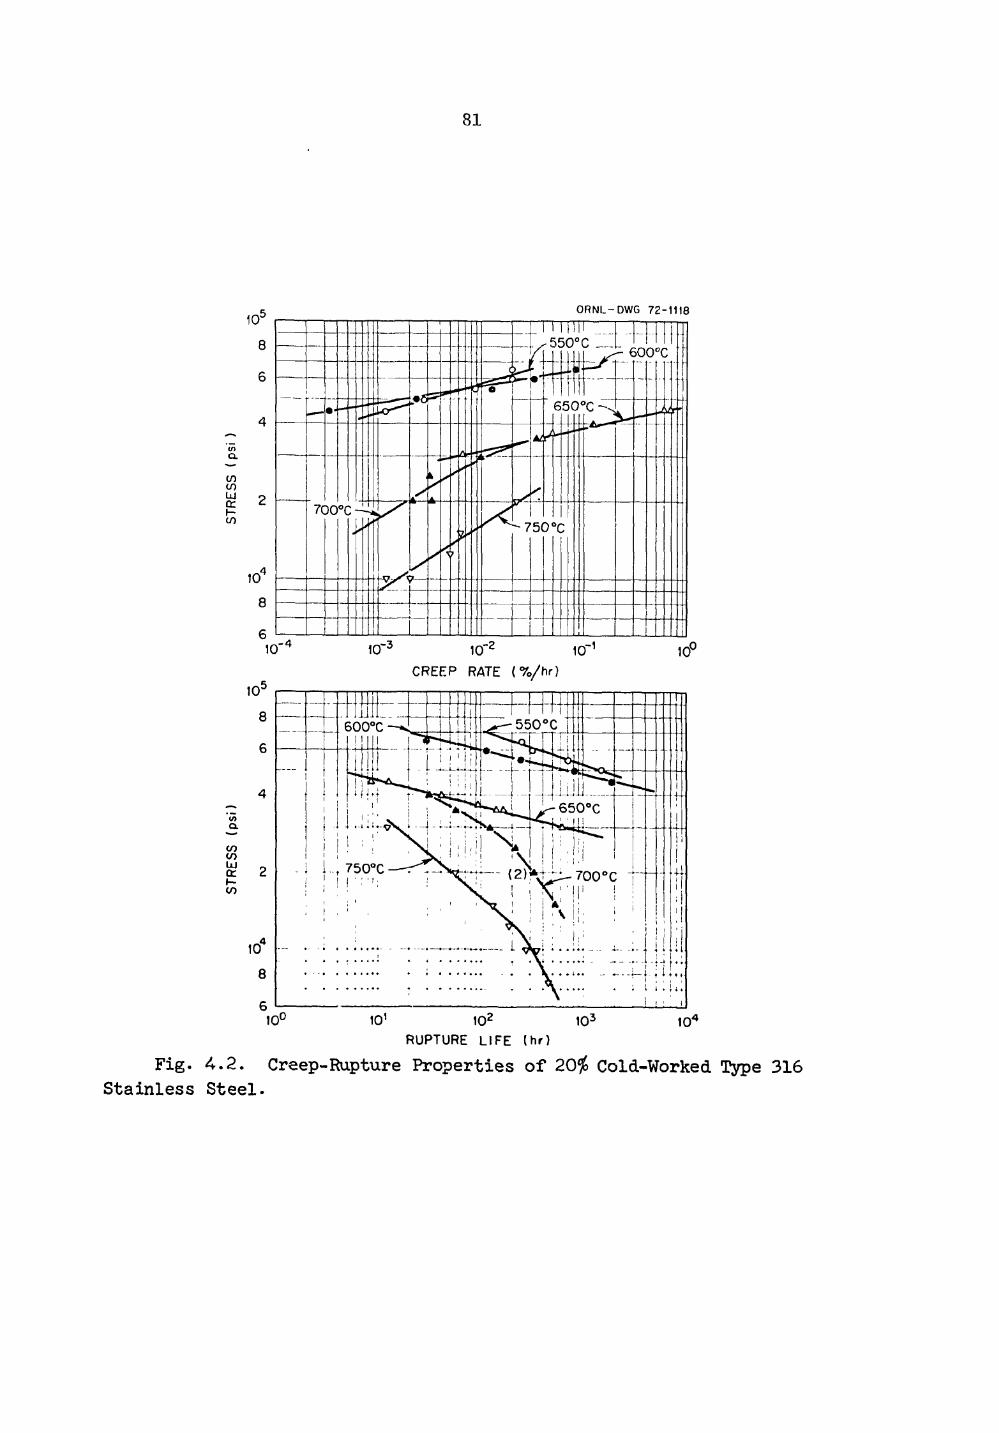
81
O R N L - DWG 72-1118
</i Q .
to cn LU cc I-</>
l/> Q. in in UJ cc h~ m
101 102
RUPTURE L I F E ( h r )
Fig. 4.2. Creep-Rupture Properties of 20$ Cold-Worked Type 316 Stainless Steel.
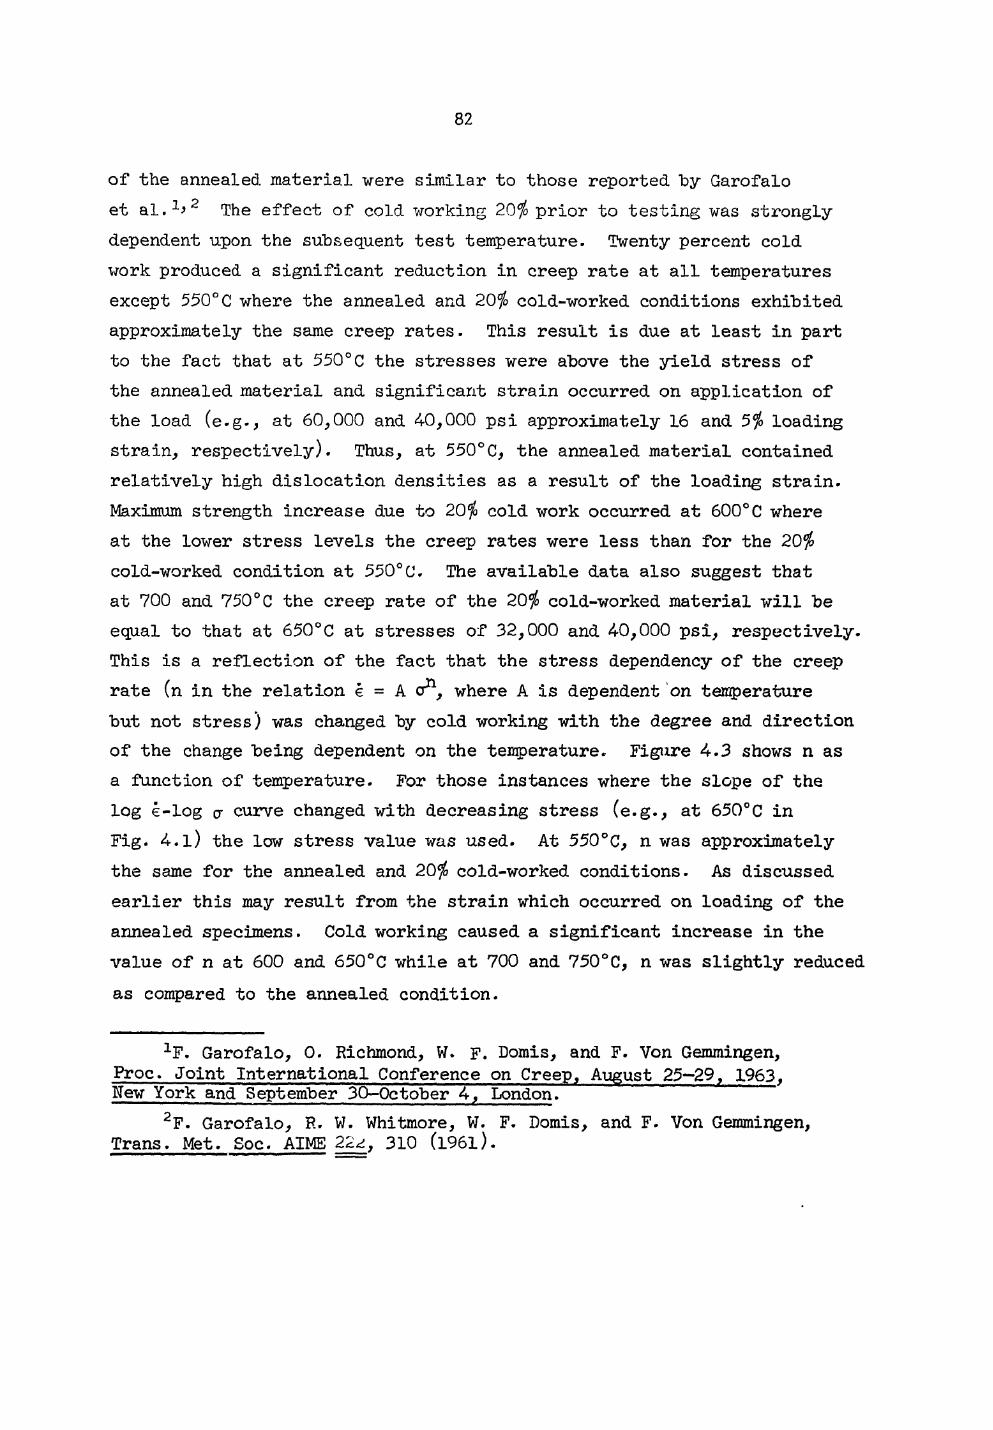
82
of the annealed material were similar to those reported by Garofalo et al.1'2 The effect of cold working 20$ prior to testing was strongly dependent upon the subsequent test temperature. Twenty percent cold work produced a significant reduction in creep rate at all temperatures except 550°C where the annealed and 20$ cold-worked conditions exhibited approximately the same creep rates. This result is due at least in part to the fact that at 550°C the stresses were above the yield stress of the annealed material and significant strain occurred on application of the load (e.g., at 60,000 and 40,000 psi approximately 16 and 5$ loading strain, respectively). Thus, at 550°C, the annealed material contained relatively high dislocation densities as a result of the loading strain. Maximum strength increase due to 20$ cold work occurred at 600°C where at the lower stress levels the creep rates were less than for the 20$ cold-worked condition at 550°C. The available data also suggest that at 700 and 750°C the creep rate of the 20$ cold-worked material will be equal to that at 650°C at stresses of 32,000 and 40,000 psi, respectively. This is a reflection of the fact that the stress dependency of the creep rate (n in the relation k = A a11, where A is dependent on temperature but not stress) was changed by cold working with the degree and direction of the change being dependent on the temperature. Figure 4.3 shows n as a function of temperature. For those instances where the slope of the log e-log cr curve changed with decreasing stress (e.g., at 650°C in Fig. 4.l) the low stress value was used. At 550°C, n was approximately the same for the annealed and 20$ cold-worked conditions. As discussed earlier this may result from the strain which occurred on loading of the annealed specimens. Cold working caused a significant increase in the value of n at 600 and 650°C while at 700 and 750°C, n was slightly reduced as compared to the annealed condition.
1F. Garofalo, 0. Richmond, W. F. Domis, and F. Von Gemmingen, Proc. Joint International Conference on Creep, August 25-29, 1963, New York and September 30-0ctober 4, London.
2F. Garofalo, R. W. Whitmore, W. F. Domis, and F. Von Gemmingen, Trans. Met. Soc. AIME 22^, 310 (l96l).
83
ORNL-OWG 72-<117
TEMPERATURE (*C>
Fig. 4.3. Variation of the Stress Dependency of the Secondary Creep Rate with Temperature for Annealed and 20$ Cold-Worked T}*pe 316 Stainless Steel.
The increased creep strength which is imparted by cold working results from the presence of an extremely high dislocation density and from precipitation of M23C6 carbides on the dislocations. Barriby3'4 has demonstrated ttat in type 316 stainless steel significant strength-ening occurs by precipitation of M23C6 precipitates on the dislocations generated during creep deformation. In the case of cold-worked material this precipitation can occur on the dislocations introduced, by cold working. Strain aging of the dislocation structure probably occurs at temperatures as low as 550°C, but because of the dislocations generated during loading of the annealed specimens, they exhibit nearly the same response as the dislocations generated by 20$ cold work. At higher tem-peratures and thus lower stresses, the amount of loading strain decreases sharply. The kinetics of the precipitation lead to maximum strengthening
3J. T. Barriby, J. Iron Steel Inst. (London) 204, 23 (l966). T. Barnby, J. Iron Steel Inst. (London) 203, 392 (1965).
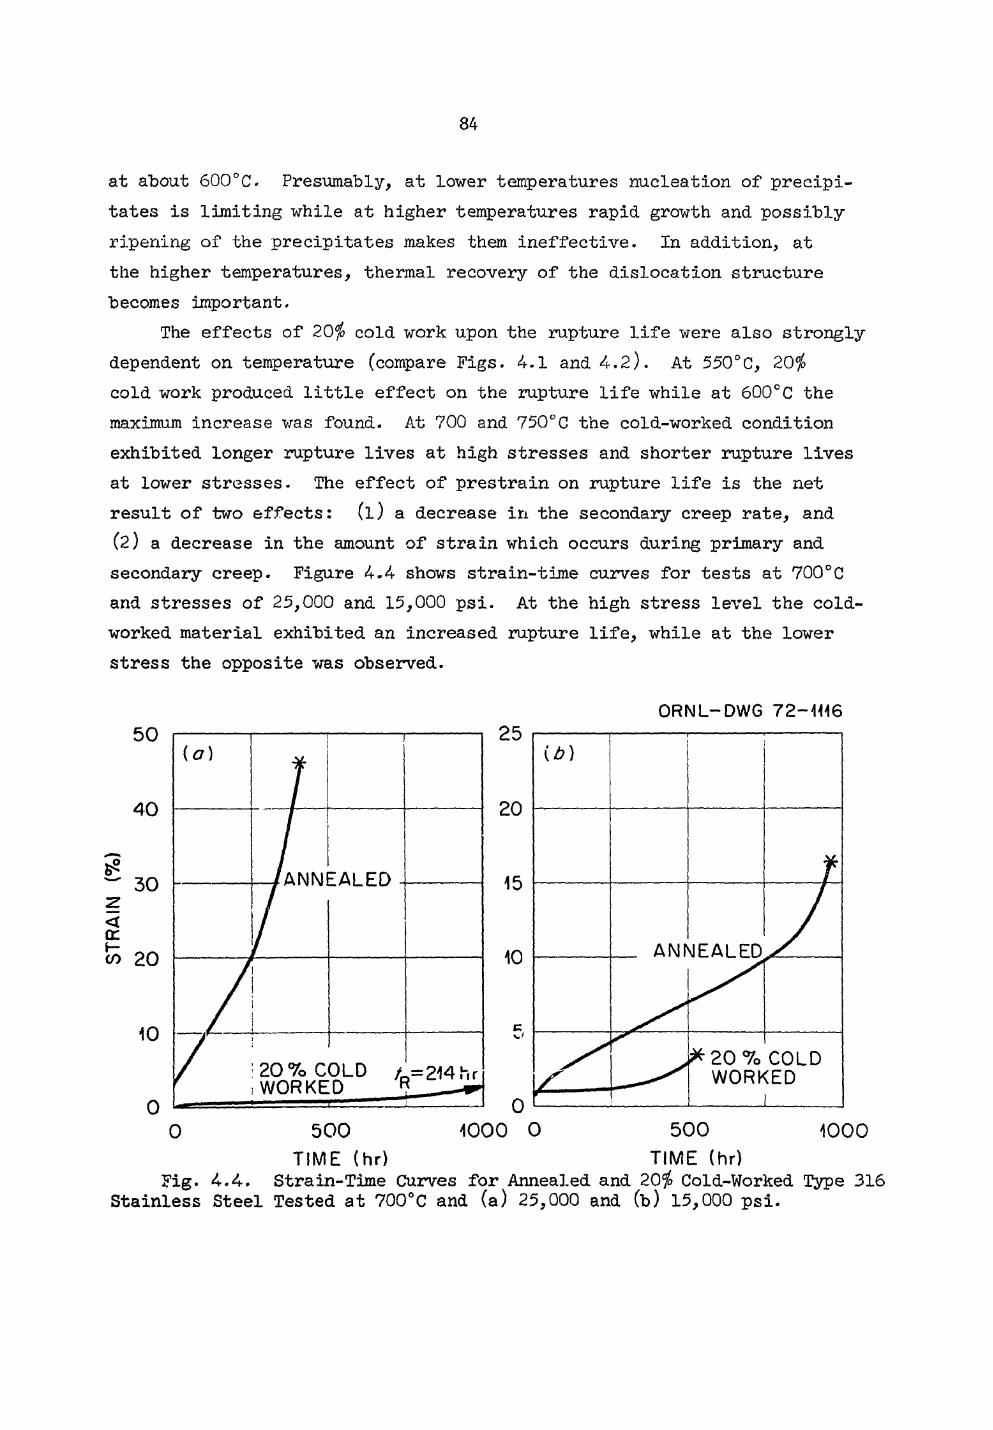
84
at about 600°C. Presumably, at lower temperatures nucleation of precipi-tates is limiting while at higher temperatures rapid growth and possibly ripening of the precipitates makes them ineffective. In addition, at the higher temperatures, thermal recovery of the dislocation structure becomes important.
The effects of 20$ cold work upon the rupture life were also strongly dependent on temperature (compare Figs. 4.1 and 4.2). At 550°C, 20$ cold work produced little effect on the rupture life while at 600°C the maximum increase was found. At 700 and 750°C the cold-worked condition exhibited longer rupture lives at high stresses and shorter rupture lives at lower stresses. The effect of prestrain on rupture life is the net result of two effects: (l) a decrease in the secondary creep rate, and (2) a decrease in the amount of strain which occurs during primary and secondary creep. Figure 4.4 shows strain-time curves for tests at 700°C and stresses of 25,000 and 15,000 psi. At the high stress level the cold-worked material exhibited an increased rupture life, while at the lower stress the opposite was observed.
ORNL-DWG 72-\m
TIME (hr) TIME (hr) Fig. 4.4. Strain-Time Curves for Annealed and 20$ Cold-Worked Type 316
Stainless Steel Tested at 700°C and (a) 25,000 and (b) 15,000 psi.
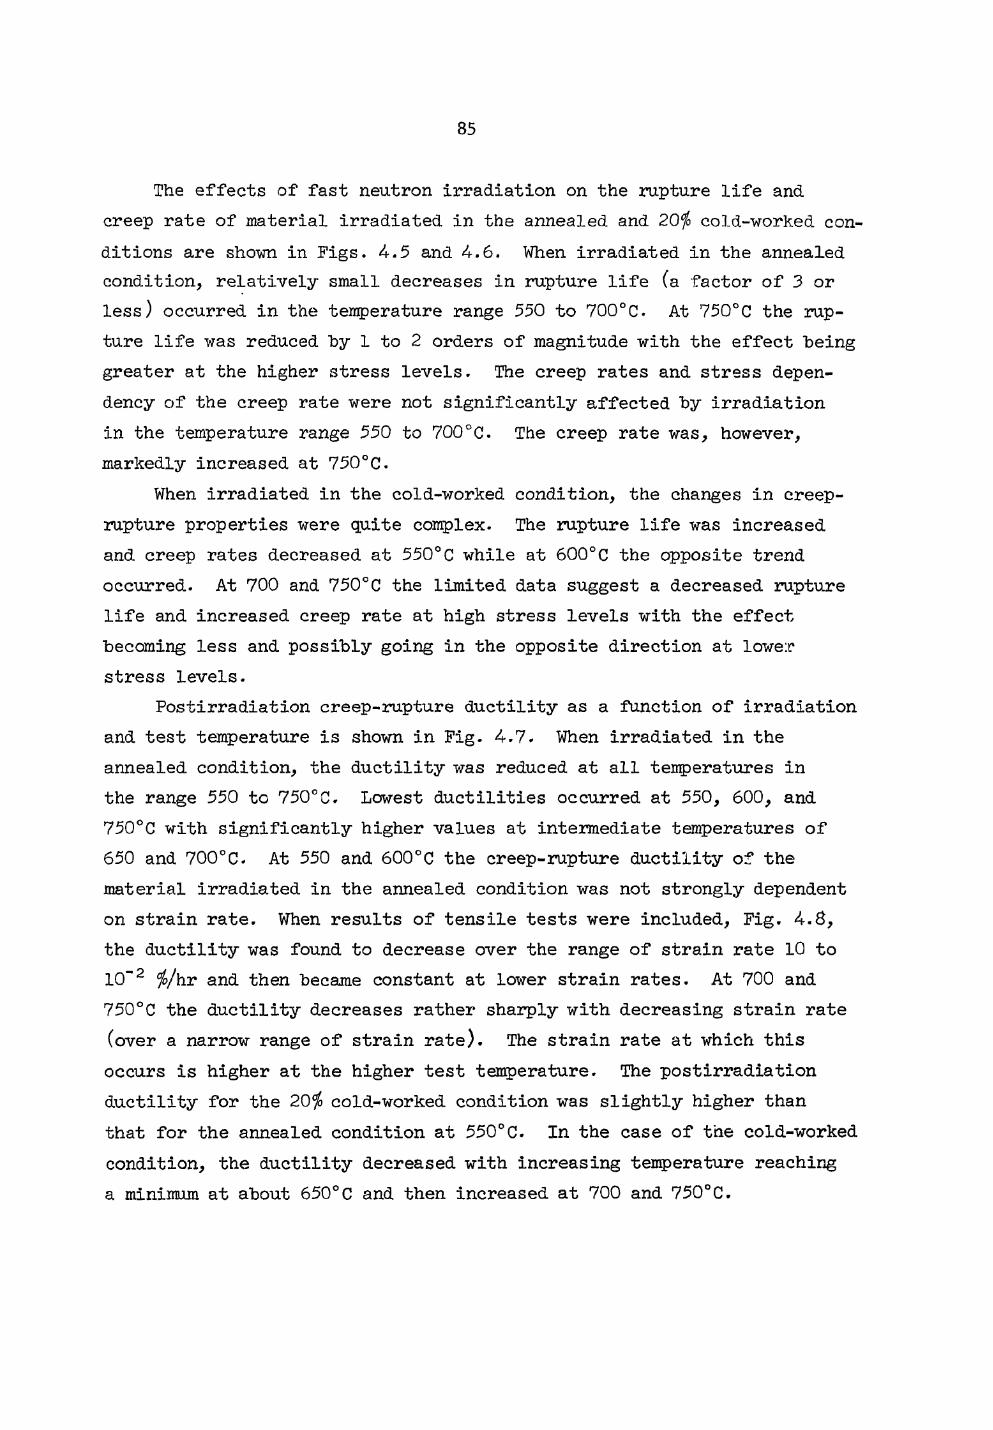
85
The effects of fast neutron irradiation on the rupture life and creep rate of material irradiated in the annealed and 20$ cold-worked con-ditions are shown in Figs. 4.5 and 4.6. When irradiated in the annealed condition, relatively small decreases in rupture life (a factor of 3 or less) occurred in the temperature range 550 to 700°C. At 750°C the rup-ture life was reduced hy 1 to 2 orders of magnitude with the effect being greater at the higher stress levels. The creep rates and stress depen-dency of the creep rate were not significantly affected by irradiation in the temperature range 550 to 700°C. The creep rate was, however, markedly increased at 750°C.
When irradiated in the cold-worked condition, the changes in creep-rupture properties were quite complex. The rupture life was increased and creep rates decreased at 550°C while at 600°C the opposite trend occurred. At 700 and 750°C the limited data suggest a decreased rupture life and increased creep rate at high stress levels with the effect becoming less and possibly going in the opposite direction at lower stress levels.
Postirradiation creep-rupture ductility as a function of irradiation and test temperature is shown in Fig. 4.7. When irradiated in the annealed condition, the ductility was reduced at all temperatures in the range 550 to 750°C. Lowest ductilities occurred at 550, 600, and 750°C with significantly higher values at intermediate temperatures of 650 and 700°C. At 550 and 600°C the creep-rupture ductility of the material irradiated in the annealed condition was not strongly dependent on strain rate. When results of tensile tests were included, Fig. 4.8, the ductility was found to decrease over the range of strain rate 10 to 10"2 $/hr and then became constant at lower strain rates. At 700 and 750°C the ductility decreases rather sharply with decreasing strain rate (over a narrow range of strain rate). The strain rate at which this occurs is higher at the higher test temperature. The postirradiation ductility for the 20$ cold-worked condition was slightly higher than that for the annealed condition at 550°C. In the case of the cold-worked condition, the ductility decreased with increasing temperature reaching a minimum at about 650°C and then increased at 700 and 750°C.
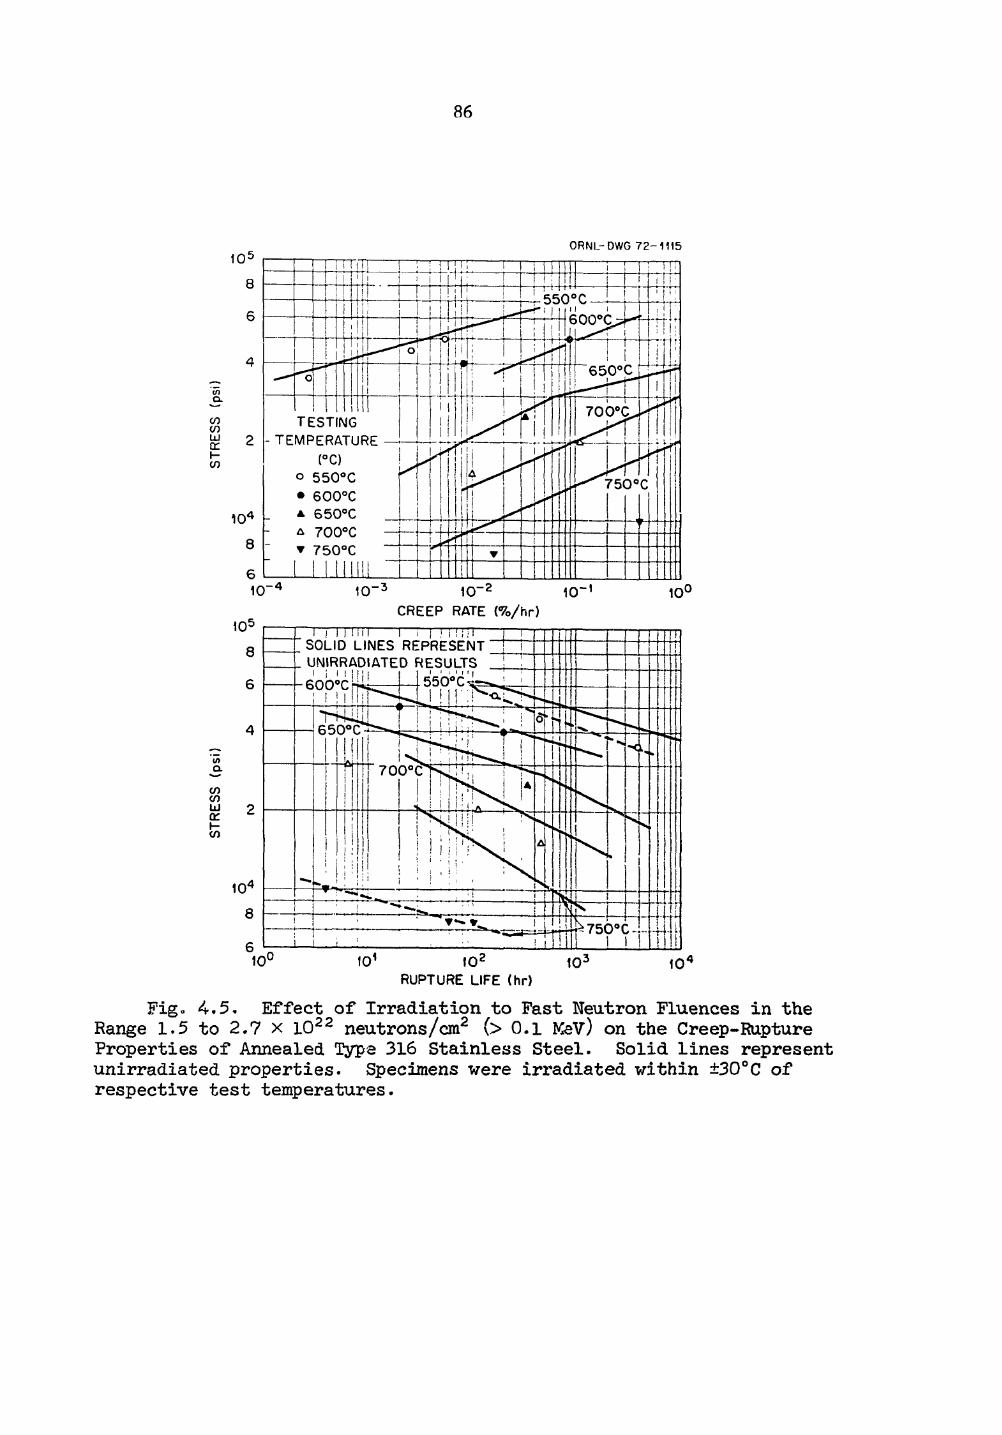
86
ORNL-DWG 7 2 - 1114
RUPTURE LIFE (hr )
Fig. 4.5. Effect of Irradiation to Fast Neutron Fluences in the Range 1.5 to 2.7 x 10²² neutrons/cm2 (>0.1 MeV) on the Creep-Rupture Properties of Annealed Type 316 Stainless Steel. Solid lines represent unirradiated properties. Specimens were irradiated within ±30°C of respective test temperatures.
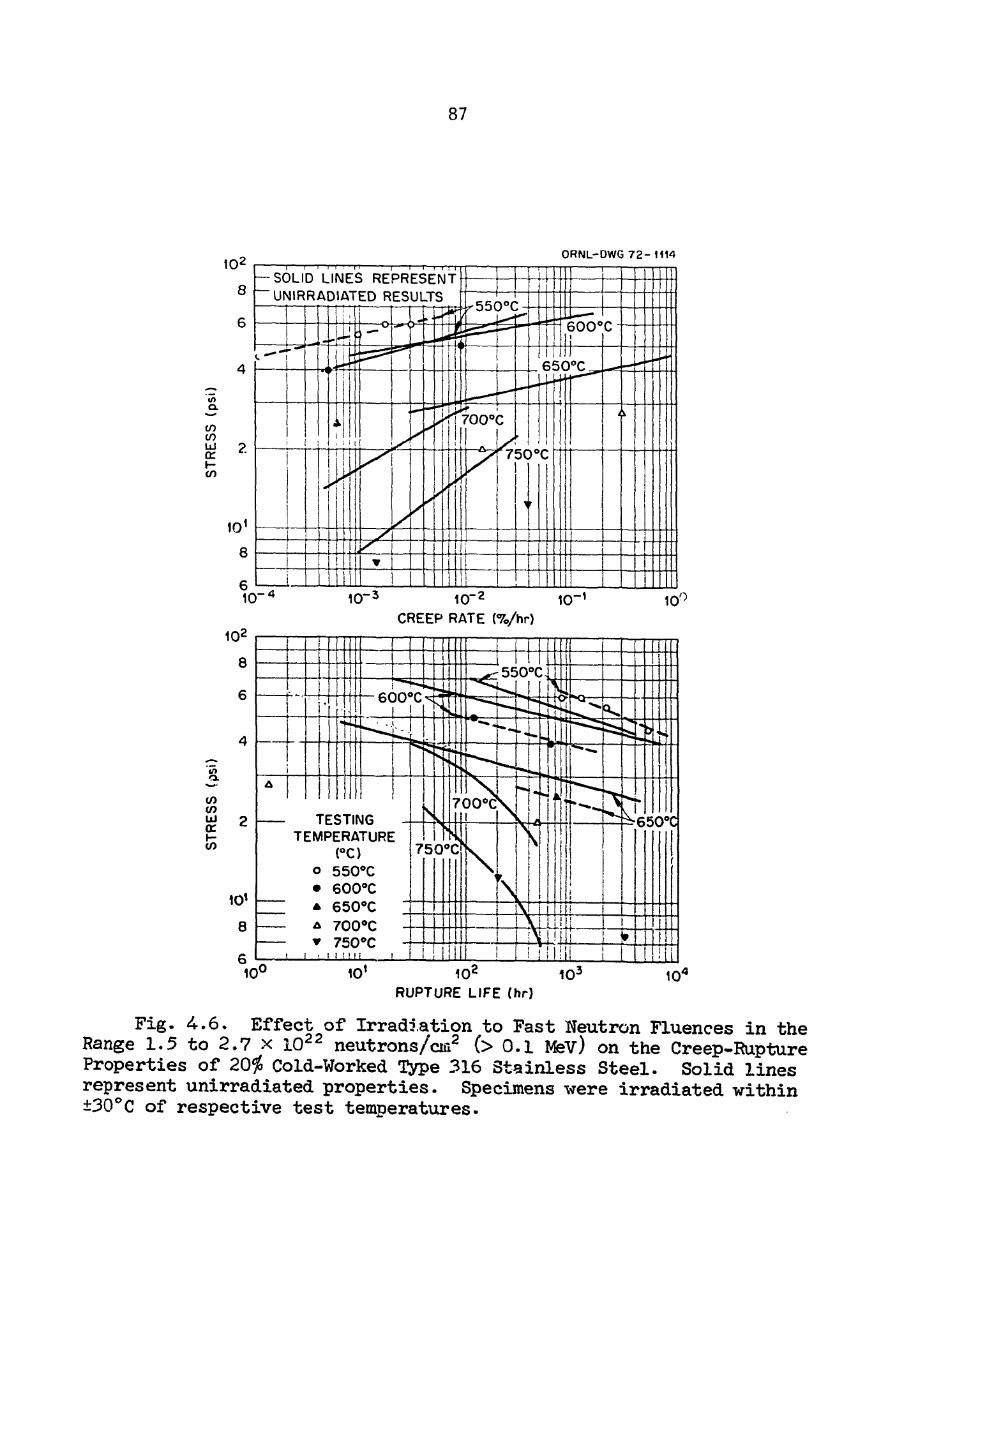
87
ORNL-DWG 7 2 - 1114
RUPTURE L I F E ( h r )
Fig. <4.6. Effect of Irradiation to Fast Neutron Fluences in the Range 1.5 to 2.7 x 10²² neutrons/cm2 (>0.1 Mev) on the Creep-Rupture Properties of 20$ Cold-Worked type 316 Stainless Steel. Solid lines represent unirradiated properties. Specimens were irradiated within ±30°C of respective test temperatures.
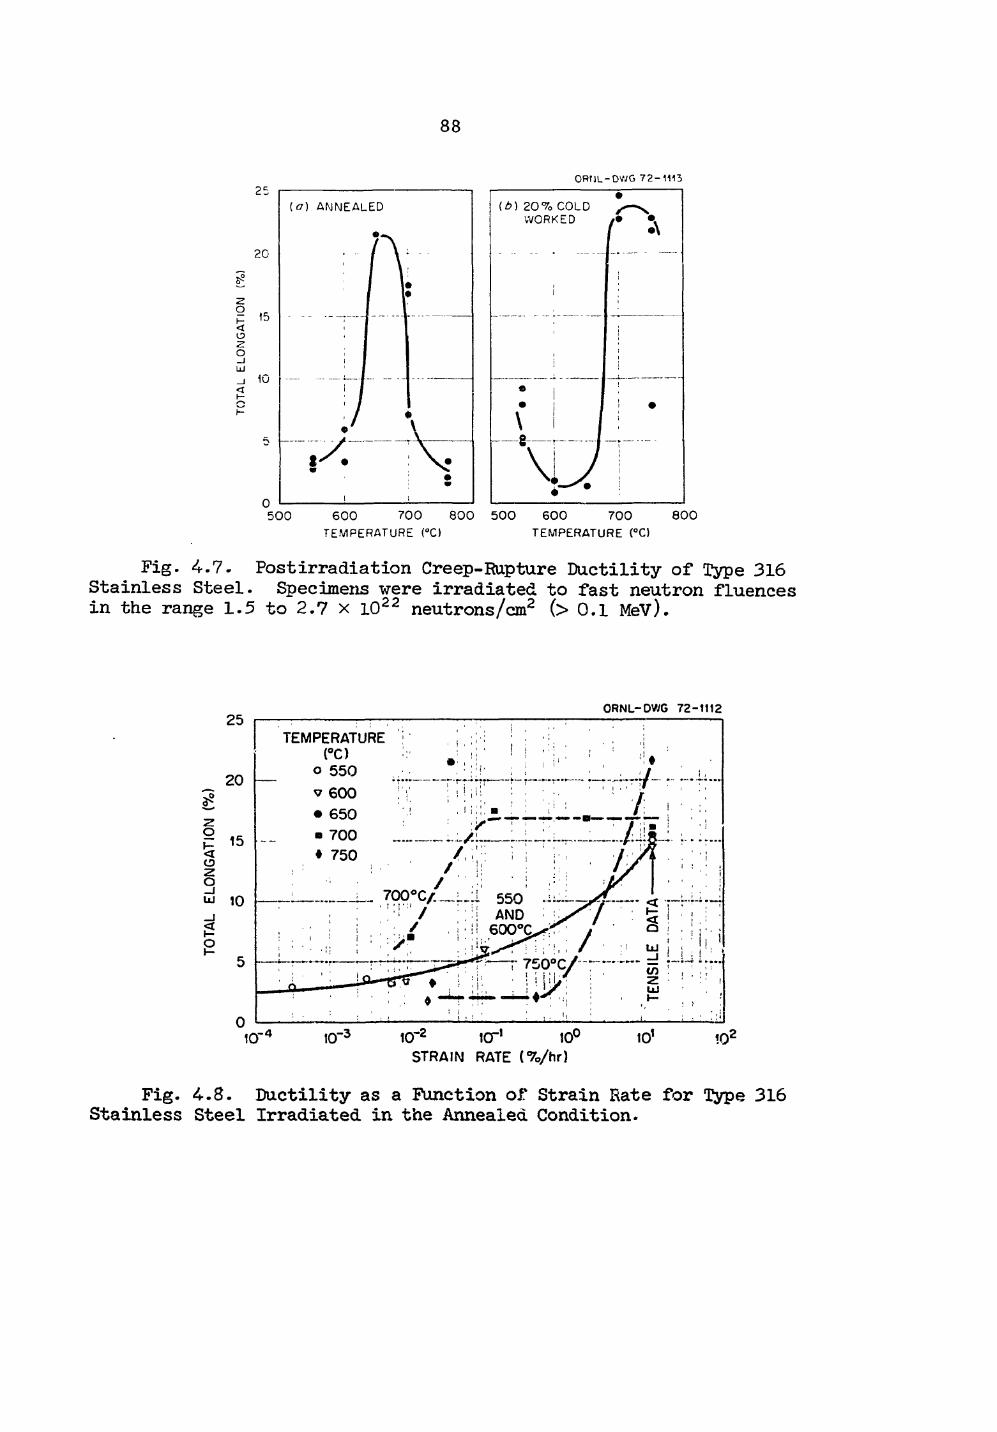
88
ORML-DWG 72- 1113 (b) 2 0 % COLD
WORKED
•
i
* I
\ I 8 r
•
j
5 0 0 6 0 0 7 0 0 8 0 0 5 0 0 6 0 0 7 0 0 8 0 0 TEMPERATURE (°C) TEMPERATURE CC]
Fig. 4.7. Postirradiation Creep-Rupture Ductility of Type 316 Stainless Steel. Specimens were irradiated to fast neutron fluences in the range 1.5 to 2.7 x 10²² neutrons/cm2 (> 0.1 MeV).
ORNL-DWG 72-1112
10~ 2 1CT1 J 0 °
S T R A I N R A T E ( % / h r )
Fig. 4.8. Ductility as a Function of Strain Rate for Type 316 Stainless Steel Irradiated in the Annealed Condition.
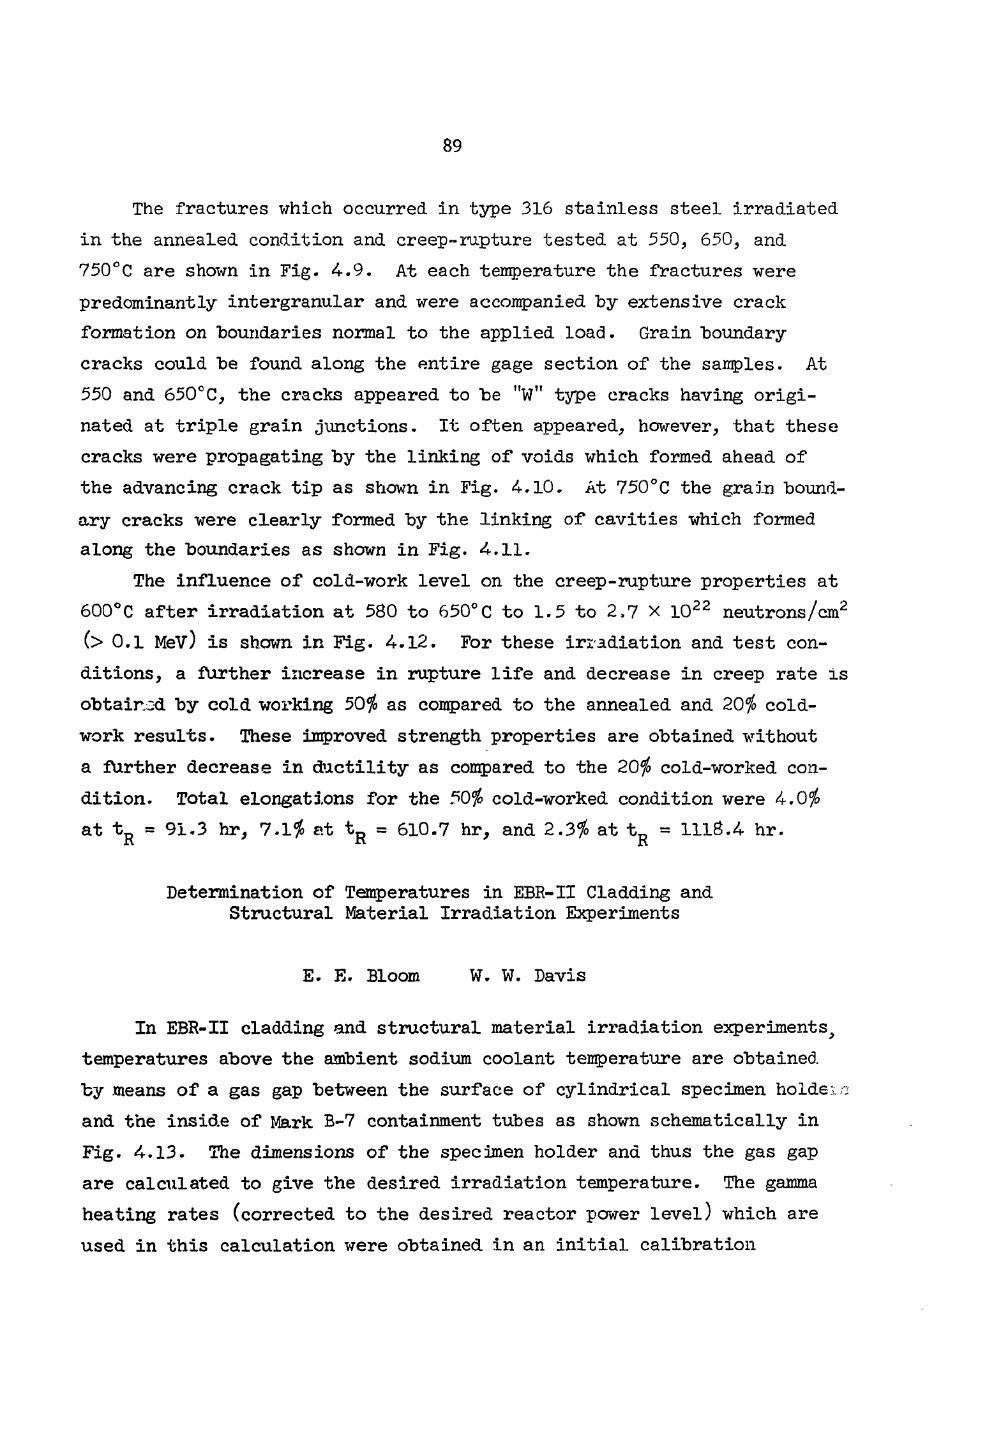
89
The fractures which occurred in type 316 stainless steel irradiated in the annealed condition and creep-rupture tested at 550, 650, and 750°C are shown in Fig. 4.9. At each temperature the fractures were predominantly intergranular and were accompanied hy extensive crack formation on boundaries normal to the applied load. Grain boundary cracks could be found along the entire gage section of the samples. At 550 and 650°C, the cracks appeared to be "w" type cracks having origi-nated at triple grain junctions. It often appeared, however, that these cracks were propagating by the linking of voids which formed ahead of the advancing crack tip as shown in Fig. 4.10. At 750°C the grain bound-ary cracks were clearly formed by the linking of cavities which formed along the boundaries as shown in Fig. 4.11.
The influence of cold-work level on the creep-rupture properties at 600°C after irradiation at 580 to 650°C to 1.5 to 2,7 x 10²² neutrons/cm2 (> 0.1 MeV) is shown in Fig. 4.12. For these irradiation and test con-ditions, a further increase in rupture life and decrease in creep rate is obtained by cold working 50$ as compared to the annealed and 20$ cold-work results. These improved strength properties are obtained without a further decrease in ductility as compared to the 20$ cold-worked con-dition. Total elongations for the 50$ cold-worked condition were 4.0$ at tR = 91.3 hr, 7.1$ at tR = 610.7 hr, and 2.3$ at tR = 1118.4 hr.
Determination of Temperatures in EBR-II Cladding and Structural Material Irradiation Experiments
E. E. Bloom W. W. Davis
In EBR-II cladding and structural material irradiation experimentsJ temperatures above the ambient sodium coolant temperature are obtained by means of a gas gap between the surface of cylindrical specimen ho Idem and the inside of Mark B-7 containment tubes as shown schematically in Fig. 4.13. The dimensions of the specimen holder and thus the gas gap are calctilated to give the desired irradiation temperature. The gamma heating rates (corrected to the desired reactor power level) which are used in this calculation were obtained in an initial calibration
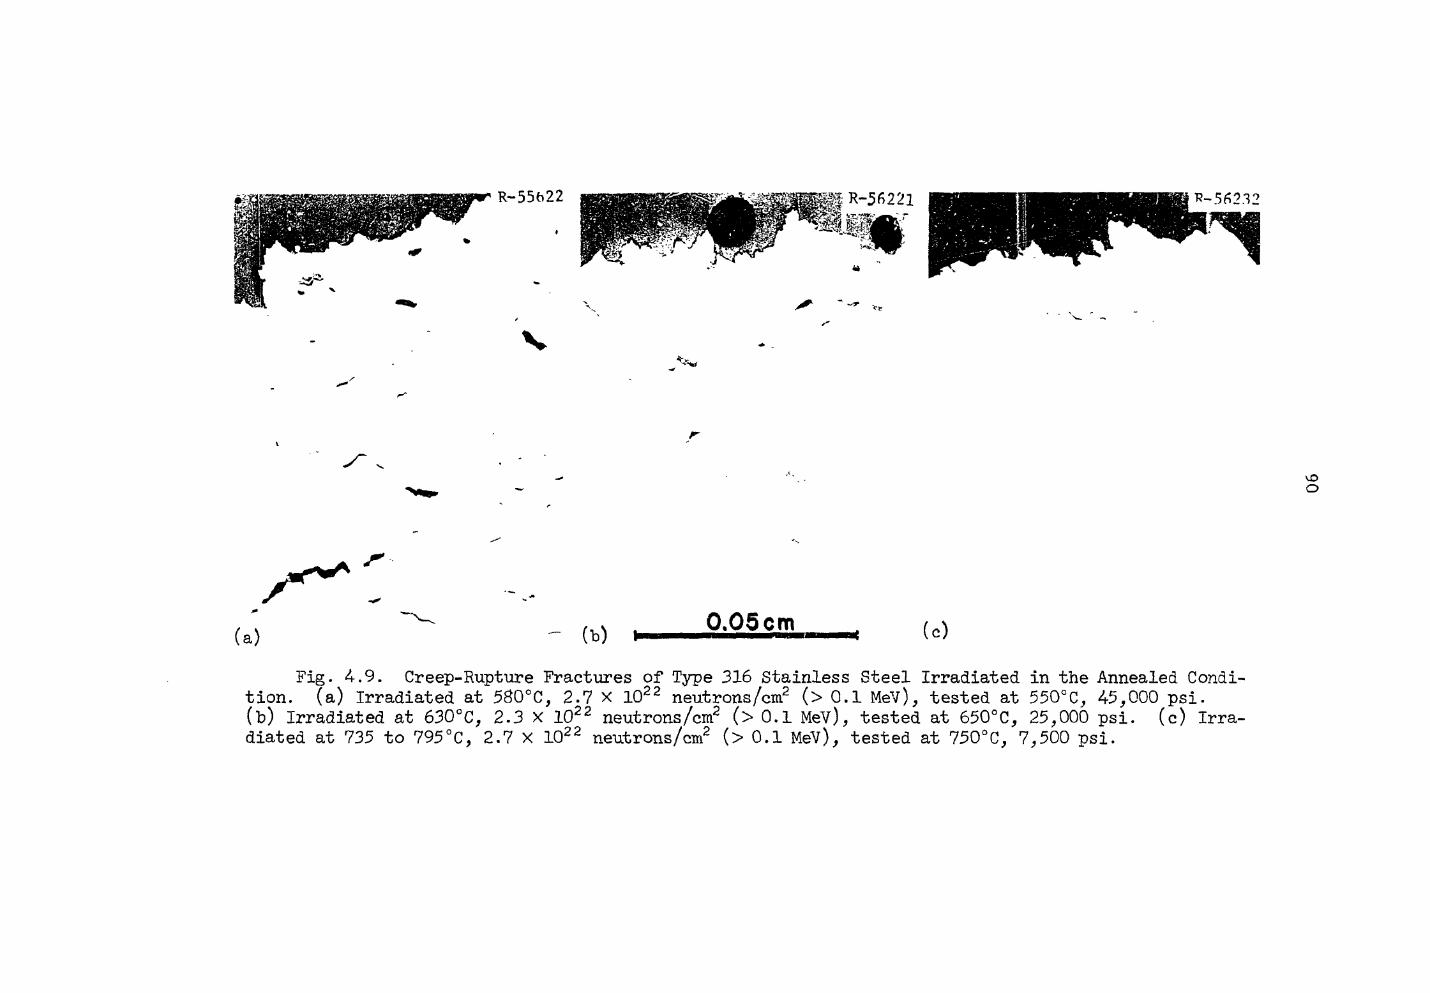
Fig. 4.9. Creep-Rupture Fractures of Type 316 Stainless Steel Irradiated in the Annealed Condi-tion. (a) Irradiated at 580°C, 2.7 X 10²² neutrons/cm2 (> 0.1 MeV), tested at 550°C, 45,000 psi. (b) Irradiated at 630°C, 2.3 X 10²² neutrons/cm2 (> 0.1 MeV), tested at 650°C, 25,000 psi. (c) Irra-diated at 735 to 795°C, 2.7 X 10²² neutrons/cm2 (> 0.1 MeV), tested at 750°C, 7,500 psi.
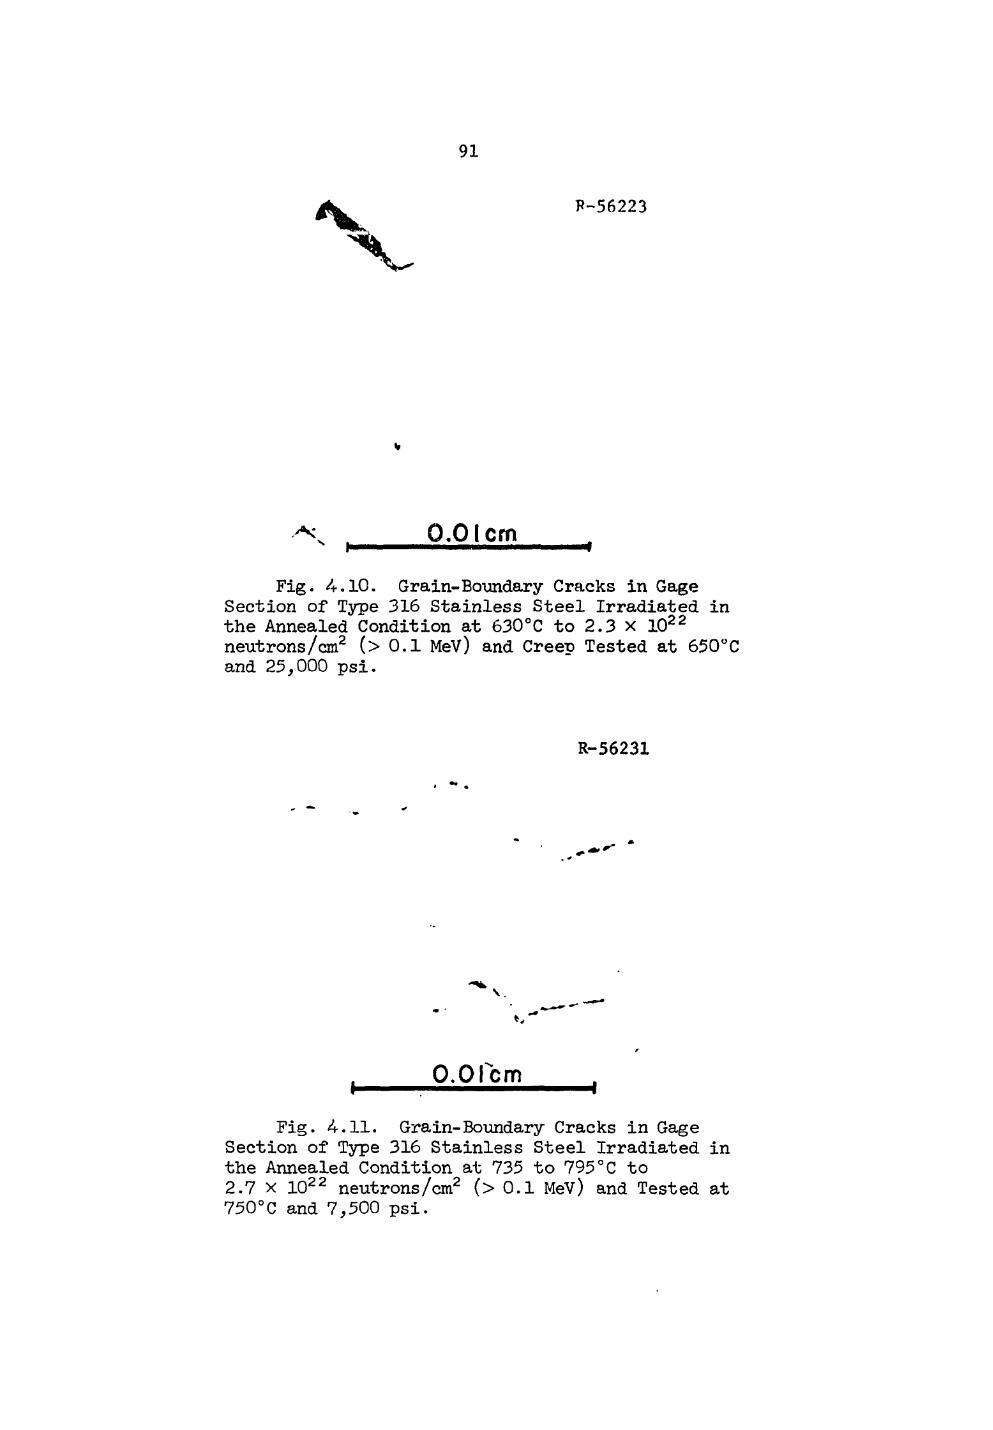
" V
91
P-56223
v
0.01 cm f
Fig. <4.10. Grain-Boundary Cracks in Gage Section of Type 316 Stainless Steel Irradiated in the Annealed Condition at 630°C to 2.3 x 10²²
neutrons/cm2 (> 0.1 MeV) and Creep Tested at 650°C and 25,000 psi.
R-56231
0.01 c m
Fig. <4.11. Grain-Boundary Cracks in Gage Section of Tyipe 316 Stainless Steel Irradiated in the Annealed Condition at 735 to 795°C to 2.7 x 10²² neutrons/cm2 (> 0.1 MeV) and Tested at 750°C and 7,500 psi.
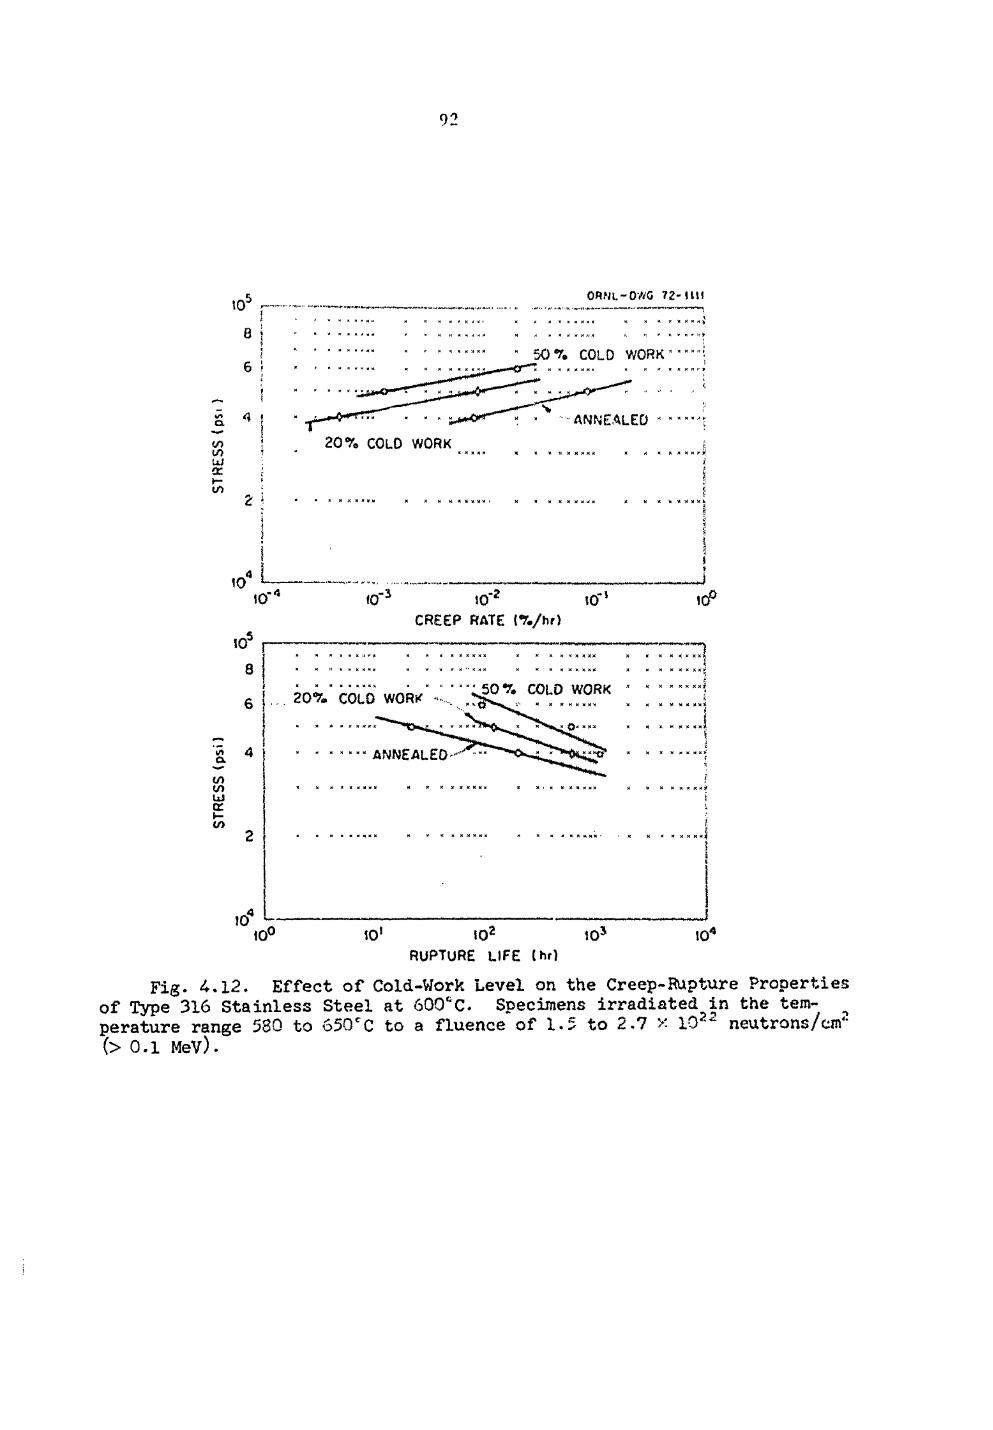
92
to3 8 i 6 f
trt Q.
to tS> UJ cc. V-IA
ORNL-OWC 72- 111!
5 0 % COLO WORK
2 0 % COLO WORK
ANNEALED
10 10"
a </>
Ui tr h-io
10 8
6
4
JO
<0 -1 -2 JO
CREEP RATE { % / h r )
10
2 0 % COLO WORK -' 5 0 % COLO WORK
"" ANNEALED"""
10° 1 0 ' I 0 2
RUPTURE L I F E ( h r )
10J
-J Kf
TF X M K M X ]
i * nxi f
..J
10"
Fig. 4.12. Effect of Cold-Work Level on the Creep-Rupture Properties of Type 316 Stainless Steel at 60QcC. Specimens irradiated in the tern- ^ perature range 580 to 650cC to a fluence of 1.5 to 2.7 x 10²² neutrons/cm" (> 0.1 MeV)•
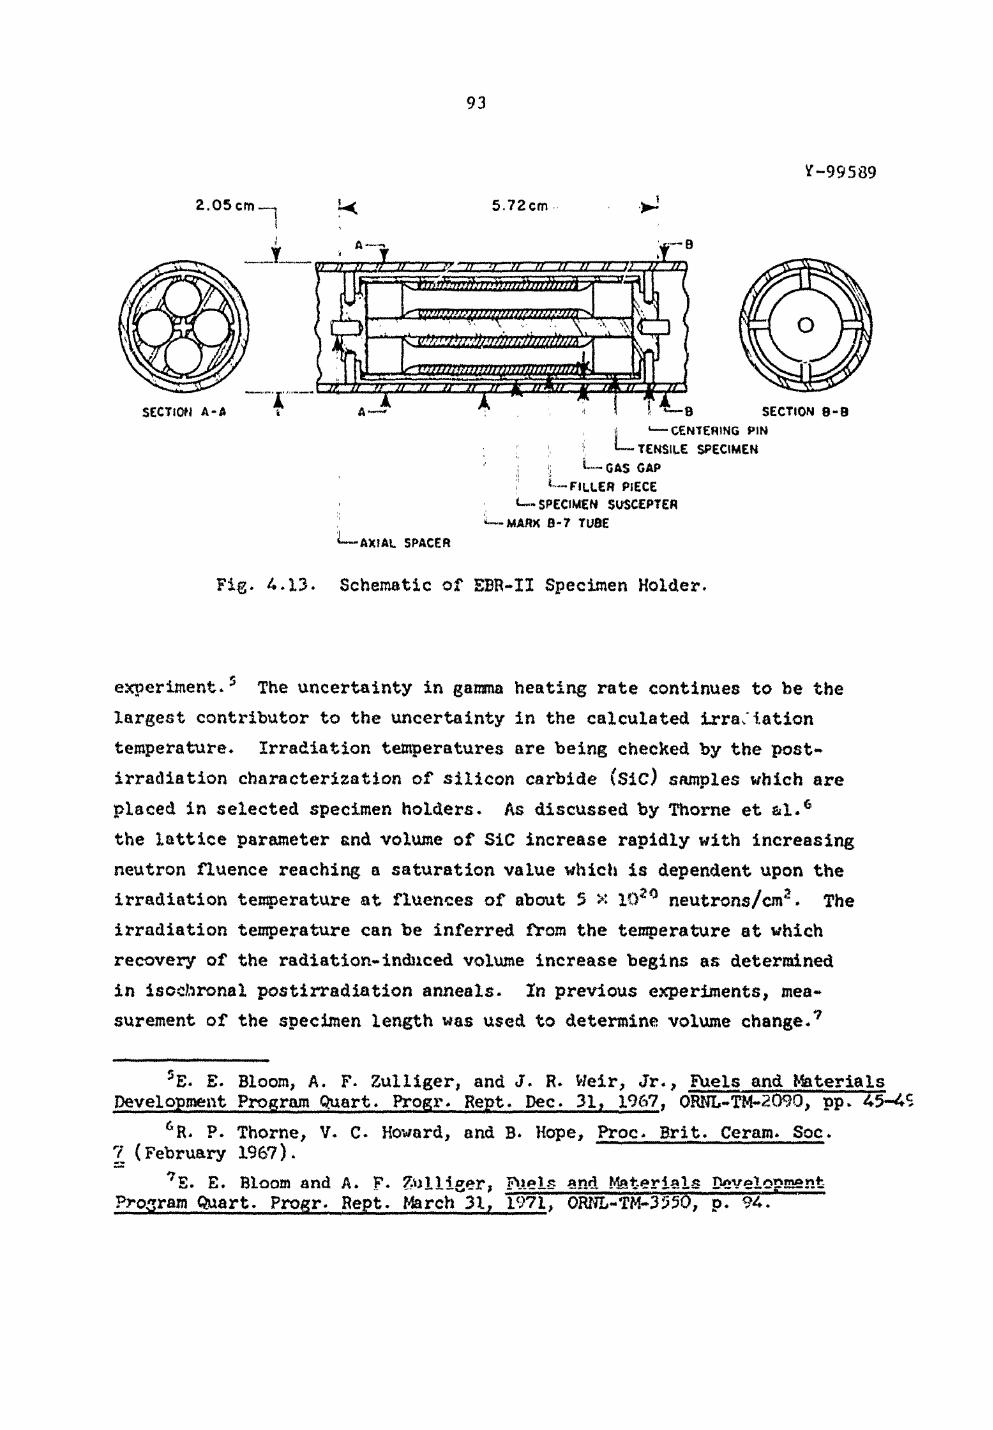
93
* - 9 9 5 8 9
2 .05cm
SECTION A - A
5.72cm
— B w )f p >/ » "w rr » fi a tt » ir iryr^rn
SECTION 8 - B I <—CENTERING PIN
!; TENSILE SPECIMEN ; »—GAS GAP < - F I L L E R PIECE
-SPECIMEN SUSCEPTEfl ™ MARK 0 - 7 TUBE
AXIAL SPACER
Fig. 4.13. Schematic of EBR-II Specimen Holder.
experiment.5 The uncertainty in gamma heating rate continues to be the largest contributor to the uncertainty in the calculated Irradiation temperature. Irradiation temperatures are being checked by the post-irradiation characterization of silicon carbide (Sic) samples which are placed in selected specimen holders. As discussed by Thome et &1.6 the lattice parameter end volume of SiC increase rapidly with increasing neutron fluence reaching a saturation value which is dependent upon the irradiation temperature at fluences of about 5 x lO20 neutrons/cm2. The irradiation temperature can be inferred lYom the temperature at which recovery of the radiation-induced volume increase begins as determined in Isochronal postirradiation anneals. In previous experiments, mea-surement of the specimen length was used to determine volume change.7
5E. E. Bloom, A. F. Zulliger, and J. R. Weir, Jr., Fuels and Materials Development Program Quart. Progr. Rept. Dec. 31, 1967, 0RNL-TM-2090, pp. 45-4$
6R. P. Thorne, V. C. Howard, and B. Hope, Proc. Brit. Ceram. Soc. 7 (February 1967).
7E. E. Bloom and A. F- 7.ulliger, Fuels and Materials Development Program Quart. Progr. Rept. March~3l, 1971, QRNL-TM-355Q, p. 94.
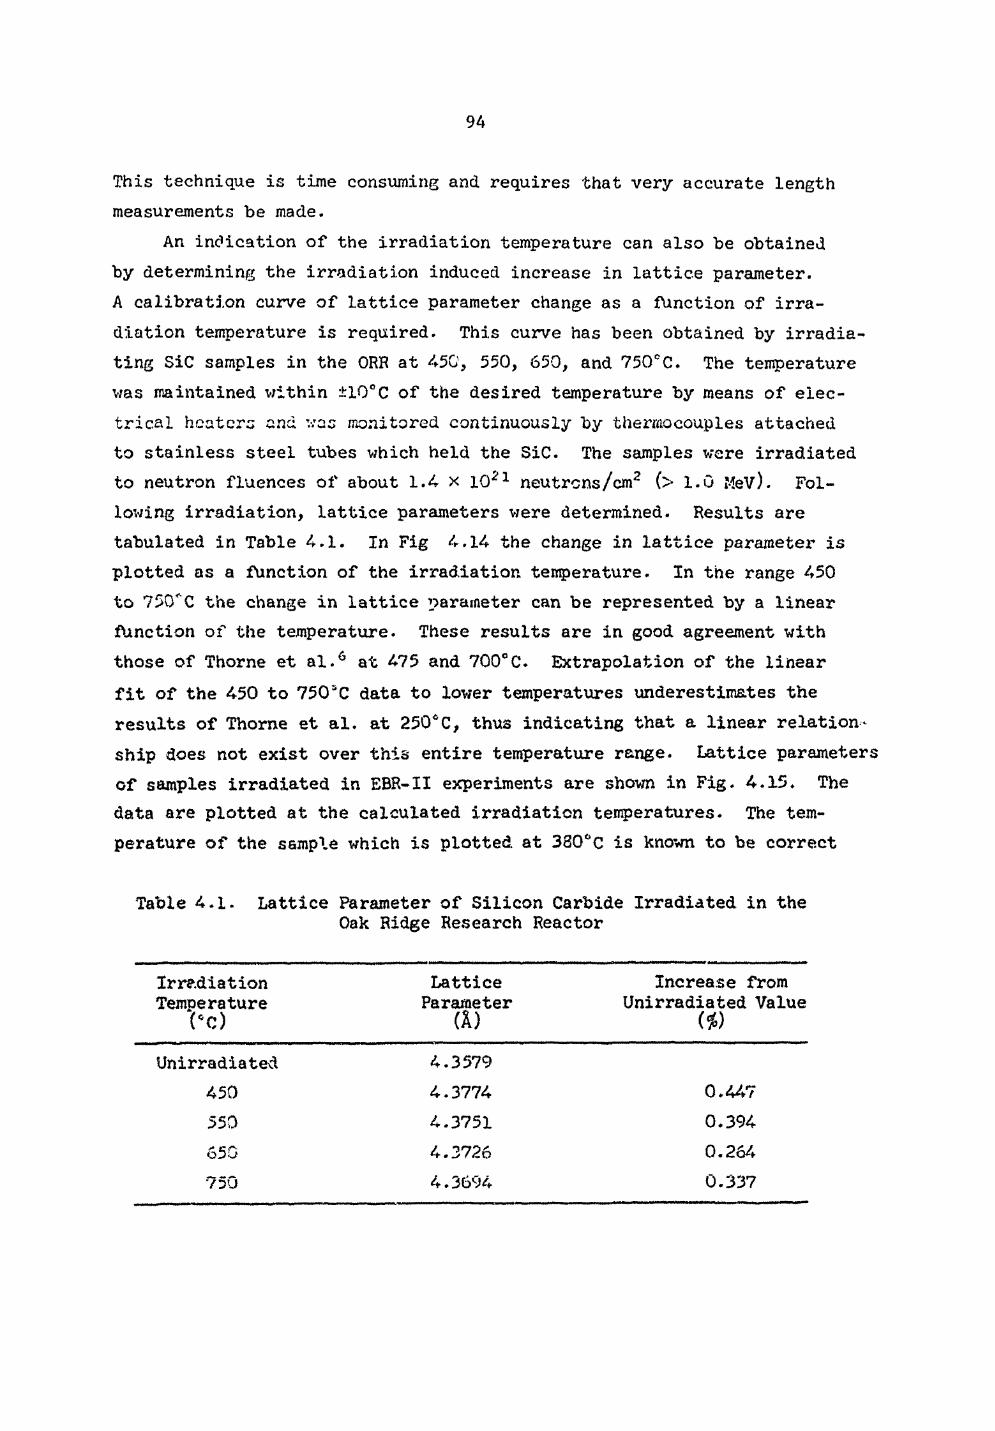
94
This technique is time consuming and requires that very accurate length measurements be made.
An indication of the irradiation temperature can also be obtained by determining the irradiation induced increase in lattice parameter. A calibration curve of lattice parameter change as a function of irra-diation temperature is required. This curve has been obtained by irradia-ting SiC samples in the ORR at 450, 550, 650, and 750°C. The temperature was maintained within ±10°C of the desired temperature by means of elec-trical heaters and vac monitored continuously by thermocouples attached to stainless steel tubes which held the SiC. The samples were irradiated to neutron fluences of about 1.4 x lQ21 neutrons/cm2 (> 1.0 MeV). Fol-lowing irradiation, lattice parameters were determined. Results are tabulated in Table 4.1. Xn Fig 4.14 the change in lattice parameter is plotted as a function of the irradiation temperature. In the range 450 to 75CTC the change in lattice parameter can be represented by a linear function of the temperature. These results are in good agreement with those of Thome et al.6 at 475 and 700°C. Extrapolation of the linear fit of the 450 to 750*C data to lower temperatures underestimates the results of Thorne et al. at 250*C, thus indicating that a linear relation-ship does not exist over this entire temperature range. Lattice parameters of samples irradiated in EBR-II experiments are shown in Fig. 4.15. The data are plotted at the calculated irradiation temperatures. The tem-perature of the sample which is plotted at 330*0 is known to be correct
Table 4.1. Lattice Parameter of Silicon Carbide Irradiated in the Oak Ridge Research Reactor
Irradiation Temperature
Cc)
Lattice Parameter
tt) Increase from
Unirradiated Value (*)
Unirradiated 4.3579 450 4.3774 0.447 550 4.3751 0.394 650 4.3726 0.264 750 4.3694 0.337
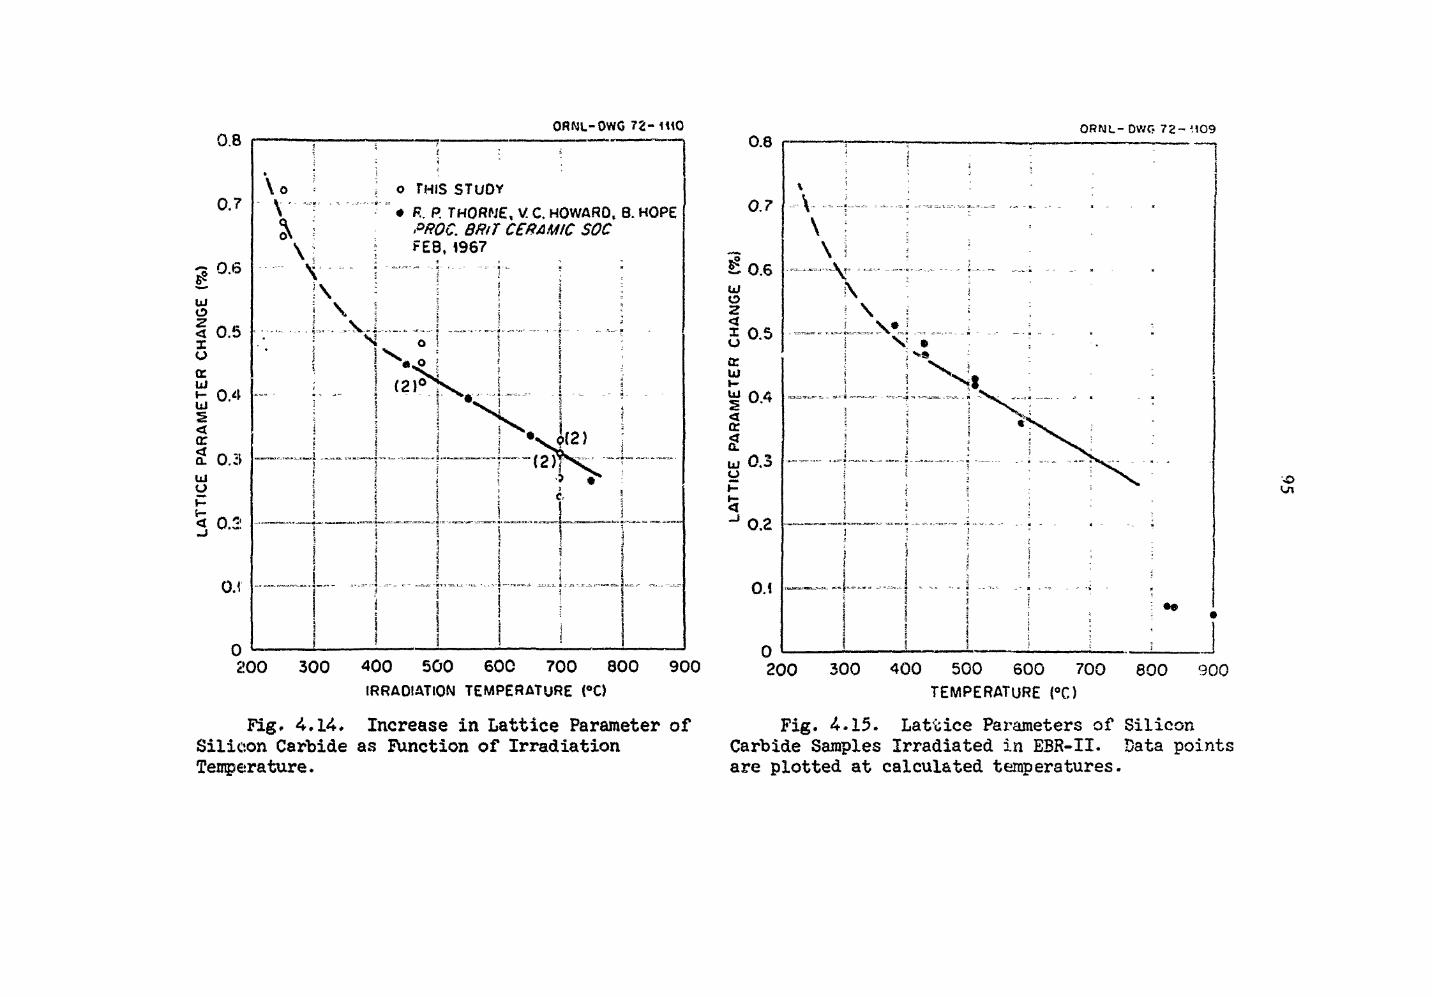
ORNl-OWG 72-\\\Q
O THIS STUDY • P., P. THORNE, V. C. HOWARQ, 8. HOPE PROC. QRfT CERAMIC SOC FEB, 1967
200 300 400 500 600 700 800 IRRAOIATlON TEMPERATURE (°C)
900
Fig. 4.14. Increase in Lattice Parameter of Silicon Carbide as Function of Irradiation Temperature.
O R N L - OWCf 7 2 - ^ 0 9
V \ \ Y \ \
v
200 300 400 500 600 700 TEMPERATURE (°C)
800 900
Fig. 4.15. Lattice Parameters of Silicon Carbide Samples Irradiated in EBR-II. Data points are plotted at calculated temperatures.
96
to about 10°C since the sample was in a specimen holder which was located below the reactor core and was designed to operate close to the ambient coolant temperature (370°C on the inlet side of the core). This data point agrees well with the OKR results. In the range 370 to about 650°C, the calculated temperatures agree with the temperatures indicated by the SiC within about 25°C. Silicon carbide from specimen holders having cal-culated temperatures of 825 and 835°C gave results which indicated much higher irradiation temperatures, about 1050°C, on the basis of extrapola-tion of the ORR results. The stainless steel samples which were irra-diated in these holders contained a high concentration of carbide precipitates both in the matrix and at the grain boundaries. This indi-cates that the temperature could not have reached 1050°C since this is above the solution temperature for these carbides. The discrepancy at high temperatures may arise because a linear extrapolation of the 4-50 to 750°C SiC data is invalid.
Analysis of Stress-Strain Behavior of Unirradiated Type 316 Stainless Steel
D. Fahr
These tests were carried out in order to enhance our understanding of this type of steel with respect to its mechanical behavior. As-annealed and cold-worked specimens were tested in aged and unaged con-ditions at different temperatures and crosshead speeds in tensile tests.
Without a thorough understanding of the behavior characteristics of an unirradiated steel no progress can be expected as to the interpreta-tion of the effects of irradiation on mechanical properties.
Considering the fact that significant macroscopic changes in mechan-ical properties are caused by irradiation as a result of microscopic and submicroseopic changes in the defect structure and alloy composition (transmutation products and radiation-induced precipitation) it appears to be much more important to find out why things occur than to simply observe and describe what happens. It is for this reason that a detailed, qualitative analysis of tensile data has been attempted to correlate
97
microscopic processes with mechanical behavior. A basic understanding of the phenomena involved and their mutual interactions during processing and testing will enable one to extrapolate and to predict, within limits, mechanical behavior for similar alloys and other conditions.
The Significance and Potential of Stress-Strain Curves Long before the concepts of line and point defects had been developed
and substantiated, engineers tested metals and alloys to determine yield and ultimate tensile strength as well as elongation values. Today, with the availability of an advanced dislocation theory backed up by electron microscopy, we still refuse to extract more information from a stress-strain curve than we did a century ago. We confine ourselves to choosing only 3 or 4 points, which represent the end of elastic (yield strength) and plastic (elongation) deformation and that of uniform strain ar.d max-imum sustainable load (ultimate tensile strength), ignoring completely the wealth of information available in the rest of the stress-strain curve.
To understand the behavior characteristics of a material one has to study what happens between these end points at which one can arrive via different ways. High ultimate strength values can be obtained at high and low work-hardening rates. How can one effect these different ways of achieving the same result? Can they be combined for additional bene-fits? Such questions can certainly not be answered by a table listing only the usual tensile test data. Seldom does one find a reference to the shape of a stress-strain curve or the occurrence of serrations in it, although such eviuence reveals important atom-atom, atom-defect, and/or defect-defect interactions.
Serrations can be observed in stress-strain curves of many different alloys, and depending on soecific alloy characteristics and test condi-tions, they may be due to short-range order hardening,® vacancy hardening,'
W. Cahn, "Correlation of Local Order with Mechanical Properties," p. 1S1 in Proceedings of Symposium on Local Atomic Arrangements Studied by X-ray Diffraction, Gordon and Breach, New York, 196:3. ~
9H. Green and N. Brown, Trans. AIME 197, 1240 (19:53).
98
creation of stacking faults,1 martensitic phase transformations and other mechanisms. The serrations observed in the study of type 316 stainless steel at temperatures of 353"C and above are attributed to the interaction of interstitial carbon and nitrogen acorns with dislocations. Thus, the occurrence of serrations in stress-strain curves of type 316 stainless steel is a function of the tesb temperature (diffusion rate), strain rate [diffusion « f (time)j, alloy content (affects diffusion rate and binding energy between vacancies and solute atoms), aging treatments (carbon, nitrogen, and other elements may form precipitates, and thus not be able anymore to directly interact with dislocations) and several other factors. Most of these factors can be separated experi-mentally and a study of serrations, therefore, can lead to probable explanations of the mechanical property results. It should prove espe-cially useful for the comparison of irradiated specimens with the cor-responding unirradiated control specimens. The increased vacancy concentration as well as possible radiation-induced precipitation {depleting the matrix of carbon and nitrogen) will certainly be reflected in the appearance of the serrations. Moreover, transmutation products will also affect the type, shape, frequency, and amplitude of the serra-tions. For example.. Wilcox and Smith11 showed that stress-strain curves for hydrogen-charged nickel were heavily serrated while hydrogen-free nickel exhibited a completely smooth stress-strain curve as did the originally hydrogen-charged nickel after degassing. The different dif-Hxsivities of elements like hydrogen and carbon, for instance, would allow a separation of these effects. The above tensile tests on hydrogen charged and hydrogen-free nickel were run at -SO^C, a temperature too low for carbon- or nitrogen-caused serrations to occur even at the lowest possible crosshead speed.
10C» H. White and R. W. Honeycomb, J. Iron Steel Inst. (London) 200, 457 (1962).
UB. A* Wilcox and G. C. Smith, Acta Met- 12, 371-376 (1964).
99
Discontinuous Yielding
The Portevin-LeChatelier effect1 or the phenomenon of repeated or discontinuous yielding during a tensile test has been attributed to dynamic strain aging and the solute responsible is considered to diffuse fast enough to slow down freely moving dislocations by forming an atmo-sphere or "cloud"13 around them. Eventually, the stress rises suffi-ciently to cause the dislocations to break away from their solute atmospheres and/or to generate new dislocations. This process is then repeated. Accordingly, dislocation movement oscillates between fast and slew motion and a serrated stress-strain curve is observed.
The manifold and complex appearance of such serrations must have been the main reason why so many researchers found it more convenient to simply ignore them than to correlate their shape, amplitude, and frequency with processes on an atomic scale. It is, however, possible to ascribe different types of serrations to different atom-defect inter-actions within an f»lloy if the processing and testing conditions are known.
Classification of Serrations Careful analysis and comparison of the original load-elongation
graphs and the respective test temperatures and strain rates permit one to distinguish between three types of serrations due to significantly different micromechanisms. Figure 4.16 shows typical portions of stress-strain curves which, more often than not, contain combinations of two and, under certain conditions, even all three types of serrations* Rueselwas the first to distinguish between two types of serrations, A and B, studying repeated yielding in tin-bronze alloys. In inference to Russel's work, Soler-Gomez and TegartiS also distinguished between
12 A* Portevin and F. LeChatelier, C. R. Acad. Sci. (Paris) 176, 507 (1923).
13A. H. Cottrell and B. A. Bilby, Proc- Phys. Soc. (London) 67, 49 (1949).
1AB. Russel, Phil. Mag, g, 615 (1963). 15A.J.R. Soler-Gomez and W. J. McG- Tegart, Phil. Mag. 20, 495 (1969).
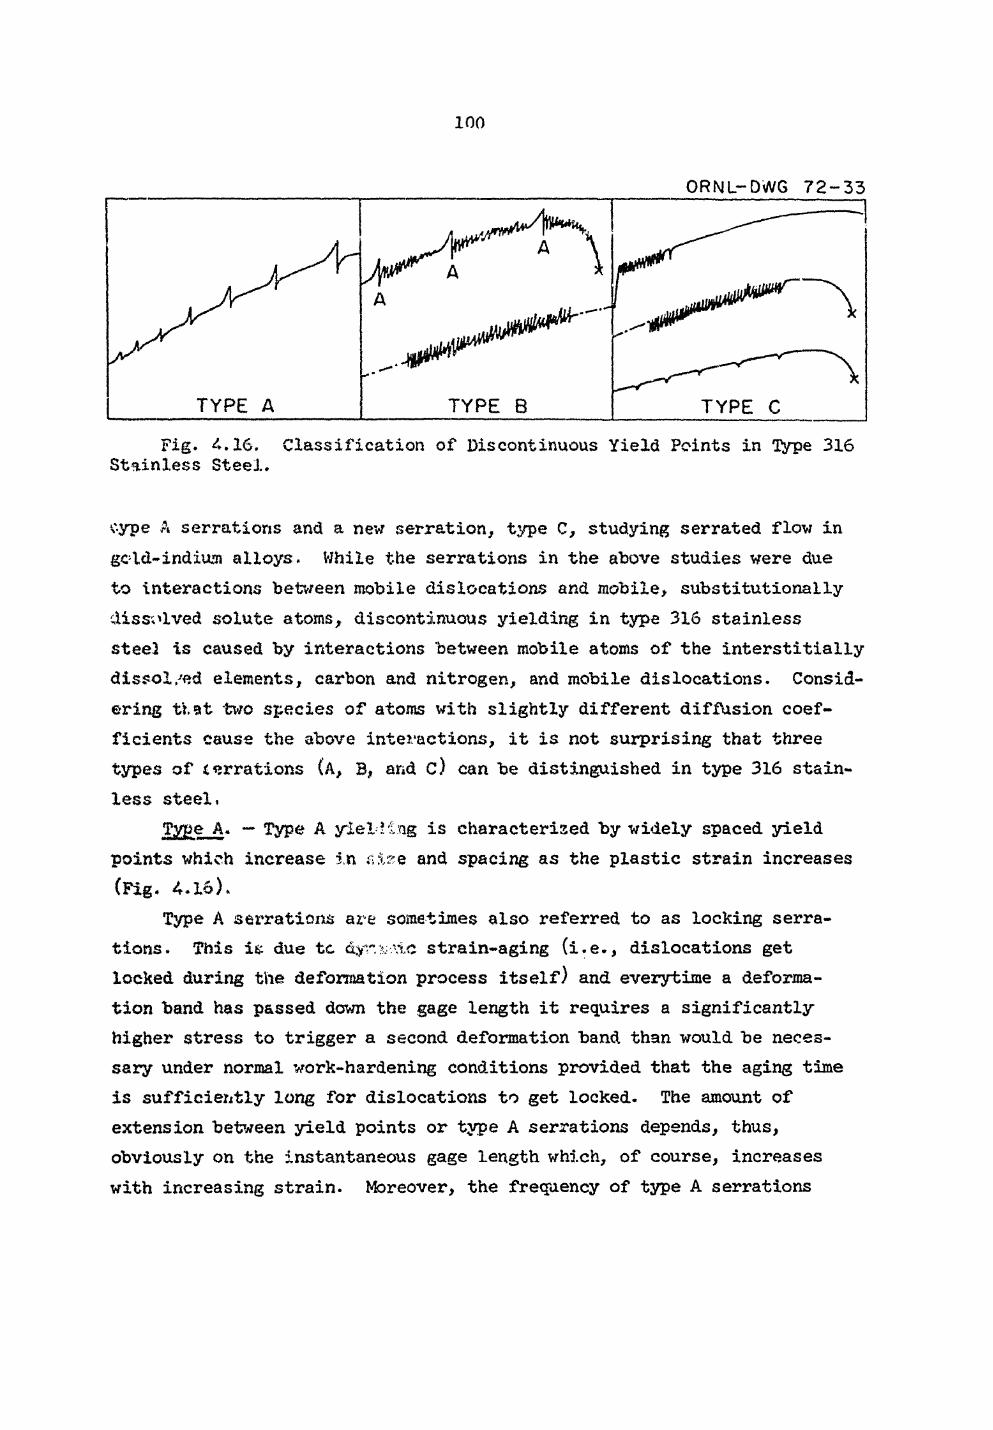
100
ORNL-DWG 7 2 - 3 3
TYPE A TYPE B TYPE C
Fig. 4.16. Classification of Discontinuous Yield Points in Type 316 Stainless Steel.
cype A serrations and a new serration, type C, studying serrated flow in gold-indium alloys. While the serrations in the above studies were due to interactions between mobile dislocations and mobile, substitutionally dissolved solute atoms, discontinuous yielding in type 316 stainless steel is caused by interactions between mobile atoms of the interstitially dissol/ed elements, carbon and nitrogen, and mobile dislocations. Consid-ering ti.at two species of atoms with slightly different diffusion coef-ficients cause the above interactions, it is not surprising that three types of *«»rrations (A, B, and c) can be distinguished in type 316 stain-less steel,
Type A. — Type A yiel Hag is characterised by widely spaced yield points which increase in f.Xze and spacing as the plastic strain increases (Fig. 4.16).
Type A serrations are sometimes also referred to as locking serra-tions. This i& due tc dyr.v.vic strain-aging (i.e., dislocations get locked during the deformation process itself) and everytime a deforma-tion band has passed down the gage length it requires a significantly higher stress to trigger a second deformation band than would be neces-sary under normal work-hardening conditions provided that the aging time is sufficiently long for dislocations to get locked. The amount of extension between yield points or type A serrations depends, thus, obviously on the instantaneous gage length which, of course, increases with increasing strain. Moreover, the frequency of type A serrations
101
is also temperature and time, that is to say, strain rate dependent. If the strain rate is too high for locking to occur at a given temperature, no serrations "will occur due to the above mechanism. On the other hand, if the temperature would be increased, the higher diffusivity of the carbon and nitrogen atoms would make locking serrations possible even at a relatively high strain rate.
Since the diffiisivity of the carbon and nitrogen atoms as well as the average dislocation velocity are affected by the amount of strain, an increased, strain rate or lowered temperature may merely shift the onset of serrations to higher strain values on the stress-strain curve. During plastic deformation vacancies are formed which are known to increase the diffusion rate; moreover, the increased dislocation density may also enhance diffusion via the so-called pipe diffusion mechanism. At the same time, the average dislocation velocity is decreased because of the more frequent interactions with other dislocations. Thus, at larger strains, mobile atoms can diffuse more rapidly while dislocations are slowed down. This, of course, facilitates anchoring of dislocations by atmospheres and explains why serrations appear only late during a test (i.e., at large strains) under certain test conditions.
While some of the above remarks apply to dynamic strain aging in general, they do not apply exclusively to type A serrations. Type A serrations occur when mobile atoms cannot affect the dislocation within the narrow deformation band. Due to the stress concentrations in the band, dislocations are torn from their solute atmospheres and move rapidly, while those left behind move more slowly under the applied stress and gradually slow down as their solute atmospheres are renewed. The dis-locations finally become locked to such a degree that plastic flow is restricted to a minimum and the stress rises sharply until a new defor-mation band forms as a result of breakaway and/or freshly generated dis-locations. The amplitude of type A serrations depends on the time between successive yield points, the temperature of testing, and the instanta-neous diffusion coefficient which increases with plastic strain.
Type B. — "While type A serrations are thought to be due to dynamic strain aging effects on dislocations left behind a deformation front
102
which moves along the specimen every few minutes, type B serrations occur when the fast-moving dislocations within the deformation band are affected by dynamic strain aging. Such a condition requires a higher minimum diffusion coefficient, or, in other words, type B serrations usually occur at higher temperatures, lower strain rates, and/or larger strains than type A serrations and often in combination with them. Unstable movement of dislocations in the deformation front, therefore, results in a jerky progress of the front and the typically serrated stress-strain curve. Thus, a necessary condition for type A serrations to occur is that the velocity of solute atoms diffusing through the alloy js about equal to that of the relatively slow moving dislocations behind the deformation band, while for type B serrations to occur, the velocity of solute atoms has to be approximately equal to the average drift veloc-ity of dislocations in the deformation band.
Type C. — Figure 4.16 shows that type C serrations are characterized by having yield drops that are always below the general level of the stress-strain curve in contrast to type A and B serrations which oscil-late above and below the curve. Type C serrations are considered to result from dislocation unlocking and usually occur only when the mini-mum solute diffusion coefficient is higher than that required for type B serrations. In other words, type C serrations require test conditions that would actually result in no serrations when the deformation is homogeneous, for the diffusion rate of the solute must be high enough for them to migrate with the dislocations in the deformation band. How-ever, whenever the deformation becomes inhomogeneous because of stress concentrations at grain boundaries or nonuniform cross-sectional area of the specimen, small sections of the gage sections will deform at a strain rate greater than the overall strain rate. This results in an increased drag of the atmospheres on the dislocations which, however, does not lead to a measurable stress increase but instead causes the dislocations to break away from their atmospheres. The sudden availabil-ity of many ,:free" dislocations decreases the stress which, in turn, lowers the average dislocation velocity in the deformation band so that the relatively fast moving solute atoms can relock the dislocations temporarily for the process to be repeated. This results in very
103
strain-rate dependent type C serrations. The serrations will continue until the diffusion rate is enhanced to the extent that the dislocations can "be permanently relocked. As soon as that condition is attained ser-rations may stop forming very abruptly (Fig. 4.16).
"Locking" at the above diffusion rates does not imply immobilization of dislocations but rather surrounding of dislocations with drag-exerting, solute atmospheres.
It is obvious that the temperature range, where the diffusion rate is such that solute atoms can migrate with the dislocations, is very narrow and that the balance between the dislocations being locked or unlocked is so critical that any slight deviation from ideality results in catastrophic unlocking. The critical nature is substantiated by the abrupt change from a serrated to a smooth stress-strain curve and by the randomness of the occurrence of the serrations on the curve.
Since the instantaneous diffusion rate increases with increasing plastic strain one would expect type B serrations to be followed by, or appear in combination with, type C serrations as the tensile test pro-ceeds. This has been observed. Moreover, it is not impossible to find, under certain conditions, evidence of all three types of serrations in different portions of the stress-strain curve.
The results to be discussed below actually reveal even a fourth type of serration, which could be called type D, since it can be observed at temperatures below the "type A" temperatures. The mechanism and appearance are, however, very similar to that of type C serrations so that it was decided rot to extend the above classi_ication, although Soler-Gomez and Tegart15 stated that type C serrations can occur only at high temperatures.
Unlocking of more or lees immobile dislocations can, however, occur at relatively low temperatures simply as a result of the increasing stress due to work hardening and very limited formation of atmospheres. This is possible because the atmospheres are relatively small at low tempera-tures and not much stress is required for the dislocations to break away.
The yield drops are always below the general level of the stress-strain and are separated from one another by a considerable amount of
104
strain as are the typj A yield drops. The separation also increases •with increasing strain, however, not because the instantaneous gage length increases but rather on account of an increase in the instanta-neous diffusion rate, which permits the formation of larger solute atmosphere and thus requires a higher stress level for dislocations to break away. At a constant work-hardening rate, higher stress levels can only be reached with larger strains.
The Effect of Different Strain Rates on Tensile Data While body-centered cubic metals and alloys are very sensitive to
changes in strain rate, tensile data of face-centered cubic metals or alloys such as type 316 stainless steel can be affected very little by variations of that parameter. Tensile data of 50$ cold-worked specimens tested at room temperature and as-annealed specimens tested at 650°C are listed in Table 4.2 for crosshead speeds increasing by factors of 10 from 0.002 to 2 in./min.
The increase in yield strength, presumably due to this 1000-fold increase in crosshead speed, was for each condition less than 4-000 psi. While the yield strength was practically not affected by such drastic changes in strain rate, the ultimate tensile strength can be affected as soon as diffusion, and thus time-dependent processes play a role. The most drastic change would be expected when recrystallization could take place during the test. But even in annealed specimens significant changes can be observed. For instance, a change in crosshead speed from 0.002 to 0.020 in,/min at 650°c resulted hi no change in yield strength (Table 4.2) but in an increase in ultimo' ' nsile strength of about 8000 psi. This is due to an increase i; hardening rate as a result of mobile dislocatTor?-mobile solute atom int-. aotions which are revealed by serrations in tl, : respective strem-strai "» ; 1 17 nhovs 650°C stress-strain curves of as-aunc c 1 " •Ter nt crosshead speeds. A careful comparison of i 'w > lent agreement with the above develop i i • i. i u..ut <. . (most time for diffusion^ only unlock! • > >pr which abruptly disappear after about • » <m < h- • 4.»/(«)! because the instantaneous diffusion coefficien! u ... m-U onoupji Ui re on to
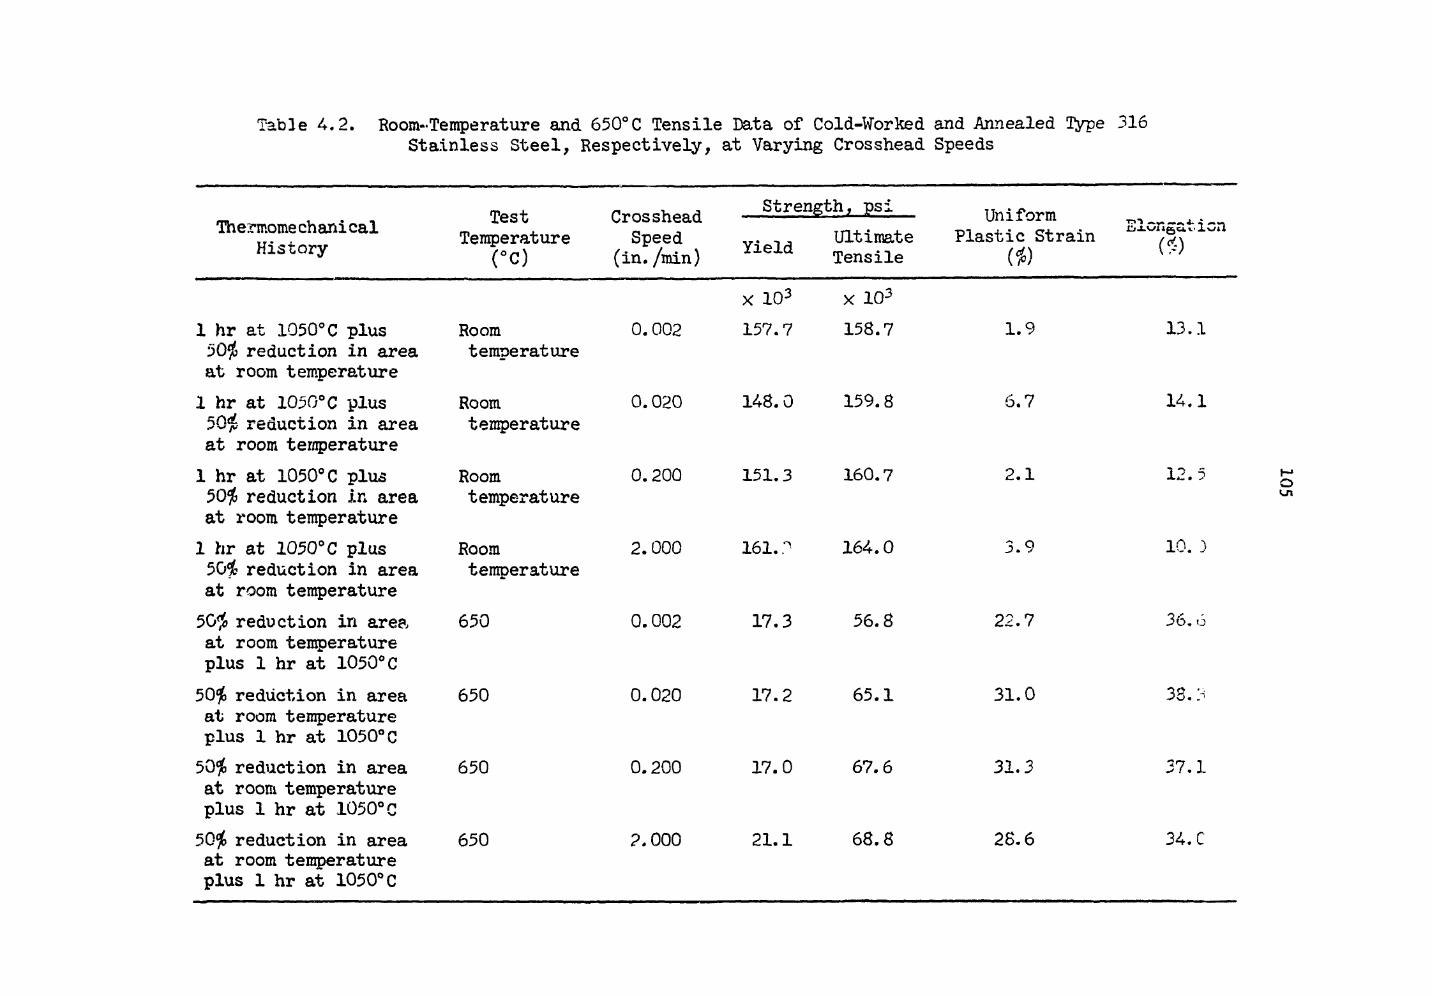
Table 4.2. Room-Temperature and 650°C Tensile Data of Cold-Worked and Annealed [type 316 Stainless Steel, Respectively, at Varying Crosshead Speeds
Thermome chani cal History
Test Crosshead Temperature Speed
(°C) (in. /min)
Strength, ps: Yield Ultimate
Tensile
Uniform Plastic Strain
($) n> Ion gcit ion
1 hr at 1050°C plus 50$ reduction in area at room temperature 1 hr at 1050°C plus 50$ reduction in area at room temperature 1 hr at 1050°C plus 50$ reduction in area at room temperature 1 hr at 1050°C plus 50$ reduction in area at room temperature 50$ reduction in area at room temperature plus 1 hr at 1050°C 50$ reduction in area at room temperature plus 1 hr at 1050°C 50$ reduction in area at room temperature plus 1 hr at 1050°C 50$ reduction in area at room temperature plus 1 hr at 1050°C
Room 0.002 temperature
Room 0.020 temperature
Room 0.200 temperature
Room 2.000 temperature
650 0.002
650 0.020
650 0.200
650 2.000
X 103 x 103 157.7 158.7
148.0
151.3
161. :
17.3
17.2
17.0
21.1
159.8
160.7
164.0
56.8
65.1
67.6
68.8
1.9
6.7
2.1
j). o
22.7
31.0
31.3
28.6
13.1
14.1
12.5
10.
36,
38.3
37.1
34. C
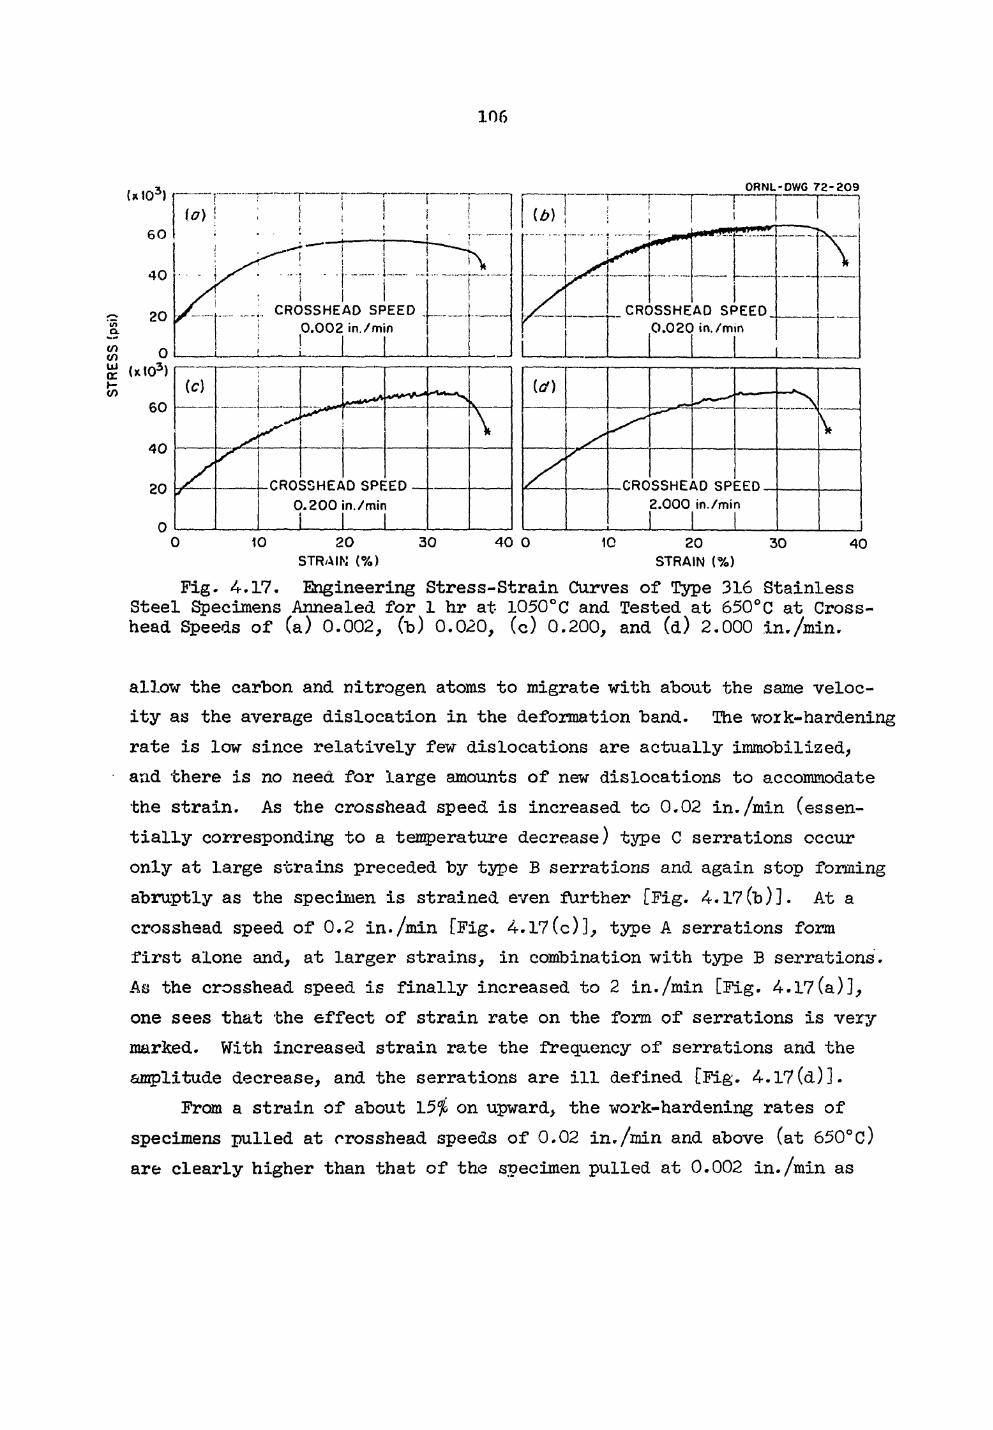
106
STRAIN ( % ) STRAIN ( % )
Fig. 4-.17. Engineering Stress-Strain Curves of Type 316 Stainless Steel Specimens Annealed for 1 hr at 1050°C and Tested at 650°C at Cross-head Speeds of (a) 0.002, (b) 0.020, (c) 0.200, and (d) 2.000 in./min.
allow the carbon and nitrogen atoms to migrate with about the same veloc-ity as the average dislocation in the deformation band. The work-hardening rate is low since relatively few dislocations are actually immobilized, and there is no need for large amounts of new dislocations to accommodate the strain. As the crosshead speed is increased to 0.02 in./min (essen-tially corresponding to a temperature decrease) type C serrations occur only at large strains preceded by type B serrations and again stop forming abruptly as the specimen is strained even further [Fig. 4.17(b)]. At a crosshead speed of 0.2 in./min [Fig. 4.17(c)], type A serrations form first alone and, at larger strains, in combination with type B serrations. As the crosshead speed is finally increased to 2 in./min [Fig. 4.17(a)], one sees that the effect of strain rate on the form of serrations is very marked. With increased strain rate the frequency of serrations and the amplitude decrease, and the serrations are ill defined [Fig. 4.17(d)].
From a strain of about 15% on upward, the work-hardening rates of specimens pulled at crosshead speeds of 0.02 in./min and above (at 650°c) are clearly higher than that of the specimen pulled at 0.002 in./min as
107
reflected in their higher uniform plastic strains and ultimate tensile strengths (Table 4.2) as well as in the more extensive serrations of their respective stress-strain curves (Fig. 4.17).
The more serrated a stress-strain curve of a specimen, the higher is its work-hardening rate and its dislocation density for a given amount of strain. This has been substantiated by electron micros copy16 >17 and is considered due to the fact that more new dislocations have to be gen-erated to accommodate the strain when the originally mobile dislocations get anchored by solute clouds.
The Effect of Different Test Temperatures on Tensile Data Specimens in the Annealed Condition. — Tensile data of specimens
annealed for 1 hr at 1050°C and tesLed at various temperatures from 350 to 750°C are listed in Table 4.3. While the yield strengths of the annealed specimens hardly vary with temperature up to 750°C, the ultimate tensile strength and uniform plastic strain values drop rapidly above 550°C (Fig. 4.18). Both measures reflect the work-hardening rate of these specimens which remains essentially the same between 350 and 550°C. The stress-strain curves for these test temperatures [Fig. 4.19(a), (b), and (c)] show serrations along almost the entire stress-strain curve, while the stress-strain curve of the specimen tested at 650°C exhibits some type C serrations only at very low strains. At 350°C the serrations are of the low-temperature type C, at 450°C they are of almost pure type A, and at 550°C a combination of types A and B can be seen. When the test temperature increases, the frequency of the serrations must increase in ordei to maintain approximately the same work-hardening rate. As the diffusion rates of the carbon and nitrogen atoms increase to the extent that they can migrate at a velocity equal to or higher than that of the average dislocation, no significant dislocation solute atom interactions will take place anymore. Moreover, the tendency toward formation of
16B. A. Wilcox and G. C. Smith, Acta Met. 12, 371-376 (l964). 37J. W. Edington and R. E. Smallman, Acta Met. 12, 1313 (1964).
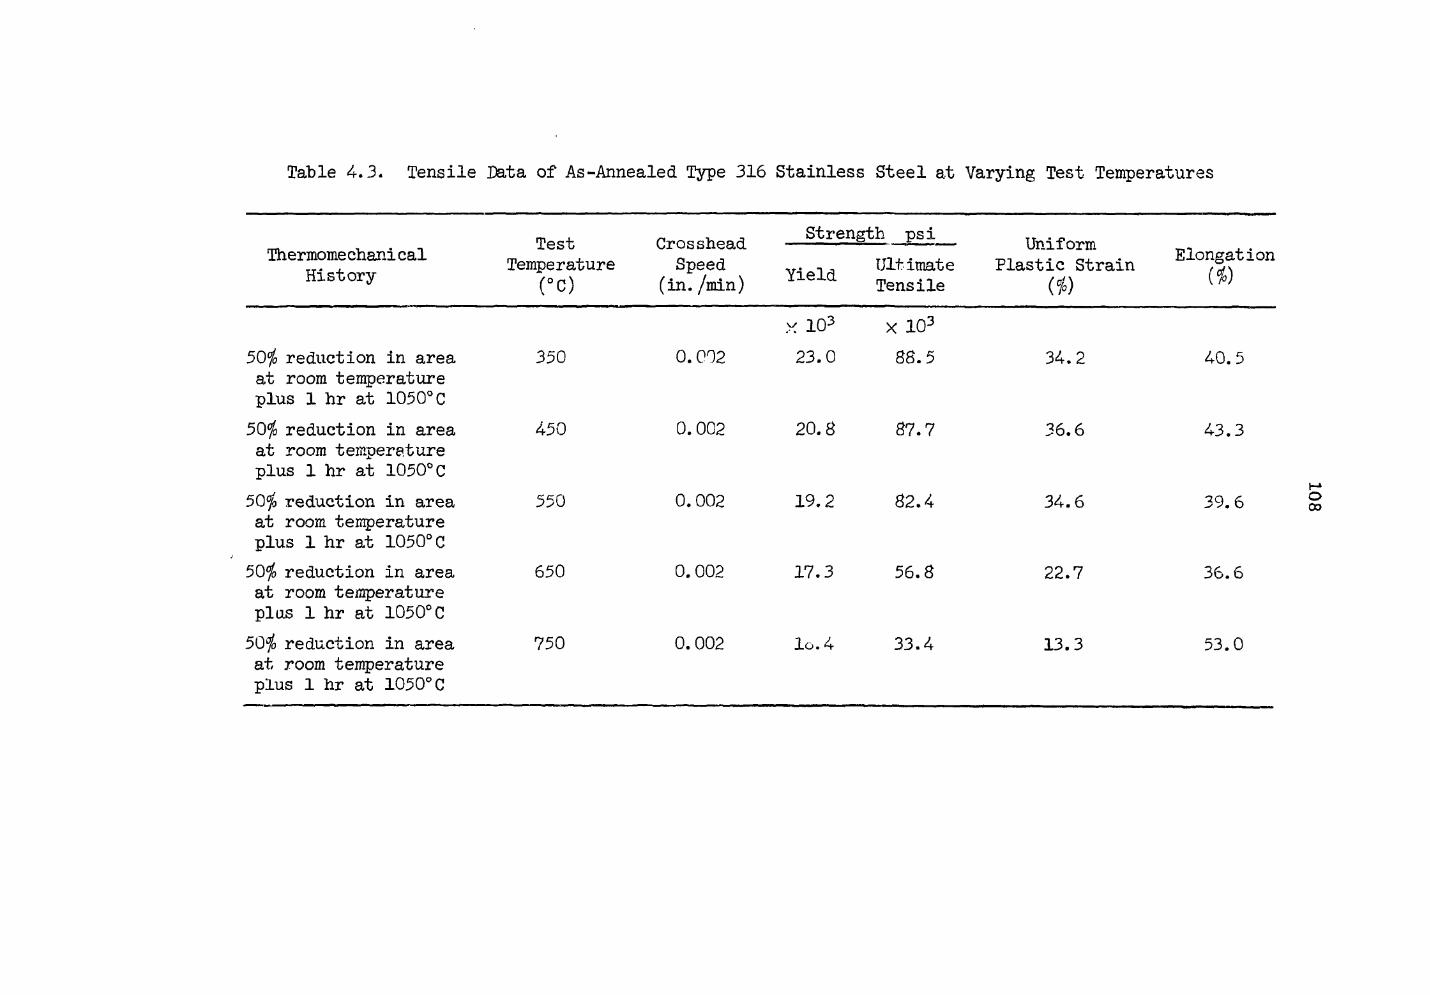
Table 4.3. Tensile Data of As-Annealed Type 316 Stainless Steel at Varying Test Temperatures
Thermome chani cal History
Test Temperature
(°C)
Crosshead Speed
(in. /min)
Strength psi
Yield Ultimate Tensile
Uniform Plastic Strain
($) Elongation
50$ reduction in area at room temperature plus 1 hr at 1050°C b reduction in area
at room temperature plus 1 hr at 1050°C 50$ reduction in area at room temperature plus 1 hr at 1050°C 50$ reduction in area at room temperature pi as 1 hr at 1050° C 50$ reduction in area at room temperature plus 1 hr at 1050°C
350
450
550
650
750
0.002
0.002
0.002
0. 002
0. 002
- 103
23.0
20.8
19.2
17.3
10.4
X 103
88.5
87.7
82.4
56.8
33.4
34.2
36.6
34.6
22.7
13.3
40.5
43.3
59.6
36.6
53.0
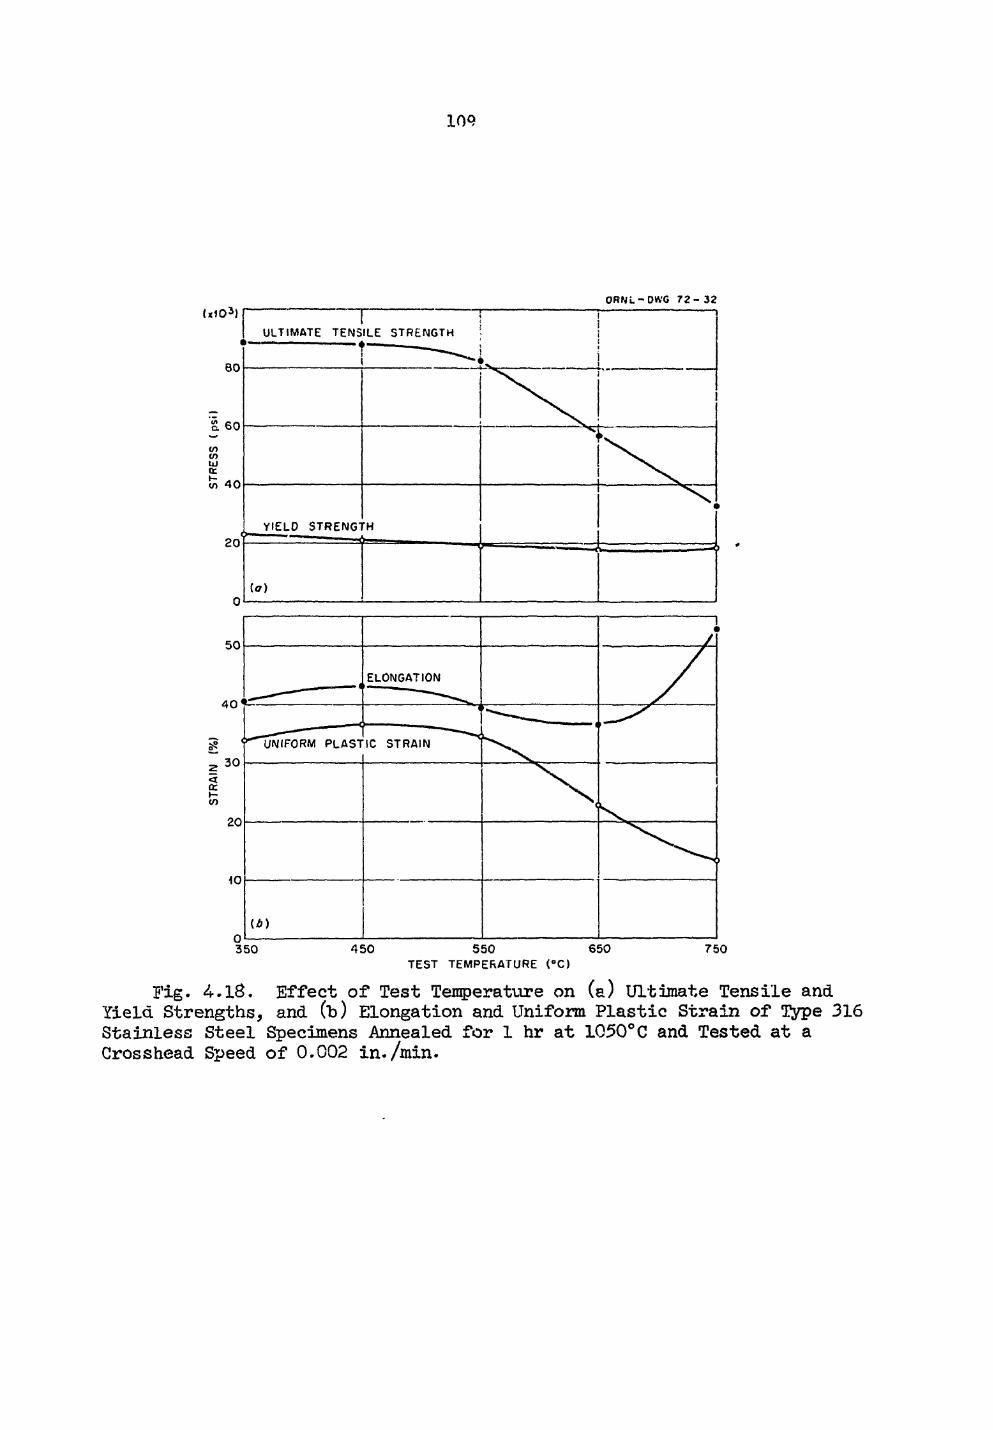
109
ORNu-OWG 72- 32
Fig. 4-. 18. Effect of Test Temperature on (a) Ultimate Tensile and Yield Strengths, and (b) Elongation and Uniform Plastic Strain of Type 316 Stainless Steel Specimens Annealed for 1 hr at 1050°C and Tested at a Crosshead Speed of 0.002 in./min.
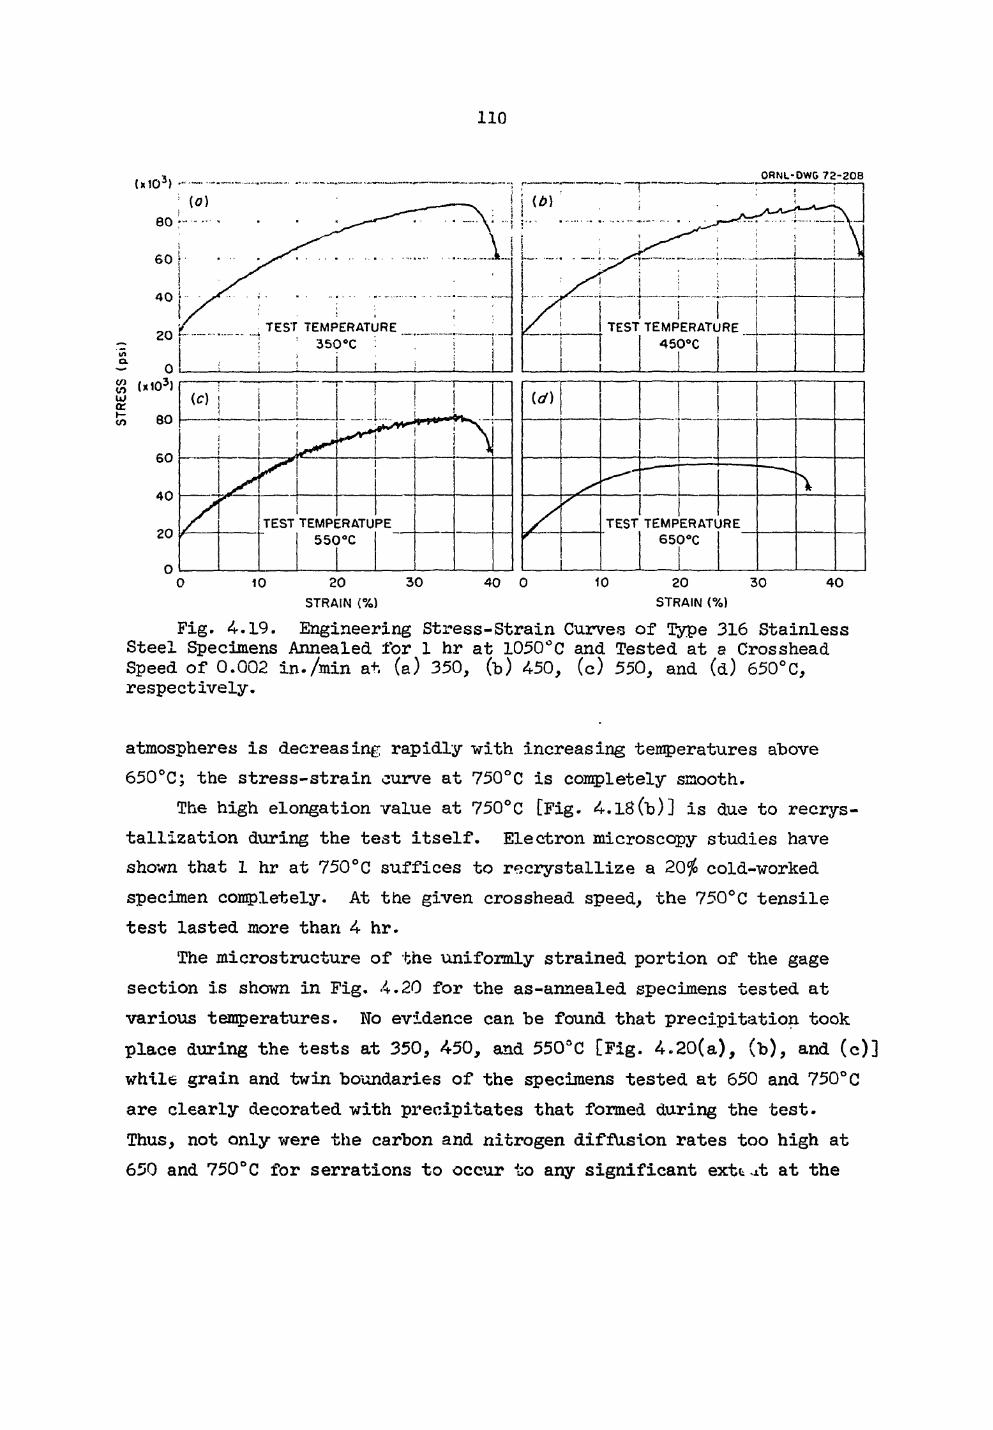
110
Fig. 4.19. Engineering Stress-Strain Curves of Type 316 Stainless Steel Specimens Annealed for 1 hr at 1050°C and Tested at a Crosshead Speed of 0.002 in./min at (a) 350, (b) 450, (c) 550, and (d) 650°C, respectively.
atmospheres is decreasing rapidly with increasing temperatures above 650°C; the stress-strain curve at 750°C is completely smooth.
The high elongation value at 750°C [Fig. 4.18(b)] is due to recrys-tallization during the test itself. Electron microscopy studies have shown that 1 hr at 750°C suffices to recrystallize a 20$ cold-worked specimen completely. At the given crosshead speed, the 750°C tensile test lasted more than 4 hr.
The microstructure of the uniformly strained portion of the gage section is shown in Fig. 4.20 for the as-annealed specimens tested at various temperatures. No evidence can be found that precipitation took place during the tests at 350, 450, and 550SC [Fig. 4.20(a), (b), and (c)] while grain and twin boundaries of the specimens tested at 650 and 750°C are clearly decorated with precipitates that formed during the test. Thus, not only were the carbon and nitrogen diffusion rates too high at 650 and 750°C for serrations to occur to any significant extt at at the
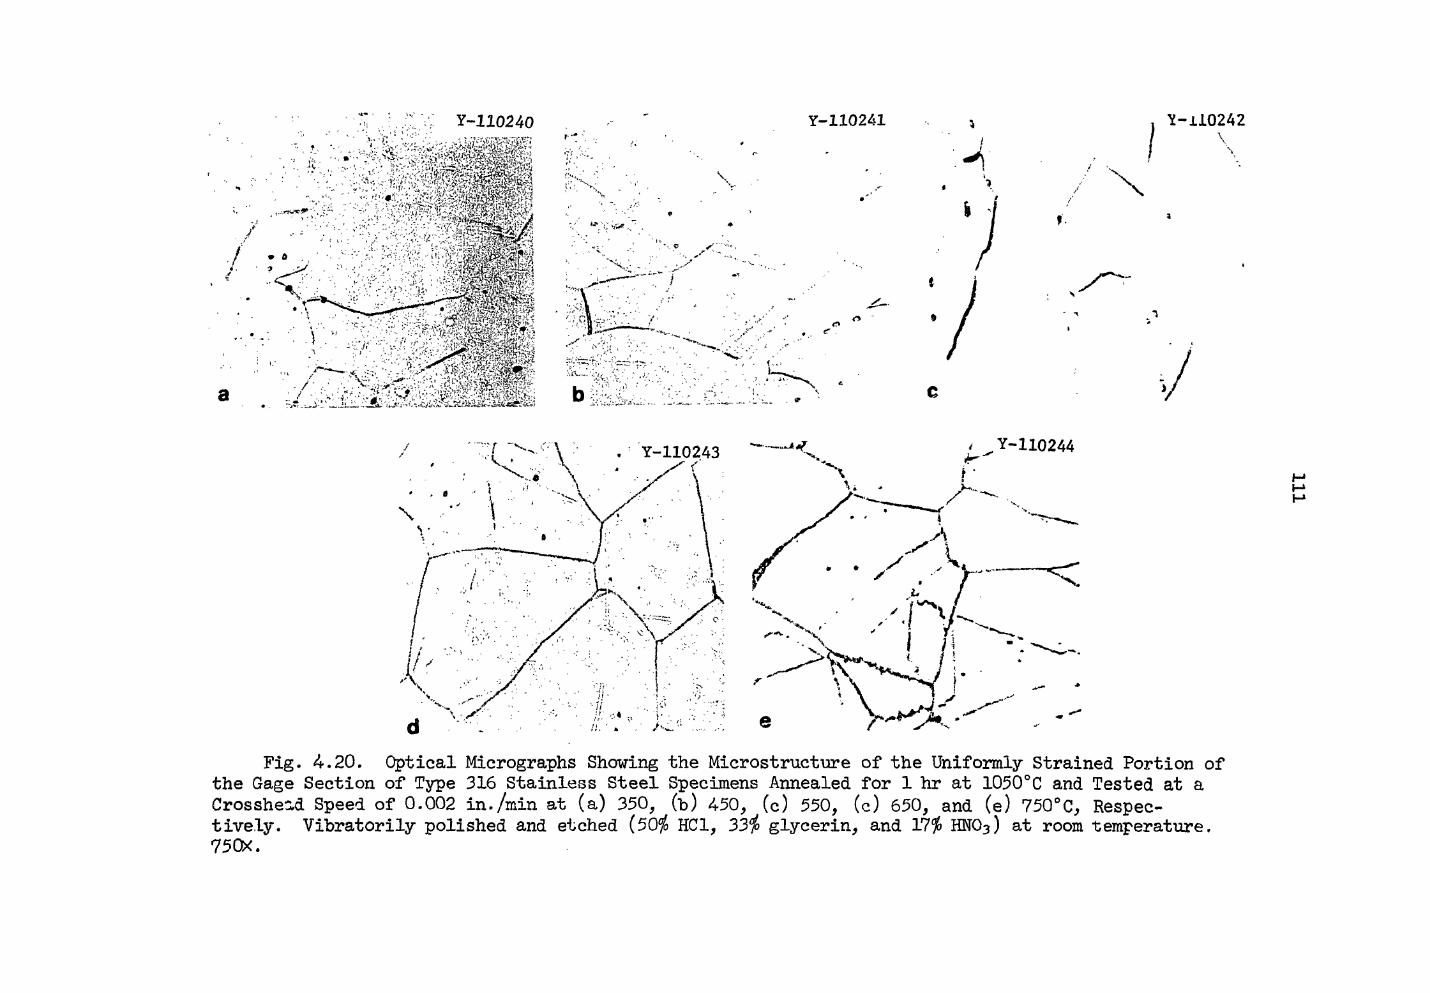
Fig. 4.20. Optical Micrographs Showing the Microstructure of the Uniformly Strained Portion of the Gage Section of Type 316 Stainless Steel Specimens Annealed for 1 hr at 1050°C and Tested at a Crosshead Speed of 0.002 in./min at (a) 350, (b) 450, (c) 550, (c) 650, and (e) 750°C, Respec-tively. Vibratorily polished and etched (50$ HC1, 33$ glycerin, and 17$ HN03) at room temperature. 750X.
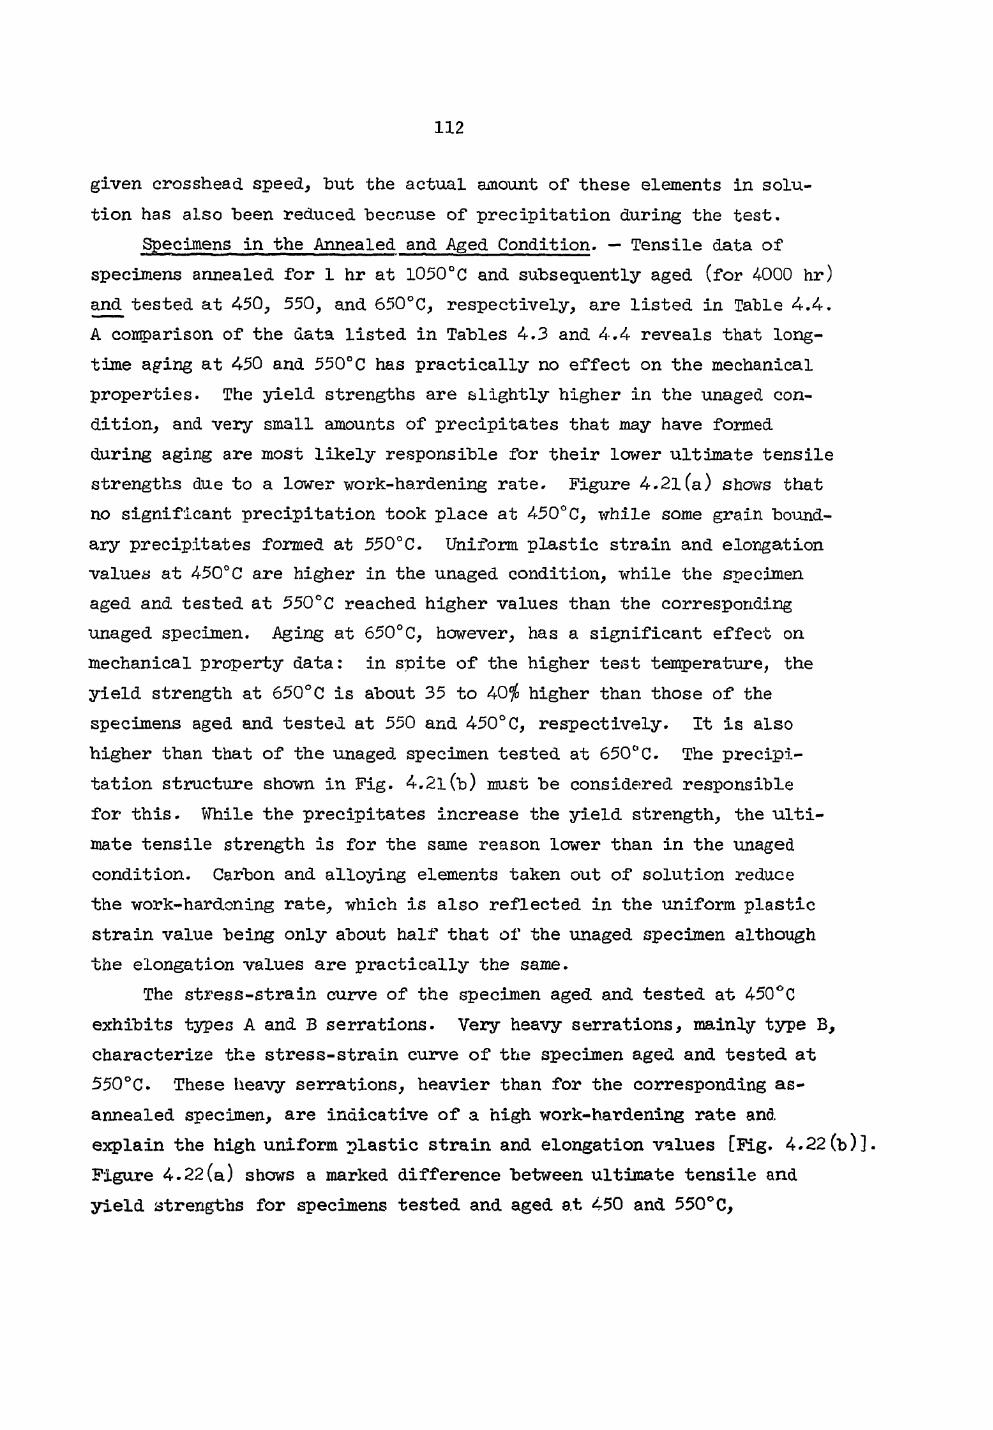
112
given crosshead speed, hut the actual amount of these elements in solu-tion has also been reduced beccuse of precipitation during the test.
Specimens in the Annealed and Aged Condition. — Tensile data of specimens annealed for 1 hr at 1050°C and subsequently aged (for 4-000 hr) and tested at 450, 550, and 650°C, respectively, are listed in Table 4.4. A comparison of the data listed in Tables 4.3 and 4.4 reveals that long-time aging at 450 and 550°C has practically no effect on the mechanical properties. The yield strengths are slightly higher in the unaged con-dition, and very small amounts of precipitates that may have formed during aging are most likely responsible for their lower ultimate tensile strengths due to a lower work-hardening rate. Figure 4.21(a) shows that no significant precipitation took place at 450°C, while some grain bound-ary precipitates formed at 550°C. Uniform plastic strain and elongation values at 450°C are higher in the unaged condition, while the specimen aged and tested at 550°C reached higher values than the corresponding unaged specimen. Aging at 650°C, however, has a significant effect on mechanical property data: in spite of the higher test temperature, the yield strength at 650°C is about 35 to 40$ higher than those of the specimens aged and tested at 550 and 450°C, respectively. It is also higher than that of the unaged specimen tested at 650° C. The precipi-tation structure shown in Fig. 4.21 (b) must be considered responsible for this. While the precipitates increase the yield strength, the ulti-mate tensile strength is for the same reason lower than in the unaged condition. Carbon and alloying elements taken out of solution reduce the work-hardoning rate, which is also reflected in the uniform plastic strain value being only about half that of the unaged specimen although the elongation values are practically the same.
The stress-strain curve of the specimen aged and tested at 450°C exhibits types A and B serrations. Very heavy serrations, mainly type B, characterize the stress-strain curve of the specimen aged and tested at 550°C. These heavy serrations, heavier than for the corresponding as-annealed specimen, are indicative of a high work-hardening rate and explain the high uniform plastic strain and elongation values [Fig. 4.22(b)]. Figure 4.22(a) shows a marked difference between ultimate tensile and yield strengths for specimens tested and aged at 450 and 550° C,
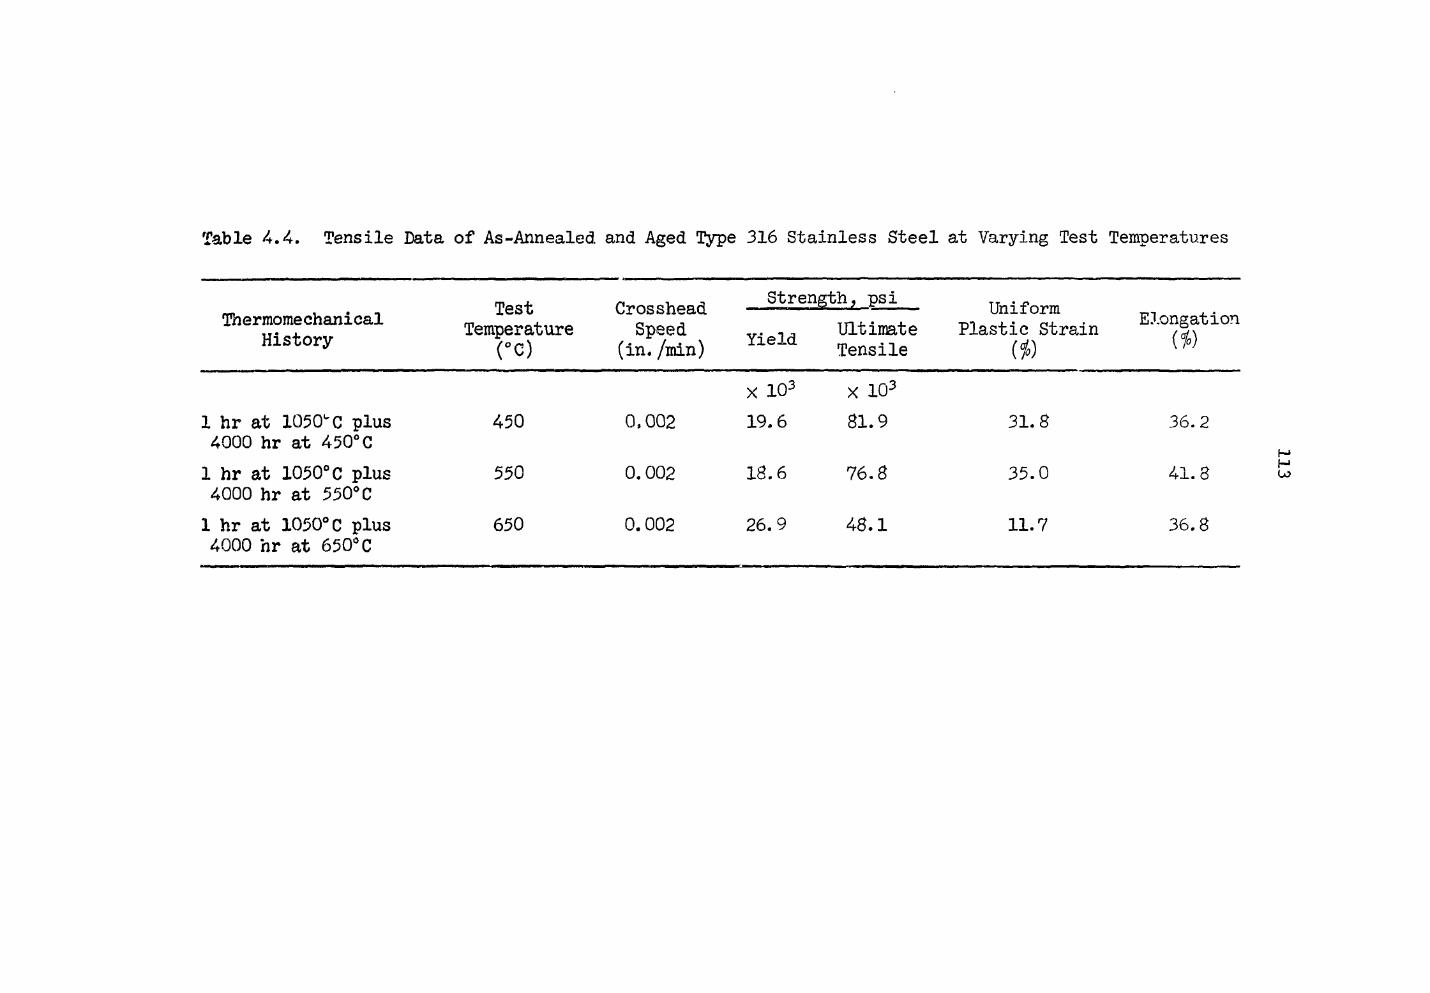
Table 4.4. Tensile Data of As-Annealed and Aged Type 316 Stainless Steel at Varying Test Temperatures
Thermomechanical History
Test Temperature
(°C)
Crosshead Speed
(in. /min)
Strength, psi
Yield Ultimate Tensile
Uniform Plastic Strain Elongation •T-Lcio L.J-C O 1>-L d/J-JLJ. / nt \
1 hr at 1050UC plus 4000 hr at 450°C 1 hr at 1050°C plus 4000 hr at 550°C 1 hr at 1050°C plus 4000 hr at 650°C
450
550
650
0,002
0.002
0.002
X 103
19.6
18.6
26.9
X 103
81.9
76.8
48.1
31.8
35.0
11.7
36.2
41.8
36.8
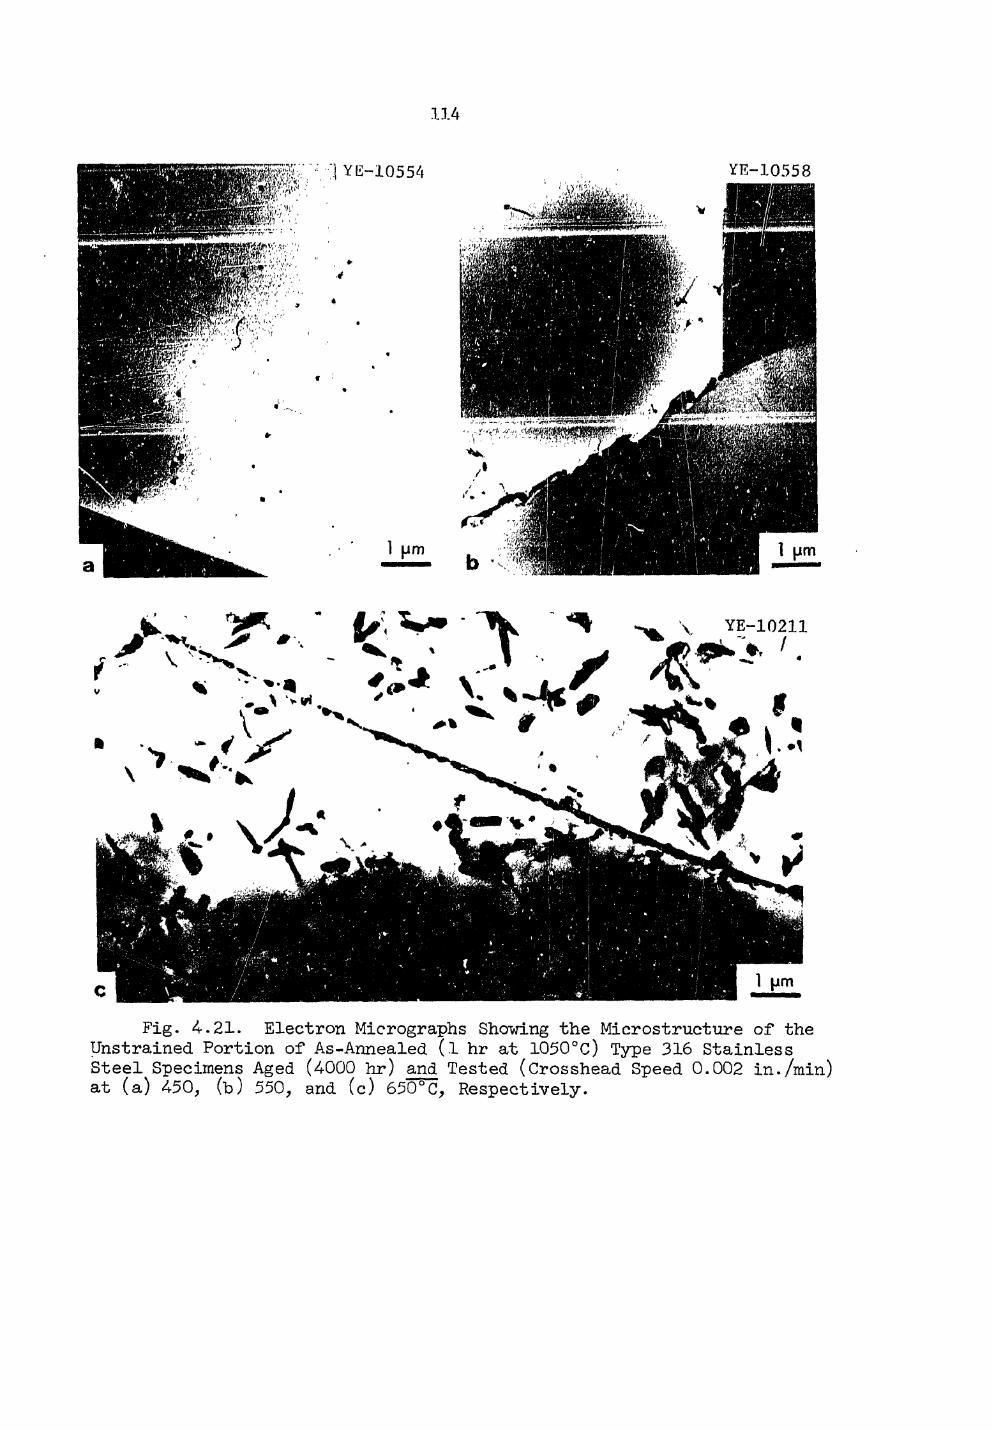
114
fjr\ V * * ' \ ^ y YE-10211 "V 1 M ^^ ^m. M 1 /
x ' . / "ST
Fig. 21. Electron Micrographs Showing the Mierostructure of* the Unstrained Portion of As-Annealed (l hr at 1050°C) Type 316 Stainless Steel Specimens Aged (4000 hr) and Tested (Crosshead Speed 0.002 in./min) at (a) 450, (b) 550, and (c) 650°C, Respectively.
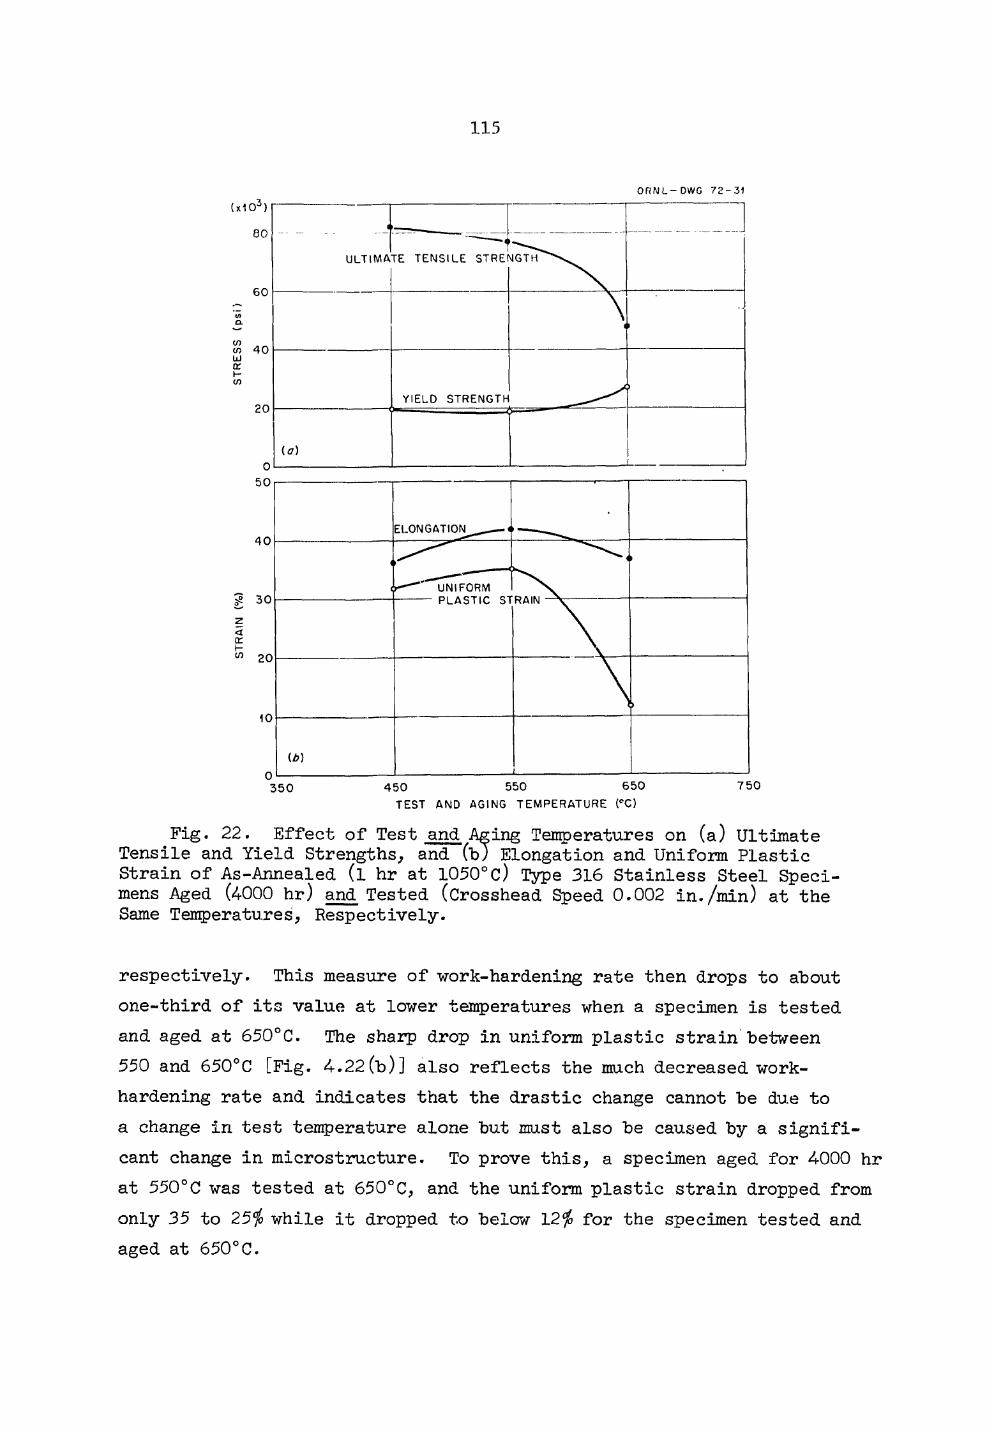
115
ONNL-DWG 7 2 - 3 1
TEST AND AGING TEMPERATURE (°C)
Fig. 22. Effect of Test and Aging Temperatures on (a) Ultimate Tensile and Yield Strengths, and (b7 Elongation and Uniform Plastic Strain of As-Annealed (l hr at 1050°c) Type 316 Stainless Steel Speci-mens Aged (4000 hr) and Tested (Crosshead Speed 0.002 in./min) at the Same Temperatures, Respectively.
respectively. This measure of work-hardening rate then drops to about one-third of its value at lower temperatures when a specimen is tested and aged at 650°C. The sharp drop in uniform plastic strain between 550 and 650°C [Fig. 4.22(b)] also reflects the much decreased work-hardening rate and indicates that the drastic change cannot be due to a change in test temperature alone but must also be caused by a signifi-cant change in microstructure. To prove this, a specimen aged for 4000 hr at 550°C was tested at 650°C, and the uniform plastic strain dropped from only 35 to 25$ while it dropped to below 12$ for the specimen tested and aged at 650°C.
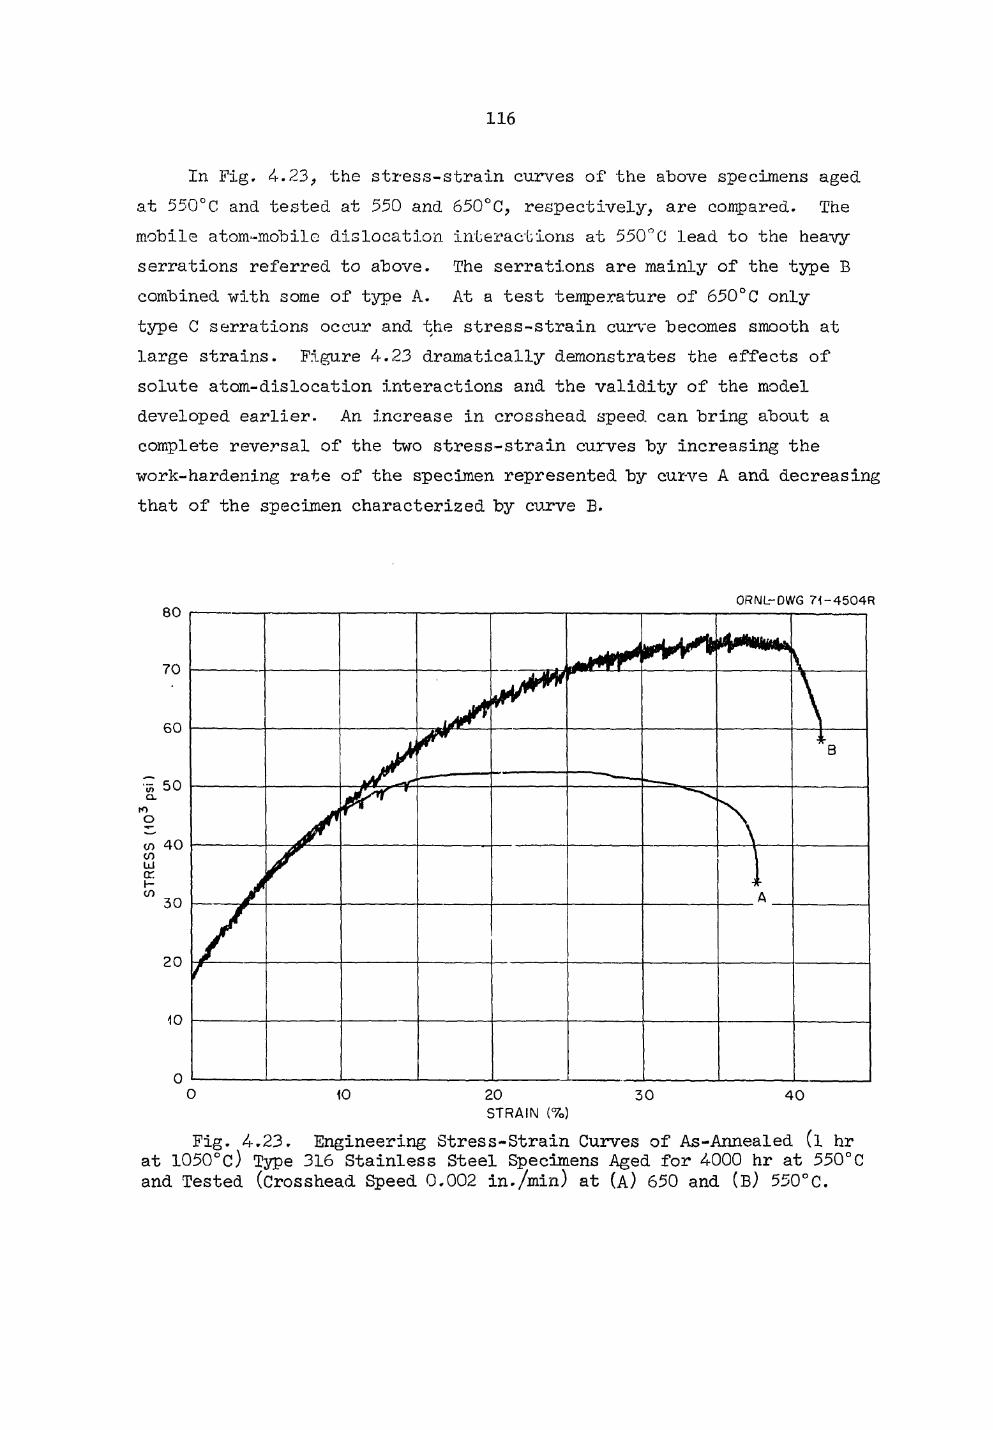
116
In Fig. 4.23, the stress-strain curves of the above specimens aged at 550°C. and tested at 550 and 650°C, respectively, are compared. The mobile atom-mobile dislocation interactions at 550°C lead to the hea-vy serrations referred to above. The serrations are mainly of the type B combined with some of type A. At a test temperature of 650°C only type C serrations occur and the stress-strain curve becomes smooth at large strains. Figure 4.23 dramatically demonstrates the effects of solute atom-dislocation interactions and the validity of the model developed earlier. An increase in crosshead speed can bring about a complete reversal of the two stress-strain curves by increasing the work-hardening rate of the specimen represented by curve A and decreasing that of the specimen characterized by curve B.
ORNL-DWG 71-4504R
0 10 20 S T R A I N (%)
30 40
Fig. 4.23. Engineering Stress-Strain Curves of As-Annealed (l hr at 1050°c) Type 316 Stainless Steel Specimens Aged for 4000 hr at 550°C and Tested (Crosshead Speed 0.002 in./min) at (A) 650 and (B) 550°C.
117
Specimens in the Cold-Worked Condition. — Tensile data of specimens reduced 20$ in area "by swaging at room temperature and tested at various temperatures from 350 to 650°C are listed in Table 4.5.
The work-hardening rate of the cold-worked specimens is very low for all test temperatures, as can be seen from the small difference between ultimate tensile and yield strengths in Fig. 4.24(a) and the low uniform plastic strain in Fig. 4.24(b). Moreover, none of the stress-strain curves exhibits any serrations, while serrations could be found in most of the stress-strain curves of as-annealed specimens tested at corresponding temperatures (Fig. 4.19).
The absence of serrations in stress-strain curves of cold-worked specimens is believed to be due to the much higher stress level at which plastic deformation took place and the resulting higher average dis-location velocity. Moreover, more carbon and nitrogen can be expected to be tied up by the much larger number of dislocations which also facilitate precipitation on heating to the test temperature and during the test.
The tensile data presented in Fig. 4.24 seem to indicate that recovery has taken place before and during the test at 650°C. The elongation value increases abruptly at 650°C [Fig. 4.24Cbj], and the drop of both the yield and ultimate tensile strength between 550 and 650°C is sharper for cold-worked [Fig. 4.24(a)] than for as-annealed specimens [Fig. 4.19(a)], indicating that changes in the cold-worked structure accentuate the decline in strength due to an increased test temperature alone.
Optical micrographs of the uniformly strained portion of the gage section (Fig. 4.25) reveal that precipitation during the test has pro-ceeded further in the specimen tested at 650°C [Fig. 4.25(b)] than in the specimen tested at 550°C [Fig. 4.25(a)]. A comparison of Fig. 4.25 with Fig. 4.20 also shows that precipitation occurs more readily in cold-worked than in annealed specimens.
Specimens in the Cold-Worked and Aged Condition
Long-Time Aging. — Tensile data of specimens reduced 20$ in area by-swaging at room temperature and subsequently aged (for 4000 hr) and tested at 450, 550, and 650°C, respectively, are listed in Table 4.6.
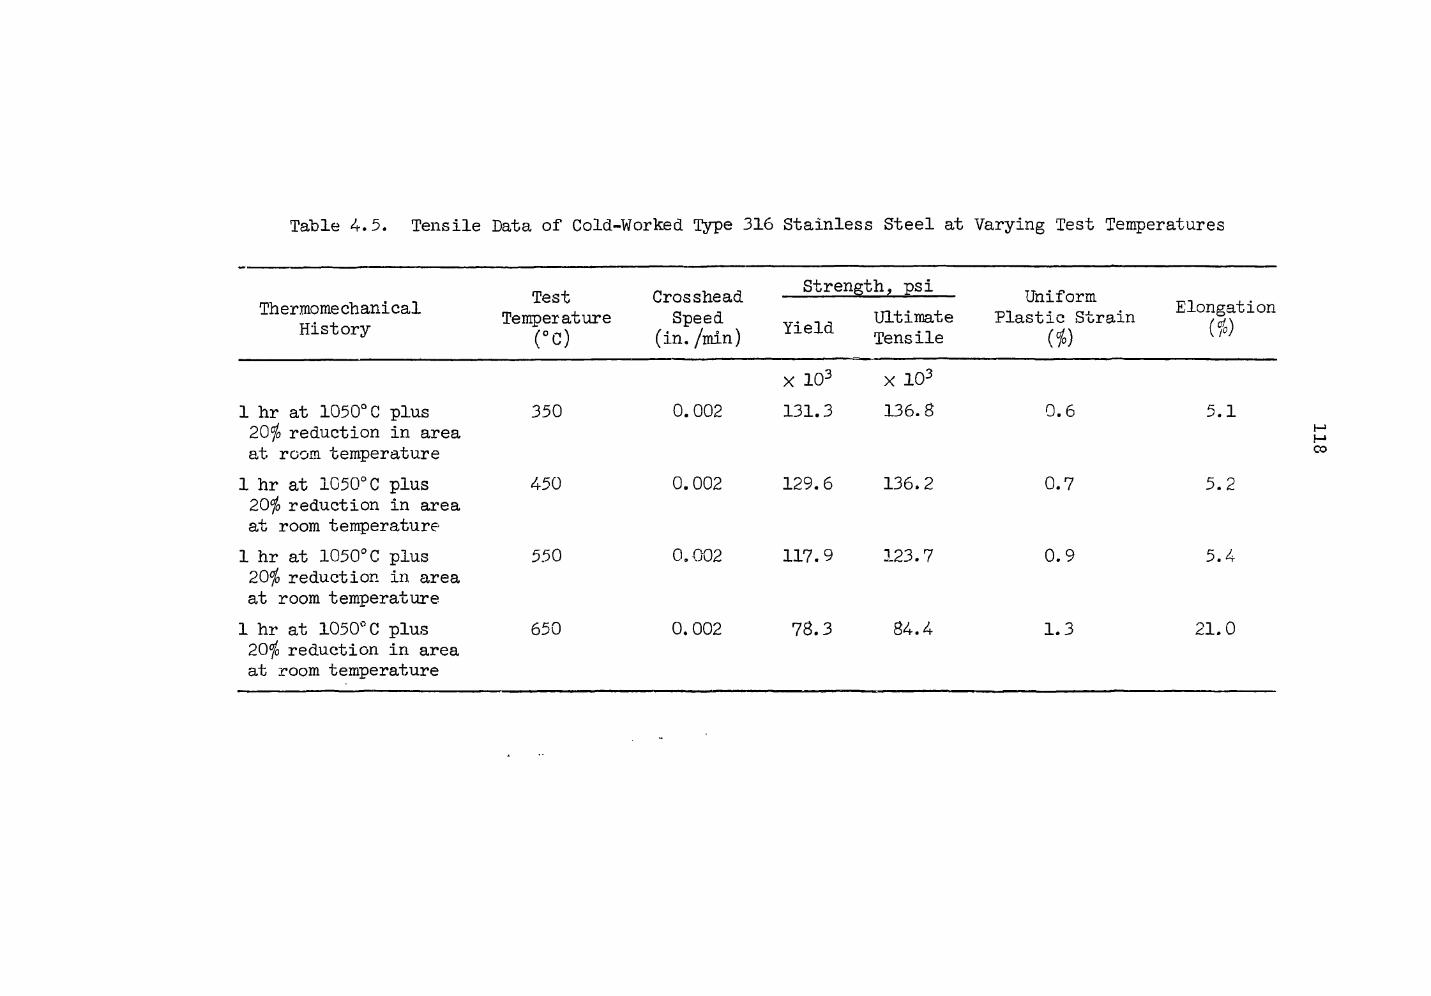
Table 4.5. Tensile Data of Cold-Worked Type 316 Stainless Steel at Varying Test Temperatures
Thermo mechanical History
Test Temperature
(°C)
Crosshead Speed
(in. /min)
Strength, psi
Yield Ultimate Tens ile
Uniform _ . Plastic Strain
\fi)
1 hr at 1050°C plus 20$ reduction in area at room temperature 1 hr at 1050°C plus 20$ reduction in area at room temperature 1 hr at 1050°C plus 20$ reduction in area at room temperature 1 hr at 1050°C plus 20$ reduction in area at room temperature
350
450
550
650
0.002
0.002
0.002
0.002
X 103
131.3
129.6
117.9
78.3
x 103
136.8
136.2
123.7
84.4
0.6
0.7
0.9
1.3
5.1
5.2
5.4
21.0
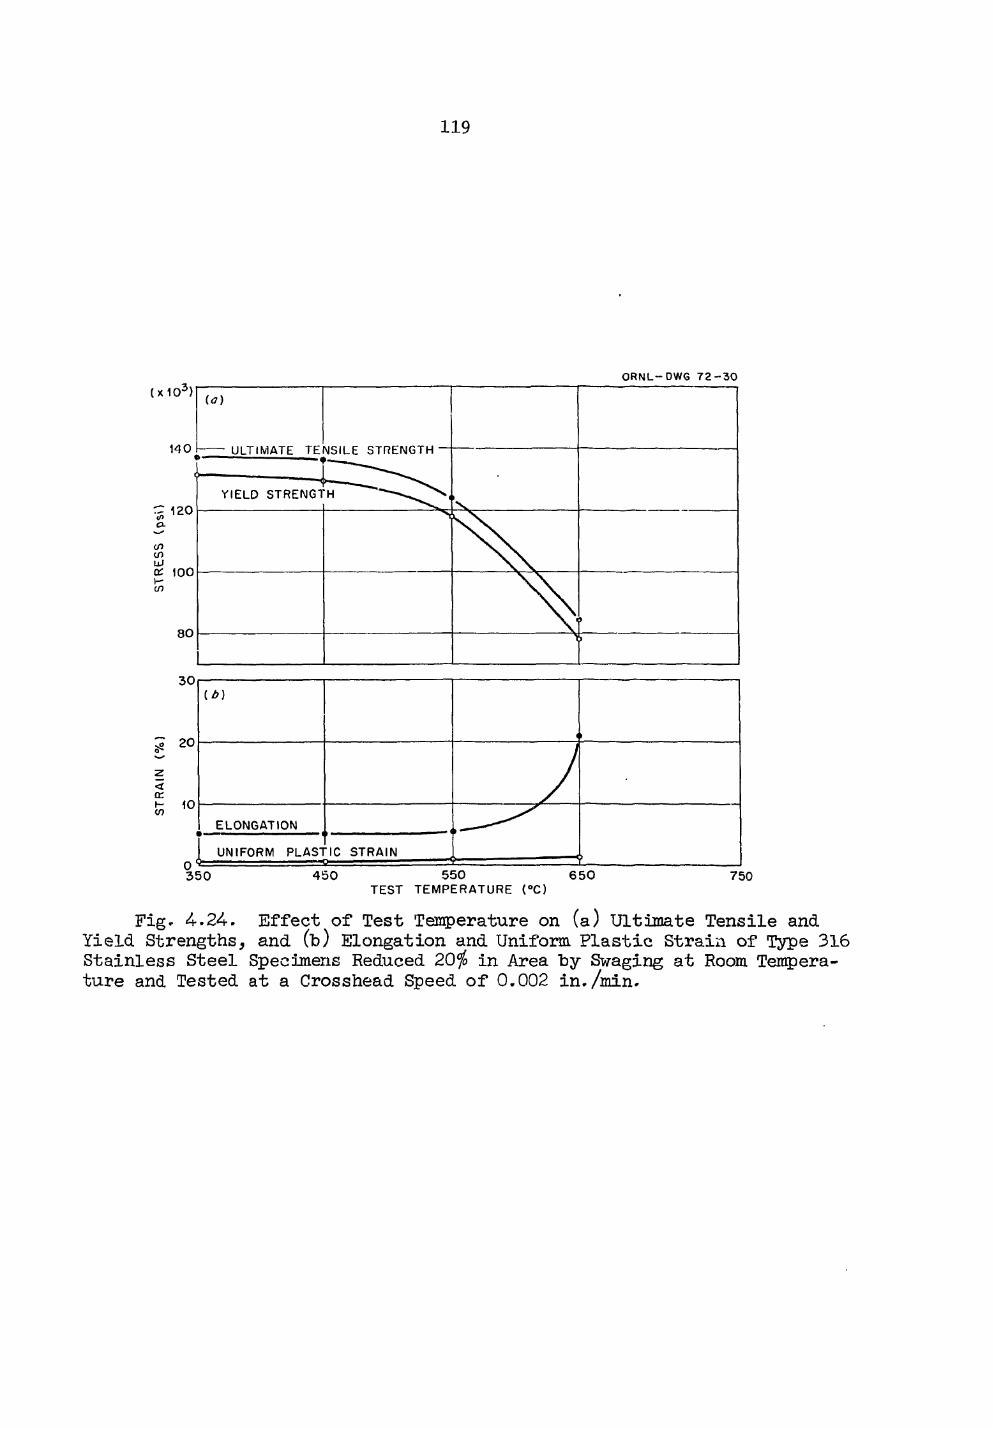
119
O R N L - D W G 7 2 - 3 0
Fig- 4.24. Effect of Test Temperature on (a) Ultimate Tensile and Yield Strengths, and (t) Elongation and Uniform Plastic Strain of Type 316 Stainless Steel Specimens Reduced 20$ in Area by Swaging at Room Tempera-ture and Tested at a Crosshead Speed of 0.002 in./min.
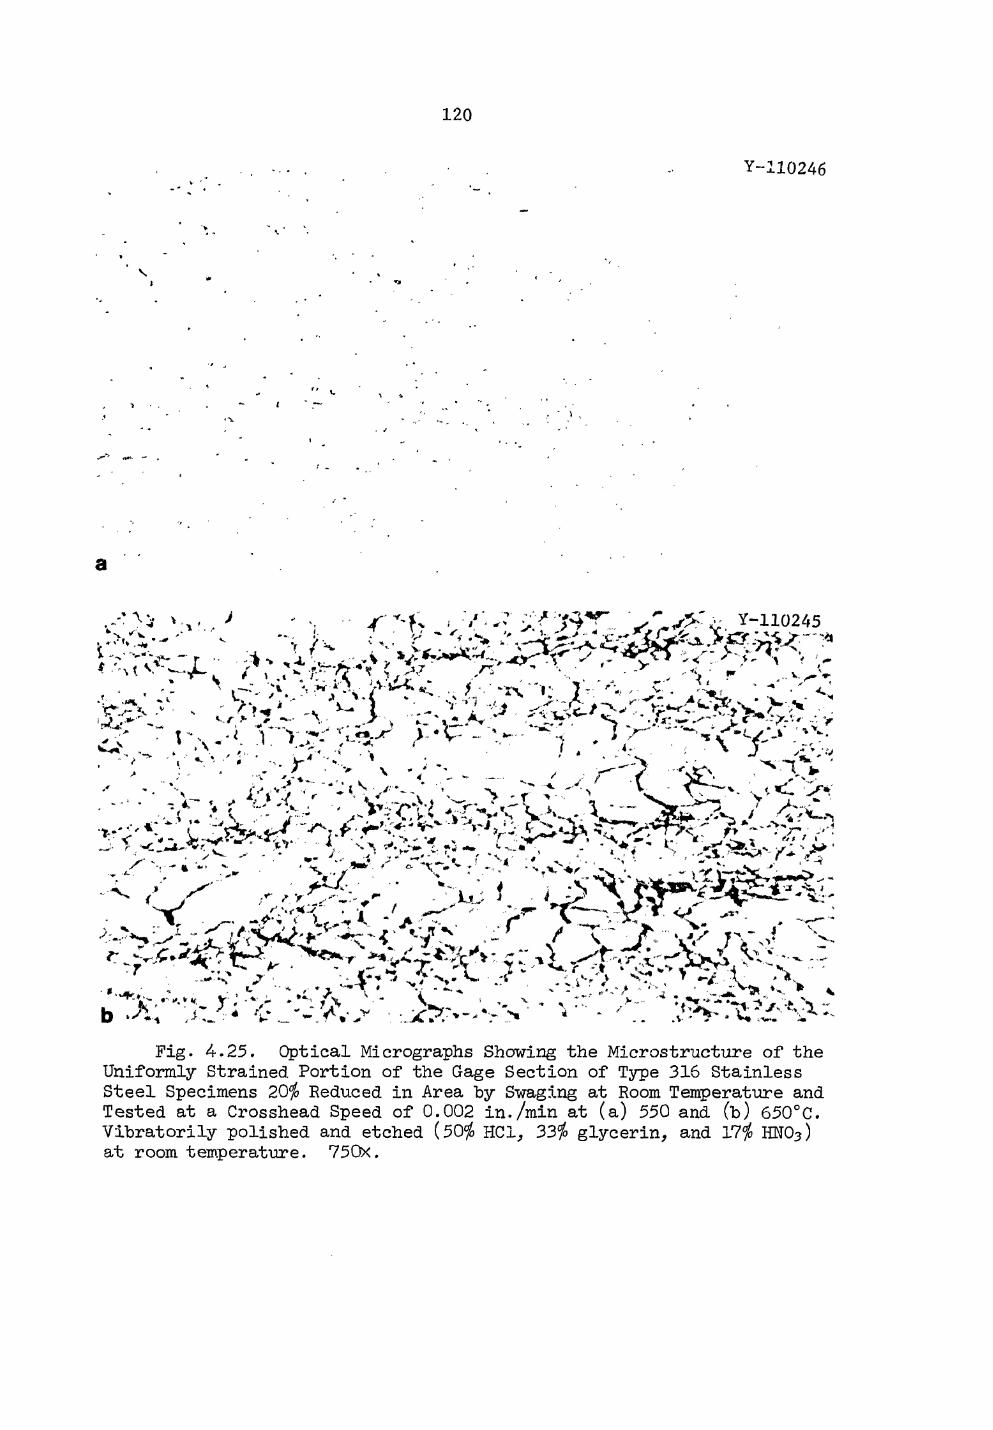
120
Y-110246
a
i '
\l > v ..... , yr ?• ^
- -- J 7> "T \ v <*.. r - t * V - •
r* i 4 - -A . v „ 4 - - T' v, T>- - Jr-. «~» . Fig. 4.25. Optical Micrographs Showing the Microstructure of the
Uniformly Strained Portion of the Gage Section of Type 316 Stainless Steel Specimens 20$ Reduced in Area hy Swaging at Room Temperature and Tested at a Crosshead Speed of 0.002 in./min at (a) 550 and (b) 650°C. Vibratorily polished and etched (50$ HC1, 33$ glycerin, and 17$ HN03) at room temperature. 75Gx.
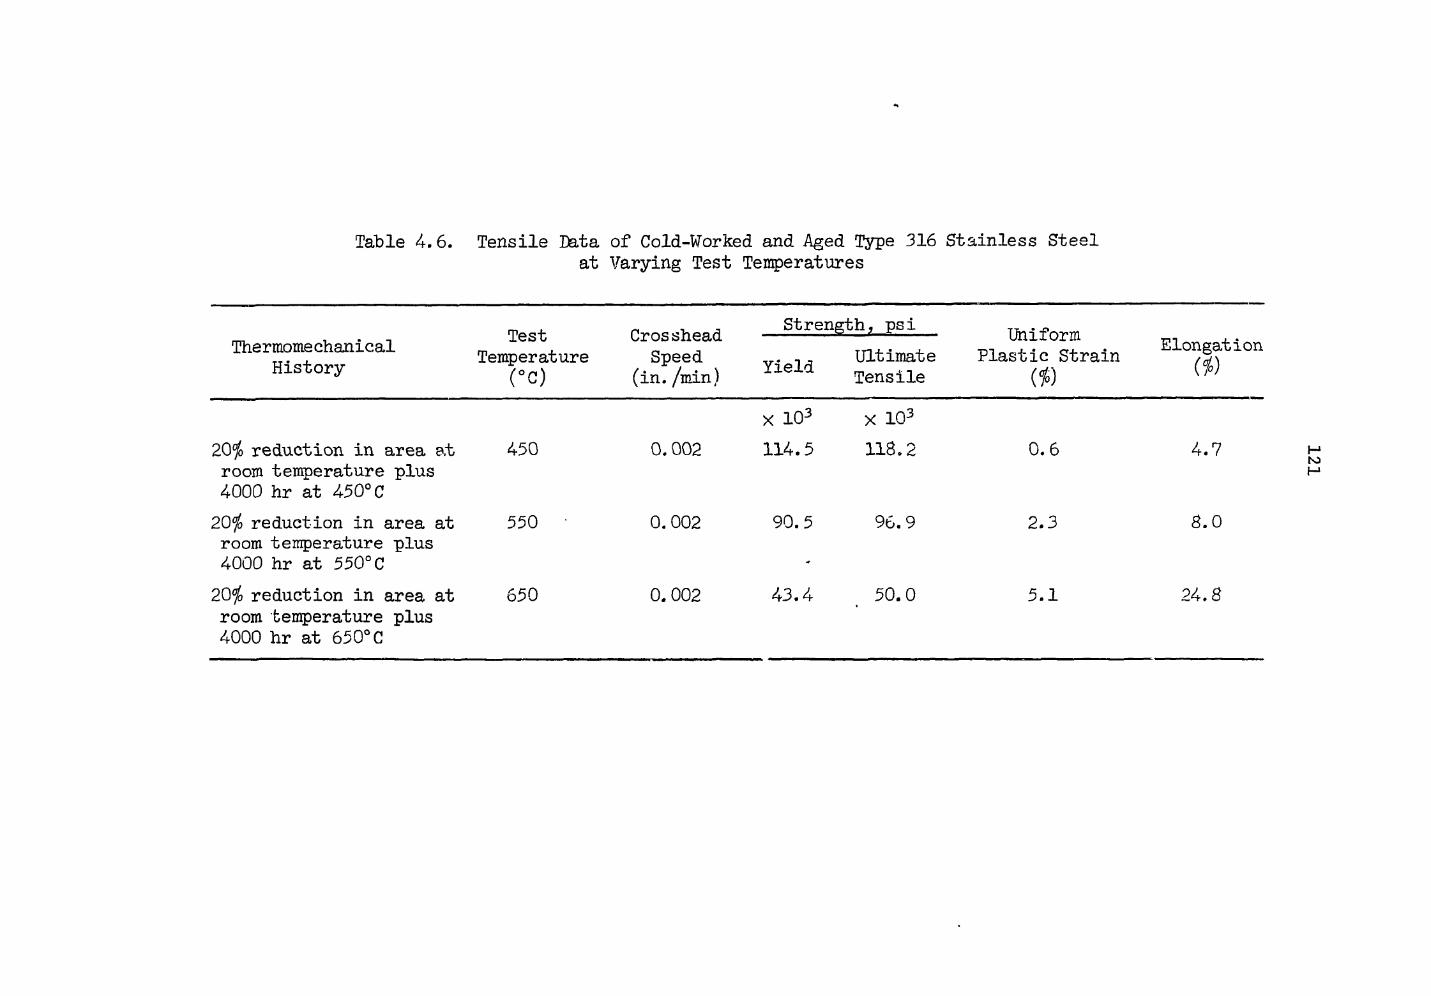
Table 4.6. Tensile Data of Cold-Worked and Aged Type 316 Stainless Steel at Varying Test Temperatures
Ther mome chanical History
Test Temperature
(°C)
Cros shead Speed
(in./min)
Strength, psi
Yield Ultimate Tensile
Uniform Plastic Strain Elongation
w
20fo reduction in area a.t room temperature plus 4000 hr at 450°C h reduction in area at
room temperature plus 4000 hr at 550°C b reduction in area at
room temperature plus 4000 hr at 650°C
450
550
650
0.002
0.002
0. 002
X 103 x 103 114.5 118.2
90.5
43.4
96.9
50.0
0.6
2.3
5.1
4.7
8.0
24.8
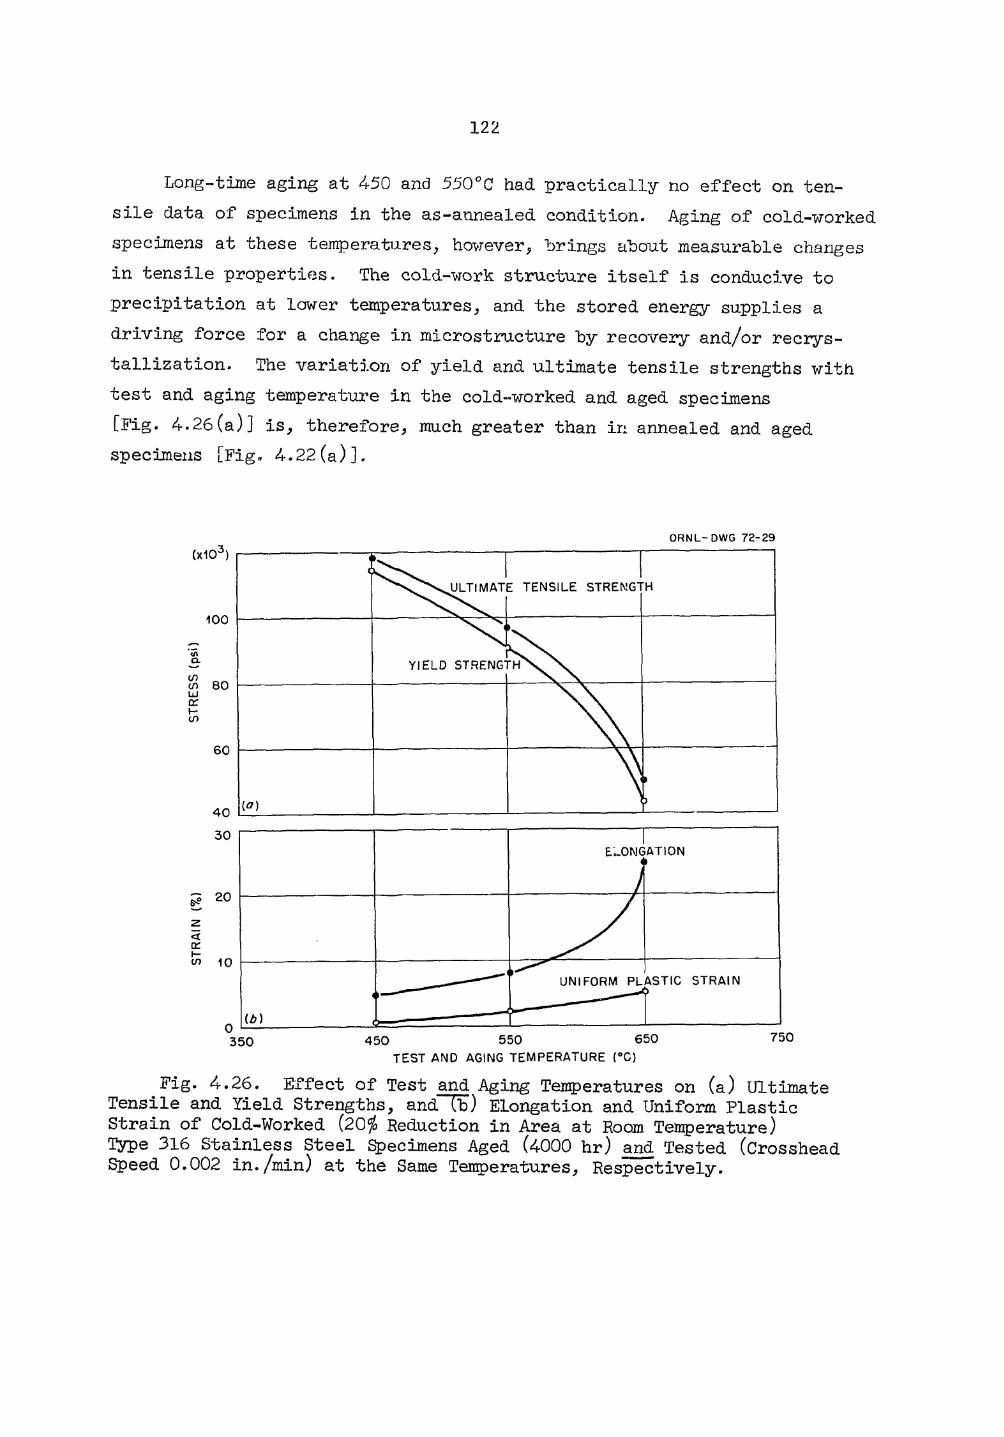
.122
Long-time aging at 450 and 550°C had practically no effect on ten-sile data of specimens in the as-annealed condition. Aging of cold-worked specimens at these temperatures, however, "brings about measurable changes in tensile properties. The cold-work structure itself Is conducive to precipitation at lower temperatures, and the stored energy supplies a driving force for a change in microstructure by recovery and/or recrys-tallization. The variation of yield and ultimate tensile strengths with test and aging temperature in the cold-worked and aged specimens [Fig. 4.26(a)] is, therefore, much greater than in annealed and aged specimens [Fig. 4.22(a)].
O R N L - D W G 7 2 - 2 9
Fig. 4.26. Effect of Test and Aging Temperatures on (a) Ultimate Tensile and Yield Strengths, and~Tb) Elongation and Uniform Plastic Strain of Cold-Worked (20$ Reduction in Area at Room Temperature) Type 316 Stainless Steel Specimens Aged (4000 hr) and Tested (Crosshead Speed 0.002 in./min) at the Same Temperatures, Respectively.
.123
While the work-hardening rates in the cold-worked and aged specimens were as low as in the unaged cold-worked specimens, the strength level decreased significantly, and the rate of loss of yield and ultimate ten-sile strength with increasing test and aging temperatures was higher for the cold-worked and aged [Fig. 4.26(a)] than for the as-cold-worked con-dition [Fig. 4.24(a)]. This was due to more extensive recovery and pre-cipitation, and at 650°C, even partial (20$) recrystallization. Electron micrographs, depicting the microstructure of the unstrained portion of cold-worked specimens aged and tested at 450, 550, and 650°C, respectively, substantiate this (Fig. 4.27).
The possible effect of a lower stress level on the appearance of the stress-strain curves was offset by a larger amount of precipitates which increased as the stress level (due to recovery and recrystalliza-tion) decreased.
As for annealed specimens, aging at 450°C resulted in lower uniform plastic strain and elongation, and aging at 550°C in an improvement of these parameters over those of the corresponding unaged specimens (Tables 4.5 and 4.6).
A comparison of the elongation values of aged and unaged cold-worked specimens shows that test temperatures up to 550°C do not affect elonga-tion in unaged specimens [Fig. 4.24(b)], while the effect of long-time aging is revealed in the continuous increase in elongation with test and aging temperatures [Fig. 4.26(b)].
Long-time aging of as-annealed specimens led to a decrease in ulti-mate tensile strength and an increase in yield strength (because of pre-cipitates) as the test and aging temperatures increased [Fig. 4.22(a)]. For cold-worked specimens both yield and ultimate tensile strengths, though at a higher level, decreased with increasing test and aging tem-peratures [Fig. 4.26(a)]. Since the drop in strength with test and aging temperatures was much larger for the previously cold-worked speci-mens, the ultimate tensile strengths were the same for the annealed and aged and the cold-worked and aged specimens at a test and aging tempera-ture of 650°C. The yield strength of the cold-worked and aged specimen was still higher at 650°C than that of the annealed and aged specimen.
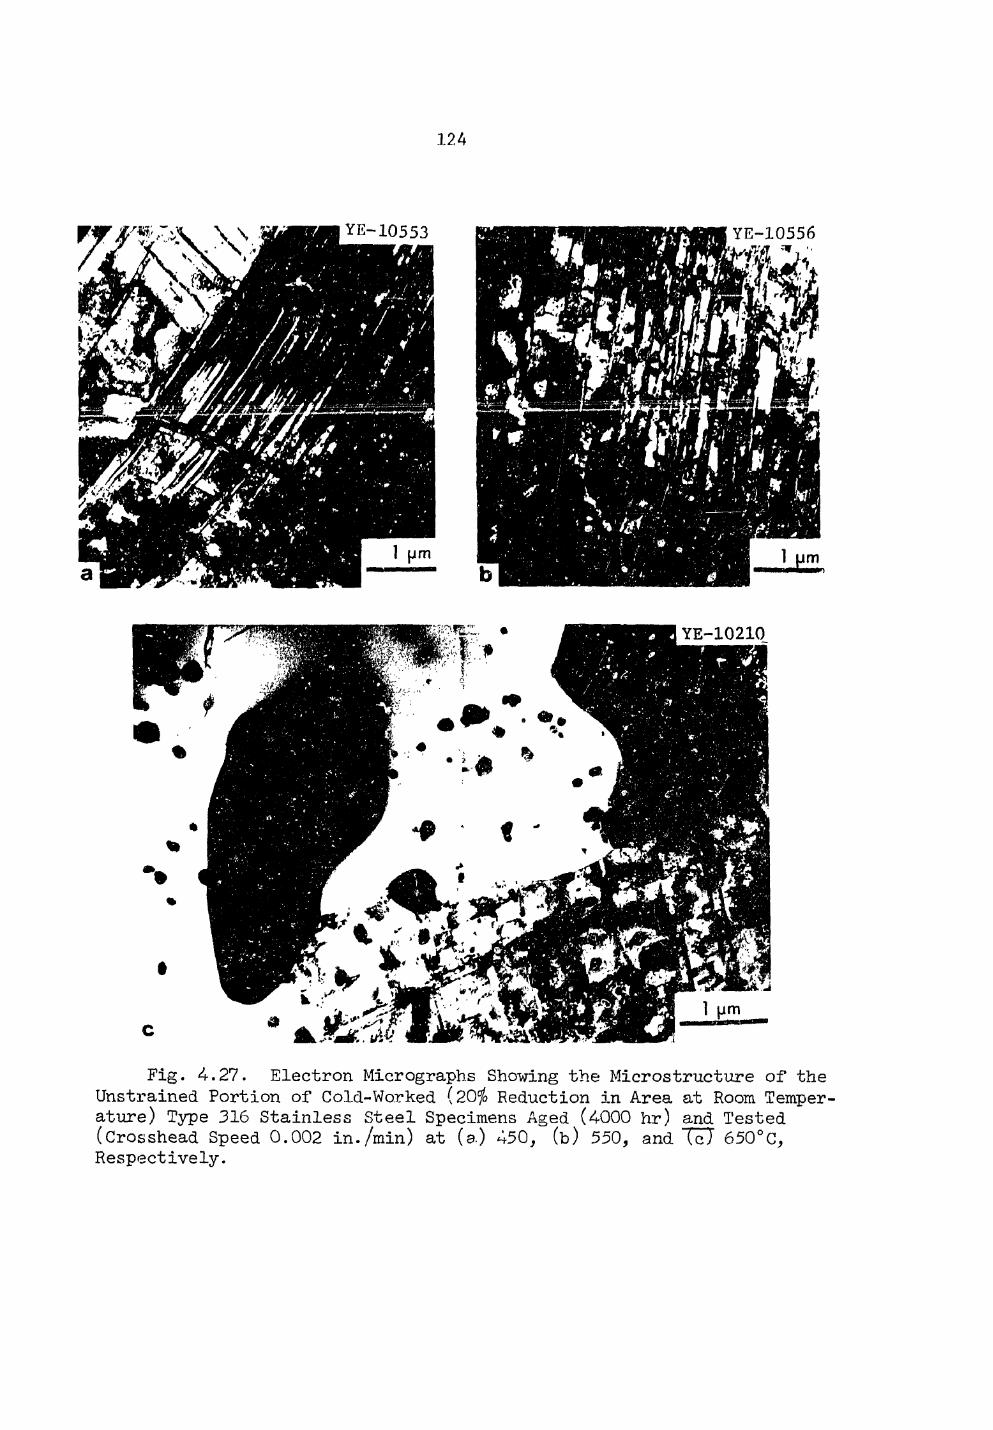
.124
Fig. 4.27. Electron Micrographs Showing the Microstructure of the Unstrained Portion of Cold-Worked (20$ Reduction in Area at Room Temper-ature) Type 316 Stainless Steel Specimens Aged (4000 hr) a.nd Tested (Crosshead Speed 0.002 in./min) at (a) 450, (b) 550, and TcT 650°C, Respectively.
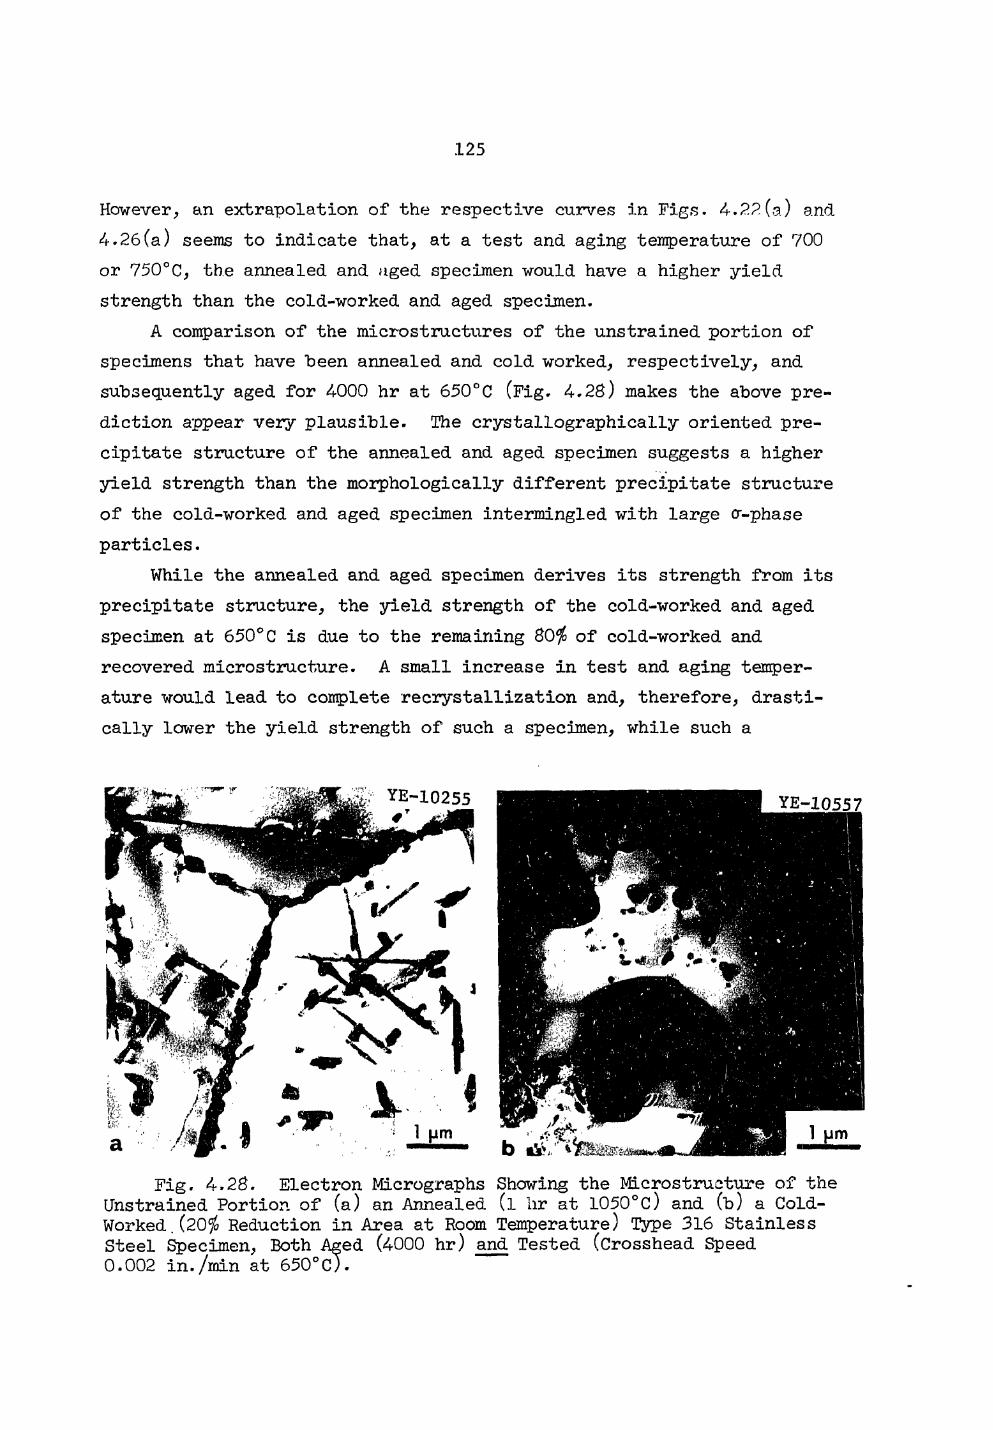
.125
However, an extrapolation of the respective curves in Figs. 3.) and 4.26(a) seems to indicate that, at a test and aging temperature of 700 or 750°C, the annealed and aged specimen would have a higher yield strength than the cold-worked and aged specimen.
A comparison of the microstructures of the unstrained portion of specimens that have been annealed and cold worked, respectively, and subsequently aged for 4000 hr at 650°C (Fig. 4.28) makes the above pre-diction appear very plausible. The crystallographically oriented pre-cipitate structure of the annealed and aged specimen suggests a higher yield strength than the morphologically different precipitate structure of the cold-worked and aged specimen intermingled with large cr-phase particles.
While the annealed and aged specimen derives its strength from its precipitate structure, the yield strength of the cold-worked and aged specimen at 650°C is due to the remaining 80$ of cold-worked and recovered microstructure. A small increase in test and aging temper-ature would lead to complete recrystallization and, therefore, drasti-cally lower the yield strength of such a specimen, while such a
Fig. 4.28. Electron Micrographs Showing the Microstructure of the Unstrained Portion of (a) an Annealed (l lir at 1050°c) and (b) a Gold-Worked. (20$ Reduction in Area at Room Temperature) Type 316 Stainless Steel Specimen, Both Aged (4000 hr) and Tested (Crosshead Speed 0.002 in./min at 650°C).
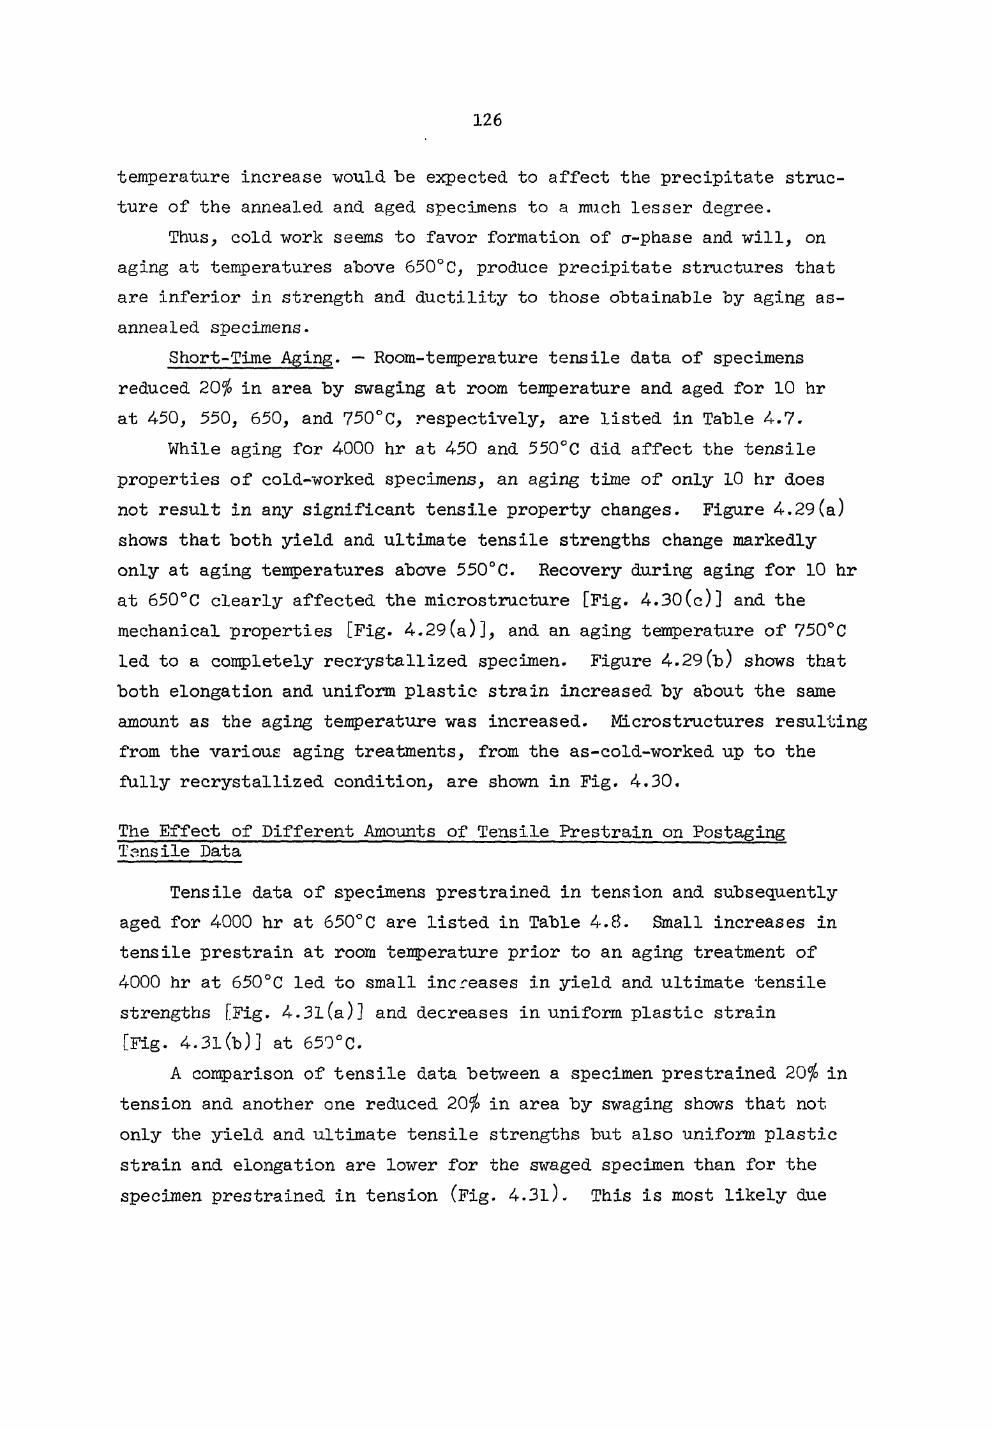
.126
temperature increase would be expected to affect the precipitate struc-ture of the annealed and aged specimens to a much lesser degree.
Thus, cold work seems to favor formation of cr-phase and will, on aging at temperatures above 650°C, produce precipitate structures that are inferior in strength and ductility to those obtainable by aging as-annealed specimens.
Short-Time Aging. — Room-temperature tensile data of specimens reduced 20$ in area by swaging at room temperature and aged for 10 hr at 450, 550, 650, and 750°C, respectively, are listed in Table 4.7.
While aging for 4000 hr at 450 and 550°C did affect the tensile properties of cold-worked specimens, an aging time of only 10 hr does not result in any significant tensile property changes. Figure 4.29(a) shows that both yield and ultimate tensile strengths change markedly only at aging temperatures above 550°C. Recovery during aging for 10 hr at 650°C clearly affected the microstructure [Fig. 4.30(c)] and the mechanical properties [Fig. 4.29(a)], and an aging temperature of 750°C led to a completely recrystallized specimen. Figure 4.29(b) shows that both elongation and uniform plastic strain increased by about the same amount as the aging temperature was increased. Microstructures resulting from the various aging treatments, from the as-cold-worked up to the fully recrystallized condition, are shown in Fig. 4.30.
The Effect of Different Amounts of Tensile Prestrain on Postaging Tansile Data
Tensile data of specimens prestrained in tension and subsequently aged for 4000 hr at 650°C are listed in Table 4.8. Small increases in tensile prestrain at room temperature prior to an aging treatment of 4000 hr at 650°C led to small increases in yield and ultimate tensile strengths [Fig. 4.31(a)] and decreases in uniform plastic strain [Fig. 4.31(b)] at 650°C.
A comparison of tensile data between a specimen prestrained 20$ in tension and another one reduced 20$ in area by swaging shows that not-only the yield and ultimate tensile strengths but also uniform plastic strain and elongation are lower for the swaged specimen than for the specimen prestrained in tension (Fig. 4.3l). This is most likely due
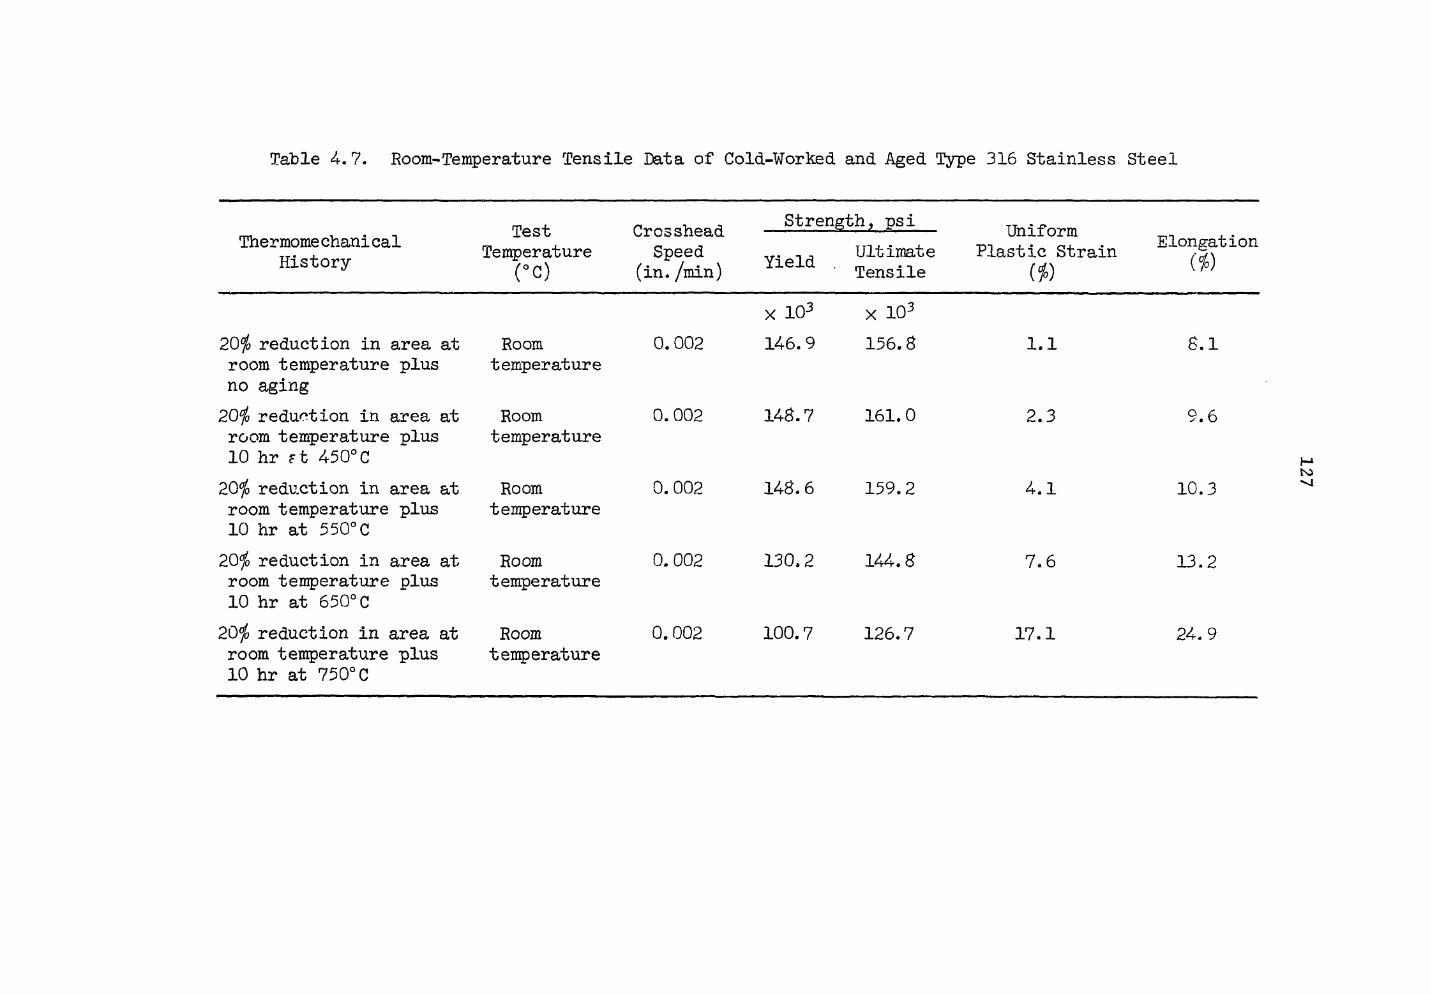
Table 4.7. Room-Temperature Tensile Data of Cold-Worked and Aged Type 316 Stainless Steel
Thermome chani cal History
Test Temperature
(°C)
Crosshead Speed
(in. /min)
Strength, psi
Yield Ultimate Tensile
Uniform -m ,. . Elongation Plastic Strain ^
20$ reduction in area at room temperature plus no aging 20$ reduction in area at room temperature plus 10 hr ft 450°C 20$ reduction in area at room temperature plus 10 hr at 550°C 20$ reduction in area at room temperature plus 10 hr at 650°C 20$ reduction in area at room temperature plus 10 hr at 750°C
Room 0.002 temperature
Room 0.002 temperature
Room 0.002 temperature
Room 0.002 temperature
Room 0.002 temperature
x 103 x 103
146.9 156.8
148.7
148.6
130.2
100.7
161.0
159.2
144.8
126.7
1.1
2.3
4.1
7.6
17.1
8.1
o .6
10.3
13.2
24. 9
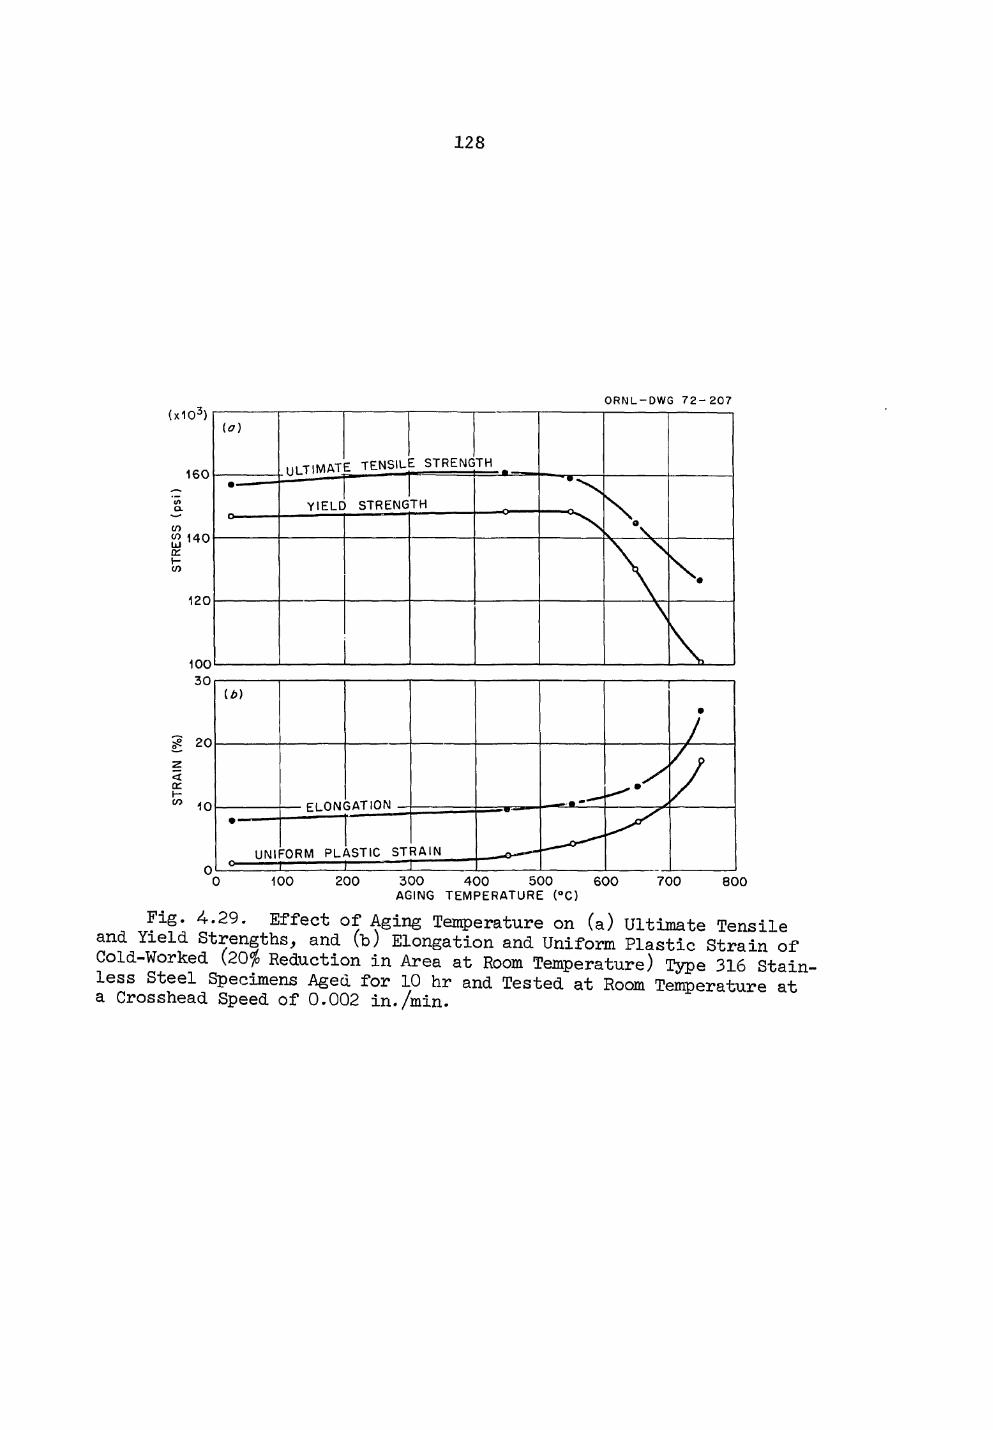
.128
O R N L - D W G 7 2 - 2 0 7
Fig. 4.29. Effect of Aging Temperature on (a) Ultimate Tensile and Yield Strengths, and (b) Elongation and Uniform Plastic Strain of Cold-Worked (20$ Reduction in Area at Room Temperature) Type 316 Stain-less Steel Specimens Aged for 10 hr and Tested at Room Temperature at a Crosshead Speed of 0.002 in./min.
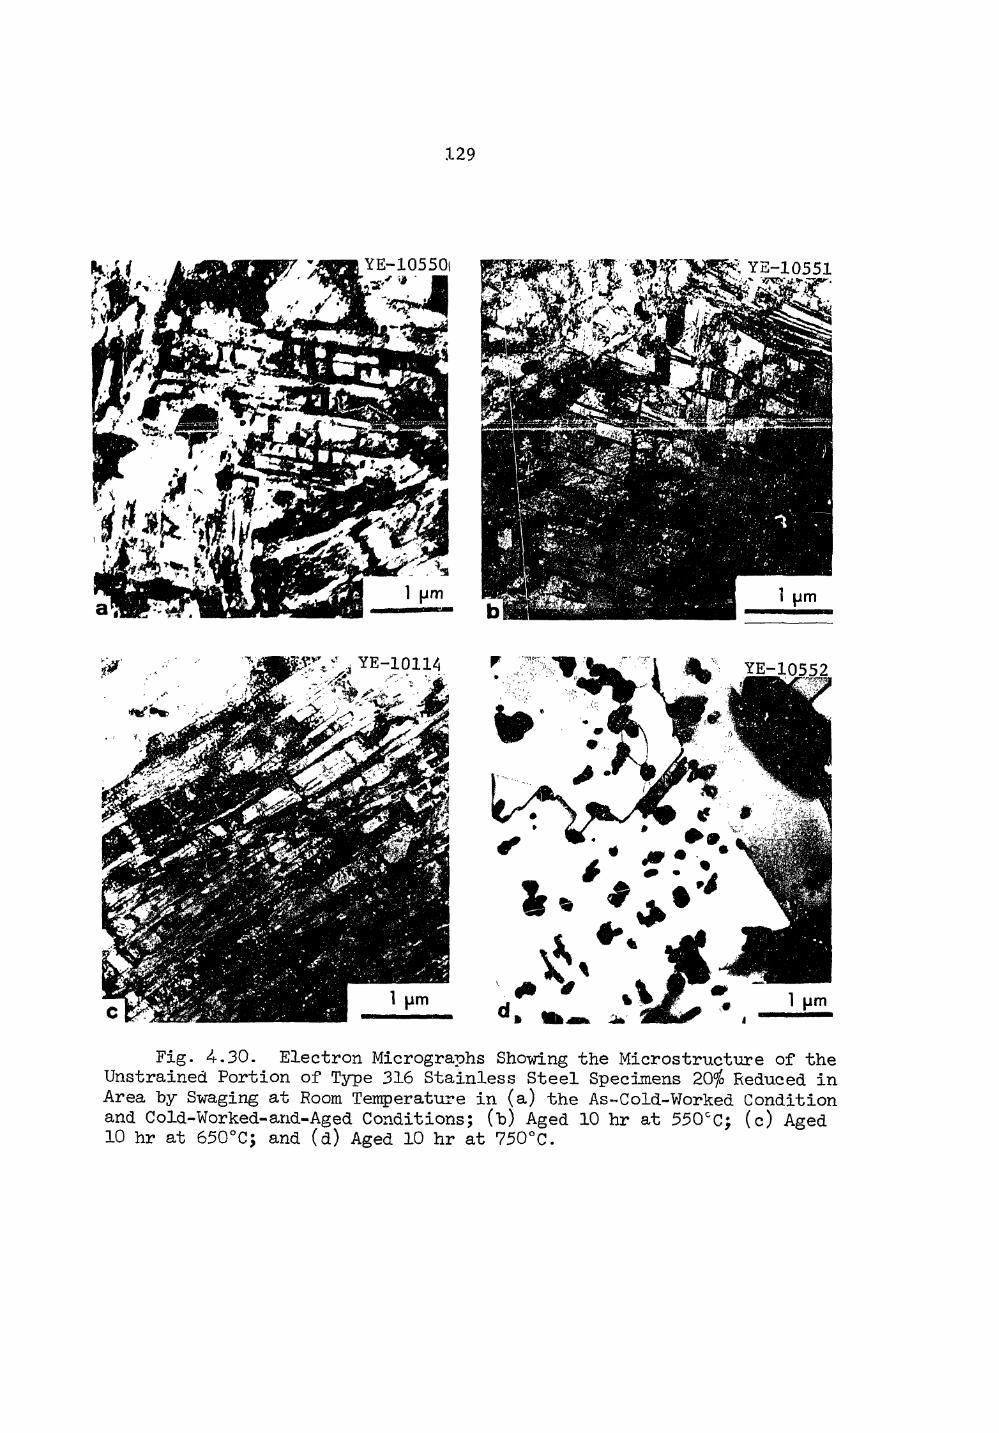
.129
, YE-10114 . JV • - - - YE-10552
Fig. 4.30. Electron Micrographs Showing the Microstructure of the Unstrained Portion of Type 316 Stainless Steel Specimens 20$ Reduced in Area by Swaging at Room Temperature in (a) the As-Cold-Worked Condition and Cold-Worked-arid-Aged Conditions; (b) Aged 10 hr at 550cC; (c) Aged 10 hr at 650°C; and (d) Aged 10 hr at 750°C.
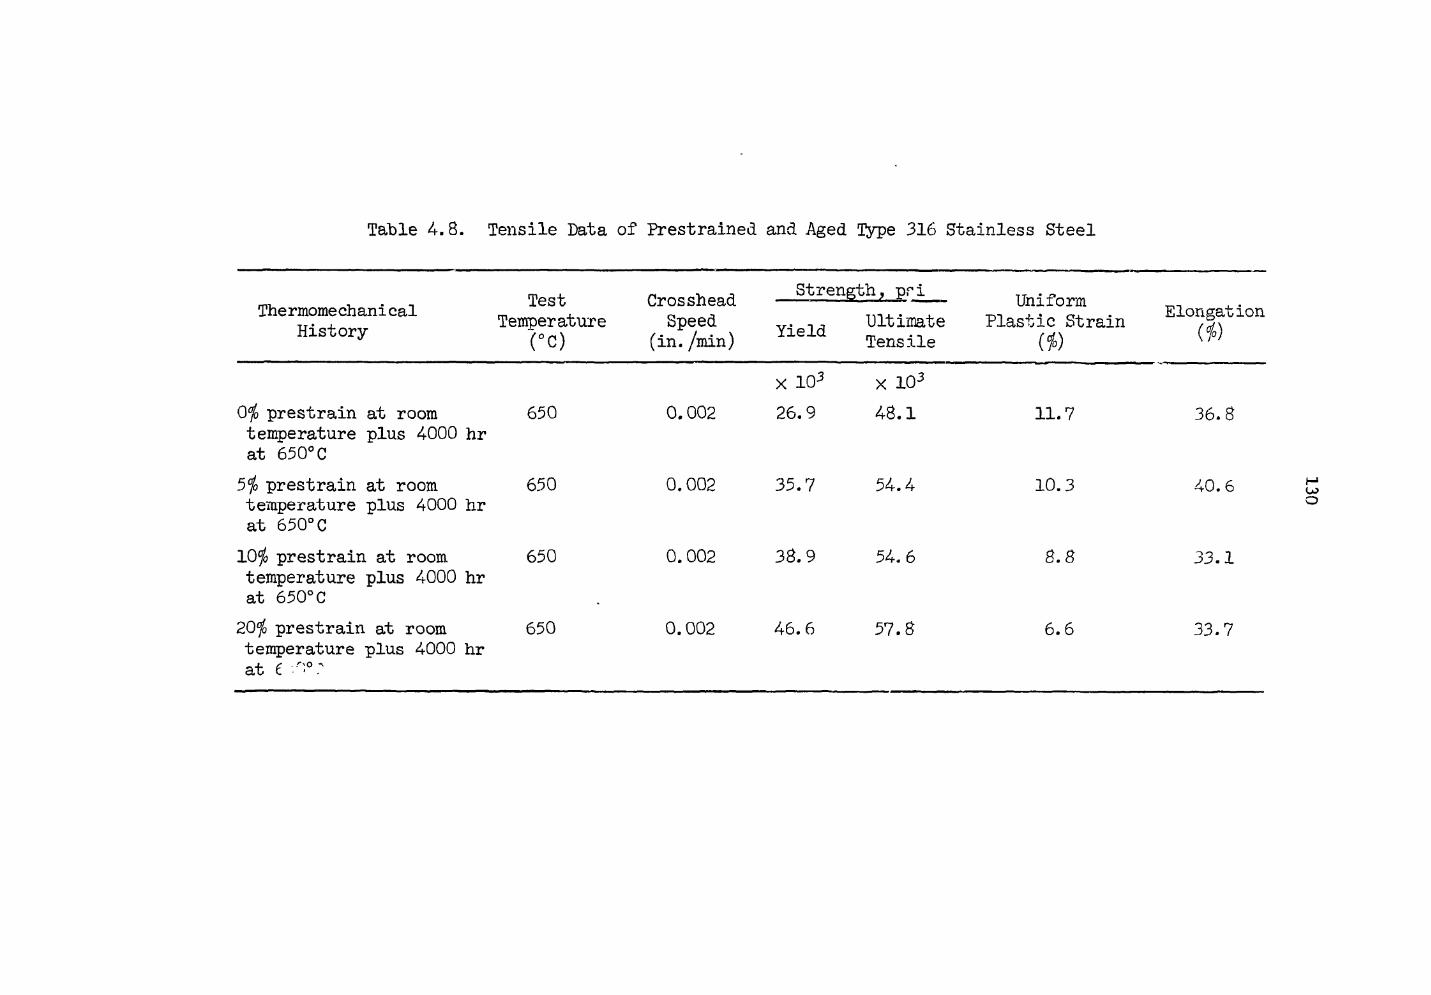
Table 4.8. Tensile Data of Prestrained and Aged Dtype 316 Stainless Steel
Thermomechani cal History-
Test Temperature
(°C)
prestrain at room temperature plus 4000 hr at 650° C
5$ prestrain at room temperature plus 4000 hr at 650°C b prestrain at room
temperature plus 4000 hr at 650°C h prestrain at room
temperature plus 4000 hr at C r-°?
650
650
650
650
Crosshead Speed
(in. /min)
Strength, ppi
Yield "Ultimate Tensile
Uniform Plastic Strain
0.002
0.002
0.002
0.002
X 10 3
26.9
35.7
38.9
46.6
x 103
48.1
54.4
54.6
57.8
11.7
10.3
8.8
6.6
Elongation (0
36.8
40.6
33.1
33.7
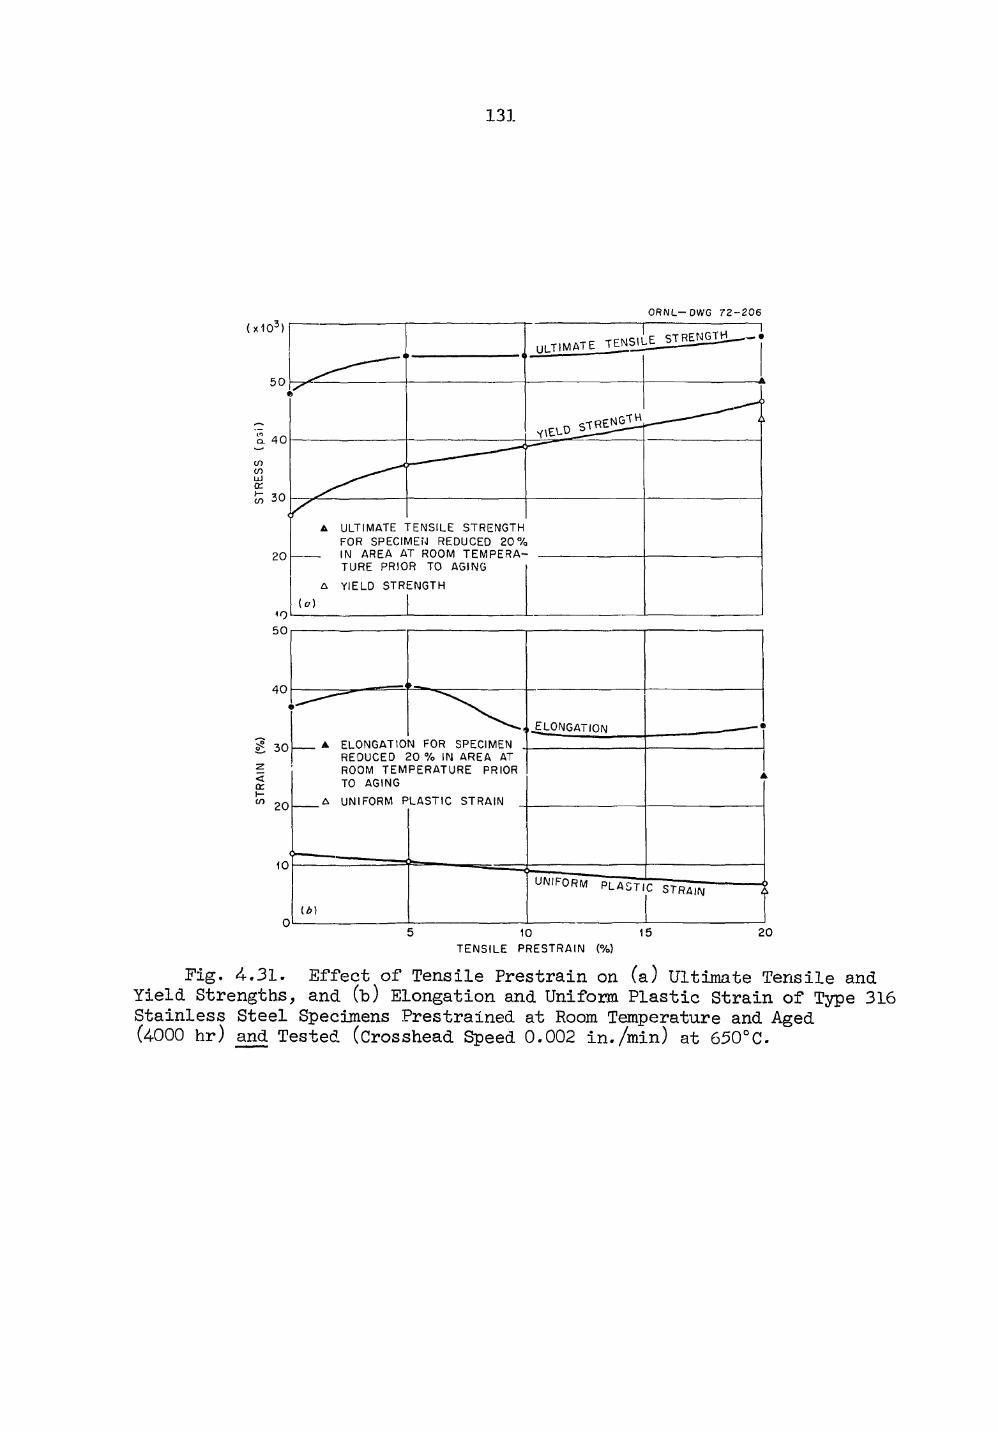
.131
O R N L - 0 W 6 7 2 - 2 0 6
T E N S I L E P R E S T R A I N (%)
Fig. 4-.31. Effect of Tensile Prestrain on (a) Ultimate Tensile and Yield Strengths, and Cb) Elongation and Uniform Plastic Strain of Type 316 Stainless Steel Specimens Prestrained at Room Temperature and Aged (4-000 hr) and Tested (Crosshead Speed 0.002 in./min) at 650°C.
.132
to the different kinds of deformation resulting in different amounts of cold work and grain orientation. Since partial 20$) recrystalliza-tion took place during aging of the specimen reduced 20$ in area by swaging, the difference in yield and ultimate tensile strengths may well be due to different degrees of pretest recrystallization, expected to be less for the specimen prestrained 20$ in tension. At lower pre-strains, recrystallization may not take place at all.
The lower elongation and uniform plastic strain values for the specimen reduced 20$ in area by swaging as compared to the specimen prestrained 20$ in tension may well be explained by the difference in directionality of the deformation process. Grains will be oriented differently and so will grain boundary precipitates with respect to the direction of the tensile stress during the test.
Wo serrations were observed in the stress-strain curves of the above specimen in agreement with other findings and the low work-hardening rate.
.133
5. FABRICATION DEVELOPMENT FOR FBR CIADDING
G. M. Aaamson, Jr. W. R. Martin
Our effort is currently directed toward a better evaluation of the effects of delects on the properties of unirradiated and irradiated type 316 stainless steel tubing.
Effect of Fabrication Variables
Biaxial Stress-Rupture Properties of Type 316 Stainless Steel Tubing (R. T. King, G. A. Reimann, K. V. Cook)
The effects of certain fabrication variables on the biaxial stress-rupture properties of type 316 stainless steel tubing at 650°C have been characterized. This study was performed on tubing produced from one heat of steel, Allegheny-Ludlum Heat 65808. The tubing was fabricated at ORNL to either 0.250 in. O.D. x 0.016 in. nominal wall thickness, or 0.230 in. O.D. X 0.0155 in. nominal wall thickness finished dimensions. The precise fabrication schedules used to produce the tubing have been published previously.192 Three lots of tubing were produced which had conventional grain sizes between ASTM 3 and ASTM 8: (l) solution annealed tubing (final anneal 1 hr at 925°C) with an ASTM 5 to 6 grain size designated BA1-1, (2) 20% cold-worked tubing with an ASTM 6 to 8 grain size prior to the final drawing passes, designated BA1-2, and (3) 20$ cold-worked tubing with an ASTM 3 to 5 grain size prior to the final drawing passes, designated BA1-3. Three other lots of tubing were prepared by a fabrication schedule which produced so-called "ultrafine grain size" tubing in which virtually all of the available carbon was precipitated during the fabrication processes. One tube of each lot was used in this study and each was tested in a different
1G. As Reimann, "Drawing of Type 316 Stainless Steel Tubing", Fuels and Materials Program Quart. Progr. Rept. June 30, 1969, 0RNL-4<440, p. 76.
2G. A. Reimann, Development of an Ultrafine Grain Size Type 316 Stainless Steel Cladding, 0RNL-TM-2937 (May, 1970).
.134
condition: (l) the 20$ cold-worked condition with an ASTM 14 grain size (Tube 44), (2) the 20$ cold-worked condition plus 1-hr stress relief anneal at 700°C with an ASTM 14 grain size (Tube 46), and (3) 'the fully recrystallized condition, produced by cold-working 53$ and annealing for 1 hr at 760PC, having an ASTM 13 grain size.
All of the tubing used in this study was inspected for longitudinal and transverse discontinuities yielding signal responses greater than those produced by a standard 0.002 in.-deep by 0.0025-in. wide by 0.030-in.-long notch; none of the tubing exhibited such discontinuities.
Pour-in. long specimens were then fitted with end caps and pressurizing tubes, and tested at 650 ± 1°C under a series of constant internal pressures, P. An inert pressurize.ng gas was used and the environment was He—1$ 02.
The stress versus rupture time results are plotted in logarithmic form in Fig. 5.1. The dotted line represents Atomics International data for 20$ cold-worked tubing fabricated elsewhere from the same heat of stainless steel; it had an ASTM 7 grain size.3 The ultrafine grain size tubing has consistently shorter rupture times over the range of test conditions investigated than does the conventional grain size tubing. The curves tend to converge to common values for shorter rupture times. The annealed tubing of the ultrafine grain size series has shorter rupture times than comparable cold-worked tubing (Tube 38 versus Tubes 44 and 46), and the annealed conventional grain size tubing likewise exhibits shorter rupture times than do its cold-worked counterparts (BA1-1 versus BA1-2 and -3). Stress-relieving the cold-worked ultrafine grain size tubing has only a minor effect on rupture time (Tube 44 versus Tube 46). The effect of changing grain size prior to the final cold-working for conventional tubing has little effect on rupture time (BA1-2 versus BA1-3).
3W. T. Lee, Biaxial Stress-Rupture Properties of Austenitic Stainless Steel in Static Sodium, AI-AEC-12694 (June 30, 1968).
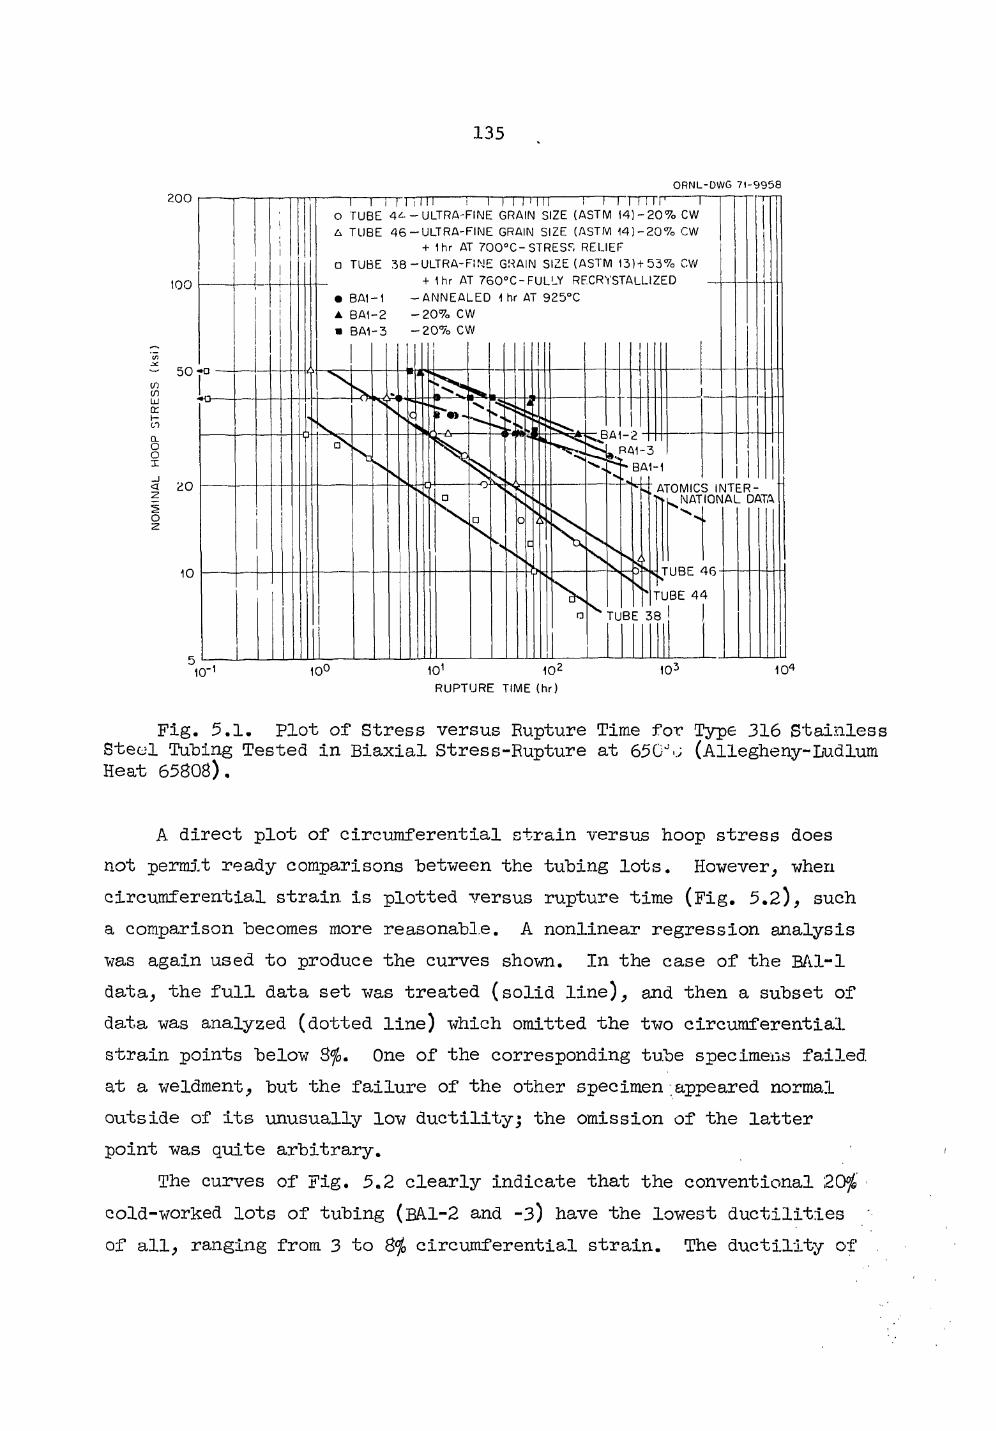
135
ORNL-DWG 7 1 - 9 9 5 8 200
100
101 102
R U P T U R E T I M E ( h r )
Fig. 5.1. Plot of Stress versus Rupture Time for Type 316 Stainless Steel Tubing Tested in Biaxial Stress-Rupture at 65C\; (Allegheny-Ludlum Heat 65808).
A direct plot of circumferential strain versus hoop stress does not permit ready comparisons between the tubing lots. However, when circumferential strain is plotted versus rupture time (Fig. 5.2), such a comparison becomes more reasonable. A nonlinear regression analysis was again used to produce the curves shown. In the case of the BA.1-1 data, the full data set was treated (solid line), and then a subset of data was analyzed (dotted line) which omitted the two circumferential strain points below 8$. One of the corresponding tube specimens failed at a weldment, but the failure of the other specimen appeared normal outside of its unusually low duetilltyj the omission of the latter point was quite arbitrary.
The curves of Fig. 5.2 clearly indicate that the conventional 20$ cold-worked lots of tubing ( B A I - 2 and - 3 ) have the lowest ductilities of all, ranging from 3 to 8$ circumferential strain. The ductility of
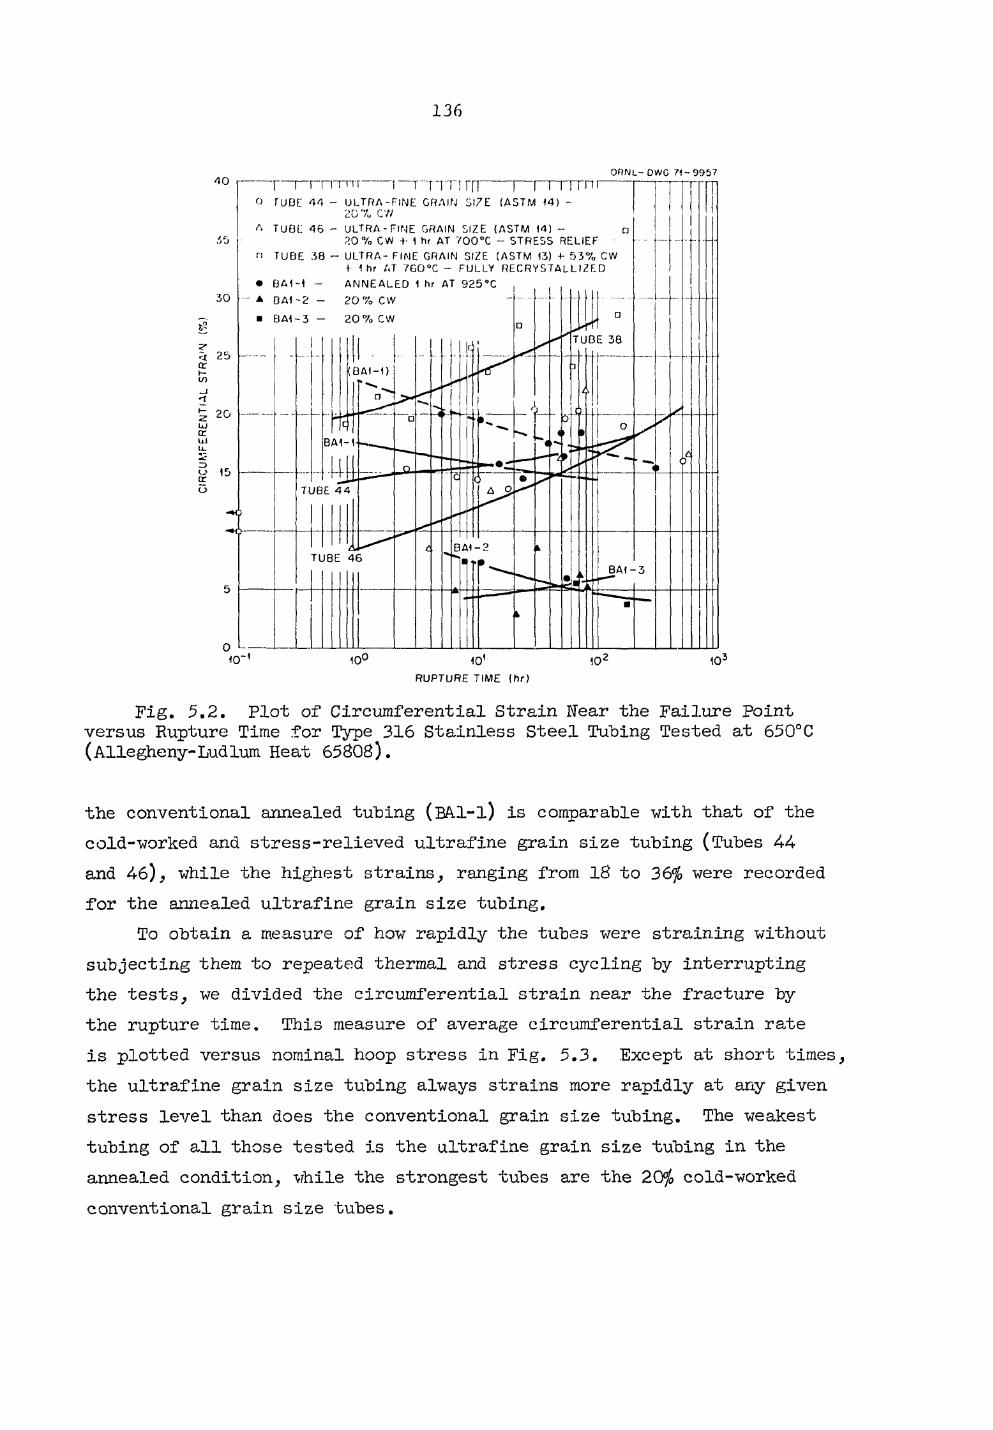
136
200 OftNL- DWC 71-9957 rrrmTi i —7-7-rn rn i rrTTTTT 1 TUBE - ULTRA - F I N E GRAIN SI7E (ASTM ( 4 ) -
20 7U C/1 TUBE 4 6 - U L T R A - F I N E GRAIN SIZE (ASTM 14) -
? . 0 % CW -t- 1 hr AT 7 0 0 ° C - STRESS RELIEF TUBE 3 8 - ULTRA- FINE GRAIN SIZE (ASTM 13) -t- 5 3 7 „ CW
+• 1 hr AT 7 6 0 ° C - FULLY R E C R Y S T A L L I Z E D A N N E A L E D 1 hr AT 9 2 5 ° C 2 0 7o CVV 2 0 7„ CW
I
101
RUPTURE TIME (hr )
Fig. 5.2. Plot of Circumferential Strain Near the Failure Point versus Rupture Time for Type 316 Stainless Steel Tubing Tested at 650°C (Allegheny-Ludlum Heat 65808).
the conventional annealed tubing (BA.1-1) is comparable with that of the cold-worked and stress-relieved ultrafine grain size tubing (Tubes 44 and 46), while the highest strains, ranging from 18 to 36$ were recorded for the annealed ultrafine grain size tubing.
To obtain a measure of how rapidly the tubes were straining without subjecting them to repeated thermal and stress cycling by interrupting the tests, we divided the circumferential strain near the fracti^re by the rupture time. This measure of average circumferential strain rate is plotted versus nominal hoop stress in Fig. 5.3. Except at short times, the ultrafine grain size tubing always strains more rapidly at any given stress level than does the conventional grain size tubing. The weakest tubing of all those tested is the ultrafine grain size tubing in the annealed condition, while the strongest tubes are the 20$ cold-worked conventional grain size tubes.
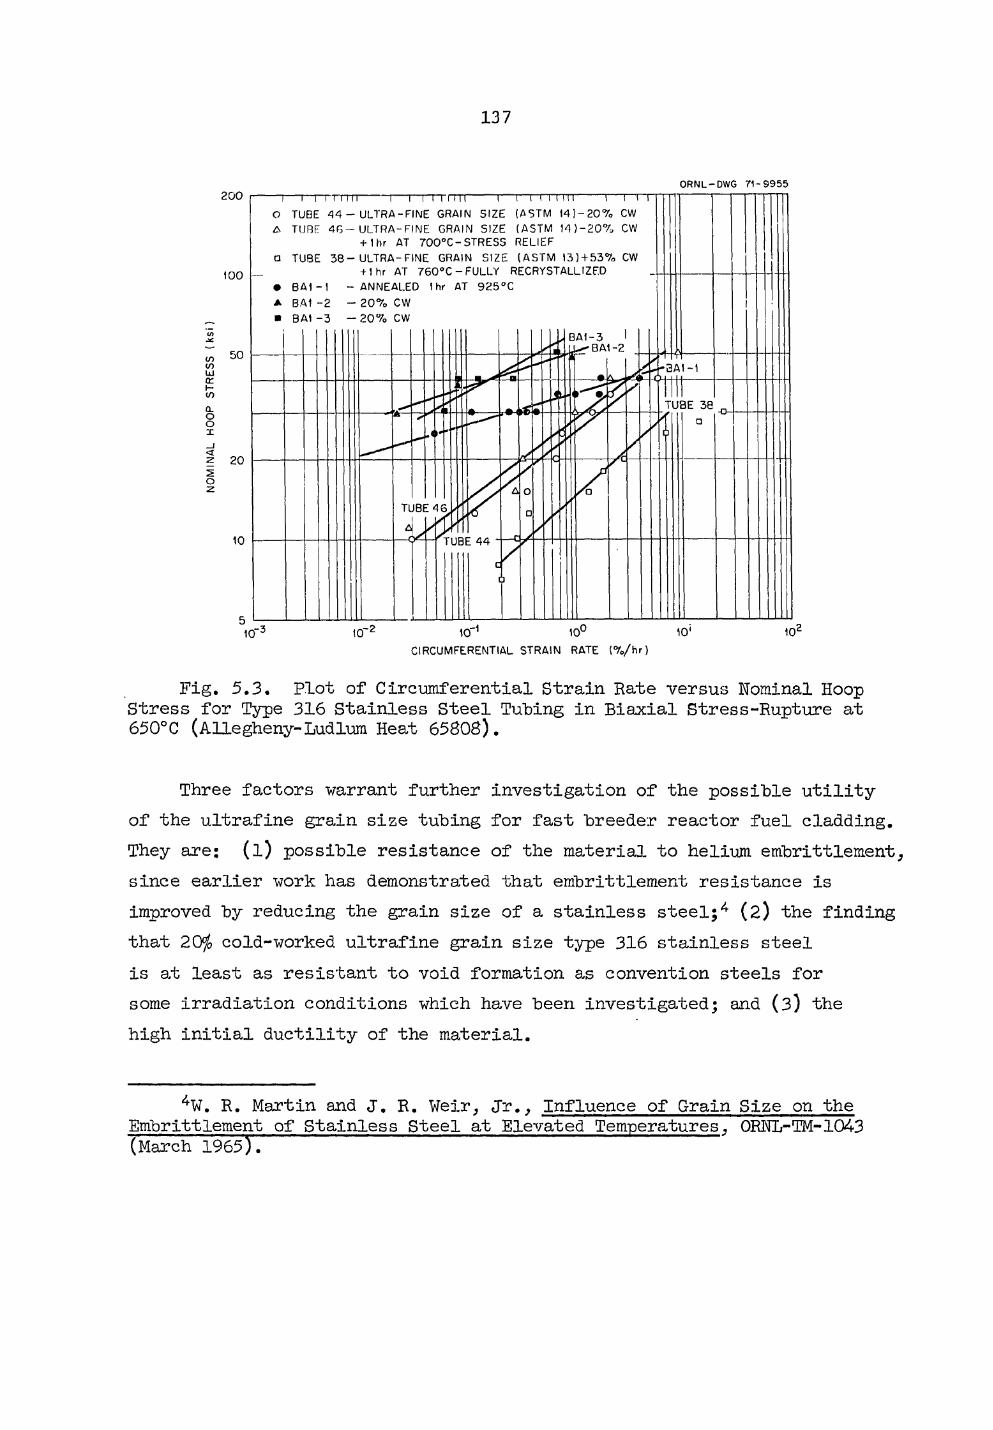
200
100
to
CO UJ a: H 10 a. O o x < z 20
10
V 3 t0~2 10_1 10° 10' 102 CIRCUMFERENTIAL STRAIN RATE ( % / h r )
Fig. 5.3. Plot of Circumferential Strain Rate versus Nominal Hoop Stress for Type 316 Stainless Steel Tubing in Biaxial Stress-Rupture at 650°C (Allegheny-Ludlum Heat 65808).
Three factors warrant further investigation of the possible utility of the ultrafine grain size tubing for fast breeder reactor fuel cladding. They are: (l) possible resistance of the material to helium embrittlement, since earlier work has demonstrated that embrittlement resistance Is improved by reducing the grain size of a stainless steel;* (2) the finding that 20$ cold-worked ultrafine grain size type 316 stainless steel is at least as resistant to void formation as convention steels for some irradiation conditions which have been investigated; and (3) the high initial ductility of the material.
137
ORNL-DWG 71-9955 i—i—i ni I'II 1—i—rrrrm i i i i II m i i i i n Mill O TUBE 4 4 — U L T R A - F I N E GRAIN SIZE (ASTM 1 4 ) - 2 0 % CW A TUBE 4 6 - U L T R A - F I N E GRAIN SIZE ( A S T M 14 > - 2 0 7 : , CW
+ 1hr AT 7 0 0 ° C - S T R E S S RELIEF • TUBE 3 8 - U L T R A - F I N E GRAIN S IZE ( A S T M 13) + 537o CW
+1 hr AT 7 6 0 ° C - FULLY RECRYSTALLIZF.D • B A 1 - 1 - A N N E A L E D 1 hr AT 9 2 5 ° C A BA1 - 2 - 2 0 % CW • B A 1 - 3 — 2 0 % CW
R. Martin and J. R. Weir, Jr., Influence of Grain Size on the Embrittlement of Stainless Steel at Elevated Temperatures, 0RNL-TM-104-3 (March 1965).
.138
Studies of Defected Tubing
Stress-Rupture Properties of Stainless Steel Tubing with Defects (R. T. King, G. A. Reimann, K. V. Cook)
We have reported the effects of electro-discharge machined notches on the biaxial stress-rupture properties of type 316 stainless steel tubing (Allegheny-Ludlum Heat 65808) at 650°C.5>6 Regardless of whether the tubes were tested in the annealed or cold-worked condition, the notches exerted an adverse effect on the rupture time and circumferential, strain which occurred prior to failure. However, the specimens were all produced from one heat of stainless steel and the same technique was used to produce each notch. There remains some questions as to whether only this heat or type of steel might be sensitive to notches, or whether the manner of introducing the notches might have unique effects. We have examined some earlier test results and some preliminary test results from testing series now in progress in order to answer these questions. It is too soon to place any statistical confidence in the more recent results. However, the overall picture at this time is clearly that any flaw which locally reduces the wall thickness of cladding or otherwise destroys the load-bearing ability of the tubing (such as folds) is likely to be a point at which failure occurs. The degree to which the failure is premature is governed by the geometry and orienta-tion of the defect. The evidence which supports this view includes the following cases; (l) A study of the biaxial creep-rupture properties of 0.2$ Ti-modified type 304L stainless steel tubing (Allvac Heat 3756) at 600°C and 700°C resulted in the conclusion that scratches introduced during tubing fabrication affect the location of the failure.7 Rapid,
5R, T. King, G. A. Reimann, and K. V. Cook, Fuels and Materials Develop-ment Program Quart. Progr. Rept. Juae 30, 1971, 0RNL-TM-3540, p. 81
6R. T. King, G. A. Reimann, and K. V. Cook, Fuels and Materials Develop-ment Program Quart. Progr. Rept. December 31, 1970, ORNL-IM-3300, p. 135.
7R. T. King, Fuels and Materials Development Program Quart. Progr. Rept. December 31, 1968, 0RNL-4390, p. 213.
.139
extensive intergranular separation occurred beneath the 0.003 in. deep scratches, and there -was a tendency for scratched tubes to exhibit shorter rupture times and lower ductilities than more perfect tubes. Because this study was performed on a different type of stainless steel, and because the scratches were of a different origin than the more recent work, it tends to support the general nature of the effects of defects on tubing. (2) We have initiated a program to evaluate the effect of notch sharpness (at the root of the notch) on the biaxial stress-rupture properties of 20$ cold-worked type 316 stainless steel tubing from Allegheny-Ludlum Heat 65808.8 Defects are electro-discharge machined into the tubing at an early stage of the fabrication process, and undergo a series of cold working-annealing cycles which reduce their width. This process probably destroys any effects peculiar to the electro-discharge machining process. Such sharp notches are apparently at least as effective as the broader electro-discharge machined notches in degrading the rupture, time and strain to failure of the tubing. As an example, a tube bearing a 0.25 in. long X 0.0005 in. deep X 0.00015 in. wide sharp (altered) notch failed after 82.4 hr at 650°C under 30,000-psi hoop stress. Figure 5.4 clearly shows that the failure occurred at the sharp altered notch which was located on the internal surface of the tube. By comparison, control specimens fabricated in the same manner ruptures after approximately 200 hr, specimens bearing as-electro-discharge machined notches 0.250 in.long X 0.0015 in. deep X 0.0025 in. wide ruptured after approximately 100 hr. Although it is too early to have quantitative assurance of the statistical validity of this and similar results, they do indicate that the origin, history, and geometry of defects may play an important role in determining their effects upon tubing properties. (3) We have initiated a small program to evaluate the effects of electro-discharge machined notches on the properties of another lot of type 316 stainless steel tubing to ascertain whether the degrading effects of these notches occur only for the Allegheny-Ludlum
8K. V. Cook, G. A. Reimann, and R. W. McClung, Fuels and Materials Development Program Quart. Progr. Rept. J-me 30, 1971, 0RNL-TM-3540, p. 80.
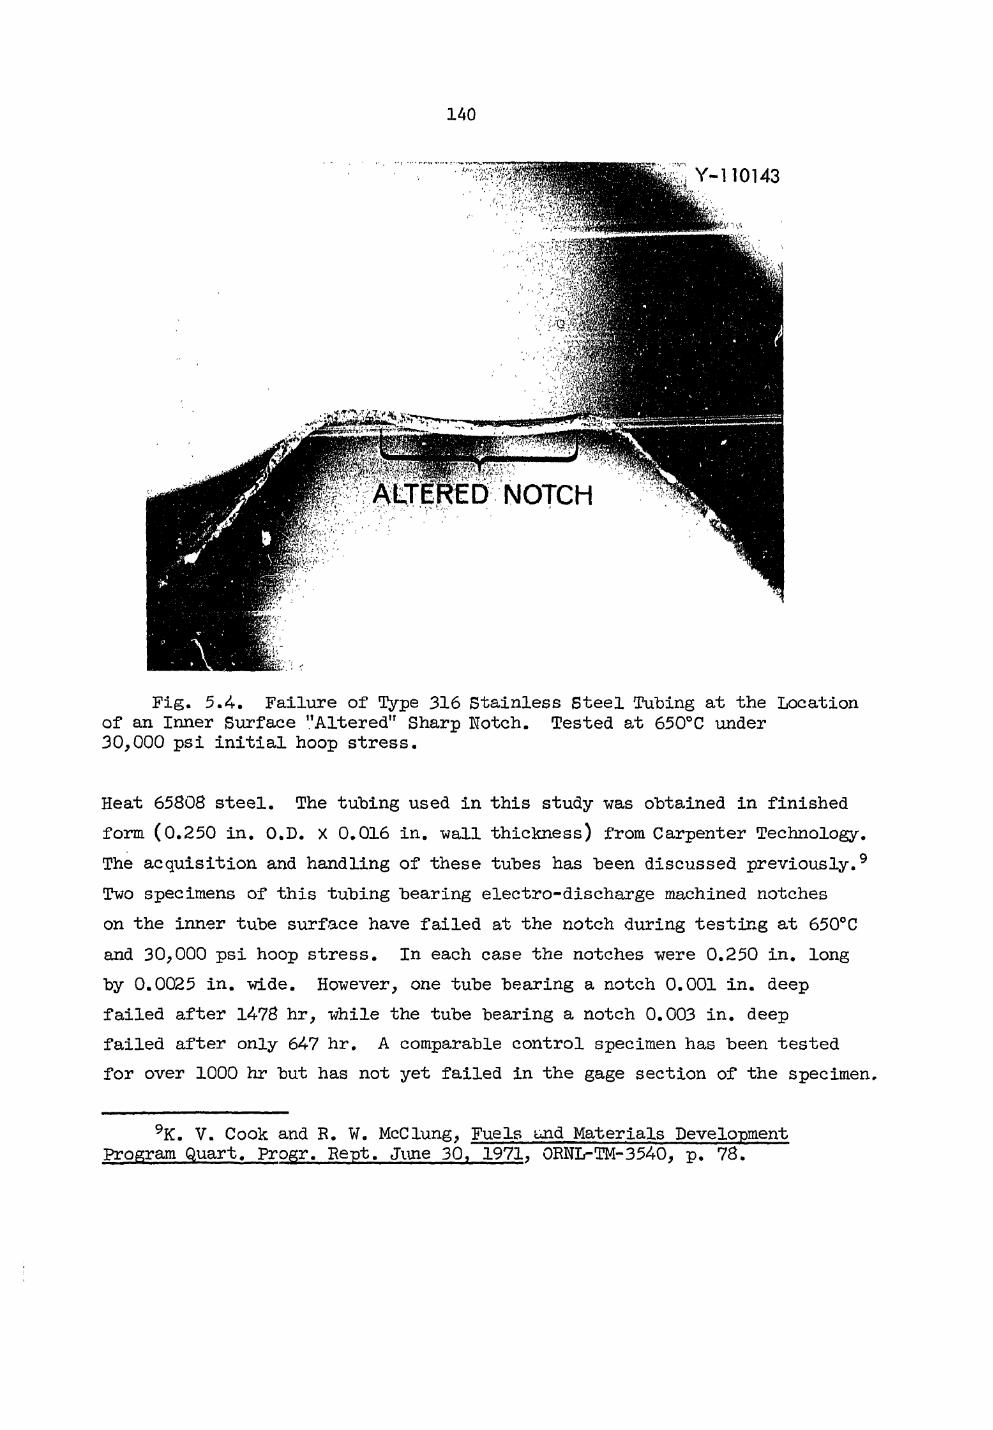
.140
Fig. 5.4. Failure of Type 316 Stainless Steel Tubing at the Location of an Inner Surface "Altered" Sharp Notch. Tested at 650°C under 30,000 psi initial hoop stress.
Heat 65808 steel. The tubing used in this study was obtained in finished form (0.250 in. O.D. X 0.016 in. wall thickness) from Carpenter Technology. The acquisition and handling of these tubes has been discussed previously.9 Two specimens of this tubing bearing electro-discharge machined notches on the inner tube surface have failed at the notch during testing at 650°C and 30,000 psi hoop stress. In each case the notches were 0.250 in. long by 0.0025 in. wide. However, one tube bearing a notch 0.001 in. deep failed after 1478 hr, while the tube bearing a notch 0.003 in. deep failed after only 647 hr. A comparable control specimen has been tested for over 1000 hr but has not yet failed in the gage section of the specimen.
9K. V. Cook and R. W. McClung, Fuels and Materials Development Program Quart. Progr. Rept. June 30, 1971, ORNL-TM-3540, p. 78.
.141
Again, the results may he interpreted as evidence that the effect of notches is not limited to one heat of stainless steel. (4) An experimental problem in the testing program has been the failure of specimens near the end caps. Our specimen design utilizes a slip-fit cap approximately 0.375 in. long which is positioned inside the specimen tube and then welded to the tube. We have observed that foreign matter or rough surfaces can cause small scratches on the inside surface of the tube where the end cap is located, and that premature failure can sometimes be traced to the presence of such scratches. These defects are not unlike those which were found to affect the failure of the 0*2$ Ti type 304L stainless steel tubing.
In summary, then, we have found that notches or defects in thin-wall stainless steel tubing of the type proposed for Fast Breeder Reactor fuel cladding do degrade the creep-rupture properties of the tubing and initiate premature failure. The precise effects will probably vary with the defect geometry and orientation, and perhaps the type or metallurgical condition of the stainless steel tubing. However, the effect has been found to persist through several heats of steel, and to be present for defects of several different origins or histories.
.142
6. COMPATIBILITY OP STEAM GENERATOR MATERIALS
P. Patriarca J. R. Weir, Jr.
Steam Corrosion of Advanced Steam Generator Materials
G. M. Slaughter
The purpose of this program is to investigate the corrosion behavior of steam generator alloy weldments. Special emphasis is placed upon materials for LMFBR steam generator use and stress corrosion as the mode of failure.
The program currently includes t-wo areas of investigation: (l) general corrosion (uniform scaling, including internal oxidation and localized attack at -weld fusion lines) at 480 and 595°C (900 and 1100°F), and (2) stress corrosion cracking (induced by chloride or caustic as contami-nants) in steam environments that include superheated conditions and cycling between the superheated and water-saturated states.
General Corrosion (J. P. Hammond) A group of test specimens prepared from materials of interest for LMFBR
steam generators was installed in the high-pressure steam corrosion loop on December 7, 1971, for isothermal tests at 480 and 595°C. A list of the alloys represented together with a description of the exposures and type of corrosion analyses to be made were given in the last quarterly report.1
In the interim, sheet material was' received in the much-publicized 26% Cr—1% Mo alloy from Airco Vacuum Metals. Because of its unique composi-tion and special fabrication process (prepared by electron-beam melting), this material is ejected to exhibit interesting corrosion properties. Eighteen specimens were prepared in it, each in the ground and electro-polished condition for studies of corrosion by the three principal methods of analysis, both at 480 and 595°C. These were inserted in the corrosion loop at the 1000-hr exposure mark of the main body of specimens.
•J. P. Hammond, Fuels and Materials Development Program Quart. Progr. Rept. Sept. 30, 1971, 0RNL-TM-3550, pp. 134-142.
.143
Stress-Corrosion Cracking (J. P. Hammond)
Construction and Operation of Loops. — During the last reporting period, a seventh stress-corrosion run was completed in the chloride-injection corrosion loop and is reported here. With the completion of run 7, a total of 24 weeks of exposure in contaminated steam without incident was logged on the Incoloy BOO stress-corrosion loop since the time of its failure and repair. Although the crack found in the loop had all the external appear-ances of a stress corrosion crack, the continued serviceability of this loop raises the question of whether the crack indeed stemmed from stress corrosion. It is now planned to conduct an eighth and possibly still additional runs in this loop before removing a section from the failed region to attempt to determine the origin of the crack.
All of the loop fittings and pipe have now been received for the Inconel 625 loop being constructed for the caustic-injection phase of the program. It is planned to operate the caustic loop at a pressure twice that used in the present chloride loop (at about 1800 psi), which will be helpful in greatly increasing the solubility of contaminants in the steam.
Test Results. — The results of the sixth stress corrosion run, which consisted of cycling between 425 and 280°C (24 hr at 280°C saturation temperature three times per week) with 10 ppm NaCl and 20 ppm 0, were given in the last report.1 The seventh run was conducted under identical condi-tions but for a somewhat longer period (16 weeks), and the test materials included several new categories.
The results of run 7 are given in Table 6.1. The first two categories of test materials included in this run were also tested in run 6. The first consisted of strip specimens cut from similar-metal weldments prepared in l/2-in.-plate material, furnished in the hot-rolled condition (specimen groups 1 through 7 of Table 6.1). These weldments incorporate types 304 and 410 stainless steel, Incoloy 800, and various high-nickel alloys as base metals. The second category consisted of strip specimens cut from non-welded, l/16-in.-thick sheet in many of the same base metals (groups 8 through 12). A third and new category of specimens consisted of strip specimens cut from nonwelded, 1/16 -in. -thick sheet in nickel-base alloys which are generally produced by the Cabot Corporation (groups 13 through 17),
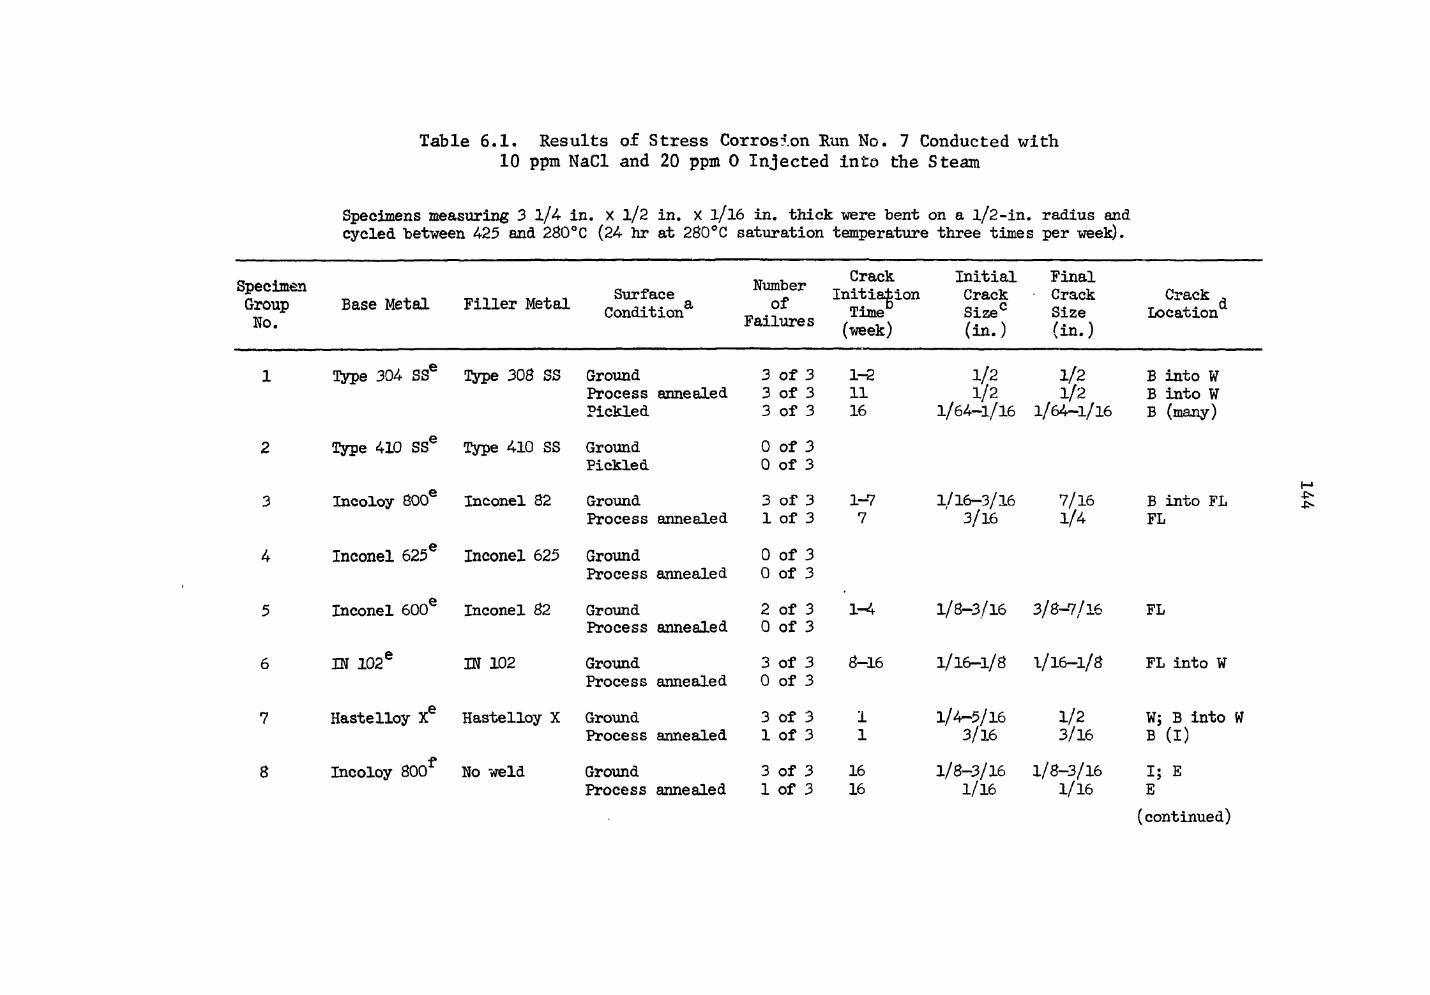
Table 6.1. Results of Stress Corrosion Run No. 7 Conducted with 10 ppm NaCl and 20 ppm 0 Injected into the Steam
Specimens measuring 3 1/4- in. X l/2 in. X i/16 in. thick were bent on a l/2-in. radius and cycled between 425 and 280°C (24 hr at 280°C saturation temperature three times per week).
Specimen Group Ho.
Base Metal Filler Metal Surface Condition
Number of
Failures
Crack Initiation Time (week)
Initial Crack Size0 (in.)
Final Crack Size (in.)
Crack ^ Location
1 Type 304 SSe Type 308 SS Ground 3 of 3 1-2 1/2 1/2 B into W Process annealed 3 of 3 11 1/2 1/2 B into W Pickled 3 of 3 16 1/64-1/16 1/64-1/16 B (many)
2 Type 410 SSe Type 410 SS Ground 0 of 3 Pickled 0 of 3
3 Incoloy 800® Inconel 82 Ground 3 of 3 1-7 1/16-3/16 7/16 B into FL Process annealed 1 of 3 7 3/16 1/4 FL
4 Inconel 625e Inconel 625 Ground 0 of 3 Process annealed 0 of i.
5 Inconel 600e Inconel 82 Ground 2 of 3 1-4 1/8-3/16 3/8-7/16 FL Process annealed 0 of 3
6 IN 1026 IN 102 Ground 3 of 3 8-16 1/16-1/8 1/16-1/8 FL into W Process annealed 0 of 3
7 Hastelloy Xe Hastelloy X Ground 3 of 3 I 1/4-5/16 1/2 W; B into W Process annealed 1 of 3 1 3/16 3/16 B (I)
8 Incoloy 800f No weld Ground 3 of 3 16 1/8-3/16 1/8-3/16 I; E Process annealed 1 of 3 16 1/16 1/16 E
(continued)
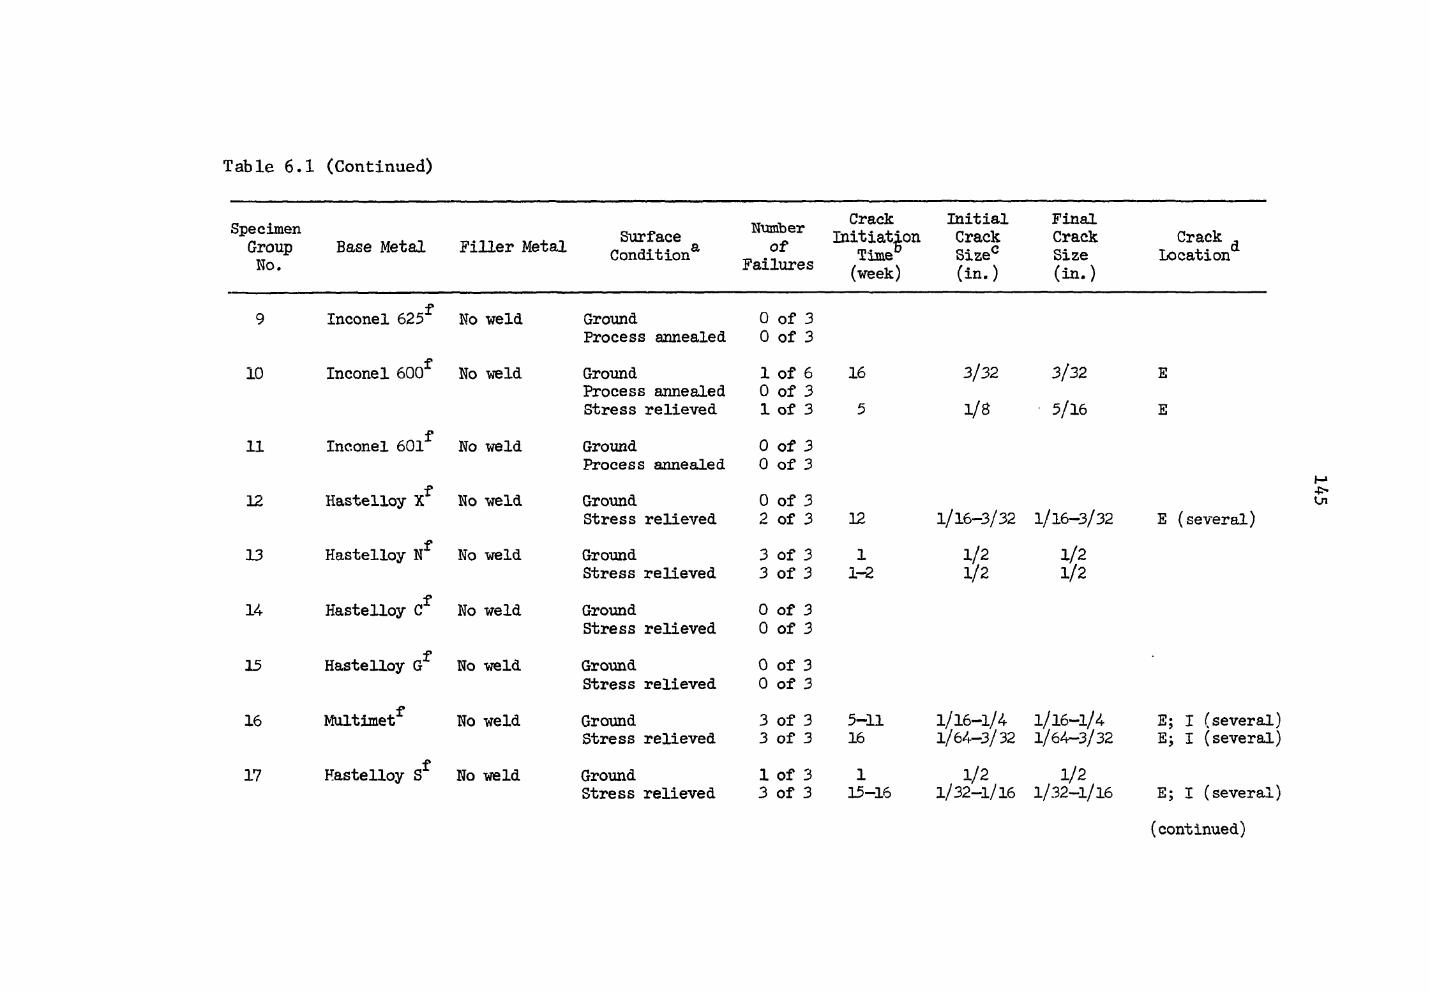
Table 6.1 (Continued)
Specimen Surface Group Base Metal Filler Metal Condition51 No.
Inconel 625 No weld Ground Process annealed
10 Inconel 600 No weld Ground Process annealed Stress relieved
11 Inconel 601 No weld Ground Process annealed
12
13
Hastelloy X No weld
f Hastelloy N No weld
Ground Stress relieved
Ground Stress relieved
14 Hastelloy C No weld Ground Stress relieved
15 Hastelloy G No weld Ground Stress relieved
16
17
Multimet No weld
Hastelloy S No weld
Ground Stress relieved
Ground Stress relieved
Number Crack Initial Final _ Initiation Crack Crack Crack
_ Time1* Sizec Size Location Failures , . s /• \ \ (week; (in.) (in.)
0 of 3 0 of 3
1 of 6 16 3/32 3/32 E 0 of 3 1 of 3 5 1/8 5/16 E
0 of 3 0 of 3
0 of 3 2 of 3 12 1/16-3/32 1/16-3/32 E (several)
3 of 3 1 1/2 1/2 3 of 3 1-2 1/2 1/2
0 of 3 0 of 3
0 of 3 0 of 3
3 of 3 5-11 1/16-1/4 1/16-1/4 E; I (several) 3 of 3 16 1/64-3/32 1/64-3/32 E; I (several)
1 of 3 1 1/2 1/2 3 of 3 15-16 1/32-1/16 1/32-1/16 E; I (several)
(continued)
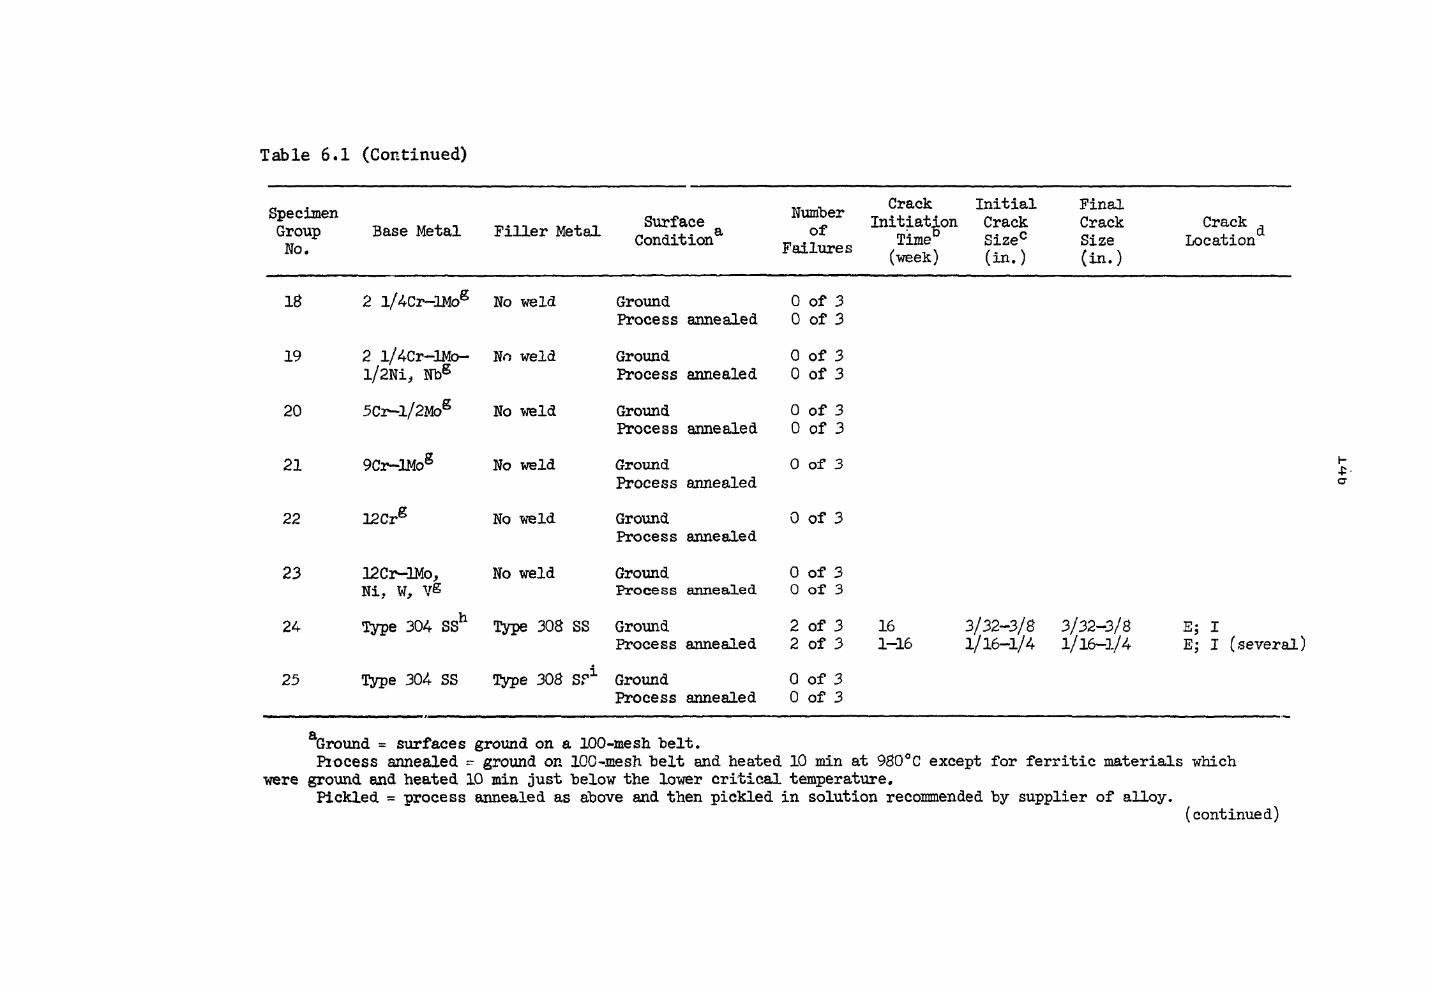
Table 6.1 (Continued)
q • TCiim-h^ Crack Initial Final bpecimen Surface wumoer I n i t i a t4 0 1 1 C r a c k C r a c k C r a c k Group Base Metal Filler Metal . a of m- d c x- d w * Condition T i m e Sizec Size Location No. Failures , . x s r. \ (week) (in.) (in.)
18
19
20
21
22
23
24
25
2 l/4Cr-lMo6 No weld
2 l/4Cr—IMo— Ho weld l/2Ni, NbS
5Cz-l/2Mog No weld
9Cr-lMoS No weld
12Crg
12Cr-lMo, Ni, W, VS
Type 304 SS
Type 304 SS
h
No weld
No weld
Ground 0 of 3 Process annealed 0 of 3
Ground 0 of 3 Process annealed 0 of 3
Ground 0 of 3 Process annealed 0 of 3
Ground 0 of 3 Process annealed
Ground 0 of 3 Process annealed
Ground 0 of 3 Process annealed 0 of 3
Ground 2 of 3 Process annealed 2 of 3
Ground 0 of 3 Process annealed 0 of 3
16 3/32-3/8 3/32-3/8 1-16 1/16-1/4 1/16-1/4
E; I E; I (several)
Ground = surfaces ground on a 100-mesh "belt. Process annealed - ground on lOO-mesh belt and heated 10 min at 980°C except for ferritic materials which
were ground and heated 10 min just below the lower critical temperature. Pickled = process annealed as above and then pickled in solution recommended by supplier of alloy.
(continued)
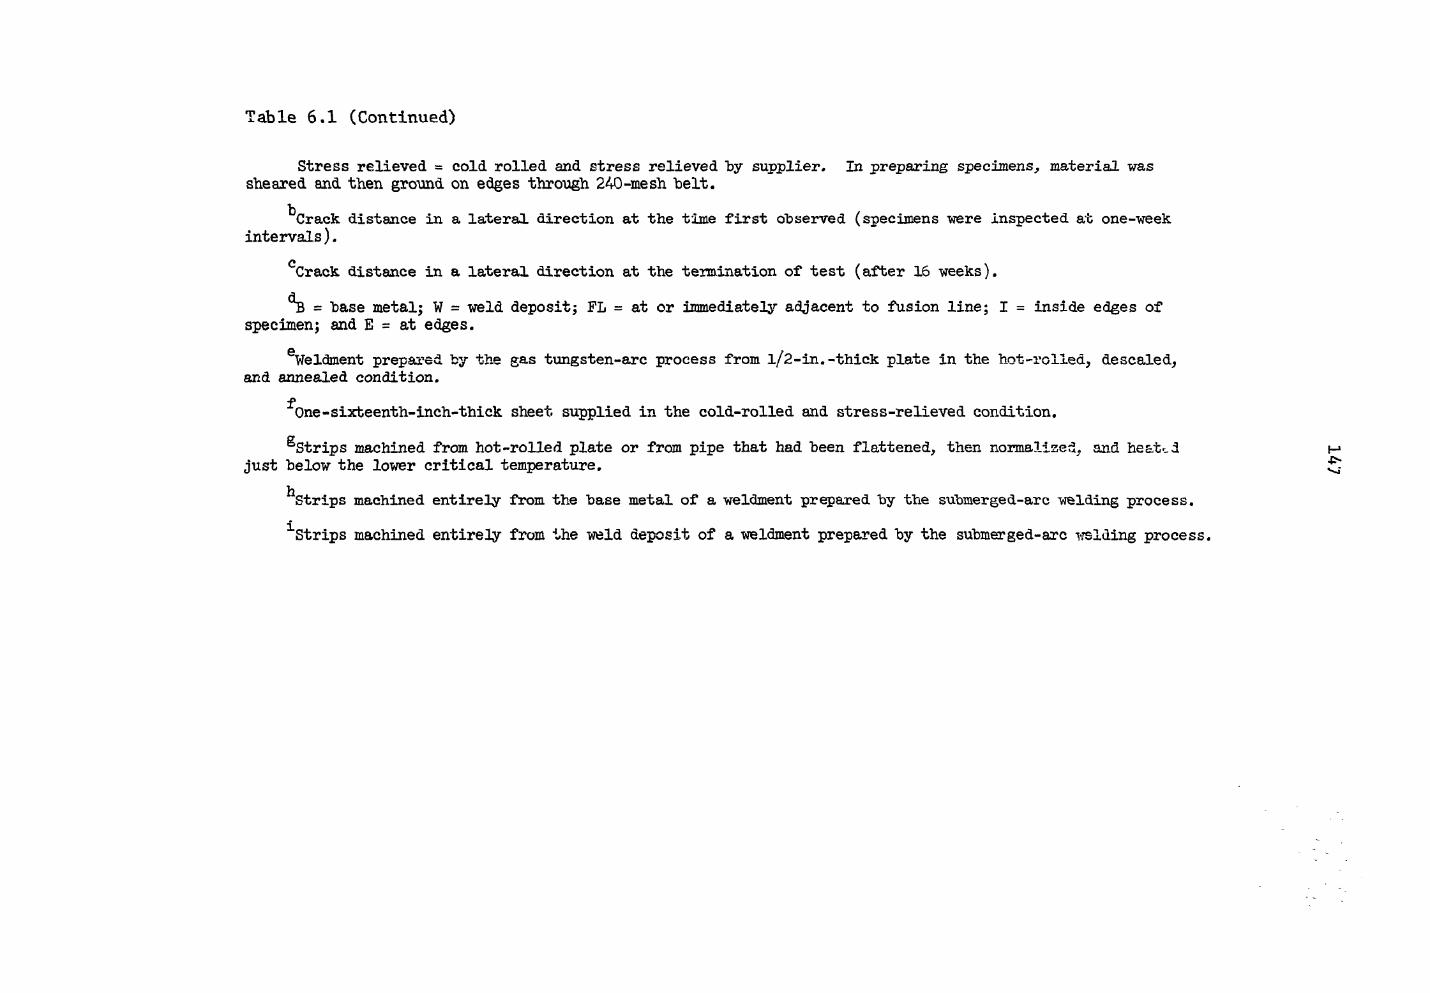
Table 6.1 (Continued)
Stress relieved = cold rolled and stress relieved "by supplier. In preparing specimens, material was sheared and then ground on edges through 240-mesh belt.
^Crack distance in a lateral direction at the time first observed (specimens were inspected at one-week intervals).
°Crack distance in a lateral direction at the termination of test (after 16 weeks).
^B = base metal; W = weld deposit; FL = at or immediately adjacent to fusion line; I = inside edges of specimen; and E = at edges.
eWeldment prepared by the gas tungsten-arc process from l/2-in.-thick plate in the hot-rolled, descaled, and annealed condition, f
One-sixteenth-inch-thick sheet, supplied in the cold-rolled and stress-relieved condition.
^Strips machined from hot-rolled plate or from pipe that had "been flattened, then normalized, and heated just below the lower critical temperature.
Strips machined entirely from the "base metal of a weldment prepared by the submerged-arc welding process. 1Strips machined entirely from the weld deposit of a weldment prepared by the submerged-arc welding process.
.148
while still a fourth new category consisted of strip specimens prepared in ferritic alloys of interest for LMFBR steam generators that are generally furnished as tubular products (groups IB through 23). The materials of categories 2 and 3 were received in the cold-rolled and stress-relieved condition, while specimens of category 4 were usually machined from alloys as tubular products that had been flattened and heat treated.
Finally, a fifth category of specimens (groups 24 and 25) was included to determine whether submerged-arc welds in stainless steel behave differ-ently from welds made by the gas tungsten-arc process (group l).
As in the earlier testing, the specimens were generally examined in several conditions to establish the effects of surface condition. These generally included (l) 100-mesh ground, (2) ground and heat treated in various ways or heat treated as furnished, and (3) ground, heat treated, and pickled.
In the sixth stress-corrosion run, it was found that type 304 stainless steel and various commercial nickel-base alloys, including Incoloy 800 and Hastelloy X, were more prone to crack when tested as specimens cut from l/2-in.-plate weldments than when tested as nonwelded sheet material. The cracks in the weld specimens were generally intergranular and usually located in the base metal adjacent to the weld fusion line. On the basis of these results, this type of comparative study was more or less duplicated in run 7 and a more comprehensive investigation was planned for run 8 to throw additional light on the factors involved.
An examination of the results of tests on the first two categories of specimens of Table 6.1 (groups 1 through 7 and 8 through 12), however, does not appear to completely bear out the findings of run 6 in that many of the alloys in sheet form in the last run developed cracks. This was true, for example, for Incoloy 800 and Hastelloy X (groups 8 and 12). Otherwise, the results of these two categories of specimens were similar to their behavior in run 6. Weldment specimens in Inconel 625 and type 410 stainless steel joined with themselves did not crack in any surface condition, whereas type 304 stainless steel welded with type 308 filler metal failed in all three conditions. Again, plate weldments of Hastelloy X, Inconel 600, and IN 102 showed substantial to moderate susceptibility to cracking. Incoloy 800
.149
welded with Inconel 82 displayed about the same cracking response as previously, although the crack propagation rate appeared to he increased somewhat.
Of the various surface preparations tested, the ground condition again showed the highest susceptibility to cracking, with one exception. In the case of the materials furnished in the cold-rolled and stress-relieved condition (groups 8 through 17 of Table 6.1), some of these showed a greater tendency to crack when tested as furnished (stress relieved) than when ground. This proved true for Hastelloy X (group 12) and seemingly for Hastelloy S2 (group 17). In preparing these materials for test in the as-received (stress-relieved) condition, they were first sheared to produce specimens and then the specimen edges were ground with 100-mesh through 240-mesh belts to remove the very crack-susceptible shear effect. It appears that the 240-mesh grind on edges may make specimens more susceptible to cracking than the 100-mesh grind, although the cracks do not usually appear as large with the 240-mesh grind.
Of the nonwelded sheet specimens, Inconel 601, Hastelloy C, and Hastelloy G, along with Inconel 625, resisted cracking in all test conditions. On the other hand, all of the specimens tested in Hastelloy N and Hastelloy M, including both surface conditions, cracked.
Significantly, the ferritic category of test materials (groups 18 through 23) displayed a perfect record of resisting cracking. The type 304 stainless steel weldments prepared with type 308 filler metal by two submerged-arc procedures (groups 24 and 25) gave results similar to those obtained on weldments made by the gas tungsten-arc method (group l) in that cracking appeared to initiate in the base metal and was confined largely to the base metal. However, for reasons unknown, the cracking behavior in the latter category of specimens was more superficial in nature than in the former.
The stress-corrosion specimens for run 8, which will be conducted under the same operating conditions as runs 6 and 7, are now being prepared. These specimens will include a number of materials that have not been examined. Specimens also have been prepared in Incoloy 800, and type 304 stainless
2This is an experimental alloy furnished by the Cabot Corporation, Kokomo, Indiana; it nominally contains 15.5% Cr-15.5% Mo-l$ Fe-0.2% Al, 0.02$ max C, 0.02$ La, and bal Ni.
.150
steel designed to gain information on the relative importance to cracking of such factors as whether the material be plate or sheet, welded or nonwelded, and orientation of the test specimen with respect to the materials rolling plane and direction. Work is presently being conducted to develop static stress-corrosion tests that use tubular specimens in order to more closely simulate the welded components in steam generators.
Examination of Alco/BLH Steam Generator G. M. Slaughter J. H. DeVan R. W. McClung B. C. Leslie R. H. Jones3 G. M. Goodwin
We are examining the Alco/BLH steam generator which failed while under test at the Liquid Metal Engineering Center (LMEC) 5 After installation at the Sodium Components Test Installation of the LMEC in 1965, the steam generator operated intermittently with sodium for 7600 hr and with steam for 4-100 hr. A water leak on the feedwater chest was found in May 1970, and it was traced to an area of extensive cracking in the lower tube sheet. Exten-sive corrosion resulting from leakage of steam into sodium was also subse-quently observed near the top tube sheet. In view of the vital role of steam generators in the LMFBR demonstration plant program and the well-documented fabrication and operational history of this unit, it is being examined to determine the mechanisms of failure and to study other metallurgi-cal features of interest.
A progress report covering the work to date has been drafted and is being reviewed. In this quarterly, we will briefly discuss recent activi-ties in several selected areas of work which encompass the rather wide scope of our investigation. Thermographic Inspection of Bond Quality in Tubes
Sections of several of the duplex tubes from the steam generator varying in length between 5 and 8 ft were inspected with a liquid crystal thermal
3Member of the Plant and Equipment Division, ORNL. 4G. M. Slaughter, J. H. DeVan et al., Fuels and Materials Development
Program Quart. Prog. Rept., June 30, 1971, 0RNL-TM-3540, pp. 97-98. 5G. M. Slaughter, J. H. DeVan et al., Fuels and Materials Development
Program Quart. Prog. Rept., September 30, 1971, 0RNL-3550, pp. 124-133.
.151
test that was developed to detect unusual bond conditions. These tubes came from row 5 in the assembly, and their locations were designated as the "gas-sodium, interface region" and the "center-of-bundle region."
The thermal test used a small heater probe wound to closely fit the inner bore of the duplex tube. The heater coil was fabricated from commer-cial heater wire (0.040-in. diam) composed of an Inconel sheath containing MgO insulation and a nichrome heating element. The heater was approximately 1 in. long and was mounted on the end of a tube that is approximately 6 ft long. Current flow to the coil was maintained at approximately 2.4- amp at around 25 V during the test.
The duplex tube was scanned by drawing the tube over the "hot" stationary heater coil by a dolly containing a three-prong lathe steady rest (into which one end of the tube was clamped) that was drawn along a horizontal 5-ft-long lead-screw mechanism.. Maximum scan length was 45 in., and intermediate support was maintained by rubber-coated wheels.
Heat generated by the probe inside the bore of the duplex tube diffuses to the outer surface and sets up a heat front that travels along the tube length at a •uniform rate, provided heat input and tube movement are appro-priately balanced. Both infrared and liquid crystal techniques were examined as detection methods. A black coating was sprayed onto the tube to reduce the emissivity problem associated with infrared tests and to reduce the surface glare that is prevalent when the liquid crystal is melted.
The liquid crystal technique for evaluating heat movement was selected because of its response to the dynamic test conditions and because a visual image of nonbonding could be formed. Both wide response (45 to 57°C) and narrow range (40 to 42°C and 50 to 52°C) liquid crystals, which change through the color spectrum as temperature rises, were tried first. None of these crystals were very good for the dynamic testing conditions, although in a static or semistatic test they are very promising. The heat front diffuses rapidly in this tubing, a condition that is necessary to obtain a fast inspection, and even the wide range crystal was not satisfactory for reproducible tests. However, a memory type of liquid crystal that changes from green to black as the temperature rises above 42°C proved to be a very good heat detector. We were able to visually monitor the heat front as it traveled along the tube length and to record the image with a closed-circuit
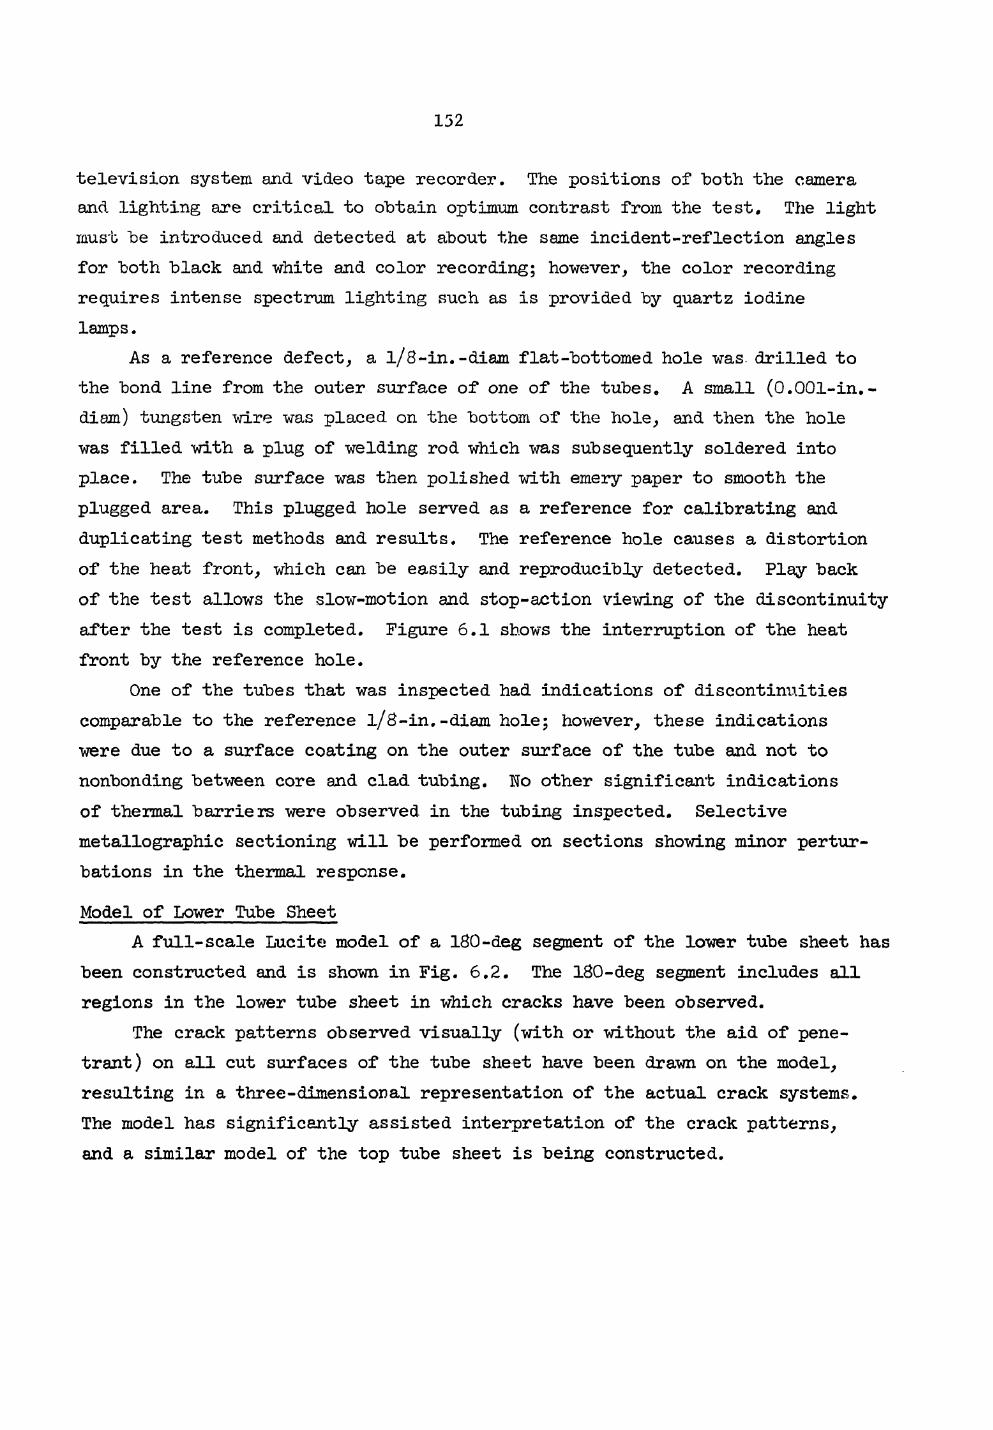
.152
television system and video tape recorder. The positions of "both the camera and lighting are critical to obtain optimum contrast from the test. The light must be introduced and detected at about the same incident-reflection angles for both black and white and color recording; however, the color recording requires intense spectrum lighting such as is provided by quartz iodine lamps.
As a reference defect, a l/8-in.-diam flat-bottomed hole was. drilled to the bond line from the outer surface of one of the tubes. A small (0.001-in.-diam) tungsten wire was placed on the bottom of the hole, and then the hole was filled with a plug of welding rod which was subsequently soldered into place. The tube surface was then polished with emery paper to smooth the plugged area. This plugged hole served as a reference for calibrating and duplicating test methods and results. The reference hole causes a distortion of the heat front, which can be easily and reproducibly detected. Play back of the test allows the slow-motion and stop-action viewing of the discontinuity after the test is completed. Figure 6.1 shows the interruption of the heat front by the reference hole.
One of the tubes that was inspected had indications of discontinuities comparable to the reference l/8-in.-diam hole; however, these indications were due to a surface coating on the outer surface of the tube and not to nonbonding between core and clad tubing. Wo other significant indications of thermal barriers were observed in the tubing inspected. Selective metallographic sectioning will be performed on sections showing minor pertur-bations in the thermal response.
Model of Lower Tube Sheet A full-scale Lucite model of a 180-deg segment of the lower tube sheet has
been constructed and is shown in Fig. 6.2. The 180-deg segment includes all regions in the lower tube sheet in which cracks have been observed.
The crack patterns observed visually (with or without the aid of pene-trant) on all cut surfaces of the tube sheet have been drawn on the model, resulting in a three-dimensional representation of the actual crack systems. The model has significantly assisted interpretation of the crack patterns, and a similar model of the top tube sheet is being constructed.
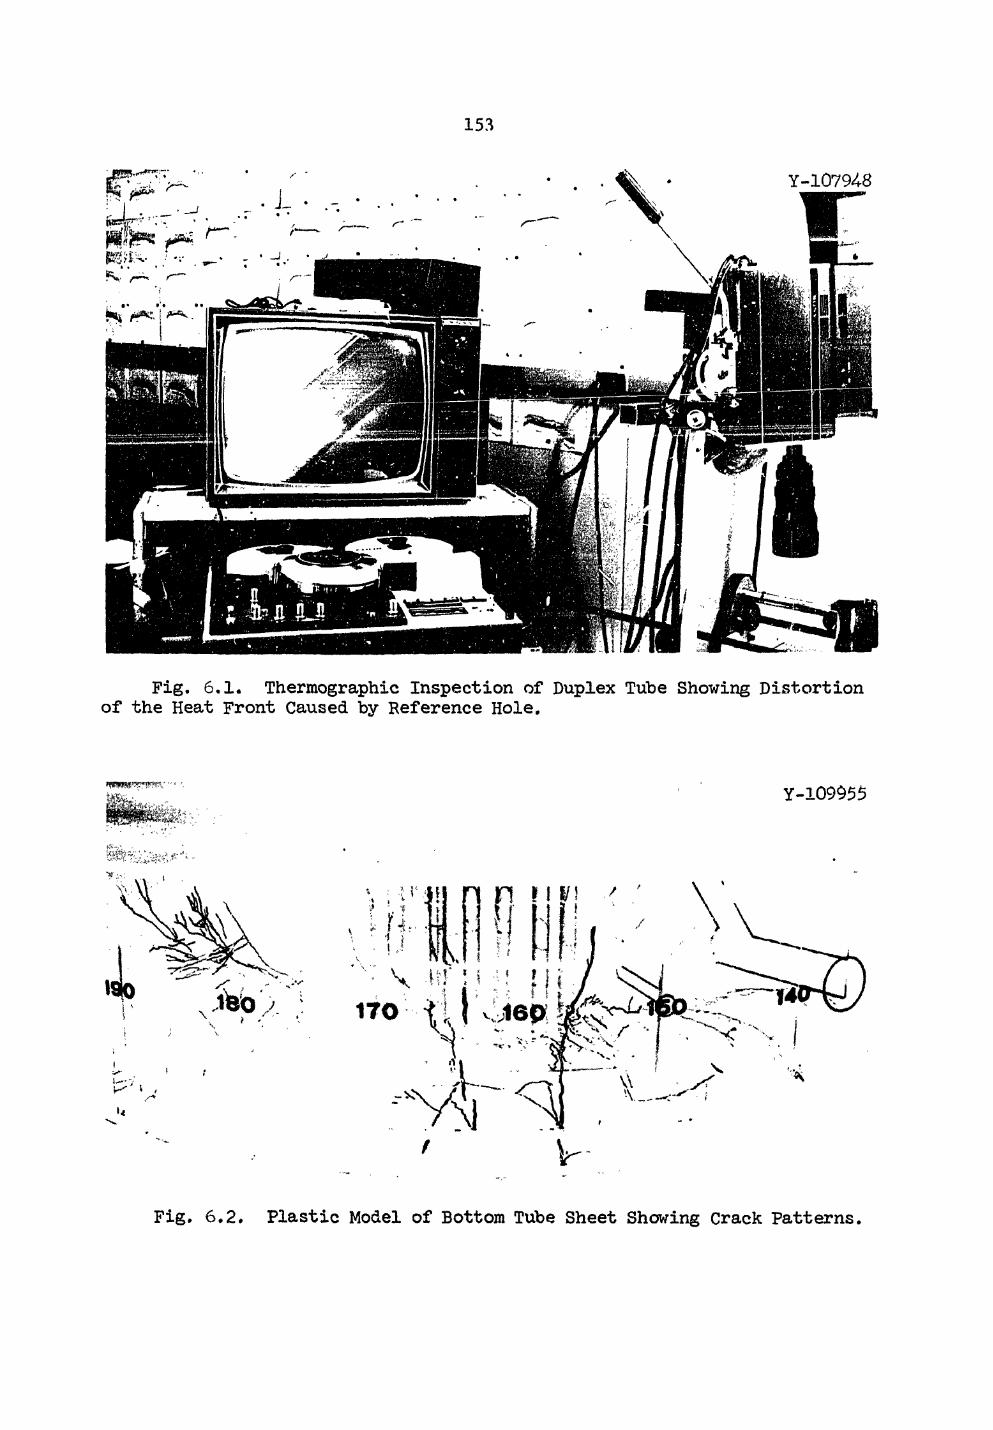
.153
fcO . Y-10794-8
Fig. 6.1. Thermographic Inspection of Duplex Tube Showing Distortion of the Heat Front Caused by Reference Hole.
Y-109955
^ i <
* ; -M'-'lt
' x - . « r!1 y ^ n \ v- « O / *
Fig. 6.2. Plastic Model of Bottom Tube Sheet Showing Crack Patterns.
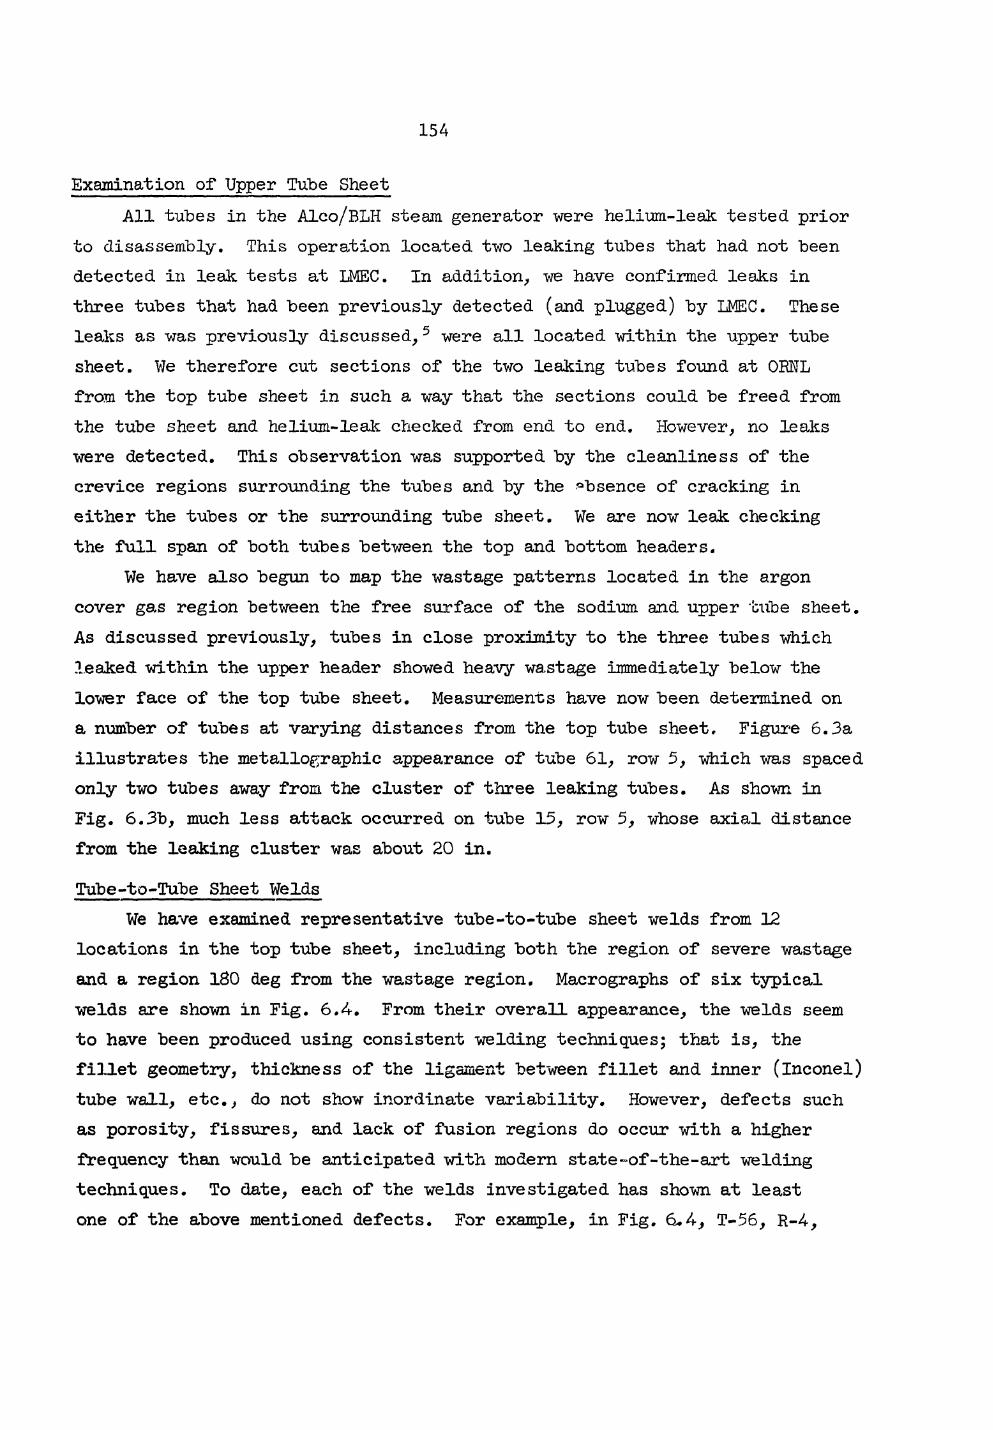
.154
Examination of Upper Tube Sheet All tubes in the Alco/BLH steam generator were helium-leak tested prior
to disassembly. This operation located two leaking tubes that had not been detected in leak tests at LMEC. In addition, we have confirmed leaks in three tubes that had been previously detected (and plugged) by LMEC. These leaks as was previously discussed,5 were all located within the upper tube sheet. We therefore cut sections of the two leaking tubes found at ORNL from the top tube sheet in such a way that the sections could be freed from the tube sheet and helium-leak checked from end to end. However, no leaks were detected. This observation was supported by the cleanliness of the crevice regions surrounding the tubes and by the absence of cracking in either the tubes or the surrounding tube sheet. We are now leak checking the full span of both tubes between the top and bottom headers.
We have also begun to map the wastage patterns located in the argon cover gas region between the free surface of the sodium and upper tube sheet. As discussed previously, tubes in close proximity to the three tubes which leaked within the upper header showed heavy wastage immediately below the lower face of the top tube sheet. Measurements have now been determined on a number of tubes at varying distances from the top tube sheet. Figure 6.3a illustrates the metallographic appearance of tube 61, row 5, which was spaced only two tubes away from the cluster of three leaking tubes. As shown in Fig. 6.3b, much less attack occurred on tube 15, row 5, whose axial distance from the leaking cluster was about 20 in. Tube-to-Tube Sheet Welds
We have examined representative tube-to-tube sheet welds from 12 locations in the top tube sheet, including both the region of severe wastage and a region 180 deg from the wastage region. Macrographs of six typical welds are shown in Fig. 6.4. From their overall appearance, the welds seem to have been produced using consistent welding techniques; that is, the fillet geometry, thickness of the ligament between fillet and inner (inconel) tube wall, etc., do not show inordinate variability. However, defects such as porosity, fissures, and lack of fusion regions do occur with a higher frequency than would be anticipated with modern state-of-the-art welding techniques. To date, each of the welds investigated has shown at least one of the above mentioned defects. For example, in Fig. 6.4, T-56, R-4,
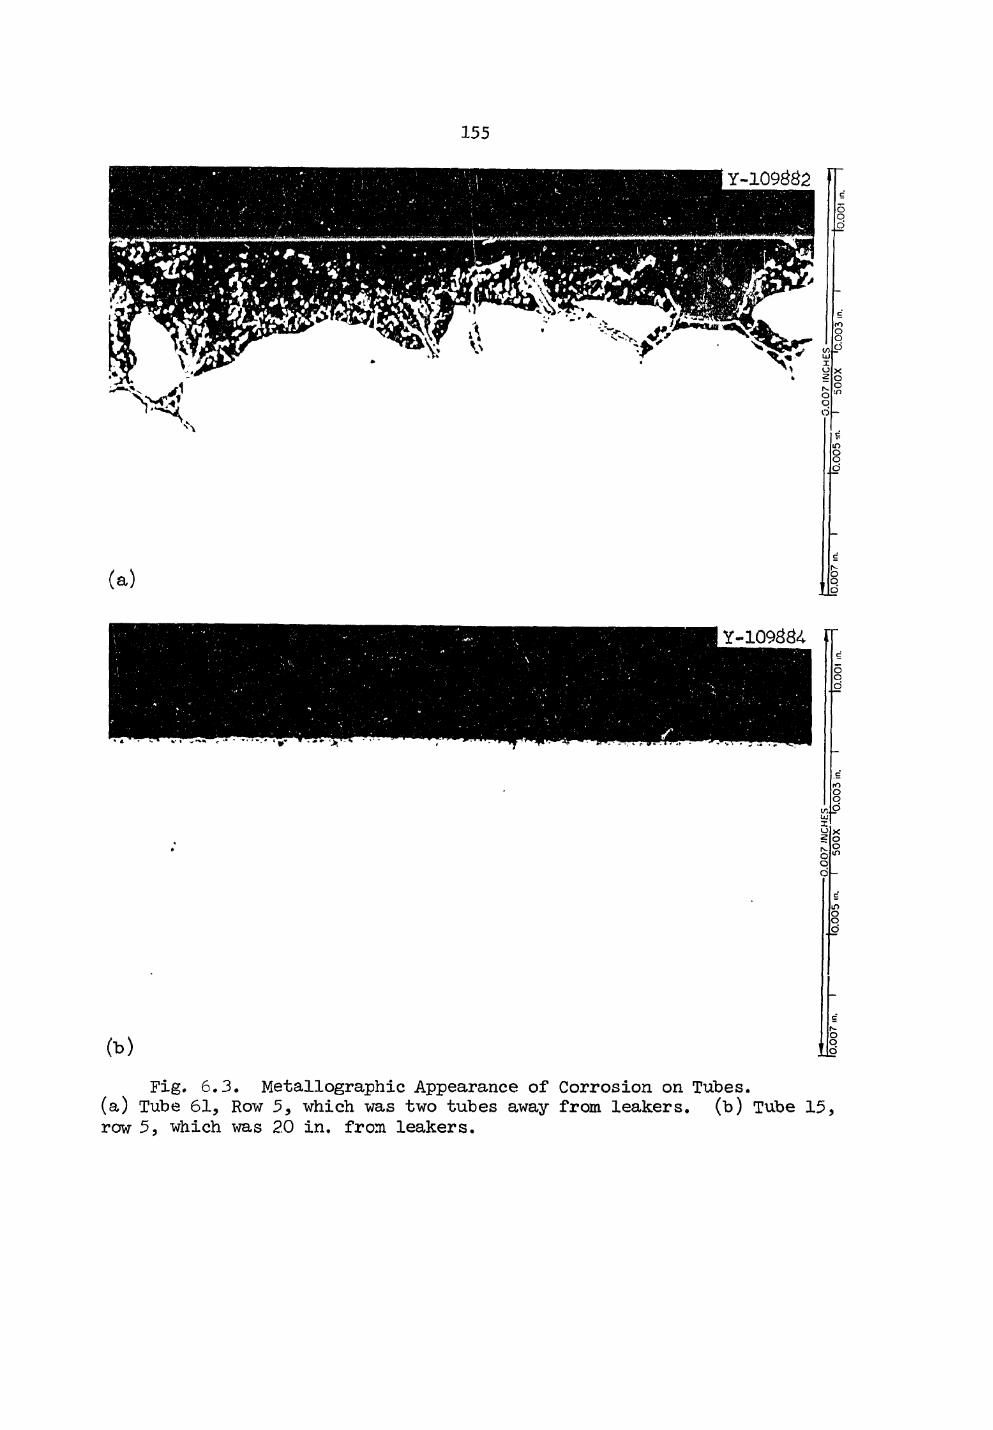
.155
Fig. 6.3. Metallographic Appearance of Corrosion on Tubes, (a) Tube 61, Row 5, which was two tubes away from leakers, (b) Tube 15, row 5, which was 2,0 in. from leakers.
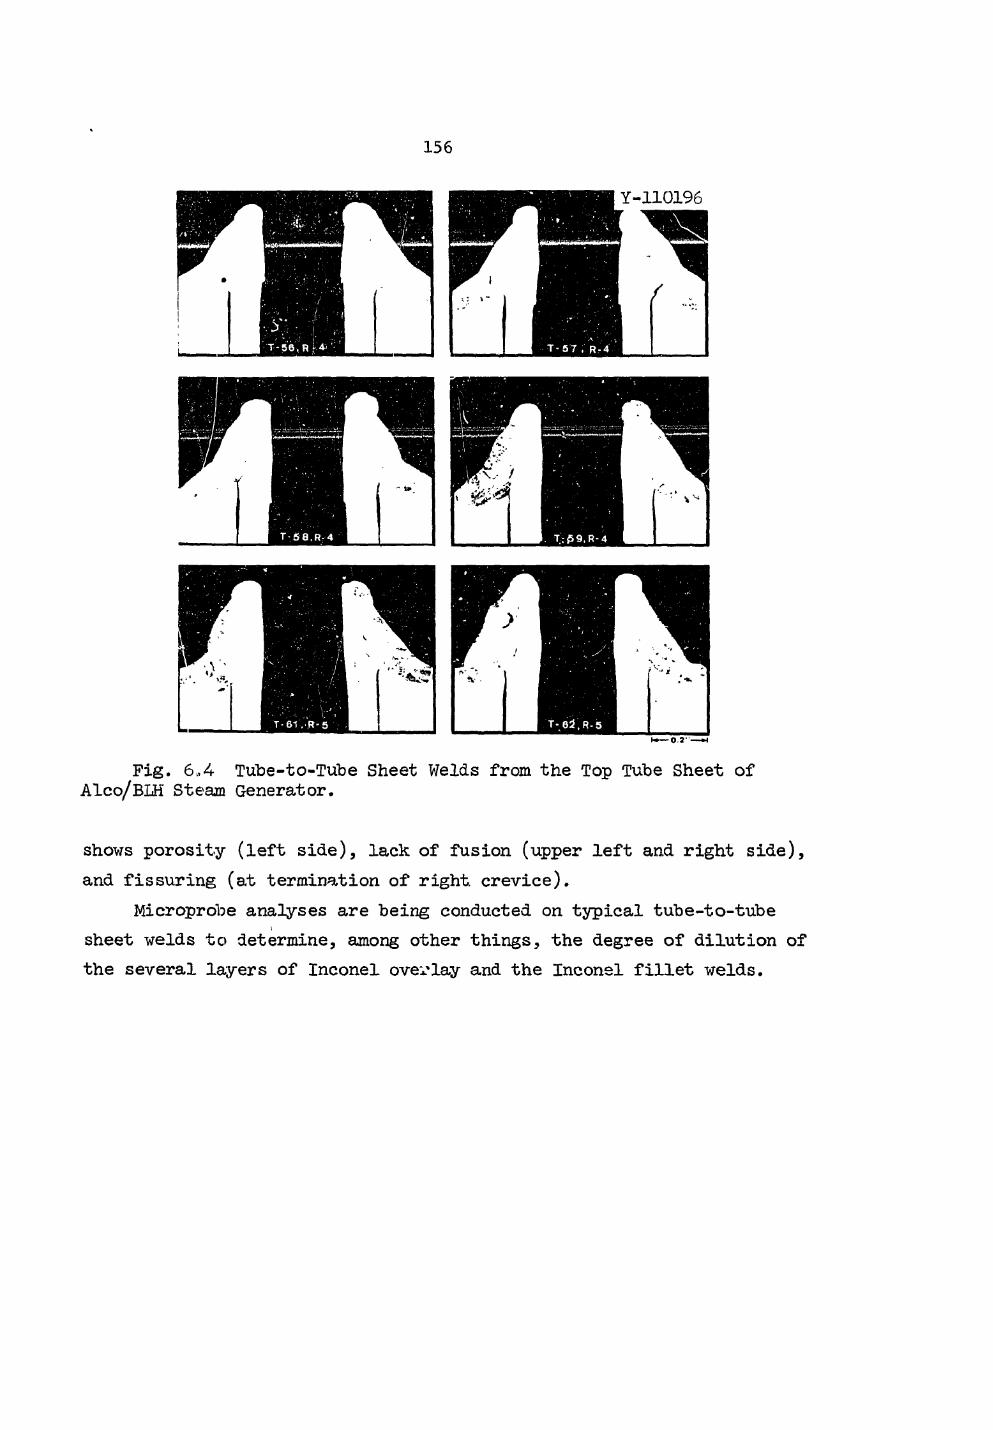
.156
K.— 0-2"—H
Fig. 6,4 Tube-to-Tube Sheet Welds from the Top Tube Sheet of Alco/BLH Steam Generator.
shows porosity (left side), lack of fusion (upper left and right side), and fissuring (at termination of right crevice).
Microprobe analyses are being conducted on typical tube-to-tube i
sheet welds to determine, among other things, the degree of dilution of the several layers of Inconel overlay and the Inconel fillet welds.
.157
7. JOINING OF STRUCTURAL MATERIALS
J. R. Weir G. M. Slaughter
Joining research and development is being carried out on a wide variety of structural materials of interest to the Liquid Metal Fast Breeder Reactor Project. The vessel, primary piping, intermediate heat exchanger, and core support structure of the Fast Flux Test Facility (FFTF) are being made of austenitic stainless steel while steam genera-tors for the demonstration plants will likely contain ferritic steels or Incoloy 800. Inconel 718, on the other hand, is being used or con-sidered for such applications as the Power Burst Facility, the instru-ment tree for FFTF, and valves and bearing surface components for liquid metal service.
In view of the diversity of problems associated with those differ-ent classes of materials, the progress is reported under the general materials types (i.e., austenitic stainless steels, ferritic steels, and nickel-rich alloys).
AUSTENITIC STAINLESS STEELS
Welding Development for FBR Stainless Steel Components
G. M. Slaughter H. E. McCoy
We are evaluating the behavior of weldments in austenitic stainless steel at 370 to 750°C as a function of both welding process and the vari-ables within a process for application to liquid-metal-cooled fast breeder reactor (LMFBR) vessels and components. The solidification sub-structure of the weld metal markedly influences the mechanical properties of a weldment at elevated temperature; since the size and type of sub-structure are significantly influenced by factors which the welder can control, our approach is to determine this link between welding variaKI.es, th& solidification substructure which these variables produce, and the resultant mechanical properties. Also included in the studies are
.158
corrosion behavior, irradiation stability, and the effect of heat treat-ment, and, of course, deposit composition, on structure and properties. A new task involving the use of radioisotopes to study the mechanism of weld cracking is likewise discussed in this report.
Investigations of Mechanical Properties (R. G. Berggren, G. M. Goodwin) Submerged-Arc Welds. — Creep-rupture tests on five type 308
submerged-arc weldments, designated SA-2 through SA-6,1 have extended the data for these welds to rupture times greater than 1000 hr. A creep-rupture test is still in progress on weld SA-7 after 1300 hr. The results of the completed tests do not significantly alter the results previously published.2 A test on weld SA-2 at 650° C (1200°F) and 12,000 psi ruptured at 2673 hr with a total elongation of 6.2$. The other welds, SA-3 through SA-6, also exhibited good elongations (6 to 12$>) for rupture times of 1000 to 2100 hr. Tests are now in progress on specimens from the 2-in. -thick submerged-arc weldment, SA-9, in the "as-welded" condition to rupture times greater than 1000 hr. We pre-viously published2 creep-rupture results for this weldment in four post-weld heat-treatment conditions. A creep-rupture test program is now in progress on a submerged-arc weldment made with a low-silicon flux, Linde CR-10. The available results from this test series are about the same as previously published2 for welds SA-2 through SA-7. One test of this weldment is still in progress after 1300 hr. As previously reported, we see no marked property differences between these submerged-arc weldments.
Shielded Metal-Arc Welds. — We previously reported the development of a weld composition, F-21, containing boron, phosphorus, and ferro-titanium, having superior creep ductilities and strength. Creep-rupture data on this weld have been extended to a rupture time of 3030 hr and the weld still exhibited 12$ elongation. This and other tests on the shielded metal-arc welds did not alter the results previously reported.2
aR. G. Berggren and G. M. Goodwin, Fuels and Materials Development Program Quart. Progr. Rept. , March 31, 1971, 0RNL-TM-3416, p. 118.
2R. G. Berggren and G. M. Goodwin, Fuels and Materials Development Program Quart. Progr. Rept.a September 30, 1971, 0RNL-TM-3550, pp. 144-148.
.159
Electroslag Welds. - A creep-rupture study of two electroslag welds is now in progress. One weld was made on wrought type 304 stainless steel and one was made on cast type CF8 stainless steel. The filler wire was type 308 stainless steel. Seventeen creep-rupture tests have "been completed to date on the weld metal, wrought plate, cast plate, and composite specimens. Preliminary results indicate strengths about the same as for the submerged-arc welds and ductilities at least as good as for the submerged-arc welds. Additional tests are now in progress,
Gas Tungsten-Arc Welds, — A tensile and creep-rupture test program is in progress on welds in types 304 and 316 stainless steel. This study is part of the development of improved bare filler wires for welding stainless steel piping by the gas tungsten-arc process, reported in the following section of this report. Fourteen experimental welds have been made and ten are now in test with five short-time creep tests completed.
Filler Metal Development for Pipe Welding (N. C. Cole, G. M. Goodwin) We are developing improved bare filler wires and electrodes for
welding stainless steel piping. The initial aim is to duplicate the deposit analysis produced by the special shielded metal-arc electrodes used in the production of the FFTF vessel. Since the amount of minor elements recovered in the deposit is unknown for the gas tungsten-arc process5 initial experiments must be conducted to optimize the composi-tion of the filler wire itself. Screening mechanical properties studies will then be conducted to determine the degree of improvement afforded by the controlled minor element additions.
Production and Procurement of Experimental Filler Wires. — As reported previously,3 special heats of type 308 stainless steel have been melted, cast, and drawn into wire. Most of them were made with the same (type 308) base stock. Various combinations of selected additions of B, P, and Ti were attempted. In addition, two heats were made by
3N. C. Cole and G. M. Goodwin, Fuels and Materials Development Program quart. Progr. Rept., September 30, 1971, 0RNL-TM-3550, p. 150.
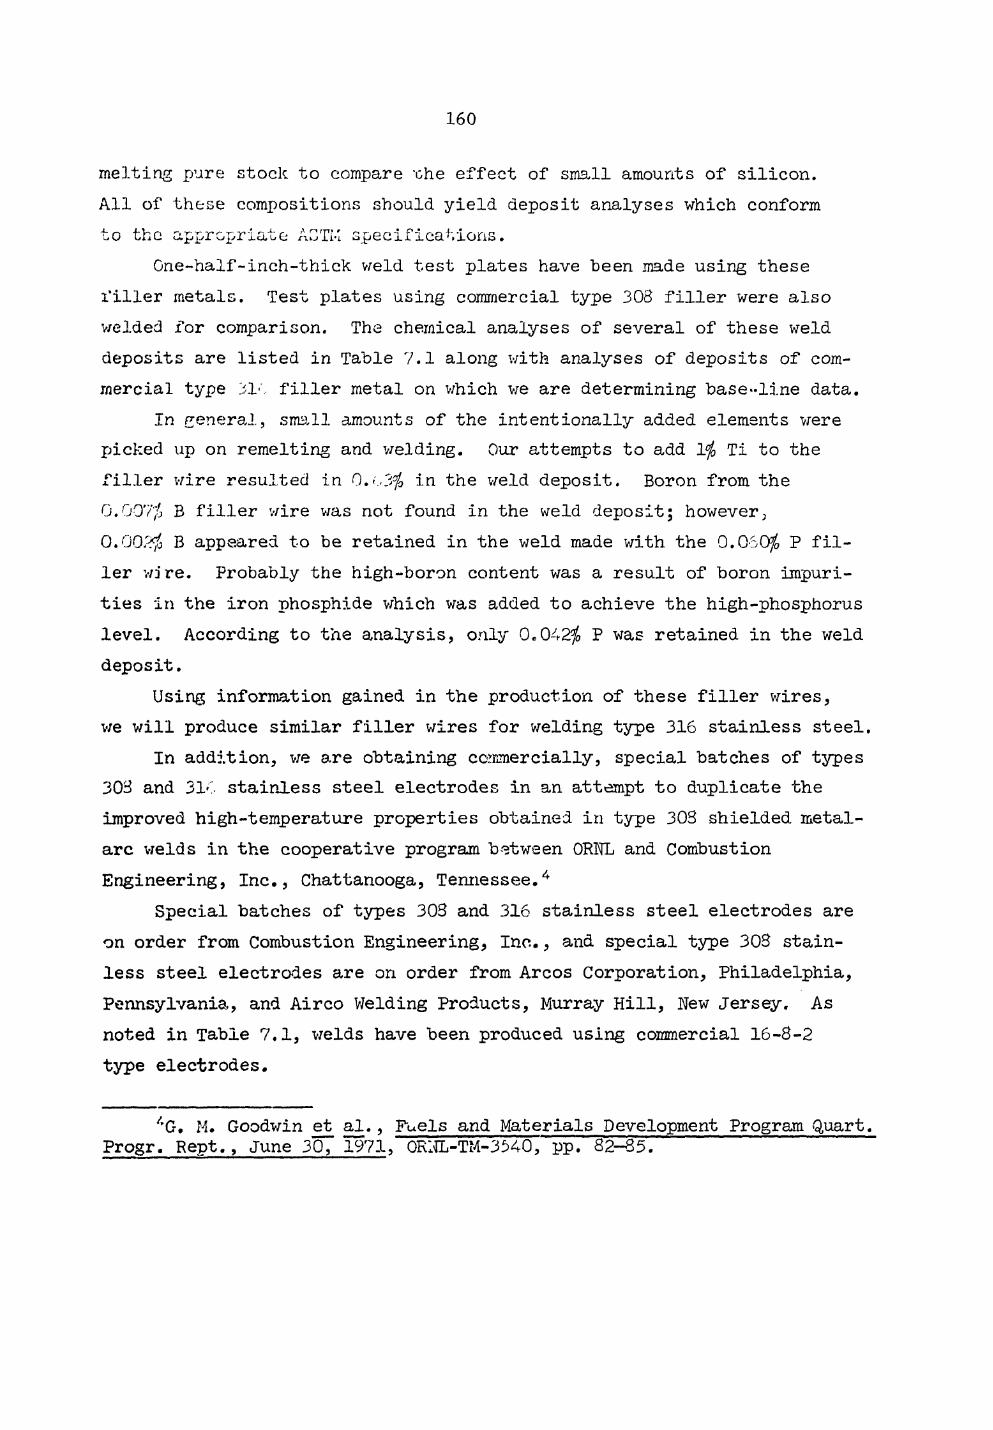
.160
melting pure stock to compare -che effect of small amounts of silicon. All of these compositions should yield deposit analyses which conform to the appropriate ACTM specifications.
One-half-inch-thick weld test plates have been made using these filler metals. Test plates using commercial type 308 filler were also welded for comparison. The chemical analyses of several of these weld deposits are listed in Table 7.1 along with analyses of deposits of com-mercial type 31. filler metal on which we are determining base-line data.
In general, small amounts of the intentionally added elements were picked up on remelting and welding. Our attempts to add 1$ Ti to the filler wire resulted in 0.<\,3$ in the weld deposit. Boron from the 0.007$ B filler wire was not found in the weld deposit; however3 0.002$ B appeared to be retained in the weld made with the 0.060$ P fil-ler wire. Probably the high-boron content was a result of boron impuri-ties in the iron phosphide which was added to achieve the high-phosphorus level. According to the analysis, only 0.042$ P was retained in the weld deposit.
Using information gained in the production of these filler wires, we will produce similar filler wires for welding type 316 stainless steel.
In addition, we are obtaining cc amercially, special batches of types 30S and 310 stainless steel electrodes in an attempt to duplicate the improved high-temperature properties obtained in type 308 shielded metal-arc welds in the cooperative program between ORNL and Combustion Engineering, Inc., Chattanooga, Tennessee.4
Special batches of types 308 and 316 stainless steel electrodes are on order from Combustion Engineering, Inc., and special type 308 stain-less steel electrodes are on order from Arcos Corporation, Philadelphia, Pennsylvania, and Airco Welding Products, Murray Hill, New Jersey. As noted in Table 7.1, welds have been produced using commercial 16-8-2 type electrodes.
/rG. M. Goodwin et al., Fuels and Materials Development Program Quart. Progr. Rept., June 30, 1971, QRltL-TM-3540, pp. 82-85.
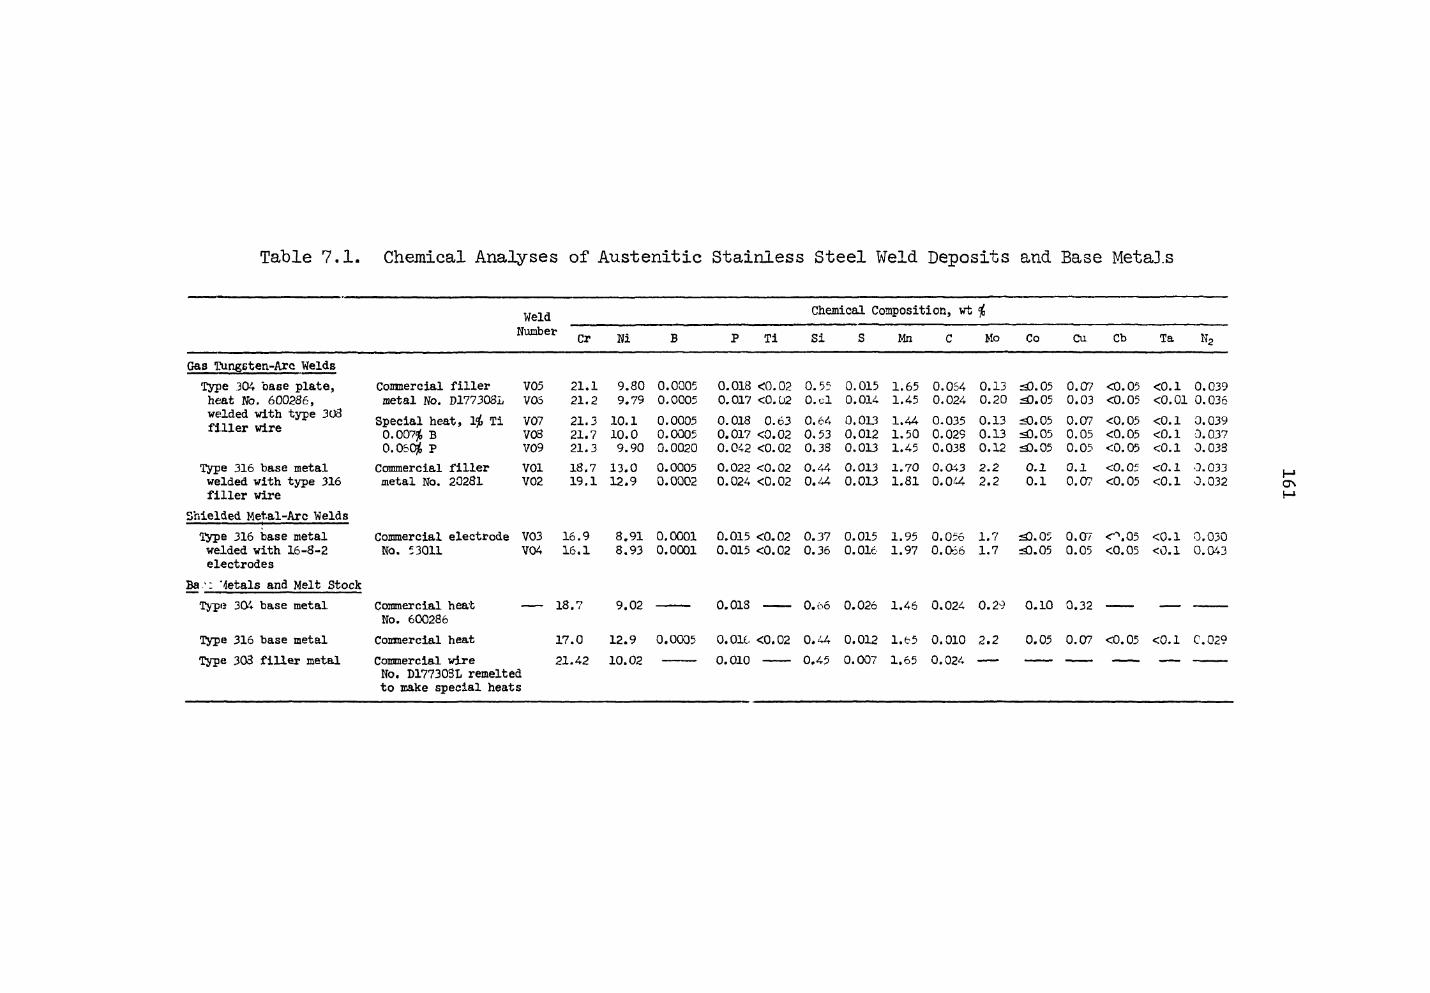
Table 7.1. Chemical Analyses of Austenitic Stainless Steel Weld Deposits and Base Metals
Chemical Composition, wt $ Number CJ) Mi B P Ti Si S Mn C Mo Co Cu Cb Ta N2
Gas Tungsten-Arc Welds Type 304 base plate, Conmercial filler V05 21.1 9.80 0.0005 0.018 <0.02 0. 55 0.015 1.65 0.054 0.13 -0.05 0.07 <0.05 <0.1 0.039 heat Mb. 600286, metal No. D177308L V06 21.2 9.79 0.0005 0.017 <0.02 O.cl 0.014 1.45 0.024 0.20 0.03 <0.05 <0.01 0.036 welded with type 303 1 1 AM f.fj Special heat, 1$ Ti V07 21.3 10.1 0.0005 0.018 0.63 0.64 0.013 1.44 0.035 0.13 <0.05 0.07 <0.05 <0.1 0.039 ii j.j.er wire O.OO756 B V08 21.7 10.0 0.0005 0.017 <0.02 0.53 0.012 1.50 0.029 0.13 <33.05 0.05 <0.05 <0.1 0.037 o.osojt P V09 21.3 9.90 0.0020 0.042 <0.02 0.38 0.013 1.45 0.038 0.12 sf).05 0.05 <0.05 <0.1 0.033
Type 316 base metal Commercial filler V01 18.7 13.0 0.0005 0.022 <0.02 0.44 0.013 1.70 0.04 3 2.2 O.l 0.1 <0.0; <0.1 0.033 welded with type 316 metal No. 20281 V02 19.1 12.9 0.0002 0.024 <0.02 0.44 0.013 1.81 Q.O'-J* 2.2 0.1 0.07 <0.05 <0.1 0.032 filler wire
Shielded Metal-Arc Welds Type 316 base metal Commercial electrode V03 16.9 8.91 0.0001 0.015 <0.02 0.37 0.015 1.95 0.056 1.7 -0.05 0.07 <'\05 <0.1 0.030 welded with 16-8-2 No. 53011 V04 16.1 8.93 0.0001 0.015 <0.02 0.36 0.016 1.97 0.06b 1.7 =30.05 0.05 <0.05 <0.1 0.043 electrodes
Ba Metals and Melt Stock Type 304 base metal Commercial heat 18.7 9.02 0.01S — O.bo 0.026 1.46 0.024 0.29 0.10 0.32
No. 600286 Type 316 base metal Coranercial heat 17.0 12.9 0.0005 0.01C <0.02 0.44 0.012 1.65 0.010 2.2 0.05 0.07 <0.05 <0.1 C.029 Type 303 filler metal Commercial wire 21.4-2 10.02 0.010 0.45 0.007 1.65 0.024 • . •
No. D177303L remelted to make special heats
.162
Use of Radioisotopes to Study Cracking
G. M. Slaughter
A study has been initiated to investigate weld cracking in stainless steels using microautoradiography as the main investigative tool. Suscep-tibility to hot cracking will be determined by the spot Varestraint Test.• By introducing radioactive tracers in welding wires, the roles of various microconstituents and such factors as alloy mixing during welding can be examined and correlated with propensity toward cracking.
Selection of Radioisotopes (j. P. Hammond)
The radioisotopes considered for tracers fall into two classifica-tions: (l) ones that are highly soluble in the matrix of stainless steel and thus evenly distribute in it, and (2) isotopes that concentrate in or are stoichiometrically linked with secondary phases and, hence, are selectively distributed. The former tracers are useful for examining extent of alloy mixing between filler metal and base metal during velding. The latter class of isotopes should aid in identifying and delineating specific microconstituents commonly associated with hot cracking, such as the sulfide and phosphide or their eutectics.
A second factor considered in selecting isotopes was the jharacter-istics of the rays emitted by them as they relate to achieving needed autoradiographic resolution. Gamma-emitting tracers are unsuitable for autoradiographic work because of the very penetrating nature of their radiation. On the other hand, isotopes that emit alpha or beta radiation are useful6 and should be especially suited when free of stray gamma rays (produces film fogging) and are sufficiently low in energy to assure good autoradiographic resolution*
5P. W. Turner, Effect of Iron on Fissuring of Uranium Weld Metal, Y-1678 (Aug. 11, 1969), pp. 17-19.
6Claude Laymonie, Radioactive Tracers in Physical Metallurgy, Chapman and Hall, London, 1963.
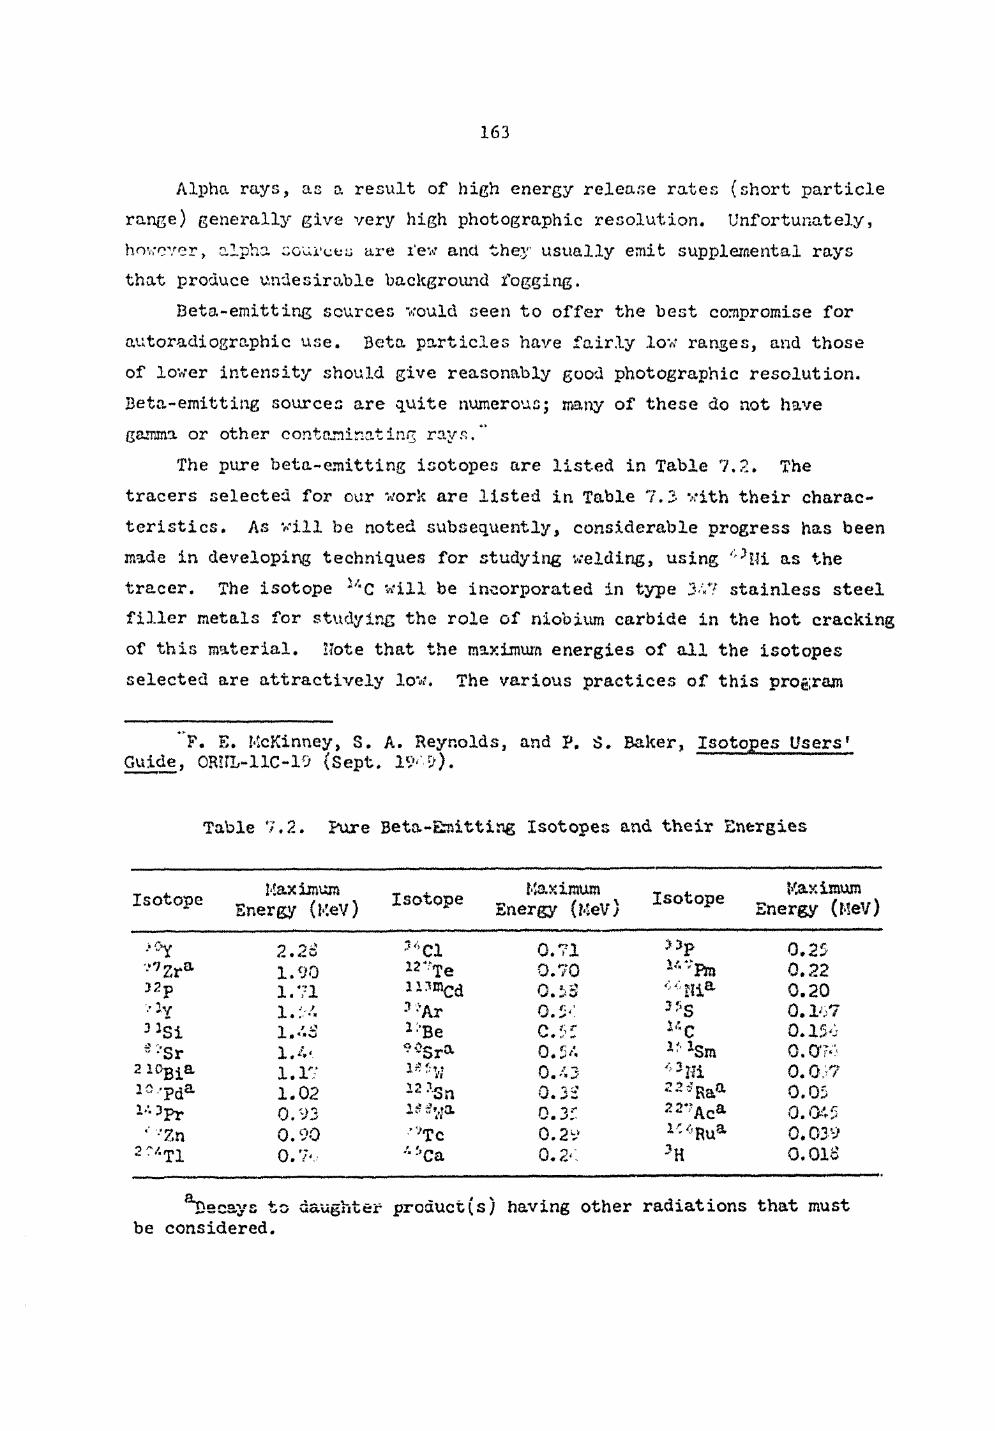
.163
Alpha rays, as a result of high energy release rates (short particle range) generally give very high photographic resolution. Unfortunately, however, alpha sourceu are few and they usually emit supplemental rays that produce undesirable background fogging.
Beta-emitting sources would seen to offer the best compromise for autoradiographic use. Beta particles have fairly low ranges, and those of lower intensity should give reasonably good photographic resolution. Beta-emitting sources are quite numerous; many of these do not have gamma or other contaminating rays."
The pure beta-emitting isotopes are listed in Table 7.2. The tracers selected for our work are listed in Table 7.3 with their charac-teristics. As will be noted subsequently, considerable progress has been made in developing techniques for studying welding, using as the tracer. The isotope u c will be incorporated in type 307 stainless steel filler metals for studying the role of niobium carbide in the hot cracking of this material. Note that the maximum energies of all the Isotopes selected are attractively low. The various practices of this program
E. McKinney, S. A. Reynolds, and P. Baker, Isotopes Users' Guide, OR!IL-11C-19 (Sept. 19* •>).
Table 7.2. Pure Beta-Emitting Isotopes and their Energies
Isotope Maximum Energy (KeV) Isotope Maximum
Energy (MeV") Isotope Maximum Energy (MeV)
ly "Si 2ioBia ie,pda
' ''Zn 2 ?/"Tl
•7Zra 32p 2 1.90 1. /I 1..' •» 1 . '»vi 1.4' 1.1" 1.02 0.93 0.90 0.7"
1 -1 - Ar 2-Be *oSra 2 £ » T,t
•"'Cl 12VTe n m c d
0.71 0.70 n V. > • r • 0.54 0/ ^
0.32 0.3r 0.29 0.2-1
0.25 0.22 0.20 0.147 0.150 0.070 0.0)7 0.05 0.045 0.039 o.oia
jj 3 Ra * 22*?Aca ic<!Rua
decays to daughter product(s) having other radiations that must be considered.
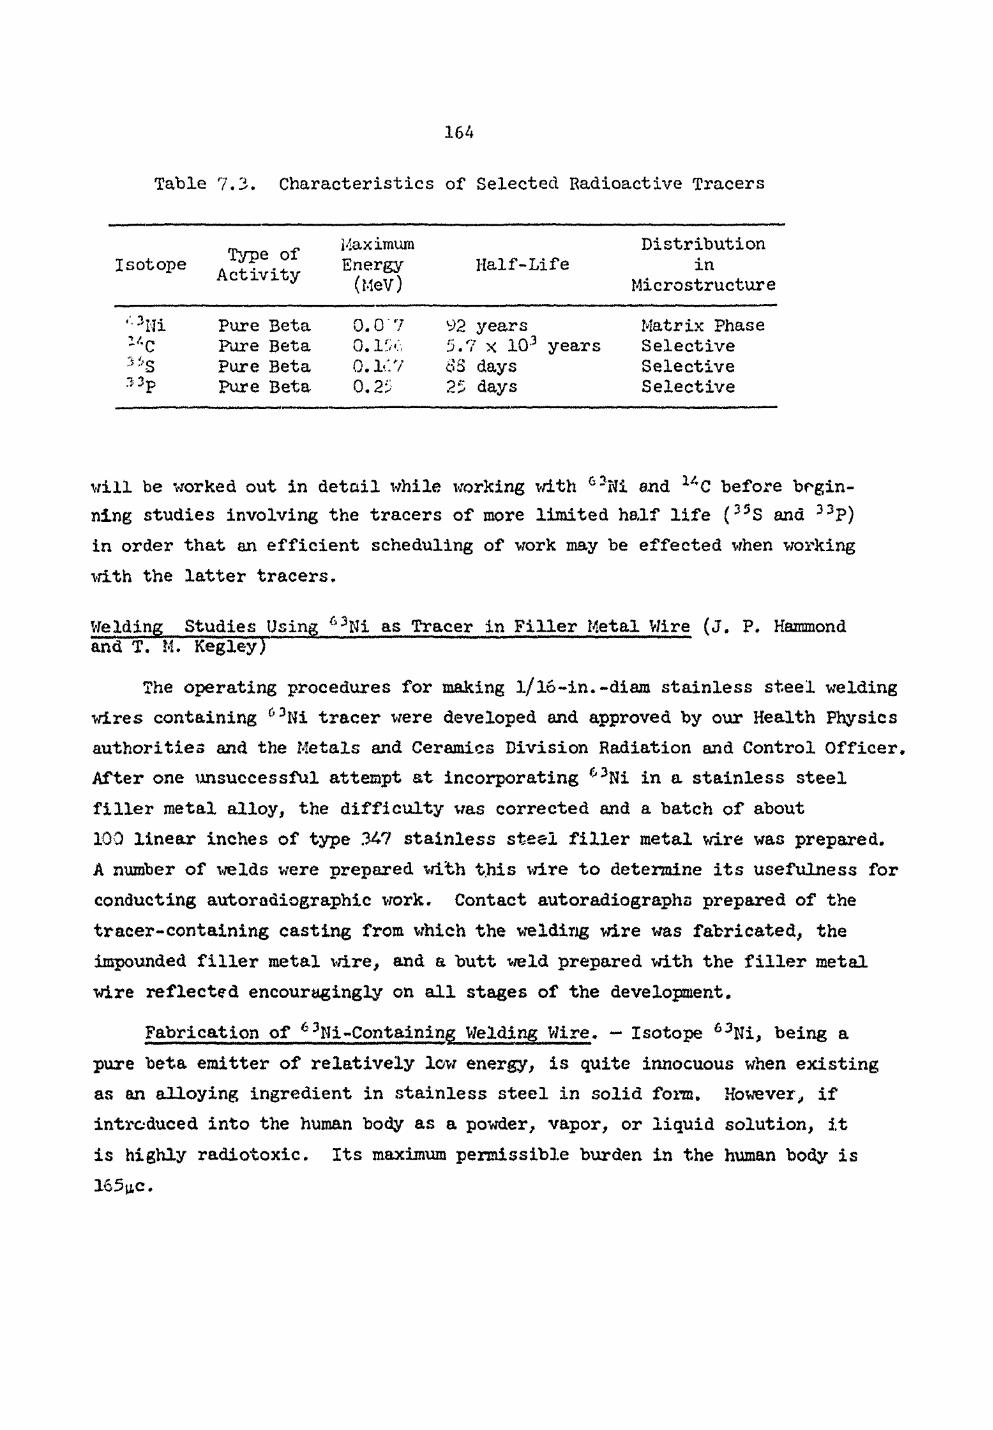
.164
Table 7.3. Characteristics of Selected Radioactive Tracers
Isotope Type of Activity
Maximum Energy (MeV)
Half-Life Distribution
in Microstructure
''3 Hi Pure Beta 0.0' 7 92 years Matrix Phase Fore Beta 0.1%-. 5.7 x 10 years Selective Pure Beta 0.K7 SS days Selective
3 3 p Pure Beta 0.25 25 days Selective
will be worked out in detail while working with 6-Hi end U C before begin-ning studies involving the tracers of more limited half life (35S and 33P) in order that an efficient scheduling of work may be effected when working with the latter tracers.
Welding Studies Using 63Ni as Tracer in Filler Metal Wire (J. P. Hammond and T. M. Kegley)
The operating procedures for making l/16-in.-diam stainless steel welding wires containing f,3Ni tracer were developed and approved by our Health Physics authorities and the Metals and Ceramics Division Radiation and Control Officer, After one unsuccessful attempt at incorporating f>3Ni in a stainless steel filler metal alloy, the difficulty was corrected and a batch of about 100 linear inches of type 347 stainless steel filler metal wire was prepared. A number of welds were prepared \iith this wire to determine its usefulness for conducting autoradiographic work. Contact autoradiographs prepared of the tracer-containing casting from which the welding wire was fabricated, the impounded filler metal wire, and a butt weld prepared with the filler metal wire reflected encouragingly on all stages of the development.
Fabrication of 63Ni-Containing Welding Wire. — Isotope 63Ni, being a pure beta emitter of relatively low energy, is quite innocuous when existing as an alloying ingredient in stainless steel In solid form. However, if introduced into the human body as a powder, vapor, or liquid solution, it is highly radiotoxic. Its maximum permissible burden in the human body is 165iiC.
.165
In terms of operating practice, this means that when the isotope-associated material is in a highly spreadable form, the operation must be restricted to a limited amount of radioactivity (< 50 mc) and the operation conducted in an airtight hood connected to an absolute filter. This would be the case for fusion welding, for example. On the other hand, when handling materials as solids, such as machining a casting or cold swaging a wire, the operation could be carried out in the open.
Isotope 6 %i m s available at ORNL, but only as an aqueous solution of the following description:
Form: 1 M HC1 solution Specific Activity: > 5 curies/g Ni
Radiochemical purity: > 95'%, 59Ni about 0.1$ Price: 0-200 mc &7.50/mc
> 200 mc $5.50/mc Of several approaches considered for converting the isotope to a form
suitable for incorporation in a stainless steel alloy, the following proved the most practicable: electroplate 63Ni out of an aqueous solution onto a fine metal wire and subsequently incorporate the wire in a stainless steel ingot by melting and casting.
A calculation conducted to establish an appropriate amount of 63Ni to incorporate in the welding wire to suitably expose an autoradiographic film in a period of 2 hr gave a value of about 1 mc/cm3 of casting or wire. This concentration was based on a beta particle range in stainless steel of 1 yjm and the assumption that 107 total particles/cm2 would appropriately expose the film. The calculated value proved to be reasonably close as 24-hr exposures on Kodak NTB-2 plates gave good autoradiographs.
The procedure established for manufacturing experimental 6 3Ni-containing filler metal wires in types 347 and 308 stainless steel consists of the following steps.
1. Conversion of the radioisotope from the available aqueous form to a usable, solid form by electroplating it on a nickel wire 0.020-in. diam x 1 ft long.
2. Preparation of a l/2-in.-diam X 2 l/4-in.-long casting of the stainless steel alloy containing the isotope-plated wire of Step 1 as a melting charge ingredient. The casting is made by tungsten-arc melting six times to achieve good homogeneity and then drop casting in a water-cooled copper mold.
.166
3. Reduction of the pencil-shaped casting to a welding wire l/l6 in. in diameter (approx 100 in. long). This is accomplished by first warm swaging at 650°C (12Q0°F) to break up the cast structure, then acid cleaning to remove any adhering oxide scale, and, finally, reducing to final wire size by alternately cold swaging and vacuum annealing at 1065°C (1950°F).
The conversion operation of this process (Step l) required considerable experimentation before success, and it required converting from a hydro-chloric plating bath to one based on ammonium oxalate. After plating out the isotope, it was secured to the wire by electroplating additional, natural nickel over it by a conventional nickel-electroplating process. An isotopic analysis conducted for 63Ni on an arc-melted casting prepared by the above procedures indicated that about 95°}o of the tracer supplied in the original source solution was retained.
Figure 7.1 shows autoradiographs prepared of the sprue and the body of the 63Ni-conta.ining casting that was prepared by our standard fabrication procedure while Fig. 7.2 is an autoradiograph taken of the end of the welding wire that was made from the casting. Note that good isotopic homogeneity is achieved at each of these stages of fabrication. The crack seen at the end of the swaged wire (Fig. 7.2) illustrates the effectiveness of this auto-radiographic techniques for delineating cracks. The crack is spurious, however, and does not reflect on the quality of the welding wire.
Autoradiographic Examinations. — To study weld cracking and alloy mixing between filler and base metals, welds were prepared with tracer-impounded, 1/16 -in. -diam, type 347 stainless steel welding wire and type 347 stainless steel base metal in three different weldment designs. These consisted of the following joints, in order of increasing restraint:
1. Butt weld on l/16-in.-thick sheet. 2. Root pass on l/2-in.-thick plate with 100 deg included V-groove,
using welding parameters designed to give a high dilution of weld deposit with base metal.
3. Bead-on-plate weld along a 2 l/2-in.-long slot of l/l6-in. width on a square plate measuring 5/8-in. -thick and 6 in. on an edge.
None of these welds produced any cracking or serious porosity that was detectable with a stereoscopic microscope (80x) or by metallographic
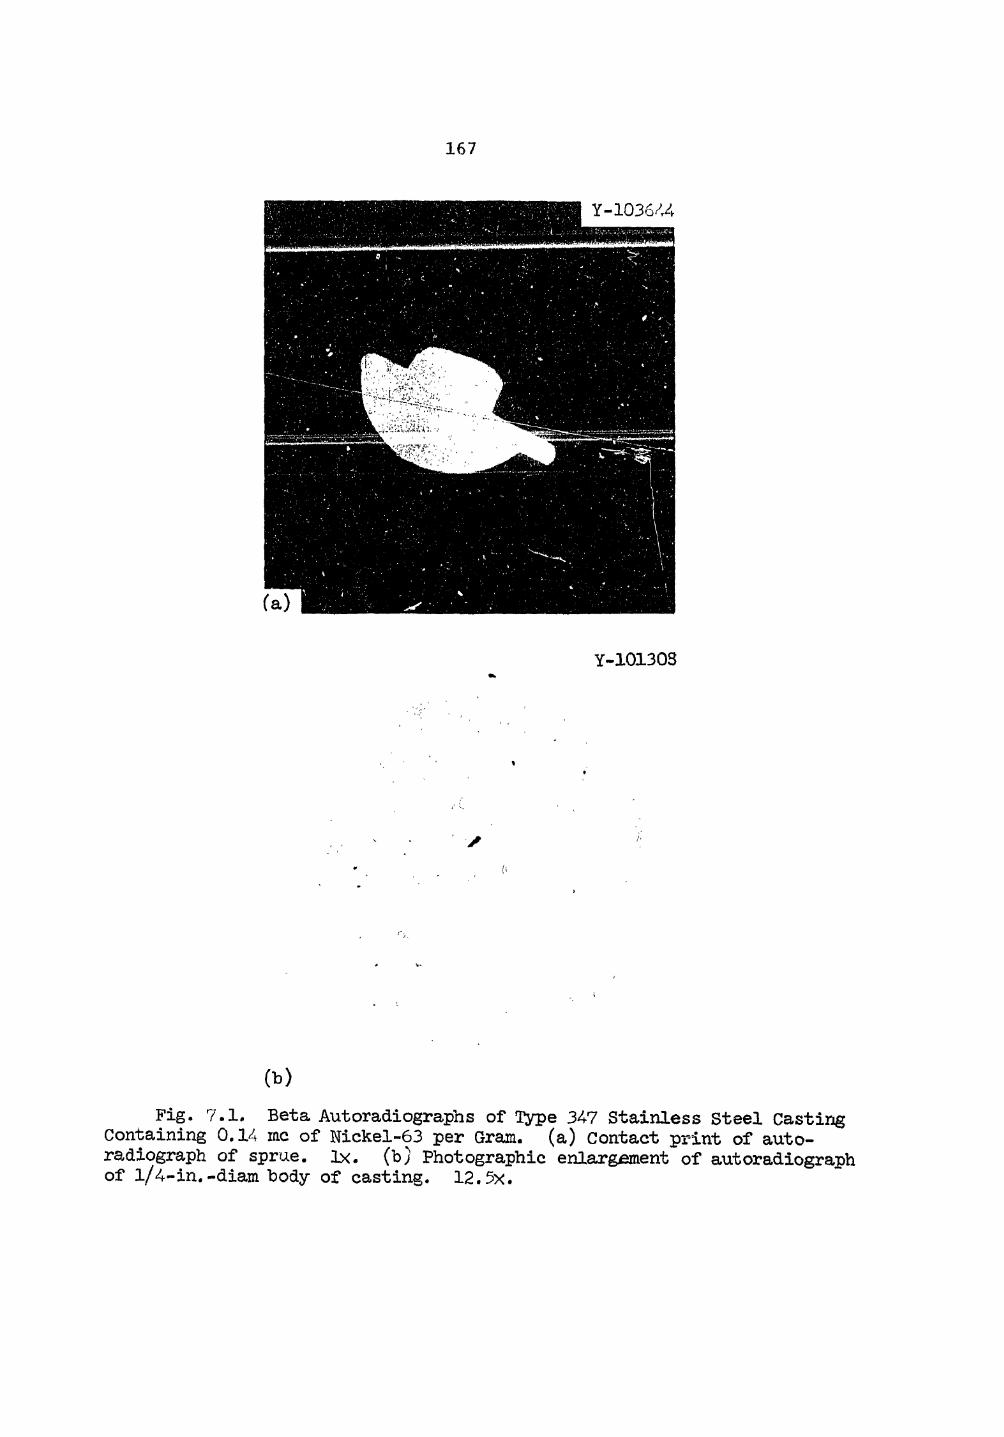
.167
Y-103644
Y-10130S
/
(b)
Fig. 7.1. Beta Autoradiographs of lype 347 Stainless Steel Casting Containing 0.14 mc of Nickel-63 per Gram, (a) Contact print of auto-radiograph of sprue. lx. (b) Photographic enlargement of autoradiograDh of l/4-in.-diam body of casting. 12.5x.
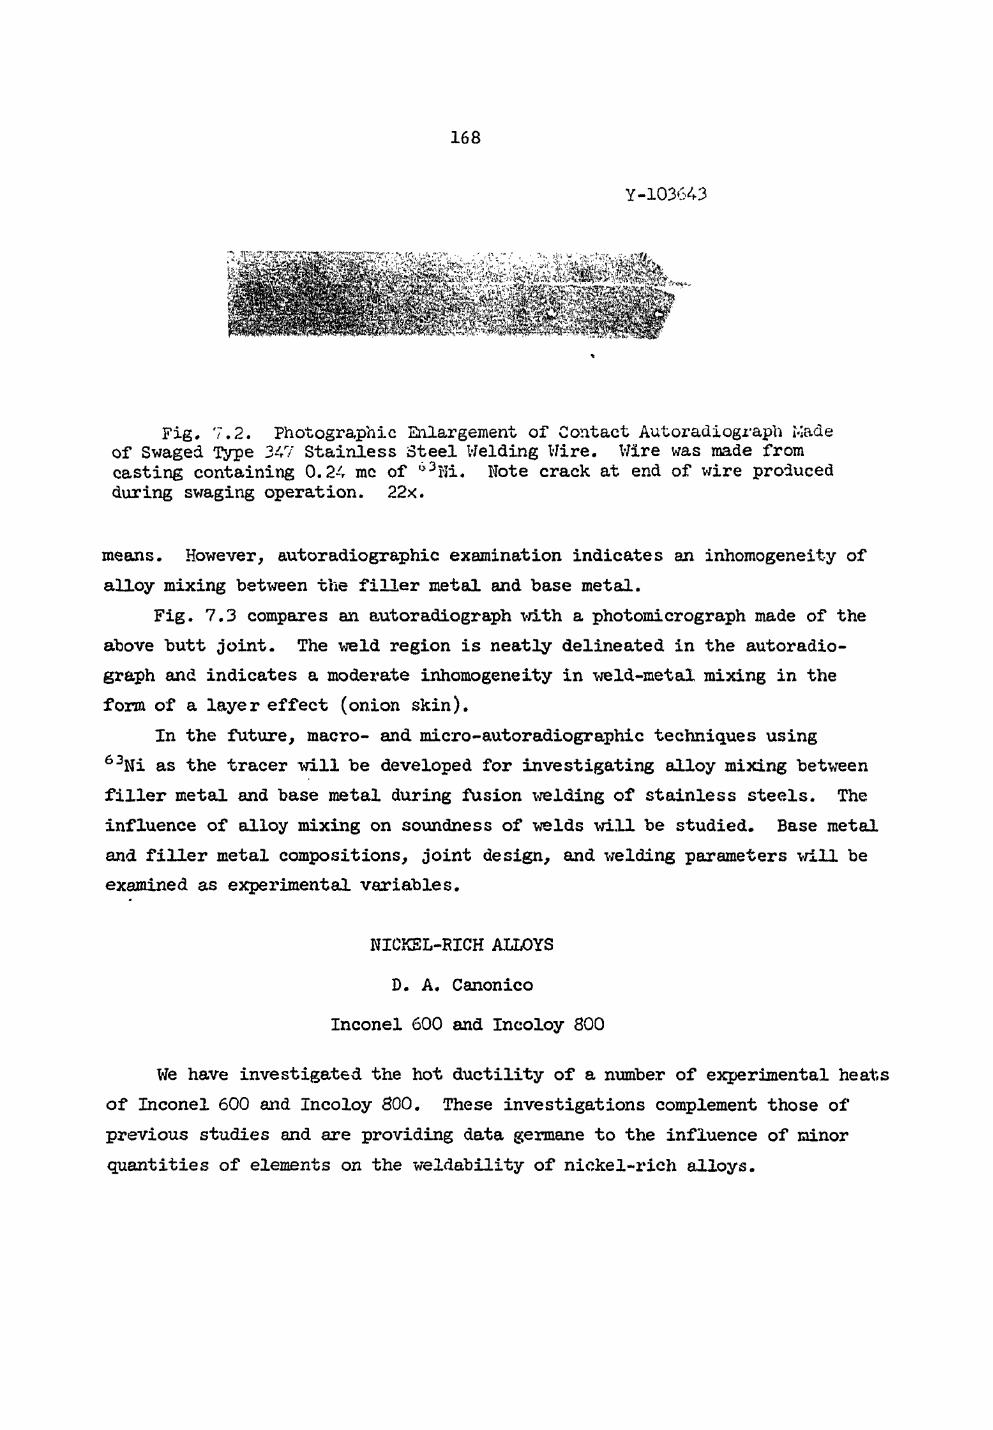
.168
Y-103643
Fig, '7.2. Photographic Enlargement of Contact Autoradiograph Made of Swaged Type 347 Stainless Steel Welding Wire. Wire was made from casting containing 0.24 mc of 63Hi. Note crack at end of wire produced during swaging operation. 22x.
means. However, autoradiographic examination indicates an inhomogeneity of alloy mixing between the filler metal and base metal.
Fig. 7.3 compares an autoradiograph with a photomicrograph made of the above butt joint. The weld region is neatly delineated in the autoradio-graph and indicates a moderate inhomogeneity in weld-metal mixing in the form of a layer effect (onion skin).
In the future, macro- and micro-autoradiographic techniques using 63Ni as the tracer will be developed for investigating alloy mixing between filler metal and base metal during fusion welding of stainless steels. The influence of alloy mixing on soundness of welds will be studied. Base metal and filler metal compositions, joint design, and welding parameters will be examined as experimental variables.
NICKEL-RICH ALLOYS D. A. Canonico
Inconel 600 and Incoloy 800
We have investigated the hot ductility of a number of experimental heats of Inconel 600 and Incoloy 800. These investigations complement those of previous studies and are providing data germane to the influence of minor quantities of elements on the voidability of nickel-rich alloys.
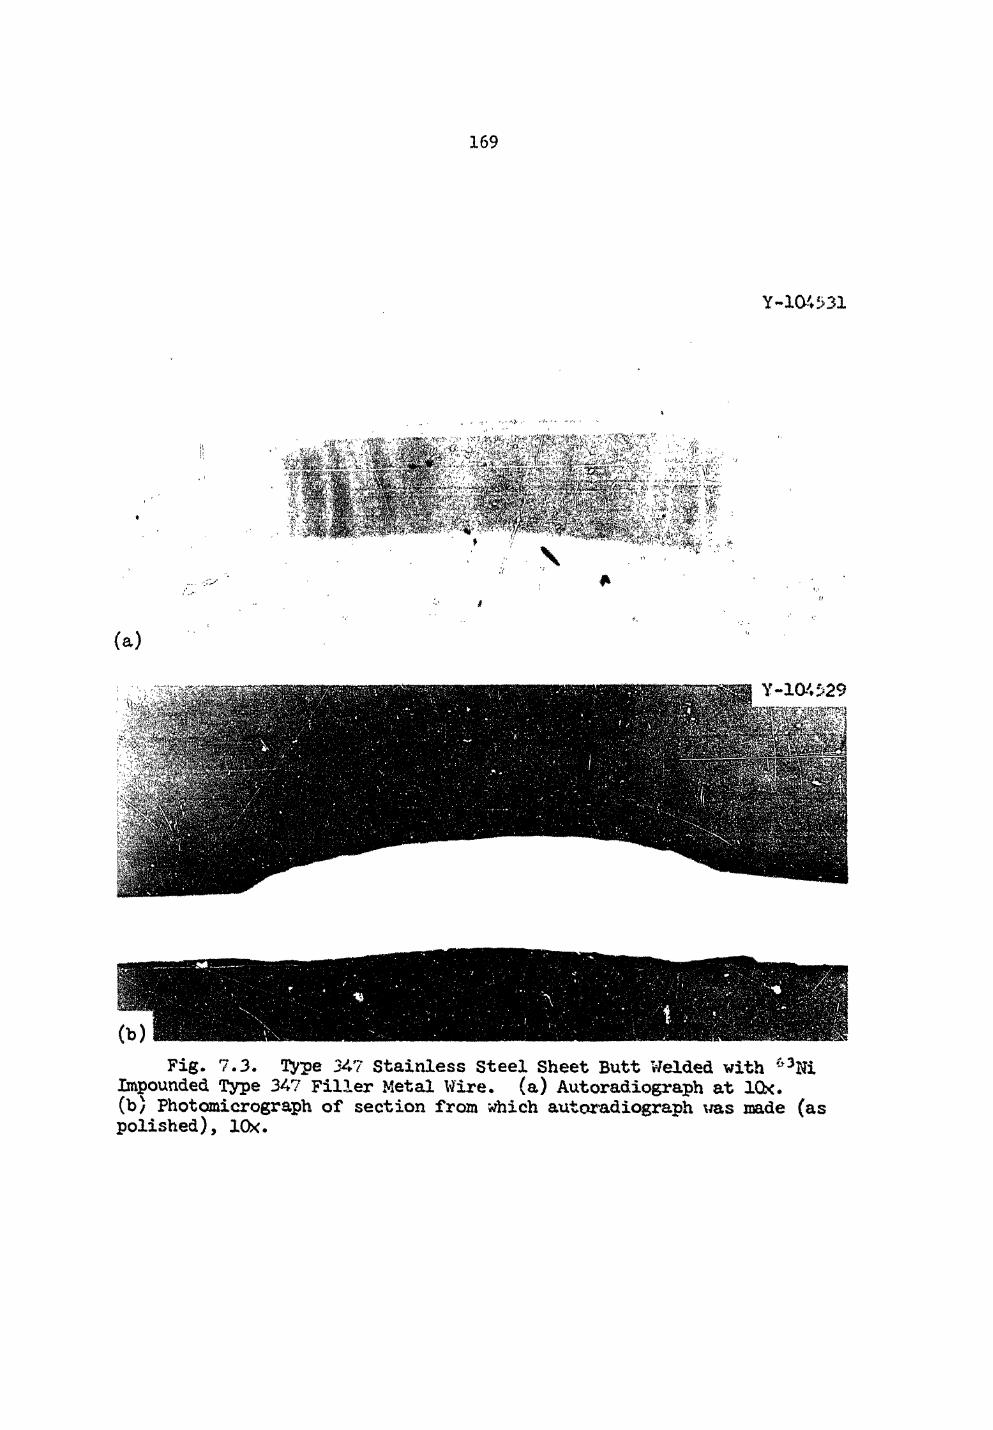
.169
Y-104531
(a)
Fig. 7.3. Type 347 Stainless Steel Sheet Butt Welded with 63Ni Impounded Type 347 Filler Metal Wire, (a) Autoradiograph at lOx. (b) Photomicrograph of section from which autoradiograph was made (as polished), lOx.
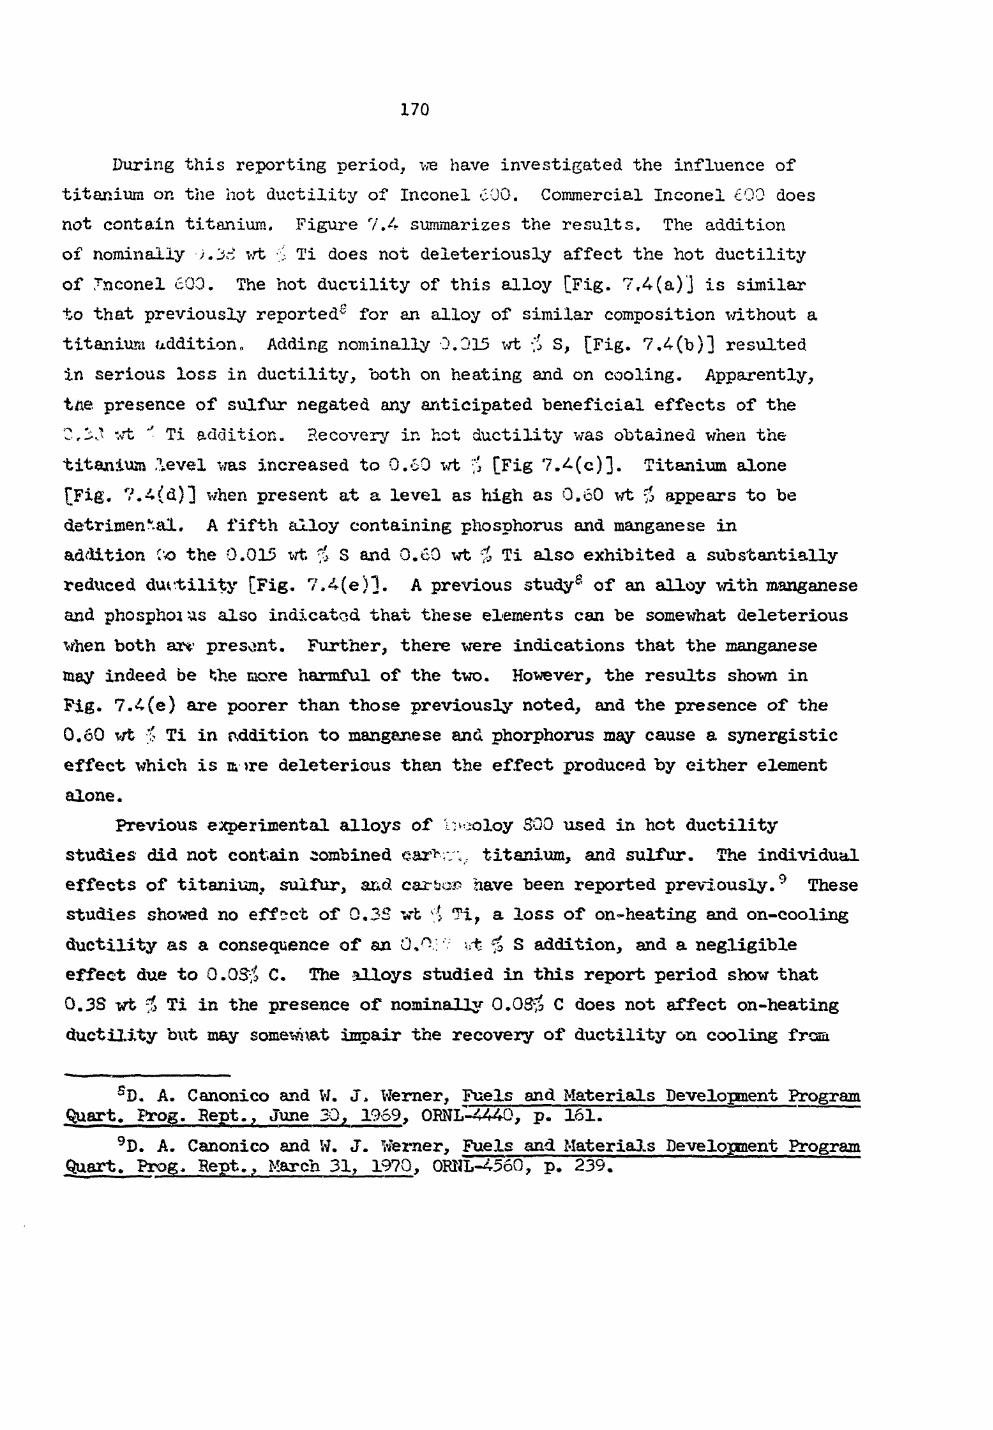
.170
During this reporting period, -we have investigated the influence of titanium on the hot ductility of Inconel cOG. Commercial Inconel £00 does not contain titanium. Figure 7.4 summarizes the results. The addition of nominally wt Ti does not deleteriously affect the hot ductility of Tncone1 c00. The hot ducxility of this alloy [Fig. 7.4(a)] is similar to that previously reported1' for an alloy of similar composition without a titanium addition,, Adding nominally 0.015 wt Vj S, [Fig. 7.4(b)] resulted in serious loss in ductility, both on heating and on cooling. Apparently, tne presence of sulfur negated any anticipated beneficial effects of the C, j-o -'ft J Ti addition. Recovery in hot ductility was obtained when the titanium .level was increased to 0.60 wt £ [Fig 7.4(c)]. Titanium alone [Fig. 7.4(d)] when present at a level as high as 0.60 wt $ appears to be detrimental. A fifth alloy containing phosphorus and manganese in addition Co the 0.015 wt $ S and 0.60 wt % Ti also exhibited a substantially reduced ductility [Fig. 7,4(e)1. A previous study® of an alloy with manganese and phosphoi us also indicated that these elements can be somewhat deleterious when both ax* presont. Further, there were indications that the manganese may indeed be the more harmful of the two. However, the results shown in Fig. 7.4(e) are poorer than those previously noted, and the presence of the 0.60 vt Ti in addition to manganese and phorphorus may cause a synergistic effect which is a >re deleterious than the effect produced by either element alone.
Previous experimental alloys of l>;oloy SQO used in hot ductility studies did not contain combined «?ar>;v;: titanium, and sulfur. The individual effects of titanium, sulfur, and carhop have been reported previously.9 These studies showed no effect of 0.3S vt i Ti, a loss of on-heating and on-cooling ductility as a consequence of an b-t % S addition, and a negligible effect due to 0.05$ C. The alloys studied in this report period show that 0.3S wt =f3 Ti in the presence of nominally 0 . 0 C does not affect on-heating ductility but may somewhat impair the recovery of ductility on cooling frcaa
SD. A. Canonico and W. J, Werner, Fuels and Materials Development Program Quart. Prog. Rept., June 30, 1969, 0RNL-4440, p. 161.
9D. A. Canonico and W. J. Werner, Fuels and Materials Development Program Quart. Prog, Rept., March 31, 1970, 0RHL-4560, p. 239.
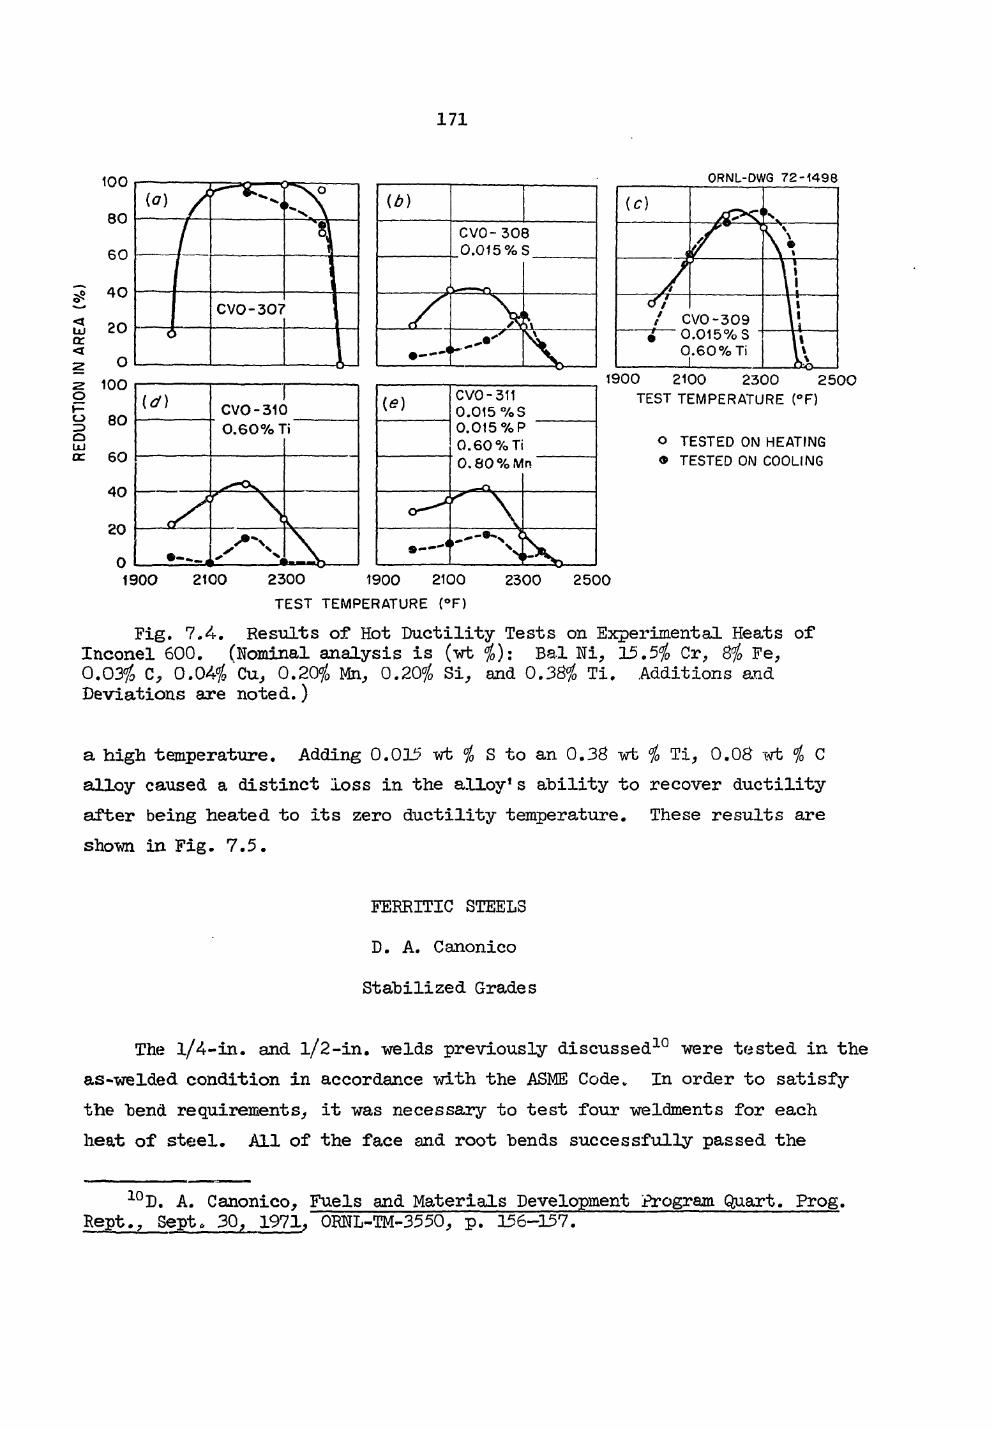
171
( a ) /
CV0-307
1 CVO-310 0.60% 1
• — « L
id)
C V O - 3 0 8 0 . 0 1 5 % S
/ • — ' \
ORNL-DWG 7 2 - 1 4 9 8
( e ) C V O - 3 1 1 0 . 0 1 5 % S 0 . 0 1 5 % P 0.60 %Ti 0.80%Mn
1 9 0 0 2 1 0 0 2 3 0 0 2 5 0 0
T E S T T E M P E R A T U R E ( ° F )
o T E S T E D ON HEATING
® T E S T E D ON COOLING
1 9 0 0 2 1 0 0 2 3 0 0 1 9 0 0 2 1 0 0
T E S T T E M P E R A T U R E ( ° F )
2 3 0 0 2 5 0 0
Fig. 7.4-. Results of Hot Ductility Tests on Experimental Heats of Inconel 600. (Nominal analysis is (wt $): Bal Ni, 15.5$ Cr, 8$ Fe, 0.03$ C, 0.04$ Cu, 0.20$ Mn, 0.20$ Si, and 0.38$ Ti. Additions and Deviations are noted.)
a high temperature. Adding 0.015 wt $ S to an 0.38 wt $ Ti, 0.08 wt $ C alloy caused a distinct loss in the alloy1s ability to recover ductility after being heated to its zero ductility temperature. These results are shown in Fig. 7.5.
FERRITIC STEELS D. A. Canonico Stabilized Grades
The l/4-in. and l/2-in. welds previously discussed10 were tested in the as-welded condition in accordance with the ASME Code. In order to satisfy the bend requirements, it was necessary to test four weldments for each heat of steel. All of the face and root bends successfully passed the
10D. A. Canonico, Fuels and Materials Development Program Quart. Prog. Rept., Sept, 30, 1971, 0RNL-TM-3550, p. 156-157.
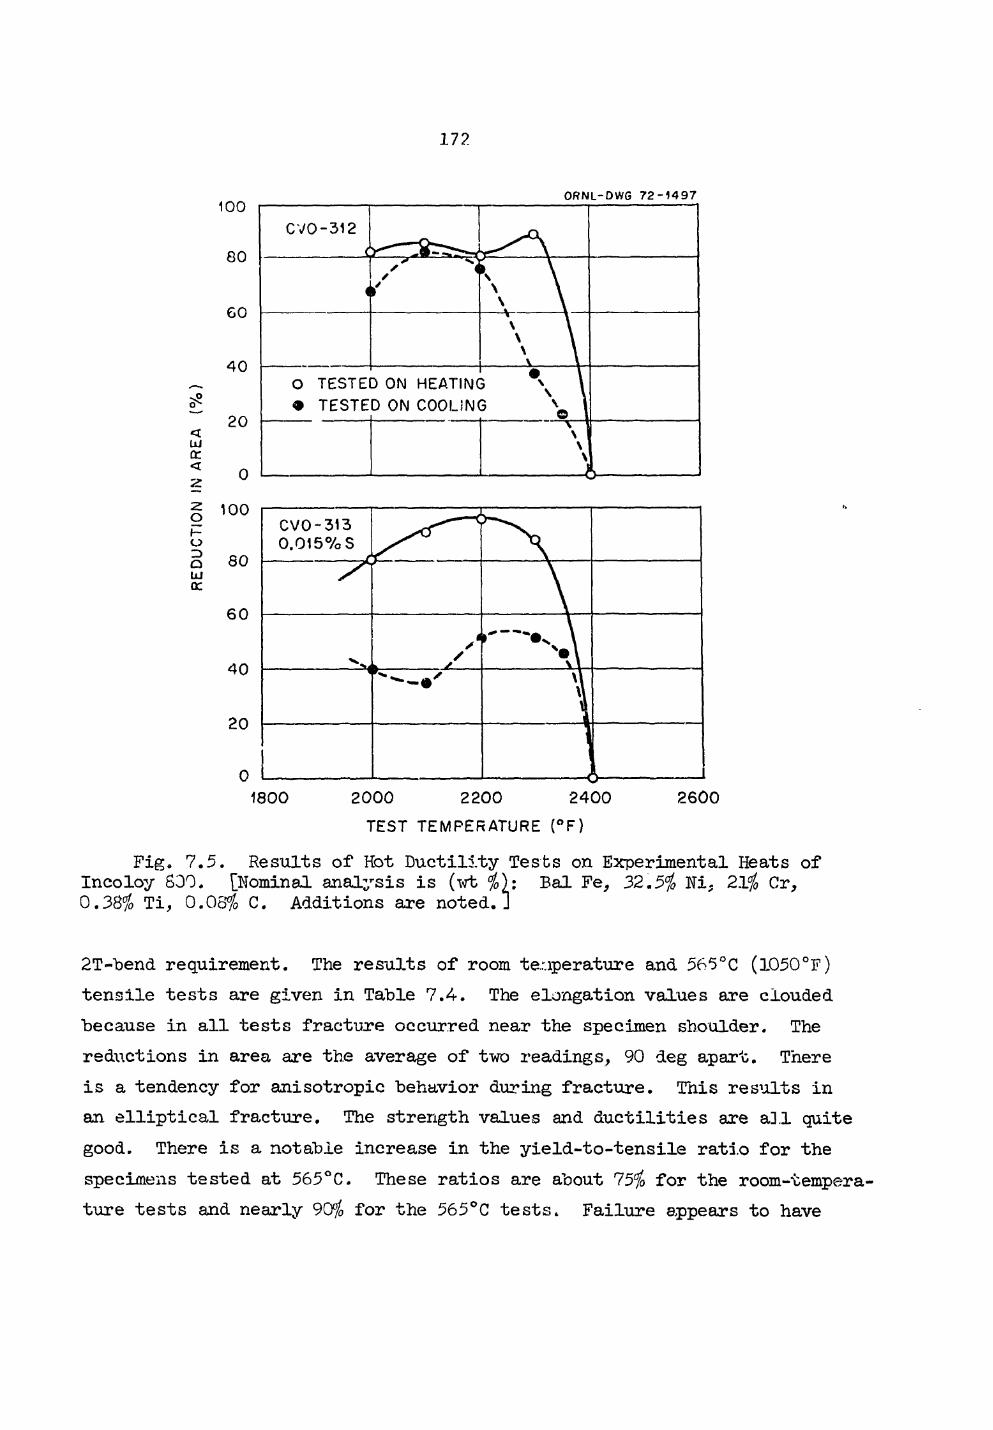
172
o < UJ CC <
o Q UJ CC
1 0 0
8 0
60
40
20
0 100
80
60
40
20
0
ORNL-DWG 7 2 - 1 4 9 7
CV0-312
<
r ^ ^ < < \
\ \ \ \ l I \ \ \ \ \ \
\ V O TESTEI • TESTE
D ON HEATINC D ON COOIJNI
\ \ ^ 1 , -, . V,H \ \ \ ;
1800 2 0 0 0 2200 2400
TEST TEMPERATURE (°F)
CVO-313 0 .015% S
i s /
*
• \ \ \\
/ \\ \\
I 1 2600
Fig. 7.5. Results of Hot Ductility Tests on Experimental Heats of Incoloy 800. [Nominal analysis is (wt $): Bal Fe, 32.5$ Ni. 21$ Cr, 0.38$ Ti, 0.08% C. Additions are noted.]
2T~bend requirement. The results of room temperature and 565°C (1050°F) tensile tests are given in Table 7.4. The elongation values are clouded because in all tests fracture occurred near the specimen shoulder. The reductions in area are the average of two readings, 90 deg apart. There is a tendency for anisotropic behavior during fracture. This results in an elliptical fracture. The strength values and ductilities are all quite good. There is a notable increase in the yield-to-tensile ratio for the specimens tested at 565°C. These ratios are about 75$ for the room-tempera-ture tests and nearly 90$ for the 565°C tests. Failure appears to have
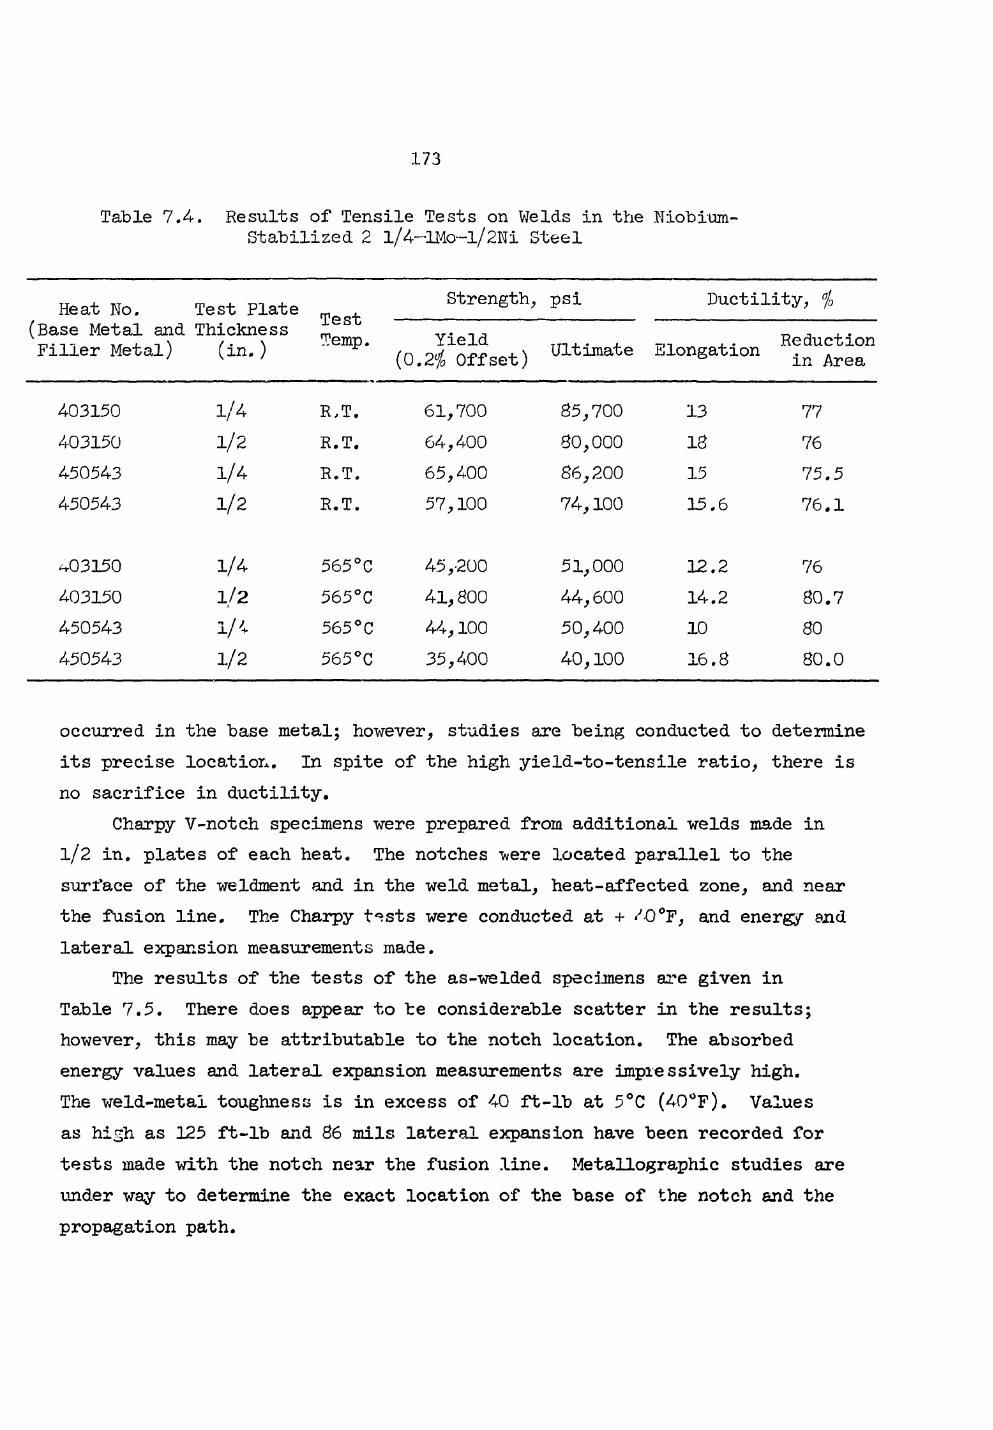
.173
Table 7.4. Results of Tensile Tests on Welds in the Niobium-Stabilized 2 l/4—lMo~l/2Ni Steel
Heat No. (Base Metal and Filler Metal)
Test Plate Thickness (in. )
Test Temp.
Strength, psi Ductility, % Heat No. (Base Metal and Filler Metal)
Test Plate Thickness (in. )
Test Temp. Yield
(0.2$ Offset) Ultimate Elongation Reduction in Area
403150 1/4 R,T. 61,700 85,700 13 77 403150 1/2 R.T. 64,400 80,000 18 76 450543 1/4 R.T. 65,400 86,200 15 75.5 450543 1/2 R. T. 57,100 74,100 15.6 76.1
^03150 1/4 565°C 45 ,-200 51,000 12.2 76 403150 1/2 565°C 41,800 44,600 14.2 80.7 450543 V * 565 °C 44,100 50,400 10 80 450543 1/2 565°C 35,400 40,100 16.8 80.0
occurred in the base metal; however, studies are being conducted to determine its precise location. In spite of the high yield-to-tensile ratio, there is no sacrifice in ductility.
Charpy V-notch specimens were prepared from additional welds made in l/2 in. plates of each heat. The notches were located parallel to the surface of the weldment and in the weld metal, heat-affected zone, and near the fusion line. The Charpy t^sts were conducted at + F, and energy and lateral expansion measurements made.
The results of the tests of the as-welded specimens are given in Table 7.5. There does appear to be considerable scatter in the results; however, this may be attributable to the notch location. The absorbed energy values and lateral expansion measurements are impressively high. The weld-metal toughness is in excess of 40 ft-lb at 5°C (40 °F). Values as high as 125 ft-lb and 86 mils lateral expansion have been recorded for tests made with the notch near the fusion line. Metallographic studies are under way to determine the exact location of the base of the notch and the propagation path.
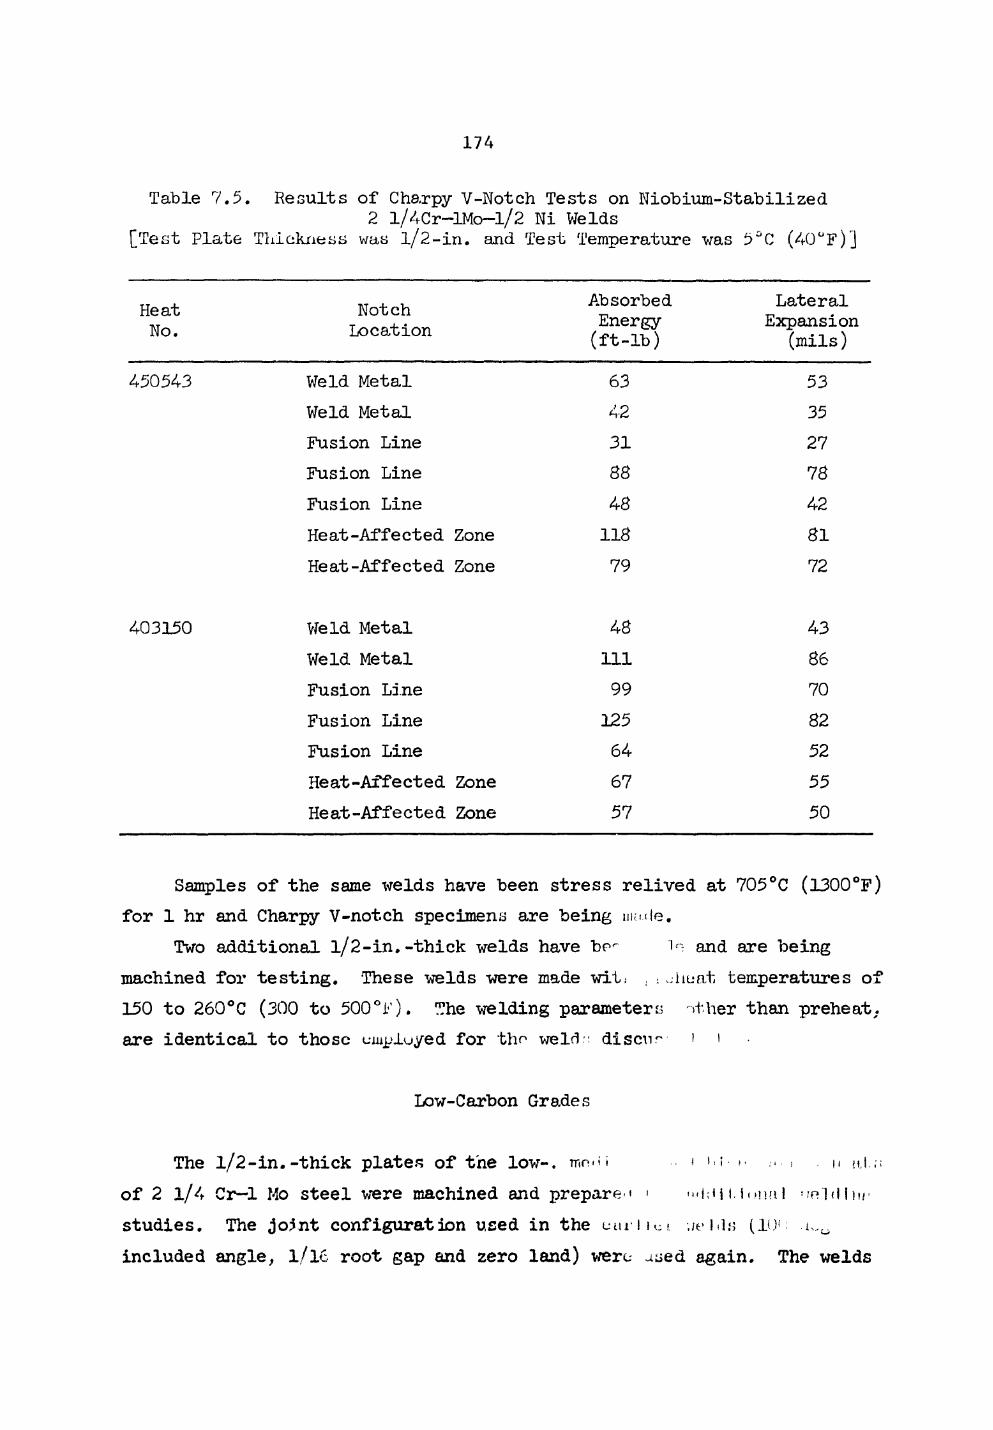
.174
Table 7.5. Results of Charpy V-Notch Tests on Niobium-Stabilized 2 l/4Cr—IMo—1/2 Ni Welds
[Test Plate Thickness was l/2-in. and Test Temperature was 5°C (40°F)]
Heat No.
Notch Location
Absorbed Energy (ft-lb)
Lateral Expansion
(mils) 450543 Weld Metal 63 53
Weld Metal 42 35 Fusion Line 31 27 Fusion Line 78 Fusion Line 48 42 Heat-Affected Zone 118 81 Heat-Affected Zone 79 72
403150 Weld Metal 48 43 Weld Metal 111 86 Fusion Line 99 70 Fusion Line 125 82 Fusion Line 64 52 Heat-Affected Zone 67 55 Heat-Affected Zone 57 50
Samples of the same welds have been stress relived at 705°C (1300°F) for 1 hr and Charpy V-notch specimens are being imi.de.
Two additional l/2-in.-thick welds have bc^ in and are being machined for testing. These welds were made witi .uliunt temperatures of 150 to 260°C (300 to 5 0 0 T h e welding parameters other than preheat, are identical to those employed for tho weld : discu- 1 1
Low-Carbon Grades
The l/2-in.-thick plates of the low-, rr.n.u 1 M• , m r| of 2 1/4 Cr—1 Mo steel were machined and prepare.* • <<<i;H i.luiml wolHhir studies. The jo?nt configuration used in the uui'iim. ,/e his (10f included angle, l/lc root gap and zero land) were aaed again. The welds
.175
were made usi.og a commercial 5% Cr-1$ Mo filler metal and a filler metal obtained from the base plate.
The welds made with the commercial alloy were unacceptable due to a high degree of porosity. Rather than spend the funds necessary to prepare samples from this questionable material, we immediately reprepared the base metal for welding and made welds with filler metal obtained from the base metal. A preheat of 150 to 260°C (300 to 500°F) was used. These welds have been submitted for preparation for mechanical property tests.
Tube-to-Tube Sheet Studies
Our tubular welding studies suffer from the problem of having to make the tubular welds from the outside (rather than bore-side). Our work has included 1 l/2-in., 7/8-in., and 3/<4-in.-diam tubf s. The wall thickness of the 1 1/2 -in. diam tubes, 0,188 to 0.353 in., is too great for a single-pass weld. Smaller tubes with thinner wallr? (e.g., 0.171 in.) tend to exhibit burn-through upon reaching the original "start" position and penetration tends to be non-uniform. An example of the problem is shown in Table 7.6 where the results of a study on 7/8-in.-diam tubes are given. It can be seen that buildup of heat in these tubular welds results in a considerable difference in penetration between the weld start (0 deg.) and 180 deg locations. There is a difference of nearly 50$ in the penetration at these two locations. Additional work is being done to minimize these differences, but the possible influence of heat buildup on microstructure and properties must be taken into consideration in the optimization of welding procedures by industrial fabricators.
Several simulated tube-to-tube sheet welds of a configuration like that shown previously11 have been made. M a i n t a i n i n g the alignment between the "tube-sheet" and "tube" is critical and troublesome. Complete-penetration welds have been made made with parameters of about 165 amp, 12 v, and 7 imp travel speed. Welds have been made with (150 to 260°C) and without preheat, t iiejLinocouples were embedded in the plates and temperatures measured during
i:iD. A. Canonico, Fuels and Materials Development Program Quart. Prog. Rept., Sept. 30, 1971, 0RNL-TM-3550, p. 159.
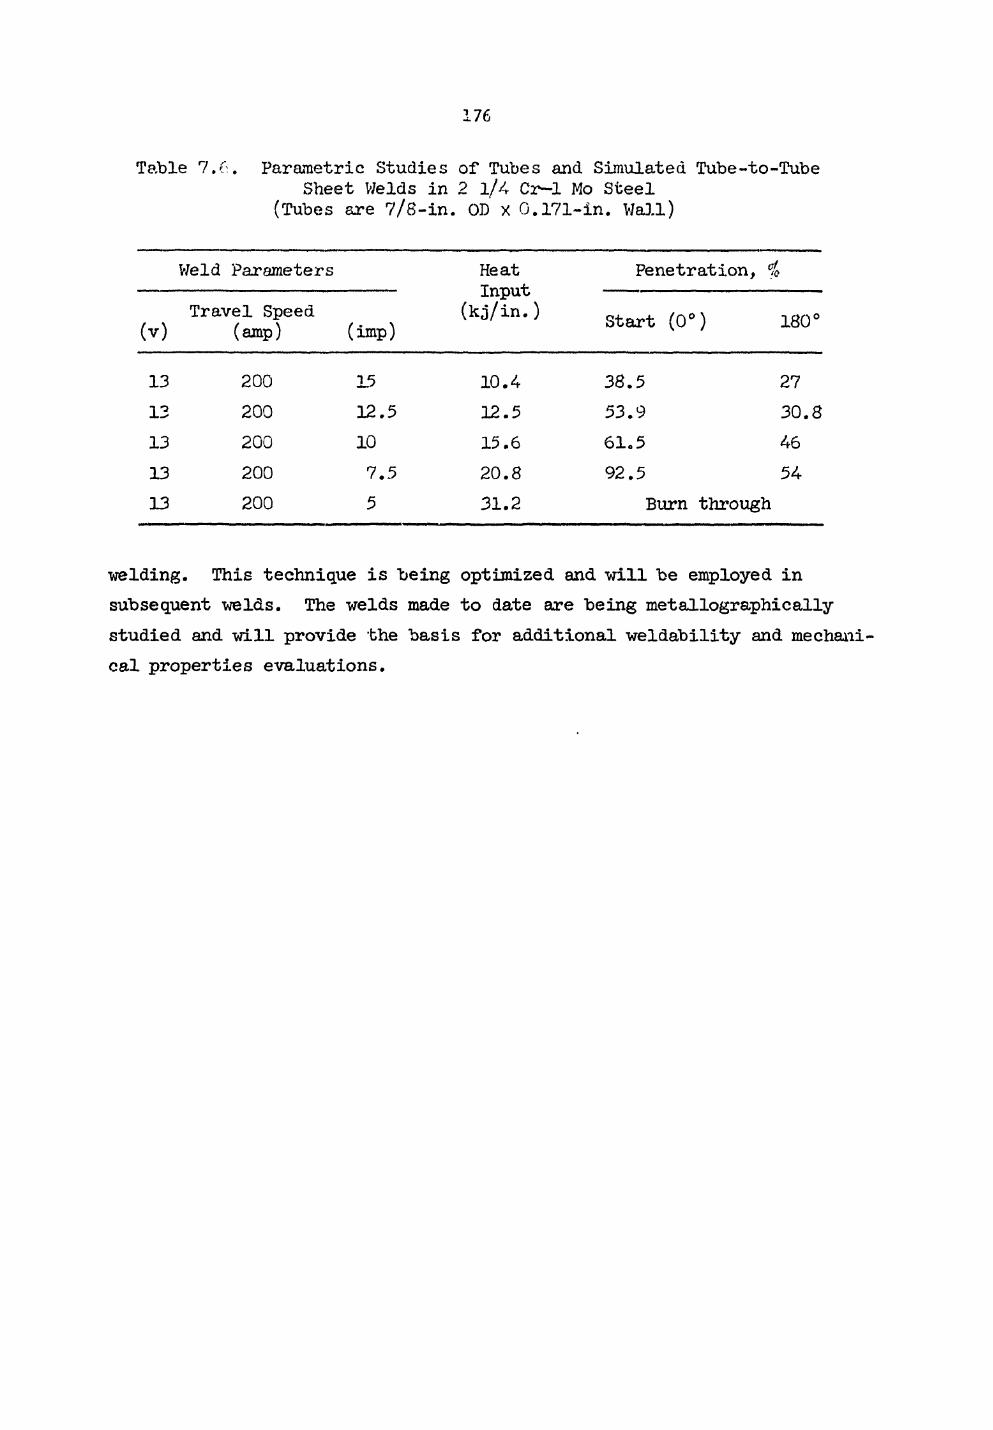
.176
Table 7.0. Parametric Studies of Tubes and Simulated Tube-to-Tube Sheet Welds in 2 l/4 Cz—1 Mo Steel
(Tubes are 7/8-in. OD x 0.171-in. Wall)
Weld Parameters Heat Input
(kj/in.) Penetration, %
(v ) Travel Speed
(amp) (imp)
Heat Input
(kj/in.) Start (0°) 180°
13 200 15 1 0 . 4 3 8 . 5 27
13 200 1 2 . 5 1 2 . 5 5 3 . 9 3 0 . 8
13 200 10 15 .6 6 1 . 5 46
13 200 7 . 5 2 0 . 8 9 2 . 5 54
13 200 5 3 1 . 2 Burn through
welding. This technique is being optimized and will be employed in subsequent welds. The welds made to date are being metallographically studied and will provide the basis for additional weldability and mechani cal properties evaluations.
.177
8. NONDESTRUCTIVE TESTING DEVELOPMENT
W. 0. Harms R. W. McClung
This program is designed to develop new and improved methods of examining LMFBR materials and components. Among the methods being studied are electromagnetic induction, ultrasonics, and penetrating radiation. Special emphasis is being given to developing techniques for inspection problems related to the steam generator.
NDT Development for Steam Generators
R. W. McClung
We have begun a development program to solve specific problems of nondestructive testing of steam generators for LMFBR. Emphasis is being given to the inspection of bore-side tube-to-tube sheet joints although other problems such as in-place inspection of tubing for wall thinning and integrity will also receive attention. Radiography (R. W. McClung, B. E. Foster)
Further investigation has been made into the availability and capabil-ity of radiographic equipment for inspection of the bore-side weld. In conjunction with other European travel, a visit was made to Roentgen Technische Dienst in Rotterdam, Holland, to ,see and discuss the small diameter, long rod anode x-ray tube developed by them. The present device opertjes at a peak energy of 80 kvp and has a focal spot size of 0.1 ram in the 15-mm-diam rod that has been made as long as 0.5 meter. The system contains its own pump for maintenance of the vacuum, allowing simple, rapid interchange of the target and filament. Development work is under way to extend the x-ray energy up to about 150 kvp. A mechanical framework with counterweights allows ready movement of the x-ray tube in x-, y- and z-directions. Several organizations have investigated the possibility of using Thulium 170 as a radiographic source with varying opinions about its capability relative to the x-ray sources. There is
.178
general agreement, however, on the obvious fact that the inherently larger physical size of the isotopic source will reduce the sharpness and image detail of the radiograph. Further investigations into the energy of 109Cd disclosed that the useful portion of the spectrum (for this project the 87 keV gamma) was such a small contributor to the overall radiation output that it is no longer considered a contender. Liquid Penetrants (K. V. Cook, B. E. Foster)
We are developing techniques for the performance of liquid penetrant inspection of the tube-to-tube sheet weld joints. For the first stage of development we are working with a system using tubing as the specimen and have prepared appropriate mechanical fixturing that will allow us to work as much as 3 l/2 ft inside a tube with an inner bore of l/2 in. The first technique being considered employs a high sensitivity post emulsification fluorescent liquid penetrant and a 3/8-in.-diam black-light borescope. In order to adequately wash the emulsified penetrant from the ..oner surface, we fabricated a water spray nozzle from a length of 3/8-in. brass tubing with radial holes around the circumference to direct the forcible spray. Similar spray devices will be developed for the other liquids required in the penetrant process.
With the current system, a modified 10-in. lathe is used as the scanning mechanism. The chuck is used to hold and center the black-light borescope which can be manually rotated or locked in position. The tube which is mounted on the tool post assembly is driven over the borescope by the lead screw. It will be necessary to reverse this mechanical arrangement later to permit linear movement of the borescope.
Concurrently we are investigating the coupling of closed-circuit television (CCTV) to the borescope to ease the viewing of -indications and to offer the potential for recording. For the preliminary specimen, we used an aluminum plate containing quench cracks which had been subjected to a standard application of the fluorescent dye penetrant. The fluorescent wavelength was approximately 5600A (green-yellow) which, of course, is in the region of maximum sensitivity of the eye as well as a standard CCTV Vidicon. The CCTV was a Sony, high resolution, high sensitivity, black and white system.
.179
We investigated various lens combinations including CCTV lens with <4:1 zoom, 10:1 zoom, and standard 16 mm with and without lens on the black-light borescope. The fluorescent indications of the cracks in the aluminum were faintly visible with the best imaging provided by the 4:1 zoom lens with borescope optics. However, we were not able to achieve optimum magnification due to the low intensity.
We evaluated a miniature ultra-sensitive camera with a newly developed "Tivicon" mosaic which has a sensitivity to white light several times higher than the standard vidicon. However, its maximum sensitivity is in the red region of the visible spectrum. At the wavelength of the fluorescent penetrant (green-yellow 5600A), the sensitivity was approximately 2—3 times that of the standard vidicon. However, the combination of light intensity and camera sensitivity still seems to be insufficient for optimum viewing of the penetrant indications.
A red dye penetrant, utilizing white light illumination will be evaluated for possible increase in light intensity reaching the vidicon and improved system sensitivity. Eddy Currents (C. V. Dodd, W. A. Simpson, Jr.)
We are using our previously developed computer calculational techniques for determining the optimum parameters for a dual encircling coil eddy-current bridge for the detection of defects in tubing. This is the first phase of a study to develop techniques for inspection of installed tubing and detection of flaws in tube-to-tube sheet welds. The bridge is designed to operate in an unbalanced mode and has the advantages of high through-put rate and low sensitivity to changes in those tubing properties which normally vary slowly with distance (e.g., conductivity, wall thickness and diameter). Discrimination against these unwanted variables is achieved by mounting the coils close together and including them in opposite legs of the bridge. Additional discrimination against diametral (fill-factor) changes is obtained through judicious choice of the unbalanced operating point.
Preliminary computer studies indicate that it is possible to select the operating frequency such that both maximum sensitivity to a defect located on the tubing surface opposite the coil and minimum sensitivity to fill-factor variations are achieved simultaneously. The studies also show
.180
that at this optimum frequency and for the bridge unbalance chosen so as to minimize fill-factor variations, the sensitivity to equal size defects located at various depths in the wall first increases as the depth decreases and then decreases as the defect gets very near the surface. This paradoxical result is due to the fact that near the surface the phase of the defect-produced voltage is parallel to that produced by fill-factor variations and is thus discriminated against by the unbalance configuration. This short-coming can easily be overcome by using a two-frequency system, the first frequency being chosen for those defects located deep in the wall and the second, and higher, being chosen for those located on or near the surface.
Preliminary results indicate that it should be possible to detect defects having diameters of the order of 10$ of the wall thickness at the maximum possible depth. This figure may improve as the design progresses. We recognize that spherical flaws are not normally encountered in practice (except as porosity in welds), however, these simply serve as convenient reference flaws for determining relative results. Planar discontinuities will produce significantly larger responses.
Electromagnetic Inspection Methods (Eddy Currents)
C. V. Dodd, W. A. Simpson, Jr., C. C. Cheng,1 C. W. Nestor,2 and W. E. Deeds3
We continued research and development of electromagnetic inspection methods on both theoretical and experimental bases. We are studying the measurement of thickness of single layers as well as thickness of one material clad on another using the phase-sensitive eddy-current instrument. We determined the optimum coil design for various cases of thickness measure-ment to give minimum lift-off effects. We are varying the coil dimensions (primarily the minimum lift-off and the coil length) to give the minimum lift-off effect at the same value of w^or2 as the maximum sensitivity. For the case of thickness measurements of a single conductor, there is an
•••Consultant, Knoxville, Tennessee. 2Mathematics Division. Consultant from the University of Tennessee.
.181
optimum value of the dimensicnless product wjacrr for maximum sensitivity •which in turn depends on the ratio of the thickness of the conductor divided "by the coil mean radius. Figure 8.1 shows how the coil length for minimum lift-off effect varies as a function of thickness/r2 for various values of minimum lift-off.
We have completed the experimental measurements needed to verify the thickness and clad thickness calculations. One series of measurements was made with six coils, all of which were of an identical design so therefore •would have the same results except for fabrication variables. A summary of the calculated and measured results follows;
A. Measurement range 0.1108 to 0.1304- in. of 7075 Al (p = 3.755 nfl cm) at 500 Hz. Average measured phase shift = 2.84°, std dev = 0.07°. Calculated phase shift = 2.80°. Measured error = +0.04° = -1-1.4$. Calculated lift-off variation = 0.07°. Measured lift-off variation = 0.07°.
B. Measurement range 0.0755 to 0.0853 in. of 7075 Al (p = 3.755 [iQ cm) at 1 KHz. Average measured phase shift = 2.41°, std dev = 0.08°. Calculated phase shift = 2.43°. Measured error = -0.02° = -0.8$. Calculated lift-off variation = 0.045°. Measured lift-off variation = 0.05°.
C. Measurement range 0.0755 to 0.0853 in. of 7075 Al (p = 3.755 IJLO cm) clad on a Ni-Cu alloy (commercially designated 60 Alloy) (p = 9.65 \iQ, cm) at 1 KHz. Average measured phase shift =0.99°, std dev = 0.03°. Calculated phase shift = 1.02 Measured error = -0.03° = —3$. Calculated lift-off variation = 0.04°. Measured lift-off variation = 0.04°.
Other measurements were made at various frequencies with other coils, including thicknesses up to 0.360 in.
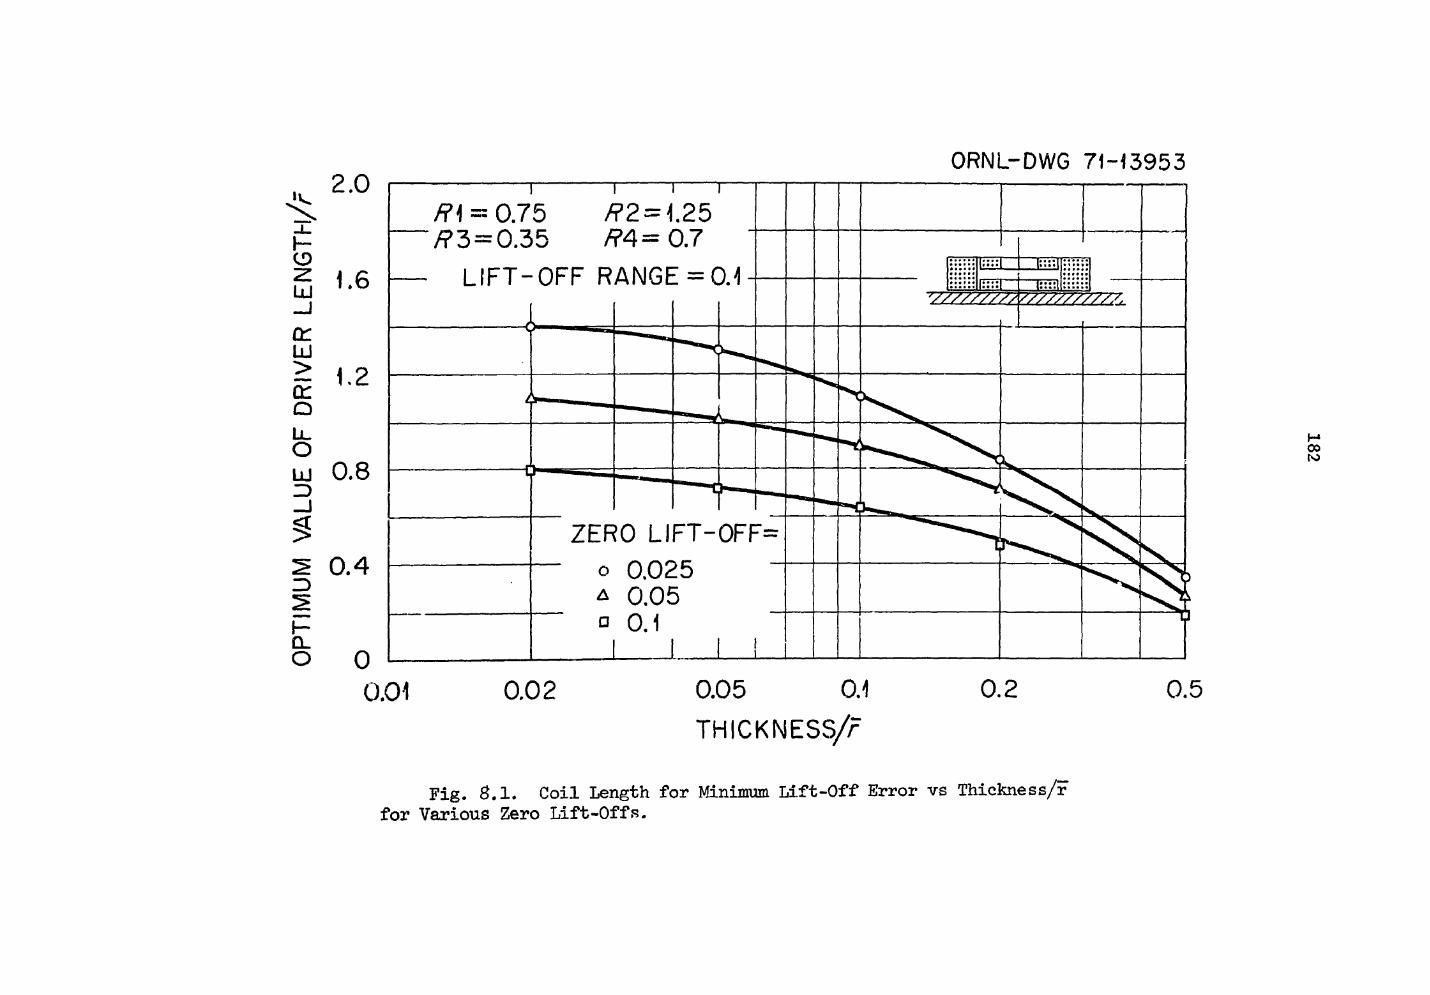
ORNL-DWG 71-43953 2.0
J L 1 -E >
UJ _j 1 . 6
(Z LlJ > 1.2 cc: 1.2 O
LJL O LU 0.8 3 _J <C >
0 .4 ^ H Q_ O 0
0.01
R\ = 0.75 R 3 = 0.35
/?2 = 1.25 # 4 = 0 . 7
L IFT-OFF RANGE = 0.1
0.02 0.05 0.1
THICKNESS/r
0.2 0.5
Fig. 8.1. Coil Length for Minimum Lift-Off Error vs Thickness/r for Various Zero Lift-Offs.
.183
All errors in phase shift were less than 10$ of the range for measure-ments with any single coil, and all errors were well within experimental error. The repeatability of the measurements was within +0.02° (in all cases where the material was homogeneous). The measured lift-off variation was approximately the same as the calculated lift-off variation. The lift-off variation was so small that it was difficult to measure and to adjust. It was on the order of the resolution of the instrument (0.01°).
We feel that these measurements have demonstrated that: (l) the previously derived eddy-current theory is quite accurate and can he used to design optimum eddy-current testsj and (2) the sensitivity and lift-off variation of the optimally designed test will he quite close to the calcu-lated values and exceedingly accurate, and repeatable eddy-current measure-ments can he made (typically +0.1$ of the thickness).
We have written a single computer program that will allow us to design reflection-type coils and the external circuitry for measurement of thick-ness and cladding thickness. This program replaces three previous programs and is faster, more accurate and versatile.
We are also studying the design of attenuators to use with the various probes. These attenuators, consisting of R-C networks, can have the following beneficial effects, if properly matched to the particular inspection problem: (l) they limit the bandwidth of the coil and therefore reduce the noise; (2) they can significantly reduce the temperature drifts of the coil; and (3) they can vary the lift-off characteristics of a coil.
Measurement of Cold Work in Stainless Steel We are continuing our studies of the application of electromagnetic
methods to the determination of the degree of cold work in type 316 stainless steel. We are presently utilizing two methods for the detection of changes in magnetic permeability produced by cold working. The first employs a low-frequency eddy-current bridge and is used for examining tubular specimens. The second method, applicable to flat-plate specimens, emphasizes the use of the Phase-Sensitive Eddy-Current Instrument.
We completed our measurements on the various available samples of 0.230-in. OB FFTF tubing, including those of the "Round-Robin" program. In general, we have found that it is possible to obtain {*cod correlation
.184
"between instrument reading and the degree of cold work for a given fabrica-tion lot of tubing, but that recalibration is necessary whenever heats or vendors are changed. This eventuality was anticipated from the beginning.
We received a number of flat plate specimens from Argonne National Laboratory and began a computer study and coil optimization procedure preparatory to making the necessary measurements with the Phase-Sensitive Eddy-Current Instrument. It is anticipated that the same problems which accompanied the tubing measurements will be encountered. The phase-sensitive instrument, however, as a standard piece of equipment, lends itself more readily to the solution of these problems.
Ultrasonic Inspection Methods »
K. V. Cook, H. L. Whaley, and Laszlo Adler3
Ultrasonic Frequency Analysis We continued our basic studies of frequency effects in ultrasonic
testing by means of spectral analysis. We are employing a special electronic system developed for these studies to learn more about the effects of frequency on conventional ultrasonic techniques and to develop new test techniques based upon principles derived from these studies.
We are studying the spectral variations in broadbanded ultrasonic pulses as a function of the acoustical discontinuity with which they have interacted. Such a study will lead to improvements in the characterization of hidden flaws in materials and components by ultrasonic inspection.
In the last report on this work,4" an inconsistency in results obtained with the two-transducer technique was reported. This problem occurred when-ever the reflector was inclined in the general direction of the receiver and disappeared when the reflector was inclined away from the receiver. This situation has been investigated in more detail and found to be due to specular reflections reaching the receiver. This condition can be identi-fied experimentally by the occurrence of abrupt amplitude changes in the rf
L. Whaley, K. V, Cook and Laszlo Adler, Fuels and Materials Development Program Quart. Progr. Rept. September 30, 1971, 0RNL-TM-3550, p. 169-171.
.185
waveform and by irregular changes in the frequency spectrum as the receiver position is varied slightly. The receiver can then be rotated to a position where no specular reflections are obtained. With the solution to this problem in hand, it was seen that the assumptions made to simplify the mathematical analysis were correct, and a simple computer program was written for the two-transducer technique. This program was used to process new data from the spectral analysis of ten reflectors of irregular shapes and contours at random angles with respect to the source and receiver. Good results were obtained for reflector size in each case.
A number of practical considerations for data taking with the two-transducer technique were formulated as a result of this experience. A few of the more important ones are listed below:
1. Use of the dual electronic gate (for selecting portions of the complex rf signal for analysis) is necessary for all but the simplest of reflector shapes.
2. The most critical part of the technique is the placement of the two gates for each Af determination. The correct positioning of the gates is aided by experience and the ability to make small changes in the receiver position while observing the corresponding changes in the rf signal.
3. Reflections with irregular contours may reflect specularly in a number of directions, and care must be taken not to analyze these specular signals. They may be recognized as large abrupt changes in signal amplitude as a receiver position is varied. Experience again is an important factor in separating specular signals from the desired scattered signals from the edges of the reflector.
Ultrasonic Imaging Optical techniques are useful to gain an understanding of ultrasonic
interactions that are difficult to analyze by conventional methods employing electronic equipment only. Schlieren techniques image the sound itself, while Bragg diffraction and volume holography display any acoustical discontinuity with which the ultrasound field has interacted. We are
.186
interested in all such techniques and have developed a flexible optical system for various studies. The basic system is a mirror schlieren system with both continuous and pulsed light sources, a 6-in.-diam field of view and a television display. We have added a video tape system for data recording.
The new optical table employing simplified, inexpensive optical benches and component carriers was used to set up an experimental interferometric system for imaging ultrasound. The principle of operation is quite similar to that of the Michelson interferometer. A reorientation of interference fringes was observed when the ultrasound was propagated through a water bath located in one leg of the interferometer. It was very difficult both to initially adjust the optics and to maintain alignment due to the relative instability of the mechanical fixturing and the marginal coherence of the small cw laser available for this experiment. However, this technique shows a promise as a supplementary visualization technique under more carefully controlled conditions.
The auxiliary optical system is now being employed to set up the Bragg diffraction technique for imaging of acoustical discontinuities in materials. New mechanical fixtures have been built to provide the necessary support and motions for the transducer, manipulator, water tank, laser, and smaller optical components. We also constructed four transducer units of square cross section and high power capacity especially for the Bragg diffraction work. A minor change allows the television system of the schlieren optics to be used in the Bragg system. Blurred images of wire hooks placed in the water between the ultrasonic transducer and the area where the laser beam passes through the water bath have already been obtained. We hope to even-tually be able to image flaws in the weld samples discussed in recent Quarterly Reports by this technique for comparison with the results obtained by inspecting these samples in the schlieren system and by conventional ultrasonics. We will continue to improve the image quality, sensitivity, and ease of use of this system.
.187
Penetrating Radiation Inspection Methods
B. E. Foster and S. D. Snyder
We have continued our development of a closed-circuit television system5 for use as a rapid high sensitivity densitometer for interpreting radiographs. The optimum system response is achieved with the sensitivity controls on the sampling unit and x-y recorder set at 10 and 200 mv/cm, respectively.
A model 160 Boxcar Integrator was evaluated as a replacement for the 1S1 sampling unit. The Boxcar Integrator provided variable gate width, sampling rate and integration time as well as the capability of noise suppression. Quite an improvement of the system could be achieved with such an instrument.
We have virtually eliminated the earlier problem of vertical jitter by utilizing coincidence triggering of the line selection and read-out devices.
5B. E. Foster and S. D. Snyder, Fuels and Materials Development Program Quart. Progr. Rept. September 30, 1971, ORNL-TM-3550, p. 173-174.
.188
9. MECHANICAL PROPERTIES OF STRUCTURAL MATERIALS
J. R. Weir, Jr., H. McCoy, Jr., and W. R. Martin
The use of structural materials in nuclear reactors at progressively higher temperatures requires that we improve design methods to insure dependable and safe operation of such systems. The improved design methods involve the procurement of mechanical property data under various possible service conditions and that analytical methods be developed for using these materials properties to design complex structures. ORNL is currently active in both of these areas, but the present report will be concerned only with the mechanical properties information.
Although many of the methods that will be developed will be uni-versally applicable for high temperature design, the current work is concerned primarily with IMFBR's. The materials being studied include types 304 and 316 stainless steel, types 304 and 316 stainless steel weldments prepared "by different welding processes, and base metal and weldments of Cr-Mo steels of various compositions.
Mechanical Properties of Type 304 Stainless Steels
R. W. Swindeman R. D. Waddell, Jr.
We are continuing in our efforts to generate the sort of mechanical property data on type 304 stainless steel which will prove useful for design applications. Part of our work is in direct support of the Structural Design Methods for IMFBR Components Program (AEC 189 Activity No. 10556), which requires a wide variety of exploratory tests including tensile, creep, relaxation, and strain cycling. Data are needed to assist in the development of the constitutive equations required for design analysis. The program emphasis is on a single heat of type 304 stainless steel (9T2796), although some preliminary work has been per-formed using a different heat (8043813),
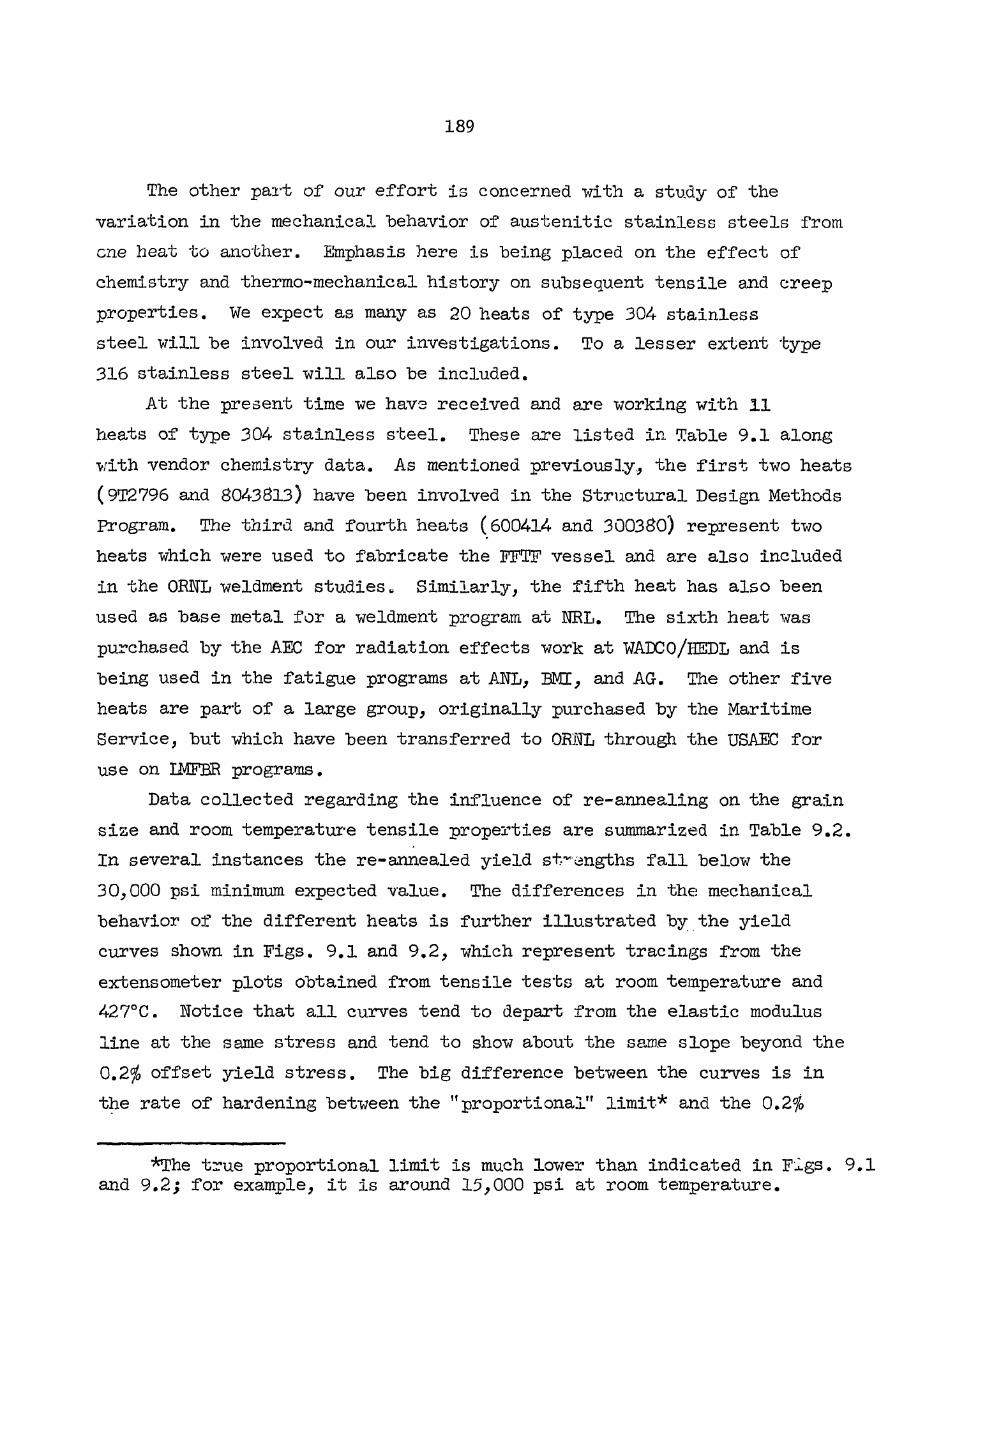
.189
The other part of our effort is concerned with a study of the variation in the mechanical "behavior of austenitic stainless steels from one heat to another. Emphasis here is being placed on the effect of chemistry and thermo-mechanical history on subsequent tensile and creep properties. We expect as many as 20 heats of type 304 stainless steel will be involved in our investigations. To a lesser extent type 316 stainless steel will also be included.
At the present time we have received and are working with 11 heats of type 304 stainless steel. These are listed in Table 9.1 along with vendor chemistry data. As mentioned previously., the first two heats (9T2796 and 8043813) have been involved in the Structural Design Methods Program. The third and fourth heats (600414 and 300380) represent two heats which were used to fabricate the FFTF vessel and are also included in the ORNL weldment studies u Similarly, the fifth heat has also been used as base metal for a weldment program at NRL. The sixth heat was purchased by the AEC for radiation effects work at WADCO/HEDL and is being used in the fatigue programs at AWL, BMI, and AG. The other five heats are part of a large group, originally purchased by the Maritime Service, but which have been transferred to 0R2TL through the USAEC for use on IMFBR programs.
Data collected regarding the influence of re-annealing on the grain size and room temperature tensile properties are summarized in Table 9.2. In several instances the re-annealed yield st^angths fall below the 30,000 psi minimum expected value. The differences in the mechanical behavior of the different heats is further illustrated by the yield curves shown in Figs. 9.1 and 9.2, which represent tracings from the extensometer plots obtained from tensile tests at room temperature and 427°C. Notice that all curves tend to depart from the elastic modulus line at the same stress and tend to show about the same slope beyond the 0.2$ offset yield stress. The big difference between the curves is in the rate of hardening between the "proportional" limit* and the 0.2$
*The true proportional limit is much lower than indicated in Figs. 9.1 and 9.2; for example, it is around 15,000 psi at room temperature.
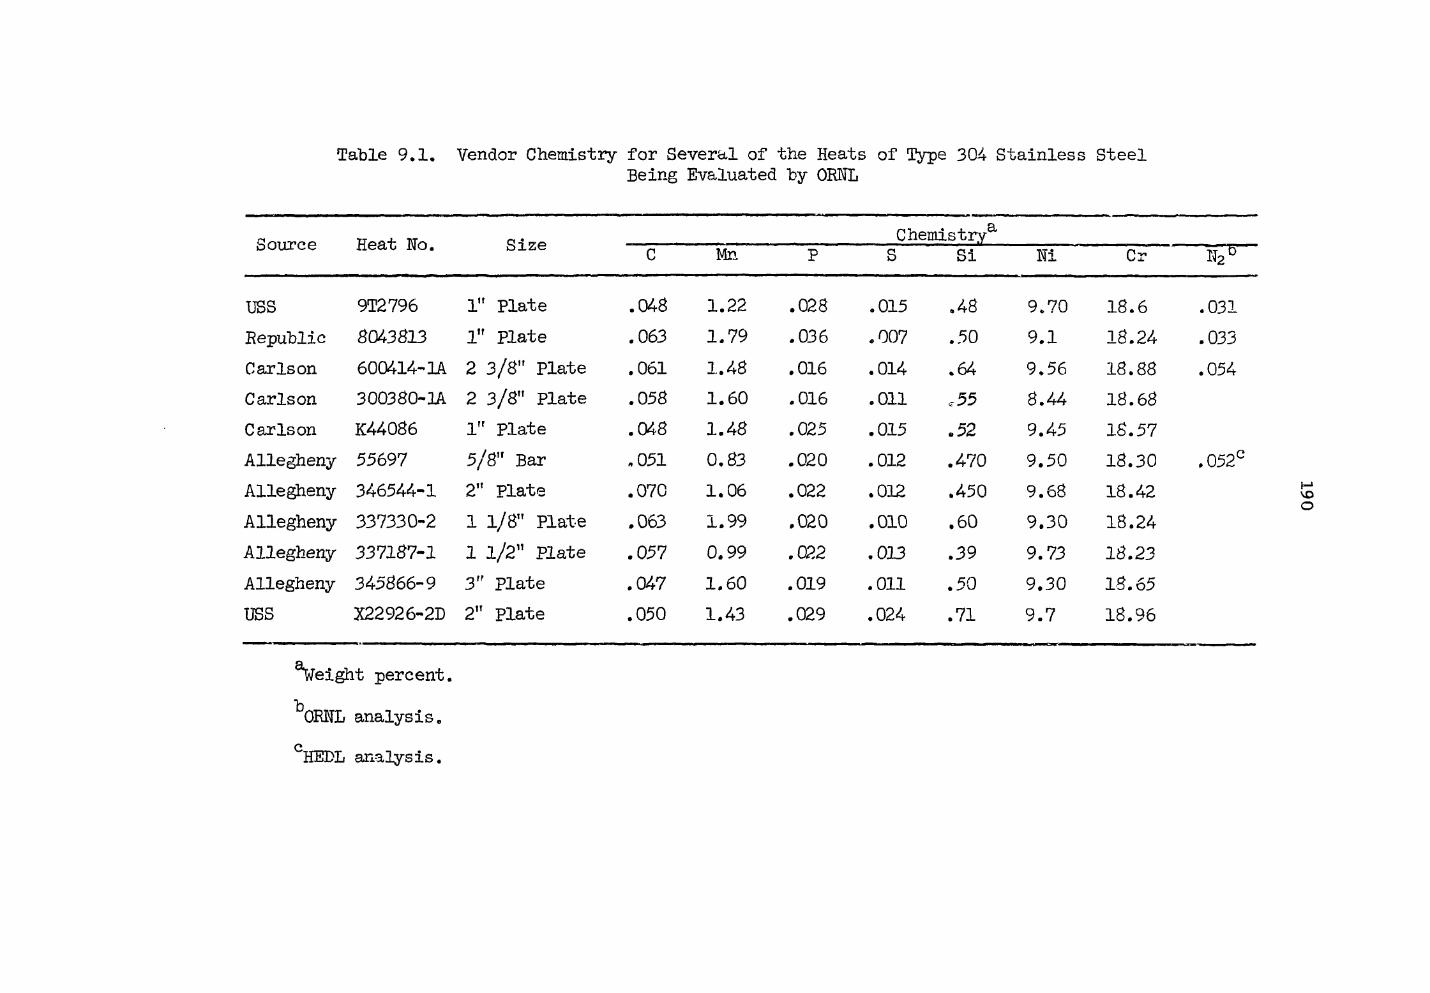
Table 9.1. Vendor Chemistry for Several of the Heats of Type 304 Stainless Steel Being Evaluated by ORNL
source Heat »b. Size — 5 ^hemxstr/ ^
u s s 9T2796 1" Plate
•co • 1.22 .028 .015 .48 9.70 18.6 .031 Republic 8043813 1" Plate .063 1.79 .036 .007 .50 9.1 18.24 .033 Carlson 600414-1A 2 3/8" Plate .061 1.48 .016 .014 .64 9.56 18.88 .054 Carlson 300380-1A. 2 3/8" Plate .058 1.60 .016 .011 ,55 8.44 18.68 Carlson K44086 1" Plate .048 1.48 .025 .015 .52 9.45 18.57 Allegheny 55697 5/8" Bar ,051 0.83 .020 .012 .470 9.50 18.30 »052c
Allegheny 346544-1 2" Plate .070 1.06 .022 .012 .450 9.68 18.42 Allegheny 337330-2 1 1/8" Plate .063 1.99 .020 .010 .60 9.30 18.24 Allegheny 337187-1 1 1/2" Plate .057 0.99 .022 .013 .39 9.73 18.23 Allegheny 345866-9 3" Plate .047 1.60 .019 .011 . 5 0 9.30 18.65 USS X22926-2D 2" Plate .050 1.43 .029 .024 .71 9.7 18.96
height percent.
^ORNL analysis. c HEDL analysis.
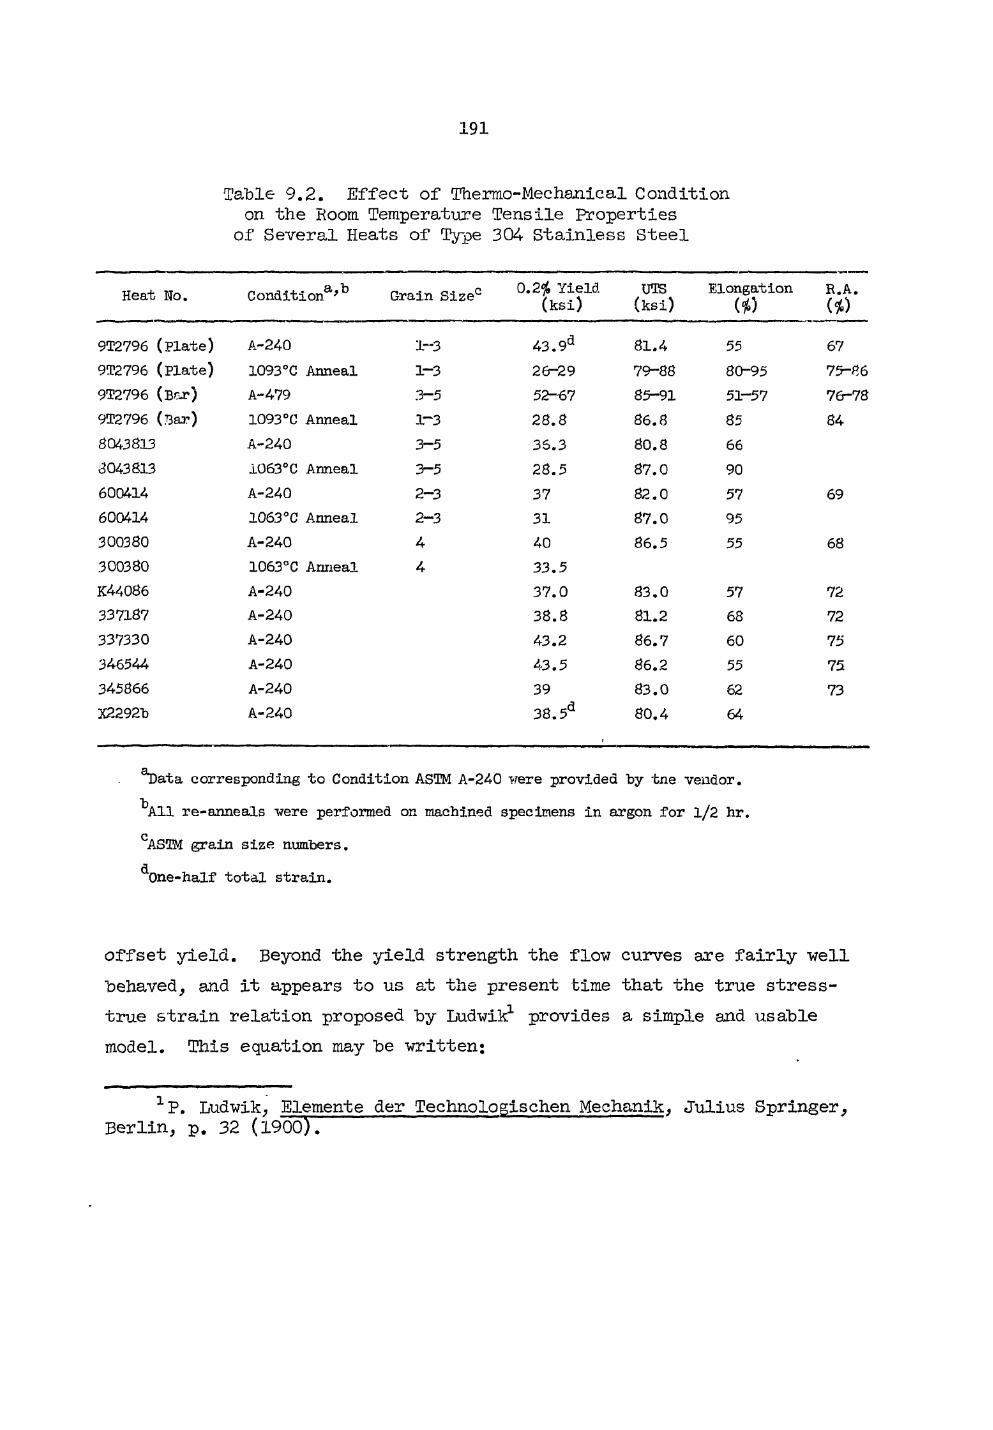
.191
Table 9.2. Effect of Thermo-Mechanical Condition on the Room Temperature Tensile Properties
of Several Heats of Type 304 Stainless Steel
Heat No. Condition8"'13 Grain Size0 0.2$ Yield (ksi)
UTS (ksi)
Elongation w
R.A. (*)
9T2796 (Plate) A-240 1-3 43.9d 81.4 55 67 9T2796 (Plate) 1093°C Anneal 1-3 26-29 79-88 80-95 75-86 9T2796 (Bar) A-479 3-5 52-67 85-91 51-57 76-78 9T2796 (Bar) 1093°C Anneal 1-3 28.8 86.8 85 84 8043813 A-240 3-5 36.3 80.8 66 £043813 1063°C Anneal 3-5 28.5 87.0 90 600414 A-240 2-3 37 82.0 57 69 600414 1063°C Anneal 2-3 31 87.0 95 300380 A-240 4 40 86.5 55 68 300380 1063°C Anneal 4 33.5 K44086 A-240 37.0 83.0 57 72 337187 A-240 38.8 81.2 68 72 337330 A-240 43.2 86.7 60 75 346544 A-240 43.5 86.2 55 75 345866 A-240 39 83.0 62 73 X2292b A-240 38.5d 80.4 64
^ata corresponding to Condition ASTM A-240 were provided by tne vendor.
All re-anneals -were performed on machined specimens in argon for 1/2 hr. CASTM grain size numbers.
One-half total strain.
offset yield. Beyond the yield strength the flow curves are fairly well "behaved, and it appears to us at the present time that the true stress-true strain relation proposed by Ludwik1 provides a simple and usable model. This equation may be written:
1P. Ludwik, Elemente der Technologischen Mechanik, Julius Springer, Berlin, p. 32 (1900).
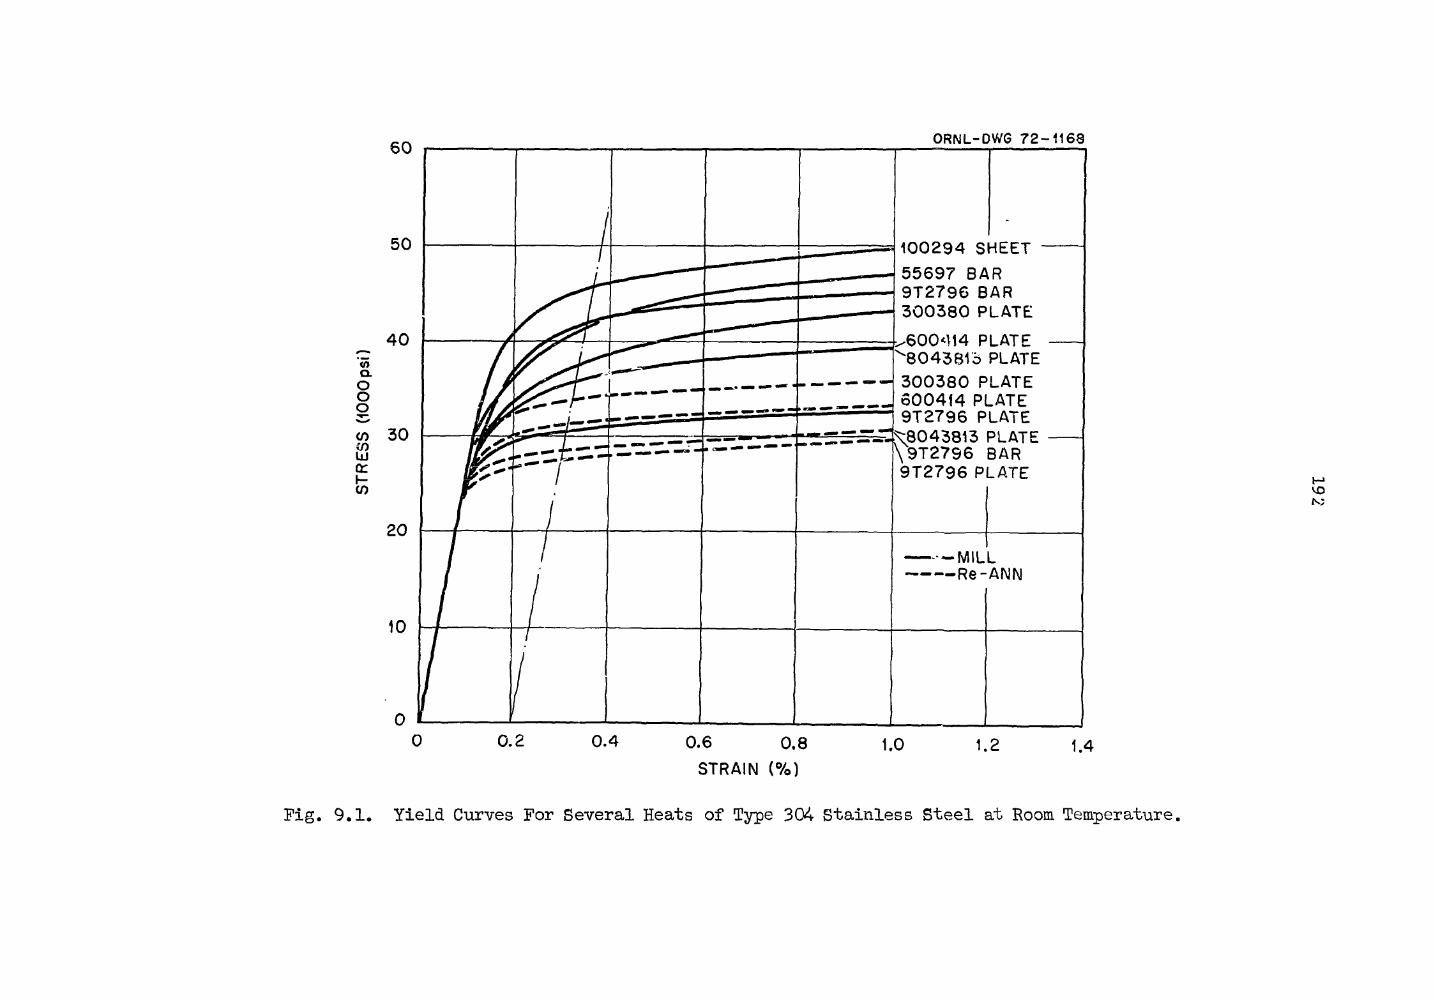
ORNL-DWG 7 2 - 1 1 6 8
1 0 0 2 9 4 SHEET "
5 5 6 9 7 BAR 9 T 2 7 9 6 BAR 3 0 0 3 8 0 PLATE
600<\14 PLATE 8 0 4 3 8 1 5 PLATE
3 0 0 3 8 0 PLATE 6 0 0 4 1 4 PLATE 9 T 2 7 9 6 PLATE
^ 8 0 4 3 8 1 3 PLATE \ 9 T 2 7 9 6 BAR 9 T 2 7 9 6 PLATE
— — M I L L R e - A N N
vo Ni
0.6 0.8 STRAIN ( % )
1.2 1.4
Fig. 9.1. Yield Curves For Several Heats of Type 304 Stainless Steel at Room Temperature.
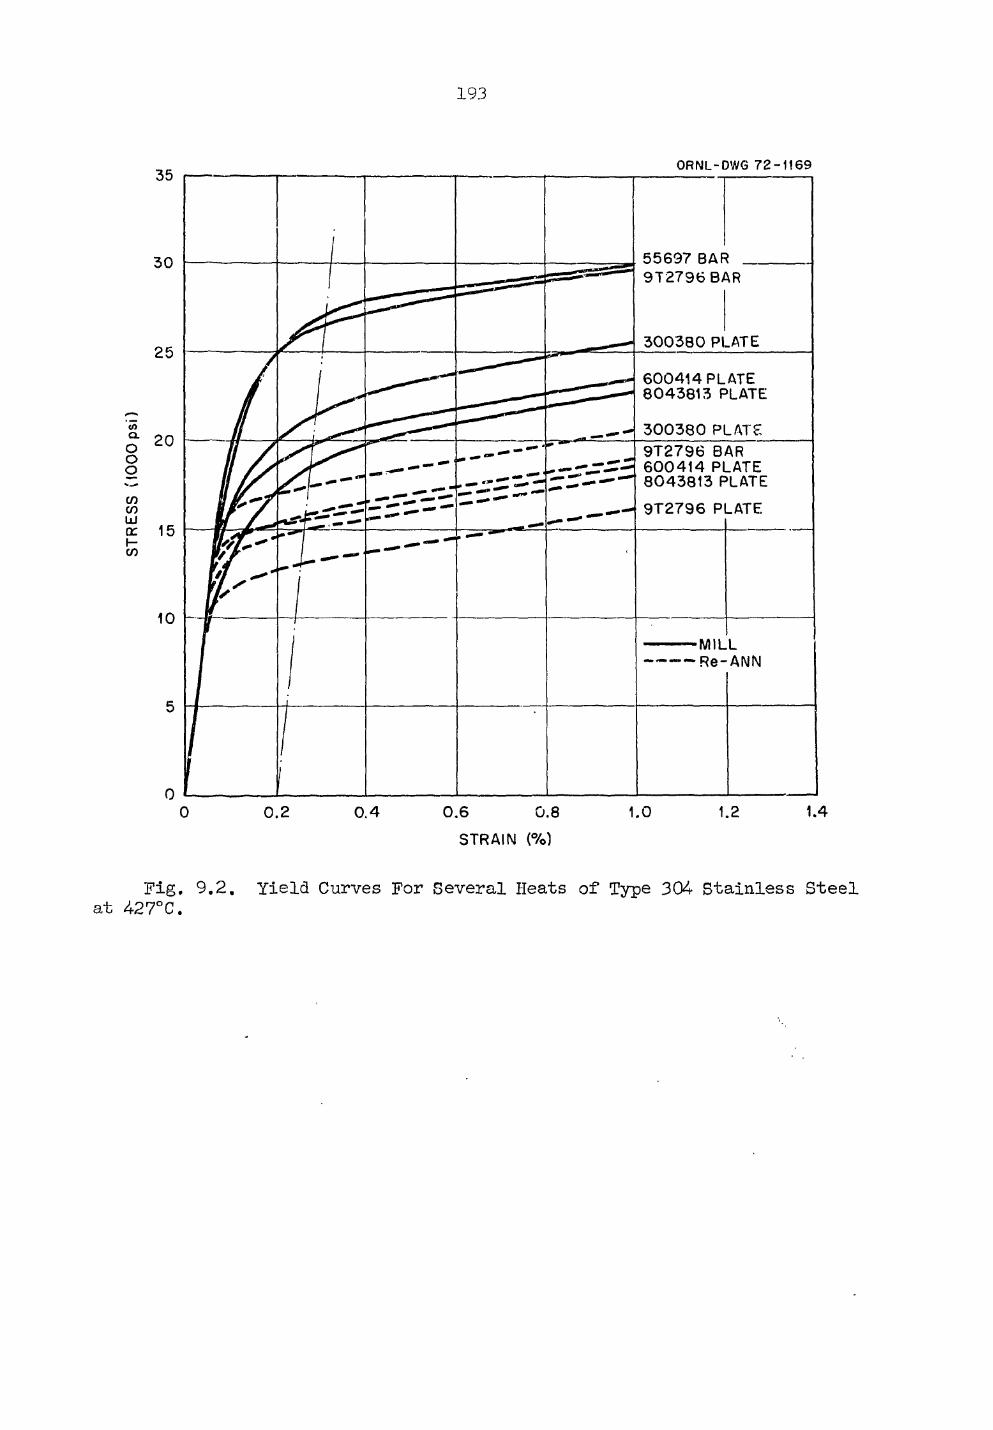
.193
STRAIN (%)
Fig. 9.2. Yield Curves For Several Heats of Type 304 Stainless Steel at 427°C.
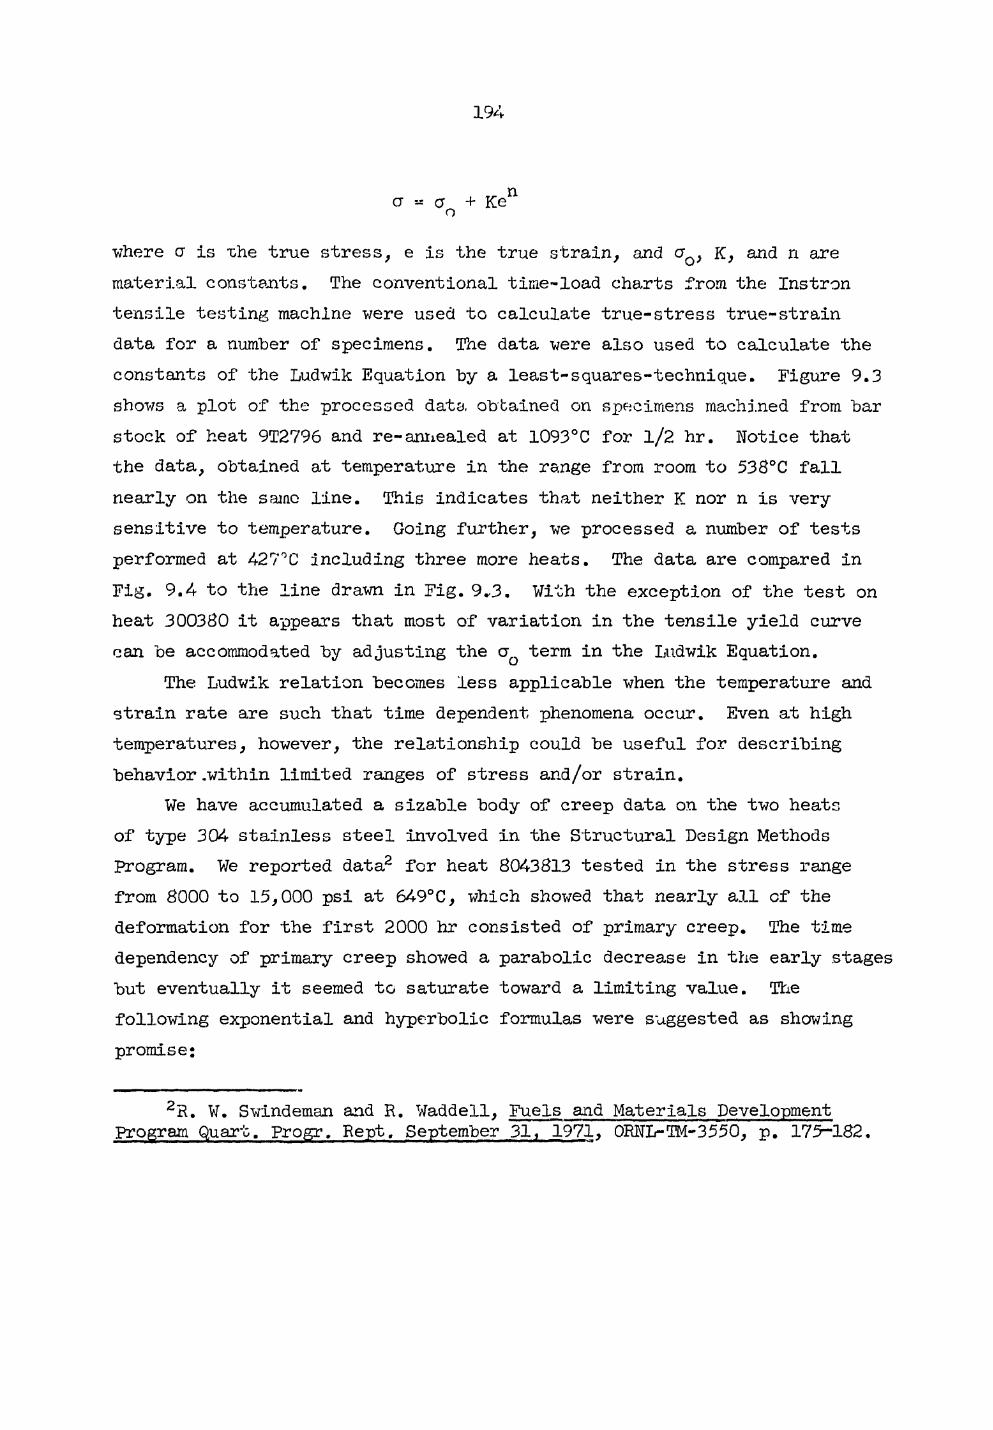
.194
, if n CT a + K e
o
where CT is the true stress, e is the true strain, and CTq, K, and n are material constants. The conventional time-load charts from the Instron tensile testing machine were used to calculate true-stress true-strain data for a number of specimens. The data were also used to calculate the constants of the Ludwik Equation by a least-squares-technique. Figure 9.3 shows a plot of the processed data obtained on specimens machined from bar stock of heat 9T2796 and re-annealed at 1093°C for 1/2 hr. Notice that the data, obtained at temperature in the range from room to 538°C fall nearly on the same line. This indicates that neither K nor n is very sensitive to temperature. Going further, we processed a number of tests performed at 427°C including three more heats. The data are compared in Fig. 9.4 to the line drawn in Fig. 9.3. With the exception of the test on heat 300380 it appears that most of variation in the tensile yield curve can be accommodated by adjusting the oQ term in the Ludwik Equation.
The Ludwik relation becomes less applicable when the temperature and strain rate are such that time dependent phenomena occur. Even at high temperatures, however, the relationship could be useful for describing behavior .within limited ranges of stress and/or strain.
We have accumulated a sizable body of creep data on the two heats of type 304 stainless steel involved in the Structural Design Methods Program. We reported data2 for heat 8043813 tested in the stress range from 8000 to 15,000 psi at 649°C, which showed that nearly all of the deformation for the first 2000 hr consisted of primary creep. The time dependency of primary creep showed a parabolic decrease in the early stages but eventually it seemed to saturate toward a limiting value. The following exponential and hyperbolic formulas were suggested as showing promise;
2R. W. Swindeman and R. Waddell, Fuels and Materials Development program Quart. Progr. Rept. September 31, 1971, 0RNL-TM-3550, p. 175-182.
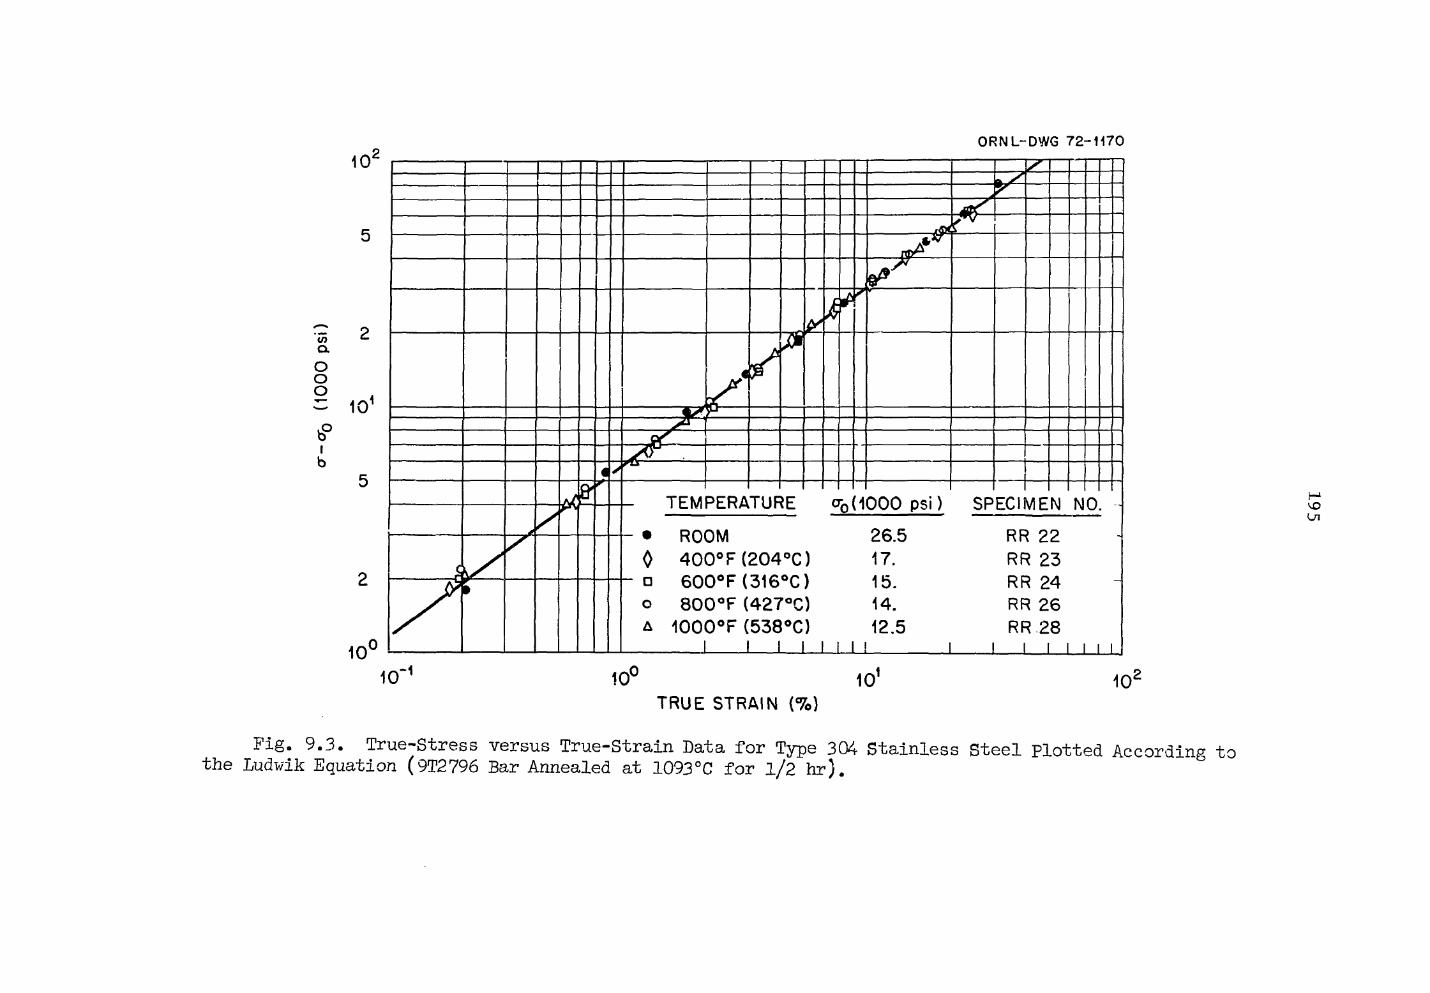
O R N L - D W G 72-1168
1 0 - 1
1 0 v 1 0 1 0 ' T R U E S T R A I N ( % )
Fig. 9.3. True-Stress versus True-Strain Data for Type 304 Stainless Steel plotted According to the Ludwik Equation (9T2796 Bar Annealed at 1093°C for l/2 hr).
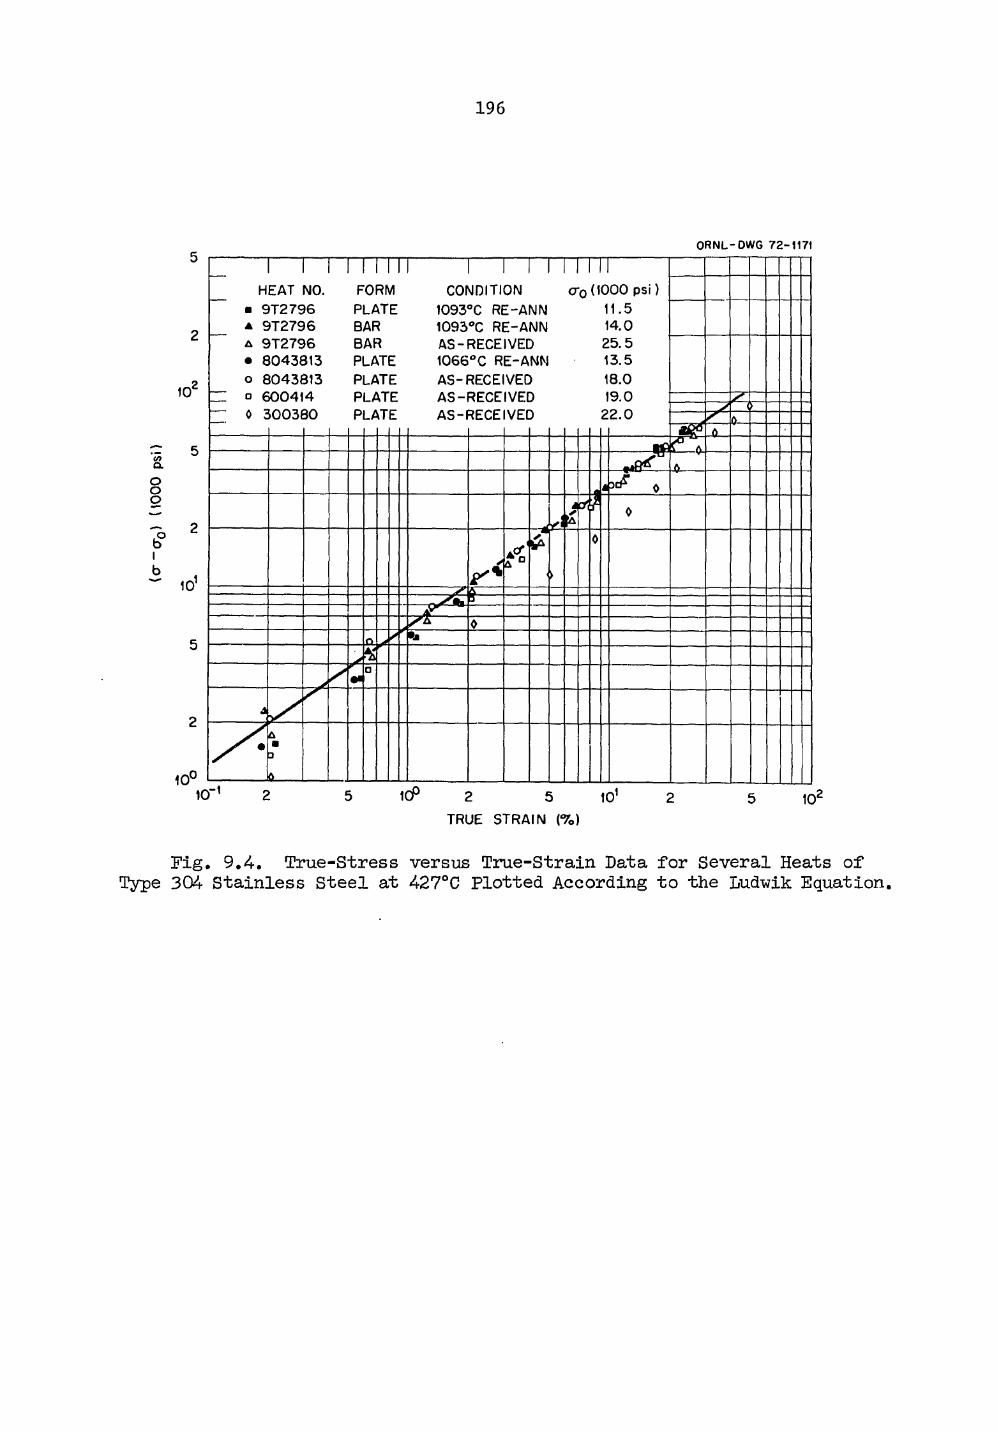
196
ORNL-DWG 72- 1180
</> a. O O O
b°
HEAT NO. FORM CONDITION CTQ (1000 ps i ) • 9 T 2 7 9 6 PLATE 1093°C R E - A N N 11.5 A 9 T 2 7 9 6 BAR 1093°C R E - A N N 14.0 A 9 T 2 7 9 6 BAR A S - R E C E I V E D 2 5 . 5 • 8 0 4 3 8 1 3 PLATE 1 0 6 6 ° C R E - A N N 13 .5 O 8 0 4 3 8 1 3 PLATE A S - R E C E I V E D 18.0 • 6 0 0 4 1 4 PLATE A S - R E C E I V E D 19.0 0 3 0 0 3 8 0 PLATE A S - R E C E I V E D 2 2 . 0
2 5
TRUE S T R A I N ( % )
Fig. 9.4. True-Stress versus True-Strain Data for Several Heats of Type 304 Stainless Steel at 427°C Plotted According to the Ludwik Equation.
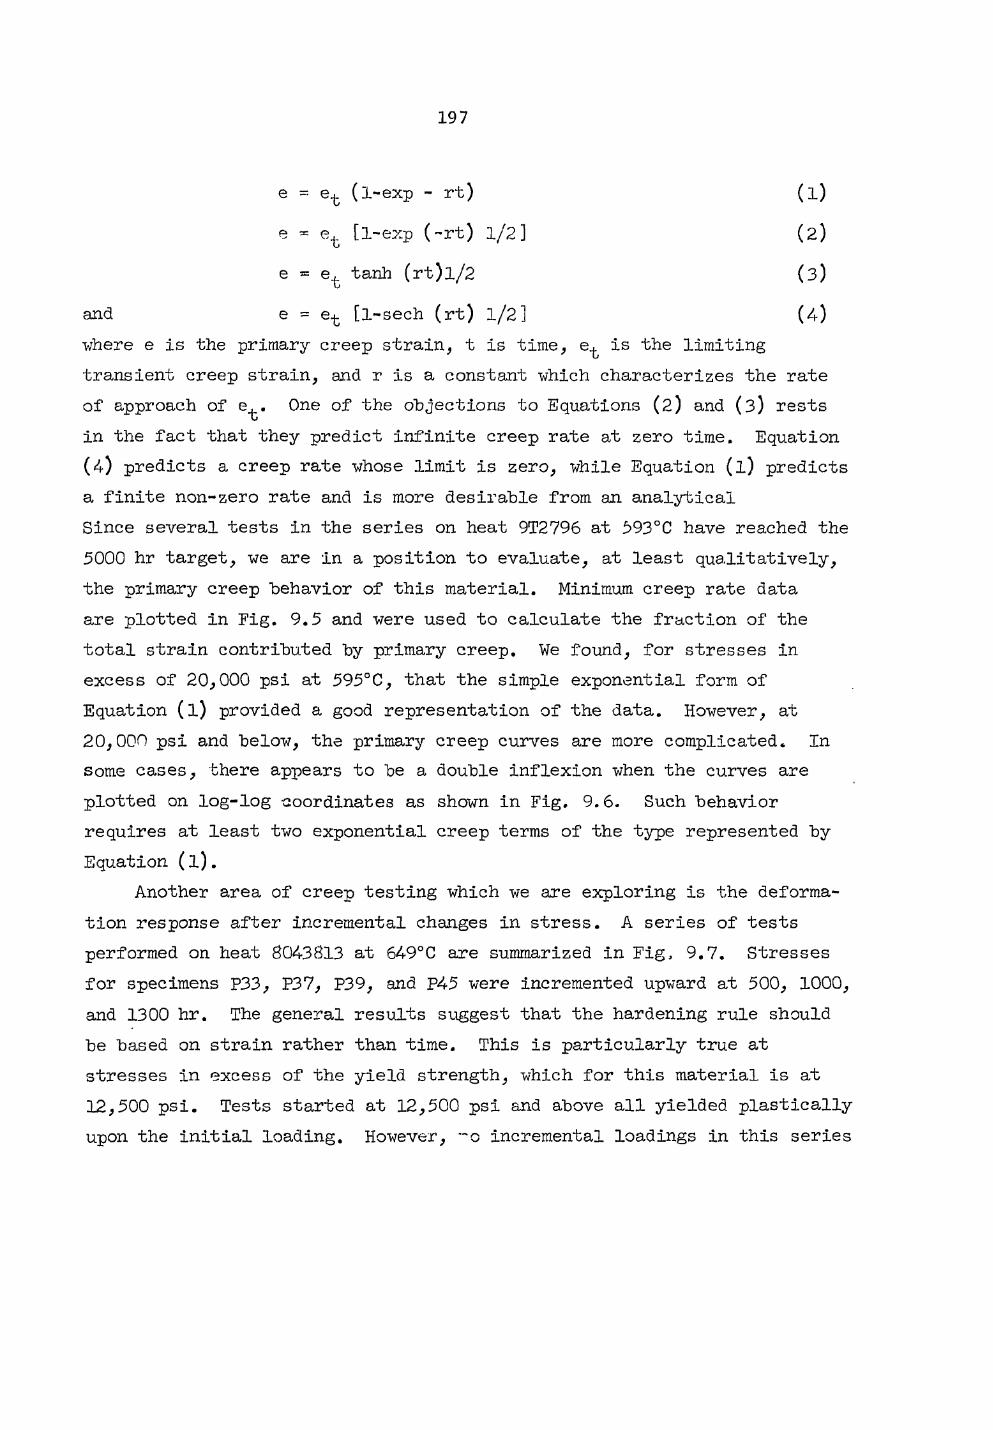
.197
e = e^ (l-exp - rt) (l)
e = et [l-exp (-rt) 1/2] (2)
e = et tanh (rt)l/2 (3)
and e = et [l-sech (rt) 1/2] (4) where e is the primary creep strain, t is time, e^ is the limiting transient creep strain, and r is a constant which characterizes the rate of approach of e^. One of the objections to Equations (2) and (3) rests in the fact that they predict infinite creep rate at zero time. Equation (4) predicts a creep rate whose limit is zero, while Equation (l) predicts a finite non-zero rate and is more desirable from an analytical Since several tests in the series on heat 9T2796 at 593°C have reached the 5000 hr target, we are in a position to evaluate, at least qualitatively, the primary creep behavior of this material. Minimum creep rate data are plotted In Fig. 9.5 and were used to calculate the fraction of the total strain contributed by primary creep. We found, for stresses in excess of 20,000 psi at 595°C, that the simple exponential form of Equation (l) provided a good representation of the data. However, at 20,000 psi and below, the primary creep curves are more complicated. In some cases, there appears to be a double inflexion when the curves are plotted on log-log coordinates as shown in Fig. 9.6. Such behavior requires at least two exponential creep terms of the type represented by Equation (l).
Another area of creep testing which we are exploring is the deforma-tion response after incremental changes in stress. A series of tests performed on heat 8043813 at 649°C are summarized in Fig, 9.7. Stresses for specimens P33, P37, P39, and P45 were incremented upward at 500, 1000, and 1300 hr. The general results suggest that the hardening rule should be based on strain rather than time. This is particularly true at stresses in excess of the yield strength, which for this material is at 12,500 psi. Tests started at 12,500 psi and above all yielded plastically upon the initial loading. However, incremental loadings in this series
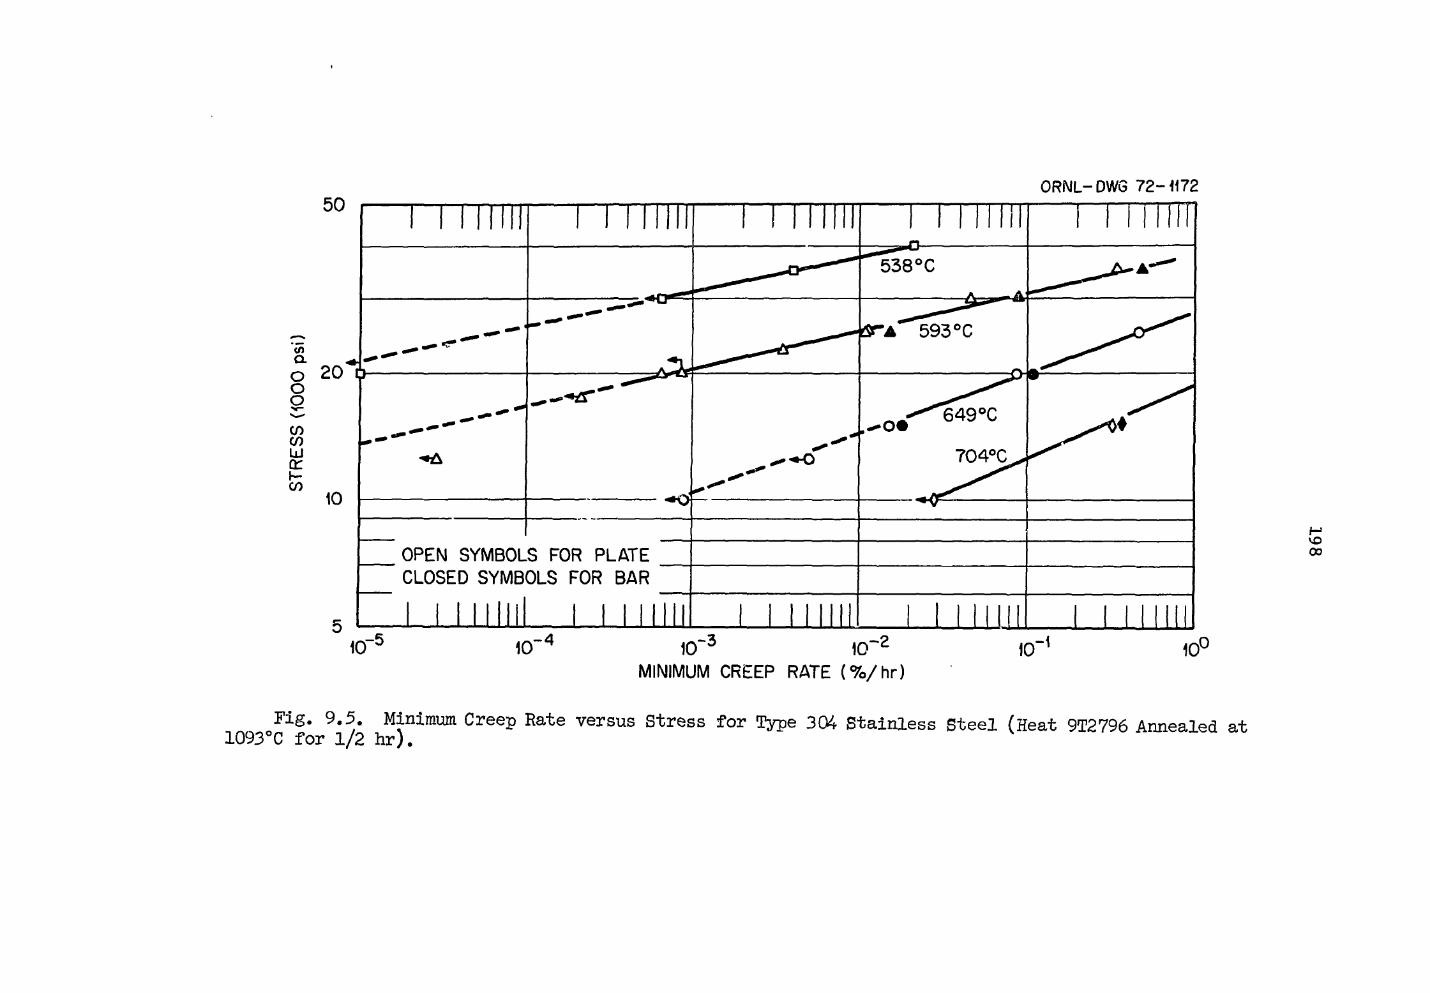
ORNL-DWG 72-1172 5 0
<n
O O
CO C/) UJ or i -c n
10
i i l i n n 1 1 1 M i l l i i l i n n i i M I I I I 1 1 1 m i
Y ^
»»
704%^*
OPEN SYMBOLS FOR PLATE CLOSED SYMBOLS FOR BAR
1 1 1 M i l l 1 1 1 M i l l 1 1 1 I N I 1 1 M I I I I 1 1 1 m i 10" -5
1 0 -4
1 0 -3 10 - 2
1 0 - 1
MINIMUM CREEP RATE ( % / h r ) 1 0
, 0
Fig. 9.5. Minimum Creep Rate 1093°C for 1/2 hr).
versus Stress for Type 304 Stainless Steel (Heat 9T2796 Annealed at
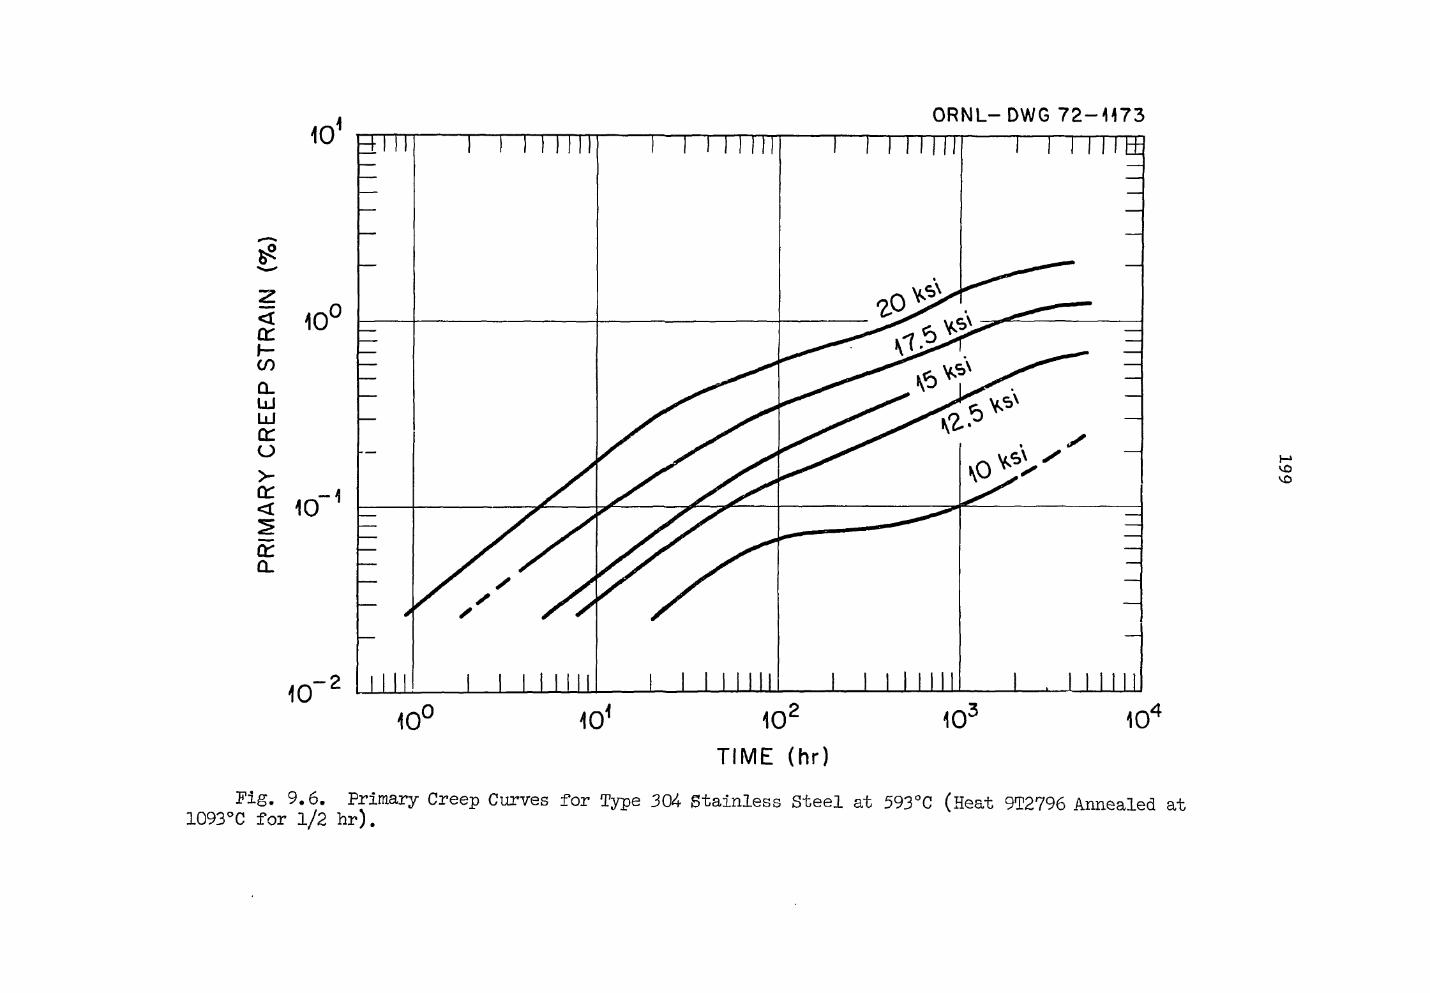
1 0 O R N L - DWG 7 2 - H 7 3
10° b
„ o
< cc h -c o
Q . L U Ld Q: o >
t r -a < 10
a: CL
10 - 2
H1 VO VO
10 o 101 10
TIME (hr) 10c 10
Fig. 9.6. Primary Creep Curves for Type 304 Stainless Steel at 593°C (Heat 9T2796 Annealed at 1093°C for 1/2 hr).
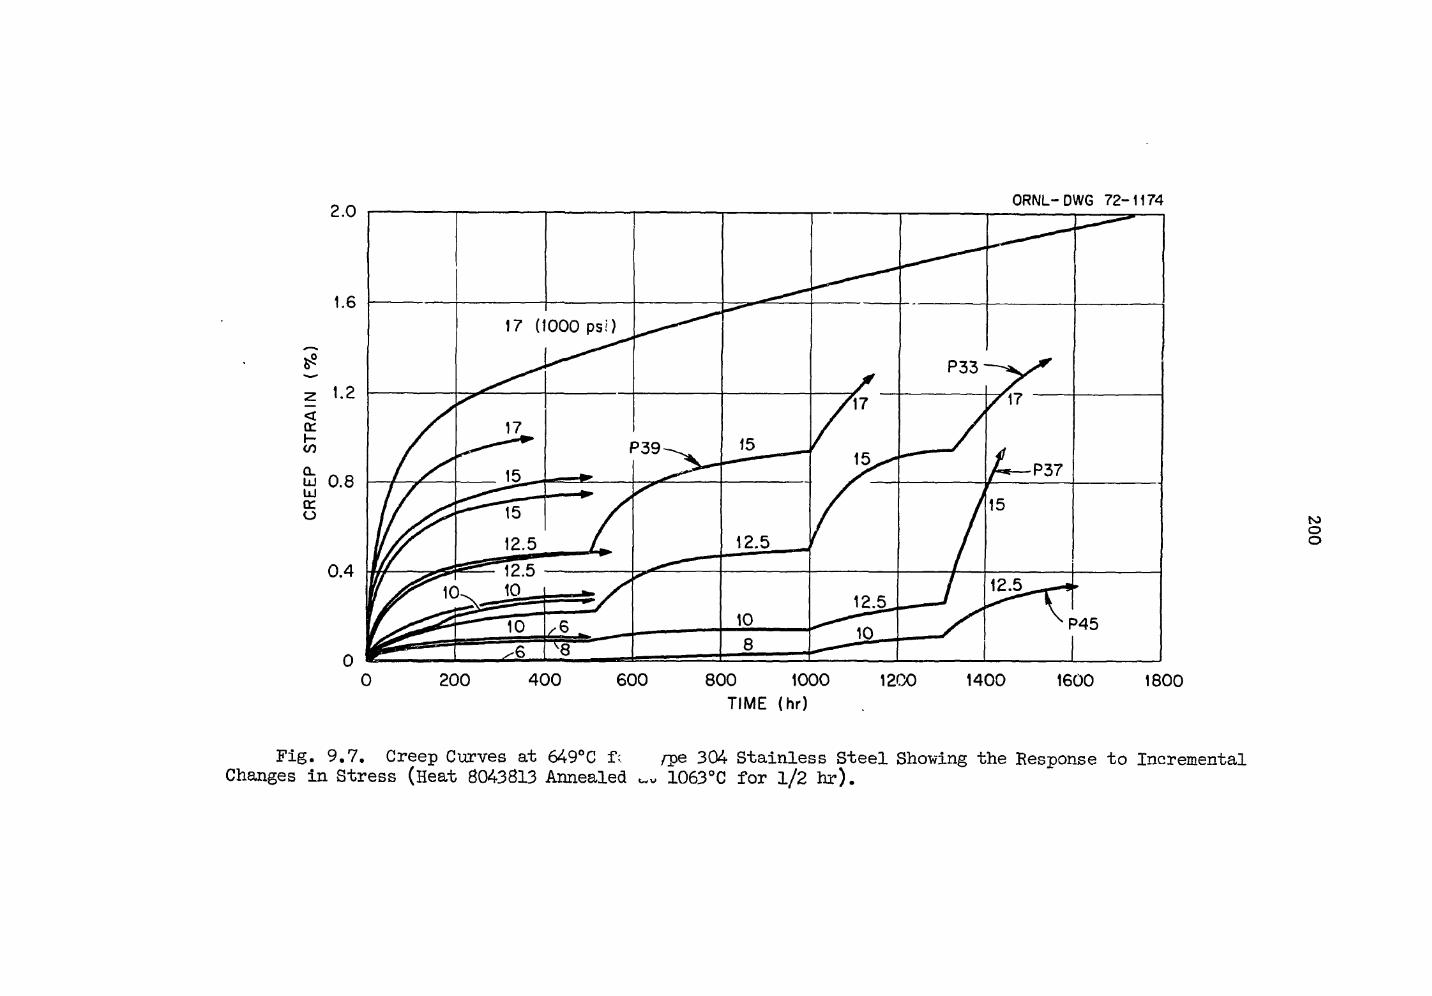
ORNL-DWG 72-1174
to o o
800 1000 TIME (hr)
1200 1400 1600 1800
Fig. 9.7. Creep Curves at 649°C f; /pe 304 Stainless Steel Showing the Response to Incremental Changes in Stress (Heat 8043813 Annealed 1063°C for 1/2 hr).
2Q1
produced plastic flow. Based on these and other data not included here we feel that the magnitude of plastic flow that occurs when the stress is increased depends largely on the size of the stress increment and the amount of strain accumulated at the lower stress.
That part of our study which deals with the heat-to-heat variation in creep strength is now underway. The initial testing condition was selected to be 593°C at stresses which should produce rupture in 100 and 1000 hr, assuming heats of average strength. These stresses were 35,000 and 30,000 psi, respectively. A third stress was selected to be 17,000 psi and should produce approximately total strain in 1000 hr for heats of average strength. The stress-rupture data which we have obtained are compared to average and minimum expected rupture properties in Table 9.3. Lives at 35,000 psi range from 23 to 325.9 hr and at 30,000 psi from 101 to 3184- hr. Heats 6004-14- and 300380 show losses in rupture strength as a result of the re-anneal at 1063°C while K44086 indicated a gain in strength. Creep curves for tests at 17,000 and 17,500 psi at 593°C are shown in Fig. 9.8. These curves include the elastic and plastic strain which occur on loading. It is apparent plastic yielding is extremely important in determining whether or not ±<f0 strain is achieved within the first 1000 hr. Those heat which were in the A-24-0 condition exhibited small plastic strains on loading and were well below the 1 $ level. Weak heats, such as 9T2796 and 8043813 in the re-annealed conditions, exceeded the 1$ strain level at time zero.
A test series was initiated to explore the relaxation behavior of type 304 stainless steel (heat 9T2796). The test results are summarized in Table 9.4 and Fig. 9.9. Testing was performed in an electro-hydraulic machine and the servo-controlled strains were within ± 25M< in./in. (approximately ± 500 psi). One group of tests, shown in the upper plot was performed at 593°C at different strain levels ranging from 0.2 to 1.8$. In all tests, relaxation became noticeable in about 1 hr. The other group of tests in the lower plot was conducted at 0.5% totcl strain and at temperatures ranging from 538 to 816°C. Relaxation is noticeable
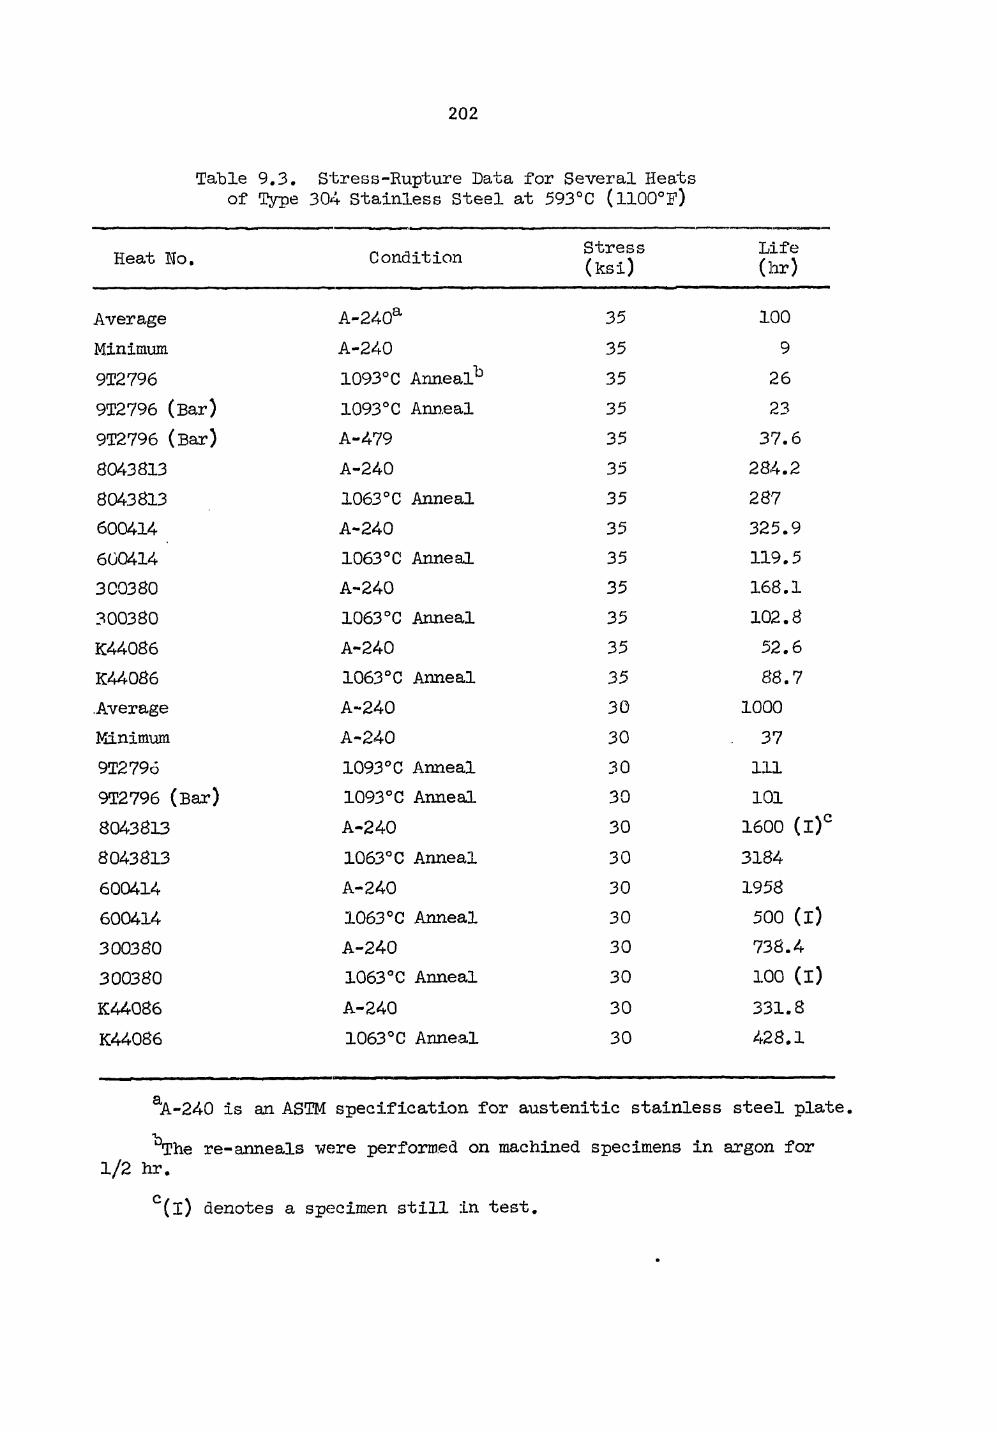
.202
Table 9.3. Stress-Rupture Data for Several Heats of Type 304 Stainless Steel at 593°C (ll00°F)
Heat No. Condition Stress (ksi)
Life (hr)
Average A-240a 35 100 Minimum A-240 35 9 9T2796 1093°C Anneal^ 35 26 9T2796 (Bar) 1093°C Anneal 35 23 9T2796 (Bar) A-479 35 37.6 8043813 A-240 35 284.2 8043813 1063°C Anneal 35 287 600414 A-240 35 325.9 600414 1063°C Anneal 35 119.5 300380 A-240 35 168.1 300380 1063°C Anneal 35 102.8 K44086 A-240 35 52.6 K44086 1063°C Anneal 35 88.7 Average A-240 30 1000 Minimum A-240 30 37 9T2796 1093°C Anneal 30 111 9T2796 (Bar) 1093°C Anneal 30 101 8043813 A-240 30 1600 (l)° 8043813 1063°C Anneal 30 3184 600414 A-240 30 1958 600414 1063°C Anneal 30 500 (i) 300380 A-240 30 738.4 300380 1063°C Anneal 30 100 (I) K44086 A-240 30 331.8 K44086 1063°C Anneal 30 428.1
aA~240 is an ASTM specification for austenitic stainless steel plate. •v
The re-anneals were performed on machined specimens in argon for 1/2 hr.
C(l) denotes a specimen still in test.
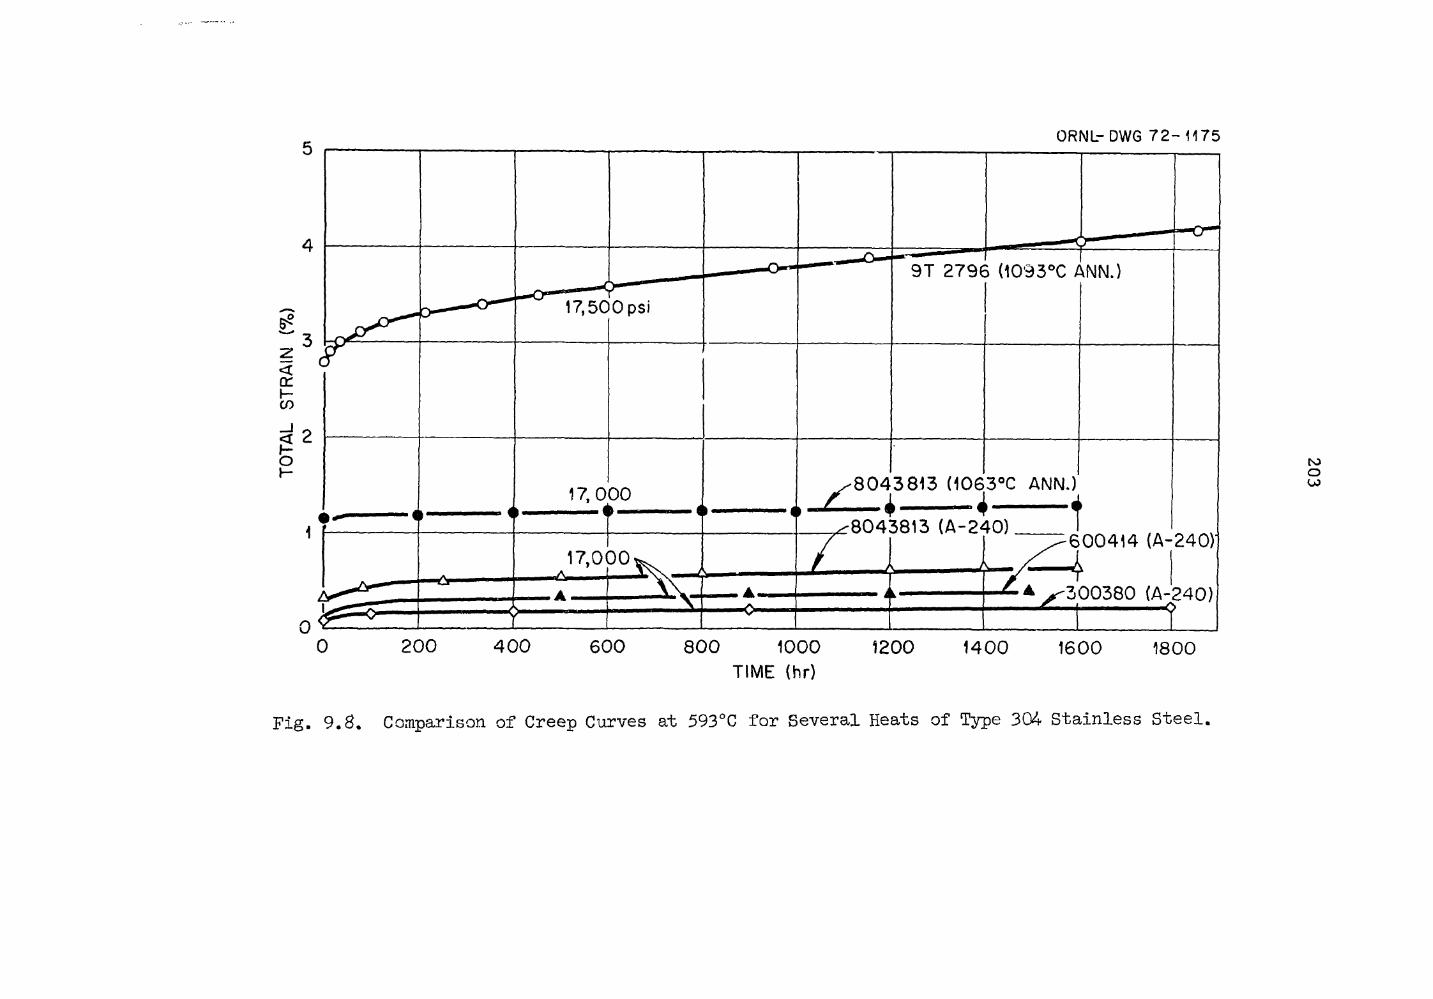
T I M E (hr)
Fig. 9.8. Comparison of Creep Curves at 593°C for Several Heats of Type 304 Stainless Steel.
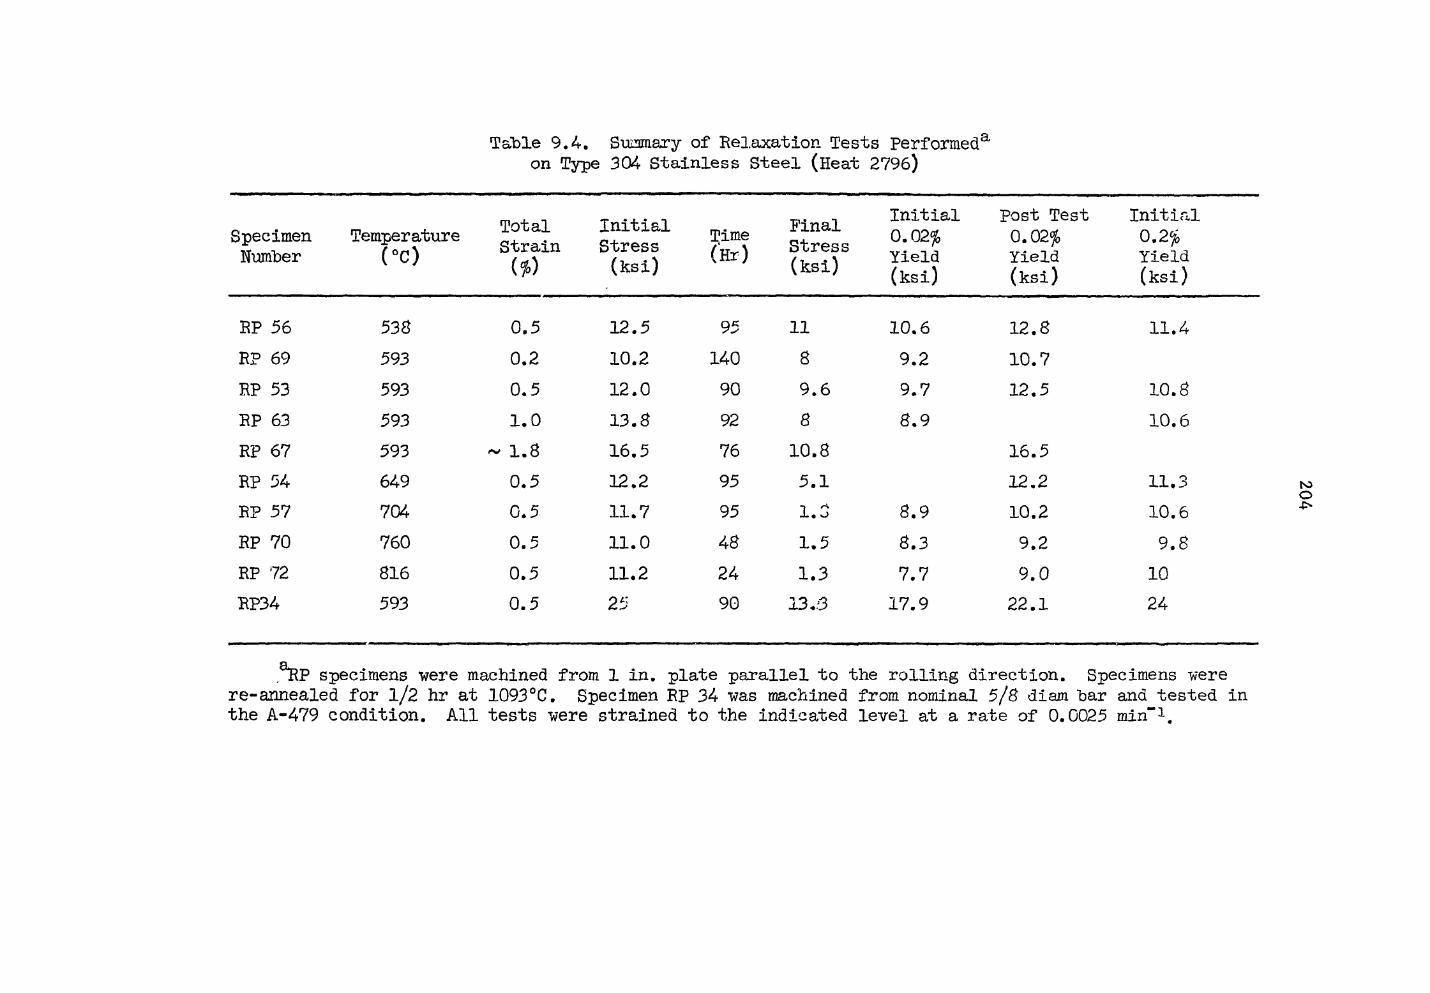
Table 9.4. Summary of Relaxation Tests Performed3, on Type 304 Stainless Steel (Heat 2796)
Specimen Number
Temperature (°c)
Total Strain w
Initial Stress (ksi)
Time (Hr)
Final Stress (ksi)
Initial 0.02% Yield (ksi)
Post Test 0.02$ Yield (ksi)
Initial 0.2% Yield (ksi)
RP 56 538 0.5 12.5 95 11 10.6 12.8 11.4 RP 69 593 0.2 10.2 140 8 9.2 10.7 RP 53 593 0.5 12.0 90 9.6 9.7 12.5 10.8 RP 63 593 1.0 13.8 92 8 8.9 10.6 RP 67 593 - 1.8 16.5 76 10.8 16.5 RP 54 649 0.5 12.2 95 5.1 12.2 11.3 RP 57 704 0.5 11.7 95 1. o 8.9 10.2 10.6 RP 70 760 0.5 11.0 48 1.5 8.3 9.2 9.8 RP 72 816 0.5 11.2 24 1.3 7.7 9.0 10 RP34 593 0.5 25 90 13.3 17.9 22.1 24
specimens were machined from 1 in. plate parallel to the rolling direction. Specimens were re-annealed for 1/2 hr at 1093°C. Specimen Rp 34 was machined from nominal 5/8 diam bar and tested in the A-479 condition. All tests were strained to the indicated level at a rate of 0.0025 min"1.
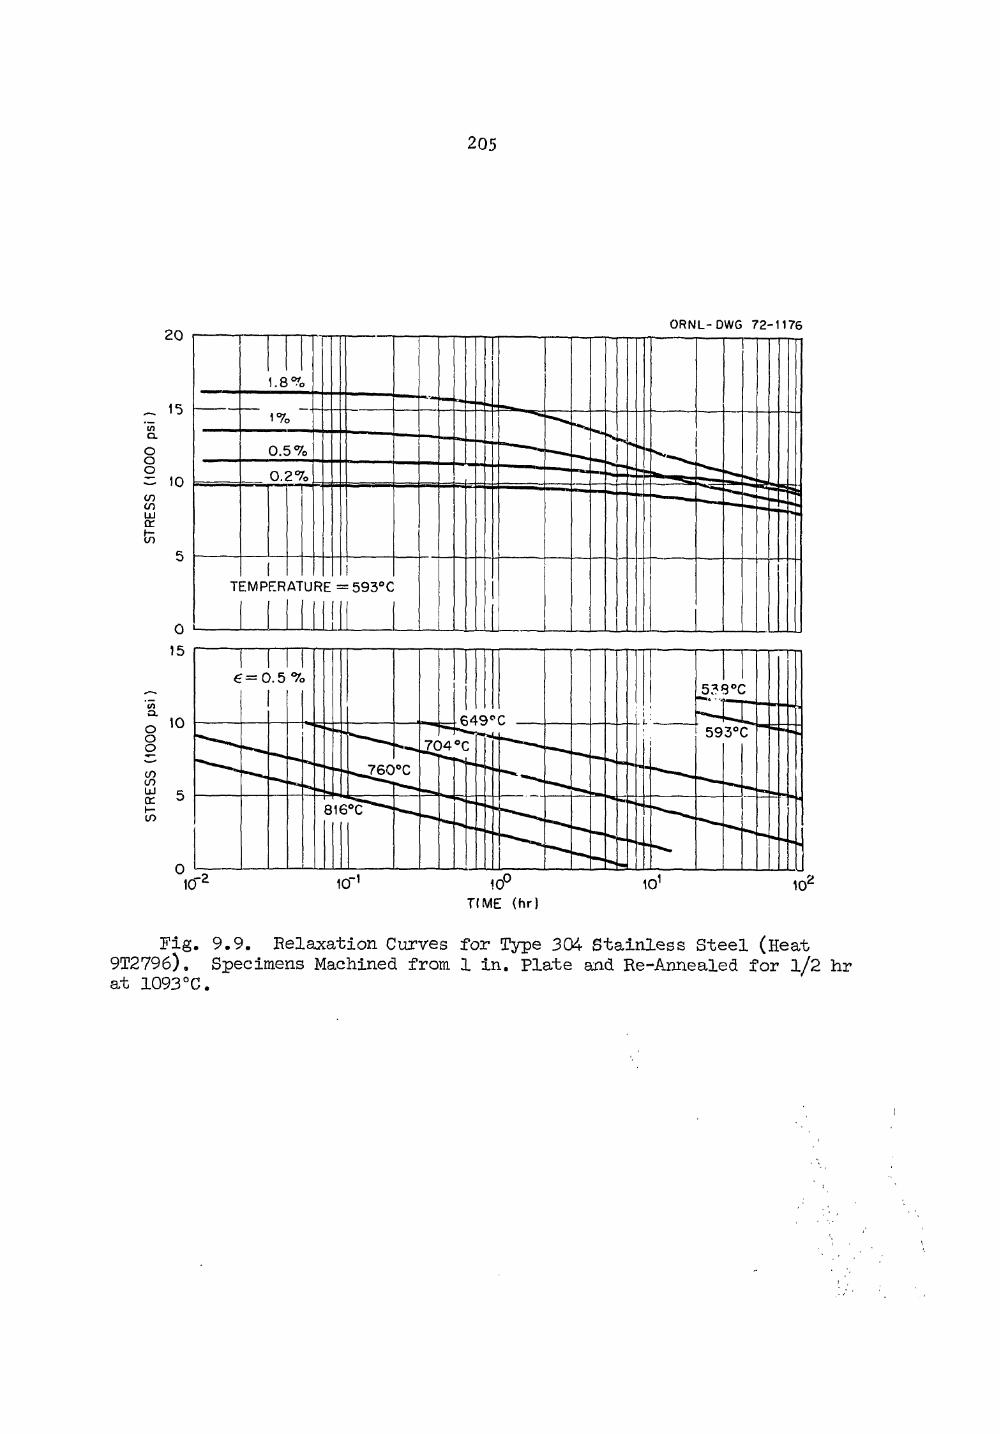
205
ORNL-DWG 72-1176
1 0
T I M E ( h r )
Fig. 9.9. Relaxation Curves for Type 304 Stainless Steel (Heat 9T2796). Specimens Machined from 1 in. Plate and Re-Annealed for l/2 hr at 1093°C.
.206
after 10 hr at 538°C and Immediately at 816°C. A comparison of the 0.02$ yield strengths "before -and after relaxation indicates that none of the specimens recovered to a strength comparable to the virgin condition.
Because the rearmealed specimens were very weak in regard to tensile yield strength the stresses resulting from strains up to 1.8$ were quite low. To explore relaxation at a higher stress, one test was performed on a specimen taken from the 5/8 in. diam bar in the as-received condition (ASTM A-479). This condition resulted in a much higher initial stress at 0.5$ total strain. The relaxation curve was processed to yield the type of plot suggested by Conway3 for describing relaxation behavior. In this plot, shown in Fig. 9.10, the data should fall on a straight line according to the equation:
^ <f?> - At™
where cr is the instantaneous stress, (da/dt) the rate of stress decrease, t is time, while A and m are material constants. For times in excess of 1 hr the data tend toward this type of behavior.
Analysis Phases in Type 316 Stainless Steel
J. E. Spruiell R. E. Gehlbach
Our studies of precipitation occurring in type 316 stainless steel have been directed primarily towards refinement of techniques and develop-ment of methods to semiquantitatively determine the relative amounts of the various phases present in a sample. Our previous efforts of phase identification by x-ray diffraction of extracted precipitates were hampered by instrumental problems which prevented adequate separation of overlapping diffraction peaks to identify the precipitates. In addition, fluorescence from the iron in the precipitates due to the use of CUKq,
radiation created excessive backgrounds.
3J. B. Conway, An Analysis of the Relaxation Behavior of AISI 304- and 316 Stainless Steel at Elevated Temperature, GEMP-730 (December 1969).
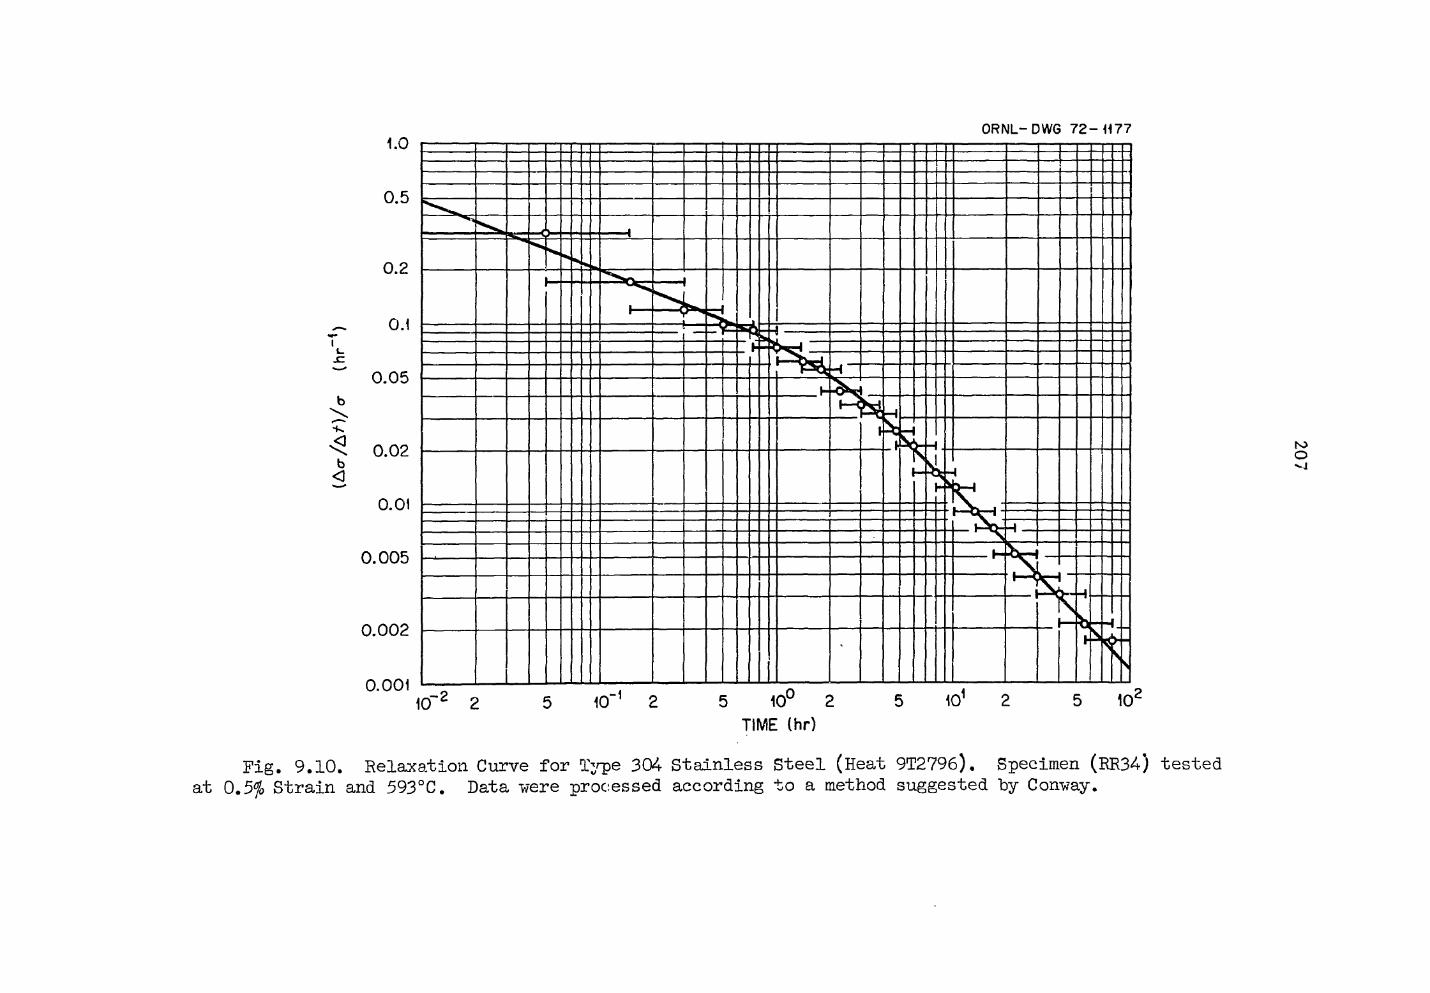
ORNL-DWG 7 2 - 1 1 6 8
-k.
b <3
T I M E ( h r )
Fig. 9.10. Relaxation Curve for Type 304 Stainless Steel (Heat 9T2796). Specimen (RR34) tested at 0.5f0 Strain and 593°C. Data -were processed according to a method suggested by Conway.
f o O -vl
.208
To overcome these problems ve have installed a graphite crystal diffracted beam monachromator on a Rorelco diffractometer. Both line-to-background ratios and peak resolution are greatly improved. We are also using silicon single crystals, cut so that no diffraction peaks occur, as substrates for the extracted precipitates to minimize background. As a result, the background level has decreased from 200-2000 cps to 2—8 cps. Data is collected on punch tape and computer processed, employing a goniometer scanning speed of 1/8 degree per minute to obtain reasonable counting statistics.
We have rerun patterns from specimens of standard type 316 stainless steel aged 4000 hr with and without 20$ prior cold work, conditions which have been previously reported.4- The residue from the non-cold worked specimen was found to contain small amounts of M23C6, Chi and Laves phases in addition to copious amounts of a. We were previously unable to resolve the Chi and M 2 3C 6 phases. The monochromator system described above has permitted resolution of peaks with differences in
o O
interplanar spacings of 0.005 A in the 2.0 to 2.5 A range. Estimation of relative quantities of the various precipitates is still
difficult because of superposition. A semiquantitative technique for estimating the relative amounts of phases is being developed, based upon the analysis of Giamei and Freise.5 This method involves comparison of the relative intensities of several peaks from each phase and employs an interactive procedure to obtain estimates of relative amounts of phases present in cases where superposition and preferred orientation are encountered.
These techniques are being developed in order to carry out a com-prehensive study of phases formed by thermal-mechanical treatments of austenitic stainless steels.
4R. E. Gehlbach, Fuels and Materials Development Program Quart. Progr. Rept., December 31, 1970, 0RTTL-TM-3300, pp. 120-222.
5A. F. Giamei and E. J. Freise, Trans. AIME, 239, pp. 1676-1685 (1967).
.209
Properties of FFTF Vessel Type 308 Stainless Steel Test Weldments
Procurement of FFTF Welds (G. M. Goodwin)
Using techniques outlined in the previous quarterly,6 Combustion Engineering, Incorporated, Chattanooga, Tennessee, has continued the production of FFTF weld test plates. Electrodes from seven of the nine production batches used in the vessel to date are now represented in test plates.
As of this date, approximately 85$ of the total number of test pieces has been completed, and the remainder is scheduled for delivery during January 1972.
Tensile Properties (R. T. King and G. Goodwin)
We have begun a program to investigate the tensile properties of type 308 stainless steel test weldments. The acquisition of material, fabrication of test pieces, and history of the welding process at Combustion Engineering, Inc., of Chattanooga, has already been described. All of the weld specimens discussed below came from one of three test plates, CE-3, CE-15, or CE-17. These three test plates were made by joining two sections of metal from one of the heats of type 304- stainless steel used in the FFTF vessel, Carlson Heat 600414-1A., using the HBEA batch of type 308 stainless steel welding rods.
In order to conserve material, the specimens for this program were fabricated by joining gage blanks of the weld metal using a low heat input welding process to type 304 stainless steel specimen end pieces and machining to the dimensions shown in Fig. 9.11-a. These specimens tended to fail near the ends of the gage length where the end pieces were joined to the gage length, and the specimen design was later modified to that shown in Fig. 9.11-b.
6G. M. Goodwin, Fuels and Materials, Development Program Quart. Progr. Rept. September 30, 1971, 0RNL-TM-3550.
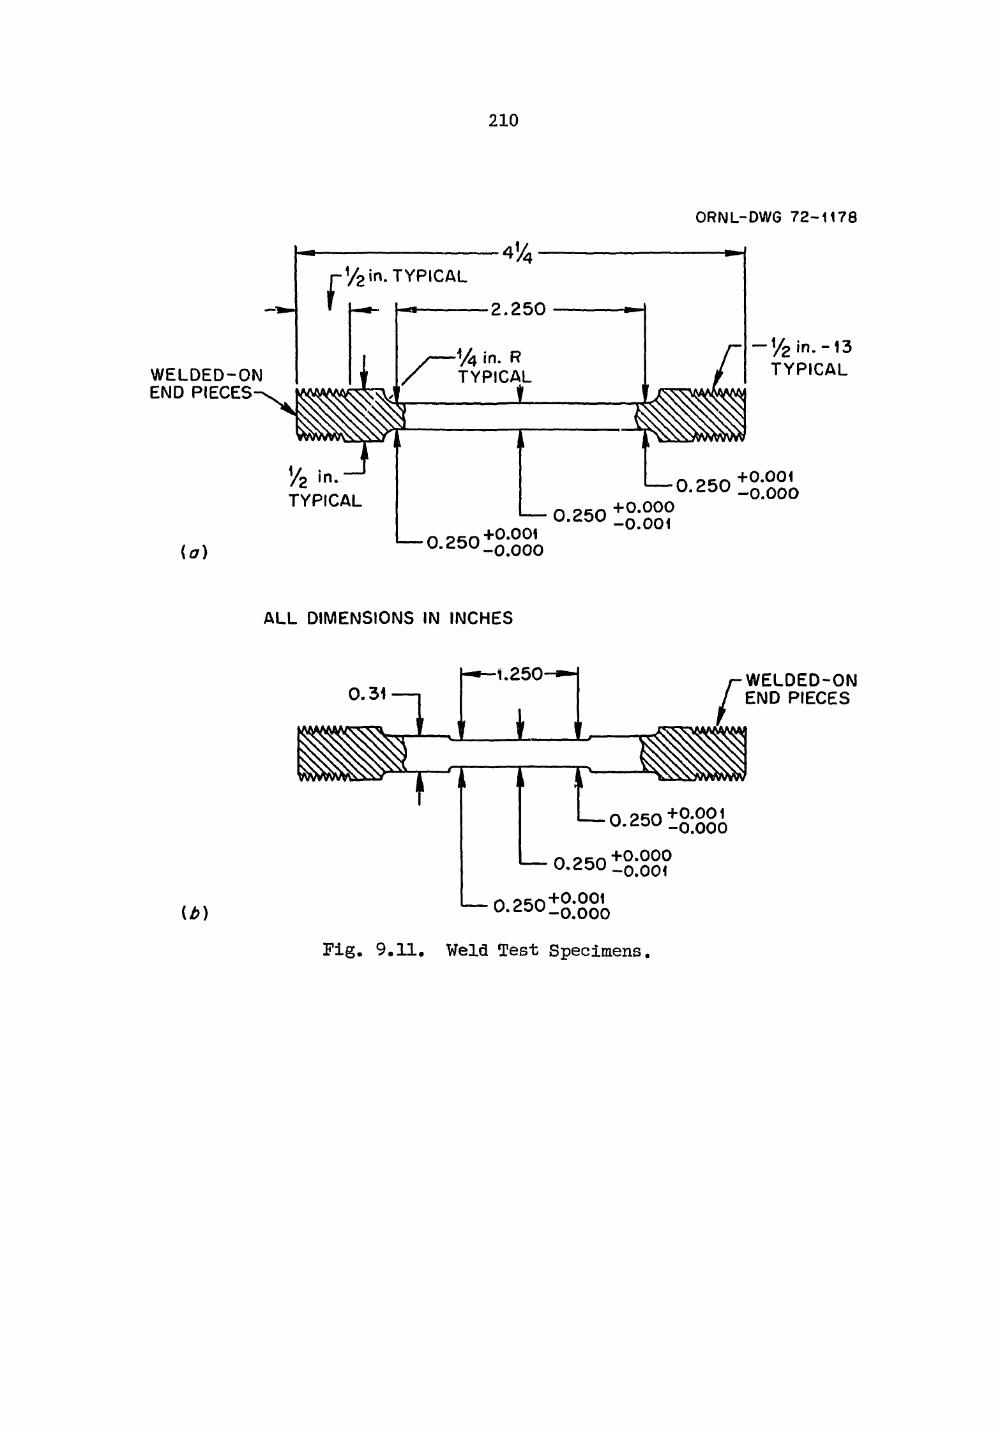
210
ORNL-DWG 7 2 - 1 1 8 0
W E L D E D - O N END PIECES
1 / 2 in. T Y P I C A L
ia)
T Y P I C A L
4 ' / 4
• 2 . 2 5 0
% in. R T Y P I C A L
i
T
- y z i n . - 1 3 T Y P I C A L
0 . 2 5 0
0 . 2 5 0
0 . 2 5 0 +0.001 - 0 . 0 0 0
+0.000 -0.001
+0.001 - 0 . 0 0 0
A L L DIMENSIONS IN INCHES
(b)
W E L D E D - O N END PIECES
O 2 5 0 + a 0 0 1 U . c o u - 0 . 0 0 0
n o c n + 0 . 0 0 0 -Q.001
0 2 5 0 + 0 - 0 0 1 - 0 . 0 0 0
F i g . 9 . 1 1 . W e l d T e s t S p e c i m e n s .
.211
Because we had found that the room temperature hardness of the weld-ments varied through the thickness of the weld, tending to he relatively-soft near the surface of the test plates,7 we segregated the specimens a cording to their distance from the weld test plate surface. All weld metal specimens prepared with their gage lengths parallel to the welding direction, with their centerlines located 0.19 in. below the surface, were designated LI-type specimens (longitudinal-Level l). Specimens located 0.56 in. below the surface were designated type 12, and specimens located 0.94 in. below the surface were designated type L3. Fig. 9.12 illustrates the locations from which these specimens were cut. Each set of longitudinal specimens prepared according to this scheme yields no more than four type LI, four type 12, and two type L3 specimens, and no more than three such sections can be prepared from each weld test plate.
The scope of the tensile testing program is to provide information for test temperatures between 23 and 649°C, at different strain rates. We have begun testing in air at 23, 566 (the upper temperature for the FFTF vessel), and 649°C (the proposed upper temperature for a demonstration LMFBR), Although extensometers were used to provide accurate stress-strain information at small strains, the effects which we wish to discuss are adequately described by the Instron load-crosshead travel chart. The strain results presented here have been corrected for deflections of the Instron machine components during testing. With the exception of one special test to be described below, all of the tests reported in this section were performed on specimens in the as-welded condition.
The results for some tests which have been performed are presented in Table 9.5. Specimens made by the Fig. 9.11-a design frequently failed near the end piece weldment. Because these ruptures may have involved deformation in a heat-affected zone, despite the low heat input welding techniques used, the measured properties must be considered preliminary values subject to verification by later testing. We are particularly suspicious that the results for specimens 376, 375, and 374 are not proper for these reasons.
7R. T. King and R. E. Gehlbach, Fuels and Materials Development Program Quart. Progr. Rept. September 30, 1971, 0RNL-TM-3550, p. 187.
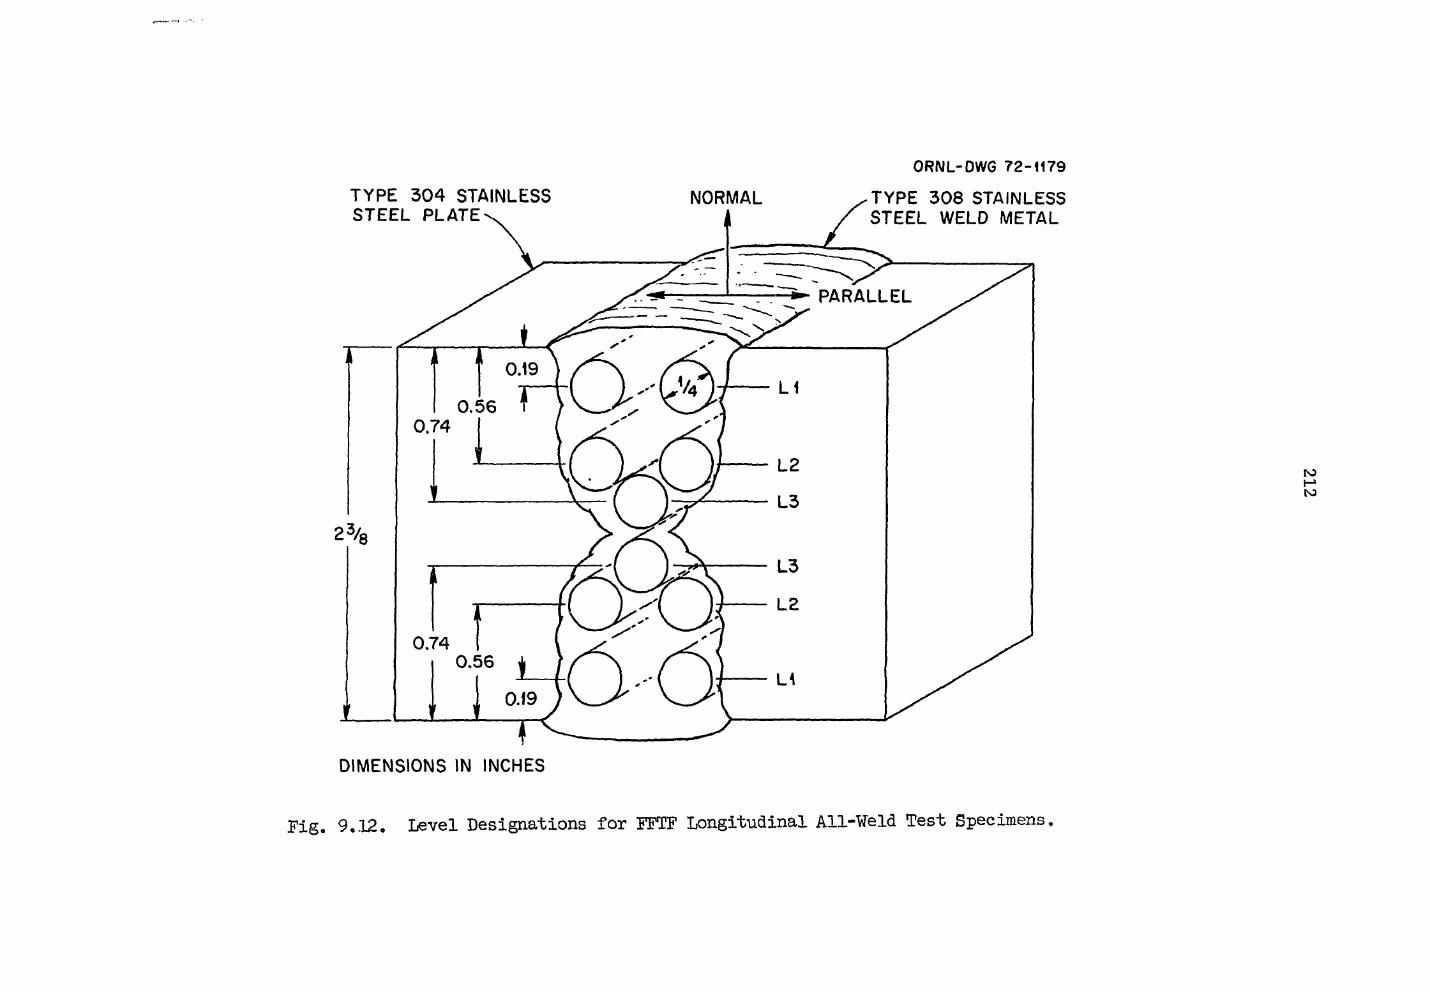
ORNL-DWG 72-1168
Fig. 9.12. Level Designations for FFTF Longitudinal All-Weld Test Specimens.
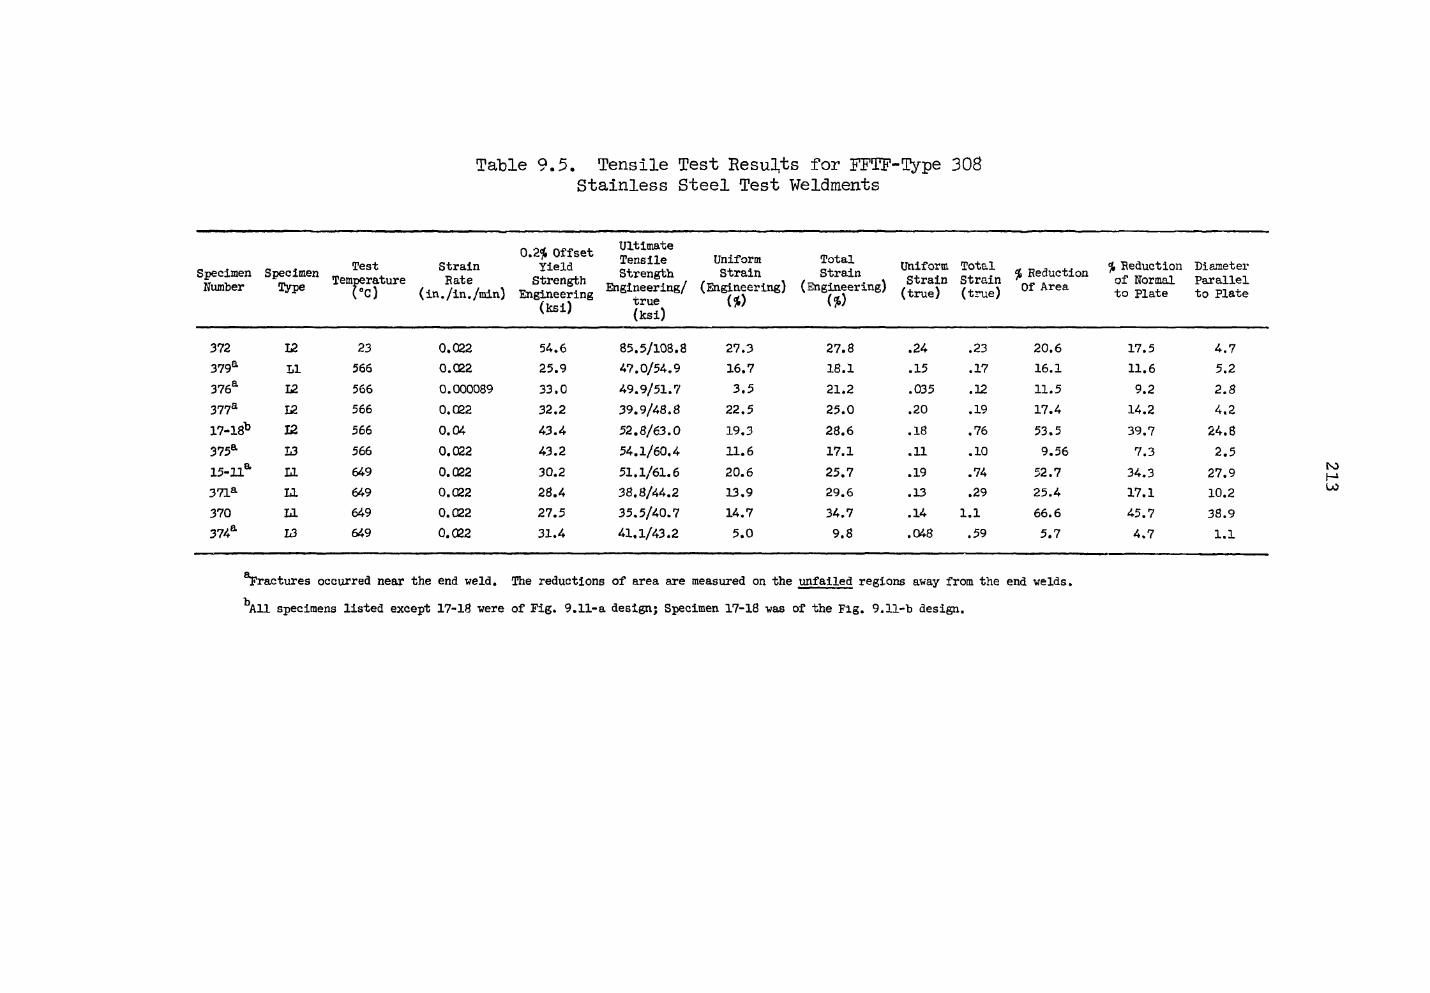
Table 9.5. Tensile Test Results for FFTF-Type 308 Stainless Steel Test Weldments
T©s"t S E T i f n Temperature Number l y p e (°C)
Strain Rate
0.2* Offset Yield
Strength
Ultimate Tensile Strength
Uniform Strain
Total Strain Uniform Total , % Seduction Diameter
Strain Strain * of Normal Parallel ( W E M O tSSSS. OF A™ - -
(ksi) true (ksi)
372 12 23 0.022 54.6 85.5/108.8 27.3 27.8 .24 .23 20.6 17.5 4.7 379a LI 566 0.C22 25.9 47.0/54.9 16.7 18.1 .15 .17 16.1 11.6 5.2 376a L2 566 0.000089 33.0 49.9/51.7 3.5 21.2 .035 .12 11.5 9.2 2.8 377a 12 566 0.022 32.2 39.9/48.8 22.5 25.0 .20 .19 17.4 14.2 4.2 17-18b 1 2 566 0.04 43.4 52.8/63.0 19.3 28.6 .18 .76 53.5 39.7 24.8 375a L3 566 0.022 43.2 54.1/60.4 11.6 17.1 .11 .10 9.56 7.3 2.5 15-lla LI 649 0.022 30.2 51.1/61.6 20.6 25.7 .19 .74 52.7 34.3 27.9 371a LI 649 0.022 28.4 38.8/44.2 13.9 29.6 .13 .29 25.4 17.1 10.2 370 LI 649 0.022 27.5 35.5/40.7 14.7 34.7 .14 1.1 66.6 45.7 38.9 374a L3 649 o . o e 2 31.4 41.1/43.2 5.0 9.8 .048 .59 5.7 4.7 1.1
fractures occurred near the end weld. The reductions of area are measured on the unfailed regions away from the end welds.
tsl H» LO
All specimens listed except 17-18 were of Fig. 9.11-a design; Specimen 17-18 was of the Fig. 9.11-"b design.
2078
Comparing the results for the L1-, 12-, and L3-type specimens tested at 566°C leads to the conclusion that the 0.2% offset yield strength at 566°C varies with the location of the specimen. The trend is for the strength to increase with increasing distance from the specimen surface. This result agrees with our original hardness results.8 The weld metal is relatively strong, when compared with the "base metal, and ductile. The room temperature yield strength for base metal is about 30,000 to 4-0,000 psi compared to 54,600 psi for the weld metal, and at 649°C the base metal yields at 10,000 to 20,000 psi whereas the weld metal yields at about 27,000 to 32,000 psi.
One point is particularly worthy of note. The deformation character-istics of the weld metal are anisotropic. After testing each specimen we measured the maximum and minimum diameter of the failed cross section, or the maximum and minimum diameter of a cross section away from the end piece weldment if rupture occurred near that weldment. The ratio of the maximum to minimum diametral strain vardes between about 1.5 and 4, but there are too few data to understand the effects of any variables upon the degree of anisotropy. We are preparing specimens having other orientations within the weld test plate to characterize the anisotropy for some test conditions, since this behavior must be considered for reactor design purposes. Metallography performed on tested specimens has shown that the greatest diametral strain occurs in the direction normal to the test plate surface (see Fig. 9.12 for orientation).
Because the anisotropy was observed in specimens which were heavily deformed as well as those which deformed only a few percent, we speculated that the anisotropy effect occurred even at very small plastic strains. To verify this for one test and specimen condition, we tested a specimen FF17-9 (Type Ll) at room temperature and 2.2$/min strain rate, and periodically halted the Instron crosshead to measure the diametral strain which had occurred. The maximum and minimum strains were measured with micrometers at three locations, 0.25 in. from either end of the gage
W. Swindeman and R. D. Waddell, Fuels and Materials Development Program Quart. Progr. Rept. September 30, 1971, 0RITL-TM-3550, p. 175.
.215
length and at the center of the gage length. These diametral strains are plotted versus the nominal engineering strain in Fig. 9.13. The measure-ments made at the three locations agree quite veil and they demonstrate "beyond any doubt that for these conditions the material strains anisotropically at all plastic strains ahove 0.25$. We feel that this is probably also true at smaller strains.
In order to determine whether the anisotropic behavior could be eliminated by annealing, specimen FF17-10 (type Ll) was annealed for 2 hr at 954°C in argon and tested in the same manner that specimen FF17-9 was tested. The results are shown in Fig. 9.14; it is apparent that the degree of anisotropy after this annealing treatment is nearly identical to that for the as-welded specimen. The 0.2$ offset yield strength of the as-welded specimen was 50,200 psi and its fracture strain 40.7$, while those values for the annealed specimen were 40,400 psi and 60.1$, respectively, indicating that the annealing treatment was probably adequate to cause some structural changes in the weld metal.
Creep-Rupture (R. T. King)
The creep-rupture testing of as-welded specimens of the design shown in Fig. 9.11-b and from test weldment plates CE-15 and CE-17 is in progress. The tests were performed in air at 482, 566, and 649°C. The specimens were all tested with longitudinal extensometers on a 1-ifi. section of the gage length to measure strain.
Because we were already aware of the variation of hardness and tensile strength across the test weld cross-section when the first series of creep-rupture tests was started, we selected test conditions and specimens to determine whether this variable might also be important during creep-rupture testing.
The initial round of testing at 566°C involved testing one type Ll, two type 12, and one type L3 specimen at 35,000 psi (see Fig. 9.15). The type Ll specimen failed after straining 37.8$ in 139.6 hr; the type 12 specimens have been in test for approximately 800 and 600 hr, straining
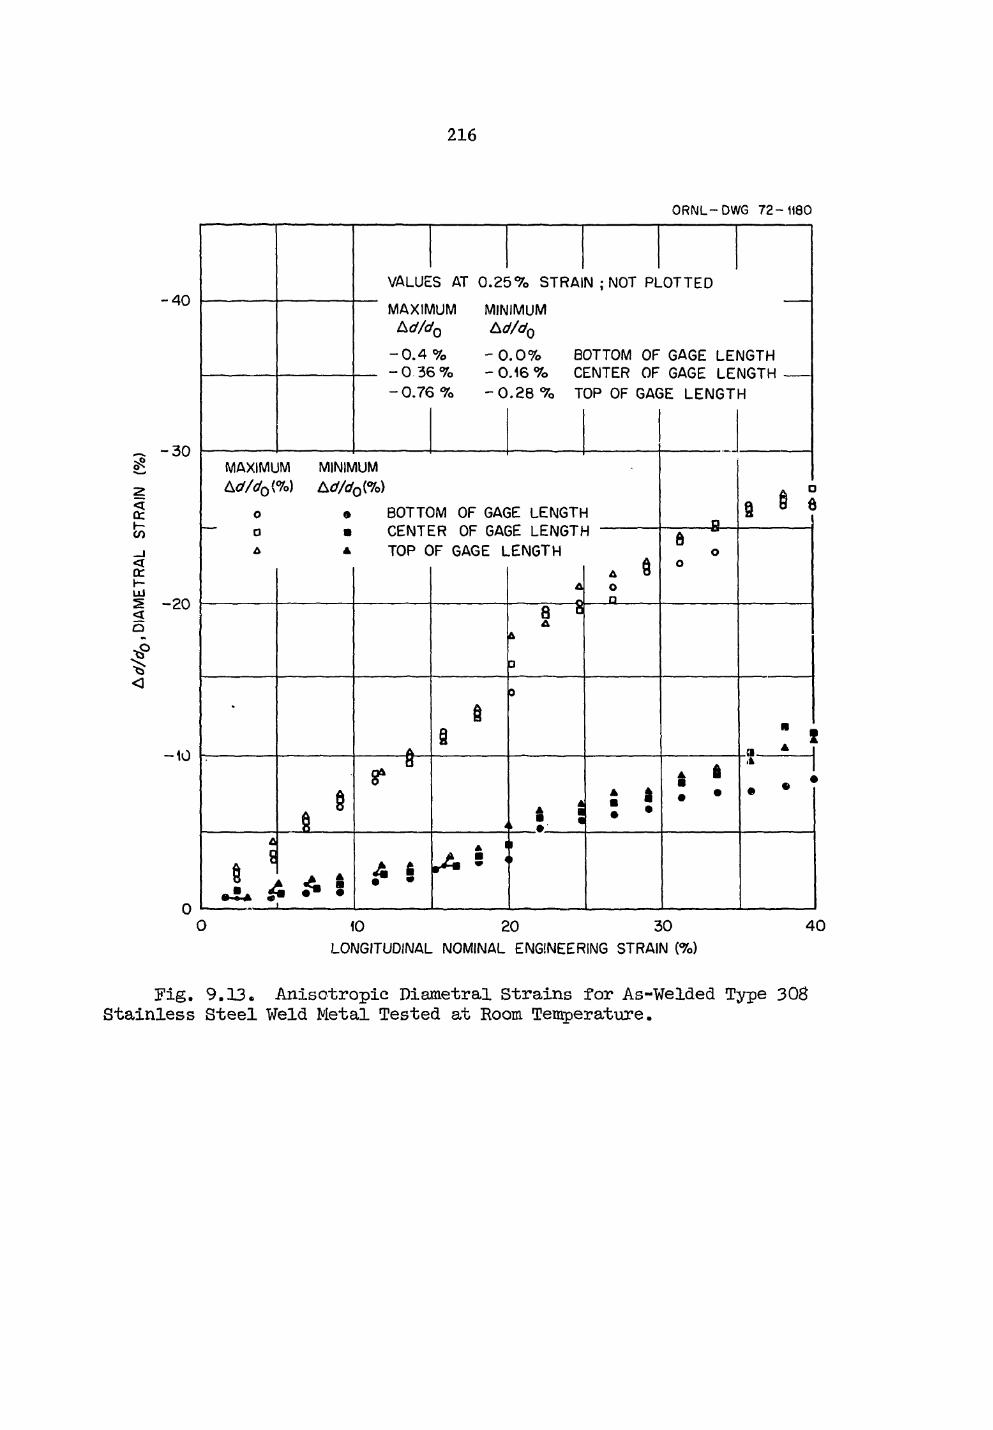
216
ORNL-DWG 72- 1180
- 4 0
~ - 3 0
2 - 2 0
- 1 0
VALUES AT 0 . 2 5 % STRAIN ; NOT PLOTTED
MAXIMUM A d/dQ
- 0 . 4 % - 0 3 6 % - 0 .76 %
MINIMUM A d/dQ
- 0.0% - 0.16 % -0.28 %
BOTTOM OF GAGE LENGTH CENTER OF GAGE LENGTH TOP OF GAGE LENGTH
MAXIMUM MINIMUM &d/d0(%) A d/d0{%)
o » BOTTOM OF GAGE LENGTH o • CENTER OF GAGE LENGTH a a TOP OF GAGE LENGTH
.4 £ I A '
I
w* *
A m
A o
J L
: i
6 o
- B -8 § e
A ft •
0 10 20 3 0 LONGITUDINAL NOMINAL ENGINEERING STRAIN (%)
4 0
Fig. 9.13. Anisotropic Diametral Strains for As-Welded Type 308 Stainless Steel Weld Metal Tested at Room Temperature.
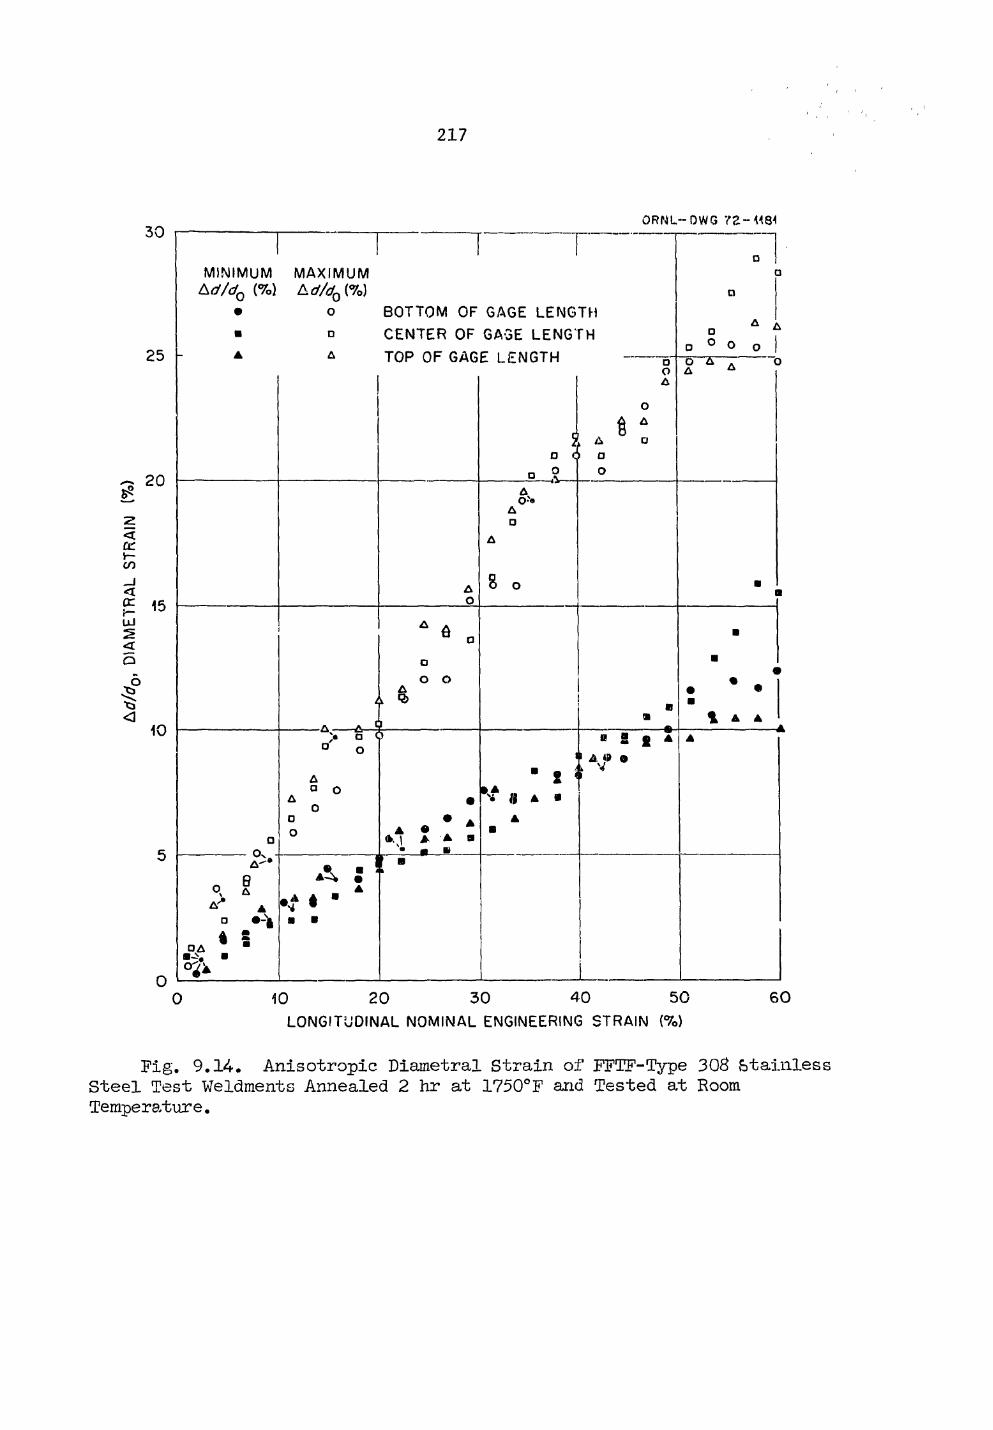
217
ORNL-DWG 72- 1180
MINIMUM MAXIMUM Ld/dQ (%) A ef/dQ(%)
BOTTOM OF GAGE LENGTH CENTER OF GAGE LENGTH TOP OF GAGE LENGTH
A O
• O A
A
A o *
8
A •
o
o A
• ° O
0 ~ 2 "
Ov
6 A
• 4 o
i S •
6
• o o
«a>
> a 0
A a O
• o
V « A • \ \ A A B
m s
A : •t * •
1 A •
a 2 £
o 10 2 0 3 0 4 0 5 0
LONGITUDINAL NOMINAL ENGINEERING STRAIN (%)
60
Fig. 9.14. Anisotropic Diametral Strain of FFTF-Type 308 Stainless Steel Test Weldments Annealed 2 hr at 1750°F and Tested at Room Temperature.
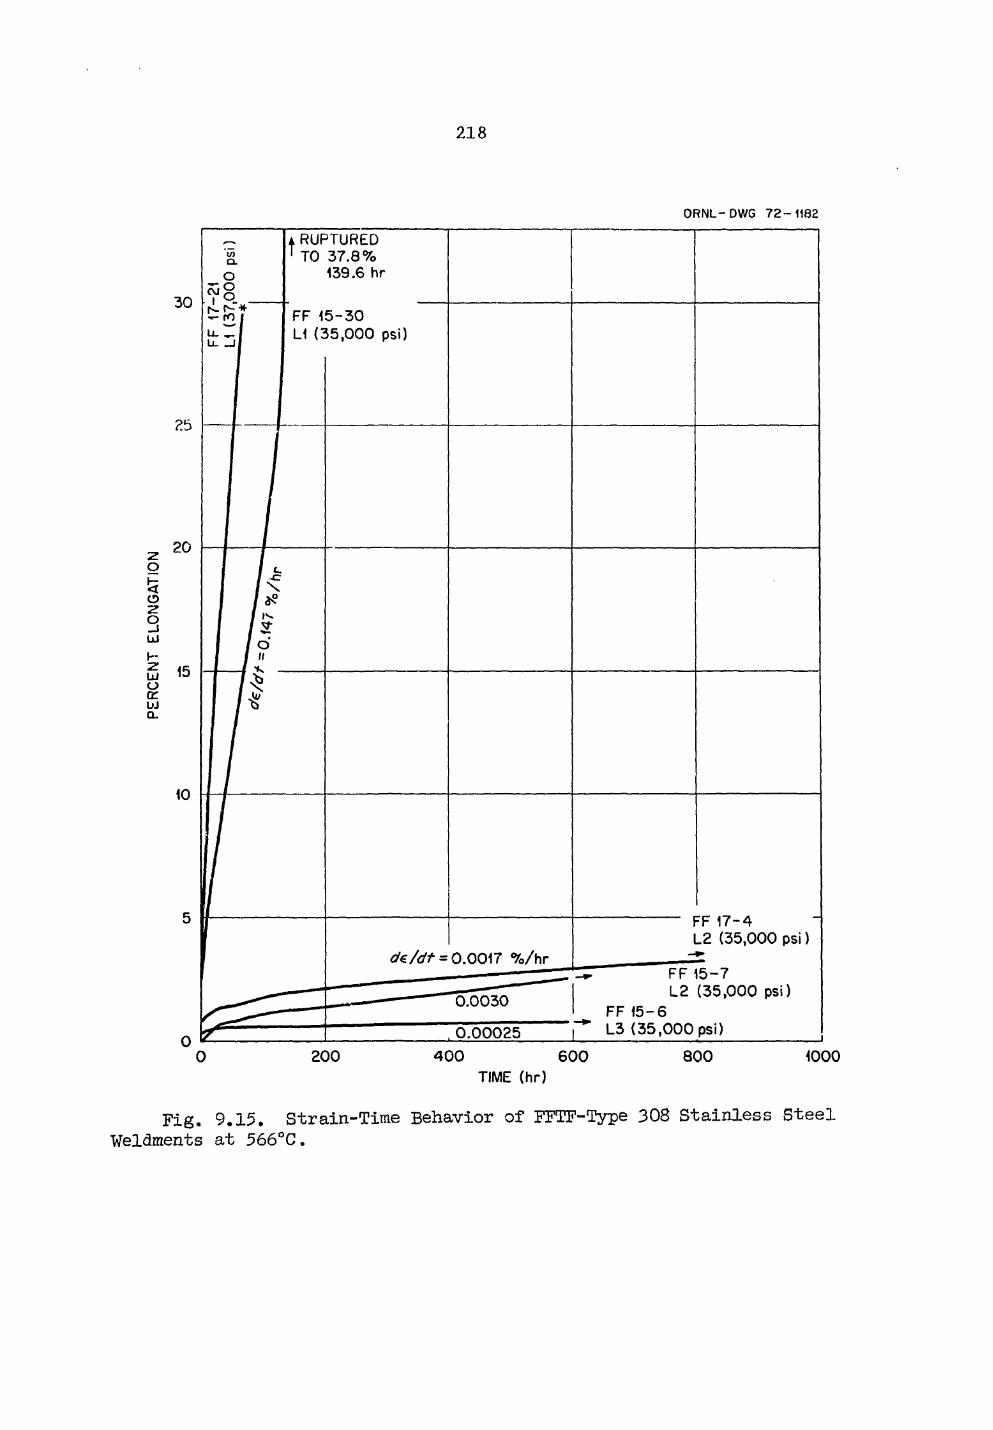
218
ORNL-DWG 72- 1180
3 0
25
20
15
10
'in CL
O
7 8
1 RUPTURED 1 TO 3 7 . 8 %
139.6 hr
12 i U . Z I Li I I
FF 1 L I (2
5 - 3 0 J5.000 psi)
1 1 t~ 1 / - C 1 / \
1 / ^ 1 / N
1 1 ~ 1 / O 1 / " 1 / 1
/
f
dn/dt = 0 .0017 % / h r
0 . 0 0 3 0
r r
L2 (35 ,000 psi)
~ FF 1 5 - 7 L2 ( 3 5 , 0 0 0 psi)
FF 1 5 - 6 L3 ( 3 5 , 0 0 0 psi) , 0 . 0 0 0 2 5
r r
L2 (35 ,000 psi)
~ FF 1 5 - 7 L2 ( 3 5 , 0 0 0 psi)
FF 1 5 - 6 L3 ( 3 5 , 0 0 0 psi)
0 200 4 0 0 6 0 0 TIME (hr)
800 1000
Fig. 9.15. Strain-Time Behavior of FFTF-Type 308 Stainless Steel Weldments at 566°C.
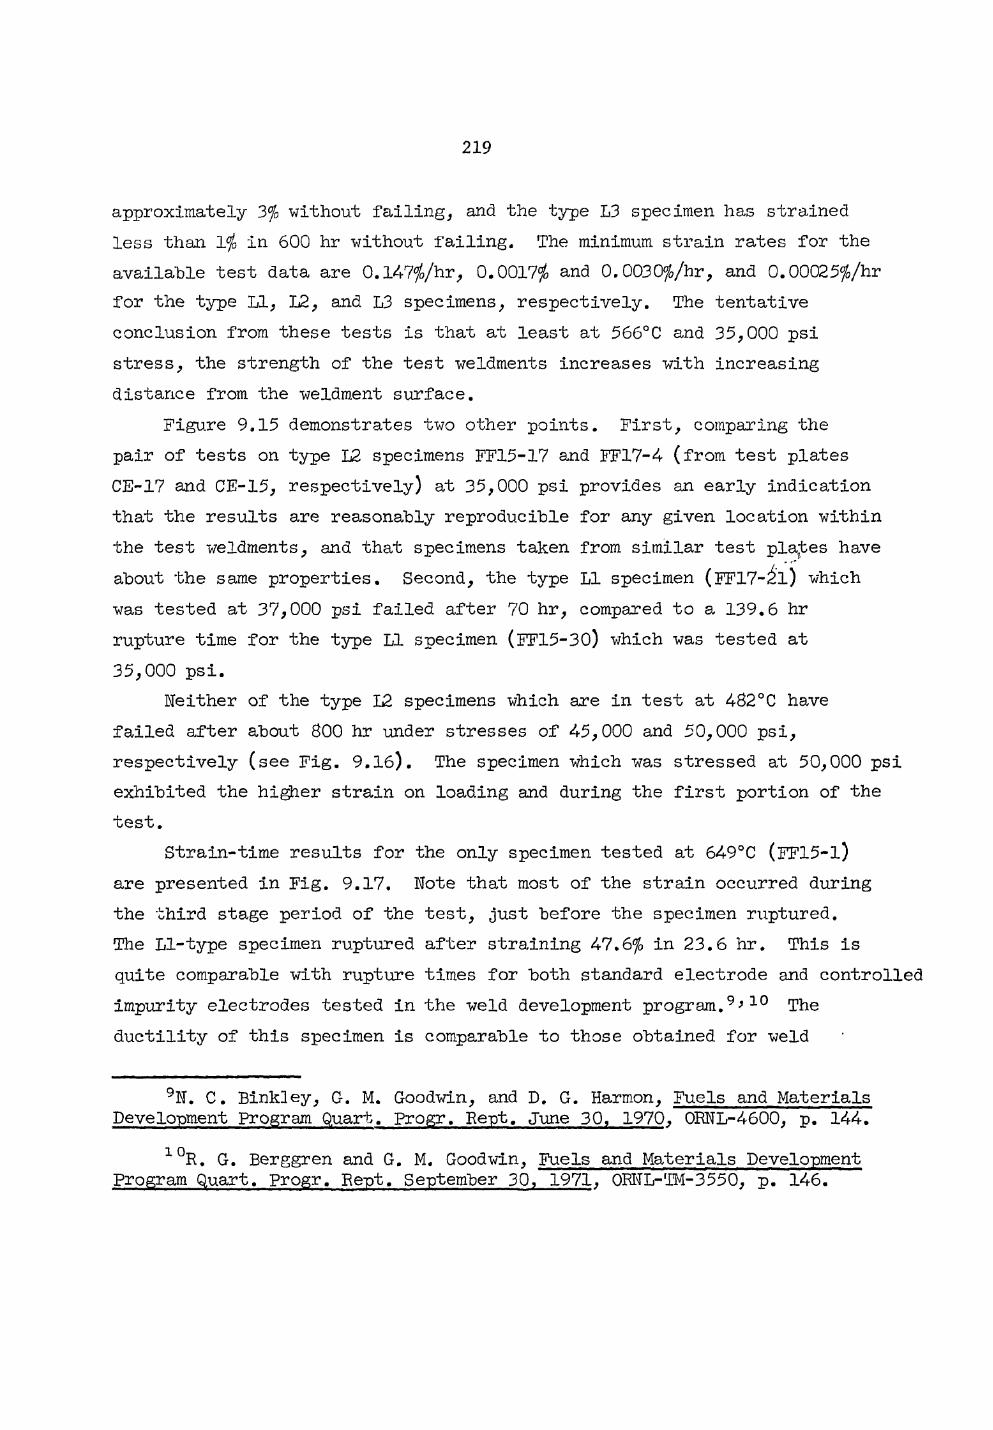
.219
approximately 3% without failing, and the type L3 specimen has strained less than Vfa in 600 hr without failing. The minimum strain rates for the available test data are 0.l47#/hr, 0.0017$ and 0.0030$/hr, and 0.00025^/hr for the type LI, L2, and L3 specimens, respectively. The tentative conclusion from these tests is that at least at 566°C and 35,000 psi stress, the strength of the test weldments increases with increasing distance from the weldment surface.
Figure 9.15 demonstrates two other points. First, comparing the pair of tests on type L2 specimens FF15-17 and FF17-4 (from test plates CE-17 and CE-15, respectively) at 35,000 psi provides an early indication that the results are reasonably reproducible for any given location within the test weldments, and that specimens taken from similar test places have about the same properties. Second, the type LI specimen (FF17-£l) which was tested at 37,000 psi failed after 70 hr, compared to a 139.6 hr rupture time for the type LI specimen (FF15-30) which was tested at 35,000 psi.
Neither of the type L2 specimens which are in test at 4B2°C have failed after about 800 hr under stresses of 45,000 and 50,000 psi, respectively (see Fig. 9.16). The specimen which was stressed at 50,000 psi exhibited the higher strain on loading and during the first portion of the test.
Strain-time results for the only specimen tested at 649°C (FF15-1) are presented in Fig. 9.17. Note that most of the strain occurred during the third stage period of the test, just before the specimen ruptured. The LI-type specimen ruptured after straining 47.6°[o in 23.6 hr. This is quite comparable with rupture times for both standard electrode and controlled impurity electrodes tested in the weld development program.9'10 The ductility of this specimen is comparable to those obtained for weld
9N. C. Binkley, G. M. Goodwin, and D. G. Harmon, Fuels and Materials Development Program Quart. Progr. Rept. June 30, 1970, 0RNL-4600, p. 144.
1 0R. G. Berggren and G. M. Goodwin, Fuels and Materials Development Program Quart. Progr. Rept. September 30, 1971, 0RNL-TM-3550, p. 146.
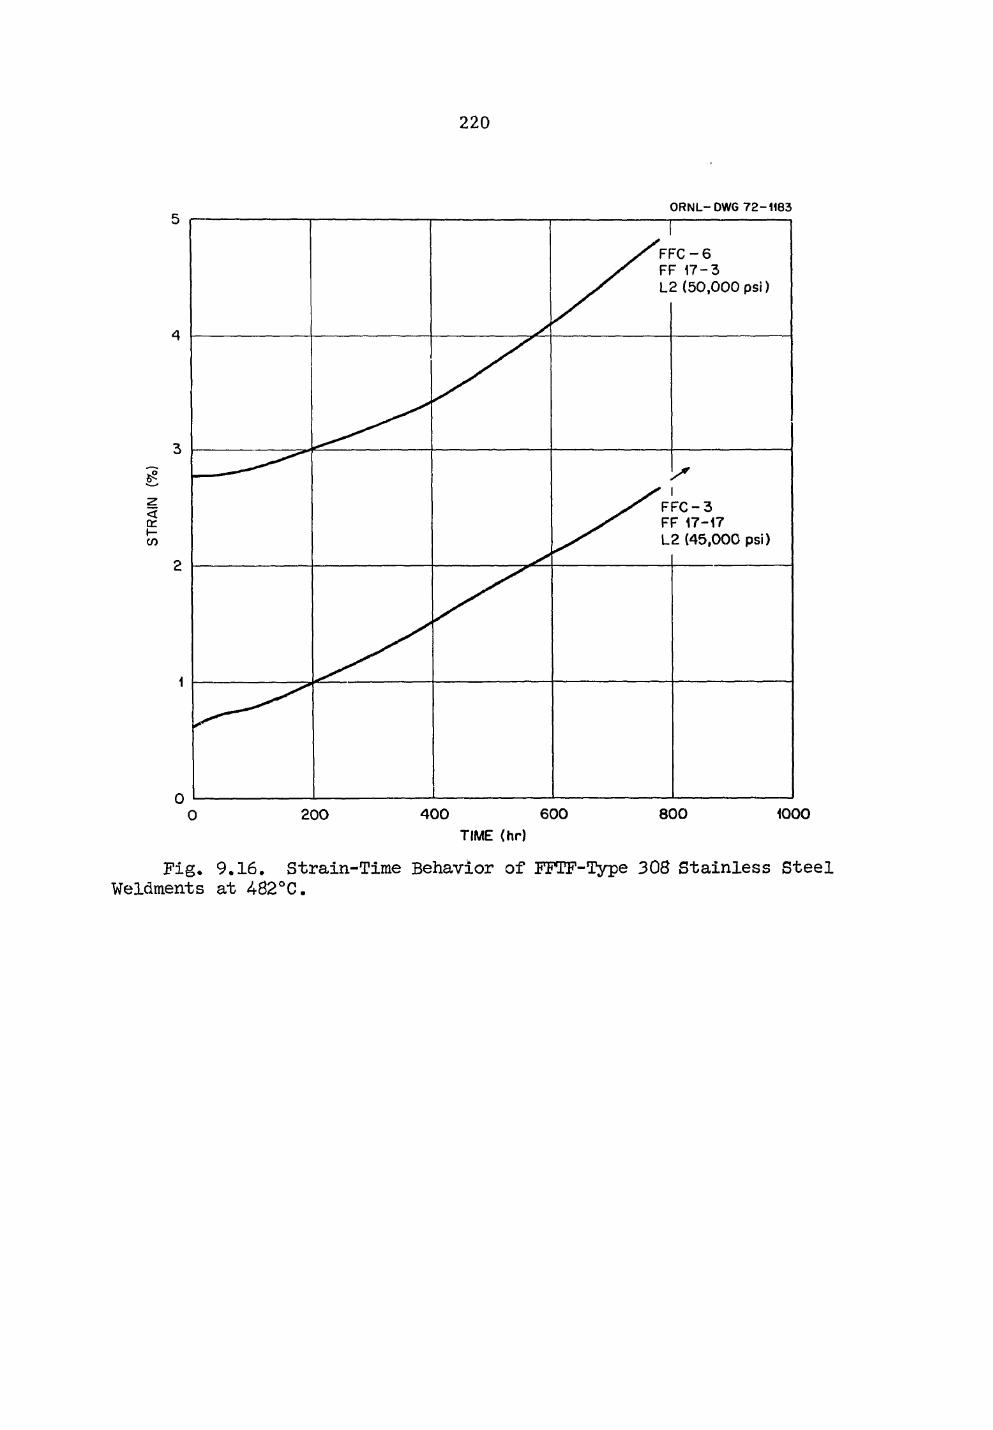
220
ORNL-DWG 7 2 - 1180
Fig. 9.16. Strain-Time Behavior of FFTF-Type 308 Stainless Steel Weldments at 482°C.
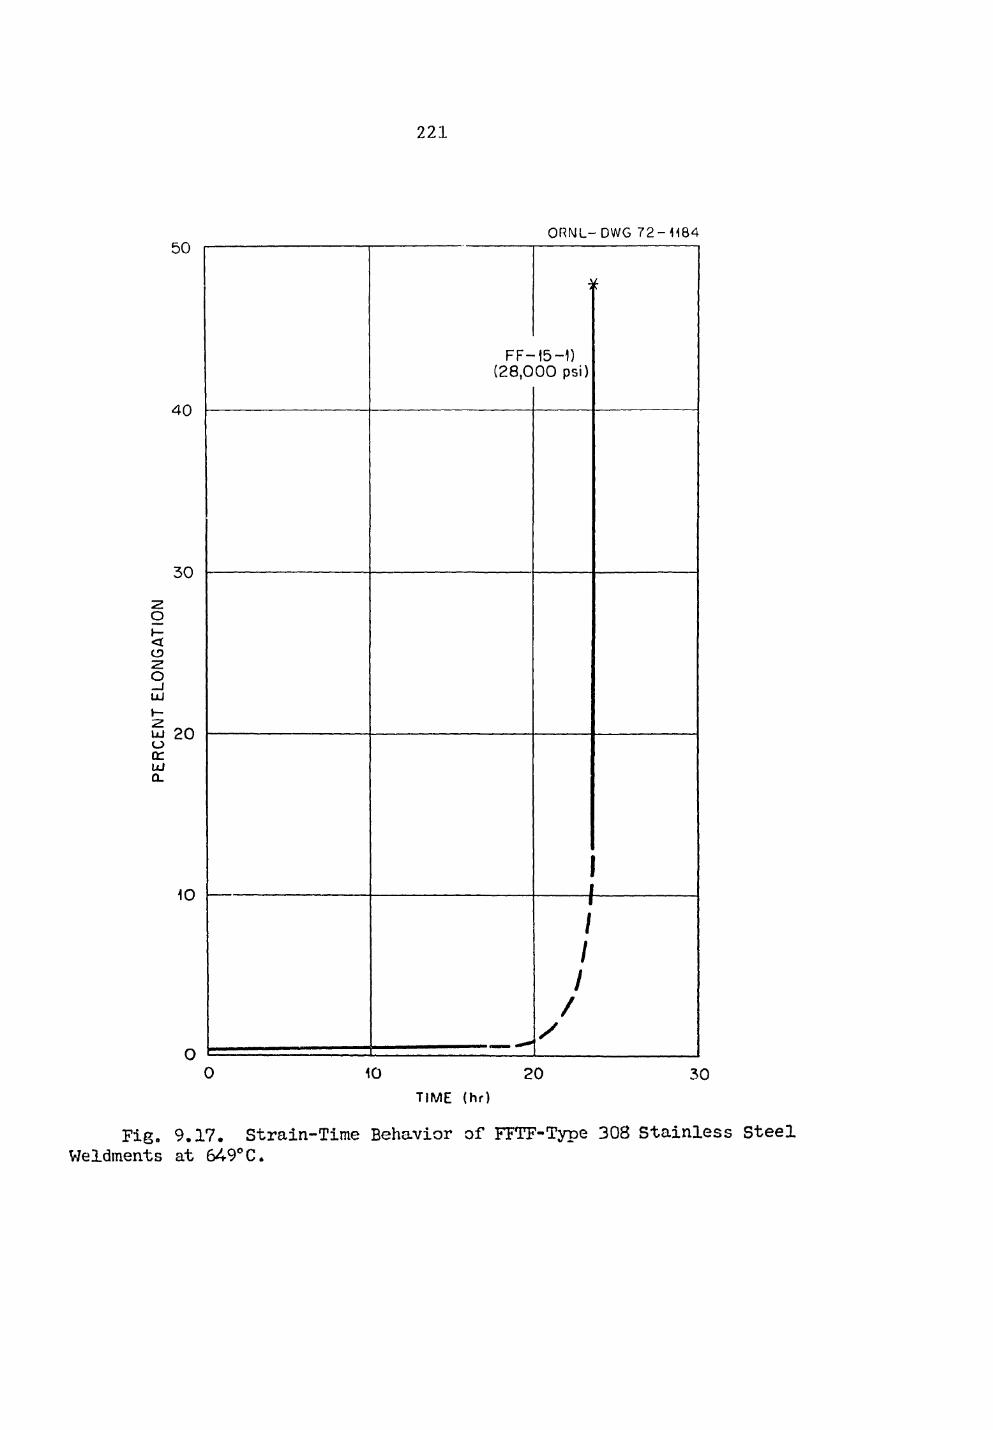
221
O R N L - DWG 7 2 - 1 1 8 4 50
4 0
3 0
< CD
O _J LU
2 20 o t r UJ QL
10
0
F F -(28 ,0
j i
15-1) 0 0 psi)
L \
I 1
/ / /
/ y
0 10 20 3 0
TIME (hr)
Fig. 9.17. Strain-Time Behavior of FFTF-Type 308 Stainless Steel Weldments at 649°C.
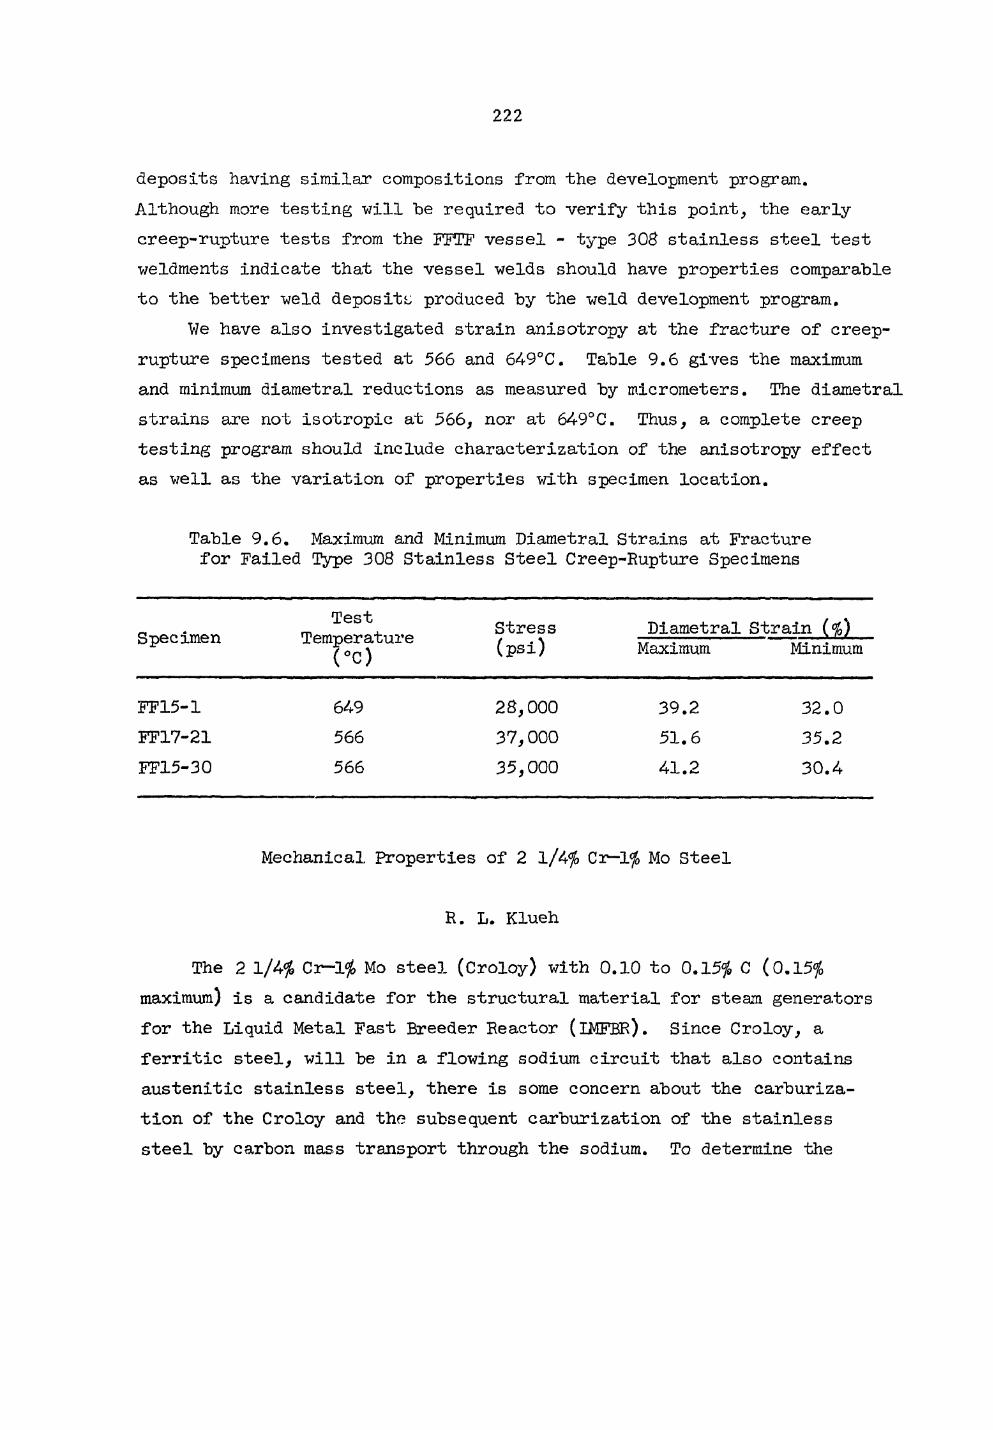
.222
deposits having similar compositions from the development program. Although more testing will he required to verify this point, the early creep-rupture tests from the FFTF vessel - type 308 stainless steel test weldments indicate that the vessel welds should have properties comparable to the better weld deposits produced by the weld development program.
We have also investigated strain anisotropy at the fracture of creep-rupture specimens tested at 566 and 649°C. Table 9.6 gives the maximum and minimum diametral reductions as measured by micrometers. The diametral strains are not isotropic at 566, nor at 649°C. Thus, a complete creep testing program should include characterization of the anisotropy effect as well as the variation of properties with specimen location.
Table 9.6. Maximum and Minimum Diametral Strains at Fracture for Failed Type 308 Stainless Steel Creep-Rupture Specimens
Specimen Test
Temperature (°C)
Stress (psi)
Diametral Strain (%) Maximum Minimum
FF15-1 FF17-21 FF15-30
649 566 566
28,000 37,000 35,000
39.2 51.6 41.2
32.0 35.2 30.4
Mechanical Properties of 2 l/4$ Cr-1# Mo Steel
R. L. Klueh
The 2 1/4$ Ci-1$ Mo steel (Croloy) with 0.10 to 0.15$ C (0.15$ maximum) is a candidate for the structural material for steam generators for the Liquid Metal Fast Breeder Reactor (IMFBR). Since Croloy, a ferritic steel, will be in a flowing sodium circuit that also contains austenitic stainless steel, there is some concern about the carburiza-tion of the Croloy and the subsequent carburization of the stainless steel by carbon mass transport through the sodium. To determine the
.223
effect of decarburization, it is necessary to know the mechanical proper-ties of 2 Cr-1$ Mo as a function of carbon content. Also, with such data it will be possible to determine whether the use of low carbon 2 1/4$ Cr—1$ Mo as a structural material is feasible.
Three 300 lb heats of 2 l/4$ Cr~l$ Mo steel with 0.003, 0.035, and 0.11$ C have been acquired from the Bureau of Mines. Small tensile specimens (l in. gage length, 0.125-in.-diam) of all weld metal and transverse weldments, both made from welded l/2-in.-plate, and larger base metal tensile specimens (2 in. gage length, 0.250 in. diam) made from 7/8-in.-diam rod are being tested. A l~in.-thick plate of standard Croloy (0.135$ C) was procured from Babcock and Wilcox and is being factored into the program.
Annealing Studies
We previously reported on the tempering characteristics of the three modified carbon steels.11 We have now heat treated specimens of these materials for examination by electron microscopy. An effort will be made to determine the nature of the precipitates present after normalizing 1 hr at 927°C and after normalizing and tempering 1 hr at 704°C.
Mechanical Properties
Welds
We have continued our studies on the creep-rupture properties of all weld metal and transverse weldments. In Tables 9.7 and 9.8 we list the creep rupture properties for the all weld metal and transverse weld specimens, respectively; Figures 9.18 and 9.19 show the respective creep-rupture curves,
I:LR. L. Klueh and H. E. McCoy, Fuels and Materials Development Program Quart. Progr, Re-pt. September 30, 1971, 0RNL-TM-3550, pp. 193-203.
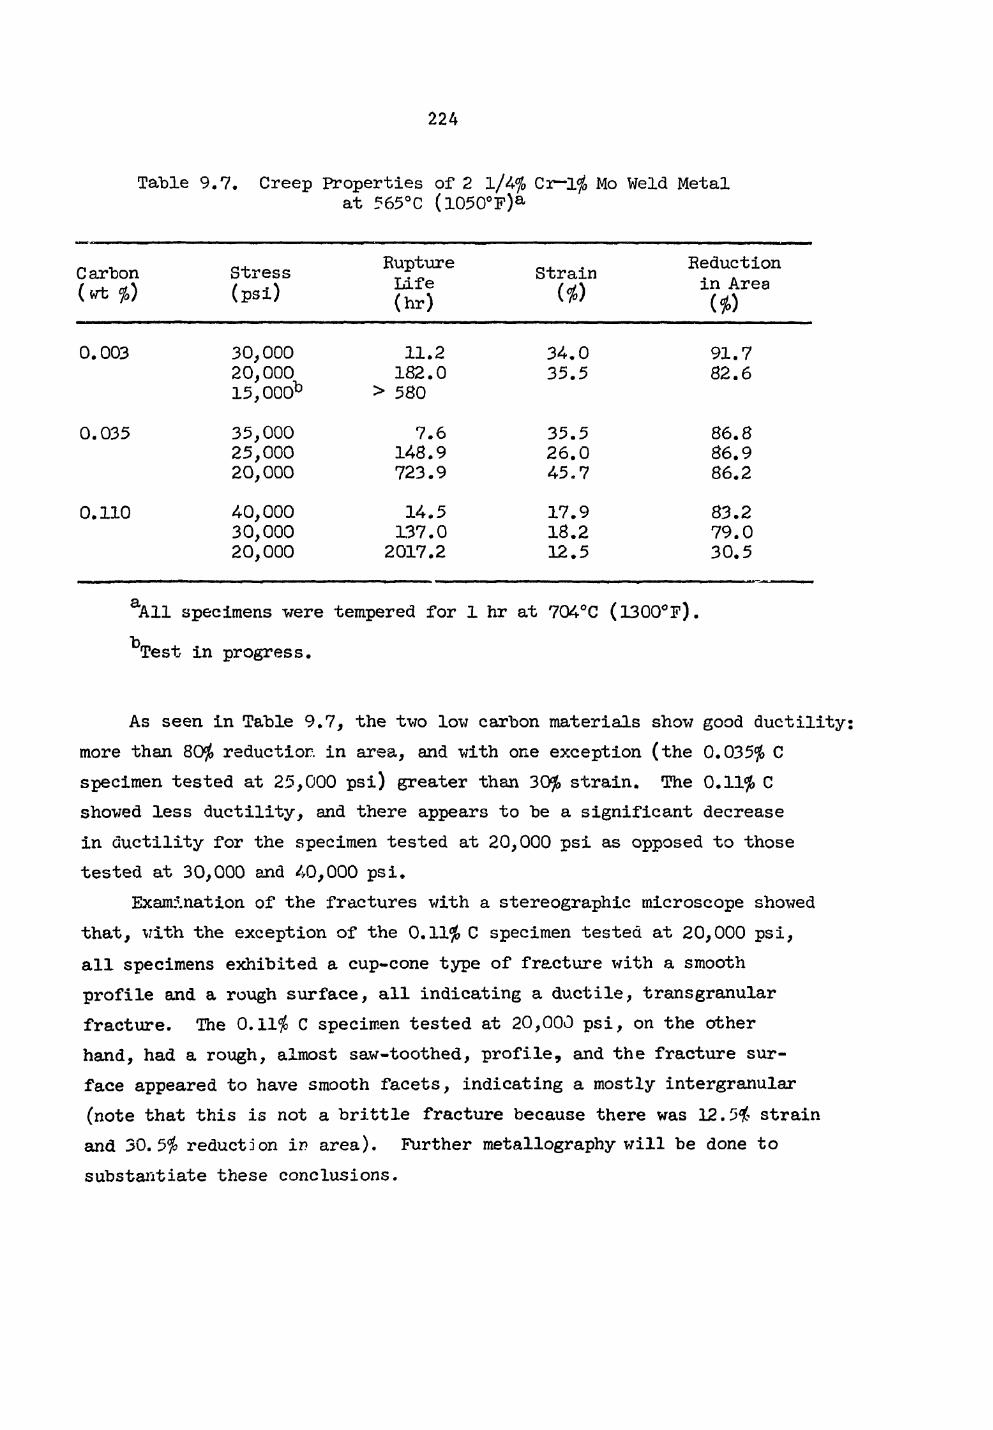
.224
Table 9.7. Creep Properties of 2 1/4$ Cr-1$ Mo Weld Metal at 565°C (l050°F)a
Carbon (wt $)
Stress (psi)
Rupture Life (hr)
Strain ($)
Reduction in Area ($)
0.003 30,000 11.2 34.0 91.7 20,000 182.0 35.5 82.6 15, OOO13 > 580
0.035 35,000 7.6 35.5 86.8 25,000 148.9 26.0 86.9 20,000 723.9 45,7 86.2
0.110 40,000 14.5 17.9 83.2 30,000 137.0 18.2 79.0 20,000 2017.2 12.5 30.5
aAll specimens were tempered for 1 hr at 704°C (1300°F).
^Test in progress.
As seen in Table 9.7, the two low carbon materials show good ductility: more than 80$ reduction, in area, and with one exception (the 0.035$ C specimen tested at 25,000 psi) greater than 30$ strain. The 0.11$ C showed less ductility, and there appears to be a significant decrease in ductility for the specimen tested at 20,000 psi as opposed to those tested at 30,000 and 40,000 psi.
Examination of the fractures with a stereographic microscope showed that, with the exception of the 0.11$ C specimen tested at 20,000 psi, all specimens exhibited a cup-cone type of fracture with a smooth profile and a rough surface, all indicating a ductile, transgranular fracture. The 0.11$ C specimen tested at 20,000 psi, on the other hand, had a rough, almost saw-toothed, profile, and the fracture sur-face appeared to have smooth facets, indicating a mostly intergranular (note that this is not a brittle fracture because there was 12.5$ strain and 30.5$ reduction in area). Further metallography will be done to substantiate these conclusions.
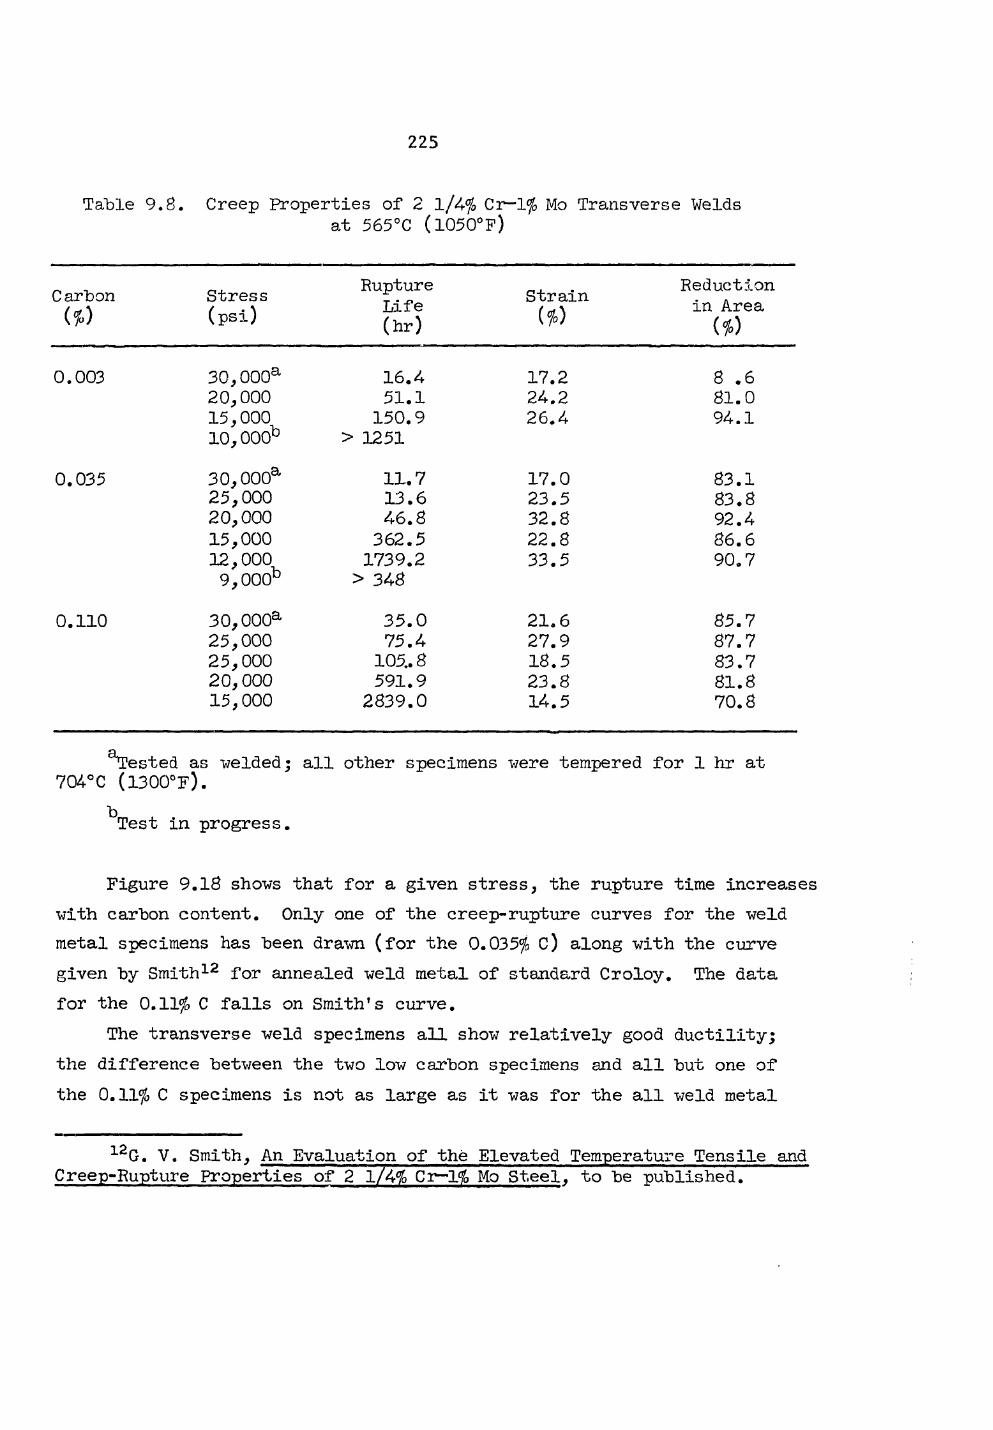
.225
Table 9.8. Creep Properties of 2 l/4$ Cr-1$ Mo Transverse Welds at 565°C (l050°F)
_ . Rupture . Reduction Carbon Stress Strain . . (nf\ ( L l f e in Area ( * ) ( P B I ) ( h r ) ( $ ) ( f o )
0.003
0.035
0 . 1 1 0
30,000a 16.4 17.2 8 .6 20,000 51.1 24.2 81.0 15,000 150.9 26.4 94.1 10,000b > 1251
30,000a 11.7 17.0 83.1 25,000 13.6 23.5 83.8 20,000 46.8 32.8 92.4 15,000 362.5 22.8 86.6 12,000 1739.2 33.5 90.7 9,000b > 348
30,000a 35.0 21.6 85.7 25,000 75.4 27.9 87.7 25,000 105.. 8 18.5 83.7 20,000 591.9 23.8 81.8 15,000 2839.0 14.5 70.8
tested as welded; all other specimens were tempered for 1 hr at 704°C (1300°F).
b . . Test m progress.
Figure 9.18 shows that for a given stress, the rupture time increases with carbon content. Only one of the creep-rupture curves for the weld metal specimens has been drawn (for the 0.035$ C) along with the curve given by Smith12 for annealed weld metal of standard Croloy. The data for the 0.11$ C falls on Smith's curve.
The transverse weld specimens all show relatively good ductility; the difference between the two low carbon specimens and all but one of the 0.11$ C specimens is not as large as it was for the all weld metal
12G. V. Smith, An Evaluation of the Elevated Temperature Tensile and Creep-Rupture Properties of 2 1/4% Ct-1% Mo Steel, to be published.
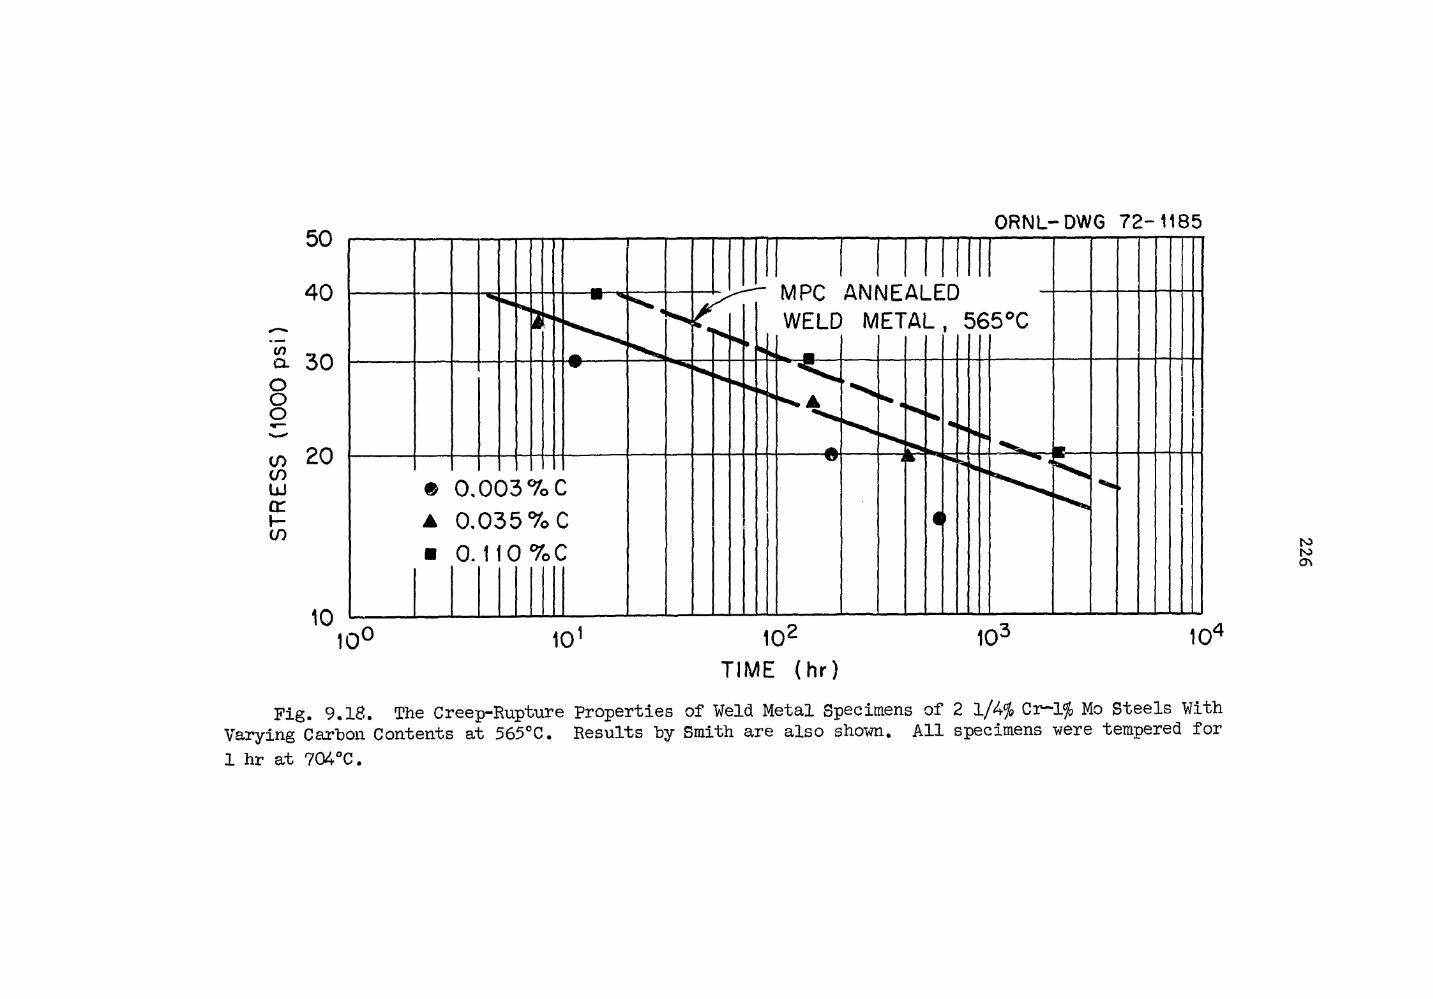
ORNL-DWG 7 2 - 1 1 8 5
Fig. 9.18. The Creep-Rupture Properties of Weld Metal Specimens of 2 1/4$ Cr~l$ Mo Steels With Varying Carbon Contents at 565°C. Results hy Smith are also shown. All specimens were tempered for 1 hr at 704°C.
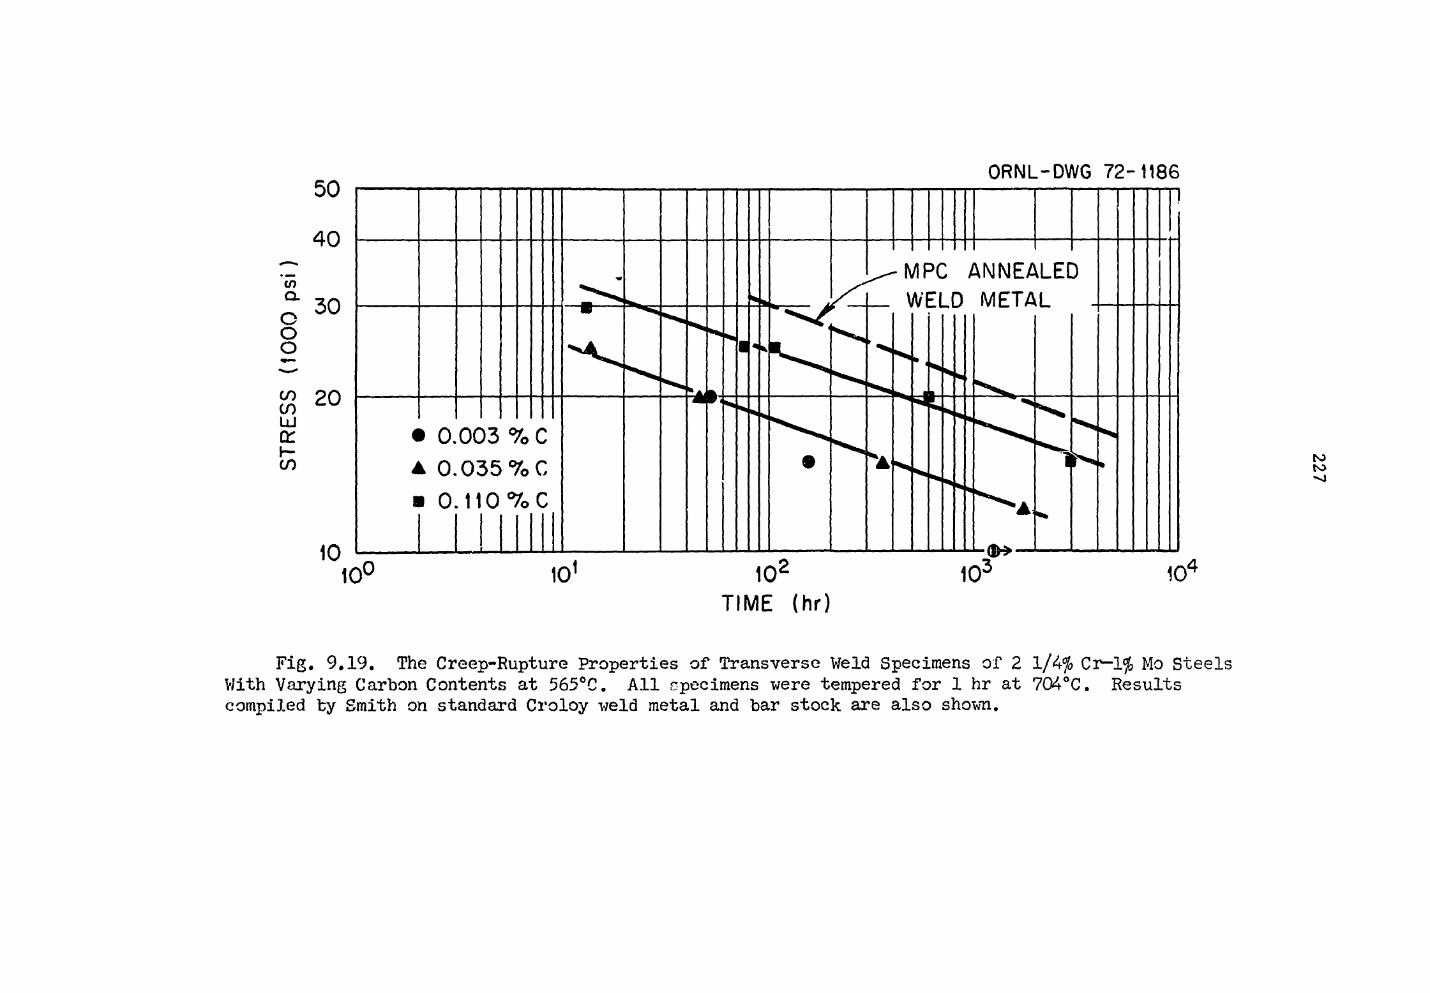
ORNL-DWG 72-1186
TIME (hr)
Fig. 9.19. The Creep-Rupture Properties of Transverse Weld Specimens of 2 1/4$ Cr-1% Mo Steels With Varying Carbon Contents at 565°C. All specimens were tempered for 1 hr at 704°C. Results compiled by Smith on standard Croloy weld metal and bar stock are also shown.
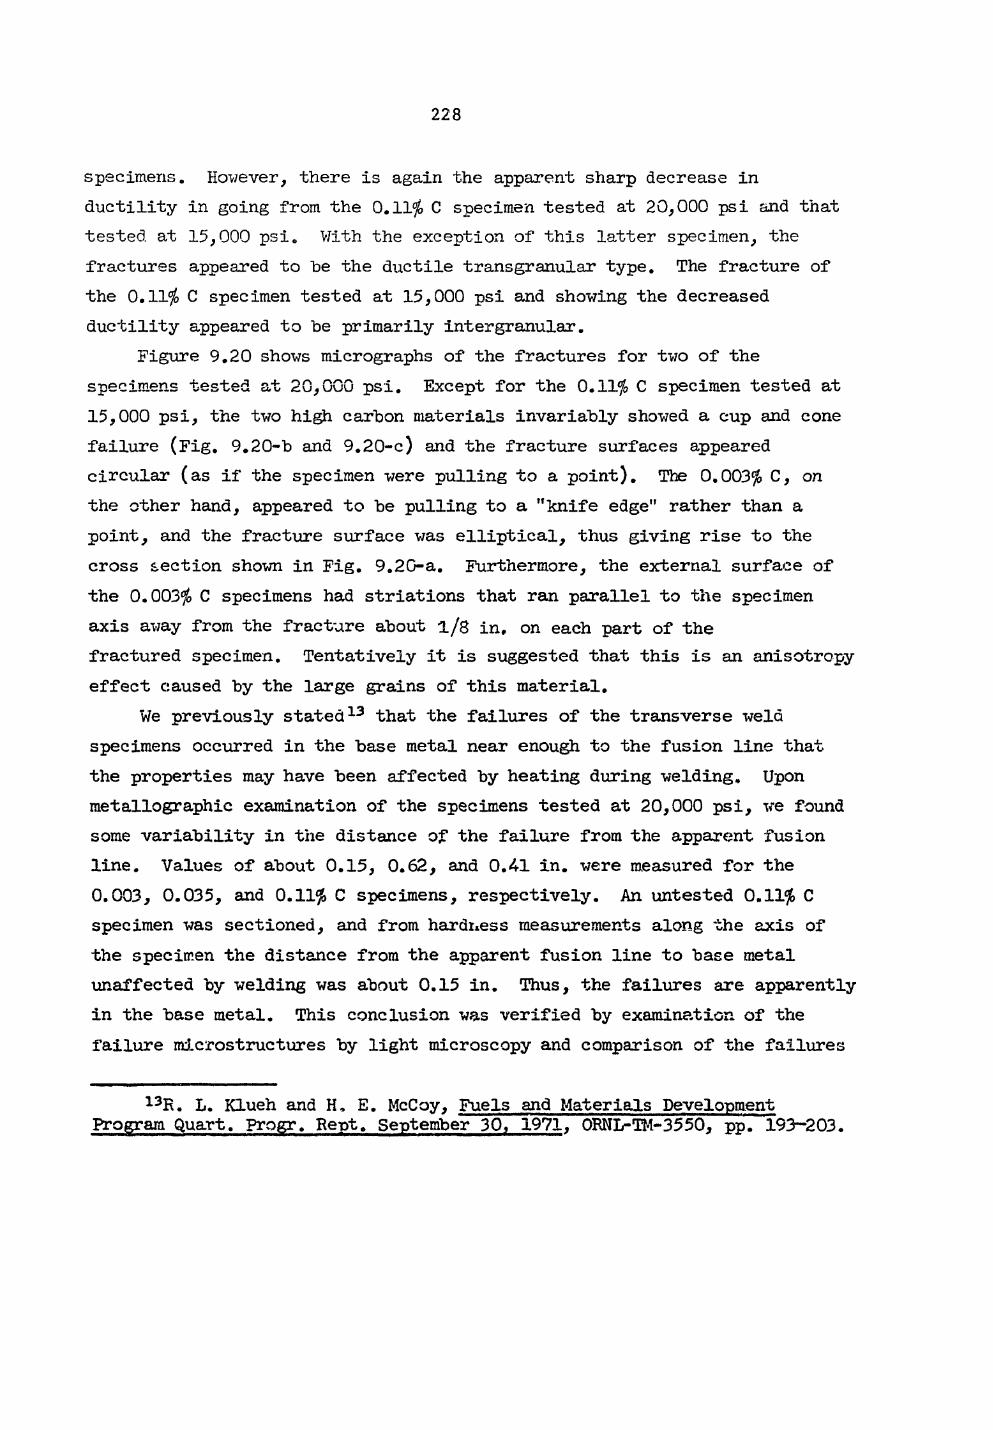
.228
specimens. However, there is again the apparent sharp decrease in ductility in going from the 0.11$ C specimen tested at 20,000 psi and that tested at 15,000 psi. With the exception of this latter specimen, the fractures appeared to he the ductile transgranular type. The fracture of the 0.11$ C specimen tested at 15,000 psi and showing the decreased ductility appeared to he primarily Intergranular.
Figure 9.20 shows micrographs of the fractures for two of the specimens tested at 20,000 psi. Except for the 0.11$ C specimen tested at 15,000 psi, the two high carbon materials invariably showed a cup and cone failure (Fig. 9.20-b and 9.20-c) and the fracture surfaces appeared circular (as if the specimen were pulling to a point). The 0.003$ C, on the other hand, appeared to be pulling to a "knife edge" rather than a point, and the fracture surface was elliptical, thus giving rise to the cross section shown in Fig. 9.20-a. Furthermore, the external surface of the 0.003$ C specimens had striations that ran parallel to the specimen axis away from the fracture about l/S in, on each part of the fractured specimen. Tentatively it is suggested that this is an anisotropy effect caused by the large grains of this material.
We previously stated13 that the failures of the transverse weld specimens occurred in the base metal near enough to the fusion line that the properties may have been affected by heating during welding. Upon metallographic examination of the specimens tested at 20,000 psi, ve found some variability in the distance of the failure from the apparent fusion line. Values of about 0.15, 0.62, and 0.41 in. were measured for the 0.003, 0.035, and 0.11$ C specimens, respectively. An untested 0.11$ C specimen was sectioned, and from hardness measurements along the axis of the specimen the distance from the apparent fusion line to base metal unaffected by welding was about 0.15 in. Thus, the failures are apparently in the base metal. This conclusion was verified by examination of the failure microstructures by light microscopy and comparison of the failures
13R. L. Klueh and H, E. McCoy, Fuels and Materials Development Program Quart. Progr. Rept. September 30, 1971, 0RNL-TM-3550, pp. 193-203.
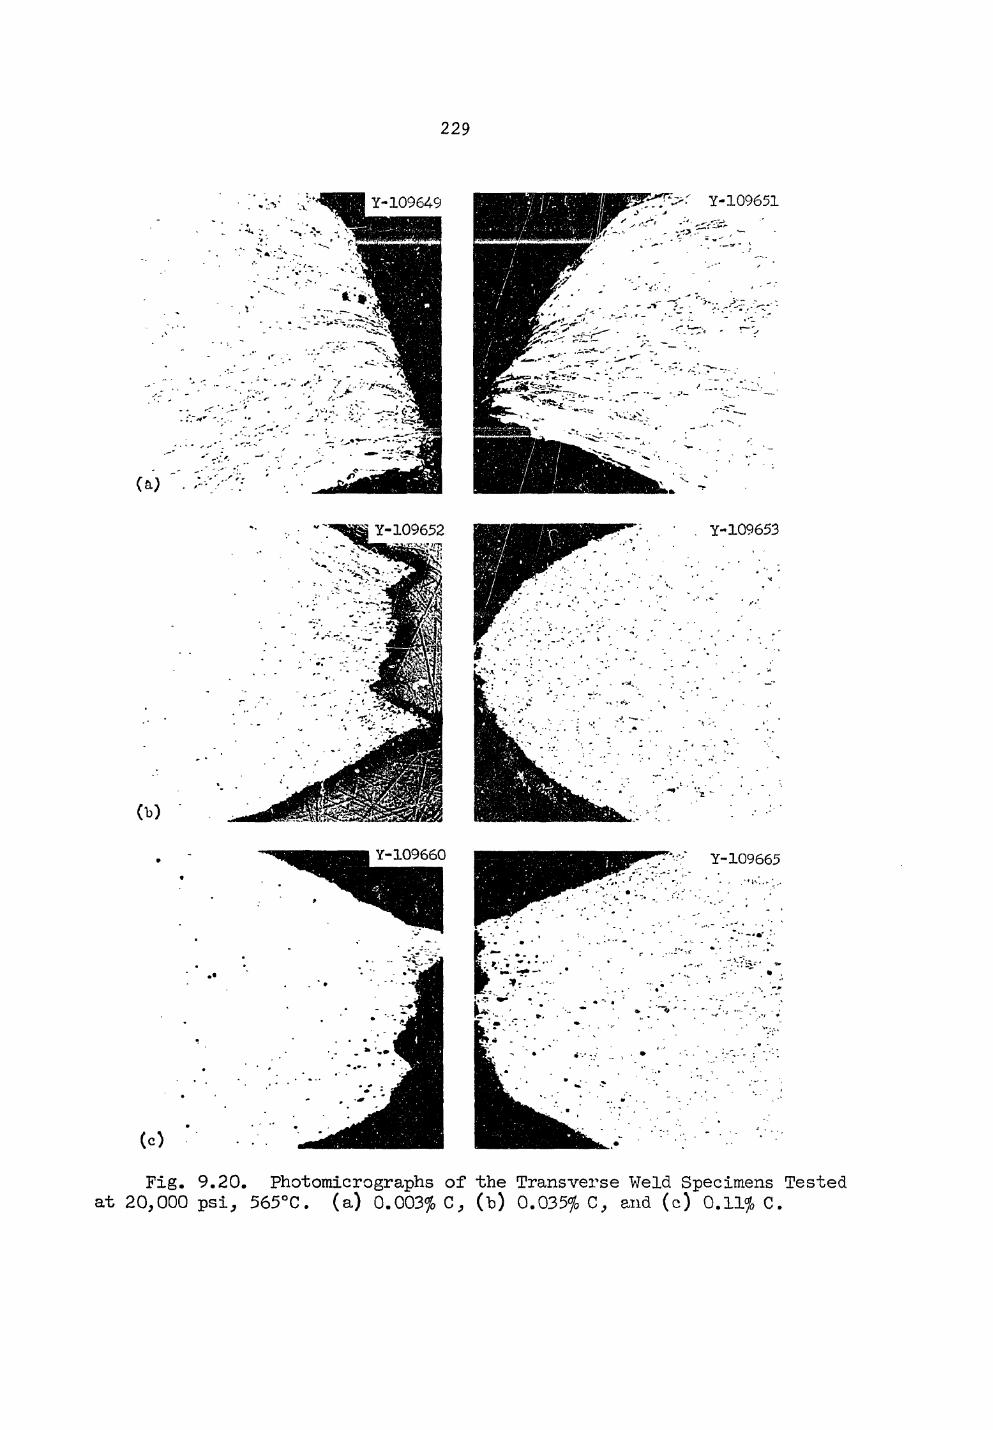
.229
0>)
(c)
Fig. 9.20. Photomicrographs of the Transverse Weld Specimens Tested at 20,000 psi, 565°C. (a) 0.003$ C, (b) 0.035$ C, and (c) 0.11$ C.
.230
with macro-etched specimens of similarly welded materials. Base metal failures also occurred in the nine tensile specimens (three from each material) that have been examined by light microscopy.
We began creep testing transverse welds at 510°C and discovered some unexpected results. When this program began, only dead-load machines were available, and all the 565°C tests on transverse welds were done on such machines (the all weld metal and base metal tests have been done on lever arm machines). Similarly, the first tests, at 510°C were conducted at 30,000 psi for each material on dead load machines; the results are shown in Table 9.9. Because of the larger loads and because lever-arm machines became available, creep tests of the 0.035 and 0.11$ C at 35,000 psi were made on 12:1 lever arm machines; as seen in Table 9.9, the ruptxire times exceeded those for the 30,000 psi tests (i.e., longer times for the higher stress). Retests at 30,000 psi on the lever arm machines gave times longer than those at 35,000 psi.
The only difference in the tests appears to be the loading. For a 30,000 psi test on the button head specimens used, a dead load machine has to be loaded to about 345 lb, whereas a 12:1 lever arm needs only about 30 lb. Both machines are loaded with 20 lb weights up to the nearest 20 lb; then the balance of the weight is put on the pan using 5, 1, and 1/2 lb weights and lead shot. Since great care is used to ensure that the weight is gently lowered onto the pan, the only apparent difference is the time required to place 30 and 345 lb on the respective weight pans. The 30 lb load can very quickly be placed on the pan, whereas the 345 lb load requires that seventeen 20 lb weights be individually placed on the pan, an operation that could require several minutes to complete.
Similar observations on the effect of loading have been found by Hodgson1*4 who showed that a 1 Cr-Mo-V steel annealed to produce ferrite plus pearlite is extremely sensitive to the initial strain history above about 0.42 Tra. Hodgson states:
l4B.J.R. Hodgson, The Effect of Pre-Strain and Pre-Strain Rate on the Creep 3ehavior of 1 Cr-Mo-V Steel* RD/B/N113Q (Sept. 1968).
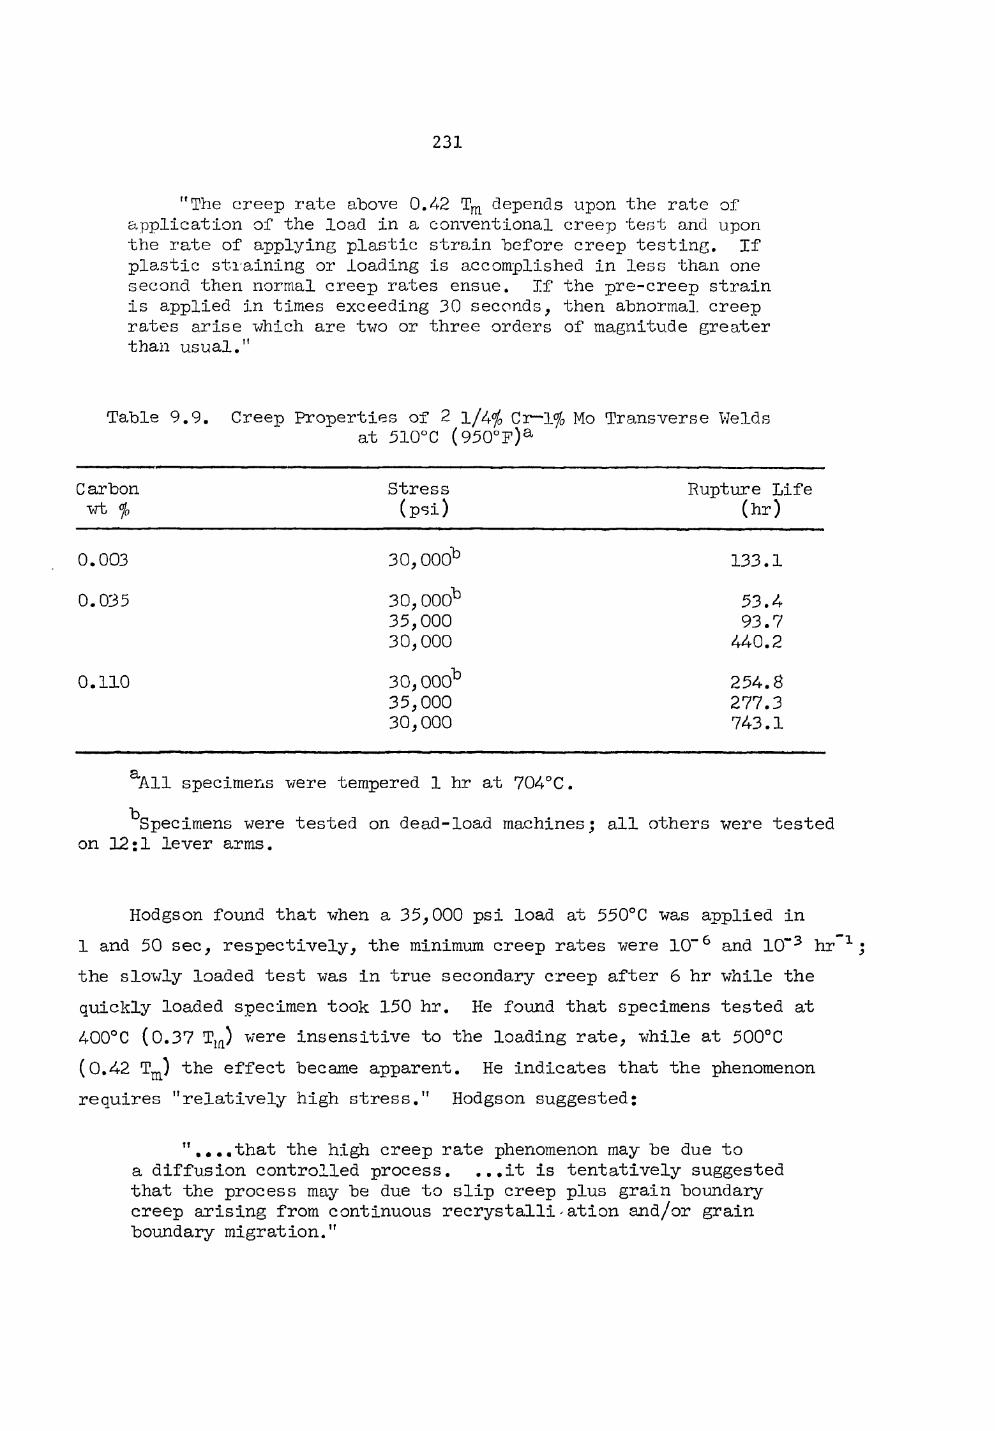
.231
"The creep rate above 0.42 Tm depends upon the rate of application of the load in a conventional creep test and upon the rate of applying plastic strain before creep testing. If plastic straining or loading is accomplished in less than one second then normal creep rates ensue. If the pre-creep strain is applied in times exceeding 30 seconds, then abnormal, creep rates arise which are two or three orders of magnitude greater than usual."
Table 9.9. Creep Properties of 2 l/4</0 Cr-1% Mo Transverse Welds at 510°C (950°F)a
C arbon Stress Rupture Life wt % (psi) (hr)
0.003 30,000^ 133.1
0.035 SO^OO13 53.4 35,000 93.7 30,000 440.2
0.110 30,000b 254.8 35,000 277.3 30,000 743.1
SL All specimens were tempered 1 hr at 704°C.
Specimens were tested on dead-load machines; all others were tested on 12:1 lever arms.
Hodgson found that when a 35,000 psi load at 550°C was applied in 1 and 50 sec, respectively, the minimum creep rates were 10"6 and 10" 3 hr 1 j the slowly loaded test was in true secondary creep after 6 hr while the quickly loaded specimen took 150 hr. He found that specimens tested at 400°C (0.37 T m) were insensitive to the loading rate, while at 500°C (0.42 Tm) the effect became apparent. He indicates that the phenomenon requires "relatively high stress." Hodgson suggested;
"....that the high creep rate phenomenon may be due to a diffusion controlled process. ...it is tentatively suggested that the process may be due to slip creep plus grain boundary creep arising from continuous recrystalli-ation and/or grain boundary migration."
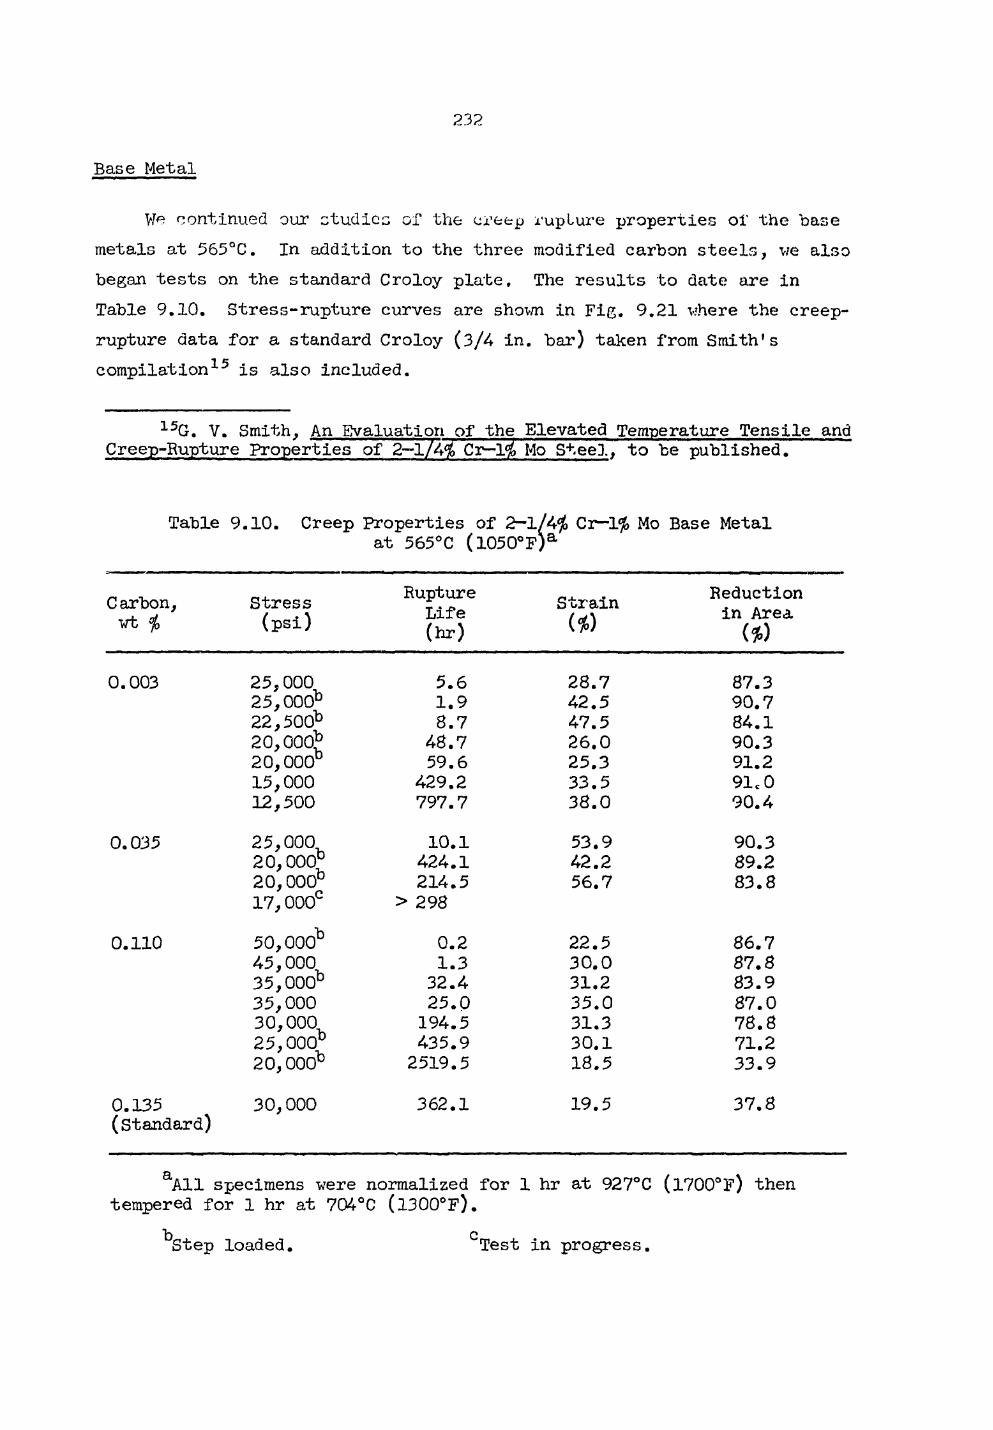
232
Base Metal
We continued our ctudiec of the oretp x'upLure properties oi' the base metals at 565°C. In addition to the three modified carbon steels, we also began tests on the standard Croloy plate. The results to date are in Table 9.10. Stress-rupture curves are shown in Fig. 9.21 where the creep-rupture data for a standard Croloy (3/4 in. bar) taken from Smith's compilation15 is also included.
15G. V. Smith, An Evaluation of the Elevated Temperature Tensile and Creep-Rupture Properties of 2-1/4$ Cr-1$ Mo Steel, to be published.
Table 9.10. Creep Properties of 2-1/4$ Ci—1$ Mo Base Metal at 565°C (l050°F)a
„ , Rupture OJL . Reduction Carbon, Stress 5.,, Strain . A t . \ Life / i n Area vt $ (psi) ( h r ) ($) ^
0.003
0.035
0.110
0.135 (Standard)
2 5 , 0 0 0 5 . 6 2 8 . 7 8 7 . 3 2 5 , 0 0 0 b 1 . 9 4 2 . 5 9 0 . 7 2 2 , 5 0 0 b 8 . 7 4 7 . 5 8 4 . 1 2 0 , 0 0 0 b 4 8 . 7 2 6 . 0 9 0 . 3 2 0 , 0 0 0 5 9 . 6 2 5 . 3 9 1 . 2 1 5 , 0 0 0 4 2 9 . 2 3 3 . 5 91c 0 1 2 , 5 0 0 7 9 7 . 7 3 8 . 0 9 0 . 4
2 5 , 0 0 0 1 0 . 1 5 3 . 9 9 0 . 3 2 0 , 0 0 0 ° 4 2 4 . 1 4 2 . 2 8 9 . 2 2 0 , 0 0 0 b 2 1 4 . 5 5 6 . 7 8 3 . 8 1 7 , 0 0 0 c > 2 9 8
5 0 , 0 0 0 b 0 . 2 2 2 . 5 8 6 . 7 4 5 , 0 0 0 1 . 3 3 0 . 0 8 7 . 8 3 5 , 0 0 0 3 2 . 4 3 1 . 2 8 3 . 9 3 5 , 0 0 0 2 5 . 0 3 5 . 0 8 7 . 0 3 0 , 0 0 0 1 9 4 . 5 3 1 . 3 7 8 . 8 2 5 , 0 0 0 4 3 5 . 9 3 0 . 1 7 1 . 2 2 0 , 0 0 0 b 2 5 1 9 . 5 1 8 . 5 3 3 . 9
3 0 , 0 0 0 3 6 2 . 1 1 9 . 5 3 7 . 8
aAll specimens were normalized for 1 hr at 927°C (l700°F) then tempered for 1 hr at 704°C (l300°F).
b c Step loaded. Test in progress.
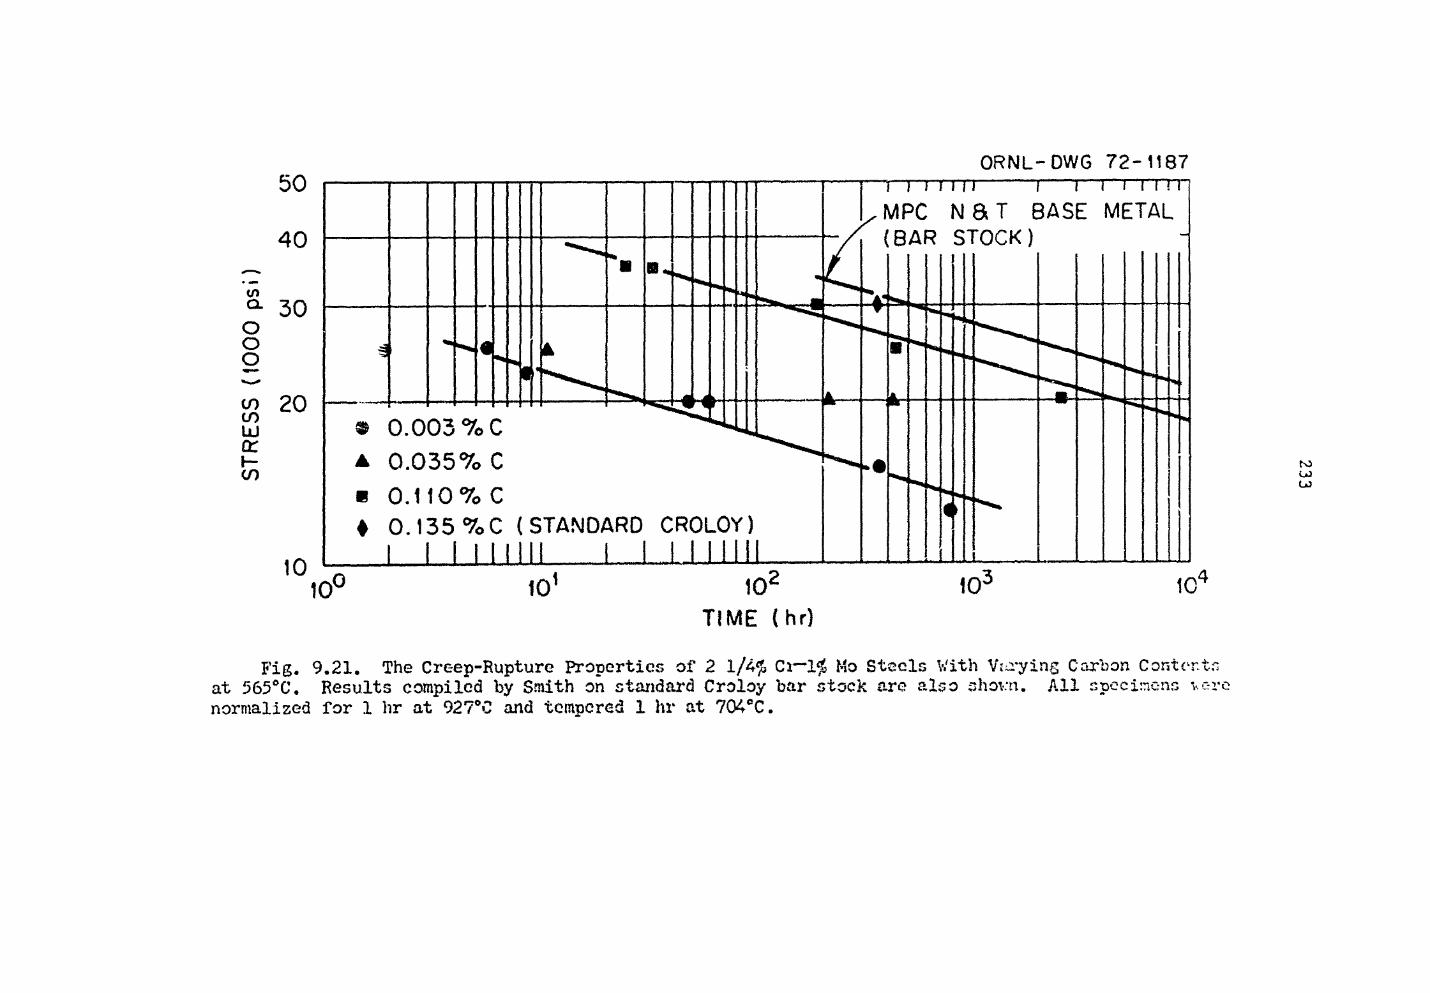
ORNL-DWG 7 2 - 1 1 8 6
CO G L
o o o to cn UJ or h -c o
TIME (hr)
Fig. 9.21. The Creep-Rupture Properties of 2 1/4$ Ci~l$ Mo Steels With Vitryins Carlson Content at 565°C. Results compiled by Smith on standard Croloy bar stock are also ahovn. All specimens vc-normalized for 1 hr at 927°C and tempered 1 hr at 704eC.
.234
A study of the ductility data given in Table 9.10 shows the results to he similar to those found for the welds: the high carbon specimens loaded to the lower stresses showed decreased ductility; note also the lower ductility for the one standard Croloy specimen tested.
Although the base metal specimens were tested on lever-arm machines, the method of loading varied. Some machines contain elevators that allow the loaded weight pans to be smoothly and quickly lowered (loading is complete in a few seconds). Some tests were step loaded (such loading could take up to a minute). In Table 9.10 the step-loaded specimens are noted; all others were elevator loaded. Since the loading effect dis-cussed above was just recently found, no tests specifically designed to study the loading effect have yet been completed. Nevertheless, from the limited results of Table 9.10, there are indications that the effect is present in the base metal tests.
The repeated tests of Table 9.10 were repeated because the first test failed near the end of the gage length. (We now feel that these end ruptures were caused by the set screws of the extensometers being too tight.) Although the end rupture may cause an error in the strain data, the rupture times should correspond quite well to those observed for a center rupture. Comparison of the two 0.003$ C specimens loaded to 25,000 psi shows that the step-loaded specimen failed almost four times as fast as the elevator loaded specimen. Likewise, if the rupture time of the step-loaded 0.11$ C specimen tested at 50,000 psi is compared with a value extrapolated from the curve of Fig. 9.20,. a factor of 10 difference is detected. However, the two 0.11$ C specimens tested at 35,000 psi show essentially no change. Indeed, the step-loaded specimen outlasted the elevator-loaded specimen.
Tentatively we conclude that the effect of loading is stress de-pendent as Hodgson16 has indicated, and we plan tests designed to further document the nature of this effect.
16B.J.R. Hodgson, The Effect of Pre-Strain and Pre-Strain Rate on the Creep Behavior of 1 Cr-Mo-V Steel, RD/B/N1139 (Sept. 1968).

PART II. SPACE POWER TECHNOLOGY
.2100
10. DEVELOPMENT OF URANIUM MONONITRIDE FUELS
J. L. Scott P. Patriarca
The objective of the ORNL program for irradiation testing of uranium mononitride (UN) is to obtain basic information on fuel swelling, fission-gas release, and compatibility with cladding materials at fuel temperatures from 1000 to 1500°C, claddirg outside surface temperatures of 900 to 14-00°C, and linear heat ratings of 5 to 10 kW/ft. Detailed descriptions of our capsule design1 and previous test results2'3>*' have been reported.
Thermal Simulation Tests
E. J. Manthos
The eight thermal simulation fuel pins for capsules UN-4, -5, and -6 described previously5 were transferred to the Materials Compati-bility group for simulation exposure at temperatures comparable to those in the ORR. The UN-4 and -5 simulation fuel pins will be maintained at a cladding temperature of 1000°C on a 12-day isothermal hold cycle. The UN-6 simulation pins will also be maintained on a 12-day isothermal hold cycle; however, the cladding temperatures will be 350° C for the first 1500 hr and 1000°C for the remaining 6500 hr. All tests will be conducted in vacuum.
XV. A. DeCarlo, F. R. McQuilkin, R. L. Senn, K. R. Thorns, and S. C. Weaver, Design of a Capsule for Irradiation Testing of Uranium Nitride Fuel, 0RNL-TM-2363 (February 1969). ~
2T. N. Washburn, D. R. Cuneo, and E. L. Long, Jr., "Irradiation Performance of Uranium Nitride at 1500°C, Am. Ceram. Soc. Bull. 50, 427
3T. N. Washburn, K. R. Thorns, S. C. Weaver, D. R. Cuneo, and E. L. Long, Jr., "Examination of UN-Fueled Pins Irradiated at 14 Cladding Temperature," Trans. Am. Nucl. Soc. 13, 101 (1971).
4S. C. Weaver, K. R. Thorns, and V. A. DeCarlo, "Irradiation Testing of UN in 0RR," Trans. Am. Nucl. Soc. 12, 54? (1969).
5B. Fleischer, K. R. Thorns, and T. N. Washburn, Fuels ana Materials Development Program Quart. Progr. Rept. September 30. 1971, ORNL-355?, pp. 209-211.

BLANK PAGE
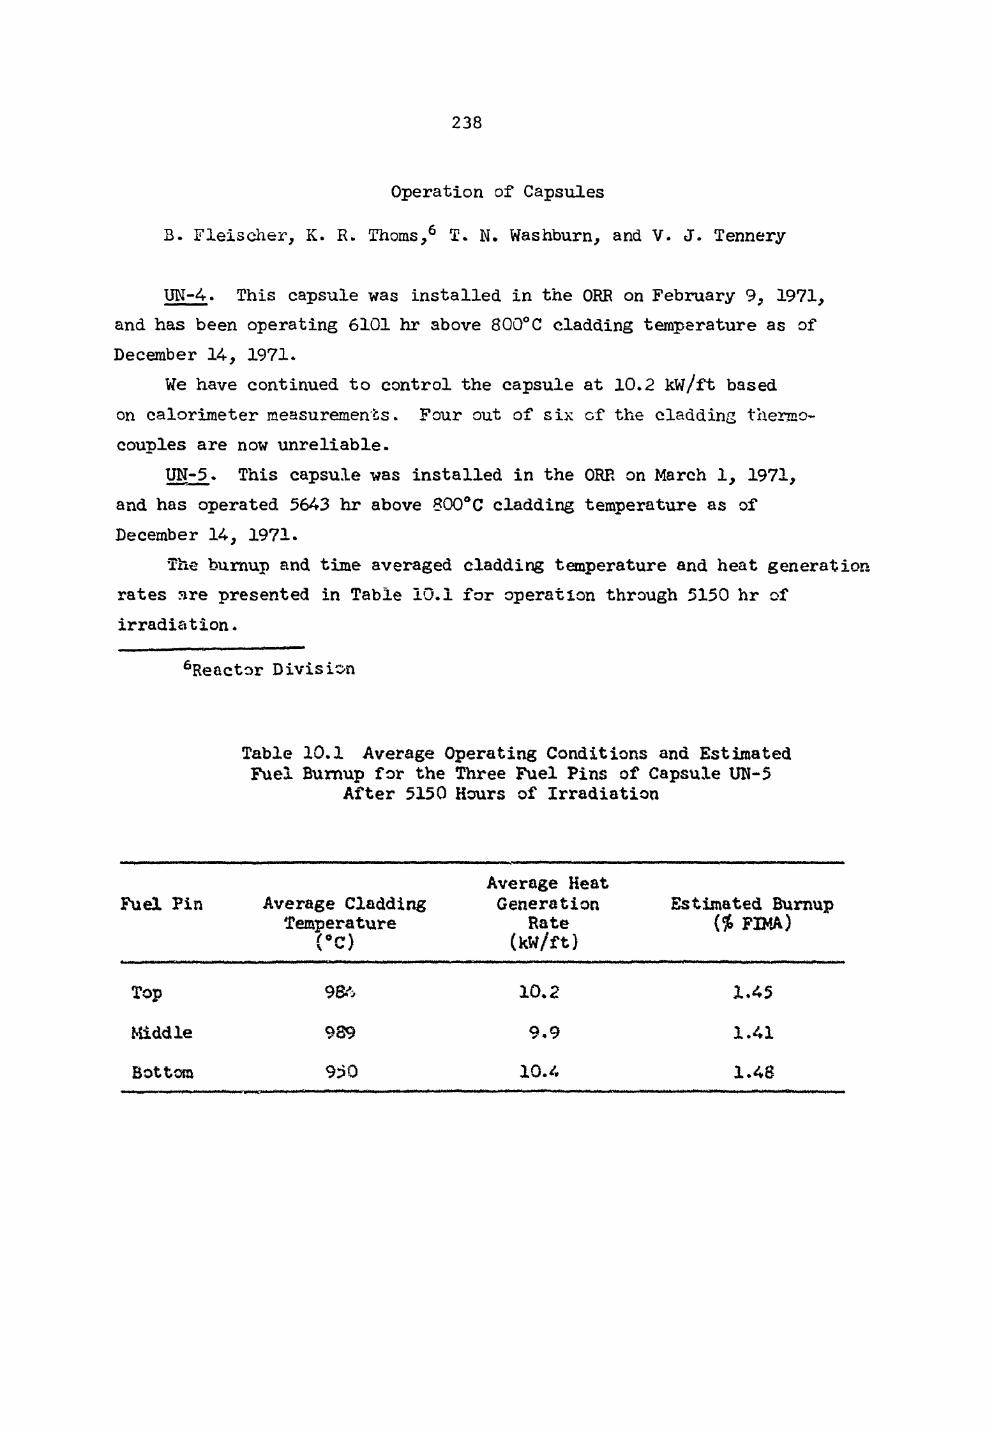
.238
Operation of Capsules
B. Fleischer, K. R. Thorns,6 T. N. Washburn, and V. J. Tennery
UN-4. This capsule was installed in the ORR on February 9, 1971, and has been operating 6101 hr above 800°C cladding temperature as of December 14, 1971.
We have continued to control the capsule at 10.2 kW/ft based on calorimeter measurements. Four out of six of the cladding thermo-couples are now unreliable.
UN-5. This capsule was installed in the ORR on March 1, 1971, and has operated 5643 hr above 800ftC cladding temperature as of December 14, 1971.
The burnup and time averaged cladding temperature and heat generation rates are presented in Table 10.1 for operation through 5150 hr of irradiation.
6Reactor Division
Table 10.1 Average Operating Conditions and Estimated Fuel Bumup for the Three Fuel Pins of Capsule UN-5
After 5X50 Hours of Irradiation
Fuel Pin Average Cladding Temperature
t*n\ \ w
Average Heat Generation
Rate Estimated Bumup
($> FIMA) (kW/ft)
Top
Middle
Bottom
98ft
989
950
10.2 9 . 9
1 0 . 4
1.45
1.41
1.48
.239
UN-6. Capsule UN-6 was installed in the ORR on August 1971, and has operated 2691 hr above -BOTC as of December .V*, 1971.
An extensive analysis of the capsule data revealed that gamma heating was contributing a larger than expected proportion of the heat generated. Correction of the calorimeter calibration curves for £2$ gamma heat rather than 9$ used previously showed good correlation between measured and predicted cladding temperatures. To achieve increased cladding temperature without raising the heat rating of the fuel element we substituted argon for helium in the secondary gas gap. Consequently, we are no longer operating the capsule using a Unit of 1030°C on the top fuel element cladding temperature and 1000°C on the bottom element. The average operating conditions for the previous and present mode of operation are presented in Table 10.2 along with the estimated burnup values..
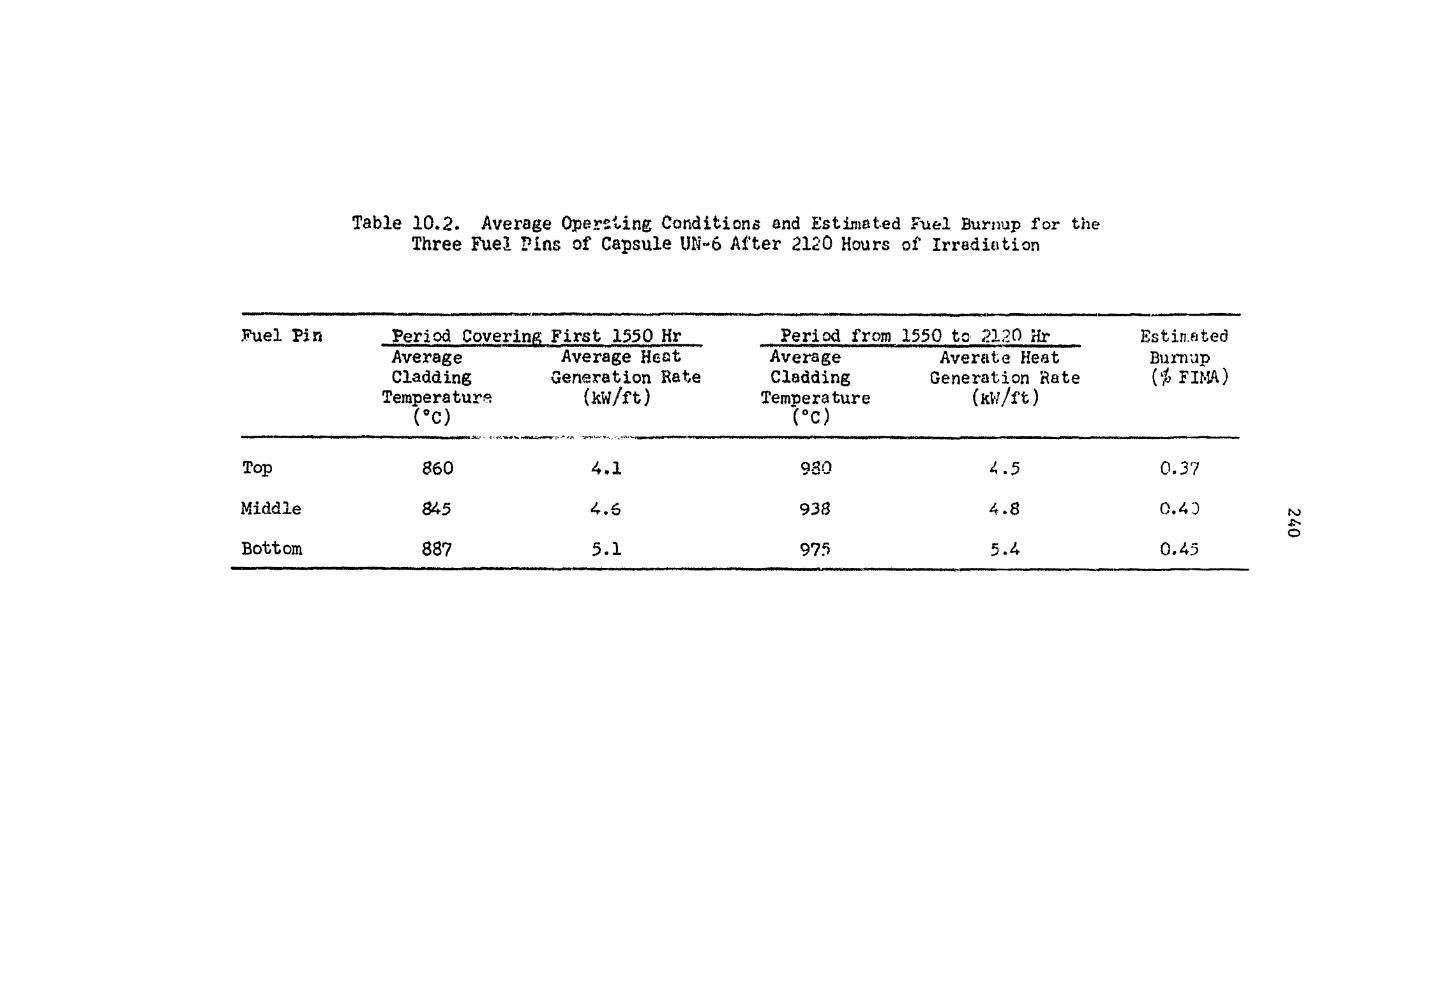
Table 10.2. Average Operating Conditions and Estimated Fuel Burnup for the Three Fuel Pins of Capsule UN«6 After 2120 Hours of Irradiation
Fuel Pin Period Covering First 1550 Hr Average Average Heat Cladding Generation Rate Tempera turs {kw/f t)
(°C)
Top 860 4.1
Middle 845 4.6
Bottom 887 5.1
Period from 1550 to 2120 Hr Estimated Average Averate Heat Burnup Cladding Generation Rate FIMA) Tempera ture (kV//f t)
(°C)
9S0 4.5 0.37
938 4.8 0.43
975 5.4 0.45
.241
11. TUNGSTEN METALLURGY
A. C. Schaffhauser
The objective of this program is to provide the base technology on tungsten materials for advanced space power applications. We are developing fabrication processes for tungsten alloys based on chemical vapor deposition (CVD) and high-temperature extrusion techniques. Since a primary criterion for use of tungsten materials for fuel cladding is based on the creep properties, we are conducting extensive long-time tests at the temperatures of interest and determining the mechanisms that control creep behavior. The effects of decomposition products from a reactor fuel on creep properties are being determined. We are also evaluating the effects of high-temperature fast-neutron irradiation on the structure and physical properties of tungsten alloys.
Creep Properties of Tungsten Materials
J. 0. Stiegler H. E. McCoy
Variations in The Creep Properties of Fluoride CVD Tungsten
Previous work1 has shown that the elevated temperature creep proper-ties of CVD tungsten deposited from WF6 display strong variability from batch to batch and that a rough correlation can be made between creep properties and fluorine content. Deposits containing 9 ppm F or more exhibit relatively high creep strengths and rupture lives but generally have significantly lower fracture strains than deposits con-taining 7 ppm F or less. Typical properties of deposits containing 17 and 7 ppm F are given in Table 11.1.
XH. E. McCoy, Fuels and Materials Development Program Quart. Progr. Rept. September 30, 1971, 0RNL-TM-3550, pp. 216-219.
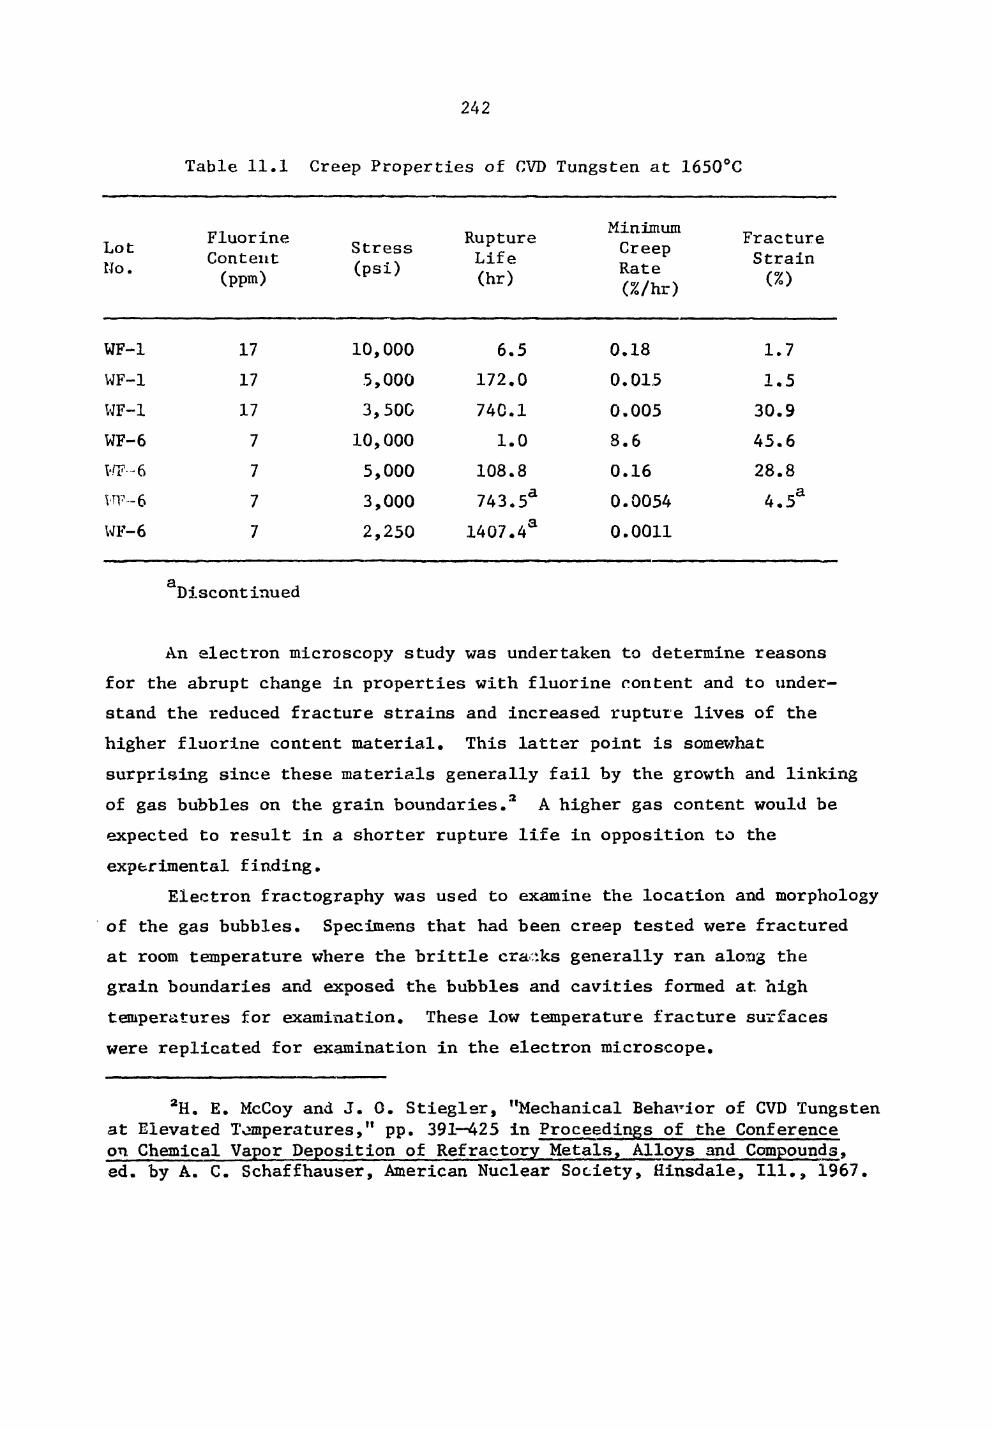
242
Table 11.1 Creep Properties of CVD Tungsten at 1650°C
Lot No.
Fluorine Content (ppm)
Stress (psi)
Rupture Life (hr)
Minimum Creep Rate (%/hr)
Fracture Strain (%)
WF-1 17 10,000 6.5 0.18 1.7 WF-1 17 5,000 172.0 0.015 1.5 WF-1 17 3,50G 74C.1 0.005 30.9 WF-6 7 10,000 1.0 8.6 45.6 WF-6 7 5,000 108.8 0.16 28.8 vrp-6 7 3,000 743.5a 0.0054 4.5a
WF-6 7 2,250 1407.4a 0.0011
Discontinued
An electron microscopy study was undertaken to determine reasons for the abrupt change in properties with fluorine content and to under-stand the reduced fracture strains and increased rupture lives of the higher fluorine content material. This latter point is somewhat surprising since these materials generally fail by the growth and linking of gas bubbles on the grain boundaries.3 A higher gas content would be expected to result in a shorter rupture life in opposition to the experimental finding.
Electron fractography was used to examine the location and morphology of the gas bubbles. Specimens that had been creep tested were fractured at room temperature where the brittle cracks generally ran along the grain boundaries and exposed the bubbles and cavities formed at. high temperatures for examination. These low temperature fracture surfaces were replicated for examination in the electron microscope.
2H. E. McCoy and J. 0. Stiegler, "Mechanical Behavior of CVD Tungsten at Elevated Temperatures," pp. 391—425 in Proceedings of the Conference on Chemical Vapor Deposition of Refractory Metals, Alloys and Compounds, ed. by A. C. Schaffhauser, American Nuclear Society, Hinsdale, 111., 1967.
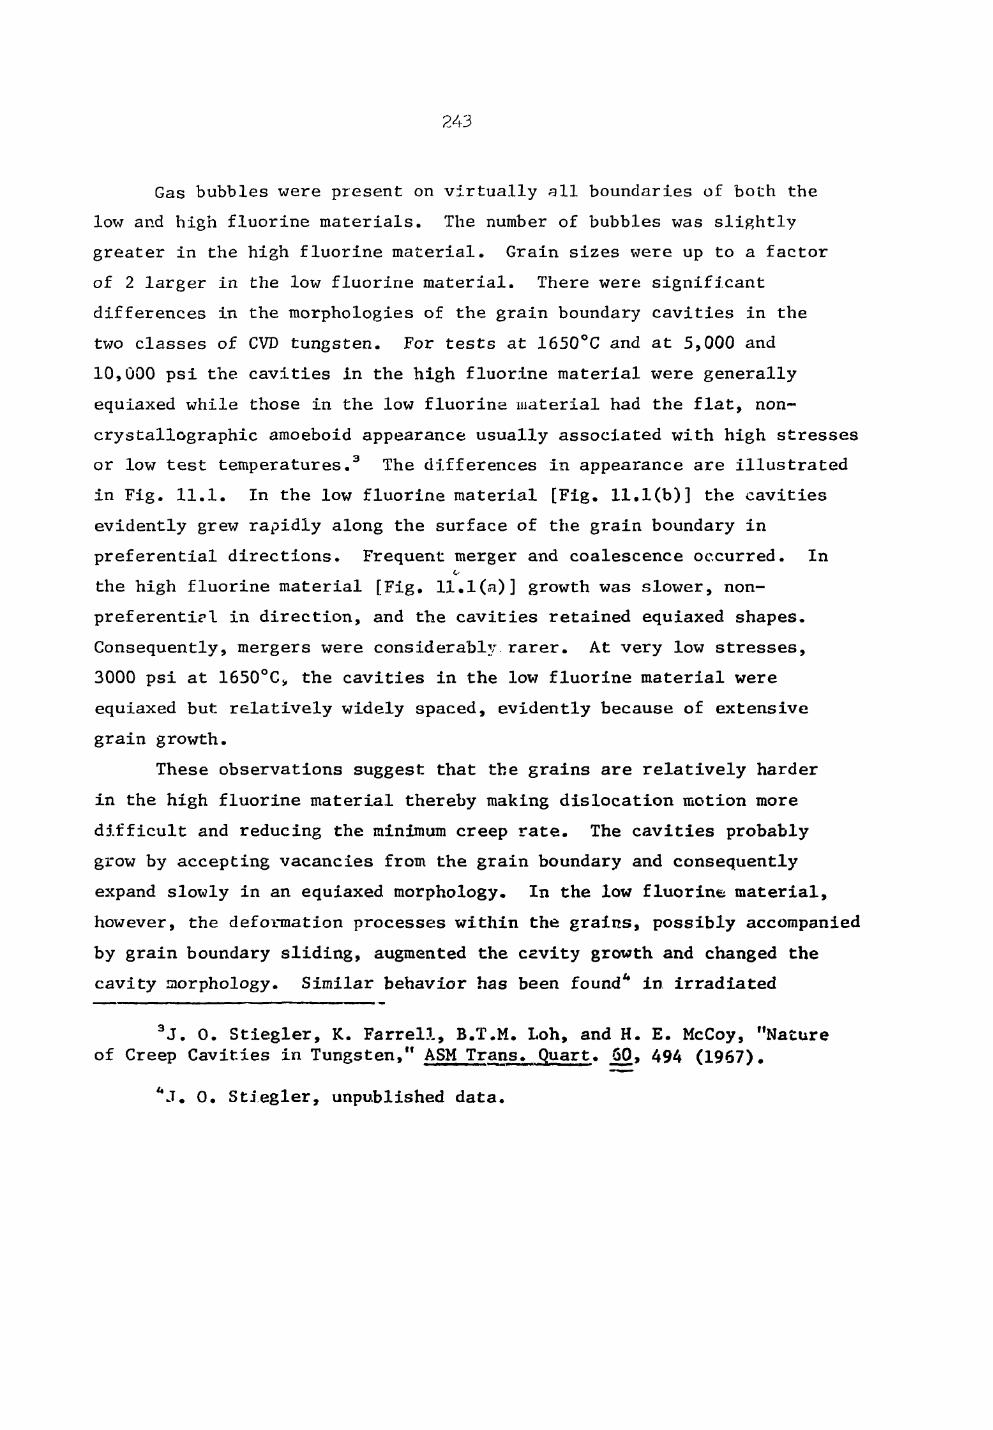
243
Gas bubbles were present on virtually all boundaries of both the low and high fluorine materials. The number of bubbles was slightly greater in the high fluorine material. Grain sizes were up to a factor of 2 larger in the low fluorine material. There were significant differences in the morphologies of the grain boundary cavities in the two classes of CVD tungsten. For tests at 1650°C and at 5,000 and 10,000 psi the cavities in the high fluorine material were generally equiaxed while those in the low fluorine material had the flat, non-crystallographic amoeboid appearance usually associated with high stresses or low test temperatures.3 The differences in appearance are illustrated in Fig. 11.1. In the low fluorine material [Fig. 11.1(b)] the cavities evidently grew rapidly along the surface of the grain boundary in preferential directions. Frequent merger and coalescence occurred. In the high fluorine material [Fig. 11.1(a)] growth was slower, non-preferenti?! in direction, and the cavities retained equiaxed shapes. Consequently, mergers were considerably rarer. At very low stresses, 3000 psi at 1650°CS1 the cavities in the low fluorine material were equiaxed but relatively widely spaced, evidently because of extensive grain growth.
These observations suggest that the grains are relatively harder in the high fluorine material thereby making dislocation motion more difficult and reducing the minimum creep rate. The cavities probably grow by accepting vacancies from the grain boundary and consequently expand slowly in an equiaxed morphology. In the low fluorine material, however, the deformation processes within the grains, possibly accompanied by grain boundary sliding, augmented the c2vity growth and changed the cavity morphology. Similar behavior has been found* in irradiated
3J. 0. Stiegler, K. Farrell, B.T.M. Loh, and H. E. McCoy, "Nature of Creep Cavities in Tungsten," ASM Trans. Quart. 60, 494 (1967).
\T. 0. Stiegler, unpublished data.
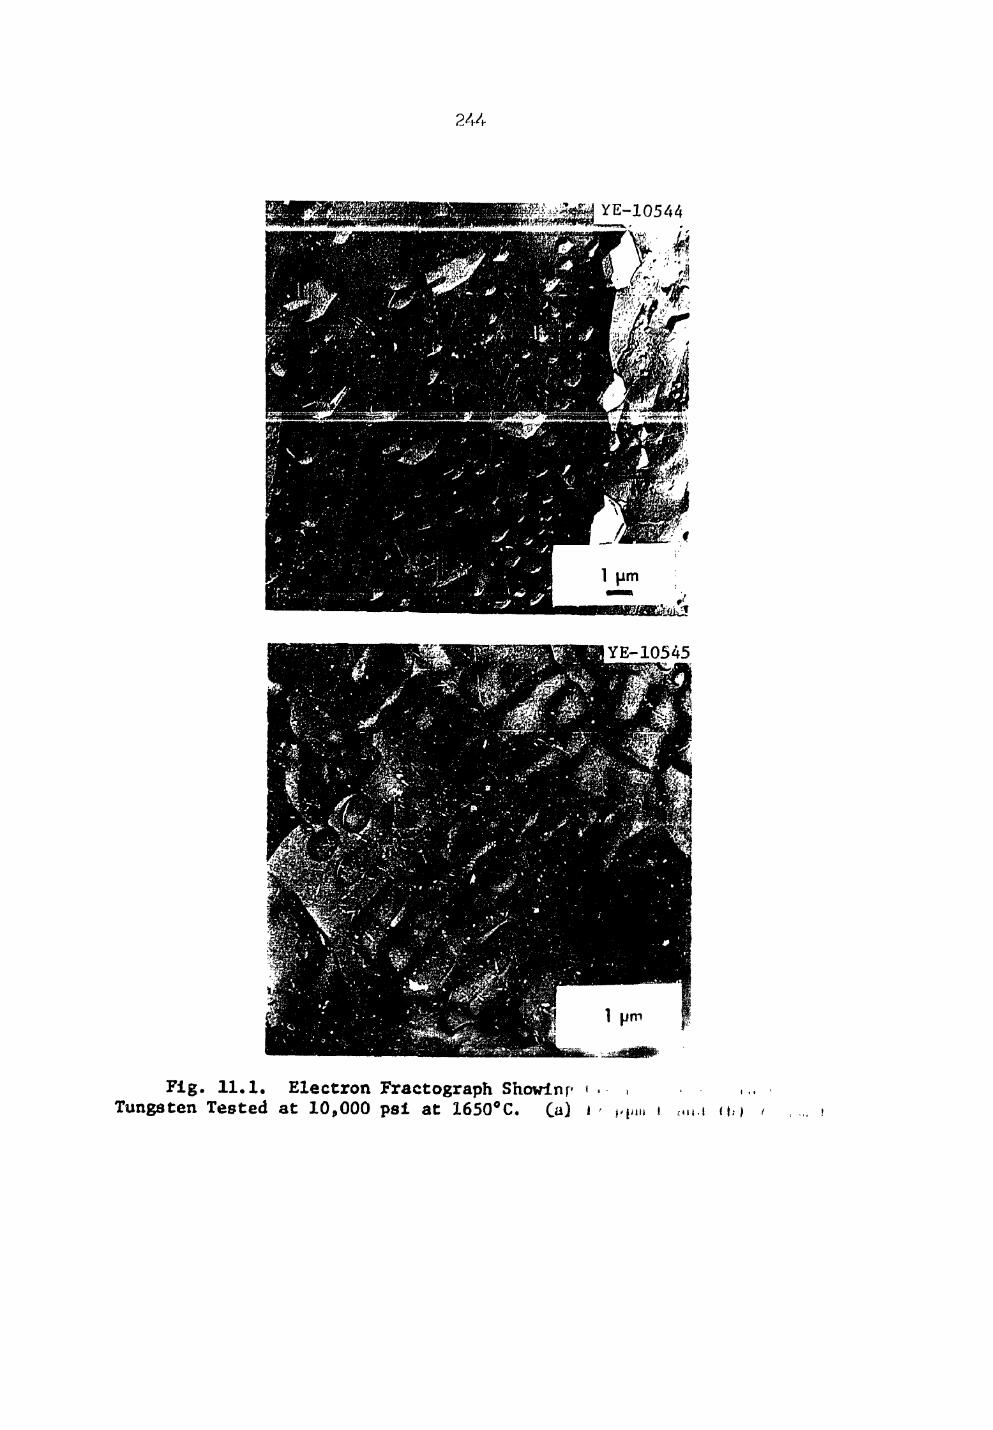
Fig. 11.1. Electron Fractograph Showinp « .- • Tungaten Tested at 10,000 psi at 1650°C. Ca) » i mu a> /
245
tungsten where the creep rate is reduced by solution hardening from transmutation-produced rhenium and osmium atoms. In that case, as the neutron fluence increased, the minimum creep rate decreased and the cavities changed from the flat to equiaxed morphology at constant stress and temperature. In the case of the low fluorine CVD tungsten the more rapid linking of the cavities caused by their flat growth mode leads to a shorter rupture life but the enhanced deformation within the grains allows the material to undergo a greater elongation before fracture.
At very low stresses the elongation in both classes of material occurs by cavity growth. Therefore, greater elongations are obtained in the high fluorine material because of a higher bubble concentration and a smaller grain size. The large elongation given in Table 11.1 for the deposit containing 17 ppm F tested at 3500 psi is somewhat misleading because much of this elongation occurred late in the test through the opening of cracks formed by the linking of thf bubbles.
Although a correlation can be made between creep properties and fluorine content, it is not toLally clear that there is a direct relation-ship. As stated above, the principal difference between the two classes of CVD tungsten is that the grains of the high fluorine material are harder and more resistant to dislocation motion. This could arise from a fine distribution of small gas bubbles within the grains. Alternatively it could be a solution hardening effect from some other impurity intro-duced during the deposition. This question is currently under investi-gation.
It is clear that the creep properties of CVD tungsten can be varied over a wide range through manipulation of the deposition parameters. Service requirements should dictate the parameters to be used for a particular application. If a rigid structure is required, the high fluorine material would be satisfactory, but if the structure must deform to accommodate stresses during service the low fluorine material would be preferable.
246
Creep of Duplex Deposits of CVD Tungsten
Creep tests have also been conducted on some duplex deposits of CVD tungsten supplied by Gulf General Atomic. Specimens were made from sheets in which about three-quarters of the thickness had been deposited from WF6
and the remainder from WC16. The microstructure of the as-received material is shown in Fig. 11.2. Chemical analysis showed that the fluoride part of the deposit contained about 16 ppm F, which places it in the high fluorine category with respect to creep properties.
Test results given in Table 11.2 show, however, that the duplex material does not fit into the grouping of creep properties for fluoride deposits discussed above. In a test at 5000 psi at 1650°C the minimum creep rate was that to be expected from the high fluorine content material, but the fracture strain significantly exceeded that for the low fluorine material. In addition, the rupture life was almost an order of magnitude longer than for any of the fluoride deposits. For tests at 5000 psi at 1650°C the duplex material combines the best creep properties of the various fluoride materials with an exceptionally long rupture life.
Metallographic examination suggested some reasons for this unusual combination of properties. Following the test the initially flat gage length of the specimen was curved and in cross section resembled a quadrant of a piece of tubing as illustrated in the scanning electron micrograph shown in Fig. 11.3. The fluoride deposit, which was dull in appearance and showed numerous intergranular cracks, provided the outer diameter of the curved piece while the chloride deposit, which appeared bright and relatively free of grain boundary cracks, made up the inner diameter. A cross section of the specimen (Fig. 11.4) shows the extensive grain boundary separation in the fluoride portion of the material. Extensive grain growth occurred in the chloride deposit, but little was evident in the fluoride part of the specimen.
The reason for the exceptional creep properties and the unusual morphology of the tested specimen is that the elongation occurred by distinctly different mechanisms in the two parts of the deposit. In the chloride part dislocation motion was the principal deformation mode. This was accompanied by the usual reduction in area. On the fluoride
247
Fig, 11.2, Microstructure of Duplex Deposit of CVD Tungsten. The chloride material, approximately 0.030 in. thick, was deposited on top of a fluoride deposit approximately 0.090 in. thick. 35X.
Table 11.2 Creep Properties of Duplex Deposits of CVD Tungsten at 1650°C
Miminum Rupture Creep Fracture
Stress Life Rate Strain (psi) (hr) (Z/hr) (%)
7000 5000
6.1 1686.7
0.86 0.015
5.9 51.1
248
Fig. 11.3. Scanning Electron Micrograph Illustrating Curvature of the Gage Section of a Duplex CVD Deposit Tested at 5000 psi at 1650°C. The fracture surface shown on this micrograph was obtained by breaking the specimen at room temperature following the test. The fluoride part of the deposit failed intergranularly and showed a high concentration of equiaxed cavities (Fig. 11.5) in addition to cracks. The chloride part of the deposit had a very large grain size and failed by cleavage. Micrograph courtesy of L. D. Hulett, ORNL Analytical Chemistry Division.
part little dislocation motion occurred and elongation occurred mainly by the growth of equiaxed grain boundary cavities as shown in Fig. 11.5. This type of elongation is not accompanied by any significant reduction in area. The curvature of the creep specimen results from elongation with reduction in area on one side of the specimen and elongation without it on the other.
Normally a fluoride deposit of this type would have failed in a small fraction of the rupture life that was observed. Evidently the chloride part of the deposit supported enough of the load to prevent
Fig. 11.4. Longitudinal Cross S action of Duplex CVD Tungsten Cn^ep Specimen Tested at 5000 psi at 1650°C. 100X.
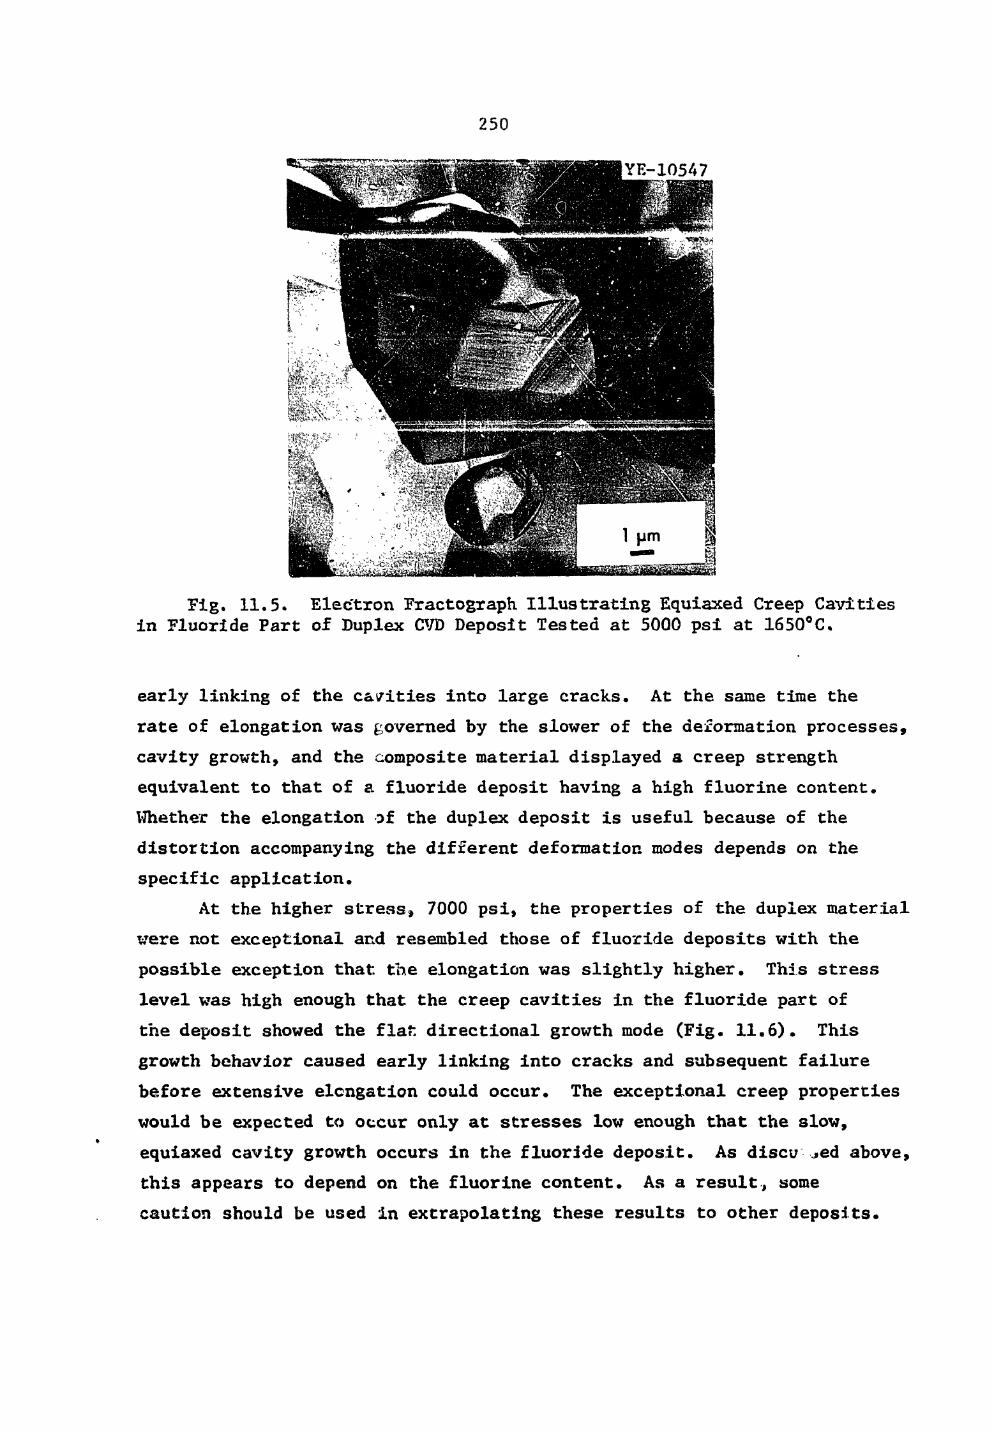
250
Pig. 11.5. Electron Fractograph Illustrating Equiaxed Creep Cavities in Fluoride Part of Duplex CVD Deposit Tested at 5000 psi at 1650°C.
early linking of the ca/ities into large cracks. At the same time the rate of elongation was governed by the slower of the deformation processes, cavity growth, and the composite material displayed a creep strength equivalent to that of a fluoride deposit having a high fluorine content. Whether the elongation of the duplex deposit is useful because of the distortion accompanying the different deformation modes depends on the specific application.
At the higher stress, 7000 psi, the properties of the duplex material were not exceptional and resembled those of fluoride deposits with the possible exception that the elongation was slightly higher. This stress level was high enough that the creep cavities in the fluoride part of the deposit showed the flat directional growth mode (Fig. 11.6). This growth behavior caused early linking into cracks and subsequent failure before extensive elongation could occur. The exceptional creep properties would be expected to occur only at stresses low enough that the slow, equiaxed cavity growth occurs in the fluoride deposit. As disci; ^ed above, this appears to depend on the fluorine content. As a result, some caution should be used in extrapolating these results to other deposits.
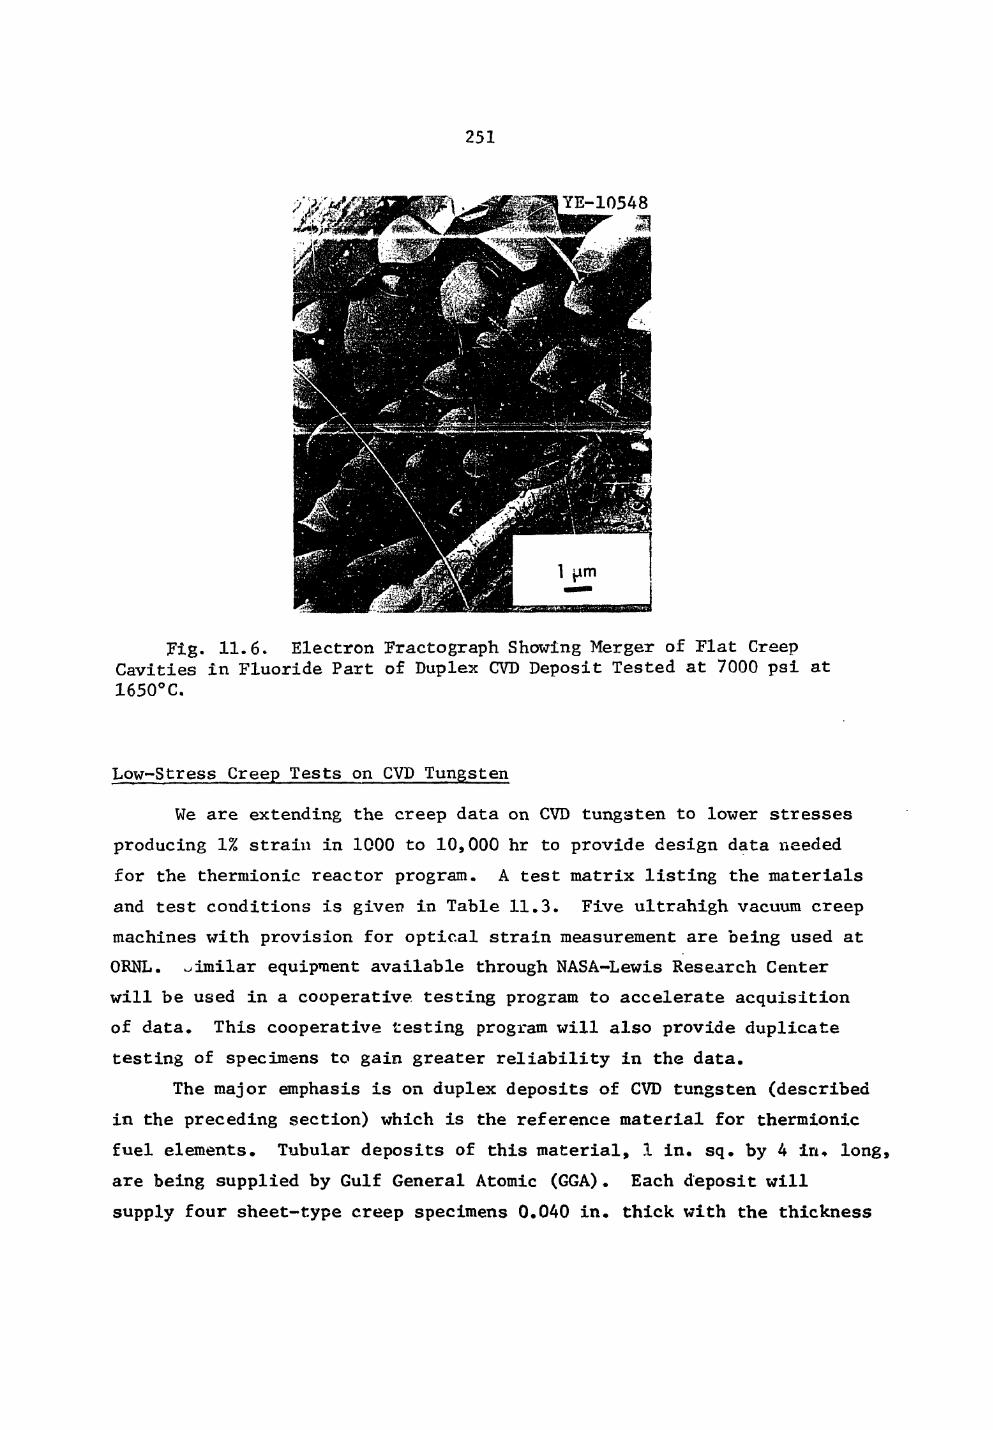
251
Fig. 11.6. Electron Fractograph Showing Merger of Flat Creep Cavities in Fluoride Part of Duplex CVD Deposit Tested at 7000 psi at 1650°C.
Low-Stress Creep Tests on CVD Tungsten
We are extending the creep data on CVD tungsten to lower stresses producing 1% strain in 1000 to 10,000 hr to provide design data needed for the thermionic reactor program. A test matrix listing the materials and test conditions is given in Table 11.3. Five ultrahigh vacuum creep machines with provision for optical strain measurement are being used at ORNL. similar equipment available through NASA-Lewis Research Center will be used in a cooperative testing program to accelerate acquisition of data. This cooperative testing program will also provide duplicate testing of specimens to gain greater reliability in the data.
The major emphasis is on duplex deposits of CVD tungsten (described in the preceding section) which is the reference material for thermionic fuel elements. Tubular deposits of this material, 1 in. sq. by 4 in. long, are being supplied by Gulf General Atomic (GGA). Each deposit will supply four sheet-type creep specimens 0.040 in. thick with the thickness
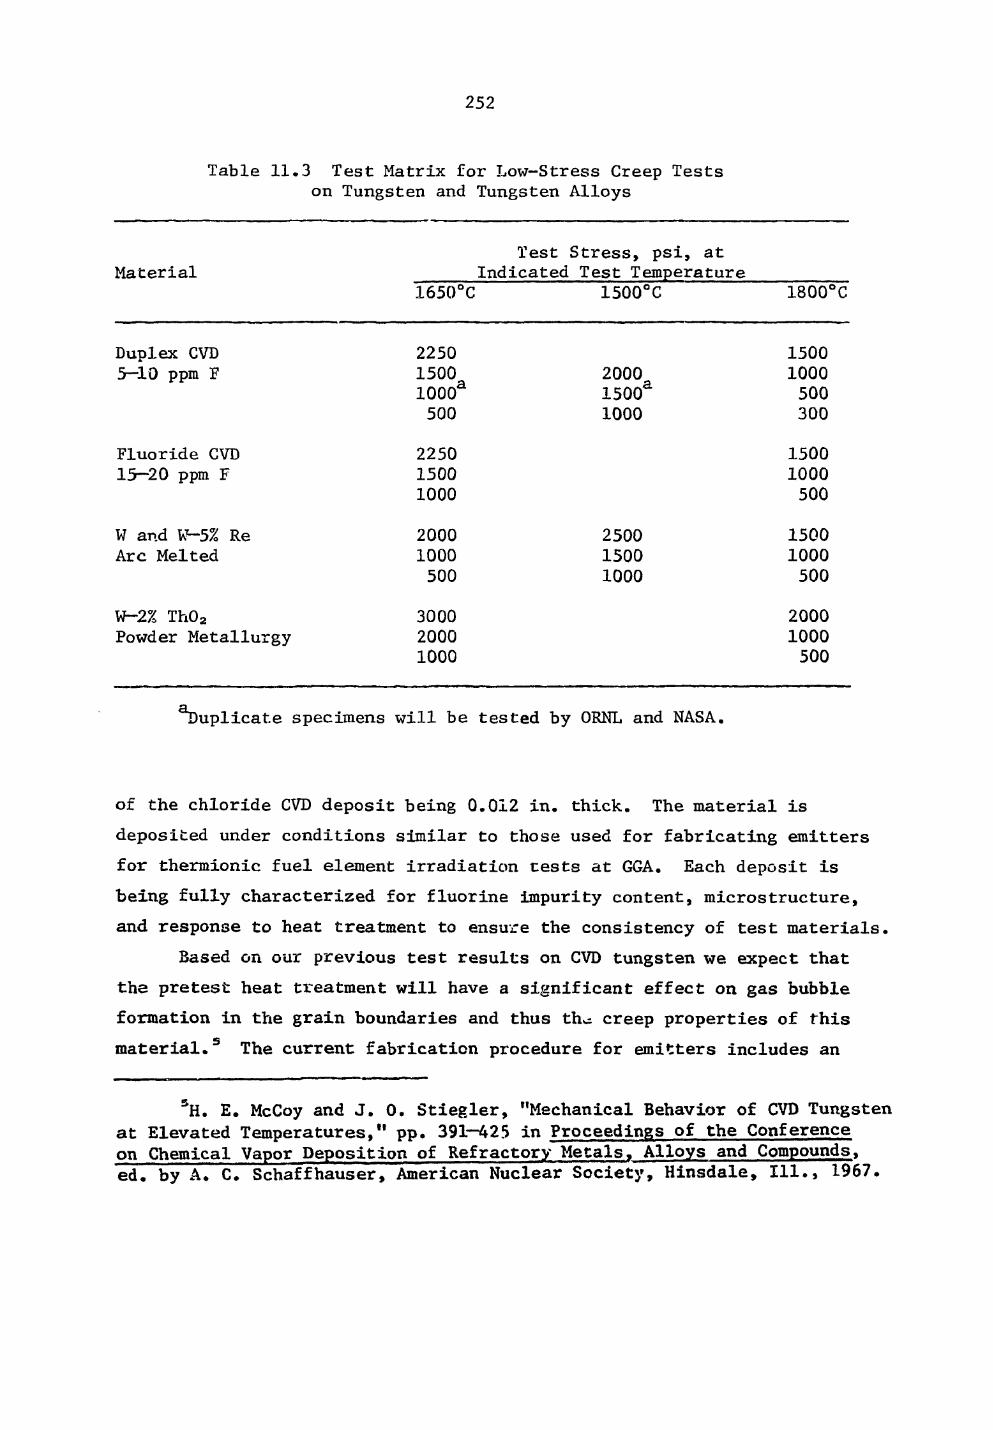
252
Table 11.3 Test Matrix for Low-Stress Creep Tests on Tungsten and Tungsten Alloys
Material Test Stress, psi, at
Indicated Test Temperature 1650°C 1500°C 1800°C
Duplex CVD 5-10 ppm F
2250 1500 ioooa 500
2000 1500* 1000
1500 1000 500 300
Fluoride CVD 15-20 ppm F
2250 15 00 1000
1500 1000 500
W and W—5% Re Arc Melted
2000 1000 500
2500 1500 1000
1500 1000 500
W-2% Th02 Powder Metallurgy
3000 2000 1000
2000 1000 500
duplicate specimens will be tested by QRNL and NASA.
of the chloride CVD deposit being 0.012 in. thick. The material is deposited under conditions similar to those used for fabricating emitters for thermionic fuel element irradiation tests at GGA. Each deposit is being fully characterized for fluorine impurity content, microstructure, and response to heat treatment to ensure the consistency of test materials.
Based on our previous test results on CVD tungsten we expect that the pretest heat treatment will have a significant effect on gas bubble formation in the grain boundaries and thus th^ creep properties of this material.5 The current fabrication procedure for emitters includes an
SH. E. McCoy and J. 0. Stiegler, "Mechanical Behavior of CVD Tungsten at Elevated Temperatures," pp. 391—425 in Proceedings of the Conference on Chemical Vapor Deposition of Refractory Metals, Alloys and Compounds, ed. by A. C. Schaffhauser, American Nuclear Society, Hinsdale, 111., 1967.
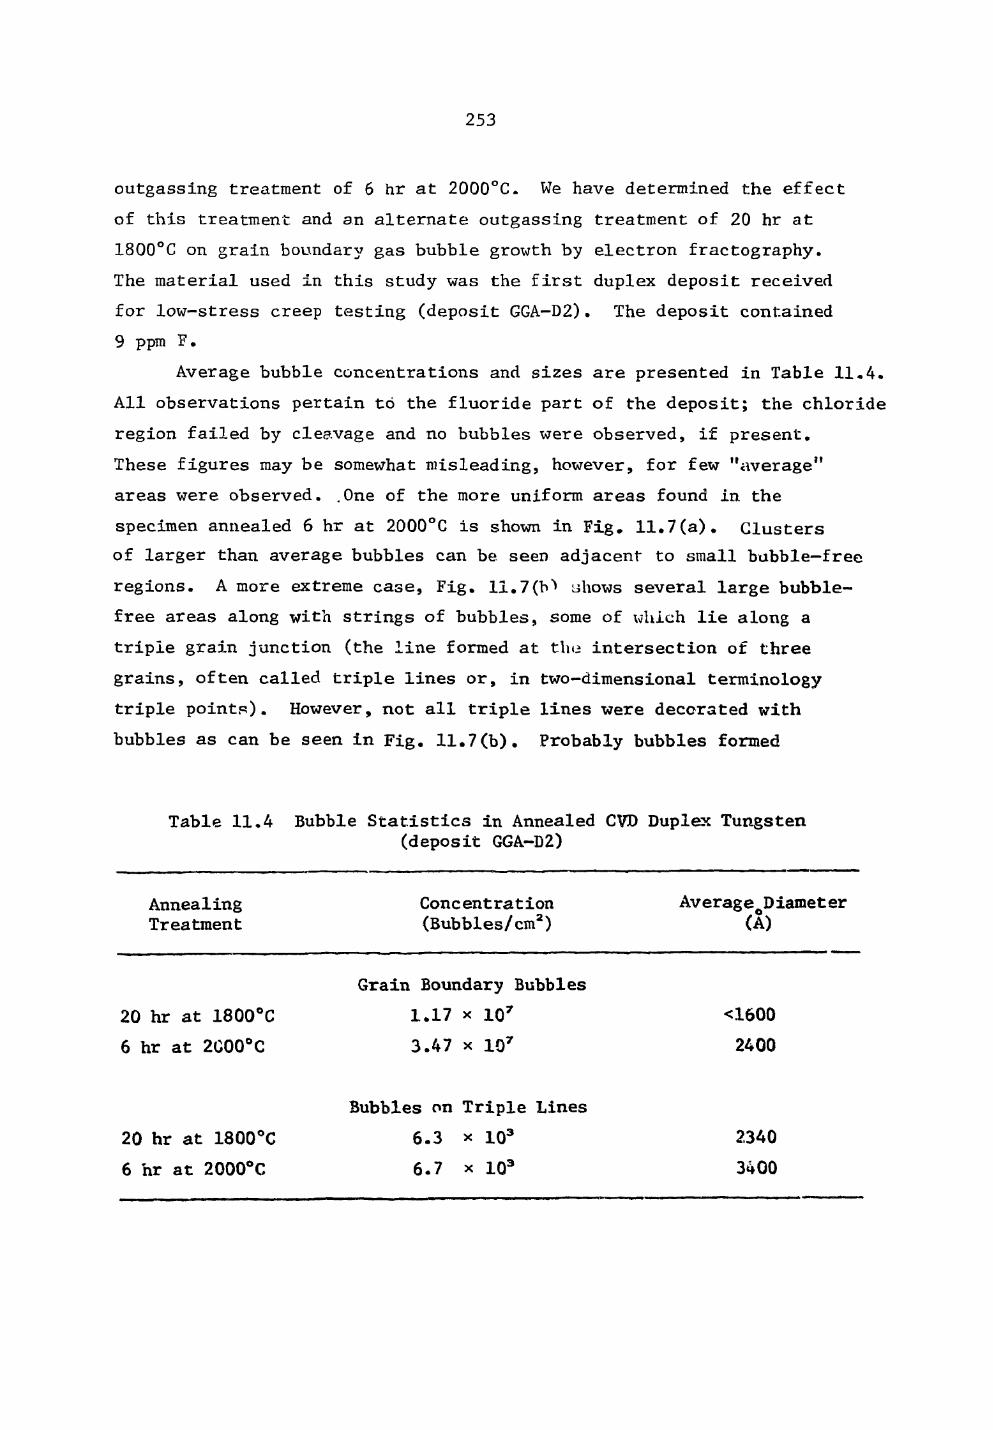
253
outgassing treatment of 6 hr at 2000°C. We have determined the effect of this treatment and an alternate outgassing treatment of 20 hr at 1800°C on grain boundary gas bubble growth by electron fractography. The material used in this study was the first duplex deposit received for low-stress creep testing (deposit GGA-D2). The deposit contained 9 ppm F.
Average bubble concentrations and sizes are presented in Table 11.4. All observations pertain to the fluoride part of the deposit; the chloride region failed by cleavage and no bubbles were observed, if present. These figures may be somewhat misleading, however, for few "average" areas were observed. .One of the more uniform areas found in the specimen annealed 6 hr at 2000°C is shown in Fig. 11.7(a). Clusters of larger than average bubbles can be seen adjacent* to small bubble-free regions. A more extreme case, Fig. 11.7(b"* shows several large bubble-free areas along with strings of bubbles, some of which lie along a triple grain junction (the line formed at the intersection of three grains, often called triple lines or, in two-dimensional terminology triple points). However, not all triple lines were decorated with bubbles as can be seen in Fig. 11.7(b). Probably bubbles formed
Table 11.4 Bubble Statistics in Annealed CVD Duplex Tungsten (deposit GGA-D2)
Annealing Treatment
20 hr at 1800°C 6 hr at 2C00°C
Concentration (Bubbles/cm2)
Grain Boundary Bubbles 1.17 x io7 3.47 x 10⁷
Average Diameter (A)
<1600 2400
20 hr at 1800°C 6 hr at 2000°C
Bubbles on Triple Lines 6.3 x 10³ 6.7 x 10³
2340 3400
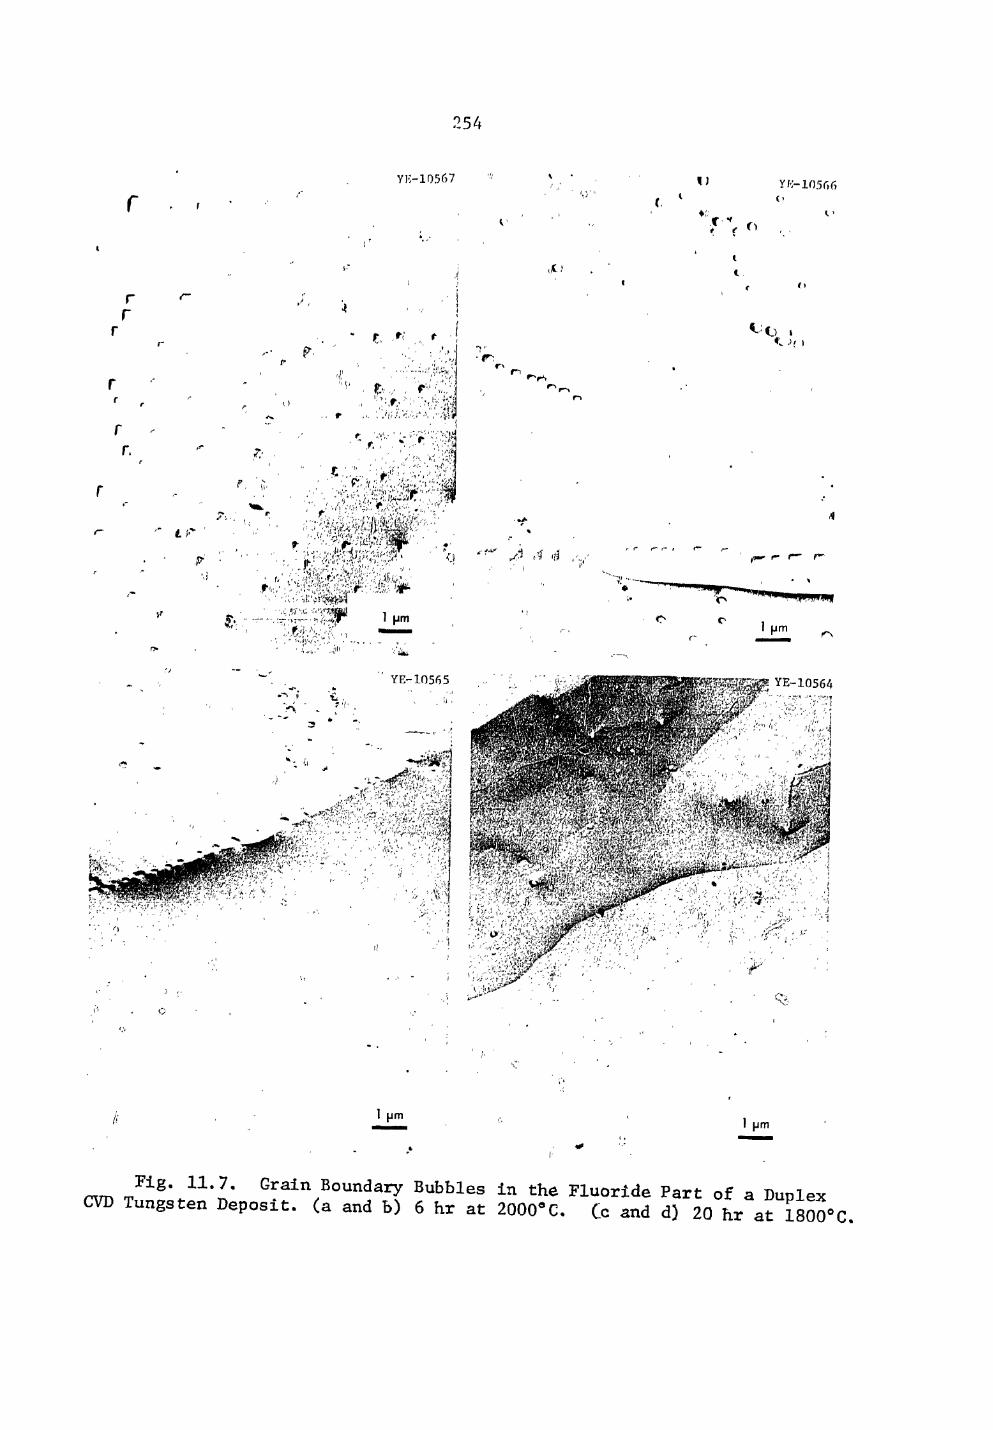
254
YK-10567 I) YV-10566
* r
r r
r ,,, <• •!
„t) i t f)
ij » Of .
r.
! . t> / . V , r ... '.'/(;aVA/.'.",-.';!!
\i
' • r ' . - .
-f \ J 4
YE-10565 10564 . - i f
i •'<<.;• , •- *
"1 (7c; -si
Hm • i I Hm
Fig. 11.7. Grain Boundary Bubbles in the Fluoride Part of a Dunlex Tungsten Deposit, (a and b) 6 hr at 2000«C. Cc and d) 20 hr at 1800°C,
255
initially along most triple lines, but during further annealing many of these lines migrated leaving strings of bubbles behind and forming bubble-free segments of triple line. In Fig. 11.7(b) part of a line evidently migrated slightly. The string of bubbles above it extends from the segment of the line decorated by bubbles and thus probably marks the initial position of the line. Some of the bubble-free areas on two grain interfaces may have resulted from migration of grain boundaries although conventional ripening processes cannot be ruled out.
Similar features were found in the specimen annealed 20 hr at 1800°C [Fig. 11.7(c)]. The bubbles were significantly smaller and were present in a somewhat lower concentration than in the specimen annealed 6 hr at 2000°C. Some bubble-free triple lines were also observed as can be seen in Fig. 11.7(d). In this case the line is not close to being straight, suggesting that it may be pinned at points by bubbles too small to be seen.
Because of the small size of the bubbles and the possibility that many are not being resolved, the statistics given in Table 11.4 for the specimen annealed 20 hr at 1800°C may be biased. In this specimen o 85% of the bubbles had diameters less than about 1750 A and were grouped together in the smallest size interval in our counting instrument. All that we can say at present is that the average diameter is less than o
about 1600 A. Likewise, the value listed for the bubble concentration is a lower estimate. Since the measured concentration was higher for the annealing treatment at 2000°C, it is likely that we are not resolving all the bubbles for the 1800°C anneal.
The bubble concentrations were lower and sizes smaller than in the material studied previously by Farrell et al.6'7 This likely reflects differences in deposition parameters or fluorine content.
®K. Farrell, J. T. Houston, and A. C. Schaffhauser, "The Growth of Grain Boundary Gas Bubbles in Chemically Vapor Deposited Tungsten," pp. 363-390 in Proceedings of the Conference on Chemical Vapor Deposition of Refractory Metals, Alloys and Compounds, ed. by A. C. Schaffhauser, American Nuclear Society, Hinsdale, 111., 1967.
7A. Wolfenden and K. Farrell, "Bubble Growth Processes at Grain Boundaries in CVD Tungsten," J. Nucl. Mater. 29, 133 (1969).
256
Our previous work has indicated that in creep tests at low stresses these materials fail by the growth and linking of these bubbles to form cracks,8> 9 Unlimited growth of a bubble occurs only if it exceeds some critical radius r related to the stress a by r = 0.77 v/a, where v is o o the surface tension shown to be about 2100 ergs/cm2 for bubbles in CVD tungsten at 1650°C.10 Accordingly, no stress-induced bubble growth will occur in the specimen annealed 20 hr at 1800°C at stresses of 2540 psi or less. In the specimen annealed 6 hr at 2000°C the critical stress is about 1670 psi. This neglects stress-induced growth of the occasional large bubbles along the triple lines and possible thermal-induced growth of large bubbles at the expense of the smaller ones.
Another factor influencing the creep properties of this material is the apparent strengthening of the matrix by fluorine impurities in solution or in the form of extremely fine bubbles. The higher annealing treatment would cause more of the fluorine impurities to precipitate in larger bubbles thus weakening the matrix in addition to growing larger grain boundary bubbles. Based on these results we recommend the outgassing treatment for emitters be limited to 20 hr at 1800°C. This heat treatment will be used as the pretest treatment for the low-stress creep test specimens.
eH. E. McCoy and J. 0. Stiegler, "Mechanical Behavior of CVD Tungsten at Elevated Temperatures," pp. 391-425 in Proceedings of the Conference on Chemical Vapor Deposition of Refractory Metals, Alloys and Compounds, ed. by A. C. Schaffhauser, American Nuclear Society, Hinsdale, 111., 1967.
9J. 0. Stiegler, K. Farrell, and H. E. McCoy, "Stress-Induced Growth of Gas Bubbles in Solids," J. Nucl. Mater. J|, 3 4 0 (1968>•
xoJ. 0. Stiegler, unpublished data. j
257
Effect of Carburization on the Creep Properties of Tungsten Alloys
H. Inouye
The creep properties of 0.040-in.-diam W wire are being measured in low-pressure CH<» to simulate the effect of carburization by (JC at thermionic temperatures. Previously, we reported that COu lowers both the rupture ductility and the rupture life at 1800°C but strengthens tungsten at 1650°C.11
During this period, a series of creep tests were run to determine the effect of CH<, pressure on the creep properties. Table 11.5 summarizes the results of creep tests on tungsten stressed to 2000 psi at 1650°C. A considerable amount of scatter in the measured creep strains during the early stages of the tests does not permit any conclusions regarding the effect of the CHz, pressure; however, for creep strains of 1% or more, it is observed that the time required to produce a given strain increased and the creep rate decreased as the CH*. pressure increased. Posttest x-ray analyses showed W2C and W as the phases present in the specimen
11H. Inouye, Fuels and Materials Development Program Quart. Progr. Rept, September 30, 1971, ORNL-TM-3550, pp. 222-223.
Table 11.5 Effect of CHt, Pressure on Creep Properties of Tungsten Stressed to 2000 psi at 1650°C
a )
Pressure of Test Time (hr) Minimum Environment Time for Strain of Creep Rate
(torr) (hr) 0.5% 1.0% 1.5% 2.0% (in./in. ~7hr~l)
3 x 10 8 (vacuum) 959 75 188 292 385 5.0 x 10""5 3 x 10~5 (CH/J 721 232 375 562 (750)b 2.6 x 10~5 9 x 10~5 (CHA) 1007 52 445 862 (1280) 1.2 x 10"5
Discontinued tests at indicated times without rupture. Parentheses indicate extrapolated values.
258
exposed to CH*. Analyses showed 0.18 and 0.11% C for specimens exposed to 3 x 10"5 and 9 * 10~5 torr CH*, respectively. The fact that the carbon content did not increase with the CH* pressure suggests that carbon diffusion through the W2C is controlling the carburization rate.
Effect of Fast-Neutron Irradiation on the Properties of Tungsten Alloys
F. W. Wiffeu
Our high temperature tungsten irradiation experiment was inserted into EBR-II at the beginning of run 51C on September 19, 1971. The one pin experiment, described previously,12 is located in subassembly X136 along with two insulator irradiation experiments from Los Alamos Scientific Laboratory in the 7C1 position of EBR-II.
The experiment will be withdrawn at the end of run 56 in late March 1972 after receiving an exposure of 7100 MWd, producing an estimated peak fluence of 8 x 10²¹ neutrons/cm2 (>0.1 MeV).
12F. W. Wiffen and D. A. Dyclin, Fuels and Materials Development Program Quart. Progr. Quart. Progr. Rept. December 31, 1970, ORNL-TM-330D, p. 258.
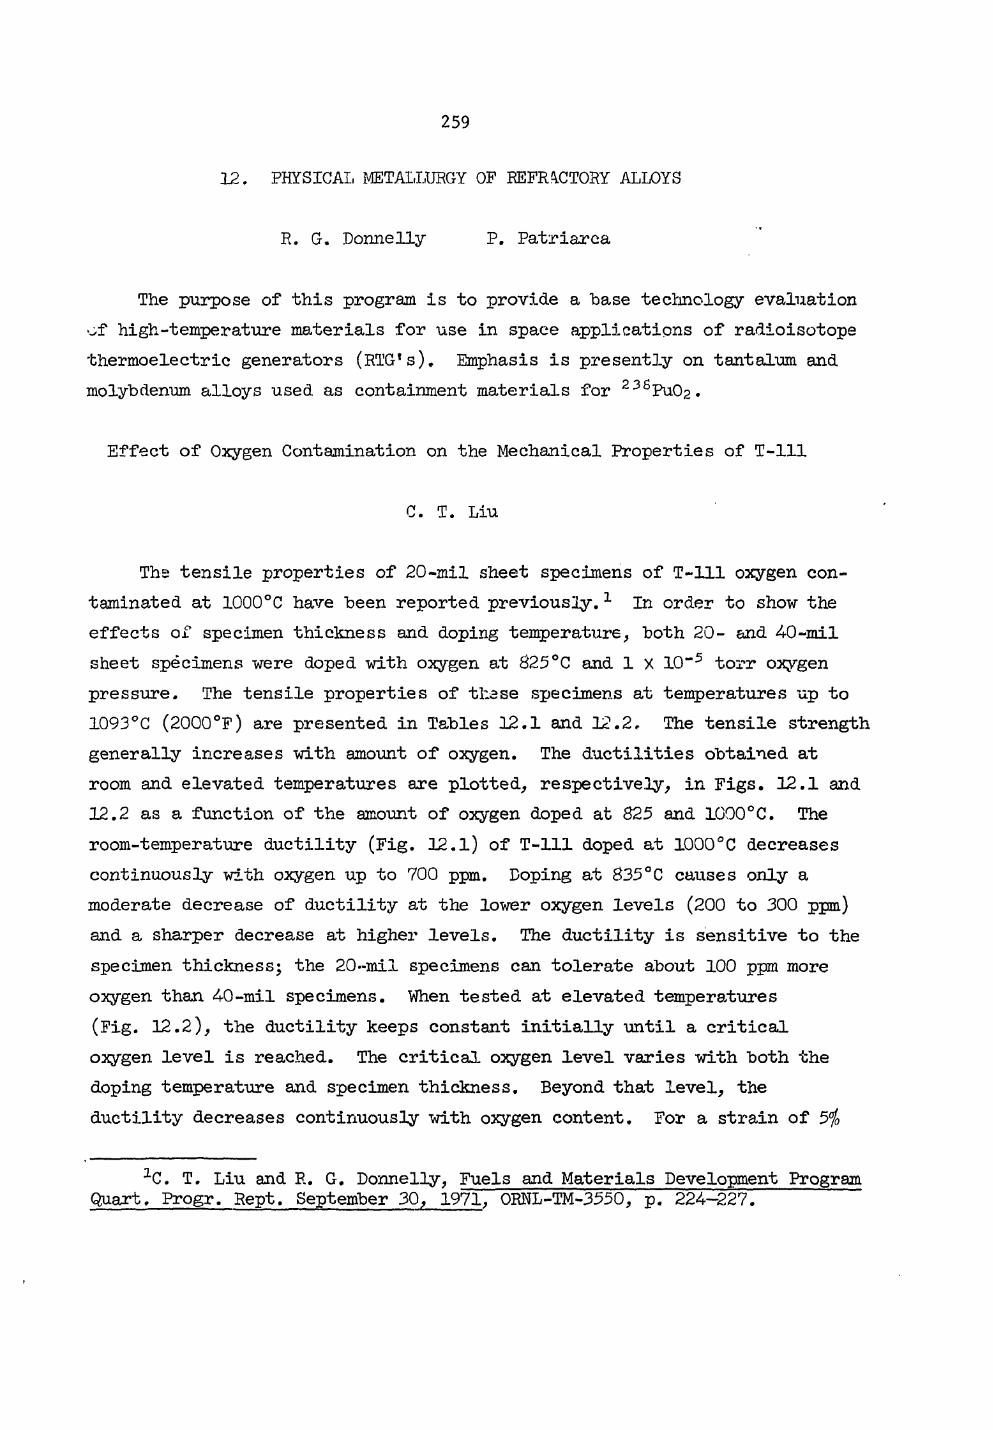
259
12. PHY SIC All METALLURGY OF REFRACTORY ALLOYS
R. G. Donnelly P. Patriarca
The purpose of this program is to provide a "base technology evaluation of high-temperature materials for use in space applications of radioisotope thermoelectric generators (RTG's). Emphasis is presently on tantalum and molybdenum alloys used as containment materials for 236Pu02.
Effect of Oxygen Contamination on the Mechanical Properties of T-lll
C. T. Liu
The tensile properties of 20-mil sheet specimens of T-lll oxygen con-taminated at 1000°C have been reported previously.1 In order to show the effects of specimen thickness and doping temperature, both 20- and 40-mil sheet specimens were doped with oxygen at 825 °C and 1 X 10"5 torr oxygen pressure. The tensile properties of these specimens at temperatures up to 1093°C (2000°F) are presented in Tables 12.1 and 12.2. The tensile strength generally increases with amount of oxygen. The ductilities obtained at room and elevated temperatures are plotted, respectively, in Figs. 12.1 and 12.2 as a function of the amount of oxygen doped at 825 and 1000°C. The room-temperature ductility (Fig. 12.1) of T-lll doped at 1000°C decreases continuously with oxygen up to 700 ppm. Doping at 835°C causes only a moderate decrease of ductility at the lower oxygen levels (200 to 300 ppm) and a sharper decrease at higher levels. The ductility is sensitive to the specimen thickness; the 20»mil specimens can tolerate about 100 ppm more oxygen than 40-mil specimens. When tested at elevated temperatures (Fig. 12.2), the ductility keeps constant initially until a critical oxygen level is reached. The critical oxygen level varies with both the doping temperature and specimen thickness. Beyond that level, the ductility decreases continuously with oxygen content. For a strain of 5$
1C. T. Liu and R. G. Donnelly, Fuels and Materials Development Program Quart, Progr. Rept. September 30, 1971, 0RNL-TM-3550, p. 224-227.
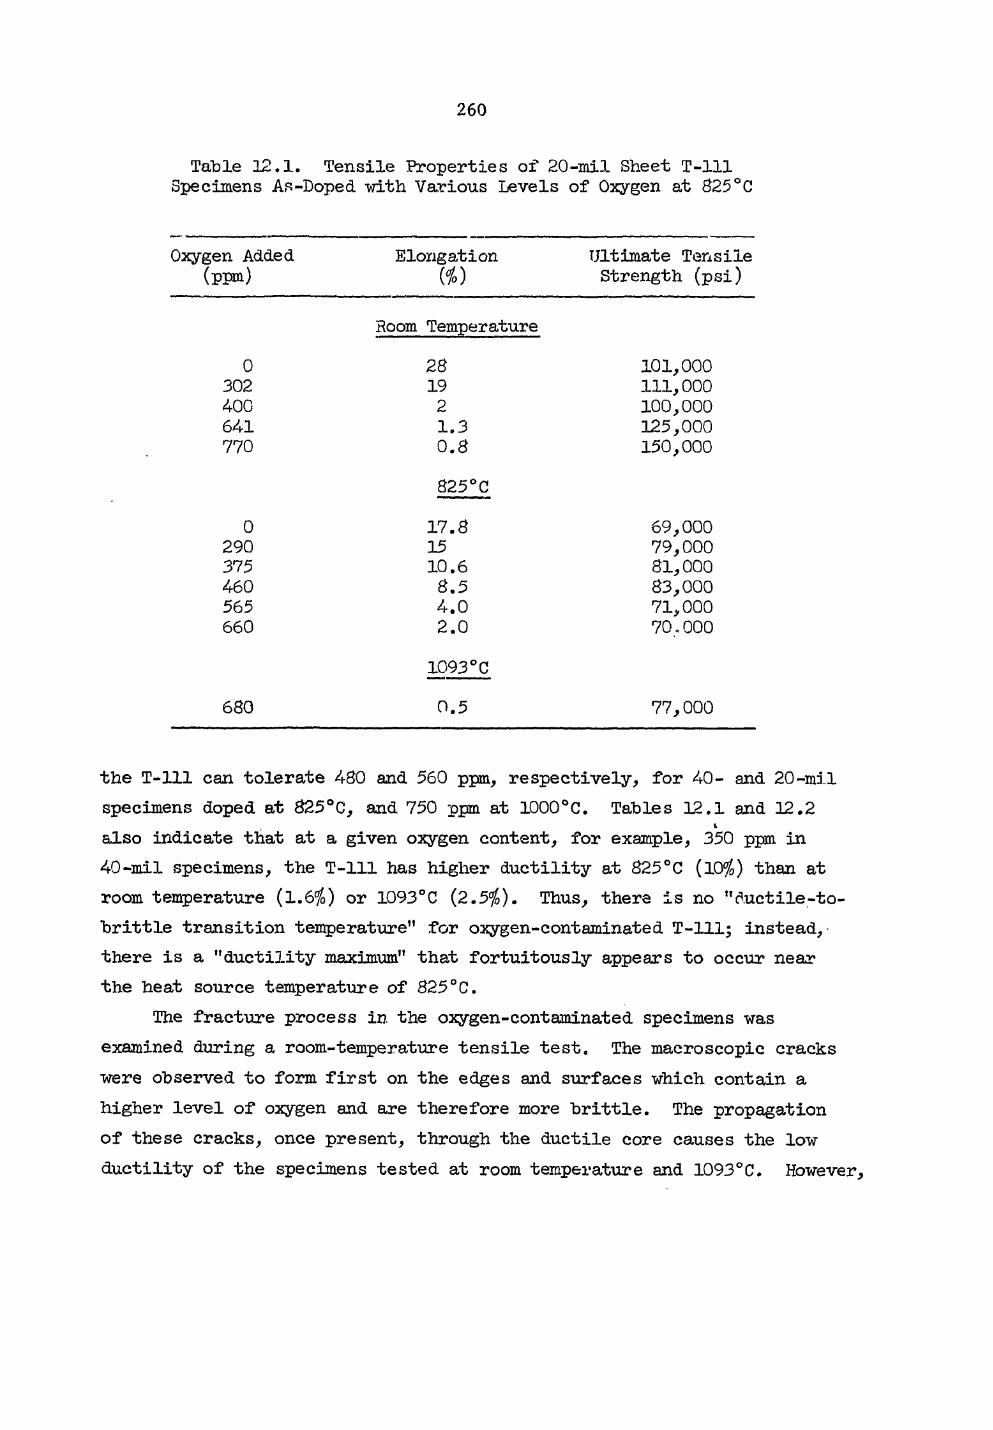
260
Table 12.1. Tensile Properties of 20-mil Sheet T-lll Specimens As-Doped, -with Various Levels of Oxygen at 825°C
Oxygen Added (ppm)
Elongation ($)
Ultimate Tensile Strength (psi)
Room Temperature
0 28 101,000 302 19 111,000 400 2 100,000 641 1.3 125,000 770 0.8 150,000
825 °C
0 17.8 69,000 290 15 79,000 375 10.6 81,000 460 8.5 83,000 565 4.0 71,000 660 2.0 70.000
1093°C
680 0.5 77,000
the T-lll can tolerate 4-80 and 560 ppm, respectively, for 40- and 20-mil specimens doped at 825°C, and 750 ppm at 1000°C. Tables 12.1 and 12.2
i
also indicate that at a given oxygen content, for example, 350 ppm in 40-mil specimens, the T-lll has higher ductility at 825°C (10$) than at room temperature (1.6$) or 1093°C (2.5$). Thus, there is no "ductile-to-brittle transition temperature" for oxygen-contaminated T-lll; instead, there is a "ductility maximum" that fortuitously appears to occur near the heat source temperature of 825°C.
The fracture process in the oxygen-contaminated specimens was examined during a room-temperature tensile test. The macroscopic cracks were observed to form first on the edges and surfaces which contain a higher level of oxygen and are therefore more brittle. The propagation of these cracks, once present, through the ductile core causes the low ductility of the specimens tested at room temperature and 1093°C. However,
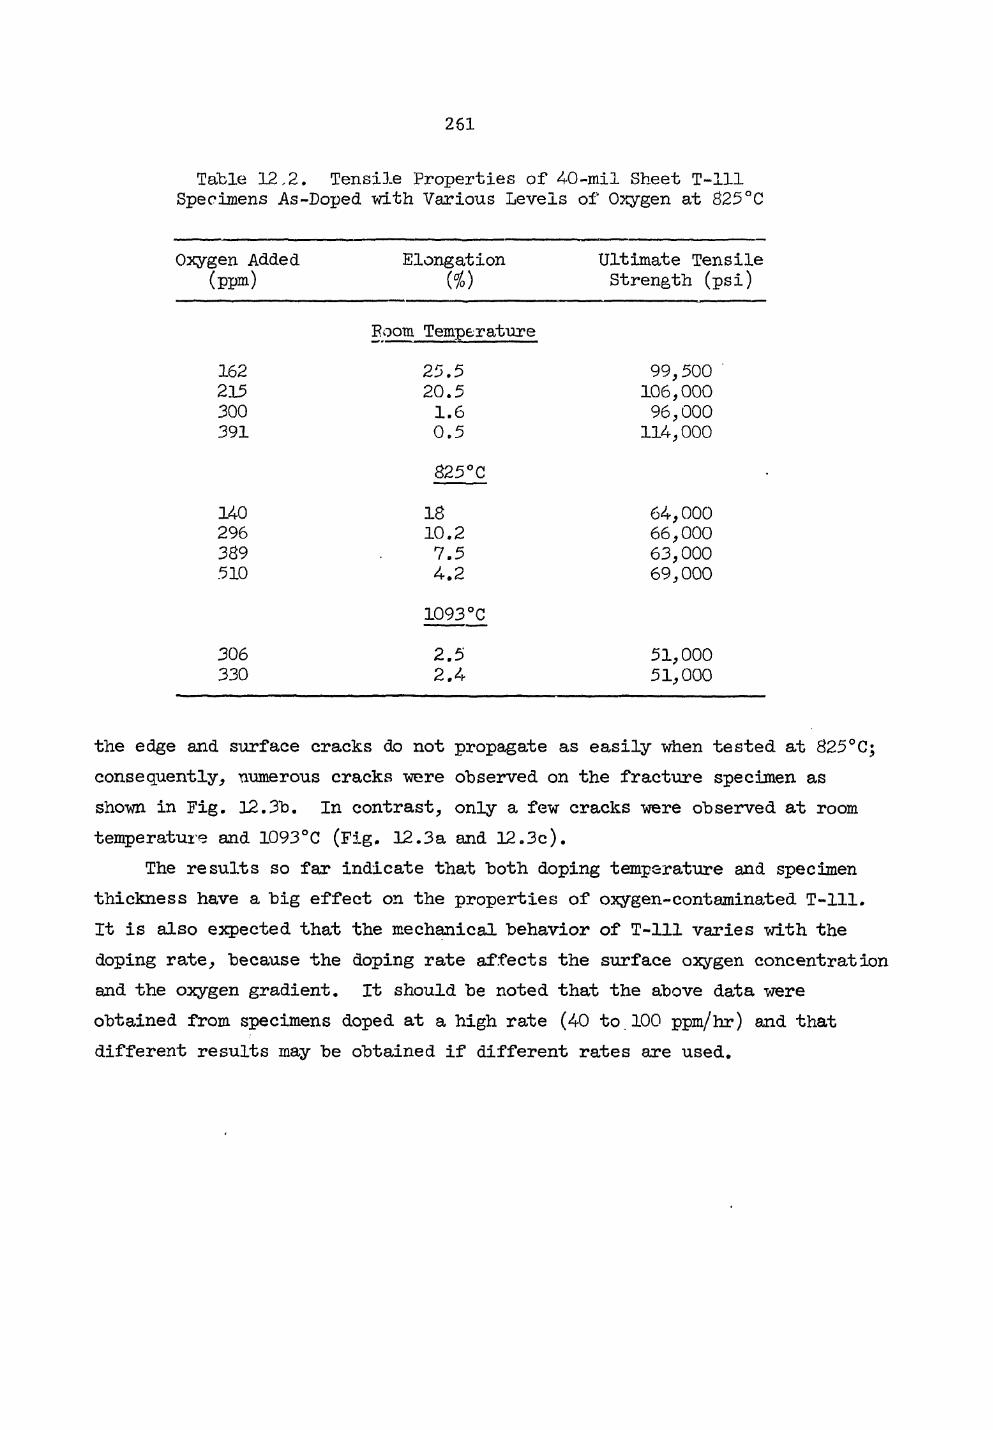
261
Table 12,2. Tensile Properties of 40-mil Sheet T-lll Specimens As-Doped with Various Levels of Oxygen at 825°C
Oxygen Added Elongation Ultimate Tensile (ppm) {%) Strength (psi)
Boom Temperature
162 25.5 99,500 215 20.5 106,000 300 1.6 96,000 391 0.5 114,000
825 °C
140 18 64,000 296 10.2 66,000 389 7.5 63,000 510 4.2 69,000
1093°G
306 2.5 51,000 330 2.4 51,000
the edge and surface cracks do not propagate as easily when tested at 825°C; consequently, numerous cracks were observed on the fracture specimen as shown in Fig. 12.3b. In contrast, only a few cracks were observed at room temperature and 1093°C (Fig. 12.3a and 12.3c).
The results so far indicate that both doping temperature and specimen thickness have a big effect on the properties of oxygen-contaminated T-lll. It is also expected that the mechanical behavior of T-lll varies with the doping rate, because the doping rate affects the surface oxygen concentration and the oxygen gradient. It should be noted that the above data were obtained from specimens doped at a high rate (40 to 100 ppm/hr) and that different results may be obtained if different rates are used.
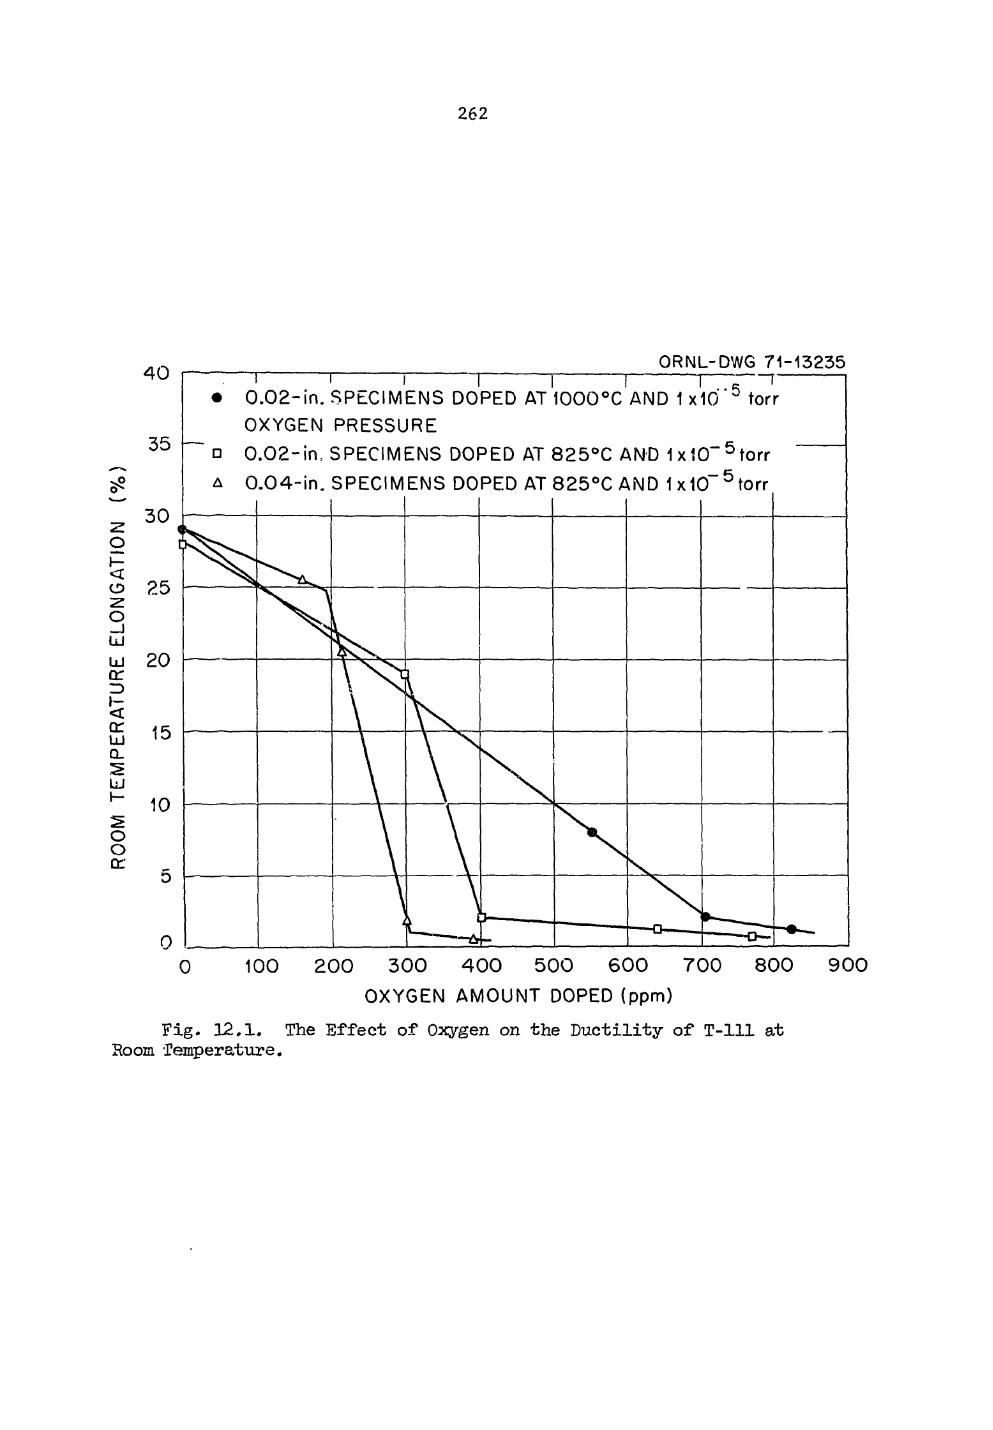
262
4 0
35
ORNL-DWG 71-13235 1 1 i 1 I I 1—p-—T
• 0 .02 - in . SPECIMENS DOPED AT 1000°C AND 1 x10'"5 torr
OXYGEN PRESSURE • 0 .02- in , SPECIMENS DOPED AT 825°C AND 1xiO~"5torr A 0 .04 - i n . SPECIMENS DOPED AT 825°C AND 1x10" 5 to r r
0 100 2 0 0 3 0 0 4 0 0 5 0 0 6 0 0 7 0 0 OXYGEN AMOUNT DOPED (ppm)
8 0 0 9 0 0
Fig. 12.1. The Effect of Oxygen on the Ductility of T-lll at Room Temperature.
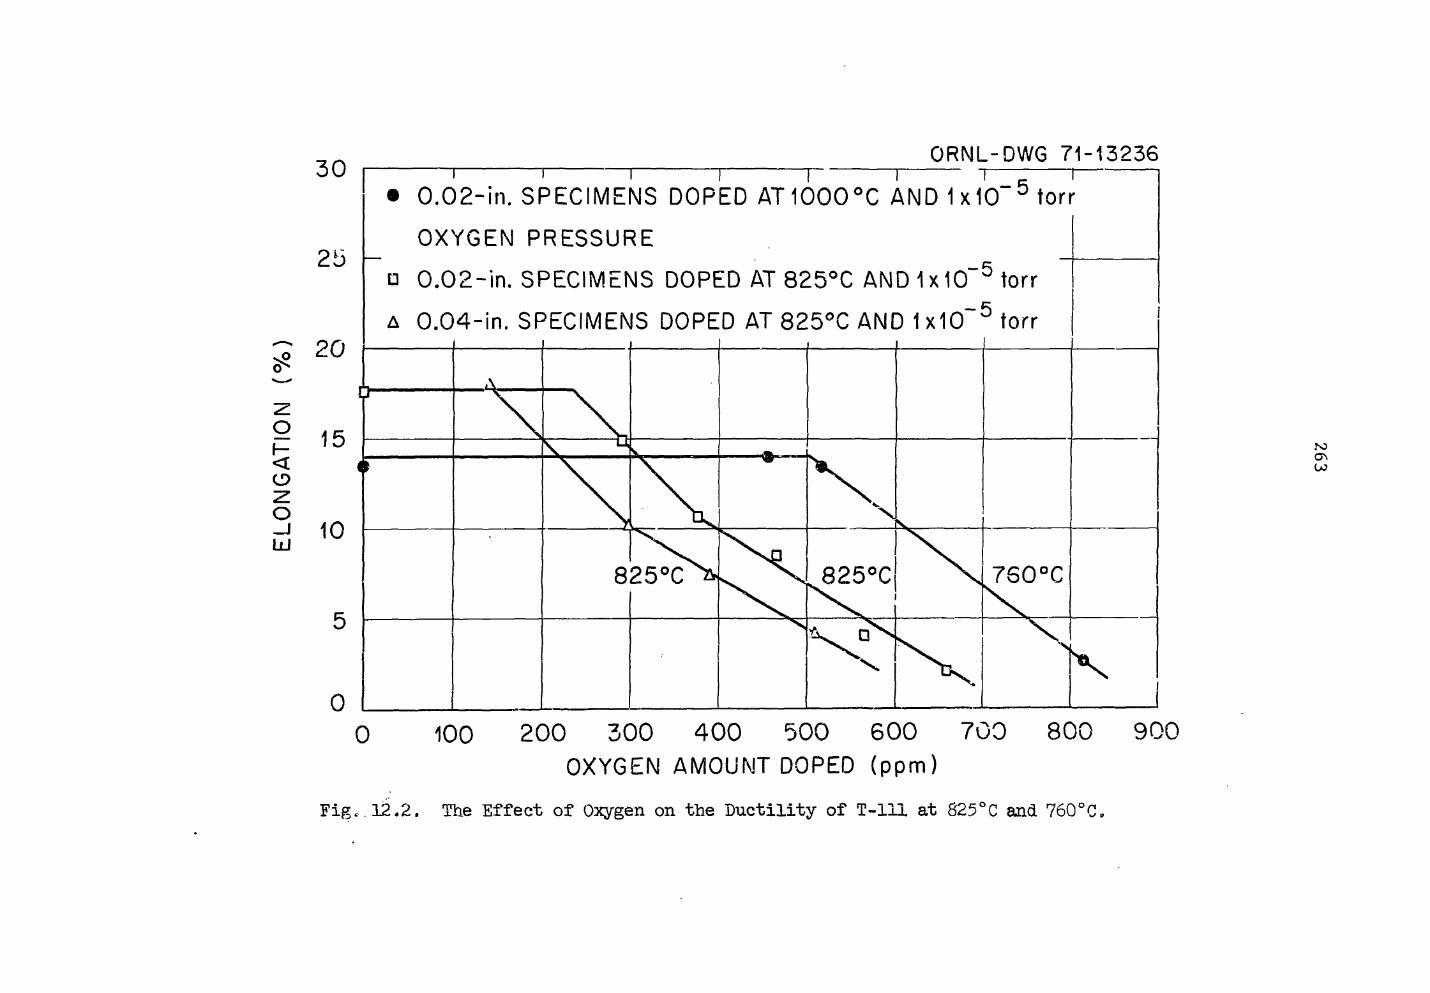
30 ORNL-DWG 7 1 - 1 3 2 3 6
25
20
0 . 0 2 - i n . SPECIMENS DOPED A T 1 0 0 0 ° C AND 1 x 1 0 " 5 torr
OXYGEN PRESSURE
• 0 . 0 2 - i n . SPECIMENS DOPED AT 825°C AND 1 x 10 5 torr
A 0 . 0 4 - i n . SPECIMENS DOPED AT 825°C AND 1 x10~ 5 torr
15
10
0 0
ON
100 2 0 0 3 0 0 4 0 0 5 0 0 6 0 0 7 0 0 OXYGEN AMOUNT DOPED (ppm)
8 0 0 9 0 0
Fig. 12.2. The Effect of Oxygen on the Ductility of T-lll at 825°C and 760 °C
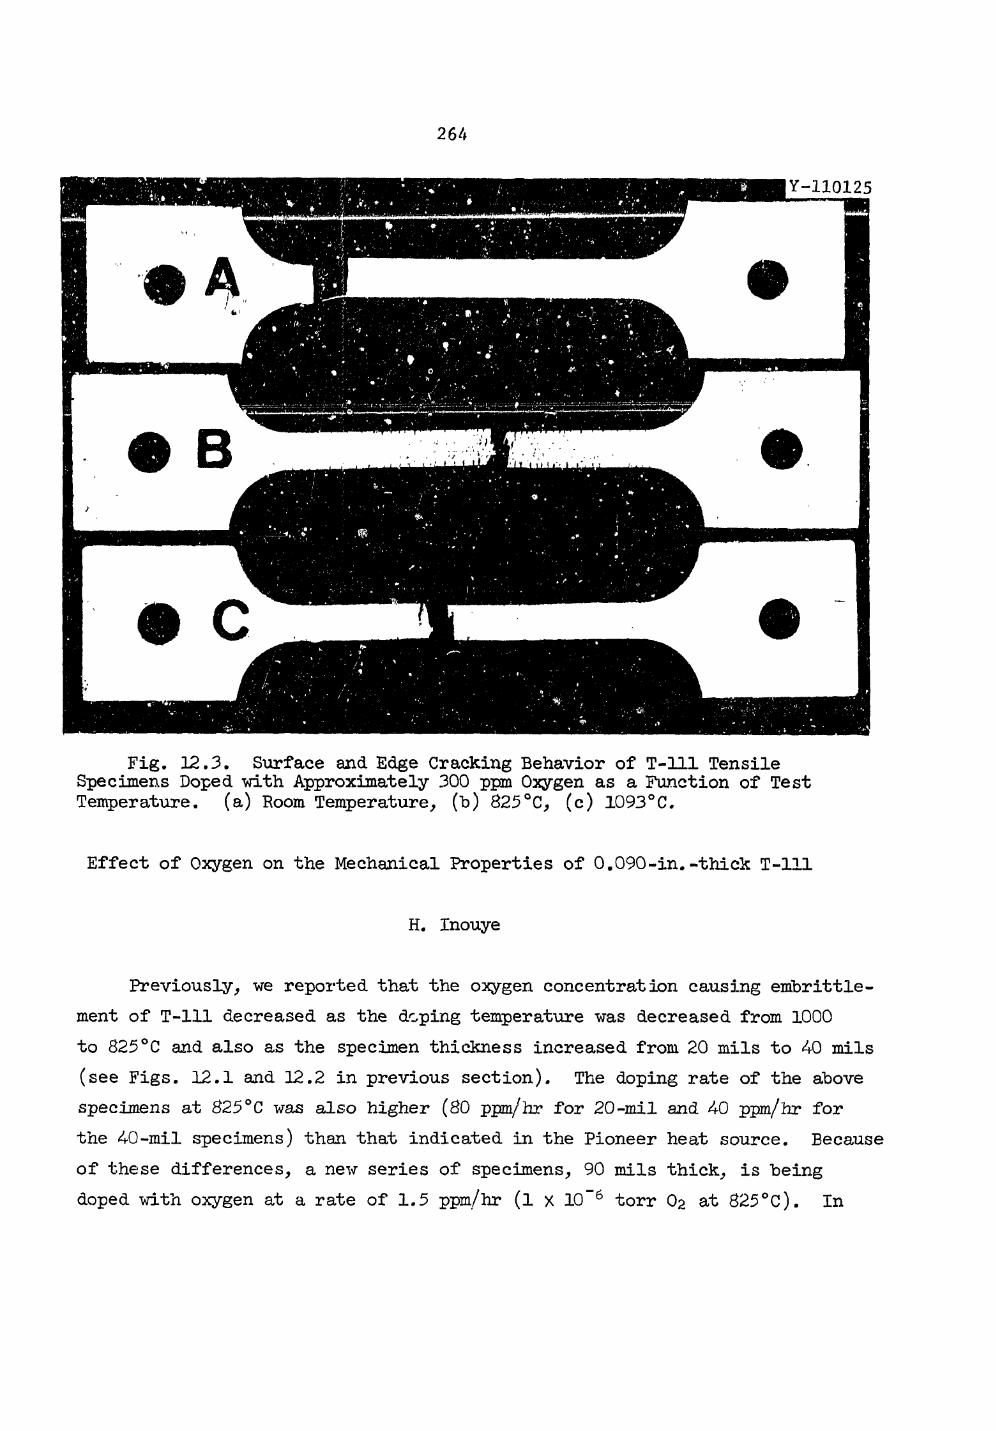
264
Fig. 12.3. Surface and Edge Cracking Behavior of T-lll Tensile Specimens Doped with Approximately 300 ppm Oxygen as a Function of Test Temperature. (a) Room Temperature, (h) 825°C, (c) 1093°C.
Effect of Oxygen on the Mechanical Properties of 0.090-in.-thick T-lll
H. Inouye
Previously, we reported that the oxygen concentration causing embrittle-ment of T-lll decreased as the doping temperature was decreased from 1000 to 825°C and also as the specimen thickness increased from 20 mils to 40 mils (see Figs. 12.1 and 12.2 in previous section). The doping rate of the above specimens at 825°C was also higher (80 ppm/hr for 20-mil and 40 ppm/hr for the 40-mil specimens) than that indicated in the Pioneer heat source. Because of these differences, a new series of specimens, 90 mils thick, is being doped with oxygen at a rate of 1.5 ppm/hr (l x 10~6 torr O2 at 825°C). In
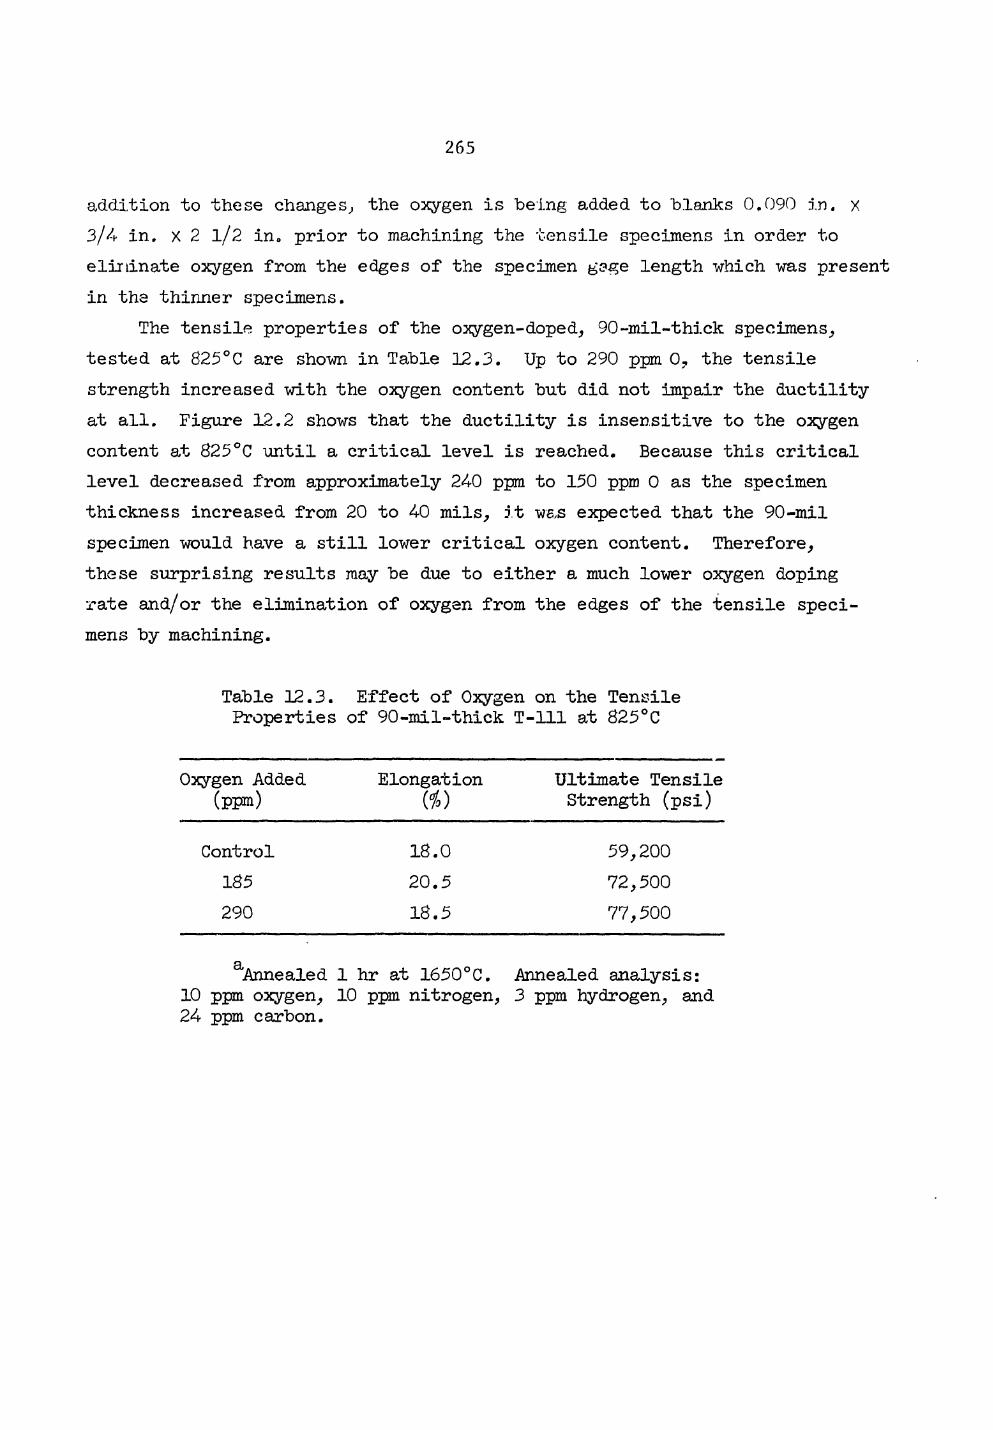
265
addition to these changes, the oxygen is being added to blanks 0.090 in. X 3/4 in, x 2 l/2 in. prior to machining the tensile specimens in order to eliminate oxygen from the edges of the specimen gage length "which was present in the thinner specimens.
The tensile properties of the oxygen-doped, 90-mil-thick specimens, tested at 825°C are shown in Table 12.3. Up to 290 ppm 0? the tensile strength increased with the oxygen content but did not impair the ductility at all. Figure 12.2 shows that the ductility is insensitive to the oxygen content at 825°C until a critical level is reached. Because this critical level decreased from approximately 24-0 ppm to 150 ppm 0 as the specimen thickness increased from 20 to 4-0 mils, it was expected that the 90-mil specimen would have a still lower critical oxygen content. Therefore, these surprising results may be due to either a much lower oxygen doping rate and/or the elimination of oxygen from the edges of the tensile speci-mens by machining.
Table 12.3. Effect of Oxygen on the Tensile Properties of 90-mil-thick T-lll at 825°C
Oxygen Added (ppm)
Ultimate Tensile Strength (psi)
Control
290 185
18.0 20.5 18.5
59,200 72,500 77,500
Annealed 1 hr at 1650°C. Annealed analysis: 10 ppm oxygen, 10 ppm nitrogen, 3 ppm hydrogen, and 24- ppm carbon.
a
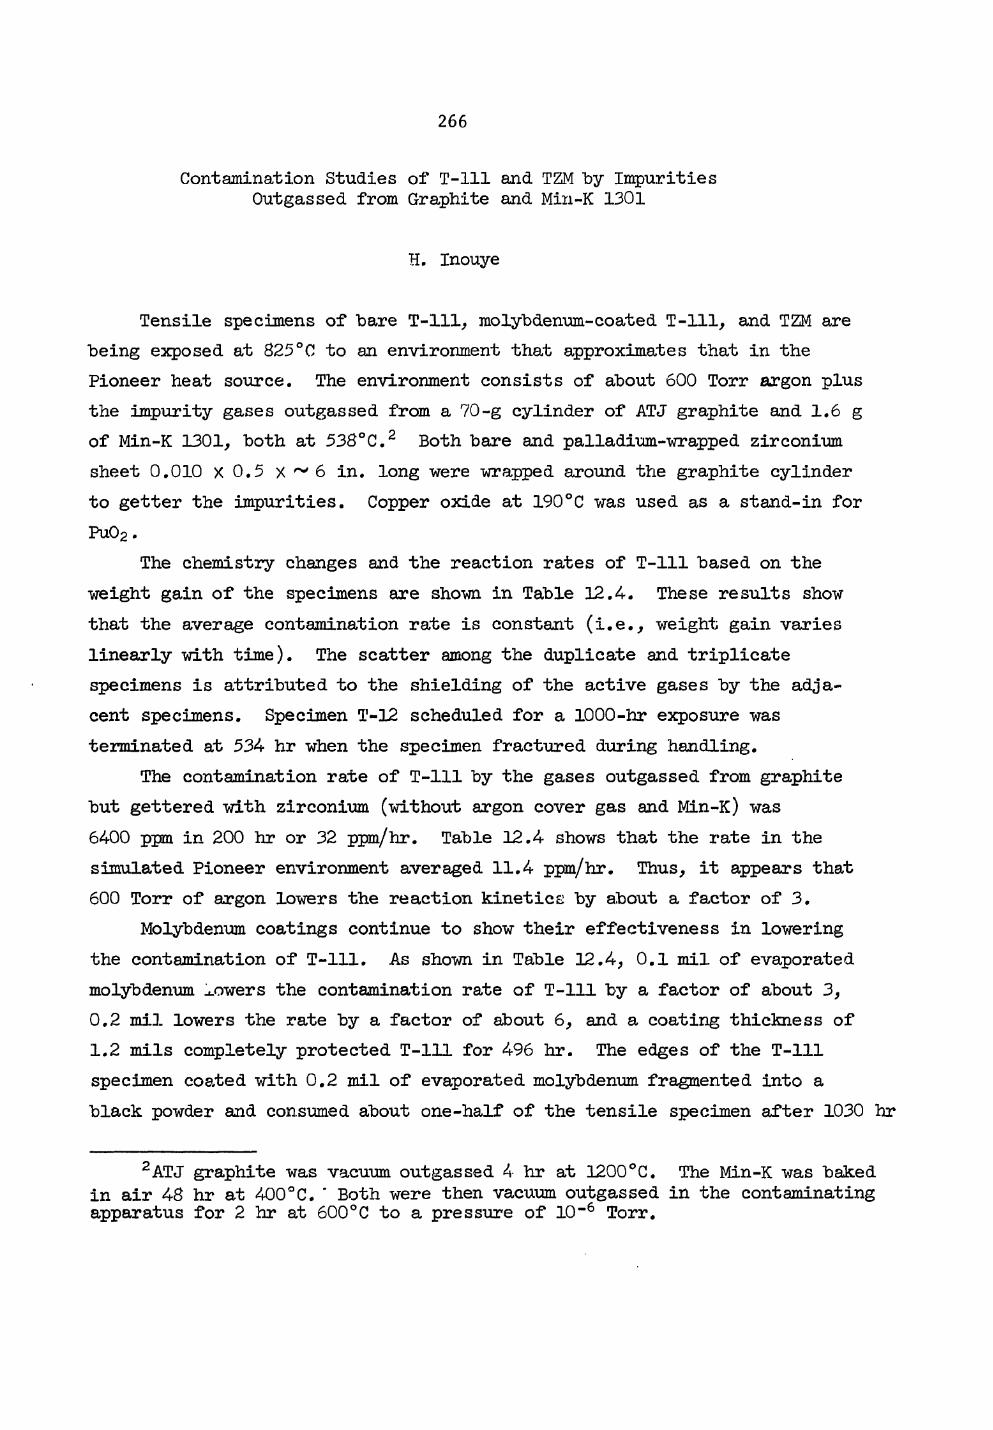
266
Contamination Studies of T-lll and TZM by Impurities Outgassed from Graphite and Min-K 1301
H. Inouye
Tensile specimens of bare T-lll, molybdenum-coated T-lll, and TZM are being exposed at 825°C to an environment that approximates that in the Pioneer heat source. The environment consists of about 600 Torr argon plus the impurity gases outgassed from a 70-g cylinder of ATJ graphite and 1.6 g of Min-K 1301, both at 538°C.2 Both bare and palladium-wrapped zirconium sheet 0.010 X 0.5 x 6 in. long were wrapped around the graphite cylinder to getter the impurities. Copper oxide at 190°C was used as a stand-in for Pu02.
The chemistry changes and the reaction rates of T-lll based on the weight gain of the specimens are shown in Table 12.4. These results show that the average contamination rate is constant (i.e., weight gain varies linearly with time). The scatter among the duplicate and triplicate specimens is attributed to the shielding of the active gases by the adja-cent specimens. Specimen T-12 scheduled for a 1000-hr exposure was terminated at 534 hr when the specimen fractured during handling.
The contamination rate of T-lll by the gases outgassed from graphite but gettered with zirconium (without argon cover gas and Min-K) was 6400 ppm in 200 hr or 32 ppm/hr. Table 12.4 shows that the rate in the simulated Pioneer environment averaged 11.4 ppm/hr. Thus, it appears that 600 Torr of argon lowers the reaction kinetics by about a factor of 3.
Molybdenum coatings continue to show their effectiveness in lowering the contamination of T-lll. As shown in Table 12.4, 0.1 mil of evaporated molybdenum ^owers the contamination rate of T-lll by a factor of about 3, 0.2 mil lowers the rate by a factor of about 6, and a coating thickness of 1.2 mils completely protected T-lll for 496 hr. The edges of the T-lll specimen coated with 0.2 mil of evaporated molybdenum fragmented into a black powder and consumed about one-half of the tensile specimen after 1030 hr
2ATJ graphite was vacuum outgassed 4 hr at 1200°C. The Min-K was baked in air 48 hr at 400°C. " Both were then vacuum outgassed in the contaminating apparatus for 2 hr at 600°C to a pressure of 10"6 Torr.
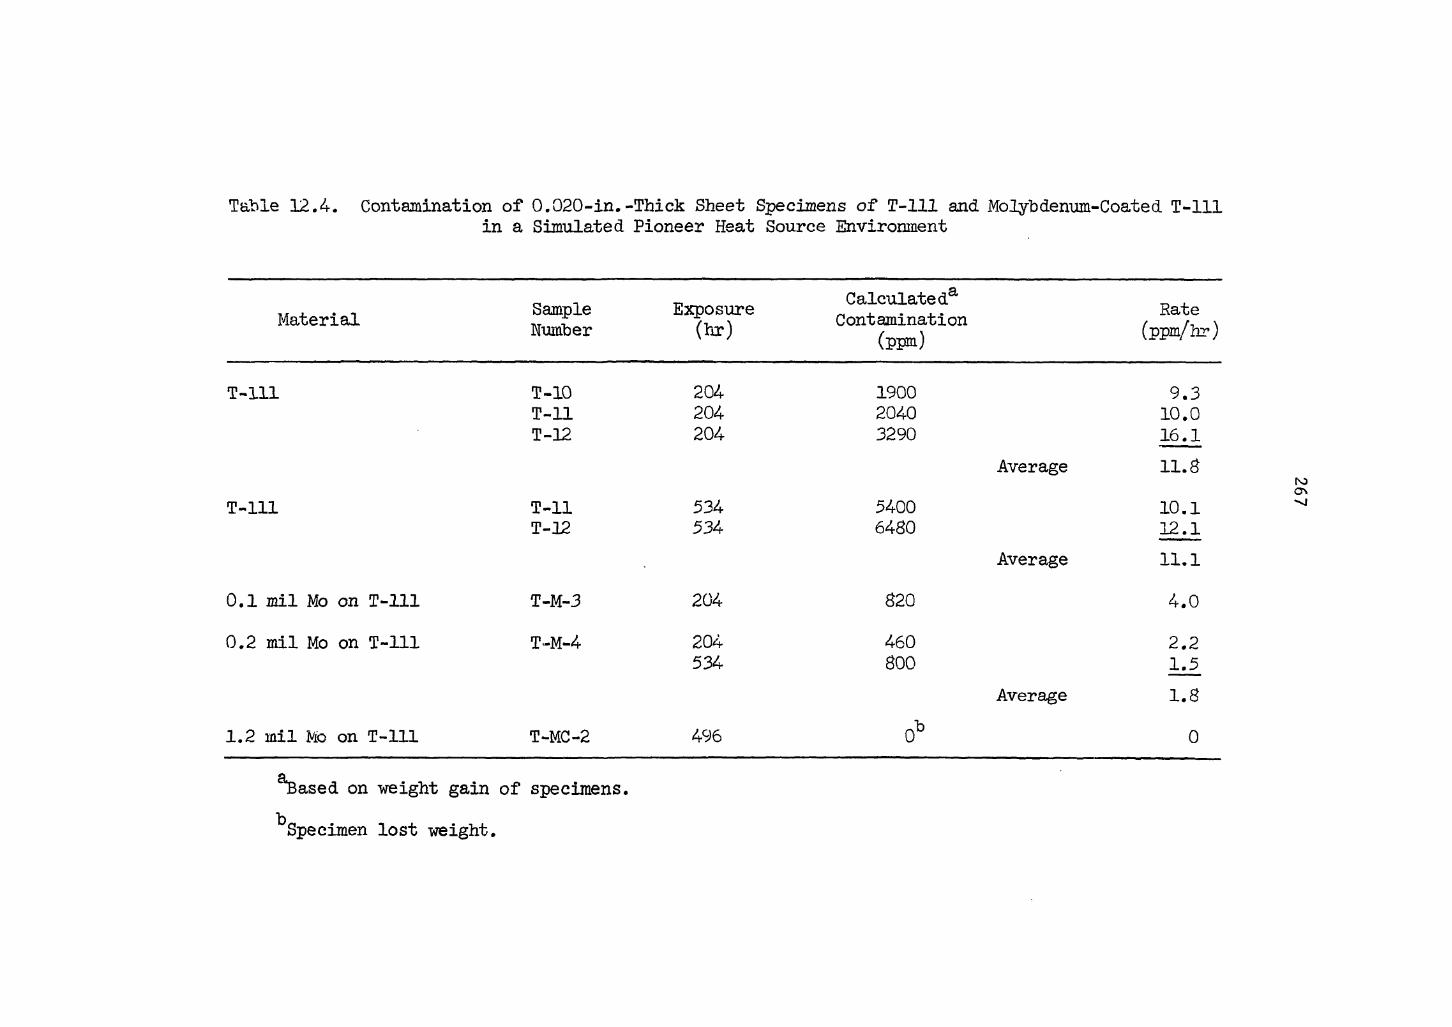
Table 12.4. Contamination of 0.020-in.-Thick Sheet Specimens of T-lll and Molybdenum-Coated T-lll in a Simulated Pioneer Heat Source Environment
Material Sample Number
Exposure (hr)
Calculate da
Contamination (ppm)
Rate (ppm/hr)
T-lll T-10 204 1900 9.3 T-ll 204 2040 10.0 T-12 204 3290 16.1
Average 11.8
T-lll T-ll 534 5400 10.1 T-12 534 6480 12.1
Average 11.1
0.1 mil Mo on T-lll T-M-3 204 820 4.0
0.2 mil Mo on T-lll T-M-4 204 460 2.2 534 800 1.5
Average 1.8
1.2 mil Mo on T-lll T-MC-2 496 ob 0
^ased on weight gain of specimens.
Specimen lost weight.
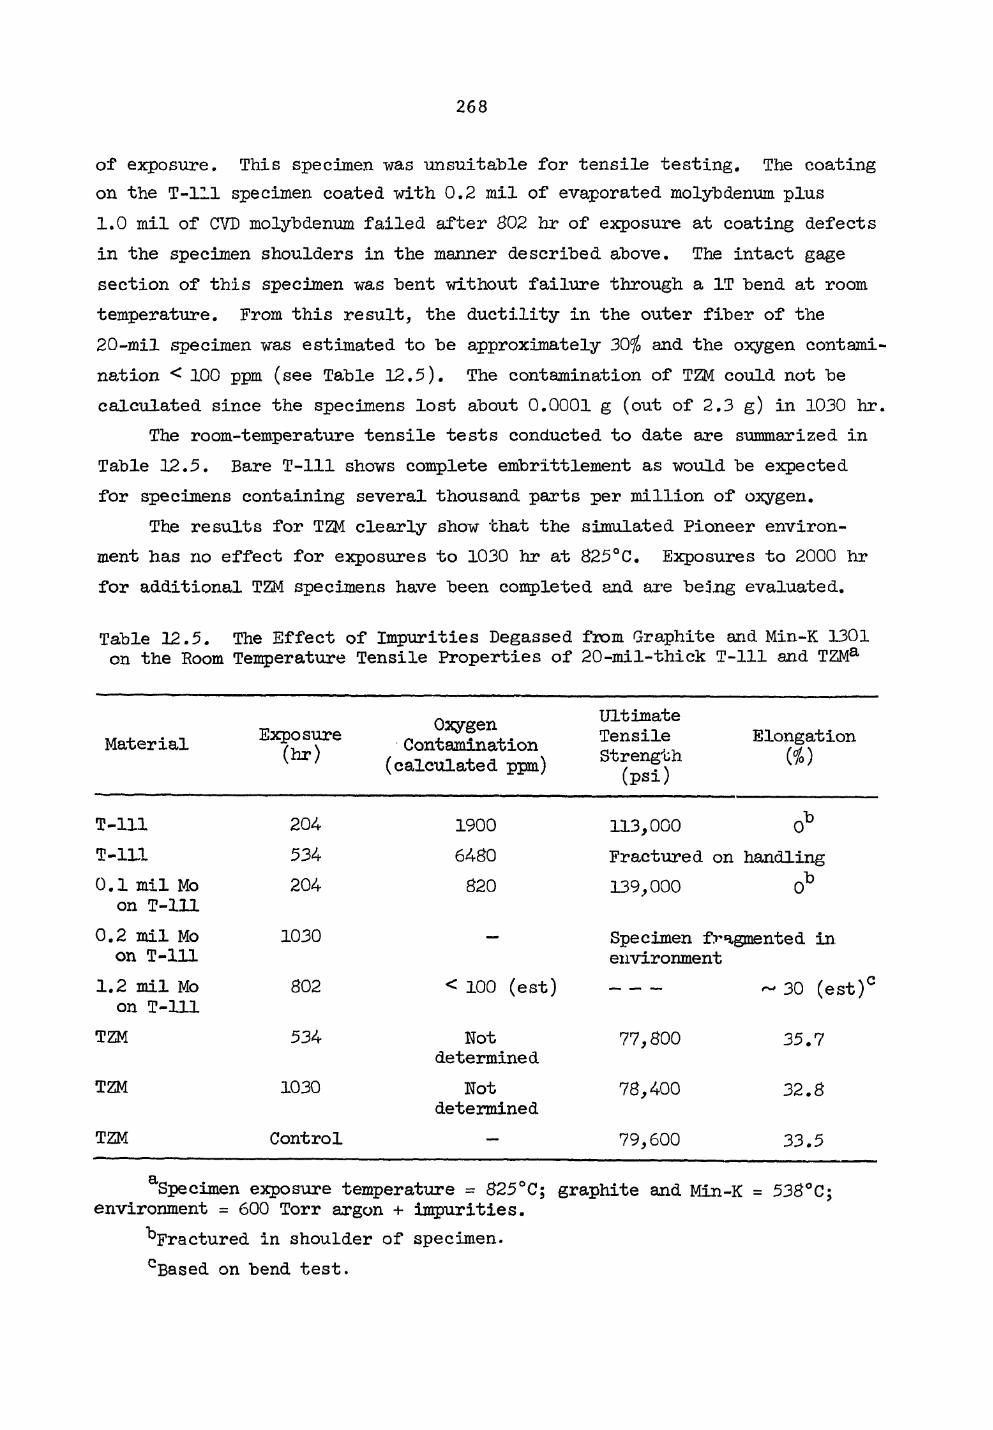
268
of exposure. This specimen was unsuitable for tensile testing. The coating on the T-lll specimen coated with 0.2 mil of evaporated molybdenum plus 1.0 mil of CVD molybdenum failed after 802 hr of exposure at coating defects in the specimen shoulders in the manner described above. The intact gage section of this specimen was bent without failure through a IT bend at room temperature. From this result, the ductility in the outer fiber of the 20-mil specimen was estimated to be approximately 30$ and the oxygen contami-nation < 100 ppm (see Table 12.5). The contamination of TZM could not be calculated since the specimens lost about 0.0001 g (out of 2.3 g) in 1030 hr.
The room-temperature tensile tests conducted to date are summarized in Table 12.5. Bare T-lll shows complete embrittlement as would be expected for specimens containing several thousand parts per million of oxygen.
The results for TZM clearly show that the simulated Pioneer environ-ment has no effect for exposures to 1030 hr at 825°C. Exposures to 2000 hr for additional TZM specimens have been completed and are being evaluated.
Table 12.5. The Effect of Impurities Degassed from Graphite and Min-K 1301 on the Room Temperature Tensile Properties of 20-mil-thick T-lll and TZMa
Material Exposure (hr)
Oxygen Contamination
(calculated ppm)
Ultimate Tensile Strength
(psi)
Elongation « )
T-lll 204- 1900 113,000 0 b
T-lll 534- 64-80 Fractured on handling 0.1 mil Mo on T-lll
204- 820 139,000 o b
0.2 mil Mo on T-lll
1030 — Specimen fragmented in. environment
1.2 mil Mo on T-lll
802 < 100 (est) ~ 30 (est)0
TZM 534- Not determined
77,800 35.7
TZM 1030 Not determined
78,4-00 32.8
TZM Control — 79,600 33.5
Specimen exposure temperature = 825°C; graphite and Min-K = 538°C; environment = 600 Torr argon + impurities.
^Fractured in shoulder of specimen. cBased on bend test.
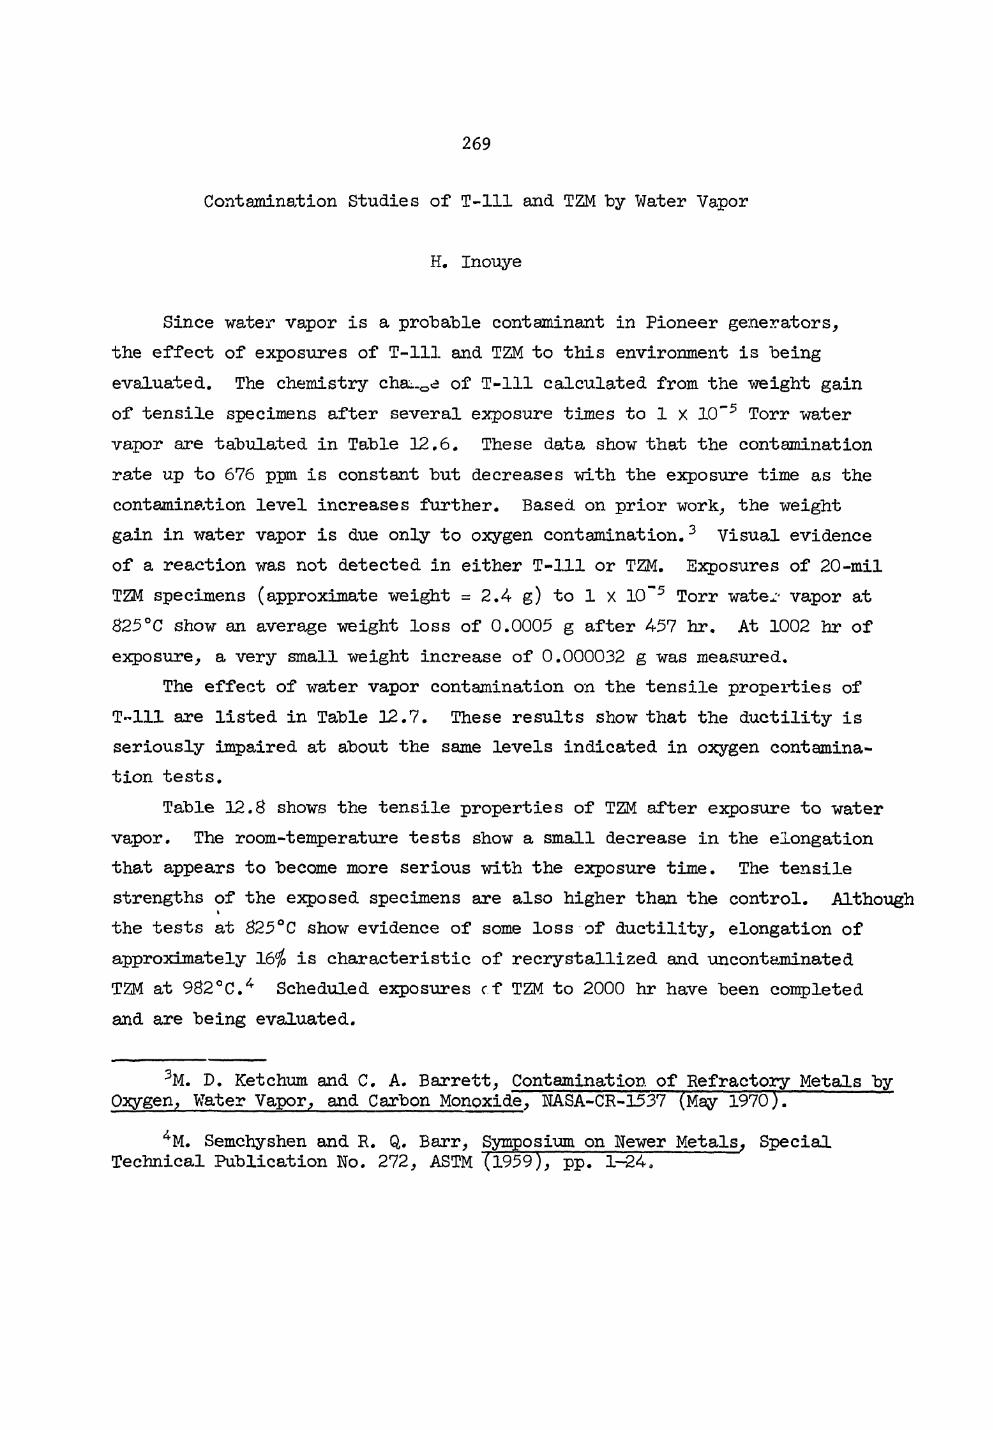
269
Contamination Studies of T-lll and TZM by Water Vapor
H. Inouye
Since water vapor is a probable contaminant in Pioneer generators, the effect of exposures of T-lll and TZM to this environment is being evaluated. The chemistry chai.0e of T-lll calculated from the weight gain of tensile specimens after several exposure times to 1 x 10~5 Torr water vapor are tabulated in Table 12.6. These data show that the contamination rate up to 676 ppm is constant but decreases with the exposure time as the contamination level increases further. Based on prior work, the weight gain in water vapor is due only to oxygen contamination.3 Visual evidence of a reaction was not detected in either T-lll or TZM. Exposures of 20-mil TZM specimens (approximate weight = 2.4 g) to 1 x 10~5 Torr water vapor at 825°C show an average weight loss of 0.0005 g after 457 hr. At 1002 hr of exposure, a very small weight increase of 0.000032 g was measured.
The effect of water vapor contamination on the tensile properties of T-lll are listed in Table 12.7. These results show that the ductility is seriously impaired at about the same levels indicated in oxygen contamina-tion tests.
Table 12.8 shows the tensile properties of TZM after exposure to water vapor. The room-temperature tests show a small decrease in the elongation that appears to become more serious with the exposure time. The tensile strengths of the exposed specimens are also higher than the control. Although » the tests at 825°C show evidence of some loss of ductility, elongation of approximately 16% is characteristic of recrystallized and uncontaminated TZM at 982°C.4 Scheduled exposures cf TZM to 2000 hr have been completed and are being evaluated.
3M. D. Ketchum and C. A. Barrett, Contamination of Refractory Metals by Oxygen, Water Vapor, and Carbon Monoxide, NASA-CR-1537 (May 1970).
4M. Semchyshen and R. Q. Barr, Symposium on Newer Metals, Special Technical Publication No. 272, ASTM (1959), pp. 1-24.
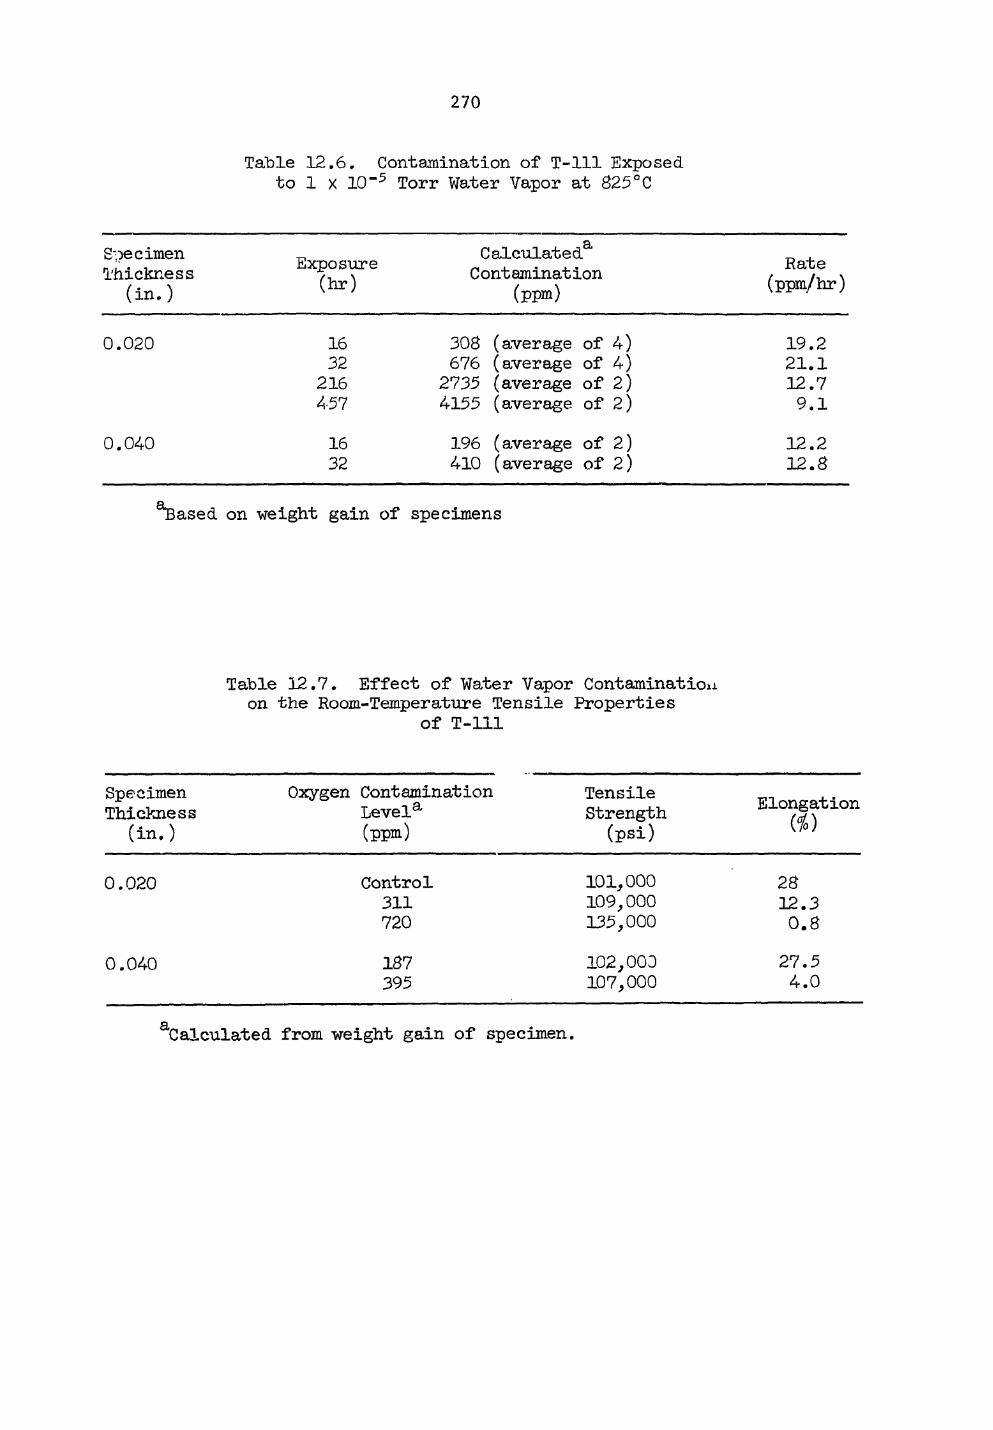
270
Table 12.6. Contamination of T-lll Exposed to 1 X 10~5 Torr Water Vapor at 825°C
Specimen Thickness
(in.) Exposure
(hr) Calculated8, Contamination
(ppm) Rate
(ppm/hr)
0.020 16 308 (average of 4) 19.2 32 676 (average of 4) 21.1 216 2735 (average of 2) 12.7 45 7 4155 (average of 2) 9.1
0.040 16 196 (average of 2) 12.2 32 410 (average of 2) 12.8
^ased on weight gain of specimens
Table 12.7. Effect of Water Vapor Contarainatioxi on the Room-Temperature Tensile Properties
of T-lll
Specimen Thickness
(in.)
Oxygen Contamination Level8, (ppm)
Tensile Strength (psi)
Elongation Ho)
0.020 Control 101,000 28 311 109,000 12.3 720 135,000 0.8
0.040 187 102,000 27.5 395 107,000 4.0
Calculated from weight gain of specimen.
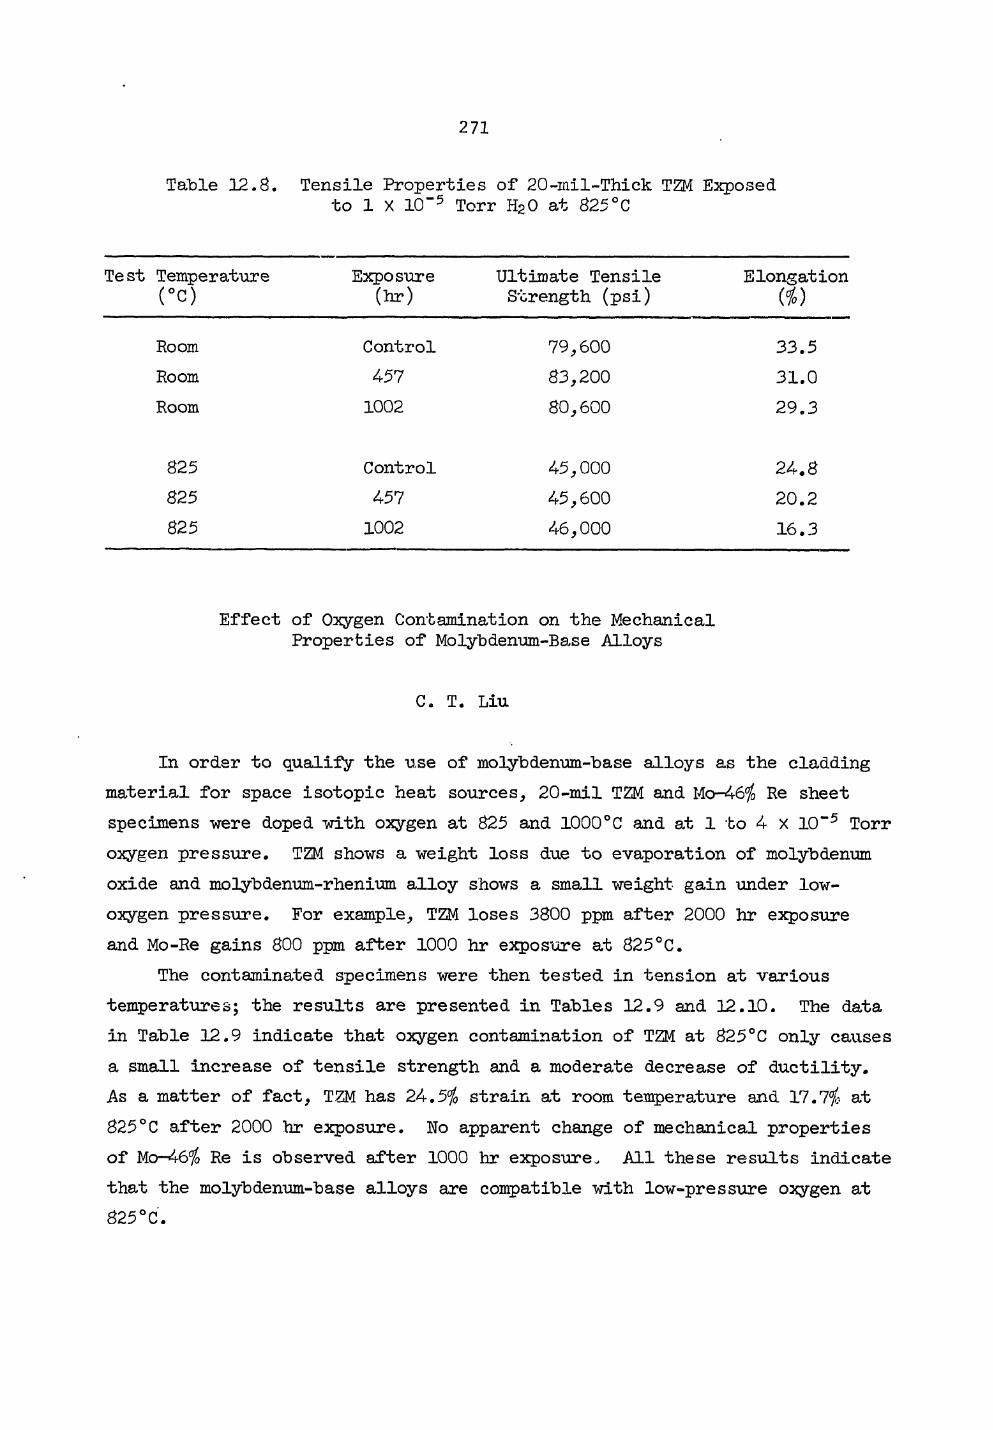
271
Table 12.8. Tensile Properties of 20-mil-Thick TZM Exposed to 1 X 10"5 Torr H20 at 825°C
Test Temperature (°c)
Exposure (hr)
Ultimate Tensile Strength (psi)
Elongation ($)
Room Control 79,600 33.5 Room 4-57 83,200 31.0 Room 1002 80,600 29.3
825 Control 45,000 24.8 825 4-57 45,600 20.2 825 1002 46,000 16.3
Effect of Oxygen Contamination on the Mechanical Properties of Molybdenum-B8.se Alloys
C. T. Liu
In order to qualify the use of molybdenum-base alloys as the cladding material for space isotopic heat sources, 20-mil TZM and Mo-46$ Re sheet specimens were doped with oxygen at 825 and 1000°C and at 1 to 4 x 10"5 Torr oxygen pressure. TZM shows a weight loss due to evaporation of molybdenum oxide and molybdenum-rhenium alloy shows a small weight gain under low-oxygen pressure. For example, TZM loses 3800 ppm after 2000 hr exposure and Mo-Re gains 800 ppm after 1000 hr exposure at 825°C.
The contaminated specimens were then tested in tension at various temperatures; the results are presented in Tables 12.9 and 12.10. The data in Table 12.9 indicate that oxygen contamination of TZM at 825°C only causes a small increase of tensile strength and a moderate decrease of ductility. As a matter of fact, TZM has 24.5$ strain at room temperature and 17.7$ at 825°C after 2000 hr exposure. No apparent change of mechanical properties of Mo-46$ Re is observed after 1000 hr exposure. All these results indicate that the molybdenum-base alloys are compatible with low-pressure oxygen at 825°C.
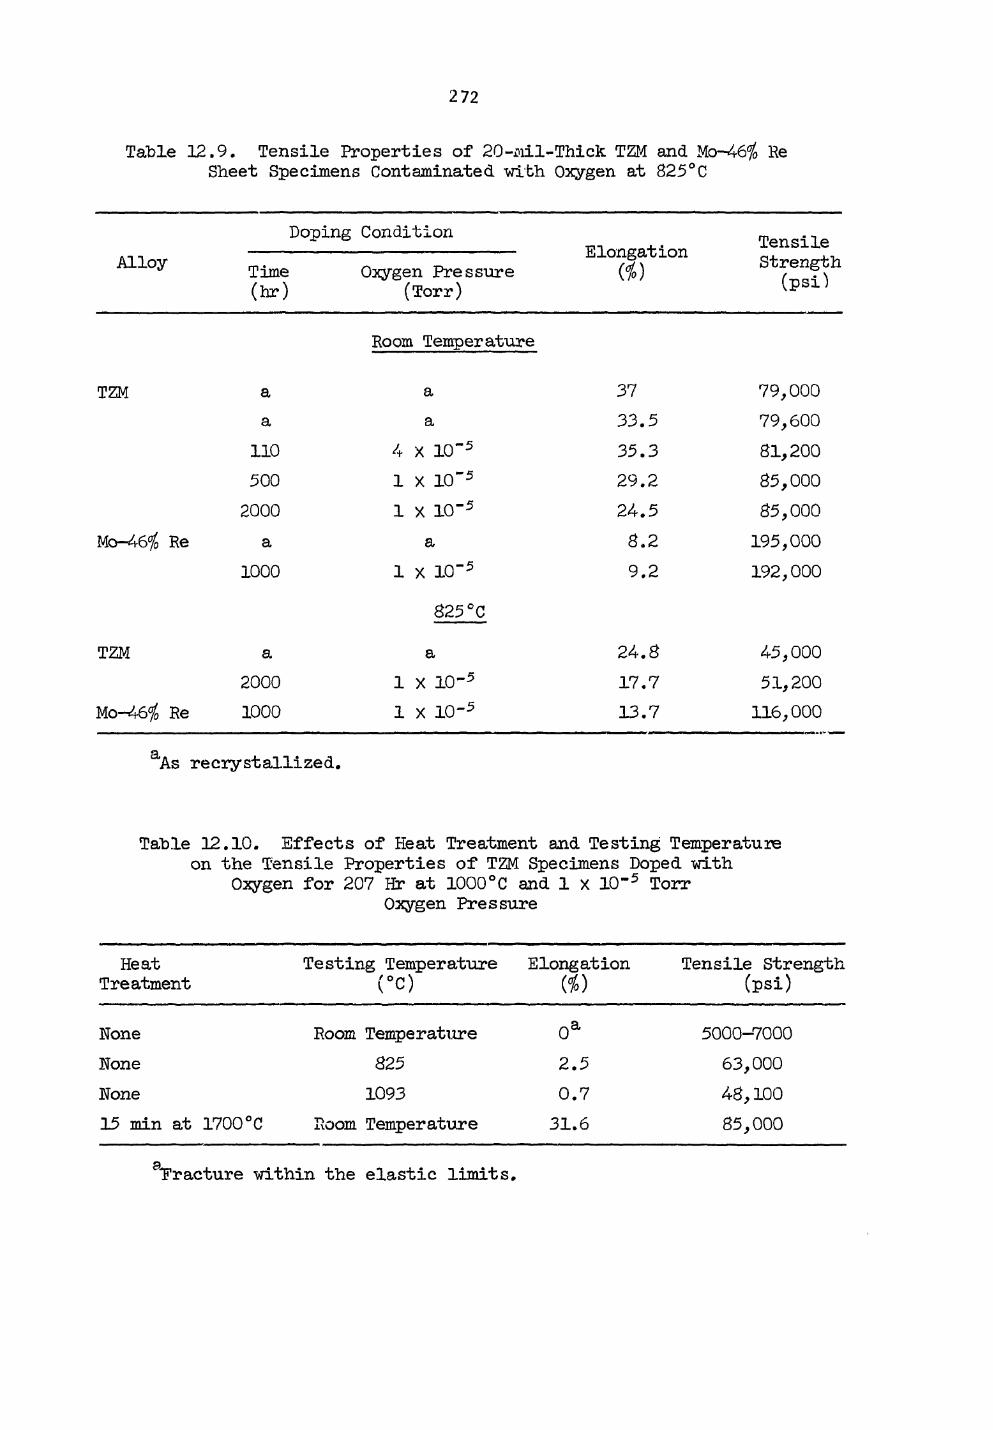
272
Table 12.9. Tensile Properties of 20-ail-Thick TZM and Mo-46% Re Sheet Specimens Contaminated with Oxygen at 825°C
Alloy Doping Condition
Time (hr)
Oxygen Pressure (Torr)
Elongation d)
Tensile Strength
(psi)
Room Temperature
TZM
Mo-46i Re
TZM
Mo-46io Re
a a 110 500
2000
a 1000
a 2000
1000
a a
4 X 10" 5
1 X 10" 5
1 X 1 0 ' 5
a 1 x 10" 5
825 °C
a 1 X io - 5
l x i o - 5
37
33 .5
3 5 . 3
29 .2
2 4 . 5
8.2 9 . 2
2 4 . 8
17 .7
13 .7
79,000
79,600
81,200 85,000
85,000
195,000
192,000
45,000 51,200 116,000
a As recrystallized.
Table 12 .10 . Effects of Heat Treatment and Testing Temperature on the Tensile Properties of TZM Specimens Doped with
Oxygen for 207 Hr at 1000°C and 1 x 10"5 Torr Oxygen Pressure
Heat Treatment
Testing Temperature (°c)
Elongation « ) Tensile Strength (psi)
None Room Temperature 0 a 5000-7000 None 825 2.5 63,000 None 1093 0.7 48,100 15 min at 1700°C Room Temperature 31.6 85,000
fracture within the elastic limits.
2 73
Table .12.10 shows the effects of testing temper at lire and heat treatment on the tensile properties of TZM specimens doped at 1000°C and 1 X 10~5 Torr oxygen pressure. The as-doped specimen was extremely brittle and fractured within the elastic limit when tested at room temperature. Increasing the test temperature to 1093°C does not improve the ductility significantly. But the ductility of the specimen is completely restored after 15 min heating at 1700°C. These results clearly indicate that TZM and T-lll behave similarly after oxygen contamination.5 However, due to the low rate of oxygen penetration in molybdenum matrix, it is important to note that from the standpoint of environmental stability, TZM may be suitable as a cladding material for space power systems when the operation temperature is low, for example, 225°C, as in the Pioneer radioisotope thermal generators.
Effect of CO-Gas Contamination on the Mechanical Properties of Molybdenum-Base Alloys
C. T. Liu
The 20-mil sheet specimens of TZM and Mo-46$ Re alloys were contaminated at a CO pressure of 1 X 10"5 Torr and 825°C. The amount of contamination is controlled by doping time. Both alloys show a small weight gain after long-time exposure. The contaminated specimens were then tested in tension at room temperature and 825°C; the data are presented in Table 12.11. Both the tensile strength and elongation of the contaminated specimens are not signi-ficantly different from the as-recrystallized ones, even after 2000 hr exposure. We, therefore, conclude that the molybdenum-base alloys are compatible with CO gas at 825°C. Combination of these results with the results of oxygen contamination and exposure to graphite and Min-K reported in the previous sections leads to the general conclusion that, from the standpoint of environmental stability, TZM and Mo-46$ Re alloys are suitable for use as fuel cladding materials for Pioneer space power systems whose operation temperature is in the range of 800 to 850°C.
5C. T. Liu, Fuels and Materials Development Program Quart. Progr. Rept. June 30, 1971, OHNL-TM-3540, p. 110.
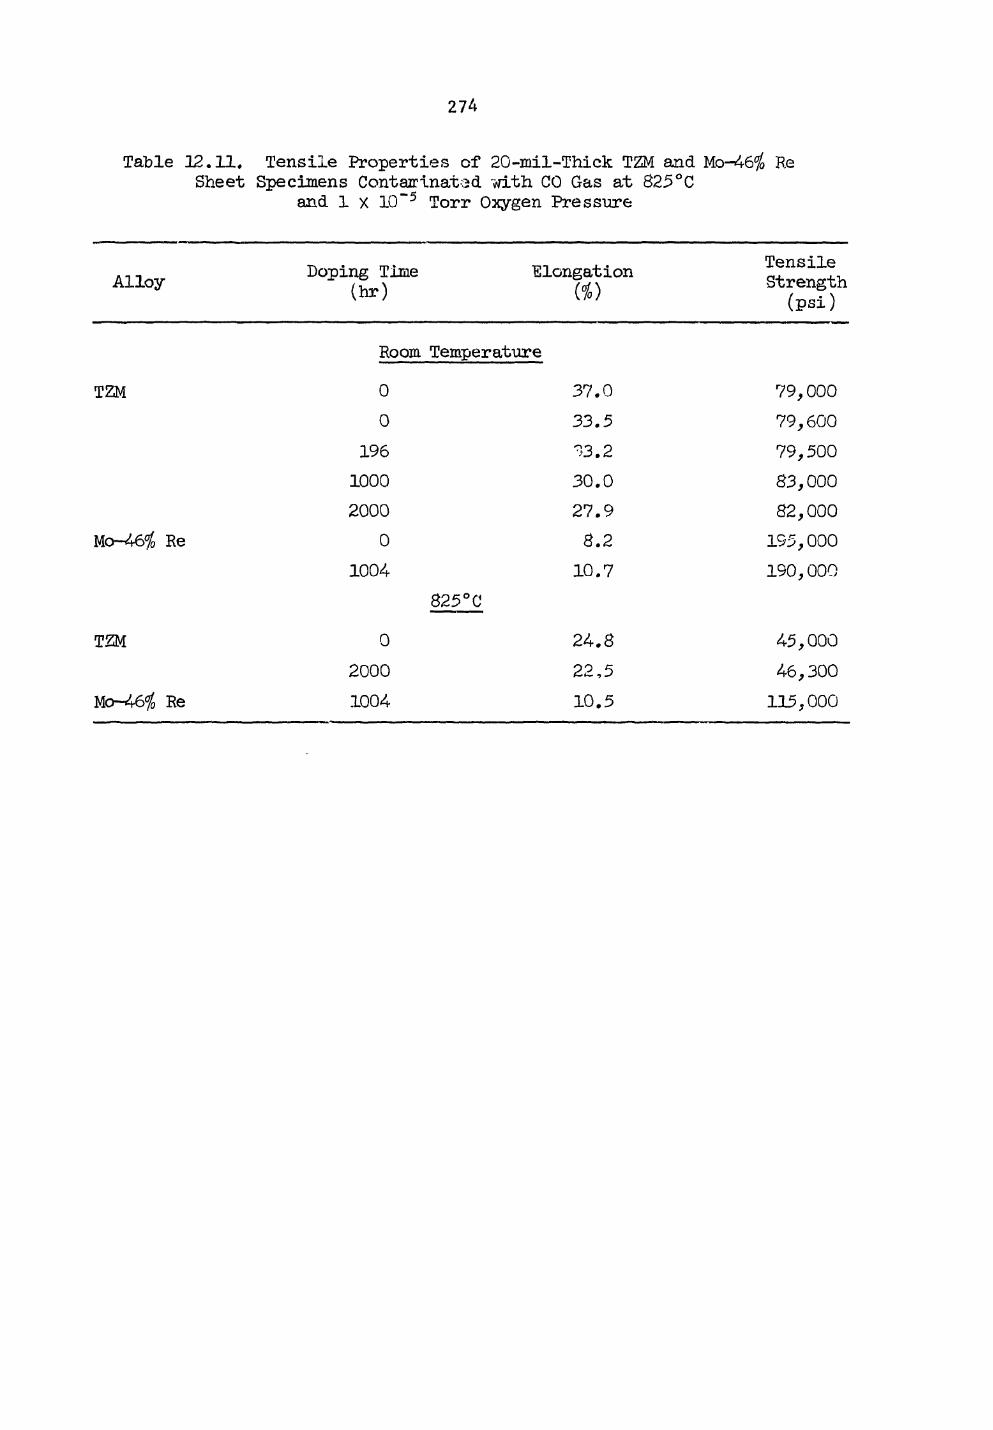
274
Table 12.11. Tensile Properties of 20-mil-Thick TZM and Mo-46$ Re Sheet Specimens Contaminated with CO Gas at 825°C
and 1 x 10"5 Torr Oxygen Pressure
Alloy Doping Time (hr)
Elongation M )
Tensile Strength (psi)
Room Temperature
TZM 0 37.0 79,000 0 33.5 79,600
196 33.2 79,500 1000 30.0 83,000 2000 27.9 82,000
Mo-46% Re 0 8.2 195,000 1004 10.7 190,000
825 °C
TZM 0 24.8 45,000 2000 22,5 46,300
Mo-46$ Re 1004 10.5 115,000
275
13. CLADDING MATERIALS FOR SPACE ISOTOPIC HEAT SOURCES
R. G. Donnelly H. Inouye
The purpose of this program is to develop alloys with a superior combination of properties to better assure reliable containment of radioisotope fuels such as 230PuO2 and 24"4Cm203 under both operating and accident conditions for space thermoelectric generators. Ideally the encapsulating material should be insensitive to the operating environment and capable of surviving launch aborts, reentry heating, and earth impact as well as provide maximum post-impact containment of the fuel. At the same time it must be both fabricable and weldable.
We feel these goals can best be accomplished with high-strength, noble-based alloys having melting points above 2000°C, Presently, we are characterizing Pt-Rh-W alloys for this application.
Preparation of Pt-Rh-W Sheet
•J. H. Erwin
To compare th° fabricability of the Pt-Rh-W alloy with small changes in composition, 500-g melts of each of three alloys with nominal composi-tions of Pt—26$ Rh-8$ W, Pt—30$ Rh—10$ W, and Pt-30$ Rh-10$ W-l$ Hf-0.1$ Ti were electron-beam melted and drop-cast to make 0.5-in. -thick by 1-in.-wide by 2-in.-long ingots as shown in Fig. 13.1. These ingots were hot-rolled at 1200 to 1300°C without environmental protection to make 0,04-0-in.-thick sheet (Fig. 13.2). The hot-rolled sheet was cold-rolled with intermediate anneals to 0.030-in. thickness. Formability of the alloys was then evaluated from standard bend test8 carried out in accordance with Materials Advisory Board recommendations (MAB-176-M). Each alloy was heat-treated in vacuum at the appropriate temperature to produce specimens representative of stress relieved, nominally 50$ recrystallized, and fully recrystallized structures. Data from the bend tests are given in Table 13.1. The alloys were compared at a 4-T bend radius followed by other smaller bend radii that provided the basis for calculation of minimum bend, radius.
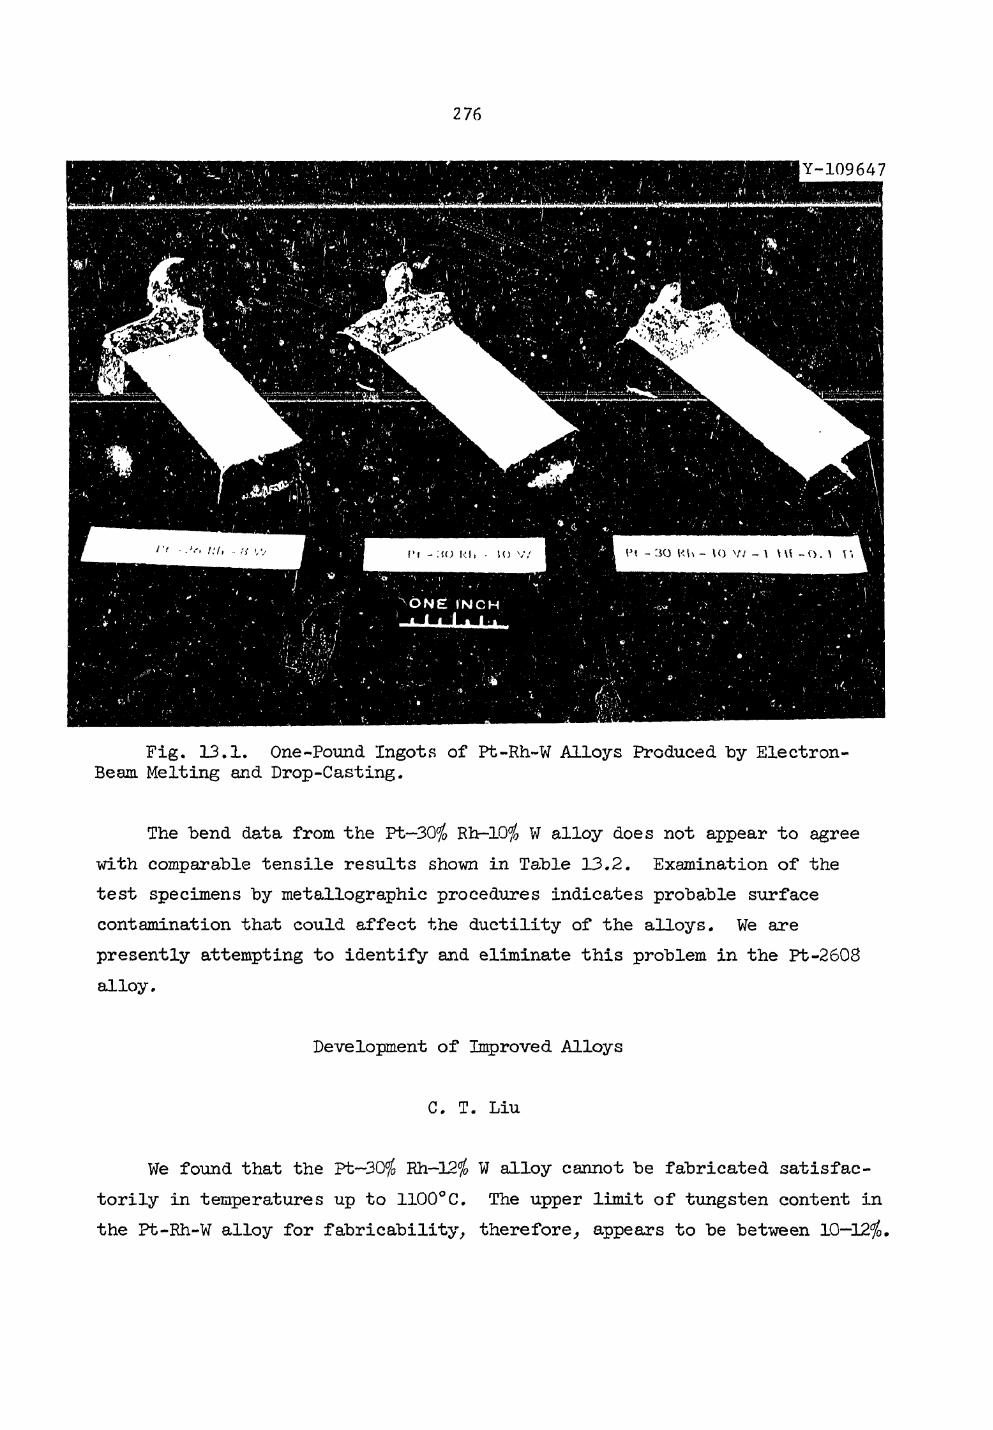
276
Fig. 13.1. One-Pound Ingots of Pt-Rh~W Alloys Produced "by Electron-Beam. Melting and Drop-Casting.
The bend data from the Ft—30$ Rh—10$ W alloy does not appear to agree with comparable tensile results shown in Table 13.2. Examination of the test specimens by metallographic procedures indicates probable surface contamination that could affect the ductility of the alloys. We are presently attempting to identify and eliminate this problem in the Pt-2608 alloy.
Development of Improved Alloys
C. T. Liu
We found that the Pt-30$ Eh-12$ W alloy cannot be fabricated satisfac-torily in temperatures up to 1100°C. The upper limit of tungsten content in the Pt-Rh-W alloy for fabricability, therefore, appears to be between 10—12$.
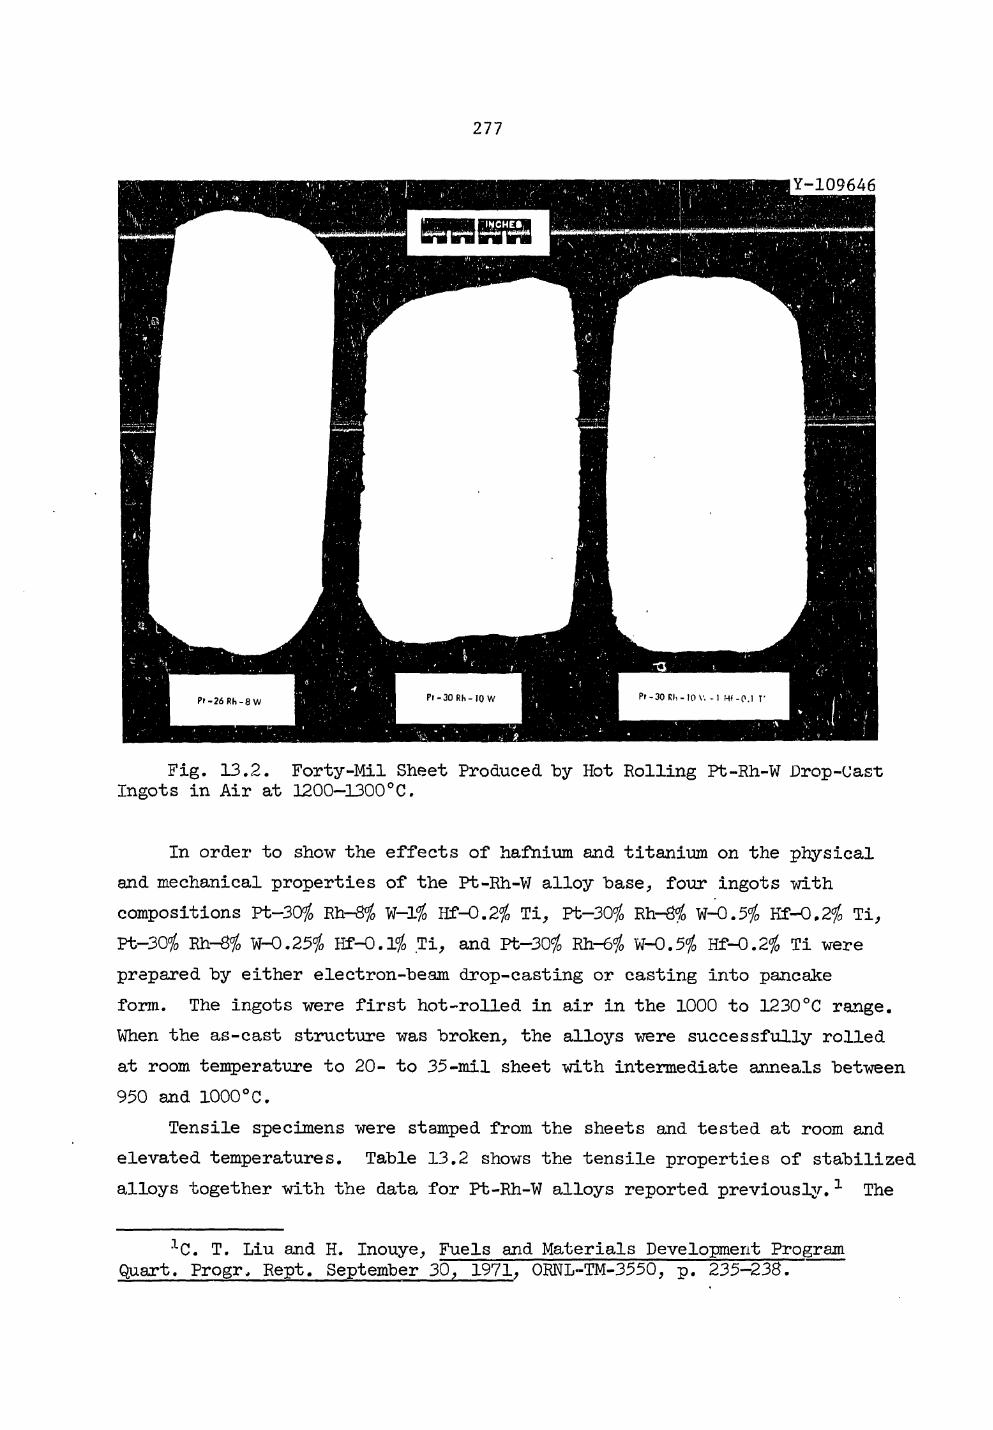
277
Fig. 13.2. Forty-Mil Sheet Produced by Hot Rolling Pt-Rh-W Drop-cast Ingots in Air at 1200-1300°C.
In order to show the effects of hafnium and titanium on the physical and mechanical properties of the Pt-Rh-W alloy base, four ingots with compositions Pt-30$ Rh-8# hJ-1% Hf-0.2$ Ti, Pt-30% Hh-Si ¥-0.5% Kf-O.2% Ti, Pt-30f0 Rh-8f0 W-0.2 5i m-O.1% Ti, and Pt-30$ Rh-6 i W-0.5% Hf-0.2 % Ti were prepared by either electron-beam drop-casting or casting into pancake form. The ingots were first hot-rolled in air in the 1000 to 1230°C range. When the as-cast structure was broken, the alloys were successfully rolled at room temperature to 20- to 35-mil sheet with intermediate anneals between 950 and 1000°C.
Tensile specimens were stamped from the sheets and tested at room and elevated temperatures. Table 13.2 shows the tensile properties of stabilized alloys together with the data for Pt-Rh-W alloys reported previously.1 The
1C. T. Liu and H. Inouye, Fuels and Materials Development Program Quart. Progr, Rept. September 30, 1971, 0RNL-TM-3550, p. 235-238.
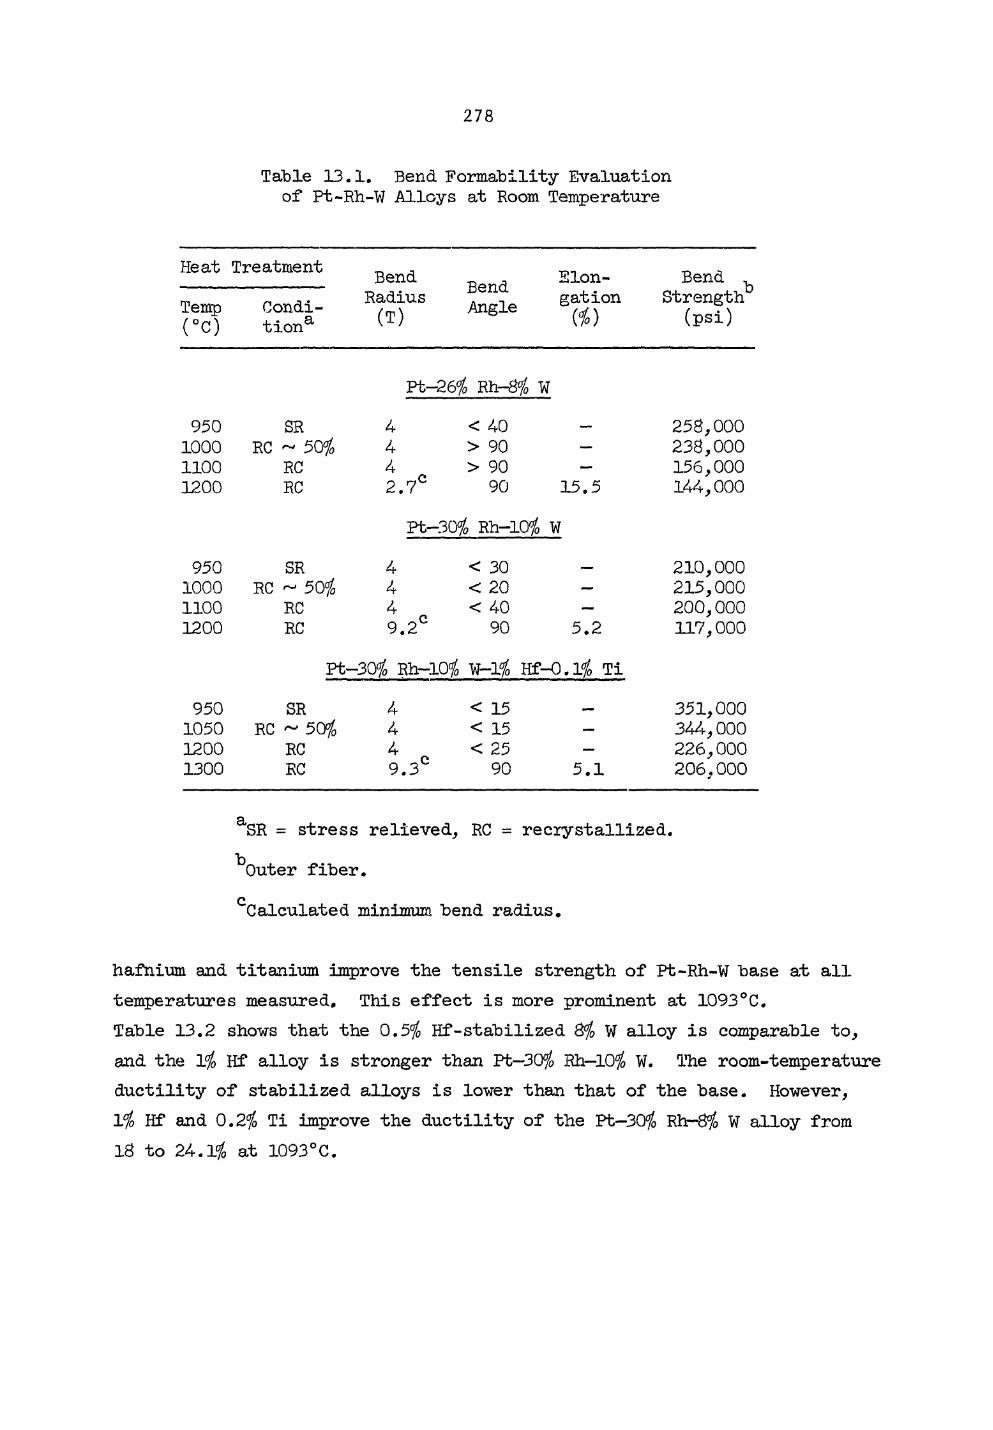
278
Table 13.1. Bend Formability Evaluation of Pt-Eh-W Alloys at Room Temperature
Heat Treatment Bend Bend Angle
Elon- Bend , E Strength ( p s i )
Temp ( °c )
Condi-tiona
Radius (T)
Bend Angle gation
($)
Bend , E Strength ( p s i )
Pt—26$ Rh—8$ W
950 10 00 1100 1200
SR RC ~ 50$
RC RC
4 4 4 2.7°
< 40 > 90 > 90 90 15.5
258,000 238,000 156,000 144,000
Pt—30$ Rh—10$ W
950 1000 1100 1200
SR RC - 50$
RC RC
4 4 4 9.2°
< 30 < 20 < 40 90 5.2
210,000 215,000 200,000 117,000
Pt—30$ Rh—10$ W-l$ Hf-O.1$ Ti
950 1050 1200 1300
SR RC ~ 50$
RC RC
4 4 4 9.3°
< 15 < 15 < 25 90 5.1
351,000 344,000 226,000 206,000
aSR = stress relieved, RC = recrystallized.
Outer fiber • c Calculated minimum bend radius.
hafnium and titanium improve the tensile strength of Pt-Rh-W base at all temperatures measured. This effect is more prominent at 1093°C. Table 13.2 shows that the 0.5$ Hf-stabilized 8$ W alloy is comparable to, and the 1$ Hf alloy is stronger than Pt—30$ Rh—10$ W. The room-temperature ductility of stabilized alloys is lower than that of the base. However, 1$ Hf and 0.2$ Ti improve the ductility of the Pt-30$ Rhr-8$ W alloy from 18 to 24.1$ at 1093°C.
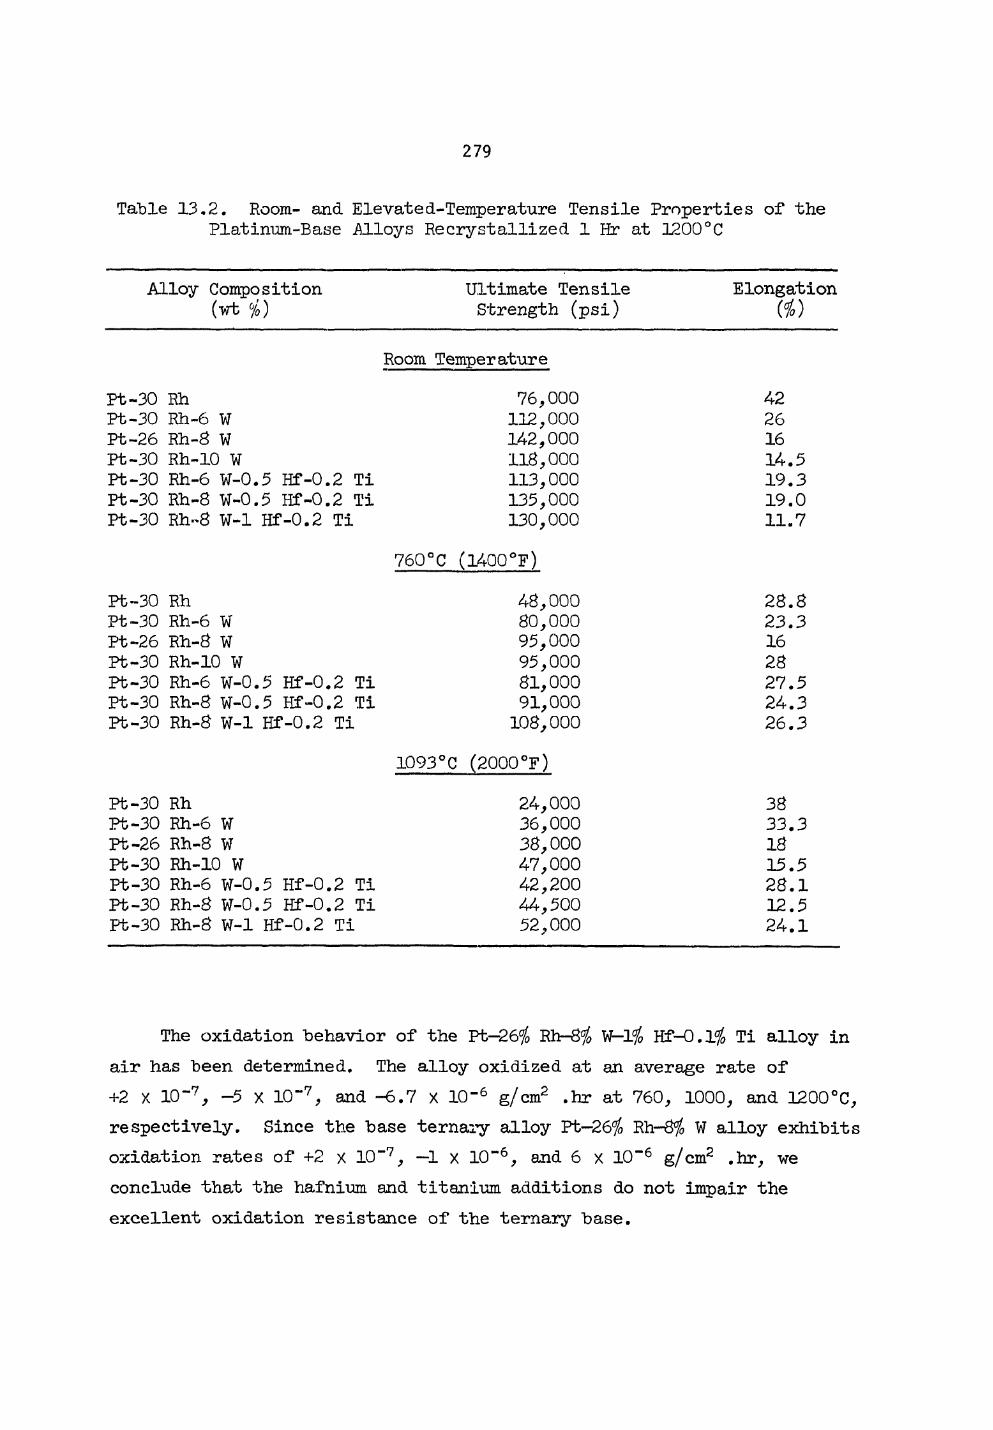
279
Table 13.2. Room- and Elevated-Temperature Tensile Properties of the Platinum-Base .Alloys Re crystallized 1 Hr at 1200 °C
Alloy Composition Ultimate Tensile Elongation (wt %) Strength (psi) Ho)
Room Temperature
Pt-30 Rh 76,000 42 Pt-30 Rh-6 W 112,000 26 Pt-26 Rh-8 W 142,000 16 Pt-30 Rh-10 W 118,000 14.5 Pt-30 Rh-6 W-0.5 Hf-0, .2 Ti 113,000 19.3 Pt-30 Rh-8 W-0.5 Hf-0, .2 Ti 135,000 19.0 Pt-30 Rh-8 W-l Hf-0.2 Ti 130,000 11.7
760°C (1400°F)
Pt-30 Rh 48,000 28.8 Pt~30 Rh-6 W 80,000 23.3 Pt-26 Rh-8 W 95,000 16 Pt-30 Rh-10 W 95,000 28 Pt-30 Rh-6 W-0.5 Hf-0 .2 Ti 81,000 27.5 Pt-30 Rh-8 W-0.5 Hf-0 .2 Ti 91,000 24.3 Pt-30 Rh-8 W-l Hf-0.2 Ti 108,000 26.3
1093°C (2000°F)
Pt-30 Rh 24,000 38 Pt-30 Rh-6 W 36,000 33.3 Pt-26 Rh-8 W 38,000 18 Pt-30 Rh-10 W 47,000 15.5 Pt-30 Rh-6 W-0.5 Hf-0 .2 Ti 42,200 28.1 Pt-30 Rh-8 W-0.5 Hf-0 .2 Ti 44,500 12.5 Pt-30 Rh-8 W-l Hf-0.2 Ti 52,000 24.1
The oxidation behavior of the Pt-26$ Rh-8$ W-lf0 Hf-0. 1$ Ti alloy in air has been determined. The alloy oxidized at an average rate of +2 X 10~7, -5 X 10"7, and -6.7 X 10~6 g/cm2 .hr at 760, 1000, and 1200°C, respectively. Since the base ternary alloy Pfc-26$ Rh-8$ W alloy exhibits oxidation rates of +2 x 10~7, —1 x 10~6, and 6 x 10"6 g/cm2 .hr, we conclude that the hafnium and titanium additions do not impair the excellent oxidation resistance of the ternary base.
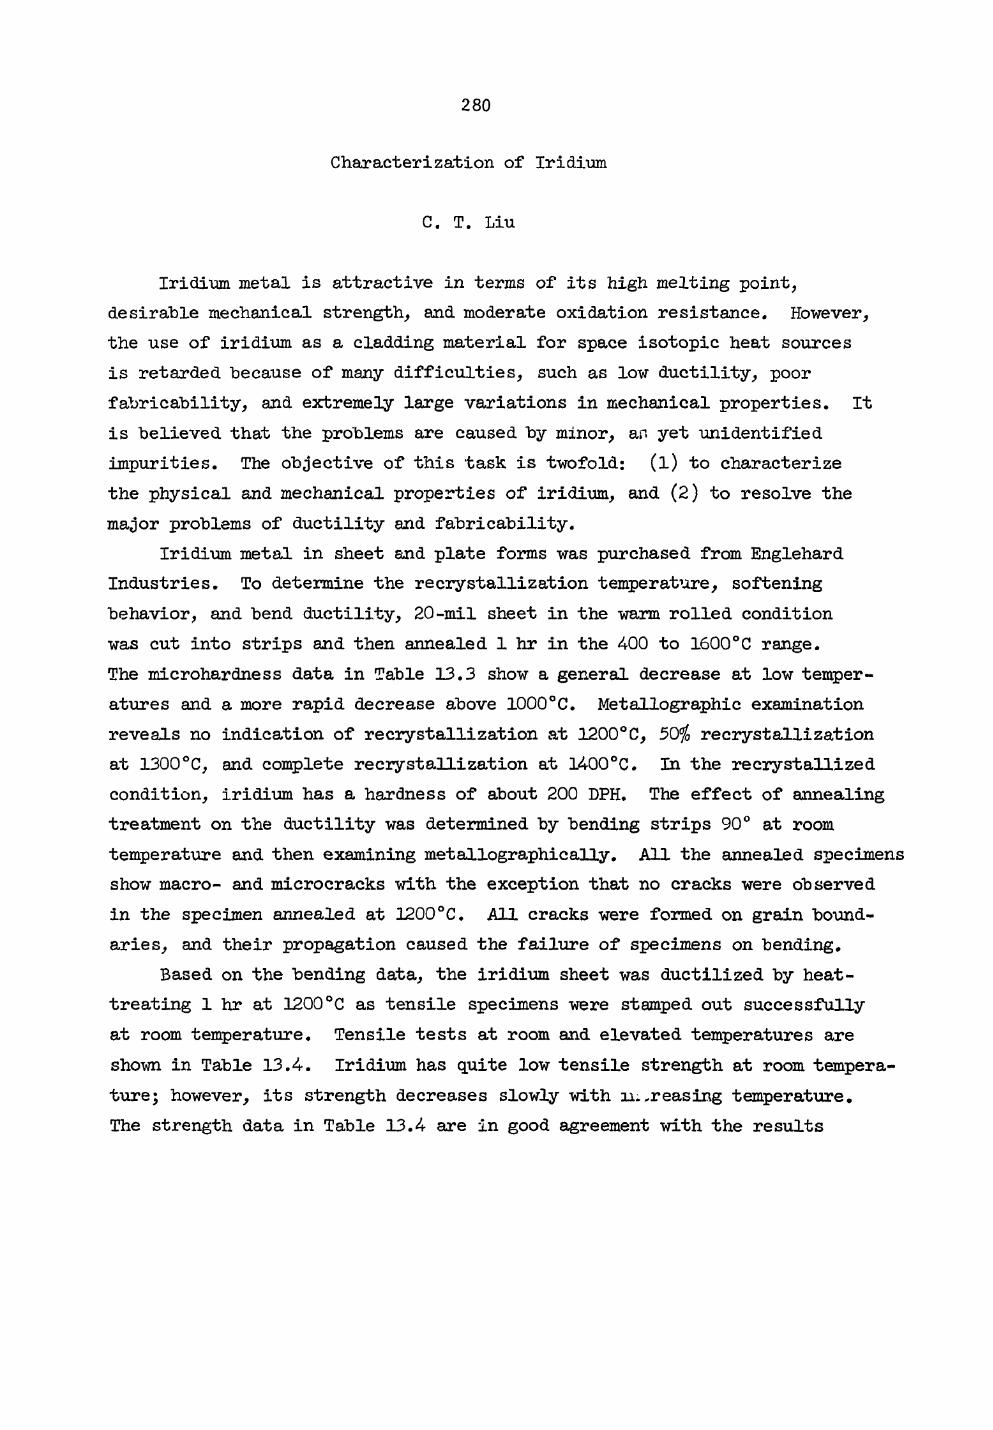
280
Characterization of Iridium
C. T. Liu
Iridium metal is attractive in terms of its high melting point, desirable mechanical strength, and moderate oxidation resistance. However, the use of iridium as a cladding material for space isotopic heat sources is retarded because of many difficulties, such as low ductility, poor fabricability, and extremely large variations in mechanical properties. It is believed that the problems are caused by minor, an yet unidentified impurities. The objective of this task is twofold: (l) to characterize the physical and mechanical properties of iridium, and (2) to resolve the major problems of ductility and fabricability.
Iridium metal in sheet and plate forms was purchased from Englehard Industries. To determine the recrystallization temperature, softening behavior, and bend ductility, 20-mil sheet in the warm rolled condition was cut into strips and then annealed 1 hr in the 400 to 1600°C range. The microhardness data in Table 13.3 show a general decrease at low temper-atures and a more rapid decrease above 1000°C. Metallographic examination reveals no indication of recrystallization at 1200°C, 50$ recrystallization at 1300°C, and complete recrystallization at 1400°C. In the recrystallized condition, iridium has a hardness of about 200 DPH. The effect of annealing treatment on the ductility was determined by bending strips 90° at room temperature and then examining metallographic ally. All the annealed specimens show macro- and microcracks with the exception that no cracks were observed in the specimen annealed at 1200°C. All cracks were formed on grain bound-aries, and their propagation caused the failure of specimens on bending.
Based on the bending data, the iridium sheet was ductilized by heat-treating 1 hr at 1200°C as tensile specimens were stamped out successfully at room temperature. Tensile tests at room and elevated temperatures are shown in Table 13.4. Iridium has quite low tensile strength at room tempera-ture; however, its strength decreases slowly with n.„reasing temperature. The strength data in Table 13.4 are in good agreement with the results
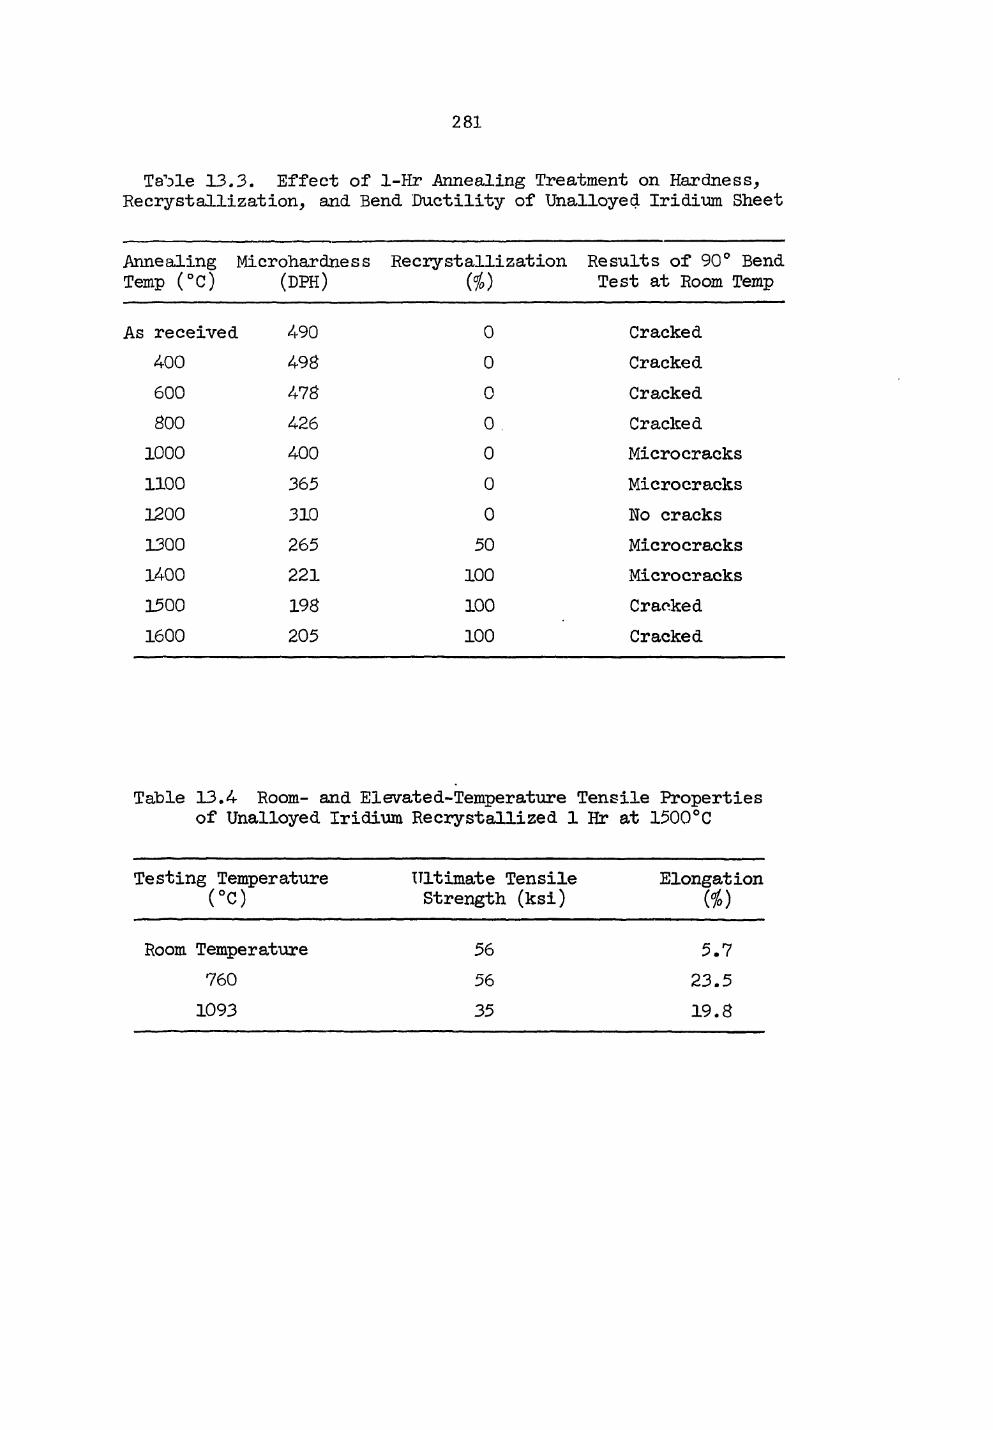
281
Table 13.3. Effect of 1-Hr Annealing Treatment on Hardness, Recrystallization, and Bend Ductility of Unalloyed Iridium Sheet
Annealing Microhardness Recrystallization Results of 90° Bend Temp (°C) (DPH) ($) Test at Room Temp
received 490 0 Cracked 400 498 0 Cracked 600 478 0 Cracked 800 426 0 . Cracked 1000 400 0 Microcracks 1100 365 0 Microcracks 1200 310 0 No cracks 1300 265 50 Microcracks 14 00 221 100 Microcracks 1500 198 100 Cracked 1600 205 100 Cracked
Table 13.4 Room- and Elevated-Temperature Tensile Properties of Unalloyed Iridium Re crystallized 1 Hr at 1500 °C
Testing Temperature (°c)
Ultimate Tensile Strength (ksi)
Elongation
Room Temperature 56 5.7 760 56 23.5 1093 35 19.8
282
for commercially pure iridium reported "by Jaffee et al.2 It should be noted that iridium is much weafcer than the hafnium- and titanium-stabilized Pt-Rh-W alloys as shown in Table 13.2.
The ductility of iridium is low at room temperature and increases to 23.5$ at 760°C. This result is also consistent with the -work of Jaffee who found the ductile-to-brittle transition temperature of iridium to be approximately 600°C.
The recrystallized iridium sheet specimens were oxidized in static air at 1040, 900, and 770°C for 1100 hr. The results are described below:
Oxidation at 1040°C — Wo oxide layer is observed at this temperature. After 50-hr exposure, the material on the edge and surface of the specimen gradually loses its adhesion and begins to flake off in the form of metallic grains. However, the oxidation rate is quite linear, at an average rate of -880 x 10"6 g/cm2 .hr. This value is in excellent agreement with the reported value (-900 x 10"6 g/cm2 .hr) by Jaffee et al.2 Oxidation at 900 °C — An adherent dark blue oxide layer gradually appears on the surface of specimen at 900°C. The initial rate of oxidation is parabolic with low oxidation rate. However, after 600-hr exposure, the specimen begins to show corner effects and the oxidation rate increases to approximately —27 X 10"6 g/cm2 .hr. Oxidation at 770 °C - Although the dark blue oxide layer is observed to form, no apparent weight change can be measured at this temperature.
2R. I. Jaffee et al. "Rhenium and the Refractory Pt-Group Metals," p. 383 in Refractory Metals and Alloys, Vol II, edited by M. Semchyshen and J. J. Harwood, Interscience, N.Y. (1961).
283
Previous reports in this series are:
ORNL--TM-920 Period ORNL--TM-960 Period ORNL-•TM-1000 Period ORNL-•TM-1100 Period ORNL--TM-1200 Period ORNL--TM-1270 Period ORNL-•TM-1400 Period ORNL-•TM-1500 Period ORNL--TM-1570 Period ORNL--TM-1700 Period ORNL--TM-1720 Period ORNL--TM-1825 Period ORNL--TM-1941 Period ORNL--TM-2020 Period ORNL--TH-2090 Period ORNL--• 1-2217 Period ORNL--4330 Period ORNL--4350 Period ORNL--4390 Period ORNL--4420 Period ORNL--4440 Period ORNL--4480 Period ORNL--4520 Period ORNL--4560 Period ORNL--4600 Period ORNL--4630 Period ORNL--TM-3300 Period ORNL--TM-3416 Period ORNL--TM-3540 Period ORNL--TM-3550 Period
Ending June 30, 1964 Ending September 30, 1964 Ending December 31, 1964 Ending March 31, 1965 Ending June 30, 1965 Ending September 30., 1965 Ending December 31, 1965 Ending March 31, 1966 Ending June 30, 1966 Ending September 30, 1966 Ending December 31, 1966 Ending March 31, 1967 Ending June 30, 1967 Ending September 30, If 57 Ending December 31, 1967 Ending March 31, 1968 Ending June 30, 1968 Ending September 30, 1968 Ending December 31, 1968 Ending March 31, 1969 Ending June 30, 1969 Ending September 30, 1969 Ending December 31, 1969 Ending March 31, 1970 Ending June 30, 1970 Ending September 30, 1970 Ending December 31, 1970 Ending March 31, 1971 Ending June 30, 1971 Ending September 30, 1971