Contract No. HY/2012/07 Tuen Mun – Chek Lap Kok Link
226
The business of sustainability Contract No. HY/2012/07 Tuen Mun – Chek Lap Kok Link – Southern Connection Viaduct Section Third Annual Environmental Monitoring & Audit (EM&A) Report 26 May 2017 Environmental Resources Management 16/F, Berkshire House 25 Westlands Road Quarry Bay, Hong Kong Telephone 2271 3000 Facsimile 2723 5660 www.erm.com Report
-
Upload
khangminh22 -
Category
Documents
-
view
0 -
download
0
Transcript of Contract No. HY/2012/07 Tuen Mun – Chek Lap Kok Link

The business of sustainability
Contract No. HY/2012/07 Tuen Mun – Chek Lap Kok Link –Southern Connection Viaduct Section
Third Annual Environmental Monitoring & Audit (EM&A) Report
26 May 2017
Environmental Resources Management 16/F, Berkshire House 25 Westlands Road Quarry Bay, Hong Kong Telephone 2271 3000 Facsimile 2723 5660
www.erm.com
Report

ERM consulting services worldwide www.erm.com
Contract No. HY/2012/07 Tuen Mun – Chek Lap Kok Link –Southern Connection Viaduct Section
Third Annual Environmental Monitoring & Audit (EM&A) Report
Document Code: 0215660_3rd annual EM&A_20170526.docx
Environmental Resources Management
16/F, Berkshire House 25 Westlands Road Quarry Bay, Hong Kong Telephone: (852) 2271 3000 Facsimile: (852) 2723 5660 E-mail: [email protected]://www.erm.com
Client:
Gammon
Project No:
0215660
Summary: Date: 26 May 2017
This document presents the Third Annual EM&A Report for Tuen Mun – Chek Lap Kok Link Southern Connection Viaduct Section.
Approved by:
Mr Craig Reid Partner Certified by:
Mr Jovy Tam ET Leader
3rd Annual EM&A Report MM JT CAR 26/05/17
Revision Description By Checked Approved Date
This report has been prepared by Environmental Resources Management the trading name of ‘ERM Hong-Kong, Limited’, with all reasonable skill, care and diligence within the terms of the Contract with the client, incorporating our General Terms and Conditions of Business and taking account of the resources devoted to it by agreement with the client.
We disclaim any responsibility to the client and others in respect of any matters outside the scope of the above.
Distribution
Internal
Public
Confidential


TABLE OF CONTENTS
EXECUTIVE SUMMARY I
1 INTRODUCTION 1
1.1 BACKGROUND 1
1.2 SCOPE OF REPORT 2
1.3 ORGANIZATION STRUCTURE 2
1.4 SUMMARY OF CONSTRUCTION WORKS 3
1.5 SUMMARY OF EM&A PROGRAMME REQUIREMENTS 5
2 EM&A RESULTS 6
2.1 AIR QUALITY 6
2.2 NOISE MONITORING 11
2.3 WATER QUALITY MONITORING 15
2.4 DOLPHIN MONITORING 25
2.5 EM&A SITE INSPECTION 31
2.6 WASTE MANAGEMENT STATUS 31
2.7 ENVIRONMENTAL LICENSES AND PERMITS 32
2.8 IMPLEMENTATION STATUS OF ENVIRONMENTAL MITIGATION MEASURES 37
2.9 SUMMARY OF EXCEEDANCES OF THE ENVIRONMENTAL QUALITY PERFORMANCE
LIMIT 37
2.10 SUMMARY OF COMPLAINTS, NOTIFICATION OF SUMMONS AND SUCCESSFUL
PROSECUTIONS 37
3 COMPARISON OF EM&A RESULTS WITH EIA PREDICTIONS AND
BASELINE MONITORING RESULTS 39
3.1 AIR QUALITY MONITORING 39
3.2 NOISE IMPACT MONITORING 40
3.3 WATER QUALITY MONITORING 40
3.4 MARINE ECOLOGY 42
3.5 WASTE MANAGEMENT 42
3.6 SUMMARY OF MONITORING METHODOLOGY AND EFFECTIVENESS 43
3.7 SUMMARY OF MITIGATION MEASURES 43

4 FUTURE KEY ISSUES 44
4.1 KEY ISSUES FOR THE COMING PERIOD 44
5 CONCLUSION AND RECOMMENDATIONS 45

List of Appendices
Appendix A Project Organization for Environmental Works
Appendix B Implementation Schedule of Environmental Mitigation Measures (EMIS)
Appendix C Summary of Action and Limit Levels
Appendix D Impact Air Quality Monitoring Result in Graphical Presentation
Appendix E Impact Noise Monitoring Results in Graphical Presentation
Appendix F Impact Water Quality Monitoring Results in Graphical Presentation
Appendix G Impact Dolphin Monitoring Survey Results
Appendix H Event Action Plan
Appendix I Summary of Waste Flow Table
Appendix J Cumulative Statistics on Exceedances, Complaints, Notifications of Summons
and Successful Prosecutions

ENVIRONMENTAL RESOURCES MANAGEMENT GCL
0215660_3RD ANNUAL EM&A_20170526.DOCX 26 MAY 2017
I
EXECUTIVE SUMMARY
Under Contract No. HY/2012/07, Gammon Construction Limited (GCL) is
commissioned by the Highways Department (HyD) to undertake the design
and construction of the Southern Connection Viaduct Section of the Tuen Mun
– Chek Lap Kok Link Project (TM-CLK Link Project) while AECOM Asia
Company Limited was appointed by HyD as the Supervising Officer. For
implementation of the environmental monitoring and audit (EM&A)
programme under the Contract, ERM-Hong Kong, Limited (ERM) has been
appointed as the Environmental Team (ET). Ramboll Environ Hong Kong
Ltd. was employed by the HyD as the Independent Environmental Checker
(IEC) and Environmental Project Office (ENPO) in accordance with
Environmental Permit No. EP-354/2009/A. Further applications for variation of
environmental permit (VEP), EP-354/2009/B, EP-354/2009/C and
EP-354/2009/D, were granted on 28 January 2014, 10 December 2014 and 13
March 2015, respectively.
The southern landfall of TM-CLK Link lies alongside the Hong Kong - Zhuhai
- Macao Bridge Hong Kong Boundary Crossing Facilities (HKBCF) where a
reclamation area is constructed by Contract No. HY/2010/02 under
Environmental Permit No. EP-353/2009/K and EP-354/2009/D. Upon the
agreement and confirmation between the Supervising Officer Representatives
and Contractors of HY/2010/02 and HY/2012/07 in September 2015, part of the
reclamation area for southern landfall under EP-353/2009/K and
EP-354/2009/D was handed-over to Contract No. HY/2012/07. Another part of
the southern landfall area under EP-354/2009/D was handed-over to Contract
No. HY/2012/07 after completion of reclamation works by Contract No.
HY/2010/02 in June 2016.
The construction phase of the Contract commenced on 31 October 2013 and
will be tentatively completed by 2018. The impact monitoring of the EM&A
programme, including air quality, noise, water quality and marine ecological
monitoring as well as environmental site inspections, commenced on 31
October 2013.
This is the Third Annual EM&A Report presenting the EM&A works carried
out during the period from 1 November 2015 to 31 October 2016 for the
Southern Connection Viaduct Section in accordance with the Updated EM&A
Manual of the TM-CLK Link Project. As informed by the Contractor, major
activities in the reporting period included:
Marine-based Works
Construction and installation of pile caps;
Uninstallation of marine piling platform;
Pier construction;
Launching gantry operation;

ENVIRONMENTAL RESOURCES MANAGEMENT GCL
0215660_3RD ANNUAL EM&A_20170526.DOCX 26 MAY 2017
II
Installation of deck segment and pier head segment; and
Construction of marine section of berth at Southern Landfall.
Land-based Works
Construction and installation of pile caps;
Pier construction;
Re-alignment of Cheung Tung Road;
Predrilling at Viaduct F;
Additional land ground investigation (GI), trial pits and laboratory
testing;
Installation of pier head and deck segments;
Slope work of Viaducts A, B & C;
Construction of land section of berth at Southern Landfall;
Relocation of MTRC fence; and
Road works along North Lantau Highway
A summary of monitoring and audit activities conducted in the reporting
period is listed below:
24-hour TSP monitoring 68 sessions at ASR8A
68 sessions at ASR9
1-hour TSP monitoring 68 sessions at ASR8A
68 sessions at ASR9
Noise monitoring 68 sessions at NSR1A
Water quality monitoring 153 sessions
Dolphin monitoring 24 sessions
Joint Environmental site inspection 52 sessions
Breaches of Action and Limit Levels for Air Quality
No exceedance of Action and Limit Levels was recorded for 1-hour or 24-hour
monitoring in the reporting period.
Breaches of Action and Limit Levels for Noise

ENVIRONMENTAL RESOURCES MANAGEMENT GCL
0215660_3RD ANNUAL EM&A_20170526.DOCX 26 MAY 2017
III
No exceedance of Action and Limit Levels was recorded for construction noise
monitoring in the reporting period.
Breaches of Action and Limit Levels for Water Quality
No exceedance of Action and Limit Levels was recorded for water quality
monitoring in the reporting.
Impact Dolphin Monitoring
Two (2) Action Level and three (3) Limit Level exceedances for both NEL and
NWL regions were recorded for four (4) sets of quarterly dolphin monitoring
data between November 2015 and October 2016. No unacceptable impact
from the construction activities of the TM-CLKL Southern Connection Viaduct
Section on Indo-Pacific humpback dolphin Sousa chinensis (i.e. Chinese White
Dolphin) was noticeable from general observations during the dolphin
monitoring in this reporting period.
Daily marine mammal exclusion zone monitoring was undertaken during the
period of marine works under this Contract. No Passive Acoustic Monitoring
(PAM) was implemented as the marine piling works were not carried out
outside the daylight hours in this reporting period. No sighting of the
Chinese White Dolphin was recorded in the monitoring period during the
exclusion zone monitoring.
Environmental Complaints, Non-compliance & Summons
There was one (1) complaint received from EPD on 22 September 2016
regarding effluent discharge from flat top barge in the reporting period.
Upon investigation, there was no adequate evidence to conclude that the
complaint case was related to this Project.
There was no notification of summons or successful prosecution recorded in
the reporting period.
Reporting Change
There was no reporting change in this reporting period.
Future Key Issues
Potential environmental impacts arising from the upcoming construction
activities in the coming annual period are mainly associated with air quality,
noise, marine water quality, marine ecology and waste management issue.

ENVIRONMENTAL RESOURCES MANAGEMENT GCL
0215660_3RD ANNUAL EM&A_20170526.DOCX 26 MAY 2017
1
1 INTRODUCTION
1.1 BACKGROUND
According to the findings of the Northwest New Territories (NWNT) Traffic
and Infrastructure Review conducted by the Transport Department, Tuen
Mun Road, Ting Kau Bridge, Lantau Link and North Lantau Highway would
be operating beyond capacity after 2016. This forecast has been based on the
estimated increase in cross boundary traffic, developments in the Northwest
New Territories (NWNT), and possible developments in North Lantau,
including the Airport developments, the Lantau Logistics Park (LLP) and the
Hong Kong – Zhuhai – Macao Bridge (HZMB). In order to cope with the
anticipated traffic demand, two new road sections between NWNT and North
Lantau – Tuen Mun – Chek Lap Kok Link (TM-CLKL) and Tuen Mun Western
Bypass (TMWB) are proposed.
An Environmental Impact Assessment (EIA) of TM-CLKL (the Project) was
prepared in accordance with the EIA Study Brief (No. ESB-175/2007) and the
Technical Memorandum of the Environmental Impact Assessment Process
(EIAO-TM). The EIA Report was submitted under the Environmental Impact
Assessment Ordinance (EIAO) in August 2009. Subsequent to the approval
of the EIA Report (EIAO Register Number: AEIAR-146/2009), an
Environmental Permit (EP-354/2009) for TM-CLKL was granted by the
Director of Environmental Protection (DEP) on 4 November 2009, and EP
variation (EP-354/2009/A) was issued on 8 December 2010.
Under Contract No. HY/2012/07, Gammon Construction Limited (GCL) is
commissioned by the Highways Department (HyD) to undertake the design
and construction of the Southern Connection Viaduct Section of TM-CLKL
(“the Contract”) while AECOM Asia Company Limited was appointed by
HyD as the Supervising Officer. For implementation of the environmental
monitoring and audit (EM&A) programme under the Contract, ERM-Hong
Kong, Limited (ERM) has been appointed as the Environmental Team (ET).
Ramboll Environ Hong Kong Ltd. was employed by HyD as the Independent
Environmental Checker (IEC) and Environmental Project Office (ENPO) in
accordance with Environmental Permit No. EP-354/2009/A. Further
applications for variation of environmental permit (VEP), EP-354/2009/B,
EP-354/2009/C and EP-354/2009/D, were granted on 28 January 2014, 10
December 2014 and 13 March 2015, respectively.
The southern landfall of TM-CLK Link lies alongside the Hong Kong - Zhuhai
- Macao Bridge Hong Kong Boundary Crossing Facilities (HKBCF) where a
reclamation area is constructed by Contract No. HY/2010/02 under
Environmental Permit No. EP-353/2009/K and EP-354/2009/D. Upon the
agreement and confirmation between the Supervising Officer Representatives
and Contractors of HY/2010/02 and HY/2012/07 in September 2015, part of the
reclamation area for southern landfall under EP-353/2009/K and
EP-354/2009/D was handed-over to Contract No. HY/2012/07. Another part of
the southern landfall area under EP-354/2009/D was handed-over to Contract

ENVIRONMENTAL RESOURCES MANAGEMENT GCL
0215660_3RD ANNUAL EM&A_20170526.DOCX 26 MAY 2017
2
No. HY/2012/07 after completion of reclamation works by Contract No.
HY/2010/02 in June 2016.
The construction phase of the Contract commenced on 31 October 2013 and
will be tentatively be completed by 2018. The impact monitoring phase of
the EM&A programme, including air quality, noise, water quality and marine
ecological monitoring as well environmental site inspections, commenced on
31 October 2013.
The general layout plan of the Contract components is presented in Figures 1.1
& 1.2a to l.
1.2 SCOPE OF THIS REPORT
This is the Third Annual EM&A Report under the Contract No. HY/2012/07
Tuen Mun – Chek Lap Kok Link – Southern Connection Viaduct Section. This
report presents a summary of the environmental monitoring and audit works
from 1 November 2015 to 31 October 2016.
1.3 ORGANIZATION STRUCTURE
The organization structure of the Contract is shown in Appendix A. The key
personnel contact names and contact details are summarized in Table 1.1
below.
Table 1.1 Contact Information of Key Personnel
Party Position Name Telephone Fax
HyD (Highways
Department)
Project Coordinator Stanley Chan 2762 3406 3188 6614
Senior Engineer Steven Shum 2762 4133 3188 6614
SOR
(AECOM Asia
Company Limited)
Chief Resident
Engineer
Daniel Ip 3553 3800 2492 2057
Resident Engineer Kingman Chan 3691 3950 3691 2899
ENPO / IEC
(Ramboll Environ
Hong Kong Ltd.)
ENPO Leader Y.H. Hui 3465 2850 3465 2899
IEC Dr. F.C. Tsang 3465 2851 3465 2899
Contractor
(Gammon
Construction Limited)
Environmental
Manager
Brian Kam 3520 0387 3520 0486
Environmental
Officer
Roy Leung 3520 0387 3520 0486
24-hour Complaint
Hotline
9738 4332
ET (ERM-HK) ET Leader Jovy Tam 2271 3113 2723 5660

碧濤
碧濤軒Coastline Villa
倚濤軒Crestmont Villa
大白灣DISCOVERY BAY
頤峰
GreenvaleVillage
下角咀
蟹鉗咀蔚陽
Headland Village
康慧台Hillgrove Village
海堤居La Costa
海寧居La Vista
犁壁山
老虎頭
鹿頸灣LUK KENG BAY
畔峰Midvale Village
牛頭灣
明翠台
寶峰Parkvale Village
三白Sam Pak
三白灣SAM PAK WAN
深水角
四白坳
SZE
大蠔灣TAI HO WAN
大山
大小磨刀
菜園灣TSOI YUEN
WAN
匙羹洲
陰仔Yam Tsai
陰仔灣YAM TSAI WAN
二白灣YI PAK WAN
蘅峰Peninsula Village
海藍居La Serene
小蠔灣SIU HO WAN
BeachVillage
大白咀Tai Pak Tsui
NGAU TAU WAN
ParkridgeVillage
(TAI PAK WAN)
THE BROTHERS
TSZ KAN CHAU
Ha Kok Tsui
LAI PIK SHAN
SZE PAK AU
TAI SHASham Shui Kok
Hai Kam Tsui
LO FU TAU
海澄湖畔Siena
東葉坑Tung Yip Hang
時峰
大蠔
污水處理廠Sewage Treatment
Works
打棚埔Ta Pang Po
榴花峒LAU FA TUNG
三白坳SAM PAK AU
大輋峒TAI CHE TUNG
二白坳YI PAK AU
愉景灣Discovery Bay
白芒Pak Mong
欣澳篤YAN O TUK
欣澳灣YAN O WAN
Chianti尚堤
濾水廠Water Treatment
Works
NeoHorizon
鐵路車廠
Railway Depot
鹿頸村Luk Keng
Tsuen
津堤Amalfi
EnvironmentalResourcesManagement
General Layout Plan of the Project
Figure 1.1
File: T:\GIS\CONTRACT\0215660\Mxd\0215660_General_layout_plan.mxdDate: 6/8/2014
Key
Site Boundary0 10.5Kilometers´
Jamius.Yeung
Polygonal Line
Jamius.Yeung
Text Box
Site Office WA5
Jamius.Yeung
Arrow

Jamius.Yeung
Text Box
Figure 1.2a

Jamius.Yeung
Text Box
Figure 1.2b

Jamius.Yeung
Text Box
Figure 1.2c

Jamius.Yeung
Text Box
Figure 1.2d

Jamius.Yeung
Text Box
Figure 1.2e

Jamius.Yeung
Text Box
Figure 1.2f

Jamius.Yeung
Text Box
Figure 1.2g

Jamius.Yeung
Text Box
Figure 1.2g
Jamius.Yeung
Text Box
Figure 1.2h

Jamius.Yeung
Text Box
Figure 1.2h
Jamius.Yeung
Text Box
Figure 1.2i
Jamius.Yeung
Text Box
Figure 1.2i
Jamius.Yeung
Text Box
Figure 1.2j

Jamius.Yeung
Text Box
Figure 1.2j
Jamius.Yeung
Text Box
Figure 1.2k

Jamius.Yeung
Text Box
Figure 1.2k
Jamius.Yeung
Text Box
Figure 1.2l
ENVIRONMENTAL RESOURCES MANAGEMENT GCL
0215660_3RD ANNUAL EM&A_20170526.DOCX 26 MAY 2017
3
1.4 SUMMARY OF CONSTRUCTION WORKS
As informed by the Contractor, details of the major works carried out in this
reporting period are listed below:
Marine-based Works
Construction and installation of pile caps;
Uninstallation of marine piling platform;
Pier construction;
Launching gantry operation;
Installation of deck segment and pier head segment; and
Construction of marine section of berth at Southern Landfall.
Land-based Works
Construction and installation of pile caps;
Pier construction;
Re-alignment of Cheung Tung Road;
Predrilling at Viaduct F;
Additional land Ground Investigation (GI), trial pits and laboratory
testing;
Installation of pier head and deck segments;
Slope work of Viaducts A, B & C;
Construction of land section of berth at Southern Landfall;
Relocation of MTRC fence; and
Road works along North Lantau Highway
The locations of the construction activities are shown in Figure 1.3. The
Environmental Sensitive Receivers in the vicinity of the Project are shown in
Figure 1.4.
The environmental mitigation measures implementation schedule is presented
in Appendix B.

ENVIRONMENTAL RESOURCES MANAGEMENT GCL
0215660_3RD ANNUAL EM&A_20170526.DOCX 26 MAY 2017
4
Figure 1.3 Locations of Construction Activities in the Reporting Period
#
"
"
"
"
(
!
!
老老老
牛老牛
深深深
小小小
大大牛TAI HO WAN
大小小小
匙匙匙
小大牛SIU HO WAN
NGAU TAU WAN
SIU MO TO
THE BROTHERS
TSZ KAN CHAU
Sham Shui Kok
LO FU TAU
璧璧璧
東東東Tung Yip Hang
大大TAI HO
污深污污污Sewage Treatment
Works
榴榴榴LAU FA TUNG
大大榴TAI CHE TUNG
二二二YI PAK AU
牛牛牛Ngau Kwu Long
二白Pak Mong
大大大大Tai HoSan Tsuen
田田Tin Liu
濾深污Water Treatment
Works
鐵鐵鐵污
Railway
Depot
Environmental
Resources
Management
Environmental Sensitive Receivers in the Vicinity of Contract No. HY/2012/07Tuen Mun " Chek Lap Kok Link " Southern Connection Viaduct Section
Figure 1.4
File: T:\GIS\CONTRACT\0215660\Mxd\0215660_Environmental_Sensitive_Receiver.mxdDate: 18/5/2015
KeyKeyKeyKey
! Air Sensitive Receiver
( Noise Sensitive Receiver
" Water Sensitive Receiver
# Site of Special Scientific Interest (SSSI)
Known Coral Communities
Site Boundary
0 21Kilometers
´
香香香香香香Hong Kong International Airport

ENVIRONMENTAL RESOURCES MANAGEMENT GCL
0215660_3RD ANNUAL EM&A_20170526.DOCX 26 MAY 2017
05 JUNE 2017
5
1.5 SUMMARY OF EM&A PROGRAMME REQUIREMENTS
The EM&A programme required environmental monitoring for air quality,
noise, water quality and marine ecology as well as environmental site
inspections for air quality, noise, water quality, waste management, marine
ecology and landscape and visual impacts. The EM&A requirements and
related findings for each component are described in the following sections,
which include:
Monitoring parameters;
Action and Limit levels for all environmental parameters;
Event Action Plan;
Tested environmental impact hypotheses;
Environmental mitigation measures, as recommended in the approved
EIA Report; and
Environmental requirement in contract documents.

ENVIRONMENTAL RESOURCES MANAGEMENT GCL
0215660_3RD ANNUAL EM&A_20170526.DOCX 26 MAY 2017
05 JUNE 2017
6
2 EM&A RESULTS
The EM&A programme required environmental monitoring for air quality,
noise, water quality and marine ecology as well as environmental site
inspections for air quality, noise, water quality, waste management, marine
ecology and landscape and visual impacts. The EM&A requirements and
related findings for each component are summarized in the following sections.
2.1 AIR QUALITY
The baseline air quality monitoring undertaken by the Hong Kong – Zhuhai –
Macao Bridge Hong Kong Projects (HKZMB) during October 2011 included
the two monitoring stations ASR9A and ASR9C for this Project(1) . Thus, the
baseline monitoring results and Action/ Limit Level presented in HKZMB
Baseline Monitoring Report (2) are adopted for this Project.
2.1.1 Monitoring Requirements and Equipment
In accordance with the Updated EM&A Manual, impact 1-hour TSP
monitoring was conducted three (3) times in every six (6) days and impact
24-hour TSP monitoring was carried out once in every six (6) days when the
highest dust impact was expected.
1-hour TSP and 24-hour TSP monitoring were conducted at two alternative air
quality monitoring stations, ASR8A (Area 4) and ASR9 (Entrance of MTR
Depot) during the reporting period in accordance with the requirement
stipulated in the Updated EM&A Manual. Details of the monitoring stations
are provided in Figure 2.1 and Table 2.1.
High Volume Samplers (HVSs) were installed at two alternative air quality
monitoring stations for carrying out 1-hour and 24-hour TSP monitoring in the
(1) Agreement No. CE 35/2011 (EP) Baseline Environmental Monitoring for Hong Kong - Zhuhai -
Macao Bridge Hong Kong Projects - Investigation. Baseline Environmental Monitoring Report
(Version C). Submitted on 8 March 2012 and subsequently approved by EPD

!
!
老虎頭
牛頭灣
深水角
小磨刀
大蠔灣TAI HO WAN
大小磨刀
匙羹洲
小蠔灣SIU HO WAN
NGAU TAU WAN
SIU MO TO
THE BROTHERS
TSZ KAN CHAU
Sham Shui Kok
LO FU TAU
璧如臺
東葉Tung Yip
大蠔TAI HO
污水處理廠Sewage Treatment
Works
榴花峒LAU FA TUNG
大輋TAI CHE
二白坳YI PAK A
牛牯塱Ngau Kwu Long
白芒Pak Mong
大蠔新村Tai HoSan Tsuen
田寮Tin Liu
濾水廠Water Treatment
Works
鐵路車廠
Railway Depot
ASR9
ASR8A
EnvironmentalResourcesManagement
Locations of Air Quality Monitoring Stations
Figure 2.1
File: T:\GIS\CONTRACT\0215660\Mxd\0215660_AQMS.mxdDate: 7/1/2015
Key
! Alternative Air Monitoring Station
Site Boundary
0 21Kilometers´
香港國際機場Hong Kong International Airport

ENVIRONMENTAL RESOURCES MANAGEMENT GCL
0215660_3RD ANNUAL EM&A_20170526.DOCX 26 MAY 2017
05 JUNE 2017
7
reporting period. The wind sensor was installed at ASR8A (Area 4) for
logging wind speed and wind direction in the reporting period. Details of
the equipment deployed in air quality monitoring are provided in Table 2.2.
Table 2.1 Locations of Impact Air Quality Monitoring Stations and Monitoring Dates
in this Reporting Period
Monitoring
Station (1)
Monitoring
Period
Location Description Parameters & Frequency
ASR8A From 1 November
2015 to 31 October
2016
Area 4 On ground at
the Area 4
1-hour Total
Suspended Particulates
(1-hour TSP, µg/m3), 3
times per day every 6
days
TSP, µg/m3), daily for
24-hour every 6 days
ASR9 From 1 November
2015 to 31 October
2016
Entrance of
MTRC
Depot
On ground at
the entrance
Note:
(1) Air Quality Monitoring Stations ASR9A and ASR9C at Siu Ho Wan MTRC Depot proposed
in accordance with the Updated EM&A were relocated to ASR9 and ASR8A respectively.
Table 2.2 Air Quality Monitoring Equipment
Equipment Brand and Model
High Volume Sampler
(1-hour TSP and 24-hour TSP)
Tisch Environmental Mass Flow Controlled
Total Suspended Particulate (TSP) High
Volume Sampler (Model No. TE-5170)
Wind Sensor Global Water (Wind Speed Sensor: WE550;
Wind Direction Sensor: WE570)
Wind Anemometer for calibration Lutron (Model No. AM-4201)
2.1.2 Action & Limit Levels
The Action and Limit Levels of the air quality monitoring are provided in
Appendix C. The Event Action Plan is presented in Appendix H.
2.1.3 Monitoring Schedule for the Reporting Period
The schedules for air quality monitoring in the reporting period were
presented in the approved Twenty-fifth to Thirty-sixth Monthly EM&A Reports.

ENVIRONMENTAL RESOURCES MANAGEMENT GCL
0215660_3RD ANNUAL EM&A_20170526.DOCX 26 MAY 2017
05 JUNE 2017
8
Air Quality Monitoring on 20 October 2016 was postponed to 26 October 2016
due to adverse weather conditions.
2.1.4 Results and Observations
The major dust sources in the reporting period included construction activities
under the Contract as well as nearby traffic emissions.
A total of 68 events were undertaken at ASR8A and ASR9 in the reporting
period. Neither Action nor Limit Level exceedance was recorded for 1-hour
TSP and 24-hour TSP monitoring, thus no action was required to be taken in
accordance with the Event Action Plan.
The impact monitoring results for 1-hour TSP and 24-hour TSP in the
reporting period are summarized in Tables 2.3 and 2.4, respectively. Baseline
and impact monitoring are presented graphically in Appendix D. The
detailed impact monitoring data and meteorological information were
reported in the Twenty-fifth to Thirty-sixth Monthly EM&A Reports.
Table 2.3 Summary of 1-hour TSP Monitoring Results in this Reporting Period
Month Station Average
(µg/m3)
Range (µg/m3) Action Level
(µg/m3)
Limit Level
(µg/m3)
Nov 2015 ASR 8A 91 54 - 157 394 500
ASR 9 105 53 - 181 393 500
Dec 2015 ASR 8A 92 62 - 131 394 500
ASR 9 94 57 – 145 393 500
Jan 2016 ASR 8A 71 49 - 118 394 500
ASR 9 63 45 - 111 393 500
Feb 2016 ASR 8A 89 39 - 153 394 500
ASR 9 105 39 – 172 393 500
Mar 2016 ASR 8A 129 58 - 259 394 500
ASR 9 106 65 - 182 393 500
Apr 2016 ASR 8A 100 44 - 224 394 500
ASR 9 86 62 - 129 393 500
May 2016 ASR 8A 82 44 - 187 394 500
ASR 9 95 62 – 146 393 500
Jun 2016 ASR 8A 58 48 - 69 394 500
ASR 9 59 48 – 87 393 500
Jul 2016 ASR 8A 57 47 - 69 394 500
ASR 9 68 44 - 107 393 500
Aug 2016 ASR 8A 61 41 - 116 394 500
ASR 9 75 45 - 114 393 500
Sept 2016 ASR 8A 84 48 - 177 394 500
ASR 9 110 53 - 205 393 500
Oct 2016 ASR 8A 77 43 - 107 394 500
ASR 9 82 54 - 122 393 500
ENVIRONMENTAL RESOURCES MANAGEMENT GCL
0215660_3RD ANNUAL EM&A_20170526.DOCX 26 MAY 2017
05 JUNE 2017
9
Month Station Average
(µg/m3)
Range (µg/m3) Action Level
(µg/m3)
Limit Level
(µg/m3)
Table 2.4 Summary of 24-hour TSP Monitoring Results in this Reporting Period
Month Station Average
(µg/m3)
Range
(µg/m3)
Action Level
(µg/m3)
Limit Level
(µg/m3)
Nov 2015
ASR 8A 64 51 - 91 178 260
ASR 9 74 55 - 98 178 260
Dec 2015
ASR 8A 64 54 – 81 178 260
ASR 9 78 65 - 113 178 260
Jan 2016
ASR 8A 54 47 - 64 178 260
ASR 9 56 49 - 64 178 260
Feb 2016
ASR 8A 64 51 – 100 178 260
ASR 9 73 55 – 114 178 260
Mar 2016
ASR 8A 76 59 – 112 178 260
ASR 9 73 56 – 111 178 260
Apr 2016
ASR 8A 57 43 – 81 178 260
ASR 9 59 51 – 73 178 260
May 2016
ASR 8A 55 44 – 71 178 260
ASR 9 60 50 – 73 178 260
Jun 2016
ASR 8A 45 40 – 50 178 260
ASR 9 46 40 – 56 178 260
Jul 2016
ASR 8A 46 43 – 50 178 260
ASR 9 55 42 – 102 178 260
Aug 2016
ASR 8A 48 44 – 53 178 260
ASR 9 59 45 – 101 178 260
Sept 2016
ASR 8A 60 44 – 83 178 260
ASR 9 71 50 – 106 178 260
Oct 2016 ASR 8A 49 43 - 52 178 260
ASR 9 59 48 - 67 178 260
As shown in Table 2.5, the annual-averaged 1-hour TSP and 24-hour TSP levels
in the reporting period were lower than the corresponding average baseline
levels at all monitoring stations.
In order to determine any significant air quality impacts caused by
construction activities from this Contract, One-way ANOVA (with α set at
0.05) was conducted to examine any significant difference in average TSP
levels between the impact monitoring in this reporting period and the baseline
monitoring before commencement of construction activities. The
annual-averaged levels of TSP level are presented in Table 2.5 and the
statistical results are presented in Table 2.6.
For 1-hour TSP and 24-hour TSP at ASR8A and 1-hour TSP at ASR9, the TSP
levels in the reporting period were significantly lower than the baseline levels.

ENVIRONMENTAL RESOURCES MANAGEMENT GCL
0215660_3RD ANNUAL EM&A_20170526.DOCX 26 MAY 2017
05 JUNE 2017
10
There was no significant difference in 24-hour TSP levels at ASR9 between
baseline and impact monitoring.
Table 2.5 Summary of Average Levels of TSP Level of Baseline Monitoring and
Reporting Period (in µg/m3)
Monitoring Station Average Baseline Monitoring Average Impact Monitoring
ASR9
(1-hour TSP)
220 88
ASR9
(24-hour TSP)
74 64
ASR8A
(1-hour TSP)
222 83
ASR8A
(24-hour TSP)
74 57
Table 2.6 One-way ANOVA Results for annual-averaged level of TSP level Comparison
between Impact and Baseline Periods
Monitoring Station F ratio p-value
ASR9
(1-hour TSP)
F 1,244 = 244 <0.01
ASR9
(24-hour TSP)
F 1,80 = 3.8 0.05
ASR8A
(1-hour TSP)
F 1,244 = 234 <0.01
ASR8A
(24-hour TSP)
F 1,80 = 11.9 <0.01
Note:
By setting α at 0.05, p-values < 0.05 (significant difference) are bold.
In addition, linear regression was conducted to examine any relationship
between TSP levels and time during this yearly monitoring period at each
monitoring station. Linear regression analysis makes assumptions of equal
variance and normal distribution of data. Therefore, the significance level of
the test was set at 1 % (i.e. p = 0.01) to reduce the chance of committing a Type
1 error. If a significant regression relationship was found between TSP level
and time (i.e. p < 0.01), r2 value from the analysis would be further assessed.
This value represents the proportion of the total variation in the dependent

ENVIRONMENTAL RESOURCES MANAGEMENT GCL
0215660_3RD ANNUAL EM&A_20170526.DOCX 26 MAY 2017
05 JUNE 2017
11
variable (i.e. TSP level) that is accounted for by the fitted regression line and is
referred to as the coefficient of determination. An r2 value of 1 indicates a
perfect relationship (or fit) whereas a value of 0 indicates that there is no
relationship (or no fit) between the dependent and independent variables.
As there are no specific criteria to indicate how meaningful an r2 value is, for
the purposes of this EM&A programme a value of 0.60 was adopted to
indicate a meaningful regression. If r2 < 0.60 then it was considered that
there was a weak relationship between TSP level and time or none at all. If
the regression analysis indicated r2 > 0.60 then it had been interpreted that
there was in fact a strong relationship between the dependent and
independent variables (i.e. a strong temporal trend of increasing / decreasing
TSP level with time).
As shown in Table 2.7, results of the regression analysis indicated that there
was no significant relationship between TSP level and time during this
yearly monitoring period. As such, it is considered that there is no apparent
trend of increasing / decreasing TSP level in this monitoring period.
Table 2.7 Linear Regression Result of TSP Monitoring
Parameter Station R2 F-ratio p-value Intercept Coefficient
1-hour TSP ASR8A 0.048 10.3 <0.001 159 -0.084
ASR9 0.015 3.1 <0.001 123 -0.039
24-hour TSP ASR8A 0.123 9.3 <0.001 102 -0.049
ASR9 0.064 4.5 <0.001 104 -0.044
Note:
1. Dependent variable is set as TSP levels (in µg/m3) and independent variable is set as
number of day of construction works.
2. R2 values of insignificant regression model are underlined.
2.2 NOISE MONITORING
The baseline noise monitoring undertaken by the HKZMB Projects during the
period of 18 October to 1 November 2011 included the monitoring station
NSR1 for this Project. Thus, the baseline monitoring results and Action/

ENVIRONMENTAL RESOURCES MANAGEMENT GCL
0215660_3RD ANNUAL EM&A_20170526.DOCX 26 MAY 2017
05 JUNE 2017
12
Limit Level presented in HKZMB Baseline Monitoring Report (1) are adopted for
this Project.
2.2.1 Monitoring Requirements and Equipment
In accordance with the Updated EM&A Manual, impact noise monitoring was
conducted once per week during the construction phase of the Contract.
Noise monitoring was conducted at the alternative noise monitoring station,
NSR1A (Pak Mong Village Pavilion) during the reporting period in
accordance with the requirement stipulated in the Updated EM&A Manual.
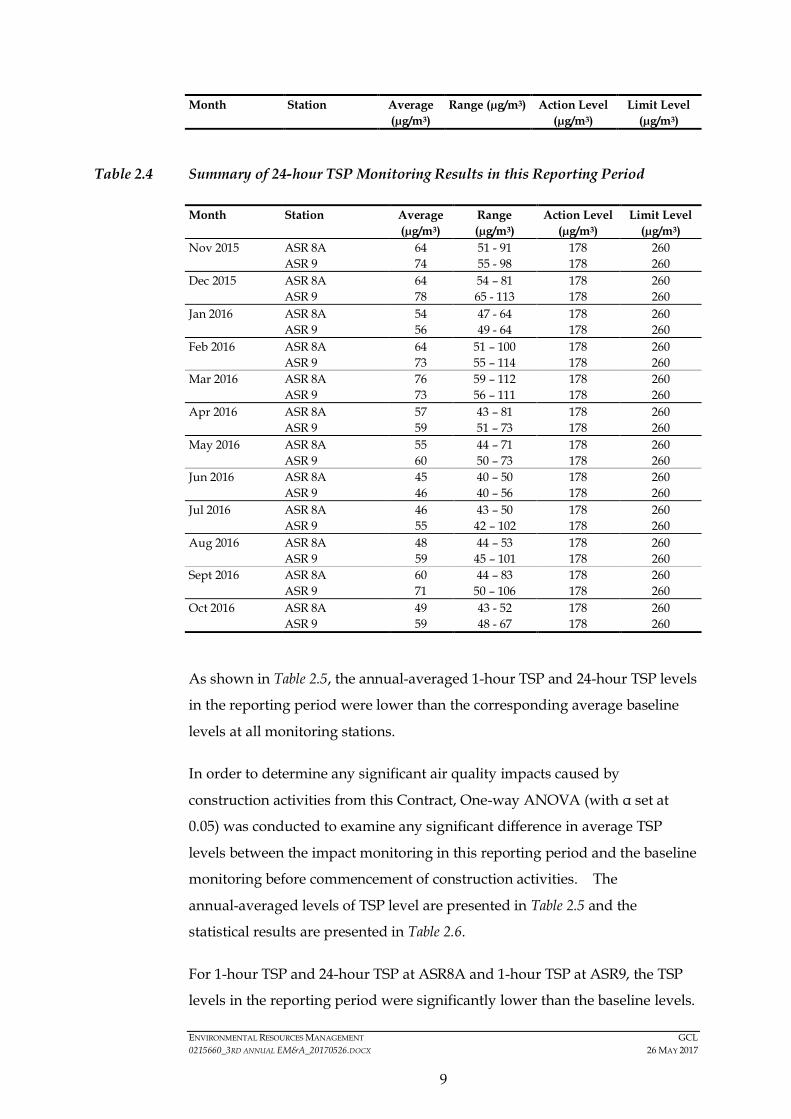
Details of the monitoring stations are provided in Figure 2.2 and Table 2.8.
Noise monitoring was performed by sound level meter in compliance with the
International Electrotechnical Commission Publications (IEC) 651:1979 (Type
1) and 804:1985 (Type 1) specifications at the designated monitoring station.
Details of the equipment deployed in noise monitoring are provided in Table
2.9.
Table 2.8 Location of Impact Noise Monitoring Station and Monitoring Dates in this
Reporting Period
Monitoring
Station
Monitoring
Period
Location Parameters & Frequency
NSR1A From 1 November
2015 to 31 October
2016
Entrance of
Pak Mong
Village
30-mins measurement at each monitoring
station between 0700 and 1900 on normal
weekdays (Monday to Saturday). Leq, L10
and L90 would be recorded.
At least once a week
Note:
(1) Noise Monitoring Station NSR1 at Pak Mong Village proposed in accordance with the
Updated EM&A was relocated to NSR1A.
(1) Agreement No. CE 35/2011 (EP) Baseline Environmental Monitoring for Hong Kong - Zhuhai -
Macao Bridge Hong Kong Projects - Investigation. Baseline Environmental Monitoring Report
(Version C). Submitted on 8 March 2012 and subsequently approved by EPD
!
老虎頭
牛頭灣
深水角
小磨刀
大蠔灣TAI HO WAN
大小磨刀
匙羹洲
小蠔灣SIU HO WAN
NGAU TAU WAN
SIU MO TO
THE BROTHERS
TSZ KAN CHAU
Sham Shui Kok
LO FU TAU
璧如臺
東葉Tung Yip
大蠔TAI HO
污水處理廠Sewage Treatment
Works
榴花峒LAU FA TUNG
大輋TAI CHE
二白坳YI PAK A
牛牯塱Ngau Kwu Long
白芒Pak Mong
大蠔新村Tai HoSan Tsuen
田寮Tin Liu
濾水廠Water Treatment
Works
鐵路車廠
Railway Depot
NSR1A
EnvironmentalResourcesManagement
Locations of Noise Monitoring Stations
Figure 2.2
File: T:\GIS\CONTRACT\0215660\Mxd\0215660_NMS.mxdDate: 7/1/2015
Key
! NSR1A
Site Boundary
0 21Kilometers´
香港國際機場Hong Kong International Airport
Jamius.Yeung
Rectangle
Jamius.Yeung
Text Box
Alternative Noise Monitoring Station
Jamius.Yeung
Rectangle
Jamius.Yeung
Text Box
Location of Noise Monitoring Station

ENVIRONMENTAL RESOURCES MANAGEMENT GCL
0215660_3RD ANNUAL EM&A_20170526.DOCX 26 MAY 2017
05 JUNE 2017
13
Table 2.9 Noise Monitoring Equipment
Equipment Brand and Model
Integrated Sound Level Meter Rion NL-31
Acoustic Calibrator Rion NC-73
2.2.2 Action and Limit Levels
The Action and Limit levels of the noise monitoring are provided in Appendix
C. The Event Action Plan is presented in Appendix H.
2.2.3 Monitoring Schedule for the Reporting Period
The schedules for noise monitoring in the reporting period are provided in the
Twenty-fifth to Thirty-sixth Monthly EM&A Reports. Noise Monitoring on 20
October 2016 was postponed to 26 October 2016 due to adverse weather
conditions.
2.2.4 Results and Observations
Major noise sources during the noise monitoring included construction
activities, nearby traffic noise and aircraft noise.
A total of sixty-eight (68) monitoring events were undertaken in the reporting
period with no Action Level and Limit Level exceedance recorded at the
monitoring stations in the reporting period, thus no action was required to be
taken in accordance with the Event Action Plan.
The impact monitoring results for noise monitoring in the reporting period are
summarized in Table 2.10. Baseline and impact monitoring are presented
graphically in Appendix E. The detailed impact monitoring data was reported
in the Twenty-fifth to Thirty-sixth Monthly EM&A Reports.

ENVIRONMENTAL RESOURCES MANAGEMENT GCL
0215660_3RD ANNUAL EM&A_20170526.DOCX 26 MAY 2017
05 JUNE 2017
14
Table 2.10 Summary of Construction Noise Monitoring Results at NSR1A in the
Reporting Period
Month Average , dB(A), Leq
(30mins)
Range, dB(A), Leq
(30mins)
Limit Level, dB(A), Leq
(30mins)
Nov 2015 59 57 – 60 75
Dec 2015 60 59 – 62 75
Jan 2016 61 59 – 62 75
Feb 2016 60 58 – 63 75
Mar 2016 59 58 – 61 75
Apr 2016 59 58 – 61 75
May 2016 60 59 – 61 75
Jun 2016 59 59 - 60 75
Jul 2016 59 56 - 60 75
Aug 2016 60 58 - 62 75
Sep 2016 60 58 - 62 75
Oct 2016 61 60 - 62 75
Note:
Noise Monitoring Station NSR1 was relocated to NSR1A since December 2014.
As shown in Table 2.11, the annual-averaged noise level in the reporting
period was higher than the average baseline levels at the monitoring station.
In order to determine any significant noise impacts caused by construction
activities from this Contract, One-way ANOVA (with α set at 0.05) was
conducted to examine any significant difference in average noise levels
between the impact monitoring in this reporting period and the baseline
monitoring before commencement of construction activities. The statistical
results are presented in Tables 2.12. Difference in noise level between
reporting and baseline monitoring periods was significant, in which the
annual-averaged noise level in the reporting period was slightly higher than
average baseline level. However, all monitoring results in the reporting
period complied with the Action/Limit Levels. In general, noise levels
recorded in the reporting period were mostly comparable to the results
obtained during the baseline monitoring period. No specific trend of the
noise monitoring results or existence of persistent noise impact from the
Contract during the impact monitoring period was noticeable. The ET will
keep track on the future noise monitoring results during construction phase.

ENVIRONMENTAL RESOURCES MANAGEMENT GCL
0215660_3RD ANNUAL EM&A_20170526.DOCX 26 MAY 2017
05 JUNE 2017
15
Table 2.11 Summary of Average Levels of Noise Level of Baseline Monitoring and
Reporting Period (in dB(A))
Monitoring Station Average Baseline Monitoring Average Impact Monitoring
NSR1A 56 60
Table 2.12 One-way ANOVA Results for Annual-averaged Level of Noise Level
Comparison between Impact and Baseline Periods
Monitoring Station F ratio p-value
NSR1A F 1,354 = 139 <0.01
Note:
By setting α at 0.05, p-values < 0.05 (significant difference) are bold.
In addition, linear regression was conducted to examine any relationship
between noise levels and time during this yearly monitoring period at the
designated noise monitoring station. The method of data interpretation
followed the same method as indicated in Section 2.1.4 for TSP monitoring.
As shown in Table 2.13, results of the regression analysis indicated that there
was no significant relationship between noise level and time during this
yearly monitoring period. As such, it is considered that there is no apparent
trend of increasing / decreasing noise level during this yearly monitoring
period.
Table 2.13 Linear Regression Result of Noise Monitoring
Parameter Station R2 F-ratio p-value Intercept Coefficient
Leq 30min NSR1A 0.007 0.482 <0.001 59 0.001
Note:
1. Dependent variable is set as Leq 30min (in dB(A)) and independent variable is set as number
of day of construction works.
2. R2 values of insignificant regression model are underlined.
2.3 WATER QUALITY MONITORING
The baseline water quality monitoring undertaken by the HKZMB Projects
between 6 and 31 October 2011 included all monitoring stations except SR4a

ENVIRONMENTAL RESOURCES MANAGEMENT GCL
0215660_3RD ANNUAL EM&A_20170526.DOCX 26 MAY 2017
05 JUNE 2017
16
for the Project. Thus, the baseline monitoring results except for station SR4a
and Action/Limit Level presented in HKZMB Baseline Monitoring Report (1)
are adopted for this Project. Baseline water quality monitoring was
conducted at station SR4a from 29 August to 24 September 2013.
2.3.1 Monitoring Requirements and Equipment
Impact water quality monitoring was carried out to ensure that any
deterioration of water quality was detected, and that timely action could be
taken to rectify the situation. Impact water quality monitoring was
undertaken three days per week during mid-ebb and mid-flood tides in the
construction period at seven water quality monitoring stations in accordance
with the Updated EM&A Manual. Details of monitoring stations are
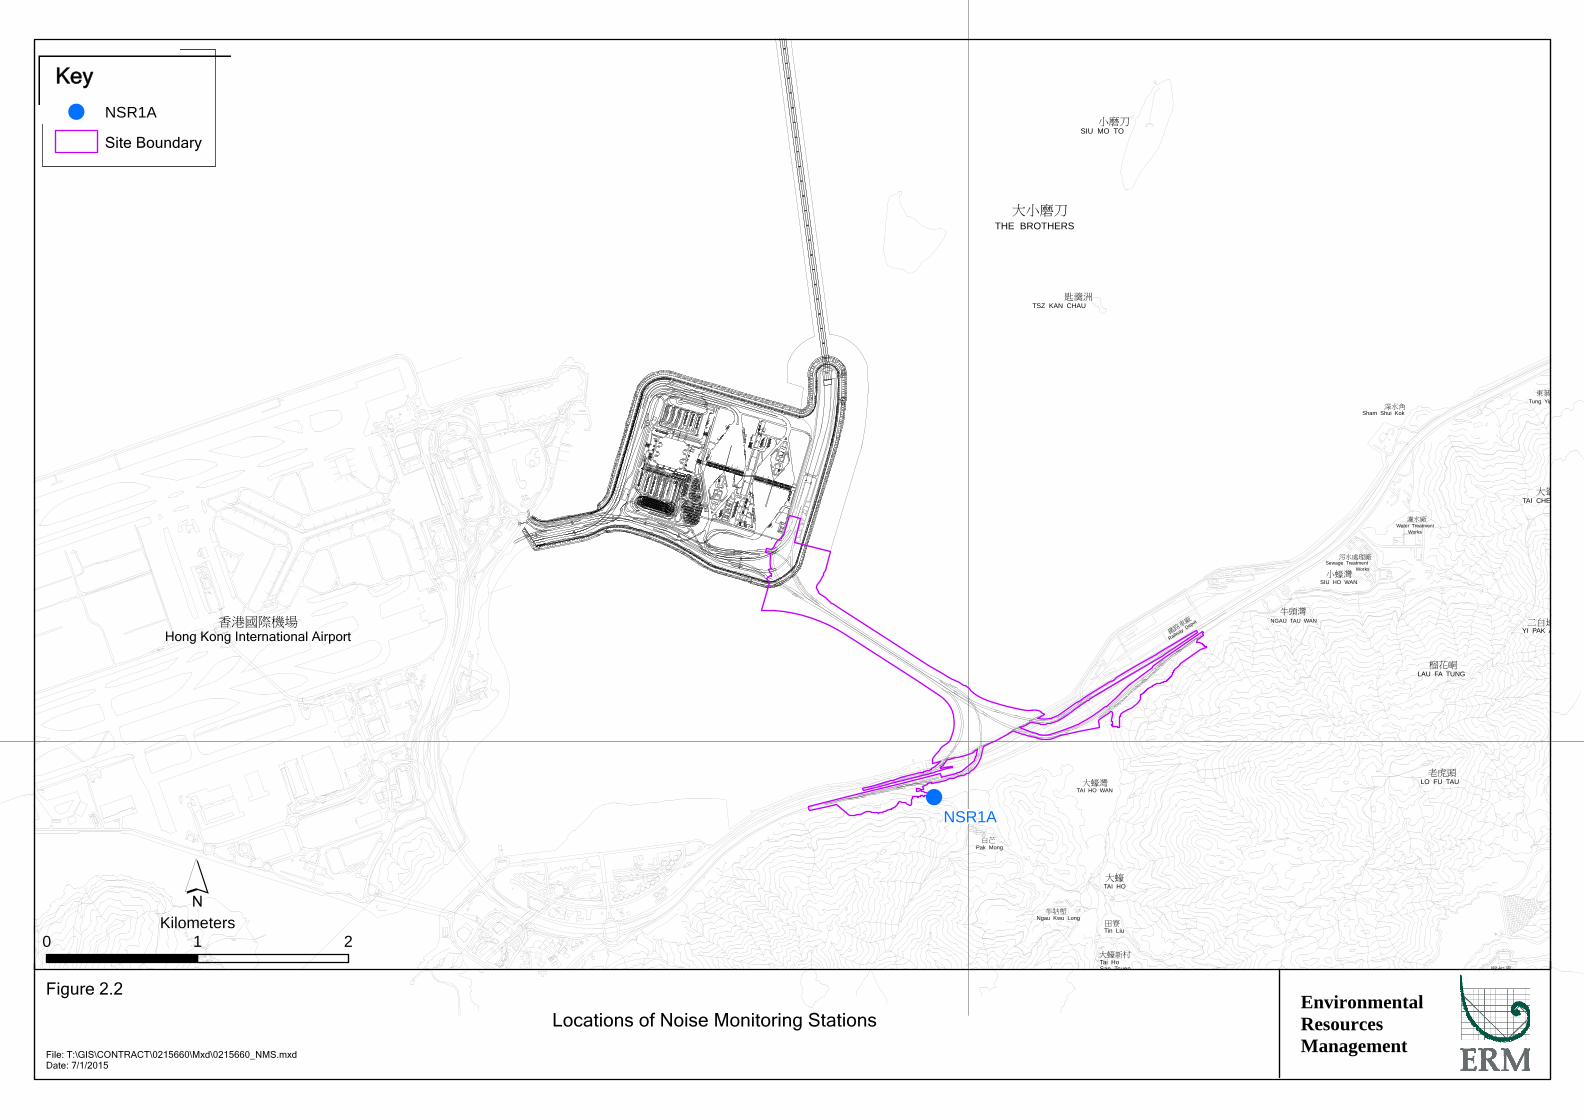
provided in Figure 2.3 and Table 2.14.
Table 2.14 Locations of Water Quality Monitoring Stations and the Corresponding
Monitoring Requirements
Station
ID
Type Coordinates *Parameters, unit Depth Frequency
Easting Northing
IS(Mf)9 Impact
Station (Close
to HKBCF
construction
site)
813273 818850 Temperature(°C)
pH(pH unit)
Turbidity (NTU)
Water depth (m)
Salinity (ppt)
Dissolved
Oxygen (DO)
(mg/L and % of
saturation)
Suspended Solid
(SS) (mg/L)
3 water
depths: 1m
below sea
surface,
mid-depth
and 1m
above sea
bed. If the
water depth
is less than
3m,
mid-depth
Impact
monitoring: 3
days per
week, at
mid-flood and
mid-ebb tides
during the
construction
period of the
Contract.
IS(Mf)16 Impact
Station (Close
to HKBCF
construction
site)
814328 819497
(1) Agreement No. CE 35/2011 (EP) Baseline Environmental Monitoring for Hong Kong - Zhuhai -
Macao Bridge Hong Kong Projects - Investigation. Baseline Environmental Monitoring Report
(Version C). Submitted on 8 March 2012 and subsequently approved by EPD.
!
!
!
! !
!
!
老虎頭
牛頭灣
深水角
小磨刀
大蠔灣TAI HO WAN
大小磨刀
匙羹洲
小蠔灣SIU HO WAN
NGAU TAU WAN
SIU MO TO
THE BROTHERS
TSZ KAN CHAU
Sham Shui Kok
LO FU TAU
璧如臺
東葉Tung Yip
大蠔TAI HO
污水處理廠Sewage Treatment
Works
榴花峒LAU FA TUNG
大輋TAI CHE
二白坳YI PAK A
牛牯塱Ngau Kwu Long
白芒Pak Mong
大蠔新村Tai HoSan Tsuen
田寮Tin Liu
濾水廠Water Treatment
Works
鐵路車廠
Railway Depot
CS(Mf)5CS(Mf)3
IS8
IS(Mf)9
IS(Mf)16
SR4
SR4a
EnvironmentalResourcesManagement
Locations of Water Quality Monitoring Stations
Figure 2.3
File: T:\GIS\CONTRACT\0215660\Mxd\0215660_WQMS.mxdDate: 6/12/2013
Key
! Control / Far Field Station
! Impact Station
! Sensitive Receiver Station
Site Boundary
0 21Kilometers´
香港國際機場Hong Kong International Airport
WQMS X YImpact StationIS8 814251 818412IS(Mf)9 813273 818850IS(Mf)16 814328 819497Control / Far Field StationCS(Mf)3 809989 821117CS(Mf)5 817990 821129Sensitive Receiver StationSR4 814760 817867SR4a 815247 818067

ENVIRONMENTAL RESOURCES MANAGEMENT GCL
0215660_3RD ANNUAL EM&A_20170526.DOCX 26 MAY 2017
05 JUNE 2017
17
Station
ID
Type Coordinates *Parameters, unit Depth Frequency
Easting Northing
IS8 Impact
Station(Close
to HKBCF
construction
site)
814251 818412 sampling
only. If
water depth
less than 6m,
mid-depth
may be
omitted. SR4 Sensitive
receiver (Tai
Ho Inlet)
814760 817867
SR4a Sensitive
receiver
815247 818067
CS(Mf)3 Control
Station
809989 821117
CS(Mf)5 Control
Station
817990 821129
Notes:
In addition to the parameters presented monitoring location/position, time, water depth,
sampling depth, tidal stages, weather conditions and any special phenomena or works
underway nearby were also recorded.
Details of the equipment deployed in water quality monitoring are provided
in Table 2.15.
Table 2.15 Water Quality Monitoring Equipment
Equipment Brand and Model
DO, Temperature meter and
Salinity
YSI Pro2030
Turbidimeter HACH Model 2100Q
pH meter Thermo Scientific Orion 2 Star / HANNA HI8314
Positioning Equipment Koden913MK2 with KBG-3 DGPS antenna
Water Depth Detector Speedtech Instrument SM-5
Water Sampler Kemmerer 1520 (1520-C25) 2.2L with messenger

ENVIRONMENTAL RESOURCES MANAGEMENT GCL
0215660_3RD ANNUAL EM&A_20170526.DOCX 26 MAY 2017
05 JUNE 2017
18
2.3.2 Action & Limit Levels
The Action and Limit Levels of the water quality monitoring are provided in
Appendix C. The Event Action Plan is presented in Appendix H.
2.3.3 Monitoring Schedule for the Reporting Period
The schedules for water quality monitoring in the reporting period are
provided in the Twenty-fifth to Thirty-sixth Monthly EM&A Reports. Water
quality monitoring on 09 February 2016 was cancelled due to suspension of
marine works during holiday. Water Quality Monitoring scheduled on 2
August 2016 and 18 October 2016 were canceled due to adverse weather
conditions.
2.3.4 Results and Observations
Impact water quality monitoring was conducted at all designated monitoring
stations in the reporting period. The detailed impact water quality
monitoring data was reported in the Twenty-fifth to Thirty-sixth Monthly
EM&A Reports.
In this reporting period, a total of 153 monitoring events were undertaken.
Neither Action Level nor Limit Level exceedance was recorded at the
monitoring stations in the reporting period. No action is thus required to be
undertaken in accordance with the Event Action Plan.
In order to determine any significant water quality impacts caused by
construction activities from this Contract, One-way ANOVA (with α set at
0.05) was conducted to examine any significant difference in average DO,
Turbidity and SS levels between the impact monitoring in this reporting
period and the baseline monitoring before commencement of construction
activities. The annual-averaged levels of DO, Turbidity and SS are presented
in Tables 2.16 to 2.18 and the statistical results are presented in Tables 2.19 to
2.21. Baseline and impact monitoring results are presented graphically in
Appendix F.
In the reporting period, most of the annual-averaged DO levels during both
mid-ebb and mid-flood tides at all depth of the impact monitoring stations

ENVIRONMENTAL RESOURCES MANAGEMENT GCL
0215660_3RD ANNUAL EM&A_20170526.DOCX 26 MAY 2017
05 JUNE 2017
19
were significantly higher than corresponding average baseline levels (see Table
2.16 and 2.19). The annual depth-averaged turbidity level recorded during
the reporting period were mostly comparable to the results obtained during
the baseline monitoring period (see Table 2.17 and 2.20). In the reporting
period, most of the annual-averaged SS levels recorded were comparable to
the baseline monitoring results, except for IS(Mf)16 during mid-flood tide and
SR4a during mid-ebb tide and mid-flood tide in which annual-averaged SS
levels were significantly higher than the corresponding average baseline levels
(see Table 2.18 and 2.21). In general, DO, turbidity and SS levels were varied
across sampling months (see Appendix F) and these variations were, however,
not consistent throughout the reporting period. The graphical plots of the
trends of the monitoring results suggested that there was no specific trend in
the overall water quality monitoring.
Table 2.16 Summary of Annual Means of DO Level of Baseline Monitoring and
Reporting Period (in mg/L)
Tide Station Depth Annual mean of DO of
baseline monitoring
Annual mean of DO
of reporting period
Mid-ebb IS(Mf)16 Surface 6.3 6.7
IS(Mf)9 Surface 6.6 6.7
IS8 Surface 6.4 6.6
SR4 Surface 6.1 6.6
SR4a Surface 5.5 6.6
Mid-flood IS(Mf)16 Surface 6.3 6.8
IS(Mf)9 Surface 6.5 6.7
IS8 Surface 6.4 6.7
SR4 Surface 6.3 6.7
SR4a Surface 5.5 6.7
Mid-ebb IS(Mf)16 Middle 6.3 6.6
Mid-flood IS(Mf)16 Middle 6.1 6.6
Mid-ebb IS(Mf)16 Bottom 5.9 6.4
IS(Mf)9 Bottom 6.6 6.5
IS8 Bottom 6.2 6.5
SR4 Bottom 6.0 6.5

ENVIRONMENTAL RESOURCES MANAGEMENT GCL
0215660_3RD ANNUAL EM&A_20170526.DOCX 26 MAY 2017
05 JUNE 2017
20
Tide Station Depth Annual mean of DO of
baseline monitoring
Annual mean of DO
of reporting period
SR4a Bottom 5.3 6.5
Mid-flood IS(Mf)16 Bottom 6.0 6.5
IS(Mf)9 Bottom 6.7 6.6
IS8 Bottom 6.3 6.6
SR4 Bottom 6.2 6.5
SR4a Bottom 5.2 6.6
Table 2.17 Summary of Annual Means of Depth-averaged Turbidity Level of Baseline
Monitoring and Reporting Period (in NTU)
Station Station Annual mean of depth-averaged
turbidity of baseline monitoring
Annual mean of depth-averaged
turbidity of reporting period
Mid-ebb IS(Mf)16 8.9 9.4
IS(Mf)9 8.2 9.2
IS8 8.4 9.1
SR4 8.9 9.1
SR4a 8.9 9.1
Mid-flood IS(Mf)16 11.3 9.1
IS(Mf)9 10.2 8.9
IS8 11.9 8.9
SR4 10.3 8.8
SR4a 7.8 8.9
Table 2.18 Summary of Annual Means of Depth-averaged SS Level of Baseline
Monitoring and Reporting Period (in mg/L)
Station Station Annual mean of depth-averaged
SS of baseline monitoring
Annual mean of depth-averaged
SS of reporting period
Mid-ebb IS(Mf)16 11.3 13.0
IS(Mf)9 10.9 12.8
IS8 11.3 12.7
SR4 11.1 12.6

ENVIRONMENTAL RESOURCES MANAGEMENT GCL
0215660_3RD ANNUAL EM&A_20170526.DOCX 26 MAY 2017
05 JUNE 2017
21
Station Station Annual mean of depth-averaged
SS of baseline monitoring
Annual mean of depth-averaged
SS of reporting period
SR4a 9.1 12.7
Mid-flood IS(Mf)16 10.4 12.6
IS(Mf)9 14.7 12.4
IS8 13.5 12.3
SR4 12.2 12.3
SR4a 9.8 12.3
Table 2.19 One-way ANOVA Results for DO Comparison between Impact and Baseline
Periods
Tide Station Depth F ratio p-value
Mid-ebb IS(Mf)16 Surface F 1,163 = 9.6 0.002
Mid-ebb IS(Mf)9 Surface F 1,163 = 0.1 0.728
Mid-ebb IS8 Surface F 1,163 = 3.4 0.068
Mid-ebb SR4 Surface F 1,163 = 21.0 <0.001
Mid-ebb SR4a Surface F 1,163 = 111.5 <0.001
Mid-flood IS(Mf)16 Surface F 1,163 = 19.8 <0.001
Mid-flood IS(Mf)9 Surface F 1,161 = 2.0 0.155
Mid-flood IS8 Surface F 1,163 = 10.0 0.002
Mid-flood SR4 Surface F 1,163 = 13.7 <0.001
Mid-flood SR4a Surface F 1,163 = 113.2 <0.001
Mid-ebb IS(Mf)16 Middle F 1,158 = 2.5 0.116
Mid-flood IS(Mf)16 Middle F 1,159 = 20.7 <0.001
Mid-ebb IS(Mf)16 Bottom F 1,163 = 19.8 <0.001
Mid-ebb IS(Mf)9 Bottom F 1,163 = 0.2 0.628
Mid-ebb IS8 Bottom F 1,163 = 10.0 0.002
Mid-ebb SR4 Bottom F 1,160 = 13.7 <0.001
Mid-ebb SR4a Bottom F 1,163 = 113.2 <0.001
Mid-flood IS(Mf)16 Bottom F 1,163 = 19.9 <0.001
Mid-flood IS(Mf)9 Bottom F 1,161 =0.4 0.546
Mid-flood IS8 Bottom F 1,163 = 6.0 0.015
Mid-flood SR4 Bottom F 1,161 =10.7 0.001

ENVIRONMENTAL RESOURCES MANAGEMENT GCL
0215660_3RD ANNUAL EM&A_20170526.DOCX 26 MAY 2017
05 JUNE 2017
22
Tide Station Depth F ratio p-value
Mid-flood SR4a Bottom F 1,163 = 163.1 <0.001
Note:
By setting α at 0.05, p-values <0.05 (significant difference) are bold.
Table 2.20 One-way ANOVA Results for Depth-averaged Turbidity Comparison between
Impact and Baseline Periods
Tide Station F ratio p-value
Mid-ebb
Mid-ebb
Mid-ebb
Mid-ebb
Mid-ebb
IS(Mf)16 F 1,163 = 0.5 0.460
IS(Mf)9 F 1,163 = 1.8 0.181
IS8 F 1,163 = 1.3 0.252
SR4 F 1,163 < 0.1 0.859
SR4a F 1,163 < 0.1 0.786
Mid-flood IS(Mf)16 F 1,163 = 11.5 <0.001
Mid-flood IS(Mf)9 F 1,163 = 3.1 0.081
Mid-flood IS8 F 1,163 = 18.4 <0.001
Mid-flood SR4 F 1,163 = 4.8 0.030
Mid-flood SR4a F 1,163 = 3.2 0.076
Note:
By setting α at 0.05, p-values < 0.05 (significant difference) are bold.
Table 2.21 One-way ANOVA Results for Depth-averaged SS Comparison between
Impact and Baseline Periods
Tide Station F ratio p-value
Mid-ebb IS(Mf)16 F 1,163 = 3.0 0.085
Mid-ebb IS(Mf)9 F 1,163 = 3.9 0.051
Mid-ebb IS8 F 1,163 = 2.1 0.145
Mid-ebb SR4 F 1,163 = 2.7 0.105
Mid-ebb SR4a F 1,163 = 12.2 <0.001
Mid-flood IS(Mf)16 F 1,163 = 6.5 0.012
Mid-flood IS(Mf)9 F 1,163 = 5.4 0.021
Mid-flood IS8 F 1,163 = 1.7 0.192
Mid-flood SR4 F 1,163 < 0.1 0.938
Mid-flood SR4a F 1,163 = 7.4 0.007

ENVIRONMENTAL RESOURCES MANAGEMENT GCL
0215660_3RD ANNUAL EM&A_20170526.DOCX 26 MAY 2017
05 JUNE 2017
23
Tide Station F ratio p-value
Note:
By setting α at 0.05, p-values < 0.05 (significant difference) are bold.
In addition, linear regression was conducted to examine any significant
relationship between DO / Turbidity / SS levels and time during this yearly
monitoring period at each monitoring station. The method of data
interpretation followed the same method as indicated in Section 2.1.4 for TSP
monitoring. As shown in Tables 2.22 to 2.24, results of the regression analysis
indicated that there was no significant relationship between DO / Turbidity /
SS level and time during this yearly monitoring period. As such, it is
considered that there is no apparent trend of increasing or decreasing DO /
Turbidity / SS levels in this reporting period.
Table 2.22 Linear Regression Result of DO
Parameter Station R2 F1,151 p-value Intercept Coefficient of days
of construction
Mid-ebb
Surface DO
IS(Mf)16 0.036 5.6 0.019 6.19 <0.001
IS(Mf)9 0.049 7.8 0.006 6.10 <0.001
IS8 0.034 5.3 0.023 6.15 <0.001
SR4 0.035 6.6 0.011 6.09 <0.001
SR4a 0.033 5.2 0.024 6.14 <0.001
Mid-flood
surface DO
IS(Mf)16 0.031 4.8 0.030 6.28 <0.001
IS(Mf)9 0.038 5.9 0.016 6.21 <0.001
IS8 0.027 4.2 0.043 6.24 <0.001
SR4 0.032 5.0 0.026 6.21 <0.001
SR4a 0.036 5.7 0.019 6.19 <0.001
Mid-ebb
middle DO
IS(Mf)16 0.026 4.1 0.045 6.07 <0.001
Mid-flood
middle DO
IS(Mf)16 0.026 4.0 0.047 6.16 <0.001
Mid-ebb
bottom DO
IS(Mf)16 0.043 6.7 0.010 5.84 <0.001
IS(Mf)9 0.032 4.9 0.028 6.03 <0.001
IS8 0.042 6.7 0.011 5.92 <0.001
SR4 0.050 7.9 0.006 5.85 <0.001

ENVIRONMENTAL RESOURCES MANAGEMENT GCL
0215660_3RD ANNUAL EM&A_20170526.DOCX 26 MAY 2017
05 JUNE 2017
24
Parameter Station R2 F1,151 p-value Intercept Coefficient of days
of construction
SR4a 0.041 6.5 0.012 5.90 <0.001
Mid-flood
bottom DO
IS(Mf)16 0.039 6.1 0.015 5.93 <0.001
IS(Mf)9 0.023 3.6 0.059 6.16 <0.001
IS8 0.125 3.4 0.066 6.12 <0.001
SR4 0.113 4.3 0.040 6.06 <0.001
SR4a 0.143 5.7 0.018 6.02 <0.001
Note:
1. Dependent variable is set as DO (in mg/L) and independent variable is set as number of day
of construction works.
2. R2 values of insignificant regression model are underlined.
Table 2.23 Linear Regression Result of Turbidity
Parameter Station R2 F1,151 p-value Intercept Coefficient of days
of construction
Mid-ebb
depth-averaged
turbidity
IS(Mf)16 0.030 4.6 0.033 12.59 -0.004
IS(Mf)9 0.032 5.0 0.027 12.60 -0.004
IS8 0.018 2.8 0.097 11.59 -0.003
SR4 0.010 1.6 0.214 10.90 -0.002
SR4a 0.022 3.4 0.068 11.61 -0.003
Mid-flood
depth-averaged
turbidity
IS(Mf)16 0.024 3.6 0.059 11.7 -0.003
IS(Mf)9 0.020 3.1 0.082 11.4 -0.003
IS8 0.010 1.5 0.222 10.5 -0.002
SR4 0.006 1.0 0.328 10.1 -0.001
SR4a 0.014 2.2 0.144 10.7 -0.002
Note:
1. Dependent variable is set as turbidity (in NTU) and independent variable is set as number of
day of construction works.
2. R2 values of insignificant regression model are underlined.

ENVIRONMENTAL RESOURCES MANAGEMENT GCL
0215660_3RD ANNUAL EM&A_20170526.DOCX 26 MAY 2017
05 JUNE 2017
25
Table 2.24 Linear Regression Result of SS
Parameter Station R2 F1,151 p-value Intercept Coefficient of days
of construction
Mid-ebb
depth-averaged SS
IS(Mf)16 0.050 8.0 0.088 18.95 -0.007
IS(Mf)9 0.043 6.8 0.208 18.43 -0.006
IS8 0.026 4.0 0.211 16.84 -0.005
SR4 0.027 4.3 0.202 16.99 -0.005
SR4a 0.037 5.8 0.108 17.22 -0.005
Mid-flood
depth-averaged SS
IS(Mf)16 0.039 6.2 0.014 17.59 -0.005
IS(Mf)9 0.028 4.3 0.039 16.58 -0.005
IS8 0.014 2.1 0.148 14.98 -0.003
SR4 0.021 3.3 0.072 15.82 -0.004
SR4a 0.021 3.2 0.074 15.50 -0.004
Note:
1. Dependent variable is set as suspended solids (in mg/L) and independent variable is set as
number of day of construction works.
2. R2 values of insignificant regression model are underlined.
2.4 DOLPHIN MONITORING
2.4.1 Monitoring Requirements
Impact dolphin monitoring is required to be conducted by a qualified dolphin
specialist team to evaluate whether there have been any effects on the
Indo-Pacific humpback dolphin Sousa chinensis (i.e. Chinese White Dolphin)
from the Contract. In order to fulfil the EM&A requirements and make good
use of available resources, the on-going impact line transect dolphin
monitoring data collected by HyD’s Contract No. HY/2011/03 Hong
Kong-Zhuhai-Macao Bridge. Hong Kong Link Road - Section between Scenic Hill and
Hong Kong Boundary Crossing Facilities on monthly basis is adopted to avoid
duplicates of survey effort.
2.4.2 Monitoring Equipment
Table 2.25 summarizes the equipment used for the impact dolphin monitoring.

ENVIRONMENTAL RESOURCES MANAGEMENT GCL
0215660_3RD ANNUAL EM&A_20170526.DOCX 26 MAY 2017
05 JUNE 2017
26
Table 2.25 Dolphin Monitoring Equipment
Equipment Model
Global Positioning System (GPS)
Camera
Laser Binoculars
Marine Binocular
Vessel for Monitoring
Garmin 18X-PC
Geo One Phottix
Nikon D90 300m 2.8D fixed focus
Nikon D90 20-300m zoom lens
Infinitor LRF 1000
Bushell 7 x 50 marine binocular with compass
and reticules
65 foot single engine motor vessel with
viewing platform 4.5m above water level
2.4.3 Monitoring Parameter, Frequencies & Duration
The dolphin monitoring covered all transect lines in Northeast Lantau (NEL)
and the Northwest Lantau (NWL) survey areas twice per month throughout
the entire construction period. The monitoring data were compatible with,
and should be made available for, long-term studies of small cetacean ecology
in Hong Kong. In order to provide a suitable long-term dataset for
comparison, identical methodology and line transects employed in baseline
dolphin monitoring was followed in the impact dolphin monitoring.
2.4.4 Monitoring Location
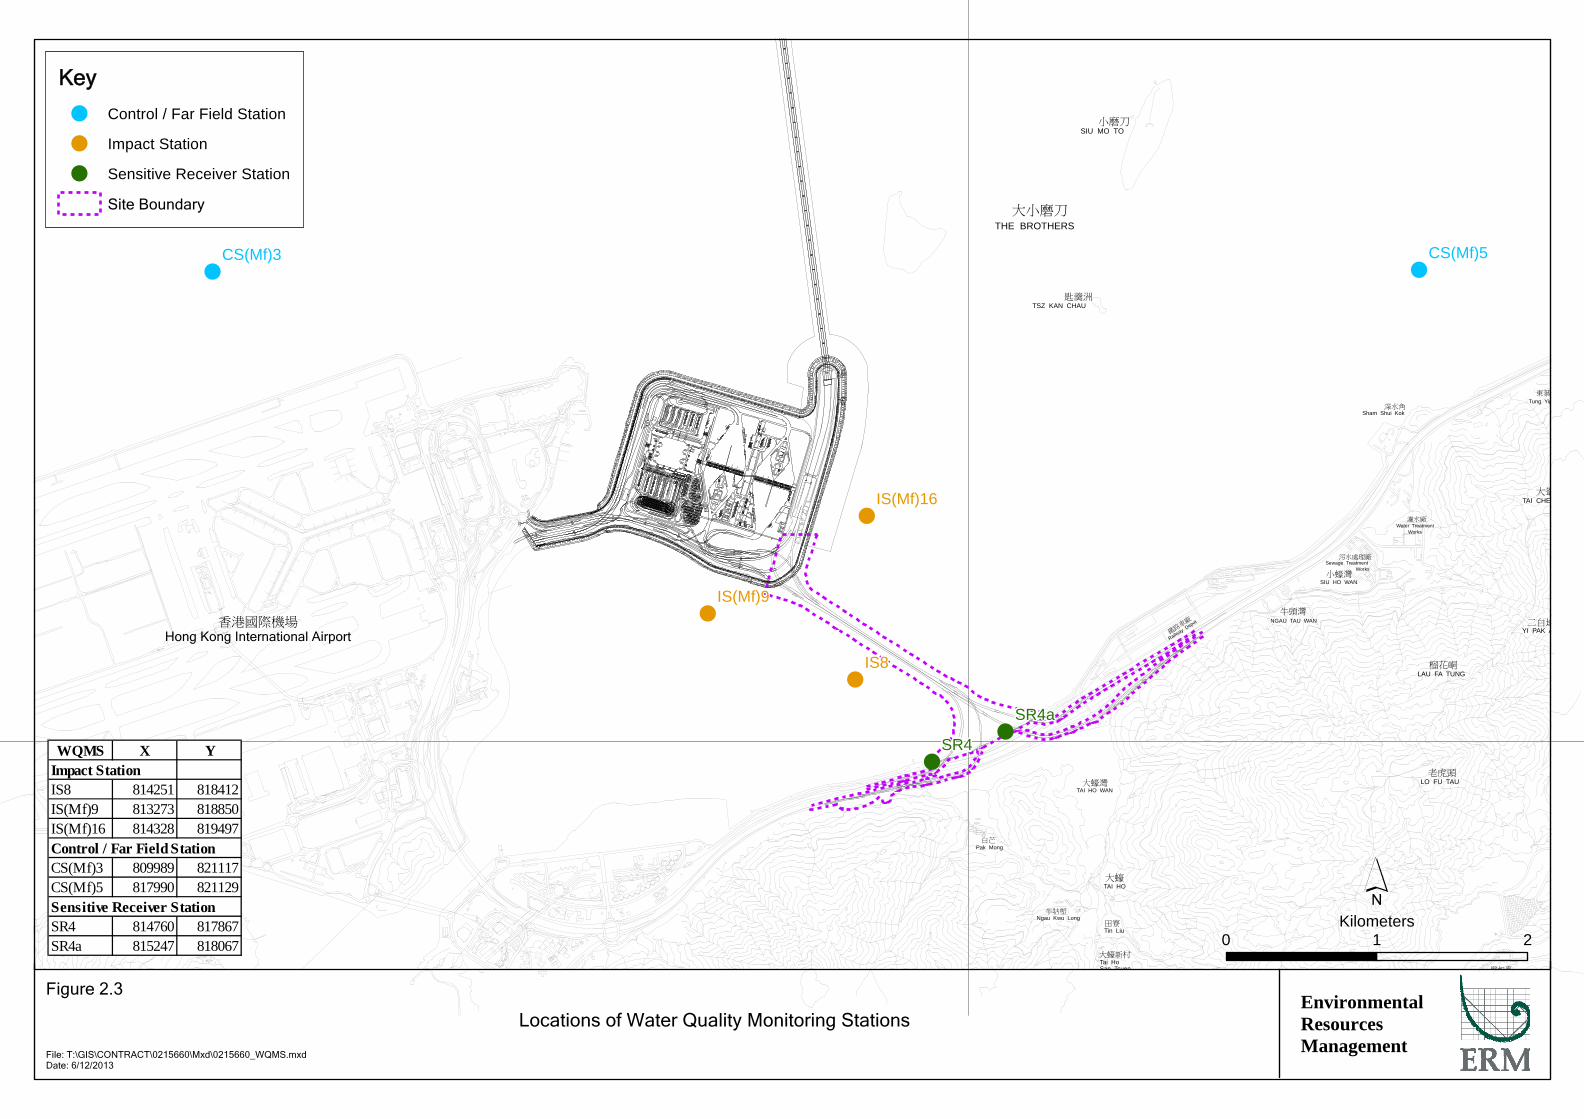
The impact dolphin monitoring was carried out in the NEL and NWL along
the line transect as depicted in Figure 2.4. The co-ordinates of all transect
lines are shown in Table 2.26 below.
Table 2.26 Impact Dolphin Monitoring Line Transect Co-ordinates
Line No. Easting Northing Line No. Easting Northing
1 Start Point 804671 815456 13 Start Point 816506 819480
1 End Point 804671 831404 13 End Point 816506 824859
2 Start Point 805475 815913 14 Start Point 817537 820220
2 End Point 805477 826654 14 End Point 817537 824613
3 Start Point 806464 819435 15 Start Point 818568 820735
1
2
4 5
6
12
7
22
3
8 913 14
10 15
21
2316
11
17 18
2019
EnvironmentalResourcesManagement
Layout of Transect Lines of Dolphin Monitoring in Northwest and Northeast Lantau Areas
Figure 2.4
File: T:\GIS\CONTRACT\0212330\Mxd\0212330_Transect_of_Dolphin_Monitoring.mxdDate: 10/12/2013
KeyLine Transects for Dolphin Monitoring
Northeast Lantau (NEL) Survey Area
Northwest Lantau (NWL) Survey Area
HKSAR BoundaryTuen Mun
Tsing Yi
Hong KongInternational
Airport
LANTAU ISLAND
NEW TERRITORIES
´0 52.5
Kilometers

ENVIRONMENTAL RESOURCES MANAGEMENT GCL
0215660_3RD ANNUAL EM&A_20170526.DOCX 26 MAY 2017
05 JUNE 2017
27
Line No. Easting Northing Line No. Easting Northing
3 End Point 806464 822911 15 End Point 818568 824433
4 Start Point 807518 819771 16 Start Point 819532 821420
4 End Point 807518 829230 16 End Point 819532 824209
5 Start Point 808504 820220 17 Start Point 820451 822125
5 End Point 808504 828602 17 End Point 820451 823671
6 Start Point 809490 820466 18 Start Point 821504 822371
6 End Point 809490 825352 18 End Point 821504 823761
7 Start Point 810499 820880 19 Start Point 822513 823268
7 End Point 810499 824613 19 End Point 822513 824321
8 Start Point 811508 821123 20 Start Point 823477 823402
8 End Point 811508 824254 20 End Point 823477 824613
9 Start Point 812516 821303 21 Start Point 805476 827081
9 End Point 812516 824254 21 End Point 805476 830562
10 Start Point 813525 820872 22 Start Point 806464 824033
10 End Point 813525 824657 22 End Point 806464 829598
11 Start Point 814556 818853 23 Start Point 814559 821739
11 End Point 814556 820992 23 End Point 814559 824768
12 Start Point 815542 818807
12 End Point 815542 824882
2.4.5 Action & Limit Levels
The Action and Limit levels of dolphin impact monitoring are shown in
Appendix C. The Event Action Plan is presented in Appendix H.
2.4.6 Monitoring Schedule for the Reporting Period
The dolphin monitoring schedules for the reporting period are provided in the
Twenty-fifth to Thirty-sixth Monthly EM&A Reports.
2.4.7 Results & Observations
A total of 3,598.07 km of survey effort was collected, with 92.7% of the total
survey effort being conducted under favourable weather conditions (i.e.
Beaufort Sea State 3 or below with good visibility). Among the two areas,

ENVIRONMENTAL RESOURCES MANAGEMENT GCL
0215660_3RD ANNUAL EM&A_20170526.DOCX 26 MAY 2017
05 JUNE 2017
28
1,373.63 km and 2,224.44 km of survey effort were conducted in NEL and
NWL survey areas, respectively. The total survey effort conducted on
primary lines was 2,609.11 km while the effort on secondary lines was 988.96
km. Both survey efforts conducted on primary and secondary lines were
considered as on-effort survey data. The survey efforts are summarized in
Appendix G.
During the twenty-four sets of monitoring surveys from November 2015 to
October 2016, a total of 45 groups of 168 Chinese White Dolphins (CWDs)
were sighted. In this 12-month period, all except seven (7) dolphin sightings
were made during on-effort search. Thirty-three (33) out of 38 on-effort
dolphin sightings were made on primary lines, while five (5) groups of
dolphins were sighted on secondary lines. All sightings were made in NWL
region except one (1), in which the sighting in NEL was a lone animal. No
sighting was made in the proximity of the Project’s alignment. Summary
table of the dolphin sightings is shown in Appendix II of Appendix G.
During the present 12-month impact phase monitoring period, the average
daily encounter rates of Chinese White Dolphins were deduced in NEL and
NWL survey areas, and compared to the ones deduced from the baseline,
transitional and first year of impact phases as shown in Table 2.27.

ENVIRONMENTAL RESOURCES MANAGEMENT GCL
0215660_3RD ANNUAL EM&A_20170526.DOCX 26 MAY 2017
05 JUNE 2017
29
Table 2.27 Average Dolphin Encounter Rates
Encounter rate (STG)
(no. of on-effort dolphin sightings
per 100 km of survey effort)
Encounter rate (ANI)
(no. of dolphins from all on-effort
sightings per 100 km of survey
effort)
Northeast
Lantau
Northwest
Lantau
Northeast
Lantau
Northwest
Lantau
Impact Phase
(2015-16, this
reporting
period)
0.00 2.10 ± 1.83 0.00 8.54 ± 8.53
Impact Phase
(2014-15) 0.11 ± 0.54 2.54 ± 2.49 0.11 ± 0.54 11.64 ± 14.04
Impact Phase
(2013-14) 0.22 ± 0.74 6.93 ± 4.08 0.76 ± 2.59 26.31 ± 17.56
Transitional
Phase (2012-13) 1.70 ± 2.26 7.68 ± 4.36 4.75 ± 7.61 27.51 ± 18.06
Baseline Phase
(2011-12) 6.05 ± 5.04 7.75 ± 5.69 19.91 ± 21.30 29.57 ± 26.96
Comparison of average daily dolphin encounter rates from this impact phase (November 2015 –
October 2016), the first two years of impact phases (November 2013 – October 2015),
transitional phase (November 2012 – October 2013) and baseline phase monitoring periods
(February 2011 – January 2012). (± denotes the standard deviation of the value)
Group size of Chinese White Dolphins ranged from 1-12 individuals per
group in North Lantau region during November 2015 - October 2016. The
average dolphin group sizes from the 12-month impact phase monitoring
period were compared with the ones deduced from baseline and transitional
and first two years of impact phases, as shown in Table 2.28.

ENVIRONMENTAL RESOURCES MANAGEMENT GCL
0215660_3RD ANNUAL EM&A_20170526.DOCX 26 MAY 2017
05 JUNE 2017
30
Table 2.28 Comparison of Average Dolphin Group Size
Average Dolphin Group Size
Overall Northeast Lantau Northwest
Lantau
Impact Phase (2015-16, this
reporting period)
3.73 ± 3.14
(n = 45)
1.00 (n = 1) 3.80 ± 3.14
(n = 44)
Impact Phase (2014-15) 4.24 ± 3.15
(n = 54)
1.00 (n = 1) 4.30 ± 3.15
(n = 53)
Impact Phase (2013-14) 3.76 ± 2.57
(n = 136)
5.00 ± 2.71
(n = 4)
3.73 ± 2.57
(n = 132)
Transitional Phase (2012-13) 3.37 ± 2.98
(n = 186)
2.64 ± 2.38
(n = 22)
3.47 ± 3.05
(n = 164)
Baseline Phase (2011-12) 3.32 ± 2.86
(n = 288)
2.80 ± 2.35
(n = 79)
3.52 ± 3.01
(n = 209)
Comparison of average dolphin group size from this impact phase (November 2015– October
2016, the first two years of impact phases (November 2013 – October 2015), transitional phase
(November 2012 – October 2013) and baseline phase monitoring periods (February 2011 –
January 2012). (± denotes the standard deviation of the value)
Two (2) Action Level exceedances and three (3) Limit Level exceedances for
both NEL and NWL regions were recorded for four (4) sets of quarterly
dolphin monitoring data between November 2015 and October 2016. In this
reporting period, no unacceptable impact from the activities of this Contract
on Chinese White Dolphins was noticeable from general observations. It is
essential to continue monitoring the dolphin usage in North Lantau region for
the rest of the impact phase monitoring period. Photo IDs of sighted dolphin
are presented in Appendix K of the Twenty-fifth to Thirty-sixth Monthly EM&A
Report.
2.4.8 Marine Mammal Exclusion Zone Monitoring
Daily marine mammal exclusion zone monitoring was undertaken during the
period of marine works under this Contract. No sighting of Chinese White
Dolphin was recorded in the monitoring period during the exclusion zone
monitoring.
Passive Acoustic Monitoring (PAM) was not undertaken in this reporting
period as no marine piling works was carried out outside the daylight hours
since September 2015. Daytime marine mammal exclusion zone was still in
effect to cater for temporary staging installation and uninstallation works.

ENVIRONMENTAL RESOURCES MANAGEMENT GCL
0215660_3RD ANNUAL EM&A_20170526.DOCX 26 MAY 2017
05 JUNE 2017
31
2.5 EM&A SITE INSPECTION
Site inspections were carried out on weekly basis to monitor the
implementation of proper environmental pollution control and mitigation
measures under the Contract. Fifty-two (52) site inspections were carried out
in the reporting period. Key observations were summarized in the section of
EM&A Site Inspection in the Twenty-fifth to Thirty-sixth Monthly EM&A Reports.
The Contractor has rectified all of the observations identified during
environmental site inspections in the reporting period.
2.6 WASTE MANAGEMENT STATUS
The Contractor had submitted application form for registration as chemical
waste producer under the Contract. Sufficient numbers of receptacles were
available for general refuse collection and sorting.
Wastes generated during this reporting period include mainly construction
wastes (inert and non-inert), recyclable materials and chemical waste.
Reference has been made to the waste flow table prepared by the Contractor
(Appendix I). The quantities of different types of wastes are summarized in
Table 2.29.

ENVIRONMENTAL RESOURCES MANAGEMENT GCL
0215660_3RD ANNUAL EM&A_20170526.DOCX 26 MAY 2017
05 JUNE 2017
32
Table 2.29 Quantities of Different Waste Generated in the Reporting Period
Month/Year Inert
Construction
Waste (a) (m3)
Imported
Fill (m3)
Inert
Construction
Waste
Re-used
(m3)
Non-inert
Construction
Waste (b)
(tonnes)
Recyclable
Materials (c)
(kg)
Chemical
Wastes
(kg)
Marine Sediment (m3)
Category
L
Category
M
Nov 2015 204 642 725 64,740 98 2,000 0 0
Dec 2015 198 0 516 66,000 0 0 0 0
Jan 2016 1,334 0 606 69,400 105 0 0 0
Feb 2016 692 0 92 85,890 112 0 0 0
Mar 2016 965 0 537 88,360 0 2,000 0 0
Apr 2016 565 0 789 79,580 8,724 3,000 0 0
May 2016 440 0 617 75,620 0 3,000 0 0
Jun 2016 383 0 116 103,270 105 0 0 0
Jul 2016 277 0 230 94,760 1,890 2,200 0 0
Aug 2016 610 0 684 116,990 9,888 0 0 0
Sept 2016 2,314 0 270 130,060 105 0 0 0
Oct 2016 2,183 0 156 141,300 28 0 0 0
Total 10,165 0 5,279 1,115,970 21,055 12,200 0 0
Notes:
(a) Inert construction wastes include hard rock and large broken concrete, and materials disposed as public fill.
(b) Non-inert construction wastes include general refuse disposed at landfill.
(c) Recyclable materials include metals, paper, cardboard, plastics, timber and others.
The Contractor was advised to properly maintain on site C&D materials and
waste collection, sorting and recording system, dispose of C&D materials and
wastes at designated ground and maximize reuse/ recycle of C&D materials
and wastes. The Contractor was also reminded to properly maintain the site
tidiness and dispose of the wastes accumulated on site regularly and properly.
For chemical waste containers, the Contractor was reminded to treat properly
and store temporarily in designated chemical waste storage area on site in
accordance with the Code of Practice on the Packaging, Labelling and Storage of
Chemical Wastes.
2.7 ENVIRONMENTAL LICENSES AND PERMITS
The status of environmental licensing and permit is summarized in Table 2.30
below.
ENVIRONMENTAL RESOURCES MANAGEMENT GCL
0215660_3RD ANNUAL EM&A_20170526.DOCX 26 MAY 2017
33
Table 2.30 Summary of Environmental Licensing and Permit Status
License/ Permit License or Permit No. Date of Issue Date of Expiry License/
Permit
Holder
Remarks
Environmental Permit EP-353/2009/K 11-Apr-16 N/A HyD Hong Kong Boundary Crossing
Facilities
Environmental Permit EP-354/2009/D 13-Mar-15 N/A HyD Tuen Mun- Chek Lap Kok Link
Environmental Permit EP-353/2009/I 17-Jul-15 N/A HyD
Hong Kong Boundary Crossing
Facilities (effective from Septermber
2015)
Chemical Waste Registration 5213-951-G2380-17 12-Jun-14 N/A GCL Viaducts A, B, C, D & E
Chemical Waste Registration 5213-961-G2380-13 10-Oct-13 N/A GCL
Chemical waste produced in Contract
HY/2012/07 (Area 1 adjacent to
Cheng Tung Road, Siu Ho Wan)
Chemical Waste Registration 5213-961-G2380-14 10-Oct-13 N/A GCL
Chemical waste produced in Contract
HY/2012/07 (Area 2 adjacent to
Cheung Tung Road, Pak Mong
Village)
Chemical Waste Registration 5213-974-G2588-03 04-Nov-13 N/A GCL
Chemical waste produced in Contract
HY/2012/07 (WA5 adjacent to
Cheung Tung Road, Yam O)
Construction Dust Notification 361571 05-Jul-13 N/A GCL
Construction Dust Notification 362093 17-Jul-13 N/A GCL For Area 23
Construction Noise Permit for night works and
works in general holidays
Construction Noise Permit for night works and
works in general holidays
Construction Noise Permit for night works and
works in general holidays
Construction Noise Permit for night works and
works in general holidays
GW-RS0691-15
GW-RS1144-15
GW-RS0080-16
GW-RS0383-16
23-Jun-15
20-Oct-15
01-Feb-16
20-Apr-16
22-Dec-15
19-Feb-16
30-Apr-16
19-Oct-16
GCL
GCL
GCL
GCL
For Broad Permit
For Broad Permit
For Broad Permit
For Broad Permit

ENVIRONMENTAL RESOURCES MANAGEMENT GCL
0215660_3RD ANNUAL EM&A_20170526.DOCX 26 MAY 2017
34
License/ Permit License or Permit No. Date of Issue Date of Expiry License/
Permit
Holder
Remarks
Construction Noise Permit for night works and
works in general holidays
GW-RS1045-16 14-Oct-16 13-Apr-17 GCL For Broad Permit
Construction Noise Permit for night works and
works in general holidays GW-RS0809-15 29-Jul-15 29-Jan-16 GCL
For Plant mobilization using tractor
with trailer
Construction Noise Permit for night works and
works in general holidays
Construction Noise Permit for night works and
works in general holidays
Construction Noise Permit for night works and
works in general holidays
Construction Noise Permit for night works and
works in general holidays
GW-RS0854-15
GW-RS0109-16
GW-RS0718-16
GW-RS1044-16
12-Aug-14
05-Feb-16
13-Jul-16
14-Oct-16
15-Feb-16
14-Aug-16
13-Jan-17
13-Apr-17
GCL
GCL
GCL
GCL
Pre-casted pile cap shell installation
at E10-E13
Pre-casted pile cap shell installation
at E10-E13
Pre-casted pile cap shell installation
at E10-E13
Pre-casted pile cap shell installation
at E8-E13
Construction Noise Permit for night works and
works in general holidays GW-RS0855-15 12-Aug-15 11-Feb-16 GCL Pier construction at C7, D8, D9
Construction Noise Permit for night works and
works in general holidays
Construction Noise Permit for night works and
works in general holidays
Construction Noise Permit for night works and
works in general holidays
Construction Noise Permit for night works and
works in general holidays
Construction Noise Permit for night works and
works in general holidays
Construction Noise Permit for night works and
works in general holidays
GW-RS0911-15
GW-RS0056-16
GW-RS0279-16
GW-RW0504-16
GW-RW0707-16
GW-RS0958-16
27-Aug-15
1-Feb-16
29-Mar-16
25-May-16
11-Jul-16
15-Sep-16
26-Feb-16
31-Mar-16
30-May-16
31-Aug-16
30-Sep-16
30-Nov-16
GCL
GCL
GCL
GCL
GCL
GCL
Broad Permit for Segment Launching
at Land Portion
Broad Permit for Segment Launching
at Land Portion
Broad Permit for Segment Launching
at Land Portion
Broad Permit for Segment Launching
at Land Portion
Broad Permit for Segment Launching
at Land Portion
Broad Permit for Segment Launching
at Land Portion
Construction Noise Permit for night works and
works in general holidays GW-RS1054-15 30-Sep-15 29-Mar-16 GCL
For Load unload at NLH near
Viaduct D
Construction Noise Permit for night works and
works in general holidays GW-RS1086-15 07-Oct-15 15-Dec-15 GCL TTA Case 009 Ch.2.1E-4.2E

ENVIRONMENTAL RESOURCES MANAGEMENT GCL
0215660_3RD ANNUAL EM&A_20170526.DOCX 26 MAY 2017
35
License/ Permit License or Permit No. Date of Issue Date of Expiry License/
Permit
Holder
Remarks
Construction Noise Permit for night works and
works in general holidays
GW-RS1046-15
04-Jan-16
31-Jan-16
GCL
Erection of GT324, GT326-GT328 sign
gantry leg
Construction Noise Permit for night works and
works in general holidays
Construction Noise Permit for night works and
works in general holidays
Construction Noise Permit for night works and
works in general holiday
GW-RW0422-15
GW-RW0045-16
GW-RW0339-16
21-Aug-15
27-Jan-16
17-Jun-16
25-Jan-16
25-Jul-16
19-Dec-16
GCL
GCL
GCL
General works at WA5
General works at WA5
General works at WA5
Construction Waste Disposal Account 7017735 10-Jul-13 N/A GCL -
Construction Waste Disposal Account 7019470 03-Mar-14 N/A GCL Vessel CHIT Account
Marine Dumping Permit EP/MD/16-102 13-Oct-15 16-Apr-16 GCL For dumping Type I sediment
Marine Dumping Permit
Marine Dumping Permit
Marine Dumping Permit
EP/MD/16-138
EP/MD/17-037
EP/MD/17-115
10-Dec-15
14-Jun-16
20-Oct-16
13-Jun-16
13-Dec-16
31-Dec-16
GCL
GCL
GCL
For dumping Type I sediment
For dumping Type I sediment
For dumping Type I sediment
Marine Dumping Permit EP/MD/16-112 22-Oct-15 29-Nov-15 GCL For dumping Type I (Dedicated Site)
and Type II sediment
Marine Dumping Permit EP/MD/16-134 27-Nov-15 29-Dec-15 GCL For dumping Type I (Dedicated Site)
and Type II sediment
Marine Dumping Permit
Marine Dumping Permit
EP/MD/16-147
EP/MD/16-166
18-Dec-15
25-Jan-16
29-Jan-16
29-Feb-16
GCL
GCL
For dumping Type I (Dedicated Site)
and Type II sediment
For dumping Type I (Dedicated Site)
and Type II sediment
Marine Dumping Permit EP/MD/16-186 26-Feb-16 31-Mar-16 GCL For dumping Type I (Dedicated Site)
and Type II sediment
Marine Dumping Permit EP/MD/16-203 29-Mar-16 30-Apr-16 GCL For dumping Type I (Dedicated Site)
and Type II sediment
Marine Dumping Permit EP/MD/17-028 31-May-16 30-Jun-16 GCL For dumping Type I (Dedicated Site)

ENVIRONMENTAL RESOURCES MANAGEMENT GCL
0215660_3RD ANNUAL EM&A_20170526.DOCX 26 MAY 2017
36
License/ Permit License or Permit No. Date of Issue Date of Expiry License/
Permit
Holder
Remarks
and Type II sediment
Marine Dumping Permit EP/MD/17-047 22-Jun-16 31-Jul-16 GCL For dumping Type I (Dedicated Site)
and Type II sediment
Marine Dumping Permit
Marine Dumping Permit
EP/MD/17-066
EP/MD/17-084
19-Jul-16
22-Aug-16
31-Aug-16
30-Sep-16
GCL
GCL
For dumping Type I (Dedicated Site)
and Type II sediment
For dumping Type I (Dedicated Site)
and Type II sediment
Marine Dumping Permit EP/MD/17-102 28-Sep-16 31-Oct-16 GCL For dumping Type I (Dedicated Site)
and Type II sediment
Waste Water Discharge License WT00019017-2014 13-May-14 31-May-19 GCL Discharge for marine portion
Waste Water Discharge License WT00019018-2014 13-May-14 31-May-19 GCL Discharge for land portion

ENVIRONMENTAL RESOURCES MANAGEMENT GCL
0215660_3RD ANNUAL EM&A_20170526.DOCX 26 MAY 2017
05 JUNE 2017
37
2.8 IMPLEMENTATION STATUS OF ENVIRONMENTAL MITIGATION MEASURES
A summary of the Environmental Mitigation and Enhancement Measure
Implementation Schedules (EMIS) is presented in Appendix B. The necessary
mitigation measures were implemented properly for this Contract.
2.9 SUMMARY OF EXCEEDANCES OF THE ENVIRONMENTAL QUALITY PERFORMANCE
LIMIT
There was no exceedance in 1-hour TSP, 24-hour TSP, construction noise and
water quality in the reporting period
There were a total of five (5) Action and Limit Levels exceedances for impact
dolphin monitoring in the reporting period, whereas both NEL and NWL
regions each recorded one (1) Action Level exceedance and three (3) Limit
Level exceedances. No unacceptable impact from the construction activities
of the TM-CLKL Southern Connection Viaduct Section on Chinese White
Dolphins was noticeable from general observations during the dolphin
monitoring in this reporting period. Detailed investigation reports were
presented in Appendix L of Eighth to Eleventh Quarterly EM&A Reports.
2.10 SUMMARY OF COMPLAINTS, NOTIFICATION OF SUMMONS AND SUCCESSFUL
PROSECUTIONS
The Environmental Complaint Handling Procedure is provided in Figure 2.5.
One (1) complaint was received in the reporting period. The complaint was
received from EPD in September 2016 regarding effluent discharge from flat
top barge. Upon investigation, there was no adequate evidence to conclude
that the complaint case was related to this Project. The detailed investigation
report was presented in the Appendix N of the Thirty-fifth Monthly EM&A
Report.

Figure 2.6
FILE: 0215660n2.cdr
DATE: 06/12/2013
EnvironmentalResourcesManagement
Environmental Complaint Handling Procedure
Complaint received,
obtain details of complaint
Register in the complaint log
Investigate complaint
Is the project the
source of the problem?
Is the source of
complaint from EPD?
Submit
Identify mitigation measures
Are mitigation measures
required to be
undertaken by
Contractor ?
Advise the Contractor
and ER accordingly
Contractor to implement
mitigation measures
Review the existing
mitigation measures and
updates situation, undertake
additional monitoring if necessary
Is ET Leader satisfiedComplete
complaint log
Reply to complaint log
Record complaint
details in monthly
EM&A Report
Yes
Yes
No
Yes
interim reportto EPD
Jamius.Yeung
Text Box
Figure 2.5

ENVIRONMENTAL RESOURCES MANAGEMENT GCL
0215660_3RD ANNUAL EM&A_20170526.DOCX 26 MAY 2017
05 JUNE 2017
38
No notification of summons or successful prosecution was received in the
reporting period.
Statistics on complaints, notifications of summons, successful prosecutions are
summarized in Appendix J.

ENVIRONMENTAL RESOURCES MANAGEMENT GCL
0215660_3RD ANNUAL EM&A_20170526.DOCX 26 MAY 2017
05 JUNE 2017
39
3 COMPARISON OF EM&A RESULTS WITH EIA PREDICTIONS AND
BASELINE MONITORING RESULTS
The EM&A results in the reporting period are compared to the predictions
from EIA Report and baseline monitoring result in order to review the validity
of EIA predictions.
3.1 AIR QUALITY MONITORING
Air quality monitoring for this Contract was undertaken during the baseline
and impact monitoring periods. As identified in the TM-CLKL EIA Report,
key construction activities of this Contract include excavation works, road
works, slope works and foundation works. Comparison of EM&A results
with EIA predictions is presented in Table 3.1. Maximum 1-hour TSP and
24-hour TSP levels in this yearly impact monitoring were comparable to the
baseline range, in which most of the impact and baseline TSP levels were
higher than the levels predicted in the EIA Report. The average 1-hour TSP
and 24-hour TSP levels measured in this yearly impact monitoring were lower
than the corresponding TSP levels measured in the baseline monitoring at all
stations and thus suggested that no noticeable deterioration of air quality was
caused by the construction activities of this Contract during the impact
monitoring period.
Table 3.1 Comparison of Impacts on Air Quality (in μg/m³) between EIA Prediction and
Impact Monitoring Period
Monitoring
Station
EIA
Predicted
Maximum
Maximum
Baseline
Monitoring
Maximum
Impact
Monitoring
Average
Baseline
Monitoring
Average
Impact
Monitoring
ASR8/ASR9
(1-hour TSP) 205 (1) /240 462 205 220 88
ASR8/ASR9
(24-hour TSP) 83 (1) / 108 113 114 74 64
ASR8A
(1-hour TSP) 293 / 205 (1) 464 259 222 83
ASR8A
(24-hour TSP) 105 /83 (1) 128 112 74 57
Note:
1. EIA prediction of maximum of ASR8 is presented for reference.

ENVIRONMENTAL RESOURCES MANAGEMENT GCL
0215660_3RD ANNUAL EM&A_20170526.DOCX 26 MAY 2017
05 JUNE 2017
40
Monitoring
Station
EIA
Predicted
Maximum
Maximum
Baseline
Monitoring
Maximum
Impact
Monitoring
Average
Baseline
Monitoring
Average
Impact
Monitoring
2. Scenario 1 of EIA prediction is adopted, in which north and south reclamations of TMCLKL
were included in the modelling.
3. EIA predictions and baseline monitoring results of ASR9A and ASR9C are applied to
ASR8A and ASR8/ASR9 respectively.
3.2 NOISE IMPACT MONITORING
Noise impact monitoring for this Contract was undertaken during the baseline
and impact monitoring periods. Major noise sources of this Contract during
the reporting period included construction activities, nearby traffic noise and
aircraft noise. Construction Noise Permits (CNP), as recommended in the
EIA Report, were applied and complied with when Power Mechanical
Equipment (PME) was deployed for construction works during restricted
hours. The EIA assessment has predicted that marginal impacts would be
expected at the Pak Mong Village during construction phase. Comparison of
EM&A results with EIA predictions is presented in Table 3.2. In general, the
average impact noise monitoring results recorded in the reporting period were
within the range of the predicted noise levels in the EIA Report and thus
suggested that no unacceptable level of construction noise generated from the
Contract during the impact monitoring period.
Table 3.2 Comparison of Impacts on Noise (in dB (A)) between EIA Prediction and
Impact Monitoring Period
Monitoring Station EIA Predicted
Maximum
Maximum Impact
Monitoring
Average Baseline
Monitoring
Average Impact
Monitoring
NSR1 74 63.0 56.8 59.6
Note:
1. EIA maximum noise level was predicted in SPL. Baseline and impact monitoring were
measured in Leq,30min.
3.3 WATER QUALITY MONITORING
Water quality monitoring for this Contract was undertaken during the
baseline and impact monitoring periods. Major construction activities of this

ENVIRONMENTAL RESOURCES MANAGEMENT GCL
0215660_3RD ANNUAL EM&A_20170526.DOCX 26 MAY 2017
05 JUNE 2017
41
Contract in the reporting period included marine platform erection, piling and
pier construction works were undertaken in the monitoring period.
According to EIA prediction, no SS exceedance is anticipated from this Project
at the water sensitive receivers nearby the Contract works area (WSR 22a,
WSR 22b and WSR 22c). The average baseline and impact monitoring results
are presented in Table 3.3. It is noted that most of the annual-averaged SS
levels recorded in the reporting period were comparable to the baseline
monitoring results, except for IS(Mf)16 during mid-flood tide and SR4a during
mid-ebb tide and mid-flood tide in which annual-averaged SS levels were
significantly higher than the corresponding average baseline levels, including
upstream control stations (i.e. CS(Mf)3 and CS(Mf)5 in both tides). However,
all recorded levels of depth-averaged SS were below Action and Limit Levels.
Thus, no exceedance of Action and Limit Levels on depth-averaged SS was
recorded in the reporting period. The impact monitoring results are
considered influenced by fluctuation of background regional water quality
and no unacceptable impacts on marine water was observed caused by this
Project.
Table 3.3 Comparison of Depth-averaged SS (in mg/L) between Baseline and Impact
Monitoring Period
Monitoring Station Tide Baseline monitoring Impact Monitoring of this
Reporting Period
CS(Mf)3 Mid-ebb 8.8 13.4
CS(Mf)5 9.2 13.0
IS(Mf)16 11.3 13.0
IS(Mf)9 10.9 12.8
IS8 11.3 12.7
SR4 11.1 12.6
SR4a 9.1 12.7
CS(Mf)3 Mid-flood 12.4 12.8
CS(Mf)5 11.5 12.7
IS(Mf)16 10.4 12.6
IS(Mf)9 14.7 12.4
IS8 13.5 12.3
SR4 12.2 12.3

ENVIRONMENTAL RESOURCES MANAGEMENT GCL
0215660_3RD ANNUAL EM&A_20170526.DOCX 26 MAY 2017
05 JUNE 2017
42
Monitoring Station Tide Baseline monitoring Impact Monitoring of this
Reporting Period
SR4a 9.8 12.3
3.4 MARINE ECOLOGY
According to the baseline results in the Appendix F of the approved EIA
Report, the dolphin groups were largely sighted near waters around Lung
Kwu Chau and Sha Chau. There was no dolphin sighted along the
alignment of this Contract. Two-way ANOVAs with repeated measures
were conducted to compare results of average encounter rate of sightings
(STG) and average encounter rate of dolphins (ANI) between baseline,
transitional and impact periods. Although the STG and ANI in impact
monitoring period were lower than that before the commencement of this
Contract (see Section 2.4.7) and the differences between the five periods are
statistically significant (see Section 3.3.4 of Appendix G), the distribution pattern
was still similar between the impact monitoring periods and before the
commencement (i.e. transition period in 2012 – 2013) of this Contract.
Dolphins are observed heavily utilized area around Lung Kwu Chau and less
frequently in the North Lantau region where the works area of this Contract is
situated. The monitoring results in this reporting period are considered to be
in line with the EIA predictions, and the review of monitoring data suggested
that no unacceptable impacts was noted from the marine works under this
Contract. It is essential to monitor the dolphin usage in North Lantau region
for the rest of impact monitoring period to keep track on the trend of dolphin
ranging pattern.
3.5 WASTE MANAGEMENT
In general, wastes generated from the construction activities including C&D
materials (inert and non-inert), chemical wastes and recyclable materials.
The summary of waste generation amount is presented in Table 2.29.
Waste monitoring and audit programme has been undertaken during this
reporting period. Wastes arising from this Project have been managed in
ENVIRONMENTAL RESOURCES MANAGEMENT GCL
0215660_3RD ANNUAL EM&A_20170526.DOCX 26 MAY 2017
05 JUNE 2017
43
accordance with the recommendations in the EIA Report, the EM&A Manual,
the Waste Management Plan and other relevant statutory requirements.
The requirements for construction waste management have been reviewed
and were considered as adequate. No change to the requirements was
considered to be necessary.
3.6 SUMMARY OF MONITORING METHODOLOGY AND EFFECTIVENESS
The EM&A monitoring programme has been reviewed and was considered
effective and adequate to cater for the nature of works in progress. No
further change to the monitoring programme was considered to be necessary.
The EM&A programme will be evaluated as appropriate in the next reporting
period and improvements in the EM&A programme will be recommended if
deemed necessary.
3.7 SUMMARY OF MITIGATION MEASURES
The mitigation measures stipulated in the Updated EM&A Manual were
undertaken by the Contractor in the reporting period. The mitigation
measures were reviewed and considered effective. No addition or change on
mitigation measures was considered to be necessary.
ENVIRONMENTAL RESOURCES MANAGEMENT GCL
0215660_3RD ANNUAL EM&A_20170526.DOCX 26 MAY 2017
05 JUNE 2017
44
4 FUTURE KEY ISSUES
4.1 KEY ISSUES FOR THE COMING PERIOD
Potential environmental impacts arising from the upcoming construction
activities are mainly associated with air quality, noise, marine water quality,
marine ecology and waste management issues.

ENVIRONMENTAL RESOURCES MANAGEMENT GCL
0215660_3RD ANNUAL EM&A_20170526.DOCX 26 MAY 2017
05 JUNE 2017
45
5 CONCLUSION AND RECOMMENDATIONS
This Third Annual EM&A Report presents findings of the EM&A activities
undertaken during the period from 1 November 2015 to 31 October 2016, in
accordance with the Updated EM&A Manual and the requirements of the
Environmental Permits (EP-354/2009/D and EP-353/2009/I).
Neither Action Level nor Limit Level exceedances were observed for air
quality, noise and water quality monitoring in this reporting period.
A total of 45 groups of 168 Chinese White Dolphins (CWDs) were sighted.
Two (2) Action Level exceedance and three (3) Limit Level exceedances for
both NEL and NWL regions were recorded for 4 sets of quarterly dolphin
monitoring data between November 2015 and October 2016, whilst no
unacceptable impact from the activities of this Contract on Chinese White
Dolphins was noticeable from the general observations. It is essential to
continue monitoring the dolphin usage in North Lantau region for the rest of
the impact phase monitoring period.
Environmental site inspection was carried out fifty-two (52) times in the
reporting period. Recommendations on remedial actions were given to the
Contractor for the deficiencies identified during the site audits.
There was one (1) complaint received from EPD on 22 September 2016
regarding effluent discharge from flat top barge in the reporting period.
Upon investigation, there was no adequate evidence to conclude that the
complaint case was related to this Project.. No summons/ prosecution were
received during the reporting period.
The review of monitoring data suggested that the construction works under
this Contract have proceeded in an environmentally acceptable manner in this
reporting period. In general, the monitoring results were in line with EIA
predictions.
The monitoring programme has been reviewed and was considered as
adequate to cater for the nature of works in progress. Change to the
monitoring programme was thus not recommended at this stage. The

ENVIRONMENTAL RESOURCES MANAGEMENT GCL
0215660_3RD ANNUAL EM&A_20170526.DOCX 26 MAY 2017
05 JUNE 2017
46
monitoring programme will be evaluated as appropriate in the next reporting
period. The ET will keep track on the construction works to confirm
compliance of environmental requirements and the proper implementation of
all necessary mitigation measures.

Appendix A
Project Organization for
Environmental Works

Environmental Resources Management
Contract No. HY/2012/07 Southern Connection Viaduct Section Project Organization
Figure 1.1
DATE: 06/03/2013
Jamius.Yeung
Text Box
Appendix A1

Appendix B
Environmental Mitigation
and Enhancement Measure
Implementation Schedules
(Adopted from: CINOTECH (2011) Agreement No.
CE35/2011 EP Baseline Environmental Monitoring for
Hong Kong-Zhuhai-Macao BridgeTuen Mun-Chep Lap
Kok Link – Investigation. UpdatedEM&A Manual for
Tuen Mun-Chek Lap Kok Link)

1
Contract No. HY/2012/07 Tuen Mun – Chek Lap Kok Link
Southern Connection Viaduct Section Environmental Mitigation and Enhancement Measure Implementation Schedule
EIA
Reference
EM&A
Manual
Reference
Environmental Protection Measures Location/ Timing Implementation
Agent
Relevant Standard
or Requirement
Implementation
Stages
Status
D C O
AIR QUALITY
4.8.1 3.8 An effective watering programme of eight daily
watering with complete coverage, is estimated to
reduce by 50%. This is recommended for all areas in
order to reduce dust levels to a minimum;
All areas / throughout
construction period
Contractor TMEIA Avoid smoke
impacts and
disturbance
Y <>
4.8.1 3.8 The Contractor shall, to the satisfaction of the
Engineer, install effective dust suppression measures
and take such other measures as may be necessary to
ensure that at the Site boundary and any nearby
sensitive receiver, dust levels are kept to acceptable
levels.
All areas / throughout
construction period
Contractor TMEIA Avoid dust
generation
Y
4.8.1 3.8 The Contractor shall not burn debris or other materials
on the works areas.
All areas / throughout
construction period
Contractor TMEIA Avoid dust
generation
Y
4.8. 1 3.8 In hot, dry or windy weather, the watering programme
shall maintain all exposed road surfaces and dust
sources wet.
All unpaved haul roads
/ throughout
construction period in
hot, dry or windy
weather
Contractor TMEIA Avoid smoke
impacts and
disturbance
Y <>
4.8.1 3.8 Where breaking of oversize rock/concrete is required,
watering shall be implemented to control dust. Water
spray shall be used during the handling of fill material at
the site and at active cuts, excavation and fill sites where
dust is likely to be created.
All areas / throughout
construction period
Contractor TMEIA Avoid dust
generation
Y
4.8. 1 3.8 Open dropping heights for excavated materials shall be
controlled to a maximum height of 2m to minimise the
fugitive dust arising from unloading.
All areas / throughout
construction period
Contractor TMEIA Avoid dust
generation
Y <>
4.8.1 3.8 During transportation by truck, materials shall not be
loaded to a level higher than the side and tail boards, and
shall be dampened or covered before transport.
All areas / throughout
construction period
Contractor TMEIA Avoid dust
generation
Y <>

2
EIA
Reference
EM&A
Manual
Reference
Environmental Protection Measures Location/ Timing Implementation
Agent
Relevant Standard
or Requirement
Implementation
Stages
Status
D C O
4.8.1 3.8 Materials having the potential to create dust shall not be
loaded to a level higher than the side and tail boards, and
shall be covered by a clean tarpaulin. The tarpaulin shall
be properly secured and shall extend at least 300mm over
the edges of the side and tail boards.
All areas / throughout
construction period
Contractor TMEIA Avoid dust
generation
Y <>
4.8.1 3.8 No earth, mud, debris, dust and the like shall be
deposited on public roads. Wheel washing facility shall
be usable prior to any earthworks excavation activity on
the site.
All site exits /
throughout construction
period
Contractor TMEIA Avoid dust Y <>
4.8.1 3.8 Areas of exposed soil shall be minimised to areas in
which works have been completed shall be restored as
soon as is practicable.
All exposed surfaces /
throughout construction
period
Contractor TMEIA Avoid dust
generation
Y
4.8.1 3.8 All stockpiles of aggregate or spoil shall be enclosed or
covered and water applied in dry or windy condition.
All areas / throughout
construction period
Contractor TMEIA Avoid dust
generation
Y <>
4.11 Section 3 EM&A in the form of 1 hour and 24 hour dust
monitoring and site audit
All representative
existing ASRs
/ throughout
construction period
Contractor EM&A Manual Y
NOISE
5.11 Section 4 Noise monitoring All existing
representative
sensitive receivers /
during North Lantau
Viaduct construction
Contractor EM&A Manual Y
WATER QUALITY
General Marine Works
6.10 - Bored piling to be undertaken within a metal casing. Marine viaducts of TM-
CLKL
and HKLR/ bored piling
Contractor TM-EIAO Y
6.10 - Barges and hopper dredgers shall have tight fitting seals
to their bottom openings to prevent leakage of material.
All areas/ throughout
construction period
Contractor Marine Fill Committee
Guidelines. DASO
permit conditions.
Y

3
EIA
Reference
EM&A
Manual
Reference
Environmental Protection Measures Location/ Timing Implementation
Agent
Relevant Standard
or Requirement
Implementation
Stages
Status
D C O
6.10 - Any pipe leakages shall be repaired quickly. Plant should
not be operated with leaking pipes.
All areas/ throughout
construction period
Contractor Marine Fill Committee
Guidelines. DASO
permit conditions.
Y <>
6.10 - Loading of barges and hoppers shall be controlled to
prevent splashing of dredged material to the
surrounding water. Barges or hoppers shall not be filled
to a level which will cause overflow of materials or
pollution of water during loading or transportation.
All areas/ throughout
construction period
Contractor Marine Fill Committee
Guidelines. DASO
permit conditions.
Y
6.10 - Excess material shall be cleaned from the decks and
exposed fittings of barges and hopper dredgers before
the vessel is moved
All areas/ throughout
construction period
Contractor Marine Fill Committee
Guidelines. DASO
permit conditions.
Y <>
6.10 - Adequate freeboard shall be maintained on barges to
reduce the likelihood of decks being washed by wave
action;
All areas/ throughout
construction period
Contractor Marine Fill Committee
Guidelines. DASO
permit conditions.
Y
6.10 - All vessels shall be sized such that adequate clearance is
maintained between vessels and the sea bed at all states
of the tide to ensure that undue turbidity is not generated
by turbulence from vessel movement or propeller wash.
All areas/ throughout
construction period
Contractor Marine Fill Committee
Guidelines. DASO
permit conditions.
Y
6.10 - The works shall not cause foam, oil, grease, litter or other
objectionable matter to be present in the water within
and adjacent to the works site.
All areas/ throughout
construction period
Contractor Marine Fill Committee
Guidelines. DASO
permit conditions.
Y <>
Temporary Staging work
5.2 Regular inspection for the accumulation of floating
refuse and collection of floating refuse if required
During temporary
staging works
Contractor Y
5.2 Provision of temporary drainage system on the
temporary staging for collection of construction site
runoff to allow appropriate treatment before discharge
into the sea
During temporary
staging works
Contractor Y <>
5.2 Wastewater generated from construction works such as
bored / drilling water will be collected, treated,
neutralized and de-silted through silt trap or
sedimentation tank before disposal
During temporary
staging works
Contractor Y
5.2 One additional water quality monitoring station is During temporary Contractor Y

4
EIA
Reference
EM&A
Manual
Reference
Environmental Protection Measures Location/ Timing Implementation
Agent
Relevant Standard
or Requirement
Implementation
Stages
Status
D C O
proposed at station SR4a In case elevated SS or turbidity
is identified during the water quality monitoring, the
source of pollution will be tracked down and be removed
as soon as possible. In case depletion of dissolved oxygen
is identified, artificial aeration will be arranged at the
monitoring station SR4a,
staging works
Land Works
6.10 - Wastewater from temporary site facilities should be
controlled to prevent direct discharge to surface or marine
waters.
All areas/ throughout
construction period
Contractor TM-EIAO Y <>
6.10 - Sewage effluent and discharges from on- site kitchen
facilities shall be directed to Government sewer in
accordance with the requirements of the WPCO or
collected for disposal offsite. The use of soaks away shall
be avoided.
All areas/ throughout
construction period
Contractor TM-EIAO Y
6.10 - Storm drainage shall be directed to storm drains via
adequately designed sand/silt removal facilities such as
sand traps, silt traps and sediment basins. Channels, earth
bunds or sand bag barriers should be provided on site to
properly direct storm water to such silt removal facilities.
Catch pits and perimeter channels should be constructed
in advance of site formation works and earthworks.
All areas/ throughout
construction period
Contractor TM-EIAO Y
6.10 - Silt removal facilities, channels and manholes shall be
maintained and any deposited silt and grit shall be
removed regularly, including specifically at the onset of
and after each rainstorm.
All areas/ throughout
construction period
Contractor TM-EIAO Y
6.10 - Temporary access roads should be surfaced with crushed
stone or gravel.
All areas/ throughout
construction period
Contractor TM-EIAO Y <>
6.10 - Rainwater pumped out from trenches or foundation
excavations should be discharged into storm drains via silt
removal facilities.
All areas/ throughout
construction period
Contractor TM-EIAO Y
6.10 - Measures should be taken to prevent the washout of
construction materials, soil, silt or debris into any drainage
system.
All areas/ throughout
construction period
Contractor TM-EIAO Y

5
EIA
Reference
EM&A
Manual
Reference
Environmental Protection Measures Location/ Timing Implementation
Agent
Relevant Standard
or Requirement
Implementation
Stages
Status
D C O
6.10 - Open stockpiles of construction materials (e.g. aggregates
and sand) on site should be covered with tarpaulin or
similar fabric during rainstorms.
All areas/ throughout
construction period
Contractor TM-EIAO Y <>
6.10 5.8 Manholes (including any newly constructed ones) should
always be adequately covered and temporarily sealed so
as to prevent silt, construction materials or debris from
getting into the drainage system, and to prevent storm
run-off from getting into foul sewers.
All areas/ throughout
construction period
Contractor TM-EIAO Y
6.10 - Discharges of surface run-off into foul sewers must always
be prevented in order not to unduly overload the foul
sewerage system.
All areas/ throughout
construction period
Contractor TM-EIAO Y
6.10 - All vehicles and plant should be cleaned before they leave
the construction site to ensure that no earth, mud or debris
is deposited by them on roads. A wheel washing bay
should be provided at every site exit.
All areas/ throughout
construction period
Contractor TM-EIAO Y <>
6.10 - Wheel wash overflow shall be directed to silt removal
facilities before being discharged to the storm drain.
All areas/ throughout
construction period
Contractor TM-EIAO Y <>
6.10 - Section of construction road between the wheel washing
bay and the public road should be surfaced with crushed
stone or coarse gravel.
All areas/ throughout
construction period
Contractor TM-EIAO Y <>
6.10 - Wastewater generated from concreting, plastering,
internal decoration, cleaning work and other similar
activities, shall be screened to remove large objects.
All areas/ throughout
construction period
Contractor TM-EIAO Y <>
6.10 - Vehicle and plant servicing areas, vehicle wash bays and
lubrication facilities shall be located under roofed areas.
The drainage in these covered areas shall be connected to
foul sewers via a petrol interceptor in accordance with the
requirements of the WPCO or collected for offsite
disposal.
All areas/ throughout
construction period
Contractor TM-EIAO Y
6.10 - The Contractor shall prepare an oil / chemical cleanup
plan and ensure that leakages or spillages are contained
and cleaned up immediately.
All areas/ throughout
construction period
Contractor TM-EIAO Y
6.10 - Waste oil should be collected and stored for recycling or
disposal, in accordance with the Waste Disposal
Ordinance.
All areas/ throughout
construction period
Contractor TM-EIAO Waste
Disposal Ordinance
Y

6
EIA
Reference
EM&A
Manual
Reference
Environmental Protection Measures Location/ Timing Implementation
Agent
Relevant Standard
or Requirement
Implementation
Stages
Status
D C O
6.10 - All fuel tanks and chemical storage areas should be
provided with locks and be sited on sealed areas. The
storage areas should be surrounded by bunds with a
capacity equal to 110% of the storage capacity of the
largest tank.
All areas/ throughout
construction period
Contractor TM-EIAO Y <>
6.10 - Surface run-off from bunded areas should pass through
oil/grease traps prior to discharge to the stormwater
system.
All areas/ throughout
construction period
Contractor TM-EIAO Y <>
6.10 - Roadside gullies to trap silt and grit shall be provided
prior to discharging the stormwater into the marine
environment. The sumps will be maintained and cleaned
at regular intervals.
Roadside/design and
operation
Design
Consultant/
Contractor
TM-EIAO Y Y n/a
6.10 Section 5 All construction works shall be subject to routine audit to
ensure implementation of all EIA recommendations and
good working practice.
All areas/ throughout
construction period
Contractor EM&A Manual Y
Water Quality Monitoring
6.10 Section 5 Water quality monitoring shall be undertaken for
suspended solids, turbidity, and dissolved oxygen.
Nutrients and metal parameters shall also be measured
for Mf sediment operations (only HKBCF and HKLR
required handling of Mf sediment) during baseline,
backfilling and post construction period.
One year operation phase water quality monitoring at
designated stations
Designated monitoring
stations as defined in
EM&A Manual, Section
5/ Before, through-out
marine construction
period, post construction
and monthly operational
phase water quality
monitoring for a year.
Contractor EM&A Manual Y Y
ECOLOGY
8.14 6.3 Specification for and implement pre, during and post
construction dolphin abundance monitoring.
All Areas/Detailed
Design/ during
construction works/post
construction
Design
Consultant/
Contractor
TMEIA Y Y Y
8.14 6.3 Specification for bored piling monitoring Detailed Design Design
Consultant
TMEIA Y
8.14 6.3 Implement any recommendations of the bored piling
monitoring
Southern marine
viaduct/Throughout
Contractor TMEIA Y

7
EIA
Reference
EM&A
Manual
Reference
Environmental Protection Measures Location/ Timing Implementation
Agent
Relevant Standard
or Requirement
Implementation
Stages
Status
D C O
construction during
bored piling
8.14 6.3,6.5 Avoidance of peak CWD calving season in May and June
for driving of metal caissons during bored piling works
Southern marine
viaduct/ May and
June during bored piling
Contractor TMEIA Y
8.14 6.3,6.5 Specification and implementation of
250m dolphin exclusion zone.
All marine bored piling
and temporary staging
works areas/Detailed
Design/during all
marine bored piling and
temporary staging works
Design
Consultant/
Contractor
TMEIA Y Y
8.15 6.3, 6.5 Specification and deployment of an artificial reef of an
area of 3,600m2 in an area where fishing activities are
prohibited.
Area of prohibited
fishing
activities/Detailed
Design/towards end of
construction period
TM-CLKL/
HKBCF Design
Consultant/
TM-CLKL/
HKBCF
Contractor
TMEIA Y Y AFCD
8.14 6.3, 6.5 Specification and implementation of marine vessel
control specifications
All areas/Detailed
Design/during
construction works
Design
Consultant/
Contractor
TMEIA Y Y
8.14 6.3, 6.5 Design and implementation of acoustic decoupling
methods for marine bored piling and the whole lifespan
of temporary staging works.
All areas/ Detailed
Design/during marine
bored piling and
temporary staging works
Design
Consultant/
Contractor
TMEIA Y Y
8.15 6.3, 6.4 Pre-construction phase survey and coral translocation Tai Ho Wan (donor site)
and Yam Tsui Wan
(receptor site) /Detailed
Design/Prior to
construction
Design
Consultant/
Contractor
TMEIA Y Y
8.15 6.5 Audit coral translocation success Yam Tsui Wan (receptor
site)/Post translocation
Contractor TMEIA Y
7.13 6.5 Undertaken gabion wall works in
Stream NL1 in the dry season
North Lantau slope
works/dry
Contractor TMEIA Y

8
EIA
Reference
EM&A
Manual
Reference
Environmental Protection Measures Location/ Timing Implementation
Agent
Relevant Standard
or Requirement
Implementation
Stages
Status
D C O
season/construction
phase
7.13 6.5 The loss of habitat shall be supplemented by
enhancement planting in accordance with the landscape
mitigation schedule.
All areas /
As soon as accessible
Contractor TMEIA Y AFCD/LCSD
7.13 6.5 Spoil heaps shall be covered at all times. All areas / Throughout
construction period
Contractor TMEIA Y
7.13 6.5 Avoid damage and disturbance to the remaining and
surrounding natural habitat
All areas / Throughout
construction period
Contractor TMEIA Y
7.13 6.5 Placement of equipment in designated areas within the
existing disturbed land
All areas / Throughout
construction period
Contractor TMEIA Y <>
7.13 6.5 Disturbed areas to be reinstated immediately after
completion of the works.
All areas / Throughout
construction period
Contractor TMEIA Y
7.13 6.5 Construction activities should be restricted to the
proposed works boundary
All areas / Throughout
construction period
Contractor TMEIA Y <>
LANDSCAPE AND VISUAL
10.9 7.6 Round angle, patterned finishes, and oval shaped pier
were considered in the viaduct design, and further
details will be developed under ACABAS submission
(DM3)
All areas/detailed design Design
Consultant
TMEIA Y n/a
10.9 7.6 Details of the street furniture will be developed in the
detailed design stage (DM4)
All areas/detailed design Design
Consultant
TMEIA Y n/a
10.9 7.6 Aesthetic design of the viaduct, retaining wall and other
structures will be developed under ACABAS submission
(DM5)
All areas/detailed design Design
Consultant
TMEIA Y n/a
10.9 7.6 Existing trees on boundary of the Project Area shall be
carefully protected during construction. Detailed Tree
Protection Specification shall be provided in the Contract
Specification. Under this specification, the Contractor
shall be required to submit, for approval, a detailed
working method statement for the protection of trees
prior to undertaking any works adjacent to all retained
trees, including trees in contractor’s works areas. (Tree
All areas/detailed
design/ during
construction
Design
Consultant/
Contractor
TMEIA Y Y

9
EIA
Reference
EM&A
Manual
Reference
Environmental Protection Measures Location/ Timing Implementation
Agent
Relevant Standard
or Requirement
Implementation
Stages
Status
D C O
protection measures will be detailed at Tree Removal
Application stage) (CM1)
10.9 7.6 Trees unavoidably affected by the works shall be
transplanted where practical. Trees will be transplanted
straight to their final receptor site and not held in a
temporary nursery. A detailed Tree Transplanting
Specification shall be provided in the Contract
Specification. Sufficient time for necessary tree root and
crown preparation periods shall be allowed in the project
programme (CM2)
All areas/detailed
design/ during
construction
Design
Consultant/
Contractor
TMEIA Y Y
10.9 7.6 Hillside and roadside screen planting to proposed roads,
associated structures and slope works (CM3).
All areas/detailed
design/ during
construction/post
construction
Design
Consultant/
TMEIA Y Y
10.9 7.6 Hydroseeding or sheeting of soil stockpiles with visually
unobtrusive material (in earth tone) (CM4)
All areas/detailed
design/ during
construction/post
construction
Design
Consultant/
Contractor
TMEIA Y Y <>
10.9 7.6 Screening of construction works by hoardings around
works area in visually unobtrusive colours, to screen
works (CM5)
All areas/detailed
design/ during
construction/post
construction
Design
Consultant/
Contractor
TMEIA Y Y
10.9 7.6 Control night-time lighting and glare by hooding all
lights (CM6)
All areas/detailed
design/ during
construction
Design
Consultant/
Contractor
TMEIA Y Y
10.9 7.6 Ensure no run-off into water body adjacent to the Project
Area (CM7)
All areas/detailed
design/ during
construction
Design
Consultant/
Contractor
TMEIA Y Y
10.9 7.6 Avoidance of excessive height and bulk of buildings and
structures (CM8)
All areas/detailed
design/ during
construction
Design
Consultant/
Contractor
TMEIA Y Y
10.9 7.6 Recycle/Reuse all felled trees and vegetation, e.g.
mulching (CM9)
All areas/detailed
design/ during
construction
Design
Consultant/
Contractor
TMEIA Y Y

10
EIA
Reference
EM&A
Manual
Reference
Environmental Protection Measures Location/ Timing Implementation
Agent
Relevant Standard
or Requirement
Implementation
Stages
Status
D C O
10.9 7.6 Compensatory tree planting shall be provided to the
satisfaction of relevant Government departments.
Required numbers and locations of compensatory trees
shall be determined and agreed separately with
Government during the Tree Felling Application process
under ETWBTC 3/2006 (CM10).
All areas/detailed
design/ during
construction
Design
Consultant/
Contractor
TMEIA Y Y
10.9 7.6 Re-vegetation of affected woodland/shrubland with
native species (OM1)
All areas/detailed
design/ during
construction/ during
operation
Design
Consultant/
Contractor
TMEIA Y Y Y AFCD/HyD/
L CSD
10.9 7.6 Tall buffer screen tree / shrub / climber planting should
be incorporated to soften hard engineering structures
and facilities (OM2)
All areas/detailed
design/ during
construction/ during
operation
Design
Consultant/
Contractor
TMEIA Y Y Y HyD/LCSD
10.9 7.6 Streetscape elements (e.g. paving, signage, street
furniture, lighting etc.) shall be sensitively designed in a
manner that responds to the local context, and minimises
potential negative landscape and visual impacts.
Lighting units
should be directional and minimise unnecessary light
spill (OM3)
All areas/detailed
design/ during
construction / during
operation
Design
Consultant/
Contractor
TMEIA Y Y Y HyD/LCSD
10.9 7.6 Structure, ornamental tree / shrub / climber planting
should be provided along roadside amenity strips,
central dividers and newly formed slopes to enhance the
townscape quality and further greenery enhancement
(OM4)
All areas/detailed
design/ during
construction / during
operation
Design
Consultant/
Contractor
TMEIA Y Y Y HyD/LCSD
10.9 7.6 Aesthetically pleasing design (visually unobtrusive and
non-reflective) as regard to the form, material and
finishes
All areas/detailed
design/ during
construction / during
operation
Design
Consultant/
Contractor
TMEIA Y Y Y HyD
WASTE
12.6 The Contractor shall identify a coordinator for the
management of waste.
Contract mobilisation Contractor TMEIA Y
12.6 The Contractor shall prepare and implement a Waste Contract mobilisation Contractor TMEIA, Works Y

11
EIA
Reference
EM&A
Manual
Reference
Environmental Protection Measures Location/ Timing Implementation
Agent
Relevant Standard
or Requirement
Implementation
Stages
Status
D C O
Management Plan which specifies procedures such as
a ticketing system, to facilitate tracking of loads and to
ensure that illegal disposal of wastes does not occur,
and protocols for the maintenance of records of the
quantities of wastes generated, recycled and disposed.
A recording system for the amount of waste
generated, recycled and disposed (locations) should
be established.
Branch Technical
Circular No. 5/99 for
the Trip-ticket
System for Disposal
of Construction and
Demolition Material
12.6 The Contractor shall apply for and obtain the
appropriate licenses for the disposal of public fill,
chemical waste and effluent discharges.
Contract mobilisation Contractor TMEIA, Land
(Miscellaneous
Provisions)
Ordinance (Cap
28); Waste Disposal
Ordinance (Cap 354);
Dumping at Sea
Ordinance (Cap 466);
Water Pollution
Control Ordinance.
Y
12.6 8.1 Training shall be provided to workers about the
concepts of site cleanliness and appropriate waste
management procedures including waste reduction,
reuse and recycling.
Contract Mobilisation Contractor TMEIA Y
12.6 8.1 The extent of cutting operation should be optimised
where possible. Earth retaining structures and bored
pile walls should be proposed to minimise the extent
of cutting.
All areas / throughout
construction period
Contractor TMEIA Y
12.6 8.1 Rock armour from the existing seawall should be
reused on the new sloping seawall as far as possible
All areas / throughout
construction period
Contractor TMEIA Y
12.6 8.1 The site and surroundings shall be kept tidy and
litter free.
All areas / throughout
construction period
Contractor TMEIA Y
12.6 8.1 No waste shall be burnt on site. All areas / throughout
construction period
Contractor TMEIA Y
12
EIA
Reference
EM&A
Manual
Reference
Environmental Protection Measures Location/ Timing Implementation
Agent
Relevant Standard
or Requirement
Implementation
Stages
Status
D C O
12.6 8.1 Provisions to be made in contract documents to
allow and promote the use of recycled aggregates
where appropriate.
Detailed Design Design
Consultant
TMEIA Y
12.6 8.1 The Contractor shall be prohibited from disposing of
C&D materials at any sensitive locations. The
Contractor should propose the final disposal sites in
the EMP and WMP for approval before
implementation.
All areas / throughout
construction period
Contractor TMEIA Y
12.6 8.1 Stockpiled material shall be covered by tarpaulin and
/or watered as appropriate to prevent windblown
dust/ surface run off.
All areas / throughout
construction period
Contractor TMEIA Y
12.6 8.1 Excavated material in trucks shall be covered by
tarpaulins to reduce the potential for spillage and dust
generation.
All areas / throughout
construction period
Contractor TMEIA Y
12.6 8.1 Wheel washing facilities shall be used by all trucks
leaving the site to prevent transfer of mud onto public
roads.
All areas / throughout
construction period
Contractor TMEIA Y
12.6 8.1 Standard formwork or pre-fabrication should be used
as far as practicable so as to minimise the C&D
materials arising. The use of more durable
formwork/plastic facing for construction works
should be considered. The use of wooden hoardings
should be avoided and metal hoarding should be
used to facilitate recycling. Purchasing of construction
materials should avoid over-ordering and wastage.
All areas / throughout
construction period
Contractor TMEIA Y
12.6 8.1 The Contractor should recycle as many C&D
materials (this is a waste section) as possible on-site.
The public fill and C&D waste should be segregated
and stored in separate containers or skips to facilitate
the reuse or recycling of materials and proper
disposal. Where practicable, the concrete and
masonry should be crushed and used as fill materials.
Steel reinforcement bar should be collected for use by
All areas / throughout
construction period
Contractor TMEIA Y

13
EIA
Reference
EM&A
Manual
Reference
Environmental Protection Measures Location/ Timing Implementation
Agent
Relevant Standard
or Requirement
Implementation
Stages
Status
D C O
scrap steel mills. Different areas of the sites should be
considered for segregation and storage activities.
12.6 8.1 All falsework will be steel instead of wood. All areas / throughout
construction period
Contractor TMEIA Y
12.6 8.1 Chemical waste producers should register with the
EPD. Chemical waste should be handled in
accordance with the Code of Practice on the
Packaging, Handling and Storage of Chemical
Wastes as follows:
- suitable for the substance to be held, resistant to
corrosion, maintained in good conditions and
securely closed;
- Having a capacity of <450L unless the
specifications have been approved by the EPD;
and
- Displaying a label in English and Chinese
according to the instructions prescribed in
Schedule 2 of the Regulations. Clearly labelled
and used solely for the storage of chemical
wastes;
- Enclosed with at least 3 sides;
- Impermeable floor and bund with capacity to
accommodate 110% of the volume of the largest
container or 20% by volume of the chemical
waste stored in the area, whichever is greatest;
- Adequate ventilation;
- Sufficiently covered to prevent rainfall entering
(water collected within the bund must be tested
and disposed of as chemical waste, if necessary);
and
- Incompatible materials are adequately
separated.
All areas / throughout
construction period
Contractor TMEIA Y <>
12.6 8.1 Waste oils, chemicals or solvents shall not be
disposed of to drain,
All areas / throughout Contractor TMEIA Y

14
EIA
Reference
EM&A
Manual
Reference
Environmental Protection Measures Location/ Timing Implementation
Agent
Relevant Standard
or Requirement
Implementation
Stages
Status
D C O
construction period
12.6 8.1 Adequate numbers of portable toilets should be
provided for on-site workers. Portable toilets should
be maintained in reasonable states, which will not
deter the workers from utilizing them.
All areas / throughout
construction period
Contractor TMEIA Y
12.6 8.1 Night soil should be regularly collected by licensed
collectors.
All areas / throughout
construction period
Contractor TMEIA Y n/a
12.6 8.1 General refuse arising on-site should be stored in
enclosed bins or compaction units separately from
C&D and chemical wastes. Sufficient dustbins shall
be provided for storage of waste as required under
the Public Cleansing and Prevention of Nuisances By-
laws. In addition, general refuse shall be cleared daily
and shall be disposed of to the nearest licensed
landfill or refuse transfer station. Burning of refuse on
construction sites is prohibited.
All areas / throughout
construction period
Contractor TMEIA Y <>
12.6 8.1 All waste containers shall be in a secure area on
hard standing.
All areas /
throughout
construction period
Contractor TMEIA Y
12.6 8.1 Training shall be provided to workers about the
concepts of site cleanliness and appropriate waste
management procedure, including waste
reduction, reuse and recycling.
All areas /
throughout
construction period
Contractor TMEIA Y
12.6 8.1 Office wastes can be reduced by recycling of
paper if such volume is sufficiently large to
warrant collection. Participation in a local
collection scheme by the Contractor should be
advocated. Waste separation facilities for paper,
aluminum cans, plastic bottles, etc. should be
provided on-site.
Site Offices/
throughout
construction period
Contractor TMEIA Y
12.6 Section 8 EM&A of waste handling, storage, transportation,
disposal procedures and documentation through
All areas /
throughout
Contractor EM&A Manual Y <>

15
EIA
Reference
EM&A
Manual
Reference
Environmental Protection Measures Location/ Timing Implementation
Agent
Relevant Standard
or Requirement
Implementation
Stages
Status
D C O
the site audit programme shall be undertaken. construction period
CULTURAL HERITAGE
11.8 Section 9 EM&A in the form of audit of the mitigation
measures
All areas /
throughout
construction period
Highways
Department
EIAO-TM Y n/a
Notes:
Legend: D=Design, C=Construction, O=Operation
Note: Funding Agent for all mitigation measures will be the Highways Department of the Hong Kong SAR Government
Remark:
Compliance of Mitigation Measures
<> Compliance of Mitigation but need improvement
x Non-compliance of Mitigation Measures
▲ Non-compliance of Mitigation Measures but rectified by Contractor
Deficiency of Mitigation Measures but rectified by Contractor
N/A Not Applicable in Reporting Period

Appendix C
Summary of Action and
Limit Levels

ENVIRONMENTAL RESOURCES MANAGEMENT
C1
Table C1 Action and Limit Levels for 1-hour and 24-hour TSP
Parameters Action Limit
24 Hour TSP Level in µg/m³
ASR9A/ASR8A = 178
ASR9C/ASR8/ASR9 = 178
260
1 Hour TSP Level in µg /m³
ASR9A/ASR8A = 394
ASR9C/ASR8/ASR9 = 393
500
Table C2 Action and Limit Levels for Construction Noise (0700-1900 hrs of normal
weekdays)
Time Period Action Limit
0700-1900 hrs on normal weekdays
When one documented complaint is
received
75* dB(A)
Table C3 Action and Limit Levels for Water Quality
Parameter Action Level# Limit Level#
DO in mg/L (a) Surface and Middle Surface and Middle
5.0 mg/L 4.2 mg/L
Bottom Bottom
4.7 mg/L 3.6 mg/L
Turbidity in NTU (Depth-averaged (b), (c))
120% of upstream control station at the same tide of the same day and 95%-ile of baseline data, i.e.,
27.5 NTU
130% of upstream control station at the same tide of the same day and 99%-ile of baseline data, i.e.,
47.0 NTU
SS in mg/L (Depth-averaged (b), (c))
120% of upstream control station at the same tide of the same day and 95%-ile of baseline data, i.e.,
23.5 mg/L
130% of upstream control station at the same tide of the same day and 10mg/L for WSD Seawater Intakes at Tuen Mun and 99%-ile of baseline data, i.e.,
34.4 mg/L
Notes:
# Baseline data: data from HKZMB Baseline Water Quality Monitoring between 6 and 31 October 2011.
(a) For DO, non-compliance of the water quality limits occurs when monitoring result is lower than the limits.
(b) “Depth-averaged” is calculated by taking the arithmetic means of reading of all three depths
(c) For turbidity and SS, non-compliance of the water quality limits occurs when monitoring result is higher than the limits.
(d) All figures given in the table are used for reference only, and EPD may amend the figures whenever it is considered as necessary

ENVIRONMENTAL RESOURCES MANAGEMENT
C2
Parameter Action Level# Limit Level#
(e) The 1%-ile of baseline data for surface and middle DO is 4.2 mg/L, whilst for bottom DO is 3.6 mg/L.
Table C4 Action and Limit Levels for Impact Dolphin Monitoring
North Lantau Social Cluster
NEL NWL
Action Level STG < 70% of baseline &
ANI < 70% of baseline
STG < 70% of baseline &
ANI < 70% of baseline
Limit Level [STG < 40% of baseline & ANI < 40% of baseline]
and
STG < 40% of baseline & ANI < 40% of baseline
Notes:
1. STG means quarterly encounter rate of number of dolphin sightings, which is 6.00 in
NEL and 9.85 in NWL during the baseline monitoring period
2. ANI means quarterly encounter rate of total number of dolphins, which is 22.19 in NEL
and 44.66 in NWL during the baseline monitoring period
3. For North Lantau Social Cluster, AL will be trigger if NEL or NWL fall below the criteria;
LL will be triggered if both NEL and NWL fall below the criteria.
Table C5 Derived Value of Action Level (AL) and Limit Level (LL)
North Lantau Social Cluster
NEL NWL
Action Level STG < 4.2 & ANI< 15.5 STG < 6.9 & ANI < 31.3
Limit Level [STG < 2.4 & ANI <8.9]
and
[STG < 3.9 & ANI <17.9]

Appendix D
Impact Air Quality
Monitoring Graphical
Presentation

Appendix D1 Air Quality Monitoring Results
Weather condition within the reporting period varied between sunny to rainy. The overall monitoring results were not affected by weather
conditions.
Major construction works undertaken within the reporting period include Predrilling at Viaduct F; Construction and installation of pile caps; Pier
construction; Re-alignment of Cheung Tung Road; Additional land GI, trial pits & lab testing; Relocation of MTRC fence; Construction of land
section of berth at Southern Landfall; Road works along North Lantau Highway; Installation of pier head and deck segments; and Slope work of
Viaducts A, B & C.
Marine works within the reporting period include Construction and installation of pile caps; Uninstallation of marine piling platform; Construction
of marine section of berth at southern landfall; Pier construction; Launching gantry operation; and Installation of deck segment and pier head
segment.
0
100
200
300
400
500
6001-hr TSP at ASR8A (µg/m3)
ASR8A
HY/2012/07Commencement of1st-3rd reportingperiodAction Level = 394
Limit Level = 500
BaselineMonitoring Period
Impact MonitoringPeriod
1st & 2nd annualreporting period
Re
sult
pre
sen
ted
in t
he
1st
&2
nd
An
nu
al R
ep
ort
0
100
200
300
400
500
600
1-hr TSP at ASR9 (µg/m3) ASR9
HY/2012/07Commencement of1st-3rd reportingperiodAction Level = 393
Limit Level = 500
BaselineMonitoring Period
Impact MonitoringPeriod
1st & 2nd annualreporting period
Re
sult
pre
sen
ted
in t
he
1st
&2
nd A
nn
ual
Re
po
rt

Appendix D2 Air Quality Monitoring Results
Weather condition within the reporting period varied between sunny to rainy. The overall monitoring results were not affected by weather
conditions.
Major construction works undertaken within the reporting period include Predrilling at Viaduct F; Construction and installation of pile caps; Pier
construction; Re-alignment of Cheung Tung Road; Additional land GI, trial pits & lab testing; Relocation of MTRC fence; Construction of land
section of berth at Southern Landfall; Road works along North Lantau Highway; Installation of pier head and deck segments; and Slope work of
Viaducts A, B & C.
Marine works within the reporting period include Construction and installation of pile caps; Uninstallation of marine piling platform; Construction
of marine section of berth at southern landfall; Pier construction; Launching gantry operation; and Installation of deck segment and pier head
segment.
0
50
100
150
200
250
3002
011
/10
/18
20
11/1
0/2
1
20
11/1
0/2
4
20
11/1
0/2
7
20
11/1
0/3
0
20
13/1
0/3
1
20
15-1
1-0
4
20
15-1
1-1
9
20
15-1
2-0
7
20
15-1
2-2
2
20
16-0
1-0
6
20
16-0
1-2
1
20
16-0
2-0
5
20
16-0
2-2
3
20
16-0
3-0
9
20
16-0
3-2
4
20
16-0
4-1
1
20
16-0
4-2
6
20
16-0
5-1
1
20
16-0
5-2
7
20
16-0
6-1
3
20
16-0
6-2
8
20
16-0
7-1
3
20
16-0
7-2
8
20
16-0
8-1
5
20
16-0
8-3
0
20
16-0
9-1
4
20
16-0
9-2
9
20
16-1
0-1
7
24-hr TSP at ASR8A (µg/m3) ASR8A
Baseline MonitoringPeriod
Impact MonitoringPeriod
Action Level = 178
Limit Level = 260
HY/2012/07Commencement of1st-3rd reportingperiod1st & 2nd annualreporting period
Re
sult
pre
sen
ted
in t
he
1st
& 2
nd A
nn
ual
Re
po
rt
0
50
100
150
200
250
300
20
11/1
0/1
8
20
11/1
0/2
1
20
11/1
0/2
4
20
11/1
0/2
7
20
11/1
0/3
0
20
13/1
0/3
1
20
15-1
1-0
4
20
15-1
1-1
9
20
15-1
2-0
7
20
15-1
2-2
2
20
16-0
1-0
6
20
16-0
1-2
1
20
16-0
2-0
5
20
16-0
2-2
3
20
16-0
3-0
9
20
16-0
3-2
4
20
16-0
4-1
1
20
16-0
4-2
6
20
16-0
5-1
1
20
16-0
5-2
7
20
16-0
6-1
3
20
16-0
6-2
8
20
16-0
7-1
3
20
16-0
7-2
8
20
16-0
8-1
5
20
16-0
8-3
0
20
16-0
9-1
4
20
16-0
9-2
9
20
16-1
0-1
7
24-hr TSP at ASR8/ASR9 (µg/m3) ASR9
Baseline MonitoringPeriod
Impact MonitoringPeriod
Action Level = 178
Limit Level = 260
HY/2012/07Commencement of1st-3rd reportingperiod1st & 2nd annualreporting period
Re
sult
pre
sen
ted
in t
he
1st
& 2
nd A
nn
ual
Re
po
rt

Appendix E
Impact Noise Monitoring
Graphical Presentation

Appendix E Noise Monitoring Results
Weather condition within the reporting period varied between sunny to rainy. The overall monitoring results were not affected by weather conditions.
Major construction works undertaken within the reporting period include Predrilling at Viaduct F; Construction and installation of pile caps; Pier construction; Re-alignment of
Cheung Tung Road; Additional land GI, trial pits & lab testing; Relocation of MTRC fence; Construction of land section of berth at Southern Landfall; Road works along North
Lantau Highway; Installation of pier head and deck segments; and Slope work of Viaducts A, B & C.
Marine works within the reporting period include Construction and installation of pile caps; Uninstallation of marine piling platform; Construction of marine section of berth at
southern landfall; Pier construction; Launching gantry operation; and Installation of deck segment and pier head segment.
Baseline monitoring results are presented graphically in daily average.
0
10
20
30
40
50
60
70
80
Noise Monitoring Results at NSR1A (Leq, 30min)
NSR1A
HY/2012/07 Commencement of 1st - 3rd annual reportingperiodLimit Level = 75dB(A)
Baseline Monitoring Period
Impact Monitoring Period
1st & 2nd annual reporting period
Re
sult
pre
sen
ted
in t
he
1st
& 2
nd
An
nu
al R
ep
ort

Appendix F
Impact Water Quality
Monitoring Graphical
Presentation

Figure F1 Impact Monitoring – Mean Level of Dissolved Oxygen
(mg/L) in surface waters during mid-ebb tide between 1 November
2015 and 31 October 2016 at CS(Mf)3 and CS(Mf)5. (Weather condition varied between sunny to rainy within the reporting period.
Overall monitoring results were not affected by weather conditions.
Marine works in the reporting period include Construction and installation of pile
caps; Uninstallation of marine piling platform; Construction of marine section of berth
at southern landfall; Pier construction; Launching gantry operation; and Installation
of deck segment and pier head segment. WQM on 09 February 2016 was cancelled due
to suspension of marine works during holiday, as well as WQM on 02 August 2016
and 18 October 2016 were cancelled due to adverse weather.)
Environmental
Resources
Management

Figure F2 Impact Monitoring – Mean Level of Dissolved Oxygen
(mg/L) in surface waters during mid-ebb tide between 1 November
2015 and 31 October 2016 at IS(Mf)16 and IS(Mf)9.
(Weather condition varied between sunny to rainy within the reporting period.
Overall monitoring results were not affected by weather conditions.
Marine works in the reporting period include Construction and installation of pile
caps; Uninstallation of marine piling platform; Construction of marine section of berth
at southern landfall; Pier construction; Launching gantry operation; and Installation
of deck segment and pier head segment. WQM on 09 February 2016 was cancelled due
to suspension of marine works during holiday, as well as WQM on 02 August 2016
and 18 October 2016 were cancelled due to adverse weather.)
Environmental
Resources
Management

Figure F3 Impact Monitoring – Mean Level of Dissolved Oxygen
(mg/L) in surface waters during mid-ebb tide between 1 November
2015 and 31 October 2016 at IS8 and SR4.
(Weather condition varied between sunny to rainy within the reporting period.
Overall monitoring results were not affected by weather conditions.
Marine works in the reporting period include Construction and installation of pile
caps; Uninstallation of marine piling platform; Construction of marine section of
berth at southern landfall; Pier construction; Launching gantry operation; and
Installation of deck segment and pier head segment. WQM on 09 February 2016 was
cancelled due to suspension of marine works during holiday, as well as WQM on 02
August 2016 and 18 October 2016 were cancelled due to adverse weather.)
Environmental
Resources
Management
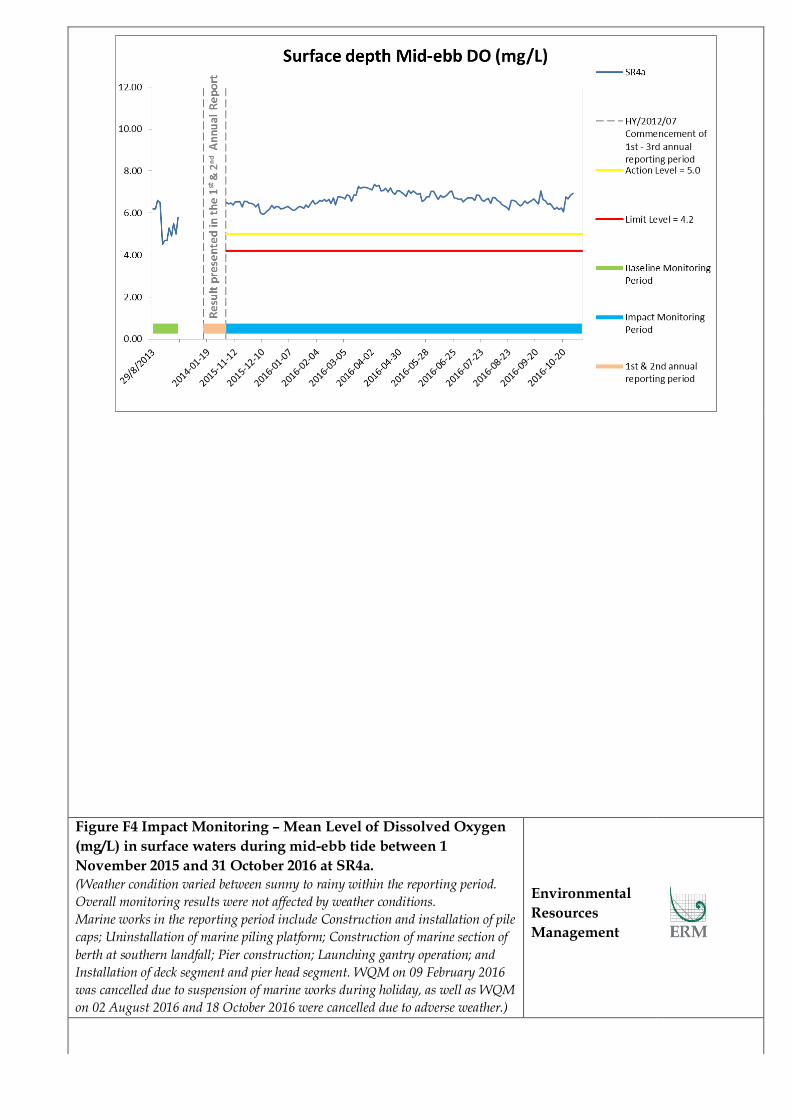
Figure F4 Impact Monitoring – Mean Level of Dissolved Oxygen
(mg/L) in surface waters during mid-ebb tide between 1
November 2015 and 31 October 2016 at SR4a.
(Weather condition varied between sunny to rainy within the reporting period.
Overall monitoring results were not affected by weather conditions.
Marine works in the reporting period include Construction and installation of pile
caps; Uninstallation of marine piling platform; Construction of marine section of
berth at southern landfall; Pier construction; Launching gantry operation; and
Installation of deck segment and pier head segment. WQM on 09 February 2016
was cancelled due to suspension of marine works during holiday, as well as WQM
on 02 August 2016 and 18 October 2016 were cancelled due to adverse weather.)
Environmental
Resources
Management
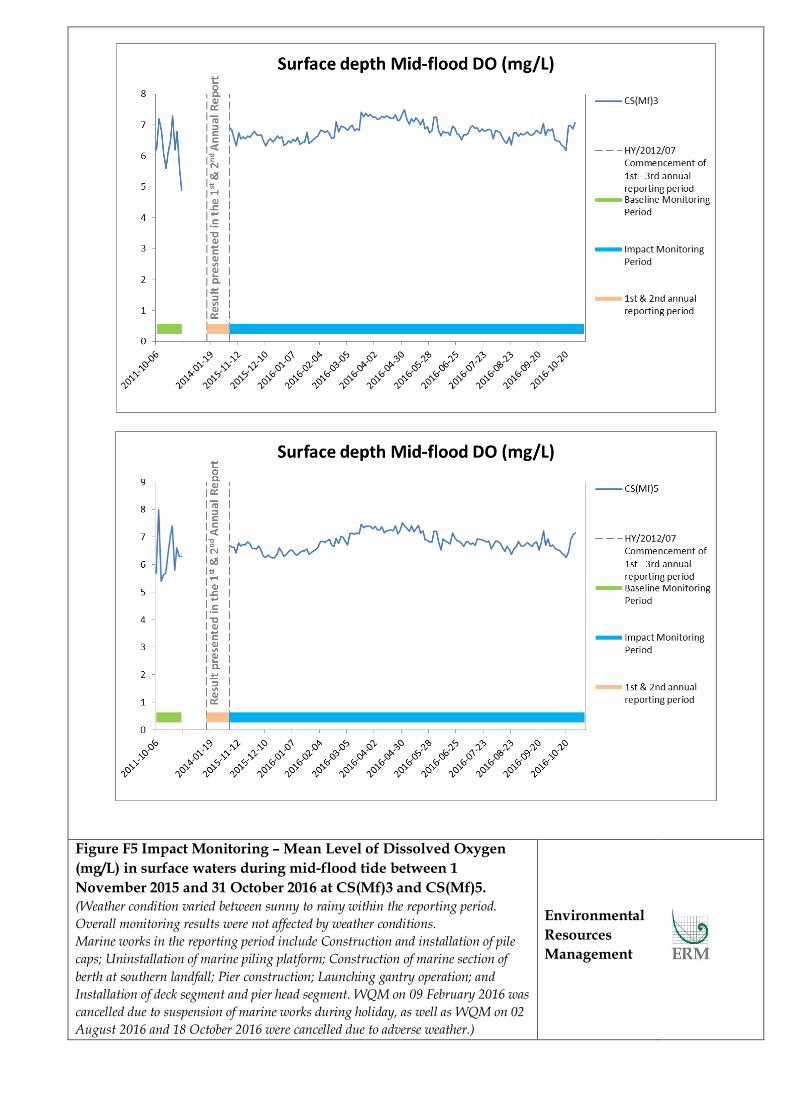
Figure F5 Impact Monitoring – Mean Level of Dissolved Oxygen
(mg/L) in surface waters during mid-flood tide between 1
November 2015 and 31 October 2016 at CS(Mf)3 and CS(Mf)5.
(Weather condition varied between sunny to rainy within the reporting period.
Overall monitoring results were not affected by weather conditions.
Marine works in the reporting period include Construction and installation of pile
caps; Uninstallation of marine piling platform; Construction of marine section of
berth at southern landfall; Pier construction; Launching gantry operation; and
Installation of deck segment and pier head segment. WQM on 09 February 2016 was
cancelled due to suspension of marine works during holiday, as well as WQM on 02
August 2016 and 18 October 2016 were cancelled due to adverse weather.)
Environmental
Resources
Management

Figure F6 Impact Monitoring – Mean Level of Dissolved Oxygen
(mg/L) in surface waters during mid-flood tide between 1
November 2015 and 31 October 2016 at IS(Mf)16 and IS(Mf)9.
(Weather condition varied between sunny to rainy within the reporting period.
Overall monitoring results were not affected by weather conditions.
Marine works in the reporting period include Construction and installation of pile
caps; Uninstallation of marine piling platform; Construction of marine section of
berth at southern landfall; Pier construction; Launching gantry operation; and
Installation of deck segment and pier head segment. WQM on 09 February 2016 was
cancelled due to suspension of marine works during holiday, as well as WQM on 02
August 2016 and 18 October 2016 were cancelled due to adverse weather.)
Environmental
Resources
Management

Figure F7 Impact Monitoring – Mean Level of Dissolved Oxygen
(mg/L) in surface waters during mid-flood tide between 1
November 2015 and 31 October 2016 at IS8 and SR4. (Weather condition varied between sunny to rainy within the reporting period.
Overall monitoring results were not affected by weather conditions.
Marine works in the reporting period include Construction and installation of pile
caps; Uninstallation of marine piling platform; Construction of marine section of
berth at southern landfall; Pier construction; Launching gantry operation; and
Installation of deck segment and pier head segment. WQM on 09 February 2016 was
cancelled due to suspension of marine works during holiday, as well as WQM on 02
August 2016 and 18 October 2016 were cancelled due to adverse weather.)
Environmental
Resources
Management

Figure F8 Impact Monitoring – Mean Level of Dissolved Oxygen
(mg/L) in surface waters during mid-flood tide between 1 November
2015 and 31 October 2016 at SR4a.
(Weather condition varied between sunny to rainy within the reporting period.
Overall monitoring results were not affected by weather conditions.
Marine works in the reporting period include Construction and installation of pile
caps; Uninstallation of marine piling platform; Construction of marine section of berth
at southern landfall; Pier construction; Launching gantry operation; and Installation
of deck segment and pier head segment. WQM on 09 February 2016 was cancelled due
to suspension of marine works during holiday, as well as WQM on 02 August 2016
and 18 October 2016 were cancelled due to adverse weather.)
Environmental
Resources
Management
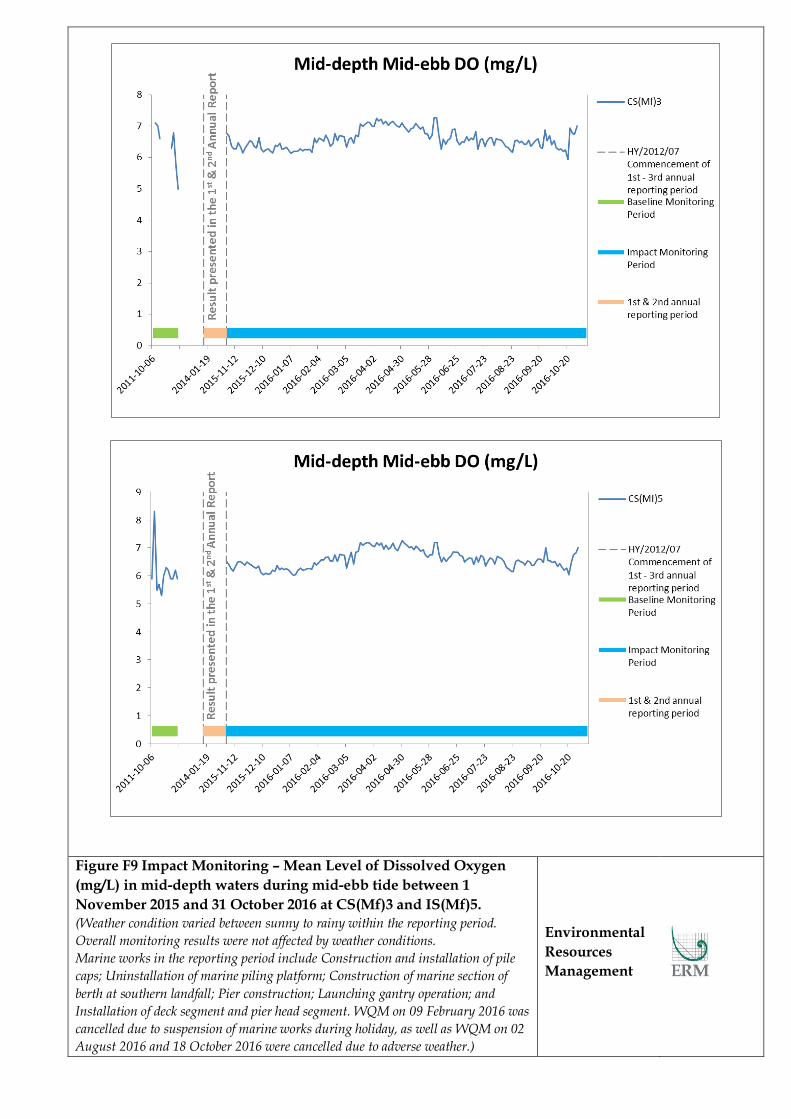
Figure F9 Impact Monitoring – Mean Level of Dissolved Oxygen
(mg/L) in mid-depth waters during mid-ebb tide between 1
November 2015 and 31 October 2016 at CS(Mf)3 and IS(Mf)5.
(Weather condition varied between sunny to rainy within the reporting period.
Overall monitoring results were not affected by weather conditions.
Marine works in the reporting period include Construction and installation of pile
caps; Uninstallation of marine piling platform; Construction of marine section of
berth at southern landfall; Pier construction; Launching gantry operation; and
Installation of deck segment and pier head segment. WQM on 09 February 2016 was
cancelled due to suspension of marine works during holiday, as well as WQM on 02
August 2016 and 18 October 2016 were cancelled due to adverse weather.)
Environmental
Resources
Management

Figure F10 Impact Monitoring – Mean Level of Dissolved Oxygen
(mg/L) in mid-depth waters during mid-ebb tide between 1
November 2015 and 31 October 2016 at IS(Mf)16.
(Weather condition varied between sunny to rainy within the reporting period.
Overall monitoring results were not affected by weather conditions.
Marine works in the reporting period include Construction and installation of pile
caps; Uninstallation of marine piling platform; Construction of marine section of
berth at southern landfall; Pier construction; Launching gantry operation; and
Installation of deck segment and pier head segment. WQM on 09 February 2016 was
cancelled due to suspension of marine works during holiday, as well as WQM on 02
August 2016 and 18 October 2016 were cancelled due to adverse weather.)
Environmental
Resources
Management

Figure F11 Impact Monitoring – Mean Level of Dissolved Oxygen
(mg/L) in mid-depth waters during mid-flood tide between 1
November 2015 and 31 October 2016 at CS(Mf)3 and IS(Mf)5. (Weather condition varied between sunny to rainy within the reporting period.
Overall monitoring results were not affected by weather conditions.
Marine works in the reporting period include Construction and installation of pile
caps; Uninstallation of marine piling platform; Construction of marine section of
berth at southern landfall; Pier construction; Launching gantry operation; and
Installation of deck segment and pier head segment. WQM on 09 February 2016 was
cancelled due to suspension of marine works during holiday, as well as WQM on 02
August 2016 and 18 October 2016 were cancelled due to adverse weather.)
Environmental
Resources
Management

Figure F12 Impact Monitoring – Mean Level of Dissolved Oxygen
(mg/L) in mid-depth waters during mid-flood tide between 1
November 2015 and 31 October 2016 at IS(Mf)16.
(Weather condition varied between sunny to rainy within the reporting period.
Overall monitoring results were not affected by weather conditions.
Marine works in the reporting period include Construction and installation of pile
caps; Uninstallation of marine piling platform; Construction of marine section of
berth at southern landfall; Pier construction; Launching gantry operation; and
Installation of deck segment and pier head segment. WQM on 09 February 2016 was
cancelled due to suspension of marine works during holiday, as well as WQM on 02
August 2016 and 18 October 2016 were cancelled due to adverse weather.)
Environmental
Resources
Management

Figure F13 Impact Monitoring – Mean Level of Dissolved Oxygen
(mg/L) in bottom waters during mid-ebb tide between 1 November
2015 and 31 October 2016 at CS(Mf)3 and CS(Mf)5.
(Weather condition varied between sunny to rainy within the reporting period.
Overall monitoring results were not affected by weather conditions.
Marine works in the reporting period include Construction and installation of pile
caps; Uninstallation of marine piling platform; Construction of marine section of
berth at southern landfall; Pier construction; Launching gantry operation; and
Installation of deck segment and pier head segment. WQM on 09 February 2016 was
cancelled due to suspension of marine works during holiday, as well as WQM on 02
August 2016 and 18 October 2016 were cancelled due to adverse weather.)
Environmental
Resources
Management

Figure F14 Impact Monitoring – Mean Level of Dissolved Oxygen
(mg/L) in bottom waters during mid-ebb tide between 1 November
2015 and 31 October 2016 at IS(Mf)16 and IS(Mf)9.
(Weather condition varied between sunny to rainy within the reporting period.
Overall monitoring results were not affected by weather conditions.
Marine works in the reporting period include Construction and installation of pile
caps; Uninstallation of marine piling platform; Construction of marine section of
berth at southern landfall; Pier construction; Launching gantry operation; and
Installation of deck segment and pier head segment. WQM on 09 February 2016 was
cancelled due to suspension of marine works during holiday, as well as WQM on 02
August 2016 and 18 October 2016 were cancelled due to adverse weather.)
Environmental
Resources
Management

Figure F15 Impact Monitoring – Mean Level of Dissolved Oxygen
(mg/L) in bottom waters during mid-ebb tide between 1 November
2015 and 31 October 2016 at IS8 and SR4.
(Weather condition varied between sunny to rainy within the reporting period.
Overall monitoring results were not affected by weather conditions.
Marine works in the reporting period include Construction and installation of pile
caps; Uninstallation of marine piling platform; Construction of marine section of
berth at southern landfall; Pier construction; Launching gantry operation; and
Installation of deck segment and pier head segment. WQM on 09 February 2016 was
cancelled due to suspension of marine works during holiday, as well as WQM on 02
August 2016 and 18 October 2016 were cancelled due to adverse weather.)
Environmental
Resources
Management

Figure F16 Impact Monitoring – Mean Level of Dissolved Oxygen
(mg/L) in bottom waters during mid-ebb tide between 1 November
2015 and 31 October 2016 at SR4a.
(Weather condition varied between sunny to rainy within the reporting period.
Overall monitoring results were not affected by weather conditions.
Marine works in the reporting period include Construction and installation of pile
caps; Uninstallation of marine piling platform; Construction of marine section of
berth at southern landfall; Pier construction; Launching gantry operation; and
Installation of deck segment and pier head segment. WQM on 09 February 2016 was
cancelled due to suspension of marine works during holiday, as well as WQM on 02
August 2016 and 18 October 2016 were cancelled due to adverse weather.)
Environmental
Resources
Management

Figure F17 Impact Monitoring – Mean Level of Dissolved Oxygen
(mg/L) in bottom waters during mid-flood tide between 1
November 2015 and 31 October 2016 at CS(Mf)3 and CS(Mf)5.
(Weather condition varied between sunny to rainy within the reporting period.
Overall monitoring results were not affected by weather conditions.
Marine works in the reporting period include Construction and installation of pile
caps; Uninstallation of marine piling platform; Construction of marine section of
berth at southern landfall; Pier construction; Launching gantry operation; and
Installation of deck segment and pier head segment. WQM on 09 February 2016 was
cancelled due to suspension of marine works during holiday, as well as WQM on 02
August 2016 and 18 October 2016 were cancelled due to adverse weather.)
Environmental
Resources
Management
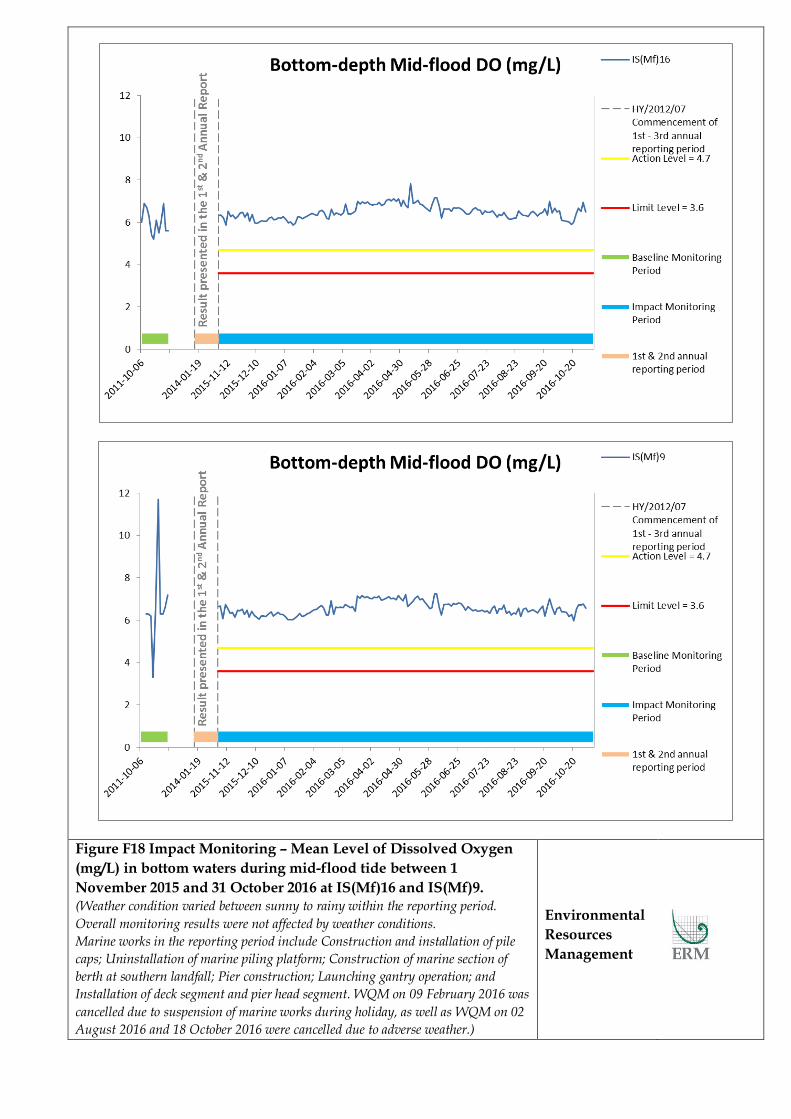
Figure F18 Impact Monitoring – Mean Level of Dissolved Oxygen
(mg/L) in bottom waters during mid-flood tide between 1
November 2015 and 31 October 2016 at IS(Mf)16 and IS(Mf)9. (Weather condition varied between sunny to rainy within the reporting period.
Overall monitoring results were not affected by weather conditions.
Marine works in the reporting period include Construction and installation of pile
caps; Uninstallation of marine piling platform; Construction of marine section of
berth at southern landfall; Pier construction; Launching gantry operation; and
Installation of deck segment and pier head segment. WQM on 09 February 2016 was
cancelled due to suspension of marine works during holiday, as well as WQM on 02
August 2016 and 18 October 2016 were cancelled due to adverse weather.)
Environmental
Resources
Management

Figure F19 Impact Monitoring – Mean Level of Dissolved Oxygen
(mg/L) in bottom waters during mid-flood tide between 1
November 2015 and 31 October 2016 at IS8 and SR4.
(Weather condition varied between sunny to rainy within the reporting period.
Overall monitoring results were not affected by weather conditions.
Marine works in the reporting period include Construction and installation of pile
caps; Uninstallation of marine piling platform; Construction of marine section of
berth at southern landfall; Pier construction; Launching gantry operation; and
Installation of deck segment and pier head segment. WQM on 09 February 2016 was
cancelled due to suspension of marine works during holiday, as well as WQM on 02
August 2016 and 18 October 2016 were cancelled due to adverse weather.)
Environmental
Resources
Management

Figure F20 Impact Monitoring – Mean Level of Dissolved Oxygen
(mg/L) in bottom waters during mid-flood tide between 1
November 2015 and 31 October 2016 at SR4a.
(Weather condition varied between sunny to rainy within the reporting period.
Overall monitoring results were not affected by weather conditions.
Marine works in the reporting period include Construction and installation of pile
caps; Uninstallation of marine piling platform; Construction of marine section of
berth at southern landfall; Pier construction; Launching gantry operation; and
Installation of deck segment and pier head segment. WQM on 09 February 2016 was
cancelled due to suspension of marine works during holiday, as well as WQM on 02
August 2016 and 18 October 2016 were cancelled due to adverse weather.)
Environmental
Resources
Management

Figure F21 Impact Monitoring – Mean Level of depth-averaged
Turbidity (NTU) during mid-ebb tide between 1 November 2015
and 31 October 2016 at CS(Mf)3 and CS(Mf)5. (Weather condition varied between sunny to rainy within the reporting period.
Overall monitoring results were not affected by weather conditions.
Marine works in the reporting period include Construction and installation of pile
caps; Uninstallation of marine piling platform; Construction of marine section of
berth at southern landfall; Pier construction; Launching gantry operation; and
Installation of deck segment and pier head segment. WQM on 09 February 2016 was
cancelled due to suspension of marine works during holiday, as well as WQM on 02
August 2016 and 18 October 2016 were cancelled due to adverse weather.)
Environmental
Resources
Management
Figure F22 Impact Monitoring – Mean Level of depth-averaged
Turbidity (NTU) during mid-ebb tide between 1 November 2015
and 31 October 2016 at IS(Mf)16 and IS(Mf)9. (Weather condition varied between sunny to rainy within the reporting period.
Overall monitoring results were not affected by weather conditions.
Marine works in the reporting period include Construction and installation of pile
caps; Uninstallation of marine piling platform; Construction of marine section of
berth at southern landfall; Pier construction; Launching gantry operation; and
Installation of deck segment and pier head segment. WQM on 09 February 2016 was
cancelled due to suspension of marine works during holiday, as well as WQM on 02
August 2016 and 18 October 2016 were cancelled due to adverse weather.)
Environmental
Resources
Management
Figure F23 Impact Monitoring – Mean Level of depth-averaged
Turbidity (NTU) during mid-ebb tide between 1 November 2015
and 31 October 2016 at IS8 and SR4.
(Weather condition varied between sunny to rainy within the reporting period.
Overall monitoring results were not affected by weather conditions.
Marine works in the reporting period include Construction and installation of pile
caps; Uninstallation of marine piling platform; Construction of marine section of
berth at southern landfall; Pier construction; Launching gantry operation; and
Installation of deck segment and pier head segment. WQM on 09 February 2016 was
cancelled due to suspension of marine works during holiday, as well as WQM on 02
August 2016 and 18 October 2016 were cancelled due to adverse weather.)
Environmental
Resources
Management
Figure F24 Impact Monitoring – Mean Level of depth-averaged
Turbidity (NTU) during mid-ebb tide between 1 November 2015
and 31 October 2016 at SR4a.
(Weather condition varied between sunny to rainy within the reporting period.
Overall monitoring results were not affected by weather conditions.
Marine works in the reporting period include Construction and installation of pile
caps; Uninstallation of marine piling platform; Construction of marine section of
berth at southern landfall; Pier construction; Launching gantry operation; and
Installation of deck segment and pier head segment. WQM on 09 February 2016 was
cancelled due to suspension of marine works during holiday, as well as WQM on 02
August 2016 and 18 October 2016 were cancelled due to adverse weather.)
Environmental
Resources
Management

Figure F25 Impact Monitoring – Mean Level of depth-averaged
Turbidity (NTU) during mid-flood tide between 1 November 2015
and 31 October 2016 at CS(Mf)3 and CS(MF)5.
(Weather condition varied between sunny to rainy within the reporting period.
Overall monitoring results were not affected by weather conditions.
Marine works in the reporting period include Construction and installation of pile
caps; Uninstallation of marine piling platform; Construction of marine section of
berth at southern landfall; Pier construction; Launching gantry operation; and
Installation of deck segment and pier head segment. WQM on 09 February 2016 was
cancelled due to suspension of marine works during holiday, as well as WQM on 02
August 2016 and 18 October 2016 were cancelled due to adverse weather.)
Environmental
Resources
Management

Figure F26 Impact Monitoring – Mean Level of depth-averaged
Turbidity (NTU) during mid-flood tide between 1 November 2015
and 31 October 2016 at IS(Mf)16 and IS(Mf)9. (Weather condition varied between sunny to rainy within the reporting period.
Overall monitoring results were not affected by weather conditions.
Marine works in the reporting period include Construction and installation of pile
caps; Uninstallation of marine piling platform; Construction of marine section of
berth at southern landfall; Pier construction; Launching gantry operation; and
Installation of deck segment and pier head segment. WQM on 09 February 2016 was
cancelled due to suspension of marine works during holiday, as well as WQM on 02
August 2016 and 18 October 2016 were cancelled due to adverse weather.)
Environmental
Resources
Management

Figure F27 Impact Monitoring – Mean Level of depth-averaged
Turbidity (NTU) during mid-flood tide between 1 November 2015
and 31 October 2016 at IS8 and SR4. (Weather condition varied between sunny to rainy within the reporting period.
Overall monitoring results were not affected by weather conditions.
Marine works in the reporting period include Construction and installation of pile
caps; Uninstallation of marine piling platform; Construction of marine section of
berth at southern landfall; Pier construction; Launching gantry operation; and
Installation of deck segment and pier head segment. WQM on 09 February 2016 was
cancelled due to suspension of marine works during holiday, as well as WQM on 02
August 2016 and 18 October 2016 were cancelled due to adverse weather.)
Environmental
Resources
Management

Figure F28 Impact Monitoring – Mean Level of depth-averaged
Turbidity (NTU) during mid-flood tide between 1 November 2015
and 31 October 2016 at SR4a.
(Weather condition varied between sunny to rainy within the reporting period.
Overall monitoring results were not affected by weather conditions.
Marine works in the reporting period include Construction and installation of pile
caps; Uninstallation of marine piling platform; Construction of marine section of
berth at southern landfall; Pier construction; Launching gantry operation; and
Installation of deck segment and pier head segment. WQM on 09 February 2016 was
cancelled due to suspension of marine works during holiday, as well as WQM on 02
August 2016 and 18 October 2016 were cancelled due to adverse weather.)
Environmental
Resources
Management

Figure F29 Impact Monitoring – Mean Level of depth-averaged
Suspended Solids (mg/L) during mid-ebb tide between 1 November
2015 and 31 October 2016 at CS(Mf)3 and CS(Mf)5.
(Weather condition varied between sunny to rainy within the reporting period.
Overall monitoring results were not affected by weather conditions.
Marine works in the reporting period include Construction and installation of pile
caps; Uninstallation of marine piling platform; Construction of marine section of
berth at southern landfall; Pier construction; Launching gantry operation; and
Installation of deck segment and pier head segment. WQM on 09 February 2016 was
cancelled due to suspension of marine works during holiday, as well as WQM on 02
August 2016 and 18 October 2016 were cancelled due to adverse weather.)
Environmental
Resources
Management
Figure F30 Impact Monitoring – Mean Level of depth-averaged
Suspended Solids (mg/L) during mid-ebb tide between 1 November
2015 and 31 October 2016 at IS(Mf)16 and IS(Mf)9.
(Weather condition varied between sunny to rainy within the reporting period.
Overall monitoring results were not affected by weather conditions.
Marine works in the reporting period include Construction and installation of pile
caps; Uninstallation of marine piling platform; Construction of marine section of
berth at southern landfall; Pier construction; Launching gantry operation; and
Installation of deck segment and pier head segment. WQM on 09 February 2016 was
cancelled due to suspension of marine works during holiday, as well as WQM on 02
August 2016 and 18 October 2016 were cancelled due to adverse weather.)
Environmental
Resources
Management

Figure F31 Impact Monitoring – Mean Level of depth-averaged
Suspended Solids (mg/L) during mid-ebb tide between 1 November
2015 and 31 October 2016 at IS8 and SR4.
(Weather condition varied between sunny to rainy within the reporting period.
Overall monitoring results were not affected by weather conditions.
Marine works in the reporting period include Construction and installation of pile
caps; Uninstallation of marine piling platform; Construction of marine section of
berth at southern landfall; Pier construction; Launching gantry operation; and
Installation of deck segment and pier head segment. WQM on 09 February 2016 was
cancelled due to suspension of marine works during holiday, as well as WQM on 02
August 2016 and 18 October 2016 were cancelled due to adverse weather.)
Environmental
Resources
Management

Figure F32 Impact Monitoring – Mean Level of depth-averaged
Suspended Solids (mg/L) during mid-ebb tide between 1 November
2015 and 31 October 2016 at SR4a.
(Weather condition varied between sunny to rainy within the reporting period.
Overall monitoring results were not affected by weather conditions.
Marine works in the reporting period include Construction and installation of pile
caps; Uninstallation of marine piling platform; Construction of marine section of
berth at southern landfall; Pier construction; Launching gantry operation; and
Installation of deck segment and pier head segment. WQM on 09 February 2016 was
cancelled due to suspension of marine works during holiday, as well as WQM on 02
August 2016 and 18 October 2016 were cancelled due to adverse weather.)
Environmental
Resources
Management

Figure F33 Impact Monitoring – Mean Level of depth-averaged
Suspended Solids (mg/L) during mid-flood tide between 1
November 2015 and 31 October 2016 at CS(Mf)3 and CS(Mf)5. (Weather condition varied between sunny to rainy within the reporting period.
Overall monitoring results were not affected by weather conditions.
Marine works in the reporting period include Construction and installation of pile
caps; Uninstallation of marine piling platform; Construction of marine section of
berth at southern landfall; Pier construction; Launching gantry operation; and
Installation of deck segment and pier head segment. WQM on 09 February 2016 was
cancelled due to suspension of marine works during holiday, as well as WQM on 02
August 2016 and 18 October 2016 were cancelled due to adverse weather.)
Environmental
Resources
Management

Figure F34 Impact Monitoring – Mean Level of depth-averaged
Suspended Solids (mg/L) during mid-flood tide between 1
November 2015 and 31 October 2016 at IS(Mf)16 and IS(Mf)9 .
(Weather condition varied between sunny to rainy within the reporting period.
Overall monitoring results were not affected by weather conditions.
Marine works in the reporting period include Construction and installation of pile
caps; Uninstallation of marine piling platform; Construction of marine section of
berth at southern landfall; Pier construction; Launching gantry operation; and
Installation of deck segment and pier head segment. WQM on 09 February 2016 was
cancelled due to suspension of marine works during holiday, as well as WQM on 02
August 2016 and 18 October 2016 were cancelled due to adverse weather.)
Environmental
Resources
Management

Figure F35 Impact Monitoring – Mean Level of depth-averaged
Suspended Solids (mg/L) during mid-flood tide between 1
November 2015 and 31 October 2016 at IS8 and SR4.
(Weather condition varied between sunny to rainy within the reporting period.
Overall monitoring results were not affected by weather conditions.
Marine works in the reporting period include Construction and installation of pile
caps; Uninstallation of marine piling platform; Construction of marine section of
berth at southern landfall; Pier construction; Launching gantry operation; and
Installation of deck segment and pier head segment. WQM on 09 February 2016 was
cancelled due to suspension of marine works during holiday, as well as WQM on 02
August 2016 and 18 October 2016 were cancelled due to adverse weather.)
Environmental
Resources
Management

Figure F36 Impact Monitoring – Mean Level of depth-averaged
Suspended Solids (mg/L) during mid-flood tide between 1
November 2015 and 31 October 2016 at SR4a. (Weather condition varied between sunny to rainy within the reporting period.
Overall monitoring results were not affected by weather conditions.
Marine works in the reporting period include Construction and installation of pile
caps; Uninstallation of marine piling platform; Construction of marine section of
berth at southern landfall; Pier construction; Launching gantry operation; and
Installation of deck segment and pier head segment. WQM on 09 February 2016 was
cancelled due to suspension of marine works during holiday, as well as WQM on 02
August 2016 and 18 October 2016 were cancelled due to adverse weather.)
Environmental
Resources
Management

Appendix G
Impact Dolphin Monitoring
Survey Result

HK CETACEAN RESEARCH PROJECT
香港鯨豚研究計劃 ________________________________________________________________________________________________
- Page 1 -
CONTRACT NO. HY/2012/07 Hong Kong-Zhuhai-Macao Bridge Tuen Mun – Chek Lap Kok Link (Southern Connection Viaduct Section) Chinese White Dolphin Monitoring
Third Annual Progress Report (November 2015 - October 2016) submitted to Gammon Construction Limited Submitted by Samuel K.Y. Hung, Ph.D., Hong Kong Cetacean Research Project 23 March 2017
1. Introduction 1.1. The Tuen Mun-Chek Lap Kok Link (TM-CLKL) comprises a 1.6 km long dual 2-lane viaduct
section between the Hong Kong Boundary Crossing Facilities (HKBCF) and the North Lantau Highway and associated roads at Tai Ho. Gammon Construction Limited (hereinafter called the “Contractor”) was awarded as the main contractor of “Contract No. HY/2012/07 – Hong Kong-Zhuhai-Macao Bridge Tuen Mun-Chek Lap Kok Link – Southern Connection Viaduct Section”.
1.2. According to the updated Environmental Monitoring and Audit (EM&A) Manual (for
TM-CLKL), monthly line-transect vessel surveys for Chinese White Dolphin should be conducted to cover the Northwest (NWL) and Northeast Lantau (NEL) survey areas as in AFCD annual marine mammal monitoring programme. However, as such surveys have been undertaken by the HKLR03 and HKBCF projects in the same areas (i.e. NWL and NEL), a combined monitoring approach is recommended by the Highways Department, that the TM-CLKL EM&A project can utilize the monitoring data collected by HKLR03 or HKBCF project to avoid any redundancy in monitoring effort. Such exemption for the dolphin monitoring will end upon the completion of the dolphin monitoring carried out by HKLR03 contract as well as the TM-CLKL Northern Connection Sub-Sea Tunnel Section (HY/2012/08)
1.3. In November 2013, the Director of Hong Kong Cetacean Research Project (HKCRP), Dr.
Samuel Hung, has been appointed by Gammon Construction Limited as their dolphin specialist for the TM-CLKL Southern Viaduct Section EM&A project. He is responsible for the dolphin monitoring study, including the data collection on Chinese White Dolphins during the construction phase (i.e. impact period) of the TM-CLKL project in Northwest Lantau (NWL) and Northeast Lantau (NEL) survey areas.
1.4. During the construction period of HKLR, the dolphin specialist would be in charge of
reviewing and collating information collected by HKLR03 dolphin monitoring programme to
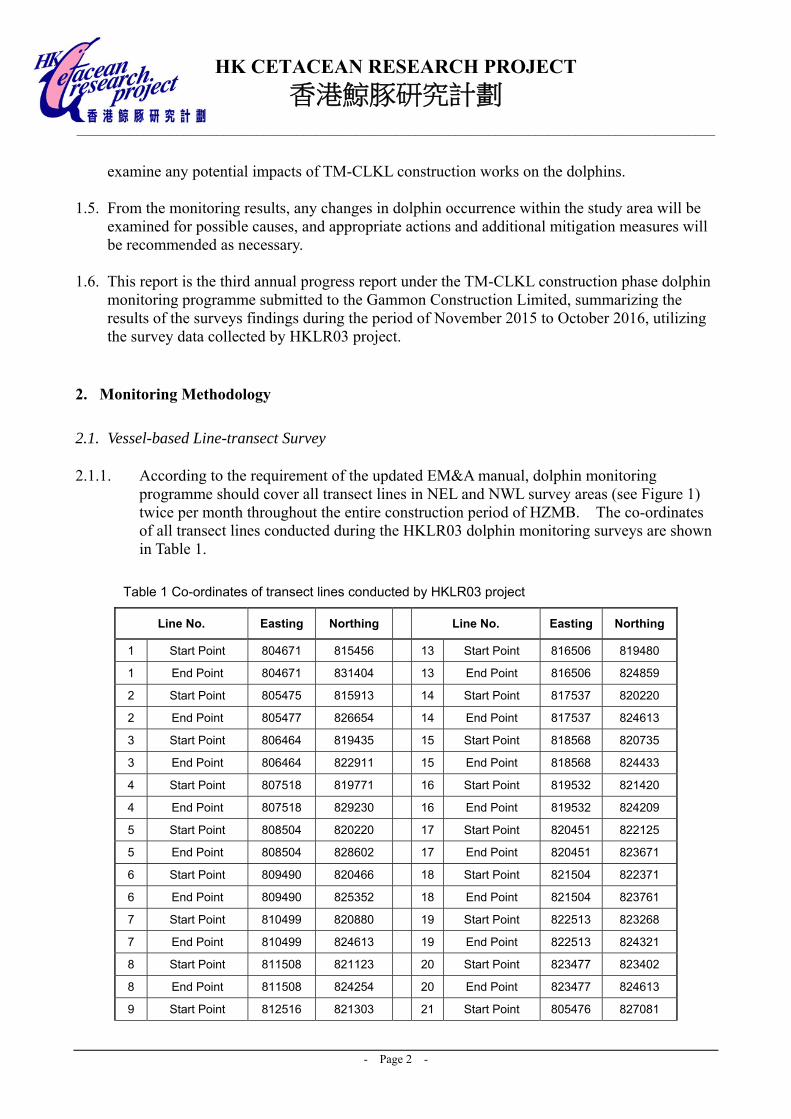
HK CETACEAN RESEARCH PROJECT
香港鯨豚研究計劃 ________________________________________________________________________________________________
- Page 2 -
examine any potential impacts of TM-CLKL construction works on the dolphins. 1.5. From the monitoring results, any changes in dolphin occurrence within the study area will be
examined for possible causes, and appropriate actions and additional mitigation measures will be recommended as necessary.
1.6. This report is the third annual progress report under the TM-CLKL construction phase dolphin
monitoring programme submitted to the Gammon Construction Limited, summarizing the results of the surveys findings during the period of November 2015 to October 2016, utilizing the survey data collected by HKLR03 project.
2. Monitoring Methodology 2.1. Vessel-based Line-transect Survey 2.1.1. According to the requirement of the updated EM&A manual, dolphin monitoring
programme should cover all transect lines in NEL and NWL survey areas (see Figure 1) twice per month throughout the entire construction period of HZMB. The co-ordinates of all transect lines conducted during the HKLR03 dolphin monitoring surveys are shown in Table 1.
Table 1 Co-ordinates of transect lines conducted by HKLR03 project
Line No. Easting Northing Line No. Easting Northing
1 Start Point 804671 815456 13 Start Point 816506 819480
1 End Point 804671 831404 13 End Point 816506 824859
2 Start Point 805475 815913 14 Start Point 817537 820220
2 End Point 805477 826654 14 End Point 817537 824613
3 Start Point 806464 819435 15 Start Point 818568 820735
3 End Point 806464 822911 15 End Point 818568 824433
4 Start Point 807518 819771 16 Start Point 819532 821420
4 End Point 807518 829230 16 End Point 819532 824209
5 Start Point 808504 820220 17 Start Point 820451 822125
5 End Point 808504 828602 17 End Point 820451 823671
6 Start Point 809490 820466 18 Start Point 821504 822371
6 End Point 809490 825352 18 End Point 821504 823761
7 Start Point 810499 820880 19 Start Point 822513 823268
7 End Point 810499 824613 19 End Point 822513 824321
8 Start Point 811508 821123 20 Start Point 823477 823402
8 End Point 811508 824254 20 End Point 823477 824613
9 Start Point 812516 821303 21 Start Point 805476 827081

HK CETACEAN RESEARCH PROJECT
香港鯨豚研究計劃 ________________________________________________________________________________________________
- Page 3 -
9 End Point 812516 824254 21 End Point 805476 830562
10 Start Point 813525 820872 22 Start Point 806464 824033
10 End Point 813525 824657 22 End Point 806464 829598
11 Start Point 814556 818853 23 Start Point 814559 821739
11 End Point 814556 820992 23 End Point 814559 824768
12 Start Point 815542 818807
12 End Point 815542 824882
2.1.2. The HKLR03 survey team used standard line-transect methods (Buckland et al. 2001) to
conduct the systematic vessel surveys, and followed the same technique of data collection that has been adopted over the last 20 years of marine mammal monitoring surveys in Hong Kong developed by HKCRP (see Hung 2015, 2016). For each monitoring vessel survey, a 15-m inboard vessel with an open upper deck (about 4.5 m above water surface) was used to make observations from the flying bridge area.
2.1.3. Two experienced observers (a data recorder and a primary observer) made up the
on-effort survey team, and the survey vessel transited different transect lines at a constant speed of 13-15 km per hour. The data recorder searched with unaided eyes and filled out the datasheets, while the primary observer searched for dolphins and porpoises continuously through 7 x 50 Fujinon or Steiner marine binoculars. Both observers searched the sea ahead of the vessel, between 270o and 90o (in relation to the bow, which is defined as 0o). One to two additional experienced observers were available on the boat to work in shift (i.e. rotate every 30 minutes) in order to minimize fatigue of the survey team members. All observers were experienced in small cetacean survey techniques and identifying local cetacean species.
2.1.4. During on-effort survey periods, the survey team recorded effort data including time,
positions (latitude and longitude), weather conditions (Beaufort sea state and visibility), and distance traveled in each series (a continuous period of search effort) with the assistance of a handheld GPS.
2.1.5. Data including time, position and vessel speed were also automatically and continuously
logged by handheld GPS throughout the entire survey for subsequent review. 2.1.6. When dolphins were sighted, the survey team would end the survey effort, and
immediately record the initial sighting distance and angle of the dolphin group from the survey vessel, as well as the sighting time and position. Then the research vessel was diverted from its course to approach the animals for species identification, group size estimation, assessment of group composition, and behavioural observations. The perpendicular distance (PSD) of the dolphin group to the transect line was later calculated from the initial sighting distance and angle.
2.1.7. Survey effort being conducted along the parallel transect lines that were perpendicular to
the coastlines (as indicated in Figure 1) was labeled as “primary” survey effort, while the survey effort conducted along the connecting lines between parallel lines was labeled as

HK CETACEAN RESEARCH PROJECT
香港鯨豚研究計劃 ________________________________________________________________________________________________
- Page 4 -
“secondary” survey effort. According to HKCRP long-term dolphin monitoring data, encounter rates of Chinese white dolphins deduced from effort and sighting data collected along primary and secondary lines were similar in NEL and NWL survey areas. Therefore, both primary and secondary survey effort were presented as on-effort survey effort in this report.
2.2. Photo-identification Work 2.2.1. When a group of Chinese White Dolphins were sighted during the line-transect survey,
the HKLR03 survey team would end effort and approach the group slowly from the side and behind to take photographs of them. Every attempt was made to photograph every dolphin in the group, and even photograph both sides of the dolphins, since the colouration and markings on both sides may not be symmetrical.
2.2.2. A professional digital camera (Canon EOS 7D or 60D model), equipped with long
telephoto lenses (100-400 mm zoom), were available on board for researchers to take sharp, close-up photographs of dolphins as they surfaced. The images were shot at the highest available resolution and stored on Compact Flash memory cards for downloading onto a computer.
2.2.3. All digital images taken in the field were first examined, and those containing potentially
identifiable individuals were sorted out. These photographs would then be examined in greater detail, and were carefully compared to the existing Chinese White Dolphin photo-identification catalogue maintained by HKCRP since 1995.
2.2.4. Chinese White Dolphins can be identified by their natural markings, such as nicks, cuts,
scars and deformities on their dorsal fin and body, and their unique spotting patterns were also used as secondary identifying features (Jefferson 2000).
2.2.5. All photographs of each individual were then compiled and arranged in chronological
order, with data including the date and location first identified (initial sighting), re-sightings, associated dolphins, distinctive features, and age classes entered into a computer database.
2.3. Data Analysis 2.3.1. The following analyses were performed utilizing the HKLR03 dolphin monitoring data
collected under the present impact phase (the third year of TMCLKL construction; i.e. November 2015 to October 2016). In addition, these analyses were also conducted for the one-year baseline phase (one year before any HZMB construction works have commenced; i.e. February 2011 to January 2012); the one-year transitional phase (one year after the HZMB construction works (HKBCF and HKLR works) have commenced, but before the commencement of TMCLKL construction works; i.e. November 2012 to October 2013); and the first and second years of TMCLKL construction (i.e. November 2013 to October 2014 & November 2014 to October 2015).

HK CETACEAN RESEARCH PROJECT
香港鯨豚研究計劃 ________________________________________________________________________________________________
- Page 5 -
2.3.2. Along with the analyzed results from the baseline and transitional as well as the first and second years of impact phase, results from the third year of impact phase can then be interpreted from the examination of any temporal changes before and during the construction activities of TMCLKL on dolphin usage in North Lantau waters. For the baseline phase, both baseline monitoring data collected under HZMB contract as well as the AFCD long-term dolphin monitoring data were included to increase the sample size in order to match the similar amount of survey effort in transitional and impact phases, both of which only HKLR03 monitoring data were included for the various analyses.
Distribution analysis
2.3.3. The line-transect survey data was integrated with the Geographic Information System (GIS) in order to visualize and interpret different spatial and temporal patterns of dolphin distribution using sighting positions. Location data of dolphin groups were plotted on map layers of Hong Kong using a desktop GIS (ArcView© 3.1) to examine their distribution patterns in details. The dataset was also stratified into different subsets to examine distribution patterns of dolphin groups with different categories of group sizes, young calves and activities.
Encounter rate analysis
2.3.4. Encounter rate analysis – Encounter rates of Chinese white dolphins (number of on-effort sightings per 100 km of survey effort, and total number of dolphins sighted on-effort per 100 km of survey effort) were calculated in NEL and NWL survey areas in relation to the amount of survey effort conducted during each month of monitoring survey. Only data collected under Beaufort 3 or below condition would be used for the encounter rate analyses. Dolphin encounter rates during the impact phase were calculated in two ways for comparisons with the HZMB baseline and transitional period monitoring results as well as to the AFCD long-term marine mammal monitoring results.
2.3.5. Firstly, for the comparison with the HZMB monitoring results, the encounter rates were
calculated using primary survey effort alone. The average encounter rate of sightings (STG) and average encounter rate of dolphins (ANI) were deduced based on the encounter rates from the 24 events during the present 12-month study period (i.e. 24 sets of line-transect surveys in North Lantau), which was also compared with the ones deduced from the events during the first and second years of impact period as well as the transitional period and baseline period.
2.3.6. Secondly, the encounter rates were also calculated using both primary and secondary survey
effort as in AFCD long-term monitoring study. The encounter rate of sightings and dolphins were deduced by diving the total number of on-effort sightings (STG) and total number of dolphins (ANI) by the amount of survey effort for the present 12-month study period.
Quantitative grid analysis on habitat use
2.3.7. To conduct quantitative grid analysis of habitat use, positions of on-effort sightings of Chinese White Dolphins collected during the quarterly impact phase monitoring period were plotted onto 1-km2 grids among NWL and NEL survey areas on GIS. Sighting densities (number of on-effort sightings per km2) and dolphin densities (total number of dolphins
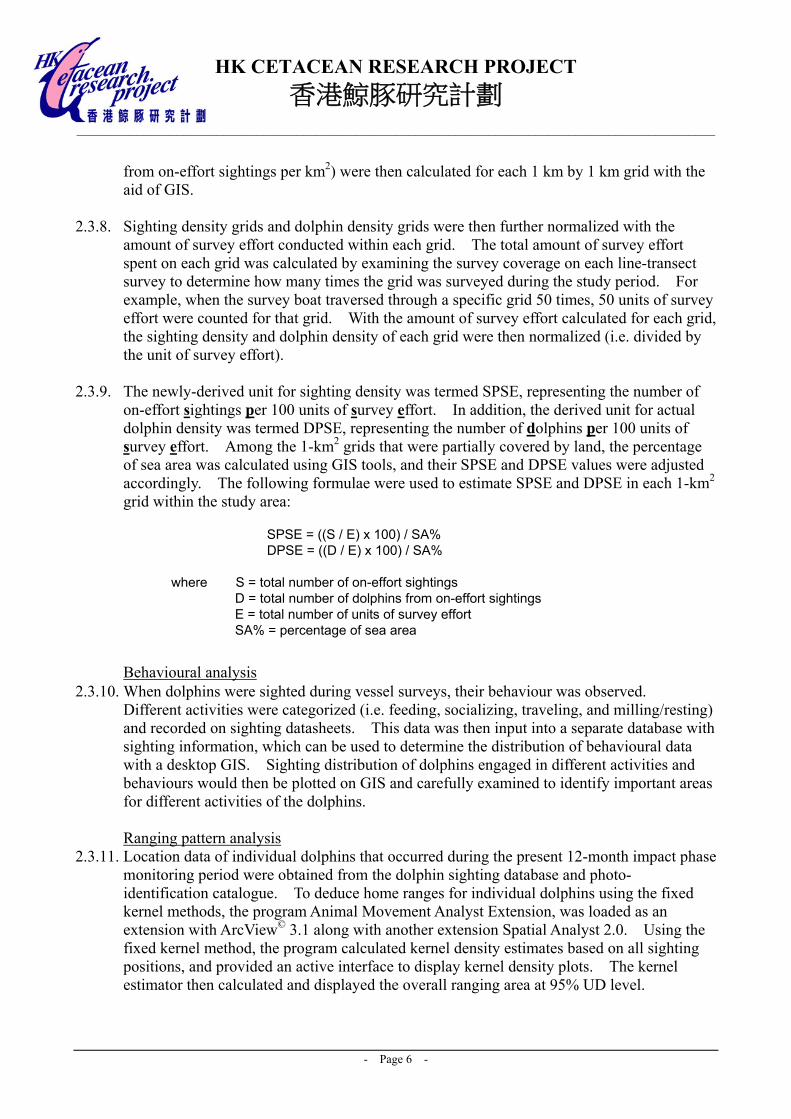
HK CETACEAN RESEARCH PROJECT
香港鯨豚研究計劃 ________________________________________________________________________________________________
- Page 6 -
from on-effort sightings per km2) were then calculated for each 1 km by 1 km grid with the aid of GIS.
2.3.8. Sighting density grids and dolphin density grids were then further normalized with the
amount of survey effort conducted within each grid. The total amount of survey effort spent on each grid was calculated by examining the survey coverage on each line-transect survey to determine how many times the grid was surveyed during the study period. For example, when the survey boat traversed through a specific grid 50 times, 50 units of survey effort were counted for that grid. With the amount of survey effort calculated for each grid, the sighting density and dolphin density of each grid were then normalized (i.e. divided by the unit of survey effort).
2.3.9. The newly-derived unit for sighting density was termed SPSE, representing the number of
on-effort sightings per 100 units of survey effort. In addition, the derived unit for actual dolphin density was termed DPSE, representing the number of dolphins per 100 units of survey effort. Among the 1-km2 grids that were partially covered by land, the percentage of sea area was calculated using GIS tools, and their SPSE and DPSE values were adjusted accordingly. The following formulae were used to estimate SPSE and DPSE in each 1-km2 grid within the study area:
SPSE = ((S / E) x 100) / SA% DPSE = ((D / E) x 100) / SA%
where S = total number of on-effort sightings
D = total number of dolphins from on-effort sightings E = total number of units of survey effort SA% = percentage of sea area
Behavioural analysis
2.3.10. When dolphins were sighted during vessel surveys, their behaviour was observed. Different activities were categorized (i.e. feeding, socializing, traveling, and milling/resting) and recorded on sighting datasheets. This data was then input into a separate database with sighting information, which can be used to determine the distribution of behavioural data with a desktop GIS. Sighting distribution of dolphins engaged in different activities and behaviours would then be plotted on GIS and carefully examined to identify important areas for different activities of the dolphins.
Ranging pattern analysis
2.3.11. Location data of individual dolphins that occurred during the present 12-month impact phase monitoring period were obtained from the dolphin sighting database and photo- identification catalogue. To deduce home ranges for individual dolphins using the fixed kernel methods, the program Animal Movement Analyst Extension, was loaded as an extension with ArcView© 3.1 along with another extension Spatial Analyst 2.0. Using the fixed kernel method, the program calculated kernel density estimates based on all sighting positions, and provided an active interface to display kernel density plots. The kernel estimator then calculated and displayed the overall ranging area at 95% UD level.

HK CETACEAN RESEARCH PROJECT
香港鯨豚研究計劃 ________________________________________________________________________________________________
- Page 7 -
3. Monitoring Results 3.1. Summary of survey effort and dolphin sightings 3.1.1. During the third year of TMCLKL impact phase monitoring (November 2015 to October
2016), a total of 24 sets of systematic line-transect vessel surveys were conducted under the HKLR03 monitoring works to cover all transect lines in NWL and NEL survey areas twice per month.
3.1.2. From these HKLR03 surveys, a total of 3,598.07 km of survey effort was collected, with
92.7% of the total survey effort being conducted under favourable weather conditions (i.e. Beaufort Sea State 3 or below with good visibility). Among the two areas, 1,373.63 km and 2,224.44 km of survey effort were conducted in NEL and NWL survey areas respectively.
3.1.3. The total survey effort conducted on primary lines was 2,609.11 km, while the effort on
secondary lines was 988.96 km. The survey effort conducted on primary and secondary lines were both considered as on-effort survey data. Summary table of the survey effort is shown in Appendix I.
3.1.4. From the 24 sets of HKLR03 monitoring surveys from November 2015 to October 2016,
a total of 45 groups of 168 Chinese White Dolphins were sighted. All except seven dolphin groups were sighted during on-effort search. Among the 38 on-effort sightings, 33 of them were made on primary lines, while the other five dolphin sightings were made on secondary lines.
3.1.5. During this 12-month period, all except one dolphin sighting were made in NWL, and the
only rare off-effort sighting made in NEL on June 6th was a lone animal. A summary table of the dolphin sightings is shown in Appendix II.
3.2. Distribution 3.2.1. Distribution of dolphin sightings made during the HKLR03 monitoring surveys in
November 2015 to October 2016 is shown in Figure 1. 3.2.2. Similar to the first and second years of impact phase, the majority of dolphin sightings
made during the third year of impact phase were concentrated at the northwestern end of the North Lantau region, mainly to the north of Lung Kwu Chau (Figure 1). Some dolphin groups were also sighted around Lung Kwu Chau and Sha Chau, near Pillar Point and near Shum Wat in NWL, while the lone sighting made in NEL was located in the coastal water between Shum Shui Kok and Yam O (Figure 1).
3.2.3. None of the dolphin groups were sighted in the vicinity of TMCLKL southern viaduct,
but one group was sighted adjacent to the northern landfall of TMCLKL construction site (Figure 1). Moreover, another sighting was made just to the north of HKBCF, while four sightings were made adjacent to the HKLR09 alignment near Shum Wat (Figure 1).

HK CETACEAN RESEARCH PROJECT
香港鯨豚研究計劃 ________________________________________________________________________________________________
- Page 8 -
3.2.4. In general, dolphins appeared to have mostly avoided the construction areas of HZMB works during the present impact phase monitoring period, which was consistent with the dolphin distribution during the first two years of impact phase.
3.2.5. Dolphin sighting distribution of the present impact phase monitoring period (November
2015 to October 2016) was compared to the ones during the baseline phase (February 2011 to January 2012), the transitional phase (November 2012 to October 2013) and the first and second years of impact phase (November 2013 to October 2014 & November 2014 to October 2015 respectively).
3.2.6. During the present impact phase period in 2015-16, the distribution was largely similar to
the previous impact phase period in 2014-15, with dolphins being largely vacated from the NEL survey area and the eastern half of the NWL survey area (Figure 2). This was in stark contrast to their very frequent occurrence around the Brothers Islands, Shum Shui Kok, the waters between Pillar Point and airport platform, and the vicinity of HZMB-associated work sites during the baseline period (Figure 2). Even in the transitional phase, dolphins still utilized these waters in a moderate extent, but such usage has progressively diminished during the three periods of impact phase of TMCLKL construction (Figure 2).
3.2.7. The only area where dolphin occurrence was consistent across the five periods was
around the Lung Kwu Chau area, but even so such occurrence there was progressively diminishing in recent years (Figure 2).
3.2.8. Notably, dolphin usage around Lung Kwu Chau reached to a lower point in 2015-16, with
only a few dolphin groups sighted at this critical dolphin habitat in the past (Figure 2). Such decline could be related to the recent diversion of high-speed ferry traffic originated from the Airport’s Sky Pier, where the ferries have been traversing through the waters to the north of Lung Kwu Chau since late December 2015.
3.3. Encounter rate 3.3.1. During the present 12-month impact phase monitoring period, the average daily encounter
rates of Chinese White Dolphins were deduced in NEL and NWL survey areas, and compared to the ones deduced from the baseline, transitional and first year of impact phases (Table 2).
3.3.2. To facilitate the comparison with the AFCD long-term monitoring results, the encounter
rates were also calculated for the present 12-month study period using both primary and secondary survey effort. The encounter rates of sightings (STG) and dolphins (ANI) in NWL were 1.82 sightings and 7.08 dolphins per 100 km of survey effort respectively, while the encounter rates of sightings (STG) and dolphins (ANI) in NEL were both nil with no on-effort sighting being made there in 2015-16.
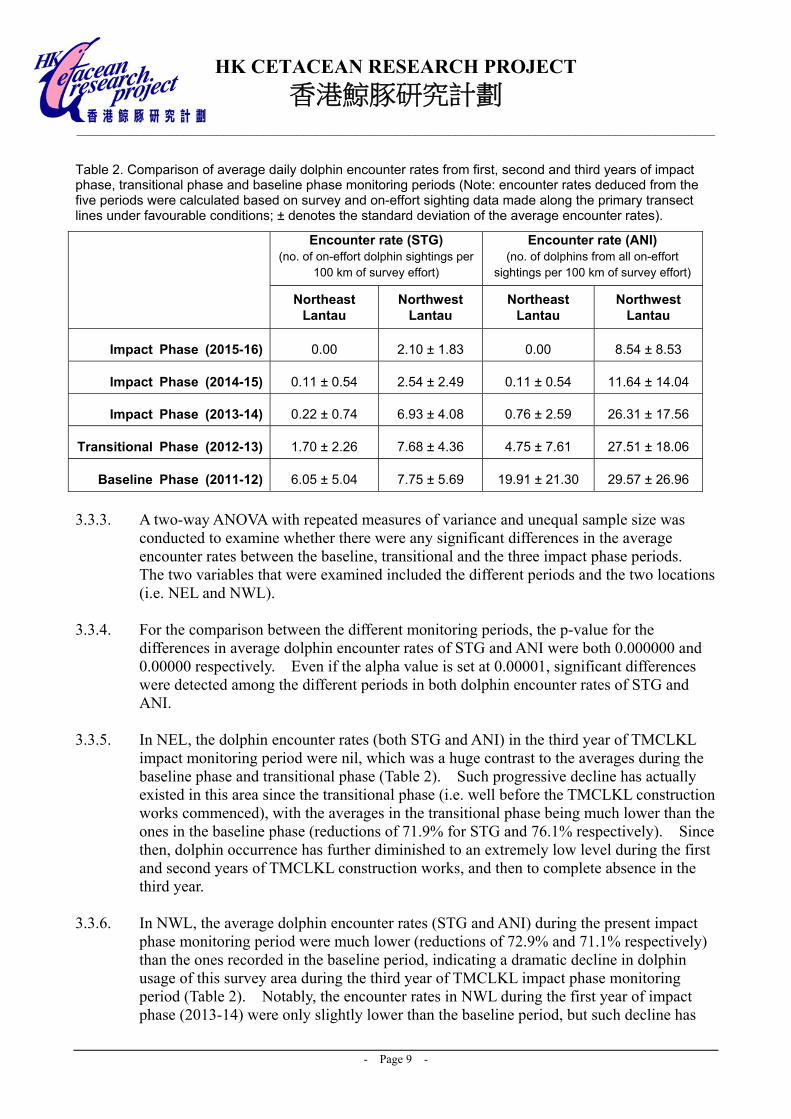
HK CETACEAN RESEARCH PROJECT
香港鯨豚研究計劃 ________________________________________________________________________________________________
- Page 9 -
Table 2. Comparison of average daily dolphin encounter rates from first, second and third years of impact phase, transitional phase and baseline phase monitoring periods (Note: encounter rates deduced from the five periods were calculated based on survey and on-effort sighting data made along the primary transect lines under favourable conditions; ± denotes the standard deviation of the average encounter rates).
3.3.3. A two-way ANOVA with repeated measures of variance and unequal sample size was
conducted to examine whether there were any significant differences in the average encounter rates between the baseline, transitional and the three impact phase periods. The two variables that were examined included the different periods and the two locations (i.e. NEL and NWL).
3.3.4. For the comparison between the different monitoring periods, the p-value for the
differences in average dolphin encounter rates of STG and ANI were both 0.000000 and 0.00000 respectively. Even if the alpha value is set at 0.00001, significant differences were detected among the different periods in both dolphin encounter rates of STG and ANI.
3.3.5. In NEL, the dolphin encounter rates (both STG and ANI) in the third year of TMCLKL
impact monitoring period were nil, which was a huge contrast to the averages during the baseline phase and transitional phase (Table 2). Such progressive decline has actually existed in this area since the transitional phase (i.e. well before the TMCLKL construction works commenced), with the averages in the transitional phase being much lower than the ones in the baseline phase (reductions of 71.9% for STG and 76.1% respectively). Since then, dolphin occurrence has further diminished to an extremely low level during the first and second years of TMCLKL construction works, and then to complete absence in the third year.
3.3.6. In NWL, the average dolphin encounter rates (STG and ANI) during the present impact
phase monitoring period were much lower (reductions of 72.9% and 71.1% respectively) than the ones recorded in the baseline period, indicating a dramatic decline in dolphin usage of this survey area during the third year of TMCLKL impact phase monitoring period (Table 2). Notably, the encounter rates in NWL during the first year of impact phase (2013-14) were only slightly lower than the baseline period, but such decline has
Encounter rate (STG) (no. of on-effort dolphin sightings per
100 km of survey effort)
Encounter rate (ANI) (no. of dolphins from all on-effort
sightings per 100 km of survey effort)
Northeast Lantau
Northwest Lantau
Northeast Lantau
Northwest Lantau
Impact Phase (2015-16) 0.00 2.10 ± 1.83 0.00 8.54 ± 8.53
Impact Phase (2014-15) 0.11 ± 0.54 2.54 ± 2.49 0.11 ± 0.54 11.64 ± 14.04
Impact Phase (2013-14) 0.22 ± 0.74 6.93 ± 4.08 0.76 ± 2.59 26.31 ± 17.56
Transitional Phase (2012-13) 1.70 ± 2.26 7.68 ± 4.36 4.75 ± 7.61 27.51 ± 18.06
Baseline Phase (2011-12) 6.05 ± 5.04 7.75 ± 5.69 19.91 ± 21.30 29.57 ± 26.96
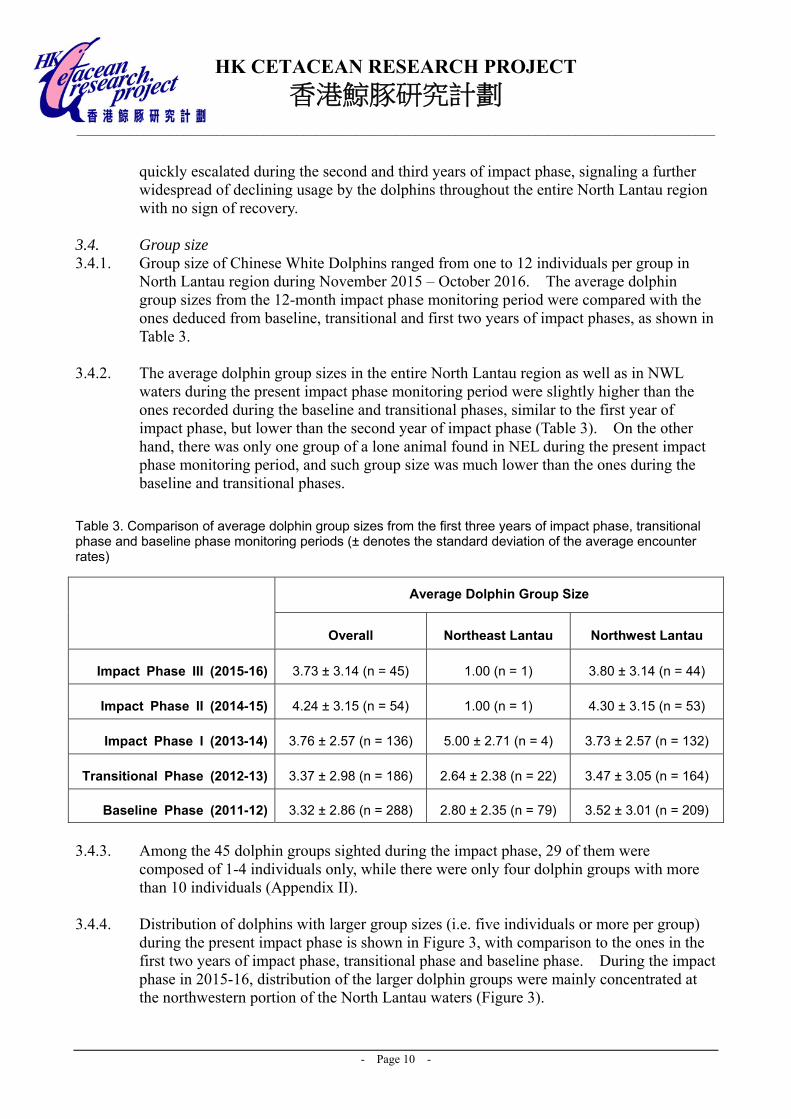
HK CETACEAN RESEARCH PROJECT
香港鯨豚研究計劃 ________________________________________________________________________________________________
- Page 10 -
quickly escalated during the second and third years of impact phase, signaling a further widespread of declining usage by the dolphins throughout the entire North Lantau region with no sign of recovery.
3.4. Group size 3.4.1. Group size of Chinese White Dolphins ranged from one to 12 individuals per group in
North Lantau region during November 2015 – October 2016. The average dolphin group sizes from the 12-month impact phase monitoring period were compared with the ones deduced from baseline, transitional and first two years of impact phases, as shown in Table 3.
3.4.2. The average dolphin group sizes in the entire North Lantau region as well as in NWL
waters during the present impact phase monitoring period were slightly higher than the ones recorded during the baseline and transitional phases, similar to the first year of impact phase, but lower than the second year of impact phase (Table 3). On the other hand, there was only one group of a lone animal found in NEL during the present impact phase monitoring period, and such group size was much lower than the ones during the baseline and transitional phases.
Table 3. Comparison of average dolphin group sizes from the first three years of impact phase, transitional phase and baseline phase monitoring periods (± denotes the standard deviation of the average encounter rates)
3.4.3. Among the 45 dolphin groups sighted during the impact phase, 29 of them were
composed of 1-4 individuals only, while there were only four dolphin groups with more than 10 individuals (Appendix II).
3.4.4. Distribution of dolphins with larger group sizes (i.e. five individuals or more per group)
during the present impact phase is shown in Figure 3, with comparison to the ones in the first two years of impact phase, transitional phase and baseline phase. During the impact phase in 2015-16, distribution of the larger dolphin groups were mainly concentrated at the northwestern portion of the North Lantau waters (Figure 3).
Average Dolphin Group Size
Overall Northeast Lantau Northwest Lantau
Impact Phase III (2015-16) 3.73 ± 3.14 (n = 45) 1.00 (n = 1) 3.80 ± 3.14 (n = 44)
Impact Phase II (2014-15) 4.24 ± 3.15 (n = 54) 1.00 (n = 1) 4.30 ± 3.15 (n = 53)
Impact Phase I (2013-14) 3.76 ± 2.57 (n = 136) 5.00 ± 2.71 (n = 4) 3.73 ± 2.57 (n = 132)
Transitional Phase (2012-13) 3.37 ± 2.98 (n = 186) 2.64 ± 2.38 (n = 22) 3.47 ± 3.05 (n = 164)
Baseline Phase (2011-12) 3.32 ± 2.86 (n = 288) 2.80 ± 2.35 (n = 79) 3.52 ± 3.01 (n = 209)
HK CETACEAN RESEARCH PROJECT
香港鯨豚研究計劃 ________________________________________________________________________________________________
- Page 11 -
3.4.5. Notably, throughout the three impact phases, distribution of these larger groups has been restricted to the northwestern portion of North Lantau region. Such restriction was drastically different from the baseline phase, when the larger dolphin groups were distributed more evenly in NWL waters with many also sighted in NEL waters (Figure 3).
3.5. Habitat use 3.5.1. During the impact phase monitoring period in 2015-16, the most heavily utilized habitat
by Chinese White Dolphins was only found around Lung Kwu Chau (Figures 4a and 4b). For the rest of North Lantau region, only a handful of grids to the west of Sha Chau, around Sha Chau, near HKLR09 alignment and near the northern landfall of TMCLKL have recorded low to moderately low dolphin densities (Figures 4a and 4b). Moreover, all grids near the reclamation sites of HKLR03 and HKBCF projects sites did not record any presence of dolphins in the present 12-month impact monitoring period in 2015-16 (Figures 4a and 4b).
3.5.2. When compared with the habitat use patterns during the baseline phase, dolphin usage in
NEL has progressively diminished during the transitional phase and the three periods of impact phases (Figure 5). During the baseline period, a number of grids between Siu Mo To and Shum Shui Kok recorded moderately high to high dolphin densities, and most grids in NEL recorded dolphin usage. This was in stark contrast to the complete absence of dolphin in this area during the present impact phase period (Figure 5).
3.5.3. Moreover, dolphin usage of NWL waters also declined dramatically during the present
impact phase monitoring period, with the only higher densities occurred right around the Lung Kwu Chau area, in contrast to a more evenly spread usage in NWL during the baseline phase, transitional phase and first year of impact phase monitoring (Figure 5). It appeared that there was a more widespread decline of dolphin usage throughout the North Lantau waters in the second and third years of the impact phase.
3.6. Mother-calf pairs 3.6.1. During the present 12-month impact phase monitoring period, no young calves were
sighted at all with their mothers in North Lantau waters. This was drastically different from the regular occurrence of young calves in North Lantau region during the baseline phase, transitional phase and the first year of impact phase monitoring (Figure 6).
3.7. Activities and associations with fishing boats 3.7.1. Five and four dolphin sightings were associated with feeding and socializing activities
respectively during the 12-month impact phase monitoring period. The percentage of sightings associated with feeding activities during the present impact phase (11.1%) was higher than the impact phase in 2013-14 (5.9%) and transitional phase (8.6%), but lower than the previous impact phase in 2014-15 (18.5%) and baseline phase (12.8%).
3.7.2. On the contrary, the percentage of socializing activities during the present impact phase
monitoring period (8.9%) was higher than the first two years of impact phases (5.5% in 2014-15 and 5.9% in 2013-14), as well as the baseline period (3.8%) and transitional period (6.4%). Notably, only one of the 45 dolphin groups was engaged in traveling activity, while none of these groups was engaged in resting activity during the present

HK CETACEAN RESEARCH PROJECT
香港鯨豚研究計劃 ________________________________________________________________________________________________
- Page 12 -
impact phase monitoring period in 2015-16. 3.7.3. Distribution of dolphins engaged in feeding, socializing and traveling activities during the
present impact phase monitoring period is shown in Figure 7. The five dolphin groups associated with feeding activities occurred near Lung Kwu Chau and Sha Chau as well as adjacent to HKLR09 alignment near Shum Wat, while the four dolphin groups associated with socializing activities were located to the north of Lung Kwu Chau, near the northern landfall of TMCLKL as well as adjacent to the HKLR09 alignment (Figure 7).
3.7.4. In contrast, during the baseline phase, feeding activities were frequently sighted along the
Urmston Road, within the marine park, to the west of airport platform and around the Brothers Islands, while the socializing activities were more scattered throughout the North Lantau region in the same period as well as in the transitional phase (Figure 7). It is apparent that the “hotspots” where dolphins engaged in different activities were considerably different between the baseline, transitional and impact phases.
3.7.5. Notably, none of the 45 dolphin groups sighted during the impact phase monitoring period
in 2015-16 was found to be associated with any operating fishing vessel. The extremely rare event of fishing boat association during the three periods of impact phase as well as the transitional phase was quite different from the baseline period with 14 of 288 dolphin groups associated with fishing boats.
3.8. Summary of photo-identification works 3.8.1. During the 12-month impact phase monitoring period in 2015-16, a total of 42 individuals
sighted 118 times altogether were identified (see Appendix III). All of these re-sightings were made in NWL, while the lone individual sighted in NEL was not identified.
3.8.2. Nearly two-thirds of the 42 identified individuals were sighted only once or twice, while
the rest were sighted more frequently during the 12-month period. For example, seven individuals were sighted more than five to nine times (NL136, NL182, NL202, NL210, NL285, NL286 and NL320), while one individual (NL48) were sighted ten times during the HKLR03 surveys in 2015-16. Their frequent occurrences during the third year of impact phase monitoring indicated strong reliance of NWL waters as their home ranges.
3.8.3. Notably, five recognized females (i.e. NL33, NL104, NL202, NL233 and NL264) were
accompanied with their calves during their re-sightings, and all of these calves are older and already in their juvenile stage. For example, the calves of NL264 (i.e. NL288) and NL202 (i.e. NL286) have been accompanying their mothers for over 7-8 years.
3.9. Individual range use 3.9.1. Ranging patterns of the 42 individuals identified during the 12-month impact phase
monitoring period in 2015-16 were determined by fixed kernel method, and are shown in Appendix IV.
3.9.2. Almost all identified dolphins sighted within this 12-month period were utilizing their
ranges primarily in NWL (with the exception of NL293 and WL243), while 16 of them have extended their range use to West Lantau waters (e.g. NL104, NL136, NL210,

HK CETACEAN RESEARCH PROJECT
香港鯨豚研究計劃 ________________________________________________________________________________________________
- Page 13 -
NL302) based on the HKLR09 monitoring data collected concurrently during the same 12-month period. All of these identified dolphins have avoided the NEL waters (Appendix IV), the area where many of them have utilized as their core areas of activities in the past.
3.9.3. Temporal changes in range use of 31 individual dolphins that ranged across different
survey areas in North, West and South Lantau waters were examined in details during baseline phase, transitional phase and three periods of impact phases (Appendix V). It is apparent that 17 of them (e.g. CH34, NL33, NL210, NL259) have gradually shifted their range use away from their previously important habitat in NEL in the past few years, and have been completely absent from there in the present impact phase (Appendix V).
3.9.4. Moreover, 20 individual dolphins have gradually diminished their utilization of NWL
waters during the TMCLKL impact phases, and at the same time all of them (e.g. NL98, NL261, NL287, NL302) have increased their utilization of WL waters, apparently expanding their range use into West Lantau waters (Appendix V). Six individuals (NL33, NL120, NL123, NL224, NL269 and NL287) have even expanded their range use to Southwest Lantau waters as well during the past two periods of impact phase (Appendix V).
3.9.5. Notably, while some individuals have expanded their range use in WL and diminished
their range use in NWL, ten individuals (e.g. NL103, NL264, WL17) have utilized waters of Hong Kong generally less during the past two impact phase periods (Appendix V). This corresponded well with a much lower dolphin encounter rate in NWL in 2014-15 and 2015-16 impact phase periods as examined in Section 3.3.4.
3.9.7. The apparent range shifts of many identified individual dolphins examined above were
also documented in Hung (2016), and such shifts could be related to the disturbance of construction activities and other existing threats in the North Lantau region. This should be continuously monitored for the rest of the TMCLKL impact phase monitoring period to determine whether such range shifts are temporary or permanent, and whether the dolphins would continue the North Lantau waters once the HZMB-related construction works have completed.
4. Conclusion
4.1. During the third year of TMCLKL impact phase monitoring of Chinese white dolphins,
no adverse impact from the activities of the TMCLKL construction project on the dolphins was noticeable from general observations.
4.2. Although the dolphins infrequently occurred along the alignment of TMCLKL southern
connection viaduct in the past and during the baseline monitoring period, it is apparent that dolphin usage has been drastically reduced in the entire North Lantau region, and many individuals have shifted away from the important habitats around the Brothers Islands and the rest of North Lantau waters.

HK CETACEAN RESEARCH PROJECT
香港鯨豚研究計劃 ________________________________________________________________________________________________
- Page 14 -
4.3. It is critical to monitor the dolphin usage in North Lantau region for the rest of the impact
phase monitoring period, to determine whether the dolphins are continuously affected by the various construction activities in relation to the HZMB-related works, and whether suitable mitigation measure can be applied to revert the situation.
5. References
- Buckland, S. T., Anderson, D. R., Burnham, K. P., Laake, J. L., Borchers, D. L., and Thomas, L. 2001. Introduction to distance sampling: estimating abundance of biological populations. Oxford University Press, London.
- Hung, S. K. 2015. Monitoring of marine mammals in Hong Kong waters – data
collection: final report (2014-15). An unpublished report submitted to the Agriculture, Fisheries and Conservation Department of Hong Kong SAR Government, 198 pp.
- Hung, S. K. 2016. Monitoring of marine mammals in Hong Kong waters – data
collection: final report (2015-16). An unpublished report submitted to the Agriculture, Fisheries and Conservation Department of Hong Kong SAR Government, 163 pp.
- Jefferson, T. A. 2000. Population biology of the Indo-Pacific hump-backed dolphin in
Hong Kong waters. Wildlife Monographs 144:1-65.


F G H I J K L M N O P Q R S T U V W X Y Z5 5
6 6
7 7
8 8
9 9
10 10
11 11
12 12
13 13
14 14
15 15
16 16
17 17
18 18
19 19
20 20
21 21
22 22
F G H I J K L M N O P Q R S T U V W X Y Z
Figure 4a. Sighting density of Chinese white dolphins with corrected survey effort per km2 in Northeastand Northwest Lantau survey areas, using data collected during HKLR03 impact monitoring periodmonitoring period (Nov15 - Oct16) (SPSE = no. of on-effort sightings per 100 units of survey effort)
F G H I J K L M N O P Q R S T U V W X Y Z5 5
6 6
7 7
8 8
9 9
10 10
11 11
12 12
13 13
14 14
15 15
16 16
17 17
18 18
19 19
20 20
21 21
22 22
F G H I J K L M N O P Q R S T U V W X Y Z
Figure 4b. Density of Chinese white dolphins with corrected survey effort per km2 in Northeast andNorthwest Lantau survey areas, using data collected during HKLR03 impact monitoring period(Nov15 -Oct16) (DPSE = no. of dolphins per 100 units of survey effort)
N
N

F G H I J K L M N O P Q R S T U V W X Y Z F G H I J K L M N O P Q R S T U V W X Y Z5 5 5
6 6 6
7 7 7
8 8 8
9 9 9
10 10 10
11 11 11
12 12 12
13 13 13
14 14 14
15 15 15
16 16 16
17 17 17
18 18 18
19 19 19
20 20 20
21 21 21
22 22 22
F G H I J K L M N O P Q R S T U V W X Y Z F G H I J K L M N O P Q R S T U V W X Y Z5 5 5
6 6 6
7 7 7
8 8 8
9 9 9
10 10 10
11 11 11
12 12 12
13 13 13
14 14 14
15 15 15
16 16 16
17 17 17
18 18 18
19 19 19
20 20 20
21 21 21
22 22 22
F G H I J K L M N O P Q R S T U V W X Y Z F G H I J K L M N O P Q R S T U V W X Y Z5 5
6 6
7 7
8 8
9 9
10 10
11 11
12 12
13 13
14 14
15 15
16 16
17 17
18 18
19 19
20 20
21 21
22 22
F G H I J K L M N O P Q R S T U V W X Y Z
Figure 5. Comparison of density of Chinese white dolphins with corrected survey effort per km2 in NWL and NEL survey
areas between the three impact phases (Nov15-Oct16, Nov14-Oct15 and Nov13-Oct14), transitional phase (Nov12-Oct13)
and baseline phase (Feb11-Jan12) monitoring periods (DPSE = no. of dolphins per 100 units of survey effort)
N
N N
N
Baseline Phase (11-12) Transitional Phase (12-13)
Impact Phase I (13-14) Impact Phase II (14-15)
N
Impact Phase III (15-16)
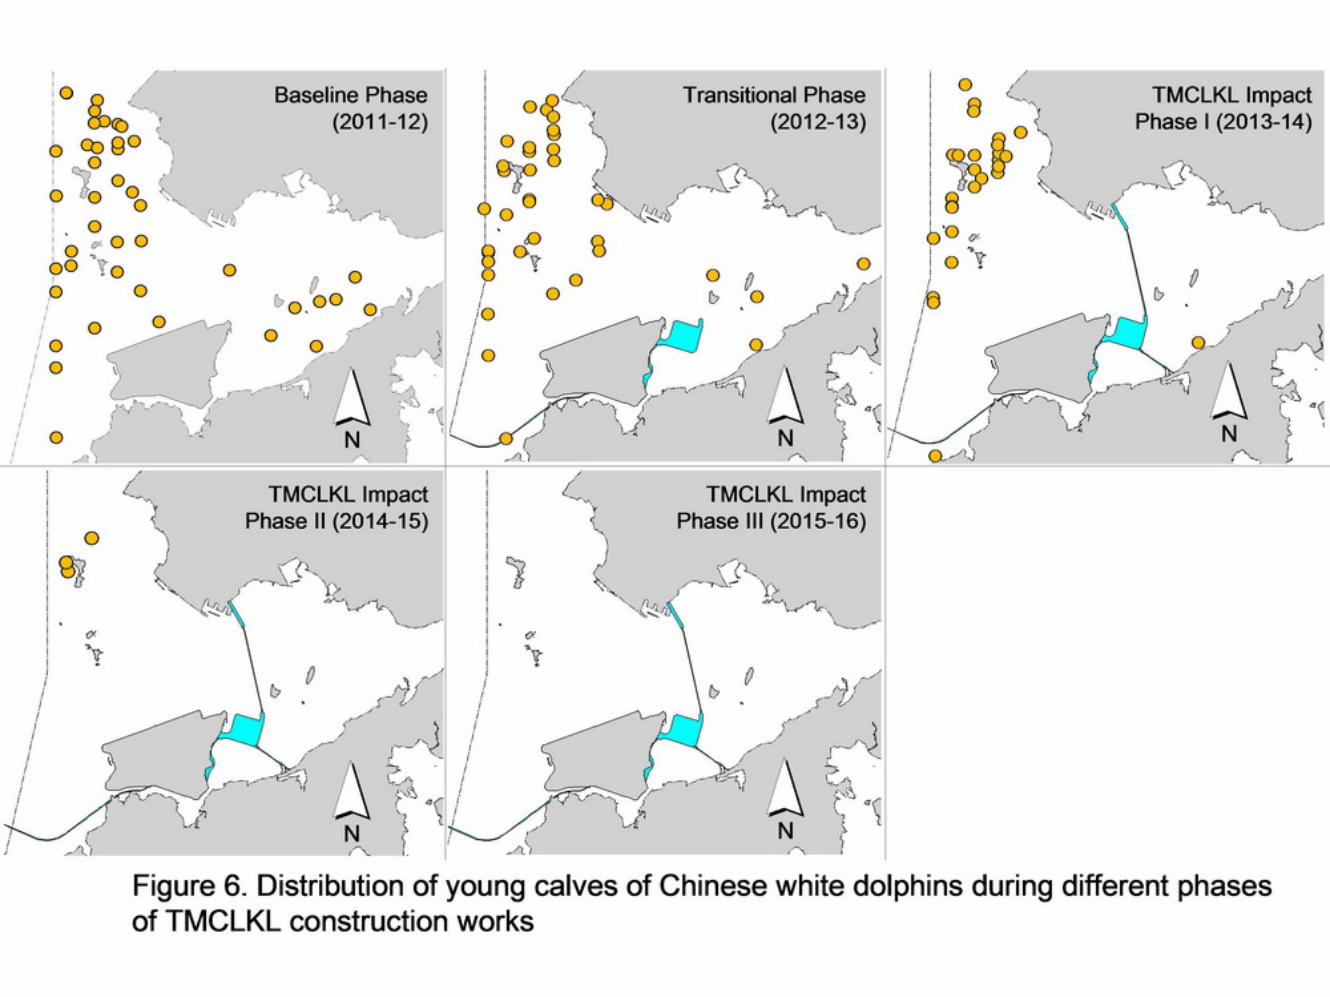


Appendix I. HKLR03 Survey Effort Database (November 2015 - October 2016(Abbreviations: BEAU = Beaufort Sea State; P = Primary Line Effort; S = Secondary Line Effort)
DATE AREA BEAU EFFORT SEASON VESSEL TYPE P/S2-Nov-15 NW LANTAU 2 6.50 AUTUMN STANDARD31516 HKLR P2-Nov-15 NW LANTAU 3 27.18 AUTUMN STANDARD31516 HKLR P2-Nov-15 NW LANTAU 4 7.13 AUTUMN STANDARD31516 HKLR P2-Nov-15 NW LANTAU 2 2.30 AUTUMN STANDARD31516 HKLR S2-Nov-15 NW LANTAU 3 7.55 AUTUMN STANDARD31516 HKLR S2-Nov-15 NW LANTAU 4 2.74 AUTUMN STANDARD31516 HKLR S2-Nov-15 NE LANTAU 2 14.92 AUTUMN STANDARD31516 HKLR P2-Nov-15 NE LANTAU 3 1.70 AUTUMN STANDARD31516 HKLR P2-Nov-15 NE LANTAU 2 7.98 AUTUMN STANDARD31516 HKLR S2-Nov-15 NE LANTAU 3 2.40 AUTUMN STANDARD31516 HKLR S6-Nov-15 NW LANTAU 3 18.35 AUTUMN STANDARD31516 HKLR P6-Nov-15 NW LANTAU 4 13.86 AUTUMN STANDARD31516 HKLR P6-Nov-15 NW LANTAU 3 6.79 AUTUMN STANDARD31516 HKLR S6-Nov-15 NE LANTAU 2 5.90 AUTUMN STANDARD31516 HKLR P6-Nov-15 NE LANTAU 3 14.15 AUTUMN STANDARD31516 HKLR P6-Nov-15 NE LANTAU 2 6.70 AUTUMN STANDARD31516 HKLR S6-Nov-15 NE LANTAU 3 3.95 AUTUMN STANDARD31516 HKLR S
10-Nov-15 NW LANTAU 2 2.44 AUTUMN STANDARD31516 HKLR P10-Nov-15 NW LANTAU 3 27.80 AUTUMN STANDARD31516 HKLR P10-Nov-15 NW LANTAU 4 0.98 AUTUMN STANDARD31516 HKLR P10-Nov-15 NW LANTAU 2 0.28 AUTUMN STANDARD31516 HKLR S10-Nov-15 NW LANTAU 3 6.23 AUTUMN STANDARD31516 HKLR S10-Nov-15 NW LANTAU 4 1.30 AUTUMN STANDARD31516 HKLR S10-Nov-15 NE LANTAU 2 9.09 AUTUMN STANDARD31516 HKLR P10-Nov-15 NE LANTAU 3 10.38 AUTUMN STANDARD31516 HKLR P10-Nov-15 NE LANTAU 2 8.03 AUTUMN STANDARD31516 HKLR S10-Nov-15 NE LANTAU 3 2.70 AUTUMN STANDARD31516 HKLR S16-Nov-15 NE LANTAU 2 5.26 AUTUMN STANDARD31516 HKLR P16-Nov-15 NE LANTAU 3 12.22 AUTUMN STANDARD31516 HKLR P16-Nov-15 NE LANTAU 2 7.72 AUTUMN STANDARD31516 HKLR S16-Nov-15 NE LANTAU 3 2.10 AUTUMN STANDARD31516 HKLR S16-Nov-15 NW LANTAU 2 6.48 AUTUMN STANDARD31516 HKLR P16-Nov-15 NW LANTAU 3 21.03 AUTUMN STANDARD31516 HKLR P16-Nov-15 NW LANTAU 4 9.27 AUTUMN STANDARD31516 HKLR P16-Nov-15 NW LANTAU 5 4.10 AUTUMN STANDARD31516 HKLR P16-Nov-15 NW LANTAU 2 2.53 AUTUMN STANDARD31516 HKLR S16-Nov-15 NW LANTAU 3 7.79 AUTUMN STANDARD31516 HKLR S16-Nov-15 NW LANTAU 4 2.60 AUTUMN STANDARD31516 HKLR S2-Dec-15 NW LANTAU 2 34.36 WINTER STANDARD31516 HKLR P2-Dec-15 NW LANTAU 3 6.71 WINTER STANDARD31516 HKLR P2-Dec-15 NW LANTAU 2 12.06 WINTER STANDARD31516 HKLR S2-Dec-15 NW LANTAU 3 0.90 WINTER STANDARD31516 HKLR S2-Dec-15 NE LANTAU 1 0.77 WINTER STANDARD31516 HKLR P2-Dec-15 NE LANTAU 2 15.53 WINTER STANDARD31516 HKLR P2-Dec-15 NE LANTAU 2 10.30 WINTER STANDARD31516 HKLR S7-Dec-15 NE LANTAU 2 18.39 WINTER STANDARD31516 HKLR P7-Dec-15 NE LANTAU 3 1.75 WINTER STANDARD31516 HKLR P7-Dec-15 NE LANTAU 2 9.11 WINTER STANDARD31516 HKLR S7-Dec-15 NE LANTAU 3 1.35 WINTER STANDARD31516 HKLR S7-Dec-15 NW LANTAU 2 3.22 WINTER STANDARD31516 HKLR P7-Dec-15 NW LANTAU 3 28.58 WINTER STANDARD31516 HKLR P7-Dec-15 NW LANTAU 2 0.27 WINTER STANDARD31516 HKLR S

Appendix I. (cont'd)(Abbreviations: BEAU = Beaufort Sea State; P = Primary Line Effort; S = Secondary Line Effort)
DATE AREA BEAU EFFORT SEASON VESSEL TYPE P/S7-Dec-15 NW LANTAU 3 7.53 WINTER STANDARD31516 HKLR S9-Dec-15 NW LANTAU 2 1.20 WINTER STANDARD31516 HKLR P9-Dec-15 NW LANTAU 3 13.30 WINTER STANDARD31516 HKLR P9-Dec-15 NW LANTAU 4 14.71 WINTER STANDARD31516 HKLR P9-Dec-15 NW LANTAU 5 2.69 WINTER STANDARD31516 HKLR P9-Dec-15 NW LANTAU 2 1.10 WINTER STANDARD31516 HKLR S9-Dec-15 NW LANTAU 3 1.84 WINTER STANDARD31516 HKLR S9-Dec-15 NW LANTAU 4 4.72 WINTER STANDARD31516 HKLR S9-Dec-15 NE LANTAU 2 12.20 WINTER STANDARD31516 HKLR P9-Dec-15 NE LANTAU 3 7.10 WINTER STANDARD31516 HKLR P9-Dec-15 NE LANTAU 2 8.50 WINTER STANDARD31516 HKLR S9-Dec-15 NE LANTAU 3 2.30 WINTER STANDARD31516 HKLR S
15-Dec-15 NW LANTAU 2 10.12 WINTER STANDARD31516 HKLR P15-Dec-15 NW LANTAU 3 17.24 WINTER STANDARD31516 HKLR P15-Dec-15 NW LANTAU 4 13.57 WINTER STANDARD31516 HKLR P15-Dec-15 NW LANTAU 2 2.83 WINTER STANDARD31516 HKLR S15-Dec-15 NW LANTAU 3 10.47 WINTER STANDARD31516 HKLR S15-Dec-15 NE LANTAU 2 15.04 WINTER STANDARD31516 HKLR P15-Dec-15 NE LANTAU 3 1.60 WINTER STANDARD31516 HKLR P15-Dec-15 NE LANTAU 2 10.16 WINTER STANDARD31516 HKLR S
8-Jan-16 NW LANTAU 2 25.03 WINTER STANDARD31516 HKLR P8-Jan-16 NW LANTAU 3 15.46 WINTER STANDARD31516 HKLR P8-Jan-16 NW LANTAU 2 10.60 WINTER STANDARD31516 HKLR S8-Jan-16 NW LANTAU 3 2.21 WINTER STANDARD31516 HKLR S8-Jan-16 NE LANTAU 2 16.39 WINTER STANDARD31516 HKLR P8-Jan-16 NE LANTAU 2 8.31 WINTER STANDARD31516 HKLR S8-Jan-16 NE LANTAU 3 2.10 WINTER STANDARD31516 HKLR S
11-Jan-16 NE LANTAU 1 1.97 WINTER STANDARD31516 HKLR P11-Jan-16 NE LANTAU 2 15.21 WINTER STANDARD31516 HKLR P11-Jan-16 NE LANTAU 3 2.72 WINTER STANDARD31516 HKLR P11-Jan-16 NE LANTAU 2 11.00 WINTER STANDARD31516 HKLR S11-Jan-16 NE LANTAU 3 1.30 WINTER STANDARD31516 HKLR S11-Jan-16 NW LANTAU 2 11.76 WINTER STANDARD31516 HKLR P11-Jan-16 NW LANTAU 3 19.32 WINTER STANDARD31516 HKLR P11-Jan-16 NW LANTAU 2 4.82 WINTER STANDARD31516 HKLR S11-Jan-16 NW LANTAU 3 1.00 WINTER STANDARD31516 HKLR S11-Jan-16 NW LANTAU 4 2.10 WINTER STANDARD31516 HKLR S13-Jan-16 NE LANTAU 1 1.00 WINTER STANDARD31516 HKLR P13-Jan-16 NE LANTAU 2 15.93 WINTER STANDARD31516 HKLR P13-Jan-16 NE LANTAU 2 9.63 WINTER STANDARD31516 HKLR S13-Jan-16 NE LANTAU 3 0.64 WINTER STANDARD31516 HKLR S13-Jan-16 NW LANTAU 2 26.61 WINTER STANDARD31516 HKLR P13-Jan-16 NW LANTAU 3 15.03 WINTER STANDARD31516 HKLR P13-Jan-16 NW LANTAU 2 5.05 WINTER STANDARD31516 HKLR S13-Jan-16 NW LANTAU 3 6.87 WINTER STANDARD31516 HKLR S19-Jan-16 NW LANTAU 2 22.73 WINTER STANDARD31516 HKLR P19-Jan-16 NW LANTAU 3 9.01 WINTER STANDARD31516 HKLR P19-Jan-16 NW LANTAU 2 6.16 WINTER STANDARD31516 HKLR S19-Jan-16 NW LANTAU 3 1.50 WINTER STANDARD31516 HKLR S19-Jan-16 NE LANTAU 1 0.90 WINTER STANDARD31516 HKLR P19-Jan-16 NE LANTAU 2 16.70 WINTER STANDARD31516 HKLR P19-Jan-16 NE LANTAU 3 2.29 WINTER STANDARD31516 HKLR P19-Jan-16 NE LANTAU 1 2.30 WINTER STANDARD31516 HKLR S19-Jan-16 NE LANTAU 2 8.41 WINTER STANDARD31516 HKLR S

Appendix I. (cont'd)(Abbreviations: BEAU = Beaufort Sea State; P = Primary Line Effort; S = Secondary Line Effort)
DATE AREA BEAU EFFORT SEASON VESSEL TYPE P/S2-Feb-16 NE LANTAU 2 20.46 WINTER STANDARD31516 HKLR P2-Feb-16 NE LANTAU 2 6.05 WINTER STANDARD31516 HKLR S2-Feb-16 NE LANTAU 3 4.59 WINTER STANDARD31516 HKLR S2-Feb-16 NW LANTAU 2 6.80 WINTER STANDARD31516 HKLR P2-Feb-16 NW LANTAU 3 26.28 WINTER STANDARD31516 HKLR P2-Feb-16 NW LANTAU 2 2.32 WINTER STANDARD31516 HKLR S2-Feb-16 NW LANTAU 3 4.50 WINTER STANDARD31516 HKLR S3-Feb-16 NW LANTAU 2 21.30 WINTER STANDARD31516 HKLR P3-Feb-16 NW LANTAU 3 19.74 WINTER STANDARD31516 HKLR P3-Feb-16 NW LANTAU 2 10.82 WINTER STANDARD31516 HKLR S3-Feb-16 NW LANTAU 3 2.24 WINTER STANDARD31516 HKLR S3-Feb-16 NE LANTAU 1 1.82 WINTER STANDARD31516 HKLR P3-Feb-16 NE LANTAU 2 14.48 WINTER STANDARD31516 HKLR P3-Feb-16 NE LANTAU 1 2.49 WINTER STANDARD31516 HKLR S3-Feb-16 NE LANTAU 2 8.08 WINTER STANDARD31516 HKLR S
16-Feb-16 NW LANTAU 2 6.05 WINTER STANDARD31516 HKLR P16-Feb-16 NW LANTAU 3 31.35 WINTER STANDARD31516 HKLR P16-Feb-16 NW LANTAU 4 3.00 WINTER STANDARD31516 HKLR P16-Feb-16 NW LANTAU 2 5.70 WINTER STANDARD31516 HKLR S16-Feb-16 NW LANTAU 3 4.80 WINTER STANDARD31516 HKLR S16-Feb-16 NW LANTAU 4 3.10 WINTER STANDARD31516 HKLR S16-Feb-16 NE LANTAU 1 1.10 WINTER STANDARD31516 HKLR P16-Feb-16 NE LANTAU 2 15.25 WINTER STANDARD31516 HKLR P16-Feb-16 NE LANTAU 1 1.40 WINTER STANDARD31516 HKLR S16-Feb-16 NE LANTAU 2 8.16 WINTER STANDARD31516 HKLR S16-Feb-16 NE LANTAU 3 1.09 WINTER STANDARD31516 HKLR S22-Feb-16 NE LANTAU 2 20.26 WINTER STANDARD31516 HKLR P22-Feb-16 NE LANTAU 2 9.08 WINTER STANDARD31516 HKLR S22-Feb-16 NE LANTAU 3 1.86 WINTER STANDARD31516 HKLR S22-Feb-16 NW LANTAU 2 14.88 WINTER STANDARD31516 HKLR P22-Feb-16 NW LANTAU 3 16.99 WINTER STANDARD31516 HKLR P22-Feb-16 NW LANTAU 2 2.43 WINTER STANDARD31516 HKLR S22-Feb-16 NW LANTAU 3 5.10 WINTER STANDARD31516 HKLR S22-Feb-16 NW LANTAU 4 0.30 WINTER STANDARD31516 HKLR S7-Mar-16 NW LANTAU 1 18.42 SPRING STANDARD31516 HKLR P7-Mar-16 NW LANTAU 2 10.78 SPRING STANDARD31516 HKLR P7-Mar-16 NW LANTAU 3 10.30 SPRING STANDARD31516 HKLR P7-Mar-16 NW LANTAU 1 2.50 SPRING STANDARD31516 HKLR S7-Mar-16 NW LANTAU 2 3.70 SPRING STANDARD31516 HKLR S7-Mar-16 NW LANTAU 3 6.70 SPRING STANDARD31516 HKLR S7-Mar-16 NE LANTAU 2 16.44 SPRING STANDARD31516 HKLR P7-Mar-16 NE LANTAU 2 10.46 SPRING STANDARD31516 HKLR S
11-Mar-16 NW LANTAU 2 15.40 SPRING STANDARD31516 HKLR P11-Mar-16 NW LANTAU 3 16.20 SPRING STANDARD31516 HKLR P11-Mar-16 NW LANTAU 2 7.60 SPRING STANDARD31516 HKLR S11-Mar-16 NW LANTAU 3 0.30 SPRING STANDARD31516 HKLR S11-Mar-16 NE LANTAU 1 2.04 SPRING STANDARD31516 HKLR P11-Mar-16 NE LANTAU 2 17.97 SPRING STANDARD31516 HKLR P11-Mar-16 NE LANTAU 1 2.40 SPRING STANDARD31516 HKLR S11-Mar-16 NE LANTAU 2 6.19 SPRING STANDARD31516 HKLR S11-Mar-16 NE LANTAU 3 2.20 SPRING STANDARD31516 HKLR S22-Mar-16 NE LANTAU 2 7.42 SPRING STANDARD31516 HKLR P22-Mar-16 NE LANTAU 3 27.44 SPRING STANDARD31516 HKLR P22-Mar-16 NE LANTAU 4 2.30 SPRING STANDARD31516 HKLR P

Appendix I. (cont'd)(Abbreviations: BEAU = Beaufort Sea State; P = Primary Line Effort; S = Secondary Line Effort)
DATE AREA BEAU EFFORT SEASON VESSEL TYPE P/S22-Mar-16 NE LANTAU 2 5.86 SPRING STANDARD31516 HKLR S22-Mar-16 NE LANTAU 3 8.18 SPRING STANDARD31516 HKLR S22-Mar-16 NE LANTAU 4 0.40 SPRING STANDARD31516 HKLR S22-Mar-16 NW LANTAU 2 3.59 SPRING STANDARD31516 HKLR P22-Mar-16 NW LANTAU 3 9.39 SPRING STANDARD31516 HKLR P22-Mar-16 NW LANTAU 4 8.10 SPRING STANDARD31516 HKLR P22-Mar-16 NW LANTAU 5 2.40 SPRING STANDARD31516 HKLR P22-Mar-16 NW LANTAU 2 1.40 SPRING STANDARD31516 HKLR S22-Mar-16 NW LANTAU 3 5.12 SPRING STANDARD31516 HKLR S23-Mar-16 NW LANTAU 2 27.12 SPRING STANDARD31516 HKLR P23-Mar-16 NW LANTAU 3 22.69 SPRING STANDARD31516 HKLR P23-Mar-16 NW LANTAU 2 4.11 SPRING STANDARD31516 HKLR S23-Mar-16 NW LANTAU 3 5.20 SPRING STANDARD31516 HKLR S
5-Apr-16 NW LANTAU 0 0.83 SPRING STANDARD31516 HKLR P5-Apr-16 NW LANTAU 1 5.38 SPRING STANDARD31516 HKLR P5-Apr-16 NW LANTAU 2 21.07 SPRING STANDARD31516 HKLR P5-Apr-16 NW LANTAU 3 13.64 SPRING STANDARD31516 HKLR P5-Apr-16 NW LANTAU 2 3.00 SPRING STANDARD31516 HKLR S5-Apr-16 NW LANTAU 3 10.08 SPRING STANDARD31516 HKLR S5-Apr-16 NE LANTAU 1 1.60 SPRING STANDARD31516 HKLR P5-Apr-16 NE LANTAU 2 15.44 SPRING STANDARD31516 HKLR P5-Apr-16 NE LANTAU 1 2.10 SPRING STANDARD31516 HKLR S5-Apr-16 NE LANTAU 2 8.06 SPRING STANDARD31516 HKLR S
12-Apr-16 NE LANTAU 2 3.81 SPRING STANDARD31516 HKLR P12-Apr-16 NE LANTAU 3 13.73 SPRING STANDARD31516 HKLR P12-Apr-16 NE LANTAU 4 2.60 SPRING STANDARD31516 HKLR P12-Apr-16 NE LANTAU 2 4.20 SPRING STANDARD31516 HKLR S12-Apr-16 NE LANTAU 3 6.46 SPRING STANDARD31516 HKLR S12-Apr-16 NW LANTAU 3 4.57 SPRING STANDARD31516 HKLR P12-Apr-16 NW LANTAU 4 25.36 SPRING STANDARD31516 HKLR P12-Apr-16 NW LANTAU 5 1.90 SPRING STANDARD31516 HKLR P12-Apr-16 NW LANTAU 3 5.97 SPRING STANDARD31516 HKLR S12-Apr-16 NW LANTAU 4 2.10 SPRING STANDARD31516 HKLR S15-Apr-16 NW LANTAU 2 5.14 SPRING STANDARD31516 HKLR P15-Apr-16 NW LANTAU 3 20.36 SPRING STANDARD31516 HKLR P15-Apr-16 NW LANTAU 4 6.20 SPRING STANDARD31516 HKLR P15-Apr-16 NW LANTAU 2 3.40 SPRING STANDARD31516 HKLR S15-Apr-16 NW LANTAU 3 3.10 SPRING STANDARD31516 HKLR S15-Apr-16 NW LANTAU 4 1.40 SPRING STANDARD31516 HKLR S15-Apr-16 NE LANTAU 2 14.06 SPRING STANDARD31516 HKLR P15-Apr-16 NE LANTAU 3 6.93 SPRING STANDARD31516 HKLR P15-Apr-16 NE LANTAU 2 7.11 SPRING STANDARD31516 HKLR S15-Apr-16 NE LANTAU 3 2.90 SPRING STANDARD31516 HKLR S19-Apr-16 NE LANTAU 3 10.81 SPRING STANDARD31516 HKLR P19-Apr-16 NE LANTAU 4 6.46 SPRING STANDARD31516 HKLR P19-Apr-16 NE LANTAU 3 10.03 SPRING STANDARD31516 HKLR S19-Apr-16 NW LANTAU 2 6.79 SPRING STANDARD31516 HKLR P19-Apr-16 NW LANTAU 3 15.26 SPRING STANDARD31516 HKLR P19-Apr-16 NW LANTAU 4 9.20 SPRING STANDARD31516 HKLR P19-Apr-16 NW LANTAU 5 9.70 SPRING STANDARD31516 HKLR P19-Apr-16 NW LANTAU 6 1.30 SPRING STANDARD31516 HKLR P19-Apr-16 NW LANTAU 2 3.83 SPRING STANDARD31516 HKLR S19-Apr-16 NW LANTAU 3 3.01 SPRING STANDARD31516 HKLR S19-Apr-16 NW LANTAU 4 6.39 SPRING STANDARD31516 HKLR S

Appendix I. (cont'd)(Abbreviations: BEAU = Beaufort Sea State; P = Primary Line Effort; S = Secondary Line Effort)
DATE AREA BEAU EFFORT SEASON VESSEL TYPE P/S3-May-16 NE LANTAU 2 15.29 SPRING STANDARD31516 HKLR P3-May-16 NE LANTAU 3 1.40 SPRING STANDARD31516 HKLR P3-May-16 NE LANTAU 2 10.01 SPRING STANDARD31516 HKLR S3-May-16 NW LANTAU 2 16.24 SPRING STANDARD31516 HKLR P3-May-16 NW LANTAU 3 23.50 SPRING STANDARD31516 HKLR P3-May-16 NW LANTAU 2 7.16 SPRING STANDARD31516 HKLR S3-May-16 NW LANTAU 3 5.60 SPRING STANDARD31516 HKLR S
12-May-16 NW LANTAU 2 15.26 SPRING STANDARD31516 HKLR P12-May-16 NW LANTAU 3 16.74 SPRING STANDARD31516 HKLR P12-May-16 NW LANTAU 2 7.60 SPRING STANDARD31516 HKLR S12-May-16 NE LANTAU 2 6.52 SPRING STANDARD31516 HKLR P12-May-16 NE LANTAU 3 13.33 SPRING STANDARD31516 HKLR P12-May-16 NE LANTAU 2 4.72 SPRING STANDARD31516 HKLR S12-May-16 NE LANTAU 3 6.69 SPRING STANDARD31516 HKLR S17-May-16 NE LANTAU 2 10.20 SPRING STANDARD31516 HKLR P17-May-16 NE LANTAU 3 9.92 SPRING STANDARD31516 HKLR P17-May-16 NE LANTAU 2 6.30 SPRING STANDARD31516 HKLR S17-May-16 NE LANTAU 3 4.38 SPRING STANDARD31516 HKLR S17-May-16 NW LANTAU 2 2.74 SPRING STANDARD31516 HKLR P17-May-16 NW LANTAU 3 28.07 SPRING STANDARD31516 HKLR P17-May-16 NW LANTAU 4 0.79 SPRING STANDARD31516 HKLR P17-May-16 NW LANTAU 3 7.80 SPRING STANDARD31516 HKLR S26-May-16 NW LANTAU 2 14.13 SPRING STANDARD31516 HKLR P26-May-16 NW LANTAU 3 26.67 SPRING STANDARD31516 HKLR P26-May-16 NW LANTAU 2 7.10 SPRING STANDARD31516 HKLR S26-May-16 NW LANTAU 3 6.00 SPRING STANDARD31516 HKLR S26-May-16 NE LANTAU 2 2.62 SPRING STANDARD31516 HKLR P26-May-16 NE LANTAU 3 14.38 SPRING STANDARD31516 HKLR P26-May-16 NE LANTAU 2 3.70 SPRING STANDARD31516 HKLR S26-May-16 NE LANTAU 3 6.10 SPRING STANDARD31516 HKLR S
1-Jun-16 NW LANTAU 3 5.57 SUMMER STANDARD31516 HKLR P1-Jun-16 NW LANTAU 4 24.03 SUMMER STANDARD31516 HKLR P1-Jun-16 NW LANTAU 5 1.80 SUMMER STANDARD31516 HKLR P1-Jun-16 NW LANTAU 3 2.80 SUMMER STANDARD31516 HKLR S1-Jun-16 NW LANTAU 4 5.30 SUMMER STANDARD31516 HKLR S1-Jun-16 NE LANTAU 2 6.91 SUMMER STANDARD31516 HKLR P1-Jun-16 NE LANTAU 3 12.82 SUMMER STANDARD31516 HKLR P1-Jun-16 NE LANTAU 2 8.05 SUMMER STANDARD31516 HKLR S1-Jun-16 NE LANTAU 3 2.52 SUMMER STANDARD31516 HKLR S6-Jun-16 NW LANTAU 1 4.44 SUMMER STANDARD31516 HKLR P6-Jun-16 NW LANTAU 2 30.16 SUMMER STANDARD31516 HKLR P6-Jun-16 NW LANTAU 3 5.59 SUMMER STANDARD31516 HKLR P6-Jun-16 NW LANTAU 2 13.61 SUMMER STANDARD31516 HKLR S6-Jun-16 NE LANTAU 2 15.55 SUMMER STANDARD31516 HKLR P6-Jun-16 NE LANTAU 3 0.80 SUMMER STANDARD31516 HKLR P6-Jun-16 NE LANTAU 2 10.94 SUMMER STANDARD31516 HKLR S
13-Jun-16 NW LANTAU 3 28.50 SUMMER STANDARD31516 HKLR P13-Jun-16 NW LANTAU 4 5.40 SUMMER STANDARD31516 HKLR P13-Jun-16 NW LANTAU 3 4.90 SUMMER STANDARD31516 HKLR S13-Jun-16 NW LANTAU 4 4.90 SUMMER STANDARD31516 HKLR S13-Jun-16 NE LANTAU 2 14.58 SUMMER STANDARD31516 HKLR P13-Jun-16 NE LANTAU 3 5.31 SUMMER STANDARD31516 HKLR P13-Jun-16 NE LANTAU 2 6.03 SUMMER STANDARD31516 HKLR S13-Jun-16 NE LANTAU 3 5.18 SUMMER STANDARD31516 HKLR S

Appendix I. (cont'd)(Abbreviations: BEAU = Beaufort Sea State; P = Primary Line Effort; S = Secondary Line Effort)
DATE AREA BEAU EFFORT SEASON VESSEL TYPE P/S17-Jun-16 NW LANTAU 2 20.32 SUMMER STANDARD31516 HKLR P17-Jun-16 NW LANTAU 3 18.28 SUMMER STANDARD31516 HKLR P17-Jun-16 NW LANTAU 2 3.00 SUMMER STANDARD31516 HKLR S17-Jun-16 NW LANTAU 3 5.50 SUMMER STANDARD31516 HKLR S17-Jun-16 NE LANTAU 2 11.80 SUMMER STANDARD31516 HKLR P17-Jun-16 NE LANTAU 3 5.68 SUMMER STANDARD31516 HKLR P17-Jun-16 NE LANTAU 2 3.32 SUMMER STANDARD31516 HKLR S17-Jun-16 NE LANTAU 3 2.90 SUMMER STANDARD31516 HKLR S
5-Jul-16 NW LANTAU 2 4.50 SUMMER STANDARD31516 HKLR P5-Jul-16 NW LANTAU 3 29.29 SUMMER STANDARD31516 HKLR P5-Jul-16 NW LANTAU 4 6.90 SUMMER STANDARD31516 HKLR P5-Jul-16 NW LANTAU 2 2.10 SUMMER STANDARD31516 HKLR S5-Jul-16 NW LANTAU 3 7.30 SUMMER STANDARD31516 HKLR S5-Jul-16 NW LANTAU 4 3.70 SUMMER STANDARD31516 HKLR S5-Jul-16 NE LANTAU 2 2.30 SUMMER STANDARD31516 HKLR P5-Jul-16 NE LANTAU 3 13.62 SUMMER STANDARD31516 HKLR P5-Jul-16 NE LANTAU 4 0.81 SUMMER STANDARD31516 HKLR P5-Jul-16 NE LANTAU 2 4.30 SUMMER STANDARD31516 HKLR S5-Jul-16 NE LANTAU 3 5.77 SUMMER STANDARD31516 HKLR S
12-Jul-16 NW LANTAU 1 4.04 SUMMER STANDARD31516 HKLR P12-Jul-16 NW LANTAU 2 27.40 SUMMER STANDARD31516 HKLR P12-Jul-16 NW LANTAU 1 2.10 SUMMER STANDARD31516 HKLR S12-Jul-16 NW LANTAU 2 6.27 SUMMER STANDARD31516 HKLR S12-Jul-16 NE LANTAU 2 19.99 SUMMER STANDARD31516 HKLR P12-Jul-16 NE LANTAU 2 11.81 SUMMER STANDARD31516 HKLR S18-Jul-16 NW LANTAU 2 4.34 SUMMER STANDARD31516 HKLR P18-Jul-16 NW LANTAU 3 29.06 SUMMER STANDARD31516 HKLR P18-Jul-16 NW LANTAU 4 7.70 SUMMER STANDARD31516 HKLR P18-Jul-16 NW LANTAU 2 2.00 SUMMER STANDARD31516 HKLR S18-Jul-16 NW LANTAU 3 7.60 SUMMER STANDARD31516 HKLR S18-Jul-16 NW LANTAU 4 3.00 SUMMER STANDARD31516 HKLR S18-Jul-16 NE LANTAU 2 15.66 SUMMER STANDARD31516 HKLR P18-Jul-16 NE LANTAU 3 1.06 SUMMER STANDARD31516 HKLR P18-Jul-16 NE LANTAU 2 9.89 SUMMER STANDARD31516 HKLR S27-Jul-16 NE LANTAU 2 18.79 SUMMER STANDARD31516 HKLR P27-Jul-16 NE LANTAU 3 0.70 SUMMER STANDARD31516 HKLR P27-Jul-16 NE LANTAU 2 10.91 SUMMER STANDARD31516 HKLR S27-Jul-16 NW LANTAU 2 19.61 SUMMER STANDARD31516 HKLR P27-Jul-16 NW LANTAU 3 11.30 SUMMER STANDARD31516 HKLR P27-Jul-16 NW LANTAU 4 0.60 SUMMER STANDARD31516 HKLR P27-Jul-16 NW LANTAU 2 6.89 SUMMER STANDARD31516 HKLR S27-Jul-16 NW LANTAU 3 1.20 SUMMER STANDARD31516 HKLR S5-Aug-16 NW LANTAU 1 0.88 SUMMER STANDARD31516 HKLR P5-Aug-16 NW LANTAU 2 39.05 SUMMER STANDARD31516 HKLR P5-Aug-16 NW LANTAU 2 11.73 SUMMER STANDARD31516 HKLR S5-Aug-16 NW LANTAU 3 1.70 SUMMER STANDARD31516 HKLR S5-Aug-16 NE LANTAU 2 16.76 SUMMER STANDARD31516 HKLR P5-Aug-16 NE LANTAU 2 9.74 SUMMER STANDARD31516 HKLR S9-Aug-16 NW LANTAU 1 23.75 SUMMER STANDARD36826 HKLR P9-Aug-16 NW LANTAU 2 7.05 SUMMER STANDARD36826 HKLR P9-Aug-16 NW LANTAU 1 6.40 SUMMER STANDARD36826 HKLR S9-Aug-16 NW LANTAU 2 1.70 SUMMER STANDARD36826 HKLR S9-Aug-16 NE LANTAU 1 1.61 SUMMER STANDARD36826 HKLR P9-Aug-16 NE LANTAU 2 9.89 SUMMER STANDARD36826 HKLR P

Appendix I. (cont'd)(Abbreviations: BEAU = Beaufort Sea State; P = Primary Line Effort; S = Secondary Line Effort)
DATE AREA BEAU EFFORT SEASON VESSEL TYPE P/S9-Aug-16 NE LANTAU 3 7.85 SUMMER STANDARD36826 HKLR P9-Aug-16 NE LANTAU 2 8.65 SUMMER STANDARD36826 HKLR S9-Aug-16 NE LANTAU 3 2.10 SUMMER STANDARD36826 HKLR S
17-Aug-16 NE LANTAU 2 13.69 SUMMER STANDARD36826 HKLR P17-Aug-16 NE LANTAU 3 6.29 SUMMER STANDARD36826 HKLR P17-Aug-16 NE LANTAU 2 10.92 SUMMER STANDARD36826 HKLR S17-Aug-16 NW LANTAU 2 23.13 SUMMER STANDARD36826 HKLR P17-Aug-16 NW LANTAU 3 4.78 SUMMER STANDARD36826 HKLR P17-Aug-16 NW LANTAU 4 2.58 SUMMER STANDARD36826 HKLR P17-Aug-16 NW LANTAU 2 5.31 SUMMER STANDARD36826 HKLR S17-Aug-16 NW LANTAU 3 2.44 SUMMER STANDARD36826 HKLR S17-Aug-16 NW LANTAU 4 0.56 SUMMER STANDARD36826 HKLR S23-Aug-16 NW LANTAU 1 0.94 SUMMER STANDARD31516 HKLR P23-Aug-16 NW LANTAU 2 38.76 SUMMER STANDARD31516 HKLR P23-Aug-16 NW LANTAU 2 13.50 SUMMER STANDARD31516 HKLR S23-Aug-16 NE LANTAU 1 1.00 SUMMER STANDARD31516 HKLR P23-Aug-16 NE LANTAU 2 15.48 SUMMER STANDARD31516 HKLR P23-Aug-16 NE LANTAU 2 9.82 SUMMER STANDARD31516 HKLR S13-Sep-16 NE LANTAU 2 15.97 AUTUMN STANDARD31516 HKLR P13-Sep-16 NE LANTAU 2 10.03 AUTUMN STANDARD31516 HKLR S13-Sep-16 NW LANTAU 2 36.84 AUTUMN STANDARD31516 HKLR P13-Sep-16 NW LANTAU 3 2.60 AUTUMN STANDARD31516 HKLR P13-Sep-16 NW LANTAU 2 15.06 AUTUMN STANDARD31516 HKLR S14-Sep-16 NW LANTAU 3 16.30 AUTUMN STANDARD36826 HKLR P14-Sep-16 NW LANTAU 4 14.20 AUTUMN STANDARD36826 HKLR P14-Sep-16 NW LANTAU 3 2.30 AUTUMN STANDARD36826 HKLR S14-Sep-16 NW LANTAU 4 5.30 AUTUMN STANDARD36826 HKLR S14-Sep-16 NW LANTAU 5 0.50 AUTUMN STANDARD36826 HKLR S14-Sep-16 NE LANTAU 2 2.79 AUTUMN STANDARD36826 HKLR P14-Sep-16 NE LANTAU 3 16.35 AUTUMN STANDARD36826 HKLR P14-Sep-16 NE LANTAU 4 0.76 AUTUMN STANDARD36826 HKLR P14-Sep-16 NE LANTAU 2 2.40 AUTUMN STANDARD36826 HKLR S14-Sep-16 NE LANTAU 3 9.00 AUTUMN STANDARD36826 HKLR S21-Sep-16 NW LANTAU 2 30.13 AUTUMN STANDARD36826 HKLR P21-Sep-16 NW LANTAU 3 9.42 AUTUMN STANDARD36826 HKLR P21-Sep-16 NW LANTAU 2 10.37 AUTUMN STANDARD36826 HKLR S21-Sep-16 NW LANTAU 3 2.31 AUTUMN STANDARD36826 HKLR S21-Sep-16 NE LANTAU 1 1.80 AUTUMN STANDARD36826 HKLR P21-Sep-16 NE LANTAU 2 14.60 AUTUMN STANDARD36826 HKLR P21-Sep-16 NE LANTAU 1 2.10 AUTUMN STANDARD36826 HKLR S21-Sep-16 NE LANTAU 2 8.10 AUTUMN STANDARD36826 HKLR S23-Sep-16 NE LANTAU 2 18.82 AUTUMN STANDARD36826 HKLR P23-Sep-16 NE LANTAU 3 0.81 AUTUMN STANDARD36826 HKLR P23-Sep-16 NE LANTAU 2 10.07 AUTUMN STANDARD36826 HKLR S23-Sep-16 NW LANTAU 2 1.25 AUTUMN STANDARD36826 HKLR P23-Sep-16 NW LANTAU 3 28.81 AUTUMN STANDARD36826 HKLR P23-Sep-16 NW LANTAU 4 0.80 AUTUMN STANDARD36826 HKLR P23-Sep-16 NW LANTAU 3 7.34 AUTUMN STANDARD36826 HKLR S
4-Oct-16 NW LANTAU 2 25.94 AUTUMN STANDARD36826 HKLR P4-Oct-16 NW LANTAU 3 5.70 AUTUMN STANDARD36826 HKLR P4-Oct-16 NW LANTAU 2 6.60 AUTUMN STANDARD36826 HKLR S4-Oct-16 NE LANTAU 2 15.22 AUTUMN STANDARD36826 HKLR P4-Oct-16 NE LANTAU 3 4.57 AUTUMN STANDARD36826 HKLR P4-Oct-16 NE LANTAU 2 10.41 AUTUMN STANDARD36826 HKLR S

Appendix I. (cont'd)(Abbreviations: BEAU = Beaufort Sea State; P = Primary Line Effort; S = Secondary Line Effort)
DATE AREA BEAU EFFORT SEASON VESSEL TYPE P/S7-Oct-16 NE LANTAU 2 16.19 AUTUMN STANDARD36826 HKLR P7-Oct-16 NE LANTAU 2 10.71 AUTUMN STANDARD36826 HKLR S7-Oct-16 NW LANTAU 1 4.54 AUTUMN STANDARD36826 HKLR P7-Oct-16 NW LANTAU 2 36.45 AUTUMN STANDARD36826 HKLR P7-Oct-16 NW LANTAU 1 1.03 AUTUMN STANDARD36826 HKLR S7-Oct-16 NW LANTAU 2 11.81 AUTUMN STANDARD36826 HKLR S7-Oct-16 NW LANTAU 3 0.40 AUTUMN STANDARD36826 HKLR S
11-Oct-16 NW LANTAU 2 29.01 AUTUMN STANDARD36826 HKLR P11-Oct-16 NW LANTAU 3 10.75 AUTUMN STANDARD36826 HKLR P11-Oct-16 NW LANTAU 2 12.21 AUTUMN STANDARD36826 HKLR S11-Oct-16 NW LANTAU 3 1.40 AUTUMN STANDARD36826 HKLR S11-Oct-16 NE LANTAU 2 15.82 AUTUMN STANDARD36826 HKLR P11-Oct-16 NE LANTAU 3 0.80 AUTUMN STANDARD36826 HKLR P11-Oct-16 NE LANTAU 2 7.48 AUTUMN STANDARD36826 HKLR S11-Oct-16 NE LANTAU 3 2.40 AUTUMN STANDARD36826 HKLR S13-Oct-16 NW LANTAU 2 14.72 AUTUMN STANDARD36826 HKLR P13-Oct-16 NW LANTAU 3 15.81 AUTUMN STANDARD36826 HKLR P13-Oct-16 NW LANTAU 2 3.21 AUTUMN STANDARD36826 HKLR S13-Oct-16 NW LANTAU 3 5.06 AUTUMN STANDARD36826 HKLR S13-Oct-16 NE LANTAU 2 20.06 AUTUMN STANDARD36826 HKLR P13-Oct-16 NE LANTAU 2 11.14 AUTUMN STANDARD36826 HKLR S

Appendix II. HKLR03 Chinese White Dolphin Sighting Database (November 2015 - October 2016)(Abberviations: STG# = Sighting Number; HRD SZ = Dolphin Herd Size; BEAU = Beaufort Sea State; PSD = Perpendicular Distance; BOAT ASSOC. = Fishing Boat Association; P/S: Sighting Made on Primary/Secondary Lines)
DATE STG # TIME HRD SZ AREA BEAU PSD EFFORT TYPE NORTHING EASTING SEASON BOAT ASSOC. P/S2-Nov-15 1 1143 7 NW LANTAU 2 181 ON HKLR 828699 806450 AUTUMN NONE P6-Nov-15 1 1106 1 NW LANTAU 3 77 ON HKLR 826830 805262 AUTUMN NONE P
10-Nov-15 1 1042 1 NW LANTAU 3 465 ON HKLR 825312 805475 AUTUMN NONE P16-Nov-15 1 1455 5 NW LANTAU 5 662 ON HKLR 827241 804645 AUTUMN NONE P2-Dec-15 1 1058 1 NW LANTAU 2 477 ON HKLR 826399 804684 WINTER NONE P2-Dec-15 2 1149 2 NW LANTAU 2 257 ON HKLR 827946 806459 WINTER NONE P7-Dec-15 1 1449 10 NW LANTAU 3 553 ON HKLR 828945 805462 WINTER NONE P9-Dec-15 1 1209 9 NW LANTAU 4 126 ON HKLR 829795 806761 WINTER NONE S
15-Dec-15 1 1015 1 NW LANTAU 2 ND OFF HKLR 814683 804794 WINTER NONE15-Dec-15 2 1303 2 NW LANTAU 2 169 ON HKLR 822328 808518 WINTER NONE P15-Dec-15 3 1329 3 NW LANTAU 3 236 ON HKLR 826060 808504 WINTER NONE P
8-Jan-16 1 1209 1 NW LANTAU 2 591 ON HKLR 822365 806458 WINTER NONE P11-Jan-16 1 1303 6 NW LANTAU 3 140 ON HKLR 830351 805495 WINTER NONE P13-Jan-16 1 1355 1 NW LANTAU 3 54 ON HKLR 823584 806162 WINTER NONE S13-Jan-16 2 1458 2 NW LANTAU 2 83 ON HKLR 830961 805085 WINTER NONE S19-Jan-16 1 1112 8 NW LANTAU 3 332 ON HKLR 829044 805503 WINTER NONE P3-Feb-16 1 1318 5 NW LANTAU 3 28 ON HKLR 826580 808505 WINTER NONE P
16-Feb-16 1 1414 6 NW LANTAU 3 145 ON HKLR 824082 812518 WINTER NONE P11-Mar-16 1 1300 1 NW LANTAU 2 ND OFF HKLR 821158 812895 SPRING NONE23-Mar-16 1 1338 3 NW LANTAU 2 5 ON HKLR 828123 806459 SPRING NONE P
5-Apr-16 1 1059 8 NW LANTAU 2 454 ON HKLR 824938 804702 SPRING NONE P19-Apr-16 1 1426 2 NW LANTAU 2 ND OFF HKLR 828998 806471 SPRING NONE19-Apr-16 2 1451 2 NW LANTAU 2 ND OFF HKLR 829109 806461 SPRING NONE19-Apr-16 3 1504 3 NW LANTAU 2 177 ON HKLR 829696 806297 SPRING NONE P19-Apr-16 4 1519 3 NW LANTAU 2 465 ON HKLR 829442 806050 SPRING NONE S6-Jun-16 1 1556 1 NE LANTAU 2 ND OFF HKLR 821150 818561 SUMMER NONE5-Jul-16 1 1016 2 NW LANTAU 2 434 ON HKLR 815337 804661 SUMMER NONE P
12-Jul-16 1 1335 1 NW LANTAU 2 531 ON HKLR 825962 807516 SUMMER NONE P12-Jul-16 2 1446 3 NW LANTAU 2 165 ON HKLR 822433 805459 SUMMER NONE P18-Jul-16 1 1014 1 NW LANTAU 3 ND OFF HKLR 815004 805073 SUMMER NONE5-Aug-16 1 1049 11 NW LANTAU 2 95 ON HKLR 822169 804686 SUMMER NONE P5-Aug-16 2 1130 7 NW LANTAU 2 415 ON HKLR 823742 804689 SUMMER NONE P
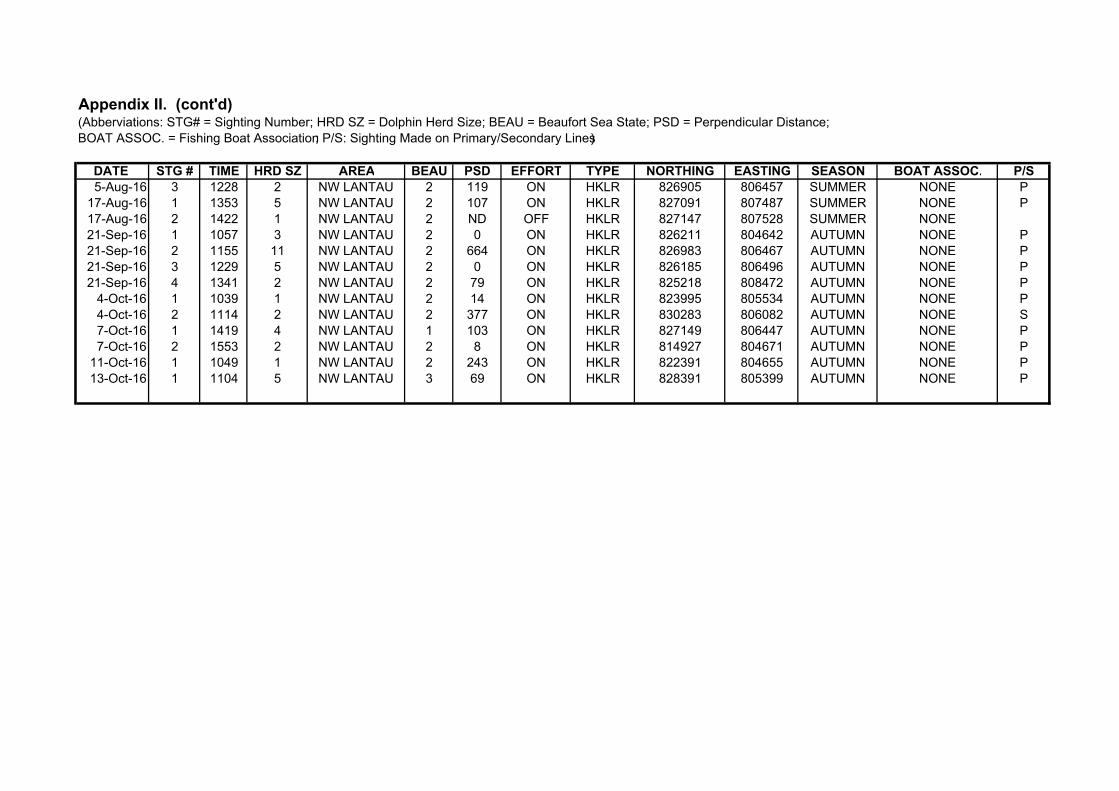
Appendix II. (cont'd)(Abberviations: STG# = Sighting Number; HRD SZ = Dolphin Herd Size; BEAU = Beaufort Sea State; PSD = Perpendicular Distance; BOAT ASSOC. = Fishing Boat Association; P/S: Sighting Made on Primary/Secondary Lines)
DATE STG # TIME HRD SZ AREA BEAU PSD EFFORT TYPE NORTHING EASTING SEASON BOAT ASSOC. P/S5-Aug-16 3 1228 2 NW LANTAU 2 119 ON HKLR 826905 806457 SUMMER NONE P
17-Aug-16 1 1353 5 NW LANTAU 2 107 ON HKLR 827091 807487 SUMMER NONE P17-Aug-16 2 1422 1 NW LANTAU 2 ND OFF HKLR 827147 807528 SUMMER NONE21-Sep-16 1 1057 3 NW LANTAU 2 0 ON HKLR 826211 804642 AUTUMN NONE P21-Sep-16 2 1155 11 NW LANTAU 2 664 ON HKLR 826983 806467 AUTUMN NONE P21-Sep-16 3 1229 5 NW LANTAU 2 0 ON HKLR 826185 806496 AUTUMN NONE P21-Sep-16 4 1341 2 NW LANTAU 2 79 ON HKLR 825218 808472 AUTUMN NONE P
4-Oct-16 1 1039 1 NW LANTAU 2 14 ON HKLR 823995 805534 AUTUMN NONE P4-Oct-16 2 1114 2 NW LANTAU 2 377 ON HKLR 830283 806082 AUTUMN NONE S7-Oct-16 1 1419 4 NW LANTAU 1 103 ON HKLR 827149 806447 AUTUMN NONE P7-Oct-16 2 1553 2 NW LANTAU 2 8 ON HKLR 814927 804671 AUTUMN NONE P
11-Oct-16 1 1049 1 NW LANTAU 2 243 ON HKLR 822391 804655 AUTUMN NONE P13-Oct-16 1 1104 5 NW LANTAU 3 69 ON HKLR 828391 805399 AUTUMN NONE P
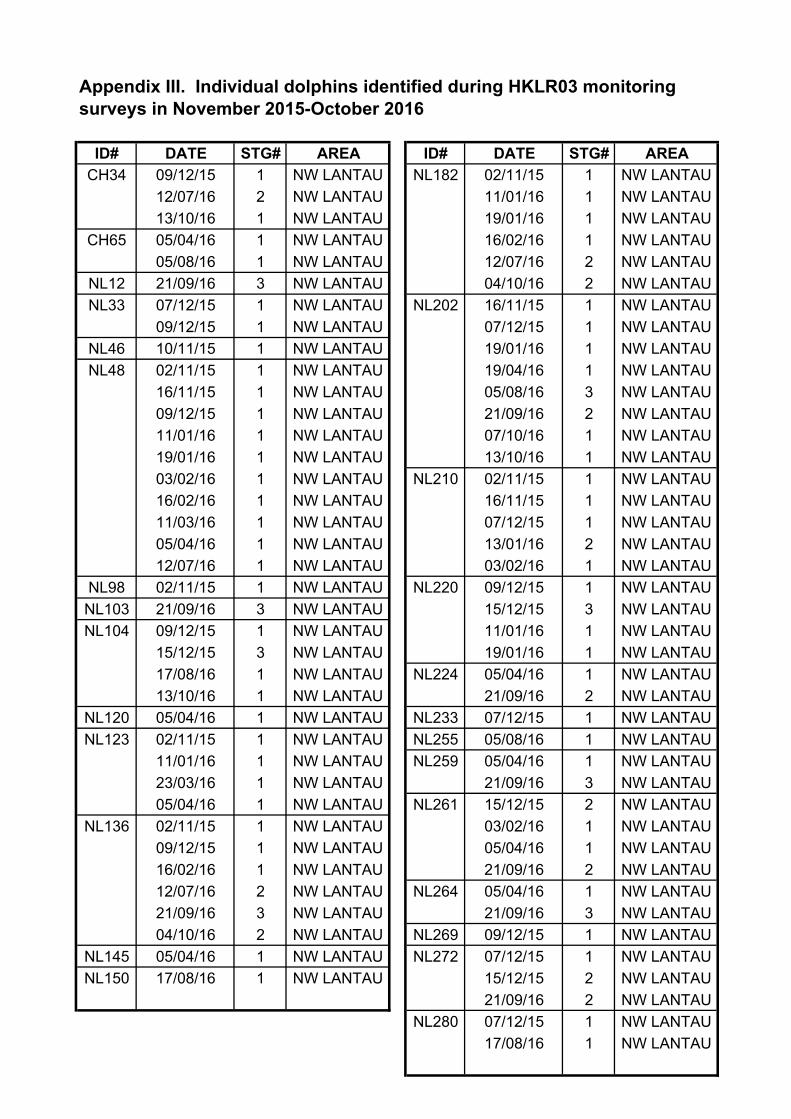
Appendix III. Individual dolphins identified during HKLR03 monitoringsurveys in November 2015-October 2016
ID# DATE STG# AREA ID# DATE STG# AREA
CH34 09/12/15 1 NW LANTAU NL182 02/11/15 1 NW LANTAU
12/07/16 2 NW LANTAU 11/01/16 1 NW LANTAU
13/10/16 1 NW LANTAU 19/01/16 1 NW LANTAU
CH65 05/04/16 1 NW LANTAU 16/02/16 1 NW LANTAU
05/08/16 1 NW LANTAU 12/07/16 2 NW LANTAU
NL12 21/09/16 3 NW LANTAU 04/10/16 2 NW LANTAU
NL33 07/12/15 1 NW LANTAU NL202 16/11/15 1 NW LANTAU
09/12/15 1 NW LANTAU 07/12/15 1 NW LANTAU
NL46 10/11/15 1 NW LANTAU 19/01/16 1 NW LANTAU
NL48 02/11/15 1 NW LANTAU 19/04/16 1 NW LANTAU
16/11/15 1 NW LANTAU 05/08/16 3 NW LANTAU
09/12/15 1 NW LANTAU 21/09/16 2 NW LANTAU
11/01/16 1 NW LANTAU 07/10/16 1 NW LANTAU
19/01/16 1 NW LANTAU 13/10/16 1 NW LANTAU
03/02/16 1 NW LANTAU NL210 02/11/15 1 NW LANTAU
16/02/16 1 NW LANTAU 16/11/15 1 NW LANTAU
11/03/16 1 NW LANTAU 07/12/15 1 NW LANTAU
05/04/16 1 NW LANTAU 13/01/16 2 NW LANTAU
12/07/16 1 NW LANTAU 03/02/16 1 NW LANTAU
NL98 02/11/15 1 NW LANTAU NL220 09/12/15 1 NW LANTAU
NL103 21/09/16 3 NW LANTAU 15/12/15 3 NW LANTAU
NL104 09/12/15 1 NW LANTAU 11/01/16 1 NW LANTAU
15/12/15 3 NW LANTAU 19/01/16 1 NW LANTAU
17/08/16 1 NW LANTAU NL224 05/04/16 1 NW LANTAU
13/10/16 1 NW LANTAU 21/09/16 2 NW LANTAU
NL120 05/04/16 1 NW LANTAU NL233 07/12/15 1 NW LANTAU
NL123 02/11/15 1 NW LANTAU NL255 05/08/16 1 NW LANTAU
11/01/16 1 NW LANTAU NL259 05/04/16 1 NW LANTAU
23/03/16 1 NW LANTAU 21/09/16 3 NW LANTAU
05/04/16 1 NW LANTAU NL261 15/12/15 2 NW LANTAU
NL136 02/11/15 1 NW LANTAU 03/02/16 1 NW LANTAU
09/12/15 1 NW LANTAU 05/04/16 1 NW LANTAU
16/02/16 1 NW LANTAU 21/09/16 2 NW LANTAU
12/07/16 2 NW LANTAU NL264 05/04/16 1 NW LANTAU
21/09/16 3 NW LANTAU 21/09/16 3 NW LANTAU
04/10/16 2 NW LANTAU NL269 09/12/15 1 NW LANTAU
NL145 05/04/16 1 NW LANTAU NL272 07/12/15 1 NW LANTAU
NL150 17/08/16 1 NW LANTAU 15/12/15 2 NW LANTAU
21/09/16 2 NW LANTAU
NL280 07/12/15 1 NW LANTAU
17/08/16 1 NW LANTAU

Appendix III. (cont'd)
ID# DATE STG# AREA
NL281 05/08/16 1 NW LANTAU
NL284 07/12/15 1 NW LANTAU
19/01/16 1 NW LANTAU
16/02/16 1 NW LANTAU
NL285 08/01/16 1 NW LANTAU
11/01/16 1 NW LANTAU
19/01/16 1 NW LANTAU
03/02/16 1 NW LANTAU
16/02/16 1 NW LANTAU
23/03/16 1 NW LANTAU
05/04/16 1 NW LANTAU
NL286 16/11/15 1 NW LANTAU
02/12/15 1 NW LANTAU
02/12/15 2 NW LANTAU
07/12/15 1 NW LANTAU
19/04/16 1 NW LANTAU
05/08/16 3 NW LANTAU
21/09/16 2 NW LANTAU
07/10/16 1 NW LANTAU
13/10/16 1 NW LANTAU
NL287 05/04/16 1 NW LANTAU
NL288 05/04/16 1 NW LANTAU
21/09/16 3 NW LANTAU
NL293 18/07/16 1 NW LANTAU
NL302 13/01/16 2 NW LANTAU
05/07/16 1 NW LANTAU
NL307 05/07/16 1 NW LANTAU
21/09/16 2 NW LANTAU
NL308 19/04/16 3 NW LANTAU
NL319 21/09/16 2 NW LANTAU
NL320 11/01/16 1 NW LANTAU
19/01/16 1 NW LANTAU
03/02/16 1 NW LANTAU
23/03/16 1 NW LANTAU
21/09/16 2 NW LANTAU
07/10/16 1 NW LANTAU
NL321 13/10/16 1 NW LANTAU
WL17 16/02/16 1 NW LANTAU
WL243 07/10/16 2 NW LANTAU

Appendix IV. Ranging patterns (95% kernel ranges) of 42 individual dolphins that were sighted during the third year of TMCLKL construction works, utilizing the HKLR03 and HKLR09 monitoring data (note: yellow dots indicates sightings made in November 2015 to October 2016)
N N N
N N N

Appendix IV. (cont’d)
N N N
N N N

Appendix IV. (cont’d)
N N N
N N N

Appendix IV. (cont’d)
N N N
N N N

Appendix IV. (cont’d)
N N N
N N N

Appendix IV. (cont’d)
N N N
N N N

Appendix IV. (cont’d)
N N N
N N N

Appendix V. Temporal changes in range use patterns of 31 individual dolphins during baseline, transitional & three impact phases of TMCLKL construction
(note: yellow dots indicates sightings made in corresponding period)

Appendix V. (cont’d)

Appendix V. (cont’d)

Appendix V. (cont’d)

Appendix V. (cont’d)
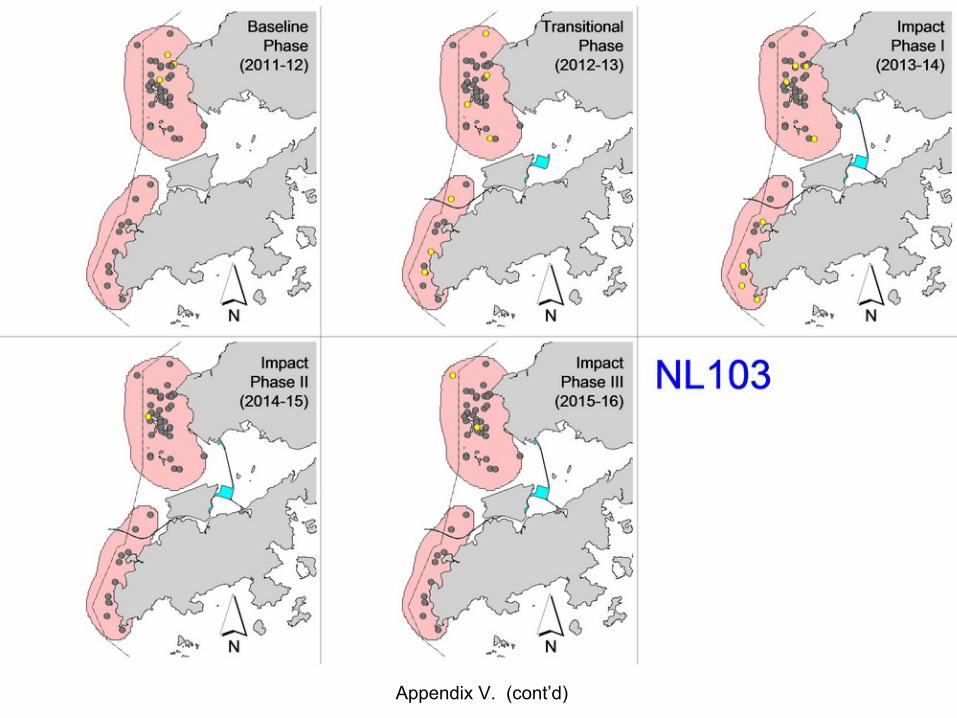
Appendix V. (cont’d)

Appendix V. (cont’d)

Appendix V. (cont’d)

Appendix V. (cont’d)

Appendix V. (cont’d)

Appendix V. (cont’d)

Appendix V. (cont’d)

Appendix V. (cont’d)

Appendix V. (cont’d)

Appendix V. (cont’d)

Appendix V. (cont’d)

Appendix V. (cont’d)

Appendix V. (cont’d)

Appendix V. (cont’d)

Appendix V. (cont’d)
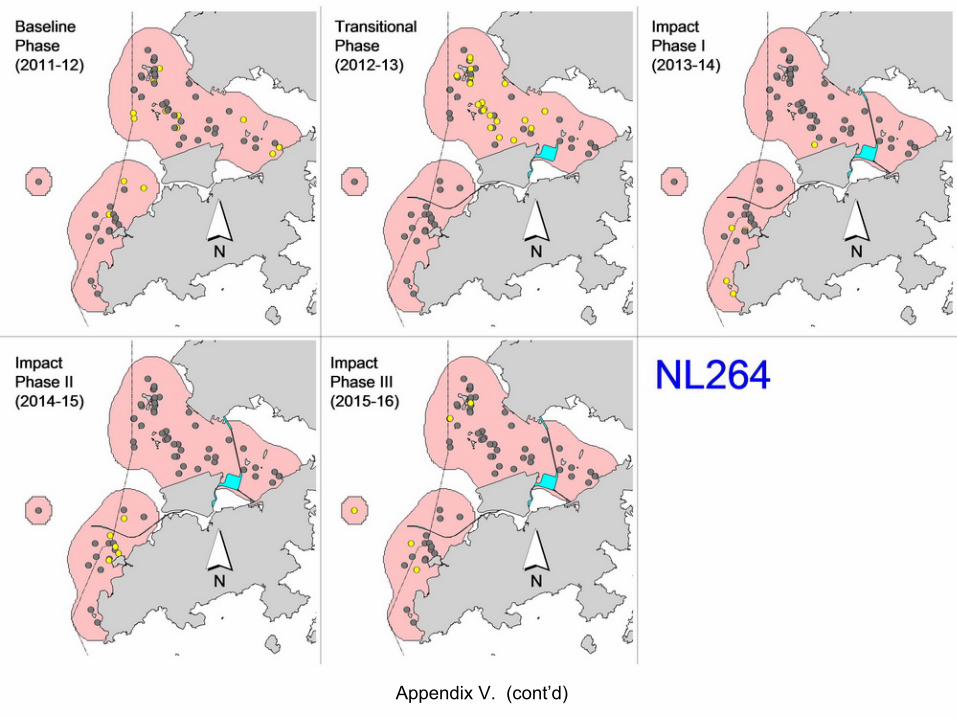
Appendix V. (cont’d)

Appendix V. (cont’d)

Appendix V. (cont’d)

Appendix V. (cont’d)
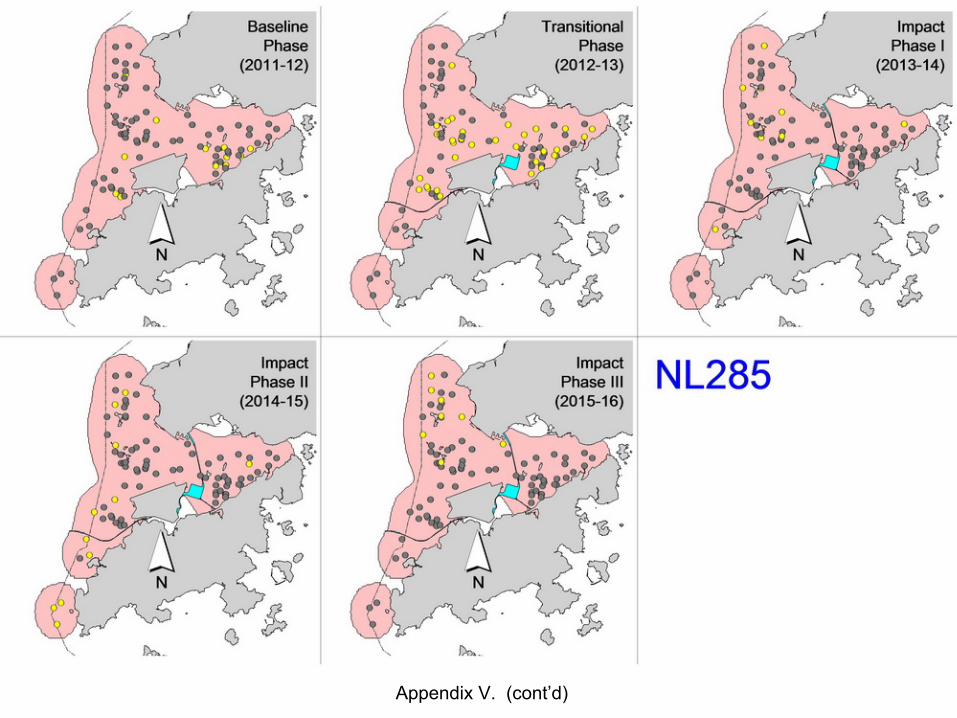
Appendix V. (cont’d)
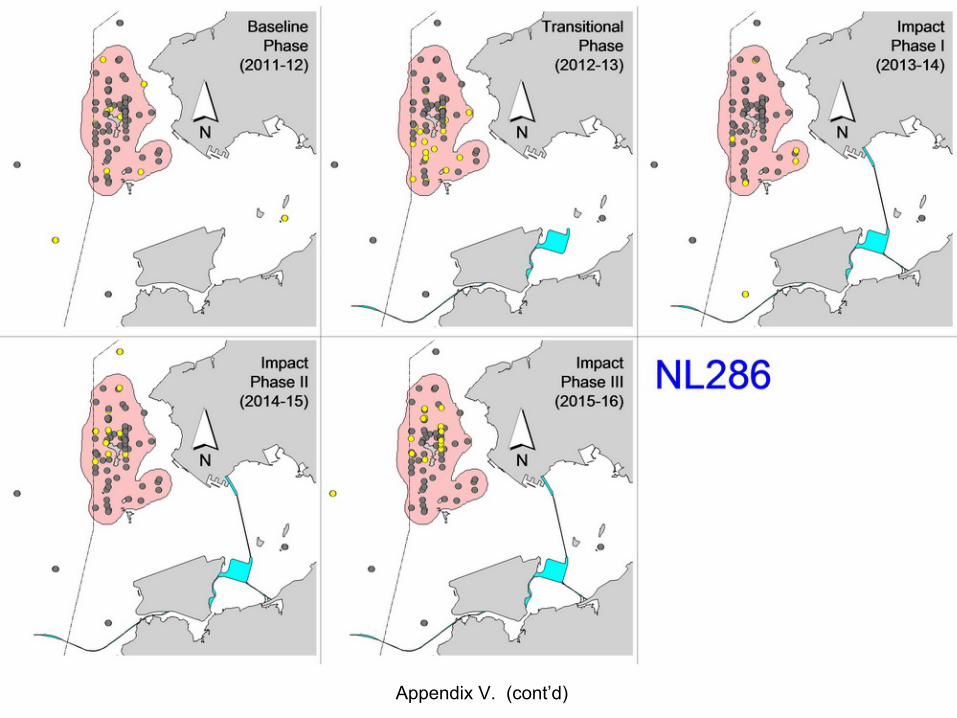
Appendix V. (cont’d)

Appendix V. (cont’d)

Appendix V. (cont’d)

Appendix V. (cont’d)

Appendix V. (cont’d)

Appendix V. (cont’d)

Appendix H
Event Action Plan

1
AppendixH1 Event/ Action Plan for Air Quality
ACTION
EVENT ET
(1) IEC
(1) SOR
(1) Contractor
Action Level
1. Exceedance for one
sample
1. Identify the source.
2. Inform the IEC and the SOR.
3. Repeat measurement to confirm
finding.
4. Increase monitoring frequency to
daily.
1. Check monitoring data submitted
by the ET.
2. Check Contractor’s working
method.
1. Notify Contractor. 1. Rectify any unacceptable practice
2. Amend working methods if
appropriate
2. Exceedance for two
or more consecutive
samples
1. Identify the source.
2. Inform the IEC and the SOR.
3. Repeat measurements to confirm
findings.
4. Increase monitoring frequency to
daily.
5. Discuss with the IEC and the
Contractor on remedial actions
required.
6. If exceedance continues, arrange
meeting with the IEC and the
SOR.
7. If exceedance stops, cease
additional monitoring.
1. Check monitoring data
submitted by the ET.
2. Check the Contractor’s working
method.
3. Discuss with the ET and the
Contractor on possible remedial
measures.
4. Advise the SOR on the
effectiveness of the proposed
remedial measures.
5. Supervisor implementation of
remedial measures.
1. Confirm receipt of notification of
failure in writing.
2. Notify the Contractor.
3. Ensure remedial measures properly
implemented.
1. Submit proposals for remedial
actions to IEC within 3 working
days of notification
2. Implement the agreed proposals
3. Amend proposal if appropriate

2
ACTION
EVENT ET
(1) IEC
(1) SOR
(1) Contractor
Limit Level
1. Exceedance for one
sample
1. Identify the source.
2. Inform the SOR and the DEP.
3. Repeat measurement to confirm
finding.
4. Increase monitoring frequency to
daily.
5. Assess effectiveness of Contractor’s
remedial actions and keep the IEC,
the DEP and the SOR informed of
the results.
1. Check monitoring data submitted
by the ET.
2. Check Contractor’s working
method.
3. Discuss with the ET and the
Contractor on possible remedial
measures.
4. Advise the SOR on the effectiveness
of the proposed remedial measures.
5. Supervisor implementation of
remedial measures.
1. Confirm receipt of notification of
failure in writing.
2. Notify the Contractor.
3. Ensure remedial measures are
properly implemented.
1. Take immediate action to avoid
further exceedance
2. Submit proposals for remedial
actions to IEC within 3 working
days of notification
3. Implement the agreed proposals
4. Amend proposal if appropriate
2. Exceedance for two
or more consecutive
samples
1. Notify the IEC, the SOR, the DEP
and the Contractor.
2. Identify the source.
3. Repeat measurements to confirm
findings.
4. Increase monitoring frequency to
daily.
5. Carry out analysis of the
Contractor’s working
procedures to determine
possible mitigation to be
implemented.
6. Arrange meeting with the IEC
and the SOR to discuss the
remedial actions to be taken.
7. Assess effectiveness of the
Contractor’s remedial actions
1. Discuss amongst the SOR, ET
and the Contractor on the
potential remedial actions.
2. Review the Contractor’s
remedial actions whenever
necessary to assure their
effectiveness and advise the
SOR accordingly.
3. Supervise the implementation of
remedial measures.
1. Confirm receipt of notification of
failure in writing.
2. Notify the Contractor.
3. In consultation with the IEC, agree
with the Contractor on the
remedial measures to be
implemented.
4. Ensure remedial measures are
properly implemented.
5. If exceedance continues, consider
what activity of the work is
responsible and instruct the
Contractor to stop that activity of
work until the exceedance is
abated.
1. Take immediate action to avoid
further exceedance.
2. Submit proposals for remedial
actions to IEC within 3 working
days of notification.
3. Implement the agreed proposals.
4. Resubmit proposals if problem still
not under control.
5. Stop the relevant activity of works
as determined by the SOR until the
exceedance is abated.
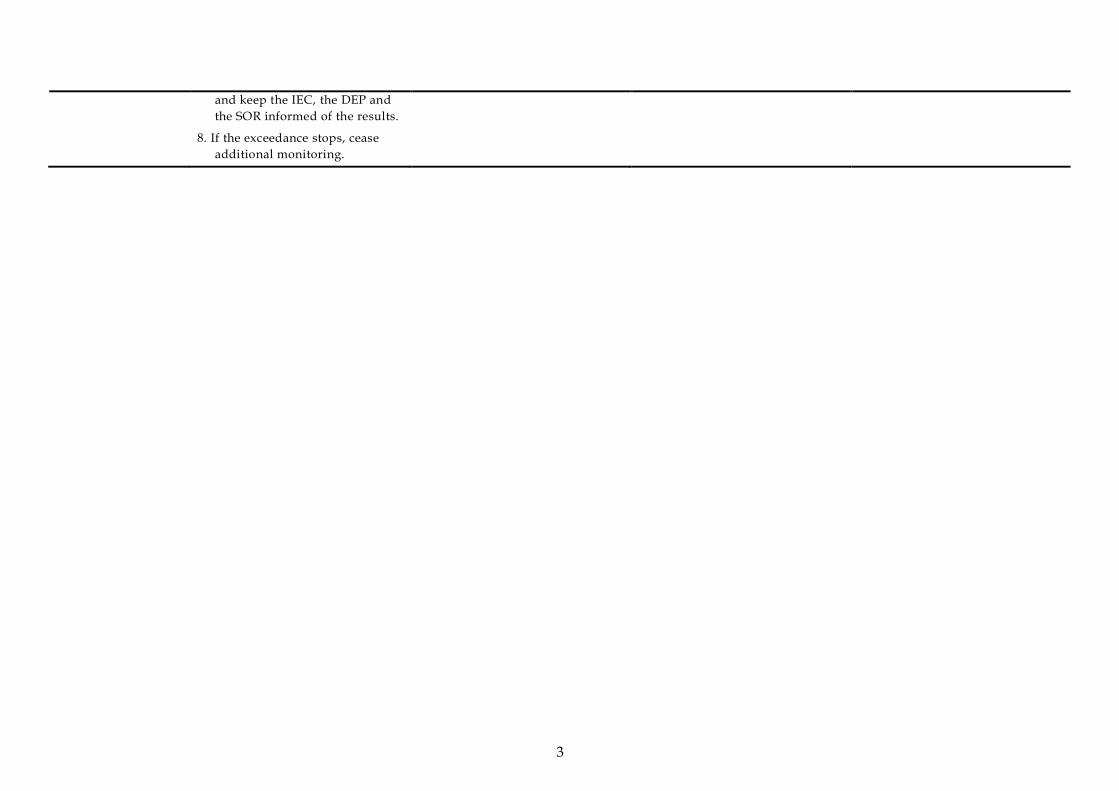
3
and keep the IEC, the DEP and
the SOR informed of the results.
8. If the exceedance stops, cease
additional monitoring.

4
Appendix H2 Event/ Action Plan for Construction Noise
ACTION
EVENT ET IEC SOR Contractor
Action Level 1. Notify the IEC and the Contractor.
2. Carry out investigation.
3. Report the results of investigation to
the IEC and the Contractor.
4. Discuss with the Contractor and
formulate remedial measures.
5. Increase monitoring frequency to
check mitigation effectiveness.
1. Review the analysed results
submitted by the ET.
2. Review the proposed remedial
measures by the Contractor and
advise the SOR accordingly.
3. Supervise the implementation of
remedial measures.
1. Confirm receipt of notification of
failure in writing.
2. Notify the Contractor.
3. Require the Contractor to propose
remedial measures for the analysed
noise problem.
4. Ensure remedial measures are
properly implemented.
1. Submit noise mitigation proposals
to IEC
2. Implement noise mitigation
proposals
Limit Level 1. Notify the IEC, the SOR, the DEP
and the Contractor.
2. Identify the source.
3. Repeat measurement to confirm
findings.
4. Increase monitoring frequency.
5. Carry out analysis of Contractor’s
working procedures to determine
possible mitigation to be
implemented.
6. Inform the IEC, the SOR and the
DEP the causes & actions taken for
the exceedances.
7. Assess effectiveness of the
Contractor’s remedial actions and
keep the IEC, the DEP and the SOR
informed of the results.
8. If exceedance stops, cease additional
monitoring.
1. Discuss amongst the SOR, the ET
and the Contractor on the potential
remedial actions.
2. Review the Contractor’s remedial
actions whenever necessary to
assure their effectiveness and advise
the SOR accordingly.
3. Supervise the implementation of
remedial measures.
1. Confirm receipt of notification of
failure in writing.
2. Notify the Contractor.
3. Require the Contractor to propose
remedial measures for the analysed
noise problem.
4. Ensure remedial measures are
properly implemented.
5. If exceedance continues, consider
what activity of the work is
responsible and instruct the
Contractor to stop that activity of
work until the exceedance is abated.
1. Take immediate action to avoid
further exceedance
2. Submit proposals for remedial
actions to IEC within 3 working
days of notification
3. Implement the agreed proposals
4. Resubmit proposals if problem still
not under control
5. Stop the relevant activity of works
as determined by the SOR until the
exceedance is abated.
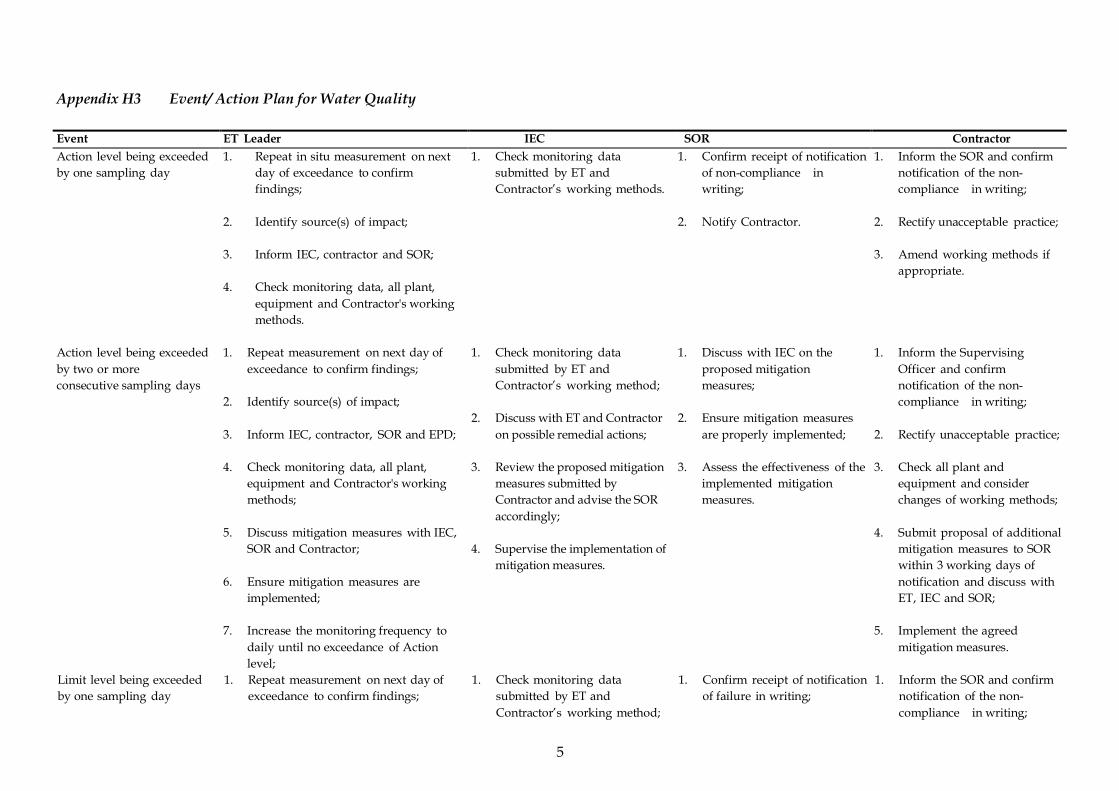
5
Appendix H3 Event/ Action Plan for Water Quality
Event ET Leader IEC SOR Contractor
Action level being exceeded
by one sampling day
1. Repeat in situ measurement on next
day of exceedance to confirm
findings;
2. Identify source(s) of impact;
3. Inform IEC, contractor and SOR;
4. Check monitoring data, all plant,
equipment and Contractor's working
methods.
1. Check monitoring data
submitted by ET and
Contractor’s working methods.
1. Confirm receipt of notification
of non-compliance in
writing;
2. Notify Contractor.
1. Inform the SOR and confirm
notification of the non-
compliance in writing;
2. Rectify unacceptable practice;
3. Amend working methods if
appropriate.
Action level being exceeded
by two or more
consecutive sampling days
1. Repeat measurement on next day of
exceedance to confirm findings;
2. Identify source(s) of impact;
3. Inform IEC, contractor, SOR and EPD;
4. Check monitoring data, all plant,
equipment and Contractor's working
methods;
5. Discuss mitigation measures with IEC,
SOR and Contractor;
6. Ensure mitigation measures are
implemented;
7. Increase the monitoring frequency to
daily until no exceedance of Action
level;
1. Check monitoring data
submitted by ET and
Contractor’s working method;
2. Discuss with ET and Contractor
on possible remedial actions;
3. Review the proposed mitigation
measures submitted by
Contractor and advise the SOR
accordingly;
4. Supervise the implementation of
mitigation measures.
1. Discuss with IEC on the
proposed mitigation
measures;
2. Ensure mitigation measures
are properly implemented;
3. Assess the effectiveness of the
implemented mitigation
measures.
1. Inform the Supervising
Officer and confirm
notification of the non-
compliance in writing;
2. Rectify unacceptable practice;
3. Check all plant and
equipment and consider
changes of working methods;
4. Submit proposal of additional
mitigation measures to SOR
within 3 working days of
notification and discuss with
ET, IEC and SOR;
5. Implement the agreed
mitigation measures.
Limit level being exceeded
by one sampling day
1. Repeat measurement on next day of
exceedance to confirm findings;
1. Check monitoring data
submitted by ET and
Contractor’s working method;
1. Confirm receipt of notification
of failure in writing;
1. Inform the SOR and confirm
notification of the non-
compliance in writing;

6
Event ET Leader IEC SOR Contractor
2. Identify source(s) of impact;
3. Inform IEC, contractor, SOR and EPD;
4. Check monitoring data, all plant,
equipment and Contractor's working
methods;
5. Discuss mitigation measures with
IEC, SOR and Contractor;
2. Discuss with ET and Contractor
on possible remedial actions;
3. Review the proposed mitigation
measures submitted by
Contractor and advise the SOR
accordingly.
2. Discuss with IEC, ET and
Contractor on the proposed
mitigation measures;
3. Request Contractor to review
the working methods.
2. Rectify unacceptable practice;
3. Check all plant and
equipment and consider
changes of working methods;
4. Submit proposal of mitigation
measures to SOR within 3
working days of notification
and discuss with ET, IEC and
SOR.
Limit level being exceeded
by two or more consecutive
sampling days
1. Repeat measurement on next day of
exceedance to confirm findings;
2. Identify source(s) of impact;
3. Inform IEC, contractor, SOR and EPD;
4. Check monitoring data, all plant,
equipment and Contractor's working
methods;
5. Discuss mitigation measures with
IEC, SOR and Contractor;
6. Ensure mitigation measures are
implemented;
7. Increase the monitoring frequency to
daily until no exceedance of Limit level
for two consecutive days;
1. Check monitoring data
submitted by ET and
Contractor’s working method;
2. Discuss with ET and Contractor
on possible remedial actions;
3. Review the Contractor’s
mitigation measures whenever
necessary to assure their
effectiveness and advise the
SOR accordingly;
4. Supervise the implementation
of mitigation measures.
1. Discuss with IEC, ET and
Contractor on the
proposed mitigation
measures;
2. Request Contractor to
critically review the
working methods;
3. Make agreement on the
mitigation measures to be
implemented;
4.
5. Ensure mitigation measures
are properly implemented;
6.
7. Consider and instruct, if
necessary, the Contractor
to slow down or to stop all
or part of the construction
activities until no
exceedance of Limit level.
1. Take immediate action to
avoid further exceedance;
2. Submit proposal of mitigation
measures to SOR within 3
working days of notification
and discuss with ET, IEC and
SOR;
3. Implement the agreed
mitigation measures;
4. Resubmit proposals of
mitigation measures if
problem still not under
control;
5. As directed by the
Supervising Officer, to slow
down or to stop all or part of
the construction activities
until no exceedance of Limit
level.

7
Appendix H4 Implementation of Event-Action Plan for Dolphin Monitoring
Event ET Leader IEC SOR Contractor
Action Level 1. Repeat statistical data analysis to confirm findings;
2. Review all available and relevant data, including
raw data and statistical analysis results of other
parameters covered in the EM&A, to ascertain if
differences are as a result of natural variation or
previously observed seasonal differences;
3. Identify source(s) of impact;
4. Inform the IEC, SOR and Contractor;
5. Check monitoring data.
6. Review to ensure all the dolphin protective
measures are fully and properly implemented and
advise on additional measures if necessary.
1. Check monitoring data submitted
by ET and Contractor;
2. Discuss monitoring results and
findings with the ET and the
Contractor.
1. Discuss monitoring with the IEC
and any other measures
proposed by the ET;
2. If SOR is satisfied with the
proposal of any other measures,
SOR to signify the agreement in
writing on the measures to be
implemented.
1. Inform the SOR and confirm
notification of the non-
compliance in writing;
2. Discuss with the ET and the
IEC and propose measures to
the IEC and the SOR;
3. Implement the agreed
measures.

8
Event ET Leader IEC SOR Contractor
Limit Level 1. Repeat statistical data analysis to confirm findings;
2. Review all available and relevant data, including
raw data and statistical analysis results of other
parameters covered in the EM&A, to ascertain if
differences are as a result of natural variation or
previously observed seasonal differences;
3. Identify source(s) of impact;
4. Inform the IEC, ER/SOR and Contractor of
findings;
5. Check monitoring data;
6. Repeat review to ensure all the dolphin protective
measures are fully and properly implemented and
advise on additional measures if necessary;
7. If ET proves that the source of impact is caused by
any of the construction activity by the works
contract, ET to arrange a meeting to discuss with
IEC, ER/SOR and Contractor the necessity of
additional dolphin monitoring and/or any other
potential mitigation measures (e.g., consider to
modify the perimeter silt curtain or consider to
control/temporarily stop relevant construction
activity etc.) and submit to IEC a proposal of
additional dolphin monitoring and/or mitigation
measures where necessary.
1. Check monitoring data submitted
by ET and Contractor;
2. Discuss monitoring results and
findings with the ET and the
Contractor;
3. Attend the meeting to discuss
with ET, ER/SOR and Contractor
the necessity of additional
dolphin monitoring and any other
potential mitigation measures;
4. Review proposals for additional
monitoring and any other
mitigation measures submitted by
ET and Contractor and advise
ER/SOR of the results and
findings accordingly;
5. Supervise / Audit the
implementation of additional
monitoring and/or any other
mitigation measures and advise
ER/SOR the results and findings
accordingly.
1. Attend the meeting to discuss
with ET, IEC and Contractor the
necessity of additional dolphin
monitoring and any other
potential mitigation measures;
2. If ER/SOR is satisfied with the
proposals for additional dolphin
monitoring and/or any other
mitigation measures submitted
by ET and Contractor and
verified by IEC, ER/SOR to
signify the agreement in writing
on such proposals and any other
mitigation measures;
3. Supervise the implementation of
additional monitoring and/or
any other mitigation measures.
1. Inform the ER/SOR and
confirm notification of the
non- compliance in writing;
2. Attend the meeting to discuss
with ET, IEC and ER/SOR the
necessity of additional dolphin
monitoring and any other
potential mitigation measures;
3. Jointly submit with ET to IEC
a proposal of additional
dolphin monitoring and/or
any other mitigation measures
when necessary;
4. Implement the agreed
additional dolphin monitoring
and/or any other mitigation
measures.
T

9
Appendix H5 Event and Action Plan on Dolphin Acoustic Behaviour
EVENT ACTION
ET Leader IEC SO Contractor
Action Level
With the numerical values presented in
Table 5.7 of Baseline Monitoring Report, when
any of the response variable for dolphin
acoustic behaviour recorded in the
construction phase monitoring is 20% lower
or higher than that recorded in the baseline
monitoring (see Table 5.8 of Baseline
Monitoring Report), or when there is a
difference of 20% in dolphin acoustic signal
detection at nighttime period at Site C1 only,
the action level should be triggered
1. Repeat statistical data analysis to confirm
findings;
2. Review all available and relevant data to
ascertain if differences are as a result of natural
variation or seasonal differences;
3. Identify source(s) of impact;
4. Inform the IEC, SO and Contractor;
5. Check monitoring data;
6. Carry out audit to ensure all dolphin protective
measures are implemented fully and additional
measures be proposed if necessary
1. Check monitoring data
submitted by ET and
Contractor;
2. Discuss monitoring with
the ET and the Contractor;
1. Discuss with the IEC
the repeat monitoring
and any other
measures proposed by
the ET;
2. Make agreement on
measures to be
implemented.
1. Inform the SO and
confirm notification of the
non- compliance in
writing;
2. Discuss with the ET and
the IEC and propose
measures to the IEC and
the SO;
3. Implement the agreed
measures.

10
EVENT ACTION
ET Leader IEC SO Contractor
Limit Level
With the numerical values presented in
Table 5.7 of Baseline Monitoring Report, when
any of the response variable for dolphin
acoustic behaviour recorded in the
construction phase monitoring is 40% lower
or higher than that recorded in the baseline
monitoring (see Table 5.8 of Baseline
Monitoring Report), or when there is a
difference of 40% in dolphin acoustic signal
detection at nighttime at Site C1 only, the
limit level should be triggered
1. Repeat statistical data analysis to confirm
findings;
2. Review all available and relevant data to
ascertain if differences are as a result of natural
variation or seasonal differences;
3. Identify source(s) of impact;
4. Inform the IEC, SO and Contractor;
5. Check monitoring data;
6. Carry out audit to ensure all dolphin protective
measures are implemented fully and additional
measures be proposed if necessary
7. Discuss additional dolphin monitoring and any
other potential mitigation measures (eg consider
to temporarily stop relevant portion of
construction activity) with the IEC and
Contractor.
1. Check monitoring data
submitted by ET and
Contractor;
2. Discuss monitoring with
the ET and the Contractor;
3. Review proposals for
additional monitoring and
any other measures
submitted by the
Contractor and advise ER
accordingly.
1. Discuss with the IEC
the repeat monitoring
and any other
measures proposed by
the ET;
2. Make agreement on
measures to be
implemented.
1. Inform the SO and
confirm notification of the
non- compliance in
writing;
2. Discuss with the ET and
the IEC and propose
measures to the IEC and
the SO;
3. Implement the agreed
measures.
Abbreviations: ET – Environmental Team, IEC – Independent Environmental Checker, SO – Supervising Office, DEP – Director of Environmental Protection

Appendix I
Summary of Waste Flow
Table

Contract No. : HY/2012/07
Tuen Mun Chek Lap Kok Link – Southern Connection Viaduct Section
Monthly Summary Waste Flow Table for 2015 (Year)
Actual Quantities of C&D wastes Generation
Total Quantity
Generated
Marine
Sediment, Cat.
L
Marine
Sediment, Cat.
Mp
Marine
Sediment, Cat.
Mf
Marine
Sediment, Cat.
H
Unit ('000m3) ('000m
3) ('000m
3) ('000m
3) ('000m
3) ('000m
3) ('000m
3) ('000m
3) ('000m
3) ('000m
3) ('000Kg) ('000Kg) ('000Kg) ('000Kg) ('000Kg) ('000Kg)
Jan 13.578 0.081 0.990 - 12.474 0.115 0.178 0.229 0.258 - - 132.170 - 61.380 0.091 -
Feb 6.233 0.148 0.461 - 5.759 0.014 0.801 0.110 0.223 - 0.400 141.020 - 73.690 0.112 -
Mar 10.149 0.220 0.473 - 9.600 0.077 0.618 0.073 0.149 - - 120.940 - 9.140 0.203 -
Apr 9.986 0.410 2.261 - 7.694 0.032 - - - - - 133.630 - 2.740 0.105 -
May 8.870 0.177 0.779 - 8.091 - 0.550 - - - - 107.920 - 13.070 0.042 -
Jun 8.627 0.132 1.462 - 7.166 - 0.324 0.118 0.169 - 0.017 89.930 - 2.000 0.119 -
SUB-TOTAL 57.444 1.168 6.424 - 50.782 0.238 2.471 0.530 0.799 - 0.417 725.610 - 162.020 0.672 -
Jul 4.520 0.137 2.121 - 2.322 0.078 - - - - 1.400 111.570 - - 0.105 -
Aug 1.992 0.203 0.352 - 1.265 0.375 - - - - 1.200 87.760 - - 0.133 -
Sep 4.148 0.160 0.623 - 3.525 - - - - - 0.600 66.680 - - 0.105 -
Oct 2.286 0.317 0.651 - 1.635 - - - - - - 102.080 - - 0.084 -
Nov 1.571 0.273 0.725 - 0.204 0.642 - - - - 2.000 64.740 - - 0.098 -
Dec 0.714 0.216 0.516 - 0.198 - - - - - - 66.000 - - - -
TOTAL 72.675 2.476 11.412 - 59.930 1.333 2.471 0.530 0.799 - 5.617 1,224.440 - 162.020 1.197 -
Notes :
1 - The waste flow table shall also include C&D materials that are specified in the Contract to be imported for use at the Site.
2 - Plastics refer to plastic bottles/containers, plastic sheets/foam from packaging material.
3 - Broken concrete for recycling into aggregates.
4 - Assumed 5 kg per damaged water-filled barrier.
5 - 'Reused in the Contract' and 'Disposed as Public Fills' include 'Hard Rock and Large Broken Concrete'.
Metals Felled trees
Paper/
cardboard
packaging
Plastics
Month\Material
Actual Quantities of Inert C&D Materials Generation Actual Quantities of Recyclables Generation
Hard Rock and
Large Broken
Concrete
Reused in the
Contract
Reused in
other Projects
Disposed as
Public FillsImported Fill
Chemical
WasteGeneral Refuse

Contract No. : HY/2012/07
Tuen Mun Chek Lap Kok Link – Southern Connection Viaduct Section
Monthly Summary Waste Flow Table for 2016 (Year)
Actual Quantities of C&D wastes Generation
Total Quantity
Generated
Marine
Sediment, Cat.
L
Marine
Sediment, Cat.
Mp
Marine
Sediment, Cat.
Mf
Marine
Sediment, Cat.
H
Unit ('000m3) ('000m
3) ('000m
3) ('000m
3) ('000m
3) ('000m
3) ('000m
3) ('000m
3) ('000m
3) ('000m
3) ('000Kg) ('000Kg) ('000Kg) ('000Kg) ('000Kg) ('000Kg)
Jan 1.941 0.263 0.606 - 1.334 - - - - - - 69.400 - - 0.105 -
Feb 0.783 0.185 0.092 - 0.692 - - - - - - 85.890 - - 0.112 -
Mar 1.502 0.429 0.537 - 0.965 - - - - - 2.000 88.360 - - - -
Apr 1.354 0.402 0.789 - 0.565 - - - - - 3.000 79.580 - 8.640 0.084 -
May 1.057 0.192 0.617 - 0.440 - - - - - 3.000 75.620 - - - -
Jun 0.499 0.277 0.116 - 0.383 - - - - - - 103.270 - - 0.105 -
SUB-TOTAL 7.136 1.747 2.757 - 4.379 0.000 - - - - 8.000 502.120 - 8.640 0.406 -
Jul 0.507 0.211 0.230 - 0.277 - - - - - 2.200 94.760 - 1.540 0.350 -
Aug 1.294 0.144 0.684 - 0.610 - - - - - - 116.990 - 9.790 0.098 -
Sep 2.584 0.155 0.270 - 2.314 - - - - - - 130.060 - - 0.105 -
Oct 2.338 0.180 0.156 - 2.183 - - - - - - 141.300 - - 0.028 -
Nov - - - - - - - -
Dec - - - - - - - -
TOTAL 13.858 2.437 4.096 - 9.762 - - - - - 10.200 985.230 - 19.970 0.987 -
Notes :
1 - The waste flow table shall also include C&D materials that are specified in the Contract to be imported for use at the Site.
2 - Plastics refer to plastic bottles/containers, plastic sheets/foam from packaging material.
3 - Broken concrete for recycling into aggregates.
4 - Assumed 5 kg per damaged water-filled barrier.
5 - Disposed as Public Fills includes Hard Rock and Large Broken Concrete.
Metals Felled trees
Paper/
cardboard
packaging
Plastics
Month\Material
Actual Quantities of Inert C&D Materials Generation Actual Quantities of Recyclables Generation
Hard Rock and
Large Broken
Concrete
Reused in the
Contract
Reused in
other Projects
Disposed as
Public FillsImported Fill
Chemical
WasteGeneral Refuse

Appendix J
Cumulative Statistics on
Exceedances, Complaints,
Notifications of Summons
and Successful Prosecutions

ENVIRONMENTAL RESOURCES MANAGEMENT
J1
Appendix J1 Cumulative Statistics on Exceedances
Total No. recorded in
this reporting period
Total No. recorded
since project
commencement
1-Hr TSP Action 0 0
Limit 0 0
24-Hr TSP Action 0 2
Limit 0 0
Noise Action 0 0
Limit 0 0
Water Quality Action 0 2
Limit 0 0
Impact Dolphin
Monitoring
Action 2 9
Limit 3 6
Appendix J2 Cumulative Statistics on Complaints, Notifications of Summons and
Successful Prosecutions
Reporting Period Cumulative Statistics
Complaints Notifications of
Summons
Successful
Prosecutions
This Reporting Period
(Nov 2015 – Oct 2016)
1 0 0
Total No. received
since project
commencement
5
0 0


![chek ,oa izko/kk;h fuf/k foHkkx]cuhikdZ]t;iqj fufonk izi - SIPF](https://static.fdokumen.com/doc/165x107/633329645c229e42ad09c880/chek-oa-izkokkh-fufk-fohkkxcuhikdztiqj-fufonk-izi-sipf.jpg)