navi mumbai mun corporation draft plan 2018 (dp report)
215
NAVI MU COR DRAFT PLA (D PUBLISHED U/S 26 (1) OF MAHA I UMBAI MUNICIP RPORATION T DEVELOPMEN AN 2018-2038 DP REPORT) ARASHTRA REGIONAL AND TOWN PLANNI PA L NT ING ACT,1966
-
Upload
khangminh22 -
Category
Documents
-
view
0 -
download
0
Transcript of navi mumbai mun corporation draft plan 2018 (dp report)

NAVI MUMBAI MUNICIPACORPORATION
DRAFT PLAN 2018
(DP REPORT)
PUBLISHED U/S 26 (1) OF MAHARASHTRA REGIONAL AND TOWN PLANNING ACT,1966
I
NAVI MUMBAI MUNICIPACORPORATION
DRAFT DEVELOPMENT PLAN 2018-2038
(DP REPORT)
) OF MAHARASHTRA REGIONAL AND TOWN PLANNING ACT,1966
NAVI MUMBAI MUNICIPAL CORPORATION
DEVELOPMENT 2038
) OF MAHARASHTRA REGIONAL AND TOWN PLANNING ACT,1966

II
INDEX
Sr. No.
Description Page No.
1. CONTENT OF DEVELOPMENT PLAN. III to V
2. LIST OF MAPS. VI
3. LIST OF FIGURES. VII
4. LIST OF TABLES. VIII to X
5. LIST OF SCHEDULES. XI
6. LIST OF ANNEXURES. XI
7. GLOSSARY/ ABBREVIATIONS. XII

III
CONTENTS CHAPTER 1: GENERAL .................................................................................................................................................... 1
1.1. History of Navi Mumbai: .............................................................................................................................. 1 1.2. About Navi Mumbai Municipal Corporation (NMMC): ........................................................................... 2 1.3. Civic Administration: .................................................................................................................................. 15
CHAPTER 2: GEOGRAPHICALSETTINGS ................................................................................................................ 18 2.1 National and Regional Settings: ................................................................................................................. 18 2.2 Physiography: .............................................................................................................................................. 18 2.3 Minerals: ...................................................................................................................................................... 20 2.4 Soils: ............................................................................................................................................................. 20 2.5 NMMC Area: ............................................................................................................................................... 22 2.6 Topography and Landscape: ...................................................................................................................... 22 2.7 Climatology: ................................................................................................................................................. 23 2.8 Wind: ............................................................................................................................................................ 24
CHAPTER3: DEMO GRAPHIC CHARACTERISTICS .............................................................................................. 25 3.1. Population Growth: ..................................................................................................................................... 25 3.2. Population Structure and Distribution:..................................................................................................... 25 3.3. Demographic projection: ............................................................................................................................ 28 3.4. Occupational structure and employment pattern: ................................................................................... 36
CHAPTER 4: DEVELOPMENT PLAN-PROCESS, VISION AND ............................................................................. 38 4.1. Planning efforts in past: .............................................................................................................................. 38 4.2. Need for revision of Development Plan: ..................................................................................................... 53 4.3. Legal Formalities: ........................................................................................................................................ 53 4.4. Consultation with stakeholders: ................................................................................................................. 56 4.5. Main stages of preparation of Development Plan: ....................................................................................... 58 4.5.1. Preparation of base map: ............................................................................................................................ 58 4.5.2. Surveys – Analysis and Findings: ............................................................................................................... 58 4.5.3. Distribution of Land Use: ............................................................................................................................ 59 4.6. Structural conditions of buildings/ houses: ................................................................................................ 73 4.7. Slums: ........................................................................................................................................................... 75
CHAPTER 5: SOCIAL INFRASTRUCTURE ................................................................................................................ 76 5.1. General: ........................................................................................................................................................ 76 5.2. Education facilities: ..................................................................................................................................... 76 5.3. Health and medical facilities: ..................................................................................................................... 78 5.4. Commercial facilities: ................................................................................................................................. 79 5.5. Recreational and entertainment facilities: ................................................................................................ 79 5.6. Cremation and burial grounds:.................................................................................................................. 81 5.7. Ancient and Historical monuments and sites: ........................................................................................... 81
CHAPTER 6: TRANSPORT AND COMMUNICATION ............................................................................................. 84

IV
6.1. Transport: .................................................................................................................................................... 84 6.2. Water Transport Facilities: ........................................................................................................................ 85 6.3. Motorized Transport: ................................................................................................................................. 85 6.4. General conditions of roads: ....................................................................................................................... 87 6.5. Roadways (External): .................................................................................................................................. 87 6.6. Roads (Internal): ......................................................................................................................................... 88 6.7. Coastal Road:............................................................................................................................................... 90 6.8. Railways: ...................................................................................................................................................... 91 6.9. Airways: ....................................................................................................................................................... 93 6.10. Bus and passenger traffic: .......................................................................................................................... 93 6.11. Road Accidents: ........................................................................................................................................... 95 6.12. Parking facilities: ......................................................................................................................................... 95 6.13. Terminal Facilities: ..................................................................................................................................... 96 6.13.1. Railway Terminal: ....................................................................................................................................... 96
CHAPTER 7: ECONOMIC BASE AND GROWTH POTENTIAL ............................................................................. 98 7.1 Introduction: ................................................................................................................................................ 98 7.2 Industrial Activities:.................................................................................................................................... 98 7.3 Trade and Commerce: ................................................................................................................................ 99
CHAPTER 8:UTILITIES AND SERVICES ................................................................................................................. 100 8.1. Water supply: ............................................................................................................................................ 100 8.1.1. Water supply (Network): .......................................................................................................................... 100 8.1.2. Status of Water Resources: ....................................................................................................................... 101 8.2. Surface Water: ........................................................................................................................................... 101 8.3. Lakes and ponds: ....................................................................................................................................... 103 8.4. Drainage and Sewerage: ........................................................................................................................... 104 8.5. Municipal Solid Waste Management: ...................................................................................................... 107 8.5.1. Solid Waste Generation and Collection: .................................................................................................. 107 8.5.2. Solid Waste Disposal: ................................................................................................................................ 108 8.6. Power supply: ............................................................................................................................................ 109 8.7. Fire Brigade Station: ................................................................................................................................. 110 8.8. Library and Study Centre’s: .................................................................................................................... 111
CHAPTER 9:CONCLUSIONS AND OBSERVATIONS ............................................................................................. 112 9.1 Level of implementation of Development Plan: ...................................................................................... 112 9.2 Identification of problems: ....................................................................................................................... 113
CHAPTER 10:FRAMING OF PROPOSALS ............................................................................................................... 114 10.1. General: ...................................................................................................................................................... 115 10.2. Vision of Development Plan: .................................................................................................................... 115 10.3. Need for Development Plan Revision: ..................................................................................................... 115 10.4. The main objectives of the Development Plan: ....................................................................................... 116

V
10.5. Demographic Projection: .......................................................................................................................... 116 10.6. Planning sectors: ....................................................................................................................................... 118 10.7. Need for paradigm shift: ........................................................................................................................... 119 10.8. Proposed land use zoning: ........................................................................................................................ 122 10.8.1. Residential Zone: ....................................................................................................................................... 123 10.8.2. Commercial Zone: ..................................................................................................................................... 123 10.8.3. Industrial Zone: ......................................................................................................................................... 124 10.8.4. Public, Semi-Public Zone:......................................................................................................................... 124 10.8.5. NDZ/ Hill top hill slope. ............................................................................................................................ 124 10.8.6. Green Belt/Buffer Zone around Mangroves: .......................................................................................... 124 10.8.7. Water Bodies: ............................................................................................................................................ 125 10.8.8. Forest Land ................................................................................................................................................ 125 10.8.9. Transportation network ............................................................................................................................ 126 10.8.10. National Highways: 126 10.8.11. State Highways: 126 10.8.12. Major links : 126 10.9. Development Control Regulation: ........................................................................................................... 127 10.10. Social Amenities: ....................................................................................................................................... 128 10.11. Rearrangement of Existing Recreational Open Space / Garden / Play Ground / Other amenities: ... 129 10.12. Rearrangement of Existing School Buildings on Adjacent Play Ground for Reconstruction of School
Buildings: ................................................................................................................................................... 129 10.13. City Level Amenities: ................................................................................................................................ 129 10.14. Other Amenities: ....................................................................................................................................... 132 10.15. Proposed reservation for city level Amenities:........................................................................................ 133 10.16. Sustainable development – Provision of Cycle track: ............................................................................ 133 11.1. General: ...................................................................................................................................................... 134 11.2. Cost of Development Plan Proposals: ...................................................................................................... 135 11.3. Implementation through Town Planning Schemes: ............................................................................... 136 11.4. Implementation through Accommodation Reservation Concept: ......................................................... 136 11.5. Implementation through Monetary Compensation:............................................................................... 136 11.6. IMPLEMENTATION THROUGH TRANSFERABLE DEVELOPMENT RIGHTS ........................ 137 11.7. Implementation through Resource Mobilization: .................................................................................. 138 11.7.1. Provision of premium ................................................................................................................................ 138 11.7.2. Development Charges ............................................................................................................................... 138 11.7.3. Other charges ............................................................................................................................................. 138 11.7.4. Implementation by public participation .................................................................................................. 138 11.8. Need for monitoring: ................................................................................................................................. 139 11.9. Programming: ............................................................................................................................................ 139 11.10. Conclusion: ................................................................................................................................................ 139

VI
LIST OF MAPS:
Map 1: Map of India ..................................................................................................................................... 6
Map 2: Map of Maharashtra ........................................................................................................................ 6
Map 3: Map of Konkan Division................................................................................................................... 7
Map 4: Plan Showing NMMC limit within MMR ......................................................................................... 8
Map 5: Plan of CIDCO’s DP showing NMMC jurisdiction ............................................................................ 9
Map 6: Map of Thane District showing NMMC’s Jurisdiction .................................................................. 10
Map 7: NMMC limit within Thane Taluka .......................................................................................... 11
Map 8: Plan Showing Nodes within NMMC limit ............................................................................... 12
Map 9: Plan Showing various SPAs i.e. MIDC and CIDCO’s jurisdiction within NMMC limit ................. 13
Map 10: Plan Showing Administrative Wards within NMMC limit ...................................................... 14
Map 11-A: Existing Land Use Map as on 11th May, 2018 (Airoli Node). ............................................. 64
Map 11-B: Existing Land Use Map as on 11th May, 2018 (Ghansoli Node). ......................................... 65
Map 11-C: Existing Land Use Map as on 11th May, 2018 (Koparkhairane Node). ................................ 66
Map 11-D: Existing Land Use Map as on 11th May, 2018 (Vashi Node). .............................................. 67
Map 11-E: Existing Land Use Map as on 11th May, 2018 (Sanpada Node). ......................................... 68
Map 11-F: Existing Land Use Map as on 11th May, 2018 (Nerul Node). .............................................. 69
Map 11-G: Existing Land Use Map as on 11th May, 2018 (Belapur Node). .......................................... 70
Map 11-H: Existing Land Use Map (combined) as on 11th May, 2018. ............................................... 71
Map 12: Typical Cross Section of 15 M. wide Road. ......................................................................... 173
Map 13: Typical Cross Section of 18 M. wide Road. ......................................................................... 173
Map 14: Typical Cross Section of 20 M. wide Road. ......................................................................... 174
Map 15: Typical Cross Section of 24 M. wide Road. ......................................................................... 174
Map 16: Typical Cross Section of 30 M. wide Road. ......................................................................... 175
Map 17: Typical Cross Section of 32 M. wide Road. ......................................................................... 175

VII
LIST OF FIGURES :
Figure 01: Administrative hierarchy of NMMC ......................................................................................... 15
Figure 02: Administrative hierarchy of Department of City Engineer, NMMC ........................................ 16
Figure 03: Administrative hierarchy of Town Planning, NMMC ............................................................... 17
Figure 04: Month wise temperature in NMMC 2017-18 ........................................................................... 23
Figure 05: Decadal Trend of Annual Rainfall Recorded in Navi Mumbai ................................................. 24
Figure 06: The population growth for last 5 years in Navi Mumbai ......................................................... 25
Figure 07: Trend of the number of vehicles in the last 7 years within NMMC area ................................ 85
Figure 08: Details of accidents for the last 5 years in Navi Mumbai ........................................................ 94
Figure 09: Yearly influx of commodities in various markets of APMC ..................................................... 98
Figure 10: Highlights of the water supply network at a glance ................................................................ 99
Figure 11: Power consumption pattern in 2017-18 ................................................................................ 109

VIII
LIST OF TABLES:
Table 01 : CIDCO as Special Planning Authority within the limit of NMMC ...................................... 4
Table 02 : Villages included within the limit of NMMC ............................................................................ 4
Table 03 : Draft CZMP 2018 Breakup of Areas ......................................................................................... 20
Table 04 : Distribution of population as per Census 2011 .................................................................. 26
Table 05 : Distribution of population as per 2017-18 (as per records of HealthDeptt.) .......... 26
Table 06 : Distribution of population as per 2011 Census .................................................................. 27
Table 07 : Distribution of population as per 2017-18(as per records of Health Deptt.) .......... 27
Table 08 : Details of population of last six decades within NMMC .................................................... 28
Table 09 : Details of Node wise population as per census 2011 within NMMC area. ................. 29
Table 10 : Summary of population projection by defferent methods as on 2028 & 2038 ....... 35
Table 11 : Occupational structure and employment pattern as per census 2011 ...................... 37
Table 12 : Occupational structure and employment pattern as per census 2001 ...................... 37
Table 13 : The break - up of plots developed & undeveloped in Belapur and Nerul Nodes.
(plots handed over by CIDCO to NMMC) ............................................................................... 38
Table 14 : The break - up of plots developed & undeveloped in - Vashi/ Turbhe & Sanpada
Nodes. (plots handed over by CIDCO to NMMC) ................................................................ 40
Table 15 : The break - up of plots developed & undeveloped in - Koparkhairane & Ghansoli
Nodes. (plots handed over by CIDCO to NMMC) ............................................................... 42
Table 16 : The break - up of plots developed & undeveloped in - Airoli Node & MIDC. (plots
handed over by CIDCO to NMMC) ........................................................................................... 43
Table 17 : Summary of plots allotted to NMMC by CIDCO and plots developed by NMMC ....... 45
Table 18 : Plots details demanded by NMMC to CIDCO and its status.............................................. 47
Table 19 : List of Plots demanded by NMMC & pending with CIDCO. ............................................... 49
Table20: Details of meetings conducted by NMMC for public consultation (before
publication). ................................................................................................................................. 56
Table 21 : Area Statement as per Existing Land Use (ELU) Survey & ELU map(Node wise). ... 60
Table 22 : Summary of Existing Land Use .................................................................................................. 63
Table 23 : Distribution of houses by age (Year) ...................................................................................... 73
Table 24 : Details of Slum - Year 2001 ........................................................................................................ 74
Table 25 : Details of Slum - Year 2011 ........................................................................................................ 74
Table 26: Number of Primary and Secondary School and students enrolled for the year 2018-
2019. ................................................................................................................................................... 75

IX
Table 27 : Arts/Commerce/Science and other Colleges ...................................................................... .76
Table 28 : Engineering/Architecture College ........................................................................................... 76
Table 29 : Medical/D.Ed./B.Ed./Special College ...................................................................................... 76
Table 30 : Summary of social infrastructure within NMMC ................................................................ 79
Table 31 : Node-wise details of Crematorium and burial grounds................................................... 80
Table 32 : Total number of vehicles for the last 7 years....................................................................... 84
Table 33 : Node/ Ward wise length of cement and asphalt roads in NMMC .................................. 86
Table 34 : Length of major roads(Classified roads) passing through NMMC area ..................... 87
Table 35 : Road Network Proposed in Draft RP of MMR passing through NMMC ....................... 87
Table 36 : Ward wise details of length/ width of the roads ................................................................ 88
Table 37 : Details of Metro-Mono Network proposed in RP MMR passing through NMMC ..... 91
Table 38 : Suburban Rail network and its total length passing through NMMC area ................ 91
Table 39 : No. of Buses plying in Navi Mumbai area and passing through NMMC area per day
................................................................................................................................................................................... 93
Table 40 : Total No. of Accidents reported in NMMC area for the last 5 years (till September
2018).. ............................................................................................................................................... 94
Table 41 : Node/ Ward-wise details of Parking Facilities .................................................................... 95
Table 42 : Spatial Clustering ........................................................................................................................... 97
Table 43 : List of Industrial Units in Navi Mumbai ................................................................................. 97
Table 44 : Yearly influx of commodities in Agricultural Produce Market Committee (APMC),
Vashi .................................................................................................................................................. 98
Table 45 : Details of Source and amount of water drawn from resources................................... 100
Table 46 : Specification of Morbe Dam ..................................................................................................... 101
Table 47 : Node wise details of lakes and their coverage in NMMC area ...................................... 102
Table 48 : Node wise length of storm water drains in NMMC area ................................................. 103
Table 49 : Node wise details of sewerage Zones.................................................................................... 104
Table 50 : Node-wise length of sewerage line ........................................................................................ 104
Table 51 : List of functional Sewarage Treatment Plants in NMMC area (2017-18) ................ 105
Table 52 : Category-wise details of the waste generated ................................................................... 107
Table 53 : Power consumption (MW) in last 4 years ........................................................................... 108
Table 54 : Node/ Ward wise library and study centers ...................................................................... 110
Table 55 : Node wise details of existing amenities& its areas .......................................................... 111
Table 56 : Population Projection (as on 2028 & 2038)....................................................................... 116

X
Table 57 : Node wise Projected Population as on 2028 & 2038 ...................................................... 117
Table 58 : Revenue Villages included in Nodes ..................................................................................... 117
Table 59 : Proposed Land Use Classification .......................................................................................... 120
Table 60: Length of proposed roads in Draft DP (width wise) ......................................................... 125
Table 61 : Planning Standard Adopted ..................................................................................................... 128
Table 62 : Municipal Finance Revenue (Rs.in crores) ......................................................................... 135
Table A : Details of Public sites required & proposed in Draft DP considering projected 141
population of 23.30 Lakhs as on2028 .................................................................................. 139
Table B : Phase wise Programme (Phase of two years each) ............................................................ 168
Table C-1 : Municipal Finance Revenue (Rs.in crores)........................................................................ 169
Table C-2 : Municipal Finance Expenditure (Rs.in crores) ................................................................ 169
Note :- The facts & figures mentioned in various tables are as on 11/2/2019 Subject to the
changes made in revised proposal due to Govt. direcctions u/s 154 (1) of
Maharashtra Regional & Town Planning Act, 1966 issued by Govt. vide dated
14/06/2020 & 06/09/2021.
XI
LIST OF SCHEDULES:
Schedule A : List of villages included in developed nodes where NMMC exercises powers as
planning authority as per Govt. order dated 15/12/1994 ........................................... 3
Schedule B : List of villages included in developed nodes where NMMC exercises powers
asplanning authority as per Govt. order dated 29/07/2008 ...................................... 3
Schedule C : List of lands for which CIDCO has been appointed as Special Planning Authority
vide Government Notification dated 31st October 2017 ............................................... 4
ANNEXURES:
Annexure A : Gaothan/Aadivasi Pada Settlement within NMMC limits ..................................... 176
Annexure B-1: Details of slum- Year 2001 .............................................................................................. 177
Annexure B-2:Details of slum- Year 2011 ............................................................................................... 179
Annexure C : Health and Medical Facilities .......................................................................................... 181
Annexure D : Regular line of street proposed under section 210 (1) of MMC Act.1949. ..... 184
Annexure E : DP Team. ................................................................................................................................ 191

XII
GLOSSARY/ ABBREVIATION:
APMC Agricultural Produce Market Committee
BOD Biochemical Oxygen Demand
CBSE Central Board of Secondary Education
CIDCO City & Industrial Development Corporation
CAAQMS Continuous Ambient Air Quality Monitoring Stations
ESR Environment Status Report
IMD Indian Meteorology Department
MLD Million Liters per Day
MMR Mumbai Metropolitan Region
MMB Maharashtra Maritime Board
MSW Municipal Solid Waste
NTDA New Town Development Authority
NMMC Navi Mumbai Municipal Corporation.
STPs Sewage Treatment Plants
SPA Special Planning Authority
TBIA Thane Belapur Industry Association
UDD Urban Development Department
UHP Urban Health Post
PA Planning Authority

1
CHAPTER 1: GENERAL
1.1. History of Navi Mumbai:
By the end of 1970s, Mumbai became congested due to overcrowding and the
need of diverting the ever growing population arise which would harbour surplus
population. Mumbai, built on joining 7 existing islands by reclaiming was unable to hold
pressures exerted by overpopulation. To avoid possible consequences, under the provision
of Maharashtra Regional and Town Planning Act, 1966(hereinafter referred to as the
‘said Act’), a plan for Mumbai Metropolitan Region was prepared with the main objective of
developing a new metro city in Trans Thane creek and Trans harbour area which was
coined as ‘Navi Mumbai’. In 1970, CIDCO (City & Industrial Development Corporation), a
state public sector undertaking, was established with purpose to plan, develop and maintain
the city of Navi Mumbai under ‘Companies Act' of 1956.
The State Govt. had adopted the following objectives for the Navi Mumbai Project
1) To reduce the growth rate of population in Greater Mumbai by creating an attractive
urban area on the land across the Mumbai Harbour which will,
a) Absorb immigrants who would otherwise come to Mumbai.
b) attract some of Mumbai’s present population
2) To support State wide location policies which will lead eventually to an efficient and
rational distribution of industries over the State, and to a balanced development of urban
centers in the hinterland.
3) To provide physical and social services which raise living standards and reduce
disparities in the amenities available to different sections of population?
4) To provide an environment which permits the citizens of the Navi Mumbai to live fuller
& richer lives free, in so far as this is possible, of the physical and social tensions which
are commonly associated with urban living.
5) To provide training and all possible facilities to the existing local population in the
project area, to enable them to adopt to the new urban setting and to participate fully
and activity in the economics and social life in Navi Mumbai.
Considering the objectives framed by Govt. of Maharashtra, CIDCO was appointed as
Newtown Development Authority (NTDA) on 20/03/1971 under section 113 (3a)of said

2
Act. In 1973, CIDCO had prepared development plan (DP) for Navi Mumbai covering 95
villages from Thane & Raigad District with an estimated area of 343.70 sq.km. The said DP
was sanctioned by Govt. of Maharashtra in 1979-1980 which came into effect
w.e.f.01/03/1980. The said DP is only a structural plan.
Navi Mumbai, considered as twin city of Mumbai, lies between Thane creek and
Sahyadri mountains at the west coast of the state of Maharashtra in Konkan division. Being, a
planned & developed city by CIDCO, it is well equipped with the state of art facilities
specially related to urban services like solid waste management, public transport, healthcare
facilities, sewage treatment, well established road network, efficient storm water
management system and many more. Along with residential zone, the city boosts large
industrial and commercial complex with offices/ facilities and stores of numerous national
and international industrial and commercial brands.
1.2. About Navi Mumbai Municipal Corporation (NMMC):
As the city started expanding, a need of creation of an urban local body arises for
city maintenance and other functions such as public health, transportation, education
among others. Thus the NMMC came in existence. The NMMC was established by the Govt.
of Maharashtra vide Govt. Resolution No. NBC/1091/140/CR14/91/UD20 dated 17th Dec.
1991 which came into existence from dated 01/01/1992. As per this Notification ,44
villages were included in NMMC area out of which 29 revenue villages are part and parcel of
sanctioned DP of CIDCO. Out of remaining 15 revenue villages, 14 (villages excluding
Adavali-Bhutavali) were excluded from the NMMC area and only one village i.e. Adavali-
Bhutavali is included in NMMC area as per Govt. Notification dated 8th June, 2007. In all,
there are now 30 villages within the jurisdiction of NMMC area. As mentioned earlier out of
these 30 revenue villages 29 revenue villages are part &parcel of sanctioned DP and only
Adavali-Bhutavali is out of said DP. And therefore, NMMC has taken up the revision of said
DP and preparation of new DP for Adavali-Bhutavali (in Adavali-Bhutavali, there is no DP
now.) The total area of Navi Mumbai is 343.70 sq. km (excluding Adavali-Bhutavali) out of
which 109.59 sq. km area falls under NMMC jurisdiction (including Adavali-Bhutavali).
CIDCO had planned to develop 14 nodes in Navi Mumbai.
The Govt. vide order dated 15th December 1994 had delegated the powers of Chapter
III & IV of said Act to NMMC as Planning Authority(PA)with respect to following areas &
accordingly, CIDCO had handed over the said area to NMMC.

3
SCHEDULE- A
Appended to Govt. Memorandum No.NMMC/1692/1187/CR-138/98/UD-24 dated
15.12.1994.
List of villages included in developed nodes where NMMC will exercise powers as planning
authority
1. Vashi –Sanpada
1) Vashi (pt)
2) Ju (pt)
3) Khairane (pt)
4) Pawane (pt)
5) Turbhe (pt)
6) Sanpada (pt)
7) Sonkhar (pt)
8) Kukshet (pt)
2. Nerul 1) Nerul (pt)
2) Sarsole (pt)
3) Sonkhar (pt)
4) Shiravane (pt)
5) Shahabaj (pt)
6) Darave (pt)
7) Karave (pt) (pt)
3. Belapur C.B.D. 1) Shahbajj
4. Airoli 1) Airoli (pt)
2) Chinchavali (pt)
3) Rabale (pt)
4) Dive (pt)
5) Gothivali
5. Koparkhairane 1) Koparkhairane (pt) 2) Savali (pt) 3) Khairna
Note : Villages shown above are (in part) for the reason that wherever, the area in these villages falls in MIDC, MIDC will be the Planning Authority in respect of areas falling
under MIDC’s control.
The Govt. vide order dated 29th July 2008 had further delegated the powers of Chapter
III & IV of said Act to NMMC as planning authority with respect to following areas & accordingly,
CIDCO had handed over the said area to NMMC.
SCHEDULE –B
1. Ghansoli Node Ghansoli (pt), Rabale (pt), Gothivali (pt), Talavali (pt)
(parts which are not included in the MIDC area.)
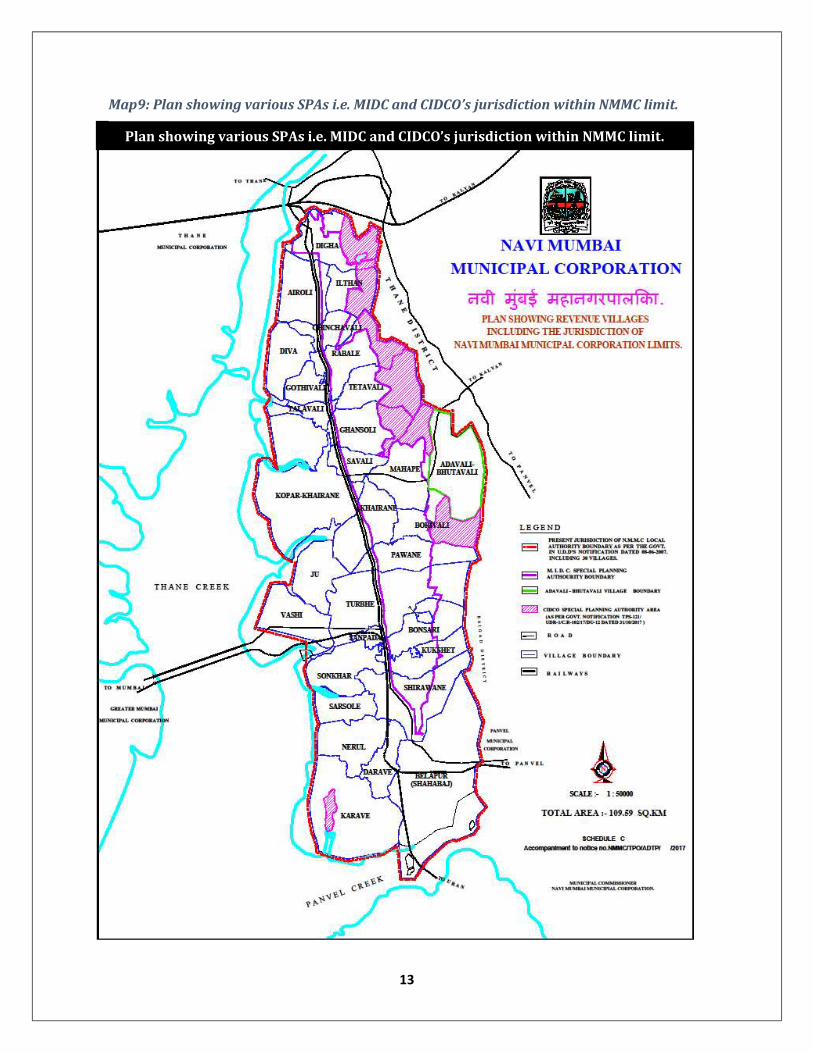
Further, vide Govt’s Notification dated 31/10/2017 ,CIDCO is appointed as Special
Planning Authority (SPA) under section 40 of said Act for the following area :

4
SCHEDULE - C
List of lands for which CIDCO has been appointed as Special Planning Authority vide
Government Notification No.TPS/1217/VOR-1/C.R. 102/17/UD-12 dated 31st October 2017 is as
follows:
Table No. 1: CIDCO as Special Planning Authority within the limit of NMMC.
Sr. No. Name of Revenue
Villages Survey Nos.
1. Dighe 260, 231
2. Ilthan 100, 99
3. Tetavali 146
4. Rabale 110
5. Ghansoli 528
6. Mahape 202A
7. Borivali 94
8. Karave
143, 144, 145, 146, 147, 148, 149, 150, 151, 152, 153, 154, 155, 156, 157, 158, 159, 160, 161, 162, 163, 164, 165, 166, 167, 168, 169, 170, 171, 172, 173, 174, 175, 176, 177, 221, 222, 223, 230 (New survey No.290) 256, 264B, 224, 297
In short, NMMC is functioning as Planning Authority within the limit of NMMC
comprising of following villages.
Table 2: Villages included within the limit of NMMC. Sr. No. Name of the Village Sr. No. Name of the Village
1. Airoli (Part) 2. Kukshet (Part)
3. Belapur (Shahabaj) 4. Mahape (Part)
5. Bonsari (Part) 6. Nerul
7. Boravali (Part) 8. Pawane (Part)
9. Chinchavali (Part) 10. Rabale (Part)
11. Dighe (Part) 12. Sanpada
13. Dive 14. Sarsole
15. Darave 16. Savali (Part)
17. Ghansoli (Part) 18. Shiravane (Part)

5
19. Gothivali (Part) 20. Sonkhar
21. Ilthan (Part) 22. Talavali (Part)
23. Ju 24. Tetavali (Part)
25. Karve 26. Turbhe (Part)
27. Khairane (Part) 28. Vashi
29. Koparkhairane (Part) 30. Adavali-Bhutavali
Note : In the above referred villages wherever part of the area in these revenue villages falls in MIDC’s jurisdiction, MIDC will continue to be the SPA. Further CIDCO will continue to be SPA for the land as shown in above referred schedule-B.
Gaothan/ Adivasi Pada Settlements within NMMC limits – The local/ native inhabitants of
Navi Mumbai are traditionally located in the areas commonly recognized as gaothan. There
are21gaothans and these are marked in the revised DP 2018.
The gaothan area commonly identified as densely populated habitant of the Agari and Koli
community along the coastal areas. There is no land record available regarding koliwadas to
identify the exact area and extent of koliwadas. The demarcation of gaothan area in revenue
records is underway. The development of gaothan shall be as per provisions of DCPR which is
part & parcel of Draft DP of Navi Mumbai.
In addition to gaothan, there are number of Adivasi padas within geographical limits of NMMC.
The list of Adivasi padas as received by the Tribal Development Department is appended as
Annexure-A to this report.

6
Map2: Map of Maharashtra.
Map1: Map of India.
Map of Maharashtra

7
Map of Konkan Division
Map3: Map of Konkan Division.

8
Map4: Plan Showing NMMC limit within MMR.
Plan Showing NMMC limit within MMR
NMMC

9
Map5: Plan of CIDCO’s DP showing NMMC jurisdiction.
Plan of CIDCO’s DP Showing NMMC jurisdiction

10
Map of Thane District
Map6: Map of Thane District as on 1st August, 2014 showing NMMC’s Jurisdiction

11
Plan showing NMMC limit within Thane Taluka
Map7: NMMC limit within Thane Taluka.

12
Plan Showing Nodes within NMMC limit
Map8: Plan Showing Nodes within NMMC limit.
13
Plan showing various SPAs i.e. MIDC and CIDCO’s jurisdiction within NMMC limit.
Map9: Plan showing various SPAs i.e. MIDC and CIDCO’s jurisdiction within NMMC limit.

14
Plan Showing Administrative Wards within NMMC limit
Map10: Plan Showing Administrative Wards within NMMC limit.

1.3. Civic Administration
NMMC was constituted by Govt. vide Urban Development Departments (UDD’s)
Notification No. NBC/1091/140/CR14/91/UD20 dated 17th Dec. 1991 which c
existence w.e.f. Date 1st January 1992
Commissioner supported by T
Commissioner and Ward L
There are numerous Depts.
disciplined administration. The head office of NMMC is located in its owned building at Plot
No. 1, Near Kille Gaothan, Sector
are in operation at Belapur, Nerul, Turbhe, Vashi, Kopark
The purpose of these ward offices
facilities to the residents of respective ward.
NMMC is reported
feet and erected/located at head office of
as under:
Figure
15
Administration:
NMMC was constituted by Govt. vide Urban Development Departments (UDD’s)
Notification No. NBC/1091/140/CR14/91/UD20 dated 17th Dec. 1991 which c
. Date 1st January 1992. The administrative head of NMMC is Munic
Commissioner supported by Two Additional Municipal Commissioner
r and Ward Level Assistant Municipal Commissioner/ Ward Officer (
Depts. working under Municipal Commissioner to ease normal and
disciplined administration. The head office of NMMC is located in its owned building at Plot
No. 1, Near Kille Gaothan, Sector-15A, CBD Belapur, Navi Mumbai. The eight
are in operation at Belapur, Nerul, Turbhe, Vashi, Koparkhairane, Ghansoli, Airoli &
The purpose of these ward offices is to control civic administration and to provide c
facilities to the residents of respective ward.
NMMC is reported to have one of the tallest National Flag of India at a height of 225
feet and erected/located at head office of NMMC. The administrative hierarchy of NMMC is
Figure 01: Administrative hierarchy of NMMC.
NMMC was constituted by Govt. vide Urban Development Departments (UDD’s)
Notification No. NBC/1091/140/CR14/91/UD20 dated 17th Dec. 1991 which came into
. The administrative head of NMMC is Municipal
, Two Zonal Dy.
al Commissioner/ Ward Officer (8 Nos.).
under Municipal Commissioner to ease normal and
disciplined administration. The head office of NMMC is located in its owned building at Plot
lapur, Navi Mumbai. The eight ward offices
ansoli, Airoli &Dighe.
to control civic administration and to provide civic
to have one of the tallest National Flag of India at a height of 225
hierarchy of NMMC is

Figure 02: Administrative hierarchy of D
16
: Administrative hierarchy of Department of City Engineer, NMMCepartment of City Engineer, NMMC.

Figure 03: Administrative hierarchy of Town Planning, NMMC
The NMMC, which was const
villages of which details are given in
functioning as SPA for the areas as mentioned in
functioning as SPA for the areas which are included in
areas under MIDC Jurisdiction are
17
: Administrative hierarchy of Town Planning, NMMC.
The NMMC, which was constituted with effect from 1st January 1992, includes total 30
villages of which details are given in Table No. 2.However, within NMMC area, CIDCO in also
functioning as SPA for the areas as mentioned in Table No. 1. In addition to CIDCO, MIDC is also
functioning as SPA for the areas which are included in MIDC’s Industrial Area
ction are narrated in note below Schedule-A of this report.
.
1992, includes total 30
NMMC area, CIDCO in also
. In addition to CIDCO, MIDC is also
Area. The details of
this report.

18
CHAPTER 2: GEOGRAPHICALSETTINGS
2.1 National and Regional Settings:
The NMMC is lying between 19°00’ to 19°12’ North Latitude and 72°58’ to
73°03’ East Longitude with 3.25 meters mean height above sea level. NMMC is situated
along Mumbai-Pune highway and a fast developing area and has tremendous development
potential due to development of Navi Mumbai as Twin City, upcoming International
Airport in the vicinity of Navi Mumbai area, Development of proposed Nhava-Sheva link
road, proposed water transport services along the coastal area touching NMMC, existing
Mumbai-Pune express highway which start from eastern boundary of NMMC. The NMMC is
closed to Greater Mumbai & developed as new town by CIDCO where most of the
population migrated from Mumbai & surroundings is residing in Navi Mumbai. In addition
to above, Metro, railway from CBD Belapur to Pendhar has been taken up by CIDCO. Trans
harbor railway from Nerul/Belapur to Uran in also being implemented by CIDCO, which is
link up with existing Trans Harbor/ Harbor Railway. JNPT is also located nearby Navi
Mumbai where bulk cargo facility is available.
There are seven nodes under NMMC namely Belapur, Nerul, Sanpada, Vashi,
Koparkhairane, Ghansoli, Airoli and eight administrative wards e.i. Belapur, Nerul, Turbhe,
Vashi, Koparkhairane, Ghansoli, Airoli& Digha.
Source : ESR 2017-2018.
2.2 Physiography:
Physiographically, Navi Mumbai region can be divided into three divisions, viz.(i)
The Upland, (ii) The level land plains and (iii) The coastal zone (The low lying areas).
(i) The Upland: It covers Parsik hills with peaks rising from 200 to 250 meters, above
MSL lies in the north-eastern part of the study area.
(ii) The Level Land (Plains): Plain land is found in the eastern, southern and northern
part of the Navi Mumbai. Northern part of Navi Mumbai, it lies between low lying
areas in the west and hills in the east, which covers the major industrial region of
Thane-Belapur industrial belt.
(iii) The Coastal Zone (The low lying areas): The western part of the Navi Mumbai

19
region is a coastal region, covers western parts of Airoli, Ghansoli, Khoparkhairane,
Vashi, Sanpada, Nerul southern parts of Belapur node.
According to CRZ Notification dated 19th February, 1991, first CZMP was prepaid &
sanctioned by MoEF on 8th September, 1996 which was further revalidated till 31st July,
2018. The said Notification 1991 was further amended by MoEF on 6th January, 2011. And
accordingly, Draft CMZP plans, as per Notification 6th January, 2011 was published by
MoEF on 7th May 2018. The said Draft CZMP is not yet finalized by MoEF.
According to the draft CRZMP (revised)published under CRZ Notification dated 6th
January, 2011 the coastal stretches of Navi Mumbai are divided into following three zones.
CRZ I-This is essentially an area between the low tide line and high tide line which
is environmentally sensitive zone. This CRZ I area covers 18.67Sq. kms. In Navi
Mumbai which include mangroves.
CRZ II- This is coastal area within 500 meter buffer zone from sea and 100 meter
or equal to the width of the creeks whichever is lesser that is already developed.
The development is permissible in the zone only on land ward side of the existing
road or structure , provided the land use and FSI remains same as permissible as
on 19th February 1991. CRZ II covers 6.45 Sq. kms. Of area in Navi Mumbai.
CRZ III- It includes areas that are relatively undisturbed and those do not belong to
either CRZ I or CRZ II which include coastal zone in the rural areas (developed and
undeveloped) and also areas within Municipal limits which are not substantially
built. Within CRZ III area up to 200 meter from the HTL on the land ward side in
case of sea front and 100 meter along tidal influenced water bodies or width of the
creek whichever is less is earmarked as “No development zone”. CRZ III covers 0
Sq. kms. Area in Navi Mumbai.
The total area covered under NMMC is 109.59 sq. km. out of which 25.12sq. km area
is affected by CRZ Notification. The break-up of areas covered under Draft CZMP 2011 is as
under:

20
Table 03: Draft CZMP 2011 breakup of areas.
CRZ Category/ Zone Area under CRZ (Sq. km) (%) compared to total CRZ
area
CRZ I 18.67 74.32%
CRZ II 6.45 25.67 %
CRZ III - -
[Source : CRZ Notification & Net Information.]
By supersession of said CRZ Notification 2011, new CRZ Notification 2019 has also
been issued by MoEF on 18thJanuary, 2019. Under this new CRZ Notification 2019, the NDZ
in CRZ-III area is reduced from 200 meter to 50/200meter depending upon the population
density. Even CRZ-II area along the creeks is also reduced to 50 m. instead of 100 m.
According to this CRZ Notification2019, revised CZMP needs to be prepared afresh & to be
sanctioned by MoEF. Till then, earlier CZMP 2011 will be operative& needs to be taken into
consideration while considering the proposal as per this notification dated 18th January,
2019.Therefore, the details, as per CRZ Notification 2019, is not worked out.
2.3 Minerals:
Mineral is a natural inorganic substance which possesses a definite chemical
composition and definite physical and chemical properties. Presence of minerals plays an
important role in the development of a region or a country.
Navi Mumbai lacks in respect of mineral resources endowment. Trap rocks being
hard, dense and durable are most suitable for building purposes, but generally lack in
minerals. Saltpans, due to rapid urbanization, are lying vacant, along the coast. Sand mining
takes place in the areas like Belapur Creek, Thane Creek of Navi Mumbai.
Source : Net Information.
2.4 Soils:
In general, soil refers to the loose surface of the earth as distinguished from soil
rocks. Soils a natural body consisting of mineral matter, decaying organic matters and
micro-organisms. It is a living body and reacts in different manner depending on different
climatic factors. Soil is one of the predominant natural resources of nature, which gives
21
bread and butter to mankind for survival. There is a relationship between soil and
vegetation, between soil and climate, between climate and vegetation, between soil and
parent rock, between soil and slope, and even climate and slope all these factors co-operate
in the production of the actual soil.8 No life without soil and no soil without life, they have
evolved together.
Soil forms one of the important natural resources of any region. These support the
variety of terrestrial life. Soil is effectively a non-renewable resource. The coastal saline
soils occur in the area due to periodical inundation of cultivable land by creek/ seawater
during high tides. Such periodical inundations render otherwise fertile soil progressively
saline and in time make it completely unfit for growing any crop. Even when putting an
embankment checks the encroachment of saline creek water, the blackish water from
shallow water table rises through the capillaries due to evaporation, enriching the upper
crust of the soil with salts and thus the salinity problem persists.
Coarse Shallow Soils
These soils are found all along the steeper slopes. They are shallow in depth,
heavily eroded and sandy in its texture and yellowish red to yellowish gray in colour
with acidic reaction. They are poor in organic matter and nitrogen and possess very
little retention of moisture. They are good for millets.
Coastal Alluvium Soils
These soils are found all along the coastland at places where there are no
creeks. They are deep soils developed on flat land and loamy in texture. They are
devoid of clay fraction or humus and are open in nature. The sub-soil water level is
only from ten to fifteen feet deep. The salt contents are higher in the proximity of
the sea; but due to excellent drainage, its use has not produced any deleterious
effects. It is suitable for garden crops like coconut, areca- nut, plantain, etc.
Laterite Soils
These soils occur on the mountain peaks. They are coarser in texture. They
are yellowish-red in colour and shallow in depth and yield coarse millets and Niger.
The heavy rains in the mountainous regions thoroughly leach the soils turning them
acidic in reaction and devoid of calcium carbonate. They are rich in sesquioxides
being less than two. But they are generally poor in fertility constituents. However,
the soils from the forest region are well supplied with nitrogen and organic matter.

22
Medium Black Soils
These soils are found on the plain areas. These soils are well suitable for rice
cultivation. Because of high urbanization, these soils are subjected for erosion.
Source : Net Information.
2.5 NMMC Area:
Navi Mumbai is a part of Konkan coast line and is located in center of MMR
(Mumbai Metropolitan Region) with Thane creek on west side while the Parsik hill ranges
surrounded on east side, whereas Thane and Panvel region covers the North and South
zone. NMMC jurisdiction is divided in eight zones starting with Dighe in north and Belapur
in south. Out of the total area of 343.70 sq. km (excluding Adavali-Bhutavali) for Navi
Mumbai, 109.59 sq. km area is under NMMC (including Adavali-Bhutavali). As per UHP
(Urban Health Post) estimate for the year 2017-18 the population residing within NMMC,
area is more than 15 lakhs (15,00,011) with an average population density of about
13,688 persons per sq. km. Koparkhairane UHP tops in terms of population with 1,27,816
individuals while Indira Nagar UHP (Turbhe) is having lowest population of about 35,024
among all UHPs. The total number of properties have also increased to 3,09,841 with
residential properties having the highest share of 83% followed by commercial buildings
with 17% share and MIDC commercial with at least 1% share.
[Source : ESR 2017-2018.]
2.6 Topography and Landscape:
Out of the total area, 57% of land accounts for Built Up area followed by Forests
(24%)1, Wetlands (12%)1 and the remaining area is broadly classified under water
bodies or agriculture.
Navi Mumbai lacks in respect of mineral resources endowment. Trap rocks being
hard, dense and durable are most suitable for building purposes, but generally lack in
minerals. Saltpans, due to rapid urbanization, are lying vacant, along the coast. Sand
mining takes place in the areas like Belapur Creek and Thane Creek of Navi Mumbai. Soil
forms one of the important natural resources of any region. These support the variety of
terrestrial life. Soil is effectively a non-renewable resource.
[Source: Environmental Status Report of Navi Mumbai Municipal Corporation 2017-18 (ESR)& Internet.]

23
2.7 Climatology:
Climate is a decisive factor which makes a place livable. Along with combination of
weather types, the climate of a particular location also depends on manmade features like
presence of industrial complexes, population density, transportation network and amount
of green cover present in that particular area. The climate of Navi Mumbai is hot and
humid. It has a high humidity throughout the year. It lies in the tropical climatic zone and
has three seasons namely summer, monsoon and winter. The annual temperature in Navi
Mumbai varies from 22°C to 36°C while in summers the maximum temperature ranges
between 36°C to 41°C and the minimum temperatures in winter ranges between 17°C to
20°C. The average annual rainfall is 2000-2500 mm and humidity is 61-86 %. Based on
IMD’s (Indian Meteorology Department) observations recorded at TBIA’s (Thane Belapur
Industry Association’s) premises, the predominant wind direction in Navi Mumbai is
southwest in monsoon and north-east during rest of the year.6
Based on the data recorded at the CAAQMS (Continuous Ambient Air Quality
Monitoring Stations), for NMMC, the monthly average temperatures (Figure No.04) were
recorded to be between 26°C to 31°C for the year 2017-18. The highest maximum average
temperature of 31.4°C was recorded in the month of May (summer season) and the lowest
temperature of about 26.1°C was recorded in the December month.
Figure 04: Month wise temperature in NMMC 2017-18.
[Source: Environment Status Report (ESR) 2017-18]

24
Figure 05: Decadal Trend of Annual Rainfall Recorded in Navi Mumbai.
[Source: Environment Status Report (ESR) 2017-18]
2.8 Wind:
Navi Mumbai is influenced by west, east and north-east winds. It is clear from the
metrological data that, in general, the wind speed is least in Navi Mumbai in the month of
October followed by November and December months. Wind speed increases slightly
during the months of January to March and thereafter, rapidly from April to August
months reaching the maximum value in June (47.96 MPH). It falls off very rapidly in
September. Winds are generally moderate except during the south-west monsoon season
when they are stronger.
[Source: Internet.]

25
CHAPTER3: DEMO GRAPHIC CHARACTERISTICS
3.1. Population Growth:
Each year, NMMC conducts survey in UHPs (Urban Health Posts) coming under
NMMC jurisdiction area for estimating population. In the year 2017-18, the population of
NMMC was 15,00,011 and registered a growth of about 0.6% as compared to 2016-17
(14,66,110).Koparkhairane UHP having highest number of population share with 1,27,816
individuals while lowest population is residing in Indira Nagar, Turbhe with population of
35,024 individuals. The rate of migration is increasing year by year because Navi Mumbai
is having huge employment opportunities due to the presence of industrial belt, well
established IT sector, and commercial services. The city’s better infrastructure and quality
of living has led to migration of people in the city. The population growth for last 5 years
for Navi Mumbai has been represented in (Figure-06)
Figure 06: The population growth for last 5 years in Navi Mumbai.
[Source: Health Deptt., NMMC.]
3.2. Population Structure and Distribution:
The sex ratio for NMMC as per 2011 census works out to be 837 female per 1000 male as against the respective sex ratio figures of 929 for Maharashtra State. Out of total population of 1500011persons, the number of males are 7,68,949 and 7,31,062 are female.
Demographic characteristic
Distribution of population as per Census 2011.
1322573 13486591403167
1466110 1500011
12000001250000130000013500001400000145000015000001550000
2 0 1 3 - 2 0 1 4 2 0 1 4 - 2 0 1 5 2 0 1 5 - 2 0 1 6 2 0 1 6 - 2 0 1 7 2 0 1 7 - 2 0 1 8
POPU
LATI
ON
AXIS TITLE
Population Growth In Navi MumbaiPopulation

26
Table 04 : Distribution of population as per Census 2011.
Node Villages included in Node Area in hectare
Approx. population
Gross density per hectare
Airoli Dighe, Airoli, Ilthan, Dive, Chinchvali, 1565.73 216888 138
Ghansoli Rabale, Gothivali, Talavali, Ghansoli, Savali,
2193.51 136525 62
Koparkhairane Tetavali, Mahape, Koparkhairane, Khairane, Pawane, Adavali-Bhutavali
1971.69 177789 90
Vashi Borivali, Ju, Vashi, Turbhe 1616.51 209781 130
Sanpada Sanpada, Sonkhar 860.99 82863 96
Nerul Bonsari, Kukshet, Shiravane, Sarsole, Nerul, Darave, Karave
1782.33 231355 130
Belapur Belapur-Shahbaz 968.00 65346 68
Total 10958.76 (`109.59 sq.km.)
1120547 102
Table 05 : Distribution of population as per 2017-18 (as per records of Health Department.)
Node Villages included in
Node Area in hectare
Approx. population
Male population
Female population
Proportionate population of
female for 1000 male
Airoli Dighe, Airoli, Ilthan, Dive, Chinchvali,
1565.73 206835 108046 98789 914
Ghansoli Rabale, Gothivali, Talavali, Ghansoli, Savali,
2193.51 276604 141446 135158 956
Koparkhairane
Tetavali, Mahape, Koparkhairane, Khairane, Pawane, Adavali-Bhutavali
1971.69 291162 156724 134438 858
Vashi Borivali, Ju, Vashi, Turbhe
1616.51 218186 109292 108894 996
Sanpada Sanpada, Sonkhar 860.99 78467 38534 39933 1036
Nerul Bonsari, Kukshet, Shiravane, Sarsole, Nerul, Darave, Karave
1782.33 339307 169207 170100 1005
Belapur Belapur-Shahbaz 968.00 89450 45700 43750 957
Total
10958.76 i.e.
109.59 sq.km.
1500011 768949 731062 950

27
Table 06: Distribution of population as per 2011 census.
Node Villages included in Node Approx. population
Male population
Female population
Proportionate population of
female for 1000 male
Airoli Dighe, Airoli, Ilthan, Dive, Chinchvali,
216888
Node wise breakup not available in census record
Ghansoli Rabale, Gothivali, Talavali, Ghansoli, Savali,
136525
Koparkhairane Tetavali, Mahape, Koparkhairane, Khairane, Pawane, Adavali-Bhutavali
177789
Vashi Borivali, Ju, Vashi, Turbhe 209781
Sanpada Sanpada, Sonkhar 82863
Nerul Bonsari, Kukshet, Shiravane, Sarsole, Nerul, Darave, Karave
231355
Belapur Belapur-Shahbaz 65346
Total 1120547 610060 510487 837
[Source: Census record 2011.]
Note: Node-wise breakup not available in census record.
Table 07: Distribution of population as per 2017-18 (as per records of Health Department.)
Node. Villages included in Node Approx.
population Male
population Female
population
Proportionate population of
female for 1000 male
Airoli Dighe, Airoli, Ilthan, Dive, Chinchvali,
206835 108046 98789 914
Ghansoli Rabale, Gothivali, Talavali, Ghansoli, Savali,
276604 141446 135158 956
Koparkhairane Tetavali, Mahape, Koparkhairane, Khairane, Pawane, Adavali-Bhutavali
291162 156724 134438 858
Vashi Borivali, Ju, Vashi, Turbhe 218186 109292 108894 996
Sanpada Sanpada, Sonkhar 78467 38534 39933 1036
Nerul Bonsari, Kukshet, Shiravane, Sarsole, Nerul, Darave, Karave
339307 169207 170100 1005
Belapur Belapur-Shahbaz 89450 45700 43750 957
Total 1500011 768949 731062 950

28
3.3. Demographic projection:
Projected Population as on 2028 & 2038
Existing population : To review the overall growth of city, socio-economic indicators
play an important role. These indicators give a true picture of the level or standard of
living city is offering to its inhabitants. Also gives measuring tool to rate city over the
surrounding settlement.
Population of Navi Mumbai Municipal Corporation area is 11.19 lakhs according
to the 2011 Census. Details of population of last six decades within NMMC area is
shown in following table.
Table 08: Details of population of last six decades within NMMC area.
Sr.No. Year Population Decade
Variation Decade
Variation% Incremental
Increase per decade
1. 1951 16273 - - -
2. 1961 20797 4524 27.80% -
3. 1971 40298 19501 93.77% 14977
4. 1981 89907 49609 123.11% 30108
5. 1991 308230 218323 242.83% 168714
6. 2001 691272 383042 124.27% 164719
7. 2011 1120547 429275 62.10% 46233
In NMMC area there are 7 administrative wards and the breakup of population as per
2011 Census is as under :

29
Table 09: Details of Node wise population as per census 2011 within NMMC area.
Sr. No.
Nodes/ Wards
Total wards within Node
Population within
Gaothan
Nodal Population MIDC / Slum
Population
Total Population CIDCO
Bldgs. LIG Others
1. Airoli / Dighe 21 8483 29812 29186 47775 101632 216888
2. Ghansoli 14 60544 15526 0 28277 32178 136525
3. Koparkhairane 18 38844 12821 59738 58486 7900 177789
4. Vashi 20 30941 35483 19585 71370 52402 209781
5. Sanpada 8 10484 25167 0 47212 0 82863
6. Nerul 24 36168 57099 10330 117740 10018 231355
7. Belapur 6 13222 16240 2221 29557 4106 65346
Total 111 198686 192148 121060 400417 208236 1120547
Since the Draft Development Plan is being prepared considering the next two decade
population i.e. 2018-2038, it is also necessary to project the population as on 2028 & 2038. As par
the provision of section 31 (5) of the said Act, it is necessary to frame the proposal of reservation
considering 10 years population & for zoning, it is 20 years and therefore, projected population as
on 2028 & 2038 (respectively) needs to be considered. The population projections provide a base
for determining the future need. Based on past trends and internal and external factors,
assumptions are framed and thus population projections are worked out. It is very crucial to
determine the growth trends as it gives base data to estimate the physical and social infrastructure.
For deciding the projected population, there are no. of methods. However, following methods has
been considered to work out the population as on 2028 & 2038.

30
1. Arithmetical Increase Method
As per this method the total population as on 2028 & 2038 would be
18,50,315& 22,79,590 respectively.
Formula PN = Po + N 1.
P2001 = 6,91,272
P2011 = 11,20,547
R = 11,20,547-6,91,272
R = 4,29,275
P2028 = [P2011] + [1.70 X R]
= [11,20,547] + [ 1.70 X 4,29,275]
P2028 = 18,50,314.5 say 18,50,315
P2038 = [P2028] + [1 X R]
= [18,50,315] + [1 X 4,29,275]
= 22,79,590

31
2. Geo Method Increase Method
As per this method the total population as on 2028 & 2038 would be
25,43,418&41,20,337respectively.
Formula: PN = Po [1+R] N
P2001 = 6,91,272
P20011 = 11,20,547
11,20,547 = 6,91,272 [1 + R]10
[1+R]10 = 1.62
1 + R = 10√1.62
1+R = 1.0494
R = 0.0494
P2028 = 11,20,547 [1+0.0494]17
= 11,20,547 [2.2698] = 25,43,417.58 Say 25,43,418
P2038 = 25,43,418 [1+0.0494]10
= 25,43,418 X 1.62 = 41,20,337.16
P2038 = Say 41,20,337

32
3. Percentage Increase Method
As per this method the total population as on 2028 & 2038 would be
32,59,974&69,21,251 respectively
Formula : Pn = PO+ PO X i 100
PO = Present Population (2011) = 11, 20,547
= 27.80+93.77+123.11+242.83+124.27+62.10 6
i = 112.310%
P2028 = 11,20,547 + [11,20,547 X 112.31 X 1.70 /100]
= 32,59,973.77 Say 32,59,974
P2038 = 32,59,974+ [32,59,974 X 112.31 X 1/100]
P2038 = 69,21,250.79 Say 69,21,251

33
4. Incremental Increase Method
As per this method the total population as on 2028 & 2038 would be 16,28,385
& 18,97,381 respectively.
Formula : PN = PO+ nR +n(n+1 ) X K 2
R = 4524+19501+49609+218323+383042+429275 6
= 1104274 6
= 1,84,046
K = Avg. Incremental Increase in Population per decade
= 14977+30108+168714+164719+46233 5
= 84,950.00
P2028 = 11,20,547 +[1.70x184046] + 1.70 x [1.70+1]X 84950 2
= 11,20,547+3,12,878.20+1,94,960.25
= 16,28,385.45 Say 16,28,385
P2038 = 1628385 + [1.00X 184046] + 1X(1+1)X84950 2
P2038 = 18,97,381

34
5. Public Health Department Method
As per this method the total population as on 2028 & 2038 would be
26,29,014&42,59,082 respectively
Formula : PO = PO X2000 + NG 2000 - NG
11,20,547 = 6,91,272 X2000+10XG 2000–10XG
1.62 X (2000 – 10G) = 2000 + 10G
3240-16.2G = 2000 + 10G
26.2G = 1240
G = 47.33
P2028 = 11,20,547 [2000+(17.00X47.33) 2000-(17.00 X 47.33)
=
11,20,547 X[2804.61] 1195.39
= 26,29,014.23 Say 26,29,014
P2038 = 26,29,0142000+(10X47.33) 2000-(10X47.33)
= 26,29,014 X2473.30 1526.70
P2038 = 42,59,081.89 Say 42,59,082
6. Graphical Method
As per this method, the total population as on 2038 would be 30, 10,000
Projected Population as on 2028 = 18, 85,000/-
Projected Population as on 2038 = 30, 10,000/-
7. As per DPR
The detailed project report for Improvement of Water Distribution Network in NMMC
area was prepared by authorized agency to the get the grant-in-aid under Jawaharlal Nehru
Nation Urban Renewal Mission (JNNURM). The said report was prepared in 2007 which was
approved by Central Government in 2008. As per this DPR the projected population as on

35
2042 was considered as 29,11,032 and the same is also considered for deriving the projected
population as on 2038.
8. As per report of CRISIL
The NMMC had entrusted the work of “Impact Assessment for Increasing the FSI in
NMMC Area” to CRISL Risk and Infrastructure Solution Limited. The CRISIL had submitted
its report in 2012. The said report was also submitted to Government of Maharashtra. This
study assesses the impact of increasing the allowable FSI on infrastructure and environment
by identifying the sustainable level of population that can be supported by the currently
available physical, social and environmental infrastructure. The study also identifies the areas
(inside the city) which could be allowed a changes in FSI to enable NMMC in better achieving
the vision of providing work class infrastructure and slum free city.
The CRISIL, in its report had considered the population as 28 to 30 lakhs, within the next 20
years.
The summary of projected population by different methods as on 2028 and 2038 is as under:
Table 10: Summary of population projection by different methods as on 2028 & 2038.
Sr.No. Method of Population Projection Projected Population
2028 2038
1 Arithmetical Increase Method 18,50,315 22,79,590
2 Geometrical Increase Method 25,43,418 41,20,337
3 Percentage Increase Method 32,59,974 69,21,251
4 Incremental Increase Method 16,28,385 18,97,381
5 Public Health Department Method 26,29,014 42,59,082
6 Graphical Method 18,85,000 30,10,000
7 As per DPR of JNNURM Project (2042) -- 29,11,032
8 As per Impact Assessment Report of Crisil 25,00,000
(as on 2031) 28,00,000-30,00,000
However, to work out the population as on 2028 & 2038, all methods has been
considered, the report at 7 & 8 are near about same and based on various assumptions as
detailed in its report. Both reports has been accepted by Central & State Government
respectively. However, it is observed from the available record that population as on 2011

36
&2018 was 11.20 lakhs & 15 lakhs respectively which indicates that there was near about
50,000 rise every year. Considering this data, the population as on 2021 will be near about
16.5 to 17 lakhs. The method @ Sr.No.8 indicates population as on 2031 is 25 lakhs.
Considering all these facts, the projected population as on 2028 is therefore,
considered as 23.30 lakhs. And population as on 2038 is considered as 28 lakhs.
This projected population as on 2028 & 2038 has been considered to frame the
planning proposal of Draft Development Plan.
3.4. Occupational structure and employment pattern:
Year-wise detailed bifurcation of the occupational structure and employment
pattern for the last 5 years.
The total population of the city i.e. municipal corporation as per 2011 census was
1120547 souls out of which 610060 were males and 510487 were females forming ratio
of 837females per 1000 males. The total working population in the city was 455485 both
including main and marginal workers which works out to be 40.64% of the total
population.
Main worker: A person who has worked for major part of the reference period ( i.e. six
months or more during the last one year preceding the date of enumeration) in any
economically productive activity is termed as ‘Main worker’.
Marginal worker: A person who worked for less than six months of the reference period
( i.e. in the last one year preceding the date of enumeration ) in any economic activity is
termed as ‘Marginal worker’.

37
Table 11 : Occupational structure and employment pattern as per census 2011.
Persons/ Males/
Females
Total Population
Total workers
(main and marginal workers)
Category of Workers
Cultivators Agricultural
laborers Household
Industry Workers Other Workers
Number % Number % Number % Number %
Persons 1120547 455485 1909 0.42 3198 0.7 10725 2.35 439653 96.52
Males 610060 361222 1195 0.33 2357 0.65 6602 1.83 351068 97.19
Females 510487 94263 714 0.76 841 0.89 4123 4.37 88585 93.98
[Source: Census 2011.]
Table 12: Occupational structure and employment pattern as per census 2001.
Persons/ Males/
Females
Total Population
Total workers
(main and marginal workers)
Category of Workers
Cultivators Agricultural laborers
Household Industry Workers
Other Workers
Number % Number % Number % Number %
Persons 704002 270692 1651 0.6 665 0.2 3504 1.3 264872 97.8
Males 395705 231922 1067 0.5 331 0.1 1848 0.8 228676 98.6
Females 308297 38770 584 1.5 334 0.9 1656 4.3 36196 93.4
[Source: Census 2001]
(Note: The above population includes 14 villages which were excluded from NMMC Jurisdiction
in 2007.)

38
CHAPTER 4: DEVELOPMENT PLAN-PROCESS, VISION AND OBJECTIVES
4.1. Planning efforts in past:
In NMMC area, prior to its inception, CIDCO was functioning as NTDA as
mentioned in chapter No. I of this report. NMMC was constituted by Govt. with effect from
1st Jan. 1992. Even powers of planning authority were delegated to NMMC partly in 1994
and 2008 respectively. CIDCO is still continued to act as new town development authority,
therefore, most of the lands were acquired by CIDCO for development of new town i.e. Navi
Mumbai. CIDCOs sanctioned DP was a Structural Plan showing zoning of lands i.e.
residential, commercial, industrial, regional park, NDZ etc. and there were no provision for
reservations of any public ammonites etc. CIDCO has developed 7Nodes in NMMC area
with proper layout and civic amenities and therefore, since its inception, NMMC had
requested CIDCO to grant vacant plot for developing basic civic amenities and
infrastructure.
The break - up of plots demanded, plot granted by CIDCO, Plots physically
developed by NMMC and plots yet to be granted by CIDCO is as under.
Table 13 : The break - up of plots developed & undeveloped in Belapur and Nerul Nodes. (plots handed over by CIDCO to NMMC)
Sr. No.
Category of plot
NAME OF NODE BELAPUR NERUL
No of plots Handover
Total Area of plot hand
over in sq.mt
Nos. of plot developed
Undeveloped plot
No of plots Handover
Total Area of plot hand over
in sq.mt
Nos. of plot developed
Undeveloped plot
1 Play ground 6 61253.00 4 2 10 80454.4 9 1
2 Garden 30 137356.49 21 9 43 1369576.02 36 7
3 Tree plantation
1 6736.00 1 0 9 26871.01 7 2
4 Open space 1 36700.00 1 0 24 29684.14 10 14
5 Community center
2 2473.01 1 1 - - - -
6 Library 1 1973.01 1 0 - - - -
7 Hospital 2 2609.33 2 0 2 1288.96 1 1
8 UHP 1 349.57 1 0 3 1906.68 2 1
9 Crematorium/burial ground
3 11424.91 2 1 4 12741.98 3 1
10 Parking 3 12113.86 0 3 4 9779 1 3

39
Sr. No.
Category of plot
NAME OF NODE BELAPUR NERUL
No of plots Handover
Total Area of plot hand
over in sq.mt
Nos. of plot developed
Undeveloped plot
No of plots Handover
Total Area of plot hand over
in sq.mt
Nos. of plot developed
Undeveloped plot
11 MBR/GSR/ESR 2 10325.39 2 0 1 771.08 1 0
12 Daily bazar<Hawker zone
3 4097.00 2 1 16 8495.692 8 8
13 Zunka Bhakaar center
5 92.46 5 0 7 129.72 5 2
14 School 2 6990.00 1 1 5 13478.12 2 3
15 NMMC office 2 20352.27 2 0 - - - -
16 Staff Quarter 1 1035.00 1 0 - - - -
17 Social Welfare/facility
1 332.33 1 0 6 2305.95 4 2
18 Fire bridge - - - - 2 9000 1 1
19 Taxi/ Rickshaw parking
- - - - 5 1673.82 4 1
20 Bank 1 665.48 0 1
21 Holding pond
1 33743.71 0 1
22 Toilet 3 152.65 2 1
23 Temple 2 1312.56 0 2
24 Pond/ Talava 2 306714.70 2 0
25 Pathway 1 4094.46 0 1
26 Police station
1 745.48 0 1
27 Post office 1 745.48 0 1
28 Public Utility
1 74.07 0 1
29 Village Panchayat office
1 726 0 1
30 Women trust
1 744 1 0
31 Women welfare
32 Sports complex
33 Water park
34 Women Gym
35 Auditorium
36 Biogas
37 Dumping ground
38 Night shelter

40
Sr. No.
Category of plot
NAME OF NODE BELAPUR NERUL
No of plots Handover
Total Area of plot hand
over in sq.mt
Nos. of plot developed
Undeveloped plot
No of plots Handover
Total Area of plot hand over
in sq.mt
Nos. of plot developed
Undeveloped plot
39 Recreational ground
40 Rehabilitation/Social Amenity
41 Tamasha Theatre
42 Senior citizen center
43 MJP
44
NMMT Bus depot/Terminal/ Workshop
1 1850.00 1 - 2 7176.19 2 -
45 Amusement park
- - -
Total 67 3318063.63 49 18 158
19255051.35 101 57
Table 14 : The break - up of plots developed & undeveloped in - Vashi/ Turbhe & Sanpada Nodes.
(plots handed over by CIDCO to NMMC)
Sr. No.
Category of plot
NAME OF NODE
VASHI/TURBHE SANPADA
No of plots Handover
Total Area of plot hand over in sq.mt
Nos. of plot developed
Undeveloped plot
No of plots Handover
Total Area of plot hand over in
sq.mt
Nos. of plot
developed
Undeveloped plot
1 Play ground 6 61183.92 4 2 15 62629.51 12 3
2 Garden 37 254411.627 37 0 12 65165.74 9 3
3 Tree plantation 11 97216.35 9 2 6 49061.07 4 2
4 Open space 7 29344.623 5 2
5 Community center
6 Library 2 311.89 2 0
7 Hospital 1 13987 1 0
8 UHP 2 723.12 2 0
9 Crematorium/burial ground 4 14342.93 4 0
10 Parking 3 14514.132 3 0 1 294.21 0 1
11 MBR/GSR/ESR
12 Daily bazar<Hawker zone
4 3575.62 3 1 3 2877.29 0 3

41
Sr. No.
Category of plot
NAME OF NODE
VASHI/TURBHE SANPADA
No of plots Handover
Total Area of plot hand over in sq.mt
Nos. of plot developed
Undeveloped plot
No of plots Handover
Total Area of plot hand over in
sq.mt
Nos. of plot
developed
Undeveloped plot
13 Zunka Bhakaar center 9 165.5 0 9 2 35.686 0 2
14 School 2 6825.18 2 0 1 1200 1 0
15 NMMC office
16 Staff Quarter
17 Social Welfare/facility 2 3407.75 2 0 3 3496.31 1 2
18 Fire bridge
19 Taxi/Rickshaw parking 5 2797.74 4 1 2 367.4 0 2
20 Bank
21 Holding pond 2 219195.46 1 1
22 Toilet 2 0 2 0
23 Temple
24 Pond/ Talava 1 8179.47 1 0
25 Pathway
26 Police station
27 Post office
28 Public Utility
29 Village Panchayat office
30 Women trust
31 Women welfare 1 377.31 0 1
32 Sports complex 1 4049.82 0 1
33 Water park 1 289410.6 1 0
34 Women Gym 1 456.00 0 1
35 Auditorium 1 5422.5 1 0
36 Biogas 1 1156 0 1
37 Dumping ground 1 260000 1 0
38 Night shelter
39 Recreational ground
40 Rehabilitation/Social Amenity
41 Tamasha Theatre
42 Senior citizen center
43 MJP
44 NMMT Bus depot/Terminal
1 9600.00 1 0

42
Sr. No.
Category of plot
NAME OF NODE
VASHI/TURBHE SANPADA
No of plots Handover
Total Area of plot hand over in sq.mt
Nos. of plot developed
Undeveloped plot
No of plots Handover
Total Area of plot hand over in
sq.mt
Nos. of plot
developed
Undeveloped plot
/ Workshops
45 Amusement park
1 50000.00 1 0
Total 102 1088398.11 82 20 52 447383.646 32 20
Table 15: The break - up of plots developed & undeveloped in - Koparkhairane & Ghansoli. Nodes. (plots handed over by CIDCO to NMMC)
Sr. No.
Category of plot
NAME OF NODE
KOPARKHAIRANE GHANSOLI
No
of p
lots
H
and
over
Tot
al A
rea
of
plo
t h
and
ov
er in
sq
.mt
Nos
. of p
lot
dev
elop
ed
Un
dev
elop
ed
plo
t
No
of p
lots
H
and
over
Tot
al A
rea
of
plo
t h
and
ov
er in
sq
.mt
Nos
. of p
lot
dev
elop
ed
Un
dev
elop
ed
plo
t
1 Play ground 13 68396.39 12 1 5 24041.59 4 1
2 Garden 18 78067.17 13 5 9 65192.297 7 2
3 Tree plantation
4 Open space
5 Community center 1 1902.04 0 1
6 Library
7 Hospital 1 949.86 0 1
8 UHP 3 1670 0 3
9 Crematorium/burial ground 2 21356.3 2 0 2 2195.96 1 1
10 Parking
11 MBR/GSR/ESR
12 Daily bazar<Hawker zone 23 5012.36 12 11
13 Zunka Bhakaar center 2 35.69 2 0 5 87.87 5 0
14 School 6 17333.64 5 1 2 7011.07 1 1
15 NMMC office 1 1632 1 0
16 Staff Quarter 1 4997.82 0 1
17 Social Welfare/ Facility 7 157217.95 2 5
18 Fire bridge 1 5619.46 1 0
19 Taxi/ Rickshaw parking 31 5948.62 25 6

43
Sr. No.
Category of plot
NAME OF NODE
KOPARKHAIRANE GHANSOLI
No
of p
lots
H
and
over
Tot
al A
rea
of
plo
t h
and
ov
er in
sq
.mt
Nos
. of p
lot
dev
elop
ed
Un
dev
elop
ed
plo
t
No
of p
lots
H
and
over
Tot
al A
rea
of
plo
t h
and
ov
er in
sq
.mt
Nos
. of p
lot
dev
elop
ed
Un
dev
elop
ed
plo
t
20 Bank
21 Holding pond
22 Toilet 2 0 2 0
23 Temple
24 Pond/ Talava
25 Pathway
26 Police station
27 Post office
28 Public Utility
29 Village Panchayat office
30 Women trust
31 Women welfare
32 Sports complex
33 Waterpark
34 Women Gym
35 Auditorium
36 Biogas
37 Dumping ground
38 Night shelter 1 486.08 0 1
39 Recreational ground 2 5872 1 1
40 Rehabilitation/Social Amenity 5 24003.46 2 3
41 Tamasha Theatre 1 3542.28 0 1
42 Senior citizen center
43 MJP
44 NMMT Bus depot/Terminal/ Workshop
2 34200 2 - 1 30000.00 1 0
45 Amusement park
Total 114 276533.03 80 34 33 290238.877 21 12

44
Table 16:The break - up of plots developed & undeveloped in - Airoli Node & MIDC. (plots handed over by CIDCO to NMMC)
Sr. No.
Category of plot
NAME OF NODE
AIROLI MJP
No
of p
lots
H
and
over
Tot
al A
rea
of
plo
t han
d
over
in s
q.m
t
Nos
. of p
lot
dev
elop
ed
Un
dev
elop
ed
plo
t
No
of p
lots
H
and
over
Tot
al A
rea
of
plo
t han
d
over
in s
q.m
t
Nos
. of p
lot
dev
elop
ed
Un
dev
elop
ed
plo
t
1 Play ground 12 118871.93 4 8
2 Garden 19 81801.68 14 5
3 Tree plantation 6 19381.38 2 4
4 Open space 14 43905.42 3 11
5 Community center 3 2876.51 3 0
6 Library
7 Hospital
8 UHP
9 Crematorium/burial ground 3 10449.2 2 1
10 Parking 4 1490.06 0 4
11 MBR/GSR/ESR
12 Daily bazar<Hawker zone 3 1102.4 2 1
13 Zunka Bhakaar center 5 91.05 1 4
14 School 2 7627.55 1 1
15 NMMC office
16 Staff Quarter
17 Social Welfare/facility 1 262.08 0 1
18 Fire bridge
19 Taxi/ Rickshaw parking
20 Bank
21 Holding pond 1 150060.95 0 1
22 Toilet 12 1666.25 9 3
23 Temple
24 Pond/ Talava
25 Pathway
26 Police station
27 Post office
28 Public Utility
29 Village Panchayat office
30 Women trust
31 Women welfare 1 260.63 0 1

45
Sr. No.
Category of plot
NAME OF NODE
AIROLI MJP
No
of p
lots
H
and
over
Tot
al A
rea
of
plo
t han
d
over
in s
q.m
t
Nos
. of p
lot
dev
elop
ed
Un
dev
elop
ed
plo
t
No
of p
lots
H
and
over
Tot
al A
rea
of
plo
t han
d
over
in s
q.m
t
Nos
. of p
lot
dev
elop
ed
Un
dev
elop
ed
plo
t
32 Sports complex
33 Waterpark
34 Women Gym
35 Auditorium 1 289.29 0 1
36 Biogas
37 Dumping ground
38 Night shelter
39 Recreational ground
40 Rehabilitation/Social Amenity 2 39660 2 0
41 Tamasha Theatre
42 Senior citizen center 1 259 0 1
43 MJP 1 1,18,50,00
0 1 0
44 NMMT Bus depot/Terminal/ Workshop
2 18768.36 2 0
45 Amusement park
Total 92 498823.74 45 47 1 11850000 1 0
The CIDCO had also granted plots to NMMC for water supply scheme originated from
Morbe. These plots are out of NMMC limit and therefore, shown as MJP in above referred
table.

46
Table 17 : Summary of plots allotted to NMMC by CIDCO and plots developed by NMMC.
Sr. No. Category of plot Total No. of
plots Handover
Total Area of plot hand over
in sq.mt
Total No. of plot
developed
Total No. of plot
undeveloped
1 Play ground 67 476830.74 49 18
2 Garden 168 2051571.02 137 31
3 Tree Plantation 33 199265.81 23 10
4 Open Space 46 139634.18 19 27
5 Community Center 6 7251.56 4 2
6 Library 3 2284.90 3 0
7 Hospital 6 18835.15 4 2
8 UHP 9 4649.37 5 4
9 Crematorium/ Burial Ground 18 72511.28 14 4
10 Parking 15 38191.26 4 11
11 MBR/GSR/ESR 3 11096.47 3 0
12 Daily bazar/ Hawker zone 52 25160.37 27 25
13 Zunka Bhakaar Center 35 637.98 18 17
14 School 20 60465.56 13 7
15 NMMC Office 3 21984.27 3 0
16 Staff Quarter 2 6032.82 1 1
17 Social Welfare/ Facility 20 167022.37 10 10
18 Fire Bridge 3 14619.46 2 1
19 Taxi/ Rickshaw Parking 43 10787.58 33 10
20 Bank 1 665.48 0 1
21 Holding Pond 4 403000.12 1 3
22 Toilet 19 1818.90 15 4
23 Temple 2 1312.56 0 2
24 Pond/ Talava 3 314894.17 3 0
25 Pathway 1 4094.46 0 1
26 Police Station 1 745.48 0 1
27 Post Office 1 745.48 0 1

47
Sr. No. Category of plot Total No. of
plots Handover
Total Area of plot hand over
in sq.mt
Total No. of plot
developed
Total No. of plot
undeveloped
28 Public Utility 1 74.07 0 1
29 Village Panchayat Office 1 726.00 0 1
30 Women Trust 1 744.00 1 0
31 Women Welfare 2 637.94 0 2
32 Sports Complex 1 4049.82 0 1
33 Waterpark 1 289410.60 1 0
34 Women Gym 1 456.00 0 1
35 Auditorium 2 5711.79 1 1
36 Biogas 1 1156.00 0 1
37 Dumping Ground 1 260000.00 1 0
38 Night Shelter 1 486.08 0 1
39 Recreational Ground 2 5872.00 1 1
40 Rehabilitation/Social Amenity 7 63663.46 4 3
41 Tamasha Theatre 1 3542.28 0 1
42 Senior Citizen Center 1 259.00 0 1
43 MJP 1 11850000.00 1 0
44 NMMT Bus depot/Terminal/ Workshop 9 101594.55 9 0
45 Amusement park 1 50000.00 1 0
Total 619 16694492.39 411 208
This information is related to NMMC since its inception (01/01/1992 to 31/12/2018).

48
Table 18 :Plots details demanded by NMMC to CIDCO and its status.
Sr. No.
Purpose of plots
Tot
al N
o. o
f plo
ts
Dem
and
ed b
y N
MM
C to
CID
CO
Plo
ts g
ran
ted
by
CID
CO
Tot
al a
rea
of p
lots
(sq
. m
trs.
)
Dem
and
of p
lots
p
end
ing
wit
h C
IDCO
No.
of p
lots
tak
en o
ver
by
NM
MC
Plo
ts p
hys
ical
ly
dev
elop
ed b
y N
MM
C
Plo
ts u
nd
er
dev
elop
men
t
No.
of p
lots
wh
ere
dev
elop
men
t not
at
stat
ed
1. Play Grounds/Recreational Ground 155 69 482702.74 86 69 50 0 19
2. Open Space/Tree Belt 147 79 338899.99 68 79 42 0 37
3. Garden/Park 270 168 2051571.02 102 168 137 0 31
4. ESR/GSR 53 3 11096.47 50 3 3 0 0
5. School 60 20 60465.56 40 20 13 0 7
6. PHC/Dispensary/Hospitals 62 15 21579.84 47 15 9 0 6
7. Municipal Offices/Police Station/Post Office
29 6 24201.23 23 6 3 0 3
8. STP/SPH 20 0 0.00 20 0 0 0 0
9. Dumping Ground 1 1 260000.00 0 1 1 0 0
10. Bus Station/Depot 5 0 0.00 5 0 0 0 0
11. Parking/Truck Terminal 97 58 48978.84 39 58 37 0 21
12. Community Centre 17 6 7251.56 11 6 4 0 2
13. Public Toilets 32 19 1818.90 13 19 15 0 4
14. Sport Academy/swimming Pool/Stadium/Gymnasium
5 2 4505.82 3 2 0 0 2
15. Shops/Market/Hawkers Zone/Stalls/Veg & Fruit & Fish Market 321 87 25798.34 234 87 45 0 42
16. Open Space below HT line 26 0 0.00 26 0 0 0 0
17. Crematorium/Burial Ground 37 18 72511.28 19 18 14 0 4
18. Holding Pond/Pond/Tank 25 7 717894.29 18 7 4 0 3
19. Auditorium/Multiplex/Tamasha Theatre
6 3 9254.07 3 3 1 0 2
20. Cattle Pond 1 0 0.00 1 0 0 0 0
21. Library 8 3 2284.90 5 3 3 0 0
22. Fire Station 8 3 14619.46 5 3 2 0 1
23. Social Facility 98 30 232067.77 68 30 15 0 15
24. Public Utility 38 1 74.07 37 1 0 0 1

49
Sr. No.
Purpose of plots
Tot
al N
o. o
f plo
ts
Dem
and
ed b
y N
MM
C to
CID
CO
Plo
ts g
ran
ted
by
CID
CO
Tot
al a
rea
of p
lots
(sq
. m
trs.
)
Dem
and
of p
lots
p
end
ing
wit
h C
IDCO
No.
of p
lots
tak
en o
ver
by
NM
MC
Plo
ts p
hys
ical
ly
dev
elop
ed b
y N
MM
C
Plo
ts u
nd
er
dev
elop
men
t
No.
of p
lots
wh
ere
dev
elop
men
t not
at
stat
ed
25. Institutional 1 0 0.00 1 0 0 0 0
26. Staff Quarter 2 2 6032.82 0 2 1 0 1
27. Bank 1 1 665.48 0 1 0 0 1
28. Temple 2 2 1312.56 0 2 0 0 2
29. Pathway 1 1 4094.46 0 1 0 0 1
30. Waterpark 1 1 289410.60 0 1 1 0 0
31. Biogas 1 1 1156.00 0 1 0 0 1
32. Night Shelter 1 1 486.08 0 1 0 0 1
33. Senior Citizen Center 1 1 259.00 0 1 0 0 1
34. MJP 1 1 11850000.00 0 1 1 0 0
35. NMMT BUS DEPO/TERMINAL/WORKSHOP 9 9
101594.55 0 9 9 0 0
36. Amusement park 1 1 50000.00 0 1 1 0 0
Total 1543 619 16692587.71
924 619 411 0 208
From the above table, it is found that the CIDCO has not yet granted no. of plots which
were demanded by NMMC and therefore, there will be short fall of basic civic/social amenities. The
NMMC has developed following plots in 7 nodes.

Table 19 :List of Plots demanded by NMMC & pending with CIDCO.
Sr. No.
Purpose of plots
CBD Belapur Node
Nerul Node Sanpada Node Vashi-Turbhe
Node Koparkhairane
Node Ghansoli
Node Airoli Node
Total
Tot
al N
o. o
f plo
ts
Tot
al a
rea
Tot
al N
o. o
f plo
ts
Tot
al a
rea
Tot
al N
o. o
f plo
ts
Tot
al a
rea
Tot
al N
o. o
f plo
ts
Tot
al a
rea
Tot
al N
o. o
f plo
ts
Tot
al a
rea
Tot
al N
o. o
f plo
ts
Tot
al a
rea
Tot
al N
o. o
f plo
ts
Tot
al a
rea
Tot
al N
o. o
f plo
ts
Tot
al a
rea
1. Play Grounds/Recreational Ground
11 107984.28 35 286630.28 7 22657.50 7 48760.12 17 39019.61 7 151401.5
5 2 9997.10 86 666450.44
2. Open Space/Tree Belt
12 378493.59 22 65933.75 3 3904.00 17 110856.52 7 109859.71 1 4731.94 6 14536.90 68 688316.41
3. Garden/Park 26 48501.14 21 210548.98 2 13351.40 27 144044.34 7 24282.14 1 1888.06 18 64127.01 102 506743.07
4. ESR/GSR 6 28362.18 7 29739.09 5 15173.16 20 48288.41 5 15236.83 3 14379.66 4 17281.13 50 168460.46
5. School 5 14000.00 15 33676.25 4 8784.30 6 21862.5 6 7527.78 0 0.00 4 11722.45 40 97573.28
6. PHC/Dispensary/Hospitals
2 8502.62 10 6550.00 9 7271.27 6 9030.71 11 7859.05 3 5423.84 6 8810.85 47 53448.34
7.
Municipal Offices/Police Station/Post office
3 13696.27 3 9325.88 5 3454.44 4 3734.66 6 64171.05 1 3172.46 1 23.14 23 97577.90
8. STP/SPH 4 23680.00 6 82859.98 1 36480.00 2 42204.81 3 133857.46 2 46009.28 2 66924.82 20 432016.35
9. Dumping Ground
0 0.00 0 0.00 0 0.00 0 0 0 0.00 0 0.00 0 0.00 0 0.00
10. Bus Station/Depot
2 8085.00 0 0.00 0 0.00 3 45745.12 0 0.00 0 0.00 0 0.00 5 53830.12
11. Parking/Truck Terminal
13 84504.00 2 1002.14 0 0.00 17 94043.88 2 775.87 0 0.00 5 11952.44 39 192278.33
12. Community Centre
1 500.00 2 5085.00 1 480.00 2 2127.00 1 2622.00 1 1006.13 3 3073.00 11 14893.13

51
Sr. No.
Purpose of plots
CBD Belapur Node
Nerul Node Sanpada Node Vashi-Turbhe
Node Koparkhairane
Node Ghansoli
Node Airoli Node
Total
Tot
al N
o. o
f plo
ts
Tot
al a
rea
Tot
al N
o. o
f plo
ts
Tot
al a
rea
Tot
al N
o. o
f plo
ts
Tot
al a
rea
Tot
al N
o. o
f plo
ts
Tot
al a
rea
Tot
al N
o. o
f plo
ts
Tot
al a
rea
Tot
al N
o. o
f plo
ts
Tot
al a
rea
Tot
al N
o. o
f plo
ts
Tot
al a
rea
Tot
al N
o. o
f plo
ts
Tot
al a
rea
13. Public Toilets 1 96.00 1 81.45 1 182.50 3 419.68 4 573.68 1 111.37 2 408.96 13 1873.64
14.
Sport Academy/swimming Pool/Stadium/Gymnasium
1 17000.00 0 0.00 1 325.20 0 0.00 0 0.00 1 80000.00 0 0.00 3 97325.20
15.
Shops/Market/Hawkers Zone/Stalls/Veg & Fruit & Fish Market
11 6907.81. 49 12237.28 25 9681.98 23 12523.51 87 21004.88 3 1692.98 36 21062.02 234 85110.46
16. Open Space below HT line 0 0.00 5 52371.22 0 0.00 14 136470.48 0 0.00 0 0.00 7
162399.14 26 351240.84
17. Crematorium/Burial Ground 4 12352.73 3 6181.08 5 8847.84 1 1197.00 2 5660.20 1 3425.90 3 12743.00 19 50407.75
18. Holding Pond/Pond/Tank
3 144300.00 1 3654.36 2 111001.00 5 513957.41 3 210355.48 0 0.00 4 33387.00 18 1016655.25
19. Auditorium/Multiplex 0 0.00 0 0.00 0 0.00 0 0.00 0 0.00 1 18818.74 2 15028.80 3 33847.54
20. Cattle Pond 0 0.00 0 0.00 0 0.00 0 0.00 0 0.00 0 0.00 1 1275.64 1 1275.64
21. Library 2 12400.00 1 580.00 0 0.00 0 0.00 0 0.00 0 0.00 2 2212.15 5 15192.15
22. Fire Station 1 6600.00 1 6000.00 1 8000.00 1 5850.00 0 0.00 0 0.00 1 3361.00 5 29811.00

52
Sr. No.
Purpose of plots
CBD Belapur Node
Nerul Node Sanpada Node Vashi-Turbhe
Node Koparkhairane
Node Ghansoli
Node Airoli Node
Total
Tot
al N
o. o
f plo
ts
Tot
al a
rea
Tot
al N
o. o
f plo
ts
Tot
al a
rea
Tot
al N
o. o
f plo
ts
Tot
al a
rea
Tot
al N
o. o
f plo
ts
Tot
al a
rea
Tot
al N
o. o
f plo
ts
Tot
al a
rea
Tot
al N
o. o
f plo
ts
Tot
al a
rea
Tot
al N
o. o
f plo
ts
Tot
al a
rea
Tot
al N
o. o
f plo
ts
Tot
al a
rea
23. Social Facility 4 61700.00 22 13314.15 3 2040.79 14 26635.44 12 6427.68 5 3166.50 8 14278.44 68 127563.00
24. Public Utility 4 1200.00 13 6597.32 7 4356.10 4 1032.52 2 434.55 0 0.00 7 5512.86 37 19133.35
25. Institutional 0 0.00 0 0.00 0 0.00 0 0.00 0 0.00 0 0.00 1 4000.29 1 4000.29
Total 116 971957.81 219 832368.21 82 255991.48 176 1268784.11 175 649667.97 31 335228.41 125 484118.14 924 4805023.93

53
4.2. Need for revision of Development Plan:
In NMMC area, the Development Plan which was prepared by CIDCO and
sanctioned by Government was made applicable to NMMC since its inception. NMMC was
constituted with effect from 1st January, 1992. The CIDCO’s DP is only a structural plan
indicates the various zoning such as Residential, Commercial, Industrial, NDZ & wet
land etc. It’s only a broad zoning plan and was not prepared at Micro Level Planning
and therefore, this DP does not content any provision / reservation for public / social
amenities and infrastructure services. The CIDCO has developed the 07 Nodes within
the limit of NMMC. In this Nodes, the provision for recreational, social amenities has been
made i.e. only a layout amenities, within the jurisdiction of that Node. These amenities are
not part of compulsory acquisition. Considering the Population as on today and the
population forecast of 2028 & 2038, the existing amenities does not fulfill the requirement
of amenities that may require in future for projected population. Even the CIDCO’s existing
DP covers 344 sq. km area and approximately 20 lakhs population. In this DP, CIDCO’s new
town, Khopta township, NAINA area, partly Panvel Municipal Corporation area is also
covered and NMMC is also part and parcel of this DP. NMMC is functioning as a planning
authority and has obligatory duty to provide all civic and social amenities to the citizen of
NMMC area. Navi Mumbai is fast growing developed city and having connected by Railway,
Road Transport, nearby Air Services, Water Transport and Cargo Services. Considering the
above facts and to maintain the dignity & self-oriented respect of the citizens within NMMC,
it is now necessary to prepare separate DP for NMMC area under the provisions of said Act.
And therefore, NMMC has taken up the revision of this DP (within the limit of NMMC) with
due process of Law and after obtaining approval from the General Body.
4.3. Legal Formalities:
The NMMC, being planning authority, has declared its intention to prepare
Revised Draft Development Plan for 29 revenue villages included in NMMC area and
fresh draft development plan for a village Adavali-Bhutavali which is also included in
NMMC area(total 30 villages). The Adavali-Bhutavali was included in NMMC area vide
Govt. notification dated 8th June 2007. The above referred intention was declared by
NMMC on 14th Dec. 2017 under section 23(1) of the “said Act”. The notice of said
intention was also published in Maharashtra Govt. Gazette on 15th Dec. 2017.

54
The Assistant Director of Town Planning, NMMC was also appointed as Town
Planning officer (TPO) by NMMC as required under section 24 of said Act vide
Corporation Resolution No. 1261, Dated 29th Sep. 2016 & No.1850, Dated 24th July 2017
read with office order Dated 6th Feb. 2018 issued by Municipal Commissioner of NMMC.
The said appointment of TPO has also been confirmed by Joint Director of Town Planning,
Konkan Division, Navi Mumbai vide its Order No. 549, dated 23/01/2018.
After carrying out Existing land use survey, the Town Planning officer had
prepared existing land use (ELU) map under section 25 of the said Act & handed it over
to Municipal Commissioner NMMC on Dated 15th May 2018.
The Draft DP prepared by said TPO was submitted to Municipal
Commissioner on dated 11th February, 2019 for approval and further to submit to the
General body. The Municipal Commissioner endorsed the said draft DP and submitted to
General body for its approval.
The said Draft Development Plan was considered for discussion in the
General Body meeting held on dated 13/12/2019. After discussion on the said Draft
Development Plan in the same meeting the General Body made 226 modification & 16
suggestions with respect to the draft regulations & approved with Resolution no. 1516 on
dated 13/12/2019 to publish said Draft Development Plan with changes as per the
suggestions mentioned in the same resolution.
The copy of the General Body Resolution was received on dated 28/02/2020
by Town Planning Officer. In due course of time while the process for incorporating the
changes as suggested by General Body was in progress. Hon. Secretary, Urban
Development Department, Govt. of Maharashtra called for joint meeting with CIDCO with
respect to the reservations proposed on CIDCO’s land.
Urban Development Department, Govt. of Maharashtra vide letter dated
19/11/2020 directed Navi Mumbai Municipal Corporation to delete the reservations
proposed on CIDCO’s leased plot. Also in mean time CIDCO raised objection with respect

55
to the similar kind of reservations proposed on CIDCO land with the contention
that CIDCO will have to bear heavy losses in future.
Considering CIDCO’s objection Govt. of Maharashtra issued directions
u/s 154 of Maharashtra Regional & Town Planning Act, 1966 to Navi Mumbai
Municipal Corporation on dated 14/06/2021 & 06/09/2021. As per these
directions Navi Mumbai Municipal Corporation is not supposed to propose
reservation on CIDCO’s any plot having area more than 500.00 sq.mtr. The
directions issued u/s 154 of Maharashtra Regional & Town Planning Act, 1966 is
binding on Navi Mumbai Municipal Corporation.
Also considering the provisions in Unified Development Control &
Promotional Regulation with respect to the clause-11.1 & the changes suggested
by General Body in the reservations was incorporated with change in the
nomenclature of the said reservations. So that these reservations can be
developed in future as per the needs & requirement of Navi Mumbai Municipal
Corporation in General Public Interest.
Urban Development Department, Government of Maharashtra has
given directives U/S 154 of MR & TP Act 1956 dated 14/06/2021. Directives of
the Govt. are binding on planning authority, also CIDCO wide letter dated
18/07/2022 has informed NMMC regarding the re-arrangement of plots
earmarked for Social Facilities / Amenities in CIDCO’s layout. Further CIDCO has
also mentioned that CIDCO has made this change as per the power wasted to
CIDCO by Govt. GR dated 15/12/1994. Also vide letter dated 31/12/2021 has
informed NMMC regarding the tender of Plot No. 32 in Sector 10A & has informed
NMMC to honour the development plan proposal for Plot No. 32 in Sector 10A

56
in light of directive issued by the Government. As per the provision of UDCPR the Plot
potential is related to the abutting road width of the plot. Considering the redevelopment
of CIDCO constructed buildings it was necessary to proposed road winding in such areas.
Hence to make these necessary changes it was mandatory to modified the draft
development plan which was approved by GB for publication vide resolution by
13/12/2019.
Hence the Modified Draft Development Plan proposal with the report was
submitted to Municipal Commissioner & Administrator on dated 08.08.2022 for approval
& to further make Resolution to publish the same in the capacity of Administrator as the
General Body is dissolved & also necessary changes from planning point of view and
considering the applicability of UDCPR, are made in the earlier proposal submitted to the
General Body. Hence, considering the provision mentioned in the Act as on date it is
necessary to make a fresh Resolution before Publication of modified proposal Draft
Development Plan.
Accordingly Hon’ble Commissioner & Administrator approved the said
Revised Draft Development Plan proposal submitted by Town Planning Department by
Resolution no. 2648 dated 08/08/2022 for publication u/s 26(1) of Maharashtra
Regional & Town Planning Act, 1966.
4.4. Consultation with stakeholders:
Under the provisions of Said Act, it is not mandatory to consult the
stakeholders or nothing is mentioned about public consultation prior to publication of DP
in this said Act. However, to promote and to enhance the public participation and to
consider the sentiments of the stakeholders over the proposal of draft DP, the NMMC has
taken up the initiative of consultation before the publication of Draft DP. Development
Plan is a document which is very much concerned with the citizens more
particularly representatives of the people in the corporation, developers, architects, etc.
The representatives of the people in the corporation are concerned with overall
development of the city and therefore, their suggestions are important for preparation of
the Development Plan. Developers, architects, etc. are concerned about the policies to be
framed in the Development Plan which, in one or other way, may affect their business.

57
There may be many other sections of the society who may have concerned with the
Development Plan, one or other way. Therefore, public participation through consultation
with all these sections of people is desirable so as to achieve comprehensive,
participative, stakeholder friendly, rational, implementable and growth driven
Development Plan. accordingly, in this regard, following meetings were conducted with
stakeholders.
The details of meetings conducted for public consultation before publication
of Draft DP, is narrated as under,
Table 20 : Details of meetings conducted by NMMC for public consultation (before publication).
Sr.No.
Date of Meeting &
Time
Venue of Meeting
Name of Participants / Stakeholders
/Organizations / NGO
No. of participants attended the
meeting
Whether any suggestions offered by
participants / stakeholders
Remarks
1. 21/01/2019 Collector Office,
Thane
Government Official from various State and Central Govt.
Dept. / Public Sector Undertaking etc.
Approximately 16 Nos. Yes
2. 14/11/2018 Municipal
Corporation, ADTP Office
Office bearers of Builders association
of Navi Mumbai.
Approximately 15 Nos.
Yes
3. 14/11/2018 Municipal
Corporation, ADTP Office
Office bearers of Architect’s
association of Navi Mumbai.
Approximately 10 Nos.
Yes
In all total 03 meetings were conducted for Public participation. Considering all these
suggestion received from various groups, an effort has been made to prepare comprehensive,
participative, stakeholder friendly, rational, implementable, promotional and growth driven
Development Plan.

58
4.5. Main stages of preparation of Development Plan:
4.5.1. Preparation of base map:
For the purpose of Development Plan, a base map showing the limits of the
area within the jurisdiction of the corporation is prepared. A village wise combined map
to a scale of 1: 20000is prepared.
4.5.2. Surveys – Analysis and Findings:
Surveys are essential to understand the city for which the Development
Plan is being prepared. They give an idea about the exact needs of the city and help the
planner in framing the proposals. The following various surveys have been carried out
for the purpose of the Development Plan of NMMC.
It is the basic fundamental and most important survey. It shows the use or
uses to which each and every piece and parcel of land within the jurisdiction of the
Planning Authority is put. This survey is the best indicator of the character of the area
to be planned. Its analysis helps in determining the optimum and most beneficial
distribution of the land uses in the interest of the community, which in turns gives
guidance to proper zoning and framing proper proposals in the Development Plan. The
detailed investigation and analysis of this survey also gives idea about
a) Existing trend of land uses,
b) The position of conforming and non-conforming uses,
c) Intensity of land uses,
d) The relative importance of the activity and deficiencies if any,
e) Constructed and vacant areas,
f) Existing roads and water ways / bodies,
g) Features of importance, liable to be protected.
The total area within the Navi Mumbai Municipal Corporation limits is
about 109.59 sq.km. in NMMC area, 07 Nodes were developed by CIDCO being New
Town Development Authority and all these Nodes are well developed with proper
layout and amenities, Roads and Infrastructures.

59
4.5.3. Distribution of Land Use:
Existing land use of the corporation area are shown on existing land use
plan submitted to the Corporation by the Town Planning Officer vide letter dated
15/05/2018. Total developed area is about 51.15 % of the total corporation area out of
which 22.14 % is residential. This clearly shows that vast areas within the corporation
limits are either developed area and only village i.e. Adavali – Bhutavali is undeveloped
or under agriculture / forest use. The area under cultivation is about 1.47 % of the total
area in Adavali – Bhutavali. . Out of the total developed area, predominant land use is
residential which constitute 22.14% and next to it is industrial, which is about 38.53 %.
Table below gives the detailed existing land use analysis of the entire Corporation area.
The inferences could be drawn as follows
i. The residential development marked on the existing land use map, indicate that
the trend of residential development is mostly in developed Nodes such as
Belapur, Nerul, Vashi, Sanpada, Koparkhairane, Ghansoli and Airoli Node with
residential land use also fully developed, however this area is covered under
MIDC Industrial Lands.
ii. There are agricultural lands in Adavali – Bhutavali.
iii. In the recent past, residential developments are taking place mostly in above
referred Nodes, leaving the lands in undeveloped area of Adavali – Bhutavali.
iv. There is not so much undeveloped land available within the limits which can be
suitably brought under non-agricultural use to meet the need of the increasing
population except Adavali – Bhutavali where measure lands are covered
agricultural use and protected forest.
v. The commercial activity is mainly concentrated on developed Nodes such as
Vashi, Nerul, Sanpada, C.B.D. Belapur and Airoli Nodes, However, commercial
activities are developed in MIDC’s area of Airoli Node. The Agricultural Produce
Market Committee Yard / the Vegetable Markets are situated in Vashi Node.
Wholesale dealers in food grains / fruits / dry fruits / Spices etc. with their
shops are located in APMC market Vashi. Cold storage for Non veg items is also
situated in APMC markets. Milk processing units with wholesale distribution of
milk also situated APMC markets. In addition to this, the retailer with small
shops are also situated in APMC markets. Major Roads in the developed areas/

60
Nodes also serve as shopping streets.
vi. Public - Semi Public users constitute 3.81% of the developed area. Institutions
like D.Y. Patil Deemed University, Bharati Vidhyapeeth, National Institute of
Fashion Technology, Reserve Bank of India (RBI), Regional offices of State &
Central Govt., Public sector offices of Central and State Govt., Mahatma Gandhi
Medical College, and other medical institution, Police Commissioner office, SSC
& HSC Board, CIDCO’s Head Office, Head Office of Konkan Railway, Tata Press,
staff quarters of Govt. Public bodies, PSU, and Semi-Govt. organizations.
Hospitals, Schools etc. cover most of the land under this land use.
vii. Industrial uses constituted 38.53 % of the developed area which mainly cover
Airoli IT sector, Industrial area around Thane-Belapur Road, Mahape
Millennium Business Park etc.
viii. Forest lands are found at Adavali – Bhutavali (part),CBD Belapur (part), Rabale
(part), which constitute 20.07 % of the total area.
ix. A large open space known as D. Y. Patil stadium @ Nerul, Rajiv Gandhi Krida
Sankul @ CBD Belapur, Wonders Park @ Nerul, Central park @ Ghansoli,
Ganpat Tandel Maidan @ Nerul, Airoli Krida Sankul @ Airoli, Amusement park
@ Vashi (Kopari) are some of the grounds and gardens existing in Navi Mumbai
area.
x. Wonders Park @ Nerul, CIDCO’s Exhibition Ground @ Vashi are important
recreational places in the area. Major creeks e.g. Thane &Belapur creeks are
passing through city area.

61
Table 21 :Area Statement as per Existing Land Use (ELU) Survey & ELU map (Node wise).
Sr. No
Existing User
AIROLI GHANSOLI KOPARKHAIRNE VASHI SANPADA NERUL BELAPUR MIDC/
ADAVALI-BHUTAVALI
OTHER Total Sites
Total Area
Nos. Area in Hec. Nos. Area in
Hec. Nos. Area in Hec. Nos. Area in
Hec. Nos. Area
in Hec.
Nos. Area
in Hec.
Nos. Area
in Hec.
Nos. Area in Hec. Nos.
Area in
Hec.
1 RECREATIONAL AREA
Garden 29 15.98 10 5.33 21 9.8 52 33.06 11 6.56 45 56.57 48 23.94 3 11 219 162.2
Play Ground 24 13.08 8 4.6 24 13.66 35 29.13 19 8.39 37 33.45 17 12.35 164 114.7
Open Space 8.6 0.52 0.18 0.6 0 6 2.78 0.42 6 13.11
Tree Belt 3.75 7.45 6.23 21.48 27 12.29 6 2.2 65.98 33 119.4
RG 0.11 4.57 0 15.04 1.35 20.42 2.4 0 43.89
2 PUBLIC PURPOSE
High School 20 6.18 13 4.66 20 10.51 27 9.72 10 2.85 34 12.23 12 3.47 5 2 141 51.62
College 5 5.63 1 1.38 9 3.08 5 5.82 5 1.39 9 20.11 5 4.74 39 42.16
Hospital/ PHC/CC 9 1.07 5 3.03 9 2.84 18 9.72 5 0.49 23 3.7 9 2.73 78 23.57
Police Station 1 0.02 2 0.31 1 0.2 3 0.34 1 0.03 2 0.41 1 0.58 11 1.89
Municipal Office 1 0.17 1 0.03 2 0.33 1 9.24 2 0.1 2 12.89 12.75 9 35.5
Fire Station 1 0.38 0 1 0.51 1 0.56 0 1 0.42 1 0.66 5 2.53
Post Office 1 0.38 0 0 2 0.3 0 1 0.12 0 4 0.8
Library & Gym 5 0.05 1 0.05 4 0.34 9 0.41 1 0.09 19 3.38 2 0.3 41 4.62
Telephone Exchange 0 0 0 0 5 1.5 1 0.5 1 0.53 1 0.1 8 2.63
Temple /Masjid 47 2.34 11 1.07 40 1.29 46 7.84 12 0.7 52 3.69 6 2.8 1 0.11 215 19.84
SF/UPH 2.97 0.42 17 1.17 16.49 14 1.1 3.26 3.16 31 28.57
3 PUBLIC UTILITY
MSEB/ESS 31 0.76 11 0.58 38 1.23 75 6 34 5.53 89 8.14 35 2.85 2 44 315 69.1
Draft NMMC Development Plan, 2018-2038

62
Sr. No
Existing User
AIROLI GHANSOLI KOPARKHAIRNE VASHI SANPADA NERUL BELAPUR MIDC/
ADAVALI-BHUTAVALI
OTHER Total Sites
Total Area
Nos. Area in Hec. Nos. Area in
Hec. Nos. Area in Hec. Nos. Area in
Hec. Nos. Area
in Hec.
Nos. Area
in Hec.
Nos. Area
in Hec.
Nos. Area in Hec. Nos.
Area in
Hec.
ESR&GSR 1.32 5 1.28 10 2.58 20 4.04 5 1.25 13 5.36 9 7.49 62 23.32
B.G.& C.G. 3 1.51 6 0.93 4 0.67 6 1.91 3 0.49 5 2.43 5 1.37 32 9.32
Sewage Treatment Plant/ Water Tank
1 3.63 1 4.49 1 7.09 5 4.45 1 2.7 3 5.59 0 12 27.95
Dumping Ground 0 0 1 3 0 0 0 0 1 38 2 41
Public Utility 0.01 0.06 0.12 0 0.22 0.35 0 0 0.77
Toilet 7 0.09 1 0.01 5 0.04 19 0.31 5 0.06 20 0.23 22 0.32 79 1.04
4 COMMERCIAL
Market, Shopping Centre& Stall
31 1.49 4 0.28 82 1.04 33 2.54 16 0.7 31 2.22 16 0.95 213 9.22
Hotel 0 0 0 3 0.25 4 0.02 5 2.64 6 3.66 18 6.57
Petrol Pump 3 0.53 3 0.31 4 0.59 12 1.63 5 0.66 5 0.8 3 0.43 35 4.95
Commercial/APMC Market
3.37 0.67 2.90 187.92 3.43 11.27 39.37 0.13 0 228.3
5 INDUSTRIAL
Industrial 1.89 0 0 42.76 0 0 0 2100 0 2145
Small Scale Industry 0 0.62 3.21 0 1.31 6.23 0 5 0 16.37
6 FOREST
Forest & Hill Area 0 0 0 0 0 0 0 2200 0 2200

63
7 WATER
Water bodies, Nallahs & Pond
29.64 22.56 29.7 77.09 20.82 276.9 25.57 452 0 934.3
8 RESIDENTIAL ZONE
Residential 133.1 166.66 161.6 200.36 91.01 338.4 132.6 18 0 1242.5
9 TRANSPORT / TERMINAL
Bus Stand & Bus Depots
1 0.48 1 2.91 1 0.69 6 7.38 0 4 18.16 5 5.81 18 35.42
Parking 6 0.28 0 0.03 21 15.98 11 2.74 2 0.42 6 1.83 46 21.28
Taxi Rickshaw Parking
0 0 0.49 2 0.38 1 2.31 2 0.13 1 1.06 6 4.37
Railway 5.3 11.72 18.41 14.19 60.11 36.93 16.73 32 0 195.4
10 ROADS
85.6 85.95 54.8 151.73 49.01 214.3 113.1 104 858.5
11 AGRICULTURAL LAND
12 MANGROVES/ Govt. Forest
2.15 0.72 0 54.75 0 303 11.94 1247.74 0 1620.3
13 VACANT LAND
57.13 99.43 13.32 11.85 16.16 130 59.56 210 0 597.5
TOTAL AREA :- 387 432 350 942.32 293 1536 556 6463.98 10958.76
7 NODES AREA :- 4496.31
Source: Town Planning Department, NMMC.

64
Table 22 : Summary of Existing Land Use.
Sr.No.
Land Use
Area in Hectares
% of Total Developed Areas
% of the Total Area
1 Residential 1241.74 22.15% 11.33%
2 Commercial 178.83 3.19% 1.63%
3 Industrial 2161.01 38.54% 19.72%
4 Public and Semi-Public 213.73 3.81% 1.95%
5 Public Utility 172.50 3.08% 1.57%
6 Transportation 256.47 4.57% 2.34%
7 Garden, Play Ground and
Recreation 453.26
8.08% 4.14%
8 Roads 929.69 16.58% 8.48% Total Developed Area
(1 to 8) 5607.23 ---- 51.17%
9 Agricultural 160.80 3.00% 1.47%
10 Water Bodies 934.32 17.46% 8.53%
11 Forest 2200.00 41.11% 20.08%
12 Man grows 1459.50 27.27% 13.32%
13 Vacant Land 596.91 11.15% 5.45%
Total Un-developed Area (9 to 13) 5351.53 --- 48.83%
Total Area 10958.76 100.00%
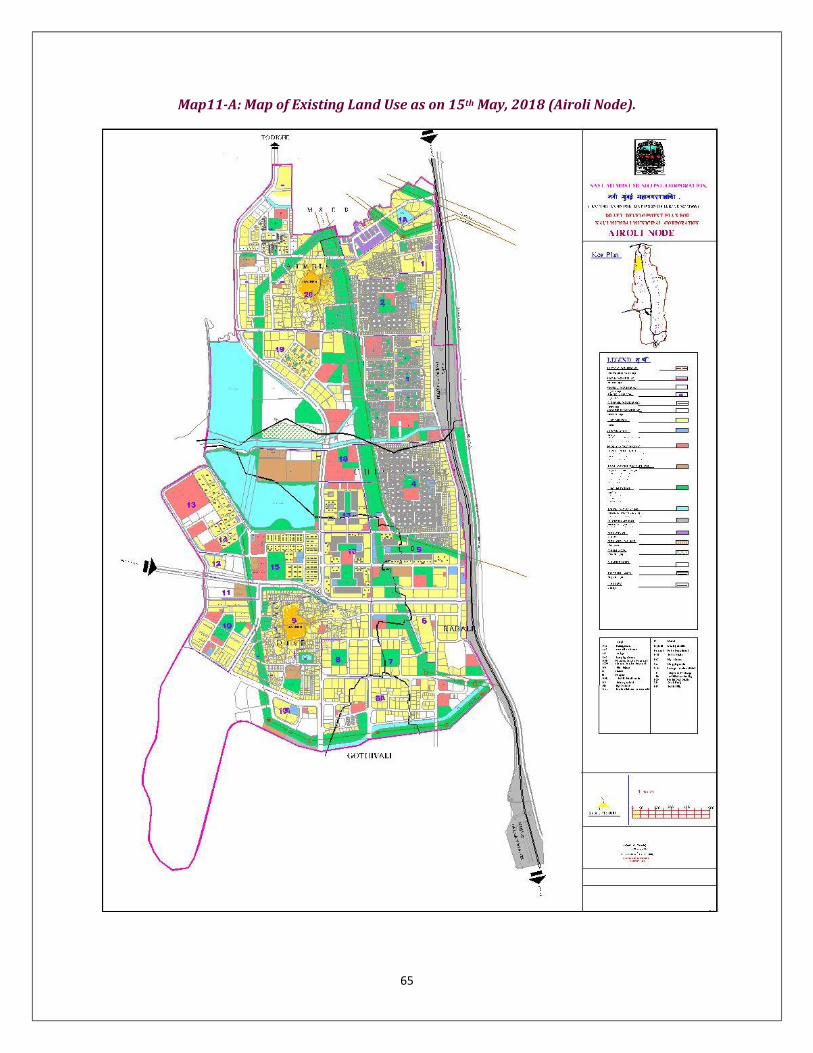
65
Map11-A: Map of Existing Land Use as on 15th May, 2018 (Airoli Node).

66
Map11-B : Map of Existing Land Use as on 15th May, 2018 (Ghansoli Node).

67
Map11-C : Map of Existing Land Use as on 15th May, 2018 (Koparkhairane Node).

68
Map11-D : Map of Existing Land Use as on 15th May, 2018 (Vashi Node).

69
Map11-E : Map of Existing Land Use as on 15th May, 2018 (Sanpada Node).

70
Map11-F : Map of Existing Land Use as on 15th May, 2018 (Nerul Node).

71
Map11-G : Map of Existing Land Use as on 15th May, 2018 (Belapur Node).

72
Map 11-H: Existing Land Use Map (combined) as on 15th May, 2018.

73
4.6. Structural conditions of buildings/ houses:
It is necessary to get the information about housing stock available at present,
age, ownership, type of construction and condition of buildings, types of uses of houses,
etc. The figures of the year 2018, with the municipal corporation show that, there are
about 92856 existing houses/ tenements(approximately) which were constructed by
CIDCO (as per the report of crisil). In addition to this there are near about1395 buildings
having aged more than 30 years & for which approvals were granted by NMMC/ CIDCO.
Very few old houses in gaothan area have stone foundations with bricks and remaining
structures / building either in gaothan area or outside gaothan area (only Navi Mumbai
area) are RCC type structures with no. of tenements. The modern houses being built in
NMMC area are mostly of RCC constructions with burnt brick walls plastered with cement.
Most of the houses in old gaothans are existing in Adavali – Bhutavali village where there
is lack of amenities.
In Navi Mumbai City, CIDCO is still continued to act as new town development
authority which came into existence in 1971 & thereafter, CIDCO started development of
new Mumbai. First residential colony at Vashi was developed by CIDCO and thereafter,
Navi Mumbai sharpened to grow smoothly because it was being attracted by migrated
population from Mumbai. Therefore, Navi Mumbai slowly came into existence as New City
which clearly indicates that Navi Mumbai is totally new developed city came into existence
1981 onwards. Now, this city has aged nearly 38 years and building which were developed
by CIDCO, way back in 1980-85, becomes dangerous and in dilapidated conditions.
Considering these fact, Govt. has formulated new policy for Reconstruction/
Redevelopment of old and dilapidated building which were constructed by CIDCO and
having aged more than 30 years. As per this G.R. dated 04/02/2015, all such buildings are
now eligible for Reconstruction / Redevelopment. Considering this fact, building having
aged more than 30 years and below 30 years are categorized as under;
In addition to CIDCO constructed building, private building are also
categorized accordingly as under;
The table below shows distribution of number of houses by age and year.

74
Table 23 : Distribution of Houses by age (Year).
Sr. No. Type of Buildings 0 – 30 yrs.
Above 30 yrs.
Remark
1. Privately Constructed Building
13196 1395
This information is derived on the basis of
C.C./O.C. granted by NMMC & CIDCO during
last 40 years.
2. CIDCO Constructed Tenements/ Units
--- 92856
[Source: Property Tax / Estate Department, NMMC.]
The population of the city in year 2011 and 2017-2018 was 11,20,547 &
15,00,011 respectively and in the Development Plan, projected population for the year 2038
is projected to 28,00,000.Considering the average size of family, the requirement of houses
for 2011 population is 2,24,000 houses against the existing 131916. There is deficit of
92084 houses required for population of 2011. Huge housing stock will also be required to
meet the requirement of population of 2038 incrementally. Moreover, families living in
temporary / slum pockets and old dilapidated buildings will need new accommodation. This
requires increase in urban land for housing and also policies to create more housing stock
which is taken care off in the present Development Plan.
Above figures also indicates that, the old areas / slum pockets, because of
condition of structures, need immediate attention for redevelopment and also to bring them
at par with the areas, which have reasonable level of amenities. Therefore, this Development
Plan also provides for the regulation for re-development of slum areas which will ultimately
lead to proper development and improvement in level of amenities in slum pockets, gaothan
& gaothan expansion areas.

75
4.7. Slums:
Table 24 : Details of Slum - Year 2001.
Name of the Nodes Number of Slums Ownership of land Population 2001
Airoli+Dighe
41805
MIDC/ CIDCO 64388
Ghansoli MIDC/ CIDCO 20692
Koparkhairane MIDC 7133
Turbhe+Vashi MIDC/ Govt. 28589
Nerul MIDC 7589
Belapur CIDCO 906
Total 41805 129297
[Source: Compiled by Town Planning Department based on Census 2001 data.]
Table 25: Details of Slum - Year 2011.
Name of the Nodes Number of Slums Ownership of land Population 2011
Airoli+Dighe
67327
MIDC/CIDCO 101632
Ghansoli MIDC/CIDCO 32178
Koparkhairane MIDC 7900
Turbhe+Vashi MIDC/Govt. 52402
Nerul MIDC 10018
Belapur CIDCO 4106
Total 67327 208236
[Source: Compiled by Town Planning Department based on Census 2011 data.]
The detail of slums as on 2001 & 2011 is annexed at Annexure- B1&B2.

76
CHAPTER 5: SOCIAL INFRASTRUCTURE
5.1. General:
A Development Plan also aims at creating an environment to enable the
residents to enjoy the desired standard of living conditions in addition to ensuring
orderly development of a city by prescribing the land use zoning and transportation
network along with provisions of proper development control. Therefore, it is necessary
to study the existing level of social infrastructure. The Government has laid down
minimum essential standards for different social amenities comprising of educational,
health, recreational facilities, in terms of area or number of sites required for the probable
population of the city. The existing facilities have been analyzed as described
subsequently.
5.2. Education facilities:
Navi Mumbai Municipal Corporation has become the first Municipal
Corporation in Maharashtra state which facilitates schools with Central Board
Secondary Education (CBSE) Board course. One in Nerul and one in Koparkhairane.
Both schools offer free education, RFID cards for all students, mid-day meals,
uniforms, books and 15 subsidiary items, all free of cost.
There are in all 292 primary schools with total number of 2,38,894students
and 133 high school with total number of 51,084 students in the corporation area.
The table below gives the detailed information about the schools
Table 26 : Number of Primary & Secondary School and students enrolled for the year 2018-19.
Sr. No. Management
Primary School
No. of Students
Secondary School
No. of Students
1. Municipal Corporation 55 30389 18 5258
2. Zilla Parishad 0 0 0 0
3. Social/ Tribal Welfare Dept. 6 425 0 0
4. Private-Aided 64 43701 31 15175
5. Private-Non Aided 24 4527 16 1800
6. Self-Aided 143 159852 68 28851
Total 292 238894 133 51084 [Source: Education Department, NMMC]

77
Table 27 :Arts/Commerce/Science and other Colleges.
Sr. No.
Management No. of college
No. of Students
Remark
1. Municipal Corporation/Govt. - -
2. Social/ Tribal Welfare Dept. - -
3. Private-Aided 3 7138
4. Private-Non Aided 48 25679
5. Self-Aided - -
Total 51 32817 [Source: University of Mumbai.]
Table 28: Engineering/Architecture College.
Sr. No.
Management Engineering college
No. of Students
Architecture College
No. of Students
Remark
1. Municipal Corporation/Govt. - - - -
2. Social/ Tribal Welfare Dept. - - - -
3. Private-Aided - - - -
4. Private-Non Aided 10 23766 3 1524
5. Self-Aided - - - -
Total 10 23766 3 1524
[Source: University of Mumbai.]
Table 29: Medical/D.Ed./B.Ed./Special College.
Sr. No.
Management B.Ed.
college No. of
Students
Special Course College
No. of Students
Remark
1. Municipal Corporation/Govt. - - - -
2. Social/ Tribal Welfare Dept. - - - -
3. Private-Aided - - 1 16
4. Private-Non Aided 7 386 - -
5. Self-Aided - - - -
Total 7 386 1 16
[Source: University of Mumbai.]

78
In NMMC area, there are colleges providing higher educational facilities in
various faculties like Science, Arts, Commerce, Engineering, Pharmacy, Law, Medicine,
Management etc. Some of them also conduct courses in modern techniques like
Computer Programming and Management, Business Administration and Management,
Information Technology etc. There are Engineering and Medical Colleges and also one
Deemed Universities i.e. D. Y. Patil, Nerul within the corporation area. There are 51
Arts/Commerce/Science Colleges with an intake capacity of 32817 students, 10
Engineering colleges with an intake capacity of 23766 students. There are 03
Architecture colleges with intake capacity of 1524 students, 07 B.Ed. colleges with
intake capacity of 386 students & One special course college with an intake capacity of
16 students.
There are number of technical and management institutes, pharmacy
colleges, medical colleges etc. which is highest in any town of Maharashtra State.
Terna Medical &Dental College has an intake capacity of 992 students & D.Y. Patil
Medical, Dental, Ayurveda, Physiotherapy, Occupational and Nursing College has an
intake of 2397 students & D.Y.Patil Hospitality & Tourism College has an intake of 1625
students. Also, there are in all 7 D.Ed. colleges in NMMC area with intake capacity of 390
candidates.
5.3. Health and medical facilities:
Health of an individual depends on its surrounding environmental conditions.
People living in better environment tend to live longer and possess healthy lifestyle
compared to those lives in polluted environment. In developing countries like India,
Pollution is one of the major problems to tackle on which leads to deaths. It is necessary
for cities, towns and villages to have well equipped medical facilities which can provide
proper and effective medical treatment to the people. There are many private and
government hospitals in Navi Mumbai that are equipped with latest technologies and
specialist doctors, experienced staff which can handle any emergency cases. Day and night
chemists are also available in the city. Besides the Government and Navi Mumbai
Municipal Corporation’s Hospitals, private hospitals and dispensaries also cater the needs
of the people to a great extent.

79
There are 6 NMMC hospitals (municipal hospitals) having total capacity of 650
beds. There are 211 private& public trust hospitals, 22 NMMC dispensaries, in all there
are 900 dispensaries run by indusial, private/ public trust (including Ayurvedic,
Homeopathic, Nursing Home, Pediatrics, Gynecology) within NMMC limits. Each medical
facility is having a staff of highly trained and experienced doctors and support staff. Along
with these professionals, NMMC is having its own team of experienced doctors and
support staff which monitors the status of each disease every year and puts their sincere
efforts to prevent the spread of diseases through various workshops, awareness
campaigns, trainings and preventive measures like fogging and anti-larval spraying.
Detailed information about each hospital and its medical facilities is annexed at
Annexure C.
5.4. Commercial facilities:
The commercial facilities such as Agricultural Produce Market Committee Yard,
wholesale/ retail grain markets, vegetable markets, mutton markets, masala markets
exist in the developed part of the corporation area. There are other commercial
establishments like shopping malls, departmental store company showrooms etc. and so
many retail shops. There are some vegetable markets. However, at many places it is seen
that vegetables vendors are doing business along road sides. Moreover there is no
organized space for hawkers.
5.5. Recreational and entertainment facilities:
In NMMC area Rajiv Gandhi Stadium at CBD Belapur, Ganpat Sheth Tandel
Maidan, @ Nerul, Yashvantrao Chavan Maidan, @ Nerul, Bhumiputra Maidan, @
Koparkhairane are some of large play grounds available in NMMC area. D. Y. Patil Sports
Stadium, at Nerul is one of the international stadium of India for sports like cricket and
football. In Navi Mumbai, for betterment of healthy life of people, joggers track at Nerul
which is called Jewell of Navi Mumbai, Nisarg Udyan, at Koparkhairane, Central park @
Ghansoli, Mini Sea shore @ Vashi, and Sector-8 Airoliare constructed and well
maintained by NMMC. The Wonder’s Park, Rock Garden, @ Nerul, Nisarg Udyan @
Koparkhairane, Amusement park @ Vashi (Kopari), Central park @ Ghansoli, are some

80
of the well maintained large garden which are available in Navi Mumbai.
Considering cultural sentiment of people in Navi Mumbai, Vishnudas Bhave
Natyagrih @ Vashi has been developed by CIDCO and handed over to NMMC for
operating and maintenance purposes. The local communities whose contribution for
development of Navi Mumbai can’t be forgotten are the Agari &Koli communities and
therefore CIDCO has also developed Agari Koli Bhavan @ Nerul i.e. community hall as a
mark of respect to the said communities. NMMC also plans to construct drama theatre@
Airoli, Tamasha theatre @ Ghansoli which will come up in near future, Balaji multiplex @
Koparkhairane, Palm Beach Galleria multiplex, Inorbit multiplex, Raghuleela mall
multiplex,@ Vashi, Haware mall multiplex @ Nerul are some of the multiplexes under
NMMC jurisdiction developed by private land owners for entertainment& recreational
purposes.
There are in all 232 gardens and 91 playgrounds in the city having total area of
200.86 Hectares and 58.07 Hectares respectively.
Table30: Summary of social infrastructure within NMMC.
Node Belapur Nerul Sanpada Vashi Koparkhairane Ghansoli Airoli Total
Anganwadi 2 1 1 0 0 5 0 9
Gymnasium 1 5 0 4 2 5 5 22
Market [Fish & Veg.] 6 5 2 10 1 0 2 26
Community Centre 3 8 1 7 0 7 4 30
Garden 33 40 12 55 33 17 42 232
Play Ground 8 13 12 26 13 9 10 91
Crematorium 2 5 3 6 6 5 5 32
Burial Ground 2 6 1 2 0 1 4 16
Library/Study Centre 1 1 1 5 0 1 2 11
School 5 10 2 11 12 12 6 58
[Source: City Engineer Department, NMMC]

81
5.6. Cremation and burial grounds:
Existing cremation grounds are located along the bank of creek or nallas. There
are total 33 sites at different locations covering an area of 61584.96 sq. mtrs. of land.
Burial grounds are located at different locations, specifically in Nerul and Airoli area.
There are total 15 burial ground sites covering an area of 39958.35 sq. mtrs. of land. The
combined sites for cremation and burial grounds are 48 in numbers covering an area of
101543.31 sq. mtrs. of land.
Table 31: Node-wise details of Crematorium and burial grounds. Sr. No.
Name of the Node Crematorium
Total Area in Sq. mtrs.
Burial Ground
Total Area in Sq. mtrs. Total
Total Area in Sq. mtrs.
1. Belapur 2 3022.06 2 9171.91 4 12193.97
2. Nerul 5 10785.85 7 14495.13 11 25280.98
3. Sanpada 3 5412.92 0 - 4 5412.92
4. Vashi 6 10542.58 2 7543.35 8 18085.93
5. Koparkhairane 6 13893.55 0 0 6 13893.55
6. Ghansoli 5 7288 1 1990.96 6 9278.96
7. Airoli /Dighe 5 10640 4 5757 9 16397.00
Total 32 61584.96 16 38958.35 48 100543.31
[Source: City Engineer Department, NMMC]
5.7. Ancient and Historical monuments and sites:
Navi Mumbai is a part of Konkan Coastal area and is located in center of MMR
(Mumbai Metropolitan Region) with Thane creek on west side, while the Parsik hill
ranges surrounded on east side, whereas Thane and Panvel region covers the North and
South zone.
Many structure and temples were constructed prior to existence of NMMC.
There are historical/ Old Temples constructed prior to independence of India whose
details are as under.

82
Belapur Fort: It is a fort near the township of Belapur in Navi Mumbai,
Maharashtra, India. The fort was built by the Siddis of Janjira. It was later conquered
by the Portuguese, and then Marathas. In the early 19th century, the fort was
captured by the British. After the British gained supremacy in the region, with the
expansion of the Bombay Presidency, the strategic importance of the fort declined,
and it was stopped from use.
Built in 1560–1570 by the Siddis, (after they wrested control of the area from
the Portuguese) it is located atop a hillock, near the mouth of the Panvel Creek. In
1682, the fort was recaptured by the Portuguese, who had managed to annex the
regions controlled by the Siddis, near Belapur (at that time known as Shabaz).
In 1733, the Marathas, led by Chimaji Appa, wrested control of the fort from
the Portuguese. He had made a vow that if it were to be successfully recaptured
from the Portuguese, he would place a garland of beli leaves in a nearby
Amruthaishwar temple, and after the victory the fort was christened as Belapur
Fort. The Marathas ruled the area until 23 June 1817, when it was captured by
Captain Charles Gray of the British East India Company. The British partially
destroyed the fort under their policy of razing any Maratha stronghold in the area.
During its active days, the fort stationed four companies each of 180 men, and
14 guns ranging from 4–12 pounds (2–5 kg) in weight. An underground tunnel is
also supposed to exist, which many locals believe connects it to Gharapuri Island,
the site of the Elephanta Caves. The fort comes under the jurisdiction of NMMC.
Ramtanu Mata Mandir: The most relevant feature of this village remains the
Ramtanu Mata Mandir, built way back in 1941 but remains a beautiful structure
surrounded by well-structured landscaping. From the outside the structure does
not quite resemble a temple with its high walls and imposing entrance. The temple
was constructed in 1941 by Samant Dadani, who at that time was a chief officer
with the Thane Municipal Corporation. It took a mere four days to build and he
asked the local residents to help out with the construction. The locals were only too
happy, having a temple in their midst was a blessing and so everything from digging
to building was done by the residents. No salaries were paid to these local workers.

83
Shri. Datta Mathsthan Sanpada: This temple constructed by the villagers of
Sanpada way back in 1825-1830 . Originally there was Audumber tree were
siddhayogi was performing poojas & prayers.
Shri Sulaidevi Mandir: This temple is existing in hilly area (at mountain) behind
Rabale MIDC whish was constructed way back in 1850-1860 (exact year of
construction is not available) These temple is gramdevata at Gothivali villages and
surrounded by forest area.
The Government has, from time to time, issued instructions to local authorities
for preservation/ conservation of the historical/ archeological monuments.
Gavalidev: This Gavalidev i.e. shila( )is situated at the hill atop Parsik hillock
near Ghansoli MIDC area. This temple i.e. Shila is very old & attract the devotees.
There is a lake near this area. NMMC has already allotted a grant of Rs. 1 Crore to
Forest Department for the development of this spot as a tourist attraction as during
rainy season with the hilly areas and dense forests surrounding it, this place
attracts the tourists.

84
CHAPTER 6: TRANSPORT AND COMMUNICATION
NMMC area lies in eastern part of Thane creek. It starts from Dighe, Airoli in North and
extends till CBD Belapur in the south. Navi Mumbai is well connected to neighboring Mumbai both
by roads and rapid transit system.
JNPT (Jawaharlal Nehru Port Trust), one of the largest container port in India is located
south to Navi Mumbai just approximately 10 kms. from Belapur.
6.1. Transport:
As Navi Mumbai is a planned city, the city is having integrated transport system
consisting of roads, railways, waterways and airways. All the nodes of a city are very well
connected to each other by a network of mass commuter rail service which is also cost
effective and economical option compared to other transport services. The city has a cluster
of flyovers crisscrossing areas.
The NMMC area is served by 4 bus transport agencies operating between
Mumbai-NMMC area, within NMMC area, Thane-NMMC area and surrounding areas. The
road transport wing of Navi Mumbai includes connectivity from bus operators of BEST
(Brihanmumbai Electric Supply and Transport), NMMT (Navi Mumbai Municipal
Transport), KDMT (Kalyan- Dombivli Municipal Transport) and KMT (Khopoli Municipal
Transport) which provide bus services to entire Navi Mumbai city as well as to certain parts
of Mumbai, Thane, Kalyan, Dombivli, Badlapur, Taloja, Panvel and Uran.
NMMT has 3 Depots and buses runs on 75 routes daily. The number of
operational buses under NMMT was 480 in the year 2017-18. NMMC has a fleet of both AC
(82) and Non AC(398) buses in its inventory. Buses run either on Diesel or CNG. As per the
data records of NMMT, The distance travelled by buses per day is on an average 275 km for
both CNG and Diesel buses and annual diesel consumption was around 7.4 lacs liters and
CNG consumption was about 3.5 lacs kg.
Many projects, like the Navi Mumbai Metro, trans-harbour link between
Mumbai (Wadala) and Navi Mumbai (Ulwe), elevated corridor on Palm Beach road, as well
as the ambitious international airport proposed near Panvel, are expected to enhance the
connectivity as well as the status of the city. Once complete, The Navi Mumbai International
airport will act as a counter magnet to Mumbai and will also help reducing congestion at
Mumbai airport.

85
6.2. Water Transport Facilities:
In the past, CIDCO had developed water transport facilities at Vashi, Nerul and
Belapur. Even jetties were constructed at these sites & still are in existence. Due to poor
response, the water transport services heading towards Mumbai (Bhaucha Dhakka or
Gateway of India) were terminated by the concerned operating agency. CIDCO had
entrusted these services to a private agency. Now CIDCO has proposed ferry services to be
operated from Nerul to Mumbai. All these jetties are shown in the Draft DP.
6.3. Motorized Transport:
The details about the total no. of vehicles cars, motorcycles, 3-wheelers, etc. for
the last 7 years is illustrated in the following table.
Table 32: Total number of vehicles for the last 7 years.
Year / Vehicles 2011-12 2012-13 2013-14 2014-15 2015-16 2016-17 2017-18
Motor Cycle 15269 17395 16525 18455 24354 22535 22175
Car 13288 11808 8298 10799 10709 10345 10180
Tourist/ Meter Taxi 719 851 439 1006 1966 3155 1288
Auto Rickshaw 493 628 1663 3469 2445 1993 4695
Buses 237 184 157 308 378 274 202
School Bus 136 171 99 101 143 32 84
Pvt. Service vehicle 32 10 5 15 11 10 16
Ambulance 28 30 16 39 18 18 20
Truck 1067 901 725 1802 2609 1057 802
Tanker 220 249 155 241 267 283 403
D/Van 4 wheelers 643 512 213 322 284 197 655
P/Van 3 wheelers 1462 1565 1019 1648 1866 1129 788
Trailers 381 438 230 364 364 344 434
Other Govt vehicle 49 7 15 25 9 45 159
Total 34024 34749 29559 38594 45423 41417 41901
[Source: Dy. RTO, Navi Mumbai]
The growth chart is prepared from the above table depicting the increase/ decrease
in the trend. It is shown in the below figure.

86
Figure 07: Trend of the number of vehicles in the last 7 years within NMMC area.

87
6.4. General conditions of roads:
Total constructed road length within corporation area is 559.635Kms. Out of which
cement concrete roads are 76.821 kms. and Asphalted 482.814 kms.
Table 33: Node/ Ward wise length of cement and asphalt roads in NMMC.
Node/ Ward Cement Asphalt Total in mtrs.
Belapur 1600 114761 116361
Nerul 6120 85222 91342
Turbhe 26069 66724 92793
Vashi 3310 49954 53264
Koparkhairane 8265 77229 85494
Ghansoli 7877 37695 45572
Airoli 6258 38809 45067
Dighe 3522 7620 11142
Thane/ Belapur Road
13800 4800 18600
Total 76821 482814 559635
[Source: C.E. Dept., NMMC.]
6.5. Roadways (External):
The city is having network of roads across NMMC jurisdiction area including
NH-4 (National Highway-4) which passes through Vashi (Navi Mumbai) and Kharghar
which connects the city further to Pune and other parts of Maharashtra.
There two major classify road passing through NMMC area i.e. Mumbai-Pune
National Highway No.4, Panvel-Uran national linked highway No.4B which connects to NH-
4. In addition to this, Thane-Belapur state highway is also passing through NMMC area. The
breakup of length of these roads, passing through NMMC area, is as under.

88
Table 34: Length of major roads(Classified roads) passing through NMMC area. Sr.
No. Name of Major Roads
Total length of Road passing
through NMMC (km)
1. Mumbai-Pune highway NH-4 12.79
2. Panvel-Uran national linked
highway NH-4B (Aamra Marg) 4.14
3. Thane-Belapur state highway
NH-48 21.42
The MMRDA has also published revised Draft Regional Plan (RP) 2016 – 2036 for
MMR region dated 16/09/2016. Under this RP, following road networks have also been
proposed which are as under-
Table 35:Road Network Proposed in Draft RP of MMR passing through NMMC.
Sr.No. Road Details Passing Through Total Length
(km)
1 Airoli to Katai Naka
(50 m wide)
Airoli, Airoli (MIDC),
Ilthanpada and towards
Kalyan
5.0 km
2 Vikhroli - Ghansoli Ghansoli 2.93 km
3 Mankhurd – Kiravali
(Towards Kalyan)
Vashi, Turbhe (MIDC) 10.00 km
4 Vashi – Panvel & towards
Expressway
Shiravane, Sanpada,
Nerul, CBD Belapur
26.50 km
6.6. Roads (Internal):
Navi Mumbai is well planned and developed city undertaken by CIDCO as new
town development authority under the said Act. The city is divided into 7 nodes with
proper layout and road pattern. The width of road and its length in each nodes is narrated
as under-

89
Table 36: Ward wise details of length / width of the roads.
Sr. No.
Name of Wards
Below 6 mtrs. Wide roads
6-9 mtrs. Wide roads
9-15 mtrs. Wide roads
15-24 mtrs. Wide roads
24-27 mtrs. Wide roads
27 mtrs. and above
Wide roads
Total
1 2 3 4 5 6 7 8 9
1. Belapur 3095.74 17639.49 11266.95 11123.11 0 13480.30 56605.59
2. Nerul 7999.00 16204.61 37504.81 31898.87 0 11474.29 105081.00
3. Sanpada 2822.60 4690.86 6181.20 15044.81 0 1765.51 30504.98
4. Vashi/ Turbhe 3451.00 21622.76 36147.846 17796.47 0 20368.95 99387.00
5. Koparkhairane 5960.01 21637.96 9952.10 12137.94 0 3134.42 52822.43
6. Ghansoli 9805.00 5083.00 11049.58 20036.50 0 6343.42 52317.00
7. Airoli 4389.00 14978.68 18144.09 9816.35 560.44 4996.80 52885.00
8. Dighe 3011.67 0 0 0 0 0 3012.00
9. Palm Beach Road 0 0 0 0 0 12744.01 12744.01
10. MIDC 1391.46 0 2207.25 44290.13 0 27618.71 75507.39
11. Thane-Belapur Road
17169.00 17169.00
12. Aamra Marg 1600.00 1600.00
Total 41925.48 101857.36 132453.826 162144.18 560.44 120695.41 559635.40
The CIDCO has developed 7 Nodes in NMMC area with proper layout & amenities
in this layout CIDCO had proposed minimum 6 mtrs wide roads and maximum 32 mtrs
wide roads. Even in EWS/LIG housing sectors, 03 mtrs to 06 mtrs roads had also been
proposed. These roads are now found inadequate. Looking to the current scenario of traffic
problems, inadequate & lack of parking spaces and looking to problems faced by residents
for redevelopment of old & dilapidated buildings, Hon’ Municipal Commissioner NMMC, in
exercise of the powers vested under section 210 (1) of Maharashtra Municipal Corporation
Act, 1949 (hereafter referred to as the said MMC Act ), has now prescribed the regular
street of lines in Vashi, Nerul & Koparkhairane & in this context, an order dated 04
December, 2018 has also been issued by Hon’ble Municipal Commissioner, NMMC. The
order along with plan is annexed as Annexure D.
Govt. has formulated new policy on 4th February 2015 for re-construction/re-
development of old and dilapidated building in NMMC area where the minimum required

90
width of the road is categorized as 9 meter and 15 meter. In NMMC area, there are number
of buildings which require immediate attention towards re-construction/re-development
due to their existing dilapidated conditions and some buildings which are beyond repair
work. However, under existing conditions, there are some building which are accessible
from roads having width less than 9 meter/ 15 meter. And therefore, the roads whose
width are less than 9 meters/ 15 meters are proposed to be widen to 9 meter/ 15 meter.
Many projects, like the Navi Mumbai Metro, trans-harbour link between
Mumbai (Wadala) and Navi Mumbai (Ulwe), elevated corridor on Palm Beach road, as well
as the ambitious international airport proposed near Panvel, are expected to enhance the
connectivity as well as the status of the city. Once complete, The Navi Mumbai International
airport will act as a counter magnet to Mumbai
6.7. Coastal Road:
NMMC area is surrounded by coastal stretch, JNPT, Mumbai as a capital of
Maharashtra, MPT, New International Airport (Navi Mumbai). As per the available report,
JNPT handles approx.. 65% of India’s container traffic. CIDCO has undertaken the
construction of New International Airport @ Kopra- Panvel. NAINA (Navi Mumbai Airport
Influence Notified Area) project (561.72 sq. km or more) is also undertaken by CIDCO
within 25 km radius of the new airport and is expected to be the biggest smart city of India.
Due to the scenario of the above referred situation, the citizens of Navi
Mumbai also facing some problems as under –
1. Traffic plying to the central suburbs of Mumbai via Airoli bridge has only one
alternative road i.e. Thane Belapur road.
2. All goods traffic and passenger traffic coming from Thane, Gujarat, Rajasthan, etc.
and going to JNPT and Uran use Thane - Belapur road
3. Large Industrial and Commercial development in the vicinity of Navi Mumbai, JNPT,
etc.
4. Proposed SEZ near JNPT area will attract large number of goods and passenger
vehicles
5. High growth rate of residential area in Navi Mumbai and surrounding areas, leading
to traffic congestion.
6. With NAINA, impetus to residential and commercial growth is expected

91
7. The Thane- Belapur road, Palm Beach road and Sion Panvel expressway have
become city roads and separate corridors by passing the city for faster passenger
and goods traffic is the need of the hour.
Considering all these problems/ difficulties, NMMC has decided to undertake
Coastal road from CBD – Belapur to Thane along the coastal stretch of Navi Mumbai area.
Project Management Consultant (PMC) has also recommended to undertake this project
and therefore it is divided into 2 phases i.e. Belapur to Vashi and Vashi to Thane. Entire
project will be financed by NMMC and will be entirely implemented by NMMC itself. This
coastal road is also shown in the Draft DP.
6.8. Railways:
Harbour Railway from CSMT, Mumbai to Panvel and Trans-harbour form Thane
to Panvel via CBD Belapur and Thane to Vashi via Sanpada are already passing through
NMMC area and served as Suburban Railway Services for the benefit of citizen of NMMC
area. In addition to this, a new suburban railway network from Belapur to Kharkopar and
Nerul to Kharkopar is already completed by CIDCO & Indian Railway under joint venture.
This project is opened for operation from 11thNovember 2018. These 3 railway projects
(Suburban) had been taken up by CIDCO with majors stake holding i.e. 67% and remaining
33% stake holding are held by railway. Unless CIDCO had taken up initiative & financed the
projects, these projects would have been never come up and fulfill the dreams of citizen of
NMMC area. Though these projects had been undertaken and financed by CIDCO, but
operated by Indian railway itself. The entire railway projects are meant for suburban of rail
services and there is no separate track for out station mail express. The CIDCO has also
taken up Metro Project from CBD Belapur to Pendhar (Near Taloja) having total length 23.4
km. Out of which approximately 1.05 km is passing through NMMC limit.
The MMRDA, through its Mumbai Metro Rail Corporation (MMRC) has also
proposed metro/ mono network in MMR area of which some network also passes through
NMMC. All the infrastructure such as Metro, Mono in MMR area has been undertaken by
MMRDA through MMRC. The details of networking passing through NMMC area are as
under-

92
Table 37: Details of Metro-Mono Network proposed in RP MMR passing through NMMC. Sr. No.
Type of Network Passing Through Total Length (km)
1. Metro from Mankhurd (Mumbai)
to Kharghar, (Navi Mumbai) Vashi, Turbhe, Sanpada 7.97 km
2. Vashi to proposed Navi Mumbai
Airport
Sanpada, Nerul, CBD Belapur (along Palm
Beach road) 9.86 km
3. NMMC Head Office to Kharghar CBD Belapur 3.20 km
4. Vikhroli to Shilphata Ghansoli, Rabale and MIDC 5.40 km
5. Dighe to New Airport (Navi
Mumbai)
Dighe (MIDC), Airoli (MIDC), Rabale (MIDC),
Mahape (MIDC), Turbhe (MIDC), Shiravane
(MIDC) along Aamra Marg
20.85 km
6. Proposed Mono rail
Airoli R.S. to Vashi R.S. Ghansoli, Airoli, Vashi, Kopar Khairane 15 km
7. Monorail – Vikhroli to Shilphata
& Towards Kalyan Ghansoli, Mahape (MIDC), Adavali - Bhutavali 4.5 km
All these networks are part and parcel of revised Draft RP 2016 – 2036 published by
MMRDA dated 16/9/2016 and therefore, all these proposals are incorporated in NMMC’s Draft DP.
In case of rail network, Navi Mumbai is well connected to Thane through Thane –
Belapur rail link, similarly has an independent mainline rail terminal connecting the city directly to
Chhatrapati Shivaji Maharaj Terminus (town side) as well as western parts of Mumbai.
The breakup of suburban railway lines/ metro line passing through NMMC area is as under: Table 38: Suburban Rail network and its total length passing through NMMC area.
Sr. No. Rail Network Total Length (km.) Remarks
1. CSMT/ Andheri – Panvel 13.78 Harbour Line
2. Thane – Nerul- Panvel 17.28 Trans Harbour Line
3. Turbhe – Sanpada - Vashi 5.00 Trans Harbour Line
4. Nerul – Seawoods – Kharkopar 5.13 Harbour Line
5. CBD Belapur – Kharkopar 5.70 Harbour Line
6. CBD Belapur – Pendhar Approx. 1.05 Metro Line

93
6.9. Airways:
There is no airport for civilians within Navi Mumbai Municipal Corporation
limits. The nearest one is at Chhatrapati Shivaji Maharaj International Airport (Domestic &
International facilities) which is located about 20 km from the city center. It is operated by
GVK & Domestic airport is operated by airport authority of India Ltd. This airport has a
facility of Cargo Terminal through which export/import business is operated. In addition to
this, a new airport i.e. Navi Mumbai International airport is also under construction which
is close to NMMC area. It is hardly located at 02km from southern boundary of NMMC area
i.e. towards Belapur side. This airport is likely to be completed in Dec. 2019 and may be
functionable in the middle of 2020. After completion this airport, the citizen of NMMC area
will be accessible from both the airport.
Navi Mumbai International Airport (NMIA), is the second airport for Mumbai
Metropolitan Region (MMR) to be located at Navi Mumbai. Cementing Mumbai’s future as
an International Financial Centre, air passenger number is expected to grow over 100
million by 2034.The Mumbai airport alone will be unable to handle such an increase in
demand. And therefore, a second Airport is being constructed by CIDCO in Navi Mumbai.
[Source: CIDCO (https://cidco.maharashtra.gov.in/navi_mumbai_airport).]
6.10. Bus and passenger traffic:
City bus service, at present, is run by NMMT, through its 03 depot i.e. Asudgao
depot (outside NMMC area), Turbhe depot and Ghansoli depot. However there in no bus
depot of State transport (MSRTC) in NMMC area. However, ST buses originating from
Mumbai Central, Dadar, Borivali, Kurla, Parel, Thane, Kalyan, Dombivli and heading towards
Pune and other cities are passing through NMMC area. Under Jawaharlal Nehru National
Urban Renewal Mission (JNNURM), 285 buses are provided to NMMT. In addition to NMMT,
buses of KDMT (Kalyan- Dombivli Municipal Transport), TMT (Thane Municipal Transport),
BEST (Brihanmumbai Electric Supply and Transport), KMT (Khopoli Municipal Transport),
are also plying through city for the services of citizens of Navi Mumbai. Majors services are
operated by NMMT & thereafter BEST, KDMT and TMT respectively. The State Transport
(ST) buses are also passing through NMMC area & its bus stops (pickup & drop-up services)
are located in Vashi, Nerul, CBD Belapur, Rabale, Airoli, Turbhe, Uran Fata etc. The number
of buses plying in Navi Mumbai area and passing through NMMC area per day are as under.
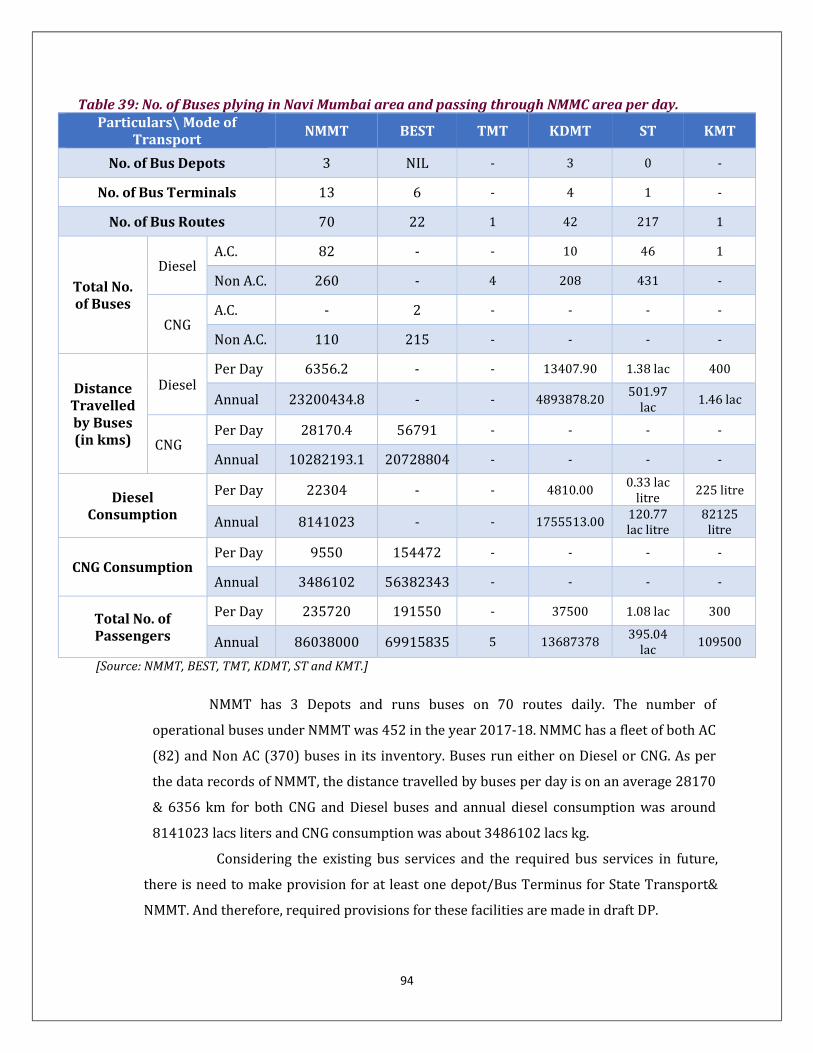
94
Table 39: No. of Buses plying in Navi Mumbai area and passing through NMMC area per day. Particulars\ Mode of
Transport NMMT BEST TMT KDMT ST KMT
No. of Bus Depots 3 NIL - 3 0 -
No. of Bus Terminals 13 6 - 4 1 -
No. of Bus Routes 70 22 1 42 217 1
Total No. of Buses
Diesel A.C. 82 - - 10 46 1
Non A.C. 260 - 4 208 431 -
CNG A.C. - 2 - - - -
Non A.C. 110 215 - - - -
Distance Travelled by Buses (in kms)
Diesel Per Day 6356.2 - - 13407.90 1.38 lac 400
Annual 23200434.8 - - 4893878.20 501.97
lac 1.46 lac
CNG Per Day 28170.4 56791 - - - -
Annual 10282193.1 20728804 - - - -
Diesel Consumption
Per Day 22304 - - 4810.00 0.33 lac
litre 225 litre
Annual 8141023 - - 1755513.00 120.77 lac litre
82125 litre
CNG Consumption Per Day 9550 154472 - - - -
Annual 3486102 56382343 - - - -
Total No. of Passengers
Per Day 235720 191550 - 37500 1.08 lac 300
Annual 86038000 69915835 5 13687378 395.04 lac
109500
[Source: NMMT, BEST, TMT, KDMT, ST and KMT.]
NMMT has 3 Depots and runs buses on 70 routes daily. The number of
operational buses under NMMT was 452 in the year 2017-18. NMMC has a fleet of both AC
(82) and Non AC (370) buses in its inventory. Buses run either on Diesel or CNG. As per
the data records of NMMT, the distance travelled by buses per day is on an average 28170
& 6356 km for both CNG and Diesel buses and annual diesel consumption was around
8141023 lacs liters and CNG consumption was about 3486102 lacs kg.
Considering the existing bus services and the required bus services in future,
there is need to make provision for at least one depot/Bus Terminus for State Transport&
NMMT. And therefore, required provisions for these facilities are made in draft DP.

95
6.11. Road Accidents:
As per the data of road accidents, collected from Additional Commissioner of
Police, Turbhe and Vashi Division for the year 2014 till 2018, total number of accidents in
the city limits amount to 2920. And the major road accidents took place on the NH 4,
Mumbai Pune Highway, NH 4B Panvel – Uran Highway, Palm Beach Road and Thane
Belapur Road. The data for the total no. of accidents in the NMMC area for the last 5 years
(till September 2018)
Table 40: Total no. of accidents reported in NMMC area for the last 5 years
(Till September 2018).
Year 2014 2015 2016 2017 2018 Total
Total No. of Accidents 556 735 611 644 437 2983
[Source: Additional Commissioner of Police, Turbhe and Vashi Division.]
Also the trend of the road accidents for the last 5 years is shown in the below figure no. 08.
Figure 08 :Details of accidents for the last 5 years in Navi Mumbai.
6.12. Parking facilities:
There are in all 56 parking facilities within the NMMC area. Node wise details is
shown below.
556
735
611 644
437
0
100
200
300
400
500
600
700
800
2014 2015 2016 2017 2018
Num
ber o
f Roa
d Ac
cide
nts
Year
Number of Road Accidents
Number of Road Accidents

96
Table 41: Node/ Ward-wise details of Parking Facilities.
Node Total No. of Parking Facility
Belapur 9
Nerul 11
Sanpada 4
Vashi 24
Koparkhairane 0
Ghansoli 0
Airoli 8
Total 56 [Source: City Engineer Department, NMMC.]
6.13. Terminal Facilities:
CIDCO has developed truck terminal at plot number 1, sector 19 of Vashi
measuring about 65264.08 sq. mtrs. This terminal is part and parcel of APMC markets
which is maintained by APMC and which accommodates near about 1200 trucks in it. This
terminal facility seems to be inadequate considering the in and out trucks that comes from
various parts of the country. So, it is thus, necessary to make provision for additional truck
terminal. Near about 5000 trucks arrive at this APMC truck terminal coming from across
the country which can be partially accommodated in the proposed truck terminal.
6.13.1. Railway Terminal:
The Dadar Terminus is around 20 kms from Vashi. This terminus is
easily accessible from Navi Mumbai. The another railway terminus near to Navi
Mumbai is Lokmanya Tilak Terminus which is around 15 kms from Vashi which is
well connected by roads and harbour line railways. There is Mumbai Central
Terminus located in Western Mumbai and is approximately 29 kms from Vashi. One
more terminus in western Mumbai which is accessible from Navi Mumbai is Bandra
Terminus which is around 22 kms from Vashi. The Chhatrapati Shivaji Maharaj

97
Terminus is around 30 kms from Vashi and easily accessible via road and through
harbor line railways.
The CIDCO has also undertaken construction of railway terminals at Panvel
which is hardly 10 km from NMMC & close to NMMC area. Panvel railway station is
already in existence & which is also developed by CIDCO & now the CIDCO is
converting this station into terminus. Entire expenditure will be boned by CIDCO.

98
CHAPTER 7: ECONOMIC BASE AND GROWTH POTENTIAL
7.1 Introduction:
With the unleashing of economic reform in 1991, new economic
opportunities are opened up in sectors such as IT and ITES, entertainment, hospitality,
banking, financial services and insurance. Several policies at the Central and State level
pertaining to the location of the industries have guided the economic transformation of
the cities. The new industrial policy was introduced in 1991 to help Indian industry to
modernize, increase productivity and competitiveness. Incentives were also given to
start industries. As per this industrial location policy, NMMC area covered under Zone-
II. Trends indicate that certain activities as referred above are likely to drive the
NMMC’s economy over the next decade.
Table 42: Spatial Clustering.
Sr. No. Key Cluster Location
1. Financial Services including banking and insurance
Vashi, CBD Belapur
2. IT/ ITES Thane- Belapur Road (from Dighe to Ghansoli)
3. Media and Entertainment Thane- Belapur Road (Airoli)
4. Retail Vashi/ Turbhe
5. Logistics and Warehousing Turbhe/ Sanpada
7.2 Industrial Activities:
There are micro, small, medium and large scale Industrial Units in Navi
Mumbai and the details are listed in the below table.
Table43: List of Industrial Units in Navi Mumbai.
Sr. No.
Area Micro Scale Industries
Small Scale
Industries
Medium Scale
Industries
Large Scale
Industries
Total Industries
1 Industries in Navi Mumbai
(MIDC TTC Area) 1036 1383 109 230 2528
2 Industries in Navi Mumbai (CIDCO Developed Area)
8749 1074 542 0 10365
Total 9785 2457 651 230 12893
[Source: District Industries Center (DIC) and Maharashtra Pollution Control Board, Thane.]

7.3 Trade and Commerce
Agricultural Produce Market Committee (APMC) is a statutory market
committee constituted by a State Government in respect of trade in certain notified
agricultural/horticultural/livestock products. Mumbai Agricultural Produce Market
Committee has been established on 15th January, 1977 under the provisions of the
Maharashtra Agricultural Produce Marketing (Regulation and development) Act, 1963
Table44: Yearly influx o(APMC),Vashi.
Sr. No.
Year
1 2013-14
2 2014-15
3 2015-16
4 2016-17
5 2017-18
[Source: Mumbai Agricultural Produce Market Committee
Figure 09 : Yearly influx of commodities in various markets of APMC
99
Trade and Commerce:
Agricultural Produce Market Committee (APMC) is a statutory market
committee constituted by a State Government in respect of trade in certain notified
ticultural/livestock products. Mumbai Agricultural Produce Market
Committee has been established on 15th January, 1977 under the provisions of the
Maharashtra Agricultural Produce Marketing (Regulation and development) Act, 1963
: Yearly influx of commodities in Agricultural Produce Market Committee
Vegetables in quintals
Food grains in quintals
5314633 14325771
5317573 13368629
5640558 13970133
4063907 238689943
10291002 12010597
Mumbai Agricultural Produce Market Committee.]
: Yearly influx of commodities in various markets of APMC
Agricultural Produce Market Committee (APMC) is a statutory market
committee constituted by a State Government in respect of trade in certain notified
ticultural/livestock products. Mumbai Agricultural Produce Market
Committee has been established on 15th January, 1977 under the provisions of the
Maharashtra Agricultural Produce Marketing (Regulation and development) Act, 1963.
f commodities in Agricultural Produce Market Committee
Fruits in quintals
1894610
6382026
6638305
6070573
7122599
: Yearly influx of commodities in various markets of APMC.

100
CHAPTER 8:UTILITIES AND SERVICES
8.1. Water supply:
8.1.1. Water supply (Network):
Due to the sufficient rainfall in the catchment area of Morbe dam in
previous year, NMMC was able supply water smoothly with increase in water
supply from 392 MLD in 2016-17 to 429.54 MLD on an average (supply across all
months) in this financial year. Upon deducing the water losses, which account to
about 18.28% of the water supply, it is estimated that around 351.01 MLD water
was supplied by NMMC out of which 231.31 MLD was supplied to domestic
sector, 26.62 MLD to the commercial sector and around 93.08 MLD to gaonthan
and slums. NMMC supplies water to 1,20,493 connections (domestic) and 8744
connections (commercial) through a well distributed network of around 1118.86
km long facilitated by 154 booster pumps.
Figure 10 : Highlights of the water supply network at a glance.
Head Details
Total Average water supply in 17-18 429.54MLD
Processing and Distribution losses ~18.28%
Net Water Supply to Navi Mumbai (NMMC limits)
351.01MLD
Length of distribution network 1130 Km
Number of booster pumps 154
Water supply breakup Metered:351.01MLDUnmetered:78.53MLD
Water supply sector all breakup Domestic:231.31MLD Commercial:26.62MLD Gaothan&Slums:93.08MLD
[Source: ESR 2017-18, NMMC.]
NMMC is blessed with abundant water resources in terms of both surface
and ground water. The surface water resources include 24 major lakes and
ponds, 11 holding ponds and creek front of about 22km, NMMC area merits
various vital environmental and physical services provided by these entities in

101
terms of controlling the floods, water logging, and surface runoffs and so on.
NMMC regularly monitors the levels of its surface and ground water resources.
In terms of ground water resources there are 110 Wells & Bore well
115 regularly monitored by NMMC for their water quality.
Table 45: Details of Source and amount of water drawn from resources.
Water Source Water Drawn (MLD)
Design Population
(lakh) Remarks
Morbe Dam 450 29.46
Considering 15% Losses& 150 LPCD Consumptions Bari Dam 70
[Source: Water Supply Department, NMMC.]
8.1.2. Status of Water Resources:
NMMC region is blessed with numerous surface and groundwater
resources. NMMC region is having multiple ponds, lakes, creeks, dams as surface
water resources while in case of groundwater resources; the region is having
wells and bore wells. NMMC meets the need of water demand of the city from
these resources for daily water supply and other activities. Knowing the
importance of these resources, NMMC regularly monitors and record the water
quality.
8.2. Surface Water:
Dam (Reservoir)
Three dams namely Hetawane, Barvi and Morbe dam are situated near
vicinity of NMMC region out of which city gets water from Morbe dam for its daily
requirement. Morbe dam, a gravity dam, on the Dhavri River (tributary of Patalganga
River) near Khalapur, Raigad district is the source of fresh water for NMMC jurisdiction
area. The height of the dam above lowest foundation is 194 ft. while the length is
11,220 ft. It covers the surface area of about 9,780 sq. km. It was constructed by MJP
(Maharashtra Jeevan Pradhikaran), Government of Maharashtra in 1999, who then
granted possession of Morbe dam to NMMC in November 2002. The feature of Morbe
dam is given Table No. 36.

102
Table46: Specification of Morbe Dam.
Specifications Attributes
Name of the dam Morbe
Distance from city (NMMC Jurisdiction) 31km
Type of dam Gravity
Impounds Dhavaririver
Height 53.40 m
Length 3,250 m
Dam volume 18,075 x 103m3
Total capacity 19,089 x 104m3
Surface area 978 hectares
[Source: ESR 2017-18, NMMC.]
Around450MLD (Million Liters per Day)water is supplied from Morbe dam to
the treatment plant at Bhokarpada in the year 2017–18. NMMC supplied water 24X7 to
nearly 75% of the area of the city while the remaining area is catered to water supply
for about 4–8 hours per day, thus ensuring 100% coverage.
NMMC reported water losses which account to about 18.28% of total water
supply. NMMC had initiated a drive for installing node wise AMRs (Automatic Meter
Readings) system to maintain the tally of water consumption and to increase the share
of metered water supply. Under this, it was made mandatory to install AMRs for piped
water supply with connection of 20mm and above. As of March 2018, around 3676
active consumers from residential sector, 759 from commercial and 187 from
institutional sector have installed AMR. NMMC undertook active drive on disconnecting
illegal water connections in the year 2017-18. Also NMMC was vigilant for prompt
action and 100% addressable of complaints for pipe breaks and leakages in NMMC
area, thus helping bring down the losses to a large extent.
In 2017-18, NMMC monitored 20,296 drinking water samples at the tap end,
from all the nodes. Out of these about 3.4% (690) samples were detected to be non–
potable compared to 4.7% during 2016-17 which indicated high portability, ensuring
that the water supplied by NMMC was of good quality. This is true for samples collected
in rainy season and recurrently of some village & slum area which merit attention.

103
NMMC recorded Non-Revenue Water extent of 18.28% in 2017-18 which
is 1.72% less than the 20% benchmark set by Ministry of Water Resources.
8.3. Lakes and ponds:
Lakes and Ponds, diverse set of inland freshwater habitats are of great
human importance as these are the sources of water used for domestic, industrial and
agricultural purposes as well as provides source of food. Lakes and ponds not only
support biodiversity but also helps regulate the processes of soil formation,
groundwater recharge and flood protection. Within NMMC, there are total 24 lakes with
varying capacities and account to a total coverage area of 2.23 Lakh sq.m. The Belapur
node has 5 lakes, maximum number amongst all nodes, and accounts around 28% of the
lake area share in NMMC jurisdiction. This is followed by Ghansoli node with 25% of
share area and has 4 lakes within the node. The Gothivali Lake in Ghansoli is the biggest
lake and has a surface area of 32,635 sq. m. The Mahape Lake in Koparkhairane node is
smallest lake with area of 1,338 sq. m. Node wise details of the lakes with coverage area
are described in the Table No.xx below. Most of the lakes are observed to be surrounded
by residential areas and have Gabion wall structures.
Table 47: Node wise details of lakes and their coverage in NMMC area.
Node Name of
Lake/Pond Riparian
zone Surrounding area
Area of lake
(Sq.m)
Airoli AiroliNaka Concrete wall Residential 3,988 Dive Gabion wall Residential 2,042
Belapur
Agroli Gabion wall Trees and Garden 12,693 Belapur Concrete wall Residential and a temple 17,905 Darave Gabion wall Residential 5,724 Karave Concrete wall Residential 23,506 Killegaonthan Gabion wall Residential 2,650
Dighe Borol - - 1,500 Khokad Gabion wall Residential and Highway 17,842
Ghansoli
Gothivali Gabion wall Residential & Informal hutments 32,635 Gunali Concrete wall Residential 3,596 Rabada Gabion wall Residential and Highway 7,823 Talvali Gabion wall Residential 11,590
Koparkhairane
Khairne Concrete wall Residential 13,870 Koparkhairane Concrete wall Residential 2,231

104
Node Name of
Lake/Pond Riparian
zone Surrounding area Area of
lake (Sq.m)
Mahape Concrete wall MIDC area 1,338 Savaligaon - Slums 6,060
Nerul Nerul Sector 20 Gabion wall Residential 9,894 Shirvane Gabion wall Residential 13,686
Turbhe Sanpada Natural Residential 2,500 Turbhegaon Gabion wall Residential 8,482
Vashi Juhugaon Concrete wall Dense residential area on all
four sides 1,486
Kopari Gabion wall Trees and Garden 10,000 Vashigaon Gabion wall Residential 10,620
Total 2,23,661
[Source:ESR 2017-18, NMMC.]
8.4. Drainage and Sewerage:
Storm Water Drainage
NMMC area has storm water drain networks of total 550 km (Table No. 48)
in length. The main features of the storm water drains are the Nalla and the unique
holding ponds of the city which prevent flooding of water in the city. NMMC regularly
monitors the water quality in the Nalla as well as the holding ponds.
Table 48: Node wise length of storm water drains in NMMC area.
Sr. No. Node Storm Water Drain Length (mtrs.)
1. Belapur 51439.00
2. Nerul 149819.00
3. Sanpada 57801.35
4. Vashi 196371.94
5. Koparkhairane 210253.00
6. Ghansoli 58911.00
7. Airoli 81349.00
8. Thane/ Belapur Road 19380.00
Total 825324.29
[Source: Sewerage Department, NMMC.]

105
Overview of the Sewerage System
NMMC has a well-planned underground sewage network which caters to
about 2,66,766 connections. The total length of sewer lines is 457.25 km. Nodal areas
of the city are having sufficient sewage lines. NMMC is having a dedicated workforce of
around 343members working in sewerage department.
Table 49: Node wise details of sewerage Zones.
Sr. No. Sewerage Zone Number of SPHs Number of STPs
1 Belapur 3 1
2 Nerul 4 1
3 Sanpada 3 1
4 Vashi 8 1
5 Koparkhairane 2 1
6 Ghansoli 1 1
7 Airoli 1 1
Total 22 7
[Source: Sewerage Department, NMMC.]
Table 50: Node-wise length of sewerage line.
Sr. No. Node Length of Sewerage Line (km)
1 Belapur 72.575
2 Nerul 65.925
3 Vashi 75.839
4 Sanpada 77.366
5 Koparkhairane 62.945
6 Ghansoli 48.738
7 Airoli 53.869
Total 457.257
[Source: Sewerage Department, NMMC.]

106
The STP’s possess Primary as well as Secondary treatment system which
works on the of Cyclic Activated Sludge Treatment technology using advanced
Sequencing Batch Reactor (SBR) process. The system operates in a batch reactor mode
which eliminates all the inefficiencies of the continuous processes. The complete process
takes place in a single reactor, within which all biological treatment steps take place
sequentially. Water quality tests are conducted daily during secondary treatment at an
ISO certified laboratory. A brief detail of the STP’s in Navi Mumbai under NMMC is
provided in Table51.
NMMC has 7 active STPs (Sewage Treatment Plants) which have secondary
treatment facilities with an aggregate capacity of about 454 MLD as shown in the below
Table 47. It is estimated that around 210 MLD of sewage is generated in the NMMC area
and all the generated sewage is collected and 100% of the sewage gets treated in STPs,
before releasing in the creek. NMMC has further proposed sewage network in slum
pockets for collection and connect it to STPs. NMMC has prepared plan for Airoli and
Ghansoli node. Plan for Turbhe, Dighe and Nerul is under process.
Table 51: List of functional Sewerage Treatment Plants in NMMC area (2017-18).
Sr. No. Node & Sector
Design Capacity(MLD) Treatment Technology
1 CBD Belapur–Sec- 12 19
CyclicActivatedSludgeProcess(SBRTech)
2 Nerul–Sec –50 100
3 Sanpada-Sec – 20 37.5
4 Vashi-Sec –18 100
5 Koparkhairane-Sec - 14 87.5
6 Ghansoli- Sec - 15 30
7 Airoli-Sec – 18 80
Total 454
[Source: ESR 2017-18, NMMC]
NMMC regularly monitors the inlet and outlet water samples for bacteriological and
chemical parameters. In the year 2017-18, the efficiency of the STPs were almost 100% in terms of
regulating the BOD (Biochemical Oxygen Demand), COD levels, suspended solids, pH, oil and
grease, nitrate, nitrite and dissolved oxygen levels. The average effluent water quality released

107
from the STPs was well within the standards for all the parameters.
Under the central government’s AMRUT Yojana, NMMC plans to recycle and reuse
sewage water. The corporation plans to treat 20 MLD water at a tertiary plant, proposed to be set
up in Koparkhairane and Airoli node each. The treated sewage water then would be supply again to
industrial sector for non-drinking purposes thereby creating an alternative to municipal water.
NMMC proposed to set up at Vashi to treat 15MLD sewage water. It will be used to water gardens.
Thereby NMMC would recycle and reuse around 55MLD of sewage water on daily basis.
Indian Institute of Technology, Mumbai is working on preliminary phase of “Enhanced
solubilisation of sewage sludge for Resource Recovery” project under which sewage from NMMC’s
STPs would be treated for easy separation of solid and liquid stream of available sludge. Solid
fraction can be utilized as soil-conditioner, manure while liquid fraction can further be processed
to recover proteins, fatty acids, nutrients and for biogas or ethanol generation.
8.5. Municipal Solid Waste Management:
8.5.1. Solid Waste Generation and Collection:
NMMC has designed a specific solid waste management strategy for
effective disposal of municipal waste. In the year 2017-18, the daily average
Municipal Solid Waste (MSW) was 750 Metric Tons (MT) which has increased by
about 25 tons as compared to the last year. The major share of about 92% (692 MT)
of the total waste is generated from residential areas of which the Turbhe node
generated the maximum MSW, more than 112.8 MT/day while Dighe node
generated about 34.7 MT/day of MSW. The waste generated from the city
comprises mainly of biodegradable waste (58%). It is important to note that the
share of plastic waste has gone down from 17% to 11.7% in 2017-18 after
initiatives taken by NMMC to curb the problem of plastic pollution.
Waste from the roads is collected through sweeping while household
waste is mechanically collected and loaded in refuse transportation vehicles by
transportation contractors. Each node is provided with green and blue dustbins.
The green bins are used to collect the wet waste while the blue for dry waste. About
90% of solid waste is segregated at source in NMMC regions.
Along with green and blue dustbins, NMMC has started disseminating

108
red bins for e-waste collection. Eco Friend Industries has been appointed by NMMC
to collect e-waste as sample as demonstration project from red bins placed at
NMMC headquarters at CBD Belapur, Wonders Park at Nerul and at Inorbit mall,
Vashi.
Table52: Category-wise details of the waste generated.
Sr. No. Establishment Type Numbers Covered
1 Household 248965
2 Commercial 48106
3 Industrial 4806
Total 301877
[Source: Solid Waste Management Department, NMMC.]
8.5.2. Solid Waste Disposal:
In the year 2017-18, the Turbhe landfill site received around 750 MTs of
MSW per day. On the basis of waste type, NMMC has allotted waste collection
vehicles which bring particular type of waste on site which includes wet, dry, mixed
and green waste. Mixed waste comes from roadside dustbins and few community
bins which gets segregated at site once received. Wet waste gets converted into
compost at in-house composting unit while dry waste (plastic) is transferred to
baling unit which converts plastic pieces into small beads which is then supplied to
plastic recycling vendors and other industrial applications.
Waste LDPE (Low Density Polyethylene) collected by NMMC is
converted to granules and then processed to use as replacement for Bitumen for
road construction. During the year of 2017-18, as per NMMC sources, these
granules were used for the road construction measuring 4.5 kms in length The
dry waste like paper, cardboard, plastic and other corrugated materials are used
to produce a homogenous material known as RDF (Refuse Derived Fuel), while
waste like glass, metal are recycled. Below is the list of accolades received to
NMMC for Municipal Solid Waste Management.

109
Navi Mumbai was awarded as Best City in Solid Waste Management in
more than 10 lakh population category as per Swachh Survekshan (Survey) –
2018.
Navi Mumbai was ranked 1st in Maharashtra (West Zone) and 8th in country
as the cleanest city as per Swachh Survekshan (Survey) – 2017
Under Swachh Bharat Abhiyan, NMMC ranked first in Advanced Public
Toilets and Information, Education and Behaviour Change Communication
(IEBC) categories and received awards during 45th Skoch Award-2016 held in
Hyderabad on 8th &9th September, 2016.
Award for Exceptional Performance in Waste Segregation on 5th May
2017 on the eve of Urban Development Day.
Maximum Tax Recovery award on 5th May, 2017 on the eve of Urban
Development Day
8.6. Power supply:
Table 53: Power consumption (MW) in last 4 years.
Years 2014-15 2015-16 2016-17 2017-18
No. of Consumers 714585 763775 814191 860204
Power in Residential (MW) 1344.52 1425.75 1513.15 1594.87
Power in HT Industries (MW) 1770.55 1781.95 1812.91 1827.72
Power in LT Industries (MW) 292.29 302.79 299.26 300.8
Power in Commercial (MW) 365.71 389.63 430.76 465.04
Power in Other (MW) 28.41 31..31 36.9 42.08
Total Power (MW) 3801.48 3931.43 4092.98 4230.51
Load Growth (KW) 129950 161550 137530
Source: Energy Department, NMMC.

110
Figure 11: Power consumption pattern in 2017-18.
8.7. Fire Brigade Station:
There are 5 existing Fire Brigade stations at following locations.
1. Sec – 16 A, Vashi 2. Sec – 1 A, C.B.D. Belapur 3. Sec – 3, Airoli 4. Sec – 19 A, Nerul 5. Sec – 2, Koparkhairane
Considering the spread of the city and increasing needs of the ever growing
population in Navi Mumbai, few more fire brigade stations, equipment and man-power are required at following locations.
1. Sec - 2, Nerul 2. Ghansoli Bus Depot 3. Dighe Ward Office

111
8.8. Library and Study Centre’s:
There are in all 10 libraries and study centers in NMMC area and the node-wise
break up of which is shown as below.
Table 54: Node/ Ward wise library and study centers.
Sr. No. Node Library/ Study Centre
1. Belapur 1
2. Nerul 1
3. Sanpada 1
4. Vashi 5
5. Koparkhairane 0
6. Ghansoli 1
7. Airoli 2
Total 11
[Source: City Engineer Department, NMMC.]
There is no central library or state level exam study center in NMMC area &
therefore, central library is proposed in draft DP. This central library will be developed by
NMMC where national/ state level facilities for study will be made available.

112
CHAPTER 9:CONCLUSIONS AND OBSERVATIONS
9.1 Level of implementation of Development Plan:
The existing Development Plan was sanctioned by Govt. on dated 18/08/1979
and 18/01/1980 and came into force on 01/03/1980 .This DP was prepared by CIDCO
and sanctioned by Govt. This DP is only a structural plan which indicate only broad
zoning and provisions for any public amenities/ reservation was not made in said DP.
However, detailed layout plans for 7Nodes were prepared & developed by CIDCO. The
details of existing amenities in these nodes are narrated under Chapter No. 4 Para No.
4.5 which can be pursued please. As per Existing Land Use map (ELU), number of plots
developed by CIDCO/ NMMC ,in each node, is narrated in para No. 4.1 (Table 19) which
is self-explanatory.
Table 55: Node wise details of existing amenities& its areas.
Sr. No.
Name of Node
Total number of plots/ amenities
Developed in each Node
Total Area under amenities (sq.
mtrs) Remark
1. Airoli 125 484118.14
2. Ghansoli 31 335228.41
3. Koparkhairane 175 649667.97
4. Vashi 176 1268784.11
5. Sanpada 82 255991.48
6. Nerul 219 832368.20
7. Belapur 116 971957.80
Total 924 4805023.30
In addition to above, the demand of NMMC for allotting plots for various
public purpose is still pending with CIDCO i.e. demand of 935 plots. The plots which
were allotted by CIDCO to NMMC for various public purposes/ amenities were
developed by NMMC from its own fund. Prior to inception of NMMC i.e. 01/01/1992,
some plots were developed by CIDCO which are also handed over to NMMC for
maintenance/ beautification and operation.

113
9.2 Identification of problems:
1) There is paucity of housing for existing population. Also more housing stock will be
required for future population. Moreover, houses in core area are older and many of
them need redevelopment. The rates of lands and houses are increasing rapidly day
by day.
2) Slum population in the NMMC area city is remarkable. These slum dwellers need to
be provided proper accommodation and amenities.
3) The residential and other development is taking place all over the city. However,
trend of development is observed on major roads passing through city like National
Highways, State Highways, Palm Beach road, Linked NH-04 B.
4) There is inadequate and un-coordinated traffic transportation network. The flyover
on Thane-Belapur road, Mumbai-Pune Highway, Linked NH-04-B is constructed;
under pass at Mahape junction is also constructed by NMMC. However, there is
necessity of other bypass roads to link other National and State Highways.
5) There is necessity of effective mass rapid transportation system so that congestion
of vehicles on the roads gets reduced.
6) Provision of public parking is required at the places like C.B.D., Vashi sector-17, all
main roads, all Station plaza etc.
7) As far as educational facilities are concerned, it seems that major burden of it is
taken over by private sector. However, some provision for primary education needs
to be made in view of future population.
8) Facilities for medical/health, made available by the NMMC are reasonable.
Moreover, contribution of private sector in providing health facilities is also
remarkable. Existing Government hospital (ESIS) at Vashi and NMMCs Hospital at
Vashi meets the needs of the needy persons.
9) There are many commercial establishments. However, at some busy places
vegetable markets are along road side and needs to be relocated at proper places.
There is no organized space for hawkers.
10) In all there are existing 232 gardens, having area 200.86 hectares. Out of which
some are of bigger size. This works out to be 1.34 sq. mtrs. per person which is less.
11) There are 91 playgrounds having 58.07 hectares area out of which 3.67are of bigger
size. This includes stadium also. This works out to be 0.39 sq. mtrs. per person
which is less.

114

115
CHAPTER 10:FRAMING OF PROPOSALS
10.1. General:
On the basis of various studies and information available, some problems
have been identified in earlier chapters. The Development Plan does not only aim at
solving the problems identified but also should aim at incorporating some new concept
/ ideas, so that Development Plan becomes a pro development vision document and
drive the city’s development in planned manner. Accordingly following vision and
objectives have been set to frame the planning proposals.
10.2. Vision of Development Plan:
To achieve planned, comprehensive, participative, stakeholder friendly,
rational, sustainable and growth driven development of NMMC and make citizen
oriented policies, so that Navi Mumbai city should emerge as an orderly developed city
on the map of India
10.3. Need for Development Plan Revision:
Navi Mumbai is a planned city developed by CIDCO since 1970. The city is
developed upto 95% with only 5% of developed land is vacant and available for future
development. The original development plan was sanctioned in 1979 and as per
MR&TP Act 1966, the Development Plan was required to be revised atleast once in 20
years which means the Development Plan required to be revised by 1999, the same did
not happen due to various unavoidable circumstances. The sanctioned Development
Plan is a broad structure plan with basic zoning and detail planning is not incorporated
in Development Plan. Based on the Development Plan, CIDCO prepared zonal layout
plan at its own level and the plan was not required to be sanctioned by Government, this
resulted in frequent amendment of amenities facilities. There have been reports of
conversion of amenities to developable plot and was tendered and sold in the open
market. Therefore, since only 5% of land remains to be developed, it was felt to make a
plan freezing of all the earlier amenities and proposing new amenities. Therefore, this
Development Plan has been prepared considering the above factors in mind and the
requirements in lieu of projected population to 2038.

116
10.4. The main objectives of the Development Plan:
a) To ensure proper utilization of the land and to guide the future development in
disciplined and orderly manner.
b) To plan and provide the most efficient traffic-transportation network so as to
improve connectivity.
c) To make the provision for social and physical infrastructure by minimizing the
personal inequality.
d) To frame development control regulation, more rational, participative, simple and
user friendly, understandable by common citizen and make provisions to promote
the development.
e) To make provisions in the DCPR so as to promote the use of solar energy.
f) To make provisions in the DP and DCPR to create more housing stock in the market
and try to bring it within the reach of common man.
g) To make provisions in the DCPR to increase the density of the population along the
transport corridor and also encourage the owner/developer to make provision for
wider roads in development projects.
h) To make provisions for redevelopment of Core Area (Gaothan area& surrounding)
so as to make overall change in environment and quality of life of the residents.
i) To make provisions for redevelopment for slums, so that deprived class of the
society can be brought in the main stream.
j) To make the provisions for increasing the resources of the corporation to take up
up-gradation, creation of infrastructure and creation of social amenities.
k) To make the provisions for cycle track and movement of pedestrians so as to
contribute to pollution free &sustainable development of the city.
10.5. Demographic Projection:
The Population Projection has been done considering the population as per
census year 2011. Various methods mentioned below have been adopted for
demographic projection.

117
i. Arithmetical Increase Method.
ii. Geometrical Increase Method.
iii. Percentage Increase Method
iv. Incremental Increase Method.
v. Public Health Department Method
vi. Graphical Method
vii. As per DPR
viii. As per Report of Crisil
The intention for preparation of revised Development Plan was published in
the Government gazette on 15/12/2017. After completion of all legal procedures, the
Development Plan is expected to be sanctioned by the Government, in the year 2018-19.
Considering the period for development of reservation as 10 years, population
projection is calculated for the year 2028 for the purposes of provisions of amenities
and for the year 2038 for the purposes of zoning proposals.
After analyzing the result obtained from the various methods mentioned
above, the population projection is given below-
Table 56: Population Projection (as on 2028 & 2038).
Year Projected Population
2028 23,30,000(for amenities)
2038 28,00,000 (for Zoning)
Note: The details of the method adopted for project population is narrated in paragraph 3.3 of this report.
Navi Mumbai is well developed city and CIDCO has played a major role in its
entire development. The existing area under NMMC jurisdiction was divided into 7
nodes by CIDCO and all these nodes are already fully developed by CIDCO with proper
infrastructure and layout and there is hardly any scope or space left for further
development. Most of the lands are held by CIDCO and leased out to individuals,
housing societies, charitable trusts, institutions, government and semi-government
organizations, local bodies, etc. for its development. Hardly 5% of the land is available
for development and therefore, there is no point to consider sectorial planning of
NMMC. Hence, entire NMMC area is considered as one sector and accordingly, planning
proposals are framed and reflected in Draft DP.

118
Table 57: Node wise Projected Population as on 2028 & 2038.
Sector/ Node 2028 2038
CBD Belapur 122079 142084
Nerul 485365 584678
Sanpada 202031 252649
Vashi 372406 426403
Koparkhairane 363898 435388
Ghansoli 330246 412223
Airoli 453975 546575
Total 23,30,000 28,00,000
10.6. Planning sectors:
In NMMC area, there are 8 administrative wards. Prior to existence of
NMMC, CIDCO, being NTDA had developed 7 planning nodes. Since such infrastructure
planning is a continuous process, the Draft DP propose that NMMC could separately
take a view on this or an appropriate decision. Following table shows the area covered
in each Nodes.(please refer Map No.8 for Plan showing boundaries of Nodes.)
Table 58:RevenueVillages included in Nodes.
Node Revenue Villages included in Node Area in hectare
Airoli-Dighe Dighe, Airoli, Ilthan, Dive, Chinchvali, 1565.73
Ghansoli Rabale, Gothivali, Talavali, Ghansoli, Savali,
2193.51
Koparkhairane Tetavali, Mahape, Koparkhairane, Khairane, Pawane, Adavali-Bhutavali
1971.69
Vashi Borivali, Ju, Vashi, Turbhe 1616.51
Sanpada Sanpada, Sonkhar 860.99
Nerul Bonsari, Kukshet, Shiravane, Sarsole, Nerul, Darave, Karave
1782.33
CBD Belapur Belapur-Shahbaz 968.00
Total Area 10958.76
(say 109.59 sq.km.)

119
10.7. Need for paradigm shift:
As per the provisions of section 22 of the said Act, the Development Plan
shall provide so far as may be necessary for all or any of the following matters, that is to
say,
a) proposals for allocating the use of land for purposes, such as residential,
industrial, commercial, agricultural, recreational;
b) proposals for designation of land for public purpose, such as schools, colleges
and other educational institutions, medical and public health institutions,
markets, social welfare and cultural institutions, theatres and places for public
entertainment, or public assembly, museums, art galleries, religious buildings
and government and other public buildings as may from time to time be
approved by the State Government;
c) proposals for designation of areas for open spaces, playgrounds, stadia,
zoological gardens, green belts, nature reserves, sanctuaries and dairies;
d) transports and communications, such as roads, high-ways, park ways, railways,
water-ways, canals and airports, including their extension and development;
e) water supply, drainage, sewerage, sewage disposal, other public utilities,
amenities and services including electricity and gas;
f) reservation of land for community facilities and services;
Further clauses (g) to (l) mentions the other matters and clause (m)
provides for provisions for permission to be granted for controlling and
regulating the use and development of land within the jurisdiction of local
authority.
From the above provisions it is clear that, Development Plan can be
prepared for one or more matters mentioned above.
Provisions of section 31(5) stipulates that if a Development Plan
contains any proposal for the designation of any land for a purpose specified in
clause of (b) and (c) of section 22, and if such land does not vest in the Planning
Authority, the State Government shall not include that purpose in the
Development Plan, unless it is satisfied that the Planning Authority will be able
to acquire such land by private agreement or compulsory acquisition not later
than 10 years from the date on which the Development Plan comes into
operation.

120
From this provision, it is very clear that the reservation of sites for
public amenities should be such that it is within the capacity of the Planning
Authority to acquire these sites within a period of 10 years.
Now days, Development Plan is becoming a matter of more concern to
the land owners, whose lands are reserved in the Development Plan. They
invariably appose to such reservations which gives rise to public agitation
against the Development Plan. Imposing of reservation also creates inequality
amongst the persons. This problem is aggravating day by day. However, not all,
but some specific amenities like town level parks, playground need to be made
available through the proposals of Development Plan because such amenities
may not be created through any other means if lands not reserved in
Development Plan. Moreover, the lands for public utilities like water supply and
sewage installation, solid waste management, cremation and burial ground,
need to be earmarked in the Development Plan because these activities are
more or less location specific and land for them at particular location may not
be available in future. Therefore, emphasis is given only to reserve land for such
type of purposes and various provisions have been made thereby making
acquisition / development of such land simpler and beneficial to both, owner
and Planning Authority.
g) The share of other amenities like education, medical, commercial, etc., have
been taken over to great extent by private sector. Some share of primary and
secondary education, public health will have to be borne by the Corporation.
Some amenities like vegetable market will have to be provided by the
Corporation. It will not be appropriate to reserve the lands for all these
amenities in the Development Plan because it will be against the provisions of
section 31(5) of the Act considering the financial position of Corporation and
level of implementation of the sanctioned Development Plan. This Development
Plan envisage to part with some percentage of the land to the corporation at the
time of development permission by the owner / developer in lieu of in-situ FSI
to make available land for such amenities. The owners / developers have also
been given choice of constructing such amenities if they desire so.
The development of reserved sites through accommodation reservation
principal has been made more rational. All these measures will lead to reduce personal

121
inequality and in the result, implementation of the Development Plan will get
momentum.
Keeping this as a central idea, the Development Plan proposals are framed
which are mentioned in foregoing paras.
Floor Space Index
FSI is considered as a tool for containment of growth and density. By fixing FSI
limit, it is assumed that the proper development would undertake within the area with
desired density. The main reason behind this is also not to overburden the existing
infrastructure. However, we have also failed to control the prices of houses and dream of
home has gone beyond the reach of common man and poor persons. Therefore, we need
to rethink about this paradigm. If FSI is increased and major corridors are allowed to be
densified, then, problem of housing will ease to great extent and also population living
along major corridors will opt for public transport. If infrastructure gets overburdened, it
can be augmented from the premium charges to be levied on additional FSI.

122
10.8. Proposed land use zoning:
The proposed land use classification for the entire area is given in table below.
Table 59: Proposed Land Use Classification.
Sr. No.
Land Use Area in Hectares % of Total Developed Areas
% of the Total Area
DEVELOPED AREA 1 Residential Zone 3968.635 59.773 36.213 2 Industrial 2143.111 32.278 19.556 3 Commercial 118.312 1.782 1.080 4 Wholesale Market &
Warehousing zone 153.449 2.311 1.400
5 R.G. 207.19 3.121 1.891 6 Slum Improvement zone 16.245 0.245 0.148 7 Traffic and Transportation
Zone 32.59 0.491 0.297
TOTAL :- 6639.532 100.000 60.585 UNDEVELOPED AREA 0.000
1.
Regional Park 498.749 11.547 4.551
2.
Forest 2233.06 51.698 20.376
3.
Mangroves 558.205 12.923 5.094
4.
NDZ 323.411 7.487 2.951
5.
NDZ ( Due to 50m / 100m buffer zone from Mangroves & Creeks respectively
251.155 5.814 2.292
6.
Creek 454.888 10.531 4.151
TOTAL :- 4319.468 100.000 39.415 Total Developed + Undeveloped
area :- 10959.000 100.000

123
10.8.1. Residential Zone:
The residential zone is generally proposed so as to accommodate
projected population at the end of plan period i.e. for the year 2038. The density
of population is generally considered as 250 tenements per hectare. For this
Draft DP, density of population is considered as 350 tenements per hectare. The
spread of residential zone should be such that the corporation should be able to
extend the infrastructure at minimum cost. In other words, the extent of zoning
should be compact. This also helps in developing the effective mass
transportation system. However, other side of the coin is that the lands in urban
area are always under pressure of development because of so many reasons. If
these lands are prohibited from development legally, it tends to un-authorized
development and the problem becomes manifold. Moreover, supply of more
residential land in the market helps in creation of more housing stock which
ultimately helps in keeping the prices under control. Therefore, zoning needs to
be proposed rationally. In this Development Plan.
While proposing for residential zone following aspects are also
taken into consideration.
a) Trend of development
b) Contiguity with existing or proposed development
c) Vicinity to major road links
d) Major existing or proposed work centers
e) Physiographic of the area
10.8.2. Commercial Zone:
In the city where there is predominant commercial activity, such areas
have been shown in Development Plan in commercial zone. In addition to this,
sites reserved for commercial purposes like municipal markets, shopping
centers, vegetable markets, etc., are shown in commercial zone. Some sites are
reserved for Municipal Markets in the Development Plan.

124
10.8.3. Industrial Zone:
In the sanctioned Development Plan, 2161.01 Hectares of land was
shown in industrial zone which includes Nodes such as Airoli, Ghansoli,
Koparkhairane, Vashi, Sanpada and Nerul and industrial township under MIDC’s
jurisdiction.
No more lands have been zoned for industrial purpose. This
Development Plan also envisages the provision for allowing
residential/commercial use in industrial zone subject to some conditions as per
Govt. notification dated 20/08/2018 and notifications issued by Govt. from time
to time.
10.8.4. Public, Semi-Public Zone:
The lands which are predominantly being used for public semi-public
activities like premises of Government and Semi Government offices, educational
institutions, health facilities, etc. and reservations for public semi-public purpose
are shown in public semi-public zone.
10.8.5. NDZ / Hill top hill slope.
Under UDD’s order dated 14th November, 2017 which was issued by
Govt. under section 154 of said Act, it has been categorically mentioned that 100
ft. distance from hill top/ hill slop shall be observed and these set back shall be
shown in No Development Zone/ open space reservation. This land under
setback shall be used for layout open space, internal road. Considering this
direction, specific provision has been made in UDCPR-2020. (Since this set back
is not part of reservation and therefore, not under compulsory acquisition)
10.8.6. Green Belt/Buffer Zone around Mangroves:
There are two creeks, i.e. Thane and Ulve passing through NMMC limit.
Under CRZ notification dated 6th January, 2011, it is mandatory to keep 100 mtrs.
Set back/ buffer zone on both side creeks from HTL and to be shown as NDZ. To
protect environmental under CRZ regulation, 100 mtrs NDZ from High Tide Line
(HTL)is proposed along both sides of these creeks. Under CRZ regulation, no

125
construction is allowed within 100 mtrs From the HTL and therefore, this 100
mtrs Belt is shown as /NDZ in draft DP. (Since this NDZ is not part of
reservation and therefore, not under compulsory acquisition)However this
100 mtrs Buffer zone is reduced upto 50 mtrs by the Govt. of India MoEF & CC’s
notification dated 18/01/2019.This NDZwill be automatically reduced to 50
mtrs as and when final CZMP will be approved by the Govt. of India MoEF & C.C.
as per this notification dated 18/01/2019.And therefore, there would be no
necessity to modify this DP.
In addition to above, where there are identified (and certified by
Competent Authority)mangroves along both side of these creeks/
Nalla’s/Channels or any other place within NMMC limit and to protect these
mangroves, 50 mtrs Buffer zone is also proposed along this mangroves as per
Govt. directives dated 13th Nov. 2018 (which was issued by Govt. under section
154 of said Act) and the direction issued by Mumbai High Court in this regard.
This buffer zone is not part of reservation and therefore, not under
compulsory acquisition. this buffer zone is subject to Govt. direction and
Hon. High Court directions issued from time to time.
In addition to above, it is also proposed that all areas under high
tension line (Tata Power/MSEB or any other Power Co.) to be shown as green
belt in draft DP where 3.0 M. wide cycle track will be allowed.
10.8.7. Water Bodies:
There are 24 lakes existing in NMMC area which are shown as water
bodies in the Development Plan.
The area covered under water bodies (which includes lake also) is
934.32 Hectares, which constitute 8.52 % of the total area.
10.8.8. Forest Land
The forest lands are shown as it is, which admeasures about 2200.00
Hectares and constitutes 20.07% of the total area. These are at Adavli-Bhutavali,
Parsik Hill ranging from Belapur to Digha and MIDC area.

126
10.8.9. Transportation network
A comprehensive transportation network is proposed in the Development
Plan. There are National and State Highways passing through the city.
In order to facilitate redevelopment of CIDCO constructed building &
considering the permissible potential of the Plot as mentioned in UDCPR in
relation with width of the road. Necessary Road widening is proposed to road
abutting CIDCO constructed buildings.
10.8.10. National Highways:
Mumbai – Pune NH4 (passes through Vashi – CBD Belapur)
Uran – Panvel NH4B (passes through CBD Belapur)
10.8.11. State Highways:
Thane-Belapur – Pune ling High SH48 (passes through Airoli – CBD
Belapur)Following are the major road links proposed in the Development
Plan which connects the different parts of the city and also to Highways.
10.8.12. Major links :
i. 60mtrs wide Palm Beach bypass road. (Passing through Airoli-CBD
Belapur along costal stage towards west). In this60mtrs. wide road, it is
also proposed to earmark 15mtrs.wide service road on both side of Palm
Beach so that no direct entry or exist will be allowed on Palm Beach road.
However, within service road cycle track with 3 M maximum wide shall
be allowed.
ii. Proposed 50 m wide Airoli-Katai via Shil phata
It is already proposed in Draft DP as clarified in Table No. 35.
iii. Turbhe-Mahape-Kalyan link road.
It is already proposed in Draft DP as clarified in Table No. 35.
In addition to this, road networks of 9m roads are also proposed.
Following table shows the road length in kilometers of each type of roads as
under.

127
Table 60: Length of proposed Roads in Draft DP (width wise).
Sr. No. Width of Road in Meters
Total Length of Road in km.
Remark
1. 6 4.49
2. 8 0.29
3. 9 8.65
4. 11 0.28
5. 12 7.42
6. 15 47.07
7. 18 21.33
8. 20 6.67
9. 24 4.40
10. 30 3.29
11. 34 1.67
12. 38 0.45
13. 40 0.57
14. Coastal Road 28.00
Total 134.58
It is expected that this comprehensive road network will improve the
connectivity and facilitate the transportation. Further, these roads should have
provisions for pedestrian way and construction of road should be undertaken
accordingly in future. For this purpose road section for proposed roads are annexed in
this report as Map Nos. 12 to 17. These sections may be suitably modified if mass rapid
transportation system is implemented on these roads.
10.9. Development Control Regulation:
Government of Maharashtra, Urban Development Department vide notification
dated 2nd December, 2020 has sanctioned Unified Development Control &
Promotional Regulation for all the planning authorities areas (Excluding some
authorities) as ameneded from time to time shall be applicable to New Mumbai
Municipal Corporation.

128
10.10. Social Amenities:
To ensure orderly development of the city, land use zoning, traffic
transportation network and development control are the foremost important aspects,
that needs to be taken care in Development Plan. However, Development Plan also aims
at creating an environment to enable the residents to enjoy the desired standard of
living conditions. For that purpose, various amenities need to be created through
Development Plan. Reserving the land for such amenities is first primary step in this
regard. However, acquisition of these sites should not go beyond the financial capacity
of the planning authority.
Provisions of section 31(5) stipulates that if a Development Plan contains
any proposal for the designation of any land for a purpose specified in clause of (b) and
(c) of section 22, and if such land does not vest in the planning authority, the State
Government shall not include that purpose in the Development Plan, unless it is
satisfied that the Planning Authority will be able to acquire such land by private
agreement or compulsory acquisition not later than 10 years from the date on which
the Development Plan comes into operation.
From the provisions, it is very clear that the reservation of sites for public
amenities should be such that it is within the capacity of the Planning Authority to
acquire these sites within a period of 10 years. Moreover, issue of maintaining of these
amenities is of more importance than creation of amenities. Many created amenities
remain unused because of improper maintenance and lead to misuse in many cases.
Therefore, amenities need to be created at threshold level.
Now a days it is becoming a matter of more concern to the land owners, whose lands
are reserved in the Development Plan. They invariably appose to such reservation
which gives rise to public agitation against the Development Plan. Imposing of
reservation also creates inequality amongst the persons. This problem is aggravating
day by day. Keeping this in mind, the amenities are proposed.

129
10.11. Rearrangement of Existing Recreational Open Space / Garden / Play
Ground / Other amenities:
Urban Development Department, Govt. of Maharashtra vide letter dated
11th September, 2019 has approved the policy of rearrangement of Existing Recreational
Open Space / Garden / Play Ground / Other amenities accordingly in case of
redevelopment of old & dilapidated building as envisaged under Unified Development
Control & Promotional Regulation no. 10.10.2 or 7.6 as the case may be, the existing
recreational open spaces / Play Ground / Gardens in the condominium / plots shown in
the nodal plan / Development Plan shall be rearranged along with existing road if any
without decreasing in area with the consent of societies / federation and CIDCO for
which separate modification proposal to Development Plan / Unified Development
Control & Promotional Regulation will not be necessary.
10.12. Rearrangement of Existing School Buildings on Adjacent Play
Ground for Reconstruction of School Buildings:
Urban Development Department, Govt. of Maharashtra vide letter dated
13th July, 2020 has approved CIDCO’s policy dated 13 December, 2018 of
rearrangement of School Buildings on adjacent play ground. Accordingly
rearrangement of existing old & dilapidated school buildings on adjacent play ground
shall be permissible as per the terms & conditions mentioned in the policy within Navi
Mumbai Municipal Corporation area also. In such cases separate modification proposal
to Development Plan / Unified Development Control & Promotional Regulation will not
be necessary.
10.13. City Level Amenities:
It is necessary to make grouping of amenities that would necessarily be
created through Development Plan and that would likely to be created by private
sector. Some specific amenities like town level parks, playground can only be created
through the proposals of Development Plan because such amenities may not be created
through any other means if lands not reserved in Development Plan. Moreover, the
lands for public utilities like water supply and sewage installation, solid waste
management, cremation and burial ground, need to be earmarked in the Development
Plan because these activities are more or less location specific and land for them, at

130
particular location, may not be available in future. Therefore, emphasis is given only to
reserve land for such type of purposes and various provisions have been made thereby
making acquisition / development of such land simpler and beneficial to both, owner
and Planning Authority. Considering the various studies carried out in this regard, the
planning standards adopted for making provisions of these amenities are given in
following table.
Table61: Planning Standard Adopted.
The Planning Standards adopted while framing the proposal are as CIDCO’s
Planning Standards.
Sr. No.
Purpose Planning Standards adopted by CIDCO
Required Area in Ha
1 2 3 4
RG
a Garden
0.3 ha per 1000 population 699.00
b Play Ground
c Open Space
d Tree Belt
e RG
f Indoor recreation 0.3 Ha per 1,00,000 population 6.99
g Sport Complex 5.0 Ha per 5,00,000 population 23.30
Total :- 729.29
PUBLIC PURPOSE
Educational
a High School / Primary School 0.4 ha per 10170 Population. 91.64
b College
Degree college 1 ha for 125000 population.
18.64
Proff. college 2 ha for 125000 popu.
37.28
c Residential School Residential school 5 ha 600000 population.
19.42
d University 1 City 50 ha/ 0.13 m2 per capita.
30.29
Total :- 197.27

131
Health
a Nursing Home Nursing home 0.15 ha for 25000 population. 13.98
b Hospital 0.5 Ha as per 1,00,000 population. 11.65
c Super Specialty 2 ha for 250000 population 18.64
Total :- 44.27
Religious
Total :- 34.95 Cultural
a Cultural & Linguistic 0.60 ha per 100000 population 13.98
b Community Centers 0.20 ha per 100000 population 4.66
c Auditorium 0.40 ha per 400000 population 2.33
d Central Library 4.00 ha per 2000000 population.
4.66
Institutional
a Professional Scientific and other Institutions 8.30 ha per 100000 population 193.39
b Working Women’s Hostel 0.30 ha per 100000 population 6.99
c Other Hostels 0.30 ha per 100000 population 6.99
d Museum 2.00 ha per 500000 population 9.32
e Film studio city 80 ha. 80.00
Total :- 296.69
Other Users
a Police Station
As Per NMMC Requirement
b Police comm. office
c Municipal office
d Fire Station
e Post Office
f Telephone Exchange
Total :-

132
PUBLIC UTILITY
a MSEB/ESS
As Per NMMC Requirement
b E.S.R. / G.S.R./M.B.R.
c C.G & B.G
d Sewage Treatment Plant
e Dumping Ground
f Public utility
g Toilet
Total :-
COMMERCIAL
a Vegetable Market/Fish Market/Mutten Market ,Shopping Centre&Stall
As Per NMMC Requirement
Total :-
TRANSPORT
a Bus Stand &Depot BT
As Per NMMC Requirement b Parking / Truck Terminal
c Taxi Rickshaw Parking
Total :-
10.14. Other Amenities:
Other amenities include education, health, markets, library and parking etc.
The share of amenities like education, health, commercial, etc., have been taken over to
great extent by private sector. Still, some share of primary and secondary education,
public health will have to be borne by the Corporation. Some amenities like vegetable
market will have to be provided by the Corporation. This Development Plan envisage
to part with some percentage of the land, as amenity space to the Corporation at the
time of development permission by the owner/ developer in lieu of in-situ FSI or TDR
to make land available for such amenities. The owner/ developer has also been given
choice of constructing some specific amenities if he desires so.

133
10.15. Proposed reservation for city level Amenities:
The Table-A annexed to this report gives the details about every site
reserved in this revised Development Plan. The Table also gives the details about the S.
No / C.T.S No/ F. P. No, etc. of the site, its area, its approximate cost of acquisition and
probable cost of development, appropriate authority for whom the site has been
reserved in Development Plan etc. Each of the site so reserved has been distinctly
shown on the purposed land use plan with red verge, indicating the purpose of amenity
and its number corresponding to that shown in this table.
The Table-A annexed to this report gives the requirement of site for various
amenities for projected population of 23.30 Lakhs as on 2028, existing amenities and
proposed amenities in this Development Plan.
10.16. Sustainable development – Provision of Cycle track:
To contribute to the sustainable development of the city, it is also
proposed to allow cycle track in green belt areas which are shown under High
Tension Line (Tata power/MSEB or any other power co.) in draft DP.

134
CHAPTER 11: IMPLEMENTATION OF DEVELOPMENT PLAN
11.1. General:
This draft Development Plan is prepared for the horizon year of 2038 and
contains land use zoning proposals for projected population of 28 lacks for the said
year. It also contains amenity sites for the projected population of 23.30 lakhs for the
year 2028. The plan period is 2018 – 2038.
The implementation of Development Plan proposals particularly reserved sites
and proposed roads, has been the issue of more concern for all local bodies, years
together. It is seen that, implementation of the Development Plan proposals had been,
most of the time, beyond the financial capacity of local bodies and is disproportionate to
the income of the local bodies. This aspect is well taken care of in this Development Plan
and provisions made in this regards will lead to better, satisfactory and remarkable
implementation of the Development Plan. The analysis in this regard, is enumerated in
following paragraphs.
There are mainly three components which constitute implementation of Development
Plan.
1. Zoning.
2. Road Network.
3. Sites for social amenities and public utilities.
The land use zoning is provided in the plan. As development progresses, it is
guided by these proposals and no financial aspect is involved in this implementation.
The land under proposed roads is to be acquired but much of the land can
be obtained through approval of layouts in residential zone. Some road lands will need
to be acquired independently. However, the problem is more serious with acquisition of
land under sites reserved for social amenities and public utilities. There are four ways
to acquire such land i.e.
1. Through Town Planning schemes (TPS),
2. Acquisition through monetary compensation,
3. Development of reservation through accommodation reservation principle
(AR).
4. In lieu of transferable development rights (TDR).

135
11.2. Cost of Development Plan Proposals:
The cost of various proposals of Development Plan has been worked out in
Table-A. The cost of the land is worked out on the basis of Govt. policy bearing
No.NMQ/1092/1045/CR-121/92/UD-20 Dated 6th January, 1994 (for CIDCO
land)&rates given in Annual Statement of Rates of Registration department (for
private land).This policy is self explanatory, which was issued by Govt. in exercise of
the powers conferred by Article 201(i) of the Memorandum of Association and Articles
of Association of the CIDCO. It has been categorically mentioned that the NMMC being a
Planning Authority under the Maharashtra Regional and Town Planning Act.1966 has to
do the planning for the areas covered by it and being a local municipal body under the
Maharashtra Municipal Corporation Act.1949 (MMC Act.) has the obligatory duty to
provide civic services to the residents of the NMMC for which it needs lands/plots
reserved for public purposes under the Development Plan of Navi Mumbai Municipal
Corporation Mumbai and, as such, are a matters involving substantial public interest.
The Govt. vide said order Directed CIDCO to handover (Transfer) the lands/Plots
reserved for public purpose in the Development Plan of Navi Mumbai to NMMC
immediately subject to conditions mentioned therein In the said order, it has been
further mentioned that Govt. will further guarantee to the CIDCO in respect of the
payment for such plots as are reserved for Hospitals, Dispensaries and Community
Health Centres, CIDCO may work out the amount involved in respect of this transaction
and submit a proposal to Govt. for consideration.
The minimum cost required for development of amenity is also work out in
the said statement. So far as the planning authority is concerned, the total approximate
cost of mere acquisition of all the sites for implementing the Development Plan works
out to be Rs. 1763.92 crores. Another Rs. 6824.87 crores will be required towards the
cost of development / construction envisaged in these sites. Thus, total approximate
cost of acquisition and development of the sites, to the planning authority will be
around Rs. 8588.79 crores. Since, provision of TDR is made more rational and lucrative,
it is expected that most of the land under roads will be obtained through this tool.
However, approximately, 60% of the road land (98.27kms.+Costal Road) will have to
acquired and developed by the Municipal Corporation. The approximate cost of

136
acquisition / construction of roads and other related works will be around Rs. 2000
crores (including Costal Road). The total cost of the plan, will be about Rs. 10588.79
crores. This will be subject to escalation due to passage of time, but income of the
Corporation will also increase proportionately.
11.3. Implementation through Town Planning Schemes:
The provisions of town planning scheme under the said Act have been
amended recently which will enable the execution of scheme smoothly & efficiently.
Navi Mumbai area is already developed by CIDCO with proper layout with
infrastructure / social amenities and therefore it will not be desirable to adopt town
planning scheme and therefore, IMPLEMENTATION THROUGH TOWN PLANNING
SCHEMES is dropped.
11.4. Implementation through Accommodation Reservation Concept:
Accommodation reservation concept envisages development on fixed
percentage of area of the reservation and hand it over to the planning authority in lieu
of FSI and allows development of remaining land under reservation by the owner for
the use permissible in adjoining zone. This Development Plan has brought out effective
changes in this regulation which entitle the owner FSI/TDR of surrendered land and
construction as provided in TDR regulations. Moreover, FSI utilization limits on the
remaining land of the reservation, also have been protected.
As per sanctioned Unified Development Control & Promotion Regulations
Chapter – 11 provisions are made for acquisition and development of reserved sites in
development plans, which is self-expiatory and therefore, needs to be adopted by
NMMC.
11.5. Implementation through Monetary Compensation:
The reserved land can be acquired by paying monetary compensation by
negotiation or by compulsory land acquisition under The Right to Fair Compensation
and Transparency in Land Acquisition, Rehabilitation and Resettlement Act, 2013. The
development/ construction cost of amenity is to be borne by the planning authority.

137
The income - expenditure chart is given in Table C-1 and C-2. The municipal income for
last five years is as below.
Table 62: Municipal Finance Revenue (Rs.in crores).
Sr.No. Ref. Year (Last 5 Years) Total Tax revenue
1 2013-14 1164.50
2 2014-15 1242.04
3 2015-16 1525.98
4 2016-17 1639.88
5 2017-18 1914.19
The Government, vide resolution dated 11 December, 2014, has directed all
planning authorities to reserve 20% of the municipal finance for implementation of
the Development Plan. Considering the revenue receipt of Rs. 1914.19 crores for the
year 2013-14, the 20% amount to be earmarked for this purpose will be Rs. 382.84
crores. The amount which can be utilized in the span of 10 years shall be Rs. 38.284
crores. Here, escalation in the cost of plan is not considered because revenue receipt of
the corporation is bound to increase every year which will ultimately increase the 20%
share to meet the escalated cost.
The amenities are to be expected to be constructed within span of 10 years,
however, road development may continue up to span of 20 years. Therefore, this
difference of burden can be met from the yearly budget beyond 10 years. Hence, the
expenditure for implementation of Development Plan seems to be within the capacity
of Municipal Corporation. In addition to this, resources can be mobilised to create
buffer amount to meet the contingencies arising during implementation.
11.6. IMPLEMENTATION THROUGH TRANSFERABLE DEVELOPMENT RIGHTS
More than 90% of the land within the jurisdiction of Navi Mumbai belongs to
CIDCO as per the regulations mentioned in chapter 11 of UDCPR. Hence in future
attempts will be made to acquire the reserved land in lieu of TDR.

138
11.7. Implementation through Resource Mobilization:
11.7.1. Provision of premium
As per sanctioned Unified Development Control & Promotion
Regulations premium for additional FSI, Ancillary FSI, Premium in lieu of TDR
etc. will be charged.
11.7.2. Development Charges
The development charges are to be levied as per section 124(A) of
the said Act for development permissions. The charges collected under this
section for the preceding two years i.e. 2016-2017, 2017-2018& upto January,
2019 are Rs. 2.17 crores, Rs.16.60 crores & Rs.20.18 crores respectively. This
average amount of Rs.20.00 crores can also be utilized for the implementation
which will be part of 20% amount to be spared by the Corporation from the
budget, for implementation of Development Plan as stated above.
11.7.3. Other charges
Other charges like premium for scrutiny fees, compounding charges
to be levied under section 143 of said Act etc. will also generate good revenue. In
this context, NMMC has already formulated policy & issued circulars on 3rd
December, 2018 by which premium chargeable for various features of building
has been revised i.e. balcony, scrutiny fees, internal changes/ addition alteration,
security deposit.
Due to this NMMC’s policy/circular, it is expected that Rs.100 Cr. Per
year may be generated & which can be utilized for development of
infrastructure/ civic ammonites.
11.7.4. Implementation by public participation
It is possible that instead of shouldering entire burden of creation
and maintenance of amenity by the Corporation, this work may be entrusted to
willing private institutions which are engaged in similar activities. The modalities

139
can be worked out for such a venture. Amenities like garden, road street
furniture etc. may also be developed under this concept.
Reserving 20% of the municipal income, in normal course, may be
difficult. However, new avenues which are opened for resource generation will
definitely enable the corporation to spare 20% of fund for implementation of
Development Plan.
All these measures will lead to successful implementation of
Development Plan.
11.8. Need for monitoring:
At present implementation of Development Plan is not monitored by
separate cell though, it is of utmost importance. Creation of better amenities through
Development Plan enhances the quality of the life of the citizens. Therefore, this aspect
needs to be taken seriously. The aspects like types of amenities to be created
immediately, course of action to be adopted for acquisition and development of
reserved land, selection of the new road linkages to be taken on priority, augmentation
of resources, etc. need to be monitored frequently and for that purpose a devoted cell
is required on permanent basis and will be created under administrative control
of Town Planning Department.
11.9. Programming:
A phased Program for implementation of reservations in the Development
Plan for the various civic amenities is mentioned in Table-B and is annexed to this
report. This Program is prepared after taking into consideration necessity of various
amenities and possible availability of funds to meet the expenditure. The municipal
commissioner shall be at liberty to vary this list as an when exigency arises.
11.10. Conclusion:
Navi Mumbai is one of the most important and fastest growing city in
Maharashtra. It is closed to Mumbai City which is capital of Maharashtra State
&financial capital of India. It is situated along southern coastal stretch & surrounded by

140

141
Table-A
Statement showing list of reservations for amenities and their cost of acquisition and development.
AIROLI NODE
Sr. No.
Sector No.
Plot no / Survey No
Approx. Area in sq.mt.
New Site No. Final Proposed Reservation
Land Status Planning Authority
Approx Land Acquisition Cost [Rs.]
Approx. Construction Cost
[Rs.] 1 1A 116 3667.87 A-1 Garden CIDCO NMMC 0.00 9763869.94
2 1A 5 383.96 A-2 Toilet CIDCO NMMC 0.00 11243116.72
3 1A 6,7 312.58 A-3 Parking CIDCO NMMC 860767.18 9152967.56
4 1 3 186.10 A-4 Hospital CIDCO NMMC 512472.88 5449380.20
5 1 47, 48, 49 & 50 335.28 A-5 Educational CIDCO NMMC 3693109.20 9817668.96
6 1 52-59 1732.06 A-6 Play Ground CIDCO NMMC 0.00 4610743.72
7 3 98A 461.37 A-7 Parking CIDCO NMMC 1270497.64 13509836.34
8 3 98C, 98D 193.67 A-8 Parking CIDCO NMMC 533318.76 5671044.94
9 3 99 97.93 A-9 Library CIDCO NMMC 269674.74 2867586.26
10 3 182A 112.40 A-10 Parking CIDCO NMMC 309521.50 3291296.80
11 3 261C 173.58 A-11 Parking CIDCO NMMC 477995.93 5082769.56
12 3 122A 146.20 A-12 Market NMMC NMMC 0.00 4281028.40
13 3 32 [Part},33A 1462.65 A-13 Parking CIDCO NMMC 4027772.44 42829317.30
14 3 36,37,38 3638.57 A-14 E.S.R./G.S.R & Garden
NMMC NMMC 0.00 106544606.74

142
Sr. No.
Sector No.
Plot no / Survey No
Approx. Area in sq.mt.
New Site No. Final Proposed Reservation
Land Status Planning Authority
Approx Land Acquisition Cost [Rs.]
Approx. Construction Cost
[Rs.] 15 4 79,80 226.26 A-15 Municipal Purpose CIDCO NMMC 623063.48 6625345.32
16 4 Near Condominium
No. 16
203.59 A-16 Parking CIDCO NMMC 560635.96 5961522.38
17 4 T-160 & Open Land
665.83 A-17 Parking CIDCO NMMC 1833529.36 19496834.06
18 4 221 [PART] 64.79 A-18 Parking CIDCO NMMC 178415.46 1897180.78
19 6 8A/1 396.27 A-19 Parking CIDCO NMMC 0.00 11603578.14
20 6 28/8G 642.71 A-20 Municipal Purpose CIDCO NMMC 1769862.66 18819834.22
21 6 8B,8C 427.60 A-21 Market / Stall CIDCO NMMC 0.00 12520983.20
22 6 8/8 359.70 A-22 Parking NMMC NMMC 0.00 10532735.40 23 6 30 13229.64 A-23 Bus depot NMMT NMMC 0.00 387390318.48
24 6 33 1280.12 A-24 Night Shelter/Oldage
Home
CIDCO NMMC 3525130.45 37484473.84
25 8A 109 1439.52 A-25 M.S.E.B. CIDCO NMMC 0.00 0.00
26 8A 110 / 111 1999.96 A-26 Education & Training Centre
CIDCO NMMC 22029559.40 58562828.72
27 8A 113 2630.23 A-27 Garden CIDCO NMMC 0.00 7001672.26
28 8A 97 204.10 A-28 Parking CIDCO NMMC 562040.38 5976456.20
29 8A 94 995.94 A-29 Nursing Home CIDCO NMMC 2742569.78 29163115.08
30 8A 116 1194.75 A-30 Police station CIDCO NMMC 0.00 0.00

143
Sr. No.
Sector No.
Plot no / Survey No
Approx. Area in sq.mt.
New Site No. Final Proposed Reservation
Land Status Planning Authority
Approx Land Acquisition Cost [Rs.]
Approx. Construction Cost
[Rs.] 31 8A 86 1243.21 A-31 Garden CIDCO NMMC 0.00 3309425.02
32 8A 79 103.37 A-32 Parking CIDCO NMMC 284655.14 3026880.34
33 8A 74,75 2791.03 A-33 Community Center CIDCO NMMC 7685798.86 81726940.46
34 8A 65 1895.64 A-34 Municipal Staff Quarter
CIDCO NMMC 20880474.60 55508130.48
35 8A 17 to 20 & 22 944.31 A-35 Market CIDCO NMMC 0.00 27651285.42
36 8A 33 618.45 A-36 Public Utility CIDCO NMMC 0.00 18109452.90
37 8A 28 399.64 A-37 Urban Health Post CIDCO NMMC 1100508.65 11702258.48
38 8A 39 1381.48 A-38 Garden CIDCO NMMC 0.00 3677499.76
39 8A 24,25,37A+37/3 1907.02 A-39 Parking CIDCO NMMC 5251456.33 55841359.64
40 9A 50,51 295.35 A-40 Parking CIDCO NMMC 813320.06 8648438.70
41 -- --- 523.00 A-41 Community Centre CIDCO NMMC 1440211.25 15314486.00
42 9 E 73, 74, 75, 76 759.60 A-42 Open Space CIDCO NMMC 0.00 2022055.20
43 9 E --- 593.86 A-43 Fish & Vegetable Market
CIDCO NMMC 0.00 17389408.52
44 10A 1 [PART] 188.32 A-44 Parking CIDCO NMMC 518586.20 5514386.24
45 10A 3 1143.88 A-45 Market CIDCO NMMC 0.00 33495094.16
46 10A 5 8243.29 A-46 Bus Terminus CIDCO NMMC 22699959.84 241380017.78
47 10A 12,14 6947.24 A-47 Parking CIDCO NMMC 19130962.15 203429081.68

144
Sr. No.
Sector No.
Plot no / Survey No
Approx. Area in sq.mt.
New Site No. Final Proposed Reservation
Land Status Planning Authority
Approx Land Acquisition Cost [Rs.]
Approx. Construction Cost
[Rs.] 48 10A 17 6725.70 A-48 TERI CIDCO NMMC 0.00 0.00
49 10A 16 5763.40 A-49 Play Ground CIDCO NMMC 0.00 15342170.80
50 10A 15 3559.62 A-50 School NMMC NMMC 0.00 104232792.84
51 10A OPEN LAND 8431.28 A-51 Garden CIDCO NMMC 0.00 22444067.36
52 10A 35 to 38 12116.26 A-52 Parking CIDCO NMMC 33365150.98 354788325.32
53 10A 39 to 53 48684.74 A-53 Laser Park & Botanical Garden
CIDCO NMMC 0.00 129598777.88
54 10A 25 to 34, 54 to 77 139349.00 A-54 Medical College N.M.M.C Super
speciality Hospital
CIDCO NMMC 383732308.75 4080417418.00
55 11 2 10302.37 A-55 Public Ground CIDCO NMMC 0.00 27424908.94
56 12 2 490.56 A-56 Urban Health Post CIDCO NMMC 1350879.60 14364577.92
57 12 3 3217.90 A-57 High School CIDCO NMMC 35445168.50 94226547.80
58 12 4 4335.13 A-58 Play Ground CIDCO NMMC 0.00 11540116.06
59 14 7 4188.32 A-59 Play Ground NMMC NMMC 0.00 11149307.84
60 13 6A,6B 1793.43 A-60 Cultural Centre CIDCO NMMC 4938657.86 52515217.26
61 13 6 2145.95 A-61 Hospital CIDCO NMMC 5909409.81 62837707.90
62 13 2,3 8066.50 A-62 Research Centre CIDCO NMMC 22213124.38 236203253.00
63 17 23 436.52 A-63 Community Centre CIDCO NMMC 1202066.95 12782178.64

145
Sr. No.
Sector No.
Plot no / Survey No
Approx. Area in sq.mt.
New Site No. Final Proposed Reservation
Land Status Planning Authority
Approx Land Acquisition Cost [Rs.]
Approx. Construction Cost
[Rs.] 64 18 3 2102.69 A-64 Library CIDCO NMMC 0.00 61570968.58
65 18 10,/3 5546.10 A-65 Telephone Exchange
CIDCO NMMC 0.00 0.00
66 18 10,/4 1040.25 A-66 Public Utility CIDCO NMMC 0.00 30460600.50
67 19 10 1174.61 A-67 Garden NMMC NMMC 0.00 3126811.82
68 19 12 6277.30 A-68 Play Ground NMMC NMMC 0.00 16710172.60
69 19 13 1643.44 A-69 Extension to existing school
CIDCO NMMC 0.00 48123210.08
70 19 62,63,64 3844.56 A-70 Hospital CIDCO NMMC 10586957.10 112576405.92
71 19 74 42379.72 A-71 Municipal Purpose NMMC NMMC 0.00 1240962961.04
72 20 -- 3102.50 A-72 Municipal Purpose CIDCO NMMC 34174037.50 90847405.00
73 20D -- 1223.93 A-73 Parking CIDCO NMMC 3370397.24 35839118.26
74 20D D13 1008.04 A-74 Market CIDCO NMMC 0.00 29517427.28
75 20C C-14,C-17/1 2756.79 A-75 Parking CIDCO NMMC 7591510.46 80724324.78
76 20C C-15 745.62 A-76 Play Ground CIDCO NMMC 0.00 1984840.44
77 20C C-16/1, C-13/2 2213.05 A-77 Garden NMMC NMMC 0.00 5891139.10
78 20C C-12 1010.73 A-78 Crematorium Ground
CIDCO NMMC 2783297.74 2690563.26
79 20B 47, 48 1453.37 A-79 Children Park NMMC NMMC 0.00 3868870.94

146
Sr. No.
Sector No.
Plot no / Survey No
Approx. Area in sq.mt.
New Site No. Final Proposed Reservation
Land Status Planning Authority
Approx Land Acquisition Cost [Rs.]
Approx. Construction Cost
[Rs.] 80 20B 85 3994.30 A-80 Public Ground NMMC NMMC 0.00 10632826.60
81 20A 3,4,6 5817.14 A-81 Fire Station CIDCO NMMC 16018949.28 170337493.48
82 Airoli Gaon
Gat No.4 [Part] 3333.28 A-82 M.S.E.B. CIDCO NMMC 0.00 0.00
82 10A 81 5267.05 A-83 Municipal Purpose CIDCO NMMC 14504138.94 154229758.10
702771925.33 8964860577.64
GHANSOLI NODE
Sr. No.
Sector No.
Plot no / Survey No
Approx. Area in sq.mt.
New Site No. Final Proposed Reservation
Land Status Planning Authority
Approx Land Acquisition Cost [Rs.]
Approx. Construction Cost
[Rs.]
1 1 25/1 160.00 G-1 Parking CIDCO NMMC 382000.00 4685120.00
2 1 119/1 320.00 G-2 Parking CIDCO NMMC 764000.00 9370240.00
3 1 213/1 164.32 G-3 Parking CIDCO NMMC 392314.00 4811618.24
4 1 240/1 164.00 G-4 Parking CIDCO NMMC 391550.00 4802248.00
5 1 335/1 302.80 G-5 Parking CIDCO NMMC 722935.00 8866589.60
6 2 Adj. Darga plot no 9 part
3964.77 G-6 Parking CIDCO NMMC 9465876.44 116096248.73
7 2 Adj to Santoshi Mata Temple
14464.00 G-7 Beautification pond & Garden
CIDCO NMMC 0.00 38503168.00
8 2 1,2 & 3 1368.76 G-8 Market CIDCO NMMC 0.00 40080030.32
9 3 Between plot no 2 & 23
2294.56 G-9 Parking CIDCO NMMC 5478264.39 67189335.20

147
Sr. No.
Sector No.
Plot no / Survey No
Approx. Area in sq.mt.
New Site No. Final Proposed Reservation
Land Status Planning Authority
Approx Land Acquisition Cost [Rs.]
Approx. Construction Cost
[Rs.]
10 3 Between plot no 16 & 18
1599.98 G-10 Parking CIDCO NMMC 3819949.86 46850585.08
11 3 Between plot no 12 & 13
1985.56 G-11 Municipal Purpose CIDCO NMMC 4740514.95 58141050.79
12 4 526 570.07 G-12 Market CIDCO NMMC 0.00 16692789.74
13 4 247 548.70 G-13 Market CIDCO NMMC 0.00 16067004.12
14 4 216 695.00 G-14 Market CIDCO NMMC 0.00 20350990.00
15 6 18, 19 & 20 829.73 G-15 Parking CIDCO NMMC 1980980.38 24296153.86
16 6 15 284.49 G-16 Parking CIDCO NMMC 679219.88 8330436.18
17 6 56 1824.03 G-17 Market CIDCO NMMC 0.00 53411246.46
18 6 55 2817.29 G-18 Community Center
CIDCO NMMC 6726279.88 82495885.78
19 6 34 134.26 G-19 Parking CIDCO NMMC 320545.75 3931401.32
20 6 1 12592.06 G-20 High School & Collage
CIDCO NMMC 120254153.90 368720642.36
21 7 23 1777.27 G-21 Parking CIDCO NMMC 4243227.35 52041961.58
22 7 9 & 10 1658.33 G-22 Cultural / Community
Center
CIDCO NMMC 3959255.71 48559131.21
23 7 6 & 7 1418.24 G-23 Hospital CIDCO NMMC 13544192.00 41528903.68
24 8 16 & 17 6131.55 G-24 Municipal Ward Office
CIDCO NMMC 14639080.40 179544105.66
25 8 22 5089.48 G-25 Auditorium / Drama Theoter
NMMC NMMC 0.00 149030211.92
26 8 9 Part 498.61 G-26 Parking CIDCO NMMC 1190431.38 14600298.02
27 8 9 103043.25 G-27 Recreational open space
CIDCO NMMC 0.00 274301131.50

148
Sr. No.
Sector No.
Plot no / Survey No
Approx. Area in sq.mt.
New Site No. Final Proposed Reservation
Land Status Planning Authority
Approx Land Acquisition Cost [Rs.]
Approx. Construction Cost
[Rs.]
28 8 9 4000.00 G-28 Parking NMMC 9550000.00 117128000.00
29 8 Plot No 3a,1a,23a
12309.46 G-29 Play Ground CIDCO NMMC 0.00 32767769.21
30 8 23 3493.14 G-30 School CIDCO NMMC 33359525.20 102286242.61
31 9 5 351.66 G-31 Market CIDCO NMMC 0.00 10297220.27
32 9 3 890.56 G-32 Central Medical Store
NMMC NMMC 0.00 26077465.77
33 9 Near Nalla, Sec 9 740.00 G-33 Market CIDCO NMMC 0.00 21668680.00
34 9 Near Nalla, Sec 9 4000.00 G-34 School CIDCO NMMC 38200000.00 117128000.00
35 9 Near Nalla, Sec 9 3360.00 G-35 Play Ground CIDCO NMMC 0.00 8944320.00
36 9 Near Nalla, Sec 9 2650.00 G-36 Community Center
CIDCO NMMC 6326875.00 77597300.00
37 9 Near Nalla, Sec 9 7600.00 G-37 Hospital CIDCO NMMC 72580000.00 222543200.00
38 10 Sector 10 5934.67 G-38 Fire Station CIDCO NMMC 14169015.08 173778889.81
39 10 Sector 10 11498.83 G-39 Parking CIDCO NMMC 27453449.46 336708652.21
40 11 3 & 4 2037.36 G-40 Hostel CIDCO NMMC 19456826.20 59658092.65
41 11 1 & 2 2010.88 G-41 Community Center
CIDCO NMMC 4800976.00 58882588.16
42 12 Sector 12 156935.72 G-42 Sport Complex CIDCO NMMC 374684031.50 417762886.64
43 13 Sector 13 142309.90 G-42 Sport Complex NMMC NMMC 0.00 378828953.80
44 14 Adj to Plot No 1 11287.69 G-43 Garden CIDCO NMMC 0.00 30047825.46
45 14 10 4200.00 G-44 Multipurpose Ground
CIDCO NMMC 0.00 11180400.00
46 15 29 760.17 G-45 Public Utility CIDCO NMMC 1814910.65 22259356.50

149
Sr. No.
Sector No.
Plot no / Survey No
Approx. Area in sq.mt.
New Site No. Final Proposed Reservation
Land Status Planning Authority
Approx Land Acquisition Cost [Rs.]
Approx. Construction Cost
[Rs.]
47 15 24 3677.59 G-46 Play Ground NMMC NMMC 0.00 9789741.92
48 15 25 3887.25 G-47 School NMMC NMMC 0.00 113826454.50
49 15 26 4606.31 G-48 Play Ground CIDCO NMMC 0.00 12261997.22
50 15 27 1003.67 G-49 Garden NMMC NMMC 0.00 2671772.20
51 15 51 917.87 G-50 Hospital CIDCO NMMC 8765648.95 26877040.06
52 16 106 2686.00 G-51 Market CIDCO NMMC 0.00 78651452.00
53 16 Near plot no 1&2,Sect-21
4917.21 G-52 Play Ground CIDCO NMMC 0.00 13089613.02
54 16 Gat.No.152,Ghansoli Gaon
1332.25 G-53 Ext.to Crematorium
CIDCO NMMC 0.00 39011003.06
55 16 Gat.No.170,Ghansoli Gaon
3836.71 G-54 Garden CIDCO NMMC 0.00 10213327.34
56 16 Gat.No.174,175,Ghansoli Gaon
3528.12 G-55 ESR/GSR CIDCO NMMC 8423379.34 103310321.99
57 21 2 3451.64 G-56 School CIDCO NMMC 32963142.90 101070863.92
58 21 1 4246.16 G-57 Play Ground CIDCO NMMC 0.00 11303275.26
59 21 9 651.38 G-58 Parking CIDCO NMMC 1555169.75 19073709.16
60 21 57 393.38 G-59 Community Center
CIDCO NMMC 939194.75 11518953.16
61 21 Near plot no 19,Sect-21
3953.11 G-60 Garden CIDCO NMMC 0.00 10523178.82
62 21 68 238.43 G-61 Parking CIDCO NMMC 569249.24 6981677.98
63 21 76/1 43.36 G-62 Market CIDCO NMMC 0.00 1269667.52
64 21 28 410.84 G-63 Library CIDCO NMMC 980880.50 12030216.88
65 21 17 & 18 1409.44 G-64 Market CIDCO NMMC 0.00 41271251.36

150
Sr. No.
Sector No.
Plot no / Survey No
Approx. Area in sq.mt.
New Site No. Final Proposed Reservation
Land Status Planning Authority
Approx Land Acquisition Cost [Rs.]
Approx. Construction Cost
[Rs.]
66 21 20 71.80 G-65 Market CIDCO NMMC 0.00 2102447.60
67 21 Near plot no 86,Sect-21
2605.01 G-66 Garden CIDCO NMMC 0.00 6934536.62
68 21 Junction of Sect-21
1255.46 G-67 Garden CIDCO NMMC 0.00 3342034.52
69 21 Near plot no 138,Sect-21
5600.62 G-68 Garden CIDCO NMMC 0.00 14908845.12
70 21 80 1974.76 G-69 Parking CIDCO NMMC 4714739.50 57824922.32
71 21 85 1940.47 G-70 Garden CIDCO NMMC 0.00 5165525.82
72 21 115 235.22 G-71 Market CIDCO NMMC 0.00 6887712.04
73 22 Near Crematorium
393.38 G-72 Market CIDCO NMMC 0.00 11518953.16
74 24 27Part, 98Part, 28 Part
25154.00 G-73 Educational CIDCO NMMC 240220700.00 736559428.00
75 24 Survey No 112,Talaivali
8289.17 G-74 School CIDCO NMMC 79161583.05 242723505.22
76 24 Near Gat no.22 ,Talaivali
10721.25 G-75 Play Ground CIDCO NMMC 0.00 28539959.51
77 23 46 3176.20 G-76 Garden CIDCO NMMC 0.00 8455044.40
78 23 Gat no.14,15 Gothivali
5685.83 G-77 Garden CIDCO NMMC 0.00 15135668.81
79 23 5 9387.46 G-78 Multipurpose Ground
CIDCO NMMC 0.00 24989418.52
80 23 44 244.55 G-79 Cultural Center CIDCO NMMC 583863.13 7160913.10
81 23 27,33,34,40 194.00 G-80 Market CIDCO NMMC 0.00 5680708.00
82 27 Sector 27 80096.87 G-81 Beautification pond & Garden
CIDCO NMMC 0.00 213217867.94
83 27 In between Sect 27 & 28
2062.14 G-82 Parking CIDCO NMMC 4923354.48 60383524.92
84 29 Survey No 28 Part
2525.57 G-83 Garden CIDCO NMMC 0.00 6723067.34

151
Sr. No.
Sector No.
Plot no / Survey No
Approx. Area in sq.mt.
New Site No. Final Proposed Reservation
Land Status Planning Authority
Approx Land Acquisition Cost [Rs.]
Approx. Construction Cost
[Rs.]
85 30 Near Gat no.91,Gothivali
7982.03 G-84 STP & SWM CIDCO NMMC 19057101.40 233729861.02
86 30 25 827.94 G-85 Market CIDCO NMMC 0.00 24243826.93
87 30 29 1068.50 G-86 Community Center
CIDCO NMMC 2551041.36 31287787.72
88 30 37 3701.48 G-87 Play Ground CIDCO NMMC 0.00 9853334.44
89 30 30 3227.20 G-88 School CIDCO NMMC 30819769.55 94498899.68
90 30 9 Part, 205 Part 580.04 G-89 Library CIDCO NMMC 1384845.50 16984731.28
91 30 12 Part , 206 Part
2243.34 G-90 Municipal Housing CIDCO NMMC 21423897.00 65689481.88
92 23 Gut No 50 and 48 Part
18454.15 G-91 Multipurpose Ground
CIDCO NMMC 0.00 49124947.30
93 14 1 20000.00 G-92 Proffectional College
CIDCO NMMC 191000000.00 585640000.00
94 14 5 4920.00 G-93 Play Ground CIDCO NMMC 0.00 13097040.00
95 14 6 4000.00 G-94 School CIDCO NMMC 38200000.00 117128000.00
96 14 7 10050.00 G-95 College CIDCO NMMC 95977500.00 294284100.00
97 14 8 5300.00 G-96 Hospital CIDCO NMMC 50615000.00 155194600.00
98 14 9 4000.00 G-97 School CIDCO NMMC 38200000.00 117128000.00
1255127940.73 6587256841.02

152
KOPARKHAIRANE NODE Sr. No.
Sector No.
Plot no / Survey No
Approx. Area in sq.mt.
New Site No. Final Proposed Reservation
Land Status Planning Authority
Approx Land Acquisition Cost [Rs.]
Approx. Construction Cost
[Rs.]
1 1 37 529.75 K-1 Municipal Purpose CIDCO NMMC 1698510.94 15512139.50
2 1 7-A 85.19 K-2 Parking NMMC NMMC 0.00 2494533.58
3 1 8N 48.56 K-3 Market NMMC NMMC 0.00 1421933.92
4 2 7-A 56.05 K-4 Parking CIDCO NMMC 179710.31 1641256.10
5 2 15 323.77 K-5 Parking NMMC NMMC 0.00 9480633.14
6 2 5/A 63.48 K-6 Market NMMC NMMC 0.00 1858821.36
7 2 26 489.37 K-7 Night Shelter NMMC NMMC 0.00 14329732.34
8 2 35 952.01 K-8 Library CIDCO NMMC 3052382.06 27876756.82
9 3 5/B 26.21 K-9 Market CIDCO NMMC 0.00 767481.22
10 3 35 39.98 K-10 Market CIDCO NMMC 0.00 1170694.36
11 3 7-A 84.27 K-11 Parking NMMC NMMC 0.00 2467594.14
12 4 7-A 84.76 K-12 Parking CIDCO NMMC 271761.75 2481942.32
13 4 26 159.14 K-13 Parking CIDCO NMMC 510242.63 4659937.48
14 4 27 489.06 K-14 Community center CIDCO NMMC 1568048.63 14320654.92
15 4A 27 458.00 K-15 Hospital CIDCO NMMC 5873850.00 13411156.00
16 4A 1 part 845.00 K-16 Civic center NMMC NMMC 0.00 24743290.00

153
Sr. No.
Sector No.
Plot no / Survey No
Approx. Area in sq.mt.
New Site No. Final Proposed Reservation
Land Status Planning Authority
Approx Land Acquisition Cost [Rs.]
Approx. Construction Cost
[Rs.]
17 4A Near K.K. Railwat Station
4532.59 K-17 Parking CIDCO NMMC 14532616.69 132723300.38
18 5 25 4821.32 K-18 Market NMMC NMMC 0.00 141177892.24
19 7 37pt. 116.95 K-19 Parking NMMC NMMC 0.00 3424529.90
20 9 34 and 35 2500.21 K-20 Parking CIDCO NMMC 8016298.31 73211149.22
21 9 36 937.24 K-21 Community center CIDCO NMMC 3005025.75 27444261.68
22 9 37 and 30 3035.74 K-22 Market CIDCO NMMC 0.00 88892538.68
23 9 19 and 20 3729.75 K-23 Parking CIDCO NMMC 11958510.94 109214539.50
24 9 18 3792.69 K-24 Play Ground NMMC NMMC 0.00 10096140.78
25 9 16A 298.47 K-25 Urban Health Post NMMC NMMC 0.00 8739798.54
26 9 4 493.14 K-26 Parking CIDCO NMMC 1581130.13 14440125.48
27 9 Lay-by Parking 670.34 K-27 Parking CIDCO NMMC 2149277.63 19628895.88
28 9 14/3 684.22 K-28 Community center CIDCO NMMC 2193780.38 20035330.04
29 11 25 3671.56 K-29 Multipurpose ground
NMMC NMMC 0.00 9773692.72
30 11 34part 1343.40 K-30 Garden NMMC NMMC 0.00 3576130.80
31 11 62 72.02 K-31 Market CIDCO NMMC 0.00 2108889.64
32 11 14/5 5013.48 K-32 Municipal Staff Quarter
NMMC NMMC 0.00 146804721.36
33 11 19C/1 2047.00 K-33 Municipal Purpose CIDCO NMMC 6563193.75 59940254.00

154
Sr. No.
Sector No.
Plot no / Survey No
Approx. Area in sq.mt.
New Site No. Final Proposed Reservation
Land Status Planning Authority
Approx Land Acquisition Cost [Rs.]
Approx. Construction Cost
[Rs.]
34 11 19/C 1837.30 K-34 Municipal Purpose CIDCO NMMC 5890843.13 53799818.60
35 11 18 B and 18/D 1113.85 K-35 Civic center CIDCO NMMC 3571281.56 32615755.70
36 11 18 3500.00 K-36 Multipurpose Ground
CIDCO NMMC 0.00 9317000.00
37 12A 20 703.21 K-37 Parking CIDCO NMMC 2254667.06 20591395.22
38 13 10 2625.34 K-38 Telephone Exchange
CIDCO NMMC 0.00 0.00
39 13 11 1406.23 K-39 Municipal Purpose CIDCO NMMC 4508724.94 41177226.86
40 14 21 1585.49 K-40 Pump House CIDCO NMMC 5083477.31 46426318.18
41 14 22 599.70 K-41 Hospital NMMC NMMC 0.00 17560415.40
42 14 66 487.00 K-42 Market CIDCO NMMC 0.00 14260334.00
43 14 95 424.97 K-43 Gymnasium CIDCO NMMC 1362560.06 12443971.54
44 14 111 2473.67 K-44 Parking CIDCO NMMC 7931204.44 72434004.94
45 14 114A, 114 B & 114C
7137.95 K-45 Parking NMMC NMMC 0.00 209013451.90
46 16 38 495.00 K-46 Community center NMMC NMMC 0.00 14494590.00
47 18 28 530.94 K-47 Community center CIDCO NMMC 1702326.38 15546985.08
48 18 29 166.80 K-48 Parking NMMC NMMC 0.00 4884237.60
49 17 23 part 122.48 K-49 Parking CIDCO NMMC 392701.50 3586459.36
50 20 8 & 9 1250.10 K-50 Post & Telegraph CIDCO NMMC 0.00 0.00

155
Sr. No.
Sector No.
Plot no / Survey No
Approx. Area in sq.mt.
New Site No. Final Proposed Reservation
Land Status Planning Authority
Approx Land Acquisition Cost [Rs.]
Approx. Construction Cost
[Rs.]
51 20 53 675.70 K-51 Market CIDCO NMMC 0.00 19785847.40
52 20 70 980.88 K-52 Hospital CIDCO NMMC 12579786.00 28722128.16
53 20 58, 59, 60, 61 & 62
3712.53 K-53 School CIDCO NMMC 47613197.25 108710303.46
54 19 372-A 1993.68 K-54 ESR/GSR CIDCO NMMC 6392236.50 58378937.76
55 22 6 479.33 K-55 EXT NMMC Hospital CIDCO NMMC 6147407.25 14035741.06
56 22 12 538.35 K-56 Library CIDCO NMMC 1726084.69 15763964.70
57 22 10 404.87 K-57 Hospital CIDCO NMMC 5192457.75 11855403.34
58 23 20A 3507.23 K-58 Play ground NMMC NMMC 0.00 9336246.26
59 23 17 4813.00 K-59 School NMMC NMMC 0.00 140934266.00
60 23 13, 14 978.79 K-60 Community Centre CIDCO NMMC 3138245.44 28660928.78
61 23 12 1370.37 K-61 Municipal Purpose CIDCO NMMC 4393748.81 40127174.34
62 23 10A 64.42 K-62 Municipal Purpose NMMC NMMC 0.00 1886346.44
63 --- vacant ( Forest) 3469200.00 &
1393500.00
K-63 Regional Park Forest
Private
NMMC 0 12944507400.00
64 --- vacant ( Forest) K-63 Regional Park Forest
Private
NMMC 12541500000.00
65 --- vacant ( Forest) K-63 NMMC
66 9 25 4000.00 K-64 Recreational Open Space / Garden
CIDCO NMMC 0.00 10648000.00

156
Sr. No.
Sector No.
Plot no / Survey No
Approx. Area in sq.mt.
New Site No. Final Proposed Reservation
Land Status Planning Authority
Approx Land Acquisition Cost [Rs.]
Approx. Construction Cost
[Rs.]
67 11 32 1300.43 K-65 Civic center CIDCO NMMC 4169503.69 38079191.26
68 19 120 648.89 K-67 Garden NMMC NMMC 0.00 1727345.18
69 19 120 648.89 K-66 Parking NMMC NMMC 0.00 19000796.98
12728704793.63 15070182733.54
VASHI NODE
Sr. No.
Sector No.
Plot no / Survey No
Approx. Area in sq.mt.
New Site No. Final Proposed Reservation
Land Status Planning Authority
Approx Land Acquisition Cost [Rs.]
Approx. Construction Cost
[Rs.]
1 7 50 26729.47 V-1 Play ground & Road
NMMC NMMC 0.00 71153857.13
2 7 OL-2 & L-2 166.54 V-2 Parking CIDCO NMMC 780239.90 4876624.28
3 7 OL-1 & L-1 193.13 V-3 Parking CIDCO NMMC 904814.05 5655232.66
4 8 159 970.36 V-4 Market CIDCO NMMC 4546136.60 28414081.52
5 10 18/4 2131.70 V-5 Parking CIDCO NMMC 9987033.24 62420556.53
6 10A 11 & 12 19811.39 V-6 Play Ground and Indoor Stadium
NMMC NMMC 0.00 52737917.52
7 10A 24D 149556.96 V-7 Water Park NMMC NMMC 0.00 398120616.87
8 10A 28 4240.20 V-8 Nursing College NMMC NMMC 0.00 124161594.96
9 12 210 324305.79 V-9 Water Park NMMC NMMC 0.00 863302023.63
10 12 196 & 196A 9376.59 V-10 Bus Terminus / Sport Complex
NMMC / NMMT
NMMC 0.00 274565425.51

157
Sr. No.
Sector No.
Plot no / Survey No
Approx. Area in sq.mt.
New Site No. Final Proposed Reservation
Land Status Planning Authority
Approx Land Acquisition Cost [Rs.]
Approx. Construction Cost
[Rs.]
11 12 192, 193 749.99 V-11 Community Centre CIDCO NMMC 3513712.52 21961265.74
12 12 182 642.06 V-12 Garden CIDCO NMMC 0.00 1709174.37
13 14 Near plot 51 408.02 V-13 Parking CIDCO NMMC 1911573.70 11947641.64
14 19A 6, 7, 7B & 8 4919.23 V-14 Museum and Parking
CIDCO NMMC 23046597.24 144044922.14
15 19A 47 & 50 3993.74 V-15 Parking CIDCO NMMC 18710662.53 116944636.12
16 19D 39 2287.34 V-16 Parking CIDCO NMMC 10716206.64 66978007.01
17 19D 43 521.64 V-17 Parking CIDCO NMMC 2443864.66 15274545.35
18 20, 21 Adj to plot no 7, Near Temple
498.22 V-18 Night Shelter CIDCO NMMC 2334156.02 14588848.76
19 20 3 19012.23 V-19 ST Bus Terminus / Parking
CIDCO NMMC 89072297.55 556716118.86
20 21 Near plot 146 132.36 V-20 Public Utility CIDCO NMMC 620106.60 3875765.52
21 22 337 634.95 V-21 women welfare center
NMMC NMMC 0.00 18592605.90
22 24 39/2 & 39/3 417.55 V-22 Parking CIDCO NMMC 1956217.07 12226669.82
23 26 13 & 14 4236.74 V-23 Parking CIDCO NMMC 19849117.53 124060162.12
24 26 17 1693.62 V-24 Urban Health Post CIDCO NMMC 31738457.54 49592610.12
25 26 18 1322.40 V-25 School CIDCO NMMC 24781682.30 38722370.39
26 26 19 1350.87 V-26 Play Ground CIDCO NMMC 0.00 3596013.28
27 26 20 1440.10 V-27 Market CIDCO NMMC 0.00 42168920.35
28 26 46 462.53 V-28 Public Utility CIDCO NMMC 2166971.79 13543920.59

158
Sr. No.
Sector No.
Plot no / Survey No
Approx. Area in sq.mt.
New Site No. Final Proposed Reservation
Land Status Planning Authority
Approx Land Acquisition Cost [Rs.]
Approx. Construction Cost
[Rs.]
29 26 9/20 458.26 V-29 Public Utility CIDCO NMMC 2146934.05 13418681.47
30 26 9/22 234.40 V-30 Parking CIDCO NMMC 1098140.58 6863554.39
31 26 Near NMMC Market
301.34 V-31 Parking NMMC NMMC 0.00 8823837.88
32 27 9 & 11 1755.14 V-32 Veterinary Hospital NMMC NMMC 0.00 51393892.35
33 28 . 206 341.51 V-33 Market CIDCO NMMC 0.00 10000125.10
34 29 109/A 9361.18 V-34 Tree belt NMMC NMMC 0.00 24919461.16
35 30 1 10610.72 V-35 Parking CIDCO NMMC 49711223.20 310703103.04
36 30A . 45 9488.17 V-36 Garden NMMC NMMC 0.00 25257511.20
37 30A 43 7025.93 V-37 Garden NMMC NMMC 0.00 18703025.66
38 30A . 46A 1556.84 V-38 Public Amenities CIDCO NMMC 7293814.14 45587506.01
39 30A . 486 5406.03 V-39 Primary School CIDCO NMMC 101308927.24 158299253.33
40 30A . 486 B 2961.12 V-40 Play Ground CIDCO NMMC 0.00 7882498.78
41 31 . 173 & 174 336.74 V-41 Market CIDCO NMMC 0.00 9860303.55
42 MIDC Survey no 376, 377, 378 and 379
403210.47 V-42 Solid/Liquid/ Medical /Biological
Waste Management Plant
NMMC NMMC 0.00 11806808982.54
43 MIDC Survey no 378 13454.45 V-43 Sewerage Treatment Plant
NMMC NMMC 0.00 393973204.90
44 MIDC Survey no 329 To 336
161096.99 V-44 Slum Rehabilitation
Scheme
GOVT. NMMC 0.00 0.00
45 14 and 15
51/A 5509.81 V-45 Multipurpose Ground
NMMC NMMC 0.00 14667114.22

159
Sr. No.
Sector No.
Plot no / Survey No
Approx. Area in sq.mt.
New Site No. Final Proposed Reservation
Land Status Planning Authority
Approx Land Acquisition Cost [Rs.]
Approx. Construction Cost
[Rs.]
46 17 D 3 678.00 V-46 Market CIDCO NMMC 0.00 19853196.00
47 31 Near 60/1 2055.16 V-47 Civic Centre CIDCO NMMC 9628424.60 60179195.12
48 31 Near 60/1 1191.60 V-48 Garden CIDCO NMMC 5582646.00 3172039.20
49 31 257A 421.73 V-49 Community Centre NMMC NMMC 0.00 12349097.86
50 31 2A 8531.32 V-50 Municipal Purpose CIDCO NMMC 39969234.20 249814112.24
51 30 Near Plot No.14 1981.19 V-51 children park CIDCO NMMC 0.00 5273927.78
52 --- --- 23419.79 V-52 Fish Processing & allied activity
CIDCO NMMC 0.00 685778290.78
53 30A 1B 37316.22 V-53 Municipal Purpose CIDCO NMMC 174826490.70 1092693554.04
54 Turbhe Sector
Gut no. 376 (Part)
5000.00 V-54 Municipal Purpose Government NMMC 23425000.00 146410000.00
55 Turbhe Sector
Gut no. 376 (Part)
1200.00 V-55 Play Ground Government NMMC 5622000.00 3194400.00
1297109.82 669692682.17 18327831997.29

160
SANPADA NODE Sr. No.
Sector No.
Plot no / Survey No
Approx. Area in sq.mt.
New Site No. Final Proposed Reservation
Land Status Planning Authority
Approx Land Acquisition Cost [Rs.]
Approx. Construction Cost
[Rs.]
1 1 16 315.83 S-1 Library CIDCO NMMC 1235684.88 9248134.06
2 2 13 378.76 S-2 Parking NMMC NMMC 0.00 11090850.32
3 2 1B 128.40 S-3 Market CIDCO NMMC 0.00 3759808.80
4 3 P1 535.87 S-4 Community Center CIDCO NMMC 2096591.38 15691345.34
5 3 P 2 535.87 S-5 Parking CIDCO NMMC 2096591.38 15691345.34
6 3 CP 4 311.91 S-6 Parking CIDCO NMMC 1220347.88 9133348.62
7 4 14 489.58 S-7 Community Center CIDCO NMMC 1915481.75 14335881.56
8 4 25, 25A, 26 408.65 S-8 Market CIDCO NMMC 0.00 11966089.30
9 4 12A 57.63 S-9 Parking CIDCO NMMC 225477.38 1687521.66
10 5 515 & 19 4697.45 S-10 Extension to Play Ground
NMMC NMMC 0.00 12504617.22
11 5 515A 726.19 S-11 Welfare centre NMMC NMMC 0.00 21264295.58
12 5 5,8,10,69,6 pt. 27877.52 S-12 Garden CIDCO NMMC 0.00 74209958.24
13 5 survey no 62part,67part(near underpass)
1726.19 S-13 Parking CIDCO NMMC 6753718.38 50546295.58
14 5 113 1002.39 S-14 Garden NMMC NMMC 0.00 2668362.18
15 5 255 175.24 S-15 Parking CIDCO NMMC 685626.50 5131377.68
16 6 20 182.50 S-16 Public Toilet CIDCO NMMC 714031.25 5343965.00
17 6 25 506.33 S-17 Community Center CIDCO NMMC 1981016.13 14826355.06

161
Sr. No.
Sector No.
Plot no / Survey No
Approx. Area in sq.mt.
New Site No. Final Proposed Reservation
Land Status Planning Authority
Approx Land Acquisition Cost [Rs.]
Approx. Construction Cost
[Rs.]
18 6 23 290.68 S-18 Post office & Telegram
CIDCO NMMC 0.00 0.00
19 8 19 2024.85 S-19 Public Amenities CIDCO NMMC 7922225.63 59291657.70
20 8 8 382.96 S-20 Parking CIDCO NMMC 1498331.00 11213834.72
21 8 26 A 136.89 S-21 Market CIDCO NMMC 0.00 4008412.98
22 8 29 700.24 S-22 Market CIDCO NMMC 0.00 20504427.68
23 8 2 part 189.93 S-23 Parking CIDCO NMMC 743101.13 5561530.26
24 8 33 130.36 S-24 Parking CIDCO NMMC 510033.50 3817201.52
25 8 51 110.80 S-25 Parking CIDCO NMMC 433505.00 3244445.60
26 8 46A 212.63 S-26 Parking CIDCO NMMC 831914.88 6226231.66
27 8 48, 49 576.78 S-27 Market CIDCO NMMC 0.00 16889271.96
28 8 1 6281.82 S-28 Multipurpose ground
NMMC NMMC 0.00 16722204.84
29 9 2 D 1000.00 S-29 Hospital (NMMC) CIDCO NMMC 15650000.00 29282000.00
30 9 2A 797.77 S-30 Primary School CIDCO NMMC 12485100.50 23360301.14
31 10 3 213.44 S-31 Parking NMMC NMMC 0.00 6249950.08
32 10 36 401.28 S-32 Market CIDCO NMMC 0.00 11750280.96
33 10 25 554.04 S-33 Municipal Office CIDCO NMMC 2167681.50 16223399.28
34 10 27 A 161.05 S-34 Gymnasium CIDCO NMMC 630108.13 4715866.10
35 10 20 132.35 S-35 Public Utility CIDCO NMMC 517819.38 3875472.70
36 10 13 102.87 S-36 Parking CIDCO NMMC 402478.88 3012239.34

162
Sr. No.
Sector No.
Plot no / Survey No
Approx. Area in sq.mt.
New Site No. Final Proposed Reservation
Land Status Planning Authority
Approx Land Acquisition Cost [Rs.]
Approx. Construction Cost
[Rs.]
37 10 189 1741.63 S-37 Hospital CIDCO NMMC 27256509.50 50998409.66
38 10 190 2046.35 S-38 Parking CIDCO NMMC 8006344.38 59921220.70
39 10 192 & 191 4139.35 S-39 Municipal Housing CIDCO NMMC 16195206.88 121208446.70
40 11 --- 7606.64 S-40 Bus Terminus CIDCO NMMC 29760979.00 222737632.48
41 11 1 1755.01 S-41 Library NMMC NMMC 0.00 51390202.82
42 14 20 1072.78 S-42 Market NMMC NMMC 0.00 31413143.96
43 14 1 1865.69 S-43 Police Station CIDCO NMMC 0.00 0.00
44 15 12A 648.49 S-44 Library CIDCO NMMC 2537217.13 18989084.18
45 16A 9 384.75 S-45 Public Utility CIDCO NMMC 1505334.38 11266249.50
46 16A 8 994.99 S-46 Market CIDCO NMMC 0.00 29135297.18
47 16 A 10 849.89 S-47 Parking CIDCO NMMC 3325194.63 24886478.98
48 17 3 599.81 S-48 Parking CIDCO NMMC 2346756.63 17563636.42
49 20 10 5499.82 S-49 Fire Station CIDCO NMMC 21518045.75 161045729.24
50 20 9 4069.80 S-50 Skill Development Training Centre
(Educational)
CIDCO NMMC 63692370.00 119171883.60
51 20 8 4382.18 S-51 Cattle pound CIDCO NMMC 17145279.25 128318994.76
52 20 7 1593.27 S-52 Pump House CIDCO NMMC 6233668.88 46654132.14
53 20 2 1335.41 S-53 Crematorium CIDCO NMMC 0.00 3554861.42
54 20 3 1908.12 S-54 Burial Ground CIDCO NMMC 0.00 5079415.44

163
Sr. No.
Sector No.
Plot no / Survey No
Approx. Area in sq.mt.
New Site No. Final Proposed Reservation
Land Status Planning Authority
Approx Land Acquisition Cost [Rs.]
Approx. Construction Cost
[Rs.]
55 20 4 2137.22 S-55 Crematorium CIDCO NMMC 0.00 5689279.64
56 23 7 216.42 S-56 Market CIDCO NMMC 0.00 6337210.44
57 23 270 96.35 S-57 Police Chowki CIDCO NMMC 0.00 0.00
58 23 67 201.37 S-58 Community Center CIDCO NMMC 787860.13 5896516.34
59 24 35, 35-B, 35-A, & 35 C
538.25 S-59 Garden CIDCO NMMC 0.00 1432821.50
60 24 28 245.13 S-60 Parking CIDCO NMMC 959071.13 7177896.66
61 24 43 A 171.91 S-61 Market CIDCO NMMC 0.00 5033868.62
62 24 60 1093.10 S-62 Parking CIDCO NMMC 4276753.75 32008154.20
63 24 15 864.31 S-63 Market CIDCO NMMC 0.00 25308725.42
64 24 5 & 6 1142.87 S-64 Veterinary Hospital CIDCO NMMC 17885915.50 33465519.34
65 25 26 207.38 S-65 Parking NMMC NMMC 0.00 6072501.16
66 25 25 206.44 S-66 Market CIDCO NMMC 0.00 6044976.08
67 25 13 161.26 S-67 Market CIDCO NMMC 0.00 4722015.32
68 13 --- 883.00 S-68 Garden CIDCO NMMC 0.00 2350546.00
69 21 --- 12363.10 S-69 Multipurpose ground
CIDCO NMMC 0.00 32910572.20
70 23 273 3296.41 S-70 Multipurpose Ground
NMMC NMMC 0.00 8775043.42
286149373.25 1811608745.58

164
NERUL NODE Sr. No.
Sector No.
Plot no / Survey No
Approx. Area in sq.mt.
New Site No. Final Proposed Reservation
Land Status Planning Authority
Approx Land Acquisition Cost [Rs.]
Approx. Construction Cost
[Rs.]
1 - Sr no 323 B (part)
84413.35 N-1 Integrated Veterinary Complex
NMMC NMMC 0.00 2471791714.70
2 1 27A 362.85 N-2 Parking CIDCO NMMC 1460017.69 10624973.70
3 1 740 & 742 1020.02 N-3 Extension of Urban Health Post
CIDCO NMMC 16417221.90 29868225.64
4 1 - 773.33 N-4 Open fish market CIDCO NMMC 0.00 22644649.06
5 1 2D 474.13 N-5 Community Centre CIDCO NMMC 1907780.59 13883474.66
6 3 18B 559.39 N-12 Parking NMMC NMMC 0.00 16380057.98
7 3 7A 182.00 N-13 Community Centre CIDCO NMMC 732322.50 5329324.00
8 3 7B 231.87 N-14 Community Centre CIDCO NMMC 932986.91 6789617.34
9 29 1 2762.52 N-122 Parking CIDCO NMMC 11115689.85 80892110.64
10 19 45 (Part ) 125.83 N-72 Parking CIDCO NMMC 506308.46 3684554.06
11 19 45 (part ) 378.80 N-73 Market CIDCO NMMC 0.00 11092021.60
12 19 46 421.29 N-74 Public Utility CIDCO NMMC 1695165.64 12336213.78
13 19 A 13A 594.82 N-77 Public Amenities CIDCO NMMC 2393406.98 17417519.24
14 19 A 13 b (part) 536.00 N-78 Market CIDCO NMMC 0.00 15695152.00
15 19 A 5 1770.98 N-79 Parking CIDCO NMMC 7125980.78 51857836.36
16 19 A 2 1743.32 N-80 Community Centre CIDCO NMMC 7014683.85 51047896.24
17 19 A 59 818.23 N-81 Library CIDCO NMMC 3292352.96 23959410.86

165
Sr. No.
Sector No.
Plot no / Survey No
Approx. Area in sq.mt.
New Site No. Final Proposed Reservation
Land Status Planning Authority
Approx Land Acquisition Cost [Rs.]
Approx. Construction Cost
[Rs.]
18 19 A 50 (Part) 34761.93 N-82 Science Centre NMMC NMMC 0.00 1017898834.26
19 21 111A (part) 2214.20 N-85 Parking NMMC NMMC 0.00 64836204.40
20 23C 10 1325.03 N-89 Market NMMC NMMC 0.00 38799528.46
21 23B 13, 14, 15 785.87 N-91 Market CIDCO NMMC 0.00 23011845.34
22 23B 13, 14, 15 400.00 N-92 Children park CIDCO NMMC 0.00 1064800.00
23 25 20 854.63 N-95 Municipal Purpose CIDCO NMMC 3438817.46 25025275.66
24 25 27 part 584.22 N-97 Night Shelter CIDCO NMMC 2350755.23 17107130.04
25 25 27 part 2267.44 N-98 Market CIDCO NMMC 0.00 66395178.08
26 27 2 (part ) 3150.00 N-102 Parking CIDCO NMMC 12674812.50 92238300.00
27 27 2 (part ) 27530.15 N-103 NMMT RDTI CIDCO NMMC 110774441.06 806137852.30
28 27 71 & 72 1399.66 N-104 Hospital CIDCO NMMC 22527527.70 40984844.12
29 27 75 399.96 N-105 Community Centre CIDCO NMMC 1609339.05 11711628.72
30 50 E 140 1000.00 N-177 Garden CIDCO NMMC 0.00 2662000.00
31 50 E 118 354.84 N-178 Community Centre CIDCO NMMC 1427787.45 10390424.88
32 50 E 118A 1863.61 N-179 Civic Center CIDCO NMMC 7498700.74 54570228.02
33 50 E 118B, 118C, 118D, 118E
1755.13 N-182 Garden CIDCO NMMC 0.00 4672156.06
34 50 E 121 A, 121 B, 121 D
758.80 N-180 Public Ground CIDCO NMMC 0.00 2019925.60
35 50 E 57 909.91 N-181 Hospital CIDCO NMMC 14645001.45 26643984.62
36 52 --- 700.00 N-190 Market & Parking CIDCO NMMC 0.00 20497400.00

166
Sr. No.
Sector No.
Plot no / Survey No
Approx. Area in sq.mt.
New Site No. Final Proposed Reservation
Land Status Planning Authority
Approx Land Acquisition Cost [Rs.]
Approx. Construction Cost
[Rs.]
37 52 --- 3543.62 N-191 Garden CIDCO NMMC 0.00 9433116.44
38 54, 56 & 58
--- 6419.19 N-192 Civic Centre CIDCO NMMC 25829215.76 187966721.58
39 54, 56 & 58
--- 22142.00 N-193 Play ground CIDCO NMMC 0.00 58942004.00
40 50W 2 3498.66 N-183 Civic Center NMMC NMMC 0.00 102447762.12
41 50W 13 3499.58 N-184 Educational NMMC NMMC 0.00 102474701.56
42 50W 13A 3264.53 N-185 Play Ground NMMC NMMC 0.00 8690178.86
43 50W 46A, 46B 478.98 N-186 Public Utility CIDCO NMMC 1927295.78 14025492.36
44 46 7 111.07 N-164 Market CIDCO NMMC 0.00 3252351.74
45 48 18 376.79 N-166 Municipal Purpose CIDCO NMMC 1516108.76 11033164.78
46 48 32 214.43 N-167 Civic center CIDCO NMMC 862812.71 6278939.26
47 48 47 210.13 N-168 women welfare centre
CIDCO NMMC 845510.59 6153026.66
48 48 4 198.68 N-169 Market CIDCO NMMC 0.00 5817747.76
49 48 A 4A,4B,4C 234.47 N-173 Market CIDCO NMMC 0.00 6865750.54
50 48 A 11 109.91 N-174 Library CIDCO NMMC 442250.36 3218384.62
51 44 52 643.10 N-161 Hospital CIDCO NMMC 10350694.50 18831254.20
52 44 162 831.43 N-162 Public Amenities CIDCO NMMC 3345466.46 24345933.26
53 42 23 854.98 N-160 Public Ground CIDCO NMMC 0.00 2275956.76
54 40 24 690.50 N-156 Hostel CIDCO NMMC 2778399.38 20219221.00
55 40 5 4013.20 N-157 School CIDCO NMMC 64592454.00 117514522.40

167
Sr. No.
Sector No.
Plot no / Survey No
Approx. Area in sq.mt.
New Site No. Final Proposed Reservation
Land Status Planning Authority
Approx Land Acquisition Cost [Rs.]
Approx. Construction Cost
[Rs.]
56 40 6 5363.93 N-158 Play Ground CIDCO NMMC 0.00 14278781.66
57 38 - 672.71 N-153 Fish Market NMMC NMMC 0.00 19698294.22
58 38 13, 14 397.00 N-154 Public Amenities CIDCO NMMC 1597428.75 11624954.00
59 38 6A 617.88 N-155 Parking CIDCO NMMC 2486194.65 18092762.16
60 36 515 2173.77 N-138 Open space CIDCO NMMC 0.00 5786575.74
61 36 511, 512 & 513 507.46 N-139 Parking CIDCO NMMC 2041892.18 14859443.72
62 36 430 858.89 N-140 Garden CIDCO NMMC 0.00 2286365.18
63 36 363 1500.00 N-141 Garden CIDCO NMMC 0.00 3993000.00
64 36 318 55.62 N-142 Market CIDCO NMMC 0.00 1628664.84
65 36 277 70.61 N-143 Market CIDCO NMMC 0.00 2067602.02
66 36 233 30.93 N-144 Market CIDCO NMMC 0.00 905692.26
67 36 404, 405 113.99 N-145 Market CIDCO NMMC 0.00 3337855.18
68 36 299 51.65 N-146 Market CIDCO NMMC 0.00 1512415.30
69 36 298 27.79 N-147 Market CIDCO NMMC 0.00 813746.78
70 36 256 40.05 N-148 Market CIDCO NMMC 0.00 1172744.10
71 36 47 35.72 N-149 Market CIDCO NMMC 0.00 1045953.04
72 36 -- 1281.05 N-150 Community centre CIDCO NMMC 5154624.94 37511706.10
73 36 -- 4880.28 N-151 Play Ground CIDCO NMMC 0.00 12991305.36
74 36 -- 933.00 N-152 GSR /ESR GOI NMMC 0.00 27320106.00

168
Sr. No.
Sector No.
Plot no / Survey No
Approx. Area in sq.mt.
New Site No. Final Proposed Reservation
Land Status Planning Authority
Approx Land Acquisition Cost [Rs.]
Approx. Construction Cost
[Rs.]
75 30 -- 5000.00 N-124 Community Center NMMC NMMC 0.00 146410000.00
76 30 -- 5000.00 N-125 Indoor game & stadium
NMMC NMMC 0.00 146410000.00
77 30 -- 23122.12 N-126 Play ground NMMC NMMC 0.00 61551083.44
78 30 -- 4476.00 N-127 Garden NMMC NMMC 0.00 11915112.00
79 30 -- 6079.06 N-128 Multipurpose ground
CIDCO NMMC 0.00 16182457.72
80 30 -- 8816.62 N-128 Multipurpose ground
CIDCO NMMC 0.00 23469842.44
81 30 -- 11421.39 N-128 Multipurpose ground
CIDCO NMMC 0.00 30403740.18
82 30 -- 1281.05 N-128 Multipurpose ground
CIDCO NMMC 0.00 3410155.10
83 30 8 B 5057.11 N-129 College CIDCO NMMC 81394185.45 148082295.02
84 30 8 C 6238.29 N-130 College Play Ground
CIDCO NMMC 25101319.39 16606327.98
85 30 8-A 3999.85 N-131 School CIDCO NMMC 64377585.75 117123607.70
86 30 8 D 6062.36 N-132 School Play Ground
CIDCO NMMC 24393421.05 16138002.32
87 30 8 E 6943.76 N-133 Open space CIDCO NMMC 0.00 18484289.12
88 30 6 (Part ) 1945.47 N-134 Public Amenities CIDCO NMMC 7828084.91 56967252.54
89 28 5 A (part) 7999.59 N-108 NMMC Officer's Club
CIDCO NMMC 32188350.26 234243994.38
90 28 5 A (part) 7773.68 N-109 Aquarium CIDCO NMMC 31279344.90 227628897.76
91 28 5 A (part) & 8 (Part)
12893.67 N-110 Competitive Exam & Training Centre
CIDCO NMMC 207523618.65 377552444.94
92 28 6 3242.00 N-111 Cultural Centre CIDCO NMMC 13044997.50 94932244.00

169
Sr. No.
Sector No.
Plot no / Survey No
Approx. Area in sq.mt.
New Site No. Final Proposed Reservation
Land Status Planning Authority
Approx Land Acquisition Cost [Rs.]
Approx. Construction Cost
[Rs.]
93 28 8 (Part ) 6727.17 N-112 Govt Hostel CIDCO NMMC 108273801.15 196984991.94
94 28 8 (Part) 6250.50 N-113 Parking CIDCO NMMC 25150449.38 183027141.00
95 28 8(Part ) & 10A (part)
24412.46 N-115 Garden & Tree Belt CIDCO NMMC 0.00 64985968.52
96 28 10A (part) 4229.26 N-114 Parking CIDCO NMMC 17017484.93 123841191.32
97 28 12 F 3499.85 N-116 School CIDCO NMMC 56330085.75 102482607.70
98 28 12 G 4947.52 N-117 School Play Ground
CIDCO NMMC 19907583.60 13170298.24
99 28 10 8804.79 N-118 Public Ground CIDCO NMMC 0.00 23438350.98
100 28 12-A 6607.37 N-119 Institute for senior citizen & person with disabilities
CIDCO NMMC 26586405.04 193477008.34
101 28 12-D 1418.50 N-120 Garden CIDCO NMMC 0.00 3776047.00
102 28 12 E 4197.41 N-121 Police station CIDCO NMMC 0.00 122908559.62
103 22 12D & 12 C 2016.58 N-86 Garden NMMC NMMC 0.00 5368135.96
104 22 open land 5561.51 N-87 Parking CIDCO NMMC 22378125.86 162852135.82
105 22 -- 3183.53 N-88 Vegetable & fish market
CIDCO NMMC 0.00 93220125.46
106 22 -- 3183.53 N-88 Vegetable & fish market
CIDCO NMMC 0.00 93220125.46
107 26/24 2 & 6 (Part) 20513.38 N-96 Play Ground NMMC NMMC 0.00 54606617.56
108 24 7 867.35 N-94 Parking NMMC NMMC 0.00 25397742.70
109 24 13 4464.65 N-95 Garden CIDCO NMMC 0.00 11884898.30
110 20 CTS 361 112.91 N-83 Library NMMC NMMC 0.00 3306230.62

170
Sr. No.
Sector No.
Plot no / Survey No
Approx. Area in sq.mt.
New Site No. Final Proposed Reservation
Land Status Planning Authority
Approx Land Acquisition Cost [Rs.]
Approx. Construction Cost
[Rs.]
111 20 16 533.10 N-84 Multipurpose ground
NMMC NMMC 0.00 1419112.20
112 18 A 153 219.50 N-62 Market CIDCO NMMC 0.00 6427399.00
113 18 A 79 152.73 N-63 Market CIDCO NMMC 0.00 4472239.86
114 18 A 93 107.56 N-64 Market CIDCO NMMC 0.00 3149571.92
115 18 A 173 215.87 N-65 Parking CIDCO NMMC 868606.91 6321105.34
116 18 A 188 215.73 N-66 Market CIDCO NMMC 0.00 6317005.86
117 18 A 69A 141.19 N-67 Market CIDCO NMMC 0.00 4134325.58
118 18 A 197 216.10 N-68 Market CIDCO NMMC 0.00 6327840.20
119 18 A 55 116.19 N-69 Market CIDCO NMMC 0.00 3402275.58
120 18 A 28A 79.50 N-70 Market CIDCO NMMC 0.00 2327919.00
121 18 A 206 375.66 N-71 Urban Health Post CIDCO NMMC 6046247.70 11000076.12
122 18 17 444.16 N-59 Parking CIDCO NMMC 1787188.80 13005893.12
123 18 34 820.43 N-61 Vegetable Market CIDCO NMMC 0.00 24023831.26
124 18 28 3707.55 N-60 Parking CIDCO NMMC 14918254.31 108564479.10
125 16 DRS 15 291.53 N-54 Civic Center CIDCO NMMC 1173043.84 8536581.46
126 16 DRS 13 417.38 N-55 Community Centre CIDCO NMMC 1679432.78 12221721.16
127 16 A 146 1494.42 N-56 Play Ground CIDCO NMMC 0.00 3978146.04
128 16 A 147, 148, 149 3661.28 N-57 Garden NMMC NMMC 0.00 9746327.36
129 14 P-16 1647.76 N-42 Market NMMC NMMC 0.00 48249708.32

171
Sr. No.
Sector No.
Plot no / Survey No
Approx. Area in sq.mt.
New Site No. Final Proposed Reservation
Land Status Planning Authority
Approx Land Acquisition Cost [Rs.]
Approx. Construction Cost
[Rs.]
130 14 P-7 665.48 N-43 Cultural & Community centre
NMMC NMMC 0.00 19486585.36
131 14 P-8, P-9 1471.48 N-44 Municipal office NMMC NMMC 0.00 43087877.36
132 14 Open Space 4 432.00 N-45 Garden NMMC NMMC 0.00 1149984.00
133 14 P-17, open space -1
5617.93 N-46 Garden NMMC NMMC 0.00 14954916.35
134 14 P-17, open space -1
5617.93 N-47 Multipurpose Ground
NMMC NMMC 0.00 14954916.35
135 14 Open Space 3 540.00 N-48 Garden NMMC NMMC 0.00 1437480.00
136 14 P-1 623.48 N-49 Community / Cultural Centre
NMMC NMMC 0.00 18256741.36
137 14 P-13 1185.85 N-50 Crematorium NMMC NMMC 0.00 34724059.70
138 10A -- 1130.00 N-33 Vegetable Market CIDCO NMMC 0.00 33088660.00
139 10A -- 960.00 N-34 Community Centre CIDCO NMMC 3862800.00 28110720.00
140 10A 14 207.86 N-32 Library CIDCO NMMC 836376.68 6086556.52
141 8A 17, 18 & 19 697.27 N-26 Fish & Mutton Market
CIDCO NMMC 0.00 20417460.14
142 8A 12, 13, 14 व 15 932.34 N-27 women welfare centre
CIDCO NMMC 3751503.08 27300779.88
143 8A 5, 6, 7, 8, 9, 10 & 11
1366.38 N-28 Community Centre CIDCO NMMC 5497971.53 40010339.16
144 8A 1, 2, 3 & 4 961.81 N-29 Parking CIDCO NMMC 3870082.99 28163720.42
145 8 2A 638.57 N-30 Urban Health Post CIDCO NMMC 10277784.15 18698606.74
146 8 10A 209.19 N-31 Market NMMC NMMC 0.00 6125501.58
147 6 GES 281 353.29 N-20 Community Centre CIDCO NMMC 1421550.64 10345037.78

172
Sr. No.
Sector No.
Plot no / Survey No
Approx. Area in sq.mt.
New Site No. Final Proposed Reservation
Land Status Planning Authority
Approx Land Acquisition Cost [Rs.]
Approx. Construction Cost
[Rs.]
148 6 DRS 11, 12 1272.40 N-23 Market CIDCO NMMC 0.00 37258416.80
149 6 GES 30 46476.00 N-21 Helipad CIDCO NMMC 187007805.00 1360910232.00
150 Near 6 GES
- 112226.01 N-22 Garden CIDCO NMMC 0.00 298745638.62
151 4 17 C 1246.61 N-19 Public Amenities CIDCO NMMC 5016046.99 36503234.02
152 2 30 4500.00 N-10 Fire Station NMMC NMMC 0.00 131769000.00
153 2 23, 23A 15366.72 N-11 Sports Complex NMMC NMMC 0.00 40906208.64
154 1 123 373.80 N-6 GSR /ESR CIDCO NMMC 1504077.75 10945611.60
155 1 - 542.17 N-7 Public Amenities CIDCO NMMC 2181556.54 15875821.94
156 48 41 (Part) 5152.54 N-170 Garden NMMC NMMC 0.00 13716061.48
157 48 41 (Part) 1814.14 N-171 Play Ground NMMC NMMC 0.00 4829240.68
158 14 P-6 790.35 N-51 Civic Centre NMMC NMMC 0.00 23143028.70
159 6 DRS 14 656.41 N-24 Community Centre NMMC NMMC 0.00 19220997.62
160 6 DRS 16A 831.54 N-25 Civic Centre NMMC NMMC 0.00 24349154.28
161 3 11-A 4126.58 N-15 Common Playground
NMMC NMMC 0.00 10984955.96
162 3 6-A 53.00 N-16 Senior Citizen / Civic Centre
CIDCO NMMC 213258.75 1551946.00
163 3 6-B
15.00 N-17 Stall for Handicap CIDCO NMMC 60356.25 439230.00
164 3 6-C
46.00 N-18 Library CIDCO NMMC 185092.50 1346972.00

173
Sr. No.
Sector No.
Plot no / Survey No
Approx. Area in sq.mt.
New Site No. Final Proposed Reservation
Land Status Planning Authority
Approx Land Acquisition Cost [Rs.]
Approx. Construction Cost
[Rs.]
165 15 6-A 413.56 N-52 Community Centre CIDCO NMMC 1664062.05 12109863.92
166 15 Near NL-4 & NL-5
74.81 N-53 Library CIDCO NMMC 301016.74 2190586.42
167 29 18 1146.00 N-123 Children play ground
CIDCO NMMC 0.00 3050652.00
168 13 46-A 197.82 N-38 Civic Center CIDCO NMMC 795978.23 5792565.24
169 13 48 5072.21 N-39 Community Centre CIDCO NMMC 20409304.99 148524453.22
170 13 49 685.16 N-40 Parking CIDCO NMMC 2756912.55 20062855.12
171 13 33, 34, 35, 36 व 44
4327.78 N-41 Parking CIDCO NMMC 17413904.78 126726053.96
172 12 1 (Part) 374.60 N-35 Taxi & Tempo Stand
CIDCO NMMC 1507296.75 10969037.20
173 12 6-B 5067.41 N-36 Multipurpose Ground
CIDCO NMMC 0.00 13489445.42
174 12 5 व 6 2032.55 N-37 Community Centre CIDCO NMMC 8178473.06 59517129.10
175 18 9 234.55 N-58 Police Chowki CIDCO NMMC 0.00 6868093.10
176 19-A 54, 55, 56 व 57 6984.55 N-76 Science Park CIDCO NMMC 28104083.06 204521593.10
177 40 21 1129.89 N-159 Civic Centre CIDCO NMMC 4546394.89 33085438.98
178 48 25 202.25 N-172 Market CIDCO NMMC 0.00 5922284.50
179 50W 17-B 339.53 N-187 Educational CIDCO NMMC 5464735.35 9942117.46
180 50W -- 1513.19 N-188 Play Ground CIDCO NMMC 0.00 4028111.78
181 50W -- 12382.41 N-189 Recreational garden
CIDCO NMMC 0.00 32961975.42
182 48-A 5-A/5 409.36 N-175 Market NMMC NMMC 0.00 11986879.52
183 48-A 2 215.30 N-176 Women Welfare Centre
CIDCO NMMC 866313.38 6304414.60

174
Sr. No.
Sector No.
Plot no / Survey No
Approx. Area in sq.mt.
New Site No. Final Proposed Reservation
Land Status Planning Authority
Approx Land Acquisition Cost [Rs.]
Approx. Construction Cost
[Rs.]
184 1 1 to 45 1647.35 N-8 Stall CIDCO NMMC 6628524.56 48237702.70
185 1 Near to plot No. 771 t o 773
542.17 N-7 Public Amenities CIDCO NMMC 2181556.54 15875821.94
186 1 262 to 278 2196.64 N-9 Multipurpose Ground
NMMC NMMC 0.00 5847455.68
187 34 -- 14000.00 N-135 Educational CIDCO NMMC 225330000.00 409948000.00
188 34 - 500.00 N-136 Civic Centre & DP Road
CIDCO NMMC 2011875.00 14641000.00
189 34 - 20000.00 N-137 Garden CIDCO NMMC 0.00 53240000.00
190 44-A 36A, 36B 400.00 N-163 Municipal Purpose CIDCO NMMC 1609500.00 11712800.00
191 46-A 6 5205.00 N-165 Swimming Pool & Indoor game
NMMC NMMC 0.00 152412810.00
192 23 C Near Plot No. C-7
1323.03 N-90 Municipal Purpose CIDCO NMMC 5323541.96 38740964.46
193 23 A-73 579.24 N-93 Garden CIDCO NMMC 0.00 1541936.88
194 25 2-D 219.00 N-100 Civic Centre CIDCO NMMC 881201.25 6412758.00
195 25 2C 457.15 N-101 Women Welfare Centre
CIDCO NMMC 1839457.31 13386266.30
196 27 3 5794.08 N-106 Garden CIDCO NMMC 0.00 15423848.96
197 27 2 (Part) 23573.85 N-107 Play ground CIDCO NMMC 0.00 62753588.70
198 19 87 36924.00 N-75 Sport Complex NMMC NMMC 0.00 98291688.00
1708059462.71 13637177848.36

175
BELAPUR NODE
Sr. No.
Sector No.
Plot no / Survey No
Approx. Area in sq.mt.
New Site No. Final Proposed Reservation
Land Status Planning Authority
Approx Land Acquisition Cost [Rs.]
Approx. Construction Cost
[Rs.]
1 1 4 A, 4B & 4C 458.80 B-1 Parking CIDCO NMMC 1294389.5 13434581.6
2 2 3 & 3A 1322.74 B-2 Community Centre CIDCO NMMC 3731780.225 38732472.68
3 3A 7,10A,4,5,6 36290.14 B-3 Sport Complex NMMC NMMC 0 96604352.68
4 6 Vacant land 1328.65 B-4 Market CIDCO NMMC 0 38905529.3
5 8 G 21, 22 547.00 B-5 Parking NMMC NMMC 0 16017254
6 8 B E 326.30 B-6 Market CIDCO NMMC 0 9554716.6
7 8 B 28 B 1251.01 B-7 Urban Health Post NMMC NMMC 0 36632074.82
8 8 B 20 B 1099.44 B-8 MSEB CIDCO NMMC 0 0
9 8 B 20 A 960.58 B-9 Hospital CIDCO NMMC 10840145.3 28127703.56
10 9N --- 119649.54 B-10 Garden CIDCO NMMC 0 318507075.5
11 9N 3 1873.00 B-11 Navi Mumbai Municipal
Corporation Guest House
NMMC NMMC 0 54845186
12 10 13 2112.80 B-12 Market NMMC NMMC 0 61867009.6
13 10 1-A (part) 9149.73 B-13 Government Office CIDCO NMMC 25813675.76 267922393.9

176
Sr. No.
Sector No.
Plot no / Survey No
Approx. Area in sq.mt.
New Site No. Final Proposed Reservation
Land Status Planning Authority
Approx Land Acquisition Cost [Rs.]
Approx. Construction Cost
[Rs.]
14 10 1-A (part) & 16 Part
1862.33 B-14 Parking CIDCO NMMC 5254098.513 54532747.06
15 10 15 8644.92 B-15 Central Library CIDCO NMMC 24389480.55 253140547.4
16 10 15 A 4274.31 B-16 Garden CIDCO NMMC 0 11378213.22
17 11 70 5548.02 B-17 Play Ground CIDCO NMMC 0 14768829.24
18 11 5 4115.38 B-18 MSEB CIDCO NMMC 0 0
19 12 Open Land 2855.00 B-19 Public Utility CIDCO NMMC 8054668.75 83600110
20 13 4 & 5 22567.71 B-20 Public Ground CIDCO NMMC 0 60075244.02
21 15 1-A 6114.34 B-21 Parking CIDCO NMMC 17250081.73 179040103.9
22 15 33,34 7547.04 B-22 Play Ground CIDCO NMMC 0 20090220.48
23 15 26 1672.66 B-23 Open Space CIDCO NMMC 0 4452620.92
24 15 39 4705.81 B-24 Parking NMMC NMMC 0 137795528.4
25 15 72 6759.86 B-25 Parking NMMC NMMC 0 197942220.5
26 15 A --- 31325.79 B-26 Play Ground CIDCO NMMC 0 83389252.98
27 15 A --- 16641.09 B-27 Museum CIDCO NMMC 46948675.16 487284397.4
28 15 A 2 2436.68 B-28 Garden CIDCO NMMC 0 6486442.16
29 15 A 6 & 7 10108.41 B-29 Public Ground CIDCO NMMC 0 26908587.42

177
Sr. No.
Sector No.
Plot no / Survey No
Approx. Area in sq.mt.
New Site No. Final Proposed Reservation
Land Status Planning Authority
Approx Land Acquisition Cost [Rs.]
Approx. Construction Cost
[Rs.]
30 15 A 8 6454.80 B-30 Bus Terminus & Parking
CIDCO NMMC 18210604.5 189009453.6
31 19/20 W116 A & W116 Part
223.75 B-31 MSEB CIDCO NMMC 0 0
32 19/20 CC1 (Part) 1922.01 B-32 Open Space CIDCO NMMC 0 5116390.62
33 19/20 CC1 (Part) 2004.12 B-33 Parking CIDCO NMMC 5654123.55 58684641.84
34 19/20 S-5, Hawker's Zone-AS-3
680.33 B-34 Market CIDCO NMMC 0 19921423.06
35 19/20 AS-2 & AS-2/a 688.47 B-35 Public Utility CIDCO NMMC 1942345.988 20159778.54
36 21/22 16/A 292.38 B-36 Community Centre CIDCO NMMC 824877.075 8561471.16
37 21/22 19,20 5294.70 B-37 Post &Telegram CIDCO NMMC 0 0
38 21/22 6 & Open Plot 1560.40 B-38 Parking CIDCO NMMC 4402278.5 45691632.8
39 21/22 --- 535.97 B-39 Market CIDCO NMMC 0 15694273.54
40 21/22 10A 308.49 B-40 Parking CIDCO NMMC 870327.4125 9033204.18
41 21/22 13 A, 13B 1892.88 B-41 Public utility CIDCO NMMC 5340287.7 55427312.16
42 21/22 15, 16 1218.62 B-42 Garden CIDCO NMMC 0 3243966.44
43 23 11 4000.00 B-43 School NMMC NMMC 0 117128000
44 23 12 3830.40 B-44 Play Ground NMMC NMMC 0 10196524.8

178
Sr. No.
Sector No.
Plot no / Survey No
Approx. Area in sq.mt.
New Site No. Final Proposed Reservation
Land Status Planning Authority
Approx Land Acquisition Cost [Rs.]
Approx. Construction Cost
[Rs.]
45 23 13A 5952.42 B-45 Nursing Collage CIDCO NMMC 67173059.7 174298762.4
46 23 15 2507.59 B-46 Public utility CIDCO NMMC 7074538.288 73427250.38
47 26/27 Near Plot No 156 & 157
437.07 B-47 Parking NMMC NMMC 0 12798283.74
48 26/27 28A , 28B 693.45 B-48 Public Ground CIDCO NMMC 0 1845963.9
49 28 Near Sector 28 Pump House
1442.61 B-49 Cremation Ground CIDCO NMMC 0 3840227.82
50 29 Vacant land near Plot No B-
70
875.91 B-50 Garden CIDCO NMMC 0 2331672.42
51 29 Vacant land near Plot No B-
30
1053.71 B-51 Play Ground CIDCO NMMC 0 2804976.02
52 29 B51, B52, B53 343.65 B-52 Garden CIDCO NMMC 0 914796.3
53 29 E5/A 529.70 B-53 Parking CIDCO NMMC 1494416.125 15510675.4
54 29 D5/A, D5/B, D5/C
394.18 B-54 Market NMMC / CIDCO
NMMC 0 11542378.76
55 29 Near Plot No B-96
532.69 B-55 Parking CIDCO NMMC 1502851.663 15598228.58
56 29 Near Plot No B-1
221.86 B-56 Approach road & Parking
CIDCO NMMC 625922.525 6496504.52
57 30/31 14 Part 2657.54 B-57 School CIDCO NMMC 29990338.9 77818086.28
58 30/31 14 Part 4412.56 B-58 Play Ground CIDCO NMMC 0 11746234.72

179
Sr. No.
Sector No.
Plot no / Survey No
Approx. Area in sq.mt.
New Site No. Final Proposed Reservation
Land Status Planning Authority
Approx Land Acquisition Cost [Rs.]
Approx. Construction Cost
[Rs.]
59 26/27 131, 132 1380.33 B-59 Garden CIDCO NMMC 0 3674438.46
60 --- Survey No 261, 260
124790.31 B-60 Regional Park CIDCO NMMC 0 332191805.2
TOTAL :- 492681.98 288682967.41 3906743773.02

180
Table – B
Phase wise Program (Phase of two years each) Sr. No. Purpose of Reservation Phase-I Phase-II Phase-III Phase-IV Phase-V
1. GARDEN √ √
2. OPEN SPACE √ √
3. RG √ √
4. PLAY GROUND √ √
5. SPORT COMPLEX / INDOOR REC. √ √ √ √ √ 6. PRIMARY SCHOOL √ √ √ √ √ 7. HOSPITAL / UHP √ √ √ √ √
8. MUNICIPAL OFFICE/ MUNICIPAL PURPOSE √ √ √ √ √
9. FIRE STATION √ √ √ √ √ 10. GYM √ √ √ √ √ 11. CULTURAL √ √ √ √ √ 12. COMMUNITY CENTER √ √ √ √ √ 13. LIBRARY √ √ √ √ √
14. HOSTE / WORKING WOMEN HOSTEL √ √ √ √ √
15. ESR/GSR/PUMP HOUSE √ √ √ √ √ 16. B.G.&C.G. √ √ √ √ √ 17. STP / PUMP HOUSE √ √ 18. PUBLIC UTILITY √ √ √ √ √ 19. TOILET √ √ √ √ √ 20. MARKET & STALL √ √
21. BUS STAND & DEPO √ √ 22. TAXI / RIKSHAW STAND √ √ √
23. PARKING √ √ √ √ √ 24. ROADS √ √ √ √ √

181
Table No. C-1
Municipal Finance Revenue (Rs.in crores)
Sr.No.
Ref.Years
Income From Taxes(Rs.) Total
Income Including opening Balance
Hou
se T
ax
LBT/
CES
S
Tax
on S
hops
an
d es
tabl
ishm
ent
Veh
icle
Tax
Oth
er T
axes
Tota
l ow
n so
urce
re
venu
e
Gra
nts
Deb
it a
nd
cred
it
Inco
me
from
ot
her
sour
ces
Ope
ning
B
alan
ce
1 2 3 4 5 6 7 8 9 10 11 12 13
2013-14 309.57 705.31 - - 149.60 1164.50 39.45 63.71 55.60 156.86 1480.11
2014-15 343.39 725.36 - - 173.28 1242.04 17.93 63.61 137.91 134.33 1595.81
2015-16 441.39 870.59 - - 214.01 1525.98 23.42 74.37 81.63 172.22 1877.63
2016-17 535.16 883.24 - - 221.48 1639.88 33.88 109.38 55.80 291.10 2130.04
2017-18 535.05 1195.73
- - 183.41 1914.19 31.68 73.07 28.42 984.51 3031.88
Table No. C-2
Municipal Finance Expenditure (Rs.in crores)
Year Staff
establishment Education Water supply Drainage Medical
health Communication
Extra ordinary
dept.
Other expenditure
Total expenditure
1. 2. 3. 4. 5. 6. 7. 8. 9. 10.
2013-14 142.17 68.38 49.09 36.08 80.57 - - 969.49 1345.78
2014-15 149.97 76.62 62.57 46.80 48.03 - - 1039.61 1423.60
2015-16 164.49 91.37 63.37 44.99 37.71 - - 1184.60 1586.52
2016-17 217.75 28.35 49.43 35.44 38.07 - - 776.49 1145.53
2017-18 236.54 36.03 71.88 49.61 44.67 - - 1085.57 1524.30
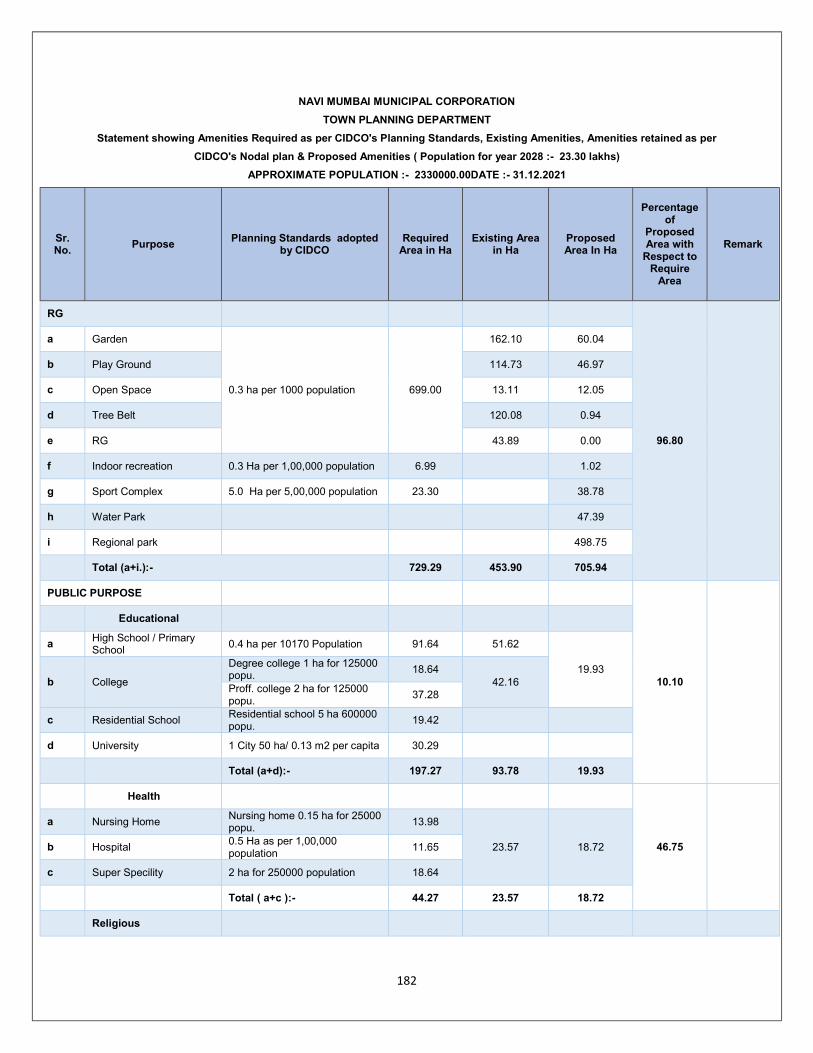
182
NAVI MUMBAI MUNICIPAL CORPORATION
TOWN PLANNING DEPARTMENT
Statement showing Amenities Required as per CIDCO's Planning Standards, Existing Amenities, Amenities retained as per
CIDCO's Nodal plan & Proposed Amenities ( Population for year 2028 :- 23.30 lakhs)
APPROXIMATE POPULATION :- 2330000.00DATE :- 31.12.2021
Sr. No.
Purpose Planning Standards adopted
by CIDCO Required
Area in Ha Existing Area
in Ha Proposed Area In Ha
Percentage of
Proposed Area with
Respect to Require
Area
Remark
RG
96.80
a Garden
0.3 ha per 1000 population 699.00
162.10 60.04
b Play Ground 114.73 46.97
c Open Space 13.11 12.05
d Tree Belt 120.08 0.94
e RG 43.89 0.00
f Indoor recreation 0.3 Ha per 1,00,000 population 6.99 1.02
g Sport Complex 5.0 Ha per 5,00,000 population 23.30 38.78
h Water Park
47.39
i Regional park
498.75
Total (a+i.):- 729.29 453.90 705.94
PUBLIC PURPOSE
10.10
Educational
a High School / Primary School
0.4 ha per 10170 Population 91.64 51.62
19.93 b College
Degree college 1 ha for 125000 popu.
18.64 42.16
Proff. college 2 ha for 125000 popu.
37.28
c Residential School Residential school 5 ha 600000 popu.
19.42
d University 1 City 50 ha/ 0.13 m2 per capita 30.29
Total (a+d):- 197.27 93.78 19.93
Health
46.75
a Nursing Home Nursing home 0.15 ha for 25000 popu.
13.98
23.57 18.72 b Hospital 0.5 Ha as per 1,00,000 population
11.65
c Super Specility 2 ha for 250000 population 18.64
Total ( a+c ):- 44.27 23.57 18.72
Religious

183
Sr. No.
Purpose Planning Standards adopted
by CIDCO Required
Area in Ha Existing Area
in Ha Proposed Area In Ha
Percentage of
Proposed Area with
Respect to Require
Area
Remark
a Religious 0.15 ha per 10000 population 34.95 19.92 0.00 0.00
Cultural
40.46
a Cultural & Linguistic 0.60 ha per 100000 population 13.98
1.81
b Community Centers 0.20 ha per 100000 population 4.66
4.56
c Central Library 4.00 ha per 2000000 population 4.66 4.61 1.74
d Auditorium 0.40 ha per 400000 population 2.33
0.00
e Civic Center
2.25
Total ( a+g ):- 25.63 4.61 10.36
Institutional
a Proffectional scientific and other institutions
8.30 ha per 100000 population 193.39
4.85
2.68
b Working Women’s Hostel 0.30 ha per 100000 population 6.99
0.95
c Other Hostels 0.30 ha per 100000 population 6.99
0.00
d Museums 2.00 ha per 500000 population 9.32
2.16
e Film studio city 80 ha. 80.00
0.00
Total ( a+e ):- 296.69 0.00 7.96
Other Users
a Police Station
As per requirement
0.00
1.89 0.76
b Police comm. office 0.00
c Municipal / Govt. Office / Municipal Purpose
35.50 15.51
d Fire Station 2.53 2.18
e Post Office 0.80 0.68
F Telephone Exchange 2.63 0.82
g Women Welfare Centre 0.00 0.32
h SF 28.85 0.00
I Gym 0.00 0.06
J Night Shelter 0.00 0.95
K Public Amenity 0.00 9.85
Total ( a+h ):- 0.00 72.19 31.13

184
Sr. No.
Purpose Planning Standards adopted
by CIDCO Required
Area in Ha Existing Area
in Ha Proposed Area In Ha
Percentage of
Proposed Area with
Respect to Require
Area
Remark
PUBLIC UTILITY
a MSEB/ESS
As per requirement
69.06 1.02
b E.S.R. / G.S.R./M.B.R. 23.32 1.21
c C.G & B.G 9.32 1.04
d Sewage Treatment Plant 27.95 2.30
e Dumping Ground 41.00 40.32
f Public utility 0.77 1.28
g Toilet 1.06 0.06
Total :- ( a to g ) 0.00 172.48 47.23
COMMERCIAL
a Vegetable Market/Fish Market/Mutten Market ,Shopping Centre ,Stall
9.22 8.82
b Hotel 6.57 0.00
c Petrol Pump 4.95 0.00
d Commercial 228.30 0.00
e Hawkers Zone 0.00 0.00
Total ( a to e ):- 0.00 249.05 8.82
R ZONE
a Residential 1242.58 16.11
Total :- 0.00 1242.58 16.11
TRANSPORT
a Bus Stand & Depo BT 35.42 0.00
b Parking / Truck Terminal 21.28 27.94
c Taxi Rikshaw Parking 4.37 0.00
d Railway 195.39 0.00
e Helipad 0.00 4.65
Total ( a to d ) :- 0.00 256.47 32.59

185
TYPICALPLANS&CROSSSECTIONSOFROAD:
• MAP-12 : 15 M. Wide
--------------------------------------------------------------------------------------------
• MAP-13 : 18M. Wide

186
• MAP-14 : 20 M. Wide
------------------------------------------------------------------------------------------------------------------------------
• MAP-15 : 24 M. Wide

187
• MAP-16 : 30 M. Wide
------------------------------------------------------------------------------------------------------------------------------
• MAP-17 : 32 M. Wide

188
Annexure-A : Gaothan/Koliwada/Aadivasi Pada Sttlement within NMMC limits.
1
2
3
4
5
6
7
8

189
Annexure B-1: Details of slum- Year 2001.
0
0
0
0
0
0
0
0

190
0 0
0 0
0 0
0 0
0
0 0
0 0
0
0 0
0
0
0
0 0
0 0
0 0
0 0

191
Annexure B-2: Details of slum- Year 2011.
0 0
0
0 0
0 0
0 0
0 0
0 0
0 0
0 0
0 0
0 0
0
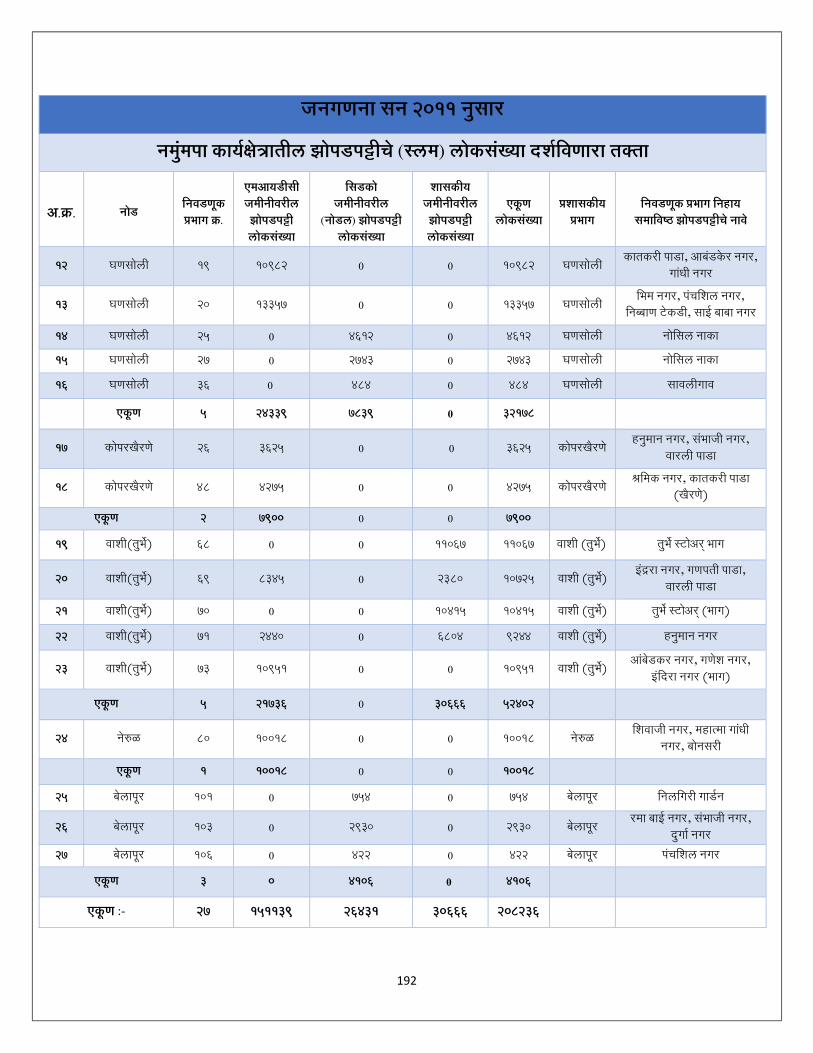
192
0 0
0 0
0 0
0 0
0 0
0
0 0
0 0
0 0
0 0
0
0 0
0
0 0
0
0 0
0 0
0 0
0 0
0 0
0

193
ANNEXURE-C : Health and Medical Facilities.
NMMC Hospital /MCH
Sr. No.
Location (Name of the
Hospital/Nursing home/Institution)
No. of Beds
Facility Available
(Services Provided) Remarks
1 General Hospital Vashi sector 10
300 Maternity, General, Lab, X-ray, USG, ICCU, ICU, Ambulance, NICU, Dialysis Unit, Cancer rx,Lab,Truma care SICU, MICU, CATH LAB, CAT SCAN, CARDIAC CARE UNIT,centre,Blood Bank, ART centre.
VASHI
2 Ahilyabai Holkar Maternal & Child Health Centre, KoparKhairne, sec- 22, Navi Mumbai.
50 KOPERKHIANE
3 Maasaheb Meenatai Thakre Hospital Sec.15, Nerul, Navi Mumbai.
100 Maternity, General , Lab, Xray, USG, Ambulance, Rntcp
NERUL
4 Shree Ram Tannu Mata Bal Rughnalay, Turbhe, Navi Mumbai.
50 TURBHE
5 Rajmata Jijau General Hospital, sec 3. Airoli, Navi Mumbai.
100 Maternity, General , Lab, Xray, USG, Ambulance, Rntcp
AIROLI
6 Mata bal Hospital, Belapur, Sec.20 , Navi Mumbai
50 Maternity & Child Care, USG,LAB,Xray
BELAPUR

194
NMMC Hospital /MCH
Sr. No.
Location
Facility Available
(Services Provided)
Remarks
Name of Unit (UPHC) Type of Center (UPHC)
Details Address
1. CBD UHP Sec-2, Near Hanuman Temple, CBD Belapur
1) Out patient services.
2) Implementation of all National Health Programmes.
3) Referral services to NMMC Hospital.
4) Inspection under Acts, (BNHR PCPNDT,MTP,MMPA, etc.)
BELAPUR
2. Karave UHP Near Karavegaon Bus Stop, Karave
NERUL
3. Nerul 1 UHP
Rangoli Hotel Near, SIES Management School, Samaj Mandir ground floor, Nerul
NERUL
4. Nerul 2 UHP Nerul Gaon, Samaj Mandir, Marathi School Nerul (West)
NERUL
5. Shirawane UHP Shirvane Gaon, Beside Ganpati Mandir
NERUL
6. Sanpada UHP Sanpada Gaon, Opp. Samshan Bhumi
SANAPADA
7. Turbhe UHP
Shivshikit Nagar,kulkarni garden Near, NMMC New School Near, Turbhe Stores, Turbhe
TURBHE
8. Pawane UHP Plot c 12 Pwane MIDC, Thane Belapur Road
KOPERKHAIRNE
9. Indiranagar UHP Bagade Company, NMMC School Near, Indiranagar, Turbhe
TURBHE
10. Juhugaon UHP Samaj Mandir, Sec.14, Opp Div. office, Vashi
VASHI
11. Vashigaon UHP Samaj Mandir, Sec.14, Opp Div. office, Vashi
VASHI
12. Khairane UHP Sec-12 D Amol Apartment Building Near, Khairne Gaon,
KOPERKHAIRNE
13. Mahape UHP UHP MAHAPE, Mahape goan, Near Miliname Business Park
KOPERKHAIRNE
14. Ghansoli UHP Ghansoli Gaon, Near Union Bank
GHANSOLI
15. Rabale UHP Rabada Gaon, Opp. Om Sai Studio
GHANSOLI

195
16. Katkaripada UHP Katkaripada (Panchashil Nagar)
GHANSOLI
17. Airoli UHP Sector-2, NMMC Hospital Near, Airoli
AIROLI
18. Chinchpada UHP Sector-2, NMMC Hospital Near, Airoli
AIROLI
19. Digha UHP Digha Gaon Near NMMC School
DIGHA
20. Ilthanpada UHP Digha Gaon Near
NMMC School DIGHA
21. Nocilnaka UHP Nocilnaka Ghansoli GHANSOLI
Private / Public Trust Hospital /MCH
As per the record of Public Health Deptt. NMMC, there are near about
211 Private / Public Trust Hospital /MCH run by individual medical
practitioners/ Charitable Public Trust/ Institutions & its details can be
had from the concerned dept. All these Private / Public Trust Hospital
/MCH are providing medical facilities to citizens of Navi Mumbai.
Private / Trust Dispensaries
As per the record of Public Health Deptt. NMMC, there are near
about 900 dispensaries/ clinics run by individual medical practitioners
& its details can be had from the concerned deptt. All these
dispensaries/ clinics are providing medical facilities to citizens of Navi
Mumbai.

196
ANNEXURES-D : Regular line of street proposed u/s 210 (1) of MMC Act.1949.

197

198
Regular line of street proposed u/s 210 (1) of MMC Act.1949 (Nerul Node-1)

199
Regular line of street proposed u/s 210 (1) of MMC Act.1949 (Nerul Node-2)

200
Regular line of street proposed u/s 210 (1) of MMC Act.1949 (Vashi Node)

201
Regular line of street proposed u/s 210 (1) of MMC Act.1949 (Koparkhairane Node.)

202

203
Annexure –E
Revised Draft Development Plan 2018-2038 Team Sr. No.
Name Designation
1. Smt. Jyoti Kawade : Town Planning Officer & Officiating Asst. Director Town Planning ( I/C)
2. Shri. Somnath Kekan : Town Planner
3. Shri. Rajesh Pawar : Deputy Engineer
4. Shri. Umesh Patil : Deputy Engineer
5. Shri. Shahaji Paralkar : Deputy Engineer
6. Shri. Kiran Khandare : Deputy Engineer
7. Shri. Gajanan Puri : Deputy Engineer
8. Shri. Sameer Thakre : Sectional Engineer
9. Shri. Sunil Kokate : Sectional Engineer
10. Shri. Amit Pawara : Sectional Engineer
11. Shri. Rajesh Patil : Jr. Engineer
12. Shri. Sandeep Mhatre : Jr. Engineer
13. Shri. Santosh Pawar : Jr. Engineer
14. Shri. Vishal Suryvanshi : Jr. Engineer
15. Shri. Suhas Takle : Jr. Engineer
16. Shri. Babu Janki : Draftsman
17. Shri. Ashok Pachpute : Draftsman
18. Smt. Asawari Gage : Draftsman
19. Shri. Sanjay Misale : Sr. Clerk (Account)
20. Shri. Rajendra Pawar : Sr. Clerk cum Tax Inspector
21. Shri. Tushar Godave : Sr. Clerk cum Tax Inspector