August 2020 - DP World
39
August 2020
-
Upload
khangminh22 -
Category
Documents
-
view
2 -
download
0
Transcript of August 2020 - DP World

August 2020

2
THIS PRESENTATION DOES NOT CONSTITUTE OR FORM PART OF, AND SHOULD NOT BE CONSTRUED AS, AN OFFER TO SELL OR TO ISSUE ANY SECURITIES OR SOLICITATION OF AN OFFER TO PURCHASE,SUBSCRIBE OR SELL SECURITIES IN ANY JURISDICTION OR AN INDUCEMENT TO ENTER INTO INVESTMENT ACTIVITY. IT IS SOLELY FOR USE AS AN INVESTOR PRESENTATION AND IS PROVIDED FORINFORMATIONAL PURPOSES ONLY. THE PRESENTATION DOES NOT CONTAIN ALL OF THE INFORMATION THAT IS MATERIAL TO AN INVESTOR.
By attending the meeting where this presentation is made, or by reading the presentation slides, you agree to be bound by the limitations set out below.
Neither DP World Limited ("DP World") nor any other person or party is under any obligation to update or keep current the information contained herein. Whilst DP World has taken reasonable care toensure that the information contained in this presentation is accurate at the time of last revision, no reliance may be placed for any purpose whatsoever on the information contained in this presentation, orany other material discussed verbally, or on its completeness, accuracy or fairness. Accordingly, DP World and each of its subsidiaries, associates, affiliates and each of their respective directors, officers,employees, agents and representatives (together, the "Relevant Entities") expressly disclaims any liability for any loss howsoever arising out of or in connection with a recipient's use of, or reliance on, orotherwise arising in connection with, this presentation. No representation or warranty or undertaking, express or implied, is given by or on behalf of any Relevant Entity or any other person in respect of thecompleteness, accuracy or fairness of the information contained in this presentation.
Certain information in this presentation is of a historical nature and may now be out of date. All historical information should be understood as speaking from the date of its first publication. In addition, thispresentation contains statements about future events and expectations that are forward-looking statements that reflect DP World's current intentions, beliefs or expectations. No forward-lookingstatements should be taken as forecasts or promises nor should they be taken as implying any indication, assurance or guarantee that the assumptions on which such forward-looking statements have beenprepared are correct or exhaustive or, in the case of assumptions, fully-stated in this presentation. Neither DP World nor any other person assumes any obligation to update the forward-looking statementscontained herein to reflect actual results, changes in assumptions or changes in factors affecting these statements.
This presentation should not be construed as the giving of advice or the making of a recommendation and should not be relied on as the basis for any decision or action. In particular, actual results anddevelopments may be materially different from any opinion or expectation expressed in this presentation.This presentation and its contents are restricted and are being provided to you solely for your information and may not be taken away, re-transmitted, further distributed to any other person, published orreproduced, in whole or in part, by any medium or in any form for any purpose without the prior written consent of DP World. If handed out at a physical investor meeting or presentation, this presentationshould be returned promptly at the end of such meeting or presentation. If this presentation has been received in error it must be returned immediately to DP World.
The opinions and information presented herein are based on general information gathered at the time of writing and are subject to change without notice at any time. Past performance is not necessarilyindicative of future results. For industry-related information, DP World relies on information obtained from sources believed to be reliable but does not guarantee its accuracy or completeness and norepresentation or warranty, express or implied, is made with respect thereto.
This presentation is not intended to provide the basis for any credit or any third party evaluation of DP World and should not be relied upon for investment decision purposes.
DISCLAIMER

Local Port Operator1972 - 1998
Regional Port Operator1999 - 2004
Global Port Operator2005 - 2017
Supply Chain Solution Provider 2018 - Present
3
OUR JOURNEY FROM LOCAL PORTOPERATOR TO SUPPLY CHAIN SOLUTION PROVIDER
1972. Development of Port Rashid (UAE).
1979. Opening of Jebel Ali Port (UAE).
1991. Port Rashid and Jebel Ali combine creating Dubai ports Authority (DPA).
1999. Dubai Ports International FZE (DPI) formed.
2000. Concession won in Jeddah (KSA) and Doraleh (Djibouti).
2002 – 2004. Concessions won in Visakhpatnam (India), Constanta (Romania) and Cochin (India).
2005/6. CSX World Terminals and The Peninsular & Oriental Steam Navigation Company (P&O) acquired. Global network and market position increased.
2007. DP World lists on Nasdaq Dubai.
2013. Opening of London Gateway (UK) deep sea port and logistics park.
2014. Opening of Jebel Ali Terminal 3 (UAE), one of the largest semi-automated facilities in the world.
2015. Economics Zones World FZE (EZW) acquired.
2016. Consolidated stake in Pusan Newport (South Korea) with 66% ownership.
2017. Consolidate DP World Santos(Brazil) with 100% ownership.
Dubai Maritime City and Drydocks World acquisitions (UAE).
Created investment platform with NIIF to invest up to US$ 3bn in ports, logistics and related sectors in India.
Acquisition of Cosmos Agencia Maritima, a fully integrated logistics services provider (Peru).
Acquisition of Continental Warehousing Corporation (India) an integrated multimodal logistics company.
Acquisition of Unifeeder, an integrated logistics company with the largest and best connected feeder and growing shortsea network in Northern Europe.
Acquisition of Topaz Energy and Marine Limited, a leading international marine logistics services and solutions company to the global energy industry.
De-listed from stock exchange.
DP World Overview E S G Container Industry Overview Throughput and Financials Business Development

4
SUPPLY CHAIN SOLUTION PROVIDER –FULLY INTEGRATED ACROSS THE SUPPLY CHAIN
Extending the core business to play a wider role in the supply chain
Connecting directlywith cargo owners & aggregators of demand
Providing technologyled solutions to remove inefficiencies
Improvequality of earningsand drive returns
DP World Overview E S G Container Industry Overview Throughput and Financials Business Development

5
DP WORLD PORTS OVERVIEW
DP World manages 95 million TEU capacity
DP World focuses on the faster growing markets and key trade routes
DP World focuses on origin and destination cargo which has pricing power
DP World operates container terminals through long term concession agreements
Global network of 127 business units 51 countries across 6 continents
9 newdevelopmentsand major expansions
55% of total revenue generated by port operations
9% marketshare
Approximately 75% of our volumes generated from emerging or frontier markets in 2019
Diversifiedportfolio
Strong presence in key East- West trade route
Over 70% of our gross volumes were O&D in 2019 and have to go through our ports
Shipping lines do not dictate our volumes – imports and exports do
Average life of port concessions is approximately 36 years
Very highbarriers to entry
DP World Overview E S G Container Industry Overview Throughput and Financials Business Development

Innovation
20
Transport
Companies
CFS
Operators
Freight
Forwarders
Port
Authority
Terminal
Operators
Shipping
Lines
Customs
GovernmentExporters &
Importers
Mawani Portal
❑ Delivering goods at the speed of air transport and the cost of land transport.
❑ Intelligent yard system storing containers 11 stories high.
❑ Each container individually accessible: significant improvements in efficiency, capacity and safety.
❑ Proof of Concept under construction in Jebel Ali, commercial roll out from 2020 to DPW & other port operators.
Blockchain Initiative
❑ Blockchain is an open source technology that can support supply chain solutions.
❑ DPW to develop a suite of solutions for BCOs addressing pain points and offering a range of value propositions.
❑ DPW to integrate port and other logistics infrastructure into solutions for BCOs.
DP World Overview E S G Container Industry Overview Throughput and Financials Business Development
6

REVENUE DIVERSIFICATION*7
2014
80%Containerized
20%Non-containerized
80%
20%
2017
70%Containerized
30%Non-containerized
70%
30%
1H2020
45%Containerized
55%Non-containerized
45%55%
* Rounded Figures
DP World Overview E S G Container Industry Overview Throughput and Financials Business Development

REVENUE AND EBITDA MIX*8
1H2020 REVENUE
52.5%Ports & Terminals
7.5%Parks & Economic Zones
52.5%
40%
1H2020 EBITDA
65%
20%
15%
7.5%
40%Logistics & Maritime
65%Ports & Terminals
15%Parks & Economic Zones
20%Logistics & Maritime
* Rounded Figures
DP World Overview E S G Container Industry Overview Throughput and Financials Business Development

9
CLIENT MIX CHANGE
Traditional Container Customers
Beneficial Cargo Owners
▪ Shipping Lines
▪ Automotive▪ Oil & Gas▪ Manufacturers
▪ Logistics and Transportation▪ FMCG▪ Consumer Staples
DP World Overview E S G Container Industry Overview Throughput and Financials Business Development

10
OUR GLOBAL FOOTPRINT127 BUSINESS UNITS IN 51 COUNTRIESACROSS 6 CONTINENTS
IMF World Economic Outlook Real GDP Growth2021 Projections
<0
0-4%
4-6%
+6%
EM & Frontier
Advanced Economies
World
China
India
5.9%
4.8%
5.4%
8.2%
6.0%
IMF World Economic Outlook | June 2020 Ports & Terminals Parks & Economic Zones Logistics & Maritime Services
DP World Overview E S G Container Industry Overview Throughput and Financials Business Development

11
KEY ENVIRONMENTAL & SUSTAINABILITY INITIATIVES
In 2017, DP World joined the United Nations IMPACT 2030 initiative and became Regional Voice Lead for the UAE.
DP World continues to play an active part in the Transport Taskforce, which brings together 40 of the world’s leading wildlife organizations and transport businesses to tackle illegal wildlife trade.
DP World is rated ‘Low’ ESG Risk by Sustainalytics with a score of 14.8 as of September 2019.
ESG Risk Rating improvement:
o Ranking improved from 4th to 1st in the ‘Marine Ports’ sub-industry group,
o Ranking improved from 35th to 21st in the ‘Transportation Infrastructure’ industry group.
First international marine and inland trade services provider to join the renowned CDP.
Achieved overall score of Leadership/ A- in 2019, placing DP World in the top 24% in our activity group.
In 2019, achieved 10% reduction in emission intensity (kgCO2e/ModTEU) against 2013 baseline.
In 2019, DP World scored 54 points in the DJSI Index, which qualified us for the Emerging Markets Index. The industry average is 36 and the industry best score is 85.
DP World is the only company in the region which is in the DJSI Index..
DP World Overview ESG Container Industry Overview Throughput and Financials Business Development

12
KEY ENVIRONMENTAL & SUSTAINABILITY INITIATIVES
DP World has satisfied the requirements to become a constituent of the FTSE4Good Index Series following the December 2019 index review.
Created by FTSE Russell, the FTSE4Good Index Series measures the performance of companies demonstrating strong ESG practices.
The DP World Solar Power Programmephases 1 and 2 include the installation of 154,000 solar panels on the roofs of DP World and JAFZA buildings, parking lots, warehouses and at Port Rashid.
In 2018, the company launched the UAE’s first green storage, passenger terminal and warehouse facilities.
In 2018, DP World repriced and extended its $2bn conventional and Murabaharevolving credit facilities by two years to July 2023. The loan pricing is linked to DP World’s carbon emission intensity.
The first green loan in the region with an Islamic format that links pricing to environmental performance.
DP World is committed to ensuring that there is no modern slavery or human trafficking in any part of our business and to seeking to ensure our supply chains globally are also free of these issue.
Issue modern slavery and human trafficking statement on an annual basis, pursuant to section 54(1) of the UK Modern Slavery Act 2015.
GreenLoan
DP World Overview ESG Container Industry Overview Throughput and Financials Business Development

-10%
-5%
0%
5%
10%
15%
19
91
19
92
19
93
19
94
19
95
19
96
19
97
19
98
19
99
20
00
20
01
20
02
20
03
20
04
20
05
20
06
20
07
20
08
20
09
20
10
20
11
20
12
20
13
20
14
20
15
20
16
20
17
20
18
20
19
20
20
F
20
21
F
13
GLOBALISATION AND THE GROWTH OF THE CONTAINER
More than 90% of cargois transported on Sea
World container traffic vs. World GDP
Why does a multiplier exist?
o Distance between manufacturing and consumption location requires transhipment which leads to containers being handled more than once.
o Trade imbalance leads to empty repositioning.
o Low container penetration rates in emerging markets.
Container Ports Characteristics
o Resilient volumes, high cash generation, and limited operators.
o Light regulation – cost of container handling is less than 10% of total transport logistics.
o High entry barriers – capital expenditure heavy, strategic assets.
Source:World GDP data from the IMF World Economic Outlook Update June 2020.
Global Container Throughput Growth data reported from Drewry Maritime Research July 2020 Report.
DP World Overview ESG Container Industry Overview Throughput and Financials Business Development

14
CONTAINERISATION PENETRATION RATES REMAIN LOW
17,357 1,368 13
11,196 67 168
68,674 494 139
139,724 834 167
800,756 7,694 104
48,328 520 93
10,592 211 50
5,174 146 35
28,393 1,308 22
17,357 1,368 13
Region / Country 2019 Port Throughput
(mn TEU) Estimated Population in 2019
(mn People)
Container / Thousand Capitain 2019
(TEU /’000 people)
China
UK
North America
Europe
World
Latin America
Brazil
Russia
Africa
India
Notes: o Port throughput figures include gateway and transhipment volumes.o Significant volumes of unitised traffic also move in ro-ro mode in some countries e.g. UKSource: Drewry Maritime Research
DP World Overview ESG Container Industry Overview Throughput and Financials Business Development

15MAINTAINING DIFFERENTIATION FROM TERMINAL OPERATING PEERS: TOP 5 GLOBAL OPERATORS
Operator 2019
ThroughputCapacity
2019Market Share
2019 Equity TEU*
Market ShareKey Focus
China Cosco Shipping 109.8 142.1 13.7% 6.1%
o Around 75% of activity generated by emerging markets.
o Mainly focused on China although rapid expansion internationally.
o Primarily gateway, limited exposure to transhipment.
o Consolidation of port and terminal ownership in China.
o Large investment in the One Belt and Road initiative.
PSA International 84.8 117.0 10.6% 7.5%
o Significant exposure to transhipment especially in Singapore.
o Mix of mature & emerging markets, strong home base in Singapore.
o Global activities but limited presence in Americas and no investments in Africa.
o Increasing portfolio expansion plans (greenfield) and development of capacity at
existing locations e.g. Singapore.
APM Terminals 84.2 107.6 10.5% 5.8%o Exposed to one shipping line – more than 50% of revenueo Primarily gateway (some transhipment exposure)o High (global presence). Oceania the only world region where not present.
Hutchinson Port Holdings¹ 82.6 119.6 10.3% 5.7%
o Mainly emerging markets although significant presence in Europe.
o Mostly gateway. Some exposure to transhipment in certain terminals.
o High (global presence) although significant proportion of volumes in home base of
China. Limited presence in North and South America and Africa.
DP World 69.4 91.0 8.7% 5.5%²
o Primarily origin and destination cargo (70%) with pricing power
o Emerging market focus and strong presence in Europe, Australia and North
America
o High global presence, limited in North America
o Expansion in emerging and mature markets
o Only operator with activities in all 12 world regions and remains the leading player
in the Middle East by a large margin.
Source: Drewry Maritime Research 2020 Annual Report.*Equity TEU adjusts figures to match the % ownership of terminals, (1) Hutchison figure include HPH Trust volumes (2) DP World equity league ranking: #4 in 2018
DP World Overview ESG Container Industry Overview Throughput and Financials Business Development

16
COVID-19 IMPACT
o Drewry forecast 7.3% volume contraction in 2020 and 10% growth in2021.
o 2Q2020 and 3Q2020 are expected to be the weakest quarters.
o Volumes to improve as world economy normalises.
o DP World ports remain fully operational globally.
o Pro-active safety measures out in place i.e. equipment, socialdistancing, working from home.
o DP World focused on managing costs and disciplined capex.
Source: Drewry Maritime Research, July 2020
800
742
816
870
2019 2020 2021 2022
Drewry Global Throughput Forecast* (World)2019-2022(Million TEU)
*Levels represented take into consideration the impact of the coronavirus
-2.7%
0.3%
-16.2%
-7.9%
-10.0%
0.1%
-7.3%
2.1%
18.2%
12.0%
8.4%
10.0%
6.6%
-20.0%
-10.0%
0.0%
10.0%
20.0%
Drewry Global Throughput Forecast (World) 2020-2022
1Q20 1Q20 (DPW) 2Q20 2Q20 (DPW) 3Q20 4Q20 FY20 1Q21 2Q21 3Q21 4Q21 FY21 FY22
DP World Actual Throughput
1Q20: +0.3%2Q20: -7.9%
DP World Overview ESG Container Industry Overview Throughput and Financials Business Development

17
THROUGHPUT OVERVIEW
Gross Volumes‘000 TEU
1Q 2019(YoY)
1Q 2020(YoY)
1Q 2020Volume
2Q 2019(YoY)
2Q 2020(YoY)
2Q 2020Volume
1H 2019(YoY)
1H 2020(YoY)
1H 2020Volume
Asia Pacific & India +3.9% -5.8% 7,551 +4.1% -12.2% 7,227 +4.0% -9.0% 14,778
Europe, Middle East and Africa* -4.1% -0.9% 7,332 -1.7% -7.6% 7,153 -2.9% -4.3% 14,485
Americas & Australia -3.7% +10.7% 2,303 +4.4% -0.6% 2,331 +0.4% +4.7% 4,635
Total Group -0.6% -1.7% 17,185 +1.6% -8.8% 16,712 +0.5% -5.3% 33,897
Consolidated Volumes‘000 TEU
1Q 2019(YoY)
1Q 2020(YoY)
1Q 2020Volume
2Q 2019(YoY)
2Q 2020(YoY)
2Q 2020Volume
1H 2019(YoY)
1H 2020(YoY)
1H 2020Volume
Asia Pacific & India +3.7% +3.5% 2,384 +8.1% -20.2% 1,900 +5.9% -8.6% 4,284
Europe, Middle East and Africa* -5.7% +0.9% 5,732 -2.4% -8.9% 5,449 -4.1% -4.1% 11,181
Americas & Australia +19.9% +90.3% 2,226 +94.3% +15.2% 2,279 +57.9% +43.1% 4,505
Total Group -0.8% +12.9% 10,342 +10.6% -6.9% 9,628 +4.9% +2.4% 19,970
*Jebel Ali volumes included in Middle East, Africa and Europe region
-8.8% -3.4% 3,373 -6.3% -10.0% 3,300 -7.5% -6.8% 6,673
DP World Overview ESG Container Industry Overview Throughput and Financials Business Development

18
KEY CAPACITY ADDITIONS
2019 Year End Capacity New Developments and major expansions
2020 Year End Forecast
Consolidated Capacity 54.0m TEU
o Karachi (Pakistan)
o Sokhna (Egypt)
o Yarimca (Turkey)
o Fraser Surrey Docks (Canada)
o Posorja (Ecuador)
Approx.
57.5m TEU
Gross Capacity
(Consolidated plus equity-accounted investees)
92.0m TEU As above Approx.
95.0m TEU
o Many of our existing portfolio of terminals have the ability to increase capacity as utilization rates and customer demand increases.
o 2020 expected new capacity: Sokhna (Egypt) 0.7m TEU; Karachi (Pakistan) 0.4m TEU; Yarimca (Turkey) 0.4mn TEU
DP World Overview ESG Container Industry Overview Throughput and Financials Business Development

OVERVIEW OF 2020 INTERIM FINANCIAL RESULTS19
Results before separately disclosed items(1) unless otherwisestated | USD million
1H 2020 1H 2019As Reported
% change
% changeLike-for- like at
constant currency(2)
Gross throughput(3) (TEU ‘000) 33,897 35,811 (5.3%) (3.9%)
Consolidated throughput(4) (TEU ‘000) 19,970 19,495 2.4% (5.4%)
Revenue 4,076 3,463 17.7% (11.6%)
Revenue (excluding Emaar land sale) 4,076 3,163 28.9% (3.4%)
Share of profit from equity-accounted investees 55 86 (36.7%) (14.8%)
Adjusted EBITDA(5) 1,534 1,611 (4.8%) 1.1 (6)
Adjusted EBITDA margin(7) 37.6% 46.5% - 43.9%(7)
Profit for the period 333 753 (55.7%) (46.5%)
1 Before separately disclosed items (BSDI) primarily excludes non-recurring items. DP World reported separately disclosed items of a $2.3 million profit.2 Like-for-like at constant currency is without the new additions at KRIL (India), Posorja (Ecuador), Topaz (UAE) Fraser Surrey Docks (Canada), Ferries & Ferry Masters (UK), Feedertech (Singapore), Puertos y Logistica (Chile);
the discontinuation of Surabaya (Indonesia) and Tianjin (China); consolidation of DPWA (Australia) and Caucedo (Dominican Republic)3 Gross throughput is throughput from all consolidated terminals plus equity-accounted investees.4 Consolidated throughput is throughput from all terminals where the Group has control as per IFRS.5 Adjusted EBITDA is Earnings before Interest, Tax, Depreciation & Amortisation including share of profit from equity-accounted investees before separately disclosed items.6 Adjusted EBITDA (excluding land sale to Emaar) adjust for the land sale transaction in 1H2019.7 The adjusted EBITDA margin is calculated by dividing adjusted EBITDA by revenue, including our share of profit from equity-accounted investees.
DP World Overview ESG Container Industry Overview Throughput and Financials Business Development

752 743 773 897 948 1030 1060
565 604 656 696 703 688 758342 403 387 422
682
1153
1982
150 278
280
292
291
277
301
93
$0
$500
$1,000
$1,500
$2,000
$2,500
$3,000
$3,500
$4,000
$4,500
1H 2014 1H 2015 1H 2016 1H 2017 1H 2018 1H 2019 1H 2020
US$
Mill
ion
s
Container 'Stevedoring' Container 'Other' Non-Container (excl. Lease Revenue) Lease Revenue (part of non-container) Sales of plots
REVENUE BREAKDOWN20
o At 1H2020, non-containerized revenue accounted for approximately 55% of total revenue.o Like-for-like revenue decreased by 11.6% due to a decline in non-containerized revenue.o Total Lease revenue was $277 million. Lease revenue is included in total non-container revenue for reporting purposes.
DP World Overview ESG Container Industry Overview Throughput and Financials Business Development

21
DP WORLD KEY FINANCIAL METRICS
$ million 2009 2010 2011 2012 2013 2014 2015 2016 2017 2018 2019
Gross Throughput (TEU mn) 43.4 49.6 54.7 56.1 55.0 59.9 61.7 63.7 70.1 71.4 71.2
Consolidated Throughput (TEU mn) 25.6 27.8 27.5 27.1 26.1 28.3 29.1 29.2 36.4 36.8 39.9
Revenue 2,821 3,078 2,978 3,121 3,073 3,411 3,968 4,163 4,715 5,646 7,686
Adjusted EBITDA 1,072 1,240 1,307 1,404 1,414 1,588 1,928 2,263 2,469 2,808 3,306
EBITDA margin 38.0% 40.3% 43.9% 45.0% 46.0% 46.6% 48.6% 54.4% 52.4% 49.7% 43.0%
Leverage (Net Debt / EBITDA) 4.7 4.2 2.7 2.0 1.7 1.3 3.2 2.8 2.5 2.8 3.9*
PAT 332.7 450.1 531.7 624.8 674.2 756.7 969.9 1,259.5 1,362.5 1,332.8 1,341.4
EPS (USD cents) 35.6 45.0 55.3 65.7 72.8 81.4 106.3 135.7 145.6 153.0 160.0
ROCE % 3.8% 4.4% 6.0% 6.8% 6.7% 7.1% 7.9% 9.5% 8.8% 8.4% 7.5%
Interest cover x 3.8 4.4 4.5 4.7 5.0 5.6 5.0 6.7 7.5 6.5 4.6
Capex 967 1,129 481 685 1,063 807 1,389 1,298 1,090 908 1,146
Acquisition & Monetisation 142 0 (1,504) (374) (637) 83 4,100 174 300 2,500 3,100
Consolidated Terminal Capacity (TEU mn) 34.4 35.1 33.6 34.7 35.2 37.9 40.1 42.4 49.7 49.7 54.2
Gross Capacity (TEU mn) 59.7 64.1 69.4 69.7 70.7 76.1 79.6 84.6 88.2 90.5 91.8
Gross Capacity Utilisation 72.7% 77.3% 78.8% 80.4% 77.8% 78.7% 77.5% 75.2% 79.5% 78.9% 77.6%
* Post IFRS16
DP World Overview ESG Container Industry Overview Throughput and Financials Business Development

22
HISTORICAL OPERATING PERFORMANCE
0
10
20
30
40
50
60
70
80
0
1,000
2,000
3,000
4,000
5,000
6,000
7,000
8,000
9,000
2009 2010 2011 2012 2013 2014 2015 2016 2017 2018 2019
TEU mU
SD m
Gross Volumes
REVENUE
EBITDA
PAT
DP World Overview ESG Container Industry Overview Throughput and Financials Business Development

23
2019 RETURN ON CAPITAL EMPLOYED
-40.0%
-20.0%
0.0%
20.0%
40.0%
60.0%
80.0%
100.0%
RO
CE
Capital Employed
❑ Variable costs increased to 66.2% in 2018 from 63.3% in 2017.
❑ Cost breakdown remains the same as 2018 with payroll and concessions representing about 60% of total costs.
˃ 15% ROCE : 27% 5 - 15% ROCE : 37% ˂ 5% ROCE : 36%
DP World Terminals
Medium Term Target of 15%
o ROCE was at 7.5% in 2019 from 8.4% in 2018.
o Approximately 30% of our capital employed delivers returns in excess of 15%.
o Newer operations or investment in pre-operational businesses reduces Group ROCE.
o Includes all DP World consolidated operations and our equity-accounted investees.
DP World Overview ESG Container Industry Overview Throughput and Financials Business Development

DEBT POSITION24
o Well matched debt profile with long-term debt to meet long-term nature of our business.o Cash from operating activities remains strong at $1,124 million in 1H2020 compared to $1,046 million in 1H2019o Leverage (Net debt to annualised adjusted EBITDA) increased to 3.7 times (Pre-IFRS16) from 3.4 times at FY2019. On a post-IFRS16 basis, net leverage
stands at 4.3 times compared to 3.9 times at FY2019.
$ Million 30 June 2019 31 Dec 2019 30 June 2020
Interest Bearing Debt 11,095 13,281 12,955
IFRS 16 Lease Liability 2,399 2,513 2,953
Total Debt 13,494 15,794 15,908
Cash Balance 2,050 2,943 2,139
Adjusted Net Debt 11,444 12,851 13,769
Adjusted Net Debt (Excluding lease liabilities) 9,045 10,338 10,816
Net Debt / Adjusted EBITDA pre IFRS 16 3.0x 3.4x 3.7x
Net Debt / Adjusted EBITDA post IFRS 16 3.7x 3.9x 4.3x
Interest Cover pre IFRS 16 6.0x 5.3x 3.9x
Interest Cover post IFRS 16 5.1x 4.6x 3.5x
DP World Overview ESG Container Industry Overview Throughput and Financials Business Development

25
DEBT MATURITY PROFILE – PROFORMA POST PERPETUAL ISSUANCE
1,200
1,000 1,000
500
254
842
431
1,750
1,300
500
95190
317
803
320
601
243 232 191 66 87 69
479
65 47 25 16
3,400
3,000
1,500
0
500
1000
1500
2000
2500
3000
3500
4000
2020 2021 2022 2023 2024 2025 2026 2027 2028 2029 2030 2031 2032 2033 2034 2037 2039 2048 2049
US $
mill
ions
Sukuk MTN Bank Loans and Others PFZW Loan (Guaranteed by DPW) Perpetual Hybrid Sukuk (First Call Date)
*
* Proceeds received 1st July 2020
DP World Overview ESG Container Industry Overview Throughput and Financials Business Development

26
DP WORLD DEBT
DP World Overview ESG Container Industry Overview Throughput and Financials Business Development

27
KEY PORT DEVELOPMENTS
DP World Australia (Australia)
DP World raised its holding in DP World Australia (DPWA).
Australia remains a stable market with an opportunity to grow in logistics
Berbera (Somaliland)
Strategically located to serve east Africa including Ethiopia. Expanding capacity from 0.15 million TEU to 0.55 million TEU.
TIS Container Terminal (Ukraine)
DP World agrees to acquire a 51% stake in TIS Container Terminal in the Port of Yuzhny, Ukraine. The port is a deepwater multipurpose terminal ideally located to serve the strong domestic market, Belarus and Eastern Europe.
Fraser Surrey Docks (Canada)
FSD is a multipurpose terminal which handles containers (400k TEU capacity), steel and agri-bulk.
The acquisition gives DP World the ability to further diversify cargo mix with a focus on non-
container cargo.
Posorja (Ecuador)
Opened in August 2019 with 0.75m TEU capacity.
Only deep-water port in the fast growing container market of Ecuador
Puertos y Logistica (Chile)
Puertos y Logistica S.A. (“Pulogsa”), a leading port operator in Chile with two terminals; Puerto
Central (“PCE”) and Puerto Lirquen (“PLQ”).
DP World Overview ESG Container Industry Overview Throughput and Financials Business Development

28
KEY LOGISTICS & MARITIME DEVELOPMENTS
Continental Warehousing Corporation (India)
DP World and NIIF joint venture acquired 90% of Continental Warehousing Corporation (CWC) in India.
CWC is a leading integrated multimodal logistics provider of Warehousing, Container Freight Stations (CFS), Inland Container Depots (ICD), Private Freight Terminals (PFT) and integrated logistics solutions.
Feedertech (Singapore)
Unifeeder, acquired a 77% stake in Feedertech Group. Feedertech operates two businesses, Feedertech, an independent feedering service and Perma, a regional short-sea network.
KRIBHCO Infrastructure Limited (INDIA)
KRIL operates three major Inland Container Depots/Private Freight Terminals at Pali, Haryana; Modinagar, Uttar Pradesh and Hazira, Gujarat and has container train operations with a pan India outreach. KRIL has a strong presence in the National Capital Region (NCR), which is India’s largest Import/Export market with a population of over 46 million, including a terminal located on a notified double stack route.
P&O Ferries (UK)
P&O Ferries is a pan-European integrated logistics business consisting of a market leading roll-on-roll-off (Ro-Ro) ferries operation and a European
transportation and logistics solutions provider (P&O Ferrymasters).
P&O Ferries handles over 2.5 million freight units per year which accounts for approx. 75% of group revenues.
Topaz (Caspian, MENA & Africa)
Topaz is a leading international provider of critical marine logistics and solutions to the global energy industry. The Company operates a modern
and versatile fleet of 117 vessels, predominantly in the Caspian Sea, MENA, and West Africa regions.
Unifeeder Group (Denmark)
Unifeeder operates the largest and most densely connected common user container feeder and an important and growing shortsea network in Europe.
DP World Overview ESG Container Industry Overview Throughput and Financials Business Development

Unifeeder and P&O Ports
DP World Terminals & Logistic Parks
Rail connections
Shortsea connections
Jebel Ali
SoharKhalifa
Hamad
Dammam
Jubali
Jeddah
Sudan Vizag
Tuticorin
Colombo
HaldiaChittagong
Paradip
Leam ChabangManila
PusanQingdao
Xingang
Shanghai
Shekou
Port Klang
Singapore
Medium-haul services integrated with unparalleled inland capabilities across East Asia, Wider ISC, and Arabian Gulf
True multimodal network with unparalleled coverage from East Asia to Gulf and Red Sea
Services spanning full spectrum of medium-haul lines, shortsea, and coastal
Largest regional equipment pool serving the full range of regional cargo flows
20 terminals connected across region
Port centric freight forwarding capabilities enabling seemless D2D connectivity in Jebel Ali
Regional and domestic carriers NVOCCs Freight forwarding
EW
ISC
Part of Unifeeder Group
Mundra
Karachi
Hazira
Nhava Sheva
Kattupalli
Cochin
Chennai
Krishnapatnam
ADDING SCALE TO UNIFEEDER’S LOGISTICS PLATFORM29

30
DP WORLD CHILE
A
B
Puerto Lirquen is located near the main productive center of Southern Chile, serving blue-chip forestry and pulp clients who ensure stable export demand
o PLQ is amongst the largest private public-access ports in Chile, benefiting from the largest storage in the VIII Region
Pulogsa concession in the San Antonio bay is for a 20 year period with the option to extend it until 2041.
o Pulogsa is one of the largest and the most modern container ports in Chile.
o PCE’s total capacity of 1.15m TEUs and the port facility counts with direct connectivity to Santiago through modern highways and railway.
DP World Chile owns two multipurpose seaport assets; A. Puerto Central (PCE) concession in San Antonio, V Region, and B. Lirquen port (PLQ) which serves mainly forestry product exports in the VIII Region.
Reasons for DP World to invest
Both PCE & PLQ handle gateway cargo, and would allow DP World to serve cargo owners and shipping lines at five key gateways on the west coast of South America in Posorja (Ecuador), Callao and Paita (Peru) and San Antonio and Lirquen (Chile).
Chile is an investment grade (A1/ Stable) country with strong GDP growth.
PCE is the most modern terminal in the Santiago region (>50% national cargo demand) and expected to maintain a favorable supply/demand balance. PLQ is a freehold asset.
• Acquired in January 2019
DP World Overview ESG Container Industry Overview Throughput and Financials Business Development

31
P&O FERRIES & FERRYMASTERS
M
European Network
Dover
Tilbury
Calais
Larne / Belfast
Dublin
Cork
Riga
Poznan
Europoort
Klaipeda
St. Petersburg
Duisburg
Oslo
Harwich
Teesport
Hull
Liverpool
Lovosice
Ostrava
Ploiesti
Constanta
Oradea
Novara
Budapest
Zeebrugge
Nola Bari
Pomezia
Dourges
RostockLübeck
Talinn
HelsinkiHanko
Cairnryan
Piacenza
Segrate
Stockholm
Gothenburg
Bilbao
MadridBarcelona
Perpignan
Mersin
Patras
Port / Terminal / Hub
Core Asset Areas
Ferry Routes
Chartering Train Services
Shuttle Services
Road Shunts
New Services 2019
Calais
Malmö
Toulon
Trieste
Pendik (Istanbul)
• Acquired in February 2019
DP World Overview ESG Container Industry Overview Throughput and Financials Business Development

32
TOPAZ ACQUISITION STRENGTHENING DP WORLD’S MARINE SERVICES OFFERING
Fleet Number of ships117
(primarily OSVs)281
(primarily tugs/barges and other small vessels)
FY18 financials Revenue and EBITDA
US$349mRevenue
US$190mEBITDA
US$230mRevenue
US$80mEBITDA
Geographic exposureFY18 revenue split by operational location EMEA
50%
Australasia & PNG36%
S. America14%
Caspian45%
Solutions32%
MENA13%
Africa10%
• Acquired in July 2019
DP World Overview ESG Container Industry Overview Throughput and Financials Business Development

33
FEEDERTECH ACQUISITION – TRANSACTION OVERVIEW
o Acquired 77% stake in Feedertech Group.
o Established in 2003 and based in Singapore, Feedertech operates two businesses: Feedertech (an independent feederingservice) and Perma (regional short-sea network).
o Feedertech Group will broaden DP World’s Group feedering and short-sea product offering to multiple geographies.
o Further enhance DP World’s logistics capability to offer an end-to-end solution to both the shipping lines and cargo owners.
Pier-to-pier operation through customized services which primarily relies on Feedertech.
Utilizes 11 services (ISC – Middle East drives c.52% of volumes; Far East & Southeast Asia drives 32%; Africa drives 4%; remaining is reefer or special services).
PermaFeedertech
Port-to-port operations through VSAs/consortium with Main-Line Operators (MLO).o No owned vessel.
o The company has 5 service routes in Indian Subcontinent and Far East regions.
• Acquired in December 2019
DP World Overview ESG Container Industry Overview Throughput and Financials Business Development

DUBAI
34
DUBAI - SERVES A WIDE REGION
$373 trn non-oil foreign trade (2019) Largest domestic market in the regionJebel Ali Free Zone non-oil trade worth $99 bn (2019)
Pro-business government Rapidly growing trade and services sectorsCosmopolitan city with high standard of livingExcellent healthcare & educational servicesDiverse living environment, over 200 nationalitiesSecure environment
Midway between Asia & Europe Trade gateway for GCC, ISC & Africa with population access of over 2bn Logistics hub for Arabian Gulf Host to the World Expo 2020
Trading Across Borders 2019 (World Bank) - MENA region
#8
Globally in Ease of Doing Business Report 2020 (World Bank) and ranked #1 in Arab countries for 7th consecutive year
#16
Global Connectedness Index 2018 (DHL)
#5
2019 Economic Freedom Index – Global ranking and Rank #1 in the Region
#9
o Jebel Ali Port is 11th largest port worldwide o 19.3 million TEU capacity (2018)o Sea connectivity: 180+ shipping lines, 80+
weekly services, 140+ direct ports of call
o World's busiest international airport o 87.9 million passengers in 2019o Handled 2.6m tons air freight in 2019. o DWC: Dubai’s emerging cargo airporto Customs bonded corridor connects sea-air box
within 45mins of discharge
o Rail network in GCC by 2020o Etihad Rail (UAE) will span 1,200 kmso 75 Kms of Metroo Tramway of 14 kmso Etihad Rail will have a depot within Jebel Ali
facility, connecting UAE to GCC
o Connected to the main UAE/GCC road network – 2 to 3 days road transit to anywhere in the GCC.
DP World Overview ESG Container Industry Overview Throughput and Financials Business Development

35
JEBEL ALI PORT & FREE ZONE (JAFZ)Integrated One Stop Shop for Business Solution
Spans 57 sq km
Over 7,900 customers from 140 countries
Over 135,000Jobs sustained
Main Logistics & Trade Hub for the region
Operate in an Integrated One-Stop-Shop
Over 100 Fortune 500 companies
Over 350 logistics companies. 8 out of the 10 largest logistics companies in the world have their Regional base in JAFZA
Multimodal ConnectivityJebel Ali Port, Al Maktoum Intl. Airport, Etihad Railway, Regional Highways
Access to 3 Bn+ people in the MEASA region
Dubai Logistics Corridor Sea – air customs bonded corridor
One of the largest Business Communities in the region
Facilitates trade (2019) worth $99 Bn
DP World Overview ESG Container Industry Overview Throughput and Financials Business Development
36
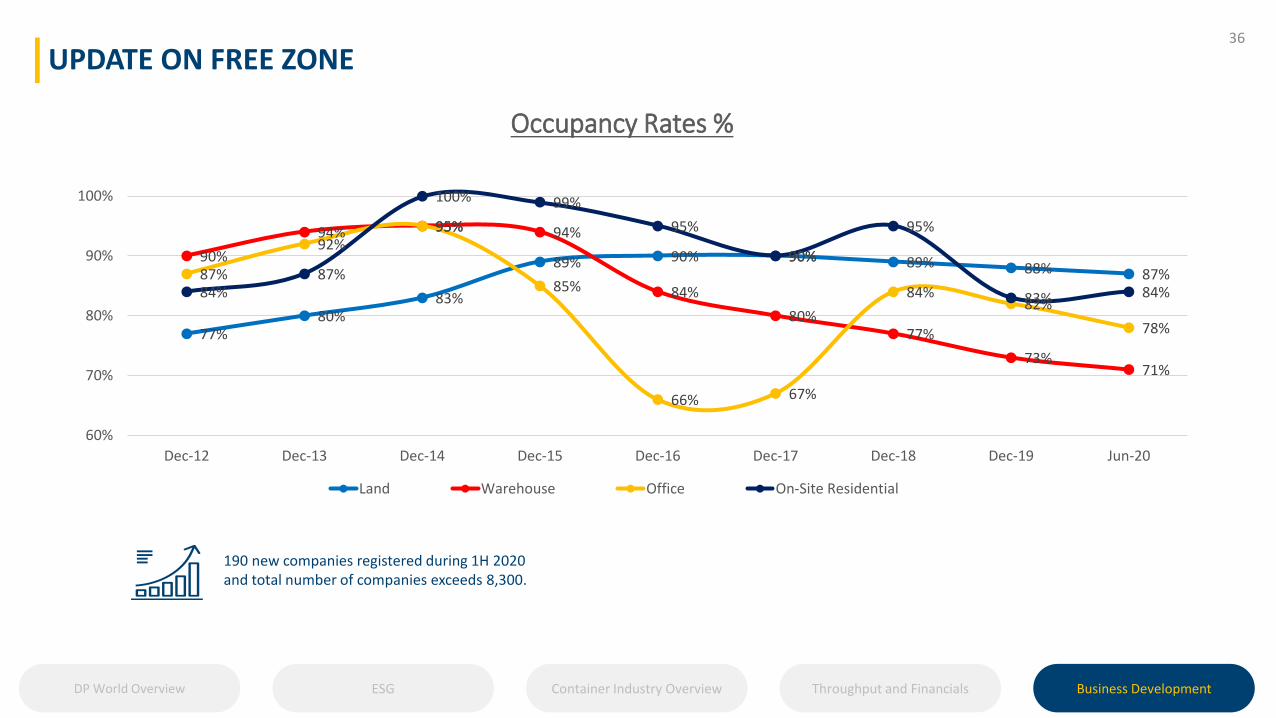
UPDATE ON FREE ZONE
77%80%
83%
89% 90% 90% 89% 88% 87%90%
94% 95% 94%
84%
80%77%
73%71%
87%
92%95%
85%
66% 67%
84%82%
78%
84%87%
100% 99%
95%
90%
95%
83% 84%
60%
70%
80%
90%
100%
Dec-12 Dec-13 Dec-14 Dec-15 Dec-16 Dec-17 Dec-18 Dec-19 Jun-20
Occupancy Rates %
Land Warehouse Office On-Site Residential
190 new companies registered during 1H 2020 and total number of companies exceeds 8,300.
DP World Overview ESG Container Industry Overview Throughput and Financials Business Development

Mundra
Vallarpadam
Chennai
Visakhapatnam
Ahmedabad
Hyderabad
Panipat
Tuticorin
Mumbai
Surat
Bangalore
Sahibabad,
Delhi NCR
CFS Facility
ICD/PFT Facility
FTWZ Facility Under development
Port Terminal
Cold Chain Facility
37
DP WORLD INDIA OVERVIEW
DP World is one of the largest solution providers in South Asia.
DP World has created a wide network of logistics assets in India including CFSs, ICD PFTs, Cold chain facilities, road and rail transportation networks.
India Transportation Growth Forecastso India Container Terminal CAGR 8-10%o Container Freight Station (CFS) and Inland Container Depot (ICD) CAGR 10-12%o Private Freight terminal CAGR 30-35%
6Port Terminals
5Container Freight Stations
3Inland Container Depots/Private Freight Stations
2Free TradeWarehousing Zones
6Cold Chain Facilities(Winter Logistics)
4Inland Container Depots(Kribhco Infrastructure Ltd)
DP World Overview ESG Container Industry Overview Throughput and Financials Business Development

38
INVESTOR RELATIONS APP
https://www.myirapp.com/dpworld/

Redwan AhmedEmail: [email protected]
Amin FikreeEmail: [email protected]
Investor RelationsEmail: [email protected]
Investor Relations Contact
THANK YOU