Continuous Excellence is Key to Growth and Sustainability
149
c IJ Í D 0 ' 0 KE Energy That Moves Life Continuous Excellence is Key to Growth and Sustainability Annual Report I 201 7
-
Upload
khangminh22 -
Category
Documents
-
view
0 -
download
0
Transcript of Continuous Excellence is Key to Growth and Sustainability

KE Energy Th•t Move• Lita
0 0 K-Electric KElectricPk @KElectricPk KElectricPk KElectricPk www.ke.com.pk KE Live
KE House, 39-B, Sunset Boulevard, Phase II (Ext), DHA, Karachi, Pakistan. UAN: (+92 21) 111 - 537- 211
::t> :::J :::J c
0)
IJ CD D 0 ' .--+
[\.)
0 ---->.
KE Energy That Moves Life
Continuous Excellence
is Key to Growth and Sustainability
Annual Report I 201 7

1 | KE Annual Report 2017
Continuous Excellence is Key to Growth and SustainabilityThe theme for this year’s Annual Report, “Continuous Excellence is Key to Growth and Sustainability”, reflects KE’s unwavering commitment to be the best utility company through the provision of uninterrupted, safe and affordable power. A company-wide effort is being made to develop and reinvigorate infrastructure so that there is continuous growth towards an energised Karachi. Our aim of empowering and sustaining our customers is underpinned by a corporate culture that keeps customer-centricity, accountability, respect and safety at the heart of every action.

KE Annual Report 2017 | 2
Contents
03Financial Performance59606163646566686970717273
Six Years PerformanceKey Financial IndicatorsGraphical AnalysisVertical AnalysisHorizontal AnalysisCommentary on PerformanceAuditors Report to the MembersBalance SheetProfit & Loss AccountCash Flow StatementStatement of Changes in EquityStatement of Comprehensive IncomeNotes to the Financial Statements
04Shareholders Information126134136142144146
Pattern of ShareholdingCategories of ShareholdersShare Price Sensitivity AnalysisJama PunjiProxy Form – UrduProxy Form – English
030506
070809111415172021
137
01Company Profile
Company ProfileCompany InformationAttendance in Board and Committees MeetingsChairman’s Message & ReviewCEO’s MessageVision & MissionNotice of 107th Annual General MeetingLeadershipBoard of DirectorsBoard Committees TORsCode of ConductDirectors’ ReportDirectors’ Report-Urdu
02Governance & Compliance2931333537
39
404143474851
53
54
56
GenerationTransmissionDistributionCorporate ValuesCustomer-Centricity Is a CoreOrganisational Value Environmental, Social, Governance & Sustainability ManagementEnergy Management InitiativesOur People are a Key Human CapitalCorporate GovernanceReport of the Board Audit CommitteeStatement of Compliance with CCG 2012Review Report to the Members on Statement of Compliance with The Code of Corporate GovernanceStatement of Compliance Prepared by ManagementIndependent Assurance Report to the Board of Directors on the Statement of Compliance with the Issue of Sukuk Regulations, 2015 for the Year endedJune 30, 2017Major Business Risks and their Mitigation
3 | KE Annual Report 2017
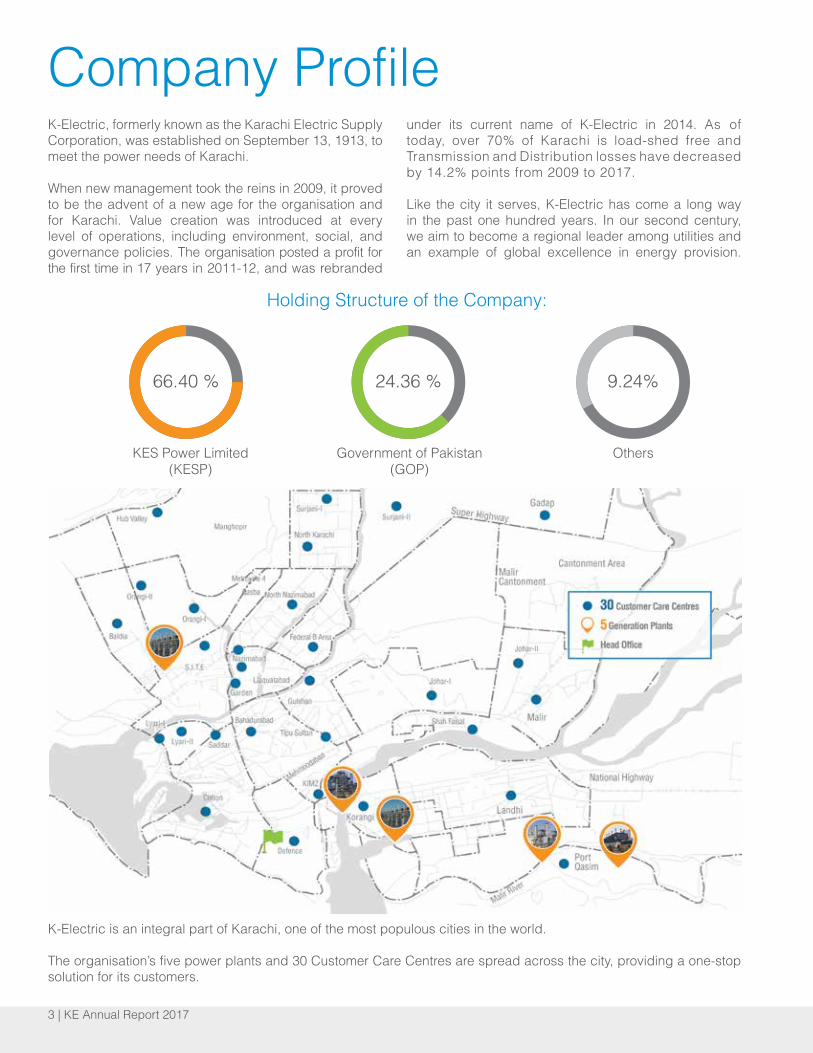
K-Electric, formerly known as the Karachi Electric Supply Corporation, was established on September 13, 1913, to meet the power needs of Karachi.
When new management took the reins in 2009, it proved to be the advent of a new age for the organisation and for Karachi. Value creation was introduced at every level of operations, including environment, social, and governance policies. The organisation posted a profit for the first time in 17 years in 2011-12, and was rebranded
under its current name of K-Electric in 2014. As of today, over 70% of Karachi is load-shed free and Transmission and Distribution losses have decreased by 14.2% points from 2009 to 2017.
Like the city it serves, K-Electric has come a long way in the past one hundred years. In our second century, we aim to become a regional leader among utilities and an example of global excellence in energy provision.
Company Profile
Holding Structure of the Company:
66.40 %
KES Power Limited(KESP)
24.36 %
Government of Pakistan(GOP)
9.24%
Others
K-Electric is an integral part of Karachi, one of the most populous cities in the world.
The organisation’s five power plants and 30 Customer Care Centres are spread across the city, providing a one-stop solution for its customers.

KE Annual Report 2017 | 4

5 | KE Annual Report 2017
Company InformationBoard of Directors (BOD)Ikram Ul-Majeed Sehgal ChairmanSyed Moonis Abdullah Alvi CEOKhalid Rafi Adeeb AhmadChaudhary Khaqan Saadullah Khan Dr. Ahmed Mujtaba MemonMubasher H. Sheikh Muhammad Zubair MotiwalaNayyer HussainShan A. AsharySyed Mohammad Akhtar ZaidiWaseem Mukhtar
Board Audit Committee (BAC)Khalid Rafi Chairman Chaudhary Khaqan Saadullah Khan MemberMubasher H. Sheikh MemberNayyer Hussain Member
Board Human Resource &Remuneration Committee (BHR&RC)Khalid Rafi Chairman Nayyer Hussain MemberSyed Moonis Abdullah Alvi Member
Board Finance Committee (BFC)Shan A. Ashary Chairman Chaudhary Khaqan Saadullah Khan MemberKhalid Rafi MemberNayyer Hussain Member
Board Strategy & ProjectCommittee (BS&PC)Khalid Rafi Chairman Chaudhary Khaqan Saadullah Khan MemberNayyer Hussain MemberShan A. Ashary MemberSyed Moonis Abdullah Alvi Member
Board Risk Management &Safety Committee (BRM&SC)Khalid Rafi Chairman Dr. Ahmed Mujtaba Memon MemberMubasher H. Sheikh MemberSyed Moonis Abdullah Alvi Member
Chief Financial Officer Muhammad Aamir Ghazlani
Chief People Officer &Company SecretaryMuhammad Rizwan Dalia
Chief of Internal AuditAsif Raza
Legal AdviserAbid S. Zuberi & Co.
External AuditorsM/s. A.F. Ferguson & Co.M/s. BDO Ebrahim & Co.
Share RegistrarCentral Depository Company of Pakistan LimitedCDC House, 99-B, Block “B”, SMCHS, Main Shahrah-e-Faisal, Karachi. Office: 111-111-500
BankersAllied Bank LimitedAskari Bank LimitedBank Alfalah LimitedBank Al-Habib LimitedBank Islami Pakistan LimitedBank of PunjabBank of China Limited, Shanghai BranchDubai Islamic Bank Pakistan LimitedFaysal Bank LimitedFirst Women Bank LimitedHabib Bank LimitedIndustrial & Commercial Bank of China Limited JS Bank LimitedMCB Bank LimitedMCB Islamic Bank LimitedMeezan Bank LimitedNational Bank of PakistanSamba Bank LimitedSoneri Bank LimitedStandard Chartered Bank (Pakistan) LimitedStandard Chartered Bank (UK)Summit Bank LimitedUnited Bank Limited
Registered Office KE House, 39-B, Sunset Boulevard, Phase-II,Defence Housing Authority, Karachi, Pakistan
Follow Uswww.ke.com.pk UAN: 111-537-211
KElectricPK @KElectricPk KElectricPk K-Electric KElectricPk www.ke.com.pk KE Live

KE Annual Report 2017 | 6
Meetings of KE Board of Directors – FY 2017
Meetings of Board Audit Committee (BAC) – FY 2017
Meetings of Board Finance Committee (BFC) – FY 2017
Meetings of Board Human Resource & Remuneration Committee (BHR&RC) – FY 2017
S. No.
01020304050607080910111213
010203 04
010203 0405
010203
222
222
Waqar Hassan SiddiqueMuhammad Tayyab TareenKhalid RafiMuhammad Anwer ShaikhMuhammad Zubair MotiwalaOmar Khan LodhiShan A. AsharyMubasher H. SheikhNayyer HussainFrederic SicreAziz MooljiCh. Khaqan Saadullah Khan Zafar Abbas
No meeting of Audit Committee and Board of Directors of the Company was
held during FY 2017, due to reasons described in Directors’ Report.
No meeting held
No meeting held
Khalid RafiAziz MooljiMubasher H. SheikhNayyer Hussain
Shan A. AsharyMuhammad Tayyab TareenNayyer HussainAziz MooljiOmar Khan Lodhi
Omar Khan LodhiMuhammad Tayyab TareenShan A. Ashary
Name Number of meetings held 1 Number of meetings attended
S. No.
S. No.
S. No.
Name
Name
Name
Number of meetings held 1
Number of meetings held 1
Number of meetings held 1
Number of meetings attended
Number of meetings attended
Number of meetings attended

7 | KE Annual Report 2017
Dear Shareholders, K-Electric Limited is a hundred and six years old Company powering Karachi, the largest city of Pakistan and its surrounding areas in Baluchistan and Sindh, serving over twenty-two million people living in these areas. Delivering on a robust strategy to reposition, restructure and re-energise the Company in areas related to power generation, transmission, distribution and customer care are already evident in our performance, and in the commitment of our people. As Pakistan’s only vertically integrated power utility, the Management’s long-term vision is providing a sustainable flow of energy to serve the customers and stakeholders better, despite the formidable challenges we face on a day-to-day basis. Our organisation’s achievements stem from the dedication and diligence of our people. From the field force to executive leadership, at KE, everyone is united and committed towards the mission of empowering lives and powering greater prosperity for Karachi, the economic hub of Pakistan. KE partners with a multitude of leading NGOs involved in the fields of environment, health and education to support communities through environmental social governance and youth development initiatives as part of our Corporate Social Responsibility. Remaining proud of our people and processes we are determined to continue delivering our best to our customers and to contribute significantly to the national growth. FY 2017 offered multiple challenges including the determination of a Multi-Year Tariff (MYT), which is completely different from the Company’s previous tariff, resulting in sizeable reduction in profitability as compared to the last year. However, aligned with our vision of delivering efficient power supply to the customers, the Company continued to make investments across the value chain, enabling the Company to improve operationally whilst progressing on the value creation curve through innovation and technological advancements. The most important transition in our entire 100 plus year old history encompasses significant changes and advancements to enhance our potential to serve our customers better. Despite the challenges, we are committed to make our planned investments, which would enable the Company to move to the next level of operational excellence. Being elected as the Chairman of the Board of Directors of K-Electric for this crucial period is a matter of great pride for me personally. It is also an honour and privilege to be part of a tremendous second-to-none team of professionals overseeing this transition to serve the city better. Karachi being the economic and manufacturing hub of the country, K-Electric will In Sha Allah be a prime economic force-multiplier for Pakistan.
Chairman’s Message & Review
Ikram Ul-Majeed SehgalChairman

KE Annual Report 2017 | 8
K-Electric Limited has undergone a transformation since 2009. Despite formidable challenges, the Company has been successful over the years because of the dedication of our teams, good corporate governance, enhanced financial controls, mega-investments coupled with continuous excellence in its operations. To further strengthen this foundation, we continue to give attention to our values and best business practices. Integrity, customer focus, technical innovation, teamwork, meticulous planning and operational excellence are some of the key areas we focus on amongst others. Given multiple demographic and infrastructure challenges of operating in Karachi, during 2009 to 2017 over USD 1.7 billion has been invested in re-building and modernising KE’s infrastructure. This translated into addition of 1,057 MW in Generation capacity. The Transmission & Distribution functions have also undergone immense transformation. The number of Customer Care Centres have increased to 30, Transmission and Distribution capacity has enhanced by 21% and 55% respectively, and over 7,500 PMTs have been converted to Aerial Bundled Cabling as of date. Further, Transmission & Distribution losses have also been brought down to 21.7% as of 2017. On behalf of the Leadership team, I am proud of our teams, who are passionate about their work and are committed to the organisation. We remain committed to People’s Development, Diversity, Inclusion, and specifically Women Empowerment. In addition to our support to communities and our CSR, KE promotes women through Sports, be it through Women’s Football League or the Girls’ Boxing Championships in Pakistan. Women meter readers at KE is another industry first initiative, introduced in 2018. Our commitment to ensure uninterrupted and sustainable power supply to over 2.5 million consumers across Karachi and its surrounding areas continues, with an aim to bring value to the economic hub of Pakistan. Our future vision encompasses enhanced renewable energy mix and cost-effective energy to Karachi and for bringing positive impact to Pakistan’s economy.
CEO’s Message
Syed Moonis Abdullah AlviChief Executive Officer

9 | KE Annual Report 2017
Our VisionTo restore and maintain pride in
KE, Karachi and Pakistan.
Our VisionTo restore and maintain pride in
KE, Karachi and Pakistan.

KE Annual Report 2017 | 10
Our MissionBrightening lives by building the capacity
to deliver uninterrupted, safeand affordable power to Karachiites.
Our MissionBrightening lives by building the capacity
to deliver uninterrupted, safeand affordable power to Karachiites.

11 | KE Annual Report 2017
Notice of 107th Annual General Meeting
Ordinary Business
1. To confirm minutes of the Annual General Meeting (AGM) held on 19 September 2017.
2. To consider, approve and adopt the annual Audited Financial Statements of the Company (with the Directors’ and Auditors’ Reports thereon) for the year ended 30 June 2017.
3. To elect Directors in place of retiring Directors. The Board of Directors has fixed the number of
Directors to be elected under Section 159(1) of the Companies Act, 2017 at thirteen (13). The retiring Directors are: -
1. Ikram Ul-Majeed Sehgal2. Syed Moonis Abdullah Alvi3. Khalid Rafi4. Dr. Ahmed Mujtaba Memon5. Muhammad Zubair Motiwala 6. Shan A. Ashary7. Mubasher H. Sheikh8. Nayyer Hussain9. Chaudhary Khaqan Saadullah Khan10. Syed Mohammad Akhtar Zaidi11. Waseem Mukhtar12. Adeeb Ahmad
4. To appoint Auditors for FY 2017-18 and fix their remuneration.
Special Business
5. To consider and, if deemed fit, pass the following as Special Resolutions, with or without modification, to amend the Memorandum & Articles of Association of the Company in order to be aligned with the provisions of the Companies Act 2017 and to remove the articles added pursuant to the requirement of “Companies (E-voting) Regulations 2016” since repealed and replaced with the “Companies (Postal Ballot) Regulations 2018.
RESOLVED THAT the words “Companies Ordinance 1984” wherever appearing in the Memorandum & Articles of Association of the Company be and are hereby replaced and substituted with the words “Companies Act 2017”.
RESOLVED FURTHER THAT the Article 47-A and Article 50-A, previously added to comply with the requirements of now repealed “Companies (E-voting) Regulations 2016” be and are hereby deleted and removed.”
RESOLVED FURTHER THAT the Chief Executive
Officer and/or the Company Secretary be and are hereby jointly or severally authorized to take such other steps, execute such other documents and make necessary corporate and other actions and statutory filings as may be necessary/expedient for the purpose of giving effect to the above resolutions and all other matters incidental or ancillary thereto.
A statement under Section 134(3) of the Companies Act 2017, relating to the aforesaid special business to be transacted at the AGM is annexed.
6. Any other business with the permission of the Chair.
Note:(i) The Share Transfer Books of the Company, for the
purpose of attending AGM, will remain closed from 23 to 30 July 2019 (both days inclusive). Transfer received at CDC Share Registrar Department, Central Depository Company of Pakistan Limited, CDC House 99-B, Block-B, S.M.C.H.S., Main Shahrah-e-Faisal, Karachi-74400 by the close of business on Monday 22 July 2019 will be treated in time.
(ii) A member entitled to attend and vote at the meeting may appoint a proxy in writing to attend the meeting and vote on the member’s behalf. A proxy must be a member of the Company.
By order of the Board
Muhammad Rizwan DaliaChief People Officer & Company Secretary
K-Electric Limited
Karachi, 8 July 2019
Notice is hereby given that the 107th Annual General Meeting (AGM) of K-Electric Limited will be held at Pearl Continental (PC) Hotel, Grand Ball Room (Ground Floor), Club Road Karachi on Tuesday 30 July 2019 at 10:30 a.m. to transact the following business:

KE Annual Report 2017 | 12
(iii) Duly completed forms of proxy must be deposited with the Company Secretary at the KE Corporate Affairs Department, First Floor, Block-A, Elander Road Power House, Off I.I. Chundrigar Road, Karachi-74200 no later than 48 hours before the time fixed for the meeting.
(iv) Shareholders (non-CDC) are requested to promptly notify to the Share Registrar of the Company (CDC Share Registrar Department, Central Depository Company of Pakistan Limited, CDC House 99-B, Block-B, S.M.C.H.S., Main Shahrah-e-Faisal, Karachi-74400) of any change in their addresses. All the shareholders holding their shares through the CDC are requested to please update their addresses with their participants.
CDC account holders will further have to follow the undermentioned guidelines as laid down in Circular 1 dated 26 January 2000 issued by the Securities & Exchange Commission of Pakistan.
A. For attending the meeting (i) In case of individuals, the account holders or
sub-account holders, whose registration details are uploaded as per the regulations shall authenticate his/her identity by showing his/her ORIGINAL CNIC or ORIGINAL passport at the time of attending the meeting.
(ii) In case of corporate entity, the Board of Directors’ resolution / power of attorney with specimen signature of the nominee shall be produced (unless it has been provided earlier) at the time of the meeting.
B. For appointing proxies(i) In case of individuals, the account holders or sub-
account holders, whose registration details are uploaded as per the regulations shall submit the proxy form as per the below requirement.
(ii) Attested copies of valid CNIC or the passport of the beneficial owners and the proxy shall be furnished with the proxy form.
(iii) The proxy shall produce his/her valid ORIGINAL CNIC or ORIGINAL passport at the time of the meeting.
(iv) In case of corporate entity, the Board of Directors’ resolution / power of attorney with specimen signature shall be submitted (unless it has been provided earlier) along with proxy form to the Company.
(v) The proxy form must be witnessed by two persons whose names, addresses and CNIC numbers shall be mentioned on the form.
(vi) If a member appoints more than one proxy and more than one instruments of proxy are deposited by a member with the Company, all such instruments of proxy shall be
rendered invalid.
C. Election of Directors Any person seeking to contest the election to the
office of Director, whether he/she is a retiring Director or otherwise, shall file the following documents with the Company at its Registered Office, no later than fourteen (14) days before the above said meeting.
a) Intention to offer himself or herself for election as
a Director in accordance with the provisions of the Companies Act, 2017.
b) Consent to act as Director in Form-28, duly completed,
as required under Section 167 of the Companies Act, 2017.
c) Detailed profile along with office address for placement
onto the Company’s website seven (7) days prior to the date of election in terms of SRO 25(1) 2012 of 16 January 2012; and
d) Signed declarations in respect of being compliant with
the requirements of the Code of Corporate Governance Regulations 2017 and the eligibility criteria as set out in the Companies Act 2017 to act as Director of a listed company.
D. Postal Ballot Members may exercise their right to vote by means of
postal ballot i.e. by post or through electronic mode subject to the requirements of section 143-145 of the Companies Act 2017 and applicable clauses of Companies (Postal Ballot) Regulations 2018.
Video Conference FacilityCompany may provide video-conference facility during the meeting to members collectively holding 10% or more shareholding and considering geographical dispersal of its members and availability of such facility in that city, as per the applicable SECP law, provided their consent to participate in the meeting through video conference receives at least 10 days prior to date of meeting. In order to avail this video-conference facility, the following information needs to be provided to Company’s Share Registrar: I/We, ______________________ of ____________________being a member of K-Electric Limited, holder of ________ ordinary shares as per registered Folio No. / CDC Account No. ___________ hereby opt for video conference facility at ___________________________.
_________________signature of member

13 | KE Annual Report 2017
Availability of Audited Financial Statements on Company’s websiteThe Audited Financial Statements of the Company for the year ended 30 June 2017 have been made available on the Company’s website (www.ke.com.pk).
Payment of Dividend through Electronic Mode (Mandatory)Pursuant to Section 242 of the Companies Act 2017, any dividend payable in cash shall only be paid through electronic mode directly into the bank account designated by the entitled shareholders. Members are, therefore, requested to provide mandatory information duly signed, along with a copy of valid CNIC to their respective Participant/CDC Investor Account Services in case of Book Entry Form, or to Company’s Share Registrar (CDC) in case of Physical Form at the earliest.
Dividend Mandate Form is available at Company’s website: http://www.ke.com.pk.
Submission of copy of CNIC / NTN Certificate (Mandatory)Members are requested to please provide valid copy of CNIC / NTN Certificate to their respective Participant/CDC Investor Account Services in case of Book Entry Form, or to Company’s Share Registrar (CDC) in case of Physical Form, duly quoting thereon Company’s name and respective folio number.
Deduction of Tax on Dividend – Finance Act 2018Pursuant to the Finance Act 2018, applicable rates of deduction of Income Tax under section 150 of Income Tax Ordinance 2001 on dividend payments will be as follows:
i. For those who file income tax return 15%ii. For those who do not file income tax return 20%
In order to process any future dividend payments in accordance with the tax payment status, the shareholders are requested to update their tax paying status (filer / non-filer) and provide NTN number and other related information duly signed, to their respective Participant/CDC Investor Account Services in case of Book Entry Form, or to the Company’s Share Registrar (CDC) in case of Physical Form. Shareholders who hold shares jointly are requested to provide shareholding proportions of Principal Shareholder and Joint Holder(s) in respect of shares held by them to Company’s Share Registrar.
Please note that non-receipt / non-availability of above information would result in treatment of that shareholder as “non-filer” and will, therefore, be subject to deduction of 20% tax on dividend payments as and when declared by the Company.
Dissemination of Annual Audited Financial Statements and Notice of Meeting on CDPursuant to SECP’s SRO dated 31 May 2016 and in accordance with the special resolution passed by shareholders of the Company at AGM held on 19 September 2017, the Annual Audited Financial Statements for FY2017 are being disseminated to the members through CD. However, a shareholder may submit a written request for provision of a hard copy of the said financial statements. Requisite Form is available at the
Company’s website: http://www.ke.com.pk.
Transmission of Annual Audited Financial Statements and Notice of Meeting through Email (Optional)Further, pursuant to SECP’s SRO dated 08 September 2014, members desirous of having Company’s financial statements / Notice of Meeting through email are requested to fill-in the requisite form available at the Company’s website: http://www.ke.com.pk
Statement on material facts under section 134(3) of the Companies Act 2017The Proposed amendments in the Memorandum & Articles of Association of the Company are of technical nature and necessitated due to:
I. Promulgation of Companies Act 2017 by repealing and substituting Companies Ordinance 1984. Therefore, reference to the repealed Companies Ordinance 1984, wherever appearing in the Memorandum & Articles of Association of the Company is proposed to be replaced and substituted with Companies Act 2017.
II. With the notification of Companies (Postal Ballot) Regulations 2018 by SECP, thereby, repealing the Companies (E-voting) Regulations 2016, Article 47-A and 50-A became redundant and are therefore proposed to be deleted.
The Board of Directors, at its meeting held on 4 July 2019, observed that the said amendments in the Memorandum & Articles of Association of the Company are required to align the document in line with the new Act/Law and has therefore recommended to place the said amendments before the members at the AGM for consideration and approval.
The Directors of the Company have no interest in the said special business.

KE Annual Report 2017 | 14
LeadershipSyed Moonis Abdullah AlviChief Executive Officer
Mr. Moonis Alvi was appointed CEO of K-Electric in June 2018. Mr. Alvi has more than 28 years of diversified experience in the finance industry, with a focus towards driving operational efficiencies, financial planning and capital restructuring. Mr. Alvi joined K-Electric in 2008 and has served as K-Electric’s Chief Financial Officer, Company Secretary and Head of Treasury. He is a Fellow member of the Institute of Chartered Accountants of Pakistan.
Eram HasanChief Strategy Officer Mr. Eram Hasan joined K-Electric in 2010. He has over 25 years of international general management experience. His experience includes working with The Coca-Cola Company, as Chief Operating Officer, for the Pakistan bottling business, responsible for Sales and Supply Chain and with Unilever Pakistan as the Head of Sales and Supply Chain. Mr. Hasan holds an MBA from Harvard Business School and an MS/BS in Materials Science and Engineering from MIT.
Dale SinklerChief Generation & Transmission Officer
Mr. Dale Sinkler brings over 25 years of experience in the power sector ranging from energy sector reforms to development, execution, operations and management across multiple power plants. He has served as the Co-founder of O&M Solutions. His presence of fifteen years in this part of the world is a testament to his dedication to Asia’s emerging markets and particularly Pakistan.
Syed Fakhar AhmedChief Marketing & Communication OfficerMr. Syed Fakhar Ahmed has over 20 years of diversified management experience in communications, marketing, corporate affairs, FMCG business, strategic planning, value chain, and international development. He has worked as Director Corporate Affairs (CSV & Special Projects) for Nestlé in the Greater China Region, as Head of Corporate Affairs & Corporate Communications for Nestlé Pakistan/ Afghanistan and formerly worked in the finance and International development organisations. He holds an MBA in Marketing and an MA in Political Science.
Muhammad Rizwan DaliaChief People Officer & Company SecretaryMr. Muhammad Rizwan Dalia was appointed as Head of HR in March 2018. In addition, he serves as the Company Secretary reporting to the Board of Directors. He joined K-Electric in 2008 and has served in senior roles in the Finance and Corporate Affairs functions. Mr. Dalia has also worked at Pakistan State Oil from 2001 to 2007 in diverse roles in the Finance function. Mr. Dalia is also a Certified Director from the Pakistan Institute of Corporate Governance.
Muhammad Aamir GhazianiChief Financial OfficerMr. Aamir Ghaziani has more than 19 years of experience in areas of accounting, financial management, risk management, policy reforms, regulatory compliance and business turnarounds. He joined K-Electric in 2008. Prior to this, he has also led KE’s Corporate planning and Regulatory compliance function. He is a Fellow member of the Institute of Chartered Accountants of Pakistan (ICAP) and has also attended executive management programmes at INSEAD and other prestigious institutions.
Amer ZiaChief Distribution OfficerMr. Amer Zia is the Chief Distribution Officer, leading a team of over 7,000 employees. Prior to this, Mr. Zia has worked in the private sector with USAID-Power Distribution Program and has also served as an independent consultant with the World Bank through the Competition Commission of Pakistan.He has a Bachelor’s degree in Electrical Engineering from UET Peshawar, a Master’s degree in Electrical Engineering from Bradley University USA, and an MBA in Project Management.

15 | KE Annual Report 2017
Adeeb AhmadNon-Executive DirectorMr. Ahmad’s career spans over 30 years with premier multilateral, leading private equity firms and several international investment banks primarily in the Gulf region. He has held C-suite positions engaged in multi-sectoral asset management, private equity investments and M&A across multiple emerging markets, including Pakistan. He has raised and led several large funds, managed landmark investments, and led several M&A advisory assignments. His last role was as Senior Advisor to the CEO (& Deputy CEO-Designate) at Islamic Corporation for the Development of the Private Sector (“ICD”) in Saudi Arabia. Mr. Ahmad holds an M.Sc. from the London School of Economics, United Kingdom, and an MBA from the Institute of Business Administration, Karachi, Pakistan.Other Engagements: Chairman, Al-Shaheer Corporation Ltd.
Ch. Khaqan Saadullah KhanNon-Executive Director
Mr. Khan has been a Non-Executive Director of the Company since October 2015. Mr. Khan joined The Abraaj Group as a Director in 2015. He has also worked as an Investment Consultant in the Board of Investment, Government of Pakistan, and as a manager in Ernst & Young’s Transaction Advisory Services group based in Chicago. Mr. Khaqan holds a BA in Economics from Northwestern University, US, and is a CFA charter holder. Other Engagement: Director, The Abraaj Group.
Board of Directors
Dr. Ahmed Mujtaba MemonNon-Executive Director (GOP Nominee)
Dr. Ahmed Mujtaba Memon represents the Government of Pakistan and was appointed on the Board of KE in June 2018. He is the Additional Finance Secretary in the Finance Division and has previously served as Director-General (IOCO) in the Federal Bureau of Revenue (FBR). He has also worked with the Asian Development Bank on a project as the Secretary Trade Export Promotion and Industrialisation in the FBR. His academic qualifications include an MBBS, an MA (Economics) and an MBA (Finance).Other Engagement: Board of Director, NESPAK
Ikram Ul-Majeed SehgalChairmanWith more than 40 years of business experience, Mr. Ikram Sehgal is Chairman Pathfinder Group Pakistan, employing several thousand people in 50 towns and cities across Pakistan. While serving in the Pakistan Army, Mr. Ikram Sehgal was the first Pakistani PW in history to escape from an Indian PW Camp. He also holds a Commercial Pilot License and is the author of several books (including “Escape from Oblivion” published by Oxford University Press in 2012). Mr. Ikram Sehgal has served on many Boards, including Bank Alfalah for 16 years, is also Foundation Member of the World Economic Forum (WEF) and organises the renowned Pakistan Breakfast every year at the WEF Annual Meeting at Davos since the last 18 years. Additionally, he is Director EastWest Institute (EWI) USA, for the last 9 years. He is also Chairman Karachi Council on Foreign Relations (KCFR) and Vice President Council of Pakistan Newspaper Editors (CPNE).
Syed Moonis Abdullah AlviChief Executive Officer
Mr. Moonis Alvi was appointed CEO and the Board member of the Company in June 2018. Mr. Alvi has more than 28 years of diversified experience in the finance industry, with a focus towards driving operational efficiencies, financial planning and capital restructuring.
Mr. Alvi joined K-Electric in 2008 and has served as K-Electric’s Chief Financial Officer, Company Secretary and Head of Treasury and has played an integral role in the transformation of K-Electric. He is a Fellow member of the Institute of Chartered Accountants of Pakistan.
Khalid Rafi Independent Director
Mr. Rafi is an Independent Director, elected at the AGM of the company held on October 8, 2012, and also Chairman of the Board Audit Committee. Mr. Rafi was a Senior Partner at A. F. Ferguson & Co., Chartered Accountants, a member firm of PricewaterhouseCoopers LLP, for 20 years. He was also the President of the Institute of Chartered Accountants of Pakistan and of Management Association of Pakistan. Mr. Rafi is a Chartered Accountant, being a Fellow at the Institute of Chartered Accountants in England and Wales.

KE Annual Report 2017 | 16
Mubasher H. SheikhNon-Executive Director
Mr. Sheikh has been a Non-Executive Director of the Company since its privatization in November 2005. He joined the National Industries Group (Holding), Kuwait, in 2001 and is currently Chief Financial Officer. He is also a Non-Executive Director in Proclad Group Limited, UAE. He graduated with a degree in mathematics and statistics from the University of Punjab and is a Chartered Certified Accountant UK (FCCA). Other Engagements: Chief Financial Officer, National IndustriesGroup (Holding), Kuwait, Non-Executive Director, Proclad Group Limted, UAE.
Nayyer HussainNon-Executive Director
Mr. Hussain has been a Non-Executive Director of K-Electric and CEO, Pakistan Investment Fund, since November 2014. He was the CEO of KE from Feb 2013 to Nov 2014, and was an Executive Director of the company and Chief Distribution Officer between November 2009 and February 2013. While in Citigroup, from 1991 to 2005, Mr. Hussain worked with their franchise in Pakistan, Saudi Arabia and Russia as Head of Retail Risk Management.
Syed Mohammed Akhtar ZaidiNon-Executive Director
Mr. Zaidi was appointed as Non-Executive Director of the Company in April 2019. He has been a Partner at Coopers and Lybrand (now PWC) and the Executive Vice-President & Chief Operating Officer of Dabbagh Group in Saudi Arabia. He led the privatisation and subsequent acquisition of KESC (K-Electric), and established Pakistan`s first private sector Lenders Club of multilateral (ADB and IFC) and domestic financial institutions. Prior to this, he served as a CEO of KASB Group Pakistan, and also served as Director and Chairman Executive Committee of K-Electric. Other major assignments include AT&T divestiture and litigation work at World Court. Akhtar is a Fellow Member of the Institute of Chartered Accountants (England & Wales) and Pakistan, and has vast experience in transforming institutions worldwide.Other Engagement: CEO, Ramz Capital Limited
Waseem MukhtarNon-Executive Director (GOP Nominee)
With more than 25 years of experience at the Provincial and Federal Government levels, covering policy implementation and formulation in the arena of corporate management, public financial management, project management and public service delivery, Mr. Mukhtar is currently serving as Additional Secretary, Power Division, Government of Pakistan. Mr. Mukhtar has previously served as Managing Director of Utility Stores Corporation and National Fertilizer Marketing Limited.
Muhammad Zubair MotiwalaNon-Executive Director (GOP Nominee)
Mr. Motiwala is a Non-Executive Director of the Company and represents the Government of Pakistan. An industrialist by profession, he was elected as President, Karachi Chamber of Commerce & Industry from 2000-2001. Mr. Motiwala has led Pakistan’s trade delegations for promoting investment in the province of Sindh to China, UAE, Russia, Turkey, Malaysia, Singapore, Korea and various other countries. He is the Honorary Consul General of the Republic of Burundi.Other Engagements: Director: Port Qasim Authority, Inter State Gas Systems Limited, Pak Oman Investment Company Limited, Education City, Dawood University of Engineering & Technology.
Shan A. AsharyNon-Executive Director
Mr. Ashary has been a Non-Executive Director of the Company since its privatization in November 2005. He is a senior executive with over thirty years of proven success in managing international investments, operations of a large diversified group, finance, treasury, public accounting, and strategic and corporate planning. He currently serves on the boards of several companies in the US and the Middle East. He is a Fellow of the Institute of Chartered Accounts of England and Wales.Other Engagements: Investment Adviser, Al-Jomaih Holding Co. (Saudi Arabia)

17 | KE Annual Report 2017
Board Committees TORsBoard Audit Committee (BAC) - Terms of Reference
A. Determination of appropriate measures to safeguard the company’s assets.
B. Review of Annual and Interim Financial Statements of the Company, prior to their approval by the Board of Directors, focusing on:
* major judgmental areas;
* significant adjustments resulting from the audit;
* going concern assumption;
* any changes in accounting policies and practices; * compliance with applicable accounting standards;
* compliance with CCG regulations and other statutory and regulatory requirements; and
* all related party transactions.
C. Review of preliminary announcements of results prior to external communication and publication;
D. Facilitating the external audit and discussion with external auditors of major observations arising from interim and final audits and any matter that the auditors may wish to highlight (in the absence of management, where necessary);
E. Review of Management Letter issued by external auditors and management’s response thereto;
F. Ensuring coordination between the internal and external auditors of the Listed Company;
G. Review of the scope and extent of internal audit, audit plan, reporting framework and procedures and ensuring that the Internal Audit function has adequate resources and is appropriately placed within the Company;
H. Consideration of major findings of internal investigations of activities characterised by fraud, corruption and abuse of power and management’s response thereto;
I. Ascertaining that the internal control systems including financial and operational controls, accounting systems for timely and appropriate recording of purchases and sales, receipts and payments, assets and liabilities and the reporting structure are adequate and effective;
J. Review of the Company’s statement on internal control systems prior to endorsement by the Board of Directors and internal audit reports;
K. Instituting special projects, value for money studies or other investigations on any matter specified by the Board of Directors, in consultation with the Chief Executive Officer and to consider remittance of any matter to the external auditors or to any other external body;
L. Determination of compliance with relevant statutory requirements;
M. Monitoring compliance with the Code of Corporate Governance regulations and identification of significant violations thereof;
N. Review of arrangement for staff and management to report to Audit Committee in confidence, concerns, if any, about actual or potential improprieties in financial and other matters and recommend instituting remedial and mitigating measures;
O. Recommend to the Board of Directors the appointment of external auditors, their removal, audit fees, the provision of any service permissible to be rendered to the company by the external auditors in addition to audit of its financial statements. The Board of Directors shall give due consideration to the recommendations of the audit committee and where it acts otherwise it shall record the reasons thereof.
P. Consideration of any other issue or matter as may be assigned by the Board of Directors.

KE Annual Report 2017 | 18
Board Human Resource & Remuneration Committee (BHR&RC) - Terms of Reference
Board Finance Committee (BFC) - Terms of Reference
A. Recommend to the Board for consideration and approval, a policy framework for determining remuneration of directors (both executive and non-executive directors and members of senior management). The definition of senior management will be determined by the Board which shall normally include the first layer of management below the Chief Executive Officer level;
B. Undertaking annually, a formal process of evaluation of performance of the Board as a whole and its committees either directly or by engaging external independent consultant and if so appointed, a statement to that effect shall be made in the directors’ report disclosing name, qualifications and major terms of appointment;
C. Recommending Human Resource management policies to the Board:
* all proposals requiring mandatory/statutory approval of the Board of Directors. * all proposals on development, revision, modification and/or interpretation of human resources policies.
D. Recommending to the Board the selection, evaluation, compensation (including retirement benefits) and
succession planning of the Chief Executive Officer;
E. Recommending to the Board the selection, evaluation, development, compensation (including retirement benefits) of Chief Operating Officer, Chief Financial Officer, Company Secretary and Chief of Internal Audit;
F. Consideration and approval on recommendations of Chief Executive Officer on such matters for key management positions who report directly to CEO or COO;
G. Where Human Resource and Remuneration Consultants are appointed, their credentials shall be known by the committee and a statement shall be made by them as to whether they have any other connection with the company;
H. Reviewing and approving on behalf of the Board of Directors all matters relating to implementation of the human resources related proposals previously approved by the Board; and
I. Recommending to the Board to make such changes in the mandate of the committee as it may deem fit from time to time.
A. To review and discuss on an ongoing basis an effective system for managing the financial risks faced by KE.
B. To review and discuss financial strategy and plan together with an annual budget (including balance sheet, profit & loss and functional cash flow) and KPIs prior to submission to the Board for approval.
C. To review and discuss capex programme together with financial commitment and financing strategy.
D. To review financial policies and transactions which have material financial impact such as tariff, cost of fuel, etc.
E. To review and discuss treasury management to ensure efficient management of cash to reduce financial cost (i.e. effective management of balance sheet and profit & loss items).
F. To review and discuss annual financing plan and requirements with respect to:
* running finance;
* short-term, medium-term facility; and * L/C facilities and bank guarantees etc.
G. To carry out monthly / quarterly review and discussion of MIS reports with respect to code provisions, to ensure major variances are identified and corrective action taken in a timely manner to minimize financial losses.
H. To review insurance policy of the Company.
I. To undertake any other assignment entrusted by the Board of Directors.

19 | KE Annual Report 2017
Board Strategy and Projects Committee (BS&PC) - Terms of Reference (TOR)A. Review the performance of the Company in meeting
strategic objectives.
B. Periodically reviewing the Mission, Vision and Strategic Plan, and recommending changes to the Board.
C. Review of the Company’s overall performance on the Annual Strategy Plan by monitoring the Key Performance Indicators (KPIs) bi-annually.
D. Understanding the organisation’s industry, market/community, and core competencies. Keeping up-to-date on industry and local market trends, advances in technology and other opportunities to improve the
scope, cost effectiveness and quality of services provided by the organisation.
E. Have the authority to bring external industry experts into Board meetings from time to time to discuss topics of interest related to strategy in order to stimulate ideas and strategic thinking by directors.
F. To identify and review progress on major Generation, Transmission, Distribution and other projects to achieve strategic objectives and materialise the long-term business plan of the Company.
G. To undertake any other assignment entrusted by the Board.

KE Annual Report 2017 | 20
Following are the salient features of the Code of Conduct (Code) of K-Electric Limited intended to assist its Board members and employees in meeting the standards of professional and personal integrity expected and required of them. Compliance with the Code is mandatory for all KE Board members and employees and deemed to be a part of the employment contracts / appointment letters for all Board members / employees of the Company. Contravention of the Code is regarded as misconduct and forms the basis for termination of the Board member / employee’s association with the Company.
Salient features of the Code:
Code of Conduct
1. Conflict of Interest
KE Board members / employees must be alert to any situation that could compromise the position of trust they hold as a KE Board Member/ Employee and avoid any kind of conflict between personal interests and those of KE.
Each Board member / employee has a primary responsibility to the Company and is expected to avoid any activity that could interfere with that responsibility. Board members / employees should not engage in activities or transactions which may give rise to, or which may be seen to be giving rise to, any conflict between their personal interests and the interests of the Company. Such a conflict could arise in a number of ways and in a number of situations and may have to be individually assessed by the Board member / employee in each individual scenario.
2. Confidentiality
KE Board members / employees must protect confidential information and trade secrets, and prevent such information from being improperly disclosed to others inside or outside KE.
3. Contributions
KE Board members / employees may not use their position to coerce or pressure employees to make contributions or support candidates or political causes.
4. Inducement Payments
KE Board members / employees must refrain from bringing in outside pressure or influence to attain personal gains within the organization.
KE Board members / employees shall neither ask for nor receive money or any personal benefit (material or non-material) from a supplier or contractor in exchange for an order for goods or services.
5. Health and Safety
KE Board members / employees must comply with all applicable laws and KE policies relating to safety, health and the environment.
6. Trading in Company’s Shares
Certain restrictions / reporting requirements are applied on the Directors / employees regarding trading in Company’s shares. They shall make sure that they remain compliant with these statutory requirements.
7. Workplace Harassment
KE Board members / employees will maintain an environment that is free from harassment of any kind and in which all Board members / employees are equally respected.
8. Compliance with the Code KE Board members / employees must read, understand and comply with the Code at all times during their association with the Board / Company. Any violation to the Code or any applicable law or regulation, must be reported so that KE can take appropriate action.

21 | KE Annual Report 201721
Directors’ Report On behalf of the Board of Directors, we are pleased to present the Company’s Annual Report together with audited financial statements for the year ended June 30, 2017. These accounts are delayed due to finalisation of the Multi-Year Tariff (MYT) which now stands resolved and the concerns will be put for adjudication by Appellate Tribunal, when constituted.
Performance HighlightsThe Company has remained resolute in the face of multiple external challenges and has continued to deliver on its commitment to powering Karachi and serving its customers. It is important to highlight that between 2009 and 2017, the Company has invested over USD 1.7 billion across the energy value chain resulting in addition of over 1,057 MW of efficient power generation capacity, improvement of overall fleet efficiency from 30% in 2009 to 37% in 2017, 14.2% points reduction in Transmission and Distribution (T&D) losses and most importantly, today over 70% of the city is exempt from load-shed with 100% exemption to industries since 2010. These measures have unarguably proved critical in catalysing economic growth in the city and in Pakistan at large. (Refer to pages 29, 31 & 33 for more details.)
These investments were underpinned by the power utility’s Previous MYT which was valid from 2009 to 2016. With the expiry of this tariff in 2016, the Company filed its Integrated Multi Year Tariff (i-MYT) petition on March 31, 2016, through which the Company requested determination of MYT for a period of ten (10) years. The Company’s MYT Petition was finalised by NEPRA on July 5, 2018 (MYT Decision).
During the Financial Year 2017, key operational indicators showed sustained progress, however, the Company’s Net Profit reduced to Rs. 10,419 Million (FY 16: Rs. 31,807 Million), a 67% decline as compared to last year, mainly due to significant reduction in tariff level along with change in tariff structure.
The Company continued to improve operationally, driven by investments across the value chain, which is expected to continue further on the back of a robust investment plan.
Further, continued investments in all core functions resulted in a net increase of Rs. 14,253 Million in Company’s Property, Plant and Equipment and the balance sheet remained healthy, with total assets amounting to Rs. 395,943 Million (FY 2016: Rs. 377,798 Million).
Given the significant impact of the MYT determined by National Electric Power Regulatory Authority (NEPRA) on the Company’s returns and its significance for sustainable operations and continued investments, the Company will pursue the matter with the Appellate Tribunal, once functional, and is engaged with relevant stakeholders in this regard.
Revenue (Million)
2017 183,8552016 188,607
Total Assets (Million)
2017 395,9432016 377,798
EBITDA (Million)
2017 26,1002016 43,035
Total Equity (Million)
2017 184,3162016 171,288
Earnings per Share
2017 0.382016 1.15
Return on PPE1 (%)
2017 4.4%2016 14.2%
Net Profit (Million)
2017 10,4192016 31,807
Financial Overview of the Year
1. PPE: Property, Plant & Equipment
Return on Equity (%)
2017 5.7%2016 18.6%

KE Annual Report 2017 | 2222
Current Investments The Company remains committed to its vision of powering Karachi by ensuring uninterrupted power supply, system reliability and customer support. The Company has significantly progressed its over USD 450 Million, TP–1000 project, under which 7 grid stations and associated power lines, transformers and switches would be added, resulting in addition of over 1,000 MVAs to transmission capacity. To date, under TP–1000, 4 grid stations and 21 power trafos have been added accumulating to net addition of 724 MVAs in power transformation capacity and expected project completion is by the end of 2nd Quarter of FY 2020.
Further, power supply has been bolstered through the addition of 4 IPPs including 101 MW (50.5 MW x 2) from Sindh Nooriabad Power Company Limited I & II, 52 MW from Fauji Power Company Limited and Oursun, a solar based IPP with capacity of 50 MW. The power utility has also signed an MoU with the state-owned China Machinery Engineering Corporation (CMEC) to develop a 700 MW Independent Power Producer (IPP) based power project at Port Qasim, Karachi. The power project already has an approved tariff from NEPRA, whereas land has also been acquired in Port Qasim area of Karachi for the project. Details of these are elaborated in page 29.
Liquidity & Capital StructureCredit RatingDespite challenges on many fronts, the Company successfully managed to maintain Entity Credit Rating of “AA” for Long-term and “A1+” for short-term. In addition to that, rating of “AA+” was retained by Islamic International Rating Agency (IIRA) for Rs. 22 Billion Sukuk ul Shirkah issued by the Company in 2015 for 7 years tenor.
Financing UpdatePost-expiry of the Previous MYT on June 30, 2016 and till the notification of MYT Decision on May 22, 2019, the Company’s claims for tariff variations including fuel price adjustments remained suspended, alongside accumulation of Tariff Differential Claims. This significantly increased the working capital requirements of the Company and was managed through extended and continued support of the banks, who had also supported the Company’s stance for a sustainable and investment friendly tariff.
Further, banks have also expressed strong interest for financing of long-term generation projects of the Company which are of strategic significance to bridge the existing electricity shortfall and to meet the increasing future demand.
Islamic Commercial PaperIn August 2018, the Company issued Pakistan’s largest-ever, privately placed, Islamic Commercial Paper of Rs. 7 Billion which was rolled over and enhanced to Rs. 10 Billion in March 2019.
Syndicate Financing FacilityOverseas Private Investment Corporation (OPIC), the United States government’s development finance institution, had signed a USD 250 Million financing agreement with the Company in February 2016, primarily to fund a major transmission project. After signing of the Sale and Purchase Agreement (SPA) between KES Power and Shanghai Electric Power Company Limited (SEP), a Chinese state-owned corporation, financing agreement with OPIC had to be terminated as OPIC’s charter does not allow to lend to an organisation controlled by a state-owned entity. The major portion of the gap, arising due to exit of OPIC, was filled through a Rs. 23.5 Billion syndicated facility from a consortium of 6 local commercial banks in November 2018.
SukukIn February 2019, the Board of Directors of the Company approved the issuance of Rs. 25 Billion listed Sukuk, including green-shoe option of up to Rs. 5 Billion, to fund the permanent working capital requirements of the Company and ongoing routine capital expenditures on generation, transmission and distribution segments. Sukuk is planned to be issued near the end of the first quarter of FY 2020, after completion of all statutory requirements.

23 | KE Annual Report 2017
Delays in Multi-Year Tariff Finalisation have Impacted Execution of Planned InvestmentsIt is important to highlight that the Company had submitted a comprehensive business plan along with its MYT Petition in March 2016 where it was expected that by 2020 demand-supply gap will be eliminated and the Company will have surplus generation capacity. However, NEPRA, in its tariff determination of March 2017, determined a rebased and restructured MYT having significant implications on the Company’s planned investments. Accordingly, the Company filed a Review Motion against NEPRA’s tariff determination in April 2017, which was decided by NEPRA in October 2017, wherein the Authority largely maintained its earlier decision.
Subsequently, the Ministry of Energy (Power Division), Government of Pakistan (GoP) on request of the Company filed a ‘Reconsideration Request’ with NEPRA dated October 26, 2017 to consider afresh its earlier determination in order to ensure that consumer interest in terms of continuous and efficient service delivery is maintained. NEPRA issued its decision on the Reconsideration Request filed by the Ministry of Energy (Power Division), GoP, on July 5, 2018. The Company, being aggrieved, approached the Appellate Tribunal under the NEPRA Amendment Act, 2018, however, the Appellate Tribunal is yet to be made functional by the GoP. In parallel, the Company also approached the High Court of Sindh against NEPRA’s decision on the Reconsideration Request and filed a suit in which a stay order was granted on July 26, 2018.
The Company unwaveringly believes in its principled stance for an investment-friendly, fair and equitable tariff and will plead its legitimate right before the Appellate Tribunal to be constituted under the NEPRA Amendment Act, 2018. The Company has requested the Ministry of Energy (Power Division), GoP, to expedite the formation of Appellate Tribunal so that the issues in tariff can be resolved at the earliest and the planned investments can be made in a timely manner. Absence of a notified tariff resulted in delayed preparation of financial statements and accumulation of Tariff Differential Claims, which in turn adversely impacted the Company’s cash flows. Therefore, in order to manage sustainability of the business and cash flows, the Company withdrew the lawsuit filed with the High Court of Sindh against MYT implementation and the tariff was notified by the Ministry of Energy (Power Division), GoP, on May 22, 2019.
The significant delays and uncertainty around tariff finalisation combined with marked reduction and changes in tariff structure have delayed planned investments in generation projects. Notable among these is the 900 MW RLNG power generation plant, phase one of which would have been commissioned ahead of 2019, if not for the delayed tariff. However, despite the delays in tariff determination and finalisation, the Company remains committed to its planned investments, which would enable the Company to manage the growing power demand, along with ensuring reliable and sustainable power supply to its consumers.
Circular Debt is a Concern for the Power Sector as a wholeAnother area of concern for the Company, as with other power sector companies, is the prevailing circular debt situation since this compromises the sustainability of the sector. As of May, 2019 the Company’s gross receivables from various Federal and Provincial public sector entities stand at c. Rs. 177 billion and are nearly two times the Company’s payables which total c. Rs. 99 billion. Of this payable amount, only Rs. 13.7 billion (including Rs. 4.67 Billion refundable on account of GIDC) is the actual principal payment due to Sui Southern Gas Company (SSGC) against gas supply, while the remaining dues relate to National Transmission & Despatch Company / Central Power Purchasing Agency (NTDC / CPPA) and other Federal and Provincial public sector entities. It is important to clarify that the Company has not defaulted on any current payment to SSGC since 2012, and has paid over Rs. 285 billion to SSGC, which includes all the current running bills and payments for arrears to the tune of Rs. 13.55 billion. The remaining amount claimed by SSGC appears to be grossly inflated through the inclusion of mark-up or interest which has been challenged in the court of law and is still sub-judice and pending judgement.
The Company has receivables of Rs. 32 billion from Karachi Water and Sewerage Board (KWSB), as of May, 2019. However, in consideration of KWSB’s strategic importance and the best interests of the people of Karachi, the Company continues to prioritise power supply to all strategic KWSB pumping stations while at the same time engaging with relevant stakeholders for a swift and equitable resolution to this issue.

KE Annual Report 2017 | 24
The Company is making all possible efforts for swift settlement of its receivables since these have a strong impact on its project financing and has reiterated that financial settlements between the Company and public sector entities must be treated in a fair and uniform manner and the yardstick applied on the Company’s payables should also apply to its receivables from Provincial, Federal and other public sector entities and all settlements whether Federal or Provincial should be tabled together under one umbrella. Hence, the Company is of the view that the settlement of these outstanding balances shall be made on a net basis.
Annual General Meeting for FY 2017 Finalisation of Audited Financial Statements and holding of AGM for FY 2017 were delayed due to reasons and circumstances beyond the control of the Company, as fully described in preceding paragraphs. The similar tariff related circumstances were also encountered by some other listed companies in public sector and consequently their AGMs were delayed for years together.
However, following the notification of MYT decision on May 22, 2019, the preparation and audit process of financial statements for FY 2017 was expedited and after getting Auditors’ confirmation, the Company, on June 18, 2019, applied for Securities & Exchange Commission of Pakistan’s (SECP) direction to hold AGM for FY 2017 latest by August 31, 2019, which has been allowed by SECP through its letter dated June 21, 2019.
Auditors’ ObservationsWith respect to Auditors’ observations in their report to the members, it is informed that:
I. As explained in Note 30.1.1 to the financial statements, the issue of late payment surcharges / interest on delayed payment will ultimately be settled on a net basis with similar treatment of receivables and payables without accounting for any delayed payment surcharge / interest, and this Company’s narrative is duly supported by legal opinions obtained in this respect. However, being prudent, the Company has made a provision on a net basis.
Compliance with the Code of Corporate Governance (CCG)The Company, in its report to the shareholders, certifies that:a. The Financial Statements of the Company have been prepared in conformity with the provisions of the Companies
Ordinance 1984 (now repealed) and present fairly its state-of-affairs, results of its operations, cash flows and changes in equity.
b. Proper books of accounts of the Company have been maintained.c. Appropriate accounting policies have been consistently applied in preparation of Financial Statements and
accounting estimates are based on reasonable and prudent judgement. d. International Financial Reporting Standards (IFRS), as applicable in Pakistan, have been followed in preparation of
Financial Statements and any departures therefrom have been adequately disclosed and explained. e. The name of persons who, during review and subsequent period, were Directors of the Company are given below
(under “Board of Directors” at page 25).f. The KES Power Limited, incorporated in Cayman Islands, is the holding Company of K-Electric.g. A sound internal control system is in place and is continuously monitored by the Company’s effective internal audit
function as well as by Board Audit Committee on regular basis. h. There are no significant doubts upon the Company’s ability to continue as a going concern. i. Key operating and financial highlights of the Company for the last six (06) years are given on page 59.j. The Company, due to reinvestment requirements and certain lenders covenants, has not declared dividend / bonus
shares. Earnings Per Share (EPS) for the year ended June 30, 2017 is Rs. 0.38 (basic / diluted).k. Statutory payments on account of taxes, duties, levies and charges outstanding as on June 30, 2017 have been
disclosed in the financial statements.l. Significant business plans and decisions and impact on the environment have been covered in the Directors’ Report
to the members.

25 | KE Annual Report 2017
m. Major business risks and their mitigation are properly described at page 56.n. The main trends and factors likely to affect the future development, performance and positions of the Company’s
business are described under Future Outlook at page 26. o. The value of investments of KE Provident Fund (KEPF) is Rs. 9.89 billion; whereas KE Employees Gratuity Fund
(KEGF) is valued Rs. 1.18 billion as of June 30, 2017. The pension scheme does not exist in the Company.p. Statement showing the number of Board and Board Committees’ meetings held during the year is placed at page 06. q. The training of the Directors is an ongoing process and the Directors, on a regular basis, are provided with and
updated on relevant laws, codes, and guidelines on best practices of corporate governance. Most of the Directors are professionals and senior executives having national and international exposure and experience and are fully aware of their duties and responsibilities. Up to June 30, 2017 four directors of the Company have acquired certification under Directors Training Program (DTP) offered by Pakistan Institute of Corporate Governance.
r. The pattern of shareholding is placed at page 126.s. All trades in the shares of the Company, carried out by its directors, executives and their spouses and minor children
during the year, have been disclosed at page 134.t. A report on the activities undertaken by the Company in relation to corporate social responsibility during the year is
placed at page 39.
Board of Directors (BOD)During review and subsequent period, following casual vacancies occurred on the Board and all were filled-up by the directors within the specified time period: During the review period * GoP nominee, Mr. Noor Ahmed was replaced by Mr. Muhammad Anwar Sheikh, Joint Secretary (CF-II), Ministry of Finance, GoP, on December 30, 2016.
Post Balance-sheet date * GoP nominee, Mr. Zafar Abbas was replaced by Dr. Aamer Ahmed, Additional Secretary, Ministry of Energy (Power Division), GoP, on August 9, 2017.
* GoP nominee, Mr. Muhammad Anwer Shaikh was replaced by Dr. Ahmed Mujtaba Memon, Additional Finance Secretary, Finance Division, GoP, on June 7, 2018.
* Mr. Waqar H. Siddique resigned from the position of Director/Chairman and Mr. Muhammad Tayyab Tareen, CEO was elected as Chairman effective from June 7, 2018.
* Syed Moonis Abdullah Alvi was appointed as Director/Chief Executive Officer effective from June 7, 2018.
* GoP nominee, Dr. Aamer Ahmed was replaced by Mr. Hassan Nasir Jamy, Special Secretary (Power Division), Ministry of Energy, GoP, on December 14, 2018.
* Mr. Muhammad Tayyab Tareen Chairman, resigned from the position of Director/Chairman and Mr. Ikram Ul- Majeed Sehgal was elected Director/Chairman in his place effective from January 18, 2019.
* Mr. Omar Khan Lodhi and Mr. Frederic Sicre resigned from the directorship effective from February 8, 2019.
* Syed Mohammad Akhtar Zaidi appointed as Director on the Company’s Board effective from April 15, 2019 against casual vacancy.

KE Annual Report 2017 | 26
* GoP nominee Mr. Hasan Nasir Jamy ceased to be Director w.e.f. February 13, 2019 and was replaced by Mr. Waseem Mukhtar, Additional Secretary, Ministry of Energy (Power Division), GoP, on April 15, 2019.
* Mr. Aziz Moolji resigned from the directorship of the Company effective from May 6, 2019. * Mr. Adeeb Ahmad appointed as Director on the Company’s Board effective from July 04, 2019 against casual
vacancy.
The Board wishes to place on record appreciation for services of outgoing Directors and welcomes the incoming Directors.
AuditorsM/s KPMG resigned from the position of statutory auditor of the Company for the year ended June 30, 2017, resulting in a casual vacancy and accordingly Board of Directors of the Company at the meeting held on December 14, 2018 appointed A.F. Ferguson & Co., and BDO Ebrahim & Co., as statutory joint auditors of the Company to hold the said position till the conclusion of the next AGM when the shareholders shall appoint the auditors for the next term. The Company has acted strictly in accordance with the provisions of the Companies Act 2017 and Pakistan Stock Exchange Regulations and obtained requisite extension and sought direction from SECP as well as posted statutory announcements through PUCARS for information of the Exchange and shareholders of the company. Being eligible, A.F. Ferguson & Co. and BDO Ebrahim & Co. have offered themselves for re-appointment. BAC has recommended their re-appointment as statutory joint auditors.
Acquisition by Shanghai Electric Power Shanghai Electric Power (SEP) entered into a SPA with KES Power Limited (holding company) to acquire up to 66.4 percent shares in the Company. The completion of the transaction contemplated by SPA is subject to receipt of applicable regulatory approvals and satisfaction of other conditions precedent specified therein. Despite delays in the required approvals, this strategic investor has reiterated its keenness to acquire a controlling stake in the Company, which will prove to be a game changer in transforming Karachi’s power infrastructure in line with international standards for a smooth electricity supply. SEP has also shared a plan with the GoP to invest USD 9 billion in generation, transmission, and distribution systems in Karachi which should have a significant impact on Pakistan’s GDP.
While the acquisition of a controlling stake by SEP would not only take the Company to a new level of excellence and would go a long way in attracting private sector investment in line with the Government’s plans for privatising state-owned distribution companies in the country; it is important to state that the current management remains committed to delivering on the business plan which will see investments of over USD 3 billion over the span of five years.
Future OutlookK-Electric is a dynamic organisation that has demonstrated its resilience and determination to grow and thrive, overcoming multiple challenges in its 106-year journey since inception in 1913. Most importantly, since the take-over by the current management in 2009, a successful turnaround has been executed through a combination of well-timed investments and professional management.
The Company remains firm in its vision to provide safe, reliable and consistent power to all its customers underpinned by investments of over USD 3 Billion over the span of five years, spanning across the power value-chain, resulting in energy self-sufficiency and propelling the socio-economic growth of Karachi and resultantly Pakistan. A key feature of this investment plan is the move towards cost-effective and efficient sources of generation, including coal, RLNG and most importantly increasing the share of renewables; both solar and wind. These are in line with the organisation’s overarching priorities to be environmentally sustainable and economically viable for the city’s growth.
Further, the Company’s planned investments include capacity addition in Transmission and Distribution business, along with system improvement and loss reduction projects. In this regard, the Company’s over USD 450 Million TP-1000 Project is expected to complete by the end of 2nd Quarter of FY 2020, adding over 1,000 MVAs to its Transmission capacity, followed by another Transmission Package to further strengthen the Transmission Network. On the Distribution front, the Company is also scaling up its efforts to combat power theft, which is a societal menace, by converting existing PMTs to Aerial Bundled Cables while also continuing Project Ujala as a sustainable solution to power theft.

27 | KE Annual Report 2017
Syed Moonis Abdullah AlviChief Executive Officer
Khalid RafiDirector
Also, as in previous years, we will continue to prioritise safety in all our operations and remain firm in our commitment to ensure the safety of our people, our infrastructure, as well as the safety of the people and the communities that we work with.
Customer-centricity is a core organisational value, reiterating the Company’s belief that customers are at the heart of our business. Making ourselves increasingly more accessible to customers and enabling self-service solutions are high on the Company’s agenda. In this regard, we have further extended and enhanced our customer service portfolio through the addition of a Mobile App as well as a Web-based Consumer Portal, with efforts already underway to scale up its offerings. The Company is also exploring multiple payment solutions to further facilitate customers. A key lever that has propelled the Company’s growth is technology, underpinning many of our customer platforms and driving the organisation to explore more efficient and innovative ways of doing business. The Company is also exploring Automatic Meter Reading (AMR) technologies which focus on real-time consumption and enable both the customer and the Company to better manage the use and the supply of electricity while ensuring transparency.
We strongly believe in our professionally driven workforce and dynamic management, who are fundamental to the success of the Company till now and for the future and continue to strengthen our processes with the objective of attracting, hiring and retaining a high calibre and diverse employee base that can take our organisation to the next level.
Challenges due to Delay in Sale Process:Due to the pending government approvals for completion of SEP’s acquisition of upto 66.4 percent stake in the Company, the sale process has still not concluded despite a lapse of over 2 years since signing of the SPA in October 2016.
Important to note that the Company’s planned investments have already been delayed due to delays in tariff finalisation and the pending completion of the sale process has resulted in consequential delays in beginning the implementation of SEP’s USD 9 Billion investment plan, aimed at bringing accelerated improvements in Generation, Transmission and Distribution capacity as well as technological advancements across the value chain, thus improving the lives of Karachi’s citizens.
Accumulation of Funding Requirements:Due to a significant delay in tariff finalisation and completion of SEP’s acquisition transaction which, among other things, has delayed the Company’s strategic projects aimed for enhancing power generation capacity to accommodate the growing power demand. These include 900 MW RLNG based and 700 MW coal-based projects. Consequentially, the Company is now forced to initiate these projects together which requires arrangement of significant amount of financing for both the projects simultaneously. On top of that, the unreasonable delay in finalisation and notification of tariff did not permit the Company to process its fuel price and other tariff variations for considerable period of time alongside accumulation of Tariff Differential Claims, thus resulting in accumulated funding requirements to a level which will challenge the lending limits and appetite of the local banking sector.
In conclusion, the Company continues to engage with relevant governmental, regulatory and other external entities in order to ensure an enabling and pro-investment environment for the power sector at large and for the Company in particular as Pakistan’s only privatised and vertically integrated power utility.
With collective support from all stakeholders, the Company continues to maintain a positive outlook for the future and looks towards profitable and sustainable growth while also strengthening service provision to the customers.
AcknowledgementsThe Board wishes to extend its gratitude to the Government of Pakistan (GoP), shareholders and customers of the Company for their cooperation and support, and appreciation for the employees of the Company.

KE Annual Report 2017 | 28

29 | KE Annual Report 2017
GenerationIn FY 2017, the Company continued to build on the significant enhancements made to its generation infrastructure. In a strong endorsement of the Company’s efforts, General Electric named our flagship BQPS-II power plant located at Bin Qasim as the most reliable GE power plant in the Middle East & Africa (MENA) region during 2016, with a gas turbine reliability factor of over 99% in 2016 and 2017. GE also awarded the plant the best in this category in MENA region in 2017.
The Company has completed several rehabilitation projects at its power plants in recent years as a result of which the average fleet efficiency of generating plants rose to 37% in FY 2017 (vs 30% in FY 2009) through enhanced performance at its plants.
KE continues to expand its generation portfolio through external developers as Independent Power Producers (IPPs) as well as through self-generation. During 2017 and 2018, four IPPs were added to KE’s system, which are as follows:
• Fauji Power Company Limited (FPCL)’s 52 MW coal-fired power plant was commissioned in May 2017
• 101 MW from Sindh Nooriabad Power Company (SNPC I & II) (50.5 MW x 2) gas-fired power plant was added in January 2018.
• Oursun Solar secured upfront tariff and generation license from NEPRA and the Company’s first ever Energy Purchase Agreement (EPA) for 50 MW was initialled in FY 2017 and the power supply from this plant to KE started in FY 2019.
In order to enhance KE’s self-power generation, planned investments include BQPS III, a 900 MW RLNG-based power plant at our Bin Qasim site. The first phase of 900 MW is expected to be commissioned as combined cycle in the 4th quarter of FY 2021. The process for the procurement of RLNG for the project is also underway.
To diversify its fuel mix for power generation, the Company is planning a 700 MW coal fired power plant for which an upfront tariff was issued in 2016. NEPRA awarded the generation license to the project in May 2017 and Commercial Operations Date (COD) is expected in the 4th quarter of FY 2022.
KE is also pursuing with Pakistan Atomic Energy Commission (PAEC), Ministry of Energy (Power Division), CPPA and NTDC for power import of 500 MW from the new nuclear power plants KANUPP II/III at 500kV voltage level. In addition, the Company also purchases surplus power from various captive power plants set up by industrial-scale users and in this regard, an option of supply of 11-14 MW from Lotte Chemicals Pakistan Limited is also being pursued.
In renewables, KE is pursuing additional projects to expand its renewable portfolio mainly in wind and solar. In addition to Oursun Solar, Gharo Solar, a 50 MW solar IPP which was initiated in FY 2017, is under construction and is expected to be commissioned by the end of 2nd quarter of FY 2020.

KE Annual Report 2017 | 30

31 | KE Annual Report 2017
As of June 30, 2017, the Company’s transmission system comprises a total of 1,253 km of 220kV, 132kV and 66kV lines, with 64 grid stations and 138 power transformers. KE took significant steps towards enhancing the existing transformation capacity and improving system reliability. This included improved fault response on power transformers and transmission lines, as indicated by a 29.3% overall reduction in unserved energy compared to FY 2016.
The over USD 450 million TP-1000 transmission enhancement project is scheduled for completion by the end of 2nd quarter of FY 2020. The Company completed a major part of the civil and electrical design during FY 2017. Further, the transmission line design for the major material has been approved, and type tests for the 220kV and 132kV cables have been carried out. Subsequent to the year end, to date, 4 grid stations and 21 power trafos have been added under the TP-1000 project and the project is on course for a successful completion.
Other initiatives during FY 2017 included:Six power transformers were installed at various locations to help curb overloading.
165 11 kV switch installations were carried out in FY 2017, taking the total since July 2014 till FY 2017 to 477 installations, demonstrating the company’s comprehensive effort to replace and improve grid equipment where required. The replacement of obsolete current/potential transformers, circuit breakers and relays has also contributed to greater reliability in the system.
The Transmission team has implemented an early temperature warning scheme on 11 kV incoming switchgears. Thermography (predictive maintenance) was carried out regularly through the year to help prevent outages and damage. In addition, the company rehabilitated several GIS Bays across various key 220kV
and 132kV grid locations. This is a three-year project involving 80 GIS Bays and is an important step towards increasing the reliability of the grid network. Under this project, till date, 62 GIS bays have been retrofitted.
During FY 2017 KE introduced its first 11 kV mobile substation in Karachi, completely built using in-house resources. This can be mobilised to cater to outages in case of any emergencies. KE also rehabilitated various EHT transmission lines, whereby conductors, insulators and associated hardware installations were replaced to ensure smooth network operational capability.
Furthermore, quarterly line insulator cleaning activities were performed on all 220 kV and strategic 132 kV lines. Additionally, more than 151 annual preventive maintenance activities were carried out across various grid stations. These are some key initiatives taken each year to ensure the operational efficiency and reliability of the entire network.
Transmission

KE Annual Report 2017 | 32

33 | KE Annual Report 2017
DistributionThe Company’s distribution network covers around 6,500 square kilometers, including around 29,000 km of power lines, and serves over 2.5 million customers. Through continuous improvement in KE systems, today, 70% of the territory is load-shed free with complete exemption to industries. Furthermore, Transmission and Distribution losses have declined steeply over the past eight years and stand at 21.7% for FY 2017. Distribution business being at the forefront, operates in a diverse and dynamic environment and strives its best to overcome multiple challenges presented due to it. It is primarily responsible for delivering safe and reliable power to the residents of Karachi and its adjoining areas in Sindh and Baluchistan. However, we extend our responsibility, and cater to the well-being of our society at large through effective relationship management in communities.
In FY 2017 a robust maintenance programme was carried out on 235 feeders and 36 critical feeders, resulting in fewer trips and a stronger network. Additionally, during the year, KE added 130 new feeders to the system, improving capacity and reliability. In addition to the investments made in the existing network, initiatives such as Aerial Bundled Cables (ABC) and Technical Loss Reduction will further increase customer satisfaction and extend the downward trajectory of T&D losses.
ABC project was initiated to address rampant power theft; it involves the replacement of bare conductors with aerial bundled insulated cable, specifically designed to act as a theft deterrent. These cables also protect against the humid weather of the coastal city, and result in lower fault rates, better voltage profiles and require lesser maintenance. To curb power theft, during FY 17, 3,100 PMTs were converted on to ABC, and subsequently to date, KE has converted over 7,500 PMTs onto ABC.
To further enhance the capability of our distribution system and increase energy capacity, we have executed more than 500 System Improvement Projects (SIPs) along with Primary Automated Protection System to bring in efficiency for the energy we serve.
To help bring communities on board, KE initiated Project Ujala. Through ABC, the distribution of low-cost meters and comprehensive community engagement (including
health camps and clean-up drives) in non-affluent areas, KE is paving the way for consistent and reliable supply of electricity with a safer infrastructure and consequently better livelihoods. (For more details, refer to page 39).
KE also introduced a simplified variant to our New Connections product line in FY 2017, called ‘Aasaan Meter’. The project was launched with the intention to bring ease, pace, automation and transparency at all levels. This customer-centric initiative has simplified the new connection process where applications can now be registered through any of KE’s 30 Customer Care Centres. KE is also offering e-payment solutions for this service.
The Company also initiated IBC on Wheels, in which the idea was to approach customers directly. A special vehicle designed as a mobile Integrated Business Centre was launched. This set up is situated in various neighborhoods, especially focusing on far flung areas where the actual IBC is at a distance. During FY 2017, nine IBC on Wheels vehicles were introduced to better facilitate our consumers.
With the aim of maintaining our uncompromising focus on safety, KE introduced the Aerial Work Platform Vehicle to its fleet in FY 2017. This is a mobile, mechanised, insulated access platform that allows our employees a secure space to stand when performing maintenance activities on our overhead network.

KE Annual Report 2017 | 34

35 | KE Annual Report 2017
Corporate ValuesValues are the guiding principles that form the foundation on which we work and conduct ourselves. They shape the culture and define the character of a company. The key advantage of having a clearly defined set of organisational values is that they guide workplace behaviour, leadership development and decision making.
Keeping this in mind, in FY 2017 we initiated a thorough organisational review, following which we introduced our new core corporate values which come together in the KE CARES system, as outlined below.
Customer-centric
We aim to satisfy our customers and all our stakeholders by anticipating their needs and delivering the best possible solutions and services.
Energised
We are energised to inspire and empower our people to add real value for all stakeholders.
Accountable
We take ownership, initiative and responsibility for all our actions and we are honest and fair in all our dealings.
Safe
We ensure that safety remains our top priority in all our operations and behaviors.
Respectful
We respect each other in all aspects, and support our communities for societal and environmental well being.

KE Annual Report 2017 | 36

37 | KE Annual Report 201737
Customer-centricity is a core Organisational Value Core operational improvements have gone hand in hand with strengthened processes and development of a skilled and competent human resource – underpinned by a belief that customers are at the heart of our business.
We have also continued to extend our customer touchpoints in line with our commitment to be more accessible to our customers: In addition to our 118 Call Centre, 8119 SMS service and Social Care operations on Facebook and Twitter, we have introduced the IBC on Wheels to facilitate customers who may not be able to visit any of our 30 Customer Care Centres. KE has also announced Universal Customer Care Centres and customers can now avail services at any Customer Care Centre irrespective of their registered address.
Moreover, in FY 2017, the KE Digital Media team has won 2 awards for innovation and best digital media team in the country. The Company also conducted the ninth wave of its study into consumer satisfaction and brand perception through Nielsen, the research firm.
In addition to numerous valuable insights, the Brand Equity Index of the company went from its previous score of 5.2 to 6.5 in 2018.
Educating our users about the benefits of conservation is a pivotal aspect of our customer-centric approach. KE also makes recommendations which translate into economic savings, playing an important role in preserving natural resources as well as protecting the environment, at the same time achieving optimisation of the company’s electrical network. In FY 2017, KE conducted several energy audits and hundreds of power factor improvement surveys.
These are conducted by a team trained on the global ISO 50001 standard for energy management systems. This has helped in making concrete recommendations on energy efficiency in industrial, commercial and public sectors that translate into economic savings through energy efficient transformation.

KE Annual Report 2017 | 3838

39 | KE Annual Report 2017
In addition to investments in infrastructure, KE has also continued stakeholder engagement within the communities it operates in with community engagement and social investment programmes.
The Company respects and supports communities in the pursuit of societal and environmental wellbeing – and this is clearly encapsulated in Project Ujala, under which KE strives towards reliable and consistent electricity supply in disadvantaged communities by installing Aerial Bundled Cables, low-cost meters and supporting community development. A key point is that Ujala is sustainable because it is mutually beneficial to KE and to the people, creating a continuous cycle of good with long-term benefits. By FY 2017, more than 3,000 PMTs have been converted to ABC, and approximately 3.1 million lives have benefitted.
Under its Social Investment Programme, in FY 2017 the Company provided subsidised electricity to 15 renowned philanthropic institutions working in the field of education and health for the underprivileged people.
The programme has benefitted approximately 3.9 million people across Karachi in FY 2017.
Furthermore, through the #PlantforPakistan initiative, an external and internal plantation drive in which we provide our employees and external stakeholders with tree saplings which they plant in their homes/neighbourhoods, people made a pledge and noted down messages for a greener Pakistan. Over 12,000 students and youth engaged in the campaign in FY 2017, and over 80,000 trees have been planted.
Environmental, Social, Governance & Sustainability Management

KE Annual Report 2017 | 40
In FY 2017 KE rolled out the ISO 50001 Energy Management System across the company. This is a comprehensive Energy Management framework to achieve optimal energy performance under a continuous improvement plan. KE’s implementation of this system will allow the utility to further integrate energy management, efficiency and conservation into its overall operations and reduce greenhouse gas emissions and other related environmental impact. The ISO certification also reiterates the Company’s commitment to the UN’s Sustainable Development Goals and our commitment to combat climate change. KE’s Energy Conservation department is creating real impact for KE’s stakeholders by taking proactive measures to save energy and apply global energy efficiency standards. As a result of these efforts, the Company saved 4.6 MW and reduced carbon emissions by 7,325 MT CO2 in FY 2017.
As part of its commitment to energy conservation and in-house energy efficiency, in FY 2017 the parking lot at the Company’s Head Office was converted to a state-of-the-art solar PV parking structure, producing 265 KW of solar energy. This was in addition to transforming its head office lighting load from conventional to LED lighting, reducing the load by up to 80%. As a result of this initiative, KE mitigates an estimated 150,000 kg of CO2 emissions annually, which is equivalent to planting
3,344 trees. KE’s school initiative for educating children about energy conservation has become a major success where not only school children but parents, teachers and the overall school community has embraced the organisation’s message on saving electricity and the country’s natural resources as part of sustainable living. More than 12,000 students around the city have pledged to save electricity as part of KE’s Energy Conservation Initiative. Additionally, during FY 2017, the Energy Department, Government of Sindh and the Company inked a Memorandum of Understanding to raise public awareness around Energy Conservation and actively promote Energy Efficiency Initiatives.
Energy Management Initiatives

41 | KE Annual Report 2017
Our People are a Key Human CapitalWe are proud of our talented team, who are passionate about their work and are committed to continuous excellence.
At KE, we are energised to inspire and empower our people to add real value for all our stakeholders. In FY 2017, KE set up People Connect, an employee-centric service centre focused on maximising employee facilitation and connectivity. This is a first of its kind initiative in Pakistan, where various service channels have been consolidated and synergised using both digital and physical mediums. Offering a one-stop solution to employees 24/7, People Connect has proved itself a major stepping-stone towards employee empowerment and enablement.
In today’s world, where information of an organisation is categorised as a strategic asset, KE is embracing transformation through digitisation as a key priority. In October 2016, SuccessFactors (an SAP state-of-the-art cloud-based HR solution) was adopted and deployed to help drive a high-performance culture across the organisation. This has enabled us to digitalise our HR processes, supporting core business in decision making through enhanced visibility. SuccessFactors promises to deliver further business alignment and drive key leadership behaviours.
The Emerging Talent Programme is designed for fresh graduates who aspire to become the future of the company. The programme has been carefully tailored to our evolving business needs and allows induction of the young trainees in our system through structured exposure to our core businesses. With a focus on building gender diversity, ETP 2017 inducted 41% female engineers from across Pakistan. KE also provides internship opportunities under the Aspiring Talent Programme.
FY 2017 also saw the launch of the Apprenticeship Programme, which imparts training in KE’s core business
areas of Generation, Transmission and Distribution. The programme enables KE to serve the nation as a responsible corporate entity geared towards transferring the most needed technical skills to the youth and enabling them to secure employment. It also creates training opportunities for over 650 apprentices in different business areas over two years in terms of Apprenticeship Ordinance 1962
KE also launched AZM Learning (Online Learning Management System) in 2017, which is a major step in our company-wide business transformation and opens new frontiers for learning with endless possibilities of personal growth and development. Our greatest strength lies in our people; through AZM Learning we strive to empower our teams and equip them with the tools necessary for professional and organisational success. Apart from online learning opportunity, the number of learning hours spent, and courses conducted were 188,561 and 246 respectively in FY 2017.

KE Annual Report 2017 | 42

43 | KE Annual Report 2017
The Board of Directors’ Role
A thirteen (13) member Board of Directors is elected by the shareholders of the Company and is therefore accountable to the shareholders for the discharge of its fiduciary functions in the best interest of the Company. The Board recognises its fundamental responsibility to safeguard and enhance shareholders’ value and stewardship of the Company’s assets and sets its principal focus on strategic direction, key policy framework, provides oversight in the governance, management and control of the Company’s long-term business plan, setting the goals, objectives and formulating policies and guidelines towards achieving those goals and objectives and adoption of best practices of good corporate governance. The Board reviews and approves financial performance and financial statements with the main focus on the auditors’ observations, business policies and practices, ethics, values and code of conduct, annual budget and major capital expenditure programs, internal controls, governance and compliance framework. The responsibilities of the Board have increased manifold with the enforcement of Companies Act 2017 and CCG 2017 etc. introducing a strict governance, compliance, reporting and disclosure environment envisaging time-lined corporate and other actions. KE BOD is fully aware and cognisant of its duties and responsibilities and, for the purpose, has constituted a number of Directors’ Committees to oversee the entire functional ambit of the Company. The Board is fully aware of its role in between the responsibility and authority matrices of the management and the shareholders; the delicate balance is kept intact by not getting involved in day to day management of the Company and simultaneously obtaining all shareholders-related statutory approvals in a timely manner. The Directors exercise managerial oversight to provide strategic guidance, whereas the management and the performance of the Company are the responsibility of executives. It is management’s fundamental responsibility to implement the policies, guidelines and strategic direction laid down by the Board aiming to achieve short and long-term objectives of the Company. By adopting this balanced and prudent approach, the Board not only avoids overlaps, controversies and auditors’ and regulators’ questions but also places itself in a much better position to build and improve shareholders value, key performance indicators, governance and Company’s image.
Roles and Responsibilities of the Chairman and the Chief Executive Officer (CEO)
For more than the last two decades, the Board as a matter of policy, ensured that the positions of Chairman and CEO are entrusted in separate persons. The roles and responsibilities of the Chairman and CEO are distinct and clearly defined.
The Chairman is a non-executive Director and provides leadership to the Board, chairs the Board meetings and ensures that the Directors are kept properly informed and all the issues which are required to be considered at the Board level are presented to the Board and Board’s decisions are implemented in a timely manner and that the views of the shareholders are known to the Board. The Chairman evaluates the performance of individual Directors on the basis of attendance in Board and Board’s committee meetings, level of participation and value addition through suggestions and recommendations. The Chairman meets and consults the Directors, especially non-executive and independent ones on a regular basis to discuss corporate governance issues, performance of the Company and conducive environment enabling the Directors to fulfil their fiduciary duties. Whereas, the CEO has the ultimate responsibility of leading the management, operational performance of the Company, handling the day-to-day affairs and implementing the policies, strategies and business plans approved by the Board and risk management alongside custody and maintenance of Company’s properties, assets, records and accounts in accordance with set out policies, statutes, guidelines and standards. CEO exercises powers vested in him through the Companies Act 2017, KE Memorandum & Articles of Association, General Power of Attorney and any other mandate given by the Board from time to time. The CEO is also responsible for the smooth functioning of the business with optimum utilisation of the Company’s resources and effective implementation of internal controls.
Board’s Performance Evaluation
The KE Board is comprised of professionals representing various work streams possessing diversified experience and expertise and fully believes in the importance of globally recognised best practices of good corporate governance. Providing upfront leadership and setting high performance standards & values are the core ingredients of Board’s vision and strategic policy, with firm conviction that it is the Board’s performance which ultimately decides the future of the Company and its position among the peers. The process to put in place a formal and effective mechanism for annual evaluation of the Board’s own performance, members of Board and of its committees, has been initiated. A questionnaire with main focus on some basic issues relating to conduct and performance of the Board was circulated in June 2018 to the directors seeking their input on certain fundamental yardsticks. Board Human Resource & Remuneration Committee (BHR&RC) is mandated to undertake annually a formal process of evaluation of performance of the Board as a whole and its committees either directly or by engaging external independent consultant. BHR&RC would review the input of the directors and would decide to undertake
Corporate Governance

KE Annual Report 2017 | 44
the said evaluation internally or to engage external independent consultant. Nevertheless, the process will remain more or less same whether done internally or externally and include interview, open discussion with individual / group of directors mainly focusing on some of the specific questions relating to performance and conduct of the Board. Alongside, professional institutes / entities possessing experience and expertise on the subject are being consulted for the purpose. Essentially, the Board’s performance evaluation is based on how effectively and efficiently it discharges its fundamental responsibility to safeguarding and enhancing shareholders’ value, setting policy framework, strategic direction, oversight, control and good corporate governance. KE being a public utility in the private sector, therefore remains under active focus of over 22 million citizens of Karachi and the Directors, in addition to having first-hand information about the Company’s performance, also come across independent coverage by electronic & print media and customers’ direct feedback through emails and other modes, in relation to key performance indicators such as load-shed, tripping & breakdowns and billing & customer services related issues which are used as a yardstick to judge and evaluate the Company’s as well as the Board’s performance. Simultaneously, an informal Board’s performance evaluation mechanism is also in place based on meaningful participation and input of executive, non-executive and independent Directors. The Board evaluates its performance in an objective manner on a regular basis, essentially based on the overall performance of the Company, and the implementation of strategic policies & business plans and achievement of budget targets and key performance indicators. In every meeting, the Board takes stock of successful achievements of the strategic and business objectives of the company vis-à-vis set targets, continued compliance with regulatory requirements and best practices of good corporate governance with added focus on its sustainability strategy based on corporate social responsibility. As a part of evaluation process, the Board, on a regular basis, analyses segmented performance of the Company and also reviews reports and recommendations of respective Board and Management committees, gives direction to address any inefficiency / delay and sets timelines for corrective actions. The Board further ensures that all of its decisions and guidelines are observed in letter and spirit and there is a standing discussion point for every Board meeting viz. “Report on Implementation of Board’s Actionable Decisions” under which the status update of previous Board’s decisions/directions is presented which further enables the Board to evaluate the effectiveness of its role and take any additional actions. The Chairman consults the Directors, especially non-executive and independent ones on policy and governance related issues and performance of the Company and effectiveness of Board’s role and suggestions for further improvement. The Board values independent professional input and places special attention on the report of external auditors on six monthly and annual financial statements of the Company and the points raised and issues highlighted by them
are deliberated at length by the Board Audit Committee as well as by the Board itself. The Board considers these observations and reports as an independent assessment /evaluation of the Board’s performance and as an instrument to identify the issues requiring more efforts to strengthen Board’s role in successful achievement of strategic objectives and implementing long-term business plan of the Company to benefit all stakeholders.
CEO’s Performance Review by the Board
CEO holds key position in the Company and liaises between Board and management and ensures effective & meaningful communication between management and Board with main focus on governance and operational management of the Company in a professional manner, essentially in line with policies and strategic direction set out by the Board to achieve operational, financial and strategic objectives of the Company. Key Performance Indicators (KPIs) and responsibilities of CEO include smooth functioning of the business with optimal utilisation of the Company’s resources and effective & timely implementation of Board’s directions / decisions, internal controls and improving operational and financial performance of the Company, which ultimately determine his performance level. The Board appoints CEO for a three-year term considering recommendations of Board Human Resource & Remuneration Committee (BHR&RC) which is also mandated for his performance evaluation and reports to the Board. Alongside, the Board sets key operational and financial targets and policy guideline at the time of approving Annual Budget of the Company. The CEO provides leadership to the management team in achieving the set objectives / targets and presents to the Board on quarterly basis a report showing the level of achievement in relation to key budget targets, supported by an objective comparison of actual performance with the budget and last year’s performance elaborating variance analysis / justifications. Further, in every Board meeting a business update is presented to the Board by CEO and KE leaders envisaging operational and financial performance of the Company and key issues, major projects, opportunities and challenges facing the Company, suggesting the way forward and seeking the Board’s guidance to address the issues to uphold interest of the Company. Invariably, the Board in every meeting, reviews a report on implementation of its earlier decisions in terms of timelines, cost estimates and benefits to the Company which, in effect, is tantamount to CEO’s performance evaluation in achieving the set targets. In fact, CEO’s performance evaluation by the Board provides constructive support to the management actions, enhances trust level, transparency and inculcates a collective decision-making process to improve Company’s performance and value addition for all the stakeholders. Further, review and approval of Company’s annual audited financial statements by BAC and BOD is, among other things, used as CEO’s performance review through an objective comparison of actual results vis a vis preset strategic, operational and financial goals, and effective implementation of strategic decisions and

45 | KE Annual Report 2017
policies of the Board. Moreover, sufficient details on Company’s overall performance, governance structure and control environment are available in observations and findings of BAC and report of statutory auditors on financial statements and CCG compliance discerning the level and effectiveness of CEO’s performance and assist the Board in conducting a performance review.
Conflict of Interest Policy
The Board of Directors of the Company places main emphasis on identification, monitoring and management of conflict of interest relating to Board members and officers of the Company. The Company’s policy on the subject is fundamentally driven through the direction and guideline provided by the Companies Act 2017 and Code of Corporate Governance Regulations 2017 and is further augmented by the Code of Conduct enforced by the Board, setting high general and company-specific ethical standards, best practices of good corporate governance and enabling mechanism with main focus to uphold interest of the Company. It is ensured that every director at the time of his / her appointment, along with consent, provides to the Company a signed declaration detailing therein all contracts, agreements and arrangements in which he /she is interested directly or indirectly and to immediately disclose any subsequent addition / change, thereof. Disclosure of the said interest is placed in the very next Board meeting ensuring that the interested Director does not participate in voting / discussion on the subject. Requirement of specified number of independent directors to constitute quorum in a board meeting discussing the said agreements etc. would be observed after next election of directors. Moreover, requirement of shareholders’ approval in relation to conflict of interest cases under specified circumstances will be observed in letter and spirit. Simultaneously, any officer of the Company who is in any way, directly or indirectly, concerned or interested in any contract or arrangement with the Company is required to disclose his /her interest as above and obtain approval of the Board before entering into any such contract or arrangement. Discussion/decision on the said issues is duly recorded in the minutes of meeting and entered into statutory register maintained for the purpose. Alongside, all transactions with related parties are duly approved by the Board Audit Committee and Board of Directors and properly disclosed in the financial statements of the Company. Investors’ Grievances Policy and Investors’ Relation Section on KE’s Website
The Company, as a matter of policy, values equity contribution, irrespective of quantum of investment, of present and prospective investors who collectively form capital base of the Company. In general, shareholders and investors are kept informed of the Company’s affairs on a regular basis. For the purpose, the Company maintains a comprehensive website and “Investors
Relations” segment on KE’s website, essentially designed to provide shareholders and investors with key financial, operational highlights, material information, key projects and other corporate & regulatory updates to facilitate making informed and timely investment decisions. All material information and disclosures are timely updated on Company’s website alongside simultaneous regulatory corporate announcements through SECP and PSX. Whereas, specific queries including grievances and requests for information are dealt with by Corporate Affairs Team in a professional and proactive manner. With an objective to facilitate and encourage shareholders and prospective investors to provide their feedback / suggestions / queries / complaints and request for any info/ document, Investor Relation segment prominently specifies complete details of contact person of the Company in addition to the links to Securities & Exchange Commission of Pakistan (SECP)’s ‘Service Desk’ and investor education portal ‘JamaPunji’ and Pakistan Stock Exchange (PSX). Internal controls and monitoring mechanism are in place to ensure that personal, telephonic, emails and written requests of the shareholders and / or prospective investors and letters received through SECP or PSX are given prioritised attention and the issues are promptly addressed and responded to at the earliest.
Policy for Safety of Records
K-Electric fully recognises the importance of historical and valuable records which it carries relating to over a century’s period since its incorporation back in 1913. Therefore, in view of KE’s unique position as above, its policy for safety of records is primarily designed to preserve the essential documents for periods beyond the statutory time limits set by the regulators. Given the age of the Company and periods when electronic means and facilities were practically non-existent, most of the records were in physical form and prone to defacement. The said records include constitution documents, legal, corporate, property title documents, original contracts / agreements, financial statements, share certificates, statutory registers, minutes & policy decisions taken in the meetings of Board of Directors and shareholders and others. The policy framework envisages identification of essential documents and then to categorise these documents on the basis of valuation in terms of corporate, legal, financial etc., importance and validity and then the documents are accordingly earmarked for appropriate storage facility. Accordingly, valuable original property title documents, constitution documents, key agreements and others are prioritised for safe custody in fire-proof cabinets. A computerised database of all records in safe custody is in place with the procedure and authority levels for putting in and taking out any essential document, in addition to periodical checks and internal control mechanism. As a backup support, an ongoing parallel I.T. based digitisation / screening and scanning process was undertaken a couple of years ago focusing on value documents of the Company. While the Company has been performing most of records safety functions in house; a

KE Annual Report 2017 | 46
reputable professional service provider was engaged a few years ago with a view to diversify, economise the process and enhance productivity but without compromising on service quality and confidentiality of the records. Outsourcing is however limited and restricted to less important records of the Company and is subject to monitoring and regular review; the arrangement is working satisfactorily.
Company has successfully achieved ISO27001:2013 Certification of Information Security Management System (ISMS) in April 2017. Through this Management System, it ensures that adequate policies are in place for safety of records throughout the company’s systems. These policies and their implementation are regularly subject to Internal and External Audits.
Whistle-Blower Policy, AZM Speak Up and ‘Awaaz’ Advocacy Channel
KE values an open dialogue on integrity and responsibility in interactions with its employees. It created a direct communication bridge between the leadership and the employees through various communication mediums which include confidential email address, PO BOX and hotline. KE employees can directly report misconduct or any unethical practice through these mediums. KE also encourages its employees to give suggestions and feedback on a specific topic or idea. Investigations on a specific complaint are ordered by the highest authority of the relevant department. KE investigates all alleged breaches of its code and applies appropriate measures when complaints turn out to be substantiated.
Risk Management and Business Continuity Plan
The Board of Directors and the management periodically review major financial and operating risks faced by the business. Although mitigation strategies are implemented for all identified operational and financial risks, the organisation is working on a holistic Business Continuity Plan (BCP). Through the BCP, the organisation plans to reduce the impact of disasters by adopting suitable disaster mitigation strategies catering to the Business units and their support functions.
Management teams assess, review and manage Technology and Information Security Risks on regular basis through an integrated Risk Management approach for Company’s critical assets and resources based on various risk factors.
Business Continuity and Disaster Recovery plans are in place and are documented, maintained and regularly tested by respective departments.
Disaster Management Plan
The disaster management plan is categorised into the following three types of response elements as the initial part of the BCP project:
• Operational Response: To get the disruption under control as quickly as possible so that normal
operations can be resumed.
• Management Response: To allocate resources and make critical decisions needed to resolve the situation.
• Communication Response: To communicate effectively with the employees, their families, officials, customers, other agencies and media.
• Management has documented and maintained the Disaster Management Plan to ensure availability of critical services, systems and processes in disaster situations. This Plan is regularly checked and updated on the basis of testing drills and exercises conducted throughout the year.
We have disaster management plans in place for all our critical business operations like IT, distribution, transmission, generation and finance.

47 | KE Annual Report 2017
The role of the Board Audit Committee (BAC) in the context of Board’s broader governance framework is to monitor the integrity of financial information and provide comfort to the Board that Company’s internal controls are appropriately designed, implemented and regularly reviewed.
Committee’s Procedures
The Committee reviews the Company’s financial performance, business plans and other key performance indicators and internal audit reports. In compliance with the corporate governance guidelines, the Committee meets external and internal auditors at least once in a year without the management team. The terms of reference of the Committee are duly approved by the Board and are available in the annual report.
No meeting of BAC was held during the financial year ended June 30, 2017, the reasons for which are mentioned in the Statement of Compliance.
Internal Audit
KE treats Internal Audit (IA) as an independent assurance and consulting activity designed to add value and improve its operations. KE’s Internal Audit Department (IAD) is independent of the activities being audited and the Chief Internal Auditor reports directly to the Board Audit Committee. The IAD is governed by an IA charter duly approved by the Committee, which describes the purpose, authority, responsibility and reporting relationship of IAD.
All assurance activities are performed in accordance with an annual risk-based internal audit plan approved by the BAC, whereas consulting activities are based on the services requested by the management, with agreed objectives, scope and reporting.
The Committee on the basis of IA reports reviews the adequacy of internal controls and discusses corrective actions in the light of Management responses. This review allows the Company to improve controls and compliance in areas where weaknesses are identified.
The Committee also reviews and ensures that IA function is adequately staffed with professionals who possess the requisite internal audit training and experience to perform their duties.
External Audit
The statutory auditor of the Company, M/s. KPMG Taseer Hadi & Co. resigned and the Board of Directors of the Company filled-up the casual vacancy and appointed M/s. A.F. Ferguson & Co., and M/s. BDO Ebrahim & Co., to act as joint statutory auditors of the Company.
The statutory auditors of the Company have completed their audit of the Company’s Financial Statements and Statement of Compliance with Code of Corporate Governance for the financial year ended June 30, 2017. The Committee has reviewed and discussed audit observations with external auditors and they have been allowed direct access to the Committee to ensure their independence and objectivity. The Committee also met with the external auditors without the management team.
Coordination between external and internal auditors is also enabled and encouraged to allow sharing of information in order to ensure integrity of financial reporting system and its compliance with laws and regulations.
The Committee undertakes a periodic review of the appointment of external auditors, taking into consideration a number of factors such as, assessment of past performance, quality of ongoing discussions and the length of time the firm has been engaged for. Based upon the results of evaluation, the Committee has recommended reappointment of the current external auditors to the Board.
Report of the Board Audit Committee
Mr. Khalid RafiChairman, Board Audit Committee

KE Annual Report 2017 | 48
Name of the Company: K-Electric LimitedFor the year ended: June 30, 2017
This statement is being presented to comply with the Code of Corporate Governance (CCG) contained in Rule 5.19 of the Pakistan Stock Exchange (PSX) Rule Book for the purpose of establishing a framework of good governance, whereby a listed company is managed in compliance with the best practices of corporate governance.
The Company has applied the principles contained in the
CCG in the following manner. 1. The Company encourages representation of
Independent, Non-Executive Directors and Directors representing minority interests on its Board of Directors. During the year ended June 30, 2017 and at present, the Board comprised of the following members:
2. The Directors have confirmed that none of them is serving as a Director on more than seven listed companies, including this Company (excluding the listed subsidiaries of listed holding companies where applicable).
3. All the resident Directors of the Company are registered as taxpayers and none of them has defaulted in payment of any loan to a banking company, a DFI or an NBFI, or being a broker of a stock exchange, has been
declared as a defaulter by that stock exchange.
4. A casual vacancy occurring on the Board on December 30, 2016 was filled up by the Directors on the same day.
5. The Company has prepared a “Code of Conduct” and has ensured that appropriate steps have been taken to disseminate it throughout the Company along with its supporting policies and procedures.
Statement of Compliance with The Code of Corporate Governance 2012
Non-Executive Director
Executive Director
Independent Director
Non-Executive Director
Non-Executive Director
Non-Executive Director
Non-Executive Director
Non-Executive Director
Non-Executive Director
Non-Executive Director
Non-Executive Director
Non-Executive Director
*DOA/E/RE = Date of Appointment / Election / Re-Election**DOE = Date of Exit
The independent Director meets the criteria of independence under clause i(b) of the CCG.
CATEGORYIkram Ul-Majeed Sehgal, Chairman
Syed Moonis Abdullah Alvi, CEO
Khalid Rafi
Chaudhary Khaqan Saadullah Khan
Mubasher H. Sheikh
Nayyer Hussain
Shan A. Ashary
Muhammad Zubair Motiwala, GOP nominee
Dr. Ahmed Mujtaba Memon, GOP nominee
Syed Mohammad Akhtar Zaidi
Waseem Mukhtar, GOP nominee
Adeeb Ahmad
Aziz Moolji
Frederic Sicre
Muhammad Tayyab Tareen
Noor Ahmed
Omar Khan Lodhi
Waqar H. Siddique
Zafar Abbas
Muhammad Anwar Sheikh
Dr. Aamer Ahmed
Hassan Nasir Jamy
NAMEJanuary 18, 2019
June 7, 2018
October 16, 2015
October 16, 2015
October 16, 2015
October 16, 2015
October 16, 2015
February 23, 2016
June 7, 2018
April 15, 2019
April 15, 2019
July 04, 2019
October 16, 2015
October 16, 2015
October 16, 2015
October 16, 2015
October 16, 2015
October 16, 2015
October 16, 2015
December 30, 2016
August 9, 2017
December 14, 2018
DOA/E/RE*
May 6, 2019
February 8, 2019
January 18, 2019
December 30, 2016
February 8, 2019
June 7, 2018
August 9, 2017
June 7, 2018
December 14, 2018
February 13, 2019
DOE**

49 | KE Annual Report 2017
6. The Board has developed a vision/mission statement, overall corporate strategy and significant policies of the Company. A complete record of particulars of significant policies along with the dates on which they were approved or amended has been maintained.
7. No fresh appointment of the CEO was made during the year ended June 30, 2017 and neither any revision was made in the remuneration of the CEO. However, performance reward / bonus of CEO for the year ended June 30, 2017, as recommended for approval by the Board of Human Resource and Remuneration Committee (BHR&RC) was approved by the Board subsequent to year end. Further, the related party transactions were approved by the Board subsequent to year end.
8. In March 2016 the Company filed a petition with National Electric Power Regulatory Authority (NEPRA) for renewal of Multi-Year Tariff which expired on June 30, 2016 (MYT 2009-16). NEPRA determined the new MYT (MYT 2017-23) after about one year in March 2017, against which the Company filed a review petition with NEPRA in April 2017. NEPRA announced its decision dated October 9, 2017 on the Company’s review petition, however, did not address genuine and critical concerns of the Company. The Ministry of Energy (Power Division), Government of Pakistan (MOE) taking note of the situation filed a ‘Reconsideration Request’ with NEPRA on October 26, 2017 to reconsider afresh its earlier determination. NEPRA issued its final determination on July 5, 2018. In the absence of determined tariff due to the reasons and circumstances narrated above, the annual financial statements of the Company for the year ended June 30, 2016 and the quarterly financial statements of the Company for the quarters ended September 30, 2016, December 31, 2016 and March 31, 2017 could not be finalized. Consequently no meetings of Audit Committee and Board of Directors of the Company were held during the year ended June 30, 2017 to review / approve the financial statements.
Moreover, key function of the Board is policy decision making, approving major projects & capital expenditures, budget, financing proposals and other major transactions. In the absence of a valid tariff since July 1, 2016, there was no clarity on projected revenue stream of the Company which is a basic prerequisite to prepare the budget, undertake major projects, develop business plan, cash flow projections and take other policy decisions. For projects and other financing arrangements, lenders require audited financial statements. Therefore, all major projects, financing proposals, budget and other policy decisions were kept in abeyance during the review this period due to tariff issue. However, operational management of the Company was carried out by the CEO and senior management team, in line with the Company’s policy and pursuant to the Board’s authorisation and necessary approvals of the Board on routine matters were obtained through circular resolutions. Due to
foregoing, there were no major business items and policy decisions for submission to the Board and therefore no Board meeting was convened.
9. The training of the Directors is an ongoing process and the Directors, on a regular basis are provided with and updated on relevant laws, codes, and guidelines on best practices of corporate governance. Most of the Directors are professionals and senior executives having national and international exposure and experience and are fully aware of their duties and responsibilities. Up to June 30, 2017 four directors of the Company have acquired certification under Directors Training Program (DTP) offered by Pakistan Institute of Corporate Governance.
10. During the year ended June 30, 2017 no fresh appointment of CFO, Company Secretary and Head of Internal Audit was made. Revision in their remuneration for the year ended June 30, 2017 was made as per the Company policy in line with their terms of appointment approved by the Board.
11. The Director’s Report for the year ended June 30, 2017 has been prepared in compliance with the requirements of the CCG and fully describes the salient matters required to be disclosed.
12. During the year ended June 30, 2017 no quarterly and annual financial statements of the Company were prepared, for the reasons described in paragraph 8 above. The annual financial statements for the year ended June 30, 2016 and the quarter financial statements for the quarters ended September 31, 2016, December 31, 2016 and March 31, 2017 were duly endorsed by CEO and CFO prior to approval of the same by the Board.
13. The Directors, CEO and executives do not hold any interest in the shares of the Company other than that disclosed in the pattern of shareholding.
14. The Company has complied with all the corporate requirements of the CCG, except for financial reporting requirements as no quarterly and annual financial statements were prepared and no Board meetings were held during the year ended June 30, 2017. The reasons and circumstances for delay in releasing the annual and quarterly financial statements of the Company, have been explained in paragraph 8 above.
15. The Board has formed an Audit Committee comprising of four (4) members, all of whom are Non-Executive Directors and the Chairman of the committee is an independent Director.
16. The terms of reference of Audit Committee have been formed and advised to the committee for compliance. However, no meetings of the Audit Committee were held during the year ended June 30, 2017, for the reasons explained in paragraph 8 above.

KE Annual Report 2017 | 50
17. The Board has formed a Human Resource and Remuneration Committee (BHR&RC). It comprises of three (3) members, majority of whom are Non-Executive Directors, including an Independent Director as Chairman of the Committee.
18. The Board has set up an effective internal audit function manned by suitably qualified and experienced personnel that are involved in the internal audit function on a full time basis and are conversant with policies and procedures of the Company.
19. The statutory auditor of the Company, M/s. KPMG Taseer Hadi & Co. resigned subsequent to year end and the Board of Directors of the Company in its meeting held on December 14, 2018, in exercise of powers vested under section 246 of the Companies Act 2017, filled-up the casual vacancy and appointed M/s. A.F. Ferguson & Co. and M/s. BDO Ebrahim & Co. to act as joint statutory auditors of the Company for the year ended June 30, 2017.
The statutory auditors of the Company have confirmed that they have been given a satisfactory rating under the quality control review program of the Institute of Chartered Accountants of Pakistan (ICAP), that they or any of the partners of the firms, their spouses and minor children do not hold shares of the Company and that the firms and all its partners are in compliance with International Federation of Accountants (IFAC) guidelines on code of ethics as adopted by the ICAP.
20. The statutory auditors or the persons associated with them have not been appointed to provide other services except in accordance with the listing regulations and the auditors have confirmed that they have observed IFAC guidelines in this regard.
21. As no Board Meetings were held during the year for reasons explained in paragraph 8 above therefore no ‘closed period’ was determined and was hence not applicable.
22. Material/price sensitive information has been disseminated among all market participants at once through the stock exchange.
23. The Company has complied with the requirements relating to maintenance of register of persons having access to inside information by designated senior management officer in a timely manner and maintained proper record including basis for inclusion or exclusion of names of persons from the said list.
24. We confirm that all other material principles enshrined in the CCG have been complied with except that the related party transactions were placed before the Audit Committee subsequent to the year end.
For and on behalf of the Board of Directors
Syed Moonis Abdullah AlviChief Executive Officer
Karachi, July 4, 2019
Khalid RafiDirector

51 | KE Annual Report 2017
Review Report to the Members on Statement of Compliance with The Code of Corporate GovernanceWe have reviewed the enclosed Statement of Compliance with the best practices contained in the Code of Corporate Governance (the Code) prepared by the Board of Directors of K-Electric Limited (the Company) for the year ended June 30, 2017 to comply with the requirements of Rule 5.19 of the Rule Book of the Pakistan Stock Exchange where the Company is listed.
The responsibility for compliance with the Code is that of the Board of Directors of the Company. Our responsibility is to review, to the extent where such compliance can be objectively verified, whether the Statement of Compliance reflects the status of the Company’s compliance with the provisions of the Code and report if it does not and to highlight any non-compliance with the requirements of the Code. A review is limited primarily to inquiries of the Company’s personnel and review of various documents prepared by the Company to comply with the Code.
As a part of our audit of the financial statements we are required to obtain an understanding of the accounting and internal control systems sufficient to plan the audit and develop an effective audit approach. We are not required to consider whether the Board of Directors’ statement on internal control covers all risks and controls or to form an opinion on the effectiveness of such internal controls, the Company’s corporate governance procedures and risks.
The Code requires the Company to place before the Audit Committee, and upon recommendation of the Audit Committee, place before the Board of Directors for their review and approval its related party transactions distinguishing between transactions carried out on terms equivalent to those that prevail in arm’s length transactions and transactions which are not executed at arm’s length price and recording proper justification for using such alternate pricing mechanism. We are only required to ensure compliance of this requirement to the extent of the approval of the related party transactions by the Board of Directors upon recommendation of the Audit Committee. We have not carried out any procedures to determine whether the related party transactions were undertaken at arm’s length price or not.
Based on our review, nothing has come to our attention which causes us to believe that the Statement of Compliance does not appropriately reflect the Company’s compliance, in all material respects, with best practices contained in the Code as applicable to the Company for the year ended June 30, 2017.

KE Annual Report 2017 | 52
Further, we highlight below instances of non-compliances with the requirements of the Code as reflected in the paragraph references where these are stated in the Statement of Compliance.
S. No. Paragraph Description reference
(i) 7 & 8 No meeting of the Board of Directors of the Company was held during the year ended June 30, 2017. Accordingly, certain material transactions (i.e. related party transactions and performance reward / bonus of the Chief Executive Officer) were approved subsequent to the year end.
(ii) 12 & 14 During the year ended June 30, 2017 no interim or annual financial statements of the Company were prepared. (iii) 8, 16 & 24 No meetings of the Audit Committee were held during the year ended June 30, 2017. Accordingly, the related party transactions were placed before the Audit Committee subsequent to the year end.
A. F. Ferguson & Co.Chartered Accountants
Date: July 8, 2019Place: Karachi
BDO Ebrahim & Co.Chartered Accountants

53 | KE Annual Report 2017
Statement of Compliance with the Issue of Sukuk Regulations, 2015
This Statement is being presented to comply with the requirements under the Issue of Sukuk Regulations, 2015 issued by the Securities and Exchange Commission of Pakistan (SECP). This Statement of Compliance (the Statement) is for the year ended June 30, 2017.
The financial arrangements, contracts and transactions, entered into by K-Electric Limited (the Company) in respect of Rs 22,000 million Sukuk-ul-Shirkah for the period from July 1, 2016 to June 30, 2017 are in compliance with the Sukuk features and Shari’ah requirements in accordance with the issue of Sukuk Regulations, 2015.
We also confirm that:
• The Company has established procedures and processes for all Sukuk related transactions to comply with Sukuk features and Shari’ah requirements.
• The Company has implemented and maintained such internal control and risk management system, the management determines are necessary to mitigate the risk of non-compliances of the Sukuk features and Shari’ah requirements, whether due to fraud or error.
• The Company has a process to ensure that the management, where appropriate, those charged with governance and personnel involved with the Company’s compliance with the Sukuk related features and Shari’ah requirements are properly trained and systems are properly updated.
The Sukuk features and Shari’ah requirements shall mean the following:
• Requirements of the Fatwa (Shari’ah opinion) dated February 6, 2015 issued by Shari’ah Advisory Board.
• The Company’s compliance with terms of the documents listed in Fatwa dated February 6, 2015.
• Compliance with the Issue of Sukuk Regulations, 2015 issued by the SECP.
Statement of Compliance prepared by Management
Syed Moonis Abdullah Alvi Chief Executive Officer
Karachi, July 4, 2019

KE Annual Report 2017 | 54
Scope of our WorkWe have performed an independent assurance engagement of K-Electric Limited (the Company) to express an opinion on the annexed Statement of Compliance with the requirements of the Issue of Sukuk Regulations, 2015 as notified by the Securities and Exchange Commission of Pakistan (SECP) for the year June 30, 2017 here-in referred to as (the statement).
Applicable CriteriaThe criteria for the assurance engagement against which the underlying subject matter (the statement) is assessed comprises of compliance with the features and Shariah requirements of Sukuk in accordance with the requirements of the Issue of Sukuk Regulations, 2015. Therefore, the underlying subject matter may not be suitable for another purpose. Our engagement was carried out as required under Rule 13 of Chapter V of the Issue of Sukuk Regulations, 2015 as notified by the SECP.
Responsibility of the Company’s ManagementThe responsibility for the preparation and fair presentation of the Statement (the subject matter information) and for compliance with the features and Shariah requirements of Sukuk in accordance with the requirements of the Issue of Sukuk Regulations, 2015 is that of the management of the Company. The management is also responsible for the design, implementation and maintenance of appropriate internal control procedures with respect to such compliance and maintenance of relevant documentation/records. The management is also responsible to ensure that the personnel involved are conversant with the Criteria for the purpose of the Company’s compliance.
Our Independence and Quality ControlWe are independent of the Company in accordance with the International Ethics Standards Board for Accountants’ Code of Ethics for Professional Accountants as adopted by the Institute of Chartered Accountants of Pakistan (the Code) and we have fulfilled our other ethical responsibilities in accordance with the Code. The firms apply International Standard on Quality Control 1 “Quality Control for Firms That Perform Audits and Reviews of Financial Statements, And Other Assurance and Related Services Engagements” and accordingly maintain a comprehensive system of quality control including documented policies and procedures regarding compliance with ethical requirements, professional standards and applicable legal and regulatory requirements.
Responsibility of Independent Assurance ProviderOur responsibility is to express our conclusion on the Statement based on our independent assurance engagement, performed in accordance with the International Standard on Assurance Engagements 3000 ‘Assurance Engagements other than Audits or Reviews of Historical Financial Information’ (ISAE 3000). This standard requires that we plan and perform the engagement to obtain reasonable assurance about whether the annexed Statement reflects the status of the Company’s compliance with the features and Shariah requirements of Sukuk in accordance with the requirements of the Issue of Sukuk Regulations, 2015 and is free from material misstatement.
Independent Assurance Report to the Board of Directors on the Statement of Compliance with the Issue of Sukuk Regulations, 2015 for the Year ended June 30, 2017

55 | KE Annual Report 2017
The procedures selected by us for the engagement depend on our judgment, including an assessment of the risks of material non-compliances with the Criteria. In making those risk assessments; we have considered internal controls relevant to the Company’s compliance with the Criteria in order to design procedures that are appropriate in the circumstances, for gathering sufficient appropriate evidence to determine that the Company was not materially non-compliant with the Criteria. Our engagement was not for the purpose of expressing an opinion on the effectiveness of the Company’s internal control.
Our procedures applied to the selected data primarily comprised of:
- Inquiry and evaluation of the systems, procedures and practices in place with respect to the Company’s compliance with the Criteria;
- Verification of Sukuk related transactions on a sample basis to ensure the Company’s compliance with the Criteria during the year ended June 30, 2017;
- Review of Shariah structure, transaction documents and Fatwa (Shariah opinion) approval letter issued by the Shariah Advisor of the Sukuk; and
- Review of the Statement based on our procedures performed and conclusion reached.
We believe that the evidences we have obtained through performing our aforementioned procedures were sufficient and appropriate to provide a basis for our opinion.
ConclusionBased on our independent assurance engagement, in our opinion, the Statement has been prepared, in all material respects, in compliance with the features and Shariah requirements of Sukuk in accordance with the Issue of Sukuk Regulations, 2015.
A. F. Ferguson & Co.Chartered Accountants
Date: July 8, 2019Place: Karachi
BDO Ebrahim & Co.Chartered Accountants
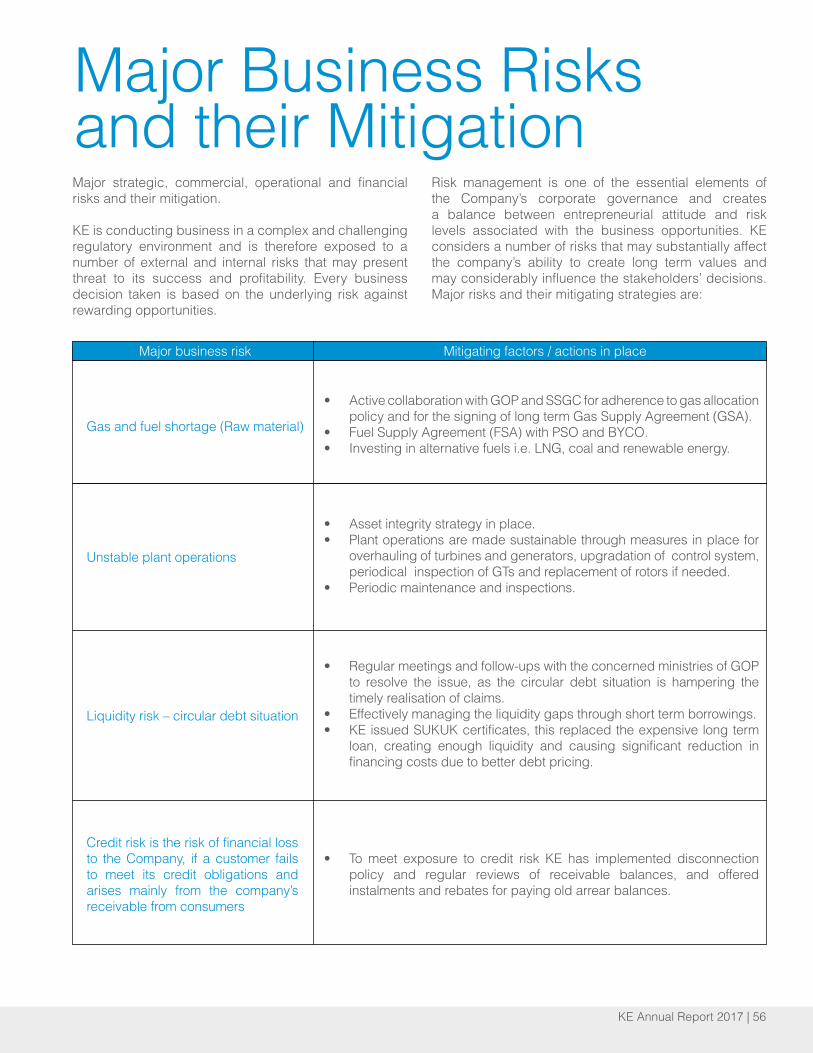
KE Annual Report 2017 | 56
Major strategic, commercial, operational and financial risks and their mitigation.
KE is conducting business in a complex and challenging regulatory environment and is therefore exposed to a number of external and internal risks that may present threat to its success and profitability. Every business decision taken is based on the underlying risk against rewarding opportunities.
Risk management is one of the essential elements of the Company’s corporate governance and creates a balance between entrepreneurial attitude and risk levels associated with the business opportunities. KE considers a number of risks that may substantially affect the company’s ability to create long term values and may considerably influence the stakeholders’ decisions. Major risks and their mitigating strategies are:
• Active collaboration with GOP and SSGC for adherence to gas allocation policy and for the signing of long term Gas Supply Agreement (GSA).
• Fuel Supply Agreement (FSA) with PSO and BYCO.• Investing in alternative fuels i.e. LNG, coal and renewable energy.
• Asset integrity strategy in place.• Plant operations are made sustainable through measures in place for
overhauling of turbines and generators, upgradation of control system, periodical inspection of GTs and replacement of rotors if needed.
• Periodic maintenance and inspections.
• Regular meetings and follow-ups with the concerned ministries of GOP to resolve the issue, as the circular debt situation is hampering the timely realisation of claims.
• Effectively managing the liquidity gaps through short term borrowings.• KE issued SUKUK certificates, this replaced the expensive long term
loan, creating enough liquidity and causing significant reduction in financing costs due to better debt pricing.
• To meet exposure to credit risk KE has implemented disconnection policy and regular reviews of receivable balances, and offered instalments and rebates for paying old arrear balances.
Gas and fuel shortage (Raw material)
Unstable plant operations
Liquidity risk – circular debt situation
Credit risk is the risk of financial loss to the Company, if a customer fails to meet its credit obligations and arises mainly from the company’s receivable from consumers
Major Business Risksand their Mitigation
Major business risk Mitigating factors / actions in place

57 | KE Annual Report 2017
• KE safety standards are compliant with the highest world class safety standards. The safety management system is compliant with the principles of ISO 9000, ISO 14000, and OHSAS 18000.
• Comprehensive business insurance is in place to cover monetary risk.• Climate change policy is in place.• Established disaster recovery / business continuity plans have been
implemented at all locations and the staff is fully equipped to quickly recover from a natural disaster.
• Increased security for employees at operational centers.• Operations suspended whenever the situations get worse in a particular
area.• Work on off days in case of strikes and other unexpected situations.
• Rigorous checks on latest updates in regulatory framework are carried out to prevent any breach of law.
• Resourcing policies designed and implemented are aligned with business strategy and our vision and value statement.
• An organisation–wide vision and value training programme executed for all employees at all levels.
• Code of conduct is mandatory to be signed by all employees.
• Detailed succession planning has been emphasised at all levels throughout the organisation, together with culture of employee training and development
• Effective management trainee programme is also in place.
• IT controls are in place to prevent unauthorised access to confidential information.
• Regular IT audits and trainings are conducted to monitor and minimise the risk of breaches, errors or other irregularities.
• A robust internal control system is in place and is continuously monitored by the Company’s effective Internal Audit Function and through other monitoring procedures. The process of monitoring internal controls is an ongoing process with the objective to further strengthen the controls and bring improvements in the system.
• The controls in place also cover areas ranging from safeguarding of assets, compliance with laws and regulations and accuracy and reliability of records and financial reporting
• Managed actively by hedging open positions wherever necessary.
Safety and climate risk
Law and order situation
Foreign currency exchange rate and interest rate risk
Non–compliance of statutoryrequirements, company values and standard of governance
Loss of trained and high potential employees
IT security risk
Internal control risk

KE Annual Report 2017 | 58
FinancialPerformance
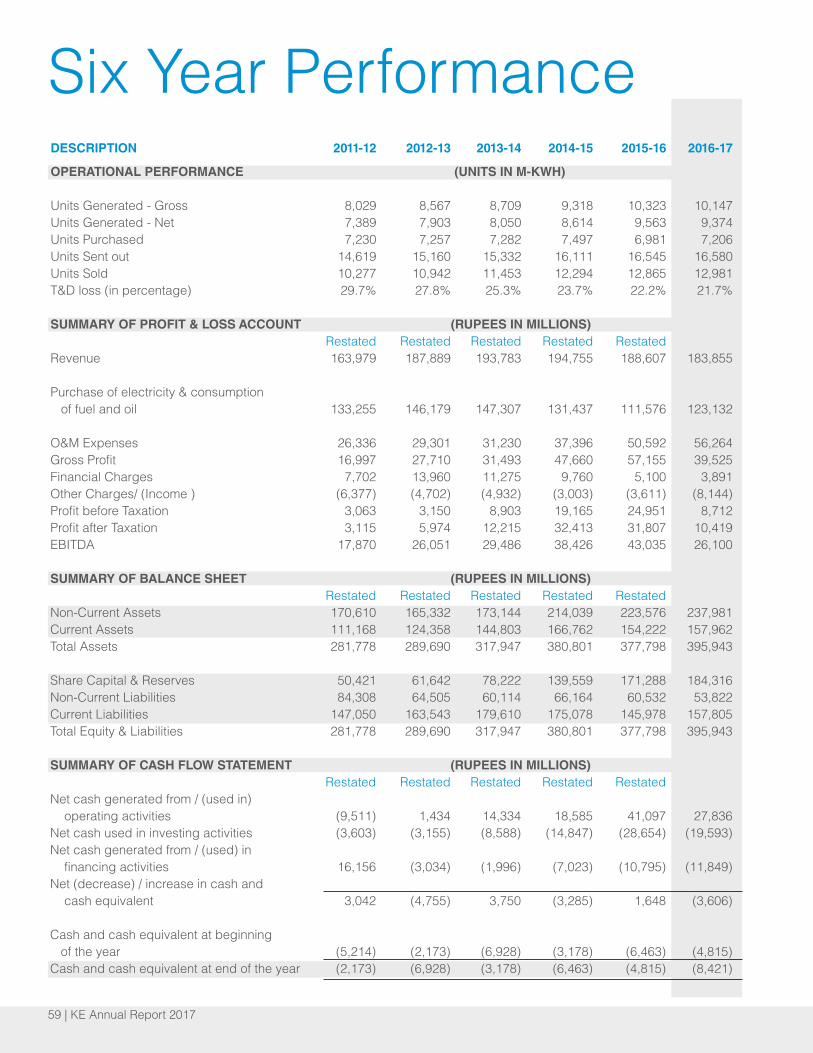
59 | KE Annual Report 2017
DESCRIPTION 2011-12 2012-13 2013-14 2014-15 2015-16 2016-17
OPERATIONAL PERFORMANCE (UNITS IN M-KWH)
Units Generated - Gross 8,029 8,567 8,709 9,318 10,323 10,147 Units Generated - Net 7,389 7,903 8,050 8,614 9,563 9,374 Units Purchased 7,230 7,257 7,282 7,497 6,981 7,206 Units Sent out 14,619 15,160 15,332 16,111 16,545 16,580 Units Sold 10,277 10,942 11,453 12,294 12,865 12,981 T&D loss (in percentage) 29.7% 27.8% 25.3% 23.7% 22.2% 21.7% SUMMARY OF PROFIT & LOSS ACCOUNT (RUPEES IN MILLIONS) Restated Restated Restated Restated Restated Revenue 163,979 187,889 193,783 194,755 188,607 183,855 Purchase of electricity & consumption of fuel and oil 133,255 146,179 147,307 131,437 111,576 123,132 O&M Expenses 26,336 29,301 31,230 37,396 50,592 56,264 Gross Profit 16,997 27,710 31,493 47,660 57,155 39,525 Financial Charges 7,702 13,960 11,275 9,760 5,100 3,891 Other Charges/ (Income ) (6,377) (4,702) (4,932) (3,003) (3,611) (8,144)Profit before Taxation 3,063 3,150 8,903 19,165 24,951 8,712 Profit after Taxation 3,115 5,974 12,215 32,413 31,807 10,419 EBITDA 17,870 26,051 29,486 38,426 43,035 26,100
SUMMARY OF BALANCE SHEET (RUPEES IN MILLIONS) Restated Restated Restated Restated Restated Non-Current Assets 170,610 165,332 173,144 214,039 223,576 237,981 Current Assets 111,168 124,358 144,803 166,762 154,222 157,962 Total Assets 281,778 289,690 317,947 380,801 377,798 395,943 Share Capital & Reserves 50,421 61,642 78,222 139,559 171,288 184,316 Non-Current Liabilities 84,308 64,505 60,114 66,164 60,532 53,822 Current Liabilities 147,050 163,543 179,610 175,078 145,978 157,805 Total Equity & Liabilities 281,778 289,690 317,947 380,801 377,798 395,943
SUMMARY OF CASH FLOW STATEMENT (RUPEES IN MILLIONS) Restated Restated Restated Restated Restated Net cash generated from / (used in) operating activities (9,511) 1,434 14,334 18,585 41,097 27,836 Net cash used in investing activities (3,603) (3,155) (8,588) (14,847) (28,654) (19,593)Net cash generated from / (used) in financing activities 16,156 (3,034) (1,996) (7,023) (10,795) (11,849)Net (decrease) / increase in cash and cash equivalent 3,042 (4,755) 3,750 (3,285) 1,648 (3,606) Cash and cash equivalent at beginning of the year (5,214) (2,173) (6,928) (3,178) (6,463) (4,815)Cash and cash equivalent at end of the year (2,173) (6,928) (3,178) (6,463) (4,815) (8,421)
Six Year Performance

KE Annual Report 2017 | 60
DESCRIPTION 2011-12 2012-13 2013-14 2014-15 2015-16 2016-17 Restated Restated Restated Restated RestatedPROFITABILITY RATIOS (IN PERCENTAGE %)Gross Profit Margin 10.4% 14.7% 16.3% 24.5% 30.3% 21.5%Net Profit Margin 1.9% 3.2% 6.3% 16.6% 16.9% 5.7%EBITDA Margin 10.9% 13.9% 15.2% 19.7% 22.8% 14.2%PBT Margin 1.9% 1.7% 4.6% 9.8% 13.2% 4.7%PBT to adjusted invested equity (average) 3.3% 2.9% 7.3% 13.7% 15.1% 4.6% LIQUIDITY RATIOS (IN TIMES) Current Ratio 0.76 0.76 0.81 0.95 1.06 1.00 Cash flow from operations to revenue (0.06) 0.01 0.07 0.10 0.22 0.15
INVESTMENT / MARKET RATIOS (IN RUPEES) Earnings per Share - Basic / Diluted 0.12 0.22 0.44 1.17 1.15 0.38 Price earning ratio (In Times) 25.94 28.75 19.19 7.17 7.00 18.29 Market Value Per Share - year end 3.24 6.22 8.49 8.42 8.06 6.90 - High during the year 4.95 7.94 9.25 10.55 8.67 10.92 - Low during the year 1.34 3.20 4.90 6.01 6.52 6.50 Price to book ratio (In Times) 0.29 0.59 0.74 0.61 0.59 0.48 Breakup Value per Ordinary Share (including Surplus on Revaluation of Property, Plant & Equipment) 2.02 2.23 2.83 5.05 6.20 6.67 Breakup Value per Ordinary Share (excluding Surplus on Revaluation of Property, Plant & Equipment) 0.94 1.32 1.84 3.09 4.39 4.95
CAPITAL STRUCTURE RATIOS (IN TIMES) Long-term debt to equity ratio (including revaluation surplus) 0.53 0.39 0.26 0.18 0.16 0.14 Long-term debt to equity ratio (excluding revaluation surplus) 0.71 0.52 0.36 0.27 0.21 0.17 Interest Cover ratio 1.40 1.23 1.79 2.96 5.89 3.24 Average Cost of Debt 0.09 0.12 0.13 0.13 0.08 0.07 Financial Leverage Ratio (local and foreign lenders) 1.60 1.26 0.91 0.49 0.32 0.25
Key Financial Indicators

61 | KE Annual Report 2017
GraphicalAnalysis
164.0 187.9 193.8 194.8 188.6 183.9
FY-12 FY-13 FY-14 FY-15 FY-16 FY-17
Revenue(PKR In Billions) (PKR In Billions)
30.7 41.7 46.5
63.3
77.0
60.7
FY-12 FY-13 FY-14 FY-15 FY-16 FY-17
Contribution Margin
(PKR In Billions)
17.9
26.1 29.5
38.4 43.0
26.1
FY-12 FY-13 FY-14 FY-15 FY-16 FY-17
EBITDA(PKR In Billions)
3.1 6.0
12.2
32.4 31.8
10.4
FY-12 FY-13 FY-14 FY-15 FY-16 FY-17
Net Profit
0.12 0.22
0.44
1.17 1.15
0.38
FY-12 FY-13 FY-14 FY-15 FY-16 FY-17
Earnings per Share (EPS)(In PKR )29.7%
27.8%
25.3%23.7%
22.2% 21.7%
FY-12 FY-13 FY-14 FY-15 FY-16 FY-17
T&D Losses

KE Annual Report 2017 | 62
GraphicalAnalysis
169 164
168 171
183
151
FY-12 FY-13 FY-14 FY-15 FY-16 FY-17
Gas (MMCFD)
0.76 0.76 0.81 0.95 1.06 1.00
FY-12 FY-13 FY-14 FY-15 FY-16 FY-17
Current Ratio(in times)
147.0 163.5
179.6 175.1
146.0 157.8
84.3 64.5
60.1 66.2 60.5 53.8 50.4
61.6
78.2
139.6
171.3 184.3
FY-12 FY-13 FY-14 FY-15 FY-16 FY-17
Equities & Liabilities
Current Liabilities Non-Current Liabilities
Share Capital & Reserves
(PKR In Billions)
2.02 2.23 2.83
5.05
6.20 6.67
0.94 1.32 1.84
3.09
4.39 4.95
FY-12 FY-13 FY-14 FY-15 FY-16 FY-17
Breakup Value per Share
(including revaluation surplus) (excluding revaluation surplus)
(in PKR)
3.24
6.22
8.49 8.42 8.06 6.90
4.95
7.949.25
10.55
8.67
10.92
1.34
3.20
4.906.01 6.52 6.50
FY-12 FY-13 FY-14 FY-15 FY-16 FY-17
Market Value per Share
Year end High during the year Low during the year
(in PKR)
170.6 165.3 173.1 214.0 223.6 238.0
111.2 124.4 144.8
166.8 154.2 158.0
FY-12 FY-13 FY-14 FY-15 FY-16 FY-17
Total Assets
Non-Current Assets Current Assets
(PKR In Billions)

63 | KE Annual Report 2017
Vertical Analysis
BALANCE SHEET 2011-12 2012-13 2013-14 2014-15 2015-16 2016-17
Restated Restated Restated Restated RestatedNon-Current Assets 60.5% 57.1% 54.5% 56.2% 59.2% 60.1%Current Assets 39.5% 42.9% 45.5% 43.8% 40.8% 39.9%Total Assets 100.0% 100.0% 100.0% 100.0% 100.0% 100.0%
Share Capital & Reserves 17.9% 21.3% 24.6% 36.6% 45.3% 46.6%Non-Current Liabilities 29.9% 22.3% 18.9% 17.4% 16.0% 13.6%Current Liabilities 52.2% 56.5% 56.5% 46.0% 38.6% 39.9%TOTAL EQUITY AND LIABILITIES 100.0% 100.0% 100.0% 100.0% 100.0% 100.0%
PROFIT & LOSS ACCOUNT 2011-12 2012-13 2013-14 2014-15 2015-16 2016-17 Restated Restated Restated Restated Restated REVENUE 100.0% 100.0% 100.0% 100.0% 100.0% 100.0%
EXPENDITURE Purchase of electricity (45.5%) (41.7%) (42.8%) (36.7%) (28.8%) (33.5%)Consumption of fuel and oil (35.7%) (36.1%) (33.2%) (30.8%) (30.4%) (33.4%) (81.3%) (77.8%) (76.0%) (67.5%) (59.2%) (67.0%)Expenses incurred in generation, transmission and distribution (8.4%) (7.5%) (7.7%) (8.0%) (10.5%) (11.5%)GROSS PROFIT 10.4% 14.7% 16.3% 24.5% 30.3% 21.5%
Consumers services and administrative expenses (7.7%) (8.1%) (8.4%) (11.2%) (16.3%) (19.1%)Other Operating expenses (0.6%) (0.3%) (0.7%) (1.7%) (1.6%) (0.7%)Other Operating income 4.5% 2.8% 3.3% 3.3% 3.5% 5.1% (3.8%) (5.6%) (5.8%) (9.6%) (14.4%) (14.6%)PROFIT BEFORE FINANCE COST 6.6% 9.1% 10.4% 14.9% 15.9% 6.9%
Finance cost (4.7%) (7.4%) (5.8%) (5.0%) (2.7%) (2.1%)PROFIT BEFORE TAXATION 1.9% 1.7% 4.6% 9.8% 13.2% 4.7%
Taxation 0.0% 1.5% 1.7% 6.8% 3.6% 0.9%PROFIT AFTER TAXATION 1.9% 3.2% 6.3% 16.6% 16.9% 5.7%

KE Annual Report 2017 | 64
Horizontal Analysis
BALANCE SHEET 2011-12 2012-13 2013-14 2014-15 2015-16 2016-17
Restated Restated Restated Restated RestatedNon-Current Assets 100.0% 96.9% 101.5% 125.5% 131.0% 139.5%Current Assets 100.0% 111.9% 130.3% 150.0% 138.7% 142.1%Total Assets 100.0% 102.8% 112.8% 135.1% 134.1% 140.5% Share Capital & Reserves 100.0% 122.3% 155.1% 276.8% 339.7% 365.6%Non-Current Liabilities 100.0% 76.5% 71.3% 78.5% 71.8% 63.8%Current Liabilities 100.0% 111.2% 122.1% 119.1% 99.3% 107.3%TOTAL EQUITY AND LIABILITIES 100.0% 102.8% 112.8% 135.1% 134.1% 140.5% PROFIT & LOSS ACCOUNT 2011-12 2012-13 2013-14 2014-15 2015-16 2016-17 Restated Restated Restated Restated Restated REVENUE 100.0% 114.6% 118.2% 118.8% 115.0% 112.1% EXPENDITURE Purchase of electricity 100.0% 105.0% 111.1% 95.8% 72.7% 82.6%Consumption of fuel and oil 100.0% 115.7% 109.8% 102.3% 97.7% 104.9% 100.0% 109.7% 110.5% 98.6% 83.7% 92.4%Expenses incurred in generation, transmission and distribution 100.0% 102.0% 109.2% 114.1% 144.8% 154.4%GROSS PROFIT 100.0% 163.0% 185.3% 280.4% 336.3% 232.5% Consumers services and administrative expenses 100.0% 121.4% 128.9% 172.4% 243.6% 278.1%Other operating expenses 100.0% 61.9% 147.9% 339.9% 311.3% 128.1%Other operating income 100.0% 72.1% 86.7% 86.1% 90.5% 127.8% 100.0% 170.1% 181.6% 300.6% 434.9% 432.0%PROFIT BEFORE FINANCE COST 100.0% 158.9% 187.4% 268.7% 279.1% 117.1% Finance cost 100.0% 181.2% 146.4% 126.7% 66.2% 50.5%PROFIT BEFORE TAXATION 100.0% 102.8% 290.7% 625.7% 814.7% 284.4% Taxation 100.0% 5454.2% 6396.3% 25584.6% 13239.9% 3297.6%PROFIT AFTER TAXATION 100.0% 191.8% 392.2% 1040.7% 1021.2% 334.5%

65 | KE Annual Report 2017
Horizontal & Vertical Analysis
• An increasing trend in the profitability of the company over the past years to 2016 has been dropped in 2017 owing to reduction in Company’s tariff level along with significant change in tariff structure. However, it is worth noting that Company continued to improve operationally, particularly in the area of T&D losses. Operational improvement is expected to continue further on the back of planned investments of the Company alongside capacity additions in Generation and Transmission business.
• Finance cost has been reduced by 49% over the last six years as a result of repayment of expensive long-term loans during the previous years, decrease in interest rates and renegotiation of loans at better financing terms.
• Consistent profitability to the tune of Rs . 95,943 million and increase of Rs . 20,510 million on account of revaluation surplus over the past 06 years has resulted in increase in Share Capital and Reserves of the Company to almost 365%. All of these profits earned so far have been reinvested into the Company.
• Non-current assets have been increased by 39.5% in the last six years mainly due to investments made by the Company across the value chain. There is also an impact of revaluation surplus amounting to Rs. 20,510 million on certain assets, kept on fair value model, in accordance with applicable IAS.
• Trade debts have shown an increasing trend mainly due to significant increase in receivables from Public Sector Consumers including Rs. 33,173 million from KWSB and Rs. 12,740 million from CDGK. The Company is in continuous engagement with these entities as well as relevant government departments for earliest release of these outstanding receivables to support Company’s cashflow position.
• Current liabilities of the Company increased by 7% over the last six years driven majorly by increase in trade and other payables due to the prevailing circular debt situation. This includes payable to NTDC / CPPA – G, which is to be set-off with the Company’s Tariff Differential Claims receivable from the Government of Pakistan.
Cashflow Statement
• Growing over the years to 2016, cashflows from operating activities, showed drop in FY-17 due to lower profits as explained in section above.
• Cashflows from investing activities showed increase in Capital Expenditure incurred as compared to last year which reiterates the Company’s commitment for operational improvements through continuous investments across the value chain.
Ratios
• As explained in Horizontal and Vertical section, overall profitability ratios have shown a drop in FY-17 after posting consistent growth from FY-12 to FY-16.
• Better profitability coupled with repayment of expensive loans ahead of time and renegotiation of borrowings on further favourable terms has resulted in improved Interest cover over the years.
• Current ratio has shown sustained improvement over six years on the back of profitability and improved operational performance.
Commentary on Performance

KE Annual Report 2017 | 66
Auditors’ Report to the MembersWe have audited the annexed balance sheet of K-Electric Limited (the Company) as at June 30, 2017 and the related profit and loss account, statement of comprehensive income, statement of changes in equity and cash flow statement together with the notes forming part thereof, for the year then ended and we state that we have obtained all the information and explanations which, to the best of our knowledge and belief, were necessary for the purposes of our audit.
It is the responsibility of the Company’s management to establish and maintain a system of internal control, and prepare and present the above said statements in conformity with the approved accounting standards and the requirements of the Companies Ordinance, 1984. Our responsibility is to express an opinion on these statements based on our audit.
We conducted our audit in accordance with the auditing standards as applicable in Pakistan. These standards require that we plan and perform the audit to obtain reasonable assurance about whether the above said statements are free of any material misstatement. An audit includes examining on a test basis, evidence supporting the amounts and disclosures in the above said statements. An audit also include assessing the accounting policies and significant estimates made by management, as well as, evaluating the overall presentation of the above said statements. We believe that our audit provides a reasonable basis for our opinion and, after due verification, we report that:
(a) in our opinion, proper books of account have been kept by the Company as required by the Companies Ordinance, 1984;
(b) in our opinion:
(i) the balance sheet and profit and loss account together with the notes thereon have been drawn up in conformity with the Companies Ordinance, 1984, and are in agreement with the books of account and are further in accordance with accounting policies consistently applied;
(ii) the expenditure incurred during the year was for the purpose of the Company’s business; and
(iii) the business conducted, investments made and the expenditure incurred during the year were in accordance with the objects of the Company;
(c) in our opinion and to the best of our information and according to the explanations given to us, the balance sheet, profit and loss account, statement of comprehensive income, statement of changes in equity and cash flow statement together with the notes forming part thereof conform with approved accounting standards as applicable in Pakistan, and, give the information required by the Companies Ordinance, 1984, in the manner so required and respectively give a true and fair view of the state of the Company’s affairs as at June 30, 2017 and of the profit, its cash flows and changes in equity for the year then ended; and
(d) in our opinion, Zakat deductible at source under the Zakat and Ushr Ordinance, 1980 (XVIII of 1980) was deducted by the Company and deposited in the Central Zakat Fund established under section 7 of that Ordinance.

67 | KE Annual Report 2017
We draw attention to the note 30.1.1 to the accompanying financial statements which describes that the mark-up / financial charges on outstanding liabilities due to government controlled entities will be payable by the Company only when it will reciprocally receive mark-up on outstanding receivable balances on account of tariff differential claims and energy dues of the Company’s public sector consumers. Our opinion is not modified in respect of this matter.
Other matterThe financial statements of the Company for the year ended June 30, 2016 were audited by KPMG Taseer Hadi & Co. Chartered Accountants, who through their report dated August 9, 2017, expressed an unmodified opinion thereon.
A. F. Ferguson & Co.Chartered Accountants
Engagement Partner: Waqas A. Sheikh
Date: July 8, 2019Place: Karachi
BDO Ebrahim & Co.Chartered Accountants
Engagement Partner: Raheel Shahnawaz

KE Annual Report 2017 | 68
Balance SheetAs at June 30, 2017
June 30, 2017
(Restated)
June 30, 2016
(Restated)Opening
balance as atJuly 1, 2015
ASSETS Non-current assets
Property, plant and equipment 4 237,730,775 223,478,001 213,869,249 Intangible assets 5 215,406 63,860 134,152 Long-term investment 6 - - - Long-term loans 7 21,777 25,908 27,837 Long-term deposits 8 13,497 8,297 7,907 237,981,455 223,576,066 214,039,145 Current assets Stores, spares and loose tools 9 9,439,133 7,946,560 6,795,900 Trade debts 10 103,419,754 101,044,031 91,330,982 Loans and advances 11 774,217 771,863 798,387 Deposits and short-term prepayments 12 3,158,284 1,936,357 5,771,338 Other receivables 13 33,131,412 33,296,413 59,298,573 Taxation - net 2,962,142 890,524 1,498,955 Short-term investments - 3,000,000 - Cash and bank balances 14 2,077,916 2,178,070 1,267,633 154,962,858 151,063,818 166,761,768
Assets classified as held for sale 15 2,999,116 3,157,822 - TOTAL CURRENT ASSETS 157,961,974 154,221,640 166,761,768
TOTAL ASSETS 395,943,429 377,797,706 380,800,913
EQUITY AND LIABILITIES
Share capital and reserves Issued, subscribed and paid-up capital 16 96,261,551 96,261,551 96,261,551
Reserves Capital reserves 17 2,009,172 2,009,172 2,009,172 Revenue reserves 5,372,356 5,350,193 5,372,356 7,381,528 7,359,365 7,381,528
Unappropriated profit / (Accumulated loss) 33,068,043 17,700,303 (18,225,056) 136,711,122 121,321,219 85,418,023
Surplus on revaluation of property, plant and equipment 18 47,605,194 49,966,810 54,141,026
LIABILITIES Non-current liabilities
Long-term diminishing musharaka 19 17,305,568 21,526,916 21,527,233 Long-term financing 20 2,841,364 7,588,587 6,545,714 Long-term deposits 21 8,600,108 7,629,009 6,712,048 Employee retirement benefits 22 4,881,949 5,119,160 5,521,630 Deferred revenue 23 20,193,359 18,065,386 17,300,219 Deferred taxation 24 - 602,998 8,556,948 53,822,348 60,532,056 66,163,792 Current liabilities Current maturity of long-term diminishing musharaka 19 4,400,000 - - Current maturity of long-term financing 20 4,433,753 2,926,610 3,027,915 Trade and other payables 25 120,212,801 106,775,321 122,331,154 Accrued mark-up 26 5,809,192 5,469,650 5,866,849 Short-term borrowings - secured 27 17,278,006 23,351,923 36,743,121 Short-term deposits 28 5,624,563 7,444,139 7,099,055 Provision 29 46,450 9,978 9,978 157,804,765 145,977,621 175,078,072 TOTAL LIABILITIES 211,627,113 206,509,677 241,241,864
TOTAL EQUITY AND LIABILITIES 395,943,429 377,797,706 380,800,913
Contingencies and Commitments 30 The annexed notes 1 to 57 form an integral part of these financial statements.
(Rupees in ‘000)Note
Muhammad Aamir GhazianiChief Financial Officer
Syed Moonis Abdullah AlviChief Executive Officer
Khalid RafiDirector

69 | KE Annual Report 2017
Profit & Loss AccountFor the year ended June 30, 2017
REVENUE Sale of energy - net 31 168,569,213 166,517,327 Tariff adjustment 32 15,285,893 22,089,527 183,855,106 188,606,854 COST OF SALES Purchase of electricity 33 (61,665,237) (54,309,231) Consumption of fuel and oil 34 (61,466,583) (57,266,315) Expenses incurred in generation, transmission and distribution 35 (21,198,151) (19,876,732) (144,329,971) (131,452,278) GROSS PROFIT 39,525,135 57,154,576 Consumers services and administrative expenses 36 (35,066,159) (30,714,925) Other operating expenses 37 (1,254,850) (3,048,986) Other income 38 9,398,778 6,660,303 (26,922,231) (27,103,608) PROFIT BEFORE FINANCE COST 12,602,904 30,050,968 Finance cost 39 (3,891,178) (5,099,520) PROFIT BEFORE TAXATION 8,711,726 24,951,448 Taxation 40 1,707,557 6,855,908 NET PROFIT FOR THE YEAR 10,419,283 31,807,356 EARNING BEFORE INTEREST, TAX, DEPRECIATION AND AMORTIZATION (EBITDA) 41 26,100,157 43,035,250
EARNINGS PER SHARE - BASIC AND DILUTED 42 0.38 1.15 The annexed notes 1 to 57 form an integral part of these financial statements.
(Rupees in ‘000)2017
(Restated)2016
Note
(Rupees)
Muhammad Aamir GhazianiChief Financial Officer
Syed Moonis Abdullah AlviChief Executive Officer
Khalid RafiDirector

KE Annual Report 2017 | 70
Cash Flow StatementFor the year ended June 30, 2017
Cash flows from operating activities
Profit before taxation 8,711,726 24,951,448
Adjustments for non-cash charges and other items:
Depreciation and amortization 13,497,253 12,984,282 Provision for employee retirement benefits 756,951 812,258 Provision for slow-moving and obsolete stores, spare parts and loose tools (263,907) 100,914 Provision for debts considered doubtful 18,140,501 15,211,165 Provision for impairment of property, plant and equipment 357,419 - Provision for fatal accident cases 36,472 - Gain on sale of property, plant and equipment (1,323,956) (26,594)Gain on sale of assets classified as held for sale (169,652) - Finance cost 3,891,178 5,099,520 Amortization of deferred revenue (1,531,800) (1,402,785)Return on bank deposits (229,344) (250,613) 41,872,841 57,479,595 Working capital changes:
(Increase) / Decrease in current assets Stores, spare parts and loose tools (1,228,666) (1,251,574)Trade debts (20,516,224) (24,924,214)Loans and advances (2,354) 26,524 Trade deposits and short term prepayments (1,221,927) 3,834,981 Other receivables 165,001 36,748,997 (22,804,170) 14,434,714 Increase / (Decrease) in current liabilities Trade and other payables 13,459,643 (26,327,100)Short-term deposits (1,819,576) 345,084 11,640,067 (25,982,016)Cash generated from operations 30,708,738 45,932,293
Employee retirement benefits paid (1,312,179) (1,270,941)Income tax paid (2,075,705) (489,611)Receipts against deferred revenue 3,659,773 2,167,952 Finance cost paid (3,372,984) (5,494,769)Interest received on bank deposits 229,344 250,613 Long-term loans 4,131 1,929 Long-term deposits (5,200) (390) (2,872,820) (4,835,217)Net cash generated from operating activities 27,835,918 41,097,076
Cash flows from investing activities
Capital expenditure incurred (23,767,386) (22,840,432)Acquisition of assets classified as held for sale - (2,999,116)Proceeds from disposal of property, plant and equipment 845,854 185,578 Proceeds from disposal of assets classified as held for sale 328,358 - Short-term investments redeemed / (made) 3,000,000 (3,000,000)Net cash utilised in investing activities (19,593,174) (28,653,970)
Cash flows from financing activities
Long-term financing - net (3,240,080) 941,568 Short-term borrowings - net (9,579,838) (12,653,936)Security deposit received from consumers 971,099 916,961 Net cash utilised in financing activities (11,848,819) (10,795,407)Net (decrease) / increase in cash and cash equivalents (3,606,075) 1,647,699
Cash and cash equivalents at the beginning of the year 44 (4,814,950) (6,462,649)Cash and cash equivalent at end of the year 44 (8,421,025) (4,814,950) The annexed notes 1 to 57 form an integral part of these financial statements.
(Rupees in ‘000)2017
(Restated)2016
Note
Muhammad Aamir GhazianiChief Financial Officer
Syed Moonis Abdullah AlviChief Executive Officer
Khalid RafiDirector

71 | KE Annual Report 2017
Statement of Changesin EquityFor the year ended June 30, 2017
Muhammad Aamir GhazianiChief Financial Officer
Syed Moonis Abdullah AlviChief Executive Officer
Khalid RafiDirector
Balance as at July 1, 2015 as previously stated 96,653,179 (391,628) 96,261,551 1,500,000 509,172 2,009,172 5,372,356 - 5,372,356 (29,568,641) 74,074,438 Effect of restatement 54 - - - - - - - - - 11,343,585 11,343,585
Balance as at July 1, 2015 as restated 96,653,179 (391,628) 96,261,551 1,500,000 509,172 2,009,172 5,372,356 - 5,372,356 (18,225,056) 85,418,023
Total comprehensive income for the year ended June 30, 2016
Profit for the year - restated 54 - - - - - - - - - 31,807,356 31,807,356
Other comprehensive loss - - - - - - - (22,163) (22,163) (56,213) (78,376) - - - - - - - (22,163) (22,163) 31,751,143 31,728,980 Incremental depreciation relating to surplus on revaluation of property, plant and equipment - net of deferred tax - - - - - - - - - 4,174,216 4,174,216
Balance as at June 30, 2016 - as restated 96,653,179 (391,628) 96,261,551 1,500,000 509,172 2,009,172 5,372,356 (22,163) 5,350,193 17,700,303 121,321,219
Total comprehensive income for the year ended June 30, 2017
Profit for the year - - - - - - - - - 10,419,283 10,419,283
Other comprehensive income / (loss) - - - - - - - 22,163 22,163 (222,623) (200,460) - - - - - - - 22,163 22,163 10,196,660 10,218,823 Incremental depreciation relating to surplus on revaluation of property, plant and equipment - net of deferred tax - - - - - - - - - 5,171,080 5,171,080
Balance as at June 30, 2017 96,653,179 (391,628) 96,261,551 1,500,000 509,172 2,009,172 5,372,356 - 5,372,356 33,068,043 136,711,122
The annexed notes 1 to 57 form an integral part of these financial statements.
(Accumulatedloss) /
Un-appropriatedprofitGeneral
reservesOthers
Issued, subscribed and paid-up capital Reserves Total
TotalTotal
Note
Capital RevenueOther
Ordinaryshares
Transactioncost
Total sharecapital
Sharepremium
(Note 16.3)(Rupees in ‘000)

KE Annual Report 2017 | 72
Statement ofComprehensive Income
Net profit for the year 10,419,283 31,807,356 OTHER COMPREHENSIVE INCOME: Items that may be reclassified to profit or loss
Changes in fair value of cash flow hedges (10,028) (24,430) Adjustment for amounts transferred to profit or loss 32,191 2,267 22,163 (22,163)Items that will not be reclassified to profit or loss Remeasurement of post employee benefit obligations (318,033) (56,213) Less: Taxation thereon 95,410 - (222,623) (56,213) (200,460) (78,376) TOTAL COMPREHENSIVE INCOME FOR THE YEAR 10,218,823 31,728,980 The annexed notes 1 to 57 form an integral part of these financial statements.
For the year ended June 30, 2017
(Rupees in ‘000)2017
(Restated)2016
Muhammad Aamir GhazianiChief Financial Officer
Syed Moonis Abdullah AlviChief Executive Officer
Khalid RafiDirector

73 | KE Annual Report 2017
Notes to the Financial StatementsFor the year ended June 30, 2017
1. THE COMPANY AND ITS OPERATIONS 1.1 K-Electric Limited “the Company” was incorporated as a limited liability company on September 13, 1913 under the repealed Indian Companies Act, 1882 (now Companies Act, 2017) and its shares are quoted on the Pakistan Stock Exchange. The registered office of the Company is situated at KE House, 39-B, Sunset Boulevard, Phase II, DHA, Karachi.
The Company is principally engaged in the generation, transmission and distribution of electric energy to industrial and other consumers under the Electricity Act,1910 and National Electric Power Regulatory Authority (NEPRA) Act, 1997, to its licensed areas. KES Power Limited (the holding company) holds 66.40 percent (2016: 66.40 percent) shares in the Company as at June 30, 2017. 1.2 As notified on Pakistan Stock Exchange on October 28, 2016 Shanghai Electric Power (SEP) Company Limited has en tered into a Sale and Purchase Agreement (SPA) with KES Power Limited (holding company) to acquire up to 66.4 percent of the shares in the Company. The completion of the transaction contemplated by SPA is subject to receipt of applicable regulatory approvals and satisfaction of other conditions precedent specified therein. SEP notified its initial Public Announcement of Intention (PAI) for the above equity acquisition on October 3, 2016. Sub sequently, in order to comply with the statutory requirements under Securities Act 2015 and Listed companies (Substantial acquisition of voting shares and takeovers) regulations 2017, SEP notified fresh PAIs on June 29, 2017, March 29, 2018 and December 25, 2018, incorporating amended / additional requirements pursuant to the Securities Act and the takeovers regulations.
1.3 The Company, being regulated entity, is governed through Multi Year Tariff (MYT) regime. Accordingly, NEPRA determines tariff for the Company for the tariff control period from time to time. The MYT, which was determined in 2009 was for a seven-year period, expired on June 30, 2016. On March 31, 2016 the Company filed a tariff petition with NEPRA for continuation of the MYT for a further 10 year period starting from July 01, 2016 along with certain modifications in the tariff. NEPRA vide its determination on March 20, 2017, determined the MYT for the period commencing from July 01, 2016 till June 30, 2023. Considering that some of the assumptions in the MYT determined by NEPRA were not reflective of ground realities and would be detrimental to the long-term investment plan and operations, the Company, in order to protect long-term interest of the business filed a review motion with NEPRA on April 20, 2017.
Subsequent to the year ended June 30, 2017, NEPRA issued its decision dated October 09, 2017 on the Company’s review motion and largely maintained its earlier decision. The Ministry of Energy (Power), Government of Pakistan (the GoP) on request of Company filed a ‘Reconsideration request‘ with NEPRA dated October 26, 2017 under Section 31 (4) of the NEPRA Act 1997 (Act, 1997) to consider afresh its earlier determination to ensure that consumer interest in terms of continuous and efficient service delivery is maintained. NEPRA, vide its decision dated July 5, 2018 (MYT decision) in the matter of ‘Reconsideration request’ filed by the GoP, determined the revised MYT. The Company after considering that the MYT de cision does not consider actual equity invested into the Company, applies notional capital structure based on the assumption of 70:30 debt to equity ratio and is a drastic departure from the previous structure without providing the Company an appropriate transition period, approached the Appellate Tribunal for the relief under Section 12G of the Act, 1997 (as amended). The Appellate Tribunal is yet to be made functional by the GoP. The Company also approached the Sindh High Court against the aforementioned MYT decision and filed a suit in which a stay order was granted on July 26, 2018. The Company, on April 03, 2019, withdrew its case filed with SHC against MYT decision, as the Company decided to pursue its legitimate concerns/issues with Appellate Tribunal and reserves its right to again approach the SHC. Further, the Ministry of Energy (Power) has notified the MYT decision through SRO 576 (I) /2019 dated May 22, 2019.
The Company’s revenue for the current year has been based on the revised MYT decision, which has been notified on May 22, 2019 by Ministry of Energy.
2. BASIS OF PREPARATION
2.1 Statement of compliance These financial statements have been prepared in accordance with approved accounting standards applicable in Pakistan. As per the requirements of Circular No. CLD/CCD/PR(II)/2017 dated July 20, 2017 issued by the Securities and Ex change Commission of Pakistan (SECP), companies whose financial year closes on or before June 30, 2017 shall prepare

KE Annual Report 2017 | 74
their financial statements in accordance with the provisions of the repealed Companies Ordinance, 1984. Accordingly, approved accounting standards comprise of such International Financial Reporting Standards (IFRS) issued by the International Accounting Standards Board (IASB) as are notified under the repealed Companies Ordinance, 1984, provisions of and directives issued under the repealed Companies Ordinance, 1984. In case requirements differ, the provisions of or directives issued under the repealed Companies Ordinance, 1984 shall prevail.
2.2 Basis of measurement These financial statements have been prepared under the historical cost convention except otherwise stated, in these financial statements.
2.3 Functional and presentation currency
Items included in these financial statements are measured using the currency of the primary economic environment in which the Company operates. These financial statements are presented in Pakistan Rupees, which is also the Company’s functional currency.
2.4 Use of estimates and judgments The preparation of financial statements in conformity with approved accounting standards, requires management to make judgments, estimates and assumptions that affect the application of policies and the reported amount of assets, liabilities, income and expenses. The estimates and associated assumptions are based on historical experience and various other factors that are believed to be reasonable under the circumstances, the results of which form the basis of making the judgments about the carrying values of assets and liabilities that are not readily apparent from other sources. Actual results may differ from these estimates. The estimates underlying the assumptions are reviewed on an ongoing basis. Revisions to account ing estimates are recognised in the period in which the estimate is revised if the revision affects only that period, or in the period of the revision and future periods if the revision affects both current and future periods.
In the process of applying the Company’s accounting policies, management has made the following accounting estimates and judgments which are significant to these financial statements:
2.4.1 Tariff adjustment determination As per the mechanism laid out in the MYT–Decision, the Company seeks adjustments for fuel price, cost of power purchase, operation and maintenance cost, and unrecovered cost including non-recoverable dues written-off as per NEPRA’s determination on a monthly / quarterly / annual basis. The monthly /quarterly / annual determination of the tariff adjustment is approved by NEPRA on a time to time basis. 2.4.2 Property, plant and equipment The Company reviews appropriateness of the useful lives and residual values used in the calculation of depreciation on an annual basis. The estimates of revalued amounts of leasehold land, plant and machinery and transmission grid equipment are based on valuation carried out by professional valuers. Further, where applicable, an estimate of the recoverable amount of assets is made for possible impairment on an annual basis. Any change in these estimates in the future might affect the carrying amount of respective items of property, plant and equipment, with corresponding effects on the depreciation charge and impairment. 2.4.3 Provision for impairment and write-off of trade debt and other receivables The Company assesses the recoverability of its trade debts and other receivables if there is an objective evidence that the Company will not be able to collect all the amount due according to the original terms. Judgement by the management is required in estimation of the amount and timing of future cash flows when determining the level of provision required and in determining the debts that are not recoverable and are to be written-off. 2.4.4 Stores, spare parts and loose tools The Company reviews the carrying values of stores, spare parts and loose tools to assess any diminution against which provision for impairment is made. The determination of provision involves the use of estimates with regards to holding period of stores, spare parts and loose tools.

75 | KE Annual Report 2017
2.4.5 Provision for retirement and other service benefit obligation
The present value of these obligations depends on a number of factors and is based on actuarial valuations, which uses a number of assumptions. Any change in these assumptions will impact the carrying amounts of these obligations. The present values of these obligations and the underlying assumptions / estimations are disclosed in note 22.
2.4.6 Taxation In making the estimate for income tax payable, the Company takes into account the applicable laws. Deferred tax asset is recognised for all unused tax losses and available credits to the extent that it is probable that sufficient taxable temporary differences and taxable profits will be available against which such losses and credits can be utilized. Significant judgement is exercised to determine the amount of deferred tax asset to be recognised.
2.4.7 Fair values
Based on the inputs used in valuation techniques, fair values are categorised into different levels in fair value hierarchy as defined in IFRS 13 ‘Fair value measurements’. Information about valuation techniques and inputs used in the fair value of property, plant and equipment and derivatives is included in notes 4.1.4 and 45, respectively. 2.4.8 Derivatives
The Company has entered into cross currency swap and interest rate swap arrangements. The calculation involves the use of estimates with regard to interest rates and foreign currency exchange rates which fluctuate with the market forces.
2.5 Initial application of standards, amendments or an interpretation to existing standards
a) Amendments to approved accounting standards effective during the year ended June 30, 2017 There were certain amendments to approved accounting standards which became effective for the first time for the year ended June 30, 2017 but these are neither considered relevant nor have any significant effect on the Company’s financial reporting and are, therefore, not disclosed in these financial statements. b) Standards and amendments to published standards that are not yet effective and have not been early adopted by the Company The following standards and amendments to published standards are not effective for the year ended June 30, 2017 and have not been early adopted by the Company: - IFRS 9 ‘Financial instruments’ - (effective for periods / year ending on or after June 30, 2019). This standard replaces the guidance in IAS 39. It includes requirements on the classification and measurement of financial assets and liabilities; it also includes an expected credit losses model that replaces the current incurred loss impairment model. At present the impacts of the adoption of this standard are being assessed by the Company’s management. - IFRS 15 ‘Revenue from contracts with customers’ - (effective for the Company’s annual accounting period beginning on July 1, 2018). This standard deals with revenue recognition and establishes principles for reporting useful information to users of financial statements about the nature, amount, timing and uncertainty of revenue and cash flows arising from an entity’s contracts with customers. Revenue is recognised when a customer obtains control of a good or service and thus has the ability to direct the use and obtain the benefits from the good or service. The standard replaces IAS 18 ‘Revenue’ and IAS 11 ‘Construction contracts’ and related interpretations. At present the impacts of the adoption of this standard are being assessed by the Company’s management. - IFRS 16 ‘Leases’ - (effective for the Company’s annual accounting period beginning on July 1, 2019). This standard replaces the current guidance in IAS 17 and is a far reaching change in accounting by lessees in particular. Under IAS 17 lessees are required to make a distinction between a finance lease (on balance sheet) and an operating lease (off balance sheet). IFRS 16 requires lessees to recognize a lease liability reflecting future lease payments and a ‘right-of-use asset’ for virtually all lease contracts. The IASB has included an optional exemption for certain short-term leases and leases of low-value assets; however, this exemption can only be applied by lessees. For lessors, the accounting stays almost the same. However, as the IASB has updated the guidance on the definition of a lease (as well as the guidance on the combination and separation of contracts), lessors will also be affected by the new standard. Under IFRS 16, a contract is, or contains, a lease if the contract conveys the right to control the use of an identified asset for a period of time

KE Annual Report 2017 | 76
in exchange for consideration. At present the impacts of the adoption of this standard are being assessed by the Company’s management. - Amendment to IAS 7 - ‘Cash flow statements ‘- Disclosure initiative (effective for the Company’s annual accounting period beginning on July 1, 2017). This amendment requires disclosure to explain changes in liabilities for which cash flows have been, or will be classified as financing activities in the cash flow statement. This amendment is expected to result in few additional disclosures in the financial statements. There are certain other amendments and interpretations to the published standards that are not yet effective and are also not relevant to the Company and therefore, have not been detailed in these financial statements. In addition to the foregoing, the Companies Act, 2017 which is not effective on these financial statements, has added certain disclosures which will be applicable for the annual financial statements for the year ended June 30, 2018 and onwards.
3. SUMMARY OF SIGNIFICANT ACCOUNTING POLICIES
The accounting policies set out below have been applied consistently to all the periods presented in these financial statements, unless otherwise stated. 3.1 Property, plant and equipment 3.1.1 Operating fixed assets Initial recognition The cost of an item of property, plant and equipment is recognised as an asset if it is probable that future economic benefits associated with the item will flow to the Company and the cost of such item can be measured reliably. Recognition of the cost of an item of property, plant and equipment ceases when the item is in the location and condition necessary for it to be capable of operating in the manner intended by the management. Major spare parts, stand by equipment and servicing equipments are capitalised from the date of purchase of such spares. Measurement All items of property, plant and equipment are stated at cost less accumulated depreciation and accumulated impairment losses, if any, except for leasehold land, plant and machinery and transmission grid equipment which are measured at revalued amounts, which is the fair value at the date of revaluation less accumulated depreciation and accumulated impairment losses, if any, recognised subsequent to the date of revaluation. Capital spares held by the Company for replacement of major items of plant and machinery are stated at cost less accumulated depreciation and impairment losses, if any. If significant components of an item of property, plant and equipment have different useful lives, these are accounted for as separate items (major components) of property, plant and equipment. Expenditure incurred to replace a component of an item of property, plant and equipment is capitalised. The carrying amount of the replaced part is derecognised. Other subsequent costs are included in the asset’s carrying amount or recognised as a separate asset, as appropriate, only when it is probable that future economic benefits associated with the asset will flow to the Company and the cost of the asset can be measured reliably.
Normal repairs and maintenance are charged to the profit and loss account during the period in which these are incurred. Depreciation Depreciation is charged to the profit and loss account, applying the straight line method where by cost of assets, less the residual values, is written off over the estimated useful lives at rates disclosed in note 4.1. Depreciation on additions is charged from the month in which the asset is available for use and on disposals up to the month preceding the disposal.
Useful lives are determined on expected usage of asset, expected physical wear and tear, technical and commercial obsolescence, legal and similar limits on the use of assets and other similar factors. The assets’ residual values, useful lives and depreciation methods are reviewed and adjusted if appropriate, at each reporting date.
77 | KE Annual Report 2017
Derecognition An item of property, plant and equipment is derecognised upon disposal or when no future economic benefits are expected to arise from the continued use of the asset. Any gain or loss arising on de-recognition of the asset (calculated as the difference between the net disposal proceeds and the carrying amount of the item) is included in the profit and loss account in the year the asset is derecognised. When revalued assets are sold, the relevant remaining surplus is reclassified directly to unappropriated profit. 3.1.2 Capital work-in-progress Capital work-in-progress is stated at cost less accumulated impairment, if any, and consists of expenditure incurred and advances made in respect of property, plant and equipment in the course of the acquisition, erection, construction and installation, including salaries and wages and any other costs directly attributable to capital work-in-progress. The assets are transferred to relevant category of operating fixed assets when those are available for use. Spare parts, standby equipment and servicing equipment are recognised as property plant and equipment when these meet the conditions to be classified as such. 3.1.3 Assets subject to finance lease Finance leases, which transfer to the Company substantially all the risks and benefits incidental to ownership of the leased item, are capitalised at the inception of the lease at the fair value of leased assets or, if lower, at the present value of the minimum lease payments. In calculating the present value of the minimum lease payments, the discount factor is the effective interest rate. The outstanding obligations under the lease less finance charges allocated to future periods are shown as liability. Financial charges are calculated at the interest rate implicit in the lease and are charged to the profit and loss account. Depreciation is charged to the profit and loss account applying the straight-line method on a basis similar to owned assets. 3.2 Intangible assets Intangible assets acquired separately are measured on initial recognition at cost. Costs that are directly associated with identifiable software and have probable economic benefit beyond one year are recognised as intangible assets. Following initial recognition, intangible assets are carried at cost less accumulated amortisation and accumulated impairment losses, if any. Intangible assets with finite useful lives are amortised on a straight line basis over the useful economic life specified in note 5.2.1, and are assessed for impairment whenever there is an indication of impairment. Amortization on additions is charged from the month of acquisition and on disposals up to the month preceding the deletion. Gains or losses arising from derecognition of an intangible asset are measured as the difference between the net disposal proceeds and the carrying amount of the asset and are recognised in profit or loss account when the asset is derecognised. 3.3 Investment in associates / joint venture Investment in associates / joint venture are accounted for using the equity method. These are recognised initially at cost. Subsequent to initial recognition, the carrying value of investment in associate includes share of the profit or loss and other comprehensive income of the associate after the date of acquisition. 3.4 Financial instruments 3.4.1 Financial assets Classification The Company classifies its financial assets in the following categories: at fair value through profit or loss, held to maturity, loans and receivables and available-for-sale. The classification depends on the purpose for which the financial assets were acquired. The Company determines the classification of its financial assets at initial recognition.

KE Annual Report 2017 | 78
a) At fair value through profit or loss A financial asset is classified as at fair value through profit or loss if it is held for trading or is designated as such on initial recognition. b) Held to maturity Held to maturity financial assets are non-derivative financial assets with fixed or determinable payments and fixed maturity with a positive intention and ability to hold to maturity. c) Loans and receivables
Loans and receivables are non-derivative financial assets with fixed or determinable payments that are not quoted in active market. d) Available for sale Available for sale financial assets are non-derivative financial assets that are either designated in this category or not classified in any of the other categories. Recognition and measurement The Company recognises financial asset when it becomes a party to the contractual provisions of the instrument. Regular purchases and sales of financial assets are recognised on the trade date i.e. the date on which the Company commits to purchase or sell the asset.
Financial assets are initially recognised at fair value plus transaction costs except for financial assets carried at fair value through profit or loss. Financial assets carried at fair value through profit or loss are initially recognised at fair value and transaction costs are expensed in profit and loss account as incurred. Financial assets are derecognised when the rights to receive cash flows from the financial assets have expired or have been transferred and the Company has transferred substantially all risks and rewards of ownership. Available-for-sale financial assets and financial assets at fair value through profit or loss are subsequently measured at fair value. Held to maturity financial assets and loans and receivables are subsequently measured at amortized cost using the effective interest method.
Gains or losses arising from changes in the fair value of the ‘financial assets at fair value through profit or loss’ category are recognised in the profit and loss account. Changes in fair value of available-for-sale financial assets are recognised in other comprehensive income. When available-for-sale financial assets are sold or impaired, the accumulated fair value adjustments recognised in statement of comprehensive income are reclassified to profit and loss account. 3.4.2 Financial liabilities All financial liabilities are recognised at the time when the Company becomes a party to the contractual provisions of an instrument. Financial liabilities are derecognised when these are extinguished i.e. when the obligation is discharged or cancelled or expired.
3.4.3 Offsetting financial Instruments Financial assets and financial liabilities are offset and the net amount is reported in the financial statements only when there is legally enforceable right to offset the recognised amounts and the Company intends either to settle on a net basis or to realize the assets and to settle the liabilities simultaneously. 3.5 Assets held for sale Assets are classified as held for sale if the carrying amount of the asset is to be recovered principally through a sale transaction rather than through continuing use, the sale is considered highly probable within one year from reporting date and the asset is available for immediate sale in the present condition. These are measured at the lower of carrying amount and fair value less costs to sell. Assets classified as held for sale are presented separately from the other assets in the balance sheet.

79 | KE Annual Report 2017
An impairment loss is recognised for any initial or subsequent write-down of the asset to fair value less costs to sell. A gain is recognised for any subsequent increases in fair value less costs to sell of an asset, but not in excess of any cumulative impairment loss previously recognised. Assets are not depreciated or amortized while such are classified as held for sale. 3.6 Stores and spares These are measured at moving average cost less impairment loss, if any, except items in transit, which are stated at cost. Provision is made for obsolete, damaged and slow moving items where necessary and is recognised in the profit and loss account. 3.7 Trade debts and other receivables Trade debts and other receivables are stated initially at fair value and subsequently measured at amortised cost using the effective interest rate method, if applicable, less provision for impairment, if any. A provision for impairment is established where there is objective evidence that the Company will not be able to collect all amounts due according to the original terms of the receivables. Trade debts and receivables are written-off when considered irrecoverable. No provision is made for trade debts due from federal / provincial governments and local bodies unless specifically required, as management believes that these trade debts are not impaired and will be recovered. 3.8 Derivative financial instruments and hedge accounting The Company uses derivative financial instruments to hedge its interest rate risk and foreign currency risk. Such derivative financial instruments are initially recognised at fair value on the date on which the derivative contract is entered into and are subsequently re-measured at fair value. Derivatives are classified as financial assets when the fair value is positive and as financial liabilities when the fair value is negative. Any gains or losses arising from changes in fair value on derivatives during the year that do not qualify for hedge accounting and the ineffective portion of an effective hedge are taken to the profit and loss account. The fair value of derivative financial instruments is determined by reference to market values for similar instruments or by using discounted cash flow method. At the inception of a hedge relationship, the Company formally designates and documents the hedge relationship to which the Company intends to apply hedge accounting and the risk management objective and strategy for undertaking the hedge. The documentation includes identification of the hedging instrument, the hedged item or transaction, the nature of the risk being hedged and how the Company will assess the hedging instrument’s effectiveness in offsetting the exposure to changes in the hedged item’s fair value or cash flows attributable to the hedge risk. Such hedges are expected to be highly effective in achieving offsetting changes in fair values or cash flows and are assessed on an ongoing basis to determine that these actually have been highly effective throughout the financial reporting periods for which such were designated. Derivative instruments that are designated as, and are effective hedging instruments, are classified consistent with the classification of the underlying hedged item. The derivative instrument is separated into a current portion and non current portion only if a reliable allocation can be made. Fair value hedges Fair value hedge is a hedge of exposure to changes in the fair value of a recognised asset or liability or an unrecognised firm commitment. The change in the fair value of a hedging derivative is recognised in the profit and loss account. The change in the fair value of the hedged item attributable to the risk hedged is recorded as a part of the carrying value of the hedged item and is also recognised in the profit and loss account. If the hedged item is derecognised, the unamortized fair value is recognised immediately in the profit and loss account. Cash flow hedges Cash flow hedge is a hedge of the exposure to variability in cash flows that is either attributable to a particular risk associated with a recognised asset or liability or a highly probable forecast transaction.

KE Annual Report 2017 | 80
The effective portion of changes in the fair value of derivatives that are designated and qualify as cash flow hedges is recognised in equity and accumulated in the hedging reserve. The gain or loss relating to the ineffective portion is recognised immediately in the profit and loss account. Amounts accumulated in equity are reclassified to the profit and loss account in the periods when the hedged item affects profit and loss account i.e. when the hedged financial income or expense is recognised or when the forecasted transaction occurs. Where the hedged item is the cost of a non-financial asset or non-financial liability, the amounts taken to equity are transferred to the initial carrying amount of the non-financial asset or liability. If the forecast transaction is no longer expected to occur, the hedge no longer meets the criteria for hedge accounting, the hedging instrument expires or is sold, terminated or exercised, or the designation is revoked, then hedge accounting is discontinued prospectively. If the forecast transaction is no longer expected to occur, then the amount accumulated in equity is reclassified to profit or loss.
3.9 Impairment Financial assets A financial asset is assessed at each reporting date to determine whether there is any objective evidence that it is impaired. A financial asset is considered to be impaired if objective evidence indicates that one or more events have had a negative effect on the estimated future cash flows of that asset. Non-financial assets The carrying amounts of non-financial assets other than inventories and deferred tax asset, are assessed at each reporting date to ascertain whether there is any indication of impairment. If any such indication exists then the asset’s recoverable amount is estimated. An impairment loss is recognised, as an expense in the profit and loss account, for the amount by which the asset’s carrying amount exceeds its recoverable amount. The recoverable amount is the higher of an asset’s fair value less cost to sell and value in use. Value in use is ascertained through discounting of the estimated future cash flows using a discount rate that reflects current market assessments of the time value of money and the risk specific to the assets. For the purpose of assessing impairment, assets are grouped at the lowest levels for which there are separately identifiable cash flows (cash-generating units).
An impairment loss is reversed if there has been a change in the estimates used to determine the recoverable amount. An impairment loss is reversed only to the extent that the asset’s carrying amount does not exceed the carrying amount that would have been determined, net of depreciation or amortization, if no impairment loss had been recognised. 3.10 Cash and cash equivalents
For the purposes of cash flow statement, cash and cash equivalents comprise cash in hand, balances with banks and short-term placements readily convertible to known amounts of cash and subject to insignificant risk of changes in value. Cash and cash equivalents also include bank overdrafts which form an integral part of the Company’s cash management. 3.11 Share capital Ordinary shares are classified as equity and are recognised at the face value. Incremental costs directly attributable to the issue of new shares or options, net of any tax effects, are recognised as a deduction from equity. 3.12 Surplus on revaluation of property, plant and equipment The surplus arising on revaluation of operating fixed assets is credited to the “Surplus on revaluation of property, plant and equipment” presented below equity in the balance sheet, in accordance with the requirements of section 235 of the repealed Companies Ordinance, 1984 and SRO 45(I) / 2003 dated January 13, 2003. Depreciation on assets which are revalued is determined with reference to the value assigned to such assets on revaluation, and depreciation charge for the year is taken to the profit and loss account. An amount equivalent to incremental depreciation for the year net of deferred taxation is directly reclassified from “Surplus on revaluation of property, plant and equipment” to unappropriated profit through the ‘Statement of changes in equity’ to record realisation of surplus to the extent of the incremental depreciation charge for the year.

81 | KE Annual Report 2017
3.13 Borrowings All loans and borrowings are initially recognised at the fair value of the consideration received less directly attributable transaction costs, if any. Loans and borrowings are subsequently stated at amortised cost with any difference between the proceeds (net of transaction cost) and the redemption value being recognised in the profit and loss account over the period of the borrowing, using the effective interest method. 3.14 Deferred revenue Deferred revenue represents amounts received from consumers as contribution towards the cost of supplying and laying service connections, extension of mains and street lights. Amortization of deferred revenue commences upon completion of related work and is taken to profit and loss account at the rate of 5% per annum corresponding to the annual depreciation charge of respective asset (note 23). 3.15 Employee retirement and other service benefits
3.15.1 Defined benefit plans Provisions are made to cover the obligations under defined benefit gratuity scheme, post retirement medical benefits and electricity rebate on the basis of actuarial valuation. The most recent valuation was carried out as of June 30, 2017 using the “Projected Unit Credit Method”. The amount recognised in the balance sheet represents the present value of defined benefit obligations less fair value of any plan assets. Remeasurement gains and losses arising from experience adjustments and changes in actuarial assumptions are recognised in other comprehensive income with no subsequent recycling through the profit and loss account. The Company operates following retirement schemes for its employees. (a) Defined benefit gratuity scheme The Company operates a funded gratuity scheme managed by trustees. The funded gratuity scheme covers all regular employees of the company. The scheme provides for an ascending scale of benefits dependent on the length of service of employees or terminal dates subject to completion of minimum qualifying period of service. Gratuity is based on employee’s last drawn salary. Contributions are made to the fund in accordance with the actuarial recommendations. Actuarial valuations are conducted by qualified actuaries annually using projected unit credit method.
(b) Post retirement medical benefits The Company offers post retirement medical coverage to its eligible employees and their dependants. Under the unfunded scheme all such employees are entitled for such coverage for a period of 10 years and spouse and minor children of retired and deceased employees for a period of 5 years starting from the date of retirement / death. (c) Electricity rebate The Company provides a rebate on the electricity bills to its eligible retired employees for the first five years after retirement. 3.15.2 Defined contributory provident fund
The Company operates an approved contributory provident fund for all its eligible management and non-management employees. Equal monthly contributions are made, both by the Company and the employees, to the fund at the prevailing prescribed rates of basic salary. 3.15.3 Earned leave The Company allows Leave Preparatory to Retirement (LPR) for staff and eligible officers. The liabilities for earned leave relate to earned leave that employee will use and encash in future. The amount recognised in the balance sheet represents the present value of the obligation based on actuarial valuation. Remeasurement gains and losses pertaining to long-term compensated absences are recognised in the profit and loss account immediately. This comprise of staff and officers as follows:

KE Annual Report 2017 | 82
(a) Staff Employees earn 42 days leave each year. Accumulation is limited to a maximum of 365 days’ earned leave, no encashment is permitted.
(b) Officer Employees earn 30 days leave each year. No accumulation or encashment is permitted. Unused leave lapses at the end of the year. Some historical balances of accumulated leave remain. These are available for encashment and leave preparatory to retirement. 3.16 Current and deferred income tax The tax expense for the year comprises current and deferred tax. Tax is recognised in the profit and loss account, except to the extent that it relates to items recognised in the statement of comprehensive income or directly in equity, in which case, the tax is also recognised in the statement of comprehensive income or directly in equity, respectively.
3.16.1 Current The current income tax charge is based on the taxable income for the year calculated on the basis of the tax laws enacted or substantively enacted at the balance sheet date, and any adjustment to tax payable / receivable in respect of previous years. 3.16.2 Deferred Deferred tax is recognised using the balance sheet method, providing for all significant temporary differences between the carrying amounts of assets and liabilities for financial reporting purposes and the amounts used for taxation purposes. Deferred tax is based on the expected manner of realisation or settlement of the carrying amount of assets and liabilities, using the tax rates enacted or substantively enacted at the balance sheet date. The Company recognises deferred tax asset to the extent that it is probable that taxable profits for the foreseeable future will be available against which the temporary differences can be utilised. Deferred tax assets are reviewed at each reporting date and are reduced to the extent that it is no longer probable that the related tax benefit will be realised.
3.17 Trade and other payables Trade and other payables are recognised initially at fair value less directly attributable cost, if any, and subsequently measured at amortized cost. 3.18 Provisions A provision is recognised when the Company has a present legal or constructive obligation as a result of a past event and it is probable that an outflow of economic benefits will be required to settle the obligation and a reliable estimate can be made of the amount of obligation. 3.19 Revenue recognition Revenue is recognised when it is probable that future economic benefits will flow to the entity and these benefits can be measured reliably. Revenue is measured at the fair value of the consideration received or receivable. Revenue is recognised on the following basis:
3.19.1 Energy sale Revenue is recognised on supply of electricity to consumers based on meter readings at the rates notified by the government from time to time. Revenue is also recognised for the estimated electricity supplied to customers between the date of last meter reading and the reporting date.
3.19.2 Tariff adjustment Tariff differential subsidy including claim for variation in fuel prices, cost of power purchase, operation and maintenance cost and unrecovered cost are recognised on accrual basis. 3.19.3 Late payment surcharge Surcharge on late payment is accounted for after the due date of payment has passed. In case of government and local bodies, late payment surcharge is accounted for on receipt basis.

83 | KE Annual Report 2017
3.19.4 Rebate on electricity duty
Rebate on electricity duty is recognised at the rates specified by the government and is recognised on electricity duty collected.
3.19.5 Interest / Mark-up income The Company recognises interest income / mark-up on time proportion basis. 3.20 Borrowing costs Borrowing costs are recognised in profit and loss account in the period in which these are incurred except to the extent of borrowing costs that are directly attributable to the acquisition, construction or production of a qualifying asset. Such borrowing costs, if any, are added to the cost of those assets, during the period of time that is required to complete and prepare the asset for its intended use. 3.21 Assets held under operating leases / Ijarah financing Assets held under operating leases / Ijarah financing are not recognised on the Company’s financial statements and payments made under operating leases / Ijarah financing are recognised in the profit and loss account on a straight line basis over the term of the lease. 3.22 Foreign currency transactions and translation Foreign currency transactions are recorded in Pakistani Rupees using the exchange rate approximating those ruling on the date of the transaction. Monetary assets and liabilities in foreign currencies are translated at the rates of exchange which approximate those prevailing on the balance sheet date. Gains and losses on translation are taken to the profit and loss account, however, in case of monetary assets and liabilities designated as hedged items against a cash flow hedge, the gains and losses on translation of the same are taken to statement of comprehensive income to the extent that related hedges are effective. Non-monetary items that are measured in terms of historical cost in a foreign currency are translated using the exchange rates as at the dates of the initial transaction. Non-monetary items measured at fair value in a foreign currency are translated using the exchange rates at the date when the fair value was determined.
3.23 Dividend and appropriation to reserves Dividend and appropriation to reserves are recognised in the period in which these are approved. 3.24 Earnings per share The Company presents basic and diluted Earnings Per Share (EPS) data for its ordinary shares. Basic EPS is calculated by dividing the profit or loss attributable to ordinary shareholders of the Company by the weighted average number of ordinary shares outstanding during the period. Diluted EPS is determined by adjusting the profit or loss attributable to ordinary shareholders and the weighted average number of ordinary shares outstanding for the effects of all dilutive potential ordinary shares.
4. PROPERTY, PLANT AND EQUIPMENT
Operating fixed assets 4.1 207,386,187 193,448,746 Capital work-in-progress 4.3 30,344,588 30,029,255 237,730,775 223,478,001
(Rupees in ‘000)2017 2016
Note

KE Annual Report 2017 | 84

85 | KE Annual Report 2017
4.1.1 Leasehold land This represents leasehold land sites owned by the Company which are freely transferable. 4.1.2 Other land Land classified as ‘other’ comprises sites in possession of the Company, which are not freely transferable. These include:
Amenity - Leasehold 521,885 508,522 - Freehold (mainly grid) 671 671 522,556 509,193
Leasehold land – owned 4.1.2.2 38,576 38,576 561,132 547,769
4.1.2.1 During the year, the Company has written-off Rs. 16,000 in respect of 10 sites which were allotted to it under amenity for setting up sub-stations. These have been fully encroached over the period with no possibility of any recovery. 4.1.2.2 This represents leasehold land in respect of which lease renewals are in process. 4.1.3 Details of the latest revaluation exercises carried out by the external valuers and recorded in the financial statements are as follows:
Leasehold land Colliers International Pakistan (Private) Limited June 30, 2017 8,065,664 12,079,184 12,079,184
Plant and machinery Iqbal Nanjee and - owned Company (Private) Limited June 30, 2015 73,574,382 93,556,692 94,078,280
Plant and machinery - assets given under diminishing musharaka sukuk - do - - do - 19,215,833 24,453,534 20,065,960
Transmission grid equipment - do - - do - 19,321,706 31,959,539 31,342,295 These valuations fall under level 2 and 3 hierarchy which have been explained in note 4.1.4. 4.1.3.1 Had there been no revaluation, the values of specific classes of leasehold land, plant and machinery and transmission grid equipment as at June 30, 2017 under the cost model would have been as follows:
Leasehold land 704,775 609,947 659,365 566,536 Plant and machinery - owned 94,831,821 87,884,048 67,464,228 60,684,885 Plant and machinery - assets given under diminishing musharaka sukuk 18,268,370 18,268,370 5,994,269 6,504,190 Transmission grid equipment 27,414,976 22,578,381 15,440,353 11,323,227 141,219,942 129,340,746 89,558,215 79,078,838
(Rupees in ‘000)2017 2016
Note
Name of external valuer
--------------------- (Rupees in ‘000) --------------------
Revaluation date
Written down value before revaluation
Revalued amount as at revaluation
date
Carrying values as at June 30,
2017
20172017 20162016
Cost Written down value
--------------------- (Rupees in ‘000) --------------------
KE Annual Report 2017 | 86
4.1.4 Non-financial asset fair valuation Fair value is the price that would be received to sell an asset or paid to transfer a liability in an orderly transaction between market participants at the measurement date. The valuation techniques and inputs used to develop fair value measurements are as follows: Level 1: Quoted prices in active markets for identical assets or liabilities; Level 2: Those involving inputs other than quoted prices included in Level 1 that are observable for the asset or liability, either directly (as prices) or indirectly (derived from prices); and Level 3: Those whose inputs for the asset or liability that are not based on observable market date (unobservable inputs). Valuation techniques and significant unobservable inputs Valuation techniques used in measuring the fair value of leasehold land, plant and machinery and transmission grid equipments and the significant unobservable inputs used in the valuation are as follows: Leasehold land The fair value of leasehold land was determined by obtaining market values of the properties and considering its size, nature and location, as well as the trend in the real estate and property sector. All relevant factors affecting the saleability of the asset, availability of the buyers and the assessment of its real value under prevailing economic conditions were accounted for. The value of the land was assessed based on information available in current real estate market and has been categorized as level 2. The estimated fair value of land would increase / decrease in line with the selling prices for property of same nature in the immediate neighbourhood and adjoining areas. Transmission grid equipment For the valuation of transmission grid equipment, the valuers referred to current cost from various manufacturers and also considered cost as incurred by the Company and the trend of prices of major raw material i.e. copper and steel. The estimated fair value of transmission grid equipment would increase / decrease in line with the current selling prices of these equipment and has been categorized as level 3. Plant and machinery The valuer approached vendors for current prices. In view of the technological developments, where costs were not up to date, indexation according to European Power Capital Cost Index (EPCCI) was considered. The actual fair value of plant and machinery would increase / decrease if indexation according to EPCCI increases / (decreases) and has been categorized as level 3. The effect of changes in the unobservable inputs used in the above valuations cannot be determined with certainty. Accordingly, a quantitative disclosure of sensitivity has not been presented in these financial statements. 4.1.5 The cost of fully depreciated assets as at June 30, 2017 is Rs. 19,893 million (2016: Rs. 16,573 million). 4.1.6 Due to nature of Company’s operations, certain assets included in transmission and distribution network are not in possession of the Company. In view of large number of consumers, the management considers it impracticable to disclose particulars of assets not in the possession or control of the Company as required under the Fourth Schedule to the Companies Ordinance, 1984. 4.1.7 During the year, provision for impairment amounting to Rs. 357 million has been recorded, to the extent of remaining book values of two transmission lines (132 KV single circuit underground cable from Creek City grid to DHA Cogen grid and 220 KV underground oil filled double circuit from Lalazar grid to PLDP near ICI bridge) and related civil works. These have been identified as faulty and beyond repair.

87 | KE Annual Report 2017
4.1.8 Depreciation charge for the year has been allocated as follows:
Expenses incurred in generation, transmission and distribution 35 11,421,686 10,990,863
Consumers services and administrative expenses 36 2,011,424 1,887,125 13,433,110 12,877,988 4.2 The details of property, plant and equipment disposed off during the year are as follows:
Plant and machinery Cleaning water pumps with motors 51,039 45,936 5,103 6,001 898 Tender M. Ali & Sons Commuter electro and ignition rod 350 297 53 6 (47) - do - Mr. Baber Khan Cooler, pumping casing and 1,077 377 700 730 30 - do - Brothers Metal (Pvt.) Ltd. mechanical seals Copper bus bar with insulation 2,862 1,455 1,407 3,323 1,916 - do - Naushad Metal Works (Pvt.) td. material Exhaust chimneys and ducts 7,472 1,382 6,090 728 (5,362) - do - Mr. Ajab Khan Instruments 170 47 123 294 171 - do - Mr. Baber Khan Panels resistance cabinet and line feeder 1,671 270 1,401 17 (1,384) - do - Mr. Saifullah
Transmission grid equipment and lines Aluminium conductor 355 257 98 159 61 - do - Sun Metal Industries (Pvt.) Ltd. Batteries 1,336 813 523 180 (343) - do - Mr. Ajab Khan Batteries - nickel cadium 1,052 184 868 1 (867) - do - Malik & Brothers Battery bank 1,336 675 661 55 (606) - do - Oriental Trading Battery bank 4,009 2,207 1,802 88 (1,714) - do - Brothers Metal Works (Pvt.) Ltd. Battery bank 11,817 4,825 6,992 86 (6,906) - do - Anwar Traders Battery charger, compression 632 437 195 169 (26) - do - Anwar Traders machines and welding plant Breakers, current transformers and 1,658 848 810 220 (590) - do - Naushad Metal Works (Pvt.) Ltd. potential transformers Busbar coupling 370 320 50 628 578 - do - Sher Muhammad & Co. Bushing and isolators 495 356 139 160 21 - do - Mr. Muhammad Faisal Bushing, isolators, breakers, current 20,593 11,868 8,725 562 (8,163) - do - Mr. Saqib Nisar transformers and potential transformers Cable temperature monitoring system 11,082 1,945 9,137 26,000 16,863 - do - Irshad Iron Merchant Capacitor cells 2,956 1,708 1,248 8 (1,240) - do - Mr. Muhammad Ashfaq Charger batteries 527 302 225 96 (129) - do - Rehmani Metal Traders Copper conductors 926 670 256 7,231 6,975 - do - Universal Metal (Pvt.) Ltd. Current transformers 791 588 203 99 (104) - do - Anwar Traders Current transformers and potential transformers 595 439 156 79 (77) - do - Sun Metal Industries (Pvt.) Ltd. Current transformers, breakers, capacitor 34,501 20,241 14,260 296 (13,964) - do - Mr. Saqib Nisar coupling and wall bushing Disc insulators 7,712 5,834 1,878 1,114 (764) - do - Mr. Anwar Ali Electronics cubical panels 709 114 595 16 (579) - do - Mr. Muhammad Faisal ETI panel 5,769 3,510 2,259 76 (2,183) - do - Irshad Iron Merchant Frame battery 313 195 118 498 380 - do - Malik & Brothers Gears, isolator bus bar and bus couplers 6,505 4,644 1,861 192 (1,669) - do - Mr. Naeem Ahmed Insulators, suspension, tension and long 2,237 1,663 574 91 (483) - do - Anwar Traders rod insulators Isolators 2,719 1,761 958 175 (783) - do - Malik & Brothers Knife switches and line trape 820 593 227 59 (168) - do - Mr. Saifullah Line trape 288 196 92 150 58 - do - Landhi Traders Mechanism box 5,246 2,907 2,339 276 (2,063) - do - Anwar Traders Oil filled underground cables 800mm 594 495 99 376 277 - do - Mr. Ajab Khan
Original cost /
Revalued amount
Accumulated depreciation
---------------------------- (Rupees in ‘000) ------------------------------
Written down value
Sale proceeds / Exchange
value
Gain / (Loss)
on disposal
Mode of disposal
Particulars of buyer
(Rupees in ‘000)2017 2016
Note

KE Annual Report 2017 | 88
Optical ground wire 2,350 749 1,601 407 (1,194) - do - Mr. Jan Gul Khan Out going switch gears and panels 8,478 2,755 5,723 453 (5,270) - do - Mr. Baber Khan Pin, long rod and disc insulators 3,820 2,773 1,047 49 (998) - do - Mr. Anwar Ali Protection panels 483 261 222 14 (208) - do - Mr. Rasheed Ghulam Nabi Steel tubular poles 155 104 51 60 9 - do - Mr. Chaudhry Masood Arshad Suspension and tension insulators 2,060 1,468 592 77 (515) - do - Mashallah Scrap Merchant Suspension and tension insulators 1,425 1,051 374 50 (324) - do - Landhi Traders Suspension string 12,630 9,084 3,546 536 (3,010) - do - Anwar Traders Switch gear 945 575 370 104 (266) - do - Oriental Trading Switches and trollies 8,556 6,023 2,533 727 (1,806) - do - Anwar Traders Telecom cabinet, ETI panel, rectifier of 1,645 937 708 100 (608) - do - Mr. Rasheed Ghulam Nabi voltage and amplifier Telecom cabinets 11,591 4,201 7,390 475 (6,915) - do - Mr. Mushtaq Ahmed Telecommunication cabinet, ETI and 5,430 2,381 3,049 160 (2,889) - do - Mr. Saqib Nisar auxiliary panels Underground cables 1,581 1,418 163 3,651 3,488 - do - Universal Metal (Pvt.) Ltd. Underground cables 366 299 67 1,239 1,172 - do - Naushad Metal Works (Pvt.) Ltd. Vaccum circuit breaker and oil circuit breaker trollies 473 409 64 78 14 - do - Oriental Trading
Distribution networks Aluminium cable 1,813 1,329 484 1,644 1,160 - do - Universal Metal (Pvt.) Ltd. Aluminium cable 18,913 10,204 8,709 11,703 2,994 - do - Sun Metal Industries (Pvt.) Ltd. Aluminium cables (high tension and low tension) 10,786 7,093 3,693 6,874 3,181 - do - Universal Metal (Pvt.) Ltd. Aluminium conductor 54,805 22,826 31,979 29,220 (2,759) - do - Universal Metal (Pvt.) Ltd. Aluminium conductor 22,342 6,287 16,055 11,371 (4,684) - do - Sun Metal Industries (Pvt.) Ltd. Aluminium conductor wires 12,906 3,552 9,354 7,127 (2,227) - do - Mr. Ahmed Raza Khan Aluminium underground cables 11,057 6,485 4,572 8,373 3,801 - do - Sun Metal Industries (Pvt.) Ltd. Breakers and current transformers 1,735 883 852 218 (634) - do - Anwar Traders Breakers, current transformers and 9,371 6,474 2,897 1,259 (1,638) - do - Naushad Metal Works potential transformers (Pvt.) Ltd. Breakers, current transformers and 4,037 1,711 2,326 365 (1,961) - do - Mr. Muhammad Bilal potential transformers Breakers, current transformers and 8,661 5,815 2,846 771 (2,075) - do - Anwar Traders potential transformers Circuit breakers 6,718 3,686 3,032 406 (2,626) - do - Anwar Traders Copper / aluminium bus bar 617 396 221 775 554 - do - Mr. Anwar Ali Copper bus bar 627 400 227 1,031 804 - do - Naushad Metal Works (Pvt.) Ltd. Copper cable 53,808 31,685 22,123 56,906 34,783 - do - Universal Metal (Pvt.) Ltd. Copper cable 37,700 22,406 15,294 34,836 19,542 - do - Naushad Metal Works (Pvt.) Ltd. Copper cables 27,725 15,179 12,546 21,145 8,599 - do - New Delite Co. (Pvt.) Ltd. Copper cables 10,734 6,473 4,261 8,047 3,786 - do - Khurram Brothers Copper conductor 552,467 384,283 168,184 448,154 279,970 - do - Universal Metal (Pvt.) Ltd. Copper conductors 1,383 1,021 362 12,289 11,927 - do - Naushad Metal Works (Pvt.) Ltd. Current transformers, potential 2,462 1,507 955 328 (627) - do - Sun Metal Industries transformers and breakers (Pvt.) Ltd. Current transformers, potential 1,623 757 866 301 (565) - do - Anwar Traders transformers and breakers Disc and pin Insulators 107 34 73 4 (69) - do - Mashallah Scrap Merchant Disc insulators and lighting arrestor 799 662 137 10 (127) - do - Anwar Traders Energy and static meters 349,568 259,477 90,091 86,476 (3,615) - do - Sun Metal Industries (Pvt.) Ltd.
Original cost /
Revalued amount
Accumulated depreciation
---------------------------- (Rupees in ‘000) ------------------------------
Written down value
Sale proceeds / Exchange
value
Gain / (Loss)
on disposal
Mode of disposal
Particulars of buyer

89 | KE Annual Report 2017
Energy meters 72,716 44,970 27,746 12,476 (15,270) - do - Faisal Impex Oil circuit breaker trollies and mechanism 1,580 1,407 173 83 (90) - do - Anwar Traders Power transformers 21,299 16,913 4,386 1,052 (3,334) - do - Bismillah Metal Impex RMUs, vaccum circuit breaker and 770 693 77 128 51 - do - Oriental Trading oil circuit breaker trollies Steel tubular poles 1,853 1,129 724 718 (6) - do - Mr. Chaudhry Masood Arshad Steel tubular poles 6,500 4,577 1,923 2,553 630 - do - Mr. Baber Khan Steel tubular poles 555 400 155 283 128 - do - Anwar Traders Steel tubular poles 627 562 65 447 382 - do - Oriental Trading Steel tubular poles 1,785 1,082 703 503 (200) - do - Rehmani Metal Traders Steel tubular poles (high tension and low tensions) 2,013 1,226 787 632 (155) - do - Mr. Baber Khan Switch gears 7,030 2,003 5,027 208 (4,819) - do - Mr. Naeem Ahmed Switch gears and RMUs 3,526 2,898 628 242 (386) - do - Oriental Trading Switch gears and trollies 2,110 1,651 459 170 (289) - do - Irshad Iron Merchant Switch gears, current transformers and trollies 4,142 2,614 1,528 221 (1,307) - do - Mr. Baber Khan Switches and Ring Man Units (RMUs) 2,470 2,196 274 210 (64) - do - Anwar Traders Underground aluminium cables 4,831 2,900 1,931 3,785 1,854 - do - Sun Metal Industries (Pvt.) Ltd. Underground XLPE cables 542 488 54 584 530 - do - Mr. Naeem Ahmed Computers and related equipment CPUs, printers, monitors and scanners 5,880 4,981 899 51 (848) - do - RKF Traders Furniture, air conditioner and office equipment Air conditioner split 2,869 2,117 752 394 (358) - do - Mr. Himmat Khan Air conditioner split 1,313 929 384 108 (276) - do - Ahmed & Sons Air conditioner split and chiller 1,864 1,423 441 264 (177) - do - Malik & Brothers Chairs, sofas, table and cabinets 377 208 169 170 1 - do - Muhammad Shabbir & Brothers Split and windows air conditioners 850 686 164 76 (88) - do - RKF Traders Split and windows air conditioners 313 258 55 9 (46) - do - Mr. Rasheed Ghulam Nabi Tools and general equipment Fire extinguishers 1,251 1,126 125 9 (116) - do - Mr. Naeem Ahmed Meter testing benches 3,960 3,564 396 117 (279) - do - Mr. Rasheed Ghulam Nabi 1,610,362 1,058,473 551,889 833,545 281,656 Items having written down value below Rs. 50,000 Computers and related equipment 5,982 5,979 3 134 131 - do - Various Distribution networks 1,165 934 231 1,181 950 - do - Various Furniture, air conditioner and office equipment 767 664 103 252 149 - do - Various Tools and general equipment 605 544 61 14 (47) - do - Various Transmission grid equipment and lines 3,508 3,285 223 6,093 5,870 - do - Various Vehicles 4,845 4,368 477 4,635 4,158 - do - Various 16,872 15,774 1,098 12,309 11,211 1,627,234 1,074,247 552,987 845,854 292,867 Exchange of Assets Turbine hot gas path parts 3,263,521 362,430 2,901,091 3,932,180 1,031,089 Negotiated/ General Electric Exchanged June 30, 2017 4,890,755 1,436,677 3,454,078 4,778,034 1,323,956
Original cost /
Revalued amount
Accumulated depreciation
---------------------------- (Rupees in ‘000) ------------------------------
Written down value
Sale proceeds / Exchange
value
Gain / (Loss)
on disposal
Mode of disposal
Particulars of buyer

KE Annual Report 2017 | 90
4.3 CAPITAL WORK-IN-PROGRESS The movement in capital work-in-progress during the year is as follows:
Balance at beginning of the year 11,157,559 9,918,539 6,284,070 2,669,087 30,029,255 15,567,659 Additions during the year (note 4.3.1) 7,508,374 5,659,074 11,921,281 2,610,837 27,699,566 22,840,432 18,665,933 15,577,613 18,205,351 5,279,924 57,728,821 38,408,091 Transfers to operating fixed assets and intangible assets (notes 4.1 and 5.1) (15,128,404) (3,019,701) (8,179,724) (1,056,404) (27,384,233) (8,378,836) Balance at end of the year 3,537,529 12,557,912 10,025,627 4,223,520 30,344,588 30,029,255
4.3.1 These include borrowing cost capitalised during the year amounting to Rs. 870 million (2016: Rs. 2,260 million).
5. INTANGIBLE ASSETS Computer software Cost 5.1 1,077,285 861,596 Amortization to date 5.2 (861,879) (797,736) 215,406 63,8605.1 Cost Opening balance 861,596 825,594 Additions during the year 4.3 215,689 36,002 1,077,285 861,5965.2 Amortization to date Opening balance (797,736) (691,442) Amortization during the year 36 (64,143) (106,294) (861,879) (797,736)
5.2.1 Useful life 3 years 3 years
5.3 Computer software include ERP system - SAP, antivirus and other software. 6. LONG-TERM INVESTMENT
Investment in joint venture - at cost 6.1 - -
6.1 The Board of Directors of the Company in its meeting held on August 9, 2017 approved the write-off of Company’s investment in Karachi Organic Energy (Private) Limited (KOEL) amounting to Rs. 44 million, comprising of Rs. 10 million being equity investment and Rs. 34 million (note 13) as advance against equity. These were already fully provided for by the Company in prior years.
7. LONG-TERM LOANS
Considered good Executives - 36 36 66 Employees 429 26,521 26,950 33,400 429 26,557 26,986 33,466 Recoverable within one year shown under current assets 11 (429) (4,780) (5,209) (7,558) - 21,777 21,777 25,908 Considered doubtful Employees - - - 4,333 - 21,777 21,777 30,241 Provision for impairment against loans considered doubtful - - - (4,333) - 21,777 21,777 25,908
(Rupees in ‘000)2017 2016
Note
Plant and machinery
Transmission system
---------------------------- (Rupees in ‘000) ------------------------------
Distribution system
Others 2017 2016
2017 2016SecuredHouse
building loans (note 7.1)---------------------- (Rupees in ‘000) ------------------------
UnsecuredFestival loans
(note 7.1)Note

91 | KE Annual Report 2017
7.1 House building loans, carrying mark-up @ 6% (2016: 6%) per annum, are recoverable over a period of sixteen years. These are secured against equitable mortgage of related properties. Festival loans are non-interest bearing loans.The Board of Directors in its meeting held on February 1, 2003 approved the deferment of the recovery of these loans in instalments and decided that the said loans would be recovered against the final settlement of the employees at the time of their retirement. The amount disclosed as recoverable within one year is receivable from employees expected to retire within one year.
7.2 Long-term loans have not been discounted to their present values as the financial impact thereof is not considered to be material. 7.3 The maximum aggregate amount of loans due from the executives and employees of the Company at the end of any month during the year was Rs. 36 million (2016: Rs. 41 million). 8. LONG-TERM DEPOSITS
Considered good Rental premises and others 13,497 8,297 Considered doubtful Rental premises 1,020 1,020 Provision for impairment (1,020) (1,020) - - 13,497 8,297
9. STORES, SPARES AND LOOSE TOOLS Stores, spares and loose tools 10,059,636 8,830,970 Provision against slow moving and obsolete stores, spare parts and loose tools 9.1 (620,503) (884,410) 9,439,133 7,946,560 9.1 Provision against slow moving and obsolete stores, spares and loose tools Opening balance 884,410 783,496 Provision / (Reversal of provision) recognised during the year - net 35 & 36 (263,907) 100,914 620,503 884,410 10. TRADE DEBTS
Considered good Secured – against deposit from consumers 10.1 2,006,797 1,596,486 Unsecured 10.2, 10.3 & 46 101,412,957 99,447,545 103,419,754 101,044,031 Considered doubtful 58,197,616 48,593,591 161,617,370 149,637,622 Provision for impairment (against debts considered doubtful) 10.3 (58,197,616) (48,593,591) 103,419,754 101,044,031
10.1 The Company maintains deposit from consumers, taken as a security for energy dues (note 21). 10.2 These balances do not include any Late Payment Surcharge (LPS) on receivables from public sector consumers on the contention that due to the circular debt situation, the LPS should only be received by the Company from its public sector consumers, if any surcharge is levied on the Company on account of delayed payments of its liabilities.
As at June 30, 2017, receivable from government and autonomous bodies amounting to Rs. 52,060 million (2016: Rs. 51,840 million) includes unrecognized LPS of Rs. 7,550 million (2016: Rs. 6,536 million). This includes receivable from Karachi Water and Sewerage Board (KW&SB) amounting to Rs. 33,173 million including LPS of Rs 4,028 million (2016:
(Rupees in ‘000)2017 2016
Note
Note (Rupees in ‘000)2017
(Restated)2016

KE Annual Report 2017 | 92
Rs. 36,002 million including LPS of Rs. 3,614 million) and City District Government Karachi (CDGK) amounting to Rs. 12,740 million including LPS of 1,690 million (2016: Rs. 9,815 million including LPS of Rs. 1,370 million).
As at June 30, 2017, adjustment orders has been received from the Government of Sindh (GoS) whereby the Company’s liability amounting to Rs. 10,507 million (2016: Rs. 7,056 million) on account of electricity duty has been adjusted against the KW&SB dues.
10.3 Provision for impairment
Opening balance 48,593,591 36,164,740 Provision made during the year 36 18,140,501 15,211,165 66,734,092 51,375,905 Write-off against provision during the year 10.3.1 (8,536,476) (2,782,314) 58,197,616 48,593,591
10.3.1 This includes write-off of Rs. 6,195 million to be claimed as tariff adjustment in accordance with the criteria prescribed by NEPRA as explained in note 32.2.
10.4 Energy sales to and purchases from Karachi Nuclear Power Plant (KANUPP) are recorded at net amounts to facilitate recovery of energy dues by offsetting receivables against liabilities for purchase of energy.
10.5 The age analysis of trade debts that are not impaired is as follows:
Neither past due nor impaired Upto 30 days 14,948,006 22,150,007
Past due but not impaired 30 days upto 6 months 16,771,103 16,475,518 6 months upto 1 year 17,195,687 15,366,410 1 - 2 years 23,044,152 20,418,875 2 - 3 years 15,940,839 13,884,834 3 - 4 years 5,910,104 4,977,556 Over 4 years 9,609,864 7,770,831 103,419,755 101,044,031
11. LOANS AND ADVANCES
Loans – secured Considered good Current portion of long term loans 7 5,209 7,558
Advances – unsecured Considered good Employees 11.1 55,329 38,196 Suppliers 713,679 726,109 769,008 764,305 Considered doubtful Suppliers 130,340 130,340 899,348 894,645
Provision for impairment against advances considered doubtful (130,340) (130,340) 769,008 764,305 774,217 771,863
(Rupees in ‘000)2017 2016
Note
(Rupees in ‘000)2017 2016
Note

93 | KE Annual Report 2017
11.1 These are advances to employees for business related expenses.
12. DEPOSITS AND SHORT-TERM PREPAYMENTS Deposits 12.1 & 12.2 3,062,878 1,845,380
Prepayments Rent 21,877 10,515 Insurance and others 73,529 80,462 95,406 90,977 3,158,284 1,936,357
12.1 These include Rs. 87 million (2016: Rs. 27 million), representing margins / guarantee deposits held by commercial banks against guarantees, letter of credits and other payments. 12.2 These also include Rs. 2,939 million (2016: Rs. 1,789 million) representing deposits under lien against settlement of letter of credits, loans and sukuk repayments with commercial banks. These carry mark-up ranging from 4% to 5% per annum (2016: 5% to 6% per annum).
13. OTHER RECEIVABLES
Considered good Sales tax - net 2,997,626 3,052,575
Due from the Government of Pakistan (GoP) - net: - Tariff adjustment 13.1, 13.2 & 13.3 29,809,793 29,860,899 - Interest receivable from GoP on demand finance liabilities 237,173 237,173 30,046,966 30,098,072 Others 86,820 145,766 33,131,412 33,296,413 Considered doubtful Sales tax 13.4 851,320 851,320 Provision for impairment (851,320) (851,320) - -
Due from a consortium of suppliers of power plant 363,080 363,080 Provision for impairment (363,080) (363,080) - -
Others - 33,537 Provision for impairment 6.1 - (33,537) - - 33,131,412 33,296,413
(Rupees in ‘000)2017 2016
Note
Note (Rupees in ‘000)2017
(Restated)2016

KE Annual Report 2017 | 94
13.1 This includes Rs. 6,037 million on account of unrecovered cost of prior years. In previous years, the tariff adjustment mechanism was to pass on the effect of variation in cost of fuel and power purchase on quarterly basis. This formula capped adjustment on account of quarterly fuel price and cost of power purchase to 4% and the remaining burden or relief was to be carried forward to the next quarterly adjustment. However, the adverse fuel price movements since 2005 resulted in additional costs which were not being recovered due to 4% cap and increasing burden was being placed upon the Company with respect to such unrecovered amount. The Economic Co-ordination Committee (ECC), on a summary moved by the Ministry of Energy (Power), in case No. ECC-164/16/2008 dated October 14, 2008 decided that the said unrecovered cost due to 4% cap has been incurred by the Company and NEPRA may take the amount into account in the subsequent quarterly tariff adjustment. However, NEPRA is of the view that the tariff mechanism does not allow for adjustment of such unrecovered cost. Subsequently, the Power Division through letter dated June 1, 2012 to the Finance Division (GoP), communicated that the unrecovered costs of the Company were pending due to non availability of adjustment mechanism with NEPRA, although it has already been acknowledged by ECC and that the GoP owes this amount to the Company. Accordingly, this unrecovered cost of Rs. 6,037 million is to be settled as per the options available with the GoP.
In view of the above, the Company’s management considers that the unrecovered costs of Rs. 6,037 million will be recovered. Accordingly, the entire amount of Rs. 6,037 million is being carried as tariff adjustment subsidy receivable from the GoP. The Company continues to pursue an early settlement of long outstanding receivable from GoP on account of 4% capping and is confident that the same will be recovered in due course of time.
13.2 This also include subsidy receivable of Rs. 698 million (2016: Rs. 698 million) in respect of subsidised electricity supplied to certain areas of Balochistan for the period December 2012 to June 2014, in accordance with the notification issued by the Finance Division dated November 28, 2012. However, in June 2014, the Ministry of Energy (Power) denied the aforementioned subsidy claim contending that the subsidised electricity claim is not applicable for the Company and that it was only for Quetta Electric Supply Company Limited that supplied electricity in similar areas. The Company is in continuous engagement with the Ministry of Energy (Power) for resolution of this matter, however, the subsidised portion will be recovered by the Company from the relevant consumers in the event the subsidy claim is not honored and recovered from the Government.
13.3 This also include gas load management plan differential amounting to Rs. 2,618 million (2016: Rs. 2,618 million), outstanding tariff differential claims pertaining to the period January 2014 to December 2014 amounting to Rs. 12,672 million (2016: Rs. 12,672 million), and outstanding industrial support package adjustment amounting to Rs. 11,699 million (2016: Rs. 4,884 million) which has been referred to Ministry of Energy (Power) by Ministry of Finance (MoF) for appropriate action including approval from ECC. The Company is of the view that all these claims have arisen due to decision / directions of the GoP and have been duly verified by Ministry of Energy (Power) and GoP. Hence, these are valid and legitimate receivables of the Company from GoP. Further, this includes tariff variations pending determination by NEPRA, accrued in accordance with MYT decision.
13.4 This includes Rs. 610 million in respect of refunds claimed for the period from July 2000 to June 2007 withheld by the sales tax department on account of sales tax on service connection charges, sales tax on meter burnt charges, input inadmissible and certain other matters. The remaining amount of Rs. 241 million represents other input sales tax amount which is not claimable as per the provisions of Sales Tax Act, 1990. Based on prudence, the Company has recorded provision against the entire receivable of Rs. 851 million.

95 | KE Annual Report 2017
Movement in provision:
Balance at the beginning of the year 851,320 236,922 Provision recognised during the year - 614,398 851,320 851,320
14. CASH AND BANK BALANCES Cash in hand 19,787 18,441 Cash with: Conventional banks: - Current accounts 301,081 492,819 - Deposit accounts 14.1 51,378 270,274 - Collection accounts 1,479,854 790,213 1,832,313 1,553,306 Islamic banks: - Current accounts - 22,392 - Deposit accounts 13,798 1,521 - Collection accounts 212,018 582,410 225,816 606,323 2,077,916 2,178,070
14.1 These carry mark-up at rates ranging from 3.75 % to 4.0% (2016: 2.86% to 5.76%) per annum.
15. ASSETS CLASSIFIED AS HELD FOR SALE
Leasehold land 15.1 2,999,116 2,999,116 Plant and machinery - owned 15.2 - 158,706 2,999,116 3,157,822
15.1 Last year, the Company purchased a land for development of 700 MW (2 x 350 MW) coal-based power plant (the Project). The Project will be developed by a separate company i.e. “Datang Pakistan Karachi Power Generation Limited (DPKPGL)”, as fully disclosed in note 30.3.2. The land acquired will be transferred to DPKPGL subsequent to the financial close of the Project. The period of one year has lapsed from the date of classification of this land as ‘Held for Sale’. However, this land continues to be classified as ‘Held for Sale’ as the Company remains committed to its plan to transfer this land to DPKPGL.
15.2 During the year, these assets were sold for Rs. 328 million to Ayan ship breakers through tender.
(Rupees in ‘000)2017 2016
Note
(Rupees in ‘000)2017 2016
Note

KE Annual Report 2017 | 96
16. ISSUED, SUBSCRIBED AND PAID UP CAPITAL
Authorized share capital Ordinary shares of Rs.3.5 32,857,142,857 32,857,142,857 each fully paid 115,000,000 115,000,000 Redeemable preference 2,857,142,857 2,857,142,857 shares of Rs. 3.5 each fully paid 10,000,000 10,000,000 35,714,285,714 35,714,285,714 125,000,000 125,000,000
Issued, subscribed and paid-up capital Issued for cash Ordinary shares of Rs. 3.5 14,493,490,368 14,493,490,368 each fully paid 16.2 & 16.3 50,727,215 50,727,215 Issued for consideration other than cash Ordinary shares of Rs. 3.5 12,988,827,989 12,988,827,989 each fully paid 16.4 - 16.8 45,460,898 45,460,898 Issued as bonus shares Ordinary shares of Rs. 3.5 132,875,889 132,875,889 each fully paid as bonus shares 465,066 465,066 13,121,703,878 13,121,703,878 45,925,964 45,925,964 Transaction costs on issuance - - of shares (391,628) (391,628) 27,615,194,246 27,615,194,246 16.1 96,261,551 96,261,551
16.1 KES Power Limited (Holding Company) held 18,335,542,678 ordinary shares as at June 30, 2017 (2016: 18,335,542,678) i.e. 66.40% of the Company’s issued, subscribed and paid up capital. 16.2 During the year ended June 30, 2013, the shareholders of the Company, by way of a special resolution passed in the Extra Ordinary General Meeting (EOGM) of the Company, held on October 08, 2012, resolved the issuance of additional share capital to International Finance Corporation and Asian Development Bank. As a result of the said resolution, the Company issued 698,071,428 ordinary shares and 696,785,714 ordinary shares having a face value of Rs. 3.5 each to International Finance Corporation and Asian Development Bank, respectively. The issuance of shares was made pursuant to terms of the amended subscription agreement dated May 5, 2010 whereby the aforementioned lenders exercised their right to convert their debt of USD 25 million each into ordinary shares of the Company. 16.3 During the year ended June 30, 2013, the Company converted its redeemable preference shares into ordinary shares of the Company. The conversion of redeemable preference shares to ordinary shares was executed in accordance with Article 4 of the subscription agreement dated November 14, 2005. As per the terms of conversion, each redeemable preference shareholder of the Company became the holder of three ordinary shares for every four redeemable preference shares held. Consequently, the Company converted 1,714,285,713 redeemable preference shares having face value of Rs. 3.5 each which amounts to Rs. 6,000 million into 1,285,714,284 ordinary shares having face value of Rs. 3.5 each which amounts to Rs. 4,500 million resulting in a share premium of Rs. 1,500 million.
16.4 During the year ended June 30, 1999, the Company issued 304,512,300 ordinary shares of Rs. 10 each as a result of the conversion of overdue outstanding balance of (a) rescheduled foreign currency loan of Rs. 1,968 million; and (b) cash development loan of Rs. 1,077 million, aggregating Rs. 3,045 million at that date, into equity. 16.5 During the year ended June 30, 2002, the shareholders of the Company, by way of a special resolution, passed in the Annual General Meeting (AGM) of the Company, finalized the conversion of the Company’s debt servicing liabilities, aggregating Rs. 17,835 million, into equity. As a result of the said resolution, the Company issued 1,783,456,000 ordinary shares of Rs. 10 each at par. The subscription agreement in this regard was entered into on January 24, 2002.
(Rupees in ‘000)2017 2016
Note2017 2016

97 | KE Annual Report 2017
16.6 As per the decision taken in the ECC meeting, held on April 16, 2002, which was also approved by the President of Pakistan, the Ministry of Finance (MoF) conveyed through its letter dated April 27, 2002, that all the loans of GoP and GoP guaranteed loans outstanding against the Company, aggregating Rs. 65,341 million, were converted into GoP equity. 16.7 The shareholders of the Company, by way of a special resolution passed in the AGM of the Company held on December 2, 2004, resolved the conversion of (a) GoP funds, amounting to Rs. 6,081 million; and (b) GoP long term loan amounting to Rs. 9,203 million, aggregating to Rs.15,284 million into equity. As a result of the said resolution, the Company issued 4,366,782,389 ordinary shares of Rs. 3.5 each at par. The subscription agreement in this regard was entered into on December 20, 2004. 16.8 The shareholders of the Company during the year ended June 30, 2002, by way of a special resolution passed, in the EOGM held on May 27, 2002, resolved the reduction of share capital of the Company, subsequent to the completion of the conversion of GoP and GoP guaranteed loans of Rs. 65,341 million into equity (note 16.6 above). The paid-up capital, which was lost or not represented by assets of the Company, to the extent of Rs. 6.50 per share on each of the issued ordinary shares of the Company at that time, was reduced and a new nominal value thereof was fixed at Rs. 3.50 per share. The High Court of Sindh, vide its order, dated October 12, 2002, ordered the reduction in the nominal value of share capital of the Company by Rs. 6.50 per share. The Board of Directors of the Company in its meeting held on October 26, 2002 also approved the reduction in nominal value of share capital, amounting to Rs. 57,202 million. The GoP, vide its Finance Division letter dated January 31, 2003, conveyed the sanction of the President of Pakistan to write-off the GoP equity in the Company. Accordingly, the reduction in share capital of Rs. 57,202 million was adjusted against the accumulated losses of the Company. 16.9 Profits earned by the Company since 2009 have all been reinvested into the Company’s business taking into account the capital expenditure requirements, the Company’s financial position and level of accumulated losses and requirements of the lenders. Consequently, the level of adjusted invested equity in the business at the end of June 30, 2017 (hereinafter defined as “Adjusted Invested Equity”) comprises of issued share capital, reserves (excluding surplus on revaluation of fixed assets), adjusted profits since 2009 which were retained in the business (excluding impact of deferred tax asset and incremental depreciation relating to surplus on revaluation of fixed as sets) and excluding impact of accumulated losses till the year ended June 30, 2011 The reconciliation of ‘Adjusted Invested Equity’ to the shareholders equity is as follows:
Shareholder’s equity in the balance sheet 136,711,122 121,321,219 Accumulated losses up to June 30, 2011 79,864,661 79,864,661 Deferred tax net recognised (20,402,309) (20,811,433) Adjusted Invested Equity (excluding impact of accumulated losses up to June 30, 2011) 196,173,474 180,374,447 The Adjusted Invested Equity is summarized below: Issued, subscribed and paid up capital 16 96,261,551 96,261,551 Share premium 17 1,500,000 1,500,000 Capital reserves 17 509,172 509,172 Revenue reserves 5,372,356 5,350,193 Profits available for distribution reinvested in the Company (Total comprehensive income for the year excluding the impact of deferred tax asset and incremental depreciation):
- FY 2012 4,972,374 4,972,374 - FY 2013 8,144,896 8,144,896 - FY 2014 11,914,617 11,914,617 - FY 2015 21,961,285 21,961,285 - FY 2016 29,760,359 29,760,359 - FY 2017 15,776,864 - 92,530,395 76,753,531 Adjusted Invested Equity (excluding impact of accumulated losses up to June 30, 2011) 196,173,474 180,374,447
Note (Rupees in ‘000)2017
(Restated)2016
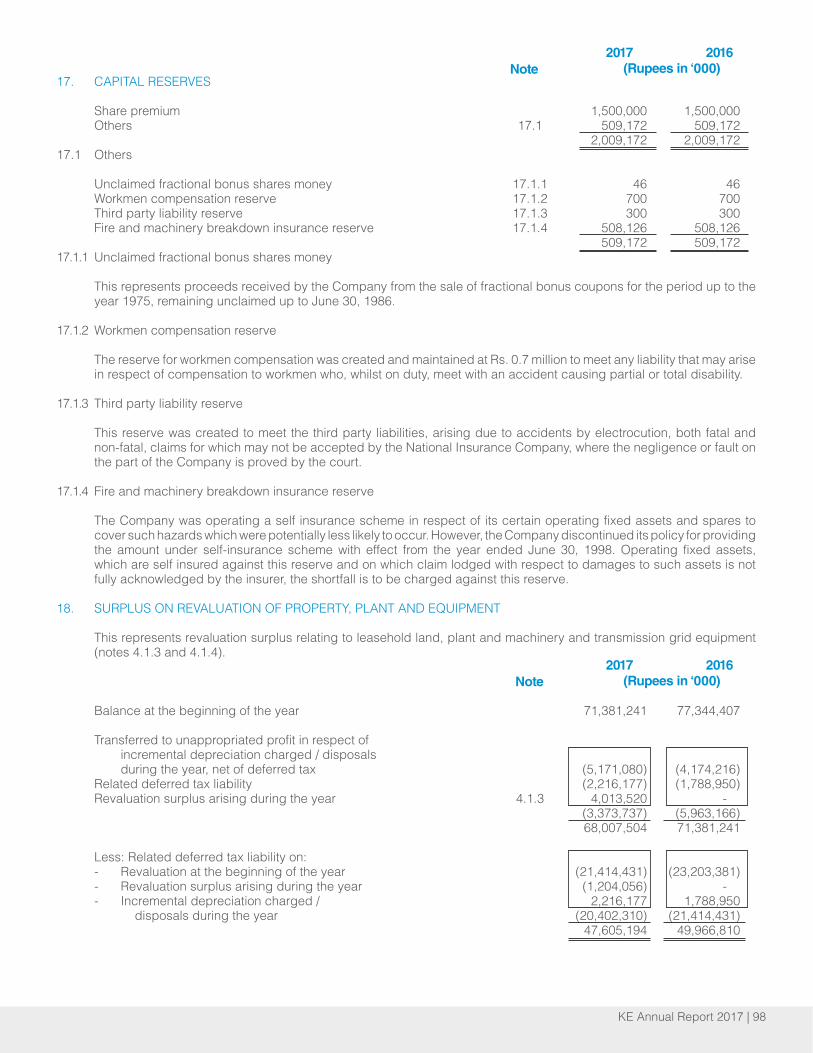
KE Annual Report 2017 | 98
17. CAPITAL RESERVES Share premium 1,500,000 1,500,000 Others 17.1 509,172 509,172 2,009,172 2,009,172 17.1 Others Unclaimed fractional bonus shares money 17.1.1 46 46 Workmen compensation reserve 17.1.2 700 700 Third party liability reserve 17.1.3 300 300 Fire and machinery breakdown insurance reserve 17.1.4 508,126 508,126 509,172 509,172 17.1.1 Unclaimed fractional bonus shares money This represents proceeds received by the Company from the sale of fractional bonus coupons for the period up to the year 1975, remaining unclaimed up to June 30, 1986. 17.1.2 Workmen compensation reserve The reserve for workmen compensation was created and maintained at Rs. 0.7 million to meet any liability that may arise in respect of compensation to workmen who, whilst on duty, meet with an accident causing partial or total disability. 17.1.3 Third party liability reserve This reserve was created to meet the third party liabilities, arising due to accidents by electrocution, both fatal and non-fatal, claims for which may not be accepted by the National Insurance Company, where the negligence or fault on the part of the Company is proved by the court. 17.1.4 Fire and machinery breakdown insurance reserve
The Company was operating a self insurance scheme in respect of its certain operating fixed assets and spares to cover such hazards which were potentially less likely to occur. However, the Company discontinued its policy for providing the amount under self-insurance scheme with effect from the year ended June 30, 1998. Operating fixed assets, which are self insured against this reserve and on which claim lodged with respect to damages to such assets is not fully acknowledged by the insurer, the shortfall is to be charged against this reserve. 18. SURPLUS ON REVALUATION OF PROPERTY, PLANT AND EQUIPMENT This represents revaluation surplus relating to leasehold land, plant and machinery and transmission grid equipment (notes 4.1.3 and 4.1.4).
Balance at the beginning of the year 71,381,241 77,344,407
Transferred to unappropriated profit in respect of incremental depreciation charged / disposals during the year, net of deferred tax (5,171,080) (4,174,216) Related deferred tax liability (2,216,177) (1,788,950) Revaluation surplus arising during the year 4.1.3 4,013,520 - (3,373,737) (5,963,166) 68,007,504 71,381,241
Less: Related deferred tax liability on: - Revaluation at the beginning of the year (21,414,431) (23,203,381) - Revaluation surplus arising during the year (1,204,056) - - Incremental depreciation charged / 2,216,177 1,788,950 disposals during the year (20,402,310) (21,414,431) 47,605,194 49,966,810
(Rupees in ‘000)2017 2016
Note
(Rupees in ‘000)2017 2016
Note

99 | KE Annual Report 2017
19. LONG-TERM DIMINISHING MUSHARAKA Diminishing musharaka - secured 19.1 21,705,568 21,526,916 Less: Current maturity shown under current liabilities (4,400,000) - 17,305,568 21,526,916
19.1 During the year ended June 30, 2015, the Company issued 4.4 million KE AZM Sukuk certificates, having face value of Rs. 5,000 each, i.e. aggregating to Rs. 22,000 million and entered into a diminishing musharaka agreement with the investment agent, Pak Brunei Investment Company (trustee on behalf of the Sukuk holders) as a co-owner of the Musharaka assets. The issue resulted in cash receipts of subscription money of Rs. 22,000 million. The Company, however, paid transaction cost from the said receipts amounting to Rs. 491 million resulting in proceeds net of transaction cost of Rs. 21,509 million. The Sukuk certificates carry profit at the rate of 3 month KIBOR + 1% and with quarterly rental payments. These certificates are issued for a tenure of seven years and are structured in such a way that first quarterly principal repayment installment commenced from the quarter ended September 2017. These certificates are issued to generate funds under Islamic mode of financing and are structured as long-term diminishing musharaka. Under this arrangement the Company sold the beneficial ownership of the musharaka assets, mainly plant and machinery to the investment agent (for the benefit of sukuk holders) although legal title remains with the Company. The overall arrangement has been accounted for on the basis of substance in these financial statements.
20. LONG-TERM FINANCING From banking companies and financial institutions - secured Medium-term loan 20.1 2,750,000 3,450,000 Syndicated loan 20.2 & 20.5 2,912,067 6,050,000 Hermes financing facility 20.3 & 20.5 611,138 149,992 Sinosure financing facility 20.4 & 20.5 975,302 838,595 20.6 7,248,507 10,488,587
Current maturity shown under current liabilities (4,407,143) (2,900,000) 2,841,364 7,588,587 Others - Secured Due to oil and gas companies 610 610 Current maturity shown under current liabilities (610) (610) - - Unsecured GoP loan for the electrification of Hub area 20.7 26,000 26,000 Current maturity shown under current liabilities (26,000) (26,000) - - 2,841,364 7,588,587
20.1 This represents financing facility of Rs. 2,750 million (2016: Rs. 3,000 million) availed from a commercial bank for a period of 3 years. The loan carries mark-up at 3 months KIBOR + 0.07% (2016: 3 months KIBOR plus 0.25% per annum). This facility is secured against charge on specific operating fixed assets with 20% margin. As per the terms of the facility, it is at the discretion of the Company to repay the remaining outstanding amount any time after the date of disbursement, without any prior notice to the bank and the same has been fully repaid subsequent to the year end. 20.2 On March 28, 2014 the Company entered into agreements for syndicate facility amounting to Rs. 5,700 million, term finance facility of Rs. 1,360 million and Musharaka facility of Rs. 640 million. The finances were utilized for the procurement and services required to increase output and efficiency of 90 MW GE Jenbacher engines and to convert single cycle operation to combined cycle operation. The loan carries mark-up at 3 month KIBOR + 0.5% (2016: 3 months KIBOR plus 2.5% per annum). The loan and term finance facility is to be settled in 14 quarterly installments with installment commencing on December 31, 2015 and repayable by March 16, 2019. Whereas, Musharaka facility is to be settled in 14 quarterly installments with the installment commencing on January 1, 2016 and repayable by March 16, 2019. Moreover, in September 2016 the Company also partially prepaid the syndicate loan to the tune of Rs. 1,357 million.
(Rupees in ‘000)2017 2016
Note
(Rupees in ‘000)2017 2016
Note

KE Annual Report 2017 | 100
20.3 This represents Pakistani Rupee equivalent drawdowns of EUR 5 million (2016: EUR 1.3 million) disbursed under Hermes supported facility agreement entered into on December 22, 2015 amounting to EUR 46.5 million, with Standard Chartered Bank, London Branch. The loan is to be utilized to fund the Transmission Project (TP 1000-04). During the year, through 1st amendment to the facility agreement the margin has been reduced and accordingly the loan now carries mark-up at 3 month EURIBOR + 1.65% (2016: 3 months EURIBOR plus 1.75% per annum). The loan is to be settled in 28 quarterly instalments with first instalment due on March 16, 2019 and is repayable by December 16, 2025. The Company has executed cross currency swaps with commercial banks to hedge the Company’s foreign currency payment obligation under the facility together with EURIBOR interest accruing thereon. Subsequent to the year end, through 2nd amendment to the facility agreement, amount under the facility has been enhanced to EUR 51.5 million. 20.4 This represents Pakistani Rupee equivalent drawdowns of USD 9 million (2016: USD 8 million) disbursed under Sinosure supported facility agreement entered into on December 22, 2015 amounting to USD 91.5 million, with a syndicate of foreign commercial lenders. The loan is to be utilized to fund the Transmission Project (TP 1000-03).The loan carries mark-up at 3 month USD LIBOR + 3.5%. The loan will be settled in 28 quarterly installments with the first installment due on March 16, 2019 and is repayable by December 16, 2025. The Company has executed cross currency swaps with commercial banks to hedge the Company’s foreign currency payment obligation under the facility together with USD LIBOR interest accruing thereon.
20.5 The above facilities, stated in notes 20.2, 20.3 and 20.4 are secured as follows: - Assets and properties (excluding stores, spares and fuel) existing and located on each of the Bin Qasim Site (other than units 3 and 4 of BQPS-1), the Korangi site, the Korangi Gas Plant Site and S.I.T.E Plant site. - Such stores and spares of the Company, not exceeding fifteen percent (15%) of the aggregate value, wheresoever located. - Hypothecation charge over specific consumers’ receivables - Lien on specific accounts and deposits by way of first pari passu charge for the benefit of facility parties. 20.6 The bifurcation of long-term financing under Conventional banking and Islamic banking made is as follows:
Conventional: Medium-term loan 2,750,000 3,450,000 Syndicated loan 2,580,000 5,547,143 Hermes financing facility 611,138 149,992 Sinosure financing facility 975,302 838,595 6,916,440 9,985,730 With Islamic banks: Syndicated loan 332,067 502,857 7,248,507 10,488,587
20.7 During the year ended June 30, 2004, the Finance Division of GoP vide its letter dated April 20, 2004, released a sum of Rs. 26 million as cash development loan for village electrification in Hub and Vinder Areas, District Lasbella. This loan is repayable in 20 years with a grace period of five years, which ended on June 30, 2009, along with mark-up charge able at the prevailing rate for the respective years. Accordingly, the Company is in process of settlement of the said loan.
21. LONG-TERM DEPOSITS These represent deposits from customers, taken as a security for energy dues. Such deposits are repayable at the time when electricity connection of consumer is permanently disconnected after adjustment thereof against any amount receivable from the consumer at the time of disconnection.
22. EMPLOYEE RETIREMENT BENEFITS
Gratuity 22.1 3,600,032 3,867,485 Post retirement medical benefits 22.1 468,554 519,621 Post retirement electricity benefits 22.1 294,641 282,973 Accumulating leave payable 22.1.14 518,722 449,081 4,881,949 5,119,160
(Rupees in ‘000)2017 2016
(Rupees in ‘000)2017 2016
Note

101 | KE Annual Report 2017
22.1 Actuarial valuation of retirement benefits The latest actuarial valuation was carried out as at June 30, 2017, using the “Projected Unit Credit Method”. Details of which are presented in notes 22.1.1 to 22.1.14.
22.1.1 Net recognised liability Net liability at the beginning of the year 3,867,485 4,270,711 519,621 573,969 282,973 242,412 Expense recognised in profit and loss account 600,216 675,938 49,036 69,201 38,042 52,576 Contributions / benefits paid during the year (1,207,011) (1,134,010) (60,845) (69,987) (44,323) (66,944) Remeasurement recognised in other comprehensive income 339,342 54,846 (39,258) (53,562) 17,949 54,929 Net liability at the end of the year 3,600,032 3,867,485 468,554 519,621 294,641 282,973 22.1.2 Expense recognised in profit and loss account
Current service cost 363,578 314,827 11,680 12,244 9,177 6,606 Past service, termination and settlement cost - - 3,895 7,058 16,139 33,542 Net interest 236,638 361,111 33,461 49,899 12,726 12,428 Chargeable in profit and loss account 600,216 675,938 49,036 69,201 38,042 52,576 22.1.3 Remeasurement losses / (gains) recognised in other comprehensive income
Remeasurement due to: change in demographic assumptions - experience obligation 346,421 88,989 (39,258) (53,562) 17,949 54,929 - return on investment (7,079) (34,143) - - - - Chargeable in other comprehensive income 339,342 54,846 (39,258) (53,562) 17,949 54,929
22.1.4 Balance sheet reconciliation
Present value of defined benefit obligation 4,778,997 4,149,915 468,554 519,621 294,641 282,973 Fair value of plan assets (1,178,965) (282,430) - - - - Net liability at end of the year 3,600,032 3,867,485 468,554 519,621 294,641 282,973 22.1.5 Movement in present value of defined benefit obligations
Present value of defined benefit obligations at the beginning of the year 4,149,915 3,846,822 519,621 573,969 282,973 242,412 Current service cost 363,578 314,827 11,680 12,244 9,177 6,606 Past service cost - - 3,895 7,058 16,139 33,542 Interest cost 287,513 352,949 33,461 49,899 12,726 12,428 Remeasurement: Actuarial loss / (gain) 346,421 88,989 (39,258) (53,562) 17,949 54,929 Benefits paid (368,430) (453,672) (60,845) (69,987) (44,323) (66,944) Present value of defined benefit obligations at the end of the year 4,778,997 4,149,915 468,554 519,621 294,641 282,973
22.1.6 Movement in fair value of plan assets
Beginning of the year 282,430 (423,889) - - - - Interest income 50,875 (8,162) - - - - Remeasurement gain due to investment return 7,079 34,143 - - - - Contributions made 1,207,011 1,134,010 - - - - Benefits paid (368,430) (453,672) - - - - End of the year 1,178,965 282,430 - - - -
Medical benefits
20172016 20172017 20162016
Gratuity Electricity benefits
---------------------------- (Rupees in ‘000) ------------------------------

KE Annual Report 2017 | 102
22.1.7 Plan assets comprise of: Bank deposits 324,130 586,295 - - - - Corporate bonds 70,279 71,631 - - - - Mutual funds 259,833 - - - - - National Savings Certificates 860,810 - - - - - Benefits due (336,087) (375,496) - - - - 1,178,965 282,430 - - - -
22.1.7.1 Bank deposits are held with banks having credit rating of A-1+. 22.1.7.2 The corporate bonds represent term finance certificates which are quoted on Pakistan Stock Exchange and are rated AA. 22.1.8 Principal actuarial assumptions used in the actuarial valuation: Financial assumptions 2017 2016
Discount rate 7.80% 7.25% Salary increase 5.70% 5.20% Medical cost trend 2.70% 2.15% Electricity price increase 2.70% 2.15%
Demographic assumptions Expected mortality rate 70% of EFU 70% of EFU (61-66) Table (61-66) Table
Expected withdrawal rate Moderate Moderate 22.1.9 The plans expose the Company to the following risks: Salary risk The risk that the final salary at the time of cessation of service is higher than what was assumed. Since the benefit is calculated on the final salary, the benefit amount increases similarly. Mortality / withdrawal risk The risk that the actual mortality / withdrawal experience is different. The effect depends upon the beneficiaries’ service / age distribution and the benefit. Investment risks The risk of the investment underperforming and not being sufficient to meet the liabilities. This is managed by formulating an investment policy and guidelines based on which investments are made after obtaining approval from trustees of the gratuity fund. 22.1.10 Sensitivity analysis for actuarial assumptions The impact of one percent movement in the assumption used in determining retirement benefit obligations would have had the following effects on June 30, 2017 valuation:
Medical benefits
20172016 20172017 20162016
Gratuity Electricity benefits
---------------------------- (Rupees in ‘000) ------------------------------

103 | KE Annual Report 2017
June 30, 2017 1% increase 1% decrease (Rupees in ‘000)
Discount rate (366,233) 420,537 Salary increase 372,377 (329,554) Electricity tariff increase 16,858 (14,976) Medical cost trend 37,603 (33,098)
The sensitivity analysis is based on a change in an assumption while holding all other assumptions constant. In practice, this is unlikely to occur, and changes in some of the assumptions may be correlated. When calculating the sensitivity of the defined benefit obligation to significant actuarial assumptions, the same method i.e. present value of defined benefit obligation calculated using projected unit credit method has been applied.
22.1.11 Maturity Profile Projected contribution / payments during each of the following year:
Contribution made: FY 2017 865,790 - -
Benefit payments: FY 2017 257,140 43,454 16,015
FY 2018 499,203 41,501 16,450
FY 2019 590,343 40,131 17,873
FY 2020 696,786 38,773 21,288
FY 2021 725,392 37,378 22,866
FY 2022-26 3,628,801 200,652 132,245 22.1.12 Plan duration June 30, 2016 7.80 8.40 8.60 June 30, 2017 8.00 8.50 8.30
The weighted average of plan duration was 8.0 years on June 30, 2017 and 7.9 years on June 30, 2016. 22.1.13 Based on actuarial advice, the Company intends to charge approximately Rs. 663 million, Rs. 51 million and Rs. 32 million in respect of gratuity, medical benefits and electrical benefits schemes, respectively, for the year ended June 30, 2018. 22.1.14 Accumulating leaves This represent liabilities for eligible employees accumulating earned leaves in respect of outstanding leave encashment payments.
23. DEFERRED REVENUE
Opening balance 18,065,386 17,300,219 Recoveries from customers during the year 23.1 3,659,773 2,167,952 21,725,159 19,468,171
Amortization for the year 38 (1,531,800) (1,402,785) 20,193,359 18,065,386
(Rupees in ‘000)2017 2016
Note
(Rupees in ‘000)
Medical benefits
Electrical benefits
Gratuity
(Years)
Medical benefits
Electrical benefits
Gratuity

KE Annual Report 2017 | 104
23.1 This represents non-interest bearing recoveries from the consumers towards the cost of service connection, extension of mains and street lights.
24 DEFERRED TAXATION 24.1 The deferred tax balance as at June 30, 2017 comprise of the following:
Deferred tax liability on:
Accelerated tax depreciation (32,226,772) 7,005,666 (25,221,106) (1,771,262) - (26,992,368) Surplus on revaluation of property, plant and equipment (23,203,381) 1,788,950 (21,414,431) 2,216,177 (1,204,056) (20,402,310) (55,430,153) 8,794,616 (46,635,537) 444,915 (1,204,056) (47,394,678) Deferred tax assets on:
Available tax losses 31,181,314 (1,694,944) 29,486,370 (1,619,375) - 27,866,995
Provision for gratuity and compensated absences 1,724,386 (181,311) 1,543,075 (173,900) 95,410 1,464,585 Others 13,967,505 1,035,589 15,003,094 3,060,004 - 18,063,098 46,873,205 (840,666) 46,032,539 1,266,729 95,410 47,394,678 (8,556,948) 7,953,950 (602,998) 1,711,644 (1,108,646) -
24.2 As at June 30, 2017, the Company has aggregated deferred tax debits amounting to Rs. 113,304 million (2016: Rs. 118,780 million) out of which deferred tax asset amounting to Rs. 47,395 million (2016: Rs. 46,033 million) has been recognised and remaining balance of Rs. 65,909 million (2016: Rs. 72,747 million) remain unrecognised. As at year end, the Company’s carried forward tax losses amounted to Rs. 312,588 million (2016: Rs. 340,779 million), out of which business losses amounting Rs. 157,072 million (2016: Rs. 200,414 million) have expiry period ranging between 2018 and 2023.
25. TRADE AND OTHER PAYABLES Trade creditors Power purchases 48,607,487 35,355,486 Fuel and gas 20,225,897 23,396,802 Others 4,980,004 3,998,847 73,813,388 62,751,135 Murabaha finance facilities 25.1 3,145,500 500,000 Accrued expenses 25.2 4,106,631 3,595,096 Advances / Credit balances of consumers Energy 25.3 1,868,780 1,719,016 Others 25.4 1,960,560 1,712,708 3,829,340 3,431,724 Other liabilities Unclaimed and unpaid dividend 650 650 Employee related dues 149,549 138,042 Payable to provident fund 66,252 50,909 Electricity duty 25.5 2,675,755 3,949,256 Tax deducted at source 25.5 150,027 86,993 PTV license fee 25.5 398,518 613,566 Derivative financial liabilities 25.6 34,458 24,430 Workers’ Profits Participation Fund 25.7 3,691,394 3,228,537 Workers’ Welfare Fund 25.8 944,391 1,294,080 Payable to the Managing Agent - PEA (Private) Limited 28,871 28,871 Others including clawback 30.1.2 27,178,077 27,082,032 35,317,942 36,497,366 120,212,801 106,775,321
(Rupees in ‘000)2017
(Restated)2016
Note
Balance as at July 1,
2015
Recognised in profit and loss
account
---------------------------- (Rupees in ‘000) ------------------------------
Balance as at June 30,
2016
Recognised in profit and loss account
(Note 18)
Recognised in equity(Note 18)
Balance as at June 30,
2017

105 | KE Annual Report 2017
25.1 This includes murabaha financing facility under Islamic mode of financing to meet the Company’s working capital requirements amounting to USD 30 million (2016: Nil), for a period of six months. The facility is so structured that the Company’s cost is effectively 3-month KIBOR minus 0.08% and is secured against joint pari passu hypothecation charge over current assets and charge over specific fixed assets. 25.2 These include an aggregate sum of Rs. 958 million (2016: Rs. 764 million) representing outstanding claims / dues of property taxes, water charges, ground rent and occupancy value payable to various government authorities. 25.3 These represent amount due to the consumers on account of excess payments and revision of previous bills. 25.4 These represent general deposits received from consumers, in respect of meters, mains & lines alteration, scrap sales, etc. 25.5 Electricity duty, tax deducted at source and PTV license fee are collected by the Company from the consumers on behalf of the concerned authorities.
25.6 Derivative financial liabilities
Cross currency swap 34,458 24,430
25.6.1 The Company entered into multiple cross currency swaps arrangement with commercial banks in connection with foreign currencies borrowings as disclosed in notes 20.3 and 20.4 respectively. Pursuant to the agreements, the Company’s foreign currency borrowings up to USD 9.3 million (2016: USD 8 million) and EUR 5.1 million (2016: EUR 1.30 million) were converted into hedged Pakistani Rupee amount and the interest rate accruing thereon is payable to the hedging bank at 3 month KIBOR plus spread ranging from negative 95 to positive 20 basis points. 25.6.2 The above hedge of exposures arising due to variability in cash flows owing to interest / currency risks were designated as cash flow hedges by the management of the Company.
25.7 Sindh Companies Profit (Workers Participation) Act, 2015 (SWPPF Act) was enacted on April 22, 2016 and is applicable retrospectively with effect from July 1, 2011. Subsequent to the year ended June 30, 2017, Sindh Revenue Board (SRB) issued show cause notices to the Company for the years 2012 and 2013 for payment of leftover amounts out of the annual allocation to the fund constituted under Workers Welfare Fund Ordinance, 1971. The Company has challenged SWPPF Act before the High Court of Sindh and obtained stay order based on the contention that the Company is a trans-provincial entity and that the retrospective application of SWPPF can not be enforced. However, based on prudence a provision of Rs. 3.7 billion in respect of years 2012 to 2017 is being maintained in these financial statements. 25.8 The Supreme Court of Pakistan (SCP) vide its judgement dated November 10, 2016, has upheld the view of Lahore High Court and decided that Workers Welfare Fund (Federal WWF) is not a tax and hence the amendments introduced through the Finance Act, 2006 and the Finance Act, 2008 are ultra vires to the Constitution of Pakistan. In view of the said decision of the SCP, the Company having taxable losses, after consulting with its legal advisers has during the year reversed the Federal WWF liability amounting to Rs. 350 million relating to the financial years 2012 to 2014. The Federal Board of Revenue has filed a Civil Review Petition in respect of above judgement of the SCP which is pending for decision.
Further, Sindh Workers Welfare Fund Act, 2014 (SWWF) was enacted on June 4, 2015, which requires every industrial undertaking in the Province of Sindh to pay 2% of its total income as SWWF. The Company has received show cause notices for the years 2015 and 2016 from Sindh Revenue Board (SRB) for the payment of SWWF. The Company has challenged the applicability of SWWF before the High Court of Sindh and has obtained stay orders. However, based on the advice of legal expert and prudence a provision of Rs. 944 million in respect of years 2015 and 2016, for which show cause notices have been received, is recorded in these financial statements.
(Rupees in ‘000)2017 2016

KE Annual Report 2017 | 106
26. ACCRUED MARK-UP
Mark-up on Long-term financing 20 106,014 132,596 Mark-up on borrowings relating to Financial Improvement Plans 15,357 15,357 Mark-up on short term borrowings 27 136,798 52,874 Interest on consumer deposits 30.1.6 282,200 - Financial charges on delayed payment to suppliers 26.1 5,268,823 5,268,823 5,809,192 5,469,650
26.1 This represents financial charges accrued on net basis in respect of power purchased and gas supplied (refer note 30.1.1). 27. SHORT-TERM BORROWINGS – secured From banking companies: Bills payable 27.1 350,147 7,827,860 Short-term running finances 27.2 10,498,941 6,993,020 Short-term loans 27.3 426,208 345,142 Structured invoice financing 27.4 4,043,337 2,599,967 15,318,633 17,765,989
From others: KES Power Limited - Holding Company 27.5 36,870 45,088 KE Azm Certificates 27.6 496,647 492,456 KE Azm Sukuk Certificates 27.7 1,425,856 5,048,390 27.8 17,278,006 23,351,923
27.1 These are payable to various commercial banks at a maturity ranging from 30 to 90 days from the date of discounting in respect of payments made to fuel and oil suppliers of the Company and Independent Power Producers (IPPs) and are secured against charge on specific fixed operating assets and joint pari passu hypothecation charge over current assets of the Company. 27.2 The Company has arranged various facilities for short-term running finances from commercial banks, on mark-up basis. These are for a period of one year and carry mark-up of 1 to 3 months KIBOR plus 0.02% to 1.40% per annum. These finances are secured against joint pari passu hypothecation charge over current assets and charge over specific fixed assets. In addition, demand promissory notes in respect of the above mentioned facilities have also been furnished by the Company. 27.3 This includes short-term loan amounting to Rs. 426 million (2016: Rs. 345 million), being Pakistan Rupee equivalent of USD 4.1 million, availed from a commercial bank at 3-month LIBOR plus 1.5%. This facility is secured against joint pari passu hypothecation charge over current assets and charge over specific fixed assets. 27.4 This represents structured working capital finance facility obtained from various commercial banks for financing of vendors’ / suppliers’ payments and carries mark-up ranging from KIBOR minus 0.20% to KIBOR plus 0.25% for relevant period, with maximum repayment dates of 90 days from each invoice financed. These are secured against joint pari passu hypothecation charge over current assets and charge over specific fixed assets. 27.5 This represents excess funds received from KES Power limited (Holding Company) while subscribing its share of right issue, and USD 0.25 million paid by KES Power Limited to a supplier as deposit on behalf of the Company. During the year, the Company has settled certain portion of the aggregate dues by adjusting the expenses incurred by the Company on behalf of KES Power Limited. 27.6 This represents the outstanding balance of 100,000 certificates having original face value of Rs. 5,000, net off unamortized transaction cost due to mature by August 2017. The profit payments on these certificates are based on the fixed rate of 15.5% per annum. As at June 30, 2017, the certificate holders had the option for early repayment. These certificates are secured by way of exclusive hypothecation over certain specific consumer receivable and specific fixed assets.
(Rupees in ‘000)2017 2016
Note
(Rupees in ‘000)2017 2016
Note

107 | KE Annual Report 2017
27.7 This represents the outstanding balance of 300,000 listed Sukuk certificates having original face value of Rs. 5,000 net off amortized transaction cost due to mature by March 2019. The profit payments on these certificates are based on 3-month KIBOR + 2.75%. As of June 30, 2017, the Sukuk holders had the option for early repayment. These Sukuk certificates are secured by way of exclusive hypothecation charge on specific fixed operating assets. 27.8 The bifurcation of short term borrowings from banking and other companies under conventional and shariah compliant mode is as follows:
Conventional:
Bills payable 350,147 7,827,860 Short-term running finances 9,370,661 4,751,948 Short-term loan 426,208 345,142 Structured invoice financing 4,043,337 2,599,967 KES Power Limited - Holding Company 36,870 45,088 KE Azm Certificates 496,647 492,456 14,723,870 16,062,461 Shariah compliant: Short-term running finances 1,128,280 2,241,072 KE Azm Sukuk certificates 1,425,856 5,048,390 2,554,136 7,289,462
17,278,006 23,351,923 28. SHORT-TERM DEPOSITS Service connection deposits 28.1 3,656,362 4,240,174 Suppliers’ security deposits 66,718 90,333 Earnest / Retention money 28.2 1,901,483 3,113,632 5,624,563 7,444,139
28.1 These include non - interest bearing amounts deposited by the consumers in respect of service connections, extension of mains and street lights. The same are refundable if related work is not completed by the Company. Upon completion of work, these deposits are transferred to deferred revenue (note 23).
28.2 These include non-interest bearing refundable / adjustable deposits received from various contractors / suppliers.
29. PROVISIONS Balance at beginning of the year 9,978 9,978 Provision recognized during the year 36,472 - Balance at end of the year 46,450 9,978
29.1 This represents provision in respect of fatal accident cases. The addition represents management’s best estimate for the settlement of on going fatal accident related cases. 30. CONTINGENCIES AND COMMITMENTS 30.1 Contingencies 30.1.1 Mark-up on overdue balances with National Transmission and Dispatch Company (NTDC) / Central Power Purchase Agency (CPPA), major government owned power supplier, has not been accrued in these financial statements. With effect from June 2015, the CPPA has assumed the central power purchase division of NTDC along with the related assets, rights and liabilities of NTDC, including alleged receivables from the Company. The Company is of the view that in accordance with the mechanism defined in the Power Purchase Agreement (PPA) dated January 26, 2010 with NTDC, NTDC’s dues are to be settled by the MOF through payment of the Company’s tariff differential claims directly to NTDC. Up to June 30, 2017 MOF has released the Company’s tariff differential claims aggregating Rs. 365,847 million directly to NTDC / CPPA. Additionally, the Company has directly paid Rs. 15,653 million up to June 30, 2017 to NTDC / CPPA on account of its outstanding dues on an agreed mechanism. The PPA with NTDC has
(Rupees in ‘000)2017 2016
(Rupees in ‘000)2017 2016
Note

KE Annual Report 2017 | 108
expired on January 25, 2015. However, the supply of electricity of 650 Megawatts (MW) continues in line with the High Court of Sindh’s order dated February 6, 2014. Accordingly, to date NTDC / CPPA continues to raise invoices in line with terms of PPA. Discussions with NTDC / CPPA are underway for the renewal of PPA. Subsequent to the year end on June 22, 2018, NTDC / CPPA filed a suit in the Civil Court of Islamabad for recovery of Rs. 83,990 million up to May 2018, comprising of principal amounting to Rs. 66,347 million and mark-up thereon amounting to Rs. 17,643 million, the decision of which is pending to date. Within the alleged claims filed by NTDC / CPPA in the aforementioned suit, release of tariff differential claims amounting to Rs. 15,021 million was unilaterally adjusted by NTDC / CPPA against the disputed mark-up claim. This was subsequently corrected by NTDC / CPPA and adjusted against the principal balance (resulting in decrease in principal amount with corresponding increase in mark-up), as confirmed from invoices and correspondence received afterwards. NTDC / CPPA’s claim for mark-up on outstanding amount is on the premise that while the outstanding amounts were to be adjusted against tariff differential claims, the Company is eventually responsible for payments of all outstanding amounts, including mark-up. However, the Company has not acknowledged the disputed mark-up claimed by NTDC / CPPA as debt, as the Company is of the view that the disputed mark-up claims would not have arisen in case tariff differential claims payments, including payments related to claims of unrecovered cost due to 4% capping and gas load management plan were released to NTDC / CPPA by the MOF on behalf of the Company on timely basis. In addition to above, the mark-up claimed by Sui Southern Gas Company Limited (SSGC) through its monthly invoices from July 2010 to June 2017 aggregates to Rs. 50,891 million, which has not been accrued by the Company. In view of the Company, the unilateral reduction of gas by SSGC in year 2009-10, in violation of the Economic Coordination Committee (ECC) allocation and Head of Term Agreement dated July 31, 2009, led to increased consumption of furnace oil, which coupled with non-payment by government entities as more fully explained below, significantly affected the Company’s liquidity and hence the mark-up claim is not tenable.
In the year 2013, SSGC filed a suit in the High Court of Sindh for recovery of unpaid gas consumption charges and interest thereon and the damages amounting to Rs. 45,705 million and Rs. 10,000 million, respectively. The Company also filed a suit against SSGC in the High Court of Sindh for recovery of damages / losses of Rs. 59,600 million resulting from SSGC’s failure to comply with its legal obligation to supply the allocated and committed quantity of 276 MMCFD of natural gas to the Company. Both these suits are pending adjudication to date. Further, the Company entered into a payment plan with SSGC in the year 2014 and subsequently renewed the plan in years 2015 and 2016, which provided for a mechanism for payment of principal arrears by the Company on supply of adequate gas by SSGC. The dispute of mark-up claim has also been mentioned in the payment plan. The Company’s management is of the view that the principal payments made by the Company to SSGC have been unilaterally adjusted by SSGC against SSGC’s disputed mark-up claim, which is in violation of the payment plan which clearly mentions that the payments are to be adjusted against outstanding principal balances and hence any adjustment against the mark-up by SSGC in the Company’s view is not tenable. The Company’s management believes that overdue amounts have only arisen due to circular debt situation caused by delayed settlement of tariff differential claims by the MOF as well as delayed settlement of the Company’s energy dues by certain public sector consumers i.e. (KW&SB), the dues of which have been guaranteed by the GoP under the Implementation Agreement dated November 14, 2005 and amended through the Amended Agreement dated April 13, 2009 (“IA”); and Government Of Sindh (GOS) departments and entities (GOS Entities). Given that NTDC and SSGC are both majorly owned and controlled by the GoP and considering that tariff differential claims and energy dues of KW&SB (guaranteed by the GoP under the Implementation Agreement) are Company’s receivables from the GoP and energy dues of GOS Entities are also receivable from GOS, the Company’s management is of the view that the settlement of these outstanding balances will be made on a net basis. Further, this contention of the Company’s management is also supported by the legal advices that it has obtained. Hence, mark-up / financial charges will be payable by the Company only when it will reciprocally receive mark-up on outstanding balances receivable from the Company’s outstanding tariff differential claims and energy dues of public sector consumers. Without prejudice to the aforementioned position of the Company and solely on the basis of abundance caution, a provision amounting to Rs. 5,269 million is being maintained by the Company in these financial statements on account of mark-up on delayed payment. 30.1.2 The Multi Year Tariff (MYT) applicable to the Company, for the previous tariff control period from 2009 to 2016, outlines a clawback mechanism whereby the Company is required to share a portion of its profits with consumers when such profits exceed the stipulated thresholds. NEPRA vide its determination orders dated October 17, 2014, June 10, 2015, July 24, 2018 and November 01, 2018 has determined claw-back amount of Rs. 43,601 million for the financial years 2012 to 2016. The Company is not in agreement with the interpretation and calculation of clawback mechanism performed by NEPRA, and accordingly has filed suits in the High Court of Sindh, praying that while finalizing the claw-back determination in respect of the financial years 2012 to 2016, NEPRA has misapplied the claw back formula as prescribed in the MYT

109 | KE Annual Report 2017
determination dated December 23, 2009. Amongst others, NEPRA has unlawfully included ‘accumulated losses’ as part of reserve, not taken into account ‘surplus on revaluation of property, plant and equipment’ and calculated the claw-back on notional (EBIT) instead of EBIT based on audited financial statements. On June 19, 2015, in respect of suit for financial years 2012 and 2013, the High Court of Sindh (Single Bench) passed an order suspending the earlier relief granted to the Company against implementation of NEPRA’s order dated October 17, 2014, which was duly contested by the Company through an appeal before the High Court of Sindh (Divisional Bench), the adjudication of which is pending to date. However, the decision dated June 19, 2015 has been suspended and interim relief against implementation of NEPRA’s order dated October 17, 2014 continues. Further, in other suits filed in respect of financial years 2014 to 2016, the interim relief provided to the Company against NEPRA’s order for each year continues in the field.
Considering the above proceedings and the expert opinion obtained by the Company, the Company’s management considers that the Company has a good case and expects favourable outcome of the suits pending before the High Court of Sindh. Without prejudice to the Company’s aforementioned legal position and on the basis of abundant caution, a provision amounting to Rs. 25,232 million is being maintained by the Company in these financial statements, in this respect. 30.1.3 On January 22, 2015, NEPRA issued an order directing the Company to discontinue charging of meter rent to the consumers and refund the total amount collected to the consumers and also imposed a fine of Rs. 10 million, on the Company. The Company filed a review application to NEPRA against the aforementioned order and challenged the order on various grounds including that the direction issued by NEPRA is ultra vires and also that NEPRA has ignored certain provisions of its own rules and regulations which allows the Company to charge meter rent from its consumers. The review application filed by the Company with NEPRA was dismissed in April 2015. Thereafter, the Company filed a constitutional petition before the High Court of Sindh, which is pending to date. Meanwhile, a stay has been granted to the Company against any coercive action by NEPRA. The Company’s management in accordance with the advice of its legal advisor expects a favorable outcome of the above-mentioned constitutional petition. However, on the basis of prudence and as an abundant caution the Company carries a provision of Rs. 326 million in the financial statements on account of meter rent charged from January 22, 2015 up to June 30, 2016. Further, NEPRA has excluded meter rent from “Other Income” component of tariff in the MYT Decision effective from July 01, 2016, accordingly there is no dispute between the Company and NEPRA on the matter of meter rent for the period July 01, 2016 and onwards. 30.1.4 NEPRA through its order dated March 13, 2015 directed the Company not to collect bank charges as a separate revenue from its consumers through monthly billings, as these bank charges were already included in the MYT 2009–16 as part of operations and maintenance cost. NEPRA further directed the Company to refund the amount collected as bank charges to its consumers. The Company refuted NEPRA’s aforementioned order and filed a review petition which was rejected by NEPRA through its review decision dated October 27, 2015. Thereafter, the Company filed a suit before the High Court of Sindh which is pending to date. Meanwhile, through an interim order dated November 17, 2015 by the High Court of Sindh, NEPRA has been restrained from taking any coercive action against the Company in this regard. The Company, is of the view that such charges are being collected from the customers as per the directives of the State Bank of Pakistan and as per NEPRA’s approval dated July 21, 2010 issued in this regard and these were never made part of MYT 2009–16. Therefore, in accordance with the advices obtained from its legal advisors, the Company is confident of a favorable outcome of this matter, and accordingly, no provision has been recognised in this respect. Further, NEPRA has separately included bank charges in the operations and maintenance’ component of tariff in the MYT Decision effective from July 01, 2016, accordingly there is no dispute between the Company and NEPRA on the matter of bank charges for the period July 1, 2016 and onwards. 30.1.5 The Supreme Court, in its judgment dated August 22, 2014 in civil appeal declared that the levy of GIDC under Gas Infrastructure Development Cess Act, 2011 was unconstitutional and all amounts collected by the gas companies were due to be refunded back to the consumers. The Federal Government on September 24, 2014, promulgated Gas Infrastructure Development Cess (GIDC) Ordinance, 2014. Under that Ordinance, the Federal Government again levied GIDC chargeable on gas consumers (both power sector and industrial) other than domestic consumers and also fixed the responsibility of charging and collection of GIDC on gas companies. This Ordinance retrospectively validated the cess collected / levied or paid under the previous Gas Infrastructure Development Cess Act, 2011 which had been held illegal by the Supreme Court.

KE Annual Report 2017 | 110
In October 2014, SSGC in its monthly bills issued to the Company, claimed GIDC amounting to Rs. 1,925 million, excluding GST, for the period from July to September 2014. The Company filed a fresh legal suit before the Honourable High Court of Sindh. The Honourable Sindh High Court through its order dated October 21, 2014, granted stay and restrained the Federal Government and SSGC from raising any demand which continues till date. The GIDC Ordinance lapsed on January 24, 2015, and therefore all amounts previously paid by the Company to SSGC amounting to Rs. 4,672 million in respect of GIDC became immediately due and recoverable from SSGC. On May 23, 2015, GOP after having approval from the parliament promulgated the GIDC Act 2015 again levying cess on gas consumers and made the gas companies responsible to collect the cess. The Company again filed a suit in the Sindh High Court challenging the GIDC Act 2015 and through its counsel maintains that certain grounds were not taken into consideration while passing GIDC Act 2015. The Court while granting stay issued notices to the respondents and restrained SSGC from raising any demand under the GIDC Act 2015. Single bench of High Court of Sindh through its single judgment (by consolidating all similar cases) dated 26 October 2016, held the GIDC Act 2011, GIDC Ordinance 2014 and GIDC Act 2015 to be ultra vires and un-constitutional and amount collected in pursuance of the above laws is liable to be refunded / adjusted in the future bills. Subsequently, GOP filed an appeal before the divisional bench of High Court of Sindh challenging the above judgment (in respect of few other parties), whereby the decision of the single bench was suspended by the double bench of High Court of Sindh on November 10, 2016. In the eventual outcome, the amount payable by the Company, if any, on account of GIDC will be ultimately recovered through tariff mechanism. 30.1.6 As part of MYT decision, NEPRA has directed the Company to pay interest on security deposit collected from consumers. However, the Company, disagrees with the direction of NEPRA, being without any lawful justification and discriminatory as no other utility in Pakistan is required to pay interest on security deposit. Accordingly, the Company filed a CP 3810 of 2019 in the High Court of Sindh on May 30, 2019. The High Court of Sindh through its order dated May 30, 2019 has restrained NEPRA from taking any coercive action against the Company. Based on the advice of the legal advisor, the Company’s management expects a favorable outcome of the suit. However, on the basis of prudence and as an abundant caution, a provision amounting to Rs. 282 million has been recognized in this respect. 30.2 Claims not acknowledged as debts 30.2.1 A claim amounting to Rs. 73 million, was lodged by (PASMIC) in respect of right of way charges for transmission line passing through the premises of PASMIC. The said claim has been calculated on the basis of the minutes of the meeting held on July 19, 1994 wherein the key terms were subject to approval of the Company and PASMIC which was not duly approved. The Company vide its letter dated June 27, 2007 refuted the aforementioned claim of PASMIC’s on the grounds that as per section 12 and section 51 of the Electricity Act, 1910, any licensee is permitted to lay down or place electric supply lines with the permission of local authority or the occupier of that land, subject to conferment of powers under Part III, of the Telegraph Act, 1885. Moreover, public utility is also barred from payment of annual rentals to any authority under Electricity Act, 1910 and that the claim is time barred. Further, the Company was issued license from provincial government and all concessions and the permissions for such exemptions are provided in the license. Based on the above mentioned facts, the Company is not liable to pay any amount, whatsoever, in this regard and therefore has not acknowledge the aforementioned claim as debt.
30.2.2 Fatal accident cases 30.2.5 92,773 3,123,697
30.2.3 Architect’s fee in respect of the Head Office project 30.2.5 50,868 50,868
30.2.4 Outstanding dues of property tax, water charges, custom duty, ground rent and occupancy value 30.2.5 7,365,004 6,945,702
30.2.5 The Company is party to number of cases in respect of fatal injuries, billing disputes, property tax, water charges, custom duty, occupancy charges, ground rent, rent of electric poles and cable and employee related cases. Based on the opinion of Company’s lawyers, the management is confident that the outcome of the cases will be in favour of the Company. Accordingly, no provision has been made in respect of those cases in these financial statements.
(Rupees in ‘000)2017 2016
Note

111 | KE Annual Report 2017
30.3 Commitments 30.3.1 Guarantees from banks 25,425 1,105,360
30.3.2 DPKPG project The Company entered into the Shareholders’ Agreement dated May 20, 2016, for the development of a 700MW (2 x 350 MW) coal-based power plant (the project) at Port Qasim, Karachi under an IPP structure. In this respect a project company i.e. Datang Pakistan Karachi Power Generation Limited (DPKPG) has been incorporated on May 26, 2016. The sponsors of the Project include China Datang Overseas Investment Company Limited (CDTO) having 51% shareholding, China Machinery Engineering Corporation (CMEC) having 25% shareholding and KE having 24% shareholding in DPKPG. The principal operations of DPKPG will be to carry out the business of power generation and sell electricity to KE under a Power Purchase Agreement (PPA). Subsequent to the year end on March 20, 2019, the Company entered into a MoU with CDTO and CMEC wherein CDTO has agreed to sell its entire shareholding in DPKPG to the Company as per the terms of the Share Purchase Agreement to be entered into by CDTO and the Company. Upon completion of the transaction, the Company’s shareholding in DPKPG will increase to 75% from 24%.
30.3.3 Transmission projects 1,084,564 1,869,653
30.3.4 Transmission Project (TP-1000) 37,359,875 28,504,718
30.3.5 Outstanding letters of credit 5,509,053 3,174,680
30.3.6 Generation projects - KGTPS-II & SGTPS-II steam turbines 476,237 500,057
30.3.7 Dividend on preference shares 1,119,453 1,119,453
The Company has not recorded any dividend on redeemable preference shares in view of certain restrictions on dividend placed under the loan agreements with certain local and foreign lenders.
30.3.8 Commitments for rentals under operating lease agreements in respects of vehicles are as follows:
- Not later than one year 142,517 55,523
- Later than one year but not later than five years 570,069 222,092
These commitments are under Ijarah facilities obtained from a Islamic bank having a tenure of 3 to 5 years. These are secured against promissory notes.
31. SALE OF ENERGY – net Residential 31.1 80,357,970 78,019,592 Commercial 31.1 36,840,798 36,518,888 Industrial 31.1 45,678,646 49,976,020 Karachi Nuclear Power Plant (KANUPP) 31.1 141,871 100,374 Pakistan Steel Mills Corporation (Private) Limited (PASMIC) 823,368 869,082 Fuel surcharge adjustment 31.2 971,174 (1,715,619) Others 31.1 & 31.3 3,755,386 2,748,989 168,569,213 166,517,327
(Rupees in ‘000)2017 2016
(Rupees in ‘000)2017 2016
(Rupees in ‘000)2017 2016
(Rupees in ‘000)2017
(Restated)2016
Note

KE Annual Report 2017 | 112
31.1 The above includes net cycle day impact amounting to Rs. 1,508 million (2016: Negative Rs. 230 million). 31.2 This represents monthly fuel surcharge adjustment as per mechanism provided in MYT decision . The said amount has been / will be charged to the consumers subsequently as per notification by Ministry of Energy (Power). 31.3 This includes Rs. 2,809 million (2016: Rs. 2,423 million) in respect of supply of energy through street lights. 31.4 The above sales are net of sales tax of Rs. 33,477 million (2016: Rs. 31,061 million) on account of sale of energy.
32. TARIFF ADJUSTMENT Tariff adjustment 32.1 and 32.2 15,285,893 22,089,527
32.1 This represents tariff differential subsidy claim for variation in fuel prices, cost of power purchases, operation and maintenance cost, and adjustments required as per NEPRA’s MYT decision and those resulting in adjustment of tariff due from Government. 32.2 Includes Rs 6,195 million (comprising of 79,620 customers) recognized during the year against actual write-off of bad debts, as allowed by NEPRA under the MYT decision for the period from July 1, 2016 to June 30, 2023, through the decision dated July 5, 2018. The write-off amount has been claimed by the Company on May 27, 2019 on a provisional basis as part of quarterly tariff adjustment for the fourth quarter ended June 30, 2017 aggregating to Rs. 7,104 million.
As required under the aforementioned NEPRA decision of July 5, 2018, for the purpose of claim of tariff adjustment in respect of actual write-off of bad debts, the Company ensured the following mandatory procedures: - The defaulter connection against which the bad debts have been written off were disconnected prior to June 30, 2017 and the customers were inactive in the Company’s system i.e. SAP up to June 30, 2017. - The aforementioned amount of write-off of bad debts has been approved by the Company’s Board of Directors, certifying that the Company has made all best possible efforts to recover the amount being written-off in accordance with the “Policy and Procedures for Write-off of Bad Debts”.
- The actual write-off of bad debts has been determined in accordance with the terms of write-off detailed in the “Policy and Procedures for Write-off of Bad Debts”, as approved by the Board of Directors of the Company.
Further, the statutory auditors of the Company verified that the write-off of bad debts amount is not-recoverable notwithstanding the efforts of the Company. In case any amount written-off, as included in the aforementioned claim, is subsequently recovered from the customer, the recovered amount shall be adjusted in next year’s tariff, as required under the aforementioned NEPRA decision of July 5, 2018. In respect of all the defaulter connections, against which the aforementioned write-off amount has been claimed by the Company as tariff adjustment for the year ended June 30, 2017, the Company in addition to the defaulter customer identification and traceability procedures mentioned in the “Policy and Procedures for Write-off of Bad Debts” has carried out physical surveys for establishing the fact that the defaulter connection is physically disconnected and the defaulter customer who utilised the electricity is untraceable or recovery in the present circumstances is not possible. There are number of locations / premises which were removed as a result of anti-encroachment drives by the government authorities, whereas, in a number of other cases the premises to which electricity was supplied is no more traceable due to change in either the mapping of the area (including unleased area), demolition of the original premises, structural changes (including division of single premises into many) to the original premises and discontinuation / demolition of single bulk PMT connection. In all of these cases due to the specific situation the connection and / or premises are no more traceable. In addition, there are certain defaulter customers; who were not able to pay off their outstanding dues, in various forms including outstanding amounts on hook connection at the time of transfer of defaulter customers to metered connections and other settlements. Accordingly, the same has been claimed as part of write-off for the year ended June 30, 2017 and corresponding amount has been claimed in the tariff adjustment after verifying underlying facts.
(Rupees in ‘000)2017
(Restated)2016
Note

113 | KE Annual Report 2017
33. PURCHASE OF ELECTRICITY
Central Power Purchasing Agency (CPPA-G) / NTDC 40,038,820 37,173,889 Independent Power Producers (IPPs) 18,503,195 14,633,984 Karachi Nuclear Power Plant (KANUPP) 3,123,222 2,499,448 Pakistan Steel Mills Corporation (Private) Limited (PASMIC) - 1,910 61,665,237 54,309,231 34. CONSUMPTION OF FUEL AND OIL Natural gas 29,451,834 40,109,446 Furnace and other Fuel / oil 32,014,749 17,156,869 61,466,583 57,266,315
35. EXPENSES INCURRED IN GENERATION, TRANSMISSION AND DISTRIBUTION
Salaries, wages and other benefits 35.1 & 35.2 1,620,423 2,505,932 4,126,355 3,795,934 Stores and spares 1,188,583 300,756 1,489,339 1,286,474 Office supplies 34,276 61,124 95,400 70,400 NEPRA license fee 25,631 40,051 65,682 65,784 Repairs and maintenance 12,248 245,505 257,753 230,503 Transport expense 32,718 92,261 124,979 75,352 Rent, rates and taxes 191,859 80,440 272,299 205,592 Depreciation 4.1.8 7,647,587 3,774,099 11,421,686 10,990,863 Interdepartmental consumption 16,344 261,244 277,588 283,250 Provision against slow moving and obsolete stores, spare parts and loose tools (124,455) (111,845) (236,300) 98,667 Third party services 1,283,685 1,521,828 2,805,513 2,350,064 Others 470,168 27,689 497,857 423,849 12,399,067 8,799,084 21,198,151 19,876,732
35.1 This includes Rs. 222 million (2016: Rs. 267 million) in respect of defined benefit plans, Rs. 120 million (2016: Rs. 101 million) in respect of defined contribution plan and Rs. 23 million (2016: Rs. 5 million) in respect of other long-term employee benefits. 35.2 Free electricity benefit to employees amounting to Rs. 80 million (2016: Rs. 43 million) has been included in salaries, wages and other benefits.
(Rupees in ‘000)2017 2016
2017 2016Generationexpenses
---------------------- (Rupees in ‘000) ------------------------
Transmission and
distribution expenses
Note

KE Annual Report 2017 | 114
36. CONSUMERS SERVICES AND ADMINISTRATIVE EXPENSES
Salaries, wages and other benefits 36.1 & 36.2 5,700,190 3,028,881 8,729,071 7,859,878 Bank collection charges 170,265 15,661 185,926 23,337 Transport cost 222,551 62,248 284,799 121,684 Depreciation and amortization 4.1.8 & 5.2 1,881,263 194,304 2,075,567 1,993,419 Repairs and maintenance 47,546 94,980 142,526 126,992 Rent, rates and taxes 85,966 17,820 103,786 102,148 Public relations and publicity 66,866 147,219 214,085 218,930 Legal expenses 41,909 106,767 148,676 134,390 Professional charges 36.3 9,349 197,240 206,589 302,503 Auditors’ remuneration 36.4 - 111,000 111,000 13,391 Directors’ fee - - - 2,650 Provision against debts considered doubtful 10.3 18,140,501 - 18,140,501 15,211,165 Office supplies 162,518 158,456 320,974 274,639 Interdepartmental consumption 117,361 45,597 162,958 166,281 Third party services 2,701,529 570,483 3,272,012 3,046,221 Provision against slow moving and obsolete stores, spare parts and loose tools (16,548) (11,060) (27,607) 2,247 Others 613,312 381,985 995,296 1,115,050 29,944,578 5,121,581 35,066,159 30,714,925
36.1 This includes Rs. 465 million (2016: Rs. 530 million) in respect of defined benefit plans, Rs. 253 million (2016: Rs. 202 million) in respect of defined contribution plan and Rs. 47 million (2016: Rs. 10 million) in respect of other long term employee benefits.
36.2 Free electricity benefit to employees, amounting to Rs. 158 million (2016: Rs. 198 million) has been included in salaries, wages and other benefits.
36.3 This includes fee of Rs. 31 million charged by M/s A. F. Ferguson & Co., essentially in connection with the assistance provided to the Company on various matters relating to MYT 2017-23. These services were provided by M/s A. F. Ferguson & Co., prior to their appointment as statutory auditors of the Company.
36.4 Auditors’ remuneration
Fee for statutory audit, half yearly review, and review of compliance with the Code of Corporate Governance 5,000 5,000 3,750 Out of pocket expenses 500 500 310 Fees for additional cost incurred 36.4.1 70,000 30,000 - Fee for other services - - 9,331 75,500 35,500 13,391
36.4.1 This represents additional fee charged for providing permitted services essentially in connection with write off of bad debts verified by the auditors as required under MYT 2017-23 as more fully explained in note 32.2 of these financial statements.
37. OTHER OPERATING EXPENSES Exchange loss - net 37.1 51,050 170,683 Workers’ Profits Participation Fund 25.7 458,512 1,341,476 Workers’ Welfare Fund 25.8 - 536,590 Donations 37.2 86,179 100,250 Listing fee 1,713 2,038 Others 657,396 897,949 1,254,850 3,048,986
(Rupees in ‘000)2017
(Restated)2016
Note
2017 2016Consumer Services and
Billing Expenses
---------------------- (Rupees in ‘000) ------------------------
Administrativeand GeneralExpenses
Note
2017 2016A. F.
Ferguson & Co.
----------------- (Rupees in ‘000) -------------------
BDO Ebrahim
& Co. Note
KPMG Taseer Hadi
& Co.

115 | KE Annual Report 2017
37.1 Includes exchange loss of Rs. 3 million (2016: Rs. 2 million) on derivative financial instruments. 37.2 This includes donation to Injaz Pakistan and Aman Foundation amounting to Rs. 5 million (2016: Rs. 5.3 million) and Nil (2016: Rs. 6.3 million), respectively, where the then Chairman of the Company, i.e. Mr. Waqar H. Siddique is also on Board of Trustees / Directors.
38. OTHER INCOME
Income from financial assets Return on bank deposits 229,344 250,613 Late payment surcharge 38.1 2,479,073 2,158,992 2,708,417 2,409,605 Income from non-financial assets Liquidated damages recovered from suppliers and contractors 265,050 246,981 Scrap sales 277,336 120,132 Amortization of deferred revenue 23 1,531,800 1,402,785 Service connection charges 2,081,816 1,339,601 Collection charges - TV license fee 101,434 97,943 Rental of meters and equipment - 227,171 Gain on disposal of property, plant and equipment 1,323,956 26,594 Gain on sale of assets classified as held for sale 169,652 - Others 939,317 789,491 6,690,361 4,250,698 9,398,778 6,660,303
38.1 In accordance with the Company’s policy, Late Payment Surcharge (LPS) receivable on delayed payment of electricity bills from various Government / Government controlled entities (Public Sector consumers, “PSCs”) amounting to Rs. 7,550 million up to June 30, 2017 (2016: Rs. 6,536 million) has not been recorded in these financial statements and will be accounted for on receipt basis. It is the Company’s management contention that the calculation of LPS on PSCs should be made on the same basis as the accrued interest on delayed payments on account of circular debt situation. If similar basis is adopted, the LPS income amount would substantially increase.
39. FINANCE COST
Mark-up / interest on: - Long term financing 1,855,012 2,041,960 - Short-term borrowings 1,198,071 1,558,172 3,053,083 3,600,132
Late payment surcharge on delayed payment to creditors 2,564 116,548 Bank charges, guarantee commission, commitment fee and other service charges 356,779 485,144 Interest on consumer deposits 30.1.6 282,200 - Letter of credit discounting charges 196,552 897,696 3,891,178 5,099,520
40. TAXATION
Current tax expense (4,087) (1,098,042) Deferred tax credit 24 1,711,644 7,953,950 1,707,557 6,855,908
(Rupees in ‘000)2017 2016
Note
(Rupees in ‘000)2017 2016
Note
(Rupees in ‘000)2017
(Restated)2016
Note

KE Annual Report 2017 | 116
40.1 The Taxation Officer passed assessment orders under section 122 (A) of the Income Tax Ordinance, 2001 in respect of tax years 2010 and 2011 and made certain disallowances resulting in minimum tax liability of Rs. 543 million and Rs. 1,408 million for the tax years 2010 and 2011 respectively. The Taxation Officer held the tariff adjustment (i.e. subsidy) claimed by the Company to be part of turnover for the purpose of computing minimum tax liability and also added back total tax depreciation allowance instead of depreciation related to cost of sales of the Company for the purpose of assessment of minimum tax liability under aforementioned section 113(1) of the Income Tax Ordinance 2001. The appeal filed by the Company against the aforementioned assessment orders, was rejected by the Commissioner Inland Revenue (Appeals) –CIR(A). Subsequently, the Company filed an appeal thereagainst before the Appellate Tribunal Inland Revenue (ATIR). During the previous years, this matter was decided in favor of the Company in its appeals at the level of ATIR for tax years 2004, 2005, 2008, 2010 and 2011. However, for tax years 2010 and 2011 the FBR has preferred an appeal against the decision of ATIR, before the High Court of Sindh, the decision of which is pending to date. Further on similar matter, the Taxation Officer has issued the assessment orders for tax years 2004 to 2008, raising tax demand aggregating to Rs. 399 million. The issues are pending at various appellate forums. The Company’s management based on advice of its tax consultants expects a favourable outcome of these appeals and therefore, no provision in this respect has been made. 40.2 Relationship between tax income and accounting profit The tax on the Company’s profit before tax differs from the theoretical amount that would arise using the Company’s applicable tax rate as follows:
Profit before taxation 8,711,726 24,951,448 Tax at the applicable tax rate of 31% (2016: 32%) (2,700,635) (7,984,463) Tax effect of exempt income 4,738,627 7,068,649 Effects of: - super tax (76,659) (610,089) - minimum turnover tax (1,731,301) (1,515,677) - tax on undistributed reserves (653,379) - - tax credit, un-utilized tax losses and others 2,130,904 9,897,489 1,707,557 6,855,908
41. EARNING BEFORE INTEREST, TAX, DEPRECIATION and AMORTIZATION (EBITDA) Profit before finance cost 12,602,904 30,050,968 Depreciation and amortization 13,497,253 12,984,282 26,100,157 43,035,250
42. EARNINGS PER SHARE - BASIC AND DILUTED There is no dilutive effect on the basic earnings per share of the Company, which is based on: Earning attributable to ordinary share holders 10,419,283 31,807,356
Weighted average number of ordinary shares outstanding during the year 27,615,194,246 27,615,194,246
Earnings per share - basic and diluted 0.38 1.15
(Rupees in ‘000)2017
(Restated)2016
---------(Number of shares)---------
-------------(Rupees)-------------

117 | KE Annual Report 2017
43. REMUNERATION OF CHIEF EXECUTIVE, DIRECTORS AND EXECUTIVES
Directors’ fee (note 43.3) - - - 2,650 - Managerial remuneration (note 43.3) 11,208 - 3,536,341 11,360 355 2,716,493 Bonus (note 43.3) 21,600 - 674,751 - - 389,989 Reimbursable expenses (note 43.3) 149 - 51,180 - - 35,058 Contribution to fund 1,014 - 199,586 1,011 - 132,731 House rent / accommodation 4,529 - 851,476 4,529 145 584,796 38,500 - 5,313,334 16,900 3,150 3,859,067 Number of persons including those who worked part of the year 1 12 1,867 1 12 1,301
43.1 The Executives and Chief Executive Officer (CEO) of the Company are provided with medical facilities. CEO is also provided with car facility and accommodation. 43.2 The Company also makes contributions for Executives and CEO, based on actuarial calculations to gratuity funds. 43.3 Non-executive directors are paid director fees for attending the meeting of Board of Directors and its committees, with no other remuneration. 43.4 Comparative figures have been restated to provided additional information to users of financial statements. However, the difference represents gratuity amounting to Rs. 38 million (2016: 52 million) was paid to outgoing executives.
44. CASH AND CASH EQUIVALENTS Cash and bank balances 14 2,077,916 2,178,070 Short term running finances 27.2 (10,498,941) (6,993,020) (8,421,025) (4,814,950)
45. FINANCIAL INSTRUMENTS BY CATEGORY
Financial assets measured at amortized cost Long-term loans 21,777 25,908 Long-term deposits 13,497 8,297 Trade debts 103,419,754 101,044,031 Short-term investments - 3,000,000 Loans and advances 60,538 45,754 Trade deposits 3,062,878 1,845,380 Other receivable 33,131,412 33,296,413 Cash and bank balances 2,077,916 2,178,070 141,787,772 141,443,853 Financial liabilities measured at amortized cost Long-term diminishing musharaka 17,305,568 21,526,916 Long-term financing 2,841,364 7,588,587 Long-term deposits 8,600,108 7,629,009 Current maturity of long-term diminishing musharaka 4,400,000 - Current maturity of long-term financing 4,433,753 2,926,610 Trade and other payables 115,426,989 76,933,959 Accrued mark-up 5,809,192 5,469,650 Short-term borrowings 17,278,006 23,351,923 Short-term deposits 5,624,563 7,444,139 181,719,543 152,870,793 Financial liabilities measured at fair value Derivative financial liabilities 34,458 24,430
(Rupees in ‘000)2017 2016
Note
(Rupees in ‘000)2017
(Restated)2016
DirectorsDirectors ExecutivesChief Executive
Officer
ExecutivesChief Executive
officer
2017 2016
----------------------------------------- (Rupees in ‘000) -----------------------------------------
KE Annual Report 2017 | 118
Derivative financial liabilities have been classified into level 2 fair value measurement hierarchy and are calculated as the present value of estimated future cash flows based on observable yield. 46. FINANCIAL RISK MANAGEMENT OBJECTIVES AND POLICIES Financial Risk factors The Company has exposure to the following risks arising from financial instruments: - Market Risk - Credit Risk - Liquidity Risk This note presents information about the Company’s exposure to each of the following risks, the Company’s objectives, policies and processes for measuring and managing risks and the Company’s management of capital. Risk management framework The Board of Directors (BoD) have the overall responsibility for the establishment and oversight of the Company’s risk management framework. The BoD has established a Board Finance Committee (the committee), which is responsible for developing and monitoring the Company’s risk management policies. The Committee regularly reports to the BoD on its activities.
The Company’s risk management policies are established to identify and analyse the risks faced by the Company, to set appropriate risk limit and controls and to monitor risks and adherence to limits. Risk management policies and systems are reviewed regularly to reflect changes in market conditions and the Company’s activities. The Company, through its training and management standards and procedures, aims to develop a disciplined and constructive control environment in which all employees understand their roles and obligations. The Company’s Board Audit Committee oversees how management monitors compliance with the Company’s risk management policies and procedures and reviews the adequacy of the risk management framework in relation to risks faced by the Company. The Audit Committee is assisted in its oversight role by the internal audit function. Internal audit undertakes both regular and ad hoc reviews of risk management controls and procedures the results of which are reported to the Audit Committee. The Company’s principal financial liabilities other than derivatives, mainly comprise bank loans, overdrafts and trade payables. The main purpose of these financial liabilities is to raise finance for Company’s operations. The Company has various financial assets such as trade and other receivables, cash and bank balances, short-term deposits, etc. which arise directly from its operations. The Company also enters into derivative transactions, primarily cross currency and interest rate swap contracts. The purpose is to manage currency and interest rate risk from Company’s operation and its source of finance. It is the Company’s policy that no trading in derivatives for speculative purposes shall be undertaken. The Board of Directors reviews and agrees policies for managing each of these risks which are summarized below: 46.1 Market risk
Market risk is the risk that the value of the financial instrument may fluctuate as a result of changes in market interest rates or the market prices of instruments due to change in credit rating of the issuer or the instrument, changes in market sentiments, speculative activities, supply and demand of instruments and liquidity in the market. The Company manages the market risk by monitoring exposure on financial instruments and by following internal risk management policies.
Market risk comprise of three components - currency risk, interest rate risk and other price risk. 46.1.1 Currency risk Currency risk arises mainly where receivables and payables exist due to transactions entered into foreign currencies. The Company primarily has foreign currency exposures in US Dollars, Euro and UK Pound in the form of bank balances (note 14), long term financing (note 20), trade and other payables (note 25) and short term borrowings (note 27). As at June 30, 2017, had the Company’s functional currency strengthened / weakened by 5% against US Dollar, Euro and UK Pound, with all other variables held constant, profit after taxation for the year then ended would have been higher / lower by Rs. 3,075 million (2016: Rs. 3,103 million) mainly as a result of foreign exchange gains / losses.

119 | KE Annual Report 2017
46.1.2 Interest rate risk Interest rate risk is the risk that the fair value or future cash flows of a financial instrument will fluctuate because of changes in market interest rates. The Company’s interest rate risk arises from long-term financing and short-term borrowing facilities for financing its generation, transmission and distribution projects and meeting working capital requirements at variable rates. The Company manages these mismatches through risk management policies where significant changes in gap position can be adjusted. The Company had hedged its interest rate risk on long-term financing through cross currency and interest rate swaps. At the reporting date, the interest rate profile of Company’s interest-bearing financial instruments was:
Fixed rate instruments Financial assets Deposit account 51,378 270,274 Long-term loans 429 1,067 Short-term investment - 3,000,000 Deposit under lien against LC 1,328,539 1,134,517 1,380,346 4,405,858 Financial liabilities Short-term borrowings 496,647 492,456 Variable rate instruments Financial liabilities Long-term diminishing musharaka 17,305,568 21,526,916 Long-term financing 2,841,364 7,588,587 Short-term borrowing 16,744,489 22,814,380 Trade and other payables 3,145,500 500,000 Current portion of long-term financing 4,407,143 2,900,000 44,444,064 55,329,883
Fair value sensitivity analysis The Company does not account for fixed rate financial assets and liabilities at fair value through profit and loss. Therefore a change in interest rates at the reporting date would not affect profit and loss account. Cash flow sensitivity analysis for variable rate instruments If KIBOR / LIBOR had been 1% higher / lower with all other variables held constant, the profit after tax for the year would have been higher / lower by Rs. 444 million (2016: Rs. 553 million). 46.1.3 Other price risk Other price risk is the risk that the fair value of future cash flows of the financial instruments will fluctuate because of changes in market prices such as equity price risk. Equity price risk is the risk arising from uncertainties about future value of investment securities. As at balance sheet date, the Company is not exposed to equity price risk. 46.2 Credit risk Credit risk is the risk of financial loss to the Company if a customer or a counter party to a financial instrument fails to meet its contractual obligation, and arises principally from the Company’s receivables from customers and balances held with banks. Out of the total financial assets as set out in note 45, those that are subject to credit risk aggregated Rs. 64,772 million as at June 30, 2017 (2016: Rs. 54,823 million). The analysis below summarises the credit quality of the Company’s financial assets as at June 30, 2017:
- The Company’s electricity is sold to industrial and residential consumers and government organisations. Due to large number and diversity of its consumer base, concentration of credit risk with respect to trade debts is limited. Further, the Company manages its credit risk by obtaining security deposits from the consumers.
(Rupees in ‘000)2017 2016
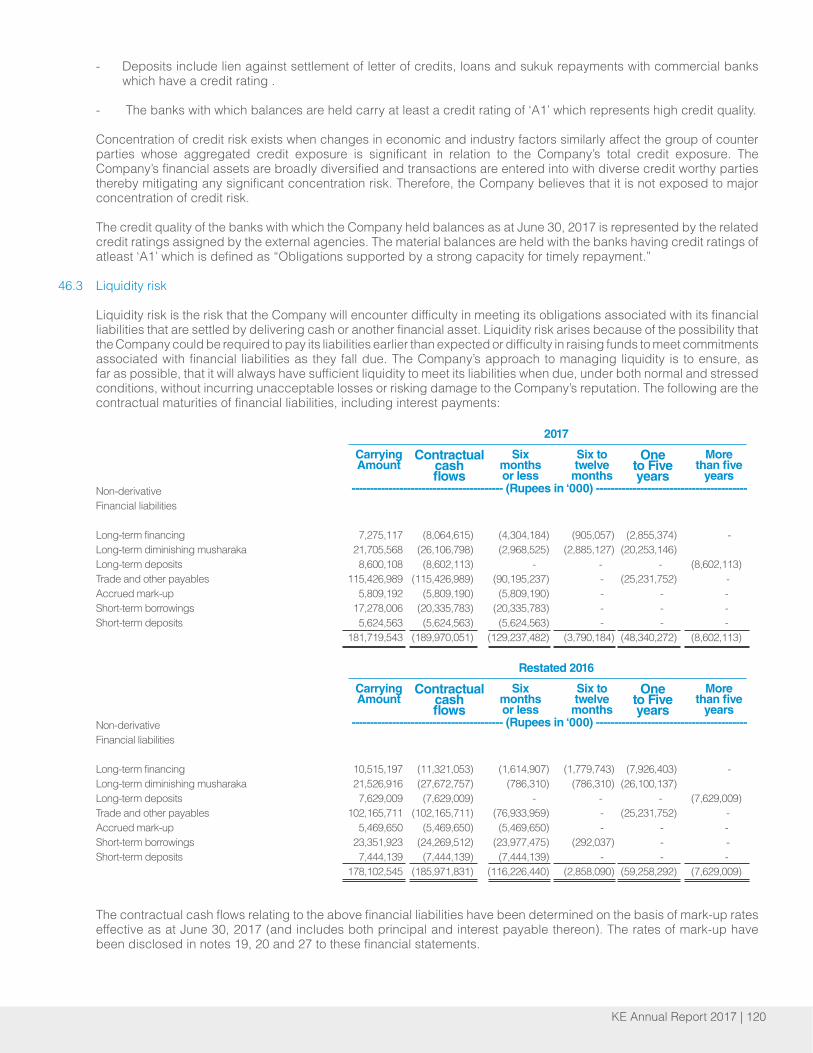
KE Annual Report 2017 | 120
- Deposits include lien against settlement of letter of credits, loans and sukuk repayments with commercial banks which have a credit rating . - The banks with which balances are held carry at least a credit rating of ‘A1’ which represents high credit quality.
Concentration of credit risk exists when changes in economic and industry factors similarly affect the group of counter parties whose aggregated credit exposure is significant in relation to the Company’s total credit exposure. The Company’s financial assets are broadly diversified and transactions are entered into with diverse credit worthy parties thereby mitigating any significant concentration risk. Therefore, the Company believes that it is not exposed to major concentration of credit risk.
The credit quality of the banks with which the Company held balances as at June 30, 2017 is represented by the related credit ratings assigned by the external agencies. The material balances are held with the banks having credit ratings of atleast ‘A1’ which is defined as “Obligations supported by a strong capacity for timely repayment.” 46.3 Liquidity risk Liquidity risk is the risk that the Company will encounter difficulty in meeting its obligations associated with its financial liabilities that are settled by delivering cash or another financial asset. Liquidity risk arises because of the possibility that the Company could be required to pay its liabilities earlier than expected or difficulty in raising funds to meet commitments associated with financial liabilities as they fall due. The Company’s approach to managing liquidity is to ensure, as far as possible, that it will always have sufficient liquidity to meet its liabilities when due, under both normal and stressed conditions, without incurring unacceptable losses or risking damage to the Company’s reputation. The following are the contractual maturities of financial liabilities, including interest payments:
Non-derivative Financial liabilities
Long-term financing 7,275,117 (8,064,615) (4,304,184) (905,057) (2,855,374) - Long-term diminishing musharaka 21,705,568 (26,106,798) (2,968,525) (2,885,127) (20,253,146) Long-term deposits 8,600,108 (8,602,113) - - - (8,602,113) Trade and other payables 115,426,989 (115,426,989) (90,195,237) - (25,231,752) - Accrued mark-up 5,809,192 (5,809,190) (5,809,190) - - - Short-term borrowings 17,278,006 (20,335,783) (20,335,783) - - - Short-term deposits 5,624,563 (5,624,563) (5,624,563) - - - 181,719,543 (189,970,051) (129,237,482) (3,790,184) (48,340,272) (8,602,113)
Non-derivative Financial liabilities
Long-term financing 10,515,197 (11,321,053) (1,614,907) (1,779,743) (7,926,403) - Long-term diminishing musharaka 21,526,916 (27,672,757) (786,310) (786,310) (26,100,137) Long-term deposits 7,629,009 (7,629,009) - - - (7,629,009) Trade and other payables 102,165,711 (102,165,711) (76,933,959) - (25,231,752) - Accrued mark-up 5,469,650 (5,469,650) (5,469,650) - - - Short-term borrowings 23,351,923 (24,269,512) (23,977,475) (292,037) - - Short-term deposits 7,444,139 (7,444,139) (7,444,139) - - - 178,102,545 (185,971,831) (116,226,440) (2,858,090) (59,258,292) (7,629,009)
The contractual cash flows relating to the above financial liabilities have been determined on the basis of mark-up rates effective as at June 30, 2017 (and includes both principal and interest payable thereon). The rates of mark-up have been disclosed in notes 19, 20 and 27 to these financial statements.
One to Five years
Contractual cash flows
Six months or less
Carrying Amount
More than five
years
Six to twelve
months
2017
----------------------------------------- (Rupees in ‘000) -----------------------------------------
One to Five years
Contractual cash flows
Six months or less
Carrying Amount
More than five
years
Six to twelve
months
Restated 2016
----------------------------------------- (Rupees in ‘000) -----------------------------------------

121 | KE Annual Report 2017
46.4 Hedging activities and derivatives The Company uses foreign currency denominated borrowings to manage some of its transactions exposures. These include cross currency swaps which are designated as cash flow hedge and are dealt in accordance with IAS 39 “Financial Instruments: Recognition and Measurement”. Such derivatives qualify for hedge accounting (note 3.8). Cash flow hedges During the year, the Company had held cross currency swaps with commercial banks, designated as cash flow hedges of expected future principal repayments of loan from foreign lenders The cross currency swaps were being used to hedge the currency risk and interest rate risk in respect of long-term financing as stated in notes 20.3 and 20.4 to these financial statements. The critical terms of the cross currency swap contracts have been negotiated to match the terms of the aforementioned financial liability (note 25.6). 47. CAPITAL RISK MANAGEMENT The primary objective of the Company’s capital management is to ensure that it maintains healthy capital ratios in order to support its business, sustain future development of the business and maximize shareholders value. No changes were made in the objectives, policies or processes during the year ended June 30, 2017. The Company manages its capital structure and makes adjustment to it in the light of changes in economic conditions. Investment and financing decisions are made after taking into account the tariff structure under previous MYT determined in 2009 which was applicable till 2016, the company’s financial position and level of accumulated losses and requirements of lenders This necessitated injection of new equity as well as re-investment of profits to strengthen the Company’s financial position to comply with requirements of lenders as well as to fund new projects. Details of adjusted invested equity as at the balance sheet date are given in note 16.9. The Company monitors capital using debt to equity ratios. During the year, the Company’s strategy was to maintain leveraged gearing. The long-term debt to equity ratio as at June 30 is as follows:
Long-term diminishing musharaka 19 17,305,568 21,526,916 Long-term financing 20 2,841,364 7,588,587 Long-term debt 20,146,932 29,115,503
Total equity 136,711,122 121,321,219 Cash flow hedge - 22,163 Total capital 156,858,054 150,458,885
Long-term debt to equity 0.13 0.19
48. TRANSACTIONS AND BALANCES WITH RELATED PARTIES Related parties of the Company comprise of associated companies, state-controlled entities, staff retirement benefit plans, and the Company’s directors and key management personnel. Details of transactions / balances with related parties not disclosed elsewhere in the financial statements are as follows:
48.1 KES Power Limited, Parent Company
Short-term loan payable 36,870 45,088
48.2 OMS (Private) Limited, Associate Services rendered 272,687 14,701
Amount payable included in creditors - 11,349
(Rupees in ‘000)2017 2016
Note
(Rupees in ‘000)2017 2016

KE Annual Report 2017 | 122
48.3 Government related entities The Company has availed the exemption available to it under its reporting framework, and therefore has not provided detailed disclosures of its transactions with government related entities except for transactions stated below, which the Company considers to be significant.
48.4 National Transmission and Dispatch Company (NTDC)
Purchases 40,038,820 37,173,889
Amount payable included in creditors 42,601,487 30,821,726
48.5 Pakistan State Oil Company Limited (PSO) Purchases 30,354,056 15,977,734
Late payment surcharge - 75,370
Amount payable included in creditors 1,488,677 1,165,084
48.6 Sui Southern Gas Company Limited (SSGC) Purchases 29,451,834 40,109,446
Amount payable included in creditors 18,409,025 21,979,552
48.7 BYCO Petroleum Pakistan Limited Amount payable included in creditors 328,195 252,166
Purchases 1,963,515 891,587
Late Payment Surcharge - 27,400
48.8 Key management personnel Managerial remuneration 302,747 229,013
Housing and utilities 166,510 125,815
Other allowances and benefits 317,198 238,516
Retirement benefits 33,832 123,126
Leave encashment - 703
48.9 Provident fund Contribution to provident fund 746,811 607,182
Payable to provident fund 66,252 50,909
48.10 Remuneration to the executive officers of the Company (disclosed in note 43 to these financial statements) and loans and advances to them (disclosed in note 11 to these financial statements) are determined in accordance with the terms of their employment. 49. PROVIDENT FUND DISCLOSURE The Company operates approved funded contributory provident fund for both its management and non-management employees. Detail of net assets and investments of the fund is as follows:
Size of the fund - Net assets 10,456,075 8,764,985
Cost of the investment made 6,203,316 6,004,927
Percentage of the investment made 59.33% 68.51%
Fair value of the investment made 9,893,517 8,982,432
(Rupees in ‘000)2017 2016
(Rupees in ‘000)2017 2016
(Audited)

123 | KE Annual Report 2017
Government securities 5,160,570 52.16% 4,995,880 55.62% Sukuk 4,062 0.04% 88,351 0.98% Debt securities 94,046 0.95% 93,286 1.04% Mutual funds 4,438,940 44.87% 3,662,311 40.77% Bank balances 195,899 1.98% 142,604 1.59% 9,893,517 8,982,432
Investments out of provident fund have been made in accordance with the provisions of Section 227 of the Companies Ordinance, 1984 and the rules formulated for this purpose. 50. CAPACITY AND PRODUCTION The actual production during the year was 10,147 Gwh (2016: 10,323 Gwh). The gross dependable capacity in FY-17 was 1,956 MW as compared to 1,942 MW in FY 16. 51. OPERATING SEGMENT These financial statements have been prepared on the basis of a single reportable segment which is consistent with the internal reporting used by the chief operating decision-maker. The chief operating decision-maker is responsible for allocating resources and assessing performance of the operating segments. The internal reporting provided to the chief operating decision-maker relating to the Company’s assets, liabilities and performance is prepared on a consistent basis with the measurement and recognition principles of approved accounting standards as applicable in Pakistan. There were no change in the reportable segments during the year.
The Company is domiciled in Pakistan. The Company’s revenue is generated substantially from the sale of electric energy to industrial and other consumers under the Electric Act, 1910 and NEPRA Act, as amended, to its licensed areas. All non-current assets of the Company at June 30, 2017 are located in Pakistan. 52. BENAZIR EMPLOYEES STOCK OPTION SCHEME (BESOS) On August 14, 2009, GoP launched Benazir Employees’ Stock Option Scheme (“the Scheme”) for employees of certain State Owned Enterprise (SOEs) and non-state Owned Enterprise where GoP holds significant investments (non-SOEs). The scheme was applicable to permanent and contractual employees who were in employment of these entities on the date of launch of the scheme, subject to completion of five years vesting period by all contractual employees and by permanent employees in certain instances. The Scheme provides for a cash payment to employees on retirement or termination based on the price of shares of respective entities. To administer the Scheme, GoP was to transfer 12% of its investment in such SOEs and non-SOEs to a trust fund to be created for the purpose by each of such entities. The eligible employees would be allotted units by each trust fund in proportion to their respective length of service and on retirement or termination such employees would be entitled to receive such amounts from trust funds in exchange for the surrendered units as would be determined based on the market price of the listed entities or breakup value for non-listed entities. The shares relating to the surrendered units would be transferred back to the GoP. The Scheme also provides that 50% of dividend related to shares transferred to the respective trust Fund would be distributed amongst the unit-holder employees. The balance 50% dividend would be transferred by the respective trust fund to the central revolving fund managed by the Privatisation Commission of Pakistan for the payment to employees against surrendered units. The deficit, if any, in Trust funds to meet the re-purchase commitment would be met by the GoP.
%(Rupees in ‘000)
%
(Audited)
2017
(Audited)
2016
(Rupees in ‘000)

KE Annual Report 2017 | 124
The Scheme, developed in compliance with the stated GoP policy of empowerment of employees of SOEs needs to be accounted for by the entities, including the Company, under the IFRS 2 “Share Based Payments” (IFRS-2). However, keeping in view the difficulties that may be faced by the entities covered under the Scheme, the SECP on receiving representations from some of entities covered under the Scheme and after having consulted the Institute of Chartered Accountants of Pakistan (ICAP) vide the letter number CAIDTS/PS& TAC/2011-2036 dated February 2, 2011 has granted exemption to such entities from the application of IFRS 2 to the Scheme vide SRO 587 (I)/2011 dated June 7, 2011. Had the exemption not been granted, the staff costs of the Company for the year would have been lower by Rs. 186 million (2016: Rs. 63 million), profit after taxation would have been higher by Rs. 187 million (2016: Rs. 61 million), accumulated profit would have been lower by Rs. 1,056 million (2016: higher by Rs. 1,361 million), earnings per share would have been higher by Rs. 0.007 (2016: Rs. 0.002) and reserves would have been lower by Rs. 1,056 million (2016: Rs. 1,361 million). The expense reflects change in the market price of shares. Since market price fell during these two years, expense is negative for both years However, various formalities relating to the finalisation of the Scheme such as trust deed and vesting period are yet to be finalized. The liability of BESOS for the Company’s employees is a liability of the fund and Company has no liability towards these payments. Moreover, due to certain administrative issues, trust fund has not yet been created by GoP. 53. NUMBER OF EMPLOYEES The average number of employees for the year ended June 30, 2017 were 10,884 (2016: 10,487) and number of employees as at June 30, 2017 were 10,822 (2016: 10,761). 54. RESTATEMENT OF COMPARATIVES During the year, the management of the Company, considering certain events and conditions and in order to make the financial statements more relevant and reliable, has carried out a review of its revenue and trade debts cycle. As a result of this review it was noted that upto June 30, 2016, the revenue was recorded on the basis of units billed to consumers based on meter readings applying the rates fixed by NEPRA and the revenue for units delivered to the consumers between the last meter reading date and the reporting date was not being accounted for. Accordingly, revenue recognition policy has been amended and the related impacts have been rectified in accordance with the requirements of IAS 8 ‘Accounting Policies, Changes in Accounting Estimates and Errors’ in these financial statements with retrospective effect resulting in restatement of amounts previously presented as detailed below:
June 30, 2016: Impact on balance sheet Increase in trade debts 7,809,997 Decrease in other receivables (213,821) Decrease in trade and other payables (2,797,136)
Impact on profit and loss account Decrease in sale of energy (230,423) Decrease in tariff adjustment (791,327) Decrease in other operating expenses 71,477
Impact on statement of changes in equity Increase / (decrease) in accumulated profit: For 2016 (950,273) Prior to 2016 11,343,585
Opening balance as at July 1, 2015: Impact on balance sheet Increase in trade debts 8,040,420 Increase in other receivables 2,335,219 Decrease in trade and other payables (967,946)
Effect of Change
(Rupees. In ‘000)
Effect of Change

125 | KE Annual Report 2017
55. CORRESPONDING FIGURES Corresponding figures have been rearranged and reclassified, wherever considered necessary, for the purpose of comparison. Significant reclassification are as follows:
Other receivables Trade and other payables 28,258,471 17,511,634
56. DATE OF AUTHORIZATION FOR ISSUE These financial statements were authorized for issue on 04 July 2019, by the Board of Directors of the Company.
57. GENERAL All figures have been rounded off to the nearest thousand rupees.
Muhammad Aamir GhazianiChief Financial Officer
Syed Moonis Abdullah AlviChief Executive Officer
Khalid RafiDirector
Opening balance as at July 1, 2015
June 30, 2016
(Rupees. In ‘000)
ToFrom

KE Annual Report 2017 | 126
Pattern of Shareholdingas of 30 June 2017
# of Shareholders Shareholdings Slab Total Shares Held
6026380324474863191274457841925216117674
310768949575640342322
25128291022261622138
50891895885
1101501
10015001
100011500120001250013000135001400014500150001550016000165001700017500180001850019000195001
100001105001110001115001120001125001130001135001140001145001150001155001160001165001170001175001180001185001190001
totototototototototototototototototototototototototototototototototototototototototo
100500
10005000
100001500020000250003000035000400004500050000550006000065000700007500080000850009000095000
100000105000110000115000120000125000130000135000140000145000150000155000160000165000170000175000180000185000190000195000
170,7611,220,6072,207,075
14,050,41615,943,3209,764,514
10,917,45110,036,7627,223,6535,394,9476,843,5033,209,342
15,393,0494,040,3015,250,7703,115,9643,922,6344,155,1983,155,3332,826,5002,034,6372,063,814
25,087,7982,890,3833,151,1901,143,0002,617,6933,235,0002,063,2222,942,4251,820,0001,152,1907,484,5001,226,9061,434,909
165,0001,347,1501,560,120
899,0001,469,5001,510,695
963,900

127 | KE Annual Report 2017
# of Shareholders Shareholdings Slab Total Shares Held
195001200001205001210001215001220001225001230001235001240001245001250001255001260001265001270001275001285001290001295001300001305001310001315001320001330001335001345001350001355001360001365001370001375001380001385001390001395001400001405001410001420001425001430001435001445001450001
80121127
144128
3964768154
462367463
14412132232
27331243281
tototototototototototototototototo
totototototototototototototototototototototototototototototo
340000350000355000360000365000370000375000380000385000390000395000400000405000410000415000425000430000435000440000450000455000
200000205000210000215000220000225000230000235000240000245000250000255000260000265000270000275000280000290000295000300000305000310000315000320000325000335000
15,985,1962,441,1282,298,686
427,0001,533,5003,142,500
914,000233,000475,000
1,944,0009,741,5001,515,0271,036,5001,854,0001,603,8252,194,000
280,0001,442,0001,180,000
13,795,500605,500929,764
1,883,5002,223,5001,295,5002,004,9051,015,3494,896,0001,416,079
359,000729,000370,000
1,124,025759,500769,000
1,162,500789,500
10,800,0001,214,5001,226,764
414,000850,000
1,712,6501,297,840
879,5003,600,000
452,000

KE Annual Report 2017 | 128
# of Shareholders
2111
41422211232112291328112329121282111121112111
470001475001480001485001495001500001505001510001515001520001525001530001545001555001560001570001575001580001595001600001620001635001645001655001660001665001685001690001695001700001705001730001735001745001750001755001765001770001785001795001800001825001830001845001855001865001890001
tototototototototototototototototototototototototototototototototototototototototototototototo
475000480000485000490000500000505000510000515000520000525000530000535000550000560000565000575000580000585000600000605000625000640000650000660000665000670000690000695000700000705000710000735000740000750000755000760000770000775000790000800000805000830000835000850000860000870000895000
949,500479,500483,500489,000
20,500,0002,014,4601,012,4751,027,7461,040,000
525,000530,000
1,063,1001,645,5001,116,334
564,000575,000
1,151,5001,167,5005,399,148
600,5001,872,0001,280,0005,200,000
660,000663,500
1,336,5002,065,0001,386,5006,300,000
703,1581,417,413
733,0001,478,0006,000,0001,508,500
759,500770,000775,000785,500
1,600,000801,200829,000835,000
1,698,500859,500870,000895,000
Shareholdings Slab Total Shares Held

129 | KE Annual Report 2017
# of Shareholders Shareholdings Slab Total Shares Held
tototototototototototototototototo
totototototototototototototototototototototototototototototo
5112212
31111131211212112311232112211224112111911
895001900001925001945001950001955001970001995001
100000110050011010001101500110300011035001104500110700011080001109500111000011115001112000111300011135001114500111600011165001117000111950011210001122000112350011245001129500113150011340001134500113750011395001140000114050011445001145500114700011485001149500115000011545001
900000905000930000950000955000960000975000
1000000100500010100001015000102000010350001040000105000010750001085000110000011050001120000112500011350001140000115000011650001170000117500012000001215000122500012400001250000130000013200001345000135000013800001400000140500014100001450000146000014750001490000150000015050001550000
4,500,000905,000925,500
1,900,0001,905,009
960,0001,946,500
31,000,0001,000,5001,006,9561,011,8001,020,0003,098,7501,040,0002,100,0001,075,0001,082,1672,200,0001,100,8292,240,0001,121,0001,135,0002,275,5003,447,5001,162,0001,170,0002,346,5003,600,0002,425,5001,225,0001,235,6002,500,0002,600,0001,319,7611,340,5002,700,0002,755,5005,600,0001,403,5001,410,0002,900,0001,460,0001,475,0001,490,000
13,500,0001,500,5001,550,000

KE Annual Report 2017 | 130
# of Shareholders Shareholdings Slab Total Shares Held
tototototototototototototototototo
totototototototototototototototototototototototototototototo
11131313122232129111111121113
21
2131111111111111
15550011575001159000115950011625001164000116550011695001170000117350011775001178000117950011845001197500119800011995001200500120350012090001209500121150012120001214500121950012230001225500122650012295001233000123450012395001245500124950012505001252500125300012540001254500125700012585001264000126850012700001271000128100012830001
15600001580000159500016000001630000164500016600001700000170500017400001780000178500018000001850000198000019850002000000201000020400002095000210000021200002125000215000022000002235000226000022700002300000233500023500002400000246000025000002510000253000025350002545000255000025750002590000264500026900002705000271500028150002835000
1,560,0001,579,3871,594,5004,798,5001,630,0004,927,5021,660,0005,100,0001,705,0003,479,9003,553,7003,560,7005,400,0003,700,0001,977,5943,965,338
18,000,0002,010,0002,038,0002,091,5002,100,0002,118,5002,125,0002,150,0004,400,0002,233,5002,256,0002,270,0006,900,0002,335,0004,695,5004,800,0002,458,7267,500,0002,508,9672,525,5002,531,5002,543,0002,546,0002,573,5002,588,0002,642,0002,688,0002,705,0002,712,9002,811,0002,833,400

131 | KE Annual Report 2017
# of Shareholders Shareholdings Slab Total Shares Held
tototototototototototototototototo
totototototototototototototototototototototototototototototo
11111161111111111111311111121111111117111111111
28350012845001286000128700012915001293000129950013005001309500132250013320001335000133950013435001352000136950013795001380500139450013990001399500140550014260001429500143150014335001436000144950014595001467000147000014710001476000147700014885001489000149650014995001500000152450015395001549500155050015730001575000159950016015001
28400002850000286500028750002920000293500030000003010000310000032300003325000335500034000003440000352500037000003800000381000039500003995000400000040600004265000430000043200004340000436500045000004600000467500047050004715000476500047750004890000489500049700005000000500500052500005400000550000055100005735000575500060000006020000
2,837,0002,850,0002,862,5002,875,0002,918,0002,933,000
18,000,0003,005,5003,100,0003,227,0003,325,0003,352,5003,400,0003,437,6763,522,0003,700,0003,800,0003,810,0003,950,0003,990,500
12,000,0004,055,5004,263,5004,300,0004,319,5004,340,0004,365,0009,000,0004,600,0004,673,7754,701,7604,715,0004,765,0004,775,0004,886,0004,893,5004,970,000
35,000,0005,001,0005,250,0005,400,0005,500,0005,508,5005,733,5005,753,0406,000,0006,020,000

KE Annual Report 2017 | 132
# of Shareholders Shareholdings Slab Total Shares Held
tototototototototototototototototo
totototototototototototototototototototototototototototototo
11111111111111411111111111111111111111111111111
6095001611500162900016295001646500169350017245001798500183250018350001895000190900019160001970500199950011026000110455001109800011099500111225001114250011166000111845001119700011226500112495001126450011271500112745001128750011315500113190001139650011415000114845001149950011639500116485001172550011908000119090001197000011999500120845001227450012337000124050001
61000006120000629500063000006470000694000072500007990000833000083550008955000909500091650009710000100000001026500010460000109850001100000011230000114300001166500011850000119750001227000012500000126500001272000012750000128800001316000013195000139700001415500014850000150000001640000016490000172600001908500019095000197050002000000020850000227500002337500024055000
6,099,0006,117,0006,291,5006,298,0006,468,0006,937,0007,250,0007,987,5008,327,0008,351,4008,955,0009,093,0009,161,5009,706,969
40,000,00010,264,00010,456,00010,981,50011,000,00011,230,00011,428,00011,665,00011,850,00011,972,73612,267,00012,500,00012,647,00012,716,50012,749,50012,878,00013,157,50013,191,00013,969,90014,155,00014,850,00015,000,00016,398,50016,490,00017,256,50019,083,04219,093,00019,701,26420,000,00020,845,50022,748,50023,374,50024,050,500

133 | KE Annual Report 2017
# of Shareholders Shareholdings Slab Total Shares Held
totototototototototototototototototototototo23594
111111111111111111111
247650012788500129995001313600013199500132295001329150013407500135405001356950014215500143510001467150016014000163810001665650016740500170690001
2147200016726910001
18335540001
247700002789000030000000313650003200000032300000329200003408000035410000357000004216000043515000467200006014500063815000665700006741000070695000
2147250006726915000
18335545000
24,768,50027,885,50030,000,00031,365,00032,000,00032,295,50032,917,68834,078,00035,407,50035,700,00042,156,65043,512,50046,719,00060,144,50063,812,50066,568,50067,408,00070,693,000
214,723,0006,726,912,278
18,335,542,67827,615,194,246

KE Annual Report 2017 | 134
Categories of ShareholdersAs of 30 June 2017 Ordinary Shares
Categories of Shareholders TotalSharesNumber %age
Associated Companies, Undertakings and related parties
AND / OR
Shareholders holding five percent or more voting rights in the Company
KES Power Limited (Holding Company)
President of the Islamic Republic of Pakistan (GOP)
CDC - TRUSTEE MCB PAKISTAN STOCK MARKET FUNDCDC - TRUSTEE PICIC INVESTMENT FUNDCDC - TRUSTEE PICIC GROWTH FUNDCDC - TRUSTEE ALHAMRA ISLAMIC STOCK FUNDCDC - TRUSTEE ATLAS STOCK MARKET FUND CDC - TRUSTEE MEEZAN BALANCED FUNDCDC - TRUSTEE FIRST DAWOOD MUTUAL FUNDCDC - TRUSTEE AKD INDEX TRACKER FUNDCDC - TRUSTEE PICIC ENERGY FUNDCDC - TRUSTEE AKD OPPORTUNITY FUNDCDC - TRUSTEE ALHAMRA ISLAMIC ASSET ALLOCATION FUNDCDC - TRUSTEE AL MEEZAN MUTUAL FUNDCDC - TRUSTEE MEEZAN ISLAMIC FUNDCDC - TRUSTEE ATLAS ISLAMIC STOCK FUNDCDC - TRUSTEE AL-AMEEN SHARIAH STOCK FUNDCDC - TRUSTEE DAWOOD ISLAMIC FUNDCDC - TRUSTEE NAFA ISLAMIC ASSET ALLOCATION FUNDCDC - TRUSTEE MCB PAKISTAN ASSET ALLOCATION FUNDCDC - TRUSTEE LAKSON EQUITY FUNDCDC - TRUSTEE NAFA SAVINGS PLUS FUND - MTCDC - TRUSTEE KSE MEEZAN INDEX FUNDCDC - TRUSTEE FIRST CAPITAL MUTUAL FUNDCDC - TRUSTEE AL-AMEEN ISLAMIC ASSET ALLOCATION FUNDCDC - TRUSTEE FAYSAL SAVINGS GROWTH FUND - MTCDC - TRUSTEE AL-AMEEN ISLAMIC RET. SAV. FUND-EQUITY SUB FUND CDC - TRUSTEE NATIONAL INVESTMENT (UNIT) TRUSTCDC - TRUSTEE ASKARI HIGH YIELD SCHEME - MTCDC - TRUSTEE NAFA ISLAMIC STOCK FUNDCDC - TRUSTEE NAFA INCOME OPPORTUNITY FUND - MTCDC - TRUSTEE AL AMEEN ISLAMIC DEDICATED EQUITY FUNDCDC - TRUSTEE NAFA ISLAMIC ACTIVE ALLOCATION EQUITY FUNDCDC - TRUSTEE FAYSAL MTS FUND - MTCDC - TRUSTEE MEEZAN ASSET ALLOCATION FUNDCDC - TRUSTEE NAFA ISLAMIC ENERGY FUNDCDC - TRUSTEE LAKSON TACTICAL FUNDCDC - TRUSTEE UBL GROWTH AND INCOME FUNDCDC - TRUSTEE UNIT TRUST OF PAKISTANCDC - TRUSTEE PAKISTAN INCOME ENHANCEMENT FUND - MTCDC - TRUSTEE MCB DYNAMIC CASH FUND - MTCDC - TRUSTEE ALFALAH GHP INCOME FUND - MTCDC - TRUSTEE ALFALAH GHP INCOME MULTIPLIER FUND - MTCDC - TRUSTEE LAKSON ISLAMIC TACTICAL FUNDCDC - TRUSTEE MEEZAN ENERGY FUNDCDC - TRUSTEE PAKISTAN INCOME FUND - MTCDC - TRUSTEE PAKISTAN CAPITAL MARKET FUNDCDC - TRUSTEE FAYSAL ASSET ALLOCATION FUNDCDC - TRUSTEE FIRST HABIB INCOME FUNDCDC - TRUSTEE HBL - STOCK FUNDMC FSL TRUSTEE JS - INCOME FUNDCDC - TRUSTEE NAFA ASSET ALLOCATION FUNDCDC - TRUSTEE LAKSON INCOME FUND - MTCDC - TRUSTEE UBL ASSET ALLOCATION FUNDCDC - TRUSTEE PIML STRATEGIC MULTI ASSET FUNDCDC - TRUSTEE PIML ISLAMIC EQUITY FUNDCDC - TRUSTEE UBL RETIREMENT SAVINGS FUND - EQUITY SUB FUND CDC - TRUSTEE PIML VALUE EQUITY FUNDCDC - TRUSTEE FIRST HABIB INCOME FUND - MT
111111111111111111111111111111111111111111111111111111111
18,335,542,6786,726,912,278
20,845,500 2,531,500 4,765,000 5,508,500 3,000,000
27,885,500 225,000 599,148
2,200,000 31,365,000
4,000,000 34,078,000
214,723,000 4,000,000
11,972,736 237,500
11,665,000 16,398,500 13,969,900
859,500 5,753,040
200,000 4,970,000 1,011,800 1,500,000 4,673,775 8,351,400 3,810,000 6,117,000
19,701,264 5,733,500
194,400 14,155,000
2,118,500 2,458,726
925,500241,500 62,000
1,033,500 1,121,000
666,500389,452
12,716,500266,800
1,000,000100,000
81,50015,000,000
33,0002,642,0001,739,9001,300,000
400,000200,000
1,400,000400,000
50,000
66.4024.36
0.08 0.01 0.02 0.02 0.010.10 0.00 0.000.010.11 0.01 0.12 0.78 0.01 0.04 0.00 0.04 0.06 0.05 0.00 0.02 0.00 0.02 0.00 0.01 0.02 0.03 0.01 0.02 0.07 0.02 0.00 0.05 0.01 0.01 0.00 0.00 0.00 0.00 0.000.000.000.050.000.000.000.000.050.000.010.010.000.000.000.010.000.00
Mutual Funds
1
1

135 | KE Annual Report 2017
CDC - TRUSTEE FAYSAL ISLAMIC ASSET ALLOCATION FUNDCDC - TRUSTEE PIML ASSET ALLOCATION FUNDMCBFSL TRUSTEE MCB PAKISTAN FREQUENT PAYOUT FUND - MTCDC - TRUSTEE UNITED GROWTH AND INCOME FUND - MT
Directors, CEO & their Spouse and Minor Children
Mr. Khalid Rafi
Executives
Public Sector Companies and corporations
Banks, Development Finance Institutions, Non-Banking Finance Companies Insurance Companies, Takaful, Modarabas and Pension Funds
Banks, Financial InstitutionsInvestment CompaniesInsurance CompaniesJoint Stock CompaniesModarabah Management CompaniesModarabas Charitable TrustsLeasing Companies
General Public - Local
Foreign Shareholders
Others
Additional Information
Trading in shares of the Company during the year
- Director Khalid Rafi
- Executive Jamil Afzal Bajwa
1111
1
4
15
343
26209
31517
1
23,025
100
78
23,594
350,000400,000384,000
6,298,000
500
405,100
50,354,660
199,709,9693,412
105,603,407386,408,742
15,0012,222,835
652,61312,500
895,284,936
253,618,660
117,668,214
27,615,194,246
500,000
50,000
500,000
50,000
Purchase Sale
0.000.000.000.02
0.00
0.00
0.18
0.720.000.380.400.000.010.000.00
3.24
0.92
0.43
100.00

KE Annual Report 2017 | 136
Share PriceSensitivity AnalysisKE’s share price, like all listed companies, is impacted and governed through a host of internal and external factors. The main internal factors include: improvements in operational and financial performance reflected through an objective comparison of key performance indicators, and its translation into improved profitability and enhanced shareholders’ value; investors’ confidence through adequate return on investment; customers’ satisfaction through high service standards; standards of corporate governance and adherence to best practices; the competency and profile of the Board of Directors and key management team; internal controls; business strategy; and future business plans.
External factors that significantly impact the Company’s share price, include: continuous fuel supply at economic rates; furnace oil to gas ratio (and price differential); timely tariff determination and notification by NEPRA, taking into account the cost of doing business and adequate
return on investment; settlement of the circular debt issue in a fair and equitable manner; timely settlement of tariff differential claims by the Government, and recovery of huge electricity arrears outstanding
against government-related entities (KWSB in particular) the prevailing law and order situation in Karachi and Pakistan. interest rates and the PKR:USD exchange rate impact, financing costs and the debt profile of the company. the overall national economic performance and continuity of government policies stock market dynamics and investor sentiment in the wake of national and international developments.
During FY 2017, 4.99 billion shares were traded at the Pakistan Stock Exchange. However, the share price could not maintain parity with the index and lost 14.4% in value during the year. The erosion in value can be attributed to various setbacks, mostly due to the unfavorable determination on KE’s MYT by NEPRA for the period starting from 01 July 2016. The average price of the Company share, based on daily closing rates, was PKR 8.73 while low / high share rates during FY 2017 was PKR 6.50 (Jun 17) and PKR 10.92 (Jan 17) per share respectively.
With shareholders’ support, concerted efforts, professional management and effective business strategy are in place to restore operational and financial viability and take performance to a greater level.
12
10
8
6
4
2
0
SP Month Open SP Month end Turnover (Mn) Shares
1000
900
800
600
400
200
700
500
300
100
0Jul-16 Aug-16 Sep-16 Oct-16 Nov-16 Dec-16 Jan-17
Share Price Movement and Turnover
Sh
are
Pri
ce (
SP
) P
KR
Per
Sh
are
Feb-17 Mar-17 Apr-17 May-17 Jun-17
Volu
me Tu
rnover (M
n)

137 | KE Annual Report 2017

KE Annual Report 2017 | 138

139 | KE Annual Report 2017

KE Annual Report 2017 | 140

141 | KE Annual Report 2017

KE Annual Report 2017 | 142

143 | KE Annual Report 2017

KE Annual Report 2017 | 144
107107

No postagenecessary if
mailed inPakistan KE Corporate Affairs Department
1st Floor, Block AElander Road, Power HouseKarachi, Pakistan.
145 | KE Annual Report 2017

Form of Proxy107th Annual General Meeting
I / we __________________________________________________________ of _________________________ being a member(s) of K-Electric Limited, hereby appoint Mr._____________________________ of ______________________, or failing him / her Mr.________________________________ of ______________________ as my / our proxy to attend and vote for me / us and on my / our behalf at the Annual General Meeting of the Company to be held at Pearl Continental (PC) Hotel, Grand Ball Room (Ground Floor), Club Road, Karachi on Tuesday, 30 July 2019 at 10:30 a.m. or at any adjournment thereof.
As witnessed given under my / our hand(s) this ___________ day of July 2019.
Shares held
Shareholder’s Folio / Account #
CNIC #
Signature Proxy Holder’s Folio / Account # Proxy Holder’s CNIC #
Signature
1. Witness: 2. Witness: Signature: Signature: Name: Name: CNIC: CNIC: Address: Address:
Note: 1. Duly completed Form of Proxy must be deposited to the Company Secretary at Corporate Affairs Department, 1st Floor, Block A, Elander Road, Power House Karachi no later than 48 hours before the time fixed for the meeting.
2. Proxy must be given to a person who is a member of the Company, except in the case of Companies where the proxy may be given to any of its employee for which certified true copy of Power of Attorney and / or Board Resolution with regard to appointment of proxy should be attached.
3. In case the proxy is the beneficial owner of CDC, an attested copy of his / her CNIC or Passport must
be enclosed.
4. The proxy shall produce his / her original CNIC or original passport at the time of the meeting.
5. If a member appoints more than one proxy and more than one instruments of proxy are deposited by a member with the Company, all such instruments of proxy shall be rendered invalid.
The signature should agree with specimen signature registered with the Company.
Revenue Stamp of
Rs.5
KE Annual Report 2017 | 146

KE Annual Report 2017 | 147
No postagenecessary if
mailed inPakistan KE Corporate Affairs Department
1st Floor, Block AElander Road, Power HouseKarachi, Pakistan.

KE Energy Th•t Move• Lita
0 0 K-Electric KElectricPk @KElectricPk KElectricPk KElectricPk www.ke.com.pk KE Live
KE House, 39-B, Sunset Boulevard, Phase II (Ext), DHA, Karachi, Pakistan. UAN: (+92 21) 111 - 537- 211
::t> :::J :::J c
0)
IJ CD D 0 ' .--+
[\.)
0 ---->.
KE Energy That Moves Life
Continuous Excellence
is Key to Growth and Sustainability
Annual Report I 201 7