Contents of Session Fundamental Analysis: Stock Valuation
22
Session on Stock Valuation Pr. Chateau, Malaga 2017 1 Contents of Session Fundamental Analysis: Stock Valuation (Based on: Siegel’s Stock for the Long-Run, chapters 6 and 7, last ed. is 2014) Reasons why one should know the firm’s value; three valuation approaches Wealth, comparative and dynamic firm or stock valuations, with examples Dividend policy and earnings allocation Valuation yardsticks: PER, Tobin’s Q and SMV/GDP Stock price valuation in 2017 The total payout ratio Summary
-
Upload
khangminh22 -
Category
Documents
-
view
3 -
download
0
Transcript of Contents of Session Fundamental Analysis: Stock Valuation

Session on Stock Valuation Pr. Chateau, Malaga 20171
Contents of Session
Fundamental Analysis: Stock Valuation
(Based on: Siegel’s Stock for the Long-Run, chapters 6 and 7, last ed. is 2014)
Reasons why one should know the firm’s value; three valuation approaches
Wealth, comparative and dynamic firm or stock valuations, with examples
Dividend policy and earnings allocation
Valuation yardsticks: PER, Tobin’s Q and SMV/GDP
Stock price valuation in 2017
The total payout ratio
Summary

Session on Stock valuation Pr. Chateau, Malaga 20172
REASONS why the firm’s stock market value need to b e known
− The “equilibrium” or “fair” market value of a firm need to be known in the following instances:
• By the firm to decide its initial public offering (IPO) price.
• By the firm to decide whether or not to issue additional new shares .
If the market price exceeds the equilibrium level, then it’s in the firm’s interest to issuenew shares, because the issue price will be higher than the equilibrium price of existing(outstanding) shares; if not, it is not the appropriate moment for the firm to issue newshares.
• By firms in an operation of merger & acquisition .
• By the firm’s shareholders to make investment decisions .
If the equilibrium price exceeds the actual market price, then shareholders should buymore stocks and wait until the market price rises to its equilibrium level; if not, then theyshould sell stocks they hold before the market price falls to its equilibrium level.
− There are three approaches in determining equity prices.
• The wealth (or patrimony) approach consists in valuating the stock according to thepatrimony that the firm has acquired in the past. This is also called the past approach .
• The comparative approach consists in valuating the stock with respect to the financialratio of a firm which is similar to the firm to be evaluated and is actually listed on theequity market. This is also called the present approach .
• The dynamic approach consists in valuating the firm according to the dividend flowsshareholders will receive in the future. This is also called the future approach .

Session on Stock Valuation Pr. Chateau, Malaga 20173
1. The wealth (patrimony/past) approach
− The firm’s market value is based on the book value of the firm.• The book value of a firm is the value of the firm’s tangible or physical assets minus that of its
liabilities, both evaluated at historical costs. So
Historical book value (HBV) = Assets – Liabilities (both est imated at historical costs)
� Book value is limiting because it uses historical prices and thus ignores the effect ofchanging prices on the value of the assets or liabilities. To wit, If a firm had purchased aplot of land for $1 million that is worth today $10 million, examining its book value will notreveal this value increase. To correct these distortions, book value should be “revalued”or adjusted.
• The present or revalued book value is the book value adjusted to take into account today’smarket value of the assets and liabilities.
Present book value (PBV) = Historical Book value + Re-valuat ion difference
or PBV = HBV + ∆ Re-valuation
� re-valuation only concerns tangible or physical assets, while intangible or non-physicalassets (such as trademarks, skills, clients, group synergy and intellectual capital), are nottaken into account. For example, Microsoft has a present book value of about $50 billionbut a stock market value seven times as large.
• The goodwill , namely any difference between the sale price of the firm and its book value,should be added to the present book value.
Stock (market) value = Historical book value + Re-valuation difference + Goodwill
or SMV = PBV + Goodwill = HBV + ∆ Re-valuation + Goodwill
Session on Stock Valuation Pr. Chateau, Malaga 20174
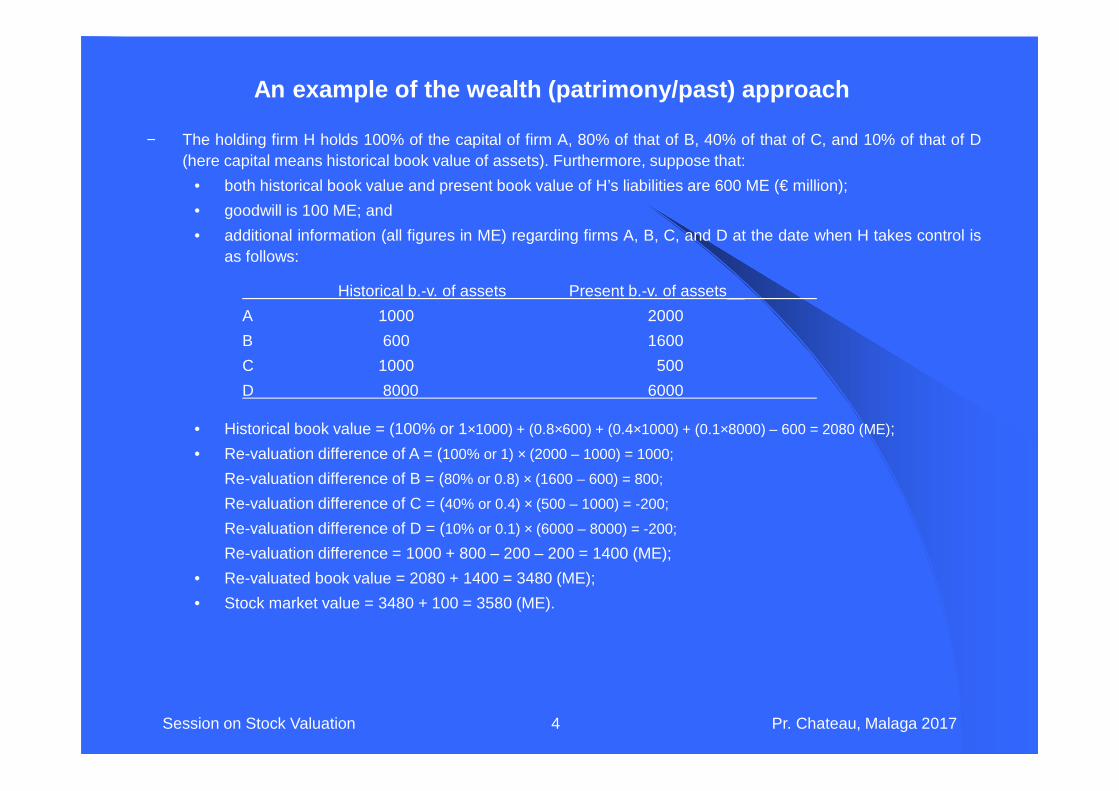
− The holding firm H holds 100% of the capital of firm A, 80% of that of B, 40% of that of C, and 10% of that of D(here capital means historical book value of assets). Furthermore, suppose that:
• both historical book value and present book value of H’s liabilities are 600 ME (€ million);
• goodwill is 100 ME; and
• additional information (all figures in ME) regarding firms A, B, C, and D at the date when H takes control isas follows:
Historical b.-v. of assets Present b.-v. of assets__
A 1000 2000
B 600 1600
C 1000 500
D 8000 6000
• Historical book value = (100% or 1×1000) + (0.8×600) + (0.4×1000) + (0.1×8000) – 600 = 2080 (ME);
• Re-valuation difference of A = (100% or 1) × (2000 – 1000) = 1000;
Re-valuation difference of B = (80% or 0.8) × (1600 – 600) = 800;
Re-valuation difference of C = (40% or 0.4) × (500 – 1000) = -200;
Re-valuation difference of D = (10% or 0.1) × (6000 – 8000) = -200;
Re-valuation difference = 1000 + 800 – 200 – 200 = 1400 (ME);
• Re-valuated book value = 2080 + 1400 = 3480 (ME);
• Stock market value = 3480 + 100 = 3580 (ME).
An example of the wealth (patrimony/past) approach

Session on Stock Valuation Pr. Chateau, Malaga 20175
2. The comparative (or present) approach
− The firm’s market value is computed by using a financial ratio from another stockwhich has similar characteristics.
• A first financial ratio is related to the firm’s economic value (i.e. the market value of itsequity + the market value of its liabilities):
� Sales (or Turnover) ratio = Economic Value / Sales (or Turnov er)
� It can be interpreted as 1) the number of years necessary for the firm to getcumulative sales whose amount is equivalent to its economic value; 2) the priceshareholders and bondholders are prepared to pay for one unit’s worth of sales.
• Three other financial ratios are related to the firm’s aggregate value (# ofshares times the value of each share) or to its per-share price:
� PER (Price-Earnings Ratio) = Stock Market Value / Earnings
� It is either 1) the number of years necessary for the firm to get cumulative earningswhose amount is equivalent to its stock market value; or 2) the price shareholdersare prepared to pay for one unit’s worth of current earnings.
� PBR (Price-to-Book Ratio) = Stock Market Value / Book Value
� It is either 1) the number of years necessary for the firm to get a cumulative bookvalue which is equivalent to its stock market value; or 2) the price shareholders areprepared to pay for one unit’s worth of book value.
� Dividend Yield = Dividend / Stock Market Value
� It is the dividend expressed as a % of the price paid by shareholders. Its reverse isthe number of years necessary for shareholders to get back their investmentthrough dividends.

Session on Stock Valuation Pr. Chateau, Malaga 20176
An example of the comparative approach
− X, a manufacturer of computer games, wants to list its shares. It asks its bank to determinethe firm’s value for an initial public offering (IPO). To do this, the bank locates a firm Y, which isalready listed. Suppose that:
• Y has the same activity and the same size as X;
• Some financial aggregates of X and Y are as follows (all figures in M€):
Stock market value Liabilities Sales Earnings
X ? 3700 240 60
Y 1000 2000 100 20
• Compute the value of X by reference to the sales or turnover ratio:
� Sales multiple of X = (Stock market value of X + 3700) / 240
� Sales multiple of Y = (1000 + 2000) / 100 = 30
� Sales multiple of X = Sales multiple of Y
⇒ Stock market value of X = 3500 (M€)
• Compute the value of X by way of the aggregate PER:
� PER of X = Stock market value of X / 60
� PER of Y = 1000 / 20 = 50
� PER of X = PER of Y
⇒ Stock market value of X = 3000 (M€)
• The IPO value proposed by the bank is between 3000 and 3500 M€.

Session on Stock Valuation Pr. Chateau, Malaga 20177
3. The dynamic(or future) approach
− The firm’s market value is the discounted value of all future dividends of the stock.The approach is often referred to the “discounted dividend model ” (DDM).
• Why should future dividend flows be used to evaluate stocks?
� In contrast to a work of art, stocks have market value because their potential cash flowscome primarily from dividends.
• Why future cash flows need to be discounted?
� The innate preferences of most individuals is to enjoy consumption today rather thanwait for tomorrow;
� Productivity allows funds invested today to yield a higher return tomorrow;
� Inflation reduces the future purchasing power of cash received in the future;
� There is a risk insofar as the recovery of the present value is not sure. Due to thisuncertainty, investors ask for the risk-free rate on a bond plus a risk premium .
• Which discount rate should the shareholders used?
� The discount rate to be used is the expected return on the firm’s stock.
� The latter is determined by way of the Capital Asset Pricing Model . This means thatthe riskier is the stock, the higher is its expected return. Namely
E(Ri) = Rf + βi × [E(RM) - Rf ]
where E(Ri) is the expected return of the stock, Rf the risk-free interest rate, E(RM) theexpected return of the whole equity market, βi the systematic risk of the stock comparedwith the whole market.
• In practice, dividend flows are sometimes replaced by available or free cash flows.

Session on Stock Valuation Pr. Chateau, Malaga 20178
How to create value for shareholders?
− Earnings are used in four different ways to enhance shareholders’ value:• Payment of cash dividends
• Repurchase of shares : by reducing the number of outstanding shares, this increasesfuture earnings per share, even if the firm’s total earnings remain unchanged.
� Some people argue that shareholders most value stocks’ cash dividends. But this is notnecessarily true. In fact, from a tax standpoint, share repurchases are superior todividends when the marginal tax rate on dividend is higher than that on capital gains.
• Retirement of debt : by reducing the interest expense, this increases the cash flowavailable to shareholders.
� Others might argue that debt repayment lowers shareholders’ value because the interestsaved on the debt retired generally is less than the rate of return earned on equity capital.They also might claim that by retiring debt, the firm looses the ability to deduct the interestpaid as an expense. However, debt entails a fixed commitment that must be met in goodor bad times. Reducing debt lowers the volatility of shareholders’ earnings and may notdiminish shareholders’ value.
• Reinvestment for future growth : by investing in productive assets (financial or real),this will increase future profits.
� Many investors claim that earnings reinvestment is the most important source of value,but this is not always the case. If retained earnings are reinvested profitably, value willsurely be created. However, retained earnings may tempt managers to pursue othersgoals, such as overbidding to acquire other firms or spending on perquisites that do notincrease the value to shareholders. That’s why the market views the buildup of cashreserves and marketable securities with suspicion and discounts their value.

Session on Stock Valuation Pr. Chateau, Malaga 20179
Dividends and earnings
− The ultimate source of future dividend flows is the earnings of firms.
• Earnings = Revenues (sales) - Costs of production (labor, material costs, interest ondebt, corporate taxes, and allowance for depreciation). So, E = R - C
• Earnings can be paid out as dividends (called distributed earnings ) or retained by firms(called retained earnings ) to be put to work to provide greater cash flows in the future.To wit, Earnings = 0.4 Dividend + (1- 0.4) Retained Earnings.
� The ratio of cash dividends to total earnings is called the dividend payout ratio, D/E .
− How firms determine their dividend policy? They consider factors such as:
• the difference in tax rates between dividend income and capital gains;• the need to generate internal funds to retire debt or to reinvest;• the desire to keep dividends relatively constant in the face of fluctuating earnings.
− Does the value of the stock depend on the dividend policy?
• It appears that dividend policy is crucial to determining the value of the stock.• However, this is not generally true. In fact, as long as the firm earns the same return on
its retained earnings as the discount rate, it does not matter how much is the payoutratio. Earnings not paid out today as dividends are reinvested by the firm and paid aseven larger dividends in the future. The lower the present payout ratio, the smaller theactual dividends; but over time, dividends will rise and eventually will exceed the dividendpath associated with a higher payout ratio.
� This explains why firms that pay no dividends, such as Warren Buffet’s BerkshireHathaway, have value; their assets, which earn cash returns, can be liquidated anddisbursed to shareholders in the future.

Session on Stock Valuation Pr. Chateau, Malaga 201710
Some models in the framework of the DDM
• Irwing-Fisher model : The price of a stock is equal to the sum of the presentvalue of the future dividends over a period and the present value of the sellingprice of the stock at the end of this period. CP means capitaux propres in French;n end date with n < ∝. Caveat: E(RCP) ≡ E(Ri), the CAPM return defined p. 7
• Gordon-Shapiro model : The price of a stock is equal to the present value of allfuture dividends until infinity, by assuming that the dividend growth rate is constant(designated g). Ditto for E(RCP).
• Mododovki model : The price of a stock is equal to the present value of allfuture dividends until infinity, by assuming that the dividend increases at a firstrate over the first period, at a second rate over the second period, and at azero rate from the end of the second period.
• Bates model is similar to the Irwing-Fisher model. Furthermore, it assumesthat during the whole life of the stock, 1) the dividend payout ratio, δ, remainsconstant; 2) dividends increase at a constant rate designated g. So, we have:
nCP
nn
tt
CP
t
RE
V
RE
DV
)](1[)](1[10
++∑
+=
=
in
i
CPn
CPn g
RE
g
REPERPER ∑
++−
++×=
−
=
1
00 1
)(1
1
)(1 δ
∑∞
= −=
+=
1
10 )()](1[t CP
tCP
t
gRE
D
RE
DV

Session on Stock Valuation Pr. Chateau, Malaga 201711
Examples of the dynamic approach
− Suppose that the last dividend paid by firm F is €6, the dividend growth rate is 6% (0.06), andthe shareholders’ expected return is 12% (0.12).
• What is the stock-market price according to the Gordon-Shapiro model?
• What is the stock-market price if the shareholders’ expected return becomes 13% (.13)?
− Suppose that the present PER of a start-up firm is 30, the shareholders’ expected return is .12(or 12%), the dividend payout ratio is 30% (or 0.3), and the dividend growth rate over the next5 years is 0.25 (or 25%).
• What is the firm’s PER in five years according to Bates model?
PER0 = 30, E(RCP) = 12%, δ = 30%, g = 25%, and n = 5 years.
⇒ PER5 = 16.10 (ME)
106%6%12
%)61(6
)(
)1(
)(01
0 =−+×=
−+×=
−=
gRE
gD
gRE
DV
CPCP
%)29.14(86.90%6%13
%)61(6
)(
)1(
)(01
0 −=−+×=
−+×=
−=
gRE
gD
gRE
DV
CPCP
10.16%251
%121%30
%251
%12130
1
)(1
1
)(1
4
0
5
1
00
=
++×−
++×=
++−
++×=
∑
∑
=
−
=
i
i
n
i
i
CP
n
CPn g
RE
g
REPERPER δ

Session on Stock Valuation Pr. Chateau, Malaga 201712
Comparison between the three approaches
Type of approach Advantages Limitations
Wealth or past
� Suitable for firms whoseactivity is related to thenotion of patrimony, suchas real estate companiesand holdings.
� The appreciation ofgoodwill may be subjective.
� Not suitable for servicecompanies.
Comparative or present
� Suitable for all firms on thecondition that a similar firmalready listed can be found.
� Founded on relativecriteria, instead of absolutecriteria.
� The result is directly relatedto the circumstances of thestock market.
Dynamic or future
� Suitable for firms whichbegin to realize earnings.
� Depends directly on theforecast of future dividends,which is not always correct.
� Result is very sensitive tothe hypothesis onshareholders’ expectedreturn.

Session on Stock Valuation Pr. Chateau, Malaga 201713
Historical yardsticks for valuing the equity market (1)− Yardsticks used to evaluate whether stock prices are overvalued or undervalued:
• Most of them measure the market value of the shares outstanding relative to economicfundamentals such as earnings, dividends, book value, or some economic aggregate ,such as GDP (gross domestic product) or total replacement cost of the capital stock.
• Stock prices often are said to be “too high” if they exceed the average value over time.
� Yet such a comparison begs the question: have the historical valuation measures beenconsistent with the return shareholders should expect from equities? As indicatedpreviously, on average, stocks have been undervalued through history. Therefore, highervaluation could be justified as investors recognize the superior returns on stocks and bidtheir prices up relative to earnings or dividends.
− The most basic and fundamental yardstick for valuing stocks is the PER.• If investors believe that earnings growth is going to accelerate, they will pay a higher
price relative to current earnings than if they expect earnings to stagnate or decline.
• As shown in Figure 6-2, the market PER moved into all-time high ground in 2001 ,reaching a level twice its historical average value of 14.5 since 1870 . However, peaksin the PER are not always bad omens for investors. a) If a sharp drop in earnings causesthe PER to rise, real returns following these rises have averaged 9.7% annually over thesubsequent 5 years. In fact, sharp declines in earnings have always been temporary, andearnings as well as stocks prices have rebounded subsequently. b) When surges in stockprices cause the PER to rise, 5-year future real returns have averaged only 1.1%.Surging stock prices often reflect undue optimism about future earnings growth. Whenexpected earnings growth is not realized, stock prices fall, and returns suffer.

Session on Stock Valuation Pr. Chateau, Malaga 201714

Session on Stock Valuation Pr. Chateau, Malaga 201715

Session on Stock Valuation Pr. Chateau, Malaga 201716

Session on Stock Valuation Pr. Chateau, Malaga 201717
Historical yardsticks for valuing the equity market (2)
− James Tobin developed a theory that indicated that the “equilibrium” or “correct”market price of a firm should equal its book value adjusted for inflation.
• Tobin designated the ratio of the market value to the replacement cost with the letter Qand indicated that its ratio should be unity if the stock market were properly valued or atits “equilibrium” level. As shown in Figure 6-3a, Tobin’s Q has fluctuated between a highof 1.83 in 1999 and a low of 0.33 in 1920, with the average being 0.72.
• However, book value is a construct of the past, while market value derives fromprospective earnings and looks to the future. Prospective earnings more accuratelyestablish the basis of stock valuation than the historical costs at which the firmspurchased their assets.
− GDP is a more familiar benchmark to compare with aggregate market value ofequity than is book value.
• The ratio of the value of equity to GDP can be superior or inferior to 1 (cf. Figure 6-3b). Infact, a) equity valuation is a balance sheet item, while GDP is an annual flow; b) equitycapital is only a part of total capital and values only publicly traded firms.
• The ratio of market capitalization to GDP differs among countries (cf. Table 6-2).
� What do these valuation measures show?� They send the same message: relative to economic fundamentals, the level of the stock
market reached in 2000 was extremely high, and in the past, these valuations have beenfollowed by lower stock returns.
� The question is: can the market continue its upward movement thanks to the “neweconomy”, or will history reassert itself and bring stock prices downward?

Session on Stock Valuation Pr. Chateau, Malaga 201718

Session on Stock Valuation Pr. Chateau, Malaga 201719

Stock price growth from 2017onwards
For the next decade, the rate of growth per annum of stock price is made up of 4 building blocks: (according to Fortune 2017)
* The dividend yield, which is today a slim 2.5%;* The real growth in earnings per share (EPS): current best assumption is1.5% adjusted for inflation (since firms are issuing new shares and makeacquisitions)* The rate of inflation, predicted at 1.5%; and* The expected change in PER (at 24 it is expected to shrink and shares to
take a beating).
Bottom line: with NO PER change, the expected return on equities amountsto 5.5% a year. But for a typical portfolio (namely with a 60/40 stock-bond mix and yield of 2.2% on the 40% bond segment), the expected return comes to 4.2%, far from the historical average of 7.6% for that asset mix. Caveat emptor: today`s financial markets are stretched.
Session on Stock Valuation Pr. Chateau, Malaga 201720

New concept of total payoutOur illustration is using recent data from the bank Morgan Stanley:The traditional payout is indeed: dividend per share times numberof shares, namely 0.55 x 1,953 = 1,074 bil.But now you`ve to add the market shares repurchased by the bank,namely 2,125 bil.So the total payed out of quarterly earnings becomes: 3,1999/5,672 = .56 or 56 %.
Notice that if, say, all repurchased shares are used to fund the executives stock options, the accounting picture is distorted: the cost of executive options should appear as a cost before net earnings, which would then be much lower. In addition, underpressure of active shareholders, firms are sometimes using debt(the interest on borrowing is tax deductible) to fund the repurchaseof shares and hence increase the total payout ratio. This strategy isdangerous since the debt/equity ratio may increase significantly in the previous case and bank covenant be broken.
Session on Stock Valuation Pr. Chateau, Malaga 201721

Session on Stock Valuation Pr. Chateau, Malaga 201722
Summary
− To determine stock (market) price, three approaches can be used: the wealth orpatrimony approach, the comparative approach and the dynamic approach.
− Historical yardsticks are used to evaluate whether stock prices are over- orundervalued. They include micro yardsticks (the PER) as well as macro ones such asTobin’s Q and market value relative to GDP. Stocks prices are said to be “too high” ifthey exceed the average value over time.
− Over the last 20 years, reductions in inflation, the increased stability of the overalleconomy, the sharp drop in transactions costs, as well as a low capital gains tax, arefactors that point out to a higher level of stock valuation. However, these factors thatboost stock prices make it less likely that stocks will be able to achieve their historicallong-run returns. From PER of 15, stocks easily should achieve the 7% historical realreturn. But from PER in the low 20s, which are observed nowadays, future real returnson stocks could be 1% to 2% lower.
− Stocks in 2017 and onwards may not match the impressive returns of the past, but in abalanced portfolio they will still significantly outperform bonds over the long run.
− While firms are using the total payout ratio (dividends + share repurchases as apercentage of earnings) to increase total returns to shareholders, stock repurchasesmay be detrimental when financed by debt (borrowing).
− Practice is available