Contents 1. Rebranding and Staff Perception through Change ...
119
Contents 1. Rebranding and Staff Perception through Change Communication Factors Mohammad Firdaus Low bin Abdullah 1 2. Communicative Competence of Overseas Chinese Students in an MBA Program in a Private University in Malaysia Zhong Kai, Mogana Dhamotharan 11 3. Proposing Values for Encouraging People to Share Knowledge: A Case of Active Learning Mohamad Hisyam Selamat, Sugumaran Selladurai 45 4. Job Motivation among Employees in Construction Companies in Selangor, Malaysia Uma Murthy, Paul Anthony Mariadas, Suguna Sinniah, Gopal Perumal 81 5. Factors Influencing Home Purchase Decision: A Case Study in Selangor, Malaysia Uma Murthy, Paul Anthony Mariadas, Gopal Perumal, Suguna Sinniah 94
-
Upload
khangminh22 -
Category
Documents
-
view
1 -
download
0
Transcript of Contents 1. Rebranding and Staff Perception through Change ...

iv
Contents
1. Rebranding and Staff Perception through Change Communication Factors Mohammad Firdaus Low bin Abdullah
1
2. Communicative Competence of Overseas Chinese Students in an MBA Program in a Private University in Malaysia Zhong Kai, Mogana Dhamotharan
11
3. Proposing Values for Encouraging People to Share Knowledge: A Case of Active Learning Mohamad Hisyam Selamat, Sugumaran Selladurai
45
4. Job Motivation among Employees in Construction Companies in Selangor, Malaysia Uma Murthy, Paul Anthony Mariadas, Suguna Sinniah, Gopal Perumal
81
5. Factors Influencing Home Purchase Decision: A Case Study in Selangor, Malaysia Uma Murthy, Paul Anthony Mariadas, Gopal Perumal, Suguna Sinniah
94

i
Editorial Board
Scope of Papers Asia Pacific Journal of Business, Humanities and Education is the official and the biannually publication of the SEGi University in Malaysia. It provides an avenue for members of its academic fraternity as well as its support staff to publish their views and scholarly findings arising from research conducted by themselves or in collaboration with others. Asia Pacific Journal of Business, Humanities and Education is also open to others outside the SEGi University who wish to publish their papers. Research papers from undergraduates as well as graduate students are especially welcome. The journal's scope is multidisciplinary. It will publish research and applied articles from all areas of Social Sciences, Humanities and Education. Variety of methodological approaches will be also considered in this journal. The journal encourages manuscript submissions from authors all over the world, both from academia and industry. Articles in Asia Pacific Journal of Business, Humanities and Education will include, but are not limited to the following areas:
Athletic Training and Health Management Business Communications
Chief Editor : Professor Dr. Stanley Yap (SEGi University) Editors : Assoc. Prof. Dr. Firdaus Low Abdullah (SEGi University) Dr. Mahadevan Supramaniam (SEGi University) Dr. Puvaneswaran Kunasekaran (Universiti Putra Malaysia) Prof. Dr. Ahmad Shuib (Universiti Putra Malaysia) Assoc. Prof. Dr. Anes Janee Ali (Universiti Sains Malaysia) Assoc. Prof. Dr. Sridar Ramachandran (Universiti Putra
Malaysia) Prof. Ronald L. Jacobs (University of Illinois at Urbana –
Champaign) Prof. Khong Kok Wei (The University of Nottingham
Malaysia Campus) Assoc. Prof. Dr. Lawrence Arokiasamy (International
University Malaya Wales) Technical Team
: Leow Hon Wei, Chok Nyen Vui & Yalda Soleimanzadeh
Printer : Ted Print Sdn BhdAddress : No. 63, Jalan PBS 14/9, Taman Perindustrian Bukit Serdang, 43300, Seri Kembangan, Selangor, Malaysia.Telephone : +603 8941 2119Facsimile : +603 8941 2119
i
Editorial Board
Scope of Papers Asia Pacific Journal of Business, Humanities and Education is the official and the biannually publication of the SEGi University in Malaysia. It provides an avenue for members of its academic fraternity as well as its support staff to publish their views and scholarly findings arising from research conducted by themselves or in collaboration with others. Asia Pacific Journal of Business, Humanities and Education is also open to others outside the SEGi University who wish to publish their papers. Research papers from undergraduates as well as graduate students are especially welcome. The journal's scope is multidisciplinary. It will publish research and applied articles from all areas of Social Sciences, Humanities and Education. Variety of methodological approaches will be also considered in this journal. The journal encourages manuscript submissions from authors all over the world, both from academia and industry. Articles in Asia Pacific Journal of Business, Humanities and Education will include, but are not limited to the following areas:
Athletic Training and Health Management Business Communications
Chief Editor : Professor Dr. Stanley Yap (SEGi University) Editors : Assoc. Prof. Dr. Firdaus Low Abdullah (SEGi University) Dr. Mahadevan Supramaniam (SEGi University) Dr. Puvaneswaran Kunasekaran (Universiti Putra Malaysia) Prof. Dr. Ahmad Shuib (Universiti Putra Malaysia) Assoc. Prof. Dr. Anes Janee Ali (Universiti Sains Malaysia) Assoc. Prof. Dr. Sridar Ramachandran (Universiti Putra
Malaysia) Prof. Ronald L. Jacobs (University of Illinois at Urbana –
Champaign) Prof. Khong Kok Wei (The University of Nottingham
Malaysia Campus) Assoc. Prof. Dr. Lawrence Arokiasamy (International
University Malaya Wales) Technical Team
: Leow Hon Wei, Chok Nyen Vui & Yalda Soleimanzadeh

ii
Business dynamics and strategy
Business Education
Business Ethics
Business Law
Case studies related to Business or Management
Cross-culture issues
Culture, conflict and cognition
Decision Sciences
E-Commerce Management
Economics, Finance & Accounting (Cost, Managerial, Auditing, Financial
Institutions, Investing, etc.)
Educational Administration; Educational Planning
Entrepreneurship
Exercise Health Management
Global business
Health and Hospital Administration
Human Resource Management
Hotel Management
Hospitality and Tourism Management
International Marketing
International Areas of Business, Economics, Finance, and Management
Kinesiology, Health, and Leisure Management
Leisure Industry Management
Organizational Communication ;Organizational Psychology
Management (Production, Behaviour, Management Science, Operations,
Policy, )
Marketing and operations (Consumer Behaviour, Marketing Management
etc.)
Manufacturing Engineering
Organization and management (Organizational Communication &
Psychology)
Political economics, public policy, political science
Public Administration & Public Relation
Quantitative Methods
Recreation and Sport Management
Sports and Health Care Management
Strategic human resources and industrial relations
Taxes (Estate, Gifts, Corporate Individual, Partnership etc.)
Tourism/ Travel / Transportation
All other international Business areas

iii
While the Editorial Board reserves the right to edit and review papers it may not
necessarily concur with, nor be responsible for, the views expressed by the respective
authors.
Website : http://onlinereview.segi.edu.my
Email : [email protected]
Address : No. 9, Jalan Teknologi Taman Sains Selangor, Kota Damansara
PJU 5, 47810 Petaling Jaya, Selangor Darul Ehsan, Malaysia
Telephone : +6(03)61451777
Facsimile : +6(03)61452717

iv
Contents
1. Rebranding and Staff Perception through Change
Communication Factors
Mohammad Firdaus Low bin Abdullah
1
2. Communicative Competence of Overseas Chinese
Students in an MBA Program in a Private University in
Malaysia
Zhong Kai, Mogana Dhamotharan
11
3. Proposing Values for Encouraging People to Share
Knowledge: A Case of Active Learning
Mohamad Hisyam Selamat, Sugumaran Selladurai
45
4. Job Motivation among Employees in Construction
Companies in Selangor, Malaysia
Uma Murthy, Paul Anthony Mariadas, Suguna Sinniah,
Gopal Perumal
81
5. Factors Influencing Home Purchase Decision: A Case
Study in Selangor, Malaysia
Uma Murthy, Paul Anthony Mariadas, Gopal Perumal,
Suguna Sinniah
94
1
Rebranding and Staff Perception through
Change Communication Factors
Mohammad Firdaus Low bin Abdullah*
Faculty of Communication & Creative Design , SEGI University,
47810 Petaling Jaya, Selangor ________________________________________________________
ABSTRACT
The purpose of this study is to investigate rebranding and staff
perception through Change Communication Factors (consisting of
Receiving Information, Providing Input, Value of Input and
Involvement in Decision Making). A set of self-administered
questionnaire was used. The study use a sample size of 87 executives
and 276 non-executives in a selected telecommunication company
which has rebranded. Data was gathered, recorded, analysed and
interpreted on the basis of the research objective and research questions
using the Statistical Package for social sciences (SPSS) software. T-
test was used to differentiate the results from the staff (Executive and
Non-Executives) on the change communication factors during the
rebranding exercise. The study found only Receiving Information
produced significance difference between the executives and non-
executives through the study.
Keywords: Rebranding; Change Communication; Receiving
Information; Providing Input; Value of Input and Involvement in
Decision Making
_________________________________
* Corresponding author:
E-mail Address: [email protected]
Affiliation: Faculty of Communication & Creative Design, SEGI
University

2
1. Introduction
Past studies tells us that, not all rebranding in the past has been
successful (Lowery, 2007; Muzellec & Lambkin, 2006;
Olafsson, 2010; Tevi, 2013). Success in change is dependent on
the ability of the organization to change the behaviour of its
employees. Rebranding requires implementation of an internal
communications programme to encourage and inspire employees
to support the new vision (Malmelin & Hakala, 2009).
Rebranding is about creating an emotional connection between
employees and organisation that transcends their personal
experience, but to create a brand vision in employees’ mind that
mobilises support for the brand in every decision they make
(Mitchell, 2002).Therefore, organisations need to take time
during the rebranding process to ensure employees internalise
and commit to the new brand values (Kaikati, 2001).
Thus, communication about the change is important, and
information to these employees is vital (Lewis, 2006). This study
is about rebranding. The importance of communication has been
discussed by many authors. Kotter (1996) argued that one of the
common ways to overcome resistance to change is to inform
people about it in advance. Employees need to be informed on
when the change will take place, how it will be implemented,
what is anticipated of them, how they will be affected from the
change in their jobs, and how the company will sustain and
motivate them to be more dedicated to the change.
Communication about the change not only allows employees to

3
understand the brand, but encourages employees to take
ownership of the brand through their organizational
responsibilities (Devasagayam, et al, 2010). An effective
communication is the sine qua non of the successful change
initiative (Lewis, 2000). It is legitimate for managers to employ
such a mechanism to clarify the facts to various stakeholders of
what is going to change, why, and what benefits they can expect
to derive from the change. An ultimate goal of communication in
change is to convey meaningful messages in a strategic manner
across the organization to achieve employee’s corporate
acculturation and employees’ commitment (Unzicker et al.,
2000). Without effective communication, organizations cannot
survive and continue their operation (Hickson, Stacks & Greely,
1998). Through communication, organization members
exchange information to progress their tasks and to achieve
organizational goals. One of the important elements in
organizational communication research is the study of superior –
subordinates communication, which is also known as supervisory
communication (Bakar, Mohammad & Mustafa, 2007).
According to Kotter (1996,) the main reason communication is
unsuccessful is simply because not enough effort is put in doing
it. It is often assumed that the vision and plan that top
management or change coalition have worked on for months can
be clearly and easily digested by the rest of the employees in the
period of time of the planned change (Kotter 1996; Rearta &
Mimoza, 2017).

4
Kitchen and Daly (2002) identified three types of messages or
information that affect employees during the unfolding of the
organizational change process. First, what employees must
know, including job specific information; second, what
employees should know, including desirable information about
the organization; and finally, what employees could know,
including relatively unimportant office gossip. Accordingly to
Goodman and Truss (2004) employees would want to know as
much information as possible in order to minimize uncertainty.
This is supported by Smith (2006) that communication with
employees on these matters should occur early in the change
process, preferably well before change begins. By doing this,
employees’ confidence, commitment and willingness to
participate can be developed from the planning stages to the
implementation phases of change.
Hence, this study tries to differentiate between executives’ and
non-executives’ change communication factors in a selected
organization during rebranding.
2. Research Method
The study employs the quantitative research design using the
survey method. The sample of the study was confined to
executive and non-executive staffs in a selected
telecommunication company. A sample of 363 were selected
using stratified random sampling. All data obtained were

5
analysed using the SPSS software. Descriptive analysis was
employed to examine the data.
3. Data Analysis and Findings
A total of 363 respondents consists of executive and non-
executives returned and completed their questionnaire with mean
age 39 years old for executive and 43 years old for non-executive,
and the sample had slightly higher proportion of male (62.1%)
for executive staff and higher female (58.7%) for non-executive
staff. In terms of years of services 71.3% of the executives served
the organization less than 20 years compared to non-executives
where 43.9% served more than 21 years.
The overall mean of rebranding (M = 2.98, SD = 0.38) showed
that 59.8% executives (M = 3.06, SD = 0.39) and 71.0% non-
executives (M = 2.96, SD = 0.38) responded to the receiving
information during rebranding. This indicate that the amount of
information received among the executives were sufficient
compared to the non-executives. The independent samples t-test
showed that there was statistically differences between the
executives and non-executives in receiving information with t =
2.077, p = 0.039 as shown I Table 1. The results indicated that
there were differences in the executive’s and non-executives
perception of receiving information during rebranding.
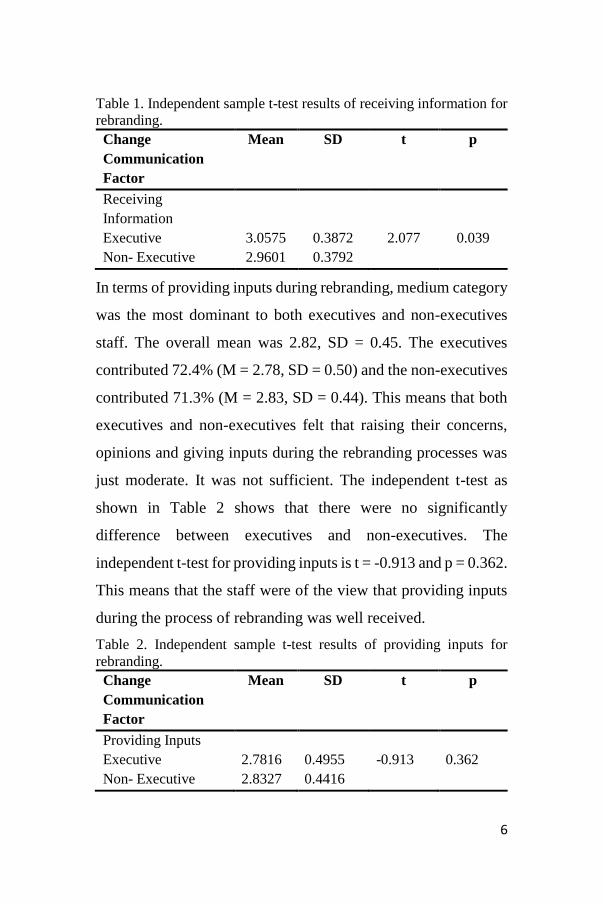
6
Table 1. Independent sample t-test results of receiving information for
rebranding.
Change
Communication
Factor
Mean SD t p
Receiving
Information
Executive 3.0575 0.3872 2.077 0.039
Non- Executive 2.9601 0.3792
In terms of providing inputs during rebranding, medium category
was the most dominant to both executives and non-executives
staff. The overall mean was 2.82, SD = 0.45. The executives
contributed 72.4% (M = 2.78, SD = 0.50) and the non-executives
contributed 71.3% (M = 2.83, SD = 0.44). This means that both
executives and non-executives felt that raising their concerns,
opinions and giving inputs during the rebranding processes was
just moderate. It was not sufficient. The independent t-test as
shown in Table 2 shows that there were no significantly
difference between executives and non-executives. The
independent t-test for providing inputs is t = -0.913 and p = 0.362.
This means that the staff were of the view that providing inputs
during the process of rebranding was well received.
Table 2. Independent sample t-test results of providing inputs for
rebranding.
Change
Communication
Factor
Mean SD t p
Providing Inputs
Executive 2.7816 0.4955 -0.913 0.362
Non- Executive 2.8327 0.4416

7
The finding for value of inputs among the staff indicated that the
executives and non-executives during = rebranding process
resulted in an overall mean of M = 2.79, SD = 0.51. The total
number of respondents among the executives were 69.0% (M =
2.79, SD = 0.51) and the total number of respondents among the
non-executives were 73.5% (M = 2.82, SD = 0.48). It shows that
both executives and non-executives felt that they did not have
enough opportunities to express their opinions and their opinion
about the rebranding processes were moderately requested by the
organization. The t-test result for vale of inputs showed that there
were no statistically differences between executive and non-
executives (t = -0.470, p = 0.639) as shown in Table 3. This
implies that the value of inputs were well received by the
respondents during the process of rebranding.
Table 3. Independent sample t-test results of value of inputs for
rebranding.
Change
Communication
Factor
Mean SD t p
Value of Inputs
Executive 2.7952 0.5117 -0.470 0.639
Non- Executive 2.8235 0.4818
Finally, for Involvement in decision making, the overall mean for
rebranding was 2.73 and SD = 0.49. The executives contributed
70.1% (M = 2.75, SD = 0.55) and non-executives contributed
76.4% (M = 2.72, SD = 0.47). Both executives and non-
executives felt that their superior has moderately encourage them
to participate in the decision making and implementation and

8
decision are usually made by the top management with moderate
inputs from the staff at different level in the organization. The t-
test shown in Table 4 indicates that the executives and non-
executives were of the view that involvement in decision making
during rebranding was well received (t = 0.330, p = 0.742). There
were no significant differences between the executives and non-
executives.
Table 4. Independent sample t-test results of involvement in decision
making for rebranding.
Change
Communication
Factor
Mean SD t p
Value of Inputs
Executive 2.7471 0.5464 0.330 0.742
Non- Executive 2.7272 0.716
4. Conclusion and Recommendation
The study found that ultimately, staff perception on rebranding
processes depends on how effectively the strategy and the
substance of change were communicated to the staff. The result
indicates that there were difference in executives’ and non-
executives’ perception of receiving information in the selected
organization. The staff felt that there should not be any
differences in information sharing between them. Being the staff
of the organization, they believed that they have the right to know
what was expected from them, and they need to know how to
contribute and become involve before, during and after the
rebranding processes. Information about when, how and what to

9
communicate to the staff can reduce fear of unpleasant
consequences, lack of trust, uncertainty, surprises and personality
conflicts among the staff.
References
Bakar, H.A., Mohammad, B., & Mustafa, C.S (2007). Superior
subordinates communication dimensions and working
relationship: gender preferences in a Malaysian organization.
Journal of Intercultural Communication Research, 36 (1), 51 –
69.
Devasagayam, P., Buff, C., Aurand, T. & Judson, K. (2010), Building
brand community membership within organizations: a viable
internal branding alternative?, Journal of Product and Brand
Management, Vo. 19, No. 3, pp. 210-217
Goodman, J. & Trust, C. (2004). The medium and the message:
communicating effectively during a major change initiative,
Journal of Change Management. 4 (3), 217 – 228.
Hickson, M., Stacks, D.W., & Greely, M.P (1998). Organizational
communication in the personnel context:From interview to
retirement. Neddham Heights, M.A: Allyn & Bacon.
Kaikati, J. & Kaikati, A. (2003), A rose by any other name: rebranding
campaigns that work, Journal of Business Strategy, Vol. 24,
No. 6, pp. 17-23
Kitchen, P.J. & Daly, F. (2002). Internal communication during change
management. Corporate Communication: An Internal Journal
7(1), 46 – 53.
Kotter, J. P. 1996). Leading Change. Harvard Business School Press.
Lewis, L. K. (2000). Communicating change: Four cases of quality
programs. Journal of Business
Communication, 37 (2) April, pp. 128-155.

10
Lewis, K. 2006). “Employee perspectives on implementation
communication as predictors of perceptions
of success and resistance”. Western Journal of Communication.
70 (1), 23-46.
Lowery, K. B. (2007). A rebranding campaign: Toyota’s quest to be
viewed as an American company (A Masters’ thesis). School of
Communication, American University, Washington, DC.
Malmelin, N. & Hakala, J. (2009), Guided by the brand: from brand
management to integrative corporate communications, Business
Strategy Series, Vol. 10, No. 5, pp. 248-258.
Rezarta, H & Mimoza, M, (2017), Importance of communication
during change: A case study of the municipality of Vlora,
European Journal of Multidisciplinary Studies, Vol 4, No.1 pp.
15 – 16.
Smith, I. (2206). Continuing professional development and workplace
learning – 14, communicating on times of change. Library
Management, 27, 108 – 112.
Unzicker, D., Clow, K. E. & Babakus, E. (2000). The role of
organizational communications on employee perceptions of a
firm. Journal of Professional Services Marketing, 21 (2), pp. 87-
104.

11
Communicative Competence of Overseas
Chinese Students in an MBA Program in a
Private University in Malaysia
Zhong Kaiᵃ, Mogana Dhamotharanᵇ*
ᵃFaculty of Education, SEGI University, 47810 Petaling Jaya, Selangor
ᵇFaculty of Education, SEGI University, 47810 Petaling Jaya, Selangor
_______________________________________________________________________________________________
ABSTRACT
An increasing number of Chinese university students choose to study
abroad and attention should be paid to their communicative
competence that may affect their scores, performance in class, social
interactions, and knowledge acquisition. Chinese MBA students need
good communicative competence as an essential quality so they can
play an important role in business and management fields. This study
investigates the level of communicative competence of a sample of
Chinese MBA students enrolled at a private university in Selangor,
Malaysia. Their communicative competence was assessed from the
following aspects: affiliation and support, empathy, interaction
management, social relaxation and behavioural flexibility. The data
were collected in this study by means of a 36-item communicative
competence questionnaire. There were a total of 164 questionnaires
completed and 157 were used in the study. The findings of this study
are as follows: The level of communicative competence of MBA
________________________________
* Corresponding author:
E-mail Address: [email protected]
Affiliation: Faculty of Education, SEGI University

12
students from China in the private university ranged from good to very
good with respect to affiliation and support, empathy, interaction
management, social relaxation and behavioural flexibility. Chinese
MBA students investigated with respect to affiliation and support,
empathy, interaction management, and behavioural flexibility.
However, male students outperformed female students in terms of
social relaxation. There were no age differences in the communicative
competence of the sample of Chinese MBA students investigated.
There were no differences in the communicative competence between
students with working experience and students without working
experience. Communicative competence of students in the sample who
communicated with both Chinese and foreign interactants were better
than those who communicated with mostly Chinese interactants.
Keywords: communicative competence; affiliation and support;
empathy; social relaxation; behavioural flexibility
________________________________________________________
1. Introduction
Employers require MBA graduates to have soft-skills or
competencies in the following areas; dealing with customers,
coordinating work, arranging events, upgrading skills, teamwork,
and, problem solving through innovative solutions. Thus,
language proficiency and more specifically communicative
ability across a broad range of contexts are invaluable for the
MBA graduate to remain adaptable and transferable amongst
departments within corporations. Wagner (2008) observes that
fuzzy thinking and inability to express thoughts were the major
complaints of business leaders during recruitment of fresh
graduates. From a global perspective, English is still the
predominant language of global business compared to Mandarin

13
despite China’s growing economic might. A global survey on
English proficiency concludes that nations with high English
proficiency levels had relatively high key economic and social
indicators. (Education First, English Proficiency Index Rankings,
2017, Executive Report). Therefore, an advanced proficiency in
the global language of business, English, is required of all MBA
students and especially of international students.
To make its education system fit for globalization, educationists
in China have shifted their focus from content or subject matter
to specified skills or competencies. In the past decade, the
educational processes in China have come under increasing
scrutiny for reform. Huang (2004) suggests that the College
Entrance Examinations that were reinstated after the Cultural
Revolution met the needs of China’s growing economy at the
time by creating talents across many diverse fields. However, the
purely academic focus of the College Entrance Examinations had
failed to address the skills-gap in these competencies,
particularly, in the area of communicative competence.
According to a survey conducted by Bai, Wang, and Liang (2015)
of 77 business students at Jiang Yin Vocational and Technical
College, it was found that 70% of students assessed their
communicative competence as average while 64% could not
address problems in communication. Zhang (2012) notes that
university students do not take the initiative to communicate with
teachers or classmates and they have less empathy with others.
Besides, poor communicative competence among students in

14
Chinese universities can be attributed to various factors such as
shortcomings in personality, a lack of social practice and
awareness of the importance of social interactions.
It is interesting to compare and contrast the Chinese context of
communicative competency with that of other countries to
examine if this skill gap is a global phenomenon. A survey of 102
individuals in New Zealand organizations, indicate that men are
better than women at keeping the conversation going and women
fared better than men in social-group settings. The findings of the
same research showed that age, work experience and seniority at
work are unrelated to communicative competence (Schischka,
2015). Research conducted at City University, New York
concluded that overseas Chinese students who were willing to
form friendships with American students outside their circle of
country-mates exhibited stronger language skills, better
academic performance, lower levels of stress and better overall
adjustment to a new culture (Gareis, 2012).
China now regards communicative proficiency in the English
language as well as Mandarin as foundational to equipping a
labour force in a globalized era, leading to a shift in emphasis in
language learning. The Government of China has responded by
placing emphasis on English proficiency in the national school
curricula. Approximately 523,700 students chose overseas
education in 2015 (Government of China, Xinhua News Agency
dated 17th March 2016). The Government of China recognizes
that studying abroad strengthens bilateral cooperation in the area

15
of culture, economy, and science on an international basis and
has implemented a series of policies to support overseas students,
giving them more options and scope to realize their aspirations.
Overseas Chinese students pursuing the MBA program at a
private University in Selangor, Malaysia need to have good
communicative competency particularly for the sake of academic
performance, interpersonal interaction and employment.
However, the researcher has observed that MBA students from
China, enrolled at this University are more inclined to
communicate exclusively with their country mates in their first
language, Mandarin. They are reluctant to join social gatherings
and communicate with the students from other countries or other
ethnicities. The researcher seeks to assess if his observations
indicate a lack of communicative competence and to evaluate the
extent of this deficiency by the specific research methodology.
The study also aims to identify if various factors such as gender,
age, working experience, and the characteristics of the
interactants of communication had any correlation to
communicative competency.
The notion of communicative competence has evolved from
Chomsky’s purely linguistic concept, encompassing knowledge
of language and its performance, to one which incorporates a
sociolinguistic dimension where language is used in a variety of
communicative situations. Communicative competence is seen
as a dynamic exchange where the communicator has to adapt to
the linguistic and non-verbal input of the participants (Savignon,

16
1972). Wiemann’s definitional model (1977) is adopted where
communicative competency is expressed as a behavioural aspect
in the ability to interact effectively with other people, i.e.
interaction management. Wiemann (1977) states that
communicative competency may be assessed by evaluating the
subject in the following five aspects: affiliation/support, social
relaxation, empathy, behavioural flexibility and interaction
management. The subject that shows high levels of ‘affiliation
and support’ demonstrates openness and availability to receive
input from others. ‘Social relaxation’ is equated with being
relaxed in any given social situation without provoking anxiety
in others by exhibiting it oneself. ‘Empathy’ is the ability to
understand and share the feelings of others. Subjects with high
‘behavioural flexibility’ have a large enough behavioural
repertoire to adjust to different situations. Finally ‘interaction
management’ is the ability to follow the ‘faces and lines’ of
fellow interactants.
Students from China, enrolled in the MBA program overseas in
countries like Malaysia, have a relatively unique communicative
environment where they have to deal with people from different
cultures, languages, customs, and backgrounds and it would be
interesting to see if these students can adapt and form cross-
cultural friendships that may give them a balance and holistic
worldview. While a great number of studies have been conducted
on university students’ communicative competence within China,
there has been a dearth of research on the communicative

17
competence of Chinese students who study abroad in different
cultural and language contexts. Furthermore, researchers may
conduct related studies based on this survey and use the results
to bridge the gap in existing literature.
This study is conducted at a private university in Malaysia and
surveys the communicative competence of students from China
enrolled in its MBA program. However, the findings cannot
represent and reflect the communicative competence of other
Chinese students in Malaysia, or even, all overseas Chinese
students. There are limitations to self-reported data through the
questionnaire and interviews because they show the respondents’
perceptions of investigated factors instead of observable factors.
2. Literature Review
Chomsky (1965) proposed the idea of linguistic competence and
linguistic performance together in language study. Linguistic
competence means syntactic competence and the knowledge of a
language system. In Chomsky’s view (1965), competence is the
interlocutors’ inherent language knowledge. Linguistic
competence is a certain state of knowledge more abstract than
language itself. It is a system of principles, a knowledge system
rather than the ability to organize and understand sentences.
According to Chomsky (1965), a native speaker’s competence
may include the ability to recognize ambiguities in sentences, to
detect relationships between sentences, to tell the difference
between grammatical and ungrammatical sentences and to

18
paraphrase relations between sentences. Chomsky’s theory
(1972) does not show what a speaker has to know in real
communication, which is known as the socio-cultural dimension.
In 1972, Hymes proposed the term “communicative competence”
to perfect Chomsky’s linguistic competence. Hymes (1972)
claimed Chomsky’s competence does not include the use of
language and the systematic consideration of the particular use of
language in situations. To use the language properly in
communication, people have to understand what meets the rules
of language, what accords to the cultural conventions and what
can be acknowledged by culture. Hymes’s communicative
competence (1972) further proposes that language learning or
acquisition should not only include grammar and phonology, but
also the interpersonal, cross-cultural and social aspects.
A series of scholars (such as Argyle & Kendon, 1967; Dance &
Larson, 1972; Duncan, 1968; Ruesch, 1957) proposed that a
strong correlation exists between a person’s ability of using the
communication process and the ability to function in society.
“Communicative competence” includes language and non-
language components so it is not merely restricted to using
language. As Allen and Brown (1976) observe, “communicative
competence”, distinct from “linguistic competence”, contains the
awareness of transactions existing between people. In social
settings, communicative competence is highly relevant to actual
language performance.
Wiemann (1977) came up with a comprehensive notion that

19
communicative competence is a communicator’s ability to select
from available communicative behaviours in order to
successfully achieve interpersonal goals and maintain the others’
“face and line” within the constraints of the circumstances during
communication. Larson, Backlund, Redmond, and Barbour
(1978) also associated behaviour with communicative
competence, that it is the ability of an individual to apply
knowledge of the proper communicative behaviours in certain
situations. Wiemann (1977), based on literature dealing with
face-to-face conversational encounters, proposed a definitional
model of communicative competence composed of the following
five dimensions; affiliation/support, social relaxation, empathy,
behavioural flexibility, and interaction management skills.
Wiemann’s Communicative Competence Scale accords with the
researcher’s aim of investigating communicative competence
from a wider behavioural aspect. Linguistic competence, is just
the basic competence of communication and knowing how to
communicate to accomplish one’s goals while maintaining the
interactants’ face in situations, is a higher level of
communication. Research on college students in China found that
their communicative competence was generally poor, which
mainly had the following outcomes. According to a survey
conducted by Li (2010) through the Shanghai Education
Television Station of 500 undergraduates from Tongji University,
China Textile University, East China University of Science and
Technology and Shanghai Normal University, it was found that,

20
the speaking time of 45.8% participants each day was no more
than 30 minutes. In addition, up to 10.7% of college students
were men of few words who spoke less than 10 minutes per day.
According to Liu’s (2011) pragmatic perspective, some students
communicate improperly. There is a general lack of consideration
for the moral orientation and decency of others when
communicating, resulting in rudeness and uncouth behaviour.
Liu, (2011) observes that while many college students desire to
communicate with others, poor interaction management skills
impair this goal. For example, they often speak without taking
into account social contexts and audiences. Communication
serves their self-interests and they seek to entertain themselves at
the expense of others. This creates misunderstanding and
conflicts that results in fractured relationships.
According to Li and Xu (2014), as both schools and parents are
primarily concerned about grades and high scores, the cultivation
of the students’ communication and interpersonal skills are very
likely to be overlooked. As a result, when these students enter
university, it is inevitable that they have trouble communicating.
Yue (2014), observes that college students do not have exposure
to ‘communication training’ in high school and they lack the
social environment to be truly adept at communication. As far as
Li and Xu, (2014), are concerned, courses that specifically
improve communicative competence are uncommon at Chinese
universities. Even though a communication course is made
available, it is only optional and not compulsory. According to

21
Zhou and Wang (2013), Chinese families prioritize academic
scores and other capabilities are of secondary importance. Young
people do not realize the importance of communication and there
is little awareness about developing such skills from childhood.
Qi (2007) observes that the Hunan child prodigy Wei Kangyong,
studied at the Chinese Academy of Sciences and then dropped
out of school, going back home in 2003. This is a typical case of
someone who could not function independently and effectively
in society due to the lack of communication skills.
The importance of communicative competence in business has
been recognized for years. Curtis, Stephens, and Winsor (1989)
mentioned that communication was one of the most useful skills
in helping graduating college students obtain employment.
O’Donovan (1997) mentioned that experts discuss and compare
the importance of an MBA or MA to communicators’ success.
Bill Kokontis, Vice President of marketing programs for the
Chicago Mercantile Exchange, notes that his company prizes
those who have business expertise as well as first-rate
communication skills. When Chinese students communicate with
international students, there are other factors that largely
influence their communicative competence; intercultural
competence. According to Gao’s research on 257 students from
the following Faculties: Business, Laws, Mathematics, Science,
Chemistry, and Information Technology in Suzhou University in
2006, it was found that most students’ intercultural
communicative competence was not satisfactory. More than 60%

22
of the respondents did not read books related to intercultural
communication. Almost half (48.9%) had limited non-language
communicative knowledge. Around 37.5% of the respondents
were stressed and afraid of communicating with foreigners via
telephone calls and 42% of respondents chose “poor competence
of intercultural communication” as the main reason that deterred
their attempts at intercultural communication.
3. Methodology
The research aimed to answer the following research questions:
1. What is the level of communicative competence of
students from China enrolled in the MBA program at the
private university?
2. Are there gender differences in communicative
competence?
3. Are there differences in communicative competence
between students of different age groups?
4. Are there differences in communicative competence of
the MBA students with working experience and those
without working experience?
5. Are there differences in communicative competence of
the MBA students depending on the interactants?
The data collected in this study is based on students’ responses to
an online questionnaire that uses a modified version of a 36-item
Communicative Competence Scale developed by Wiemann
(1977). This questionnaire comprises two parts. Part 1 includes

23
six questions with respect to students’ background; gender, age,
hometown, working experience, communicative interactants,
and, communicative situations. Part 2 is the Communicative
Competence Questionnaire that includes 36 items concerning
affiliation and support, empathy, interaction management,
behavioural flexibility, and social relaxation. The respondents
had to state their preference and/or experience and answer by
circling a number on a 5-point Likert scale from 1 (strongly
disagree) to 5 (strongly agree). The higher the score respondents
choose, the better their communicative competence.
There are 845 Chinese students from various disciplines studying
in this private university for the 2016 academic year and they
come from 20 different provinces of China. There are 203
students enrolled in the MBA program with ages ranging from 21
to 30. Invitation to participate in the study was sent to all MBA
students and 164 students responded by completing the
questionnaire. After data cleaning, 157 students’ responses were
found to be suitable to be used in the study.
In this study, the Cronbach’s alpha coefficient of Communicative
Competence Scale was found to be 0.94, which is above the
preferable level (Cronbach α=0.8). The Cronbach’ alpha
coefficient for the subscales in terms of affiliation and support,
empathy, interaction management, behavioural flexibility and
social relaxation were found to be acceptable as well.

24
4. Discussion
4.1. Overall Communicative Competence
Table 1. Survey Score Descriptive (negatively expressed items were
reverse coded before summation).
*Highest/ middle/ lowest score: the possible highest/ middle/ lowest score for
each sub-score.
Table 1 shows the highest, middle and lowest scores possible for
each of the 5 constructs of the communicative competence and
mean and standard deviation of communicative competence with
respect to social relaxation, affiliation and support, empathy,
interaction management and behavioural flexibility, which is the
sum of all the items in the questionnaire.
The overall communicative competence of students was assessed
to be good to very good because their mean score was 113.43,
greater than the middle score of 87. More particularly with
respect to social relaxation, affiliation and support, empathy,
interaction management and behavioural flexibility, students’

25
communicative competence was classified as good to very good
because their mean scores were 37.74, 30.48, 18.35, 18.8, and
8.06 respectively. These values are greater than the theoretical
mean scores 27, 24, 15, 15 and 6 respectively. According to the
results, it can be seen that all the means are greater than the
middle score for each component. It can be concluded that
Chinese MBA students’ communicative competence is good to
very good for overall communicative competence as well as in
the five components.
4.2. Differences in Communicative Competence between the
Sample of Male and Female Students
Table 2. Distribution of Means, Standard Deviations, t-values and p-
values of Communicative Competence of Male and Female Students.
* p ≤ 0.05 ** p ≤ 0.01 (2-tailed) *** p ≤ 0.001 (2-tailed)

26
Table 2 shows the means, standard deviations, t-values and p-
values of communicative competence of male and female
students concerning affiliation and support, empathy, interaction
management, social relaxation and behavioural flexibility. The
results show that there was no statistically significant difference
in the means of the overall communicative competence between
male (M=114.8, SD=14.23) and female (M=112.53, SD=13.3)
students, t(124.22)=1.01, p=0.32. This means that the
communicative competence of male and female students was
about the same. Differences in the mean scores can be attributed
to chance.
In the affiliation and support component of communicative
competence, there was no statistically significant difference
between male (M=37.73, SD=3.91) and female (M=37.75,
SD=4.24) students, t(137.87)=-0.03, p=0.97. It can be concluded
that there were no differences between male and female students
with respect to affiliation and support.
In the empathy component of communicative competence, there
was no statistically significant difference between male
(M=30.58, SD=5.39) and female (M=30.41, SD=4.62) students,
t(116.27)=0.21, p=0.84. It can be concluded that there were no
differences between male and female students with respect to
empathy.
In the interaction management component of communicative
competence, there was no statistically significant difference
between male (M=18.85, SD=3.08) and female (M=18.02,

27
SD=3.26) students, t(135.75)=1.62, p=0.11. It can be concluded
that there were no differences between male and female students
with respect to interaction management.
In the social relaxation component of communicative
competence, there were statistically significant differences
between male (M=19.59, SD=3.42) and female (M=18.28,
SD=2.55) students, t(104.35)=2.58, p=0.011. It can be concluded
that there are differences between male and female students with
respect to social relaxation. Male students are better than female
students at social relaxation.
In the behavioural flexibility component of communicative
competence, there was no statistically significant difference
between male (M=8.05, SD=1.19) and female (M=8.06,
SD=1.24) students, t(133.78)=-0.08, p=0.94. It can be concluded
that there were no differences between male and female students
with respect to behavioural flexibility.

28
4.3. Differences in Communicative Competence between the
Different Age Groups
Table 3. Distribution of Means, Standard Deviations, t-values and p-
values of Communicative Competence of Students (21 to 25 years old)
and Students (above 26).
* p ≤ 0.05 ** p ≤ 0.01 (2-tailed) *** p ≤ 0.001 (2-tailed)
Table 3 shows the means, standard deviations, t-values and p-
values of communicative competence of younger students (21 to
25 years old) and older students (above 25) with respect to
affiliation and support, empathy, interaction management, social
relaxation and behavioural flexibility.
The results show that there was no statistically significant
difference in the means of overall communicative competence of
younger students (21 to 25 years old) (M=112.79, SD=13.9) and

29
older students (above 25) (M=114.87, SD=13.17), t(94.52)=-
0.90, p=0.37. This result shows that there was no difference in
the communicative competence between younger students (21 to
25 years old) and older students (above 25).
In the affiliation and support component of communicative
competence, there was no statistically significant difference
between younger students (21 to 25 years old) (M=37.57,
SD=4.15) and older students (above 25) (M=38.13, SD=3.98),
t(93.43)=-0.80, p=0.43. It can be concluded that there were no
differences between younger students (21 to 25 years old) and
older students (above 25) with respect to affiliation and support.
In the empathy component of communicative competence, there
was no statistically significant difference between younger
students (21 to 25 years old) (M=30.21, SD=4.89) and older
students (above 25) (M=31.08, SD=5.01), t(87.97)=-1.01,
p=0.31. It can be concluded that there were no differences
between younger students (21 to 25 years old) and older students
(above 25) with respect to empathy.
In the interaction management component of communicative
competence, there was no statistically significant difference
between younger students (21 to 25 years old) (M=18.22,
SD=3.2) and older students (above 25) (M=18.65, SD=3.22),
t(89.54)=-0.76, p=0.45. It can be concluded that there were no
differences between younger students (21 to 25 years old) and
older students (above 25) with respect to interaction
management.

30
In the social relaxation, component of communicative
competence, there was no statistically significant difference
between younger students (21 to 25 years old) (M=18.76,
SD=3.12) and older students (above 25) (M=18.89, SD=2.66),
t(104.47)=-0.27, p=0.79. It can be concluded that there were no
differences between younger students (21 to 25 years old) and
older students (above 25) with respect to social relaxation.
In the behavioural flexibility component of communicative
competence, there was no statistically significant difference
between younger students (21 to 25 years old) (M=8.03,
SD=1.24) and older students (above 25) (M=8.13, SD=1.61),
t(95.89)=-0.47, p=0.64. It can be concluded that there were no
differences between younger students (21 to 25 years old) and
older students (above 25) with respect to behavioural flexibility.

31
4.4. Differences in Communicative Competence between
Students with Working Experience and without Working
Experience
Table 4. Distribution of Means, Standard Deviations, t-values and p-
values of Communicative Competence of Students with Working
Experience and Students without Working Experience.
* p ≤ 0.05 ** p ≤ 0.01 (2-tailed) *** p ≤ 0.001 (2-tailed)
Table 4 shows the means, standard deviations, t-values and p-
values of the communicative competence of students with and
without working experience with respect to affiliation and

32
support, empathy, interaction management, social relaxation and
behavioural flexibility. The results show that there was no
statistically significant difference in the means of the overall
communicative competence of students with working experience
(M=114.14, SD=12.08) and students without working experience
(M=113.05, SD=14.48) t(125.81)=0.50, p=0.62. This result
shows that there was no difference in the communicative
competence between students with working experience and
students without working experience.
In the affiliation and support component of communicative
competence, there was no statistically significant difference
between students with working experience (M=37.63, SD=3.94)
and students without working experience (M=37.80, SD=4.19);
t(113.60)=-0.25, p=0.81. It can be seen that there were no
differences between students with and without working
experience with respect to affiliation and support.
In the empathy component of communicative competence, there
was no statistically significant difference between students with
working experience (M=30.93, SD=4.63) and students without
working experience (M=30.24, SD=5.08); t(116.79)=-0.85,
p=0.40. It can be concluded that there were no differences
between students with and without working experience with
respect to empathy.
In the interaction management component of communicative
competence, there was no statistically significant difference
between students with working experience (M=18.37, SD=2.80)

33
and students without working experience (M=18.34, SD=3.41);
t(127.26)=-0.06, p=0.95. It can be concluded that there were no
differences between students with and without working
experience with respect to interaction management.
In the social relaxation component of communicative
competence, there was no statistically significant difference
between students with working experience (M=19.01, SD=2.58)
and students without working experience (M=18.69, SD=3.18);
t(155)=-0.65, p=0.52. It can be concluded that there were no
differences between students with and without working
experience with respect to social relaxation.
In the behavioural flexibility component of communicative
competence, there was no statistically significant difference
between students with working experience (M=8.20, SD=1.23)
and students without working experience (M=7.98, SD=1.20);
t(105.46)=-1.09, p=0.28. It can be concluded that there were no
differences between students with and without working
experience with respect to behavioural flexibility.
34
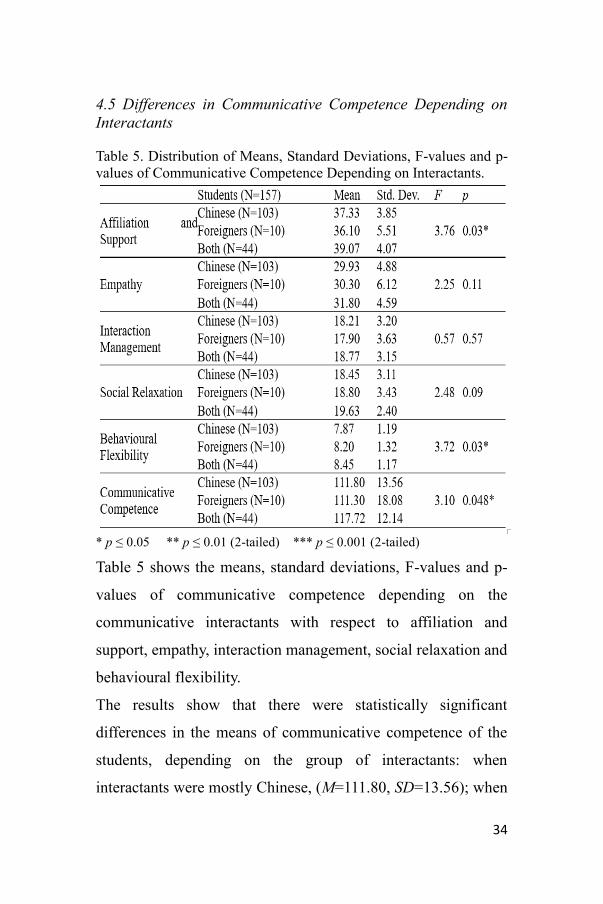
4.5 Differences in Communicative Competence Depending on
Interactants
Table 5. Distribution of Means, Standard Deviations, F-values and p-
values of Communicative Competence Depending on Interactants.
* p ≤ 0.05 ** p ≤ 0.01 (2-tailed) *** p ≤ 0.001 (2-tailed)
Table 5 shows the means, standard deviations, F-values and p-
values of communicative competence depending on the
communicative interactants with respect to affiliation and
support, empathy, interaction management, social relaxation and
behavioural flexibility.
The results show that there were statistically significant
differences in the means of communicative competence of the
students, depending on the group of interactants: when
interactants were mostly Chinese, (M=111.80, SD=13.56); when

35
interactants were mostly foreigners, (M=111.30, SD=18.08); and,
when interactants comprised either Chinese or foreigners,
(M=117.72, SD=12.14), F=3.10, p=0.048. These results show
that there were differences in the communicative competence of
students depending on different groups of interactants. According
to post-hoc results, students who communicated with either
Chinese or foreign interactants were more competent than
students who communicated with mostly Chinese interactants.
There was no difference in competence, when the interactants
comprised either Chinese or foreigners, and when interactants
were mostly foreigners. There was also no difference in
competence when interactants were mostly foreigners, and, when
interactants were mostly Chinese.
In the affiliation and support component of communicative
competence, there were statistically significant differences,
depending on the group of interactants: when interactants were
mostly Chinese, (M=37.33, SD=3.85); when interactants were
mostly foreigners, (M=36.10, SD=5.51); and, when interactants
comprised of either Chinese or foreigners, (M=39.07, SD=4.07),
F=3.76, p=0.03. According to post-hoc results, students who
communicated with either Chinese or foreign interactants were
more competent at affiliation and support than students who
communicated with mostly Chinese interactants. There was no
difference in competence at affiliation and support, when the
interactants comprised of either Chinese or foreigners, and, when
interactants were mostly foreigners. There was also no difference

36
in competence at affiliation and support, when interactants were
mostly foreigners and when interactants were mostly Chinese.
In the empathy component of communicative competence, there
were no statistically significant differences, depending on the
group of interactants: when interactants were mostly Chinese,
(M=29.93, SD=4.88); when interactants were mostly foreigners,
(M=30.30, SD=6.12); and, when interactants comprised of either
Chinese or foreigners, (M=31.80, SD=4.59), F=2.25, p=0.11. It
can be concluded that there were no differences in the
competence of students at empathy when communicating with
different groups of interactants.
In the interaction management component of communicative
competence, there were no statistically significant differences,
depending on the group of interactants: when interactants were
mostly Chinese, (M=18.21, SD=3.20); when interactants were
mostly foreigners, (M=17.90, SD=3.63); and, when interactants
comprised of either Chinese or foreigners, (M=18.77, SD=3.15),
F=0.57, p=0.57. It can be concluded that there were no
differences in the competence of students at interaction
management when communicating with different groups of
interactants.
In the social relaxation component of communicative
competence, there were no statistically significant differences,
depending on the group of interactants: when interactants were
mostly Chinese, (M=18.45, SD=3.11); when interactants were
mostly foreigners, (M=18.80, SD=3.43); and, when interactants

37
comprised of either Chinese or foreigners, (M=19.63, SD=2.40),
F=2.48, p=0.09. It can be concluded that there were no
differences in the competence of students at social relaxation
when communicating with different groups of interactants.
In the behavioural flexibility component of communicative
competence, there were statistically significant differences,
depending on the group of interactants: when interactants were
mostly Chinese, (M=7.87, SD=1.19); when interactants were
mostly foreigners, (M=8.20, SD=1.32); and, when interactants
comprised of either Chinese or foreigners, (M=8.45, SD=1.17),
F=3.72, p=0.03. According to post-hoc results, students who
communicated with either Chinese or foreign interactants were
more competent at behavioural flexibility than students who
communicated with mostly Chinese interactants. There was no
difference in competence at behavioural flexibility, when the
interactants comprised of either Chinese or foreigners, and, when
interactants were mostly foreigners. There was also no difference
in competence at behavioural flexibility, when interactants were
mostly foreigners, and, when interactants were mostly Chinese.
5. Conclusions and Recommendations
This study investigated the level of communicative competence
of overseas Chinese students enrolled in the MBA program at a
private university in Malaysia. The results showed that the
overall communicative competence of Chinese MBA students at
the private university in Malaysia was good to very good. Their

38
competence with respect to affiliation and support, empathy,
interaction management, social relaxation and behavioural
flexibility were also good to very good.
In other words, in communication, these MBA students could
perform well and were competent. With respect to affiliation and
support, they liked to be close and personal with people, typically
did not make unusual demands of their friends, could easily put
themselves in another person’s shoes, generally knew what type
of behaviour was appropriate in any given situation, listened to
what people said to them, were supportive of others, were good
listeners and were easy to talk to. With respect to empathy, they
found it easy to get along with others, did not have cold and
distant personal relationships, adapted to changing situations
well, were rewarding to talk to, were relaxed and comfortable
while speaking, had smooth conversational behaviour and were
likeable to people. As for interaction management, they were
generally relaxed when conversing with new acquaintances,
enjoyed social gatherings where they could meet new people, did
not mind meeting strangers, were interested in what others have
to say, and followed the conversation very well. With respect to
social relaxation, they used their voice and body expressively,
were sensible to others’ needs of the moment, were flexible,
generally said the right things at the right time and would not
argue with someone just to prove they were right. In terms of
behavioural flexibility, they understood other people and let other
people know that they understood them.

39
Yao (2000) found that the communicative competence of the
majority of students in his research sample was satisfactory; they
were considerate of others, got on well with others, had close
relationships, listened to what others talked about and were
relaxed during communication.
Conversely, a survey conducted by Zhou and Wang (2013) found
that the majority of university students participating in the survey
had problems with communication.
In regard to gender differences in communicative competence of
the sample of Chinese MBA students investigated, the
communicative competence of both gender was equal in all the
components surveyed except for one. Male students
outperformed female students in the social relaxation component
of communicative competence; male students liked to use their
voice and body more expressively than female students, were
more sensitive to the interactants immediate needs, were more
flexible, said the right things at the right time, and were less likely
to argue with the interactant just to prove they were right. With
respect to the other components of communicative competence
such as affiliation and support, empathy, interaction
management, social relaxation and behavioural flexibility, it can
be concluded that there were no gender differences in the students
surveyed.
The findings of the present study differed from the findings of a
study by Ma (2009). In her study, she found that female students
were better than male students in using body language and voice

40
in communication. Female students were also better at observing
details during communication and catching subtle information
via voice, intonation and gestures.
Age of the students seemed to have no discernible influence on
their communicative competence. The sample of Chinese MBA
students was split into two age groups for the purposes of this
study; younger students (21-25 years old), and older students
(above 25). There were no differences in communicative
competence between the younger and older students in respect to
affiliation and support, empathy, interaction management, social
relaxation and behavioural flexibility.
The students’ work experience or lack of work experience
seemed to have no discernible influence on their communicative
competence. The results showed that there were no differences in
communicative competence between students with working
experience and students without working experience in respect to
affiliation and support, empathy, interaction management, social
relaxation and behavioural flexibility.
The type of people the students interacted with seemed to
influence their communicative competence. Students who
interacted with both Chinese and foreigners outperformed those
who interacted with mostly Chinese in respect to affiliation and
support, and behavioural flexibility. There was no difference in
communicative competence between students who
communicated with both Chinese and foreigners and students
who communicated mostly with foreigners. There was also no

41
difference in communicative competence between students who
communicated mostly with foreigners and those who
communicated mostly with Chinese with respect to empathy,
interaction management and social relaxation.
The findings of this study showed that the communicative
competence of Chinese MBA students was satisfactory in terms
of affiliation and support, empathy, interaction management,
social relaxation and behavioural flexibility. However, there was
still room for improvement in certain behavioural aspects of
communication such as the usage of body language and vocal
expressions. The willingness to engage with others in social
settings must be overcome before overall communicative
competence can be enhanced through practise.
References
Aegyle, M., & Kendon, A. (1967). The experimental analysis of social
performance. Advances in experimental social psychology,
3, 55-98.
Allen, R. R., & Brown, K. L. (1976). Developing communication
competence in children. Skokie, National Textbook.
Bai, X. F., Wang, L. S., & Liang. S. H. (2015). A study of current
situation and suggestions of business students’
communicative competence in vocational and technical college.
University English, 4, 62-63.
Chomsky, N. (1965). Aspects of the Theory of Syntax. Cambridge,
Massachusetts: The M.I.T. Press.

42
Chomsky, N. (1972). Language and Mind. San Diego: Harcourt, Brace
& Jovanovich.
Curtis, D. B., Winsor, J. L, & Stephens, R. D. (1989). National
preferences in business and communication education.
Communication Education, 38, 6-14.
Dance, F. E. X., & Larson, C. E. (1972). Speech communication:
Concept and behaviour. New York, Holt, Rinehart and
Winston.
Duncan, H. (1968). Symblos in society. New York: Oxford University
Press.
Education First, English Proficiency Index Rankings, 2017, Executive
Report.
http://www.ef.com/__/~/media/centralefcom/epi/downloads/ful
l-reports/v7/ef-epi- 2017-english.pdf
Gao, Y. C. (2006). A study of current situation of university students’
cross-cultural communication. Foreign Languages and
Teaching, 11, 26-28.
Gareis, E. (2012). Intercultural friendship: effects of home and host
region. Journal of International and Intercultural
Communication, 5, 309-328.
Huang, L. (2004). Journal of Shangqiu Vocational and Technical
College. A Discuss of Test- Oriented Education and
Quality-Oriented Education, 1, 82.
Hymes, D. H. (1972). On Communicative Competence. In John B.
Pride & Janet Holmes (Hrsg.) Sociolinguistics: Selected
Readings. Harmondsworth: Penguin, 269-293.
Larson, C. E., Backlund, P. M., Redmond, M. K., & Barbour, A.
(1978). Assessing communicative competence. Speech
Communication Association and ERIC.

43
Li, D., & Xu, X. L. (2014). A Study of Cultivation of University
Students’ Communicative Competence. Culture Forum,
1, 169-171.
Li, J. (2010). The Study of Communication Problem of University
Students. Journal of Zhenjiang Technological College, 1,
(23), 101-104.
Liu, X. (2011). Journal of Qilu Normal University. Cultivation of
University Students’ Communication Skills from the
Perspective of Employability, 26, (6), 26-29.
O’Donovan, C. (1997). Which Master's matter? Communication
World, 14, 36-40.
Qi, B. (2007). The soft strength of university students and its
cultivation. Chang Chun: Northeast Normal University.
Ruesch, J. (1957). Disturbed communication. New York: Norton.
Savignon, S. J. (1972). Communicative Competence: An Experiment in
Foreign Language. Philadelphia: Center for Curriculum
Development.
Schischka, C. E. (2015). An Exploration of Occupational Personality
Traits and Communicative Competence in New Zealand
Leaders and Non-Leaders (Unpublished master’s
thesis). Massey University. New Zealand. Retrieved from
https://mro.massey.ac.nz/bitstream/handle/10179/7444/02_who
le.pdf?sequence=2&isAllowed=y
The Report of Study Abroad Trend in 2016. (2016). Retrieved from
http://cs.xdf.cn/liuxue/201604/218266458.html
Wagner, T. (2008). The global achievement gap: Why even our best
schools don't teach the new survival skills our children need
and what we can do about it. New York: Basic Books.

44
Wiemann, J. M. (1977). Explication and test of a model of
communicative competence. Human Communication
Research, 3, 195-213.
Yue, C. M. (2014). A Study of Cultivation and Approach of Implement
of University Students’ Communicative Competence. Good
Parents, 29, 127-128.
Zhang, M. L. (2012). Brief Analysis of Cultivation of Current
Students’ Communicative Competence. Journal of
University Management, 3, 16-17.

45
Proposing Values for Encouraging People to
Share Knowledge: A Case of Active
Learning
Mohamad Hisyam Selamat ᵃ*, Sugumaran Selladurai ᵇ
ᵃFaculty of Business, Accounting and Management, SEGi University, 47810
Petaling Jaya, Selangor
ᵇFaculty of Business, Accounting and Management, SEGi University, 47810
Petaling Jaya, Selangor
_____________________________________________________________
ABSTRACT
The present study is designed to propose values for encouraging people
to share knowledge in the workplace. The implementation of active
learning in the higher education institutions (HEI) was selected as the
case study. Its aim is to develop lecturers’ commitment to encourage
students to share knowledge in the classroom, which can improve the
development of students’ soft and technical skills. The proposed values
are grouped under three constructs, namely, affective commitment
(faith and sincerity), continuance commitment (contemplation and goal
obsession) and normative commitment (means and attitude towards
university). The researchers have applied cross-sectional survey
research to validate the framework. It is found that faith, means,
contemplation and sincerity influenced the development of lecturers’
commitment to encourage students to share knowledge in the
classroom significantly. The practical implications are the discovery of
____________________________________ * Corresponding author:
E-mail Address: [email protected]
Affiliation: Faculty of Business, Accounting and Management, SEGI
University

46
theoretical, personal, and workplace practical best practices for the
establishment of active learning in the HEI.
Keywords: Faith; Means; Contemplation; Sincerity; Goal Obsession;
Attitude towards University; Active Learning; Universities
________________________________________________________
1. Introduction
The conventional methods of instruction, which is based on
retention of facts rather than student engagement, have not
maximized student learning (Stage, Muller, Kinzie, & Simmons,
1998). Barr and Tagg (1995) proposed a paradigm shift in college
instruction that allows students to reap complete benefits of the
undergraduate experience and name this new perspective of
college instruction as active learning (Barr & Tagg, 1995;
Hallinger & Lu, 2013).
This new method focuses on student learning (outputs) through
active engaging learning rather than delivery of knowledge
(input) that emphasizes passive learning only. Other different
labels of active learning are constructivist, experiential learning,
and problem based learning (von Glasersfeld, 1987; Vygotsky,
1987; Fogarty, 1999). In short, active learning involves the
engagement and empowerment of the students in the learning
process. However, the most important condition that needs to be
fulfilled before active learning could take place, is that the
lecturers must have a commitment to motivate students to express
ideas and participate in the group discussion. Thus, there is a need
to understand values that could develop lecturers’ commitment

47
to encourage students to share knowledge in the classroom.
Knowledge sharing amongst students in turn establishes active
learning in the classroom.
To assist in the process of developing lecturers’ commitment to
encourage students to share knowledge in the classroom, this
research proposes three constructs of individual commitment,
namely, affective commitment, continuance commitment and
normative commitment (Meyer & Allen, 1991). Affective
commitment consist the elements of faith and sincerity.
Continuance commitment consist the elements of contemplation
and goal obsession. Normative commitment consist the elements
of means and attitude towards university. All these are included
in the conceptual framework.
The paper is organized as follows. Next section presents a
theoretical justification for every element in the conceptual
framework. Section 3 offers a diagram of the proposed
conceptual framework. Finally, a conclusion is presented in the
concluding section.
2. Theoretical Overview
For the theoretical understanding of the establishment of the
commitment of the lecturers to encourage students to share
knowledge in the classroom we posit that lecturers’ commitment
to instigate knowledge sharing amongst students is based on the
concepts of individual commitment (Selamat, Selladurai &
48
Abdul Halim, 2015). In the following sections a discussion of
individual commitment is offered.
2.1 Lecturer-Centred and Student Centred Teaching Approach
There are two types of teaching approach that are being practiced
by the higher education institutions which are lecturer-centred
teaching approach and student-centred teaching approach (Barr
& Tagg, 1995; Gardiner, 1994). Lecturer-centred teaching
approach is commonly known as passive teaching whereas
student-centred teaching approach is commonly known as active
learning.Within lecturer-centred teaching approach, the lecturers
hold centre stage for the purposes of the transfer of course content
to the students, who are passive recipients for this information.
Lecturer-centred teaching approach uses demonstration,
discussion, and lectures with learning content, structured mainly
around the textbook. The students in these classrooms are rarely
allowed to engage in reflection about their learning (Gardiner,
1994), and hold attitudes that are competitive and individualistic.
Their learning progress becomes dependent on the actions of the
lecturers, who control the manner and type of information
dispensed, the development of learning objectives, the design of
learning activities, and the choice of learning evaluation tools
(Weimar & Associates, 1996).
On the other hand student-centred teaching approach is more
inclined towards active learning, where the focus moves from the
lecturers to the students, and the goal of teaching is to improve

49
the quality of learning for the students (Gardiner, 1994; Stage et
al., 1998; Hallinger & Lu, 2013). Instead of being concerned with
transferring information, the lecturer is concerned with how
students learn and whether they are making sense of the
information they have received. The role of the lecturer in this
aspect is therefore to facilitate understanding and promote the
development of higher order thinking skills, rather than the
memorization of facts, and with more importance given to
student-generated solutions and problems (Gardiner, 1994;
Prawat, 1992; Stage et al., 1998; Weimer & Associates, 1996;
Hallinger & Lu, 2013). The focus on the lecture is minimized to
give more emphasis to varied teaching methods like problem
solving and problem-based learning, experiential, field-based
learning, role playing, case studies, service learning,
simulations, cooperative learning and collaborative learning
(Bonwell & Eison, 1991; Gardiner, 1994; Guskey, 1994; Meyers
& Jones, 1993; Stage et al., 1998; Travis, 1995). The selection
choices among these methods depends on students' needs,
abilities, and skills (Stage et al., 1998; Travis, 1995; Weimer,
1996; Hallinger & Lu, 2013).
The focus of this research is active learning or student-centred
learning. This is because it is argued that the dependency on the
lecturer undermines the development of higher order thinking,
and instead only encourages superficial learning of low-level,
factual material (Hallinger & Lu, 2013). As contemporary
society becomes increasingly diverse and complex, developing
50
students’ critical thinking through active learning becomes a
necessity for every higher education institutions.
2.2 Active Learning and the Role of Lecturers
From the above definition it can be seen that active learning
moves beyond isolated set of activities, discussions or seminars
that encourage social interaction and support among students and
their lecturers. It also involves repetition and integration of
meaningful experiences that allow students to generalize their
knowledge to different situations and problems (Korthagen &
Kessels, 1999; Loucks-Horsely, Hewson, Love, & Style, 1998;
Mintz, 1999). The learning activities used are concrete, involving
input from several sensory systems, to stimulate multiple regions
of the brain to perform. The interactions with other individuals
and materials that occur in this type of classroom increase
effectiveness and efficiency in the learning process (Davis, 1993;
1995). The transition to active learning requires the lecturers to
change their views of teaching from "covering the content" to
"helping students to learn" (Svinicki, 1990), and to alter their
teaching methods to incorporate activities that challenge students
to become actively engaged in learning. Within this approach,
lecturers take on the role of coaches, facilitators, negotiators, and
guides who mediate between the students' current knowledge
base and the demands of the learning objectives expected from
them. This requires the need for lecturers to be sensitive to

51
students' goals and motivation in order to identify and utilize
activities that facilitate the development of solutions and insights.
In short, it could be said that within active learning the success
of a course is determined by the level to which students are
involved in the learning process and the quality of the learning
that takes place in the classroom (Fox, 1997; Fox-Cardamone &
Rue, 2003). The move toward more student-centred learning has
been growing since the 1990s (Bonwell & Eison, 1991; Davis,
1993; Gardiner, 1994; Grasha, 1996; Grubb et al., 1999; Weimer,
1990; Weimer & Associates, 1996). In view of the limitations of
traditional lecturer-centred methods which cannot meet the needs
of the students in as these methods do not provide the necessary
critical thinking, problem-solving, and interpersonal and
intercultural skills needed in the knowledge age and the rapidly
changing business environment (Drucker 1992; Grubb et al.,
1999). This transition from a focus on teaching to student
learning requires a shift in the role of the lecturer in order to
accommodate this change successfully.
However, it was seen that many lecturers resist involving
students in the learning process (Guskey, 1994). This is due to
barriers such as discomfort and anxiety associated with change,
a possible increase in preparation time, and a lack of needed
materials, equipment, and resources. Implicit in these barriers is
that the use of active learning requires a different skill set that
goes beyond teaching by lecturer, and is accompanied by a
different mental model (Bonwell & Eison, 1991; Chickering &
52
Gamson, 1987). Senge (1990) defined a mental model as "deeply
ingrained assumptions, generalizations, or even pictures or
images that influence how we change the world and how we take
action" (p. 8). Thus there is a need to understand values that could
develop lecturers’ positive mental model so that they are ready to
involve students in the classroom discussion. This research coins
this scenario as the commitment to encourage students to share
knowledge in the classroom.
2.3 Tacit Knowledge and Commitment to Encourage Students to
Share Knowledge
The above highlights that the success of active learning relies on
the commitment of the lecturers to encourage students to share
tacit knowledge in the classroom. Tacit knowledge can be
defined as something that is being understood but is not being
openly expressed (Random House Dictionary of the English
Language, 1971). It is knowledge that people do not have words.
It is representing people’s intuition, beliefs, assumptions and
values that are developed through a series of experiences (Saint-
Onge, 1996). Thus it could be said that tacit knowledge is highly
personal, subjective form of knowledge is usually informal and
can be inferred from the statements of others (Sternberg, 1997).
Tacit knowledge is critical in the process of decision making and
influencing others in the workplace (Liebowitz & Beckman,
1998). In short tacit knowledge is so embedded in an individual’s
mind. Thus it is highly personal, hard to externalize and hard to

53
share (Nonaka & Takeuchi, 1995; Tsoukas, 2002; Selamat &
Choudrie, 2007; Amayah, 2013). In turn, there is a need for the
lecturers to encourage students to externalize and share their tacit
knowledge in the classroom. By practising this, every student in
the classroom can be trained to analyze others’ ideas critically
and examine the feasibility of their ideas in the practical setting.
Eventually, the students will make a consensus. The consensus
represents a synergy that is created through knowledge sharing
activity in the classroom. Ignoring the critical role of
externalizing and sharing tacit knowledge amongst students in
the classroom, as argued by Saint-Onge (1996) and Selamat et al.
(2015), could lead to the creation of passive students and the
inefficiencies in developing holistic human capital.
2.4 Developing Lecturers’ Commitment to Encourage Students
to Share Knowledge
To develop lecturers’ commitment to encourage students to share
knowledge in the classroom this paper proposes the following
constructs: (1) affective commitment; (2) continuance
commitment; and (3) normative commitment. These constructs
are developed based on Meyer and Allen’s (1991) organizational
commitment model. The focus of this research is on what values
that can develop lecturers’ self-commitment (individual
commitment) and not what the faculty should do to increase
lecturers’ commitment in active learning (organizational

54
commitment). In other words, this research extends the use of
Meyer and Allen’s (1991) model.
2.4.1 Affective Commitment
Affective commitment refers to the emotional or psychological
connection of an individual to identify and participate in the
organization (Meyer & Allen, 1991). This research proposes two
affective commitment values that could develop lecturers’
commitment to encourage students to share knowledge, namely,
faith and sincerity.
2.4.1.1 Faith
Faith is a great trust or confidence in something or someone
(Cambridge International Dictionary of English, 1995). Its
position is much higher than trust or confidence. Having faith in
active learning enables lecturers to appreciate students’
communication skill and critical thinking development
(Gardiner, 1994; Prawat, 1992; Stage et al., 1998; Weimer &
Associates, 1996; Hallinger & Lu, 2013; Selamat et al., 2015). In
turn, forces them to encourage students to share knowledge in the
classroom. This enables the students to experience soft skills
development more effectively and efficiently.
Pedler, Burgoyne and Boydell (1994), Butcher, Harvey and
Atkinson (1997) and Harvey and Butcher (1998) found that there
is a significant relationship between faith in organization and

55
organizational performance. On the other hand, Selamat and
Choudrie (2007) and Abdul Wahab, Selamat and Saad (2013)
found a significant relationship between faith in organization and
the willingness to externalize and share knowledge and skills
within the organization. Haldin-Herrgard (2000) further
supported this axiom by saying that lack of faith prevents staff
members from externalizing and sharing their tacit knowledge.
In short, there is a potential relationship between the value of
faith and the commitment to encourage students to share
knowledge in the classroom. Thus the following hypothesis is
developed:
H1: There is a relationship between faith and commitment to
encourage students to share knowledge in the classroom.
2.4.1.2 Sincerity
Sincerity is the most important value that should be instilled in
the workplace including lecturers. Every lecturer must have a
feeling that he or she works for the sake of the university and for
fulfilling his or her responsibility to the university. The important
role of sincerity in developing effective individuals has been
stressed by Schroder (1989). This is further supported by Selamat
and Choudrie (2007), Abdullah and Selamat (2007) and Abdul
Wahab, Selamat and Saad (2012) whereby they obtained an
effective role of sincerity in motivating staff members to
participate in learning environment. The main reason why an
organization recruits people is to assist management in the

56
maximizing of its profits. Thus every recruited staff has to bear
in his or her mind in the workplace that “we must perform
organizational tasks sincerely.” The value of sincerity also gives
staff members a strength to ignore any negative sentiment to the
management, that is created through gossip and slander
(Schroder, 1989; Selamat & Choudrie, 2007).
Based on the above discussion it could be argued that sincere
lecturers will encourage students to share knowledge in the
classroom without hesitation. This is to assist the university to
produce quality graduates for the industry. Thus the following
hypothesis is proposed:
H2: There is a relationship between sincerity and commitment to
encourage students to share knowledge in the classroom.
2.4.2 Continuance Commitment
Continuance commitment means that when employees enter into
an organization they are bound to maintain a bond with the
organization or remain with the organization due to the
awareness of costs associated with leaving the organization
(Meyer & Allen, 1991). This research proposes two continuance
commitment values that could develop lecturers’ commitment to
encourage students to share knowledge in the classroom, namely,
contemplation and goal obsession.

57
2.4.2.1 Contemplation
People are always contemplating the reward or profit that they
will obtain before doing something. In the workplace, rewards
can be categorized into monetary rewards (salary, bonus,
allowance, promotion) and non-monetary rewards
(complimentary words such as thank you and congratulation)
(Lohman, 2000; Ashton, 2004; Bryson, Pajo, Ward & Mallon,
2006). The employees in the manufacturing companies
(Sambrook & Stewart, 2000; Bryson et al., 2006) and
multinational corporations consider reward system as a basis
before participating actively in the organizational activities.
Similarly, Lohman (2000) found that teachers contemplate
rewards first before get involve in additional school activities
such as sponsoring student clubs, reviewing curriculum,
mentoring colleagues, leading teams and departments and
supervising student teachers. However, professionals such as
accountants (Hicks, Bagg, Doyle & Young, 2007) and system
analyst (Lohman, 2009) did not consider rewards as a main
evaluation basis before participating in any organizational
activities.
One of the reasons why the lecturers are reluctant to change their
teaching style is due to the absence of incentives (Bonwell &
Eison, 1991; Haas & Keley, 1998; Halpern & Associates, 1994;
Seldin & Associates, 1995; Travis, 1995; Weimer, 1990, 1996,
2002; Weimer & Associates, 1996). Based on the social

58
exchange theory and norm of reciprocity, when employers
acknowledge their employees’ efforts by offering opportunities
and benefits, employees may feel obligated to reciprocate and
become more committed to the organization (Shore, Thornton, &
Newton, 1990; Tansky & Cohen, 2001). Thus it is logical to
relate reward contemplation to lecturers’ commitment to
encourage students to share knowledge in the classroom. This
leads to the following hypothesis:
H3: There is a relationship between contemplation and
commitment to encourage students to share knowledge in the
classroom.
2.4.2.2 Goal Obsession
The second element of continuance commitment construct is goal
obsession. In this research goal obsession is defined as a
continuous visualization of university’s goals and commitment
to achieve them (adapted from Selamat & Choudrie, 2007).
Every lecturer must be obsessed with the university’s goal,
especially the aim to produce high quality graduates. Being
obsessed with this aim enables them to become more receptive to
knowledge sharing amongst students because it is considered as
the best approach to develop students’ analytical and
communication skills (Gardiner, 1994; Prawat, 1992; Stage et al.,
1998; Weimer & Associates, 1996; Hallinger & Lu, 2013).
Previous studies have found a significant relationship between
aims or targets understanding with organizational performance

59
(Butcher et al., 1997; Manogran & Liang, 1998; Selamat &
Choudrie, 2007; Abdul Wahab et al., 2013). Being equipped with
right understanding on organizational aims and targets enables
staff members to undertake tasks diligently and monitor
performance prudently. In addition, it assists staff members to
effectively navigate the difficult and dynamic organizational
reality. As this understanding enables adept use of knowledge
and skills, it is beneficial when considering knowledge sharing
and active learning activities and is therefore adopted in this
research. In short, the inspiration to build up university’s image
through quality graduates makes goal obsession applicable for
developing lecturers’ commitment to encourage students to share
knowledge in the classroom. Thus the following hypothesis is
developed:
H4: There is a relationship between goal obsession and
commitment to encourage students to share knowledge in the
classroom.
2.4.3 Normative Commitment
Normative commitment is related to employees’ sense of
responsibility or obligation to remain at the current organization
due to employees’ various pre-entry and socialization
experiences (Meyer & Allen, 1991). Employees with normative
commitment feel that they have a moral obligation in paying back
the organization through remain with the employing
organization. This research proposes two normative commitment

60
values that could develop lecturers’ commitment to encourage
students to share knowledge in the classroom, namely, means and
attitude towards university.
2.4.3.1 Means
In the organizations, means is normally coined as standard
operating procedure or organizational best practice (Barham &
Rassam, 1989; Burgoyne, 1988; Schroder, 1989; Morgan, 1989;
Drucker, 1992; Selamat & Choudrie, 2007). By adopting
standard operating procedure, staff members can undertake tasks
based upon “the right approach for the right situation.” This in
turn enables cost, time and energy savings (Barham & Rassam,
1989; Burgoyne, 1988; Schroder, 1989; Morgan, 1989; Drucker,
1992; Selamat & Choudrie, 2007; Abdul Wahab et al., 2013).
The use of active learning requires a different skill set that goes
beyond teaching by lecturer, and is accompanied by a different
mental model (Bonwell & Eison, 1991; Chickering & Gamson,
1987). Armstrong-Stassen (2008), McEvoy and Blahna (2001),
Kooij, de Lange, Jansen and Dikkers (2008) and Maurer and
Rafuse (2001) stated that the opportunity to develop skills and
competencies may facilitate workers’ commitment because the
availability of training is a strong signal that the organization is
willing to ‘invest’ in its workforce. Thus it could be said that
extensive training on active learning methods can improve
lecturers’ skill and mentality on active learning and in turn their
commitment to encourage students to share knowledge in the

61
classroom. In short, every lecturer must know how to encourage
students to externalize and share knowledge in the classroom.
Thus the following hypothesis is developed:
H5: There is a relationship between means and commitment to
encourage students to share knowledge in the classroom.
2.4.3.2 Attitude towards University
Under theory of reasoned action, Fishbein and Ajben (1975)
stated that attitudes are learned disposition to respond to an object
or behavior. It is representing a hierarchy of effect from feeling
or judgments toward person, object or issue and linked to user
behavior (McMillan, Hwang, & Lee, 2003). Attitude is one of the
essential factors in influencing user behaviour and become as one
of the most investigated concepts (Fishbein & Ajben, 1975;Jahng
Jain & Ramamurthy, 2007; McMillan et al., 2003; Simon &
Peppas, 2004). It has been the focus of marketing researches,
especially to investigate the impact of advertisement on sales
(McMillan et al., 2003; Simon & Peppas, 2004). It continues
from research in the offline world into a concept of attitude
towards the website that measures online user predisposition to
respond favorably or unfavorably to a website, especially with
the enormous growth of e-commerce (Chen, Clifford, & Wells,
2002). Derived from this scenario this research argues that
positive attitude towards university make lecturers more
receptive to active learning activity and vice versa. This axiom
leads to the pre-supposition that attitude towards university

62
influences lecturers’ intention to encourage knowledge sharing
amongst students in the classroom and in turn gives impact on
the process of establishing active learning activities. Thus the
following hypothesis is developed:
H6: There is a relationship between attitude towards university
and commitment to encourage students to share knowledge in the
classroom.
3. Research Methodology
Data of this study were gathered through a survey approach.
Survey is one of the most common data collection methods for
examining the participation in active learning and learning
activities (Barr & Tagg, 1995; O'Banion, 1999; Baxter,
Terenzini, & Hutchings, 2002). Survey research suits the unit of
analysis of this study, which are lecturers in the Malaysian higher
education institutions (Dwivedi, 2005). This study utilized
stratified random sampling as a sampling technique. Stratified
random sampling, as its name implies, involves a process of
stratification or segregation, followed by random selection of
subjects from each stratum (universities) (Sekaran, 2003; Fowler,
2009; Babin & Griffin, 2010). A total of 370 lecturers in public
and private universities across Malaysia were randomly selected.
The questionnaires (as per attached below) were distributed by
liaison lecturers (most of them are deans of the faculty or school)
of the universities. Multiple regression analysis was used to test

63
the relationship between independent variables and dependent
variable.
4. Research Findings
Out of 370 distributed questionnaires, 253 were returned. This
resulted in a response rate of 68.38%. As suggested by Sekaran
(2003), a response rate of 30% is considered adequate for mail
survey research. Based on this suggestion, the response rate of
this study (68.38%) was above the recommended rate. In turn,
the findings of this research can be generalized to the population.
4.1 Profile of Respondents
The frequency and percentage of each demographic profile are
illustrated in Table 1. The reported demographic profiles include
gender, age and number of years working in the current
university.
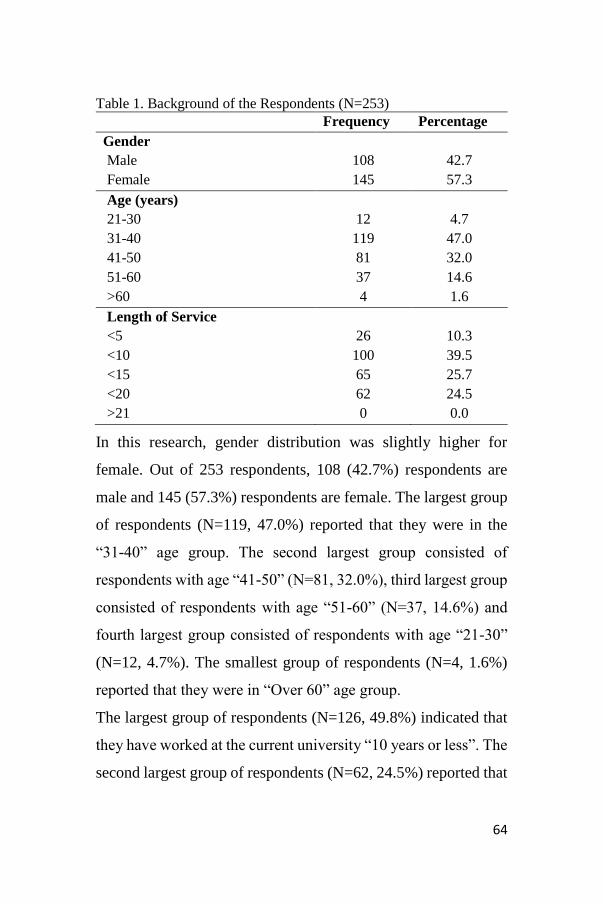
64
Table 1. Background of the Respondents (N=253) Frequency Percentage
Gender
Male 108 42.7
Female 145 57.3
Age (years)
21-30 12 4.7
31-40 119 47.0
41-50 81 32.0
51-60 37 14.6
>60 4 1.6
Length of Service
<5 26 10.3
<10 100 39.5
<15 65 25.7
<20 62 24.5
>21 0 0.0
In this research, gender distribution was slightly higher for
female. Out of 253 respondents, 108 (42.7%) respondents are
male and 145 (57.3%) respondents are female. The largest group
of respondents (N=119, 47.0%) reported that they were in the
“31-40” age group. The second largest group consisted of
respondents with age “41-50” (N=81, 32.0%), third largest group
consisted of respondents with age “51-60” (N=37, 14.6%) and
fourth largest group consisted of respondents with age “21-30”
(N=12, 4.7%). The smallest group of respondents (N=4, 1.6%)
reported that they were in “Over 60” age group.
The largest group of respondents (N=126, 49.8%) indicated that
they have worked at the current university “10 years or less”. The
second largest group of respondents (N=62, 24.5%) reported that

65
they have worked at the current university “20 years or less). This
is followed by “15 years or less” category (N=65, 25.7%).
4.2 Reliability Analysis
To test the reliability of the research instrument, as suggested by
Sekaran (2003), this study utilized internal consistency method
which is measured by Cronbach’s alpha. The coefficient for the
Cronbach’s alpha is expressed between 0 and 1.00. The results of
the Cronbach’s alpha values of the variables are as illustrated in
Table 2.
Table 2. Reliability Coefficients for Variables (N=253).
Variable N of Item Cronbach
Alpha
Faith 8 0.890
Means 5 0.931
Contemplation 6 0.924
Sincerity 3 0.790
Goal obsession 6 0.932
Attitude towards university 5 0.901
Commitment to encourage
students to share knowledge
6 0.767
As shown in Table 2, the Cronbach’s alpha values for variables
varied between 0.767 (commitment to encourage students to
share knowledge) and 0.932 (goal obsession). Four variables
possessed Cronbach’s alpha values above 0.90 (means,
contemplation, goal obsession and attitude towards university),
one between 0.80 and 0.90 (faith) and only two below than 0.80
(sincerity and commitment to encourage students to share

66
knowledge). In other words, none of the study variables
demonstrated below the minimum reliability level of 0.60 (Hair,
Black, Babin, Anderson, & Tatham, 2006). Thus the internal
consistency of the measures used in this study was considered
acceptable (Churchill, 1979; Sekaran, 2003).
4.3 Multiple Regression Analysis
Date refinement was undertaken prior to multiple regression
analysis. It was divided into data screening and data testing,
which aim to fulfill the multivariate assumptions (Hair et al.,
2006). Data screening consists of three tests which are missing
data, response bias and outliers identification. On the other hand,
data testing consists of linearity, normality, homoscedasticity and
multicollinearity tests. The criteria for all these tests were met in
this study.
To test this research hypotheses multiple regression analysis was
utilized and its findings are illustrated in Tables 3, 4 and 5. As
illustrated in Table 3, the value of adjusted R square is 0.597.
This shows that all independent variables (faith, means,
contemplation, sincerity, goal obsession and attitude towards
university) explain 59.7% variance in the commitment to
encourage students to share knowledge.

67
Table 3. Model Summary b
Note: a. Predictor: (Constant): Faith, Means, Contemplation, Sincerity, Goal
Obsession and Attitude towards Universsity.
b. Dependent Variable: Commitment to Encourage Students to Share
Knowledge
Table 4. ANOVAb for Multiple Regression Analysis
Note: a. Predictor: (Constant): Faith, Means, Contemplation, Sincerity, Goal
Obsession and Attitude towards University.
b. Dependent Variable: Commitment to Encourage Students to Share
Knowledge
Table 5. Coefficienta for Multiple Regression Analysis
Note: a. Dependent Variable = IS Outsourcing Success, *p is significant at
level ≤0.05

68
Only four variables were found to have significant effect on the
commitment to encourage students to share knowledge. They
were faith (B=0.345, t=7.028, p<0.01), means (B=0.153,
t=3.266, p<0.01), contemplation (B=0.241, t=4.978, p<0.01) and
sincerity (B=0.126, t=3.215, p<0.05). Thus H1, H2, H3 and H5
were accepted.
4.4 Discussion
This study found that faith was positively and significantly
influenced lecturers’ commitment to encourage students to share
knowledge in the classroom. This finding is consistent with the
previous studies such as Gardiner (1994), Prawat (1992), Stage
et al. (1998), Weimer and Associates (1996), Hallinger and Lu
(2013) and Selamat et al. (2015). The result implies that the
lecturers that have low faith or do not believe in active learning
will not encourage students to participate in the classroom
discussion actively. This is because active learning requires more
time and resources for preparation and two-way communication
between lecturer and students and also amongst students
themselves. Thus the lecturers must believe that only through
active learning the students are able to improve their soft skills
effectively and in turn able to face challenges in the business real
life situation confidently. This belief in turn will motivate them
to encourage students to share knowledge in the classroom.
This study also found that means was positively and significantly
influenced lecturers’ commitment to encourage students to share

69
knowledge in the classroom. This finding is consistent with the
previous studies whereby the understanding on best practices
develops staff members’ internal strength to bring success to their
organizations (Barham & Rassam, 1989; Burgoyne, 1988;
Schroder, 1989; Morgan, 1989; Drucker, 1992; Selamat &
Choudrie, 2007; Abdul Wahab et al., 2013).The result implies
that the lecturers that do not know how to establish active
learning will not implement it in the classroom. The probable
reason behind this scenario is that active learning requires a
different skill set that goes beyond teaching by lecturer, and is
accompanied by a different mental model. Thus adequate training
on active learning must be provided to the lecturers so that it
could be practiced extensively in the university.
This study also found that contemplation was positively and
significantly influenced lecturers’ commitment to encourage
students to share knowledge in the classroom. This finding is
consistent with the previous studies where lecturers are reluctant
to change their teaching style is due to the absence of incentives
(Bonwell & Eison, 1991; Haas & Keley, 1998; Halpern &
Associates, 1994; Seldin & Associates, 1995; Travis, 1995;
Weimer, 1990, 1996, 2002; Weimer & Associates, 1996). In
other words, lecturers contemplate rewards first before include
students in the teaching and learning activities. The probable
explanation could be extra workload that they have to bear due
to tedious preparation of active learning. Thus the universities

70
must consider financial and non-financial incentives to
encourage the use of active learning amongst lecturers.
This study also found that sincerity was positively and
significantly influenced lecturers’ commitment to encourage
students to share knowledge in the classroom. This finding is
consistent with the previous studies such as Selamat and
Choudrie (2007), Abdullah and Selamat (2007) and Abdul
Wahab et al. (2012). The result indicates that this factor was
perceived by the lecturers as the motivational factor in the
implementation of active learning activities in the classroom. The
probable explanation could be the norm that sincerity is the most
important value in every human endeavour and active learning is
not exceptional. This is because, based on the norm of
reciprocity, when the universities offer job and salary to sincere
lecturers, they may feel obligated to reciprocate and become
more committed to the success of teaching and learning activities
in the universities.
Surprisingly, this study found that goal obsession was not
positively and significantly influenced participation in active
learning. The result indicates that this factor was not perceived
by the lecturers as the motivational factor in the process of
establishing active learning in the classroom. In other words, the
lecturers are not really obsessed with the inspiration to build up
university’s image through quality graduates. Last but not least,
this study also found that attitude towards university was not
positively and significantly influenced participation in active

71
learning. The result indicates that this factor was not perceived
by the lecturers as the motivational factor in the process of
establishing active learning activity in the classroom. This result
complements goal obsession result whereby lecturers are not so
bothered with what is happening in the university. The probable
reason for this scenario might be because of the nature of
academic world whereby the lecturers are busy with their own
work at the workplace. Thus to develop lecturers’ commitment
to encourage students to share knowledge in the classroom and
in turn establish active learning the elements of faith, means,
contemplation and sincerity need to be given more attention by
the HEI.
5. Conclusion
The objective of this study was to determine whether individual
affective commitment (faith and sincerity), continuance
commitment (contemplation and goal obsession) and normative
commitment (means and attitude toward university) develop
lecturers’ commitment to encourage students to share knowledge
in the classroom. From the findings, the proposed conceptual
framework was substantially validated. The findings showed that
the effect of faith, means, contemplation and sincerity on the
commitment to encourage students to share knowledge in the
classroom was significant.
Although this study have contributed to active learning area, but
several limitations have to be considered. First, the context of this

72
study is limited to the lecturers. For future research it is suggested
that a comparison is made between lecturers and students.
Second, this research conceptual framework was tested and
examined from the Malaysian perspective. Thus obtaining
feedback from the HEI in other countries is necessary. Third, this
research adopted cross-sectional survey for data collection. To
gain broad view on the issues related to active learning and
knowledge sharing, a longitudinal study is advised. Last but not
least, unit of analysis of this study was an individual whereby the
lecturers were selected as the respondents. To gain more variance
in the analysis, obtaining feedback from all individuals working
in the HEI is strongly recommended.
References
Abdul Wahab, M. S., Selamat, M. H., & Saad, R. A. (2012). Work
environment inhibitors to informal workplace learning activities
amongst accountants: A Malaysian case study. Paper presented
at the first UUMCOB Qualitative Research Conference, Kuala
Lumpur (4-7 November 2012).
Abdul Wahab, M. S., Selamat, M. H., & Saad, R. A. J. (2013). The
importance of continuing professional education activities
amongst Malaysian accountants in public accounting firms.
Paper presented at the fourteenth Asian Academic Accounting
Association, Penang.
Abdullah, A., & Selamat, M. H. (2007). Preparing individuals for
establishing learning-based management accounting and
control system. Paper presented at the Accounting Studies
International Conference, Kuala Lumpur (30-31 October 2007).

73
Amayah, A. T. (2013). Determinants of knowledge sharing in a public
sector organization. Journal of Knowledge Management, 17(3),
454-471.
Armstrong-Stassen, M. (2008). Organisational practices and post-
retirement employment experience of older workers. Human
Resource Management Journal, 18, 36–53.
Ashton, D. N. (2004). The impact of organizational structures and
practices on learning in the workplace. International Journal of
Training and Development, 8(2), 43-53.
Babin, Z., & Griffin, C. (2010). Business research method (8th ed.).
Ohio: South-Western/Cengage Learning.
Barham, K., & Rassam, C. (1989). Shaping the corporate future.
London: Ashridge Management Research Group, Unwin
Hyman.
Barr, R., & Tagg, J. (1995, November/December). From teaching to
learning: A new paradigm for undergraduate education.
Change, 27(6), 13-25.
Baxter, M., Terenzini, P. T., & Hutchings, P. (2002). Learning and
teaching in the 21st century: Trends and implications for
practice. Retrieved on April 30, 2012, from the W o r l d
W i d e
W e b : http://www.acpa.nche.edu/seniorsscholars/trends/t
rends4.htm
Bonwell, C., & Eison, J. (1991). Active learning: Creating
excitement in the classroom. ERIC Digest (ED340272).
Retrieved on December 17, 2013, from the World Wide
Web: http://ericae.net/db/edo/ED340272.htm
Bryson, J., Pajo, K., Ward, R., & Mallon, M. (2006). Learning at work:
Organizational affordances and individual engagement. Journal
of Workplace Learning, 18(5), 279-297.
Burgoyne, J. (1988). Competency approaches to management
development. Paper presented at the IMP conference, Harrogate.

74
Butcher, D., Harvey, P., & Atkinson, S. (1997). Developing business
through developing individuals. Research Paper, Cranfield
School of Management, Cranfield University.
Cambridge International Dictionary of English (1995). Bath, UK: Bath
Press.
Chen, Q., Clifford, S. J., & Wells, W. D. (2002, April). Attitude toward
the site ll : New information. Journal of Advertising Research,
33-45.
Chickering, A. W., & Gamson, Z. F. (1987). Seven principles for
good practice. AAHE Bulletin, 39, 3-7.
Churchill, G. A. (1979). A paradigm for developing better measures of
marketing constructs. Journal of Marketing Research, 16(1), 64-
73.
Davis, J. R. (1993). Better teaching, more learning. Strategies for
success in post secondary settings. Phoenix, AR: Oryx Press.
Davis, J. R. (1995). Re-engineering teaching for the 21st century
learning. Educational Record, 76(4), 16-22.
Drucker, P. (1992). Managing for the future. Butterworth-Heinemann.
Dwivedi, Y. K. (2005). Adoption, usage and impact of broadband: UK
households (Unpublished doctoral dissertation). Brunel
University, UK.
Fishbein, M., & Ajzen, I. (1975). Belief, attitude, intention and
behavior: An introduction to theory and research. Addison-
Wesley.
Fogarty, R. (1999). Architects of the intellect. Educational Leadership,
57(3), 76-78.
Fowler, F. J. Jr. (2009). Survey research method. London: Sage
Publications.
Fox, E. A. (1997). Examining factors which influence and significantly
impact faculty teaching goals. Unpublished Doctoral
Dissertation, University of South Carolina.

75
Fox-Cardamone, L., & Rue, S. (2003). Students’ responses to active-
learning strategies: An examination of small-group and whole-
class discussion. Research for Educational Reform, 8, 3-15.
Gardiner, L. F. (1994). Redesigning higher education: Producing
dramatic change in student learning. ASHE Report No. 7.
Washington, D.C.: Graduate School of Education and
Human Development, The George Washington University.
Grasha, A. F. (1996). Teaching with style: A practical guide to
enhancing learning by understanding teaching and learning
styles. Pittsburgh, PA: Alliance Publishers, (800) 718-4287.
Grubb, W. N., Worthen, H., Byrd, B., Webb, E., Badway, N.,
Case, C., Groto, S., & Villenueve, J. C. (1999). Honored
but invisible: An inside look at teaching in community
colleges. New York: Routledge.
Guskey, T. R. (1994, Fall). Results oriented professional
development: In search of an optimal mix of effective
practice. Journal of Staff Development, 15(4), 42-50.
Haas, P. P., & Keeley, S. M. (1998). Coping with faculty resistance to
teaching critical thinking. College Teaching, 46 (2), 63-67.
Hair, J. F., Black, W. C., Babin, B. J., Anderson, R. E., &
Tatham, R. L. (2006). Multivariate data analysis (6th ed.).
New Jersey: Pearson International Edition.
Haldin-Herrgard, T. (2000). Difficulties in diffusion of tacit knowledge
in organisations. Journal of Intellectual Capital, 1(4), 357-365.
Hallinger, P., & Lu, J. (2013). Learner centered higher education in
East Asia: Assessing the effect on student engagement.
International Journal of Educational Management, 27(6), 594-
612.
Halpern, D. F., & Associates. (1994). Changing college classrooms:
New teaching and learning strategies for an increasingly
complex world. San Francisco, CA: Jossey-Bass.
76
Harvey, P., & Butcher, D. (1998). Those who make a difference:
developing businesses through developing individuals.
Industrial and Commercial Training, 30(1), 12-15.
Hicks, E., Bagg, R., Doyle, W., & Young, J. D. (2007). Canadian
accountants: Examining workplace learning. Journal of
Workplace Learning, 19(2), 61-77.
Jahng, J., Jain, H., & Ramamurthy, K. (2007). Effects of interaction
richness on consumer attitudes and behavioral intentions in e-
commerce: some experimental results. European Journal of
Information Systems, 16, 254-269.
Kooij, D., de Lange, A., Jansen, P., & Dikkers, J. (2008). Older
workers’ motivation to continue to work: five meanings of age.
A conceptual review. Journal of Managerial Psychology, 23(4),
364-394.
Korthagen, 1., & Kessels, I. (1999). Linking theory and
practice: Changing the pedagogy of teacher education.
Educational Researcher, 28(4), 4-17.
Liebowitz, J., & Beckman, T. (1998). Knowledge organisation: What
every manager should know. Boca Raton, FL: CRC Press.
Lohman, M. C. (2000). Environmental inhibitors to informal learning
in the workplace: A case study of public school teachers. Adult
Education Quarterly, 52(2), 83-101.
Lohman, M. C. (2009). A survey of factors influencing the engagement
of information technology professionals in informal workplace
learning activities. Information Technology, Learning and
Performance Journal, 25(1), 43-52.
Loucks-Horsley, S., Hewson, P. N., Love, N., & Styles, K. E.
(1998). Designing professional development for teachers of
science and mathematics. Thousand Oaks, CA: Corwin Press.
Manogran, P., & Liang, L. S. (1998). Developing a knowledge
management system for local government in Malaysia. Paper
presented at the national seminar on local government, Kuala
Lumpur.

77
Maurer, T. J., & Rafuse, N. E. (2001). Learning, not litigating:
Managing employee development and avoiding claims of age
discrimination. The Academy of Management Executive, 15(4),
110-121.
McEvoy, G. M., & Blahna, M. J. (2001). Engagement or
disengagement? Older workers and the looming labor
shortage. Business Horizons, 44(5), 46-52.
McMillan, S. J., Hwang, J., & Lee, G. (2003). Effects of structural and
perceptual factors on attitudes toward the website. Journal of
Advertising Research, 43(4), 400–409.
Meyer, J. P., & Allen, N. J. (1991). A three-component
conceptualization of organizational commitment. Human
Resource Management Review, 1(61). doi:10.1016/1053-
4822(91)90011-Z.
Meyers, C., & Jones, T. B. (1993). Promoting active learning:
Strategies for the college classroom. San Francisco: Jossey-Bass
Publishers.
Mintz, J. A. (1999, Spring). Faculty development and teaching:
A holistic approach. Academic Search Premiere, 99(85),
32-37.
Morgan, G. (1989). Riding the waves of change: Developing
managerial competencies for a turbulent world. Jossey-Bass
Publishers.
Nonaka, I., & Takeuchi, H. (1995). The knowledge creating company.
New York: Oxford University Press.
O'Banion, T. (1999). A learning college for the 21st century.
Phoenix, AZ: Oryx Press.
Pedler, M., Burgoyne, J., & Boydell, T. (1994). A manager’s guide to
self-development. London: McGraw-Hill.
Prawat, R. S. (1992). Teachers' beliefs about teaching and learning:
A constructivist perspective. American Journal of Education,
100(3), 354-395.

78
Random House Dictionary of the English Language (1971). New York:
Random House.
Saint-Onge, H. (1996, March-April). Tacit knowledge: The key to the
strategic alignment of intellectual capital. Strategy and
Leadership Journal, 24(2), 10-14.
Sambrook, S., & Stewart, J. (2000). Factors influencing learning in
European leaning oriented organizations: Issues for
management. Journal of European Industrial Training, 24(2-4),
209-219.
Schroder, H. (1989). Managerial competence: The key to excellence.
New York: Kendall/Hunt Publishing.
Sekaran, U. (2003). Research method for business: A skill building
approach (4th ed.). Danvers, MA: John Wiley & Sons.
Selamat, M. H., & Choudrie, J. (2007). Using meta-abilities and tacit
knowledge for developing learning based systems: A case study
approach. The Learning Organization, 14(4), 321-344.
Selamat, M. H., Selladurai, S., & Abdul Halim, H. M. (2015). The
influence of task accomplishment and attitude on active teaching
in Malaysian universities. European Journal of Business and
Social Science, 4(1), 35-48.
Seldin, P., & Associates. (1995). Improving college teaching. Bolton,
MA: Anker Publishing Co.
Senge, P. M. (1990). The leader’s new work: building learning
organizations. Sloan Management Review, 32(1), Fall, 7-23.
Shore, L. M., Thornton, G. C., & Newton, L. A. (1990). Job satisfaction
and organizational commitment as predictors of behavioral
intentions and employee behaviour. Academy of Management
Proceedings, 229–233.
Simon, S. J., & Peppas, S. C. (2004). An examination of media richness
theory in product web site design: An empirical study. Info, 6(4),
270-281.

79
Stage, F. K., Muller, P. A., Kinzie, J., & Simmons, A. (1998).
Creating learning centered classrooms: What does learning
theory have to say? ASHE-ERIC Higher Education Report
No. 4. Washington, D.C.: Graduate School of Education and
Human Development, The George Washington University.
Sternberg, R. J. (1997). Successful intelligence. New York: Penguin
Putnam.
Svinicki, M. D. (Ed.) (1990). The changing face of college teaching.
New Directions for Teaching and Learning. 42.
Tansky, J. W., & Cohen, D. J. (2001). The relationship between
organizational support, employee development, and
organizational commitment: An empirical study. Human
Resource Development Quarterly, 12(3), 285-300.
Travis, J. E. (1995). Models for improving college teaching: A
faculty resource. ASHE-ERIC Higher Education Report No.
6. Washington, DC: Graduate School of Education and
Human Development, The George Washington University.
Tsoukas, H. (2002). Do we really understand tacit knowledge?
Knowledge Economy and Society Seminar, London.
n Glasersfeld, E. (1987). Learning as a constructive activity. In C.
Janvier, Problems of representation in the teaching and learning
of mathematics (pp.3-17). New Jersey: Lawrence Erlbaum
Associates, Inc.
Vygotsky, L. S. (1987). Thinking and speech. In R.W. Rieber & A.S.
Carton (Eds.), The collected works of L.S. Vygotsky, Volume 1:
Problems of general psychology (pp. 39-285). New York:
Plenum Press.
Ward, J., & Peppard, J. (2002). Strategic planning for information
system (3rd ed.). Canada (WP): John Wiley.
Weimer, M. E. (1990). Improving college teaching. San Francisco,
CA: JesseyBass.

80
Weimer, M. E. (1996). Integration of teaching and research: Myth,
reality and possibility. In P. Cranton (Ed.), University
challenges in faculty work: Fresh perspectives from around
the world. San Francisco, CA: JesseyBass.
Weimer, M. E., & Associates. (1996). Teaching on solid ground:
Using scholarship to improve practice. San Francisco, CA:
Jossey-Bass.
Weimer, M. E. (2002). Learner-centered teaching: Five key
changes to practice. San Francisco, CA: Jossey-Bass.

81
Job Motivation among Employees in
Construction Companies in Selangor,
Malaysia
Uma Murthyᵃ, Paul Anthony Mariadasᵇ*, Suguna Sinniahᶜ,
Gopal Perumalᵈ
ᵃFaculty of Business, Accounting and Management, SEGi University, 47810
Petaling Jaya, Selangor
ᵇFaculty of Business, Accounting and Management, SEGi University, 47810
Petaling Jaya, Selangor
ᶜFaculty of Business, Accounting and Management, SEGi University, 47810
Petaling Jaya, Selangor
ᵈFaculty of Business, Accounting and Management, SEGi University, 47810
Petaling Jaya, Selangor
_____________________________________________________________
ABSTRACT
Job motivation is one of the substantial challenges faced by employees.
Past studies have proved alarming impact on companies’ growth due
to lower levels of motivation among the workers. Since the levels of
motivation affect productivity, they sway the performance of business
organizations. Thus, the objective of this study is to determine the
critical factors influencing job motivation among employees in
selected constructions companies in Selangor, Malaysia. The result
showed work-life balance, flexibility at work and job security are
_____________________________________
* Corresponding author:
E-mail Address: [email protected]
Affiliation: Faculty of Business, Accounting and Management, SEGI
University

82
significantly related to job motivation. This article aims to deliver a
medium among employers and employees to find common ground for
the motivation levels to ensure a pleasant working environment.
Keywords: Motivation; construction; work-life balance; flexibility;
job security; pay satisfaction
________________________________________________________
1. Introduction
Motivation is a process that starts with psychological deficiency
or the need that drives employees to strive to do better with a
promise of return in extrinsic form, which relates to rewards in
form of salary, benefits or security or intrinsic form relates to the
sense of challenge or achievement (Mullins, 1996). According to
Susanna Kultalahti and Riita Liisa Viitala (2014) Job motivation
defines as “a set of energetic forces that originate both within as
well as beyond an individual’s being, to initiate work-related
behaviour and to determine its form, direction, intensity and
duration”. From personal understanding, job motivation is what
drives employees strive to be better, and work better in terms of
task or team play (Kultalahti & Viitala, 2014).
Work motivation can bring alarming negative effects such as
increased rate of absenteeism among employees. Hence, the
organizations must ensure to motivate their employees towards
achieving their mission and vision. (Abdullah, 2013). Less
motivation among employees in construction industry in
Malaysia, will lead to an abandonment of construction projects
(ACP). Yap Eng Hoe (2013) state that ACP is considered as one

83
of the most common and serious problems affecting the
Malaysian construction industry where it influences not only the
immediate purchasers but also the project players and the public.
This article focuses on selected workers in construction
companies and their job satisfaction. Main objective for this
research is to investigate the factors influencing job satisfaction
among the employees in selected construction companies in
Selangor, Malaysia. This research is important to the
construction companies whereby it will help the management to
realize the effects on lack of job motivation towards the
company. The remainder of this paper is organised as follows:
we start by looking at literature on selected variables in Section
2, while the method is described in Section 3. The results are
described in Section 4 and Section 5 concludes.
2. Review on Selected Variables
2.1 Work-life balance
Kultalahti and Riita Liisa Viitala (2014) define work life balance
as where work that should apparently not take over one’s life.
This shows how work-life balance influences the job motivation
and work performance. The lack of work-life balance influence
employees’ health and wellbeing which is affected by factors
such as work stress, degree of job control and conflict between
work and life (Zheng et al.,2015). Work-life balance means the
harmonious interface between different life domains. It

84
emphasizes on concept of a person resources such as time, energy
and money, to have both satisfaction in personal life as well as
performing well upon delivering excellent result (Koubova &
Buchko, 2013). In addition, work-life balance is a relationship
between employee and employer where it strikes the right
balance between the two of them. Achieving the balance requires
factors such as employees should be open about their needs and
be transparent about it and to have an open dialogue with their
employer or manager. Adding to being open with each other,
balance can never be achieved without the respect on boundaries
(Cincotta, 2016).
2.2 Flexibility at work
Flexibility at work or flexi-time improves employees’ attendance
and performance as it provides control over the employees’
working environment. In addition, flexible working contributes
to employees’ happiness and positivism (Atkinson & Hall, 2011).
According to Dirk Hofacker and Stefanie Konig (2013)
flexibility at work place is beneficial for both employee and
employers as they have the option to care of their family.
Furthermore, flexibility in terms of working hours including shift
work, non-Monday to Friday schedules, work on call, and
location of work influence the individuals’ motivation in working
environment. Sussanna Shagvaliyeva and Rashad Yazdanifard
(2013) echoed this by saying flexibility at work place benefits
women more, as work flexibility does not only implies on

85
variation in time and place of the job, but also career breaks in
terms of maternity leaves. Flexi-time offers convenience in
planning, not in reducing the working time. Thus, flexibility in
work might be summarized as the ability of employees to control
their working time duration as well as location of work which
many prefer to conduct their work at home or outside of the office
(Shagvaliyeva & Yazdanifard, 2014).
Adding to flexi-time as define by Lou Lu (2011) reveals that
flexibility is the most important factor to influence job motivation
that leads to job satisfaction which also brings large effects on
family and social commitment. Therefore, taking into careful
consideration on employee individual needs and desires effects
on the arrangement of flexible working time (Lu, 2011). Flexible
working time appears to be the most valued management
privilege as according to Vathsala Wickramasinghe (2012)
flexible work as a form of contributory support received formally
through organisational advantages to lessen job stress that can
create more positive working environment (Wickramasinghe,
2012).
2.3 Job security
Job security is an assurance for the employee where it is about
the continuity of employment. Job security usually arises from
the terms of the contract of employment, collective bargaining
agreement, or labour legislation that prevents random
termination and layoffs. (Griffin & Moorhead, 2014). According

86
to Ali Bassam Mahmoud and William D. reisel (2014) security
is a need which relates to the second level of Maslow’s hierarchy
of needs theory. It describes that the employees’ job position in
the company is secure. Hence, employees are not facing
termination any time soon and this contributes to job motivation
(Mahmoud & Reisel, 2014).
Furthermore, Fazil Senol (2011) state that it is a part of external
motivators among employees as job security plays an important
role in both social and working life, as it helps people not to
concern about their future, provides sustaining labour peace,
increasing organizations’ productivity and keeping social
balance and values. Therefore, job security is one of the most
substantial variables of employee satisfaction which states the
overall attitudes of the employees towards their job and it also
contributes to the way of achieving organizational aims. The
concept of job security has arisen with the goal of guaranteeing
steadiness of employment and avoiding arbitrary/random
terminations (Senol, 2011).
2.4 Pay satisfaction/reward
Pay satisfaction comes in many forms and one of it is by giving
bonuses to the employee. Bonuses are given to the workers based
on their performance and how much efforts they have contributed
to the company. According to Ayuninnisa Rizqi N. and Saptoto
Ridwan (2015), since the beginning of the concept of pay
satisfaction, there have been some arguments and studies

87
improving this concept until a concept of its dimensions
developed. The researchers believe that pay level is a dimension
of pay satisfaction. Later, it was found that besides pay level,
there are other causes contribute to pay satisfaction, namely
benefits and pay raise. The two dimensions together affect pay
satisfaction level (Rizqi N & Ridwan, 2015).
However Jonathan C. Shrader and Luke Singer (2014) determine
pay satisfaction as a question on how companies consent about
incentivizing talents of their employees where one of the key
aspects is by compensation. Even more of a driving factor of pay
satisfaction, it starts off with the assumption that pay satisfaction
is multidimensional with four dimensions consisting of benefits,
level, raises and structure/administration (Shrader & Singer,
2014). Jai Prakash Sharma and Naval Bajpai (2011) describe
salary as a form of periodic payment from an employer to an
employee. It is weighed in with piece wages, while each job, hour
or other component is paid separately, rather than on a periodic
basis. From the point of view of running a business, pay
satisfaction can also be observed as an important reward to
motivate the performance of employees. All other behavioural
factors are important for enhancing job satisfaction of employees
but satisfaction from pay is a must (Sharma & Bajpai, 2011).

88
3. Methodology
3.1 Research Design
In this study, a sample of 60 workers consisting of 30 male and
30 female from Putrajaya Holdings Sdn Bhd, Perunding Eagles
Engineers and Pure Projects Management Sdn Bhd are selected.
This proportion is selected in a balance gender to reduce bias in
the analysis. Employees come from various position.
3.2 Method of Data Selection
Stratified sampling has been used in this study. An efficient
sample can be collected with this sampling method. The sample
replicates the population exactly on the basis of the criterion used
for stratification. Each stratum has an equal size which is 30
samples for male and 30 samples for female. A simple random
sampling is used to collect the data for each stratum means that
in each stratum will have an identical chance of being included
in the sample.
3.3 Technique Used
Data is gathered by distributing the questionnaire. Closed ended
question is used whereby the respondents have specific limited
alternative response and they are asked to choose the closest
response to their own opinion. Self-administered questionnaire is
used where the respondents take the responsibility for reading

89
and answering the questions. This exercise encourages more
objective compare to other methods. In addition, it is also fast
and easy to gather information from respondent.
4. Results
4.1 Multiple Regression Analysis
Regression assumes all variables have a normal distribution.
Distribution of variables that are not normal (highly skewed or
kurtosis variables or variables with substantial outliers) can affect
relationships and significant test.
Table 1. Model summary for multiple regression analysis.
a. Predictors: (Constant), Pay Satisfaction, Work life balance, Flexibility
Work, Job Security
b. Dependent Variable: Job Motivation
The model summary in table 1 is an analysis between the
dependent variable (Job Motivation) and the independent
variables (Job Security, Work-life Balance, Flexibility at Work
and Pay Satisfaction). The key factor in this summary that can
give further interpretation is the R square and the Durbin-Watson
value. R-square explains the total variation in the dependent
variable with usage of the independent variable (Hamilton,
2015). The data is a perfectly linear model when the R squared is
equals to 1.0, moreover, when R squared is less than 1.0 shows

90
that some variability in the data failed to be describe by the
model. R-square value for this research is 0.478 which can also
be understood as 47.8% of the overall variation of the dependent
variable can be explained by the independent variable. On the
other hand, the Durbin-Watson values in between 1 to 3 indicate
that there is no autocorrelation. Hence, autocorrelation is absent
in this study as the Durbin-Watson value is 2.014.
Table 2. Regression Coefficient of Multi Linear Regression Analysis
of a Dependent Variable and Independent Variables.
The significant value was used to determine whether the
hypothesis is accepted or rejected. When the significance value
is less than or equal to 0.05, the value is significant therefore
rejects the null hypothesis. There are three independent variables
with significance value less than or equal to 3 which is work-life
balance (0.005), flexibility at work (0.000) and job security
(0.015). However, pay satisfaction with value 0.540 is more than

91
0.05 therefore fail to reject null hypothesis. Based on the table
above, the equation of the research can be derived with the results
achieved by the multiple regression analysis.
Job Motivation = 1.388 + 0.097 (Work-life balance) + 0.461
(Flexibility at work) + 0.142 (Job security) – 0.047 (Pay
Satisfaction).
According to the equation, work-life balance, flexibility at work
and job security are positively related with job motivation. The
Variance Inflation Factor (VIF) is used to analyse the severity of
multicollinearity in the model. Based on theory, the accumulated
VIF should be less than 10 in order to conclude that there is no
multicollinearity. Based from the table above, the Variance
Inflation Factor (VIF) for this model is 6.783 and can be
concluded that multicollinearity is absent.
5. Conclusion
The findings of this study can perform as medium for the
employers and employees to determine the level of motivation in
order to enhance company’s growth. Based on the findings,
company can plan for the effective strategy to become more
competitive. This information may influence employee
absenteeism, productivity and staff turnover. Work-life balance,
flexibility at work and job security are the most significance to
job motivation among employee. In addition, the result showed
that there is no significance difference between the job
motivation and pay satisfaction. This finding is the same with

92
Claude Ferneta et al. (2012) research, which state that job
motivation may differ reliant on the working environment. In an
autonomy-supportive environment, which raises motivation,
individuals assume that they have the rights to choose and to
make decisions and that they are supported in their work by their
superior. Employees who assume that their supervisor adopts
autonomy-supportive behaviours demonstrate greater job
satisfaction and higher psychological well-being than those who
feel controlled by their supervisor. This shows that to some of the
employees, pay satisfaction (reward, monetary, salary, bonuses)
does not bring a huge impact towards motivation rather than the
rights to choose and to make decisions. Furthermore, due to the
time and resources, the researcher decided to conduct a small
scale of 60 respondents from employees on various construction
firms in Malaysia. This mean that the number of respondents may
not be strong enough to fully represent the majority of employees
in the construction industry in Malaysia. Thus, for future studies,
researchers can conduct a comparative analysis among each of
the construction firms to achieve more appropriate results. Also
a longer span of time can be conducted to eliminate the time
constraint that can result in more reliable findings.

93
References
Atkinson, C., & Hall, L. (2011). Flexible working and happiness
in the NHS. Employee relations.
Griffin, R. W., & Moorhead, G. (2014). Organizational
behaviour. South wastern , Natorp Boulevard Maso, Ohio,
USA: South Western Cengage Learning.
Hofacker, D., & Konig, S. (2013). Flexibility and work life
conflict in time of crisis: a gender perspective.
International journal of sociology and social policy.
Kultalahti, S., & Viitala, R. L. (2014). Sufficient challenges and
a weekend ahead- Generation Y describing motivation at
work. Journal of organization change management .
Mahmoud, A. B., & Reisel, W. D. (2014). Relating patient
satisfaction to nurses job satisfaction, job security and
obedience OCB's. International journal of pharmaceutical
and healthcare marketing.
Mullins, L. J. (1996). Management and organisational
behaviour. Long Acre, London, England: Pitman
Oublishing.
Zheng, C., Molineux, J., Mirshekary, S., & Scarparo, S. (2015).
Developing individual and organisational work-life
balance strategies to improve employee health and
wellbeing. employee Relations.

94
Factors Influencing Home Purchase
Decision: A Case Study in Selangor,
Malaysia
Uma Murthyᵃ*, Paul Anthony Mariadasᵇ, Gopal Perumalᶜ,
Suguna Sinniahᵈ
ᵃFaculty of Business, Accounting and Management, SEGi University, 47810
Petaling Jaya, Selangor
ᵇFaculty of Business, Accounting and Management, SEGi University, 47810
Petaling Jaya, Selangor
ᶜFaculty of Business, Accounting and Management, SEGi University, 47810
Petaling Jaya, Selangor
ᵈFaculty of Business, Accounting and Management, SEGi University, 47810
Petaling Jaya, Selangor
_____________________________________________________________
ABSTRACT
The objective of this paper is to study the factors influencing the home
buyers’ purchase decision in Selangor, Malaysia. A total of 180
respondents were participated in this survey. Results showed positive
correlation between dependent variable (purchase decision) and
independent variables (property attributes, location, property
environment and financials). The Statistical Package for Social
Sciences (SPSS) version 23.0 was used to analyze the data collected
through the survey. Recommendations are presented offering
beneficial suggestions for further studies.
_____________________________________
* Corresponding author:
E-mail Address: [email protected]
Affiliation: Faculty of Business, Accounting and Management, SEGI
University

95
Key words: Purchase decision; property attributes; location; property
environment and financial.
________________________________________________________
1. Introduction
Property industry in Malaysia is progressing as there are many
undeveloped local lands with great potentials especially in
Selangor state. In the recent years, the rapid economic
development has created an increasing demand for properties
among the urban areas in Malaysia (Ong, 2013). There are some
well-known developer companies building many constructions
such as Eco World Corporation, IJM Land Berhad, Gamuda Land
and Ekovest. Selangor has the highest demand for property in
Malaysia in which the top areas of preference are Damansara,
Puchong, Cheras, Shah Alam and Kuala Lumpur (Rehda, 2017).
However, the average housing price range in Selangor is RM
500,000 to RM 1,000,000 which is considered expensive
compare to other states.
In addition, the available housing stocks are increasing. In other
words, there are many unsold units in the property market. In the
recent years, unsold properties have dampened the property
market in Selangor. In the 1st quarter of 2016, the residential and
commercial properties were both increasing by 16% (Bill, 2017).
According to the National Property Information Centre (2016)
18,908 units of the residential properties and 81,894 units of
commercial properties launched in the first quarter of 2016 had
yet to be sold. The price of unsold properties was approximately
96
RM 9.4 billion and the market slowed down 16% compared to
the previous year (The malay mail online, 2016). This issue may
result in momentous imbalances in the property market. There
has been approximately 35% growth in housing stock over 10
years between 2005 to 2015, which means the available housing
stock increased from 3.7million in 2005 to 4.9 million in 2015
(REHDA, 2016). The major concerns in choosing a new house
are the quality of the area, the easier access to facilities and sense
of community. Geographical location could be an important
consideration before purchasing a property. Moreover, facilities
such as convenience stores, eateries, education centres and other
amenities can enhance the chance of attracting Selangor
homebuyers. Especially, the majority of people living in
metropolises, place particular value on convenient access to a
range of facilities. Besides, some buyers may prefer areas with
secure gates and guard houses to ensure their safety. Meanwhile,
the housing price increases 20% in the market whereas the
household income only increases 5% annually (Ong, 2013).
When property price growth rate exceeds the household income
level, it causes an issue with affordability of purchasing houses.
As a result, more people intend to purchase a small size property
such as an apartment or condominium as their preferred property
type within 800 to 1,500 square feet (REHDA, 2016). However,
there are even condominiums and apartments with these
characteristics that are still unsold. Thus, this study aims to
investigate the home purchase decision in Selangor. It contributes

97
the knowledge to the first-time home buyers to avoid the
common home-buying mistakes and help them to make a better
choice. Furthermore, the property developers can gain
information on the customers’ preferences on properties.
Therefore, it endeavours to support the business to become
sustainable in the competitive market. This paper is organized as
follows: Section 1 generally reviews the housing issues in
Malaysia followed by literature review discussed in Section 2. In
Section 3, the methodology employed in this study is presented.
Section 4 discusses the findings of the study while the
conclusions and recommendations are presented in Section 5.
2. Literature Review
Purchase decision is defined as a process of thoughts of consumer
to identify products, generate alternatives, and choose the best
product for the customer (Upennedu, 2017). The purchase
decision indicates an individual’s willingness to perform the
buying behaviour towards a property (Han & Kim, 2010).
Purchase decision determines the property buyers following their
past experience, personal preferences, and external environment
and gathers the information to assess the alternatives before
purchase house (Han & Kim, 2010). According to Kunshan and
Yiman (2011) and Sidi & Sharipah (2011), homebuyers are more
likely to purchase what they intended to get initially. On the other
hand, any purchase decision which begins with an analysis of the

98
market, will affect the purchase decision (Natasha, & Hassan,
2015). Moreover, if a homebuyer is willing to pay more for a
house, he/she is likely to have a more positive decision attitude
to deal with the seller (AL-Nahdi1, Habib, & Albdour, 2015).
Homebuyers are usually concerned about the size of living room
and kitchen, as well as the number of bedrooms and bathrooms
(Thaker, 2016). They consider the physical condition depending
on the family size (Popoola, Jinadu, Liman, & Abd Razack,
2015). In addition, the studies found that there is a relationship
between living space and homebuyers’ purchase decision as the
dimension of a space is the initial factor that purchaser thinks
over, in order to fit the requirement of family size (Al-Nahdi,
Ghazzawi, & Abu Bakar, 2015). On the other hand, Liew and
Haron (2013) believe that the size of bathroom and dining room
plays a dominant role on the purchase decision. Furthermore,
44.5% of respondents of a study by Lonappan (2013), have opted
the size of house space as a major factor for purchase intention.
Njo & Aileen’s (2015) claim that property attribute is the first
priority for homebuyers due to the size of house and the number
of bathrooms or bedrooms. According to Hurtubia (2010), the
feature of houses such as the number of bathrooms and
bedrooms, size of living hall and kitchen are the issues before
making home-ownership decision. Moreover, some of the
working individuals that move alone from other states prefer to
purchase smaller units such as apartments and condominiums
which is sufficient for them (Kohler, 2013).

99
In another study, Razak (2013) found that 46.7% of the
respondents strongly agree that the distance between house and
amenities is their main concern. Residents prefer to live in an area
which is close to amenities to perform their daily activities
(Maoludyo & Aprianingsih, 2015). Another study done by
Manivannan and Somasundaram (2014) shows that the
respondents regard distance as the secondary factor of property
purchase. Besides, availability of schools, groceries and
shopping malls plays a vital role towards homebuyers’ purchase
decision (Ong, 2013). Since many parents emphasize on their
children’s education, they tend to select a location close to high
quality educational centres (Kohler, 2013). According to Azmia,
Sallehb, & Nawawia, (2013) study, about 48.4% of the residents
show interests toward the property distance to the amenities.
In a different study, Zrobek, Trojanek, & Sokolnik (2015) found
that the level of environment satisfaction directly depends on the
issues of traffic noise, green environment, cleanliness, safety and
scenic view of the property. According to the Agnieszka (2014)
living in a certificated green environment building is significant
to the home buyer purchase decision. At the same time, a good
scenic view can enhance the social class of inhabitants (Si, 2012).
However, the current inhabitants’ living condition is declining
due to the environment pollutions from developments in the
urban areas such as construction noises, dusts and littering.
Therefore, developers are urged to incorporate with ecologically
friendly design and revolution into their real estate such as the

100
construction of noise barriers (Ong, 2013). In fact, green
buildings can increase the property price while eliminate the
pollution to provide healthy living residential space. Developers
believe investing on a green business would help a property firm
to become more sustainable and marketable (Jayantha & Man,
2013). According to Popoola, Jinadu, Liman, & Abd Razack
(2015), a green environmental property increases the property
value up to 20%. Meanwhile, it also improves the commercial
value of the property.
The requirement of a quality neighbourhood is to meet the needs
of the inhabitants’ daily activities as well as to allowing the
inhabitants to conserve energy, safety and securities and control
pollution (Hong, 2016). Neighbourhood security is a major
concern of property purchasers as well, since it ensures an
individual’s safeness and well-being. In Malaysia, the frequent
crimes are burglary and snatch thefts are leading buyers in paying
more money to invest in gated communities and guarded
neighbourhoods to obtain a peaceful life (Almatarneh, 2013). In
order to eliminate the house break-ins issue, developers need to
take actions to upgrade the security systems such as closed-
circuit cameras, intercoms, alarms, gated-guarded communities
to protect the residents (Fung, Jeng & Liu, 2010). Additionally,
installing the surveillance system in the housing estate enables
the management to monitor and record the people entering and
exiting the neighbourhood. Management team can also provide

101
patrol services by auxiliary policemen around the residential area
to plummet the criminal rate (Agnieszka, 2014).
In a different study, Razak et al (2013) argue that house price is
the first priority and has a strong influence on the house buyers’
purchase decision. As a homebuyer, the financials must
be the major concern. According to Tan & Saw (2014), it is hard
for homebuyers to get mortgage loan approval from banks since
January 2010 due to the stricter rules. Therefore, many
homebuyers who apply for loans are rejected. Thus, the ease and
convenience in getting approval from banks is the main factor in
homebuyers’ purchase decision. Uchenna & Lim (2013) claim
that the access to finance for homebuyers is positively related to
the housing purchase decision in China. Also in a research by
Nasar & Manoj (2015), the respondents highly agreed that easy
accessibility of mortgage loans from local banks was the main
factor to the purchase decision in India.
Chin (2013) asserts that the majority of homebuyers in Malaysia
prefer to get high amount of mortgage loan from banks with small
amount of down payments. Yet, Faishal and Atik (2015) study
shows that the majority of respondents prefer large amount of
down payments and less amount in bank instalments. However,
both studies indicate that house price has been a significant factor
to homebuyers’ purchase decision. Furthermore, Njo and Aileen
(2015) suggest that financial factors are very significant in the
homebuyers’ purchase decision. Interest rate can affect house
buyers’ purchase decision while lower interest rates encourage

102
house buyers to purchase properties (Chia et al, 2016). If the bank
increases the lending rate, house buyers tend to be cautious
during purchase decision as the higher interest rate will increase
the total final payment (Eze & Lim, 2013). According to Ong
(2013) when financial institutions tend to enhance the availability
of credits, banks will implement lower interest rate in order to
attract more investors. In another word, the more availability of
credits, the higher demand for house loans.
3. Methodology
To determine the sample size for this study, a general rule by
Hair, Black, Bablin, Anderson, and Tatham (2006) was used.
Questionnaires were distributed to 180 residents who are living
in Selangor and are above 18 years old.

103
4. Data Analysis
4.1 Correlation Analysis
Table 1. Correlation Analysis between Dependent Variable and
Independent Variables.
Table 1 illustrates the results of the correlation analysis between
the dependent variable and the four independent variables. Under
correlation analysis, any value that is closest to one can be
considered to have a very high correlation. The table depicts that
the correlation value for the purchase decision (DV) is 1. Based
on this value, the values of other four independent variables are
compared to observe the correlation. The first independent
variable is property attribute with the value of 0.380 which shows
a low correlation with the purchase decision. The value for the
next (IV) which is location is 0.231 and demonstrates a low
correlation with the purchase decision. Property environment has

104
a value of 0.293 and displays a low correlation with the purchase
decision and lastly, finance with 0.084 that reflects a low
correlation.
4.2 Multiple Regression Analysis
Multiple Regression Analysis was conducted to evaluate both
dependent and independent variables for this study. It was done
in order to test the hypothesis result. Below are the results for
Multiple Regression Analysis.
Table 2. Model Summary
Table 2 shows the results of R² and Durbin-Watson. Under the
R², the value is 0.183 or 18.3% that can be depicted as the
purchase decision (DV) and explained by the property attribute,
location, property environment and finance (IV). In addition to
that, the Durbin-Watson value for this research is 1.168 which
falls between 1-3 values, which further reflects that there are no
autocorrelation issues.

105
Table 3. ANOVA
In Table 3 the analysis of the sig. value is 0.000, and it falls below
the suggested value of under 0.05. Again, it shows that this model
is fit to be used for this research.
Table 4: Coefficient
In Table 4, the main focused area is the unstandardized
coefficient B values. The highest B value within the four
dependents variables is the strongest contributor to the dependent
variables. Based on the table above, property attribute shows the
highest value (B=0.308). Hence, making it the strongest predictor
that contributed to this research. Property environment comes in

106
second (B=0.127), financial (B=0.112) is third, and the last but
not least perceived location (B=0.053).
5. Conclusion and Recommendation
As mentioned, one of the research objectives was to recognize
the relationship between property attribute and the purchase
decision. According to the results, a positive relationship was
noted to be accepted for this research. The past research
conducted by Thaker (2016) achieved the same result that
property attribute plays a very significant role in motivating
customers into purchase decision. Also, Saw and Tan (2014)
came out with the same result in their study, as property attribute
was related strongly with image and that it played as the key
factor. Based on the research objectives, it was also mentioned to
recognize the relationship between property environment and the
purchase decision. The hypothesis for this relationship was
rejected between location and purchase decision. Thus, People
are concerned more about the size of house and numbers of the
bedrooms than the location of property. Home buyers willing to
purchase a bigger house rather than a smaller house in a good
location. In addition, there is positive relationship between
property environment and purchase decision. Ong (2013) states
that property environment is essential to the purchase decision
and has significant impact on customers. Si (2012) found that
neighbourhoods were essential in supporting purchase decisions.
Furthermore, there is a positive relationship between financials

107
and purchase decision. Eze and Lim (2013) believe finance has
significant influence on the purchase decision. Ong (2013)
asserts that financials have a direct link on the purchase decision.
5.1 Implication of Study
The main reason for conducting this research was to analyse the
factors that added to the purchase decision. The four major
contributions are property attributes, location, and property
environment, financials. This study can help customers be aware
of the presence of other varieties of purchase decisions. Many
Malaysian homebuyers are still unaware of purchase decisions
that have been around the industry. The results of this research
endeavours to assist the government in determining the policies
needed in requiring residential housing companies to provide
details about housing attribute alternatives modelled to measures
of housing and service attributes developed in this research. The
information provided in this study, seeks to support both
potential home buyers and house owners to understand housing
selection criteria in general.
5.2 Limitation and Recommendation of the Study
There are still some limitations to this study. A clear drawback
of this research is the independent variables. It is because the
variables in this study were only property attributes, location,
property environment and financials. However, there are still

108
various variables such as land, household income, house price,
etc. that can be applied to this research and might be more
suitable for the targeted respondents and areas that were not
included in this survey. Moreover, the focused area in this
research was solely the state of Selangor, Malaysia. The area was
too limited since there could be fewer respondents willing to
participate in this research.
References
Agnieszka, Z.J. (2014) "Parameters contributing to occupants’
satisfaction: Green and conventional residential buildings",
Facilities, Vol. 32 Issue: 7/8, pp.411-437, DOI: 10.1108/F-03-
2013-0021
Aaker, D. A., Kumar, V., & Day, G. S. (2007). Marketing research (9
ed.). Massachusetts: Wiley.
Almatarneh, R.T. (2013). Choices and changes in the housing market
and community preferences: Reasons for the emergence of
gated communities in Egypt: A case study of the Greater Cairo
Region, Egypt. Ain Shams Engineering Journal, 4(3), 563-
583. DOI: 10.1016/j.asej.2012.11.003
Al-Nahdi, T.S & Ghazzawi, O.H. (2015). Behavioural Factors
Affecting Real Estate Purchasing. International Journal of
Business and Social Science, 6(8(1)), 146-154.
Al-nahdi, T.S, Habib, S.A & Albdour, A.A. (2015). Factors
Influencing the Intention to Purchase Real Estate in Saudi
Arabia: Moderating Effect of Demographic Citizenship.
International Journal of Business and Management, 10(4), 35-
48. DOI: 10.5539/ijbm. v10n4p35
Al-Nahdi, T.S., Nyakwende, E., Banamah, A.M., Jappie, A.A. (2015).
Factors Affecting Purchasing Behaviour in Real Estate in
Saudi Arabia. International Journal of Business and Social
Science, 6(2), 113-125.

109
Anastasia, N & Suwitro, A.L. (2015). The Rational and Irrational
Factors Underlying Property Buying Behaviour. Journal of
Economics and Behavioural Studies, 7(2), 183-191.
Astroawanicom. (2017). Astroawanicom. Retrieved 2 October, 2017,
from http://www.astroawani.com/
Azmia, A.S.M. (2013). Cognitive Behaviour of Residents Toward
Living in Landslide Prone Area: Ulu Klang. Procedia - Social
and Behavioural Sciences, 101(8), 379-393. DOI:
org/10.1016/j.sbspro.2013.07.212
Bajari, P.; Kahn, M. E. (2015). Estimating Housing Demand with an
Application to Explaining Racial Segregation in Cities.
Journal of Business and Economic Statistics. Volume 23 Issue
1 (Jan). Pp. 20-33.
Bill, H.N. (2017). NATIONAL ASSOCIATION 4 of REALTORS.
Commercial Real Estate Market Trends: Q42016, 2(11), 2-12.
Cherise, B & Geoffrey, S. (2015). Factoring location costs into home
buying decisions. Location Matters, 1(1), 12-16.
Chin, C. (2013). Young professionals struggle to own property. The
Star Online. Retrieved July 14, from,
http://www.thestar.com.my/News/Nation/2013/07/14/Dad-
dont-kick-me-out-yet.aspx/
Chia, J., Harun, A., Kassim, A.W.M., Martin, D., Kepal, N. (2016).
Understand Factors That Influence House Purchase Intention
Among in Kota Kinabalu: An Application of Buyer Behaviour
Model Theroy. Journal of Technology Management and
Business, 3(2), 94-110.
Cilisosmy. (2016). CILISOS - Current Issues Tambah Pedas!.
Retrieved 7 October, 2017, from https://cilisos.my/you-wont-
believe-which-msian-state-has-the highest-no-of-rapes/
Eze, U.C. & Lim, Y.Y. (2013). Indicators in the Purchase of Housing
Properties. Journal of Southeast Asian Research, 2013(2013),
1-10. DOI: 10.5171/2013.432043

110
Faishal , T.M & Atik, A. (2015). Factors influencing buying intention
for housing unit in Depok. Journal of Business and
Management, 4(4), 484-493.
Fung, Hung-Gay, Jeng, Jau-Lian, & Liu, Qingfeng "Wilson". (2010).
Development of China’s Real Estate Market. Chinese
Economy 43(1), 71 – 92
Gupta, U & Sinha, R. (2015). A Comparative Study on Factors
Affecting Consumer’s Buying Behaviour towards Home
Loans (With Special Reference to State Bank of India And Life
Insurance Corporation, Allahabad). Journal of Business and
Management, 17(2), 13-17. DOI: 10.9790/487X-17211317
Han, H., and Y. Kim, 2010. An investigation of customers’ decision in
property: Developing an extended model of the theory of
planned behaviour. International Journal of Hospitality
Management, 29(4): 659-668.
Hurtubia, B., Gallay, O., & Bielaire, M. (2010). Attributes of
household, locations and real estate for land use modeling.
Sustain City Working Paper, 2.7. Lausanne: EPFL.
Hair, J.F., Jr, Anderson, R. E., Tatham, R.L. & Black, W.C. (1998).
Multivariate data analysis. (5th Ed). Upper Saddle River, NJ:
Prentice-Hall.
Hair, J.K., Black, B. R., Babin, H. B., Anderson, P. R., & Tatham, C.R
(2006). Multivariate data analysis. 6th edition. New Jersey.
Pearson Education, Inc.
Investorwordscom. (2017). InvestorWordscom. Retrieved 16 April,
2017, from
http://www.investorwords.com/8613/home_loan.html
Jayantha, W. N., & Man, W.S. (2013) "Effect of green labelling on
residential property price: a case study in Hong Kong", Journal
of Facilities Management, Vol. 11 Issue: 1, pp.31-51. DOI:
10.1108/14725961311301457
Jarad, I.A., Yusof N.A., and Mohd Shafiei M.W. (2010). The
organizational performance of housing developers in
Peninsular Malaysia. International Journal of Housing
Markets and Analysis. Vol. 3(2), pp. 146-162

111
Kunshan, W., & Yiman, T. (2011). Applying the extended theory of
plannedbehavior to predict the intention of visiting a green
hotel. African Journal of Business Management, 5(17), 7579-
7587
Kamal, M, Sarker, M.O.F.S & Prramanik, K. (2016). Investigation of
Market Factors That Affect Customers’ Buying Attitude
towards Apartment Buying: An Opportunity Analysis from
Bangladesh Perspective. International Journal of Business
Administration, 7(3), 153-165. DOI:10.5430/jibe. v7n3p153
Khuong, M.N & Duyen, H.T.M. (2016). Personal Factors Affecting
Consumer Purchase Decision towards Men Skin Care Products
— A Study in Ho Chi Minh City, Vietnam. International
Journal of Trade, Economics and Finance, 7(2), 44-49. DOI:
10.18178/ijtef.2016.7.2.497
Liew, C & Haron, N.A. (2013). Factors Influencing the Rise of House
Price in Klang Valley. International Journal of Research in
Engineering and Technology, 2(10), 261-272.
Lonappan, J. (2013). An Evaluation of factors influencing customer’s
home buying decision. Indian Journal of Research, 2(11), 158-
160.
Maoludyo, F.T. & Aprianingsih, A. (2015). Factors Influencing
Consumer Buying Intention for Housing Unit in Depok.
Journal of Business and Management, 4(4), 484-493.
Manivannan, P., & Dr. Somasundaram, M. (2014). Purchase of
Residential Flats - Factors Influencing the Decision of Buyers
in Selected Cities in Tamil Nadu. International Research
Journal of Business and Management, 5(9), 67-73.
Mahtani, S. (2012). The Property Report: Real-Estate Exuberance Hits
Jakarta. The Wallstreet Journal
Mariadas, P.A. 2016. A Study on Housing Price in Klang Valley,
Malaysia. International Business
Research. [Online]. 9(12), 103-109. [16 November
2017]. Available from:
http://dx.doi.org/10.5539/ibr.v9n12p103

112
Nasar, K.K & Manoj, P.K. (2015). Purchase Decision for Apartments:
A closer loser look into the major influencing factors.
International Journal of Research in Applied, 3(5), 105-112.
Narwal, M.S, Rani, S & Radhika. (2013). Customer Preferences for
Home Loans. International Journal of Banking, Risk and
Insurance, 1(1), 48-55.
Natasha, I & Hassan, Z. (2015). Factors that influencing property
investment decisions among Employees in Felcra Bhd.
International Journal of Accounting, Business and
Management, 3(2), 177-195.
Nunnally, J.C. (1981). Psychometric theory. (2nd Ed). New Delhi: Tata
McGraw-Hill publishing Co Ltd.
Oklen, F., & Rotem, D. (1986). Simple Random Sampling from
Relational Database. Paper presented at the Twelfth
International Conference on Very Large Data Bases. Retrieved
from http://www.vldb.org/conf/1986/P160.PDF
Ong, T.S. (2013). Finance and Banking (JEIEFB), An Online
International Monthly. Journal of Emerging Issues in
Economics, 1(5), 414-429.
Ong, T.S. 2013. Factors Affecting the Price of Housing in Malaysia.
Journal of Emerging Issues in Economics, Finance and
Banking (JEIEFB). 1(5), pp. 414-429.
Popoola, N.I., Jinadu, M.A., Liman H.S., & Abd Razack, N.T.A.
(2015). Effect of Environmental Quality on Property Rental
Values in Peri-urban Neighbourhoods of Minna, Nigeria.
Journal of Environmental Technology, 8(2), 42-51.
Ray, D & Choudhury, S.R. (2015). Factors Affecting Consumer
Decision Making for Purchasing Selected Home Appliance
Products Based on Market Segmentation-A Feedback Study of
People Associated with Management Education. Journal of
Research in Business and Management, 3(2), 6-11.
Razak, M.I.D., Ibrahim, R., Abdullah N.S.H., & Hoo, J. (2013).
Purchasing Intention towards Real Estate Development in
Setia Alam, Shah Alam: Evidence from Malaysia.

113
International Journal of Business, Humanities and
Technology, 3(6), 66-75.
Rehdacom. (2017). Rehdacom. Retrieved 2 October, 2017, from
http://rehda.com/wp-content/uploads/2017/06/05-REHDA-
Bulletin-May-2017-45.pdf
Sekaran, U. (2003). Research Method for Business: A Skill Building
Approach. (4th Ed.) New York: John Wiley & Sons.
Salleh. N.A., Zoher, S.A., Mahayuddin, S.A., & Abdul, Y. (2015).
Influencing Factors of Property Buyer in Hillside Residential
Development. Procedia - Social and Behavioural
Sciences,Volume 170, 27 January 2015, Pages 586-595,
170(6), 586-595. DOI: org/10.1016/j.sbspro.2015.01.060
Si, P. T. (2012). Key factors affecting house purchase decision of
customers in Vietnam. (Unpublished master thesis). University
of Economics Ho Chi Minh City, Ho Chi Minh City, Vietnam
Sidi, S., & Sharipah, N. (2011). Quality affordable housing: A
theoretical framework for planning and design of quality
housing. Journal of TechnoSocial,2(1).
Tan, T.H. (2016) "Residential satisfaction in gated communities: Case
study of Desa Park City, Kuala Lumpur, Malaysia", Property
Management, Vol. 34 Issue: 2, pp.84-99, DOI: 10.1108/PM-
02-2015-0009
Tan, T.H & Saw, L.S. (2014). Factors Affecting the Purchase Decision
of Investors in the Residential Property Market in Malaysia.
Journal of Surveying, Construction and Property (JSCP), 5(2),
1-13.
Thaker, K., Sakaran, C. (2016) "Prioritisation of key attributes
influencing the decision to purchase a residential property in
Malaysia: An analytic hierarchy process (AHP) approach",
International Journal of Housing Markets and Analysis, Vol.
9 Issue: 4, pp.446-467. DOI: 10.1108/IJHMA-09-2015-0052
Themalaymailonlinecom. (2016). Themalaymailonlinecom. Retrieved
2 October, 2017, from
http://www.themalaymailonline.com/malaysia/article/unsold-
units-continue-to-dampen-property-market-in-malaysia

114
Uitmedumy. (2017). Uitmedumy. Retrieved 5 April, 2017, from
https://fspu.uitm.edu.my/cebs/images/stories/ajebs12may201
0c1.pdf
Upennedu. (2017). KWHS. Retrieved 17 April, 2017, from
http://kwhs.wharton.upenn.edu/term/purchase-decision/
Uchenna , C.E & Lim, Y.Y. (2013). Indicators in the Purchase of
Housing Properties. Journal of Southeast Asian Research,
2013(2013), 1-10.
Yasuyo , M & Shobhakar, D. (2012). Urban Climates. Relationship
between urban form and CO2 emissions: Evidence from fifty
Japanese cities, 2(12), 55-57. Retrieved, from doi.org/10.1016
Źróbek, S., Trojanek, J., Źróbek-Sokolnik, A., & Radosław, T. (2015).
The influence of environmental factors on property buyers’
choice of residential location in Poland. Journal of
International Studies, 8(3), 164-174. DOI: 10.14254/2071-
8330.2015/8-3/13
Zainal, A.H. (2010). House Price and Affordability in Housing in
Malaysia. House Price and Sustainability, 37(46),
78./j.uclim.2012.