content May14.indd - Reserve Bank of India
96
MAY 2014 VOLUME LXVIII NUMBER 5
-
Upload
khangminh22 -
Category
Documents
-
view
9 -
download
0
Transcript of content May14.indd - Reserve Bank of India

MAY 2014
VOLUME LXVIII NUMBER 5

EDITORIAL COMMITTEEM. D. PatraBrajamohan MisraGautam ChatterjeeAmitava Sardar
EDITOR Sanjay Kumar Hansda
The Reserve Bank of India Bulletin is issued monthly by the Department of Economic and Policy Research, Reserve Bank of India, under the direction of the Editorial Committee.The Central Board of the Bank is not responsible for interpretation and opinions expressed. In the case of signed articles, the responsibility is that of theauthor.
© Reserve Bank of India 2014
All rights reserved.Reproduction is permitted provided an acknowledgment of the source is made.
For subscription to Bulletin, please refer toSection ‘Recent Publications’
The Reserve Bank of India Bulletin can beaccessed at http://www.bulletin.rbi.org.in

CONTENTS
Speeches
Competitive Monetary Easing: Is it yesterday once more?Raghuram G. Rajan 1
Inclusion, Growth and Governance - Issues and Way ForwardK. C. Chakrabarty 13
Currency Management in India: Issues and ChallengesK. C. Chakrabarty 25
Regulation of Indian Debt & Derivatives Markets: Some perspectives on post-crisis paradigmHarun R. Khan 31
Regulating Capital Account: Some ThoughtsHarun R. Khan 45
Current Statistics 53
Recent Publications 86


SPEECHES
Competitive Monetary Easing: Is it yesterday once more?Raghuram G. Rajan
Inclusion, Growth and Governance - Issues and Way ForwardK. C. Chakrabarty
Currency Management in India: Issues and ChallengesK. C. Chakrabarty
Regulation of Indian Debt & Derivatives Markets: Some perspectives on post-crisis paradigmHarun R. Khan
Regulating Capital Account: Some ThoughtsHarun R. Khan


SPEECH
RBI Monthly Bulletin May 2014 1
Competitive Monetary Easing: Is it yesterday once more?
Before starting, I should disclose my interests in
this era of transparency. For the last few months India
has experienced large infl ows of capital, not outfl ows,
and is seen by the markets as an emerging economy
that has made some of the necessary policy
adjustments.1 We are well buffered with substantial
reserves, though no country can be de-coupled from
the international system. My remarks are motivated
by the desire for a more stable international system,
a system that works equally for rich and poor, large
and small, and not the specifi cs of our situation.
Unconventional Policy
I want to focus on unconventional monetary
policies (UMP), by which I mean both policies that
hold interest rates at near zero for long, as well as
balance sheet policies such as quantitative easing or
exchange intervention, that involve altering central
bank balance sheets in order to affect certain market
prices.2 The key point that I will emphasise throughout
this talk is that quantitative easing and sustained
exchange intervention are in an economic equivalence
class, though the channels they work through may be
somewhat different. Our attitudes towards them
should be conditioned by the size of their spillover
effects rather than by any innate legitimacy of either
form of intervention.
Let me also add there is a role for unconventional
policies – when markets are broken or grossly
dysfunctional, central bankers do have to think
innovatively. Fortunately for the world, much of what
they did immediately after the fall of Lehman was
exactly right, though they were making it up as they
went in the face of extreme uncertainty. They eased
Good morning. As the world seems to be
struggling back to its feet after the great fi nancial
crisis, I want to draw attention to an area we need to
be concerned about: the conduct of monetary policy
in this integrated world. A good way to describe the
current environment is one of extreme monetary
easing through unconventional policies. In a world
where debt overhangs and the need for structural
change constrain domestic demand, a sizeable portion
of the effects of such policies spillover across borders,
sometimes through a weaker exchange rate. More
worryingly, it prompts a reaction. Such competitive
easing occurs both simultaneously and sequentially,
as I will argue, and both advanced economies and
emerging economies engage in it. Aggregate world
demand may be weaker and more distorted than it
should be, and fi nancial risks higher. To ensure stable
and sustainable growth, the international rules of the
game need to be revisited. Both advanced economies
and emerging economies need to adapt, else I fear we
are about to embark on the next leg of a wearisome
cycle.
Central bankers are usually reluctant to air their
concerns in public. But because the needed change
has political elements to it, I take my cue from
speeches by two central bankers whom I respect
greatly, Ben Bernanke in his 2005 ‘Global Savings Glut’
speech, and Jaime Caruana in his 2012 speech at
Jackson Hole, both of whom have raised similar
concerns to mine, although from different perspectives.
* Remarks by Dr. Raghuram G. Rajan at the Brookings Institution, April 10, 2014. These are my personal views. I acknowledge very useful comments from Joshua Felman, Prachi Mishra, Jonathan Ostry, Michael Patra, Eswar Prasad and Tharman Shanmughar atnam.
1 See Mishra et al. (2014).
2 See Borio and Disyatat (2009) for an excellent early comprehensive taxonomy and assessment of balance sheet policies.
Competitive Monetary Easing: Is it yesterday once more?* Raghuram G. Rajan
SPEECH
RBI Monthly Bulletin May 20142
Competitive Monetary Easing: Is it yesterday once more?
access to liquidity through innovative programs such
as TALF, TAF, TARP, SMP, and LTRO. By lending long
term without asking too many questions of the
collateral they received, by buying assets beyond usual
limits, and by focusing on repairing markets, they
restored liquidity to a world fi nancial system that
would otherwise have been insolvent based on
prevailing market asset prices. In this matter, central
bankers are deservedly heroes.3
The key question is what happens when these
policies are prolonged long beyond repairing markets
– and there the benefi ts are much less clear. Let me
list 4 concerns:
1. Is unconventional monetary policy the right
tool once the immediate crisis is over? Does
it distort behavior and activity so as to stand
in the way of recovery? Is accommodative
monetary policy the way to fi x a crisis that
was partly caused by excessively lax policy?
2. Do such policies buy time or does the belief
that the central bank is taking responsibility
prevent other, more appropriate, policies
from being implemented? Put differently,
when central bankers say, however reluctantly,
that they are the only game in town, do they
become the only game in town?
3. Will exit from unconventional policies be
easy?
4. What are the spillovers from such policies to
other countries?
Since I have dwelt at length on the fi rst two
concerns in an earlier speech, let me focus on the last
two.4
Exit
The macroeconomic argument for prolonged
unconventional policy in industrial countries is that
it has low costs, provided infl ation stays quiescent.
Hence it is worth pursuing, even if the benefi ts are
uncertain. A number of economists have, however,
raised concerns about fi nancial sector risks that may
build with prolonged use of unconventional policy.5
Asset prices may not just revert to earlier levels on
exit, but they may overshoot on the downside, and
exit can cause signifi cant collateral damage.
One reason is that leverage may increase both in
the fi nancial sector and amongst borrowers as policy
stays accommodative.6 One channel seems to be that
a boost to asset liquidity leads lenders to believe that
asset sales will backstop loan recovery, leading them
to increase loan to value ratios. When liquidity
tightens, though, too many lenders rely on asset sales,
causing asset prices and loan recovery to plummet.
Because lenders do not account for the effects of their
lending on the ‘fi re sale’ price, and subsequently on
lending by others, they may have an excessive
incentive to build leverage.7 These effects are
exacerbated if, over time, lenders become reliant on
asset sales for recovery, rather than on upfront project
evaluation and due diligence. Another possible
channel is that banks themselves become more
levered, or equivalently, acquire more illiquid balance
3 I was not a member of the fraternity at that time, so I do not feel a confl ict in doling out praise!
4 ‘A step in the dark: unconventional monetary policy after the crisis’, Raghuram Rajan, Andrew Crockett Memorial Lecture delivered at the BIS on June 23, 2013.
5 See Borio (2014), Borio and Disyatat (2009), Stein (2013), though see Chodorow-Reich (2014) for an alternative viewpoint. One question about Chodorow-Reich’s assessment that quantitative easing does not, by and large, prompt risk taking is that he uses market prices to estimate effects, even though these prices themselves could be distorted by risk taking.
6 For evidence, see for example Becker and Ivashina (2013), Bruno and Shin (2014 a,b), Ioannidou, Ongena and Peydró (2009), Maddaloni and Peydró (2010).
7 Stein, Jeremy. 2012. Monetary Policy as Financial-Stability Regulation. Quarterly Journal of Economics 127, no. 1: 57-95.

SPEECH
RBI Monthly Bulletin May 2014 3
Competitive Monetary Easing: Is it yesterday once more?
sheets, if the central bank signals it will intervene in
a sustained way when times are tough because
unemployment is high.8
Leverage need not be the sole reason why exit
may be volatile after prolonged unconventional policy.
Investment managers may fear underperforming
relative to others. This means they will hold a risky
asset only if it promises a risk premium (over safe
assets) that makes them confident they will not
underperform holding it.9 A lower path of expected
returns on the safe asset makes it easier for the risky
asset to meet the required risk premium, and indeed
draws more investment managers to buy it – the more
credible the forward guidance on ‘low for long’, the
more the risk taking. However, as investment
managers crowd into the risky asset, the risky asset
is more fi nely priced so that the likelihood of possible
fi re sales increases if the interest rate environment
turns. Every manager dumps the risky asset at that
point in order to avoid being the last one holding it.
Leverage and investor crowding may therefore
exacerbate the consequences of exit. When monetary
policy is ultra-accommodative, prudential regulation,
either of the macro or micro kind, is probably not a
suffi cient defence. In part, this is because, as Fed
Governor Stein so succinctly put it, monetary policy
‘gets into every crack’, including the unregulated part
of the fi nancial system.10 In part, ultra accommodative
monetary policy creates enormously powerful
incentive distortions whose consequences are
typically understood only after the fact. The
consequences of exit, however, are not just felt
domestically, they could be experienced internationally.
Spillovers
Perhaps most vulnerable to the increased risk-
taking in this integrated world are countries across
the border. When monetary policy in large countries
is extremely and unconventionally accommodative,
capital fl ows into recipient countries tend to increase
local leverage; this is not just due to the direct effect
of cross-border banking fl ows but also the indirect
effect, as the appreciating exchange rate and rising
asset prices, especially of real estate, make it seem
that borrowers have more equity than they really
have.11
Exchange rate fl exibility in recipient countries in
these circumstances sometimes exacerbates booms
rather than equilibrates. Indeed, in the recent episode
of emerging market volatility after the Fed started
discussing taper in May 2013, countries that allowed
the real exchange rate to appreciate the most during
the prior period of quantitative easing suffered the
greatest adverse impact to financial conditions.12
Countries that undertake textbook policies of fi nancial
sector liberalisation are not immune to the infl ows
– indeed, their deeper markets may draw more fl ows
in, and these liquid markets may be where selling
takes place when conditions in advanced economies
turn.13
Macro-prudential measures have little traction
against the deluge of infl ows – Spain had a housing
boom despite its countercyclical provisioning.
Recipient countries should adjust, of course, but credit
and fl ows mask the magnitude and timing of needed
adjustment. For instance, higher collections from
8 See Diamond and Rajan (2012), Farhi and Tirole (2012) and Acharya, Pagano and Volpin (2013). The problem is exacerbated if unemployment is driven by factors that move to a different cycle and pace than the fi nancial cycle.
9 See Feroli , Kashyap, Schoenholtz, and Shin (2014) for details.
10 See Stein (2013).
11 See Bruno and Shin (2014 a, b), Calvo, Leiderman, and Reinhart (1996), Obstfeld (2012), Rey (2013), and Schularick and Taylor (2012) for example.
12 See Eichengreen and Gupta (2013) and Mishra, Moriyama, N’Diaye, and Nguyen (2014).
13 See Prasad (2014, p 198) and Eichengreen and Gupta (2013).

SPEECH
RBI Monthly Bulletin May 20144
Competitive Monetary Easing: Is it yesterday once more?
property taxes on new houses, sales taxes on new
sales, capital gains taxes on fi nancial asset sales, and
income taxes on a more prosperous fi nancial sector
may suggest a country’s fi scal house is in order, even
while low risk premia on sovereign debt add to the
sense of calm. At the same time, an appreciating
nominal exchange rate may also keep down infl ation.
The diffi culty of distinguishing the cyclical from
the structural is exacerbated in some emerging
markets where policy commitment is weaker, and the
willingness to succumb to the siren calls of populist
policy greater. But it would be a mistake to think that
pro-cyclical policy in the face of capital infl ows is
primarily a disease of the poor; Even rich recipient
countries with strong institutions, such as Ireland and
Spain, have not been immune to capital-fl ow-induced
fragility.
Ideally, recipient countries would wish for stable
capital inflows, and not flows pushed in by
unconventional policy. Once unconventional policies
are in place, however, they do recognise the problems
stemming from prolonged easy money, and thus the
need for source countries to exit. But when source
countries move to exit unconventional policies, some
recipient countries are leveraged, imbalanced, and
vulnerable to capital outfl ows. Given that investment
managers anticipate the consequences of the future
policy path, even a measured pace of exit may cause
severe market turbulence and collateral damage.14
Indeed, the more transparent and well-communicated
the exit is, the more certain the foreign investment
managers may be of changed conditions, and the more
rapid their exit from risky positions.
Recipient countries are not being irrational when
they protest both the initiation of unconventional
policy as well as an exit whose pace is driven solely
by conditions in the source country. Having become
more vulnerable because of leverage and crowding,
recipient countries may call for an exit whose pace
and timing is responsive, at least in part, to conditions
they face.
The Case for International Monetary Policy
Coordination
Hence, my call is for more coordination in
monetary policy because I think it would be an
immense improvement over the current international
non-system. International monetar y pol icy
coordination, of course, is unpopular among central
bankers, and I therefore have to say why I reiterate
the call and what I mean by it.
I do not mean that central bankers sit around a
table and make policy collectively, nor do I mean that
they call each other regularly and coordinate actions.
In its strong form, I propose that large country central
banks, both in advanced countries and emerging
markets, internalise more of the spillovers from their
policies in their mandate, and are forced by new
conventions on the ‘rules of the game’ to avoid
unconventional policies with large adverse spillovers
and questionable domestic benefits.15 Given the
difficulties of operationalising the strong form, I
suggest that, at the very least, central banks reinterpret
their domestic mandate to take into account other
country reactions over time (and not just the
immediate feedback effects), and thus become more
sensitive to spillovers. This weak ‘coordination’ could
be supplemented with a re-examination of global
safety nets.
14 See Feroli et al. (2014).
15 Though see Caruana (2012), Eichengreen et al. (2011), Jeanne (2014), and Taylor (2013) for proposals by current and former policy makers and monetary economists.
SPEECH
RBI Monthly Bulletin May 2014 5
Competitive Monetary Easing: Is it yesterday once more?
The Gains from Coordination
Economists generally converged on the view that
the gains to policy coordination were small provided
each country optimised its own policies keeping in
mind the policies of others. The ‘Nash equilibrium’
was not that far from the global optimum, hence the
‘own house in order’ doctrine was dominant in the
international monetary fi eld.16 National macroeconomic
stability was seen as sufficient for international
macroeconomic stabil ity. The domestic and
international aspects were essentially regarded as two
sides of the same coin.
Two factors have led to a rethinking of the
doctrine. First, domestic constraints including political
imperatives of bringing unemployment down and the
economic constraint of the zero lower bound may lead
monetary policy to be set at levels different from the
unconstrained domestic optimal. Dysfunctional
domestic politics could also contribute in moving
monetary policy further from the unconstrained
optimal. In other words, the central bank, responding
to a variety of political pressures and weaknesses, may
stray away from even the constrained optimal –
towards third best policies rather than second best
policies. Second, cross-border capital fl ows can lead
to a more dramatic transmission of policies, driven
by agency (and other) considerations that do not
necessarily relate to economic conditions in the
recipient countries.
One argument along these lines is that if some
large country adopts unconventional and highly
accommodative sub-optimal policies, other countries
may follow suit to avoid exchange rate appreciation
in a world with weak demand.17 As a result, the policy
equilibrium may establish at rates that are too low
compared to that warranted by the global optimal.
Another argument is that when the sending country
is at the zero lower bound, and the receiving country
responds to capital infl ows with aggressive reserve
accumulation, both may be better off with more
moderate policies.18 Indeed, it may well be that
coordination may allow policy makers political room
to move away from sub-optimal policies. If political
paralysis and consequent fi scal tightening forces a
source country to a sub-optimal reliance on monetary
stimulus, policy coordination that allows for expanded
demand elsewhere could allow the source country to
cut back on its dependence on monetary stimulus.19
Domestic Optimal is close to the Global Optimal
Despite these arguments, offi cial statements by
multilateral institutions such as the IMF continue to
endorse unconventional monetary policies while
downplaying the adverse spillover effects to other
countries. Indeed, in an excellent analysis of the
obstacles to international policy coordination, the
IMF’s own Jonathan Ostry and Atish Ghosh argue that
‘impartial’ international policy assessments by
multilateral entities could be suspected of bias20
‘…if there were a systematic tendency of the
assessor to identify a change in policy (tighter fi scal
policy; looser monetary policy; structural reform) as
always yielding welfare gains at the national and global
levels. This would breed suspicion because the base
case should be that countries do not fail to exploit
available welfare gains…it is implausible that welfare
gains at the national and global levels should always
be positively correlated…’
16 See Eichengreen et al. (2011). For an articulation of the doctrine, see Rose (2007) or Taylor (2013).
17 See Taylor (2013).
18 See Jeanne (2014).
19 See Ostry and Ghosh (2013).
20 See Ostry and Ghosh (2013, p23).

SPEECH
RBI Monthly Bulletin May 20146
Competitive Monetary Easing: Is it yesterday once more?
By downplaying the adverse effects of cross-
border monetary transmission of unconventional
policies, we are overlooking the elephant in the post-
crisis room. I see two dangers here. One is that any
remaining rules of the game are breaking down. Our
collective endorsement of unconventional monetary
policies essentially says it is ok to distort asset prices
if there are other domestic constraints to reviving
growth, such as the zero-lower bound. But net
spillovers, rather than fancy acronyms, should
determine internationally acceptable policy.
Otherwise, countries could legitimately practice
what they might call quantitative external easing or
QEE, whereby they intervene to keep their exchange
rate down and build huge reserves. The reason we
frowned on QEE in the past is because we believed
the adverse spillover effects for the rest of the world
were signifi cant. If we are unwilling, however, to
evaluate all policies based on their spillover effects,
there is no legitimate way multilateral institutions
can declare that QEE contravenes the rules of the
game. Indeed, some advanced economy central
bankers have privately expressed their worry to me
that QE ‘works’ primarily by altering exchange rates,
which makes it different from QEE only in degree
rather than in kind.
The second danger is a mismanaged exit will
prompt fresh distortionary behaviour. Even as source
country central banks go to great pains to communicate
how their removal of accommodation will be
contingent on domestic activity, they have been silent
on how they will respond to foreign turmoil. Market
participants conclude that recipient countries,
especially those that do not belong to large reserve
currency blocks, are on their own, and crowd
devastatingly through the exit.
Indeed, the lesson some emerging markets will
take away from the recent episode of turmoil is
(i) don’t expand domestic demand and run large
defi cits (ii) maintain a competitive exchange rate
(iii) build large reserves, because when trouble comes,
you are on your own. In a world with deficient
aggregate demand, is this the message the international
community wants to send?
For this is not the fi rst episode in which capital
has been pushed fi rst in one direction and then in
another, each time with devastating effect. In the early
1990s, rates were held low in the United States, and
capital fl owed to emerging markets. The wave of
emerging market crises starting with Mexico in 1994
and ending with Argentina in 2001, sweeping through
East Asia and Russia in between, was partially caused
by a reversal of these fl ows as interest rates rose in
industrial countries. The subsequent reserve build up
in emerging markets, including China, contributed to
weak global demand and excess spending by some
industrial countries, culminating in the global
fi nancial crisis of 2007-09. Once again, though, post-
crisis unconventional monetary policy has pushed
capital to emerging markets, with the associated build
up in fragility. Are we setting the stage for a
resumption of the ‘global savings glut’ as emerging
markets build reserves once again?
Two obvious remedies suggest themselves; Less
extreme monetary policies on all sides with some
thought given to adverse spillover effects when setting
policy, and better global safety nets to mitigate the
need for countries to self-insure through reserve
buffers.
More Moderate Policy
Even though we live in a world where monetary
transmission is global, policy focus is local. Central
banks mount a number of defences as to why they
should not take full account of spillovers. One way to
demonstrate the weaknesses in the usual arguments

SPEECH
RBI Monthly Bulletin May 2014 7
Competitive Monetary Easing: Is it yesterday once more?
that are put forward to defend the status quo is to see
how they would sound if they were used to defend
QEE, that is, sustained intervention in the exchange
market to keep the exchange rate competitive.
Defense 1: We are a developing country and we
are mandated to support growth. Institutional
constraints in enhancing productivity, and our
vulnerability to sudden stops, means that a competitive
exchange rate, and thus QEE, is essential to fulfi lling
our mandate.21
Defense 2: Would the world not be better off if
we grew strongly? QEE is essential to our growth.
Defense 3: We take into account feedback effects
to our economy from the rest of the world while
setting policy. Therefore, we are not oblivious to the
consequences of QEE on other countries.
Defense 4: Monetary policy with a domestic focus
is already very complicated and hard to communicate.
It would be impossibly complex if we were additionally
burdened with having to think about the effects of
QEE on other countries.
There are many problems with these defenses
that those who have complained about currency
manipulation will recognise. Currency manipulation
may help growth in the short run (even this is
debatable), but creates long-run distortions that hurts
the manipulating country. There are more sensible
policies to foster growth. And even if a central bank
has a purely domestic mandate, the country’s
international responsibilities do not allow it to
arbitrarily impose costs on the rest of the world. The
net spillover effects need to be estimated, and it
cannot be taken for granted that the positive spillovers
from the initiating country’s growth (say through
greater trade) more than offset the adverse spillovers
to other countries. Feedback effects to the source
country represent only a small part of the spillover
effects experienced by the world, and a central bank
will be far from implementing the globally optimal
policy if it is solely domestically-oriented, even if it
takes these feedback effects into account. Countries
are required to pay attention to the effects of their
policies on others, no matter how much the added
complication, because we all have international
responsibilities.
Of course, the reader will recognise that each one
of these arguments has been made defending
unconventional monetary policy. Yet multilateral
institutions treat sustained currency intervention
with great opprobrium while giving unconventional
monetary policy a clean chit. Should the cleanliness
of the chit not depend on the size of the net spillovers
and the competitive response it engenders? Without
estimating them carefully, how can we tell?
Operationalising Coordination: Some Suggestions
We need to break away from this cycle of
unconventional policies and competitive monetary
easing. Already, the events of recent months have set
the stage for renewed reserve accumulation by the
emerging markets. And this time, it will be harder for
advanced economies to complain if they downplay
their own spillover effects while they are pushing for
recovery.
An Independent Assessor
In an ideal world, unconventional monetary
policies such as QE or QEE should be vetted by an
independent assessor for their spillover effects.22 The
assessment procedure is easy to visualise; Perhaps
following a complaint by an impacted country (as in
21 See Rodrik (2008) on why exchange undervaluation may be essential for
emerging economies. 22 See Ostry and Ghosh (2013) for the idea of an independent assessor.

SPEECH
RBI Monthly Bulletin May 20148
Competitive Monetary Easing: Is it yesterday once more?
the WTO), the independent assessor could analyse
the effects of such policies and come to a judgment
on whether they follow the rules of the game. Policies
where the benefi ts are largely domestic, while the
costs fall largely abroad, would be especially carefully
scrutinised. And if the assessor deems the policy
reduces global welfare, international pressure should
be applied to stop such policies.
The problems with such an idealistic process are
easy to see. Where is such an impartial assessor to be
found? The staff at multilateral institutions is
excellent, and well capable of independent judgment.
But political pressure subsequent to the initial
assessment operates unevenly. Initial assessments
typically remain unaltered when a small country
complains (no country likes independent assessments),
but are often toned down when a large economy
protests. There are many exceptions to this, but more
work is needed to build trust in the impartiality of
assessments of multilateral institutions.
Even if multilateral organisations become
immune to power politics, they are not immune to
cognitive capture. Their staff has been persuaded by
the same models and frameworks as the staff of
industrial country central banks – models where
monetary policy is an extremely powerful tool to
elevate activity, and exchange rate fl exibility does
wonders in insulating countries from the most
debilitating spillovers. ‘Decoupling’ is always possible
in such models, even though the evidence is that the
models typically underestimate the extent of
‘coupling’. Indeed, many of these models do not have
realistic models of credit, or of monetary transmission
in an economy with debt overhang, which reduces
their value considerably. Progress is being made but
it will take time.
And, of course, even if a truly independent
assessment came to the conclusion that certain
policies were in violation, how would such a judgment
be enforced?
The reality is that the rules of the game were
framed in a different era to deter competitive
devaluations and currency manipulation. They have
not been updated for today’s world of more varied
competitive easing. But it is unclear that even if they
were updated, they could be assessed and enforced
in the current environment.
A More Modest Proposal
Perhaps then, it would be better to settle for a
more modest proposal. Central banks should assess
spillover effects from their own actions, not just in
terms of immediate feedback, but also in terms of
medium term feedback as other countries alter their
policies. In other words, the source country should
not just worry about the immediate fl ows of capital
to other countries from its policies, but the longer run
reaction such as sustained exchange intervention that
this would bring about. This would allow central banks
to pay more attention to spillovers even while staying
within their domestic mandate.
For example, this would mean that while exiting
from unconventional policies, central banks would
pay attention to conditions in emerging markets also
while deciding the timing of moves, while keeping
the overall direction of moves tied to domestic
conditions. Their policy statements should
acknowledge such concerns. To be concrete in a
specific case, the Fed postponing tapering in
September 2013 allowed emerging economies more
time to adjust after the initial warning in May 2013.
Whatever the underlying rationale for postponement,
it helped tapering start smoothly in December 2013,
without disrupting markets. In contrast, with volatility
hitting emerging markets after the Argentinian
problems in January 2014, the Fed policy statement

SPEECH
RBI Monthly Bulletin May 2014 9
Competitive Monetary Easing: Is it yesterday once more?
in January 2014, with no mention of concern about
the emerging market situation, and with no indication
Fed policy would be sensitive to conditions in those
markets in the future, sent the probably unintended
message that those markets were on their own.
Speeches by Regional Fed Presidents emphasising the
Fed’s domestic mandate did not help. Since then, Fed
communication has been more nuanced, though the
real challenge in communication lies ahead when
policy rates have to move up.23
International Safety Nets
Emerging economies have to work to reduce
vulnerabilities in their economies, to get to the point
where, like Australia, they can allow exchange rate
fl exibility to do much of the adjustment for them to
capital infl ows. But the needed institutions take time
to develop. In the meantime, the difficulty for
emerging markets in absorbing large amounts of
capital quickly and in a stable way should be seen as
a constraint, much like the zero lower bound, rather
than something that can be altered quickly. Even while
resisting the temptation of absorbing fl ows, they will
look to safety nets.
So another way to prevent a repeat of substantial
reserve accumulation is to build stronger international
safety nets.24 As the fi nancial crisis suggested, this is
not just an emerging economy concern. In a world
where international liquidity can dry up quickly, the
world needs bilateral, regional, and multilateral
arrangements for liquidity. Multilateral arrangements
are tried and tested, and are available more widely,
and without some of the possible political pressures
that could arise from bilateral and regional
arrangements. Indeed swap arrangements can be
channelled through multilateral institutions like the
IMF instead of being conducted on a bilateral basis,
so that the multilateral institution bears any (small)
credit risk, and the source central bank does not have
to justify the arrangements to its political authorities.
Perhaps equally valuable would be a liquidity line
from the IMF, where countries are pre-qualifi ed by the
IMF and told (perhaps privately) how much of a line
they would qualify for under current policy – with
access limits revised every Article IV and any
curtailment becoming effective 6 months later.25 Access
to the line would get activated by the IMF Board in a
situation of generalised liquidity shortage (as, for
example, when policy tightening in source countries
after an extended period of low rates causes
investment managers to become risk averse). The IMF
has suggested such arrangements in a discussion
paper, and they should be explored because they allow
countries access to liquidity without the stigma of
approaching the Fund, and without the conditionality
that accompanies most Fund arrangements.26
Clearly, the Fund’s resources will be safe only if
the situation is one of genuine temporary illiquidity
rather than one where countries need signifi cant
reforms to regain market access. Equally clearly, access
will vary across countries, and prolonged use after the
liquidity emergency is declared over will necessitate
an IMF program. Nevertheless, the twin proposals of
the Global Stability Mechanism and Short-term
Liquidity Line that the IMF Board has examined in
the past deserve close examination for they come
closest to genuinely helping offset reserve build-up.
Finally, it would be a useful exercise for the Fund,
in a period of growing vulnerability to capital fl ow
23 For a recent nuanced view from a key Fed President, see Dudley (2014).
24 See Farhi, et al. (2011) for comprehensive proposals, as also Prasad (2014).
25 So as to give a country time to adjust policies to qualify for higher limits, or to fi nd alternative arrangements.
26 See “The Fund’s Mandate – The Future Financing Role: Reform Proposals”, IMF June 29 2010.

SPEECH
RBI Monthly Bulletin May 201410
Competitive Monetary Easing: Is it yesterday once more?
reversals, to identify those countries that do not have
own, bilateral, regional, or multilateral liquidity
arrangements to fall back on, and to work to improve
their access to some safety net. The role of honest
ex-ante marriage broker may be one that could prove
to be immensely important when the interest rate
environment changes.
Conclusion
The current non-system in international
monetary policy is, in my view, a source of substantial
risk, both to sustainable growth as well as to the
financial sector. It is not an industrial country
problem, nor an emerging market problem, it is a
problem of collective action. We are being pushed
towards competitive monetary easing.
If I use terminology reminiscent of the Depression
era non-system, it is because I fear that in a world
with weak aggregate demand, we may be engaged in
a futile competition for a greater share of it. In the
process, unlike Depression-era policies, we are also
creating fi nancial sector and cross-border risks that
exhibit themselves when unconventional policies
come to an end.27 There is no use saying that everyone
should have anticipated the consequences. As the
former BIS General Manager Andrew Crockett put it,
‘financial intermediaries are better at assessing
relative risks at a point in time, than projecting the
evolution of risk over the fi nancial cycle.’
A fi rst step to prescribing the right medicine is
to recognise the cause of the sickness. Extreme
monetary easing, in my view, is more cause than
medicine. The sooner we recognise that, the more
sustainable world growth we will have.
References
Acharya, V, Marco Pagano and Paolo Volpin
(2013), Seeking Alpha: Excess Risk Taking and
Competition for Managerial Talent, NBER Working
Paper 18891.
Becker, Bo and Victoria Ivashina (2012), “Reaching for
Yield in the Bond Market”, NBER working paper 18909.
Borio, Claudio (2014), “Monetary Policy and Financial
Stability: What Role in Prevention and Recovery”, BIS
Working Paper 440, January 2014.
Borio, Claudio and Piti Disyatat (2009), “Unconventional
Monetary Policies: An Appraisal”, BIS working paper
292.
Bruno, Valentina and Hyun Song Shin (2014 a),
“Capital fl ows and the risk-taking channel of monetary
policy”, American University working paper.
Bruno, Valentina and Hyun Song Shin (2014 b), “Cross-
Border Banking and Global Liquidity”, American
University working paper.
Calvo, Guillermo, Leonardo Leiderman, and Carmen
Reinhart (1996), “Infl ows of Capital to Developing
Countries in the 1990s”, Journal of Economic
Perspectives, Vol 10, no 2, pp 123-139.
Caruana, Jaime (2012), “Policy Making in an Inter-
connected World”, http://www.kansascityfed.org/
publications/research/escp/escp-2012.cfm
Chodorow-Reich, Gabriel (2014), “Effects of
Unconventional Monetary Policy on Financial
Institutions”, Brookings Panel on Economic Activity
Conference Draft.
Coval, Josh and Tobias Moscowitz (1999), “Home Bias
at Home: Local Equity Preference in Domestic
Portfolios”, Journal of Finance, 54(6), pp. 2045-73.
Diamond, Douglas and Raghuram Rajan (2012),
“Illiquid Banks, Financial Stability, and Interest Rate 27 For an interesting episode, see the farm mortgage crisis in the United States documented in Rajan and Ramcharan (2013).

SPEECH
RBI Monthly Bulletin May 2014 11
Competitive Monetary Easing: Is it yesterday once more?
Policy”, Journal of Political Economy Volume: 120
Issue: 3 Pages: 552-591, JUN 2012.
Dudley, William (2014), “U.S. Monetary Policy and
Emerging Market Economies”, Remarks at the
Roundtable Discussion in Honor of Terrence Checki:
Three Decades of Crises: What Have We Learned?,
Federal Reserve Bank of New York, New York City.
Eichengreen, B., M. El-Erian, A. Fraga, T. Ito, J. Pisani-
Ferry, E. Prasad, R. Rajan, M. Ramos, C. Reinhart, H.
Rey, D. Rodrik, K. Rogoff, H.S. Shin, A. Velasco, B.
Weder di Mauro and Y. Yu, “Rethinking Central
Banking” (2011), Brookings Institution.
Eichengreen, Barry and Poonam Gupta (2013),
“Tapering Talk: The Impact of Expectations of Reduced
Federal Reserve Security Purchases on Emerging
Markets”, Working Paper, University of California,
Berkeley.
Farhi, E., Gourinchas, P.O., Rey, H. (2011), “Reforming
t h e I n t e r n a t i o n a l M o n e t a r y S y s t e m ”
http://www.helenerey.eu/RP.aspx?pid=Policy-Papers_
en-GB&aid=72587282480_67186463733.
Farhi, Emmanuel and Jean Tirole (2012), “Collective
Moral Hazard, Maturity Mismatch, and Systemic
Bailouts.” American Economic Review 102: 60–93.
Feroli, Michael, Anil Kashyap, Kermit Schoenholz,
Hyun Song Shin (2014), “Market Tantrums and
Monetary Policy”, Chicago Booth Working Paper 101.
Ioannidou, V. and S. Ongena and J. Peydró (2009),
“Monetary policy and subprime lending: a tall tale of
low federal funds rates, hazardous loan and reduced
loans spreads.”
Jeanne, Olivier (2014), “Macro-prudential policies in
a global perspective”, NBER Working paper 19967.
Maddaloni, A. and J. Peydró (2010), “Bank risk taking,
securitisation, supervision, and low interest rates:
evidence from lending standards.” Working Paper no.
1248, ECB Series.
Mishra, Prachi, Kenji Moriyama, Papa N’Diaye and
Lam Nguyen (2014), “The Impact of Fed Tapering
Announcements on Emerging Markets”, IMF working
paper.
Obstfeld, Maurice (2012), “Does the Current Account
Still Matter”, Richard T. Ely Lecture, American
Economic Association Annual Meetings, Chicago IL.
Ostry, Jonathan and Atish Ghosh (2013), “Obstacles
to International Policy Coordination, and How to
Overcome them”, IMF Staff Discussion Note
SDN/13/11X.
Mitchell Petersen and Raghuram Rajan (2002), “Does
Distance Still Matter? The Revolution in Small
Business Lending”,Journal of Finance, 57(6), pp. 2533-
2570.
Prasad, Eswar (2014), The Dollar Trap: How the U.S.
Dollar Tightened Its Grip on Global Finance, Princeton
University Press, Princeton, NJ.
Rajan, Raghuram and Rodney Ramcharan (2013), “The
Anatomy of a Credit Crisis: The Boom and Bust in
Farm Land Prices in the United States in the 1920s”,
working paper, University of Chicago.
Rodrik, Dani (2008), “Undervaluation is good for
growth, but why?”, Brookings Papers on Economic
Activity, Fall 2008.
Rose, A. (2007), A Stable International Monetary
System Emerges: Infl ation Targeting is Bretton Woods,
Reversed. Journal of International Money and Finance,
26, 663-681.
Schularick, Moritz and Alan M. Taylor (2012), “Credit
Booms Gone Bust: Monetary Policy: Leverage Cycles,
and Financial Crises, 1870-2008.” American Economic
Review 102, 1029-61.
Stein, Jeremy (2012), Monetary Policy as Financial-
Stability Regulation. Quarterly Journal of Economics
127, no. 1: 57-95.

SPEECH
RBI Monthly Bulletin May 201412
Competitive Monetary Easing: Is it yesterday once more?
Stein, Jeremy (2013), “Overheating in Credit Markets:
Origins, Measurement, and Policy Responses”, speech
at the “Restoring Household Financial Stability after
the Great Recession: Why Household Balance Sheets
Matter” research symposium sponsored by the Federal
Reserve Bank of St. Louis, St. Louis, Missouri, February
7, 2013.
Stein, Jeremy (2014), “Incorporating Financial Stability
Considerations into a Monetary Policy Framework”,
speech at the International Research Forum on
Monetary Policy, Washington, D.C. , March 21, 2014.
Taylor, John (2013), “International Monetary Policy
Coordination: Past, Present, and Future”, BIS Working
Papers No 437.

SPEECH
RBI Monthly Bulletin May 2014 13
Inclusion, Growth and Governance – Issues and Way Forward
General credit cards (GCCs) issued, etc. These numbers
are by no means small. But, if you ask me whether we
are satisfi ed with the progress, the answer would be
an unqualifi ed ‘NO.’ We are not happy with the quality
of Financial Inclusion that we have achieved over
these years. When we say quality, we mean that
although a number of accounts have been opened,
many people have been issued KCCs and GCCs; the
number of transactions in these accounts continues
to be minuscule. What really pains me is that contrary
to the potential that exists, the progress is quite
unsatisfactory. The larger question, therefore, is what
is holding us back? Why are the banks not able to bring
in meaningful fi nancial inclusion? To my mind, a fair
share of the collective failure of the stakeholders can
be attributed to poor governance of our Financial
Inclusion framework and lack of accountability at the
highest policy level i.e. Board and at the level of senior
management.
2. I am, therefore, happy that SKOCH has chosen
this theme, which is aimed at highlighting this linkage
between inclusion, growth and governance. As I
mentioned a little while back, we set in motion a
structured framework for promoting financial
inclusion some 5-6 years ago and hence, this is an
ideal time to take stock of our initiatives, refl ect on
our achievements and initiate course correction,
wherever necessary. In my address today, I intend to
focus on the progress made in our fi nancial inclusion
efforts, the attendant issues and challenges and the
improvements needed in the governance framework
of the fi nancial inclusion initiatives in the banks in
order to make it truly meaningful.
3. There is an inalienable link between growth and
governance and this has been established through
several empirical studies. The concept of good
governance emerged at the end of the 1980s, fi rst at
the World Bank which was further developed upon
Lord Meghnad Desai, Professor Emeritus, London
School of Economics; Shri Rana Kapoor, Managing
Director & CEO, Yes Bank and President, ASSOCHAM;
Shri Sameer Kochhar, Chairman, SKOCH Group;
members of the print and electronic media; ladies and
gentlemen! It is a pleasure and privilege for me to be
present here today at the inaugural session of this
SKOCH Summit which features the theme of
‘Inclusion, Growth and Governance’. The theme of
the conference is particularly relevant at this juncture
in our economy when the economic growth has
considerably slowed down. Across the globe, especially
in the wake of the fi nancial crisis, there has been a
growing appreciation of the fact that sustainable
growth and fi nancial stability can only be achieved
through greater fi nancial inclusion. The policymakers
in India have been cognizant of the need for equitable
development and have pursued polices which aimed
at greater fi nancial inclusion over the years. Generating
sustainable economic growth through increased
fi nancial inclusion has, of late, become the central
mantra of the regulators and policy makers, not only
in India, but across the globe. But, how far have we
succeeded in our efforts? Undoubtedly, over the last
fi ve-six years, ever since RBI has encouraged the banks
to adopt a structured approach for fi nancial inclusion,
the banking sector has done a good job. One can see
the statistics related to number of basic bank accounts
opened, number of Kisan credit cards (KCCs) and
* Address delivered by Dr. K. C. Chakrabarty, Deputy Governor, Reserve Bank of India at the 35th SKOCH Summit in New Delhi on March 21, 2014. Assistance provided by Shri Bipin Nair and Ms. Mruga Paranjape in preparation of this address is gratefully acknowledged.
Inclusion, Growth and Governance – Issues and Way Forward* K. C. Chakrabarty

SPEECH
RBI Monthly Bulletin May 201414
Inclusion, Growth and Governance – Issues and Way Forward
by international development aid agencies and
organisations such as UNDP and OECD. According to
the World Bank, good governance entails sound public
sector management (efficiency, effectiveness and
economy), accountability, exchange and free fl ow of
information (transparency), and a legal framework for
development (justice, respect for human rights and
liberties)(World Bank, 1994). UNDP states 9 major
characteristics of good governance: Participation, Rule
of law, Transparency, Responsiveness, Consensus
orientation, Equity, Effectiveness and Efficiency,
Accountability and Strategic Vision. Good governance
can spur the process of economic growth and lead to
gains which are tangible, equitable and inclusive.
4. Similarly, there is an equally compelling link
between growth and fi nancial inclusion especially in
the emerging market economies. This is on account
of the pivotal role that the banks play as fi nancial
intermediaries in these economies, both at a macro
and a micro level. At a macro level, banks contribute
to growth through mobilisation of savings and
allocation of credit towards the most optimal
deployment avenues available in the economy; while
at a micro level, banks provide households and
businesses an opportunity to realise their economic
goals and improve their fi nancial position by providing
a range of fi nancial services, thereby contributing to
overall growth. However, the ability of banks to play
this vital role is constrained by their lack of reach
across a large segment of the population on account
of fi nancial exclusion. Financial inclusion and the
consequent increased penetration of banks to the
hitherto unbanked segments, thus, have strong
linkages to economic growth.
Growth through financial inclusion: Historical
Perspective
5. The criticality of the fi nancial sector in ensuring
equitable and sustainable development was realised
quite early in the post-independence period and there
was a focus on channeling credit to the neglected
sectors of the economy and weaker sections of the
population. Increasing access to credit for the poor
has remained a core concern for India’s planning
architecture, in its fight against poverty. Having
recognised the social and economic imperatives of
broader fi nancial inclusion early, the policy makers
set about fi nding innovative ways to empower the
poor. Starting with the nationalisation of banks
(1969/1980), outlining priority sector lending
requirements for banks, introduction of the Lead Bank
Scheme, establishment of Regional Rural Banks (RRBs-
1975-76), Service Area Approach (1989) and Self-Help
Group-Bank Linkage Programme (1989-90), all these
initiatives were taken with an underlying objective of
taking banking services to the masses and making
them participate in the developmental process of the
economy. The fi nancial sector reforms, set in motion
in the 1990s, saw the focus shift to strengthening
fi nancial institutions and bringing in new players to
infuse competitiveness, with the ultimate objective
of achieving enhanced financial access, greater
effi ciency and improved consumer satisfaction. These
initiatives, undoubtedly, had a positive impact and
resulted in some improvement in access of banking
services to remote parts of the country. However, since
these initiatives lacked a structured and coordinated
approach, the developments were rather skewed with
few regions witnessing better fi nancial access and
inclusion than others. The skewness in fi nancial
development across regions could mainly be attributed
to poor polices as well as inadequacy of Governance
framework. The lack of formal structure and effective
co-ordination in the fi nancial inclusion initiatives,
thus, contributed to regional disparities in growth and
economic prosperity.
Good Governance: An essential pre-requisite
6. The vision of inclusive growth and governance
dictates the need to broaden and deepen access to

SPEECH
RBI Monthly Bulletin May 2014 15
Inclusion, Growth and Governance – Issues and Way Forward
development fi nance for all. Only well functioning
and effi ciently governed fi nancial institutions can
provide fi nancial services to meet the growing needs
of the economy. Despite early recognition of the need
for universal fi nancial inclusion, a large cross-section
of the population remained fi nancially excluded. As
I mentioned before, though various measures initiated
by the regulator/Government in the post-independent
period resulted in impressive gains in rural outreach
and volume of credit, the structure suffered from
inherently weak governance. The achievements were
‘quantitatively impressive, but qualitatively weak’.
Due to the target driven approach to social banking,
the initiatives were not part of the business strategy
of banks. The effort on the part of the banks was
always aimed at somehow meeting the lending targets,
mostly at subsidised rates of interest, or with subsidy
from the Government under various government
directed schemes.
7. Overtime and especially, in the wake of the
adoption of the RBI encouraged structured Financial
Inclusion Framework adopted by banks over the last
few years, there has been substantive development
in the architecture and thinking on fi nancial inclusion.
There has been a growing realisation that there is no
“one-size-fi ts-all” fi nancial inclusion strategy which
can be cloned over the length and breadth of our
country, although few core conditions are essential
to maximise the benefi ts derived from such a strategy.
Effective Governance is the most predominant of
these conditions and is, in fact, a sine qua non for
achieving fi nancial inclusion.
8. Effective fi nancial inclusion cannot be achieved
until the entire structure of the fi nancial inclusion
programme is supported by good governance. Good
governance in our fi nancial inclusion programme is
supposed to be achieved by having a planned and
structurally integrated framework, supported by a
policy vision. As a fi rst step towards creating this
governance structure, effort has been made to
precisely defi ne fi nancial inclusion and all ingredients
associated with it. In the subsequent paragraphs we
shall be presenting the entire governance structure of
our financial inclusion programme, the progress
achieved so far and issues and challenges that need
to be tackled to make it a success.
(A) Defi nition of fi nancial inclusion
9. Financial Inclusion is the process of ensuring
access to appropriate fi nancial products and services
needed by all sections of the society in general and
vulnerable groups such as weaker sections and low
income groups in particular, at an affordable cost, in
a fair and transparent manner, by regulated,
mainstream institutional players.
Approach to Financial Inclusion
(a) A Bank led Model
10. We have adopted a bank- led model for fi nancial
inclusion, which seeks to leverage on technology. Our
belief has been that in view of the geographic expanse
of our country, the success of Financial Inclusion
initiatives would depend on the solution being ICT-
enabled, with the market participants developing new
delivery models to best suit their individual
requirements.
11. Our experience has shown that the goal of
financial inclusion can be best served through
mainstream banking institutions as only they have
the ability to offer the entire suite of products
necessary for effective fi nancial inclusion. There has
been criticism of our approach in not recognising
mono product offerings from service providers like
telcos (remittance) and MFIs/SHGs (credit) as part of
the mainstream fi nancial inclusion process. As I said
before, unless the players can offer the entire suite
of products, it cannot be considered fi nancial inclusion
SPEECH
RBI Monthly Bulletin May 201416
Inclusion, Growth and Governance – Issues and Way Forward
as it will only cater to a small chunk of the fi nancial
needs of the population and would, hence, not be a
complete fi nancial inclusion. In fact, the mainstream
fi nancial players i.e. banks have the ability to cross-
subsidise across various products/services and offer
the Financial Inclusion (FI) products in most effi cient
and cost-effective manner. This does not, however,
mean that we have entirely excluded other players.
We have suggested that other entities, such as mobile
service providers, can synergistically collaborate with
banks in offering services. Our belief is that such
partnerships with banks could be a game changer as
far as fi nancial inclusion is concerned.
(b) An Integrated approach – Financial Inclusion &
Financial Literacy
12. We have adopted a structured, planned and
integrated approach towards Financial Inclusion
which is focusing on improving access to fi nancial
services and also encouraging demand for fi nancial
services through Financial Literacy initiatives. We
recognise that the success of the fi nancial inclusion
efforts depend not just on the extent to which the
reach of the formal fi nancial sector is improved, but
also on whether the target population is aware about
the benefi ts of moving on to the formal fi nancial
system and is inclined to make this transition.
(c) Building a Robust Institutional mechanism for
FI
13. Let me now dwell upon the institutional
mechanism that has been built for ensuring success
of fi nancial inclusion across the country.
i. The Financial Stability and Development Council
(FSDC) headed by the Finance Minister is at the
apex. Under the aegis of the FSDC, we have a
Sub-Group of FSDC headed by the Governor, RBI
and within that is a Technical Group, headed by
a Deputy Governor, the RBI exclusively mandated
to focus on financial inclusion and financial
literacy. The membership of these groups
comprises of representatives of all financial
sector regulators, which makes the structure of
the group very strong.
ii. In order to gauge the performance of banks and
to continuously review the various models
adopted under Financial Inclusion, the RBI has
constituted a Financial Inclusion Advisory
Committee (FIAC), headed by a Deputy Governor
from the RBI, which has members comprising of
few Directors from the Central Board of the RBI
as also experts drawn from various NGOs/other
civil society representatives, etc. The collective
expertise and experience of these members is
expected to be leveraged towards developing
viable and sustainable banking services delivery
models for meeting the objective of total fi nancial
inclusion.
iii. Further, we also leverage upon the infrastructure
created at the state level, wherein we have the
State Level Bankers Committee (SLBC) at the
Apex which is ably supported by the Lead District
Managers (LDMs) at the District level.
iv. In order to ensure that the initiatives on the
supply side are ably supported by initiatives on
the demand side, we have around 896 fi nancial
literacy centres set up by banks. Banks have been
advised to educate, train and counsel people in
the rural areas regarding the benefi ts of getting
linked to the mainstream fi nancial system and
also to take all out efforts to ensure that such
people get converted into long term customers
of the banks.
(d) Bouquet of Financial products
14. In the absence of banks, a large number of
informal fi nancial market intermediaries mushroomed,

SPEECH
RBI Monthly Bulletin May 2014 17
Inclusion, Growth and Governance – Issues and Way Forward
particularly in the rural areas, which were acting as
proxy to the banks. Many of these entities were in the
business of extending only credit products, that too
at exorbitant rates of interest, mostly to the illiterate
section of the population. This led to huge indebtedness
amongst the poor people and their deteriorating
financial health. Under our financial inclusion
framework, we expect the banks to ensure that all the
fi nancial needs of the customers are met by offering
them, at a minimum, the following four basic
products:
A savings cum overdraft account
A pure savings account, ideally a recurring or
variable recurring deposit
A remittance product to facilitate EBT and
other remittances, and
Entrepreneurial credit products like a GCC or
a KCC
15. The objective is to ensure that customers who
are linked to the banking system are provided with
all the basic fi nancial products that are required to
enhance their income generation capacity, thereby,
helping them to come out of poverty.
(e) Leveraging on Technology
16. We realise that the task of Financial Inclusion is
gigantic and it would not be possible without
leveraging technology. Recognising that banking
services through the traditional brick and mortar
model is expensive for banks, we have encouraged
them to adopt and leverage technology to attain
greater reach and penetration while keeping the cost
of providing fi nancial services to the minimum. While
we remain technology neutral, we require banks to
seamlessly integrate whatever technology they choose,
with their CBS architecture. This approach is expected
to enable banks to minimise the cost of providing
fi nancial services in far fl ung areas of the country,
which is the key for success of our fi nancial inclusion
initiatives.
(f) Combination of Branch and BC Outlets
17. We have been advocating a combination of Brick
and Mortar structure i.e., Branch with Click and Mouse
technology (Business Correspondents (BC) outlets) for
extending financial inclusion, especially in
geographically dispersed areas. However, for the BC
model to succeed there is need for strong support
from the base branch. Banks have, therefore, been
advised to open small intermediary brick and mortar
structures between the base branch and the BC outlets.
The whole purpose of the exercise is to create an
entire ecosystem for ensuring effi cient delivery of
services, effi ciency in cash management, redress of
customer grievances and closer supervision of BC
operations for better credit administration.
(B) Regulatory Initiatives
(i) Enhancing Reach
(a) Agent Banking Model – Use of Business Correspondents
18. In January 2006, the Reserve Bank permitted
banks to utilise the services of intermediaries such as
business facilitators and business correspondents in
providing banking services. The BC model allows
banks to do ‘cash in - cash out’ transactions at a
location closer to the rural population, with the help
of technology. This innovative model aimed at
addressing the last mile problem.
(b) Branch Expansion
19. The RBI has considerably relaxed the branch
opening norms for banks. Branch authorisation has
been relaxed to the extent that banks do not require
prior permission to open branches in centres with
population less than 1 lakh, they have only to report
having done so.

SPEECH
RBI Monthly Bulletin May 201418
Inclusion, Growth and Governance – Issues and Way Forward
20. To further step up the opening of branches in
rural areas, banks have been mandated to open at least
25 per cent of their new branches in unbanked rural
cent res . To fu r ther encourage the banks
towards pursuing this mandate, banks have been
advised to consider frontloading (prioritising) the
opening of branches in unbanked rural centres over
a three year cycle co-terminus with their Financial
Inclusion Plans. This is expected to facilitate quicker
branch expansion in unbanked rural centres.
21. Along with increasing brick and mortar presence
through branch expansion, we have also encouraged
banks to adopt modes such as ICT-BC outlets, Kiosks,
off-site Rural ATMs, mobile vans, etc.
(ii) Enhancing Access
(a) Relaxed KYC norms
22. One of the major constraints faced by the people
in getting linked to the formal banking system was
the strict Know Your Customer (KYC) norms. To
facilitate easy opening of accounts especially for small
customers, the KYC guidelines have been simplifi ed
so that these accounts can be opened by means of
self-certifi cation in the presence of bank offi cials.
Further, in order to leverage upon the initiative of
UIDAI, RBI has recently allowed ‘Aadhaar’, the unique
identifi cation number to be used as one of the eligible
documents for meeting the KYC requirement for
opening a bank account. Very recently, the RBI has
also allowed banks to use the E-Aadhaar facility
provided by UIDAI for KYC purposes.
(b) Basic Savings Bank Deposit Accounts (BSBDAs)
23. Banks have been advised to make available Basic
Savings Bank Deposit Accounts (BSBDAs) for all
individuals with zero minimum balance and facility
of ATM card/Debit card. Existing impediments of
minimum balance maintenance, bank charges, etc. are
being addressed through the same. With this it has
become a right for every eligible Indian citizen to open
basic savings account with banks. Further, banks have
also been advised to provide in-built overdrafts in such
basic savings accounts so as to meet the emergency
credit needs of the customer and prevent them from
having to approach money lenders in distress
situation. The entrepreneurial credit has also been
simplified in the form of KCC for farm sector
household and GCC for non-farm sector households.
(c) Leveraging the banking network for extending social benefi ts - Direct Benefi t Transfers
24. The recent introduction of direct benefi t transfer,
based on validation of the identity of the benefi ciary
through Aadhaar, will help facilitate delivery of social
welfare benefi ts by direct credit to the bank accounts
of benefi ciaries, thereby preventing leakages and
wastages in the system. The government, in future,
has plans of routing all social security payments
through the banking network using the Aadhaar based
platform as a unique fi nancial address of benefi ciaries.
In order to ensure smooth roll out of the Government’s
Direct Benefi t Transfer (DBT) initiative, banks have
been advised to:
Open accounts of all eligible individuals in camp
mode with the support of local Government
authorities.
Seed the existing and new accounts with Aadhaar
numbers.
Put in place an effective mechanism to monitor
and review the progress in implementation of
DBT (G2P – Government to Personal Payments).
(C) Financial Inclusion: A Viable Business Proposition
Financial Inclusion Plan of banks
25. Contrary to common perception, financial
inclusion can, with better governance, be a viable

SPEECH
RBI Monthly Bulletin May 2014 19
Inclusion, Growth and Governance – Issues and Way Forward
business proposition because of the huge untapped
market, which can be brought into the fold of banking
services. Financial Inclusion, prima facie, needs to be
viewed as “money at the bottom of the pyramid”. With
the banks being free to charge reasonable interest rates
on the advances as also to internally fi x charges for
various service offerings, what banks actually need is
to develop an appropriate business and delivery model
in line with their business strategy and comparative
advantage and align the same to their business plan.
This will create an environment of competitiveness
amongst banks and in the process will benefi t the
unbanked population.
26. As I have mentioned above, we have encouraged
banks to adopt a structured and planned approach to
fi nancial inclusion with commitment at the highest
levels. Towards this end, the banks have been advised
to prepare Financial Inclusion Plans (FIPs) containing
self-determined targets on various parameters to be
achieved during the FIP period, with the approval from
their respective Boards. The fi rst phase of FIPs was
implemented over the period 2010-2013 and the
second phase of FIPs has been fi nalised and is under
implementation. The Reserve Bank has used the FIPs
to gauge the performance of banks under their FI
initiatives. For this purpose, a structured and
comprehensive monitoring mechanism has been put
in place for evaluating banks’ performance vis-à-vis
their planned targets. To ensure engagement of the
Top Management/senior functionaries of the Bank in
the FI process, a system of annual review meetings
between CMDs/CEOs of banks and Deputy Governor
of RBI has also been institutionalised.
Performance of banks under the Financial Inclusion
Plan
27. The achievements of the banking system under
the FIP can be accessed from the following monitoring
data (for the period up to December 2013):
i. Banking connectivity has been extended to nearly
328679 villages from 67,694 villages in March
2010.
ii. The total no of BSBDAs have gone up to 229
million of which 108 million are ICT based
accounts.
iii. Credit to farm sector households have touched
39 million households while credit to non farm
sector households have touched more than 6
million households
iv. About 238 million transactions have already been
carried out in ICT based accounts through BCs
during the nine month period ended December
2013 as against 250 million transactions recorded
during the year 2012-2013.
28. After completion of the fi rst FIP period, it was
realised that although a large banking network had
been created along with the opening of large number
of bank accounts, simply creating the banking
infrastructure and opening banking accounts would
not fulfi ll the objectives of achieving meaningful
financial inclusion. As an improved governance
measure, with an underlying objective of ensuring
involvement of all stakeholders in the Financial
Inclusion efforts and in order to ensure uniformity in
the reporting structure under the Financial Inclusion
Plan, banks were advised to ensure that their FIPs are
disaggregated and that they percolate down up to the
branch level. The focus under the new plan is to
ensure that the newly created banking network is
utilised not just for offering deposit and remittance
products, but also for extending other products viz.,
credit, which can help make the business more viable
for banks. This would also ensure that not only the
volume of transactions in the newly opened accounts
increase but the people also reap the benefi ts of
getting linked to the formal fi nancial system.
SPEECH
RBI Monthly Bulletin May 201420
Inclusion, Growth and Governance – Issues and Way Forward
Facilitating a balanced approach - Roadmap for
providing Banking Services in unbanked Villages
29. With the banks slowly realising the potential
business opportunity in financial inclusion and
gearing up to penetrate the rural areas, the RBI came
up with the idea of notional allocation of villages
amongst banks, in order to ensure that the efforts of
banks are not duplicated. This was also with the
objective of ensuring presence of at least one banking
outlet in all the unbanked villages of the country.
30. In this direction, a phase-wise approach was
adopted wherein SLBCs/DCCs were advised to identify
unbanked villages with population more than 2000
and notionally allocate them amongst banks operating
in the region. While the fi rst phase saw coverage of
almost 74,000 unbanked villages (having a population
above 2000), in the second phase, the SLBCs/DCCs
have identifi ed approximately 4,90,000 remaining
unbanked villages. These villages have also been
notionally allotted to banks and the target is to provide
each of these villages with a banking outlet by 2016.
Financial Literacy and Financial Education
31. As I had mentioned earlier, we have adopted an
integrated approach of promoting supply of fi nancial
services through improved financial access and
ensuring greater demand for fi nancial services through
fi nancial literacy initiatives. In the Indian context, the
problem of fi nancial illiteracy is more acute with
awareness levels of the rural population regarding the
benefits of linking with mainstream financial
institutions, being extremely poor.
32. Therefore, we have ensured that our supply side
initiatives are ably supported by initiatives on the
demand side. Our idea is to include fi nancial education
in the school curriculum so as to educate children
about the benefi ts of banks and banking services. In
this direction, the Technical Group of the FSDC has
already come out with a National Strategy on Financial
Education, which has been approved by the FSDC.
33. The RBI has advised banks to set up Financial
Literacy Centres (FLCs) across the country. Banks have
so far set up around 896 FLCs as of December 2013.
These FLCs have reportedly educated more than 10
million people through various literacy programs.
Banks have been further advised to scale up fi nancial
literacy efforts through conduct of outdoor Financial
Literacy Camps, at least once a month, both by the
FLCs and also by the rural branches.
34. In order to standardise the literacy material, the
RBI has prepared a comprehensive Financial Literacy
Guide containing Guidance Note for Trainers,
Operational Guidelines for conduct of Financial
Literacy Camps, Standard Financial Literacy Material,
Financial Diary for use of rural customers and a set
of 16 posters. Banks have been advised to use the
material as a standard curriculum to impart basic
conceptual understanding of fi nancial products and
services.
(D) Issues & Challenges
35. While several initiatives are being taken for
ensuring widespread fi nancial access, certain factors
continue to impede progress of fi nancial inclusion.
Let me come to these issues and challenges one by
one.
Governance Defi cit
36. The need for effective governance implies that
the underpinning of all processes, through norms that
defi ne our actions, allocate power and prescribe a
matrix against which we can calibrate our performance.
Lack of effective governance has been one of the major
reasons for slow progress in implementing our
Financial Inclusion initiatives.

SPEECH
RBI Monthly Bulletin May 2014 21
Inclusion, Growth and Governance – Issues and Way Forward
Ownership and Accountability
37. Why Financial Inclusion is not happening even
after the infrastructure being in place? It is clearly due
to lack of accountability and a problem of attitude.
Many of the banks still have not developed an
appropriate, cost-effective delivery model for Financial
Inclusion and therefore, they are still not thoroughly
convinced about FI being a profitable business
opportunity. Resultantly, they still perceive this to be
a social/regulatory obligation and consequently their
efforts are half-hearted. The inadequacy of MIS
creates further complications. The sunken cost for
setting up the intermediate brick and mortar
structures and developing the BC network has to be
seen as future investment. Obviously, it cannot be
revenue accretive from day one. Still, if one were to
logically work out the mathematics of serving the
customers in a brick and mortar branch and through
a BC, keeping the fi xed and variable cost in mind,
certainly the BC model would work out much cheaper
in the intermediate term. Therefore, for the FI model
to work, the banks need to take ownership of the
model and ensure continuous and full support to the
Business Correspondents at the ground level. There
is need to punish the non-performers in the system
and the governance system has to be improved for
ensuring buy-in from the Top Management and
commitment and accountability from the rank and
fi le of the bank.
Delivery Model
38. One of the major challenges is that banks are yet
to develop a sustainable and scalable business delivery
model to guide its Financial Inclusion initiatives.
While several alternate models have been tried out,
the BC-ICT model has gained prominence amongst
banks. However, many banks are yet to settle upon
on a BC model which is scalable and will help them
achieve their targets under fi nancial inclusion.
Viability Issues
39. While access to fi nancial services has improved,
the usage of the fi nancial infrastructure continues to
be tardy. While more than 3 lakh banking outlets are
available across the country, the number of transactions
in many accounts opened by the BCs, remains
unimpressive. This not only restricts the potential
benefi ts that could accrue from increased fi nancial
access but also reduces the viability of Financial
Inclusion activities for banks and BCs. The reduced
viability, in turn, impacts the scalability of the model
and, in the process, hampers the Financial Inclusion
efforts.
Hindrances constraining BC operations
40. We have identifi ed certain defi ciencies which are
hampering the scaling up of the BC model.
These include restrictive Cash Management Systems
followed by banks wherein BCs are required to fully
prefund their business operations in terms of cash
limits and security obtained from BCs; Non-insurance
of cash held in transit by BCs; Low or untimely
remuneration paid to BCs/CSPs; allowing transactions
only in limited products through the BC channel.
These have restricted the involvement and
effectiveness of the BCs as a vital peg in the fi nancial
inclusion jigsaw.
41. Our review has shown that different banks are
adopting different practices. We feel that the time has
come for banks to come together and identify the best
practices for the scaling up of the BC model. We have
asked banks to work under the aegis of IBA and come
up with “Best Self Regulatory Practices for BC
Operations” based on industry best practices. The RBI
is also considering issuing instructions to banks for
standardising operations under the BC model.
Technology issues
42. While banks have innovated on technology, the
same has not resulted in signifi cant reduction in the

SPEECH
RBI Monthly Bulletin May 201422
Inclusion, Growth and Governance – Issues and Way Forward
cost of providing fi nancial services. Benefi ciaries/
stakeholders often complain of constraints in digital/
physical connectivity. This, coupled with delays in
issuance of smart cards, reliability issues in hardware
infrastructure such as hand held devices, etc. have
impacted the quick roll out of fi nancial services across
the country. Over dependence on vendors and the
resultant problems is a serious governance defi cit
which needs to be overcome for effective rollout of
our Financial Inclusion initiatives.
Collaboration
43. Finally, the collective will power of the society
and of all the concerned stakeholders is lacking and
this adversely impacts the effective implementation
of our Financial Inclusion initiatives.
(E) Regulatory Governance to Self Governance
44. The primary role of the regulator is to issue broad
guidelines to ensure standardised practices across the
banks at the national level. In line with these broad
guidelines, it is the responsibility of the bank
management to develop their own internal processes,
structures and governance framework based on their
business model and overall business strategy. The
internal governance should ensure that a robust
system is developed to keep a check on adherence to
rules and regulations.
45. Presently, there is a top-down approach to
implementation of regulation and regulatory controls
at all levels. Financial Inclusion delivery models also
operate in similar ways where top-down approach is
followed by banks while deciding the operational
aspects of Business Correspondents and other delivery
channels. It is this approach which needs a fundamental
change. We need to move from forced implementation
to willing participation to facilitate achievement of
Financial Inclusion goals. Effective governance at all
levels within banks would ensure that regulations are
seen as an essential element of business and are not
adhered to merely for compliance sake. Banks’ policies
should evolve from best practices and ground level
realities. The regulator should not be required to micro
manage the principles on which Financial Inclusion
model operates. This can be achieved in following
ways:
i. Alignment of business plan with all micro policies
ii. Self regulation
iii. Bottom up and participatory approach
iv. Robust internal checks and control
v. Knowledge sharing at industry level
46. In general, Governance is administered in three
ways viz. through market forces, through governing
body or through network. In an organisational set up,
it’s about the rules and regulations that guide all
activities. Regulatory governance reflects the
emergence of de-centered and mutually adaptive
policy regimes which rest on regulation rather than
service provision. From the perspective of the
Governance framework guiding the fi nancial inclusion
process, banks need to devise their own strategies to
ensure that an effective and conducive governance
regime is in place to ensure attainment of the FI goals.
Conclusion
47. Good governance is at the core of improving the
delivery of public services. Good governance provides
a mechanism for linking inclusion, decision making,
and accountability. Problems in infrastructure, critical
for building an inclusive India, can often be traced
back to lack of ownership and poor governance. Many
of the initiatives launched over the years for achieving
the objective of rapid growth coupled with poverty
alleviation and inclusiveness have failed to achieve
their goals because of lack of ownership, ineffective
governance and insuffi cient accountability at various

SPEECH
RBI Monthly Bulletin May 2014 23
Inclusion, Growth and Governance – Issues and Way Forward
levels. Without effective implementation, even
substantial government expenditure results in limited
success.
48. The success of banks cannot be measured simply
in terms of profi t their banking operations generate.
The banking services are equally about addressing the
fi nancial needs of various stakeholders. Not only is it
about making the system more inclusive, it is also
about protecting the fi nancial consumer, through
improved awareness and better grievance redressal
mechanisms. The mantra of good corporate governance,
therefore, does not just encompass ethics and
business practices followed by the bank or its
personnel; it has to go beyond compliance with
regulatory directives. It must consider fair and
acceptable behavior, among others, to those who are
more vulnerable, even if it is at some cost to their
bottom lines.
49. For our Financial Inclusion initiatives to succeed,
it is important for banks to craft new policies on
governance and compliance, wherein good governance
should be the primary responsibility of the bank’s
board of directors and its senior management. While
we respect the mandate of the leadership of each bank
to make strategic decisions as it is these choices that
differentiate one bank from another as a business
proposition; however, the governance perspective that
we seek must be fundamentally entrenched as a core
competency across all banks.
50. There is a causal linkage between growth and
good Governance. The defi cit of governance can impair
and impede development. I am often asked why the
BC model is not scaling up as it should to meet the
humungous credit needs of our population. The
answer is simple. The model lacks effective governance
at every level. There is inadequate supervision of the
banks’ frontline staff. The vision of the Board room
is not transmitted to the frontline manager. Governance
failure is also refl ected in the vendor dependence in
the usage of technology. We have to chart a clear path
and change this dependence into efficient and
effective systems which are scalable and sustainable.
So, the overarching theme here is a persistent and
immediate need to address the governance defi cit to
ensure fi nancial inclusion and concomitant growth.
51. In sum, good governance and accountability at
different levels of bank management is the key for
the success of the fi nancial inclusion programme.
Maximum attention needs to be paid to firmly
showcase the virtues of fi nancial inclusion to the
banks’ boards and to ensure its acceptance at the
highest level. It is also important at the same time to
make the Boards accountable to deliver the results on
the mandate of fi nancial inclusion. The acceptability
and accountability at lower level of management will
automatically follow. We also need to improve
governance mechanism for delivery of banking
services through BC network by ensuring better co-
ordination and governance amongst all stakeholders,
including the technology providers, vendors, etc. Up
until now, we have followed a carrot and stick policy
to ensure the success of fi nancial inclusion programme
with the carrots being used more predominantly.
Having created a flexible and friendly regulatory
environment for financial inclusion for inclusive
banking practices, time has come for us to use the
stick more often, albeit judiciously, to make fi nancial
inclusion an integral part of banking operation and
its acceptability at bank board level. This has to be
supported by good governance at every level of the
management associated with the delivery of the
fi nancial inclusion programme.
52. I once again congratulate the organisers for the
topical selection of the theme and hope that delegates
at the summit would appreciate the role of governance
defi cit in impeding fi nancial inclusion and growth in
the country and take correctives steps within their

SPEECH
RBI Monthly Bulletin May 201424
Inclusion, Growth and Governance – Issues and Way Forward
respective organisations to ensure that universal
fi nancial inclusion can be achieved in a time-bound
manner. I would like to close with an extract from
Robert Frost’s famous poem:-
“The woods are lovely, dark and deep,
but I have promises to keep
and miles to go before I sleep”.
Yes, a lot has been achieved in our journey towards
universal fi nancial inclusion, but there is a long road
still to travel for fulfi lling the promises we have made
to the people of this country. What can ensure success
in this challenging task of delivering meaningful
fi nancial inclusion is full commitment of the Board
and the senior management of the banks.

SPEECH
RBI Monthly Bulletin May 2014 25
Currency Management in India: Issues and Challenges
in-charge of the currency management function in the country, we at the Reserve Bank of India, the Central Bank of the country, have experienced severe constraints, some of which can be traced, directly or indirectly to the operations of the global suppliers and vendors in the banknote industry. I intend to use the presence of these global suppliers and vendors and the opportunity to speak at this platform today to highlight some of these concerns, which I feel must be bothering other Central Banks which rely on imports for their currency management, especially in the emerging markets. I would be extremely happy if the suppliers/vendors could refl ect on our concerns and develop some practical solutions to our problems. However, before I get into the specifi c issues, let me begin with a brief perspective on various dimensions of the Indian currency system and the issues and challenges that we face in our currency management efforts. I would also like to share some of the recent steps we have taken in this area with a view to seeking your views and feedback for improvements.
Introduction
3. Currency management has a great degree of signifi cance for Central Banks the world over as it is one of the most visible functions which touches the lives of every individual. Since people often tend to judge the effi cacy of the central bank from the ease of continuous access and quality of notes in their possession, currency management function entails a certain degree of reputational risk for the central bank. As is the case in most jurisdictions, issue of banknotes and management of currency is one of the core functions of the Reserve Bank of India. It is enshrined in the preamble to the RBI Act, 1934 as “…to regulate the issue of Bank Notes and keeping of reserves with a view to securing monetary stability in India and generally to operate the currency and credit system of the country to its advantage.”
4. The mandate of any central bank is to protect the integrity of banknotes through new design and security features, estimate the demand for banknotes and coins,
Mr. Tom Ferguson, Chairman, Banknote Conference
2014; Mr. Tim Vigotsky, Director, Banknote Conference
2014, my fellow speakers - Mr. Barna Barabas, DMD,
Jura Security Printing Alliance; Dr. Wolfram Seidemann,
Managing Director, Louisenthal; other delegates; ladies
& gentlemen. At the outset, I thank the organizers of
Banknote Conference 2014 for inviting me to speak at
this august gathering. From the contents of the
Conference Schedule and from the feedback that I have
received from my colleagues in the Reserve Bank of
India, who have participated in this Conference over
the years, I gather that the Conference seeks to serve
certain useful purposes, notably, providing a platform
for a free and frank exchange of views, showcasing the
latest developments in the rapidly changing fi eld of
currency management, bringing together the service
providers and the service seekers from across the world
under one roof and generally helping the participants
to chalk out their future strategies and plans of action.
2. Because of the sheer size of our population and
the quantum of banknotes that we are required to put
into circulation every year, India has emerged as one
of the biggest consumers of the ingredients that go into
production of banknotes in the world. In keeping with
the magnitude of the banknotes that are put into
circulation, the corresponding need to import other
machinery for processing, detection and destruction of
the bank notes is also humongous. Thus, India is a very
signifi cant market for the suppliers of all ingredients
and equipments, which form the entire ecosystem of
the banknote production and destruction process. As
* Keynote address by Dr. K. C. Chakrabarty, Deputy Governor, Reserve Bank of India at the Banknote Conference 2014, Washington on April 8, 2014. The assistance provided by Shri B. P. Vijayendra, Ms. Kaya Tripathi and Shri Arvind Kumar is gratefully acknowledged.
Currency Management in India: Issues and Challenges* K. C. Chakrabarty

SPEECH
RBI Monthly Bulletin May 201426
Currency Management in India: Issues and Challenges
plan the supply and distribution of adequate quantity of banknotes and coins and ensure quality of banknotes in circulation by timely withdrawal of soiled banknotes. It is equally important to maintain confidence in currency through improvement in systems/procedures and by raising public awareness by enlisting support from all associated with the design, production and supply of banknotes.
Some Numbers
5. There has been a steady increase in the demand for banknotes and coins over the years, despite the increased use of technology-driven non-cash modes of payments/e-currency/virtual currency-bit coins, etc. Even internationally, notes in circulation have been increasing despite the use of non-cash modes of payment. However, the large numbers in India present a unique situation as compared to other countries. A comparative picture of the Notes in Circulation (NIC) in India as compared to some major countries is indicated in the table given below:
Year 2012/13 India US UK Euro zone
Australia Canada
No. of Pieces (in billion)
76.47 34.5 2.99 15.8 1.15 2.00
Value in home currency terms
12468 billion
1198 billion
58 billion
933.7 billion
53.6 million
63.7 million
6. Globally, the cash in circulation to GDP ratio has ranged from 2.5% to 8% whereas in India it has been around 13% due to the predominant usage of cash by a majority of the population. The world-wide growth rates of cash in circulation has varied between 6% and 13%, with Central & South America fi guring at the top end followed by Africa (12%), Middle East (11%), Europe (10%), Asia (7%) and fi nally UK and Ireland at 6%. In the year 2013, 154 billion banknotes were issued globally, of which the maximum banknotes, 54 billion, were issued by China and almost 20 billion banknotes by India. The global projections for the next three years have been worked out at 160 billion, 166 billion and 173 billion banknotes, respectively. These numbers are simply astounding. While it presents a massive
opportunity for the vendors associated with the production of banknotes, I believe it simultaneously enjoins upon them certain responsibilities. For instance, the vendors need to be conscious of the impact of their activities on the environment. I will touch upon some of these issues later in my address. At this stage, I would like to mention that there needs to be more investment in research and development efforts by the vendors to ensure that the longevity of the banknotes improves and eventually, the cost of printing of banknotes for the society as a whole comes down. Vendors need to develop such banknote paper that can resist dirt and moisture, thereby increasing the life and quality of the banknotes in circulation. But while the focus needs to be on bringing down the cost of printing banknotes, it cannot be done by compromising on security. In fact, effort has to be on making the banknotes more secure with lesser, but stronger security features.
Currency Management in India- Major Challenges
7. Let me now share with you some of the challenges that we encounter in currency management and currency distribution in India. In a country like India having an area of approximately 3.3 mn sq. km. and a population of more than 1.2 billion, reaching the currency to the end users in far fl ung areas dotted with diffi cult terrains, poses an enormous challenge. As on December 31, 2013, there is a network of 110,520 commercial bank branches and 137,080 ATMs. The notes in circulation as on the same date was approximately 76.47 billion pieces valued at ` 12, 468 billon while the coins in circulation were around 89.91 billion pieces valued at ` 168 billion. As the demand for notes and coins is subject to diverse socio-economic, behavioural and other often unpredictable factors, the task of forecasting demand for currency is a challenging task and can be subject to large variations. At present, the system poses considerable diffi culties in capturing the structural and cyclical demands for currency and projecting demand with precision. I would, therefore, also take this opportunity to extend an invitation to

SPEECH
RBI Monthly Bulletin May 2014 27
Currency Management in India: Issues and Challenges
the delegates present here to come forward and see if they can work with us for making accurate projections for the demand of banknotes and coins.
8. The other challenges in currency management relates to ensuring durability of banknotes, ensuring adequate supply of all denominations, improving operational efficiency in distribution of notes by controlling cost of handling, distribution and security in transit/storage, providing last mile connectivity at reasonable cost, ensuring equity in distribution and repositioning RBI as an upstream facilitator in the fresh note/coin supply chain, rather than as a retailer with limited reach. Let me highlight the challenge associated with durability of the banknotes in India by giving some figures. We in India, withdraw more number of banknotes from circulation than the number of banknotes collectively produced by all countries taken together with the exception of China. In fact, we are constrained to withdraw over 75% of all notes that we circulate every year as may be seen from the table below:
Supply of Banknotes by RBI to Currency Chests and disposal of Soiled notes
Denomination Volume(Million Pieces)
2010-11 2011-12 2012-13
Supply Dis-posal
Supply Dis-posal
Supply Dis-posal
1 2 3 4 5 6 7
`1000 706 179 371 375 1536 450
`500 4347 1864 5560 1994 2725 2263
`100 4085 5227 1091 5577 6348 5627
`50 1114 2095 1522 1578 1257 1357
`20 1296 664 4237 562 904 609
`10 5580 3657 3379 3584 5991 3752
up to `5 549 166 1440 101 105 72
Total 17677 13852 17600 13771 18866 14130 (78%) (78%) (75%)
9. Such massive withdrawal of banknotes from circulation not only means additional cost for printing of fresh notes but also additional requirement of various resources used in production of banknotes. In this context, it becomes imperative that efforts are made to enhance the durability of the banknotes so
that not only the wastages are reduced, but also resources are utilized in a sustainable manner, thereby ensuring that the environmental footprint of our currency management operations is minimised.
10. Mechanisation of soiled note processing while augmenting capacity has also thrown up new challenges like ensuring standardisation of machine parameters, slow progress in improvement in processing capacity by commercial banks and security risks on account of manual intervention. Another challenge with the likely potential to evolve into a reputational risk for RBI is the shortage/‘perceived’ shortage of coins and the lack of understanding on the exact role of the central bank in its distribution. It needs to be understood that while the responsibility for issue of coins is that of the Government of India (GoI), RBI’s role is restricted to putting into circulation the coins received by it. Then, there are issues arising out of similar shapes and sizes of coins of different denominations. Last, but not the least, is the growing menace of forged notes in circulation and creating public awareness about various aspects of banknotes.
Recent Measures in India
a) Constitution of High Level Committee
11. To address the signifi cant challenges faced by us in India and other related issues, a High Level Committee was recently constituted by GoI (Chairman: Dr. K. C. Chakrabarty) having members representing GoI, RBI, Note Presses & Mints. The Committee reviewed the forecasting methodology and studied the international best practices in cash distribution by other Central Banks. It made wide-ranging recommendations, notably, (i) RBI to focus exclusively on management and planning of currency system while passing on the responsibility for distribution of banknotes and coins entirely to commercial banks, (ii) need to introduce private entrepreneurs for distribution of banknotes and coins on behalf of banks, if last mile connectivity for distribution has to be achieved, (iii) identifi cation of a bank willing to assume leadership of currency

SPEECH
RBI Monthly Bulletin May 201428
Currency Management in India: Issues and Challenges
management function in the district, etc. All these recommendations have been accepted and are at various stages of implementation.
b) Distribution Mechanism
12. The functions relating to issuance of currency (both banknotes and coins) and their management is performed by the Reserve Bank through its 19 issue offi ces and a network of 4,209 Currency Chests and 3,966 Small Coin Depots spread across the country. Despite the large number of currency chests (extended arms of the RBI’s Issue Department), the primary responsibility for reaching currency to the banks rests with the RBI because of the currency management structure. Every year, based on the Bank’s indent for banknotes and coins, the Printing Presses and Mints dispatch notes and coins to the RBI offi ces. From the RBI offi ces, the notes and coins are remitted to currency chests operated by commercial banks. The central bank arranges for transport and police escort for transfer of treasure and bears all the expenditure related to it unlike other countries where the commercial banks are responsible for transport of cash. Thus, distribution of cash in India is the primary responsibility of the central bank. The treasure held in the currency chests is the property of the central bank and is subject to audit/verifi cation. Any withdrawal or deposit in the currency chest by the bank holding the chest is refl ected as debit/credit in the bank’s account held with the RBI.
13. To improve last mile connectivity, we have decided to involve private entrepreneurs in the distribution function. The Cash-in Transit (CIT) companies/Business Correspondents have been allowed to process coin and banknotes, including packaging, sorting and delivery to banks’ customers and for retrieval. Banks, including urban co-operative banks and regional rural banks, are also being involved to ensure that last mile delivery of cash related services penetrates throughout the country. We have also initiated a pilot exercise under the lead bank scheme for currency management and intend to upscale it going forward, based on the experience gained.
c) Direct remittance of banknotes
14. At present, remittances of notes from printing presses accompanied by press representatives and police escort are received at our Issue Offi ces. After receiving these boxes, they are subjected to preliminary verifi cation (PV) wherein the contents of the box are verifi ed by the vault joint custodians in the presence of the press representative. Later, at the time of sending remittance to banks, packing of the boxes is done in the presence of the accompanying the RBI staff and vault joint custodians. At the bank, the RBI staff remains stationed till the verifi cation of notes is completed by the bank offi cials.
15. We have realized that the present process has some inherent ineffi ciency as the currency notes have to be transported several times before they reach the public. This not only reduces productivity but is also cost-ineffi cient. Accordingly, we have introduced a scheme for direct remittance of banknotes from Banknote Printing Presses to the commercial banks instead of routing them through the RBI Issue offi ces to save time, efforts and resources. The new process is being given greater impetus by the RBI.
d) Pursuit of Clean Note Policy
16. Since the year 1999, the Bank has been pursuing a ‘Clean Note Policy’ to ensure an uninterrupted supply and circulation of good quality banknotes. As may be seen from the Table at para 8 above, during the last three years, 13852 million pieces (mpcs), 13771 mpcs and 14130 mpcs respectively of soiled banknotes were withdrawn and disposed of. While the objectives of Clean Note Policy have been by and large achieved in respect of higher denomination notes, the quality of lower denomination notes, especially `10, continues to be a cause for concern, possibly due to reluctance/constraints on the part of banks to mop up such notes from circulation.
17. To ensure that genuine banknotes alone are put into circulation, high priority is accorded to detection of counterfeit notes in the banking system. Towards

SPEECH
RBI Monthly Bulletin May 2014 29
Currency Management in India: Issues and Challenges
this end, banks have been directed to enhance the use of technology to re-align their cash management systems so as to ensure that cash receipts in the denominations of `100 and above are not put into re-circulation without being machine processed for authenticity. Banks have also been advised to put in place suitable systems to ensure that counterfeit notes detected are duly impounded and reported by following the prescribed procedure.
e) Currency Processing in India -Trends in Expenditure
18. The currency production costs in our country have been substantial over the years. We in RBI have incurred an expenditure of `23.76 billion in 2010-11, `27.36 billion in 2011-12 and ̀ 28.72 billion in 2012-13 on this activity. The two note printing presses, BRBNMPL and SPMCIL, exhibit an increasing trend in their overall expenses viz. `12.22 billion, `13.09 billion and `14.23 billion in the case of the former and ̀ 26.17 billion, ̀ 27.88 billion and ̀ 32.82 billion in the case of the latter during the last three years respectively, with the cost of paper and ink contributing signifi cantly in the overall costs. Additionally, RBI has incurred an expenditure of ̀ 5.23 billion for acquisition, upgradation and overhaul of its 59 CVPS machines and 28 SBS (Shredding and Briquetting system) machines employed for destruction of soiled notes.
The Road Ahead & Key Messages
19. Currency management offers signifi cant business opportunities for the players as the cost of printing of banknotes is increasing every year due to the increasing demand for banknotes. As I mentioned earlier, this also enjoins certain amount of responsibility on the part of the vendors. It is expected from them that the products offered are of high quality and reliability and they strictly adhere to the agreed technical specifi cations. In this context, I wish to allude to the failure of the selected bidders in meeting the technical specifi cations of the plastic banknotes in `10 denomination that we are proposing to introduce on a trial basis in India, necessitating undertaking the exercise afresh, thereby
delaying the process. The vendors are also expected to co-operate with the national governments and Central Banks to avoid production of counterfeits by developing country-specifi c security features and bringing about improvisation in raw materials like paper, ink, thread, etc. Any failure of the vendors in this regard could result in total loss of business with individual countries making efforts to indigenize.
20. Let me now focus your attention on some expectations that we have from the various vendors present in the Banknote Conference here. We all agree that the integrity of banknotes is the most important factor. In this context, it is also actually quite ironical that for the circulation of forged notes the blame is put on the central bank when, in fact, the blame should go to the manufacturer of the forged notes as in the case of spurious drugs, where the manufacturers are prosecuted. However, it is my considered opinion that the integrity of the banknotes is not a technology issue but more of a law and order issue. When I say this I feel I would be echoing the sentiments of all consumers of various products that the industry produces, especially the representatives of the emerging market countries, who rely heavily on imports for currency production in their respective jurisdictions. I fi rmly believe that upgrading the security and design features of the banknotes every few years to outsmart the counterfeiters is not a long-term solution but only adds to the cost of producing the banknotes.
21. Let me elaborate what I mean. If the counterfeiters are able to do a good job of producing duplicate currency, they are obviously having access to good quality currency paper, printing ink and other components that are necessary for production of banknotes. So, the question is, what is the source of supply for the fraudsters and what is the role of vendors in perpetration of these unlawful activities. The commercial banks the world over follow stringent KYC procedures on their customers. As counterfeiting is a global issue, what I would like the vendors present here is to similarly do a proper customer identifi cation/due

SPEECH
RBI Monthly Bulletin May 201430
Currency Management in India: Issues and Challenges
diligence on all their customers. The vendors must join hands to find out who has supplied ink, paper, machinery, etc. to the counterfeiters which would enable the regulators to take appropriate action. In a manner the banks close accounts of customers doing any doubtful transactions; the suppliers should be able to cut off their links with their doubtful customers. In fact, the need of the hour is that counterfeiting should be tackled as a criminal activity with active co-ordination and collective might of all stakeholders-the vendors, Central Banks, law enforcement agencies, etc. Finding a long-term solution to this menace may also require close cross-border cooperation between various countries. The global vendors have, in fact, the maximum stake in ensuring that these problems are countered at the earliest. Over time, the vendors have made signifi cant investments in building capacities and, in the process, created economies of scale and scope. They are the least cost producers of the various ingredients/components used in production of banknotes and any attempt by individual countries at creating manufacturing capacities could prove ineffi cient and in many cases, wasteful investment. But the bottom line is that any failure to initiate necessary corrective measures would push more and more countries like India to go for indigenisation thereby resulting in loss of big business for the vendors.
22. The global banknote industry, comprising various manufacturers of machines, paper, ink, security features, etc is very huge. I understand that the overall market for this industry is roughly US$ 27 to 28 billion. So, while the opportunities for the vendors are immense, I would also take this opportunity to request all the manufacturers, suppliers, vendors in the banknote industry to put their minds together and
come up with ideas on not only reducing the cost of
paper, ink, machines, etc. but also for enhancing the
durability of the banknotes through technological
innovations. The vendors must realize that they also
have a responsibility towards the environment. These
innovations are necessary to refl ect that the vendors
are conscious about promoting environmental
sustainability and ‘green’ practices. Thus, it is extremely
signifi cant that currency production activities are not
viewed as mere business proposition for the vendors
but also as something which has serious implications
for the reputation of all stakeholders - the national
governments, Central Banks and the vendors
themselves.
23. I once again thank the organisers for the
opportunity provided to me and appreciate the patient
hearing given by the participants. I hope that the
delegates present at the Conference would refl ect on
the messages/concerns that I have tried to convey this
morning. I hope the Conference would deliberate on
these issues and come up with practical solutions to
the present/impending challenges. Global co-ordination
and intensive efforts to ensure integrity of banknotes
is the need of the hour and I hope that all stakeholders viz., the Central Banks, state, policy makers and vendors
who are involved in the process of production, supply
and distribution of banknotes, would discuss these
issues in a more purposeful manner. Ultimately, this
is the prime objective of the Conference. It is our
collective responsibility to bring greater effi ciency in
the entire currency management function – an essential
commitment that all of us must make to the end users
spread across regions and jurisdictions.
Thank you.

SPEECH
RBI Monthly Bulletin May 2014 31
Regulation of Indian Debt & Derivatives Markets: Some perspectives on post-crisis paradigm
some perspectives on regulations of Indian debt and
derivatives markets in the recent times in the context
of post-crisis paradigm.
I. Why do we need regulation?
I.I Importance of regulation for markets
2. Wayne Byres, Secretary General, Basel Committee
on Banking Supervision (BCBS) described fi nancial
market participants as ‘glass half full’ people, and
regulators as their ‘glass half empty’ counterparts. The
reason for such description is that market participants
will fi rst see opportunity for reward whereas regulators
will fi rst see exposure to risk. The two perspectives
are different sides of the same coin and are essential
for development of financial markets and, by
extension, development of the real economy. The
operation of an effi cient fi nancial sector is dependent
on effi cient fi nancial regulation. The recent fi nancial
crisis has amply demonstrated the need for effective
regulation.
3. The fi nancial crisis has been triggered by actions
of fi nancial fi rms motivated by incentives which were
misaligned with the requirements of financial
stability. The regulators were not able to accurately
gauge the impact of the actions of fi nancial fi rms,
whether they are sub-prime lenders or dealers in
complex derivatives, leading to a crisis of humongous
magnitude. The “free markets paradigm”, which
emphasised the effi ciency and self-correcting nature
of markets, has been found inadequate. The build-up
of systemic vulnerabilities arising from excess
liquidity, leverage, risk-taking and interconnectedness
across the financial system was not detected by
regulators. The crisis has in a sense changed the global
regulatory landscape dramatically.
4. Besides taking monetary and fi scal steps intended
to restore market confidence and help economic
recovery from the crisis, the policy makers have also
shown determination to introduce new financial
regulations in an attempt to mitigate the impact of
Shri N. S. Venkatesh, Chairman, Fixed Income
Money Market Derivatives Association (FIMMDA),
Shri B. Prasanna, Chairman, Primary Dealers
Association of India (PDAI), Shri C.E.S. Azariah,
outgoing Chief Executive Offi cer and Shri Prasad,
incoming CEO of the FIMMDA, distinguished
speakers and panellists and delegates to the
conference. It gives me immense pleasure to be
amidst you all for the 15th annual meeting of the
FIMMDA and the PDAI in this beautiful, historic city
of Jaipur. After holding meeting overseas for some
years, holding the meeting here is like home coming.
Jaipur with its majestic forts and palaces, archaeological
monuments and beautiful gardens provides
appropriate ambience for the bond and derivatives
dealers to refl ect on the very topical subject of the
conference: Risk, Regulation & Opportunities in Globalised Markets. I would like to compliment the
organisers for very thoughtfully choosing the session
themes covering dynamics of Impossible Trinity in
the context of the EMEs, liquidity risk and capital
requirements under the Basel framework, regulations
relating to Financial Market Infrastructures (FMIs)
and current issues and challenges in the fi nancial
market development and the eminent panellists. By
way of background to some of the issues that would
be discussed in these sessions, I would like to share
* Detailed version of the keynote address of Shri Harun R Khan, Deputy Governor, Reserve Bank of India delivered at 15th FIMMDA-PDAI Annual Conference at Jaipur on March 8, 2014. The speaker acknowledges the contribution of Shri N. R. V. V. M. K Rajendra Kumar, Shri Sudarsana Sahoo and Shri Surajit Bose of the Reserve Bank of India.
Regulation of Indian Debt & Derivatives Markets: Some perspectives on post-crisis paradigm* Harun R Khan

SPEECH
RBI Monthly Bulletin May 201432
Regulation of Indian Debt & Derivatives Markets: Some perspectives on post-crisis paradigm
such crisis in future. The regulatory reform is
therefore focused on strengthening micro-prudential
and market-conduct regulation supplemented with
focus on build-up of systemic risks.
5. As the crisis spread to the developed countries,
interconnectedness of global fi nance highlighted need
for co-ordination of regulation at the global level,
prompting G-20 countries to launch a co-ordinated
and concerted regulatory reform initiative. G-20 also
emphasised on effective enforcement of regulation
which should be co-ordinated internationally so that
national authorities and international standard
setters work together and assist each other in
strengthening financial regulatory and oversight
frameworks. G-20 has recognised that regulatory
reform requires enhancements to a range of
supporting policies and infrastructure, including
compensation practices that promote prudent risk
taking; the greater standardisation of derivatives
contracts and the use of risk-proofed central
counterparties (CCPs); improved accounting standards
that better recognise loan-loss provisions and dampen
adverse dynamics associated with fair-value
accounting. At the global level, strict new rules on
capital, liquidity and leverage have been designed so
as to ensure that there are sizable buffers available
in the system as cushion against event of failure and
the risks assumed by the fi nancial fi rms are limited.
6. In the advanced economies, comprehensive
regulatory reforms have been ushered in key areas
through legislation (e.g. passage of Dodd-Frank Act in
US) and comprehensive review (e.g. Vickers review of
banking system in United Kingdom). The global scale
of crisis and the complex financial system with
entities straddling across national jurisdictions
necessitated coordinated regulatory action through
international agencies, and the G-20 has therefore
taken an enhanced role in shaping international
fi nancial regulatory arrangements.
I.II Global Initiatives on Regulation
7. The new regulatory initiatives are intended to be
both more intrusive in their impact on the fi nancial
sector than the “light touch” approach to regulation
and supervision that prevailed – particularly in some
jurisdictions – before the crisis, and they are also
designed to be much broader in scope. They cover not
only capital and liquidity required by financial
institutions (e.g. Basel-III), but also market activities,
fi nancial instruments, infrastructure, and benchmarks
[e.g. Markets in Financial Instruments Directive
(MiFID-II), Markets in Financial Instruments
Regulation (MiFIR), European Market Infrastructure
Regulation (EMIR), European Commission’s proposed
Regulation on indices used as benchmarks in fi nancial
instruments and fi nancial contracts]. The cost to the
industry for complying with these new regulations is
certain to be high, but it is outweighed by the potential
benefi t of a stable fi nancial system.
I.III Financial Market Regulation – The Indian
Perspective
8. The Reserve Bank of India is the regulator of
Money, G-Sec and over-the-counter (OTC) credit,
foreign exchange and interest rate derivatives
including Repo. In pursuit of the regulatory mandate,
the Reserve Bank has been endeavouring to develop
broad and deep markets. Deeper and broader fi nancial
markets serve important public policy objectives in
terms of improving the effi ciency of capital allocation
and absorbing the risks entailed in fi nancing growth.
As sound regulation is an essential institutional factor
to ensure market development, the Reserve Bank has
been focussing on prudent regulations for furthering
the development of Money, G-Sec and OTC derivatives
markets. Reforms in the G-Sec market carried out since
the early 90s have ensured that the G-Sec market is a
well-organised and regulated market with world class
market infrastructure for trading and settlement.

SPEECH
RBI Monthly Bulletin May 2014 33
Regulation of Indian Debt & Derivatives Markets: Some perspectives on post-crisis paradigm
9. Reserve Bank of India’s approach to regulation
and development of the fi nancial markets has been
guided by three broad principles.
i. First, the menu of fi nancial products available to
enable economic agents to hedge emergent risks
and meet their funding requirements should be
widened.
ii. Second, the introduction of new products should
follow a graduated process guided by the
acceptance of the product by market participants.
iii. Lastly, the robustness of the market infrastructure
for trading, settlement and reporting of existing
as well as new financial products should be
improved.
From the outset, India has resolved to attain
standards of international best practice but the
endeavour has been to fi ne tune the process
keeping in view the underlying structural,
institutional and operational issues.
10. The philosophy behind such policy action is
preference for safety and stability of the fi nancial
system over the considerations of short term market
activity. This was well articulated by Governor
Dr. Raghuram Rajan that the Reserve Bank of India’s
policy focus is to broaden and deepen financial
markets and increase their liquidity and resilience so
that they can help allocate and absorb the risks
entailed in fi nancing India’s growth. Efforts of the
Reserve Bank has been to strike a balance between
market development and fi nancial stability.
11. We can describe our regulatory and developmental
measures for the debt and derivatives markets under
two broad focus areas – building resilience and
increasing liquidity.
II. Building Resilience of Debt & Derivatives Markets
12. Safe and sound markets ensure fi nancial stability
and orderly market development. The resilience of
fi nancial markets is ensured by the Reserve Bank of
India mandating requirements for registration and
reporting, requirements for capital and collateral and
orderly market rules.
II.I Requirements for registration & reporting
13. The requirements of registration ensure that safe
and fi nancially strong entities have access to the
financial system. For instance, Reserve Bank’s
guidelines for authorisation of Primary Dealers (PDs)
prescribe that besides fi nancials, experience in the
fi nancial sector and commitment to serve the market
including retail/mid-segment participants are required
for becoming a PD. The reporting requirements foster
transparency, market integrity as well as discipline.
Lack of transparency has often been cited as a major
reason for global fi nancial crisis. In India, the Reserve
Bank has taken several steps to improve transparency
through mandated reporting requirements. G-Sec
trades are captured by the anonymous trading
platform owned by the Reserve Bank (Negotiated
Dealing System- Order Matching [NDS-OM]). All OTC
outright and repo transactions in G-sec and Call/
Notice/Term money transactions are reported to CCIL.
Commercial Paper/Certifi cate of Deposit trades are
reported on FIMMDA’s reporting platform.
Comprehensive OTC Derivative trade reporting is in
place.
II.II Requirements for capital and collateral
14. Requirements of capital and collateral are
prudential in nature and ensure that the market
participants do not take undue counterparty risks
while trading in the market. Capital requirements act
as buffer against various risks including credit and
market risks. Indian banks have been well capitalised
and have been conforming to the international best
practices with regard to bank capital as delineated by
the Basel prescriptions. We have announced migration
to Basel III to strengthen the banks’ capital base and
improve their ability to withstand systemic shocks.
The norms would come into effect in a phased

SPEECH
RBI Monthly Bulletin May 201434
Regulation of Indian Debt & Derivatives Markets: Some perspectives on post-crisis paradigm
manner. We are in the process of revamping capital
adequacy standards of standalone primary dealers on
lines of Basel III framework. Collateral requirements
reduce counterparty risk in market transactions. The
international consensus on sound regulation for OTC
derivatives as articulated by G-20 declaration for
moving these derivatives to central clearing and
mandatory posting of margins emphasises the
importance attached to collateral. In India collateral
protocols are available for G-sec, repo and equity
markets. We are in the process of operationalising
similar dispensation in OTC derivatives markets.
II.III Orderly market rules
15. In order to protect the integrity of market prices
so that they provide credible price information and
encourage wider market participation, orderly market
rules are put in place by the regulators. These rules
need not necessarily be prescribed by the regulator
itself rather they could evolve through consensus
among market participants. FIMMDA’s Code of
Conduct is an example in this regard. FIMMDA has
also constituted a Dispute Resolution Committee
recently with wider representation of varied market
participants to resolve the disputes arising out of
erroneous trades in the government securities market.
Wherever gaps are seen, the market regulator steps in
to ensure orderly conduct. Financial stability concerns
have been the prime motive behind such actions.
Rules prescribed by the Reserve Bank, such as, the
users of Credit Default Swap (CDS) to buy them only
with underlying exposure; placing appropriate limits
on short selling; ensuring consumer protection by
measures that would curb mis-selling with emphasis
on “appropriateness & suitability”; placing appropriate
limits on interest rate futures positions, etc. must be
seen in this perspective. One can say that the approach
has served Indian fi nancial markets well as India was
relatively unscathed from the contagion effects of
global fi nancial crisis.
III. Enhancing liquidity in Debt & Derivatives
Markets
16. Liquid debt markets are essential for both issuers
and investors. In the recent years concerted efforts
have been made to improve liquidity in debt markets.
There have been regular issuances across yield curve,
which spans up to 30 years, safe and efficient
settlement system with world class infrastructure, a
state of art trading system that enables anonymous
order matching and a liquid repo market that offers
funding options. Hedging and trading instrument are
available to enable market participants to freely
express their views. Investor base of domestic and
foreign investors is expanding and various instruments
are being offered to cater to the needs of investors.
Though liquidity has improved in G-sec market, the
number of securities traded continues to be low.
Liquidity is patchy and bonds are traded at a few
points, especially at 10 year maturity. The concentration
has increased during recent years even though
issuances have been spread across the curve and
critical mass required for liquidity is built through
re-issuances. Liquidity remains a function of bear and
bull phases and we see exuberance during bull runs
and freezes during a bear phase. We have seen
volumes touching over ` one lakh crore and
plummeting to `10,000-15,000 crore.
17. I n t h e r e c e n t p e r i o d , i m p l e m e n t i n g
recommendations of the Working Group on Enhancing
Liquidity in the Government Securities and Interest
Rate Derivatives Markets (Chairman: Shri R. Gandhi)
(Gandhi Working Group) has been the priority of the
Reserve Bank. Action has been initiated/completed in
near ly 70% of the recommendat ions . The
recommendations, such as, truncating the time
window for bidding in the primary auction; changing
the settlement cycle of primary auctions in Treasury
Bills (T-Bills) from T+2 to T+1; conduct of primary
auctions in G-Sec as a mix of both uniform-price and

SPEECH
RBI Monthly Bulletin May 2014 35
Regulation of Indian Debt & Derivatives Markets: Some perspectives on post-crisis paradigm
multiple price formats and re-issuances of existing
securities in state development loans; standardising
Interest Rate Swap (IRS) contracts to facilitate
centralised clearing and settlement of these contracts;
and migration of secondary market reporting of OTC
trades in G-Sec (outright and repo) from PDO-NDS to
NDS-OM and CROMS, respectively, have been
implemented.
18. Further measures include issuance of Infl ation
Indexed bonds for institutional as well as retail/
individual investors and, introduction of cash settled
10-year Interest Rate Futures. Steps towards active
debt management have been taken by undertaking
debt switch of securities from 2014-15 and 2015-16
maturity buckets for face value of about ̀ 27,000 crore
to longer tenor security. All such initiatives have been
taken after extensive market consultations and taking
into account the feedback received.
19. It is our expectation that market participants
would actively participate in the debt markets and
improve liquidity. In this regard, I would discuss about
two issues that would have a bearing on liquidity viz. market making and short selling.
III.I Market making
20. PDs are mandated to make markets in G-sec and
provide liquidity. There is scope for improvement in
market making efforts of PDs. Gandhi Working Group
has recommended that one of the ways for improving
liquidity is to consider allocating specifi c securities to
each PD for market making in them and if required,
rotate the stock of securities among the PDs, by turn,
at periodic intervals. This would ensure continuous
availability of prices for a select group of securities.
The Reserve Bank is in consultation with the PDAI
and the Government to operationalise this
recommendation. It is expected that vigorous efforts
will be made by the PDs to provide two way quotes
for suffi ciently high number of securities to develop
liquidity in the market. We plan to operationalise the
market making scheme in the next fi scal and expect
signifi cant improvement in liquidity. In this context,
the present annual minimum turnover ratios of 5
times for Government dated securities and 10 times
for T-Bills/CMBs of the average month-end stocks need
to reviewed and suitably revised to a higher level.
III.II Short selling
21. The Reserve Bank has allowed short selling in
G-sec to enable market participants to express interest
rate views. Best practice in regulation demands that
short selling should be subject to appropriate controls
so as to reduce or minimise the potential risks that
could affect the orderly and effi cient functioning and
stability of financial markets and be subject to a
reporting regime that provides timely information to
the regulators. Short selling was permitted in a
sequential manner to enable market participants to
take positions based on emergent interest rate scenarios
and cap risks that could emanate from increased short
selling. Intraday short selling in G-Sec was permitted
in 2006; it was extended to fi ve days in 2007 and then
to three months in 2011. Participant-level quantitative
limits (0.25 per cent and 0.50 per cent of the outstanding
amount respectively for illiquid and liquid securities)
have also been prescribed on the short positions to
obviate risk of ‘squeeze’ in the securities and cap the
overall risk in the market due to short selling.
Appropriate reporting requirements have been
prescribed to enable regulators to monitor the build-up
of risks in the market. Some market participants
expressed view that these regulations are limiting the
freedom to express interest rate views and sought a
much more liberal regime. The recent regulatory action
on limiting short sale in American and European
markets underscores the need for appropriate
regulation of short selling. The Reserve Bank is,
however, constantly reviewing its policy and would
consider further relaxations keeping in view the needs
of market participants and imperatives of fi nancial
stability.

SPEECH
RBI Monthly Bulletin May 201436
Regulation of Indian Debt & Derivatives Markets: Some perspectives on post-crisis paradigm
22. In the context of liquidity, I would like to make
a broader point which market bodies like FIMMDA &
the market participants need to ponder over. Liquidity,
like many other market concepts, is a self-fulfi lling
one. An instrument is as liquid as the participants
believe it to be. If more participants believe that an
instrument is liquid and evince buying interest, it
“becomes” liquid. While the product design, trading
systems, regulatory dispensations, etc. do have an
impact on the liquidity of an instrument, more
importantly, it is the activity by the participants that
makes the instrument liquid. All it requires is a few
participants taking the first step. While we have
certain market segments which boast of sizeable
trading volume and wider participation, there is a
signifi cant skewness in other market segments. It is
everybody’s interest that we make the markets broad
and deep. Just to remind - it is the market-participants
that make markets and regulators can only play a
facilitator’s role.
IV. Recent measures
23. I would briefl y summarise recent developments
with regard to G-Sec, Corporate Bond, money and
derivatives markets.
IV.I Interest Rate Futures
24. As announced in the Second Quarter Review of
Monetary Policy 2013-14, the Reserve Bank permitted
cash settled Interest Rate Futures (IRF) on 10-year
Government of India security after extensive
consultations with stakeholders. The IRF is unique in
design as settlement price is based on a single
benchmark bond. The instrument is currently trading
on three exchanges. The trading volume, which was
very encouraging on the first few days of the
introduction, has tapered thereafter. The participation
is also subdued as many of the banks are yet to start
using the product. The product helps in better
management of interest rate risks and market
participants can make use of the same. Going forward,
based on the experience gained and assessment of
the market demand, we can consider similar cash
settled interest rate futures on benchmark securities,
money market futures, etc.
IV.II Term Repo
25. The Reserve Bank introduced variable rate term
repo facility in October 2013 to provide market
participants with additional access to primary liquidity
as well as impart greater fl exibility in managing their
reserve requirements. The reduced reliance on
overnight funds by the banks would hopefully
encourage them to actively transact in the term money
market, paving the way for development of a liquid
term money market. The term repo is now available
up to 28 day tenor. Keeping in view the overall
liquidity conditions in the banking system, going
forward, Reserve Bank may appropriately extend the
tenor and nature of term repos.
IV.III CP CD Markets
26. Reserve Bank of India has introduced DvP-I based
settlement of all OTC transactions in Certifi cates of
Deposit (CDs) and Commercial Papers (CPs) on the
lines of the arrangement already existing in case of
settlement of OTC trades in corporate bonds to
eliminate the settlement risk. Guidelines on CPs have
been comprehensively reviewed. Changes introduced
includes changing minimum rating requirement for
CP issuance to A3, allowing buy-back of CP through
the secondary market and at prevailing market price,
etc. With regard to CDs, I would like to mention a
rather disturbing phenomenon, which I would term
as “March Rush”. It has been observed for some time
that banks raise deposits at exorbitant cost to infl ate
balance sheets. While this may spruce up appearance
of bank’s fi nancials, it would have a deleterious impact
on money market rates, creating avoidable stress. I
suggest that FIMMDA may engage with banks and take
steps to avoid such stress.

SPEECH
RBI Monthly Bulletin May 2014 37
Regulation of Indian Debt & Derivatives Markets: Some perspectives on post-crisis paradigm
IV.IV Repo in Corporate Debt
27. To widen the participant base in corporate bond
repo market, Scheduled Urban Cooperative banks have
been permitted to participate in the instrument. To
encourage activity in corporate bond repo, eligible
category of collateral has been expanded to include
short term instruments like CPs, CDs and NCDs and
minimum haircut requirement has been further
reduced. There is, however, no activity in the corporate
bond repo markets. Progress in signing Global Market
Repo Agreement (GMRA) is slow. I request FIMMDA
to advise its members to sign GMRA to enable trading
in corporate bond repo. In case the progress continues
to be slow, the Reserve Bank would examine the
option of mandating signing of GMRA as a market
development measure.
V. Emerging issues
28. I would like to share my thoughts on some of the
emerging issues that require deeper deliberations as
this is the right forum to exercise our minds on these
issues as they are likely to have fi nancial system wide
impact. It could be very informative to have the market
participants’ views on these issues. The issues include
enhancing investment limit for foreigners in our debt
markets, debate over appropriate benchmarks and
their regulation, issues emerging out of G-20
declaration on OTC derivatives, legal issues relating
to bilateral netting, and extraterritorial application of
certain laws enacted in developed countries.
V.I Enhancing foreign investment limits in G-Sec and corporate bonds
29. Pursuing our policy of enhancing foreign
investment in domestic financial markets in a
calibrated and gradual manner, the total limit for
foreign investment in Government Securities has been
increased over a period of time to the current limit of
USD 30 billion. While being sensitive to the demand
for opening markets to foreign investors, the risk-
reward trade off needs to be carefully examined. The
imperatives of widening and diversifying investor
base leading to higher demands for debt instruments
need to be kept in view along with the considerations
about fi nancial stability and insulation from sudden-
stop risks. Going forward our focus would be on
encouraging participation of long term investors in
our debt markets and reducing the availability of
short-term debt instruments for foreign investors who
often act as “investment tourists”, particularly during
period of stress.
V.II Financial Benchmarks
30. The benchmark rates/indices in the financial
markets are in the nature of “public goods”. They serve
as common reference points for pricing of fi nancial
instruments. Any attempted manipulation of the
benchmarks not only erodes their credibility but also
poses serious threat to stability of the fi nancial system
as large volume of fi nancial contracts are referenced
to the widely used benchmarks. The benchmark rate
setting process, therefore, has to be robust with strong
governance standards for maintaining the credibility
and reliability of the benchmarks. The recent scandals
relating to manipulation of several key global
benchmarks, viz. LIBOR, EURIBOR, TIBOR, London 4
PM FX fi xing, etc., have severely impaired the trust of
the international community on the financial
benchmarks. Regulators and public authorities in
several jurisdictions have conducted wide ranging
probes involving many major benchmarks and have
penalised several banks and brokerage fi rms for their
misconduct. The probes are still on.
31. Meanwhile, various international standard
setting bodies, central banks and market regulators
have undertaken comprehensive review of the
existing benchmark setting system and recommended
several reform measures for restoring the credibility
of the fi nancial benchmarks. Such reform measures
have been undertaken/underway in many jurisdictions.
To mention a few major ones; the LIBOR has been

SPEECH
RBI Monthly Bulletin May 201438
Regulation of Indian Debt & Derivatives Markets: Some perspectives on post-crisis paradigm
notifi ed as a regulated activity under FSMA (Financial
Services and Markets Act 2000) since April 2, 2013
with provisions for criminal sanctions for manipulation
of the benchmark. The administration of LIBOR has
recently been transferred to the Intercontinental
Exchange Group (ICE) Benchmark Administration
Limited. The European Commission has issued the
draft legislation for regulation of fi nancial benchmarks
in the Euro region. The Administrator of EURIBOR,
viz. EURIBOR-European Banking Federation, has taken
several measures to strengthen the governance
framework including reducing the representation of
the panel banks in the steering committee to minority.
The Japanese Banking Association, the administrator
of TIBOR, has announced forming a new entity for
calculation and publication of TIBOR. The Monetary
Authority of Singapore (MAS) has issued proposed
regulations of the fi nancial benchmarks containing
str ingent provisions, such as , l icensing of
administrators and submitters, designation of key
benchmarks, criminal and civil sanction for benchmark
manipulations, etc.
32. We have initiated similar action in India also. As
you all know, the Reserve Bank of India’s Committee
on Financial Benchmarks (Chairman: Shri P Vijaya
Bhaskar) (Vijaya Bhaskar Committee) have submitted
its fi nal Report recently. It has recommended several
measures for strengthening the governance framework
and setting methodology of major Indian Rupee
interest rate and foreign exchange benchmarks.
Although methodologies used for determination of
major Indian benchmarks were found generally
satisfactory by the Committee, it has recommended
for bringing in several improvements on the lines of
international developments. Wherever possible, the
benchmark calculation is to be based on observable
transactions subject to appropriate threshold.
Overnight MIBOR fi xing is to be shifted from the
existing polling method to volume weighted average
of call trades. On the governance of the benchmarks,
the Committee has recommended several measures
for strengthening the governance frameworks with
the benchmark administrators, calculation agents as
well as the submitters. Governance structure of
FIMMDA and FEDAI with their Boards comprising
directors from their member institutions could entail
confl icts of interest in the context of benchmark
settings. As recommended by the Committee, it would
be appropriate for the FIMMDA and FEDAI to create
a separate independent structure, either jointly or
separately, for administration of the benchmarks.
Further, I would like to urge FIMMDA and FEDAI to
complete the reality self-check of their governance
framework vis-à-vis the recommended principles
within timeline of three months suggested by the
Committee and inform the Reserve Bank for further
consideration. They should also initiate necessary
actions to strengthen the benchmark setting
methodologies. I may also make a mention that it
would be highly desirable to enforce some degree of
supervisory oversight over the benchmarks as
recommended by the Committee. The Reserve Bank
is currently examining the recommendations of the
Committee for implementation.
V.III Valuation of State Development Loans
33. While on the subject of valuation and benchmarks,
I would like to briefl y discuss pricing and valuation
of State Development Loans (SDLs). Historically, the
SDLs are valued at 25 basis points over similar tenor
Government of India security. This heuristic yardstick
is not in line with best practice and Gandhi Working
Group has recommended that the valuation
methodology for SDLs may be reviewed. Subsequently,
Vijaya Bhaskar Committee has reiterated the
s u g g e s t i o n . W h i l e e x a m i n a t i o n o f t h e s e
recommendations is underway and no policy decision
is taken as yet, I would like to highlight that pricing
of SDL by market participants does not seem to be in
line with the nature of the instrument. How can one
explain the pricing of SDL at spreads higher than those

SPEECH
RBI Monthly Bulletin May 2014 39
Regulation of Indian Debt & Derivatives Markets: Some perspectives on post-crisis paradigm
of highest rated corporate bonds when state
governments are sovereigns and carry absolutely no
default risk? SDLs are eligible investment for SLR
requirement of the banks and carry Zero risk weight.
Furthermore, SDLs are eligible investment for
institutional investors, such as, insurance companies
and pension funds as per the investment guidelines
laid down by their respective regulators. The states
have initiated fi scal reforms and all of them have
enacted fi scal responsibility legislation. Their fi scal
health has been relatively better than the Central
Government as States, at the aggregate level, have
recorded revenue surplus. During 2012-13, twenty
three states recorded revenue surplus. Reserve Bank
of India is the banker and debt manager for the states.
It has been taking steps to improve liquidity in SDLs
by announcing quarterly indicative quantum, limited
re-issuances, etc. SDLs have been made LAF/market
repo eligible. In view of the above, it seems odd for
the market to charge for large risk premium while
pricing SDLs. The pricing anomaly needs to be looked
at seriously. For market integrity, the price must refl ect
true value of the bond and valuation must refl ect the
market reality.
V.IV OTC Derivatives Market Reforms
34. In September 2009, G-20 leaders declared in
Pittsburgh that all standardised OTC derivative
contracts should be traded on exchanges or electronic
trading platforms, where appropriate, and cleared
through central counterparties (CCPs) by end-2012 at
the latest; OTC derivative contracts should be reported
to trade repositories and non-centrally cleared
contracts should be subject to higher capital
requirements. In 2011, the G-20 Leaders agreed to add
margin requirements on non-centrally-cleared
derivatives to the reform programme. Some progress
has been achieved in accomplishment of regulatory
reform. The Financial Stability Board (FSB) estimated
that approximately 10 per cent of outstanding credit
default swaps and approximately 40 per cent of
outstanding interest rate derivatives were centrally
cleared as of end-August 2012. It also estimated that
well over 90 per cent of OTC interest rate and credit
derivative contracts are being reported to Trade
Repositories (TRs) whereas around 50 per cent of
foreign exchange derivatives transactions are being
reported to TRs.
35. India is committed to achieve the G-20 reform
agenda for OTC derivatives. In order to guide the
process of implementation of the key reform
measures, an implementation group for OTC
derivatives was constituted on the directions of the
Sub Committee of the Financial Stability and
Development Council (FSDC) with representatives
from the Reserve Bank of India and market participants
with Shri R. Gandhi, Executive Director, Reserve Bank
of India as Chairman. The Implementation Group has
submitted its report with a roadmap for implementation
of reform measures with regard to OTC derivatives in
India with timelines. We have made reasonable
progress in implementation of G-20 recommendations
in this regard and would work towards taking the
process forward. Here, I would like to comment on a
few major issues.
V.IV.I Trade Reporting
36. To ensure transparency in IRS trades, banks and
PDs have been mandated to report the inter-bank/PD
IRS trade data since August 2007. Forex forwards,
swaps and options are mandatorily reported with
phased roll-out of trade reporting since July 2012. The
last phase was rolled out recently on December 30,
2013 mandating reporting of Inter-bank and client
transactions in Currency Swaps, Inter-bank and client
transactions in FCY FRA/IRS and Client transactions
in INR FRA/IRS. Clearing Corporation of India Ltd.
(CCIL) has developed the confi dentiality protocols for
reporting of client transactions in consultation with
FIMMDA and other market representative bodies. The
reporting platform for CDS was put in place from the

SPEECH
RBI Monthly Bulletin May 201440
Regulation of Indian Debt & Derivatives Markets: Some perspectives on post-crisis paradigm
date of introduction of the instrument itself. Thus,
in compliance with the G-20 commitments, trade
reporting arrangement for various OTC interest rate,
foreign exchange and credit derivatives have since
been completed. Reserve Bank of India will periodically
assess the extent of use of various OTC derivative
instruments and will introduce reporting for other
derivative instruments as and when market
participants start actively using these instruments.
Going forward, the reported OTC derivative
transactions will be used for strengthening Reserve
Bank of India’s conduct of surveillance of OTC
derivative markets, fi nancial stability assessments
and, micro-prudential supervision of banks and PDs
apart from disseminating the price and volume
information (anonymised) for enhancing transparency
of the Indian OTC derivative markets.
V.IV.II Standardisation
37. Gandhi Working Group has recommended that
IRS contracts should be standardised and Swap
Execution Facility (SEF) may be introduced for IRS
trades. Against the backdrop of G-20 commitment and
in order to improve tradability and facilitate migration
of IRS contracts to centralised clearing and settlement
in future, it has been decided to standardise inter –
bank IRS contracts. The IRS contracts shall be
standardised in terms of minimum notional principal
amount, tenors, trading hours, settlement calculations
etc. which will be prescribed by FIMMDA in
consultation with the market participants. To begin
with, standardisation has been made mandatory for
Rupee Overnight Index Swap (OIS) contracts from
April 1, 2013 and will be extended to other benchmarks
in due course. Forex derivatives are currently non-
standardised as they are primarily driven by customised
client needs. With regard to CDS, the product is
standardised since inception. It has been decided that
the option of CCP for settlement could be examined
once volumes improve and reach critical mass.
V.IV.III Swap Execution Facility (SEF)
38. With regard to introduction of SEF, a trading
system for IRS is expected to be operational in the
second half of 2014. A related issue is whether these
derivative trades can be moved to exchanges. The SEF
cannot be compared to exchanges as they are mainly
accessed by institutional investors (including dealers-
brokers) for trading in specialised products and in
large amounts. It is essential to maintain the
distinction between exchanges and SEF because
exchanges are meant to provide access to retail
investors whereas SEFs are for institutional investors
who access the market to provide liquidity and/or
manage their balance sheets. Exchange traded IRS may
not cater to the needs of institutional traders who
trade in large lots. The long tenor contracts and
management of cash-fl ows for extended periods of
time (e.g. 5, 10, 20 years) are uncommon in exchange
traded instruments which are possible in OTC trades
(e.g., OIS up to 5 year tenor are very active in Indian
market). Hence, globally attempts at trading of IRS on
exchanges met with little success. For instance,
exchange trading of interest rate swaps launched on
the Chicago Mercantile Exchange (CME) witnessed
minuscule trading volumes. Further, validity of OTC
derivatives under Indian laws necessitates that one
of the counterparties to the transaction has to be a
Reserve Bank of India regulated entity. It is extremely
diffi cult to ensure this condition in an exchange-
traded environment.
V.IV.IV Migration to Central Clearing/CCPs
39. Globally broad objective for regulatory reform is
that OTC derivative products have to migrate to central
clearing. Only products meeting certain conditions,
such as, standardisation; relative lack of complexity in
contract terms; suffi cient market liquidity; and readily
available pricing information can migrate to central
clearing. Regulators are exploring the possibility of
mandating the migration to central clearing and/or

SPEECH
RBI Monthly Bulletin May 2014 41
Regulation of Indian Debt & Derivatives Markets: Some perspectives on post-crisis paradigm
incentivising. For example Basel III capital rules create
an incentive to move to central clearing because
exposures to a CCP will generally attract a lower capital
charge than other bilateral exposures.
40. A large number of legal/operational issues, such
as, inter-operability across different CCPs, legal
complexity, regulatory uncertainties, applicability of
insolvency regimes, default management processes
of CCPs and potential increase in collateral
requirements are engaging regulators’ attention.
41. In India, guaranteed clearing exists for USD/INR
forward transactions. Rupee IRS and Forward Rate
Agreements (FRA), which form the bulk of interest
rate derivative transactions, are currently being
centrally cleared in a non-guaranteed mode. An “in
principle” decision to bring IRS and FRA transactions
in the Indian rupee within the ambit of guaranteed
settlement has been taken. Though, it is not
mandatory for market participants to clear their trades
through CCIL, more than 90 per cent of IRS trades are
cleared through CCIL’s non-guaranteed settlement
system. Therefore moving IRS to central clearing is
expected to be smooth.
42. Recently, Reserve Bank has issued guidelines on
capital requirements for bank exposures to central
counterparties. The guidelines prescribe the capital
requirements for banks’ exposure to qualifi ed CCPs
(QCCPs) and non-qualifi ed CCPs. One of the signifi cant
aspects in the guidelines is that it has been proposed
to treat the exposures to the Clearing Corporation of
India Ltd (CCIL) on net basis. In cases, where the CCIL
provides guaranteed settlement, banks may reckon
their total replacement cost (MTM) on net basis, i.e., on net replacement cost as part of trade exposure
determination. This would provide signifi cant capital
relief to banks.
43. In this context, an issue that is receiving close
attention of policy makers is increase in concentration
risks of the CCPs. It is imperative that the risk
management system of the CCP is very robust and
compliant with best global standards. In India, it has
been our endeavour to benchmark our institutions
and practices with international standards. In pursuit
of this objective, the CCP in India (viz. CCIL) has been
evaluated for governance and risk management by
domestic and international asessors. Further, Financial
Sector Assessment Programme (FSAP) has also
evaluated the CCP and found the system to be robust.
The CCP has also done a self-assessment of “Principles
for Financial Market Infrastructures” (PFMI) published
by CPSS-IOSCO. The self-assessment is being evaluated
by us. It is essential that periodic assessments may be
conducted in view of importance of these institutions
for systemic stability.
V.IV.V Margining
44. G-20 leaders have added margin requirements
for non-centrally cleared derivatives as a reform
measure in 2011 and advised BCBS and IOSCO to
develop consistent global standards for these margin
requirements. These margin requirements have been
finalised and would be implemented. There are,
however, concerns that the greater collateralisation
of transactions may, in turn, lead to new credit and
liquidity risks which would have systemic implications,
such as, increased asset encumbrances and possible
shortage of safe assets. The regulators are deliberating
on these issues. In case of IRS in Indian derivatives
market, margins are not posted as per market practice.
This practice engenders elevated counterparty risks
and systemic risks. The Reserve Bank would shortly
initiate steps to mandate margin requirements for IRS.
This would make IRS regulation consistent with CDS
regulation which mandates margin posting. The
mandatory requirements would, however, be
introduced after consultations with market participants
and implemented in phased manner.

SPEECH
RBI Monthly Bulletin May 201442
Regulation of Indian Debt & Derivatives Markets: Some perspectives on post-crisis paradigm
V.IV.VI Bilateral netting
45. The imposition of margins brings us to the issue
of bilateral netting with regard to margins posted for
derivatives trades and netting of Mark-to-Market
(MTM) positions for capital adequacy purpose. While
it is universally accepted that close-out netting
improves fi nancial market effi ciency, legal provisions
regarding enforcement of netting arrangements differ
across jurisdictions. For close-out netting to work, it
needs to be legally enforceable in the jurisdiction in
which the defaulting party is incorporated. Reserve
Bank is examining the issue and would explore all the
possible options including changing the legal
framework to resolve the issue.
V.V Extraterritorial application of laws and harmonising global regulatory effort
46. Laws like Dodd Frank Act, EMIR, etc. enacted in
the wake of fi nancial crisis. have certain provisions
that have extraterritorial implications on foreign
jurisdictions as they impose registration/recognition,
reporting requirements, etc. with potential to increase
complexity, introduce uncertainty through overlapping
and confl icting rules and impose large costs on global
OTC derivatives markets. Such provisions have
implications for regulatory independence and
authority of other countries and have raised concerns
regarding the primacy of home country regulators.
Though there is recognition of substituted compliance,
there is lack of clarity on the implementation of such
regime. Convergence of regulatory standards
prescribed by G-20 and those of the US, Europe & other
advance countries is required so as to limit regulatory
arbitrage and at the same time impose lesser cost on
the market participants. Regulatory reform initiatives
through a globally agreed mechanism of substituted
compliance could address such regulatory arbitrage
more effectively than extraterritorial legislation.
Substituted compliance assessment should be based
on the individual jurisdiction’s compliance with
applicable global standards set by international
standard-setting bodies like the CPSS, IOSCO and the
BCBS. As responsible member of committee of
supervisors, Reserve Bank along with Government of
India and other regulators, such as, SEBI and the
Indian CCP have been constantly engaging with
regulators in developed and emerging markets to
resolve these issues.
V.VI Regulator-market body interactions & consultations
47. The relation between the regulator and the
regulated market participants is very important as
both need to work towards the same goal, i.e., safe
and sound fi nancial market for economic development.
Hence, it is imperative that there should be effective
communication between them. Such communication
would aid regulation as the intent of regulatory action
and incentives that should guide market behaviour
must be clearly understood by the market so that the
actions can be suitably modifi ed. In addition to the
communication which generally happens through
offi cial channels, Reserve Bank undertakes structured
interactions to put forth its point of view and elicit
market participants’ response. For example, pre-
monetary policy meetings, bi-monthly meetings with
FIMMDA and monthly meetings with PDAI provide
opportunity for such interactions. All of us have
gained a lot of insights from such meetings. The
consultations between the Reserve Bank and the
FIMMDA on various issues of policy have not only
helped us in understanding the point of view of the
participants but have also led to giving greater
responsibility on FIMMDA as a market body.
48. Today, apart from coming out with price
valuations for G-Sec and non-G-Sec securities such as
corporate bonds, FIMMDA has been given added
responsibilities such as accrediting brokers in the OTC
interest rate derivatives market, publishing daily CDS
curve for valuation of open position, constitution and
working of the Determination Committee, etc. FIMMDA has played a pivotal role in several other

SPEECH
RBI Monthly Bulletin May 2014 43
Regulation of Indian Debt & Derivatives Markets: Some perspectives on post-crisis paradigm
areas, such as, documentation of CDS, repos, CP and
CDs, and codifying market practices through
“Handbook of Market Practices”. FIMMDA has been
proactive and started review of the efficacy of
benchmarks like MIBOR in wake of the LIBOR
controversy. Likewise, PDAI has also been playing a
very important role in making our G-Sec market more
liquid and in the successful completion of the
Government’s market borrowing programme every
year. The activities of FIMMDA and its role in the
underlying market clearly indicate its important self-
regulatory role in the concerned markets. In line with,
the Commit tee on Financ i a l Benchmarks
recommendations on governance, I would like to urge
FIMMDA to strengthen their technological and
administrative capabilities to discharge the challenging
responsibilities. I would also urge FIMMDA and PDAI
to continuously engage with the regulator in a
proact ive manner drawing upon intensive
consultations with their members, other important
stakeholders (e.g., the IBA, corporates, retail investors)
and cross-country developments and make constructive
suggestions for improvement of the markets and also
appreciate the concerns of regulators and communicate
them to their members appropriately.
49. In addition to regular interactions with market
bodies, the Reserve Bank has consistently followed a
consultative process while framing guidelines. Draft
regulations are placed on the Reserve Bank’s website
for public comments; and expertise of market
participants is regularly sourced by making them
members in various committees appointed by the
Reserve Bank to examine issues relating to market
development and regulation. Markets are dynamic
and evolut ionar y and ca l l for cont inuous
improvisations. Here I would like to highlight that
one cannot wait to design a perfect product, as the
waiting may be endless. While it is reasonable that
the participants’ view primarily emanate from their
own ‘book’ (their positions, their experience, etc.), it
is expected that the suggestions would also be given
from the macro perspectives leveraging on the
experience. Further feedback/suggestions are required
not only from participants whose immediate interests
are affected but also from all players including the
Indian Banks’ Association (IBA) who have a stake in
the improvisation of the system.
VI. Concluding Thoughts
50. Deep and liquid debt and derivatives markets are
essential to ensure a robust and effi cient fi nancial
system which aids economic development. In India,
there exists a very large Government securities
market, which needs to be regulated effi ciently &
effectively to ensure fi nancial stability. The need for
such regulation has been underscored by the global
fi nancial crisis. Regulation may act as a guiding force
in such times by prescribing appropriate rules, or by
creating incentives for appropriate behaviour. We in
India were reasonably insulated from the global
fi nancial crisis, but have been facing challenges. Our
regulatory approach has been cautious and calibrated
with focus on financial stability and market
development. Reforms in the G-Sec market carried out
since the early ‘90s have ensured that the market is a
well-organised and appropriately regulated with world
class market infrastructure for trading and settlement.
Our endeavour has been to promote market
transparency, fi nancial soundness of institutions by
prudential regulation and orderly market conduct.
FIMMDA and PDAI have been playing a pivotal role
in such endeavours by providing valuable support and
inputs. Our approach to regulation has been
appreciated globally and the Reserve Bank of India
was awarded the 2012 Dufrenoy Prize for its approach
to the regulation of derivatives market, thus facilitating
fi nancial innovation in a responsible manner. The
global fi nancial reform initiatives have become more
onerous. The G-20 reform agenda, which we have
committed to implement has signifi cant implications
for domestic markets. The proposals to shift OTC

SPEECH
RBI Monthly Bulletin May 201444
Regulation of Indian Debt & Derivatives Markets: Some perspectives on post-crisis paradigm
derivatives to trading platforms, creation of trade
repositories, migration to central clearing and,
mandated margining regime will change the business
models and market practices. Issues relating to market
integrity (e.g. fi xing of benchmarks like MIBOR) and,
accounting dispensations (e.g. requirement of HTM)
need to be resolved in non-disruptive manner.
51 To conclude, no country can be an “island” and
we need to comply with international best practices
in regulation. We will adopt the regulations in a
calibrated manner keeping in view domestic
circumstances and market dynamics. The markets
should, however, be prepared for the transition. This
would not only help fi nancial sector but also the real
sector. Market bodies like FIMMDA and PDAI along
with the IBA have to play a more active and
collaborative role with the regulators to take this
process forward. I wish the conference great success.
I also wish the conference participants all the best for
exciting business with serious fun.

SPEECH
RBI Monthly Bulletin May 2014 45
Regulating Capital Account: Some Thoughts
development of the interbank forex market, promoting uniform bank-client business practices, training bank personnel working in foreign exchange desks, and most importantly, acting as an interface between the Reserve Bank and the Authorised Dealers. During the last 56 years of its existence it has seen, rather played a major role in, the transition from a fi xed exchange rate regime to almost fl oating exchange rate one; from a non-existent or at best a shallow interbank forex market to one whose activity not infrequently causes the regulator to sit up and take notice, and sometimes act; and from an era when every non-trade forex transaction with a client required a ‘Exchange Control Permit’ to a time when the Authorised Dealers (ADs) have more power and freedom than they are perhaps willing to exercise.
Capital controls: old paradigms & new realities
3. The evolution of the foreign exchange market in India has been shaped by the exchange rate regime and the changing degrees of control. With full convertibility on the current account since 1994 and enactment of Foreign Exchange Management Act, 1999 (FEMA), controls on the capital account have been the principal theme of foreign exchange management during the last two decades. The motivation for imposing controls and restraining the freedom of the residents to transact with non-residents stems from one major concern: addressing the structural imbalances in the balance of payments. But the philosophy and the form of controls have evolved over time. Let me give an example. India has had two major devaluations following severe balance of payment crisis: in 1966 and in 1991. Post 1966 devaluation, we had moved in an inward looking direction with the help of a very stringent exchange control regime. Post 1991 devaluation, however, we moved in the exactly opposite direction: towards more openness on current and capital account and in due course, a legislation with a different objective and a different orientation. This approach has in a sense stood us in good stead. Counterintuitive as it may seem, is it then that greater
1. It gives me great pleasure to be with you in this beautiful city of Cape Town for the 9th Annual Conference of the Foreign Exchange Dealers Association of India (FEDAI). Cape Town is a celebrated tourist destination, particularly at this time of the year. The place and time are ideal for mixing business with pleasure. For me, speaking to you, the pleasure is mixed with some trepidation because we are living in times when there is uncertainty all round not only in the unfolding of events but also in the way we think about them. You may be aware that close to this place is a great tourist attraction which is called ‘The Cape of Good Hope’ for as many as 300 years because it provided a sea–route to India and the East Indies. But, only till opening of the Suez Canal in 1869 when the complexion of East-West sea faring changed. There are thus many events in the course of human history which change dramatically our approach to issues and problems. The events of the past few years – both in the domestic as well as in the global arena - have made us think afresh about many of our approaches to public policy relating to regulation. I intend to discuss some of the current issues relating to our approach to capital account management as it has evolved over time and I beg your indulgence if some questions come up to which answers are not yet as clear as we would wish them to be.
2. The FEDAI, set up in 1958 as a section 25 company, has been a multi-faceted organization, playing an important role in each of its functional domain. It has had immense contribution in
* Inaugural address delivered by Shri Harun R Khan, Deputy Governor, Reserve Bank of India delivered at the 9th Annual Conference of FEDAI in Cape Town on April 12, 2014. Contributions of Shri H S Mohanty & Shri Surajit Bose of the Reserve Bank of India are gratefully acknowledged by the speaker.
Regulating Capital Account: Some Thoughts* Harun R Khan

SPEECH
RBI Monthly Bulletin May 201446
Regulating Capital Account: Some Thoughts
external openness, particularly capital account openness, provides a more stable solution to balance of payments problems? As Robert Aumann says, though in a different context, in his Nobel Prize Lecture: “You want to prevent war. To do that, obviously you should disarm, lower the level of armaments. Right? No, wrong. You might want to do the exact opposite.” Let me give another instance of how the thinking changes. In the 1990’s it was a widely held normative belief, though not uncontested, that capital controls ought to be avoided and free fl ow of capital promoted. In the aftermath of the Asian crisis of the late 1990’s, the substantive argument did not undergo any change, but was only tempered to the extent that removal of capital controls has to keep pace with strengthening of domestic fi nancial sector. Post the global fi nancial crisis, capital controls have come to be seen as an active tool of macro-prudential policy albeit in diffi cult situations.
4. Why have any controls on capital account? The history of capital account openness has been chequered. It may be recalled that capital controls were a part of international milieu throughout the Bretton Woods era and it was only in the 1970’s that the advanced economies started dismantling them. This was followed by several emerging economies, particularly in Latin America and East Asia. The argument in favour of opening up of the capital account was mainly based on ‘allocative effi ciency’: the capital-scarce but projects-rich developing countries can surely improve their welfare and better their lot with the help of capital infl ows. The crisis in several Latin American countries and the East Asian countries in the late 1990’s pointed out the destabilizing effect of capital account openness and raised many question about its desirability. Subsequent literature has shown, on the one hand, that capital account openness by itself may not induce growth in absence of appropriate institutions and on the other, capital controls can indeed be used as a macro-prudential tool to restore or promote stability. In the Indian context, we have had two committees – at a gap of about a
decade - look into the issues relating to a possible roadmap for fuller capital account convertibility1. The macroeconomic preconditions emphasized by these Committees, viz., sustained, low infl ation and strong fi scal position have not yet materialized. As mentioned earlier, the issue of free capital fl ows versus capital controls have evoked a wide range of response over time and the academic literature does not provide clear and consensus view in the matter except some stylized themes, such as, need for capital infl ows for augmenting domestic investment, possible destabilizing impacts of free capital/fi nancial fl ows, improvement in domestic conditions to enable better utilization of capital fl ows and lessen the possibility of instability, need for capital controls in extreme situations, and need for coordinated capital fl ows management policy across nations. Considering our state of affairs and realizing that there is no certainty on the consequence of full CAC, we have committed to progressive opening up of the capital account in a calibrated manner for several reasons including greater integration with the global economy, need to fi nance the persistent current account defi cit, and above all to mobilize resources for the investment needs of a growing economy, particularly the infrastructure sector. At the same time, the vulnerabilities of an open emerging economy and the problems of extreme volatility in the exchange rate informs and guides our approach.
Stability in exchange rates: means & mechanics
5. The proximate problem that a central bank faces is maintaining a reasonably stable exchange rate, a variable that captures not only the external sector imbalances but also the future expectations of the relevant fundamentals. Empirical studies show that, in the short run, exchange rates behave as asset prices and follow a ‘random walk’. Even so, any sharp
1 Unfortunately, both these Committees’ report preceded fi nancial crises, the East-Asian and the Global Financial Crisis, and hence their recommendations were not pursued as seriously as they would have been otherwise.

SPEECH
RBI Monthly Bulletin May 2014 47
Regulating Capital Account: Some Thoughts
depreciation in the exchange rate is likely to see large scale capital exodus by the short-term investors before the value of their investment is further eroded. At the same time, through the instrument of derivatives, it is possible for exporters, importers and others to adjust their inter-temporal demand for foreign currency: to either postpone the present demand to a future time or advance the future demand to the present time. Like any other asset price, a sharply falling exchange rate has the tendency to gather quick momentum. The problem of an appreciating currency in the face of surging capital infl ows poses a separate set of problems, principal amongst which is loss of export competitiveness.
6. The question then is that whether such situations should invite regulatory response? An infl uential line of thought in this context is to solve the problem of the impossible trinity by leaving the exchange rate out of reckoning: letting the exchange rate fi nd its own level depending on the market process. Though the merit in this position cannot be logically denied, it may not be an optimal solution in real life because though exchange rate behaves as an asset price, it is an important macroeconomic variable that infl uences optimal decision making of a large number of economic agents in an economy progressively integrating with the rest of the world. Secondly, sharp movements in the currency capture as well as breed expectations for future, often in a self-fulfi lling spiral, and perhaps need to be addressed in the same spirit as sharp and persistent rise in the general price level needs to be addressed lest it entrenches infl ationary expectations.
7. The most obvious and immediate tool for dealing with heightened volatility or sharp movement either way is the central bank’s intervention operations. For instance, in the face of sharp appreciation, the intervention is directed at mopping up the excess supply of foreign currency in order to preserve export competitiveness. Such operations obviously do have monetary implications and steps to neutralize these involve a cost. On the other hand, intervention in the
face of sharp depreciation is a diffi cult choice for several reasons, including loss of reserves, particularly in a country like India where the external liabilities far exceed the offi cial reserves.
8. As an aside, let me add that the importance of a suffi ciently large kitty of offi cial reserves to deal with sudden fl ow reversals has been underscored time and again. In fact, the large reserves that many emerging market economies have built up post Asian-crisis is often viewed as a bulwark against contagion effects of global crises and risk aversion. Therefore, accumulation of reserves as an objective by itself rather than a byproduct of market actions of the central bank to stabilize the exchange rate is a theme that cannot be dismissed out of hand, more so when there is no assured and easy access to any collective insurance for the EMEs like India.
9. Coming back to our discussion, given the problems with sustained or aggressive intervention in the face of sharp movements in exchange rate– leaving aside its optimality or desirability - what tools do we have to deal with it? Mainly two: modulate capital controls appropriately and restrain the freedom of market participants to carry out derivative transactions which can be used to speculate on the currency and camoufl age capital fl ows. During the periodic bouts of volatility in the Rupee since late-2011, we have used a mix both tools, to which I now turn. You will recall that the Rupee had exhibited relative stability after the post-Lehman volatility of 2009 and traded in a narrow band during most of 2010 and 2011. The volatility started in the second half of 2011 on the wake of US downgrade and related problems. Since then we have had three different spates of volatility: end-July 2011 to mid-December 2011 (about 18% depreciation of INR against USD), end-February 2012 to end-June 2012 (about 12%) and end-April to end-August 2013 (about 19%)2. Most emerging market currencies also fell in value during the period and this elicited varying
2 Source: Bloomberg

SPEECH
RBI Monthly Bulletin May 201448
Regulating Capital Account: Some Thoughts
response from the respective authorities which included capital controls on the one hand and taking measures to attract relatively longer term fl ows on the other.
Capital infl ows & outfl ows: hierarchy of choices
10. Let me now make some comments on capital controls. Our framework of capital account management, has been more inclined towards capital inflows than capital outflows. In a, capital scarce growing economy with large investment needs, it has been our long-standing policy to encourage capital inflows to augment domestic savings with a bias towards fl ows that are stable, long term and those that are least prone to sudden stoppages and reversals. Here I would like to highlight our approach to some of the critical elements of capital fl ows.
Foreign Direct Investments
11. Foreign Direct Investment (FDI), characterized by lasting interest and some degree of management control by the investor, is positioned high in the hierarchy of capital infl ows not only because of it is resource augmenting but also because it usually brings in better technology and more effi cient management and business practices. The framework for FDI, which gets legal sanctity under the regulations notifi ed by the Reserve Bank under FEMA, is set by the Government of India in consultation with the Reserve Bank of India, and the only restriction on FDI pertains to sectoral investment limits - the degree of control that can be ceded to a non-resident- motivated by strategic or socio-economic considerations. The rest of the regulatory framework is a matter of procedural detail, and we have been continuously trying to rationalize and streamline the regime to make it as investor friendly as possible. To illustrate the point, one can cite some of our recent measures, such as, doing away with the regulatory prescription of pricing methodology, introduction of optionality in inward FDI, etc.
Foreign Portfolio Investors
12. There is a tendency to see infl ows on account of foreign portfolio investment as ‘hot money’ which can
cause sudden stoppages or reversals. Over two decades of experience as well as recent studies show that this fear is perhaps exaggerated. Portfolio investment fl ows do exhibit some volatility and surge either way, but at an aggregate level there is a fair degree of stability. Since its introduction in 1992, the regulatory regime for portfolio investment has evolved over time. You are all aware of the recent simplifications and liberalizations brought about in the scheme in sync with regulations notified by the Securities and Exchange Board of India (SEBI) wherein the Foreign Institutional Investors (FIIs) and Qualifi ed Foreign Investors (QFIs) have been merged into a single class of investors known as Foreign Portfolio Investors (FPI) and simplifi ed the KYC verifi cation norms have been prescribed for opening of bank accounts for the portfolio investors. Foreign portfolio investors were granted access to the Government securities segment of the domestic debt market in 1999. Over the years the scope of their investment has been expanded to include corporate debt and the limits for investments in Government securities and corporate bonds have also been progressively increased. As we have seen, our cautious approach is based on perception of potential risk of sudden stops & swift reversals during periods of uncertainty. The investor appetite in this segment has been biased towards the securities of short term maturity: treasury bills, commercial papers, and bonds maturing in less than a year. Both with a view to developing the market as well as encouraging long term flows, the current policy priority is to encourage investment in bonds of relatively longer duration. Accordingly, we had created, and subsequently expanded, a separate window for long-term foreign investors. We have recently moved towards restricting incremental access to treasury bills and government securities with less than one year residual maturity segments to the foreign portfolio investors. The less than expected response of the foreign investors to the debt instruments even in relation to relatively small limits available to them has presumably also to do with the lack of liquidity in this segment. This is an important goal for us and several steps have been taken and are being contemplated to deal with this problem,

SPEECH
RBI Monthly Bulletin May 2014 49
Regulating Capital Account: Some Thoughts
particularly in the light of the recommendation of the Working Group on Enhancing Liquidity in the Government Securities and Interest Rate Derivatives Markets (Chairman: Shri R. Gandhi).
External Commercial Borrowings
13. In contrast with foreign investment in rupee-denominated marketable domestic debt securities, External Commercial Borrowings (ECBs) are bi-partite loan contracts denominated in foreign currency and initiated by the domestic borrowers. The approach here has been that since the external liability of the economy should not be allowed to expand excessively, the ECBs need to be allocated, as it were, to their most productive use. This objective is sought to be achieved through a regulatory regime comprising restrictions in regard to quantum of loan, end use, tenor, lender credentials, and cost of borrowing. The last, the ceiling on cost of borrowing, may seem to be superfl uous in view of the restriction on the quantum of borrowing. But it has to be appreciated that there is an automatic route for ECB, and it is necessary to address the adverse selection problem so that ECBs do not fl ow into risky projects. In recent years, keeping in view the need for capital inflows as well as the investment needs, particularly for those in the infrastructure sector and those having forex earning capabilities to service ECBs, we have relaxed the regulatory framework for ECB in several respects.
14. In this context, let us examine the motivation for fi rms resorting to ECB. If a fi rm has a foreign currency revenue stream it is optimal for it to borrow in foreign currency as well so that its balance sheet does not carry any currency risk. But if its revenue is all in Rupees, it ought to fully hedge its foreign currency liability and a fully hedged ECB should offer no arbitrage in ideal market conditions. Unhedged foreign currency liability poses a currency risk, potentially explosive in volatile times, and also a risk to its other stake-holders, particularly the domestic lenders. Individual corporate vulnerability could easily aggregate to systemic stability risks. The issue then is: do the domestic lenders assess this risk price it appropriately while granting various
facilities to the fi rms concerned? We are not sure. Hence the regulatory prescription for incremental provisioning and capital requirements has been introduced for bank exposures to fi rms with unhedged foreign currency liability.
Non-Resident Deposits
15. Incentivised deposit accounts for diaspora Indians was one of the earliest measures to strengthen capital infl ows. It has served us well when the other forms of capital fl ows were either non-existent or at best, weak. Though the importance of NRI deposits has relatively declined over time, we still have a fairly friendly set of schemes to encourage the diaspora to use the Indian banking system for their banking as well as savings needs. In fact, in the recent periods of currency volatility, more incentives were offered to such NRI depositors to attract long-term fl ows.
Rupee bonds abroad
16. So far, because of non-convertibility of the Rupee on the capital account, we had been averse to the idea of Rupee-denominated bonds in overseas markets. Such an instrument, to replicate a Rupee-pay-off, will need an onshore Indian asset and further, the investor will require access to the onshore derivative market to hedge her currency risk. Both of these were restricted. Approached by the International Finance Corporation (IFC), and recognizing that there are keen offshore investors with Indian interest which can be tapped, we have permitted Rupee-linked bond to be fl oated abroad for US$ one billion and proceeds invested in Indian assets. This is a pilot project and the experience, including market impact, will guide us in further expanding such issuances. In fact, some other multilateral institutions are also now evaluating the option of similar bond issuances.
Regulations on capital outfl ows
17. In a capital scarce economy like ours, it is perhaps logical that there should be close monitoring of out-bound investments. The case for overseas direct investment (ODI) rests on permitting Indian entrepreneurs to exploit avenues for profitable

SPEECH
RBI Monthly Bulletin May 201450
Regulating Capital Account: Some Thoughts
investment abroad. With this in view, we have progressively liberalized the regulatory regime for ODI. But as in case of any investment, ODI must also yield returns over time. Notwithstanding not very satisfactory experience so far in respect of infl ow of income from our investments abroad, an investor friendly regulatory regime continues in place. Recent changes in the ODI regulations no way seeks to dent globalization efforts of Indian investors but only that under extraordinary circumstances investments beyond a threshold, other than fi nancing by ECBs, have been moved to the approval route. Going forward, as stability in forex markets becomes well established, we shall be unwinding them partially or fully. The case for portfolio investment by individuals rests on affording an opportunity to Indian residents to diversify their portfolio. We have been progressively liberalizing the facility till the last bout of Rupee volatility when we had to take steps to moderate it. It may be recalled that it was raised substantially to US$ 200,000 per annum when we had massive infl ows. Such limit under the Liberalised Remittance Scheme (LRS), used widely for current account transactions and also some capital account transactions, including acquisition of property abroad, was brought down when there were apprehensions of large scale transfers in the face of currency volatility. It must be noted that as a measure of further liberalization setting up of companies abroad by resident individuals now has been permitted under the revised LRS.
18. This brings me to an important issue in foreign exchange regulation, or any regulation for that matter. Any regulatory framework fi rst and foremost has to be predictable and time-consistent. Investment and business is a matter of trust and investors and fi rms can plan and execute their strategies only if they believe that the regulatory regime will not change in the midway. Since the external factors in the today’s world change rapidly, there will be great temptation to adjust the regulatory framework as well. Let me give an example. During 2007-08, we faced an unprecedented surge in capital infl ows. Sharp appreciation of the Rupee, Reserve Bank’s market operations, consequent
liquidity impact and the fi scal cost of sterilization are all in recent memory. Several measures were taken in this milieu, such as, increase in the limits for LRS, allowing foreign companies to raise capital in India through Indian Depository Receipt (IDR), introduction of currency futures, etc. The situation changed rapidly post onset of the Global Financial Crisis (GFC), and, after some lull during 2010-11, again post US downgrade, EU crisis, etc. Do we unwind all the decisions and measure taken during times of plenty? This, in a way, justifies the approach of cautious gradualism that we have been adopting so far.
Regulating derivative contracts: onshore & offshore
19. Now I come to the other tool I mentioned about for controlling Rupee volatility: restriction on derivatives. Our view of derivatives has been to treat them as a tool of risk management and as an instrument of hedging foreign exchange risk. This is refl ected in the regulatory regime for forex derivatives in the OTC market which has the following two distinguishing characteristics. First, the ability of a fi rm or an individual to execute a derivative contract is based on an underlying exposure embodying risk. Second, these contracts, at least those involving Rupee, are predominantly to be executed by physical delivery. Over the years, to enable the fi rms to manage their foreign exchange risk fl exibly and effi ciently, several relaxations have been introduced, such as, carrying out derivative transactions on the basis of past performance rather than on the basis of individual underlying contracts, cancelling derivative contracts even as the underlying exposure exists (and getting the benefi t or bearing the loss thereof) with scope to rebook the contract against the same exposure, etc. These relaxations can potentially be used to take a view on the Rupee when expectation of sharp depreciation (or appreciation), rightly or wrongly, is strong. This aggravates the market conditions. We have often resorted to curtailing the freedom of market participants in respect of booking derivative transactions both to curb panic as well as to stem speculative view taking on the Rupee.
SPEECH
RBI Monthly Bulletin May 2014 51
Regulating Capital Account: Some Thoughts
Non-Deliverable Forward markets
20. The issue of forex derivatives has become complex because of two reasons. First, there has come to exists a large offshore market in Rupee. Rupee futures are now traded in some of the international exchanges. There is a sizeable Non-Deliverable Forward (NDF) market in Rupee in several international fi nancial centers. This market is opaque and the exact size or details of participants is not known. Our interaction with market participants tend to indicate that the fi gures published by the Bank for International Settlements (BIS) in the last two triennial surveys may have been over-estimated, but surely they are large enough to impact the domestic market, particularly during periods of heightened volatility. Notwithstanding absence of any clear link between the onshore and offshore markets, it cannot be ruled out that some arbitrage may be happening.
21. What is the reason for an NDF market to exist? The increasing global linkage of the Indian markets on the trade, capital and fi nancial account on the one hand and inadequate or cumbersome access of international agents with Rupee exposure to the onshore domestic market on the other seems to be the obvious answer. There are many investors – mostly portfolio investors – who hold Rupee assets but are either not allowed to hedge their risk in the onshore market, or if allowed, the regime, with restrictions on rebooking of cancelled contracts, may not suit their hedging strategy. There may also be a large home country bias inasmuch as they would prefer an entity in their place or jurisdiction of residence as counterparty rather than an AD in an alien place. The same set of logic holds also for many multinational fi rms in India who use transfer pricing and/or have centralized treasury. There is also the question of economic/potential exposures in a rapidly globalizing world, where one without explicit foreign exchange exposure, could still be affected by exchange rate movements. Be that as it may, NDF has now warranted closer attention of the regulators.
Exchange Traded Derivatives
22. The second issue relates to the on-shore Exchange Traded Derivative (ETD) market introduced in 2008
when the external situation was quite different. The objective was to afford real sector agents - particularly the small entities - an easy, safe, transparent and cost-effective instrument to hedge their currency risk. This market is very different from the over-the-counter (OTC) segment in respect of the two characteristics we mentioned earlier: (a) there is no requirement of underlying exposure for accessing this market and as such, entry as well as exit is unrestricted and (b) contracts are cash settled. In other words, it may be used for hedging, but it is also a perfect instrument for speculation for it makes trading in exchange rate just like trading in any other financial asset. The question that arises is: how can the two markets – the OTC with the regulatory restrictions and the ETD without – coexist? More importantly, will the restrictive measures in the OTC market to control rupee volatility not be rendered completely ineffective if market participants are free to migrate to the ETD segment? With this perspective, at the height of Rupee volatility, we, and, at our request SEBI, were constrained to take several measures in respect of the ETD segment including putting a ceiling on individual positions/open interest, restricting arbitrage between the two markets through banks and increasing the margin requirements. Here I would like to add that with return of stability in the exchange rate, we have already unwound some of the restrictive measures in the OTC/ETD market and, in fact, gone further for hegding in the OTC markets (e.g. permitting hedging upto US$ 250,000 without any documentation requirements). Similarly some more relaxations in the ETD segment, including permitting participation of foreign investors are under consideration.
23. The emergence and growth of NDF market as well as its possible impact on the domestic market poses two important questions. Should attempts not be made to bring the offshore market in Rupee onshore and thereby add depth to our markets and also possibly, income and employment? Secondly, since NDF market is often seen to be affecting the domestic markets, implying thereby the possibility of arbitrage, should

SPEECH
RBI Monthly Bulletin May 201452
Regulating Capital Account: Some Thoughts
domestic banks be allowed to participate in this market? Let me add here that in some countries, the central banks are reported to have intervened in the NDF market of their respective currencies to curb the volatility at its root.
24. If the answer to both questions is positive, it requires some fundamental rethinking on the regulatory framework for foreign exchange derivatives. Already, as mentioned above, we are committed to allowing foreign investors access to the ETD segment with minimal restrictions. But will this access be inviting enough to the investors if the futures prices are not tightly linked with the spot prices? But this is possible only by permitting frictionless arbitrage between the two markets. Secondly, if we are to allow access to the offshore markets to domestic entities, it may not serve any purpose if arbitrage between the offshore and onshore markets is blocked. If we are to pursue it to its logical end, this leads us to a situation where there is no restriction on forex derivative transactions in domestic markets and across the borders – either on eligibility, entry and exit of participants or on settlement.
25. Here, what tempers our thinking is the principle I mentioned earlier: the imperative of regulatory consistency and irreversibility over time. Do we have the appetite and wherewithal to tide over any possible future spate of volatility without undoing any relaxations we contemplate bringing about? This consideration argues in favour of moderation, gradualism and pacing our steps. The challenge is to hit an optimal middle path between throwing caution to the wind and allowing excessive caution to prevent any forward movement.
Concluding thoughts
26. Having outlined some of our policy dilemmas in respect of capital controls and forex market
development and regulations, let me now in conclusion turn to the role FEDAI and its member foreign exchange dealers can play in appreciating the challenges and actively engaging with the regulators. Between the world where they just had to execute a transaction according to an RBI permit and the world where a foreign exchange transaction will be like any other inland rupee transaction except the currency risk falls a large territory where the foreign exchange dealers will have to facilitate external trade and investment related transactions keeping in view the genuine needs of the real sector without losing sight of the prudential requirements. Authorised Dealers will have to constructively engage themselves in appreciation of the evolving regulatory dispensation and, more importantly, provide a friendly, effi cient and transparent interface with the end-users. Regulatory framework, of course, has to evolve, amongst others, keeping pace with the way business is done and it is important for Authorized Dealers to be conversant with the purpose and principle behind change in regulatory regime not only for effective implementation but also for providing a conducive atmosphere for doing business. We find many violations of regulations occur not intentionally but due to ignorance or lack of appreciation. There is surely enough scope for bringing in improvement in this regard. The well thought out sessions planned for this conference, in a sense, will provide many insights to our understanding of some of the current issues relating to our fi nancial markets. Lastly, I wish to emphasize that there is a need for establishing highest standard of code and ethics of doing business and guarding against temptations of perverse incentives, particularly in the financial sector. The financial markets and institutions survive and thrive on trust and it must be our constant endeavor to continue to deserve that trust.
Thank you very much for your attention.

CURRENT STATISTICS
Select Economic Indicators
Reserve Bank of India
Money and Banking
Prices and Production
Government Accounts and Treasury Bills
Financial Markets
External Sector
Payment and Settlement Systems


CURRENT STATISTICS
RBI Monthly Bulletin May 2014 53
No. Title Page
1 Select Economic Indicators 55
Reserve Bank of India
2 RBI – Liabilities and Assets 56
3 Liquidity Operations by RBI 57
4 Sale/ Purchase of U.S. Dollar by the RBI 57
5 RBI's Standing Facilities 58
Money and Banking
6 Money Stock Measures 58
7 Sources of Money Stock (M3) 59
8 Monetary Survey 60
9 Liquidity Aggregates 60
10 Reserve Bank of India Survey 61
11 Reserve Money – Components and Sources 61
12 Commercial Bank Survey 62
13 Scheduled Commercial Banks' Investments 62
14 Business in India – All Scheduled Banks and All Scheduled Commercial Banks 63
15 Deployment of Gross Bank Credit by Major Sectors 64
16 Industry-wise Deployment of Gross Bank Credit 65
17 State Co-operative Banks Maintaining Accounts with the Reserve Bank of India 66
Prices and Production
18 Consumer Price Index (Base: 2010=100) 67
19 Other Consumer Price Indices 67
20 Monthly Average Price of Gold and Silver in Mumbai 67
21 Wholesale Price Index 68
22 Index of Industrial Production (Base: 2004-05=100) 70
Government Accounts and Treasury Bills
23 Union Government Accounts at a Glance 70
24 Treasury Bills – Ownership Pattern 71
25 Auctions of Treasury Bills 71
Financial Markets
26 Daily Call Money Rates 72
27 Certifi cates of Deposit 73
28 Commercial Paper 73
29 Average Daily Turnover in Select Financial Markets 73
30 New Capital Issues by Non-Government Public Limited Companies 74
Contents

CURRENT STATISTICS
RBI Monthly Bulletin May 201454
No. Title Page
External Sector
31 Foreign Trade 75
32 Foreign Exchange Reserves 75
33 NRI Deposits 75
34 Foreign Investment Infl ows 76
35 Outward Remittances under the Liberalised Remittance Scheme (LRS) for Resident Individuals 76
36 Indices of Real Effective Exchange Rate (REER) and Nominal Effective Exchange Rate (NEER) of the Indian Rupee
77
37 External Commercial Borrowings (ECBs) 77
38 India’s Overall Balance of Payments (US $ Million) 78
39 India's Overall Balance of Payments (` Billion) 79
40 Standard Presentation of BoP in India as per BPM6 (US $ Million) 80
41 Standard Presentation of BoP in India as per BPM6 (` Billion) 81
42 International Investment Position 82
Payment and Settlement Systems
43 Payment System Indicators 83
Occasional Series
44 Small Savings
45 Ownership Pattern of Government of India Dated Securities (Face Value)
46 Combined Receipts and Disbursements of the Central and State Governments
Notes: .. = Not available. – = Nil/Negligible. P = Preliminary/Provisional. PR = Partially Revised.

CURRENT STATISTICS
RBI Monthly Bulletin May 2014 55
No. 1: Select Economic Indicators
2012-13 2013-14
Q2 Q3 Q2 Q3
2 3 4 5
4.6 4.4 4.8 4.71.8 0.8 4.6 3.60.1 2.0 1.5 -1.26.5 6.1 5.8 6.75.5 5.0 2.7 2.8
-0.6 4.4 1.8 -1.1
Item2012-13
11 Real Sector (% Change) 1.1 GDP 4.5 1.1.1 Agriculture 1.4 1.1.2 Industry 0.9 1.1.3 Services 6.2 1.1a Final Consumption Expenditure 5.2 1.1b Gross Fixed Capital Formation 0.8
2013-14
1 1.2 Index of Industrial Production ..2 Money and Banking (% Change) 2.1 Scheduled Commercial Banks 2.1.1 Deposits 14.6 2.1.2 Credit 14.3 2.1.2.1 Non-food Credit 14.5 2.1.3 Investment in Govt. Securities 10.7 2.2 Money Stock Measures 2.2.1 Reserve Money (M0) 8.8 2.2.2 Broad Money (M3) 13.43 Ratios (%) 3.1 Cash Reserve Ratio 4.00 3.2 Statutory Liquidity Ratio 23.0 3.3 Cash-Deposit Ratio 4.7 3.4 Credit-Deposit Ratio 77.7 3.5 Incremental Credit-Deposit Ratio 76.1 3.6 Investment-Deposit Ratio 28.7 3.7 Incremental Investment-Deposit Ratio 21.84 Interest Rates (%) 4.1 Policy Repo Rate 8.00 4.2 Reverse Repo Rate 7.00 4.3 Marginal Standing Facility (MSF) Rate 9.00 4.4 Bank Rate 9.00 4.5 Base Rate 10.00/10.25 4.6 Term Deposit Rate >1 Year 8.00/9.25 4.7 Savings Deposit Rate 4.00 4.8 Call Money Rate (Weighted Average) 8.59 4.9 91-Day Treasury Bill (Primary) Yield 8.86 4.10 182-Day Treasury Bill (Primary) Yield 8.86 4.11 364-Day Treasury Bill (Primary) Yield 8.96 4.12 10-Year Government Securities Yield 8.845 RBI Reference Rate and Forward Premia 5.1 INR-US$ Spot Rate (` Per Foreign Currency) 60.10 5.2 INR-Euro Spot Rate (` Per Foreign Currency) 82.58 5.3 Forward Premia of US$ 1-month (%) 9.78 3-month (%) 8.79 6-month (%) 8.956 Inflation (%) 6.1 Wholesale Price Index 5.9 6.1.1 Primary Articles 9.9 6.1.2 Fuel and Power 10.1 6.1.3 Manufactured Products 2.9 6.2 All India Consumer Price Index 9.49 6.3 Consumer Price Index for Industrial Workers 9.717 Foreign Trade (% Change) 7.1 Imports -7.7 7.2 Exports 4.0
2013 2014
Feb Mar Feb Mar
2 3 4 50.6 3.5 -1.9 ..
12.8 14.2 16.6 14.616.3 14.1 15.7 14.316.1 14.0 15.9 14.512.5 15.4 13.9 10.7
7.5 6.2 8.8 14.4
12.7 13.8 14.5 13.3
4.00 4.00 4.00 4.0023.0 23.0 23.0 23.05.2 4.8 5.0 4.7
78.1 77.9 77.5 77.778.6 77.1 74.1 76.129.9 29.7 29.2 28.734.6 31.9 25.5 21.8
7.75 7.50 8.00 8.006.75 6.50 7.00 7.008.75 8.50 9.00 9.008.75 8.50 9.00 9.00
9.70/10.50 9.70/10.25 10.00/10.25 10.00/10.257.50/9.00 7.50/9.00 8.00/9.10 8.00/9.25
4.00 4.00 4.00 4.007.85 8.30 7.93 8.598.10 8.19 9.15 8.868.03 8.01 9.10 8.867.90 7.79 8.67 8.967.87 7.95 8.86 8.84
53.77 54.39 62.07 60.1070.68 69.54 85.03 82.588.26 7.72 9.47 9.787.96 7.57 9.09 8.797.40 7.28 8.64 8.95
7.3 5.7 4.7 5.7
10.5 7.4 6.3 7.710.6 7.8 8.8 11.24.8 4.3 2.8 3.2
10.9 10.4 8.0 8.312.1 11.4 6.7 6.7
1.7 -3.4 -17.9 -2.15.9 5.9 -5.5 -3.2

CURRENT STATISTICS
RBI Monthly Bulletin May 201456
No. 2: RBI - Liabilities and Assets
(` Billion)
Last Friday/ Friday2013 2014
Apr. Mar. 28 Apr. 4 Apr. 11 Apr. 18 Apr. 25
2 3 4 5 6 7
1 Issue Department
1 Liabilities
101 1.1.1 Notes in Circulation12,106.71 12,835.11 12,887.76 13,133.87 13,276.11 13,246.84
102 1.1.2 Notes held in Banking Department0.15 0.17 0.10 0.11 0.13 0.11
103 1.1/1.2 Total Liabilities (Total Notes Issued) or Assets12,106.86 12,835.28 12,887.85 13,133.98 13,276.24 13,246.94
2 Assets
104 1.2.1 Gold Coin and Bullion732.22 682.33 679.19 679.19 679.19 679.19
105 1.2.2 Foreign Securities11,363.82 12,141.07 12,195.03 12,441.52 12,584.05 12,555.23
106 1.2.3 Rupee Coin 0.35 1.41 3.16 2.80 2.53 2.06
107 1.2.4 Government of India Rupee Securities10.46 10.46 10.46 10.46 10.46 10.46
2 Banking Department
1 Liabilities
108 2.1.1 Deposits3,519.56 4,721.36 3,780.25 3,681.65 3,632.62 3,691.33
109 2.1.1.1 Central Government103.05 534.25 150.45 60.37 1.00 1.00
110 2.1.1.2 Market Stabilisation Scheme– – – – – –
111 2.1.1.3 State Governments0.42 0.42 0.42 0.42 0.83 0.42
112 2.1.1.4 Scheduled Commercial Banks3,113.32 3,805.71 3,265.98 3,249.79 3,266.24 3,321.13
113 2.1.1.5 Scheduled State Co-operative Banks32.22 39.04 34.48 33.94 34.11 35.34
114 2.1.1.6 Non-Scheduled State Co-operative Banks2.93 5.50 5.70 4.64 4.94 5.18
115 2.1.1.7 Other Banks145.05 174.92 163.79 163.85 165.16 168.18
116 2.1.1.8 Others122.58 161.52 159.42 168.63 160.35 160.07
117 2.1.2 Other Liabilities7,000.89 8,567.95 8,568.91 8,638.63 8,647.20 8,866.13
118 2.1/2.2 Total Liabilities or Assets10,520.46 13,289.32 12,349.16 12,320.28 12,279.82 12,557.46
2 Assets
119 2.2.1 Notes and Coins0.15 0.17 0.10 0.11 0.13 0.11
120 2.2.2 Balances held Abroad3,025.73 4,588.34 4,740.60 4,644.85 4,533.41 4,801.02
121 2.2.3 Loans and Advances
122 2.2.3.1 Central Government– – – – – –
123 2.2.3.2 State Governments 4.85 14.88 28.40 16.38 19.45 20.81
124 2.2.3.3 Scheduled Commercial Banks301.64 421.78 371.88 394.14 318.69 472.48
125 2.2.3.4 Scheduled State Co-op.Banks0.40 – – – – –
126 2.2.3.5 Industrial Dev. Bank of India– – – – – –
127 2.2.3.6 NABARD– – – – – –
128 2.2.3.7 EXIM Bank– – – – – –
129 2.2.3.8 Others6.79 77.15 74.36 71.90 78.64 79.23
2.2.4 Bills Purchased and Discounted
130 2.2.4.1 Internal– – – – – –
131 2.2.4.2 Government Treasury Bills– – – – – –
132 2.2.5 Investments6,437.63 7,387.75 6,326.74 6,402.35 6,554.13 6,421.57
133 2.2.6 Other Assets 743.26 799.25 807.08 790.53 775.38 762.25
134 2.2.6.1 Gold665.14 619.82 616.97 616.97 616.97 616.97
Item
2013-14
1
1 Issue Department
1.1 Liabilities
1.1.1 Notes in Circulation 12,835.11
1.1.2 Notes held in Banking Department 0.17
1.1/1.2 Total Liabilities (Total Notes Issued) or Assets 12,835.28
1.2 Assets
1.2.1 Gold Coin and Bullion 682.33
1.2.2 Foreign Securities 12,141.07
1.2.3 Rupee Coin 1.41
1.2.4 Government of India Rupee Securities 10.46
2 Banking Department
2.1 Liabilities
2.1.1 Deposits 4,721.36
2.1.1.1 Central Government 534.25
2.1.1.2 Market Stabilisation Scheme –
2.1.1.3 State Governments 0.42
2.1.1.4 Scheduled Commercial Banks 3,805.71
2.1.1.5 Scheduled State Co-operative Banks 39.04
2.1.1.6 Non-Scheduled State Co-operative Banks 5.50
2.1.1.7 Other Banks 174.92
2.1.1.8 Others 161.52
2.1.2 Other Liabilities 8,567.95
2.1/2.2 Total Liabilities or Assets 13,289.32
2.2 Assets
2.2.1 Notes and Coins 0.17
2.2.2 Balances held Abroad 4,588.34
2.2.3 Loans and Advances
2.2.3.1 Central Government –
2.2.3.2 State Governments 14.88
2.2.3.3 Scheduled Commercial Banks 421.78
2.2.3.4 Scheduled State Co-op.Banks –
2.2.3.5 Industrial Dev. Bank of India –
2.2.3.6 NABARD –
2.2.3.7 EXIM Bank –
2.2.3.8 Others 77.15
2.2.4 Bills Purchased and Discounted
2.2.4.1 Internal –
2.2.4.2 Government Treasury Bills –
2.2.5 Investments 7,387.75
2.2.6 Other Assets 799.25
2.2.6.1 Gold 619.82
As on the Last Friday/ Friday
Reserve Bank of India

CURRENT STATISTICS
RBI Monthly Bulletin May 2014 57
2013 2014
Mar. Feb. Mar.
2 3 4
820.00 –530.00 7,782.00
3,165 - 8,752
2,345.00 530.00 970.00
40.11 –30.68 502.94
–2,601.00 1,210.00 8,992.00
–153.16 83.26 586.19
–11,006.00 –31,318.00 –31,030.00
No. 4: Sale/ Purchase of U.S. Dollar by the RBI
Item2013-14
1
1 Net Purchase/ Sale of Foreign Currency (US$ Million) (1.1–1.2) 8,992.00
1.1 Purchase (+) 52,394.00
1.2 Sale (–) 43,402.00
2 ` equivalent at contract rate ( ` Billion) 586.19
3 Cumulative (over end-March) (US $ Million) 8,992.00
( ` Billion) 586.19
4 Outstanding Net Forward Sales (–)/ Purchase (+) at the end of month (US$ Million)
–31,030.00
No. 3: Liquidity Operations by RBI
(` Billion)
Date Liquidity Adjustment Facility
MSFStandingLiquidityFacilities
OMO (Outright) Net Injection (+)/Absorption (-)
(1+3+4+5+7-2-6)Repo Reverse
Repo Term Repo Sale Purchase
1 2 3 4 5 6 7 8Mar. 3, 2014 116.81 97.84 – 8.35 –170.79 – – –143.47Mar. 4, 2014 28.17 105.52 – 8.30 0.64 – – –68.41Mar. 5, 2014 22.70 25.54 – 6.20 97.76 – – 101.12Mar. 6, 2014 224.60 78.23 – 1.30 –74.95 – – 72.72Mar. 7, 2014 267.70 28.40 390.04 93.42 96.17 – – 818.93Mar. 10, 2014 320.03 65.39 – 30.50 97.37 – – 382.51Mar. 11, 2014 308.25 12.43 – 22.50 –99.52 – – 218.80Mar. 12, 2014 294.15 15.98 – 1.80 103.13 – – 383.10Mar. 13, 2014 342.11 105.88 – 0.20 1.42 – – 237.85Mar. 14, 2014 364.71 8.14 500.06 208.25 –130.95 – – 933.93Mar. 18, 2014 408.13 31.88 – 160.85 237.02 – – 774.12Mar. 19, 2014 409.03 24.02 100.04 119.87 2.11 – – 607.03Mar. 20, 2014 398.98 27.64 – 90.75 7.50 – – 469.59Mar. 21, 2014 373.84 29.63 400.09 176.30 –104.36 – – 816.24Mar. 24, 2014 393.82 34.55 – 20.35 103.62 – – 483.24Mar. 25, 2014 387.33 111.28 – 2.65 –50.07 – – 228.63Mar. 26, 2014 367.36 216.96 100.04 – –23.40 0.20 0.25 227.10Mar. 27, 2014 347.51 153.49 – 4.25 17.68 0.10 0.10 215.95Mar. 28, 2014 361.04 118.80 200.04 283.00 –39.19 0.15 0.10 686.04Mar. 29, 2014 – – – 235.10 – – – 235.10Mar. 31, 2014 – – – 219.29 – – – 219.29

CURRENT STATISTICS
RBI Monthly Bulletin May 201458
No. 5: RBI's Standing Facilities
Item
2013-14
1
1 MSF 176.3
2 Export Credit Refinance for Scheduled Banks
2.1 Limit 568.0
2.2 Outstanding 410.4
3 Liquidity Facility for PDs
3.1 Limit 28.0
3.2 Outstanding 22.2
4 Others
4.1 Limit –
4.2 Outstanding –
5 Total Outstanding (1+2.2+3.2+4.2) 608.9
(` Billion)
2013 2014
Mar. 22 Oct. 18 Nov. 29 Dec. 27 Jan. 24 Feb. 21 Mar. 21
2 3 4 5 6 7 8
– 434.2 86.5 385.4 105.6 56.0 176.3
412.3 436.8 472.3 488.1 533.7 542.8 568.0
136.3 364.5 371.5 418.1 297.9 400.2 410.4
28.0 28.0 28.0 28.0 28.0 28.0 28.0
15.2 25.0 25.7 23.6 25.5 15.7 22.2
50.0 – – – – – –
– – – – – – –
151.5 823.7 483.7 827.1 428.9 471.9 608.9
As on the Last Reporting Friday
Item
2013-14 2013 2014
Mar. 22 Feb. 21 Mar. 7 Mar. 21
1 2 3 4 5
1 Currency with the Public (1.1 + 1.2 + 1.3 – 1.4) 12,482.9 11,413.7 12,399.6 12,489.5 12,549.0
1.1 Notes in Circulation 12,837.4 11,725.5 12,747.7 12,824.9 12,903.5
1.2 Circulation of Rupee Coin 164.3 146.0 164.3 164.3 164.3
1.3 Circulation of Small Coins 7.4 7.4 7.4 7.4 7.4
1.4 Cash on Hand with Banks 526.1 465.2 519.8 507.1 526.1
2 Deposit Money of the Public 8,081.8 7,486.8 7,793.3 7,899.1 8,079.8
2.1 Demand Deposits with Banks 8,062.8 7,471.7 7,778.2 7,884.5 8,062.8
2.2 ‘Other’ Deposits with Reserve Bank 19.1 15.1 15.1 14.6 17.0
3 M (1 + 2) 20,564.7 18,900.5 20,192.8 20,388.6 20,628.8
4 Post Office Saving Bank Deposits 50.4 50.4 50.4 50.4 50.4
5 M (3 + 4) 20,615.1 18,950.9 20,243.2 20,439.0 20,679.2
6 Time Deposits with Banks 74,501.7 64,887.8 73,422.2 74,194.6 74,501.7
7 M (3 + 6) 95,066.4 83,788.3 93,615.0 94,583.2 95,130.5
8 Total Post Office Deposits 259.7 259.7 259.7 259.7 259.7
9 M (7 + 8) 95,326.1 84,048.0 93,874.7 94,842.9 95,390.2
No. 6: Money Stock Measures
(` Billion)
Outstanding as on March 31/last reporting Fridays of the month/reporting Fridays
1
2
3
4
Money and Banking

CURRENT STATISTICS
RBI Monthly Bulletin May 2014 59
No. 7: Sources of Money Stock (M )
Sources
2013-14 2013 2014
Mar. 22 Feb. 21 Mar. 7 Mar. 21
1 2 3 4 5
1 Net Bank Credit to Government 30,504.6 27,041.5 30,224.0 30,459.4 29,987.0
1.1 RBI’s net credit to Government (1.1.1–1.1.2) 7,077.5 5,854.2 6,589.5 6,870.6 6,559.9
1.1.1 Claims on Government 7,862.3 6,733.0 6,830.4 6,872.0 7,181.3
1.1.1.1 Central Government 7,844.1 6,732.6 6,825.9 6,872.0 7,171.0
1.1.1.2 State Governments 18.2 0.4 4.5 0.0 10.3
1.1.2 Government deposits with RBI 784.8 878.8 240.9 1.4 621.5
1.1.2.1 Central Government 784.4 878.3 240.5 1.0 621.0
1.1.2.2 State Governments 0.4 0.4 0.4 0.4 0.4
1.2 Other Banks’ Credit to Government 23,427.1 21,187.3 23,634.5 23,588.8 23,427.1
2 Bank Credit to Commercial Sector 64,497.0 56,681.0 62,947.9 63,712.3 64,494.0
2.1 RBI’s credit to commercial sector 88.4 28.4 78.8 76.7 85.4
2.2 Other banks’ credit to commercial sector 64,408.6 56,652.6 62,869.0 63,635.7 64,408.6
2.2.1 Bank credit by commercial banks 60,130.9 52,604.6 58,617.4 59,372.5 60,130.9
2.2.2 Bank credit by co-operative banks 4,241.8 3,994.2 4,213.5 4,227.5 4,241.8
2.2.3 Investments by commercial and co-operative banks in other securities 35.9 53.7 38.2 35.7 35.9
3 Net Foreign Exchange Assets of Banking Sector (3.1 + 3.2) 18,998.4 16,399.8 18,875.1 18,689.2 18,909.2
3.1 RBI’s net foreign exchange assets (3.1.1–3.1.2) 18,025.3 15,613.8 17,902.0 17,716.1 17,936.1
3.1.1 Gross foreign assets 18,025.6 15,615.1 17,902.3 17,716.5 17,941.9
3.1.2 Foreign liabilities 0.3 1.3 0.4 0.4 5.8
3.2 Other banks’ net foreign exchange assets 973.1 786.0 973.1 973.1 973.1
4 Government’s Currency Liabilities to the Public 171.7 153.4 171.7 171.7 171.7
5 Banking Sector’s Net Non-monetary Liabilities 19,105.2 16,487.4 18,603.7 18,449.4 18,431.4
5.1 Net non-monetary liabilities of RBI 8,524.2 6,976.8 8,897.7 8,721.7 8,716.4
5.2 Net non-monetary liabilities of other banks (residual) 10,581.0 9,510.6 9,706.0 9,727.7 9,715.0
M (1+2+3+4–5) 95,066.4 83,788.3 93,615.0 94,583.2 95,130.5
(` Billion)
Outstanding as on March 31/last reporting Fridays of the month/reporting Fridays
3
3

CURRENT STATISTICS
RBI Monthly Bulletin May 201460
No. 8: Monetary Survey
Item
2013-14 2013 2014Mar. 22 Feb. 21 Mar. 7 Mar. 21
1 2 3 4 5Monetary AggregatesNM1 (1.1 + 1.2.1+1.3) 20,452.3 18,782.9 20,084.4 20,279.7 20,516.4NM (NM + 1.2.2.1) 52,102.0 46,923.7 51,218.8 51,753.8 52,166.1NM (NM + 1.2.2.2 + 1.4 = 2.1 + 2.2 + 2.3 – 2.4 – 2.5) 92,995.3 83,534.7 91,529.7 92,499.5 93,059.41 Components1.1 Currency with the Public 12,497.3 11,427.0 12,414.5 12,505.6 12,563.41.2 Aggregate Deposits of Residents 78,268.6 69,876.0 76,842.3 77,702.0 78,268.6 1.2.1 Demand Deposits 7,935.9 7,340.8 7,654.8 7,759.5 7,935.9 1.2.2 Time Deposits of Residents 70,332.7 62,535.1 69,187.5 69,942.6 70,332.7 1.2.2.1 Short-term Time Deposits 31,649.7 28,140.8 31,134.4 31,474.2 31,649.7 1.2.2.1.1 Certificates of Deposit (CDs) 3,741.3 3,835.3 3,315.3 3,340.3 3,741.3 1.2.2.2 Long-term Time Deposits 38,683.0 34,394.3 38,053.1 38,468.4 38,683.01.3 ‘Other’ Deposits with RBI 19.1 15.1 15.1 14.6 17.01.4 Call/Term Funding from Financial Institutions 2,210.3 2,216.6 2,257.8 2,277.3 2,210.32 Sources2.1 Domestic Credit 97,269.3 85,884.2 95,486.1 96,413.8 96,748.7 2.1.1 Net Bank Credit to the Government 29,932.4 26,541.1 29,651.2 29,883.9 29,414.8 2.1.1.1 Net RBI credit to the Government 7,077.5 5,854.2 6,589.5 6,870.6 6,559.9 2.1.1.2 Credit to the Government by the Banking System 22,854.9 20,686.9 23,061.7 23,013.3 22,854.9 2.1.2 Bank Credit to the Commercial Sector 67,336.9 59,343.1 65,834.9 66,529.9 67,333.9 2.1.2.1 RBI Credit to the Commercial Sector 88.4 28.4 78.8 76.7 85.4 2.1.2.2 Credit to the Commercial Sector by the Banking System 67,248.5 59,314.6 65,756.1 66,453.2 67,248.5 2.1.2.2.1 Other Investments (Non-SLR Securities) 4,052.2 3,741.1 4,056.3 4,015.8 4,052.22.2 Government’s Currency Liabilities to the Public 171.7 153.4 171.7 171.7 171.72.3 Net Foreign Exchange Assets of the Banking Sector 16,132.5 14,831.6 15,779.3 15,788.0 16,043.4 2.3.1 Net Foreign Exchange Assets of the RBI 18,025.3 15,613.8 17,902.0 17,716.1 17,936.1 2.3.2 Net Foreign Currency Assets of the Banking System –1,892.7 –782.2 –2,122.7 –1,928.1 –1,892.72.4 Capital Account 15,821.2 13,009.3 16,056.5 15,850.8 15,821.22.5 Other items (net) 4,757.1 4,325.2 3,850.9 4,023.2 4,083.2
(` Billion)
Outstanding as on March 31/last reporting Fridays of themonth/reporting Fridays
12
3
1
2
No. 9: Liquidity Aggregates(` Billion)
Aggregates 2013-14 2013 2014Mar. Jan. Feb. Mar.
1 2 3 4 51 NM 92,973.4 83,575.6 90,743.4 91,509.1 92,973.4
2 Postal Deposits 1,553.8 1,388.4 1,539.9 1,553.8 1,553.83 L ( 1 + 2) 94,527.2 84,964.0 92,283.3 93,062.8 94,527.2
4 Liabilities of Financial Institutions 26.6 26.6 26.6 26.6 26.6 4.1 Term Money Borrowings 0.3 0.3 0.3 0.3 0.3 4.2 Certificates of Deposit 2.5 2.5 2.5 2.5 2.5 4.3 Term Deposits 29.3 29.3 29.3 29.3 29.35 L (3 + 4) 94,556.5 84,993.4 92,312.7 93,092.1 94,556.5
6 Public Deposits with Non-Banking Financial Companies 128.3 106.0 .. .. 128.37 L (5 + 6) 94,684.8 85,099.3 .. .. 94,684.8
1
2
3
3

CURRENT STATISTICS
RBI Monthly Bulletin May 2014 61
No. 10: Reserve Bank of India Survey
Item
2013-14 2013 2014Mar. 22 Feb. 21 Mar. 7 Mar. 21
1 2 3 4 51 Components1.1 Currency in Circulation 13009.0 11878.9 12919.4 12996.6 13075.21.2 Bankers’ Deposits with the RBI 4297.0 2996.2 3316.8 3415.1 3362.4 1.2.1 Scheduled Commercial Banks 4070.8 2822.7 3120.0 3216.8 3163.41.3 ‘Other’ Deposits with the RBI 19.1 15.1 15.1 14.6 17.0Reserve Money (1.1 + 1.2 + 1.3 = 2.1 + 2.2 + 2.3 – 2.4 – 2.5) 17325.1 14890.2 16251.3 16426.2 16454.62 Sources2.1 RBI’s Domestic Credit 7652.4 6099.9 7075.3 7260.2 7063.2 2.1.1 Net RBI credit to the Government 7077.5 5854.2 6589.5 6870.6 6559.9 2.1.1.1 Net RBI credit to the Central Government (2.1.1.1.1 + 2.1.1.1.2 + 2.1.1.1.3 + 2.1.1.1.4 – 2.1.1.1.5) 7059.7 5854.3 6585.4 6871.0 6550.0
2.1.1.1.1 Loans and Advances to the Central Government – – – – – 2.1.1.1.2 Investments in Treasury Bills – – – – – 2.1.1.1.3 Investments in dated Government Securities 7842.9 6730.3 6824.6 6869.4 7169.2 2.1.1.1.3.1 Central Government Securities 7832.4 6719.8 6814.1 6858.9 7158.7 2.1.1.1.4 Rupee Coins 1.3 2.3 1.4 2.6 1.8 2.1.1.1.5 Deposits of the Central Government 784.4 878.3 240.5 1.0 621.0 2.1.1.2 Net RBI credit to State Governments 17.8 – 4.1 -0.4 9.9 2.1.2 RBI’s Claims on Banks 486.5 217.2 406.9 312.9 417.9 2.1.2.1 Loans and Advances to Scheduled Commercial Banks 484.7 215.9 405.0 311.0 416.1 2.1.3 RBI’s Credit to Commercial Sector 88.4 28.4 78.8 76.7 85.4 2.1.3.1 Loans and Advances to Primary Dealers 25.2 15.2 24.7 13.5 22.2 2.1.3.2 Loans and Advances to NABARD – – – – –2.2 Government’s Currency Liabilities to the Public 171.7 153.4 171.7 171.7 171.72.3 Net Foreign Exchange Assets of the RBI 18025.3 15613.8 17902.0 17716.1 17936.1 2.3.1 Gold 1296.2 1413.8 1254.3 1302.1 1302.1 2.3.2 Foreign Currency Assets 16729.3 14200.1 16647.9 16414.1 16634.12.4 Capital Account 8315.7 6393.4 8557.7 8354.0 8315.72.5 Other Items (net) 208.5 583.4 340.0 367.7 400.7
(` Billion)
Outstanding as on March 31/last reporting Fridays of themonth/reporting Fridays
No. 11: Reserve Money - Components and Sources
Item
2013-14 2013 2014Mar. 29 Feb. 28 Mar. 7 Mar. 14 Mar. 21 Mar. 28
1 2 3 4 5 6 7Reserve Money (1.1 + 1.2 + 1.3 = 2.1 + 2.2 + 2.3 + 2.4 + 2.5 – 2.6) 17,325.1 15,582.2 16,397.6 16,426.2 16,982.7 16,454.6 17,055.3
1 Components1.1 Currency in Circulation 13,009.0 11,925.6 12,883.7 12,996.6 13,074.9 13,075.2 13,006.81.2 Bankers' Deposits with RBI 4,297.0 3,620.4 3,499.7 3,415.1 3,890.5 3,362.4 4,025.21.3 ‘Other’ Deposits with RBI 19.1 36.3 14.3 14.6 17.3 17.0 23.32 Sources2.1 Net Reserve Bank Credit to Government 7,077.5 6,367.5 6,796.3 6,870.6 7,350.4 6,559.9 6,863.92.2 Reserve Bank Credit to Banks 486.5 420.1 360.6 312.9 282.8 417.9 423.52.3 Reserve Bank Credit to Commercial Sector 88.4 30.6 78.6 76.7 78.2 85.4 88.42.4 Net Foreign Exchange Assets of RBI 18,025.3 15,597.1 17,927.9 17,716.1 17,972.6 17,936.1 18,034.02.5 Government's Currency Liabilities to the Public 171.7 153.4 171.7 171.7 171.7 171.7 171.72.6 Net Non- Monetary Liabilities of RBI 8,524.2 6,986.3 8,937.5 8,721.7 8,873.0 8,716.4 8,526.2
(` Billion)
Outstanding as on March 31/ last Fridays of the month/ Fridays

CURRENT STATISTICS
RBI Monthly Bulletin May 201462
No. 13: Scheduled Commercial Banks' Investments
(` Billion)
Item As onMarch 21,
2014
2013 2014
Mar. 22 Feb. 21 Mar. 7 Mar. 21
1 2 3 4 51 SLR Securities 22,216.5 20,061.0 22,369.8 22,375.0 22,216.52 Commercial Paper 157.0 324.3 150.0 149.6 157.03 Shares issued by 3.1 PSUs 82.9 86.8 88.6 87.7 82.9 3.2 Private Corporate Sector 336.2 338.0 334.7 334.0 336.2 3.3 Others 9.4 8.7 11.2 8.5 9.44 Bonds/Debentures issued by 4.1 PSUs 804.4 460.5 775.2 765.4 804.4 4.2 Private Corporate Sector 1,147.9 1,026.2 1,148.5 1,141.6 1,147.9 4.3 Others 457.4 480.8 441.9 398.2 457.45 Instruments issued by 5.1 Mutual funds 391.8 436.7 474.1 449.9 391.8 5.2 Financial institutions 575.5 489.5 605.1 591.3 575.5
No. 12: Commercial Bank Survey
Item
2013-14 2013 2014Mar. 22 Feb. 21 Mar. 7 Mar. 21
1 2 3 4 51 Components1.1 Aggregate Deposits of Residents 74,942.4 66,677.8 73,514.4 74,377.3 74,942.4 1.1.1 Demand Deposits 7,208.0 6,623.0 6,925.7 7,031.6 7,208.0 1.1.2 Time Deposits of Residents 67,734.4 60,054.8 66,588.6 67,345.7 67,734.4 1.1.2.1 Short-term Time Deposits 30,480.5 27,024.7 29,964.9 30,305.5 30,480.5 1.1.2.1.1 Certificates of Deposits (CDs) 3,741.3 3,835.3 3,315.3 3,340.3 3,741.3 1.1.2.2 Long-term Time Deposit 37,253.9 33,030.1 36,623.7 37,040.1 37,253.91.2 Call/Term Funding from Financial Institutions 2,210.3 2,216.6 2,257.8 2,277.3 2,210.32 Sources2.1 Domestic Credit 86,332.5 76,376.1 85,070.5 85,700.6 86,332.5 2.1.1 Credit to the Government 22,197.6 20,036.5 22,420.4 22,356.6 22,197.6 2.1.2 Credit to the Commercial Sector 64,134.9 56,339.6 62,650.1 63,344.0 64,134.9 2.1.2.1 Bank Credit 60,130.9 52,604.6 58,617.4 59,372.5 60,130.9 2.1.2.1.1 Non-food Credit 59,146.1 51,640.4 57,551.7 58,372.2 59,146.1 2.1.2.2 Net Credit to Primary Dealers 22.5 59.0 45.2 27.0 22.5 2.1.2.3 Investments in Other Approved Securities 18.9 24.5 21.0 18.4 18.9 2.1.2.4 Other Investments (in non-SLR Securities) 3,962.6 3,651.5 3,966.6 3,926.1 3,962.62.2 Net Foreign Currency Assets of Commercial Banks (2.2.1–2.2.2–2.2.3) –1,892.7 –782.2 –2,122.7 –1,928.1 –1,892.7 2.2.1 Foreign Currency Assets 1,495.3 919.6 1,367.8 1,569.1 1,495.3 2.2.2 Non-resident Foreign Currency Repatriable Fixed Deposits 2,451.4 826.8 2,537.4 2,545.8 2,451.4 2.2.3 Overseas Foreign Currency Borrowings 936.6 875.0 953.2 951.4 936.62.3 Net Bank Reserves (2.3.1+2.3.2–2.3.3) 3,209.7 3,011.7 3,170.7 3,347.6 3,209.7 2.3.1 Balances with the RBI 3,163.4 2,822.7 3,120.0 3,216.8 3,163.4 2.3.2 Cash in Hand 462.4 404.9 455.7 441.9 462.4 2.3.3 Loans and Advances from the RBI 416.1 215.9 405.0 311.0 416.12.4 Capital Account 7,263.8 6,374.2 7,257.1 7,255.1 7,263.82.5 Other items (net) (2.1+2.2+2.3–2.4–1.1–1.2) 3,233.0 3,337.0 3,089.2 3,210.4 3,233.0 2.5.1 Other Demand and Time Liabilities (net of 2.2.3) 3,467.1 3,241.3 3,428.1 3,432.1 3,467.1 2.5.2 Net Inter-Bank Liabilities (other than to PDs) –665.8 –809.8 –688.1 –661.3 –665.8
(` Billion)
Outstanding as on last reporting Fridays of the month/reporting Fridays of the month

CURRENT STATISTICS
RBI Monthly Bulletin May 2014 63
No. 14: Business in India - All Scheduled Banks and All Scheduled Commercial Banks
(` Billion)
All Scheduled Commercial Banks
2013-14 2013 2014
Mar. Feb. Mar.
5 6 7 8
146 151 146 146
1,264.5 1,331.0 1,136.6 1,264.5
777.3 846.5 743.0 777.3
352.5 393.6 344.8 352.5
134.7 90.9 48.8 134.7
84,007.9 73,837.5 83,981.0 84,007.9
77,393.9 67,504.5 76,577.0 77,393.9
7,208.0 6,623.0 7,294.0 7,208.0
70,185.9 60,881.5 69,283.0 70,185.9
2,210.3 2,216.6 2,628.1 2,210.3
4,403.7 4,116.3 4,775.9 4,403.7
416.1 215.9 358.7 416.1
– – – –
416.1 215.9 358.7 416.1
3,625.9 3,227.6 3,796.3 3,625.9
462.4 404.9 493.8 462.4
3,163.4 2,822.7 3,302.5 3,163.4
2,046.5 2,199.5 1,753.1 2,046.5
1,145.3 960.8 1,015.9 1,145.3
95.4 111.9 107.4 95.4
1,049.9 848.9 908.5 1,049.9
290.0 296.0 239.9 290.0
167.4 126.9 140.6 167.4
443.9 815.8 356.8 443.9
22,216.5 20,061.0 22,375.1 22,216.5
22,197.6 20,036.5 22,358.8 22,197.6
18.9 24.5 16.4 18.9
60,130.9 52,604.6 59,330.2 60,130.9
984.8 964.2 1,057.9 984.8
57,878.7 50,591.7 57,109.1 57,878.7
385.9 248.6 388.9 385.9
1,105.8 1,094.5 1,083.1 1,105.8
263.4 214.9 262.8 263.4
497.1 454.7 486.3 497.1
Item
All Scheduled Banks
2013-14 2013 2014
Mar. Feb. Mar.
1 2 3 4
Number of Reporting Banks 213 218 213 213
1 Liabilities to the Banking System 1,311.5 1,368.2 1,181.7 1,311.5
1.1 Demand and Time Deposits from Banks 821.9 879.3 785.0 821.9
1.2 Borrowings from Banks 354.8 398.0 347.8 354.8
1.3 Other Demand and Time Liabilities 134.8 90.9 48.8 134.8
2 Liabilities to Others 86,236.5 75,818.5 86,189.2 86,236.5
2.1 Aggregate Deposits 79,538.0 69,420.0 78,691.3 79,538.0
2.1.1 Demand 7,380.9 6,783.3 7,462.4 7,380.9
2.1.2 Time 72,157.1 62,636.7 71,228.9 72,157.1
2.2 Borrowings 2,227.7 2,227.2 2,653.7 2,227.7
2.3 Other Demand and Time Liabilities 4,470.8 4,171.3 4,844.3 4,470.8
3 Borrowings from Reserve Bank 417.9 217.2 360.6 417.9
3.1 Against Usance Bills /Promissory Notes – – – –
3.2 Others 417.9 217.2 360.6 417.9
4 Cash in Hand and Balances with Reserve Bank 3,732.8 3,320.9 3,904.6 3,732.8
4.1 Cash in Hand 473.7 414.8 507.1 473.7
4.2 Balances with Reserve Bank 3,259.0 2,906.1 3,397.5 3,259.0
5 Assets with the Banking System 2,420.3 2,448.3 2,116.7 2,420.3
5.1 Balances with Other Banks 1,273.6 1,051.5 1,145.1 1,273.6
5.1.1 In Current Account 112.9 127.6 128.4 112.9
5.1.2 In Other Accounts 1,160.7 923.9 1,016.7 1,160.7
5.2 Money at Call and Short Notice 465.0 397.6 401.8 465.0
5.3 Advances to Banks 170.8 136.1 146.0 170.8
5.4 Other Assets 511.0 863.0 423.8 511.0
6 Investment 22,886.9 20,660.3 23,042.9 22,886.9
6.1 Government Securities 22,865.4 20,633.5 23,023.6 22,865.4
6.2 Other Approved Securities 21.5 26.7 19.3 21.5
7 Bank Credit 61,984.5 54,281.4 61,162.5 61,984.5
7a Food Credit 1,095.2 1,045.6 1,168.3 1,095.2
7.1 Loans, Cash-credits and Overdrafts 59,704.9 52,244.1 58,914.4 59,704.9
7.2 Inland Bills-Purchased 389.4 253.1 391.9 389.4
7.3 Inland Bills-Discounted 1,121.8 1,109.9 1,099.7 1,121.8
7.4 Foreign Bills-Purchased 267.4 216.6 266.7 267.4
7.5 Foreign Bills-Discounted 501.0 457.7 489.7 501.0
As on the Last Reporting Friday (in case of March)/ Last Friday

CURRENT STATISTICS
RBI Monthly Bulletin May 201464
No. 15: Deployment of Gross Bank Credit by Major Sectors
(` Billion)
Item Outstanding as on Growth (%)
Mar. 21,2014
2013 2014 Financialyear so far
Y-o-Y
Mar. 22 Feb. 21 Mar. 21 2013-14 2014
1 2 3 4 5 61 Gross Bank Credit 56,572 49,642 55,193 56,572 14.0 14.0
1.1 Food Credit 912 946 990 912 –3.6 –3.6
1.2 Non-food Credit 55,660 48,696 54,203 55,660 14.3 14.3
1.2.1 Agriculture & Allied Activities 6,694 5,899 6,511 6,694 13.5 13.5
1.2.2 Industry 25,229 22,302 24,648 25,229 13.1 13.1
1.2.2.1 Micro & Small 3,517 2,843 3,404 3,517 23.7 23.7
1.2.2.2 Medium 1,274 1,247 1,275 1,274 2.2 2.2
1.2.2.3 Large 20,438 18,211 19,970 20,438 12.2 12.2
1.2.3 Services 13,370 11,519 12,884 13,370 16.1 16.1
1.2.3.1 Transport Operators 895 796 885 895 12.4 12.4
1.2.3.2 Computer Software 176 169 175 176 3.8 3.8
1.2.3.3 Tourism, Hotels & Restaurants 392 354 392 392 10.5 10.5
1.2.3.4 Shipping 99 82 94 99 20.3 20.3
1.2.3.5 Professional Services 707 564 693 707 25.3 25.3
1.2.3.6 Trade 3,228 2,760 3,151 3,228 17.0 17.0
1.2.3.6.1 Wholesale Trade 1,701 1,501 1,665 1,701 13.3 13.3
1.2.3.6.2 Retail Trade 1,527 1,259 1,486 1,527 21.3 21.3
1.2.3.7 Commercial Real Estate 1,544 1,261 1,470 1,544 22.4 22.4
1.2.3.8 Non-Banking Financial Companies (NBFCs) 2,946 2,603 2,819 2,946 13.2 13.2
1.2.3.9 Other Services 3,375 2,930 3,205 3,375 15.2 15.2
1.2.4 Personal Loans 10,367 8,976 10,159 10,367 15.5 15.5
1.2.4.1 Consumer Durables 128 84 124 128 53.1 53.1
1.2.4.2 Housing 5,408 4,567 5,291 5,408 18.4 18.4
1.2.4.3 Advances against Fixed Deposits 641 611 569 641 4.9 4.9
1.2.4.4 Advances to Individuals against share & bonds 38 31 36 38 23.8 23.8
1.2.4.5 Credit Card Outstanding 249 249 254 249 –0.2 –0.2
1.2.4.6 Education 600 550 602 600 9.2 9.2
1.2.4.7 Vehicle Loans 1,304 1,111 1,285 1,304 17.4 17.4
1.2.4.8 Other Personal Loans 1,998 1,774 1,999 1,998 12.6 12.6
1.2A Priority Sector 18,781 15,398 18,073 18,781 22.0 22.0
1.2A.1 Agriculture & Allied Activities 6,694 5,899 6,511 6,694 13.5 13.5
1.2A.2 Micro & Small Enterprises 7,511 5,623 6,933 7,511 33.6 33.6
1.2A.2.1 Manufacturing 3,852 2,843 3,725 3,852 35.5 35.5
1.2A.2.2 Services 3,659 2,779 3,497 3,659 31.6 31.6
1.2A.3 Housing 3,034 2,672 2,985 3,034 13.5 13.5
1.2A.4 Micro-Credit 174 165 175 174 5.5 5.5
1.2A.5 Education Loans 579 526 571 579 10.1 10.1
1.2A.6 State-Sponsored Orgs. for SC/ST 2 1 1 2 29.0 29.0
1.2A.7 Weaker Sections 3,862 2,734 3,580 3,862 41.3 41.3
1.2A.8 Export Credit 483 422 434 483 14.4 14.4

CURRENT STATISTICS
RBI Monthly Bulletin May 2014 65
No. 16: Industry-wise Deployment of Gross Bank Credit
(` Billion)
Industry Outstanding as on Growth (%)
Mar. 21,2014
2013 2014 Financialyear so far
Y-o-Y
Mar. 22 Feb. 21 Mar. 21 2013-14 2014
1 2 3 4 5 6
1 Industry 25,229 22,302 24,648 25,229 13.1 13.1
1.1 Mining & Quarrying (incl. Coal) 353 346 357 353 2.0 2.0
1.2 Food Processing 1,480 1,174 1,454 1,480 26.1 26.1
1.2.1 Sugar 348 330 337 348 5.5 5.5
1.2.2 Edible Oils & Vanaspati 213 171 211 213 24.7 24.7
1.2.3 Tea 32 26 31 32 25.5 25.5
1.2.4 Others 887 648 874 887 37.0 37.0
1.3 Beverage & Tobacco 186 165 173 186 12.6 12.6
1.4 Textiles 2,040 1,835 2,000 2,040 11.1 11.1
1.4.1 Cotton Textiles 1,011 925 988 1,011 9.3 9.3
1.4.2 Jute Textiles 20 22 20 20 –8.6 –8.6
1.4.3 Man-Made Textiles 216 189 214 216 14.1 14.1
1.4.4 Other Textiles 793 699 779 793 13.4 13.4
1.5 Leather & Leather Products 103 87 100 103 18.4 18.4
1.6 Wood & Wood Products 94 77 92 94 21.9 21.9
1.7 Paper & Paper Products 331 283 329 331 17.2 17.2
1.8 Petroleum, Coal Products & Nuclear Fuels 635 643 571 635 –1.3 –1.3
1.9 Chemicals & Chemical Products 1,677 1,592 1,571 1,677 5.3 5.3
1.9.1 Fertiliser 306 269 268 306 13.8 13.8
1.9.2 Drugs & Pharmaceuticals 492 495 491 492 –0.7 –0.7
1.9.3 Petro Chemicals 435 441 363 435 –1.4 –1.4
1.9.4 Others 443 387 448 443 14.7 14.7
1.10 Rubber, Plastic & their Products 368 312 364 368 18.0 18.0
1.11 Glass & Glassware 87 74 87 87 17.0 17.0
1.12 Cement & Cement Products 541 459 529 541 18.0 18.0
1.13 Basic Metal & Metal Product 3,620 3,141 3,532 3,620 15.2 15.2
1.13.1 Iron & Steel 2,685 2,366 2,630 2,685 13.5 13.5
1.13.2 Other Metal & Metal Product 934 775 903 934 20.5 20.5
1.14 All Engineering 1,456 1,284 1,418 1,456 13.3 13.3
1.14.1 Electronics 367 334 349 367 9.9 9.9
1.14.2 Others 1,088 950 1,069 1,088 14.6 14.6
1.15 Vehicles, Vehicle Parts & Transport Equipment 677 589 673 677 15.1 15.1
1.16 Gems & Jewellery 720 611 697 720 17.7 17.7
1.17 Construction 614 522 608 614 17.7 17.7
1.18 Infrastructure 8,398 7,297 8,286 8,398 15.1 15.1
1.18.1 Power 4,883 4,158 4,847 4,883 17.4 17.4
1.18.2 Telecommunications 904 878 871 904 3.0 3.0
1.18.3 Roads 1,574 1,313 1,551 1,574 19.9 19.9
1.18.4 Other Infrastructure 1,036 948 1,016 1,036 9.3 9.3
1.19 Other Industries 1,850 1,810 1,807 1,850 2.2 2.2

CURRENT STATISTICS
RBI Monthly Bulletin May 201466
No. 17: State Co-operative Banks Maintaining Accounts with the Reserve Bank of India
(` Billion)
Last Reporting Friday (in case of March)/Last Friday/ Reporting Friday
2012 2013
Dec. 28 Nov. 15 Nov. 29 Dec. 13 Dec. 27
2 3 4 5 6
Number of Reporting Banks 31 31 31 31 31
1 Aggregate Deposits (2.1.1.2+2.2.1.2) 339.7 365.4 367.6 368.6 410.0
2 Demand and Time Liabilities
2.1 Demand Liabilities 120.1 129.2 129.7 132.3 131.8
2.1.1 Deposits
2.1.1.1 Inter-Bank 19.1 18.3 17.2 17.3 14.9
2.1.1.2 Others 70.3 74.5 74.0 74.3 75.1
2.1.2 Borrowings from Banks 11.5 12.7 12.4 13.4 13.6
2.1.3 Other Demand Liabilities 19.2 23.7 26.1 27.2 28.2
2.2 Time Liabilities 762.6 826.4 829.0 835.3 838.6
2.2.1 Deposits
2.2.1.1 Inter-Bank 483.1 525.8 525.9 529.0 491.3
2.2.1.2 Others 269.4 290.8 293.6 294.3 334.8
2.2.2 Borrowings from Banks 2.4 – – 2.0 2.9
2.2.3 Other Time Liabilities 7.6 9.8 9.4 10.0 9.6
3 Borrowing from Reserve Bank – – – – –
4 Borrowings from a notified bank / State Government 307.0 377.6 379.1 376.7 380.0
4.1 Demand 129.2 147.9 151.6 150.2 147.5
4.2 Time 177.8 229.7 227.5 226.5 228.0
5 Cash in Hand and Balances with Reserve Bank 34.2 36.5 34.9 34.6 35.3
5.1 Cash in Hand 2.1 2.4 2.2 2.2 2.3
5.2 Balance with Reserve Bank 32.0 34.1 32.7 32.4 33.0
6 Balances with Other Banks in Current Account 5.2 7.4 6.4 6.1 7.3
7 Investments in Government Securities 266.5 280.8 282.7 280.0 281.1
8 Money at Call and Short Notice 156.0 176.6 177.8 176.0 178.6
9 Bank Credit (10.1+11) 335.6 365.5 363.6 365.9 366.9
10 Advances
10.1 Loans, Cash-Credits and Overdrafts 335.4 365.4 363.5 365.8 366.8
10.2 Due from Banks 561.9 648.2 645.4 645.5 647.0
11 Bills Purchased and Discounted 0.2 0.1 0.1 0.1 0.1
Item
2012-13
1
Number of Reporting Banks 31
1 Aggregate Deposits (2.1.1.2+2.2.1.2) 356.5
2 Demand and Time Liabilities
2.1 Demand Liabilities 127.2
2.1.1 Deposits
2.1.1.1 Inter-Bank 25.0
2.1.1.2 Others 70.1
2.1.2 Borrowings from Banks 10.2
2.1.3 Other Demand Liabilities 21.8
2.2 Time Liabilities 802.5
2.2.1 Deposits
2.2.1.1 Inter-Bank 507.0
2.2.1.2 Others 286.4
2.2.2 Borrowings from Banks 0.5
2.2.3 Other Time Liabilities 8.6
3 Borrowing from Reserve Bank –
4 Borrowings from a notified bank / State Government 319.3
4.1 Demand 132.1
4.2 Time 187.2
5 Cash in Hand and Balances with Reserve Bank 44.2
5.1 Cash in Hand 2.1
5.2 Balance with Reserve Bank 42.1
6 Balances with Other Banks in Current Account 7.0
7 Investments in Government Securities 269.3
8 Money at Call and Short Notice 156.2
9 Bank Credit (10.1+11) 365.0
10 Advances
10.1 Loans, Cash-Credits and Overdrafts 364.9
10.2 Due from Banks 570.8
11 Bills Purchased and Discounted 0.1
Last Reporting Friday (in case of March)/Last Friday/ Reporting Friday

CURRENT STATISTICS
RBI Monthly Bulletin May 2014 67
No. 18: Consumer Price Index (Base: 2010=100)
Rural Urban Combined
Mar. 13 Feb. 14 Mar. 14 Mar. 13 Feb. 14 Mar. 14 Mar. 13 Feb. 14 Mar. 14
4 5 6 7 8 9 10 11 12
128.9 140.6 141.6 128.9 137.7 138.6 128.9 139.7 140.6
125.8 137.7 138.7 126.1 135.7 136.0 125.9 137.2 138.0
115.0 120.1 120.7 113.3 116.7 117.3 114.5 119.1 119.7
142.6 145.2 145.5 146.5 138.8 138.9 143.9 143.1 143.4
135.2 148.0 148.3 138.1 151.3 150.9 136.2 149.1 149.2
136.1 149.1 150.6 131.2 145.4 146.6 134.3 147.7 149.1
128.6 138.1 138.4 124.6 138.4 139.3 127.4 138.2 138.7
123.0 145.6 147.5 116.1 125.4 127.2 120.8 139.2 141.1
141.1 164.6 168.7 139.1 152.7 158.5 140.2 159.5 164.3
110.9 107.4 107.4 108.6 100.1 101.1 110.2 105.3 105.6
128.6 138.6 139.1 131.3 140.2 140.8 129.8 139.3 139.8
128.4 139.1 139.7 131.9 142.2 142.1 130.1 140.6 140.9
136.7 147.4 147.9 139.0 152.7 153.3 137.3 148.9 149.4
130.8 139.7 140.1 129.6 136.2 136.0 130.3 138.4 138.5
-- -- -- 126.4 137.9 138.9 126.4 137.9 138.9
136.9 149.5 150.0 137.9 148.4 149.1 137.3 149.1 149.7
137.6 150.3 150.9 139.4 150.4 151.0 138.2 150.3 150.9
133.2 144.5 144.9 129.2 137.0 137.4 131.8 141.8 142.2
123.7 132.2 132.7 120.8 127.9 128.4 122.4 130.2 130.7
119.2 127.2 127.7 119.1 125.3 125.9 119.2 126.6 127.1
119.6 129.2 129.8 119.4 129.5 129.8 119.5 129.4 129.8
116.9 124.0 124.3 109.1 115.4 116.0 112.2 118.8 119.3
126.3 134.1 134.7 122.2 128.2 128.6 124.0 130.8 131.3
121.0 129.3 129.9 118.1 124.2 124.9 119.8 127.2 127.9
129.9 137.8 138.4 123.5 130.9 131.4 127.3 135.0 135.6
136.5 151.7 152.3 140.8 153.7 154.6 138.2 152.5 153.2
128.3 138.9 139.7 126.5 135.3 136.0 127.5 137.3 138.1
Group/Sub group 2013-14
Rural Urban Combined
1 2 3
1 Food, beverages and tobacco 138.8 138.0 138.5
1.1 Cereals and products 132.9 131.9 132.6
1.2 Pulses and products 118.2 115.2 117.3
1.3 Oils and fats 143.9 141.9 143.3
1.4 Egg, fish and meat 143.1 146.8 144.4
1.5 Milk and products 144.2 139.0 142.3
1.6 Condiments and spices 134.3 132.9 133.9
1.7 Vegetables 161.4 157.5 160.2
1.8 Fruits 155.7 147.2 152.1
1.9 Sugar etc 109.5 105.0 108.2
1.10 Non-alcoholic beverages 135.0 136.9 135.8
1.11 Prepared meals etc 135.0 137.8 136.4
1.12 Pan, tobacco and intoxicants 143.5 147.8 144.7
2 Fuel and light 136.9 133.9 135.7
3 Housing -- 133.5 133.5
4 Clothing, bedding and footwear 144.1 144.2 144.1
4.1 Clothing and bedding 144.8 146.0 145.2
4.2 Footwear 140.0 133.8 137.7
5 Miscellaneous 128.8 125.0 127.1
5.1 Medical care 124.1 122.6 123.6
5.2 Education, stationery etc 125.7 126.9 126.4
5.3 Recreation and amusement 121.2 113.3 116.4
5.4 Transport and communication 131.0 125.3 127.8
5.5 Personal care and effects 126.2 121.6 124.3
5.6 Household requisites 134.1 127.5 131.4
5.7 Others 145.8 148.4 146.9
General Index (All Groups) 136.4 133.3 135.0
Source: Central Statistics Office, Ministry of Statistics and Programme Implementation, Government of India.
No. 19: Other Consumer Price Indices
2013 2014Mar. Feb. Mar.
4 5 6
224 238 239
704 757 763
705 759 765
Item Base Year LinkingFactor
2013-14
1 2 3
1 Consumer Price Index for Industrial Workers 2001 4.63 236
2 Consumer Price Index for Agricultural Labourers 1986-87 5.89 750
3 Consumer Price Index for Rural Labourers 1986-87 – 751
Source: Labour Bureau, Ministry of Labour and Employment, Government of India.
No. 20: Monthly Average Price of Gold and Silver in Mumbai
Source: Business Standard/Business Line/The Economic Times, Mumbai for Gold and Silver prices in Mumbai.
Item 2013-14 2013 2014
Mar. Feb. Mar.
1 2 3 4
1 Standard Gold ( per 10 grams) 29,190 29,514 30,211 29,8322 Silver ( per kilogram) 46,637 54,995 46,383 45,978
`
`
Prices and Production

CURRENT STATISTICS
RBI Monthly Bulletin May 201468
No. 21: Wholesale Price Index(Base: 2004-05 = 100)
2013 2014
Mar. Jan. Feb. (P) Mar. (P)
3 4 5 6170.1 179.1 178.9 179.8223.1 238.8 238.6 240.2214.1 233.7 232.9 235.3216.1 229.4 230.1 231.1212.5 229.9 230.6 231.3233.1 226.9 227.9 230.1186.6 209.0 203.6 210.3186.8 216.8 200.7 202.8186.4 202.4 206.1 216.5210.2 225.7 228.4 230.1255.6 284.9 284.0 284.2222.3 265.7 265.6 264.7243.1 214.8 212.2 210.7207.6 216.4 217.4 217.2219.2 245.0 248.3 238.5205.1 202.2 203.7 207.5212.1 217.3 215.9 219.2151.9 213.0 214.8 196.8351.8 349.1 352.1 350.9447.1 387.6 386.5 387.4217.1 209.8 211.6 209.3320.3 349.1 354.4 352.3191.6 212.4 212.6 213.1189.7 189.8 189.8 189.8213.9 235.4 235.6 236.5132.4 163.8 163.8 163.8148.7 152.9 152.7 153.5165.6 169.1 168.2 168.7176.1 185.5 185.7 186.1147.2 175.5 175.8 175.2166.4 170.3 170.4 170.5132.4 142.5 142.2 142.3184.2 179.3 177.0 178.2146.7 147.1 146.6 146.8216.5 215.8 218.0 216.2169.1 175.5 177.8 177.6185.4 190.3 185.8 185.0171.1 180.1 180.8 184.2181.6 188.1 187.6 195.1126.6 132.4 129.0 135.5170.4 171.8 170.1 171.8157.7 162.8 162.8 163.5210.8 229.6 219.5 229.8133.4 140.8 140.4 141.3150.1 159.7 159.5 160.6164.1 176.3 176.3 178.2134.3 140.9 140.7 140.8127.5 134.5 134.3 134.1127.7 134.3 134.0 133.7126.8 135.1 135.2 135.3149.8 157.9 158.1 159.4181.5 185.8 185.2 185.8109.0 114.3 113.2 115.1174.1 179.0 182.1 183.1141.8 146.0 148.1 148.1179.9 186.5 185.8 186.5198.9 210.1 210.1 211.3151.8 154.9 154.8 160.8
Commodities Weight 2013-14
1 21 ALL COMMODITIES 100.000 177.61.1 PRIMARY ARTICLES 20.118 241.7 1.1.1 Food articles 14.337 238.9 1.1.1.1 Food Grains 4.090 226.1 1.1.1.1.1 Cereals 3.373 225.5 1.1.1.1.2 Pulses 0.717 228.5 1.1.1.2 Fruits & Vegetables 3.843 244.5 1.1.1.2.1 Vegetables 1.736 295.1 1.1.1.2.2 Fruits 2.107 202.9 1.1.1.3 Milk 3.238 220.6 1.1.1.4 Eggs, Meat & Fish 2.414 275.9 1.1.1.5 Condiments & Spices 0.569 245.6 1.1.1.6 Other Food Articles 0.183 227.9 1.1.2 Non-Food Articles 4.258 213.1 1.1.2.1 Fibres 0.877 239.8 1.1.2.2 Oil Seeds 1.781 202.7 1.1.2.3 Other Non-Food Articles 1.386 213.1 1.1.2.4 Flowers 0.213 190.8 1.1.3 Minerals 1.524 347.0 1.1.3.1 Metallic Minerals 0.489 387.9 1.1.3.2 Other Minerals 0.135 213.5 1.1.3.3 Crude Petroleum 0.900 344.71.2 FUEL & POWER 14.910 205.3 1.2.1 Coal 2.094 190.8 1.2.2 Mineral Oils 9.364 225.9 1.2.3 Electricity 3.452 158.41.3 MANUFACTURED PRODUCTS 64.972 151.3 1.3.1 Food Products 9.974 168.8 1.3.1.1 Dairy Products 0.568 180.4 1.3.1.2 Canning, Preserving & Processing of Food 0.358 164.9 1.3.1.3 Grain Mill Products 1.340 167.9 1.3.1.4 Bakery Products 0.444 139.0 1.3.1.5 Sugar, Khandsari & Gur 2.089 183.0 1.3.1.6 Edible Oils 3.043 147.0 1.3.1.7 Oil Cakes 0.494 223.7 1.3.1.8 Tea & Coffee Proccessing 0.711 182.2 1.3.1.9 Manufacture of Salt 0.048 186.0 1.3.1.10 Other Food Products 0.879 177.8 1.3.2 Beverages, Tobacco & Tobacco Products 1.762 184.8 1.3.2.1 Wine Industries 0.385 128.3 1.3.2.2 Malt Liquor 0.153 170.7 1.3.2.3 Soft Drinks & Carbonated Water 0.241 161.8 1.3.2.4 Manufacture of Bidi, Cigarettes, Tobacco & Zarda 0.983 215.7 1.3.3 Textiles 7.326 138.7 1.3.3.1 Cotton Textiles 2.605 157.5 1.3.3.1.1 Cotton Yarn 1.377 173.8 1.3.3.1.2 Cotton Fabric 1.228 139.2 1.3.3.2 Man-Made Textiles 2.206 131.6 1.3.3.2.1 Man-Made Fibre 1.672 131.3 1.3.3.2.2 Man-Made Fabric 0.533 132.6 1.3.3.3 Woollen Textiles 0.294 155.1 1.3.3.4 Jute, Hemp & Mesta Textiles 0.261 183.6 1.3.3.5 Other Misc. Textiles 1.960 113.3 1.3.4 Wood & Wood Products 0.587 178.3 1.3.4.1 Timber/Wooden Planks 0.181 144.8 1.3.4.2 Processed Wood 0.128 185.0 1.3.4.3 Plywood & Fibre Board 0.241 204.5 1.3.4.4 Others 0.038 153.8

CURRENT STATISTICS
RBI Monthly Bulletin May 2014 69
No. 21: Wholesale Price Index (Concld.)(Base: 2004-05 = 100)
2013 2014
Mar. Jan. Feb. (P) Mar. (P)
3 4 5 6140.2 145.9 146.2 146.3138.5 144.8 144.6 144.9130.7 132.2 132.4 131.7154.7 164.8 166.2 166.5134.7 144.4 145.3 146.0112.7 115.9 116.0 115.9148.8 160.3 160.4 160.5130.3 143.7 147.3 149.8139.5 148.2 148.4 149.2162.4 176.7 176.6 176.7162.2 176.7 176.6 176.7165.1 176.5 176.9 176.5130.1 138.5 138.8 140.0148.2 152.9 152.7 153.2145.9 150.9 150.8 151.1148.9 151.1 151.2 151.5143.0 154.3 153.8 152.4147.7 149.0 148.8 149.1152.3 153.0 152.7 152.9122.5 127.2 127.2 128.3144.4 148.7 148.9 148.7128.1 135.6 135.0 137.7125.4 127.3 127.3 127.2153.3 159.1 159.6 159.7144.3 148.4 148.5 148.6136.9 142.1 142.6 144.7167.0 172.6 172.4 173.7144.8 152.2 152.3 152.5166.8 166.2 166.5 167.6167.6 180.2 180.3 183.2131.7 132.6 132.8 133.0172.3 164.4 164.9 165.4170.5 173.8 173.6 173.6164.8 166.4 166.6 167.6154.7 156.3 156.3 157.5154.8 156.9 156.3 158.7166.9 166.0 166.6 167.0153.5 154.9 155.2 155.8127.4 132.1 132.1 131.8158.7 162.2 162.5 163.6141.3 142.9 142.8 144.7153.1 159.1 156.4 159.4161.5 165.3 165.4 166.5134.7 139.5 139.2 140.0186.9 189.8 190.3 191.6215.3 215.7 216.5 216.6129.4 132.4 132.4 132.7137.6 144.4 144.4 144.3147.6 150.9 151.1 151.2136.7 136.9 136.9 136.9157.9 159.9 160.5 160.4113.7 115.7 117.4 119.4123.1 124.3 124.4 124.2134.1 137.4 137.1 137.6144.9 151.6 151.5 151.2117.2 117.7 117.7 117.787.3 89.0 88.7 89.589.2 88.5 88.5 88.593.7 95.5 95.9 95.7
132.2 135.8 135.5 135.8131.7 135.4 135.0 135.2131.3 134.6 134.6 135.5149.7 151.7 151.7 151.7
Commodities Weight 2013-14
1 2 1.3.5 Paper & Paper Products 2.034 142.8 1.3.5.1 Paper & Pulp 1.019 141.5 1.3.5.2 Manufacture of boards 0.550 131.2 1.3.5.3 Printing & Publishing 0.465 159.6 1.3.6 Leather & Leather Products 0.835 143.1 1.3.6.1 Leathers 0.223 114.3 1.3.6.2 Leather Footwear 0.409 159.8 1.3.6.3 Other Leather Products 0.203 141.4 1.3.7 Rubber & Plastic Products 2.987 145.9 1.3.7.1 Tyres & Tubes 0.541 174.2 1.3.7.1.1 Tyres 0.488 174.5 1.3.7.1.2 Tubes 0.053 171.4 1.3.7.2 Plastic Products 1.861 136.2 1.3.7.3 Rubber Products 0.584 150.9 1.3.8 Chemicals & Chemical Products 12.018 148.7 1.3.8.1 Basic Inorganic Chemicals 1.187 150.3 1.3.8.2 Basic Organic Chemicals 1.952 147.1 1.3.8.3 Fertilisers & Pesticides 3.145 148.2 1.3.8.3.1 Fertilisers 2.661 152.3 1.3.8.3.2 Pesticides 0.483 125.7 1.3.8.4 Paints, Varnishes & Lacquers 0.529 147.5 1.3.8.5 Dyestuffs & Indigo 0.563 131.6 1.3.8.6 Drugs & Medicines 0.456 126.8 1.3.8.7 Perfumes, Cosmetics, Toiletries etc. 1.130 157.3 1.3.8.8 Turpentine, Plastic Chemicals 0.586 147.1 1.3.8.9 Polymers including Synthetic Rubber 0.970 141.7 1.3.8.10 Petrochemical Intermediates 0.869 171.2 1.3.8.11 Matches, Explosives & other Chemicals 0.629 150.2 1.3.9 Non-Metallic Mineral Products 2.556 166.2 1.3.9.1 Structural Clay Products 0.658 175.9 1.3.9.2 Glass, Earthenware, Chinaware & their Products 0.256 131.6 1.3.9.3 Cement & Lime 1.386 167.1 1.3.9.4 Cement, Slate & Graphite Products 0.256 170.9 1.3.10 Basic Metals, Alloys & Metal Products 10.748 164.5 1.3.10.1 Ferrous Metals 8.064 154.7 1.3.10.1.1 Iron & Semis 1.563 153.8 1.3.10.1.2 Steel: Long 1.630 165.6 1.3.10.1.3 Steel: Flat 2.611 153.8 1.3.10.1.4 Steel: Pipes & Tubes 0.314 129.8 1.3.10.1.5 Stainless Steel & alloys 0.938 159.6 1.3.10.1.6 Castings & Forgings 0.871 142.5 1.3.10.1.7 Ferro alloys 0.137 155.5 1.3.10.2 Non-Ferrous Metals 1.004 164.0 1.3.10.2.1 Aluminium 0.489 137.8 1.3.10.2.2 Other Non-Ferrous Metals 0.515 188.9 1.3.10.3 Metal Products 1.680 211.5 1.3.11 Machinery & Machine Tools 8.931 131.6 1.3.11.1 Agricultural Machinery & Implements 0.139 141.7 1.3.11.2 Industrial Machinery 1.838 150.1 1.3.11.3 Construction Machinery 0.045 136.9 1.3.11.4 Machine Tools 0.367 160.1 1.3.11.5 Air Conditioner & Refrigerators 0.429 115.6 1.3.11.6 Non-Electrical Machinery 1.026 123.8 1.3.11.7 Electrical Machinery, Equipment & Batteries 2.343 136.5 1.3.11.8 Electrical Accessories, Wires, Cables etc. 1.063 150.3 1.3.11.9 Electrical Apparatus & Appliances 0.337 117.7 1.3.11.10 Electronics Items 0.961 87.7 1.3.11.11 IT Hardware 0.267 88.4 1.3.11.12 Communication Equipments 0.118 95.9 1.3.12 Transport, Equipment & Parts 5.213 134.5 1.3.12.1 Automotives 4.231 134.0 1.3.12.2 Auto Parts 0.804 133.5 1.3.12.3 Other Transport Equipments 0.178 150.1
Source: Office of the Economic Adviser, Ministry of Commerce and Industry, Government of India.

CURRENT STATISTICS
RBI Monthly Bulletin May 201470
February2013 2014
6 7General Index
General IndexGeneral Index176.2 172.8
Sectoral Classification
Sectoral Classification1. Mining & Quarrying124.6 126.32. Manufacturing190.8 183.73. Electricity 140.5 156.7
Use-Based Classification
Use-Based Classification1. Basic Goods150.2 156.12. Capital Goods285.5 235.93. Intermediate Goods144.3 150.44. Consumer Goods200.7 191.64(a).Consumer Durables289.7 262.74(b).Consumer Non-durables165.4 163.4
April-February2012-13 2013-14
4 5General Index
General IndexGeneral IndexGeneral Index170.2 169.9
Sectoral Classification
Sectoral ClassificationMining & QuarryingMining & Quarrying123.6 122.1ManufacturingManufacturing181.1 179.7ElectricityElectricity 154.4 163.9
Use-Based Classification
Use-Based ClassificationBasic GoodsBasic Goods152.3 154.7Capital GoodsCapital Goods243.3 237.0Intermediate GoodsIntermediate Goods145.6 150.3Consumer GoodsConsumer Goods189.0 183.7Consumer DurablesConsumer Durables300.1 263.6Consumer Non-durablesConsumer Non-durables145.0 152.0
No. 22: Index of Industrial Production (Base:2004-05=100)
Industry Weight 2011-12 2012-13
1 2 3General IndexGeneral Index 100.00 170.3 172.2
1 Sectoral Classification 1.1 Mining and Quarrying 14.16 128.5 125.5 1.2 Manufacturing 75.53 181.0 183.3 1.3 Electricity 10.32 149.3 155.2
2 Use-Based Classification 2.1 Basic Goods 45.68 150.0 153.6 2.2 Capital Goods 8.83 267.8 251.6 2.3 Intermediate Goods 15.69 144.4 146.7 2.4 Consumer Goods 29.81 186.1 190.6 2.4.1 Consumer Durables 8.46 295.1 301.1 2.4.2 Consumer Non-Durables 21.35 142.9 146.9
Source : Central Statistics Office, Ministry of Statistics and Programme Implementation, Government of India.
No. 23: Union Government Accounts at a Glance
Source: Controller General of Accounts, Ministry of Finance, Government of India.
Budget Account Item Code April–February
2012-13(Actuals)
2013-14(Actuals)
Percentage to Revised Estimates
2012-13 2013-14
2 3 4 5
6,788.3 7,836.0 77.9 76.15,719.3 6,271.3 77.1 75.01,069.0 1,564.6 82.4 81.05,407.1 6,161.6 96.7 109.8
105.6 105.8 75.0 97.9228.0 62.9 95.0 24.3
5,073.6 5,993.0 97.4 114.312,195.4 13,997.6 85.2 88.0
8,665.2 9,908.2 86.5 88.97,871.5 8,996.0 85.6 87.52,638.5 3,218.4 83.3 84.7
793.7 912.2 96.9 104.63,530.2 4,089.3 82.3 86.02,877.9 3,183.7 83.8 85.6
652.3 905.6 76.0 87.312,195.4 13,997.6 85.2 88.010,749.4 12,179.7 85.1 87.0
1,446.0 1,817.8 86.2 95.23,961.1 4,343.8 101.2 117.35,073.6 5,993.0 97.4 114.32,435.1 2,774.6 119.2 192.1
Item Financial Year
2013-14(Revised
Estimates)1
1 Revenue Receipts 10,292.5 1.1 Tax Revenue (Net) 8,360.3 1.2 Non-Tax Revenue 1,932.32 Capital Receipts 5,611.8 2.1 Recovery of Loans 108.0 2.2 Other Receipts 258.4 2.3 Borrowings and Other Liabilities 5,245.43 Total Receipts (1+2) 15,904.34 Non-Plan Expenditure 11,149.0 4.1 On Revenue Account 10,276.9 4.1.1 Interest Payments 3,800.7 4.2 On Capital Account 872.15 Plan Expenditure 4,755.3 5.1 On Revenue Account 3,718.5 5.2 On Capital Account 1,036.86 Total Expenditure (4+5) 15,904.47 Revenue Expenditure (4.1+5.1) 13,995.48 Capital Expenditure (4.2+5.2) 1,909.09 Revenue Deficit (7-1) 3,702.910 Fiscal Deficit {6-(1+2.1+2.2)} 5,245.411 Gross Primary Deficit [10-4.1.1] 1,444.7
(Amount in ` Billion)
Government Accounts and Treasury Bills
Source: Controller General of Accounts, Ministry of Finance, Government of India.

CURRENT STATISTICS
RBI Monthly Bulletin May 2014 71
(` Billion)
2013 2014Mar. 29 Feb. 21 Feb. 28 Mar. 7 Mar. 14 Mar. 21 Mar. 28
2 3 4 5 6 7 8
– – – – – – –– – – – – – –
1,422.2 866.4 889.8 879.5 1,072.2 1,231.5 1,101.83.7 6.2 5.3 5.0 8.2 8.7 6.6
345.6 192.9 208.1 215.1 262.1 269.4 286.0248.9 302.9 310.1 322.1 332.7 315.5 286.9282.0 618.9 613.9 586.9 521.2 481.2 381.9174.4 282.1 269.8 271.7 237.2 267.3 300.3
234.9 200.6 240.3 208.3 272.2 226.3 270.0207.9 285.6 289.1 298.3 276.3 276.4 255.3
– 10.8 6.8 6.8 6.8 6.8 74.1199.2 172.6 139.4 162.1 130.3 176.3 164.6
335.7 272.3 299.4 257.3 340.6 298.9 356.1447.9 563.8 608.8 559.1 515.6 522.6 480.7
3.8 7.0 7.0 6.9 6.9 6.9 6.9517.4 503.5 431.5 533.5 493.6 538.8 523.6
4,423.5 4,285.7 4,319.2 4,312.6 4,475.9 4,626.6 4,494.7
No. 24: Treasury Bills – Ownership Pattern
Item 2013-14
11 14-day
1.1 Banks –1.2 Primary Dealers –1.3 State Governments 1,101.81.4 Others 6.6
2 91-day2.1 Banks 286.02.2 Primary Dealers 286.92.3 State Governments 381.92.4 Others 300.3
3 182-day3.1 Banks 270.03.2 Primary Dealers 255.33.3 State Governments 74.13.4 Others 164.6
4 364-day4.1 Banks 356.14.2 Primary Dealers 480.74.3 State Governments 6.94.4 Others 523.6
5 Total 4,494.7
No. 25: Auctions of Treasury Bills(Amount in ` Billion)
Date ofAuction
NotifiedAmount
Bids Received Bids Accepted TotalIssue(6+7)
Cut-offPrice
Implicit Yieldat Cut-offPrice (per
cent)
Number Total Face Value Number Total Face ValueCompetitive Non-
CompetitiveCompetitive Non-
Competitive
1 2 3 4 5 6 7 8 9 1091-day Treasury Bills
2013-14 Feb. 26 70 90 133.47 107.64 76 70.00 107.64 177.64 97.77 9.1485Mar. 5 80 90 166.10 73.08 66 80.00 73.08 153.08 97.76 9.1905Mar. 12 80 89 173.44 3.07 71 80.00 3.07 83.07 97.74 9.2744Mar. 19 80 136 462.24 1.10 28 80.00 1.10 81.10 97.76 9.1905Mar. 26 80 120 254.51 11.35 49 80.00 11.35 91.35 97.84 8.8550
182-day Treasury Bills2013-14 Feb. 26 60 104 200.79 0.02 55 60.00 0.02 60.02 95.66 9.0987Mar. 12 60 109 315.88 0.05 22 60.00 0.05 60.05 95.65 9.1206Mar. 26 60 83 192.66 74.08 34 60.00 74.08 134.08 95.77 8.8579
364-day Treasury Bills2013-14 Feb. 5 60 156 285.80 – 36 60.00 – 60.00 91.79 8.9689Feb. 18 60 170 258.05 – 42 60.00 – 60.00 91.76 9.0046Mar. 5 60 145 315.85 – 23 60.00 – 60.00 91.74 9.0284Mar. 19 60 135 260.66 0.52 15 60.00 0.52 60.52 91.86 8.8857

CURRENT STATISTICS
RBI Monthly Bulletin May 201472
No. 26: Daily Call Money Rates
As on Range of Rates Weighted Average Rates
1 Borrowings/ Lendings Borrowings/ Lendings
1 2
March 1, 2014 1.00-8.15 7.51
March 3, 2014 6.00-8.10 7.78
March 4, 2014 6.00-8.15 7.76
March 5, 2014 6.00-9.00 8.00
March 6, 2014 6.00-8.10 7.83
March 7, 2014 6.00-8.50 8.03
March 8, 2014 6.00-8.50 7.97
March 10, 2014 6.00-8.60 7.97
March 11, 2014 6.00-8.35 8.05
March 12, 2014 6.00-8.60 8.12
March 13, 2014 6.00-9.50 8.08
March 14, 2014 1.25-9.25 8.62
March 15, 2014 5.00-9.50 8.24
March 18, 2014 6.00-9.25 8.95
March 19, 2014 6.00-9.05 8.92
March 20, 2014 6.00-9.10 8.92
March 21, 2014 6.00-10.50 8.79
March 22, 2014 5.00-8.25 6.74
March 24, 2014 6.00-9.05 8.89
March 25, 2014 6.50-10.10 8.65
March 26, 2014 6.00-8.80 8.18
March 27, 2014 6.50-9.00 8.03
March 28, 2014 6.00-14.00 9.57
March 29, 2014 5.00-11.03 9.70
April 1, 2014 8.80-15.00 9.89
April 2, 2014 7.00-9.20 8.80
April 3, 2014 6.50-9.00 8.34
April 4, 2014 5.00-9.00 8.01
April 5, 2014 5.00-8.10 6.79
April 7, 2014 6.00-9.10 8.39
April 9, 2014 6.50-8.50 8.11
April 10, 2014 6.50-8.25 7.96
April 11, 2014 6.00-8.35 8.04
April 12, 2014 5.00-8.00 6.34
April 15, 2014 6.15-8.95 8.33
(Per cent per annum)
Financial Markets

CURRENT STATISTICS
RBI Monthly Bulletin May 2014 73
No. 27: Certificates of Deposit
Item 2013 2014
Mar. 22 Feb. 7 Feb. 21 Mar. 7 Mar. 21
1 2 3 4 5
1 Amount Outstanding ( Billion) 3,896.1 3,296.9 3,303.8 3,349.0 3,758.0
1.1 Issued during the fortnight ( Billion) 877.5 357.0 286.1 751.3 908.5
2 Rate of Interest (per cent) 8.80-10.12 8.41-9.75 8.58-10.06 8.75-10.27 8.94-10.35
`
`
No. 28: Commercial Paper
Item 2013 2014
Mar. 31 Feb. 15 Feb. 28 Mar. 15 Mar. 31
1 2 3 4 5
1 Amount Outstanding ( Billion) 1,092.6 1,767.1 1,646.0 1,653.4 1,066.1
1.1 Reported during the fortnight ( Billion) 192.7 351.3 292.0 414.2 250.4
2 Rate of Interest (per cent) 8.05-13.42 8.33-12.70 7.84-13.06 7.96-14.18 8.64-12.61
`
`
(` Billion)
2013 2014
Mar. 29 Feb. 28 Mar. 7 Mar. 14 Mar. 21 Mar. 28
2 3 4 5 6 7
296.8 213.0 268.3 269.9 254.9 314.4
54.0 100.8 95.8 77.7 118.5 29.1
12.3 4.3 5.9 2.2 9.3 6.4
698.6 1,385.8 1,352.3 1,279.0 1,076.4 1,293.6
481.9 856.5 1,285.1 1,048.8 1,048.0 617.6
– – 2.2 – – 0.9
79,630 58,419 58,691 58,777 55,236 67,283
511.3 379.4 493.6 427.6 294.7 286.5
19.7 16.4 8.6 19.8 15.0 21.1
23.3 14.5 35.5 29.5 35.2 33.0
22.3 11.7 11.6 13.0 26.3 15.0
36.9 19.0 15.2 24.1 40.3 25.8
– – – – – –
613.5 441.0 564.4 514.1 411.4 381.5
21.6 3.4 0.1 – 1.0 1.9
No. 29: Average Daily Turnover in Select Financial Markets
Item 2013-14
1
1 Call Money 230.7
2 Notice Money 71.6
3 Term Money 5.4
4 CBLO 1,196.3
5 Market Repo 986.8
6 Repo in Corporate Bond 0.3
7 Forex (US $ million) 50,568
8 Govt. of India Dated Securities 662.5
9 State Govt. Securities 12.8
10 Treasury Bills
10.1 91-Day 26.7
10.2 182-Day 12.9
10.3 364-Day 25.4
10.4 Cash Management Bills 7.3
11 Total Govt. Securities (8+9+10) 740.3
11.1 RBI –

CURRENT STATISTICS
RBI Monthly Bulletin May 201474
Mar. 2013 Mar. 2014
No. ofIssues
Amount No. ofIssues
Amount
7 8 9 10
1 Equity Shares 11 10.7 7 21.3
1A Premium10 3.8 3 20.2
1.1 Prospectus8 3.5 5 0.2
1.1.1 Premium8 3.1 1 0.1
1.2 Rights 3 7.2 2 21.1
1.2.1 Premium2 0.7 2 20.1
2 Preference Shares – – – –
2.1 Prospectus– – – –
2.2 Rights – – – –
3 Debentures – – – –
3.1 Convertible – – – –
3.1.1 Prospectus– – – –
3.1.2 Rights– – – –
3.2 Non-Convertible – – 3 6.1
3.2.1 Prospectus– – 3 6.1
3.2.2 Rights– – – –
4 Bonds – – – –
4.1 Prospectus– – – –
4.2 Rights – – – –
5 Total (1+2+3+4)11 10.7 10 27.4
5.1 Prospectus8 3.5 8 6.3
5.2 Rights 3 7.2 2 21.1
2012-13 (Apr.-Mar.) 2013-14 (Apr.-Mar.)
No. ofIssues
Amount No. ofIssues
Amount
3 4 5 6
1 Equity Shares 48 138.8 53 58.1
1A Premium44 120.9 43 53.2
1.1 Prospectus32 49.4 38 12.4
1.1.1 Premium30 46.0 30 10.7
1.2 Rights16 89.4 15 45.8
1.2.1 Premium14 74.9 13 42.5
2 Preference Shares – – – –
2.1 Prospectus– – – –
2.2 Rights – – – –
3 Debentures 6 22.2 12 50.2
3.1 Convertible – – – –
3.1.1 Prospectus– – – –
3.1.2 Rights– – – –
3.2 Non-Convertible 6 22.2 16 58.3
3.2.1 Prospectus6 22.2 15 56.4
3.2.2 Rights– – – –
4 Bonds – – – –
4.1 Prospectus– – – –
4.2 Rights – – – –
5 Total (1+2+3+4)54 161.0 69 116.4
5.1 Prospectus38 71.6 54 70.7
5.2 Rights16 89.4 15 45.8
No. 30: New Capital Issues By Non-Government Public Limited Companies
Security & Type of Issue 2013-14
No. ofIssues
Amount
1 2
1 Equity Shares 53 58.1
1A Premium 43 53.2
1.1 Prospectus 38 12.4
1.1.1 Premium 30 10.7
1.2 Rights 15 45.8
1.2.1 Premium 13 42.5
2 Preference Shares – –
2.1 Prospectus – –
2.2 Rights – –
3 Debentures 12 50.2
3.1 Convertible – –
3.1.1 Prospectus – –
3.1.2 Rights – –
3.2 Non-Convertible 16 58.3
3.2.1 Prospectus 15 56.4
3.2.2 Rights – –
4 Bonds – –
4.1 Prospectus – –
4.2 Rights – –
5 Total (1+2+3+4) 69 116.4
5.1 Prospectus 54 70.7
5.2 Rights 15 45.8
(Amount in ` Billion)
Source: Based on prospectus/advertisements issued by companies, replies to Reserve Bank’s questionnaire and information received from SEBI, stock exchanges, press reports, etc.

CURRENT STATISTICS
RBI Monthly Bulletin May 2014 75
No. 31: Foreign Trade
Item Unit 2013-14 2013 2014Mar. Nov. Dec. Jan. Feb. Mar.
1 2 3 4 5 6 7
1 Exports` Billion 18,928.9 1,661.6 1,498.8 1,618.6 1,642.5 1,568.2 1,804.7
US $ Million 312,355.5 30,541.4 23,929.9 26,144.9 26,459.2 25,201.2 29,578.4
1.1 Oil` Billion .. 298.0 298.7 296.0 282.4 294.8 ..
US $ Million .. 5,477.2 4,768.9 4,780.7 4,549.1 4,738.2 ..
1.2 Non-oil` Billion .. 1,363.6 1,200.1 1,322.7 1,360.1 1,273.4 ..
US $ Million .. 25,064.3 19,161.0 21,364.2 21,910.1 20,463.1 ..
2 Imports` Billion 27,192.1 2,227.7 2,108.3 2,258.4 2,247.9 2,083.7 2,445.8
US $ Million 450,949.0 40,947.8 33,661.0 36,478.5 36,211.7 33,485.5 40,085.8
2.1 Oil` Billion 10,137.1 729.5 812.9 862.0 818.6 853.3 963.0
US $ Million 167,624.6 13,408.2 12,979.0 13,922.9 13,186.6 13,711.8 15,783.8
2.2 Non-oil` Billion 17,054.9 1,498.3 1,295.4 1,396.4 1,429.3 1,230.5 1,482.8
US $ Million 283,324.4 27,539.6 20,682.0 22,555.7 23,025.1 19,773.7 24,302.0
3 Trade Balance` Billion –8,263.1 –566.2 –609.5 –639.8 –605.4 –515.5 –641.1
US $ Million –138,593.6 –10,406.3 –9,731.1 –10,333.7 –9,752.4 –8,284.2 –10,507.3
3.1 Oil` Billion .. –431.5 –514.2 –566.0 –536.2 –558.4 ..
US $ Million .. –7,931.0 –8,210.1 –9,142.2 –8,637.5 –8,973.6 ..
3.2 Non-oil` Billion .. –134.7 –95.3 –73.8 –69.2 42.9 ..
US $ Million .. –2,475.3 –1,521.0 –1,191.4 –1,114.9 689.4 ..Source: DGCI & S and Ministry of Commerce & Industry.
1.4 Reserve Tranche Position in IMF ` Billion 125 110 110 110 111 111 112
US $ Million 2,309 1,801 1,831 1,827 1,842 1,837 1,839
1.3 SDRs SDRs Million 2,887 2,887 2,888 2,888 2,888 2,888 2,888
` Billion 236 272 268 268 270 270 274
US $ Million 4,342 4,462 4,458 4,448 4,484 4,473 4,478
No. 32: Foreign Exchange Reserves
Item Unit 2013 2014
Apr. 26 Mar. 21 Mar. 28 Apr. 4 Apr. 11 Apr. 18 Apr. 25
1 2 3 4 5 6 7
1 Total Reseves ` Billion` Billion` Billion` Billion 16,094 18,252 18,292 18,493 18,646 18,677 18,919
US $ Million 296,371 298,636 303,674 306,648 309,445 309,413 309,913
1.1 Foreign Currency Assets ` Billion 14,335 16,568 16,612 16,818 16,968 16,999 17,237
US $ Million 264,028 271,394 276,406 278,806 281,552 281,536 282,029
1.2 Gold ` Billion 1,397 1,302 1,302 1,296 1,296 1,296 1,296
US $ Million 25,692 20,978 20,978 21,567 21,567 21,567 21,567
No. 33: NRI Deposits
(US$ Million)
Flows
2012-13 2013-14
Apr.-Mar. Apr.-Mar.
5 6
14,844 38,892
220 26,660
16,399 11,976
–1,775 257
2013 2014
Mar. Feb. Mar.
2 3 4
70,823 100,247 104,108
15,188 40,963 41,848
45,924 50,642 53,227
9,710 8,642 9,034
Scheme
2013-14
1
1 NRI Deposits 104,108
1.1 FCNR(B) 41,848
1.2 NR(E)RA 53,227
1.3 NRO 9,034
Outstanding
External Sector

CURRENT STATISTICS
RBI Monthly Bulletin May 201476
No. 34: Foreign Investment Inflows(US$ Million)
2013 2014
Mar. Feb. Mar.
4 5 6
1.1 Net Foreign Direct Investment (1.1.1–1.1.2) 822 –60 2,908
1.1.1 Direct Investment to India (1.1.1.1–1. 1.1.2) 2,089 2,817 4,502
1.1.1.1 Gross Inflows/Gross Investments 2,720 3,022 4,707
1.1.1.1.1 Equity 1,616 2,109 3,625
1.1.1.1.1.1 Government (SIA/FIPB) 14 52 13
1.1.1.1.1.2 RBI 1,008 1,365 3,259
1.1.1.1.1.3 Acquisition of shares 503 601 262 1.1.1.1.1.4 Equity capital of unincorporated bodies 91 92 92
1.1.1.1.2 Reinvested earnings 911 842 842
1.1.1.1.3 Other capital 194 71 240
1.1.1.2 Repatriation/Disinvestment 631 206 206
1.1.1.2.1 Equity 619 180 180
1.1.1.2.2 Other capital 12 26 26 1.1.2 Foreign Direct Investment by India (1.1.2.1+1.1.2.2+1.1.2.3–1.1.2.4) 1,267 2,877 1,594
1.1.2.1 Equity capital 1,420 2,944 1,358
1.1.2.2 Reinvested Earnings 99 99 99
1.1.2.3 Other Capital 280 134 436
1.1.2.4 Repatriation/Disinvestment 531 300 300
1.2 Net Portfolio Investment (1.2.1+1.2.2+1.2.3–1.2.4) 1,171 1,452 5,341
1.2.1 GDRs/ADRs – – –
1.2.2 FIIs 1,246 1,509 5,397
1.2.3 Offshore funds and others – – –
1.2.4 Portfolio investment by India 75 56 56
1 Foreign Investment Inflows 1,993 1,392 8,248
2012-13 2013-14
Apr.-Mar. Apr.-Mar.
2 3
1.1 Net Foreign Direct Investment (1.1.1–1.1.2) 19,819 23,770
1.1.1 Direct Investment to India (1.1.1.1–1. 1.1.2) 26,953 31,659
1.1.1.1 Gross Inflows/Gross Investments 34,298 36,396
1.1.1.1.1 Equity 22,884 25,283
1.1.1.1.1.1 Government (SIA/FIPB) 2,319 1,185
1.1.1.1.1.2 RBI 15,967 14,869
1.1.1.1.1.3 Acquisition of shares 3,539 8,245 1.1.1.1.1.4 Equity capital of unincorporated bodies 1,059 984
1.1.1.1.2 Reinvested earnings 9,880 9,047
1.1.1.1.3 Other capital 1,534 2,066
1.1.1.2 Repatriation/Disinvestment 7,345 4,737
1.1.1.2.1 Equity 6,853 4,242
1.1.1.2.2 Other capital 493 495 1.1.2 Foreign Direct Investment by India (1.1.2.1+1.1.2.2+1.1.2.3–1.1.2.4) 7,134 7,889
1.1.2.1 Equity capital 7,101 10,530
1.1.2.2 Reinvested Earnings 1,189 1,167
1.1.2.3 Other Capital 4,331 3,188
1.1.2.4 Repatriation/Disinvestment 5,488 6,995
1.2 Net Portfolio Investment (1.2.1+1.2.2+1.2.3–1.2.4) 26,891 4,917
1.2.1 GDRs/ADRs 187 20
1.2.2 FIIs 27,582 5,010
1.2.3 Offshore funds and others – –
1.2.4 Portfolio investment by India 878 114
1 Foreign Investment Inflows 46,710 28,687
Item 2013-14
1
1.1 Net Foreign Direct Investment (1.1.1–1.1.2) 23,770
1.1.1 Direct Investment to India (1.1.1.1–1. 1.1.2) 31,659
1.1.1.1 Gross Inflows/Gross Investments 36,396
1.1.1.1.1 Equity 25,283
1.1.1.1.1.1 Government (SIA/FIPB) 1,185
1.1.1.1.1.2 RBI 14,869
1.1.1.1.1.3 Acquisition of shares 8,245 1.1.1.1.1.4 Equity capital of unincorporated bodies 984
1.1.1.1.2 Reinvested earnings 9,047
1.1.1.1.3 Other capital 2,066
1.1.1.2 Repatriation/Disinvestment 4,737
1.1.1.2.1 Equity 4,242
1.1.1.2.2 Other capital 495 1.1.2 Foreign Direct Investment by India (1.1.2.1+1.1.2.2+1.1.2.3–1.1.2.4) 7,889
1.1.2.1 Equity capital 10,530
1.1.2.2 Reinvested Earnings 1,167
1.1.2.3 Other Capital 3,188
1.1.2.4 Repatriation/Disinvestment 6,995
1.2 Net Portfolio Investment (1.2.1+1.2.2+1.2.3–1.2.4) 4,917
1.2.1 GDRs/ADRs 20
1.2.2 FIIs 5,010
1.2.3 Offshore funds and others –
1.2.4 Portfolio investment by India 114
1 Foreign Investment Inflows 28,687
No. 35: Outward Remittances under the Liberalised Remittance Scheme (LRS) for Resident Individuals
(US$ Million)2013 2014
Feb. Dec. Jan. Feb.2 3 4 5
96.2 75.2 105.9 74.82.5 1.9 1.4 2.58.0 0.5 1.3 1.4
18.2 11.2 7.3 10.624.3 19.7 22.6 16.60.1 0.2 0.1 –3.4 0.8 1.0 0.7
20.7 9.4 9.8 8.60.1 0.3 0.7 0.39.3 18.1 22.0 9.69.7 13.0 39.8 24.4
Item 2012-13
11 Outward Remittances under the LRS 1,206.4 1.1 Deposit 20.1 1.2 Purchase of immovable property 77.7 1.3 Investment in equity/debt 236.9 1.4 Gift 261.6 1.5 Donations 4.5 1.6 Travel 44.8 1.7 Maintenance of close relatives 226.6 1.8 Medical Treatment 4.9 1.9 Studies Abroad 124.7 1.10 Others 204.1
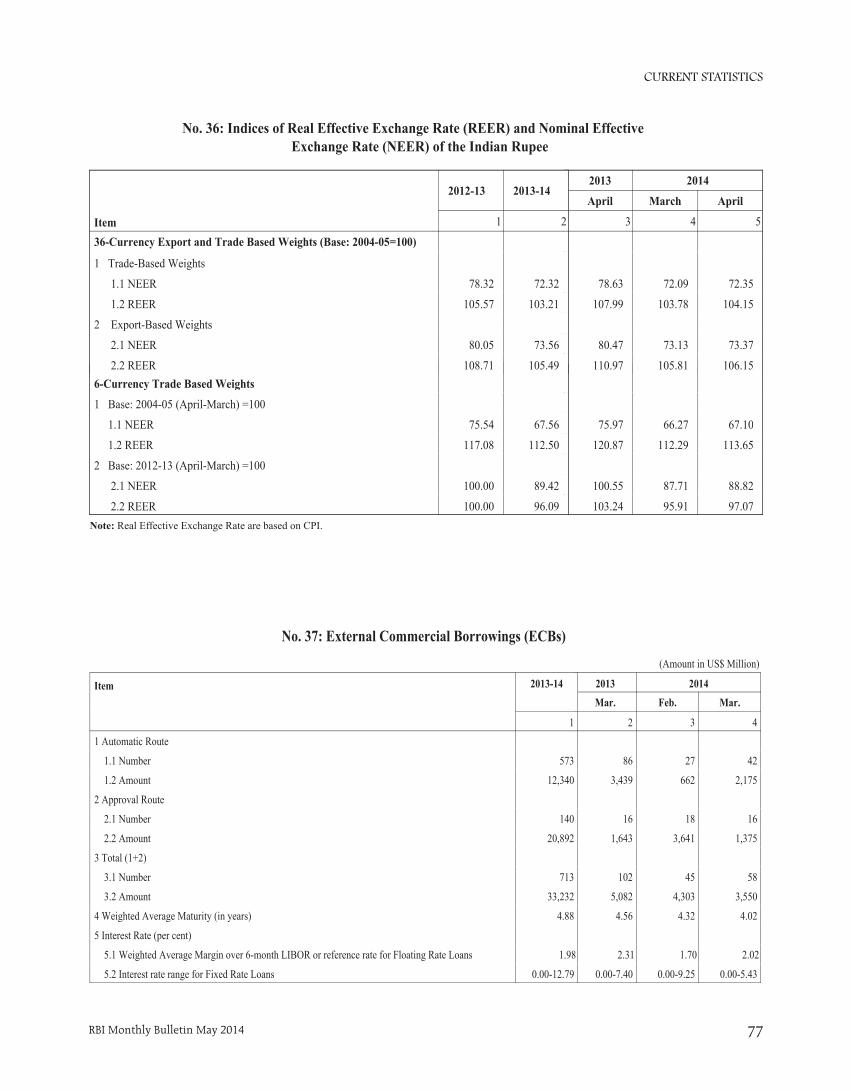
CURRENT STATISTICS
RBI Monthly Bulletin May 2014 77
No. 36: Indices of Real Effective Exchange Rate (REER) and Nominal Effective Exchange Rate (NEER) of the Indian Rupee
75.97 66.27 67.10
120.87 112.29 113.65
100.55 87.71 88.82
103.24 95.91 97.07
2013 2014
April March April
3 4 5
78.63 72.09 72.35
107.99 103.78 104.15
80.47 73.13 73.37
110.97 105.81 106.152012-13 2013-14 6-Currency Trade Based Weights
1 Base: 2004-05 (April-March) =100
1.1 NEER 75.54 67.56
1.2 REER 117.08 112.50
2 Base: 2012-13 (April-March) =100
2.1 NEER 100.00 89.42
2.2 REER 100.00 96.09
Item
2012-13 2013-14
1 2
36-Currency Export and Trade Based Weights (Base: 2004-05=100)
1 Trade-Based Weights
1.1 NEER 78.32 72.32
1.2 REER 105.57 103.21
2 Export-Based Weights
2.1 NEER 80.05 73.56
2.2 REER 108.71 105.49
(Amount in US$ Million)
2013 2014
Mar. Feb. Mar.
2 3 4
86 27 42
3,439 662 2,175
16 18 16
1,643 3,641 1,375
102 45 58
5,082 4,303 3,550
4.56 4.32 4.02
2.31 1.70 2.02
0.00-7.40 0.00-9.25 0.00-5.43
No. 37: External Commercial Borrowings (ECBs)
Item 2013-14
1
1 Automatic Route
1.1 Number 573
1.2 Amount 12,340
2 Approval Route
2.1 Number 140
2.2 Amount 20,892
3 Total (1+2)
3.1 Number 713
3.2 Amount 33,232
4 Weighted Average Maturity (in years) 4.88
5 Interest Rate (per cent)
5.1 Weighted Average Margin over 6-month LIBOR or reference rate for Floating Rate Loans 1.98
5.2 Interest rate range for Fixed Rate Loans 0.00-12.79
Note: Real Effective Exchange Rate are based on CPI.

CURRENT STATISTICS
RBI Monthly Bulletin May 201478
No. 38: India's Overall Balance of Payments
(US $ Million)
Item
Oct-Dec 2012 (PR) Oct-Dec 2013 (P)
Credit Debit Net Credit Debit Net
1 2 3 4 5 6
Overall Balance of Payments(1+2+3) 251,313 250,532 781 266,988 247,885 19,1031 CURRENT ACCOUNT (1.1+ 1.2) 130,741 162,511 –31,770 138,057 142,154 –4,0971.1 MERCHANDISE 74,236 132,613 –58,378 79,795 112,947 –33,1521.2 INVISIBLES (1.2.1+1.2.2+1.2.3) 56,505 29,898 26,608 58,262 29,207 29,054 1.2.1 Services 37,063 20,417 16,646 37,643 19,523 18,120 1.2.1.1 Travel 5,050 3,010 2,039 5,091 2,748 2,343 1.2.1.2 Transportation 4,350 3,570 780 4,114 3,421 693 1.2.1.3 Insurance 530 552 –21 487 290 197 1.2.1.4 G.n.i.e. 140 153 –13 104 171 –67 1.2.1.5 Miscellaneous 26,993 13,132 13,860 27,847 12,893 14,953 1.2.1.5.1 Software Services 16,466 565 15,901 17,475 654 16,821 1.2.1.5.2 Business Services 7,135 7,906 –770 6,905 6,720 186 1.2.1.5.3 Financial Services 1,195 898 298 1,708 1,277 432 1.2.1.5.4 Communication Services 358 250 108 516 219 297 1.2.2 Transfers 16,778 1,017 15,762 17,649 1,269 16,380 1.2.2.1 Official 287 196 92 401 229 172 1.2.2.2 Private 16,491 821 15,670 17,247 1,040 16,208 1.2.3 Income 2,664 8,464 –5,800 2,970 8,416 –5,446 1.2.3.1 Investment Income 1,898 7,896 –5,998 2,150 7,763 –5,613 1.2.3.2 Compensation of Employees 766 568 198 820 653 1672 CAPITAL ACCOUNT (2.1+2.2+2.3+2.4+2.5) 119,491 88,021 31,470 128,931 105,146 23,7852.1 Foreign Investment (2.1.1+2.1.2) 52,399 40,512 11,887 54,564 46,108 8,456 2.1.1 Foreign Direct Investment 8,659 6,554 2,106 9,689 3,623 6,066 2.1.1.1 In India 7,064 2,720 4,344 7,188 1,410 5,778 2.1.1.1.1 Equity 4,373 2,624 1,749 4,224 1,324 2,900 2.1.1.1.2 Reinvested Earnings 2,590 – 2,590 2,374 – 2,374 2.1.1.1.3 Other Capital 101 96 5 590 86 504 2.1.1.2 Abroad 1,595 3,834 –2,238 2,501 2,213 288 2.1.1.2.1 Equity 1,595 2,123 –528 2,501 1,292 1,209 2.1.1.2.2 Reinvested Earnings – 297 –297 – 297 –297 2.1.1.2.3 Other Capital – 1,413 –1,413 – 624 –624 2.1.2 Portfolio Investment 43,740 33,959 9,781 44,875 42,485 2,390 2.1.2.1 In India 43,297 33,444 9,853 44,777 42,243 2,534 2.1.2.1.1 FIIs 43,289 33,444 9,845 44,777 42,243 2,534 2.1.2.1.1.1 Equity 33,735 25,617 8,118 36,278 30,057 6,221 2.1.2.1.1.2 Debt 9,554 7,827 1,727 8,498 12,186 –3,688 2.1.2.1.2 ADR/GDRs 8 – 8 – – – 2.1.2.2 Abroad 443 515 –72 98 242 –1442.2 Loans (2.2.1+2.2.2+2.2.3) 41,217 30,423 10,795 31,440 28,430 3,010 2.2.1 External Assistance 1,340 996 343 1,044 1,085 –41 2.2.1.1 By India 13 84 –72 11 62 –51 2.2.1.2 To India 1,327 912 415 1,033 1,023 10 2.2.2 Commercial Borrowings 7,336 4,563 2,773 7,551 3,340 4,211 2.2.2.1 By India 409 498 –89 234 90 144 2.2.2.2 To India 6,927 4,065 2,862 7,317 3,250 4,067 2.2.3 Short Term to India 32,541 24,863 7,678 22,846 24,005 –1,159 2.2.3.1 Suppliers' Credit > 180 days & Buyers' Credit 30,872 24,863 6,009 22,846 23,255 –409 2.2.3.2 Suppliers' Credit up to 180 days 1,669 – 1,669 – 750 –7502.3 Banking Capital (2.3.1+2.3.2) 20,245 15,001 5,243 38,288 22,530 15,758 2.3.1 Commercial Banks 20,245 14,964 5,281 38,100 22,530 15,570 2.3.1.1 Assets 2,688 1,540 1,148 3,191 7,811 –4,620 2.3.1.2 Liabilities 17,557 13,424 4,133 34,909 14,719 20,190 2.3.1.2.1 Non-Resident Deposits 15,505 12,853 2,651 33,025 11,577 21,448 2.3.2 Others – 37 –37 188 – 1882.4 Rupee Debt Service – – – – – –2.5 Other Capital 5,630 2,085 3,545 4,638 8,077 –3,4393 Errors & Omissions 1,081 – 1,081 – 585 –5854 Monetary Movements (4.1+ 4.2) – 781 –781 – 19,103 –19,103 4.1 I.M.F. – – – – – – 4.2 Foreign Exchange Reserves (Increase - / Decrease +) – 781 –781 – 19,103 –19,103

CURRENT STATISTICS
RBI Monthly Bulletin May 2014 79
No. 39: India's Overall Balance of Payments
(` Billion)
Item
Oct-Dec 2012 (PR) Oct-Dec 2013 (P)
Credit Debit Net Credit Debit Net
1 2 3 4 5 6
Overall Balance of Payments(1+2+3) 13,608 13,566 42 16,567 15,382 1,1851 CURRENT ACCOUNT (1.1+ 1.2) 7,080 8,800 –1,720 8,567 8,821 –2541.1 MERCHANDISE 4,020 7,181 –3,161 4,951 7,009 –2,0571.2 INVISIBLES (1.2.1+1.2.2+1.2.3) 3,060 1,619 1,441 3,615 1,812 1,803 1.2.1 Services 2,007 1,106 901 2,336 1,211 1,124 1.2.1.1 Travel 273 163 110 316 171 145 1.2.1.2 Transportation 236 193 42 255 212 43 1.2.1.3 Insurance 29 30 –1 30 18 12 1.2.1.4 G.n.i.e. 8 8 –1 6 11 –4 1.2.1.5 Miscellaneous 1,462 711 751 1,728 800 928 1.2.1.5.1 Software Services 892 31 861 1,084 41 1,044 1.2.1.5.2 Business Services 386 428 –42 428 417 12 1.2.1.5.3 Financial Services 65 49 16 106 79 27 1.2.1.5.4 Communication Services 19 14 6 32 14 18 1.2.2 Transfers 909 55 853 1,095 79 1,016 1.2.2.1 Official 16 11 5 25 14 11 1.2.2.2 Private 893 44 849 1,070 65 1,006 1.2.3 Income 144 458 –314 184 522 –338 1.2.3.1 Investment Income 103 428 –325 133 482 –348 1.2.3.2 Compensation of Employees 41 31 11 51 41 102 CAPITAL ACCOUNT (2.1+2.2+2.3+2.4+2.5) 6,470 4,766 1,704 8,001 6,525 1,4762.1 Foreign Investment (2.1.1+2.1.2) 2,837 2,194 644 3,386 2,861 525 2.1.1 Foreign Direct Investment 469 355 114 601 225 376 2.1.1.1 In India 383 147 235 446 88 359 2.1.1.1.1 Equity 237 142 95 262 82 180 2.1.1.1.2 Reinvested Earnings 140 – 140 147 – 147 2.1.1.1.3 Other Capital 5 5 – 37 5 31 2.1.1.2 Abroad 86 208 –121 155 137 18 2.1.1.2.1 Equity 86 115 –29 155 80 75 2.1.1.2.2 Reinvested Earnings – 16 –16 – 18 –18 2.1.1.2.3 Other Capital – 77 –77 – 39 –39 2.1.2 Portfolio Investment 2,368 1,839 530 2,785 2,636 148 2.1.2.1 In India 2,345 1,811 534 2,779 2,621 157 2.1.2.1.1 FIIs 2,344 1,811 533 2,779 2,621 157 2.1.2.1.1.1 Equity 1,827 1,387 440 2,251 1,865 386 2.1.2.1.1.2 Debt 517 424 94 527 756 –229 2.1.2.1.2 ADR/GDRs – – – – – – 2.1.2.2 Abroad 24 28 –4 6 15 –92.2 Loans (2.2.1+2.2.2+2.2.3) 2,232 1,647 585 1,951 1,764 187 2.2.1 External Assistance 73 54 19 65 67 –3 2.2.1.1 By India 1 5 –4 1 4 –3 2.2.1.2 To India 72 49 22 64 63 1 2.2.2 Commercial Borrowings 397 247 150 469 207 261 2.2.2.1 By India 22 27 –5 15 6 9 2.2.2.2 To India 375 220 155 454 202 252 2.2.3 Short Term to India 1,762 1,346 416 1,418 1,490 –72 2.2.3.1 Suppliers' Credit > 180 days & Buyers' Credit 1,672 1,346 325 1,418 1,443 –25 2.2.3.2 Suppliers' Credit up to 180 days 90 – 90 – 47 –472.3 Banking Capital (2.3.1+2.3.2) 1,096 812 284 2,376 1,398 978 2.3.1 Commercial Banks 1,096 810 286 2,364 1,398 966 2.3.1.1 Assets 146 83 62 198 485 –287 2.3.1.2 Liabilities 951 727 224 2,166 913 1,253 2.3.1.2.1 Non-Resident Deposits 840 696 144 2,049 718 1,331 2.3.2 Others – 2 –2 12 – 122.4 Rupee Debt Service – – – – – –2.5 Other Capital 305 113 192 288 501 –2133 Errors & Omissions 59 – 59 – 36 –364 Monetary Movements (4.1+ 4.2) – 42 –42 – 1,185 –1,185 4.1 I.M.F. – – – – – – 4.2 Foreign Exchange Reserves (Increase - / Decrease +) – 42 –42 – 1,185 –1,185

CURRENT STATISTICS
RBI Monthly Bulletin May 201480
(US $ Million)
Item Oct-Dec 2012 (PR) Oct-Dec 2013 (P)Credit Debit Net Credit Debit Net
1 2 3 4 5 61 Current Account (1.A+1.B+1.C) 130,476 162,333 –31,857 137,707 141,930 –4,223 1.A Goods and Services (1.A.a+1.A.b) 111,298 153,031 –41,732 117,438 132,469 –15,032 1.A.a Goods (1.A.a.1 to 1.A.a.3) 74,236 132,613 –58,378 79,795 112,947 –33,152 1.A.a.1 General merchandise on a BOP basis 72,032 113,675 –41,643 79,214 109,812 –30,597 1.A.a.2 Net exports of goods under merchanting 2,204 1,154 1,049 580 – 580 1.A.a.3 Nonmonetary gold – 17,784 –17,784 – 3,135 –3,135 1.A.b Services (1.A.b.1 to 1.A.b.13) 37,063 20,418 16,645 37,643 19,523 18,120 1.A.b.1 Manufacturing services on physical inputs owned by others 28 10 18 18 5 13 1.A.b.2 Maintenance and repair services n.i.e. 33 78 –45 30 63 –33 1.A.b.3 Transport 4,350 3,570 780 4,114 3,421 693 1.A.b.4 Travel 5,050 3,010 2,039 5,091 2,748 2,343 1.A.b.5 Construction 252 264 –12 299 320 –21 1.A.b.6 Insurance and pension services 530 552 –21 487 290 197 1.A.b.7 Financial services 1,195 898 298 1,708 1,277 432 1.A.b.8 Charges for the use of intellectual property n.i.e. 71 1,084 –1,012 179 1,024 –845 1.A.b.9 Telecommunications, computer, and information services 16,928 930 15,997 18,035 932 17,102 1.A.b.10 Other business services 7,135 7,906 –770 6,905 6,720 186 1.A.b.11 Personal, cultural, and recreational services 238 141 97 301 193 109 1.A.b.12 Government goods and services n.i.e. 140 153 –13 104 171 –67 1.A.b.13 Others n.i.e. 1,112 1,822 –710 371 2,360 –1,989 1.B Primary Income (1.B.1 to 1.B.3) 2,664 8,464 –5,800 2,970 8,416 –5,446 1.B.1 Compensation of employees 766 568 198 820 653 167 1.B.2 Investment income 1,568 7,800 –6,232 1,819 7,711 –5,892 1.B.2.1 Direct investment 592 4,070 –3,478 824 3,469 –2,645 1.B.2.2 Portfolio investment 73 1,056 –983 90 1,190 –1,100 1.B.2.3 Other investment 102 2,674 –2,571 130 3,052 –2,922 1.B.2.4 Reserve assets 801 – 800 775 – 775 1.B.3 Other primary income 330 96 234 331 52 279 1.C Secondary Income (1.C.1+1.C.2) 16,513 838 15,675 17,299 1,045 16,254 1.C.1 Financial corporations, nonfinancial corporations, households, and NPISHs 16,491 821 15,670 17,247 1,040 16,208 1.C.1.1 Personal transfers (Current transfers between resident and/ non-resident households) 15,827 741 15,087 16,713 986 15,728 1.C.1.2 Other current transfers 663 80 583 534 54 480 1.C.2 General government 22 17 5 52 6 472 Capital Account (2.1+2.2) 669 648 22 406 297 110 2.1 Gross acquisitions (DR.)/disposals (CR.) of non-produced nonfinancial assets 12 59 –46 41 35 6 2.2 Capital transfers 657 589 68 365 261 1033 Financial Account (3.1 to 3.5) 119,565 88,811 30,754 128,909 124,211 4,699 3.1 Direct Investment (3.1A+3.1B) 8,659 6,554 2,106 9,689 3,623 6,066 3.1.A Direct Investment in India 7,064 2,720 4,344 7,188 1,410 5,778 3.1.A.1 Equity and investment fund shares 6,963 2,624 4,339 6,598 1,324 5,274 3.1.A.1.1 Equity other than reinvestment of earnings 4,373 2,624 1,749 4,224 1,324 2,900 3.1.A.1.2 Reinvestment of earnings 2,590 – 2,590 2,374 – 2,374 3.1.A.2 Debt instruments 101 96 5 590 86 504 3.1.A.2.1 Direct investor in direct investment enterprises 101 96 5 590 86 504 3.1.B Direct Investment by India 1,595 3,834 –2,238 2,501 2,213 288 3.1.B.1 Equity and investment fund shares 1,595 2,421 –825 2,501 1,589 912 3.1.B.1.1 Equity other than reinvestment of earnings 1,595 2,123 –528 2,501 1,292 1,209 3.1.B.1.2 Reinvestment of earnings – 297 –297 – 297 –297 3.1.B.2 Debt instruments – 1,413 –1,413 – 624 –624 3.1.B.2.1 Direct investor in direct investment enterprises – 1,413 –1,413 – 624 –624 3.2 Portfolio Investment 43,732 33,959 9,773 44,875 42,485 2,390 3.2.A Portfolio Investment in India 43,289 33,444 9,845 44,777 42,243 2,534 3.2.1 Equity and investment fund shares 33,735 25,617 8,118 36,278 30,057 6,221 3.2.2 Debt securities 9,554 7,827 1,727 8,498 12,186 –3,688 3.2.B Portfolio Investment by India 443 515 –72 98 242 –144 3.3 Financial derivatives (other than reserves) and employee stock options 840 1,200 –360 2,286 1,498 788 3.4 Other investment 66,325 46,309 20,016 72,059 57,502 14,557 3.4.1 Other equity (ADRs/GDRs) 8 – 8 – – – 3.4.2 Currency and deposits 15,505 12,891 2,614 33,213 11,577 21,636 3.4.2.1 Central bank (Rupee Debt Movements; NRG) – 37 –37 188 – 188 3.4.2.2 Deposit-taking corporations, except the central bank (NRI Deposits) 15,505 12,853 2,651 33,025 11,577 21,448 3.4.2.3 General government – – – – – – 3.4.2.4 Other sectors – – – – – – 3.4.3 Loans (External Assistance, ECBs and Banking Capital) 13,416 7,670 5,746 13,670 15,378 –1,708 3.4.3.A Loans to India 12,994 7,088 5,906 13,425 15,226 –1,801 3.4.3.B Loans by India 422 582 –160 245 152 93 3.4.4 Insurance, pension, and standardized guarantee schemes 8 8 – 13 181 –168 3.4.5 Trade credit and advances 32,541 24,863 7,678 22,846 24,005 –1,159 3.4.6 Other accounts receivable/payable - other 4,855 885 3,970 2,317 6,361 –4,043 3.4.7 Special drawing rights – – – – – – 3.5 Reserve assets – 781 –781 – 19,103 –19,103 3.5.1 Monetary gold – – – – – – 3.5.2 Special drawing rights n.a. – – – – – – 3.5.3 Reserve position in the IMF n.a. – – – – – – 3.5.4 Other reserve assets (Foreign Currency Assets) – 781 –781 – 19,103 –19,1034 Total assets/liabilities 119,565 88,811 30,754 128,909 124,211 4,699 3.0.1 Equity and investment fund shares 43,585 32,385 11,200 47,775 34,891 12,884 3.0.2 Debt instruments 71,118 54,760 16,358 78,817 63,856 14,961 3.0.3 Other financial assets and liabilities 4,863 1,666 3,197 2,317 25,463 –23,1465 Net errors and omissions – – 1,081 – – –585
No. 40: Standard Presentation of BoP in India as per BPM6

CURRENT STATISTICS
RBI Monthly Bulletin May 2014 81
(` Billion)
Item Oct-Dec 2012 (PR) Oct-Dec 2013 (P)Credit Debit Net Credit Debit Net
1 2 3 4 5 61 Current Account (1.A+1.B+1.C) 7,065 8,790 –1,725 8,545 8,807 –262 1.A Goods and Services (1.A.a+1.A.b) 6,027 8,286 –2,260 7,287 8,220 –933 1.A.a Goods (1.A.a.1 to 1.A.a.3) 4,020 7,181 –3,161 4,951 7,009 –2,057 1.A.a.1 General merchandise on a BOP basis 3,900 6,155 –2,255 4,915 6,814 –1,899 1.A.a.2 Net exports of goods under merchanting 119 63 57 36 – 36 1.A.a.3 Nonmonetary gold – 963 –963 – 195 –195 1.A.b Services (1.A.b.1 to 1.A.b.13) 2,007 1,106 901 2,336 1,211 1,124 1.A.b.1 Manufacturing services on physical inputs owned by others 2 1 1 1 – 1 1.A.b.2 Maintenance and repair services n.i.e. 2 4 –2 2 4 –2 1.A.b.3 Transport 236 193 42 255 212 43 1.A.b.4 Travel 273 163 110 316 171 145 1.A.b.5 Construction 14 14 –1 19 20 –1 1.A.b.6 Insurance and pension services 29 30 –1 30 18 12 1.A.b.7 Financial services 65 49 16 106 79 27 1.A.b.8 Charges for the use of intellectual property n.i.e. 4 59 –55 11 64 –52 1.A.b.9 Telecommunications, computer, and information services 917 50 866 1,119 58 1,061 1.A.b.10 Other business services 386 428 –42 428 417 12 1.A.b.11 Personal, cultural, and recreational services 13 8 5 19 12 7 1.A.b.12 Government goods and services n.i.e. 8 8 –1 6 11 –4 1.A.b.13 Others n.i.e. 60 99 –38 23 146 –123 1.B Primary Income (1.B.1 to 1.B.3) 144 458 –314 184 522 –338 1.B.1 Compensation of employees 41 31 11 51 41 10 1.B.2 Investment income 85 422 –337 113 478 –366 1.B.2.1 Direct investment 32 220 –188 51 215 –164 1.B.2.2 Portfolio investment 4 57 –53 6 74 –68 1.B.2.3 Other investment 6 145 –139 8 189 –181 1.B.2.4 Reserve assets 43 – 43 48 – 48 1.B.3 Other primary income 18 5 13 21 3 17 1.C Secondary Income (1.C.1+1.C.2) 894 45 849 1,073 65 1,009 1.C.1 Financial corporations, nonfinancial corporations, households, and NPISHs 893 44 849 1,070 65 1,006 1.C.1.1 Personal transfers (Current transfers between resident and/ non-resident households) 857 40 817 1,037 61 976 1.C.1.2 Other current transfers 36 4 32 33 3 30 1.C.2 General government 1 1 – 3 – 32 Capital Account (2.1+2.2) 36 35 1 25 18 7 2.1 Gross acquisitions (DR.)/disposals (CR.) of non-produced nonfinancial assets 1 3 –3 3 2 – 2.2 Capital transfers 36 32 4 23 16 63 Financial Account (3.1 to 3.5) 6,474 4,809 1,665 7,999 7,708 292 3.1 Direct Investment (3.1A+3.1B) 469 355 114 601 225 376 3.1.A Direct Investment in India 383 147 235 446 88 359 3.1.A.1 Equity and investment fund shares 377 142 235 409 82 327 3.1.A.1.1 Equity other than reinvestment of earnings 237 142 95 262 82 180 3.1.A.1.2 Reinvestment of earnings 140 – 140 147 – 147 3.1.A.2 Debt instruments 5 5 – 37 5 31 3.1.A.2.1 Direct investor in direct investment enterprises 5 5 – 37 5 31 3.1.B Direct Investment by India 86 208 –121 155 137 18 3.1.B.1 Equity and investment fund shares 86 131 –45 155 99 57 3.1.B.1.1 Equity other than reinvestment of earnings 86 115 –29 155 80 75 3.1.B.1.2 Reinvestment of earnings – 16 –16 – 18 –18 3.1.B.2 Debt instruments – 77 –77 – 39 –39 3.1.B.2.1 Direct investor in direct investment enterprises – 77 –77 – 39 –39 3.2 Portfolio Investment 2,368 1,839 529 2,785 2,636 148 3.2.A Portfolio Investment in India 2,344 1,811 533 2,779 2,621 157 3.2.1 Equity and investment fund shares 1,827 1,387 440 2,251 1,865 386 3.2.2 Debt securities 517 424 94 527 756 –229 3.2.B Portfolio Investment by India 24 28 –4 6 15 –9 3.3 Financial derivatives (other than reserves) and employee stock options 45 65 –19 142 93 49 3.4 Other investment 3,591 2,508 1,084 4,471 3,568 903 3.4.1 Other equity (ADRs/GDRs) – – – – – – 3.4.2 Currency and deposits 840 698 142 2,061 718 1,343 3.4.2.1 Central bank (Rupee Debt Movements; NRG) – 2 –2 12 – 12 3.4.2.2 Deposit-taking corporations, except the central bank (NRI Deposits) 840 696 144 2,049 718 1,331 3.4.2.3 General government – – – – – – 3.4.2.4 Other sectors – – – – – – 3.4.3 Loans (External Assistance, ECBs and Banking Capital) 726 415 311 848 954 –106 3.4.3.A Loans to India 704 384 320 833 945 –112 3.4.3.B Loans by India 23 32 –9 15 9 6 3.4.4 Insurance, pension, and standardized guarantee schemes – – – 1 11 –10 3.4.5 Trade credit and advances 1,762 1,346 416 1,418 1,490 –72 3.4.6 Other accounts receivable/payable - other 263 48 215 144 395 –251 3.4.7 Special drawing rights – – – – – – 3.5 Reserve assets – 42 –42 – 1,185 –1,185 3.5.1 Monetary gold – – – – – – 3.5.2 Special drawing rights n.a. – – – – – – 3.5.3 Reserve position in the IMF n.a. – – – – – – 3.5.4 Other reserve assets (Foreign Currency Assets) – 42 –42 – 1,185 –1,1854 Total assets/liabilities 6,474 4,809 1,665 7,999 7,708 292 3.0.1 Equity and investment fund shares 2,360 1,754 606 2,965 2,165 799 3.0.2 Debt instruments 3,851 2,965 886 4,891 3,962 928 3.0.3 Other financial assets and liabilities 263 90 173 144 1,580 –1,4365 Net errors and omissions – – 59 – – –36
No. 41: Standard Presentation of BoP in India as per BPM6

CURRENT STATISTICS
RBI Monthly Bulletin May 201482
(US$ Million)
2012 2013
Dec. Sep. Dec.
Assets Assets Assets
3 4 5
–296,674 –299,549 –317,214
Item 2012-13
Assets
1
6 IIP (Assets - Liabilities) –322,190
(US$ Million)
2012 2013
Dec. Sep. Dec.
Assets Liabilities Assets Liabilities Assets Liabilities
3 4 5 6 7 8
118,072 224,988 120,126 218,129 119,838 226,748
84,081 215,009 83,645 207,396 82,733 215,631
33,991 9,979 36,481 10,733 37,105 11,117
1,521 185,768 1,315 171,598 1,315 177,220
1,440 128,932 1,179 124,343 1,179 132,348
81 56,836 136 47,255 136 44,873
28,677 329,825 38,021 346,517 43,849 372,125
5,671 84,600 8,192 89,557 10,859 88,361
3,524 165,477 5,716 168,683 5,553 171,858
6,888 67,758 10,775 75,216 13,867 98,772
12,592 11,990 13,338 13,061 13,570 13,134
295,638 – 277,233 – 293,878 –
443,907 740,582 436,695 736,243 458,879 776,093
No. 42: International Investment Position
Item2012-13
Assets Liabilities
1 2
1 Direct Investment Abroad/in India 119,510 233,659
1.1 Equity Capital and Reinvested Earnings 84,850 223,143
1.2 Other Capital 34,660 10,517
2 Portfolio Investment 1,375 196,767
2.1 Equity 1,261 139,460
2.2 Debt 114 57,307
3 Other Investment 34,822 339,517
3.1 Trade Credit 3,921 88,980
3.2 Loan 4,917 166,937
3.3 Currency and Deposits 13,058 71,003
3.4 Other Assets/Liabilities 12,926 12,597
4 Reserves 292,046 –
5 Total Assets/ Liabilities 447,753 769,943
As on Financial Year /Quarter End

CURRENT STATISTICS
RBI Monthly Bulletin May 2014 83
No. 43: Payment System Indicators
2014
Jan. Feb. Mar.
6 7 8
76,978.21 64,943.06 99,245.04
48,899.46 42,259.36 65,212.63
13,022.37 10,608.55 16,561.21
15,056.38 12,075.15 17,471.20
33,022.54 42,524.90 53,576.36
14,459.91 11,653.44 14,561.71
14,539.69 10,650.13 10,103.22
8,435.78 5,610.83 4,365.67
6,103.91 5,039.30 5,737.56
4,022.94 20,221.33 28,911.42
7,670.84 6,901.06 9,058.68
4,991.89 4,704.40 6,295.10
1,371.23 878.19 843.52
386.83 275.54 314.42
984.40 602.65 529.10
1,307.73 1,318.47 1,920.05
4,168.44 3,959.35 5,673.86
113.41 112.79 126.34
170.30 175.96 214.79
3,871.54 3,656.05 5,312.23
13.20 14.56 20.50
1,950.42 1,778.47 2,014.70
143.13 128.33 147.05
1.51 1.40 1.57
141.62 126.93 145.49
1,807.30 1,650.14 1,867.64
1,722.32 1,575.79 1,782.29
84.98 74.35 85.36
6.83 7.06 8.94
2.31 2.73 3.39
2.57 2.70 2.98
1.95 1.63 2.57
26.25 26.36 33.91
– – –
– – –
– – –
– – –
– – –
108,740.91 108,038.74 152,106.38
2013-14
5
904,968.04
573,614.03
160,638.37
170,715.64
600,714.76
175,261.92
161,848.24
89,566.99
72,281.26
263,604.59
93,003.03
44,203.14
31,129.79
16,050.82
15,078.97
17,670.10
47,415.95
1,267.96
2,492.19
43,559.98
95.81
22,143.51
1,556.62
16.77
1,539.85
20,586.89
19,632.72
954.17
79.05
27.45
27.88
23.71
224.18
–
–
–
–
–
1,497,608.70
2014
Jan. Feb. Mar.
2 3 4
7.13 6.65 8.64
6.74 6.31 8.22
0.38 0.34 0.42
0.001 0.001 0.001
0.23 0.18 0.20
0.02 0.01 0.02
0.09 0.06 0.05
0.09 0.06 0.05
0.004 0.003 0.003
0.13 0.11 0.13
104.14 93.89 122.58
66.76 65.28 81.26
20.58 12.27 14.60
5.62 3.76 3.84
14.96 8.51 10.76
16.80 16.35 26.72
95.41 93.00 114.18
16.55 15.61 17.74
10.91 11.01 10.61
65.91 64.15 82.83
2.03 2.23 3.00
638.07 591.49 674.88
45.85 41.06 46.40
0.27 0.25 0.30
45.58 40.81 46.11
592.22 550.43 628.48
538.39 501.53 571.50
53.83 48.90 56.98
13.02 13.61 15.83
10.83 11.49 13.42
2.15 2.08 2.37
0.04 0.04 0.05
9.52 8.86 10.74
399.33 405.63 413.63
19.00 19.05 19.21
380.33 386.58 394.42
145858 150008 160055
1034161 1035623 1065984
858.00 798.82 936.30
System
2013-14
1
1 RTGS 81.11
1.1 Customer Transactions 76.35
1.2 Interbank Transactions 4.75
1.3 Interbank Clearing 0.011
2 CCIL Operated Systems 2.56
2.1 CBLO 0.18
2.2 Govt. Securities Clearing 0.87
2.2.1 Outright 0.82
2.2.2 Repo 0.046
2.3 Forex Clearing 1.51
3 Paper Clearing 1,253.97
3.1 Cheque Truncation System (CTS) 589.32
3.2 MICR Clearing 438.96
3.2.1 RBI Centres 229.97
3.2.2 Other Centres 208.99
3.3 Non-MICR Clearing 225.70
4 Retail Electronic Clearing 1,018.79
4.1 ECS DR 192.91
4.2 ECS CR (includes NECS) 152.54
4.3 EFT/NEFT 657.97
4.4 Immediate Payment Service (IMPS) 15.36
5 Cards 7,219.13
5.1 Credit Cards 512.03
5.1.1 Usage at ATMs 2.96
5.1.2 Usage at POS 509.08
5.2 Debit Cards 6,707.10
5.2.1 Usage at ATMs 6,088.02
5.2.2 Usage at POS 619.08
6 Prepaid Payment Instruments (PPIs) 144.26
6.1 m-Wallet 106.09
6.2 PPI Cards 37.65
6.3 Paper Vouchers 0.53
7 Mobile Banking 94.71
8 Cards Outstanding 413.63
8.1 Credit Card 19.21
8.2 Debit Card 394.42
9 Number of ATMs (in actuals) 160055
10 Number of POS (in actuals) 1065984
11 Grand Total (1.1+1.2+2+3+4+5+6) 9,719.80
Value ( Billion)
Volume (Million) `
Payment and Settlement Systems

CURRENT STATISTICS
RBI Monthly Bulletin May 201484
Explanatory Notes to the Current Statistics
Table No. 11.2 & 6: Annual data are averages of months.3.5 & 3.7: Relate to ratios of increments over fi nancial year so far.4.1 to 4.4, 4.8, 4.12 & 5: Relate to the last day of the month/fi nancial year. 4.5, 4.6 & 4.7: Relate to fi ve major banks on the last Friday of the month/fi nancial year. 4.9 to 4.11: Relate to the last auction day of the month/fi nancial year.
Table No. 22.1.2: Include paid-up capital, reserve fund and Long-Term Operations Funds. 2.2.2: Include cash, fi xed deposits and short-term securities/bonds, e.g., issued by IIFC (UK).
Table No. 4Maturity-wise position of outstanding forward contracts is available at http://nsdp.rbi.org.in under ‘‘Reserves Template’’.
Table No. 5Special refi nance facility to Others, i.e. to the EXIM Bank, is closed since March 31, 2013.
Table No. 6For scheduled banks, March-end data pertain to the last reporting Friday.2.2: Exclude balances held in IMF Account No.1, RBI employees’ provident fund, pension fund, gratuity and superannuation fund.
Table Nos. 7 & 113.1 in Table 7 and 2.4 in Table 11: Include foreign currency denominated bonds issued by IIFC (UK).
Table No. 8NM2 and NM3 do not include FCNR (B) deposits.2.4: Consist of paid-up capital and reserves.2.5: includes other demand and time liabilities of the banking system.
Table No. 9Financial institutions comprise EXIM Bank, SIDBI, NABARD and NHB. L1 and L2 are compiled monthly and L3 quarterly. Wherever data are not available, the last available data have been repeated.
Table No. 172.1.1: Exclude reserve fund maintained by co-operative societies with State Co-operative Banks2.1.2: Exclude borrowings from RBI, SBI, IDBI, NABARD, notifi ed banks and State Governments.4: Include borrowings from IDBI and NABARD.
Table No. 24Primary Dealers (PDs) include banks undertaking PD business.
Table No. 30 Exclude private placement and offer for sale. 1: Exclude bonus shares.2: Include cumulative convertible preference shares and equi-preference shares.
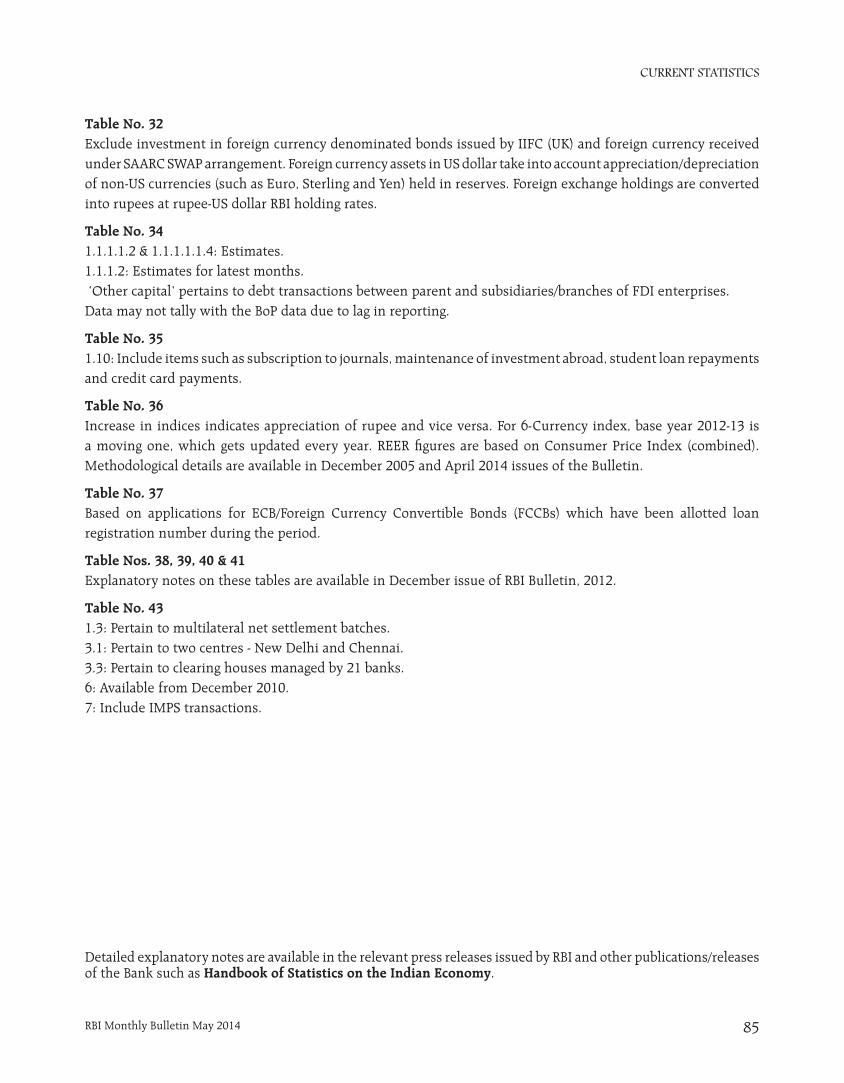
CURRENT STATISTICS
RBI Monthly Bulletin May 2014 85
Table No. 32Exclude investment in foreign currency denominated bonds issued by IIFC (UK) and foreign currency received under SAARC SWAP arrangement. Foreign currency assets in US dollar take into account appreciation/depreciation of non-US currencies (such as Euro, Sterling and Yen) held in reserves. Foreign exchange holdings are converted into rupees at rupee-US dollar RBI holding rates.
Table No. 341.1.1.1.2 & 1.1.1.1.1.4: Estimates.1.1.1.2: Estimates for latest months. ‘Other capital’ pertains to debt transactions between parent and subsidiaries/branches of FDI enterprises.Data may not tally with the BoP data due to lag in reporting.
Table No. 351.10: Include items such as subscription to journals, maintenance of investment abroad, student loan repayments and credit card payments.
Table No. 36 Increase in indices indicates appreciation of rupee and vice versa. For 6-Currency index, base year 2012-13 is a moving one, which gets updated every year. REER fi gures are based on Consumer Price Index (combined). Methodological details are available in December 2005 and April 2014 issues of the Bulletin.
Table No. 37Based on applications for ECB/Foreign Currency Convertible Bonds (FCCBs) which have been allotted loan registration number during the period.
Table Nos. 38, 39, 40 & 41 Explanatory notes on these tables are available in December issue of RBI Bulletin, 2012.
Table No. 431.3: Pertain to multilateral net settlement batches.3.1: Pertain to two centres - New Delhi and Chennai. 3.3: Pertain to clearing houses managed by 21 banks.6: Available from December 2010.7: Include IMPS transactions.
Detailed explanatory notes are available in the relevant press releases issued by RBI and other publications/releases of the Bank such as Handbook of Statistics on the Indian Economy.

RECENT PUBLICATIONSRECENT PUBLICATIONS
RBI Monthly Bulletin May 201486
Name of Publication Price
India Abroad
1. Reserve Bank of India Bulletin 2014 `180 per copy (over the counter)
`220 per copy (inclusive of postage)
`2,600 (one year subscription - inclusive of postage)
US$ 10 per copy (inclusive of postage)
US$ 120 (one-year subscription)
2. Weekly Statistical Supplement to RBI
Monthly Bulletin 2014
`20 per copy (over the counter)
`1200 (one-year subscription)
US$ 40 one-year subscription (inclusive
of air mail charges)
3. Report on Trend and Progress of
Banking in India 2012-13
`270 per copy (over the counter)
`310 per copy (including postal charges)
`240 per copy (concessional including postage)
`200 per copy (concessional price over the counter)
US$ 11 per copy
(inclusive of air mail courier charges)
4. Handbook of Statistics on the Indian
Economy 2012-13
`175 (over the counter)
`250 (inclusive of postage)
`125 (concessional)
`200 (concessional with postage)
US$ 32
(inclusive of air mail courier charges)
5. Report on Currency and Finance 2009-12
Fiscal-Monetary Co-ordination
`515 (normal)
`555 (inclusive of postage)
US$ 16 per copy
(including air mail courier charges)
6. Report on Currency and Finance
2003-08 Vol. I to V (Special Issue)
`1,100 (normal)
` 1,170 (inclusive of postage)
` 830 (concessional)
` 900 (concessional inclusive of postage)
US$ 55 per copy
(including air mail courier charges)
7. State Finances -
A Study of Budgets of 2013-14
`480 per copy (over the counter)
`520 per copy (including postal charges)
US$ 15 per copy
(including air mail courier charges)
8. Handbook of Statistics on State
Government Finances 2010
Print version along with CD `380
`430 (inclusive of postage)
`285 (concessional)
`335 (concessional inclusive postage)
CD-ROM
`80 (normal)
`105 (inclusive of postage)
`60 (concessional)
`85 (concessional inclusive of postage)
US$ 31for print version along with CD
Rom by air mail courier charges)
US$ 16 per CD (inclusive of air mail courier charges)
US$ 4 per CD
(inclusive of registerted air mail charges)
9. CD Compendium of Articles on State
Finances (1950-51 to 2010-11)
`280 (over the counter)
`305 (inclusive of postal charges)
`210 (concessional)
`235 (concessional inclusive of postage)
US$ 8 (air mail book post charges)
Recent Publications of the Reserve Bank of India
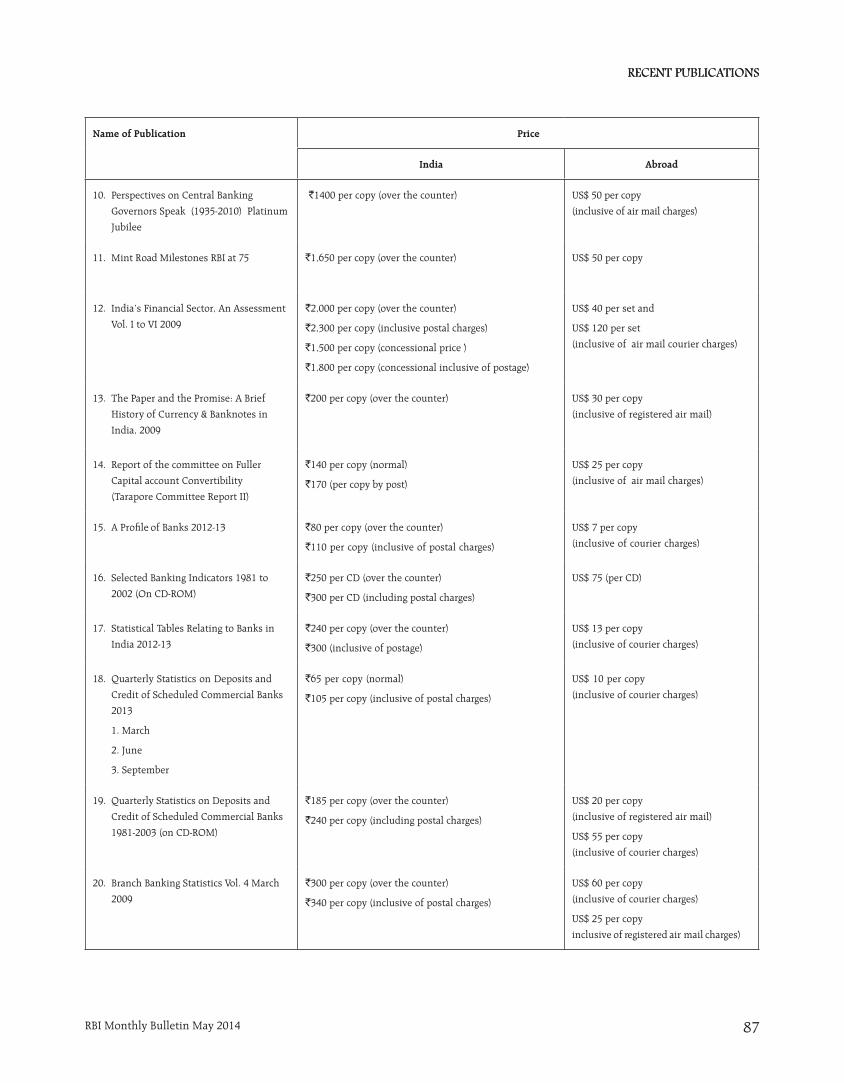
RECENT PUBLICATIONSRECENT PUBLICATIONS
RBI Monthly Bulletin May 2014 87
Name of Publication Price
India Abroad
10. Perspectives on Central Banking
Governors Speak (1935-2010) Platinum
Jubilee
`1400 per copy (over the counter) US$ 50 per copy
(inclusive of air mail charges)
11. Mint Road Milestones RBI at 75 `1,650 per copy (over the counter) US$ 50 per copy
12. India’s Financial Sector, An Assessment
Vol. I to VI 2009
`2,000 per copy (over the counter)
`2,300 per copy (inclusive postal charges)
`1,500 per copy (concessional price )
`1,800 per copy (concessional inclusive of postage)
US$ 40 per set and
US$ 120 per set
(inclusive of air mail courier charges)
13. The Paper and the Promise: A Brief
History of Currency & Banknotes in
India, 2009
`200 per copy (over the counter) US$ 30 per copy
(inclusive of registered air mail)
14. Report of the committee on Fuller
Capital account Convertibility
(Tarapore Committee Report II)
`140 per copy (normal)
`170 (per copy by post)
US$ 25 per copy
(inclusive of air mail charges)
15. A Profi le of Banks 2012-13 `80 per copy (over the counter)
`110 per copy (inclusive of postal charges)
US$ 7 per copy
(inclusive of courier charges)
16. Selected Banking Indicators 1981 to
2002 (On CD-ROM)
`250 per CD (over the counter)
`300 per CD (including postal charges)
US$ 75 (per CD)
17. Statistical Tables Relating to Banks in
India 2012-13
`240 per copy (over the counter)
`300 (inclusive of postage)
US$ 13 per copy
(inclusive of courier charges)
18. Quarterly Statistics on Deposits and
Credit of Scheduled Commercial Banks
2013
1. March
2. June
3. September
`65 per copy (normal)
`105 per copy (inclusive of postal charges)
US$ 10 per copy
(inclusive of courier charges)
19. Quarterly Statistics on Deposits and
Credit of Scheduled Commercial Banks
1981-2003 (on CD-ROM)
`185 per copy (over the counter)
`240 per copy (including postal charges)
US$ 20 per copy
(inclusive of registered air mail)
US$ 55 per copy
(inclusive of courier charges)
20. Branch Banking Statistics Vol. 4 March
2009
`300 per copy (over the counter)
`340 per copy (inclusive of postal charges)
US$ 60 per copy
(inclusive of courier charges)
US$ 25 per copy
inclusive of registered air mail charges)

RECENT PUBLICATIONSRECENT PUBLICATIONS
RBI Monthly Bulletin May 201488
Name of Publication Price
India Abroad
21. Basic Statistical Returns of Scheduled
Commercial Banks in India Vol. 41
March 2012
`270 per copy (over the counter)
`310 per copy (inclusive of postal charges)
US$ 10 per copy
(inclusive of courier charges)
22. Private Corporate Business Sector in
India - Selected Financial Statistics from
1950-51 to 1997-98 (All Industries)
`300 per copy, (print version) (inclusive postal charges)
`500 per CD (over the counter)
`500 per CD (inclusive postal charges)
US$ 60 per copy
(inclusive of registered air mail)
US$ 100 per CD ROM
(inclusive of registered air mail)
23. Banking Paribhashik Kosh (English-
Hindi) 2010
`75 per copy (over the counter)
`97 per copy (including postal charges)
–
24. Banking Glossary (2012) `80 (normal)
(postage extra)
Notes
1. Many of the above publications are available at the RBI website (www.rbi.org.in).
2. Time Series data are available at the Database on Indian Economy (http://dbie.rbi.org.in).
3. The Reserve Bank of India History 1935-1981 (3 Volumes), Challenges to Central Banking in the Context of Financial Crisis and the Regional Economy of India: Growth and Finance are available at leading book stores in India.
General Instructions
1. Publications once sold will not be taken back.
2. Publications will not be supplied on a consignment VPP basis.
3. Wherever concessional price is not indicated, a discount of 25 per cent is available for students, teachers/lecturers, academic/education institutions, public libraries and book sellers in India provided the proof of eligibility is submitted from the concerned institution. Back issues of the publication are generally not available.
4. The publications are available for sale between 10.30 am to 3.00 pm (Monday to Friday), at the Sales Section, Division of Reports and Knowledge Dissemination, Department of Economic and Policy Research, Reserve Bank of India, Amar Building, Ground Floor, Sir P. M. Road, Fort, P. B. No.1036, Mumbai - 400 001. The contact number of Sales Section is 022-2260 3000 Extn.: 4002, Email: [email protected].
5. Subscription should be sent by demand draft/cheque payable at Mumbai in favour of Reserve Bank of India, Mumbai to the Director, Division of Reports and Knowledge Dissemination, Department of Economic and Policy Research, Reserve Bank of India, Central Offi ce, Fort, Mumbai - 400 001.
6. Every endeavour will be made to despatch publications expeditiously. In case of rush of orders, dispatch will be executed on a fi rst-come fi rst-served basis. It may take a minimum of a month’s time to complete formalities and then to dispatch the available publication. Complaints regarding ‘non-receipt of publication’ may be sent within a period of 2 months.