Chantal Peltenburg CPv4.indd
189
Predicting adverse events during therapy for HIV and hepatitis C e role of ITPase activity and ITPA genotype Nicole Chantal Peltenburg
-
Upload
khangminh22 -
Category
Documents
-
view
1 -
download
0
Transcript of Chantal Peltenburg CPv4.indd

Predicting adverse events during therapy for HIV and hepatitis C
The role of ITPase activity and ITPA genotype
Nicole Chantal Peltenburg

Predicting adverse events during therapy for HIV and hepatitis C. The role of ITPase activ-ity and ITPA genotype.
ISBN 978-94-6361-281-4
The studies reported in this thesis were performed at the departments of Internal Medicine, Medical Microbiology and Infectious Diseases and Gastro-enterology and Hepatolgy of the Erasmus MC University Medical Center, Rotterdam, The Netherlands, the departments of Internal Medicine, Clinical Genetics and Medical Microbiology of the Maastricht University Medical Center, Maastricht, The Netherlands and the Faculty of Science, Leiden Academic Centre for Drug Research, Analytical BioSciences, Leiden.
Financial support for reproduction of this thesis was provided by Virology Education B.V., Gilead Sciences Netherlands B.V., Erasmus Medical Center Rotterdam
Cover design: Chantal Peltenburg, Gwenny vd Oetelaar, Jolanda v Deventer and Optima Grafische Communicatie.Lay-out and printing by Optima Grafische Communicatie (www.ogc.nl)©Nicole Chantal Peltenburg, 2019, Rotterdam
All rights reserved. No part of this thesis may be reproduced, stored in a database or re-trieval system, or published, in any form or by any means, without permission of the author.

Predicting adverse events during therapy for HIV and hepatitis CThe role of ITPase activity and ITPA genotype
Het voorspellen van bijwerkingen tijdens therapie voor HIV en hepatitis CDe rol van ITPase activiteit en ITPA genotype
Proefschrift
Ter verkrijging van de graad van doctor aan de Erasmus Universiteit Rotterdam
op gezag van de rector magnificus
Prof. dr. R.C.M.E. Engels
en volgens besluit van het College voor Promoties.
De openbare verdediging zal plaatsvinden op
woensdag 3 juli 2019 om 15:30 uur
door
Nicole Chantal PeltenburgGeboren te ’s-Gravenhage

PromotiecommissiePromotor: Prof. dr. A. VerbonOverige leden: Prof. dr. M.E. Rubio Gozalbo Prof. dr. E.J.G. Sijbrands Prof. dr. A.T. van der PloegCopromotoren: Dr. J. Bierau Dr. J.A. Bakker

Table of contents
Chapter 1. General introduction and outline of the thesis 7
Chapter 2. Inosine triphosphate pyrophosphohydrolase activity: more accurate predictor for ribavirin-induced anemia in hepatitis C infected patients than ITPA genotype.
33
Clinical Chemistry and Laboratory Medicine
Chapter 3. Inosine triphosphate pyrophosphohydrolase expression: decreased in leukocytes of HIV-infected patients using combination antiretroviral therapy.
51
Journal of Acquired Immune Deficiency Syndromes
Chapter 4. Erythrocyte inosine triphosphatase activity: a potential biomarker for adverse events during combination antiretroviral therapy for HIV.
65
PLoS One
Chapter 5. Inosine 5’-triphosphatase activity is associated with TDF-associated nephrotoxicity in HIV.
83
Submitted
Chapter 6. Metabolic events in HIV-infected patients using abacavir are associated with erythrocyte inosine triphosphatase activity.
95
Journal of Antimicrobial Chemotherapy
Chapter 7. Persistent metabolic changes in HIV-infected patients during the first year of combination antiretroviral therapy.
111
Scientific Reports.
Chapter 8. Summarizing discussion and future perspectives 147
Chapter 9. Nederlandse samenvatting 167
Chapter 10. List of publications 177PhD portfolio 181Curriculum vitae 183Dankwoord 185


Chapter 1.General introduction and outline of the thesis


9
General introduction and outline of the thesis
HumaN ImmuNOdefICIeNCy VIrus
In 1983 the Human immunodeficiency virus (HIV) was discovered after the clinical ob-servation in 1981 of a cluster of patients who were suffering from Pneumocystis jirovecii (previously carinii) pneumonia.1 This rare opportunistic infection was only reported in patients with a severely impaired immune system, but this cluster of patients did not have a medical history of immune deficiency. In 2017, there were an estimated 36.9 million (31.1-43.9 million) people living with HIV worldwide and in July 2018 21.7 million (19.1-22.6 million) of those people had access to antiretroviral therapy.2
The HIV is a single-stranded ribonucleic acid (RNA) virus, that specifically infects CD4+ T-helper lymphocytes, macrophages and dendritic cells by binding of glycoprotein 120, a protein on its trimeric envelope complex, to the CD4-receptor and one of the co-receptors CCR5 or CXCR4 on the target cell.3-5 After a series of steps, HIV glycoprotein 41 is inserted into the host cellular membrane and then undergoes a significant conformational change, forming a hairpin and bringing the membranes of the HIV and the host cell together, thereby allowing them to fuse.6 After the fusion process, the HIV capsid enters the cytoplasm of the target cell, where it releases its content: the enzymes reverse transcriptase, integrase and protease, some minor proteins, the major core protein and two single-stranded RNA strands.7 Inside the cytoplasm, HIV uses its enzyme reverse transcriptase and the nucleotides of the host to transform its single-stranded RNA into a double-stranded deoxyribonucleic acid (DNA) molecule.8 This DNA is transported to the nucleus of the host cell and via the enzyme integrase incorporated into the DNA of the host.9 The nucleotide metabolism of the host further transcribes this incorporated DNA into new RNA strands, that, after transla-tion of new essential HIV proteins, are assembled together with these proteins into a new HIV virion that buds from the host membrane and is released from the host cell.7 Finally, the HIV enzyme protease completes the last step of the HIV cycle, maturing the virus to a new infectious particle. The HIV-cycle is displayed in Figure 1.
If left untreated, HIV infection eventually leads to a depletion of CD4+ T-lymphocytes. The mechanism behind the slow decrease of CD4+ T-lymphocytes is not completely understood, but probably consists of a combination of factors. HIV is causing a direct cytotoxicity, lead-ing to massive CD4+ T-cell destruction, occurring in the early course of the infection. It is thought that this massive destruction is followed by a regenerative response of CD4+ memory T-cells, preserving CD4+ T-cell numbers and immune function. However, this ho-meostatic balance eventually fails, due to factors such as infection and death of progenitor cells,10 destruction of the secondary lymphoid tissues that support the homeostasis11 and chronic inflammation. The chronic inflammation is also sustained by a combination of fac-tors, like gastrointestinal mucosa loss (leading to microbial translocation),12 pyroptosis (a

Chapter 1.
10
highly inflammatory form of programmed cell death like apoptosis, leading to the release of the dying cells contents among which inflammatory cytokines)13 and polyclonal activation of B-cells14 and pro-inflammatory cytokines.15 Failing of the homeostasic balance between CD4+ T-cell destruction and regeneration, leads to a critical effector T-cell population loss,16 resulting in the Acquired Immune Deficiency Syndrome (AIDS). AIDS is the last stage of HIV-infection, defined by a CD4+ T-cell count below 200 cells/mm3 or the presence of an AIDS-defining illness, which are opportunistic infections or certain types of cancer, and ultimately death. However, this lethal chain of events can be reversed by combination antiretroviral therapy; cART. Antiretroviral therapy has become increasingly effective over the last decades in inhibiting the replication of HIV and enabling the restoration of the im-mune system. The drugs used in antiretroviral therapy for HIV can be categorized as CCR5 antagonists, fusion and entry inhibitors, non-nucleoside reverse transcriptase inhibitors (NNRTI), reverse transcriptase inhibitors that are nucleoside/nucleotide analogues (NRTI), integrase inhibitors (INSTI) and protease inhibitors (PI), based on their target in the HIV replication cycle (Figure 1). A cART regimen consists of a combination of drugs from dif-ferent classes. According to all commonly used guidelines17-21 the preferred initial treatment for all cART naïve patients consists of two NRTIs combined with either an NNRTI, a PI with a pharmacoenhancer (also called a booster) or an integrase inhibitor. Very recent studies, however, have shown equal effectiveness with combinations of 2 drugs instead of 3, and thus the guidelines might be adapted on short notice.22-24
After the introduction of cART, the life-expectancy of people living with HIV is now ap-proaching the life-expectancy of the non-HIV infected general population in the Western world.25 Additionally, cART significantly reduces new HIV transmissions to HIV-negative sexual partners either by treatment of the HIV-positive partner (Treatment as prevention; TASP)26,27 or by treating the HIV-negative partner prior to sexual intercourse (Pre-exposure prophylaxis; PREP).28 Although these therapeutic strategies are highly effective, cART is not curative and cessation leads to a rebound of HIV viremia. Treatment of HIV requires a life-long commitment to medication with the risk of adverse effects, sometimes severe, which have been reported for all drugs used in cART regimens. Besides HLA-B*57:01, a marker to predict hypersensitivity for abacavir, no other biomarkers or genetic susceptibility traits are known to predict the occurrence of adverse events during cART use.
Thus HIV treatment needs to be further ameliorated, in order to diminish adverse reactions during cART use, and new biomarkers to predict adverse reactions would be very helpful tools. Both the replication of HIV and the mechanism of action of the NRTIs, the backbone of the cART regimens currently recommended in the HIV treatment guidelines, depend for an important part on the human nucleotide metabolism. Further, also in other viral infec-tions, like hepatitis C (HCV), hepatitis B (HBV) and herpesviridae, nucleotide analogues
11
General introduction and outline of the thesis
are used in the treatment. Knowledge regarding the nucleotide metabolism is therefore important to improve inhibition of HIV replication and decrease adverse events during therapy with nucleotide analogue drugs in HIV and various other infectious diseases.
HumaN NuCleOTIde meTabOlIsm
Canonical nucleotidesNucleotides are the building blocks of DNA and RNA, and the basis for the function of all cells in all living species (including humans). In humans, DNA is located in the nucleus (chromosomal DNA) and in the mitochondrion (circular mtDNA). Nucleotides contain a nucleobase, a deoxyribose (together a nucleoside) and a phosphate group (Figure 2a). In RNA the nucleoside contains a ribose instead of a deoxyribose.
DNA is composed of 2 strings of nucleotides, bound together via the nucleobases by hy-drogen bonds and forming the genetic code (Figure 2b). The nucleobases incorporated in nucleic acids are adenine, guanine, cytosine and thymine, and are considered the canonical nucleobases. These nucleobases can be divided in 2 groups according to their chemical structure. Cytosine and thymidine (and uracil in RNA) are pyrimidines and have a core in
figure 1. HIV replication cycle and drug targets for combination antiretroviral therapy. Adapted from: Deeks, S.G.; Overbaugh, J.; Phillips, A.; Buchbinder, S.; HIV Infection. Nature Reviews Disease Primers, October 2015; Vol 1; p1-22. Licensed by Springer Nature RightsLink.

Chapter 1.
12
the shape of a pyrimidine ring (C4H4N2). Adenine and guanine are purines and have a core consisting of a heterocyclic aromatic ring (with the same structure as the pyrimidine ring) fused to a imidazole ring (C3H4N2) (Figure 3).
figure 2a. Chemical structure of nucleoside and nucleotide 5’-mono-, di- and triphosphate. Adapted from: Yikrazuul, own work, general overview of nucleotides and nucleosides, may 26th 2010, URL https://commons.wikimedia.org/wiki/File:Nucleotide_nucleoside_general.svg, accessed June 28th 2018.
figure 2b. Schematic DNA structure (left ) and nucleobase bonds (right). Adapted from: Pearson Education, Inc., publishing as Pearson Benjamin Cummings, URL http://logyofb io.blogspot.com/2016/02/structure-of-dna-and-nucleotides.html, accessed June 28th 2018.

13
General introduction and outline of the thesis
role of canonical nucleotides in human metabolismBesides being building blocks for DNA, the nucleotides have additional important functions in the human cell metabolism. The nucleotide-5’-triphosphates function as energy carriers because energy is released when the phosphate groups are hydrolysed from the nucleoside base by kinases. From the nucleotide-5’-triphosphates, adenosine 5’-triphosphate (ATP) is the most preferred nucleotide for most cellular processes. The preference for ATP has been observed in a large study investigating over 200 kinases and found that most had affinity for ATP and only a small number of the kinases exhibited affinity for guanosine 5’-triphosphate (GTP).29 Further, cyclic nucleotides act as secondary messengers, transducing signals from outside the cells to intracellular. For example: the primary messenger epinephrine stimulates the liver cell via triggering the secondary messenger cyclic adenosine 3’5’-monophosphate (cAMP) to convert glycogen to glucose (glycogenolysis).30 cAMP is generated from ATP by adenylyl cyclase and has three major targets in most cells: protein kinase A (PKA), exchange proteins activated by cAMP (Epacs) and cyclic-nucleotide-gated ion channels.31 PKA phosphorylates numerous metabolic enzymes, among which enzymes regulating glycogen, sugar and lipid metabolism, depending on the cell type. The Epac proteins are involved in multiple cellular functions such as (among others) cell adhesion, cell differentia-tion, apoptosis and secretion.32-34 Cyclic guanine 3’5’-monophosphate (cGMP), produced from GTP by two families of guanylyl cyclases: transmembrane particulate guanylyl cyclase (pGC) and soluble guanylyl cylclase (sGC), activate protein kinase G (PKG). PKG phos-phorylates several enzymes responsible for multiple cellular processes, like vascular tone and remodeling, neuronal adaptation, intestinal water secretion and bone growth.35 cGMP modulates cAMP concentration36 and, like cAMP, also regulates cyclic nucleotide-gated ion channels.37 Nucleotides are also important constituents of the coenzymes nicotinamide adenine dinucleotide (NAD+), nicotinamide adenine dinucleotide phosphate (NADP+) and Flavin adenine dinucleotide (FAD), which play a role in oxidation-reduction reactions. And finally, nucleosides are involved in the synthesis of polysaccharides, for instance UDP-glucose which is an intermediate in the glycogen synthesis in mammals.38
figure 3. Chemical structure of the canonical pyrimidines and purines.

Chapter 1.
14
Purine nucleotide synthesisIn the human metabolism two pathways of purine nucleotide synthesis exist: the ‘de novo’ synthesis pathway, in which the purine base is synthesized step by step on the ribose-5’-phosphate, and the salvage pathway, in which a ribose-5’-phophate is added to the preformed purine base or phosphates are added to a preformed, or rather recycled, purine nucleobase. In the de novo purine synthesis pathway (Figure 4), inosine 5’-monophosphate (IMP) is formed from the active form of ribose: 5-phosphoribosyl-1-pyrophosphate (PRPP) through 10 enzymatic steps. IMP is further converted into either adenosine 5’-monophosphate (AMP) or guanosine 5’-monophosphate (GMP) in two final steps (Figure 5). To form AMP, first the carbonyl oxygen atom at C6 is substituted for an amino group on which aspartate is added by the enzyme adenylosuccinate synthetase. Finally, fumarate is released from the amino group by adenylosuccinase. GMP is formed by oxidation of IMP at C2 by IMP dehydrogenase using NAD+ and H2O, followed by transfer of the amido-N of glutamine to the C2 position by GMP synthetase. Note that for the synthesis of AMP, GTP is used and for the synthesis of GMP, ATP is used.
figure 4. Purine nucleotide de novo pathway. Inosine 5’-monophosphate (IMP) is formed from 5-phospho-ribosyl-1-pyrophosphate (PRPP) in 10 enzymatic steps: (1) glutamine phosphoribosylpyrophosphate amido-transferase (GPAT activity - PPAT gene); (2) glycinamide ribonucleotide synthetase (GARS activity - GART gene); (3) glycinamide ribonucleotide formyltransferase (GART activity - GART gene); (4) phosphoribosyl-formylglycinamide synthase (PFAS activity - PFAS gene); (5) aminoimidazole ribonucleotide synthetase (AIRS activity - GART gene); (6) aminoimidazole ribotide carboxylase (AIRC activity - PAICS gene); (7) succinyl-aminoimidazolecarboxamide ribonucleotide synthetase (SAICAR activity - PAICS gene); (8) adenylosuccinate lyase (ADSL activity - ADSL gene); (9) 5-aminoimidazole-4-carboxamide ribonucleotide formyltransferase (AICARFT activity - ATIC gene); (10) IMP cyclohydrolase (IMPCH activity - ATIC gene). From: Lane A.N. and Fan T.W.-M. Regulation of mammalian nucleotide metabolism and biosynthesis. Nucleic Acids Research, 2015, Vol 43(4): p.2466-2485.

15
General introduction and outline of the thesis
In erythrocytes the ‘de novo’ pathway is absent, so the erythrocyte relies completely on the salvage pathway (Figure 6) for the requirement of the purine nucleotides. The salvage pathway provides a way to utilize purine bases derived from diet (exogenous) or from the normal turnover of nucleic acids (endogenous) and reconverts these purine bases to their corresponding nucleotides by phosphoribosylation. As in the de novo synthesis pathway, PRPP serves as the activated ribose-5-phosphate. The enzymes involved in the process of resynthesis of nucleotides from bases are adenine phosphoribosyltransferase (APRT) for adenine and hypoxanthine-guanine phophoribosyltransferase (HGPRT) for hypoxanthine and guanine. Thereafter, the purine nucleosides are degraded in several steps to the ultimate end product uric acid, which is excreted in the urine.
NrTIs in HIVThe mechanism of action of the NRTIs, used as backbone of the cART regimens currently recommended in HIV treatment guidelines, is based on the human nucleotide metabolism. Abacavir, tenofovir disoproxil fumarate (from now on referred to as tenofovir) and didano-sine (which is currently no longer widely used) are NRTIs resembling the natural purine nucleosides (Figure 7); abacavir and didanosine being guanosine nucleoside analogues and tenofovir being an adenine nucleotide analogue.
These drugs are first metabolized inside the cells and converted to their active 5’-triphos-phate forms. For instance, carbovir is the active ’triphosphate’ form of abacavir. The ac-tive 5’-triphosphate forms compete with the natural purine nucleotide triphosphates for incorporation in the growing viral DNA, but due to the lack of a 3’-hydroxyl group, the next nucleotide cannot be added to the DNA strand and further DNA synthesis is terminated.
figure 5. Interconversion of purines; synthesis of AMP and GMP from IMP. Adapted from: Berg J.M., Tymoczko J.L. and Stryer L. Biochemistry. 5th edition 2002. New York: W.H. Freeman.

Chapter 1.
16
figure 6. Purine salvage pathway. PNP, Purine nucleotide phosphorylase; APRT, Adenine phosphoribosyl-transferase; HGPRT, Hypoxanthine-guanine phosphoribosyltransferase; AMP, Adenosine 5’-monophosphate; IMP, Inosine 5’-monophosphate; XMP, Xanthosine 5’-monophosphate; GMP, Guanosine 5’-monophosphate; NMPK, Nucleoside monophosphate kinase; ADP, Adenosine 5’-diphosphate; IDP, Inosine 5’-diphosphate; XDP, Xanthosine 5’-diphosphate; GDP, Guanosine 5’-diphosphate; NDPK, Nucleoside diphosphate kinase; ATP, Adenosine 5’-triphosphate; ITP, Inosine 5’-triphosphate; XTP, Xanthosine 5’-triphosphate; GTP, Guano-sine 5’-triphosposphate.
figure 7. Chemical structures of the purine analogues non-reverse transcriptase inhibitors, abacavir, didano-sine and tenofovir and their resemblance with the natural purine nucleosides guanosine and adenosine.

17
General introduction and outline of the thesis
Non-canonical nucleotidesBesides the canonical purine nucleobases (adenine and guanine), other non-canonical nucleobases exist that are not building blocks of the genetic code. For instance, xanthine and hypoxanthine are important non-coding intermediates in purine metabolism. Their respective ribonucleosides are xanthosine and inosine (see Figures 6 and 8). There are also extraordinary metabolites like 8-oxo-deoxyguanosine that are damaged, potentially harm-ful, non-canonical purines.
The non-canonical nucleotides are formed when canonical nucleotides are damaged by oxidative stress and deamination.39-41 While the role of the canonical adenine and guanine based nucleotides is extensively studied, the potential role of the non-canonical purine based nucleotides xanthosine and inosine in the human metabolism has not yet been fully clarified and may be both beneficial and harmful. Inosine, inosine 5’-triphosphate (ITP) and to a lesser extend also inosine 5’-diphosphate (IDP) and IMP were found to have anti-inflammatory effects.42-44 Cyclic ITP (cITP) may function as a second messenger.45 On the other hand, incorporation of deaminated nucleotides like deoxy-Inosine 5`-triphospate (dITP) and deoxy-Xanthosine 5`-triphosphate (dXTP) into DNA and RNA is thought to have mutagenic consequences.46,47 Multiple enzymes have been described that clear the cellular nucleotide pool from these potential harmful non-canonical nucleotides.48 One of those enzymes is Inosine 5’-triphosphate pyrophosphohydrolase (Inosine triphosphatase or ITPase), which dephosphorylates ITP to IMP and xanthosine 5`-triphosphate (XTP) to xanthosine 5`-monophosphate (XMP). IMP and XMP are further processed to the canoni-cal nucleotides AMP and GMP as described above (Figures 5 and 6).
figure 8. Chemical structures of the non-canonical purine nucleobases Xanthine and Hypoxanthine and the nucleotide Inosine 5’-triphosphate.

Chapter 1.
18
INOsINe TrIPHOsPHaTe PyrOPHOsPHOHydrOlase (ITPase)
substrates, expression and functionIn 1964 Liakopoulou and Alivisatos were the first to describe this enzyme in human eryth-rocytes, found it to be very specific for ITP49 and called it ITP phosphohydrolase (ITPase). Their initial conclusion that ITPase hydrolysed ITP to IDP and further to IMP was refuted by Vanderheiden, who showed in his experiments that IDP was not involved in the reaction and that ITPase pyrophosphohydrolysed ITP to IMP.50 The natural substrates for ITPase are ITP, dITP and XTP.51 Potentially the enzyme is somewhat promiscuous, for (d)GTP, (d)ATP, (d)CTP, TTP and UTP were found in some assays to be pyrophosphohydrolysed by ITPase, although 10-100 fold less efficient.51 It was shown that (d)IMP and (d)IDP are no substrates at all, and that IDP is in fact an inhibitor of ITPase.52 The specificity of ITPase for (d)ITP and XTP is unusually high compared to other enzymes of the nucleotide metabolism53 and this is probably due to the structure of the enzyme (Figure 9).54 ITPase consists of two monomers of 21.5 kDa, composed of 194 amino acids, forming a dimer. Each monomer consists of a long central β-sheet forming the floor of the active site, with an upper and a lower lobe, between which the substrate binds. The substrate specificity for ITP and XTP is explained by the hydrogen bonds they can form with the active site, while ATP and GTP have amino-groups in those binding locations, which do not allow hydrogen bonding.55 Be-cause neither of the ribose hydroxyl groups make strong contacts with the protein, ITPase can utilize both ITP as well as dITP.55
ITPase is not only expressed in erythrocytes but in a wide range of human tissues (from leukocytes, bone marrow and lymph nodes to solid organs, skeletal muscle, spinal cord and reproductive organs).51,52 Both the specificity of the enzyme for (d)ITP and XTP and the fact that ITPase is more or less ubiquitously expressed in human tissues are consistent with the hypothesis that ITPase cleans the nucleotide pool from potential harmful nucleotides. Indeed, in embryos of mice with no ITPase activity, eight times higher levels of deoxy Ino-sine were found in the nuclear DNA compared to control mice embryos. Furthermore, the embryonic fibroblasts of these ITPase devoid mice embryos showed increased chromosome aberrations and accumulation of single-strand breaks in the nuclear DNA.46
Genetic basis of ITPase deficiencyIn 1969 Vanderheiden measured elevated levels of ITP in the erythrocytes of different fami-lies. He suggested that these high levels of ITP were due to ITPase deficiency and that this deficiency was an inheritable trait.56 In 1980, analysis of a de novo translocation between chromosomes X and 20 of a 13-year-old female showed that the gene ITPA encoding for ITPase was appointed to the short arm of chromosome 20.57 However, it was not until 2001 that the ITPA gene was cloned and characterized.51 One year later five single nucleotide

19
General introduction and outline of the thesis
polymorphisms (SNPs) in this gene were identified. Three silent SNPs (138G>A, 561G>A and 708G>A) and two SNPs that lead to decreased ITPase activity: 94C>A (p.Pro32Thr, rs1127354) and 124+21A>C (or IVS2+21A>C, rs7270101). The 94C>A missense mutation leads to a substitution of proline to threonine amino acid at codon 32. This substitution dis-rupts the protein structure (Figure 9) and also leads to missplicing of exons 2 and 3.58,59 Only homozygotes for the 94C>A SNP have nearly complete ITPase deficiency in erythrocytes, in the 94C>A heterozygotes 23% of the ITPase activity remains.58 The 124+21A>C SNP leads to a less severe state of ITPase deficiency, by miss-splicing exon 3 only,59 resulting in 60% of mean ITPase activity in heterozygotes and 30% in homozygotes.58,60 The distribution of the ITPA SNPs varies within the different world populations. The 94C>A mutation is highest in Asian populations (14-19%) compared to Caucasian/African populations (6-7%) and Central/South American (1-2%).61 The 124+21A>C SNP is extremely rare in Asian populations,62,63 but more frequent in Caucasian populations (11-13%).58,64,65 Since then, more SNPs have been identified, with varying degrees in residual ITPase activity.60,62,66
figure 9. Structure of the Inosine triphosphate pyrophosphohydrolase enzyme. In blue: the unbound (apo) structure, in pink: the ITP-bound structure. The site of the SNP 94C>A (p.Pro32Thr, rs1127354) which leads to a decreased activity of the enzyme is indicated by an arrow for both monomers. Adapted from: Stenmark, P. et al. Crystal structure of human inosine triphophatase. Substrate binding and implication of the inosine triphosphatase deficiency mutation P32T. The Journal of Biological Chemistry 2006, 282(5): 3182-3187.

Chapter 1.
20
Phenotypic correlation of ITPase deficiency with human diseases Over the years, multiple studies have been done to find phenotypic abnormalities in indi-viduals with SNPs in the ITPA genotype or a decreased ITPase activity. The first to report an increased incidence (16%) of ‘High ITP’ in a mentally retarded population versus a popula-tion with normal intelligence (3%), was Fraser67 in 1975. Additionally, in chronic paranoid schizophrenic patients a significant decrease in ITPase activity was found compared to a non-psychiatric control population.68 In 2015 the association between Early Infantile En-cephalopathy was found in 7 patients with several pathogenic mutations in ITPA that led to a severe degree of ITPase deficiency not restricted to erythrocytes.66 And recently, in 2018, two families with a very distinctive clinical presentation of lethal infantile-onset dilated cardiomyopathy and the rare Martsolf syndrome, which is characterized by congenital cataracts, postnatal microcephaly, developmental delay, hypotonia and short stature, were found to have mutations in the ITPA gene leading to undetectable ITPase protein.69
A connection between ITPA mutations and malignancy has been hypothesized, although studies investigating this subject are still sparse. In one study an increase in mitochondrial DNA mutations was found in adult hematology patients (consisting of myelodysplastic syndrome, acute myeloid leukemia and chronic lymphocytic leukemia patients), carrying the 94C>A SNP, compared to patients carrying wild-type ITPA.70 In another study ITPA is mentioned as one of the genes mutated in adenocarcinoma of the pancreas.71
One study reported on an unusually high prevalence of decreased ITPase activity and ITPA genotypes with SNPs in patients with pulmonary Langerhans’ cell histiocytosis compared to a reference population (50% versus 11% respectively).72
THe rOle Of ITPA sNPs IN druG meTabOlIsm
ITPA SNPs have been found to influence drug metabolism of azathioprine and its active metabolite mercaptopurine, methotrexate and ribavirin. Azathioprine is used as an im-munosuppressive drug prescribed after organ transplantation, and for multiple autoim-mune diseases, like inflammatory bowel disease, rheumatoid arthritis and systemic lupus erythematosus. Azathioprine is metabolized to mercaptopurine (6-MP) which is then further metabolized by multiple enzymatic steps of the purine salvage and interconver-sion pathways, including ITPase. In 2004, an association between adverse drug reactions of azathioprine such as influenza-like symptoms, rash and pancreatitis was described for the ITPA SNP 94C>A in a cohort of patients treated for inflammatory bowel disease.73 However, these findings could not be confirmed in another study.74 Since then, some studies reported an association between the 94C>A SNP and bone marrow depression such as decreased

21
General introduction and outline of the thesis
leukocytes75-77 or agranulocytosis,78 flu-like symptoms79 or arthralgia,80 but in other studies no association could be demonstrated81-84 in patients with inflammatory bowel disease. Also the outcome of azathioprine therapy was not clearly associated with ITPA SNPs.80,85 SNP 124+21A>C was in all the studies but one86 not associated with adverse events.75,77,80,81,83,84 In patients with systemic lupus erythematosus (SLE) 94C>A was associated with a better response to low-dose azathioprine therapy,87,88 but in patients with renal or liver transplants studies were inconclusive.89-91 Taken together, in adult patients treated with azathioprine, the SNP 94C>A is associated with adverse events, although not undisputed.
In children treated with mercaptopurine (6-MP) for acute lymphoblastic leukemia the SNP 94C>A in the ITPA gene was associated with hepatic toxicity,92-94 decreased leukocytes94-96 and decreased event-free survival,97 although again, these findings were not undisputed, as another study found the opposite effect on event-free survival in a comparable group of patients.98 In patients treated with methotrexate for rheumatoid arthritis the SNP 94C>A a possible association with a worse clinical response was found.99,100
ITPA, ITPase aNd INfeCTIOus dIseases
Hepatitis CIn patients treated with PEG-Interferon gamma and ribavirin for a hepatitis C virus (HCV) infection, the effect of SNPs in the ITPA gene on the occurrence of anemia and hemoglobin (Hb) decline is extensively studied.101-107 In a meta-analysis by Pineda-Tenor in 2015,108 the SNPs 94C>A, 124+21A>C and rs6051702 were all associated with protection against Hb decline. Furthermore, 94C>A was also significantly associated with protection against the occurrence of severe anemia and the necessity for ribavirin dose reduction during therapy. None of these studies investigated the association between ITPase activity and the occur-rence of anemia and the degree of Hb decline.
HIVIn spite of a genotype distribution comparable to a non-HIV infected population, ITPase activity was found to be significantly decreased in erythrocytes of HIV-infected patients compared to a non-HIV infected control population.64 However, no further studies were done to investigate whether this affected the occurrence of adverse events during the use of cART. For replication, HIV depends on the nucleotide metabolism of the infected host. For instance, HIV uses reverse transcriptase to convert its single-stranded RNA into double-stranded DNA, using the nucleotides available in the human cell, and further tran-scribes new RNA from this DNA after incorporation into the human genome, using the human nucleotide mechanism. The NRTIs are analogues of the natural ribonucleotides and

Chapter 1.
22
compete with these natural ribonucleotides for incorporation in the growing RNA chain. When incorporated, further RNA synthesis is stopped (chain termination) because of the NRTIs miss a 3’-hydroxyl group on the deoxyribose. To further improve HIV therapy by decreasing adverse events, more insight into the association between ITPA genotypes and ITPase activity on the one hand and adverse events during use of cART on the other hand could be important. Anti-retroviral drugs mimicking all nucleobases exist, but since ITPase is an enzyme in the human purine metabolism, we concentrated on the drugs abacavir (a guanosine analogue) and didanosine and tenofovir (adenosine analogues).
OuTlINe Of THe THesIs
The general aim of this thesis is to investigate the influence of the ITPA genetic SNPs 94C>A and 124+21A>C and the activity of the enzyme ITPase on the occurrence of adverse events during treatment for the infectious diseases HCV and HIV. While ITPA SNPs were previ-ously found to be protective against hemolytic anemia during therapy with ribavirin for HCV, it is not clear to what extent other SNPs contribute to ITPase activity. Therefore, in Chapter 2, ITPase activity is compared with ITPA genotype for prediction of anemia during ribavirin use for HCV.
In HIV-infected patients the ITPase activity in erythrocytes was found to be decreased compared to a population not infected with HIV. As leukocytes are the main target cells for HIV-infection, in Chapter 3 the expression of the ITPase protein in leukocytes and leukocyte subpopulations is explored in association with ITPA genotype. The results in HIV-infected patients are compared to a non-HIV infected population.
As the current therapy for HIV is highly effective, the main obstacle for treatment nowadays is adverse events during cART. In Chapter 4, we investigate the association of ITPase activ-ity and ITPA genotype with the occurrence of adverse events during combination antiret-roviral therapy for HIV. One of the most important adverse drug events during tenofovir use is nephrotoxicity. In order to test if ITPase activity and ITPA genotype could be used as a biomarker to predict nephrotoxicity during tenofovir use for HIV,these parameters are determined and compared in HIV-infected patients with and without nephrotoxicity, in Chapter 5.
Other important aspects brought on by the current effective HIV therapy, are long term consequences of cART and increasing diseases of older age, one of them being cardiovas-cular diseases. The association of ITPase activity and ITPA genotype with the occurrence

23
General introduction and outline of the thesis
of cardiovascular diseases and metabolic events during cART for HIV-infection is further explored in Chapter 6.
To further unravel effects caused by HIV-infection itself and effects caused by cART, in Chapter 7, basic cell metabolomics of untreated HIV-infected patients are compared to a control population (the effect of HIV-infection). In addition metabolomics data prior to start of cART were compared to 12 months of therapy successfully suppressing HIV replication (the effect of cART).
In Chapter 8 the results of these studies are discussed with respect to future perspectives.

Chapter 1.
24
refereNCes
1. Masur H, Michelis MA, Greene JB, Onorato I, Stouwe RA, Holzman RS, et al. An outbreak of community-acquired Pneumocystis carinii pneumonia: initial manifestation of cellular immune dysfunction. N Engl J Med. 1981;305(24):1431-8.
2. UNAIDS. Fact sheet - July 2018: Communications and Global Advocacy; 2018 [Available from: http://www.unaids.org/sites/default/files/media_asset/UNAIDS_FactSheet_en.pdf].
3. Berger EA, Murphy PM, Farber JM. Chemokine receptors as HIV-1 coreceptors: roles in viral entry, tropism, and disease. Annu Rev Immunol. 1999;17:657-700.
4. Doms RW, Peiper SC. Unwelcomed guests with master keys: how HIV uses chemokine receptors for cellular entry. Virology. 1997;235(2):179-90.
5. O’Brien WA, Koyanagi Y, Namazie A, Zhao JQ, Diagne A, Idler K, et al. HIV-1 tropism for mono-nuclear phagocytes can be determined by regions of gp120 outside the CD4-binding domain. Nature. 1990;348(6296):69-73.
6. Kowalski M, Potz J, Basiripour L, Dorfman T, Goh WC, Terwilliger E, et al. Functional regions of the envelope glycoprotein of human immunodeficiency virus type 1. Science. 1987;237(4820):1351-5.
7. Turner BG, Summers MF. Structural biology of HIV. J Mol Biol. 1999;285(1):1-32. 8. Telesnitsky A, Goff SP. Reverse transcriptase and the generation of retroviral DNA. 1997. 9. Brown PO. Integration. In: Coffin JM, Hughes SH, Varmus HE, editors Retroviruses Cold Spring
Harbor (NY): Cold Spring Harbor Laboratory Press. 1997. 10. Clark DR, Repping S, Pakker NG, Prins JM, Notermans DW, Wit FW, et al. T-cell progenitor func-
tion during progressive human immunodeficiency virus-1 infection and after antiretroviral therapy. Blood. 2000;96(1):242-9.
11. Zeng M, Paiardini M, Engram JC, Beilman GJ, Chipman JG, Schacker TW, et al. Critical role of CD4 T cells in maintaining lymphoid tissue structure for immune cell homeostasis and reconstitution. Blood. 2012;120(9):1856-67.
12. Brenchley JM, Price DA, Schacker TW, Asher TE, Silvestri G, Rao S, et al. Microbial translocation is a cause of systemic immune activation in chronic HIV infection. Nat Med. 2006;12(12):1365-71.
13. Doitsh G, Galloway NL, Geng X, Yang Z, Monroe KM, Zepeda O, et al. Cell death by pyroptosis drives CD4 T-cell depletion in HIV-1 infection. Nature. 2014;505(7484):509-14.
14. Lane HC, Masur H, Edgar LC, Whalen G, Rook AH, Fauci AS. Abnormalities of B-cell activation and immunoregulation in patients with the acquired immunodeficiency syndrome. N Engl J Med. 1983;309(8):453-8.
15. Unutmaz D, Pileri P, Abrignani S. Antigen-independent activation of naive and memory resting T cells by a cytokine combination. J Exp Med. 1994;180(3):1159-64.
16. Vidya Vijayan KK, Karthigeyan KP, Tripathi SP, Hanna LE. Pathophysiology of CD4+ T-Cell Deple-tion in HIV-1 and HIV-2 Infections. Front Immunol. 2017;8:580.
17. Panel on Antiretroviral Guidelines for Adults and Adolescents. Guidelines for the Use of Antiretro-viral Agents in Adults and Adolescents Living with HIV. Department of Health and Human Services. [Available from: https://aidsinfo.nih.gov/contentfiles/lvguidelines/adultandadolescentgl.pdf].
18. World Health Organisation Guidelines. Consolidated guidelines on the use of antiretroviral drugs for treating and preventing HIV infection. Recommendations for a public health approach. [Available from: http://www.aidsinfo.nih.gov/ContentFiles/AdultandAdolescentGL.pdf].
19. European AIDS Clinical Society Guidelines. European Guidelines for treatment of HIV-positive adults in Europe. [Available from: http://www.eacsociety.org/guidelines/eacs-guidelines/eacs-guidelines.html].

25
General introduction and outline of the thesis
20. British HIV Association guidelines for the treatment of HIV-1-positive adults with antiretroviral therapy 2015 (2016 interim update). [Available from: http://www.bhiva.org/HIV-1-treatment-guidelines.aspx].
21. Gunthard HF, Saag MS, Benson CA, del Rio C, Eron JJ, Gallant JE, et al. Antiretroviral Drugs for Treatment and Prevention of HIV Infection in Adults: 2016 Recommendations of the International Antiviral Society-USA Panel. JAMA. 2016;316(2):191-210.
22. Taiwo BO, Marconi VC, Berzins B, Moser CB, Nyaku AN, Fichtenbaum CJ, et al. Dolutegravir plus lamivudine maintains Human Immunodeficiency Virus-1 suppression through week 48 in a pilot randomized trial. Clin Infect Dis. 2018;66(11):1794-7.
23. Borghetti A, Baldin G, Lombardi F, Ciccullo A, Capetti A, Rusconi S, et al. Efficacy and tolerability of lamivudine plus dolutegravir as a switch strategy in a multicentre cohort of patients with suppressed HIV-1 replication. HIV Med. 2018.
24. Llibre JM, Hung CC, Brinson C, Castelli F, Girard PM, Kahl LP, et al. Efficacy, safety, and tolerability of dolutegravir-rilpivirine for the maintenance of virological suppression in adults with HIV-1: phase 3, randomised, non-inferiority SWORD-1 and SWORD-2 studies. Lancet. 2018;391(10123):839-49.
25. Nakagawa F, May M, Phillips A. Life expectancy living with HIV: recent estimates and future implica-tions. Curr Opin Infect Dis. 2013;26(1):17-25.
26. Rodger AJ, Cambiano V, Bruun T, Vernazza P, Collins S, van Lunzen J, et al. Sexual activity without condoms and risk of HIV transmission in serodifferent couples when the HIV-positive partner is using suppressive antiretroviral therapy. JAMA. 2016;316(2):171-81.
27. Cohen MS, Chen YQ, McCauley M, Gamble T, Hosseinipour MC, Kumarasamy N, et al. Prevention of HIV-1 infection with early antiretroviral therapy. N Engl J Med. 2011;365(6):493-505.
28. Grant RM, Lama JR, Anderson PL, McMahan V, Liu AY, Vargas L, et al. Preexposure chemoprophy-laxis for HIV prevention in men who have sex with men. N Engl J Med. 2010;363(27):2587-99.
29. Becher I, Savitski MM, Savitski MF, Hopf C, Bantscheff M, Drewes G. Affinity profiling of the cellular kinome for the nucleotide cofactors ATP, ADP, and GTP. ACS Chem Biol. 2013;8(3):599-607.
30. Sutherland EW. The effect of the hyperglycemic factor and epinephrine on enzyme systems of liver and muscle. Ann N Y Acad Sci. 1951;54(4):693-706.
31. Sassone-Corsi P. The cyclic AMP pathway. Cold Spring Harb Perspect Biol. 2012;4(12). 32. Cheng X, Ji Z, Tsalkova T, Mei F. Epac and PKA: a tale of two intracellular cAMP receptors. Acta
Biochim Biophys Sin (Shanghai). 2008;40(7):651-62. 33. Rangarajan S, Enserink JM, Kuiperij HB, de Rooij J, Price LS, Schwede F, et al. Cyclic AMP induces
integrin-mediated cell adhesion through Epac and Rap1 upon stimulation of the beta 2-adrenergic receptor. J Cell Biol. 2003;160(4):487-93.
34. Enserink JM, Price LS, Methi T, Mahic M, Sonnenberg A, Bos JL, et al. The cAMP-Epac-Rap1 path-way regulates cell spreading and cell adhesion to laminin-5 through the alpha3beta1 integrin but not the alpha6beta4 integrin. J Biol Chem. 2004;279(43):44889-96.
35. Hofmann F, Feil R, Kleppisch T, Schlossmann J. Function of cGMP-dependent protein kinases as revealed by gene deletion. Physiol Rev. 2006;86(1):1-23.
36. Zaccolo M, Movsesian MA. cAMP and cGMP signaling cross-talk: role of phosphodiesterases and implications for cardiac pathophysiology. Circ Res. 2007;100(11):1569-78.
37. Zimmerman AL, Baylor DA. Cyclic GMP-sensitive conductance of retinal rods consists of aqueous pores. Nature. 1986;321(6065):70-2.
38. Leloir LF, Olavarria JM, Goldemberg SH, Carminatti H. Biosynthesis of glycogen from uridine diphosphate glucose. Arch Biochem Biophys. 1959;81(2):508-20.

Chapter 1.
26
39. Shapiro R, Pohl SH. The reaction of ribonucleosides with nitrous acid. Side products and kinetics. Biochemistry. 1968;7(1):448-55.
40. Karran P, Lindahl T. Hypoxanthine in deoxyribonucleic acid: generation by heat-induced hydrolysis of adenine residues and release in free form by a deoxyribonucleic acid glycosylase from calf thymus. Biochemistry. 1980;19(26):6005-11.
41. Kasai H, Hayami H, Yamaizumi Z, SaitoH, Nishimura S. Detection and identification of mutagens and carcinogens as their adducts with guanosine derivatives. Nucleic Acids Res. 1984;12(4):2127-36.
42. Marton A, Pacher P, Murthy KG, Nemeth ZH, Hasko G, Szabo C. Anti-inflammatory effects of ino-sine in human monocytes, neutrophils and epithelial cells in vitro. Int J Mol Med. 2001;8(6):617-21.
43. da Rocha Lapa F, de Oliveira AP, Accetturi BG, de Oliveira Martins I, Domingos HV, de Almeida Cabrini D, et al. Anti-inflammatory effects of inosine in allergic lung inflammation in mice: evidence for the participation of adenosine A2A and A 3 receptors. Purinergic Signal. 2013;9(3):325-36.
44. Shinohara Y, Tsukimoto M. Guanine and inosine nucleotides/nucleosides suppress murine T cell activation. Biochem Biophys Res Commun. 2018;498(4):764-8.
45. Seifert R, Schneider EH, Bahre H. From canonical to non-canonical cyclic nucleotides as second messengers: pharmacological implications. Pharmacol Ther. 2015;148:154-84.
46. Abolhassani N, Iyama T, Tsuchimoto D, Sakumi K, Ohno M, Behmanesh M, et al. NUDT16 and ITPA play a dual protective role in maintaining chromosome stability and cell growth by eliminating dIDP/IDP and dITP/ITP from nucleotide pools in mammals. Nucleic Acids Res. 2010;38(9):2891-903.
47. Iyama T, Abolhassani N, Tsuchimoto D, Nonaka M, Nakabeppu Y. NUDT16 is a (deoxy)inosine diphosphatase, and its deficiency induces accumulation of single-strand breaks in nuclear DNA and growth arrest. Nucleic Acids Res. 2010;38(14):4834-43.
48. Galperin MY, Moroz OV, Wilson KS, Murzin AG. House cleaning, a part of good housekeeping. Mol Microbiol. 2006;59(1):5-19.
49. Liakopoulou A, Alivisatos SG. Distribution of nucleoside triphosphatases in human erythrocytes. Biochim Biophys Acta. 1964;89:158-61.
50. Vanderheiden BS. Human erythrocyte “ITPase”: an ITP pyrophosphohydrolase. Biochim Biophys Acta. 1970;215(3):555-8.
51. Lin S, McLennan AG, Ying K, Wang Z, Gu S, Jin H, et al. Cloning, expression, and characteriza-tion of a human inosine triphosphate pyrophosphatase encoded by the ITPA gene. J Biol Chem. 2001;276(22):18695-701.
52. Holmes SL, Turner BM, Hirschhorn K. Human inosine triphosphatase: catalytic properties and population studies. Clin Chim Acta. 1979;97(2-3):143-53.
53. Welin M, Nordlund P. Understanding specificity in metabolic pathways-structural biology of human nucleotide metabolism. Biochem Biophys Res Commun. 2010;396(1):157-63.
54. Stenmark P, Kursula P, Flodin S, Graslund S, Landry R, Nordlund P, et al. Crystal structure of human inosine triphosphatase. Substrate binding and implication of the inosine triphosphatase deficiency mutation P32T. J Biol Chem. 2007;282(5):3182-7.
55. Simone PD, Pavlov YI, Borgstahl GE. ITPA (inosine triphosphate pyrophosphatase): from surveil-lance of nucleotide pools to human disease and pharmacogenetics. Mutat Res. 2013;753(2):131-46.
56. Vanderheiden BS. Genetic studies of human erythrocyte inosine triphosphatase. Biochem Genet. 1969;3(3):289-97.
57. Mohandas T, Sparkes RS, Passage MB, Sparkes MC, Miles JH, Kaback MM. Regional mapping of ADA and ITP on human chromosome 20: cytogenetic and somatic cell studies in an X/20 transloca-tion. Cytogenet Cell Genet. 1980;26(1):28-35.
27
General introduction and outline of the thesis
58. Sumi S, Marinaki AM, Arenas M, Fairbanks L, Shobowale-Bakre M, Rees DC, et al. Genetic basis of inosine triphosphate pyrophosphohydrolase deficiency. Hum Genet. 2002;111(4-5):360-7.
59. Arenas M, Duley J, Sumi S, Sanderson J, Marinaki A. The ITPA c.94C>A and g.IVS2+21A>C sequence variants contribute to missplicing of the ITPA gene. Biochim Biophys Acta. 2007;1772(1):96-102.
60. Shipkova M, Lorenz K, Oellerich M, Wieland E, von Ahsen N. Measurement of erythrocyte inosine triphosphate pyrophosphohydrolase (ITPA) activity by HPLC and correlation of ITPA genotype-phenotype in a Caucasian population. Clin Chem. 2006;52(2):240-7.
61. Marsh S, King CR, Ahluwalia R, McLeod HL. Distribution of ITPA P32T alleles in multiple world populations. J Hum Genet. 2004;49(10):579-81.
62. Maeda T, Sumi S, Ueta A, Ohkubo Y, Ito T, Marinaki AM, et al. Genetic basis of inosine triphosphate pyrophosphohydrolase deficiency in the Japanese population. Mol Genet Metab. 2005;85(4):271-9.
63. Cheon JH, Kim JH, Kim BY, Kim SW, Hong SY, Eun CS, et al. Allele frequency of thiopurine methyl-transferase and inosine triphosphate pyrophosphatase gene polymorphisms in Korean patients with inflammatory bowel diseases. Hepatogastroenterology. 2009;56(90):421-3.
64. Bierau J, Bakker JA, Schippers JA, Grashorn JA, Lindhout M, Lowe SH, et al. Erythrocyte inosine triphosphatase activity is decreased in HIV-seropositive individuals. PLoS One. 2012;7(1):e30175.
65. Atanasova S, Shipkova M, Svinarov D, Mladenova A, Genova M, Wieland E, et al. Analysis of ITPA phenotype-genotype correlation in the Bulgarian population revealed a novel gene variant in exon 6. Ther Drug Monit. 2007;29(1):6-10.
66. Kevelam SH, Bierau J, Salvarinova R, Agrawal S, Honzik T, Visser D, et al. Recessive ITPA mutations cause an early infantile encephalopathy. Ann Neurol. 2015;78(4):649-58.
67. Fraser JH, Meyers H, Henderson JF, Brox LW, McCoy EE. Individual variation in inosine triphos-phate accumulation in human erythrocytes. Clin Biochem. 1975;8(6):353-64.
68. Vanderheiden BS, Bora G. Erythrocyte ITP pyrophosphohydrolase in chronic paranoid and undif-ferentiated schizophrenics: a biological difference. Biochem Med. 1980;23(1):76-86.
69. FitzPatrick DR, Handley MT, Reddy K, Wills J, Rosser E, Kamath A, et al. ITPase deficiency causes Martsolf Syndrome with a lethal infantile dilated cardiomyopathy. bioRxiv. 2018.
70. Zamzami MA, Duley JA, Price GR, Venter DJ, Yarham JW, Taylor RW, et al. Inosine triphosphate pyrophosphohydrolase (ITPA) polymorphic sequence variants in adult hematological malignancy patients and possible association with mitochondrial DNA defects. J Hematol Oncol. 2013;6:24.
71. Xu MD, Liu SL, Feng YZ, Liu Q, Shen M, Zhi Q, et al. Genomic characteristics of pancreatic squa-mous cell carcinoma, an investigation by using high throughput sequencing after in-solution hybrid capture. Oncotarget. 2017;8(9):14620-35.
72. Bakker JA, Bierau J, Drent M. A role for ITPA variants in the clinical course of pulmonary Langer-hans’ cell histiocytosis? Eur Respir J. 2010;36(3):684-6.
73. Marinaki AM, Ansari A, Duley JA, Arenas M, Sumi S, Lewis CM, et al. Adverse drug reactions to azathioprine therapy are associated with polymorphism in the gene encoding inosine triphosphate pyrophosphatase (ITPase). Pharmacogenetics. 2004;14(3):181-7.
74. Gearry RB, Roberts RL, Barclay ML, Kennedy MA. Lack of association between the ITPA 94C>A polymorphism and adverse effects from azathioprine. Pharmacogenetics. 2004;14(11):779-81.
75. Zelinkova Z, Derijks LJ, Stokkers PC, Vogels EW, van Kampen AH, Curvers WL, et al. Inosine triphosphate pyrophosphatase and thiopurine s-methyltransferase genotypes relationship to azathioprine-induced myelosuppression. Clin Gastroenterol Hepatol. 2006;4(1):44-9.
76. Odahara S, Uchiyama K, Kubota T, Ito Z, Takami S, Kobayashi H, et al. A prospective study evalu-ating metabolic capacity of thiopurine and associated adverse reactions in Japanese patients with inflammatory bowel disease (IBD). PLoS One. 2015;10(9):e0137798.

Chapter 1.
28
77. Shipkova M, Franz J, Abe M, Klett C, Wieland E, Andus T. Association between adverse effects under azathioprine therapy and inosine triphosphate pyrophosphatase activity in patients with chronic inflammatory bowel disease. Ther Drug Monit. 2011;33(3):321-8.
78. Uchiyama K, Nakamura M, Kubota T, Yamane T, Fujise K, Tajiri H. Thiopurine S-methyltransferase and inosine triphosphate pyrophosphohydrolase genes in Japanese patients with inflammatory bowel disease in whom adverse drug reactions were induced by azathioprine/6-mercaptopurine treatment. J Gastroenterol. 2009;44(3):197-203.
79. Ansari A, Arenas M, Greenfield SM, Morris D, Lindsay J, Gilshenan K, et al. Prospective evaluation of the pharmacogenetics of azathioprine in the treatment of inflammatory bowel disease. Aliment Pharmacol Ther. 2008;28(8):973-83.
80. Zabala-Fernandez W, Barreiro-de Acosta M, Echarri A, Carpio D, Lorenzo A, Castro J, et al. A pharmacogenetics study of TPMT and ITPA genes detects a relationship with side effects and clinical response in patients with inflammatory bowel disease receiving Azathioprine. J Gastrointestin Liver Dis. 2011;20(3):247-53.
81. Allorge D, Hamdan R, Broly F, Libersa C, Colombel JF. ITPA genotyping test does not improve detec-tion of Crohn’s disease patients at risk of azathioprine/6-mercaptopurine induced myelosuppression. Gut. 2005;54(4):565.
82. Hindorf U, Lindqvist M, Peterson C, Soderkvist P, Strom M, Hjortswang H, et al. Pharmacogenet-ics during standardised initiation of thiopurine treatment in inflammatory bowel disease. Gut. 2006;55(10):1423-31.
83. De Ridder L, Van Dieren JM, Van Deventer HJ, Stokkers PC, Van der Woude JC, Van Vuuren AJ, et al. Pharmacogenetics of thiopurine therapy in paediatric IBD patients. Aliment Pharmacol Ther. 2006;23(8):1137-41.
84. Kim JH, Cheon JH, Hong SS, Eun CS, Byeon JS, Hong SY, et al. Influences of thiopurine methyltrans-ferase genotype and activity on thiopurine-induced leukopenia in Korean patients with inflamma-tory bowel disease: a retrospective cohort study. J Clin Gastroenterol. 2010;44(10):e242-8.
85. Jung YS, Cheon JH, Park JJ, Moon CM, Kim ES, Lee JH, et al. Correlation of genotypes for thiopurine methyltransferase and inosine triphosphate pyrophosphatase with long-term clinical outcomes in Korean patients with inflammatory bowel diseases during treatment with thiopurine drugs. J Hum Genet. 2010;55(2):121-3.
86. von Ahsen N, Armstrong VW, Behrens C, von Tirpitz C, Stallmach A, Herfarth H, et al. Association of inosine triphosphatase 94C>A and thiopurine S-methyltransferase deficiency with adverse events and study drop-outs under azathioprine therapy in a prospective Crohn disease study. Clin Chem. 2005;51(12):2282-8.
87. Okada Y, Nakamura K, Hiromura K, Nojima Y, Horiuchi R, Yamamoto K. Pro32Thr polymorphism of inosine triphosphate pyrophosphatase gene predicts efficacy of low-dose azathioprine for patients with systemic lupus erythematosus. Clin Pharmacol Ther. 2009;85(5):527-30.
88. Nagamine A, Takenaka M, Aomori T, Okada Y, Hiromura K, Nojima Y, et al. Effect of genetic polymorphisms on effectiveness of low-dose azathioprine in Japanese patients with systemic lupus erythematosus. Am J Health Syst Pharm. 2012;69(23):2072-8.
89. Kurzawski M, Dziewanowski K, Lener A, Drozdzik M. TPMT but not ITPA gene polymorphism influences the risk of azathioprine intolerance in renal transplant recipients. Eur J Clin Pharmacol. 2009;65(5):533-40.
90. Xiong H, Xin HW, Wu XC, Li Q, Xiong L, Yu AR. Association between inosine triphosphate pyro-phosphohydrolase deficiency and azathioprine-related adverse drug reactions in the Chinese kidney transplant recipients. Fundam Clin Pharmacol. 2010;24(3):393-400.

29
General introduction and outline of the thesis
91. Breen DP, Marinaki AM, Arenas M, Hayes PC. Pharmacogenetic association with adverse drug reactions to azathioprine immunosuppressive therapy following liver transplantation. Liver Transpl. 2005;11(7):826-33.
92. Adam de Beaumais T, Fakhoury M, Medard Y, Azougagh S, Zhang D, Yakouben K, et al. Determi-nants of mercaptopurine toxicity in paediatric acute lymphoblastic leukemia maintenance therapy. Br J Clin Pharmacol. 2011;71(4):575-84.
93. Wan Rosalina WR, Teh LK, Mohamad N, Nasir A, Yusoff R, Baba AA, et al. Polymorphism of ITPA 94C>A and risk of adverse effects among patients with acute lymphoblastic leukaemia treated with 6-mercaptopurine. J Clin Pharm Ther. 2012;37(2):237-41.
94. Azimi F, Mortazavi Y, Alavi S, Khalili M, Ramazani A. Frequency of ITPA gene polymorphisms in Iranian patients with acute lymphoblastic leukemia and prediction of its myelosuppressive effects. Leuk Res. 2015;39(10):1048-54.
95. Dorababu P, Nagesh N, Linga VG, Gundeti S, Kutala VK, Reddanna P, et al. Epistatic interactions between thiopurine methyltransferase (TPMT) and inosine triphosphate pyrophosphatase (ITPA) variations determine 6-mercaptopurine toxicity in Indian children with acute lymphoblastic leuke-mia. Eur J Clin Pharmacol. 2012;68(4):379-87.
96. Hareedy MS, El Desoky ES, Woillard JB, Thabet RH, Ali AM, Marquet P, et al. Genetic variants in 6-mercaptopurine pathway as potential factors of hematological toxicity in acute lymphoblastic leukemia patients. Pharmacogenomics. 2015;16(10):1119-34.
97. Kim H, Kang HJ, Kim HJ, Jang MK, Kim NH, Oh Y, et al. Pharmacogenetic analysis of pediatric patients with acute lymphoblastic leukemia: a possible association between survival rate and ITPA polymorphism. PLoS One. 2012;7(9):e45558.
98. Smid A, Karas-Kuzelicki N, Milek M, Jazbec J, Mlinaric-Rascan I. Association of ITPA genotype with event-free survival and relapse rates in children with acute lymphoblastic leukemia undergoing maintenance therapy. PLoS One. 2014;9(10):e109551.
99. Wessels JA, Kooloos WM, De Jonge R, De Vries-Bouwstra JK, Allaart CF, Linssen A, et al. Relation-ship between genetic variants in the adenosine pathway and outcome of methotrexate treatment in patients with recent-onset rheumatoid arthritis. Arthritis Rheum. 2006;54(9):2830-9.
100. Pastore S, Stocco G, Moressa V, Zandona L, Favretto D, Malusa N, et al. 5-Aminoimidazole-4-carboxamide ribonucleotide-transformylase and inosine-triphosphate-pyrophosphatase genes vari-ants predict remission rate during methotrexate therapy in patients with juvenile idiopathic arthritis. Rheumatol Int. 2015;35(4):619-27.
101. Fellay J, Thompson AJ, Ge D, Gumbs CE, Urban TJ, Shianna KV, et al. ITPA gene variants protect against anaemia in patients treated for chronic hepatitis C. Nature. 2010;464(7287):405-8.
102. Thompson AJ, Santoro R, Piazzolla V, Clark PJ, Naggie S, Tillmann HL, et al. Inosine triphosphatase genetic variants are protective against anemia during antiviral therapy for HCV2/3 but do not de-crease dose reductions of RBV or increase SVR. Hepatology. 2011;53(2):389-95.
103. Nishimura T, Osaki R, Shioya M, Imaeda H, Aomatsu T, Takeuchi T, et al. Polymorphism of the inosine triphosphate pyrophosphatase gene predicts ribavirin-induced anemia in chronic hepatitis C patients. Mol Med Rep. 2012;5(2):517-20.
104. Lötsch J, Hofmann WP, Schlecker C, Zeuzem S, Geisslinger G, Ultsch A, et al. Single and combined IL28B, ITPA and SLC28A3 host genetic markers modulating response to anti-hepatitis C therapy. Pharmacogenomics. 2011;12(12):1729-40.
105. Azakami T, Hayes CN, Sezaki H, Kobayashi M, Akuta N, Suzuki F, et al. Common genetic poly-morphism of ITPA gene affects ribavirin-induced anemia and effect of peg-interferon plus ribavirin therapy. J Med Virol. 2011;83(6):1048-57.

Chapter 1.
30
106. Kurosaki M, Tanaka Y, Tanaka K, Suzuki Y, Hoshioka Y, Tamaki N, et al. Relationship between polymorphisms of the inosine triphosphatase gene and anaemia or outcome after treatment with pegylated interferon and ribavirin. Antivir Ther. 2011;16(5):685-94.
107. Sakamoto N, Tanaka Y, Nakagawa M, Yatsuhashi H, Nishiguchi S, Enomoto N, et al. ITPA gene vari-ant protects against anemia induced by pegylated interferon-alpha and ribavirin therapy for Japanese patients with chronic hepatitis C. Hepatol Res. 2010;40(11):1063-71.
108. Pineda-Tenor D, Garcia-Alvarez M, Jimenez-Sousa MA, Vazquez-Moron S, Resino S. Relationship between ITPA polymorphisms and hemolytic anemia in HCV-infected patients after ribavirin-based therapy: a meta-analysis. J Transl Med. 2015;13:320.


Chapter 2.Inosine triphosphate pyrophosphohydrolase activity: more accurate predictor for ribavirin-induced anemia in hepatitis C infected patients than ITPA genotype.
N.C. Peltenburg, J.A. Bakker, W.H.M. Vroemen, R.J. de Knegt, M.P.G. Leers, J. Bierau, A. Verbon
Clinical Chemistry and Laboratory Medicine. 2015 Nov; 53(12): 2021-9.
Chapter 2.
34
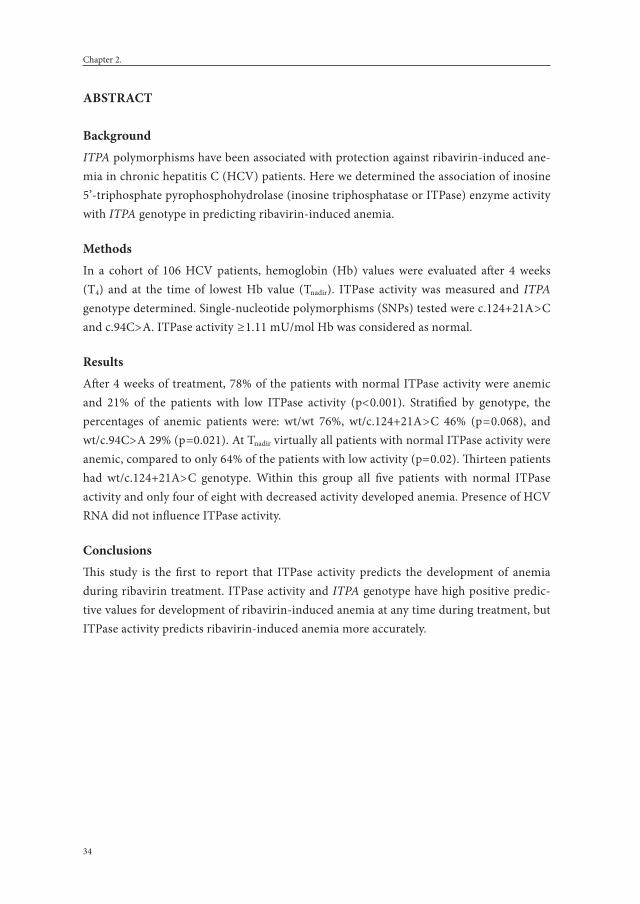
absTraCT
backgroundITPA polymorphisms have been associated with protection against ribavirin-induced ane-mia in chronic hepatitis C (HCV) patients. Here we determined the association of inosine 5’-triphosphate pyrophosphohydrolase (inosine triphosphatase or ITPase) enzyme activity with ITPA genotype in predicting ribavirin-induced anemia.
methodsIn a cohort of 106 HCV patients, hemoglobin (Hb) values were evaluated after 4 weeks (T4) and at the time of lowest Hb value (Tnadir). ITPase activity was measured and ITPA genotype determined. Single-nucleotide polymorphisms (SNPs) tested were c.124+21A > C and c.94C> A. ITPase activity ≥ 1.11 mU/mol Hb was considered as normal.
resultsAfter 4 weeks of treatment, 78% of the patients with normal ITPase activity were anemic and 21% of the patients with low ITPase activity (p< 0.001). Stratified by genotype, the percentages of anemic patients were: wt/wt 76%, wt/c.124+21A > C 46% (p = 0.068), and wt/c.94C> A 29% (p =0.021). At Tnadir virtually all patients with normal ITPase activity were anemic, compared to only 64% of the patients with low activity (p= 0.02). Thirteen patients had wt/c.124+21A> C genotype. Within this group all five patients with normal ITPase activity and only four of eight with decreased activity developed anemia. Presence of HCV RNA did not influence ITPase activity.
ConclusionsThis study is the first to report that ITPase activity predicts the development of anemia during ribavirin treatment. ITPase activity and ITPA genotype have high positive predic-tive values for development of ribavirin-induced anemia at any time during treatment, but ITPase activity predicts ribavirin-induced anemia more accurately.

35
ITPase activity potential predictor for ribavirin-induced anemia in HCV
INTrOduCTION
The prevalence of hepatitis C (HCV) infection is estimated at approximately 2.2%–3% of the world population (130– 170 million people).1 The life expectancy of infected patients is reduced significantly because of high risks for liver cirrhosis and hepatocellular carcinoma.2 HCV therefore is one of the main reasons for liver transplantation in Europe and the US.3,4 In order to prevent these complications, patients with HCV infection have been treated with the combination of pegylated-interferon-α plus ribavirin,5-7 in later years combined with protease inhibitors, such as telaprevir8 or boceprevir9 and since recently simeprevir10 or the nucleoside polymerase inhibitor sofosbuvir.11 Response to anti-HCV therapy is influenced by both viral and host factors as well as drug toxicity.12 Viral genotype has been a strong pre-dictor for treatment response. While viral remission is around 70%–80% in patients infected with HCV genotypes 2 and 3, only 50%–60% of the patients with HCV genotypes 1 and 4 acquire a sustained virological response (SVR).13 Host factors contributing to therapeutic outcome have been identified as single-nucleotide polymorphisms (SNPs) in the IL28B and LDLR genes.14-18 An important and common adverse drug reaction limiting optimal HCV therapy is ribavirin-induced anemia. It has been demonstrated that two functional ITPA SNPs, rs1127354 (c.94C > A) and rs7270101 (c.124+21A > C), are associated with protection from ribavirin-induced anemia.19-25
In recent years, the biological and pharmacogenetic significance of ITPA and its corre-sponding enzyme inosine 5’-triphosphate pyrophosphohydrolase (inosine triphosphatase or ITPase) have become a focal point of research, bringing many interesting and surprising data. Complete ITPase deficiency is strictly confined to erythrocytes and is considered to be a benign condition. No primary, causal, clinical symptoms are known under normal circumstances. However, ITPase activity lowering SNPs in ITPA are associated with adverse drug reactions to the thiopurines azathioprine and 6-mercaptopurine. This association is still subject of a lively discussion.26-30 The pharmacogenetic significance of ITPA appeared not to be limited to the thiopurines, but may also be of significance for the purine analog ribavirin. In our present study we demonstrate that ITPase activity seems a more accurate predictor for ribavirin-induced anemia than ITPA genotype.
maTerIals aNd meTHOds
PatientsConsecutive HCV infected patients attending the outpatient clinic of the Erasmus Medical Center in Rotterdam, The Netherlands were included during 6 months with the aim of inclusion of 100 patients. The following data were collected: gender, age, hemoglobin (Hb),

Chapter 2.
36
white blood cell count (WBC), HCV genotype and HCV RNA in serum, type of medication, start and end of treatment, and treatment outcome. Treatment was given according to the Dutch national guidelines at that time31 with peginterferon-α-2a or peginterferon-α-2b (in a dosage of 180 μg or 1.5 μg/kg once a week), in combination with ribavirin 800–1200 mg a day depending on patient weight. One patient also received boceprevir and one patient also received miravirsen in addition to the ribavirin and peginterferon-α.
Plasma HCV-RNA levels were measured with the use of the COBAS AmpliPrep/COBAS TaqMan HCV assay, version 1.0 (Roche molecular systems) from October 2008 until March 2012, version 2.0 (Roche molecular systems) was used from March 2012 until June 2012. Anemia was defined as Hb reduction of ≥ 1.9 mmol/L compared to pre-treatment values and/or Hb concentrations < 7.5 mmol/L for females and <8.0 mmol/L for males.22,32
The study was performed according to the Helsinki Declaration and approved by the Medi-cal Ethical Committees of the Erasmus Medical Center, Rotterdam, The Netherlands. The participants provided their written informed consent to participate in this study.
ITPase activityITPase activity was determined as described previously with some minor modifications33 and measured by formation of inosine 5’-monophosphate (IMP) from ITP. Briefly, 3 μL whole blood was incubated with 2.00 mM ITP, 50 mM MgCl2 , 0.5 mM Dithothreitol (DTT) and 0.2 mM α-,β-methyleneadenosine 5’-diphosphate (AMP- CP) in 75 mM Tris in a final volume of 200 μL. All chemicals were of the highest grade and purchased from Sigma-Aldrich (Zwijndrecht, The Netherlands).
Samples were prepared and analyzed in duplicate. In addition, blanks (negative controls) and pool samples (positive controls) were also analyzed for ITPase activity to confirm cor-rect sample preparation, analysis and quality control. High performance liquid chromatog-raphy (HPLC) separations were performed on a Supelcosil LC-18 S column (Sigma-Aldrich, Zwijndrecht), using an Alliance separation system (Waters, Etten-Leur, The Netherlands) coupled to a Jasco multi-wavelength detector (Jasco Benelux, IJsselstein, The Netherlands). Data were analyzed with TotalChrom data acquisition and handling software (Perkin-Elmer, Groningen, The Netherlands). ITPase activity was expressed as milliUnits of IMP formed from ITP per mol hemoglobin (mU/mol Hb). The intra-assay variation coefficient was < 5%, and the inter-assay variation coefficient was < 10%. The cut-off value discriminating between normal or decreased ITPase activity was set at 1.11 mU/mol Hb (= 4 mmol IMP/mmol Hb/h), which is the lowest value within the 95% CI for ITPA wild type (wt/wt) carriers.34,35

37
ITPase activity potential predictor for ribavirin-induced anemia in HCV
ITPA genotype analysisGenomic DNA was isolated from whole blood using the Wizard Genomic DNA purifi-cation kit (Promega, Madison, WI, USA) and genotyped for two ITPA polymorphisms; wt/c.94C > A (p.Pro32Thr, rs1127354) and wt/c.124+21A> C (rs7270101). When no poly-morphisms were detected at both positions and the ITPase activity was within the wt/wt reference intervals, the genotype was considered to be wt/wt. M13-tagged primers forward 5’-TGTAAAACGACGGCCAGTCTTAGGAGATGGGCAGCAG and 5’-CAGGAAA-CAGCTATGACCCACAGAAAGTCAGGTCACAGG reverse were used in a PCR reaction, which consisted of 1 x Amplitaq Gold Mastermix (Applied Biosystems, Nieuwerkerk a/d IJssel, The Netherlands), 8% glycerol, and 200 nM of each primer. PCR conditions were 40 cycles with an annealing temperature of 60°C. The resulting 241 bp PCR product was purified and directly sequenced in both directions using the Big Dye Terminator kit and was subsequently analyzed on an ABI 3720 Genetic Analyzer (Applied Biosystems, Carlsbad, CA, USA). The resulting sequence was aligned with ITPA reference sequence NM_033453.2. All sequences were evaluated by two independent laboratory experts.
statistical analysisResults were analyzed using GraphPad Prism 5.01 (Graphpad Software for Windows, San Diego, CA, USA), Microsoft Excel (Microsoft, Redmond, WA, USA) software and IBM SPSS Statistics 20 (IBM Corporation, New York, NY, USA) software. Pearson’s χ2-tests, Fisher’s exact tests (in the case of small sample sizes) or T-tests for independent samples were used to de-termine significant differences. p-Values < 0.05 were considered to be statistically significant.
resulTs
Patient characteristicsA total of 106 HCV infected patients in various stages of infection were included (Table 1). In our cohort there was a male predominance and HCV genotype 1 was most prominent. In total 69 patients were treated for chronic HCV infection and SVR was reached in 30 (43.5%) of the patients. The most prominent ITPA genotype was wt/wt (68.9%). The occur-rence of wt/c.124+21A >C and wt/c.94C > A ITPA genotype variants were 19.8% and 9.4%, respectively. One patient was homozygous for c.124+21A > C and one was compound het-erozygous, i.e. c.124+21A > C/c.94C> A. Our cohort showed expected allele frequencies for both loci and did not differ from the reference population.35,36 The population was in Hardy-Weinberg equilibrium. Age, pre-treatment Hb levels and white blood cell counts were not significantly different between patients with different ITPA genotypes. As expected, mean ITPase activity correlated with ITPA genotype (Table 1).

Chapter 2.
38
Table 1. Characteristics of the study population
Characteristic Total Population (n=106) Treated Population (n=69)
age, median years (min-max)
Total 51 (20-88) 52 (20-79)
Wt/wt 51 (20-88) 52 (20-79)
Wt/c.124+21A>C 51 (33-76) 52 (39-76)
Wt/c.94C>A 55 (41-65) 54 (41-59)
Gender, n (%)
Male 68 (64.2) 51 (73.9)
Female 38 (35.8) 18 (26.1)
HCV genotype, n (%)
Genotype 1 63 (59.4) 44 (63.8)
Genotype 2/3 28 (26.4) 20 (28.9)
Genotype 4 8 (7.5) 5 (7.2)
Unknown 7 (6.6) -
ITPA genotype, n (%)
Wt/wt 73 (68.9) 49 (71.0)
Wt/c.124+21A>C 21 (19.8) 13 (18.8)
Wt/c.94C>A 10 (9.4) 7 (10.1)
Other 2 (1.8) -
HCV genotype 1, n (%)
Total 63 (59.4) 44 (63.8)
Wt/wt 45 (71.4) 33 (75.0)
Wt/c.124+21A>C 11 (17.5) 7 (15.9)
Wt/c.94C>A 7 (11.1) 4 (9.1)
ITPase mean activitya ± SD
Wt/wt 1.64 ± 0.47 1.67 ± 0.50
Wt/c.124+21A>C 1.01 ± 0.29 1.03 ± 0.37
Wt/c.94C>A 0.46 ± 0.16 0.50 ± 0.17
Other 0.33 ± 0.19 -
absolute ITPase activity (%)
Wt/wt 100%
Wt/c.124+21A>C 62%
Wt/c.94C>A 28%
Other 20%
ITPase mean activitya ± SD
HCV RNA <5 copies/ml 1.44 ± 0.69
HCV RNA ≥ 5 copies/ml 1.34 ± 0.53
ITPase activitya, n (%)
< 1.11 29 (27.4) 16 (23.2)
≥ 1.11 77 (72.6) 53 (76.8)

39
ITPase activity potential predictor for ribavirin-induced anemia in HCV
Table 1. Characteristics of the study population (continued)
Characteristic Total Population (n=106) Treated Population (n=69)
mean white blood cell countb ± SD 5.9 ± 2.4 5.5 ± 2.4
mean Hb pre-treatmentc ± SD 9.0 ± 1.0
Treatment outcome, n (%)
SVRd 30 (43.5)
Relapse 22 (31.9)
Non-response / termination 17 (24.6)
Spontaneous clearance 7 (6.6)a mU/mol Hb; b x109/L; c mmol/L; d SVR, Sustained virological response
A
B
figure 1: (A) ITPase activity and HCV viral load. Plasma HCV viral load (copies/ml) is plotted against ITPase activity (milliUnits IMP/mol Hb). Neither the presence nor the level of plasma HCV viral load is correlated to ITPase activity. HCV, hepatitis C virus; ITPase, inosine triphosphate pyrophosphohydrolase. (B) Associa-tion of ITPase activity and Hb decrease. ITPase activity (milliUnits IMP/mol Hb) is plotted against maximum Hb decrease during therapy. ITPA genotypes are displayed in different shapes (circles: wt/wt, squares: wt/c.124+21A>C, triangles: wt/c.94C>A). Higher ITPase activity is associated with increased Hb decline. ITPase, inosine triphosphate pyrophosphohydrolase; Hb, Hemoglobin.

Chapter 2.
40
Hepatitis C and ITPase activityITPase activity was not statistically significantly different in HCV-infected patients and non-HCV controls (data not shown).35 Presence or absence of HCV-RNA was not associ-ated with ITPase activity (Figure 1A), regardless of genotype. In patients with a detectable HCV-RNA, the viral load was not associated with ITPase activity (Figure 1A).
Hemoglobin levels and ITPase activityIn total 53 of 77 patients with normal ITPase activity, and 16 of 29 patients with decreased ITPase activity were treated with pegylated-interferon-α plus ribavirin. ITPase activity was significantly associated with Hb decrease (Table 2, Figure 1B, p <0.001). Of the patients having normal ITPase activity, 78.0% (n = 39) were anemic after 4 weeks of therapy (T4), compared to 21.4% (n= 3) of the patients with reduced ITPase activity, see Table 2 (p <0.001). Exactly 92.2% of patients with normal ITPase activity developed anemia at any moment during therapy (Tnadir), compared to 64.3% of patients with low ITPase activity (p = 0.02, Table 2). Test characteristics are shown in Table 3. The positive predictive value (PPV) of normal ITPase activity was 78% for anemia at 4 weeks and 92% for the development of ane-mia at any time during therapy. The negative predictive value (NPV) of a decreased ITPase activity for the development of anemia was 79% and 36%, respectively, for T4 and Tnadir.
Hemoglobin levels and ITPA genotypeTreatment with pegylated-interferon-α plus ribavirin was started in 49 of 73 patients with the ITPA wt/wt genotype, in 13 of 21 patients with ITPA wt/c.124+21A > C genotype and
Table 2. Comparison of ITPase activity and ITPA genotype in development of anemia, and percentage of suc-cessful treatment outcome (SVR) in the treated population (n=69).
ITPase activity (mu/mol Hb) ITPA genotype
≥ 1.11(n=53)
< 1.11(n=16)
p-value Wt/wt(n=49)
Wt/c.124+21a>C(n=13)
p-value Wt/c.94C>a(n=7)
p-value
Pre-treatment
Hba 9.0 ± 1.0b 8.9 ± 1.0 0.84 9.0 ± 1.0b 8.9 ± 0.7 0.84 9.3 ± 1.3 0.45
T4
Hba 7.3 ± 1.0c 8.7 ± 1.0b <0.001 7.3 ± 1.0c 7.9 ± 1.2b 0.06 8.8 ± 1.4 0.001
Anemia; n (%) 39 (78.0)c 3 (21.4)b <0.001 35 (76.1)c 5 (45.5)b 0.07 2 (28.6) 0.02
Reductiona 1.7 ± 1.1c 0.4 ± 0.4b <0.001 1.7 ± 1.1c 1.1 ± 1.3b 0.17 0.5 ± 0.4 0.006
Tnadir
Hba 5.9 ±1.1b 7.5 ±1.2b <0.001 6.0 ± 1.1b 6.9 ± 1.1b 0.02 7.5 ± 1.5 0.002
Anemia; n (%) 47 (92.2)b 9 (64.3)b 0.02 43 (91.5)b 9 (81.8)b 0.32 4 (57.1) 0.04
Reductiona 3.1 ± 1.1b 1.5 ± 0.7b <0.001 3.0 ± 1.2b 2.2 ± 1.1b 0.04 1.8 ± 0.9 0.012
sVr; n (%) 23 (43.4) 7 (43.8) 0.98 22 (44.9) 5 (38.5) 0.68 3 (42.9) 0.99aMean ± SD (mmol/L); b Values missing from 2 patients; c Values missing from 3 patients

41
ITPase activity potential predictor for ribavirin-induced anemia in HCV
in 7 of 10 patients with ITPA wt/c.94C > A genotype. At Week 4 of therapy, anemia was observed in 76.1% of the patients carrying ITPA wt/wt, 45.5% of the patients carrying ITPA wt/c.124+21A > C (p = 0.07) and 28.6% of the patients with ITPA wt/c.94C>A genotype (Table 2, p=0.02).
Anemia at any time during treatment (Tnadir) occurred significantly less frequently in patients with the wt/c.94C > A genotype (57.1%) compared to patients with the wt/wt genotype (91.5%) (p = 0.04, Table 2). Hb at Tnadir was significantly higher in patients with the wt/c.124+21A > C ITPA genotype, and Hb reduction was significantly less compared to wt/wt ITPA genotype, but there was no difference in frequency of anemia (p =0.32).
ITPase activity vs. ITPA genotypeOf the patients with the wt/c.124+21A >C genotype, 38.5% (5 of 13) had a normal ITPase activity (Table 4). Of these five patients, four developed anemia at T4 (80%), whereas in the eight patients with the same genotype, but with decreased ITPase activity, only one patient became anemic. At Tnadir all wt/c.124+21A > C patients with normal ITPase activity devel-oped anemia in contrast to only four of the eight patients with decreased ITPase activity.
In all patients carrying wt/c.94C > A ITPA genotype ITPase activity was decreased and anemia was present in four of seven patients. Of the wt/wt genotype carrying patients, 48 of 49 had a normal ITPase activity and the patient with low ITPase activity developed anemia.
PPV for wt/wt genotype and ITPase activity were not different for both T4 and Tnadir (Table 3). NPV for the ITPase activity lowering ITPA genotypes (wt/c.124+21A > C and wt/c.94C>A together) was lower compared to NPV for ITPase activity < 1.11 mU/mol Hb for both T4 (61% vs. 79%) and Tnadir (28% vs. 36%).
Table 3. Comparison of ITPase activity and ITPA genotype in occurrence of anemia after 4 weeks of therapy (T4) and at any time during therapy (Tnadir) and positive (PPV) and negative (NPV) predicting test character-istics.
T4 (n=64) Tnadir (n=65)
anemia No anemia Predictive value anemia No anemia Predictive value
ITPase activitya
≥1.11 39 11 PPV: 78% 47 4 PPV: 92%
<1.11 3 11 NPV: 79% 9 5 NPV: 36%
ITPA genotype
Wt/wt 35 11 PPV: 76% 43 4 PPV: 91%
Wt/c.124+21A>C+Wt/c.94C>A 7 11 NPV: 61% 13 5 NVP: 28%a mU/mol Hb

Chapter 2.
42
Treatment outcomeSVR was achieved in 43.5% of the patients (n=30), whereas in 56.5% (n = 39) treatment failed due to relapse, serological non-response, or termination of therapy because of adverse events. SVR was not associated with ITPase activity or ITPA genotype (Table 2), nor with anemia (data not shown). Table 5 shows the treatment outcome stratified by HCV genotype. Taking into account HCV genotype, still SVR was not associated with ITPase activity (Fig-ure 2A) or ITPA genotype (Figure 2B). Also per-protocol analysis of the patients adherent to the entire treatment regimen, did not show an association between SVR and ITPase activity or ITPA genotype (data not shown).
Table 4. Occurrence of anemia in treated patients according to ITPA genotype and ITPase activity after 4 weeks of therapy (T4) and at any time during therapy (Tnadir).
ITPA genotype Total, n T4, n (%) Tnadir, n (%)
Wt/wt 49
Activitya <1.11 1
No anemia 1 (100)
Anemia 1 (100)
Activitya ≥1.11 48
No anemia 10 (21) 4 (8)
Anemia 35 (73) 42 (88)
Unknown 3 (6) 2 (4)
Wt/c.124+21a>C 13
Activitya <1.11 8
No anemia 5 (63) 2 (25)
Anemia 1 (13) 4 (50)
Unknown 2 (25) 2 (25)
Activitya ≥1.11 5
No anemia 1 (20)
Anemia 4 (80) 5 (100)
Wt/c.94C>a 7
Activitya <1.11 7
No anemia 5 (71) 3 (43)
Anemia 2 (29) 4 (57)
Activitya ≥1.11 0
No anemia
Anemiaa mU/mol Hb

43
ITPase activity potential predictor for ribavirin-induced anemia in HCV
Table 5. Treatment outcome per hepatitis C genotype, ITPase activity and ITPA genotype.
HCV genotype Treatment outcome ITPase activitya ITPA genotype
≥ 1.11 (n=53)
< 1.11 (n=16)
Wt/wt(n=49)
Wt/c.124+21a>C (n=13)
Wt/c.94C>a (n=7)
1
SVRb 11 3 11 2 1
Non-response 6 3 5 2 2
Relapse 16 2 14 3 1
Termination 3 0 3 0 0
2/3
SVRb 11 4 10 3 2
Non-response 1 0 1 0 0
Relapse 0 2 0 1 1
Termination 0 2 0 2 0
4
SVRb 1 - 1 - -
Non-response 2 - 2 - -
Relapse 2 - 2 - -
Termination 0 - 0 - -a mU/mol Hb; b SVR, sustained virological response
A B
figure 2. (A) The percentages of patients reaching SVR are shown when patients are stratified by hepatitis C genotype. No significant differences were observed between patients with ITPase activity ≥1.11 mU/mol Hb and with patients with ITPase activity <1.11 mU/mol Hb. SVR, sustained virological response; ITPase, inosine triphosphate pyrophosphohydrolase. (B) The percentages of patients reaching SVR are shown when patients are stratified by hepatitis C genotype. No significant differences were observed between patients with ITPA genotype wt/wt and patients with ITPA genotypes wt/c.124+21A>C and wt/c.94C>A. SVR, sustained virologi-cal response; wt, wt/wt; 124, wt/c.124+21A>C; 94,wt/c.94C>A.

Chapter 2.
44
dIsCussION
This is, to our knowledge, the first study evaluating the association of ITPase enzyme activ-ity and ribavirin-induced anemia and comparing it to ITPA genotype in patients treated for chronic HCV. All studies evaluating the association of ITPA polymorphisms with ribavirin-induced anemia assumed that in HCV patients, the reported ITPase activity directly cor-responds to a specific ITPA polymorphism.19,20,22,23,37 Here we show that an ITPA variant such as wt/c.124+21A> C leads to a variety of ITPase activities ranging from as low as 0.19 to as high as 1.52 mU/mol Hb and association is less direct as has previously been assumed. More in depth analysis showed that negative predicting value for ribavirin-associated ane-mia of the wt/c.124+21A >C genotype was only 18%. Within this group, all the patients with normal ITPase activity developed anemia throughout the treatment period, compared to 50% of the patients with decreased ITPase activity.
Most studies20,22,25,37,38 only investigated Hb values after 4 weeks of therapy as at this time point many patients may start with erythropoietin treatment to stimulate red blood cell production. In our cohort, mean time to nadir was 4 months with 61% of patients having anemia at T4, and 84% having anemia at Tnadir. ITPase activity was statistically significantly associated with anemia at both T4 and Tnadir.
In two studies ITPA genotype polymorphisms were found to be protective for anemia dur-ing the course of the entire treatment.39,40 The predictive value of ITPA genotype was similar to that reported in the literature in our hands, despite the small sample size.22,24,37 Differ-ences in occurrence of anemia were only statistically significant for ITPA wt/wt compared to wt/c.94C > A.
No influence of HCV presence or titer could be detected, this is in contrast with our observation in human immunodeficiency virus (HIV)-infected population, in which the geno-phenotype correlation differs significantly from the reference population.35 Similar to ITPA polymorphisms in other studies, ITPase activity was not predictive for SVR in our cohort.19,21,37 Some studies report higher SVR rates for patients with ITPase activity decreasing ITPA genotypes,25,41 and a recent study reported reduced relapse risk follow-ing treatment for HCV genotype 2/3 in these genotypes.42 However, probably due to small sample size, we were not able to confirm these findings in our study. Addition of the new protease inhibitors telaprevir or boceprevir improves response rates to 70% in patients with genotype 1.8,9 Although the influence of protease inhibitors and the nucleoside polymerase inhibitor sofosbuvir on ITPase activity needs to be established, ribavirin is still a part of these treatment regimens and it might be cost saving to prevent adverse events like severe anemia by more tailor-made treatment.

45
ITPase activity potential predictor for ribavirin-induced anemia in HCV
Other purines are still widely used in the treatment of other diseases (i.e., abacavir and teno-fovir in HIV, azathioprine and 6-mercaptopurine in inflammatory bowel disease and acute lymphoblastic leukemia) and may be also influenced by ITPase activity. So even though ribavirin is becoming less important in the treatment of HCV infection, further research to the impact of ITPA genotype and ITPase activity on the degradation of purine analogs will still be important.
Despite the fact that ITPase activity was measured in whole blood, the activities measured correlated with the genotype-specific reference values established in erythrocytes in our laboratory and by others.35,43,44 Although markedly more men were included in this study, this did not influence the assessment of anemia, as gender-specific Hb reference values were used.
It is not clear why decreased ITPase activity protects from ribavirin-induced anemia. A di-rect association between ribavirin levels, ITPase activity and anemia has been hypothesized but could not be proven.37 Although it has been reported that ITPase deficiency decreased the need for ribavirin dose reduction,40 this could not be confirmed in HCV mono-infected patients19 nor in HIV/HCV co-infected patients.45 Thus, direct influence of ITPase activity on ribavirin levels does not seem to be a plausible explanation.
Another possible explanation for the assumed protective effect of ITPA SNPs has been sug-gested by Hitomi et al.,46 who stated that ITPA polymorphisms resulted in decreased ITPase activity causing accumulation of ITP. However, ITP was found to only accumulate in the erythrocytes of patients homozygous for c.94C> A ITPA genotype variant.44,47 Furthermore, Hitomi et al.46 stated that ITP was a substitute for GTP in the generation of AMP by adenylo-succinate synthetase (ADSS). If this were to be correct, the proposed protective effect could only be effective in erythrocytes of patients who are homozygous for c.94C> A. However, neither Hitomi and coworkers, nor any other author (including our group) has, to the best of our knowledge, demonstrated ADSS activity in erythrocytes. The exact mechanism is still not elucidated and needs a more mechanistic approach.
In conclusion, this study is the first to describe the direct correlation of ITPase activity and decrease in Hb values during treatment with ribavirin. In addition, we demonstrated that ITPase activity is a better pre-treatment parameter to predict ribavirin-induced anemia than ITPA genotype.

Chapter 2.
46
aCkNOWledGmeNTs
We want to thank Patricia J. Nelemans MD, PhD, Department of Epidemiology, Maastricht University Medical Centre, Maastricht, The Netherlands for her help with the statistical analysis.

47
ITPase activity potential predictor for ribavirin-induced anemia in HCV
refereNCes
1. Lavanchy D. The global burden of hepatitis C. Liver Int. 2009;29 Suppl 1:74-81. 2. Yoshida H. Development of hepatocellular carcinoma from chronic hepatitis C. Nihon Rinsho.
2011;69 Suppl 4:309-13. 3. Charlton M. Hepatitis C infection in liver transplantation. Am J Transplant. 2001;1(3):197-203. 4. Unknown. Hepatitis C information for health professionals Atlanta2012 [Available from: http://
www.cdc.gov/hepatitis/HCV/HCVfaq.htm#section1]. 5. Afdhal NH, McHutchison JG, Zeuzem S, Mangia A, Pawlotsky JM, Murray JS, et al. Hepatitis C
pharmacogenetics: state of the art in 2010. Hepatology. 2011;53(1):336-45. 6. Soriano V, Poveda E, Vispo E, Labarga P, Rallón N, Barreiro P. Pharmacogenetics of hepatitis C. J
Antimicrob Chemother. 2012;67(3):523-9. 7. van der Meer AJ, Veldt BJ, Feld JJ, Wedemeyer H, Dufour JF, Lammert F, et al. Association between
sustained virological response and all-cause mortality among patients with chronic hepatitis C and advanced hepatic fibrosis. JAMA. 2012;308(24):2584-93.
8. Hézode C, Forestier N, Dusheiko G, Ferenci P, Pol S, Goeser T, et al. Telaprevir and peginterferon with or without ribavirin for chronic HCV infection. N Engl J Med. 2009;360(18):1839-50.
9. Poordad F, McCone J, Jr., Bacon BR, Bruno S, Manns MP, Sulkowski MS, et al. Boceprevir for un-treated chronic HCV genotype 1 infection. N Engl J Med. 2011;364(13):1195-206.
10. Fried MW, Buti M, Dore GJ, Flisiak R, Ferenci P, Jacobson I, et al. Once-daily simeprevir (TMC435) with pegylated interferon and ribavirin in treatment-naive genotype 1 hepatitis C: the randomized PILLAR study. Hepatology. 2013;58(6):1918-29.
11. Lawitz E, Lalezari JP, Hassanein T, Kowdley KV, Poordad FF, Sheikh AM, et al. Sofosbuvir in com-bination with peginterferon alfa-2a and ribavirin for non-cirrhotic, treatment-naive patients with genotypes 1, 2, and 3 hepatitis C infection: a randomised, double-blind, phase 2 trial. Lancet Infect Dis. 2013;13(5):401-8.
12. Rosen HR. Clinical practice. Chronic hepatitis C infection. N Engl J Med. 2011;364(25):2429-38. 13. Fried MW, Shiffman ML, Reddy KR, Smith C, Marinos G, Goncales FL, Jr., et al. Peginterferon alfa-2a
plus ribavirin for chronic hepatitis C virus infection. N Engl J Med. 2002;347(13):975-82. 14. Pár A. Genetic polymorphisms as predictors of response to antiviral treatment in chronic hepatitis C
virus infection. Orv Hetil. 2011;152(22):876-81. 15. Tanaka Y. Interleukin28B and inosine triphosphatase help to personalize hepatitis C treatment.
Digestion. 2011;84 Suppl 1:50-5. 16. Schaefer EA, Chung RT. The impact of human gene polymorphisms on HCV infection and disease
outcome. Semin Liver Dis. 2011;31(4):375-86. 17. Cariani E, Villa E, Rota C, Critelli R, Trenti T. Translating pharmacogenetics into clinical practice:
interleukin (IL)28B and inosine triphosphatase (ITPA) polymophisms in hepatitis C virus (HCV) infection. Clin Chem Lab Med. 2011;49(8):1247-56.
18. Holmes JA, Desmond PV, Thompson AJ. Redefining baseline demographics: the role of genetic test-ing in hepatitis C virus infection. Clin Liver Dis. 2011;15(3):497-513.
19. Thompson AJ, Santoro R, Piazzolla V, Clark PJ, Naggie S, Tillmann HL, et al. Inosine triphosphatase genetic variants are protective against anemia during antiviral therapy for HCV2/3 but do not de-crease dose reductions of RBV or increase SVR. Hepatology. 2011;53(2):389-95.
20. Nishimura T, Osaki R, Shioya M, Imaeda H, Aomatsu T, Takeuchi T, et al. Polymorphism of the inosine triphosphate pyrophosphatase gene predicts ribavirin-induced anemia in chronic hepatitis C patients. Mol Med Rep. 2012;5(2):517-20.

Chapter 2.
48
21. Lötsch J, Hofmann WP, Schlecker C, Zeuzem S, Geisslinger G, Ultsch A, et al. Single and combined IL28B, ITPA and SLC28A3 host genetic markers modulating response to anti-hepatitis C therapy. Pharmacogenomics. 2011;12(12):1729-40.
22. Fellay J, Thompson AJ, Ge D, Gumbs CE, Urban TJ, Shianna KV, et al. ITPA gene variants protect against anaemia in patients treated for chronic hepatitis C. Nature. 2010;464(7287):405-8.
23. Azakami T, Hayes CN, Sezaki H, Kobayashi M, Akuta N, Suzuki F, et al. Common genetic poly-morphism of ITPA gene affects ribavirin-induced anemia and effect of peg-interferon plus ribavirin therapy. J Med Virol. 2011;83(6):1048-57.
24. Kurosaki M, Tanaka Y, Tanaka K, Suzuki Y, Hoshioka Y, Tamaki N, et al. Relationship between polymorphisms of the inosine triphosphatase gene and anaemia or outcome after treatment with pegylated interferon and ribavirin. Antivir Ther. 2011;16(5):685-94.
25. Sakamoto N, Tanaka Y, Nakagawa M, Yatsuhashi H, Nishiguchi S, Enomoto N, et al. ITPA gene vari-ant protects against anemia induced by pegylated interferon-alpha and ribavirin therapy for Japanese patients with chronic hepatitis C. Hepatol Res. 2010;40(11):1063-71.
26. Bakker JA, Bierau J, Drent M. A role for ITPA variants in the clinical course of pulmonary Langer-hans’ cell histiocytosis? Eur Respir J. 2010;36(3):684-6.
27. Marinaki AM, Duley JA, Arenas M, Ansari A, Sumi S, Lewis CM, et al. Mutation in the ITPA gene predicts intolerance to azathioprine. Nucleosides Nucleotides Nucleic Acids. 2004;23(8-9):1393-7.
28. Stepchenkova EI, Tarakhovskaya ER, Spitler K, Frahm C, Menezes MR, Simone PD, et al. Func-tional study of the P32T ITPA variant associated with drug sensitivity in humans. J Mol Biol. 2009;392(3):602-13.
29. Van Dieren JM, Hansen BE, Kuipers EJ, Nieuwenhuis EE, Van der Woude CJ. Meta-analysis: Inosine triphosphate pyrophosphatase polymorphisms and thiopurine toxicity in the treatment of inflamma-tory bowel disease. Aliment Pharmacol Ther. 2007;26(5):643-52.
30. van Dieren JM, van Vuuren AJ, Kusters JG, Nieuwenhuis EE, Kuipers EJ, van der Woude CJ. ITPA genotyping is not predictive for the development of side effects in AZA treated inflammatory bowel disease patients. Gut. 2005;54(11):1664.
31. de Bruijne J, Buster EH, Gelderblom HC, Brouwer JT, de Knegt RJ, van Erpecum KJ, et al. Treatment of chronic hepatitis C virus infection - Dutch national guidelines. Neth J Med. 2008;66(7):311-22.
32. WHO/UNICEF/UNU. Iron deficiency anaemia assessment, prevention and control: a guide for programme managers. Geneva: World Health Organization 2001. p. 1-114.
33. Bierau J, Bakker JA, Lindhout M, van Gennip AH. Determination of ITPase activity in erythro-cyte lysates obtained for determination of TPMT activity. Nucleosides Nucleotides Nucleic Acids. 2006;25(9-11):1129-32.
34. Shipkova M, Lorenz K, Oellerich M, Wieland E, von Ahsen N. Measurement of erythrocyte inosine triphosphate pyrophosphohydrolase (ITPA) activity by HPLC and correlation of ITPA genotype-phenotype in a Caucasian population. Clin Chem. 2006;52(2):240-7.
35. Bierau J, Bakker JA, Schippers JA, Grashorn JA, Lindhout M, Lowe SH, et al. Erythrocyte inosine triphosphatase activity is decreased in HIV-seropositive individuals. PLoS One. 2012;7(1):e30175.
36. Bierau J, Lindhout M, Bakker JA. Pharmacogenetic significance of inosine triphosphatase. Pharma-cogenomics. 2007;8(9):1221-8.
37. D’Avolio A, Ciancio A, Siccardi M, Smedile A, Baietto L, Simiele M, et al. Inosine triphosphatase polymorphisms and ribavirin pharmacokinetics as determinants of ribavirin-associate anemia in patients receiving standard anti-HCV treatment. Ther Drug Monit. 2012;34(2):165-70.

49
ITPase activity potential predictor for ribavirin-induced anemia in HCV
38. Ochi H, Maekawa T, Abe H, Hayashida Y, Nakano R, Kubo M, et al. ITPA polymorphism affects ribavirin-induced anemia and outcomes of therapy--a genome-wide study of Japanese HCV virus patients. Gastroenterology. 2010;139(4):1190-7.
39. Suzuki F, Suzuki Y, Akuta N, Sezaki H, Hirakawa M, Kawamura Y, et al. Influence of ITPA poly-morphisms on decreases of hemoglobin during treatment with pegylated interferon, ribavirin, and telaprevir. Hepatology. 2011;53(2):415-21.
40. Thompson AJ, Fellay J, Patel K, Tillmann HL, Naggie S, Ge D, et al. Variants in the ITPA gene protect against ribavirin-induced hemolytic anemia and decrease the need for ribavirin dose reduction. Gastroenterology. 2010;139(4):1181-9.
41. Clark PJ, Aghemo A, Degasperi E, Galmozzi E, Urban TJ, Vock DM, et al. Inosine triphosphatase deficiency helps predict anaemia, anaemia management and response in chronic hepatitis C therapy. J Viral Hepat. 2013;20(12):858-66.
42. Rembeck K, Waldenstrom J, Hellstrand K, Nilsson S, Nystrom K, Martner A, et al. Variants of the inosine triphosphate pyrophosphatase gene are associated with reduced relapse risk following treat-ment for HCV genotype 2/3. Hepatology. 2014;59(6):2131-9.
43. Bakker JA, Lindhout M, Habets DD, van den Wijngaard A, Paulussen AD, Bierau J. The effect of ITPA polymorphisms on the enzyme kinetic properties of human erythrocyte inosine triphosphatase toward its substrates ITP and 6-Thio-ITP. Nucleosides Nucleotides Nucleic Acids. 2011;30(11):839-49.
44. Sumi S, Marinaki AM, Arenas M, Fairbanks L, Shobowale-Bakre M, Rees DC, et al. Genetic basis of inosine triphosphate pyrophosphohydrolase deficiency. Hum Genet. 2002;111(4-5):360-7.
45. Naggie S, Rallon NI, Benito JM, Morello J, Rodriguez-Novoa S, Clark PJ, et al. Variants in the ITPA gene protect against ribavirin-induced hemolytic anemia in HIV/HCV-coinfected patients with all HCV genotypes. J Infect Dis. 2012;205(3):376-83.
46. Hitomi Y, Cirulli ET, Fellay J, McHutchison JG, Thompson AJ, Gumbs CE, et al. Inosine triphosphate protects against ribavirin-induced adenosine triphosphate loss by adenylosuccinate synthase func-tion. Gastroenterology. 2011;140(4):1314-21.
47. Maeda T, Sumi S, Ueta A, Ohkubo Y, Ito T, Marinaki AM, et al. Genetic basis of inosine triphosphate pyrophosphohydrolase deficiency in the Japanese population. Mol Genet Metab. 2005;85(4):271-9.


Chapter 3.Inosine triphosphate pyrophosphohydrolase expression: decreased in leukocytes of HIV-infected patients using combination antiretroviral therapy.
N.C. Peltenburg, M.P.G. Leers, J.A. Bakker, S.H. Lowe, W.H.M. Vroemen, A.D.C. Paulussen, B.J.C. van den Bosch, J. Bierau, A. Verbon
Journal of Acquired Immune Defi ciency Syndromes. 2016 Dec; 73(4): 390-395.

Chapter 3.
52
absTraCT
ObjectiveIn HIV-infected patients, the enzyme Inosine triphosphate pyrophosphohydrolase (ITPase), involved in purine nucleotide homeostasis, was found to be decreased in erythrocytes. Since purine analogues are pivotal in the HIV treatment, a better understanding of ITPase expres-sion in CD4+ lymphocytes may lead to better understanding of nucleotide metabolism and (adverse) effects.
designCross-sectional, cohort, observational study.
methodsHIV-infected and control patients above 18 years were included. All DNA samples were genotyped for the 2 functional ITPA SNPs; c.94C>A (rs1127354) and c.124+21A>C (rs7270101). ITPase expression was determined by flow cytometry in all leukocyte subsets.
resultsFifty-nine HIV-infected patients and 50 controls were included. Leukocyte subtype distri-bution showed no difference in monocytes and granulocytes, but lymphocytes were higher in HIV-infected patients (p<0.001). ITPase expression was highest in activated monocytes and lowest in lymphocytes. In HIV-infected patients, the percentage of ITPase positive cells was less in all leukocyte and lymphocyte subsets compared with controls (p<0.01). In HIV-infected patients, 97.4% of CD4+ lymphocytes were ITPase positive versus 99.9% in controls (p=0.002) and 85.9% versus 99.6% of CD8+ lymphocytes (p<0.0001), respectively. Stratification according to genotype revealed no significant differences in ITPase expression in leukocytes in HIV-infected and control patients.
ConclusionsHIV-infection seems to be interfering with the nucleotide metabolism in leukocytes, including CD4+ lymphocytes, by decreasing ITPase expression, independently of ITPA genotype. Given that active metabolites of purine-analogue reverse transcriptase inhibitors are potential substrates for ITPase, these results warrant further research towards effective-ness and adverse events of purine analogues and ITPase activity.

53
ITPase decreased in leukocytes of HIV-infected patients using cART
INTrOduCTION
The Human Immunodeficiency Virus (HIV) is a retrovirus that copies its single-stranded RNA into double-stranded DNA, which is incorporated into the DNA of the host. Con-versely, new viral RNA is transcribed from the infected host DNA and packaged into new virus particles. These processes are entirely dependent on human nucleotide metabolism in the host lymphocytes. This makes nucleotide metabolism both a target and a vehicle for anti-viral therapy, reflected by the numerous anti-retroviral nucleoside analogues that have been created. Interestingly, there are indications that nucleotide metabolism is impaired in lymphocytes and erythrocytes of HIV-infected individuals. HIV-1 positive lymphocytes were demonstrated to be unable to expand their ribonucleotide pool (both purines and pyrimidines) to the same extent as HIV-1 negative lymphocytes after a strong mitogenic stimulation, prohibiting DNA-replication and leading to cell death.1 Furthermore, the activities of thymidine kinase 1 and thymidylate kinase (TMP-kinase), both enzymes in the pyrimidine nucleotide biosynthetic pathway, were significantly decreased in lymphocytes of HIV-infected patients compared with controls.2,3 Purine nucleotide homeostasis may be compromised, as the enzyme Inosine 5’-triphosphate pyrophosphohydrolase (Inosine triphosphatase; ITPase) was found to be significantly decreased in erythrocytes of HIV-infected patients compared with a control population.4 Since antiviral purine analogues are pivotal in the treatment of HIV-infection, a better understanding of ITPase expression in lymphocytes may lead to a better understanding of nucleotide metabolism and the effects of HIV treatment.
ITPase, encoded by the polymorphic gene ITPA (OMIM #147520), is one of the scavenger enzymes eliminating the potentially cyto- or genotoxic noncanonical nucleoside triphos-phates from the nucleotide pool.5 Multiple single nucleotide polymorphisms (SNPs) of ITPA have been described,6 among which 2 SNPs are proven to decrease ITPase activity: c.94C>A (p.Pro32Thr, NCBI rs1127354) and c.124+21A>C (NCBI rs7270101). The SNP c.94C>A is found in most world populations, albeit with varying frequency,7 whereas the SNP c.124+21A>C has not been found or was extremely rare among Asian populations.8–10 ITPA genotype6,11–13 and decreased ITPase activity14 have been associated with protection against anemia in the treatment of hepatitis C with the purine analogue ribavirin. Furthermore, although conflicting reports exist,15,16 SNPs in the ITPA genotype have been associated with adverse drug events during thiopurine therapy with azathioprine and 6-mercaptopurine.17,18 Also, the SNP c.94C>A led to higher concentrations of methyl-mercaptopurine nucleotides in patients treated for acute lymphoblastic leukemia and a higher probability of severe fe-brile neutropenia in these patients, when mercaptopurine dose had been adjusted for TPMT (thiopurine S-methyltransferase) genotype.19 Rare truncating mutations in the ITPA gene have recently been associated with a severe early-infantile encephalopathy.20 In an ITPA

Chapter 3.
54
knockout mouse model, ITPase deficient mice showed features of growth retardation and cardiac myofiber disarray and died soon after birth.21
In HIV-infected patients, the decreased erythrocyte ITPase activity was independent of the presence of SNPs in the ITPA gene, as it was seen in both wild-type and SNP carriers.4 This finding raised the question whether in leukocytes as well, ITPase activity is decreased, and thus purine metabolism is altered, independent of ITPA genotype in HIV infected patients on cART. We therefore analyzed the presence of the ITPase protein in leukocytes and leukocyte subpopulations, in association with ITPA genotype in a HIV-infected and a control population.
meTHOds
PatientsHIV-seropositive patients, visiting the HIV outpatient clinic of the Maastricht University Medical Centre (MUMC+) aged 18 years and older, were eligible for inclusion in the study. Consecutive patients were asked for participation and included after written informed con-sent was obtained. Data regarding age, gender at birth, country of birth, race, CD4 nadir, and date of start combination Antiretroviral therapy (cART), were obtained from the Dutch HIV monitoring foundation (Stichting HIV Monitoring; SHM). The control population consisted of anonymous samples from the general hospital population of the Zuyderland Medical Center in Heerlen. All control samples were used according to the code for proper use of human tissue as formulated by the Dutch Federation of Medical Scientific Societies. The study was approved by the Medical Ethics Committee of the MUMC+ and all patients signed written informed consent.
flow cytometric ITPase expression analysisITPase expression was determined by flow cytometry as described earlier.22 In short, EDTA anticoagulated peripheral blood samples were processed and analyzed within 24 hours after collection. One hundred microliters of whole blood was incubated with a cocktail of directly conjugated antibodies.22 Cell suspensions were incubated for 15 minutes in the dark at room temperature (RT). A Fix&Perm strategy (GAS004; Caltag, Invitrogen, Carlsbad, CA) was performed after washing with phosphate-buffered saline. The fixation step consisted of the ad-dition of 100 mL fixation reagent for 15 minutes at RT and 2 wash steps (phosphate-buffered saline). This was followed by the addition of the permeabilization medium and anti-ITPase MoAb (clone 2H8, isotype IgG2a, catalog number H00003704-M01, Abnova, Taipei City, Taiwan). Except some isoforms of ITPase protein, no other human proteins have a similar sequence, thus the specificity of the antibodies used to detect the ITPase protein is considered

55
ITPase decreased in leukocytes of HIV-infected patients using cART
to be high and the chance we measured other protein products than the ITPase protein seems negligible. After incubation for 15 minutes at RT and one wash step, 5 mL PE-conjugated anti-IgG2a (Southern Biotech, Birmingham, AL) was added. Finally, after incubation (15 minutes at RT) and washing, 500 mL CellWash (BD) was added. Samples were analyzed with a BD FAC-SCanto (BD Biosciences, San Jose, CA). Cell-bound fluorescent labels were excited with a 488 nm, air-cooled, solid-state argon ion laser, followed by a 17 mW 633 nm, Helium–Neon laser. The flow cytometer was set up daily using 7-color beads (BD) with automatic compensation settings using the FACSCanto software to achieve optimal instrument performance. Sample analysis was completed when 5000 lymphocytes were collected. All measured events were stored and analyzed. The fluorescence signal data were recorded with logarithmical amplifica-tion. FACSDiva software (BD) was used for the analysis of acquired data. A negative control (Fluorescence-minus-one: no anti-ITPase but with addition of PE-conjugated anti-IgG2A) was used to set a threshold at a maximum of 5% positivity to exclude auto-fluorescence and to confirm ITPase-specific labeling. The expression of ITPase was determined by determining the median fluorescent intensity of a certain leukocyte population.
Gating strategyParental gating, based on scatter signals and immuno-fluorescence staining as described earlier,22 resulted in a step-wise separation of subpopulations of leukocytes with accumu-lated complexity of phenotypical characteristics.
dNa isolation and ITPA genotypingTotal DNA was extracted from blood using the Blood L Kit (Macherey-Nagel GmbH & Co. KG, Düren, Germany) and the Hamilton Microlab STAR Line (Hamilton, Bonaduz, Switzer-land). Specific intronic primers with an additional M13-tag were used to amplify exon 2 of the ITPA gene and flanking intronic regions (ITPA_ex2F-CTTTAGGAGATGGGCAGCAG; ITPA_ex2R-CACAGAAAGTCAGGTCACAGG). Amplification was performed in a 10 mL reaction volume using Amplitaq Gold 360 Master Mix (Applied Biosystems, Nieuwerkerk aan den IJssel, The Netherlands) with 5% 360 GC Enhancer, 2 pmol of each primer, and 10 ng DNA. The cycle conditions were 96°C for 5 minutes, followed by 35 cycles of 94°C for 30 seconds, 60°C for 45 seconds, and 72°C for 45 seconds with a final elongation step of 72°C for 10 minutes. The resulting 245-bp PCR product was bi-directionally sequenced using the ABI Big Dye Terminator Cycle Sequencing Ready Reaction kit and the ABI3730XL genetic analyzer (Applied Biosystems, Foster City, CA). The 2 common functional polymorphisms c.94C>A (p.Pro32Thr; NCBI rs1127354) and c.124+21A>C (NCBI rs7270101) were deter-mined using Mutation Surveyor DNA variant analysis software (SoftGenetics, State College, PA) with genomic NCBI reference sequence NC_000020. All sequences were evaluated independently by 2 laboratory experts.

Chapter 3.
56
statistical analysisResults were analyzed using GraphPad Prism 5.01 (Graphpad Software for Windows, San Diego, CA), Microsoft Excel (Microsoft, Redmond, WA) software, and IBM SPSS Statistics 20 (IBM Corporation, New York, NY) software. Independent samples 2-tailed T-test was used to determine significant differences. P-values <0.05 were considered to be statistically significant.
resulTs
Patient characteristicsA total of 59 HIV-infected patients and 50 controls were included (Table 1). The mean age did not differ significantly between the groups. There was a male predominance in the HIV-infected patients. All but 1 patient used cART and the mean CD4 nadir of this group was 206 CD4+ lymphocytes per liter. Although all mean values of the hematological parameters assessed were within the reference values, significant differences between the HIV-infected patients and the control patients were found (Table 1). Mean corpuscular volume and mean corpuscular hemoglobin levels were higher in the HIV-infected population, whereas hematocrit and mean corpuscular hemoglobin concentration was lower. The HIV-infected patients had a significantly lower white blood cell and platelet count compared with the control population.
leukocytes and leukocyte subsetsThe leukocyte subtype distribution showed no difference in percentages of monocytes (6.7% versus 6.7%; p=0.9, respectively) and granulocytes (56.7% versus 61.1%; p=0.08, respec-tively) between HIV-infected and control patients (data not shown). The HIV-infected pa-tients had a statistically significant higher percentage of lymphocytes (29.4% versus 23.1%; p<0.001, respectively). No difference was found in the size of the fraction of B-lymphocytes between HIV-infected patients and controls (9.80% versus 10.03%; p=0.80, respectively). The percentage of T-lymphocytes was significantly higher in HIV-infected patients (80.0% versus 74.0%; p=0.001, respectively), with decreased T-helper cells (CD4+ T-cells) (37.6% versus 61.6%; p<0.0001) and increased cytotoxic T-cells (CD8+ T-cells) (57.9% versus 32.6%; p<0.0001) compared with the control population. The percentage of Natural killer cells was significantly lower in HIV-infected patients (10.2% versus 16.6%; p< 0.0001).
Presence of ITPase in leukocyte subsetsHigh percentages of ITPase positive cells could be demonstrated in the control popula-tion; lymphocytes 99.5%, monocytes 98.8%, and granulocytes 95.3% were ITPase positive. Less lymphocytes (90.9%) and granulocytes (77.1%) were ITPase positive in HIV-infected

57
ITPase decreased in leukocytes of HIV-infected patients using cART
patients (Figure 1A) compared with the control population (p<0.0001). Furthermore, all lymphocyte subtypes showed statistically significant lower percentages of ITPase positive cells in HIV-infected patients (Figure 1B). In the controls, all lymphocyte subtypes had a mean percentages of ITPase positive cells of 99% or more, whereas in HIV-infected patients 91% of T-lymphocytes, 97% of B-lymphocytes, and 87% of natural killer cells were ITPase positive (p<0.0001 for all). Although the CD4/CD8 ratio of T-lymphocytes is decreased in HIV-infected patients, both CD4 lymphocytes and CD8 lymphocytes had less ITPase positive cells compared with the control patients; 97.4% versus 99.9% for CD4+ lymphocytes (p=0.002) cells and 85.9% versus 99.6% for CD8+ lymphocytes (p<0.0001).
Table 1. Demographic, clinical and hematological characteristics of patients and controls.
Characteristic HIV-infected (N=59)
Controls (N=50)
reference values, range
p-value
age, Median years (range) 49.6 (28.3-68.2) 56.8 (15.9-90.2)
male gender, n (%) 45 (76.3) 50 (50.0)
ITPA genotype, n (%)
Wt/wt 40 (67.8) 26 (52.0)
Wt/c.124+21A>C 7 (11.9) 12 (24.0)
Wt/c.94C>A 7 (11.9) 9 (18.0)
c.124+21A>C/c.124+21A>C 1 (1.7) 3 (6.0)
c.94C>A/c.124+21A>C 2 (3.4) -
Unknown 2 (3.4) -
mean Cd4 nadir ± SD 205.8 ± 152.4
carT 58 (98.3)
race, n (%)
Caucasian 47 (79.7)
Hispanic 1 (1.7)
African 4 (6.8)
Asian 5 (8.5)
Mix 2 (3.4)
mean WbC, x109/L ± SD 6.33 ± 2.05 8.69 ± 2.82 4.00–10.00 <0.001
mean rbC, x1012/L ± SD 4.67 ± 0.66 4.77 ± 0.34 4.20–6.20 0.31
mean Hb, mmol/L ± SD 10.67 ± 9.40 8.94 ± 0.70 7.50–11.00 0.20
mean Ht, L/L ± SD 0.48 ± 0.06 0.43 ± 0.03 0.36–0.51 <0.001
mean mCV, fL ± SD 102.76 ± 9.69 90.24 ± 3.66 80.00–100.00 <0.001
mean mCH, ± SD 2.03 ± 0.22 1.87 ± 0.09 1.70–2.10 <0.001
mean mCHC, g/dl ± SD 19.80 ± 1.02 20.78 ± 0.61 19.30–22.50 <0.001
mean Platelets, x1012/L ± SD 222.07 ± 68.47 248.48 ± 60.62 130.00–400.00 0.04
cART, combined Antiretroviral therapy; WBC, White blood cells; RBC, Red blood cells; Hb, Hemoglobin; Ht, Hematocrit; MCV, Mean corpuscular volume; MCH, Mean corpuscular hemoglobin; MCHC, Mean corpuscu-lar hemoglobin concentration
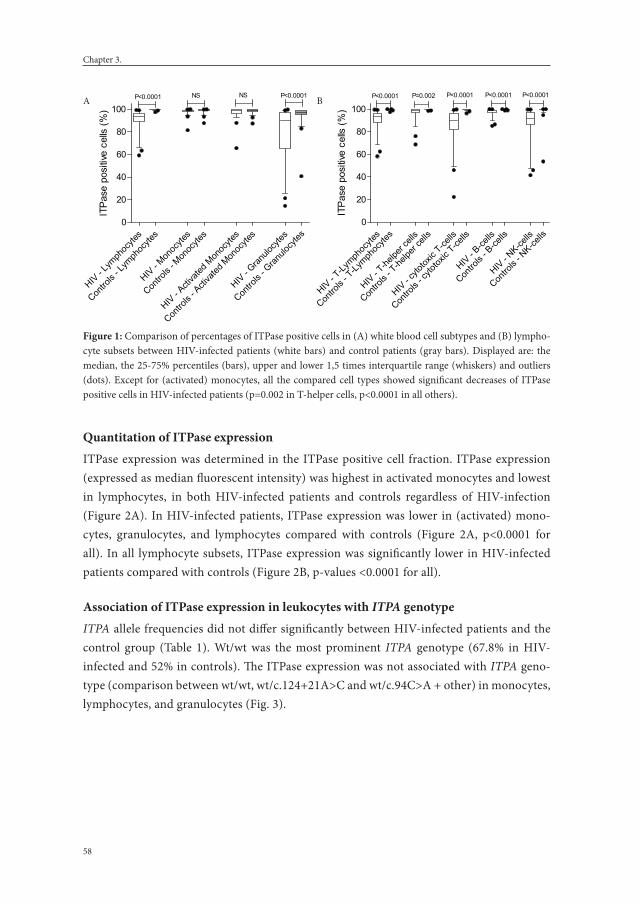
Chapter 3.
58
Quantitation of ITPase expressionITPase expression was determined in the ITPase positive cell fraction. ITPase expression (expressed as median fluorescent intensity) was highest in activated monocytes and lowest in lymphocytes, in both HIV-infected patients and controls regardless of HIV-infection (Figure 2A). In HIV-infected patients, ITPase expression was lower in (activated) mono-cytes, granulocytes, and lymphocytes compared with controls (Figure 2A, p<0.0001 for all). In all lymphocyte subsets, ITPase expression was significantly lower in HIV-infected patients compared with controls (Figure 2B, p-values <0.0001 for all).
association of ITPase expression in leukocytes with ITPA genotypeITPA allele frequencies did not differ significantly between HIV-infected patients and the control group (Table 1). Wt/wt was the most prominent ITPA genotype (67.8% in HIV-infected and 52% in controls). The ITPase expression was not associated with ITPA geno-type (comparison between wt/wt, wt/c.124+21A>C and wt/c.94C>A + other) in monocytes, lymphocytes, and granulocytes (Fig. 3).
Figure 1A.
HIV - L
ymph
ocyte
s
Contro
ls - L
ymph
ocyte
s
HIV - M
onoc
ytes
Contro
ls - M
onoc
ytes
HIV - A
ctiva
ted M
onoc
ytes
Contro
ls - A
ctiva
ted M
onoc
ytes
HIV - G
ranulo
cytes
Contro
ls - G
ranulo
cytes
0
20
40
60
80
100P<0.0001 P<0.0001NS NS
ITPa
se p
ositi
ve c
ells
(%)
Figure 1B.
HIV - T-Ly
mphoc
ytes
Contro
ls - T
-Lymph
ocyte
s
HIV - T-he
lper c
ells
Contro
ls - T
-helpe
r cell
s
HIV - c
ytotox
ic T-ce
lls
Contro
ls - c
ytotox
ic T-ce
lls
HIV - B-ce
lls
Contro
ls - B
-cells
HIV - NK-ce
lls
Contro
ls - N
K-cells
0
20
40
60
80
100P=0.002P<0.0001 P<0.0001 P<0.0001P<0.0001
ITPa
se p
ositi
ve c
ells
(%)
A B
figure 1: Comparison of percentages of ITPase positive cells in (A) white blood cell subtypes and (B) lympho-cyte subsets between HIV-infected patients (white bars) and control patients (gray bars). Displayed are: the median, the 25-75% percentiles (bars), upper and lower 1,5 times interquartile range (whiskers) and outliers (dots). Except for (activated) monocytes, all the compared cell types showed significant decreases of ITPase positive cells in HIV-infected patients (p=0.002 in T-helper cells, p<0.0001 in all others).

59
ITPase decreased in leukocytes of HIV-infected patients using cART
All cell
s
Monoc
ytes
Activa
ted M
onoc
ytes
Lymph
ocyte
s
Granulo
cytes
0
10000
20000
30000
40000
50000* * * * *
HIV-patients
Controls
* p-values <0.0001
ITPa
se e
xpre
ssio
n (M
FI)
A B
Figure 2A.
All cell
s
Monoc
ytes
Activa
ted M
onoc
ytes
Lymph
ocyte
s
Granulo
cytes
0
10000
20000
30000
40000
50000* * * * *
HIV-patients
Controls
* p-values <0.0001
ITPa
se e
xpre
ssio
n (M
FI)
figure 2: Comparison of ITPase expression (expressed as Median fluorescent intensity; MFI) in white blood cell subtypes (A) and lymphocyte subsets (B) between HIV-infected patients (white bars) and control patients (gray bars). Displayed are: the median, the 25-75% percentiles (bars), upper and lower 1,5 times interquartile range (whiskers), outliers (dots). All the compared cell types showed significant decreases of MFI in HIV-infected patients (p<0.0001 for all).
Figure 3.
0
10000
20000
30000
40000
Wt12
4 94 Wt 94124
Monocytes
124
124
124
124Wt
WtWtWt
94 94 94 94
Lymphocytes Granulocytes
HIV-patients
Controls
ITPA genotype
NSNS NS
NSNS NS
NSNS NS
NSNS NS
NSNS NS
NS
* NS
* p=0.046
ITPa
se e
xpre
ssio
n (M
FI)
figure 3. Stratification of different leukocyte subtypes by ITPA genotype and the corresponding ITPase ex-pression (expressed as Median fluorescent intensity, MFI). No association was found between ITPA genotype (wt=wt/wt; 124=wt/c.124+21A>C; 94=wt/c.94C>A) and ITPase expression in HIV-infected patients (white bars) and control patients (gray bars) in monocytes, lymphocytes and granulocytes (no significant differences except for the comparison between wt/wt and wt/c.124+21A>C in lymphocytes of control patients; p=0.046).

Chapter 3.
60
dIsCussION
Here, we report a striking significant decrease in ITPase expression in leukocyte subtypes and lymphocyte subsets in HIV-infected patients compared with controls. We observed an overall decrease in ITPase expression in white blood cells of treated HIV-positive patients, regardless of genotype suggesting that the decrease in ITPase expression in leukocytes was because of HIV-infection or cART, albeit that the influence of nucleoside analogues is likely to be limited.4
Regardless of HIV status, ITPase protein expression was highest in monocytes, being especially high in activated monocytes. This may reflect the phagocytic activity, as the destruction of pathogens and infected cells either by oxygen dependent and independent pathways releases nucleotides and very likely also noncanonical nucleotides, such as Inosine triphosphate (ITP).
Competition for the intracellular nucleotide pools between the host white blood cells and HIV appears to be a major contributor to HIV pathogenesis. Earlier reports showed that pyrimidine nucleotide metabolism (both de novo and salvage) is severely impaired in HIV-infected lymphocytes.1–3 After mitogenic stimulation, HIV-infected lymphocytes were unable to extend both their purine and pyrimidine nucleotide pools to allow prolif-eration. A major difference between HIV-infected lymphocytes and controls was that the former rely predominantly on purine salvage metabolism to meet the cellular requirement opposed to de novo synthesis of purine nucleotides being the predominant biosynthetic route in the latter. Sterile alpha motif and histidine-aspartic domain-containing protein 1 (SAMHD1) is a human defense protein that inhibits the HIV-1 replication by depleting intracellular deoxynucleotide pools.23 In HIV-2 infection, this action is counteracted by the virion-packaged accessory protein.23 These findings suggest that the infected lymphocyte’s ultimate defense mechanism is to cause a fatal imbalance in the intracellular nucleotide pool to prevent HIV-integration and replication. Our observation of reduced ITPase expression in HIV-infected lymphocytes is in line with this hypothesis. Decreased activity of ITPase leads to decreased scavenging of noncanonical nucleotides, including ITP and deoxy-ITP which contributes to the intracellular nucleotide imbalance in HIV-infected lymphocytes by increasing the availability of non-canonical nucleotides for DNA and RNA replication, causing erroneous incorporation into nucleic acids, potentially leading to programmed cell death and mutagenesis.24
The decreased ITPase expression and thus possibly the decreased ITPase activity in the blood compartment4 may have implications for the efficacy of purine analogue reverse transcriptase inhibitors. It can be expected that the efficacy of nucleos(t)ide reverse tran-

61
ITPase decreased in leukocytes of HIV-infected patients using cART
scriptase inhibitors (NRTIs) of which the nucleotide triphosphate form exerts the virostatic effect is enhanced, whereas the efficacy of NRTIs of which the nucleotide monophosphate exerts the virostatic effect is reduced. This implies treatment with purine NRTIs tenofovir, didanosine, and abacavir, which are active in their nucleotide triphosphate form, benefit from the observed decreased ITPase expression. This is in contrast to the earlier reported decreased phosphorylation of ziduvodine in HIV-infected lymphocytes due to decreased thymidine kinase 2 activity.2
ITPase protein and ITPA mRNA are likely to be ubiquitously expressed in all nucleated cells.25–27 With respect to erythrocytes, a clear-cut genotype–phenotype correlation exists, both in HIV-infected patients and in controls.28,29 According to our present findings this seems not to be the case in white blood cells, neither in HIV-infected patients and controls. Our previous results in erythrocytes may suggest decreased stability of the P32T ITPase protein and the wild type protein in the erythrocytes of HIV-infected individuals. Because no protein synthesis takes place in erythrocytes, a HIV-induced instability or reduced bio-synthesis of the ITPase protein is readily detected. A possible explanation for the fact that this is not observed in our present work may be that in white blood cells ITPA is transcribed and the ITPase protein is synthesized continuously, despite the amount of mRNA encod-ing the entire protein being reduced due to altered splicing of the pre-mRNA in the ITPA 94C>A and 121+21A>C.30 Although ITPase expression appears to be generally decreased in blood, there may still exist pharmaco-genetic phenomena associated with ITPA genotype, apart from the present observation.
In conclusion, this study is the first to report that the expression of ITPase is significantly decreased in lymphocytes and granulocytes of treated HIV-infected patients, compared with a control population. Given that purine NRTIs are active in their triphosphate form, the present results underline their importance in the backbone of cART. Our findings cor-roborate previous findings that control over intracellular nucleotide pools is vital for both HIV and its host for survival.

Chapter 3.
62
refereNCes
1. Bofill M, Fairbanks LD, Ruckemann K, Lipman M, Simmonds HA. T-lymphocytes from AIDS patients are unable to synthesize ribonucleotides de novo in response to mitogenic stimulation. Impaired pyrimidine responses are already evident at early stages of HIV-1 infection. J Biol Chem. 1995;270(50):29690-7.
2. Jacobsson B, Britton S, He Q, Karlsson A, Eriksson S. Decreased Thymidine kinase levels in periph-eral blood cells from HIV-seropositive individuals: implications for Zidovudine metabolism. AIDS Research and Human Retroviruses. 1995;11(7):805-11.
3. Jacobsson B, Britton S, Törnevik Y, Eriksson S. Decrease in Thymidylate kinase activity in peripheral blood mononuclear cells from HIV-infected individuals. Biochemical Pharmacology. 1998;56:389-95.
4. Bierau J, Bakker JA, Schippers JA, Grashorn JA, Lindhout M, Lowe SH, et al. Erythrocyte inosine triphosphatase activity is decreased in HIV-seropositive individuals. PLoS One. 2012;7(1):e30175.
5. Galperin MY, Moroz OV, Wilson KS, Murzin AG. House cleaning, a part of good housekeeping. Mol Microbiol. 2006;59(1):5-19.
6. Fellay J, Thompson AJ, Ge D, Gumbs CE, Urban TJ, Shianna KV, et al. ITPA gene variants protect against anaemia in patients treated for chronic hepatitis C. Nature. 2010;464(7287):405-8.
7. Marsh S, King CR, Ahluwalia R, McLeod HL. Distribution of ITPA P32T alleles in multiple world populations. J Hum Genet. 2004;49(10):579-81.
8. Maeda T, Sumi S, Ueta A, Ohkubo Y, Ito T, Marinaki AM, et al. Genetic basis of inosine triphosphate pyrophosphohydrolase deficiency in the Japanese population. Mol Genet Metab. 2005;85(4):271-9.
9. Kudo M, Saito Y, Sasaki T, Akasaki H, Yamaguchi Y, Uehara M, et al. Genetic variations in the HGPRT, ITPA, IMPDH1, IMPDH2, and GMPS genes in Japanese individuals. Drug Metab Pharmacokinet. 2009;24(6):557-64.
10. Cheon JH, Kim JH, Kim BY, Kim SW, Hong SY, Eun CS, et al. Allele frequency of thiopurine methyl-transferase and inosine triphosphate pyrophosphatase gene polymorphisms in Korean patients with inflammatory bowel diseases. Hepatogastroenterology. 2009;56(90):421-3.
11. Thompson AJ, Santoro R, Piazzolla V, Clark PJ, Naggie S, Tillmann HL, et al. Inosine triphosphatase genetic variants are protective against anemia during antiviral therapy for HCV2/3 but do not de-crease dose reductions of RBV or increase SVR. Hepatology. 2011;53(2):389-95.
12. Lötsch J, Hofmann WP, Schlecker C, Zeuzem S, Geisslinger G, Ultsch A, et al. Single and combined IL28B, ITPA and SLC28A3 host genetic markers modulating response to anti-hepatitis C therapy. Pharmacogenomics. 2011;12(12):1729-40.
13. Sakamoto N, Tanaka Y, Nakagawa M, Yatsuhashi H, Nishiguchi S, Enomoto N, et al. ITPA gene vari-ant protects against anemia induced by pegylated interferon-alpha and ribavirin therapy for Japanese patients with chronic hepatitis C. Hepatol Res. 2010;40(11):1063-71.
14. Peltenburg NC, Bakker JA, Vroemen WH, de Knegt RJ, Leers MP, Bierau J, et al. Inosine triphosphate pyrophosphohydrolase activity: more accurate predictor for ribavirin-induced anemia in hepatitis C infected patients than ITPA genotype. Clin Chem Lab Med. 2015;53(12):2021-9.
15. van Dieren JM, van Vuuren AJ, Kusters JG, Nieuwenhuis EE, Kuipers EJ, van der Woude CJ. ITPA genotyping is not predictive for the development of side effects in AZA treated inflammatory bowel disease patients. Gut. 2005;54(11):1664.
16. Van Dieren JM, Hansen BE, Kuipers EJ, Nieuwenhuis EE, Van der Woude CJ. Meta-analysis: Inosine triphosphate pyrophosphatase polymorphisms and thiopurine toxicity in the treatment of inflamma-tory bowel disease. Aliment Pharmacol Ther. 2007;26(5):643-52.

63
ITPase decreased in leukocytes of HIV-infected patients using cART
17. Marinaki AM, Duley JA, Arenas M, Ansari A, Sumi S, Lewis CM, et al. Mutation in the ITPA gene predicts intolerance to azathioprine. Nucleosides Nucleotides Nucleic Acids. 2004;23(8-9):1393-7.
18. Stepchenkova EI, Tarakhovskaya ER, Spitler K, Frahm C, Menezes MR, Simone PD, et al. Func-tional study of the P32T ITPA variant associated with drug sensitivity in humans. J Mol Biol. 2009;392(3):602-13.
19. Stocco G, Cheok MH, Crews KR, Dervieux T, French D, Pei D, et al. Genetic polymorphism of inosine triphosphate pyrophosphatase is a determinant of mercaptopurine metabolism and toxicity during treatment for acute lymphoblastic leukemia. Clin Pharmacol Ther. 2009;85(2):164-72.
20. Kevelam SH, Bierau J, Salvarinova R, Agrawal S, Honzik T, Visser D, et al. Recessive ITPA mutations cause an early infantile encephalopathy. Ann Neurol. 2015;78(4):649-58.
21. Behmanesh M, Sakumi K, Abolhassani N, Toyokuni S, Oka S, Ohnishi YN, et al. ITPase-deficient mice show growth retardation and die before weaning. Cell Death Differ. 2009;16(10):1315-22.
22. Vroemen WH, Munnix IC, Bakker JA, Bierau J, Huts M, Leers MP. A novel multiparameter flow cytometric assay for inosine triphosphatase expression analysis in leukocytes. Cytometry A. 2012;81(8):672-8.
23. Lahouassa H, Daddacha W, Hofmann H, Ayinde D, Logue EC, Dragin L, et al. SAMHD1 restricts the replication of human immunodeficiency virus type 1 by depleting the intracellular pool of deoxy-nucleoside triphosphates. Nat Immunol. 2012;13(3):223-8.
24. Zamzami MA, Duley JA, Price GR, Venter DJ, Yarham JW, Taylor RW, et al. Inosine triphosphate pyrophosphohydrolase (ITPA) polymorphic sequence variants in adult hematological malignancy patients and possible association with mitochondrial DNA defects. J Hematol Oncol. 2013;6:24.
25. Holmes SL, Turner BM, Hirschhorn K. Human inosine triphosphatase: catalytic properties and population studies. Clin Chim Acta. 1979;97(2-3):143-53.
26. Lin S, McLennan AG, Ying K, Wang Z, Gu S, Jin H, et al. Cloning, expression, and characteriza-tion of a human inosine triphosphate pyrophosphatase encoded by the ITPA gene. J Biol Chem. 2001;276(22):18695-701.
27. Sumi S, Ueta A, Maeda T, Ito T, Ohkubo Y, Togari H. A Japanese case with inosine triphosphate pyrophosphohydrolase deficiency attributable to an enzymatic defect in white blood cells. J Inherit Metab Dis. 2004;27(2):277-8.
28. Sumi S, Marinaki AM, Arenas M, Fairbanks L, Shobowale-Bakre M, Rees DC, et al. Genetic basis of inosine triphosphate pyrophosphohydrolase deficiency. Hum Genet. 2002;111(4-5):360-7.
29. Cao H, Hegele RA. DNA polymorphisms in ITPA including basis of inosine triphosphatase defi-ciency. J Hum Genet. 2002;47(11):620-2.
30. Arenas M, Duley J, Sumi S, Sanderson J, Marinaki A. The ITPA c.94C>A and g.IVS2+21A>C sequence variants contribute to missplicing of the ITPA gene. Biochim Biophys Acta. 2007;1772(1):96-102.


Chapter 4.Erythrocyte Inosine triphosphatase activity: a potential biomarker for adverse events during combination antiretroviral therapy for HIV.
N.C. Peltenburg, J. Bierau, J.A. Bakker, J.A. Schippers, S.H. Lowe, A.D.C. Paulussen, B.J.C. van den Bosch, M.P.G. Leers, B.E. Hansen, A. Verbon
PLoS One. 2018 Jan; 13(1): e0191069.

Chapter 4.
66
absTraCT
The purine analogues tenofovir and abacavir are precursors of potential substrates for the enzyme Inosine 5’-triphosphate pyrophosphohydrolase (ITPase). Here, we investigated the association of ITPase activity and ITPA genotype with the occurrence of adverse events (AEs) during combination antiretroviral therapy (cART) for human immunodeficiency vi-rus (HIV) infection. In 393 adult HIV-seropositive patients, AEs were defined as events that led to stop of cART regimen. ITPase activity ≥ 4 mmol IMP/mmol Hb/hour was considered as normal. ITPA genotype was determined by testing two ITPA polymorphisms: c.94C>A (p. Pro32Thr, rs1127354) and c.124+21A>C (rs7270101). Logistic regression analysis deter-mined odds ratios for developing AEs. In tenofovir-containing regimens decreased ITPase activity was associated with less AEs (p=0.01) and longer regimen duration (p=0.001). In contrast, in abacavir-containing regimens decreased ITPase activity was associated with more AEs (crude p=0.02) and increased switching of medication due to AEs (p=0.03). ITPA genotype wt/wt was significantly associated with an increase in the occurrence of AEs in tenofovir-containing regimens. Decreased ITPase activity seems to be protective against occurrence of AEs in tenofovir-containing cART, while it is associated with an increase in AEs in abacavir-containing regimens.

67
ITPase activity potential biomarker for AE in cART for HIV
INTrOduCTION
Combination anti-retroviral therapy (cART) for patients infected with the human im-munodeficiency virus (HIV) has been increasingly effective over the last years. However, adverse events (AEs) are still common and can be severe. Predicting whether AEs will occur with specific antiretroviral drugs would be a valuable tool in the choice of cART regimens. Although determination of HLA-B*57:01 status to predict hypersensitivity for abacavir, is widely used,1 no other biomarkers or genetic susceptibility traits are known that can be used to predict AEs associated with cART.
The enzyme Inosine 5’-triphosphate pyrophosphohydrolase (ITPase) is an enzyme which converts inosine 5’-triphosphate (ITP) to inosine 5’-monophosphate (IMP) and xanthosine 5’-triphosphate (XTP) to xanthosine 5’-monophosphate (XMP). IMP and XMP are central metabolites in the purine metabolism, from which adenosine 5’-monophosphate (AMP) and guanosine 5’-monophosphate (GMP) and subsequently adenosine 5’-triphosphate (ATP) and guanosine 5’-triphosphate (GTP) can be formed. ITPase is encoded by the ITPA gene located on chromosome 20p. ITPA is a polymorphic gene and a substantial part of the Western population carries one of the single nucleotide polymorphisms (SNPs) ITPA c.94C>A or ITPA c.124+21A>C.2 The frequency of c.94C>A is highest in Asian popula-tions (14–10%) compared to Central/South American (1–2%) and Caucasian and African populations (6–7%).2 The SNP c.124+21A>C is extremely rare in Asian populations.3-5 These polymorphisms result in a decreased ITPase activity.6,7 Homozygosity for ITPA c.94 C>A leads to a null activity solely in erythrocytes, while activity in nucleated cells remains detectable.8 True ITPase deficiency in humans is very rare and causes a severe form of early infantile encephalopathy.9 Decreased ITPase activity and the frequent ITPA SNPs are as-sociated with a reduced risk to develop ribavirin-induced hemolytic anemia in patients on treatment for hepatitis C,10-12 and with an increased risk of AEs in patients treated with thiopurines.13-15
Our interest in the role of ITPase in the treatment of HIV-infected patients stems from the fact that both abacavir and tenofovir as well as didanosine are purine analogues and are therefore potential precursors of substrates for ITPase. Similarly to its association with AEs during the use of thiopurines and ribavirin, ITPase activity might influence the occurrence of AEs during purine analogues containing cART. Moreover, the majority of HIV-infected patients showed a decreased erythrocyte ITPase activity compared to healthy controls.16 Therefore, we determined whether ITPase activity and ITPA genotype are associated with the occurrence of AEs during cART with purine analogues in a cohort of HIV-infected patients. In addition, we tested whether the active metabolites of abacavir and tenofovir (i.e. carbovir-triphosphate and tenofovir-diphosphate resp.) are substrates for the enzyme ITPase.

Chapter 4.
68
maTerIals aNd meTHOds
PatientsConsecutive HIV-infected patients attending the outpatient clinic of the Maastricht Univer-sity Medical Center in Maastricht, The Netherlands, between March first 2009 and January first 2014, who were treated with cART were included in this study after providing a written informed consent. Demographic, laboratory and clinical data from the moment the patients entered medical care for the HIV-infection until January first 2014 were retrieved from the database of the Dutch HIV monitoring foundation (Stichting HIV Monitoring; SHM), also known as the AIDS Therapy Evaluation in the Netherlands (ATHENA) and if needed from the medical records. The SHM includes data on demographics, comorbidities, cART, clinical, immunological and virological parameters of individuals in HIV care since January 1996 in any of the 26 HIV treatment centers in the Netherlands. Patients can opt-out after being informed by their treating physician of the purpose of collection of clinical data. The study was censored at January first 2014. The study was performed according to the Helsinki Declaration and approved by the Medical Ethical Committee of the Maastricht University Medical Center, Maastricht, The Netherlands.
ITPase activityErythrocyte ITPase activity was determined once per patient in the period of March first 2009 until January first 2014 and determined as described previously17 and assessed by formation of inosine 5’-monophosphate (IMP) from inosine 5’-triphosphate (ITP). ITPase activity was expressed as mmoles of IMP formed from ITP in one hour per mmol hemo-globin (mmol IMP/mmol Hb/hour). The cut-off value discriminating between normal or decreased ITPase activity was set at 4 mmol IMP/mmol Hb/hour, which is the lowest value within the 95% CI for ITPA wt/wt carriers.16,18
In order to test whether or not carbovir-triphosphate and tenofovir-diphosphate are sub-strates for ITPase, the enzyme activity assay was carried out as described, using 1 millimolar of ITP, carbovir-triphosphate or tenofovir-diphosphate. Erythrocytes of a non-HIV infected confirmed wild type ITPA genotype carrier individual was used for this experiment. Experi-ments were performed in triplicate. Carbovir-triphosphate and tenofovir-diphosphate were obtained from Toronto Research Chemicals (Toronto, Ontario, Canada).
ITPA genotype analysisGenomic DNA was isolated from whole blood using the Wizard Genomic DNA purification kit (Promega, Madison, WI) and genotyped using sanger sequencing for the two ITPA poly-morphisms; c.94C>A (p.Pro32Thr, rs1127354) and c.124+21A>C (rs7270101), as previously

69
ITPase activity potential biomarker for AE in cART for HIV
described.16 When both polymorphisms were not detected, the genotype was considered to be wild type (wt/wt). All sequences were evaluated by two independent laboratory experts.
adverse eventsFor a uniform definition of AEs, AEs resulting in stopping or switching of the cART regi-men and AEs that could be objectified in the laboratory were included. AEs were defined as stopping or switching for any reason except for the reasons virological failure, interac-tion with other medication, simplification or intensification of the regimen, drug taken off the market, patient deceased, low cART blood levels. Before statistical analyses, AEs were categorised and their potential association with ITPase activity or ITPA genotype was de-termined. The categorisation of the AEs was as follows: any AE (all categories of AE named hereafter taken together), gastro-intestinal (abdominal pain, nausea, diarrhoea, stomach ache, loss of appetite, pancreatitis), neurological (psychiatric complaints or dizziness, sleep-ing disorder, headache, tremor, disorders of taste), renal (renal insufficiency, kidney stones, nephritis, hypophosphatemia or lactate acidosis as reported reason for stopping the cART regimen or MDRD <60 ml/min/1.73 m2 or phosphate <0.6 mmol/L in at least two separate measurements without other obvious cause), skin (rash or abscess at the site of injection) and liver related (liver failure as reported reason for stopping the cART regimen or alanine aminotransferase and/or aspartate aminotransferase >90 U/L without other obvious cause, in at least two separate measurements, or in one measurement in case of only two measure-ments performed during that regimen).
statistical analysisResults were analysed using IBM SPSS Statistics 21 (IBM Corporation, New York, USA) and SAS system for windows version 9.3. Pearson-chi-square-tests, Fisher’s exact test and inde-pendent samples T-tests were used to determine significant differences. P values <0.05 were considered to be statistically significant. The occurrence of adverse events was analyzed with logistic regression with repeated statement and adjusted for cumulative total duration of cART therapy, cumulative duration of purine analogue therapy of all prior regimens and duration of the current regimen. Analysis included check for significant interaction with treatment and ITPase activity. When abacavir, tenofovir or didanosine were used concomi-tantly in one cART regimen, these regimens were excluded from the analysis.

Chapter 4.
70
resulTs
Patient characteristicsOf 393 HIV infected patients, 205 (52.2%) patients had a decreased ITPase activity (Table 1). There were no statistically significant differences with respect to age, gender, ethnicity and alcohol use between the groups having normal and decreased ITPase activity. Mean CD4 nadir did not differ significantly between the group of patients with decreased ITPase activity (216 ± 161 cells/μL) and normal ITPase activity (200 ± 146 cells/μL).
carT regimensIn total 393 patients accounted for 1464 prescribed regimens. The median number of regimens per patient was 3, with a maximum of 18 regimens in one patient (Table 1). In total 38.992 person months of anti-retroviral therapy were observed. 9% of the regimens started before 1998. Purine analogues (tenofovir, abacavir and didanosine) were frequently prescribed (n=601, n=244 and n=128 respectively) and the proportion of purine analogue containing regimens (69.3%) did not differ between the group of patients with normal ITPase activity and the group of patients with decreased ITPase activity (p=0.09). 17 regimens (1.1%) contained both tenofovir and didanosine, 16 regimens (1.1%) contained abacavir and didanosine and 9 regimens (0.6%) contained tenofovir and abacavir. These regimens were excluded from further analysis, so 1422 regimens were used to assess the association of ITPase activity and ITPA genotype with AEs.
ITPase activity and ITPA genotype in HIV patientsITPA genotype was determined in 386 patients. The most prominent ITPA genotype was wt/wt (265 patients, 67.4%). The occurrence of wt/c.124+21A>C and wt/c.94C>A ITPA genotype variants was 68 (17.3%) and 35 (8.9%) respectively. Other variants occurred in only 4.6% of the patients (homozygous c.124+21A>C n=5, homozygous c.94C>A n=2 and heterozygous c.124+21A>C/c.94C>A n=11). Mean ITPase activity correlated with ITPA genotype, with the highest ITPase activity in the wt/wt genotype. However, within the ITPA genotype wt/wt, 90 (34.0%) patients had decreased ITPase activity and within the ITPA genotype wt/c.124+-21A>C, 9 (13.2%) of the patients had normal ITPase activity. The other ITPA genotypes were only associated with a decreased ITPase activity.
association of ITPase activity with aes734 regimens were prescribed in 205 patients with decreased ITPase activity and 688 in 188 patients with normal ITPase activity (N.S., Table 1). In 6.8% of the regimens the reason for switching or stopping cART regimen was unknown. In total, AEs were present during 714 regimens (50.2%) with 356 AEs in patients with decreased ITPase activity and 358 in

71
ITPase activity potential biomarker for AE in cART for HIV
patients with normal ITPase activity (N.S.). The occurrence of AEs and the effect of the ITPase activity are displayed in Table 2 and Figure 1 respectively.
Table 1. Demographic and clinical characteristics of the patients (n=393) with ITPase activity <4 and ≥4 mmol IMP/mmol Hb/hour.
Characteristic ITPase activity P-value
<4a (n=205) ≥4a (n=188)
age, median years (range) 50.6 (20-81) 49.7 (27-84) 0.80
male Gender, n (%) 164 (80.0) 155 (82.4) 0.53
race, n (%) 0.81
White non-Hispanic 164 (80.0) 147 (78.2)
White Hispanic 5 (2.4) 4 (2.1)
African 22 (10.7) 27 (14.4)
Asian or other 14 (6.9) 10 (5.3)
mean ITPase activity ± SD 2.44 ± 1.12 5.24 ± 1.09 <0.001
ITPA genotype, n (%) <0.001
Wt/wt 90 (43.9) 175 (93.1)
Wt/c.124+21A>C 59 (28.8) 9 (4.8)
Wt/c.94C>A or otherb 53 (25.9) -
Unknown 3 (1.5) 4 (2.1)
alcohol, n (%) 0.51
<2 IU/day 157 (76.6) 133 (70.7)
≥2 IU/day 35 (17.1) 36 (19.1)
Unknown 13 (6.3) 19 (10.1)
recreational drugsc, n (%) 0.04
None 120 (58.5) 92 (48.9)
Yes 50 (24.4) 55 (29.3)
Unknown 35 (17.1) 41 (21.8)
Hepatitis b co-infection, n (%) 0.25
No / cleared 182 (88.8) 167 (88.8)
Yes 10 (4.9) 6 (3.2)
Unknown 13 (6.3) 15 (8.0)
Hepatitis C co-infection, n (%) 0.52
No 174 (84.9) 159 (84.6)
Yes 27 (13.2) 22 (11.8)
Unknown 4 (2.0) 7 (3.7)
mean Cd4 nadir ± SD 215.6 ± 160.9 200.1 ± 145.7 0.32
median year of start carT (range) 2006 (1987-2013)d 2006 (1987-2013)e 0.25
start carT < the year 1998 (%) 9.7 8.3 0.68
median number of carT regimens/patient (range) 3 (1-14) 3 (1-18) 0.74
Total number of carT regimens 734 688
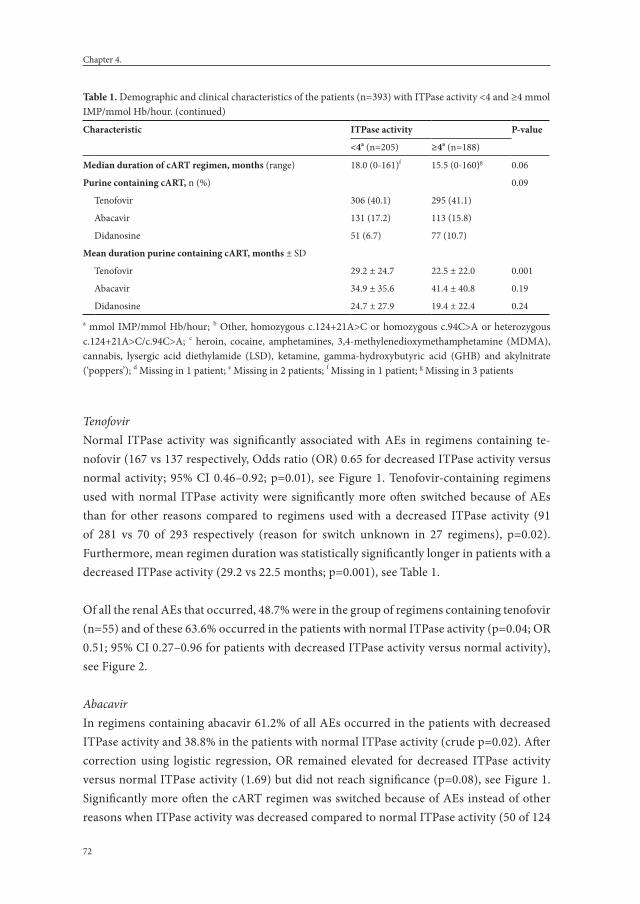
Chapter 4.
72
TenofovirNormal ITPase activity was significantly associated with AEs in regimens containing te-nofovir (167 vs 137 respectively, Odds ratio (OR) 0.65 for decreased ITPase activity versus normal activity; 95% CI 0.46–0.92; p=0.01), see Figure 1. Tenofovir-containing regimens used with normal ITPase activity were significantly more often switched because of AEs than for other reasons compared to regimens used with a decreased ITPase activity (91 of 281 vs 70 of 293 respectively (reason for switch unknown in 27 regimens), p=0.02). Furthermore, mean regimen duration was statistically significantly longer in patients with a decreased ITPase activity (29.2 vs 22.5 months; p=0.001), see Table 1.
Of all the renal AEs that occurred, 48.7% were in the group of regimens containing tenofovir (n=55) and of these 63.6% occurred in the patients with normal ITPase activity (p=0.04; OR 0.51; 95% CI 0.27–0.96 for patients with decreased ITPase activity versus normal activity), see Figure 2.
AbacavirIn regimens containing abacavir 61.2% of all AEs occurred in the patients with decreased ITPase activity and 38.8% in the patients with normal ITPase activity (crude p=0.02). After correction using logistic regression, OR remained elevated for decreased ITPase activity versus normal ITPase activity (1.69) but did not reach significance (p=0.08), see Figure 1. Significantly more often the cART regimen was switched because of AEs instead of other reasons when ITPase activity was decreased compared to normal ITPase activity (50 of 124
Table 1. Demographic and clinical characteristics of the patients (n=393) with ITPase activity <4 and ≥4 mmol IMP/mmol Hb/hour. (continued)
Characteristic ITPase activity P-value
<4a (n=205) ≥4a (n=188)
median duration of carT regimen, months (range) 18.0 (0-161)f 15.5 (0-160)g 0.06
Purine containing carT, n (%) 0.09
Tenofovir 306 (40.1) 295 (41.1)
Abacavir 131 (17.2) 113 (15.8)
Didanosine 51 (6.7) 77 (10.7)
mean duration purine containing carT, months ± SD
Tenofovir 29.2 ± 24.7 22.5 ± 22.0 0.001
Abacavir 34.9 ± 35.6 41.4 ± 40.8 0.19
Didanosine 24.7 ± 27.9 19.4 ± 22.4 0.24 a mmol IMP/mmol Hb/hour; b Other, homozygous c.124+21A>C or homozygous c.94C>A or heterozygous c.124+21A>C/c.94C>A; c heroin, cocaine, amphetamines, 3,4-methylenedioxymethamphetamine (MDMA), cannabis, lysergic acid diethylamide (LSD), ketamine, gamma-hydroxybutyric acid (GHB) and akylnitrate (‘poppers’); d Missing in 1 patient; e Missing in 2 patients; f Missing in 1 patient; g Missing in 3 patients

73
ITPase activity potential biomarker for AE in cART for HIV
vs 29 of 108 respectively (reason for switch unknown in 12 regimens), p=0.03). In general, more adverse events tended to occur in patients with decreased ITPase activity, e.g. gastro-intestinal and skin related AEs (Figure 2). Of the cART regimens containing abacavir, 6.1% were stopped or changed because of skin related AEs and 73.3% of these events occurred in the patients with decreased ITPase activity, however this difference was not statistically significant.
Effect of ITPase activity on any AE
0.1 1 10
No purine
Didanosine
Abacavir
Tenofovir
Regimen containing:
←⎯⎯ ⎯⎯→More adverse events More adverse eventsin ITPase activity ≥4 in ITPase activity <4
0.87 (0.57-1.31)
0.97 (0.45-2.10)
1.69 (0.93-3.08)
0.65 (0.46-0.92)
OR (95% CI)
0.50
0.94
0.08
0.01
P-values
figure 1. Effect ITPase activity on total adverse events. The effect of decreased versus normal ITPase activity on the occurrence of total adverse events (grouped by regimens containing tenofovir, abacavir or didanosine and regimens without tenofovir, abacavir or didanosine) is plotted. Odds ratio with 95% confidential interval and matching p-values are displayed. The analyses were conducted with repeated statement, adjusted for cumulative total duration of cART, cumulative duration of purine analogue therapy of all prior regimens and duration of the current regimen.
Effect of ITPase activity
0.1 1 10
Skin
Gastro-intestinal
Abacavir
Renal
Tenofovir
←⎯⎯ ⎯⎯→More adverse events More adverse eventsin ITPase activity ≥4 in ITPase activity <4
2.41 (0.69-8.36)
2.13 (0.56-8.13)
0.51 (0.27-0.96)
OR (95% CI)
0.84
0.86
0.04
P-values
figure 2. Effect ITPase activity on regimen associated adverse events. The effect of decreased ITPase activity on the occurrence of regimen associated adverse events (renal adverse events for tenofovir and gastro-intestinal and skin related adverse events for abacavir) is plotted. Odds ratio with 95% confidential interval and match-ing p-values are displayed. The analyses were conducted with repeated statement, adjusted for cumulative total duration of cART, cumulative duration of purine analogue therapy of all prior regimens and duration of the current regimen.

Chapter 4.
74
Didanosine and regimens without tenofovir, abacavir and didanosineNo statistically significant association was found for AEs occurring with use of didanosine or regimens without tenofovir, abacavir and didanosine and ITPase activity.
association of ITPA genotype with aesThe occurrence of AEs and the effect of the ITPA genotype are displayed in Table 3 and Figure 3 respectively. 960 regimens were prescribed for patients with wt/wt genotype and 435 for patients with one or more of the SNPs. Genotype was unknown for 27 regimens.
TenofovirITPA genotypes other than wt/wt, associated with decreased ITPase activity, seemed to be protective against AEs (p=0.04), as 72.4% of all AEs occurred in the patients with ITPA
Table 2. Occurrence of adverse events in patients grouped by ITPase activity, percentage of adverse events and crude p-values per purine type.
carTcontaining:
ITPase activity <4a ITPase activity ≥4a Crude p-value
aeb, n / Patients, n % of total aeb aeb, n / Patients, n % of total aeb
Tenofovir 137/306 45.1% 167/295 54.9% 0.004
Abacavir 74/131 61.2% 47/113 38.8% 0.02
Didanosine 27/51 40.3% 40/77 59.7% 0.91
No purine 118/246 53.2% 104/203 46.8% 0.49a mmol IMP/mmol Hb/hour; b AE, adverse events
Effect of ITPA gentoype on any AE
0.1 1 10
No purine
Didanosine
Abacavir
Tenofovir
Regimen containing:
←⎯⎯ ⎯⎯→More adverse events More adverse events
in ITPA genotype wt/wt in ITPA genotype with SNP
0.69 (0.45-1.06)
1.20 (0.51-2.78)
1.05 (0.56-1.96)
0.66 (0.45-0.97)
OR (95% CI)
0.09
0.68
0.87
0.04
P-values
figure 3. Effect ITPA genotype on total adverse events. The effect of ITPA genotype wt/wt versus the other ITPA genotypes on the occurrence of total adverse events (grouped by regimens containing tenofovir, abacavir or didanosine and regimens without tenofovir, abacavir or didanosine) is plotted. Other ITPA genotypes than wt/wt were wt/c.124+21A>C, wt/c.94C>A, c.124+21A>C/c.124+21A>C, c.94C>A/c.94C>A or c.124+21a>C/c.94C>C. Odds ratio with 95% confidential interval and matching p-values are displayed. The analyses were conducted with repeated statement, adjusted for cumulative total duration of cART, cumulative duration of purine analogue therapy of all prior regimens and duration of the current regimen.

75
ITPase activity potential biomarker for AE in cART for HIV
genotype wt/wt and 26.3% in patients with SNPs in the genotype. 1.3% Of the regimens with an AE had an unknown genotype. 76.4% of all renal AEs occurred in the regimens with wt/wt genotype, this difference was not statistically significant, see Figure 4.
AbacavirNo association was found between ITPA genotype and all AEs in patients using abacavir. For gastro-intestinal AEs a SNP in the ITPA genotype was associated with an increased number of AEs (OR 3.45 for ITPA genotypes with SNPs versus wt/wt genotype; 95% CI 0.99–11.11; p=0.05), see Figure 4.
Table 3. Occurrence of adverse events in patients grouped by ITPA genotype, and crude p-values per purine type for each type of adverse event.
carT containing:
sNP in ITPA genotypea ITPA genotype wt/wt ITPA genotype unknown Crude p-valueaeb, n /
Patients, n% of total ae
aeb, n / Patients, n
% of total aeb
aeb, n / Patients, n
% of total aeb
Tenofovir 80/186 26.3% 220/409 72.4% 4/6 1.3% 0.04
Abacavir 38/75 31.4% 82/164 67.8% 1/5 0.8% 0.52
Didanosine 18/31 26.9% 48/96 71.6% 1/1 1.5% 0.54
No purine 64/143 28.8% 151/291 68.0% 7/15 3.2% 0.36a heterozygous wt/c.124+21A>C or wt/c.94C>A, homozygous c.124+21A>C or c.94C>A or compound hetero-zygous c.124+21A>C/c.94C>A; b AE, adverse events
Effect of ITPA gentoype
0.1 1 10
Skin
Gastro-intestinal
Abacavir
Renal
Tenofovir
←⎯⎯ ⎯⎯→More adverse events More adverse events
in ITPA genotype wt/wt in ITPA genotype with SNP
2.04 (0.58-7.14)
3.45 (0.99-11.11)
0.55 (0.26-1.18)
OR (95% CI)
0.26
0.05
0.13
P-values
figure 4. Effect ITPA genotype on regimen associated adverse events. The effect of ITPA genotype wt/wt versus the other ITPA genotypes on the occurrence of regimen associated adverse events (renal adverse events for te-nofovir and gastro-intestinal and skin related adverse events for abacavir) is plotted. Other ITPA genotypes than wt/wt were wt/c.124+21A>C, wt/c.94C>A, c.124+21A>C/c.124+21A>C, c.94C>A/c.94C>A or c.124+21a>C/c.94C>C. Odds ratio with 95% confidential interval and matching p-values are displayed. The analyses were conducted with repeated statement, adjusted for cumulative total duration of cART, cumulative duration of purine analogue therapy of all prior regimens and duration of the current regimen.

Chapter 4.
76
Didanosine and regimens without tenofovir, abacavir and didanosineNo association was found between ITPA genotype and AEs in patients using didanosine or regimens without tenofovir, abacavir and didanosine.
Carbovir-triphosphate and tenofovir-diphosphate are no direct substrates for ITPaseTo test the hypothesis that carbovir-triphosphate could be a substrate for ITPase, resulting in higher carbovir levels when ITPase activity is decreased, and more pronounced adverse effects, carbovir-triphosphate was directly used as a substrate for ITPase. Carbovir-triphos-phate was not a direct substrate for ITPase and neither was tenofovir-diphosphate.
dIsCussION
Here, we show for the first time that ITPase activity is associated with the occurrence of AEs in patients using cART containing the purine analogues tenofovir and abacavir. A significant reduction in all AEs was found in patients with decreased ITPase activity using tenofovir. Moreover, mean regimen duration was significantly longer indicating a better tolerance of tenofovir containing cART regimens in patients with decreased ITPase activity. On the other hand, patients with decreased ITPase activity using abacavir were more at risk for developing AEs. Mean regimen duration was longer in the patients with normal ITPase activity, indicating a better tolerance of abacavir in these patients. No clear association be-tween AEs and regimens without tenofovir, abacavir or didanosine could be demonstrated.
These data suggest that ITPase activity may be used as a pharmacogenetic biomarker in patients starting cART containing tenofovir or abacavir. Up to now no other biomarkers are in use, apart from HLA-B*57:01 status to predict abacavir hypersensitivity syndrome. As tenofovir is used as a part of the regimen in the PrEP studies to prevent HIV transmission, we expect an increase in the use of tenofovir by indivuduals not infected with HIV. A test to identify individuals with increased risk of developing long term adverse effects due to teno-fovir would be an extremely welcome asset. The present study suggest ITPase activity is a po-tential candidate. In other diseases, results of studies using ITPA polymorphisms to predict AEs varied with the purine analogue used. The ITPase lowering ITPA polymorphisms were shown to be protective against ribavirin-induced anemia in hepatitis C on treatment.19,20 In patients with inflammatory bowel disease using azathioprine, however, adverse events occurred more frequently in patients with ITPase lowering ITPA polymorphisms.7,21 In our study a lower ITPase activity was associated with less cART regimen switches due to AEs in patients using tenofovir, whereas regimens containing abacavir were more frequently switched. The underlying cause of the observed differences between the purine analogues

77
ITPase activity potential biomarker for AE in cART for HIV
tenofovir and abacavir is yet unclear. Both abacavir and tenofovir are potent inhibitors of HIV reverse transcriptase.22-24 However, the chemical structure differs greatly between the two analogues (Figure 5). Whilst tenofovir is an acyclic adenine nucleotide analogue, abacavir is the prodrug of carbovir, which is formed by removal of the cyclopropylammonia moiety attached to the purine base and is a guanosine analogue. We expect that part of the explanation is to be found in the chemistry of these compounds.
In our hands, both carbovir-triphosphate and tenofovir-diphosphate proved to be non-substrates for ITPase, so the mechanism behind our observation that decreased ITPase activity leads to an increased occurrence of adverse events in abacavir therapy is not easily explained. As was hypothesized by Coelho et al,25 the use of cART may lead to an increase in IMP and so to an increase in cytotoxicity by an increased ITP level in patients with decreased ITPase activity. Interestingly, we observed cultured skin fibroblasts of patients with encephalopathy associated with ITPA mutations9 leading to severely reduced ITPase activity show increased levels of IMP rather than ITP when compared to controls, so direct toxicity by ITP can only explain part of the mechanism involved. Bondoc and coworkers26 demonstrated that intra-cellular anabolism of carbovir was stimulated by adenine, adenos-
figure 5. Chemical structures. Chemical structures of tenofovir, abacavir, adenosine, carbovir, didanosine, ino-sine and guanosine.
Chapter 4.
78
ine, hypoxanthine, inosine and even dideoxy-Inosine. Their hypothesis is that increased intracellular levels of IMP and ATP enhanced the anabolism of carbovir by stimulating phosphorylation by 5’-nucleotidase. In line with this, we might hypothesize that a decreased ITPase activity leads to an increase in IMP and so to an increase of carbovir anabolism. In addition to its anti-retroviral activity, carbovir-triphosphate has been demonstrated to be a competitive inhibitor of soluble guanylate cyclase influencing platelet activity.27 Considering that carbovir-triphosphate might be increased by decreased ITPase activity, the interference of carbovir-triphosphate in the nitric oxide (NO) signalling pathway may be considerable, leading to adverse events and regimen change. This hypothesis needs further investigation to clarify the mechanism.
Skin reactions related to abacavir are an immunological phenomenon. In our study, most of the skin related adverse events occurred in the abacavir-containing regimens used by patients with decreased ITPase actvitiy, although this difference was not statistically signifi-cant. The role of ITPase in immunologically induced AEs remains to be elucidated.
For tenofovir an explanation for the present results seems to be less straightforward. Tenofovir differs from carbovir in two essential aspects: tenofovir is a nucleoside-monophosphate and a adenosine analogue rather than a guanosine analogue. Tenofovir metabolites appear to be resistant to deamination28 making accumulation of the deaminated tenofovir-diphosphate metabolite due to decreased ITPase activity unlikely. At this moment we can only speculate that ITPase activity influences tenofovir metabolism in a yet unknown fashion. In this study we were not able to rule out other factors that may have influenced renal events other than tenofovir use, like hypertension, diabetes mellitus, age and the use of other medication, like non-steroidal anti-inflammatory drugs.
All previous studies evaluating the effect of ITPA genotype polymorphisms on adverse events assumed that the reported ITPase activity directly corresponds to a specific ITPA polymorphism.14,18 However, in accordance with our previous work29 we found that an ITPA variant such as wt/c.124+21A>C leads to a variety of ITPase activities from as low as 1.53 to as high as 7.70 mmol IMP/mmol Hb/hour. Moreover, in spite of wt/wt genotype, HIV-infected patients were found to have a decreased ITPase activity compared to control patients16 and therefore more often will have an ITPase activity <4 mmol IMP/mmol Hb/hour. In HIV, the association between ITPA genotype and ITPase activity is less strict as has previously been assumed. This may be an explanation why ITPA genotype correlated less to AEs compared to ITPase activity, as we found in this study. Previously we showed that ITPase activity is lower in HIV-infected patients compared to control populations in erythrocytes16 as well as in leukocytes30 independent of ITPA genotype, which did not ap-pear to be an effect of nucleoside analogues.16

79
ITPase activity potential biomarker for AE in cART for HIV
Some limitations of this research need to be mentioned. Because cART is, by definition, a combination of antiretroviral drugs, adverse events during a cART regimen might be at-tributed to more than one drug. However, by using repeated statement and adjusting the statistical analysis for cumulative total duration of cART, cumulative duration of purine analogue therapy of all prior regimens and duration of the current regimen, we were able to measure the association between ITPase activity and tenofovir and abacavir containing regimens. More studies will be needed to confirm our findings.
The lack of more significant results analyzing specific adverse events other than gastro-intestinal, renal and skin related adverse events in this study may be due to the relatively small numbers of the occurrence of these adverse events. This was probably due to the fact that in our definition of adverse event we only used the reasons for stopping a regimen in combination with retraceable laboratory values. We have chosen this strategy because in the SHM database reason for switching cART regimen is a mandatory question, whereas reporting AEs is up to the physician and not a prerequisite item in the database and there-fore is a less reliable parameter. Still, in 7% of the regimens, the reason for switching cART was unknown. The number of regimens with unknown reason for switching were equally distributed between both ITPase activity groups. We therefore do not expect this to be af-fecting the results of the study.
Because the data were collected retrospectively, the causality between the use of cART and the occurrence of AEs cannot be proven in this study. By using only the reasons for stop-ping the cART regimen or retraceable laboratory values, we avoided some bias, however, prospective trials are needed to confirm our data.
In conclusion, ITPase enzyme activity <4 mmol IMP/mmol Hb/hour seems to be protec-tive against occurrence of adverse events in cART regimens containing tenofovir, while it leads to an increase in adverse events in cART regimens containing abacavir. These results warrant further elucidation of the mechanism involved and need to be confirmed in a prospective trial.

Chapter 4.
80
refereNCes
1. Mallal S, Nolan D, Witt C, Masel G, Martin AM, Moore C, et al. Association between presence of HLA-B*5701, HLA-DR7, and HLA-DQ3 and hypersensitivity to HIV-1 reverse-transcriptase inhibi-tor abacavir. Lancet. 2002;359(9308):727-32.
2. Marsh S, King CR, Ahluwalia R, McLeod HL. Distribution of ITPA P32T alleles in multiple world populations. J Hum Genet. 2004;49(10):579-81.
3. Kudo M, Saito Y, Sasaki T, Akasaki H, Yamaguchi Y, Uehara M, et al. Genetic variations in the HGPRT, ITPA, IMPDH1, IMPDH2, and GMPS genes in Japanese individuals. Drug Metab Pharmacokinet. 2009;24(6):557-64.
4. Maeda T, Sumi S, Ueta A, Ohkubo Y, Ito T, Marinaki AM, et al. Genetic basis of inosine triphosphate pyrophosphohydrolase deficiency in the Japanese population. Mol Genet Metab. 2005;85(4):271-9.
5. Cheon JH, Kim JH, Kim BY, Kim SW, Hong SY, Eun CS, et al. Allele frequency of thiopurine methyl-transferase and inosine triphosphate pyrophosphatase gene polymorphisms in Korean patients with inflammatory bowel diseases. Hepatogastroenterology. 2009;56(90):421-3.
6. Sumi S, Marinaki AM, Arenas M, Fairbanks L, Shobowale-Bakre M, Rees DC, et al. Genetic basis of inosine triphosphate pyrophosphohydrolase deficiency. Hum Genet. 2002;111(4-5):360-7.
7. Marinaki AM, Ansari A, Duley JA, Arenas M, Sumi S, Lewis CM, et al. Adverse drug reactions to azathioprine therapy are associated with polymorphism in the gene encoding inosine triphosphate pyrophosphatase (ITPase). Pharmacogenetics. 2004;14(3):181-7.
8. Arenas M, Duley J, Sumi S, Sanderson J, Marinaki A. The ITPA c.94C>A and g.IVS2+21A>C sequence variants contribute to missplicing of the ITPA gene. Biochim Biophys Acta. 2007;1772(1):96-102.
9. Kevelam SH, Bierau J, Salvarinova R, Agrawal S, Honzik T, Visser D, et al. Recessive ITPA mutations cause an early infantile encephalopathy. Ann Neurol. 2015;78(4):649-58.
10. Nishimura T, Osaki R, Shioya M, Imaeda H, Aomatsu T, Takeuchi T, et al. Polymorphism of the inosine triphosphate pyrophosphatase gene predicts ribavirin-induced anemia in chronic hepatitis C patients. Mol Med Rep. 2012;5(2):517-20.
11. Lötsch J, Hofmann WP, Schlecker C, Zeuzem S, Geisslinger G, Ultsch A, et al. Single and combined IL28B, ITPA and SLC28A3 host genetic markers modulating response to anti-hepatitis C therapy. Pharmacogenomics. 2011;12(12):1729-40.
12. Fellay J, Thompson AJ, Ge D, Gumbs CE, Urban TJ, Shianna KV, et al. ITPA gene variants protect against anaemia in patients treated for chronic hepatitis C. Nature. 2010;464(7287):405-8.
13. Bakker JA, Bierau J, Drent M. A role for ITPA variants in the clinical course of pulmonary Langer-hans’ cell histiocytosis? Eur Respir J. 2010;36(3):684-6.
14. Marinaki AM, Duley JA, Arenas M, Ansari A, Sumi S, Lewis CM, et al. Mutation in the ITPA gene predicts intolerance to azathioprine. Nucleosides Nucleotides Nucleic Acids. 2004;23(8-9):1393-7.
15. Stepchenkova EI, Tarakhovskaya ER, Spitler K, Frahm C, Menezes MR, Simone PD, et al. Func-tional study of the P32T ITPA variant associated with drug sensitivity in humans. J Mol Biol. 2009;392(3):602-13.
16. Bierau J, Bakker JA, Schippers JA, Grashorn JA, Lindhout M, Lowe SH, et al. Erythrocyte inosine triphosphatase activity is decreased in HIV-seropositive individuals. PLoS One. 2012;7(1):e30175.
17. Bierau J, Bakker JA, Lindhout M, van Gennip AH. Determination of ITPase activity in erythro-cyte lysates obtained for determination of TPMT activity. Nucleosides Nucleotides Nucleic Acids. 2006;25(9-11):1129-32.

81
ITPase activity potential biomarker for AE in cART for HIV
18. Shipkova M, Lorenz K, Oellerich M, Wieland E, von Ahsen N. Measurement of erythrocyte inosine triphosphate pyrophosphohydrolase (ITPA) activity by HPLC and correlation of ITPA genotype-phenotype in a Caucasian population. Clin Chem. 2006;52(2):240-7.
19. Thompson AJ, Santoro R, Piazzolla V, Clark PJ, Naggie S, Tillmann HL, et al. Inosine triphosphatase genetic variants are protective against anemia during antiviral therapy for HCV2/3 but do not de-crease dose reductions of RBV or increase SVR. Hepatology. 2011;53(2):389-95.
20. Kurosaki M, Tanaka Y, Tanaka K, Suzuki Y, Hoshioka Y, Tamaki N, et al. Relationship between polymorphisms of the inosine triphosphatase gene and anaemia or outcome after treatment with pegylated interferon and ribavirin. Antivir Ther. 2011;16(5):685-94.
21. Van Dieren JM, Hansen BE, Kuipers EJ, Nieuwenhuis EE, Van der Woude CJ. Meta-analysis: Inosine triphosphate pyrophosphatase polymorphisms and thiopurine toxicity in the treatment of inflamma-tory bowel disease. Aliment Pharmacol Ther. 2007;26(5):643-52.
22. Yuen GJ, Weller S, Pakes GE. A review of the pharmacokinetics of abacavir. Clin Pharmacokinet. 2008;47(6):351-71.
23. Parker WB, White EL, Shaddix SC, Ross LJ, Buckheit RW, Jr., Germany JM, et al. Mechanism of inhi-bition of human immunodeficiency virus type 1 reverse transcriptase and human DNA polymerases alpha, beta, and gamma by the 5’-triphosphates of carbovir, 3’-azido-3’-deoxythymidine, 2’,3’-di-deoxyguanosine and 3’-deoxythymidine. A novel RNA template for the evaluation of antiretroviral drugs. J Biol Chem. 1991;266(3):1754-62.
24. Suo Z, Johnson KA. Selective inhibition of HIV-1 reverse transcriptase by an antiviral inhibitor, (R)-9-(2-Phosphonylmethoxypropyl)adenine. J Biol Chem. 1998;273(42):27250-8.
25. Coelho AV, Silva SP, Zandona L, Stocco G, Decorti G, Crovella S. Role of inosine triphosphate py-rophosphatase gene variant on fever incidence during zidovudine antiretroviral therapy. Genet Mol Res. 2017;16(1).
26. Bondoc LL, Jr., Shannon WM, Secrist JA, 3rd, Vince R, Fridland A. Metabolism of the carbocyclic nucleoside analogue carbovir, an inhibitor of human immunodeficiency virus, in human lymphoid cells. Biochemistry. 1990;29(42):9839-43.
27. Baum PD, Sullam PM, Stoddart CA, McCune JM. Abacavir increases platelet reactivity via competi-tive inhibition of soluble guanylyl cyclase. AIDS. 2011;25(18):2243-8.
28. Cihlar T, Delaney WE, Mackman R. Tenofovir and Adefovir as Antiviral Agents. In: Herdewijn P, editor. Modified Nucleosides: in Biochemistry, Biotechnology and Medicine. Herdheim: Wiley-VCH Verlag GmbH & Co. KGaA; 2008. p. 601-30.
29. Peltenburg NC, Bakker JA, Vroemen WH, de Knegt RJ, Leers MP, Bierau J, et al. Inosine triphosphate pyrophosphohydrolase activity: more accurate predictor for ribavirin-induced anemia in hepatitis C infected patients than ITPA genotype. Clin Chem Lab Med. 2015;53(12):2021-9.
30. Peltenburg NC, Leers MP, Bakker JA, Lowe SH, Vroemen WH, Paulussen AD, et al. Inosine tri-phosphate pyrophosphohydrolase expression: decreased in leukocytes of HIV-infected patients using combination antiretroviral therapy. J Acquir Immune Defic Syndr. 2016;73(4):390-5.

Chapter 5.Inosine 5’-triphosphatase activity is associated with TDF-associated nephrotoxicity in HIV.
N.C. Peltenburg, I.E.A. Wijting, C. Rokx, J.A. Bakker, B.J.A. Rijnders, J. Bierau, A. Verbon
Submitted

Chapter 5.
84
absTraCT
ObjectivesNucleotide reverse transcriptase inhibitors play a pivotal role in HIV-treatment. The enzyme Inosine 5’-triphosphatase (ITPase) is involved in the nucleotide metabolism and has been associated with adverse drug events. We studied the association between ITPase-activity and tenofovir disoproxil fumarate (TDF)-associated nephrotoxicity.
designSingle center 1:2 case control cohort study, including suppressed HIV-infected patients with (cases) and without (controls) TDF-associated nephrotoxicity.
methods26 cases (eGFR-decline >25% and/or ≥2 proximal tubular dysfunction (PTD)-markers during TDF use) were matched to 55 controls. ITPase-activity and ITPA genotype were measured in all patients. The primary endpoint was the proportion of patients with normal ITPase-activity (≥4 mmol IMP/mml Hb/hour) in cases versus controls. The eGFR-improve-ment 48 weeks after TDF-cessation was measured in cases. McNemar’s test, conditional logistic regression, and paired T-tests were used.
resultsThe eGFR in cases and controls at TDF-discontinuation was 78 and 85 ml/min. 19/26 cases (73.1%) versus 28/55 controls (50.9%) had normal ITPase activity, p=0.001 (OR 2.55, 95% CI 0.89-7.31, p=0.08). 23/26 cases (88.5%) versus 40/55 controls (72.7%) had wt/wt ITPA genotype, p=0.26 (OR 2.59, 95%CI 0.70-9.54, p=0.15). After TDF-cessation, the eGFR increased in cases with normal ITPase activity (-5.5 to +4.4 ml/min/year, p=0.008), but remained stable in cases with reduced activity (-4.3 to -4.0, p=0.97). In cases with wt/wt ITPA genotype, eGFR increased from –5.0 to +3.0 ml/min/year, p=0.021. 13/16 cases with PTD had normal ITPase activity. Of cases with available data, 50% with normal activity had PTD-recovery after TDF-cessation.
ConclusionsNormal ITPase-activity is associated with nephrotoxicity during TDF use and recovery after TDF-cessation. ITPase-activity might function as a screening-tool for probable occurrence and reversibility of TDF-toxicity.
85
ITPase activity associated with TDF-associated nephrotoxicity in HIV
INTrOduCTION
Tenofovir disoproxil-fumarate (TDF) is a recommended nucleotide-analog reverse-tran-scriptase inhibitor (NRTI) in combination antiretroviral therapy (cART) for HIV-treatment. Other indications for TDF-use are chronic hepatitis B virus infection and pre-exposure prophylaxis (PrEP).1 Use of TDF is associated with an accelerated estimated glomerular fil-tration rate (eGFR)-decline2-4 and proximal tubular dysfunction (PTD).2,5,6 In clinical trials, tenofovir alafenamide (TAF), a novel tenofovir prodrug, showed comparable virological ef-ficacy as TDF, but caused smaller eGFR-declines and renal tubular proteinuria.7,8 Therefore, TAF-containing cART became a recommended first-line regimen next to TDF-containing cART.9,10 Recently, generic TDF has become available, which might favor prescribing TDF over TAF for cost-effectiveness and aid in the roll out of cART in resource-limited countries. Additionally, the use of TDF as PrEP is increasing. Therefore, it is useful to predict in which patient the risk of TDF-associated nephrotoxicity is high, and whether it would recover.
DNA consists of the canonical nucleobases adenine, cytosine, guanine, and thymidine. However, incorporation of non-canonical nucleoside triphosphates in the DNA potentially causes cyto- or genotoxicity.11 The housekeeping enzyme Inosine 5’-triphosphatase (ITPase), encoded by the polymorphic gene ITPA (OMIM #147520), eliminates the nucleotide pool from non-canonical nucleoside triphosphates.12 In HIV-infected patients, ITPase activity and enzyme expression were decreased compared to non HIV-infected controls in erythro-cytes and CD4+ lymphocytes,13,14 which could not be fully explained by the single nucleotide polymorphisms (SNPs) c.94C>A (p.Pro32Thr, NCBI rs1127354) and c.124+21A>C (NCBI rs7270101) in the ITPA gene. In a retrospective cross-sectional study, a normal ITPase activity was associated with broadly defined nephrotoxicity in HIV-infected patients on TDF-containing cART.15
We evaluated whether ITPase activity or ITPA genotype could be useful biomarkers to predict TDF-associated nephrotoxicity, and whether they were associated with eGFR-improvement after TDF-cessation.
meTHOds
This was a 1:2 matched case-control study in a cohort of HIV-1 infected adult patients from the Erasmus Medical Center, Rotterdam, the Netherlands. The study was approved by the local ethics committee, conducted according to the Helsinki Declaration, and participants provided informed consent. Participants were selected from 2 previous studies: a cohort study on TDF-associated nephrotoxicity and a randomized clinical trial in which TDF-

Chapter 5.
86
containing cART was discontinued (DOMONO,NCT02401828).16,17 Cases were patients who developed TDF-associated nephrotoxicity, and controls were patients who did not. Matching was performed for gender, age and ethnicity. Nephrotoxicity was defined as >25% eGFR-decrease during TDF-use and/or presence of ≥2 PTD markers: normoglycaemic glucosuria, hypophosphatemia <0.8 mmol/L, urine protein:creatinine ratio (UPCR) >15.0 mg/mmol, urine albumin:protein ratio (APR) <0.4 in patients with increased UPCR, or in-creased fractional excretion of phosphate (>20%, or >10% in hypophosphatemic patients).18 ITPase activity was measured as described previously.19 ITPase activity ≥4 mmol IMP/mml Hb/hour was considered normal.20 ITPA genotype was determined by genotyping whole blood for the ITPA SNPs c.94C>A (p.Pro32Thr, rs1127354) and c.124+21A>C (rs7270101). ITPA genotypes without these SNPs were considered wt/wt. 47 patients (15 cases and 32 controls) were selected from the study of Rokx et al, and 34 patients (11 cases and 23 controls) from the DOMONO-study.16,17 Data on demographics, medical history (diabetes mellitus, hypertension, hepatitis C virus infection, cardiovascular disease), nephrotoxic medications (sulphamethoxazole/trimethoprim, non-steroidal anti-inflammatory drugs, angiotensin converting enzyme-inhibitors, angiotensin-2 receptor-antagonists, and valacy-clovir or ganciclovir), eGFR, and PTD markers during TDF-use were collected, as well as eGFR and PTD-markers 48 weeks after TDF-cessation.
The primary outcome of this study was the proportion of normal versus reduced ITPase activity in cases versus controls. Secondary outcomes were: 1) proportions of patients with wt/wt versus wt/94C>A or wt/124+21A>C ITPA-genotype in cases versus controls, and 2) improvement of eGFR and PTD 48 weeks after TDF-cessation in cases with normal versus decreased ITPase activity and wt/wt versus another ITPA genotype. A sample size of 87 (29 cases and 58 controls) was needed to prove with a 1:2 case-control study-design that a significantly greater proportion of patients with nephrotoxicity had normal ITPase activity (π1=0.5) than patients without nephrotoxicity (π2=0.2), based on previous findings, with power 1-β=80% and a 2-sided α of 0.05.15 McNemar’s Test was used to compare proportions of patients with normal ITPase activity in cases and controls. Nephrotoxicity related to both ITPase activity (normal versus reduced) and ITPA genotype (wt/wt versus genotype with SNP) was analyzed using conditional logistic regression, resulting in an odds ratio (OR) with 95% confidence interval (CI). Fishers’ Exact Test, Unpaired T-tests, Chi Square Tests, and Mann Whitney U Tests were used for other comparisons between patients with normal versus reduced ITPase-activity, and paired T-tests were performed for comparisons on eGFR-improvement. An alfa of 0.05 was used.

87
ITPase activity associated with TDF-associated nephrotoxicity in HIV
resulTs
81 Patients were included, of whom 26 patients were cases and 55 patients were controls. Although we intended to include 87 patients based on our sample size calculation, we did a preliminary analysis after including 81 patients due to repeated non-adherence to scheduled outpatient appointments of the remaining eligible patients. This analysis showed highly sig-nificant results for the primary endpoint, with a calculated power of 76%. Therefore, patient inclusion was stopped for ethical arguments, since we considered that the supporting data for our assumptions for the power calculation were limited and could deviate from the true difference. In both groups, participants were predominantly Caucasian middle-aged males. The duration of TDF-use was comparable between cases and controls (83 and 84 months), as well as use of nephrotoxic co-medication and comorbidity. The mean (SD) eGFR in cases and controls at the moment of TDF-discontinuation was 78 (19) and 85 (13) ml/min. Of the cases, 80.8% had >25% eGFR-decline since TDF initiation, 61.5% had ≥2 PTD-markers, and 42.3% had both. (Table 1).
Of the cases, 73.1% (19/26) had a normal ITPase activity versus 50.9% (28/55) of controls (p=0.001; Table 2). Wt/wt ITPA genotype was present in 88.5% of cases and 72.7% (40/55) of controls (p=0.26; Table 2). Conditional logistic regression showed an increased and nearly statistically significant risk for nephrotoxicity in patients with normal ITPase activity and ITPA genotype wt/wt: OR 2.56 (95%CI 0.89-7.31; p=0.08), and OR 2.59 (95%CI 0.70-9.54; p=0.15), respectively. The eGFR-course improved from -5.5 ml/min/year during TDF to +4.4 ml/min/year after TDF-cessation (p=0.008) in cases with normal ITPase activity (N=19), whereas it remained stable in cases with reduced activity (N=4): -4.3 versus -4.0 ml/min/year, p=0.97. (Table 2). Of 11 cases that started dolutegravir therapy after TDF-cessation, 7 had normal ITPase activity, of whom 6 had improvement of eGFR, whereas 4 had reduced activity, of whom 1 had improvement of eGFR. These results indicate that patients with a normal ITPase activity may recover from TDF-associated nephrotoxicity after TDF-cessation, but patients with reduced activity may not. In cases with wt/wt ITPA genotype (N=22), the eGFR-course improved from -5.0 to +3.0 ml/min/year, p=0.021 (Table 2). eGFR data from only 1 patient with SNPs in the ITPA genotype were available, of which no conclusions can be drawn. Of the 16 cases with PTD, 3 had decreased and 13 had normal ITPase activity. Week 48 data were available in 9 patients, of whom the only patient with decreased ITPase activity had no PTD recovery, and PTD recovered in 4 of 8 patients with normal activity.

Chapter 5.
88
Table 1. Clinical characteristics of the patients with (cases) and without (controls) TDF-associated nephrotoxic-ity.
Characteristic Cases(n=26)
Controls(n=55)
p-value
male gender, n (%) 23 (88.5) 49 (89.1) 1.00 (FE)a
age, mean years ± SDb 51 ± 10 52 ± 9 0.50 (UT)c
ethnicity, n (%) 0.87 (FE)a
Caucasian 22 (84.6) 44 (80.0)
African 2 (7.7) 3 (5.5)
Asian 0 (0.0) 1 (1.8)
Latino 2 (7.7) 7 (12.7)
route of transmission, n (%) 0.77 (FE)a
MSMd 20 (76.9) 37 (67.3)
Heterosexual 5 (19.2) 12 (21.8)
IVDUe 1 (3.8) 3 (5.5)
Unknown 0 (0.0) 3 (5.5)
smoking status, n (%) 0.60 (CS)f
Current 8 (30.8) 22 (40.0)
Previous 8 (30.8) 12 (21.8)
Never 9 (34.6) 21 (38.2)
Unknown 1 (3.8) 0 (0.0)
Comorbidities, n (%)
Hypertension 5 (19.2) 10 (18.2) 1.00 (FE)a
Diabetes mellitus 3 (11.5) 1 (1.8) 0.10 (FE)a
Hepatitis C virus infection 2 (7.7) 5 (9.1) 1.00 (FE)a
Cardiovascular disease 3 (11.5) 4 (7.3) 0.68 (FE)a
Tdfg-containing carTh, n (%) 0.86 (FE)a
+ NNRTIi-containing, N (%) 24 (92.3) 49 (89.1)
RPVj-containing 9 (34.6) 18 (32.7)
+ bPIk-containing, N (%) 2 (7.7) 5 (9.1)
+ INSTIl-containing, N (%) 0 (0.0) 1 (1.8)
median duration of Tdf-usem, months (Q1,Q3) 83 (50,117) 84 (46,115) 0.72 (MWU)n
mean eGfro at discontinuation of Tdfg, ml/min, ± SDb 78.1 ± 19.2 85.2 ± 12.9 0.09 (UT)c
Comedication during Tdfg-use, n (%)
Sulfamethoxazol/trimethoprim 0 (0.0) 1 (1.8) 1.00 (FE)a
ACEp-inhibitor 3 (11.5) 3 (5.5) 0.38 (FE)a
AT2q-antagonist 0 (0.0) 4 (7.3) 0.30 (FE)a
Acyclovir/gancyclovir 1 (3.8) 3 (5.5) 1.00 (FE)a
NSAIDr 7 (26.9) 18 (32.7) 0.62 (CS)f

89
ITPase activity associated with TDF-associated nephrotoxicity in HIV
dIsCussION
In this case-control and cohort study in HIV-patients, TDF-associated nephrotoxicity was associated with a normal ITPase activity, and in these patients their eGFR-course amelio-rated after TDF-cessation. Less patients with reduced ITPase activity had and accelerated eGFR-decline, which did not recover after TDF-cessation. ITPase activity may be used as biomarker to predict which patients are at high risk for developing nephrotoxicity during TDF-use (more pronounced in normal ITPase activity), in which patients TDF-associated nephrotoxicity may be irreversible (decreased activity), and in whom TDF therefore should
Table 1. Clinical characteristics of the patients with (cases) and without (controls) TDF-associated nephrotoxic-ity. (continued)
Characteristic Cases(n=26)
Controls(n=55)
p-value
Tdfg-associated nephrotoxicity, n (%)
>25% decrease in eGFRo 21 (80.8)
≥2 markers of PTDs 16 (61.5)
>25% decrease in eGFRo + ≥2 markers of PTDs 11 (42.3) a FE, Fisher’s Exact test; b SD, standard deviation; c UT, Unpaired T-test; d MSM, men who have sex with men; e IVDU, intravenous drug use; f CS, Chi Square test; g TDF, tenofovir disoproxil fumarate; h cART, combination antiretroviral therapy; i NNRTI, non-nucleoside reverse transcriptase inhibitor; j RPV, rilpivirine; k bPI, boosted protease inhibitor; l INSTI, integrase strand transfer inhibitor; m duration of TDF-use at inclusion and alloca-tion to ‘case’ or ‘control’; n MWU, Mann Withney U test; o eGFR, estimated glomerular filtration rate; p ACE, angiotensin converting enzyme; q AT2, Angiotensine 2 antagonist; r NSAID, Non-steroidal anti-inflammatory drug; s PTD, proximal tubular dysfunction.
Table 2. Renal outcomes related to ITPase-activity and ITPA genotype.
Tdfa-associated nephrotoxicity
P-value eGfrb-changec in cases, mean ±sdd
P-value
yes (n=26) No (n=55) during Tdfa-use
after Tdfa discontinuation
ITPase activitye 0.001 (MNf)
<4 7 (26.9%) 27 (49.1%) -4.3 ± 5.8 -4.0 ± 9.9 0.97 (PTg)
≥4 19 (73.1%) 28 (50.9%) -5.5 ± 4.8 +4.4 ±13.0 0.008 (PTg)
Mean ± SDd 4.41 ± 1.28 3.90 ± 1.31 0.103 (UTh)
ITPA genotype 0.256 (MNf)
Wt/94C>A 2 (7.7%) 3 (5.5%) * * *
Wt/124+21A>C 1 (3.8%) 12 (21.8%) * * *
Wt/wt 23 (88.5%) 40 (72.7%) -5.0 (4.7) +3.0 (13.0) 0.021 (PTg)a TDF, tenofovir disoproxil fumarate; b eGFR, estimated glomerular filtration rate; c in ml/min/year, d SD, stan-dard deviation; e mmol IMP/mmol Hb/hour; f MN, McNemar (Wt/wt versus wt/94C>A and wt/124+21A>C combined); g PT, Paired samples T-test; h UT, Unpaired T-test; * indicates that not enough data were available for analysis.

Chapter 5.
90
be discontinued when signs of TDF-associated nephrotoxicity occur. The results of the pres-ent study confirm our previous findings that a normal ITPase activity was associated with nephrotoxicity during TDF-use.15 However, in this study, we were able to strictly define nephrotoxicity and investigate the association between ITPase activity and TDF-associated nephrotoxicity.16
It is unclear why a normal ITPase activity is associated with both TDF-associated neph-rotoxicity and recovery after TDF-cessation. TDF causes mitochondrial DNA (mtDNA) toxicity in tubular cells.21-23 Imbalanced mitochondrial nucleotide pools can cause mtDNA depletion, resulting in mitochondrial dysfunction.24,25 Furthermore, TDF leads to increased oxidative stress in mitochondria of renal tubular cells.26 In cells with oxidative stress, the enzyme xanthine oxidase (XO) activity is relatively increased27 and XO is a source of free radicals28. A normal ITPase activity, compared to decreased activity, may lead to more availability of hypoxanthine (formed from inosine), a substrate for XO. Eventually, the com-bination of a normal ITPase activity and TDF-use may lead to increasing oxidative stress, resulting in nephrotoxicity. Further research is warranted to clarify whether erythrocyte ITPase activity is an adequate surrogate for ITPase activity in renal cells, and what the effect of ITPase on the nucleotide pools in renal mitochondria is. Differences in ITPase activity in mitochondria, the effect of the ITPase activity on mitochondrial TDF-metabolism, and the role of TDF in oxidative stress should be studied.
This study has some limitations. First, the sample size of the study was based on previous findings,15 but data on ITPase activity related to TDF-associated nephrotoxicity are scarce and difficult to translate to assumptions for our sample size. As the results of a preliminary analysis in the first 81 included patients were already highly significant, the final 6 patients were not included. Second, we cannot exclude that the nephrotoxicity observed in our cases was due to other, unidentified, factors, although patient characteristics were comparable between the cases and controls. Besides, data on longer follow-up were not available, and therefore we cannot exclude that patients who are included as controls, could have de-veloped nephrotoxicity with longer use of TDF. Third, recovery of nephrotoxicity may be underestimated in patients using DTG. DTG is known for its inhibitory effect on tubular creatinine clearance, leading to an increase in serum creatinine, which decreases the eGFR without impairment of actual glomerular or tubular function.29 11 of the 26 cases were former DOMONO-participants, and switched to DTG monotherapy. Indeed, in some of our patients using DTG the eGFR further decreased, but this was in only 1 of 7 patients with normal ITPase activity, versus in 2/4 cases with reduced activity. So even after a switch from TDF to DTG, the distinct between normal versus reduced ITPase activity in relation to eGFR-improvement remains. Given the low numbers of patients with follow-up of PTD-

91
ITPase activity associated with TDF-associated nephrotoxicity in HIV
markers after 48 weeks, importantly due to the observational nature of the study of Rokx et al, we were not able to provide data on recovery of PTD.
In conclusion, ITPase activity is associated with nephrotoxicity during TDF-use for HIV-infection and could be used to predict eGFR-recovery, but the underlying mechanism needs to be elucidated. ITPase activity may be used in the decision to initiate and discontinue TDF in an individual patient, and this recommendation should be confirmed in a prospective trial.
aCkNOWledGemeNTs
NP reports an unrestricted research grant from the Dutch Association of HIV treating physicians (NVHB). IW reports personal fees from Gilead and Viiv outside the submitted work. CR reports a research grant from MERCK outside the submitted work, and personal fees from Gilead and Viiv outside the submitted work. JBa reports no conflicts of interest and/or financial disclosures. BR reports grants from the EUR trustfund during the conduct of the NCT02401828 study (grant number 97030.34/15), personal fees and non-financial support from Viiv outside the submitted work. JBi reports no conflicts of interest and/or financial disclosures. AV reports an unrestricted scientific grant from Janssen pharma-ceuticals during the conduct of this study and an unrestricted grant from Viiv outside the submitted work. NP and AV designed the study and wrote the protocol. NP, IW, AV, JBi and JBa contributed to the literature search. NP and IW prepared the tables. NP, IW, CR, BR, JBi and AV contributed to the collection, analysis and interpretation of the data. NP, IW, CR, JBa, BR, JBi, and AV contributed to the writing and review of the manuscript.

Chapter 5.
92
refereNCes
1. FDA approves first drug for reducing the risk of sexually acquired HIV infection. [press release]. July 16, 2012.
2. Cheng CY, Chang SY, Lin MH, Ku SY, Sun NL, Cheng SH. Tenofovir disoproxil fumarate-associated hypophosphatemia as determined by fractional excretion of filtered phosphate in HIV-infected patients. J Infect Chemother. 2016;22(11):744-7.
3. Baxi SM, Scherzer R, Greenblatt RM, Minkoff H, Sharma A, Cohen M, et al. Higher tenofovir ex-posure is associated with longitudinal declines in kidney function in women living with HIV. AIDS. 2016;30(4):609-18.
4. Cooper RD, Wiebe N, Smith N, Keiser P, Naicker S, Tonelli M. Systematic review and meta-analysis: renal safety of tenofovir disoproxil fumarate in HIV-infected patients. Clin Infect Dis. 2010;51(5):496-505.
5. Kelly MD, Gibson A, Bartlett H, Rowling D, Patten J. Tenofovir-associated proteinuria. AIDS. 2013;27(3):479-81.
6. Verhelst D, Monge M, Meynard JL, Fouqueray B, Mougenot B, Girard PM, et al. Fanconi syndrome and renal failure induced by tenofovir: a first case report. Am J Kidney Dis. 2002;40(6):1331-3.
7. Sax PE, Zolopa A, Brar I, Elion R, Ortiz R, Post F, et al. Tenofovir alafenamide vs. tenofovir disoproxil fumarate in single tablet regimens for initial HIV-1 therapy: a randomized phase 2 study. J Acquir Immune Defic Syndr. 2014;67(1):52-8.
8. Mills A, Crofoot G, Jr., McDonald C, Shalit P, Flamm JA, Gathe J, Jr., et al. Tenofovir alafenamide versus tenofovir disoproxil fumarate in the first protease inhibitor-based single-tablet regimen for initial HIV-1 therapy: a randomized phase 2 study. J Acquir Immune Defic Syndr. 2015;69(4):439-45.
9. Panel on Antiretroviral Guidelines for Adults and Adolescents. Guidelines for the Use of Antiretro-viral Agents in Adults and Adolescents Living with HIV. Department of Health and Human Services. [Available from: https://aidsinfo.nih.gov/contentfiles/lvguidelines/adultandadolescentgl.pdf].
10. European AIDS Clinical Society Guidelines. European Guidelines for treatment of HIV-positive adults in Europe. [Available from: http://www.eacsociety.org/guidelines/eacs-guidelines/eacs-guidelines.html].
11. Abolhassani N, Iyama T, Tsuchimoto D, Sakumi K, Ohno M, Behmanesh M, et al. NUDT16 and ITPA play a dual protective role in maintaining chromosome stability and cell growth by eliminating dIDP/IDP and dITP/ITP from nucleotide pools in mammals. Nucleic Acids Res. 2010;38(9):2891-903.
12. Galperin MY, Moroz OV, Wilson KS, Murzin AG. House cleaning, a part of good housekeeping. Mol Microbiol. 2006;59(1):5-19.
13. Bierau J, Bakker JA, Schippers JA, Grashorn JA, Lindhout M, Lowe SH, et al. Erythrocyte inosine triphosphatase activity is decreased in HIV-seropositive individuals. PLoS One. 2012;7(1):e30175.
14. Peltenburg NC, Leers MP, Bakker JA, Lowe SH, Vroemen WH, Paulussen AD, et al. Inosine Triphos-phate Pyrophosphohydrolase Expression: Decreased in Leukocytes of HIV-Infected Patients Using Combination Antiretroviral Therapy. J Acquir Immune Defic Syndr. 2016;73(4):390-5.
15. Peltenburg NC, Bierau J, Bakker JA, Schippers JA, Lowe SH, Paulussen ADC, et al. Erythrocyte Inosine triphosphatase activity: A potential biomarker for adverse events during combination anti-retroviral therapy for HIV. PLoS One. 2018;13(1):e0191069.
16. Rokx C, Alshangi H, Verbon A, Zietse R, Hoorn EJ, Rijnders BJ. Renal toxicity of concomitant expo-sure to tenofovir and inhibitors of tenofovir’s renal efflux transporters in patients infected with HIV type 1. J Infect Dis. 2016;213(4):561-8.

93
ITPase activity associated with TDF-associated nephrotoxicity in HIV
17. Wijting I, Rokx C, Boucher C, van Kampen J, Pas S, de Vries-Sluijs T, et al. Dolutegravir as mainte-nance monotherapy for HIV (DOMONO): a phase 2, randomised non-inferiority trial. Lancet HIV. 2017;4(12):e547-e54.
18. Lucas GM, Ross MJ, Stock PG, Shlipak MG, Wyatt CM, Gupta SK, et al. Clinical practice guideline for the management of chronic kidney disease in patients infected with HIV: 2014 update by the HIV Medicine Association of the Infectious Diseases Society of America. Clin Infect Dis. 2014;59(9):e96-138.
19. Bierau J, Bakker JA, Lindhout M, van Gennip AH. Determination of ITPase activity in erythro-cyte lysates obtained for determination of TPMT activity. Nucleosides Nucleotides Nucleic Acids. 2006;25(9-11):1129-32.
20. Shipkova M, Lorenz K, Oellerich M, Wieland E, von Ahsen N. Measurement of erythrocyte inosine triphosphate pyrophosphohydrolase (ITPA) activity by HPLC and correlation of ITPA genotype-phenotype in a Caucasian population. Clin Chem. 2006;52(2):240-7.
21. Lebrecht D, Venhoff AC, Kirschner J, Wiech T, Venhoff N, Walker UA. Mitochondrial tubulopathy in tenofovir disoproxil fumarate-treated rats. J Acquir Immune Defic Syndr. 2009;51(3):258-63.
22. Cote HC, Magil AB, Harris M, Scarth BJ, Gadawski I, Wang N, et al. Exploring mitochondrial neph-rotoxicity as a potential mechanism of kidney dysfunction among HIV-infected patients on highly active antiretroviral therapy. Antivir Ther. 2006;11(1):79-86.
23. Kohler JJ, Hosseini SH, Hoying-Brandt A, Green E, Johnson DM, Russ R, et al. Tenofovir renal toxic-ity targets mitochondria of renal proximal tubules. Lab Invest. 2009;89(5):513-9.
24. Wang L. Mitochondrial purine and pyrimidine metabolism and beyond. Nucleosides Nucleotides Nucleic Acids. 2016;35(10-12):578-94.
25. El-Hattab AW, Craigen WJ, Scaglia F. Mitochondrial DNA maintenance defects. Biochim Biophys Acta. 2017;1863(6):1539-55.
26. Milian L, Peris JE, Gandia P, Andujar I, Pallardo L, Gorriz JL, et al. Tenofovir-induced toxicity in renal proximal tubular epithelial cells: involvement of mitochondria. AIDS. 2017;31(12):1679-84.
27. Thompson-Gorman SL, Zweier JL. Evaluation of the role of xanthine oxidase in myocardial reperfu-sion injury. J Biol Chem. 1990;265(12):6656-63.
28. Chung HY, Baek BS, Song SH, Kim MS, Huh JI, Shim KH, et al. Xanthine dehydrogenase/xanthine oxidase and oxidative stress. Age (Omaha). 1997;20(3):127-40.
29. Cottrell ML, Hadzic T, Kashuba AD. Clinical pharmacokinetic, pharmacodynamic and drug-interaction profile of the integrase inhibitor dolutegravir. Clin Pharmacokinet. 2013;52(11):981-94.


Chapter 6.Metabolic events in HIV-infected patients using abacavir are associated with erythrocyte inosine triphosphatase activity.
N.C. Peltenburg, J. Bierau, J.A. Schippers, S.H. Lowe, A.D.C. Paulussen, B.J.C. van den Bosch, M.P.G. Leers, E.-R. Andrinopoulou, J.A. Bakker, A. Verbon
Journal of Antimicrobial Chemotherapy. 2019 Jan; 74(1): 157-164.

Chapter 6.
96
absTraCT
ObjectivesAbacavir use has been associated with an increased risk of cardiovascular disease (CVD) and metabolic events in HIV-infected patients, although this finding was not consistently found. It is unclear whether abacavir only increases this risk in subpopulations of HIV-infected pa-tients. It may be hypothesized that inosine 5’-triphosphate pyrophosphohydrolase (ITPase), an enzyme involved in the metabolism of purine analogues used in HIV treatment, plays a role in the risk of CVD and metabolic events in HIV-infected patients.
methodsITPase activity and ITPA genotype were determined in 393 HIV-infected patients. ITPase activity <4 mmol IMP/mmol Hb/h was considered decreased. ITPA polymorphisms tested were: c.94C>A (rs1127354) and c.124+21A>C (rs7270101). ORs were determined using generalized estimating equation models for developing CVD in patients who had ever been exposed to abacavir, tenofovir or didanosine and for developing metabolic events in patients currently using these drugs.
resultsIn patients using abacavir, metabolic events were associated with ITPase activity. No as-sociation was demonstrated for tenofovir or didanosine. The OR for metabolic events was 3.11 in patients using abacavir with normal ITPase activity (95% CI 1.34–7.21; p=0.008) compared with patients with decreased ITPase activity (adjusted for age, BMI, cumulative duration of combination antiretroviral therapy (cART) use and the use of PI and NNRTI). CVD was not associated with ITPase activity or ITPA genotype.
ConclusionsThis study shows, for the first time, that ITPase activity is associated with the occurrence of metabolic events in patients using abacavir. Further studies are needed to confirm this association and to elucidate the possible mechanism.

97
Metabolic events in HIV associated with ITPase activity
INTrOduCTION
The life expectancy of patients infected with HIV has improved substantially in recent decades1 and in developed countries has been approaching that of the non-HIV-infected general population.2 In the Netherlands, currently, 42% of HIV patients are older than 50 years of age3 and in the USA, at year-end in 2015, the group of patients aged 50–54 years made up the largest percentage of persons living with HIV (18%).4 With increasing age, non-communicable comorbidities such as cardiovascular disease (CVD) increase, espe-cially among HIV-infected patients using combination antiretroviral therapy (cART).5–7 For CVD it is unclear what the contribution of the HIV infection itself is compared with the drugs that are part of the cART regimens. In a meta-analysis the pooled relative risk of CVD among HIV-infected patients without treatment was 1.61 compared with people not infected with HIV.8 The pooled relative risk for HIV-infected patients on treatment was 2.00 compared with non-HIV-infected people.8 Different antiretroviral medication classes have been associated with a higher risk of CVD. The relative risk of CVD was 1.41 (95% CI 1.2–1.65) for patients on PI-based cART compared with those on non-PI-based cART.8 An increased rate of myocardial infarction in patients recently treated with abacavir and didanosine was first reported in the D:A:D study.9 Since then, several cohort studies and randomized clinical trials have confirmed the association of abacavir use and increased risk for CVD10–12 and in a meta-analysis the pooled relative risk was 1.8 (95% CI 1.43–2.26; p<0.001) for patients treated with abacavir.8 Currently this association is still debated, as other studies have found either no effect or no significant effect of abacavir use on the risk of CVD.13,14
The pathogenic mechanism of the potential association between abacavir use and CVD is not clear. Which factors predispose patients using abacavir to a higher risk of CVD, apart from the classic risk factors such as dyslipidaemia, hypertension (HT) and smoking, has not yet been elucidated. It may be hypothesized that differences in the metabolism of abacavir predispose to a higher risk for CVD. The active metabolite of abacavir is carbovir triphosphate, which is a guanosine analogue. Guanosine 5’-triphosphate (GTP) is a low-affinity substrate for the enzyme inosine 5’-triphosphate pyrophosphohydrolase (ITPase) compared with the natural substrate inosine 5’-triphosphate (ITP).15 ITPase is one of the scavenger enzymes eliminating the potentially cytotoxic or genotoxic non-canonical nucleoside triphosphates from the nucleotide pool16 and is encoded by the ITPA gene on chromosome 20p (OMIM #147520). The SNPs c.94C>A (p.Pro32Thr, NCBI rs1127354) and c.124+21A>C (NCBI rs7270101) in the ITPA gene can cause a decrease in ITPase activity.17 In HIV-infected patients, ITPase was found to have decreased expression in leukocytes, which was not associated with ITPA genotype,18 and decreased activity in erythrocytes in
Chapter 6.
98
patients with ITPA genotype wt/wt or c.94C>A compared with a control population with the same genotype.19
The natural role of ITPase, the different ITPase activity in HIV-infected patients and the potential role of ITPase in the metabolism of the purine analogues used in HIV treatment, suggest that ITPase activity may play a role in the risk of CVD in patients using abacavir.
We therefore determined whether ITPase activity and ITPA genotype are associated with the occurrence of CVD and with risk factors such as HT, hypercholesterolaemia and diabe-tes mellitus (DM) during abacavir use in a cohort of HIV-infected patients.
PaTIeNTs aNd meTHOds
PatientsHIV-infected patients at the outpatient clinic of the Maastricht University Medical Center in Maastricht, The Netherlands, who were treated with cART, were included in this study after providing written informed consent. The data used for this study were collected as described previously.20 The study was performed according to the Helsinki Declaration and approved by the Medical Ethics Committee of the Maastricht University Medical Center, Maastricht, The Netherlands.
endpointsThe endpoints of the study were CVD and metabolic events. CVD was defined as: reported cerebrovascular accident (CVA) (transient ischaemic attack, haemorrhagic/ischaemic/unspecified CVA), arterial occlusion, peripheral stent or bypass, coronary event (coronary artery bypass graft, percutaneous intervention or myocardial infarction) or anamnestic complaints of peripheral claudication, during the use of cART. Metabolic events were de-fined as: dyslipidaemia as the reported reason for stopping the cART regimen, laboratory-confirmed dyslipidaemia (total cholesterol >6.5 mM, triglycerides >2.3 mM, LDL >4.5 mM), use of lipid-lowering therapy (statins and/or fibrates), DM or HT. DM was defined as fasting glucose ≥7 mM (126 mg/dL) measured on two or more consecutive occasions within 3 months, or glucose ≥11.1 mM (200 mg/dL) measured once and in combination with symptoms of hyperglycaemia, or if the patient was reported as being diabetic, or if the patient had glucose-lowering therapy.21 HT was defined as mean systolic pressure >140 mmHg, mean diastolic pressure >90 mmHg or if the patient used anti-hypertensive medica-tion.22

99
Metabolic events in HIV associated with ITPase activity
ITPase activityErythrocyte ITPase activity was determined as described previously23 and assessed by formation of inosine 5’-monophosphate (IMP) from ITP. ITPase activity was expressed as millimoles (mmol) of IMP formed from ITP in 1 h per mmol hemoglobin (mmol IMP/mmol Hb/h). ITPase activity of ≥4 mmol IMP/mmol Hb/h was considered normal, which is the lowest value within the 95% CI for ITPA wild-type (wt/wt) carriers.19,24
ITPA genotype analysisITPA genotype was analysed as described previously by Bierau et al.19 The Wizard Genomic DNA purification kit (Promega, Madison, WI, USA) was used to isolate genomic DNA from whole blood. The DNA was genotyped using Sanger sequencing for the two ITPA polymorphisms; c.94C>A (p.Pro32Thr, rs1127354) and c.124+21A>C (rs7270101). The genotype was considered to be wild-type (wt/wt) when neither of the polymorphisms was detected. All sequences were evaluated by two independent laboratory experts.
statistical analysisAll analyses were performed with IBM SPSS Statistics 21 (IBM Corporation, NY, USA) and the statistical software package R (free download from www.rproject.org) version 3.4.3. Pearson’s χ2 tests, Fisher’s exact test, independent samples T-tests and Mann–Whitney U tests were used to determine significant differences.
The occurrence of CVD was analysed using generalized estimating equation models to account for repeated statement and adjusted for differences in CVD risk profile: age at the time of changing the cART regimen, the last measured BMI, smoking status (current or former smoker), pre-existing CVD before the start of cART, HT, DM, dyslipidaemia and gender. Further adjustment for cumulative total duration of cART and use of a PI or an NNRTI at the time of the event was performed. Numerical variables were standardized in order to have the same scale.
The occurrence of a metabolic event was analysed using generalized estimating equation models to account for repeated statement and adjusted for cumulative total duration of cART, age at the time of changing the cART regimen, the last BMI measured, use of a PI and use of an NNRTI at the time of the event. Numerical variables were standardized in order to have the same scale.
Since tenofovir disoproxil fumarate (further referred to as tenofovir) and didanosine are also purine analogues, their active metabolites being adenine nucleotide analogues instead of guanosine nucleotide analogues such as carbovir, the association of ITPase activity, ITPA genotype and CVD in patients using these drugs in their cART regimen was determined in

Chapter 6.
100
addition. For exposure to either abacavir, tenofovir or didanosine, in the analysis of CVD we used current (which means use at the time of the event) and past exposure. Only current exposure was used in the analysis of metabolic events.
When abacavir, tenofovir or didanosine were used concomitantly in one cART regimen, this regimen was excluded from the analysis. P-values <0.05 were considered to be statistically sig-nificant. We did not correct for multiple testing because our analyses were hypothesis driven.
resulTs
Patient characteristicsAfter excluding regimens containing a combination of didanosine, tenofovir or abacavir, 1422 regimens in 393 patients were used in the analysis.20 Of these patients, 52.2% had an ITPase ac-tivity of <4 mmol IMP/mmol Hb/h (Table 1). No statistically significant difference was found between patients with decreased ITPase activity and with normal ITPase activity with regard to age, gender, race, CD4 nadir counts and PI and NNRTI use. In 60.1% of regimens containing no purine, a PI was part of the cART regimen; this was, respectively, 34.5%, 22.9% and 60.2% in regimens containing tenofovir, abacavir or didanosine. Current exposure to the purine analogues tenofovir, abacavir and didanosine was frequent (n=601 (42.3%), n=244 (17.2%) and n=128 (9.0%) respectively). The number of regimens with current plus past exposure to a purine analogue was 699 (49.2%) for tenofovir, 465 (32.7%) for abacavir and 365 (25.7%) for didanosine. CVD was present in 12.5% of the patients (n=49) and reported to be CVA (n=15), arterial occlusion (n=2), peripheral stent or bypass (n=6), coronary arterial bypass graft (n=6), percutaneous intervention (n=12), myocardial infarction (n=7) or anamnestic complaints of peripheral claudication (n=1). In patients with current or past exposure to abacavir, 24 CVD events occurred; CVA (n=7), coronary artery bypass grafting (n=3), percutaneous coronary intervention (n=7), myocardial infarction (n=2), arterial occlusion (n=2) and peripheral stent or bypass (n=3). In 749 regimens (52.7%) a metabolic event was found. An overview of differ-ent components of the combined endpoint metabolic event is presented in Table 2.
effect of ITPase activity and ITPA genotype on CVdNo significant difference in CVD between the regimens used in patients with decreased versus normal ITPase activity was found, irrespective of cART regimen used (22 versus 27 events, respectively; crude p=0.34). ITPase activity in combination with current or past exposure to abacavir was not associated with a higher number of CVD events compared with tenofovir or didanosine exposure in our cohort (Table 3).

101
Metabolic events in HIV associated with ITPase activity
Table 1. Demographic and clinical characteristics of the patients (n=393) with ITPase activity <4 and ≥4 mmol IMP/mmol Hb/hour.
Characteristic ITPase activitya P-value
<4 (n=205) ≥4 (n=188)
age*; mean years ± SDb 50.1 ± 11.1 49.7 ± 11.9 0.78
male gender,* n (%) 164 (80.0%) 155 (82.4%) 0.53
race, n (%)* 0.81
Caucasian 164 (80.0%) 147 (78.2%)
Hispanic 5 (2.4%) 4 (2.1%)
African 22 (10.7%) 27 (14.4%)
Asian or other 14 (6.9%) 10 (5.3%)
mean ITPase activity* ± SD 2.44 ± 1.12 5.24 ± 1.09 <0.001
ITPA genotype,* n (%) <0.001
Wt/wt 90 (43.9%) 175 (93.1%)
Wt/c.124+21A>C 59 (28.8%) 9 (4.8%)
Wt/c.94C>A or otherc 53 (25.9%) -
Unknown 3 (1.5%) 4 (2.1%)
alcohol use*, n (%) 0.51
<2 (IU/day) 157 (76.6%) 133 (70.7%)
≥2 (IU/day) 35 (17.1%) 36 (19.1%)
Unknown 13 (6.3%) 19 (10.1%)
smoking, n (%) 0.65
Never 18 (8.8%) 21 (11.2%)
Current or former 130 (63.4%) 116 (61.7%)
Not current, unknown if ever 55 (26.8%) 46 (24.5%)
Unknown 2 (1.0%) 5 (2.7%)
body mass index, n (%) 0.09
Underweight (<18.5) 14 (6.8%) 3 (1.6%)
Normal (≥18.5-<25) 102 (49.8%) 95 (50.5%)
Mild/Moderate obesity (≥25-<30) 59 (28.8%) 52 (27.7%)
Severe obesity (≥30) 10 (4.9%) 15 (8.0%)
Unknown 20 (9.8%) 23 (12.2%)
median Cd4 nadir*, x106 cells/L (range) 207 (1-1022) 209 (3-612) 0.40
median year of start carT* (range) 2006 (1987-2013)c 2006 (1987-2013)d 0.25
Total number of carT regimens* 734 688
Type carT, n (%) 0.09
NNRTId 342 (46.6%) 295 (42.9%)
PIe 239 (32.6%) 267 (38.8%)
NNRTId and PIe 59 (8.0%) 45 (6.5%)
Other 94 (12.8%) 81 (11.8%)
* previously published; a mmol IMP/mmol Hb/hour; b SD, standard deviation; c Other = homozygous c.124+21A>C or homozygous c.94C>A or heterozygous c.124+21A>C/c.94C>A; d NNRTI, nucleoside/nucleo-tide analog reverse-transcriptase inhibitor; e PI, Protease inhibitor

Chapter 6.
102
Table 2. Diabetes mellitus, dyslipidemia and use of blood pressure medication or cholesterol lowering therapy for regimens used in patients with decreased and normal ITPase activity.
all regimens P-values regimens currently containing abacavir
P-values
ITPase activitya ITPase activitya
<4 (n=734) ≥4 (n=688) <4 (n=131) ≥4 (n=113)
diabetes, n (%) 0.03 0.04
Yes 28 (3.8) 45 (6.5) 3 (2.3) 11 (9.7)
Unknown - 18 (2.6) - -
Hypertension, n (%) 0.03 0.16
Yes 146 (19.9) 171 (24.9) 26 (19.8) 31 (27.4)
Unknown - - - -
dyslipaemia, n (%) 0.01 0.17
Yes 195 (26.6) 226 (32.8) 40 (30.5) 44 (38.9)
Unknown - - - -
Cholesterol lowering therapy, n (%) 0.014 0.68
Yes 86 (11.7) 117 (17.1) 20 (15.3) 23 (20.4)
Unknown 10 (1.4) 9 (1.3) 1 (0.8) 1 (0.9)a mmol IMP/mmol Hb/hour
Table 3. CVD and metabolic events for regimens used in patients with decreased and normal ITPase activity and different ITPA genotypes.
ITPase activitya Crude p adjusted p ITPA genotype Crude p adjusted p
<4 ≥4 Otherb wt/wt
n /regimens
n /regimens
n /regimens
n /regimens
CVd
Totalc n=1422 22/734 27/688 0.34 0.82 13/435 35/960 0.72 0.86
Tenofovird n=699 12/354 17/345 0.31 0.50 7/211 21/478 0.35 0.77
Abacavire n=465 11/245 13/220 0.49 0.40 6/132 18/328 0.86 0.41
Didanosinef n=365 2/165 6/200 0.30 0.45 0/91 8/272 0.24 n.a.
metabolic events
Totalc n=1422 356/734 393/688 0.001 0.12 202/435 537/960 0.001 0.14
Tenofovirg n=601 155/306 168/295 0.12 0.55 89/186 231/409 0.13 0.53
Abacavire n=244 63/131 82/113 <0.0001 0.008 39/75 106/164 0.003 0.24
Didanosineh n=128 25/51 37/77 0.92 0.75 12/31 49/96 0.26 0.61a mmol IMP/mmol Hb/hour; b heterozygous wt/c.124+21A>C or wt/c.94C>A or homozygous c.124+21A>C or homozygous c.94C>A or compound heterozygous c.124+21A>C/c.94C>A; c Genotype unknown in 27 regi-mens; d Genotype unknown in 10 regimens; e Genotype unknown in 5 regimens; f Genotype unknown in 2 regimens; g Genotype unknown in 6 regimens; h Genotype unknown in 1 regimen

103
Metabolic events in HIV associated with ITPase activity
Regardless of cART regimen, CVD more often occurred in patients with ITPA genotype wt/wt versus the other ITPA genotypes [CVD: n=35 (71.4%) versus n=13 (26.5%) respectively; although this difference was not statistically significant (p=0.72)] (Table 3). One CVD oc-
Effect of ITPase activity on metabolic events
0.1 1 10
No purine
Didanosine
Abacavir
Tenofovir
Total
1.14 (0.64-2.03)
0.86 (0.36-2.07)
3.11 (1.34-7.21)
1.17 (0.70-1.95)
1.34 (0.93-1.94)
OR (95% CI)
0.66
0.75
0.008
0.55
0.12
P-values
←⎯⎯ ⎯⎯→ More adverse events More adverse eventsin ITPase activity <4* in ITPase activity ≥4*
(A)
0.1 1 10
No purine
Didanosine
Abacavir
Tenofovir
Total
1.42 (0.75-2.69)
1.27 (0.51-3.18)
1.68 (0.71-3.99)
1.18 (0.70-2.01)
1.35 (0.90-2.01)
OR (95% CI)
0.29
0.61
0.24
0.53
0.14
P-values
←⎯⎯ ⎯⎯→More adverse events More adverse eventsin other ITPA gentoypes in ITPA genotype wt/wt
Effect of ITPA genotype on metabolic events(B)
figure 1: Effect ITPase activity (A) and ITPA genotype (B) on metabolic events. The effect of decreased versus normal ITPase activity (A) and of other ITPA genotypes versus ITPA genotype wt/wt (B) on the occurrence of metabolic events are plotted for all regimens (Total), and for regimens containing tenofovir, abacavir, didano-sine or no purine. Odds ratio (OR) with 95% confidential interval and matching p-values are displayed. * mmol IMP/mmol Hb/hour

Chapter 6.
104
curred in a patient with unknown ITPA genotype. Adjusting the data for CVD risk profiles, cumulative cART use and PI and NNRTI use did not change the outcome for CVD.
effect of ITPase activity and ITPA genotype on metabolic eventsOf all the metabolic events, 52.5% occurred during regimens prescribed to patients with normal ITPase activity (crude p=0.001) (Table 3). In 72.6% of the regimens currently containing abacavir used by patients with normal ITPase activity, a metabolic event oc-curred, compared with 48.5% in patients with decreased ITPase activity (p<0.0001; Table 3). After adjusting for age, BMI, cumulative duration of cART use and the use of PI and NNRTI, the OR for developing a metabolic event was statistically significantly higher in patients with normal versus decreased ITPase activity (3.11, 95% CI 1.34–7.21; p=0.008) in abacavir-containing regimens. In regimens containing tenofovir or didanosine, no associa-tion between ITPase activity and the occurrence of metabolic events could be demonstrated (Figure 1a). Also in regimens without a purine analogue but in 60% containing a PI no association was found (Figure 1a).
In regimens prescribed in patients with wt/wt genotype, metabolic events were more frequently found compared with the other genotypes (537/960 regimens versus 202/435 regimens; p=0.001) (Table 3). Metabolic events occurred more frequently in patients using abacavir and having the wt/wt genotype (p=0.003). This increase could not be found in patients using tenofovir or didanosine (Table 3). However, after adjusting for age, BMI, cumulative cART use and the use of PI or NNRTI, no significant difference in metabolic events between patients using abacavir with wt/wt genotype and the other ITPA genotypes could be demonstrated (Figure 1b).
dIsCussION
In this study we show, for the first time, that ITPase activity may play a role in the as-sociation of abacavir use and the occurrence of metabolic events in HIV-infected patients using cART. In regimens containing abacavir decreased ITPase activity was associated with fewer metabolic adverse events. We could not confirm the hypothesis that decreased ITPase activity decreased the risk of CVD. No association between ITPA genotype and CVD or metabolic events was found after adjustment for other CVD risk factors.
In multiple studies it was reported that the use of abacavir increased the risk of developing CVD or myocardial infarction.9–11 Other studies, however, could not confirm this associa-tion.14,25 We found no association between abacavir use, ITPase activity and CVD events, possibly owing to the relatively small number of CVD events found in our study. Like oth-

105
Metabolic events in HIV associated with ITPase activity
ers, we found that metabolic events were associated with abacavir, but not with tenofovir use.26–30 A possible explanation may be the difference in chemical structure since tenofovir is an adenosine analogue and abacavir is a guanosine analogue.
How ITPase might be involved in the occurrence of metabolic events during abacavir use is not known. Carbovir triphosphate was found not to be a direct substrate for ITPase.20 Potentially the answer lies in cellular signal transduction. Guanosine 3’,5’-cyclic mono-phosphate (cGMP) is an important secondary messenger that modulates multiple cellular processes, such as platelet aggregation, neurotransmission, blood pressure, lipolysis and gut peristalsis.31,32 cGMP is produced from GTP by the enzyme soluble guanylate cyclase (sGC)33,34 and stimulation of sGC was found to be protective against obesity.35 However, in the presence of nitric oxide (NO) and magnesium ions (Mg2+) sGC shifts its substrate speci-ficity to ITP to form inosine 3’,5’-cyclic monophosphate (cIMP) and also, in the absence of hypoxaemia, addition of exogenous ITP to intact porcine arteries led to higher cIMP lev-els.36,37 In contrast to cGMP, which induces vasodilatation, cIMP induces vasoconstriction.36 This vasoconstriction has been well studied by measurement of flow-mediated dilatation (FMD) of the brachial artery and is strongly associated with the risk of CVD.38–40 Patients using abacavir were found to have lower FMD than patients not using abacavir,41 whereas didanosine and tenofovir use were not associated with lower FMD. Support for the hypoth-esis that abacavir shifts sGC to use ITP instead of GTP, leading to higher cIMP levels, can be found in the study by Baum et al.42 Formation of cGMP was decreased in human platelets incubated with carbovir triphosphate (the active metabolite of abacavir) and the authors concluded that carbovir triphosphate inhibited sGC. The question remains whether sGC was inhibited, carbovir triphosphate competed with GTP or a shift in substrate specificity of sGC occurred. New research is warranted to investigate under which circumstances ITP is a substrate for sGC, what the consequences of this shift in substrate specificity are and what the impact of carbovir triphosphate is on sGC activity in human cells.
In 2010 Fellay et al.17 showed that the SNPs 94C>A and 124+21A>C in the ITPA genotype were associated with the protection against hemolytic anemia during treatment with riba-virin for hepatitis C infection. We found ITPase might be a more accurate predictor of the development of hemolytic anemia in these patients than ITPA genotype.43 In HIV-infected patients both ITPase activity and ITPA genotype were associated with adverse events; how-ever, ITPA genotype correlated less well with adverse events compared with ITPase activ-ity.20 In the present study again, we found ITPA genotype and ITPase activity were both crudely associated with adverse events; however, after adjusting with the logistic mixed effects model, only ITPase activity remained statistically significant. The difference in the effect of ITPase activity versus ITPA genotype in HIV-infected patients may be explained by the finding that in these patients the wt/wt and the c.94C>A carriers have decreased

Chapter 6.
106
erythrocyte ITPase activity compared with non-HIV-infected patients carrying the same genotypes.19
Here, we report a lower risk of metabolic events in HIV-infected patients that use abacavir and have decreased ITPase activity. In a previous study, in tenofovir-containing regimens, decreased ITPase activity was also associated with a lower risk of adverse events.20 In con-trast, the use of abacavir in this previous study was crudely associated with an increase in adverse events in patients having decreased ITPase activity. The adverse events in that study were different from the current study and included gastro-intestinal, neurological, renal, skin and liver-related adverse events, and potentially this explains why decreased ITPase activity may lead to an increase in adverse events in one study, but a decrease in adverse events in the other study. In other studies the association between decreased ITPase activity or a SNP in the ITPA genotype and adverse events was shown to be dependent on the kind of adverse event and the drug that was used, leading to, for instance, an increase in hepatic toxicity (during azathioprine or 6-mercaptopurine use) but a decrease in hemolytic anemia (during ribavirin use).44–47 We hypothesize that the effect of ITPase activity in patients using abacavir is also dependent on the nature of the adverse events.
There are limitations that need to be mentioned. Our study was retrospective with all the possible caveats of retrospective studies. For example, factors other than the cART regimen could have contributed to alterations in metabolic events. This is, however, not different for patients with decreased or patients with normal ITPase activities, and thus the influence of this factor seems limited. Although our results could be mechanistically made plausible, further prospective studies are still warranted to confirm our results. Owing to the number of patients included, a low frequency of cardiovascular events was found. This may explain the lack of association of CVD with ITPase activity. Also, the clinical relevance of our find-ings is to be further established by larger prospective trials.
In conclusion, we showed that ITPase activity may be associated with a risk of metabolic events in HIV-infected patients using abacavir. Using ITPase activity as a potential bio-marker to predict adverse metabolic events may be a further step towards more patient-tailored medicine in the future. However, elucidation of the pathogenic mechanism needs further studies and our results need to be confirmed in a prospective trial.
fuNdING
This work was supported by an unrestricted scientific grant by Janssen pharmaceutical companies of Johnson & Johnson to A.V.

107
Metabolic events in HIV associated with ITPase activity
refereNCes
1. Wang H, Naghavi M, Allen C, Barber RM, Bhutta ZA, Carter A, et al. GBD Mortality Causes of Death Collaborators. Global, regional, and national life expectancy, all-cause mortality, and cause-specific mortality for 249 causes of death, 1980-2015: a systematic analysis for the Global Burden of Disease Study 2015. Lancet. 2016;388(10053):1459-544.
2. Nakagawa F, May M, Phillips A. Life expectancy living with HIV: recent estimates and future implica-tions. Curr Opin Infect Dis. 2013;26(1):17-25.
3. van Sighem A, Gras L, Smit C, Stolte I, Reiss P. Monitoring Report 2015. Monitoring of Human Immunodeficiency Virus (HIV) Infection in the Netherlands. 2015.
4. Centers for Disease Control and Prevention. HIV Surveillance Report, 2016 [Available from: http://www.cdc.gov/hiv/library/reports/hiv-surveillance.html].
5. Schouten J, Wit FW, Stolte IG, Kootstra NA, van der Valk M, Geerlings SE, et al. Cross-sectional comparison of the prevalence of age-associated comorbidities and their risk factors between HIV-infected and uninfected individuals: the AGEhIV cohort study. Clin Infect Dis. 2014;59(12):1787-97.
6. Shahmanesh M, Schultze A, Burns F, Kirk O, Lundgren J, Mussini C, et al. The cardiovascular risk management for people living with HIV in Europe: how well are we doing? AIDS. 2016;30(16):2505-18.
7. Friis-Møller N, Sabin CA, Weber R, d’Arminio Monforte A, El-Sadr WM, Reiss P, et al. Combination antiretroviral therapy and the risk of myocardial infarction. N Engl J Med. 2003;349(21):1993-2003.
8. Islam FM, Wu J, Jansson J, Wilson DP. Relative risk of cardiovascular disease among people living with HIV: a systematic review and meta-analysis. HIV Med. 2012;13(8):453-68.
9. Sabin CA, Worm SW, Weber R, Reiss P, El-Sadr W, Dabis F, et al. D:A:D Study Group. Use of nucleoside reverse transcriptase inhibitors and risk of myocardial infarction in HIV-infected patients enrolled in the D:A:D study: a multi-cohort collaboration. Lancet. 2008;371(9622):1417-26.
10. Marcus JL, Neugebauer RS, Leyden WA, Chao CR, Xu L, Quesenberry CP, Jr., et al. Use of abacavir and risk of cardiovascular disease among HIV-infected individuals. J Acquir Immune Defic Syndr. 2016;71(4):413-9.
11. Young J, Xiao Y, Moodie EE, Abrahamowicz M, Klein MB, Bernasconi E, et al. Effect of cumulating exposure to abacavir on the risk of cardiovascular disease events in patients from the Swiss HIV Cohort Study. J Acquir Immune Defic Syndr. 2015;69(4):413-21.
12. Rotger M, Glass TR, Junier T, Lundgren J, Neaton JD, Poloni ES, et al. Contribution of genetic background, traditional risk factors, and HIV-related factors to coronary artery disease events in HIV-positive persons. Clin Infect Dis. 2013;57(1):112-21.
13. Lang S, Mary-Krause M, Cotte L, Gilquin J, Partisani M, Simon A, et al. Impact of individual an-tiretroviral drugs on the risk of myocardial infarction in human immunodeficiency virus-infected patients: a case-control study nested within the French Hospital Database on HIV ANRS cohort CO4. Arch Intern Med. 2010;170(14):1228-38.
14. Ding X, Andraca-Carrera E, Cooper C, Miele P, Kornegay C, Soukup M, et al. No association of abacavir use with myocardial infarction: findings of an FDA meta-analysis. J Acquir Immune Defic Syndr. 2012;61(4):441-7.
15. Lin S, McLennan AG, Ying K, Wang Z, Gu S, Jin H, et al. Cloning, expression, and characteriza-tion of a human inosine triphosphate pyrophosphatase encoded by the ITPA gene. J Biol Chem. 2001;276(22):18695-701.
16. Galperin MY, Moroz OV, Wilson KS, Murzin AG. House cleaning, a part of good housekeeping. Mol Microbiol. 2006;59(1):5-19.

Chapter 6.
108
17. Fellay J, Thompson AJ, Ge D, Gumbs CE, Urban TJ, Shianna KV, et al. ITPA gene variants protect against anaemia in patients treated for chronic hepatitis C. Nature. 2010;464(7287):405-8.
18. Peltenburg NC, Leers MP, Bakker JA, Lowe SH, Vroemen WH, Paulussen AD, et al. Inosine tri-phosphate pyrophosphohydrolase expression: decreased in leukocytes of HIV-infected patients using combination antiretroviral therapy. J Acquir Immune Defic Syndr. 2016;73(4):390-5.
19. Bierau J, Bakker JA, Schippers JA, Grashorn JA, Lindhout M, Lowe SH, et al. Erythrocyte inosine triphosphatase activity is decreased in HIV-seropositive individuals. PLoS One. 2012;7(1):e30175.
20. Peltenburg NC, Bierau J, Bakker JA, Schippers JA, Lowe SH, Paulussen ADC, et al. Erythrocyte inosine triphosphatase activity: a potential biomarker for adverse events during combination antiret-roviral therapy for HIV. PLoS One. 2018;13(1):e0191069.
21. World Health Organization. Definition and diagnosis of diabetes mellitus and intermediate hyper-glycemia: report of a WHO/IDF consultation 2006 [Available from: https://www.who.int/diabetes/publications/Definition%20and%20diagnosis%20of%20diabetes_new.pdf].
22. Whitworth JA, World Health Organization ISoHWG. 2003 World Health Organization (WHO)/International Society of Hypertension (ISH) statement on management of hypertension. J Hypertens. 2003;21(11):1983-92.
23. Bierau J, Bakker JA, Lindhout M, van Gennip AH. Determination of ITPase activity in erythro-cyte lysates obtained for determination of TPMT activity. Nucleosides Nucleotides Nucleic Acids. 2006;25(9-11):1129-32.
24. Shipkova M, Lorenz K, Oellerich M, Wieland E, von Ahsen N. Measurement of erythrocyte inosine triphosphate pyrophosphohydrolase (ITPA) activity by HPLC and correlation of ITPA genotype-phenotype in a Caucasian population. Clin Chem. 2006;52(2):240-7.
25. Obel N, Farkas DK, Kronborg G, Larsen CS, Pedersen G, Riis A, et al. Abacavir and risk of myocar-dial infarction in HIV-infected patients on highly active antiretroviral therapy: a population-based nationwide cohort study. HIV Med. 2010;11(2):130-6.
26. Hill A, Sawyer W, Gazzard B. Effects of first-line use of nucleoside analogues, efavirenz, and ritonavir-boosted protease inhibitors on lipid levels. HIV Clin Trials. 2009;10(1):1-12.
27. Gagliardini R, Fabbiani M, Colafigli M, D’Avino A, Mondi A, Borghetti A, et al. Lipid-lowering effect and changes in estimated cardiovascular risk after switching to a tenofovir-containing regimen for the treatment of HIV-infected patients. J Chemother. 2016:1-9.
28. Arae H, Tateyama M, Nakamura H, Tasato D, Kami K, Miyagi K, et al. Evaluation of the lipid con-centrations after switching from antiretroviral drug tenofovir disoproxil fumarate/emtricitabine to abacavir sulfate/lamivudine in virologically-suppressed Human Immunodeficiency Virus-infected patients. Intern Med. 2016;55(23):3435-40.
29. Moyle GJ, Orkin C, Fisher M, Dhar J, Anderson J, Wilkins E, et al. A randomized comparative trial of continued abacavir/lamivudine plus efavirenz or replacement with efavirenz/emtricitabine/tenofovir DF in hypercholesterolemic HIV-1 infected individuals. PLoS One. 2015;10(2):e0116297.
30. Campo R, DeJesus E, Bredeek UF, Henry K, Khanlou H, Logue K, et al. SWIFT: prospective 48-week study to evaluate efficacy and safety of switching to emtricitabine/tenofovir from lamivudine/abaca-vir in virologically suppressed HIV-1 infected patients on a boosted protease inhibitor containing antiretroviral regimen. Clin Infect Dis. 2013;56(11):1637-45.
31. Friebe A, Sandner P, Seifert R. From bedside to bench – meeting report of the 7th International Conference on cGMP “cGMP: generators, effectors and therapeutic implications” in Trier, Germany, from June 19th to 21st 2015. Naunyn Schmiedebergs Arch Pharmacol. 2015;388(12):1237-46.
32. Potter LR. Guanylyl cyclase structure, function and regulation. Cell Signal. 2011;23(12):1921-6.

109
Metabolic events in HIV associated with ITPase activity
33. Katsuki S, Arnold W, Mittal C, Murad F. Stimulation of guanylate cyclase by sodium nitroprusside, nitroglycerin and nitric oxide in various tissue preparations and comparison to the effects of sodium azide and hydroxylamine. J Cyclic Nucleotide Res. 1977;3(1):23-35.
34. Hardman JG, Robison GA, Sutherland EW. Cyclic nucleotides. Annu Rev Physiol. 1971;33:311-36. 35. Hoffmann LS, Etzrodt J, Willkomm L, Sanyal A, Scheja L, Fischer AW, et al. Stimulation of
soluble guanylyl cyclase protects against obesity by recruiting brown adipose tissue. Nat Commun. 2015;6:7235.
36. Chen Z, Zhang X, Ying L, Dou D, Li Y, Bai Y, et al. cIMP synthesized by sGC as a mediator of hypoxic contraction of coronary arteries. Am J Physiol Heart Circ Physiol. 2014;307(3):H328-36.
37. Beste KY, Burhenne H, Kaever V, Stasch JP, Seifert R. Nucleotidyl cyclase activity of soluble guanylyl cyclase alpha1beta1. Biochemistry. 2012;51(1):194-204.
38. Neunteufl T, Heher S, Katzenschlager R, Wolfl G, Kostner K, Maurer G, et al. Late prognostic value of flow-mediated dilation in the brachial artery of patients with chest pain. Am J Cardiol. 2000;86(2):207-10.
39. Celermajer DS, Sorensen KE, Gooch VM, Spiegelhalter DJ, Miller OI, Sullivan ID, et al. Non-invasive detection of endothelial dysfunction in children and adults at risk of atherosclerosis. Lancet. 1992;340(8828):1111-5.
40. Gokce N, Keaney JF, Jr., Hunter LM, Watkins MT, Nedeljkovic ZS, Menzoian JO, et al. Predictive value of noninvasively determined endothelial dysfunction for long-term cardiovascular events in patients with peripheral vascular disease. J Am Coll Cardiol. 2003;41(10):1769-75.
41. Hsue PY, Hunt PW, Wu Y, Schnell A, Ho JE, Hatano H, et al. Association of abacavir and impaired endothelial function in treated and suppressed HIV-infected patients. AIDS. 2009;23(15):2021-7.
42. Baum PD, Sullam PM, Stoddart CA, McCune JM. Abacavir increases platelet reactivity via competi-tive inhibition of soluble guanylyl cyclase. AIDS. 2011;25(18):2243-8.
43. Peltenburg NC, Bakker JA, Vroemen WH, de Knegt RJ, Leers MP, Bierau J, et al. Inosine triphosphate pyrophosphohydrolase activity: more accurate predictor for ribavirin-induced anemia in hepatitis C infected patients than ITPA genotype. Clin Chem Lab Med. 2015;53(12):2021-9.
44. Shipkova M, Franz J, Abe M, Klett C, Wieland E, Andus T. Association between adverse effects under azathioprine therapy and inosine triphosphate pyrophosphatase activity in patients with chronic inflammatory bowel disease. Ther Drug Monit. 2011;33(3):321-8.
45. Buster EH, van Vuuren HJ, Zondervan PE, Metselaar HJ, Tilanus HW, de Man RA. Thiopurine-methyltransferase and inosine triphosphate pyrophosphatase polymorphism in a liver transplant recipient developing nodular regenerative hyperplasia on low-dose azathioprine. Eur J Gastroenterol Hepatol. 2008;20(1):68-72.
46. Wan Rosalina WR, Teh LK, Mohamad N, Nasir A, Yusoff R, Baba AA, et al. Polymorphism of ITPA 94C>A and risk of adverse effects among patients with acute lymphoblastic leukaemia treated with 6-mercaptopurine. J Clin Pharm Ther. 2012;37(2):237-41.
47. Tanaka Y, Manabe A, Nakadate H, Kondoh K, Nakamura K, Koh K, et al. The activity of the inosine triphosphate pyrophosphatase affects toxicity of 6-mercaptopurine during maintenance therapy for acute lymphoblastic leukemia in Japanese children. Leuk Res. 2012;36(5):560-4.


Chapter 7.Persistent metabolic changes in HIV-infected patients during the fi rst year of combination antiretroviral therapy.
N.C. Peltenburg, J.C. Schoeman, J. Hou, F. Mora, A.C. Harms, S.H. Lowe, J. Bierau, J.A. Bakker, A. Verbon, Th . Hankemeier, A. Boonstra
Scientifi c Reports. 2018 Nov; 8(1): 16947

Chapter 7.
112
absTraCT
The HIV-human metabolic relationship is a complex interaction convoluted even more by antiretroviral therapy (cART) and comorbidities. The ability of cART to undo the HIV in-duced metabolic dysregulation is unclear and under-investigated. Using targeted metabolo-mics and multiplex immune biomarker analysis, we characterized plasma samples obtained from 18 untreated HIV-1-infected adult patients and compared these to a non-HIV infected (n = 23) control population. The biogenic amine perturbations during an untreated HIV infection implicated altered tryptophan- nitrogen- and muscle metabolism. Furthermore, the lipid profiles of untreated patients were also significantly altered compared to controls. In untreated HIV infection, the sphingomyelins and phospholipids correlated negatively to markers of infection IP-10 and sIL-2R whereas a strong association was found between triglycerides and MCP-1. In a second cohort, we characterized plasma samples obtained from 28 HIV-1-infected adult patients before and 12 months after the start of cART, to investigate the immune-metabolic changes associated with cART. The identified altered immune-metabolic pathways of an untreated HIV infection showed minimal change after 12 months of cART. In conclusion, 12 months of cART impacts only mildly on the meta-bolic dysregulation underlying an untreated HIV infection and provides insights into the comorbidities present in virally suppressed HIV patients.

113
Persistent metabolic changes during first year of cART in HIV
INTrOduCTION
The interaction of the Human immunodeficiency virus (HIV) with its host is a complex process with a growing body of literature revealing the capacity of HIV to induce a plethora of metabolic changes in the human body.1-5 Hypertriglyceridemia was identified as one of the first metabolic consequences of HIV infection.6 Since then, studies using Mass Spectrometry (MS) and Nuclear Magnetic Resonance (NMR) applied to biofluids of HIV-infected indi-viduals have confirmed the presence of HIV induced metabolic alterations.1,7-9 Investigating in vitro models of HIV infection using primary macrophages and CD4+ T-cells had differ-ent metabolic outcomes during HIV infection. CD4+ T-cells infected with HIV exhibited increased glucose uptake and upregulated glycolytic intermediates compared to reduced glucose uptake and steady-state glycolytic intermediates in HIV-infected macrophages.10 While, in vivo models using rhesus macaques infected with simian immunodeficiency virus (SIV) revealed increased fatty acids, phospholipids, and acyl-carnitines, suggesting an im-paired mitochondrial fatty acid oxidation.11 Comparatively, serum and plasma derived from HIV infected individuals revealed altered metabolites of lipid and mitochondrial pathways as well as organic acids and fatty acids.1,5 Moreover, the saliva from HIV-infected patients versus healthy controls revealed alterations in carbohydrate biosynthesis and degradation.2
Infection with HIV causes a progressive malfunctioning of the human immune system. HIV infection depletes CD4+ T-cells, while also inducing functionally exhausted CD8+ T-cells and impaired NK cells, leaving the host vulnerable to opportunistic infections.12 Furthermore, the metabolic and immunological changes in untreated HIV patients increase the risk of developing comorbidities, including cardiovascular disease (CVD), insulin resis-tance and HIV-associated neurocognitive disorders (HAND).13,14
The advent of combination antiretroviral therapy (cART) provided an important lifeline for HIV patients, since cART effectively inhibits HIV replication to undetectable levels, while also enabling the restoration of the immune system with increasing CD4+ T-cell counts. Nevertheless, important metabolic-related side-effects of cART are reported in patient pop-ulations, mainly lipodystrophy and insulin resistance, which may further predispose virally suppressed patients to increased CVD, diabetes, and kidney damage.15-17 Also, studies have shown that although cART dramatically decreased the incidence of the most severe clinical phenotype of HAND (HIV associated neurocognitive disorder) – HIV-associated dementia – in virally suppressed patients the milder forms of HAND – asymptomatic neurocognitive impairment and mild neurocognitive disorders – have become more prevalent.18,19 One as-pect of the pathogenesis of CVD or HAND in successfully treated HIV patients is that while cART effectively suppresses HIV replication and activity, low levels of immune activation are sustained.20-22 The ability of cART to rectify the HIV-induced metabolic dysregulation

Chapter 7.
114
is unclear and under-investigated. However, this may be highly relevant since persistent metabolic stress could be an underlying pathogenic mechanism in the comorbidities of untreated HIV patients as well as cART suppressed HIV patients. Robust characterization of the metabolic alterations experienced during HIV infection is needed to determine the effect of cART on these pathways, in cART suppressed HIV patients.
To study this, we used comprehensive targeted metabolomics techniques integrated with classical immunological assays and compared changes in plasma of untreated HIV-1 patients to non-HIV infected individuals, and paired plasma of untreated HIV-1 patients at baseline to their plasma after 12 months of cART in the HIV-suppressed state, to assess whether profiles normalized to the situation in healthy individuals or remained perturbed. We found dysregulated biogenic amine and lipid metabolism in untreated HIV-infected patients, conditions that have been independently associated with the pathophysiology of CVD and HAND. After 12 months of cART, metabolic changes were found for some biogenic amines, while the lipid metabolites revealed increasing levels in the virally suppressed patients.
meTHOds
Patients and sample collectionUntreated HIV versus non-HIV-infected controls, population AFor the comparison of metabolic profiles of untreated HIV-1-infected patients to a non-HIV infected control population, 18 HIV-1-infected, cART naïve patients were selected from the outpatient clinic of the Erasmus Medical Center in Rotterdam, The Netherlands, archived sample bank. The plasma was stored at −80°C. Inclusion criteria were age over 18 years and no previous treatment for HIV. Exclusion criteria were severe comorbidity (e.g. diabetes mellitus, cardiovascular disease, opportunistic infection), coinfection with hepatitis B or C, use of alcohol > 2 IU/day and use of co-medication. All patients had given written informed consent for inclusion in the database of the Dutch HIV monitoring foun-dation (Stichting HIV Monitoring; SHM) also known as the AIDS Therapy Evaluation in the Netherlands (ATHENA) cohort, and collection of demographic, laboratory and clinical data from the medical records and storage and future use for scientific research of biological material. Their plasma samples were compared to a non-HIV infected control population from volunteers (n = 23), without comorbidity or co-medication, which had all given their written informed consent.
Untreated HIV versus HIV-suppressed (12 months of cART), population BFor the comparison of metabolic profiles of untreated HIV-1-infected patients to the HIV-suppressed situation, plasma samples of 28 HIV-1-infected patients from the outpatient

115
Persistent metabolic changes during first year of cART in HIV
clinic of the Maastricht University Medical Center in Maastricht, The Netherlands were selected in the archived sample bank. The plasma was stored at −80°C. All patients had given written informed consent for inclusion in the database of the Dutch HIV monitoring foundation and collection of demographic, laboratory and clinical data from the medical records and storage and future use for scientific research of biological material. From each included patient, a plasma sample was selected from before the start of cART and at 12 months after the start of cART. All patients were older than 18 years at the start of cART and had not received any previous ART therapy. All patients started with a cART regimen containing Abacavir. The patients had no diabetes mellitus and no diagnosed autoimmune diseases. We retrieved information regarding dyslipidaemia from the earlier laboratory results prior to the 12 months samples after the start of cART. Because the patients were generally not in care prior to the HIV diagnosis, no values were available from the blood sample prior to the start of cART. The study was performed according to the Helsinki Decla-ration and approved by the Ethical Committee of the Maastricht University Medical Center.
Targeted lC-ms metabolomicsTargeted metabolomics analyses were performed using standard operating procedures derived from previously published methods.23-26 Detailed procedures and target lists are provided in the Additional file 1 - Methods with a brief overview of the four platforms used given in Table 1. After LC-MS analyses, peak integration was done using the instrumental software, and the relative ratios between metabolites and their corresponding internal standards were determined.
metabolomics quality controlsQuality control (QC) samples consisted of equal aliquots of a QC pool made by combining equal volumes (±25 µL) of all study samples. A set of QC samples was then included dur-ing the analyses of the experimental groups on the individual metabolomic platforms and evenly distributed across the randomized samples prior to LC-MS analyses. In addition, independent duplicate samples (10–15%) were randomly selected. Using the QC samples and duplicate samples, a double-QC approach was applied to include metabolites that were reliably measured by the individual metabolomics platforms by reporting and using only those metabolites for which both duplicate samples and QC samples showed an RSD < 30%.
multiplex immunoassays to assess plasma biomarkersThe levels of cytokines, chemokines, growth factors and other proteins were determined us-ing the Procarta Plex human Immune Monitoring Panel (Affymetrix, Vienna, Austria). The panel measured 14 proteins simultaneously and consisted of IP-10, IL-10, IL-6, D-dimer, sIL-2R, IL-21, IL-18, MCP-1, sPD-L1, sPD-L2, sTIM-3, sPD1, CRP, and sTNF-RII. The as-say was conducted according to the manufacturer’s instructions, identical to the procedures

Chapter 7.
116
used in our previous studies.27-29 The concentrations of analytes were measured using the microsphere-based multiplex Luminex-100 (Luminex Corporation, Austin, TX, USA). Samples to compare untreated HIV with non-HIV controls were analyzed in a different run than paired samples of untreated and HIV-suppressed patients. Data were analyzed using ProcartaPlexAnalyst 1.0 (www.ebioscience.com/resources/procartaplex-analyst-1.0-software.htm).
statistical analysesSPSS 21.0 (SPSS Inc., Chicago, IL, USA) was used for Fisher’s exact tests on the patient cohort characteristics presented as frequencies, and ANOVA on the continuous values. A combination of univariate and multivariate bioinformatics approaches was performed using the R script‒based online tool Metaboanalyst 3.0, a comprehensive tool suitable for analysing metabolomics data.30 The metabolomics datasets were log transformed and auto-scaled prior to bioinformatics analyses. For the analyses between controls and untreated HIV patients, significant metabolites were identified per metabolomics platform based on the following criteria: i. a p-value < 0.05 using the unpaired student t-test, and ii. a fold change (FC) ≥ 1.30 or ≤0.70, indicating a 30% increase or decrease. The False discovery
Table 1. Metabolomics platforms. A brief overview of the platforms detailing volumes, sample preparation and analytical instruments.
Targeted metabolomics platform
Volumeserumused
sample preparation method
analytical platform
metabolite class coverage Platform targets, n
Total Qualitycontrolpassed
%missingdata
Biogenic amine24
5 µL Protein precipitation & AccQ-Tag derivatization
UPLCa-TQMSb Amino acids, catecholamines & polyamines
100 62 0%
Positive lipid23 10 µL Isopropyl alcohol extraction
UPLCa-QToFc Lysophospholipids, phospholipids, cholesterol esters, di/triglycerides & spingomyelins
250 147 0.02%
Oxylipins25 250 µL Oasis HLB SPE extraction
HPLCd-MS/MSe
Hydroxylated fatty acids, prostaglandins & thromboxanes
120 68 7.7%
Oxidative stress26 150 µL
Butanol:Ethyl acetate liquid-liquid extraction
UHPLCf-MS/MSe Low pH run
Isoprostanes, nitro-fatty acids, sphingosine & sphinganine
46 36 6.6%UHPLCf-MS/MSe High pH run
Sphingosine-1-phosphate & lysophosphatidic acids species
a UPLC, Ultra Pressure Liquid-Chromatography; b TQMS, Triple quadrupole mass spectrometer; c QToF, Quad Time of Flight; d HPLC, High-Pressure Liquid-Chromatography; e MS/MS, Triple quadrupole Mass Spectrom-eter; f UHPLC, Ultra High-Pressure Liquid-Chromatography.
117
Persistent metabolic changes during first year of cART in HIV
rate’s q-values are reported for every reported p-value. For the analyses between the paired untreated HIV patients and 12 months cART follow up, significant metabolites were iden-tified per metabolomics platform based on a False discovery rate adjusted p-value < 0.05 using a paired student t-test. Plasma protein biomarkers were analysed using the unpaired student t-test for comparing controls and untreated HIV patients, and the paired student t-tests across the paired patients’ samples at baseline and 12 months. GraphPad Prism 7 software was used in the rendering of graphs and figures.
Two types of immune-metabolic correlation networks were done. Firstly, for the control group and the untreated HIV patient group, independent Spearman correlation analyses were done using the absolute metabolite and cytokine levels. Next, per group cytokine levels were correlated with each other to form the network skeleton. The second type of correla-tion network was based on Spearman correlations of the levels of metabolites to cytokines in HIV-suppressed patients after 12 months of cART relative to the levels at baseline from paired patient samples (relative change = 12 months cART – baseline). Next, we corre-lated the relative change in cytokine levels to form the network skeleton. For both types of immune-metabolic correlations significant correlations were defined using a cut-off p-value (two-tailed) < 0.01 and were visualized as a network using the Metscape application within Cytoscape (v3.4.0).
ethics approval and consent to participateThis study was conducted in accordance with the guidelines of the Declaration of Helsinki and the principles of Good Clinical Practice. The ethical review board of the Erasmus MC has approved the study, and informed consent was obtained from all patients who were asked to donate blood.
resulTs
untreated HIV versus non-HIV-infected controlsPatient population AMost of the individuals in both the patient and the control populations listed in Table 2 were male and Caucasians. Mean age did not differ between both groups. The mean CD4+ T-cell count of the HIV-1 patients was 441 × 106 cells/L with an interquartile range (IQR) of 367.5 × 10⁶. The untreated HIV patients had a large heterogeneity in viral load with a median of 1.11 × 10⁵ viral copies and an IQR of 2.64 × 10⁵ especially when taking the minimum and maximum values as listed in Table 2 into account.

Chapter 7.
118
Altered plasma metabolic profiles in untreated HIV-infected patientsTo characterized metabolic alterations experienced during an untreated HIV-1 infection, we compared 18 untreated HIV-1-infected patients (population A) with 23 controls through profiling their biogenic amines, lipids, and signalling lipid metabolites. As shown in the volcano plot in Fig. 1a, 18 biogenic amines were differently affected in HIV patients versus controls, with reduced levels in all (see Supplementary Table S1). Reduced levels of anti-oxidants, including total glutathione and taurine, together with lipid headgroup moieties o-phosphoethanolamine and the choline metabolite sarcosine were identified as the most significantly altered amine metabolites during an untreated HIV infection. Furthermore, untreated HIV patients had decreased levels of tryptophan and serotonin compared to controls. The plasma kynurenine/tryptophan (K/T) ratio, as a readout for indoleamine 2,3-dioxygenase (IDO) activity, showed upregulated IDO activity during untreated HIV infection compared to controls (p = 0.0003) (see Supplementary Fig. S1A). Concurrently investigating the plasma serotonin/tryptophan ratio reflected the consequences of increased IDO activity for serotonin synthesis during untreated HIV infection compared to controls (p < 0.0001) (see Supplementary Fig. S1B). Decreased levels of the branch chain amino acids leucine and isoleucine as well as carnosine reflected impaired muscle metabolism during an untreated HIV infection. The significantly decreased levels of ornithine and putrescine in untreated HIV patients also hints at a reduced urea cycle and thus ammonia clearance in these patients compared to controls. Additionally, decreased levels of alanine, asparagine, α-aminobutyric acid, tyrosine, and methionine were also detected in untreated HIV patients compared to controls. Evaluation of the levels of plasma lipids, which included the differ-ent lysophospholipids classes, phospholipids, di/triglycerides, sphingomyelins, ceramides, and cholesterol esters, revealed 44 modulated metabolites with a p < 0.05 and a fold-change (FC) ≥ 1.30 or ≤0.70 (Fig. 1b and Supplementary Table S2). The lysophospholipids class presented with 6 lysophosphatidic acid (LPA) species having increased plasma levels in untreated HIV-infected patients versus controls, and one lysophosphatidylcholine (LPC) metabolite which was reduced compared to controls. Furthermore, two monounsaturated sphingomyelin (SM) species, two PUFA cholesterol ester (CE), and two long-chain saturated
Table 2. Characteristics of the untreated HIV-infected patients (Population A) and the non-HIV infected con-trol population
Characteristics Patients (n=18) Controls (n=23) P-value
age; mean years ± SDa 40 ± 10 36 ± 10 0.18
male Gender, n (%) 16 (88.9) 14 (60.9) 0.08
Caucasian, n (%) 14 (77.8) 17 (73.9) 0.90
mean Cd4+ T-cell count; x106/L ± SDa 441 ± 265 - -
HIV viral load; median copies/mL (range) 1.1 x10⁵ (60-1x10⁷) - -a SD, Standard deviation

119
Persistent metabolic changes during first year of cART in HIV
figure 1. Plasma metabolic characterization of untreated HIV vs controls. Volcano plot of (a) the biogenic amine profile, (b) the lipid profile and (c) the signalling lipid profile. Volcano plots are representative of the -log10 (Mann-Whitney p-value) on the y-axis with the x-axis showing the log2 (Fold change) of the metabolite, between the controls and the untreated HIV patients (population A) respectively. Dashed lines represent the respective significance thresholds, with the significant metabolites identifiable by coloured symbols with either a name or corresponding class colour identifier. CE, Cholesterol esters; CER, Ceramides; PC, Phosphatidylcho-lines; PC-O, Plasmalogen PCs; PE, Phosphatidylethanolamines; PE-O, Plasmalogens PEs; SM, Sphingomyelins; TG, Triglycerides; LPA, Lysophosphatidic acid; COX, Cyclooxygenase; CYP450, Cytochrome P450; LOX, Li-poxygenase; RNS, Reactive nitrogen species; ROS, Reactive oxygen species.

Chapter 7.
120
ceramides (CER) metabolites all had reduced levels in untreated HIV patients. The triglyc-erides (TG) profile presented with 14 mostly polyunsaturated triglycerides species showing significantly increased levels during untreated HIV infection. The phospholipids presented with seven phosphatidylcholines (PC), four plasmalogen phosphatidylcholines (PC-O), two phosphatidylethanolamines (PE) and two plasmalogen phosphatidylethanolamines (PE-O) all having decreased levels during untreated HIV.
The third subclass of metabolites that were evaluated for differences between untreated HIV patients and controls was the class of signalling lipid mediators, derived from the enzymatic or free radical oxidized polyunsaturated fatty acids, which includes the prostaglandins, thromboxanes, hydroxy-fatty acids, leukotrienes, resolvins, epoxy-fatty acids, isoprostanes and nitro fatty acids. During the untreated HIV infection 22 significantly affected signalling lipid metabolites were identified of which 8 had reduced levels and 14 had increased levels in the untreated HIV patients compared to controls. (Fig. 1c, Supplementary Table S3). The four signalling mediators: 5,6-DiHETrE, 8,9-DiHETrE, 11,12-DiHETrE, and 14,15-Di-HETrE all derived from arachidonic acid and synthesised by cytochrome P450 isozymes showed the most significant increased levels in the untreated HIV patients compared to the controls. Furthermore, untreated HIV patients had increased levels of dihydrosphingo-sine but decreased levels of three different Sphingosine-1-phosphate species compared to controls. The metabolites 5-HETE, 12-HETE and 15-HETE derived from the Lipoxygenase activity on Arachidonic acid, also had increased levels compared to the controls. Oxidized lipids due to the activity of ROS and RNS showed differential responses with increased levels of 8-iso-PGE2, 2,3-dinor-PGF2a and 20 HETE and decreased levels of 11-HDoHE and 8,12-iPF2α-IV in untreated HIV patients compared to controls.
untreated HIV versus HIV-suppressed (12 months of carT)Patient population BThe characteristics of the HIV-1-infected patients selected to compare baseline metabolic profile to the HIV-suppressed profile after 12 months of therapy (population B) are presented in Table 3. This is an independent population from the untreated HIV-infected population A introduced in Table 2. Most of the patients had a male gender. Mean CD4+ T-cell count at the start of cART was of 267 × 106 cells/L with an IQR of 224 × 106. There was a large heterogenicity in viral load with a median of 5.5 × 10⁴ copies/ml and an IQR of 2.7 × 10⁵. 89% of the patients were of European descent. Four patients had a blip in their viral load at 12 months on cART: their viral loads were 53, 73, 103 and 130 copies/ml. Most patients used Abacavir in combination with Lamivudine as the backbone in cART (n = 25). The patients who only used NRTI’s all used the combination Abacavir with Lamivudine and Zidovudine (n = 8) except for one patient who used Abacavir/Lamivudine with Stavudine. The protease inhibitors (PI) used were Lopinavir (in combination with ritonavir) (n = 4), Atazanavir

121
Persistent metabolic changes during first year of cART in HIV
(n = 1) and Darunavir (n = 1). The NNRTI’s used were Efavirenz (n = 8), Nevirapine (n = 4) and Rilpivirine (n = 1). Five patients used a statin. The incidence of dyslipidaemia or the use of lipid-lowering therapy (statins and/or fibrates) remained stable during the first year of cART.
Metabolic consequences following cART treatment of HIV patientsNext, we evaluated the metabolic changes associated with 12 months of cART treatment, as well as HIV suppression in the longitudinal patient population B. cART treatment of the HIV patients resulted in viral suppression with undetectable plasma HIV RNA levels and partial restoration of CD4+ T-cell counts in the blood (Table 3). Eight HIV infected
Table 3. Characteristics of 28 HIV-infected patients (Population B) at baseline and after 12 months of cART
Characteristics at baseline 12 months of carTa
age; mean years ± SDb 40 ± 10
male Gender, n (%) 21 (75.0)
european region of origin, n (%) 25 (89.3)
statin use, n (%) 4 (14.3) 5 (17.9)
mean Cholesterolc >6.5d, n (%) unknown 6 (21.4)
mean ldl >4.5d, n (%) unknown 4 (14.2)
mean Triglycerides >2.3d, n (%) unknown 8 (28.6)
mean bmIe, kg/m2 ± SDb 22.7 (3.1) 23.1 (3.3)
Hepatitis b coinfection, n (%) 1 (3.6%)
Hepatitis C coinfection, n (%) 8 (28.6%)
alcohol ≥5 IE/day, n (%) 1 (3.6%)
Hard drugsf/methadone use, n (%) 8 (28.6%)
mean Cd4+ T-cell counth, x106/L ± SDb 267.4 (158.9) 489.0 (209.4)
mean time on carT, months ± SDb n.a. 12.5 (1.2)
HIV viral load <102 h, n (%) 0 (0%) 26 (93.6%)
HIV viral load >102 h, n (%) 28 (100%) 2 (7.2%)
median HIV viral loadh (range) 5.5x10⁴ (1.6x10³ – 8.1x10⁵)
carT regimen
NRTIi + NNRTIj, n (%) n.a. 13 (46.4%)l
NRTIi + PIk, n (%) n.a. 6 (21.4%)l
NRTIi only (n/%) n.a. 9 (32.1%)l
a cART, combination Anti-retroviral therapy; b SD, Standard deviation; c mean value of 6 months prior to sample used; d mmol/L; e BMI, Body mass index; f cocaine, heroin and/or MDMA (3,4-methylenedioxymethamphet-amine); g x106/L; h copies/ml; i NRTI, Nucleoside reverse transcriptase inhibitor; j NNRTI, Non-nucleoside reverse transcriptase; k PI = Protease inhibitor; l Three patients used a different cART regimen at 6 months versus 12 months of cART. Because of one patient switching from a protease inhibitor (PI) based regimen to a non-nucleoside reverse transcriptase inhibitor (NNRTI) or nucleoside reverse transcriptase inhibitor (NRTI) only regimen and vice versa, the proportion of PI-based, NNRTI based or NRTI the only regimen remained unchanged in the entire group.

Chapter 7.
122
patients were HCV positive, but were untreated for HCV during the 12-month period and were not excluded from the analyses. The untreated HCV infection had minimal impact on the metabolic findings as can be seen in see Supplementary Fig. S2. Evaluation of biogenic amine levels in paired plasma samples showed significantly increased methionine sulfone, histidine and tryptophan levels during the therapy period as compared to the baseline samples (untreated HIV), whereas pipecolic acid, 3-aminoisobutyric acid, and kynurenine showed significantly decreased levels during the therapy period as compared to the baseline (Fig. 2a, Supplementary Table S4). Significant metabolites were identified by having a false discovery rate adjusted p-value < 0.05 using a paired t-test approach. The K/T ratio revealed significantly decreased IDO activation after 12 months of cART (see Supplementary Fig. S3), however, the ratio between tryptophan and serotonin showed no significant changes. The neurotransmitter dopamine and metabolite α-aminobutyric acid correlated with CD4+ T-cell counts during 12 months of therapy (see Supplementary Fig. S4A).
The lipid profile showed an overall increasing trend reflecting higher levels after the 12-month cART period compared to their baseline levels, as can be seen in Fig. 2b. Predom-inantly it was the phosphatidylcholine metabolism responding to cART with significantly increased levels of 9 phosphatidylcholine species, 8 plasmalogen phosphatidylcholine, and 3 lysophosphatidylcholine species after 12 months of cART compared to baseline values prior to starting of cART. Furthermore, 7 sphingomyelin metabolites, together with one phosphatidylethanolamine species, two plasmalogen phosphatidylethanolamine, and a cholesterol ester were also increased after 12 months of cART compared to their baseline values. Furthermore, the phosphatidylcholines also revealed a positive association with CD4+ T-cell counts of the patients (see Supplementary Fig. S4B).
Finally, we compared changes in the signalling lipid profiles in patient plasma after 12 months of cART to their untreated HIV levels and found no significant changes.
Plasma immune-metabolic networks of HIV infection and therapyPlasma levels of cytokines and immune mediators are a commonly used readout reflect-ing systemic immune activity.31,32 To correlate metabolite profiles in plasma with immune activity, we determined in subsequent plasma samples of the same patients the levels of the infection markers IP-10, sIL-2R, and D-dimer, the inflammation markers IL-6, IL-10, IL-21, IL-18, and MCP-1, and the soluble exhaustion markers sPD1, sPD-L1, sPD-L2, and sTIM-3. Significantly enhanced plasma levels of D-Dimer, IL-18, MCP-1, sPD-L2, sTIM-3, IP-10, sIL-2R, CRP, and sTNF-RII were observed in patients with untreated HIV as compared to non-HIV infected controls (Population A), and are shown in Supplementary Fig. S5. The other mediators tested were below the limit of detection of the assay, which included IL-6, IL-10, IL-21, sPD1, and sPD-L1.

123
Persistent metabolic changes during first year of cART in HIV
Evaluating the changes in the immunological parameters in population B after the 12 months cART period revealed an immunological picture of effective therapy shown in Supplementary Fig. S6. Markers of infection revealed that after the initiation of cART, both plasma IP-10 and sIL-2R levels were reduced significantly. Furthermore, initiation of cART reduced the levels of the inflammation marker IL-18 whereas MCP-1 levels remained unchanged when comparing baseline to 12 months of cART. An improvement in markers of exhaustion was found with reducing levels of both sPD-L2 and sTIM-3 after 12 months of cART.
figure 2. Plasma metabolic characterization of response to 12 months’ cART. Modified volcano plots showing (a) the biogenic amine profile, and (b) the lipid profile. The modified volcano plots are representative of the -log10 (FDR adjusted paired T-test p-value) on the y-axis with the x-axis showing the scaled mean of the paired differences per metabolite, between the baseline and 12 months cART follow-up sample (patient population B). The horizontal dashed line represents a false discovery rate adjusted q-value <0.05. Significant metabolites are identifiable by coloured symbols with either a name or corresponding class colour identifier. CE, Cholesterol esters; LPC, Lysophosphatidylcholines; PC, Phosphatidylcholines; PC-O, Plasmalogen PCs; PE, Phosphatidyl-ethanolamines; PE-O, Plasmalogens PEs; SM, Sphingomyelins.

Chapter 7.
124
(A) -
Con
trol
(B) -
Unt
reat
ed H
IV in
fect
ion
(C) -
The
effe
ct o
f 12
mon
ths
cART
TG(5
8:3) TG
(58:
1)
TG(6
0:2)
TG(5
4:2)
TG(5
2:1)
TG(5
2:0)
DG
(36:
2)8,9-
DiH
ETr
E
TG(5
7:2)
PC
(O-3
4:1)
PC
(O-3
8:4)
PC
(40:
8)
IP-1
0
TG(5
8:10
)
LPA
(18:
3)
PC
(38:
4)sT
IM-3
LPA
(22:
6)
Sph
a-1-
P-C
18:0
D-D
imer
11,1
2-D
iHE
TrE
LPA
(20:
5)
SM
(d18
:1/2
1:0)
sIL-
2RTG
(58:
9)
PC
(40:
5)
LPA
(20:
1)
sPD
-L2
SM
(d18
:1/1
5:0)
Taur
ine
TG(5
6:1)
TG(5
0:1)
TG(5
4:1)
TG(5
6:3)
TG(5
3:1)
L-K
ynur
enin
e
5,6-
DiH
ETr
E
TG(6
0:3)
IL-1
8
PE
(O-3
8:5)
SM
(d18
:1/1
4:0)
PC
(38:
7)
MC
P-1
TG(5
0:0)
TG(5
6:2)
TG(5
4:3)
TG(5
8:2)
TG(5
4:0)
TG(5
8:4)
TG(5
6:4)
19,2
0-D
iHD
PA
PE
(38:
6)
14,1
5-D
iHE
TrE
PE
(34:
2)
LPA
(20:
4)
PC
(32:
0)
L-P
rolin
e
PE
(36:
4)
PE
(O-3
6:5)
S-1
-P-C
18:1
TG(5
0:0)
CE
(22:
6)L-
Pro
line
L-A
spar
agin
eL-
Glu
tam
ine
TG(5
2:0)
PC
(34:
1)12
S-H
HTr
E
S-M
ethy
lcys
tein
e
sPD
-L2
sIL-
2R
13-K
OD
E
IL-1
8
IP-1
0
His
tam
ine
CE
(18:
2)
9,12
,13-
TriH
OM
E
TG(5
4:0)
TG(5
4:1)
TG(5
3:1)
PC
(40:
7)L-
Thre
onin
e14
,15-
DiH
ETE
N6,
N6,
N6-
Trim
ethy
l-L-
lysi
ne
L-O
rnith
ine
Sph
a-C
18:0
TG(4
2:1)
D-D
imer
sTIM
-3
O-A
cety
l-L-
serin
e
MC
P-1
TG(4
6:3)
TG(5
2:1)
L-Ly
sine
TXB
2
Tryg
lyce
rides
&
chol
estro
l est
ers
Pho
spho
lipid
s &
Lyso
-pho
spho
lipid
s
Sph
ingo
mye
lins
&Ly
so-s
phin
golip
ids
Am
ines
Sig
nalli
ng L
ipid
s(C
OX
-II, L
OX
, CY
P45
0)
Imm
unol
ogic
al m
arke
rs
Pos
itive
cor
rela
tion
(0.5
< r
< 0.
9)
Neg
ativ
e co
rrel
atio
n (-
0.6
< r <
-0.5
)
Line
thic
knes
s de
pend
s on
the
stre
nght
of t
he c
orre
latio
nA
ll co
rrel
atio
ns h
ad a
p<0
.01
Figu
re k
ey
PC
(O-3
6:6)
TG(5
1:1)
TG(4
6:0)
TG(5
0:1)
TG(5
0:2)
PC
(38:
7)TG
(51:
2)
sIL2
R
TG(5
8:8)
TG(5
4:7)
TG(5
2:6)
TNF-
RII
L-A
rgin
ine
PC
(40:
6)
S-1
-P-1
81
IL-1
8
MC
P-1
Cer
(d18
:1_2
3:0)
PD-L
2
TG(5
8:10
)
PE
(O-3
6:5)
PE
(O-3
8:7)D
G(3
6:4)
TG(5
0:0)
TG(4
8:1)
TG(O
-50:
0)
PC
(36:
4)TG
(48:
0)P
C(3
2:1)
5,6-
DiH
ETr
E
TG(4
4:0)
IP-1
0
TG(5
2:1)P
E(3
6:4)
LPA
(14:
0)
PE
(38:
6)
TG(5
0:3)
TG(4
6:1)
TG(4
8:2)
8-H
ETE
LPA
(16:
1)
LPA
(22:
6)
TG(5
8:9)
TG(5
6:8)
8,9-
DiH
ETr
E
SM
(d18
:1_1
6:1)
TIM
-3D
-Dim
er
PC
(38:
6)
SM
(d18
:1_2
0:0)
SM
(d18
:1_2
2:1)
12S
-HH
TrE

125
Persistent metabolic changes during first year of cART in HIV
figu
re 3
. Im
mun
e-m
etab
olic
net
wor
ks o
f con
trol
s, un
trea
ted
HIV
and
the
influ
ence
of c
ART
. (A
) Con
trol
imm
une-
met
abol
ic c
orre
latio
n ne
twor
k ba
sed
on c
orre
latin
g th
e ab
solu
te le
vels
of p
lasm
a m
etab
olite
s and
pla
sma
cyto
kine
s in
the
cont
rol g
roup
. (B)
Unt
reat
ed H
IV im
mun
e-m
etab
olic
cor
rela
tion
netw
ork
base
d on
cor
rela
ting
the
abso
lute
le
vels
of p
lasm
a met
abol
ites a
nd p
lasm
a cyt
okin
es in
the u
ntre
ated
HIV
gro
up (P
opul
atio
n B)
. (C
) The i
mm
une-
met
abol
ic co
rrel
atio
n ne
twor
k fo
llow
ing
12 m
onth
s cA
RT. U
s-in
g th
e pai
red
sam
ples
of p
opul
atio
n B,
the r
elat
ive c
hang
e in
leve
ls of
12
mon
ths’
cART
com
pare
d to
thei
r bas
elin
e lev
els (
untr
eate
d H
IV sa
mpl
e) w
ere d
eter
min
ed fo
r pla
sma
met
abol
ites a
nd c
ytok
ines
and
subs
eque
ntly
cor
rela
ted.
For
all
thre
e ne
twor
ks, s
pear
man
cor
rela
tions
wer
e pe
rfor
med
and
sign
ifica
nt c
orre
latio
ns w
ere
defin
ed a
s hav
ing
a st
rict p
-val
ue (t
wo-
taile
d) <
0.01
.

Chapter 7.
126
Next, we constructed immune-metabolic correlation networks respectively for the controls and the patients with an untreated HIV infection from population B using the absolute of levels of metabolites and immune mediators. Figure 3 presents these three immune-meta-bolic correlation networks showing all correlations with a strict p-value cut-off of p < 0.01. Comparing Fig. 3a (the control network) to Fig. 3b (the untreated HIV network) difference is seen in the interactions between the two networks. The control network revealed isolated clusters with IP-10 and IL-18 correlating to different lipid classes, sIL-2R and sTNF-RII correlated together and D-Dimer, sTIM-3 and MCP-1 showing correlation. Comparatively the untreated HIV shows positive correlations between sTIM-3, sIL-2R, IP-10 and sPD-L2 with D-Dimer connecting the network through sTIM-3, revealing correlations between markers of infection and exhaustion. In both networks, sTIM-3 and D-Dimer revealed strong positive correlations, while in the untreated HIV patients sTIM-2 also showed strong interactions with phospholipids as well as lysophospholipids. Furthermore, in untreated HIV patients MCP-1 correlated strongly to several triglyceride species compared to the con-trol network where MCP-1 correlate only to D-Dimer. Interestingly, in the control network, IL-18 showed strong interactions with triglyceride species, whereas IL-18 was correlated to only 5,6-DiHETrE in the untreated HIV patients.
Next, for the influence of cART on HIV infection, we constructed immune-metabolic corre-lation network based on the relative change in levels of metabolites and immune mediators in the paired plasma of the patients on 12 months cART versus their untreated HIV levels. As shown in Fig. 3c, the correlation network revealed distinct immune-metabolic interac-tions. Firstly, changes in sTIM-3, sIL-2R, IP-10, sPD-L2 and IL-18 positively correlated with each other, with D-dimer becoming disconnected from the core network. Again, MCP-1 showed minimal interactions to other immune mediators in the panel: changes in triglyc-eride levels correlated strongly to changes in MCP-1 levels as did some amine metabolites, while changes in two cholesterol-esters showed negative correlations. Furthermore, cART diminished the interaction of sTIM-3 with the phospholipids and lysophospholipids which were found in untreated HIV-patients.
dIsCussION
The data presented in this study provide some insight into the distinct effects of HIV and cART have on metabolism. Through identifying immune-metabolic pathways altered dur-ing untreated HIV infection, we can follow these pathways during the first 12 months after commencing cART in the same patients, monitoring their responses. In line with earlier research, we found decreased glutathione, taurine and tryptophan levels as well as upregu-lated IDO activity in untreated HIV patients compared to HIV-seronegative controls.8,33,34

127
Persistent metabolic changes during first year of cART in HIV
Also, increased levels of highly unsaturated long-chain triglycerides35 and decreased levels of sphingomyelin species characterized an untreated HIV infection compared to controls. After the initiation of cART, changes in the lipid metabolism were primarily found within the phospholipids while the highly unsaturated triglyceride species remained elevated. A noteworthy metabolic finding is the unresponsive signalling lipid profile, showing minimal changes after the first 12-month cART period. Signalling lipids including eicosanoids are metabolically derived immunological mediators and might represent a metabolic reflec-tion of the immune competence of HIV-infected patients.36,37 The unresponsive signalling lipid metabolism could result from the sequestering of their polyunsaturated fatty acid precursors into triglyceride species. Cassol et al. reported decreased eicosanoid levels spe-cifically 5-hydroxyeicosatetraenoic acid (5-HETE), prostaglandin B2, prostaglandin E2 and thromboxane B2 in cART-treated HIV-positive individuals compared to controls.1 Since eicosanoids also play an essential role in immunological crosstalk38 it could help to explain the dysregulated immune surveillance and exhausted phenotype persisting in virally sup-pressed patients.39
Studying the immune-metabolic networks revealed that the initiation of cART discon-nected the interactions between kynurenine and sIL-2R as well as sTIM-3’s interactions with phospholipids and lysophospholipids. Thus, HIV suppression through cART attenu-ates the pro-inflammatory sIL-2R and IDO pathways differently, since it has been reported that IDO activity remains significantly increased compared to controls even after 24 months of cART.40 Secondly, cART might contribute to an exhausted immune phenotype through dysregulating the phospholipids (increased during the first 12 months of cART) and their interactions with sTIM-3 interactions. Further, IL-18, a pro-inflammatory cytokine found elevated in advanced stages of HIV infection,41 showed strong correlations to triglycer-ide levels in the control population. The role of IL-18 in cardiovascular disease and the metabolic syndrome, as well as its association with triglyceride levels, has been previously described.42,43 Comparatively, in the untreated HIV infected population, the triglyceride species showed a strong correlation to MCP-1 levels and not to IL-18. Initiating 12 months of cART was unable to nullify this interaction, revealing that changes in triglyceride levels still strongly correlated to those of MCP-1 in the paired patient samples. Mihăilescu et al., found that the prevalence of insulin resistance and metabolic syndrome was higher in HIV suppressed patients compared to virally active patients, and that the levels of MCP-1 cor-related to both these co-morbidities,44 supporting our findings.
Disentangling the mechanism behind the observed metabolic changes during an HIV infection and therapy is a complex task. However, the importance of this task is stressed by the findings in this study that even 12 months of cART does not attenuate metabolic dysregulation. This is opposed to the finding that immune activation in HIV-infected pa-

Chapter 7.
128
tients is normalized during treatment with cART for this same period, as we also previously showed.41 Sustained immune activation thus is not the complete answer to what causes co-morbidity in HIV-infected patients, like neurocognitive disorders and cardiovascular disease. Although cART has become increasingly effective over the last years, but as we show here, is not enough to fully restore the metabolic profile of HIV-suppressed patients to normal.
This finding warrants further research, to contribute to unravelling the metabolic patho-physiological pathways in HIV comorbidities, with multiple findings in this study able to generate testable hypothesis regarding HAND and CVD. With respect to HAND, the following questions arise applicable to both untreated HIV and cART-treated HIV patients. (1) How does the sustained elevated Indoleamine-2,3-dioxygenase (IDO) activity (the rate-limiting enzyme catabolizing L-tryptophan into neurotoxic metabolites and not serotonin) contribute to neurological disorders? (2) What is the pathological mechanism underlying a dysregulated urea cycle during an untreated HIV infection? Since disorders of the urea cycle are known to manifest with neurological implications due to hyperammonemia.45 Similarly to HAND, questions relating to CVD, an important cause of morbidity and mortality in untreated and suppressed HIV-infected patients, arises.46,47 (3) Do the significant correla-tions between changes in triglycerides and MCP-1 levels, expose an alternative mechanism contributing to the development of CVD, independent of IL-18? (4) How does an unrespon-sive eicosanoid metabolism contribute to CVD, since they play an important role in normal cardiovascular function?48-50 Potentially with the answer to these questions, morbidity, and mortality in HIV-infected patients because of the non-communicable disease can be further diminished.
It is important to note that in our study the time of follow-up of these patients was too short to draw conclusions about causality. The use of targeted metabolomics platforms in conjunction with other omics technologies would provide a unique opportunity to study HIV pathogenic mechanisms, as well as to identify biomarkers relevant to co-morbidities relating to both HIV and the use of ARVs. Studies investigating the metabolic dysregulation of HIV infections and exposure of antiretrovirals can be further strengthened by investigat-ing paired longitudinal samples with a known outcome. Furthermore, these techniques could also proof complementary to antiretrovirals pharmacokinetic studies currently in clinical trials.
It is important to mention that due to the retrospective nature of the part of our study in which we compared cART naive HIV-infected patients with their samples after 12 months of therapy, it is difficult to ascertain whether all blood samples were processed identically, thereby introducing some variation in outcome parameters. Further, the duration of the

129
Persistent metabolic changes during first year of cART in HIV
HIV infection prior to starting cART is not known of these patients. Apart from the HIV infection, other factors might play a role in metabolic changes, for instance, smoking habits, aging, and timing of sampling of the material. Also, we have no data on the fasting state of both the patient as well as the control population, however, because the samples of the included patients were taken during routine outpatient visits and blood donors, in general, are instructed not to donate blood in the fasted state, it is safe to assume that both groups were in a post-prandial state. Food intake can affect metabolites and phospholipid levels,51,52 but also multiple large population studies have shown that changes in plasma lipids and lipoproteins change only modestly during the day, in response to habitual food intake.53,54 Further, although sub-analysis of 12 months cART according to PI or NNRTI used did not show differences in lipid profiles, the choice of the specific components of the cART regimen might be a significant factor or influence on the metabolic profile of a patient in the long run. For instance, abacavir use, which is associated in the literature with an increase of CVD.55,56 Population A and B differed significantly from each other regarding mean CD4+ T-cell counts and cytokine profiles, probably due to the fact that Population A was selected to be compared to a non-HIV infected, healthy control population and therefor selection criteria was more strictly defined than those for population B, where the patients were their own controls. In population B, five patients were using statins during the first year of cART, of which four were already receiving statin therapy prior to the start of cART. We were unable to identify any trends in the data indicating that lipid profiles were skewed based on the use of statins. Eight patients were coinfected with HCV, which may have had an effect on the comparison of the untreated patients compared to controls. However, during this study, none of the patients was treated for HCV, thus this was a stable factor in the comparison between untreated HIV and 12 months of cART. A sub-analysis leaving out the HCV coinfected patients showed minimal impact on the outcome. In this study, we were not able to include a sample of the control patients after one year. However, to determine the baseline stability of the metabolic/immune network, further studies are needed with follow-up samples of a control population.
In conclusion, in our study, we found significant changes in the metabolism relevant of untreated HIV infected patients and after 12 months cART. Additional to this finding, and potentially even more important is the finding that cART alone does not restore these changes. Further insight into the metabolic changes caused by HIV infection is warranted to optimize therapy in addition to cART for this patient population.
Chapter 7.
130
aCkNOWledGemeNTs
We like to thank the technical staff including B. Gonzalez Amoros and M. Martinez at the Netherlands Metabolomics Centre, Leiden University for performing the metabolomics sample analyses. This work was supported by ZonMW Enabling Technologies Hotels appli-cation 435002027, and the Virgo consortium funded by the Dutch government (FES0908).
auTHOr CONTrIbuTIONs
A.V., T.H. and A.B. served as principal investigators and conceived and designed the study; J.C.S. and A.C.H. performed the metabolomics experiments; A.B. performed the Luminex analyses; N.C.P., S.H.L., A.V. acquisition of the samples and clinical data; N.C.P., J.C.S., J.B., J.A.B., A.V., T.H., A.B. contributed to study design; J.H. and F.M. performed the statistical analyses. N.C.P. and J.C.S. wrote the first draft of the manuscript with input from all authors, and all authors approved the final manuscript revisions.
aVaIlabIlITy Of daTa aNd maTerIal
The metabolomics datasets supporting the conclusions of this article will be made available in the online MetaboLights data repository.

131
Persistent metabolic changes during first year of cART in HIV
refereNCes
1. Cassol E, Misra V, Holman A, Kamat A, Morgello S, Gabuzda D. Plasma metabolomics identifies lipid abnormalities linked to markers of inflammation, microbial translocation, and hepatic function in HIV patients receiving protease inhibitors. BMC Infect Dis. 2013;13:203.
2. Ghannoum MA, Mukherjee PK, Jurevic RJ, Retuerto M, Brown RE, Sikaroodi M, et al. Metabolomics reveals differential levels of oral metabolites in HIV-infected patients: toward novel diagnostic tar-gets. OMICS. 2013;17(1):5-15.
3. Hortin GL, Landt M, Powderly WG. Changes in plasma amino acid concentrations in response to HIV-1 infection. Clin Chem. 1994;40(5):785-9.
4. Stanley TL, Grinspoon SK. Body composition and metabolic changes in HIV-infected patients. J Infect Dis. 2012;205 Suppl 3:S383-90.
5. Williams A, Koekemoer G, Lindeque Z, Reinecke C, Meyer D. Qualitative serum organic acid profiles of HIV-infected individuals not on antiretroviral treatment. Metabolomics. 2012;8(5):804-18.
6. Grunfeld C, Kotler DP, Hamadeh R, Tierney A, Wang J, Pierson RN. Hypertriglyceridemia in the acquired immunodeficiency syndrome. Am J Med. 1989;86(1):27-31.
7. Scarpelini B, Zanoni M, Sucupira MCA, Truong HHM, Janini LMR, Segurado IDC, et al. Plasma Me-tabolomics Biosignature According to HIV Stage of Infection, Pace of Disease Progression, Viremia Level and Immunological Response to Treatment. PLoS One. 2016;11(12).
8. McKnight TR, Yoshihara HA, Sitole LJ, Martin JN, Steffens F, Meyer D. A combined chemometric and quantitative NMR analysis of HIV/AIDS serum discloses metabolic alterations associated with disease status. Mol Biosyst. 2014;10(11):2889-97.
9. Munshi SU, Rewari BB, Bhavesh NS, Jameel S. Nuclear magnetic resonance based profiling of bio-fluids reveals metabolic dysregulation in HIV-infected persons and those on anti-retroviral therapy. PLoS One. 2013;8(5):e64298.
10. Hollenbaugh JA, Munger J, Kim B. Metabolite profiles of human immunodeficiency virus infected CD4+ T cells and macrophages using LC-MS/MS analysis. Virology. 2011;415(2):153-9.
11. Wikoff WR, Pendyala G, Siuzdak G, Fox HS. Metabolomic analysis of the cerebrospinal fluid reveals changes in phospholipase expression in the CNS of SIV-infected macaques. J Clin Invest. 2008;118(7):2661-9.
12. Hoffmann M, Pantazis N, Martin GE, Hickling S, Hurst J, Meyerowitz J, et al. Exhaustion of Activated CD8 T Cells Predicts Disease Progression in Primary HIV-1 Infection. PLoS Pathog. 2016;12(7):e1005661.
13. Hogan C, Wilkins E. Neurological complications in HIV. Clin Med (Lond). 2011;11(6):571-5. 14. Gutierrez J, Albuquerque ALA, Falzon L. HIV infection as vascular risk: A systematic review of the
literature and meta-analysis. PLoS One. 2017;12(5):e0176686. 15. Mohr R, Schierwagen R, Schwarze-Zander C, Boesecke C, Wasmuth JC, Trebicka J, et al. Liver Fi-
brosis in HIV Patients Receiving a Modern cART: Which Factors Play a Role? Medicine (Baltimore). 2015;94(50):e2127.
16. van Wijk JP, Cabezas MC. Hypertriglyceridemia, Metabolic Syndrome, and Cardiovascular Disease in HIV-Infected Patients: Effects of Antiretroviral Therapy and Adipose Tissue Distribution. Int J Vasc Med. 2012;2012:201027.
17. De Wit S, Sabin CA, Weber R, Worm SW, Reiss P, Cazanave C, et al. Incidence and risk factors for new-onset diabetes in HIV-infected patients: the Data Collection on Adverse Events of Anti-HIV Drugs (D:A:D) study. Diabetes Care. 2008;31(6):1224-9.

Chapter 7.
132
18. Saylor D, Dickens AM, Sacktor N, Haughey N, Slusher B, Pletnikov M, et al. HIV-associated neuro-cognitive disorder--pathogenesis and prospects for treatment. Nat Rev Neurol. 2016;12(4):234-48.
19. Heaton RK, Franklin DR, Ellis RJ, McCutchan JA, Letendre SL, Leblanc S, et al. HIV-associated neurocognitive disorders before and during the era of combination antiretroviral therapy: differences in rates, nature, and predictors. J Neurovirol. 2011;17(1):3-16.
20. Mave V, Erlandson KM, Gupte N, Balagopal A, Asmuth DM, Campbell TB, et al. Inflammation and Change in Body Weight With Antiretroviral Therapy Initiation in a Multinational Cohort of HIV-Infected Adults. J Infect Dis. 2016;214(1):65-72.
21. Pogliaghi M, Ripa M, Pensieroso S, Tolazzi M, Chiappetta S, Nozza S, et al. Beneficial Effects of cART Initiated during Primary and Chronic HIV-1 Infection on Immunoglobulin-Expression of Memory B-Cell Subsets. PLoS One. 2015;10(10):e0140435.
22. Yukl SA, Gianella S, Sinclair E, Epling L, Li Q, Duan L, et al. Differences in HIV burden and immune activation within the gut of HIV-positive patients receiving suppressive antiretroviral therapy. J Infect Dis. 2010;202(10):1553-61.
23. Hu C, van Dommelen J, van der Heijden R, Spijksma G, Reijmers TH, Wang M, et al. RPLC-ion-trap-FTMS method for lipid profiling of plasma: method validation and application to p53 mutant mouse model. J Proteome Res. 2008;7(11):4982-91.
24. Noga MJ, Dane A, Shi S, Attali A, van Aken H, Suidgeest E, et al. Metabolomics of cerebrospinal fluid reveals changes in the central nervous system metabolism in a rat model of multiple sclerosis. Metabolomics. 2012;8(2):253-63.
25. Strassburg K, Huijbrechts AM, Kortekaas KA, Lindeman JH, Pedersen TL, Dane A, et al. Quantitative profiling of oxylipins through comprehensive LC-MS/MS analysis: application in cardiac surgery. Anal Bioanal Chem. 2012;404(5):1413-26.
26. Schoeman JC, Harms AC, van Weeghel M, Berger R, Vreeken RJ, Hankemeier T. Development and application of a UHPLC-MS/MS metabolomics based comprehensive systemic and tissue-specific screening method for inflammatory, oxidative and nitrosative stress. Anal Bioanal Chem. 2018;410(10):2551-68.
27. Hou J, van Oord G, Groothuismink ZM, Claassen MA, Kreefft K, Zaaraoui-Boutahar F, et al. Gene expression profiling to predict and assess the consequences of therapy-induced virus eradication in chronic hepatitis C virus infection. J Virol. 2014;88(21):12254-64.
28. Spaan M, van Oord G, Kreefft K, Hou J, Hansen BE, Janssen HL, et al. Immunological Analysis During Interferon-Free Therapy for Chronic Hepatitis C Virus Infection Reveals Modulation of the Natural Killer Cell Compartment. J Infect Dis. 2016;213(2):216-23.
29. Vanwolleghem T, Hou J, van Oord G, Andeweg AC, Osterhaus AD, Pas SD, et al. Re-evaluation of hepatitis B virus clinical phases by systems biology identifies unappreciated roles for the innate immune response and B cells. Hepatology. 2015;62(1):87-100.
30. Xia J, Sinelnikov IV, Han B, Wishart DS. MetaboAnalyst 3.0--making metabolomics more meaning-ful. Nucleic Acids Res. 2015;43(W1):W251-7.
31. Kamat A, Misra V, Cassol E, Ancuta P, Yan Z, Li C, et al. A plasma biomarker signature of immune activation in HIV patients on antiretroviral therapy. PLoS One. 2012;7(2):e30881.
32. Massanella M, Ouchi D, Marfil S, Llibre JM, Puertas MC, Buzon MJ, et al. Different plasma markers of inflammation are influenced by immune recovery and cART composition or intensification in treated HIV infected individuals. PLoS One. 2014;9(12):e114142.
33. Huengsberg M, Winer JB, Gompels M, Round R, Ross J, Shahmanesh M. Serum kynurenine-to-tryp-tophan ratio increases with progressive disease in HIV-infected patients. Clin Chem. 1998;44(4):858-62.

133
Persistent metabolic changes during first year of cART in HIV
34. Jenabian MA, Patel M, Kema I, Kanagaratham C, Radzioch D, Thebault P, et al. Distinct trypto-phan catabolism and Th17/Treg balance in HIV progressors and elite controllers. PLoS One. 2013;8(10):e78146.
35. Grunfeld C, Pang M, Doerrler W, Shigenaga JK, Jensen P, Feingold KR. Lipids, lipoproteins, tri-glyceride clearance, and cytokines in human immunodeficiency virus infection and the acquired immunodeficiency syndrome. J Clin Endocrinol Metab. 1992;74(5):1045-52.
36. Kalinski P. Regulation of immune responses by prostaglandin E2. J Immunol. 2012;188(1):21-8. 37. Newton K, Dixit VM. Signaling in innate immunity and inflammation. Cold Spring Harb Perspect
Biol. 2012;4(3). 38. Harizi H, Gualde N. The impact of eicosanoids on the crosstalk between innate and adaptive im-
munity: the key roles of dendritic cells. Tissue Antigens. 2005;65(6):507-14. 39. Khaitan A, Unutmaz D. Revisiting immune exhaustion during HIV infection. Curr HIV/AIDS Rep.
2011;8(1):4-11. 40. Chen J, Shao J, Cai R, Shen Y, Zhang R, Liu L, et al. Anti-retroviral therapy decreases but does not nor-
malize indoleamine 2,3-dioxygenase activity in HIV-infected patients. PLoS One. 2014;9(7):e100446. 41. Torre D, Pugliese A. Interleukin-18: a proinflammatory cytokine in HIV-1 infection. Curr HIV Res.
2006;4(4):423-30. 42. Jefferis BJ, Papacosta O, Owen CG, Wannamethee SG, Humphries SE, Woodward M, et al. Inter-
leukin 18 and coronary heart disease: prospective study and systematic review. Atherosclerosis. 2011;217(1):227-33.
43. Trøseid M, Seljeflot I, Arnesen H. The role of interleukin-18 in the metabolic syndrome. Cardiovasc Diabetol. 2010;9:11.
44. Mihailescu R, Arama V, Tiliscan C, Munteanu D, Leoveanu V, Radulescu M, et al. Correlation between inflammatory biomarkers and metabolic disorders in HIV infected patients undergoing antiretroviral therapy. BMC Infectious Diseases. 2013;13(O33).
45. Enns GM. Neurologic damage and neurocognitive dysfunction in urea cycle disorders. Semin Pediatr Neurol. 2008;15(3):132-9.
46. Freiberg MS, Chang CC, Kuller LH, Skanderson M, Lowy E, Kraemer KL, et al. HIV infection and the risk of acute myocardial infarction. JAMA Intern Med. 2013;173(8):614-22.
47. Friis-Møller N, Weber R, Reiss P, Thiebaut R, Kirk O, d’Arminio Monforte A, et al. Cardiovascular disease risk factors in HIV patients--association with antiretroviral therapy. Results from the DAD study. AIDS. 2003;17(8):1179-93.
48. Smyth EM, Grosser T, Wang M, Yu Y, FitzGerald GA. Prostanoids in health and disease. J Lipid Res. 2009;50 Suppl:S423-8.
49. McAdam BF, Catella-Lawson F, Mardini IA, Kapoor S, Lawson JA, FitzGerald GA. Systemic biosyn-thesis of prostacyclin by cyclooxygenase (COX)-2: the human pharmacology of a selective inhibitor of COX-2. Proc Natl Acad Sci U S A. 1999;96(1):272-7.
50. Seubert J, Yang B, Bradbury JA, Graves J, Degraff LM, Gabel S, et al. Enhanced postischemic func-tional recovery in CYP2J2 transgenic hearts involves mitochondrial ATP-sensitive K+ channels and p42/p44 MAPK pathway. Circ Res. 2004;95(5):506-14.
51. Wong G, Trevillyan JM, Fatou B, Cinel M, Weir JM, Hoy JF, et al. Plasma lipidomic profiling of treated HIV-positive individuals and the implications for cardiovascular risk prediction. PLoS One. 2014;9(4):e94810.
52. Karimpour M, Surowiec I, Wu J, Gouveia-Figueira S, Pinto R, Trygg J, et al. Postprandial metabolo-mics: A pilot mass spectrometry and NMR study of the human plasma metabolome in response to a challenge meal. Anal Chim Acta. 2016;908:121-31.

Chapter 7.
134
53. Sidhu D, Naugler C. Fasting time and lipid levels in a community-based population: a cross-sectional study. Arch Intern Med. 2012;172(22):1707-10.
54. Steiner MJ, Skinner AC, Perrin EM. Fasting might not be necessary before lipid screening: a nation-ally representative cross-sectional study. Pediatrics. 2011;128(3):463-70.
55. Martin A, Bloch M, Amin J, Baker D, Cooper DA, Emery S, et al. Simplification of antiretroviral therapy with tenofovir-emtricitabine or abacavir-Lamivudine: a randomized, 96-week trial. Clin Infect Dis. 2009;49(10):1591-601.
56. Olivero OA. Relevance of experimental models for investigation of genotoxicity induced by antiret-roviral therapy during human pregnancy. Mutat Res. 2008;658(3):184-90.

135
Persistent metabolic changes during first year of cART in HIV
H ea lt hy con tr ols H IV u ntre at ed0 .000
0 .002
0 .004
0 .006
0 .008
0 .010
K/T
rat
io
* **
A
H ea lt hy con tr ols H IV u ntre at ed0 .000
0 .001
0 .002
0 .003
0 .004
S/T
* ** *
B
figure s1: Tryptophan pathway and Indoleamine 2,3-dioxygenase (IDO) activity during an untreated HIV infection. (A) IDO activity during an untreated HIV infection (population A). The kynurenine and tryptophan (K/T) ratio representative of IDO activity are plotted for the controls (Closed dots) and untreated HIV group (Open circles). (B) The serotonin and tryptophan (S/T) ratio showing the altered tryptophan utilization during untreated HIV infection, with the controls (Closed dots) and untreated HIV group (Open circles). Unpaired T-test, *** p< 0.001 with **** p< 0.0001.

Chapter 7.
136
figu
re s
2 D
irect
ed p
-val
ue p
lots
inve
stig
atin
g m
etab
olic
chan
ges i
n pa
ired
base
line (
0 m
onth
s) an
d 12
mon
ths c
ART
sam
ples
(pop
ulat
ion
B), t
hrou
gh co
mpa
ring
the m
etab
olic
re
spon
ses i
n di
ffere
nt p
atie
nt su
b-po
pula
tions
. The
dire
cted
p-v
alue
plo
ts sh
own
in A
, B, a
nd C
for t
he th
ree
diffe
rent
met
abol
omic
s pla
tform
s com
pare
s the
HIV
(+)H
CV
(-)
and
HIV
(+)H
CV
(+) s
ub-p
opul
atio
ns. Th
e dire
cted
p-v
alue
plo
ts sh
own
in D
, E, a
nd F
for t
he th
ree d
iffer
ent m
etab
olom
ics p
latfo
rms c
ompa
res t
he H
IV(+
)HC
V(-
) and
HIV
(+)
HC
V(+
/-)(
All
sam
ples
) sub
-pop
ulat
ions
. A si
gnifi
cant
deg
ree
of c
orre
latio
n is
foun
d in
D, E
and
F re
veal
ing
that
the
HC
V(+
) pop
ulat
ions
has
littl
e in
fluen
ce in
skew
ing
the
data
and
in a
ctua
l effe
ct so
mew
hat d
ampe
ning
the
obse
rved
effe
ct o
f 12
mon
ths c
ART
. A p
aire
d st
uden
t T-t
est w
as u
sed,
and
the
dire
ctio
n of
cha
nge
was
det
erm
ined
by
the
fold
chan
ge d
irect
ion.
Pea
rson
corr
elat
ions
wer
e don
e per
pla
tform
to in
vest
igat
e the
deg
ree o
f cor
rela
tion
with
R2 an
d p-
valu
es re
port
ed p
er g
raph
, das
hed
lines
repr
esen
t 95%
co
nfide
nce
inte
rval
s.

137
Persistent metabolic changes during first year of cART in HIV
figure s4: Significant correlations between the CD4+ T-cell count and metabolite levels during 12 months of cART (population B). (A) Amine (green) metabolites correlated significantly (p<0.05) to CD4+ T-cell counts. (B) Phospholipid (red) metabolites correlated significantly (p<0.05) to CD4+ T-cell counts. All correlations were done using Spearman.
figure s3: Tryptophan and Indoleamine 2,3-dioxygenase (IDO) activity during cART. (A) IDO activity de-creased during 12 months of cART (population B). The kynurenine and tryptophan (K/T) ratio representative of IDO activity are plotted for the paired untreated HIV and 12 months cART samples. (B) The serotonin and tryptophan (S/T) ratio showed nonsignificant changes during the first 12months of cART in the same patients. Paired T-test with ** p< 0.01.

Chapter 7.
138
D -Dim er
H C H IV
0
5 00 0
1 00 00
1 50 00
2 00 00
2 50 00
L LOQ
***pg/ml
IL- 18
H C H IV
0
1 00
2 00
3 00
4 00
L LOQ
***
pg/ml
M CP -1
H C H IV
0
1 00
2 00
3 00
4 00
L LOQ
***
pg/ml
P D- L2
H C H IV
0
1 00 0
2 00 0
3 00 0
L LOQ
***
pg/ml
T im-3
H C H IV
0
5 00
1 00 0
1 50 0
2 00 0
L LOQ
***
pg/ml
IP- 10
H C H IV
0
5 0
1 00
1 50
L LOQ
**
pg/ml
s IL-2 R
HC H IV
0
2
4
6
8
1 0 ***
L LOQ
C RP
HC H IV
0
1 00 00 00
2 00 00 00
3 00 00 00 ***
L LOQ
pg/ml
s TN F- RI I
H C H IV
0
1 00 0
2 00 0
3 00 0
4 00 0 *
L LOQ
pg/ml
figure s5: Plasma levels of the detected immunological markers in untreated HIV patients vs controls of popu-lation A. Increased levels of all markers were found during an untreated HIV infection. Unpaired T-test with p-values: * <0.05, ** <0.01, and *** <0.001
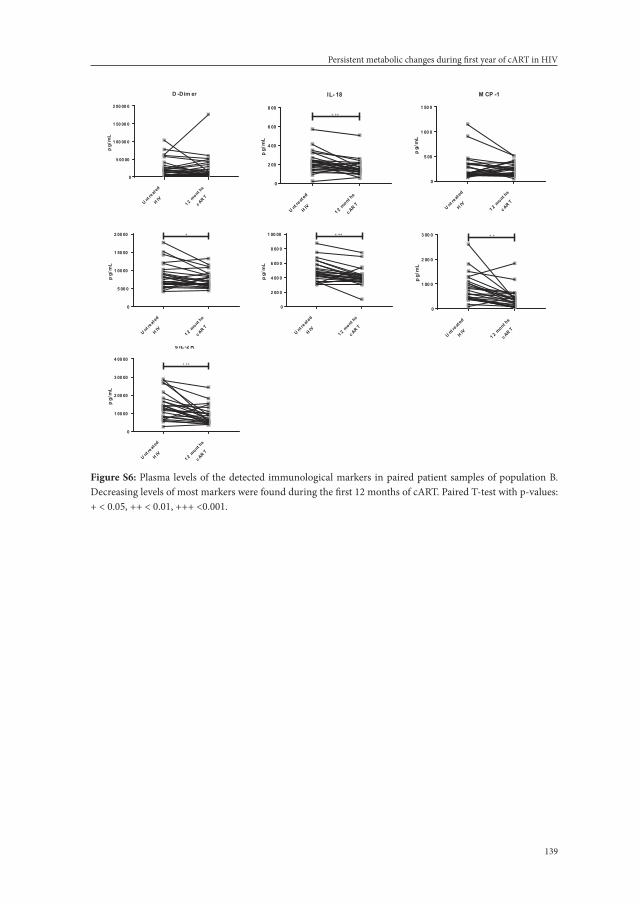
139
Persistent metabolic changes during first year of cART in HIV
U nt reat
ed
H IV
1 2 mont hs
c AR T
0
5 00 00
1 00 00 0
1 50 00 0
2 00 00 0
D -Dim er
pg/
mL
U nt reat
ed
H IV
1 2 mont hs
c AR T
0
2 00
4 00
6 00
8 00
IL- 18
pg/
mL
+ ++
U nt reat
ed
H IV
1 2 mont hs
c AR T
0
5 00
1 00 0
1 50 0
M CP -1
pg/
mL
U nt reat
ed
H IV
1 2 mont hs
c AR T
0
5 00 0
1 00 00
1 50 00
2 00 00
P D- L2
pg/
mL
+
U nt reat
ed
H IV
1 2 mont hs
c AR T
0
2 00 0
4 00 0
6 00 0
8 00 0
1 00 00
s TI M-3
pg/
mL
+ ++
U nt reat
ed
H IV
1 2 mont hs
c AR T
0
1 00 0
2 00 0
3 00 0
IP- 10
pg/
mL
+ +
U nt reat
ed
H IV
1 2 mont hs
c AR T
0
1 00 00
2 00 00
3 00 00
4 00 00
s IL-2 R
pg/
mL
+ ++
U nt reat
ed
H IV
1 2 mont hs
c AR T
0
5 00 00
1 00 00 0
1 50 00 0
2 00 00 0
D -Dim er
pg/
mL
U nt reat
ed
H IV
1 2 mont hs
c AR T
0
2 00
4 00
6 00
8 00
IL- 18
pg/
mL
+ ++
U nt reat
ed
H IV
1 2 mont hs
c AR T
0
5 00
1 00 0
1 50 0
M CP -1
pg/
mL
U nt reat
ed
H IV
1 2 mont hs
c AR T
0
5 00 0
1 00 00
1 50 00
2 00 00
P D- L2
pg/
mL
+
U nt reat
ed
H IV
1 2 mont hs
c AR T
0
2 00 0
4 00 0
6 00 0
8 00 0
1 00 00
s TI M-3p
g/m
L+ ++
U nt reat
ed
H IV
1 2 mont hs
c AR T
0
1 00 0
2 00 0
3 00 0
IP- 10
pg/
mL
+ +
U nt reat
ed
H IV
1 2 mont hs
c AR T
0
1 00 00
2 00 00
3 00 00
4 00 00
s IL-2 R
pg/
mL
+ ++
figure s6: Plasma levels of the detected immunological markers in paired patient samples of population B. Decreasing levels of most markers were found during the first 12 months of cART. Paired T-test with p-values: + < 0.05, ++ < 0.01, +++ <0.001.

Chapter 7.
140
Table s1: Descriptive statistics of the biogenic amines comparing the untreated HIV patients to the controls in patient population A.
metaboliteT-test
false discovery rate
fold change Controls untreated HIV
p-value q-value (fC) mean ± sda mean ± sda
Glutathione 1.22E-11 3.88E-10 0.43017 0.12 ± 0.03 0.050 ± 0.01
O-Phosphoethanolamine 1.38E-11 3.88E-10 0.38745 3.71 ± 1.20 1.44 ± 0.53
Sarcosine 1.72E-10 3.21E-09 0.53698 0.13 ± 0.03 0.071 ± 0.02
Serotonin 4.05E-10 5.67E-09 0.24411 0.006 ± 0.00 0.002 ± 0.00
Taurine 6.14E-08 6.88E-07 0.50741 0.66 ± 0.26 0.33 ± 0.11
L-Tryptophan 1.59E-05 0.000149 0.76073 3.25 ± 0.51 2.47 ± 0.46
L-Alanine 0.000179 0.001432 0.76731 3.88 ± 0.79 2.98 ± 0.54
L-Histidineb 0.000396 0.002773 0.81706 0.037 ± 0.01 0.030 ± 0.01
L-Asparagine 0.000463 0.002882 0.77301 0.80 ± 0.18 0.62 ± 0.11
L-Alpha-aminobutyric acid 0.000848 0.004749 0.6884 0.27 ± 0.09 0.19 ± 0.04
L-Carnosine 0.000948 0.004826 0.63414 0.000 ± 0.00 0.000 ± 0.00
Ethanolamineb 0.002506 0.011693 0.85843 0.27 ± 0.03 0.23 ± 0.05
L-Leucine 0.002953 0.012719 0.7675 1.36 ± 0.36 1.04 ± 0.22
Gamma-L-glutamyl-L-alanine 0.004387 0.017546 0.73374 0.008 ± 0.00 0.006 ± 0.00
L-Methionine 0.005782 0.020692 0.75999 1.43 ± 0.45 1.09 ± 0.24
Putrescine 0.005912 0.020692 0.64703 0.001 ± 0.00 0.001 ± 0.00
L-Tyrosine 0.006596 0.021727 0.76809 9.06 ± 2.63 6.96 ± 1.61
L-Valineb 0.011206 0.034862 0.82117 7.46 ± 1.68 6.12 ± 1.20
Ornithinec 0.017497 0.051569 0.79523 1.63 ± 0.49 1.29 ± 0.37
S-Methylcysteinec 0.023788 0.066607 0.65039 0.13 ± 0.09 0.083 ± 0.03
L-Isoleucinec 0.025046 0.066789 0.78844 3.62 ± 1.16 2.86 ± 0.69
Gamma-Glutamylglutamineb,c 0.028906 0.07358 0.8311 0.007 ± 0.00 0.006 ± 0.00
L-Lysineb,c 0.035184 0.085666 0.83576 2.04 ± 0.55 1.71 ± 0.33a SD, Standard Deviation; b Metabolites adhering to p-value<0.05 but not a FC of 30% (FC>1.3 or FC<0.7); c Metabolites having a FDR q-value>0.05

141
Persistent metabolic changes during first year of cART in HIV
Table s2: Descriptive statistics of the lipid profiling comparing the untreated HIV patients to the controls in patient population A.
metabolite T-test false discovery rate fold change Controls untreated HIV
p-value q-value (fC) mean ± sda mean ± sda
CE205b 0.0250 0.123 0.774 0.03 ± 0.01 0.02 ± 0.01
CE226b 0.0106 0.073 0.808 0.034 ± 0.01 0.027 ± 0.01
Cerd180_220b 0.0451 0.179 0.769 0.033 ± 0.01 0.025 ± 0.01
Cerd180_240b 0.0226 0.118 0.685 0.041 ± 0.02 0.028 ± 0.01
Cerd181_160b 0.0114 0.073 1.490 0.01 ± 0.00 0.02 ± 0.01
LPA-160 0.0003 0.002 2.005 0.09 ± 0.04 0.18 ± 0.13
LPA-161 0.0021 0.013 1.992 0.01 ± 0.01 0.03 ± 0.02
LPA-181 0.0017 0.011 1.847 0.10 ± 0.04 0.19 ± 0.15
LPA-182b 0.0256 0.083 1.515 0.56 ± 0.19 0.85 ± 0.57
LPA-203 0.0003 0.002 2.165 0.02 ± 0.01 0.04 ± 0.02
LPA-204 0.0000 0.000 2.047 0.15 ± 0.05 0.30 ± 0.16
LPC182b 0.0104 0.073 0.753 3.97 ± 1.30 2.99 ± 0.97
PC322b 0.0449 0.179 0.734 0.22 ± 0.09 0.16 ± 0.08
PC342b,c 0.0109 0.073 0.829 24.63 ± 5.54 20.42 ± 3.54
PC362c 0.0017 0.028 0.837 18.11 ± 2.80 15.16 ± 3.02
PC365b 0.0405 0.169 0.657 1.25 ± 0.73 0.82 ± 0.52
PC366b 0.0103 0.073 0.661 0.04 ± 0.02 0.02 ± 0.01
PC386 0.0003 0.012 0.702 5.56 ± 1.68 3.90 ± 1.17
PC404 0.0007 0.016 1.323 0.12 ± 0.04 0.16 ± 0.03
PC406 0.0014 0.026 0.712 1.64 ± 0.54 1.17 ± 0.45
PC407 0.0001 0.008 0.685 0.35 ± 0.10 0.24 ± 0.07
PC408 0.0001 0.008 0.653 0.08 ± 0.03 0.05 ± 0.02
PCO-341b,c 0.0081 0.072 0.833 0.40 ± 0.08 0.33 ± 0.08
PCO-342 0.0001 0.008 0.707 0.54 ± 0.13 0.38 ± 0.10
PCO-343 0.0008 0.016 0.690 0.52 ± 0.16 0.36 ± 0.13
PCO-363 0.0003 0.012 0.747 0.13 ± 0.03 0.10 ± 0.02
PCO-386b 0.0143 0.085 0.779 0.06 ± 0.04 0.05 ± 0.03
PCO-387b,c 0.0162 0.090 0.813 0.10 ± 0.02 0.08 ± 0.03
PE342b 0.0386 0.169 0.705 0.41 ± 0.20 0.29 ± 0.09
PE382 0.0045 0.050 0.703 3.13 ± 1.22 2.20 ± 0.70
PEO-385b 0.0200 0.108 0.777 0.67 ± 0.24 0.52 ± 0.18
PEO-387 0.0004 0.012 0.636 0.24 ± 0.09 0.16 ± 0.05
SMd181_180b,c 0.0406 0.169 0.839 1.00 ± 0.25 0.84 ± 0.22
SMd181_181b 0.0243 0.123 0.796 0.40 ± 0.12 0.32 ± 0.11
SMd181_201 0.0019 0.028 0.750 0.28 ± 0.08 0.21 ± 0.06
TG501b 0.0156 0.090 1.346 7.59 ± 4.97 10.22 ± 4.24
TG502b 0.0099 0.073 1.360 10.73 ± 5.05 14.59 ± 5.60

Chapter 7.
142
Table s2: Descriptive statistics of the lipid profiling comparing the untreated HIV patients to the controls in patient population A. (continued)
metabolite T-test false discovery rate fold change Controls untreated HIV
p-value q-value (fC) mean ± sda mean ± sda
TG503b 0.0364 0.169 1.359 5.54 ± 2.88 7.52 ± 3.54
TG511b 0.0114 0.073 1.526 0.57 ± 0.51 0.86 ± 0.45
TG512b 0.0075 0.069 1.589 0.97 ± 0.64 1.55 ± 0.82
TG513b 0.0067 0.066 1.414 0.70 ± 0.28 0.99 ± 0.38
TG514b 0.0469 0.182 1.281 0.30 ± 0.12 0.38 ± 0.14
TG522b 0.0125 0.077 1.296 30.19 ± 7.26 39.13 ± 12.24
TG531b 0.0393 0.169 1.375 0.13 ± 0.08 0.18 ± 0.08
TG552b 0.0277 0.132 1.284 0.09 ± 0.03 0.12 ± 0.04
TG565 0.0036 0.043 1.593 2.00 ± 0.52 3.19 ± 1.54
TG566b 0.0052 0.054 1.573 2.73 ± 0.74 4.29 ± 1.96
TG585 0.0034 0.043 1.535 0.14 ± 0.04 0.22 ± 0.12
TG586 0.0020 0.028 1.514 0.28 ± 0.06 0.42 ± 0.19a SD, Standard Deviation; b Metabolites having a FDR q-value>0.05; c Metabolites adhering to p< 0.05 but not a FC of 30% (FC>1.3 or FC<0.7).

143
Persistent metabolic changes during first year of cART in HIV
Table s3: Descriptive statistics of the signalling lipid profiling. Comparing the untreated HIV patients to the controls in patient population A.
metabolite T-test false discovery rate
fold change
Controls untreated HIV
p-value q-value (fC) mean ± sda mean ± sda
PGF2ab,c 0.01302 0.0509 1.15220 0.029 ± 0.004 0.033 ± 0.0065
PGE2c 0.03223 0.0904 2.10360 0.015 ± 0.005 0.028 ± 0.0255
12S-HHTrEc 0.03437 0.0943 1.48530 0.460 ± 1.018 0.684 ± 0.6429
5,6-DiHETrE 0.00000 0.0000 2.13540 0.006 ± 0.003 0.013 ± 0.0060
14,15-DiHETrE 0.00000 0.0000 1.55070 0.047 ± 0.009 0.073 ± 0.0212
11,12-DiHETrE 0.00000 0.0001 1.57940 0.036 ± 0.008 0.057 ± 0.0183
8,9-DiHETrE 0.00001 0.0002 1.64400 0.006 ± 0.002 0.010 ± 0.0033
5-HETE 0.00007 0.0008 1.86770 0.061 ± 0.024 0.114 ± 0.0457
15-HETE 0.00079 0.0060 1.61210 0.088 ± 0.040 0.143 ± 0.0593
15S-HETrE 0.00256 0.0138 1.68570 0.037 ± 0.023 0.062 ± 0.0319
12-HETE 0.00566 0.0252 2.26500 0.779 ± 0.298 1.765 ± 1.1447
12S-HEPEc 0.01717 0.0633 0.61502 0.263 ± 0.176 0.161 ± 0.1160
9/10-NO2-OA 0.00058 0.0047 0.49727 0.145 ± 0.117 0.072 ± 0.0477
11-HDoHE 0.00000 0.0000 0.25878 0.172 ± 0.074 0.045 ± 0.0180
2,3-dinor-8-iso-PGF2a 0.00000 0.0001 2.21740 0.086 ± 0.027 0.191 ± 0.0817
20-HETE 0.00223 0.0131 1.55120 0.071 ± 0.020 0.110 ± 0.0497
8,12-iPF2a-IV 0.00250 0.0138 0.80572 0.032 ± 0.006 0.025 ± 0.0087
8-iso-PGF2a 0.00533 0.0245 0.74017 0.133 ± 0.039 0.098 ± 0.0384
8-iso-PGE2c 0.04270 0.1102 2.61560 0.009 ± 0.006 0.024 ± 0.0188
SPHA-C180 0.00394 0.0195 1.66750 0.074 ± 0.023 0.123 ± 0.0825
S-1-P-161 0.00454 0.0217 0.74230 0.220 ± 0.069 0.163 ± 0.0450
S-1-P-182 0.00746 0.0321 0.77115 0.951 ± 0.250 0.734 ± 0.2526
S-1-P-181c 0.02076 0.0724 0.79819 2.914 ± 0.783 2.326 ± 0.7220a SD, Standard Deviation; b Metabolites adhering to p<0.05 but not a FC of 30 % (FC>1.3 or FC<0.7); c Metabo-lites having a FDR q-value >0.05

Chapter 7.
144
Table s4: Descriptive statistics of the biogenic Amine and lipid profiling. Comparing the untreated HIV pa-tients to their paired 12 months cART follow samples in patient population B.
metabolite Paired T-test
false discovery rate
T-stata untreated HIV (baseline)
12 months carT
p-value q-value mean ± sdb mean ± sdb
Platform: biogenic amines
Methionine sulfone 2.0E-06 1E-04 6.14 0.008 ± 0.003 0.014 ± 0.007
L-Pipecolic acid 0.0014 3E-02 -3.59 0.046 ± 0.015 0.040 ± 0.016
DL-3-aminoisobutyric acid 0.0032 4E-02 -3.26 0.023 ± 0.011 0.018 ± 0.008
L-Histidine 0.0034 4E-02 3.23 0.022 ± 0.003 0.025 ± 0.004
L-Tryptophan 0.0047 5E-02 3.10 2.715 ± 0.891 3.243 ± 0.487
L-Kynurenine 0.0051 5E-02 -3.07 0.021 ± 0.006 0.017 ± 0.004
Platform: lipid profiling
CE181 0.0086 5E-02 2.86 0.039 ± 0.011 0.047 ± 0.009
LPC181 0.0079 5E-02 2.90 2.372 ± 0.681 2.751 ± 0.558
LPC183 0.0030 4E-02 3.30 0.054 ± 0.020 0.077 ± 0.029
LPC203 0.0065 5E-02 2.98 0.291 ± 0.103 0.369 ± 0.116
PC322c 0.0127 6E-02 2.69 0.149 ± 0.061 0.192 ± 0.068
PC341 0.0011 3E-02 3.71 12.278 ± 2.382 14.096 ± 2.540
PC343 0.0009 3E-02 3.80 0.658 ± 0.195 0.886 ± 0.269
PC344c 0.0115 6E-02 2.74 0.047 ± 0.031 0.070 ± 0.039
PC361 0.0003 2E-02 4.25 2.712 ± 0.891 3.663 ± 1.115
PC362 0.0012 3E-02 3.66 15.778 ± 3.018 18.441 ± 3.238
PC363 0.0018 4E-02 3.51 10.626 ± 2.977 13.234 ± 2.799
PC364c 0.0121 6E-02 2.71 11.041 ± 2.766 12.950 ± 2.812
PC382 0.0013 3E-02 3.64 0.322 ± 0.102 0.432 ± 0.124
PC383c 0.0165 7E-02 2.58 2.514 ± 1.250 3.699 ± 1.838
PC384c 0.0141 6E-02 2.65 7.179 ± 2.238 9.006 ± 2.590
PC385c 0.0141 6E-02 2.65 3.437 ± 1.338 4.544 ± 1.349
PC404c 0.0102 5E-02 2.79 0.169 ± 0.065 0.223 ± 0.083
PC405 0.0052 4E-02 3.07 0.605 ± 0.200 0.876 ± 0.292
PC406c 0.0226 8E-02 2.44 1.231 ± 0.415 1.821 ± 0.866
PC407 0.0083 5E-02 2.88 0.311 ± 0.115 0.418 ± 0.146
PC408 0.0033 4E-02 3.27 0.058 ± 0.022 0.077 ± 0.024
PCO-341 0.0039 4E-02 3.20 0.358 ± 0.068 0.398 ± 0.075
PCO-342 0.0001 2E-02 4.68 0.532 ± 0.123 0.669 ± 0.140
PCO-343 0.0033 4E-02 3.26 0.391 ± 0.129 0.466 ± 0.101
PCO-362 0.0026 4E-02 3.36 0.188 ± 0.033 0.212 ± 0.035
PCO-363 0.0022 4E-02 3.43 0.128 ± 0.028 0.152 ± 0.028
PCO-385 0.0048 4E-02 3.11 0.861 ± 0.162 0.986 ± 0.192
PCO-406 0.0062 5E-02 3.00 0.143 ± 0.021 0.169 ± 0.029

145
Persistent metabolic changes during first year of cART in HIV
Table s4: Descriptive statistics of the biogenic Amine and lipid profiling. Comparing the untreated HIV pa-tients to their paired 12 months cART follow samples in patient population B. (continued)
metabolite Paired T-test
false discovery rate
T-stata untreated HIV (baseline)
12 months carT
p-value q-value mean ± sdb mean ± sdb
PE382 0.0010 3E-02 3.73 3.248 ± 0.995 4.343 ± 1.346
PE384c 0.0180 7E-02 2.54 0.203 ± 0.073 0.286 ± 0.146
PEO-365 0.0042 4E-02 3.16 0.300 ± 0.109 0.370 ± 0.144
PEO-385 0.0079 5E-02 2.90 0.460 ± 0.169 0.580 ± 0.243
SMd181/161c 0.0276 9E-02 2.35 1.033 ± 0.275 1.161 ± 0.248
SMd181/181c 0.0289 1E-01 2.32 0.706 ± 0.225 0.821 ± 0.244
SMd181/200 0.0033 4E-02 3.26 1.210 ± 0.274 1.470 ± 0.351
SMd181/201 0.0020 4E-02 3.47 0.403 ± 0.112 0.490 ± 0.142
SMd181/210c 0.0123 6E-02 2.71 0.367 ± 0.107 0.441 ± 0.128
SMd181/220 0.0067 5E-02 2.97 2.761 ± 0.647 3.173 ± 0.649
SMd181/221 0.0037 4E-02 3.21 1.866 ± 0.395 2.159 ± 0.393
SMd181/230 0.0084 5E-02 2.87 1.028 ± 0.250 1.176 ± 0.267
SMd181/231 0.0060 5E-02 3.01 0.758 ± 0.137 0.872 ± 0.170
SMd181/240c 0.0099 5E-02 2.80 1.827 ± 0.457 2.090 ± 0.431
SMd181/241c 0.0135 6E-02 2.67 6.005 ± 1.019 6.506 ± 1.023
SMd181/242 0.0084 5E-02 2.87 2.506 ± 0.575 2.751 ± 0.529
TG505c 0.0155 6E-02 2.61 0.178 ± 0.232 0.248 ± 0.223
TG525c 0.0257 9E-02 2.38 2.160 ± 2.715 2.727 ± 1.860
TG545c 0.0278 9E-02 2.34 7.446 ± 6.853 9.387 ± 5.391
TG546c 0.0223 8E-02 2.44 2.985 ± 3.473 3.687 ± 2.546
TG547c 0.0261 9E-02 2.37 0.688 ± 0.895 0.844 ± 0.650
TG563c 0.0192 7E-02 2.51 0.596 ± 0.582 0.756 ± 0.489a For T-stat positive values: increased in 12 months cART vs untreated HIV. For T-stat negative values: de-creased in 12 months cART vs untreated HIV; b SD, Standard Deviation; c Metabolites adhering to p<0.05 but not a FDR q-value of q<0.05


Chapter 8.Summarizing discussion and future perspectives


149
Summarizing discussion and future perspectives
INTrOduCTION
From an untreatable deadly illness HIV has become a chronic disease in less than 40 years, due to tremendous progress in treatment effectivity and tolerability. Nowadays, most patients are treated with only one combination tablet a day, whereas previously up to 16 pills were sometimes necessary. However, since HIV infection can still not be cured, HIV-infected patients need lifelong treatment and are at risk for treatment related adverse events. Some adverse events occur within the first months after the start of combination antiretroviral therapy (cART), such as gastro-intestinal complaints like nausea or abdominal pain, dizzi-ness or headache and skin rashes. Other adverse events may only become evident years or even decades after the start of a cART regimen, such as nephrotoxicity, diabetes mellitus and bone mineral density loss. Apart from determining the genotype HLA-B*57:01 to predict a hypersensitivity reaction to abacavir, it is currently still not possible to predict which patient will suffer from adverse events due to cART. New biomarkers to predict adverse events would be valuable tools in the treatment of HIV.
Recent studies have given insight in the possible role of the ITPA genotype as a biomarker to predict adverse events during purine analogue therapy for hepatitis C (HCV). SNPs in the ITPA gene, leading to a decreased ITPase activity, were found to be protective against the development of hemolytic anemia during treatment with ribavirin.1-7 Purine analogues are also used in the vast majority of cART regimens for HIV, these are abacavir and tenofovir. Thus, it can be hypothesized that the ITPA genotype is a potential genetic biomarker for adverse events associated with these drugs. However, the use of genetic biomarkers has disadvantages such as lack of sufficient evidence for consistent phenotype-genotype asso-ciations, significant overlap between genotype and influence of polygenic factors. These dis-advantages may potentially be overcome by using a protein instead of a genetic biomarker. For the ITPA gene the translated protein is ITPase, an ubiquitous enzyme in humans. In this thesis, the influence of ITPA genotype and ITPase activity on the occurrence of adverse events during the use of purine analogue drugs for HIV and HCV was investigated and the correlation between ITPA genotype and ITPase activity was determined.
The current chapter summarizes and discusses the main findings of this thesis with empha-sis on the difference between ITPA genotype and ITPase activity as biomarker and their role in the prediction of adverse events. Additionally, metabolomics after initiation of cART are discussed, as are recommendations for future research.

Chapter 8.
150
maIN fINdINGs aNd dIsCussION
ITPA genotype versus ITPase activityITPA genotype was assumed to be directly associated with ITPase activity and the current literature has mainly focussed on SNPs in the ITPA gene as biomarkers for adverse events related to drugs targeting purine metabolism. However, ITPA genotype does not always directly correspond to ITPase activity. For instance, in HIV-infected patients, ITPase activ-ity in erythrocytes is decreased compared to a HIV-negative control population, despite a similar allele frequency.8 Therefore ITPase expression and activity were investigated in correlation with ITPA genotype for both HIV and HCV infected patients.
In Chapter 2 it is described that in patients infected with HCV, ITPA genotype is not di-rectly associated with ITPase activity. While the ITPA genotype wt/c.94C>A resulted in a decreased ITPase activity in all HCV-infected patients, the ITPA genotype wt/c.124+21A>C was associated with a wide variety of ITPase activities, ranging from 0.67 to as high as 5.47 mmol IMP/mmol Hb/hr (reference values measured in Caucasian populations are 4.0-10.0 mmol IMP/mmol Hb/hour).9 Moreover, 38% of patients with this SNP had a normal ITPase activity. On the other hand, one of the patients with wt/wt ITPA genotype, presumed to have a normal ITPase activity, had a decreased activity. An explanation may be that in our study only part of the ITPA gene was sequenced to determine the prominent ITPA polymor-phisms 94C>A and 124+21A>C only. However, more ITPA SNPs have become known10-12 and we cannot exclude the possibility that the decreased ITPase activity in the patient with wt/wt genotype was due to another genetic variant in the ITPA gene. Because of the low prevalence of the other genetic variants, it was chosen not to determine these in the studies of this thesis.
In Chapter 3, presence of ITPase in leukocytes was determined using monoclonal anti-ITPase antibodies and the ITPase expression was quantitated by measuring median fluorescent intensity for the ITPase positive cell fraction. In all the leukocyte subtypes, except monocytes, of the HIV-infected patients ITPase presence was significantly decreased compared to the control population. Also, median fluorescent intensity was lower in HIV-infected patients in all cell types. No correlation of ITPA genotype with ITPase expression in leukocytes was observed.
Why ITPase expression and activity are decreased in erythrocytes and leukocytes of HIV-infected patients is yet unknown. A direct effect of nucleoside analogues on ITPase activity was excluded previously in vitro.8 It is intriguing to think of HIV infection as a struggle for dominance over intracellular nucleotide pools. As such, decreased ITPase expression may be a defensive mechanism of the host cell. There is evidence that human leukocytes can

151
Summarizing discussion and future perspectives
mount an offence against HIV-1 infection by decreasing their cytoplasmic deoxynucleotide triphosphate pools by increasing sterile alpha motif and histidine-apartic domain-contain-ing protein 1 (SAMHD1) expression thus impeding DNA replication and repair, in turn inhibiting viral replication.13 Earlier reports showed that HIV-infected T-lymphocytes were severely affected in both purine and pyrimidine nucleotide metabolism.14-16 After exog-enous mitogenic stimulation, intracellular adenosine 5’-triphosphate (ATP) and guanosine 5’-triphosphate (GTP) pools declined dramatically rather than expanded as is required for proliferation.16 In line with these observations, decreased ITPase activity may be the consequence of HIV targeting host cell nucleotide metabolism as well as another suicidal defense mechanism. By increasing non-canonical nucleotide pools, incorporation of these nucleotides into DNA and RNA is stimulated, leading to mutagenesis and, more impor-tantly, programmed cell death, thus hindering HIV replication.17
A direct intracellular effect of HIV infection cannot be the only explanation for a decrease in ITPase activity. Also in erythrocytes and B-cells ITPase activity was found to be de-creased, whereas these cells are not infected by HIV. An intracellular pathway activated by extracellular HIV particles may be hypothesized, because for B-cells, there is strong evidence that HIV binds to the CD21 receptor.18 The influence of other factors secondary to HIV infection, such as chronic inflammation is unclear.
Taken together, decreased ITPase expression might be part of the host cell’s response in defense to HIV-infection, or a consequence of HIV infection itself. On top of that there may be additional yet unidentified causes.
ITPase activity as a biomarker in predicting adverse eventsThere are several arguments in favor of preferring ITPase activity in erythrocytes as a bio-marker over ITPA genotype to be used in clinical practice: 1) ITPA genotype is less strictly associated with ITPase activity than previously assumed,8,19 2) HIV-infection most prob-ably influences ITPase activity,8,20 3) ITPA genotype did not influence ITPase expression in leukocytes,20 (in both HIV-infected as well as control patients), and finally 4) unknown and rare SNPs not detected by routine screening for the most prevalent genetic variants may cause a decrease in ITPase activity. Therefore, the role of ITPase activity as biomarker for adverse events was evaluated and compared to ITPA genotype in the viral infections HCV and HIV.
Before ITPase can be used to predict adverse events during therapy with purine analogues, there are several issues that need to be addressed. First, the intra individual variability of the ITPase activity. In order to use a test as a biomarker, one has to know that the value found is reproducible, when measured at a different time. For ITPase the intra individual vari-

Chapter 8.
152
ability was found to be low (mean variation 15.2% within each subject)21 and within- and between-day imprecision in ITPase activity measurement was 3.8% and 7.5% respectively.10 Thus, under stable conditions, ITPase activity is a reproducible parameter, with a proper test available.
Further, the effect of other parameters (as age, sex and drugs) on ITPase activity is important to assess before using it as a biomarker. In several studies age had no effect on ITPase activ-ity21,22 nor had sex.21-23 Multiple drugs were tested and found to have no inhibitory effect on ITPase activity: corticosteroids, infliximab, mesalazine, adalimumab,21 azathioprine22 and multiple nucleoside analogues (among which abacavir and TDF).8 Cytarabine and gem-citabine were found to decrease ITPase activity in MOLT-3 cells after 18 hr of incubation,8 but this effect is probably due to death of this cell population. Only ribavirin was thought to increase ITPase activity,24 this topic will be discussed more in depth below.
Hepatitis CIn Chapter 2 it was found that ITPase activity is a better biomarker than ITPA genotype to predict the development of anemia during ribavirin treatment for HCV infection. ITPase activity had a higher negative predicting value for the onset of anemia at both 4 weeks after the start of ribavirin and at the time of the lowest measured hemoglobin value during treatment. Therapy success rate, defined as sustained virological response (SVR), was not associated with either ITPase activity or ITPA genotype. During the time this study was done, standard treatment for HCV consisted of pegylated interferon alpha in combina-tion with ribavirin. Nowadays, NS5A inhibitor, NS5B RNA-dependent RNA polymerase inhibitor and NS3/4A protease inhibitor combinations are the mainstay of HCV therapy, with cure rates above 95%. Ribavirin is now only used to reduce treatment duration in well-defined clinical scenarios or for patients with specific HCV genotypes or unfavour-able patient characteristics (like cirrhosis) with known low rates of SVR.25 By using ITPase activity as a predictor, adverse events may potentially be prevented during treatment with ribavirin in a more tailor-made treatment model for these hard to treat patients.
How and why low ITPase activity and or ITPA variants are associated with less anemia dur-ing treatment with ribavirin remains somewhat enigmatic and contradictory phenomena are observed. Previously it has been assumed that low ITPase activity would decrease ribavi-rin metabolite levels in erythrocytes, while quite obviously the opposite seems to be true.26,27 This makes sense as ribavirin triphosphate makes an excellent substrate for ITPase.28 Riba-virin was found to induce ITPase activity,24 but there was no effect on ITP levels.29 This also makes sense as ITP only accumulates to detectable levels in the erythrocytes when ITPase activity is completely lacking.11,30 It is known that ribavirin depletes erythrocytes of ATP.29,31 ATP is thought to play an important role in erythrocyte membrane stability. The effect of

153
Summarizing discussion and future perspectives
ITPA genotypes on ribavirin-induced ATP depletion has been a focus of research, but the data are conflicting. An in vitro study showed a reduced ATP loss in erythrocytes from patients with ITPase activity lowering SNPs,32 and an in vivo study showed a larger ATP decrease in individuals with these SNPs compared to individuals with wt/wt genotype.29 The question rises whether ITP can function as an alternative energy source in erythro-cytes as ITP was found not to be a substrate for ATPases keeping membrane stability in erythrocytes.32 However, ITP was found to be a substitute for GTP as an energy source for adenylosuccinate synthethase (ADSS), which is the only known enzyme in erythrocytes to generate an adenine nucleotide from IMP.32 Whereas in older literature it was described that ADSS is lacking in human erythrocytes,33 a recent study showed traces of it with a deep proteomic analysis technique.34 Thus potentially a decreased ITPase may lead to more availability of ITP (yet undetectable with present day techniques) in the erythrocytes, lead-ing to generation of AMP from IMP via ADSS, restoring ATP depletion and protecting the erythrocyte from hemolysis.
In conclusion, although the mechanism is unclear, ITPase activity and ITPA genotype are biomarkers to predict hemolytic anemia during ribavirin therapy for HCV infection.
HIVIn HIV-infected patients, ITPase activity was also found to be a better predictor than ITPA genotype for adverse events during treatment with purine analogues, as described in Chapter 4, 5 and 6. An activity of ≥4 mmol IMP/mmol Hb/h was chosen as normal, being the lowest value within the 95% confidence interval for ITPA wild type carriers.8,10 Teno-fovir and abacavir are purine analogues frequently used in the backbone of the currently recommended cART regimens for HIV. Tenofovir disoproxil fumarate (TDF, referred to as tenofovir in this thesis) is a prodrug, which is phosphorylated inside the cells to tenofovir-diphosphate, which is the active metabolite and a non-canonical nucleotide 5’-triphosphate. Tenofovir-diphosphate will compete with the natural purine ATP for incorporation into the HIV DNA during its replication cycle. Abacavir is a guanosine analogue, and this prodrug is phosphorylated inside the cells to carbovir-triphosphate, the active metabolite competing with GTP. After incorporation of either tenofovir-diphosphate or carbovir-triphosphate into the growing HIV DNA-strand, further DNA synthesis is terminated because of the missing 3’-hydroxyl group in carbovir-triphosphate and tenofovir-diphosphate. Because didanosine, although being a guanosine nucleotide purine analogue, is no longer recom-mended in the treatment of HIV and no association was found between ITPase activity or ITPA genotype and adverse events during therapy with didanosine (Chapter 4 and 6), the focus in this discussion will be on abacavir and tenofovir.

Chapter 8.
154
TenofovirA decreased ITPase activity is associated with less occurrence of adverse events during the use of tenofovir in the cART regimen as is described in Chapter 4. In this retrospective study in 393 HIV-infected patients, all adverse events that led to stop of the cART regimen were analysed. Nephrotoxicity was less frequently found in patients with a decreased ITPase activity using tenofovir. This finding was confirmed in a retrospective cohort study (Chap-ter 5). Compared to the endpoints in Chapter 4, the endpoints in the latter study were more strictly defined. Nephrotoxicity was defined as >25% decrease in estimated glomerular filtration rate (eGFR) from the start of tenofovir use and/or the presence of ≥2 markers of proximal tubular dysfunction (PTD).35 HIV-infected patients with (cases) and without (controls) tenofovir-associated nephrotoxicity were matched for age, gender and ethnicity. ITPase activity, ITPA genotype and the improvement of eGFR and PTD after tenofovir ces-sation were compared between both groups. 73% of the cases had a normal ITPase activity, compared to 50% of the controls (p=0.001). Remarkably, ITPase activity was also associated with recovery of renal function after stopping tenofovir. In patients with normal ITPase activity, the recovery of eGFR was significantly better than in the patients with decreased ITPase activity. ITPA genotype wt/wt was also associated with more renal adverse events compared to patients carrying 124+21A>C or 94C>A (Chapter 4). In Chapter 5 the odds ratio for developing nephrotoxicity was not statistically significantly increased for patients with wt/wt genotype; 2.56 (95% CI 0.89-7.31). However, eGFR improvement after cessation of tenofovir was significantly better for wt/wt genotype.
It is an intriguing question what mechanism might be causing the protective effect of a decreased ITPase activity against nephrotoxicity. In tubular cells, tenofovir causes mito-chondrial DNA (mtDNA) toxicity.36-38 Imbalanced nucleotide pools may cause mtDNA depletion, potentially influenced by ITPase, thereby leading to mitochondrial dysfunc-tion.39,40 Hypothetically decreased ITPase activity could lead to an increase in ITP. Structur-ally, ITP and ATP are very similar and it is not unthinkable that ITP can substitute for ATP in reactions that are driven by ATP’s high-energy phosphate esters.41,42 Tenofovir is found to decrease the production of ATP in proximal tubular mitochondria.43 Therefore, ITP may serve as an alternative high-energy donor during ATP depletion caused by tenofovir.
Tenofovir causes increased oxidative stress in mitochondria of renal tubular cells.44 Oxida-tive stress leads to a relative increase of xanthine oxidase (XO) activity,45 a source of free radicals.46 With respect to ITPase activity and oxidative stress two scenarios can be envi-sioned. Fist, a relatively high, i.e. normal, activity drives the flux from ITP via IMP towards the production of hypoxanthine. Hypoxanthine is a substrate for XO, thereby a source of free radicals. Reasoning along this line, individuals with a normal ITPase activity may have higher levels of oxidative stress because of more availability XO substrates than individuals

155
Summarizing discussion and future perspectives
with a low ITPase activity. The second scenario considers the assumed primary function of ITPase, which is the elimination of non-canonical purine nucleoside triphosphates. Oxidative stress leads to oxidized (damaged), thus non-canonical, nucleotides.47 A high ITPase activity provides better protection against accumulation of rogue nucleotides than a low activity. Perhaps this is why individuals with normal ITPase activity experience more nephrotoxicity on tenofovir but also quickly recover once tenofovir is discontinued.
AbacavirThe results of the studies investigating ITPase activity as a potential biomarker to predict adverse events during abacavir use, are shown in Chapter 4 and 6. As opposed to regimens containing tenofovir, in regimens containing abacavir, significantly more adverse events occurred in patients with decreased ITPase activity: 61% versus 39% in patients with normal activity. This difference did not reach significance in the linear regression analysis, adjusting for confounding factors. On the other hand, metabolic adverse events (defined as dyslipidemia, use of lipid lowering therapy, diabetes mellitus or hypertension) occurred more frequently in patients with a normal ITPase activity, as is shown in Chapter 6 (odds ratio 3.11, 95% CI 1.34-7.21, p = 0.008). Although wt/wt ITPA genotype was crudely as-sociated with an increase in metabolic events, after adjusting for confounding factors this association disappeared. For cardiovascular diseases, no association with either ITPase or ITPA genotype could be demonstrated, probably due to the low incidence of these diseases.
As ribavirin-triphosphate proved to be a substrate for ITPase,28 in Chapter 4, both carbovir-triphosphate and tenofovir-diphosphate were studied for their ability to function as a substrate for ITPase. Both proved not to be substrates for ITPase. The explanation for the association between ITPase activity and adverse events is thus not a simple effect of ITPase causing accumulation of toxic metabolites. Changes in cellular signal transduction may be hypothesized to play a role.
Vasorelaxation, smooth muscle proliferation and platelet aggregation are processes medi-ated by guanosine 3’, 5’-cyclic monophosphate (cGMP). cGMP is synthesised from GTP by the enzyme soluble guanylate cyclase (sGC) and has a wide range of effects within human cells. One of these effects is vasodilatation by vasorelaxation in vascular smooth muscle48-51 and expression of sGC in endothelial cells reduces hypertension.52,53 cGMP is being studied as a target for pharmacological therapy in cardiovascular disease. Under hypoxic conditions, however, sGC was found to shift its substrate specificity from GTP to ITP, causing increased inosine 3’, 5’-cyclic monophosphate (cIMP) instead of cGMP.54,55 As opposed to cGMP, cIMP induces vasoconstriction and it was also found to be formed when intact porcine arteries were incubated with exogenous ITP.54 In human platelets, formation of cGMP was decreased when they were incubated with carbovir-triphosphate.56 Patients

Chapter 8.
156
using abacavir were found to have lower flow-mediated dilatation57 (FMD; a non-invasive technique to assess endothelial function),58 which significantly correlates with invasive test-ing of coronary endothelial function and coronary atherosclerosis.59-61 In these studies ITP and cIMP were not measured, but since the effect of cIMP is vasoconstriction, it may be hypothesized that carbovir-triphosphate made sGC substrate specificity shift from GTP to ITP, forming cIMP. It would also explain a link between varying ITPase activity, potentially leading to more or less availability of ITP in cells, abacavir use and metabolic adverse events during treatment for HIV. To further test this theory, experiments need to be conducted to determine whether carbovir-triphosphate inhibits sGC, if sGC substrate specificity shifts to ITP instead of GTP by carbovir-triphosphate or if carbovir-triphosphate competes with GTP for sGC. The effect of a decreased ITPase activity on the substrate availability for sGC and the mechanism behind its protective effect against metabolic events also needs further evaluation.
metabolic changes in HIV-infection and carT containing abacavirThe patients with a normal ITPase activity seem to have an increased risk for metabolic events during abacavir use compared to patients with decreased ITPase activity (Chapter 6). The life expectancy of HIV-infected patients increases, and nowadays patients aged 50-54 years make up the largest subpopulation of people living with HIV in the USA.62 Consequently, cardiovascular diseases (CVD) and metabolic events will also increase in the HIV-infected population. It is still unclear to what extend HIV-infection causes an increase in CVD and metabolic risk and which part of the increased risk can be attributed to the use of cART. Use of some drugs in cART has been associated with an increased risk for CVD. Patients using protease inhibitors (PIs) were found to have an increased relative risk of CVD compared to patients using cART not containing PIs.63 Abacavir use has been associated with an increased risk of CVD compared to regimens without abacavir,63-65 however, other studies could not confirm this increased risk.66,67 Lipid parameters were found to improve when cART containing abacavir was switched to a regimen containing tenofovir.68 On the other hand, it is unknown whether HIV-infection itself induces changes that increase risk of CVD and whether, if so, if it can be undone by the use of cART. To further investigate the influence of cART on metabolic events, plasma metabolites of a HIV-infected population before start of cART were compared to a non-HIV infected control population (Chapter 7). Additionally, plasma metabolites of untreated HIV-infected patients were compared to those after 12 months of cART. The comparison of the biogenic amines, lipids and signalling lipid metabolites between untreated, active HIV-infection, and non-HIV infected control patients showed a profile of mainly decreased biogenic amines in untreated HIV-infection. The decreased concentrations of leucine, isoleucine and carnosine might point to an im-paired muscle metabolism, whereas reduced levels of ornithine could suggest an affected ureum cycle and a potentially decreased ammonia clearance. After 12 months of abacavir

157
Summarizing discussion and future perspectives
containing cART, only 3 amines (methionine sulfone, histidine and tryptophan) showed a significant increase versus the baseline measurement. The lipid profile showed an overall increasing trend after 12 months of cART, however the most striking finding was that 12 months of cART had no significant effect on the signalling lipids, the group including amongst others prostaglandins, thromboxanes and leukotrienes. The signalling lipids are metabolites that play an essential role in immunological crosstalk.69 Thus although cART successfully suppresses HIV-RNA in blood and restores the number of CD4+ lymphocytes, it seems to be unable to restore all the metabolic changes caused by the infection. This may be an explanation for the persistently increased occurrence of CVD in the HIV-infected population, next to a potential direct effect of cART on CVD.
fuTure PersPeCTIVes
ITPase activity in patients with viral infectious diseasesThe results of this thesis show that ITPase activity may serve as a biomarker to predict adverse events during therapy with purine analogues for the chronic infections HCV and HIV. More specifically, during use of the purine analogues ribavirin (HCV), tenofovir and abacavir (HIV), ITPase activity was found to be associated with specific adverse events: ane-mia and hemoglobin decline, nephrotoxicity and metabolic adverse events, respectively. As currently many non-HIV infected individuals start with tenofovir as pre-exposure prophy-laxis (PrEP) against HIV, a prospective study determining ITPase activity in relation to the occurrence of nephrotoxicity is warranted in order to determine the value as biomarker for this adverse event in a non-HIV infected population. Nephrotoxicity can also be prevented by using tenofovir alafenamide (TAF) instead of tenofovir, as this was found to be equally effective in suppressing HIV in cART, but with significantly less nephrotoxicity. However, TAF has not yet been studied as PrEP. A model using tenofovir in one arm and TAF in the other can give information on both the efficacy of TAF as PrEP and the association between ITPase activity and ITPA genotype and adverse events during TAF or tenofovir use in the absence of HIV-infection.
Apart from nephrotoxicity, osteoporosis during tenofovir use is another interesting topic to investigate since ITPase plays a role in the formation of pyrophosphate, an inhibitor of bone mineralization.70,71 In a preliminary study, bone mineral density (measured by Dual Energy X-ray Absorptiometry (DEXA) scanning) of 10 HIV-infected patients with decreased ITPase activity was compared to 22 patients with normal ITPase activity at 2 time points: just before switching off tenofovir-containing cART and 48 weeks thereafter. Bone mineral density of the lumbar spine was found to significantly increase after cessa-tion of tenofovir in the patients with decreased ITPase activity, but not in the patients with

Chapter 8.
158
normal ITPase activity. In the hip, bone mineral density increased more in the patients with decreased ITPase activity than in the patients with normal activity, but these results did not reach significance. A larger, preferably prospective study, following HIV-infected patients on tenofovir containing cART compared to patients on cART not containing tenofovir, measuring bone mineral density through DEXA scanning after 24, 48 and 72 weeks and comparing outcome for patients with decreased versus normal ITPase activity, may give more insight in the association of ITPase activity and bone toxicity during tenofovir use in cART for HIV-infection.
While CVD and metabolic events are expected to increase in the HIV-infected population due to increasing age, more research, preferably large and prospective studies, should be done to further elucidate the role of ITPase activity and ITPA genotype in the occurrence of these events. Other adverse events that are known to occur during use of abacavir, such as gastro-intestinal adverse events, should be the scope of further research as well, as these are among the most frequent reasons for stopping this drug during cART.
An intriguing question is whether the headache and depression seen during triumeq use (a combination drug containing abacavir, dolutegravir and lamivudine) is associated with ITPase activity. The potential link between ITPase activity and these adverse events may be hypothesized by the findings that inosine has an inhibitory effect on Purkinje cerebral cells in rats,72 inosine is an endogenous agonistic ligand for the benzodiazepine receptors in pig brains,73 and pathogenic ITPA mutations cause an encephalopathy.12,74
Potentially a decreased ITPase activity may lead to an increase of the risk for malignancies. Studies have shown that both genetically engineered knock-out of ITPase expression in mice and naturally occurring genetic variants in the human population cause genetic insta-bility. ITPA knock-out mice incorporated more deoxyinosine residues into embryonic DNA than controls.75 In fibroblasts cultured from these embryos an increase in chromosomal aberrations and single-strand DNA breaks was observed.75 In addition, in humans the SNP 94C>A in the ITPA gene was associated with a higher number of DNA mutations.17 These observations are in line with the mutagenic properties of dITP76 and the role of ITPase in the sanitation of the nucleotide pool.77 The incidence of malignancies is increased in the HIV-infected patient population and certain malignancies are considered AIDS-defining cancers (Kaposi sarcoma, non-Hodgkin lymphoma and invasive cervical cancer).78 Although cART has reduced the incidence of these AIDS-defining cancers,79,80 still, the occurrence of cancer (both AIDS-defining and non-AIDS-defining) is higher compared to the general popula-tion.79-82 Investigating the association between ITPase activity and the risk for malignancies is an important subject to investigate in the HIV-infected population.

159
Summarizing discussion and future perspectives
In other virus infections purine analogues are also being used. For instance tenofovir is used to treat hepatitis B (HBV) infection, ribavirin is sometimes used as a treatment option for Respiratory syncytial virus (RSV), ganciclovir can be used to treat Cytomegalovirus (CMV) and acyclovir to treat Herpes simplex virus (HSV). If ITPase activity or ITPA genotype could be used as a biomarker prior to treatment for these infections, potentially adverse events like nephrotoxicity and hemolytic anemia can be prevented.
The findings in Chapter 7 on changes in metabolites during untreated HIV-infection, not fully restored by cART may function as a starting point for further unravelling the metabolic pathways affected by HIV. New insight in these pathways is important for cardiovascular risk management and prevention of malignancies.
ITPase activity in other populationsAs was mentioned before, in other populations than patients with HIV- and HCV-infection, purine analogues are being used, like azathioprine in patients with multiple autoimmune diseases and 6-mercaptopurine in patients with acute lymphoblastic leukemia. The question rises in what patient population using ITPase activity as a biomarker for adverse events during purine analogue based therapy will be most rewarding. In the Asian populations the SNP 94C>A, and thus a decrease in ITPase activity, was the most prevalent compared to other populations.83 Perhaps screening should therefore concentrate on these Asian popu-lations. A larger trial that includes mainly Asian HIV-infected patients would be helpful to investigate the use of ITPase activity and ITPA genotype as a biomarker for predicting adverse events during cART in this population.
More studies are needed to obtain more insight in the role of non-canonical nucleotides (like inosine) in human cells. Besides from having deleterious effects, the other, potentially beneficial effects could gain insight in the basic cell metabolism, as well as have potential implications for future treatment of human disease. Inosine was found to be cardioprotec-tive,84 and is currently under investigation to slow down Parkinson’s disease and amyo-trophic lateral sclerosis (ALS),85,86 via neuroprotective mechanisms of hypoxanthine. In the form of inosine pranobex, inosine is under research to alleviate influenza-like symptoms via immunomodulatory routes.87 Further, purine metabolism is under the attention in the anti-cancer field where, among other things, inosine monophosphate dehydrogenase (IMPDH) inhibitors have shown anti-leukemic effects in a variety of acute myelogenous leukemia (AML) cell lines.88 Under what conditions is inosine a substrate for sGC? What happens to intracellular nucleotide pools in cells under stress (like hypoxemia or due to certain drugs)? And what role does the variability in ITPase activity between patients play in these mecha-nisms? Could ITPase activity be used in predicting cardiovascular or neurological disease

Chapter 8.
160
in patients other than HIV-infected patients? These questions need to be answered in order to gain more insight in human metabolism, towards tailor-made therapy for every patient.
CONClusIONs Of THIs THesIs
In the leukocytes of HIV-infected patients the presence and expression of the enzyme ITPase is significantly decreased compared to non-HIV infected individuals. Further, the ITPA genotype c.124+21A>C is less strictly associated with ITPase activity than has previously been assumed. ITPase activity is a more accurate biomarker than ITPA genotype for predicting 1) anemia and hemoglobin-decrease during HCV therapy with ribavirin, 2) adverse events in general and nephrotoxicity during HIV therapy with tenofovir and 3) metabolic events during HIV therapy with abacavir, and an ITPase activity <4 mmol IMP/mmol Hb/hour was associated with a decrease in these adverse events. The situations in which a normal ITPase activity seemed to be more favourable than a decreased activity were limited to adverse events in general during HIV therapy with abacavir (however no longer significant logistic regression analysis) and the recovery of nephrotoxicity after tenofovir cessation. Metabolites changed by HIV-infection are not all fully restored to the levels of non-HIV infected patients in spite of successful suppression of the HIV-replication by cART.

161
Summarizing discussion and future perspectives
refereNCes
1. Fellay J, Thompson AJ, Ge D, Gumbs CE, Urban TJ, Shianna KV, et al. ITPA gene variants protect against anaemia in patients treated for chronic hepatitis C. Nature. 2010;464(7287):405-8.
2. Thompson AJ, Santoro R, Piazzolla V, Clark PJ, Naggie S, Tillmann HL, et al. Inosine triphosphatase genetic variants are protective against anemia during antiviral therapy for HCV2/3 but do not de-crease dose reductions of RBV or increase SVR. Hepatology. 2011;53(2):389-95.
3. Nishimura T, Osaki R, Shioya M, Imaeda H, Aomatsu T, Takeuchi T, et al. Polymorphism of the inosine triphosphate pyrophosphatase gene predicts ribavirin-induced anemia in chronic hepatitis C patients. Mol Med Rep. 2012;5(2):517-20.
4. Lötsch J, Hofmann WP, Schlecker C, Zeuzem S, Geisslinger G, Ultsch A, et al. Single and combined IL28B, ITPA and SLC28A3 host genetic markers modulating response to anti-hepatitis C therapy. Pharmacogenomics. 2011;12(12):1729-40.
5. Azakami T, Hayes CN, Sezaki H, Kobayashi M, Akuta N, Suzuki F, et al. Common genetic poly-morphism of ITPA gene affects ribavirin-induced anemia and effect of peg-interferon plus ribavirin therapy. J Med Virol. 2011;83(6):1048-57.
6. Kurosaki M, Tanaka Y, Tanaka K, Suzuki Y, Hoshioka Y, Tamaki N, et al. Relationship between polymorphisms of the inosine triphosphatase gene and anaemia or outcome after treatment with pegylated interferon and ribavirin. Antivir Ther. 2011;16(5):685-94.
7. Sakamoto N, Tanaka Y, Nakagawa M, Yatsuhashi H, Nishiguchi S, Enomoto N, et al. ITPA gene vari-ant protects against anemia induced by pegylated interferon-alpha and ribavirin therapy for Japanese patients with chronic hepatitis C. Hepatol Res. 2010;40(11):1063-71.
8. Bierau J, Bakker JA, Schippers JA, Grashorn JA, Lindhout M, Lowe SH, et al. Erythrocyte inosine triphosphatase activity is decreased in HIV-seropositive individuals. PLoS One. 2012;7(1):e30175.
9. Bakker JA, Bierau J, Drent M. A role for ITPA variants in the clinical course of pulmonary Langer-hans’ cell histiocytosis? Eur Respir J. 2010;36(3):684-6.
10. Shipkova M, Lorenz K, Oellerich M, Wieland E, von Ahsen N. Measurement of erythrocyte inosine triphosphate pyrophosphohydrolase (ITPA) activity by HPLC and correlation of ITPA genotype-phenotype in a Caucasian population. Clin Chem. 2006;52(2):240-7.
11. Maeda T, Sumi S, Ueta A, Ohkubo Y, Ito T, Marinaki AM, et al. Genetic basis of inosine triphosphate pyrophosphohydrolase deficiency in the Japanese population. Mol Genet Metab. 2005;85(4):271-9.
12. Kevelam SH, Bierau J, Salvarinova R, Agrawal S, Honzik T, Visser D, et al. Recessive ITPA mutations cause an early infantile encephalopathy. Ann Neurol. 2015;78(4):649-58.
13. Lahouassa H, Daddacha W, Hofmann H, Ayinde D, Logue EC, Dragin L, et al. SAMHD1 restricts the replication of human immunodeficiency virus type 1 by depleting the intracellular pool of deoxy-nucleoside triphosphates. Nat Immunol. 2012;13(3):223-8.
14. Jacobsson B, Britton S, Törnevik Y, Eriksson S. Decrease in Thymidylate kinase activity in peripheral blood mononuclear cells from HIV-infected individuals. Biochemical Pharmacology. 1998;56:389-95.
15. Jacobsson B, Britton S, He Q, Karlsson A, Eriksson S. Decreased Thymidine kinase levels in periph-eral blood cells from HIV-seropositive individuals: implications for Zidovudine metabolism. AIDS Research and Human Retroviruses. 1995;11(7):805-11.
16. Bofill M, Fairbanks LD, Ruckemann K, Lipman M, Simmonds HA. T-lymphocytes from AIDS patients are unable to synthesize ribonucleotides de novo in response to mitogenic stimulation. Impaired pyrimidine responses are already evident at early stages of HIV-1 infection. J Biol Chem. 1995;270(50):29690-7.

Chapter 8.
162
17. Zamzami MA, Duley JA, Price GR, Venter DJ, Yarham JW, Taylor RW, et al. Inosine triphosphate pyrophosphohydrolase (ITPA) polymorphic sequence variants in adult hematological malignancy patients and possible association with mitochondrial DNA defects. J Hematol Oncol. 2013;6:24.
18. Moir S, Fauci AS. B cells in HIV infection and disease. Nat Rev Immunol. 2009;9(4):235-45. 19. Peltenburg NC, Bakker JA, Vroemen WH, de Knegt RJ, Leers MP, Bierau J, et al. Inosine triphosphate
pyrophosphohydrolase activity: more accurate predictor for ribavirin-induced anemia in hepatitis C infected patients than ITPA genotype. Clin Chem Lab Med. 2015;53(12):2021-9.
20. Peltenburg NC, Leers MP, Bakker JA, Lowe SH, Vroemen WH, Paulussen AD, et al. Inosine Triphos-phate Pyrophosphohydrolase Expression: Decreased in Leukocytes of HIV-Infected Patients Using Combination Antiretroviral Therapy. J Acquir Immune Defic Syndr. 2016;73(4):390-5.
21. Citterio-Quentin A, Moulsma M, Gustin MP, Boulieu R. ITPA Activity in Adults and Children Treated With or Without Azathioprine: Relationship Between TPMT Activity, Thiopurine Metabo-lites, and Co-medications. Ther Drug Monit. 2017;39(5):483-91.
22. Shipkova M, Franz J, Abe M, Klett C, Wieland E, Andus T. Association between adverse effects under azathioprine therapy and inosine triphosphate pyrophosphatase activity in patients with chronic inflammatory bowel disease. Ther Drug Monit. 2011;33(3):321-8.
23. Xiong H, Xin HW, Wu XC, Li Q, Xiong L, Yu AR. Association between inosine triphosphate pyro-phosphohydrolase deficiency and azathioprine-related adverse drug reactions in the Chinese kidney transplant recipients. Fundam Clin Pharmacol. 2010;24(3):393-400.
24. Tanaka Y, Yokomori H, Otori K. Induction of inosine triphosphatase activity during ribavirin treat-ment for chronic hepatitis C. Clin Chim Acta. 2018;482:16-20.
25. Loustaud-Ratti V, Debette-Gratien M, Jacques J, Alain S, Marquet P, Sautereau D, et al. Ribavirin: Past, present and future. World J Hepatol. 2016;8(2):123-30.
26. D’Avolio A, Ciancio A, Siccardi M, Smedile A, Baietto L, Simiele M, et al. Inosine triphosphatase polymorphisms and ribavirin pharmacokinetics as determinants of ribavirin-associate anemia in patients receiving standard anti-HCV treatment. Ther Drug Monit. 2012;34(2):165-70.
27. Jimmerson LC, Urban TJ, Truesdale A, Baouchi-Mokrane F, Kottilil S, Meissner EG, et al. Variant inosine triphosphatase phenotypes are associated with increased ribavirin triphosphate levels. J Clin Pharmacol. 2017;57(1):118-24.
28. Nystrom K, Wanrooij PH, Waldenstrom J, Adamek L, Brunet S, Said J, et al. Inosine Triphosphate Pyrophosphatase Dephosphorylates Ribavirin Triphosphate and Reduced Enzymatic Activity Poten-tiates Mutagenesis in Hepatitis C Virus. J Virol. 2018;92(19).
29. Jimmerson LC, Clayton CW, MaWhinney S, Meissner EG, Sims Z, Kottilil S, et al. Effects of ribavirin/sofosbuvir treatment and ITPA phenotype on endogenous purines. Antiviral Res. 2017;138:79-85.
30. Sumi S, Marinaki AM, Arenas M, Fairbanks L, Shobowale-Bakre M, Rees DC, et al. Genetic basis of inosine triphosphate pyrophosphohydrolase deficiency. Hum Genet. 2002;111(4-5):360-7.
31. De Franceschi L, Fattovich G, Turrini F, Ayi K, Brugnara C, Manzato F, et al. Hemolytic anemia induced by ribavirin therapy in patients with chronic hepatitis C virus infection: role of membrane oxidative damage. Hepatology. 2000;31(4):997-1004.
32. Hitomi Y, Cirulli ET, Fellay J, McHutchison JG, Thompson AJ, Gumbs CE, et al. Inosine triphosphate protects against ribavirin-induced adenosine triphosphate loss by adenylosuccinate synthase func-tion. Gastroenterology. 2011;140(4):1314-21.
33. Lowy B, Dorfman BZ. Adenylosuccinase activity in human and rabbit erythrocyte lysates. J Biol Chem. 1970;245(12):3043-6.

163
Summarizing discussion and future perspectives
34. Nemkov T, Sun K, Reisz JA, Song A, Yoshida T, Dunham A, et al. Hypoxia modulates the purine salvage pathway and decreases red blood cell and supernatant levels of hypoxanthine during refriger-ated storage. Haematologica. 2018;103(2):361-72.
35. Lucas GM, Ross MJ, Stock PG, Shlipak MG, Wyatt CM, Gupta SK, et al. Clinical practice guideline for the management of chronic kidney disease in patients infected with HIV: 2014 update by the HIV Medicine Association of the Infectious Diseases Society of America. Clin Infect Dis. 2014;59(9):e96-138.
36. Lebrecht D, Venhoff AC, Kirschner J, Wiech T, Venhoff N, Walker UA. Mitochondrial tubulopathy in tenofovir disoproxil fumarate-treated rats. J Acquir Immune Defic Syndr. 2009;51(3):258-63.
37. Cote HC, Magil AB, Harris M, Scarth BJ, Gadawski I, Wang N, et al. Exploring mitochondrial neph-rotoxicity as a potential mechanism of kidney dysfunction among HIV-infected patients on highly active antiretroviral therapy. Antivir Ther. 2006;11(1):79-86.
38. Kohler JJ, Hosseini SH, Hoying-Brandt A, Green E, Johnson DM, Russ R, et al. Tenofovir renal toxic-ity targets mitochondria of renal proximal tubules. Lab Invest. 2009;89(5):513-9.
39. Wang L. Mitochondrial purine and pyrimidine metabolism and beyond. Nucleosides Nucleotides Nucleic Acids. 2016;35(10-12):578-94.
40. El-Hattab AW, Craigen WJ, Scaglia F. Mitochondrial DNA maintenance defects. Biochim Biophys Acta. 2017;1863(6):1539-55.
41. Skou JC, Hilberg C. The effect of cations, g-strophanthin and oligomycin on the labeling from [32P] ATP of the (Na+ + K+)-activated enzyme system and the effect of cations and g-strophanthin on the labeling from [32P] ITP and 32Pi. Biochim Biophys Acta. 1969;185(1):198-219.
42. Martin JL, Ishmukhametov R, Hornung T, Ahmad Z, Frasch WD. Anatomy of F1-ATPase powered rotation. Proc Natl Acad Sci U S A. 2014;111(10):3715-20.
43. Ramamoorthy H, Abraham P, Isaac B. Mitochondrial dysfunction and electron transport chain com-plex defect in a rat model of tenofovir disoproxil fumarate nephrotoxicity. J Biochem Mol Toxicol. 2014;28(6):246-55.
44. Milian L, Peris JE, Gandia P, Andujar I, Pallardo L, Gorriz JL, et al. Tenofovir-induced toxicity in renal proximal tubular epithelial cells: involvement of mitochondria. AIDS. 2017;31(12):1679-84.
45. Thompson-Gorman SL, Zweier JL. Evaluation of the role of xanthine oxidase in myocardial reperfu-sion injury. J Biol Chem. 1990;265(12):6656-63.
46. Chung HY, Baek BS, Song SH, Kim MS, Huh JI, Shim KH, et al. Xanthine dehydrogenase/xanthine oxidase and oxidative stress. Age (Omaha). 1997;20(3):127-40.
47. Kamiya H. Mutagenic potentials of damaged nucleic acids produced by reactive oxygen/nitrogen species: approaches using synthetic oligonucleotides and nucleotides: survey and summary. Nucleic Acids Res. 2003;31(2):517-31.
48. Archer SL, Huang JM, Hampl V, Nelson DP, Shultz PJ, Weir EK. Nitric oxide and cGMP cause vaso-relaxation by activation of a charybdotoxin-sensitive K channel by cGMP-dependent protein kinase. Proc Natl Acad Sci U S A. 1994;91(16):7583-7.
49. Bolotina VM, Najibi S, Palacino JJ, Pagano PJ, Cohen RA. Nitric oxide directly activates calcium-dependent potassium channels in vascular smooth muscle. Nature. 1994;368(6474):850-3.
50. Cornwell TL, Arnold E, Boerth NJ, Lincoln TM. Inhibition of smooth muscle cell growth by nitric oxide and activation of cAMP-dependent protein kinase by cGMP. Am J Physiol. 1994;267(5 Pt 1):C1405-13.
51. Murad F, Rapoport RM, Fiscus R. Role of cyclic-GMP in relaxations of vascular smooth muscle. J Cardiovasc Pharmacol. 1985;7 Suppl 3:S111-8.
52. Bauersachs J, Bouloumie A, Mulsch A, Wiemer G, Fleming I, Busse R. Vasodilator dysfunction in aged spontaneously hypertensive rats: changes in NO synthase III and soluble guanylyl cyclase expression, and in superoxide anion production. Cardiovasc Res. 1998;37(3):772-9.

Chapter 8.
164
53. Kloss S, Bouloumie A, Mulsch A. Aging and chronic hypertension decrease expression of rat aortic soluble guanylyl cyclase. Hypertension. 2000;35(1 Pt 1):43-7.
54. Chen Z, Zhang X, Ying L, Dou D, Li Y, Bai Y, et al. cIMP synthesized by sGC as a mediator of hypoxic contraction of coronary arteries. Am J Physiol Heart Circ Physiol. 2014;307(3):H328-36.
55. Beste KY, Burhenne H, Kaever V, Stasch JP, Seifert R. Nucleotidyl cyclase activity of soluble guanylyl cyclase alpha1beta1. Biochemistry. 2012;51(1):194-204.
56. Baum PD, Sullam PM, Stoddart CA, McCune JM. Abacavir increases platelet reactivity via competi-tive inhibition of soluble guanylyl cyclase. AIDS. 2011;25(18):2243-8.
57. Hsue PY, Hunt PW, Wu Y, Schnell A, Ho JE, Hatano H, et al. Association of abacavir and impaired endothelial function in treated and suppressed HIV-infected patients. AIDS. 2009;23(15):2021-7.
58. Celermajer DS, Sorensen KE, Gooch VM, Spiegelhalter DJ, Miller OI, Sullivan ID, et al. Non-invasive detection of endothelial dysfunction in children and adults at risk of atherosclerosis. Lancet. 1992;340(8828):1111-5.
59. Joannides R, Haefeli WE, Linder L, Richard V, Bakkali EH, Thuillez C, et al. Nitric oxide is re-sponsible for flow-dependent dilatation of human peripheral conduit arteries in vivo. Circulation. 1995;91(5):1314-9.
60. Takase B, Uehata A, Akima T, Nagai T, Nishioka T, Hamabe A, et al. Endothelium-dependent flow-mediated vasodilation in coronary and brachial arteries in suspected coronary artery disease. Am J Cardiol. 1998;82(12):1535-9, A7-8.
61. Neunteufl T, Katzenschlager R, Hassan A, Klaar U, Schwarzacher S, Glogar D, et al. Systemic endo-thelial dysfunction is related to the extent and severity of coronary artery disease. Atherosclerosis. 1997;129(1):111-8.
62. Centers for Disease Control and Prevention. HIV Surveillance Report, 2016 [Available from: http://www.cdc.gov/hiv/library/reports/hiv-surveillance.html].
63. Islam FM, Wu J, Jansson J, Wilson DP. Relative risk of cardiovascular disease among people living with HIV: a systematic review and meta-analysis. HIV Med. 2012;13(8):453-68.
64. Marcus JL, Neugebauer RS, Leyden WA, Chao CR, Xu L, Quesenberry CP, Jr., et al. Use of abacavir and risk of cardiovascular disease among HIV-infected individuals. J Acquir Immune Defic Syndr. 2016;71(4):413-9.
65. Young J, Xiao Y, Moodie EE, Abrahamowicz M, Klein MB, Bernasconi E, et al. Effect of cumulating exposure to abacavir on the risk of cardiovascular disease events in patients from the Swiss HIV Cohort Study. J Acquir Immune Defic Syndr. 2015;69(4):413-21.
66. Lang S, Mary-Krause M, Cotte L, Gilquin J, Partisani M, Simon A, et al. Impact of individual an-tiretroviral drugs on the risk of myocardial infarction in human immunodeficiency virus-infected patients: a case-control study nested within the French Hospital Database on HIV ANRS cohort CO4. Arch Intern Med. 2010;170(14):1228-38.
67. Ding X, Andraca-Carrera E, Cooper C, Miele P, Kornegay C, Soukup M, et al. No association of abacavir use with myocardial infarction: findings of an FDA meta-analysis. J Acquir Immune Defic Syndr. 2012;61(4):441-7.
68. Moyle GJ, Orkin C, Fisher M, Dhar J, Anderson J, Wilkins E, et al. A randomized comparative trial of continued abacavir/lamivudine plus efavirenz or replacement with efavirenz/emtricitabine/tenofovir DF in hypercholesterolemic HIV-1 infected individuals. PLoS One. 2015;10(2):e0116297.
69. Harizi H, Gualde N. The impact of eicosanoids on the crosstalk between innate and adaptive im-munity: the key roles of dendritic cells. Tissue Antigens. 2005;65(6):507-14.
70. Zimmermann H, Zebisch M, Strater N. Cellular function and molecular structure of ecto-nucleotid-ases. Purinergic Signal. 2012;8(3):437-502.

165
Summarizing discussion and future perspectives
71. Orriss IR, Arnett TR, Russell RG. Pyrophosphate: a key inhibitor of mineralisation. Curr Opin Pharmacol. 2016;28:57-68.
72. Bold JM, Gardner CR, Walker RJ. Central effects of nicotinamide and inosine which are not mediated through benzodiazepine receptors. Br J Pharmacol. 1985;84(3):689-96.
73. Yarom M, Tang XW, Wu E, Carlson RG, Vander Velde D, Lee X, et al. Identification of inosine as an endogenous modulator for the benzodiazepine binding site of the GABAA receptors. J Biomed Sci. 1998;5(4):274-80.
74. FitzPatrick DR, Handley MT, Reddy K, Wills J, Rosser E, Kamath A, et al. ITPase deficiency causes Martsolf Syndrome with a lethal infantile dilated cardiomyopathy. bioRxiv. 2018.
75. Abolhassani N, Iyama T, Tsuchimoto D, Sakumi K, Ohno M, Behmanesh M, et al. NUDT16 and ITPA play a dual protective role in maintaining chromosome stability and cell growth by eliminating dIDP/IDP and dITP/ITP from nucleotide pools in mammals. Nucleic Acids Res. 2010;38(9):2891-903.
76. Spee JH, de Vos WM, Kuipers OP. Efficient random mutagenesis method with adjustable mutation frequency by use of PCR and dITP. Nucleic Acids Res. 1993;21(3):777-8.
77. Galperin MY, Moroz OV, Wilson KS, Murzin AG. House cleaning, a part of good housekeeping. Mol Microbiol. 2006;59(1):5-19.
78. 1993 revised classification system for HIV infection and expanded surveillance case definition for AIDS among adolescents and adults. MMWR Recomm Rep. 1992;41(RR-17):1-19.
79. Franceschi S, Lise M, Clifford GM, Rickenbach M, Levi F, Maspoli M, et al. Changing patterns of cancer incidence in the early- and late-HAART periods: the Swiss HIV Cohort Study. Br J Cancer. 2010;103(3):416-22.
80. Rubinstein PG, Aboulafia DM, Zloza A. Malignancies in HIV/AIDS: from epidemiology to therapeu-tic challenges. AIDS. 2014;28(4):453-65.
81. Silverberg MJ, Lau B, Achenbach CJ, Jing Y, Althoff KN, D’Souza G, et al. Cumulative incidence of cancer among persons with HIV in North America: a cohort study. Ann Intern Med. 2015;163(7):507-18.
82. Robbins HA, Pfeiffer RM, Shiels MS, Li J, Hall HI, Engels EA. Excess cancers among HIV-infected people in the United States. J Natl Cancer Inst. 2015;107(4).
83. Marsh S, King CR, Ahluwalia R, McLeod HL. Distribution of ITPA P32T alleles in multiple world populations. J Hum Genet. 2004;49(10):579-81.
84. Czarnecki W, Mathison R, Harmsen E, Tyberg JV. Inosine--a natural modulator of contractility and myocardial blood flow in the ischemic heart? Am Heart J. 1992;124(6):1446-59.
85. Iwaki H, Ando R, Miyaue N, Tada S, Tsujii T, Yabe H, et al. One year safety and efficacy of ino-sine to increase the serum urate level for patients with Parkinson’s disease in Japan. J Neurol Sci. 2017;383:75-8.
86. The ALSUntangled Group. ALSUntangled No. 37: Inosine. Amyotroph Lateral Scler Frontotemporal Degener. 2017;18(3-4):309-12.
87. Beran J, Salapova E, Spajdel M, Isoprinosine Study T. Inosine pranobex is safe and effective for the treatment of subjects with confirmed acute respiratory viral infections: analysis and subgroup analysis from a Phase 4, randomised, placebo-controlled, double-blind study. BMC Infect Dis. 2016;16(1):648.
88. Yang H, Fang Z, Wei Y, Bohannan ZS, Ganan-Gomez I, Pierola AA, et al. Preclinical activity of FF-10501-01, a novel inosine-5’-monophosphate dehydrogenase inhibitor, in acute myeloid leukemia. Leuk Res. 2017;59:85-92.


Chapter 9.Nederlandse samenvatting.


169
Nederlandse samenvatting
HumaaN ImmuNOdefICIëNTIeVIrus
Het Humaan immunodeficiëntievirus (HIV) is een enkelstrengs ribonucleïnezuur (RNA)-virus dat specifiek CD4+ T-helper lymfocyten, macrofagen en dendritische cellen infecteert. Na binding van een oppervlakte-eiwit op de HIV celmembraan met de CD4 receptor en één van de co-receptoren CCR5 of CXCR4 op deze gastheercellen, fuseren beide celmembranen met elkaar en komt de inhoud van de HIV-cel in het cytoplasma van de gastheercel. Het HIV gebruikt daar het enzym ‘reverse transcriptase’ en de nucleotiden van de gastheercel om van de enkele RNA-streng een dubbele deoxyribonucleïnezuur (DNA)-streng te maken. Dit DNA wordt via het HIV-enzym ‘integrase’ in het DNA van de gastheer ingebouwd. Via het nucleotide-metabolisme van de gastheer worden vervolgens van dit ingebouwde DNA nieuwe RNA-moleculen afgeschreven, welke na translatie nieuwe HIV-eiwitten leveren. Deze HIV-eiwitten worden in een deel van de celwand van de gastheercel weer verpakt tot nieuwe HIV-partikels, die nieuwe gastheercellen kunnen infecteren. Onbehandelde HIV-infectie leidt tot een vermindering van CD4+ T-cel lymfocyten en uiteindelijk tot immuundeficiëntie, Acquired Immune Deficiency Syndrome; AIDS genoemd. Zonder behandeling leidt dit ziektebeeld tot het overlijden van de patiënt. De medicatie die wordt gebruikt om HIV te remmen, combinatie anti-retrovirale therapie (cART) genoemd, is in de laatste tientallen jaren steeds effectiever geworden. cART kan de virusreplicatie onder-drukken en zorgen voor (gedeeltelijk) herstel van het immuunsysteem. Er zijn meerdere stappen in de HIV-replicatie cyclus die een aangrijpingspunt vormen voor de medicatie. In een cART regime zitten altijd meerdere middelen uit verschillende klassen medicatie die op verschillende van deze aangrijpingspunten werken. De huidige richtlijnen schrijven allen een combinatie van minimaal 3 middelen voor, waarin twee NRTIs worden gecombineerd met of een niet-nucleoside reverse-transcriptase remmer (NNRTI), een protease remmer (PI) of een integrase remmer. Hoewel de huidige therapie de laatste jaren zeer sterk verbe-terd is qua effectiviteit, kunnen we HIV nog altijd niet genezen en moet een patiënt de rest van zijn leven cART blijven gebruiken. Zoals bij vrijwel alle medicatie treden ook bij cART gebruik frequent bijwerkingen op, waarvan we, behoudens middels de genetische marker HLA-B*57:01 voor abacavir, niet kunnen voorspellen welke patiënt ze krijgt en hoe ernstig deze zullen zijn.
ITPase
De replicatie van HIV en de werking van de NRTIs zijn afhankelijk van het nucleotide metabolisme van de gastheercel. De nucleotiden, adenine en guanine (purines) en cytosine en thymine (pyrimidines), zijn de bouwstenen van DNA. Deze nucleotiden zijn uitgebreid onderzocht en van hun nucleotide-5’-trifosfaat vorm is bekend dat ze betrokken zijn bij

Chapter 9.
170
de energielevering voor verschillende processen in de menselijke cel, signalen doorgeven binnen de cellen, betrokken zijn bij de vorming van polysachariden en onderdelen zijn van verschillende co-enzymen die belangrijk zijn voor oxidatie-reductie reacties. Naast deze 4 nucleotiden, zijn er nog andere nucleobasen, zoals xanthine en hypoxanthine, waar-van de laatste de base is om de nucleoside inosine te vormen. Deze nucleobasen worden gevormd binnen de metabole paden van het purine nucleotide mechanisme, maar ook bij oxidatieve stress en deaminatie. De rol van xanthine en hypoxanthine, ook wel ‘non-canonische’ nucleosiden genoemd, is minder uitgebreid onderzocht dan van de ‘canonische’ nucleosiden. Wel is bekend dat ze zowel gunstige als schadelijke effecten kunnen hebben. Inosine trifosfaat pyrofosfohydratase (ITPase) is een enzym dat inosine-5’-trifosfaat (ITP) defosforyleert naar inosine-5’-monofosfaat (IMP). Dit enzym wordt gecodeerd door het gen ITPA. Verschillende single nucleotide polymorfismen (SNPs) zijn bekend binnen dit gen, waarvan meerdere SNPs leiden tot een verminderde activiteit van het enzym ITPase. Zo leidt homozygoot dragerschap voor SNP 94C>A tot nagenoeg volledige ITPase defici-entie, terwijl heterozygote dragers van deze SNP nog 23% restactiviteit hebben. De SNP 124+21A>C leidt in homozygote dragers tot 30% en in heterozygote dragers tot 60% ITPase restactiviteit. Deze verschillende SNPs komen wereldwijd in wisselende frequenties voor bij verschillende populaties. Er is uitgebreid onderzoek gedaan naar de invloed van deze SNPs op bijwerkingen van purine analogen zoals azathioprine dat gebruikt wordt in de behande-ling van inflammatoire darmziekten, mercaptopurine voor acute lymfoblastaire leukemie en ribavirine voor hepatitis C (HCV). Voor de eerstgenoemde middelen zijn de uitkomsten van de onderzoeken niet eenduidig. Voor ribavirine is echter aangetoond dat dragerschap van een SNP in het ITPA gen, leidend tot een vermindering van de activiteit van ITPase, beschermt tegen de bijwerking hemolytische anemie. In cART voor HIV worden purine analogen gebruikt als nucleoside/nucleotide reverse-transciptase remmers (NRTIs) zoals abacavir, tenofovir en didanosine.
Dit proefschrift beschrijft de resultaten van onderzoek naar het enzym ITPase als mogelijke biomarker voor het voorspellen van bijwerkingen tijdens de behandeling met ribavirine voor HCV en cART voor HIV en wordt hierin vergeleken met het ITPA gen.
ITPase als bIOmarker VOOr bIjWerkINGeN
In hoofdstuk 2 wordt beschreven dat de ITPase activiteit een betere biomarker is dan het ITPA genotype voor het voorspellen van anemie en hemoglobine daling tijdens de behande-ling van HCV met ribavirine. In alle in dit proefschrift beschreven onderzoeken wordt een verlaagde ITPase activiteit gedefinieerd als <4 mmol IMP vorming per mmol hemoglo-bine per uur (<4 mmol IMP/mmol Hb/uur), omdat dit de laagste waarde is van het 95%

171
Nederlandse samenvatting
betrouwbaarheidsinterval van de waarde van ITPase activiteit bij mensen met een ITPA genotype zonder SNPs (die geacht worden een normale ITPase activiteit te hebben). Uit deze studie, die 106 patiënten bevat, blijkt dat een verlaagde ITPase activiteit geassocieerd is met een minder laag hemoglobine, minder grote hemoglobine daling en minder frequent voor komen van anemie (bloedarmoede). Ook patiënten met een van beide hierboven genoemde SNPs in het ITPA gen blijken een significant minder laag hemoglobine en een mindere hemoglobine daling te hebben, maar het voorkomen van anemie is alleen ver-minderd in de patiënten met de SNP 94C>A vergeleken met patiënten zonder SNP in hun genotype (wildtype; wt/wt). Een mogelijke verklaring hiervoor is dat de SNP 124+21A>C in het ITPA gen minder strikt geassocieerd is met een verminderde ITPase activiteit dan eerder werd aangenomen. De patiënten met deze SNP hebben namelijk ITPase activiteiten variërend van sterk verlaagde tot normale waarden; 38% heeft een normale ITPase activiteit. Tot slot blijkt dat zowel de ITPase activiteit als het ITPA genotype geen invloed hebben op de effectiviteit van de HCV behandeling.
In hoofdstuk 3 worden de resultaten beschreven van het onderzoek naar de aanwezigheid van het enzym ITPase in witte bloedcellen (leukocyten) van 59 HIV-patiënten vergeleken met een controle groep van 50 niet-HIV geïnfecteerde mensen. Het enzym ITPase blijkt in alle leukocyten subsets van HIV-patiënten, behalve de monocyten, minder vaak aanwezig te zijn dan in de leukocyten subsets van de controle groep. De cellen die wel ITPase bevat-ten, hebben bij de HIV-patiënten een minder sterke mate van expressie vergeleken met de cellen van de individuen in de controle groep. Deze verlaging van de aanwezigheid van ITPase is niet gerelateerd aan het ITPA genotype, want de verdeling van de genotypes is in HIV-patiënten hetzelfde als in de niet-HIV geïnfecteerde mensen. De resultaten van dit onderzoek sluiten aan bij eerder onderzoek, waarin ook in rode bloedcellen (erythrocyten) van HIV-patiënten een verlaagde ITPase activiteit werd gevonden ten opzichte van een controle populatie.
Naar aanleiding van bovenstaande bevindingen (1] ITPase activiteit lijkt een betere voor-speller te zijn van bijwerkingen tijdens therapie met een purine analoog voor HCV en 2] de ITPase activiteit is verlaagd in zowel erythrocyten als leukocyten van HIV-patiënten), werden de studies gedaan die worden beschreven in hoofdstukken 4, 5 en 6. In analogie van HCV, blijkt voor het voorspellen van bijwerkingen tijdens behandeling met de purine analogen abacavir en tenofovir in cART voor HIV de ITPase activiteit ook een betere maat dan het ITPA genotype. Didanosine is ook een purine analoog, maar omdat bij het gebruik hiervan geen relatie met ITPase activiteit en ITPA genotype is gevonden en dit middel tegen-woordig bijna niet meer gebruikt wordt, worden deze resultaten hier niet apart besproken.
Chapter 9.
172
TenofovirIn hoofdstuk 4 worden de resultaten beschreven van een retrospectieve studie in een populatie van 393 HIV-geïnfecteerde patiënten die behandeld werden met cART. De bijwer-kingen worden gegroepeerd in de categorieën maag/darmklachten, neurologische klachten, nefrotoxiciteit, huidafwijkingen en leverproblemen. Bijwerkingen ten tijde van het gebruik van de verschillende cART regimes worden vergeleken tussen patiënten met een verlaagde en patiënten met een normale ITPase activiteit. Ook wordt deze vergelijking gemaakt tussen patiënten met een of meerdere van de SNPs c.94C>A en c.124+21A>C in het ITPA gen en de patiënten zonder SNPs in dit gen (wt/wt). De patiënten met een verlaagde ITPase activiteit hebben minder bijwerkingen dan de patiënten met een normale ITPase activiteit tijdens de behandeling met een cART regime dat tenofovir bevat. Dit geldt ook voor patiënten met SNPs in het ITPA gen (c.94C>A en/of c.124+21A>C) vergeleken met patiënten met het wildtype (wt/wt) ITPA genotype. Maar als gekeken wordt naar afzonderlijke bijwer-kingen, dan is een verlaagde ITPase activiteit alleen geassocieerd met minder nierschade (nefrotoxiciteit) tijdens behandeling met tenofovir en kan deze associatie niet worden aangetoond voor het ITPA genotype. In het vervolgonderzoek (beschreven in hoofdstuk 5), vergelijken we HIV-patiënten die tenofovir gebruikten met nefrotoxiciteit tijdens therapie (26 patiënten) met 55 gematchte patiënten zonder nefrotoxiciteit. In deze studie worden de resultaten uit hoofdstuk 4 bevestigd. Patiënten met nefrotoxiciteit hebben significant vaker een normale ITPase activiteit dan patiënten zonder nefrotoxiciteit. Dit verschil wordt niet gevonden als de verschillende ITPA genotypes met elkaar worden vergeleken. Wel is het hebben van een normale ITPase activiteit geassocieerd met een beter herstel van de nierfunctie na het staken van tenofovir.
abacavirVoor abacavir zijn de resultaten, beschreven in hoofdstuk 4 en 6 minder eenduidig dan voor tenofovir. De bijwerkingen waarvoor een verminderde ITPase activiteit bij tenofovir beschermend lijkt te zijn (maag/darmklachten, neurologische klachten, nefrotoxiciteit, huidafwijkingen en leverproblemen), komen juist vaker voor bij de patiënten met een verminderde ITPase activiteit tijdens therapie met abacavir. Echter na correctie voor de factoren: duur van cART, duur van purine therapie en duur van het huidige cART regime, is dit verschil niet significant meer. Het ITPA genotype is niet geassocieerd met deze bijwer-kingen tijdens therapie met abacavir.
In hoofdstuk 6 blijkt dat het hebben van een verlaagde ITPase activiteit ook voor HIV-patiënten die abacavir gebruiken op een andere wijze gunstiger is, omdat zij minder vaak een metabole bijwerking (diabetes mellitus, hypertensie en dyslipidemie) blijken te hebben dan de patiënten met een normale ITPase activiteit. Hoewel ook in ITPA genotypes die een SNP bevatten minder metabole bijwerkingen lijken voor te komen, is deze associatie niet

173
Nederlandse samenvatting
langer significant na correctie voor leeftijd, body mass index (BMI), cumulatief gebruik van cART en het gebruik van een PI of NNRTI. Het eindpunt hart- en vaatziekten (cardiovascu-laire ziekten) is in dit onderzoek niet geassocieerd met ITPase activiteit of ITPA genotype, waarschijnlijk door het lage aantal gevallen dat voorkwam in de onderzochte populatie.
meCHaNIsme
De ITPase activiteit is geassocieerd met bijwerkingen ten tijde van therapie met tenofovir (algemene bijwerkingen en nefrotoxiciteit) en abacavir (metabole bijwerkingen) voor HIV en zou daarom mogelijk in de toekomst in kunnen worden gezet als biomarker voor het voorspellen van bijwerkingen. De ITPase activiteit lijkt in de studies beschreven in dit proefschrift een betere biomarker te zijn dan het ITPA genotype. Een voor de hand lig-gende verklaring voor de gevonden associatie zou kunnen zijn dat de actieve metabolieten van tenofovir en abacavir een substraat zijn voor het ITPase enzym en dat zo de activiteit van ITPase de vorming van toxische metabolieten beïnvloedt. Dit is echter getest en beide blijken geen direct substraat te zijn, waardoor deze hypothese moet worden verworpen (hoofdstuk 4). In de discussie (hoofdstuk 8) van dit proefschrift worden enkele hypothesen besproken over de mogelijke mechanistische verklaring achter de gevonden associaties. Mogelijk spelen verschuivingen in intracellulaire nucleotide voorraden of het ontstaan van zuurstofradicalen een rol, maar ook een veranderde cellulaire signaal transductie waarin mogelijk ITP een substraat is voor cyclisch guanosine-3’,5’-monofosfaat (cGMP) behoort theoretisch tot de mogelijkheden. Duidelijk is dat er nog veel aanvullend onderzoek nodig is om het mechanisme achter de gevonden associaties in zijn geheel te verklaren.
VeraNderINGeN VerOOrzaakT dOOr VIrus Of medICaTIe?
Een normale ITPase activiteit tijdens het gebruik van abacavir voor HIV-infectie zou dus ongunstig kunnen zijn voor onder andere het ontwikkelen van risicofactoren voor car-diovasculaire ziekten. Voor HIV-patiënten is gebleken dat het risico op cardiovasculaire ziekten verhoogd is, maar onbekend is in hoeverre dit risico wordt veroorzaakt door de infectie zelf of door de cART. Om meer inzicht te krijgen in de metabole veranderingen tijdens een actieve, onbehandelde HIV-infectie, worden in hoofdstuk 7 metabolieten in het plasma van 18 HIV-patiënten vergeleken met dat van 23 niet-HIV geïnfecteerde personen. In de onbehandelde HIV-patiënten worden meerdere verschillen gezien ten opzichte van de controle groep in de biogene amines, waarvan alle amines die verschilden, verlaagd zijn bij HIV-patiënten. Ook het lipidenprofiel verschilt tussen beide groepen met een toename van meervoudig onverzadigde triglyceride soorten in HIV, maar een afname van fosfolipiden.
Chapter 9.
174
Binnen de groep signaallipiden, met name van belang voor het doorgeven van signalen tussen immuuncellen, is een groot deel van de lipiden verhoogd, waaronder de lipiden afkomstig van de vorming van oxidatieve zuurstofradicalen. Concluderend bestaan er grote verschillen tussen HIV-patiënten en niet-HIV geïnfecteerde personen in zowel biogene amines als lipiden en signaallipiden. De resultaten van dit onderzoek kunnen bijdragen aan toekomstig onderzoek dat noodzakelijk is voor het beantwoorden van meerdere vragen, zoals waarom HIV-patiënten een verhoogd cardiovasculair risico hebben, of waarom er meer maligniteiten voorkomen bij HIV-patiënten. De meest opvallende bevinding van het onderzoek dat wordt beschreven in hoofdstuk 7 is dat 12 maanden behandeling met abaca-vir bevattende cART in HIV-geïnfecteerde patiënten met succesvolle onderdrukking van de virale replicatie toch niet leidt tot herstel van de gevonden verschillen tussen onbehandelde HIV-patiënten en de controle populatie. Slechts enkele verlaagde amines nemen significant toe na 12 maanden cART en alle signaallipiden blijven verlaagd, ondanks de therapie. De overige lipiden laten wel veranderingen zien en blijken over het algemeen toe te nemen tijdens therapie. Samenvattend betekent dit dat de metabole veranderingen die ontstaan tijdens actieve HIV-infectie, niet compleet ongedaan worden gemaakt met een jaar lang succesvolle abacavir bevattende therapie tegen HIV.
CONClusIes
In hoofdstuk 8 worden alle resultaten samengevat en wordt de balans opgemaakt tussen ITPase activiteit en ITPA genotype als biomarker voor bijwerkingen tijdens de behandeling met de purine analogen ribavirine voor hepatitis C en abacavir en tenofovir voor HIV. Ook de mogelijkheden voor toekomstig onderzoek worden hier besproken. De belangrijkste conclusies van dit proefschrift zijn: 1) In de leukocyten van HIV-patiënten is het enzym ITPase minder vaak aanwezig en is de
expressie minder sterk dan in de leukocyten van niet-HIV geïnfecteerde mensen.2) Het voorkomen van de SNP c.124+21A>C is minder sterk geassocieerd met een vermin-
derde ITPase activiteit dan voorheen werd aangenomen.3) ITPase activiteit is een betere biomarker dan ITPA genotype voor het voorspellen van: a) anemie en hemoglobine-daling ten tijde van behandeling met ribavirine voor hepa-
titis C, b) bijwerkingen in het algemeen en nefrotoxiciteit in het bijzonder ten tijde van behan-
deling met tenofovir voor HIV, c) metabole bijwerkingen ten tijde van behandeling met abacavir voor HIV.4) Bij alle bovengenoemde associaties is een verlaagde ITPase activiteit (<4 mmol IMP/
mmol Hb/uur) gunstiger dan een normale ITPase activiteit.5) Een verlaagde ITPase activiteit is echter mogelijk geassocieerd met
175
Nederlandse samenvatting
a) een slechter herstel van nefrotoxiciteit na het staken van tenofovir voor HIV, b) het vaker voorkomen van algemene bijwerkingen tijdens gebruik van abacavir voor
HIV.6) De verandering in metabolieten bij patiënten met onbehandelde HIV-infectie, wordt
niet volledig hersteld door een jaar succesvolle onderdrukking van de virale replicatie van HIV door gebruik van abacavir bevattende cART.
Toekomstig onderzoek zal uit moeten wijzen of ITPase ook bij andere indicaties voor teno-fovir geassocieerd is met bijwerkingen en of het ook met andere bijwerkingen dan anemie, nefrotoxiciteit en metabole effecten geassocieerd is tijdens therapie met purine analogen. Verder zal onderzocht moeten worden in welke populaties de biomarker het best inzetbaar zal zijn. Ook algemeen onderzoek naar ITPase en de non-canonische nucleotiden is nodig om zowel hun gunstige als schadelijke effecten beter in kaart te brengen. Hopelijk zal dit leiden tot ‘therapie op maat’ voor elke patiënt.


Chapter 10List of publicationsPhD portfolioCurriculum vitaeDankwoord


179
List of publications
lIsT Of PublICaTIONs
- Peltenburg N.C.*, Wijting I.E.A.*, Rokx C., Bakker, J.A., Rijnders B.J.A., Bierau J. and Verbon A. Inosine 5’-triphosphatase activity is associated with TDF-associated nephro-toxicity in HIV. Submitted. * Joint first authorship.
- Peltenburg N.C.*, Schoeman J.C.*, Hou J., Mora F., Harms A.C., Lowe S.H., Bierau J., Bakker J.A., Verbon A., Hankemeier T. and Boonstra A. Persistent metabolic changes in HIV-infected patients during the first year of combination antiretroviral therapy. Scientific Reports 2018. Nov 16; 8(1): 16947. PubMed PMID: 30446683. * Joint first authorship.
- Peltenburg N.C., Bierau J., Schippers J.A., Lowe S.H., Paulussen A.D.C., Van den Bosch B.J.C., Leers M.P.G., Andrinopoulou E.R., Bakker J.A. and Verbon A. Metabolic events in HIV-infected patients using abacavir are associated with erythrocyte inosine tri-phosphatase activity. Journal of Antimicrobial Chemotherapy 2019 Jan 1; 74(1): 157-164. PubMed PMID: 30304447
- Peltenburg N.C., Bierau J., Bakker J.A., Schippers J.A., Lowe S.H. Paulussen A.D.C., Van den Bosch B.J.C., Leers M.P.G., Hansen B.E. and Verbon A. Erythrocyte inosine triphosphatase activity: a potential biomarker for adverse events during combination antiretroviral therapy for HIV. PLoS One 2018. Jan 12; 13(1): e0191069. PubMed PMID: 29329318
- Peltenburg N.C., Leers M.P.G., Bakker J.A., Lowe S.H., Vroemen W.H.M., Paulussen A.D.C., Van den Bosch B.J.C, Bierau J. and Verbon A. Inosine triphosphate pyro-phosphohydrolase expression: decreased in leukocytes of HIV-infected patients using combination antiretroviral therapy. Journal of Acquired Immune Deficiency Syndromes 2016 Dec 1; 73(4): 390-395. PubMed PMID: 27792682
- Peltenburg N.C., Bakker J.A., Vroemen W.H.M., de Knegt R.J., Leers M.P.G., Bierau J. and Verbon A. Inosine triphosphate pyrophosphohydrolase activity: more accurate predictor for ribavirin-induced anemia in hepatitis C infected patients than ITPA genotype. Clinical Chemistry and Laboratory Medicine 2015 Nov; 53(12): 2012-2019. PubMed PMID: 25968438


181
PhD Portfolio
PHd POrTfOlIO
Name: Nicole Chantal PeltenburgErasmus MC Departments: Internal Medicine and Medical Microbiology and Infectious
DiseasesPromotor: Prof. Dr. Annelies VerbonCopromotors: Dr. Jörgen Bierau and Dr. Jaap A. Bakker
Presentations2014 Oral presentation, Spring congress Dutch Association for Clinical chemistry and
laboratory medicine, Veldhoven. Winner category ‘clinical’2015 Oral presentation, Science Days Internal medicine, Antwerp, Belgium2016 Poster presentation, Spring congress Dutch Association for Clinical chemistry and
laboratory medicine, Veldhoven, The Netherlands2016 2 Poster presentations, 26th ECCMID, Amsterdam, The Netherlands2016 Poster presentation, International congress on drug therapy in HIV infection,
Glasgow, United Kingdom2016 Oral presentation, MMIZ research meeting, Rotterdam, The Netherlands2016 Poster presentation, Science Days Internal medicine, Antwerp, Belgium2017 Oral presentation, Midsummer meeting NVHB, Utrecht, The Netherlands2017 Oral presentation, MMIZ research meeting, Rotterdam, The Netherlands2019 Oral poster presentation, 29th ECCMID, Amsterdam, The Netherlands
(Inter)national conferences and meetings2011 2x MINC symposium Mycology and immunosuppressive therapy and infections,
Maastricht, The Netherlands2012 2nd Euregional Maastricht symposium on Immune Compromised Travelers, Maas-
tricht, The Netherlands2012 NIV dagen, Maastricht, The Netherlands2012 Symposium Infectious diseases, AMC, Amsterdam, The Netherlands2012 Tropical medicine meeting, AMC, Amsterdam, The Netherlands2013 2x MINC symposium Gastro-intestinal infections and Immunogenetics, Maas-
tricht, The Netherlands2014 MINC symposium Infections in nursing homes, Maastricht, The Netherlands2014 3th Euregional Maastricht sumposium on Immune Compromised Travelers, Maas-
tricht, The Netherlands2014 HIV drug therapy congress, Glasgow, United Kingdom2015 11th Workshop on HIV and hepatitis co-infection, London, United Kingdom

182
Chapter 10
2015 Update and future challenges in the nationals and global fight against HCV, HBV, HIV, TB and Tropical diseases, Arnhem, The Netherlands
2016 26th European Congress on Clinical Microbiology and Infectious Diseases (ECCMID), Amsterdam, The Netherlands2016 International congress on drug therapy in HIV infection, Glasgow, United King-
dom2017 NIV dagen, Maastricht, The Netherlands2017 Midsummer meeting NVHB, Utrecht, The Netherlands2017 Symposium Infectious diseases, Amsterdam, The Netherlands2018 Conference on Retroviruses and Opportunistic Infections (CROI), Boston, United
States of America2018 Boerhaave course on Infectious Diseases, Noordwijkerhout, The Netherlands
Courses2010 HIV Masterclass, Virology Education, Utrecht, The Netherlands2011 Hepatitis Masterclass, Virology Education, Utrecht, The Netherlands2012 Vaccination Masterclass, Virology Education, Utrecht, The Netherlands2013 Basic clinical teaching, Maastricht UMC+, Maastricht, The Netherlands2016 Basis course on Regulations and Organisation for clinical investigators (BROK),
Dutch federation of University Medical Centers (NFU)2017 Research Integrity, Erasmus MC, Rotterdam, The Netherlands2018 Teach the teacher III, Rotterdam, The Netherlands
Teaching2010-ongoing Supervising doctorate and medical students2014-ongoing Education of residents Internal medicine and Medical Microbiology and
Infectious Diseases2014-ongoing Yearly elective course 2nd year medical students: Infections of the big city
research grants2015 ZonMW, A metabolomics approach to improve personalized medicine in patients
chronically infected with HIV. Co-applicant.2017 NVHB, Tenofovir toxicity: association with inosine triphosphate pyrophosphohy-
drolase activity and ITPA genotype

183
Curriculum vitae
CurrICulum VITae
Nicole Chantal Peltenburg was born on July 2nd 1980 in The Hague, The Netherlands. After she graduated in 1998 from the Fioretticollege in Lisse, she studied Pedagogy and Educational Sciences at the University of Amsterdam, The Netherlands, for one year, which she finished cum laude. In 1999 she started medical school at the University of Leiden, the Netherlands. After receiving her medical degree in April 2006, she worked for one year as a senior house officer in Internal Medicine in the Máxima Medical Center, in Eindhoven, The Netherlands, under supervision of Prof. dr. H.R. Haak. In 2007, she started as a resident in the Maastricht University Medical Center in Maastricht, The Netherlands (Prof. dr. C.D.A. Stehouwer and Prof. dr. R.P. Koopmans) and specialized in Infectious Diseases (Dr. S.H. Lowe). She started her PhD in 2010 at the Erasmus Medical Center, Rotterdam, The Netherlands, under supervision of Prof. dr. A. Verbon in collaboration with Dr. J. Bierau and Dr. J.A. Bakker, of which the results are presented in this thesis. After her training as internist-infectious disease specialist in 2014, she started working at the Erasmus Medical Center, Rotterdam, The Netherlands. Chantal is married to Aswin de Jong, and together they have three daughters: Celine (2011), Aimée (2013) and Anique (2017).

185
Dankwoord
daNkWOOrd
En opeens zit het er bijna op en kan ik gaan schrijven aan het dankwoord, dat ik in gedach-ten al zo vaak heb geschreven. Toch blijkt het in de praktijk lastiger dan ik dacht, want wat hebben er veel mensen geholpen, op allerlei verschillende manieren. Van het bedenken en uitvoeren van onderzoeken, het redigeren en corrigeren van manuscripten tot het aanhoren van oefen-presentaties, het bieden van een troostende schouder als het eens tegen zat of gewoon even afleiding van het hele promotietraject. Al die mensen, die me de afgelopen jaren hebben gesteund, wil ik hier graag bedanken.
Allereerst mijn promotor, prof. dr. A. Verbon, beste Annelies, wat heb ik toch ontzettend veel aan je te danken. Zonder jou was deze promotie nooit gelukt. Je maakte altijd tijd voor me vrij en nooit hoefde ik lang te wachten op antwoord als ik een manuscript bij je inle-verde. Het ene aspect wat beter uitlichten, het andere net op een andere manier verwoorden, altijd wist je het weer duidelijk beter te maken. Je bent een voorbeeld voor mij op gebied van wetenschap en organisatie. Heel erg bedankt voor al jouw hulp en begeleiding de afgelopen jaren, die zeker niet alleen met het promotietraject te maken hebben gehad.
Mijn co-promotor, dr. J. Bierau, beste Jörgen, het is wel duidelijk dat artsen en klinisch ge-netisch laboratorium specialisten op een andere manier denken: waar jij altijd de chemische structuren voor je ziet, zie ik de patiënten erachter. Wat bleken deze verschillende visies op hetzelfde onderwerp een goede combinatie te zijn voor dit proefschrift. Jouw mooie schrijf-stijl maakte alle teksten beter. Ik ben je zo dankbaar voor het feit dat je altijd bereikbaar voor me was, en dat je me al die jaren zo fijn hebt begeleid. Ik heb het gevoel dat ik er een vriend bij heb gekregen, dank je wel.
Mijn co-promotor, dr. J.A. Bakker, beste Jaap, net als Jörgen, was jij er al die jaren altijd om me te helpen, mee te brainstormen en de stukken beter te maken door ze kritisch na te lezen en met goede aanvullingen te komen. Je altijd weer vriendelijke woorden en e-mails hebben me vaak opgebeurd en gemaakt dat ik dit proefschrift heb kunnen maken. Dank je, Jaap, zonder jou was het niet gelukt.
De mogelijkheid om überhaupt te starten aan dit proefschrift, is gegeven door Martin Jaekel, toentertijd werkend bij Janssen pharmaceutical companies Nederland. Doordat u aan Prof. dr. Verbon een unrestricted scientific grant toekende, kreeg ik tijd en ruimte om dit traject te realiseren. Bedankt daarvoor.
Dan de leden van de leescommissie, prof. dr. E.J.G. Sijbrands, beste Eric, ik voel me vereerd dat je secretaris in de leescommissie wilde zijn. Jouw vriendelijkheid en de gesprekken aan

186
Chapter 10
jouw bijzondere tafel in de D-gang, hebben mijn enthousiasme voor wetenschappelijk on-derzoek verder aangewakkerd en er mede voor gezorgd dat ik me altijd welkom heb gevoeld als collega in het Erasmus MC. Prof. dr. A.T. van der Ploeg, beste Ans, hoewel we op het ge-bied van de metabole ziekten nog maar kort met elkaar samenwerken, heb ik al erg veel van je geleerd. Bedankt dat je in de leescommissie heb willen plaatsnemen. Prof. dr. M.E. Rubio Gozalbo, beste Estela, heel erg bedankt dat je de tijd hebt willen nemen dit proefschrift te lezen en je mooie woorden over het proefschrift in je antwoord naar Annelies.
Dan de leden van de grote commissie, bedankt voor jullie bereidheid in de oppositie plaats te nemen. Dr. A. Oude Lashof, beste Astrid, dit is meteen een goede plek om je nogmaals te bedanken dat je me, inmiddels heel wat jaren geleden, hebt aangestoken met jouw en-thousiasme over en liefde voor ons vak. En uiteraard voor de fijne begeleiding tijdens mijn opleiding als infectioloog. Dr. S.C.E. Klein Nagelvoort-Schuit, beste Stephanie, ik bewonder jouw talent voor management en hoe je dit weet te combineren met de patiëntenzorg en het blijven klaarstaan voor de medewerkers die je onder je hoede hebt. Bedankt voor jouw vertrouwen in mij in jouw team van internisten. Dr. B.E. Hansen, beste Bettina, dankzij jouw statistische kennis, konden we van mijn ingewikkelde database uiteindelijk een mooi manuscript maken. Bedankt voor je geduld bij eindeloze aanpassingen. Prof. dr. T. van Gelder, beste Teun, bedankt voor je tijd, aandacht en oppositie.
Dr. S.H. Lowe, beste Selwyn, jij bent voor dit proefschrift net zo belangrijk geweest als de co-promotoren. Jij vormde de harde kern voor de brainstormsessies en vergaderingen, die ook altijd gezellig waren. Tevens bedankt voor jouw begeleiding tijdens mijn opleiding tot infectioloog, ik heb veel van je geleerd en het altijd heel fijn gehad in het Maastricht UMC+.
Veel dank aan al mijn mede-auteurs, voor hun inzet en hulp bij het schrijven van alle ma-nuscripten. In het bijzonder dr. P.A. Boonstra, beste Andre, de reikwijdte van dit proefschrift is dankzij jou breder gemaakt dan alleen ITPase. Bedankt voor de fijne samenwerking in dit project. Hopelijk werken we in de toekomst nog samen aan nieuwe hoofdstukken. Dr. J.C. Schoeman, beste Nelus, het overleg met jou en Andre was altijd goed en gezellig. Bedankt daarvoor en veel succes met je nieuwe baan. HIV-verpleegkundige J.A. Schippers, beste Jolanda, ik heb enorme bewondering voor de manier waarop jij de HIV-patiënten van de polikliniek in Maastricht psychologisch ondersteunt. Bedankt voor het delen van jouw ervaring. Dr. E.-R. Andrinopoulou, beste Elrozy, bedankt dat je altijd op korte termijn tijd vrij wilde maken voor al mijn statistische vragen. Dr. I.E.A. Wijting, beste Ingeborg, ik bewonder jouw inzet en enthousiasme, die nooit lijdt onder zwangere buiken of op de achtergrond aandacht trekkende kinderen.

187
Dankwoord
De sectie Infectieziekten van het Erasmus MC, beste Dorine, Bart, Casper, Els, Eric, Han-nelore, Jan, Karin, Lennert, Mariana en Perry, wil ik graag bedanken voor de fijne samen-werking. Ik ben trots dat ik deel uit mag maken van deze groep. Mijn dank gaat ook uit naar Ineke v.d. Ende, we missen jouw kennis en humor, ik heb enorm veel van je geleerd de afgelopen jaren. Machteld v.d. Feltz en Paula van Biezen, ook jullie bedankt voor jullie on-dersteuning toen ik net begon als jonge klare in Rotterdam. Ook de HIV-verpleegkundigen en verpleegkundig specialiste, Nadine, Laura, Marion en Jan wil ik bedanken voor hun ondersteuning, begeleiding en zorg voor de HIV-patiënten van Rotterdam. Jan, ik vind het heel leuk dat we samen onze poli draaien. De dames van de polikliniek infectieziekten bedank ik ook graag voor hun ondersteunende werk en gezellige praatjes die we elke week weer even maken.
De staf van de afdeling Medische Microbiologie en Infectieziekten van het Erasmus MC wil ik bedanken voor de samenwerking en alles wat ik van ze geleerd heb de afgelopen jaren. Altijd is er wel iemand te vinden die even mee wil denken over een moeilijke casus of wil helpen met bijvoorbeeld het overnemen van taken als het nodig is. De secretaresses, Femke, Marian en Simone, bedankt voor de altijd openstaande deur voor ondersteuning of gewoon een gezellig praatje. De virologen van het Erasmus MC, bedankt voor jullie vriendelijke hulp en samenwerking.
Buiten de sector Infectieziekten, heb ik de laatste jaren ook intensief samen mogen werken in enkele andere sectoren van de Inwendige geneeskunde van het Erasmus MC. De sectie Acute inwendige geneeskunde, drs. J. Alsma en Prof. dr. J.L.C.M. van Saase, beste Jelmer en Jan, bedankt voor het vertrouwen dat jullie in mij stelden om de SEH te superviseren toen ik net binnenkwam in het Erasmus. En de sectie Metabole en erfelijke stofwisselingsziekten, dr. J.G. Langendonk en dr. M.A.E.M. Wagenmakers, beste Janneke en Margreet, bedankt voor jullie begeleiding bij mijn werk in deze voor mij totaal nieuwe patiëntengroep. Mijn ex-, maar sinds enkele maanden opnieuw, kamergenoot dr. M. van Hoek, beste Mandy, bedankt voor jouw altijd luisterend oor en goede adviezen.
Ook wil ik graag de mensen bedanken die voor mij belangrijk zijn geweest tijdens mijn opleiding tot internist. Prof. dr. C.D.A. Stehouwer, beste Coen, bedankt dat je jouw schat aan kennis met mij hebt willen delen, voor je bemoedigende woorden en het vertrouwen dat je in mij gesteld hebt. Prof. dr. R.P. Koopmans, beste Richard, bedankt jouw begeleiding tijdens mijn opleiding. Prof. dr. H.R. Haak, beste Harm, hoewel je strikt genomen nooit mijn opleider bent geweest, voelt het voor mij toch zo. Bedankt voor de fijne start die ik heb gehad tijdens mijn eerste jaren in de inwendige geneeskunde. Dr. D. Posthouwer, beste Dirk, bedankt voor jouw laagdrempelige bereikbaarheid tijdens mijn opleiding als infectioloog. Ook veel dank aan de staf van de Medische Microbiologie van het Maastricht UMC+, beste

188
Chapter 10
Frank, Helke, Inge, Guy en Petra, als de stage microbiologie een paar jaar eerder was geweest, had mijn loopbaan er misschien heel anders uit gezien. Bedankt voor de begeleiding bij mijn eerste stappen in jullie mooie vakgebied. De HIV-verpleegkundigen die tijdens mijn opleiding in Maastricht werkten, beste Robin en Ron, bedankt voor de ondersteuning in de zorg rondom de HIV-patiënten. De medewerkers van het microbiologisch laboratorium in Maastricht, bedankt voor jullie bereidheid om mij, ondanks jullie drukke werkdagen, te helpen bij het opzoeken van alle monsters uit de vriezer.
Een opleiding tot internist kun je niet afmaken, zonder de hulp en steun van directe collega’s om je heen. Ik ben daarom ook heel dankbaar voor alle AIOS interne geneeskunde en Medi-sche Microbiologie waar ik direct mee samen heb gewerkt in het Máxima Medisch Centrum in Eindhoven en het Maastricht UMC+. Speciale dank aan de fellows Infectieziekten Jaclyn, Maarten en Dennis voor de gezelligheid en het goede teamwork. En Eelke Lintzen, vanaf het moment dat we bij de Mexicaan gingen eten toen ik nog AGNIO in Eindhoven was, ben je een steun geweest tijdens mijn opleiding.
Mijn vrienden en vriendinnen uit Eindhoven en Aalst-Waalre (en Bishop’s Stortford) voor alle tennisdagen, stapavondjes, bbq’s, carnavals, verjaardagen en gezelligheid. Mijn nichtje Marcella, lieve Mars, wat geniet ik toch van ons jaarlijkse dagje uit, laten we er snel weer één plannen. Mijn volleybalmaatje, lieve Brenda, voor altijd elkaars ‘wing’. ‘Oude’ vrienden van vroeger, ik heb vanaf nu weer tijd, laten we gauw weer afspreken!
Mijn lieve vriendinnen, Charlotte, Annemieke, Mariëlle, Tatiana, Yvonne, Emma, Fabiënne, Marlies en Judith, dank jullie wel voor de mooie, jarenlange vriendschap vanaf onze studie. Ik kijk al weer uit naar ons volgende weekendje weg, waarin we weer fijn gaan kletsen, wandelen, kletsen, shoppen, kletsen, ontbijten, kletsen en dineren. Ik bof met jullie als vriendinnen! Lieve Charlotte, alias Statler, bedankt dat je mijn paranimf en elk weekendje weer mijn roomie wil zijn. Ik bewonder je optimisme en je geduld en ik ben blij met jouw vriendschap.
Lieve Marijke, een trouwere vriendin dan jij bestaat niet. Ik wil niet weten hoe het zou zijn geweest zonder al die momenten waarop we samen krom hebben gelegen van het lachen. Deze vriendschap, met de maan op de achtergrond, is voor altijd.
Hartelijk dank aan mijn schoonfamilie, Gwenny, Ad, Falco, Gabriël, Anneke, Ad, Jolanda, Pauwel, Jeroen, Monique en Bas, voor hun belangstelling in dit hele promotietraject en hun gezelligheid. Lieve Gwenny, Ad, Falco en Gabriël, bedankt dat jullie altijd voor ons klaar staan. Ik geniet van onze weekjes weg en dagjes uit en de manier waarop jullie met onze meiden omgaan.

189
Dankwoord
Bedankt opa en Corrie, voor de nooit aflatende belangstelling voor de voortgang van dit proefschrift. Hier is het dan eindelijk. Lieve opa, dank u wel voor het feit dat u me altijd enorm trots op mezelf laat voelen.
Lieve Mark en Suzanne, bedankt voor jullie steun en gezelligheid. Lieve broer van me, ik weet dat ik altijd bij jou terecht kan als het nodig is.
Lieve pap en mam, jullie staan altijd voor me klaar, dag en nacht. Bedankt voor jullie einde-loze vertrouwen in mij en alle steun die ik al mijn hele leven van jullie heb gekregen. Ik voel elke dag dat jullie van me houden en dat jullie trots op me zijn. Ik hou van jullie.
Lieve Celine, Aimée en Anique, lieve mooie meiden van me. Wat hou ik toch ontzettend veel van jullie. Jullie laten me zien wat echt belangrijk is in het leven.
Lieve Aswin, mijn rots in de branding, wat ben ik blij met onze liefde. Bedankt voor je geduld, je investering en je steun tijdens dit hele promotietraject. Ik hou van je. Jij en ik, for ever and ever.