Contemporary management in extractive industries
283
Contemporary management in extractive industries - multidimensional and practical approach edited by Izabela JONEK-KOWALSKA 2019
-
Upload
khangminh22 -
Category
Documents
-
view
6 -
download
0
Transcript of Contemporary management in extractive industries

Contemporary management
in extractive industries
- multidimensional and practical
approach
edited by
Izabela JONEK-KOWALSKA
2019

The monograph includes the papers presented at 4th International Conference MEET 2018
(Management, Economics, Ethics, Technics). Date: 21th of September 2018; Place: Faculty of Organization
and Management, Silesian University of Technology, Poland).
Reviewers
Cherepovitsyn Alexey, Professor at the the St. Petersburg Mining University, Russia
Dmitrieva Diana, PhD, St. Petersburg Mining University, Russia
Dzhevaga Natalia, PhD, Associate Professor at the St. Petersburg Mining University, Russia
Ilinova Alina A., PhD, Associate Professor at the St. Petersburg Mining University, Russia
Jonek-Kowalska Izabela, PhD, Associate Professor at the Silesian University of Technology, Poland
Marinina Oksana, PhD, Associate Professor at the St. Petersburg Mining University, Russia
Michalak Aneta, PhD, Associate Professor at the Silesian University of Technology, Poland
Nevskaya Marina, PhD, Associate Professor at the St. Petersburg Mining University, Russia
Ponomarenko Tatyana, Professor at the the St. Petersburg Mining University, Russia
Turek Marian, Professor at the Silesian University of Technology, Poland
Vasilev Yurii, PhD, Associate Professor at the St. Petersburg Mining University, Russia
Wolniak Radosław, PhD, Associate Professor at the Silesian University of Technology, Poland
Żabka Adam, PhD, Bielsko-Biała School of Finances and Law, Poland
Zieliński Mariusz, PhD, Associate Professor at the Opole University of Technology, Poland
Scientific committee
Bartnicka Joanna, PhD, the Silesian University of Technology, Poland
Bendkowski Józef, prof., the Silesian University of Technology, Poland
Biały Witold, PhD, Associate Professor at the Silesian University of Technology, Poland
Bijańska Jolanta, PhD, the Silesian University of Technology, Poland
Brodny Jarosław, PhD, Associate Professor at the Silesian University of Technology, Poland
Brzóska Jan, prof., the Silesian University of Technology, Poland
Cherepovicin A.E. prof., St. Petersburg Mining University, Russia
Grebski Wiesław, prof., Penn State University, USA
Jonek-Kowalska Izabela, PhD, Associate Professor at the Silesian University of Technology, Poland
Karbownik Andrzej, prof., the Silesian University of Technology, Poland
Kraslavski Andrzej, prof., Lappeenranta University of Technology, Finland
Kuzior Aleksandra, PhD, Associate Professor at the Silesian University of Technology, Poland
Marinina O.A. PhD, Associate Professor, St. Petersburg Mining University, Russia
Matusek Mirosław, PhD, the Silesian University of Technology, Poland
Mizgała Jerzy, PhD, the Silesian University of Technology, Poland
Ponomarenko T.V. prof., St. Petersburg Mining University, Russia
Sergeev I.B. prof., St. Petersburg Mining University, Russia
Turek Marian, prof., the Silesian University of Technology, Poland
Vasiliev J.N. PhD, Associate Professor, St. Petersburg Mining University, Russia
Viere Tobias, prof., Pforzheim University, Germany
Wodarski Krzysztof, PhD, Associate Professor at the Silesian University of Technology, Poland
Zieliński Mariusz, PhD, Associate Professor at the Opole University of Technology, Poland
Organizational committee
Izabela Jonek-Kowalska, PhD, Associate prof., ([email protected]) – chairperson
Jolanta Bijańska, PhD – member
Jerzy Mizgała, PhD – member
Tomasz Owczarek, PhD - member
Piotr Janke, PhD – member
Monika Stępień, MSc, Eng. – member
Jarosław Ziemski, MSc, Eng. – member
Anna Bartłomiejczyk, MSc, Eng. ([email protected]) – secretary

CONTENTS
FOREWORD……………………………………………………………………………. 7
Part I. ASSESSMENT OF COMPETITIVNESS IN EXTRACTIVE
INDUSTRIES: METHODS OF MEASUREMENT AND
STRENGTHENING TOOLS……………………………………………..
9
1. Comparative analysis of competitive advantages of Russian fertilizer
companies
(Diana DMITRIEVA, Andrzej KRASLAWSKI, Alina ILINOVA)………....
11
2. Gap-analysis of the Russian federation coal industry
(Yurii VASILEV)……………………………………………………………..
27
3. The competitive edge of the knowledge management system in the
organizational capital of an industrial company
(Tatyana PONOMARENKO, Izabela JONEK-KOWALSKA,
Oksana MARININA)………………………………………………………...
41
4. Development of a methodology for assessing the effectiveness of
arctic LNG projects based on the specifics of their implementation
(Olga EVSEEVA, Alexey CHEREPOVITSYN)……………………………..
59
5. Sources of value creation of a mining enterprise
(Jolanta BIJAŃSKA, Krzysztof WODARSKI)……………………………....
73
6. Remedial restructuring as a way to extend the final stage of an
enterprise based on the example of Polish hard coal mining
(Izabela JONEK-KOWALSKA)………………………………………………
89
Part II. IMPROVEMENT OF PRODUCTIVITY IN EXTRACTIVE
INDUSTRIES WITH THE USE OF ORGANIZATIONAL AND
TECHNOLOGICAL METHODS……………………………………..….
101
7. Consolidation in the hard coal mining sector: case study
(Marta PODOBIŃSKA-STANIEC, Patrycja BĄK)……………………..….
103
8. Parallax effect in research on community of practice
(Jacek BENDKOWSKI)…………………………………………………...…..
119

4
9. The optimal structure of coal output in a group of collieries
(Adam GUMIŃSKI, Adam BOSOWSKI)………………………………..….
133
10. Studying of the impact of calcium synthetic silicates and hydrated
silicates structure on sorption processes
(Alyona KUZHAEVA, Natalia DZHEVAGA, Igor BERLINSKII)………....
147
11. Removal and separation of lanthanides in polycomponent systems
by ion flotation method
(Natalia DZHEVAGA, Olga LOBACHEVA)…………………………..…...
159
12. Mining output stream rate in the function of probability –
calculations scheme for bidirectional shearer cutting
(Ryszard SNOPKOWSKI, Marta SUKIENNIK, Aneta NAPIERAJ)……...
173
13. Theory of inventory management with a view of stochastic models
(Barbora FRANKOVÁ, Vojtěch MEIER)…………………………………....
189
Part III. SOCIAL AND ENVIRONMENTAL ASPECTS OF
MANAGEMENT IN EXTRACTIVE INDUSTRIES………………..….
203
14. The Corporate Social Responsibility practices in Australian mining
sector
(Radosław WOLNIAK)………………………………………….…………...
205
15. The relationship between indicators of non-financial reporting of
polish companies
(Marta PODOBIŃSKA-STANIEC)…………………………….…………..
219
16. Management of social infrastructure objects of the mining
companies on newly-developed territories
(Marina NEVSKAYA, Tatiana PONOMARENKO,
Tatiana KOSOVTZEVA)……………………………………..………….......
233
17. The issues related to occupational health and safety culture in the
mining industry
(Patrycja BĄK, Marta SUKIENNIK, Mariusz KAPUSTA)……..…………
247
18. Survey of staffing needs to implement projects on the Arctic Shelf
(Alexey FADEEV, Anna TSVETKOVA, Alexey CHEREPOVITSYN)...…
261
19. Perception of environmental responsibility and risks in oil and gas
industry in Russia
(Iuliia GOMAN, Olga KOCHERGINA)…………………..……………….
273

SPIS TREŚCI
WSTĘP………………………………………………………………………………....... 7
Part I. OCENA KONKURENCYJNOŚCI W PRZEMYŚLE
WYDOBYWCZYM: METODY POMIARU I NARZĘDZIA
WZMACNIAJĄCE…………………………………………………………
9
1. Analiza porównawcza przewagi konkurencyjnej rosyjskich firm
produkujących nawozy
(Diana DMITRIEVA, Andrzej KRASLAWSKI, Alina ILINOVA)…………
11
2. Analiza luk w branży węgla kamiennego federacji rosyjskiej
(Yurii VASILEV)…………………………………………………………..…
27
3. Przewaga konkurencyjna system zarządzania wiedzą w kapitale
organizacyjnym przedsiębiorstwa przemysłowego
(Tatyana PONOMARENKO, Izabela JONEK-KOWALSKA,
Oksana MARININA)……………………………………………………..….
41
4. Opracowanie metodologii oceny skuteczności projektów
arktycznych LNG opartej na specyfice ich wdrożenia
(Olga EVSEEVA, Alexey CHEREPOVITSYN)……………………….……
59
5. Źródła tworzenia wartości przedsiębiorstwa górniczego
(Jolanta BIJAŃSKA, Krzysztof WODARSKI)…….………………………...
73
6. Restrukturyzacja naprawcza jako metoda przedłużania cyklu życia
przedsiębiorstwa na przykładzie polskiego górnictwa węgla
kamiennego
(Izabela JONEK-KOWALSKA)………………………………………….......
89
Part II. POPRAWA WYDAJNOŚCI W PRZEMYŚLE WYDOBYWCZYM
DZIĘKI WYKORZYSTANIU METOD ORGANIZACYJNYCH
I TECHNOLOGICZNYCH……………………………………………......
101
7. Konsolidacja sektora górnictwa węgla kamiennego: studium
przypadku
(Marta PODOBIŃSKA-STANIEC, Patrycja BĄK)……………………..….
103
8. Efekt Paralaxy w badaniach wspólnot działań
(Jacek BENDKOWSKI)……………………………………….……………...
119

6
9. Optymalna struktura wydobycia węgla w grupie kopalń węgla
kamiennego
(Adam GUMIŃSKI, Adam BOSOWSKI)……………………..…………….
133
10. Badanie wpływu struktury syntetycznych krzemianów wapnia
i uwodnionych krzemianów na proces sorpcji
(Alyona KUZHAEVA, Natalia DZHEVAGA, Igor BERLINSKII)…..……..
147
11. Usunięcie i oddzielenie lantanowców w układach
wielokomponentowych dzięki metodzie flotacji jonów
(Natalia DZHEVAGA, Olga LOBACHEVA)………………………..……...
159
12. Współczynnik wydobycia w funkcji prawdopodobieństwa –
schemat kalkulacyjny dla dwukierunkowego ścinania
(Ryszard SNOPKOWSKI, Marta SUKIENNIK, Aneta NAPIERAJ)…...….
173
13. Teoria zarządzania zapasami z uwzględnieniem modeli
stochastycznych
(Barbora FRANKOVÁ, Vojtěch MEIER)……………………………..……..
189
Part III. SPOŁECZNE I ŚRODOWISKOWE ASPEKTY ZARZĄDZANIA
W PRZEMYŚLE WYDOBYWCZYM ……………………………..……..
203
14. Praktyki społecznej odpowiedzialności biznesu w sektorze
australijskiego górnictwa
(Radosław WOLNIAK)…………………………………………..……...…...
205
15. Relacja miedzy wskaźnikami sprawozdawczości niefinansowej
polskich spółek
(Marta PODOBIŃSKA-STANIEC)……………………………...………….
219
16. Zarządzanie obiektami infrastruktury społecznej przedsiębiorstw
górniczych na nowo zbudowanych terenach
(Marina NEVSKAYA, Tatiana PONOMARENKO,
Tatiana KOSOVTZEVA)………………………………………..……….......
233
17. Kwestie związane z kulturą bezpieczeństwa I higieny pracy
w branży wydobywczej
(Patrycja BĄK, Marta SUKIENNIK, Mariusz KAPUSTA)…………...……
247
18. Ankieta dotycząca potrzeb kadrowych na potrzeby wdrażania
projektów w szelfie arktycznym
(Alexey FADEEV, Anna TSVETKOVA, Alexey CHEREPOVITSYN)…...
261
19. Postrzeganie odpowiedzialnosci środowiskowej i ryzyka w branży
ropy i gazu w Rosji
(Iuliia GOMAN, Olga OCHERGINA)……………………………….…….
273

FOREWARD
Extraction of natural raw materials in current market conditions raises
controversies. On the one hand, it is a necessary activity for the proper functioning of
modern and traditional branches of industry. On the other hand, both underground
and open-pit extraction of natural raw materials are a serious threat to regional
ecosystems and communities.
Having the above circumstances in mind, one must constantly look for more
effective and efficient management methods in mining industries that will make the
continuation and sufficiency of extraction possible together with minimization of
environmental burden and problems of mining regions inhabitants associated with
the exploitation. These subjects are discussed during periodic international MEET
scientific conference (Management – Economics – Ethics – Technics) organized by the
Faculty of Organization and Management of the Silesian University of Technology
(Poland) and Saint-Petersburg Mining Institute (Russia).
This monograph is composed of three parts where the authors of particular
articles – presented during the conference – focus respectively on issues associated
with:
• Competitiveness – Part 1: Assessment of competitiveness in mining industries:
methods of measurement and strengthening tools,
• Productivity – Part 2: Improvement of productivity in mining industries with
the use of organizational and technological methods,
• Sustainability – Part 3: Social and environmental aspects of management in
mining industries.
of mining industries, which reflects the constant search for balance between the
economic, social and technical aspects of management in these industries. Majority of
the articles is based on data and real problems present in national and international

8
mining industries which makes the considerations and results applicable and directly
reflected in operational and strategic management decisions.
I would like to thank the representatives of the below institutions for the
participation in the conference and for cooperation during its preparation:
• Saint-Petersburg Mining University, Russia,
• LUT School of Business and Management, Finland,
• G. P. Luzin Institute for Economic Studies of the Kola Science Centre of the
RAS, Russia,
• Technical University of Ostrava, Czech Republic,
• AGH University of Science and Technology, Poland,
• Faculty of Organization and Management, Silesian University of Technology,
Poland.

PART I
ASSESSMENT OF COMPETITIVNESS
IN EXTRACTIVE INDUSTRIES:
METHODS OF MEASUREMENT
AND STRENGTHENING TOOLS


Diana DMITRIEVA1, Andrzej KRASLAWSKI2, Alina ILINOVA3
1 Saint-Petersburg Mining University, Russia (e-mail: [email protected]) 2 LUT School of Business and Management, Finland (e-mail: [email protected]) 3 Saint-Petersburg Mining University, Russia (e-mail: [email protected])
1. COMPARATIVE ANALYSIS OF COMPETITIVE ADVANTAGES
OF RUSSIAN FERTILIZER COMPANIES
1.1. Introduction
The use of fertilizers increased vastly over the twentieth century, and fertilizer
use is forecast to continue growing also in the near future (Enger, 2010). Global
consumption of fertilizers in the agricultural years (beginning of July - end of June)
2009-2016 is presented in Figure 1. The dynamic growth of consumption of fertilizers
is seen in all three segments. The greatest increase is observed for nitrogen fertilizers,
which are the most commonly used fertilizer worldwide.
Fig. 1. Global consumption of fertilizers (agricultural years) [mln tonnes]
Rys. 1. Globalne zużycie nawozów (lata rolnicze) [mln ton]
Source: Fertilizer Outlook 2013-2017, Fertilizer Outlook 2015-2019, (Dmitrieva et.al., 2017).
Limited supply caused by resource exhaustibility influence the market situation
as well. Thus, attractive industry fundamentals determine steady growth in demand
for fertilizers in the long term (Ilinova, Dmitrieva, 2017).

12 MEET 2018
Russia accounts for about 10% of world production of fertilizers.Products of the
Russian fertilizer industry (due to the unique natural resources) are characterized by
high quality and competitive price as a whole (Dmitrieva, 2016).
Due to the launch of new production facilities (capacity growth) and increased
competition, the position of suppliers in the structure of world trade has changed in
recent years.
The world market is characterized by very intense competition. According to the
International Fertilizer Association, by 2018, it is expected a significant increase of
production capacity of nitrogen fertilizers in East Asia (China, Indonesia), Eastern
Europe (Russia), North America (USA), Africa (Algeria, Egypt, Nigeria). In the
phosphorous segment, Saudi Arabia (+3.5 million tons per year in 2017) and Morocco
(+1.8 million tons per year) will provide the main capacity growth. There are other
projects (including in the CIS countries – in Kazakhstan and Uzbekistan), but precise
data on launch dates and capacities are not yet available. In the potash market the
largest project is being implemented in Canada (Jansen, 8 million tons), but now
there is no clarity with the timing. Russian companies“ Acron” and “EuroChem” are
actively working on the construction of new mines. In 2018, new mines are expected
to be commissioned in Canada (“K+S Kali”, 2.8 million tons) and Turkmenistan
(“Turkmen chemistry”, 1.4 million tons). In 2020 it is also expected capacity
expansion in Belarus. Important for the market is the announcement of the discovery
of potash salt deposits in China.
Increased competition in the world market of mineral fertilizers will complicate
the position of Russian companies. In order to maintain leading positions Russian
companies need to gain and develop sustainable competitive advantages. Therefore,
the purpose of the research is to reveal main competitive advantages of Russian
fertilizer companies and to compare them using suggested model in order to find
more sustainable.
1.2. Literature studies
Nowadays, there are a lot of theoretical and methodological approaches and
research studies devoted to competitive advantages of the companies: their creation,
development and maintaining. In traditional approach to strategic management,
competitive advantage is described as something that helps a company consistently

Comparative analisis of competitive advantages… 13
earn a higher rate of return than its competitors (Porter, 1980; Porter, 1985; Grant,
1995; Schoemaker, 1990). Some authors define competitive advantage as a quality
that distinguishes the company from others and keeps it going and growing (Smith
and Flanagan, 2006).
Nowadays, companies should not only improve their adaptability and flexibility
(Nilson and Rapp, 2005; Wei, et al., 2017, Ponomarenko, 2016, Nevskaya and
Marinina, 2017), but also develop the strategy with the main goal to gain and boost
competitive advantages(Švárová and Vrchota, 2014; Gyampah and Acquaah, 2008).
However, in times of globalization and intensive business competition it becomes
more and more difficult to gain and maintain competitive advantages (Brown and
Eisenhardt, 1998; D’Aveni, 1994; Nilsson and Dernroth, 1995; Eisenhardt and Martin,
2000; Hamel, 2000). It is because almost all of them (resources, technologies,
information etc.) can be copied and replicated by competitors (Goldsmith, 2013;
Singh, 2012).
Previous studies, devoted to mineral fertilizers market, have addressed fertilizer
markets and forecasts of fertilizer consumption (Al Rawashdeh, 2011; Al Rawashdeh,
2016; Geman, 2013), development of phosphate and potash resources and reserves
(Mew, 2016; Ciceri, 2015; Cooper, 2011). The past research also addressed the
evolution of the fertilizer market and its forecasting in the coming decades
(Al Rawashdeh, 2014) as well as fertilizer availability in a resource-limited world
(Dawson, 2011). In addition, the research has tackled capital investment in fertilizer
companies (Geman, 2013), supply behavior of state mining enterprises
(Al Rawashdeh, 2008), and efficiency performance of the leading phosphate rock
mining companies (Geissler, 2015).
Competitive advantages of fertilizer mining companies could be classified by
degree of their sustainability (sustainable and non-sustainable (unsustainable)).
The research of sustainability of competitive advantages is a widespread subject of
research in academic debates. There are many previous studies devoted
to sustainable competitive advantages (Chaharbaghi and Lynch, 1999; Takalaa, 2013;
Kotabe, 2014 among many others).
In general, in the theory of sustainable competitive advantages, sustainability is
an attribute of advantage that shows whether competitors can copy it or not. There

14 MEET 2018
are many definitions of sustainable competitive advantages (Grant, 1995;
Chaharbaghi and Lynch, 1999; Barney et al., 1991; Barney et al., 2001; Liu, 2013).
However, there are no research papers focusing specifically on the creation and
development of competitive advantages of fertilizer mining companies. Moreover,
despite the wide range of scientific works devoted to sustainable competitive
advantages, there is no opportunity to measure the sustainability of competitive
advantages for fertilizer companies and other companies.
1.3. Methodology
Analyzing and synthesizing previous researches concerning characteristics of
sustainability of competitive advantages (Grant, 1995; Chaharbaghi and Lynch, 1999;
Barney, 1991) we suggest use three indicators for sustainability of competitive
advantages evaluation - possibility of competitive advantages copying (replicability),
time for competitive advantages invention/ implementation and resource intensity
of competitive advantages implementation (Tab. 1).
Table 1
Indicators for sustainability of competitive advantages evaluation
Indicator Symbol Characteristic Description
Possibility of
competitive
advantages
copying
P
Shows if it is
possible to copy
competitive
advantages and
analytical
measure of
possibility.
It is an evaluation of possibility of company’s
competitive advantages copying
or substitution by competitors. If competitive
advantage is easy to copy and there is no
possibility to protect intellectual property this
determinant take the value 0. If it is impossible
to copy competitive advantage the determinant
take the value 1.
Time for
competitive
advantages
invention/
implementation
T
Measure of time
needed by
competitor to
achieve
competitive
advantages and
implement it.
It is an evaluation of time needed to achieve
competitive advantage. More time needed,
closer to 1 is the determinant’s value.
Resource
intensity of
competitive
advantages
implementation
R
Shows how much
resources
competitors need
for implementing
competitive
advantage.
It is a measure of amount of resources (financial,
human etc.) that competitors need to get
competitive advantage and sustain it in
turbulent environment More resources needed,
closer to 1 is the determinant’s value.
Source: own study.

Comparative analisis of competitive advantages… 15
Takalaa (2013) suggest in his research strategy triangle and resource triangle,
using that idea in order to evaluate sustainability of competitive advantages by three
determinants we suggest to construct the triangle of sustainability of competitive
advantages where the sides would be the determinants P, T, R (the example you can
see on the Fig. 2).
We have three determinants, which are unidirectional – the bigger value each of
them takes - more sustainability the competitive advantage has. So, the bigger the
area of a triangle the higher level of sustainability the competitive advantage has.
The main idea – is to evaluate level of competitive advantages sustainability using
these determinants and reveal more and less sustainable competitive advantage for
fertilizers companies in order to create competitive strategy. The implementation of
that concept is given in the next paragraph.
Fig. 2. The concept of the triangle of sustainability of competitive advantages (an example)
Rys. 2. Koncepcja trójkąta trwałej przewagi konkurencyjnej (przykład)
Source: own study.
1.4. Research results
Intense competition forces fertilizer companies to search for sustainable
competitive advantages in order to hold or strengthen their market position. Under
such circumstances situation, it is important to understand the sustainability of
particular competitive advantages (Ilinova and Dmitrieva, 2017). First, we need to
identify main competitive advantages of fertilizer companies. There are many factors

16 MEET 2018
contributing to the competitive advantages of producers of mineral fertilizers
(Dmitrieva and Ilinova, 2016; Ilinova and Dmitrieva, 2017; Dmitrieva at al., 2017).
Using market peculiarities of fertilizer industry (Dmitrieva, 2016) and features of
Russian raw material base (Pashkevich et al., 2014) the main sources of competitive
advantages, their components and results of their implementation were established
(Table 2). After that, we need to compare competitive advantages.
Table 2
Creation of competitive advantages in fertilizer companies
Sources of competitive
advantage Competitive advantages Result of implementation
Mineral resources
Access to all kinds of mineral
resources
Mineral raw material
independence of the company
Access to unique mineral
resources
Low production expenses
High quality of products
Possibility to create large
vertically integrated
companies
Vertically integrated business
model of the company
Effective planning and management
of all the chain of value creation,
effect of synergy and low
production expenses
Possibility to transform the
production system
depending on the demand
for mineral fertilizers by
types
Flexible business model
allowing for a quick change of
the production structure
High production and sales efficiency
Possibility to transform the
sales system depending on
the demand for mineral
fertilizers by regions
Flexible sales model allowing
for a quick change of delivery
regions
High production and sales efficiency
Possibility to develop a
logistic system to optimize
the costs
Effective logistic system (with
own assets)
Low expenses on transport, timely
delivery of goods
Possibility to develop
company’s own
distribution system
Own distribution system
Low expenses on distribution,
timely delivery of goods, proximity
to final buyers, satisfaction of
individual inquiries of buyers
Diversification and
production of different
types of mineral fertilizers
Wide product range
Ability to satisfy demand of a large
number of consumers, high profit
margin, decreasing risk
Possibility to participate in
social and cultural
development of the region
Implementation of social and
infrastructural programs in the
region
Good reputation of the company,
involvement of labor, increased level
of corporate social responsibility
Fluctuation of currencies Low cost of production in
relation to the world market
Additional profit / increase in sales
caused by reduction of prices
Source: own study.
Comparative analisis of competitive advantages… 17
As we have already stated, competitive advantages can be sustainable,
conditionally sustainable and non-sustainable (Chaharbaghi and Lynch, 1999;
Takalaa, 2013; Kotabe, 2014).
In order to evaluate the sustainability of competitive advantages of fertilizer
companies we used the suggested model. For that purpose, competitive advantages
listed in Table 2 were characterized using determinants (P, T, R) and the areas of
a triangles (S) were calculated.
A group of experts (decision-makers) was involved in the evaluation of
sustainability characteristics of competitive advantages. It brought together three
specialists in business management, who have considerable experience in
forecasting, planning and managing companies in this specific industry, as well as
two specialists (senior consultants) in consulting and analytical agencies dealing with
such issues. The results of evaluation presented in Table 3.
Table 3
Characteristics of competitive advantages sustainability for fertilizers companies
Competitive advantages
No. 1 2 3 4 5 6 7 8 9 10 11
P 0,8 0,7 0,7 0,6 0,3 0,4 0,2 0,1 0,4 0,3 0,1
T 0,8 0,9 0,6 0,4 0,7 0,6 0,4 0,3 0,5 0,4 0,2
R 0,8 0,8 0,8 0,5 0,5 0,4 0,2 0,2 0,5 0,4 0,2
S 7,6974 7,7658 5,9618 3,0753 3,2827 2,7035 0,93484 0,5504939 2,6430 1,6410 0,3595
Source: compiled by the authors (1 - Access to all kinds of mineral resources, 2 - Mineral raw
independence of the company, 3 - Access to unique mineral resources, 4 - The
vertically integrated business model of the company, 5 - The flexible production
business model allowing to change structure of production quickly, 6 - The flexible
sale business model allowing to change regions of deliveries quickly, 7 - Existence of
effective logistic system (with own assets), 8 - Existence of own distribution system,
9 - Wide product range, 10 - Implementation of programs for development of social
facilities and infrastructure in the region, 11 - Low cost of production in relation to
the world market).
The triangles of sustainability of competitive advantages were built (Fig. 3). The
concept of triangle was used because it helps not only to reveal more and less
sustainable competitive advantages but also to present more informative each of it.
As it was mentioned competitive advantages could be sustainable and non-
sustainable (Chaharbaghi and Lynch, 1999; Takalaa, 2013; Kotabe, 2014 among many
others). Also in high environmental turbulence (Ilinova and Dmitrieva, 2017), some
competitive advantages that seems to be sustainable could become non-sustainable

18 MEET 2018
(conditionally sustainable). For fertilizers companies possibility of competitive
advantages copying (replicability), time for competitive advantages invention/
implementation and resource intensity of competitive advantages implementation
have equal significance for evaluation sustainability of competitive advantages. Each
of them could take the value from 0 to 1, were 0 determine competitive advantage
which is easy to copy without spending a lot of time and resources, and 1 determine
competitive advantage that is impossible to copy or it will take a lot of time and
resources. So, for these determinants we make convention: if each of determinant
take value from 0 to 0.33 competitive advantage determined as non-sustainable, from
0.33 to 0.66 – conditionally sustainable, from 0.66 to 1 – sustainable (three levels of
competitive advantages sustainability). Calculating areas of triangles for fertilizer
companies, the follows convention could be made:
0<F (P, T, R) ≤1.3098– the competitive advantage of fertilizer company
considered as non-sustainable,
1.3098 < F (P, T, R) ≤ 5.2391 – the competitive advantage of fertilizer company
considered as conditionally sustainable,
5.2391 < F (P, T, R) ≤ 12.0273 the competitive advantage of fertilizer company
considered as sustainable.
Using this classification the following conclusions could be done about
sustainability of competitive advantages of fertilizers companies: 1,2,3 – it is
sustainable competitive advantages; 4,5,6,9,10 - conditionally sustainable competitive
advantages; 7,8,11 - non-sustainable competitive advantages.
Table 4 presents sustainability of competitive advantages of Russian fertilizers
companies with examples of the Russian companies that have these competitive
advantages. In addition, table presents possible results of competitive advantages
realization for companies.

Comparative analisis of competitive advantages… 19
Fig. 3. Triangles of sustainability of competitive advantages for fertilizers companies
Rys. 3. Trójkąty trwałej przewagi konkurencyjnej dla firm nawozowych
Source: own study (1 - Access to all kinds of mineral resources, 2 - Mineral raw
independence of the company, 3 - Access to unique mineral resources, 4 - The
vertically integrated business model of the company, 5 - The flexible production
business model allowing to change structure of production quickly, 6 - The flexible
sale business model allowing to change regions of deliveries quickly, 7 - Existence of
effective logistic system (with own assets), 8 - Existence of own distribution system,
9 - Wide product range, 10 - Implementation of programs for development of social
facilities and infrastructure in the region, 11 - Low cost of production in relation to
the world market).
Table 4
Sustainability of competitive advantages of Russian fertilizers companies
in high environmental turbulence
Competitive advantages Sustainability of competitive advantage Companies
Access to all kinds of
mineral resources
Sustainable (S=7,6974)
Realization of competitive advantage allows
companies produce all kinds of fertilizers and
not depend from supplies. It is the most
sustainable competitive advantage in fertilizers
industry.
None of Russian
companies
Mineral raw independence
of the company
Sustainable (S=7,7658)
Realization of competitive advantage allows
companies operate in its own rhythm without
dependence from terms and conditions of
supplies
PhosAgro,
Uralkali, Evrochem

20 MEET 2018
cont. table 4
Competitive advantages Sustainability of competitive advantage Companies
Access to unique mineral
resources
Sustainable (S=5,9618)
Realization of competitive advantage allows
companies produce and supply unique product
to market or define conditions in case of
providing rivals with this resource.
It is almost impossible to copy that competitive
advantage
PhosAgro,
Uralkali
The vertically integrated
business model of the
company
Conditionally sustainable (S=3,0753)
This competitive advantage is easy to copy and
almost all fertilizers companies in Russia
already has it because it provide lower costs and
independence in operational activity
PhosAgro,
Evrochem, Akron,
Uralkali
The flexible production
business model allowing to
change structure of
production quickly
Conditionally sustainable (S=3,2827)
It is possible to copy that competitive advantage,
but it requires resources. At the same time it
helps company to satisfy the actual demand of
consumers
PhosAgro
The flexible sale business
model allowing to change
regions of deliveries quickly
Conditionally sustainable (S=2,7035)
It is possible to copy but requires resources and
time because of remoteness of places of
consumption from places of production for
fertilizers companies.
PhosAgro,
Uralkali
Existence of effective
logistic system (with own
assets)
Non-sustainable (S=0,9348)
It is easy to copy this competitive advantage for
rivals and it is not requires many time.
PhosAgro,
Uralkali,
Evrochem
Existence of own
distribution system
Non-sustainable (S=0,5505)
It is easy to copy this competitive advantage for
rivals and it is not requires many time
Uralkali,
PhosAgro
Wide product range
Conditionally sustainable (S=2,6430)
For fertilizers companies product range is
restricted by availability of mineral resources, so
to have this competitive advantage company
need firstly to get access to resources.
PhosAgro,
Evrochem, Akron
Implementation of
programs for development
of social facilities and
infrastructure in the region
Conditionally sustainable (S=1,6410)
It is possible to copy, but at the same time
requires effective management system to use it
for companies’ benefit.
Akron, PhosAgro,
Uralkali,
Evrochem,
Uralchem
Low cost of production in
relation to the world market
Non-sustainable (S=0,3595)
This competitive advantage is appears mainly
due to the depreciation of the ruble to the dollar.
This situation allows companies either to reduce
the price for foreign consumers, or to get
additional profit. But in high environmental
turbulence this competitive advantage could be
lost fast.
PhosAgro,
Uralkali,
Uralchem
Source: own study.
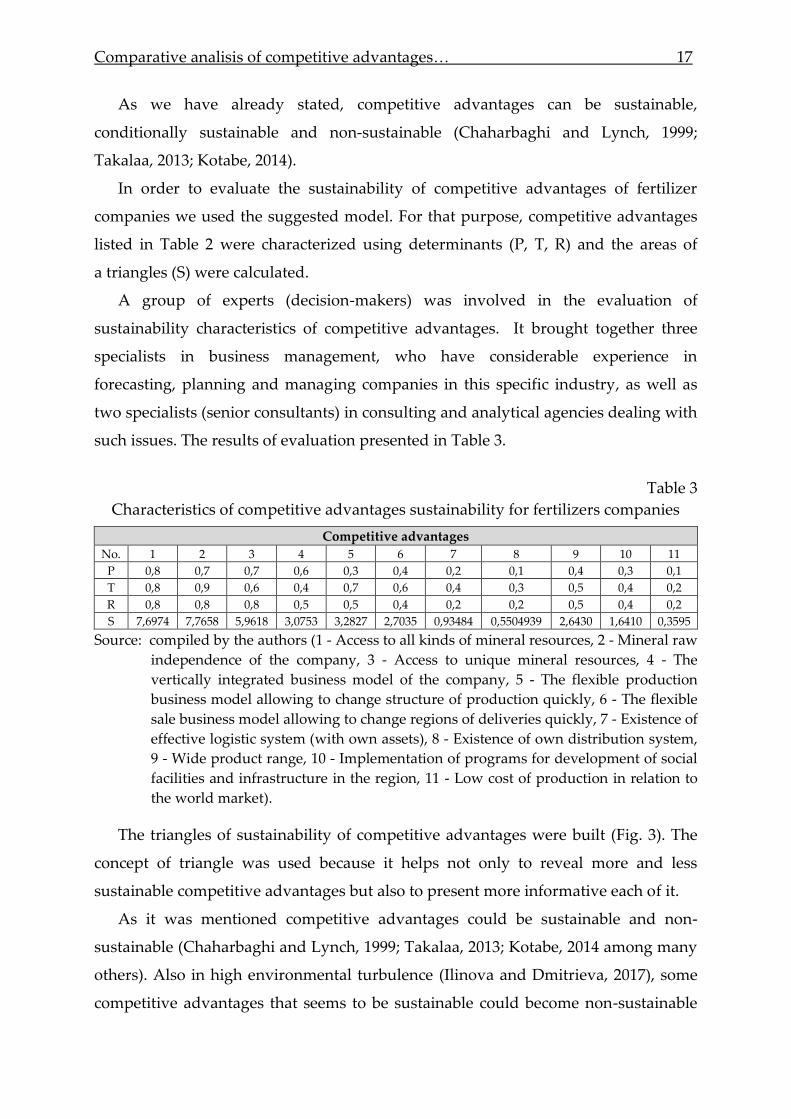
Comparative analisis of competitive advantages… 21
As it seen from the Table 4, Russian fertilizers companies that have sustainable
competitive advantages (PhosAgro, Uralkali, Evrochem) have more competitive
power than their competitors do. In addition, it was found that company PhosAgro
has almost all competitive advantages that allows it get leading positions at the
market. Companies Evrochem and Uralchem need to develop sustainable
competitive advantages or to find other directions to increase it competitiveness.
1.5. Conclusions
Sector-specific market and industry features and high level of turbulence of its
external environment connected with complexity and huge amount of unexpected
and unpredictable changes in prices, demand, behavior of competitors, policy
regulation, etc. characterize the fertilizer industry.
Russian fertilizer companies enjoy a significant share of the global fertilizer
market. However, the competitive advantages of Russian manufacturers, which are
largely resource-based, can be partially or completely lost, because the Russian
companies keep their competitiveness to a large extent through high quality raw
materials, but not through increasing of their production and management efficiency.
Our approach for a discussion on strategic development of fertilizers companies
based on necessity to create and develop sustainable competitive advantages, which
are steady basis for successful development of the companies. Fertilizers companies
have to focus precisely on the competitive advantages, which are the most
sustainable. In this way, important issue is to separate sustainable and non-
sustainable among a set of advantages. In particular, relevant issue is to formulate
conceptual approach and suitable tools allowing identify sustainability of advantage.
In this paper, we made an effort to solve this problem.
Our research focuses on investigation of main types of competitive advantages of
fertilizers companies and creation of model for assessment of degree of their
sustainability, which is necessary in order that all resources and efforts of the
company have to be directed to receiving, development and deduction of sustainable
difficult copied advantages. Concentration of the company on sustainable
competitive advantages allows cementing its stability in highly turbulent external
environment.

22 MEET 2018
The results of this paper are the concept of creation of competitive advantages by
the fertilizer companies and an analytical model for comparison of competitive
advantages of fertilizer companies regarding its sustainability.
Acknowledgement
The paper is based on research carried out with the financial support of the grant
of the Russian Science Foundation (Project No. 14-38-00009, The program-targeted
management of the Russian Arctic zone development). Peter the Great St. Petersburg
Polytechnic University.
Bibliography
1. Al Rawashdeh, R. (2008). The supply behavior of state mining enterprises: A case
study of the Jordanian phosphate industry. Resources Policy, 33, 196-202.
https://doi.org/10.1016/j.resourpol.2008.04.001
2. Al Rawashdeh, R., Maxwell, P. (2011). The evolution and prospects of the
phosphate industry. Mineral Economics, 24, 15-27.
3. Al Rawashdeh, R., Maxwell, P. (2014). Analysing the world potash industry.
Resources Policy, 41, 143-151. https://doi.org/10.1016/j.resourpol.2014.05.004
4. Al Rawashdeh, R., Xavier-Oliveira, E., Maxwell, P. (2016). The potash market
and its future prospects. Resources Policy, 47, 154-163. https://doi.org/10.1016/
j.resourpol.2016.01.011
5. Barney, J.B. (1991). Firm resources and sustainable competitive advantage.
Journal of Management, 17, 99-120. DOI: 10.1016/S0742-3322(00)17018-4
6. Barney, J.B., Wright, M., Ketchen, D.J. (2001). The resource-based view of the
firm: ten years after 1991. Journal of Management, 27 (6), 625-641.
https://doi.org/10.1016/S0149-2063(01)00114-3
7. Brown, S.L., Eisenhardt, K.M. (1998). Competing on the Edge. Harvard business
School Press: Boston, MA.
8. Chaharbaghi, K., Lynch, R. (1999). Sustainable competitive advantage: towards
a dynamic resource-based strategy. Management Decision 37/1, 45-50.
DOI: 10.1108/00251749910252012
9. Ciceri, D., Manning, D., Allanore, A. (2015). Historical and technical
developments of potassium resources. Science of the Total Environment, 502,
590-601. https://doi.org/10.1016/j.scitotenv.2014.09.013

Comparative analisis of competitive advantages… 23
10. Cooper, J., Lombardi, R., Boardman, D., Carliell-Marquet, C. (2011). The future
distribution and production of global phosphate rock reserves. Resources,
Conservation and Re-cycling, 57, 78-86.
https://doi.org/10.1016/j.resconrec.2011.09.009
11. D’Aveni, R.A. (1994). Hypercompetition: Managing the Dynamics of Strategic
Maneuvering. Free Press: New York, NY.
12. Dawson, C.J., Hilton, J. (2011). Fertilizer availability in a resource-limited world:
Production and recycling of nitrogen and phosphorus. Food Policy, 36, 14-22.
https://doi.org/10.1016/j.foodpol.2010.11.012
13. Dmitrieva (2016). Recommendations for the strategic analysis process of mining
and chemical companies improvement. Organization and Management. Scientific
Paper №91. Silesian University Of Technology Scientific Papers. №1954. 25-39.
14. Dmitrieva, D., Ilinova, A., Kraslawski, A. (2017) Strategic Management of the
Potash Industry in Russia. Resources Policy. 52. 81-89.
https://doi.org/10.1016/j.resourpol.2016.11.004
15. Dmitrieva, D., Ilinova, A. (2016). Application of Strategic Analysis Methods and
Tools in Russian Mining and Chemical Complex. International Journal of Applied
Engineering Research, 11 (8), 5567-5572.
16. Eisenhardt, K., Martin, J. (2000) “Dynamic capabilities: what are they?”. Strategic
Management Journal, 21,1105-1121.
17. Enger, E.D. (2010). Environmental Science: A Study of Interrelationships, 12th
edition. McGraw-Hill Higher Education, Boston, MA.
18. Geissler, B., Mew, M.C., Weber, O., Steiner, G. (2015). Efficiency performance of
the world’s leading corporations in phosphate rock mining. Resources,
Conservation and Recy-cling, 105, 246-258.
https://doi.org/10.1016/j.resconrec.2015.10.008
19. Geman, H., Vergel Eleuterio, P. (2013). Investing in fertilizer–mining companies
in times of food scarcity. Resources Policy, 38, 470-480.
https://doi.org/10.1016/j.resourpol.2013.07.004
20. Goldsmith, D. (2013). Rethinking the company’s competitive advantage.
Financial Executive, 29, 6, 14-17.
21. Grant, R. (1995). Contemporary Strategy Analysis, Blackwell, Cambridge, MA.
22. Gyampah, K.A., Acquaah, M. (2008). Manufacturing strategy, competitive
strategy and firm performance: an empirical study in a developing economy
environment. International Journal of Production Economics, 111 (2), 575-592.
https://doi.org/10.1016/j.ijpe.2007.02.030

24 MEET 2018
23. Hamel, G. (2000). Leading the Revolution. Harvard Business School Press:
Boston.
24. Ilinova, A., Dmitrieva, D. (2017). Competitive advantages of mining and
chemical companies in high environmental turbulence. Economic and technological
conditions of development in extractive industries. Proceedings of International
Conference on Management – Economics – Ethics – Technology (MEET 2017).
43-54.
25. Kotabe, M., Murray, J. (2004). Global sourcing strategy and sustainable
competitive advantage. Industrial Marketing Management. Vol. 33, Issue 1, 7-14.
https://doi.org/10.1016/j.indmarman.2003.08.004
26. Liu, Y. (2013). Sustainable competitive advantage in turbulent business
environments. International Journal of Production Research, 51:10, 2821-2841.
https://doi.org/10.1080/00207543.2012.720392
27. Mew, M.C. (2016). Phosphate rock costs, prices and resources interaction. Science
of the Total Environment, 542, 1008–1012.
https://doi.org/10.1016/j.scitotenv.2015.08.045
28. Nevskaya, M.A., Marinina, O.A. (2017). Challenges and opportunities of state
regulation of the innovation process in the Russian mineral resources sector.
Academy of Strategic Management Journal, № 1, V 16. pp. 149-159.
29. Nilsson, C-H., Dernroth, J. (1995) The strategic grounding of competitive
advantage – The case of Scania. International Journal of Production Economics.
Vol. 41 (1-3), 281-296. https://doi.org/10.1016/0925-5273(95)00035-6
30. Nilsson, F., Rapp, B., (2005). Understanding competitive advantage the
importance of strategic congruence and integrated control. Berlin: Springer.
31. Pashkevich N.V., Iseeva L.I., Fedchenko, А.А. (2014) Russia in the World Markets
Minerals: Reserves, Production and Export. Journal of Mining Institute. Vol. 208,
60-64.
32. Porter, M.E. (1980). Competitive Strategy. The Free Press: New York, NY.
33. Porter, M.E. (1985). Competitive Advantage. The Free Press: New York, NY.
34. Ponomarenko, T.V. (2016). Korporativnaya social'naya otvetstvennost' ugol'noj
otrasli (praktika rossijskih i evropejskih kompanij). T.V. Ponomarenko,
R. Vol'nik, O.A. Marinina. Zapiski Gornogo instituta. T. 222, s. 882-891.
doi: http://dx.doi.org/10.18454/pmi.2016.6.882.
35. Schoemaker, P.J.H. (1990). Strategy, complexity and economic rent. Management
Science, 36(10), 1178-1192.

Comparative analisis of competitive advantages… 25
36. Singh, P.K. (2012). Management of Business processes can help an organization
achieve competitive advantage. International Management Review. Vol. 8, No 2,
19-26.
37. Smith, L.J., Flanagan, G.W. (2006). Creating Competitive Advantage: Give
Customers a Reason to Choose You Over Your Competitors, 208.
38. Švárová, M., Vrchota, J. (2014). Influence of Competitive Advantage on
Formulation Business Strategy. Procedia Economics and Finance, 12, 687-694.
https://doi.org/10.1016/S2212-5671(14)00394-3.
39. Takala, J., Liu, Y., Feng, B., Yang, W. (2013). Analytical Evaluation of Sustainable
Competitive Advantage. IFAC Proceedings Volumes. Vol. 46, Issue 9,
pp. 1240-1243 https://doi.org/10.3182/20130619-3-RU-3018.00193
40. Wei, Z., Song, X., Wang, D. (2017). Manufacturing flexibility, business model
design, and firm performance. International Journal of Production Economics.
Vol. 193, 87-97. https://doi.org/10.1016/j.ijpe.2017.07.004
COMPARATIVE ANALYSIS OF COMPETITIVE ADVANTAGES OF
RUSSIAN FERTILIZER COMPANIES
Abstract
The Russian fertilizer industry is strategically important and potentially
competitive in world markets, while also having good conditions for stable growth in
Russia. Intense competition and changes in the structure of world trade forced
fertilizer companies to gain and sustain competitive advantages. Therefore, the
purpose of the article is to reveal competitive advantages of Russian fertilizer
companies and compare them by evaluating their sustainability in order to find out
most and less sustainable competitive advantages. In this paper, an analytical model
for comparison of competitive advantages of fertilizer companies regarding its
sustainability is proposed. This model was used for comparative analysis of
competitive advantages of Russian fertilizer companies. Main sources of competitive
advantages of Russian fertilizer companies, their components and results of their
implementation are presented as one of the results of the research. Sustainable and
non-sustainable competitive advantages were revealed. Russian fertilizer companies
as well as foreign companies can use the results of the research for revealing more
and less sustainable competitive advantages in order to strengthen its positions on
the world market.
Keywords: fertilizer companies, competitive advantages, sustainability, fertilizer
industry, mineral recourses.

26 MEET 2018
ANALIZA PORÓWNAWCZA PRZEWAGI KONKURENCYJNEJ
ROSYJSKICH FIRM PRODUKUJĄCYCH NAWOZY
Streszczenie
Branża nawozów w Rosji ma strategiczne znaczenie i cechuje się konkurencyjnym
potencjałem na światowych rynkach, jednocześnie ciesząc się dobrymi warunkami
na potrzeby ustabilizowanego rozwoju w Rosji. Ostra konkurencja i zmiany
w strukturze światowego handlu zmusiły spółki produkujące nawozy do zdobycia
i utrzymania przewagi konkurencyjnej. Tym samym, celem niniejszego artykułu jest
przedstawienie różnych elementów przewagi konkurencyjnej rosyjskich firm
produkujących nawozy i porównanie ich, poprzez ocenę ich zrównoważonego
rozwoju, by znaleźć najbardziej i najmniej zrównoważone elementy przewagi
konkurencyjnej. W tej pracy zaproponowano model analizy na potrzeby porównania
elementów przewagi konkurencyjnej spółek produkujących nawozy w odniesieniu
do ich zrównoważonego rozwoju. Model ten został wykorzystany na potrzeby
analizy porównawczej przewagi konkurencyjnej rosyjskich firm produkujących
nawozy. Jako wyniki badania zaprezentowano główne źródła przewagi
konkurencyjnej rosyjskich firm produkujących nawozy, ich elementy składowe
i wyniki ich wdrożenia. Przedstawiono również zrównoważone elementy przewagi
konkurencyjnej i takie, które nie wpisują się w tę kategorię. Rosyjskie spółki
produkujące nawozy oraz spółki zagraniczne mogą wykorzystać wyniki tych badań,
by wykazać mniej i bardziej zrównoważone elementy przewagi konkurencyjnej, aby
wzmocnić swoją pozycję na globalnym rynku.
Słowa kluczowe: Spółki produkujące nawozy, przewaga konkurencyjna,
zrównoważony rozwój, branża nawozów, zasoby mineralne.
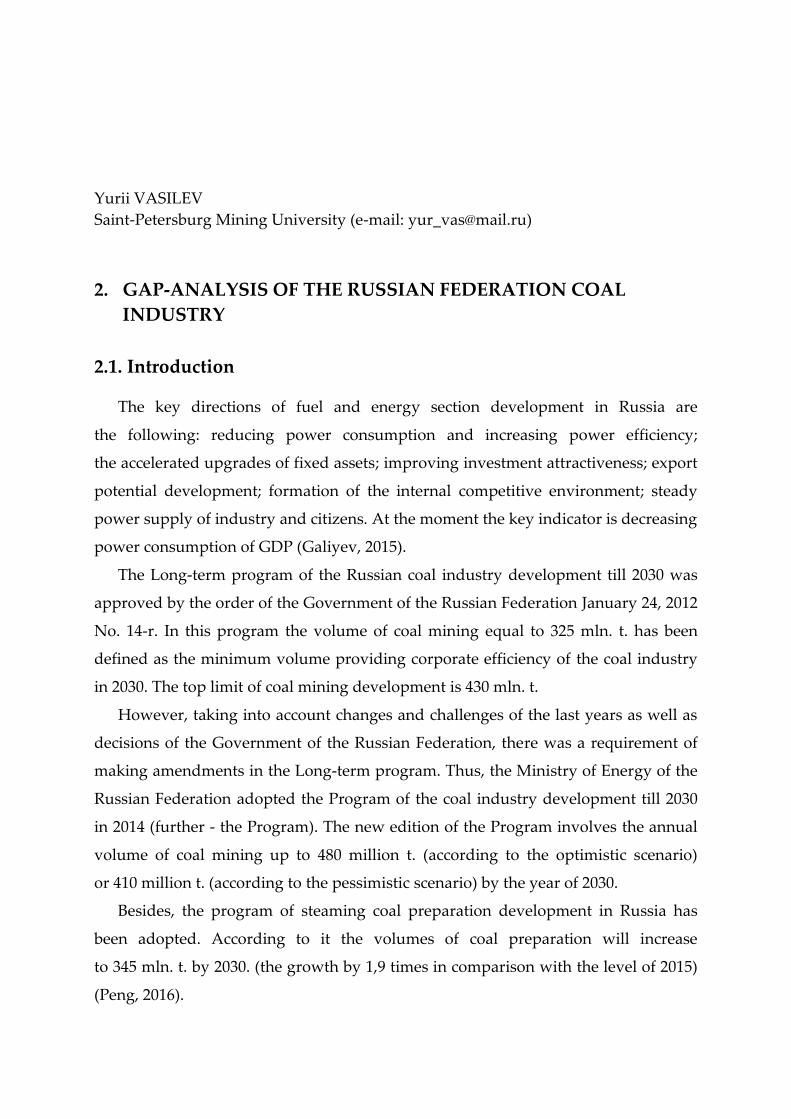
Yurii VASILEV
Saint-Petersburg Mining University (e-mail: [email protected])
2. GAP-ANALYSIS OF THE RUSSIAN FEDERATION COAL
INDUSTRY
2.1. Introduction
The key directions of fuel and energy section development in Russia are
the following: reducing power consumption and increasing power efficiency;
the accelerated upgrades of fixed assets; improving investment attractiveness; export
potential development; formation of the internal competitive environment; steady
power supply of industry and citizens. At the moment the key indicator is decreasing
power consumption of GDP (Galiyev, 2015).
The Long-term program of the Russian coal industry development till 2030 was
approved by the order of the Government of the Russian Federation January 24, 2012
No. 14-r. In this program the volume of coal mining equal to 325 mln. t. has been
defined as the minimum volume providing corporate efficiency of the coal industry
in 2030. The top limit of coal mining development is 430 mln. t.
However, taking into account changes and challenges of the last years as well as
decisions of the Government of the Russian Federation, there was a requirement of
making amendments in the Long-term program. Thus, the Ministry of Energy of the
Russian Federation adopted the Program of the coal industry development till 2030
in 2014 (further - the Program). The new edition of the Program involves the annual
volume of coal mining up to 480 million t. (according to the optimistic scenario)
or 410 million t. (according to the pessimistic scenario) by the year of 2030.
Besides, the program of steaming coal preparation development in Russia has
been adopted. According to it the volumes of coal preparation will increase
to 345 mln. t. by 2030. (the growth by 1,9 times in comparison with the level of 2015)
(Peng, 2016).

28 MEET 2018
The obligatory requirements for perspective development of the coal industry are
stated in the Program:
decreasing expenses of coal production and transportation, ensuring
competitive advantage of coal export to developing countries which increase
volumes of fuel and power resources use;
the maximum use of improving quality reserves of supplied coal to expand its
consumer's use and cut down its transportation cost;
making easy access of coal companies to the market of the loan capital for
financing production modernization and increasing work safety;
gradual modernization of coal industry which allows to increase efficiency of
labour;
transition from trade of "crude" energy resource in the external and internal
markets to trade of hi-tech "power product" which provides increasing
productivity coefficient of its final use (on the basis of advanced coal
processing) and cutting down transport costs for consumer delivery.
The influence of the main risks causes a number of system problems of the
Russian coal industry development (Gribin, 2017; Smotrihin, 2016):
intensification of dependence on external coal environment caused by
increasing export orientation while at the same time reducing capacity of
domestic market and maintenance of production level and transport expenses;
high risks of projects implementation of new fields development in the light of
industry dependence on use of foreign mining equipment in the conditions of
sanctions and limited access to credit resources;
continuous reduction of increasing labour productivity reserves with the
simultaneous growth of operational expenses owing to pay rise, electricity rate
increase as well as prices for materials;
insufficient development of outsourcing;
tough requirements for implementing license agreements to provide
exploration and production works that cause unprofitable development of
a considerable share of coal fields sites.
One of the factors having negative effect on coal mining growth rates is the
competition with natural gas. Since thermal power plants of Primorsky Region of
Gap-analysis of the Russian Federation… 29
Russia started using gas instead of coal in 2017, the volumes of coal mining have
decreased by 2,7 times in this region (URL: http://tass.ru/ekonomika/4959230).
Important aspect of ensuring efficiency of any project implementation, including
such global as the coal branch of Russia, is monitoring of indicators achievement
(efficiency indicators). For this purpose the Program contains more than forty main
target indicators. Among them there are such indicators as:
coal mining in Russia;
coal mining per capita engaged in coal industry;
updating of production capacities;
average number of injury cases causing death;
delivery volumes to various segments of domestic market
export deliveries volumes;
assets profitability of coal enterprises;
heat equivalent of coal production for power industry;
a share of prepared steam coal in the total volume of its production;
a price ratio of gas/coal in domestic market;
average range of coal production transportation.
The program provides three stages: I (2012-2015); II (2016-2020); III (2021-2030).
Control values of target indicators for the end of each stage have been established.
Control values of some indicators for 2025 have been already established.
The process of the Program implementation is controlled by the Ministry of
Energy of the Russian Federation. The Deputy Minister of Energy A. Yanovsky noted
that
"... during 2012-2016 the program was implemented successfully regarding to its
potential production development. It means growth of mining volume and
production of marketable output in general as well per capita engaged in the
industry. The export volume will exceed the level of 185 mln. t. in 2017.Thus,
together with prices increase of foreign markets it will allow to intensify investment
process and provide target achievement to update production capacities" (Yanovsky,
2017).
The research objective is to carry out the analysis of the Russian coal industry
achievements in 2017, discrepancies identification between the actual and planned
values as well as identifying their reasons.

30 MEET 2018
The research hypothesis is "gaps" existence in achieving target indicators of
strategic development of the Russian coal industry.
2.2. Literature studies
The issues connected with competitiveness of coal production, coal-mining
enterprise as well as coal industry in general are considered in the different scientific
works: (Kozlov, 2017; Ponomarenko et al., 2016; Tarazanov, 2018; Tkacheva, 2015;
Plotkin 2017; Yanovsky, 2017; Vasilev, 2017) and the others.
Enterprise strategic decisions tools are various tools, including methods of SWOT
analysis and GAP analysis developed within the American management theory
(Borovikov, 1999; Mhitaryan, 2006; Markovskiy, 2012).
It should be noted there is no sufficient number of research works devoted to the
GAP analysis both Russian and foreign scientists. It concerns not only theoretical
consideration of the GAP analysis methods but also its tools development for
application in various branches of national and foreign economies. Such scientists as
Borovikov A., Markov V., Mkhitaryan S.V., Ruben R. consider the issues of
methodology of the strategic analysis including GAP analysis in their research
works.
The GAP analysis is a complex research aiming at identification and analysis of
discrepancies, gaps between the actual and planned level of enterprise indicators.
Carrying out such analysis allows to allocate problem zones (bottlenecks) preventing
to reach planned targets and estimate degree of company readiness to achieve target
indicators.The GAP analysis can be applied in daily practice to increase overall
performance of the separate directions of the company as well as in the process of
strategic planning. In the latter case the GAP analysis application is the most effective
one as it allows to be realistic about accomplish ability and efficiency of the planned
purposes and tasks before they are coordinated, approved and financially supported.
Table 1 presents different types of "gaps" arising in any company operation.

Gap-analysis of the Russian Federation… 31
Table 1
Types and description of "gaps"
Gap Description
Market gaps
Communicational gap Gap between actually rendered service, the sold goods and
communications concerning quality of service or goods.
Gap of quality service
assessment Comparison of expectations with perception of goods and services.
Market gap
Gap between qualitative characteristics of goods (services) and
consumers requirements. Discrepancy between the range of goods and
structure of demand, discrepancy between company production
quality and similar production quality of competitors, a gap between
brand essence and consumer perception.
Competitive gap
Gap between the current company advantages and competitors'
opportunities, comparison of product and company characteristics of
competitors taking into account weight of factors.
Image gap Gap between company image and production perception by
consumers.
Organizational gaps
Production gap Gap between production and:
the available reserves: part-time employment of employees,
availability of free capacities and production facilities, etc.
potential resources: structure reorganization, personnel
training, readjustment of the equipment, efficiency equipment
performance, etc.
Gap of involvement Gap between plans of top management and real results.
Relation gap Gap between plans and directives of top management and activity of
company employees.
Gap of planning Gap between employees' understanding and attitude to real situation
Strategic gaps
Gap "strategy -
realization" Gap between strategic plans and results.
Gap of standards Gap between top management plans and consumers' requirements.
Source: (Borovikov, 1999).

32 MEET 2018
The Gap analysis general scheme is presented in Figure 1.
Fig. 1. Methodology of carrying out GAP analysis
Rys. 1. Metodyka przeprowadzania analizy GAP
Source: (Mhitaryan, 2006).
The GAP analysis is recommended to be carried out alongside SWOT analysis.
The operating procedures are given in Figure 2.
Fig. 2. Algorithm of GAP- and SWOT-analysis
Rys. 2. Algorytm analizy GAP i SWOT Source: (Markovskiy, 2006).
Activity results
past present future t
strategy gap
preliminary
benchmark
target results
obtained results
by means of
diversification
by means of
internal efficiency
by means of
integration
Company targets
Sales and profit
planned volumes
GAP-analysis
Comparison
Sales and profit
obtained volumes
Gap
identification
Analysis of
strengths
Analysis of
weaknesses
Analysis of
threats
Analysis of
opportunities
SWOT-analysis
New company
strategies

Gap-analysis of the Russian Federation… 33
The paper mainly focuses on the methodology of carrying out the GAP analysis
applying to the coal industry of the Russian Federation. The paper main objective is
to identify gaps between the planned values of the key coal branch indicators and
their actually obtained values.
2.3. Methodology
Having done the literature review devoted to the methodology the GAP analysis
it has shown that the GAP analysis includes the main stages:
1. Determination of obtained value.
2. Determination of the most available (target)value.
3. Choice of comparison criterion (criteria).
4. Tools formation for achieving target value.
In our opinion, it is necessary to provide a detailed approach to carry out the GAP
analysis. It is possible to offer the following sequence of operations to perform such
analysis:
1. Identification of gaps between the actual and planned results:
1.1. Definition of the key (strategically important) indicators defining strategic
competitive advantages.
1.2. Determination of target value indicators.
1.3. Determination of the actual values of such indicators.
1.4. Gap defining between planned and actual values of the specified
indicators.
2. Cause identification and gaps elimination between earlier revealed actual and
planned results.
2.1. Assessment of "gap" size and criticality for achieving target value
indicators.
2.2. Identification of the factors having influenced on "gap" emergence.
2.3. Actions elaboration for gap elimination.
We have carried out the research in the following order:
3. Defining strategic indicators of the coal industry development of the Russian
Federation. The indicators mentioned above have been taken into consideration

34 MEET 2018
by the Long-term program. The carried out analysis are based on the following
key indicators:
annual volumes of coal mining in Russia;
coal export volumes;
the delivery volume for power plants requirement in domestic market;
return on assets (ROA) of the Russian coal enterprises.
4. Determination of the current values of target strategic indicators. We use the
industry statistics data for the period of 5-7 years as well as the results of our
researches for determining such values.
5. Gap (no gap) identification on the basis of forecasting by means of the Microsoft
Excel tools.
The target indicators data are taken from Appendices No. 3 and No. 9 of the
Long-Term Program of the coal industry development till 2030.The actual values of
indicators were taken from different scientific publications (Vasilev, 2015; Nevskaya
and Marinina, 2017; Yanovsky 2017) and industry reviews (Tarazanov, 2018).
2.4. Research results
Our researches show that coal production volumes must be increased by
1,8% annually in order to obtain the expected value of coal mining (from 352 mln t. in
2013 up to 480 mln t. in 2030). Annual growth of coal production volume is to be
0,9% for achieving results of pessimistic scenario (410 million t.)(Vasilev, 2015).
Figure 3 presents data referring to the planned and actual values of "coal mining"
indicator. They allow to conduct the gap analysis of the indicator.
As the carried out research shows, the average growth rate of coal mining for the
last 5 years is 1,8%. Coal mining grows at the advancing rates so it is possible to say
there is no gap referring to the "coal mining "indicator. The trend shows that in the
case of maintaining the existing growth production rates, the target production
indicator will exceed 550 mln t. by 2030. Thus, it will exceed target value of 480
million t. by 14,5%. However, it should be noted that the coal mining indicator
growth is only 0,33% in 2017. It is caused by problems of gas production increase in
Primorsky Region which was mentioned above. Negative impact of such factor as the

Gap-analysis of the Russian Federation… 35
competition with gas can lead to gap emergence between planned and actual targets
of coal mining in the future.
Fig. 3. Results of the GAP analysis of the coal mining in Russia
Rys. 3. Wyniki analizy GAP wydobycia węgla w Rosji
Source: own study.
The results of the analysis of coal export volumes indicator are presented in
Figure 4.
Fig. 4. Results of the GAP analysis of coal export volumes in Russia
Rys. 4. Wyniki analizy GAP wielkości eksportu węgla w Rosji
Source: own study.
352,1 358,8 365,6 372,6
379,6 386,8
394,2
401,7
409,3
417,1
425,0
433,1
441,3
449,7
458,3 467,0
475,8
480
358,2 374 385,7 408,9
y = 335,5e0,0373x
R² = 0,9694
300,0
350,0
400,0
450,0
500,0
550,0
600,0
650,0
700,0
2013 2014 2015 2016 2017 2018 2019 2020 2021 2022 2023 2024 2025 2026 2027 2028 2029 2030
min
ing
, th
ou
san
d. t
.
years
planned mining volume actual mining volume
116
151,4 162,3
186,3
140 150 159
177 195
220
240
100
150
200
250
2010 2013 2015 2016 2017 2018 2019 2020 2025 2030
volume of export (fact), mln.t. volume of export (plan), mln.t.

36 MEET 2018
The results of the analysis referring to the indicator "the volume of deliveries for
needs of power industry" are presented in domestic market at Figure 5.
Fig. 5. The results of the GAP analysis of coal deliveries volumes for requirements of power
plants in Russia
Rys. 5. Wyniki analizy GAP wielkości dostaw węgla dla potrzeb elektrowni w Rosji Source: the author's research.
To implement the analysis of profitability of assets indicator we have used the
data of annual reports provided by the three largest enterprises of the Russian coal
industry (Tab. 2).
Table 2
GAP analysis of profitability of assets of the Russian coal branch
Indicator Netprofit (losses), mln.
rouble
Average assets cost,
mln. rouble ROA, %
JSC "SUEK"
2014
2015
2016
(12466)
200*
303*
84956,5
7582,5*
73815,5*
-
2,6
4,1
JSC "Kuzbassrazrezugol"
2014
2015
2016
(10938,8)
3683,4
2689,6
87310,4
89020,1
92368,6
-
4,1
2,9
HC"SDS-ugol"
2014
2015
2016
(2786,6)
(1367,5)
(2426,8)
29707,1
26031,6
22274,6
-
-
-
Target value in accordance
with the Program
2015
2020
2030
- -
-
15
20
25
* $ mln.
Source: it has been calculated using annual accounting reports of the coal companies.
92,1 85,2
87,5 98,9 99,8
105 106 110 115 120
40
60
80
100
120
140
2011 2012 2015 2016 2017 2018 2019 2020 2025 2030
coal deliveries for power stations (fact), mln.tons
coal deliveries for power stations (plan), mln.tons

Gap-analysis of the Russian Federation… 37
The data presented in Table 2 allow to identify the gap: the target indicator did
not reach a half of its value in 2015.
2.5. Conclusions
The final results of carrying out the GAP analysis of the coal industry of the
Russian Federation are presented in Table 3.
Table 3
Results of the GAP analysis of the coal enterprise
Strategic target Gap Type of the gap Objective
Annual coal mining
volume Not identified -
To maintain the current growth
rates of coal mining
Coal export volumes Not identified -
To increase coal export volumes
taking into account external and
internal factors
Coal supply volume
for power plants
requirements in the
domestic market
Identified Strategy-
implementation
To put into operation power plants
according to the Program (CHP in
Sovetskaya Gavan, the Sakhalin
GRPP-2, Erkovetsky GRPP, etc.)
ROA Identified Strategy-
implementation To increase level of ROA
Source: own study.
Failure to meet the deadline of the planned power plants construction can be one
of the gap reasons in supply volume for requirements of power industry. Thus,
putting into operation of the first stage of Sakhalin GRPP-2 (120 MW)was planned in
2016. However, it has been postponed till June, 2018.
CHP with power capacity of 120 MW in Sovetskaya Gavan was planned to launch
at the end of 2017. Erkovetsky GRPP simultaneously with the CHP construction
(which power capacity is 4800 MW)as well as development of coal pit with coal
mining up to 25 mln. t. are planned in 2021.
The reason of the ROA gap is insufficient volumes of net profit of the coal
enterprises. In HC "SDS-ugol", in particular, it was observed the large percent
volume of payment which is comparable with total revenue in 2016.
JSC "Kuzbassrazrezugol" had net profit decline while increasing average cost of
assets that caused ROA decrease in 2016. Thus, it is possible to confirm the research
hypothesis.

38 MEET 2018
Bibliography
1. Borovikov, А., Ruben, R. (1999). GAP & SWOT-analysis – universal for usage
methods of marketing and management. Marketing and Advertisement, 9, 23-34.
2. Galiev, G.К., Galieva, N.V. (2015). Economic and technological aspects of increase
in efficiency of the coal industry. Coal, 1, 45-52.
3. Gribin, Y.G., Popov V.N., Rozhkov, А.А. (2017). System approach to identification
of intra production reserves of increase in efficiency of social and economic
management of the mountain enterprise. Coal, 4, 11-15.
4. Kozlov, A.V., Teslya, A.B., Chzhan, S. (2017). Principles of assessment and
technique of management of the innovative capacity of the enterprises of the coal
industry. Journal of Mining Institute, 223. doi: http://dx.doi.org/10.18454/PMI.
2017.1.131
5. Markovskiy, V.A. (2012). Use of a technique of the GAP-analysis for assessment
of efficiency of a logistics system of distribution. Modern Researches of Social
Problems (online scientific magazine), 2(10).
6. Mhitaryan, S.V. (2006). Sectoral marketing. Moscow: Eksmo.
7. Nevskaya, M.A., Marinina, O.A. (2017). Challenges and opportunities of state
regulation of the innovation process in the Russian mineral resources sector.
Academy of Strategic Management Journal, 1, 149-159.
8. Extraction of coal in Primorye has decreased by 2,7 times because of transfer of
combined heat and power plant on gas. URL: http://tass.ru/ekonomika/4959230
9. Peng, P., Kirtipal, B., Junior, N. (2016). Competitiveness and Cost Sensitivity
Study of Underground Coal Gasification Combined Cycle Using Lignite. Energy
Fuels, 30(3). doi: http://dx.doi.org/10.1021/acs.energyfuels.6b0001
10. Plotkin, B.K., Haykin, М.М. (2017). Formation and development of the theory of
mineral and raw logistics. Journal of Mining Institute, 223.
doi: http://dx.doi.org//10.18454/PMI. 2017.1.139
11. Smotrihin, V.P. (2016). Coal-processing industry in Russia. Globus, 2 (14).
12. Tarazanov, I. (2018). Russia's coal industry performance for January - December,
2017.Coal, 3. doi: http://dx.doi.org/10.18796//0041-5790-2017-3-36-50
13. Tkacheva, O., Batashova, A., Zhukova, I., Smakhtina, A., Topchienko, L. (2015).
Strategic Management of Coal Mining Industry Efficiency. Asian Social Science,
11(20). doi: http://dx.doi.org/10.5539/ass.v11n20p104

Gap-analysis of the Russian Federation… 39
14. Vasilev, Y. (2015). The long-term prospects of development of coal mining in
Russia. Mining Information and Analytical Bulletin (Scientific and Technical Journal),
8.
15. Vasilev, Y., Vasileva, P. (2017). Improving efficiency of coal provision of TPS in
the Russian federation. [in:] 17th International multidisciplinary scientific
geoconference SGEM 2017. Ecology, economics, education and legislation, 17(53).
doi: http://dx.doi.org/10.5593/sgem2017/53
16. Yanovsky, A.B. (2017). Main trends and prospects of the coal industry
development in Russia. Coal, 8.
doi: http://dx.doi.org/10.18796//0041-5790-2017-8-10-14
17. Ponomarenko, Т.V., Volnik R., Marinina О.А. (2016). Corporate social
responsibility of the coal industry (experience of Russian and European
companies.). Journal of Mining Institute 222: 882- 891.
doi: http://dx.doi.org/10.18454 / PMI .2016.6.882
18. What is GAP-analysis, analysis of gaps. [Electronic resource].
URL: http://marketolog.biz/index.php?pid=125http://marketolog.biz/index.php?p
id=125
GAP-ANALYSIS OF THE RUSSIAN FEDERATION COAL
INDUSTRY
Abstract
Improving competitiveness of mineral resource complex of the Russian
Federation is one of the most relevant objectives at the current moment. For its
achievement the coal industry of the Russian Federation has to deal with a number of
strategic objectives and indicators. The paper considers the main strategic objectives
facing the coal industry of the Russian Federation. The paper provides analysis of
volumes production dynamics and coal preparation in recent years in Russia. GAP
analysis is one of the tools of strategic decision development. By means of its tools it
is possible to identify discrepancies between planned and actual activity results. The
recommendations of improving methods of providing GAP analysis of the coal
industry of the Russian Federation are given. The paper was prepared using data on
the Russian coal industry for 2013-2017. Compliance assessment of the planned and
actual strategic indicators of the coal industry activity by means of GAP analysis
tools is made. The authors have defined specific types of "gaps" for coal industry of
the Russian Federation.
Keywords: coal mining; strategic analysis; coal; coal export; GAP-analysis.

40 MEET 2018
ANALIZA LUK W BRANŻY WĘGLA KAMIENNEGO FEDERACJI
ROSYJSKIEJ
Streszczenie
Poprawa konkurencyjności kompleksu zasobów mineralnych Federacji Rosyjskiej
to – na chwilę obecną – jeden z najważniejszych celów. Aby go osiągnąć, branża
węgla kamiennego w Federacji Rosyjskiej musi zmagać się z kilkoma celami
strategicznymi i wskaźnikami. Artykuł zawiera rozważania na temat głównych
celów strategicznych stojących przed branżą węgla kamiennego w Federacji
Rosyjskiej. Artykuł stanowi analizę dynamiki wolumenów produkcji i obróbki węgla
w ostatnich latach w Rosji. Analiza luk jest jednym z narzędzi rozwoju
strategicznych decyzji. Dzięki jej elementom można zidentyfikować rozbieżności
pomiędzy planowanymi wynikami działań, a rzeczywistymi wynikami.
Przedstawiono również zalecenia dotyczące usprawnienia metod analizy luk branży
węgla kamiennego w Federacji Rosyjskiej. Artykuł przygotowano korzystając
z danych na temat Rosyjskiej branży węgla kamiennego w latach 2013-2017.
Dokonano analizy zgodności planowanych i rzeczywistych wskaźników
strategicznych branży węgla kamiennego dzięki zastosowaniu narzędzi analizy luk.
Autorzy zdefiniowali konkretne rodzaje „luk” branży węgla kamiennego Federacji
Rosyjskiej.
Słowa kluczowe: Wydobycie węgla kamiennego; analiza strategiczna; węgiel
kamienny; eksport węgla; analiza GAP.

Tatyana PONOMARENKO1, Izabela JONEK-KOWALSKA2, Oksana MARININA3 1Saint-Petersburg Mining University, Russia (e-mail: [email protected]) 2Silesian University of Technology, Poland (e-mail: [email protected]) 3Saint-Petersburg Mining University, Russia (e-mail: [email protected])
3. THE COMPETITIVE EDGE OF THE KNOWLEDGE
MANAGEMENT SYSTEM IN THE ORGANIZATIONAL
CAPITAL OF AN INDUSTRIAL COMPANY
3.1. Introduction
Today’s industrial companies and their performance largely depend on a number
of factors, such as the huge volatility of commodity prices, where changes may
amount
to 50-70% of the price, globalization of the economy and global competition in many
commodity markets, open innovation, knowledge transfer and growth in research
intensity. This is the reason why the intellectual factor and intellectual capital become
important factors in production, and strategies concerning innovation and
intellectual activity act as a major driver and spur for developing business models.
Organizational capital plays an extremely important role in operating and
investment activities of companies; however, it so far has not been studied
thoroughly enough from the theoretical and methodological points of view. The
same holds true for the organizational capital structure, the place of the knowledge
management system (KMS) in it and the role of organizational processes in the
mechanism of building competitive advantages. As these issues have not been fully
researched, it becomes impossible to systematically build competitive advantages of
the company based on its intellectual resources and, consequently, obtain intellectual
rent.

42 MEET 2018
Foreign experience in the practical use of KMS has been gathered for more than
20 years, with law firms and oil companies being leaders in this sphere. This is why
the object of this study is oil companies characterized by complex and interrelated
technological processes and some experience in applying KMS.
3.2. Literature review
Intensive research in the fields of knowledge management, the management of
intellectual capital and the management of intellectual activity in both industrial
companies and national economies has been conducted over the past 20 years
(Barney, 1991; Bontis, 1999; Daum, 2005; Edvinsson, 1997; Grant, 1996; Jurczak, 2008;
Zeghal and Maaloul, 2010). Intellectual resource management enables companies to
find new sources of competitive advantage and increase their profits and efficiency
(Petroleum Engineers, 2014; Ponomarenko and Khaertdinova, 2015; Nevskaya and
Marinina, 2017; Rumelt, 1994).
Research in the fields of intellectual capital management and knowledge
management has given rise to new theoretical concepts (Edvinsson, 1997; Pisano,
1994; Zeghal and Maaloul, 2010; Stewart, 2007), which are closely interrelated with
the dynamic concept in the resource-based theory (Teece and Pisano, 1997).
The building and development of intellectual capital is explained quite well by
various concepts of the resource approach, which view resources as long-term assets
that distinguish one company from another. The dynamic concept proves that when
resources interact and are used, they change, develop, and create sustainable
competitive advantages as well as value (Sergeev and Ponomarenko, 2011). In order
to respond to changes in the external environment, it is necessary to update key
competencies, which is ensured by the dynamic capabilities of the company (Teece
and Pisano, 1997). They are organizational actions taken when implementing
strategies through which the company manages its resource base and creates
the potential for value growth (Grant, 1996; Pisano, 1994).
The analysis of scientific literature has shown that at present there are many
approaches to understanding the essence of intellectual capital. Intellectual capital of
an organization is knowledge, qualification, experience, and motivation of personnel,
communication systems (technologies and channels) that create competitive
advantages and added value. The core of intellectual activities is innovation which is

The competitive edge of the… 43
created as a result of R&D. R&D mean a set of activities that precede the launch of
a new product or system into industrial production, including scientific research and
production of product prototypes.
Two main approaches to classify organizational capital (Figure 1):
structural approach (identification of individual elements of organizational
capital);
process approach (identification of the main processes of the formation and use
of knowledge).
Research theoretical grounds and design: dynamic concept in the resource theory
(Teece and Pisano, 1997; Grant, 1996); сoncepts of intellectual capital (Stewart, 2007;
Galbraith, 2008; Edvinsson, 1997; Zeghal and Maaloul, 2010); сoncepts of
organizational capital (Armstrong, 2008; Edvinsson, 1997; Stewart, 2007; Martнn-de-
Castro and Navas-López, 2006); knowledge management concepts (The Knowledge
Management Scenario, 1999, Ponomarenko and Khaertdinova, 2015).
Fig. 1. Basic approaches to the classification of organizational capital
Rys. 1. Podstawowe podejścia do klasyfikacji kapitału organizacyjnego
Source: own study complied by authors.
Two main approaches to classify organizational capital
Process approach
Technologies, innovations, publications,
patents, production and business processes,
strategy, culture, structures, systems, rules,
procedures (Stewards, 2008; Armstrong, 2008)
Corporate information systems, databases,
hardware and software, organizational
structures, copyrights, know-how, licences,
trademarks, corporate culture, customer
relations (Orlova, 2008)
Procedures, technologies, management systems,
hardware and software, patents, brands,
organizational culture, customer relations
(Milner, 2008)
A set of concepts of the management and
development technologies, databases, patents.
R&D costs, (Shmulev, 2007)
Along with other sorts of capital, the
component of intellectual capital that ensures
the speed of transformation of the knowledge
existing in a company into a sustainable
collective source of growth ..., (Edvinsson,1997)
The ability of a company to obtain economic
benefits from the use of organizational
resources (Garanina, 2010)
Structural approach

44 MEET 2018
Approaches to define the "knowledge management" concept are presented in
Table 1.
Table 1
Approaches to define the "knowledge management"
Knowledge management is Author (source)
,, (…) a new management function which involves "systematic and
purposeful formation, updating and application of knowledge to
maximize efficiency of a company and profits from knowledge-based
assets".
(Milner et al., 2006)
,, (…) systematic processes……; a strategy that transforms all types of
intellectual assets into higher productivity, efficiency and new value”. (Gaponenko, 2008)
,,(...) structured databases…” (The Knowledge
Management Scenario, 1999)
,, (…) a new business process to manage intellectual assets of an
enterprise, which is determined by such parameters as connection with
the strategy of an enterprise, organizational culture and discipline …”
(The Knowledge
Management Scenario, 1999)
,, (…) activities on the search, use and distribution of knowledge carried
out by an organization.” (Oslo Guidelines, 2010)
Source: own study compiled by the authors.
Based on these theoretical aspects and using oil companies as an example, the
paper demonstrates the need to develop concepts of organizational capital,
determines its structure, identifies the place of KMS in the structure of organizational
capital, and makes suggestions for improving the operation of KMS on the basis of
the project approach.
3.3. Research methods
Research objective: development of a business mechanism to manage intellectual
activities (knowledge) in the management system of a company.
RQ
1. Which direction (dynamic or static) of the resource theory should be applied to
the management of intellectual resources of a company?
2. Is there any correlation between innovation activities of companies (R&D costs)
and financial performance thereof? Is it possible to quantify this correlation?
3. What is the structure of organizational capital of an industrial company? How
does it relate to the management of intellectual activities and knowledge of
a company?

The competitive edge of the… 45
4. What are the problems of KMS functioning? What improvements will be
achieved by integration of KMS into the management system of organizational
capital of an industrial company based upon the project approach
methodology?
Research methods: system approach, comparative and regression analysis,
concepts of strategic management, resource approach, competitive advantages,
intellectual capital.
Assessment of innovative activity in the oil sector by innovative companies in the
world.The relationship between R & D expenses and the following indicators was
studied: revenue, profitability of sales, innovative intensity. Analysis of the data of
the Joint Research Center of the European Commission for 2012-2014, which contains
detailed information on the 2500 most innovative active companies in the world.
Based on this information, a statistical database was compiled from 51 oil companies,
including 34 oil producing companies and 17 oil service companies. The relationship
between R & D costs and revenues, R & D costs and profitability of sales of oil
companies was explored. The relationship between the parameters considered is
described by the regression equation: y = 189.68x + 42155.
3.4. Research Results and Discussion
Correlation between R&D costs and revenues (Fig. 2), R&D costs and return on
sales of foreign oil companies (Fig. 3).
Fig. 2. R&D costs and revenues of foreign oil companies, 2014
Rys. 2. Koszty badań i rozwoju oraz przychody zagranicznych spółek naftowych, 2014 r.
Source: (R&D Scoreboard, 2015).

46 MEET 2018
Dependence between the considered indicators is described by the following
regression equation: y = 189.68x + 42155. Determination factor R² = 0.55229 (1),
which confirms the average force of correlation between the indicators.
Fig. 3. R&D costs and return on sales of foreign oil companies, 2014
Rys. 3. Koszty badań i rozwoju oraz zwrot ze sprzedaży zagranicznych spółek naftowych,
2014 r.
Source: (R&D Scoreboard, 2015).
Figure 3 confirms the absence of dependence of return on sales on R&D costs.
Dependence is described by the following regression equation: y = -0.0031x + 9.6361.
Determination factor R² = 0.00556, which confirms the absence of connection between
the indicators.
The level of innovative activities of companies in terms of R&D cost to the volume
of products sold (revenue) – innovative intensity (Fig. 4)

The competitive edge of the… 47
Fig. 4. Innovative intensity of foreign oil companies, 2014
Rys. 4. Intensywność innowacyjna zagranicznych spółek naftowych, 2014 r.
Source: (R&D Scoreboard, 2015).
The level of innovation intensity of all companies is approximately the same. The
company with the highest indicator of innovation intensity (3.3 €/€) is California
Resources Corporation (USA); however, this company ranks only 17th in terms of
R&D costs, and its negative return on sales (-40%) confirms the absence of correlation
between research and development costs and economic results of a company.
Indicators of innovative activities of Russian oil companies are calculated on the
basis of annual reports (Tab. 2). Five largest Russian oil companies have been
selected for analysis.

48 MEET 2018
Table 2
Indicators of innovation activities of Russian oil companies, 2014
Ser.
No. Company name
R&D
costs,
€ mln
Sales volume
(Revenues),
€ mln
Volume of
oil
production,
mln tons
R&D costs/
volume of
oil
production
Innovative
intensity,
(R&D
costs/ sales
volume)
1. Rosneft 460 130447.8 204.9 2.24 0.0035
2. Lukoil 72.01 127785.6 97.2 0.74 0.0006
3. Gazprom Neft 44.73 19501.98 52.06 0.86 0.0023
4. Surgutneftegaz 23.95 13453.45 61.4 0.39 0.0018
5. Tatneft 20.77 5427.01 26.53 0.78 0.0038
Source: own study.
Innovative intensity of Russian oil companies is at a fairly low level: from 0.0018
("Surgutneftegas") to 0.0038 ("Tatneft"); while for foreign companies this indicator is
0.2-3.3 (i.e. hundreds of times higher). Rosneft has the largest amount of R&D costs
per 1 ton of the oil produced.
PJSC Tatneft headed the ranking of the best European innovative companies in
the field of oil and gas production by the number of inventions and was the absolute
leader among Russian oil and gas producing companies (Fig. 5).
Fig. 5. Dynamics of the number of IPIs of the leading oil and gas companies in Russia
Rys. 5. Dynamika liczby IPI wiodących spółek naftowych i gazowych w Rosji
Source: own study.
The absence of correlation between profitability of activities and R&D costs
confirms the studies (OTM Consulting Report, 2013) that there is no direct
correlation between the income of oil companies’ shareholders and R&D costs. The

The competitive edge of the… 49
analysis has not revealed any unambiguous correlation between the indicators of
revenue, return on sales, net profit allocated for dividends, and R&D costs, which
confirms complexity of assessing the impact of the level of innovation activities on
economic performance of a company (Tab. 3).
Table 3
Leading companies in innovative activities by the number of patents
in the oil and gas industry in 2010-2014
Source: (OTM Consulting Report, 2013).
The following shortcomings of patents as indicators of innovation activities have
been revealed: many innovations are never patented, while some are covered by
many patents at once; a number of patents have no technological or economic value,
while the value of others is very high, (Oslo Guidelines: Recommendations for
Collection and Analysis of the Data on Innovation, 2005), a large number of patents
do not reach the stage of commercial implementation (Pakhomova and Kazmin,
2013). Therefore, the number of patents indirectly characterizes effectiveness of
research activities.
Therefore, the conclusion is made that the key factors of successful innovation
activity are connected not so much with the investment sphere as with the
organizational sphere, as it influences the promotion of innovations in companies.
Main features of organizational capital: Results from intellectual activities;
Promotes interaction between intangible resources of a company; Belongs to
a company; Is able to bring economic benefits; Is/is not subject to legal protection.

50 MEET 2018
The authors propose a hierarchical type of the structure of organizational capital,
which allows considering it separately from other types of intellectual capital.
Fig. 6. Hierarchical type of the structure of organizational capital
Rys. 6. Hierarchiczny typ struktury kapitału organizacyjnego
Source: own study.
Main functions of organizational capital:
organizational support of business processes of a company, aimed at increasing
effectiveness of its activities,
organizational support of intellectual activities (creation of results of intellectual
activities),
support of system interactions between business sectors of a company.
The model of intellectual capital management with the use of KMS, proposed by
the authors (Fig. 7).

The competitive edge of the… 51
Fig. 7. The model of intellectual capital management with the use of KMS
Rys. 7. Model zarządzania kapitałem intelektualnym z wykorzystaniem KMS
Source: own study.
The result of successful R&D is the results of intellectual activities (IA) – products
of scientific and technical activities containing new knowledge or solutions and
recorded on any information medium. The studies have shown (OTM Consulting
Report, 2015) that a big share of R&D ends unsuccessfully at the stage of commercial
implementation for various reasons. IA management system is a set of methods and
technologies aimed at implementation of intelligence of employees in order to obtain
new knowledge and intellectual resources based thereon. The strategic goal
of IA management is to systematically upgrade the technological level of oil
companies to maintain leading positions in the global energy sector. The tactical goal
of IA management is to intellectually support business processes of a company and
to transform knowledge of employees into organizational one.
IA management includes management of innovation activities in the framework
of R&D and organization of intellectual activities of employees in operational
activities. In the framework of intellectual and innovative activities, processes aimed
at improving current activities, as well as research and development, are carried out.

52 MEET 2018
The result of these processes is as follows: formal knowledge – the results of
intellectual activities (RIA); systems, management methods, corporate standards and
regulatory documents. All of the above constitutes organizational capital of
a company.
The results of implementation of KMSs in foreign TNCs have confirmed practical
importance of knowledge management and included: reduction of transaction costs;
shortening of the time required to find the necessary information; improvement
of operating activities; information independence of companies, etc.
Using their knowledge and experience (human capital), on the basis of KMS
application, employees participate in creation of the results of intellectual activities
(RIA) – unformalized (undocumented) and formalized (objects of copyright, patent
rights, etc.) ones, transforming individual knowledge into organizational capital
of a company. In order to enhance effectiveness of this process, KMSs are applied,
including the stages of identification, selection, storage, protection, use and
distribution of knowledge (Fig. 8).
Fig. 8. Knowledge management systems – development of the project approach
Rys. 8. Systemy zarządzania wiedzą – rozwój podejścia projektowego
Source: own study.

The competitive edge of the… 53
KMSs provide: ability of personnel to independently obtain knowledge, quickly
find the necessary information, share experience. Problems of KMS functioning: low
level of involvement of a management team; complexity or absence of methods for
assessing effectiveness of KMS; inconsistency of strategic and tactical levels
of management; a conflict between inertial business models and innovative
management concepts. Main KMS tools: network groups of experts, centers of
competences, communities of practitioners, crowd sourcing, corporate social
networks.
3.5. Conclusions
Application of dynamic direction of the resource theory to the management of
intellectual resources of a company is justified in connection with volatility of
markets, strong competition and growth of knowledge capacity and research
intensity of the industrial complex. On the basis of the regression models of
correlation between financial indicators and R&D costs, it is concluded that there is
no correlation between the indicators. The structure of organizational capital is
proposed. The problems of functioning of the existing KMSs are revealed, including
low level of involvement of a management team, complexity or absence of methods
for assessing effectiveness of KMS, inconsistency of strategic and tactical levels of
management, a conflict between inertial intellectual models and innovative
management concepts. Modernization of KMS based upon the project approach
methodology and integration of KMS into the management system of organizational
capital of an industrial company will facilitate efficiency.
Bibliography
1. Armstrong, M., (2008). The practice of human resources management.
St. Petersburg.
2. Barney, J.B. (1991). Firm resources and sustained competitive advantage. Journal
of Management, 17 (1), 99-120.
3. Bontis, N. (1999). Managing organizational knowledge by diagnosing intellectual
capital: framing and advancing the state of the field. International Journal of
Technology Management, 18 (5-8), 433-462.

54 MEET 2018
4. Daum, J.H. (2005). Intangible Assets-Based Enterprise Management – A Practical
Approach. [in:] PMA IC Symposium, 15 December 2005, Stern School of
Business, New York University: NYC/USA
http://www.juergendaum.com/news/01_15_2006.htm
5. Edvinsson, L. (1997). Intellectual capital. Realizing Your Company’s True Value.
[in:] Edvinsson, L., Malone, M. (Eds.), Harper Business: N.Y.
6. Galbraith, J.K. (2008). New industrial society: elected. Anthology of economic
thought. Eksmo: Moscow.
7. Gaponenko, A.L., (2008). TM Knowledge management. Eksmo: Moscow.
8. Garanina, Т.А. (2010). Intangible assets and intellectual capital: a role in creating
the company's value. Bulletin of St. Petersburg University, 8 (2), 78-105.
9. Global Industry Analysis, Inc. Global Strategic Business Report (2012).
Knowledge Management Market Report. http://www.strategyr.com/
10. Grant, R. (1996). Towards a knowledge-based theory of the firm. Strategic
Management Journal, 17, 109-122. doi: http://dx.doi.org/10.1002/smj.4250171110
11. Jurczak, J. (2008). Intellectual Capital Measurement Methods. Economics and
Organization of Enterprise, 1(1), 37-45. doi: http://dx.doi.org/10.2478/v10061-008-
0005-y
12. Martin-de-Castro, G., Navas-López, J.E., López-Sáez, P., Alama-Salazar, E. (2006).
Organizational capital as competitive advantage of the firm. Journal of Intellectual
Capital, 7 (3), 324-337. doi: http://dx.doi.org/10.1108/14691930610681438
13. Milner, B.Z., (2008). Innovative development: Economics, intellectual resources,
knowledge management. Moscow: INFRA-M.
14. Milner, B.Z., Rumyantseva, Z.P, Smirnova, V.G, Blinnikova, A.V. (2006).
Knowledge management in corporations. M. Case.
15. Nevskaya, M.A., Marinina, O.A (2017). Challenges and opportunities of state
regulation of the innovation process in the Russian mineral resources sector.
Academy of Strategic Management Journal, 1(16), 149-159.
16. Orlova, T. (2008). Intellectual capital: the concept, essence, types. Problems of
Theory and Practice of Management, 4, 109-119.
17. Oslo Guidelines: Recommendations for Collection and Analysis of the Data on
Innovation, 2005 Third edition. Joint publication of OECD and Eurostat.
http://ec.europa.eu/eurostat/ramon/statmanuals/files/9205111E.pdf
18. OTM Consulting Report, 2013, https://www.otmconsulting.com
The competitive edge of the… 55
19. OTM Consulting Report, 2015, https://www.otmconsulting.com
20. Pakhomova, N.V., Kazmin, A.A, (2013). Correlation of Market Structure and
Innovative Activities of Firms: New Results with Regard for Technological
Possibilities of Industries. Problems of the Modern Economy, 4(48).
21. Petroleum Engineers, 2014, https://www.petroleumengineers.ru.
22. Pisano, G. (1994). Knowledge, integration, and the locus of learning: an empirical
analysis of process development. Strategic Management Journal, 15, Special Issue:
Competitive Organizational Behavior, 85-100. doi: http://dx.doi.org/10.1002/smj.
4250150907
23. Ponomarenko, T.V., Khaertdinova, D.Z. (2015). Corporate systems of the
knowledge management in the practices of integrated companies. Mediterranean
Journal of Social Sciences, 6 (3).
24. R&D Scoreboard 2015: World - 2500 companies ranked by R&D. Industrial
Research and Innovation, http:// http://iri.jrc.ec.europa.eu/home.
25. Rumelt, R. (1994). Toward a strategic theory of the firm. In: Lamb R. Competitive
Strategic Management. Prentice-Hall: Englewood Cliffs: NJ, 556–570.
26. Sergeev, I.B, Ponomarenko, T.V. (2011). Development of strategic competitive
advantages of mining companies: institutional and theoretical aspect. Problems of
Modern Economy, 2.
27. Shmulev, G.A., (2007). Methods for evaluating intellectual capital. Bulletin of
BSTU, 4.
28. Stewart, T.A., (2007). Intellectual capital. A new source of wealth organizations.
Generation. 368р.
29. Teece, D.J., Pisano, G.P., Shuen, A. (1997). Dynamic capabilities and strategic
management. Strategic Management Journal, 18 (7), 509-533.
30. The Knowledge Management Scenario (1999). Trends and Directions for
1998-2003. Gartner Group, http://www.gartnergroup.org
31. Zeghal, D., Maaloul, A. (2010). Analysing value added as an indicator of
intellectual capital and its consequences on company performance. Journal of
Intellectual Capital, 11 (1), 39–60. doi: http://dx.doi.org/10.1108/14691931011013325

56 MEET 2018
THE COMPETITIVE EDGE OF THE KNOWLEDGE MANAGEMENT
SYSTEM IN THE ORGANIZATIONAL CAPITAL OF AN
INDUSTRIAL COMPANY
Abstract
Today, when the economy is knowledge-based and characterized by rapid
changes in the external environment, intangible resources can become a key source of
competitive advantages and growth in the company’s value as they are unique and
cannot be copied by competitors or replaced by another asset. However, a lot of
companies do no have any system of managing intellectual activity that would
encompass R&D management, management of employee innovation activities,
as well as formation and development of knowledge management systems. The
purpose of the research is to develop an organizational and economic tool for
managing intellectual activity in the company’s management system. Research
methods include a system approach, comparative and regression analyses, as well as
concepts of a resource approach, strategic management, competitive advantages, and
intellectual capital. We have justified the application of the dynamic approach in the
resource theory to the management of the company’s intellectual resources due to
market volatility, strong competition and the growth in knowledge and science
intensity of the industrial complex.
We have developed a conceptual approach to the management of intellectual
activity as a set of methods and tools that ensure the effective use of intellectual
resources, the formation of strategic assets and the application of employees’
intellectual potential, all these factors influencing innovative and technological
performance of the company. We have proposed a model of managing the
organizational capital of an industrial company. The model has the following
characteristics: management of intellectual activity as the main function; a separate
new management function, namely knowledge management; clearly formulated
objectives in strategic and tactical management; a newly developed structure of
strategic assets connected with organizational capital and including technology,
skills, competence, and knowledge management systems (KMS).
Keywords: innovative activity, intellectual activity, knowledge management,
knowledge management system, organizational capital.

The competitive edge of the… 57
PRZEWAGA KONKURENCYJNA SYSTEM ZARZĄDZANIA
WIEDZĄ W KAPITALE ORGANIZACYJNYM PRZEDSIĘBIORSTWA
PRZEMYSŁOWEGO
Streszczenie
W dzisiejszych czasach, gdy gospodarka oparta jest na wiedzy i cechują ją szybkie
zmiany w środowisku zewnętrznym, zasoby niematerialne mogą stać się kluczowym
źródłem przewagi konkurencyjnej i wzrostu wartości spółki – jest tak dlatego, że są
one unikatowe i nie mogą zostać skopiowane przez konkurencję lub zastąpione
innym aktywem. Jednakże wiele spółek nie ma żadnego systemu na potrzeby
zarządzania działalnością intelektualną, który obejmowałby zarządzanie badaniami
i rozwojem, zarządzanie innowacyjnością pracowników oraz tworzenie i rozwój
systemów zarządzania wiedzą. Celem badania jest opracowanie narzędzia
organizacyjno-gospodarczego na potrzeby zarządzania działalnością intelektualną w
systemie zarządzania spółki. Metody badawcze obejmują podejście systemowe,
analizę porównawczą i analizę regresji, oraz koncepcje podejścia skoncentrowanego
na zasobach, zarządzania strategicznego, przewagi konkurencyjnej i kapitału
intelektualnego. Zastosowanie podejścia dynamicznego w teorii zasobów do
zarządzania zasobami intelektualnymi spółki podyktowane jest zmiennością rynku,
silną konkurencją i rozwojem natężenia wiedzy i nauki w kompleksie
przemysłowym.
Podejście konceptualne do zarządzania działalnością intelektualną zostało
opracowane jako zestaw metod i narzędzi, które zapewniają skuteczne
wykorzystanie zasobów intelektualnych, utworzenie aktywów strategicznych
i zastosowanie potencjału intelektualnego pracowników. Wszystkie te czynniki
wpływają na innowacyjność i wynik technologiczny spółki. Zaproponowano model
zarządzania kapitałem organizacyjnym w przedsiębiorstwie przemysłowym. Model
ten ma następujące cechy: zarządzanie działalnością intelektualną jako główna
funkcja; oddzielna nowa funkcja zarządzania, czyli zarządzanie wiedzą; jasno
sformułowane cele zarządzania strategicznego i taktycznego; nowo opracowane
struktury aktywów strategicznych połączonych z kapitałem organizacyjnym,
obejmujące technologię, umiejętności, kompetencje i systemy zarządzania wiedzą.
Słowa kluczowe: Innowacyjne działanie, działalność intelektualna, zarządzanie
wiedzą, system zarządzania wiedzą, kapitał organizacyjny.


Olga EVSEEVA1, Alexey CHEREPOVITSYN2 1Saint-Petersburg Mining University, Russia (e-mail: [email protected]) 2Saint-Petersburg Mining University, Russia (e-mail: [email protected])
4. DEVELOPMENT OF A METHODOLOGY FOR ASSESSING
THE EFFECTIVENESS OF ARCTIC LNG PROJECTS BASED ON
THE SPECIFICS OF THEIR IMPLEMENTATION
4.1. Introduction
The Arctic zone of the Russian Federation is a promising region, the resource base
of which can bring significant economic benefit to subsoil users and the state. Among
the main provisions of the "Strategy for the development of the Arctic zone of the
Russian Federation and ensuring national security for the period until 2020" is the
integrated use of the Arctic mineral and raw materials potential, which emphasizes
the priority of this direction in the development of the region. The need for the
development of the raw material base of the Arctic is mainly determined by the need
to ensure Russia's current and future needs for fuel and energy resources, including
export resources that affect the country's positions on the global market.
The Russian economy is currently heavily dependent on the oil and gas sector,
which forms the bulk of tax revenues to the state budget and accounts for about
20-25% of GDP (Fadeev, Cherepovitsyn and Larichkin, 2011; Carayannis,
Cherepovitsyn and Ilinova, 2017; Marinina, 2017). Depletion of resources in
traditional oil and gas production centers actualizes the complex development of the
Arctic hydrocarbon potential, which, in view of the massive reserves, is rightfully
considered the resource base of the 21st century (Sakhuja and Narula, 2016). The
Arctic zone of the Russian Federation, which accounts for the bulk of the Arctic,
concentrates most of the large hydrocarbon fields discovered in Russia (Glomsrod,
2008). The initial recoverable resources of the Arctic region are estimated at a value of
the order of 258 billion tons of fuel equivalent, 81% of which is natural gas (State

60 MEET 2018
Report, 2016). The priority task is the development of the Arctic shelf, whose huge
potential in the future can become the main raw material base not only for Russia but
the world market as a whole (Ilinova and Dmitrieva, 2016). According to current
estimates, 2/3 of the world's Arctic hydrocarbon resources are concentrated on the
Russian shelf (Henderson, 2014).
The gas complex occupies the first place in the structure of the economy of the
Arctic zone, but the development of some promising deposits, located mainly on the
shelf or in the coastal area, is impeded by the distance from the system of main gas
pipelines. The solution of this problem can be the maritime transportation of natural
gas, which requires the conversion of natural gas into a liquefied state (Ulvestad and
Overland, 2012).
The technology of cooling natural gas to -162 ° C (-260 ° F) and reducing its
volume by almost 600 times served as the basis for the formation of the fastest
growing energy sector (Dejan Ristic, 2008). According to estimates, since 2000, global
demand for LNG has increased by 7.6% per year, which is almost three times faster
than the dynamics of demand for natural gas (E&Y, 2013). The main advantage of
using LNG technologies in comparison with pipeline transport of natural gas is
mobility and supply flexibility, which allows satisfying the energy needs of the
countries remote from the main production centers, and allows natural gas
producers to expand their sales directions (Bridge and Bradshaw, 2017; Hewitt and
Ryan, 2015). As of 2015, 30% of the world's gas trade consists of LNG supplies, and,
according to current forecasts, by 2035, they will account for 50% of the gas market
(CDUTEC, 2016).
Russia's position on the global LNG market is currently weak, its share in 2016
accounted for about 4% of world trade in LNG (GIIGNL, 2017). Russia's interest in
developing new gas markets under modern conditions is quite logical, but this needs
to build new large-scale LNG assets. Thus, the implementation of LNG projects in the
Arctic zone will allow not only to develop the fields remote from the main gas
pipelines but also contribute to the implementation of a diversified export policy in
the world hydrocarbon markets.

Development of methodology for assessing… 61
4.2. Literature studies
At present, the problems of developing the resource potential of the Arctic zone
of the Russian Federation are of great interest not only in the scientific community
but also in society as a whole.
The development of the mineral resource base of the Arctic region at the state
level is carried out by developing and adopting various regulatory and legal
documents. Among such documents that determine the significance of hydrocarbon
potential in the development of the Russian Arctic, it should be noted the "Strategy
for the Development of the Arctic Zone of the Russian Federation and National
Security for the Period to 2020", the state program "Social and Economic
Development of the Arctic Zone of the Russian Federation for the Period to 2020",
as well as the Energy Strategy for the period up to 2035. These documents singled
out the main directions for the integrated development of the resource base,
identified the most promising projects, determined the need for an active increase in
the production capacity of LNG, which indicates a state interest in the development
of this sector.
Problems and prospects for the implementation of Arctic raw material projects
are often the objects of research in the world scientific community. This subject is
devoted to the work of such authors as Cherepovitsyn A.E. (Cherepovitsyn, 2015),
Konoplyanik A.A. (Konoplyanik et. al., 2016), Keil K. (Keil, 2012), Gautier D.L.
(Gautier, 2009), Conley H. (Conley, 2013). In their studies, the authors substantiated
the strategic nature of the raw material potential of the Arctic region, and suggested
the main ways to increase the efficiency of Arctic projects, taking into account their
specificity.
LNG production is an essential direction for the development of remote and hard-
to-reach deposits, as noted by such authors as Braginsky O.B. (Braginskiy, 2006),
Dejan Ristic (Dejan Ristic, 2008), S. Andrew McIntosh (McIntosh et. al., 2008).
The features of the LNG market and the prospects of modern LNG projects were
considered in the works of the author Henderson J. (Henderson and Moe, 2016),
as well as companies such as Deloitte (Deloitte, 2016), E&Y (E&Y, 2013), PWC
(PWC, 2014).
62 MEET 2018
Despite the relevance of the problem of developing LNG production, the world
scientific literature pays little attention to methodological approaches to managing
Arctic raw material projects, including LNG projects. The research analysis on this
problem revealed that most of the modern scientific papers are of an analytical
nature, while the authors often use traditional instruments of investment analysis.
However, taking into account this specificity of Arctic LNG projects, such as the need
to balance the interests of various stakeholders, a specific approach to analysis is
necessary for qualitative assessment of projects, which makes it possible to assess the
feasibility of implementing such projects regarding externalities.
4.3. Methodology
The LNG market is dynamic; a regular market and technological changes
characterize it. These include issues related to pricing, changes in the structure of
supply and demand, innovative development of the LNG sector and the possibility
of using uneconomic gas resources (Mulcahy, 2015). Sector-specific issues determine
the uniqueness of LNG projects. We have identified the following features of such
projects:
The complex value chain of the LNG product. Depending on the chosen business
model, the stages of value chain may include exploration and development of the
field, gas production and preparation, liquefaction, storage, transportation,
regasification of LNG. In this way, the LNG sector accumulates many industry tasks.
1. LNG projects have a multiplier effect on the development of related industries,
such as gas processing, shipbuilding, engineering, metallurgy, and others.
2. The implementation of LNG projects often requires the development of
international cooperation, which is due to the high capital intensity and high-
technology capacity, as well as the need to reduce market risks.
3. The need to maintain high competitiveness in the global LNG market requires
constant technological development, which emphasizes the high importance of
the innovative potential of the LNG sector.
4. Unfavorable environmental impact on the environment in the areas of
construction and operation of assets. Applied technologies should guarantee
complete safety of work.

Development of methodology for assessing… 63
5. LNG-projects have a significant effect both on the achievement of the
company's commercial and strategic goals, and on accelerating the socio-
economic development of the region in which the project is being implemented.
This aspect necessitates the use of a specific assessment toolkit that allows
assessing the external and internal effects of the project.
In previous researches of the authors, it was proved that the prospects of
development of the production potential of LNG in Russia are realistic even in the
current low price situation (Evseeva and Cherepovitsyn, 2017). The successful
experience of the first Arctic Russian LNG project Yamal LNG showed that the high
competitiveness of Arctic LNG in the world market is mainly due to the low cost of
natural gas production, as well as the successful geographic location of the project
concerning key consumers. In addition, in the LNG industry, the temperature regime
in the production region is important, which affects the productivity of trains and the
amount of energy used. These aspects actualize the construction of new LNG plants
on the resource base of the Arctic region. Other strategic reasons are presented in
Figure 1.
Fig. 1. Strategic basis of Arctic LNG production development
Rys. 1. Strategiczne podstawy rozwoju produkcji LNG w Arktyce
Source: own study.

64 MEET 2018
Investment activity in the Arctic zone is characterized by increased risks, due to
the features of the legal regulation of subsoil use and the complex natural and
climatic conditions of work. An absence of the necessary infrastructure, the need to
develop or acquire advanced technologies, commitments to meet stringent
environmental requirements significantly increase the capital intensity of Arctic
projects, which has a negative impact on the investment climate in the region. In the
conditions of limited financial resources, the definition of the directions of
investment is one of the most difficult strategic tasks.
The modern Russian practice of making investment decisions is based, as a rule,
on indicators NPV, PI, IRR, DPP, which form the basis of commercial efficiency of
projects. However, in our opinion, this approach is not rational for strategically
significant projects, which include LNG projects.
Arctic LNG projects need synchronization of all project stages with the principles
of sustainable development of the region in the long term. At the same time, it
should be noted that sufficient contribution of large projects to the development of
the infrastructure framework of the region, because most of the Arctic projects are
greenfield and currently being implemented on the territory that was not previously
developed. On this basis, there are a sufficient number of external effects associated
with the development of fundamentally new technologies for successful work in the
difficult conditions of the Arctic, increasing the investment attractiveness of the
region for the implementation of new projects and the wider development of Arctic
territories.
Thus, in addition to internal (commercial) indicators for assessing Arctic LNG
projects, which reflect the final results through the modeling and calculation of cash
flows, it is necessary to take into account additional indicators that assess the
externalities of such projects. We propose to take into account the macroeconomic,
social, geopolitical, innovative and environmental effects when assessing the
effectiveness of the project as a whole (Tab. 1).

Development of methodology for assessing… 65
Table 1
Types of effects and typical indicators of assessment that may occur in the
implementation of Arctic LNG projects
Types of effects Indicators
Macroeconomic effect
Cash inflows in the federal and regional budgets through the implementation of
projects, the creation of regional infrastructure, the gasification of Russian regions,
the share of Russian equipment and technologies in the assets of the project,
increase the GDP, the level of welfare, aggregate consumption.
Social effect
Improving the quality of life of the local population, preserving the traditional way
of life of indigenous ethnic groups, reducing the flow of migrants from the
settlements of the Arctic zone, increasing the number of workplaces in the regions
of project implementation.
Geopolitical effect
Increasing of gas production in the Arctic region, strengthening of country's
positions in the world energy markets by increasing exports, entering new markets,
contributing to the achievement of target indicators of sectoral, state and regional
strategies, strengthening international cooperation.
Innovative effect
Increasing the technical and technological levels of development of companies
implementing the project, as well as domestic products of related industries, the
creation of fundamentally new technologies and technical means for conducting
work in the Arctic, the development of the technological potential of the Russian
LNG industry, the activation of researches, targeted training.
Ecological effect
Improvement of energy efficiency and resource saving indicators, indicators of the
state of the environment in the area of project implementation and operation of
facilities and compliance with their permissible standards (noise level, wastewater
discharges, greenhouse gas emissions etc.) number of accidents and emergencies
and their consequences.
Source: own study.
4.4. Research results
The implementation of Arctic LNG projects is a difficult task. A high cost and an
increased level of risk characterize such projects, which are affected not only by the
characteristics of the industry but also by the region in which the main works on the
construction and operation of the plants are conducted. A dynamic LNG market with
its high competition and price volatility introduces additional uncertainty in the
decision to create new LNG assets. In the conditions of limited financial and
technological resources, the participation of foreign companies and the state in the
implementation of such projects becomes particularly important. Therefore, for

66 MEET 2018
example, the state support of the Yamal LNG project in the form of granting tax
benefits and state participation in financing infrastructure facilities ensured positive
indicators of investment efficiency (Sigra group, 2014). Novatek's cooperation with
such large foreign companies as Total, CNPC, SRF, which are shareholders of the
project, allowed not only to successfully implement the project goals, but also to give
a start for the further development of international partnership in the Arctic region.
The need to take into account the heterogeneity of interests and expectations on
the part of each project participant allowed achieving significant external results of
the project: (Tab. 2).
Table 2
The main externalities of the Yamal LNG project
Types of effect General characteristic of effect for Yamal LNG
Macroeconomic
Discounted tax revenues in the amount of more than 356 billion rubles*, an increase in
GDP due to the implementation of investments in the amount of more than $ 27 billion
and project commodity output of more than $ 176 billion*, indirect effects for the related
industries, the creation of transport, social and energy infrastructure in the region, increase
of investment attractiveness of the region for new projects in general.
Geopolitical
Development of an earlier uneconomic field, extraction and monetization of more than
615 billion cubic meters of Arctic natural gas, an increase in the share of the world LNG
market by 5%* after the introduction of all trains, access to the US, Spanish and Indian
gas market, expansion of the European gas market share, development of international
cooperation.
Social
Minimal impact on the way of life of indigenous peoples, the establishment of health and
education institutions in the region, the employment of local people, the creation of more
than 32,000 jobs at the current stage.
Ecological
Negative impact on the environment does not exceed the permissible standards due to the
introduction of advanced technological solutions in the production sector of the project,
the use of resource-saving technologies, effective treatment facilities, as well as the
recycling of resources.
Innovative
Creation of fundamentally new technologies for drilling and gas production in the Arctic
region, taking into account all environmental requirements, development of its own gas
liquefaction technology, targeted training of personnel for the project, accumulating
experience in implementing Arctic LNG projects and raw material projects in general.
*Calculations of authors from data from open sources.
Source: own study.

Development of methodology for assessing… 67
Yamal LNG is a pilot project in the development of Arctic LNG production in
Russia. Its main results in the future will affect the requirements for new Arctic LNG
projects. Currently, two more Arctic projects are planned for implementation
- Pechora LNG and Arctic LNG-2, and according to those data that are already
published, it can be assumed that these projects will also not bring significant
commercial effects to its participants. However, experience of Yamal LNG project
implementation showed, that even with low commercial efficiency indicators, such
projects are feasible for implementation due to a sufficient number of external effects.
Therefore, when planning Arctic LNG projects, it is essential to count not only
internal economic indicators but also to predict external results that affect both the
development of the region and the country as a whole.
4.5. Conclusions
Based on the results of the study, the following conclusions were drawn:
1. The LNG industry is of great importance in the fuel and energy sector of
Russia, its development will enable the development of remote natural gas
fields and strengthen the country's position in the global hydrocarbon raw
materials market through the diversification of gas supplies;
2. The Arctic region, in view of the promising resource base in the coastal zone,
favorable temperature conditions, favorable geographic location relative to key
importers, is strategically important for the development of the Russian LNG
industry through the implementation of new LNG projects;
3. Sectoral and regional specifics determine the uniqueness of Arctic LNG
projects, which are characterized by high capital intensity and increased risks,
a large number of participants (including foreign ones) due to the complex
value chain of the LNG product, sufficient contribution to the social and
economic development of the region and country as a whole;
4. The peculiarities of Arctic LNG projects stipulate the impossibility of their
implementation with the orientation towards achieving only commercial
results. Therefore, it is necessary to assess the potential externalities when
assessing the effectiveness of projects as a whole;

68 MEET 2018
5. Using the example of the Yamal LNG project analysis, the feasibility of
implementing similar projects was proved in view of significant
macroeconomic, geopolitical, social, environmental and innovative effects.
Bibliography
1. Braginsky, О.B. (2006). Liquefied natural gas: a new factor of the world energy
market. Moscow: The Russian Academy of Sciences.
3. Bridge, G., Bradshaw, M. (2017). Making a Global Gas Market: Territoriality and
Production Networks in Liquefied Natural Gas. Journal Economic Geography,
93 (2), 215-223. doi:http://dx.doi.org/10.1080/00130095.2017.1283212
4. Carayannis, E., Cherepovitsyn, A., Ilinova, A. (2017). Sustainable Development of
the Russian Arctic zone energy shelf: the Role of the Quintuple Innovation Helix
Model. Journal of the Knowledge Economy, 8 (2), 456-470. doi: http://dx.doi.org/
10.1007/ s13132-017-0478-9
5. CDUTEC (2016). New gas chemical and LNG projects in Russia.
http://www.cdu.ru/catalog/mintop/infograf/082015/ (12.01.2018).
6. Cherepovitsyn, A.E. (2015). Social and economic potential of large-scale projects
of oil-gas shelf development: risks and expectations of interested parties. Notes of
the Mining Institute, 215, 140-149.
7. Conley, H. et. al. (2013). Arctic economics in the 21st century. The benefits and
costs of cold. Report of the CSIS Europe Program.
8. Deloitte (2016). Building an industry: Can the United States sustainably export
LNG at competitive prices? https://www2.deloitte.com/content/dam/Deloitte/us
/Documents/energy-resources/us-er-lng-update-part-three.pdf (24.02.2018).
9. E&Y (2013). The world market of LNG New demand + new supply = new prices?
http://www.ey.com/Publication/vwLUAssets/Global-Oil-and-Gas-LNG-
RU/%24FILE/Global-Oil-and-Gas-LNG-RU.pdf (01.02.2018).
10. Evseeva, O.O., Cherepovitsyn, A.E. (2017). Comparative effectiveness analysis of
Russian and foreign liquefied natural gas projects. Economic and Technological
Conditions of Development in Extractive Industries, 73-83.
11. Fadeev, A.M., Cherepovitsyn, A.E., Larichkin, F.D. (2011). Foreign experience of
hydrocarbon resources development at the Arctic continental shelf. Economical
and Social Changes: Facts, Trends, Forecast, 13 (1), 79-89.

Development of methodology for assessing… 69
12. Gautier, D. L., et al. (2009). Assessment of undiscovered oil and gas in the Arctic.
Science, 324 (5931), 1175-1179.
13. GIIGNL (2016). The LNG Industry. http://www.giignl.org/ (01.02.2018).
14. Glomsrod, S. (2008). The Economy of the North 2008. Statistics Norway: Oslo.
15. Henderson, J. (2014). International partnership in Russia: conclusions from the oil
and gas industry. Palgrave Macmillan: London.
16. Henderson, J., Moe, A. (2016). Gazprom’s LNG offensive: a demonstration of
monopoly strength or impetus for Russian gas sector reform? Post-Communist
Economies, 28 (3), doi: https://doi.org/10.1080/14631377.2016.1203206
17. Hewitt, T., Ryan, C. (2015). What’s Different about Floating LNG? A Legal and
Commercial Perspective. Journal of Energy & Natural Resources Law, 28(4).
doi: https://doi.org/10.1080/02646811.2010.11435252
18. Ilinova, A., Dmitrieva, D. (2016). Sustainable development of the Arctic zone of
the Russian Federation: ecological aspect. Biosciences Biotechnology Research Asia,
13(4), 2101-2106.
19. Keil, K. (2012). Opening oil and gas development in the Arctic: a conflict and risk
assessment. Tvergastein Interdisciplinary Journal of the Environment, 2, 36-43.
20. Konoplyanik, A.A., Buzovsky, V.V., Popova, Y.A., Troshina, N.V. (2016).
Opportunities and ways of the Arctic shelf. Oil of Russia, 1-2, 12-17.
21. Marinina, O.A., Nevskaya, M.A. (2017). Specific nature of labour management in
the oil and gas sector in the Russian Far North. International Journal of Applied
Business and Economic Research, 15 (8), 177-185. doi: https://www.researchgate.net
/publication/317745811
22. McIntosh, S. A., Noble, P.G., Rockwell, J., Ramlakhan, C.D. (2008). Moving
natural gas across oceans. Oilfield Review, 50-63.
23. Mulcahy, С. (2015) The changing face of disputes in the liquefied natural gas
market. Journal of Energy & Natural Resources Law, 33 (3). doi: https://doi.org/
10.1080 /02646811.2015.1043819
24. PWC (2014). The progression of an LNG project. https://www.pwc.com/gx/en/
mining/publications/assets/pwc-lng-progression-canada.pdf (23.02.2018).
25. Ristic, D. (2008). Liquified Natural Gas—Overview of Prospectives. Journal
Strategic Planning for Energy and the Environment, 27 (4), 66-75. doi: https://doi.org/
10.1080/10485230809509413
26. Sakhuja, V., Narula, K. (2016). Asia in the Arctic. Narratives, Perspectives and
Policies. Singapore: Springer.

70 MEET 2018
27. Sigra Group. (2014) Government Support to Upstream Oil & Gas in Russia. How
Subsidies Influence the Yamal LNG and Prirazlomnoe Projects.
http://www.iisd.org/gsi/sites/default/files/ffs_awc_russia_yamalprirazlomnoe_en
.pdf (01.03.2018).
28. State report (2016). The state and environmental protection of the Russian
Federation in 2015. Ministry of Nature: Moscow.
29. Strategy of developing the Arctic zone of the Russian Federation and national
security system for the period till 2020. http://government.ru/info/18360/
(08.02.2018).
30. Ulvestad, M., Overland, I. (2012). Natural gas and CO2 price variation: Impact on
the relative cost-efficiency of LNG and pipelines. International Journal of
Environmental Studies, 69 (3). doi: http://dx.doi.org/10.1080/00207233.2012.677581
DEVELOPMENT OF A METHODOLOGY FOR ASSESSING THE
EFFECTIVENESS OF ARCTIC LNG PROJECTS BASED ON THE
SPECIFICS OF THEIR IMPLEMENTATION
Abstract
The development of the hydrocarbon resources of the Arctic zone is today one of
the priority directions of Russia's economic development. The implementation of
large-scale projects based on the raw material potential of the Arctic is of great
importance in ensuring national energy security, increasing exports of fossil fuels
and diversifying its directions, as well as contributing to the acceleration of the socio-
economic development of the region. The high concentration of large gas fields in the
coastal area and the favorable geographic location concerning the main gas
consumers offer wide-ranging opportunities for the implementation of Arctic LNG
projects. The purpose of this study is to clarify the approach to assessing the
effectiveness of Arctic LNG projects, taking into account their strategic nature and
industry characteristics. In research process such tasks as strategic analysis of the
prospects for the development of the LNG industry in the Arctic zone of the Russian
Federation, identification features of Arctic LNG projects, and justification of their
assessment principles were accomplished. It was used methods of generalization,
systematization, comparative and strategic analysis.
Keywords: LNG, liquefied natural gas, arctic LNG projects, Russian Arctic Zone.

Development of methodology for assessing… 71
OPRACOWANIE METODOLOGII OCENY SKUTECZNOŚCI
PROJEKTÓW ARKTYCZNYCH LNG OPARTEJ NA SPECYFICE
ICH WDROŻENIA
Streszczenie
Rozwój złóż węglowodorów w regionie Arktyki jest obecnie jednym z głównych
kierunków rozwoju gospodarczego Rosji. Wdrożenie projektów na dużą skalę,
opartych na potencjale surowcowym Arktyki, ma duże znaczenie dla zapewnienia
bezpieczeństwa energetycznego kraju, zwiększenia eksportu paliw kopalnych
i dywersyfikacji jego kierunków, oraz przyczynia się do szybszego rozwoju
społeczno-gospodarczego regionu. Duże skupisko pokładów gazu w rejonach
nadbrzeżnych i korzystne położenie głównych konsumentów gazu oferuje szeroki
zakres możliwości w zakresie wdrażania projektów LNG na Arktyce. Celem badania
jest ujednolicenie podejścia do oceny skuteczności projektów LNG na Arktyce, biorąc
pod uwagę ich charakter strategiczny i cechy przemysłowe. W ramach badania udało
się zrealizować takie zadania jak analiza strategiczna perspektyw rozwoju branży
LNG w rejonie Arktyki należącym do Federacji Rosyjskiej, identyfikacja cech
projektów LNG na Arktyce oraz uzasadnienie założeń ich oceny. Zastosowano
metodę generalizacji, systematyzacji oraz analizę porównawczą i strategiczną.
Słowa kluczowe: LNG, ciekły gaz ziemny, projekty LNG na Arktyce, rejon Arktyki
Federacji Rosyjskiej.


Jolanta BIJAŃSKA1, Krzysztof WODARSKI2 1Silesian University of Technology, Poland (e-mail: [email protected]) 2Silesian University of Technology, Poland (e-mail: [email protected])
5. SOURCES OF VALUE CREATION OF A MINING ENTERPRISE
5.1. Introduction
The modern market of hard coal is a source of difficult challenges for Polish
mining enterprises. Currently, among basic conditions for their proper functioning
and development, one can distinguish – apart from the ability of quick adjustment to
the technical and technological changes – the ability of management focused on
value creation.
Value creation of a mining enterprises is currently considered to be their basic
and strategic long-term objective (Sierpińska, 2007; Wodarski, 2009; Bluszcz et al.,
2013). This objective can be achieved by identifying the key sources that determine
this value. In literature, much attention is paid to these sources, both in general and
with reference to the specific nature of Polish enterprises. This paper summarizes the
selected research results on sources of value creation of a mining enterprise, as well
as the results of own research that refer to these determinants that are of special
importance in the context of process approach to the management of a mining
enterprise.
A premise for the research in such a context was the need of management of Polish
mining enterprises that is interested in implementing the concept of process
management to improve the efficiency and effectiveness of their business.
Identification of sources of value creation is of importance in the aspect of including
them in the developed processes management system model in a mining enterprise.
This model will constitute a representation of the procedures that will ensure
efficiency and effectiveness of processes implemented in a mining enterprise to
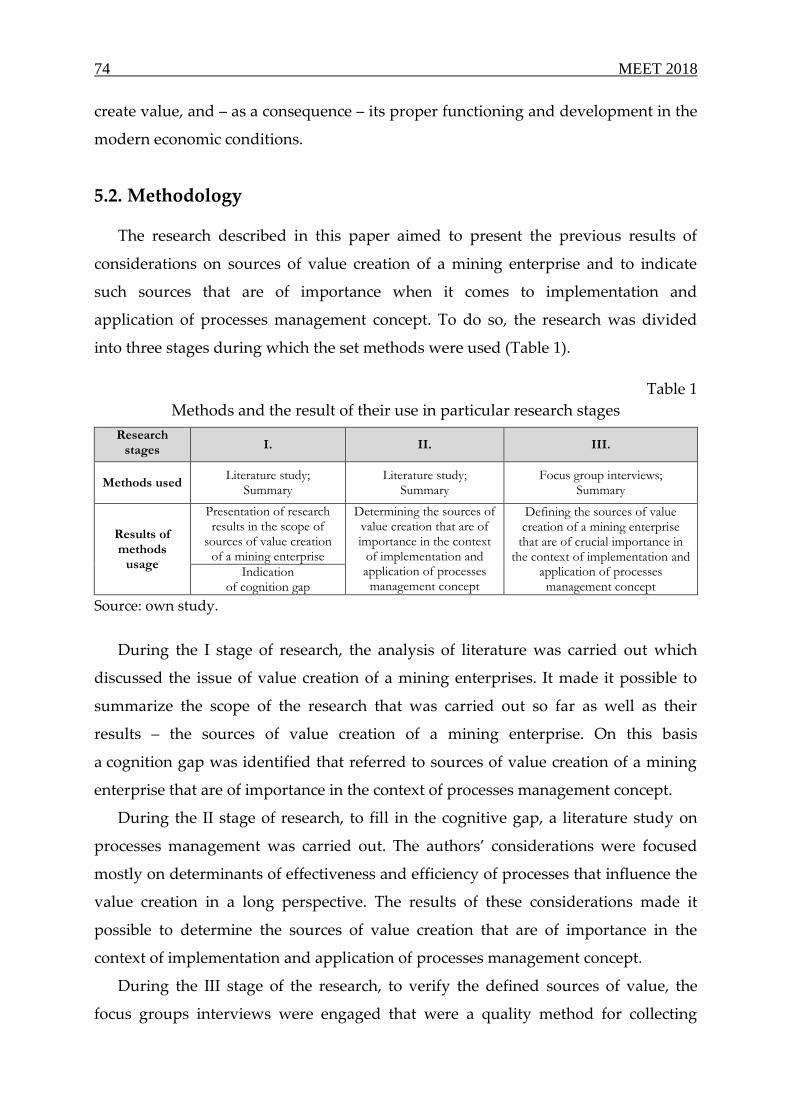
74 MEET 2018
create value, and – as a consequence – its proper functioning and development in the
modern economic conditions.
5.2. Methodology
The research described in this paper aimed to present the previous results of
considerations on sources of value creation of a mining enterprise and to indicate
such sources that are of importance when it comes to implementation and
application of processes management concept. To do so, the research was divided
into three stages during which the set methods were used (Table 1).
Table 1
Methods and the result of their use in particular research stages
Research stages I. II. III.
Methods used Literature study;
Summary Literature study;
Summary Focus group interviews;
Summary
Results of methods
usage
Presentation of research results in the scope of
sources of value creation of a mining enterprise
Determining the sources of value creation that are of importance in the context
of implementation and application of processes management concept
Defining the sources of value creation of a mining enterprise
that are of crucial importance in the context of implementation and
application of processes management concept
Indication of cognition gap
Source: own study.
During the I stage of research, the analysis of literature was carried out which
discussed the issue of value creation of a mining enterprises. It made it possible to
summarize the scope of the research that was carried out so far as well as their
results – the sources of value creation of a mining enterprise. On this basis
a cognition gap was identified that referred to sources of value creation of a mining
enterprise that are of importance in the context of processes management concept.
During the II stage of research, to fill in the cognitive gap, a literature study on
processes management was carried out. The authors’ considerations were focused
mostly on determinants of effectiveness and efficiency of processes that influence the
value creation in a long perspective. The results of these considerations made it
possible to determine the sources of value creation that are of importance in the
context of implementation and application of processes management concept.
During the III stage of the research, to verify the defined sources of value, the
focus groups interviews were engaged that were a quality method for collecting
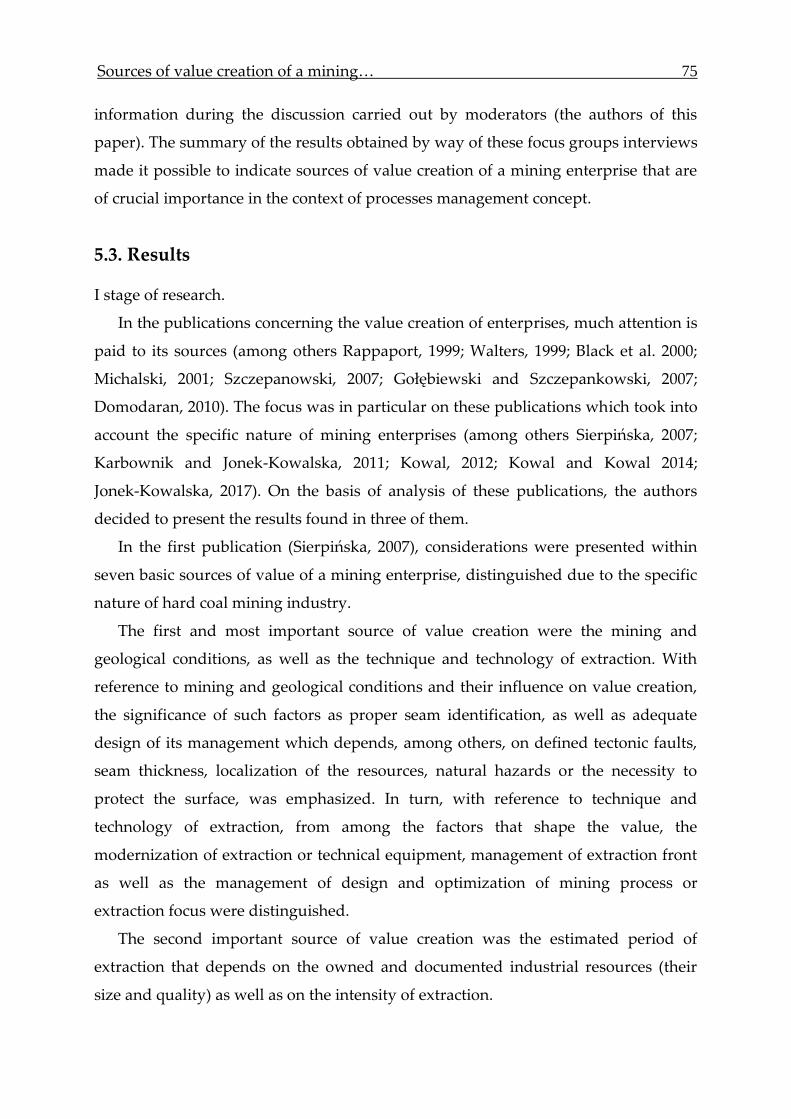
Sources of value creation of a mining… 75
information during the discussion carried out by moderators (the authors of this
paper). The summary of the results obtained by way of these focus groups interviews
made it possible to indicate sources of value creation of a mining enterprise that are
of crucial importance in the context of processes management concept.
5.3. Results
I stage of research.
In the publications concerning the value creation of enterprises, much attention is
paid to its sources (among others Rappaport, 1999; Walters, 1999; Black et al. 2000;
Michalski, 2001; Szczepanowski, 2007; Gołębiewski and Szczepankowski, 2007;
Domodaran, 2010). The focus was in particular on these publications which took into
account the specific nature of mining enterprises (among others Sierpińska, 2007;
Karbownik and Jonek-Kowalska, 2011; Kowal, 2012; Kowal and Kowal 2014;
Jonek-Kowalska, 2017). On the basis of analysis of these publications, the authors
decided to present the results found in three of them.
In the first publication (Sierpińska, 2007), considerations were presented within
seven basic sources of value of a mining enterprise, distinguished due to the specific
nature of hard coal mining industry.
The first and most important source of value creation were the mining and
geological conditions, as well as the technique and technology of extraction. With
reference to mining and geological conditions and their influence on value creation,
the significance of such factors as proper seam identification, as well as adequate
design of its management which depends, among others, on defined tectonic faults,
seam thickness, localization of the resources, natural hazards or the necessity to
protect the surface, was emphasized. In turn, with reference to technique and
technology of extraction, from among the factors that shape the value, the
modernization of extraction or technical equipment, management of extraction front
as well as the management of design and optimization of mining process or
extraction focus were distinguished.
The second important source of value creation was the estimated period of
extraction that depends on the owned and documented industrial resources (their
size and quality) as well as on the intensity of extraction.

76 MEET 2018
The third source of value creation are the sales structure and coal distribution
channel. It was noted that a key factor is management of coal sale that covers the
indication of a proper level and structure of sales, determined by its probable share
in professional and industrial power engineering, utility and municipal power
plants, other industrial recipients, coke plants and others as well as share of sales for
export. The importance of seasonal nature of sales was also emphasized. The coal
distribution channels as well as it seasonal nature influence the level of inventory
and short-term liabilities. Their high level may lead to usage of financing sources that
increase the capital acquisition cost.
The coal prices were indicated as the fourth source of value creation of a mining
enterprise. It was emphasized that the prices of coal are among the most important
external value creation factors. Their level is set by trends on global mineral materials
markets, which result from the level of coal demand and supply having defined
quality parameters.
The fifth source of value creation of a mining enterprise is the cost of coal
extraction that depends on the following:
presence of natural hazards and the necessity to ensure safe working
conditions,
necessity to reconstruct extraction front,
mining works in seams that are more difficult in terms of resources location,
carrying out necessary timely technical maintenance and repair work to prevent
downtime and ensure the safety of use of machinery and equipment,
increase of prices of foreign services, for example drilling and mining,
increase of remuneration, strongly correlated with the social conditions that
complicate the decision-making.
The sixth source were the ecological conditions that result in significant
expenditure on environmental protection which results from the generation of
mining waste, discharging waste to the environment (including saline waters),
emission of pollutants to air or noise caused by machinery and equipment.
The seventh source was the cost of capital that finances the business of mining
enterprises. It was noticed that this cost is higher in this industry as compared with
other sectors, which is due to the high risk of the business and associated
uncertainty.

Sources of value creation of a mining… 77
The second publication (Kowal, 2012) presents the results of literature study and
the focus groups in the scope of sources of value creation of a mining enterprise.
These sources were classified into seven key functional areas that take into account
the nature and essence of mining business.
The first area that is considered the source of value creation are marketing and
sales. In this area the following determinants of value creation were distinguished:
direct agreements with domestic and foreign contractors, the knowledge about the
sales market, investments into market research – knowing the customers’ needs, coal
assortments, certainty of supplies, the directions of coal sales, level of inventory,
diversification of contractors’ portfolio, number of long-term agreements, relation
between the quality of seam coal and commercial coal, the flexibility of price policy,
competitive advantage in Europe, focus on a customer, the selection of the most
effective segments of domestic and foreign market, development of distribution
network, deliveries flexibility – market segmentation, market downturn, creation of
new recipients – promotion, quality management system, investments into the
image, customer service quality policy, investments in coal bulk breaking.
The second source of value creation of a mining enterprise is the production
(technology) of coal. The following determinants of value creation were identified:
investments in new extraction fields, investments in identification and
documentation of resources, investments in unified coal mine, maintaining the
extraction ability, investments in Coal Processing Plant, investments in technologies
of output enrichment, modernization of technical equipment of the front, extension
of present extraction levels, movement of current equipment, investments in quality
control systems (quality parameters of coal), investments in implementation of
innovative solutions in terms of environmental protection, minimization of mining
exploitation effects on the environment, economic use of waste, waste management
strategy, economic use of methane.
The next, third area defined being a source of value creation were human
resources. The following value creation determinants were distinguished: personal
strategy, employment structure, payroll policy, qualified personnel, internal
movement of employees and between plants, policy of relations with trade unions,
additional employees benefits, ability to change, trainings system, cooperation with
schools/universities, investments in vocational training, managerial abilities, work
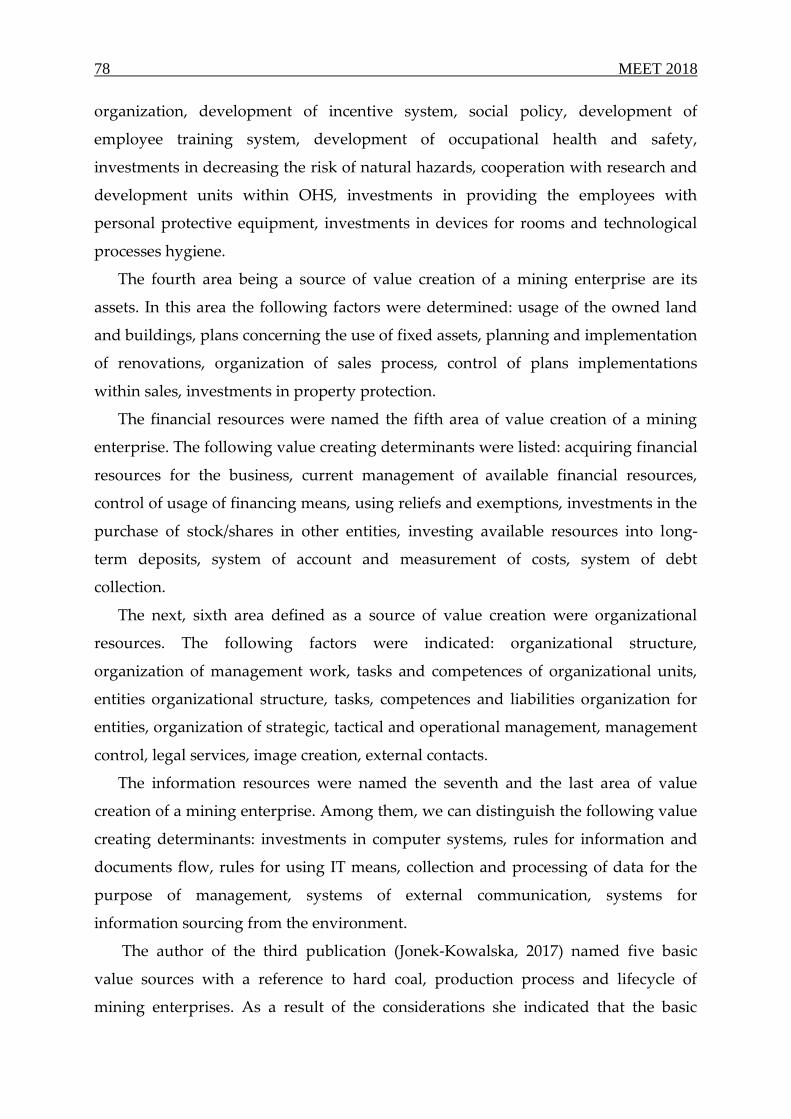
78 MEET 2018
organization, development of incentive system, social policy, development of
employee training system, development of occupational health and safety,
investments in decreasing the risk of natural hazards, cooperation with research and
development units within OHS, investments in providing the employees with
personal protective equipment, investments in devices for rooms and technological
processes hygiene.
The fourth area being a source of value creation of a mining enterprise are its
assets. In this area the following factors were determined: usage of the owned land
and buildings, plans concerning the use of fixed assets, planning and implementation
of renovations, organization of sales process, control of plans implementations
within sales, investments in property protection.
The financial resources were named the fifth area of value creation of a mining
enterprise. The following value creating determinants were listed: acquiring financial
resources for the business, current management of available financial resources,
control of usage of financing means, using reliefs and exemptions, investments in the
purchase of stock/shares in other entities, investing available resources into long-
term deposits, system of account and measurement of costs, system of debt
collection.
The next, sixth area defined as a source of value creation were organizational
resources. The following factors were indicated: organizational structure,
organization of management work, tasks and competences of organizational units,
entities organizational structure, tasks, competences and liabilities organization for
entities, organization of strategic, tactical and operational management, management
control, legal services, image creation, external contacts.
The information resources were named the seventh and the last area of value
creation of a mining enterprise. Among them, we can distinguish the following value
creating determinants: investments in computer systems, rules for information and
documents flow, rules for using IT means, collection and processing of data for the
purpose of management, systems of external communication, systems for
information sourcing from the environment.
The author of the third publication (Jonek-Kowalska, 2017) named five basic
value sources with a reference to hard coal, production process and lifecycle of
mining enterprises. As a result of the considerations she indicated that the basic

Sources of value creation of a mining… 79
source are the owned and potential geological resources, being the basis for the
mining enterprise functioning. The second came the collection of material and non-
material resources. Material resources were defined as having high intensity of
capital expenditures and are characterized by significant risk due to the product
homogeneity and the lack of possibility to use product or geographical
diversification. In turn, among non-material resources she pointed out to the
importance of extraction technology that determines not only extraction costs but
also significantly influences the harmfulness of production for the environment and
society. In this scope the role of the so-called clean coal technologies in the areas of
extraction, mechanical processing, usage of coal in power engineering, possibility of
transforming (for example into liquid fuels) and waste management was emphasized
by the author. What she also pointed to was that the technology of extraction is
important in the context of the possibility of usage of off-balance sheet and non-
industrial resources. I. Jonek-Kowalska as the third most important factor of value
creation indicated the combination and development of held material and non-
material resources, especially in the process of remedial restructuring associated with
the decreasing role of coal in the energy balance. She defined the three mentioned
sources as crucial in the aspect of influence on the operational carriers of value.
The subsequent two she classified as strongly influencing the strategic carriers. In the
first place she paid attention to the possibility (and quite often the necessity) of
establishing economic relations by the mining enterprises in the form of energy
concerns or global mining concerns that guarantee that such entities will survive and
develop. Next, she pointed out to the implementation of sustainable development
and corporate social responsibility concepts arguing that if these elements are
omitted this has disastrous effect on the image of mining enterprises and thus their
value.
It must be noted, however, that the results of the research presented in the
discussed publications (Sierpińska eds., 2007; Kowal, 2012; Jonek-Kowalska, 2017)
fall into the category of research focused on value based management emphasizing
its links with resource based view as well as the ideas of sustainable development
and corporate social responsibility. These research results did not indicate
sufficiently the sources of value creation that are of importance in the aspect of

80 MEET 2018
process approach and associated concept of processes management, even though its
main goal is the creation of enterprise’s value.
Due to the lack of direct link between the presented results of research on sources
of value creation of a mining enterprise with the concept of processes management,
it was stated that in the available academic sources there is a cognition gap in that
aspect. Yet, the identification of these sources is of importance to implement this
concept of management which according to many scientists is one of the dominant
trends of modern economic theory and practice, and which according to
management of mining enterprises is the adequate direction of changes that should
take place in the hard coal industry.
II stage of research.
It was assumed that the basis to fill in the said cognitive gap will be a literature
study. So far, there is a lack of literature on processes management in the hard
coal mining industry and scarce publications in this scope present only selected
issues concerning the classification or modeling of processes or methods and
tools that support processes management. Therefore, an analysis of literature on
the processes management in the enterprise was made (among others Czekaj,
2009; Skrzypek, and Hofman, 2010; Nowosielski, 2011; Maciejczak, 2011;
Grajewski, 2009, 2012; Bitkowska et al., 2011; Bitkowska, 2013). On this basis it
was stated that the heart of this concept is creation of enterprise value by
ensuring effectiveness and efficiency of processes implemented by such an
enterprise:
within the structure defined by stages of identification and classification,
modeling, measurement or results assessment as well as improvement and
development of course of processes,
in the interrelated organizational and social areas, areas of knowledge,
economic and financial and IT areas.
Taking this into account, it was assumed that the sources of value creation of
a mining enterprise in the concept of processes management must be search for in
determinants of effectiveness and efficiency of processes in the scope of the
abovementioned structure and areas. And so, on the basis of literature study it was
assumed that there are 40 determinants of effectiveness and efficiency of enterprise
processes (Table 2).

Sources of value creation of a mining… 81
Table 2
Determinants of effectiveness and efficiency of processes in the scope of the structure
of processes management and areas of organization and social, knowledge,
economics and finance, IT
Determinants of effectiveness and efficiency of processes
STRUCTURE OF PROCESSES MANAGEMENT
1) linking the processes with strategy and basic strategic objective (value creation),
2) identification and classification of processes in the context of value creation,
3) modeling the course of processes that ensures their maximum effectiveness and efficiency,
4) organization and control of the manner of carrying activities within the processes as compared with their
assumed course,
5) defining measures/indicators of processes results and norms/standards referring to their level,
6) making measurements, reporting and assessing processes implementation results on the basis of
assumed measures/indicators and norms/standards,
7) improvement and development of the course of processes on the basis of their implementation results
assessment,
8) using methods or tools that support the measurement, reporting and assessment of processes results, as
well as their improvement and development.
AREA OF ORGANIZATION AND SOCIAL
9) organizational structure focused on processes,
10) presence of process awareness among employees,
11) focus on teamwork,
12) determining process managers (or other relevant positions) as well as process teams,
13) integration of HR management with processes management,
14) organizational culture that fosters processes management,
15) open attitude to the changes proposed by the employees, focus on the improvement and development of
the course of processes,
16) team assessment – responsibility for the results of the processes shall be borne by process managers and
process teams.
AREA OF KNOWLEDGE
17) the knowledge of the employees in the scope of processes management concept – training on particular
stages of process management structure and its dimensions,
18) presence of relevant communication network for the use of employees’ knowledge on particular
processes and sharing this knowledge in process teams,
19) record keeping of knowledge on processes and their results,
20) access of employees to knowledge on processes, for example documentation that covers objectives, maps,
processes measurement indicators,
21) motivating employees to share knowledge and experience,
22) possibility of making changes and improvements in the processes by the employees,
23) providing the employees with relevant knowledge on particular processes in due time,
24) presence of knowledge management system for the purpose of processes management.
AREA OF ECONOMICS AND FINANCE
25) knowledge of modern accounts that make it possible to manage the costs of processes,
26) calculating, reporting and monitoring costs of processes,
27) availability of financial and accounting background for the purpose of calculating, reporting and
monitoring costs of processes,
28) using modern methods that can support calculating, reporting and monitoring costs of processes,
29) planning activities and resources for the purpose of optimization of costs of processes,

82 MEET 2018
cont. table 2
30) costs of processes and indicators based on these costs – as a basis for the assessment of process
effectiveness,
31) providing employees with information on costs of processes,
32) taking into account the costs of processes in the incentive system.
AREA OF IT
33) access to highly qualified experts (IT specialists),
34) development and implementation of IT system dedicated for processes management,
35) employees’ training on the proper usage of IT system dedicated for processes management,
36) trainings for employees on the use of IT tools to map the course, measurement, reporting, results
assessment, as well as analysis and improvement of processes,
37) use of IT tools to map the processes course,
38) use of IT tools to measure, report and assess the results of processes implementation,
39) use of IT tools to analyze and develop the processes,
40) development and implementation of a software that ensures process integration of IT systems with the
customers’ systems.
Source: own study.
It must be noted, that the listed determinants of effectiveness and efficiency of
processes are indirectly linked with the sources of value creation of a mining
enterprise defined in literature. And so, with reference to the first of the presented
publications (Sierpińska eds., 2007), one can notice their indirect link with – for
example – production process management, optimization of mining work,
management of coal sale or costs of coal extraction. With reference to the second
publication (Kowal, 2012), one can indicate an indirect link with determinants in each
of the identified sources of value creation. For example in the area of marketing and
sales it is the knowledge of sales market, in the area of production – investments into
implementation of innovative solutions, in the area of HR – development of incentive
system, in the area of tangible assets – organization of sales process, in the area of
financial resources – account and costs measurement system, in the area of
organizational processes – organizational structure, and in the area of IT resources –
rules for the use of IT resources. Similarly, in the case of the third publication (Jonek-
Kowalska, 2017), one can notice an indirect link between sources of value creation
and defined determinants, for example this applies to extraction technology or
production costs.
III stage of research.
To verify the defined sources – determinants of value creation in the context of
processes management with regard to the specific nature of the mining enterprise,

Sources of value creation of a mining… 83
two focus groups interviews were engaged. They composed of 10 representatives of
management of two Silesian mining enterprises who are interested in the issues
related to processes management and using this concept in mining practice. The
focus groups were about discussion and knowledge sharing between the participants
in the scope of the 40 presented determinants. It was assumed that each focus group
participant can share their opinion on determinants, as well as make an assessment
of their influence on the creation of value of a mining enterprise.
During the focus groups it was unanimously stated that the specific determinants
are of average, significant or very significant influence on the effectiveness and
efficiency of processes and consequently on the value creation of a mining enterprise.
Moreover, during the discussion several determinants were emphasized that
according to many of the representatives of management are important in the aspect
of the usage of processes management concept and influence on the creation of value
of mining enterprise (Fig. 1). In particular, it applies to the following determinants:
90% of answers “Very significant influence”, 10% of answers “Significant
influence”:
13) integration of HR management with processes management – during the
discussion it was noted that the key to success is a presence of incentive program
associated with the processes results,
6) making measurements, reporting and assessing processes implementation
results on the basis of assumed measures/indicators and norms/standards – during
the discussion it was emphasized that this is the basis of effectiveness and efficiency
of processes,
5) defining measures/indicators of processes results and norms/standards
referring to their level – during the discussion, the present problems were indicated;
it was also noted that such measures and norms exists with reference to several
processes,
1) linking the processes with strategy and basic strategic objective (value
creation) – during the discussion, emphasis was put on the meaning of strategic goal
cascading into objectives of processes, teams and their members,
80% of answers “Very significant influence”, 20% of answers “Significant
influence”:

84 MEET 2018
34) development and implementation of IT system dedicated for processes
management – during the discussion problems in this area were identified that are
linked with access to highly-qualified specialists,
20) access of employees to knowledge on processes, for example documentation
that covers objectives, maps, processes measurement indicators – during the
discussion the problems the solutions for which are time consuming as there is
currently no such documentation were identified,
18) presence of relevant communication network for the use of employees’
knowledge on particular processes and sharing this knowledge in process teams,
12) determining process managers (or other relevant positions) as well as process
teams – during the discussion it was noted that the establishment of a relevant
department for processes management, appointing its leader and team members is
important in the context of establishing affiliation and group responsibility and team
work,
70% of answers “Very significant influence”, 30% of answers “Significant
influence”:
33) access to highly qualified experts (IT specialists) – during the discussion it was
classified as important but sourcing such specialists is characterized by high intensity
of capital expenditures which is important in the context of current economic and
financial situation of mining enterprises,
27) availability of financial and accounting background for the purpose of
calculating, reporting and monitoring costs of processes – during the discussion,
attention was paid that the SZYK 2 IT system used in mining industry can support
processes management in this scope but is not used for that purpose,
26) calculating, reporting and monitoring costs of processes – during the
discussion the modern opportunities in this scope were identified as well as their
meaning for processes effectiveness.

Sources of value creation of a mining… 85
0% 10% 20% 30% 40% 50% 60% 70% 80% 90% 100%
2)
7)
9)
22)
14)
19)
40)
10)
11)
17)
37)
39)
28)
32)
36)
27)
12)
20)
1)
6)
Average influence Significant influence Very significant influence
Det
erm
inan
ts
Fig. 1. Results of assessment of influence significance of defined determinants on value
creation of a mining enterprise (numbers of determinants as in the text)
Rys. 1. Wyniki oceny istotności wpływu określonych determinantów na tworzenie wartości
przedsiębiorstwa górniczego (liczba determinantów jak w tekście)
Source: own study.

86 MEET 2018
5.4. Conclusions
Determining the sources of value creation of mining enterprises is of significance
in the aspect of implementation of modern management concepts that are focused on
proper functioning and development in the current economic conditions. Currently,
among such concepts the processes management can be distinguished. According to
management of mining enterprises, implementation of this concept is a proper
direction of changes that should take place in the hard coal mining industry. The
research results presented in this publication on the sources of value creation were
aimed to identify those of importance in the aspect of implementation the concept of
processes management in mining enterprises. These results are general but taking
them into consideration in the processes management system model being developed
will make it possible to focus on determinants of effectiveness and efficiency of
processes, and in turn will result in the value creation of a mining enterprise. Further
considerations and research results in this scope will be subject of other publications.
Bibligraphy
1. Bitkowska, A. (2013). Zarządzanie procesowe we współczesnych organizacjach.
Difin: Warszawa.
2. Bitkowska, A., Kolterman, K., Wójcik, G., Wójcik, K. (2011). Zarządzanie
procesami w przedsiębiorstwie. Aspekty teoretyczno-praktyczne. Difin: Warsza-
wa.
3. Black, A., Wright, P., Bachman, J. (2000). W poszukiwaniu wartości dla
akcjonariuszy. Dom Wydawniczy ABC: Warszawa.
4. Bluszcz, A., Kijewska, A., Sojda, A. (2013). Analiza efektywności zarządzania
wartością przedsiębiorstwa górniczego. Zeszyty Naukowe Uniwersytetu
Szczecińskiego, 786, 87-96.
5. Czekaj, J. (Eds.) (2009). Zarządzanie procesami biznesowymi. Aspekt
metodyczny. Wydawnictwo Uniwersytetu Ekonomicznego: Kraków.
6. Domodaran, A., (2010). Value Creation and Enhancement: Back to the Future.
http://www.stern.nyu.edu.
7. Gołębiewski, G., Szczepankowski, P. (2007). Analiza wartości przedsiębiorstwa.
Difin: Warszawa.

Sources of value creation of a mining… 87
8. Grajewski, P. (2009). Uwarunkowania implementacji procesów do organizacji.
In Nowosielski, S. (Eds.), Podejście procesowe w organizacjach, Wydawnictwo
Uniwersytetu Ekonomicznego: Wrocław, 381-395.
9. Grajewski, P. (2012). Procesowe zarządzanie organizacją. PWE: Warszawa.
10. Jonek-Kowalska, I. (2017). Prowartościowe kształtowanie parametrów produkcji
górniczej w warunkach ryzyka branżowego i rynkowego. Wydawnictwo
Politechniki Śląskiej: Gliwice.
11. Karbownik, A., Jonek-Kowalska, I. (2011). Udział kosztów wytwarzania
w kształtowaniu wartości przedsiębiorstw górniczych. Zeszyty Naukowe
Uniwersytetu Szczecińskiego, 685, 431-442.
12. Kowal, B., Kowal, D. (2014). Czynniki kształtujące wartość przedsiębiorstwa
górniczego węgla kamiennego. Przegląd Górniczy, 9, 44 -47.
13. Kowal, D. (2012). Determinanty kształtujące wartość przedsiębiorstwa
górniczego. Zarządzanie Przedsiębiorstwem, 1, 19-28.
14. Maciejczak, M. (2011). Zarządzanie procesami biznesowymi w teorii i praktyce.
Wydawnictwo PJWSTK: Warszawa.
15. Michalski, M. (2001). Zarządzanie przez wartość: firma z perspektywy interesów
właścicielskich. WIG-Press: Warszawa.
16. Nowosielski, S. (Eds.) (2011). Podejście procesowe w organizacjach.
Wydawnictwo Uniwersytetu Ekonomicznego: Wrocław.
17. Rappaport, A. (1999). Wartość dla akcjonariuszy. Poradnik menedżera i inwesto-
ra. WIG-Press: Warszawa.
18. Sierpińska, M. (Eds.) (2007). Wykorzystanie nowoczesnych koncepcji
wspomagania decyzji dla poprawy efektywności zarządzania zakładem
górniczym i spółką węglową. Patria: Kraków.
19. Skrzypek, E., Hofman, M. (2010). Zarządzanie procesami w przedsiębiorstwie.
Oficyna Wolters Kluwer business. Warszawa.
20. Szczepanowski, P. (2007). Wycena i zarządzanie wartością przedsiębiorstwa.
Wydawnictwo Naukowe PWN: Warszawa.
21. Walters, D. (1999). The Implications of Shareholder Value Planning and
Management for Logistics Decision Making. International Journal of Physical
Distribution & Logistics Management, 29 (4), 240-258.
22. Wodarski, K. (2009). Zarządzanie ryzykiem w procesie planowania
strategicznego w górnictwie węgla kamiennego. Wydawnictwo Politechniki
Śląskiej: Gliwice.

88 MEET 2018
SOURCES OF VALUE CREATION OF A MINING ENTERPRISE
Abstract
The publication summarizes the current scientific considerations in the area of
sources of value creation of a mining enterprise, as well as results of own research
directed to the identification of such sources that are important for implementation
and use of processes management concept in an enterprise. The own research
covered the literature study and focus group interviews that made it possible to
verify the obtained results with reference to the reality of hard coal mining.
Keywords: hard coal mining, value creation, processes management.
ŹRÓDŁA TWORZENIA WARTOŚCI PRZEDSIĘBIORSTWA
GÓRNICZEGO
Streszczenie
Niniejsza publikacja podsumowuje bieżące naukowe rozważania dotyczące
źródeł tworzenia wartości przedsiębiorstwa górniczego oraz wyniki własnych badań
ukierunkowanych na zidentyfikowanie takich źródeł, które mają znaczenie dla
wdrożenia i zastosowania koncepcji zarządzania procesami w przedsiębiorstwie.
Własne badanie objęło studia literatury oraz wywiady grupowe, które umożliwiły
weryfikację uzyskanych wyników, w odniesieniu do rzeczywistości wydobycia
węgla kamiennego.
Słowa kluczowe: Wydobycie węgla kamiennego, tworzenie wartości, zarządzanie
procesem.

Izabela JONEK-KOWALSKA
Silesian University of Technology, Poland (e-mail: [email protected])
6. REMEDIAL RESTRUCTURING AS A WAY TO EXTEND THE
FINAL STAGE OF AN ENTERPRISE BASED ON THE EXAMPLE
OF POLISH HARD COAL MINING
6.1. Introduction
The company lifecycle has four basic stages, i.e. foundation, development,
maturity and final stage, with the companies attempting to extend particular stages
characterised by satisfactory development pace, i.e. development and maturity, using
any ways possible. In the final stage, the company terminates its activity and
inevitably heads for liquidation. It experiences a crisis caused by internal or external
factors, or by their mutual coupling. At this stage, the company may strive to extend
the lifecycle, but due to the state of collapse it is in, this task is difficult and usually
fails (Nawrocki and Jonek-Kowalska, 2016). A standard way of exiting the crisis and
extending the final stage or maturity is the remedial restructuring.
The remedial restructuring can be carried out within the existing company
resources by means of:
improved management;
improved work organization;
cost reduction;
increased motivation;
human resources improvement;
improved quality of products and processes.
It is also possible to “make the company leaner” in order to reduce expenditure and,
consequently, improve efficiency faster than if the resources were unchanged,
though in a more radical and controversial way. In such a situation, the following

90 MEET 2018
measures are adopted:
elimination of inefficient production chain links;
sales of some assets;
shutdown of certain facilities;
dismissals;
product line limitations.
Since the 1990s, the Polish hard coal mining has been struggling with the problem of
temporary and long-term economic ineffectiveness of particular mines and,
consequently, the entire mining companies. It has also been subject to remedial
restructuring to extend the lifecycle of the companies themselves and the whole
sector. The major premise justifying that process is to maintain the energy security of
Poland for which hard coal has still been a key power resource (Karbownik and
Turek, 2011). Nonetheless, an important priority for the remedial restructuring in the
mining sector is also the job retention in the Upper Silesian Coal Basin (Dubiński and
Turek, 2009; Gumiński, 2014).
Given the above circumstances, the major objective of this article is to analyse and
assess the use of remedial restructuring as a way to extend the final stage of an
enterprise based on the example of Polish hard coal mining. To achieve the objective
formulated in this way, the first part of the article presents the reasons and
symptoms of crisis in Polish hard coal mining in the context of the lifecycle of two
mining companies, excavating power coal, i.e. Kompania Węglowa SA and
Katowicki Holding Węglowy SA (Korski et al., 2016). Next, the scope of the remedial
restructuring in years 2015–2016 was characterised. For the studies, the reference
works’ studies, market condition analysis in the Polish hard coal mining and the
profitability assessment, including its all determinants, were used (Hąbek and
Wolniak, 2016; Manowska et al., 2017).
6.2. Methodology
To assess the operations of two studied mining companies and to identify their
current development stage in the research section of the article, the total return on
assets (1) and return on sales were used.

Remedial restructuring as a way to extend… 91
A
FRROA
(1)
where:
FR — net financial result;
A — total assets.
RV
FRROS
(2)
where:
FR — net financial result;
RV — sales revenue.
What is more, chain indexes of dynamics were used for crisis symptom analysis
for production costs and sales revenue (3).
1
t
t
i
iI
(3)
where:
it — value of the variable in time t,
it-1 — value of the variable in time t-1.
For the studies, the data derived from the financial statements of the analysed
companies for years 2003–2016 and the materials of the Ministry of Economy,
concerning mean hard coal selling prices and production costs in the Polish hard coal
mining were used.
6.3. Symptoms and causes of crisis in the Polish hard coal mining
As already mentioned, the analysis of the mining company lifecycle was applied
for two mining companies excavating power coal in the Upper Silesian Coal Basin
(USCB). First of them is Katowicki Holding Węglowy SA (KHW SA) founded in 1993
by consolidating independent mines operating in USCB those days. Initially, KHW
SA comprised 11 of them. The second coal mine analysed is Kompania Węglowa SA
established in 2003 by way of merging 5 coal companies. Initially, it comprised
23 mines.
A typical symptom of crisis in a company is the deteriorated net financial result
which, in a longer perspective, results in liquidity loss and limited own capital
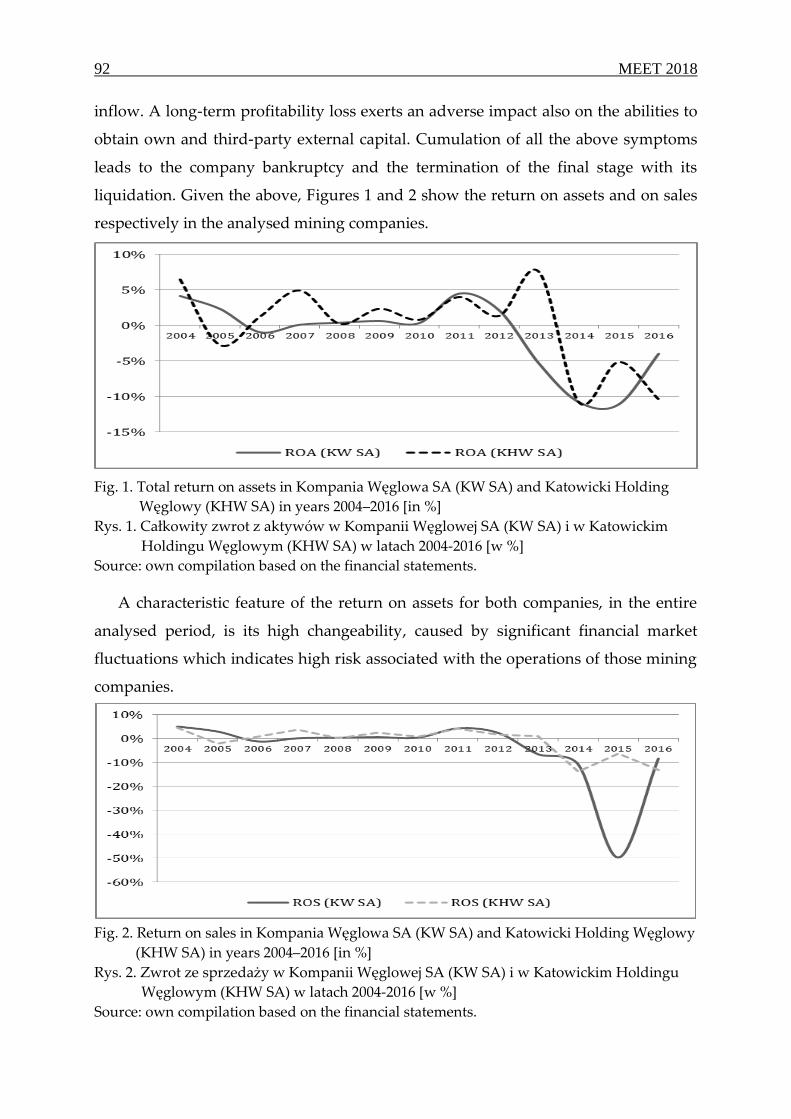
92 MEET 2018
inflow. A long-term profitability loss exerts an adverse impact also on the abilities to
obtain own and third-party external capital. Cumulation of all the above symptoms
leads to the company bankruptcy and the termination of the final stage with its
liquidation. Given the above, Figures 1 and 2 show the return on assets and on sales
respectively in the analysed mining companies.
Fig. 1. Total return on assets in Kompania Węglowa SA (KW SA) and Katowicki Holding
Węglowy (KHW SA) in years 2004–2016 [in %]
Rys. 1. Całkowity zwrot z aktywów w Kompanii Węglowej SA (KW SA) i w Katowickim
Holdingu Węglowym (KHW SA) w latach 2004-2016 [w %]
Source: own compilation based on the financial statements.
A characteristic feature of the return on assets for both companies, in the entire
analysed period, is its high changeability, caused by significant financial market
fluctuations which indicates high risk associated with the operations of those mining
companies.
Fig. 2. Return on sales in Kompania Węglowa SA (KW SA) and Katowicki Holding Węglowy
(KHW SA) in years 2004–2016 [in %]
Rys. 2. Zwrot ze sprzedaży w Kompanii Węglowej SA (KW SA) i w Katowickim Holdingu
Węglowym (KHW SA) w latach 2004-2016 [w %]
Source: own compilation based on the financial statements.

Remedial restructuring as a way to extend… 93
The best period in terms of ROA and ROS achieved were the years 2007–2012.
At that time, the analysed indexes are positive. Their highest values are recorded in
2011. Since 2012, a sudden fall of financial results in both analysed mining companies
has been recorded (Turek and Michalak, 2011).
The dynamics of revenue and own costs in both companies is presented
synthetically in Table 1 and 2.
Table 1
Chain indexes of dynamics for sales revenue and the mining production
costs in Kompania Węglowa SA in years 2005–2016
Specification Years
2005 2006 2007 2008 2009 2010
chain index for
revenue 0.977 0.960 0.986 1.285 1.000 0.976
chain index for costs 0.996 0.993 1.000 1.158 1.005 0.993
Specification Years
2011 2012 2013 2014 2015 2016
chain index for
revenue 1.211 0.882 0.967 0.872 0.180 2.287
chain index for costs 1.131 0.910 1.428 0.887 0.167 2.100
Source: own study.
Table 2
Chain indexes of dynamics for sales revenue and the mining production
costs in Katowicki Holding Węglowy SA in years 2005–2016
Specification Years
2005 2006 2007 2008 2009 2010
chain index for
revenue 0.972 1.117 0.958 1.012 1.159 0.968
chain index for costs 1.005 1.139 1.010 1.048 1.080 1.046
Specification Years
2011 2012 2013 2014 2015 2016
chain index for
revenue 1.059 0.957 1.001 0.929 0.949 0.856
chain index for costs 1.030 0.971 0.982 1.050 0.942 0.878
Source: own study.

94 MEET 2018
Sales revenue in Kompania Węglowa SA grew on a year-to-year basis solely in
2008 and 2011*. In Katowicki Holding Węglowy SA, the growth periods are slightly
more numerous and they cover the following years: 2006, 2008, 2009, 2011 and 2013.
The increase in the sales revenue in 2008–2013 in both companies results primarily
from the increased hard coal price in that period (Fig. 3).
Fig. 3. The unit selling price and unit mining production cost in years 2003–2016 [in PLN/t]
Rys. 3. Jednostkowa cena sprzedaży i jednostkowy koszt wydobycia w latach 2003-2016
[w zł/t]
Source: own compilation on the basis of data from the Ministry of Economy.
According to Figure 5, it can be seen explicitly that in years 2008–2012 the coal
price exceeded the unit mining production cost, thanks to which the analysed
companies were able to achieve good financial results and positive economic
efficiency.
For the unit production costs, it is possible to notice high fluctuations of their
level and a more numerous group of growth periods. In Kompania Węglowa SA the
unit production cost grows in 2008, 2009, 2011 and 2013. For Katowicki Holding
Węglowy SA, the costs grow continuously from 2005 to 2011, and also in 2013. This
results from two key circumstances. The first of them is the increase in the
remuneration level (Bąk and Michalak, 2018), being more than 50% of the total costs
in the Polish hard coal mining, in relation to the pressure from trade unions and the
* Years 2015–2016 are when Kompania Węglowa SA was liquidated. High dynamics index in 2016
results from practical termination of operations by the company in 2015. The value of sales revenue in
2016 refers to Polska Grupa Górnicza.
unit mining production cost
unit hard coal selling price

Remedial restructuring as a way to extend… 95
requirements of mining teams. The other is a very high overhead cost level, reaching
80% which, given decreasing output, exerts an adverse influence on the unit mining
production cost (Vaněk et al., 2017).
The slump of hard coal prices in 2013, in connection with the growing unit costs,
contributes to the end of the boom in the Polish coal mining. The efficiency fall is so
serious that the losses absorb equity which is negative in both companies in 2013–
2014, and its absolute value grows. Consequently, both companies lose their liquidity
and are on the verge of bankruptcy (Wolniak and Skotnicka-Zasadzień, 2012).
6.4. Course of remedial restructuring in 2016–2017
In connection with the bankruptcy of two largest mining companies and,
consequently, the possible loss of energy security by Poland, a decision was made to
carry out deep restructuring of both companies. The first stage was the audit in all
mines belonging to KW SA and KHW SA. Its objective was to take stock of all assets
and record the results of each of them to separate the efficient and inefficient plants.
What is more, a decision was made to sell some non-productive assets to obtain some
funds to complement the capitals. Also, buyers were found for some mines operating
within the mine structures, which were transferred to Węglokoks SA or Tauron
Wydobycie, depending on the excavated coal type (power or coke coal).
The second restructuring stage was the liquidation of mines which were
inefficient due to excessive unit production costs, deposit recovery or high level of
natural hazards. Such plants were transferred to Spółka Restrukturyzacji Kopalń SA
which manages the assets and personnel of the liquidated mines by 2018 or 2012.
The funds for the liquidation are obtained from the state budget, according to the
European regulation, assuming governmental donations for mining plants solely
when they are liquidated. The workers from the liquidated mines were offered
a chance to use the severance pays and social protection or opt for an early
retirement. Some of them were employed in the operating mines.
The third stage of remedial restructuring was the creation of a new mining
company from the mines left in Kompania Węglowa SA and Katowicki Holding
Węglowy SA, called Polska Grupa Górnicza (PGG). The structure of that company
contains solely mines having a long-term operating perspective and likely to achieve

96 MEET 2018
positive economic efficiency, meaning the ones which excavate good quality coal for
a low unit cost. The said consolidation was to enable PGG to operate in market
economy conditions, without any financial support from the state, in accordance
with the applicable European Union restrictions, assuming complete competitive
advantage of the hard coal mining (Bijańska and Wodarski, 2017).
Moreover, to assure a market for the existing hard coal companies, Polska Grupa
Górnicza was merged with the power sector and is supervised by 2 power
companies. This was the fourth, and last, currently, remedial restructuring stage in
Polish coal mining in years 2016–2017. It is worth adding here, that in 2017 the
newly-created group managed to improve profitability significantly, although it has
not been positive yet.
6.5. Conclusions
This article presents remedial restructuring as a way to extend the final stage in
the Polish hard coal mining sector. In 2013–2014, due to the decrease of hard coal
prices on the global and Polish market and the increase in unit production costs in
Polish mining companies, the sector witnessed the most serious crisis in history.
As a result of that crisis, 2 largest mining companies faced bankruptcy. To prevent
their liquidation and energy security loss of Poland, it was decided to carry out
a deep restructuring of the sector, covering 4 following stages: audit of the existing
mines and mining companies, liquidation of inefficient mines, amalgamation of the
remaining companies in Polska Grupa Górnicza, and consolidation of the newly-
created company with the power sector.
The introduced changes made it possible to extend the final stage of the studied
companies. In 2017, the efficiency of the newly-created group grew thanks to
removing any mines with insufficient resources, excessive production costs and
excessive natural hazard level. However, to ensure further effective operations of the
Group, it is necessary to ensure cost-related discipline, consistent human resources
management and effective dialogue with the community.

Remedial restructuring as a way to extend… 97
Acknowledgements
This article was funded from the charter research funds of the Faculty of
Organization and Management at the Silesian University of Technology.
Bibliography
1. Bąk, P., Michalak, A., (2018). The problem of managers' remuneration in state
-owned enterprises in the context of corporate governance. Gospodarka Surowcami
Mineralnym = Mineral Resources Policy, 34(1), 155-174.
2. Bijańska, J., Wodarski, K., (2017). Defining a strategy of coal enterprises in crisis
situation. [in:] 4th BE-ci. International Conference on Business & Economics 2017,
05-07 June, 2017, Bekirogullari, Z., Minas, M.Y., Thambusamy, R.X. (Eds.),
Future Academy: Brno, 91-105 doi: 10.15405/epms.2017.06.10
3. Dubiński, J., Turek, M. (2009). Wybrane aspekty zmian restrukturyzacyjnych
w polskim górnictwie węgla kamiennego (w latach 1990-2008). Prace Naukowe
GIG, Górnictwo, 2, 5-19.
4. Gumiński, A. (2014). Wyzwania dla zarządzania zasobami ludzkimi w polskim
górnictwie węgla kamiennego. Zeszyty Naukowe Politechniki Śląskiej, seria:
Organizacja i Zarządzanie, 69, 53-62.
5. Hąbek P., Wolniak, R. (2016). Factors influencing the development of CSR
reporting practices: experts' versus preparers' points of view. Engineering
Economy, 26(5), 560-570.
6. Karbownik, A., Turek, M. (2011). Zmiany w górnictwie węgla kamiennego
- geneza, przebieg, efekty. Przegląd Górniczy, 67(7/8), 11-18.
7. Korski, J., Tobór-Osadnik, K., Wyganowska, M., (2016). Reasons of problems of
the polish hard coal mining in connection with restructuring changes in the
period 1988–2014. Resources Policy, 48, 25-31.
8. Manowska, A., Tobór-Osadnik, K., Wyganowska, M. (2017). Economic and social
aspects of restructuring Polish coal mining: Focusing on Poland and the EU.
Resources Policy, 52, 192-200.
9. Nawrocki, T., Jonek-Kowalska, I., (2016). Assessing operational risk in coal
mining enterprises - internal, industrial and international perspective. Resources
Policy, 48, 50-67.
10. Turek, M., Michalak, A. (2011). New performance funding models as the way of
finance management improvement in mining enterprises. Equilibrium, 6(2), 77-90.

98 MEET 2018
11. Vaněk, M., Bora, P., Maruszewska, E.M., Kašparková, A. (2017). Benchmarking of
mining companies extracting hard coal in the Upper Silesian Coal Basin.
Resources Policy, 53, 378-383.
12. Wolniak, R., Skotnicka-Zasadzień, B. (2012). The concept of study of Servqual
method’s gaps. Quality and Quantity, 4(46), 1239-1247.
REMEDIAL RESTRUCTURING AS A WAY TO EXTEND THE FINAL
STAGE OF AN ENTERPRISE BASED ON THE EXAMPLE OF
POLISH HARD COAL MINING
Abstract
The major objective of this article is to analyse and assess the use of remedial
restructuring as a way to extend the final stage of an enterprise based on the example
of Polish hard coal mining. To achieve the objective formulated in this way, the first
part of the article presents the reasons and symptoms of crisis in Polish hard coal
mining in the context of the lifecycle of two mining companies, excavating power
coal, i.e.: Kompania Węglowa SA and Katowicki Holding Węglowy SA. Next, the
scope of the remedial restructuring in years 2015–2016 was characterised. For the
studies, the reference works’ studies, market condition analysis in the Polish hard
coal mining and the profitability assessment, including its all determinants, were
used.
Keywords: remedial restructuring, mining company, company lifecycle, crisis
management, Polish hard coal mining.
RESTRUKTURYZACJA NAPRAWCZA JAKO METODA
PRZEDŁUŻANIA CYKLU ŻYCIA PRZEDSIĘBIORSTWA NA
PRZYKŁADZIE POLSKIEGO GÓRNICTWA WĘGLA KAMIENNEGO
Streszczenie
Głównym celem niniejszego artykułu jest analiza i ocena wykorzystania
restrukturyzacji naprawczej jako metody przedłużenia ostatniego etapu
przedsiębiorstwa na przykładzie polskiego górnictwa węgla kamiennego. Aby
zrealizować to założenie, w pierwszej części artykułu przedstawiono powody oraz
oznaki kryzysu w polskim górnictwie węgla kamiennego w kontekście cyklu życia
dwóch przedsiębiorstw górniczych wydobywających węgiel energetyczny, to jest:
Kompania Węglowa SA i Katowicki Holding Węglowy SA. Następnie

Remedial restructuring as a way to extend… 99
scharakteryzowano restrukturyzację naprawczą w latach 2015-2016. Na potrzeby
badania zastosowano analizę dotychczasowych publikacji, analizę rynku polskiego
górnictwa węgla kamiennego i ocenę rentowności, z uwzględnieniem wszystkich
determinantów.
Słowa kluczowe: restrukturyzacja naprawcza, przedsiębiorstwo górnicze, cykl życia
przedsiębiorstwa, zarządzanie kryzysowe, polskie górnictwo węgla kamiennego.


PART II
IMPROVEMENT OF PRODUCTIVITY
IN EXTRACTIVE INDUSTRIES
WITH THE USE OF ORGANIZATIONAL
AND TECHNOLOGICAL METHODS


Marta PODOBIŃSKA-STANIEC1, Patrycja BĄK2 1AGH University of Science and Technology, Poland (e-mail: [email protected]) 2AGH University of Science and Technology, Poland (e-mail: [email protected])
7. CONSOLIDATION IN THE HARD COAL MINING SECTOR:
CASE STUDY
7.1. Introduction
Consolidation, restructuring and globalisation of companies are terms which
have been accompanying the Polish mining sector since the system changes initiated
in the 1990s. Since 1990 numerous changes in the organisation of companies and
modes of conducting mining work or determining the production volume have been
carried out in the hard coal mining sector in Poland. The hard coal mining sector still
necessitates reforms, but changes are being made in it, including consolidation,
organisational restructuring, organisation of employment and changes in the
production volume. This article contains a historical outline of changes that took
place in the organisation of coal companies in Poland between 1990 and 2018.
Furthermore, emphasising the processes of globalisation and the necessary
consolidation of companies operating as part of a single industry branch, it presents
current changes that occur in the State Treasury companies, until recently Katowicki
Holding Węglowy S.A. (KHW S.A.) and Kompania Węglowa S.A.(KW S.A.) and at
the present moment Polska Grupa Górnicza S.A. (PGG S.A.).
7.2. Organisational restructuring: consolidation activities and
globalisation
In relation to numerous organisational changes which took place in Poland
between 1990 and 2018, it has to be emphasised that the mining industry is subjected
to numerous reorganisation activities (Informacja o funkcjonowaniu górnictwa węgla
kamiennego, 2017; Program dla sektora górnictwa węgla kamiennego w Polsce …, 2018).

104 MEET 2018
For the society, the most significant process is mine merging. These activities have
the nature of consolidation and are the result of commonplace globalisation. The two
terms have a very significant meaning in the light of changes that occur in the mining
sector. The premises for consolidation and motivators of globalisation constitute the
direction and the basis of changes which not only have to be defined, but also
implemented. The first type of consolidation which should be mentioned in the case
of mining companies is a tight consolidation. Such consolidation refers to uniting
resources on a broad scale. The uniting companies merge a significant portion or all
of their resources. Merging of resources is simultaneously related to joint fulfilment
of objectives and focused on long-term cooperation of the consolidated entities
(Jonek-Kowalska and Turek, 2010). Furthermore, the uniting of entities in the form of
consolidation may be viewed on two levels: horizontal and vertical and their
combinations. Vertical integration is characterised by cooperation of companies as
part of implementation of various stages of economic activities. In the case of this
type of consolidation, it is possible to indicate production and distribution or supply
and production. The core of consolidation is the stage of the production chain. The
second type of consolidation, namely horizontal consolidation, refers to the
consolidation of the same stage of operation of companies. In this manner, the
companies narrow down their cooperation to a specific area. The combination of
horizontal and vertical consolidation offers greater possibilities of uniting elements
from both areas, resulting in the merger of both complementary and substitute
resources (Turek, 2017). It is also necessary to mention consolidation in the aspect of
merging mining companies with energy companies, i.e. merger of supplier and
buyer into one economic entity.
Globalisation is an impulse for consolidation activities and background of
operation of every economic entity. Globalisation is a set of processes of multi-
dimensional nature; it integrates entities on an international scale with respect to
social and economic aspects (Jonek-Kowalska, 2018). It is influenced by a number of
factors; in the economic area, it is strongly related to the scientific and technical
evolution (Bąk et al., 2016). Along with technological progress, a global economy tied
with specific industry markets is being formed (Cynarski, 2003). Globalisation
determines changes in company management. The process of changes in company

Consolidation in the hard coal mining… 105
management methods is made on several levels (Gierszewska and Wawrzyniak,
2001):
structural (virtualisation);
labour systems (creation of flexible systems);
competence (new knowledge creation);
organisational technology and procedures (e-business introduction);
values (emphasis on corporate social responsibility).
The basis for development of global economy in the era of globalisation are smart,
self-learning, self-regulating, virtual and agile companies, as well as network
companies relying on technological, functional, organic and geographical relations
(Hejduk, 2006). Development of companies in the present-day conditions is primarily
directed at increase of entrepreneurship, innovation and competitiveness. The
possibility of development of companies which react to changes occurring in the
environment relies on the progress of science advancing in the world of economy,
based on knowledge and techniques that enable knowledge management.
Intellectual capital has primary importance for modern companies; it encompasses
highly-qualified employees who possess knowledge and skills to use it for designing
modern production organisation systems and service provision systems as well as
modes and techniques of management that allow for complying with constantly
growing customer needs.
7.3. Analysis of organisational changes implemented in the hard coal
mining sector in Poland between 1993 and 2016
The process of merging companies, privatisation, reduction of employment and
restrictions imposed on production volume constitute numerous activities
implemented in the hard coal sector in Poland since the beginning of the 1990s. The
carried out organisational change that refers to the Polish companies from the mining
sector is the consolidation of the sector, along with liquidation of unprofitable mines.
Sector consolidation took place both in the horizontal and the vertical dimension on
account of mergers of independent mines into plants with two mining areas and
combining various coal companies, as well as expanding such combinations onto
product recipients - consolidation with energy companies.
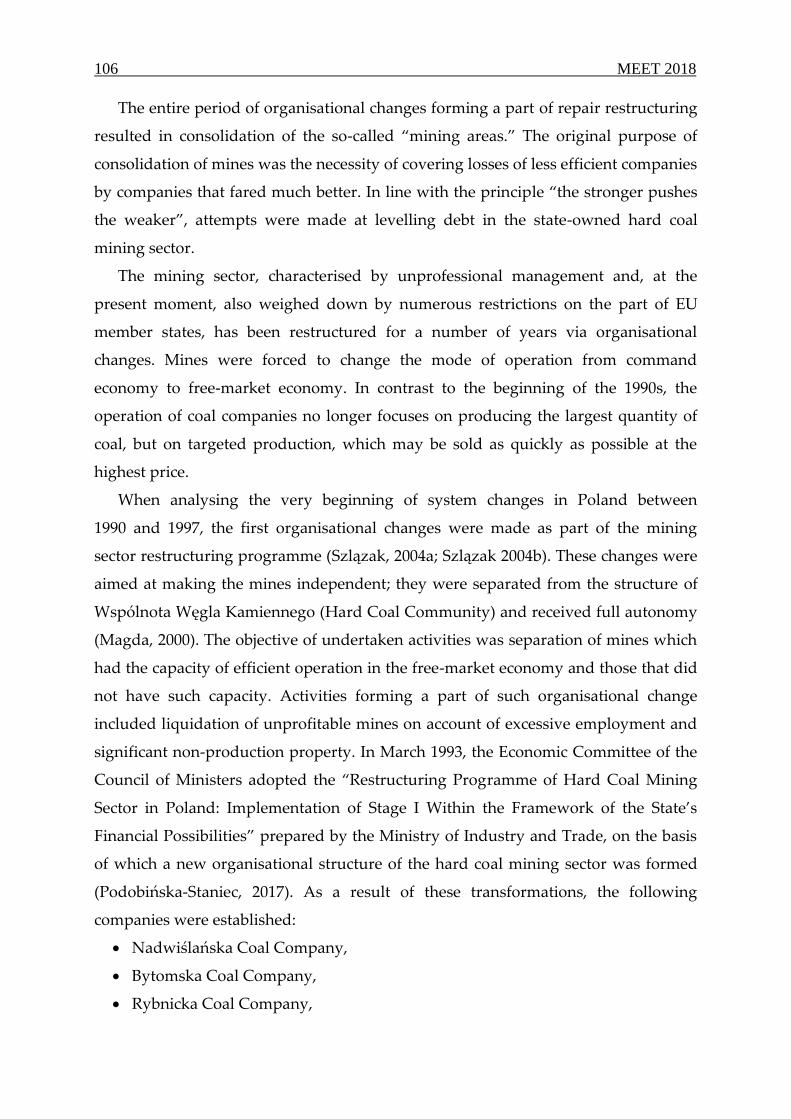
106 MEET 2018
The entire period of organisational changes forming a part of repair restructuring
resulted in consolidation of the so-called “mining areas.” The original purpose of
consolidation of mines was the necessity of covering losses of less efficient companies
by companies that fared much better. In line with the principle “the stronger pushes
the weaker”, attempts were made at levelling debt in the state-owned hard coal
mining sector.
The mining sector, characterised by unprofessional management and, at the
present moment, also weighed down by numerous restrictions on the part of EU
member states, has been restructured for a number of years via organisational
changes. Mines were forced to change the mode of operation from command
economy to free-market economy. In contrast to the beginning of the 1990s, the
operation of coal companies no longer focuses on producing the largest quantity of
coal, but on targeted production, which may be sold as quickly as possible at the
highest price.
When analysing the very beginning of system changes in Poland between
1990 and 1997, the first organisational changes were made as part of the mining
sector restructuring programme (Szlązak, 2004a; Szlązak 2004b). These changes were
aimed at making the mines independent; they were separated from the structure of
Wspólnota Węgla Kamiennego (Hard Coal Community) and received full autonomy
(Magda, 2000). The objective of undertaken activities was separation of mines which
had the capacity of efficient operation in the free-market economy and those that did
not have such capacity. Activities forming a part of such organisational change
included liquidation of unprofitable mines on account of excessive employment and
significant non-production property. In March 1993, the Economic Committee of the
Council of Ministers adopted the “Restructuring Programme of Hard Coal Mining
Sector in Poland: Implementation of Stage I Within the Framework of the State’s
Financial Possibilities” prepared by the Ministry of Industry and Trade, on the basis
of which a new organisational structure of the hard coal mining sector was formed
(Podobińska-Staniec, 2017). As a result of these transformations, the following
companies were established:
Nadwiślańska Coal Company,
Bytomska Coal Company,
Rybnicka Coal Company,

Consolidation in the hard coal mining… 107
Gliwicka Coal Company,
Rudzka Coal Company,
Katowicki Holding,
Jastrzębska Coal Company.
The next organisational change in the Polish mining sector was initiated on
1 April 1993, when JSW S.A. officially started to operate as one-person state treasury
company. It consisted of the following mines: “Borynia”, “Zofiówka”, ‘Jastrzębie”,
“Moszczenica”, “Pniówek” in Jastrzębie Zdrój and “Krupiński” in Suszec and
“Morcinek” in Kaczyce. The company also included: Municipal Management
Company in Jastrzębie Zdrój, Mine De-Methanisation Plant in Jastrzębie Zdrój,
“Moszczenica” Co-generation Plant in Jastrzębie Zdrój and “Zofiówka”
Co-generation Plant in Jastrzębie Zdrój. On 1 July, Katowicki Holding Węglowy S.A.
was also established, encompassing 11 mines. Overall, 61 mines were consolidated
into coal companies around the country. Out of the remaining ones, which remained
outside the structure of coal companies, seven were liquidated (Wałbrzych, Victoria,
Thorez, Saturn, Żory, Nowa Ruda, Sosnowiec), and three still formed independent
mines; these were Bogdanka S.A. Hard Coal Mine, Jan Kanty S.A. Hard Coal Mine,
Porąbka-Klimontów S.A. Hard Coal Mine (Szlązak, 2004a; Szlązak 2004b).
The first stage of the restructuring programme of the Polish mining sector was
continued as part the second stage, between 1994 and 1995. The aim of the
programme was to improve profitability by increasing the labour efficiency,
implementing tasks to mitigate the social effects of restructuring and pro-
environmental investments. The common elements between the present-day
transformation and the one pursued during the discussed second stage include
conclusion of long-term agreements with strategic recipients, modernisation of
technical equipment, introduction of financial incentive schemes for employees and
increase in the role of the quality of offered coal.
The subsequent stage of organisational changes took place between 2002 and
2006. In January 2007, 33 mines operated in Poland, grouped into the following
mining entities (Fornalczyk et al., 2008):
Kompania Węglowa S.A.: 17 mines (4 mining centres were established);

108 MEET 2018
Katowicka Grupa Kapitałowa, which included Katowicki Holding Węglowy
S.A., encompassing 5 mines and one limited liability mine where 100% shares
were owned by KHW S.A.;
Jastrzębska Spółka Węglowa S. A.: 5 mines;
Południowy Koncern Węglowy S.A. - one mine with two mining areas (50.45%
shares held by KW S.A., 49.55% of shares held by PKE S.A.), “Budryk” S.A.
Hard Coal Mine;
Lubelski Węgiel “Bogdanka” S. A. (90% of shares held by the State Treasury);
Siltech Sp. z o.o. (100% of shares held by a private owner).
When analysing subsequent changes in the Polish hard coal mining sector, it is
necessary to take the privatisation processes into account. LW Bogdanka S.A. made
its’ début on the stock exchange in June 2009 and Jastrzębska Spółka Węglowa S.A.,
in July 2011; in the same year, this company also completed its process of
consolidation into a coal and coke group. The year 2013 was also an important
moment of transformations: TAURON Wydobycie S.A. purchased 47.5% shares of
Południowy Koncern Węglowy S.A. from Kompania Węglowa, becoming its’ sole
owner. Organisational changes also took place in companies responsible for the
conducted restructuring process. In April 2009, Spółka Restrukturyzacji Kopalń S.A.
took over Bytomska Spółka Restrukturyzacji Kopalń Sp. z o.o., and in 2014
purchased 100% shares in Kazimierz-Juliusz Sp. z o.o. Hard Coal Mine from
Katowicki Holding Węglowy S. A. Knurów-Szczygłowice Coal Mine was separated
from the structure of Kompania Węglowa S.A. and joined JSW S.A. in August 2014.
In October 2015, LW Bogdanka became a part of Grupa Enea S.A., which has been
holding 66% of Bogdanka’s shares as of 26.10.2015. The group created in this manner
became a modern fuel and energy concern (Podobińska-Staniec, 2017).
The core of transformations of the Polish coal mining sector in the area of
consolidation took place on account of premises which have always remained the
same, namely merging less profitable mines with efficient mines. The core of such
activity is to be searched for both in the development and improvement of
profitability of mining companies. It cannot be forgotten that apart from positive
aspects, consolidation processes have been related to the processes of mine
liquidation, significant reduction of extraction and a clear cutback in employment.

Consolidation in the hard coal mining… 109
7.4. Establishment of PGG as the continuation of mining sector
consolidation in Poland
The operation programme of hard coal sector in Poland between 2007 and 2016
assumed more changes in the organisation of the sector and further transformations.
A significant change occurred in one of the largest coal companies in Poland,
Kompania Węglowa S.A. (KW S.A.). In 2011, the company’s management board
decided to liquidate the middle organisational level (extraction centres) as of
1 January 2012, thereby increasing the scope of independence of the mines. As part of
further activities between April and May 2015, KW S.A. handed over free of charge
three mines (Makoszowy, Brzeszcze and Centrum) to Spółka Restrukturyzacji
Kopalń S.A. (SRK S.A.). Subsequently, in May the same year (2015), Bobrek and
Piekary mines were sold from KW S.A. to Węglokoks Kraj Sp. z o.o. In April 2016,
KW S.A. also handed-over to SRK S.A. the mining area of Rydułtowy-Anna Mine.
The end of the organisational transformations of Kompania Węglowa S.A. on
29 April 2016 was marked by sale to the newly-established Polska Grupa Górnicza
Sp. z o.o. of 11 mines and 4 plants, including (www.pgg.pl):
Bielszowice Hard Coal Mine;
Pokój Hard Coal Mine;
Halemba-Wirek Hard Coal Mine;
Bolesław Śmiały Hard Coal Mine;
Piast Hard Coal Mine;
Ziemowit Hard Coal Mine;
Sośnica Hard Coal Mine;
Chwałowice Hard Coal Mine;
Marcel Hard Coal Mine;
Jankowice Hard Coal Mine;
Rydułtowy Hard Coal Mine,
Co-generation plants,
Mining Investment Work Company;
IT and Telecommunications Company;
Repair and Production Company.
The second important entity that belonged to the State Treasury on the hard coal
market in Poland was Katowicki Holding Węglowy S.A. which, in June 2015,
110 MEET 2018
pursuant to the provisions on the functioning of the hard coal mining sector of
07.09.2007, handed over free of charge to SRK S.A. the Mysłowice mining area
separated from Mysłowice Hard Coal Mine - Wesoła and Boże Dary mining area
separated from Murcki-Staszic Hard Coal Mine. The year 2015 was permanently
marked in the history of the Polish mining on account of establishment of Polska
Grupa Górnicza Sp. z o.o. (PGG) on 1 January 2015. The Group was established
pursuant to the agreement of the governmental side, the International Protest and
Strike Committee, company trade unions operating in Kompania Węglowa S.A. and
Zakłady Spółki Restrukturyzacji Kopalń S.A., Kompania Węglowa S.A. and
Węglokoks S.A. On 29 April, 2016, PGG purchased Kompania Węglowa S.A. The
organisational structure of the newly-established group as of 1 July 2016 consisted of
three complex mines:
Ruda Hard Coal Mine (mines Bielszowice, Halemba-Wirek and Pokój);
ROW Hard Coal Mine (mines Chwalowice, Jankowice, Marcel and Rydułtowy);
Piast-Ziemowit Hard Coal Mine (mines Piast and Ziemowit);
and two independent mines: Bolesław Śmiały Hard Coal Mine and Sośnica
Hard Coal Mine.
The shareholding structure of PGG as of 31.12.2016 was [pds]: 1 share out of
5,000,500 shares, i.e. 0.00002%, held by the State Treasury, the remaining shares held
by: Węglokoks S.A., Fundusz Inwestycyjny Polskich Przedsiębiorstw, Fundusz
Inwestycyjny Zamkniętych Aktywów Niepublicznych, Towarzystwo Finansowe
Silesia Sp. z o. o., PGE Górnictwo i Energetyka Konwencjonalna S.A., Energa
Kogeneracja Sp. z o.o. and PGNiG Termika S.A.
The formation of Polska Grupa Górnicza was continued by execution of an
agreement on 31.3.2017, pursuant to which as of 1 April 2017, PGG Sp. z o.o. took
over the mines and the employees of Katowicki Holding Węglowy S.A. Thus, the
holding became another mining area of PGG Sp. z o.o. The purpose of the merger
was to improve the potential of the largest European coal company and to offer
assistance with respect to the difficult situation of the Holding, where the debt
exceeded PLN 2.5 million (www.pgg.pl). As a result of the merger, approx. 12,500
employees were transferred to PGG from KHW (http://gornictwo.wnp.pl). The
management board of PGG noted the possibility of making use of the synergy effect
from combining the potentials of incorporated companies in the form of:

Consolidation in the hard coal mining… 111
more efficient use of the production property - possibility of allocating
machines and devices among mines and mining areas, depending on the needs;
possibility of allocating employees among mining areas - full use of the mine
long-walls;
optimisation of the technological process of enriching and sorting coal in mines;
creation of a better and fuller offer that allows for reaching new recipients;
reduction in administrative costs (www.pgg.pl).
The effects of synergy also resulted from the possibility of efficient cost reduction,
which is simultaneously the only way out of a crisis situation. Coal offered by the
Polish mines, as compared to imported coal, is characterised by high price related to
difficult conditions of ore location. However, making use of the scale effect, it is
possible to reduce production costs, and thus make the companies more competitive.
The huge change that occurred as a result of formation of PGG is also a change in
the area of employment. At the beginning of operation of PGG, it had 31,429
employees and still operating KHW had 13,036 employees - which in total gave the
number of 44,465 employees in both companies, at that time operating separately.
Right before the fusion of both companies, i.e. at the end of March 2017, the number
dropped. As a result of take-over of KHW by PGG, employment in PGG amounted
to 43,378 persons, out of which 30,558 persons were employed in PGG and 12,820
were transferred from KHW (www.pgg.pl). The last available data refer to the
beginning of 2018, when the level of employment in the largest coal company in
Poland amounted to 43,351 persons (http://nettg.pl/news). In spite of the noticeable
downward tendency in the number of employees, PGG commenced a dialogue with
local governments pertaining to the education of the young generation of miners
who, after completing a technical mining school, would find employment in the
company.
Subsequent activities undertaken in the area of organisation refer to the
transformation of Polska Grupa Górnicza Sp. z o.o. into a joint stock company - on
29 December 2017 (http://nettg.pl/news) and sale of Wieczorek Mine to SRK S.A.
The picture of organisational transformations pertaining to changes in the mines
which currently form a part of PGG S.A. is presented in Figure 1.
Delving deeper into the analysis of organisational changes and consolidation, it is
necessary to emphasise the significance of consolidation activities in reference to

112 MEET 2018
mines as production entities and entities from the heat and energy sector as
recipients of the product. This type of cooperation, oriented at targeted production
(specific quality and quantity of coal), is an opportunity to minimise losses. Long-
term agreements with recipients offer a possibility of prospective cost planning and
allow for thinking about the necessity of modernisation in the coal mining industry,
which is imposed by the EU, as well as planning investments and modernisation
work. When implementing this type of consolidation, the benefits are common for
both sides of the agreement.
It is also worth emphasising that the consolidation of mines of Katowicki Holding
Węglowy S.A. and Polska Grupa Górnicza Sp. z o.o. resulted in the fact that
companies that operated on the same market ceased to compete with one another.
As a single economic entity, PGG has a positive impact on the formation of coal
prices. Furthermore the cooperation with domestic coal recipients who guarantee
sale of coal, also guarantee a specific level of profits. An additional important factor
to the advantage of domestic mines is the certainty of supplies and their volume
(http://nettg.pl/news/148508/rynek-wegla-dobra ...). Summing up, the merger of two
important “players” in the mining sector may have a favourable effect on the
condition of the discussed sector.

Consolidation in the hard coal mining… 113
29.04.2016
1.01. 2015
Legend: KWK- Hard Coal Mine; ZG –Mining Plant
Fig. 1. Organisational changes in the hard coal mining sector between 1993 and 2018
Rys. 1. Zmiany organizacyjne w górnictwie węgla kamiennego w latach 1993-2018
Source: own study based on (Podobińska-Staniec, 2017) and (www.pgg.pl).
Polska Grupa Górnicza
S.A.
KWK ROW
Ruch “Jankowice”
Ruch ”Chwałowice”
Ruch “Marcel”
Ruch “Rydułtowy”
KWK Ruda
Ruch “Bielszowice”
Ruch “Halemba”
Ruch “Pokój”
KWK “Piast –Ziemowit”
Ruch “Ziemowit”
KWK “Bolesław Śmiały”
KWK “Sośnica”
KWK” Murcki-Staszic”
KWK “Mysłowice-Wesoła”
KWK “Wujek”

114 MEET 2018
7.5. Conclusions
Polska Grupa Górnicza S.A. was set up in order to satisfy the needs of the Polish
hard coal consumer, sealing the market and ensuring competitiveness and
profitability of Polish mining companies. The establishment of PGG was
a continuation of the restructuring process in the discussed sector. The objective set
before the management board of PGG is to create a company which will offer hard
coal at competitive prices, which is going to satisfy the market of internal clients. On
the other hand, it is good to emphasise the fact of creation of a project of integrated
mines, which simplifies the management system of mining units and may lead to
a decrease in the number of technical supervision in the production process. Changes
that are currently introduced in the largest hard coal mining company in Europe
have their source in a number of reforms implemented in Poland in the course of the
last twenty-eight years. Every government had its own idea on how to lead the mines
to profitability, how to make them competitive on the free market and how to satisfy
the needs of consumers with greatest possible efficiency of mine operation.
Furthermore, the change of employment is the best way to illustrate the scale of
organisational changes in the sector. Reaching to data published in the IBS report
pertaining to the transformation of the Polish coal sector after 1990, it may be noted
that in 1990, 388,000 persons were employed in the mining sector and in 2015, the
employment dropped to 98,000. In line with the report, employment has continued to
drop since 2015; at the end of 2017, 82,717 people were employed in the industry, out
of whom 63,721 worked underground (www.ibs.org.pl). Marked with numerous
organisational changes, changes in the number of mines and numerous manners of
work organisation, the Polish branch of the mining industry has experienced another
historic change. The consolidation of KHW S.A. and KW S.A. into one entity, namely
PGG S.A., offers another chance for improved operation of the Polish mines on the
global market. Following the expectations of clients and being aware of the reality of
the present-day economy, the management of PGG faces a grand task: maintaining
the largest possible number of work places and accomplishing satisfactory results.
Consolidation in the hard coal mining… 115
Acknowledgements
The paper presents results of research conducted in AGH University of Science
and Technology no. 11.11.100.693.
Bibliography
1. Bąk, P., Sukiennik, M., Kowal, B. (2016). Kultura korporacyjna w aspekcie
procesów zarządczych w polskich przedsiębiorstwach wydobywczych. Inżynieria
Mineralna, 17 (2), 135-144.
2. Cynarski, W.J. (2003). Globalizacja a spotkanie kultur. Wydawnictwo
Uniwersytetu Rzeszowskiego: Rzeszów.
3. Dubiński, J., Turek, M. (2014). Chances and threats of hard coal mining
development in Poland - the results of experts research. Archives of Mining
Sciences, 59 (2), 395-411.
4. Fornalczyk, A., Choroszczak, J., Mikulec, M., (2008). Restrukturyzacja górnictwa
węgla kamiennego. Programy, bariery, efektywność, pomoc publiczna.
Wydawnictwo Poltext: Warszawa.
5. Gierszewska, G., Wawrzyniak, B. (2001). Globalizacja. Wyzwania dla
zarządzania strategicznego. Wydawnictwo Poltext: Warszawa.
6. Hejduk, I.K., (2006). Główne uwarunkowania rozwoju nauk zarządzania
w Polsce. Ekonomika i Organizacja Przedsiębiorstwa, 3, 34-41.
7. Informacja o funkcjonowaniu górnictwa węgla kamiennego we wrześniu oraz
w okresie styczeń-wrzesień 2016. Ministerstwo Energii: Warszawa.
8. Jonek-Kowalska, I. (2015). Challenges For Long-Term Industry Restructuring
In The Upper Silesian Coal Basin: What Has Polish Coal Mining Achieved And
Failed From A Twenty-Year Perspective? Resources Policy , 44, 135-149.
9. Jonek-Kowalska, I. (2018a). How do turbulent sectoral conditions sector influence
the value of coal mining enterprises? Perspectives from Central-Eastern Europe
coal mining industry. Resources Policy, 55, 103-118.
10. Jonek-Kowalska, I. (2018b). Method for Assessing the Development of
Underground Hard Coal Mines on a Regional Basis: The Concept of
Measurement and Research Result. Energies, 11 (6), Article Number: 1370.
11. Jonek-Kowalska, I., Turek, M. (2010). Koncentracja przedsiębiorstw przemysło-
wych. Przyczyny-przebieg-efekty. Wydawnictwo Politechniki Śląskiej: Gliwice.

116 MEET 2018
12. Magda, R. (2000). Selected aspects of restructuring hard coal mining sector.
[in:] 9th International Symposium on Mine Planning and Equipment Selection,
449-452.
13. Podobińska-Staniec, M. (2017). Management of Intellectual Capital in the Process
of Restructuring a Coal Mine Company. Kraków.
14. Program dla sektora górnictwa węgla kamiennego w Polsce (2018). Ministerstwo
Energii; Warszawa.
15. Szlązak, J., (2004a). Reformowanie polskiego górnictwa węgla kamiennego
w latach 1990–2002, zamierzenia i efekty. [in:] Kicki, J., (Ed.) Materiały Szkoły
Eksploatacji Podziemnej 2004: forum dyskusyjne: jak wykorzystać szanse
poprawy kondycji ekonomiczno-finansowej górnictwa węgla kamiennego?
Polska Akademia Nauk. Instytut Gospodarki Surowcami Mineralnymi i Energią,
Akademia Górniczo-Hutnicza. Katedra Górnictwa Podziemnego. IGSMiE PAN:
Kraków, 107-128.
16. Szlązak, J., (2004b). Restrukturyzacja górnictwa węgla kamiennego w Polsce
w latach 1990–2002: Analiza skuteczności realizowanych programów.
Wydawnictwo Nauka-Technika: Kraków.
17. Turek, M., (2017). Uwarunkowania procesów konsolidacyjnych w polskich
przedsiębiorstwach górniczych. Zeszyty Naukowe Politechniki Śląskiej seria:
Organizacja i Zarządzanie, 101, 483-503.
18. http://gornictwo.wnp.pl/gornicze-gaszenie-pozarow-czyli-od-kw-do-pgg-z-khw,
295405_1_0_0.html.
19. http://nettg.pl/news/147972/pgg-spolka-zatrudnila-ponad-3-3-tys-nowych-
pracownikow.
20. http://nettg.pl/news/148508/rynek-wegla-dobra-kondycja-spolek-wplywa-na-
umocnienie-cen.
21. www.ibs.org.pl.
22. www.pgg.pl.

Consolidation in the hard coal mining… 117
CONSOLIDATION IN THE HARD COAL MINING SECTOR:
CASE STUDY
Abstract
This paper intends to present the major organisational changes which were
carried out in the hard coal mining sector in Poland between 1990 and 2018. The
authors of the paper indicate that in compliance with the changes in market rules and
progressing globalisation processes, the organisational change in the form of
consolidation has become a fixed part of the mining sector. In the course of the years,
mergers of mines were each time aimed at improving profitability and offered
a chance for preserving the highest number of operating mines. The authors,
indicating the historical background related to the changes in the entire sector, drew
special attention to Polska Grupa Górnicza, established recently. The premises
contained in the paper and pertaining to the consolidation carried out in the case of
PGG, which united the resources of Kompania Węglowa S.A. and Katowicki Holding
Węglowy S.A., offer a chance of improvement for the operation of the mining sector
in Poland.
Keywords: consolidation, mining companies, organisational changes.
KONSOLIDACJA SEKTORA GÓRNICTWA WĘGLA
KAMIENNEGO: STUDIUM PRZYPADKU
Streszczenie
Niniejszy artykuł prezentuje główne zmiany organizacyjne, które miały miejsce
w sektorze górnictwa węgla kamiennego w Polsce w latach 1990-2018. Autorzy pracy
wykazują, że zgodnie ze zmianami w zasadach rynkowych i postępującej
globalizacji, zmiana organizacyjna w formie konsolidacji stała się stałym elementem
sektora górniczego. Na przestrzeni lat fuzje kopalń miały każdorazowo na celu
poprawę rentowności i stanowiły szansę utrzymania jak największej liczby kopalń
w eksploatacji. Powołując się na historyczny kontekst związany ze zmianami
w całym sektorze, autorzy przykładają szczególną wagę do niedawno ustanowionej
Polskiej Grupy Górniczej. Założenia uwzględnione w niniejszym artykule
i odnoszące się do konsolidacji przeprowadzonej w PGG, w skład której wchodzą
zasoby Kompani Węglowej S.A. i Katowickiego Holdingu Węglowego S.A., dają
możliwość w zakresie udoskonalenia działania sektora węglowego w Polsce.
Słowa kluczowe: Konsolidacja, przedsiębiorstwa górnicze, zmiany organizacyjne.


Jacek BENDKOWSKI
Silesian University of Technology, Poland (e-mail: [email protected])
8. PARALLAX EFFECT IN RESEARCH ON COMMUNITY OF
PRACTICE
8.1. Introduction
In multiple scientific publications, in particular in those discussing social sciences,
terminological chaos associated with the discussed issue is a subject of many
complaints. Quite often, its main reason is not the complex and inter-disciplinary
nature of the analyzed problem, but the generality and indistinct nature of the terms
used to describe it. This can be seen in the literature on knowledge management that
is a source of general yet universal theories and practical solutions that are supposed
to be an antidote to the most ailing organizational problems. Their vague and
indistinct nature fosters their free implementation and use. As a consequence, we are
dealing with a parallax effect that is characterized by a lack of uniform approach to
the nature and character of a given phenomenon. Too much space for interpretation
is the source of multiple research perspectives as well as inconsistency in
terminology that significantly hinders the exploration of a given issue and makes it
impossible to establish a consistent theory.
An example of such a situation is the community of practice. This term comes
from the situated learning theory developed by J. Lave and E. Wenger (1991). At the
turn of the 21st century, the concept of communities of practice quickly gained
popularity as a tool for creating and distributing knowledge in organizations. In no
time it became a central subject of conferences, workshops and seminars devoted to
knowledge management (Zboralski, 2007). In recent years one can notice a decline in
interest in this concept from the side of science and practice. It is suggested that the
main reason for this is the fact that the concept still lacks a widely accepted definition
and can be interpreted in many different ways. Consequently, the term community

120 MEET 2018
of practice can be sometimes problematic: everything is and at the same time is not
a community of practice (Romhardt, 2002). This results mostly from the ambiguity of
the term “community” that can be interpreted from the point of view of numerous
fields of study, for example sociology (Tönnies, 1887; Weber, 1914), social sciences
(Rheingold, 1995) or management (Hagel and Armstrong, 1997). When adopting
a certain research perspective, it results in an emphasis on different characteristics of
communities, and – as a consequence – different criteria of their description, which in
practice makes it impossible to develop a common typology of communities.
The aim of this article is the presentation and critical analysis of the most
commonly used approaches to the community of practice on the basis of well-
established works of J. Lave and E. Wenger (1991), J. Orr (1990), J.S. Brown and
P. Duguid (1991) and E. Wenger (1998b). The paper presents main research
perspectives that view the community of practice as a space for identity
establishment, tool for knowledge management in the organization and as an
environment of social learning.
8.2. Community of practice as identity establishing
The term community of practice comes from the situated learning theory
developed by J. Lave and E. Wenger (1991). Lave and Wenger based their theory on
case studies carried out in majority by third parties: tailors’ communities from two
ethnic groups in Liberia (West Africa) (Lave, 1988), midwives in Maya mountains in
Mexico (Jordan, 1989), Alcoholics Anonymous (Cain, no data), butchers employed in
markets in the USA (Marshall, 1972) and navigators in the US Navy (Hutchins, 1996).
Their aim was to establish how learners coming from different cultures acquire their
knowledge and competences: how they settle in the local culture and how the rituals
and values of that culture are passed down (Bendkowski, 2012). The obtained results
were supposed to reconstruct the western learning theories and theories on how the
learning environment is shaped (Lave, 1993).
Lave and Wenger were able to establish that informal learning processes are
directly linked with a specific situation and thus they constitute a social construction.
Learning takes place by way of legitimate peripheral participation (LPP) that is about
learning from masters (experts) and more experienced colleagues (apprentices) and

Parallax effect in research… 121
moving towards the community center as new knowledge and competences are
being acquired, which is linked with the increase of status and gradual change of
identity: from peripheral membership to full membership in the community
(Bendkowski, 2012). The communities where this apprentice mechanism in the
master-apprentice-pupil system was functioning was defined as “communities of
practice”; although in their work they never formally defined this term.
From among other similar social structures of communities of practice that are
described and analyzed by Lave and Wenger the following may be distinguished:
legitimate peripheral participation, learning understood as establishing professional
identity and focus on practices. Despite the significant generality, the above model of
communities of practice is still used especially in research on the forming of
personnel of communities of practice (Campbell, 2009; Harris, Simons, and Carden,
2004).
Another fundamental work on the communities of practice is the ethnography of
Xerox photocopy machine technicians penned by American sociologist Julien Orr
(1990). It was prepared at the request of Xerox Palo Alto Research Center to optimize
the training program in substantive and financial scope (North, Romhardt, and
Probst, 2004). Orr’s research proved that in the traditional description of the work
position it is not possible to specify it to the fullest extent possible. The management
of Xerox assumed that the technicians will be able to carry out their tasks
independently, with the help of guidelines and procedures found in the repair
manual. However, during observations of the day-to-day work of a group of
technicians (Orr referred to them as “professional community” or “work
community”) it turned out that despite an extensive trainings program and
comprehensive technical documentation they often had to face problems that they
were unable to solve. To repair the device, the technicians were forced to skip the
procedures and create own manners of repairing. For that purpose, they used their
lunch breaks during which they could discuss their problems, exchange experience
concerning the repairs and together think of new solutions for the failures. Orr called
them “war stories”. They served two objections: to provide a practical, contextual
knowledge on particular photocopy machines and to establish a professional identity
of a technician who will do anything to find a solution and repair a device despite
limitations and missing information. Common context of activities made the “war
122 MEET 2018
stories” an effective tool for sharing private knowledge on the devices. To become
a member of the community required not only the knowledge on how to repair
a device but also the ability to pass this knowledge down in the form of a “war story”
(Murillo, 2011).
When Orr was writing his ethnography, the term of community of practice was
not wide-spread (Duguid, 2006). Therefore, Orr analyzed the work of photocopy
machines technicians from the point of view of professional community (van
Maanen, and Barley, 1984). Still, in the literature of the subject, Orr’s work is
considered the first ethnography of community of practice (Teigland, 2003; Zboralski,
2007).
8.3. Community of practice as knowledge management tool
The third fundamental work devoted to community of practice is an article of
John S. Brown and Paul Duguid titled “Organizational Learning and Communities of
Practice: Toward a Unified view of Working, Learning, and Innovation”, where they
defined community of practice as a strategic tool for the management of knowledge
in the organization (1991). Brown and Duguid claimed that despite informal nature,
the communities of practice are the key to effective learning at work and creation of
innovative solution. As a result, they are an extremely crucial challenge for the
managers, especially for managers of organizations based on knowledge. Thus,
Brown and Duguid introduced the idea of community of practice into the
organizational environment.
The theory of Brown and Duguid was founded in majority on Orr’s work
described above. The proposed model of community of practice was composed of
three dimensions corresponding with the work of technicians: narrative, cooperation
and social construction. It goes beyond the intuitive interpretation of community of
practice proposed by Lave and Wenger. This may explain why the article of Brown
and Duguid is treated by many researchers as the main source of knowledge on the
community of practice (Murillo, 2011).
The narrative covers coming up with an exchange of “war stories” concerning
repair of defined devices. The story of a broken machine was a convenient way for
the technician to create a cause and effect map that makes it possible to solve the

Parallax effect in research… 123
problem. The story turned out to be a better solution than the procedure found in the
official instruction of repairs, as it was accompanied by a relevant context that
influenced the operation of the device.
Cooperation refers to the spontaneous and informal organization of technicians.
Its aim is cooperation, exchange of stories and mutual help in terms of analyzing the
specific nature of particular devices. What is interesting is that the community of
technicians was established even though the mother organization considered their
work as independent activity and not as a group one (Murillo, 2011).
Social construction manifested itself in two dimensions. First of all, mutual
interactions resulted in common understanding of the problem and thus brought
about specific and contextual knowledge of the technicians on the particular devices.
Second of all, by way of sharing “war stories”, the technicians were establishing their
identity and contributed to the development of resources of group knowledge of the
community of practice (Bendkowski, 2012).
Fig. 1. Negotiation of meaning: participation and reification
Rys. 1. Uzgadnianie znaczenia: uczestnictwo i reifikacja
Adapted from: (Wenger, 1998).
To characterize the activities of the technicians understood as group learning and
establishing of an identity of a member of a community functioning within the
organizational environment, Brown and Duguid adapted the situated learning
theory of Lave and Wenger. As a result, the cooperation model proposed by them is
only slightly different from the community as understood by Lave and Wenger. The

124 MEET 2018
main difference is about the status of the members. Community of practice as
understood by Lave and Wenger was based on the relation master-pupil, while
Brown and Duguid argued that the members of communities of practice were equal.
The second difference lies in the fact that Brown and Duguid characterized
community functioning within an organizational environment as a community that
directly or indirectly implements the objectives of the organization. Thus, it functions
in determined power system which significantly influences its functioning. In turn,
community of practice as defined by Lave and Wenger was an autonomous being
that functions primarily due to the needs of their members and not for the needs of
an organization.
As opposed to Lave and Wenger, Brown and Duguid saw the possibility of
communities’ cooperation. This manifested itself, among others, in their approach to
organizations as huge communities composed of smaller communities of practice
used to implement superior organizational goals, in particular those associated with
knowledge management. Over the next couple of years, many works were written on
the communities of practice as a new organizational form and at the same time a key
tool of learning and sharing knowledge within the organization (Brown, and
Duguid, 1996; Brown, 1998).
As a result of the work of Brown and Duguid, two main research directions
emerged in the research on the communities of practice: one treating the community
of practice as autonomous organizational form and the other one as a tool of
knowledge management. First direction focuses on the development of theory,
describing the emerging and informal nature of communities of practice. The second
research trend emphasized the business value of communities of practice and was
directed to the identification, support and/or intentional establishment of strategic
communities of practice as a knowledge management tool (Zboralski, 2007).
Communities of practice as environment of social learning: participation,
reification and negotiation of meanings
In 1998, E. Wenger published his famous ethnography devoted to the insurance
loss indemnification titled “Communities of Practice. Learning, Meaning and
Identity”. As opposed to the work written in cooperation with J. Lave in 1991, that
focused on the process of establishing the identity of a community member, in this
case in the center of Wenger’s analysis was practice (activity). The new model of
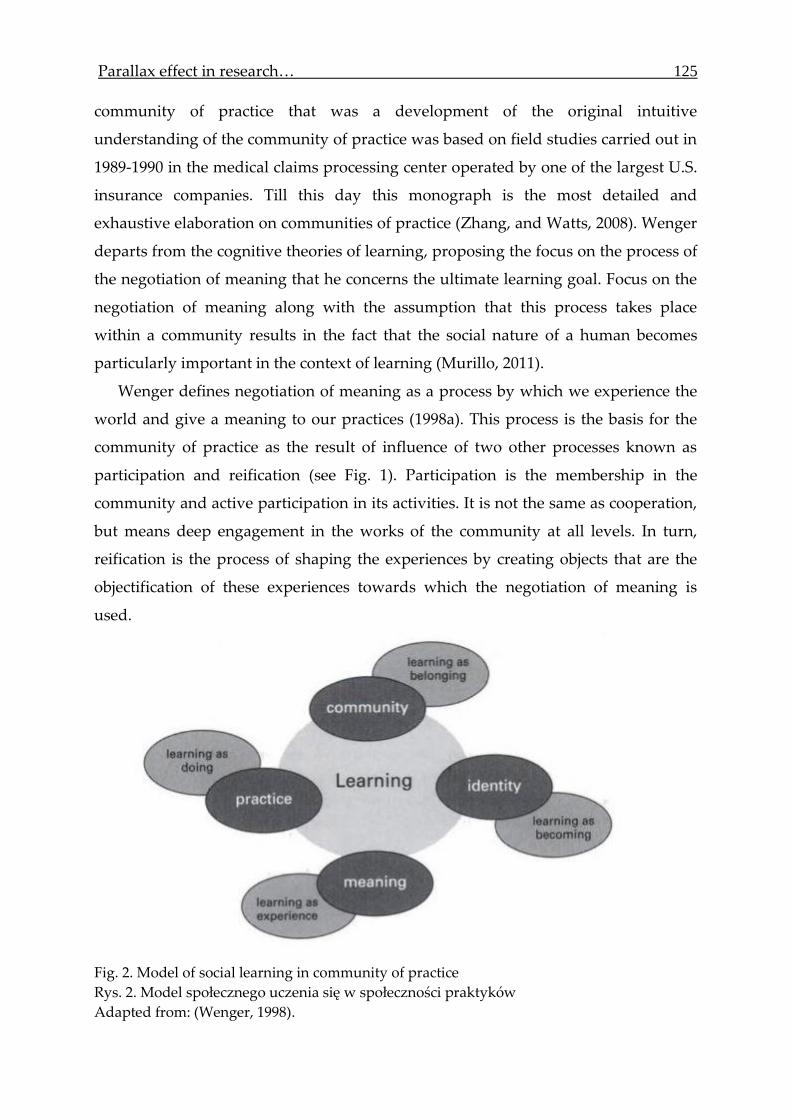
Parallax effect in research… 125
community of practice that was a development of the original intuitive
understanding of the community of practice was based on field studies carried out in
1989-1990 in the medical claims processing center operated by one of the largest U.S.
insurance companies. Till this day this monograph is the most detailed and
exhaustive elaboration on communities of practice (Zhang, and Watts, 2008). Wenger
departs from the cognitive theories of learning, proposing the focus on the process of
the negotiation of meaning that he concerns the ultimate learning goal. Focus on the
negotiation of meaning along with the assumption that this process takes place
within a community results in the fact that the social nature of a human becomes
particularly important in the context of learning (Murillo, 2011).
Wenger defines negotiation of meaning as a process by which we experience the
world and give a meaning to our practices (1998a). This process is the basis for the
community of practice as the result of influence of two other processes known as
participation and reification (see Fig. 1). Participation is the membership in the
community and active participation in its activities. It is not the same as cooperation,
but means deep engagement in the works of the community at all levels. In turn,
reification is the process of shaping the experiences by creating objects that are the
objectification of these experiences towards which the negotiation of meaning is
used.
Fig. 2. Model of social learning in community of practice
Rys. 2. Model społecznego uczenia się w społeczności praktyków
Adapted from: (Wenger, 1998).

126 MEET 2018
Individual learning is about negotiation of new meanings and not about
collecting new information or learning new skills (Wenger, 1998a). Negotiation of
meaning takes place within the community of practice understood as a social group
that was established to achieve goals considered by its members as important. At the
same time, the community defines which members are professionals in the
determined field. Learning is a process of social becoming, constant negotiation of
identity created within a specific context of cooperation (or its lack) in the
community and its activities (Wenger, 1998b).
Even though the concept of community plays a major role, for Wenger it is only
a social environment that makes the group negotiation of meaning possible. The
model of social learning covers four interconnected elements (see Figure 2) (Wenger,
1998b):
meaning – the ability of individual and collective experiencing of the world and
negotiation of meaning,
practice – mutual engagement in the community activities,
community – social environment established for a specific purpose (domain of
practice) being a motivation for cooperation (participation),
identity – feeling of belonging to a community, being its part.
Social learning takes place by negotiation of meanings with the use of four basic
mechanisms (Wenger, 1998b):
1. meaning/learning as experience,
2. practice/learning as doing,
3. community/learning as belonging,
4. identity/learning as becoming.
Community of practice understood as an environment of social learning is
determined by the following dimensions (Wenger, 1998b):
mutual engagement – employees become members of a given community by
engaging in the community practices. This mutual engagement unites the
members of the community into one social structure,
common domain of practice – field of interest around which the community is
centered. It is based on mutual or shared understanding that is constantly being
established and redefined by its members,

Parallax effect in research… 127
shared repertoire of resources – a set of shared community resources that
allows for greater engagement in the works of the community.
Presence of these three dimensions is a necessary prerequisite for the community
of practice to exist. Wenger provides a list of factors that allow to identify the
community of practice. They can be perceived as a manifestation of the main
dimensions of the community of practice (see Tab. 2).
Wenger’s model is a significant theoretical development of the intuitive model
from 1991. Even though in his work he did not provide a clear definition of the
community of practice, the model presented therein allows to limit the possibilities in
terms of interpretation. Unfortunately, researches use the Wenger’s model of 1998 in
limited scope (Murillo, 2011). More popular are the approaches defined by Lave and
Wenger (1991) or Brown and Duguid (1991).
Table 1
Factors indicating a community of practice
Dimension Main characteristics
Mutual engagement Mutual relationships – harmonious or conflictual.
Shared ways of engaging in doing things together.
Rapid flow of information and propagation of information.
Absence of introductory preambles as if conversations and
interactions were merely the continuation of ongoing processes,
Very quick setup of a problem to be discussed.
Common domain of practice Substantial overlap in participants’ descriptions of who belongs.
Knowing what others know, what they can do, and how they can
contribute to achieve a goal.
Mutually defining identities.
Ability to assess the appropriateness of actions and products.
Shared repertoire of resources Specific tools, representations and other artifacts.
Local lore, shared stories, inside jokes, knowing laughter.
Jargon and shortcuts as well as the ease of producing new ones.
Certain styles recognized as displaying membership.
Shared discourse reflecting a certain perspective on the world.
Note: Adapted from: (Wenger, 1998).
In his later works, Wenger modified his unitarian approach to community of
practice suggesting that organizations should perceive themselves as systems of
social learning composed of numerous communities of practice. Cooperation
between members of different communities (by maintaining one’s own community
identity) is possible thanks to the crossing of borders and transfer (adaptation) of
artifacts into a new context of meaning. The above changes were, it seems, dictated

128 MEET 2018
by the desire to interest the representatives of practice with the issues of communities
of practice, the example of which is a book written together with McDermott and
Snyder being a practical guide for organizations that are willing to implement the
community of practice in their works (Wenger, Snyder, and McDermott, 2002).
8.4. Conclusions
Community of practice is present in the management literature for more than
25 years. Still till now no consistent terminology as well as methods and research
tools were established. Indubitably, the main reason for this is the weakness of
traditional theories of communities of practice, and in particular lack of formal
definition of the research subject, using for that purpose general and blurry terms,
lack of dominating research perspective or establishing theories on the basis of
individual research. Chaos in terms of terminology and methodology becomes even
greater due to the fact that communities, group learning and identity are the subjects
of research of other fields of study such as sociology, anthropology and psychology.
As a result, till now there are not many works of scientific nature devoted to the
communities of practice. Majority of them are one sided case studies that present an
analysis of a selected aspect of their activities, or compilations developed for the
implementation of communities of practice as an element of knowledge management
system in an organization. Usage of different research perspectives and methods and
tools of analysis resulting from them in majority of cases makes it impossible to
compare the research results and thus to create a consistent theory.
The fact that the difficulty in researching the community of practice are its
features can be a justification for such a situation. What is meant here are such
dimensions of the community of practice as its informal nature, blurry borders or
changeable personnel. This makes difficult not only the collection of empirical data
but also their comparison. As a result, each community becomes a unique
phenomenon.

Parallax effect in research… 129
Bibliography
1. Bendkowski, J. (2012). Interaktywno-sieciowy model kształtowania wspólnot
działań w kreowaniu i dyfuzji wiedzy w organizacjach. Wydawnictwo
Politechniki Śląskiej: Gliwice.
2. Brown, J.S., Duguid, P. (1991). Organizational Learning and Communities of
Practice: Toward a Unified view of Working, Learning, and Innovation.
Organization Science, 2(1), 40-57.
3. Brown, J.S., Duguid, P. (1996). Universities in the digital age. Change, 28(4), 10-19.
4. Brown, J.S., Duguid, P. (1998). Organizing Knowledge. California Management
Review, 12(2), 90-111.
5. Campbell, M. (2009). Intersection of trajectories: a newcomer in a community of
practice. Journal of Workplace Learning, 21(8), 647-657. doi: http://dx.doi.org/10.
1108/ 13665620910996188
6. Duguid, P. (2006). What "Talking about machines" tells us. Organization Studies,
27(12), 1794-1804. doi: http://dx.doi.org/10.1177/0170840606071896
7. Hagel, J.I., and Armstrong, G.A. (1997). Net Gain: Expanding Markets Through
Virtual Communities. Harvard Business School Press: Boston.
8. Harris, R., Simons, M., and Carden, P. (2004). Peripheral journeys: learning and
acceptance of probationary constables. Journal of Workplace Learning, 16(4),
205-218. doi: http://dx.doi.org/10.1108/13665620410536291
9. Hutchins, E. (1996). Learning to navigate. In S. Chaiklin, and J. Lave (Eds.),
Understanding Practice: Perspectives on Activity and Context. Cambridge
University Press: New York.
10. Jordan, B. (1989). Cosmopolitical obstetrics: Some insights from the training of
traditional midwives. Social Science and Medicine, 28(9), 925-944.
11. Lave, J. (1988). Cognition in Practice: Mind, Mathematics and Culture in
Everyday Life. Cambridge University Press: Cambridge.
12. Lave, J. (1993). Situation learning in communities of practice. In L.B. Resnick,
J.M. Levine and S.D. Teasley (Eds.), Perspectives on Socially Shared
CognitionAmerican Psychological Association: Washington, DC.
13. Lave, J., Wenger, E. (1991). Situated Learning: Legitimate peripheral
participation. Cambridge University Press: Cambridge, UK.
14. Marshall, H. (1972). Structural constraints on learning. [in:] B. Geer (Ed.),
Learning to Work. Sage Publications: Beverly Hills.
130 MEET 2018
15. Murillo, E. (2011). Communities of practice in the business and organization
studies literature. Information Research, 16(1). Retrieved from:
http://InformationR.net/ir/16-1 /paper464.html
16. North, K., Romhardt, K., Probst, G.J.B. (2004). Wissenserzeugung und - austausch
in Wissensgemeinschaften. Communities of Practice. QUEM-Report.
Arbeitsgemeinschaft Betriebliche Weiterbildungsforschung e.V: Berlin.
17. Orr, J. (1990). Talking about Machines: An Ethnography of a Modern Job.
Dissertation. Cornell University.
18. Rheingold, H. (1995). The Virtual Community. Finding Connection in
a Computerized World. Minerva: London.
19. Romhardt, K. (2002). Wissensgemeinschaften: Orte lebendigen Wissensmana-
gements. Dynamik, Entwicklung, Gestaltungsmöglichkeiten. Versus: Zürich.
20. Teigland, R. (2003). Knowledge Networking: Structure and Performance in
Networks of Practice. Dissertation. Stockholm: Stockholm School of Economics.
21. Tönnies, F. (1887). Gemeinschaft und Gesellschaft. Darmstadt.
22. van Maanen, J., Barley, S.R. (1984). Occupational Communities: Culture and
Control in Organizations. Research in Organizational Behavior, 6, 287-365.
23. Weber, M. (1914). Wirtschaft und Gesellschaft. Tübingen: J.C.B. Mohr.
24. Wenger, E. (1998a). Communities of Practice - Learning as a Social System.
The System Thinkers, 9(5), 1-5.
25. Wenger, E. (1998b). Communities of Practice. Learning, Meaning, and Identity.
Cambridge University Press: Cambridge.
26. Wenger, E., Snyder, W.M., McDermott, R. (2002). Cultivating Communities of
Practice: A Guide to Managing Knowledge. Harvard Business School Press:
Boston, MA.
27. Zboralski, K. (2007). Wissensmanagement durch Communities of Practice. Eine
empirische Untersuchung von Wissensnetzwerken. Wiesbaden: Deutscher
Universitäts-Verlag.
28. Zhang, W., Watts, S. (2008). Online communities as communities of practice:
a case study. Journal of Knowledge Management, 12(4), 55-71. doi: http://dx.doi.org/
10.1108/13673270810884255

Parallax effect in research… 131
PARALLAX EFFECT IN RESEARCH ON COMMUNITY
OF PRACTICE
Abstract
At the turn of the 21st century the concept of communities of practice quickly
gained popularity as a tool for creating and distributing knowledge in organizations.
In recent years, however, we have noticed a decline in interest in this concept from
both science and practice. It is suggested that the main reason for this is the concept
still lacks a widely accepted definition and can be interpreted in many different
ways. Consequently, the term community of practice can be sometimes problematic:
everything is and at the same time is not a community of practice. The article
presents a critical analysis of the most popular approaches to the concept of
communities of practice.
Keywords: community of practice, legitimate peripheral participation, social learning
theory, negotiation of meaning, reification, participation.
EFEKT PARALAXY W BADANIACH WSPÓLNOT DZIAŁAŃ
Streszczenie
Na przełomie XX i XXI wieku wspólnota działań bardzo szybko zyskała
popularność jako narzędzie na potrzeby kreowania i dystrybucji wiedzy
w organizacjach. Jednakże w ostatnich latach można zauważyć spadek
zainteresowania tą koncepcją, zarówno ze strony nauki, jak i praktyki. Za główne
przyczyny tego stanu rzeczy uważa się brak formalnego zdefiniowania pojęcia
wspólnoty działań oraz szerokie możliwości jego interpretacji. Tym samym
zastosowanie terminu wspólnota działań jest w praktyce niekiedy nieco
problematyczne: wszystko jest i jednocześnie nie jest wspólnotą działań. W artykule
przedstawiono oraz poddano krytycznej analizie najbardziej rozpowszechnione
podejścia do koncepcji wspólnoty działań.
Słowa kluczowe: wspólnota działań, legitymizujące uczestnictwo na obrzeżach,
teoria społecznego uczenia się, negocjacje znaczeń, reifikacja, partycypacja.


Adam GUMIŃSKI1, Adam BOSOWSKI2
1Silesian University of Technology, Poland (e-mail: [email protected]) 2Jastrzębskie Zakłady Remontowe Sp. z o.o.
9. THE OPTIMAL STRUCTURE OF COAL OUTPUT IN A GROUP OF
COLLIERIES
9.1. Introduction
Intensive restructuring of Polish hard coal mining resulted in the changes to the
functioning of coal companies and hard coal mines. One can notice significant
changes in all areas of collieries’ activities, yet the most important changes took place
in the technical and technological as well as in organizational and management areas.
The superior objective of the activities taken was to limit the unit cost of coal and to
improve the safety and stability of production process in hard coal mines (Jonek-
Kowalska and Turek, 2016; Jonek-Kowalska, 2015; Jonek-Kowalska, 2018a; Bijańska,
2011).
The determined objectives of restructurization in the hard coal sector aim to
achieve the planned coal production with the use of a limited number of collieries
and longwalls within mining enterprises. Such a focus of production requires
optimal use of productivity of the used machines and devices, collieries
infrastructure and work resources (Klank, 2011; Jonek-Kowalska, 2018b; Jonek-
Kowalska, 2017; Jonek-Kowalska, 2014; Wodarski et al., 2017). As a result, it is
necessary to carry out such a research that will make it possible to determine factors
and conditions that influence the work efficiency. It will allow to determine
recommendations for mining managers within their activities, as well as technical
and organizational solutions to increase the work efficiency level.
The ratio of total work efficiency is determined on the basis of annual output and
average employment rate in total in a group of collieries. Both the level of hard coal
134 MEET 2018
mining as well as the level of employment are directly or indirectly influenced by the
mining and geological conditions and the used technical and organizational
solutions. Commercial coal as the effect of production process in a hard coal mine
requires effective and safe implementation of production, transport and handling
processes that are composed of several technological processes (Gumiński, 2012;
Gumiński, 2008). These processes are characterized by varied levels of labor-output
levels that depend on many factors, including technical and organizational ones for
which the management and technical staff are responsible. Appropriate organization
of production within longwalls allows for optimal selection of human resources in
terms of quantity and quality structure (Gumiński, 2016a; Klank, 2011). From the
point of view of work efficiency analysis it is important to adjust the level and
structure of employment within a group of colliery employees and group of external
companies’ employees to the scope and scale of implemented technological processes
(Karbownik and Gumiński, 2011). Optimal level of employment in particular
employees’ groups is closely related to the effective work time of the employed mine
staff and labor-output ratio of particular technological processes (Gumiński, 2016b;
Gumiński, 2010).
In the article, the author presents the research results within the determination of
optimal daily coal output structure within a group of longwalls. The ultimate result
of the analysis on the basis of 4 calculation variants was the determination, according
to the criterion of total gross performance ratio maximization, of optimal structure of
daily output for varied levels of total daily output within the group of analyzed
longwalls. Changes in the output structure influenced the changes in the employees’
workload at production and non-production positions for the analyzed longwalls.
The analysis of optimal output structure was carried out for 4 calculation variants
for a group of longwalls in two hard coal mines. The input data necessary for the
analysis were obtained from the source materials of the analyzed mines.
9.2. Work efficiency in a hard coal mine – determinants and conditions
Analysis of calculation variants necessary to determine optimal structure of hard
coal production in a group of longwalls according to the criterion of work efficiency

The optimal structure of coal output... 135
maximization required the work efficiency ratio. For further analysis, the total gross
performance ratio was used that can be presented as a following dependency:
Z
PW b (1)
where:
Pb – annual average level of gross hard coal production in the group of analyzed
collieries, [t/r],
Z – annual average level of employment in a group of collieries [empl.].
Both the level of employment as well as the level of gross hard coal production
are dependent on many parameters and factors that can be presented as a following
dependence (Gumiński, 2017):
)q...,,q,q,q(f
)p...,,p,p,p(f
Z
PW
n3212
n3211b (2)
where:
p1, p2, p3, …, pn, – parameters determining the gross hard coal production,
q1, q2, q3, …, qn, – parameters determining the level of employment.
Pb – annual average level of gross hard coal production in the group of analyzed
collieries, [t/r],
Z – annual average level of employment in a group of collieries [empl.].
The above dependence is implicit as the two amounts present in the formula,
f1 and f2, are mutually dependent, that is to some extent changes in the level of
employment may determine the changes in the production level and the changes in
the production can influence the level of employment. The search for maximum
achievable work efficiency comes down to a situation when one of the
abovementioned amounts becomes fixed. This means that by way of changes to the
technical and organizational solutions, the production level can be maximized
provided that the level and structure of employment stay the same. A second case
present in the Polish hard coal mining industry is the necessity to act to minimize the
workload to achieve the planned production level that is in line with the possibilities
in terms of hard coal sale by the coal company on the national and foreign markets.
The use of absorption curve concept of work efficiency plays a major role in the
analysis of hard coal mine resources productivity. It points to the distribution of

136 MEET 2018
changes to the work efficiency once the workload of subsequent processes carried
out by the employees of the mine was taken into account in an accumulated manner.
The analysis carried out on the basis of literature research and the experience of
the author allowed for initial indication of factors and conditions that influence the
level of hard coal mine production (Gumiński, 2017):
geological and mining conditions,
natural hazards,
employment structure and level,
effective work time of the employees,
work organization,
coal production structure,
underground transport infrastructure,
mineshaft infrastructure,
coal mechanical handling unit infrastructure,
productivity of installed devices and machinery,
used technical and technological solutions,
scope and scale of machines and devices failures.
In turn, when analyzing the factors that directly and indirectly decide on the level
of employment in a hard coal mine, the following can be indicated (Gumiński, 2017):
coal production level and structure,
effective work time of the employees,
absenteeism level of underground and office workers,
organizational structure of the mine,
scope of functions and tasks assigned to particular organizational units,
labor-output ratio of technological processes,
level of competences and qualifications of employees,
geological and mining conditions,
natural hazards,
underground transport infrastructure,
mineshaft infrastructure,
coal mechanical handling unit infrastructure,
used technical and technological solutions.

The optimal structure of coal output... 137
An important issue for each longwall are natural hazards that need to be
analyzed to determine their influence on the production process. At the same time,
they negatively influence the level and structure of gross daily output in a hard coal
mine and on the workload of technological processes, and thus they significantly
shape the level of work efficiency. Influence of natural hazards on the work
efficiency can be presented in the following way (Gumiński, 2017):
directly – by limiting the maximum daily progress of a longwall (methane
hazard due to the absolute methane content, rock burst hazard due to the
necessity of preventive actions that make it impossible to mine the body of
coal),
indirectly – by increasing the time of stoppages of longwall shearer (methane
hazard due to increased control, rock burst hazard due to the special conditions
of exploitation, endogenous fires hazard),
directly – by increasing the workload of preventive processes (methane hazard,
rock burst hazard, water hazard),
indirectly – due to the increased scale of failures and down times of machines
and devices (methane hazard, rock burst hazard).
9.3. Analysis of the optimal structure of coal output in the analyzed
group of longwalls and work efficiency for the selected
calculation variants
The following actions were needed to determine the optimal coal output structure
in the analyzed group of longwalls to maximize the total gross productivity ratio:
determining the work efficiency ratio,
selection of longwalls for analysis,
determining mining and geological as well as technical and organizational
conditions in the longwalls selected for analysis on the basis of source materials
sourced from the analyzed collieries,
monitoring of technical parameters for all of the longwalls selected for analysis
for a period of one month,
determining calculation variants for the analysis of optimal structure of daily
output,

138 MEET 2018
determining the gross daily output level for the group of longwalls being
analyzed in every calculation variant,
determining the optimal gross daily output structure for the group of longwalls
being analyzed in every calculation variant,
determining the total headcount level for the group of collieries being analyzed
in every calculation variant,
determining changes to the level of employment in the group of production
workers in the group of collieries being analyzed in every calculation variant,
determining changes to the level of employment in the group of office workers
in the group of collieries being analyzed in every calculation variant,
determining total gross productivity ratio for the analyzed group of collieries in
every calculation variant.
Table 1 presents the basic geological and mining parameters of the longwalls
selected for analysis.
Table 1
Geological and mining parameters of analyzed longwalls
Source: own study.
1. Coal deposit 205/1 209 209 209 209 206/1 206/1
2. Methane hazard category - - - - - - -
3. Water hazard category I I I I I I I
4. Rockburst hazard category - I I I I - -
5. Longwall's length [m] 225,00 230,99 184,92 146,25 169,00 195,00 110,00
6. Longwall's height [m] 1,73 2,20 2,62 3,57 4,40 2,10 2,10
7. Longwall's run [m] 403 / 1056 1094 / 2184 486,0 281,0 1 995,0 1 485,0 525,0
8. Longwall's longitudinal slope [o] 1-3 1-3 0-2 2-5 0-7 1÷8 0-9
9. Longwall's transverse slope [o] 3-5 2-5 2-6 0-1 -4,5 +8,5 1÷6 1 ÷ 6,8
10. Daily longwall advancement [m/d] 4,43 4,22 4,30 3,90 6,34 2,90 1,60
11. Longwall's exploitation time [mies.] 4,4 12,4 5,4 3,6 12,0 15,0 5,0
12. Shearer's type KGE-710FM KGE-710FM KSW-880EU/1kVKSW-2000E1 KSW-1500 EU FS 400/1.0 KSW 880 EU
13. Longwall conveyor's type Rybnik-850 Glinik 298/800 Rybnik-850 Rybnik-1100 Rybnik 1100 RYBNIK-850 GLINIK-298/800/BP
Longwall GLongwall FLongwall E
The name of a longwall
Longwall DLongwall C
Id. Parameter Unit
Longwall BLongwall A

The optimal structure of coal output... 139
Table 2 presents key technical parameters determining longwall shearers’
productivity and work productivity in analyzed longwalls.
Table 2
Key technical parameters determining longwall shearers’ productivity
and work productivity in analyzed longwalls
Source: own study.
Using the model of work efficiency analysis (Gumiński, 2017), taking into account
the work parameters of the analyzed group of longwalls and collieries, the necessary
calculations were carried out to determine optimal structure of daily output for
4 calculation variants. The basic status (variant 0) were the parameters of longwalls
determined during the monitoring carried out for a period of one month (total gross
daily output in the analyzed longwalls at the level of 27,176 Mg/d).
The following calculation variants were identified for the further analysis:
variant I – good economic condition of hard coal market, favorable prices and
lack of problems in terms of coal sale. Assumption of maximum gross daily
output that can be achieved in a group of analyzed longwalls taking into
account that the extraction can be carried out on Saturdays and Sundays,
variant II – good economic condition of hard coal market, favorable prices and
lack of problems in terms of coal sale. Assumption of maximum gross daily
output that can be achieved in a group of analyzed longwalls without taking
into account that the extraction can be carried out on Saturdays and Sundays,
The time to
reach a
longwall [min]
Non-
technological
downtime
coefficient [%]
Shearer's work time
use in technological
processes coefficient
[%]
Average
shearer's
productivity
[t/h]
Average
daily
number of
productive
shifts in a
longwall
[sh./d]
Average
daily
number of
maintenance
shifts in a
longwall
[sh./d]
The number of
workers on a
productive shift
[workers/sh.]
The number of
workers on a
maintenance
shift
[workers/sh.]
Daily
longwall
gross coal
output
[Mg/d]
Td Wpp Wwkpt PrKśr LZPDRo LZKDRo OZPo OZKo WDBo
1 2 3 4 5 6 7 8 9 10 11 12
1. Longwall A Colliery X 85,0 34,4 56,8 399,2 3,90 0,50 30,9 32,5 3 570
2. Longwall B Colliery X 50,0 17,0 74,3 298,8 3,50 0,50 30,3 38,0 4 423
3. Longwall C Colliery X 85,0 34,2 75,3 287,1 3,50 0,50 34,0 39,0 3 414
4. Longwall D Colliery X 65,0 24,2 66,0 267,2 3,50 0,50 34,8 45,0 3 209
5. Longwall E Colliery Y 115,0 18,7 72,2 688,3 5,25 0,75 24,3 44,9 9 696
6. Longwall F Colliery Y 85,0 36,5 69,8 194,1 3,85 0,78 20,4 33,9 2 064
7. Longwall G Colliery Y 100,0 29,5 52,2 90,6 4,34 0,66 22,3 34,4 800
Id. Longwall Colliery

140 MEET 2018
variant III – bad economic condition of hard coal market, unfavorable prices
and problems in terms of coal sale. Assumption of reduction of gross daily
output by 50% as compared with basic variant, with an additional prerequisite
to maintain the extraction at a minimum level for all analyzed longwalls,
variant IV – bad economic condition of hard coal market, unfavorable prices
and problems in terms of coal sale. Assumption of reduction of gross daily
output by 50% as compared with basic variant, with the possibility to cease
extraction in one of the analyzed collieries.
For each calculation variant, the analysis of changes to the employment level was
carried out, taking into account determined optimal structure of daily output. Next,
changes to the value of total gross performance ratio for all of the analyzed variants
were determined.
For each variant that takes into account optimal daily output structure, a total
gross productivity ratio was determined in a group of analyzed mines according to
the following dependency (Gumiński, 2017):
m
1i
m
1j
ipppidpp
ij
ijijijij
m
1i
m
1j
ijb
i
j
ZZ)WA1(
LZKOZKLZPOZP
P
W (3)
where:
m – number of mines in the analyzed group of collieries,
mi – number of longwalls in ith mine,
Pb-ij – annual gross coal production level in jth longwall of ith hard coal mine [t/r],
OZPij – workload of jth longwall in the ith mine during a production shift [empl.],
LZPij – number of production shifts in jth longwall of ith coal mine,
OZKij – workload of jth longwall in the ith mine during maintenance shift [empl.],
LZKij – number of maintenance shifts in jth longwall of ith coal mine,
WAij – total absenteeism ratio for jth longwall of ith coal mine [%],
Zpp-d-i – level of employment of non-production workers in the underground of ith
mine [empl.],
Zpp-p-i – level of employment of non-production workers in the offices of ith mine
[empl.].

The optimal structure of coal output... 141
Table 3 presents synthetic results for the analyzed calculation variants.
Table 3
The result parameters of simulation calculation in a group of analyzed collieries
Source: own study.
Variant I makes use of the whole extraction potential of the analyzed longwalls,
taking into account an assumption that the extraction can be carried out on Saturdays
and Sundays. This resulted in an increase of gross daily output within a group of
collieries from 27,176 Mg/d to 41,700 Mg/d, that is by 53.4%. At the same time, it was
necessary to increase the employment level from 9,410 employees to
10,754 employees, that is by 14.3%. As a result, a significant increase of total gross
productivity ratio was obtained from 727.8 Mg/y/worker to 975.5 Mg/y/worker, that
is by 34.0%.
Variant II makes use of the whole extraction potential of the analyzed longwalls,
without taking into account an assumption that extraction can be carried out on
Saturdays and Sundays. This resulted in an increase of gross daily output within
a group of collieries from 27,176 Mg/d to 30,320 Mg/d, that is by 11.6%. At the same
time, it was necessary to increase the employment level from 9,410 employees to
9,584 employees, that is by 1.9%. As a result, an increase of total gross productivity
ratio was obtained from 727.8 Mg/y/worker to 797.2 Mg/y/worker, that is by 9.5%.
In variant III, due to the assumed problems with the coal sale it was assumed that
the daily output must be reduced by 50% but it was decided to maintain minimum
Id. Parameter UnitThe initial
stateVariant I Variant II Variant III Variant IV
1. Total daily gross coal output [Mg/d] 27 176,0 41 700,0 30 320,0 13 588,0 13 588,0
2. Longwall A [%] 13,1% 13,7% 13,8% 6,7% 0,0%
3. Longwall B [%] 16,3% 15,0% 15,0% 9,3% 0,0%
4. Longwall C [%] 12,6% 14,5% 14,5% 7,2% 0,0%
5. Longwall D [%] 11,8% 11,9% 11,9% 6,7% 0,0%
6. Longwall E [%] 35,7% 34,2% 34,2% 64,7% 76,3%
7. Longwall F [%] 7,6% 7,5% 7,6% 3,9% 16,9%
8. Longwall G [%] 2,9% 3,0% 3,0% 1,4% 6,8%
9. The employment level in a group of collieries [worker] 9 410 10 754 9 584 7 801 4 143
10. The employment level change of productive workers [worker] 0 657 174 -778 -677
11. The employment level change of non-productive workers [worker] 0 687 0 -831 -4 590
12. Gross work productivity indicator [Mg/y/worker] 727,8 975,5 797,2 438,9 826,5

142 MEET 2018
production for all longwalls. The limited reduction of total level of employment in
the analyzed group of collieries from 9,410 employees to 7,801 employees, that is by
17.1%, resulted in a significant decrease of total gross efficiency ratio from
727.8 Mg/y/worker to 438.9 Mg/y/worker, that is by 39.7%.
In variant IV, due to the assumed problems with the coals sale it was assumed
that the daily output must be reduced by 50% and it was decided to cease the coal
production in several longwalls. The total goal of daily output was taken over by
3 longwalls (E, F and G) grouped in one mine, which resulted in employment
reduction from 9,410 employees to 4,143 employees, that is by 56.0%. This made it
possible to achieve a high level of gross productivity ratio that is 826.5 Mg/y/worker,
which in turn means an improvement when compared with the basic variant by
13.6%. This decision, however, brings about social problems, that is the necessity to
ensure a social plan for the dismissed miners. Another problem is the expensive
maintenance of mine infrastructure, if it is economically justified in a long run.
To summarize, determining an optimal structure of daily output that allows to
maximize the total gross productivity ratio requires varied decisions from the side of
the management and engineering and technical employees in the group of collieries.
Proper allocation or change in the size of used resources, that is change in the
production workers and non-production workers workload are of key importance
for the optimal use of technical infrastructure of collieries.
9.4. Conclusions
The research and variant calculations indicate a significant influence of the daily
output structure in the longwalls group on the level of work efficiency. Detailed
conclusions resulting from the research are as follows:
1. Irrespective of the level of total gross daily output in the group of collieries it is
justified to determine the optimal structure of the output to maximize the work
efficiency.
2. Optimal structure of coal output results in the necessity to allocate mining crew
between particular longwalls within the analyzed group of collieries. This
applies both to production as well as non-production workers. As a result,
optimal coal output structure determines the employment structure and level in

The optimal structure of coal output... 143
particular hard coal mines and thus is a key factor that influences the level of
work efficiency.
3. Further restructurization of employment towards more effective use of work
resources, including appropriate allocation of those employed within the group
of collieries is necessary to improve the work efficiency. As a result,
management should prepare allocation plans for the mining crew for various
economic conditions on the coal market.
Bibliography
1. Bijańska, J. (2011). Prognozowanie kształtowania się rentowności produkcji
w kopalniach węgla kamiennego w latach 2010-2020. Wydawnictwo Politechniki
Śląskiej: Gliwice.
2. Gumiński, A. (2010). Model planowania poziomu zatrudnienia w kopalni węgla
kamiennego i w grupie kopalń. Wydawnictwo Politechniki Śląskiej: Gliwice.
3. Gumiński, A. (2010). Efektywny czas pracy zatrudnionych w kopalni węgla
kamiennego. Przegląd Górniczy, 9, 104-107.
4. Gumiński, A. (2012). Czynniki decydujące o wydajności pracy w wybranych
kopalniach węgla kamiennego. Wiadomości Górnicze, 10.
5. Gumiński, A. (2011). Czynniki obniżające efektywny czas pracy zatrudnionych
w kopalni węgla kamiennego. Zeszyty Naukowe Politechniki Śląskiej., seria:
Organizacja i Zarządzanie, 56, 89-104.
6. Gumiński, A. (2016a). Efektywne wykorzystanie zasobów ludzkich jako
kluczowy warunek funkcjonowania przedsiębiorstwa górniczego w perspekty-
wie długoterminowej. Zeszyty Naukowe Politechniki Śląskiej, seria: Organizacja
i Zarządzanie, 89, 163-176.
7. Gumiński, A. (2016b). The influence of effective work time on an employment
level in a colliery – case study. Zeszyty Naukowe Politechniki Śląskiej, seria:
Organizacja i Zarządzanie, 91, 111-122.
8. Gumiński, A. (2017). Model analizy wydajności pracy w grupie kopalń węgla
kamiennego. Wydawnictwo Politechniki Śląskiej: Gliwice.
9. Gumiński, A. (2017). Analiza wrażliwości wskaźnika wydajności brutto w ścianie
wydobywczej. Wiadomości Górnicze, 11, 526-535.
10. Gumiński, A. (2017). The coal output reserve in a group of collieries. Zeszyty
Naukowe Politechniki Śląskiej, seria: Organizacja i Zarządzanie, 111, 83-95.

144 MEET 2018
11. Jonek-Kowalska, I. (2014). The effects of evolutionary employment restructuring
in the Polish mining enterprises in the context of sector risk. International Journal
of Contemporary Management, 13 (4), 21-40.
12. Jonek-Kowalska, I. (2015). Challenges for long-term industry restructuring in the
Upper Silesian Coal Basin: What has Polish coal mining achieved and failed from
a twenty-year perspective? Resources Policy, 44, 135-149.
13. Jonek-Kowalska, I. (2018a). Economic and social conditions of the
implementation of new technologies in coal mining industry. Zeszyty Naukowe
Politechniki Śląskiej, seria: Organizacja i Zarządzanie, 115, 113-123.
14. Jonek-Kowalska, I. (2018b). Method for assessing the development of
underground hard coal mines on a regional basis: the concept of measurement
and research results. Energies 11 (6), art. no. 1370, 1-23.
15. Jonek-Kowalska, I. (2017). Coal mining in Central-East Europe in perspective of
industrial risk. Oeconomia Copernicana, 8 (1), 131-142.
16. Jonek-Kowalska I., Turek, M. (2016). Fixed and variable costs and production
efficiency in Polish coal mines. Zeszyty Naukowe Politechniki Śląskiej, seria:
Organizacja i Zarządzanie, 97, 153-167.
17. Karbownik, A., Gumiński, A. (2011). Zakres i skala procesów technologicznych
realizowanych przez firmy zewnętrzne w kopalniach węgla kamiennego.
Przegląd Górniczy 9, 65-69.
18. Klank, M.(2011). The determinants in the development of coal mining sector
productivity. Archive of Mining Sciences, 56 (3), 507–516.
19. Wodarski, K., Bijańska, J., Gumiński, A. (2017). The method of validity evaluation
of hard coal excavation in residual seam parts. Archives of Mining Sciences, 62 (4),
675-687.
THE OPTIMAL STRUCTURE OF COAL OUTPUT IN A GROUP OF
COLLIERIES
Abstract
In this paper, the author presents the results of his research on the optimal
structure of coal output in a group of collieries according to the criterion of the
maximization of total gross performance ratio. The analysis concerned key
parameters that determine the work efficiency in a group of collieries and the
determination of the optimal output structure in the context of maximization of work

The optimal structure of coal output... 145
efficiency for several calculation variants. Technical and organizational determinants
of work efficiency were analyzed to determine the technical and organizational
solutions that allow to limit labor-output ratio of technological processes. Change in
the coal production structure in a group of longwalls requires relevant change to the
work organization that is allocation of workers to production and non-production
stations in a group of collieries. The coal mining structure in a group of longwalls is
one of key factors that determine the work efficiency. The presented analysis was
carried out for a group of longwalls in two hard coal mines, the input data of which
were determined on the basis of work parameters monitoring of the indicated
longwalls.
Keywords: daily coal output, work efficiency, group of collieries.
OPTYMALNA STRUKTURA WYDOBYCIA WĘGLA W GRUPIE
KOPALŃ WĘGLA KAMIENNEGO
Streszczenie
W artykule autor przedstawia wyniki swoich badań nt optymalnej struktury
wydobycia węgla w grupie kopalń węgla kamiennego według kryterium
maksymalizacji wskaźnika wydajności brutto ogółem. Podjęta analiza dotyczyła
kluczowych parametrów determinujących wydajność pracy w grupie kopalń węgla
kamiennego, a przede wszystkim ustalenia optymalnej struktury wydobycia
w aspekcie maksymalizacji wydajności pracy dla kilku wariantów obliczeniowych.
Techniczne i organizacyjne determinanty wydajności pracy zostały poddane analizie
w celu ustalenia rozwiązań techniczno-organizacyjnych umożliwiających
ograniczenie pracochłonności procesów technologicznych. Zmiana w strukturze
produkcji węgla w grupie ścian wydobywczych wymaga odpowiedniej zmiany
w organizacji pracy, tj. alokacji pracowników na stanowiskach produkcyjnych oraz
pozaprodukcyjnych w grupie kopalń węgla kamiennego. Struktura wydobycia
węgla w grupie ścian produkcyjnych stanowi jeden z kluczowych czynników
determinujących wydajność pracy. Zaprezentowana analiza została przeprowadzona
dla grupy ścian wydobywczych w dwóch kopalniach węgla kamiennego, dla których
dane wejściowe zostały określone na podstawie monitoringu parametrów pracy
wytypowanych ścian wydobywczych.
Słowa kluczowe: struktura wydobycia dobowego, wydajność pracy, grupa kopalń
węgla kamiennego.


Alyona KUZHAEVA1, Natalia DZHEVAGA2, Igor BERLINSKII3 1Saint-Petersburg Mining University, Russia (e-mail: [email protected]) 2Saint-Petersburg Mining University, Russia (e-mail: [email protected]) 3Saint-Petersburg Mining University, Russia (e-mail: [email protected] )
10. STUDYING OF THE IMPACT OF CALCIUM SYNTHETIC
SILICATES AND HYDRATED SILICATES STRUCTURE ON
SORPTION PROCESSES
10.1. Introduction
The highly extended active surface of finely dispersed xonotlite and wollastonite
powder make them effective sorbents for organic substances and extractants.
As sorbing and filtering powders they can effectively be used in petrochemical,
chemical, industrial rubber, food and other branches of industry, as well as sorbents
for thin-layer chromatography. Wollastonite is used for water-purification filter
production.
The problems of obtaining and usage of calcium silicates and hydrosilicates,
which stoichiometric ratio can be expressed by the formulas mCaO∙nSiO2 and
mCaO∙nSiO2∙pН2О respectively, draw increasingly greater attention lately.
10.2. Literature studies
Analysis of the principal directions of synthetic calcium silicates production
showed that currently the most commonly used are the methods of solid-phase
synthesis (consisting in sintering of calcium and silicon containing raw materials in
the presence or absence of liquid phase) and synthesis in aqueous medium at
elevated temperature and normal atmospheric pressure or at elevated temperature
and pressure (hydrothermal synthesis).
As key parameters, optimized when synthesizing the calcium silicates, the
following should be marked out: end product yield and quality, power consumption

148 MEET 2018
and material costs, removal of all harmful impurities (metal oxides, calcite, silica,
etc.) The major establishing factors, impacting the parameters to be optimized, are:
composition and ratio of the feed mixture components, initiating additives and
catalysts, feedstock preliminary processing parameters, fusion temperature, drying
time, burning duration and conditions.
When sintering calcium and silicon containing components at the temperature
range of 1,000-1,300°С the end product is obtained in the granulated form with
further classification for the required particle size. As a result the synthetic
wollastonite, supplied to the market, has 65 wt.% of particle size 44-74 μm. The
process of wollastonite solid-phase synthesis takes place when burning the mixture,
consisting of silicon and calcium containing raw materials with and without various
additives, at the temperatures below the fusion temperature of basic components and
formed silicates. The key condition for solid-phase reactions is the availability of
mass transfer between the reacting solid substances at the expense of diffusion. The
important factors, impacting the process of solid-phase synthesis, are: particle-size
composition of the mixture (including dispersity, uniformity), chemical composition
and temperature. The reduction of particle size in the mixture increases the specific
surface energy of grains and reduces the inside diffusion path, which leads to the
process rate increase, end product yield, quality improvement, as well as permits
reducing the temperature and specific power consumption when burning. However
the reduction of particle size is accompanied with the increase of costs for grinding
and increase losses at the expense of dust formation. The optimal granularity is
determined taking into account product yield and general costs for synthesis.
Relationship between the reaction rate and the temperature is determined by the
nature of the controlling step of a reaction. In the case of diffusion process the
reaction rate changes rather slowly with temperature change, and in the case of
chemical interaction the reaction rate temperature dependence is rather significant.
The nature of relationship between the reaction rate and the temperature depends on
the chemical and grain size composition, grain uniformity in terms of size and from
specific contact area between grains. The effect of pressure on the process of solid-
phase synthesis may show itself in the change of reaction kinetics because of change
in the shape of grains and their spatial relationship when prepressing the mixture
before burning, as well as in the drift of reaction equilibrium when conducted under

Studying of the impact of calcium synthetic… 149
pressure. Impurities contained in the feed mixture may both slow down and speed
up the processes, taking place when in the process of solid-phase synthesis,
impacting the composition and properties of the obtained materials.
In the system of CaО–SiO2 the following compounds exist: calcium metasilicate
СаО·SiO2, tricalcium disilicate 3CaO·2SiО2, calcium orthosilicate 2CaO·SiO2,
tricalcium silicate 3CaO·SiО2. The main reactions of this compounds formation from
oxides: mCaO+nSiO2 = mCaO·nSiО2. The change of Gibbs thermodynamic potential
of the reaction unambiguously points out that for the ratio of СаО·SiO2 = 1 the most
stable compound is wollastonite (СаО·SiO2), and for other ratios – calcium
orthosilicate (2СаО·SiO2): the process accompanied by the most significant decrease
in ∆Gº is the most probable.
The formation of wollastonite is only possible for the ratio of СаО:SiO2 = 1 from
the reaction 2СаО·SiO2+SiO2=2(СаО·SiO2). In other cases 2СаО·SiO2 is the most
stable formation.
The means of producing of synthetic calcium silicates, based on the interaction of
input components in the aqueous medium at the elevated temperature and pressure,
shall be rated as efficient and ecological. The method of hydrothermal synthesis is
based on the ability of water to change the properties of reagents (solubility,
diffusion rate, reactivity) at high temperature. In "soft" conditions it's possible to
synthesize compounds that are usually formed at higher temperatures. The
hydrothermal method has a variety of advantages over high temperature methods
and its prospects for industrial application. It provides ample opportunities for
obtaining particles that are uniform in terms of composition, shape and size. The
possibility to vary a lot of parameters (temperature, vapour pressure, synthesis
duration, and chemical composition of hydrothermal solutions) permits flexible
process control. As opposed to high temperature methods, the methods of synthesis
in aqueous medium permit obtaining calcium hydrosilicates (tobermorite, xonotlite)
that have high technological characteristics and promising practical application
(Burakov, 2014; Mei, 2017; Papynov, 2017; Shabarov, 2016; Walter, 2015). At the same
time the process of calcium hydrosilicate formation with the designated
stoichiometric ratio is the major stage of anhydrous calcium silicate (wollastonite)
synthesis.

150 MEET 2018
Among calcium hydrosilicates, xonotlite is of particular interest. It has enhanced
thermal stability and promising practical application.
10.3. Methodology
Our research is aimed at studying of sorptive characteristics of synthetic xonotlite
and wollastonite towards the components of oil and petroleum products.
Oil is a natural colloid disperse system, which characteristic property is in the
existence of so-called supermolecular structures – the internal adsorption complexes,
build of asphaltene and resin molecules that are 10–1,000 times larger than
molecular. The primary role in supermolecular structures formation is assigned to oil
asphaltene molecules.
The structural units of oil disperse system (underlying supermolecular structures,
their intermediate and end types) have complex structure, caused by the nature and
geometry of high-molecular compound macromolecules, surface forces between
them, interaction of dispersed phase with dispersion medium and other factors.
The prominent nature of complex structural unit is the difference of surface forces
between the supermolecular structure and solvation layer and between the solvation
layer and dispersion medium. Therefore complex structural units may interact with
the dispersion medium. Studying this interaction by using sorbents is a topical task.
Complex structural units of the oil disperse system may form free-disperse
systems (sols) and connected-disperse systems (gels).
Oil disperse systems (free- and connected-disperse) are characterized by
structural and mechanical strength, i.e. the capability to resist external forces and
actions. The higher the interacting forces of high-molecular compound
macromolecules in the associate and between the associates in the system, the higher
the structural and mechanical strength of the oil disperse system.
The structural and mechanical strength of oil disperse systems is determined
mainly by the thickness of solvate shell around the supermolecular structure. These
shells have certain elasticity and initiate disjoining pressure, which affects the oil
disperse system particles and tend to push them from one another.
The thinner the solvate shell is, the higher the structural and mechanical strength
of oil disperse system.

Studying of the impact of calcium synthetic… 151
In terms of structural and mechanical strength of the oil disperse system
structural unit the series is as follows: gel, sol, complex structural unit.
The temperature value has significant influence on the structural and mechanical
strength of disperse system. With temperature increase the structural and mechanical
strength of the system is decreased and tends toward zero. The system passes into
the molecular solution state.
Therefore the temperature value affects the disperse system stability, preventing
breakdown.
The oil disperse system kinetic stability is understood to be the ability of the
dispersed phase to keep for a certain time the homogeneous distribution of the
complex structural unit in the dispersion medium.
System instability has significant influence on the conduction of target processes
(production, transportation, and storage) and makes necessary the development and
takes corresponding technological measures for protection against breakdown.
The instability is shown in the form of dispersed phase particles aggregation
under the influence of intermolecular interaction with each other. At that the kinetic
stability is lost and the phase separation occurs, i.e. coagulation takes place. At that
the phase boundary is decreased. Associates coalesce and precipitate.
To figure out the mechanism of oil disperse systems behaviour in target
technological processes it's necessary to develop a physico-chemical models of these
systems, taking into consideration the nanodimensions of the component elements.
In different types of oil the basic component elements are carbon, hydrogen and
sulphur, more rarely - oxygen and nitrogen. Individual type of oil may have up to
80 different chemical elements. Carbon content may vary from 82 to 87%, hydrogen -
from 11 to 14%, sulphur - from 0.01 to 8%. Oil density changes in the range from
0.7 to 1 g/cm3.
Based on the above it's reasonable to conduct specific studies of oil disperse
system on model mixtures, consisting of the prescribed and thoroughly studied
liquideous hydrocarbons. In this study we had chosen the three-component mixture,
containing in the ratio of 5:1:1 (by weight) hexane, benzene, cyclohexane, i.e. the
substances similar in terms of physico-chemical properties, but at the same time
reflecting the main features of the oil disperse system.
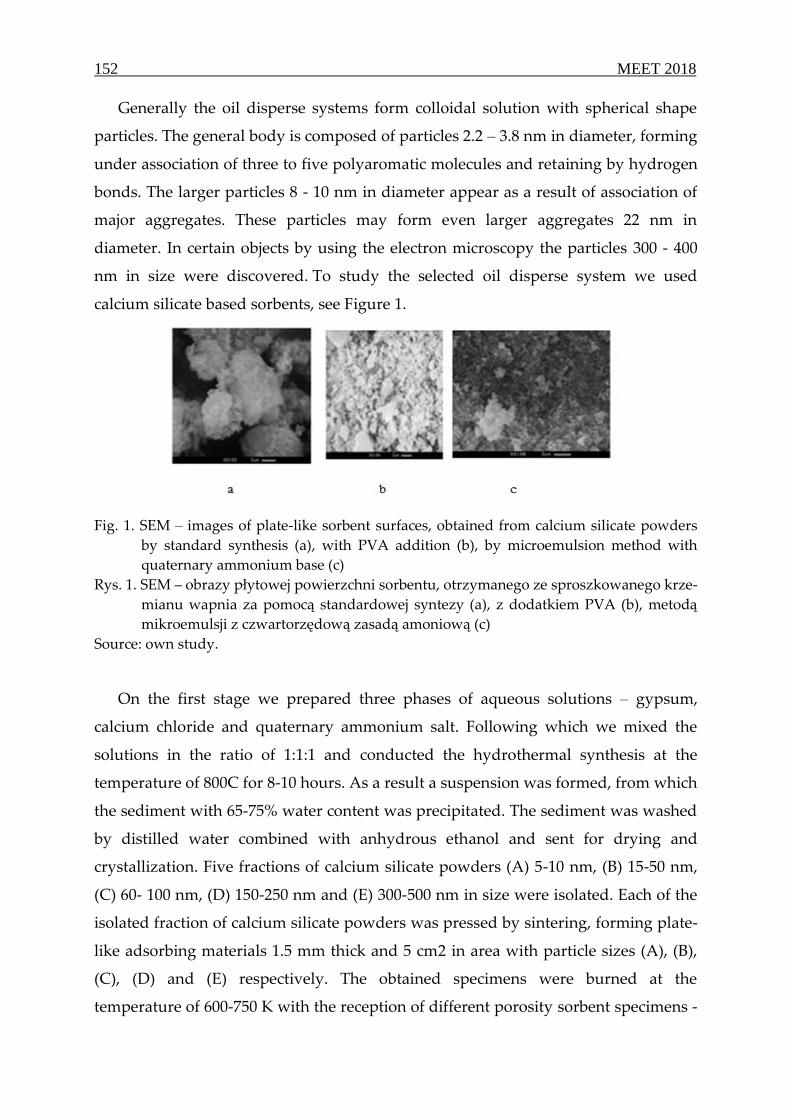
152 MEET 2018
Generally the oil disperse systems form colloidal solution with spherical shape
particles. The general body is composed of particles 2.2 – 3.8 nm in diameter, forming
under association of three to five polyaromatic molecules and retaining by hydrogen
bonds. The larger particles 8 - 10 nm in diameter appear as a result of association of
major aggregates. These particles may form even larger aggregates 22 nm in
diameter. In certain objects by using the electron microscopy the particles 300 - 400
nm in size were discovered. To study the selected oil disperse system we used
calcium silicate based sorbents, see Figure 1.
Fig. 1. SEM – images of plate-like sorbent surfaces, obtained from calcium silicate powders
by standard synthesis (a), with PVA addition (b), by microemulsion method with
quaternary ammonium base (c)
Rys. 1. SEM – obrazy płytowej powierzchni sorbentu, otrzymanego ze sproszkowanego krze-
mianu wapnia za pomocą standardowej syntezy (a), z dodatkiem PVA (b), metodą
mikroemulsji z czwartorzędową zasadą amoniową (c)
Source: own study.
On the first stage we prepared three phases of aqueous solutions – gypsum,
calcium chloride and quaternary ammonium salt. Following which we mixed the
solutions in the ratio of 1:1:1 and conducted the hydrothermal synthesis at the
temperature of 800С for 8-10 hours. As a result a suspension was formed, from which
the sediment with 65-75% water content was precipitated. The sediment was washed
by distilled water combined with anhydrous ethanol and sent for drying and
crystallization. Five fractions of calcium silicate powders (A) 5-10 nm, (B) 15-50 nm,
(C) 60- 100 nm, (D) 150-250 nm and (E) 300-500 nm in size were isolated. Each of the
isolated fraction of calcium silicate powders was pressed by sintering, forming plate-
like adsorbing materials 1.5 mm thick and 5 cm2 in area with particle sizes (A), (B),
(C), (D) and (E) respectively. The obtained specimens were burned at the
temperature of 600-750 К with the reception of different porosity sorbent specimens -

Studying of the impact of calcium synthetic… 153
(A1), (B1), (C1), (D1) и (E1). For illustrative purposes the images, received by using
scanning electron microscope (SEM), indicating sorbent surfaces with different
porosity are shown: a) – 0.02-0.029 m3/g (A1), b) - 0.01-0.02 m3/g (B1),
c) – 0.005 -0.01 (C1) m3/g.
10.4. Research results
When studying the physico-chemical properties of calcium silicate based sorbents
(A1), (B1), (C1), (D1) and (E1) it was discovered that when heating in air environment
up to the temperatures of 900 – 1,000К they do not melt and change their form and
porosity.
By using the dipping method in a certain succession of plates (A1), (B1), (C1), (D1)
and (E1) into the oil disperse system, a part of dispersed phase was selectively
adsorbed on each plate. The remainder of the non-adsorbed part of the oil disperse
system in the conducted tests didn't exceed 2 wt.%.
Studying of physico-chemical properties of each isolated part of the oil dispersed
system showed that with the increase of the oil disperse system temperature the
amount of non-adsorbed part (on the sorbent with the maximum value of porosity
equalling 0.1-0.5 m3/g (Е1)) is decreasing to almost zero with a rise in temperature
from 20 to 50 0С. At that the weight of fractions on all sorbent plates is practically
unchanged with the increase of sorption time, starting from 100- 120 minute of test.
With the increase in the sorbent porosity from 0.005 - 0.01 m3/g to 0.1- 0.5 m3/g
the share of semi-volatile fractions (resinous high-viscosity substances) on the
sorbent increases. The amount of latter increases on all sorbents with the temperature
increase of initial oil disperse system.
The liquideous initial organic matter or a mixture of organic substances by using
a peristaltic pump is transferred to the sorption vessel, in which the plate-like
nanopatterned sorbents with different porosity (A1), (B1), (C1), (D1) and (E1) are
placed. From the sorption vessel after the conduction of adsorption process the liquid
is returned to the initial vessel via a return circuit. Over the parallel circuit the liquid
is supplied to a flow-through cell, located inside the spectrophotometer ПЭ-5400В.
The measurement of solution concentration is conducted by using the standard
method of spectrophotometric analysis with a calibration curve for at the wave

154 MEET 2018
length of 580 nm. For translating the experimental data of the optical density of
solutions to adsorption capacity values the extrapolational dependences according to
experimental data in Freundlich coordinates were used (Lgx/m - LgС, where х – is
the amount of adsorbed material, m – adsorbent weight, С – concentration of
substance in the solution after the establishment of adsorption equilibrium).
By weighting the liquid mass before and after the adsorption, the weight of the
adsorbed material was determined. By weighting the sorbent plate before and after
the adsorption, the weight of the adsorbed material was also determined, and
verification of the previous measurements was conducted. By carrying out these
measurements in the course of time, the adsorbent capacity by each substance and
characteristic time of adsorption was determined to high precision.
At the first step a plate adsorbent with specified porosity that reaches its capacity
faster was determined for each substance (hexane, benzene, cyclohexane).
At the second step the adsorption on each plate adsorbent was controlled
sequentially, by comparing the adsorbed material mass with the reference for each
substance (hexane, benzene, cyclohexane).
10.5. Conclusions
The tests showed that depending on the porosity the plate adsorbents have
a selective ability towards the selected organic substances. Thus, the longer the
molecule of the organic substance is, the more effective the adsorbent with lesser
porosity (Akat'eva, 2016; Berlinskii, 2016; Fox, 2006; Nistor, 2016; Shin, 2004).
The obtained results are seen useful for modelling the oil disperse system in
general and for practical improvement of technological processes for obtaining end
products from oil, as well as for developing technologies of waste products
utilization and processing of end product production from oil disperse systems.
Bibliography
1. Akat'eva, L.V., Ivanov, V.K., Kozyukhin, S.A., Gladun, V.D., Baranchikov, A.E.,
Zhilov, V.I., Khol'kin, A.I. (2016). Using extraction and sorption processes to
obtain nanosized powders of calcium silicates and functional materials on their
basis. Theoretical Foundations of Chemical Engineering, 50(4), 490-497.
doi: http://dx.doi.org/10.1134/s0040579516040023

Studying of the impact of calcium synthetic… 155
2. Berlinskii, I., Kuzhaeva, A. (2016). The study of calsium-silicate based adsorbents
properties. Paper presented at the 16th International Multidisciplinary Scientific
Geoconference (SGEM 2016). Bulgaria: Albena.
3. Burakov, A., Romantsova, I., Kucherova, A., Tkachev, A. (2014). Removal of
Heavy-Metal Ions from Aqueous Solutions Using Activated Carbons: Effect of
Adsorbent Surface Modification with Carbon Nanotubes. Adsorption Science
&Technology, 32(9), 737-747. doi: http://dx.doi.org/10.1260/0263-6174.32.9.737
4. Fox, P.M., Davis, J.A. ,Zachara, J.M. (2006). The effect of calcium on aqueous
uranium(VI) speciation and adsorption to ferrihydrite and quartz. Geochimica
Et Cosmochimica Acta, 70(6), 1379-1387. doi: http://dx.doi.org/10.1016/j.gca.
2005.11.027
5. Mei, H.Y., Meng, Y.E., Gong, Y., Chen, X.J., Chen, C.L., Tan, X.L. (2017). Effect of
silicate on the sorption properties of kaolinite: removal of U(VI) and mechanism.
Journal of Radioanalytical and Nuclear Chemistry, 311(3), 1899-1907.
doi: http://dx.doi.org/10.1007/s10967-016-5119-4
6. Nistor, C.L., Ianchis, R., Ghiurea, M., Nicolae, C.A., Spataru, C.I., Culita, D.C.,
Donescu, D. (2016). Aqueous Dispersions of Silica Stabilized with Oleic Acid
Obtained by Green Chemistry. Nanomaterials, 6(1). doi: http://dx.doi.org/10.3390/
nano6010009
7. Papynov, E.K., Trukhin, I.S., Mayorov, V.Y., Patrusheva, O.V., Vostroknutov,
A.A., Avramenko, V.A. (2017). Sorption of phosphates on macroporous synthetic
calcium silicates. Doklady Physical Chemistry, 473, 61-65. doi: http://dx.doi.org/
10.1134/ s0012501617040030
8. Shabarov, A.N., Nikolaeva, N.V. (2016). Complex utilization of treatment wastes
from thermal power plants. Journal of Mining Institute, 220, 607-610.
doi: http://dx.doi.org/10.18454/pmi.2016.4.607
9. Shin, E.W., Han, J.S., Jang, M., Min, S.H., Park, J.K., Rowell, R.M. (2004).
Phosphate adsorption on aluminum-impregnated mesoporous silicates: Surface
structure and behavior of adsorbents. Environmental Science & Technology, 38(3),
912-917. doi: http://dx.doi.org/10.1021/es.030488e
10. Walter, M.J., Thomson, A.R., Wang, W., Lord, O.T., Ross, J., McMahon, S.C.,
Kohn, S.C. (2015). The stability of hydrous silicates in Earth's lower mantle:
Experimental constraints from the systems MgO-SiO2-H2O and MgO-Al2O3-
SiO2-H2O. Chemical Geology, 418, 16-29. doi: http://dx.doi.org/10.1016/
j.chemgeo.2015.05.001

156 MEET 2018
STUDYING OF THE IMPACT OF CALCIUM SYNTHETIC
SILICATES AND HYDRATED SILICATES STRUCTURE ON
SORPTION PROCESSES
Abstract
The highly extended active surface of finely dispersed xonotlite and wollastonite
powder make them effective sorbents for organic substances and extractants. As
sorbing and filtering powders they can effectively be used in petrochemical,
chemical, industrial rubber, food and other branches of industry, as well as sorbents
for thin-layer chromatography. Wollastonite is used for water-purification filter
production. Purpose of the article is suggesting the improvement of oil and
petroleum product refining with the removal of sulphur-bearing and other
heteroatomic compounds using cheaper catalyst systems, subject to regeneration.
Based on conducting specific studies of oil disperse system on model mixtures,
consisting of the prescribed and thoroughly studied liquideous hydrocarbons. We
had chosen the mixture hexane, benzene, cyclohexane, i.e. the substances reflecting
the main features of the oil disperse system. The obtained results are seen useful for
modelling the oil disperse system in general and for practical improvement of
technological processes for obtaining end products from oil, as well as for developing
technologies of waste products utilization and processing of end product production
from oil disperse systems. Synthetic calcium silicates, as opposed to natural, are more
uniform in terms of composition and structure, have less impurities, and are
characterized by fine-crystalline particle structure, sizing up to thousandths of
micron, and in connection with the specified advantages they have a wider practical
application. The development of effective methods of calcium silicate synthesis was
performed. The study of the impact of various factors on calcium silicate synthesis, as
well as optimization of the synthesis conditions of obtained inorganic adsorbents.
The study of mineralogical and chemical composition of the synthesized products.
The study of sorptive properties of synthetic xonotlite and wollastonite towards the
components of oil and petroleum products.
Keywords: calcium silicates and hydrosilicates, sorption.

Studying of the impact of calcium synthetic… 157
BADANIE WPŁYWU STRUKTURY SYNTETYCZNYCH
KRZEMIANÓW WAPNIA I UWODNIONYCH KRZEMIANÓW
NA PROCES SORPCJI
Streszczenie
Szeroka powierzchnia aktywna drobno zdyspergowanego proszku ksonotlitu
i wollastonitu czyni z nich skuteczne sorbenty substancji organicznych
i ekstrahentów. Jako proszki sorpcyjne i filtrujące mogą być one z powodzeniem
stosowane w przemyśle petrochemicznym, chemicznym, w branży zajmującej się
produkcją gumy przemysłowej, żywności i w innych gałęziach przemysłu, a także
jako sorbenty na potrzeby chromatografii cienkowarstwowej. Wollastonit
wykorzystywany jest na potrzeby produkcji filtrów do oczyszczania wody. Celem
artykułu jest zasugerowanie usprawnień procesu rafinacji ropy i produktów
ropopochodnych przy usunięciu związków zawierających siarkę i innych
heteroatomowych związków, z zastosowaniem tańszych systemów katalizy
podlegających regeneracji. W oparciu o wykonanie konkretnych badań układów
dyspersyjnych ropy na mieszaniach modelowych składających się z zalecanych
i dogłębnie przebadanych ciekłych węglowodorów. Wybrano mieszankę heksanu,
benzenu i cykloheksanu, czyli substancje odzwierciedlające główne cechy układu
dyspersyjnego ropy. Uzyskane wyniki uważane są za użyteczne na potrzeby
ogólnego modelowania układów dyspersyjnych ropy oraz na potrzeby praktycznego
udoskonalenia procesów technologicznych otrzymywania produktów końcowych
z ropy oraz opracowana technologii utylizacji odpadów i przetwarzania produktów
końcowych będących wynikiem układów dyspersyjnych ropy. Syntetyczne
krzemiany wapnia, w przeciwieństwie do tych naturalnych, są bardziej jednorodne
pod względem składu i struktury, cechują się mniejszą ilością zanieczyszczeń
i drobnokrystaliczną strukturą cząstek o wielkości do tysięcznych części mikrona,
a w połączeniu z określonymi zaletami mają one szersze zastosowanie praktyczne.
Opracowano skuteczne metody syntezy krzemianów wapnia. Badanie wpływu
różnych czynników na syntezę krzemianów wapnia oraz optymalizacja warunków
syntezy uzyskanych adsorbentów nieorganicznych. Badanie składu
mineralogicznego i chemicznego produktów uzyskanych w procesie syntezy.
Badanie właściwości sorpcyjnych syntetycznego ksonotlitu i wollastonitu pod kątem
składników ropy i produktów ropopochodnych.
Słowa kluczowe: Krzemiany wapnia i wodorokrzemiany, sorpcja.


Natalia DZHEVAGA1, Olga LOBACHEVA2 1Saint-Petersburg Mining University, Russia (e-mail: [email protected]) 2Saint-Petersburg Mining University, Russia (e-mail: [email protected])
11. REMOVAL AND SEPARATION OF LANTHANIDES IN
POLYCOMPONENT SYSTEMS BY ION FLOTATION METHOD
11.1. Introduction
The rare-earth raw materials can be used in many industry sectors, such as
ferrous and non-ferrous metallurgy, as the reducers in the metal-ceramic reactions, as
deoxidizers and desulphurizers, for improving the steel strength and forgeability, the
improvement of cast iron physical-mechanical properties; in nuclear engineering
when manufacturing the nuclear reactor control rods and the manufacturing of the
material for the rods; in electrical engineering and electronics as getters, emitters,
dielectrics, activators and semiconductor materials; in glass and ceramic industry for
glass colouration and ceramic production; in chemical industry for manufacturing
catalysts, lacquers and paints (Bazhin, 2018).
Nowadays, subsequent to the depletion of the mineral raw material reserves,
more complex and lean ores are drawn into the production process, as well as their
conversion products: slags, cakes, dust, etc., containing heavy and rare metals
(Pashkevich, 2016). The examples that are given below prove the necessity of
developing the technologies, including the complex use of technogenic wastes in
non-ferrous metallurgy, which are a major step for preserving the natural raw
material sources, as well as the decrease of impact on the environment. With respect
to the red muds processing, the receiving of rare-metal raw materials concentrates is
possible. The currently used pyrometallurgical technologies of germanium extraction
require large volumes of investments and power inputs (Shumilova, 2018). Besides,
the process is accompanied with the considerable quantity of effluent gas and dust.
In addition, the derived middling products are still processed by using the

160 MEET 2018
hydrometallurgical technologies. The applied hydrometallurgical technologies, based
on the sulphuric acid and hydrochloric acid solutions, do not possess selectivity
towards the target component recovery (Pashkevich, 2017). When processing the lean
raw materials, the consumption for the ballast oxides is high. And because a slag
generally has high-silicon content, during the acid break-down the difficult to filter
silica gels are formed that are sorbing the germanium.
The decrease in the risk of the raw materials dependence from the outside
suppliers and the ensuring of the metallurgical industry needs in individual rare-
earth metals, which means the development of the effective rare-earth metals
recovery and separation technology, applicable for lean rare-metal raw materials
processing, is topical, and the realization of current project will facilitate this
(Alekseenko, 2017).
The scientific project is directed to solving the actual and significant problem of
the target component recovery from heterogeneous systems and efficiency increase,
as well as the obtaining the rare-metal products, including individual products. The
formulated problem can be solved by combining the experimental data on the rare-
earth metals thermodynamic quantities and the dependencies of the rare-earth
metals distribution and separation ratios during the recovery when varying the
solution рН value and anion nature. The method of ion flotation should ensure the
more effective rare-earth metals recovery and the separation of the similar, in terms
of chemical and physical properties, components at the expense of using the
surfactants.
11.2. Methodology
According to data by foreign researchers an increase of effectiveness in current
technologies at the expense of accompanying extraction of valuable components
from production wastes is possible due to ion flotation methods in mining industry.
Thereby their toxicity level will be decreased as well as the risk of damaging the
environment. A.V. Vershkov proposes the use of ion flotation for rare-earth metals
removal from apatite sulphuric acid processing products by different types of anion
surfactants. The possibility of rare-earth metals removal from hemihydrate
phosphogypsum by ion flotation by using dialkylphosphoric acid was established.

Removal and separation of lanthanides… 161
When manufacturing phosphate fertilizers the involvement of ion flotation process
for accompanying rare-earth metals reduction from phosphate nitric-acid processing
products with the subsequent regeneration of collector agent is proposed
(Alexandrova, 2016). As opposed to extraction methods, ion flotation permits
preventing the formation of voluminous sediments, rare-earth metals loss and usage
of expensive extractants.
During ion flotation no high REM separation coefficients are observed, therefore
studying of chloride ions and aqueous phase acidity impact on these values is of
interest.
The ion flotation process was conducted on the make 137 В-ФЛ laboratory
flotation machine with the cell volume of 1 dm3 for 5 minutes.
Fig. 1. Flotation machine 137 В-ФЛ
Rys. 1. Maszyna flotacyjna 137 В-ФЛ
Source: own study.
The 0.001 mol/l solutions of chemically pure grade yttrium and ytterbium nitrates
were used as model test solutions. Volume of the solution is 200 ml. Dry sodium
dodecyl sulphate with general formula of С12Н25OSO3Na, combining the properties of
foaming and collecting agents, was used as surfactant, which concentration
corresponds with stoichiometry of the following reaction:
3
3 )DS(MeDS3Me (1)
where:
i.e. is 0.003 M,
DS- - dodecyl sulphate ions.
162 MEET 2018
Sodium chloride was added to the initial solution in the amount corresponding
with the concentration of 0.01 and 0.05 mol/l. The obtained froth pulp and flotation
tail were separated and studied. The froth was destroyed by the effect of
1 M sulphuric acid. REM concentration was determined by photometric method with
arsenazo III, chloride ions concentration – by mercurimetric titration with mixed
indicator (diphenylcarbazide alcohol liquid 0.5 % by wt, and bromphenol blue 0.05 %
by wt), dodecyl sulphate ion concentration – by potentiometric titration with 0.002 M
cetyltrimethylammonium chloride solution with ion-selective electrode, consisting of
silver-chloride-ЭВЛ-1МЗ, put into NaDS and NaCl solution, and a membrane,
selective to DS- ion (Chirkst, 2009).
Fig. 2. Spectrophotometer КФК-3КМ
Rys. 2. Spektrofotometr КФК-3КМ
Source: own study.
The membrane is made in the ionometry laboratory of the SPbU physical
chemistry department. рН of solution varied from 4 to 9 with 0.5 step and fixed by
the nitric acid solution or sodium hydroxide.
11.3. Research results
Distribution coefficients of metal cations between the froth pulp and flotation tail
was calculated by the [Me3+] ratio in the froth pulp and [Me3+] concentration in the
flotation tail according to the formula:
aq
org
C
CD (2)
and separation coefficients:
2
1
2
1
Me
Me
MeMe
D
DK (3)

Removal and separation of lanthanides… 163
In Tables 1, 2 the calculated values of distribution coefficients between the froth
pulp and flotation tail for ion flotation for yttrium and ytterbium cations are
specified (Chirkst, 2011).
Table 1
Yttrium distribution coefficients at different pH values of solutions
and chloride concentrations
pH D pH D pH D
CNaCl = 0 M CNaCl = 0,01 M CNaCl = 0,05 M
2,99 8,96 3,92 3,41 5,17 3,08
3,65 8,41 4,50 4,58 6,40 3,10
4,10 9,41 5,13 4,28 7,03 9,42
4,59 11,17 6,03 3,81 7,40 7,23
5,10 12,57 6,72 3,87 7,87 4,47
6,12 30,46 7,41 279,34 8,53 1,13
6,67 264,48 7,80 379,49
6,95 855,64 8,11 50,60
7,99 736,18 8,50 8,39
8,97 3,12
Source: own study.
Table 2
Ytterbium distribution coefficients at different pH values of solutions
and chloride concentrations
pH D pH D pH D
CNaCl = 0 M CNaCl = 0,01 M CNaCl = 0,05 M
5,03 9,51 5,86 3,10 6,02 1,88
5,50 9,22 6,30 7,31 6,33 2,84
6,00 13,77 6,85 20,76 6,71 12,44
6,40 95,42 7,36 48,35 7,47 1,36
7,06 281,39 7,85 7,63 7,83 0,52
7,38 365,37 8,57 4,00 8,20 0,53
8,30 403,74 8,40 0,61
9,10 318,41 8,85 0,70
Source: own study.
During the yttrium (III) cations flotation in acidic medium at the NaCl
concentration of 0.01 M in the range of рН < 6.7 there's almost no removal. Surge in

164 MEET 2018
Кdistr is observed at рН 6.7. Maximum Кdistr is 379 at рН 7.8, and in the nitrate
medium – 856 at рН 6.95. Chloride ions suppress the removal of yttrium (III) cations
to froth and shifts the рН of maximum removal towards higher values range from
6.95 in nitrate medium to 7.8 at NaCl concentration of 0.01 M. With sodium chloride
concentration increase up to 0.05 M the yttrium (III) cations removal from the
aqueous phase to froth dropped significantly. In the range of рН 4.0-9.0 the Кdistr not
to exceed 10. рН of the maximum removal at the chloride concentration of 0.05 M
will shift slightly to the higher values range from 6.9 in nitrate medium to 7.0.
Ytterbium (III) cations removal at the NaCl concentration of 0.01 M starts at рН
5.9 and reaches its maximum of 48 at рН 7.4. Maximum Кdistr at chloride ions
concentration of 0.05 M is 12 at рН 6.7. In the рН range from 4 to 6 and from 7.5 to 9
there is almost no removal.
Yttrium removal at the absence of chloride ions at the maximum removal рН 6.9
is in a form of 2DSYOH , and at the concentration of chlorides of 0.01 M – in a form
of 3)(OHY , because the рНhydr and pHcompl are 7.2 and 6.3 respectively. At the
maximum removal рН 7.0 at the chloride ions concentration of 0.05 M the
DS)OH(Y 2 go into the froth, because рНcompl Me(OH)2+ equals 7.0, and pHhydr is 7.2.
Ytterbium (III) hydroxododecyl sulphates 2DSYbOH up to the рНcompl Me(OH)2+
of 6.3, ytterbium (III) dihydroxododecyl sulphates DS)OH(Yb 2 in the pH range from
рНcompl Me(OH)2+ 6.3 to pHhydr 6.6 and ytterbium (III) hydroxides at рН > pHhydr 6.6 go
into the froth. In the area of maximum removal рН 6.7 ytterbium (III) goes into the
froth in the form of 3)OH(Yb , because рНhydr equals 6.6. The start of removal рН 6.0
is in the range of рНcompl MeOH2+ 5.8 and рНcompl Me(OH)2+ 6.3, therefore Yb3+ is
recovered in a form of 2DSYbOH .
The impact of chloride ions on distribution coefficient is explained by comparing
the instability constants of chloro- and hydroxocomplexes (see table 3).
naq
0
298f
3
aq
0
298f
2
aq
0
298f KlnTRClGMeGMeClG (4)
By expressing the instability constant from the equation, we received the
following:
TR
G
n
0298compl
eK
(5)

Removal and separation of lanthanides… 165
Gibbs energies of chlorocomplexes and lanthanides cations formation in aqueous
solution were accepted according to the data base. Instability constants of
hydroxocomplexes were accepted according to data (Data base TKB).
When adding chlorides, lanthanides are partly fixed in chlorocomplexes, which
are not flotative. A decrease in hydroxocomplexes part results in flotation
suppression and shifting the maximum removal to the range of higher рН values.
As a result, the conditions for yttrium and ytterbium separation are created (Chirkst,
2010).
Table 3
Instability constants of yttrium and ytterbium hydroxo- and chlorocomplexes
Compound Kn
0
298Gcompl ,
kJ/mol
Compound Kn
0
298Gcompl ,
kJ/mol
YCl2+ 0,054 7,22 Y(OH)2+ 1,56108 44,56
YbCl2+ 0,110 5,46 Yb(OH)2+ 4,99109 47,39
Source: own study.
Yttrium cations (III) are fixed in rigid chlorocomplex that is not flotative, therefore
the significant decrease of distribution coefficients is observed. In connection with
rather high value of chlorocomplex instability constant ytterbium (III) shows
a decrease of start of removal рН and maximum removal рН values at the increase of
chloride concentration.
Considering different stability of chloro- and hydroxocomplexes, a different shift
of removal рН and flotation suppression occurs, and consequentially the conditions
for yttrium and ytterbium separation arise (Chirkst, 2009). The stronger the
chlorocomplex and the weaker the hydroxocomplex, the more significant the shift
towards the higher removal рН values is.
Table 4
Separation coefficients of ytterbium and yttrium in the absence of chlorideion
pH КY/Yb
5,03 1,32
6,00 2,21
6,40 2,77
7,06 3,04
8,30 1,82
Source: own study.

166 MEET 2018
On the basis of yttrium and ytterbium Кdistr the calculation of separation
coefficients was done (tables 4, 5, 6) (Кsep) at the specified рН values depending on
the chloride ion concentration.
Table 5
Separation coefficients of ytterbium and yttrium at the chloride ion
concentration of 0.01 M
pH КY/Yb
5,86 1,23
6,85 0,19
7,36 5,78
7,85 49,73
8,57 2,10
Source: own study.
Table 6
Separation coefficients of ytterbium and yttrium at the chloride ion
concentration of 0.05 M
pH КY/Yb
6,33 1,09
6,71 0,76
7,47 5,30
7,83 8,62
8,40 1,86
Source: own study.
Maximum separation coefficient is observed at the chloride concentration of
0.01 M and equals 50 at рН 7.8. In the nitrate medium the Кsep is minimal and equals
3 at рН 7.0, and at the sodium chloride concentration of 0.05 M the Кsep equals 9 at
рН 7.8.
11.4. Conclusions
The set tasks can be accomplished by the combination of experimental data on
rare-earth metals thermodynamic quantities and the distribution coefficients and
separation coefficients during the ion flotation and extraction process as a function of
solution рН variation and anion nature. The declared methods should provide the
more effective rare-earth metals removal and separation of similar, in terms of

Removal and separation of lanthanides… 167
chemical and physical properties, components at the expense of surfactant,
characterized by low price and non-toxicity, as well as simplicity of processing.
The tests proved that chloride ions are not flotative. Therefore, the lower the
stability of chlorocomplexes and the higher the stability of hydroxocomplexes are,
the more effective the rare-earth metals removal by ion flotation is. This explains the
increase of Кdistr of samarium (III) at chloride concentration of 0.01 M compared to the
nitrate medium and the significant flotation suppression at 0.05 M of NaCl.
The model of ion flotation provides the removal of basic components by more
than 99 %, and by adding chlorides into the system it permits increasing the rare-
earth metals separation coefficients compared to the known analogues.
In the process of ytterbium ion flotation when adding chloride ions a trend for
decreasing the Кdistr and for shifting the maximum removal to the range of lower рН
values is observed. Кdistr for yttrium also decreases, and the maximum removal рН at
the chloride concentration of 0.01 M is shifted to the higher values range compared to
the nitrate medium.
Yttrium at maximum removal рН goes into the froth at chloride concentration of
0.01 M in the form of 3)(OHY , and at chloride ions concentration of 0.05 M it goes
into the froth in the form of DS)OH(Y 2. Ytterbium (III) hydroxides are recovered to
the froth at the maximum removal рН at NaCl concentration of 0.01 M, as pHhydr 6.6.
In the maximum removal рН range of 6.7 at the sodium chloride concentration of
0.5 М ytterbium (III) goes to the froth in the form of 3)OH(Yb .
The estimated results of the scientific research can be used in the analytical
chemistry scientific field for the separation of the similar, in terms of chemical and
physical properties, target components by flotation methods. The analysis of the
experimental data permits using the applied methods and techniques for the
development of new technology solutions and the creation of the subsequent
research and development models. In the longer term of the extended laboratory
studies conduction, the results of the scientific research will have the tremendous
significance for the development of the industry, expecting the possibility of the
research utilization when developing the effective methods of rare-earth elements
recovery from lean or technogenic raw materials (eudialyte concentrate). The
developed solutions correspond with the world level or research and promote the
ensuring of rare-earth raw materials base development. The processing of poor

168 MEET 2018
mineral raw materials will be cost-efficient at the expense of the capital costs
reduction.
Acknowledgements
The research was conducted in accordance with the grant by the President of the
Russian Federation for state support of young Russian scientists – candidates of
science on the project МК-14.Z56.17.424 "Intensification of rare-earth elements froth
concentration processes when processing the polycomponent industrial solutions".
Bibliography
1. Alekseenko, V.A., Pashkevich, M.A., Alekseenko, A.V. (2017). Metallisation and
environmental management of mining site soils. Journal of Geochemical
Exploration, 174, 121-127. doi: http://dx.doi.org/10.1016/j.gexplo.2016.06.010
2. Alexandrova, T.N. (2016). Key directions in processing carbonaceous rocks.
Journal of Mining Institute, 220, 568-572. doi: http://dx.doi.org/10.18454/pmi.
2016.4.568
3. Bazhin, V.Y., Aleksandrova, T.A., Kotova, E.L., Gorlenkov, D.V., Susorov,
R.S. (2018). Metallurgists of the mining university and development of monetary
industry. 245 years of history. Journal of Mining Institute, 230, 131-138.
doi: http://dx.doi.org/10.25515/pmi.2018.2.131
4. Chirkst, D.E., Lobacheva, O.L., Berlinskii, I.V. (2010). Gibbs energies of formation
of hydroxides of lanthanides and yttrium. Russian Journal of Physical Chemistry A,
84(12), 2047-2050. doi: http://dx.doi.org/10.1134/s003602441012006x
5. Chirkst, D.E., Lobacheva, O.L., Berlinskii, I.V., Dzhevaga, N.V. (2011). Effect of
chlorides on cerium(III) and samarium(III) ionic flotation. Russian Journal of
Applied Chemistry, 84(2), 341-344.
doi: http://dx.doi.org/10.1134/s1070427211020315
6. Chirkst, D.E., Lobacheva, O.L., Berlinskii, I.V., Sulimova, M.A. (2009). Recovery
and Separation of Ce3+ and Y3+ Ions from Aqueous Solutions by Ion Flotation.
Russian Journal of Applied Chemistry, 82(8), 1370-1374. doi: http://dx.doi.org/
10.1134/s1070427209080096
7. Chirkst, D.E., Lobacheva, O.L., Berlinskii, I.V., Sulimova, M.I. (2009). The
thermodynamic properties of hydroxo compounds and the mechanism of ion
flotation for cerium, europium, and yttrium. Russian Journal of Physical Chemistry
A, 83(12), 2022-2027. doi: http://dx.doi.org/10.1134/s0036024409120036
Removal and separation of lanthanides… 169
8. Data base TKB. Parameters and definitions // http://www.chem.msu.su
9. Pashkevich, M.A., Petrova, T.A. (2016). Creation of a system for industrial
environmental monitoring in hydrocarbon producing and transporting
companies of western siberia. Journal of Mining Institute, 221, 737-741. doi:
http://dx.doi.org/ 10.18454/pmi.2016.5.737
10. Pashkevich, M.A., Petrova, T.A. (2017). Technogenic impact of sulphide-
containing wastes produced by ore mining and processing at the Ozernoe
deposit: investigation and forecast. Journal of Ecological Engineering, 18(6), 127-133.
doi: http://dx.doi.org/10.12911/22998993/76700
11. Shumilova, L.V., Kostikova, O.S. (2018). Sulfidization of silver-polymetallic ores
of Goltsovoe deposit for decreasing loss of silver in mill tailings. Journal of Mining
Institute, 230, 160-166. doi: http://dx.doi.org/10.25515/PMI.2018.2.160
REMOVAL AND SEPARATION OF LANTHANIDES IN
POLYCOMPONENT SYSTEMS BY ION FLOTATION METHOD
Abstract
The technologies of the modern industry development require the growing
amount of new materials for their sustainable development. The rare-earth metals
(REM) play significant role in the metallurgy, glass, ceramic and many other industry
sectors. The rare-earth metals are divided into two subgroups: yttrium and cerium.
The innovative technologies are directed to the individualization of the rare-metal
products. The separated pure rare-earth metals possess the extrinsic value. Therefore,
the actual problem that the article addresses is the increase of the separation
effectiveness of similar, in terms of properties, rare-earth metals, permitting reducing
the individual rare-earth metals and their oxides cost, and expanding the possibilities
of their application. Purpose of the article is to offer methods for more effective
removal and separation of rare-earth metals. Methodology includes the analysis of
froth pulp and flotation tail by photometric method with arsenazo III, mercurimetric
titration with mixed indicator and potentiometric titration with 0.002 M
cetyltrimethylammonium chloride solution with ion-selective electrode. This
research was done in accordance with the project "Intensification of rare-earth
elements froth concentration processes when processing the polycomponent
industrial solutions". The realization of the results will promote the development of
mineral economics. The products (rare-earth raw materials) can be used in many
industry sectors, such as ferrous and non-ferrous metallurgy, as the reducers in the
metal-ceramic reactions, as deoxidizers and desulphurizers, for improving the steel
strength and forgeability, the improvement of cast iron physical-mechanical

170 MEET 2018
properties; in electrical engineering and electronics as getters, emitters, dielectrics,
activators and semiconductor materials; in glass and ceramic industry for glass
colouration and ceramic production; in chemical industry for manufacturing
catalysts, lacquers and paints. The scientific research is aimed at the solution of
topical and significant problem of optimization and increase of removal efficiency of
target component from heterogeneous systems, as well as obtaining the rare-earth
products, including individual.
Keywords: ion flotation, sodium dodecyl sulphate, distribution coefficient,
separation coefficient, removal.
USUNIĘCIE I ODDZIELENIE LANTANOWCÓW W UKŁADACH
WIELOKOMPONENTOWYCH DZIĘKI METODZIE FLOTACJI
JONÓW
Streszczenie
Technologie rozwoju współczesnego przemysłu wymagają coraz większej liczby
nowych materiałów, które zapewnią jego zrównoważony rozwój. Metale ziem
rzadkich odgrywają ważną rolę w metalurgii i przemyśle szklanym, ceramicznym
i wielu innych sektorach. Metale ziem rzadkich są podzielone na dwie podgrupy:
itr i cer. Innowacyjne technologie ukierunkowane są na działania w zakresie
indywidualizacji produktów metali ziem rzadkich. Wydzielone metale ziem
rzadkich w stanie czystym mają szczególną wartość. Tym samym, tematem tego
artykułu jest zwiększenie skuteczności wydzielania podobnych, jeżeli chodzi
o właściwości, metali ziem rzadkich, co pozwoli na ograniczenie kosztów
poszczególnych metali ziem rzadkich i ich tlenków i pozwoli zwiększyć możliwości
ich zastosowania. Celem artykułu jest zaoferowanie sposobu skuteczniejszego
usuwania i oddzielania metali ziem rzadkich. Metodologia obejmuje analizę miazgi
pianowej i ogona flotacyjnego metodą fotometryczną z odczynnikiem arsenazo III,
miareczkowanie merkurymetryczne z mieszanymi wskaźnikami oraz miareczkowa-
nie potencjometryczne z zastosowaniem roztworu chlorku cetrymonium 0,002 M
z elektrodą jonoselektywną. Badanie zostało przeprowadzone zgodnie z projektem
„Intensyfikacja procesów koncentracji piany metali ziem rzadkich podczas
przetwarzania przemysłowych roztworów wielokomponentowych”. Wdrożenie
wyników będzie promować rozwój gospodarki minerałami. Produkty (metale ziem
rzadkich) mogą być stosowane w wielu sektorach przemysłu, takich jak metalurgia
metali żelaznych i nieżelaznych, jako reduktory reakcji metal-ceramika, jako
odtleniacze i odsiarczacze, na potrzeby doskonalenia wytrzymałości stali i jej
kowalności, jako udoskonalenie fizyko-mechanicznych właściwości żeliwa;
w inżynierii elektrycznej i elektronice jako gettery, emitery, dielektryki, aktywatory

Removal and separation of lanthanides… 171
i materiały półprzewodnikowe; w branży szklanej i ceramicznej na potrzeby
barwienia szkła i produkcji ceramiki; w branży chemicznej na potrzeby produkcji
katalizatorów, lakierów i farb. Badanie naukowe ma na celu rozwiązanie znaczącego
problemu optymalizacji i zwiększenie skuteczności usuwania elementu docelowego
z układu heterogenicznego oraz pozyskiwanie produktów metali ziem rzadkich,
w tym indywidualnych.
Słowa kluczowe: Flotacja jonowa, dodecylosiarczan sodu, współczynnik podziału,
współczynnik separacji, usuwanie.


Ryszard SNOPKOWSKI1, Marta SUKIENNIK2, Aneta NAPIERAJ3 1AGH University of Science and Technology, Poland (e-mail: [email protected]) 2AGH University of Science and Technology, Poland (e-mail: [email protected]) 3AGH University of Science and Technology, Poland
(e-mail: [email protected])
12. MINING OUTPUT STREAM RATE IN THE FUNCTION OF
PROBABILITY – CALCULATIONS SCHEME FOR
BIDIRECTIONAL SHEARER CUTTING
12.1. Introduction
The production cycle, carried out at the longwall faces of hard coal mines, is of
particular importance from the point of view of the effectiveness of the extraction
process due to the fact that when analysing its course, unnecessary interruptions are
eliminated, which results in decreasing its duration and improvement of its
efficiency. These issues have been discussed, for example, by: (Brzychczy et al., 2014;
Kęsek, 2017; Kopacz et al., 2018; Krauze, 2010; Magda, 2011; Snopkowski et al., 2016;
Snopkowski et al., 2015; Snopkowski and Napieraj 2012; Snopkowski, 2012;
Snopkowski and Sukiennik, 2012; Snopkowski and Sukiennik, 2013; Snopkowski,
2009; Sukiennik andNapieraj, 2015).
The effectiveness of the production cycle, as proposed by the authors of the
paper, can be measured by the rate of the mining output stream. The method of its
determination is presented in (Snopkowski et al., 2017).
In this paper, an attempt was made to determine this index, assuming that its
nature would be undetermined. This will make enable the assessment of the level of
this index (in fact, the stream of mining output from a longwall) in the function of
probability. As a result, it will be possible to assess the efficiency of the production
process, what was the purpose of this paper.

174 MEET 2018
This is possible with the assumption of some parameters of the production cycle
(those that show variability) in the form of random variables.
The calculation of the index in the function of probability was preceded by the
following derivation of the formula for the calculation of this index in its determined
version, as the formula is applied in further calculations.
Figure 1 presents a diagram of the production cycle in bidirectional longwall
shearer cutting technology.
Fig. 1. Diagram of the production cycle for the bidirectional shearer cutting technology
Rys. 1. Schemat cyklu produkcyjnego w przypadku technologii dwukierunkowego cięcia
kombajnem
Source: (Snopkowski and Napieraj, 2012).
The following designations are used in the figure:
𝐿 – longwall length [m],
𝑇𝑐 – production cycle duration [min],
𝑡1, 𝑡2, … , 𝑡6 – durations of individual production cycle elements [min],
𝑑𝑘 – shearer length [m],
𝑥1, 𝑥2, 𝑥3 – mutual distances of performed activities and operations within the
shearer-support-conveyor system [m],
𝑥𝑝 – distance from the shearer stop position to the junction between the longwall
and the gate road [m].

Mining output stream rate… 175
The vertical axis represents the length of the longwall, while the horizontal axis
represents the units of time. In accordance with the adopted technology, mining with
a shearer is carried out to full height in both directions.
The scheme takes into account all activities and operations comprising coal
cutting along the entire longwall to the depth of one web cut, the drives of the
armoured face conveyor are in the perpendicular layout (recesses are not made).
The output stream rate 𝜑2𝑘 was determined using formula 1:
𝜑2𝑘 =𝑊𝑐
𝑇𝑐 (1)
where:
𝜑2𝑘 – output stream rate index in the bidirectional shearer cutting technology
[Mg/min];
𝑊𝑐 – the output from the production cycle is determined using formula (2):
𝑊𝑐 = 𝐻 ∙ 𝑧 ∙ 𝐿 ∙ 𝛾 ∙ 𝜌 (2)
where:
H – longwall height [m],
z – shearer web [m],
L – longwall length [m],
γ – bulk density of coal [Mg/m3],
𝜌 – web use index [-].
After appropriate substitutions, the formula determining the mining output
stream rate index in the bidirectional shearer cutting technology takes the following
form (3):
𝜑2𝑘 =𝐻 ∙ 𝑧 ∙ 𝐿 ∙ 𝛾 ∙ 𝜌
1𝑉𝑐𝑧
(𝑥𝑝 − 𝑑𝑘) +1𝑉𝑟∙ (𝐿 − 𝑥𝑝) + (
1𝑉𝑧+1𝑉𝑟) ∙ (𝑥2 + 𝑑𝑘 + 𝑝 + 𝑠) + 𝑡2 + 𝑡5
(3)
A more detailed description of the quantities included in formula (3) – due to the
volume limitations of this paper they are not included here – can be found in the
paper (Snopkowski, 2009).

176 MEET 2018
12.2. Mining output stream rate in the function of probability –
specification of random variables
The course of the production process carried out at a hard coal longwall face,
depends on a number of factors. They can be divided into two groups:
geological/mining conditions and technical/organisational conditions (Napieraj, 2012;
Sukiennik, 2012; Sukiennik and Napieraj, 2015).
The geological/mining conditions include, among others:
roof type,
floor type,
coal cuttability,
seam thickness and inclination,
natural hazards.
The technical/organisational conditions, which have a significant impact on the
production process, include:
mechanisation system,
technical specifications of the machines,
equipment failure rate,
the organisation of the production cycle, which includes the form of
organisation of works, the form of organisation of labour, working system,
training and experience of the employees.
It can be noted that the shearer advancement speed as well as, for example, the
time devoted to works at the ends of the longwall - due to the influence of the above
mentioned factors - can be treated as random variables, as they are variable and
cannot be predicted in advance (they show variability in each production cycle).
In the calculation example, which was later included in the paper, these values
were assumed to be random variables, which at the same time does not exclude the
possibility of carrying out these calculations for other random variables. It should
also be noted that for another set of random variables, the calculation scheme will not
change and will remain as presented below.
Determined data, assumed in the calculation example, have the following values
and designations:
𝐿 – longwall length 25 [m],
H – longwall height 3 [m],

Mining output stream rate… 177
z – web depth 0.6 [m],
γ – bulk density of coal 1.3 [Mg/m3],
ρ – web use index 1 [-],
𝑥𝑝 – distance from the shearer stop position to the junction between the longwall
and the gate road 25 [m]
𝑑𝑘 – shearer length 12 [m]
𝑥2 – distance of the advancing conveyor from the supports 10 [m]
𝑝 – minimum distance of the advancing conveyor from the shearer 10 [m]
𝑠 – distance of the advancing roof supports from the shearer 9 [m]
The random variables used in the calculation example are the shearer
advancement speed and the drive and boot end movement times. The designations
and functions adopted for these variables are as follows:
𝑉𝑐𝑧 – shearer maneuvering speed (shearer speed when clearing the shearer route)
[m/min],
𝑉𝑟 – shearer working speed [m/min],
𝑉𝑧 – shearer working speed when cutting [m/min],
𝑡2 – boot end movement time [min],
𝑡5 – drive movement time [min].
The shearer manoeuvring speed 𝑉𝑐𝑧 is given with gamma distribution and the
parameter of: 𝛼 = 28; β = 1 with the analytical expression of: 𝑓(𝑥) =1
Γ(28)∙ x27 ∙ e−x and
presented in Figure 2.
Fig. 2. Distribution of the function describing the shearer manoeuvring speed Vcz
Rys. 2. Rozkład funkcji opisującej prędkość manewrową kombajnu Vcz
0
0,01
0,02
0,03
0,04
0,05
0,06
0,07
0,08
0,09
0 10 20 30 40 50
Distribution of the function Vcz

178 MEET 2018
Source: self-reported data.
The shearer working speed 𝑉𝑟 is given with gamma distribution and the
parameter of: 𝛼 = 13; β = 1 with the analytical expression of:𝑓(𝑥) =1
Γ(13)∙ x12 ∙ e−x and
presented in Figure 3.
Fig. 3. Distribution of the function describing the shearer working speed Vr
Rys. 3. Rozkład funkcji opisującej prędkość roboczą kombajnu Vcz
Source: self-reported data.
The shearer working speed when cutting 𝑉𝑧 is given with gamma distribution and
the parameter of: 𝛼 = 6; β = 1 with the analytical expression of: 𝑓(𝑥) =1
Γ(6)∙ x5 ∙
e−x and presented in Figure 4.
Fig. 4. Distribution of the function describing the shearer working speed when cutting Vz
Rys. 4. Rozkład funkcji opisującej prędkość roboczą podczas cięcia Vz
Source: self-reported data.
0
0,02
0,04
0,06
0,08
0,1
0,12
0,14
0 10 20 30 40 50
Distribution of the function Vr
0
0,02
0,04
0,06
0,08
0,1
0,12
0,14
0,16
0,18
0,2
0 10 20 30 40 50
Distribution of the function Vz

Mining output stream rate… 179
The boot end movement time 𝑡2 is given with gamma distribution and the
parameter of: 𝛼 = 15; β = 1 with the analytical expression of: 𝑓(𝑥) =1
Γ(15)∙ x14 ∙ e−x and
presented in Figure 5.
Fig. 5. Distribution of the function describing the boot end movement time T2
Rys. 5. Rozkład funkcji opisującej czas ruchu systemu ścianowego T2
Source: self-reported data.
The drive movement time 𝑡5 is given with gamma distribution and the parameter
of: 𝛼 = 11; β = 1 with the analytical expression of:𝑓(𝑥) =1
Γ(11)∙ x10 ∙ e−x and presented
in Figure 6.
Fig. 6. Distribution of the function describing the drive movement time t5
Rys. 6. Rozkład funkcji opisującej czas ruchu napędu t5
Source: self-reported data.
0
0,02
0,04
0,06
0,08
0,1
0,12
0 10 20 30 40 50
Distribution of the function T2
0
0,02
0,04
0,06
0,08
0,1
0,12
0,14
0 10 20 30 40 50
Distribution of the function t5

180 MEET 2018
12.3. Mining output stream rate in the function of probability –
calculations scheme
The calculation scheme to be used to determine the mining output stream rate in
the function of probability involves several stages:
Stage I: Stochastic simulation of the 𝜑2𝑘 index for the adopted random variables.
Stage II: Determination of the empirical probability distribution of the 𝜑2𝑘 index.
Stage III: Determination of the empirical distribution function of the 𝜑2𝑘 index.
Stage IV: Practical application of the mining output stream rate index 𝜑2𝑘 in the
function of probability.
Stage I:
Figure 7 presents a scheme for the calculation of the output stream rate index in
the bidirectional shearer cutting technology.
The calculations use the stochastic simulation method described in the paper by
[14], among others. The method consists in iterative (n-fold) generation of values
(realisations) of random variables, described by functions f(Vcz), f(Vr), f(Vz), f(t2)
and f(t5), their substitution to equation (3) and calculation of the value of the φ2k.
index.
Generating values (realisations) of random variables is done using the
distribution function reversal method (Snopkowski, 2007).
As a result of the calculations, a set of values {2𝑘1 ;
2𝑘2 ; … ;
2𝑘𝑛 } for the output
stream rate index in the bidirectional shearer cutting technology is obtained.

Mining output stream rate… 181
Fig. 7. Calculation scheme for the output stream rate index in the bidirectional shearer
cutting technology
Rys. 7. Schemat obliczania stopy indeksu strumienia wyjściowego w technologii
dwukierunkowego cięcia kombajnem
Source: self-reported data.
Start
i = 1
Generation of Vcz acc. density funct. (Vcz)
Generation of Vr acc. density funct. f(Vr)
𝜑2𝑘 =𝐻 ∙ 𝑧 ∙ 𝐿 ∙ 𝛾 ∙ 𝜌
1𝑉𝑐𝑧
(𝑥𝑝 − 𝑑𝑘) +1𝑉𝑟∙ (𝐿 − 𝑥𝑝) + (
1𝑉𝑧+
1𝑉𝑟) ∙ (𝑥2 + 𝑑𝑘 + 𝑝 + 𝑠) + 𝑡2 + 𝑡5
i = n
{𝜑2𝑘1 ;𝜑2𝑘
2 ; … ;𝜑2𝑘𝑛 }
i = i + 1
Stop
Generation of Vz acc. density funct. f(Vz)
Generation of t2 acc. density funct. f(t2)
Generation of t5 acc. density funct. f(t5)

182 MEET 2018
Stage II:
On the basis of the set {2𝑘1 ;
2𝑘2 ; … ;
2𝑘𝑛 } of the recorded values of the 𝜑2𝑘 index,
a histogram is created, which in the tabular form contains the ranges of values of the
indicator and the corresponding absolute numbers.
Dividing the absolute numbers by the total number of iterations, equal to "n",
provides the values of the empirical probability distribution of the 𝜑2𝑘 index, which
are presented in graphic form in Figure 8.
Fig. 8. Empirical probability distribution of the output stream rate index 𝜑2𝑘
Rys. 8. Empiryczny rozkład prawdopodobieństwa stopy indeksu strumienia
wyjściowego𝜑2𝑘
Source: self-reported data.
Stage III:
The next step is to determine the empirical value of the distribution function of
the output stream rate index 𝜑2𝑘.
For this purpose, the values of the empirical probability distribution must be
added. The addition should be carried out for the values - on the X-axis - starting
from zero, up to the maximum value of the 𝜑2𝑘 index.
The left-hand boundary of the empirical distribution function is of course zero,
while the right-hand boundary is the value of "1".
The empirical distribution function of the output stream rate index 𝜑2𝑘 obtained
in this way is depicted in Figure 9.
0
0,005
0,01
0,015
0,02
0,025
0,03
0,035
0,04
4,5
5
5,2
8
6,0
0
6,7
2
7,4
5
8,1
7
8,8
9
9,6
1
10
,34
11
,06
11
,78
12
,51
13
,23
13
,95
14
,67
15
,40
16
,12
16
,84
17
,57
18
,29
mo
re

Mining output stream rate… 183
Fig. 9. Empirical distribution function of the output stream rate index
Rys. 9. Empiryczna funkcja rozkładu stopy indeksu strumienia wyjściowego
Source: self-reported data.
Stage IV:
Determination of the empirical probability distribution for the output stream rate
index φ2k (stage II of the calculations) and the empirical distribution function of the
index φ2k (stage III of the calculations) enables the assessment evaluation of the
effectiveness of the production cycle (in fact, the assessment of the mining output
stream rate) in the function of probability.
Question examples:
1. What is the probability that the output stream rate will not exceed
7 [Mg/min]?
In order to answer this question, the empirical value of the distribution function
at the point equal to 7 should be determined, i.e.
P ( φ2k< 7 [Mg/min] ) = F(7) = 0.0105
It can be noted that the calculated probability is very low, so the chance that the
output stream rate for this longwall face will not exceed 7 [Mg/min] is very low.
2. What is the probability that the output stream rate will be between 5 and 15
[Mg/min]?
In order to answer this question, the difference of the empirical values of the
distribution function at the point equal to 15 and 5 should be determined, i.e.
P ( 5 <φ2k< 15 ) = F(15) - F(5) = 0.9921 - 0.0003 = 0.9918
The calculated probability is very high.
0
0,2
0,4
0,6
0,8
1
1,2
4,5
5
5,1
3
5,7
1
6,2
9
6,8
7
7,4
5
8,0
2
8,6
0
9,1
8
9,7
6
10
,34
10
,92
11
,49
12
,07
12
,65
13
,23
13
,81
14
,39
14
,96
15
,54
16
,12
16
,70
17
,28
17
,86
18
,43
mo
re

184 MEET 2018
12.4. Conclusions
If the impact of geological/mining and technical/organisational conditions on the
production cycle at the longwall face is so significant that it results, for example, in
a variable (unstable) shearer advancement speed, then the assessment of the
effectiveness of such a production process (made, for example, by evaluating the
output stream generated in it) should take into account its unstable (undetermined)
character.
This paper proposes the use of the mining output stream rate index φ2k in the
function of probability for this purpose.
The article provides a detailed scheme for the calculations that should be made in
order to obtain a characteristic of the φ2k index.
The calculation scheme has been divided into four stages:
Stage I: Stochastic simulation of the 𝜑2𝑘 index for the adopted random variables.
Stage II: Determination of the empirical probability distribution of the 𝜑2𝑘 index.
Stage III: Determination of the empirical distribution function of the 𝜑2𝑘 index.
Stage IV: Practical application of the mining output stream rate index 𝜑2𝑘 in the
function of probability.
The last stage is also an interpretation of the obtained results, presenting some
practical possibilities of their application. The source data for this interpretation are
the empirical probability distribution and the empirical distribution function, the
determination of which for the 𝜑2𝑘 index is described in detail in this paper.
The 𝜑2𝑘 index proposed in this paper, together with the method of its
determination, may be useful in mining practice to assess the effectiveness of the
production cycle carried out in the longwall face, with the use of bidirectional
shearer cutting technology.
Acknowledgments
This paper was supported by AGH University of Science and Technology
[no. 11.11.100.693].

Mining output stream rate… 185
Bibliography
1. Brzychczy, E., Kęsek, M., Napieraj, A., Sukiennik, M. (2014). The Use Of Fuzzy
Systems In The Designing Of Mining Process In Hard Coal Mines. Archives of
Mining Sciences, 59 (3), 741-760.
2. Kęsek, M., (2017). Visual Basic as a Tool for Monitoring and Analyzing Machines.
Inżynieria Mineralna-Journal of The Polish Mineral Engineering Society, 2, 195-200.
3. Kopacz, M., Sobczyk, E., Galica, D. (2018). The Impact Of Variability And
Correlation Of Selected Geological Parameters On The Economic Assessment Of
Bituminous Coal Deposits With Use Of Non Parametric Bootstrap And Copula-
Based Monte Carlo Simulation. Resources Policy, 55, 171-183,
DOI: 10.1016/j.resourpol.2017.11.015.
4. Krauze, K. (2010). Model-Based Estimation Of Daily Production Output For
Various Technologies Of The Longwall Operation. Archives Of Mining Sciences,
55 (4), 891-906.
5. Magda, R. (2011). Modelling the mine production process in terms of planning
the output volume with regard to the aspects of uncertainty and risk. Gospodarka
Surowcami Mineralnymi-Mineral Resources Management, 27 (4), 45-57.
6. Napieraj, A., (2012). Metoda probabilistycznego modelowania czasu trwania
czynności cyklu produkcyjnego realizowanego w przodkach ścianowych kopalń
węgla kamiennego (The method of probabilistic modelling for the time
operations during the productive cycle in longwalls of the coal mine),
Wydawnictwa AGH: Kraków.
7. Snopkowski, R., Napieraj, A., Sukiennik, M. (2017). Examples of using the
intensity indicator of winning stream for various longwall shearer-based mining
technologies. Zeszyty Naukowe Politechniki Śląskiej, seeria: Organizacja i Zarządzanie,
3rd International Scientific Conference MEET 2017 (Management, Economics,
Ethics, Technics).
8. Snopkowski, R., Napieraj, A., Sukiennik, M. (2016). Method Of The Assessment
Of The Influence Of Longwall Effective Working Time Onto Obtained Mining
Output. Archives Of Mining Sciences, 61 (4), 967-977.
9. Snopkowski, R., Napieraj, A., Sukiennik, M. (2015). Wybrane aspekty ryzyka
w procesie produkcyjnym realizowanym w przodkach ścianowych kopalń węgla
kamiennego (Selected aspects of risk in the production process in longwall fronts
in coal mines). Przegląd Górniczy, 71 (8), 86-89.

186 MEET 2018
10. Snopkowski, R., Napieraj, A. (2012). Method of the production cycle duration
time modeling within hard coal longwall faces. Archives of Mining Sciences, 57 (1).
11. Snopkowski, R., (2012). Stochastyczne metody analizy procesu produkcyjnego
realizowanego w przodkach ścianowych kopalń węgla kamiennego.
Wydawnictwo AGH: Kraków.
12. Snopkowski R., Sukiennik, M. (2013). Longwall Face Crew Selection With
Respect To Stochastic Character Of The Production Process - Part 2-Calculation
Example. Archives Of Mining Sciences, 58 (1), 227-240.
13. Snopkowski, R., Sukiennik, M. (2012). Selection Of The Longwall Face Crew With
Respect To Stochastic Character Of The Production Process - Part 1-Procedural
Description. Archives Of Mining Sciences, 57 (4), 1071-1088.
14. Snopkowski, R., (2007). Symulacja stochastyczna. Wydawnictwo AGH: Kraków.
15. Snopkowski, R. (2009). Stochastic model of the longwall face excavation using
two-way shearer mining technology. Archives of Mining Sciences, 54.
16. Sukiennik, M. (2012). Metoda wyznaczania obsady w przodkach ścianowych
kopalń węgla kamiennego z uwzględnieniem stochastycznego charakteru
procesu produkcyjnego (The method to determine a longwall face staff in coal
mines considering the stochastic nature of the production process)
Wydawnictwo AGH: Kraków.
17. Sukiennik, M., Napieraj, A. (2015). Ocena ryzyka w procesie produkcyjnym
realizowanym w przodku ścianowym kopalń węgla kamiennego (Evaluation of
the risk in production process within hard coal longwall faces). Zeszyty Naukowe
Uniwersytetu Szczecińskiego, 855.
18. Sukiennik, M., Napieraj, A. (2015). Proces produkcyjny realizowany w przod-
kach ścianowych kopalń węgla kamiennego w Polsce w ujęciu logistycznym.
Logistyka, 4.
MINING OUTPUT STREAM RATE IN THE FUNCTION OF
PROBABILITY – CALCULATIONS SCHEME FOR BIDIRECTIONAL
SHEARER CUTTING
Abstract
This paper proposes the use of the mining output stream rate index in the
function of probability. This will allow an evaluation of the level of this index in the
function of probability. This is possible with the assumption of some parameters of

Mining output stream rate… 187
the production cycle (those that show variability) in the form of random variables.
The purpose of this article is to show that the assessment of the efficiency of the
production cycle can be done using the mining output stream rate index. The article
provides a detailed scheme for the calculations that should be made in order to
obtain such a characteristic of this index. The calculation scheme was divided into
four stages: stochastic simulation of the index for the assumed random variables,
determination of the empirical probability distribution of the index, determination of
the empirical distribution function of the index, practical use of the output stream
rate index in the function of probability.
Keywords: output stream rate, longwall production faces, production process
efficiency, mineral extraction.
WSPÓŁCZYNNIK WYDOBYCIA W FUNKCJI
PRAWDOPODOBIEŃSTWA – SCHEMAT KALKULACYJNY DLA
DWUKIERUNKOWEGO ŚCINANIA
Streszczenie
Artykuł proponuje zastosowanie wskaźnika współczynnika wydobycia w funkcji
prawdopodobieństwa. Pozwoli to na ocenę poziomu tego wskaźnika w funkcji
prawdopodobieństwa. Jest to możliwe dzięki założeniu kilku parametrów cyklu
produkcji (te, które wykazują zmienność) w formie dowolnych zmiennych. Celem
niniejszego artykułu jest wykazanie, że ocena skuteczności cyklu produkcji może
mieć miejsce z zastosowaniem wskaźnika współczynnika wydobycia. Artykuł
przedstawia szczegółowy schemat obliczeń, których można dokonać, by uzyskać
takie cechy tego wskaźnika. Schemat obliczeń został podzielony na cztery etapy:
stochastyczna symulacja wskaźnika dla zakładanych dowolnych zmiennych,
określenie empirycznego rozkładu prawdopodobieństwa wskaźnika, określenie
funkcji rozkładu empirycznego wskaźnika, praktyczne zastosowanie wyjściowego
wskaźnika współczynnika wydobycia w funkcji prawdopodobieństwa.
Słowa kluczowe: Współczynnik wydobycia, produkcja wyrobiska ścianowego,
skuteczność procesu produkcji, wydobycie minerałów.


Barbora FRANKOVÁ1, Vojtěch MEIER2 1Technical University of Ostrava, Czech Republic (e-mail: [email protected]) 2Technical University of Ostrava, Czech Republic (e-mail: [email protected])
13. THEORY OF INVENTORY MANAGEMENT WITH A VIEW OF
STOCHASTIC MODELS
13.1. Inventory
All types of companies, both Czech and foreign, are struggling with the problem
of the amount of inventory in stock for both raw materials and goods or products. It
can be said that the supplier is unable to meet the demand immediately if he does not
have enough inventory in stock (Winston 2004). Many authors are concerned with
various inventory optimization models. The basic inventory management models are
deterministic, but they are a decision-making model behind certainty that does not
consider the variable consumption over time (Polanecký, 2018). Deterministic models
are no longer used today.
Many companies have a variable consumption over time and they do not know
predict consumption in the future. Therefore, we will deal with stochastic models
dealing with risk-taking in this article, so consumption is counted as a random
variable. The aim of the article is therefore to optimize inventories using stochastic
models.
The main question is why company must manage its inventory? How does it
manage? Inventory must manage because they take your many. If company does not
manage inventory, it cannot meet the demand of its customers. The result may be
a lack of money but a surplus of materials in stock.

190 MEET 2018
13.2. Stochastic models for inventory optimization
If the company does not use inventory management, it may encounter several
problems. The first of them is the obsolescence of the stored products. A lot of raw
material on stock after a certain storage period they become unusable. The second
one is the financial problems. The amount of inventories and the ways in which they
are managed have a direct impact on business profitability and the need for available
financial resources. This is due to the fact that inventory is tied to company capital.
If those units are stored for a long time in the company, the capital that they
represent cannot be used or invested somewhere else. The third issue is the cost
related to the holding inventories, which includes the handling costs, the building
space for inventory. These issues should be solved through efficient inventory
management that matches a particular company (Baglin et al., 2001).
This model, otherwise known as the Miller-Ori model is based on the assumption
that the state of the current assets (inventory, cash) in the enterprise changes over
time. Against the deterministic models where demand-type variables, consumption,
acquisition time were known and constant (determined). In practice we usually
encounter stochastic models where the values of these variables are random and only
to some extent predictable (Malliaris and Brock, 1982).
Which is a more realistic approach than deterministic models. Stochastic models
can be seen as a regulatory tool for optimizing inventory in the company. These
models work with demand forecast based on previous periods. Two quantities are
used to control inventory, which is the quantity ordered and the length of the
ordering interval. Stochastic models differ from deterministic models by demand,
which is expressed by a random variable with probability distribution. The most
common assumption is the normal distribution with mean value and standard
deviation (Bartmann, 1992). There are two basic systems for stochastic models
(Bartmann, 1992), namely Q system and P system.
13.2.1. Q system
Model has a constant delivery quantity. To accomplish such a task, it is necessary
to determine the probability distribution of random demand over a period and also
to estimate its median and the standard deviation. The commonly used probability
source is data on past demand for a sufficiently long past period. It is a convenient

Theory of inventory management… 191
solution to categorize data of demand by intervals by days into a table divided by the
frequency and then determining the required values. When inventory optimization is
set, the lower limit and the value of the delivery is constant throughout. Therefore, if
the stock level drops below the lower limit (level), you need to order a given amount
(Mahadevan, 2009).
Fig. 1. Q system
Rys. 1. System Q
Source: (Vaishnavi, 2018).
13.2.2. P-system
Model has a fixed ordering interval for stock replenishment. This model specifies
the time of the order, which repeats all the time and the upper order limit. At a given
time,
we will find the inventory status of stocks and add stocks up to the upper limit.
Because there is fixed ordering time the uncertainty interval is longer than the
previous system. For example, if there was not ordered enough quantity at one time,
you need to wait until the next appointment. In order to create a sufficient supply,
the uncertainty interval must be equal to the sum of the average order completion
date and the average delivery cycle. The order quantity in this model is dependent
on demands, safety stock and current inventory (Mahadevan,2009).

192 MEET 2018
Fig. 2. P system
Rys. 2. System P
Source: (Vaishnavi, 2018).
13.3. Data
Data was provided to me by ABC ltd. whose main activity is the production of
refractory materials. There is a single product and a single location. We choose
demand for bauxite because is it is the basic raw material for production of refractory
materials. It is a Czech company, so We calculated costs related with inventory in
CZK.
Fig. 3. Total sum for demand for bauxite in the company
Rys. 3. Całkowite zapotrzebowanie na boksyt w spółce
Source: own processing.
0
5
10
15
20
1 2 3 4 5 6 7 8 9 10 11 12
To
ns
Month
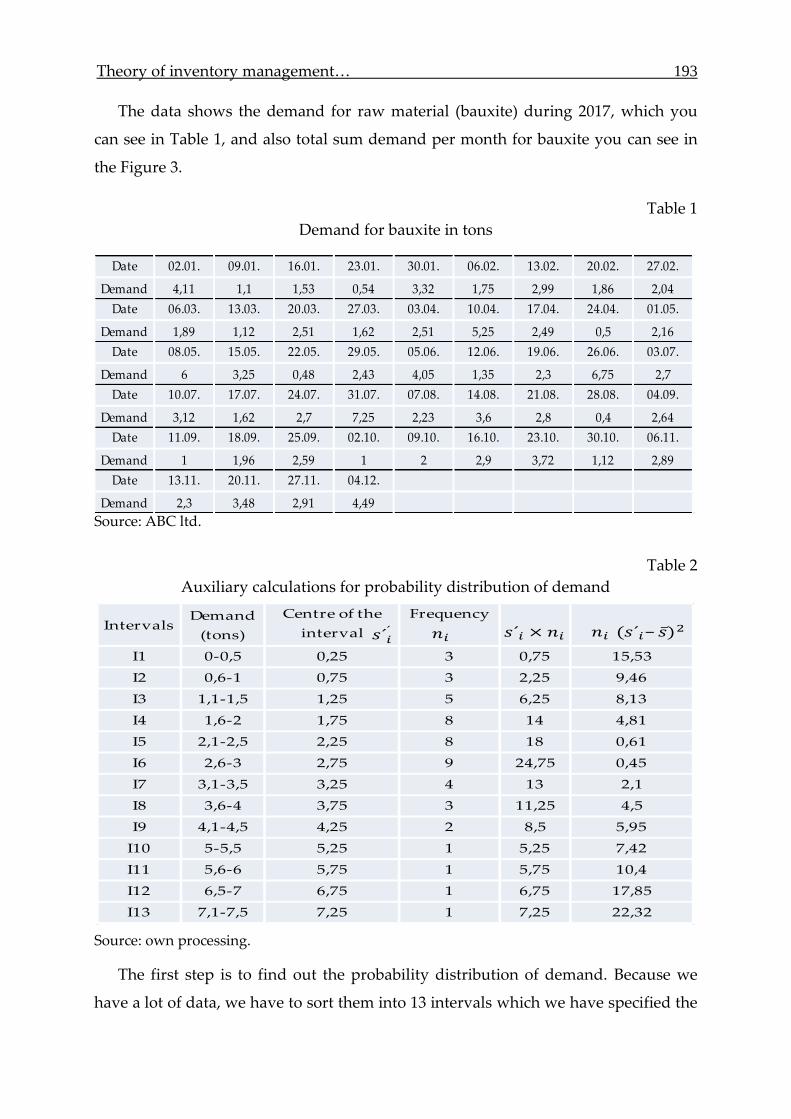
Theory of inventory management… 193
The data shows the demand for raw material (bauxite) during 2017, which you
can see in Table 1, and also total sum demand per month for bauxite you can see in
the Figure 3.
Table 1
Demand for bauxite in tons
Source: ABC ltd.
Table 2
Auxiliary calculations for probability distribution of demand
IntervalsDemand
(tons)
Centre of the
interval
Frequency
I1 0-0,5 0,25 3 0,75 15,53
I2 0,6-1 0,75 3 2,25 9,46
I3 1,1-1,5 1,25 5 6,25 8,13
I4 1,6-2 1,75 8 14 4,81
I5 2,1-2,5 2,25 8 18 0,61
I6 2,6-3 2,75 9 24,75 0,45
I7 3,1-3,5 3,25 4 13 2,1
I8 3,6-4 3,75 3 11,25 4,5
I9 4,1-4,5 4,25 2 8,5 5,95
I10 5-5,5 5,25 1 5,25 7,42
I11 5,6-6 5,75 1 5,75 10,4
I12 6,5-7 6,75 1 6,75 17,85
I13 7,1-7,5 7,25 1 7,25 22,32
𝑠 𝑠 (𝑠 𝑠 )2
Source: own processing.
The first step is to find out the probability distribution of demand. Because we
have a lot of data, we have to sort them into 13 intervals which we have specified the
Date 02.01. 09.01. 16.01. 23.01. 30.01. 06.02. 13.02. 20.02. 27.02.
Demand 4,11 1,1 1,53 0,54 3,32 1,75 2,99 1,86 2,04
Date 06.03. 13.03. 20.03. 27.03. 03.04. 10.04. 17.04. 24.04. 01.05.
Demand 1,89 1,12 2,51 1,62 2,51 5,25 2,49 0,5 2,16
Date 08.05. 15.05. 22.05. 29.05. 05.06. 12.06. 19.06. 26.06. 03.07.
Demand 6 3,25 0,48 2,43 4,05 1,35 2,3 6,75 2,7
Date 10.07. 17.07. 24.07. 31.07. 07.08. 14.08. 21.08. 28.08. 04.09.
Demand 3,12 1,62 2,7 7,25 2,23 3,6 2,8 0,4 2,64
Date 11.09. 18.09. 25.09. 02.10. 09.10. 16.10. 23.10. 30.10. 06.11.
Demand 1 1,96 2,59 1 2 2,9 3,72 1,12 2,89
Date 13.11. 20.11. 27.11. 04.12.
Demand 2,3 3,48 2,91 4,49

194 MEET 2018
centre the frequency of the data at individual intervals. The other columns are
helpful for determining average demand and standard deviation for determination
probability distribution of demand. The most commonly used theoretical
distributions are the normal, exponential, Poisson distribution, or the empirical
distribution. The best way how to find out is to illustrate the data and combine it
with a curve. Then we will compare the curve with the curve with a particular
distribution and calculate if that's true.
𝑠 =∑ 𝑠´ 𝑛 =1
(1)
𝜎𝑠 = √∑ (𝑠´ − 𝑠 )2𝑛
=1 / (2)
The average demand for bauxite from formula nr. 1 is therefore 2.53 tons and
a standard deviation which we calculated from the formula is 1.5 tons. The standard
deviation indicates how far the individual surveyed values differ from each other. If
it is small, the elements of the set are mostly similar to each other and a large
standard deviation signifies big differences to each other (Bartmann,1992).
In the next step, it is necessary to determine the normalized variable of the normal
probability distribution for the upper limit of the intervals according to the relation
(3) and find out the distribution function value from the statistical tables. The
theoretical frequencies are calculated from Gross (4). We adjust these frequencies as
the last three intervals are less than 1, so we add up and result is 11 intervals.
𝑢 =(ℎ−𝑠 )
𝜎𝑠 (3)
𝑇 = ∆ ∗ (4)
Now I have to calculate partition values 𝑥2. The condition for using this
relationship is that sums of theoretical and empirical frequencies are equal. In the
statistical tables of quanta, the chi quadratic (𝑥2) distribution can be found for the
chosen significance level (95% for common practice) and the number of degrees of
freedom c-3 (where c is the number of intervals) is the appropriate q (calculated
quantity). If the calculated values apply to 𝑥2≤ q then it is not possible to reject the
assumption of distribution normality. If the demand complies with the normal
probability distribution it is possible to estimate the amount of the insurance stock at

Theory of inventory management… 195
this point regardless of the cost of maintaining the stock the size. So, the test of the
normal distribution must meet the condition that the critical quantity must be less
than the calculated quantity (Gros, 2009; Karpíšek, 2018):
𝑣 = 𝑐 − 3 = 11 − 3 = 8, where c…number of intervals
𝑥2 = 50,6 − 49 = 1,6… critical quantity
𝑥0,952(8) = 15,5… calculated quantity
15,5 > 1,6... so, the condition is met
In this example, the normal distribution criterion is confirmed, i.e. normality is
accepted at 8 degrees of freedom at 95%. For the exponential, Poisson distribution, or
the empirical distribution, applies the same procedure with other criteria. After we
found a distribution probability we need to get additional data for the calculation.
We can use some computer programs for these calculations, but we need to know
how to calculate the result and know which distribution probability we use.
Table 3
Probabilistic distribution of demand for bauxite
Source: own processing.
Auxiliary data for inventory optimization at normal demand breakdown by ABC
ltd. are shown in Table 4. To ensure continuous production, 127.38 tons of bauxite
Intervals
Upper
limit
ℎ
Standard
variable
Distribution
function Difference
Teoretical
frequency
Adjusted
frequency
Real
frequencyShare
0 0 0
I1 0,5 -1,35 0,09 0,09 4,36 4,36 3 2,06
I2 1 -1,02 0,16 0,07 3,38 3,38 3 2,66
I3 1,5 -0,69 0,25 0,09 4,26 4,26 5 5,86
I4 2 -0,35 0,36 0,12 5,78 5,78 8 11,07
I5 2,5 -0,02 0,5 0,14 6,71 6,71 8 9,53
I6 3 0,32 0,63 0,13 6,13 6,13 9 13,22
I7 3,5 0,65 0,74 0,12 5,73 5,73 4 2,79
I8 4 0,99 0,84 0,1 4,7 4,7 3 1,91
I9 4,5 1,32 0,91 0,07 3,38 3,38 2 1,18
I10 5,5 1,99 0,98 0,07 3,38 3,43 1 0,29
I11 6 2,32 0,99 0,01 0,69 1,18 3 7,65
I12 7 2,99 1 0,01 0,44
I13 7,5 3,33 1 0 0,05
1 0 0
SUM 49 49 49 50,6
− −
𝑢 ∆ 𝑇 𝑇 2
𝑇

196 MEET 2018
must be delivered. The cost including transport is 3,333 CZK per ton. The cost of
handling and delivery is 3,000 CZK. The annual inventory maintenance costs are
approximately 20% of the average stock value per year. It is necessary to determine
how large the deliveries and how often the production of refractory materials needs
to be provided to keep costs as low as possible.
Table 4
Additional company information
Data Designation Amount Units
Annual demand S 127,38 tons/year
Standard deviation 1,5 tons
The purchase period 20 days
Unit acquisition costs20
% of the average stock
per year
Cost of order execution 3 000 CZK
Price per unit c 3 333 CZK
𝜎
𝑡
𝑠
𝜎
𝑡
𝑠
Source: ABC ltd.
Basic formulas for Q and P systems calculation (Winston, 2004):
optimal quantity delivery:
𝑄𝑜𝑝𝑡 = √2𝑆𝑛𝑗
𝑇𝑛𝑠𝑐 (5)
costs related to delivery:
𝑁(𝑄𝑜𝑝𝑡) = √2𝑆𝑇𝑐 𝑠 (6)
safety stock at 95%:
𝑤 ≥ 𝑧0,95 𝜎 (7)
safety stock at 99%:
𝑤 ≥ 𝑧0,99 𝜎 (8)
signaling stock status (reorder level):
𝑟 = S 𝑡 + 𝑤 (9)
𝑡𝑐 =𝑇
𝑆 𝑄𝑜𝑝𝑡⁄ (10)

Theory of inventory management… 197
order time:
𝜎𝑡𝑣𝑜+𝑡𝑐 = √(𝑡 𝑜 + 𝑡𝑐)𝜎 2 (11)
upper order limit:
𝑥ℎ95 = 𝑆(𝑡 𝑜 + 𝑡𝑐) + 𝑧95𝜎𝑡𝑣𝑜+𝑡𝑐 (12)
Results that a less costly is P system. P system include the lower cost of the
specified quantity and the ordered quantity of material. But this is a riskier model,
because there may be a sudden depletion of inventory, but the company can refill
this material until the 17th day of the order. At the example ABC company with P
system inventory management there will be more inventory depletion than
inventory management with Q systems.
Table 5
Calculated values Q and P system
Q system P system Q system P system
Value for
z=0,95
Value for
z=0,95
Value for
z=0,99
Value for
z=0,99
Optimal quantity delivery 6,18 6,18 6,18 6,18 tuns
Costs related to delivery 5747,92 5577,91 7728,73 5840,1 CZK
Safety stock w 2,46 0,79 3,48 1,12 tuns
Signalling stock status r 9,44 7,87 10,46 8,20 tuns
Order time - 17 - 17 days
Upper order limit - 13,95 - 14,28 tuns
DataDesignati
onUnits
Source: own processing.
You can see from Table 5 also that signaling stock status of the Q system. This
mean if inventory in stock will fall to 9,44 tons we have to order 6,18 tons material.
But the con is that we do not have inventory right now, but we need to count
delivery time. From Table 5 we also see the upper order limit of the P system is 13,95
tons. But con in this model is when we find out after 17th day that our inventory in
stock is 9,44 tons, we have to order 4,51 tons (add up to 13,95 tons) and what do we
do when the next day comes the demand for 6 tons? P system counts with 17 days
tracking, so we will not know about consumption between this period. The loss in
the amount of unsatisfied demand will be reflected in money and sales.
Given the high risk of stock depletion during variable demand, I propose to
combine the Q and P system, when inventory management considers the Q-system
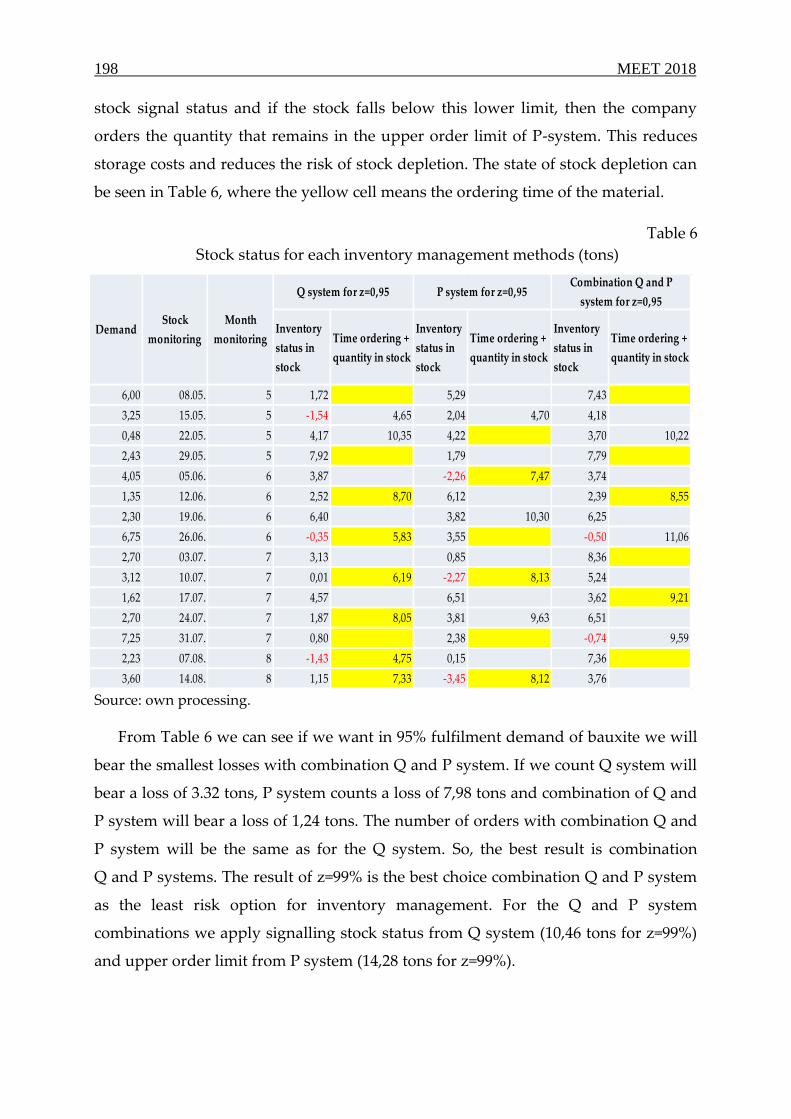
198 MEET 2018
stock signal status and if the stock falls below this lower limit, then the company
orders the quantity that remains in the upper order limit of P-system. This reduces
storage costs and reduces the risk of stock depletion. The state of stock depletion can
be seen in Table 6, where the yellow cell means the ordering time of the material.
Table 6
Stock status for each inventory management methods (tons)
Source: own processing.
From Table 6 we can see if we want in 95% fulfilment demand of bauxite we will
bear the smallest losses with combination Q and P system. If we count Q system will
bear a loss of 3.32 tons, P system counts a loss of 7,98 tons and combination of Q and
P system will bear a loss of 1,24 tons. The number of orders with combination Q and
P system will be the same as for the Q system. So, the best result is combination
Q and P systems. The result of z=99% is the best choice combination Q and P system
as the least risk option for inventory management. For the Q and P system
combinations we apply signalling stock status from Q system (10,46 tons for z=99%)
and upper order limit from P system (14,28 tons for z=99%).
Inventory
status in
stock
Time ordering +
quantity in stock
Inventory
status in
stock
Time ordering +
quantity in stock
Inventory
status in
stock
Time ordering +
quantity in stock
6,00 08.05. 5 1,72 5,29 7,43
3,25 15.05. 5 -1,54 4,65 2,04 4,70 4,18
0,48 22.05. 5 4,17 10,35 4,22 3,70 10,22
2,43 29.05. 5 7,92 1,79 7,79
4,05 05.06. 6 3,87 -2,26 7,47 3,74
1,35 12.06. 6 2,52 8,70 6,12 2,39 8,55
2,30 19.06. 6 6,40 3,82 10,30 6,25
6,75 26.06. 6 -0,35 5,83 3,55 -0,50 11,06
2,70 03.07. 7 3,13 0,85 8,36
3,12 10.07. 7 0,01 6,19 -2,27 8,13 5,24
1,62 17.07. 7 4,57 6,51 3,62 9,21
2,70 24.07. 7 1,87 8,05 3,81 9,63 6,51
7,25 31.07. 7 0,80 2,38 -0,74 9,59
2,23 07.08. 8 -1,43 4,75 0,15 7,36
3,60 14.08. 8 1,15 7,33 -3,45 8,12 3,76
Q system for z=0,95 P system for z=0,95Combination Q and P
system for z=0,95
DemandStock
monitoring
Month
monitoring

Theory of inventory management… 199
13.4. Conclusions
The aim was to propose improvements in inventory management that will lead to
a reduction costs and speeds up the process of ordering the material and thereby
stabilizing the business. Every company is forced to have inventory to take charge of
their management and decision what is more advantageous for them and what they
do not. If it orders a large amount of inventory it achieves the smooth running of the
production satisfies the needs of its customers in full it can make use of quantity
discounts for suppliers. But from a second perspective, some storage costs may
increase by increasing warehouse capacity or utilizing rent. Also, the funds
embedded in large amounts of inventory could use the companies better. Conversely
if it keeps stocks low there may be interruptions in production failure to meet
deadlines in the worst-case loss of customers. Therefore, the management of the
company or the responsible managers should choose the appropriate compromise.
Our study has answered the question of how to efficiently manage inventory using
Q and P systems. Q system use when the order quantity is fixed for all the orders and
P system is used when orders have to be placed at fixed time intervals such as
weekly, biweekly, or monthly. This information has been constituted of two
elements: the inventory level and the demand forecast. In our opinion for our
example with bauxite none of these models is effective for a given demand. That's
why we combined these models with Q-system stock signal status and the upper
order limit of P-system designed the optimal solution that companies could follow. It
has to be said that the demand for bauxite had the character of a normal distribution.
If demand for raw material had different distribution, e.g. F-distribution, Student´s
distribution, etc. we have to calculate average demand and standard deviation other
formulas for specific distribution. Then we can continue count example with basic
formulas. For further research we want to check this combination Q and P system in
demand with different distribution and we want to propose a better inventory
management system for companies. Given that demand forecasts are generally
determined by random changes, we have shown the impact of uncertainty, which is
the main source of uncertainty. We choose this topic because a lot of companies have
problem with management inventory. Companies have a lot of money in stock and
they do not know how to manage this and do business more effectively.

200 MEET 2018
Bibliography
1. Baglin, G., Bruel, O., Garreau, A., Greif, M., van Delft, C. (2001). Management
Industriel et Logistique. Economica: Paris.
2. Bartmann, D., Beckmann, M.J. (1992). Inventory Control. Models and Methods.
SpringerVerlag: Berlin.
3. Gros, I. (2009). Matematické modely pro manažerské rozhodování. University of
chemistry and technology Prague: Prague.
4. Jensen, A.P., Bard, F.J. (2001). Operations Research Models and Methods:
www.me.utexas.edu/~jensen/ORMM/supplements/models/inventory/sq_variatio
ns.pdf [25.1.2018]
5. Karpíšek, Z. Statistické tabulky: http//mathonline.fme.vutbr.cz/ [25.1.2018]
6. Kořenář, V. (2010). Stochastické procesy. Oeconomica: Prague.
7. Lukáš, L. (2005). Pravděpodobnostní modely. Západočeská univerzita: Plzeň.
8. Mahadevan, B. (2009). Operation Management: Theory and Practice. Dorling
Kindersley (India), licensees of Pearson Education in South Asia: New Delhi.
9. Malliaris, A., Brock, W. (1982). Stochastic Methods in Economics and Finance.
North- Holland: Amsterdam.
10. Polanecký, L. (2017). Teorie řízení zásob pohledem matematickým modelů:
https://search-proquest-com.ezproxy.lib.vutbr.cz/docview/1929035082?
accountid=17115 [25.1.2018]
11. Vaishnavi, N. (2018). Essay on Materials Management. http://www.business
managementideas.com/essays/materials-management-essays/essay-on-materials-
management-top-6-essays-production/12031 [29.6.2018]
12. Winston A., Wayne, L. (2004). Operations Research: Applications and Algori-
thms. Belmont: Brooks/Cole - Thomson Learning.
THEORY OF INVENTORY MANAGEMENT WITH A VIEW OF
STOCHASTIC MODELS
Abstract
Study will deal with inventory management issues. Already since the 20th
century, emphasis has been placed on the continuous improvement of the efficiency
of business activities. Due to often uncertain market trends and fluctuating demand
or production and changing delivery times, inventory management is very difficult.
Theory of inventory management… 201
Inventory management is part of the daily business process. If the company does not
figure out correct timing of the replenishment of the inventory and the quantity, the
demand may not be met, and this may lead to lost sales. Decision-making on
inventory management strategy is one of risk-taking situations. This study analyses
issues of inventory management using stochastic models. Stochastic models are used
in fluctuating demand, which is relevant with extractive industries and energy
sector. The aim is to compare stochastic models. To what extent do results differ in
their use in the specific conditions. The goal of study is to introduce the least costly
and least risk model for the company from the point of view of inventory
management.
Keywords: inventory theory, inventory management, stochastic models, supply
chain.
TEORIA ZARZĄDZANIA ZAPASAMI
Z UWZGLĘDNIENIEM MODELI STOCHASTYCZNYCH
Streszczenie
Badanie to obejmuje problemy związane z zarządzaniem zapasami. Już od XX
wieku nacisk kładzie się na ciągłe doskonalenie skuteczności działań biznesowych.
Ze względu na często niepewne tendencje rynkowe i zmieniające się
zapotrzebowanie lub produkcję i zmieniające się czasy dostaw, zarządzanie
zapasami jest bardzo trudne. Zarządzanie zapasami jest częścią codziennej
działalności przedsiębiorstwa. Jeżeli spółka nie zaplanuje odpowiednio czasu na
uzupełnienie zapasów i ilości, może jej się nie udać sprostać zapotrzebowaniu, co
będzie skutkować utratą możliwości sprzedaży. Podejmowanie decyzji
w odniesieniu do strategii zarządzania zapasami to jedna z sytuacji generujących
ryzyko. Niniejsze badanie analizuje problemy związane z zarządzaniem zapasami
z wykorzystaniem modeli stochastycznych. Modele stochastyczne są stosowane
w warunkach wahania zapotrzebowania, co ma zastosowanie w przypadku branż
wydobywczych i sektora energetycznego. Celem jest porównanie modeli
stochastycznych. W jakim zakresie wyniki różnią się w zastosowaniu w konkretnych
warunkach? Celem badania jest wprowadzenie najbardziej efektywnego kosztowo
i obarczonego najmniejszym ryzykiem modelu dla spółki, z punktu widzenia
zarządzania zapasami.
Słowa kluczowe: teoria zapasów, zarządzanie zapasami, modele stochastyczne,
łańcuch dostaw.


PART III
SOCIAL AND ENVIRONMENTAL
ASPECTS OF MANAGEMENT IN
EXTRACTIVE INDUSTRIES


Radosław WOLNIAK
Silesian University of Technology, Poland (e-mail: [email protected])
14. THE CORPORATE SOCIAL RESPONSIBILITY PRACTICES IN
AUSTRALIAN MINING SECTOR
14.1. Introduction
In last year Corporate Social responsibility has become an increasingly significant
phenomenon around the world. The mining industry also try to follow this trend and
conduct social responsibility action and participate in CSR reporting systems
(Azapagic, 2004; Cowell, 1999, Esteves, 2008, Górecki, 2010; Vintro and Comajuncosa,
2010; Wheeler et al. 2002). In many countries mines try to implement and improve
their CSR policy and practice according to world leading trends (Worral et. al., 2009).
Mining generates strong and sustainable benefits for Australia for example” export,
revenue, employment and technology transfer. The aim of presented paper is to
analyze CSR practices used in Australian mining industry.
Purpose of the article is to analyze CSR practices used in Australian mining
industry. There is in the paper an analysis of Australian industry practices in CSR.
The main method using in the research in this paper was the critical literature
analysis. The analysis of the paper of the Corporate Social responsibility systems in
Australian mining industry has been done.
14.2. Research background
The beginnings of modern corporate social responsibility can be traced back to
the 1920s. The concept rose into the public domain during the mid-20th century and
has gained increasing attention over past two decades (Hąbek and Wolniak, 2016;
Wolniak and Hąbek, 2016; Hąbek and Brodny, 2017; Ryszko, 2017; Hąbek, 2017).

206 MEET 2018
Very important triggers in this process were: the introduction of the Global reporting
Initiative in 2002 (GRI) and United nations Global Compact in 2000 (Truscott, 2007).
One of the classic definition of CSR concept say that a business organization’s
configuration of principles of social responsibility, processes of social responsiveness,
and policies, programs, and observable outcomes as they relate to the firm’s societal
relationships (Wood, 1991).
Other CSR definition is the definition use by European Union. According this
definition CSR is the responsibility of enterprises for their impact on society. CSR
should be company led. Public authorities can play a supporting role through
a smart mix of voluntary policy measures and, where necessary, complementary
regulation (Communication, 2011).
Very interesting material about the realization of CSR conception in Australia is
in the report preparing by ACCSR. In this report there are annual review of the state
of CSR in Australia and New Zealand. The newest report date from 2017. We can
distinguish the main actors within the Australian CSR industry (Truscott, 2007):
peak and industry bodies,
CSR consultants,
research centers,
media,
business,
state and local government,
federal government,
third sector organizations,
regulatory bodies.
According to mentioned report the main CSR strategy priorities in the CSR
practices in Australia are as follows (ACCSR, 2017):
building stronger relationships with stakeholders,
managing the implication of technology (data security, privacy, etc.|),
managing regulatory impacts,
strengthening our social license to operate,
building internal understanding and support for CSR sustainability approach,
developing new products or services with environmentally responsible
attributes,

The corporate social responsibility practices… 207
improving supply chain policies and practices,
working to address labor relations issues,
addressing human rights issues within sphere of influence,
working to combat business corruption.
In recent years building stronger relationship with stakeholders remains the
highest priority for almost all organization. 83% Australian organization point out
that this is the key priority in CSR strategy. Australian organization participate in the
case of CSR practices in many actions for example (ACCSR, 2017):
no poverty,
zero hunger,
good health and wellbeing,
quality education,
gender equality,
clean water and sanitation,
affordable and clean energy,
decent work and economic growth,
industry, innovation and infrastructure,
reduced inequalities,
sustainable cities and communities,
responsible consumption and production.
climate action,
life below water,
life on land,
peace, justice and strong institution,
partnership for the goals.
The most likely action are assessing organizational impacts connected to Climate
Action and engaging in strategic partnership which aim is to reduce poverty (Rao,
2016). Australian organization think that sustainability reporting should be
mandatory for organization in certain size (53% of respondents). 40% thinks that this
reporting should be obligatory only for big companies. Only 7% of respondents
think, that CSR reporting shouldn’t be obligatory.

208 MEET 2018
Reporting CSR activities is very useful according to respondents view. They can
point out following advantages of CSR reporting for they organizations (ACCSR,
2017):
built our reputation for being a responsible business,
contributed to brand positioning,
engaged senior leadership in strategic conversation about organization,
improved stakeholder engagement,
identified opportunities for performance improvement,
improved employee engagement,
helped the organization to better understand the material issues that affect
organization,
helped to better understand the risk the organization faces,
helped to identify opportunities to improve efficiency,
lead to improved investor engagement.
CSR has become an increasingly powerful phenomenon in Australia. The
governmental response has been one of encouragement, evident in the introduction
of the Prime Minister’s Business Community Partnership (PMCBP) awards,
parliamentary enquiries into CSR and related reports commissioned by government
departments. Meanwhile, the corporate sector has developed CSR positions,
departments and committees, while also seeking expert advice on CSR strategy
development from niche CSR consultancies. CSR conferences and events have also
become a regular occurrence in Australia, reflecting the topical nature of the subject
and the wide range of actors interested in its development (Truscott, 2007; Evans,
2010; Galbreath, 2010).
14.3. Research results
The main method using in the research in this paper was the critical literature
analysis. The analysis of the paper of the Corporate Social responsibility systems in
Australian mining industry has been done.
Australian mining industry is one of the better developing mining industries in
the word. While in many countries the amount of mining industry production
decrease in Australian industry is an incredible 10 years of growth largely due to

The corporate social responsibility practices… 209
strong demand for resources from emerging economies such as China (Jones et al.,
2007; Ross, 2016). New mining operations in Australia are mostly established in
remote areas or in regional, non-metropolitan, areas which are typically rural and
serviced by a small number of towns (Thirarungrueang, 2013).
Mining lifecycle is very long (fig 1). It has many relation with society, that need to
carefully considered development of social sustainable approach (Skotnicka-
Zasadzień, 2014). The key interactions of mining industry with society are as follows
(Sustainable mining, 2015):
community engagement,
resource governance,
indigenous agreement-making,
negotiations and agreements,
occupational health and safety,
precompetitive data,
regional development,
post mining economy,
environmental and water management,
mineral economics and policy,
mine closure and post mining land use,
local content and enterprise,
education, training and skills,
revenue design and administration,
infrastructure planning and delivery,
mine waste management.
Fig. 1. Mining lifecycle
Rys. 1. Cykl życia górnictwa
Source: (Sustainable mining, 2015).
Acquisition and
exploration
Construction and
development
Mining and concentration
Transport Trading,
marketing and sales
Closure, rehabilitation
and monitoring

210 MEET 2018
Mining industry need sustainability approach because of its big impact on natural
environment (Aloi, 2007). Historically in Australian mining industry we can
distinguish four approaches to mining – from concentration on maximising revenue
to sustainable mining approach (Tab. 1).
Many key studies about Australia mining industry reports that mines consider in
their activities many factors connected with CSR. The most important asset of
Australian mining industry are as follows (Satchwell, 2014):
education and training – crucial to dealing with challenges and opportunities of
the 21th century, advanced education should be integrated with research,
complementary to traditional infrastructure – knowledge-intensive and
knowledge creating, adaptable and capable to deal with uncertainty and to
engage with the emerging new global economy,
public sector and industry collaboration – development of technical colleges
and teaching centres, knowledge spillovers (trained workers can move easily
between projects and firms, taking skill set and culture with them).
Table 1
Australian approaches to mining
Approach Characteristic
Only revenue maximising Using efficient methods to address landscape and community
legacies associated with focus on revenue maximising.
Efficient
Enhancing performance through individual activities.
Developing, testing and deploying of leading edge technology
and processes to deliver industry capability to meet their
efficiency goals.
Effective
Improve benefits and performance through the connectivity
with environment. Integration of capability (engineering,
science and social science) and operating environment (life
cycle, value, chain and mining regions).
Sustainable approach
Embedding sustainability in all decision making and business
practices to consider the economic and environmental needs of
current generations without compromising the needs of future
generations. Implementation and measure of sustainable
development in an industrial context, positioning the mining
and minerals industry as a lead case for global industry.
Source: own work based on: (Satchwell, 2014).
The key factors which can ensure long-term prosperity of Australian mining
industry are closely connected with sustainable approach. We can distinguish

The corporate social responsibility practices… 211
following indispensable factors (Sustainable mining, 2015):
building institutions and governance of the resources sector,
developing infrastructure,
ensuring robust fiscal policy and competitiveness,
supporting local content,
spending resources windfall wisely,
transforming resource wealth into broad, inclusive socioeconomic
development,
gaining community support for responsible development.
On the base of study that has been done by Basu (Basu et al. 2015) we can
distinguish
We can distinguish some examples of CSR practices in Australian mining
companies (Ranangen, 2013):
donated items from Australia are shipped over by sea and distributed to
a variety of local groups and institutions in the surrounding communities,
some Australian mining companies are supporting hospital premature baby
ward and has continuously provided equipment as well as monthly donations
of cleaning items, basic medical items and baby packs,
the company has provided the visually impaired at the Ndola school with
walking canes,
the company has also introduced a community health day, to which employees,
their families and other community members are invited. On this day,
information about wellness is provided as well as health checks for ailments
such as hypertension, high cholesterol, sickle cell, diabetes and tuberculosis,
the company has been helping to restore the water bore in the Salem children’s
village in Kitwe.
Table 2
The impact of mining industry on CSR
Impact of mining
industry on CSR Characteristic
Positive
mining may bring employment and economic diversity to Indigenous
communities and rural areas,
mining is positively associated with household income, housing
affordability, communication access, education and employment in
regional and remote Australia,

212 MEET 2018
cont. table 2
through the relationship the mutual goal of improving environmental
outcomes has been achieved.
Neutral
the mining boom in Australia since 2000 with economic improvement,
as reflected in a host of economic indicators (e.g. GDP, household
incomes, employment),
manufacturing and other industries have found it hard to compete
internationally because of the high value of the dollar which has also
resulted from the mining boom,
community appeared to have positively benefitted but because there
were no performance indicators it was not possible to properly assess
the performance of the funding and to learn from the experience what
the best strategy for future community investment would be.
Negative
there is considerable evidence to suggest that coal mining has been
detrimental socially, environmentally and to public health,
the concerns of communities are often marginalised by the mining
industry,
proper monitoring and regulation of air pollution that threatens the
health of local people needs to be undertaken
Source: own work based on: (Basu et al., 2015).
14.4. Conclusions
The problem of CSR and sustainable development in mining industry is very
important and there are many problems with this kind of activity. There are many
suggestions that mining activities has been detrimental socially and to public health,
also in many mines the social problems are neglected. But in some mines we can find
some CSR and sustainable practices connected with social activities. This is
important but mines should do more in this case. On the basis of literature analysis
we can say that CSR is not good developed in Australian mining industry comparing
to for example Polish (Jarosławska-Sobór, 2011; Jonek-Kowalska, 2014; Hąbek and
Biały, 2017; Wolniak, 2017), Russian (Ponomarenko et. al., 2016; Yakovleva, 2005) or
Spanish (Mogrovejo et. al., 2007; Wolniak, 2017). There is many to do to increase
social activities in mines and to achieve good level of CSR practices in Australian
mining industry.
Practical implication: we can use the practices using in Australian mining
industry in Polish or Russian mining industry. It’s important because the mining
industry is detrimental for the natural environment and the use of CSR practices can
cope with this situation.

The corporate social responsibility practices… 213
The main limitation of this paper is the use only data from published papers and
not from companies because author doesn’t have access to primary sources from
Australia. Also the limitation is that the analysis is based only on one country in the
future analysis the more complex comparative analysis can be conducted.
Acknowledgments
The paper was prepared as a result of project BK-235/ROZ0/2018.
Bibliography
1. ACCSR. Re-imagining sustainable value: the Sustainable Development Goals
gather pace. Annual Review of the State of CSR in Australia and New Zealand,
2017,
https://www.google.pl/url?url=https://www.sbc.org.nz/__data/assets/pdf_file/
0007/127591/ACCSR-State-of-CSR-Report
2. Aloi, D.M. (2007). Reducing Social Risk and Impact by Engaging Local
Communities. Iron Ore Conference, 20-22 August Perth, Western Australia. The
Australian Institute of Mining and Metallurgy.
3. Azapagic, A. (2004). Developing a framework for sustainable development
indicators for the mining and minerals industry. Journal of Cleaner Production, 12,
639-662.
4. Basu, P.K., Hick, J., Krivokapic-Skoko, B., Sherley, Ch. (2015). Mining operations
and corporate social responsibility: A case study of a large gold mine in regional
Australia. The Extractive Industries and Society, 2(3), 531-539.
doi: https://doi.org/10.1016/j.exis.2015.03.002
5. Bice, S. (2014). What Gives You a Social Licence? An Exploration of the Social
Licence to Operate in the Australian Mining Industry, Resources, 3, 62-80,
doi: https://doi.org/10.3390/resources3010062
6. Communication from the commission to the European parliament, the council,
the European economic and social committee and the committee of the regions A
renewed EU strategy 2011-14 for Corporate Social Responsibility, https://eur-
lex.europa.eu/legal-content/EN/TXT/?uri=CELEX:52011DC0681,
[access 27.08.2018].
7. Cowell, S.J. (1999). Sustainability and the primary extraction industries: theories
and practice. Resource Policy, 25, 277-286.

214 MEET 2018
8. Esteves, A.M. (2008). Mining and social development: Refocusing community
investment using multi-criteria decision analysis. Resources Policy, 33, 39-47.
9. Evans, N. (2010). CSR and stakeholders of small businesses in regional South
Australia. Social Responsibility Journal, 6(3), 433-451, https://doi.org/10.1108/
17471111011064799
10. Galbreath, J. (2010). How does corporate social responsibility benefit firms?
Evidence from Australia. European Business Review 22 (4), 411-431, https://doi.org/
10.1108/09555341011056186
11. Górecki, J., Sermet, E. (2010) Społeczna odpowiedzialność górnictwa. Surowce
i Maszyny Budowlane, 1.
12. Hąbek ,P. (2017). Corporate social responsibility reporting. Practices of Visegrad
Group countries. Gliwice, P.A. NOVA.
13. Hąbek, P., Biały, W. (2017). Komunikacja społecznej odpowiedzialności
przedsiębiorstw. Praktyki przemysłu górniczego. [in:] Mechanizacja, automaty-
zacja i robotyzacja w górnictwie. IV Międzynarodowa konferencja, Wisła,
21-23 czerwca 2017 r. Streszczenia referatów, 44.
14. Hąbek, P., Brodny, J. (2017). Corporate social responsibility report - an important
tool to communicate with stakeholders. 4th International Multidisciplinary
Scientific Conference on Social Sciences and Arts. SGEM 2017, 24-30 August 2017,
Albena, Bulgaria. Conference proceedings. Book 1, Modern science. Vol. 5,
Business and management. Sofia: STEF92 Technology, 241-248.
15. Hąbek, P., Wolniak, R. (2016). Assessing the quality of corporate social
responsibility reports: the case of reporting practices in selected European Union
member states. Quality and Quantity, 50(1), 339-420.
16. Hąbek, P., Wolniak, R. (2016). Factors influencing the development of CSR
reporting practices: experts' versus preparers' points of view, Engineering
Economy, 26(5), 560-570.
17. Hąbek, P., Wolniak, R. (2016). Relationship between management practices and
quality of CSR reports. Procedia - Social and Behavioral Sciences, 220, 115-123.
18. Jarosławska-Sobór, S. (2011). Społeczna odpowiedzialność biznesu (CSR)
i wykorzystanie społecznego potencjału przedsiębiorstwa górniczego w budowa-
niu wizerunku branży. Studium przypadku. Przegląd Górniczy, 10.
19. Jonek-Kowalska, I. (2014). Corporate Social Responsibility a środowiskowe
i społeczne skutki likwidacji kopalń. Zeszyty Naukowe Wyższej Szkoły Bankowej
Wydział Zamiejscowy Chorzów, 16, 27-45.
The corporate social responsibility practices… 215
20. Jones, M., Marshall, S., Mitchell, R. (2007). Corporate Social Responsibility and
the Management of Labour in Two Australian Mining Industry Companies.
Corporate Governance, 15 (1), 57-67.
21. Mogrovejo, M., Pimentel, R., Zuniga, A. (2007). Modelos de inversión social para
empresas mineras. Experiencias y propuestas. Cuadernos de Difusión, 12, 115-143.
22. Ponomarenko, T.V., Wolniak, R., Marinina, O.A. (2016). Corporate Social
responsibility in coal industry (Practices of russian and european companies),
Journal of Mining Institute, 222, 882-891.
23. Ranangen, H. (2013). Corporate Social Responsibility Practice in the Mining
Industry. Lulea University of Technology: Lulea.
24. Rao, K. (2016). Board diversity and CSR reporting: an Australian study. Meditari
Accountancy Research, 24(2), 182-210. https://doi.org/10.1108/MEDAR-08-2015-
0052
25. Ross, D. (2016). Corporate Social Responsibility Initiatives in Australia’s Mining
Industry: An Applied Stakeholder Approach. [in:] Idowu (Ed.), Key initiatives in
corporate social responsibility. Springer: Heidelberg.
26. Ryszko, A. (2017). Circularity issues in the corporate social responsibility
reporting - case study from Poland, [in:] Carpathian Logistics Congress. CLC
2017, June 28th - 30th 2017, Liptovsky Jan, Slovakia. Conference proceedings,
312-317.
27. Satchwell, I. (2014). Mining and sustainability: experience from Australia,
International Mining for Development Cenntre, Mendoza,
https://www.google.pl/url?sa=t&rct=j&q=&esrc=
s&source=web&cd=1&cad=rja&uact=8&ved=0ahUKEwiz1o_v57aAhVBEVAKHZ
0JDYcQFggoMAA&url=https%3A%2F%2Fim4dc.org%2Fwp-
content%2Fuploads%2F2013%2F07%2FMining-and-sustainability-in-Australia-
English.pdf&usg=AOvVaw3TPxCcGTjjwjpw3bSC8if9, (03.04.2018).
28. Skotnicka-Zasadzień, B. (2014). Zatosowanie inżynierii jakości i niezawodności
do analizy awaryjności obiektów technicznych na przykładzie maszyn
i urządzeń górniczych. Wydawnictwo Politechniki Śląskiej: Gliwice.
29. Sustainable mining in Latin America: Australian’s competitive advantage. (2015).
Australia-Latin American Business Council, 3 February, 2015,
https://www.google.pl/url?sa=t&rct=j&q=&esrc=
s&source=web&cd=2&ved=0ahUKEwiz1o_v57aAhVBEVAKHZ0JDYcQFggwMA
E&url=https%3A%2F%2Fim4dc.org%2Fwpcontent%2Fuploads%2F2013%2F07%

216 MEET 2018
2FALABCpresentation.pdf&usg=AOvVaw2UXFNwJmmqdhk735l0J4jc,
(03.04.2018).
30. Thirarungrueang, K. (2013). Rethinking CSR in Australia: time for binding
regulation? International Journal of Law and Management 55 (3), 173-200.
doi: https://doi.org/10.1108/17542431311327628
31. Truscott, R.A. (2007). Corporate Social Responsibility in Australia: Constructing
Reputation. in: Proceedings 2007 Australia And New Zealand Marketing
Academy Conference (ANZMAC), Dunedin: New Zealand.
32. Vintro, C., Comajuncosa, J. (2010). Corporate Social responsibility in the mining
industry: Criteria and indicators, DYNA, 161.
33. Wheeler, D., Fabig, H., Boele, R. (2002). Paradoxes and dilemmas for stakeholder
responsive firms in the extractive sector: lessons from the case of Shell and the
Ogoni. Journal of Business Ethics, 39, 297-31.
34. Wolniak, R. (2017). The corporate social responsibility practices in mining sector
in Spain and in Poland – similarities and differences. Zeszyty Naukowe Politechniki
Śląskiej. Seria Organizacji i Zarządzanie, 111, 111-120.
35. Wolniak, R. Hąbek, P. (2016). Quality assessment of CSR reports – factor analysis.
Procedia - Social and Behavioral Sciences, 220, 541-547.
36. Wood, D.J. (1991). Corporate Social Performance Revisited. Academy of
Management Review, 16 (4), 691-718.
37. Worrall, R., Neil, D., Brereton, D., Mulligan, D. (2009). Towards sustainability
criteria and indicators framework for legacy mine land. Journal of Cleaner
Production, 17, 1426-1434.
38. Yakovleva, N. (2005). Corporate social responsibility in the mining industries.
Ashgate Publishing: Hampshire.
THE CORPORATE SOCIAL RESPONSIBILITY PRACTICES IN
AUSTRALIAN MINING SECTOR
Abstract
There is in the paper a description of Australian system of CSR activities and
practices. Purpose of the article is to analyze CSR practices used in Australian mining
industry. There is in the paper an analysis of Australian industry practices in CSR.
Also we concentrate on sustainable mining, impact of mining industry on CSR
practices, and some examples of CSR practices used in Australian mining industry.

The corporate social responsibility practices… 217
The main method using in the research in this paper was the critical literature
analysis. The analysis of the paper of the Corporate Social responsibility systems in
Australian mining industry has been done. Practical implication: we can use the
practices using in Australian mining industry in Polish or Russian mining industry.
It’s important because the mining industry is detrimental for the natural
environment and the use of CSR practices can cope with this situation. The main
limitation of this paper is the use only data from published papers and not from
companies because author doesn’t have access to primary sources from Australia.
Also the limitation is that the analysis is based only on one country in the future
analysis the more complex comparative analysis can be conducted.
Keywords: Corporate Social Responsibility, CSR, mining industry, CSR practices,
CSR reporting.
PRAKTYKI SPOŁECZNEJ ODPOWIEDZIALNOŚCI BIZNESU
W SEKTORZE AUSTRALIJSKIEGO GÓRNICTWA
Streszczenie
Artykuł zawiera opis australijskiego systemu działań i praktyk w zakresie
społecznej odpowiedzialności biznesu. Jego celem jest analiza praktyk społecznej
odpowiedzialności biznesu w sektorze australijskiego górnictwa. Praca stanowi
analizę praktyk branżowych w Australii w zakresie społecznej odpowiedzialności
biznesu. W artykule nacisk kładziony jest również na zrównoważone wydobycie,
wpływ branży wydobywczej na praktyki społecznej odpowiedzialności biznesu
i niektóre przykłady takich praktyk stosowane w sektorze australijskiego górnictwa.
Główna metoda zastosowana w niniejszym artykule to analiza kluczowej literatury.
Dokonano analizy systemów społecznej odpowiedzialności biznesu w branży
wydobywczej w Australii. Praktyczne założenie: możemy stosować praktyki
wykorzystywane w branży wydobywczej w Australii w górnictwie polskim
i rosyjskim. Jest to istotne, ponieważ branża wydobywcza ma szkodliwy wpływ na
środowisko naturalne, a zastosowanie praktyk społecznej odpowiedzialności biznesu
pozwoli poradzić sobie z tą sytuacją. Głównym ograniczeniem artykułu jest fakt, że
zastosowano wyłącznie dane z opublikowanych prac, a nie dane spółek, ponieważ
autor nie ma dostępu do głównych źródeł z Australii. Kolejnym ograniczeniem jest
fakt, że analiza oparta jest wyłącznie na jednym kraju; w przyszłości należy
przeprowadzić bardziej złożoną analizę porównawczą.
Słowa kluczowe: Społeczna odpowiedzialność biznesu, branża górnicza, praktyki
społecznej odpowiedzialności biznesu, raportowanie społecznej odpowiedzialności
biznesu.


Marta PODOBIŃSKA-STANIEC
AGH University of Science and Technology, Poland (e-mail: [email protected])
15. THE RELATIONSHIP BETWEEN INDICATORS OF NON-
FINANCIAL REPORTING OF POLISH COMPANIES
15.1. Introduction
In the era of knowledge in which we currently live one of the basic premises that
underlies decisions that people make in order to manage their life or run a company
is information. People undertake specific activities based on the information that they
possess and the knowledge that is built on such information. Every company
is aware of the fact that a broad group of stakeholders, both external (shareholders,
contractors, suppliers, local environment, etc.) or internal (employees) make specific
decisions pertaining to relations with the company, its operation and its products on
the basis of information that reaches them. Thus, access to most comprehensive
information is in the interest of both of the above-mentioned groups. This does not
refer exclusively to the financial standing and the condition of the company with
respect to material aspects, but also to the forecasts of such condition in the future
and non-financial aspects of the company’s operation.
The number of entities which decide to prepare corporate social responsibility
reports is nowadays on the rise. Public presentation of the above-mentioned reports
for companies specified in the Act (Act Amending the Accounting Act of
15 December 2016, Journal of Laws of 2017, item 61, 12. Ustawa z 15 grudnia 2016
r. o zmianie ustawy …) has become an official requirement as of 2017. Apart from non-
financial reporting contained in the CSR, it is also worth paying attention to the
necessity of reporting about intellectual capital. Work on the principles of new
accounting has been under way for quite a while; such new principles are going to
contain guidelines on reporting about the company’s intangible assets.
By emphasising the significance of presenting the stakeholders with ever increasing

220 MEET 2018
volume of information, this paper presents a comparison of CSR reporting and
reporting information about intellectual capital efficiency with respect to the market
value of the examined companies.
15.2. Non-financial reporting: directions of activities
Whilst operating on a market, every company is intent on multiplying its’ assets,
generating maximum profits and growing in a long-term perspective. In the recent
years, strategic targets such as financial stability and the above-mentioned
accomplishment of specific profits were extended onto two issues, namely support
strategies based on innovation and corporate social responsibility and support and
development of personnel. By means of innovation, production companies wish to
influence their productivity and expand their outlet markets. By investing in the
development of employees and their skills and expanding knowledge, companies
strive to fulfil the terms of innovation, offering their personnel a possibility of
constant improvement of their competence. Simultaneously, by acting pro-socially in
the place of its’ operation, a company influences the positive image of its brand.
Thanks to it, the company receives social support, which facilitates performance of
tasks; this is a particularly important aspect in the mining sector in Poland.
Furthermore, harmonious and good cooperation between the environment and
a company may contribute to the procurement of well-qualified employees who
- if they come from the area where the company is located - will immediately identify
with the company, work loyally and with zeal.
This is quite a general and simple mode to present the effects of a company’s
activities in the area of determining its’ targets and activities on intangible elements,
both of the company and its’ environment, which are difficult to measure and assess.
The intangible elements of a company, namely the intangible assets which generate
added value, constitute its’ intellectual capital. People, and more specifically the
knowledge that they possess, their skills, experience, willingness to work, as well as
projects, scientific and research work, patents, or the organisation culture, brand and
several other aspects form a large group of elements that build a company’s
intellectual capital. This is the capital that should be assessed and managed

The relationship between indicators of… 221
efficiently. In order to perform such activities, it is worth preparing a report on the
non-financial operation of a company.
On the other hand, it may be acknowledged that non-financial reporting is, at the
present time, associated not with the above-mentioned intellectual capital, but with
the broadly promoted CSR - corporate social responsibility, a concept according to
which, at the stage of building a strategy, social needs and environmental protection
are taken into account, along with relations with the company’s stakeholders [3].
To illustrate this issue in more detail, CSR activities in Jastrzębska Spółka Węglowa
S.A.[13] are presented below. The company includes eight aspects in the CSR area
(Fig. 1).
Fig. 1. CSR areas in JSW S.A.
Rys. 1. Obszary CSR w JSW S.A.
Source: (www.jsw.pl).
Another example is provided by a leading resource concern, KGHM Polska
Miedź S.A., which declares (www.kghm.com) that the group’s activities in the area
of corporate social responsibility are primarily focused on forming and improving
cooperation with the local communities and internal organisations, as well as
solidification of the position of a trusted and stable business partner. In the CSR
aspect, KGHM S.A. also remembers about its’ employees, wishing to play a role of
a responsible employer who implements activities increasing work safety and invests
in competence of the personnel. Furthermore, the company informs that it continues
initiatives related to the protection of the natural environment and health protection
activities.

222 MEET 2018
The above-listed two areas of non-financial reporting which, on the one hand,
include information about intellectual capital - intangible assets and on the other
information about CSR, spanning care for the local environment, natural
environment and employees, are the activities currently implemented in large
foreign companies. CSR is also present in Poland, especially in the case of listed
companies. However, activities pertaining to the reporting about intellectual capital
are still a novelty for Polish companies. Thus, there is an issue worth considering,
which constitutes one of the premises for the discussion in this paper, namely: what
is the relation between reporting information about intellectual capital and reporting
information about corporate social responsibility? Such question is justified on
account of the intangible nature of both types of information, which is difficult to
assess.
The search for the relations between the intellectual capital and CSR has already
been conducted around the world and it is possible to read about it in the papers of
Luthan E., Yohana A.&D. (Luthan and Yohana, 2016) Aras G., Aybars A., Kutlu O.
(Aras, 2011) oraz Sułkowski Ł., Fijałkowska J. (Sułkowski and Fijałkowska, 2013),
Altuner D., Celik S., Gulec T. (Altuner et al., 2015), Branwijck D. (Branwijck, 2012),
Razafindrambinina D., Kariodimedjo D. (Razafindrambinina and Kariodimedjo,
2010).
15.3. Intellectual Capital (IC) efficiency in added value formation
Knowledge and experience of employees, brand, relations with stakeholders,
structural sphere, including work systems, procedures of conduct, patents and also
trademarks are only some elements from an extensive catalogue of items that make
up the intellectual capital. This is the capital that is manifested as the effect of work
of every person, every link that is a part of an organisation. The infrastructure that
the managerial personnel has designed and that relies on its’ intellect is a tool to form
the intellectual capital. A collection of intangible activities that are difficult to assess,
and which are performed on a daily basis in the company is the result of the intellect
of people working for such company.
In 1975, the first work of G.R. Feiwel (Dietz et al., 1977) entitled “Intellectual
Capital of Michal Kawecki: A Study in Economic Theory and Policy” was published

The relationship between indicators of… 223
and sparked a discussion pertaining to the intellectual capital. The 1990s marked the
flourish of this trend; thanks to the works of the Conrad Group, K. E. Sveiba,
L. Edvinsson, M. S. Malone, A. Brooking, L. Prusak and also Polish scientists such as
D. Dobija, G. Urbanek and A. Ujwary-Gil, the knowledge about intangible resources
forming an important element of a company value, i.e. intellectual capital, has been
widely popularised.
A number of works devoted to intellectual capital were written, emphasising its’
intangible nature and, on the other hand, a number of methods were designed to
assess the intangible elements. In order to perform an assessment, methods are
prepared to verify and to quantify intellectual capital in various centres of the world.
These methods may be divided into the ones that are based on market capitalisation,
on return on assets or on result charts; there are also several other methods that
attempt at direct assessment of intellectual capital. The starting point for the above-
mentioned work on the assessment methods was to pay attention to the differences
in the value of the company which result from the book value and the market value.
The market value versus book value (MV/BV) was one of the first determinants
offering information whether a company possesses intellectual capital (MV/BV>1) or
whether it does not possess such capital (MV/BV<1).
A more complex method which allows for ascertaining absence or presence of
intellectual capital and, more precisely, indicating a tendency in its’ level is a method
based on the return on assets - VAIC (Value Added Intellectual Coefficient), which
allows for determining the efficient use of human, structural, employed and
intellectual capital. Additionally, the method assumes that the added value
constitutes an assessment criterion for a company’s operation, whereas the
intellectual capital is a factor determining its’ formation. Application of a broad
sectoral analysis allows for procuring useful information available thanks to the use
of this method. If the values of VAIC received for competing companies are
compared, it is possible to indicate which of them manage their intellectual capital
better. In reference to this paper, the information on the level of VAIC, i.e. efficiency
of intellectual added value, is significant due to the fact that it illustrates how
employed, human and structural capital is engaged in the creation of intellectual
capital which, in the next step, may be juxtaposed with the market and book value of
a company.

224 MEET 2018
For analysis purposes, the following aspects are taken into account: operating
profit, value of human capital expressed by the costs incurred on employees,
depreciation/ amortisation of fixed assets, intangible and legal assets and equity.
Based on the above-mentioned values, the following aspects are calculated (Pulic,
2000):
human capital efficiency (HCE) in added value formation;
capital employed efficiency (CEE) in added value formation;
structural capital efficiency (SCE) in added value formation;
intellectual capital efficiency (intellectual capacity) of a company (ICE = HCE
+ SCE).
For selected companies from the mining sector, such as JSW S.A., LW Bogdanka
S.A., KGHM Polska Miedź S. A., the value of VAIC determined for years 2009-2016 is
presented in Table 1. In compliance with the performed analyses, KGHM recorded
a clear advantage with respect to the level of the coefficient between 2009 and 2012.
In the subsequent years, the value of the coefficient dropped for the copper
potentate. A company with quite a fixed level of VAIC and best results between 2014
and 2016 is LW Bogdanka S.A. Furthermore, a stable level of the examined coefficient
is consistent with the stable level of the market value (Fig. 2) of LW Bogdanka S.A.
Thanks to the visualisation of capital efficiency in added value generation, it may be
noted that along with the collapse of the market value of companies (Fig. 2) in 2015,
the examined level of VAIC also dropped. Thus, it may be concluded that there is
a certain inter-dependence in the case of VAIC and the market value. However, the
years 2011 and 2012 showed a contrary tendency for KGHM: in 2011, capital
efficiency increased, whereas the market recorded a drop; in 2012, there was
a positive increase in the value of KGHM market prices, yet the efficiency of
managing capital in the formation of added value was reduced.
Table 1
VAIC for the examined companies between 2009 and 2016
VAIC [-] 2009 2010 2011 2012 2013 2014 2015 2016
JSW S.A. N.D. 3.45 3.46 2.76 2.28 1.66 -2.66 2.83
LW Bogdanka S.A. 2.73 2.97 2.99 3.48 3.49 3.31 1.50 3.06
KGHM Polska Miedź
S.A. 3.19 4.20 6.44 3.98 3.29 3.05 -0.97 0.40
Source: own study based on (Fijałkowska, 2013) and consolidated financial reports of the
examined companies.

The relationship between indicators of… 225
Fig. 2. Level of VAIC for the examined companies
Rys. 2. Poziom VAIC dla badanych firm
Source: own study based on (Fijałkowska, 2013) and consolidated financial reports of the
examined companies.
Fig. 3. Market value of examined companies
Rys. 3. Wartość rynkowa badanych firm
Source: own study based on (Fijałkowska, 2013) and consolidated financial reports of the
examined companies.
In reference to the relation between the capital efficiency with respect to added
value formation and the intellectual capital efficiency (ICE) of a company, the inter-
dependence is very strong (Fig. 4). VAIC is the aggregate efficiency of capital
employed, human and structural capital in the formation of added value, whereas
the ICE is the sum of two components, namely human capital and structural capital.
Presenting the results of JSW S.A. and KGHM, it is possible to conclude that the
value of capital employed excluded from the value of ICE does not have any major
significance, as the level of VAIC and ICE for the above-mentioned companies is very
close and, as of 2014, has almost overlapped. In the case of LW Bogdanka S.A., the
level of capital employed constitutes a significant difference between the level of
VAIC and ICE which, in turn, highlights the significance of this capital in the
0
10 000
20 000
30 000
40 000
2009 2010 2011 2012 2013 2014 2015 2016
market value
KGHM LW Bogdanka JSW
VAIC [-]

226 MEET 2018
formation of the company’s added value. Nevertheless, human capital and structural
capital exert very strong impact on the level of VAIC and thus, it is necessary to
highlight the importance of such capitals and the necessity of developing them in
order to increase the company’s added value.
Fig. 4. Level of VAIC and ICE for examined companies
Rys. 4. Poziom VAIC i ICE dla badanych firm
Source: own study.
15.4. Analysis of relations among IC, CSR and company’s Market
Value
By comparing the intellectual capital with CSR reporting and, more precisely,
with the search for effects that these two aspects may contribute to the improvement
of a company's operation, it is necessary to use the information about the market
value of examined companies. The assumption is that more positive information
offered to all groups of stakeholders about a company, its care for the environment,
employees and the local community improves the image of the brand and the
company, and should also contribute to the growth of company’s the market value.
The analysis covered three companies from the mining sector listed on the
Warsaw Stock Exchange, namely KGHM Polska Miedź S.A., JSW S.A., and LW
Bogdanka S.A. Each of these companies entered the stock exchange and started to
implement CSR reporting at a different time, thence in the breakdown presented in
-5,00
0,00
5,00
10,00
2009 2010 2011 2012 2013 2014 2015 2016
KGHM
VAIC ICE
0,00
5,00
10,00
2009 2010 2011 2012 2013 2014 2015 2016
LW Bogdanka
VAIC ICE
-5,00
0,00
5,00
2009 2010 2011 2012 2013 2014 2015
JSW
VAIC ICE

The relationship between indicators of… 227
fig. No. 4, the moment in time from which a given company has been performing
CSR reporting is marked with an arrow; furthermore, in the case of JSW S.A., the
period of analysis is shorter on account of later date of entering the stock exchange.
The first conclusion refers to the diagram illustrating MV/BV, i.e. the relation of
the market value and the book value and VAIC: the CSR reporting does not seem to
influence the formation of these values with respect to the examined companies. Lack
of CSR reports, e.g. in the case of KGHM the period from 2009 to 2011, did not pose
a problem and the efficiency of intellectual capital determined by VAIC had
a growing tendency in line with the book value, which was also growing at that time.
What is more, the example of LW Bogdanka S.A. shows one more important aspect:
the market value had a growing tendency between 2009 and 2012; in 2012, i.e. at the
start of CSR reporting, the market value dropped until 2015. The value of intellectual
capital efficiency determined by VAIC for LW Bogdanka S.A. shows an increase until
2013 and then a drop until 2015, similarly to the market value of this company.
Another example taken into account in this analysis referred to JSW S.A. The image
of this company is strongly related to the situation of the Polish mining sector and
the drop in the market value between 2012 and 2015. In parallel to the drop in the
market value, the intellectual capital efficiency diminished and the material standing
of the company aggravated, which is illustrated by the reduced book value in the
above-mentioned period. Combining this information with the data about CSR
reporting did not improve the company’s listing, which could have been expected
assuming the premises adopted in this chapter.
Summing up the entire analysis performed for the selected mining companies
illustrated in Figure 5, it may be concluded that there is no inter-dependence
between the market value and the fact whether a company reports CSR or not.
However, such inter-dependence is noticeable between the intellectual capital, its
efficiency presented with the use of VAIC and the market value; this takes place in
line with the most simple definition of intellectual capital, which stipulates that such
capital constitutes a difference between the market value and the book value of
a given company.

228 MEET 2018
Fig. 5. Relation between intellectual capital and CRS reporting
Rys. 5. Związek między kapitałem intelektualnym a sprawozdawczością wierzycieli (CRS)
Source: own study.
15.5. Conclusions
It is important to highlight the co-existence of reporting about intellectual capital
and CSR in the aspect of non-financial reporting. It seems to be correct to
acknowledge that well-performed corporate social responsibility reporting and
intellectual value reporting allow for preparing a report actually referring to the
company’s non-financial operation.
The conducted studies do not show a dependence between the intellectual capital
efficiency or the market value of a company and the fact that such company performs
market value
market value
market value
book value
book value
book value

The relationship between indicators of… 229
CSR reporting. In spite of it, the positive aspect of the performed analysis is
indication of the area that needs improvement. A CSR report, supplemented by
important information from the point of view of the level of intellectual capital, may
become a better tool in the aspect of building a company’s value. CSR reporting is to
be treated as an opportunity for intellectual capital in the sense that certain non-
financial (social) activities have already been noticed and it is necessary to report
them. The non-financial sphere which is difficult to quantify, to unify and to present
stands a chance of becoming more “material” and “tangible” thanks to such
reporting. Thus, a postulate may be put forward that indicates the possibility of
cooperation with respect to these two intangible aspects in the context of creating
a company’s value. Combining these two areas, i.e. CSR and intellectual capital, may
offer an actual increase in the market value of a company, which will definitely make
the shareholders and the management of the company very satisfied.
Acknowledgements
The paper was financed from dean’s grant No. 15.11.100.072.
Bibliogrphy
1. Altuner, D., Celik, S., Gulec, T. (2015). The linkages among intellectual capital,
corporate governance and corporate social responsibility Corporate Governance.
The International Journal Of Business In Society, 15 (4), 491-507.
2. Aras, G., Aybars, A. Kutlu , O. (2011). The interaction between corporate social
responsibility and value added intellectual capital: Empirical evidence from
Turkey. Social Responsibility Journal, 7(4), 622-637.
3. Bogacz, P. (2016). Environmental management reporting in Polish mining
companies in the context of World CSR trends. E3S Web of Conferences.
4. Branwijck, D., (2012). Corporate Social Responsibility plus Intellectual Capital.
Integrated Reporting? 4th European Conference on Intellectual Capital (ECIC)
Finland, Proceedings of the 4th European conference on intellectual capital,
75-85.
5. Dietz, J. , Sherman, H., Halevi, J. (1977). Reviewed Work: The Intellectual Capital of
Michal Kalecki by George R. Feiwel. Journal of Economic Issues, 11 (1), 133-144.

230 MEET 2018
6. Fijałkowska, J. (2013). VAIC™ jako metoda pomiaru dokonań przedsiębiorstw.
Zarządzanie i Finanse 11 (2).
7. Luthan, E., Yohana, A.D. (2016). A Correlation of CSR and Intellectual Capital, its
Implication toward Company’s Value Creation. International Journal of Business
and Management Invention, 5 (11).
8. Pulic, A. (2000). VAIC™ - an accounting tool for IC management. International
Journal of Technology Management, 20 (5-7).
9. Priyanka, J., Vyas, V., Ankur, R. (2017). Exploring the mediating role of
intellectual capital and competitive advantage on the relation between CSR and
financial performance in SMEs. Social Responsibility Journal, 13 (1), 1-23.
10. Razafindrambinina, D., Kariodimedjo, D. (2010). Intellectual Capital and Its
Impacts on Corporate Social Responsibility: Findings from Indonesia. Business
Transformation Through Innovation And Knowledge Management: An Academic
Perspective, 1-2, 496.
11. Sułkowski, Ł, Fijałkowska, J. (2013). Corporate social responsibility and
intellectual capital interaction and voluntary disclosure. Studia Ekonomiczne,
yadda.icm.edu.pl.
12. Ustawa z 15 grudnia 2016 r. o zmianie ustawy o rachunkowości, Dz. U z 2017 r.,
poz. 61.
13. www.jsw.pl
14. www.kghm.com
15. www.lw.com.pl
THE RELATIONSHIP BETWEEN INDICATORS OF NON-
FINANCIAL REPORTING OF POLISH COMPANIES
Abstract
The purpose of this article is to indicate the relationship between the reporting
about non-financial activities of companies in terms of corporate social responsibility
(CSR) and the value of intellectual capital. This article contains information about
market value, book value, intellectual capital efficiency and the information on the
presence of CSR reporting. This presentation aims to search for the links between
these factors in response to the question: how to increase the value of a company?
In this paper, the author presents the book and market values for selected companies.
The author also indicates the intellectual capital efficiency with the use of the VAIC

The relationship between indicators of… 231
(Value Added Intellectual Coefficient) method. The research was conducted for three
selected companies from the mining sector, listed on the Warsaw Stock Exchange, for
the period between 2009 and 2016. In addition, a particular year was indicated as of
which the selected enterprises have been preparing their corporate social
responsibility reports. This analysis allowed the author to draw conclusions about
non-financial reporting in the aspect of intellectual capital and CSR.
Keywords: non-financial reporting, intellectual capital (IC), corporate social
responsibility (CSR).
RELACJA MIEDZY WSKAŹNIKAMI SPRAWOZDAWCZOŚCI
NIEFINANSOWEJ POLSKICH SPÓŁEK
Streszczenie
Celem niniejszego artykułu jest wskazanie relacji między raportowaniem działań
niefinansowych spółek w zakresie społecznej odpowiedzialności biznesu oraz
wartości kapitału intelektualnego. Artykuł zawiera informacje o wartości rynkowej,
wartości księgowej, wydajności kapitału intelektualnego i informacje o raportowaniu
społecznej odpowiedzialności biznesu. Prezentacja ma na celu wyszukanie
związków pomiędzy tymi czynnikami w odpowiedzi na pytanie: jak zwiększyć
wartość spółki? W ramach niniejszej pracy autorzy prezentują wartość księgową
i rynkową wybranych spółek. Podają oni również wydajność kapitału
intelektualnego z zastosowaniem metody VAIC (ang. Value Added Intellectual
Coefficient – wskaźnik intelektualnej wartości dodanej). Badanie zostało
przeprowadzone w trzech wybranych spółkach z branży wydobywczej notowanych
na Warszawskiej Giełdzie Papierów Wartościowych w latach 2009-2016. Co więcej,
wskazano konkretny rok, z którym wybrane przedsiębiorstwa zaczęły
przygotowywać swoje raporty społecznej odpowiedzialności biznesu. Niniejsza
analiza pozwoliła autorom na wyciągnięcie wniosków dotyczących raportowania
niefinansowego w zakresie kapitału intelektualnego i społecznej odpowiedzialności
biznesu.
Słowa kluczowe: Raportowanie niefinansowe, kapitał intelektualny, społeczna
odpowiedzialność biznesu.


Marina NEVSKAYA1, Tatiana PONOMARENKO2, Tatiana KOSOVTZEVA3 1Saint-Petersburg Mining University, Russia (e-mail: [email protected]) 2 Saint-Petersburg Mining University, Russia (e-mail: [email protected]) 3 Saint-Petersburg Mining University, Russia (e-mail: [email protected])
16. MANAGEMENT OF SOCIAL INFRASTRUCTURE OBJECTS OF
THE MINING COMPANIES ON NEWLY-DEVELOPED
TERRITORIES
16.1. Introduction
In Russia the extraction of mineral resources (particularly fuel and energy
resources) is carried out in the regions with severe natural and climatic conditions
and underdeveloped infrastructure. For example, more than 50% of natural gas is
produced at the extraction sites located in the Yamalo-Nenets Autonomous Region
(http://www.mnr.gov.ru/docs). This region is characterized by severe arctic climate
(during the winter temperature can drop to - 50 degrees Celsius), as well as by the
lack of well-developed infrastructure and low density of population. The harsh
climate has a significant impact on the working conditions and health of personnel
involved in the production of natural gas (Marinina and Nevskaya, 2017). About 45%
of region population live in five cities. At the same time, the economic development
of the region is closely linked with the extraction of minerals, especially natural gas.
Therefore, companies have certain social obligations to employees and the
population.
The research problem discussed in this study incorporates social responsibility of
a mining company to the local population of the regions of presence, responsibility to
the shareholders of the mining company as well as the need to ensure social welfare
and development of human capital of the mining company.
The objective of this research is to develop the recommendations for improving
the management of social infrastructure facilities of the Subsidiary of Gazprom.

234 MEET 2018
Gazprom is the world’s biggest gas company operating the world's richest
reserves of natural gas: The Company's share of world's gas reserves is 17% and the
share of Russian reserves - 72%. Gazprom accounts for 11% of the world's gas
production as well as for 66% of Russian gas production (Gosudarstvenny …, 2016).
Currently the company is actively implementing large-scale projects on the Yamal
peninsula, development of gas resources of the Arctic shelf, Eastern Siberia and the
Far East. For example, the biggest gas project of the last decade is the “Megaproject
Yamal” which includes the development of 32 gas deposits of the Yamal peninsula
that accounts for 26.5 trillion of cubic meters of gas. The total number of Company’s
employees is around 500 thousand people (Godovoj…, 2017). Gazprom has
agreements with many constituent entities of the Russian Federation determining
mutual obligations in the field of tax, price and social policy. All Company’s
subsidiaries are regional enterprises that usually are the main employers of the
towns where they are operating. Therefore, they are focused on the complex socio-
economic development of the regions of presence.
Hence, the research problem that is being discussed in this study incorporates
social responsibility of mining company to the local population of the regions of
presence, responsibility to the shareholders of the mining company as well as the
need to ensure social welfare and development of human capital of a mining
company.
Social responsibility and social welfare are the components of the corporate social
policy of large Russian companies. The Russian Federation had its own path of social
development under the terms of planned economy (Soviet Union), when all the
issues of social development and social welfare were assumed by the state.
The main subject of this research is the management of social infrastructure
facilities of a subsidiary of Gazprom that operates in the Yamalo-Nenets
Autonomous Region. The main source of information is the reporting data from
Gazprom.
16.2. Literature study
Large companies operating in the Russian Federation are facing the growing
demands from various groups of stakeholders – shareholders, employees, local

Management of social infrastructure objects… 235
population of the regions of presence, etc. The interests of different stakeholders
usually vary and in order to manage various stakeholder relationships the companies
are having internal and external "vectors of social responsibility”, where the internal
vector is associated with the development of human capital, social security of
employees and their families, enhancement of the level and quality of life, and so on
(Blechzin, 2017).
The idea of corporate social responsibility (Husted, 2006, Lee, 2008), which
implies the development of human capital, generating additional benefits for the
company (Baron, 2001; Webb, 2004; Carroll and Buchholtz, 2012; Chen and Roberts,
2008), is widely accepted within the Russian mining companies (Ponomarenko et al.,
2016). At the same time, the economic basis of CSR is established by the social
infrastructure that entails significant extra costs of its creation and maintenance. One
of the specificities of a large company is the independent implementation of
institutional functions.
The term “social infrastructure” was introduced by Toshchenko (1980). Various
aspects and levels of social infrastructure were considered in the works of Jochimsen
(1966), Nurkse (1993) and other authors. For example, the state of the social welfare
system is defined as one of the parameters determining the quality of life of the
population (Riecen and Yavas, 2001). In more modern publications, the social
infrastructure is considered mainly in the regional aspect as a form of
institutionalization and a criterion determining the level of modernization of the
region (Koch, 2015), as well as "a set of institutions and conditions that ensure the
fulfilled human life" (Dzhafarova, 2012). In a narrower sense, social infrastructure is
a subset of the infrastructure facilities that includes assets dedicated to social services
(Kotyrlo, 2012).
According to any approach it is recognized that social infrastructure includes
various elements including healthcare, education, housing and domestic services,
transport, cultural development and many others, while its operation involves the
use of various real assets - social facilities (or social infrastructure facilities). At the
same time, the management of social infrastructure facilities of large companies
needs to be developed. Management of social infrastructure facilities of large
companies incorporates at least two key objectives: to fulfill company's obligations

236 MEET 2018
towards stakeholders and to use the opportunity to generate additional revenues by
these facilities (Maksimova and Chuzhbovski, 2017).
Meanwhile, one cannot but agree with the position of Maksimova and
Chuzhbovski that strong profit-orientation of the use of social facilities does not
enable the analysis of other ways how social infrastructure facilities may indirectly
influence the development of the company’s human capital. Moreover, in the
Northern Regions, the value and importance of social infrastructure is much higher
(Kotyrlo, 2012).
Social problems of the northern regions of Russia associated with social
infrastructure are considered in many publications of Russian scientists. In
particular, it is said that the need for state support is essential in solving these
problems. At the same time, in Gazprom the state is a major shareholder interested in
obtaining economic benefits (Agarkov, 2018). Therefore, the issues of managing the
objects of social infrastructure of Gazprom, where the state is a major shareholder,
need to be considered in more detail.
Hence follow the research questions:
1. How can social infrastructure facilities be classified by their function and
profitability?
2. What factors and conditions of activity influence the management of social
infrastructure?
3. What options for managing social infrastructure facilities are possible for a large
mining company?
16.3. Methods of the study
The methodological framework of this research includes:
1. Analysis of the factors influencing the management of social infrastructure
facilities.
2. Grouping and analysis of the social infrastructure facilities in terms of
particular parameters.
3. Elaboration of the recommendations on the management of social infrastructure
facilities.

Management of social infrastructure objects… 237
It is important to emphasize that:
1. Social infrastructure facilities are assets used for life support and social
development.
2. The state policy regarding social infrastructure facilities and non-production
assets is focused on their transfer to municipalities.
3. The policy of Gazprom is optimization of costs for the maintenance of social
infrastructure facilities.
16.4. Research results
The study identified two groups of factors: external and internal (Tab. 1).
We have also included the management policy of parent company to the group of
external factors, distinguishing three key dimensions of corporate management –
asset management, HR management and CSR management. The fact that Gazprom is
a corporation with state participation determines the key objective of the
management of social infrastructure facilities – to decrease the costs of its
maintenance.
The principle objective of HR management is to attract and retain young
specialists by providing high level of salary and promising career opportunities. CSR
management is principally focused on employees’ development, corporate
philanthropy and co-financing of socially important projects (support of children’s
sport, healthy lifestyle, support to the veterans and poor people).
At the same time the Subsidiary is fulfilling several social functions, such as
creating decent working conditions for the employees who are working on
a rotational schedule, building facilities for preventive treatment and medical aid to
employees and to the local population as well as creating facilities for the
rehabilitation of employees and their families (that implies changing climatic
conditions by going to more comfortable climate). One of the popular places for
rehabilitation and recreation is corporate health resort located on the shores of the
Sea of Azov (Gelendjik). All above mentioned supplement the basic social security
determined by the Code of labor of Russian federation and ensured by the state.

238 MEET 2018
Тable 1
Factors influencing the management of social infrastructure facilities
EXTERNAL Factors INTERNAL Factors
1.The state policy is focused on the transfer of
social infrastructure facilities of state
companies to municipalities
Special social functions of subsidiaries in the
region of presence
2.Policies of Gazprom
Type of
policy Guidelines
Functions
Particular
terms
Social
infrastructure
facilities
Asset
management
Cost optimizations in terms of
the maintenance of social
infrastructure facilities.
A unified approach to the
management of social
infrastructure facilities in
subsidiaries.
Transfer of residential
properties to municipalities
and managing companies.
Organization of
production
activities
Rotational
schedule
Infrastructure
objects of shift
camps,
dormitories,
consumer
services
facilities
HR
Management
Material incentives (high
wages)
Creation of the environment
for attracting and retaining
staff
Medical
preventive
maintenance
and medical
aid to
employees and
the population
The remoteness
of production
facilities (140-
700 km) from
urban and rural
settlements
Medical
facilities
CSR
Management
Physical and cultural
development of human
capital
Charity, sponsorship, co-
financing of social programs
Rehabilitation
of workers
The need for
long rest,
climate change
Resorts,
health resorts,
tourist centers
Source: compiled by the authors.
In order to better establish the choice of managerial tools applied within the
management of social infrastructure facilities we have developed several criteria for
its classification such as its principal purpose, functions, types of facilities and its
profitability.
We suggested the following criteria for its classification: its principal purpose,
functions, types of facilities and its profitability. We have singled out two groups of
facilities according to its principal purpose – life support facilities and social
development facilities (Fig. 1).
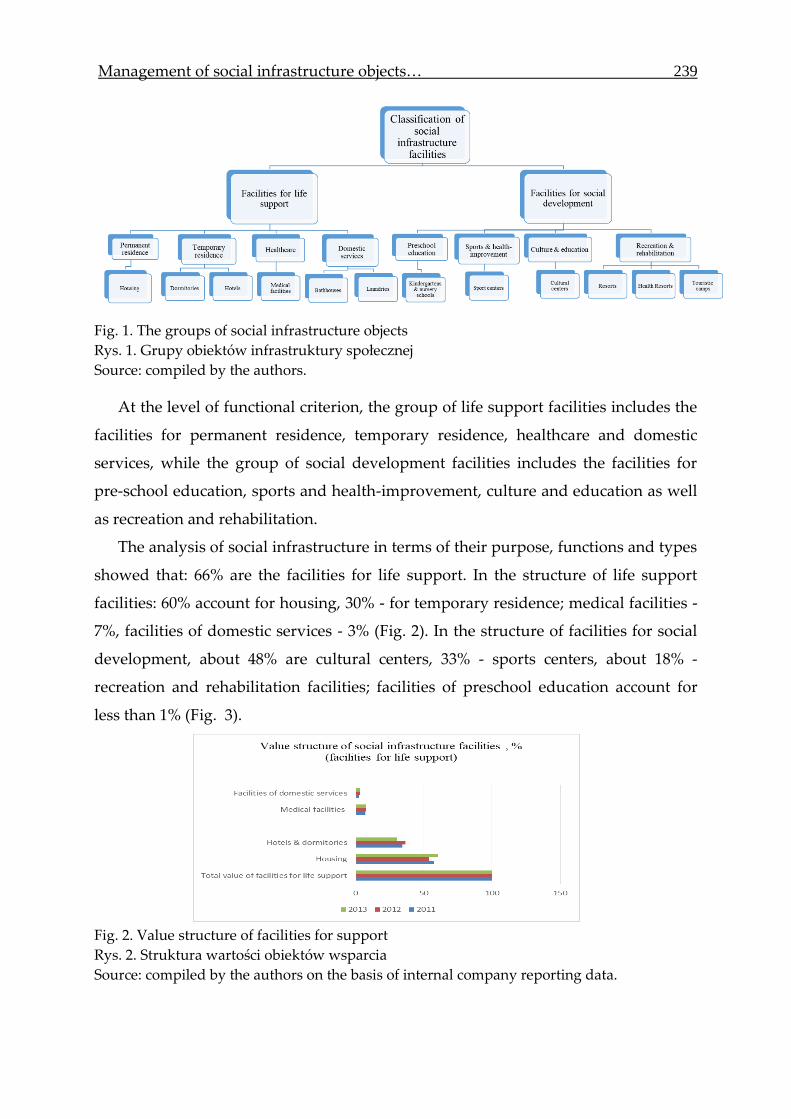
Management of social infrastructure objects… 239
Fig. 1. The groups of social infrastructure objects
Rys. 1. Grupy obiektów infrastruktury społecznej
Source: compiled by the authors.
At the level of functional criterion, the group of life support facilities includes the
facilities for permanent residence, temporary residence, healthcare and domestic
services, while the group of social development facilities includes the facilities for
pre-school education, sports and health-improvement, culture and education as well
as recreation and rehabilitation.
The analysis of social infrastructure in terms of their purpose, functions and types
showed that: 66% are the facilities for life support. In the structure of life support
facilities: 60% account for housing, 30% - for temporary residence; medical facilities -
7%, facilities of domestic services - 3% (Fig. 2). In the structure of facilities for social
development, about 48% are cultural centers, 33% - sports centers, about 18% -
recreation and rehabilitation facilities; facilities of preschool education account for
less than 1% (Fig. 3).
Fig. 2. Value structure of facilities for support
Rys. 2. Struktura wartości obiektów wsparcia
Source: compiled by the authors on the basis of internal company reporting data.

240 MEET 2018
Fig. 3. Value structure of facilities for social development
Rys. 3. Struktura wartości obiektów rozwoju społecznego
Source: compiled by the authors on the basis of internal company reporting data.
The main argument for the transfer of social infrastructure facilities to the
municipalities is high level of maintenance costs.
Indeed, the recreation and rehabilitation facilities are the only profitable type of
social infrastructure facilities while the rest of social infrastructure facilities are
unprofitable for the Subsidiary. The profitability of social infrastructure facilities is
less than 100%, with the exception of recreation and rehabilitation facilities (Fig. 4)
Fig. 4. The profitability of social infrastructure facilities
Rys. 4. Rentowność obiektów infrastruktury społecznej
Source: compiled by the authors on the basis of internal company reporting data.
Within the life support facilities, the largest share in the structure of costs
& income is provided by the facilities for temporary residence (hotels and
dormitories). The share of income coming from housing facilities is less than 10%,
the share of costs is about 20% (Fig. 5).

Management of social infrastructure objects… 241
Among the recreation and rehabilitation facilities more than 40% of the costs are
given by pre-school education facilities, sports and cultural centers. The income
coming from recreation and rehabilitation facilities is more than 60% (Fig. 6).
Fig. 5. Costs & income structure in terms of life support facilities
Rys. 5. Koszty i struktura dochodów pod względem urządzeń podtrzymujących życie
Source: compiled by the authors on the basis of internal company reporting data.
Fig. 6. Costs & income structure in terms of social development facilities
Rys. 6. Koszty i struktura dochodów pod względem rozwoju społecznego
Source: compiled by the authors on the basis of internal company reporting data.
As you can see from the analysis of the objects structure, some facilities
(healthcare, pre-school education, culture and sport centers) do not have the
potential for revenue growth, therefore, it is proposed to increase income by leasing
unused facilities. In this way, it is possible to distinguish two dimensions of
management of the facilities, they are facilities’ restructuring and decrease in loss
ratio of their usage (Fig. 7).

242 MEET 2018
Fig. 7. Options of the management of social infrastructure facilities of the Subsidiary of
Gazprom
Rys. 7. Opcje zarządzania obiektami infrastruktury społecznej Spółki Zależnej Gazprom
Source: compiled by the authors.
16.5. Conclusions
1. The social infrastructure of the gas company is a complex of facilities necessary
for the life support and social development of the company's human capital.
2. The structure of social infrastructure facilities depends on the external and
internal factors of the gas company's business activities as well as on the
operational conditions in the region of presence.
3. The effectiveness of management of social infrastructure facilities under the
context of Gazprom is determined by the management policy applied by the
state towards the companies with state participation, by the property policy of
Gazprom and by the current needs of social welfare and development of human
resources in the region of the company's presence.
4. Management of social infrastructure facilities should involve: transfer of the
facilities of domestic services to the municipalities and managing companies;
Facilities’ restructuring
Housing, dormitories, hotels, domestic services
transfer to municipalities and
managing companies
Hotels, domestic services
outsourcing of social services
Dormitories –
leasing of unused
facilities
Medical facilities - transfer to
municipalities while keeping the facilities located in the remote
areas
Decrease in loss ratio (increase in profitability)
of using facilities
Domestic services –introduction of
new services
Dormitories – increasing the payment fee
Medical facilities – introduction of
paid service available for the
population
Facilities’ restructuring
Pre-school education facilities– transfer to
municipalities
Sport & culture facilities –leasing of
unused facilities
Recreation and rehabilitation
facilities – development through the
implementation of investment
projects
Decrease in loss ratio (increase in
profitability) of using facilities
Cultural facilities-
Use of facilities for Company's
production needs
(holding corporate
meetings of shareholders)
LIFE SUPPORTING FACILITIES SOCIAL DEVELOPMENT FACILITIES

Management of social infrastructure objects… 243
limited transfer of medical facilities to the municipalities in remote areas;
leasing of unused facilities; development through the implementation of
investment projects; outsourcing of social services; introduction of additional
paid services available for the population; increasing the payment fee.
Bibliography
1. Agarkov, S.A., Kozlov, A.V., Fedoseev, S.V., Teslya, A.B. (2018). Osnovnye
napravleniya povysheniya ehffektivnosti hozyajstvennoj deyatel'nosti
v Arkticheskoj zone Rossijskoj Federacii. Zapiski Gornogo instituta 230, 209-216.
DOI: http://pmi.spmi.ru/index.php/pmi/article/view/6415/7862
2. Baron, D. (2001). Private Politics, Corporate Social Responsibility and Integrated
Strategy. Journal of Economics and Management Strategy, 10 (1), 7-45.
3. Blechzin, I.Y. (2017). The strategy of social-oriented development of a global
energy company. Izvestiya Sankt-Peterburgskogo gosudarstvennogo ehkonomicheskogo
universiteta, 1(103), 115-125.
4. Carroll, A.B., Buchholtz, A.K. (2012). Business and Society: Ethics, Sustainability
and Stakeholder Management. 8th Edition, Mason, OH: South-Western Cengage
Learning.
5. Chen, J.C., Roberts, R. (2008). Corporate Charitable Contributions: A Corporate
Social Performance or Legitimacy Strategy? Journal of Business Ethics, 131-144.
doi: http://dx.doi.org/10.1007/s10551-007-9567-1
6. Godovoj otchet PAO «Gazprom neft'» za 2016 g. (2017). https://csr2016.gazprom-
neft.ru/#safe-development
7. Gosudarstvennyj doklad «O sostoyanii i ispol'zovanii mineral'no-syr'evyh
resursov
Rossijskoj Federacii v 2015 godu» (2016). http://www.mnr.gov.ru/docs/o_sostoy
anii_i_ispolzovanii_mineralno_syrevykh_resursov_rossiyskoy_federatsii/
8. Dzhafarova, S.A. (2012). Teoreticheskie aspekty ponyatiya “social'naya
infrastruktura”. Ekonomicheskie nauki 8 (93), 68-70.
DOI: http://ecsn.ru/articles/index/201208
9. Husted, B. de Jesus Salazar J. (2006). Taking Friedman Seriously: Maximizing
Profits and Social Performance. Journal of Management Studies, 43 (1), 75-91.
doi: http://dx.doi.org/10.1111/j.1467-6486.2006.00583.x
10. Jochimsen, R. (1966) Theorie der Infrastruktur. Tubingen: Mohr (Siebeck).

244 MEET 2018
11. Koh, I.A. (2015). Social'naya infrastruktura kak forma institucializacii processov
modernizacii. Vestnik Omskogo universiteta. Seriya: ehkonomika 3, 213-219.
DOI: http://journal.omeco.ru/ru/archive/doc/2015_03.pdf
12. Kotyrlo, E. (2016). Contemporary Issues in the Circumpolar North: The Economy
of the Circumpolar North University of the Arctic. Module 9: Northern Social
Infrastructure DOI: https://members.uarctic.org/media/1596801/cs-331-1-elana-
kotyrlo-basic-economic-concepts-as-applied-to-the-circumpolar-north.pdf
13. Lee, M.P. (2008). A review of the theories of corporate social responsibility: its
evolutionary path and the road ahead. International Journal of Management Reviews
10, 53–73. doi: http://dx.doi.org/10.1111/j.1468-2370.2007.00226.x
14. Maksimova, T.G, CHuzhbovskij, K.L. (2017). Povyshenie ehffektivnosti ispol'
zovaniya neprofiltnyh aktivov predpriyatiya: problemy i puti ih resheniya
DOI: https://doi.org/10.24158/pep.2017.1.12
15. Marinina, O.A., Nevskaya, M.A. (2017). Specific nature of labour management in
the oil and gas sector in the Russian Far North. International Journal of Applied
Business and Economic Research 15 (8), 177-185 . doi: https://www.researchgate.net/
publication/317745811
16. Nurkse, R. (1953). Problems of Capital Formation in Underdeveloped Countries.
Oxford University Press: Oxford.
17. Ponomarenko, T.V., Vol'nik, R., Marinina O. A. (2016). Korporativnaya
social'naya otvetstvennost' ugol'noj otrasli (praktika rossijskih i evropejskih
kompanij). Zapiski Gornogo Instituta, 222, 882-891. doi: http://dx.doi.org/10.18454/
pmi.2016.6.882.
18. Riecen, G., Yavas, U. (2001). Improving Quality of Life in a Region: A Survey of
Area Residents and Public Sector Implications. International Journal of Public
Sector Management 14 (7), 556-568 doi: https://www.researchgate.net/
publication/247615968
19. Toshchenko, Z.H.T. (1980). Social'naya infrastruktura: sushchnost' i puti razvitiya.
M.: Mysl'.
20. Webb, K., ed. (2004). Voluntary Codes: Private Governance, the Public Interest, and
Innovation. Carleton Research Unit for Innovation, Science and Environment:
Ottawa.

Management of social infrastructure objects… 245
MANAGEMENT OF SOCIAL INFRASTRUCTURE OBJECTS OF THE
MINING COMPANIES ON NEWLY-DEVELOPED TERRITORIES
Abstract
In the Russian Federation, the extraction and production of mineral resources,
particularly, hydrocarbons are transferred to the northern regions with severe
climatic conditions and underdeveloped infrastructure. Therefore, the development
of these regions considerably depends on the business of large companies, such as
Gazprom, who are becoming responsible for the formation and development of
social infrastructure. At the same time, the maintenance of social infrastructure
facilities entails significant costs for the company, thus, provoking contradictions
between the company's social obligations and its financial capabilities. However, the
reduction of social infrastructure without regard to the need for these facilities can
lead to a decrease in the quality of life of the population of the region, and also affect
the state of the company's human resources. This circumstance requires more
objective research of the objects of the social infrastructure of the company, their
structure, condition, possible use. Purpose of the article is to develop the
recommendations for the management of social infrastructure facilities of a large
mining company. Methodology includes the analysis of the structure of social
infrastructure facilities (based on the example of Russian gas producing company),
analysis of the factors influencing the use and application of social infrastructure
facilities. This report is a synthesis of the research on the topic "Methodological
recommendations for ensuring effective asset management of a gas company". The
study is dedicated to resolving the practical problem concerning the use of social
infrastructure facilities under the context of a particular company - the subsidiary of
Gazprom. Thus, the main sources of empirical data are the materials provided by the
company. We have developed the classification of social infrastructure facilities. We
have also provided the proposals concerning the use and reorganization of social
infrastructure facilities of a gas producing company, taking into account commercial
and social significance of the facilities.
Keywords: corporate social responsibility, management, social infrastructure
facilities.

246 MEET 2018
ZARZĄDZANIE OBIEKTAMI INFRASTRUKTURY SPOŁECZNEJ
PRZEDSIĘBIORSTW GÓRNICZYCH NA NOWO ZBUDOWANYCH
TERENACH
Streszczenie
W Federacji Rosyjskiej wydobycie i produkcja zasobów mineralnych,
w szczególności węglowodorów, przenoszona jest do północnych obszarów
o surowych warunkach klimatycznych i cechujących się nierozwiniętą
infrastrukturą. Tym samym rozwój tych obszarów w dużej mierze zależy od
działalności dużych spółek, takich jak Gazprom, które stają się odpowiedzialne za
utworzenie i rozwój infrastruktury społecznej. Jednocześnie konserwacja
infrastruktury społecznej to znaczące koszty dla spółek, które tworzą sprzeczności
między zobowiązaniami społecznymi spółki a jej możliwościami finansowymi.
Jednakże ograniczenie infrastruktury społecznej bez względu na potrzeby tych
obiektów może prowadzić do obniżenia jakości życia populacji regionu i wpłynąć na
stan zasobów ludzkich firmy. Te okoliczności wymagają obiektywnych badań
dotyczących obiektów infrastruktury społecznej spółki, ich struktury, stanu,
możliwego zastosowania. Celem artykułu jest opracowanie zaleceń na potrzeby
zarządzania obiektami infrastruktury społecznej dużej spółki wydobywczej.
Metodologia obejmuje analizę struktury obiektów infrastruktury społecznej
(w oparciu o przykład rosyjskiej spółki produkującej gaz), analizę czynników
wpływających na zastosowanie i wykorzystanie obiektów infrastruktury społecznej.
Ten raport stanowi syntezę badania w temacie „Metodologiczne zalecenia
zapewniające skuteczne zarządzanie aktywami spółki gazowej”. Badanie ma na celu
rozwiązanie praktycznego problemu dotyczącego zastosowania obiektów
infrastruktury społecznej w kontekście konkretnej spółki – spółki zależnej
Gazpromu. Tym samym głównym źródłem danych empirycznych są materiały
przekazane przez spółkę. Opracowaliśmy klasyfikację obiektów infrastruktury
społecznej. Przedstawiamy również propozycje dotyczące zastosowania
i reorganizacji obiektów infrastruktury społecznej spółki produkującej gaz, biorąc
pod uwagę znaczenie handlowe i społeczne tych obiektów.
Słowa kluczowe: Społeczna odpowiedzialność biznesu, zarządzanie, obiekty
infrastruktury społecznej.

Patrycja BĄK1, Marta SUKIENNIK2, Mariusz KAPUSTA3 1AGH University of Science and Technology, Poland (e-mail: [email protected]) 2 AGH University of Science and Technology, Poland
(e-mail: [email protected]) 3 AGH University of Science and Technology, Poland (e-mail: [email protected])
17. THE ISSUES RELATED TO OCCUPATIONAL HEALTH AND
SAFETY CULTURE IN THE MINING INDUSTRY
17.1. The importance of the occupational health and safety culture in
the mining industry
Culture is defined as a comprehensive set of rules, conditions and methods of
human activity, the products of human labour and artistic activity constituting
a collective attainment of a community. Culture is built on the specific human
biological and social properties, and the living conditions, and undergoes historical
development and transformation. The relation between the rate of accidents and
near-misses in an organisation, and the occupational health and safety culture, has
been studies and analysed a number of times (Lee and Harrison, 2000). The aspect of
the culture pertaining to occupational risk and safety is defined as the safety culture
of an organisation. The culture is formed by the set of standards, values and beliefs
characteristic for the given organisation which the employees adhere to and which
determine the conduct and behaviour of individuals and groups within the
organisation (McKenna and Beech, 1999).
One of the crucial factors shaping the safety culture is employee education and
training. A high safety culture is a sign of high safety level in the organisation
(Mearns et al., 1998). Therefore, it can be said that the companies which have taken
care to provide their employees with high level of education based on current
training methods have a high safety culture. The occupational health and safety
management system, which is one of the elements of the organisation management

248 MEET 2018
system, includes: the organisational structure, planning, accountability, the rules of
conduct, the procedures, processes and resources necessary to develop, implement,
enforce, review and maintain the occupational health and safety policy. Particular
focus is given to the appropriate design and implementation of the following
elements to facilitate the growth and reinforcement of the safety culture:
determining the occupational health and safety goals,
engaging the management in the OHS (occupational health and safety) policy,
competence and training,
motivation,
communication,
monitoring.
The proper functioning of the elements listed above largely determines the
shaping of the employees’ conduct and behaviour towards the occupational health
and safety.
In the mining industry, line employees are exposed to accident and health
hazards. The process of implementing and shaping the culture among the employees
is long-term and should take into account a number of internal and external
conditions specific to the given mine. Figure 1 provides a diagram of selected factors
impacting the development of the occupational health and safety in a mining
company (Kapusta et al., 2016).

The issues related to occupational health… 249
Fig. 1. Factors impacting the safety culture level in a company
Rys. 1. Czynniki wpływające na poziom kultury bezpieczeństwa w spółce
Source: own study.
17.2. Key safety culture factors identification areas
In the Authors’ opinion, the occupational health and safety culture should be
identified and diagnosed in the following areas:
vision and goals;
occupational risk assessment;
identification of hazards;
safety controls and control of management behaviour;
training and compliance with OHS regulations;
accidents and near-misses.
In each of the aforementioned areas, the company should assess the employee
awareness of the issue, and should also work towards continuous maintenance and
improvement of the quality of those factors. Employee training is an important block
SAFETY CULTURE
manager’s personality
representative’s personality
literature of the subject
expert studies
traditions
experiences of others
company management
structure
manufacturing process
characteristics
cooperative relations with subcontractors
own experiences
law
standards
knowledge of OHS
regulations by the managers

250 MEET 2018
in building the organisation’s safety culture (Bąk et al., 2016; Sukiennik et al., 2016;
Sukiennik and Bąk, 2017). The necessity of training arises directly from the applicable
law and also from the requirements to which the occupational health and safety
management systems must conform to. All employees of the organisation must be
competent in their functions in the company. The documented competences of the
employees should conform to the requirements of the company. In the case of the
occupational health and safety management system, the employees should have the
appropriate knowledge and awareness of how to perform their duties in a manner
ensuring their own safety and the safety of their co-workers (Prawo geologiczne
i górnicze…).
Identifying the key occupational safety areas determines the employees’ approach
to and conduct in the work environment. The safety culture is shaped first and
foremost by education, beginning with the knowledge acquired in school, through
workplace training, all forms of work safety-related education in the media
(TV, radio, press), to initiatives popularising the safety culture (Nahrgang et al.,
2011). By shaping the employees’ awareness and providing them with appropriate
competences, we are conditioning the employees to behave and act in the desired
way. Those activities will succeed if the employee becomes aware of the purpose and
meaning of their activities, and the consequences of their actions for everyone around
them. The applicable laws obligate the supervisory institutions and companies to
train the workforce in the occupational health and safety rules (Kapusta et al., 2017;
Kapusta, 2017). The organisation should put in place and maintain the appropriate
procedures to make their employees aware of:
the types of hazards across the organisation and on individual positions, and
the related occupational risk,
the benefits for the employees and the organisation arising from the elimination
of hazards and the reduction of occupational risk,
their tasks and responsibilities in ensuring the compliance with the
occupational health and safety policy, and the procedures and requirements of
the occupational health and safety management system, along with the
requirements concerning the readiness and response to work accidents and
serious breakdowns,
the potential consequences of non-compliance with the procedures in place.

The issues related to occupational health… 251
Engagement of the employees in the occupational health and safety management
processes make it possible to achieve both the general and the specific goals.
17.3. Methodology of the study
The issues related to the occupational health and safety culture in the mining
industry was diagnosed using a survey of a sample group.
The results of the survey allowed the Authors to determine those elements among
the key factors which will contribute to the shaping of the OHS culture in the mining
companies.
The survey took the form of a pilot study and was conducted on a sample group
of persons professionally related to the mining industry. The analysis of the
respondents according to job seniority (Fig. 2) shows that more than half of the
sample group are young employees with short tenure (1 to 5 years). This might
suggest knowledge gaps both with respect to the company itself and the guidelines
on the knowledge of the OHS rules in the given position.
Fig. 2. Respondents according to job seniority
Rys. 2. Respondenci według stażu pracy
Source: own study.
The survey on the job satisfaction level (Fig. 3) is positive, with the clear majority
of the respondent satisfied with their job, which might translated into work
commitment.
52%
25%
9%
3%
8%
3%
1 - 5 years
6-10 years
11-15 years
16-20 years
21-25 years
more than 25 years

252 MEET 2018
Fig. 3. Job satisfaction analysis
Rys. 3. Analiza satysfakcji z pracy
Source: own study.
The survey on the safety certificates possessed by the employers of the sample
group (Fig. 4) shows than nearly half of the respondents know and are convinced
that their company has the relevant safety certificates. However, the fact that nearly
20% of the respondents had no knowledge on the matter is a reason for concern. This
suggests that either the company management has failed to communicate the
relevant information, or that the employees themselves are not interested in the
matter. Both reasons are a cause for concern and steps should be taken to ensure that
every employee has a broad knowledge on the certification of their company.
Fig. 4. Analysis of the certification of employers
Rys. 4. Analiza certyfikacji pracodawców
Source: own study.
The pilot studies comprised a questionnaire of fourteen closed-ended thematic
questions. The surveyed issues related mainly to the position and role of the OHS
rules in the company’s culture. The questions were closed-ended and scored on the
scale from 1 to 7. This methodology makes it possible to identify the degree of the
respondents’ familiarity with the given issue. The purpose of the scoring system was
to encourage the persons responding to the survey to precisely grade each question.
However, for the further analysis of the results, the Authors adopted specific
premises. The scores of 5÷7 were considered positive answers, while the scores of 1÷3
were interpreted as negative. The answers scored 4 were considered neutral.
65%
20%
15%
yes
no
I do not know
49%
33%
18%
yes
no
I do not know

The issues related to occupational health… 253
17.4. The analysis of the survey results in terms of the scope of
identification of the key aspects of the OH&S culture in the
companies
Analysing the answers to the question: “Please grade your knowledge of the
vision and goals of the company you are employed in”, one can notice that 21% of
the respondents either do not know or have only rudimental knowledge of the vision
and goals of their company (Fig. 5). This is not a majority group but it is a cause for
concern, as it shows that a sizable group of employees have no interest in the
company they are working for. This does not contribute to the improvement of the
organisational culture in those companies; furthermore, in some cases it can even
deteriorate it. The companies should pay more attention to foster and reinforce their
relationship with their employees.
Fig. 5. The percentages of answers on the knowledge of the vision and goals of the company
Rys. 5. Procentowe odpowiedzi na temat wiedzy dotyczącej wizji i celów spółki
Source: own study.
In terms of the analysis of the occupational risk, 30% of the respondents had no
knowledge of the occupational risk assessment in their company (Fig. 6). This is
a considerably large percentage which clearly shows that the issue must be
addressed appropriately. The purpose of the occupational risk assessment is to
prevent the harmful consequences of the work environment hazards. The assessment
consists in analysing the work aspects to determine which hazards in the work
environment might cause injuries or affect the employee’s health, and whether those
hazards can be eliminated. If the hazards cannot be eliminated, the risk assessment
highlights the actions to be taken to reduce the occupational risk related to those
11
10
79
What is the level of your knowledge of the vision and the
objectives of the company that you work for?
I have no knowledge average very good

254 MEET 2018
hazards. In the case in question, 20% of the respondents answering that such risk
assessment was not conducted is a major issue.
Fig. 6. The percentages of answers to the questions on the knowledge of the occupational
risk assessment by the employees
Rys. 6. Procentowe odpowiedzi na pytania dotyczące wiedzy pracowników dotyczącej oceny
ryzyka zawodowego
Source: own study.
Hazards identification is another crucial element shaping the OHS culture in the
companies. In this respect, particular focus is given on the respondents’ subjective
assessment of their own level of awareness of the potential hazards in their
workplace. The results are quite optimistic, with 86% of the respondents grading
their knowledge level as high, and only 11% reporting very low knowledge level, or
no knowledge at all (Fig. 7).
Fig. 7. The percentages of answers to the question on the knowledge of workplace hazards
Rys. 7. Procentowe odpowiedzi na pytanie dotyczące wiedzy o zagrożeniach w miejscu
pracy
Source: own study.
One of the most important areas of the study involved the supervision by the
employer and the management over the employees’ compliance with the OHS rules.
70
20
10
Has an occupational risk assessment been conducted for your
job?
yes no I do not know
11 3
86
Please indicate your perceived level of awareness concerning
the hazards present in your job
none average high

The issues related to occupational health… 255
Unfortunately, 28% of the respondents gave a negative assessment of their
immediate supervisors (Fig. 8). Moreover, a further 18% were unable to clearly
determine whether their supervisors’ actions in terms of work safety were
appropriate or not. This is undoubtedly caused by high employee turnover and
frequent changes of persons directly supervising the employees. In the case of
younger supervisors, a frequently cited argument was their inexperience caused by
short tenure in the company. On the other hand, in the case of senior employees,
their prestige and experience are offset by the comments on routine and tendency for
taking and accepting excess risk related to their work.
Fig. 8. The percentages of answers to the question on the compliance with the safety
regulations by the management
Rys. 8. Procentowe odpowiedzi na pytanie o przestrzeganie przepisów BHP przez
kierownictwo
Source: own study.
The attitudes and behaviours of the employees are heavily influenced by training
and their perceived need to comply with the OHS rules. The results of the survey
show a high correlation with the area of responsibility of the management staff. 27%
of the respondents gave a negative assessment and 22% considered it to be “neutral”
(Fig. 9). In this case, the result may be considered “disappointing”, as frequent
training is characteristic for the mining industry. The line employees attend
periodical training not less than once a year. Frequently, individual solutions are
adopted in the mining plants, e.g. weekly OHS training given by the supervisory
staff. Furthermore, the employer often provides financial incentives for the
employees by holding OHS knowledge contests.
28
18
54
What is your opinion about the behavior of the members of
your company’s management in relation to submitted
employee’ comments and observations concerning OHS?
none average full involvement
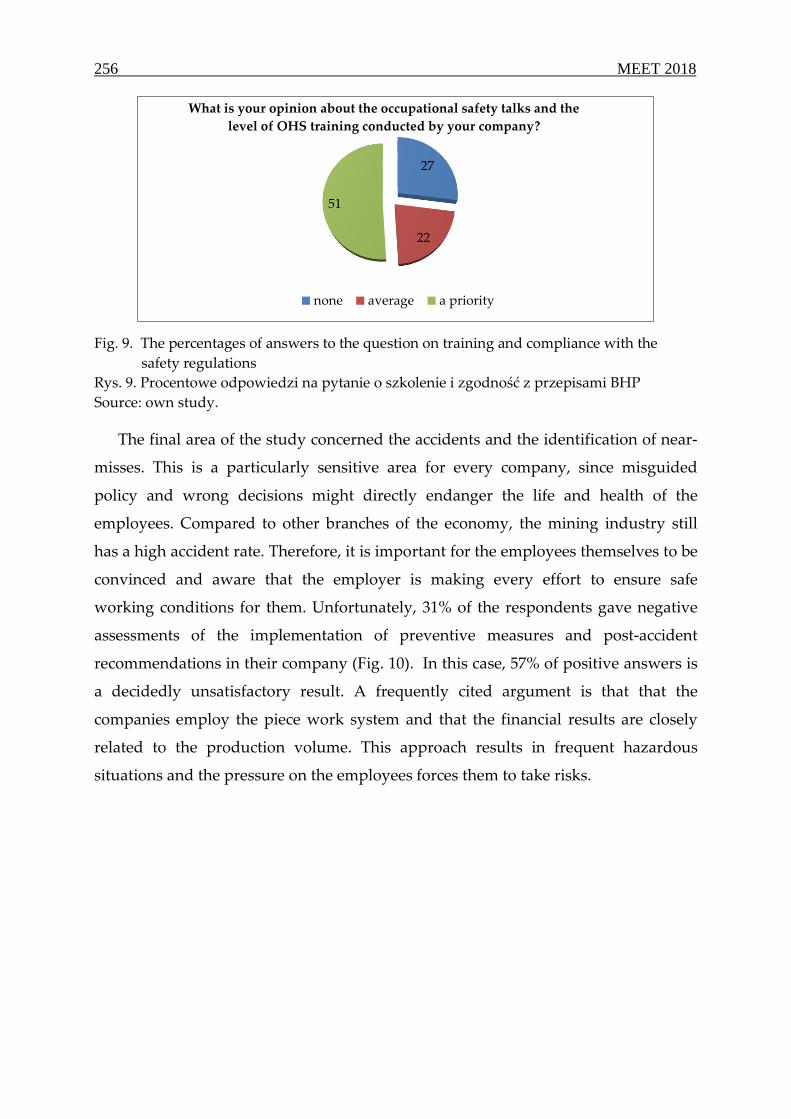
256 MEET 2018
Fig. 9. The percentages of answers to the question on training and compliance with the
safety regulations
Rys. 9. Procentowe odpowiedzi na pytanie o szkolenie i zgodność z przepisami BHP
Source: own study.
The final area of the study concerned the accidents and the identification of near-
misses. This is a particularly sensitive area for every company, since misguided
policy and wrong decisions might directly endanger the life and health of the
employees. Compared to other branches of the economy, the mining industry still
has a high accident rate. Therefore, it is important for the employees themselves to be
convinced and aware that the employer is making every effort to ensure safe
working conditions for them. Unfortunately, 31% of the respondents gave negative
assessments of the implementation of preventive measures and post-accident
recommendations in their company (Fig. 10). In this case, 57% of positive answers is
a decidedly unsatisfactory result. A frequently cited argument is that that the
companies employ the piece work system and that the financial results are closely
related to the production volume. This approach results in frequent hazardous
situations and the pressure on the employees forces them to take risks.
27
22
51
What is your opinion about the occupational safety talks and the
level of OHS training conducted by your company?
none average a priority

The issues related to occupational health… 257
Fig. 10. The percentages of answers to the question on accidents and near-misses
Rys. 10. Procentowe odpowiedzi na pytanie o wypadki i sytuacje grożące wypadkiem
Source: own study.
17.5. Conclusions
The mining business is one of the branches of industry with the highest work-
related accident rates. On the basis of the conducted surveys, it can be concluded that
there is room for improvement of the work safety conditions in a number of
identified areas. The key aspect is the broadly defined shaping of the OHS culture
among the employees. The anonymous surveys enabled the employees to
subjectively assess the weaknesses of the OHS policy and provide directions for the
employers and management.
It can also be concluded that the employees are familiar with the vision and goals
of their companies, are satisfied with their work. Also, most employees are able to
identify the workplace hazards and the occupational risk. A clear cause for concern is
the fact that around 30% of the respondents identify a deliberate disregard for the
OHS rules both by the employees and their immediate supervisors. A similar
percentage of the respondents clearly identify the issues related to the quality of
training, and the prevention and reporting of near-misses.
Bibliography
1. Bąk, P., Sukiennik, M., Kowal, B., (2016). Corporateculture in terms of
management processes in the Polish mining companies. Inżynieria Mineralna –
Journal of the Polish Mineral Engineering Society, 17 (2).
31
12
57
What is your opinion about the implementation of preventive
actions and post-accident recommendations in your
company?
none average full involvement

258 MEET 2018
2. Kapusta, M., Bąk, P., Sukiennik, M. (2016). Rola kultury bezpieczeństwa i higieny
pracy w przedsiębiorstwie wydobywczym. Przegląd Górniczy, 72 (8).
3. Kapusta, M., Sukiennik, M, Bąk, P. (2018). Effectiveness of Occupational Health
and Safety Rules in Shaping Organizational Culture. Inżynieria Mineralna –
Journal of the Polish Mineral Engineering Society, 1.
4. Kapusta, M. (2017). Wpływ osób dozoru górniczego na poprawę warunków bhp,
[The influence of mining supervision personnel on the improvement of health
and safety conditions], Inżynieria Mineralna - Journal of the Polish Mineral
Engineering Society, 2(40).
5. Lee, T., Harrison, K. (2000). Assessing safety culture in nuclear powerstation.
Safety Science, 34.
6. McKenna, E., Beech, N. (1999). Zarządzanie zasobami ludzkimi, Felberg SJA:
Warszawa.
7. Mearns, K., Flin, R., Gordon, R. (1998). Measuring safety climate on offshoring
installations. Work &Stress, 45 (2).
8. Nahrgang, J.D., Morgeson, F.P., Hofman, D.A. (2011). Safety at work: A meta-
analityc investigation of the link between job resources, burnout, engagement,
and safety outcomes. Journal of Applied Psychology, 96(1), 71-94.
doi: http://dx.doi.org/10.1037/a0021484
9. Ustawa z dnia 9 czerwca 2011 r. Prawo geologiczne i górnicze, Dz.U. Nr 163. Poz. 981.
10. Sukiennik, M., Bąk, P., Kapusta, M. (2016). Kultura korporacyjna a czynnik
ludzki w polskich przedsiębiorstwach wydobywczych. Inżynieria Mineralna –
Journal of the PolishMineral Engineering Society, 2.
11. Sukiennik, M., Bąk, P. (2017). Corporate culture versus Corporate Social
Responsibility in Polish companies of the energy sector, [in:] SEED,
2nd International Conference On The Sustainable Energy And Environment
Development, Kraków.
THE ISSUES RELATED TO OCCUPATIONAL HEALTH AND
SAFETY CULTURE IN THE MINING INDUSTRY
Abstract
The mining business is one of the branches of industry with the highest work-
related accident rates. In terms of the occupational health and safety culture, it is
crucial to make every effort to minimise or, preferably, eliminate the work accidents.

The issues related to occupational health… 259
This paper is an attempt at diagnosing the issues related to the occupational health
and safety culture, using surveys. The key aspect is the broadly defined shaping of
the OHS (occupational health and safety) culture among the employees. The
anonymous surveys enabled the employees to subjectively assess the weaknesses of
the OHS policy and provide directions for the employers and management.
Keywords: organisational culture, occupational health and safety, mining industry.
KWESTIE ZWIĄZANE Z KULTURĄ BEZPIECZEŃSTWA I HIGIENY
PRACY W BRANŻY WYDOBYWCZEJ
Streszczenie
Branża wydobywcza jest jedną z gałęzi przemysłu cechującą się najwyższym
wskaźnikiem wypadków przy pracy. W kontekście kultury bezpieczeństwa i higieny
pracy ważnym jest, by podjąć wszelkie możliwe działania, aby zminimalizować lub
wyeliminować wypadki przy pracy. Artykuł ma na celu zdiagnozowanie kwestii
związanych z kulturą bezpieczeństwa i higieny pracy z zastosowaniem ankiet.
Kluczową kwestią jest szeroko rozumiana kultura BHP (bezpieczeństwo i higiena
pracy) wśród pracowników. Anonimowe ankiety pozwoliły pracownikom
subiektywnie ocenić braki w polityce BHP i przekazać wskazówki dla pracodawców
i kierownictwa.
Słowa kluczowe: Kultura organizacyjna, bezpieczeństwo i higiena pracy, branża
wydobywcza.


Alexey FADEEV1, Anna TSVETKOVA2, Alexey CHEREPOVITSYN3 1 G. P. Luzin Institute for Economic Studies of the Kola Science Centre of the RAS,
Russia (e-mail: [email protected]) 2 Saint-Petersburg Mining University, Russia (e-mail: [email protected]) 3 Saint-Petersburg Mining University, Russia (e-mail:
18. SURVEY OF STAFFING NEEDS TO IMPLEMENT PROJECTS ON
THE ARCTIC SHELF
18.1. Introduction
Currently, the rate of growth of oil production in the world exceeds the growth
rate of its consumption. Nevertheless, the issue of maintaining the levels of oil and
gas production to meet the future needs of the world and Russian economy
continues to be relevant. In this regard, the role of the Arctic region and the Northern
Sea Route for the national security of the Russian Federation is increasingly growing.
Today, the Arctic shelf of Russia is treated as a large region, which industrial
development will balance the decline in oil and gas production in the existing oil and
gas producing centers of the country (Toskunina, 2007). It has a significant
hydrocarbon potential, which is able to satisfy a significant part of this country's
energy needs and provide great economic benefits. The area of the deposits on the
shelf promising for the development is 4-6 million km2; the shelf hydrocarbon
reserves that have been already explored amount to about 100 billion tons (Shishkin
et al., 2016). However, this potential fulfillment requires addressing complex
regulatory, legal, technical and technological, economic and environmental issues
(Kasantsev, 2006; Ananiev, 2010).
Successful development of the Arctic region is inextricably associated with
providing the projects being implemented with high-end professionals. It is human
resources that constitute the key component to success in taking strategic solutions,

262 MEET 2018
solving the most complicated engineering and technical and economic problems the
country faces today when handling the issues of development of the Arctic shelf
(Fadeev, 2010).
It should be mentioned that a number of experts put the development of the shelf
on a par with space exploration, nanotechnology and electronics. Implementation of
future projects on the shelf will require the science and industry to develop and
produce a large number of complex technical means: from vessels and drilling
platforms to equipment and instruments for geophysical, navigation and other
purposes (Ilyinsky et al., 2006). The process of development of oil and gas fields on
the shelf is characterized by high capital intensity of projects, the need to use
advanced marine technologies, and a high investment risk (Fadeev, 2012, Marinina
and Nevskaya, 2017).
It should be noted that oil is a product of a fairly uniform quality. In this aspect,
oil can be compared with coal, which is currently one of the challengers to oil, and
has a much greater heterogeneity in quality (Vasilyev, 2015). Standardized quality of
oil grades allows for their trading on the commodity exchanges. Building of a system
for exchange trading of hydrocarbon resources of the Russian Federation has been
carried out since 2009 (Vasilyev, 2012).
It stands to mention that the projects implemented in the Arctic zone, even today,
annually need dozens of thousands of additional high-end professionals (Rogozin,
2015). These figures are also confirmed by state officials. Thus, the ex-Minister of
Education and Science of the Russian Federation D. Livanov said that the average
annual staffing need for specialists with secondary vocational education to
implement projects in the Arctic zone is about 25 thousand per year (Livanov, 2015).
We are talking about complex training of experts, that is, about training of
specialists in geology and geophysics, prospecting and exploration of oil and gas
fields on the shelf of the northern seas, professionals in drilling and completion of
offshore drill wells, development of offshore fields, their development and operation,
specialists in maritime transport of hydrocarbons (including boatmasters, ship
mechanics and other specialized personnel), construction and operation of offshore
facilities and facilities for the liquefaction of natural gas and storage of hydrocarbons
and their products, management of complex offshore oil and gas projects, risk

Survey of stuffing needs… 263
assessment and decision-making specialists, integrated marine (including
international) projects, etc. (Fadeev et al., 2010).
As to the shelf of the northern seas, then specialists with unique qualifications
should work there, since liquefied gas and oil cannot be transported in the ice
anywhere else in the world. Transportation of liquefied gas needs almost space
technologies, cryogenic equipment required (gas is transported by vessel at minus
162°C). Handling this technique implies a very high educational level. Boatmasters
also should have high professional skills, since responsibility for gas transportation is
extremely high. Also, experts, candidates and doctors of sciences to conduct
a qualified examination will be required.
18.2. Literature studies
Analysis of composition of the educational institutions located in the Arctic zone
made it possible to identify the following. To date, there are 42 educational
institutions than rank among higher education organizations. For example, there are
two institutions in the Chukotka Autonomous District, six in Krasnoyarsk Territory,
twelve in Yamalo-Nenets Autonomous District (YNAO), one in Komi Republic,
fourteen in Murmansk Region, and seven in Arkhangelsk Region.
In speaking of secondary education, the number of organizations of higher
professional education that implement programs of secondary vocational education
is as follows: YNAO – 2, Murmansk Region – 4, Arkhangelsk Region – 5, Krasno-
yarsk Territory – 1.
Finally, educational organizations of secondary vocational education located in
the Arctic zone are represented as follows: YNAO – 10, Komi Republic – 5,
Arkhangelsk Region – 20, Murmansk Region – 27, Chukotka Autonomous District
– 4, Sakha Republic – 1.
At present, including with the support of the state, work is being done to increase
the network interaction between universities located in the Arctic zone. Some
universities are united in large federal universities, as well as educational consortia.
It is noteworthy that the total number of students studying at the Arctic
universities is about 40 thousand people (Leksin et al., 2000). There are also training

264 MEET 2018
centers for oil and gas corporations, where vocational training and retraining of
personnel is conducted.
Despite rather significant total number of students at the Arctic universities, the
number of students being prepared specifically for the development of the Arctic
shelf is still insufficient.
Currently, training of such specialists is carried out mainly by the following
educational institutions: the RSU of oil and gas named after I. M. Gubkin; Murmansk
State Technical University (MSTU); Northern (Arctic) Federal University;
St. Petersburg Mining University.
The proposed toolkit for estimating the demand for personnel depending on the
volume of hydrocarbons produced is a methodical basis for identifying the need for
personnel in the development of the Arctic shelf.
It must be stressed that when implementing any projects on the shelf, there is
a growing need not only for highly qualified personnel engaged directly in the
production of hydrocarbons, but also for supporting personnel. Development of
exchange trade determines the need for specialist knowledge in the field of
marketing, exchange trading, and the use of financial instruments (spot contracts,
futures, risk hedging, etc.) (Vasilyev, 2012; Tsvetkova, 2013; Nevskaya and Marinina,
2017).
The above question “Who will come to the World Ocean?” immediately sets the
task of the own personnel, capable, first, of exploring and developing new offshore
oil and gas and ocean (resource) technologies, and second, of operating the existing
technical devices ensuring the necessary level of reliability and the safety of all work
at sea, including environmental safety.
The potential of available labor resources for the implementation of projects in
many ways predetermines the staffing of the projects being implemented. The
concept of “human resources” of the company-operator implementing offshore
projects means the maximum number of employees with combined knowledge and
skills, as well as psycho-physiological and socio-cultural opportunities in the context
of specific socio-economic and scientific and technical information. Following this
logic, human resources of the oil and gas company is formed from the professional
qualities of individuals who can put into practice their knowledge, skills and
experience when implementing projects on the Arctic shelf.

Survey of stuffing needs… 265
As previously noted, the tasks related to the development of the shelf require
high-end professionals with higher professional education, as well as a whole range
of working specialties. In addition, such employees should have qualifications to
work in the Far North, and be able to withstand increased psycho-physiological
loads, which should be confirmed by the conclusion of a special medical examination
board (Fadeev, 2012).
18.3. Research results
Human resources of oil and gas companies implementing projects on the Arctic
shelf are formed of the following sources: inhabitants of the Arctic zone where the
project is being implemented; employees attracted from other regions of the country,
as well as citizens of foreign states.
In order to identify the conformity of the qualitative and quantitative
characteristics of human resources to emerging needs in the implementation of
projects on the shelf, we suggest that the model of the static balance between the
available human resources and demanded resources be employed, expressed by
a system of equations:
(1)
where:
А – higher education professionals;
В – secondary vocational education professionals;
C – auxiliary workers;
D – maintenance workers;
a – knowledge;
b – skills;
c – socio-cultural competencies;

266 MEET 2018
d – psycho-physiological possibilities;
i, n, m – types of knowledge, skills and psycho-physiological possibilities,
respectively.
φ (Aj) – actual human resources of higher education professionals, corresponding to
the expression:
(2)
φ (Вx) – actual human resources of secondary vocational education professionals,
corresponding to the expression:
(3)
φ (Сy) – actual human resources of auxiliary workers, corresponding to expression:
(4)
φ (Dz) – actual human resources of the maintenance workers, corresponding to the
expression:
(5)
λ (Aj) – regulatory human resources of higher education professionals;
λ (Вx) – regulatory human resources of secondary vocational education
professionals;
λ (Сy) – regulatory human resources of auxiliary workers;
λ (Dz) – regulatory human resources of maintenance workers;
(6)
Aji – the jth employee with higher education, possessing the ith knowledge;
Ajn – the jth employee with higher education, possessing the nth skill;
Ajk – the jth employee with higher education, possessing the kth socio-cultural
competence;

Survey of stuffing needs… 267
Ajm – the jth employee with higher education, possessing the mth psycho-
physiological capability;
Вxi – the xth employee with secondary vocational education, possessing the ith
knowledge;
Вxn – the xth employee with secondary vocational education, possessing the nth skill;
Вxk – the xth employee with secondary vocational education, possessing the kth socio-
cultural competence;
Вxm – the xth employee with secondary vocational education, possessing the mth
psycho-physiological capability;
Cyi – the yth auxiliary worker possessing the ith knowledge;
Cyn – the yth auxiliary worker possessing the nth skill;
Cyk – the yth auxiliary worker possessing the kth socio-cultural competence;
Cym – the yth auxiliary worker possessing the mth psycho-physiological capability;
Dzi – the zth maintenance worker possessing the ith knowledge;
Dzn – the zth maintenance worker possessing the nth skill;
Dzk – the zth
maintenance worker possessing the kth
socio-cultural competence;
Dzm – the zth
maintenance worker possessing the mth
psycho-physiological opportunity.
To assess the companies’ demand for personnel of various skill levels for
implementing projects on the Arctic shelf, let us denote the higher education
employees by λ (Aj), secondary vocational education employees by λ (Вх); auxiliary
workers by λ (Сy); and maintenance workers by λ (Dz).
Thus, there are three alternatives of the relationship between the human resources
of these workers and the need for employees of certain qualification. Let us consider
the following example of employees with higher education.
Case 1: λ (Aj) < φ (Aj)
The available human resources of this qualification are greater than the need for
workers with higher education. In this case, the need is fully provided by the
resources available, with a certain additional human resource formed.
Case 2: λ (Aj) = φ (Aj)
The available human resources of this qualification are equal to the need for
workers with higher education. Obviously, in this case, the need is fully provided by
the resources available. However, in case of development of production, additional

268 MEET 2018
investments, aimed at professional retraining and training of personnel, is likely to
be required.
Case 3: λ (Aj) > φ (Aj)
The available human resources of this qualification are less than the need for
higher education professionals. In this case, in order to ensure implementation of
projects, qualified training and professional retraining of personnel is required.
This model is a formalized description of the balance between the human
resources (available capacity of employees of different categories) and the need for
qualified personnel, taking into account the prospects for the development of
exploration, production and transportation of hydrocarbon raw materials. This
model can be used for forecasting and planning the number of personnel of a certain
skill in the implementation of projects on the Arctic shelf.
The static model developed by A.M. Fadeev is exemplified by shuttle tankers
operating at the Varandey field. He considers the transport component of the
Varandey field exploitation process.
First, the available potential of the North-West region of the Russian Federation
was determined in terms of the number of people who acquired professions under
curriculum of institutions of higher vocational education (HVE), secondary
vocational education (SVE), and in terms of the number of workers. As estimated, the
potential of employees with HVE is 28,070, those with SVE – 21,140, workers –
18,200, and supporting employees – 7,560 man*competencies.
Then, according to the proposed static model, A.M. Fadeev established a need for
personnel of the transport component of the process of exploitation of the Varandey
field. The below data were obtained: the demand for employees with HVE – 660, for
SVE employees – 836, for workers – 715, and for supporting employees - 88 man*
competencies.
Thus, actual demand for personnel in the transport component of the exploitation
process is less than the available potential of the region, therefore, it can be employed
without outsourcing additional labor.

Survey of stuffing needs… 269
18.4. Conclusions
Training of in-house specialists for offshore operations should become an integral
part of the country's sustainable development and a guarantee of its energy and
technological independence.
The developed toolkit for forecasting and planning the number of personnel of
a certain qualification for the development of hydrocarbon fields in the Arctic zone
can be used in a comprehensive analysis of the needs for the provision of existing
and promising projects in the Arctic region.
Along with the technical training of future engineers for the development of
marine hydrocarbon deposits, an important role in the development of the shelf is
played by the need for training personnel in the field of economics and management,
as well as a range of working specialties necessary for the safe and efficient
development of marine hydrocarbon deposits in the Arctic.
For the state, training and subsequent rational use of young specialists is an
important task: this will determine further effective social and economic
development of the country. In modern conditions, it is necessary to create a system
of training and retraining high-end professionals for the oil and gas industry
immediately in the region, which allows taking into account the features of
innovative trends in the development.
Acknowledgements
The research is carried out with the financial support of the grant of the Russian
Science Foundation, Project No. 17-02-00248 "Innovative factors in the development
of the Arctic shelf and the problem of import substitution".
Bibliography
1. Ananiev, V. (2010). To the Arctic shelf in Russia "hands do not reach". Oil & Gas
Journal, 38.
2. Dodin, D.A. (2007). Mineral resources of the Russian Arctic (state, prospects,
directions of research), 129.

270 MEET 2018
3. Fadeev, A.M., Cherepovitsyn, A.E., Larichkin, F.D., Egorov, O.I. (2010). Economic
features of the projects development of offshore hydrocarbon fields. Economic and
social changes: facts, trends, forecast 3 (11), 61-74.
4. Fadeev, A.M., Cherepovitsyn, A.E., Larichkin, F.D. (2011). Peculiarities of
personnel training for development of offshore hydrocarbon fields in the Arctic.
Problems of development of mineral-raw and fuel and energy complexes of Russia.
Proceedings of the Mining Institute 194, 332-338.
5. Fadeev, A.M. Efficient development of the Arctic territories // Website of the
Russian Council on international Affairs [Electronic resource]. – Mode of access:
http://russiancouncil.ru/inner/index.php?id_4=1328#top
6. Fadeev, A.M. (2012). Improvement of economic approaches to management of
development of marine hydrocarbon deposits of the Arctic. Apatity: publishing
house of Kola science centre RAS.
7. If Russia does not prepare personnel, then Asians will work on the development
of the Northern shelf: an interview with the Director of the Arkhangelsk branch
of the Maritime Academy. Mode of access: http://www.regnum.ru/news/
720683.html#ixzz1F9ESL0Cc
8. Ilyinsky, A.A., Mnatsakanyan, O.S., Cherepovitsyn, A.E. (2006). Oil and gas
complex of North-West Russia. Strategic analysis and development concepts.
9. Kasantsev, V. (2006). While the state is sleeping. Oil of Russia 6, 94-97.
10. Katysheva, E., Tsvetkova, A. (2017). The future of oil and gas fields development
on the Arctic shelf of Russia. [in:] International Multidisciplinary Scientific
GeoConference Surveying Geology and Mining Ecology Management, SGEM 17,
Ecology, Economics, Education and Legalizationp, 935-940.
11. Leksin, V., Shvetsov, A. (2000). Regional programs in the latest reformation
situation. Russian Economic Journal 8, 23-25.
12. Livanov, D. (2015). Arctic-info. www.arctic-info.ru (15.12 2015).
13. Rogozin, D. (2015). Arctic-info. www.arctic-infо.ru (15.12 2015).
14. Shishkin, A.I. (2016). Continental shelf of the Russian Federation and its
importance. [in:] Modern problems of natural resources management and
development of social and economic systems. Proceedings of the XII
international scientific conference. Moscow state University S.Yu. Witte:
Moscow, 93-98.

Survey of stuffing needs… 271
15. Marinina, O.A., Nevskaya, M.A. (2017). Specific nature of labour management in
the oil and gas sector in the Russian Far North. International Journal of Applied
Business and Economic Research 15(8), 177-185.
16. Nevskaya, M.A., Marinina, O.A (2017). Challenges and opportunities of state
regulation of the innovation process in the Russian mineral resources sector.
Academy of Strategic Management Journal 1(16), 149 – 159.
17. Toskunina, V.E. (2007). Program-functional approach to development of oil and
gas resources of new regions: autoref. dis. ... Doc. Econ. Sciences: 08.00.05.
18. Tsvetkova, A.Yu. (2013). Principal of information innovation in the energy and
mineral resource complexes. Zapiski of the Mining Institute 201, 247-252.
19. Vasilyev, Yu. (2015). Estimation of variation of product quality coal mining
companies of the Russian Federation. Mining information-analytical Bulletin
(scientific and technical journal) 40, 3-11.
20. Vasilyev, Yu. (2012). The use of tools for procurement in product sales fuel and
energy complex: Monograph. 148 p.
SURVEY OF STAFFING NEEDS TO IMPLEMENT PROJECTS ON
THE ARCTIC SHELF
Abstract
Theoretical aspects of strategic management of the oil and gas complex have
a different degree of development. However, the conceptual and methodological
problems of managing the development of marine Arctic oil and gas fields are not
generalized and are practically not reflected in the works of domestic and foreign
scientists. This article addresses the issues of staffing support for offshore projects in
the context of strategic management of the oil and gas complex in the development
of Arctic hydrocarbon resources on the shelf. Methodology includes methods and
tools of system, situational, strategic analysis, expert assessments, methods of
multicriteria choice of strategic alternatives, economic-mathematical and simulation
modeling, methodology of project management, methods for evaluating investment
projects were applied in the work. The proposed model can be used in forecasting
and planning the number of personnel of a certain skill in implementing projects on
the Arctic shelf. The existing potential of personnel of this qualification and the need
for workers of this qualification. The authors propose a toolkit of forecasting and
planning the number of personnel of a certain qualification for the development of
hydrocarbon fields in the Arctic zone, which can be employed for a comprehensive
analysis of the needs for support of the existing and promising projects in the Arctic.

272 MEET 2018
Keywords: strategic management, staffing support, shelf, human resources,
hydrocarbon resources, the Arctic region.
ANKIETA DOTYCZĄCA POTRZEB KADROWYCH NA POTRZEBY
WDRAŻANIA PROJEKTÓW W SZELFIE ARKTYCZNYM
Streszczenie
Teoretyczne aspekty strategicznego zarządzania kompleksami naftowo-
gazowymi cechują się różnymi stopniami rozwoju. Jednakże problemy konceptualne
i metodologiczne zarządzania rozwojem pól naftowych i gazowych Arktyki nie są
uogólnione i właściwie nie zostały odzwierciedlone w pracach badaczy z kraju
i zagranicy. Niniejszy artykuł dotyczy kwestii potrzeb kadrowych na potrzeby
projektów offshore w kontekście strategicznego zarządzania kompleksem naftowo-
gazowym w rozwoju zasobów węglowodorów Arktyki w szelfie. Metodologia
obejmuje metody i narzędzia analizy systemowej, sytuacyjnej i strategicznej, ocenę
ekspertów, metody kryteriów wielokrotnego wyboru strategicznych alternatyw,
modelowanie gospodarczo-matematyczne i symulacyjne, metodologię zarządzania
projektem, metodę oceny projektów inwestycyjnych. Zaproponowany model można
wykorzystać na potrzeby prognozowania i planowania liczby pracowników
o konkretnych umiejętnościach podczas wdrażania projektów na szelfie arktycznym.
Obecny potencjał personelu oraz zapotrzebowanie na pracowników o takich
kwalifikacjach. Autorzy proponują zestaw narzędzi prognozowania i planowania
liczby personelu o konkretnych umiejętnościach na potrzeby rozwoju pól
węglowodorów w strefie arktycznej, który można zastosować na potrzeby złożonej
analizy potrzeb wsparcia obecnych i obiecujących projektów w obszarze Arktyki.
Słowa kluczowe: Zarządzanie strategiczne, potrzeby kadrowe, szelf, zasoby ludzkie,
zasoby węglowodorów, region Arktyki.

Iuliia GOMAN1, Olga KOCHERGINA2 1 Saint-Petersburg Mining University, Russia (e-mail: [email protected]) 2 Saint-Petersburg Mining University, Russia (e-mail: [email protected])
19. PERCEPTION OF ENVIRONMENTAL RESPONSIBILITY AND
RISKS IN OIL AND GAS INDUSTRY IN RUSSIA
19.1. Introduction
Demonstration of environmental responsibility can be a principle of a country’s
international position, a characteristic of a company’s reputation as well as a trait of
a person’s character. Possible approach to environmental responsibility presupposes
indicating of environmental awareness as well as commitment to continuous
improvements. It is possible to analyze the level of environmental responsibility of
different actors by assessing their level of awareness of the problem as well as
readiness to take actions.
The aim of the article is to analyze the perception of environmental responsibility
in Russia with the help of assessing the attitude to the oil spill demonstrated by
Russian actors. The article analyzes the response of government, petroleum
companies, environmental organizations as well as researchers to the catastrophe in
the Mexican Gulf that took place in April, 2010.
Perception of risks by different actors was taken as an example of environmental
responsibility; opinions of actors have been gathered from semi-structured
interviews on the issues of research.
The position of a country is comprised of the attitudes of different actors. By the
term ‘actor' we mean a person, a company, a government body who take an active
part in international processes, can express the position on the issue. Accordingly,
international actors can be any organizations, groups and individuals that can
change the environment by means of their activities.

274 MEET 2018
Though environmental catastrophes present a challenge for society scientists
recognize their necessity in order to introduce transformations. The function of the
crises is to shock, focus attention, and generate decision-making. Learning lessons
from the accidents is considered to be a basis of risk management nowadays as it
gives information for realizing an accident modeling approach (Samia, 2018). The
Deepwater Horizon oil spill in April, 2010 surely served as a crisis of perception,
expectations and undermined trust in the capability of oil and gas industry to ensure
offshore operations safety. However, it also resulted in actions taken to overcome
further accidents.
19.2. Literature studies
The oil spill in the Mexican Gulf generated a great amount of research and
projects aimed at analyzing the actions of responsible actors, the preparedness of
industry for offshore activities. The analysis of response can be organized in several
stages: immediate one that took place after the accident and before the final report
was released by the company Beyond Petroleum in September, 2010. The longer
response can be bound to the catastrophes that took place after the one in the
Mexican Gulf and in a way ‘distracted’ attention from it, for example, the accident at
Fukushima.
Oil and gas industry has always evoked interest of researchers who can give an
overview of developing innovative business model related to offshore oil and gas
projects (Legorburu, 2018), explore accidents resulted from natural factors
(Zambrano, 2018) as well as pay attention to human factor risk (Zhou, 2017,
Marinina, 2017).
As the issue of risks has also been widely studied in different fields of research,
we can come across different approaches to studying risks: geopolitical
(Antonakakis, 2017), psychosocial (Bergh, 2017) as well as cultural (McEvoy, 2017).
Researchers also explore debate on risks taking place in different countries (Metcalfe,
2018). Some researches aim at filling the gap in studying corporate performance in
which environmental responsibility is playing an important role (Peng, 2018).
The article does not cover the possibilities of cooperation between actors in one
country as well internationally. Still, research in this direction is going on, for

Perception of environmental responsibility… 275
example, on the issue of researchers’ cooperation, thus giving new prospects for
further positive outcomes (Ochirbat, 2018, Ponomarenko, 2016).
19.3. Methodology
Methods used in this research include literature studies as well as analysis of
semi-structured expert interviews as a primary source of information. Responses
taken in four interviews have been used in this research, interviews were made
during internship in Norwegian Institute of International affairs and also during the
conference visit in Moscow. We use two interviews of researchers, Norwegian and
Russian ones, the interview of the oil and gas company’s representative as well as the
interviews of an employee of a Russian environmental organization. We also used
secondary source of data, the interview given by a former president of the Russian
Federation as one of the groups of actors under study is government. Since it was not
possible to make an interview with the government representative, we used material
suggested by one of the leading journals where answers on questions of importance
for this research have been answered by Dmitriy Medvedev.
Interviewees were asked the following questions:
What impact did catastrophe in the Mexican Gulf have on oil and gas industry?
Did the accident change perception of risks?
Did the accident have an impact on plans to manage Arctic resources?
The research problem within this study is formulated in the following way: how
can we assess environmental responsibility of country? What is the possible role of
risks’ perception in assessing the level of environmental responsibility of country’s
actors?
The hypothesis of the research is formulated as follows: firstly, it is possible to
assess the level of environmental responsibility of a country by looking at positions
of its actors: government, business, researchers, environmental organizations,
Secondly, attitude to risks in oil and gas industry by different actors – awareness of
the issue and readiness to take effective measures – can show their level of
environmental responsibility.

276 MEET 2018
19.4. Research results
The results of the study are presented according to actors’ opinions given.
Petroleum companies’ attitude is assessed based on two interviews.
Petroleum companies expressed concern that ‘agony over the accident will
hamper the development of petroleum and associated industries’. They took
a sensible approach and demanded to determine the cause of the oil spill before they
agree to draw lessons. Additional attention was focused on offshore projects in
Russia though it has no proven and long term experience in this. The head of Lukoil
stated that ‘after the accident in the Mexican Gulf we are expecting strengthening of
environmental regulations’ (Alekperov, 2010, Nevskaya and Marinina, 2017).
One more response was that a training center for the personnel working on the
shelf was established by Lukoil. It marked the necessity in further educating the
personnel to work at offshore oil projects. Companies that tend to be considered
‘international’ demonstrated their adherence to stricter environmental norms in
offshore projects; Lukoil is one of such companies.
Gazprom introduced proposals to improve the environmental policies of the
Russian Federation and placed emphasis on the increase of environmental
responsibility for the dissemination of information. The examples show that oil and
gas companies look forward to changes of the old-fashioned Russian legislation
regarding work on the continental shelf of the Russian Federation.
The catastrophe in the Mexican Gulf made an impact on the work of joint
international groups that aim at making suitable safety standards for the Barents Sea,
for instance, ‘Barents 2020’. The participant of Barents 2020’and an oil and gas
company’s employee said the following:
‘The accident in the Mexican Gulf made us think over the work we are doing
within the commission. It is difficult to refer to concrete steps made in the light of the
accident but in general what we do now regarding the Barents Sea is done having
this catastrophe in mind, taking into account the consequences of the accident in the
Mexican Gulf’.
As for the government’s opinion on the risks in oil and gas industry, plans in the
Arctic are perceived in a more responsible way and the idea that new oil and gas
projects should be environmentally friendly prevails.

Perception of environmental responsibility… 277
According to the opinion of the president of the Russian Federation the
catastrophe in the Mexican Gulf could change the prevailing attitude to authority.
The President is in favour of an international approach to risk security in the light of
the Deepwater Horizon accident saying that ‘such an accident can undermine
anything, including the authority of government… we have to find a new way of
distributing accountability regarding risk security… a new international approach
has to be found. We shall consolidate our efforts in this respect’ (Medvedev, 2010).
In October, 2010 the Committee for Natural Resources, Nature management and
Environment organized parliamentary hearings on the ‘Legislative Provision of
Protecting Seas from Oil Pollution’ where the issue of developing law projects was
discussed with the aim of establishing a clear system of environmental risk
assessment as well as requirements for industrial safety.
The law project was initiated in 2007 after the oil spill in the Kerch strait when
more than 1,500 tons of oil products poured out into the Kerch Strait. The idea was to
regulate the level of corporate environmental responsibility. Thus, it is possible to
state that the accident in the Mexican Gulf was one more ‘wake-up call’.
The next group of actors, Russian environmental organizations, has joined the
discussion with a very sound argument. One of the respondents from WWF
company gave a concrete example of how the accident could change the existing
state of things:
‘If we seek examples of the concrete steps taken in light of the accident, one of
them is the draft law project ‘On the Prevention of Sea Pollution by Oil’ though it has
not yet been accepted. The project is under discussion though a year has passed since
the catastrophe in the Mexican Gulf’.
Environmentalists appeal for concrete actions. In response to the accident in the
Mexican Gulf they wrote a letter to the Ministry of Foreign Affairs from several
organizations before the meeting of the Arctic Council explaining the arguments and
asking for the initiation of a moratorium on drilling in the Arctic:
‘The oil spill in the Mexican Gulf reminded us once more of the serious risks
involved in offshore drilling. We ask …to take the initiative at the coming meeting of
the Arctic Council …and discuss the necessity to declare a moratorium on offshore
drilling in this region…in the Arctic region warming takes place twice as fast as in

278 MEET 2018
other parts of our planet. No effective means of cleaning oil spills offshore can be
applied especially in a region containing ice’.
They traditionally keep on appealing to petroleum companies for cooperation,
taking more drastic measures to ensure nature conservation and radically stop
activities in the Arctic.
Concrete steps need time to be taken. This opinion is proved by the words of one
of the respondents – researcher:
‘Measures in Russia are not adopted in a fast manner. This is perhaps due to
financial difficulties. The financial side is a very important indicator of how
important it is for the country’.
In general, environmentalists evaluate the Russian system of response to similar
disasters as not satisfactory. For instance, one of the respondents remarked:
‘Russia has no response mechanism to damage done to mammals in the Arctic as
a result of an oil spill’.
Alternative response to the Deepwater Horizon accident was proposed by
researchers who say one should not worry about deep-water drilling in Russia since
there are no such deep projects as they have in the Mexican Gulf. The opinion of the
representative of a research institute was the following: ‘as for ecosystem damage oil
is lighter substance than water, it is on the surface thus, fish and plankton are out of
danger. Damage can occur in the places where oil reaches the shore, such contacts are
of local, limited and solvable character as we can see in the accidents that took place
so far’.
To sum up, higher level of environmental responsibility leads to more attentive
approach to risks involved in offshore projects. It is necessary to pay more attention
to the risks associated with the development phase that will increase the cost of the
projects. Risks associated with the petroleum industry did not increase, the attention
to them became more obvious after the accident in the Mexican Gulf. This
catastrophe has implications for the offshore exploration and production industry
that go well beyond the region.

Perception of environmental responsibility… 279
19.5. Conclusions
The following conclusions have been made on the basis of literature and
interviews’ analysis:
Assessment of the attitude of actors to risks shows their level of environmental
responsibility. Actors tend to take concrete measures (introduction of the law on
prevention of the sea pollution by the government) as well as provide debate on the
necessity of lessons learned from the catastrophe such as the one happened in the
Mexican Gulf in 2010.
Environmental responsibility in a country can be measured by the attitude to the
similar catastrophes (in this case, accident at Deepwater Horizon in April, 2010) and
readiness to learn lessons.
In Russia the possibility to introduce the law ‘On prevention of sea pollution by
oil’ initiated by environmental organizations is the example of increased
environmental awareness. Claim on behalf of the government about more stringent
approach to environmental management of Arctic projects; business initiative on
legislative and environmental regulations are the ones as well.
The concept of environmental responsibility in respect to the catastrophe at
Deepwater Horizon is still much manipulated by various actor groups, the reason
being the wish to promote groups’ self-interest, take initiative, improve reputation
(petroleum companies), to appeal to further cooperation with business
(environmental organizations).
The response of oil and gas companies to the Mexican Gulf was notable, though
we see that only global players reveal their positions. The example of a typical
response is to ask for changes and introduce proposals to the old-fashioned
environmental laws regarding work on the continental shelf. Russia in this respect
definitely needs to strengthen the institutions of accountability. Russia’s possible
contribution to the world’s environmental well-being’ can be reducing inefficient use
of energy, protecting the clean water and forest resources.
Managers of enterprises could take into account opinions of all actors whose
opinions are given in the article. It is advisable to analyse the reasoning given by
actors in order to prove their viewpoint.

280 MEET 2018
Opinions can be divided into the ones reflecting the level of awareness of the
problem and the ones demonstrating mitigation in the situation of high risks.
Bibliography
1. Alekperov, V. Interview to ‘Kommersant’. https://www.kommersant.ru/doc/
1391120 (30.06.2018)
2. Antonakakis, N., Gupta, R., Kollias, C., & Papadamou, S. (2017). Geopolitical
risks and the oil stock nexus over 1899-2016. Finance Research Letters, 23, 165-173.
doi: http://dx.doi.org/10.1016/j.frl.2017.07.017
3. Bergh, L.I.V., Leka, S., Zwetsloot, G. (2018). Tailoring Psychosocial Risk
Assessment in the Oil and Gas Industry by Exploring Specific and Common
Psychosocial Risks. Safety and Health at Work, 9(1), 63-70.
doi: http://dx.doi.org/10.1016/j.shaw.2017.05.001
4. Legorburu, I., Johnson, K.R., Kerr, S.A. (2018). Multi-use maritime platforms –
North Sea oil and offshore wind: Opportunity and risk. Ocean & Coastal
Management, 160, 75-85. doi: http://dx.doi.org/10.1016/j.ocecoaman.2018.03.044
5. McEvoy, J., Gilbertz, S.J., Anderson, M.B., Ormerod, K.J., Bergmann, N.T. (2017).
Cultural theory of risk as a heuristic for understanding perceptions of oil and gas
development in Eastern Montana, USA. Extractive Industries and Society-an
International Journal, 4(4), 852-859. doi: http://dx.doi.org/10.1016/j.exis.2017.10.004
6. Medvedev, D. (2010). Interview to ‘Wall Street Journal‘. http://www.kremlin.ru/
news/8082 (30.06.2018)
7. Metcalfe, J. (2018). Environmental pollution and the media, political discourses of
risk and responsibility in Australia, China and Japan. Jcom-Journal of Science
Communication, 17(2). doi: http://dx.doi.org/10.22323/2.17020702
8. Marinina, O.A., Nevskaya, M.A. (2017). Specific nature of labour management in
the oil and gas sector in the Russian Far North. International Journal of Applied
Business and Economic Research, 15 (8), 177-185 . doi: https://www.researchgate.
net/publication/317745811
9. Nevskaya, M.A., Marinina, O.A (2017). Challenges and opportunities of state
regulation of the innovation process in the Russian mineral resources sector.
Academy of Strategic Management Journal, 1(16), 149-159.
10. Ochirbat, P., Chinzorig, B. (2018). On Enhancement of Cooperation Between
Universities for Implementation of the Program «Sustainable Development –

Perception of environmental responsibility… 281
2030». Zapiski Gornogo Insituta, 229, 27-30. doi: http://dx.doi.org/10.25515/
PMI.2018.1.27
11. Peng, B.H., Tu, Y., Elahi, E., Wei, G. (2018). Extended Producer Responsibility
and corporate performance: Effects of environmental regulation and
environmental strategy. Journal of Environmental Management, 218, 181-189.
doi: http://dx.doi.org/10.1016/j.jenvman.2018.04.068
12. Samia, C., Hamzi, R., Chebila, M. (2018). Contribution of the lessons learned from
oil refining accidents to the industrial risks assessment. Management of
Environmental Quality, 29 (4), 643-665. doi: http://dx.doi.org/10.1108/meq-07-2017-
0067
13. Zambrano, J., Kovshov, S.V., Lyubin, E.A. (2018). Risk assessment of accidents
due to natural factors at the Pascuales – Cuenca multiple-use pipeline (Ecuador).
Zapiski Gornogo Instituta, 230, 190-196. doi: http://dx.doi.org/10.25515/PMI.
2018.2.190
14. Ponomarenko, T.V., Vol'nik, R., Marinina O.A., (2016). Korporativnaya
social'naya otvetstvennost' ugol'noj otrasli (praktika rossijskih i evropejskih
kompanij). Zapiski Gornogo Instituta, 222, 882-891. doi: http://dx.doi.org/10.18454/
pmi.2016.6.882.
15. Zhou, A.T., Wang, K., Zhang, H. (2017). Human factor risk control for oil and gas
drilling industry. Journal of Petroleum Science and Engineering, 159, 581-587. doi:
http://dx.doi.org/10.1016/j.petrol.2017.09.034
PERCEPTION OF ENVIRONMENTAL RESPONSIBILITY AND
RISKS IN OIL AND GAS INDUSTRY IN RUSSIA
Abstract
In the 21st century such issues as environmental sustainability, the preservation
of natural resources, and a focus on climate change are not mere words but an
internationally growing concern. Due treatment of above-mentioned issues requires
a mature level of environmental responsibility demonstrated by different groups of
actors. Hence, analysis of lessons learned from catastrophes can be an effective way
of assessing environmental responsibility of a country. Nowadays more authors tend
to perceive risks in such a way. The purpose of the article is to analyze the perception
of environmental responsibility in Russia by assessing the attitude to the oil spill
accident in the Mexican Gulf in 2010. The attitude of Russian actors such as
government, researchers, environmental organizations as well as business

282 MEET 2018
representatives has been considered. Methodology includes study of literature on the
issues of perception of risks in oil and gas industry; analysis of experts’ interviews.
Use of primary sources – interviews of representatives of actors’ groups on the issue
of risks in oil and gas industry – adds value to the outcomes of this research. This
research can be used on the classes of the English language when studying the theme
‘Environmental problems in industry’: students can analyze the positions of different
actors and make conclusions about their level of environmental responsibility.
Opinions of different actors' groups could be useful for managers of enterprises since
they demonstrate if actors stick to awareness of the problem, or they are ready to
take measures of mitigation. Anyway, reasoning of every actor's opinion should be
carefully considered. However, the article does not thoroughly study cooperation
between actors mentioned though it is considered to be a prospective trend for
a separate research. Findings of the research presuppose that attitude of actors to
risks shows their level of environmental responsibility. Actors tend to provide debate
on the necessity of lessons learned from the catastrophe such as the one happened in
the Mexican Gulf in 2010 (researchers, environmental organizations) as well as take
concrete measures (introduction of the law on prevention of the sea pollution by the
government, initiating environmental regulations by business)., environmental
organizations as well as business representatives has been considered.
Keywords: environmental responsibility; environmental risk, gas industry.
POSTRZEGANIE ODPOWIEDZIALNOSCI ŚRODOWISKOWEJ
I RYZYKA W BRANŻY ROPY I GAZU W ROSJI
Streszczenie
W XXI wieku takie kwestie jak zrównoważenie środowiskowe, zachowanie
zasobów naturalnych oraz nacisk kładziony na zmiany klimatu nie są pustymi
słowami, ale rosnącym międzynarodowym problemem. Stosowne podejście do
powyższych zagadnień wymaga dojrzałego poziomu odpowiedzialności
środowiskowej wśród różnych grup interesariuszy. Stąd analiza wniosków
wyciąganych z katastrof może być skuteczną metodą oceny odpowiedzialności
środowiskowej danego kraju. Obecnie coraz więcej badaczy patrzy na ryzyko z tej
perspektywy. Celem artykułu jest analiza postrzegania odpowiedzialności
środowiskowej w Rosji poprzez ocenę podejścia do wycieku ropy w Zatoce
Meksykańskiej w 2010 roku. Pod uwagę wzięto podejście interesariuszy rosyjskich,
takich jak rząd, badacze, organizacje środowiskowe oraz przedstawiciele
przedsiębiorstw. Metodologia obejmuje analizę literatury w kwestiach postrzegania
ryzyka w branży naftowo-gazowej; analizę wywiadów z ekspertami. Zastosowanie
źródeł głównych – wywiadów z przedstawicielami grup interesariuszy dotyczących
kwestii ryzyka w przemyśle naftowo-gazowym – stanowi wartość dodaną wyników
Perception of environmental responsibility… 283
badania. Badanie można wykorzystać podczas zajęć z języka angielskiego, przy
omawianiu tematu „Problemy środowiskowe branży”; studenci mogą analizować
stanowiska różnych interesariuszy i wyciągać wnioski dotyczące ich poziomu
odpowiedzialności środowiskowej. Opinie różnych grup interesariuszy mogą okazać
się przydatne dla kierowników przedsiębiorstw, ponieważ wykazują one czy
trzymają się oni świadomości problemu lub czy są gotowi podjąć działania
naprawcze. Niemniej jednak, przemyślenia każdego interesariusza należy uważnie
rozpatrzyć. Jednakże artykuł nie stanowi dogłębnej analizy współpracy między
interesariuszami; mimo to uważa się ten aspekt za potencjalny trend osobnego
badania. Wnioski badania zakładają, że podejście interesariuszy do ryzyka to ich
poziom odpowiedzialności środowiskowej. Interesariusze zazwyczaj debatują nad
koniecznością wniosków wyciągniętych z katastrofy, takich jak tej, która miała
miejsce w Zatoce Meksykańskiej w 2010 roku (badacze, organizacje środowiskowe)
oraz podejmują konkretne działania (wprowadzanie przepisów zapobiegania
zanieczyszczeniu morza przez rząd, zainicjowanie przepisów środowiskowych przez
przedsiębiorstwa). Uwzględniono organizacje środowiskowe oraz przedstawicieli
przedsiębiorstw.
Słowa kluczowe: odpowiedzialność środowiskowa; ryzyko środowiskowe; branża
gazowa.