2016-2021 6th Gen Camaro Dedicated Fuel System - Nitrous ...

528
www.frontiersinecology.org © The Ecological Society of America
Methane (CH4) and nitrous oxide (N2O) are twoimportant greenhouse gases (GHGs), the infrared
absorption properties of which increase near-surface tem-peratures (Forster et al. 2007; Montzka et al. 2011). Theatmospheric concentrations of CH4 and N2O haveincreased dramatically since the beginning of IndustrialRevolution and now exceed their natural ranges, accord-ing to ice core records (IPCC 2007). Methane and N2Oare, respectively, 25 and 298 times more potent in radia-tive forcing than carbon dioxide (CO2) at a 100-yeartime horizon (Forster et al. 2007), and the importance of
their roles in influencing global climate has been increas-ingly recognized (Kort et al. 2008; Schulze et al. 2009;Montzka et al. 2011; Tian et al. 2011). Among all emis-sion and uptake pathways, those within terrestrial ecosys-tems (both natural and managed) make large contribu-tions to atmospheric CH4 and N2O concentrations(Bousquet et al. 2006; Denman et al. 2007; Schulze et al.2009; Tian et al. 2010; Dlugokencky et al. 2011).However, as compared with CO2-related research, lesseffort has been invested in examining the magnitude ofand underlying mechanisms responsible for the netland–atmosphere exchanges of these two gases.
Land–atmosphere CH4 exchange is dependent on CH4
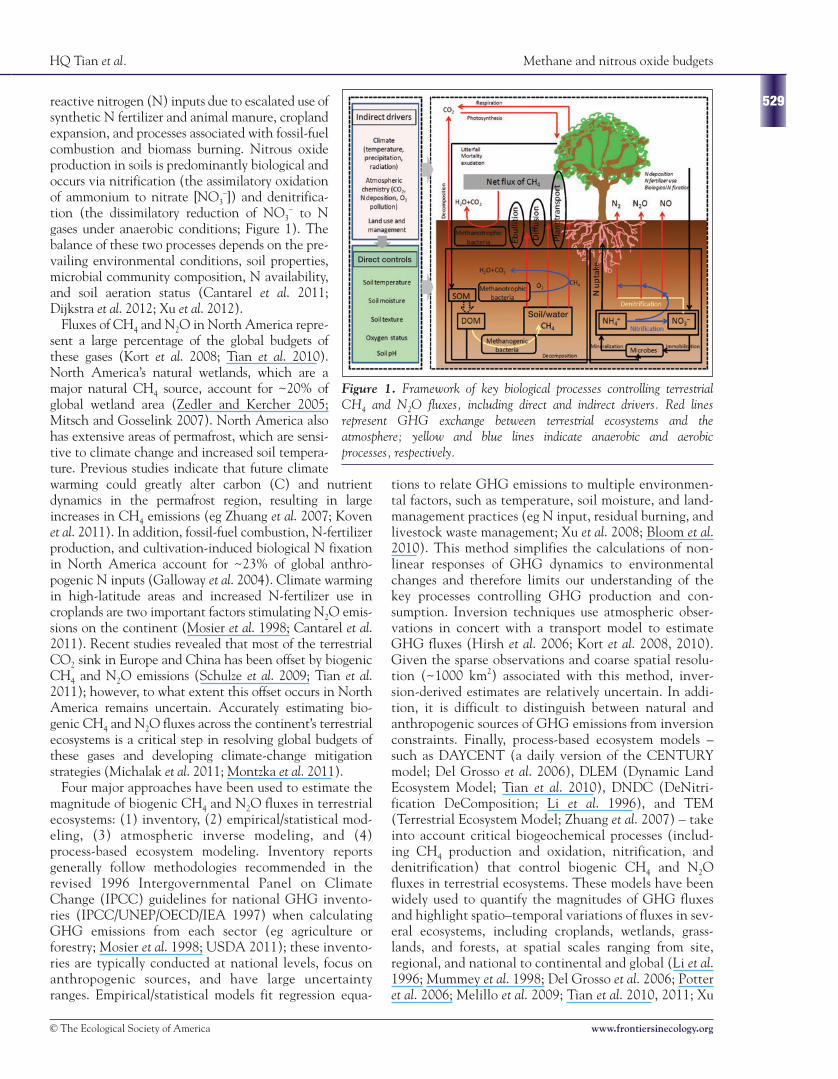
production, oxidation, and transport from soil pore waterto the atmosphere (Figure 1). Methane is produced fromanaerobic decomposition of organic materials bymethanogenic bacteria. Once produced, CH4 can bereleased into the atmosphere through three pathways: dif-fusion of dissolved CH4 along a concentration gradient,transport via vascular plants, or ebullition (emission ingas bubbles). Concurrently, CH4 oxidation by methan-otrophic bacteria will occur within and above soils duringits production and transport (Bousquet et al. 2006). Manyfactors – including water table depth, substrate qualityand quantity, soil pH, soil moisture, presence of per-mafrost, oxygen concentration, and ratio of methano-genic to methanotrophic bacteria – directly regulateCH4 production and oxidation (Zhuang et al. 2004;Tian et al. 2010; Xu et al. 2010; Banger et al. 2012;Dijkstra et al. 2012).
Atmospheric N2O accounts for about 6% of the currentgreenhouse effect (Forster et al. 2007). The observedincrease in N2O concentration is mostly attributed to the
SPECIAL ISSUE
Contemporary and projected biogenic fluxesof methane and nitrous oxide in NorthAmerican terrestrial ecosystems Hanqin Tian1*, Chaoqun Lu1, Guangsheng Chen1, Bo Tao1, Shufen Pan1, Stephen J Del Grosso2, Xiaofeng Xu3,Lori Bruhwiler4, Steven C Wofsy5, Eric A Kort6, and Stephen A Prior7
Accurately estimating biogenic methane (CH4) and nitrous oxide (N2O) fluxes in terrestrial ecosystems is criticalfor resolving global budgets of these greenhouse gases (GHGs) and continuing to mitigate climate warming. Here,we assess contemporary biogenic CH4 and N2O budgets and probable climate-change-related impacts on CH4 andN2O emissions in terrestrial North America. Multi-approach estimations show that, during 1990–2010, biogenicCH4 emissions ranged from 0.159 to 0.502 petagrams of carbon dioxide (CO2) equivalents per year (Pg CO2eq yr–1,where 1 Pg = 1 × 10¹⁵ g) and N2O emissions ranged from 0.802 to 1.016 Pg CO2eq yr–1, which offset 47–166% of ter-restrial CO2 sequestration (0.915–2.040 Pg CO2eq yr–1, as indicated elsewhere in this Special Issue). According totwo future climate scenarios, CH4 and N2O emissions are projected to continue increasing by 137–151% and157–227%, respectively, by the end of this century, as compared with levels during 2000–2010. Strategies to miti-gate climate change must account for non-CO2 GHG emissions, given their substantial warming potentials.
Front Ecol Environ 2012; 10(10): 528–536, doi:10.1890/120057
In a nutshell:• Biogenic methane (CH4) and nitrous oxide (N2O) emissions
from North American terrestrial ecosystems are estimated tooffset 50–150% or more of terrestrial CO2 uptake
• Projected climate change could substantially increase biogenicCH4 and N2O emissions from North American terrestrialecosystems by the end of the 21st century
• Although multiple approaches have been applied, large dis-crepancies still exist in estimating biogenic CH4 and N2O emis-sions. Future research must identify the sources of these discrep-ancies
1International Center for Climate and Global Change Research andSchool of Forestry and Wildlife Sciences, Auburn University, Auburn,AL *([email protected]); 2Soil Plant Nutrient Research Unit,USDA-ARS, Ft Collins, CO; 3Environmental Science Division, OakRidge National Laboratory, Oak Ridge, TN; 4NOAA Earth SystemResearch Laboratory, Boulder, CO; 5Department of Earth and PlanetaryScience, Harvard University, Cambridge, MA; 6Jet PropulsionLaboratory, California Institute of Technology, Pasadena, CA;7USDA–ARS National Soil Dynamics Laboratory, Auburn, AL
HQ Tian et al. Methane and nitrous oxide budgets
529
© The Ecological Society of America www.frontiersinecology.org
reactive nitrogen (N) inputs due to escalated use ofsynthetic N fertilizer and animal manure, croplandexpansion, and processes associated with fossil-fuelcombustion and biomass burning. Nitrous oxideproduction in soils is predominantly biological andoccurs via nitrification (the assimilatory oxidationof ammonium to nitrate [NO3
–]) and denitrifica-tion (the dissimilatory reduction of NO3
– to Ngases under anaerobic conditions; Figure 1). Thebalance of these two processes depends on the pre-vailing environmental conditions, soil properties,microbial community composition, N availability,and soil aeration status (Cantarel et al. 2011;Dijkstra et al. 2012; Xu et al. 2012).
Fluxes of CH4 and N2O in North America repre-sent a large percentage of the global budgets ofthese gases (Kort et al. 2008; Tian et al. 2010).North America’s natural wetlands, which are amajor natural CH4 source, account for ~20% ofglobal wetland area (Zedler and Kercher 2005;Mitsch and Gosselink 2007). North America alsohas extensive areas of permafrost, which are sensi-tive to climate change and increased soil tempera-ture. Previous studies indicate that future climatewarming could greatly alter carbon (C) and nutrientdynamics in the permafrost region, resulting in largeincreases in CH4 emissions (eg Zhuang et al. 2007; Kovenet al. 2011). In addition, fossil-fuel combustion, N-fertilizerproduction, and cultivation-induced biological N fixationin North America account for ~23% of global anthro-pogenic N inputs (Galloway et al. 2004). Climate warmingin high-latitude areas and increased N-fertilizer use incroplands are two important factors stimulating N2O emis-sions on the continent (Mosier et al. 1998; Cantarel et al.2011). Recent studies revealed that most of the terrestrialCO2 sink in Europe and China has been offset by biogenicCH4 and N2O emissions (Schulze et al. 2009; Tian et al.2011); however, to what extent this offset occurs in NorthAmerica remains uncertain. Accurately estimating bio-genic CH4 and N2O fluxes across the continent’s terrestrialecosystems is a critical step in resolving global budgets ofthese gases and developing climate-change mitigationstrategies (Michalak et al. 2011; Montzka et al. 2011).
Four major approaches have been used to estimate themagnitude of biogenic CH4 and N2O fluxes in terrestrialecosystems: (1) inventory, (2) empirical/statistical mod-eling, (3) atmospheric inverse modeling, and (4)process-based ecosystem modeling. Inventory reportsgenerally follow methodologies recommended in therevised 1996 Intergovernmental Panel on ClimateChange (IPCC) guidelines for national GHG invento-ries (IPCC/UNEP/OECD/IEA 1997) when calculatingGHG emissions from each sector (eg agriculture orforestry; Mosier et al. 1998; USDA 2011); these invento-ries are typically conducted at national levels, focus onanthropogenic sources, and have large uncertaintyranges. Empirical/statistical models fit regression equa-
tions to relate GHG emissions to multiple environmen-tal factors, such as temperature, soil moisture, and land-management practices (eg N input, residual burning, andlivestock waste management; Xu et al. 2008; Bloom et al.2010). This method simplifies the calculations of non-linear responses of GHG dynamics to environmentalchanges and therefore limits our understanding of thekey processes controlling GHG production and con-sumption. Inversion techniques use atmospheric obser-vations in concert with a transport model to estimateGHG fluxes (Hirsh et al. 2006; Kort et al. 2008, 2010).Given the sparse observations and coarse spatial resolu-tion (~1000 km2) associated with this method, inver-sion-derived estimates are relatively uncertain. In addi-tion, it is difficult to distinguish between natural andanthropogenic sources of GHG emissions from inversionconstraints. Finally, process-based ecosystem models –such as DAYCENT (a daily version of the CENTURYmodel; Del Grosso et al. 2006), DLEM (Dynamic LandEcosystem Model; Tian et al. 2010), DNDC (DeNitri-fication DeComposition; Li et al. 1996), and TEM(Terrestrial Ecosystem Model; Zhuang et al. 2007) – takeinto account critical biogeochemical processes (includ-ing CH4 production and oxidation, nitrification, anddenitrification) that control biogenic CH4 and N2Ofluxes in terrestrial ecosystems. These models have beenwidely used to quantify the magnitudes of GHG fluxesand highlight spatio–temporal variations of fluxes in sev-eral ecosystems, including croplands, wetlands, grass-lands, and forests, at spatial scales ranging from site,regional, and national to continental and global (Li et al.1996; Mummey et al. 1998; Del Grosso et al. 2006; Potteret al. 2006; Melillo et al. 2009; Tian et al. 2010, 2011; Xu
Figure 1. Framework of key biological processes controlling terrestrialCH4 and N2O fluxes, including direct and indirect drivers. Red linesrepresent GHG exchange between terrestrial ecosystems and theatmosphere; yellow and blue lines indicate anaerobic and aerobicprocesses, respectively.
Soil/water
Direct controls

Methane and nitrous oxide budgets HQ Tian et al.
530
www.frontiersinecology.org © The Ecological Society of America
et al. 2010, 2012). However, the accuracy of the models’estimations primarily relies on the accuracy of their spa-tially explicit input datasets and their representations ofmajor biogeochemical mechanisms.
Here, we compile country-scale estimates of net CH4and N2O fluxes in major ecosystem types from differentstudies and provide our best estimates of contemporarybudgets of biogenic CH4 and N2O in North Americanterrestrial ecosystems. We then used the DLEM – a coupledbiogeochemical model that simultaneously simulatesexchanges of three GHGs (CO2, CH4, and N2O)between terrestrial ecosystems and the atmosphere (Tianet al. 2010, 2011, 2012; Ren et al. 2011; Lu et al. 2012) –to predict possible CH4 and N2O fluxes from 2011 to2099, under two distinct future climate-change scenarios.We assume anthropogenic drivers such as land-usechange and agricultural management practices willremain constant (at 2010 levels), although futurechanges in such drivers may greatly affect CH4 and N2Ofluxes. Finally, we discuss uncertainties and futureresearch needs regarding estimations of biogenic CH4 andN2O budgets, using global warming potential to indicate
the contribution of biogenic CH4 and N2O fluxes toglobal radiative forcing in CO2 equivalents (CO2eq).
n Contemporary biogenic CH4 and N2O fluxes interrestrial North America
Over the past decades, numerous studies have been con-ducted to quantify variations in fluxes of biogenic CH4
and N2O in North American terrestrial ecosystems (egLi et al. 1996; Mummey et al. 1998; Smith et al. 2004;Zhuang et al. 2004, 2007; Del Grosso et al. 2006; Potteret al. 2006; Kort et al. 2008, 2010; Tian et al. 2010; Xu etal. 2010, 2012; Pickett-Heaps et al. 2011). However,most of these studies focused on (1) either CH4 or N2Oand (2) either a specific biome type or a portion ofNorth America. For example, multiple approaches havebeen used to estimate wetland CH4 emissions (egZhuang et al. 2004; Potter et al. 2006) and cropland N2Oemissions (Li et al. 1996; Del Grosso et al. 2006). Bybringing together estimates from different approaches,we are able to calculate the approximate ranges of CH4
and N2O budgets with relative accuracy.
Net exchange of CH4 betweenterrestrial ecosystems and theatmosphere
Estimations of terrestrial CH4
fluxes have exhibited wide varia-tions. Mean annual CH4 emissionsfrom natural wetlands in NorthAmerica during 1990–2010 wereestimated to be 0.57 petagrams ofCO2eq per year (Pg CO2eq yr–1,where 1 Pg = 1 × 10¹⁵ g) by theDLEM (Table 1). But a lower esti-mation (0.24 Pg CO2eq yr–1, circa2003) was reported in the firstState of the Carbon Cycle Report(SOCCR), one of the US ClimateChange Science Program’s synthe-sis and assessment products (CCSP2007). For the continental US, theSOCCR estimated a CH4 source of0.076 Pg CO2eq yr–1 from naturalwetlands, whereas process-basedmodels reported higher CH4 emis-sions: 0.14 Pg CO2eq yr–1 by theC a r n e g i e – A m e s – S t a n f o r dApproach (CASA) model (Zhuanget al. 2004; Potter et al. 2006) and0.21 Pg CO2eq yr–1 by the DLEM(Tian et al. 2010). Wetland areadelineation may partly explain thedivergence between the two modelestimates. For example, wetlandarea calculated from the Landsat-
Table 1. CH4 fluxes estimated by multiple approaches for three North Americancountries during 1990–2010
CH4 source (Pg CO2eq yr–1)
SOCCR* DLEM* CASA* TEM* US EPA*
Alaska 0.042 0.073 (0.07†) 0.081 (0.078†)
Continental US 0.076 0.21 0.14
Canada 0.11 0.268 (0.24†) 0.156 (0.14†)
Mexico 0.005 0.016
US 0.008 0.007
Canada 0
Mexico 0.0004
North America 0.240 ~ 0.583
CH4 sink (Pg CO2eq yr–1)
US –0.03¶
Canada –0.027 ¶
Mexico –0.024 ¶
North America –0.081
Net CH4 emissions (Pg CO2eq yr–1)
US 0.095 ~ 0.269
Canada 0.083 ~ 0.241
Mexico –0.0186 ~ –0.0076
North America 0.159 – 0.502
Notes: *Estimate sources: SOCCR (CCSP 2007); DLEM (Tian et al. 2010); CASA (Potter et al. 2006); TEM (Canada:Zhuang et al. 2004; Alaska: Zhuang et al. 2007); US EPA (2011). †Values in parentheses are original estimates for CH4
emissions from terrestrial ecosystems. For Alaska, we modified these values to wetland emissions by assuming wetlandscontributed 104% of the total terrestrial CH4 emissions as simulated by DLEM; for Canada, this ratio was 111% in theDLEM simulation. ¶DLEM’s estimates for other biomes are average values during 1990–2010.
Wet
land
Rice
pad
dyO
ther
bio
mes

HQ Tian et al. Methane and nitrous oxide budgets
531
© The Ecological Society of America www.frontiersinecology.org
based national land-cover dataset (Potter et al. 2006) was26% lower than that used in both the DLEM simulationand the SOCCR report (43 million hectares [ha]), whichwas close to the wetland area estimate from US wetlandinventory data (Dahl 1990). However, when consideringCH4 flux per unit wetland area, the SOCCR estimate wasmuch lower than those from CASA and DLEM. TheDLEM estimation (7.9–10.0 g CH4–C m–2 yr–1; Tian et al.2010), was close to the lower end of the reported rangesfrom field observations (6.1–24.1 g CH4–C m–2 yr–1 byBridgham et al. [2006] and 13.1–37.0 g CH4–C m–2 yr–1 byBarlett and Harriss 1993).
Wetland CH4 emissions in Alaska were estimated to be0.042 Pg CO2eq yr–1 by the SOCCR, but process-basedmodels generated larger biogenic CH4 sources equivalentto 0.070 Pg CO2eq yr–1 (DLEM) and 0.078 Pg CO2eq yr–1
(TEM), even with the inclusion of CH4 uptake by uplandecosystems (Zhuang et al. 2007; Tian et al. 2010). Ifupland ecosystem CH4 uptakes are excluded (as simulatedby the DLEM), DLEM and TEM estimates for wetlandCH4 emissions increase to 0.073 and 0.081 Pg CO2eq yr–1,respectively. Estimates for wetland CH4 emissions fromAlaska and the conterminous US could range from 0.118to 0.291 Pg CO2eq yr–1, with more than one-third ofthose emissions being from Alaska. The SOCCRreported a CH4 emissions estimate of 0.11 Pg CO2eq yr–1
from natural wetlands in Canada; this was close to theTEM’s estimate (0.14 Pg CO2eq yr–1) but lower than theDLEM’s estimate (0.241 Pg CO2eq yr–1; Table 1), eventhough a small CH4 sink from upland ecosystems wasincluded in the TEM results. If the DLEM-estimated CH4
uptake by upland ecosystems is excluded, TEM- andDLEM-simulated CH4 emissions from wetlands were0.156 and 0.268 Pg CO2eq yr–1, respectively.For wetlands in Mexico, both the SOCCRand DLEM reported smaller CH4 sources of0.005 and 0.016 Pg CO2eq yr–1, respectively,compared with those in Canada and the US.
In summary, the inventory and ecosystemmodeling estimations for CH4 emissions fromnatural wetlands in North America rangedfrom 0.233 to 0.575 Pg CO2eq yr–1 for thetime period 1990–2010, contributing 4–23%to global wetland emissions (2.5–5.8 PgCO2eq yr–1; Denman et al. 2007). The inversemodeling results from National Oceanic andAtmospheric Administration’s (NOAA) Car-bon Tracker (www.esrl.noaa.gov/gmd/ccgg/carbon tracker/index.html) also indicated thatCH4 emissions from natural ecosystems inNorth America were 0.337 ± 0.027 Pg CO2eqyr–1 during 2000–2009 (Bruhwiler unpub-lished data). In addition to natural wetlands,rice paddy fields were another important ter-restrial CH4 source. The SOCCR estimatedCH4 emissions of 0.0004 and 0.008 Pg CO2eqyr–1 from rice production in Mexico and the
US, respectively. However, the SOCCR does not mentionwhether livestock and manure application were consid-ered when estimating CH4 flux from rice paddies. We usedthe DLEM simulation results to estimate CH4 fluxes inupland ecosystems across North America because therewas no other large-scale estimate available. All uplandecosystems acted as CH4 sinks at a rate of 0.03, 0.027, and0.024 Pg CO2eq yr–1 in the US, Canada, and Mexico,respectively (Tian et al. 2010). Simulated results show thatCH4 emissions increased more in large, high-latitude areasthan in other regions during 1979–2010 (Tian et al. 2010;Xu et al. 2010). Methane emissions in Canada showed asubstantially increasing trend, whereas those in the USand Mexico did not appear to have changed much overthe past three decades.
Overall, net CH4 fluxes ranged from 0.096 to 0.269 PgCO2eq yr–1 for the US, 0.083 to 0.241 Pg CO2eq yr–1 forCanada, and –0.0186 to –0.0076 Pg CO2eq yr–1 forMexico. For all of North America, estimates of net CH4
exchange between terrestrial ecosystems and the atmos-phere showed large uncertainty, with average emissionsrates ranging from 0.159 to 0.502 Pg CO2eq yr–1 over thepast two decades.
Net N2O exchange between terrestrial ecosystemsand the atmosphere
Although some previous studies have estimated agricul-tural N2O emissions in the US, considerable uncertaintystill exists (Table 2). By using a combination of the DAY-CENT model and the Tier 1 IPCC method, the USEnvironmental Protection Agency (EPA) reported thatdirect N2O emissions from US agricultural soils were
Table 2. Estimates of biogenic N2O emissions (expressed in PgCO2eq yr–1) from different approaches and for different NorthAmerican ecosystems during 1990–2010
DAYCENT/IPCC* DLEM* DNDC* NGAS*
US 0.163† 0.166 0.234–0.367 0.162–0.210Canada 0.013 0.022Mexico 0.044North America 0.219–0.433
US 0.318¶
Canada 0.128¶
Mexico 0.137¶
North America 0.583
US 0.48–0.685Canada 0.141–0.15Mexico 0.181North America 0.802–1.016
Notes: *Estimate sources: DAYCENT/IPCC (US EPA 2011); DLEM (Tian et al. 2010); DNDC (US: Liet al. 1996; Canada: Smith et al. 2004); NGAS (Mummey et al. 1998). †DAYCENT estimate for agricul-tural soils is the average N2O emissions reported for 1990, 2000, and 2005–2009. §The DLEM simula-tion classified vegetated area into non-managed ecosystems (including natural plant communities) andagricultural land (including typical crop types and cropping systems). Effects of forest plantation or agestructure on CH4 and N2O fluxes were excluded. Urban area was treated as impervious surface andgrassland. ¶DLEM’s estimates for non-managed ecosystems are average values during 1990–2010.
Agric
ultur
also
ilsN
on-m
anag
edec
osys
tem
s§To
tal

Methane and nitrous oxide budgets HQ Tian et al.
532
www.frontiersinecology.org © The Ecological Society of America
0.163 Pg CO2eq yr–1 over the past two decades (US EPA2011). For the same time period, the DLEM simulationshowed a similar estimate of 0.166 Pg CO2eq yr–1 if multi-ple environmental drivers (eg climate, atmospheric CO2,tropospheric ozone [O3], N deposition, and land conver-sion) and intensive agronomic management practices (egrotation, harvest, N fertilizer use, and irrigation, etc) wereincorporated into the biogeochemical model framework.This estimate fell within the range of 0.162–0.210 PgCO2eq yr–1 as reported by Mummey et al. (1998).However, the DNDC model provided an even higherestimate of 0.234–0.367 Pg CO2eq yr–1 for low and highsoil-C scenarios (Li et al. 1996). Direct N2O emissionsfrom agricultural soils ranged from 0.013 to 0.022 PgCO2eq yr–1 for Canada and were 0.044 Pg CO2eq yr–1 forMexico (Smith et al. 2004; Tian et al. 2010).
Overall, the direct N2O emissions estimated fromNorth American agricultural land (0.219–0.433 PgCO2eq yr–1) accounted for 10–54% of the global agricul-tural N2O emissions (0.796–2.248 Pg CO2eq yr–1)reported in the IPCC Fourth Assessment Report byDenman et al. (2007). Uncertainties in N2O emissionsestimates might be caused by different environmental dri-vers and/or model structures and parameters. For exam-ple, the DLEM-based estimate (Tian et al. 2010) did notinclude manure as an N input source. This may result inan underestimation of N2O emissions, though manure-application-induced N2O emissions could be small (egestimated as 0.007–0.011 teragrams of N per year [Tg Nyr–1] by Li et al. [1996] and as 0.034 Tg N yr–1 in 2008 bythe US Department of Agriculture [USDA 2011]; where1 Tg = 1 × 10¹² g). Additionally, the DLEM simulationsexcluded tillage effects, which would have resulted inunderestimated N2O emissions from agricultural soils (Liet al. 1996), whereas the DAYCENT and DNDC modelsignored land conversion and the DNDC adopted con-stant N-fertilizer amounts (Li et al. 1996; US EPA 2011).
According to the DLEM-based estimate (Tian et al.2010), non-managed ecosystems in North Americaplayed an important role (0.583 Pg CO2eq yr–1) in deter-mining terrestrial N2O budgets, as a result of the largespatial areas involved (Table 2). In sum, N2O releasedfrom North American terrestrial ecosystems totaled up to0.802–1.016 Pg CO2eq yr–1. The relatively small variationin N2O emissions estimates as compared with that of CH4
may be due to the lack of multi-source estimates for N2Oemissions from non-managed ecosystems. Tian et al.(2010) indicated that forests were the source of the high-est biogenic N2O emissions, accounting for ~32% of totalN2O emissions across North America, followed by crop-land (29%), shrubland (13%), and grassland (11%).Other ecosystem types shared the remaining 15%.However, only a few studies focused on N2O emissionsfrom these ecosystems, especially at regional, continental,or global scales. Previous studies have indicated that N2Oemissions are sensitive to climate warming, increasingatmospheric CO2, and N addition (Dijkstra et al. 2012);
future research should therefore address N2O fluxes fromnon-managed ecosystems.
The highest N2O emissions were found in the “cornbelt” of the upper US Midwest and in tropical/subtropicalforests in the southern portion of North America (DelGrosso et al. 2006; Tian et al. 2010; US EPA 2011; Milleret al. 2012; Xu et al. 2012). From 1979 to 2010, owing toN-fertilizer uses, N2O emissions increased even more inthese two regions than in other regions. Some high-lati-tude areas (eg the northwestern Canada) were character-ized by lower N2O emissions but experienced fasterincreases primarily due to climate warming. Nitrous oxideemissions decreased in the northern and southern parts ofMexico and along the southeastern coast of the US.
Relative to the terrestrial CO2 sink of 0.915–2.040 PgCO2eq yr–1 in North America, as reported by King et al.(2012), biogenic CH4 and N2O emissions have offset47–166% of terrestrial CO2 sequestration. It is clearlyimportant to have a complete analysis of terrestrialecosystem–climate feedbacks that includes dynamics ofCO2, CH4, and N2O, rather than CO2 fluxes alone.
n Potential impact of climate change on biogenicCH4 and N2O fluxes
To examine the potential impact of climate change onbiogenic CH4 and N2O fluxes in terrestrial ecosystems ofNorth America, we set up six simulations within theDLEM, forced by six sets of projected climate data (2 sce-narios × 3 General Circulation Models [GCMs]) for theperiod 2011–2099. In these simulations, the remainingmodel input data (including atmospheric CO2 concentra-tion, N deposition, O3 pollution, and land-use and land-management practices) were kept constant at 2010 lev-els. We adopted projected future climate data from threeGCMs (CCSM3, UKMO–HadCM3, and GFDL–CM2.1)under two IPCC emissions scenarios (A2 and B1). Datawere downloaded from the World Climate ResearchProgramme’s Coupled Model Intercomparison Projectphase 3 (CMIP3) multi-model dataset (Meehl et al. 2007;www.engr.scu.edu/~emaurer/global_data). The A2 sce-nario is mainly characterized as a world of independentlyoperating nations, continuously increasing population,and regionally oriented economic development, whilethe B1 scenario is characterized by rapid economic devel-opment, population rising to nine billion in 2050 and thendeclining, clean and resource efficient technologies, andan emphasis on global solutions to economic, social, andenvironmental stability (IPCC 2007). To keep our simu-lations for the projected period (2011–2099) consistentwith the historical/contemporary period (1979–2010),we statistically downscaled the climate data projected bythe three GCMs from a resolution of 0.5 degrees lati-tude/longitude to a resolution of 32 km × 32 km.
Temperature in North America will continue toincrease throughout the 21st century under both the A2and B1 emissions scenarios. The three aforementioned

HQ Tian et al. Methane and nitrous oxide budgets
533
© The Ecological Society of America www.frontiersinecology.org
GCMs predict increases in annual temperatures of1.88˚C (B1 scenario) to 2.52˚C (A2 scenario) bythe 2050s and 2.54˚C (B1 scenario) to 5.28˚C (A2scenario) by the 2090s, relative to the averageannual temperature from 1979 to 2010. Projectedincreases in annual precipitation (averaged over thethree models) are between 6% (UKMO–HadCM3under the B1 scenario) and 15% (CCSM3 underthe A2 scenario) by the 2050s and between 10%(UKMO–HadCM3 under the B1 scenario) and26% (CCSM3 under the A2 scenario) by the2090s, with high interannual fluctuations and spatialheterogeneity.
The simulation results indicated that CH4 emis-sions would reach up to 0.784 ± 0.135 Pg CO2eqyr–1 during the 2090s (~151% of that in the 2000s)while N2O emissions would amount to 1.911 ±0.220 Pg CO2eq yr–1 (~227% of that in the 2000s)under the A2 climate scenario. In contrast, the B1climate scenario would lead to lower emissions ofCH4 and N2O at rates of 0.713 ± 0.063 Pg CO2eqyr–1 and 1.321 ± 0.131 Pg CO2eq yr–1 (equivalentto 137% and 157% of the 2000s’ level), respec-tively. Both CH4 and N2O emissions would greatlyincrease with future climate change, but bothappear to stabilize after the 2060s under the B1 cli-mate scenario and continue to increase under theA2 climate scenario, possibly as a result of A2’smore rapid warming trend (Figure 2).
At the country scale, mean annual CH4 emissions inCanada would increase by 195.9 and 123.8 Tg CO2eq yr–1
under the A2 and B1 climate scenarios, respectively, bythe end of this century. Canada would contribute the mostto the increased North American CH4 emissions (Figure3). In contrast, CH4 emissions would increase less rapidly(nearly 80 Tg CO2eq yr–1) in the US under both climatescenarios during 2011–2099. Methane uptake in Mexicowould increase by 9.1 and 3.2 Tg CO2eq yr–1 under the A2and B1 climate scenarios, respectively, but the magnitudeof increasing CH4 uptake from Mexico would be far lessthan that of the increasing CH4 emissions from Canadaand the US. The high (A2) and low (B1) temperaturescenarios would cause a greater difference in N2O fluxes(as compared with CH4 fluxes) in these different coun-tries. The US would be the largest contributor toincreased N2O emissions in North America, withincreases of 657.4 and 302.4 Tg CO2eq yr–1 under the A2and B1 scenarios, respectively. Nitrous oxide emissions inboth Canada and Mexico would increase by ~200 TgCO2eq yr–1 under the A2 scenario and by less than 100 TgCO2eq yr–1 under the B1 scenario.
To better understand future changes in CH4 and N2Oemissions in the US, we divided the country into sevenregions: Alaska, Northwest, Southwest, Great Plains,Midwest, Northeast, and Southeast, according to Karl etal. (2009) (Figure 3). Our model simulations showedlarge regional variations in CH4 and N2O emissions
responses to future climate change over the comingdecades. Because of its extensive wetland area and highsensitivity to climate warming, Alaska would have thelargest CH4 emissions increase, ranging from 33.8 to 53.5Tg CO2eq yr–1 driven by low (B1) and high (A2) temper-ature scenarios. The Northeast is the second largest con-tributor to the CH4 increase by 20.2 and 10.4 Tg CO2eqyr–1 under A2 and B1 scenarios, respectively, followed bythe Midwest. The largest increase in N2O emissions,ranging from 135.0 to 264.1 Tg CO2eq yr–1 during2011–2099, would occur in the Great Plains as a result ofhigh N availability from historical fertilizer inputs. TheMidwest and Southeast would also be characterized bysubstantial N2O emissions increases of > 100 Tg CO2eqyr–1 and ~50 Tg CO2eq yr–1 under A2 and B1 scenarios,respectively. Partly because of their relatively limitedareal extent, the Northwest and Northeast would be thesmallest overall contributors to both CH4 and N2Oincreases in the future.
n Uncertainty and future research needs
Although many studies have estimated the terrestrialbudgets of CH4 and N2O through multiple approaches,large uncertainties still exist. This study has identifiedseveral major sources of uncertainty that need to beaddressed. First, the descriptive wetland data that are cur-rently available inherently bias the estimated CH4 fluxes.A set of consistent, commonly accepted data is needed to
Figure 2. Contemporary and projected mean annual CH4 (a) and N2Ofluxes (b) in North American terrestrial ecosystems during 1979–2099as estimated by the Dynamic Land Ecosystem Model (DLEM). Notethat the future projection is driven by two climate scenarios from threeGCM models. The pink and blue shaded areas are 95% confidenceintervals of mean CH4 and N2O fluxes driven by the A2 and B1scenarios, respectively.
Ann
ual a
vera
ge
CH
4flu
x(P
g C
O2e
q y
r–1)
Ann
ual a
vera
ge
N2O
flu
x(P
g C
O2e
q y
r–1)
(a)
(b)

Methane and nitrous oxide budgets HQ Tian et al.
534
www.frontiersinecology.org © The Ecological Society of America
characterize the type, area, and distribution of wetlandsgiven that this ecosystem is one of the largest contribu-tors to divergences among reported estimates. Second,differences that contribute to uncertainty in modelingstudies might also arise from input data with divergentspatial resolutions. Examples include 0.5 × 0.5latitude/longitude degrees for TEM (Zhuang et al. 2004,2007), 32 km × 32 km for DLEM (Tian et al. 2010), 8 km× 8 km for CASA (Potter et al. 2006), state-level in theUS and soil-group level in Canada for DNDC (Li et al.1996; Smith et al. 2004), and state- and sub-state level forDAYCENT (Del Grosso et al. 2006). Refining the criticalinput datasets would therefore help reconcile the esti-mates provided by different approaches. In addition, bio-genic N2O emissions from non-managed ecosystems atthe continental scale are not well studied; future researchshould focus on N2O fluxes from natural ecosystems.
The projected CH4 and N2O fluxes in response tofuture climate change remain far from certain for severalreasons. First, we did not consider potential vegetationshifts, such as decreased wetland area due to future cli-mate warming or drought in some areas (Avis et al. 2011)or the likely increase in drained wetland area due to crop-land expansion and urbanization. Doing so would tend tooverestimate CH4 emissions or underestimate CH4
uptake across North America. Therefore, the model rep-resentation of vegetation dynamics and ecosystemhydrology in response to future climate change needs tobe incorporated to simulate changes in wetland area.Second, some underlying mechanisms should be betterrepresented in ecosystem models. For example,
freeze–thaw cycles would be an importantfactor for both CH4 and N2O fluxes but areoften excluded from current researchefforts. Inclusion of a permafrost C–climate feedback would greatly increasethe accuracy of terrestrial CH4 and N2Oflux estimates under future climate-changescenarios (Xu et al. 2010, 2012; Koven et al.2011). Soil consumption of N2O was alsonot included in this study, thereby likelyleading to overestimates of N2O emissionsfrom North America. Third, in our projec-tions, we only quantified the likely GHGpatterns under future climate scenarios,but did not consider the contributions ofother changing environmental factors,such as elevated atmospheric CO2, Ndeposition, and land-use and land-manage-ment practices. Future climate scenariosshould be related to different emissionsscenarios, which would primarily affectatmospheric CO2 concentration and Ndeposition. It is important to estimate pro-jected biogenic CH4 and N2O fluxeswithin a multi-factor environmentalchange framework (Tian et al. 2011).
Fourth, continental-scale estimates of projected biogenicCH4 and N2O budgets were primarily based on the DLEMsimulations because no other suitable estimates wereavailable. Clearly, data–model integration and model–model intercomparisons are needed to reduce uncertain-ties in estimating CH4 and N2O budgets.
n Conclusion
This study provides the most up-to-date and comprehen-sive estimates of contemporary and projected biogenicCH4 and N2O fluxes in North American terrestrialecosystems. Our results show that biogenic CH4 and N2Oemissions likely offset 47–166% of terrestrial CO2 seques-tration in North America over the past two decades.Thus, non-CO2 GHGs must be considered when assess-ing the role of terrestrial ecosystems in climate-changedynamics. Examining and modeling potential impacts ofclimate change on biogenic CH4 and N2O fluxes is there-fore crucial for accurate climate-change assessment. Ourprojections with the DLEM indicate that biogenic CH4
and N2O emissions, solely driven by climate change, willcontinue to increase and be a major influence on warm-ing in this century.
This study also provides information for identifying thepotential hotspots of CH4 and N2O emissions in NorthAmerica. For example, high-latitude regions could soonbecome a major hotspot for CH4 emissions if climatewarming continues as predicted. The conterminous USwould be the largest contributor to increased N2O emis-sions in North America, but Canada and Alaska would
Figure 3. Projected changes in CH4 and N2O emissions in response to A2 andB1 climate scenarios in the three countries of North America (upper panels) andseven regions of the US by the end of the 21st century as estimated by DynamicLand Ecosystem Model (DLEM). The y-axes display CH4 and N2O emissionchange (expressed in Tg CO2eq yr–1).
GreatPlains

HQ Tian et al. Methane and nitrous oxide budgets
experience a faster N2O increase primarily as a result ofclimate warming.
To obtain more accurate estimates of North Americanbiogenic CH4 and N2O budgets and to fully understandunderlying flux mechanisms, we need a better under-standing of critical biogeochemical processes as well asclassification and distribution of key vegetation covers,including natural wetlands and inundation extents.Future projections of CH4 and N2O emissions should con-sider additional driving forces. In particular, anthro-pogenic drivers, including land-use change and land-management practices, need to be further investigated.
n Acknowledgements
This study was supported by the US Department of Energy’sNational Institute for Climatic Change Research (NICCR)Program (DUKE-UN-07-SC-NICCR-1014), the NationalAeronautics and Space Administration (NASA) Atmos-pheric Chemistry Modeling and Analysis Program, theNASA Terrestrial Ecology Program, the NASAInterdisciplinary Science Program (NNX10AU06G,NNX11AD47G), and the Alabama Agricultural Experi-ment Station (AAES) Hatch/Multistate Funding Program.Portions of this work were performed at the Jet PropulsionLaboratory, California Institute of Technology, under con-tract with NASA. This study contributes to the NorthAmerican Carbon Program (NACP) Non-CO2 Green-house Gases Synthesis.
n ReferencesAvis CA, Weaver AJ, and Meissner KJ. 2011. Reduction in areal
extent of high-latitude wetlands in response to permafrostthaw. Nat Geosci 4: 444–48.
Banger K, Tian H, and Lu C. 2012. Do nitrogen fertilizers stimulateor inhibit methane emissions from rice fields? Glob Change Biol18: 3259–67.
Barlett KB and Harriss RC. 1993. Review and assessment ofmethane emissions from wetlands. Chemosphere 26: 261–320.
Bloom A, Palmer P, Fraser A, et al. 2010. Large-scale controls ofmethanogenesis inferred from methane and gravity spacebornedata. Science 327: 322–25.
Bousquet P, Ciais P, Miller J, et al. 2006. Contribution of anthro-pogenic and natural sources to atmospheric methane variabil-ity. Nature 443: 439–43.
Bridgham SD, Megonigal JP, Keller JK, et al. 2006. The carbon bal-ance of North American wetlands. Wetlands 26: 889–916.
Cantarel AAM, Bloor JMG, Deltroy N, et al. 2011. Effects of cli-mate change drivers on nitrous oxide fluxes in an upland tem-perate grassland. Ecosystems 14: 223–33.
CCSP (Climate Change Science Program). 2007. The first state ofthe carbon cycle report (SOCCR): the North American car-bon budget and implications for the global carbon cycle. In:King AW, Dilling L, Zimmerman GP, et al. (Eds). A report bythe US Climate Change Science Program and the subcommit-tee on Global Change Research. Asheville, NC: NOAA,National Climatic Data Center.
Dahl TE. 1990. Wetlands losses in the United States 1780s to1980s. Washington, DC: US Department of the Interior, Fishand Wildlife Service and Jamestown, ND: Northern PrairieWildlife Research Center Online. www.npwrc.usgs.gov/resource/wetlands/wetloss/index.htm. Viewed 9 Oct 2012.
535
© The Ecological Society of America www.frontiersinecology.org
Del Grosso SJ, Parton WJ, Mosier AR, et al. 2006. DAYCENTnational-scale simulations of nitrous oxide emissions fromcropped soils in the United States. J Environ Qual 35: 1451–60.
Denman KL, Brasseur G, Chidthaisong A, et al. 2007. Couplingsbetween changes in the climate system and biogeochemistry.In: Solomon S, Qin D, Manning M, et al. (Eds). Climatechange 2007: the physical science basis. Contribution ofWorking Group I to the Fourth Assessment Report of theIntergovernmental Panel on Climate Change. Cambridge, UK:Cambridge University Press.
Dijkstra FA, Prior SA, Runion GB, et al. 2012. Effects of elevatedcarbon dioxide and increased temperature on methane andnitrous oxide fluxes: evidence from field experiments. FrontEcol Environ 10: 520–27.
Dlugokencky EJ, Nisbet EG, Fisher R, et al. 2011. Global atmos-pheric methane: budget, changes, and dangers. Philos T R Soc A369: 2058–72.
Forster P, Ramaswamy V, Artaxo P, et al. 2007. Changes in atmos-pheric constituents and in radiative forcing. In: Solomon S,Qin D, Manning M, et al. (Eds). Climate change 2007: thephysical science basis. Contribution of Working Group I to theFourth Assessment Report of the Intergovernmental Panel onClimate Change. Cambridge, UK: Cambridge University Press.
Galloway JN, Dentener FJ, Capone DG, et al. 2004. Nitrogencycles: past, present, and future. Biogeochemistry 70: 153–226.
Hirsch AI, Michalak AM, Bruhwiler LM, et al. 2006. Inverse mod-eling estimates of the global nitrous oxide surface flux from1998–2001. Global Biogeochem Cy 20: GB1008.
IPCC (Intergovernmental Panel on Climate Change). 2007.Summary for policymakers. In: Solomon S, Qin D, ManningM, et al. (Eds). Climate change 2007: the physical sciencebasis. Contribution of Working Group I to the FourthAssessment Report of the Intergovernmental Panel on ClimateChange. Cambridge, UK: Cambridge University Press.
IPCC/UNEP/OECD/IEA (Intergovernmental Panel on ClimateChange/United Nations Environment Programme/Organi-sation for Economic Co-operation and Development/Inter-national Energy Agency). 1997. Revised 1996 IPCC guidelinesfor national greenhouse gas inventories. Paris, France:IPCC/UNEP/OECD/IEA.
Karl TR, Melillo JM, and Peterson TC. 2009. Global climatechange impacts in the United States. Cambridge, UK:Cambridge University Press.
King AW, Hayes DJ, Huntzinger DN, et al. 2012. North Americancarbon dioxide sources and sinks: magnitude, attribution, anduncertainty. Front Ecol Environ 10: 512–19.
Kort EA, Andrews AE, Dlugokencky EJ, et al. 2010. Atmosphericconstraints on 2004 emissions of methane and nitrous oxide inNorth America from atmospheric measurements and a receptor-oriented modeling framework. J Integr Environ Sci 7: 125–33.
Kort EA, Eluszkiewica J, Stephens BB, et al. 2008. Emissions ofCH4 and N2O over the United States and Canada based on areceptor-oriented modeling framework and COBRA-NAatmospheric observations. Geophys Res Lett 35: L18808.
Koven CD, Ringeval B, Friedlingstein P, et al. 2011. Permafrost car-bon–climate feedbacks accelerate global warming. P Natl AcadSci USA 108: 14769–74.
Li CS, Narayanan V, and Harriss RC. 1996. Model estimates ofnitrous oxide emissions from agricultural lands in the UnitedStates. Global Biogeochem Cy 10: 297–306.
Lu CQ, Tian HQ, Liu ML, et al. 2012. Effect of nitrogen depositionon China’s terrestrial carbon uptake in the context of multi-factor environmental changes. Ecol Appl 22: 53–75.
Meehl GA, Covey C, Delworth T, et al. 2007. The WCRP CMIP3multi-model dataset: a new era in climate change research. BAm Meteorol Soc 88: 1383–94.
Melillo JM, Reilly J, Kicklighter D, et al. 2009. Indirect emissionsfrom biofuels: how important? Science 326: 1397–99.
Methane and nitrous oxide budgets HQ Tian et al.
536
www.frontiersinecology.org © The Ecological Society of America
Michalak AM, Jackson RB, Marland G, et al. 2011. A US carboncycle science plan. www.carboncyclescience.gov/USCarbonCycleSciencePlan-August2011.pdf. Viewed 10 Oct 2012.
Miller SM, Kort EA, Hirsch AI, et al. 2012. Regional sources ofnitrous oxide over the United States: seasonal variation andspatial distribution. J Geophys Res 117: D06310.
Mitsch WJ and Gosselink JG. 2007. Wetlands. New York, NY:John Wiley & Sons Inc.
Montzka SA, Dlugokencky EJ, and Butler JH. 2011. Non-CO2greenhouse gases and climate change. Nature 476: 43–50.
Mosier A, Kroeze C, Nevison C, et al. 1998. Closing the globalN2O budget: nitrous oxide emissions through the agriculturalnitrogen cycle. Nutr Cycl Agroecosys 52: 225–48.
Mummey DL, Smith JL, and Bluhm G. 1998. Assessment of alter-native soil management practices on N2O emissions from USagriculture. Agr Ecosyst Environ 70: 79–87.
Pickett-Heaps CA, Rayner PJ, Law RM, et al. 2011. AtmosphericCO2 inversion validation using vertical profile measurements:analysis of four independent inversion models. J Geophys Res116: D12305; doi:10.1029/2010JD014887.
Potter C, Klooster S, Hiatt S, et al. 2006. Methane emissions fromnatural wetlands in the United States: satellite-derived estima-tion based on ecosystem carbon cycling. Earth Interact 10:1–12.
Ren W, Tian HQ, Xu XF, et al. 2011. Spatial and temporal patternsof CO2 and CH4 fluxes in China’s croplands in response to mul-tifactor environmental changes. Tellus B 63: 222–40.
Schulze ED, Luyssaert S, Ciais P, et al. 2009. Importance ofmethane and nitrous oxide for Europe’s terrestrial greenhouse-gas balance. Nat Geosci 2: 842–50.
Smith WN, Grant B, Desjardins RL, et al. 2004. Estimates of theinterannual variations of N2O emissions from agricultural soilsin Canada. Nutr Cycl Agroecosys 68: 37–45.
Tian HQ, Chen GS, Zhang C, et al. 2012. Century-scale responsesof ecosystem carbon storage and flux to multifactorial globalchange in the southern United States. Ecosystems 15: 674–94.
Tian HQ, Xu XF, Liu ML, et al. 2010. Spatial and temporal patterns
of CH4 and N2O fluxes in terrestrial ecosystems of NorthAmerica during 1979–2008: application of a global biogeo-chemistry model. Biogeosciences 7: 2673–94.
Tian HQ, Xu XF, Lu CQ, et al. 2011. Net exchanges of CO2, CH4,and N2O between China’s terrestrial ecosystems and the atmos-phere and their contributions to global climate warming. JGeophys Res 116: G02011.
USDA (US Department of Agriculture). 2011. US agriculture andforestry greenhouse gas inventory: 1990–2008. Washington,DC: Climate Change Program Office, Office of the ChiefEconomist, US Department of Agriculture. Technical BulletinNo 1930.
US EPA (US Environmental Protection Agency). 2011. Inventoryof US greenhouse-gas emissions and sinks: 1990–2009.Washington, DC: US Environmental Protection Agency. EPA430-R-12-001. www.epa.gov/climatechange/ghgemissions/usinventoryreport.html. Viewed 30 Jan 2012.
Xu XF, Tian HQ, and Hui D. 2008. Convergence in the relation-ship of CO2 and N2O exchanges between soil and atmospherewithin terrestrial ecosystems. Glob Change Biol 14: 1651–60.
Xu XF, Tian HQ, Liu ML, et al. 2012. Multiple-factor controls onterrestrial N2O flux over North America from 1979 through2010. Biogeosciences 9: 1351–66.
Xu XF, Tian HQ, Zhang C, et al. 2010. Attribution of spatial andtemporal variations in terrestrial methane flux over NorthAmerica. Biogeosciences 7: 3637–55.
Zedler JB and Kercher S. 2005. Wetland resources: status, trends,ecosystem services, and restorability. Annu Rev Env Resour 30:39–74.
Zhuang Q, Melillo JM, Kicklighter DW, et al. 2004. Methane fluxesbetween terrestrial ecosystems and the atmosphere at northernhigh latitudes during the past century: a retrospective analysiswith a process-based biogeochemistry model. Global BiogeochemCy 18: GB3010.
Zhuang Q, Melillo JM, McGuire AD, et al. 2007. Net emissions ofCH4 and CO2 in Alaska: implications for the region’s green-house gas budget. Ecol Appl 17: 203–12.
Join us to transform BiologyEducation for the 21st centuryExplore digital resources and new technologies fordata exploration and curriculum design related to
cross-cutting biology themes
RegisterOnline
TODAY!
Join us to transform BiologyEducation for the 21st century
l Ecology and Earth Systems Dynamics l Biodiversity and Ecosystem Servicesl Evolution in Action l Structure and Function
Registration deadlines: Early Bird rates - Dec 15, 2012Advanced rates - Feb 28, 2013
www.esa.org/ldcwww.esa.org/ldc
LIFE DISCOVERY – DOING SCIENCEExploring Biology for a Changing WorldMARCH 15 –16, 2013 – ST PAUL, MINNESOTA
Copyright © 2022 FDOKUMEN