Contact-dependent delivery of IL-2 by dendritic cells to CD4 T ...
16
RESEARCH ARTICLE Contact-dependent delivery of IL-2 by dendritic cells to CD4 T cells in the contraction phase promotes their long-term survival Dan Tong 1 , Li Zhang 1 , Fei Ning 1 , Ying Xu 1 , Xiaoyu Hu 1& , Yan Shi 1,2& 1 Tsinghua Institute for Immunology and Department of Basic Medical Sciences, Beijing Key Lab for Immunological Research on Chronic Diseases, School of Medicine, Tsinghua-Peking Center for Life Sciences, Tsinghua University, Beijing 100084, China 2 Department of Microbiology, Immunology and Infectious Diseases, Snyder Institute, University of Calgary, Calgary, Canada & Correspondence: [email protected] (X. Hu), [email protected] (Y. Shi) Received August 5, 2019 Accepted September 18, 2019 ABSTRACT Common γ chain cytokines are important for immune memory formation. Among them, the role of IL-2 remains to be fully explored. It has been suggested that this cytokine is critically needed in the late phase of primary CD4 T cell activation. Lack of IL-2 at this stage sets for a diminished recall response in subsequent challenges. However, as IL-2 peak production is over at this point, the source and the exact mechanism that promotes its production remain elusive. We report here that resting, previously antigen-stimulated CD4 T cells maintain a minimalist response to dendritic cells after their peak activation in vitro. This subtle activation event may be induced by DCs without overt presence of antigen and appears to be stronger if IL-2 comes from the same dendritic cells. This encounter reactivates a miniature IL-2 production and leads a gene expression profile change in these previously activated CD4 T cells. The CD4 T cells so experienced show enhanced reactivation intensity upon secondary challenges later on. Although mostly relying on in vitro evidence, our work may implicate a subtle programing for CD4 T cell survival after primary activation in vivo. KEYWORDS dendritic cell, contact dependence, long term survival, T cell memory, IL-2 INTRODUCTION In the linear model of T cell memory (Gasper et al., 2014), long lasting memory cells develop out of the contracting phase of activation. Cytokines, particularly IL-7 and IL-15, have been implicated in the formation, homeostasis and subtype differentiation of memory T cells (Gasper et al., 2014; Raeber et al., 2018). With all these advances in our understanding, exact determinant that leads to T cells’ commitment to memory is not clearly understood, particularly with regard to CD4 T cells (Bell and Westermann, 2008; MacLeod et al., 2009). Despite of different proposed mech- anisms, a common question remains whether cell extrinsic factors can guide their long-term survival following primary infection. Compared with IL-7 and IL-15, IL-2 signaling in memory T cell formation is less understood. For CD8 + T cells, IL-2 in the primary infection expands the cell number and renders them resistant to secondary challenges, mainly via anti-apoptotic signaling (Liao et al., 2013). In 2006 Bevan’s group reported that to establish CD8 T cell memory, the presence of CD25 on these cells during primary infection is critical. In that report, the authors ruled out autocrine IL-2, instead sug- gested an environmental source, such as CD4 T cells or dendritic cells (DCs) (Williams et al., 2006). This signaling was regarded as a strong one as it could be replaced only with IL-2/IL-2 antibody complex. A later report, however, suggested that CD8 + T cells could produce IL-2 for their own use in memory formation (Feau et al., 2011). Interestingly, it is generally agreed that a strong and sustained IL-2 signaling via CD25 leads to a terminal effector differentiation, detri- mental to memory development (Kalia et al., 2010). While Electronic supplementary material The online version of this article (https://doi.org/10.1007/s13238-019-00662-0) contains sup- plementary material, which is available to authorized users. © The Author(s) 2019 Protein Cell 2020, 11(2):108–123 https://doi.org/10.1007/s13238-019-00662-0 Protein & Cell Protein & Cell
-
Upload
khangminh22 -
Category
Documents
-
view
0 -
download
0
Transcript of Contact-dependent delivery of IL-2 by dendritic cells to CD4 T ...

RESEARCH ARTICLE
Contact-dependent delivery of IL-2 by dendriticcells to CD4 T cells in the contraction phasepromotes their long-term survival
Dan Tong1, Li Zhang1, Fei Ning1, Ying Xu1, Xiaoyu Hu1& , Yan Shi1,2&
1 Tsinghua Institute for Immunology and Department of Basic Medical Sciences, Beijing Key Lab for Immunological Researchon Chronic Diseases, School of Medicine, Tsinghua-Peking Center for Life Sciences, Tsinghua University, Beijing 100084,China
2 Department of Microbiology, Immunology and Infectious Diseases, Snyder Institute, University of Calgary, Calgary, Canada& Correspondence: [email protected] (X. Hu), [email protected] (Y. Shi)
Received August 5, 2019 Accepted September 18, 2019
ABSTRACT
Common γ chain cytokines are important for immunememory formation. Among them, the role of IL-2 remainsto be fully explored. It has been suggested that thiscytokine is critically needed in the late phase of primaryCD4 T cell activation. Lack of IL-2 at this stage sets for adiminished recall response in subsequent challenges.However, as IL-2 peak production is over at this point,the source and the exact mechanism that promotes itsproduction remain elusive. We report here that resting,previously antigen-stimulated CD4 T cells maintain aminimalist response to dendritic cells after their peakactivation in vitro. This subtle activation event may beinduced by DCs without overt presence of antigen andappears to be stronger if IL-2 comes from the samedendritic cells. This encounter reactivates a miniatureIL-2 production and leads a gene expression profilechange in these previously activated CD4 T cells. TheCD4 T cells so experienced show enhanced reactivationintensity upon secondary challenges later on. Althoughmostly relying on in vitro evidence, our work mayimplicate a subtle programing for CD4 T cell survivalafter primary activation in vivo.
KEYWORDS dendritic cell, contact dependence, longterm survival, T cell memory, IL-2
INTRODUCTION
In the linear model of T cell memory (Gasper et al., 2014),long lasting memory cells develop out of the contractingphase of activation. Cytokines, particularly IL-7 and IL-15,have been implicated in the formation, homeostasis andsubtype differentiation of memory T cells (Gasper et al.,2014; Raeber et al., 2018). With all these advances in ourunderstanding, exact determinant that leads to T cells’commitment to memory is not clearly understood, particularlywith regard to CD4 T cells (Bell and Westermann, 2008;MacLeod et al., 2009). Despite of different proposed mech-anisms, a common question remains whether cell extrinsicfactors can guide their long-term survival following primaryinfection.
Compared with IL-7 and IL-15, IL-2 signaling in memory Tcell formation is less understood. For CD8+ Tcells, IL-2 in theprimary infection expands the cell number and renders themresistant to secondary challenges, mainly via anti-apoptoticsignaling (Liao et al., 2013). In 2006 Bevan’s group reportedthat to establish CD8 T cell memory, the presence of CD25on these cells during primary infection is critical. In thatreport, the authors ruled out autocrine IL-2, instead sug-gested an environmental source, such as CD4 T cells ordendritic cells (DCs) (Williams et al., 2006). This signalingwas regarded as a strong one as it could be replaced onlywith IL-2/IL-2 antibody complex. A later report, however,suggested that CD8+ T cells could produce IL-2 for their ownuse in memory formation (Feau et al., 2011). Interestingly, itis generally agreed that a strong and sustained IL-2 signalingvia CD25 leads to a terminal effector differentiation, detri-mental to memory development (Kalia et al., 2010). While
Electronic supplementary material The online version of thisarticle (https://doi.org/10.1007/s13238-019-00662-0) contains sup-
plementary material, which is available to authorized users.
© The Author(s) 2019
Protein Cell 2020, 11(2):108–123https://doi.org/10.1007/s13238-019-00662-0 Protein&Cell
Protein
&Cell

these findings may not be mutually exclusive, it does how-ever, seem to indicate a discreet and managed availability ofIL-2 at this stage of T cell activation. A similar analysis wasperformed for the role of IL-2 in CD4 T cell memory as well(McKinstry et al., 2014). IL-2 was found to be critical for theexpression ratio of Blimp vs. Bcl-2, promoting cell survivaland at the same time upregulate CD127 (IL-7Rα). Again, theintensity of IL-2 signaling at this stage was considered to behigh. Because in the absence of autocrine IL-2 (IL-2 deficientT cells), the memory development required high levels ofexternal IL-2 or in the form of IL-2/IL-2 antibody complex,and was minimally rescued by co-transfer of IL-2 sufficientprimed CD4 Tcells (McKinstry et al., 2014). However, it is notclear why IL-2 is belatedly needed in the primary stimulation,and more ominously whether CD4 T cells produce sufficientIL-2 this late to support their own transition to memory (Sojkaet al., 2004).
In this short report, we describe an in vitro subtle stimu-lation event in activated T cells late in the primary phase ofactivation. In an experiment to study the CD69 expressionprofile in a typical in vivo T cell activation event, we noticedthe re-expression of CD69 on activated CD4 T cells severaldays after its peak expression in vivo. In vitro, a similaractivation can be driven by DCs in an antigen independentmanner. In our settings, contact of previously activated/res-ted CD4 T cells with dendritic cells (DCs) sent a very mildactivation signal to these Tcells and led to a re-production ofIL-2. T cells after this mild stimulation, upon transfer intonaïve recipients, can better maintain their response to anti-gen in a secondary stimulation. Instead of signaling via JAK/STAT pathways (Ross and Cantrell, 2018), RNA-seq analy-sis indicated this activation event enhanced the expressionof Bcl2 as well as Oasl2 and Isg15, two type I interferon-related genes (Zhao et al., 2013; Choi et al., 2015). Theseresults provide suggestive evidence that optimal secondaryresponse requires a brief encounter with DCs followingantigen clearance and imply that DCs could be the source ofthe “trickling” IL-2 in the later phase of T cell activation,potentially pointing to a missing link in the overall picture ofCD4 T cell survival after their primary activation.
RESULTS
Previously activated CD4 T cells upregulate CD69in response to DC binding
In our previous work studying the effect of DC/T cell contact,we made an interesting finding. In OT-II mice challenged withListeria monocytogenes expressing OVA (LM-OVA), theactivated T cells isolated from the mice showed a typical risein the percentage expression of CD69 in the primaryresponse, followed by a gradual tapering off (Fig. 1A). Inthree experiments, we noticed a small jump of CD69 around8 to 9 days after the LM inoculation (Figs. 1A and S1A,showing the FACS plots in all five mice in this group.
Fig. S1B shows the pool data of all three independentexperiments). This phenomenon was inconspicuouslyshown in a report from another group without arousing anycuriosity (Ciabattini et al., 2008). We decided to investigatewhether this phenomenon could be recaptured in vitro and
Figure 1. PA T cells upregulate CD69 in DC co-culture.
(A) OT-II mice were i.v. injected with 0.1LD50 LM-OVA.
dLNs (draining LNs) and spleen were harvested on stated
days and CD69 expression on CD4 T cells as a percent-
age was determined by FACS. n = 5 mice per group, and
total 55 mice in this experiment. Results are representative
of three independent experiments (N = 3). N = 3 for
independent repeats of the experiment. *P < 0.05, **P <
0.01, ***P < 0.001 (Unpaired Student’s t test). n (replicates
of biological samples) and N (number of independent
repeats of the experiments) designations, as well as
statistical symbols are used henceforth. (B) Left: Repre-
sentative staining of previously activated CD4 T cells (PA
T) after resting 48 h, CD69 expression was compared with
co-cultured with DC1940 cell-line or B6 BMDCs. Red line
is positive control which stands for PA T co-cultured with
DC1940 in the presence of 10 µg/mL OVA. Three
replicates in each group (n = 3), results are representative
of eight independent experiments (N = 8). Right: Pooled
data from eight independent experiments are shown.
Normalized CD69 mean fluorescence intensity (MFI) by
the PA T group in multiple independently repeated exper-
iments (N = 8) was analyzed for fold change of CD69 MFI.
**P < 0.01, ****P < 0.0001 (Unpaired Student’s t test).
(C) Similar to (B) except that naïve freshly magnetically
isolated OT-II splenic CD4 cells were used in place of PAT.
Three replicates in each group (n = 3), results are
representative of three independent experiments (N = 3).
(D) Similar to (B) except that B6 MEF and 3T3 cells were
used in place of DCs. Three replicates in each group (n =
3), results are representative of four independent experi-
ments (N = 4). (E) Magnetically isolated naïve CD4 T cells
from B6 mice were activated in vitro with anti-CD3e and
anti-CD28. Same experiment as in (B) was performed
using B6 splenic CD11c+ cells and DC1940 as the
stimulator. Three replicates in each group (n = 3), and
results are representative of three independent experi-
ments (N = 3). (F) Left: Similar to (D) except that MEF and
3T3 were in place of DCs. Three replicates in each group
(n = 3), results are representative of three independent
experiments (N = 3). Right: pooled data from three
independent experiments are shown. Normalized CD69
mean fluorescence intensity (MFI) by the B6 activated CD4
group in multiple independently repeated experiments (N =
3) was analyzed for fold change of CD69 MFI. ns means
no significant difference (Unpaired Student’s t test). Pooled
data for the panels (C and D) from multiple experiments
are shown in Fig. S3 as marked.
c
© The Author(s) 2019 109
Protein
&Cell
Dendritic cells with IL2 promote activated CD4 T cells long survival RESEARCH ARTICLE
Spl
een
01
23
45
67
89
100204060
***
***
Tim
e (d
)0
12
34
56
78
910
Tim
e (d
)
CD69+CD4
+ T cells (%)
CD69+CD4
+ T cells (%)
ALN
s
05101520
***
100
102
104
106
CD
69
100
102
104
106
CD
69
100
102
104
106
CD
6910
010
210
410
6
CD
69
05101520B
Isot
ype
cont
rol
PAT
+ D
C +
OVA
PAT
PAT
+ B
6 B
MD
C
PAT
+ D
C19
40
Of max (%)
Of max (%)
0102030
C
CD
4 +
DC
1940
CD
4
CD
4 +
B6
BM
DC
050100
150
200
D
PAT
+ M
EF
PAT
PAT
+ 3T
3
Of max (%)
F
B6
activ
ated
CD
4 +
ME
F
B6
activ
ated
CD
4
B6
activ
ated
CD
4 +
3T3
0510152025B
6 ac
tivat
ed C
D4
B6
activ
ated
CD
4 +
DC
1940
B6
activ
ated
CD
4 +
CD
11C
+
E
Of max (%)
100
102
104
106
CD
69
0510152025
Of max (%)
RESEARCH ARTICLE Dan Tong et al.
110 © The Author(s) 2019
Protein
&Cell
whether it had any relevance in regulation of T cells aftertheir primary response. We stimulated OT-II cells in vitrowith OVA, and the activated cells were harvested after 48 hby FACS purification (termed previously activated T cells, orPA T; the gradual downregulation of CD69 on these acti-vated T cells upon FACS sorting is shown in Fig. S2A).These cells were then co-cultured in the absence of antigenwith GM-CSF/IL-4-induced bone marrow DCs (BMDCs) orimmortalized DC line DC1940 (Steiner et al., 2008).Intriguingly, a percentage of previously activated OT-II re-expressed CD69 and data are pooled from multipleexperiments (Fig. 1B), although the response intensity wasconsiderably lower than that to DC + OVA. Freshly isolatednaïve OT-II CD4 T cells, however, did not show such anupregulation (Fig. 1C). This upregulation was absent in co-culture with B6 MEF or 3T3 cells (Fig. 1D). To test thisphenomenon in the complete absence of antigen, westimulated B6 CD4 T cells in vitro with anti-CD3ε and anti-CD28, and the resulting PA T cells were co-cultured withthe stimulators used above. The CD69 upregulation wasseen in these non-specifically activated CD4 T cells co-cultured with B6 splenic CD11c+ cells and DC1940(Fig. 1E), and not with B6 MEF or 3T3 cells, and data arepooled from multiple experiments (Fig. 1F). It is also worthnoting that T cells assayed here did not show significantcell death in this duration (Fig. S2B). Data in Fig. 1C–E arealso pooled from multiple experiments and shown inFig. 3A–C, respectively. These observations seem to sug-gest that PA T cells have a unique response to DCs fol-lowing their primary activation and this response itself doesnot involve antigen specificity.
PA T encounter with DCs results in limited activationindicated by upregulating of Il2 and Bcl2
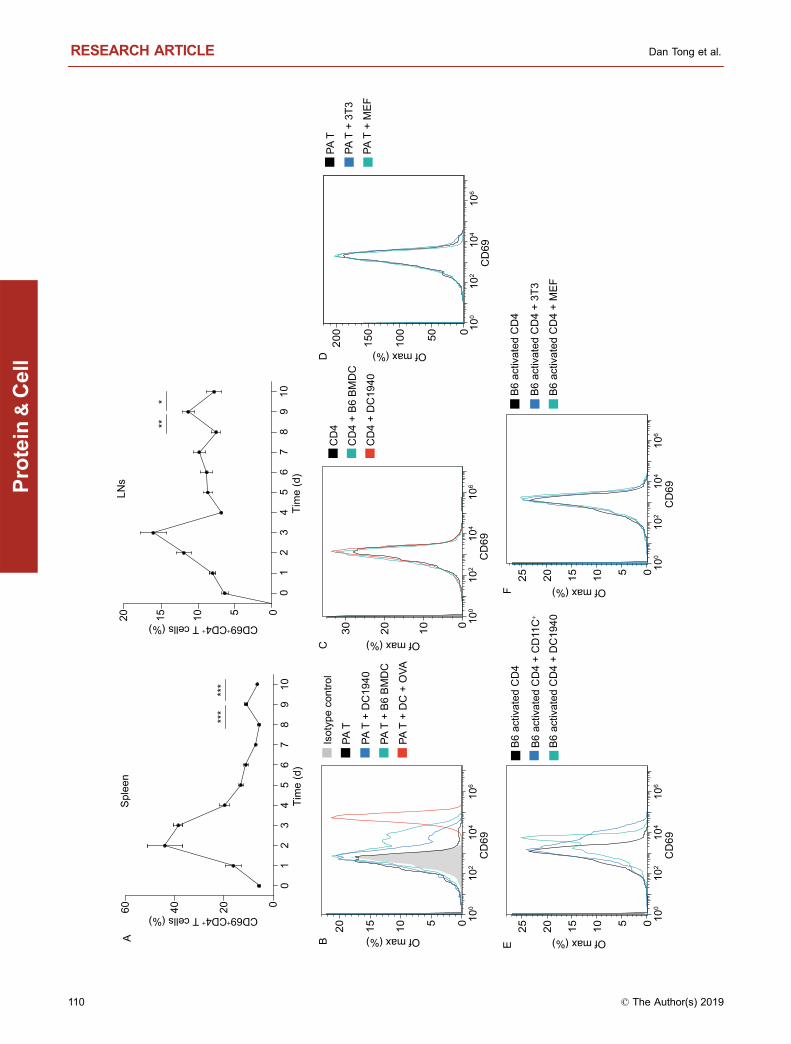
The stimulation provided by DCs to PA T cells led to somesurface marker expression change, such as a slight upregulation of CD103, CXCR5 and CCR7 in CD69+ popula-tion, while CD127 (IL7R) appeared to be expressed at sim-ilar levels (Figs. 2A and S4). A screening analysis ofcytokines in the culture supernatant indicated some differ-ences, such as the increases in IFN-γ, CCL5 and severalMIPs (Fig. 2B). In contrast to the nominal changes at thephonotypical level, Il2 and Bcl2 RNA in CD69+ T cells wereincreased, Il7r on the other hand appeared to be lower(Fig. 2C). Interestingly, Il7r mRNA level, low to begin with,was significantly reduced in CD69+ cells, yet this differencewas not seen at the protein level (Fig. 2A). We do not knowthe reason behind this discrepancy. One possible explana-tion was the slightly better activated CD69+ cells allowedmore efficient translation of this mRNA. This is certainly ourunsubstantiated speculation and the issue was not analyzedfurther. Collectively, these results indicate that secondencounter of antigen-free DCs invokes a very limited acti-vation in these T cells that could be captured by IL-2 andCD69 analyses.
PT-A reactivation is associated with IL-2 productionby DCs
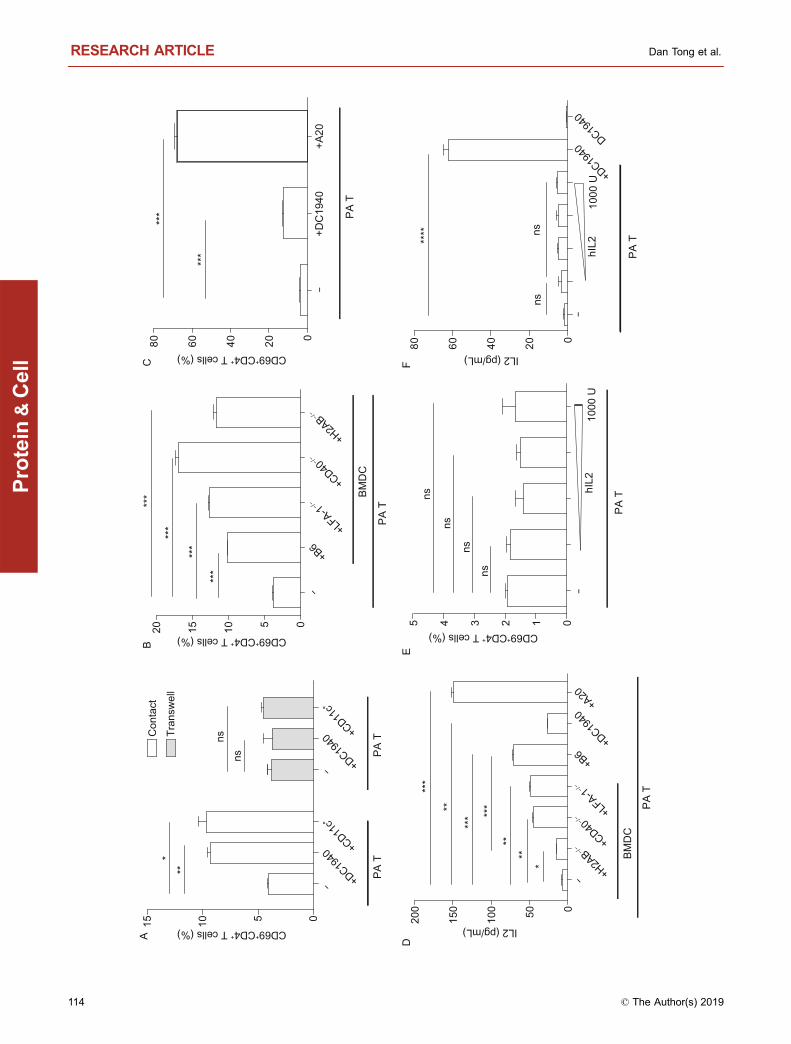
To examine the essential requirements for this low-gradeactivation, we first tested the involvement of physical con-tact. Transwell assays showed that contact was critical forthe partial CD69 expression (Fig. 3A). Yet, BMDCs fromMHC class II, LFA-1 and CD40 deficient mice were fullycapable of inducing the partial CD69 expression (Fig. 3B),dismissing the need of strong DC/T cell binding or CD40/CD40L crosstalk. In search for a potential non-surface pro-tein-mediated effect, we noticed a striking phenotype thatactivated CD4 T cells expressed exceptionally high levels ofCD69 following co-cultured with A20 B cell line (Fig. 3C). Atthe same time, all stimulatory co-cultures consistently pro-duced low levels of IL-2, with the sole exception of the A20culture where ample IL-2 was made (Fig. 3D), in line withA20’s strong ability to produce IL-2 reported in the literature(Kakiuchi et al., 1991). The higher response to A20 was notdriven by a hidden allogenic response (A20 is of H2-d) asthis upregulation of CD69 was also seen with bulk PA T cellsactivated by anti-CD3/CD28 which have a TCR pool vastlydifferent from that of singular OT-II TCR (Fig. S5). In thisexperiment, we also found that MHC class II deficiency led toa decreased IL-2 production in contrast to the similar level ofCD69 expression. It is possible that nominal IL-2 productionby T cells in response to DC contact may require the basalTCR MHC binding; effects of this nature have beendemonstrated in T cell survival and subtle growth advantagein homeostatic expansion (Kieper et al., 2004; Tanchot et al.,1997). On a whole, the result suggested that PA T reacti-vation may be linked to the IL-2 production by cells whichthey interact with. Interestingly, CD69 expression was notincreased in the presence of high IL-2 alone (Fig. 3E). IL-2production from the PA T was also not restored by exoge-nous IL-2 either (Fig. 3F), suggesting that IL-2 was deliveredvia surface contact.
Figure 2. PA T encounter with DCs results in limited
activation involving upregulation of Il2 and Bcl2. (A) PA
T cells were co-cultured with DC1940 for 24 h, then CD4+
populations were gated into CD69+ and CD69− cells by
FACS. The expression of CD103, CXCR5, CD62L, CCR9,
CCR7, CD127 and CD83 between CD69+ and CD69− cells
were compared. Three replicates in each group (n = 3),
and results are representative of three independent
experiments (N = 3). (B) CD69+ and CD69− cells cultured
in complete RPMI for 24 h without additional treatment,
then the cytokines released to the supernatant were
measured by ELISA. Pooled data from three independent
experiments are shown. (C) Gene expression of Il7r, Il2
and Bcl2 was determined by QPCR in PA T cells or in
CD69 positive or negative populations purified by FACS
sorting. Three replicates in each group (n = 3), and results
are representative of three independent experiments (N =
3). GAPDH was used for normalization.
c
Dendritic cells with IL2 promote activated CD4 T cells long survival RESEARCH ARTICLE
© The Author(s) 2019 111
Protein
&Cell
B
C
05101520 10203040
CD
103
CX
CR
5
CD
62L
CC
R7
CD
127
CD
83
CC
R9
CD
69- c
ells
CD
69+ c
ells
CD
69+ (2
4 h)
CD
69- (2
4 h)
A
0.00
0
0.00
5
0.01
0
0.01
5
mRNA/GapdhmRNA/Gapdh
mRNA/Gapdh
Il2 Il7r
Bcl2
****
PA
TC
D69
+C
D69
-
PA
TC
D69
+C
D69
-
PA
TC
D69
+C
D69
-
0.0
0.5
1.0
1.5
****
0.00
00
0.00
01
0.00
02
0.00
03
0.00
04
0.00
05**
**
GM-CSF IFN-ga
mma IL-1a
lpha
IL-6
IL-9
LIFMCP-1
MIP-1a
lpha
MIP-1b
eta
MIP-2
IP-10
CCL5
020406080 pg/mL
ns
*
nsns
***
ns
ns*
****
nsns
*
Of max (%) Of max (%)
100
102
104
106
100
102
104
106
100
102
104
106
100
102
104
106
100
102
104
106
100
102
104
106
100
102
104
106
RESEARCH ARTICLE Dan Tong et al.
112 © The Author(s) 2019
Protein
&Cell
Surface delivery of IL-2 from DCs to PA T
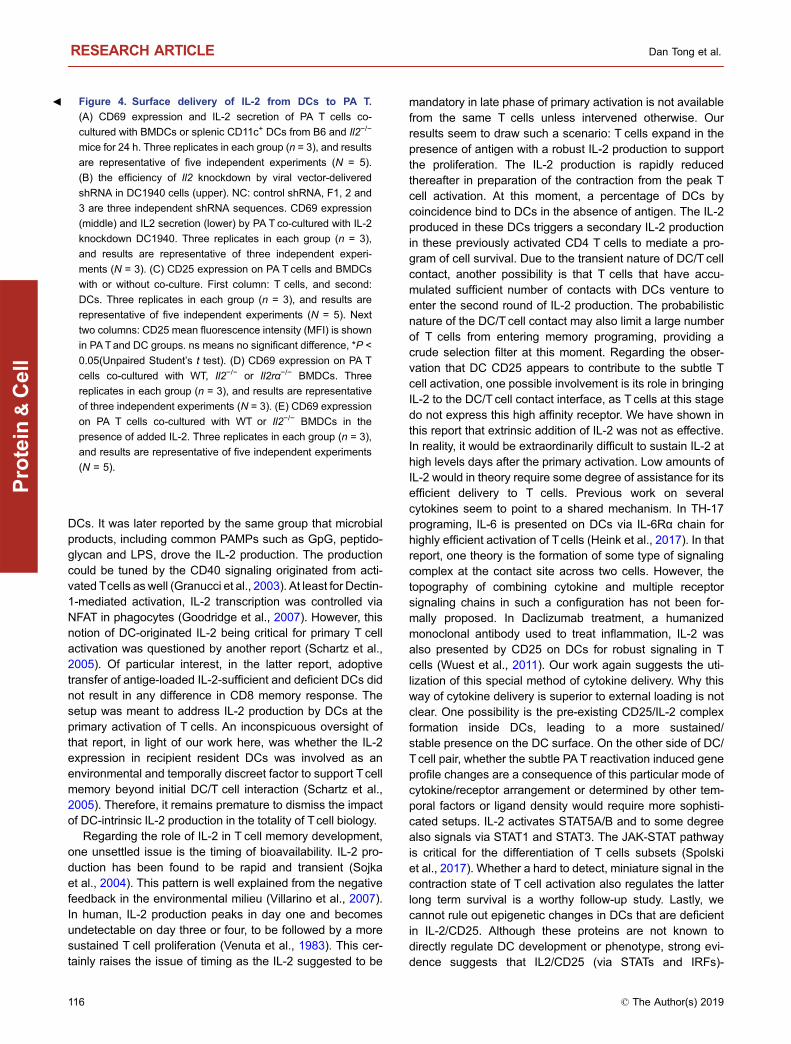
We used IL-2-deficient DCs to confirm the source of IL-2.Indeed, when these BMDCs were used in the co-cultureassay, the CD69 expression and IL-2 production werereduced (Fig. 4A). Although our data do not rule out IL-2 pro-duction from Tcells, it is clear that IL-2 fromDCswas critical tostart the “minimal” activation of the T cells, including theupregulation of CD69 in some cells and the potential contri-bution of IL-2 into the overall pool. To rule out any abnormalityin the IL-2-deficient DCs, shRNAwas used to knock down IL-2in DC1940 (Fig. 4B). Again, the CD69 expression and IL-2present in the culture supernatant were both reduced. PA Texpression of CD25 changed little with or without co-culturewith DCs and data are pooled from multiple experiments(Fig. 4C). We therefore considered if CD25 on the DC surfacewas able to transport IL-2 to CD4 T cells. Indeed, in this co-culture system, CD25 expression onWTDCswas higher thanKO (Fig. 4C). This expression may be contributing to thedelivery of IL-2 to PA T. We cultured PA T cells with CD25-deficient/IL-2-sufficient BMDCs. The result shows that in thisco-culture, similar to IL-2-deficient DCs, CD69 expression onCD4 Tcells was reduced (Fig. 4D), suggesting at least a siz-able part of IL-2 was delivered fromDC to PAT via cell surfaceCD25. In this co-culture system, CD69 expression was notcompletely restored by exogenous IL-2 in IL-2-deficientBMDCs (Fig. 4E), stressing the need for a cognate origin ofboth IL-2 and CD25. It should be noted that a fraction of A20cells, by our own analysis, also expresses CD25. To provide adirect comparison, we performed an experiment comparingthese two types of DCs in the presence or absence of addedIL-2 (Fig. S6). The results show that while CD69 expressionwas higher with extrinsic IL-2, the relative difference betweenWTand IL-2−/− DCs remained.
IL-2+DC contact leads to an altered gene expressionprofile
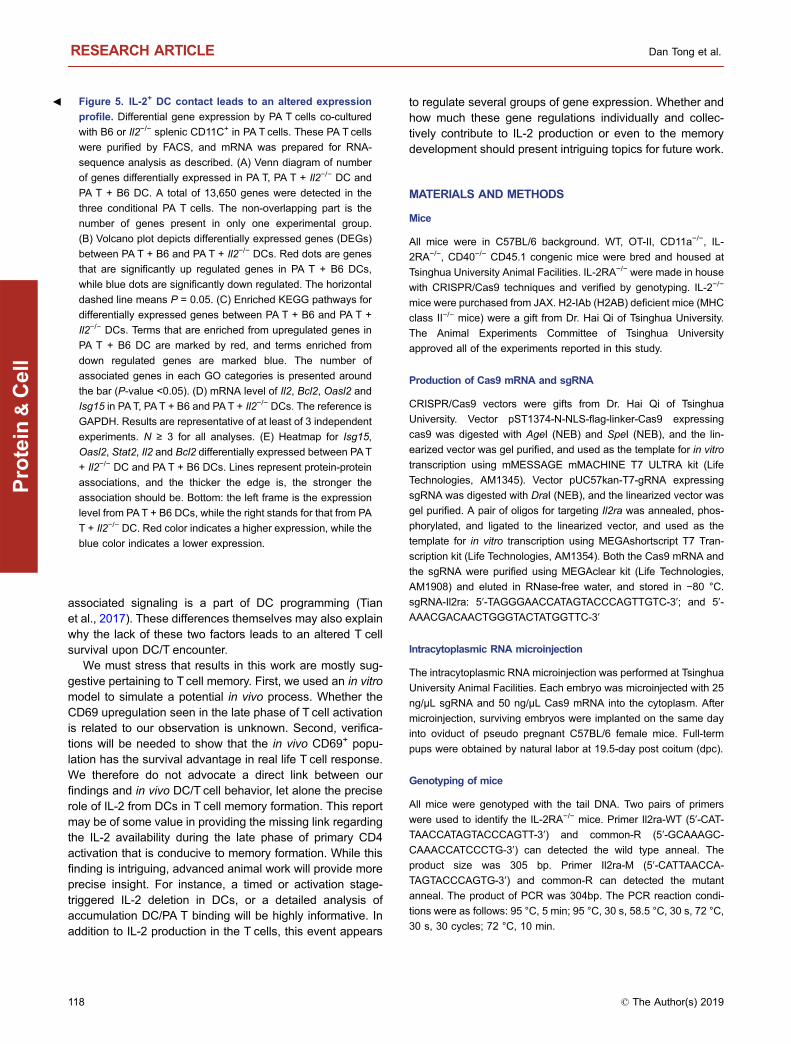
We performed RNA-seq analysis and found that PA T, andPA T cells co-cultured with B6 splenic CD11C+ DCs (PA T +B6 DC) and IL-2-deficient DCs (PA T + Il2−/− DC) had sub-stantial differences in gene expression profile (Fig. 5A). Wenext focused on the genes that were expressed differentiallyin PA T + B6 DC and PA T + Il2−/− DC by Volcano plot(Fig. 5B). In pair-wise comparison between B6 and IL-2-deficient DC co-cultured PA T cells, genes expression andtheir functional pathway are shown (Fig. 5C). The resultshowed the statistically most significant differences in cellcycle and apoptosis. Previous reports found that (Zhou et al.,2017; Park et al., 2000; Smith, 2015; Yang et al., 1997) Il2,Bcl2, Stat2, Isg15, Oasl2 may participate in the cell survivaland anti-apoptosis processes, and these genes were foundto be quantitatively different in the culture with B6 DCs andIL-2-deficient DCs by real time PCR (Fig. 5D). Gene asso-ciation analysis showed that these associated with type 1interferon responses were heavily interconnected (Fig. 5E).
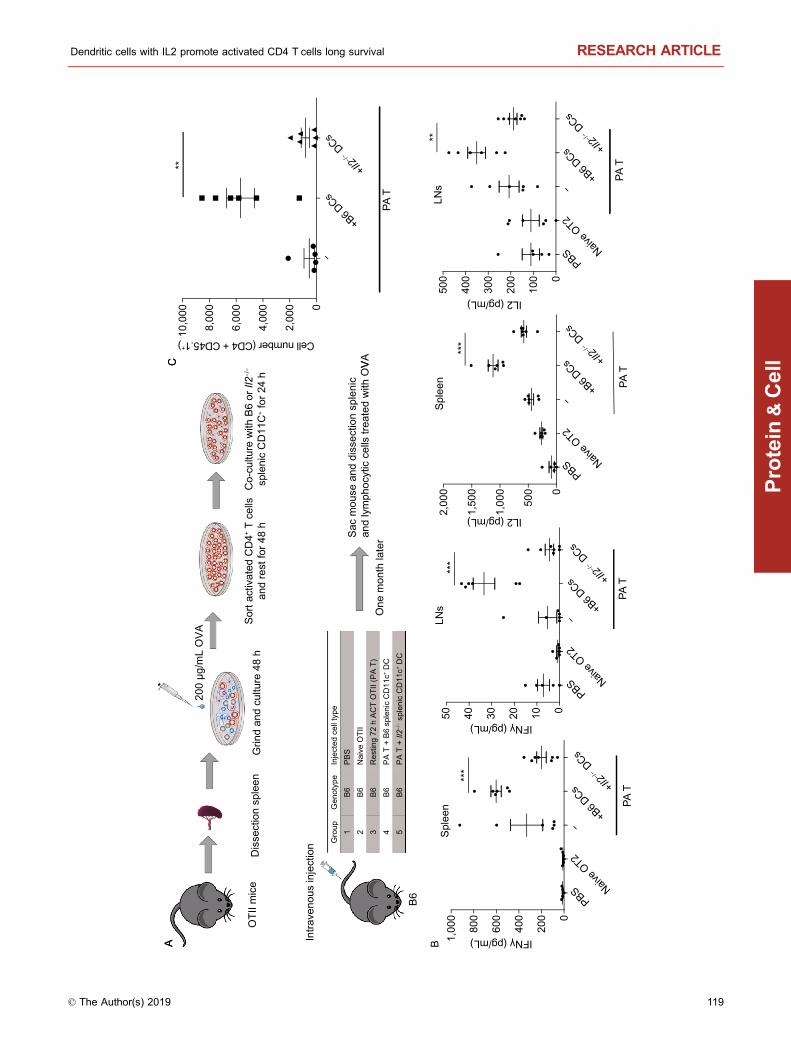
IL-2-positive DC coculture promotes activated CD4 Tcells into a long lasting population in vivo
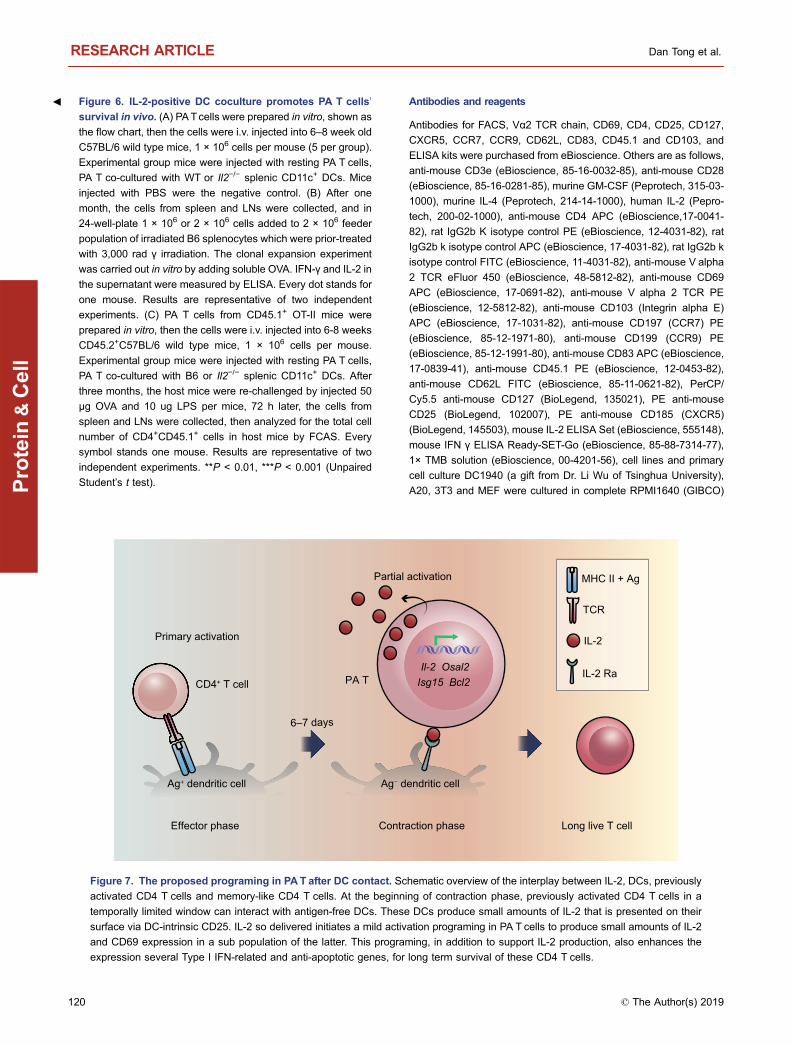
To determine whether the low-grade activation of PA T cellshad any impact on their secondary responses in vivo, wetransferred these T cells into naïve recipients, and spleensand LNs were harvested after one month for restimulationwith DC pulsed with soluble OVA (Fig. 6A scheme). Com-pared with untreated or IL-2-deficient DC-treated PA T cells,those treated with WT DCs showed stronger IFNγ and IL-2production, suggesting a stronger secondary response(Fig. 6B). To directly compare the cell number of infused Tcells, we transfused CD45.1 PA T with or without DC treat-ment into the recipient mice. Three months later, those micewere challenged with OVA plus LPS, and the CD45.1-posi-tive T cells were counted three days later. Again, the priorencounter with IL-2-sufficient DCs significantly boosted thenumber counts in comparison with the Il2−/− DCs (Fig. 6C).These results indicate that the minimalist activation, whileresulting in no overt phenotypic changes in these CD4 Tcells, altered the gene expression and was conducive to aprolonged T cell survival in the host (Fig. 7, proposed pro-graming in PA T).
DISCUSSION
IL-2 production by DCs was first revealed by Granucci et al.,with the advent of gene expression microarray (Granucciet al., 2001), and it was reported at that time to play a role inboth CD4 and CD8 T cell proliferative responses to allogenic
Figure 3. Minimal PA T reactivation is associated with
IL-2 production by DCs. (A) PA T cells were co-cultured
with DC1940 or CD11c+ splenocytes for 24 h in transwell
assays, CD69 expression was analyzed and IL-2 secretion
was detected. Three replicates in each group (n = 3), and
results are representative of three independent experi-
ments (N = 3). (B) Similar to (A), CD69 expression of PA T
cells cocultured with BMDCs from WT, CD11a−/−, Cd40−/−
and MHC class II−/− mice. Three replicates in each group
(n = 3), and results are representative of three independent
experiments (N = 3). (C) Similar to (A), CD69 expression
on PA T co-cultured with DC1940 or A20 cell lines. Three
replicates in each group (n = 3), and results are represen-
tative of three independent experiments (N = 3). (D) PA T
cells were co-cultured with DC1940, A20, WT BMDCs and
BMDCs from the indicated gene deficient mice. IL-2 in the
supernatant was measured by ELISA. Three replicates in
each group (n = 3), and results are representative of three
independent experiments (N = 3). (E) CD69 expression
and (F) IL-2 secretion as in (A) without DCs yet in the
presence of increasing amounts of IL-2 (none, 100 U,200
U, 500 U and 1,000 U/mL) for 24 h. Three replicates in
each group (n = 3), and results are representative of three
independent experiments (N = 3).
c
Dendritic cells with IL2 promote activated CD4 T cells long survival RESEARCH ARTICLE
© The Author(s) 2019 113
Protein
&Cell
-
051015C
onta
ct
Tran
swel
l**
*
nsns
CD69+CD4+ T cells (%)
CD69+CD4+ T cells (%)
CD69+CD4+ T cells (%)
CD69+CD4+ T cells (%)
PA
TP
A T
+DC19
40+C
D11c+
-+D
C1940
-
+B6
+LFA-1-/-
+CD40-/-
+H2A
B-/-
+CD11
c+
A
05101520**
*
***
***
***
***
***
BM
DC
B
PA
T
-+D
C19
40+A
20020406080
C
PA
T
D
BM
DC
PA
T
012345ns
ns
ns
ns
PA
T
FE
020406080
PA
T
-10
00 U
hIL2
-
1000
UhI
L2
ns
**** ns
050100
150
200
IL2 (pg/mL)
****
***
**
*
***
***
-
+B6
+DC19
40
+DC19
40DC19
40
+A20
+LFA-1-/-
+CD40-/-
+H2A
B-/-
IL2 (pg/mL)
RESEARCH ARTICLE Dan Tong et al.
114 © The Author(s) 2019
Protein
&Cell

A
-+B
6+I
l2-
/--
+B6
+Il2
-/-
-+B
6+I
l2-
/--
+B6
+Il2
-/-
5101520
****
***
***
*
***
***
***
****
****
***
****
****
***
****
*
0204060B
MD
CS
plen
ic C
D11
c+ DC
IL2 (pg/mL)
IL2 (pg/mL)
PA
TP
A T
B
0.00
0000
0.00
0002
0.00
0004
0.00
0006
0.00
0008
mRNA/Gapdh
*
***
NC
+NC
+Il2
F1
+Il2
F2
+Il2
F3
Il2 F
1Il2
F2
Il2 F
3D
C19
40 s
hRN
A-
0510152025
DC
1940
shR
NA
PA
T
01020304050
DC
1940
shR
NA
PA
T
0
100
200
300
0
100
200
300
% of max (T cells)
% of max (DC cells)
Isot
ype
cont
rol
PA
T +
B6
BM
DC
PA
TP
AT
+ Il2
-/- B
MD
C
CD
25
C
05101520
Spl
enic
CD
11c+ D
CP
A T
D
01020304050**
*
PA
T +
200U
hIL2
BM
DC
E
0
2,00
0
4,00
0
6,00
0M
FI o
f CD
25 in
PA
T
Mean fluorescence intensity of CD25ns
BM
DC
PA
T
0
2,00
0
4,00
0
6,00
0M
FI o
f CD
25 in
DC
Mean fluorescence intensity of CD25
*
BM
DC
CD69+CD4+ T cells (%)
CD69+CD4+ T cells (%)
CD69+CD4+ T cells (%)
CD69+CD4+ T cells (%)
-+B
6+I
l2-
/-+I
l2rd
-/-
-+B
6+I
l2-
/-
Il2
+NC
+Il2
F1
+Il2
F2
+Il2
F3
-
101
102
103
104
105
CD
2510
110
210
310
410
5-
+B6
+Il2
-/-
+B6
+Il2
-/-
Dendritic cells with IL2 promote activated CD4 T cells long survival RESEARCH ARTICLE
© The Author(s) 2019 115
Protein
&Cell
DCs. It was later reported by the same group that microbialproducts, including common PAMPs such as GpG, peptido-glycan and LPS, drove the IL-2 production. The productioncould be tuned by the CD40 signaling originated from acti-vated Tcells as well (Granucci et al., 2003). At least for Dectin-1-mediated activation, IL-2 transcription was controlled viaNFAT in phagocytes (Goodridge et al., 2007). However, thisnotion of DC-originated IL-2 being critical for primary T cellactivation was questioned by another report (Schartz et al.,2005). Of particular interest, in the latter report, adoptivetransfer of antige-loaded IL-2-sufficient and deficient DCs didnot result in any difference in CD8 memory response. Thesetup was meant to address IL-2 production by DCs at theprimary activation of T cells. An inconspicuous oversight ofthat report, in light of our work here, was whether the IL-2expression in recipient resident DCs was involved as anenvironmental and temporally discreet factor to support Tcellmemory beyond initial DC/T cell interaction (Schartz et al.,2005). Therefore, it remains premature to dismiss the impactof DC-intrinsic IL-2 production in the totality of Tcell biology.
Regarding the role of IL-2 in T cell memory development,one unsettled issue is the timing of bioavailability. IL-2 pro-duction has been found to be rapid and transient (Sojkaet al., 2004). This pattern is well explained from the negativefeedback in the environmental milieu (Villarino et al., 2007).In human, IL-2 production peaks in day one and becomesundetectable on day three or four, to be followed by a moresustained T cell proliferation (Venuta et al., 1983). This cer-tainly raises the issue of timing as the IL-2 suggested to be
mandatory in late phase of primary activation is not availablefrom the same T cells unless intervened otherwise. Ourresults seem to draw such a scenario: T cells expand in thepresence of antigen with a robust IL-2 production to supportthe proliferation. The IL-2 production is rapidly reducedthereafter in preparation of the contraction from the peak Tcell activation. At this moment, a percentage of DCs bycoincidence bind to DCs in the absence of antigen. The IL-2produced in these DCs triggers a secondary IL-2 productionin these previously activated CD4 T cells to mediate a pro-gram of cell survival. Due to the transient nature of DC/T cellcontact, another possibility is that T cells that have accu-mulated sufficient number of contacts with DCs venture toenter the second round of IL-2 production. The probabilisticnature of the DC/T cell contact may also limit a large numberof T cells from entering memory programing, providing acrude selection filter at this moment. Regarding the obser-vation that DC CD25 appears to contribute to the subtle Tcell activation, one possible involvement is its role in bringingIL-2 to the DC/T cell contact interface, as T cells at this stagedo not express this high affinity receptor. We have shown inthis report that extrinsic addition of IL-2 was not as effective.In reality, it would be extraordinarily difficult to sustain IL-2 athigh levels days after the primary activation. Low amounts ofIL-2 would in theory require some degree of assistance for itsefficient delivery to T cells. Previous work on severalcytokines seem to point to a shared mechanism. In TH-17programing, IL-6 is presented on DCs via IL-6Rα chain forhighly efficient activation of Tcells (Heink et al., 2017). In thatreport, one theory is the formation of some type of signalingcomplex at the contact site across two cells. However, thetopography of combining cytokine and multiple receptorsignaling chains in such a configuration has not been for-mally proposed. In Daclizumab treatment, a humanizedmonoclonal antibody used to treat inflammation, IL-2 wasalso presented by CD25 on DCs for robust signaling in Tcells (Wuest et al., 2011). Our work again suggests the uti-lization of this special method of cytokine delivery. Why thisway of cytokine delivery is superior to external loading is notclear. One possibility is the pre-existing CD25/IL-2 complexformation inside DCs, leading to a more sustained/stable presence on the DC surface. On the other side of DC/Tcell pair, whether the subtle PAT reactivation induced geneprofile changes are a consequence of this particular mode ofcytokine/receptor arrangement or determined by other tem-poral factors or ligand density would require more sophisti-cated setups. IL-2 activates STAT5A/B and to some degreealso signals via STAT1 and STAT3. The JAK-STAT pathwayis critical for the differentiation of T cells subsets (Spolskiet al., 2017). Whether a hard to detect, miniature signal in thecontraction state of T cell activation also regulates the latterlong term survival is a worthy follow-up study. Lastly, wecannot rule out epigenetic changes in DCs that are deficientin IL-2/CD25. Although these proteins are not known todirectly regulate DC development or phenotype, strong evi-dence suggests that IL2/CD25 (via STATs and IRFs)-
Figure 4. Surface delivery of IL-2 from DCs to PA T.
(A) CD69 expression and IL-2 secretion of PA T cells co-
cultured with BMDCs or splenic CD11c+ DCs from B6 and Il2−/−
mice for 24 h. Three replicates in each group (n = 3), and results
are representative of five independent experiments (N = 5).
(B) the efficiency of Il2 knockdown by viral vector-delivered
shRNA in DC1940 cells (upper). NC: control shRNA, F1, 2 and
3 are three independent shRNA sequences. CD69 expression
(middle) and IL2 secretion (lower) by PA T co-cultured with IL-2
knockdown DC1940. Three replicates in each group (n = 3),
and results are representative of three independent experi-
ments (N = 3). (C) CD25 expression on PA T cells and BMDCs
with or without co-culture. First column: T cells, and second:
DCs. Three replicates in each group (n = 3), and results are
representative of five independent experiments (N = 5). Next
two columns: CD25 mean fluorescence intensity (MFI) is shown
in PATand DC groups. ns means no significant difference, *P <
0.05(Unpaired Student’s t test). (D) CD69 expression on PA T
cells co-cultured with WT, Il2−/− or Il2rα−/− BMDCs. Three
replicates in each group (n = 3), and results are representative
of three independent experiments (N = 3). (E) CD69 expression
on PA T cells co-cultured with WT or Il2−/− BMDCs in the
presence of added IL-2. Three replicates in each group (n = 3),
and results are representative of five independent experiments
(N = 5).
b
RESEARCH ARTICLE Dan Tong et al.
116 © The Author(s) 2019
Protein
&Cell

0.00
0
0.00
1
0.00
2
0.00
3
0.00
4
0.00
5
PA
T
0.00
00
0.00
02
0.00
04
0.00
06
0.00
08
0.00
10
0.00
00
0.00
05
0.00
10
0.00
15
PA
TP
A T
PA
T
PA
T
PA
T +
B6
DC
PA
T +
Il2-
/-D
C
457
605
375
42834
7
485
1365
0
0
100
200
300
-10
-5
05
10Fo
ld c
hang
e (lo
g2)
-log10(P-value)
PA
T +
B6
DC
vs.
PA
T +
Il2
KO
DC
8513
87015
97583787411
211
6887087949850437559448293443855737067
4191
Lyso
som
eE
ndoc
ytos
isA
utop
hagy
-ani
mal
Hum
an p
apill
omav
irus
infe
ctio
nm
TOR
sig
nalin
g pa
thw
ayR
ibos
ome
Pha
goso
me
Hep
atoc
ellu
lar c
arci
nom
aH
uman
T-c
ell l
euke
mia
viru
s 1
infe
ctio
nM
AP
K s
igna
ling
path
way
Reg
ulat
ion
of a
ctin
cyt
oske
leto
nN
OD
-like
rece
ptor
sig
nalin
g pa
thw
ayK
apos
i sar
com
a-as
soci
ated
her
pesv
irus
infe
ctio
nH
uman
imm
unod
efic
ienc
y vi
rus
1 in
fect
ion
Hum
an c
ytom
egal
oviru
s in
fect
ion
NF-
kapp
a B
sig
nalin
g pa
thw
ayTh
1 an
d Th
2 ce
ll di
ffere
ntia
tion
JAK
-STA
T si
gnal
ing
path
way
Pla
tele
t act
ivat
ion
Col
orec
tal c
ance
rTu
berc
ulos
isP
rote
ogly
cans
in c
ance
rR
NA
deg
rada
tion
Ren
al c
ell c
arci
nom
aTh
17 c
ell d
iffer
entia
tion
Hep
atiti
s B
Apo
ptos
isO
steo
clas
t diff
eren
tiatio
nP
rote
asom
eC
ell c
ycle
010
-lo
g 10(P
-val
ue)
Il2
Oas
l2Is
g15
Bcl
2
Sta
t2
Gen
e0
24lo
g 2 (F
PK
M)
A
B
C
E
D
****
****
****
**
mRNA/Gapdh
mRNA/Gapdh
0.00
00
0.00
02
0.00
04
0.00
06
0.00
08
0.00
10mRNA/Gapdh
mRNA/GapdhPA
T +
B6
DC
PA
T +
Il2-
/-D
C
-+B
6+I
l2-
/--
+B6
+Il2
-/-
Spl
enic
CD
11c+ D
CS
plen
ic C
D11
c+ DC
-+B
6+I
l2-
/-
Spl
enic
CD
11c+ D
C
-+B
6+I
l2-
/-
Spl
enic
CD
11c+ D
C
Il2B
cl2
Oas
l2Is
g15
Dendritic cells with IL2 promote activated CD4 T cells long survival RESEARCH ARTICLE
© The Author(s) 2019 117
Protein
&Cell
associated signaling is a part of DC programming (Tianet al., 2017). These differences themselves may also explainwhy the lack of these two factors leads to an altered T cellsurvival upon DC/T encounter.
We must stress that results in this work are mostly sug-gestive pertaining to T cell memory. First, we used an in vitromodel to simulate a potential in vivo process. Whether theCD69 upregulation seen in the late phase of T cell activationis related to our observation is unknown. Second, verifica-tions will be needed to show that the in vivo CD69+ popu-lation has the survival advantage in real life T cell response.We therefore do not advocate a direct link between ourfindings and in vivo DC/T cell behavior, let alone the preciserole of IL-2 from DCs in T cell memory formation. This reportmay be of some value in providing the missing link regardingthe IL-2 availability during the late phase of primary CD4activation that is conducive to memory formation. While thisfinding is intriguing, advanced animal work will provide moreprecise insight. For instance, a timed or activation stage-triggered IL-2 deletion in DCs, or a detailed analysis ofaccumulation DC/PA T binding will be highly informative. Inaddition to IL-2 production in the T cells, this event appears
to regulate several groups of gene expression. Whether andhow much these gene regulations individually and collec-tively contribute to IL-2 production or even to the memorydevelopment should present intriguing topics for future work.
MATERIALS AND METHODS
Mice
All mice were in C57BL/6 background. WT, OT-II, CD11a−/−, IL-
2RA−/−, CD40−/− CD45.1 congenic mice were bred and housed at
Tsinghua University Animal Facilities. IL-2RA−/− were made in house
with CRISPR/Cas9 techniques and verified by genotyping. IL-2−/−
mice were purchased from JAX. H2-IAb (H2AB) deficient mice (MHC
class II−/− mice) were a gift from Dr. Hai Qi of Tsinghua University.
The Animal Experiments Committee of Tsinghua University
approved all of the experiments reported in this study.
Production of Cas9 mRNA and sgRNA
CRISPR/Cas9 vectors were gifts from Dr. Hai Qi of Tsinghua
University. Vector pST1374-N-NLS-flag-linker-Cas9 expressing
cas9 was digested with AgeI (NEB) and SpeI (NEB), and the lin-
earized vector was gel purified, and used as the template for in vitro
transcription using mMESSAGE mMACHINE T7 ULTRA kit (Life
Technologies, AM1345). Vector pUC57kan-T7-gRNA expressing
sgRNA was digested with DraI (NEB), and the linearized vector was
gel purified. A pair of oligos for targeting Il2ra was annealed, phos-
phorylated, and ligated to the linearized vector, and used as the
template for in vitro transcription using MEGAshortscript T7 Tran-
scription kit (Life Technologies, AM1354). Both the Cas9 mRNA and
the sgRNA were purified using MEGAclear kit (Life Technologies,
AM1908) and eluted in RNase-free water, and stored in −80 °C.
sgRNA-Il2ra: 5′-TAGGGAACCATAGTACCCAGTTGTC-3′; and 5′-
AAACGACAACTGGGTACTATGGTTC-3′
Intracytoplasmic RNA microinjection
The intracytoplasmic RNA microinjection was performed at Tsinghua
University Animal Facilities. Each embryo was microinjected with 25
ng/µL sgRNA and 50 ng/µL Cas9 mRNA into the cytoplasm. After
microinjection, surviving embryos were implanted on the same day
into oviduct of pseudo pregnant C57BL/6 female mice. Full-term
pups were obtained by natural labor at 19.5-day post coitum (dpc).
Genotyping of mice
All mice were genotyped with the tail DNA. Two pairs of primers
were used to identify the IL-2RA−/− mice. Primer Il2ra-WT (5′-CAT-
TAACCATAGTACCCAGTT-3′) and common-R (5′-GCAAAGC-
CAAACCATCCCTG-3′) can detected the wild type anneal. The
product size was 305 bp. Primer Il2ra-M (5′-CATTAACCA-
TAGTACCCAGTG-3′) and common-R can detected the mutant
anneal. The product of PCR was 304bp. The PCR reaction condi-
tions were as follows: 95 °C, 5 min; 95 °C, 30 s, 58.5 °C, 30 s, 72 °C,
30 s, 30 cycles; 72 °C, 10 min.
Figure 5. IL-2+ DC contact leads to an altered expression
profile. Differential gene expression by PA T cells co-cultured
with B6 or Il2−/− splenic CD11C+ in PA T cells. These PA T cells
were purified by FACS, and mRNA was prepared for RNA-
sequence analysis as described. (A) Venn diagram of number
of genes differentially expressed in PA T, PA T + Il2−/− DC and
PA T + B6 DC. A total of 13,650 genes were detected in the
three conditional PA T cells. The non-overlapping part is the
number of genes present in only one experimental group.
(B) Volcano plot depicts differentially expressed genes (DEGs)
between PA T + B6 and PA T + Il2−/− DCs. Red dots are genes
that are significantly up regulated genes in PA T + B6 DCs,
while blue dots are significantly down regulated. The horizontal
dashed line means P = 0.05. (C) Enriched KEGG pathways for
differentially expressed genes between PA T + B6 and PA T +
Il2−/− DCs. Terms that are enriched from upregulated genes in
PA T + B6 DC are marked by red, and terms enriched from
down regulated genes are marked blue. The number of
associated genes in each GO categories is presented around
the bar (P-value <0.05). (D) mRNA level of Il2, Bcl2, Oasl2 and
Isg15 in PAT, PAT + B6 and PAT + Il2−/− DCs. The reference is
GAPDH. Results are representative of at least of 3 independent
experiments. N ≥ 3 for all analyses. (E) Heatmap for Isg15,
Oasl2, Stat2, Il2 and Bcl2 differentially expressed between PAT
+ Il2−/− DC and PA T + B6 DCs. Lines represent protein-protein
associations, and the thicker the edge is, the stronger the
association should be. Bottom: the left frame is the expression
level from PAT + B6 DCs, while the right stands for that from PA
T + Il2−/− DC. Red color indicates a higher expression, while the
blue color indicates a lower expression.
b
RESEARCH ARTICLE Dan Tong et al.
118 © The Author(s) 2019
Protein
&Cell
AA
OTI
I mic
eD
isse
ctio
n sp
leen
Intra
veno
us in
ject
ion G
roup
Gen
otyp
eIn
ject
ed c
ell t
ype
1B
6
B6
PB
S2
B6
Nai
ve O
TII
3B
6R
estin
g72
h A
CT
OTI
I (P
A T
)O
ne m
onth
late
rSac
mou
se a
nd d
isse
ctio
n sp
leni
cV
Aan
d ly
mph
ocyt
ic c
ells
trea
ted
with
OV
4B
6P
A T
+ B
6 sp
leni
c C
D11
c+D
C5
B6
PA
T +
Il2-
/-sp
leni
c C
D11
c+ DC
Grin
d an
d cu
lture
48
hS
ort a
ctiv
ated
CD
4+ T c
ells
and
rest
for 4
8h
Co-
cultu
re w
ithB
6or
Il2-
/-
sple
nic
CD
11C
+fo
r 24
h
200
μg/m
LO
VA
-
+B6 D
Cs
+Il2-/-
DCs
0
2,00
0
4,00
0
6,00
0
8,00
0
10,0
00
Cell number (CD4 + CD45.1+)
**
PAT
0
500
1,00
0
1,50
0
2,00
0
IL2 (pg/mL)
IL2 (pg/mL)
0
100
200
300
400
500
**
PAT
PAT
Spl
een
Spl
een
PBS Naive O
T2
0
200
400
600
800
1,00
0**
*
IFNγ (pg/mL)
IFNγ (pg/mL)
PAT
LNs
LNs
01020304050**
***
*
PAT
B
CC
-+B
6 DCs +Il
2-/- DCs
PBS Naive O
T2
-+B
6 DCs +Il
2-/- DCs
PBS Naive O
T2
-+B
6 DCs +Il
2-/- DCs
PBS Naive O
T2
-+B
6 DCs +Il
2-/- DCs
Dendritic cells with IL2 promote activated CD4 T cells long survival RESEARCH ARTICLE
© The Author(s) 2019 119
Protein
&Cell
Antibodies and reagents
Antibodies for FACS, Vα2 TCR chain, CD69, CD4, CD25, CD127,
CXCR5, CCR7, CCR9, CD62L, CD83, CD45.1 and CD103, and
ELISA kits were purchased from eBioscience. Others are as follows,
anti-mouse CD3e (eBioscience, 85-16-0032-85), anti-mouse CD28
(eBioscience, 85-16-0281-85), murine GM-CSF (Peprotech, 315-03-
1000), murine IL-4 (Peprotech, 214-14-1000), human IL-2 (Pepro-
tech, 200-02-1000), anti-mouse CD4 APC (eBioscience,17-0041-
82), rat IgG2b K isotype control PE (eBioscience, 12-4031-82), rat
IgG2b k isotype control APC (eBioscience, 17-4031-82), rat IgG2b k
isotype control FITC (eBioscience, 11-4031-82), anti-mouse V alpha
2 TCR eFluor 450 (eBioscience, 48-5812-82), anti-mouse CD69
APC (eBioscience, 17-0691-82), anti-mouse V alpha 2 TCR PE
(eBioscience, 12-5812-82), anti-mouse CD103 (Integrin alpha E)
APC (eBioscience, 17-1031-82), anti-mouse CD197 (CCR7) PE
(eBioscience, 85-12-1971-80), anti-mouse CD199 (CCR9) PE
(eBioscience, 85-12-1991-80), anti-mouse CD83 APC (eBioscience,
17-0839-41), anti-mouse CD45.1 PE (eBioscience, 12-0453-82),
anti-mouse CD62L FITC (eBioscience, 85-11-0621-82), PerCP/
Cy5.5 anti-mouse CD127 (BioLegend, 135021), PE anti-mouse
CD25 (BioLegend, 102007), PE anti-mouse CD185 (CXCR5)
(BioLegend, 145503), mouse IL-2 ELISA Set (eBioscience, 555148),
mouse IFN γ ELISA Ready-SET-Go (eBioscience, 85-88-7314-77),
1× TMB solution (eBioscience, 00-4201-56), cell lines and primary
cell culture DC1940 (a gift from Dr. Li Wu of Tsinghua University),
A20, 3T3 and MEF were cultured in complete RPMI1640 (GIBCO)
Figure 6. IL-2-positive DC coculture promotes PA T cells’
survival in vivo. (A) PATcells were prepared in vitro, shown as
the flow chart, then the cells were i.v. injected into 6–8 week old
C57BL/6 wild type mice, 1 × 10⁶ cells per mouse (5 per group).
Experimental group mice were injected with resting PA T cells,
PA T co-cultured with WT or Il2−/− splenic CD11c+ DCs. Mice
injected with PBS were the negative control. (B) After one
month, the cells from spleen and LNs were collected, and in
24-well-plate 1 × 10⁶ or 2 × 10⁶ cells added to 2 × 10⁶ feeder
population of irradiated B6 splenocytes which were prior-treated
with 3,000 rad γ irradiation. The clonal expansion experiment
was carried out in vitro by adding soluble OVA. IFN-γ and IL-2 in
the supernatant were measured by ELISA. Every dot stands for
one mouse. Results are representative of two independent
experiments. (C) PA T cells from CD45.1+ OT-II mice were
prepared in vitro, then the cells were i.v. injected into 6-8 weeks
CD45.2+C57BL/6 wild type mice, 1 × 10⁶ cells per mouse.
Experimental group mice were injected with resting PA T cells,
PA T co-cultured with B6 or Il2−/− splenic CD11c+ DCs. After
three months, the host mice were re-challenged by injected 50
µg OVA and 10 ug LPS per mice, 72 h later, the cells from
spleen and LNs were collected, then analyzed for the total cell
number of CD4+CD45.1+ cells in host mice by FCAS. Every
symbol stands one mouse. Results are representative of two
independent experiments. **P < 0.01, ***P < 0.001 (Unpaired
Student’s t test).
CD4+ T cell
Ag+ dendritic cel Al g- dendritic cell
Effector phase Contraction phase Long live T cell
Primary activation
Partial activation
PA T
6–7 days
IL-2
TCR
MHC II + Ag
IL-2 RaIl-2 Osal2Isg15 Bcl2
Figure 7. The proposed programing in PA T after DC contact. Schematic overview of the interplay between IL-2, DCs, previously
activated CD4 T cells and memory-like CD4 T cells. At the beginning of contraction phase, previously activated CD4 T cells in a
temporally limited window can interact with antigen-free DCs. These DCs produce small amounts of IL-2 that is presented on their
surface via DC-intrinsic CD25. IL-2 so delivered initiates a mild activation programing in PA T cells to produce small amounts of IL-2
and CD69 expression in a sub population of the latter. This programing, in addition to support IL-2 production, also enhances the
expression several Type I IFN-related and anti-apoptotic genes, for long term survival of these CD4 T cells.
b
RESEARCH ARTICLE Dan Tong et al.
120 © The Author(s) 2019
Protein
&Cell
supplemented with 10% FBS (GIBCO), 100 U/mL penicillin, and 100
mg/mL streptomycin,10 mmol/L HEPES and 50 µmol/L β-mercap-
toethanol. Bone marrows were differentiated for 6 days with 20 ng/
mL GM-CSF and 10 ng/mL IL-4 in complete RPMI medium to pro-
duce BMDCs respectively. On day 6, BMDCs which were grown in
24-well plate were used directly for experiments. 293FT cells were
cultured in DMEM (GIBCO) supplemented with 10% FBS. All cells
were cultured at 37 with 5% CO2.
Isolation of primary cells
Primary CD4 Tcells were isolated from OT-II or B6 mice splenocytes
by EasySep Mouse CD4+ Tcell Isolation Kits (Stem Cell, 19852) and
sometimes sorted by FACS with an anti-Vα2 TCR antibody. Primary
CD11c DC cells were isolated from B6 or different gene knockout
mice splenocytes by EasySep Mouse CD11c positive selection kit II
(Stem Cell, 18780). Primary cells were obtained according to the
protocol of the kits.
Co-culture assay
In our study, we treated OT-II mice splenocytes with 200 µg/mL OVA
about 48 h, and isolated activated CD4+CD69+ T cells by FACS with
anti-mouseVα2 TCRandanti-mouseCD69antibodies. Then thePAT
cellswere harvested. Sometimeswe treatedB6 splenocyteswith anti-
mouse CD3e and anti-mouse CD28 for about 48 h. PA T cells were
cultured in complete RPMI1640 supplemented with 10% FBS, 200 U/
mLpenicillin, and200mg/mLstreptomycin, 10mmol/LHEPESand50
µmol/L β-mercaptoethanol. After resting for 48 h, PA Tcells were co-
cultured with different kinds of DCs or cell-lines. In 24-well-plate co-
culture assay in vitro, the ratio of PATandDCs is 2 to 1 (2 × 10⁵ and 1 ×
105 cells). Co-culture was carried out for 24 h, PATcells or DCs were
harvested to detect surfacemarkers. The supernatants were stored in
−20 °C for testing IL-2 or IFN-γ secretion by ELISA.
The transwell assay
HTS Transwell-24-well permeable support with 0.4 µm Pore Poly-
carbonate Membrane and 6.5 mm Inserts, Sterile (Corning, 3396)
were used in the transwell assay. In the transwell co-culture system,
PA T cells were seeded in the upper layer, and DCs in the substrate.
PA T cells were cultured at a 2:1 ratio with DCs for 24 h.
Gene knockdown in DC1940 cell-lines
Lentiviral plasmids encoding targeting Il2 shRNA or non-targeting
shRNA (SHC002)were purchased fromSigmaand the Il2shRNATRC
numbers were as follows: TRCN0000067198, TRCN0000067200,
TRCN0000067202. The lentivirus was produced by co-transfection of
293FT cells with lentivirus expression vector, pCMV-VSV-G and
pCMV-dR8.91 using Lipofectamine 2000 (Invitrogen, 11668027).
DC1940 cells were infected with lentivirus at 500 ×g, 32 °C for 1.5 h.
DC1940 cells were selected with puromycin (1 µg/mL) 72 h post-in-
fection. The knockdown efficiency was analyzed by real-time PCR.
Real-time PCR
RNA samples were prepared using TRIzol reagent (Invitrogen,
15596018) and first strand cDNA was synthesized with
RrimeScriptTM RT-PCR Kit (TAKARA, RR047A). Real-time PCR was
performed using 2 X RealStar Power SYBR mixture (GenStar, A311-
10) in a BIO-RAD CFX96 Real-time System. GAPDH was used for
normalization. The primer sequences were as follows: Il2, 5′-
TGAGCAGGATGGAGAATTACAGG-3′ and 5′-ATGTGTTGTCA-
GAGCCCTTTAG-3′; Oasl2, 5′-AAACAGCTGAAGGGAGACCG-3′
and 5′-CTCGCTGCTGTACATTCCA-3′; Isg15, 5′-AGCAATGGCCT
GGGACCTAAAG-3′ and 5′-TAAGACCGTCCTGGAGCACTG-3′; IL-
7 receptor (IL-7r), 5′-ACAAGAACAACAATCCCACAGAG-3′ and 5′-
TCGCTCCAGAAGCCTTTGAAG-3′; Bcl2, 5′-TGTGTGGAGAGCG
TCAACAG-3′ and 5′-CAGACATGCACCTACCCAGC-3′; GAPDH, 5′-
ATCAAGAAGGTGGTGAAGCA-3′ and 5′-AGACAACCTGGTCCTC
AGTGT-3′.
Sampling and RNA extraction for RNA-seq
We treated OT-II mice splenocytes with 200 µg/mL OVA about 48 h,
and isolated activated CD4+CD69+ T cells by FACS with anti-mouse
Vα2 TCR and anti-mouse CD69 antibodies. Then PA T cells were
harvested, and cultured in culture media. After resting 48 h, PA T
cells were co-cultured with B6 or IL-2−/− CD11c+ DCs, which had
been isolated from B6 or IL-2−/− splenocytes by EasySep Mouse
CD11c Positive Selection Kit II. PA T cells were cultured in complete
RPMI1640 alone as a control. After 24 h, these T cells were har-
vested by FACS with Vα2 TCR+CD11c−. The total RNA of each
sample was isolated using TRIzol reagent (Invitrogen). RNA quality
and concentration were determined using NanoDrop 2000 (Thermo
Scientific). The RNA samples were stored in −80 °C, and later sent
to BGI (China) for RNA sequencing.
Analysis of RNA sequencing
Sequencing was performed on a BGISEQ-500 RS unit using single-
end sequencing, and averagely 23,656,293 raw sequencing reads
were generated. Then we removed reads 1) with adaptors; 2) in
which unknown bases were more than 10%; 3) having more than
50% bases in low quality (quality is no more than 5). A total of
23,593,592 clean reads were obtained. The fastq files were aligned
to hg19 with HISAT2, with the following parameters: –phred64 -
sensitive -I1 -X 1000.
Transcriptome analysis
After alignment, the read counts for each gene were calculated by
RSEM, and the expression values of each gene were normalized
using FPKM.
DEGs were screened using Poisson distribution as in Audic and
Claverie (1997). Denoting the number of unambiguous clean tags
from gene A as x, given every gene’s expression occupies only a
small part of the library, x yields to the Poisson distribution:
p(x) =e -- λλx
x!
The total clean tag number of the sample 1 is N1, and the total
clean tag number of sample 2 is N2; gene A holds x tags in sample 1
and y tags in sample 2. The probability of gene A expressed equally
between two samples can be calculated with:
Dendritic cells with IL2 promote activated CD4 T cells long survival RESEARCH ARTICLE
© The Author(s) 2019 121
Protein
&Cell

p(y | x) =N2
N1
� �y (x + y)!
x!y!(1 + N2N1)(x1y1)
DEGs were then visualized by volcano plots, in which fold
changes are measured by
log2FPKM1
FPKM2
DEG analysis
KEGG was used to perform pathway enrichment analysis of DEGs,
which was automated by clusterProfiler. The calculated P-values
were then corrected by Bonferroni’s method and a threshold of 0.05
was set. Heatmap (log2 scaled) was plotted with pheatmap, and
protein-protein associations were analyzed by STRING (von Mering
et al., 2003).
Mouse multiplex cytokine assay
PA T cells were co-cultured at a 2:1 ratio with DC1940 cells 24 h,
then CD69+ and CD69− cells were obtained by FACS with anti-
mouse Vα2 TCR and anti-mouse CD69 antibodies. These sorted
cells were cultured 1 × 10⁵ per well in 24-well-plate in complete
RPMI1640 respectively. The supernatants were collected at different
time points (15 h and 24 h) and stored in −20 °C for mouse multiplex
cytokine detection. According to the manufacture’s protocol (Milli-
pore, MCYTOMAG-70K, MCYTOMAG-70K-PMX, MCYTMAG-70K-
PX32), the secretion of cytokines was detected by Luminex.
Listeria monocytogens infection
Listeria monocyte expressing ovalbumin (LM-OVA) were a gift from
Dr. Chen Dong of Tsinghua University. Frozen stocks of LM-OVA
were thawed and then diluted in fresh brain heart infusion (BHI)
medium (BD) to reach mid-log growth phase. 8-week-old mice were
intravenously injected via the lateral tail vein with sub-lethal (5 × 10⁴
CFUs) dose of LM-OVA that was suspended in 200 µL PBS per
mouse. After 4 h, spleens and lymph nodes were collected as day 0
samples. At day 1–10 days after infection, spleens and LNs were
collected and dissociated in PBS containing 0.05% Triton X-100,
and bacterial CFUs were determined by plating on BHI agar plates.
The CD4+ T cells in spleens and LNs were analyzed for CD69
expression by FACS.
Adoptive transfers and re-stimulation clonal expansion
experiments
After resting 48 h, PATcells were co-cultured at a 2:1 ratio with B6 or
IL-2−/− CD11c+ DCs. PATcells were cultured in complete RPMI1640
alone as a control. After 24 h, these T cells were harvested by FACS
with Vα2 TCR+CD11c−. These PA T cells were transferred 1 × 10⁶
per mice into naïve C57BL/6 mice via intravenously. After one
month, spleens and LNs were collected, 1 × 10⁶ or 2 × 10⁶ cells
were seeded with 2 × 10⁶ feeder cells and treated with 100 µg/mL
OVA for 48 h to 96 h in 24-well-plate. The feeder cells were pre-
treated X-Ray with 3,000 rad radiations (RS 2000 Pro). The culture
supernatants were collected and stored −80 °C for IFN-γ and IL-2
secretion analysis by ELISA.
Statistics
Number of experimental repeats are shown in the figure legend. All
bar graphs are means with SEM. Statistical analysis was performed
with Student’s t test in GraphPad Prism software. P value < 0.05 was
considered significant. *P < 0.05, **P < 0.01, ***P < 0.001, ****P <
0.0001. ns, not significant.
ACKNOWLEDGMENTS
We thank Drs. Li Wu, Hai Qi, and Chen Dong for providing mice and
reagents and Dr. Fei Shu for help in Listeria monocytogens infection
and adoptive transfer experiments. Y.S. is supported by the joint
Peking-Tsinghua Center for Life Sciences and the National Natural
Science Foundation of China grants 81621002, 31630023,
31370878 and 20171312479. X.H. is supported by Ministry of Sci-
ence and Technology of China National Key Research Projects
2015CB943201, National Natural Science Foundation of China
grants 31821003, 31725010, 81661130161, 91642115 and
81571580.
CONTRIBUTIONS
D. T performed all the experiments with assistance from L. Z, F. N
and Y. X. Y.S. and X.H conceptualized the project. Y.S. wrote the
manuscript with inputs from X.H
COMPLIANCE WITH ETHICS GUIDELINES
Dan Tong, Li Zhang, Fei Ning, Ying Xu, and Xiaoyu Hu declare that
they have no conflict of interest. Yan Shi has received a research
grant from Boehringer Ingelheim. All institutional and national
guidelines for the care and use of laboratory animals were followed.
OPEN ACCESS
This article is distributed under the terms of the Creative Commons
Attribution 4.0 International License (http://creativecommons.org/
licenses/by/4.0/), which permits unrestricted use, distribution, and
reproduction in any medium, provided you give appropriate credit to
the original author(s) and the source, provide a link to the Creative
Commons license, and indicate if changes were made.
REFERENCES
Audic S, Claverie JM (1997) The significance of digital gene
expression profiles. Genome Res 7:986–995Bell EB, Westermann J (2008) CD4 memory T cells on trial:
immunological memory without a memory T cell. Trends Immunol
29:405–411Choi UY, Kang J-S, Hwang YS, Kim Y-J (2015) Oligoadenylate
synthase-like (OASL) proteins: dual functions and associations
with diseases. Exp Mol Med 47:e144
Ciabattini A, Pettini E, Andersen P, Pozzi G, Medaglini D (2008)
Primary activation of antigen-specific naive CD4+ and CD8+ T
cells following intranasal vaccination with recombinant bacteria.
Infect Immun 76:5817–5825
RESEARCH ARTICLE Dan Tong et al.
122 © The Author(s) 2019
Protein
&Cell
Feau S, Arens R, Togher S, Schoenberger SP (2011) Autocrine IL-2
is required for secondary population expansion of CD8(+)
memory T cells. Nat Immunol 12:908–913Gasper DJ, Tejera MM, Suresh M (2014) CD4 T-cell memory
generation and maintenance. Crit Rev Immunol 34:121–146Goodridge HS, Simmons RM, Underhill DM (2007) Dectin-1 stim-
ulation by Candida albicans yeast or zymosan triggers NFAT
activation in macrophages and dendritic cells. J Immunol
178:3107–3115Granucci F, Vizzardelli C, Pavelka N, Feau S, Persico M, Virzi E,
Rescigno M, Moro G, Ricciardi-Castagnoli P (2001) Inducible IL-2
production by dendritic cells revealed by global gene expression
analysis. Nat Immunol 2:882–888Granucci F, Feau S, Angeli V, Trottein F, Ricciardi-Castagnoli P
(2003) Early IL-2 production by mouse dendritic cells is the result
of microbial-induced priming. J Immunol 170:5075–5081Heink S, Yogev N, Garbers C, Herwerth M, Aly L, Gasperi C,
Husterer V, Croxford AL, Moller-Hackbarth K, Bartsch HS et al
(2017) Trans-presentation of IL-6 by dendritic cells is required for
the priming of pathogenic TH17 cells. Nat Immunol 18:74–85Kakiuchi T, Tamura T, Gyotoku Y, Nariuchi H (1991) IL-2 production
by B cells stimulated with a specific antigen. Cell Immunol
138:207–215Kalia V, Sarkar S, Subramaniam S, Haining WN, Smith KA, Ahmed
R (2010) Prolonged interleukin-2Ralpha expression on virus-
specific CD8+ T cells favors terminal-effector differentiation
in vivo. Immunity 32:91–103Kieper WC, Burghardt JT, Surh CD (2004) A role for TCR affinity in
regulating naive T cell homeostasis. J Immunol 172:40–44Liao W, Lin J-X, Leonard WJ (2013) Interleukin-2 at the crossroads
of effector responses, tolerance, and immunotherapy. Immunity
38:13–25MacLeod MKL, Clambey ET, Kappler JW, Marrack P (2009) CD4
memory T cells: what are they and what can they do? Semin
Immunol 21:53–61McKinstry KK, Strutt TM, Bautista B, Zhang W, Kuang Y, Cooper AM,
Swain SL (2014) Effector CD4 T-cell transition to memory
requires late cognate interactions that induce autocrine IL-2.
Nat Commun 5:5377
Park C, Li S, Cha E, Schindler C (2000) Immune response in Stat2
knockout mice. Immunity 13:795–804Raeber ME, Zurbuchen Y, Impellizzieri D, Boyman O (2018) The role
of cytokines in T-cell memory in health and disease. Immunol Rev
283:176–193Ross SH, Cantrell DA (2018) Signaling and Function of Interleukin-2
in T Lymphocytes. Annu Rev Immunol 36:411–433Schartz NE, Chaput N, Taieb J, Bonnaventure P, Trebeden-Negre H,
Terme M, Menard C, Lebbe C, Schimpl A, Ardouin P et al (2005)
IL-2 production by dendritic cells is not critical for the activation of
cognate and innate effectors in draining lymph nodes. Eur J
Immunol 35:2840–2850
Smith KA (2015) Commentary: the Interleukin-2 Tcell system: a new
cell growth model. Front Immunol 6:414
Sojka DK, Bruniquel D, Schwartz RH, Singh NJ (2004) IL-2
secretion by CD4+ T cells in vivo is rapid, transient, and
influenced by TCR-specific competition. J Immunol 172:6136–6143
Spolski R, Gromer D, Leonard WJ (2017) The γ (c) family of
cytokines: fine-tuning signals from IL-2 and IL-21 in the regulation
of the immune response. F1000Research 6:1872
Steiner QG, Otten LA, Hicks MJ, Kaya G, Grosjean F, Saeuberli E,
Lavanchy C, Beermann F, McClain KL, Acha-Orbea H (2008)
In vivo transformation of mouse conventional CD8alpha+ den-
dritic cells leads to progressive multisystem histiocytosis. Blood
111:2073–2082Tanchot C, Lemonnier FA, Perarnau B, Freitas AA, Rocha B (1997)
Differential requirements for survival and proliferation of CD8
naive or memory T cells. Science 276:2057–2062Tian Y, Meng L, Zhang Y (2017) Epigenetic regulation of dendritic
cell development and function. Cancer J (Sudbury, Mass)
23:302–307Venuta S, Mertelsmann R, Welte K, Feldman SP, Wang CY, Moore
MA (1983) Production and regulation of interleukin-2 in human
lymphoblastic leukemias studied with T-cell monoclonal antibod-
ies. Blood 61:781–789Villarino AV, Tato CM, Stumhofer JS, Yao Z, Cui YK, Hennighausen
L, O’Shea JJ, Hunter CA (2007) Helper T cell IL-2 production is
limited by negative feedback and STAT-dependent cytokine
signals. J Exp Med 204:65–71von Mering C, Huynen M, Jaeggi D, Schmidt S, Bork P, Snel B
(2003) STRING: a database of predicted functional associations
between proteins. Nucleic Acids Res 31:258–261Williams MA, Tyznik AJ, Bevan MJ (2006) Interleukin-2 signals
during priming are required for secondary expansion of CD8+
memory T cells. Nature 441:890–893Wuest SC, Edwan J, Martin JF, Han S, Perry JSA, Cartagena CM,
Matsuura E, Maric D, Waldmann TA, Bielekova B (2011) A vital
role for IL-2 trans-presentation in DC-mediated T cell activation in
humans as revealed by daclizumab therapy. Nat Med 17:604–609
Yang J, Liu X, Bhalla K, Kim CN, Ibrado AM, Cai J, Peng TI, Jones
DP, Wang X (1997) Prevention of apoptosis by Bcl-2: release of
cytochrome c from mitochondria blocked. Science 275:1129–1132
Zhao C, Collins MN, Hsiang TY, Krug RM (2013) Interferon-induced
ISG15 pathway: an ongoing virus-host battle. Trends Microbiol
21:181–186Zhou MJ, Chen FZ, Chen HC, Wan XX, Zhou X, Fang Q, Zhang DZ
(2017) ISG15 inhibits cancer cell growth and promotes apoptosis.
Int J Mol Med 39:446–452
Dendritic cells with IL2 promote activated CD4 T cells long survival RESEARCH ARTICLE
© The Author(s) 2019 123
Protein
&Cell