Contact-dependent aggregation of functional Ca2+ channels, synaptic vesicles and postsynaptic...
14
Contact-dependent aggregation of functional Ca 2+ channels, synaptic vesicles and postsynaptic receptors in active zones of a neuromuscular junction David A. DiGregorio, 1 Oscar Negrete, 1 Andreas Jeromin, 2 H. Benjamin Peng 3,4 and Julio L. Vergara 1 1 Department of Physiology, UCLA School of Medicine, Los Angeles, CA 90095, USA 2 Samuel Lunenfeld Research Institute, Mount Sinai Hospital, Toronto, ON M5G 1X5 Canada 3 Department of Cell Biology & Anatomy, UNC at Chapel Hill, Chapel Hill, NC 27599–7090, USA 4 Department of Biology, Hong Kong University of Science and Technology, Kowloon, Hong Kong Keywords: Ca 2+ domains, synaptic transmission, synaptogenesis, Xenopus laevis Abstract To examine whether Ca 2+ channels aggregate in a contact-dependent manner, we characterized the distribution of synaptic vesicles and postsynaptic receptors, and compared it to the location of Ca 2+ entry sites, in a Xenopus laevis nerve-muscle coculture preparation using a localized Ca 2+ detection method. The majority (75%) of Ca 2+ entry sites at spontaneously formed nerve–muscle contacts were associated with enhanced immunofluorescence to the synaptic vesicle protein, SV2. In contrast, only 11% of recorded sites without Ca 2+ transients exhibited significant SV2 immunofluorescence. When comparing the spatial distribution of synaptic markers with that of Ca 2+ entry sites, we found that the majority of Ca 2+ entry sites (61%) were associated with both enhanced SV2 immunofluorescence and R-BTX fluorescence, thereby identifying putative neurotransmitter release sites where Ca 2+ channels, synaptic vesicles and postsynaptic receptors are colocalized. Using polystyrene beads coated with a heparin binding protein known to mediate in vitro postsynaptic receptor clustering, we show that the location of Ca 2+ domains was associated with enhanced SV2 immunofluorescence at neurite-to-bead contacts. We conclude that the localization of functional Ca 2+ channels to putative active zones follows a contact-dependent signalling mechanism similar to that known to mediate vesicle aggregation and AChR clustering. Introduction Action potential (AP) invasion of a nerve terminal mediates fast synaptic transmission by enabling the entry of Ca 2+ ions into the nerve terminal through voltage-gated Ca 2+ channels (Katz & Miledi, 1965; Augustine et al., 1987). It has been proposed that the rapid time course of neurotransmitter release is related to the diffusional dissipation of [Ca 2+ ] gradients and the topological distribution of synaptic vesicles at the nerve terminal (Barrett & Stevens, 1972; Zucker & Stockbridge, 1983). However, the quantitative assessment of the temporal and spatial properties of [Ca 2+ ] gradients generated at Ca 2+ entry sites, and the distribution of the latter with respect to sites of neurotransmitter release in the presynaptic terminal, remain unclear. We have recently demonstrated that the opening of channels clustered at a Ca 2+ entry site produce a local [Ca 2+ ] change (Ca 2+ domain) that, within a millisecond of AP invasion, is constrained to within < 200 nm of its site of entry (DiGregorio et al., 1999b). The purpose of this article is to establish if there is a tight spatial coupling between these Ca 2+ -domains, synaptic vesicles and postsynaptic receptors that may support fast synaptic transmission in a ‘point-to- point’ manner (Hille, 1992; Burns & Augustine, 1995; Neher, 1998). Electron microscopy has been an important tool for the character- ization of the ultrastructural features of synapses. The classic images of the vertebrate neuromuscular junction (NMJ) illustrate that presynap- tic vesicles tend to cluster opposite to postsynaptic structures thought to contain neurotransmitter receptors at specialized regions termed active zones (AZs, Birks et al. 1960; Couteaux & Pecot-Dechavassine, 1970). However, the evidence for the localization of Ca 2+ channels within AZs has been restricted to the nonspecific observation of small membrane particles near release sites (Heuser & Reese, 1981; Pumplin et al., 1981; Cooper, 1996). Light microscopy studies of fluorescent- labelled w-conotoxin (Robitaille et al., 1990; Cohen et al., 1991) and antibodies (Boudier et al., 1996) and atomic force microscopy (Haydon et al., 1994) have suggested the presence of Ca 2+ channel proteins at sites of neurotransmitter release. However, the direct colocalization of functional Ca 2+ channels, responsible for the Ca 2+ entry that triggers neurotransmitter release, and synaptic vesicle clusters at the presynaptic terminal has not yet been demonstrated. This is an important measurement as it should demonstrate whether, or not, synaptic vesicles are located within the range of action of AP- elicited Ca 2+ domains. Moreover, recent evidence (Ahmari et al. 2000) suggests that Ca 2+ channels and associated synaptic vesicle proteins may be transported to the terminal in aggregates. In addition, it is also thought that the functionality of Ca 2+ channels can be augmented by interaction with SNARE proteins (soluble N-ethylmaleimide sensitive fusion attachment protein receptors; Umbach et al., 1998; Seagar et al., 1999; Wu et al., 1999). Thus, immunocytochemical techniques alone, which are unable to distinguish between functional and nonfunctional Ca 2+ channels, may yield equivocal information about the relevance of the colocalization of synaptic proteins and channels. Correspondence: Dr Julio Vergara, as above. E-mail: [email protected] Received 22 March 2001, revised 11 June 2001, accepted 14 June 2001 European Journal of Neuroscience, Vol. 14, pp. 533–546, 2001 ª Federation of European Neuroscience Societies
-
Upload
independent -
Category
Documents
-
view
0 -
download
0
Transcript of Contact-dependent aggregation of functional Ca2+ channels, synaptic vesicles and postsynaptic...
Contact-dependent aggregation of functional Ca2+
channels, synaptic vesicles and postsynaptic receptors inactive zones of a neuromuscular junction
David A. DiGregorio,1 Oscar Negrete,1 Andreas Jeromin,2 H. Benjamin Peng3,4 and Julio L. Vergara1
1Department of Physiology, UCLA School of Medicine, Los Angeles, CA 90095, USA2Samuel Lunenfeld Research Institute, Mount Sinai Hospital, Toronto, ON M5G 1X5 Canada3Department of Cell Biology & Anatomy, UNC at Chapel Hill, Chapel Hill, NC 27599±7090, USA4Department of Biology, Hong Kong University of Science and Technology, Kowloon, Hong Kong
Keywords: Ca2+ domains, synaptic transmission, synaptogenesis, Xenopus laevis
Abstract
To examine whether Ca2+ channels aggregate in a contact-dependent manner, we characterized the distribution of synaptic
vesicles and postsynaptic receptors, and compared it to the location of Ca2+ entry sites, in a Xenopus laevis nerve-musclecoculture preparation using a localized Ca2+ detection method. The majority (75%) of Ca2+ entry sites at spontaneously formed
nerve±muscle contacts were associated with enhanced immuno¯uorescence to the synaptic vesicle protein, SV2. In contrast,
only 11% of recorded sites without Ca2+ transients exhibited signi®cant SV2 immuno¯uorescence. When comparing the spatial
distribution of synaptic markers with that of Ca2+ entry sites, we found that the majority of Ca2+ entry sites (61%) were associatedwith both enhanced SV2 immuno¯uorescence and R-BTX ¯uorescence, thereby identifying putative neurotransmitter release sites
where Ca2+ channels, synaptic vesicles and postsynaptic receptors are colocalized. Using polystyrene beads coated with a
heparin binding protein known to mediate in vitro postsynaptic receptor clustering, we show that the location of Ca2+ domainswas associated with enhanced SV2 immuno¯uorescence at neurite-to-bead contacts. We conclude that the localization of
functional Ca2+ channels to putative active zones follows a contact-dependent signalling mechanism similar to that known to
mediate vesicle aggregation and AChR clustering.
Introduction
Action potential (AP) invasion of a nerve terminal mediates fast
synaptic transmission by enabling the entry of Ca2+ ions into the
nerve terminal through voltage-gated Ca2+ channels (Katz & Miledi,
1965; Augustine et al., 1987). It has been proposed that the rapid time
course of neurotransmitter release is related to the diffusional
dissipation of [Ca2+] gradients and the topological distribution of
synaptic vesicles at the nerve terminal (Barrett & Stevens, 1972;
Zucker & Stockbridge, 1983). However, the quantitative assessment
of the temporal and spatial properties of [Ca2+] gradients generated at
Ca2+ entry sites, and the distribution of the latter with respect to sites
of neurotransmitter release in the presynaptic terminal, remain
unclear. We have recently demonstrated that the opening of channels
clustered at a Ca2+ entry site produce a local [Ca2+] change (Ca2+
domain) that, within a millisecond of AP invasion, is constrained to
within < 200 nm of its site of entry (DiGregorio et al., 1999b). The
purpose of this article is to establish if there is a tight spatial coupling
between these Ca2+-domains, synaptic vesicles and postsynaptic
receptors that may support fast synaptic transmission in a `point-to-
point' manner (Hille, 1992; Burns & Augustine, 1995; Neher, 1998).
Electron microscopy has been an important tool for the character-
ization of the ultrastructural features of synapses. The classic images of
the vertebrate neuromuscular junction (NMJ) illustrate that presynap-
tic vesicles tend to cluster opposite to postsynaptic structures thought
to contain neurotransmitter receptors at specialized regions termed
active zones (AZs, Birks et al. 1960; Couteaux & Pecot-Dechavassine,
1970). However, the evidence for the localization of Ca2+ channels
within AZs has been restricted to the nonspeci®c observation of small
membrane particles near release sites (Heuser & Reese, 1981; Pumplin
et al., 1981; Cooper, 1996). Light microscopy studies of ¯uorescent-
labelled w-conotoxin (Robitaille et al., 1990; Cohen et al., 1991) and
antibodies (Boudier et al., 1996) and atomic force microscopy
(Haydon et al., 1994) have suggested the presence of Ca2+ channel
proteins at sites of neurotransmitter release. However, the direct
colocalization of functional Ca2+ channels, responsible for the Ca2+
entry that triggers neurotransmitter release, and synaptic vesicle
clusters at the presynaptic terminal has not yet been demonstrated.
This is an important measurement as it should demonstrate whether, or
not, synaptic vesicles are located within the range of action of AP-
elicited Ca2+ domains. Moreover, recent evidence (Ahmari et al. 2000)
suggests that Ca2+ channels and associated synaptic vesicle proteins
may be transported to the terminal in aggregates. In addition, it is also
thought that the functionality of Ca2+ channels can be augmented by
interaction with SNARE proteins (soluble N-ethylmaleimide sensitive
fusion attachment protein receptors; Umbach et al., 1998; Seagar et al.,
1999; Wu et al., 1999). Thus, immunocytochemical techniques alone,
which are unable to distinguish between functional and nonfunctional
Ca2+ channels, may yield equivocal information about the relevance of
the colocalization of synaptic proteins and channels.
Correspondence: Dr Julio Vergara, as above.E-mail: [email protected]
Received 22 March 2001, revised 11 June 2001, accepted 14 June 2001
European Journal of Neuroscience, Vol. 14, pp. 533±546, 2001 ã Federation of European Neuroscience Societies
The Xenopus cultured NMJ has been used extensively to study both
the functional and ultrastructural changes underlying synaptogenesis.
In this preparation, neurite±muscle contacts (Weldon & Cohen, 1979;
Cohen et al., 1987; Buchanan et al., 1989) and latex beads coated
with speci®c extracellular matrix proteins (Dai & Peng, 1995; Peng
et al., 1995) have been shown to induce synaptic vesicle and
postsynaptic acetylcholine receptor (AChR) aggregation similar to
that observed at the mature NMJ. In this regard, the heparin-binding
associated molecule (HB-GAM) seems to be a key determinant of
vesicle aggregation as it is enriched in the extracellular matrix of
Xenopus myotomal muscle cells and its local presentation via latex
beads induces synaptic vesicle (SV) clustering at bead±neurite
contacts (Peng et al., 1995; Daggett et al., 1996). Moreover, this
contact-dependent synaptic vesicle aggregation is dependent on local
increases in the resting [Ca2+] (Dai & Peng, 1998). As we have
recently shown that presynaptic Ca2+ channels aggregate in clusters
(DiGregorio et al., 1999a, b) similar in size to clusters of AZs at
nerve±muscle contacts (Weldon & Cohen, 1979; Cohen et al., 1987;
Buchanan et al., 1989), it was necessary to examine if these channels
are spatially associated with synaptic vesicles, and can be induced to
aggregate in a contact-dependent manner by similar mechanisms as
synaptic vesicles and postsynaptic receptor aggregation.
Materials and methods
Cell culture and electrophysiology
Xenopus nerve±muscle cocultures were prepared from dissociated
neural tube tissue obtained from embryos at developmental stages
20±22 (Yazejian et al., 1997). The dissociated cells were plated onto
glass cover slips and allowed to grow for 18±36 h (at 22±24 °C) prior
to experimental use. For some experiments, beads coated with
heparin-binding growth-associated molecule (HB-GAM) were added
to the cultures after ~6 h of incubation and experiments were
performed after another 12±24 h. HB-GAM coated beads were
prepared as described previously (Peng et al., 1995). Neuronal cell
bodies were patch-clamped in order to elicit soma APs and to dialyse
the presynaptic terminal with a pipette solution of the following
composition (in mM): K-Aspartate, 85; KCl, 20; MOPS, 40; MgCl2,
0.5; EGTA, 0.05; ATP-Mg, 2; GTP-Na2, 0.5; OGB-5 N, 50 mM
(Molecular Probes, Eugene, OR, USA), pH 7.0 (5±10 MW resist-
ance). Voltage and ¯uorescence recordings were performed in a
similar manner to that described previously (DiGregorio et al.,
1999b). Neuronal APs were recorded using an Axopatch 1D ampli®er
(Axon Instruments, Foster City, CA), ®ltered at 5 kHz and acquired
at 17±55 kHz with a Digidata 1200 A data acquisition system
operating under software control (pClamp 7.0, Axon Instruments).
All experiments were performed at room temperature (19±21 °C).
Normal frog Ringer (NFR), consisting of (in mM): NaCl, 114; KCl,
2.5; MOPS, 10; CaCl2, 1.8 and D-glucose, 10; pH 7.0, was used to
bathe the cultures during recording periods. To eliminate movement
artifacts, 20 mM D-tubocurarine (Sigma, St. Louis, MO) was added to
the NFR to block synaptically evoked myocyte contraction.
Extracellular stimulation was performed using borosilicate glass
patch pipettes back-®lled with NFR (5±10 MW resistance) to apply
voltage pulses (0.8 ms) elicited by an electronic stimulator (Model
SEN 7103, Nihon Kohden, Tokyo, Japan) in series with a stimulus
isolation unit (Model 305B, WPI, New Haven, CT).
Ca2+-detection
AP-induced ¯uorescence transients were recorded from nerve
terminals using the confocal spot detection method as described
previously (DiGregorio et al., 1999b). The diode current was
ampli®ed using the capacitor-feedback mode of an Axopatch 200B
ampli®er (Axon Instruments), low-pass ®ltered at 1±1.5 kHz and
digitized at 18±20 kHz using the Digidata 1200 A. The microscope
stage was equipped with a high-resolution (100 nm) stepper motor
(UTS20PP.1, Newport, Irvine, CA) to allow high precision confocal
spot displacement within nerve terminals. Fluorescence and phase
contrast images were used to document recording sites along the
nerve terminal, and were acquired with a cooled CCD camera
(Spectra Source, Agora Hills, CA).
Fluorescence transient analysis
AP-induced OGB-5N ¯uorescence transients were analysed as
described previously (DiGregorio et al., 1999b). Peak DF/F-values
were determined by averaging 3±10 consecutive transients recorded
at a single presynaptic site, or by averaging 3±6 transients recorded
from sites in the immediate neighbourhood to where the largest
transient in a particular scan was obtained. Recording sites were
denoted as positive for Ca2+ transients if the transients exhibited a
rapid time-to-peak (< 1.5 ms) and a rapid decay phase (t < 10 ms).
Model simulations suggest that the presence of these two features is
characteristic of the existence of a Ca2+-entry site within the spot
detection volume (DiGregorio et al., 1999b). In contrast, recording
sites were considered negative for the presence of Ca2+-entry sites if
they exhibited a time-to-peak greater than 1.5 ms, or lacked the fast
decay component, or had a peak DF/F of < 5%. In cases where no
transient was observed, recording sites were only considered negative
if the SD in the amplitude of the baseline noise was < 5% DF/F
otherwise the data was rejected.
Immunocytochemistry
Nerve±muscle cultures were washed three times in phosphate buffer
saline (PBS) pH 7.4 with an osmolality adjusted to 250 mOsmol/kg
and then incubated for at least 15 min in the same solution prior to
®xation. The cultures were then ®xed for 30 min in 3% (w/v)
paraformaldehyde in PBS and permeabilized for 30 min with 0.05%
(v/v) Triton X-100 and 10% normal goat serum (Jackson
ImmunoResearch Laboratories, West Grove, PA) at either room
temperature or 4 °C. In the cases where electrophysiology was
performed ®rst, the NFR was replaced at the end of the experiment
with the 3% paraformaldehyde solution and subsequently permeabi-
lized as described above. Primary antibodies were diluted 1 : 500 in
the permeabilization solution and were incubated overnight at 4 °C or
for 1 h at room temperature. The cultures were rinsed thoroughly
(3 3 5 min) with PBS and incubated with secondary antibodies
diluted 1 : 800 in the permeabilization solution. The cultures were
then rinsed in PBS and visualized under the ¯uorescence microscope.
In some cases the PBS solution was removed and Vectashield (Vector
Laboratories, Burlingame, CA) was added prior to ¯uorescence
imaging to minimize photobleaching. The monoclonal anti-mouse
SV2 antibody was a gift from Dr Kathleen Buckley (Harvard Medical
School) and the polyclonal anti-frog cysteine string protein (CSP)
antibody was a gift from Dr Cameron Gundersen (University of
California, Los Angeles). Secondary antibodies included: Alexa 488
conjugated goat anti-mouse IgG (Molecular Probes), Cy3 conjugated
goat anti-mouse IgG (Jackson ImmunoResearch Laboratories, West
Grove, PA) and Alexa 488 conjugated goat anti-rabbit IgG
(Molecular Probes, Eugene, OR).
Tetramethylrhodamine-conjugated a-bungarotoxin (R-BTX,
Molecular Probes) was used to visualize clusters of postsynaptic
AChRs. For in situ experiments, cells were incubated for 45 min with
0.01 ng/mL of R-BTX in NFR. For the staining of ®xed cultures, the
534 D. A. DiGregorio et al.
ã 2001 Federation of European Neuroscience Societies, European Journal of Neuroscience, 14, 533±546
cells were incubated for 45 min with 0.01 ng/mL of R-BTX in PBS
prior to permeabilization.
Only those cells in which the cell outline did not change
signi®cantly after ®xation were used for analysis. We cannot rule
out the possibility that ®xation changed slightly the distribution of
SV2 or CSP immuno¯uorescence. However, as a control, our
®xation and permeabilization methods did not change signi®cantly
the distribution of alpha-bungarotoxin staining (data not shown).
Fixed cell imaging
Immuno¯uorescence images were acquired using a cooled CCD
camera (Sensys, Photometrics) coupled to an inverted Olympus
microscope. Transmitted light images were formed using a 40 3
phase contrast objective or a 100 3 (1.3 NA) Plan Fluor
objective in conjunction with differential interference contrast
optics. For ¯uorescence imaging, stained cells were illuminated
with a 100-W mercury lamp. CCD camera exposure times varied
from 0.2 to 3 s in order to maximize the dynamic range of
¯uorescence intensities. All ¯uorophores were visualized using a
multiband beamsplitter (Model 51004v2BS, Chroma Technology,
Brattleboro, VT) in combination with excitation/emission ®lters
using computer controlled ®lter wheels (Sutter Instruments,
Novato, CA). For Alexa 488 immuno¯uorescence a 480-nm
bandpass excitation ®lter (HQ480/40, Chroma) and a 535-nm band
pass ®lter (HQ535/50, Chroma) were used. For CY3 and
rhodamine-based immuno¯uorescence, a 550-nm excitation ®lter
(XF39, Omega Optical, Battleboro, VT) and a 570-nm long pass
emission ®lter (380254, Omega) were used. Using these optical
®lter combinations, we estimated the rhodamine ¯uorescence
wavelength contamination observed in the green image to be
< 10% (n = 6) for images taken with identical exposure times.
The Alexa 488 ¯uorescence wavelength contamination in the red
image was neglible (< 1%, n = 6). Metamorph imaging software
(Universal Imaging Corp., West Chester, PA) was used to operate
®lter wheels and acquire images.
Image analysis
Sixteen-bit images were analysed with either Metamorph or
ImageTool (University of Texas Health Science, San Antonio, TX)
software packages. For ®gures, the 16-bit images were exported as 8-
bit images and processed using Adobe Photoshop 5.0 (Adobe
Systems Inc., San Jose, CA).
Ca2+ transient colocalization with SV2
Phase contrast, DIC and ¯uorescent images were used to de®ne the
location of the Ca2+ entry site in relation to immunocytochemical
features at the contact region. The mean pixel intensity and its SD
were calculated from line intensity pro®les (5±10 mm in length)
traversing Ca2+ transient recording sites. Relative values for anti-SV2
¯uorescence were calculated by normalizing pixel intensities accord-
ing to the number of SD above the mean pixel intensity. The portions
of the line scan that did not traverse a recording site were made to
bisect the nerve terminal along its long axis. The line pro®le was ®ve
pixels thick (0.067 mm/pixel). The maximum relative pixel intensity
within < 1 mm of a Ca2+ transient recording site was assumed to
represent the SV2 immuno¯uorescence for that location. This method
allowed for subtle changes in morphology after ®xation due to
shrinkage or swelling, and was used for subsequent localization of all
markers. Cells in which the morphology after ®xation could not
mapped to the original phase contrast image were excluded from the
data set.
R-BTX staining
R-BTX staining along nerve±muscle contact was also assessed using
line pro®les of ®ve pixel width. Due to the image shifts between the
¯uorescence and DIC images, the line pro®le was initially drawn
along the centre of the neurite path, as determined from the DIC
image, then parallel shifted no > 6 1 mm to align it with a region
containing the greatest amount of ¯uorescence staining. The staining
length was obtained from the length of the ¯uorescence regions with
pixel values > 3 SD above the background pixel intensity of a
particular scan. To determine the background pixel intensities, line
pro®les of pixel intensity were made along nerve±muscle contacts in
which electrical stimulation did not produce a twitch. The intensity
distributions of these pixels were ®tted to Gaussian functions. In
seven nonfunctional nerve±muscle contacts, the average ratio of the
SD to the mean intensity was determined to be 0.29. This ratio was
then used to constrain double Gaussian ®ts of pixel intensity
distributions at functional synaptic contacts. The SD calculated
from the Gaussian curve ®tted to the lower intensities was assumed to
identify pixel intensities arising from background staining and is
heretofore referred to as the background SD.
Ca2+ transient colocalization with R-BTX
If the R-BTX intensity observed at a Ca2+ transient recording site was
greater than three-fold above the mean background SD of the line
pro®le bisecting the recording site, then the site was considered
positive for R-BTX.
SV2 colocalization with R-BTX
Staining lengths for R-BTX were estimated as described above,
except that the pro®le was centred along the nerve terminal as
determined from the anti-SV2 ¯uorescence image. SV2 intensity
pro®les were initially drawn along the centre of the nerve and then
shifted within 6 1 mm so as to transverse the maximum number of
staining sites. SV2 staining lengths were determined from intensity
values > 1.5 SD above the mean value of the intensity pro®le (as
described above).
Results
Spatial characterization of Ca2+ entry sites and synapticvesicle distribution
We have recently demonstrated that the size of presynaptic Ca2+
entry sites in Xenopus cultured NMJs can be estimated from the full-
width at half-maximum (FWHM) of the spatial dependence of Ca2+
indicator ¯uorescence domains (DiGregorio et al., 1999b). To
determine whether in this preparation AP-induced Ca2+ domains,
and hence Ca2+ channels, are localized to putative sites of
neurotransmitter release, we examined the clustering pattern of
synaptic vesicles in the region where Ca2+ domains were detected.
The synaptic vesicle distribution was assessed by immuno¯uores-
cence microscopy using an antibody against the synaptic vesicle
protein SV2, which has been shown, by Western blot analysis, to be
present in the Xenopus nerve±muscle cultures (Poage et al., 1999).
Antibodies to this molecule have proven to yield a robust identi®-
cation of presynaptic boutons (Lissin et al., 1999; Serpinskaya et al.,
1999) and active zones (Macleod et al., 1999).
AP-induced Ca2+ transients were recorded using the confocal spot
detection method from neurites of 1-day-old cultured Xenopus spinal
neurons at locations where the neurites contacted myocytes. The
illumination spot was focused within the neurites that had been
Ca2+ domains at active zones 535
ã 2001 Federation of European Neuroscience Societies, European Journal of Neuroscience, 14, 533±546
previously loaded with 50 mM of the low af®nity (Kd ~ 30 mM)
calcium indicator OGB-5 N (DiGregorio & Vergara, 1997) through a
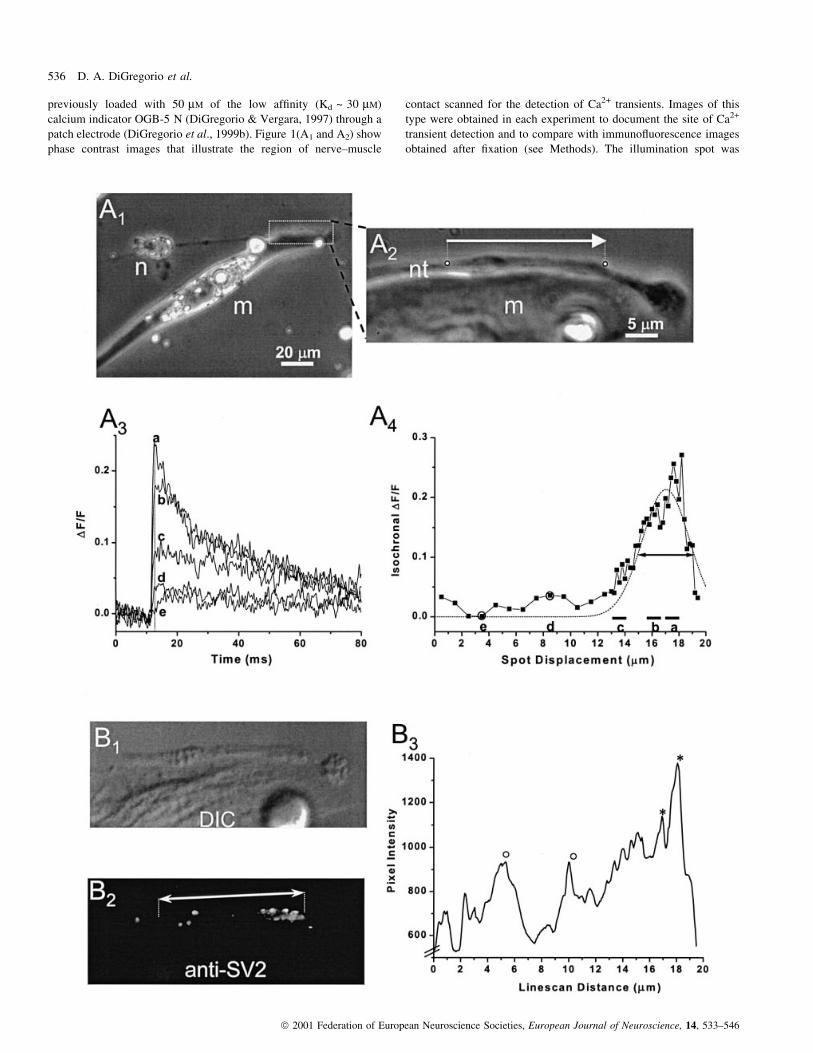
patch electrode (DiGregorio et al., 1999b). Figure 1(A1 and A2) show
phase contrast images that illustrate the region of nerve±muscle
contact scanned for the detection of Ca2+ transients. Images of this
type were obtained in each experiment to document the site of Ca2+
transient detection and to compare with immuno¯uorescence images
obtained after ®xation (see Methods). The illumination spot was
536 D. A. DiGregorio et al.
ã 2001 Federation of European Neuroscience Societies, European Journal of Neuroscience, 14, 533±546
displaced in 0.2 mm increments along the nerve terminal in the
direction indicated by the arrow [Fig. 1(A2)]. At each spot location,
¯uorescence transients were recorded at the presynaptic terminal
when APs were elicited at the cell body as shown in Fig. 1(A3, traces
a±e). Trace (a) represents an average of ®ve consecutively recorded
transients from ®ve spot locations separated by 200 nm in a region of
the nerve terminal where the amplitudes of the individual Ca2+
transients were maximal, thereby representing a spatially averaged
¯uorescence transient over 1 mm. The remaining traces (b±e) also
represent 1 mm spatially averaged transients from progressively more
distant regions from the site where the largest transients were
recorded. It can be observed that transients close to the site of
maximal ¯uorescence change (traces a and b) exhibit rapid times to
peak (< 1.5 ms) followed by a fast decay phase (t = 5 ms), typical of
Ca2+ transients when the site of recording encompasses a Ca2+ entry
site (DiGregorio et al., 1999b). In contrast, transients more distal to
the site of maximal entry (traces c±e) exhibit a slowing in their time-
to-peak and a loss of the fast decay phase. The overall extent of the
Ca2+ entry site can be more accurately estimated from the full width
at half maximum (FWHM) of the isochronal DF/F pro®le
(DiGregorio et al., 1999b). Hence, in Fig. 1(A4) we plot the
isochronal magnitude of each ¯uorescence trace at the time point
when the largest transient peaked (1.3 ms, dashed line). Note that for
the ®rst 13 mm of the scan, the data points represent average
isochronal values from ®ve neighbouring spot locations. From the
FWHM of the ®tted Gaussian function (dotted trace), the entry site
size was estimated to be 4.1 mm. Given the location and dimension of
the entry site within the nerve terminal traces `c', `d', and `e'
correspond to spot locations where there were either a very low
density of channels or none at all, and traces `a' and `b' represent
regions within the nerve terminal where a Ca2+ entry site was located.
To determine the underlying vesicle distribution in the same nerve
terminal where we measured AP-induced Ca2+ domains, we ®xed the
preparation following in situ recordings and then examined the SV2
protein distribution using ¯uorescence immunocytochemistry
(Fig. 1B). The DIC image [Fig. 1(B1)] shows a similar orientation
(after ®xation) of the synapse in Fig. 1(A2). Panel B2 is a ¯uorescence
image obtained after incubation with primary antibody against SV2
and a secondary antibody conjugated to the ¯uorescence molecule
Alexa 488, thus illustrating the anti-SV2 staining pattern. The arrow
indicates the approximate length and direction of the in situ Ca2+
transient scan. Note that the preparation is slightly skewed with
respect to the phase contrast image [Fig. 1(A2)]. It can be observed in
Fig. 1(B2) that towards the right end of the double-headed arrow,
where the Ca2+ entry site was located, SV2 immuno¯uorescence is
maximal. This is better illustrated with a line intensity pro®le
[Fig. 1(B3)] made between the start and endpoints of the ¯uorescence
scan. Here, the brightest regions (*, panel B3) appear to correspond in
space with the Ca2+ entry site of the domain shown in Fig. 1(A4).
However, there are other relatively bright regions of immuno¯uor-
escence (°, panel B3) where smaller and slower Ca2+ transients were
measured. These transients were similar in amplitude and time course
to traces (d) and (e) illustrated in Fig. 1(A3). Thus, SV2 immuno-
¯uorescence is obviously enhanced near regions of the nerve terminal
where Ca2+ entry sites are present, but regions with less SV2
immuno¯uorescence staining are associated with recording sites
where slower and smaller transients were measured.
To verify that SV2 antibody distribution in this preparation is a
good representation of the synaptic vesicle distribution, we compared
the staining pattern of SV2 with that of another speci®c synaptic
vesicle associated protein, cysteine string protein (Csp), known to be
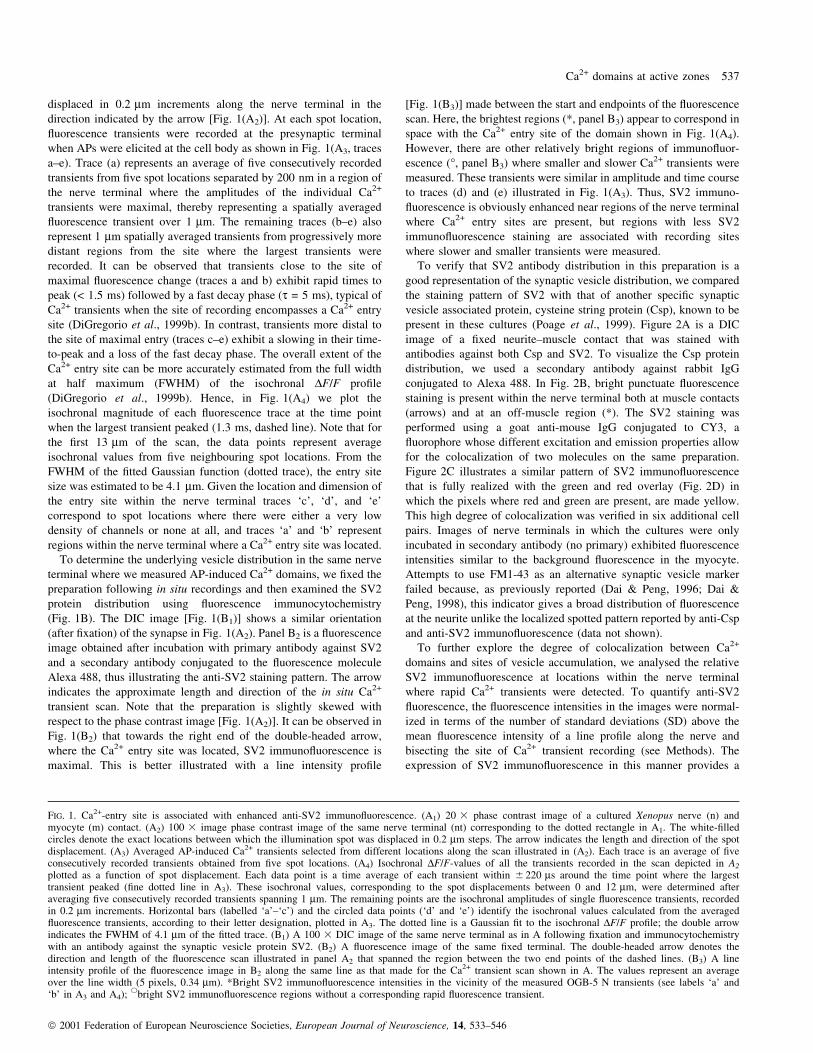
present in these cultures (Poage et al., 1999). Figure 2A is a DIC
image of a ®xed neurite±muscle contact that was stained with
antibodies against both Csp and SV2. To visualize the Csp protein
distribution, we used a secondary antibody against rabbit IgG
conjugated to Alexa 488. In Fig. 2B, bright punctuate ¯uorescence
staining is present within the nerve terminal both at muscle contacts
(arrows) and at an off-muscle region (*). The SV2 staining was
performed using a goat anti-mouse IgG conjugated to CY3, a
¯uorophore whose different excitation and emission properties allow
for the colocalization of two molecules on the same preparation.
Figure 2C illustrates a similar pattern of SV2 immuno¯uorescence
that is fully realized with the green and red overlay (Fig. 2D) in
which the pixels where red and green are present, are made yellow.
This high degree of colocalization was veri®ed in six additional cell
pairs. Images of nerve terminals in which the cultures were only
incubated in secondary antibody (no primary) exhibited ¯uorescence
intensities similar to the background ¯uorescence in the myocyte.
Attempts to use FM1-43 as an alternative synaptic vesicle marker
failed because, as previously reported (Dai & Peng, 1996; Dai &
Peng, 1998), this indicator gives a broad distribution of ¯uorescence
at the neurite unlike the localized spotted pattern reported by anti-Csp
and anti-SV2 immuno¯uorescence (data not shown).
To further explore the degree of colocalization between Ca2+
domains and sites of vesicle accumulation, we analysed the relative
SV2 immuno¯uorescence at locations within the nerve terminal
where rapid Ca2+ transients were detected. To quantify anti-SV2
¯uorescence, the ¯uorescence intensities in the images were normal-
ized in terms of the number of standard deviations (SD) above the
mean ¯uorescence intensity of a line pro®le along the nerve and
bisecting the site of Ca2+ transient recording (see Methods). The
expression of SV2 immuno¯uorescence in this manner provides a
FIG. 1. Ca2+-entry site is associated with enhanced anti-SV2 immuno¯uorescence. (A1) 20 3 phase contrast image of a cultured Xenopus nerve (n) andmyocyte (m) contact. (A2) 100 3 image phase contrast image of the same nerve terminal (nt) corresponding to the dotted rectangle in A1. The white-®lledcircles denote the exact locations between which the illumination spot was displaced in 0.2 mm steps. The arrow indicates the length and direction of the spotdisplacement. (A3) Averaged AP-induced Ca2+ transients selected from different locations along the scan illustrated in (A2). Each trace is an average of ®veconsecutively recorded transients obtained from ®ve spot locations. (A4) Isochronal DF/F-values of all the transients recorded in the scan depicted in A2
plotted as a function of spot displacement. Each data point is a time average of each transient within 6 220 ms around the time point where the largesttransient peaked (®ne dotted line in A3). These isochronal values, corresponding to the spot displacements between 0 and 12 mm, were determined afteraveraging ®ve consecutively recorded transients spanning 1 mm. The remaining points are the isochronal amplitudes of single ¯uorescence transients, recordedin 0.2 mm increments. Horizontal bars (labelled `a'±`c') and the circled data points (`d' and `e') identify the isochronal values calculated from the averaged¯uorescence transients, according to their letter designation, plotted in A3. The dotted line is a Gaussian ®t to the isochronal DF/F pro®le; the double arrowindicates the FWHM of 4.1 mm of the ®tted trace. (B1) A 100 3 DIC image of the same nerve terminal as in A following ®xation and immunocytochemistrywith an antibody against the synaptic vesicle protein SV2. (B2) A ¯uorescence image of the same ®xed terminal. The double-headed arrow denotes thedirection and length of the ¯uorescence scan illustrated in panel A2 that spanned the region between the two end points of the dashed lines. (B3) A lineintensity pro®le of the ¯uorescence image in B2 along the same line as that made for the Ca2+ transient scan shown in A. The values represent an averageover the line width (5 pixels, 0.34 mm). *Bright SV2 immuno¯uorescence intensities in the vicinity of the measured OGB-5 N transients (see labels `a' and`b' in A3 and A4); sbright SV2 immuno¯uorescence regions without a corresponding rapid ¯uorescence transient.
Ca2+ domains at active zones 537
ã 2001 Federation of European Neuroscience Societies, European Journal of Neuroscience, 14, 533±546
relative measure of SV2 staining (vesicle aggregation) at the site of
Ca2+ transient recording with respect to other regions within the same
nerve terminal. We tested this by comparing the results from spot
detection sites where no Ca2+ transients were measured with those
from recording locations where rapid Ca2+ transients were recorded.
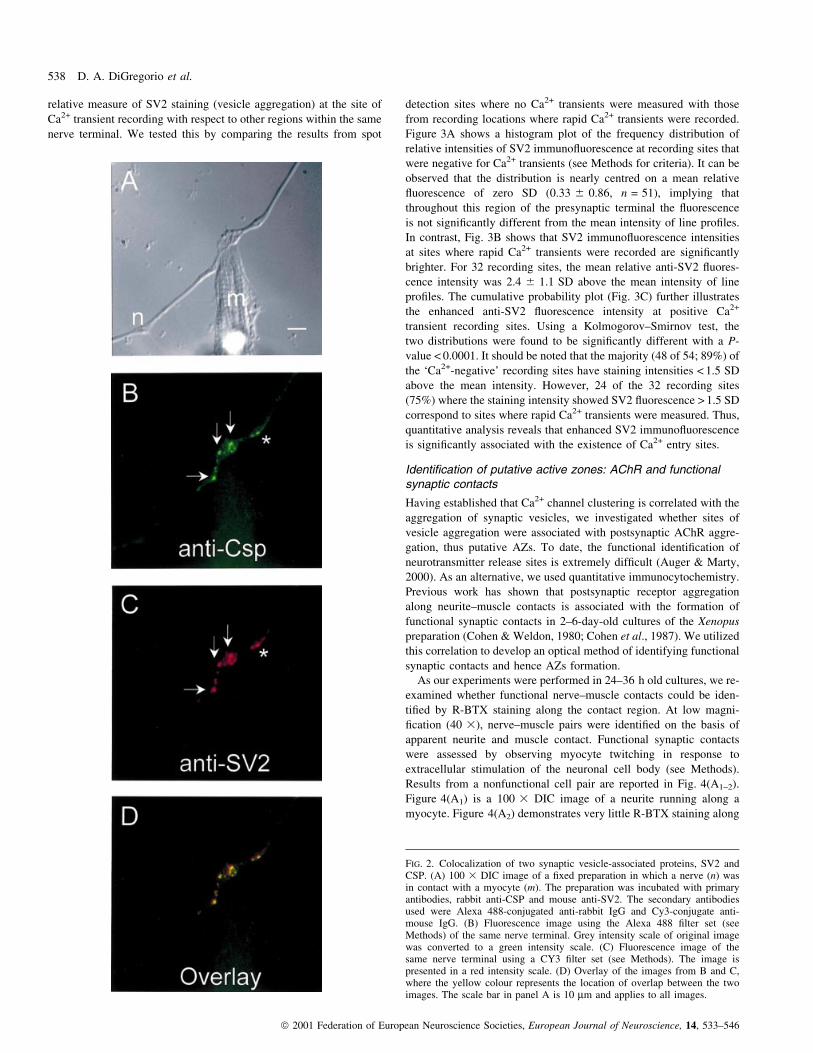
Figure 3A shows a histogram plot of the frequency distribution of
relative intensities of SV2 immuno¯uorescence at recording sites that
were negative for Ca2+ transients (see Methods for criteria). It can be
observed that the distribution is nearly centred on a mean relative
¯uorescence of zero SD (0.33 6 0.86, n = 51), implying that
throughout this region of the presynaptic terminal the ¯uorescence
is not signi®cantly different from the mean intensity of line pro®les.
In contrast, Fig. 3B shows that SV2 immuno¯uorescence intensities
at sites where rapid Ca2+ transients were recorded are signi®cantly
brighter. For 32 recording sites, the mean relative anti-SV2 ¯uores-
cence intensity was 2.4 6 1.1 SD above the mean intensity of line
pro®les. The cumulative probability plot (Fig. 3C) further illustrates
the enhanced anti-SV2 ¯uorescence intensity at positive Ca2+
transient recording sites. Using a Kolmogorov±Smirnov test, the
two distributions were found to be signi®cantly different with a P-
value < 0.0001. It should be noted that the majority (48 of 54; 89%) of
the `Ca2+-negative' recording sites have staining intensities < 1.5 SD
above the mean intensity. However, 24 of the 32 recording sites
(75%) where the staining intensity showed SV2 ¯uorescence > 1.5 SD
correspond to sites where rapid Ca2+ transients were measured. Thus,
quantitative analysis reveals that enhanced SV2 immuno¯uorescence
is signi®cantly associated with the existence of Ca2+ entry sites.
Identi®cation of putative active zones: AChR and functionalsynaptic contacts
Having established that Ca2+ channel clustering is correlated with the
aggregation of synaptic vesicles, we investigated whether sites of
vesicle aggregation were associated with postsynaptic AChR aggre-
gation, thus putative AZs. To date, the functional identi®cation of
neurotransmitter release sites is extremely dif®cult (Auger & Marty,
2000). As an alternative, we used quantitative immunocytochemistry.
Previous work has shown that postsynaptic receptor aggregation
along neurite±muscle contacts is associated with the formation of
functional synaptic contacts in 2±6-day-old cultures of the Xenopus
preparation (Cohen & Weldon, 1980; Cohen et al., 1987). We utilized
this correlation to develop an optical method of identifying functional
synaptic contacts and hence AZs formation.
As our experiments were performed in 24±36 h old cultures, we re-
examined whether functional nerve±muscle contacts could be iden-
ti®ed by R-BTX staining along the contact region. At low magni-
®cation (40 3), nerve±muscle pairs were identi®ed on the basis of
apparent neurite and muscle contact. Functional synaptic contacts
were assessed by observing myocyte twitching in response to
extracellular stimulation of the neuronal cell body (see Methods).
Results from a nonfunctional cell pair are reported in Fig. 4(A1±2).
Figure 4(A1) is a 100 3 DIC image of a neurite running along a
myocyte. Figure 4(A2) demonstrates very little R-BTX staining along
FIG. 2. Colocalization of two synaptic vesicle-associated proteins, SV2 andCSP. (A) 100 3 DIC image of a ®xed preparation in which a nerve (n) wasin contact with a myocyte (m). The preparation was incubated with primaryantibodies, rabbit anti-CSP and mouse anti-SV2. The secondary antibodiesused were Alexa 488-conjugated anti-rabbit IgG and Cy3-conjugate anti-mouse IgG. (B) Fluorescence image using the Alexa 488 ®lter set (seeMethods) of the same nerve terminal. Grey intensity scale of original imagewas converted to a green intensity scale. (C) Fluorescence image of thesame nerve terminal using a CY3 ®lter set (see Methods). The image ispresented in a red intensity scale. (D) Overlay of the images from B and C,where the yellow colour represents the location of overlap between the twoimages. The scale bar in panel A is 10 mm and applies to all images.
538 D. A. DiGregorio et al.
ã 2001 Federation of European Neuroscience Societies, European Journal of Neuroscience, 14, 533±546
the region of nerve±muscle contact. In contrast, a functional nerve±
muscle contact [Fig. 4(B1)] exhibited a robust enhancement in
staining along the region of nerve±muscle contact [Fig. 4(B2)]. To
quantitatively assess differences in R-BTX staining between func-
tional and nonfunctional contacts, we ®rst analysed line-scans of the
R-BTX ¯uorescence observed in nonfunctional nerve±muscle con-
tacts in order to establish the background levels of staining (Fig. 4C).
Figure 4(C1) shows the pixel intensity pro®le of the line-scan along
the nontwitching contact illustrated in Fig. 4(A2) and its correspond-
ing pixel intensity distribution is shown in Fig. 4(C2). A single
Gaussian distribution of normally dispersed intensities around a mean
background staining can readily ®t the data. In contrast, the pixel
intensity distribution [Fig. 4(D2)] obtained from the line-scan
[Fig. 4(D1)] along the twitching nerve±muscle contact indicates the
presence of a signi®cant population of higher pixel intensities. These
intensities correspond to the enhanced R-BTX staining seen in
Fig. 4(B2). Thus, to calculate the contact-length with signi®cant
AChR staining we normalized line-scan intensities according to the
SD of the background ¯uorescence intensity (see Methods). We set
the threshold for signi®cant staining to be 3 SD above the mean
background intensity [dotted line in Fig. 4(C1) and Fig. 4(D1)]. We
found that this threshold suf®ciently isolated the peaks in ¯uores-
cence from the background. For the two nerve±muscle contacts
presented in Fig. 4, the nonfunctional contact exhibited positive
staining for 0.6% of its contact-length and the functional contact
exhibited positive staining for 33.3% of its contact-length.
When we applied the above normalization and thresholding
method to all the nerve±muscle pairs tested for twitching, we
observed that on average, 33.6 6 2.8% (mean 6 SEM) of the
neurite±muscle contact-length stained positive for R-BTX (n = 9
cell pairs). In contrast, 5.5 6 1.6% (mean 6 SEM) of the neurite±
muscle contact-length of nontwitching contacts stained positive for
R-BTX (n = 7 cell pairs). Hence, the extent of R-BTX staining along
nerve±muscle contacts correlates with the presence of functional
synaptic contacts and the sites of receptor aggregation are thus
potential release sites.
Identi®cation of putative active zones: synaptic vesicles andacetylcholine receptors
For the development of AZs at nerve muscle contacts, it is necessary
that both Ca2+ entry and synaptic vesicles are localized in close
spatial proximity to postsynaptic receptors. To quantitatively assess
whether all three cellular requirements were ful®lled at developing
Xenopus nerve±muscle contacts, we ®rst examined the location of
enhanced SV2 immuno¯uorescence domains using the 1.5 SD above
the mean criterion with respect to AChR aggregation. Having
established that R-BTX staining is enhanced at functional nerve±
muscle contacts, it remained to be demonstrated that synaptic vesicle
aggregation also occurred at sites of AChR aggregation. Figure 5
illustrates a particular experiment in which a nerve±muscle contact
(Fig. 5A) was stained with anti-SV2 (Fig. 5B) and R-BTX (Fig. 5C)
in the same preparation. Corresponding regions (see insets) of the
neurite±muscle contact exhibited bright ¯uorescence staining for both
anti-SV2 and R-BTX. To quantitatively assess the degree of
colocalization between anti-SV2 and R-BTX, we examined the
length of overlap between the two images along line intensity
pro®les. Similar to the relative intensity analysis presented in regard
to differences in anti-SV2 staining in the presence and absence of
Ca2+ channels (Fig. 2), we set the threshold for positive anti-SV2
staining to be > 1.5 SD above the mean value of the line pro®le.
Positive R-BTX staining was set to the more stringent condition of
3 SD above the mean value of the line pro®le. Figure 5D illustrates
the normalized intensity pro®les of both the anti-SV2 staining (thick
trace) and R-BTX (thin trace) for the same cell. The traces were
scaled such that the threshold levels were made identical and the
staining length of each of the two stains could be easily identi®ed.
There is a clear spatial correspondence along the nerve±muscle
contact where anti-SV2 immuno¯uorescence overlaps with R-BTX
FIG. 3. Ca2+ entry sites are associated with larger relative SV2immuno¯uorescence intensities. (A) Histogram plot of relative SV2immuno¯uorescence intensities within 1 mm of a confocal spot recordingsite in which no rapid Ca2+ transients were detected (see Methods forcriteria). The dashed line is a Gaussian ®t to the relative intensitydistribution with a corresponding mean 6 SD. (B) Histogram plot of therelative SV2 immuno¯uorescence intensities at regions of the nerve±musclecontact within 1 mm of a confocal spot recording site where rapid Ca2+
transients were detected. The dashed line is a Gaussian ®t to the data withthe corresponding mean 6 SD. Fluorescence intensities are represented asthe number of SD above the mean value of line scans spanning therecording site. The two distribution means are statistically different,P < 0.0001, Kolmogorov±Smirnov test. (C) Cumulative probability plots ofthe two anti-SV2 intensity distributions from A (circles) and B (triangles).
Ca2+ domains at active zones 539
ã 2001 Federation of European Neuroscience Societies, European Journal of Neuroscience, 14, 533±546
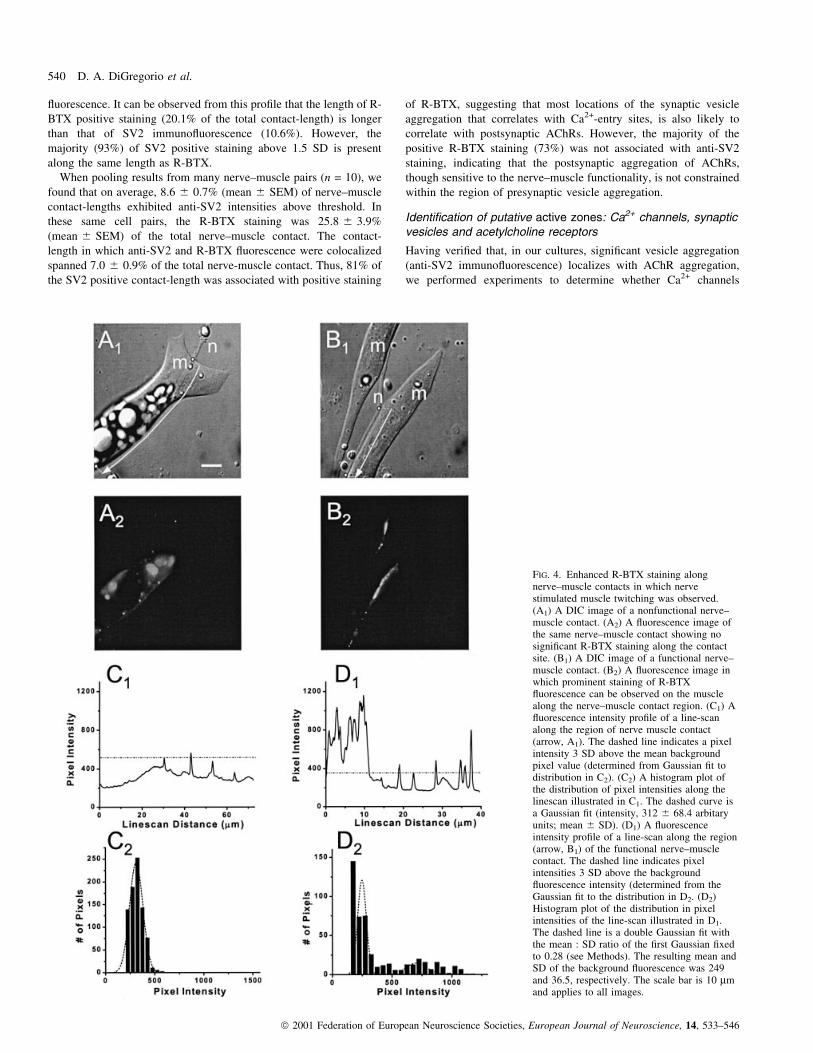
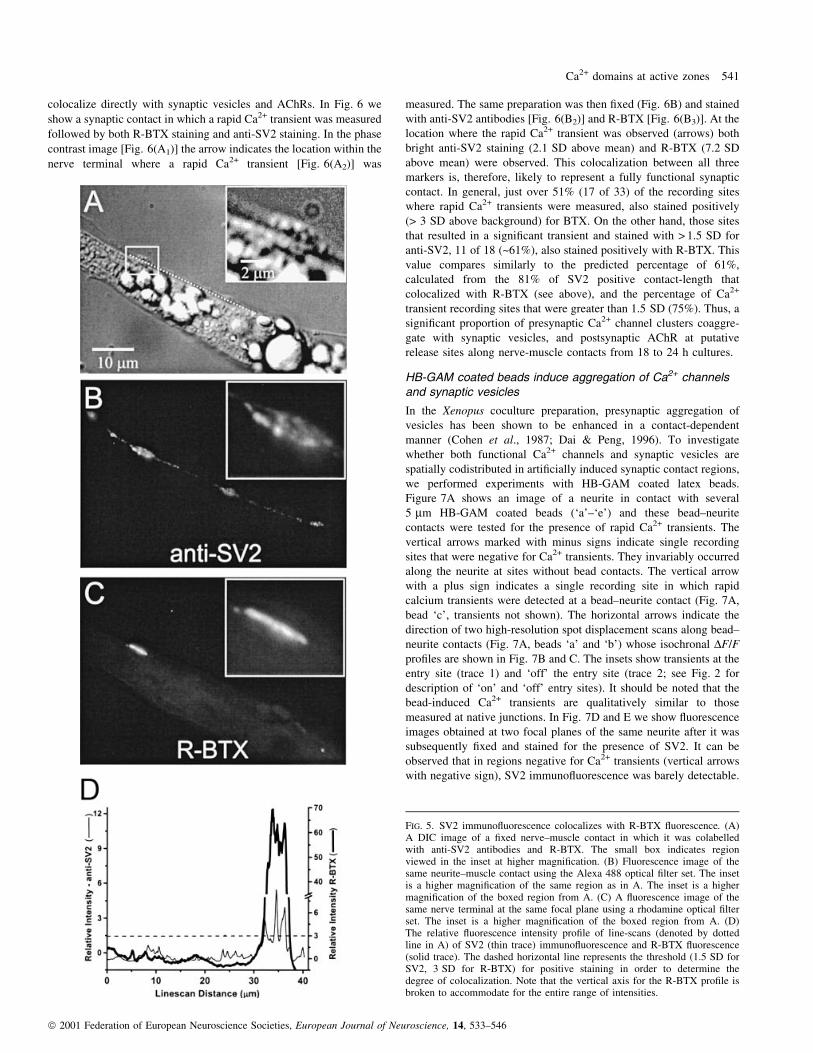
¯uorescence. It can be observed from this pro®le that the length of R-
BTX positive staining (20.1% of the total contact-length) is longer
than that of SV2 immuno¯uorescence (10.6%). However, the
majority (93%) of SV2 positive staining above 1.5 SD is present
along the same length as R-BTX.
When pooling results from many nerve±muscle pairs (n = 10), we
found that on average, 8.6 6 0.7% (mean 6 SEM) of nerve±muscle
contact-lengths exhibited anti-SV2 intensities above threshold. In
these same cell pairs, the R-BTX staining was 25.8 6 3.9%
(mean 6 SEM) of the total nerve±muscle contact. The contact-
length in which anti-SV2 and R-BTX ¯uorescence were colocalized
spanned 7.0 6 0.9% of the total nerve-muscle contact. Thus, 81% of
the SV2 positive contact-length was associated with positive staining
of R-BTX, suggesting that most locations of the synaptic vesicle
aggregation that correlates with Ca2+-entry sites, is also likely to
correlate with postsynaptic AChRs. However, the majority of the
positive R-BTX staining (73%) was not associated with anti-SV2
staining, indicating that the postsynaptic aggregation of AChRs,
though sensitive to the nerve±muscle functionality, is not constrained
within the region of presynaptic vesicle aggregation.
Identi®cation of putative active zones: Ca2+ channels, synapticvesicles and acetylcholine receptors
Having veri®ed that, in our cultures, signi®cant vesicle aggregation
(anti-SV2 immuno¯uorescence) localizes with AChR aggregation,
we performed experiments to determine whether Ca2+ channels
FIG. 4. Enhanced R-BTX staining alongnerve±muscle contacts in which nervestimulated muscle twitching was observed.(A1) A DIC image of a nonfunctional nerve±muscle contact. (A2) A ¯uorescence image ofthe same nerve±muscle contact showing nosigni®cant R-BTX staining along the contactsite. (B1) A DIC image of a functional nerve±muscle contact. (B2) A ¯uorescence image inwhich prominent staining of R-BTX¯uorescence can be observed on the musclealong the nerve±muscle contact region. (C1) A¯uorescence intensity pro®le of a line-scanalong the region of nerve muscle contact(arrow, A1). The dashed line indicates a pixelintensity 3 SD above the mean backgroundpixel value (determined from Gaussian ®t todistribution in C2). (C2) A histogram plot ofthe distribution of pixel intensities along thelinescan illustrated in C1. The dashed curve isa Gaussian ®t (intensity, 312 6 68.4 arbitaryunits; mean 6 SD). (D1) A ¯uorescenceintensity pro®le of a line-scan along the region(arrow, B1) of the functional nerve±musclecontact. The dashed line indicates pixelintensities 3 SD above the background¯uorescence intensity (determined from theGaussian ®t to the distribution in D2. (D2)Histogram plot of the distribution in pixelintensities of the line-scan illustrated in D1.The dashed line is a double Gaussian ®t withthe mean : SD ratio of the ®rst Gaussian ®xedto 0.28 (see Methods). The resulting mean andSD of the background ¯uorescence was 249and 36.5, respectively. The scale bar is 10 mmand applies to all images.
540 D. A. DiGregorio et al.
ã 2001 Federation of European Neuroscience Societies, European Journal of Neuroscience, 14, 533±546
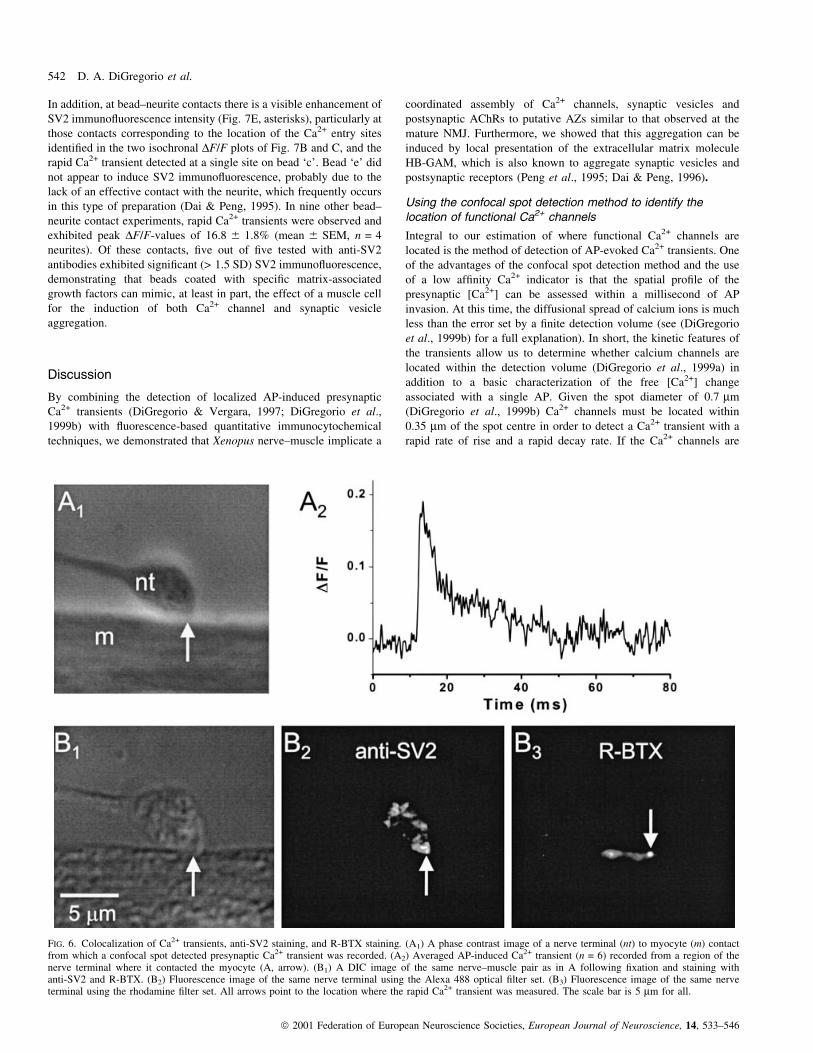
colocalize directly with synaptic vesicles and AChRs. In Fig. 6 we
show a synaptic contact in which a rapid Ca2+ transient was measured
followed by both R-BTX staining and anti-SV2 staining. In the phase
contrast image [Fig. 6(A1)] the arrow indicates the location within the
nerve terminal where a rapid Ca2+ transient [Fig. 6(A2)] was
measured. The same preparation was then ®xed (Fig. 6B) and stained
with anti-SV2 antibodies [Fig. 6(B2)] and R-BTX [Fig. 6(B3)]. At the
location where the rapid Ca2+ transient was observed (arrows) both
bright anti-SV2 staining (2.1 SD above mean) and R-BTX (7.2 SD
above mean) were observed. This colocalization between all three
markers is, therefore, likely to represent a fully functional synaptic
contact. In general, just over 51% (17 of 33) of the recording sites
where rapid Ca2+ transients were measured, also stained positively
(> 3 SD above background) for BTX. On the other hand, those sites
that resulted in a signi®cant transient and stained with > 1.5 SD for
anti-SV2, 11 of 18 (~61%), also stained positively with R-BTX. This
value compares similarly to the predicted percentage of 61%,
calculated from the 81% of SV2 positive contact-length that
colocalized with R-BTX (see above), and the percentage of Ca2+
transient recording sites that were greater than 1.5 SD (75%). Thus, a
signi®cant proportion of presynaptic Ca2+ channel clusters coaggre-
gate with synaptic vesicles, and postsynaptic AChR at putative
release sites along nerve-muscle contacts from 18 to 24 h cultures.
HB-GAM coated beads induce aggregation of Ca2+ channelsand synaptic vesicles
In the Xenopus coculture preparation, presynaptic aggregation of
vesicles has been shown to be enhanced in a contact-dependent
manner (Cohen et al., 1987; Dai & Peng, 1996). To investigate
whether both functional Ca2+ channels and synaptic vesicles are
spatially codistributed in arti®cially induced synaptic contact regions,
we performed experiments with HB-GAM coated latex beads.
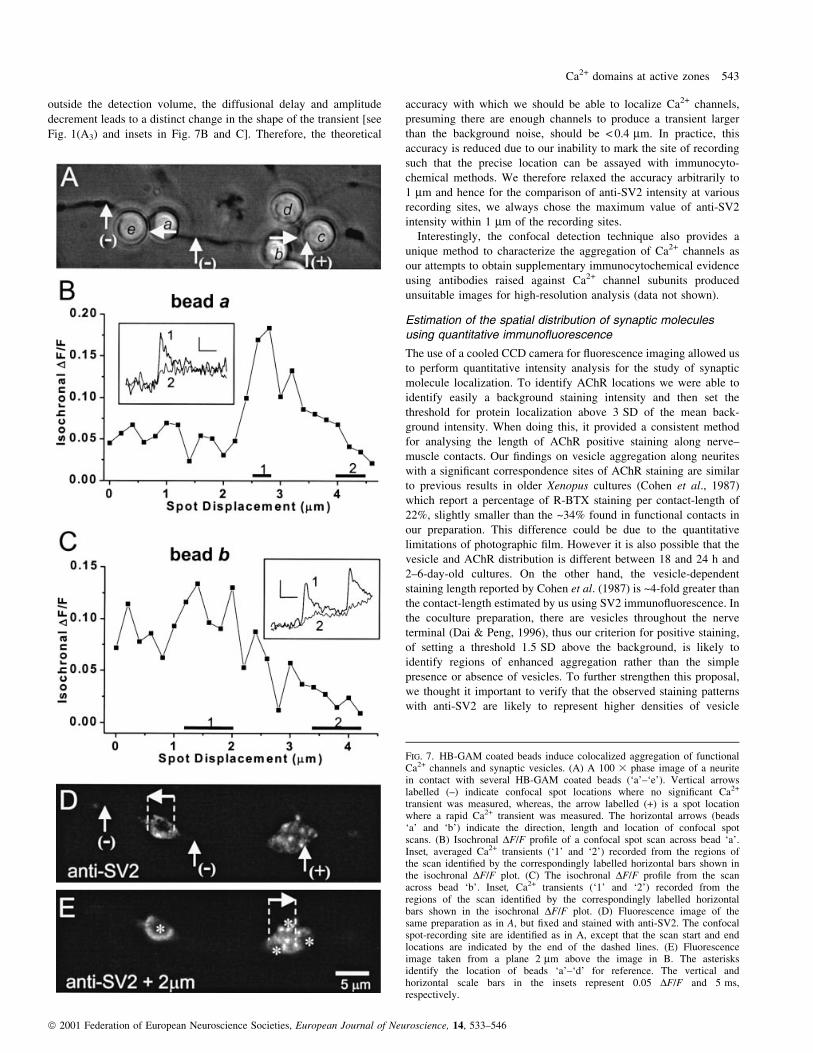
Figure 7A shows an image of a neurite in contact with several
5 mm HB-GAM coated beads (`a'±`e') and these bead±neurite
contacts were tested for the presence of rapid Ca2+ transients. The
vertical arrows marked with minus signs indicate single recording
sites that were negative for Ca2+ transients. They invariably occurred
along the neurite at sites without bead contacts. The vertical arrow
with a plus sign indicates a single recording site in which rapid
calcium transients were detected at a bead±neurite contact (Fig. 7A,
bead `c', transients not shown). The horizontal arrows indicate the
direction of two high-resolution spot displacement scans along bead±
neurite contacts (Fig. 7A, beads `a' and `b') whose isochronal DF/F
pro®les are shown in Fig. 7B and C. The insets show transients at the
entry site (trace 1) and `off' the entry site (trace 2; see Fig. 2 for
description of `on' and `off' entry sites). It should be noted that the
bead-induced Ca2+ transients are qualitatively similar to those
measured at native junctions. In Fig. 7D and E we show ¯uorescence
images obtained at two focal planes of the same neurite after it was
subsequently ®xed and stained for the presence of SV2. It can be
observed that in regions negative for Ca2+ transients (vertical arrows
with negative sign), SV2 immuno¯uorescence was barely detectable.
FIG. 5. SV2 immuno¯uorescence colocalizes with R-BTX ¯uorescence. (A)A DIC image of a ®xed nerve±muscle contact in which it was colabelledwith anti-SV2 antibodies and R-BTX. The small box indicates regionviewed in the inset at higher magni®cation. (B) Fluorescence image of thesame neurite±muscle contact using the Alexa 488 optical ®lter set. The insetis a higher magni®cation of the same region as in A. The inset is a highermagni®cation of the boxed region from A. (C) A ¯uorescence image of thesame nerve terminal at the same focal plane using a rhodamine optical ®lterset. The inset is a higher magni®cation of the boxed region from A. (D)The relative ¯uorescence intensity pro®le of line-scans (denoted by dottedline in A) of SV2 (thin trace) immuno¯uorescence and R-BTX ¯uorescence(solid trace). The dashed horizontal line represents the threshold (1.5 SD forSV2, 3 SD for R-BTX) for positive staining in order to determine thedegree of colocalization. Note that the vertical axis for the R-BTX pro®le isbroken to accommodate for the entire range of intensities.
Ca2+ domains at active zones 541
ã 2001 Federation of European Neuroscience Societies, European Journal of Neuroscience, 14, 533±546
In addition, at bead±neurite contacts there is a visible enhancement of
SV2 immuno¯uorescence intensity (Fig. 7E, asterisks), particularly at
those contacts corresponding to the location of the Ca2+ entry sites
identi®ed in the two isochronal DF/F plots of Fig. 7B and C, and the
rapid Ca2+ transient detected at a single site on bead `c'. Bead `e' did
not appear to induce SV2 immuno¯uorescence, probably due to the
lack of an effective contact with the neurite, which frequently occurs
in this type of preparation (Dai & Peng, 1995). In nine other bead±
neurite contact experiments, rapid Ca2+ transients were observed and
exhibited peak DF/F-values of 16.8 6 1.8% (mean 6 SEM, n = 4
neurites). Of these contacts, ®ve out of ®ve tested with anti-SV2
antibodies exhibited signi®cant (> 1.5 SD) SV2 immuno¯uorescence,
demonstrating that beads coated with speci®c matrix-associated
growth factors can mimic, at least in part, the effect of a muscle cell
for the induction of both Ca2+ channel and synaptic vesicle
aggregation.
Discussion
By combining the detection of localized AP-induced presynaptic
Ca2+ transients (DiGregorio & Vergara, 1997; DiGregorio et al.,
1999b) with ¯uorescence-based quantitative immunocytochemical
techniques, we demonstrated that Xenopus nerve±muscle implicate a
coordinated assembly of Ca2+ channels, synaptic vesicles and
postsynaptic AChRs to putative AZs similar to that observed at the
mature NMJ. Furthermore, we showed that this aggregation can be
induced by local presentation of the extracellular matrix molecule
HB-GAM, which is also known to aggregate synaptic vesicles and
postsynaptic receptors (Peng et al., 1995; Dai & Peng, 1996).
Using the confocal spot detection method to identify thelocation of functional Ca2+ channels
Integral to our estimation of where functional Ca2+ channels are
located is the method of detection of AP-evoked Ca2+ transients. One
of the advantages of the confocal spot detection method and the use
of a low af®nity Ca2+ indicator is that the spatial pro®le of the
presynaptic [Ca2+] can be assessed within a millisecond of AP
invasion. At this time, the diffusional spread of calcium ions is much
less than the error set by a ®nite detection volume (see (DiGregorio
et al., 1999b) for a full explanation). In short, the kinetic features of
the transients allow us to determine whether calcium channels are
located within the detection volume (DiGregorio et al., 1999a) in
addition to a basic characterization of the free [Ca2+] change
associated with a single AP. Given the spot diameter of 0.7 mm
(DiGregorio et al., 1999b) Ca2+ channels must be located within
0.35 mm of the spot centre in order to detect a Ca2+ transient with a
rapid rate of rise and a rapid decay rate. If the Ca2+ channels are
FIG. 6. Colocalization of Ca2+ transients, anti-SV2 staining, and R-BTX staining. (A1) A phase contrast image of a nerve terminal (nt) to myocyte (m) contactfrom which a confocal spot detected presynaptic Ca2+ transient was recorded. (A2) Averaged AP-induced Ca2+ transient (n = 6) recorded from a region of thenerve terminal where it contacted the myocyte (A, arrow). (B1) A DIC image of the same nerve±muscle pair as in A following ®xation and staining withanti-SV2 and R-BTX. (B2) Fluorescence image of the same nerve terminal using the Alexa 488 optical ®lter set. (B3) Fluorescence image of the same nerveterminal using the rhodamine ®lter set. All arrows point to the location where the rapid Ca2+ transient was measured. The scale bar is 5 mm for all.
542 D. A. DiGregorio et al.
ã 2001 Federation of European Neuroscience Societies, European Journal of Neuroscience, 14, 533±546
outside the detection volume, the diffusional delay and amplitude
decrement leads to a distinct change in the shape of the transient [see
Fig. 1(A3) and insets in Fig. 7B and C]. Therefore, the theoretical
accuracy with which we should be able to localize Ca2+ channels,
presuming there are enough channels to produce a transient larger
than the background noise, should be < 0.4 mm. In practice, this
accuracy is reduced due to our inability to mark the site of recording
such that the precise location can be assayed with immunocyto-
chemical methods. We therefore relaxed the accuracy arbitrarily to
1 mm and hence for the comparison of anti-SV2 intensity at various
recording sites, we always chose the maximum value of anti-SV2
intensity within 1 mm of the recording sites.
Interestingly, the confocal detection technique also provides a
unique method to characterize the aggregation of Ca2+ channels as
our attempts to obtain supplementary immunocytochemical evidence
using antibodies raised against Ca2+ channel subunits produced
unsuitable images for high-resolution analysis (data not shown).
Estimation of the spatial distribution of synaptic moleculesusing quantitative immuno¯uorescence
The use of a cooled CCD camera for ¯uorescence imaging allowed us
to perform quantitative intensity analysis for the study of synaptic
molecule localization. To identify AChR locations we were able to
identify easily a background staining intensity and then set the
threshold for protein localization above 3 SD of the mean back-
ground intensity. When doing this, it provided a consistent method
for analysing the length of AChR positive staining along nerve±
muscle contacts. Our ®ndings on vesicle aggregation along neurites
with a signi®cant correspondence sites of AChR staining are similar
to previous results in older Xenopus cultures (Cohen et al., 1987)
which report a percentage of R-BTX staining per contact-length of
22%, slightly smaller than the ~34% found in functional contacts in
our preparation. This difference could be due to the quantitative
limitations of photographic ®lm. However it is also possible that the
vesicle and AChR distribution is different between 18 and 24 h and
2±6-day-old cultures. On the other hand, the vesicle-dependent
staining length reported by Cohen et al. (1987) is ~4-fold greater than
the contact-length estimated by us using SV2 immuno¯uorescence. In
the coculture preparation, there are vesicles throughout the nerve
terminal (Dai & Peng, 1996), thus our criterion for positive staining,
of setting a threshold 1.5 SD above the background, is likely to
identify regions of enhanced aggregation rather than the simple
presence or absence of vesicles. To further strengthen this proposal,
we thought it important to verify that the observed staining patterns
with anti-SV2 are likely to represent higher densities of vesicle
FIG. 7. HB-GAM coated beads induce colocalized aggregation of functionalCa2+ channels and synaptic vesicles. (A) A 100 3 phase image of a neuritein contact with several HB-GAM coated beads (`a'±`e'). Vertical arrowslabelled (±) indicate confocal spot locations where no signi®cant Ca2+
transient was measured, whereas, the arrow labelled (+) is a spot locationwhere a rapid Ca2+ transient was measured. The horizontal arrows (beads`a' and `b') indicate the direction, length and location of confocal spotscans. (B) Isochronal DF/F pro®le of a confocal spot scan across bead `a'.Inset, averaged Ca2+ transients (`1' and `2') recorded from the regions ofthe scan identi®ed by the correspondingly labelled horizontal bars shown inthe isochronal DF/F plot. (C) The isochronal DF/F pro®le from the scanacross bead `b'. Inset, Ca2+ transients (`1' and `2') recorded from theregions of the scan identi®ed by the correspondingly labelled horizontalbars shown in the isochronal DF/F plot. (D) Fluorescence image of thesame preparation as in A, but ®xed and stained with anti-SV2. The confocalspot-recording site are identi®ed as in A, except that the scan start and endlocations are indicated by the end of the dashed lines. (E) Fluorescenceimage taken from a plane 2 mm above the image in B. The asterisksidentify the location of beads `a'±`d' for reference. The vertical andhorizontal scale bars in the insets represent 0.05 DF/F and 5 ms,respectively.
Ca2+ domains at active zones 543
ã 2001 Federation of European Neuroscience Societies, European Journal of Neuroscience, 14, 533±546

aggregation in the neurite, rather than a peculiarity of SV2 staining.
Thus, we demonstrated that antibodies against another synaptic
vesicle associated protein, CSP (Umbach et al., 1994; Umbach &
Gundersen, 1997; Poage et al., 1999; Seagar et al., 1999), produced
staining patterns identical to those of anti-SV2.
Our results provide ®rm support to the notion that Ca2+ entry sites,
and hence Ca2+ domains, are localized in regions of nerve-muscle
contact where both vesicles and postsynaptic receptors (putative AZs)
are located. We arrived at this conclusion either from the simultan-
eous assessment of R-BTX and anti-SV2 staining at a Ca2+ entry site
as shown in Fig. 6, or by paired quanti®cation of anti-SV2
¯uorescence along Ca2+ entry sites and of anti-SV2 and R-BTX
staining in functional contacts, as shown in Figs 3 and 5, respectively.
Thus, the ®rst approach demonstrated that 61% of the calcium entry
sites were associated with signi®cant SV2 aggregation (> 1.5 SD
above the mean intensity) and (> 3´SD) R-BTX staining. On the other
hand, paired comparison of global immunocytochemical and physio-
logical data revealed that 81% of SV2 positive contact-length was
colocalized with positive R-BTX staining and that 78% of Ca2+ entry
recording sites revealed positive anti-SV2 staining. The calculated
probability of the paired results predicts that 62% of the Ca2+ entry
sites should colocalize with both vesicle aggregation and postsynaptic
receptor clustering, similar to the observed probability. Thus, as
synaptic vesicle aggregation has been shown to occur juxtaposed to
postsynaptic densities (Birks et al., 1960) that represent sites of
neurotransmitter release or `active zones' (Couteaux & Pecot-
Dechavassine, 1970), we submit that our data provides unique
evidence in support of the existence of functional Ca2+ channel
clustering near active zones.
Developmental implications of the colocalization
When comparing the distribution of the two molecules, there is an
excess R-BTX staining without colocalized SV2 immuno¯uorescence
(73% of the total R-BTX staining). This may be due to `sloppiness' in
the signalling mechanisms inducing the redistribution of Ca2+
channels and synaptic vesicles with the clustering of AChR. Excess
R-BTX staining has been shown to occur beyond neurite contact
(Anderson et al., 1977) arguing for an imprecise distribution of
AChR. Furthermore, this same group showed that the neurotransmit-
ter release was not necessary for this aggregation. Thus, the physical
contact-length likely determines the AChR distribution. Moreover, in
the mature neuromuscular junction, AChR distribution is not limited
to the junctional fold region, but in fact extends laterally beyond the
region of proposed neurotransmitter release (Salpeter et al., 1988).
That only 81% of SV2 positive regions colocalized with
postsynaptic AChRs (see above, `Estimation of the spatial distribu-
tion of synaptic molecules using quantitative immuno¯uorescence')
could be due to random accumulation of vesicles not necessarily at
sites of Ca2+-entry and hence functional release (Dai & Peng, 1996).
We cannot rule out the possibility that the ®xation process induced an
apparent vesicle aggregation. Another, more interesting, possibility is
that in some cases vesicle aggregation may occur following nerve-
muscle contact yet prior to postsynaptic AChR aggregation. Finally,
the 25% of the cases in which signi®cant SV2 ¯uorescence was not
strictly associated with Ca2+ channel domains (Fig. 3C, closed
circles) suggests that synaptic vesicle aggregation occurs spontan-
eously (to a certain extent) without positive Ca2+ aggregation.
Interestingly, if we increased the threshold to ~2 SD, then the number
of positive SV2 sites which are negative for Ca2+ entry reduces to
< 4%. At this threshold, however, only > 50% of the Ca2+ entry sites
would be considered positive for SV2, thus suggesting that a
signi®cant Ca2+ channel aggregation may occur without vesicle
aggregation. Our results seem to be more compatible with this
attractive hypothesis, that Ca2+ channel aggregation is a necessary
condition for signi®cant vesicle aggregation, also consistent with
previous data showing a signi®cant Ca2+ dependence of vesicle
aggregation (Dai & Peng, 1998) and a Ca2+ dependent increase in
synaptic ef®cacy (Zoran et al., 1991). Furthermore, the size of
clusters of synaptic vesicles may not quantitatively parallel the
proximity of docked vesicles to functional Ca2+ channels as
combined electrophysiological and ultrastructural evidence, obtained
from the Xenopus cultured NMJ preparation, suggests that functional
synaptic transmission can occur without signi®cant vesicle aggrega-
tion for up to 15 h of synaptogenesis (Buchanan et al., 1989).
However, spontaneously forming synaptic contacts from 18 to 24 h
cultures do exhibit vesicle clustering opposite to postsynaptic
densities. Nonetheless, this ultrastructural feature may represent a
later stage of synaptic development as synaptic vesicle aggregation
does correlate with enhanced rates of synaptic depression in response
to high frequency stimuli at novel neurite±muscle junctions in
comparison to spontaneously formed junctions in culture
(Zakharenko et al., 1999). Whether calcium channel clustering
occurs in naõÈve neurites or novel contacts is unknown, nevertheless,
our data are consistent with the timing of calcium channel aggrega-
tion at least paralleling that of vesicle aggregation, a known marker of
synaptic maturation and indicator of synaptic strength.
Functional implications of the colocalization of functional Cachannels and synaptic vesicles
The functional importance of colocalized Ca2+ channel and synaptic
vesicle clustering has been proposed to be necessary for ef®cient
neurotransmission. The rapid formation and dissipation of the local
[Ca2+] domains around either single or clustered channels is thought
to mediate synaptic transmission (Schweizer et al., 1995; Neher,
1998). Thus, it is not surprising that clusters of vesicles are seen
juxtaposed to postsynaptic receptors and possibly interacting directly
with Ca2+ channels through the SNARE protein syntaxin (Bennett
et al., 1992). Data presented here and previously (DiGregorio et al.,
1999b), suggest that the peak of the Ca2+ transient falls to ~10% of its
maximum value within < 0.5 mm from the edge of the calcium entry
site. This steep gradient, which is likely to be greater closer to the
membrane (DiGregorio et al., 1999b), requires that releasable
vesicles be in the proximity of Ca2+ channels in order to be recruited
for release. It is, therefore, not surprising that anti-SV2 staining is
enhanced at sites where rapid Ca2+ transients were measured. Our
®ndings are not inconsistent with the suggestion that as many as 95%
of releasable vesicles may be directly linked to Ca2+ channels (Rettig
et al., 1997), however, they do not provide a demonstration for a
nanodomain Ca2+ control mechanism (Adler et al., 1991) due to the
resolution limits of the technique (DiGregorio et al., 1999b).
Candidate signalling mechanisms for contact-dependentaggregation of functional Ca2+ channels
Although the molecular signalling pathways determining vesicle and
channel clustering are unknown, our data supports the suggestion that
synaptic differentiation both functionally and ultrastructurally
appears to be dependent on cell-to-cell contact (Cohen et al., 1987;
Buchanan et al., 1989; Zoran et al., 1991; Funte & Haydon, 1993;
Bahls et al., 1998). Various proteins embedded in the basal lamina
have been implicated (Dai & Peng, 1995; Dai & Peng, 1996) in
addition to the postsynaptically expressed protein agrin (Campagna
et al., 1995; Campagna et al., 1997). By studying HB-GAM coated
bead±neurite contacts we reinforce the idea that localized application
of extracellular proteins could induce both Ca2+ channel and synaptic
544 D. A. DiGregorio et al.
ã 2001 Federation of European Neuroscience Societies, European Journal of Neuroscience, 14, 533±546
vesicle clustering. Although we cannot rule out the possibility that
HB-GAM coated beads may preferentially bind to areas with
preformed vesicle/channel complexes, the evidence appears to
suggest the opposite as muscle cells and coated beads manipulated
to come in contact with neurites seem to promote presynaptic
differentiation and vesicle aggregation (Buchanan et al., 1989; Dai &
Peng, 1995). As a contact-dependent interaction can increase resting
[Ca2+] (Zoran et al., 1993; Dai & Peng, 1995), Ca2+ may be a critical
second messenger for presynaptic differentiation. A cAMP-dependent
protein kinase has also been implicated in enhanced Ca2+ in¯ux at
cell contact-induced synaptic differentiation (Funte & Haydon, 1993).
This enhancement in Ca2+ in¯ux is consistent with ®ndings presented
here regarding functional Ca2+ channel aggregation at contact sites.
As a counterpart to the above arguments, the association of
functional Ca2+ channels with synaptic vesicles may occur in naõÈve
(noncontacted) neurites, as suggested by the results with FM-143 by
Dai & Peng (1998). However, in those experiments, vesicle turnover
was tested in response to nonphysiological depolarization by bath
applied KCl, but not by APs. Under these conditions, Ca2+ channels
are not required to be colocalized with vesicles to mediate vesicle
mobilization. In fact, EGTA was able to block a signi®cant amount of
the KCl-induced destaining of FM-143 in naõÈve neurites, but had a
minute effect in AP-induced localized Ca2+ domains detected in
contact regions (DiGregorio et al., 1999b).
As HB-GAM coated beads can also produce AChR aggregation, it
is therefore possible that for contacts at least 12±h-old, the
distribution of vesicles and Ca2+ channels, synaptic vesicles, and
postsynaptic receptors share a common temporal and or chemical
signalling mechanism. Molecules that have been shown to be
important in synaptic vesicle aggregation and postsynaptic receptor
aggregation are actin cytoskeleton (Dai & Peng, 1996) and tyrosine
kinases (Dai & Peng, 1995).
Acknowledgements
This work was supported by grants from the National Institutes of Health(AR25201 to J.L.V. and NS36754 to H.B.P.) and by the Medical ScientistTraining Program (GM 08042) and an individual fellowship (NS10197) fromNational Institutes of Health to D.A.D. The authors thank Mr Viet Tran for hishelp with the preparation of the cell cultures, Dr Hal Yee for the use of a¯uorescence microscope, Drs Buckley and Gundersen for the gift of antibodiesand Dr Angus Silver for helpful comments on the manuscript.
Abbreviations
AChR, acetylcholine receptor; AP, action potential; AZ(s), active zone(s);CSP, cysteine string protein; FWHM, full-width at half-maximum; NFR,normal frog Ringer; NMJ, neuromuscular junction; PBS, phosphate-bufferedsaline; R-BTX, tetramethylrhodamine-conjugated a-bungarotoxin.
References
Adler, E.M., Augustine, G.J., Duffy, S.N. & Charlton, M.P. (1991) Alienintracellular calcium chelators attenuate neurotransmitter release at thesquid giant synapse. J. Neurosci., 11, 1496±1507.
Ahmari, S.E., Buchanan, J. & Smith, S.J. (2000) Assembly of presynapticactive zones from cytoplasmic transport packets. Nature Neurosci., 3,445±451.
Anderson, M.J., Cohen, M.W. & Zorychta, E. (1977) Effects of innervation onthe distribution of acetylcholine receptors on cultured muscle cells. J.Physiol. (Lond)., 268, 731±756.
Auger, C. & Marty, A. (2000) Quantal currents at single-site central synapses.J. Physiol. (Lond)., 526, 3±11.
Augustine, G.J., Charlton, M.P. & Smith, S.J. (1987) Calcium action insynaptic transmitter release. Annu. Rev. Neurosci., 10, 633±693.
Bahls, F.H., Lartius, R., Trudeau, L.E., Doyle, R.T., Fang, Y., Witcher, D.,Campbell, K. & Haydon, P.G. (1998) Contact-dependent regulation of N-type calcium channel subunits during synaptogenesis. J. Neurobiol., 35,198±208.
Barrett, E.F. & Stevens, C.F. (1972) The kinetics of transmitter release at thefrog neuromuscular junction. J. Physiol. (Lond.), 227, 691±708.
Bennett, M.K., Calakos, N. & Scheller, R.H. (1992) Syntaxin: a synapticprotein implicated in docking of synaptic vesicles at presynaptic activezones. Science, 257, 255±259.
Birks, R., Huxley, H.E. & Katz, B. (1960) The ®ne structure of theneuromuscular junctions of the frog. J. Physiol., 150, 134±144.
Boudier, J.A., Charvin, N., Boudier, J.L., Fathallah, M., Tagaya, M.,Takahashi, M. & Seagar, M.J. (1996) Distribution of components of theSNARE complex in relation to transmitter release sites at the frogneuromuscular junction. Eur. J. Neuroscience, 8, 545±552.
Buchanan, J., Sun, Y.A. & Poo, M.M. (1989) Studies of nerve±muscleinteractions in Xenopus cell culture: ®ne structure of early functionalcontacts. J. Neurosci., 9, 1540±1554.
Burns, M.E. & Augustine, G.J. (1995) Synaptic structure and function:dynamic organization yields architectural precision. Cell, 83, 187±194.
Campagna, J.A., Ruegg, M.A. & Bixby, J.L. (1995) Agrin is a differentiation-inducing `stop signal' for motoneurons in vitro. Neuron, 15, 1365±1374.
Campagna, J.A., Ruegg, M.A. & Bixby, J.L. (1997) Evidence that agrindirectly in¯uences presynaptic differentiation at neuromuscular junctionsin vitro. Eur. J. Neurosci., 9, 2269±2283.
Cohen, M.W., Jones, O.T. & Angelides, K.J. (1991) Distribution of Ca2+
channels on frog motor nerve terminals revealed by ¯uorescent omega-conotoxin. J. Neurosci., 11, 1032±1039.
Cohen, M.W., Rodriguez-Marin, E. & Wilson, E.M. (1987) Distribution ofsynaptic specializations along isolated motor units formed in Xenopusnerve±muscle cultures. J. Neurosci., 7, 2849±2861.
Cohen, M.W. & Weldon, P.R. (1980) Localization of acetylcholine receptorsand synaptic ultrastructure at nerve-muscle contacts in culture: dependenceon nerve type. J. Cell Biol., 86, 388±401.
Cooper, R.L., Winslow, J.L., Govind, C.K. & Atwood, H.L. (1996) Synapticstructural complexity as a factor enhancing probability of calcium-mediatedtransmitter release. J. Neurophys., 75, 2451±2466.
Couteaux, R. & Pecot-Dechavassine, M. (1970) Synaptic vesicles and pouchesat the level of `active zones' of the neuromuscular junction. C R Acad. Sci.Hebd Seances Acad. Sci. D., 271, 2346±2349.
Daggett, D.F., Cohen, M.W., Stone, D., Nikolics, K., Rauvala, H. & Peng,H.B. (1996) The role of an agrin±growth factor interaction in ACh receptorclustering. Mol. Cell Neurosci., 8, 272±285.
Dai, Z. & Peng, H.B. (1995) Presynaptic differentiation induced in culturedneurons by local application of basic ®broblast growth factor. J. Neurosci.,15, 5466±5475.
Dai, Z. & Peng, H.B. (1996) Dynamics of synaptic vesicles in cultured spinalcord neurons in relationship to synaptogenesis. Mol. Cell Neurosci., 7,443±452.
Dai, Z. & Peng, H.B. (1998) Fluorescence microscopy of calcium and synapticvesicle dynamics during synapse formation in tissue culture. Histochem. J.,30, 189±196.
DiGregorio, D.A., Peskoff, A. & Vergara, J.L. (1999a) The dimensions ofpresynaptic calcium entry sites estimated from measured calcium domainsin cultured neuromuscular junctions. Biophys. J., 76.
DiGregorio, D.A., Peskoff, A. & Vergara, J.L. (1999b) Measurement of actionpotential-induced presynaptic calcium domains at a cultured neuromuscularjunction. J. Neurosci., 19, 7846±7859.
DiGregorio, D.A. & Vergara, J.L. (1997) Localized detection of actionpotential-induced presynaptic calcium transients at a Xenopusneuromuscular junction. J. Physiol. (Lond.), 505, 585±592.
Funte, L.R. & Haydon, P.G. (1993) Synaptic target contact enhancespresynaptic calcium in¯ux by activating cAMP-dependent protein kinaseduring synaptogenesis. Neuron, 10, 1069±1078.
Haydon, P.G., Henderson, E. & Stanley, E.F. (1994) Localization of individualcalcium channels at the release face of a presynaptic nerve terminal.Neuron, 13, 1275±1280.
Heuser, J.E. & Reese, T.S. (1981) Structural changes after transmitter releaseat the frog neuromuscular junction. J. Cell Biol., 88, 564±580.
Hille, B. (1992) G protein-coupled mechanisms and nervous signaling.Neuron, 9, 187±195.
Katz, B. & Miledi, R. (1965) The effect of calcium on acetylcholine releasefrom frog motor nerve terminals. Proc. R. Soc. B., 161, 496±503.
Lissin, D.V., Carroll, R.C., Nicoll, R.A., Malenka, R.C. & von Zastrow, M.
Ca2+ domains at active zones 545
ã 2001 Federation of European Neuroscience Societies, European Journal of Neuroscience, 14, 533±546
(1999) Rapid, activation-induced redistribution of ionotropic glutamatereceptors in cultured hippocampal neurons. J. Neurosci., 19, 1263±1272.
Macleod, G.T., Gan, J. & Bennett, M.R. (1999) Vesicle-associated proteinsand quantal release at single active zones of amphibian (Bufo marinus)motor-nerve terminals. J. Neurophysiol., 82, 1133±1146.
Neher, E. (1998) Vesicle pools and Ca2+ microdomains: new tools forunderstanding their roles in neurotransmitter release. Neuron., 20, 389±399.
Peng, H.B., Ali, A.A., Dai, Z., Daggett, D.F., Raulo, E. & Rauvala, H. (1995)The role of heparin-binding growth-associated molecule (HB-GAM) in thepostsynaptic induction in cultured muscle cells. J. Neurosci., 15,3027±3038.
Poage, R.E., Meriney, S.D., Gundersen, C.B. & Umbach, J.A. (1999)Antibodies against cysteine string proteins inhibit evoked neurotransmitterrelease at Xenopus neuromuscular junctions. J. Neurophysiol., 82, 50±59.
Pumplin, D.W., Reese, T.S. & Llinas, R. (1981) Are the presynapticmembrane particles the calcium channels?. Proc. Natl. Acad. Sci. USA,78, 7210±7213.
Rettig, J., Heinemann, C., Ashery, U., Sheng, Z.H., Yokoyama, C.T., Catterall,W.A. & Neher, E. (1997) Alteration of Ca2+ dependence of neurotransmitterrelease by disruption of Ca2+ channel/syntaxin interaction. J. Neurosci., 17,6647±6656.
Robitaille, R., Adler, E.M. & Charlton, M.P. (1990) Strategic location ofcalcium channels at transmitter release sites of frog neuromuscularsynapses. Neuron, 5, 773±779.
Salpeter, M.M., Marchaterre, M. & Harris, R. (1988) Distribution ofextrajunctional acetylcholine receptors on a vertebrate muscle: evaluatedby using a scanning electron microscope autoradiographic procedure. J. CellBiol., 106, 2087±2093.
Schweizer, F.E., Betz, H. & Augustine, G.J. (1995) From vesicle docking toendocytosis: intermediate reactions of exocytosis. Neuron, 14, 689±696.
Seagar, M., Leveque, C., Charvin, N., Marqueze, B., Martin-Moutot, N.,Boudier, J.A., Boudier, J.L., Shoji-Kasai, Y., Sato, K. & Takahashi, M.(1999) Interactions between proteins implicated in exocytosis and voltage-gated calcium channels. Philos. Trans. R. Soc. Lond B Biol. Sci., 354,289±297.
Serpinskaya, A.S., Feng, G., Sanes, J.R. & Craig, A.M. (1999) Synapseformation by hippocampal neurons from agrin-de®cient mice. Dev. Biol.,205, 65±78.
Umbach, J.A. & Gundersen, C.B. (1997) Evidence that cysteine string proteinsregulate an early step in the Ca2+-dependent secretion of neurotransmitterat Drosophila neuromuscular junctions. J. Neurosci., 17, 7203±7209.
Umbach, J.A., Saitoe, M., Kidokoro, Y. & Gundersen, C.B. (1998) Attenuatedin¯ux of calcium ions at nerve endings of csp and shibire mutantDrosophila. J. Neurosci., 18, 3233±3240.
Umbach, J.A., Zinsmaier, K.E., Eberle, K.K., Buchner, E., Benzer, S. &Gundersen, C.B. (1994) Presynaptic dysfunction in Drosophila csp mutants.Neuron, 13, 899±907.
Weldon, P.R. & Cohen, M.W. (1979) Development of synaptic ultrastructureat neuromuscular contacts in an amphibian cell culture system. J.Neurocytol., 8, 239±259.
Wu, M.N., Fergestad, T., Lloyd, T.E., He, Y., Broadie, K. & Bellen, H.J.(1999) Syntaxin 1A interacts with multiple exocytic proteins to regulateneurotransmitter release in vivo. Neuron, 23, 593±605.
Yazejian, B., DiGregorio, D.A., Vergara, J.L., Poage, R.E., Meriney, S.D. &Grinnell, A.D. (1997) Direct measurements of presynaptic calcium andcalcium-activated potassium currents regulating neurotransmitter release atcultured Xenopus nerve-muscle synapses. J. Neurosci., 17, 2990±3001.
Zakharenko, S., Chang, S., O'Donoghue, M. & Popov, S.V. (1999)Neurotransmitter secretion along growing nerve processes: comparisonwith synaptic vesicle exocytosis. J. Cell Biol., 144, 507±518.
Zoran, M.J., Doyle, R.T. & Haydon, P.G. (1991) Target contact regulates thecalcium responsiveness of the secretory machinery during synaptogenesis.Neuron., 6, 145±151.
Zoran, M.J., Funte, L.R., Kater, S.B. & Haydon, P.G. (1993) Neuron-musclecontact changes presynaptic resting calcium set-point. Dev. Biol., 158,163±171.
Zucker, R.S. & Stockbridge, N. (1983) Presynaptic calcium diffusion and thetime courses of transmitter release and synaptic facilitation at the squidgiant synapse. J. Neurosci., 3, 1263±1269.
546 D. A. DiGregorio et al.
ã 2001 Federation of European Neuroscience Societies, European Journal of Neuroscience, 14, 533±546