Variability of leaf Cadmium content in tetraploid and hexaploid wheat
Upload
independentCategory
view
0download
0
BioMed CentralBMC Plant Biology
ss
Open AcceResearch articleConstruction of two genetic linkage maps in cultivated tetraploid alfalfa (Medicago sativa) using microsatellite and AFLP markersBernadette Julier*1, Sandrine Flajoulot2, Philippe Barre1, Gaëlle Cardinet3, Sylvain Santoni4, Thierry Huguet3 and Christian Huyghe1Address: 1INRA, Unité de Génétique et d'Amélioration des Plantes Fourragères, 86600 Lusignan, France, 2Jouffray-Drillaud, INRA, 86600 Lusignan, France, 3Laboratoire des Interactions Plantes-Microorganismes, UMR CNRS-INRA 2594/441, BP27, 31326 Castanet Tolosan cedex, France and 4INRA, Station de Génétique et d'Amélioration des Plantes, Domaine de Melgueil, 34130 Mauguio, France
Email: Bernadette Julier* - [email protected]; Sandrine Flajoulot - [email protected]; Philippe Barre - [email protected]; Gaëlle Cardinet - [email protected]; Sylvain Santoni - [email protected]; Thierry Huguet - [email protected]; Christian Huyghe - [email protected]
* Corresponding author
AbstractBackground: Alfalfa (Medicago sativa) is a major forage crop. The genetic progress is slow in thislegume species because of its autotetraploidy and allogamy. The genetic structure of this speciesmakes the construction of genetic maps difficult. To reach this objective, and to be able to detectQTLs in segregating populations, we used the available codominant microsatellite markers (SSRs),most of them identified in the model legume Medicago truncatula from EST database. A genetic mapwas constructed with AFLP and SSR markers using specific mapping procedures forautotetraploids. The tetrasomic inheritance was analysed in an alfalfa mapping population.
Results: We have demonstrated that 80% of primer pairs defined on each side of SSR motifs in M.truncatula EST database amplify with the alfalfa DNA. Using a F1 mapping population of 168individuals produced from the cross of 2 heterozygous parental plants from Magali and Mercedescultivars, we obtained 599 AFLP markers and 107 SSR loci. All but 3 SSR loci showed a cleartetrasomic inheritance. For most of the SSR loci, the double-reduction was not significant. For theother loci no specific genotypes were produced, so the significant double-reduction could arisefrom segregation distortion. For each parent, the genetic map contained 8 groups of fourhomologous chromosomes. The lengths of the maps were 2649 and 3045 cM, with an averagedistance of 7.6 and 9.0 cM between markers, for Magali and Mercedes parents, respectively. Usingonly the SSR markers, we built a composite map covering 709 cM.
Conclusions: Compared to diploid alfalfa genetic maps, our maps cover about 88–100% of thegenome and are close to saturation. The inheritance of the codominant markers (SSR) and thepattern of linkage repulsions between markers within each homology group are consistent with thehypothesis of a tetrasomic meiosis in alfalfa. Except for 2 out of 107 SSR markers, we found a similarorder of markers on the chromosomes between the tetraploid alfalfa and M. truncatula genomesindicating a high level of colinearity between these two species. These maps will be a valuable toolfor alfalfa breeding and are being used to locate QTLs.
Published: 19 December 2003
BMC Plant Biology 2003, 3:9
Received: 10 October 2003Accepted: 19 December 2003
This article is available from: http://www.biomedcentral.com/1471-2229/3/9
© 2003 Julier et al; licensee BioMed Central Ltd. This is an Open Access article: verbatim copying and redistribution of this article are permitted in all media for any purpose, provided this notice is preserved along with the article's original URL.
Page 1 of 19(page number not for citation purposes)

BMC Plant Biology 2003, 3 http://www.biomedcentral.com/1471-2229/3/9
BackgroundAlfalfa (Medicago sativa L.) is the most cultivated foragelegume, with about 32 millions hectares over the world[1]. Its agronomical interest is based on its high proteincontent, suitable feeding value and favourable environ-mental balance (perenniality and no nitrogen fertilizerrequired). However the genetic progress in this species isslow because of its autotetraploidy [2], with 2n = 4x = 32[3,4], its allogamy and the synthetic structure of the varie-ties. The development of a genetic linkage map would bea significant breakthrough, either to map candidate genes,to search for QTL of agronomical traits, or to makemarker-assisted selection. Such analysis requires workingon cultivated material, either in terms of genetic back-ground or ploidy level.
In the past years, low density linkage maps were obtainedon diploid forms of the Medicago sativa species complex[5-7]. The parental plants originated from CADL plants(Cultivated Alfalfa at the Diploid Level, diploid plantsproduced from cultivated tetraploid alfalfa) [6] or fromnatural populations, the crosses being made at the sub-specific level [5,7]. All these maps comprised from 89 to153 RFLP, RAPD or isozymes markers, and spanned from467.5 cM [7] to 659 cM [6]. A denser map based on a crossbetween M. coerulea and M. quasifalcata, was published in2000 [8] and covered 754 cM for a haploid genome, with868 markers (mainly RAPDs and RFLPs). A linkage mapof tetraploid alfalfa was constructed with 82 RFLP mark-ers, using two backcross populations of 101 individuals,and covered about 470 cM, with 7 homology groups only[9]. The number of polymorphic RFLP markers is clearly alimiting factor to the development of a saturated map atthe tetraploid level in alfalfa.
Until recently, mapping procedures in autopolyploidsplants were based on SDRF (single-dose restriction frag-ments) segregation in mapping populations analysed aspseudo-test crosses [10,11]. Genetic maps were obtainedin autotetraploid species such as potato [12,13], alfalfa[9], tea [14], rose [15], birdsfoot trefoil [16] and inautooctoploid species such as sugar cane [17-19] andstrawberry [20]. Recently, theoretical studies were pub-lished to analyse gene segregation and to perform themapping in autotetraploid species [21-24] or even autooc-toploid species [25]. All types of markers can be used: adominant marker present in one parent in single dose(simplex or SDRF) or double dose (duplex), a dominantmarker present in both parents (double simplex), andcodominant markers (Figure 1). It is now possible todevelop a map in autotetraploid species, based on allcodominant or dominant markers, and to calculate link-age between pairs of markers, either in coupling phase orin repulsion phase. The software TetraploidMap, releasedin 2002 [26] is suited for this type of calculation. A
method aiming at ordering the markers into a linkagemap of autotetraploid species using simulating annealingwas also proposed [27], but no specific software is pres-ently available.
In autopolyploid species, two facts are usually unknown:(1) does the whole genome show a tetrasomic inherit-ance, or do some parts of the genome have a disomicinheritance ? (2) what is the frequency of double-reduc-tion ? Indeed, two sister chromatids could segregate in thesame gamete after formation of a tetravalent during meio-sis. Consequently, double-reduction creates new types ofgametes and modifies the probabilities of each type ofgametes in a segregating population [28-30]. Its frequencycan be calculated by TetraploidMap software on codomi-nant markers.
In this article, we report the construction of a genetic mapfor each of the parents of an F1 population obtained bycrossing one individual from each of the Magali and Mer-cedes alfalfa cultivars and using the mass-revealed domi-nant AFLP markers together with codominantmicrosatellite (SSR) markers. We have used a set of SSRs
Marker types in an autotetraploid genotypeFigure 1Marker types in an autotetraploid genotype. Markers A, B, C and D are dominant markers. A, B and C are simple dose (simplex) and D is in double dose (duplex). A and B are linked in coupling phase, A and C or B and C are linked in repulsion phase. Loci E and F show codominant alleles in sim-ple or double dose. A null allele is represented for locus E.
A
B
c
D
E1
F1
a
b
C
D
E2
F1
a
b
c
d
E3
F2
a
b
c
d
0
F3
A
B
c
D
E1
F1
a
b
C
D
E2
F1
a
b
c
d
E3
F2
a
b
c
d
0
F3
A
B
c
D
E1
F1
a
b
C
D
E2
F1
a
b
c
d
E3
F2
a
b
c
d
0
F3
Page 2 of 19(page number not for citation purposes)

BMC Plant Biology 2003, 3 http://www.biomedcentral.com/1471-2229/3/9
identified in the EST database of Medicago truncatula andmapped on M. truncatula Recombinant Inbred Lines(Huguet et al., unpublished results) to construct alfalfagenetic maps. In the recent years, M. truncatula, an annual,diploid species of the Medicago genus, was chosen as amodel species for the legume family [31,32]. A geneticmap was recently developed using an F2 population [33]and preliminary evidence was given that diploid M. sativaand M. truncatula genetic maps were aligned. Consideringthe phylogenetic proximity of M. truncatula and alfalfa, weused these EST-based SSR, and some other SSR markerspublished in M. truncatula ( [34], Santoni et al. unpubl.)or M. sativa [35], to build alfalfa linkage maps and to alignall genetic maps.
Based on 599 AFLP and 107 SSR markers, we identified,for both parents, 8 groups of 4 homologous chromo-somes each. The total length of the maps covered between88 to 100% of the genome. We have numbered thehomology groups of alfalfa as for M. truncatula [8,33].
ResultsMapping populationAlfalfa is an allogamous species with a strong inbreedingdepression. Consequently, plants are highly heterozygousand selfing gives rise to either self-sterility or lethal alleliccombinations or very "weak" plants. Homozygous linescannot be obtained and F2 populations may suffer from agenetic bias induced by the death of some genotypes. Soour mapping population is a set of 168 F1 individualsfrom the cross between Mercedes4.11 used as female par-ent and Magali2 used as male parent.
AFLP markersUsing 27 AFLP primer pairs, a total of 599 polymorphicmarkers were scored on the mapping population (Table1). Most of them segregated as simplex (Figure 1), but alarge number of markers had other segregations, mainlyduplex or double-simplex. Among all AFLP markers, thepercentage of distorted markers reached 34.8%.
SSR markersTransfer of SSR to alfalfaThe SSR primer pairs mainly originated from M. truncat-ula: 35 among those developed by Santoni et al. ( [34] andunpubl.), 1 published by Diwan et al. [35] and 187obtained by Huguet et al. (unpubl. data). Nine SSR primerpairs were developed from an alfalfa genomic library [35]and tested on diploid and tetraploid alfalfa.
The amplification and polymorphism among the 2 par-ents were tested for these 232 primer pairs (Table 2). Only19% of the primer pairs (44) gave no amplification. Overthe 81% of primer pairs (187) that gave amplification,34% (78) were monomorphic and 47% (110) were poly-morphic between Magali2 and Mercedes4.1. So far, only87 pairs have been used for genotyping in the mappingpopulation.
Inheritance of SSR markersWith the 87 primer pairs (Table 3), 318 alleles (= bands)were scored, 284 of them being polymorphic in the map-ping population. The parental genotypes were determinedfrom the segregation of alleles at each locus using the"Findgeno" procedure from TetraploidMap software. Themonomorphic bands were excluded from segregationanalyses as a monomorphic allele is present at least in tri-plex dose in a parent. For 43 loci, the parental genotypeswere determined, and the coefficient of double reduction(α) was not significantly different from 0 (Table 4). For 20loci, α was significantly different from 0 but the genotypesof the parents were also found under the absence of dou-ble reduction (Table 4). For 24 loci (Tables 5, 6), theparental genotypes could not be determined. The amplifi-cation of more than one locus was suspected from thevisual reading of the gels (a large gap between groups ofalleles was interpreted as the presence of 2 different loci,Figure 2) and from the segregation of alleles in the map-ping population (i.e. the presence of individuals withmore than 4 bands, or individuals with 3 alleles from thesame parent). From 21 primer pairs, 41 polymorphic lociwere identified, and their segregation was analysed (Table5). The genotypes of the parents were determined, withdouble reduction for only 6 loci. Finally for 3 primer pairs(Table 6), a multilocus segregation was evidenced, but itwas not possible to group the alleles in loci with anexpected segregation. For these 3 primer pairs, the bandswere treated as dominant markers to determine the paren-tal genotypes (Table 6). For the loci that showed signifi-cant double-reduction (in Tables 4 and 5), all the F1genotypes could have been formed without double-reduc-tion. So the segregation of these markers in F1 is not dif-ferent from segregation distortion.
Over the 104 polymorphic SSR loci with codominant seg-regation, the average number of alleles per locus in both
Table 1: Segregation of polymorphic AFLP markers in alfalfa F1 mapping population from Mercedes4.11 × Magali2. Simplex and duplex markers were present in one parent, in 1 and 2 doses, respectively. Double-simplex markers were present in both parents in 1 dose. Among each type of marker, the number of distorted markers (P < 0.05) is indicated.
Markers present inMercedes4.11 Magali2 Total Distorted
Simplex 196 193 389 107Duplex 36 56 92 52Double simplex 102 102 44Others 16 16Total 350 367 599
Page 3 of 19(page number not for citation purposes)

BMC Plant Biology 2003, 3 http://www.biomedcentral.com/1471-2229/3/9
parents was 2.9, and the average number of polymorphicalleles per locus was 2.6. These figures must be comparedto 8 allelic positions in 2 autotetraploid parental geno-types. The number of polymorphic alleles was 183 inMercedes4.11 (1.8 alleles per locus), and 188 in Magali2(1.8 alleles per locus). A large number of 'null' alleles wereidentified as shown in Tables 4, 5, 6.
Map constructionAll markers (simplex, duplex, double-simplex AFLPs andmulti-allele SSR loci) except the distorted double-simplexAFLP markers were used to build maps. The mapconstruction was performed in 3 steps. First, Tetraploid-Map calculated a χ2 test of independence between mark-ers, which led to 8 homology groups for each parent. Thenwithin each homology group, TetraploidMap determinedthe linkage phase, recombination rate and LOD scorebetween markers, whatever their dose. Linkage groups(i.e. chromosomes) within homology groups were manu-ally identified using the linkage phase information. Inboth Mercedes4.11 and Magali2, for each homologygroup, 4 linkage groups were found, except for homologygroup 5 in Magali2 which had only 3 linkage groups.Finally, for each linkage group, the recombination ratesand LOD scores were entered in the JoinMap software[36]. The order of the markers was calculated and themaps were drawn. For Mercedes4.11 (Figure 3), the maplength was of 3045 cM, with 339 marker positions and anaverage distance between markers of 9.0 cM. The map ofMagali2 (Figure 4) covered 2649 cM, with 350 markerpositions and an average distance between markers of 7.6cM. In both maps, the distorted markers were spread overthe genome.
The repulsion linkages were distributed among each pairof chromosomes within one homology group, and thiswas observed for each homology group (figure 5, examplefor homology group 8 in Magali2).
Twenty four SSR primer pairs out of 87 gave multi-locusprofiles. All the loci obtained with one primer pair weremapped close together (i.e. MTIC12-1 and MTIC12-2 ingroup 2, MTIC135-1 and MTIC135-2 in group 8 of
Magali2, etc.), except MTIC77-1 and MTIC77-2 whichwere mapped on group 8 and 3, respectively.
Composite mapThe large number of polymorphic SSR loci made it possi-ble to build a composite map, based on the recombina-tion rate and LOD score for each pair of SSR markers ineach homology group. Instead of 8 chromosomes perhomology group for both parents, a single linkage groupwas obtained. The total length of the map (figure 6)reached 709 cM, with 107 loci. Conflicting linkagesoccurred in group 4, so this chromosome was split in 3parts. The average distance between markers was 6.6 cM.
DiscussionThe development of a dense genetic linkage map in culti-vated tetraploid alfalfa is the first step in understandingthe genetic control (QTLs) of traits of agronomic interest.Agronomic traits are not well evaluated in wild M. sativabecause of its prostrate growth habit, so the dense mapobtained in wild diploid M. sativa [8] can hardly be usedfor QTL detection of agronomic traits. As in other hetero-zygous species, and especially in autotetraploid ones [21],we used a F1 population for mapping. Indeed, even if a F2generation could be a valuable tool in terms of number ofrecombination events, a selfing generation could lead togenetic skewing through the death of some inbred plants.We chose easy to use handy PCR markers: AFLPs and SSRs.AFLPs, because they are mass-revealed, help in coveringthe whole genome. SSRs mainly originated from ESTdatabases of M. truncatula, are codominant, locus-specificand portable. They were previously mapped in this modelspecies, and thus allow the analysis of synteny betweenthe two species, alfalfa and M. truncatula.
Marker diversity and segregation in the mapping populationA large number of polymorphic markers were obtainedfor each AFLP primer pair. Among the two parents of themapping population, almost 50% of the SSR primer pairsrevealed polymorphism. It is noteworthy that the SSR loci,which gave amplified but monomorphic bands over the 2parents of the mapping population, may reveal polymor-phism in other genetic backgrounds, so the observed
Table 2: Amplification profiles for the 232 SSR primers pairs originating from three sources
Source Tested No amplification Monomorphic Polymorphic Mapped
[34], S. Santoni (unpubl.) 35 6 13 16 7[35] 10 4 1 5 3T. Huguet (unpubl.) 187 34 64 89 77Total 232 44 78 110 87
Page 4 of 19(page number not for citation purposes)

BMC Plant Biology 2003, 3 http://www.biomedcentral.com/1471-2229/3/9
Table 3: Sequences of microsatellite primer pairs for each locus, linkage group (LG) in M. truncatula and reference. Sequences are given in the 5' to 3' direction (H for T. Huguet, unpubl.; S for S. Santoni, unpubl.)
Locus Left Right LG Reference
AFct32 TTTTTGTCCCACCTCATTAG TTGGTTAGATTCAAAGGGTTAC [35]AFct45 TAAAAAACGGAAAGAGTTGGTTAG GCCATCTTTTCTTTTGCTTC [35]MTLEC2A CGGAAAGATTCTTGAATAGATG TGGTTCGCTGTTCTCATG 3 [35]MAW208206 CTTATGTGCGTGGTATTTCC AGCTAAACCAACTACCTTTG 4 SMAA660456 GGGTTTTTGATCCAGATCTT AAGGTGGTCATACGAGCTCC 4 [34]MAA660870 GTACATCAACAACTTTCTCCT ATCAACAAAATTCATCGAAC SMAL368684 GACCCTAATAACCAACTCCA CCGTTACCGTCACTGTCGT 1 SFMT13 GATGAGAAAATGAAAAGAAC CAAAAACTCACTCTAACACAC 1 SMTR58 GAAGTGGAAATGGGAAACC GAGTGAGTGAGTGTAAGAGTGC 1 [34]MAL369471 ATTCACACAAACCCATCTTC AAACCCTTAGCACCGACA 1 SAI974357 ATCTCAATTCCCCAACTTGC TCTCCTTCACCCATCTTTGC 3 HB14B03 GCTTGTTCTTCTTCAAGCTC ACCTGACTTGTGTTTTATGC 5 HB21E13 GCCGATGGTACTAATGTAGG AAATCTTGCTTGCTTCTCAG 2 HE318681 ACCATCAACACCAACAGCAG TGCTACTTCCGCTTTGTTCA 5 HENOD20 CGAACTTCGAATTACCAAAGTCT TTGAGTAGCTTTTGGGTTGTC 8 HMTIC7 ACCACTTCTCCATCCATCCA AGCTTGCTGCATGAGTGCT HMTIC12 TTCCTCTTTTGACTCATCACCA CAACAACATGTTCATGCTTAGAAAC 2 HMTIC14 CAAACAAACAACACAAACATGG CCCATTGATTGGTCAAGGTT 6 HMTIC19 TCTAGAAAAAGCAATGATGTGAGA TGCAACAGAAGAAGCAAAACA 2 HMTIC21 GGTGATTGACTGTGGTGTCG ATCCGGTCTCCCAGGTTCTA 2 HMTIC27 CGATCGGAACGAGGACTTTA CCCCGTTTTTCTTCTCTCCT 2 HMTIC35 GAAGAAGAAAAAGAGATAGATCTGTGG GGCAGGAACAGATCCTTGAA 7 HMTIC48 TTTTTGTTAGTTTGATTTTAGGTG GCTACAAAGTCTTCTTCCACA 5 HMTIC51 AGTATAGTGATGAAGTGGTAGTGAACA ACAAAAACTCTCCCGGCTTT 3 HMTIC58 CATCATTAACAACAACGGCAAT TGCAAACACAGAACCGAAGA 5 HMTIC64 CCCGTTCTTTTATGTTGTGG AACAAACACAATGGCATGGA 1 HMTIC77 TCTTCATCGCTTTCTTCTATTTCA GCCGTATGGTGTTGTTGATG 3 HMTIC79 AAAATCCAAAGCCCTATCACA AGCGTGAGATTTTTCCATCG 5 HMTIC82 CACTTTCCACACTCAAACCA GAGAGGATTTCGGTGATGT 7 HMTIC84 TCTGAGAGAGAGACAAACAAAACAA GGGAAAAGGTGTAGCCATTG 1 HMTIC90 TTTTCTTCTTCAAACCCCTAACC GATTATCGTTGAGCGGTGGT 4 HMTIC93 AGCAGGATTTGGGACAGTTG TACCGTAGCTCCCTTTTCCA 6 HMTIC94 GCTACAACAGCGCTACATCG CAGGGTCAGAGCAACAATCA HMTIC95 AAAGGTGTTGGGTTTTGTGG AGGAAGGAGAGGGACGAAAG HMTIC103 TGGGTTGTCCTTCTTTTTGG GGGTGCAGAAGTTTGACCA 8 HMTIC107 CAAACCATTTCCTCCATTGTG TACGTAGCCCCTTGCTCATT 1 HMTIC124 TTGTCACGAGTGTTGGAATTTT TTGGGTTGTCAATAATGCTCA 3 HMTIC131 AAGCTGTATTTCTGATACCAAAC CGGGTATTCCTCTTCCTCCA 3 HMTIC134 GCAGTTCGCTGAGGACTTG CAATTAGAGTCTACAGCCAAAAACT 6 HMTIC135 GCTGACTGGACGGATCTGAG CCAAAGCATAAGCATTCATTCA 8 HMTIC145 CCAAAAGGGGCAATTTTCTT GCATAATTCAATACTTGATCCATTTC 2 HMTIC153 TCACAACTATGCAACAAAAGTGG TGGGTCGGTGAATTTTCTGT 6 HMTIC169 TCAAAACCCTAAAACCCTTTCTC GCGTGCTAGGTTTGAGAGGA 3 HMTIC183 AAATGGAAGAAAGTGTCACG TTCTCTTCAAGTGGGAGGTA 7 HMTIC185 AGATTTCAATTCTCAACAACC TCTATGATGGATACGATACGG 8 HMTIC188 GGCGGTGAAGAAGTAAACGA AATCGGAGAAACACGAGCAC 8 HMTIC189 CAAACCCTTTTCAATTTCAACC ATGTTGGTGGATCCTTCTGC 3 HMTIC210 CCAAACTGGCTGTGTTCAAA GCGGTAAGCCTTGCTGTATG 2 HMTIC230 GTAAGCGCCTGCTTGGACT GAGATTCTGCCAAAATGCAA 2 HMTIC232 TAAGAAAGCAGGTCAGGATG TCCACAAATGTCTAAAACCA 7 HMTIC233 GCGTAACGTAACAACATTCA AAGGAACAATCCCAGTTTTT 1 HMTIC237 CCCATATGCAACAGACCTTA TGGTGAAGATTCTGTTGTTG 3 HMTIC238 TTCTTCTTCTAGGAATTTGGAG CCTTAGCCAAGCAAGTAAAA 5 HMTIC247 TTCGCAGAACCTAAATTCAT TGAGAGCATTGATTTTTGTG 1 HMTIC248 TATCTCCCTTCTCCTTCTCC GGATTGTGATGAAGAAATGG 8 HMTIC249 TAGGTCATGGCTATTGCTTC GTGGGTGAGGATGTGTGTAT HMTIC250 GCCTGAACTATTGTGAATGG CGTTGATGATGTTCTTGATG 6 HMTIC251 GCGATGCTATTGAGAAAACT AAATAAACCCAAAGGACTCG 8 H
Page 5 of 19(page number not for citation purposes)

BMC Plant Biology 2003, 3 http://www.biomedcentral.com/1471-2229/3/9
variability in our experiment is only an underestimatedvalue of the extent of the variability existing within alfalfacultivars.
Interestingly, the two parents of the mapping populationshared the same characteristics: the number andproportion of simplex, duplex, double-simplex and dis-torted AFLP markers and the number of SSR alleles (1.8alleles per locus and per parent).
A large number of null alleles were found with SSRs, pos-sibly arising from mutations in alfalfa compared to M.truncatula in the sequences that match the SSR primers.The number of null alleles using SSR primers directlydeveloped in alfalfa should be lower. Indeed, there wasonly one null allele in this mapping population for eachof both SSR markers developed in alfalfa (AFct32 andAFct45). In Prunus [38] and sugar beet [39] a large numberof null alleles were also identified when using SSR mark-ers from different species.
Some SSR primer pairs (21 over 87) gave multi-locusamplification in alfalfa; this was also observed in soybean[37], Prunus sp [38], Brassica sp [39], sorghum [41],mungbean and lablab [42]. Multi-locus amplification was
evidenced from allele segregation in the mapping popula-tion. This can result from the duplication of zones ofgenome during the evolution between M. truncatula andM. sativa.
Mapping in alfalfaUsing the AFLP and SSR markers, distorted or not, weidentified 8 groups of homologous chromosomes in eachparent, each but one group with 4 chromosomes. Thehomologous status of the chromosomes was establishedby the codominant SSR loci and the repulsion linkages.
We obtained longer and more saturated maps with AFLPsand SSRs (662 and 761 cM for the haploid genome inMagali2 and Mercedes4.11, respectively) in the tetraploidcultivated alfalfa than in the previously publishedresearch with only RFLPs (470 cM for the haploidgenome) [9]. Furthermore our map lengths were close towhat was obtained in diploid alfalfa [8], with 754 cM.
We propose a portable reference map built with only SSRloci. It spans 709 cM for the haploid genome, covering94% of the genome of diploid alfalfa [8]. The average dis-tance between markers is 6.6 cM. A limited number of SSR
MTIC258 CACCACCTTCACCTAAGAAA TGAAATTCACATCAACTGGA 1 HMTIC272 AGGTGGATGGAGAGAGTCA TCATGAATAGTGGCACTCAA 3 HMTIC273 TGTTAGCAACTTTGTGATGG TCCATTACAATACCCAGAGG 7 HMTIC278 CTTACCCTCCACTGCTACTG CGCATATAACAGAGGGTTTC 2 HMTIC289 GCTGGTGTCAAAGAGGTCTA AGATTTGAAACTGCCCTACA HMTIC299 AGGCTGTTGTTACACCTTTG TCAAATGCTTAAATGACAAAT 8 HMTIC304 TTGGGCTTAATTTGACTGAT AGCGTAAAGTAAAACCCTTTC 2 HMTIC314 TCTAATCCCAACAACACTCTT GAAGAAGAAGCCATAGTGTGA 1 HMTIC318 TCAACCAACTCAATGCCACT TTGTTGTGAAATGGAAAATGG 7 HMTIC326 GATCACCCTTTATGGAGTTTGAA CGACTTCAATTGACCCCCTA 4 HMTIC331 CCCTCTTCTACCTCCTTTCCA GGAAGAGAAGATGGGGGTGT 4 HMTIC332 CCCTGGGTTTTTGATCCAG GGTCATACGAGCTCCTCCAT 4 HMTIC338 TCCCCTTAAGCTTCACTCTTTTC CATTGGTGGACGAGGTCTCT 3 HMTIC339 CCACACAAAACACGCACTCT GGTAGGATTGCCACGACTGT 4 HMTIC343 TCCGATCTTGCGTCCTAACT CCATTGCGGTGGCTACTCT 6 HMTIC345 TCCGATCTTGCGTCCTAACT CCATTGCGGTGGCTACTCT HMTIC347 TCGGTGTATTTCCGTGTTTG GGTTGAAATTGAAAGAAGAATCG 4 HMTIC354 AAGTGCCAAAGAACAGGGTTT AACCTACGCTAGGGTTGCAG 2 HMTIC356 CGGCGATGGAAAATTGATAG CCAATACAAACTTTGCGTGAGA 8 HMTIC365 ATCGGCGTCTCAGATTGATT CGCCATATCCAAATCCAAAT 2 HMTIC432 TGGAATTTGGGATATAGGAA GGCCATAAGAACTTCCACTT 7 HMTIC441 CTTCCTTATCATCGCTTCC CAGAGATTGAGAATCGAGAAG HMTIC446 ATAACTGGCTGAACAAATGC TCTCCTTCCACCCTCTATG 7 HMTIC447 TCTTGTTGTATCCTCCGAAC TCCTGAGTTGTAGAGTGAGTGA 1 HMTIC451 GGACAAAATTGGAAGAAAAA AATTACGTTTGTTTGGATGC 2 HMTIC452 CTAGTGCCAACACAAAAACA TCACAAAAACTGCATAAAGC 2 HMTIC470 GGTTCGTGTATTTGTTCGAT CCCTTCACAGAATGATTGAT 7 HMTIC471 ATCAGGTGATGATTGGTTTT CCAACCATCTTTGTTTCCTA HMTIC475 GGATTGAAATGCACTCTCTC TTAATAAACGCCGCTCCT 3 H
Table 3: Sequences of microsatellite primer pairs for each locus, linkage group (LG) in M. truncatula and reference. Sequences are given in the 5' to 3' direction (H for T. Huguet, unpubl.; S for S. Santoni, unpubl.) (Continued)
Page 6 of 19(page number not for citation purposes)

BMC Plant Biology 2003, 3 http://www.biomedcentral.com/1471-2229/3/9
Table 4: Characteristics of 63 SSR loci with tetrasomic inheritance. Are indicated: total number of alleles, number of polymorphic alleles, expected genotypes of the parents as determined by TetraploidMap software in alfalfa F1 mapping population from Mercedes4.11 × Magali2 (the non segregating bands in F1 were not considered), double reduction coefficient (α) and its statistical significant (LR). '0' indicated null allele. The letter indicating the allele (A-G) was attributed from the lowest to the highest molecular weight.
Locus Total number of alleles
Number of polymorphic alleles
Genotype of Double reduction Remark
Mercedes4.11 Magali2 α LR test 1
Loci with non significant double reductionFMT13 3 3 ABBC AABB 0.00 0.00MAW208206 1 1 0000 AA00 0.02 0.04MAA660456 4 4 ABBC ABCD 0.00 0.00MAL368684 3 3 ABC0 C000 0.00 0.00E318681 2 1 0000 B000 0.13 0.59 Allele A monomorphic, present
in both parentsMTIC27 2 2 AAB0 AA00 0.14 1.27MTIC35 2 1 B000 or BB00 BB00 or B000 0.04 0.17 Allele A monomorphic, present
in both parentsMTIC58 2 1 0000 A000 0.07 0.22 Allele B monomorphic, present
in both parentsMTIC64 3 2 A000 AC00 0.03 0.10 Allele B monomorphic, present
in both parentsMTIC79 3 2 AB00 0000 0.00 0.00 Allele C monomorphic, present
in both parentsMTIC90 1 1 A000 0000 0.02 0.02MTIC95 3 3 AACC AABC 0.00 0.00MTIC103 4 4 ACDD BDD0 0.00 0.00MTIC124 3 3 AACC AB00 0.05 0.63MTIC131 4 4 BCD0 ABD0 0.00 0.00MTIC145 3 3 0000 ABC0 0.00 0.00MTIC169 3 3 BC00 AA00 0.00 0.00MTIC189 5 5 ACD0 ABDE 0.00 0.00MTIC210 3 3 AABC AABC 0.05 0.53MTIC232 2 1 B000 0000 0.00 0.00 Allele A monomorphic, present
in both parentsMTIC237 2 1 B000 0000 0.12 0.61 Allele A monomorphic, present
in both parentsMTIC247 2 2 AAB0 AA00 0.03 0.07MTIC248 3 3 BC00 A000 0.16 0.76MTIC272 3 2 CC00 BC00 0.01 0.02 Allele A monomorphic, present
in both parentsMTIC289 4 3 0000 ACD0 0.00 0.00 Allele B monomorphic present
in both parentsMTIC299 3 3 CC00 ABC0 0.00 0.00MTIC314 2 1 0000 B000 0.00 0.00 Allele A monomorphic, present
in both parentsMTIC318 2 1 B000 0000 0.15 0.91 Allele A monomorphic, present
in both parentsMTIC332 3 3 AAB0 ABC0 0.00 0.00MTIC338 3 2 C000 BBCC 0.03 0.26 Allele A monomorphic, present
in Mercedes4.11MTIC339 3 2 BC00 B000 0.00 0.00 Allele A monomorphic, present
in both parentsMTIC343 4 4 BBCD ABDD 0.00 0.00MTIC345 5 5 BCDE AADD 0.00 0.00MTIC347 3 2 AA00 C000 0.05 0.40 Allele B monomorphic, present
in both parentsMTIC354 4 4 ABCD AABC 0.00 0.00MTIC356 2 1 0000 A000 0.16 2.13 Allele B monomorphic, present
in both parentsMTIC365 4 4 ABCD ABCC 0.00 0.00MTIC441 1 1 A000 0000 0.00 0.00
Page 7 of 19(page number not for citation purposes)

BMC Plant Biology 2003, 3 http://www.biomedcentral.com/1471-2229/3/9
markers spread on the whole genome can be chosen tobuild maps in other populations.
The dense maps including AFLPs will be valuable for anaccurate QTL analysis in our population. The compositeSSR map will be useful to compare QTL position in differ-ent populations.
As in published diploid and tetraploid alfalfa maps [43],we have found that AFct32 and MTLEC2A markers weremapped on the same chromosome (group 3) and AFct45on another chromosome (group 8).
Autotetraploidy in alfalfaCodominant markers are adequate tools to test theautotetraploid structure of the genome [22]. This study isthe first demonstration of the tetrasomic inheritance of
chromosomes in alfalfa, using SSR markers. Thisautotetraploidy pattern is confirmed by the repulsionlinkages between markers belonging to all homologouschromosomes. Recently in alfalfa, a preferential chromo-some pairing at meiosis was found with RFLP markers ina F1 population [44]. We can hypothesize that this resultoriginates from a choice of mapping population parentsthat are genetically distant (a non-dormant genotype ofM. sativa and a very dormant genotype related to M.falcata).
In our study, some loci showed a significant double reduc-tion frequency. Nevertheless, genotypes only originatingfrom double-reduction were not found. The double-reduction obtained here is not different from a segrega-tion distortion. The rate of double-reduction in alfalfa ispresumably low, so its detection would require the
MTIC446 3 2 B000 C000 0.06 0.32 Allele A monomorphic, present in both parents
MTIC451 5 5 ABCD ABCE 0.00 0.00MTIC470 2 1 A000 0000 0.00 0.00 Allele B monomorphic, present
in both parentsMTIC471 2 2 AAB0 A000 0.00 0.00MTIC475 2 1 0000 B000 0.00 0.00 Allele A monomorphic, present
in both parentsLoci with significant double reductionAfct32 6 6 BCDF ABE0 0.01 77.5Afct45 4 4 ABBD AAC0 0.01 24.75B14B03 3 3 CC00 AB00 0.02 49.09MAA660870 5 5 ACDE ABE0 0.04 46.20MAL369471 3 3 AABC AA00 0.07 5.97MTR58 4 4 AAC0 BD00 0.01 98.04ENOD20 6 6 ADEF BCE0 0.01 3.85MTIC7 2 2 AB00 BB00 0.04 20.69MTIC14 3 2 BC00 BB00 0.16 4.82 A monomorphic, present in
both parentsMTIC94 2 1 0000 AA00 0.16 5.09 B monomorphic, present in
both parentsMTIC153 4 4 ABC0 BCD0 0.15 39.4MTIC230 4 4 BCD0 AD00 0.16 7.69MTIC233 3 3 BC00 A000 0.04 142.2MTIC249 2 2 BB00 AB00 0.08 61.48MTIC251 4 4 BC00 AAD0 0.07 78.00MTIC273 3 3 AAB0 ABC0 0.00 6.71MTIC326 4 3 D000 AC00 0.14 66.21 B monomorphic, present in
both parentsMTIC331 2 1 0000 BB00 0.03 49.70 A monomorphic, present in
both parentsMTIC432 5 5 ABC0 ACDE 0.01 46.20MTIC447 3 2 AC00 0000 0.16 50.99 B monomorphic, present in
both parents
1 A LR test lower than a χ2 with 1 df (3.84) is not significant at P = 0.05
Table 4: Characteristics of 63 SSR loci with tetrasomic inheritance. Are indicated: total number of alleles, number of polymorphic alleles, expected genotypes of the parents as determined by TetraploidMap software in alfalfa F1 mapping population from Mercedes4.11 × Magali2 (the non segregating bands in F1 were not considered), double reduction coefficient (α) and its statistical significant (LR). '0' indicated null allele. The letter indicating the allele (A-G) was attributed from the lowest to the highest molecular weight. (Continued)
Page 8 of 19(page number not for citation purposes)

BMC Plant Biology 2003, 3 http://www.biomedcentral.com/1471-2229/3/9
Table 5: Characteristics of 41 SSR loci produced by 21 primer pairs showing multilocus segregation. Are indicated: total number of alleles, number of polymorphic alleles, expected genotypes of the parents as determined by TetraploidMap software in alfalfa F1 mapping population from Mercedes4.11 × Magali2 (the non segregating bands in F1 were not considered), double reduction coefficient (α) and its statistical significant (LR). '0' indicated null allele
Locus Totalnumberof alleles
Number of polymorphic alleles
Genotype of Double reduction Remark
Mercedes4.11 Magali2 α LR test 1
AI974357-1 4 4 CCD0 AB00 0.00 0.00AI974357-2 2 2 FF00 EE00 0.04 0.19B21E13-1 1 1 A000 A000 0.13 0.90B21E13-2 4 4 CDE0 BCCD 0.00 0.00B21E13-3 1 1 F000 0000 0.00 0.00MTIC12-1 4 4 ABCC ABCD 0.00 0.00MTIC12-2 2 2 E000 EF00 0.02 0.02MTIC19-1 3 3 AA00 AABC 0.00 0.00MTIC19-2 2 2 DE00 0000 0.07 0.55MTIC19-3 1 1 F000 0000 0.04 0.06MTIC48-1 4 4 A000 BCD0 0.00 0.00MTIC48-2 1 1 EE00 0000 0.14 2.17MTIC51-1 3 3 ABC0 ABC0 0.09 39.05MTIC51-2 2 2 DE00 0000 0.04 0.19MTIC77-1 2 2 0000 AB00 0.02 0.05MTIC77-2 4 4 CDEF CDDE 0.00 0.00MTIC77-3 1 1 G000 0000 0.07 0.22MTIC82 3 1 C000 0000 0.16 2.59 Alleles A and B monomorphic,
present in both parentsMTIC84-1 1 1 0000 A000 0.00 0.00MTIC84-2 4 4 BCE0 DD00 0.00 0.00MTIC84-3 1 1 0000 F000 0.09 0.30MTIC93 3 1 C000 0000 0.15 0.89 Alleles A and B monomorphic,
present in both parentsMTIC107 3 2 AA00 AAC0 0.05 3.78 Allele B monomorphic,
present in both parentsMTIC134-1 5 5 BCE0 AD00 0.04 63.0MTIC134-2 2 2 F000 G000 0.00 0.00MTIC135-1 2 2 B000 AB00 0.00 0.00MTIC135-2 2 2 CD00 or CDD0 CDD0 or CD00 0.12 0.77MTIC135-3 1 1 E000 0000 0.00 0.00MTIC183-1 5 5 ACDE BC00 0.02 43.74MTIC183-2 1 1 0000 F000 0.00 0.00MTIC185 3 2 B000 BC00 0.16 0.12 Allele A monomorphic,
present in both parentsMTIC188-1 3 3 B000 AC00 0.06 0.63MTIC188-2 4 4 DEG0 DF00 0.00 0.00MTIC238-1 3 3 AACC ABC0 0.16 57.67MTIC238-2 3 3 DEF0 FF00 0.03 5.18MTIC250-1 2 2 B000 AABB 0.00 0.00MTIC250-2 2 2 0000 CD00 0.10 1.28MTIC258 4 2 0000 AD00 0.16 22.9 Alleles B and C monomorphic,
present in both parentsMTIC304 4 3 BBDD ABDO 0.00 0.00 Allele C monomorphic,
present in both parentsMTLEC2A-1 2 2 0000 AB00 0.00 0.00MTLEC2A-2 2 1 0000 D000 0.00 0.00 Allele C monomorphic,
present in both parents
1 A LR test higher than a χ2 with 1 df (3.84) is significant
Page 9 of 19(page number not for citation purposes)

BMC Plant Biology 2003, 3 http://www.biomedcentral.com/1471-2229/3/9
analysis of a large population. This result is in accordancewith the observation of meiosis in alfalfa, which shows alow proportion of tetravalent formation [45]. Neverthe-less, in mapping procedures, double reduction cannot betaken into account [23].
Segregation distortionThe segregation distortion reached 35% over the AFLPmarkers. The double-simplex and the duplex were morefrequently distorted than the simplex markers. For theSSRs, considering the loci showing significant doublereduction as distorted loci, the proportion of distortionwas 25% (26 loci over 104). These rates of distortion aresimilar to that obtained in M. truncatula [33] or in diploidalfalfa [5-7]. But in tetraploid alfalfa, Brouwer and Osborn[9] obtained a segregation distortion of only 5.5% for thesimplex RFLP alleles, and stated that the autotetraploidycould reduce the effect of deleterious alleles that cause dis-torted segregation. However, the restriction of the segrega-tion distortion analysis to the simplex alleles could resultin an optimistic view of the distortion. The random repar-tition of the distorted markers over our maps showed thatno alfalfa genome region was particularly distorted con-trarily to the situation in the M. truncatula genome [33].
Transfer of SSR markersMore than 80% of the SSR markers initially developed inthe legume model species M. truncatula gave amplifica-tion products in alfalfa. This capacity to give rise to ampli-fication in these species is not surprising since they belongto the same genus. Indeed, such transfers have alreadybeen reported across annual and perennial species of Med-icago genus for 4 markers [43] and very recently for 89%of a set of 455 primer pairs developed from EST of M. trun-catula [46]. The transfer of SSR markers among specieswithin some genera has already been obtained in Glycinesp [37], Prunus sp [38] and Brassica sp [39], in the threecases with SSRs isolated from genomic DNA. The highlevel of SSR transferability allows the use of a largenumber of SSRs from public M. truncatula EST on alfalfa.
Comparison with M. truncatula mapOver the 94 SSR loci mapped on both M. sativa and M.truncatula, all but 2 were gathered in the same groups (T.Huguet, unpublished data) suggesting that no major chro-mosome rearrangement had occurred since the speciesdifferentiation. Unexpected mapping was obtained for (1)MTIC272 was mapped in group 3 of M. truncatula butgroup 6 in Magali2 and (2) MTIC77-1, a marker onlypresent in Magali2 was mapped in group 8, althoughMTIC77-2 was mapped in group 3 in both parents as inM. truncatula. Eight SSRs could not be mapped, due toinsufficient linkage with other markers (MTIC35,B21E13-1, B21E13-3, MTIC77-3, MTIC84-1, MTIC230and MTIC356). Some SSR markers that were not mappedin M. truncatula because of the absence of polymorphismin mapping populations, were mapped in alfalfa: MTIC95(group 1), MTIC7 (group 3), MTIC94 (group 4),MTIC289 and MTIC471 (group 7).
The order of SSR markers along chromosomes is very wellconserved between tetraploid alfalfa and M. truncatula (T.Huguet, unpubl. data). The cases of misalignment can beexplained by a lack of accuracy in the recombination rateestimation. Indeed a recombination rate has a standarderror which varies with the size of the mapping popula-tion, the recombination rate and the type and phase of thepairs of markers [21]. In autotetraploid species, for a F1mapping population of 168 individuals, the standard
Table 6: Segregation of the alleles obtained from three SSR primer pairs showing suspected multilocus segregation. Are indicated: total number of alleles, number of polymorphic alleles, expected genotypes of the parents as determined by the segregation of each allele
Primer pair Total number of alleles Number of polymorphic alleles Mercedes Magali Remark
MTIC452 7 7 ADEF BCDFGMTIC21 6 6 BCE ADFMTIC278 4 3 BCCD Allele A monomorphic, present in Mercedes4.11
Amplification pattern obtained with one primer pair (MTIC134), showing 2 lociFigure 2Amplification pattern obtained with one primer pair (MTIC134), showing 2 loci. The arrow indicates one F1 individual with 5 alleles. The red dots are for each allele in both parents.
Mercedes4.11
Locus 1 with 5 alleles
Locus 2 with 2 alleles
ladder Magali2
F1 individualsMercedes4.11
Page 10 of 19(page number not for citation purposes)

BMC Plant Biology 2003, 3 http://www.biomedcentral.com/1471-2229/3/9
error of a recombination rate of 0.2 is 0.03 for two simplexmarkers and 0.07 for a simplex and a duplex, both incoupling phase. This synteny is a very positive point forthe future use of M. truncatula genomics for genetic studiesin cultivated tetraploid alfalfa.
The comparison of the alfalfa maps with that of M. trun-catula using the SSR markers indicates that chromosomes1, 2, 6 and 8 are well covered with markers regularlyspaced all along M. truncatula homologous
chromosomes, but clearly more markers are needed ongroup 4, and on the upper parts of groups 3, 5 and 7.
We were surprised to note that the haploid genome maplength in a F2 population of M. truncatula was about 2times larger than our map on tetraploid alfalfa (1225 vs709 cM), although DNA content of haploid genome was1.5 times less in M. truncatula than in tetraploid alfalfa[47].
Genetic linkage map of Mercedes4.11, homology groups 1 to 4Figure 3Genetic linkage map of Mercedes4.11, homology groups 1 to 4. Mercedes4.11 is the female parent of a F1 mapping population in tetraploid alfalfa. Each box contains the homologous chromosomes of one group. The groups were numbered similarly to M. truncatula (T. Huguet, unpublished data) and diploid M. sativa (G. Kiss, pers. comm.). The chromosomes within each group were arbitrarily numbered from 1 to 4 and are orientated as in M. truncatula. When JoinMap software split the map of one chromosome in 2 or 3, each linkage group was named by the number followed by a letter. The number to the left of the chromosomes refers to the genetic distances (Kosambi cM) from the top. The number to the right of the chromosomes refers to the marker names. The SSR markers are in upper-case and the AFLPs in lower-case letters. AFLP markers followed by "d" had a distorted segregation. When several SSR loci came from a single primer pair, their names were composed of the name of the primer pair followed by a number.
acta2210MTIC2473cgat1579
acag12421
MTIC84-230
MTIC44137
MTIC44745
MTR5859
MAL36947174MTIC9576
FMT1384
1 acta270d0
MAL36868413
MTIC10727
MTIC84-246
MTR5871acag10472
MAL36947187
FMT1397MTIC9599
ggaa295106
2
gctt113d0
MAL36868413
MTIC24719
MTIC10727
MTIC84-248
ggaa27167
ctag22778
MAL36947191MTIC9596FMT13100
caac140112ctaa180117
3
gctt113d0
MAL36868410
MTIC24716
ccac18736
ggag8354MTR5859
MAL36947175MTIC6481FMT1385caag142caag14390
MTIC233134
4
MTIC19-1cgaa200d0
ccac10612B21E13-214MTIC21019MTIC19-320MTIC35421MTIC30425
MTIC36538
MTIC12-150
MTIC2758
MTIC45171
1
B21E13-20MTIC19-24MTIC2106MTIC3549MTIC30411MTIC21E14MTIC452D16
MTIC36526
MTIC12-136
MTIC2750
MTIC45165
gcat10373
ctag16190
gcac115107
2
B21E13-20MTIC19-24MTIC2106MTIC3548MTIC21B9MTIC30411
MTIC36525MTIC12-228
actg24234
MTIC12-142
MTIC2750
MTIC45164
3
MTIC19-10
MTIC21016MTIC35417MTIC30421
MTIC452E29
MTIC36535
MTIC12-149ggag22852
caag13069
4
MTIC1240
MTIC51-26
AFct3232MTIC18934
MTIC34545
AI974357-154
MTIC33860MTIC764
ctac17374MTIC77-277gcat24382cgat28586
MTIC16995
ggag350110
ctat114121
1
caac950
MTIC1249MTIC51-214
MTIC13136
AFct3242
MTIC34555
AI974357-163MTIC23766MTIC33870MTIC773
cgtg28984MTIC77-287
caag168100
2
101106
catg4300
MTIC1246
MTIC13134
AFct3242MTIC18943
MTIC34555
AI974357-263
acta23169
MTIC77-283
actg290ctaa178d
3
catg1170
ggaa36524
MTIC12435
catg12247
MTIC51-154
cttt23161MTIC13163
AFct3271MTIC18972
MTIC34584
AI974357-193acta9696
cttt215104
MTIC77-2114
caag228d120
4
catg3950
MTIC33218
MAA66045629gcat12534
ctac400d45MTIC9050
cctc23159ggta15764MTIC33969
ctag185d79cgat12184cgat117d87
cgat15594
acta241100
cgat153109
1
ctat246d0
cgat117d7
ctac400d15
gcac370d26MTIC24932ctac23234cctt11340ctag185d45MTIC34746
ccac10164
cgat17873
2b
MAA6604560
MTIC33211
2a
MAA6604560
ccac14713
ccac220d25
gcat12841MTIC24946MTIC33950
ctag31661
cctc23167ctat15571
acta24177
MTIC32689
3
MTIC347cgat3350
cgat3408
gcac23521ctag31826
gcac19636
4b
MAA6604560
MTIC33211
4a
Group 1
Group 3 Group 4
Group 2
Page 11 of 19(page number not for citation purposes)
BMC Plant Biology 2003, 3 http://www.biomedcentral.com/1471-2229/3/9
ConclusionsWe have obtained genetic linkage maps of cultivated tetra-ploid alfalfa using a combination of AFLP and SSR mark-ers, with length and marker density close to saturation.Their comparison to M. truncatula maps through the com-mon SSR markers reflects the synteny between these twospecies. The inheritance of the codominant SSR markersindicates a true autotetraploidy of alfalfa, with completerandom pairing of chromosomes at meiosis. The orders ofthe markers on the chromosomes are very similar. The useof such maps to identify QTLs for agronomical traits is inprogress in our laboratory.
MethodsMapping populationThe two parental plants were selected within the numer-ous alfalfa varieties bred in France. One originated fromthe Provence type cultivar Magali, and was named
Magali2. This genotype was previously used in a diallelcrossing design [48] and has high general combining abil-ity for forage digestibility and plant height. The otherplant, Mercedes4.11, originates from the high yieldingMercedes cultivar, and was kindly provided by B. Bayle,from Limagrain Genetics company. It was selected after 2cycles of selection for increased disease (Verticilliumalboatrum), pest (Ditylenchus dipsaci) and lodging resist-ance. In year 1999, the two plants were manually crossed,with Mercedes4.11 as the female parent. The flowers werecastrated before stamina dehiscence, and the style wascleaned with alcohol at 70% to remove any pollen grains.The pollen of Magali2 flowers was harvested on a brushand applied on the style of female plant. A total of 236seeds was harvested. In year 2000, a subset of 168 plantsout of 230 germinated seeds, was randomly taken to rep-resent the F1 mapping population.
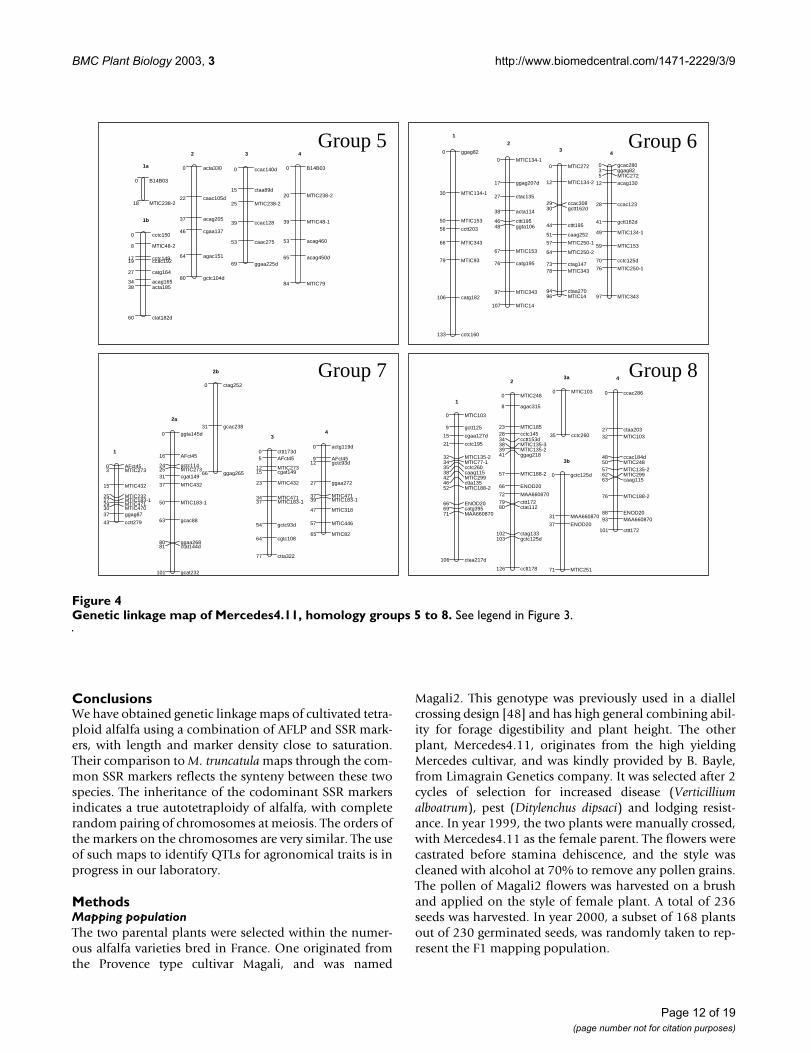
Genetic linkage map of Mercedes4.11, homology groups 5 to 8Figure 4Genetic linkage map of Mercedes4.11, homology groups 5 to 8. See legend in Figure 3.
acta3300
caac105d22
acag20537
cgaa13746
agac15164
gctc104d80
2
ccac140d0
ctaa89d15
MTIC238-225
ccac12839
caac27553
ggaa225d69
3
B14B030
MTIC238-220
MTIC48-139
acag46053
acag450d65
MTIC7984
4
cctc1500
MTIC48-28
cctc14917 ccac19219
catg16427
acag16534acta18538
ctat182d60
1b
B14B030
MTIC238-218
1a
MTIC1030
gctt1259
cgaa127d15
cctc19521
MTIC135-232MTIC77-134cctc26035caag11538MTIC29942ctta13546MTIC188-252
ENOD2066catg39569MAA66087071
ctaa217d106
1MTIC2480
agac3158
MTIC18523cctc14528cctt153d34MTIC135-338MTIC135-239ggag21841
MTIC188-257
ENOD2066
MAA66087072
cttt17279ctat11280
ctag133102gctc125d103
cctt178126
2
gctc125d0
MAA66087031
ENOD2037
MTIC25171
3b
MTIC1030
cctc26035
3a
ccac2860
ctaa20327MTIC10332
ccac184d48MTIC24850MTIC135-257MTIC29962caag11563
MTIC188-276
ENOD2088MAA66087093
cttt172101
4
ggag820
MTIC134-130
MTIC15350
cctt20356
MTIC34366
MTIC9379
catg182106
cctc160133
1
MTIC134-10
ggag207d17
ctac13527
acta11438
cttt19546ggta10648
MTIC15367
catg19576
MTIC34397
MTIC14107
2
MTIC2720
MTIC134-212
ccac30829gctt162d30
cttt19544
caag25251
MTIC250-157
MTIC250-264
ctag14773MTIC34378
ctaa27094MTIC1496
3
gcac2800ggag823MTIC2725acag13012
ccac12328
gctt162d41
MTIC134-149
MTIC15359
cctc125d70
MTIC250-176
MTIC34397
4
AFct450MTIC2733
MTIC43215
MTIC23225MTIC183-127MTIC47129MTIC47030ggag8737
cctt27943
1
ggta145d0
AFct4516
gctc11424MTIC27325cgat14931
MTIC43237
MTIC183-150
gcac8863
ggaa26880ctat144d81
gcat232101
2a
ctag2520
gcac23831
ggag26566
2b
cttt173d0AFct455
MTIC27312cgat14915
MTIC43223
MTIC47134MTIC183-137
gctc93d54
cgtc10864
ctta32277
3
actg119d0
AFct459gctc93d12
ggaa27227
MTIC47137MTIC183-139
MTIC31847
MTIC44657
MTIC8265
4
Group 5
Group 7 Group 8
Group 6
Page 12 of 19(page number not for citation purposes)

BMC Plant Biology 2003, 3 http://www.biomedcentral.com/1471-2229/3/9
DNA extractionYoung leaflets were harvested on each plant, and DNAwas extracted using a standard CTAB (hexadecylatrimeth-ylammoniumbromide) procedure [49].
AFLP markersAFLP analysis [50] was performed with the Gibco Brl kitAFLP™ Analysis System I, as recommended by themanufacturer, with some modifications designed tooptimize the readability of the gels. Pre-amplificationproducts were diluted 1:10 in water instead of 1:50. Forsome primer pairs, selective amplifications were per-formed with 33P-labeled EcoRI selective primers asrecommended by Gibco Brl. Reaction products were sep-arated on 6% denaturing polyacrylamide sequencing gelwith a 1X TBE buffer with 7 M urea. Electrophoresis was
performed at 85 W, for approximately 3 h 30 min, on a 38× 53 cm gel apparatus. The gel was subsequently placedfor 3 h at 75°C in a gel dryer and exposed to a KodakBiomax MR X-ray film for 2–5 days.
For primer pairs analyzed without 5'end-labeled EcoRIprimer, products from selective amplifications were sepa-rated on denaturing polyacrylamide sequencing gels asabove and visualized using a silver staining method [51].
Each AFLP marker was identified by the last 2 nucleotidesof the two primers, followed by a number according to thesize of the band. Only polymorphic bands were scored.Three cases of polymorphism were considered: bandspresent in Magali2 and absent in Mercedes4.11, bandsabsent in Magali2 and present in Mercedes4.11, and
Genetic linkage map of Magali2, homology groups 1 to 4Figure 5Genetic linkage map of Magali2, homology groups 1 to 4. Magali2 is the male parent of a F1 mapping population in tetraploid alfalfa. See legend in Figure 3. In group 4, the linkage group numbered "3/4" indicated that it was linked to both chro-mosomes 3 and 4.
MTIC1070
MTIC84-218
catg27025
ggaa11838
ctac7848caac14052ctta103d55ggag21858MTIC9559ccac9562FMT1367
agac12486
1
MAL3686840MTIC1072MTIC2477
MTIC84-114
ggaa18323acta178d24
gcat40033
ctta31454FMT1357
MTIC9564
MTIC6471
MTIC31492
MTIC233100
2gcat335d0
MTIC107MTIC24722MTIC84-327
ggag345d43
MTR5850
MAL36947166
FMT1376MTIC9577
3
cgaa2840
MTIC84-214
gctc250d28
MTR5840
ccac8854MAL36947156
FMT1366MTIC9567MTIC6473
4MTIC21A0MTIC19-13
MTIC452G10
B21E13-219MTIC21023MTIC35425
MTIC36541
MTIC12-154
MTIC45170
MTIC278D95
1
MTIC19-10
ctta16812B21E13-214MTIC21019MTIC35421MTIC30425
gcat37536MTIC36537MTIC145ggag245d45ggag382d48MTIC12-150ggag270d53ggag385d57cgtg14958ctta141d62
ctaa215d71acag295dctag31873ctac274MTIC45179
cgaa12695
2
MTIC19-10
B21E13-213MTIC21018MTIC35420gctc11422MTIC30424
ggaa253dMTIC12-235MTIC36537
MTIC14547MTIC12-152
MTIC2765
MTIC45179
ggta12888
cgaa12698
3
MTIC19-10
B21E13-213MTIC21019MTIC35420MTIC21F23MTIC30424
ctaa20334MTIC12-235MTIC36537ggag382dMTIC14544ggag245d46MTIC12-152gctt23154ctta141d59
caac20370MTIC2771
MTIC45186
4
MTIC1240ctag3402
MTIC51-117
MTIC13126MTLEC-130MTLEC-231AFct3237MTIC18938
MTIC34549
AI974357-157MTIC33862acta23165ggag259d67ggaa112d68
MTIC77-280cttt10584
MTIC16992
1
ctat194d0
ccac15324
cgaa19236
MTIC12443
MTIC51-159caag35063
MTIC13170
AFct3277MTIC18978
MTIC34590MTIC47591AI974357-298MTIC33899MTIC7104
MTIC77-2118
MTIC169124
2
catg1670
acag215acag21413
MTIC51-122
MTIC13128
MTLEC-135MTIC18940
agac181d47MTIC34552catg22056MTIC33860AI974357-261MTIC767
MTIC77-280
3ctac1750
caac180d12
AFct3236MTIC18938
MTIC34549caac9350
AI974357-158
MTIC33864
ggaa112d70
MTIC77-279ggag259d80
4
ctag1920
cctt112d15
MAA660456agac240d27
MTIC33238
gcac10251
ccac236d66MTIC33968
MTIC326101cctt248103
1
MAW208206gcat155d0
gcac380d6
cctc14819
ctag10530
MTIC9437
cgat15045
ggag9151acta30554
gcac99cgat15262
cttt151d79
MTIC24997
2b
ctta170d0
MAA66045624
gcac16644
2a
ccac1380
MAA66045612
MTIC33223
3catg107d0
acta112d27
MAA66045638
MTIC33249
cctt112d58
4
cgat1500acag3502
cgat15217
MTIC32624
caac11340
3/4
MTIC249MTIC3310
3/4
Group 1
Group 3 Group 4
Group 2
Page 13 of 19(page number not for citation purposes)

BMC Plant Biology 2003, 3 http://www.biomedcentral.com/1471-2229/3/9
bands present in both parents and segregating in the pop-ulation. Twenty-seven AFLP primer pairs were used togenotype the whole population.
Microsatellite markers (SSRs)The 232 SSR loci tested originated from 3 sources: 10 SSRmarkers published by Diwan et al [35], 35 from a SSR-enriched bank made on the model species M. truncatula ([34], S. Santoni, unpublished data), and 187 SSR markersdeveloped in M. truncatula from the public EST database(T. Huguet, unpublished data).
For SSR markers published by Diwan et al [35], PCR reac-tions were performed as described by the authors andamplification products were visualized using a silverstaining method. For the other SSR loci, PCR productswere revealed using silver staining method or a LI-CORIR2 automated sequencer. For silver staining, PCR reac-
tions were performed in a final volume of 20 µl in a MJResearch model PTC-100 thermocycler. The reactionbuffer contained 37.5 ng of template DNA, 0.2 mM ofeach deoxynucleotide, 1.5 mM MgCl2, 0.4 µM of eachprimer, and 0.5 unit of Platinium Taq DNA polymerase(Gibco Brl). An initial Taq polymerase activation step of 4min at 94°C, followed by a step of 35 cycles with 30 sec at94°C, 1 min at 55°C and 1 min at 72°C, plus a final elon-gation step of 7 min at 72°C were performed. The PCRproducts were then separated on denaturingpolyacrylamide sequencing gel as for AFLP markers. Forthe sequencer, 3 primers were used: the primer pairs (0.4µMeach) with one primers synthesized with a M13 for-ward or reverse primer sequence on the 5'-end, and oneIRD-labelled M13 primer (0.4 µM). The M13 primer wasadded to the PCR product during the first few cycles ofamplification. The labelled M13 primer was incorporatedin subsequent cycles, thus labelling the PCR products. The
Genetic linkage map of Magali2, homology groups 5 to 8Figure 6Genetic linkage map of Magali2, homology groups 5 to 8. See legend in Figure 3.
B14B030
catg16419
MTIC48-130
ctag166d39
gcac13360MTIC238-161
MTIC58A69ggag14070
caag202d78
cgat330d87
1
cttt2520
caac28421cgat29024
cctc200d34
B14B0347cgat18052
acag14561MTIC238-263
MTIC48-185acag11486
catg18897
2
MTIC238-20
MTIC48-121
ctaa74d44ccac16447
MTIC238-153
ccac28662caag202d66
acag26077
3
actg1540gctt123d4actg153d7cctc142d10
cttt18018acta141dAFct4524
MTIC27331
MTIC43242 MTIC183-243actg20249
MTIC28955
1
catg2830
MTIC43211
cctt23021
MTIC47129
MTIC44637
2
gcac3550
cttt1806
AFct4517
MTIC27323
MTIC43233
MTIC28944
MTIC47150 MTIC183-152
caag29066
3 agac2300
gctt123d9
ccac27518
AFct4526
cctt23032 MTIC27334
MTIC43244
MTIC28955
MTIC183-164
4
gcat2270
ggaa27916cgtg13918
MTIC77-139MTIC135-241gcat133d47MTIC29948
MTIC188-157
ENOD2074
MAA66087081
1
MAA660870
MTIC1030
cttt185d10
cctc14521
MTIC135-227MTIC77-130
gctt186d39
MTIC188-248
ENOD205762
gctt10564
ggaa36077
2
ggaa2790MTIC1851
cgtg13920ggaa287MTIC135-222
MTIC29931gcat133d36MTIC188-241catg38545
ENOD2053
catg27763
3
MTIC1030
cttt185d24
4a
ctag335d0
MTIC1857
MTIC24820
gctt18829
MTIC29936
MTIC188-249
MAA66087067
4b
MTIC2720
ctta274d14
cctt14528
MTIC134-136
MTIC15345
acag23068
MTIC250-177caac10680MTIC250-285
MTIC34399
ctaa270112
1
acta1430
ctta16325
MTIC250-137
ggta162d43
MTIC250-253
MTIC34365
cgtg31071
2
gctt250d0
MTIC27218
ctac18327
ccac30837caag23142
MTIC134-167
MTIC250-183MTIC250-287
MTIC343101
agac98109
MTIC14119
3
MTIC134-20
caag230d14
agac21022
MTIC15331
caag16838caag170d44ggaa13545
ggag13765MTIC250-170
MTIC34382
MTIC14101
4
Group 5
Group 7 Group 8
Group 6
Page 14 of 19(page number not for citation purposes)

BMC Plant Biology 2003, 3 http://www.biomedcentral.com/1471-2229/3/9
other PCR conditions were the same as for silver staining.The amplification products were separated on 6.5% dena-turing polyacrylamide gel (LI-COR) as recommended byLI-COR.
From test experiments on the 2 parental plants plus 2 F1plants, we classified the markers as showing no amplifica-tion (or a non specific amplification showing a multi-banding profile), showing amplification but with a mon-omorphic profile, and showing amplification with poly-morphic profiles. The whole mapping population wasthen genotyped for 87 of these SSR loci.
Marker detection and inheritanceWe used the "Findgeno" subroutine from the Tetraploid-Map software [26]. It gives the segregation type for eachmarker. The distorted AFLP markers were thus identified.For the SSR markers, the autotetraploid inheritance wastested. The software identifies the parental genotypes,from the phenotypes of the parents and of the F1 plants ateach locus, without or with double reduction. For 24 loci,the number of alleles exceeded 4 for some F1 individuals,and the gels patterns clearly indicated that 2 or 3 loci wereamplified (Figure 2). In these cases, several loci werescored for each primer pair and the segregation was ana-lysed as described above. The locus names were thus com-posed of the name of the primer pair followed by anumber (i.e. MTIC84-1 and MTIC84-2). When theparental genotype identification failed, the alleles ampli-fied by the primer pairs were scored as dominant markers.
Map constructionThe "Cluster" subroutine of the TetraploidMap softwarewas used to create groups of markers that do not segregateindependently. We wanted to obtain 8 groups with manymarkers, according to the number of base of chromo-somes in alfalfa. We had to ask for 9 to 11 groups, as 1 to3 of the groups had very few markers, and so had to bediscarded. All the markers were included, distorted or not,except the AFLP markers present in both parents that didnot segregate in 3:1 ratio.
Then for each homology group, the linkage for each pairof markers was analyzed ("Twopoint" subroutine). Themarkers can be unlinked, linked in a coupling phase orlinked in a repulsion phase. A linkage was considered onlyif the LOD score was above 2. From the linkage analysis,the markers that composed each linkage group (chromo-some) in each homology group were identified. TheTwopoint procedure produced an output file containingthe recombination rate and the LOD of each pair ofmarkers. The order of the markers on each chromosomewas determined using JoinMap 3.0 software [36], usingthe ouput file of the Twopoint procedure. We used theKosambi distance, and the default parameters of JoinMap.
The alfalfa map was accepted if the χ2 test in JoinMap waslow, and so, some AFLP markers were excluded.
A composite map was built with only the SSR loci. TheSSR previously assigned to the groups of homologouschromosomes, and the recombination rates between pairsof loci were used to build the map of each group usingJoinMap. Three parameters of JoinMap were changed:"the number of maximum linkages to show per locus"was decreased from 2 to 1, "use linkage with REC smallerthan" was changed from 0.40 to 0.49 and "LOD largerthan" was changed from 1 to 0.5.
The cover of the maps was calculated by the ratio betweenthe length of our maps and the length of the dense map ofdiploid alfalfa [8] (754 cM).
Author's contributionsBJ carried out the statistical and mapping analyses anddrafted the manuscript, SF carried out most molecularanalyses, TH, GC and SS provided information on M.truncatula SSR markers and contributed to the compari-sons of alfalfa and M. truncatula maps, PB gave technicaladvice and contributed to the design of the study, CHcoordinated the study and contributed to the discussion.All authors read and approved the manuscript.
Page 15 of 19(page number not for citation purposes)

BMC Plant Biology 2003, 3 http://www.biomedcentral.com/1471-2229/3/9
Repulsion linkages in the homology group 8 of Magali2 parentFigure 7Repulsion linkages in the homology group 8 of Magali2 parent. The red lines indicate alleles of a common SSR locus or duplex AFLP markers, and the blue lines show the repulsion linkages between markers.
gcat2270
ggaa27916cgtg13918
MTIC77-139MTIC135-241
gcat133d47MTIC29948
MTIC188-157
ENOD2074
MAA66087081
1
MAA660870
MTIC1030
cttt185d10
cctc14521
MTIC135-227MTIC77-130
gctt186d39
MTIC188-248
ENOD2057
62gctt10564
ggaa36077
2
ggaa2790MTIC1851
cgtg13920ggaa287MTIC135-222
MTIC29931
gcat133d36
MTIC188-241
catg38545
ENOD2053
catg27763
3
MTIC1030
cttt185d24
ctag335d0
MTIC1857
MTIC24820
gctt18829
MTIC29936
MTIC188-249
MAA66087067
4b
Page 16 of 19(page number not for citation purposes)

BMC Plant Biology 2003, 3 http://www.biomedcentral.com/1471-2229/3/9
Composite map with the SSR markers, for a F1 mapping population in tetraploid alfalfaFigure 8Composite map with the SSR markers, for a F1 mapping population in tetraploid alfalfa.
MAL3686840
MTIC2477MTIC10711
MTIC84-324MTIC84-125MTIC84-230
MTIC25836MTIC44139
MTR5848
MTIC44755
MAL36947165MTIC6468MTIC9572FMT1376
MTIC31490
MTIC23396
1MTIC21A0MTIC19-13MTIC452G10B21E13-217MTIC19-220MTIC21022MTIC19-323MTIC35424MTIC21B25MTIC21FMTIC30427B21E13-329MTIC21E31MTIC452D33MTIC12-237MTIC452E38MTIC36543MTIC14550MTIC12-154MTIC2764
MTIC45177
MTIC278D102
2
MTIC1240
MTIC51-26
MTIC51-120MTLEC-126MTLEC-229MTIC13132AFct32MTIC18935
MTIC34548MTIC47549AI974357-155AI974357-2MTIC33857MTIC23759MTIC764
MTIC77-277
MTIC16989
3
MTIC900
MTIC33915MTIC9418
MTIC34743MTIC32647
MTIC249MTIC3310
4
MAA6604560
MTIC33211
E318681B0
MTIC48E25B14B0329MTIC48-230
MTIC238-138
MTIC238-248
MTIC48-169
MTIC58A99
MTIC79105
5MTIC2720
MTIC134-225
MTIC134-131
MTIC15361
MTIC250-267
MTIC250-173
MTIC34381
MTIC14100
MTIC93117
6
AFct450
MTIC2736
MTIC43218MTIC183-219MTIC23224MTIC183-126MTIC47028MTIC47129MTIC28931MTIC31834
MTIC44645
MTIC8255
7
MTIC1030
MTIC18512
MTIC135-125MTIC24829MTIC77-1MTIC135-231
MTIC299MTIC135-341
MTIC188-149MTIC188-253
ENOD2065
MAA66087071
MTIC25187
8
Page 17 of 19(page number not for citation purposes)

BMC Plant Biology 2003, 3 http://www.biomedcentral.com/1471-2229/3/9
AcknowledgementsWe are very grateful to C.A. Hackett (Biomathematics & Statistics Scot-land, Scottish Crop Research Institute, Dundee, UK) for her assistance in using TetraploidMap software. We thank F. Durand, P. Cormenier, C. Ecalle, A. Gilly, J. Jousse, D. Henri, D. Bousseau, J.B. Pierre, C. Gibelin and S. Berland for marker typing or plant maintenance. This program was sup-ported by the Action Transversale Structurante "Medicago truncatula" of INRA (2000–2002).
References1. Michaud R, Lehman WF, Rumbaugh MD: World distribution and
historical development. Alfalfa and alfalfa improvement – AgronomyMonograph no. 29, ASA-CSSA-SSSA, Madison, USA 1988:25-91.
2. Stanford EH: Tetrasomic inheritance in alfalfa. Agron J 1951,43:222-225.
3. Armstrong JM: Cytological studies in alfalfa polyploids. Can J Bot1954, 32:531-542.
4. Demarly Y: Etude de l'hérédité de la bigarrure de la fleur chezla luzerne. Ann Amélior Plantes 1954, 4:5-20.
5. Kiss GB, Csanαdi G, Kalman K, Kaló P, Ökrész L: Construction ofa basic genetic map of Medicago using RFLP, RAPD, isozymeand morphological markers. Mol Gen Genet 1993, 238:129-137.
6. Echt CS, Kidwell KK, Knapp SJ, Osborn TC, McCoy TJ: Linkagemapping in diploid alfalfa (Medicago sativa). Genome 1993,37:61-71.
7. Brummer EC, Bouton JH, Kochert G: Development of an RFLPmap in diploid alfalfa. Theor Appl Genet 1993, 86:329-332.
8. Kaló P, Endre G, Zimαnyi L, Csanàdi G, Kiss GB: Construction ofan improved linkage map of diploid alfalfa (Medicago sativa).Theor Appl Genet 2000, 100:641-657.
9. Brouwer DJ, Osborn TC: A molecular marker linkage map oftetraploid alfalfa (Medicago sativa L.). Theor Appl Genet 1999,99:1194-1200.
10. Wu KK, Burnquist W, Sorrells ME, Tew TL, Moore PH, Tanksley SD:The detection and estimation of linkage in polyploids usingsingle-dose restriction fragments. Theor Appl Genet 1992,83:294-300.
11. Yu KF, Pauls KP: Segregation of random amplified polymor-phic DNA markers and strategies for molecular mapping intetraploid alfalfa. Genome 1993, 1:844-851.
12. Meyer RC, Milbourne D, Hackett CA, Bradshaw JE, McNicol JW,Waugh R: Linkage analysis in tetraploid potato and associa-tion of markers with quantitative resistance to late blight(Phytophthora infestans). Mol Gen Genet 1998, 259:150-160.
13. Bradshaw JE, Hackett CA, Meyer RC, Milbourne D, McNicol JW, Phil-lips MS, Waugh R: Identification of AFLP and SSR markersassociated with quantitative resistance to Globodera pallida(stone) in tetraploid potato (Solanum tuberosum subsptuberosum) with a view to marker-assisted selection. TheorAppl Genet 1998, 97:202-210.
14. Hackett CA, Wachira FN, Paul S, Powell W, Waugh R: Construc-tion of a genetic linkage map for Camellia sinensis (tea). Hered-ity 2000, 85:346-355.
15. Rajapakse S, Byrne DH, Zhang L, Anderson N, Arumuganathan K, Bal-lard RE: Two genetic linkage maps of tetraploid roses. TheorAppl Genet 2001, 103:575-583.
16. Fjellstrom RG, Steiner JJ, Beuselink PR: Tetrasomic linkage map-ping of RFLP, PCR, and isozyme loci in Lotus corniculatus L.Crop Sci 2003, 43:1006-1020.
17. Al-Janabi SM, Honeycut RJ, McClelland M, Sobral BWS: A geneti-clink to Saccharum spontaneum. Genetics 1993, 134:1249-1260.
18. Da Silva JAG, Sorrells ME, Burnquist W, Tanksley SD: RFLP linkagemap and genome analysis of Saccharum spontaneum. Genome1993, 36:782-791.
19. Grivet L, D'Hont A, Roques D, Feldmann P, Lanaud C, Glaszmann JC:RFLP mapping in cultivated sugarcane (Saccharum spp.):genome organization in a highly polyploid and aneuploidinterspecific hybrid. Genetics 1996, 142:987-1000.
20. Lerceteau-Köhler E, Guérin G, Laigret F, Denoyes-Rothan B: Char-acterization of mixed disomic and polysomic inheritance inthe octoploid strawberry (Fragaria × ananassa) using AFLPmapping. Theor Appl Genet 2003, 107:619-628.
21. Hackett CA, Bradshaw JE, Meyer RC, McNicol JW, Milbourne D,Waugh R: Linkage analysis in tetraploid species: a simulationstudy. Genet Res Camb 1998, 71:143-154.
22. Luo ZW, Hackett CA, Bradshaw JE, McNicol JW, Milbourne D: Pre-dicting parental genotypes and gene segregation for tetras-omic inheritance. Theor Appl Genet 2000, 100:1067-1073.
23. Luo ZW, Hackett CA, Bradshaw JE, McNicol JW, Milbourne D: Con-struction of a genetic linkage map in tetraploid species usingmolecular markers. Genetics 2001, 157:1369-1385.
24. Wu R, Gallo-Meagher M, Littell RC, Zeng ZB: A general polyploidmodel for analyzing gene segregation in outcrossing tetra-ploid species. Genetics 2001, 159:869-882.
25. Ripol MI, Churchill GA, da Silva JAG, Sorrells M: Statistical aspectsof genetic mapping in autopolyploids. Gene 1999, 235:31-41.
26. Hackett CA, Luo ZW: TetraploidMap, software suite for calcu-lating linkage maps for autotetraploid populations. 2002 [ftp://ftp.bioss.sari.ac.uk/pub/cah/].
27. Hackett CA, Pande B, Bryan GJ: Constructing linkage maps inautotetraploid species using simulated annealing. Theor ApplGenet 2003, 106:1107-1115.
28. Bever JD, Felber F: The theoretical population genetics ofautopolyploidy. Oxford Surv Evol Biol 1992, 8:185-217.
29. Thompson JD, Lumaret R: The evolution dynamics of polyploidplants: origins, establishment and persistence. Trends Ecol Evol1992, 7:302-307.
30. Demarly Y: Génétique des tétraploïdes et amélioration desplantes. Ann Amélior Plantes 1963, 13:307-400.
31. Barker DG, Bianchi S, Blondon F, Dattée Y, Duc G, Flament P, Gal-lusci P, Génier G, Guy P, Muel X, Tourneur J, Dénarié J, Huguet T:Medicago truncatula, a model plant for studying the molecu-lar genetics of the Rhizobium-legume symbiosis. Plant Mol BiolRep 1990, 8:40-49.
32. Cook D: Medicago truncatula : A model in the making ! CurrentOpinion in Plant Biology 1999, 2:301-304.
33. Thoquet P, Ghérardi M, Journet EP, Kereszt A, Ané JM, Prosperi JM,Huguet T: The molecular genetic linkage map of the modellegume Medicago truncatula : an essential tool for compara-tive legume genomics and the isolation of agronomicallyimportant genes. BMC Plant Biology 2002, 2:1 [http://www.biomedcentral.com/1471-2229/2/1].
34. Baquerizo-Audiot E, Desplanque B, Prosperi JM, Santoni S: Charac-terization of microsatellite loci in the diploid legume Medi-cago truncatula (barrel medic). Molecular Ecology Notes 2001,1:1-3.
35. Diwan N, Bhagwat AA, Bauchan GR, Cregan PB: Simple sequencerepeat (SSR) DNA markers in alfalfa and perennial andannual Medicago species. Genome 1997, 40:887-895.
36. Van Ooijen JW, Vorrips RE: JoinMap® Version 3.0, Software forthe calculation of genetic linkage map. Plant Research Interna-tional. Wageningen, The Netherlands 2001.
37. Peakall R, Gilmore S, Keys W, Morgante M, Rafalski A: Cross-spe-cies amplification of soybean (Glycine max) simple sequencerepeats (SSRs) within the genus and other legume genera:implications for the transferability of SSRs in plants. MolecularBiology and Evolution 1998, 15:1275-1287.
38. Aranzana MJ, Pineda A, Cosson P, Dirlewanger E, Ascasibar J, CiprianiG, Ryder CD, Testolin R, Abbott A, King GJ, Iezzoni AF, Arús P: Aset of simple-sequence repeat (SSR) markers covering thePrunus genome. Theor Appl Genet 2003, 106:819-825.
39. Rae SJ, Aldam C, Dominuez I, Hoebrechts M, Barnes SR, Edwards KJ:Development and incorporation of microsatellite markersinto the linkage map of sugarbeet (Beta vulgaris spp.). TheorAppl Genet 2000, 100:1240-1248.
40. Saal B, Plieske J, Hu J, Quiros CF, Struss D: Microsatellite markersfor genome analysis in Brassica. II. Assignement of rapeseedmicrosatellites to the A and C genomes and genetic map-ping in Brassica oleracea L. Theor Appl Genet 2001, 102:695-699.
41. Tao YZ, Jordan DR, Henzell RG, McIntyre CL: Construction of agenetic map in a sorghum RIL population using probes fromdifferent sources and its comparison with other sorghummaps. Aust J Agric Res 1998, 49:729-736.
42. Humphry ME, Konduri V, Lambrides CJ, Magner T, McIntyre CL,Aitken EAB, Liu CJ: Development of a mungbean (Vigna radi-ata) RFLP linkage map and its comparison with lablab (Lab-lab purpureus) reveals a high level of colinearity between thetwo genomes. Theor Appl Genet 2002, 105:160-166.
Page 18 of 19(page number not for citation purposes)

BMC Plant Biology 2003, 3 http://www.biomedcentral.com/1471-2229/3/9
Publish with BioMed Central and every scientist can read your work free of charge
"BioMed Central will be the most significant development for disseminating the results of biomedical research in our lifetime."
Sir Paul Nurse, Cancer Research UK
Your research papers will be:
available free of charge to the entire biomedical community
peer reviewed and published immediately upon acceptance
cited in PubMed and archived on PubMed Central
yours — you keep the copyright
Submit your manuscript here:http://www.biomedcentral.com/info/publishing_adv.asp
BioMedcentral
43. Diwan N, Bouton JH, Kochert G, Cregan PB: Mapping of simplesequence repeat (SSR) DNA markers in diploid and tetra-ploid alfalfa. Theor Appl Genet 2000, 101:165-172.
44. Ma CX, Casella G, Shen ZJ, Osborn TC, Wu R: A unified frame-work for mapping quantitative trait loci in bivalent tetra-ploids using single-dose restriction fragments: a case studyfrom alfalfa. Genome Res 2002, 12:1974-1981.
45. McCoy TJ, Bingham ET: Cytology and cytogenetics of alfalfa. In:Alfalfa and alfalfa improvement, ASA-CSSA-SSSA Agronomy monograph 29,Madison, USA 1988:737-776.
46. Eujayl I, Sledge MK, Wang L, May GD, Chekhovskiy , Zwonitzer JC,Mian MAR: Medicago truncatula EST-SSRs reveal cross-spe-cies genetic markers for Medicago spp. Theor Appl Genet 2003 inpress.
47. Blondon F, Marie D, Brown S, Kondorosi A: Genome size and basecomposition in Medicago sativa and M. truncatula species.Genome 1994, 37:264-270.
48. Guines F, Julier B, Ecalle C, Huyghe C: Genetic control of qualitytraits of lucerne (Medicago sativa L.). Austr J Agric Res 2000,53:401-407.
49. Dellaporta SL, Wood J, Hicks JB: A plant DNA minipreparation:VersionII. Plant Mol Biol Rep 1983, 1:19-21.
50. Vos P, Hogers R, Bleeker M, van de Lee T, Hornes M, Frijters A, PotJ, Peleman J, Kuiper M, Zabeau M: AFLP: A new technique forDNA fingerprinting. Nucleic Acids Res 1995, 23:4407-4414.
51. Bassam BJ, Caetano-Anolles G, Gresshoff PM: Fast and sensitivesilver staining of DNA in polyacrylamide gels. Anal Biochem1991, 19:680-683.
Page 19 of 19(page number not for citation purposes)
Copyright © 2022 FDOKUMEN