Consommation chronique d'alcool, exercice physique et tissu ...
356
HAL Id: tel-00789948 https://tel.archives-ouvertes.fr/tel-00789948 Submitted on 19 Feb 2013 HAL is a multi-disciplinary open access archive for the deposit and dissemination of sci- entific research documents, whether they are pub- lished or not. The documents may come from teaching and research institutions in France or abroad, or from public or private research centers. L’archive ouverte pluridisciplinaire HAL, est destinée au dépôt et à la diffusion de documents scientifiques de niveau recherche, publiés ou non, émanant des établissements d’enseignement et de recherche français ou étrangers, des laboratoires publics ou privés. Consommation chronique d’alcool, exercice physique et tissu osseux : modifications densitométriques, architecturales, biomécaniques et métaboliques chez le rat Delphine Maurel To cite this version: Delphine Maurel. Consommation chronique d’alcool, exercice physique et tissu osseux : modifications densitométriques, architecturales, biomécaniques et métaboliques chez le rat. Médecine humaine et pathologie. Université d’Orléans, 2011. Français. NNT : 2011ORLE2073. tel-00789948
-
Upload
khangminh22 -
Category
Documents
-
view
0 -
download
0
Transcript of Consommation chronique d'alcool, exercice physique et tissu ...
HAL Id: tel-00789948https://tel.archives-ouvertes.fr/tel-00789948
Submitted on 19 Feb 2013
HAL is a multi-disciplinary open accessarchive for the deposit and dissemination of sci-entific research documents, whether they are pub-lished or not. The documents may come fromteaching and research institutions in France orabroad, or from public or private research centers.
L’archive ouverte pluridisciplinaire HAL, estdestinée au dépôt et à la diffusion de documentsscientifiques de niveau recherche, publiés ou non,émanant des établissements d’enseignement et derecherche français ou étrangers, des laboratoirespublics ou privés.
Consommation chronique d’alcool, exercice physique ettissu osseux : modifications densitométriques,
architecturales, biomécaniques et métaboliques chez lerat
Delphine Maurel
To cite this version:Delphine Maurel. Consommation chronique d’alcool, exercice physique et tissu osseux : modificationsdensitométriques, architecturales, biomécaniques et métaboliques chez le rat. Médecine humaine etpathologie. Université d’Orléans, 2011. Français. NNT : 2011ORLE2073. tel-00789948
1
UNIVERSITÉ D’ORLÉANS
ÉCOLE DOCTORALE SCIENCES ET TECHNOLOGIES
LABORATOIRE INSERM U658
THÈSE présentée par
Delphine MAUREL
soutenue le 24 Novembre 2011
pour obtenir le grade de Docteur de l’université d’OrléansDiscipline : Biologie ostéoarticulaire, biomécanique et biomatériaux
Consommation chronique d’alcool, exercicephysique et tissu osseux : modifications
densitométriques, architecturales,biomécaniques et métaboliques chez le rat.
THÈSE dirigée par :Claude-Laurent BENHAMOU Professeur associé, INSERM /CHR OrléansNathalie BOISSEAU Professeur Université Blaise Pascal, Clermont-Fd
RAPPORTEURS :Serge FERRARI Professeur, Hôpital Universitaire de GenèveGeorges CARLE Directeur de Recherche, HDR, CNRS Nice
_______________________________________________________________________JURY
Claude-Laurent BENHAMOU Professeur associé, INSERM /CHR OrléansNathalie BOISSEAU Professeur Université Blaise Pascal, Clermont-FdSerge FERRARI Professeur, Hôpital Universitaire de GenèveGeorges CARLE Directeur de Recherche, HDR, CNRS NiceFrançoise PEYRIN Directeur de Recherche INSERM, Université LyonEdith FILAIRE Professeur, Université OrléansChristelle JAFFRE Maître de conférences, Université d’Orléans, co-
encadrante
, Présidente du jury

2

3
Remerciements
4
Ce travail a été mené au sein de l’unité Inserm U658 « Caractérisation du Tissu Osseux par
Imagerie : Techniques et Applications», à Orléans, dirigé par le Docteur Claude-Laurent
Benhamou. Ce projet a fait l’objet d’une bourse de thèse entièrement financée par la Région
Centre.
Je remercie le Dr Claude-Laurent Benhamou pour m’avoir accueilli dans son laboratoire
durant ces trois années, et pour m’avoir obtenu un financement pour effectuer cette thèse. Je le
remercie aussi de m’avoir permis de présenter mon travail dans de nombreux congrès, et pour
m’avoir guidé dans le monde de l’ostéocyte.
Je remercie le Pr Nathalie Boisseau, ma directrice de thèse, pour son soutien, son aide, sa
compréhension, et pour m’avoir guidée efficacement durant ces 3 ans.
Un grand merci au Dr Christelle Jaffré, mon encadrante de thèse, pour son aide concernant les
expérimentations, les analyses, les articles, etc. Merci de m’avoir épaulée depuis le Master et
m’avoir accompagnée durant tous mes oraux en congrès. Ce travail n’aurait pu se faire sans toi.
Merci à toi pour les financements que tu as obtenu auprès de l’IREB et de l’Université d’Orléans,
et qui ont permis d’assumer en grande partie les coûts de mes expérimentations.
Je tiens à remercier la Région Centre pour le financement de ce travail de thèse.
Merci à l’IREB pour son soutien financier, qui nous a permi de financer plusieurs
expérimentations.
Je remercie l’INSERM et son personnel pour leur aide concernant le financement des
expérimentations via la dotation annuelle et également Anne-Marie Hainaut pour son aide quant
aux frais de missions et autres documents à remplir pour les déplacements en congrès.
Merci à l’Ecole doctorale Sciences et Technologies d’Orléans de m’avoir formée sur la
communication scientifique, écrite et orale en français et en anglais grâce aux cours qu’elle met
en place. Merci également de m’avoir permis de partir en congrès à San Diego, grâce à une aide
financière conséquente.
5
Je remercie le Dr Georges Carle, Directeur de recherche au CNRS de Nice, et le Pr Serge
Ferrari d’avoir accepté d’être rapporteurs de ma thèse.
Je remercie le Dr Françoise Peyrin, Directeur de recherche au laboratoire CREATIS (Unités
INSERM U1044 et CNRS 5220) et le Pr Edith Filaire, d’avoir accepté de faire parti du jury de
ma soutenance de doctorat.
Merci au chevalier Dr Stéphane Pallu, alias Stéfano, alias Aragorn, pour ton aide, tes conseils,
tes expressions hors du commun. Tu es à la fois un bon chercheur et aussi quelqu’un sur qui on
peut compter pour se confier, et également pour détendre l’atmosphère. Tu as créé la
communauté de l’anneau au labo et ça nous a tous fait bien rigoler ! Merci aussi de m’avoir
permis d’aller avec toi au Synchrotron. Je garderai un souvenir impérissable de nos parties de
Risk…. Merci pour ton agréable compagnie en congrès.
Merci au Dr Gaël Y Rochefort pour son aide scientifique en microscopie, en biologie, pour tes
cours de PCR pour les nuls, pour ton aide sur la relecture des articles, des abstracts, des
demandes de bourses, et de ma thèse.
Je tiens à remercier les Dr Hélène Beaupied et Dr Armelle Basillais pour m’avoir expliqué les
fonctionnements de la presse mécanique et du µCT à mon arrivée au laboratoire en 2008. Merci
de m’avoir encadré sur ces appareils et rendu autonome pour la suite de mon travail.
Merci au Pr Chantal Pichon d’avoir accepté de relire mon article sur l’ostéocyte avec attention,
et pour nous avoir permis d’utiliser votre plateforme de microscopie au Centre de Biologie
Moléculaire du CNRS d’Orléans.
Merci à David Gosset, ingénieur au CBM d’Orléans, responsable de la plateforme de
microscopie du CBM, pour son aide en microscopie confocale et pour la reconstruction de mes
images en 3D.
Je remercie le Pr Rustem Uzbekov, du département des microscopies de la faculté de médecine
de Tours, pour ses images magnifiques en microscopie électronique en transmission, ainsi que
pour la coloration de nos échantillons au bleu de toluidine.
6
Merci au Dr Brigitte Arbeille pour avoir accepté de collaborer avec notre laboratoire en partie
sur mon travail, et pour nous avoir éclairé de votre savoir lors de réunions au sein de votre
laboratoire.
Merci au Pr Nick L Fazzalari, pour m’avoir conseillé sur l’analyse de mes paramètres osseux,
pour m’avoir relu et corrigé scientifiquement mes articles et pour avoir accepté de discuter avec
moi sur les valeurs et la rigueur nécessaire à la Recherche scientifique. Merci de vous être mis à
ma portée et d’avoir égaillé nos journées avec votre bonne humeur durant une année.
Je remercie Isabelle Ingrand, méthodologiste et biostatisticienne de l’Université de Poitiers,
pour l’analyse des résultats de l’étude 1 et pour vos nombreuses explications par téléphone et par
e-mail sur les plans expérimentaux en statistiques.
Je remercie le Dr Claude Tallineau, responsable médical de l’UM de biochimie générale et
d’urgence à Poitiers, pour avoir réalisé gratuitement des dosages biologiques pour nous au sein
de votre unité.
Je remercie le Dr Patrick Michenet et Mr Jean-Claude Beaubois, membres du laboratoire
d’anatomie pathologique et cytogénétique du CHR d’Orléans, pour leur collaboration concernant
la coloration des foies de mes animaux et Mlle Charlotte Bouchy, interne dans ce service, pour
le temps qu’elle a passé avec nous à examiner nos lames.
Merci au Dr Sophie Bréban, qui ne l’était pas encore quand nous nous sommes connues au
laboratoire, qui m’a épaulée et guidée en grande sœur dans la recherche comme à Palaf !!
J’appréciais ta bonne humeur et ton dynamisme et tu m’as manqué après ton départ.
Merci au futur Dr Arnaud Boudenot alias Arnix, pour ton aide en informatix, en bureautix…
Merci pour m’avoir donné ton avis sur mes posters, mes présentations orales, et pour nos
discussions scientifiques. Merci aussi pour tes goûts musicaux proches des miens (Vive Edith
Piaf et Goldman…) et pour me sentir moins seule en tant que Loir-et-Chérienne ! Vive
Clénord…. !
Je remercie Eric Dolléans pour son aide pour disséquer mes nombreux animaux : tu manies le
rasoir comme personne …! Si au début tes kata dans le couloir m’impressionnaient, tu es
rapidement devenu notre mascotte. Qui d’autre nous aurait rappelé qu’il est 12h02 et qu’il est
7
l’heure d’aller manger !! Ton doctorat en astrologie me fut grandement utile quand tu m’as prédit
que 2011 était l’année de la Vierge et du Taureau !
Je remercie Mlle Priscilla C. Aveline pour m’avoir montré comment faire des immuno-
marquages, pour avoir travaillé sur certains de mes marquages le week-end et pour ses muffins et
ses carambars!
J’aimerais remercier tout particulièrement Mr Philippe Moreau, technicien de l’animalerie du
laboratoire de neurosciences d’Orléans, pour m’avoir montré comment s’occuper des rats, et
pour m’avoir expliqué comment fonctionne une animalerie conventionnelle. J’aimerais aussi le
remercier pour sa gentillesse et pour nos conversations matinales durant deux ans.
Merci à Mr Gérard Noyer, responsable de l’atelier mécanique de la faculté des Sciences, et à
son équipe, pour leur aide concernant la maintenance du tapis roulant.
Merci au Dr Delphine Benaitreau, post-doctorante au laboratoire, pour ses explications sur les
dosages protéiques et glucidiques et pour ses recettes bio. Je pensais qu’il n’était pas possible
d’être plus à fond dans la communauté de l’anneau que ne l’est Stéphane, mais tu m’as démontré
le contraire ! Reine du casse-tête chinois, tu maîtrises le Rubik’s cube et les aiguilles comme
personne !
Zahrix, merci pour ton soutien au quotidien et pour tes paroles rassurantes. Je te souhaite du
courage pour la suite, mais c’est l’année de la Vierge, ne l’oublie pas !
Merci au Dr Eric Lespessailles pour sa gentillesse au quotidien, pour ses conseils pour mes
présentations orales et pour m’avoir financé certaines manips et congrès grâce à l’IPROS.
Un grand merci à Farida pour ses pâtisseries exquises, son thé à la menthe divin, sa gentillesse et
pour nos discussions du midi, à Domitelle, pour sa pêche, et pour toutes les commandes qu’elle a
réussi à me passer en France comme en Chine, à Nathalie, Sabrina (merci pour le rat, pour ta
gentillesse et pour les réservations de billets à la dernière minute !), Corine, Christelle L.,
Béatrice, pour leur gentillesse au quotidien. Grâce à vous je suis venue travailler au laboratoire
avec le sourire durant trois ans. Merci au Dr Sylvie Loiseau-Peres pour avoir accepté de
m’ausculter quand je ne tenais plus debout un soir d’hiver et pour m’avoir soigné efficacement
contre la grippe A !
8
Merci aux collègues qui sont passés par le labo pendant ma thèse, et qui ont égayé notre
quotidien : Montasser, le Mme Doubtfire du labo et pro de l’impro, Amine, la gentille Mouna,
Faika, Sakina (merci pour les commandes de seringues), Annamarija (pour tes questions supra
intelligentes qui nous ont forcé à se casser la tête pour y répondre), Yessine, et Clotilde.
Je remercie les élèves et étudiantes qui sont passées par le laboratoire, avec lesquelles j’ai eu le
privilège de travailler et que j’ai pu encadrer : Carine Tournier, Camille Viala, et Leila
Khacef.
Dans un dernier temps, j’aimerais remercier mes proches pour leur soutien. Tout d’abord mes
parents, sans qui je ne serais pas arrivée jusque là. Merci pour m’avoir inculqué que dans la vie,
on n’a rien sans effort et qu’il ne faut pas envier les autres, mais travailler pour arriver à nos
objectifs. Merci pour votre amour et votre soutien financier durant toutes ces années. Je vous
dédie ce travail.
Et enfin, merci à Pat pour sa compréhension et son soutien au quotidien.
9
Liste des publications et communications sur lesujet
Articles acceptés dans une revue internationale avec comité de lecture :
Maurel DB, Boisseau N, Ingrand I, Dolleans E, Benhamou CL, Jaffré C. Combined effects ofchronic alcohol consumption and physical activity on bone health. Study in a rat model.European Journal of Applied Physiology (2011), 111(12):2931-40.
Maurel DB, Jaffré C, Rochefort GY, Aveline PC, Boisseau N, Uzbekov R, Gosset D, Pichon C,Fazzalari NL, Pallu S*, Benhamou CL*. Osteocyte apoptosis plays a key role in alcohol-inducedosteoporosis. Bone, 2011; 49: 543–552.
Maurel DB, Boisseau N, Benhamou CL*, Jaffré C*. Alcohol and bone: Review of dose effectsand mechanisms. Osteoporosis International (2011). Sous presse.
Maurel DB, Boisseau N, Benhamou CL, Jaffré C. Cortical bone is more sensitive to alcoholdose effects than trabecular bone in the rat. Accepté dans Joint Bone Spine, Octobre 2011.
Articles soumis dans une revue internationale avec comité de lecture :
Maurel DB, Pallu S, Jaffré C, Fazzalari NL, Boisseau N, Uzbekov R, Benhamou CL, RochefortGY. Bone steatosis and osteocyte apoptosis as mechanisms of alcohol-induced osteoporosis.Soumis dans Alcohol & Alcoholism, Octobre 2011.
Maurel DB, Boisseau N, Pallu S, Rochefort GY, Benhamou CL*, Jaffré C*. Regular exerciseprevents alcohol induced osteoporosis and osteocyte apoptosis in rats. Soumis au Medicine andScience in Sports & Exercise, Septembre 2011.
Maurel DB, Uzbekov R, Aveline PC, Pallu S, Benhamou CL, Rochefort GY. Osteocyte primarycilium and centriole: mechanotransduction structures imaged by transmission electronmicroscopy. Soumis dans Microscopy and Microanalysis, Octobre 2011.
Pallu S, Rochefort GY, Jaffre C, Refregiers M, Maurel DB, Benaitreau D, Lespessailles E,Jamme F, Chappard C, Benhamou CL. Synchrotron ultraviolet microspectroscopy on rat corticalbone: characterization of the osteocyte and its environment. Soumis à PNAS, Octobre 2011.
Communications orales lors de congrès et symposium :
Maurel DB, Boisseau N, Benhamou CL, Jaffré C. Alcoolisme et exercice physique : effets d’uneconsommation chronique d’alcool sur le contenu minéral osseux, la masse osseuse, l’architectureosseuse et le métabolisme osseux chez le rat. Institut de Recherche Scientifique sur les Boissons(IREB), Paris, Décembre 2008.
10
Maurel DB, Boisseau N, Dolleans E, Benhamou CL, Jaffré C. Alcoholism and exercise: effectsof chronic alcohol consumption on bone mineral content, density, bone micro architecture andbone remodelling in the rat. European Society for Biomedical Research on Alcoholism(ESBRA), Helsinki, Finlande, Juin 2009.> Travel Award.
Maurel DB, Boisseau N, Pallu S, Rochefort GY, Dolleans E, Benhamou CL, Jaffré C. Alcoholconsumption: A risky behaviour for bone health. International Society for Biomedical Researchon Alcoholism (ISBRA), Paris, Septembre 2010.
Maurel DB, Pallu S, Aveline PC, Boisseau N, Rochefort GY, Dolleans E, Jaffré C, BenhamouCL. Diminution de l’ostéoformation dans l’ostéoporose d’origine alcoolique : rôle de l’ostéocytedans un modèle murin. Société Française de Rhumatologie (SFR), Paris, Décembre 2010.
Maurel DB, Jaffré C, Fazzalari NL, Uzbekov R, Boisseau N, Rochefort GY, Pallu S, BenhamouCL. Bone loss in alcohol abuse is associated with osteocyte apoptosis, bone marrow and micro-vessels fat incorporation. European Society for Biomedical Research on Alcoholism (ESBRA),Vienne, Autriche, Septembre 2011.> Proceeding dans Alcohol and Alcoholism (2011), 46 (1): O5.3 p. i32.
Communications affichées lors de congrès et symposium :
Maurel DB, Rochefort GY, Boisseau N, Benhamou CL, Jaffré C. Bone micro-architecture,mineral density and content in rats femurs after a period of chronic alcohol abuse. InternationalBone Densitometry Workshop (IBDW), Foggia, Italy, Juin 2008.
Maurel DB, Rochefort GY, Boisseau N, Lespessailles E, Benhamou CL, Jaffré C. Bonemetabolism, micro-architecture and densitometric measurement in rat femur after chronic alcoholconsumption. American Society for Bone and Mineral Research (ASBMR), Montreal, Septembre2008.> Proceeding dans JBMR 2008, M239-S432.
Maurel DB, Boisseau N, Dolleans E, Pallu S, Rochefort GY, Benhamou CL, Jaffré C. Influencede différentes doses d’alcool sur le contenu, la densité minérale osseuse, et la microarchitectureosseuse chez le rat. Journées Françaises de Biologie des Tissus Minéralisés (JFBTM), Nice, Mars2009.
Maurel DB, Boisseau N, Benhamou CL, Jaffré C. Influence of endurance training on boneparameters in alcoholised rats. Pharmacologie, Physiologie et Thérapeuthique (P2T), Marseille,Avril 2009.
Maurel DB, Boisseau N, Dolleans E, Benhamou CL, Jaffré C. Beneficial effects of physicalactivity on bone loss induced by chronic alcoholism. International Society for BiomedicalResearch on Alcoholism (ISBRA), Paris, Septembre 2010.> Proceeding dans Alcoholism : Clinical and Experimental Research, Supplément Août 2010,Vol 34 (8).
Maurel DB, Jaffré C, Dolleans E, Boisseau N, Benhamou CL. Combined effects of exercise andalcohol on bone status in rats. American Society for Bone and Mineral Research (ASBMR),Toronto, Octobre 2010.
11
> Proceeding dans JBMR
Maurel DB, Pallu S, Aveline PC, Boisseau N, Rochefort GY, Dolleans E, Jaffré C, BenhamouCL. Impact of chronic alcohol consumption on the osteocytes and bone marrow adipocytes in awistar rat model. American Society for Bone and Mineral Research (ASBMR), Toronto, Octobre201> Proceeding dans JBMR
Maurel DB, Jaffré C, Boisseau N, Benhamou CL. Exercise prevents the alcohol-induced boneloss in the rat. European Congress of Clinical and Economic aspects of Osteoporosis (ECCEO),Valence, Mars 2011.
Maurel DB, Pallu S, Aveline PC, Boisseau N, Rochefort GY, Jaffré C, Benhamou CL.Secondary alcohol-induced osteoporosis is linked to osteocyte apoptosis and bone fat excess.European Congress of Clinical and Economic aspects of Osteoporosis (ECCEO), Valence, Mars2011.
Maurel DB, Jaffré C, Aveline PC, Boisseau N, Benhamou CL, Pallu S. L’ostéoporose d’originealcoolique est liée à une augmentation de l’apoptose des ostéocytes chez le rat. JournéesFrançaises de Biologie des Tissus Minéralisés (JFBTM), Paris, Mai 2011.
Maurel DB, Pallu S, Jaffré C, Fazzalari NL, Uzbekov R, Rochefort GY, Benhamou CL. Bonesteatosis and osteocyte apoptosis in alcohol-induced osteoporosis. American Society for Boneand Mineral Research (ASBMR), San Diego, USA, Septembre 2011.> Travel Award.
12
Sommaire
Remerciements ................................................................................................................................ 3
Liste des publications et communications sur le sujet .................................................................... 9
Sommaire ...................................................................................................................................... 12
Liste des abréviations .................................................................................................................... 17
Liste des figures ............................................................................................................................ 20
Liste des tableaux .......................................................................................................................... 22
Introduction ................................................................................................................................... 23
Revue de littérature ....................................................................................................................... 26I. LE TISSU OSSEUX ......................................................................................................... 27
A. Composition .................................................................................................................. 271. Généralités................................................................................................................. 272. L’os compact ou cortical ........................................................................................... 283. L’os trabéculaire ou spongieux ................................................................................. 29
B. Composition du tissu osseux ......................................................................................... 291. La matrice organique................................................................................................. 292. La partie minérale...................................................................................................... 30
C. Les cellules osseuses ..................................................................................................... 301. La lignée ostéoclastique ............................................................................................ 312. La lignée ostéoblastique ............................................................................................ 32
a) Les cellules bordantes ........................................................................................... 32b) Les ostéoblastes..................................................................................................... 33c) Les ostéocytes ....................................................................................................... 34 Morphologie ...................................................................................................... 35 Origine des ostéocytes....................................................................................... 36 Rôles de l’ostéocyte .......................................................................................... 37
D. Le remodelage osseux ................................................................................................... 391. Concept...................................................................................................................... 392. Régulation du remodelage......................................................................................... 40
a) Les facteurs systémiques ....................................................................................... 41b) Les facteurs centraux............................................................................................. 45c) Les facteurs locaux................................................................................................ 48
II. TECHNIQUES D’EVALUATION DU TISSU OSSEUX ............................................... 55A. Caractérisation quantitative de la masse et de la densité osseuses................................ 55
1. Dual X-ray Absorptiométrie (DXA) ......................................................................... 552. Tomographie quantitative périphérique (pQCT)....................................................... 56
B. Caractérisation structurale............................................................................................. 561. L’histomorphométrie................................................................................................. 572. Radiographie ............................................................................................................. 583. Imagerie par résonance magnétique (IRM)............................................................... 584. Micro tomographie à rayons X (µCT) ...................................................................... 595. Synchrotron ............................................................................................................... 61
C. Caractérisation biomécanique ....................................................................................... 631. Ultrasons.................................................................................................................... 63
13
2. Tests de flexion ......................................................................................................... 64D. Caractéristiques biochimiques....................................................................................... 65
III. PERTE OSSEUSE ET OSTEOPOROSE ..................................................................... 68A. Ostéopénie physiologique ............................................................................................. 68B. Ostéoporose................................................................................................................... 70
1. Définition .................................................................................................................. 702. Epidémiologie ........................................................................................................... 703. L’ostéoporose primitive ............................................................................................ 714. Les ostéoporoses secondaires.................................................................................... 71
IV. ALCOOL ET PARAMETRES OSSEUX..................................................................... 73A. Métabolisme de l’alcool ................................................................................................ 73
1. Métabolisme .............................................................................................................. 732. Effets potentiels des métabolites de l’alcool ............................................................. 743. Polymorphisme génétique ......................................................................................... 754. Interactions entre hormones gonadiques et métabolisme hépatique de l’alcool ....... 765. Système nerveux central............................................................................................ 76
B. Effets de l’alcool sur le métabolisme osseux : quelles doses pour quels effets ? ......... 771. Consommation modérée............................................................................................ 77
a) Densité minérale osseuse ...................................................................................... 77b) Remodelage osseux ............................................................................................... 78
2. Consommation excessive .......................................................................................... 79a) Densité minérale osseuse ...................................................................................... 79b) Microarchitecture .................................................................................................. 80c) Remodelage osseux ............................................................................................... 80d) Résistance osseuse et fractures.............................................................................. 81e) Abstinence............................................................................................................. 83
3. Le binge drinking (intoxications alcooliques aigues et répétées) ............................. 83C. Mécanismes d’action de l’alcool sur l’os ...................................................................... 85
1. Actions indirectes ...................................................................................................... 85a) Composition corporelle ......................................................................................... 85b) Système nerveux central........................................................................................ 86c) Leptine................................................................................................................... 87d) Vitamine D et PTH................................................................................................ 88e) Calcitonine ............................................................................................................ 89f) Stéroïdes sexuels ................................................................................................... 89g) Minéraux et Ions.................................................................................................... 89
2. Effets directs de l’alcool sur l’os............................................................................... 90a) Ostéoblastes et ostéoclastes................................................................................... 90b) Ostéocytes ............................................................................................................. 92c) Stress oxydatif ....................................................................................................... 93d) Voie de signalisation Wnt ..................................................................................... 93
V. EXERCICE PHYSIQUE ET OS....................................................................................... 97A. Effets de l’exercice physique sur le métabolisme osseux ............................................. 97
1. CMO et DMO............................................................................................................ 972. Microarchitecture ...................................................................................................... 983. Effets sur le remodelage osseux ................................................................................ 994. Effets du type de pratique........................................................................................ 1005. Effets de l’âge, du statut menstruel et du sexe ........................................................ 1016. Effets de l’exercice sur la résistance osseuse .......................................................... 1027. Limites de l’exercice physique sur l’anabolisme osseux ........................................ 103
B. Mécanismes d’action de l’exercice physique sur l’os ................................................. 1041. La théorie du mécanostat de Frost........................................................................... 1042. Relation muscle - os ................................................................................................ 105
14
3. Effet de l’exercice sur les hormones gonadotropes, somatotropes, corticotropes et surles adipokines .................................................................................................................. 105
a) Axe somatotrope ................................................................................................. 106 La GH.............................................................................................................. 106 L’IGF-I ............................................................................................................ 106
b) Axe gonadotrope chez l’homme ......................................................................... 107 La testostérone................................................................................................. 107
c) Axe gonadotrope chez la femme......................................................................... 107d) Axe corticotrope : le cortisol ............................................................................... 108e) Hormones calciotropes ........................................................................................ 108 La vitamine D.................................................................................................. 109 La PTH ............................................................................................................ 109 La calcitonine .................................................................................................. 109
f) Adipokines .......................................................................................................... 110 La leptine......................................................................................................... 110 L’adiponectine................................................................................................. 110
C. Consommation d’alcool chez les sportifs.................................................................... 1111. Généralités............................................................................................................... 1112. Effets sur l’os .......................................................................................................... 112
Nos hypothèses et objectifs ......................................................................................................... 114I. Introduction ..................................................................................................................... 115II. Développement des hypothèses et objectifs dans les différentes études......................... 116
A. Etude 1......................................................................................................................... 116B. Etude 2......................................................................................................................... 116C. Etude 3......................................................................................................................... 117D. Etude 4......................................................................................................................... 117E. Etude 5......................................................................................................................... 118
Matériels et méthodes.................................................................................................................. 119I. Les animaux .................................................................................................................... 120II. Le protocole d’alcoolisation............................................................................................ 120III. Protocole d’entraînement sur tapis roulant.................................................................. 122IV. Mesures in vivo............................................................................................................ 124
A. Absorptiométrie biphotonique..................................................................................... 1241. Principe de l’absorptiométrie biphotonique ............................................................ 1242. Mesure de la composition corporelle ...................................................................... 1253. Mesure de la DMO et du CMO............................................................................... 126
V. Mesures ex vivo .............................................................................................................. 126A. Les os........................................................................................................................... 126B. Le sang et les muscles ................................................................................................. 127C. Mesure de la microarchitecture osseuse...................................................................... 127D. Macroarchitecture........................................................................................................ 134E. Mesures biomécaniques .............................................................................................. 135F. Dosages hormonaux et métaboliques .......................................................................... 138G. Analyse cellulaire par microscopie ............................................................................. 140
1. Microscopie en épifluorescence .............................................................................. 1412. Microscopie en fond clair de l’os cortical ............................................................... 1433. Microscopie électronique en transmission .............................................................. 1454. Microscopie confocale ............................................................................................ 146
VI. Statistiques .................................................................................................................. 148
15
ETUDE 1 : EFFETS COMBINES D’UNE CONSOMMATION CHRONIQUE ET MODEREED’ALCOOL ET DE L’EXERCICE PHYSIQUE SUR LE METABOLISME OSSEUX CHEZ LERAT............................................................................................................................................. 149
I. Introduction ..................................................................................................................... 150II. Objectif étude 1 ............................................................................................................... 150III. Méthodologie spécifique ............................................................................................. 150IV. Résultats de l’étude 1 .................................................................................................. 151
A. Apports hydriques et énergétiques .............................................................................. 151B. Densité osseuse et composition corporelle.................................................................. 152
1. Composition corporelle ........................................................................................... 1522. Contenu minéral osseux et densité .......................................................................... 152
C. Microarchitecture de l’os trabéculaire du fémur ......................................................... 153D. Microarchitecture de l’os cortical du fémur ................................................................ 153E. Propriétés biomécaniques du fémur ............................................................................ 153F. Remodelage osseux ..................................................................................................... 154
V. Discussion ....................................................................................................................... 154
Article 1....................................................................................................................................... 156
ETUDE 2 : EFFETS DE 3 DIFFERENTES DOSES D’ALCOOL SUR LES PARAMETRESOSSEUX CHEZ LE RAT ........................................................................................................... 167
I. Introduction ..................................................................................................................... 168II. Objectif............................................................................................................................ 168III. Protocole spécifique .................................................................................................... 168IV. Résultats ...................................................................................................................... 169
A. Consommations de boisson et de nourriture calculées sur les 4 derniers week-ends . 169B. Evolution du CMO, de la DMO et de la composition corporelle ............................... 171
Composition corporelle ................................................................................................... 172CMO et DMO.................................................................................................................. 172
C. Microarchitecture trabéculaire .................................................................................... 172D. Microarchitecture corticale ......................................................................................... 172E. Caractéristiques biomécaniques du fémur................................................................... 176F. Marqueurs de formation, résorption osseuse et leptine............................................... 176G. Corrélations ................................................................................................................. 177
V. Discussion ....................................................................................................................... 178
Article 2....................................................................................................................................... 180
ETUDE 3 : EFFETS D’UNE FORTE ALCOOLISATION CHRONIQUE SUR L’OSTEOCYTECHEZ LE RAT............................................................................................................................ 189
I. Introduction ..................................................................................................................... 190II. Objectif étude 3 ............................................................................................................... 190III. Méthodologie spécifique ............................................................................................. 190IV. Résultats ...................................................................................................................... 191
A. Coupes histologiques du foie ...................................................................................... 191B. DMO, composition corporelle et dosages biochimiques ............................................ 192C. Microarchitecture trabéculaire et corticale.................................................................. 192D. Biochimie .................................................................................................................... 193E. Immunomarquages avec les anticorps Caspase-3, CD44, ostéocalcine et collagène 1194F. Morphologie des lacunes ostéocytaires et gouttelettes lipidiques dans la moelleosseuse................................................................................................................................. 195G. Morphologie 2D des ostéocytes .................................................................................. 197H. Morphologie 3D des ostéocytes (microscopie confocale) .......................................... 198
V. Discussion ....................................................................................................................... 199
16
Article 3....................................................................................................................................... 201
ETUDE 4 : RELATION ENTRE ADIPOSITE MEDULLAIRE, DMO ET APOPTOSE DESOSTEOCYTES. .......................................................................................................................... 212
I. Introduction ..................................................................................................................... 213II. Objectif de l’étude 4 ........................................................................................................ 213III. Méthodologie spécifique ............................................................................................. 213IV. Résultats ...................................................................................................................... 213V. Discussion ....................................................................................................................... 215
Article 4....................................................................................................................................... 218
ETUDE 5 : ANALYSE DES EFFETS COMBINES D’UN ENTRAINEMENT ET D’UNECONSOMMATION EXCESSIVE D’ALCOOL SUR LE METABOLISME OSSEUX ET LESOSTEOCYTES CHEZ LE RAT. ................................................................................................ 246
I. Introduction ..................................................................................................................... 247II. But de l’étude .................................................................................................................. 247III. Méthodologie spécifique ............................................................................................. 247IV. Résultats ...................................................................................................................... 249
A. Consommation quotidienne : boisson et nourriture .................................................... 249B. Densité, contenu minéral osseux et composition corporelle ....................................... 249C. Paramètres de microarchitecture trabéculaire ............................................................. 251D. Paramètres de macroarchitecture et microarchitecture corticale................................. 252E. Paramètres biomécaniques .......................................................................................... 252F. Paramètres biochimiques............................................................................................. 252G. Apoptose des ostéocytes.............................................................................................. 255H. Corrélations ................................................................................................................. 255
V. Discussion ....................................................................................................................... 256
Article 5....................................................................................................................................... 257
Discussion ................................................................................................................................... 290
Conclusion et perspectives .......................................................................................................... 296
Bibliographie ............................................................................................................................... 300
Annexe ........................................................................................................................................ 338
17
Liste des abréviations
ADH Alcool déshydrogénase
AETQ Apport énergétique total quotidien
ALDH Aldéhyde déshydrogénase
ALP Phosphatase alcaline
BFR Bone formation rate
BMU Unité de modelage osseux
BSAP Phosphatase alcaline spécifique à l’os
BSP Bone sialoprotein
BS/TV Surface osseuse dans le volume de tissu osseux
BV/TV Fraction volumique d’os trabéculaire
Ca Calcium
CD44 Cluster de différenciation 44
CMO Contenu minéral osseux
COL 1 Collagène 1
CSA Cross-sectional area
CSF Facteurs stimulant les colonies
CSM Cellules souches mésenchymateuses
CT Calcitonine
Ct.Po Porosité corticale
Ct.Th Epaisseur de l’os cortical
CTx Telopeptide C-terminal du collagène de type I
Cx 43 Connexine 43
CYP2E1 Cytochrome P450 2E1
DA Degré d’anisotropie
DAPI 4,6 diamidino-2-phenylindole
DKK1 Dickkopf 1
DMO Densité minérale osseuse
DMP1 Dentin matrix protein 1
DPD/DPYR Deoxypyridinoline
DXA Absorptiométrie biphotonique à rayons X
EDTA Acide éthylène diamine tétracétique
ELISA Enzyme-linked Immunosorbent Assay
FITC Fluoresceine
FSH Hormone folliculo-stimulante
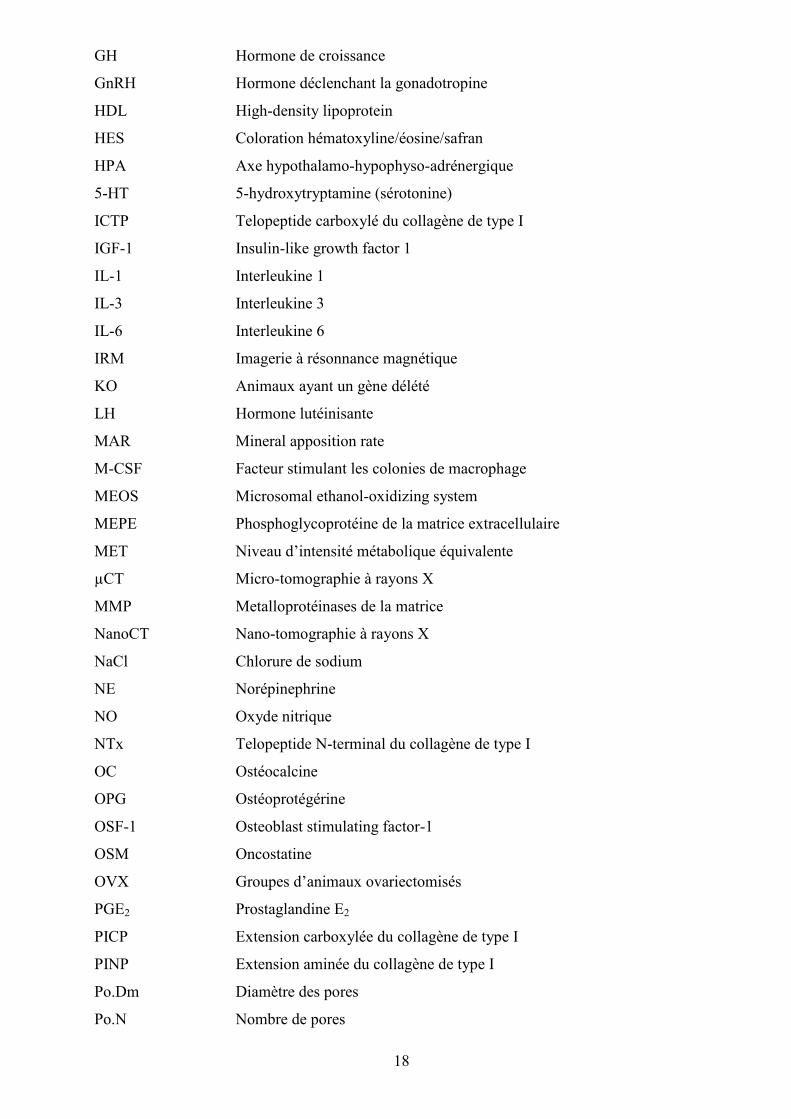
18
GH Hormone de croissance
GnRH Hormone déclenchant la gonadotropine
HDL High-density lipoprotein
HES Coloration hématoxyline/éosine/safran
HPA Axe hypothalamo-hypophyso-adrénergique
5-HT 5-hydroxytryptamine (sérotonine)
ICTP Telopeptide carboxylé du collagène de type I
IGF-1 Insulin-like growth factor 1
IL-1 Interleukine 1
IL-3 Interleukine 3
IL-6 Interleukine 6
IRM Imagerie à résonnance magnétique
KO Animaux ayant un gène délété
LH Hormone lutéinisante
MAR Mineral apposition rate
M-CSF Facteur stimulant les colonies de macrophage
MEOS Microsomal ethanol-oxidizing system
MEPE Phosphoglycoprotéine de la matrice extracellulaire
MET Niveau d’intensité métabolique équivalente
µCT Micro-tomographie à rayons X
MMP Metalloprotéinases de la matrice
NanoCT Nano-tomographie à rayons X
NaCl Chlorure de sodium
NE Norépinephrine
NO Oxyde nitrique
NTx Telopeptide N-terminal du collagène de type I
OC Ostéocalcine
OPG Ostéoprotégérine
OSF-1 Osteoblast stimulating factor-1
OSM Oncostatine
OVX Groupes d’animaux ovariectomisés
PGE2 Prostaglandine E2
PICP Extension carboxylée du collagène de type I
PINP Extension aminée du collagène de type I
Po.Dm Diamètre des pores
Po.N Nombre de pores
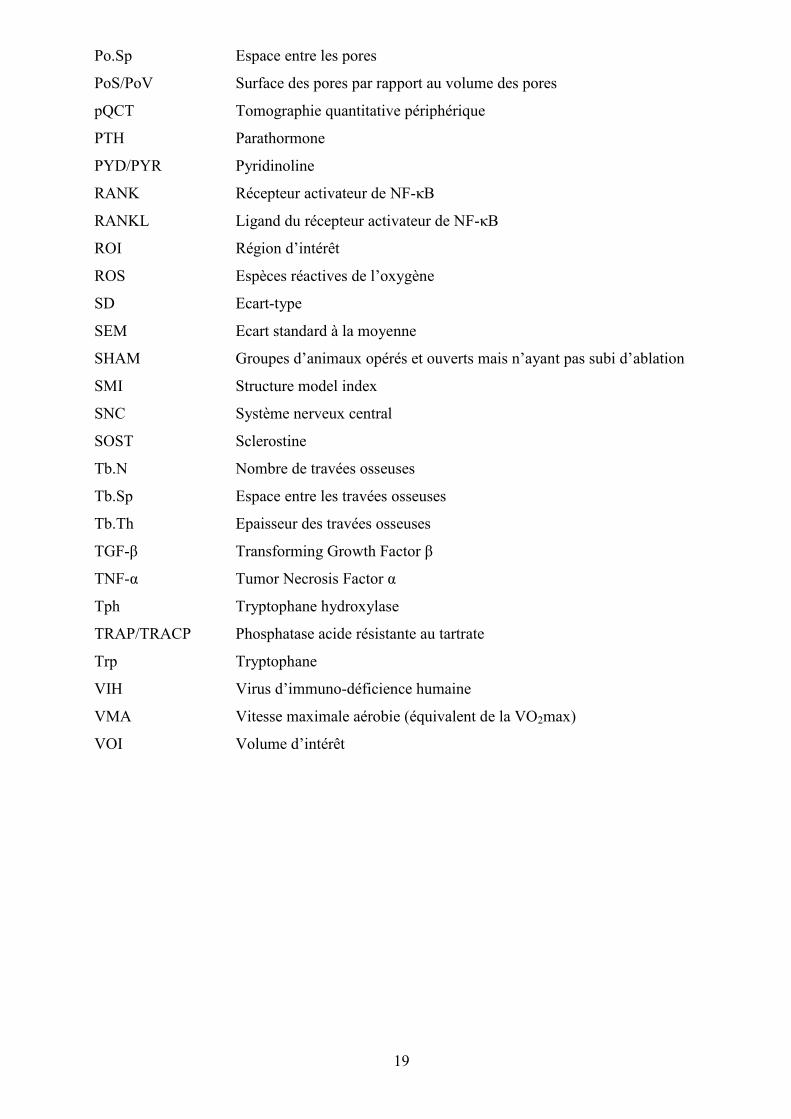
19
Po.Sp Espace entre les pores
PoS/PoV Surface des pores par rapport au volume des pores
pQCT Tomographie quantitative périphérique
PTH Parathormone
PYD/PYR Pyridinoline
RANK Récepteur activateur de NF-κB
RANKL Ligand du récepteur activateur de NF-κB
ROI Région d’intérêt
ROS Espèces réactives de l’oxygène
SD Ecart-type
SEM Ecart standard à la moyenne
SHAM Groupes d’animaux opérés et ouverts mais n’ayant pas subi d’ablation
SMI Structure model index
SNC Système nerveux central
SOST Sclerostine
Tb.N Nombre de travées osseuses
Tb.Sp Espace entre les travées osseuses
Tb.Th Epaisseur des travées osseuses
TGF-β Transforming Growth Factor β
TNF-α Tumor Necrosis Factor α
Tph Tryptophane hydroxylase
TRAP/TRACP Phosphatase acide résistante au tartrate
Trp Tryptophane
VIH Virus d’immuno-déficience humaine
VMA Vitesse maximale aérobie (équivalent de la VO2max)
VOI Volume d’intérêt
20
Liste des figures
Figure 1 : Coupe d’un os long.............................................................................................. 27Figure 2 : Histologie de l’os compact et de l’os spongieux. ................................................ 28Figure 3 : Différentes cellules osseuses. .............................................................................. 30Figure 4 : Différenciation des ostéoclastes. ......................................................................... 31Figure 5 : Différenciation possible des cellules souches mésenchymateuses...................... 33Figure 6 : Localisation des ostéocytes. ................................................................................ 35Figure 7 : Différenciation de la lignée ostéoblastique jusqu’à l’ostéocyte mature et
marqueurs associés....................................................................................................... 37Figure 8 : Communication entre les ostéocytes. .................................................................. 38Figure 9 : Le remodelage osseux. ........................................................................................ 40Figure 10 : Rôle de RANK et RANKL dans la différenciation de l’ostéoclaste. ................ 49Figure 11 : Activation et inhibition de la voie de signalisation Wnt. .................................. 50Figure 12 : Mécanismes moléculaires impliqués dans la voie Wnt en réponse à une charge
mécanique. ................................................................................................................... 51Figure 13 : Etapes de la différenciation des ostéoclastes et facteurs associés. .................... 52Figure 14 : Images d’os obtenues par pQCT. ...................................................................... 56Figure 15 : Images d’histomorphométrie d’os trabéculaire, cortical et de la moelle osseuse.
...................................................................................................................................... 58Figure 16 : Images obtenues par IRM.................................................................................. 59Figure 17 : Vue hiérarchisée des différentes structures osseuses que l’on peut imager avec
un µCT et un nanoCT. ................................................................................................. 60Figure 18 : Constitution des lignes de lumière au Synchrotron Soleil d’Orsay................... 62Figure 19 : Schéma d’un test de flexion 3 points (A) et d’un test de flexion 4 points (B). . 64Figure 20 : Marqueurs de l’activité des ostéoclastes et des ostéoblastes............................. 65Figure 21 : Evolution de la masse osseuse avec l’âge. ........................................................ 68Figure 22 : Facteurs influençant le pic de masse osseuse. ................................................... 69Figure 23 : Voies oxidatives du métabolisme de l’alcool.................................................... 74Figure 24 : Mécanismes responsables des effets directs et indirects de l’alcool sur l’os. ... 95Figure 25 : Concordance des âges au niveau du tissu osseux entre l’homme et le rat. ..... 120Figure 26 : Schématisation de l’alcoolisation volontaire des animaux.............................. 121Figure 27 : Tapis roulant à 10 couloirs utilisé pour le protocole d’entraînement des rats. 123Figure 28 : Appareil Discovery, Hologic........................................................................... 125Figure 29 : Rat anesthésié pour l’examen d’absorptiométrie biphotonique in vivo. ......... 125Figure 30 : Acquisitions de la DMO et du CMO du corps entier (A) et du fémur droit (B)
par DXA..................................................................................................................... 126Figure 31 : Micro tomographe à rayons X Skyscan 1072 (Belgique). .............................. 127Figure 32 : Placement du fémur sur le porte échantillon pour l’acquisition avec le µCT. 128Figure 33 : Reconstitution du balayage de l’échantillon par les rayons X lors de
l’acquisition au µCT. ................................................................................................. 129Figure 34 : Principe de la technique du µCT : balayage de l’échantillon avec les rayons X
puis reconstruction de la morphologie en 3D de l’échantillon. ................................. 130Figure 35 : Différentes étapes de la transformation de l’échantillon entre la phase
d’acquisition, d’analyse et de reconstruction 3D. ...................................................... 130Figure 36 : Zone du fémur analysée pour évaluer la microarchitecture. ........................... 131Figure 37 : Région d’intérêt pour l’analyse de l’os trabéculaire (métaphyse du fémur). .. 131Figure 38 : Choix de la région d’intérêt pour l’analyse de l’os cortical (métaphyse du
fémur)......................................................................................................................... 132Figure 39 : Phase de seuillage qui déterminera le plein du vide sur les coupes 2D. ......... 132
21
Figure 40 : Visualisation 2D de l’os trabéculaire, avant la reconstruction 3D du volumed’intérêt. ..................................................................................................................... 133
Figure 41 : Visualisation 2D de l’os cortical avant la reconstruction 3D de cette zone. ... 134Figure 42 : Mesure des diamètres internes et externes des os avec le logiciel Image J, et
mesure de la hauteur du fémur avec un pied à coulisse. ............................................ 134Figure 43 : Schéma d’un test de flexion 3 points............................................................... 135Figure 44 : Presse Instron Bluehill (A), positionnement du fémur sur la presse (B), et
courbe charge/déplacement obtenue avec le test de flexion 3 points (C). ................. 136Figure 45 : Représentations des diamètres externes (A et B) et internes (a et b) servant à
calculer les paramètres de résistance osseuse. ........................................................... 137Figure 46 : Différentes étapes d’un dosage ELISA. .......................................................... 138Figure 47 : Spectrophotomètre ELx 800............................................................................ 139Figure 48 : Longueurs d’onde correspondant aux couleurs dans le domaine du visible. .. 142Figure 49 : Lames concaves utilisées pour la microscopie en épifluorescence et la
microscopie confocale. .............................................................................................. 143Figure 50 : Coupes de tibia colorées au bleu de Toluidine................................................ 144Figure 51 : Analyse de la taille des lacunes ostéocytaires sur des coupes colorées au bleu de
Toluidine. ................................................................................................................... 145Figure 52 : Analyse de la taille des gouttelettes lipidiques dans la moelle sur des coupes
colorées au bleu de Toluidine. ................................................................................... 145Figure 53 : Microtome Leica (Allemagne). ....................................................................... 146Figure 54 : Etapes de l’acquisition à l’obtention des images en microscopie confocale... 147Figure 55 : Péliose hépathique (dilatation des veines sinusoïdes) observée sur des coupes de
foies colorées avec de l’hématoxyline, de l’éosine et du safran (HES). .................... 170Figure 56 : Coupes histologiques du foie. ......................................................................... 191Figure 57 : Immunomarquages avec les anticorps caspase-3, ostéocalcine (OC), cluster de
différenciation 44 (CD44) et collagène de type I (COL 1). ....................................... 194Figure 58 : Surfaces des lacunes ostéocytaires, nombre de lacunes vides dans l’os cortical
(tibia) et nombre et surfaces des gouttelettes lipidiques dans la moelle. ................... 196Figure 59 : Images d’ostéocytes en 2D obtenues sur des coupes ultra-fines et imagées en
microscopie électronique à transmission. .................................................................. 197Figure 60 : Morphologie en 3D des ostéocytes obtenues en microscopie confocale après
immuno-marquages avec du CD44 et de la caspase-3............................................... 198Figure 61 : Contenu lipidique de la moelle, des micro-vaisseaux et des ostéocytes sur des
lames colorées au bleu de Toluidine, et immuno-marquages des ostéocytes avec de lacaspase-3. ................................................................................................................... 214
Figure 62 : Contenu lipidique dans les vaisseaux sanguins (A, B), et dans les ostéocytes (C,D, E, F) du groupe A35.............................................................................................. 215
Figure 63 : Schéma récapitulatif des observations de l’étude 4......................................... 217Figure 64 : Apoptose des ostéocytes révélée par un immunomarquage à la caspase-3..... 255Figure 65 : Régulation du remodelage osseux par les ostéocytes et influence de l’alcool et
de l’exercice physique................................................................................................ 295Figure 66 : Schéma de l’appareil permettant d’appliquer un mouvement de fluides aux
cultures de cellules. .................................................................................................... 299
22
Liste des tableaux
Tableau 1 : Tableau récapitulatif des facteurs systémiques influençant l’os ....................... 45Tableau 2 : Tableau récapitulatif des facteurs centraux influençant l’os............................. 48Tableau 3 : Tableau récapitulatif des facteurs locaux du tissu osseux. ............................... 54Tableau 4 : Liste des lignes de lumière du Synchrotron Soleil d’Orsay.............................. 62Tableau 5 : Marqueurs du remodelage osseux et leurs abréviations. .................................. 66Tableau 6 : Marqueurs de différenciation entre ostéoblaste, ostéocyte jeune et ostéocyte
mature. ......................................................................................................................... 67Tableau 7 : Equivalence entre le nombre de verres ingérés, la concentration sanguine
d’éthanol et les effets physiques observés. .................................................................. 92Tableau 8 : Protocole d’entraînement sur tapis roulant pour l’étude 1.............................. 123Tableau 9 : Protocole d’entraînement sur tapis roulant pour l’étude 5.............................. 123Tableau 10 : Apports hydriques et énergétiques durant l’étude pour les 4 groupes. ......... 151Tableau 11 : Poids, densités osseuses et compositions corporelles à la fin du protocole. . 152Tableau 12 : Microarchitecture de l’os trabéculaire du fémur........................................... 153Tableau 13 : Microarchitecture de l'os cortical du fémur. ................................................. 153Tableau 14 : Propriétés biomécaniques du fémur.............................................................. 154Tableau 15 : Concentration des marqueurs du remodelage osseux. .................................. 154Tableau 16 : Consommations de boisson et nourriture des animaux des quatre groupes.. 169Tableau 17 : Evolution du CMO, de la DMO et de la composition corporelle. ................ 171Tableau 18 : Paramètres de microarchitecture trabéculaire. .............................................. 174Tableau 19 : Paramètres de microarchitecture corticale. ................................................... 175Tableau 20 : Paramètres biomécaniques du fémur. ........................................................... 176Tableau 21 : Concentrations des marqueurs du remodelage osseux et de la leptine. ........ 176Tableau 22 : Consommations de boisson et nourriture des quatre groupes....................... 249Tableau 23 : CMO, DMO et composition corporelle. ....................................................... 249Tableau 24 : Paramètres de microarchitecure trabéculaire du fémur. ............................... 251Tableau 25 : Paramètres de microarchitecture et de macroarchitecture corticale du fémur.
.................................................................................................................................... 253Tableau 26 : Paramètres biomécanique du fémur.............................................................. 254Tableau 27 : Concentrations des marqueurs du remodelage osseux : ostéocalcine (OC),
telopeptides du collagène (NTx) et de la leptine. ...................................................... 254Tableau 28 : Cibles à quantifier en réponse à un traitement alcoolisé combiné ou non à une
activité physique. ....................................................................................................... 298

23
Introduction
24
L’ostéoporose est caractérisée par une diminution de la densité minérale osseuse, une
altération de la microarchitecture osseuse et par une augmentation du risque de fracture
(Rachner et al. 2011). De nombreux organes tel que les ovaires, les intestins (Quarles 2008)
et le cerveau (Bonnet et al. 2008) peuvent influer sur la masse et la densité minérales
osseuses au cours de la vie, et ainsi provoquer une ostéopénie, voir une ostéoporose. Chez
l’homme, l’ostéoporose est moins fréquente que chez la femme mais elle existe néanmoins
(Ebeling 1998). Les facteurs connus à ce jour engendrant l’ostéoporose masculine sont
entre autres l’hypogonadisme, l’utilisation prolongée de corticoïdes et la consommation
excessive d’alcool (Szulc et Delmas 2002).
La consommation d’alcool est élevée dans nos sociétés modernes, d’autant plus en
France, où l’alcool est intégré à notre culture. Un million et demi de personnes dans notre
pays sont dépendantes à l’alcool (Perney et al. 2008) et chaque année, 15 000 à 20 000
décès sont liés à l’alcool en France (Rey et al. 2010). Parmi ces décès, 8 personnes sur 10
sont des hommes. L’alcool a des effets néfastes sur de nombreux tissus, y compris au
niveau du système osseux. En effet, une consommation élevée d’alcool entraîne une
diminution de la densité minérale osseuse (DMO) (Turner 2000) tandis qu’une DMO
supérieure a été observée chez des femmes post-ménopausées ayant eu une faible
consommation d’alcool au cours de leur vie (1 verre par jour) (Rapuri et al. 2000).
Toutefois, les effets directs et indirects des concentrations et volumes d’alcool sur les
paramètres osseux ne sont pas totalement élucidés.
D’autre part, si les effets d’une alcoolisation chronique ont été bien étudiés sur la
microarchitecture trabéculaire, peu d’études ont été réalisées concernant l’os cortical. De la
même manière, si l’activité des ostéoblastes et des ostéoclastes suite à un traitement
alcoolique a été étudiée in vivo et in vitro (Turner 2000), les effets de l’alcool sur l’activité
de l’ostéocyte ne sont pas très bien connus à ce jour (Wang et al. 2003).
Parmi les traitements recommandés aujourd’hui pour soigner l’ostéoporose, la prise
de calcium, de vitamine D, de substances pharmacologiques (bisphosphonates, raloxifène,
etc.) et la pratique d’une activité physique plusieurs fois par semaine (Schnatz et al. 2011)
sont les plus courants.
L’exercice physique applique des contraintes sur le squelette, qui modifient la masse
osseuse (Schoutens et al. 1989). En effet, il est maintenant connu que le squelette a la
capacité de s’adapter aux charges mécaniques auxquelles il est soumis, afin d’allier à la fois
25
résistance et économie d’énergie (Bonewald 2007). Des activités physiques à impacts
élevés augmentent la masse osseuse (Breban et al. 2011) tandis que des activités physiques
portées, une immobilisation prolongée, ou l’hypogravité provoquent une diminution de la
masse osseuse (Nichols and Rauh 2011).
Du fait du nombre élevé d’adultes et de jeunes adultes s’adonnant à une
consommation régulière d’alcool (Perera et al. 2011; Slutske 2005), et des effets positifs
reconnus de l’activité physique sur l’os, il nous semblait pertinent d’étudier les effets
combinés d’une alcoolisation chronique et d’une activité physique afin de juger de l’effet
« compensateur » potentiel de l’exercice physique sur le tissu osseux.
Ces réflexions introductives illustrent la complexité des relations impliquant l’alcool,
le métabolisme osseux et l’activité physique. La revue de littérature qui suit, tend à faire le
point sur ces différents aspects.

26
Revue de littérature
27
I. LE TISSU OSSEUX
A. Composition
1. Généralités
Le squelette humain adulte est constitué de 206 os (Tortora et Grabowski 1994). Les
os assurent plusieurs fonctions : protection des organes vitaux, soutien des tissus mous et
point d’attache des muscles squelettiques ; fonction mécanique permettant les
déplacements du corps en servant de point de levier aux muscles ; homéostasie des
minéraux (calcium, phosphore), formation des cellules sanguines (moelle) et réserve
d’énergie grâce aux lipides qui se trouvent dans la moelle (Confavreux 2011).
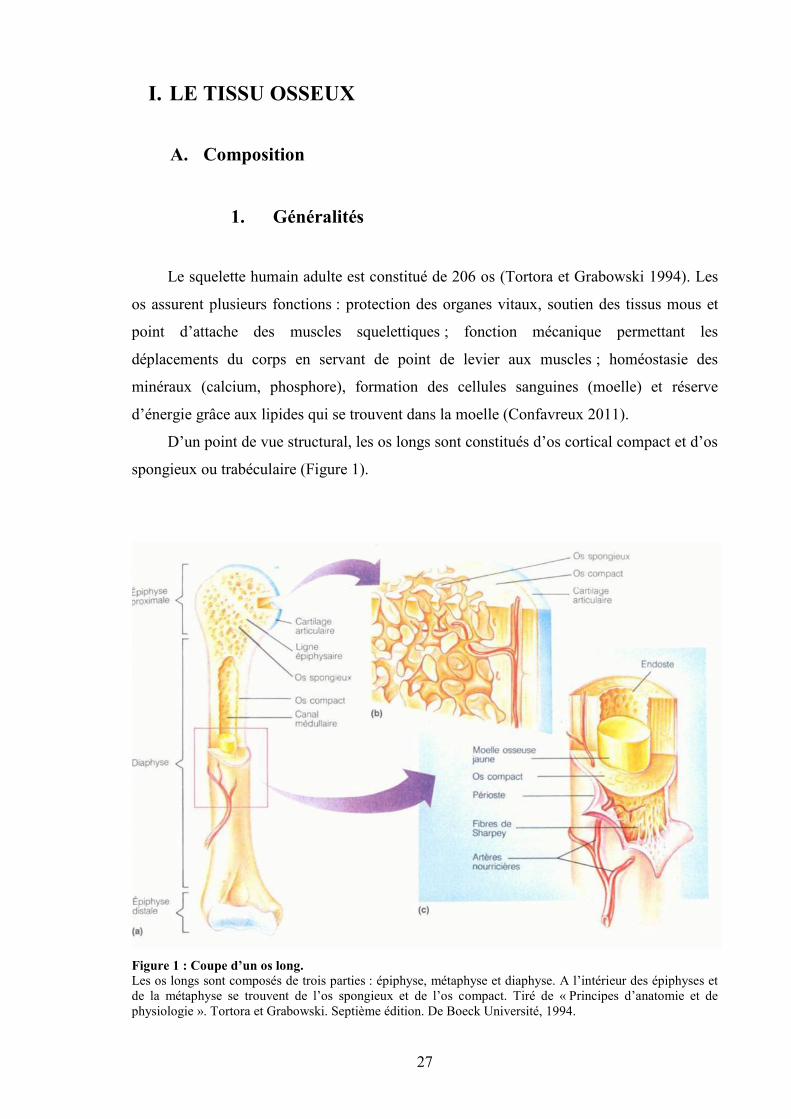
D’un point de vue structural, les os longs sont constitués d’os cortical compact et d’os
spongieux ou trabéculaire (Figure 1).
Figure 1 : Coupe d’un os long.Les os longs sont composés de trois parties : épiphyse, métaphyse et diaphyse. A l’intérieur des épiphyses etde la métaphyse se trouvent de l’os spongieux et de l’os compact. Tiré de « Principes d’anatomie et dephysiologie ». Tortora et Grabowski. Septième édition. De Boeck Université, 1994.
28
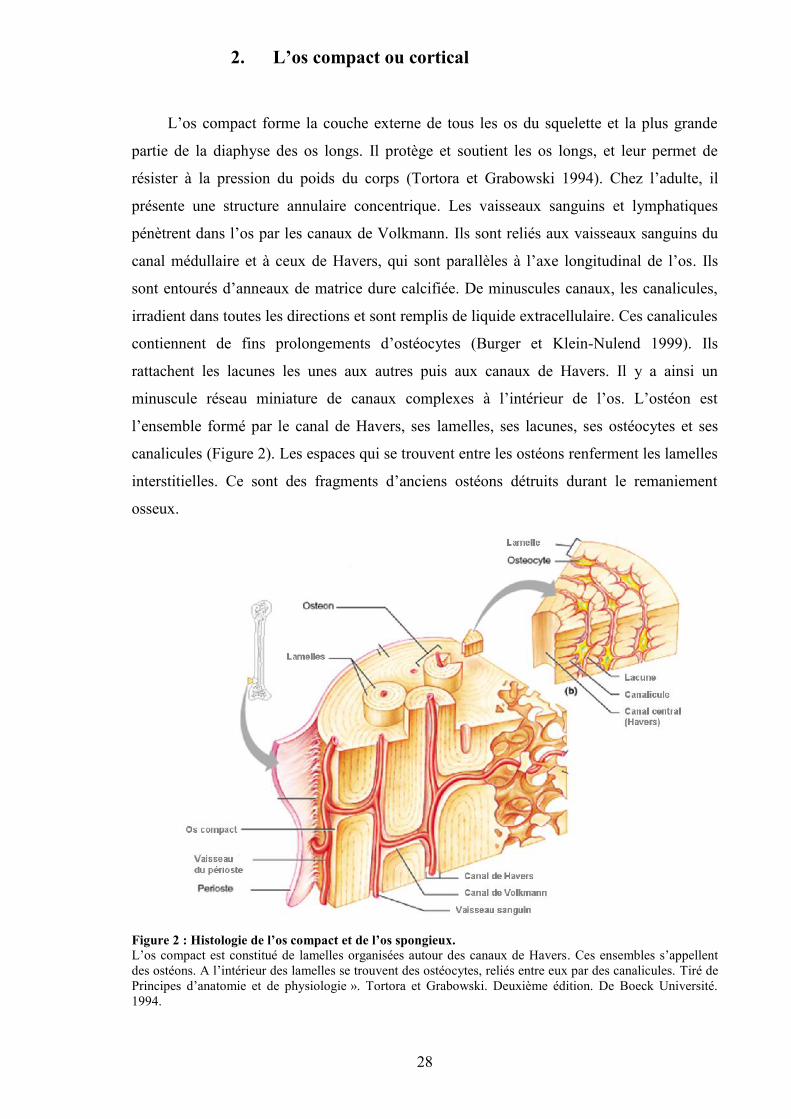
2. L’os compact ou cortical
L’os compact forme la couche externe de tous les os du squelette et la plus grande
partie de la diaphyse des os longs. Il protège et soutient les os longs, et leur permet de
résister à la pression du poids du corps (Tortora et Grabowski 1994). Chez l’adulte, il
présente une structure annulaire concentrique. Les vaisseaux sanguins et lymphatiques
pénètrent dans l’os par les canaux de Volkmann. Ils sont reliés aux vaisseaux sanguins du
canal médullaire et à ceux de Havers, qui sont parallèles à l’axe longitudinal de l’os. Ils
sont entourés d’anneaux de matrice dure calcifiée. De minuscules canaux, les canalicules,
irradient dans toutes les directions et sont remplis de liquide extracellulaire. Ces canalicules
contiennent de fins prolongements d’ostéocytes (Burger et Klein-Nulend 1999). Ils
rattachent les lacunes les unes aux autres puis aux canaux de Havers. Il y a ainsi un
minuscule réseau miniature de canaux complexes à l’intérieur de l’os. L’ostéon est
l’ensemble formé par le canal de Havers, ses lamelles, ses lacunes, ses ostéocytes et ses
canalicules (Figure 2). Les espaces qui se trouvent entre les ostéons renferment les lamelles
interstitielles. Ce sont des fragments d’anciens ostéons détruits durant le remaniement
osseux.
Figure 2 : Histologie de l’os compact et de l’os spongieux.L’os compact est constitué de lamelles organisées autour des canaux de Havers. Ces ensembles s’appellentdes ostéons. A l’intérieur des lamelles se trouvent des ostéocytes, reliés entre eux par des canalicules. Tiré dePrincipes d’anatomie et de physiologie ». Tortora et Grabowski. Deuxième édition. De Boeck Université.1994.
29
3. L’os trabéculaire ou spongieux
L’os spongieux constitue la plus grande partie des os courts, plats et de forme
irrégulière, ainsi que la plus grande partie des épiphyses des os longs. Contrairement à l’os
compact, le tissu osseux spongieux présente une structure plus irrégulière. Il ne comporte
pas de vrais ostéons mais est constitué de lamelles qui forment un treillis irrégulier de
minces plaques d’os appelées travées osseuses (Tortora et Grabowski 1994). Ces travées
sont orientées selon un réseau de plaques et de poutres ajustées de façon à répondre au
mieux aux sollicitations mécaniques subies par l’os. Les travées participent à la résistance
osseuse (Barak et al. 2010). Dans certains os (hanche, côtes, vertèbres), l’espace entre les
travées osseuses est rempli de moelle rouge qui produit les cellules sanguines. A l’intérieur
des travées osseuses se trouvent les ostéocytes qui résident dans des lacunes et les
canalicules irradient à partir de celles-ci. Les vaisseaux sanguins du périoste (enveloppe
externe de l’os) pénètrent jusqu’à l’os spongieux, et les ostéocytes des travées sont
alimentées directement par le sang qui circule à travers les cavités de moelle osseuse.
B. Composition du tissu osseux
L’os est composé d’une matrice organique et d’une partie minérale.
1. La matrice organique
La matrice extra-cellulaire de l’os représente environ 20% d’un os adulte chez les
mammifères. Elle détermine l’organisation de l’os et lui confère ses propriétés d’élasticité
et de flexibilité. Elle est composée de fibres de collagène de type I à 95%. Les 5% restant
sont des protéines non collagéniques (Marks et Hermey 1996). Le collagène est une
protéine structurale composée de 3 hélices. Cette triple hélice doit sa configuration à une
chaîne de trois polypeptides dont la séquence d’acides aminés est une répétition de Gly-X-
Y, avec un fort pourcentage de proline et d’hydroxyproline (Van der Rest et Garrone 1991)
Les principales protéines non collagéniques se trouvant dans la matrice organique sont les
protéoglycanes, les facteurs de croissance et les glycoprotéines, parmi lesquelles figurent
l’ostéonectine, la fibronectine et l’ostéopontine (Robey 2002). Les protéoglycanes
participent à l’organisation de la matrice et à la régulation de facteurs de croissance. Ils
30
sont présents durant les premières étapes de l’ostéogenèse. Les glycoprotéines sont
produites à différents stages de la maturation ostéoblastique. Elles ont des fonctions très
vastes allant du contrôle de la prolifération cellulaire, aux interactions cellules-matrice en
passant par le contrôle du dépôt d’hydroxyapatite (Gokhale et al. 2001)
2. La partie minérale
La composition de l’os varie en fonction de l’âge, de la localisation anatomique, du
régime alimentaire et de l’état de santé. En général, la partie minérale représente de 50 à
70% des os chez les adultes. Contrairement à d’autres tissus conjonctifs, la matrice du tissu
osseux renferme une quantité importante de sels minéraux, notamment une forme
cristallisée de phosphate de calcium [Ca10(PO4)6(OH)2], appelée hydroxyapatite, et un peu
de carbonate de calcium (CaCO3) (Tortora et Grabowski 1994). De petites quantités
d’hydroxyde de magnésium, de fluorure et de sulfate s’y trouvent également. Les cristaux
se trouvant dans l’os sont très petits et de fait plus solubles que les cristaux observés en
géologie, ce qui permet à l’os de servir de réservoir pour les ions calcium, phosphate et
magnésium. Lorsque les sels minéraux se déposent sur la trame des fibres de collagènes de
la matrice, la cristallisation s’effectue et le tissue osseux durcit. C’est le processus de
calcification, ou de minéralisation. L’association des sels cristallisés et du collagène
engendre la dureté, une des caractéristiques de l’os (Landis 1995)
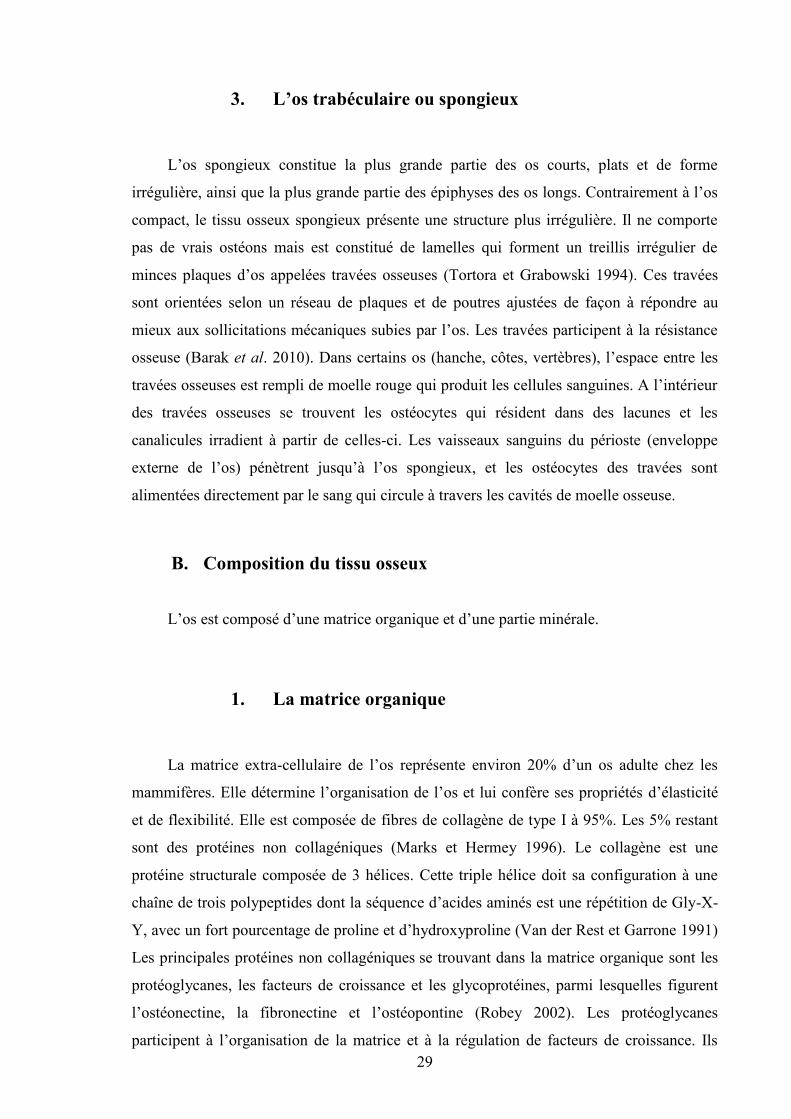
C. Les cellules osseuses
Il existe quatre types de cellules dans le tissu osseux, provenant de différentes lignées
cellulaires (Figure 3) (Marks et Odgren 2002).
Figure 3 : Différentes cellules osseuses.Les cellules ostéogènes, les ostéoblastes et les ostéocytes sont originaires de la même lignée (cellules souchesmésenchymateuses). Les ostéoclastes proviennent des cellules souches hématopoïétiques. Tiré de « Principesd’anatomie et de physiologie ». Tortora et Grabowski. Deuxième édition. De Boeck Université, 1994.
31
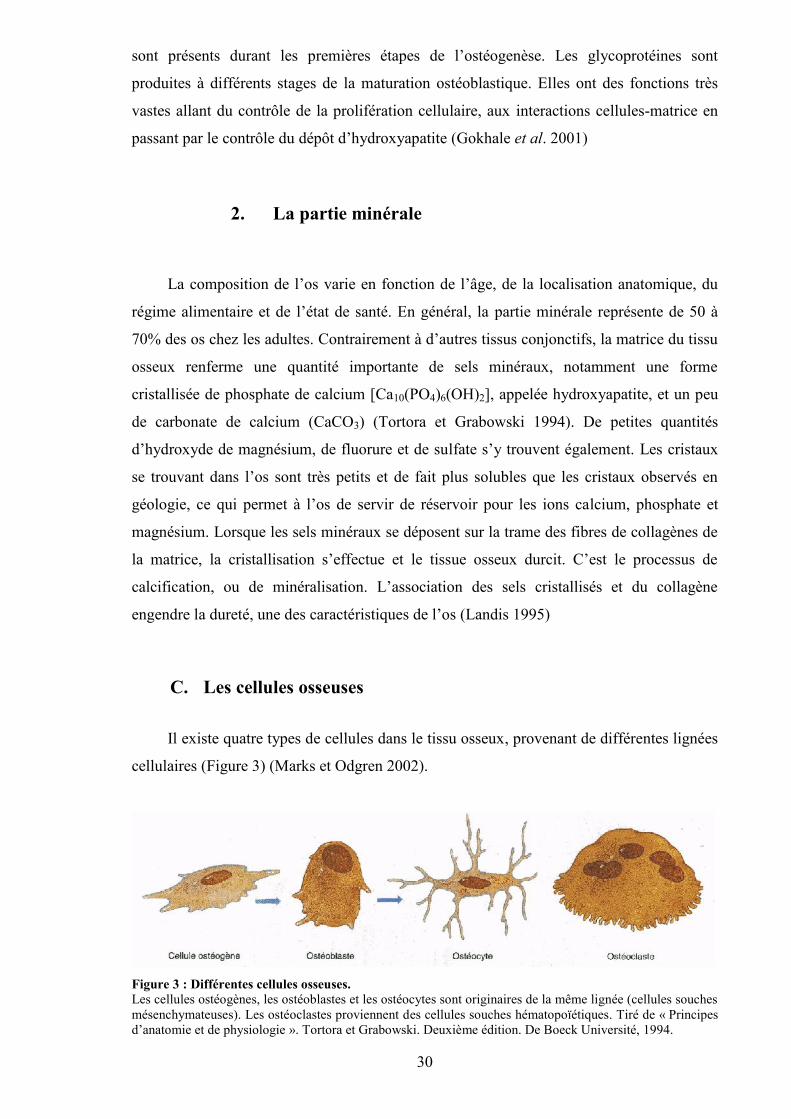
1. La lignée ostéoclastique
L’ostéoclaste est une cellule géante d’environ 100 µm de diamètre, multinucléé et
disposée à la surface de la matrice minéralisée. Elle provient des cellules hématopoïétiques
de la lignée des monocytes-macrophages (Chambers 2010). Les étapes de différenciation
précoces sont communes avec les macrophages sauf aux dernières étapes de
différenciation. La différenciation est caractérisée par l’expression séquentielle de
différents gènes (Figure 4).
Figure 4 : Différenciation des ostéoclastes.Les précurseurs des ostéoclastes se trouvent dans la moelle osseuse (Colony Forming Unit Granulocyte-Macrophage). Ces précurseurs se différencient en pré-ostéoclastes puis en ostéoclastes sous l’influence deRANKL.Tiré de Boyle (Boyle et al. 2003).
Plusieurs cytokines et facteurs de croissance sont connus pour affecter la
différenciation et la maturation de l’ostéoclaste, et le rôle central du complexe RANK-
RANKL-OPG a été confirmé (Chambers 2000). Après avoir proliféré dans la moelle
osseuse, les pré-ostéoclastes mononuclées sont guidés dans la moelle jusqu’à la surface de
l’os par des mécanismes encore mal connus. Les précurseurs sont guidés près des sites
ayant besoin d’être résorbés. Ensuite, les précurseurs mononuclées fusionnent en
ostéoclastes multinucléés. Ces cellules ont une structure particulière et la partie de
l’ostéoclaste qui est en contact avec la matrice possède une membrane plasmique dite « en
brosse » (Marks et Odgren 2002). La seule fonction de l’ostéoclaste connue à l’heure
actuelle est la résorption de l’os minéralisé, de la dentine et du cartilage calcifié.
L’ostéoclaste se fixe sur la matrice osseuse grâce à ses récepteurs d’adhésion. L’ostéoclaste
exprime au moins quatre intégrines, qui se fixent sur les protéines de la matrice extra-
cellulaire comme la vitronectine, le collagène, l’ostéopontine et la sialoprotéine (Nesbitt et
al. 1993). Grâce à sa bordure « en brosse », la surface de l’ostéoclaste en contact avec la
32
matrice osseuse est augmentée. L’ostéoclaste dissous les cristaux d’hydroxyapatite en
sécrétant des protons H+ qui diminuent le pH (Baron et al. 1985). Après dissolution de la
phase minérale, la matrice organique est dégradée par des protéinases et des
métalloprotéinases de la matrice (MMP), laissant place à une lacune de résorption
contenant des produits de dégradation osseuse (fragments de collagène). La résorption
osseuse est une étape obligatoire pour la maturation normale d’un squelette, incluant par
exemple la croissance osseuse et le remodelage osseux qui permet la réparation des os et
leur adaptation à l’environnement (Väänänen et Zhao 2002).
L’ostéoclaste fonctionne de manière cyclique, en alternant des phases migratoires le
long de la surface osseuse et des phases de résorption active qui créent des lacunes de
résorption. Au cours de la résorption osseuse, l’ostéoclaste se déplace le long de la surface
osseuse. Après un certain nombre de cycles, l’ostéoclaste entre en apoptose et disparaît
(Kanehisa et Heersche 1988; Väänänen et Zhao 2002).
2. La lignée ostéoblastique
On peut définir trois types de cellules issues des mêmes cellules précurseurs, et ayant
des fonctions différentes.
a) Les cellules bordantes
Les cellules bordantes sont des ostéoblastes quiescents qui se sont progressivement
aplatis. Elles bordent toutes les surfaces osseuses qui ne sont pas en phase de remodelage.
Ces cellules sont reliées entre elles (Miller et al. 1989) et aux ostéocytes par des « gap
junctions », permettant aux cellules à la surface et en profondeur de communiquer afin de
coordonner leurs actions. Il a été montré que les cellules bordantes nettoient les restes de
matrice dans les cavités de résorption après que les ostéoclastes aient fini de dégrader la
matrice osseuse, et que la formation osseuse ne se fait pas dans les cavités de résorption si
les cellules bordantes ne les ont pas « nettoyées » au préalable (Everts et al. 2002). Cette
action se fait à l’aide de métalloprotéinases et de protéases.
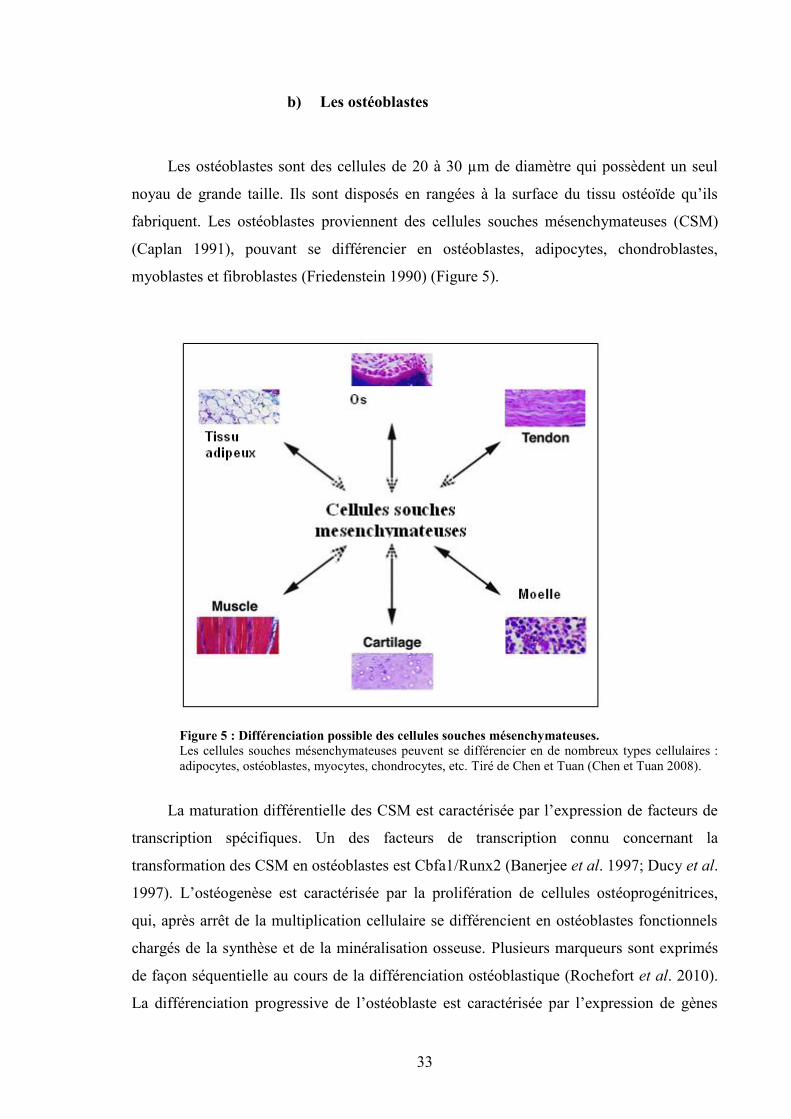
33
b) Les ostéoblastes
Les ostéoblastes sont des cellules de 20 à 30 µm de diamètre qui possèdent un seul
noyau de grande taille. Ils sont disposés en rangées à la surface du tissu ostéoïde qu’ils
fabriquent. Les ostéoblastes proviennent des cellules souches mésenchymateuses (CSM)
(Caplan 1991), pouvant se différencier en ostéoblastes, adipocytes, chondroblastes,
myoblastes et fibroblastes (Friedenstein 1990) (Figure 5).
Figure 5 : Différenciation possible des cellules souches mésenchymateuses.Les cellules souches mésenchymateuses peuvent se différencier en de nombreux types cellulaires :adipocytes, ostéoblastes, myocytes, chondrocytes, etc. Tiré de Chen et Tuan (Chen et Tuan 2008).
La maturation différentielle des CSM est caractérisée par l’expression de facteurs de
transcription spécifiques. Un des facteurs de transcription connu concernant la
transformation des CSM en ostéoblastes est Cbfa1/Runx2 (Banerjee et al. 1997; Ducy et al.
1997). L’ostéogenèse est caractérisée par la prolifération de cellules ostéoprogénitrices,
qui, après arrêt de la multiplication cellulaire se différencient en ostéoblastes fonctionnels
chargés de la synthèse et de la minéralisation osseuse. Plusieurs marqueurs sont exprimés
de façon séquentielle au cours de la différenciation ostéoblastique (Rochefort et al. 2010).
La différenciation progressive de l’ostéoblaste est caractérisée par l’expression de gènes
Tissuadipeux Os
34
ostéoblastiques précoces (phosphatase alcaline, collagène de type I, ostéopontine) ou
tardifs (bone sialoprotein, ostéocalcine) (Rochefort et al. 2010).
La fonction principale de l’ostéoblaste est de synthétiser et de minéraliser la matrice
osseuse au cours de la croissance du squelette, de renouveler la matrice osseuse chez
l’adulte et d’effectuer la réparation osseuse tout au long de la vie (Mundy 1996). La
matrice osseuse est composée majoritairement de collagène de type I, mais les ostéoblastes
synthétisent également un grand nombre de protéines matricielles (ostéocalcine,
ostéopontine), des molécules d’adhésion qui interagissent avec les intégrines, des
protéoglycanes et des facteurs de croissance.
Premièrement, les ostéoblastes sécrètent la matrice organique (ou matrice ostéoïde)
structurée par les fibres de collagènes (Marks et Odgren 2002). Ensuite les ostéoblastes
matures contrôlent la minéralisation de la matrice ostéoïde par des dépôts de cristaux
d’hydroxyapatite. Les ostéoblastes jouent aussi un rôle dans la différenciation des
ostéoclastes via la molécule RANKL (Martin et Ng 1994; Udagawa et al. 1999).
c) Les ostéocytes
Les ostéocytes sont les cellules les plus abondantes dans le tissu osseux chez les
mammifères. Elles représentent 95% de toutes les cellules du tissu osseux, soit 20 000 à
80 000 cellules/mm3 selon les espèces (Rochefort et al. 2010). Chez l’être humain, on
estime à 25 ans la durée de vie des ostéocytes. Le rôle des ostéocytes est resté inconnu
pendant très longtemps mais ces quinze dernières années, nombre de publications ont
essayé de faire la lumière sur cette cellule (Bonewald 2007; Burger et al. 1995; Ferretti et
al. 1999). L’ostéocyte est une cellule qui est isolée dans la matrice osseuse, tandis que les
ostéoclastes, les ostéoblastes et les cellules bordantes sont à la surface de l’os (Figure 6).
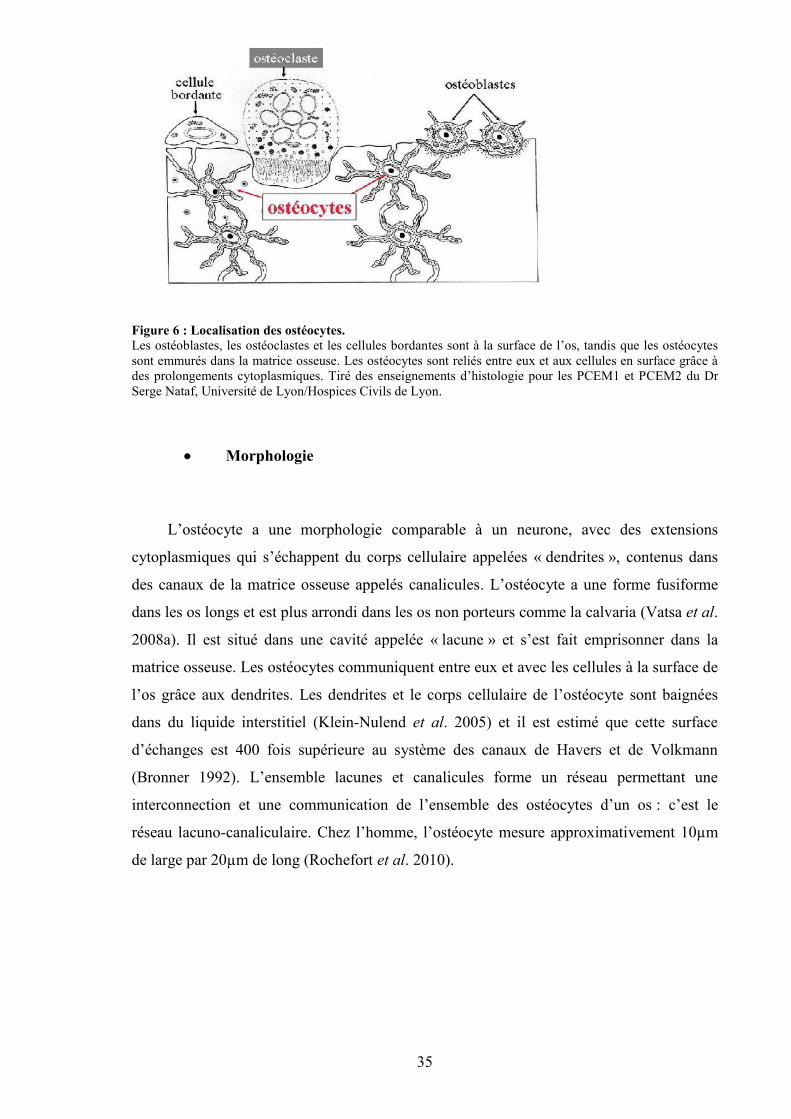
35
Figure 6 : Localisation des ostéocytes.Les ostéoblastes, les ostéoclastes et les cellules bordantes sont à la surface de l’os, tandis que les ostéocytessont emmurés dans la matrice osseuse. Les ostéocytes sont reliés entre eux et aux cellules en surface grâce àdes prolongements cytoplasmiques. Tiré des enseignements d’histologie pour les PCEM1 et PCEM2 du DrSerge Nataf, Université de Lyon/Hospices Civils de Lyon.
Morphologie
L’ostéocyte a une morphologie comparable à un neurone, avec des extensions
cytoplasmiques qui s’échappent du corps cellulaire appelées « dendrites », contenus dans
des canaux de la matrice osseuse appelés canalicules. L’ostéocyte a une forme fusiforme
dans les os longs et est plus arrondi dans les os non porteurs comme la calvaria (Vatsa et al.
2008a). Il est situé dans une cavité appelée « lacune » et s’est fait emprisonner dans la
matrice osseuse. Les ostéocytes communiquent entre eux et avec les cellules à la surface de
l’os grâce aux dendrites. Les dendrites et le corps cellulaire de l’ostéocyte sont baignées
dans du liquide interstitiel (Klein-Nulend et al. 2005) et il est estimé que cette surface
d’échanges est 400 fois supérieure au système des canaux de Havers et de Volkmann
(Bronner 1992). L’ensemble lacunes et canalicules forme un réseau permettant une
interconnection et une communication de l’ensemble des ostéocytes d’un os : c’est le
réseau lacuno-canaliculaire. Chez l’homme, l’ostéocyte mesure approximativement 10µm
de large par 20µm de long (Rochefort et al. 2010).
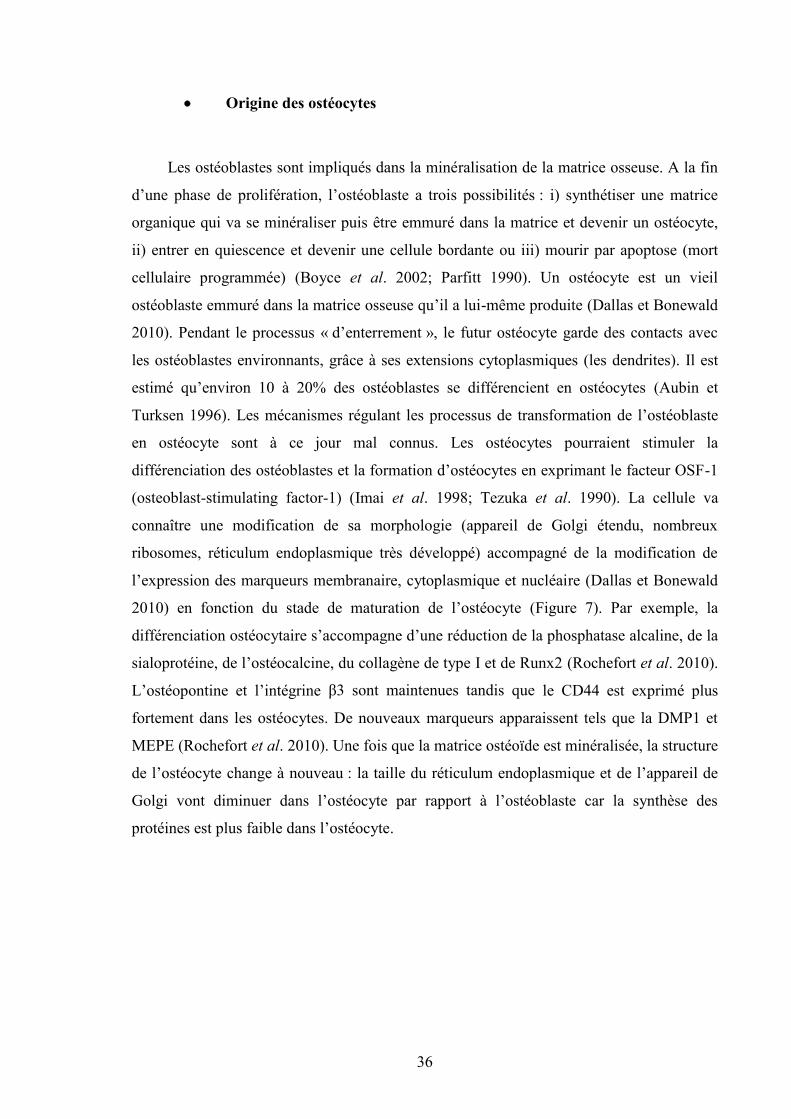
36
Origine des ostéocytes
Les ostéoblastes sont impliqués dans la minéralisation de la matrice osseuse. A la fin
d’une phase de prolifération, l’ostéoblaste a trois possibilités : i) synthétiser une matrice
organique qui va se minéraliser puis être emmuré dans la matrice et devenir un ostéocyte,
ii) entrer en quiescence et devenir une cellule bordante ou iii) mourir par apoptose (mort
cellulaire programmée) (Boyce et al. 2002; Parfitt 1990). Un ostéocyte est un vieil
ostéoblaste emmuré dans la matrice osseuse qu’il a lui-même produite (Dallas et Bonewald
2010). Pendant le processus « d’enterrement », le futur ostéocyte garde des contacts avec
les ostéoblastes environnants, grâce à ses extensions cytoplasmiques (les dendrites). Il est
estimé qu’environ 10 à 20% des ostéoblastes se différencient en ostéocytes (Aubin et
Turksen 1996). Les mécanismes régulant les processus de transformation de l’ostéoblaste
en ostéocyte sont à ce jour mal connus. Les ostéocytes pourraient stimuler la
différenciation des ostéoblastes et la formation d’ostéocytes en exprimant le facteur OSF-1
(osteoblast-stimulating factor-1) (Imai et al. 1998; Tezuka et al. 1990). La cellule va
connaître une modification de sa morphologie (appareil de Golgi étendu, nombreux
ribosomes, réticulum endoplasmique très développé) accompagné de la modification de
l’expression des marqueurs membranaire, cytoplasmique et nucléaire (Dallas et Bonewald
2010) en fonction du stade de maturation de l’ostéocyte (Figure 7). Par exemple, la
différenciation ostéocytaire s’accompagne d’une réduction de la phosphatase alcaline, de la
sialoprotéine, de l’ostéocalcine, du collagène de type I et de Runx2 (Rochefort et al. 2010).
L’ostéopontine et l’intégrine β3 sont maintenues tandis que le CD44 est exprimé plus
fortement dans les ostéocytes. De nouveaux marqueurs apparaissent tels que la DMP1 et
MEPE (Rochefort et al. 2010). Une fois que la matrice ostéoïde est minéralisée, la structure
de l’ostéocyte change à nouveau : la taille du réticulum endoplasmique et de l’appareil de
Golgi vont diminuer dans l’ostéocyte par rapport à l’ostéoblaste car la synthèse des
protéines est plus faible dans l’ostéocyte.
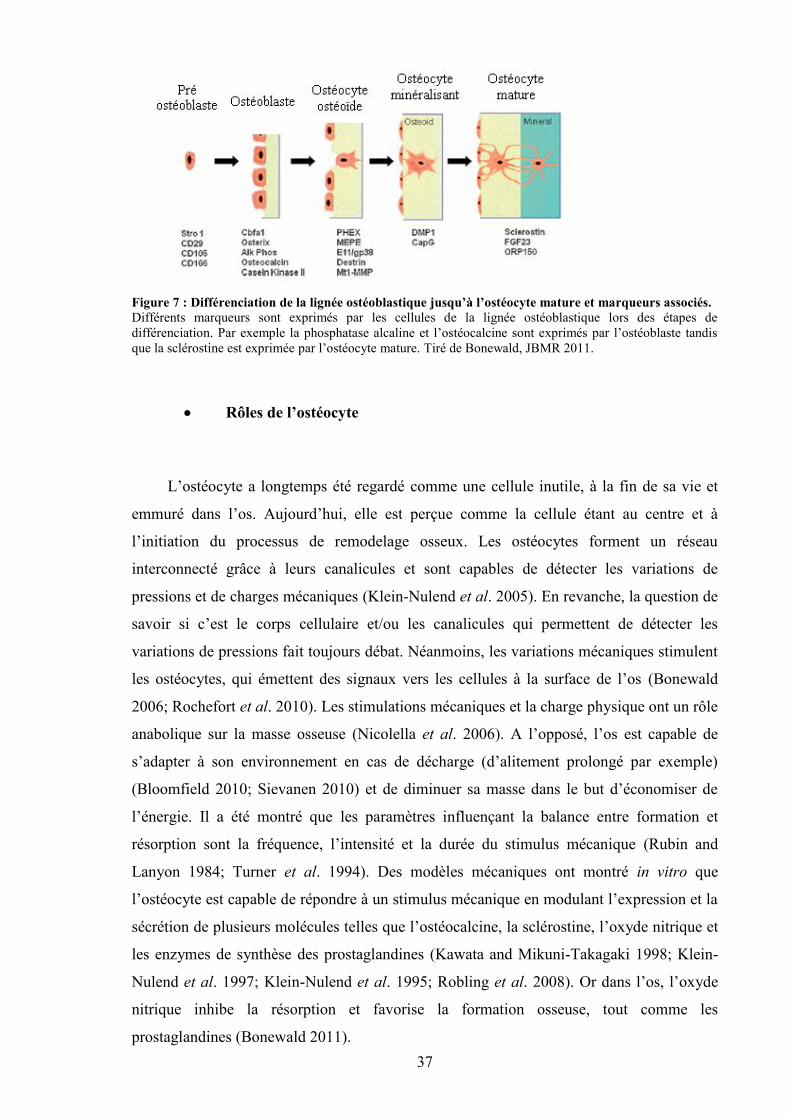
37
Figure 7 : Différenciation de la lignée ostéoblastique jusqu’à l’ostéocyte mature et marqueurs associés.Différents marqueurs sont exprimés par les cellules de la lignée ostéoblastique lors des étapes dedifférenciation. Par exemple la phosphatase alcaline et l’ostéocalcine sont exprimés par l’ostéoblaste tandisque la sclérostine est exprimée par l’ostéocyte mature. Tiré de Bonewald, JBMR 2011.
Rôles de l’ostéocyte
L’ostéocyte a longtemps été regardé comme une cellule inutile, à la fin de sa vie et
emmuré dans l’os. Aujourd’hui, elle est perçue comme la cellule étant au centre et à
l’initiation du processus de remodelage osseux. Les ostéocytes forment un réseau
interconnecté grâce à leurs canalicules et sont capables de détecter les variations de
pressions et de charges mécaniques (Klein-Nulend et al. 2005). En revanche, la question de
savoir si c’est le corps cellulaire et/ou les canalicules qui permettent de détecter les
variations de pressions fait toujours débat. Néanmoins, les variations mécaniques stimulent
les ostéocytes, qui émettent des signaux vers les cellules à la surface de l’os (Bonewald
2006; Rochefort et al. 2010). Les stimulations mécaniques et la charge physique ont un rôle
anabolique sur la masse osseuse (Nicolella et al. 2006). A l’opposé, l’os est capable de
s’adapter à son environnement en cas de décharge (d’alitement prolongé par exemple)
(Bloomfield 2010; Sievanen 2010) et de diminuer sa masse dans le but d’économiser de
l’énergie. Il a été montré que les paramètres influençant la balance entre formation et
résorption sont la fréquence, l’intensité et la durée du stimulus mécanique (Rubin and
Lanyon 1984; Turner et al. 1994). Des modèles mécaniques ont montré in vitro que
l’ostéocyte est capable de répondre à un stimulus mécanique en modulant l’expression et la
sécrétion de plusieurs molécules telles que l’ostéocalcine, la sclérostine, l’oxyde nitrique et
les enzymes de synthèse des prostaglandines (Kawata and Mikuni-Takagaki 1998; Klein-
Nulend et al. 1997; Klein-Nulend et al. 1995; Robling et al. 2008). Or dans l’os, l’oxyde
nitrique inhibe la résorption et favorise la formation osseuse, tout comme les
prostaglandines (Bonewald 2011).
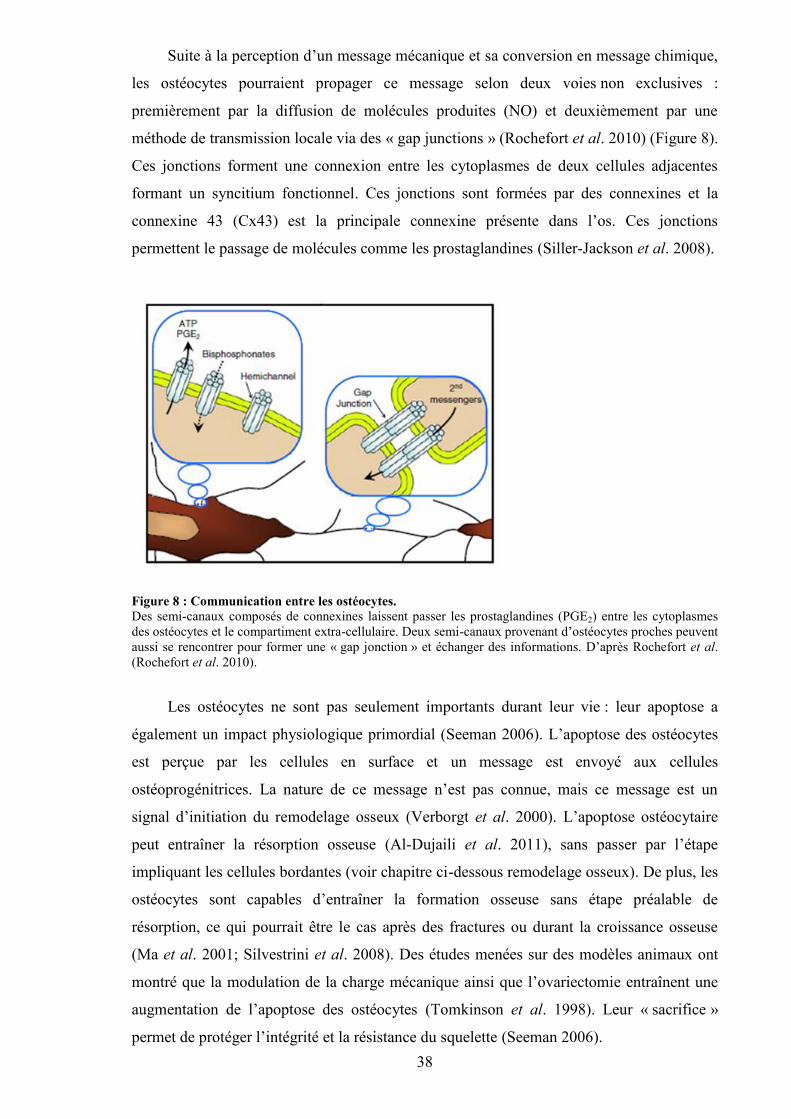
38
Suite à la perception d’un message mécanique et sa conversion en message chimique,
les ostéocytes pourraient propager ce message selon deux voies non exclusives :
premièrement par la diffusion de molécules produites (NO) et deuxièmement par une
méthode de transmission locale via des « gap junctions » (Rochefort et al. 2010) (Figure 8).
Ces jonctions forment une connexion entre les cytoplasmes de deux cellules adjacentes
formant un syncitium fonctionnel. Ces jonctions sont formées par des connexines et la
connexine 43 (Cx43) est la principale connexine présente dans l’os. Ces jonctions
permettent le passage de molécules comme les prostaglandines (Siller-Jackson et al. 2008).
Figure 8 : Communication entre les ostéocytes.Des semi-canaux composés de connexines laissent passer les prostaglandines (PGE2) entre les cytoplasmesdes ostéocytes et le compartiment extra-cellulaire. Deux semi-canaux provenant d’ostéocytes proches peuventaussi se rencontrer pour former une « gap jonction » et échanger des informations. D’après Rochefort et al.(Rochefort et al. 2010).
Les ostéocytes ne sont pas seulement importants durant leur vie : leur apoptose a
également un impact physiologique primordial (Seeman 2006). L’apoptose des ostéocytes
est perçue par les cellules en surface et un message est envoyé aux cellules
ostéoprogénitrices. La nature de ce message n’est pas connue, mais ce message est un
signal d’initiation du remodelage osseux (Verborgt et al. 2000). L’apoptose ostéocytaire
peut entraîner la résorption osseuse (Al-Dujaili et al. 2011), sans passer par l’étape
impliquant les cellules bordantes (voir chapitre ci-dessous remodelage osseux). De plus, les
ostéocytes sont capables d’entraîner la formation osseuse sans étape préalable de
résorption, ce qui pourrait être le cas après des fractures ou durant la croissance osseuse
(Ma et al. 2001; Silvestrini et al. 2008). Des études menées sur des modèles animaux ont
montré que la modulation de la charge mécanique ainsi que l’ovariectomie entraînent une
augmentation de l’apoptose des ostéocytes (Tomkinson et al. 1998). Leur « sacrifice »
permet de protéger l’intégrité et la résistance du squelette (Seeman 2006).
39
D. Le remodelage osseux
1. Concept
Le métabolisme du tissu osseux ne cesse jamais. Ce dernier est remanié
continuellement et sa matrice est remodelée le long des lignes de stress mécanique. Même à
l’âge adulte, le tissu osseux ancien est détruit et remplacé par du nouveau tissu osseux. Ce
remaniement permet également de remplacer les tissus lésés ou usés (Eriksen 2010). Le
remodelage osseux permet la constitution d’un squelette adapté à la croissance, permet
également la conservation de ses propriétés mécaniques, la capacité d’adaptation aux
contraintes, ainsi que la réparation des fractures et la mise à disposition du calcium stocké
dans les os. Le remodelage osseux a lieu dans une structure appelée BMU (Basal
Multicellular Unit) (Parfitt 1994). Cette unité multi cellulaire de base regroupe le travail
des ostéoclastes, des ostéoblastes, dont l’action couplée constitue la base du concept de
remodelage osseux, mais également des ostéocytes et des cellules bordantes (Figure 9).
Le remodelage osseux est un processus cyclique par lequel quelques zones de la
structure osseuse sont résorbées et remplacées par de l’os nouveau (Raggatt et Partridge
2010) (Figure 9). D’un point de vue temporel, la surface à résorber est préparée par les
cellules bordantes, qui digèrent la fine couche de matrice non minéralisée sur laquelle elles
reposent, afin d’exposer la partie minéralisée de la matrice pour la résorption (Everts et al.
2002). Ensuite, les ostéoclastes viennent résorber cette matrice minéralisée. Vient ensuite
une phase d’inversion (Figure 9) ou des cellules (cellules bordantes et des macrophages),
viennent compléter le processus de résorption en nettoyant les cavités de résorption (Everts
et al. 2002; Raggatt et Partridge 2010). Suite à cette phase, certains ostéoblastes vont
former de l’os nouveau, puis devenir des ostéocytes, qui vont rester pris au piège dans la
matrice, tandis que d’autres ostéoblastes vont rester à la surface de la zone remodelée,
devenir quiescent et constituer les cellules bordantes (Boyce et al. 2002). Il y a un délais
considérable entre la phase de résorption, qui prend des semaines, et la phase de formation,
qui nécessite des mois (Dunlop et al. 2009).
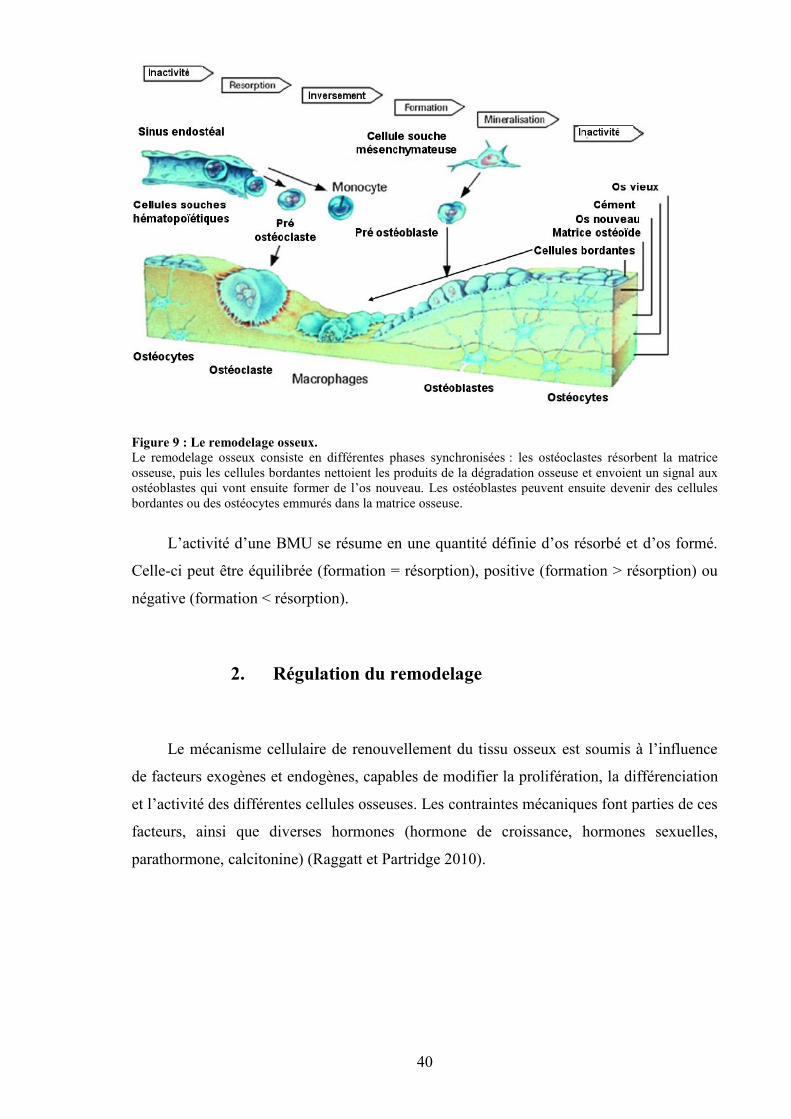
40
Figure 9 : Le remodelage osseux.Le remodelage osseux consiste en différentes phases synchronisées : les ostéoclastes résorbent la matriceosseuse, puis les cellules bordantes nettoient les produits de la dégradation osseuse et envoient un signal auxostéoblastes qui vont ensuite former de l’os nouveau. Les ostéoblastes peuvent ensuite devenir des cellulesbordantes ou des ostéocytes emmurés dans la matrice osseuse.
L’activité d’une BMU se résume en une quantité définie d’os résorbé et d’os formé.
Celle-ci peut être équilibrée (formation = résorption), positive (formation > résorption) ou
négative (formation < résorption).
2. Régulation du remodelage
Le mécanisme cellulaire de renouvellement du tissu osseux est soumis à l’influence
de facteurs exogènes et endogènes, capables de modifier la prolifération, la différenciation
et l’activité des différentes cellules osseuses. Les contraintes mécaniques font parties de ces
facteurs, ainsi que diverses hormones (hormone de croissance, hormones sexuelles,
parathormone, calcitonine) (Raggatt et Partridge 2010).
41
a) Les facteurs systémiques
Les facteurs systémiques interviennent dans la régulation de l’homéostasie de certains
ions. C’est le cas des hormones calciotropes : PTH, vitamine D et calcitonine.
- la parathormone (PTH) : est une hormone hypercalcémiante qui est synthétisée par les
glandes parathyroïdes (Aleksyniene et Hvid 2004) dans le but de maintenir un taux
suffisant de calcium dans le sang. Elle est sécrétée en cas d’hypocalcémie. La PTH agit
directement sur l’os pour promouvoir le relargage du calcium (Hodsman et al. 2002) et sur
les tubules rénaux pour augmenter la réabsorption de calcium. Dans l’os, la PTH active
indirectement la maturation et l’activité des ostéoclastes, par stimulation de l’expression du
facteur de différenciation RANKL, sur la surface des ostéoblastes (Yasuda et al. 1998).
Quand RANKL se lie à son récepteur RANK sur les pré-ostéoclastes, ces précurseurs se
différencient en ostéoclastes matures, en présence de M-CSF (macrophage-colony
stimulating factor). Les ostéoclastes résorbent ensuite la matrice et libèrent du calcium. Il
n’est pas certain que la PTH agisse directement sur RANKL. L’interaction entre RANKL
et son récepteur pré-ostéoclastique pourrait être médiée par l’ostéoprotégérine (OPG)
(Silvestrini et al. 2008), car il a été montré que celle-ci module la communication entre les
ostéoblastes et les ostéoclastes. Paradoxalement, quand la PTH est administrée par
intermittence, elle active la formation osseuse et augmente la quantité d’os trabéculaire
(Borba et Manas 2010; Drake et al. 2011).
- la vitamine D : est fabriquée dans la peau sous l’action du soleil (Norman 2002). Elle est
biologiquement inerte et doit subir deux hydroxylations successives dans le foie et les reins
pour devenir biologiquement active, sous la forme 1,25-dihydroxyvitamine D
(1,25(OH)2D3) (Reichel et al. 1989). Le principal effet de la vitamine D est de maintenir la
concentration sérique de calcium à un taux normal (Christakos 2002). Elle effectue ce
contrôle en augmentant l’efficacité de l’absorption intestinale de calcium (Amling et al.
1999; Yoshizawa et al. 1997) et en recrutant des cellules souches osseuses
hématopoïétiques qui vont se transformer en ostéoclastes matures (Christakos 2002), et
mobiliser le calcium contenu dans les os pour le libérer dans le sang. L’activité des
ostéoclastes est régulée de façon indirecte par la 1,25(OH)2D3 car les ostéoclastes n’ont pas
de récepteurs à la vitamine D. Cette régulation va se faire grâce à l’action des cellules
ostéoprogénitrices, des précurseurs ostéoblastiques et des ostéoblastes matures (Christakos
42
2002). Ceux-ci vont produire une variété d’hormones et de cytokines auxquels les
ostéoclastes sont sensibles. Les ostéoblastes matures possèdent également des récepteurs
nucléaires pour la 1,25(OH)2D3. Celle-ci augmente l’expression de la phosphatase alcaline,
de l’ostéopontine et de l’ostéocalcine (Price et Baukol 1980; Prince et Butler 1987), ainsi
que de nombreuses cytokines. La 1,25(OH)2D3 favorise aussi la minéralisation de la
matrice ostéoïde produite par les ostéoblastes en maintenant les concentrations
extracellulaires de calcium et de phosphore à un taux normal (DeLuca 1988). De ce fait de
l’hydroxyapatite de calcium est déposé dans la matrice osseuse. La production de
1,25(OH)2D3 par les reins est étroitement régulée par la concentration sérique de calcium, à
travers les actions de la PTH et du phosphore.
- la calcitonine (CT) : est un peptide composé de 32 acides aminés qui est sécrété
principalement par les cellules C de la thyroïde (Galson et Goldring 2002). Sa sécrétion est
régulée par la concentration sanguine en calcium. Sa principale action biologique est
l’inhibition de la résorption par les ostéoclastes (Deftos et First 1981). L’augmentation de
la CT entraîne un rétrécissement des ostéoclastes, qui diminuent leur activité de résorption.
Les ostéoclastes ont des récepteurs pour la CT sur leurs parois. La CT peut réguler et être
régulée par d’autres hormones calciotropes. Certaines études reportent un effet ambigu de
la CT sur les ostéocytes et les ostéoblastes.
D’autres hormones ont une action sur le tissu osseux :
- les stéroïdes : il y a trois catégories d’hormones stéroïdes : les glucocorticoïdes, les
minéralocorticoïdes, et les stéroïdes sexuels (oestrogènes, androgènes, progestérone). Les
stéroïdes sexuels sont synthétisés en réponse à des signaux envoyés par le cerveau. Les
stéroïdes ont un rôle important sur le métabolisme osseux (Bilezikian et al. 2002). Ils
régulent l’activité des ostéoblastes et des ostéoclastes et renforcent le couplage entre ces
cellules par des facteurs paracrines. La principale fonction des stéroïdes sexuels au niveau
de l’os est de maintenir un métabolisme osseux constant et de permettre l’établissement du
pic de masse osseuse (Bilezikian et al. 2002) afin de prévenir la perte de masse osseuse.
Les glucocorticoïdes sont utilisés comme traitement dans diverses pathologies (Yang et al.
2011).
* les glucocorticoïdes : le cortisol est un glucocorticoïde sécrété par les
glandes surrénales (Kream et Lukert 2002). A dose physiologique, il est essentiel pour
la différenciation et le fonctionnement des ostéoblastes et des ostéoclastes et module
43
l’effet d’autres hormones et médiateurs du fonctionnement cellulaire (Kream et Lukert
2002). A dose supra physiologique, il inhibe la formation osseuse (Kim 2010) en
inhibant la prolifération des ostéoprogéniteurs, le renouvellement et le fonctionnement
des ostéoblastes, et en augmentant l’apoptose des ostéoblastes. In vitro, les
glucocorticoïdes peuvent stimuler ou inhiber la formation osseuse, selon la maturation
du modèle utilisé (Chavassieux et al. 1993; Madsen et al. 2011).
* les stéroïdes sexuels : les stéroïdes sexuels influencent pratiquement tous
les aspects de l’os, du développement au remodelage en passant par la croissance
(Clarke et Khosla 2010a; Venken et al. 2008). Ils contribuent au dimorphisme sexuel
du squelette, à la fermeture des épiphyses (Wiren et Orwoll 2002), à la détermination
du pic de masse osseuse, au maintien de l’homéostasie durant la reproduction et à l’âge
adulte, et à la conservation de la masse osseuse et de l’architecture. Des récepteurs aux
oestrogènes sont présents à la surface des ostéoblastes, des cellules bordantes, et à un
niveau plus faibles sur les ostéocytes (Kusec et al. 1998). La diminution d’oestrogènes
et d’androgènes est accompagnée d’une perte de masse osseuse (Clarke et Khosla
2010a). Les oestrogènes et les androgènes diminuent la résorption osseuse en agissant
directement sur les ostéoclastes (Hofbauer et al. 1999; Oursler et al. 1991; Pacifici et
al. 1993). Les androgènes régulent également la production de facteurs produits par les
ostéoblastes et par les cellules stromales (Vanderschueren et Bouillon 1995; Wiren et
Orwoll 2002). Le rôle de la progestérone est moins bien connu, mais un déficit en
progestérone fait décroître la masse osseuse tandis que la supplémentation en
progestérone accroît la masse osseuse chez ces patientes (Prior et al. 1994; Prior et al.
1990). La déficience en stéroïdes sexuels est l’une des causes principale d’ostéoporose,
nous le détaillons plus loin.
- l’hormone de croissance (GH) : la GH est sécrétée par la glande pituitaire, sous
l’influence de peptides provenant de l’hypothalamus (Rosen 2002). La GH a des effets
directs et indirects sur l’os, dépendants de l’âge et de la maturité du squelette (Rosen 2002).
Indirectement, la GH peut augmenter la DMO via ses effets sur les muscles et le transport
de calcium par l’intestin (Rosen 2002). La GH peut également directement stimuler le
remodelage osseux (Kann 2004) et augmenter la croissance endochondrale à travers ses
actions sur l’ostéoblaste. La GH est essentielle pour la croissance et la maintenance de la
masse osseuse (Rosen 2002).
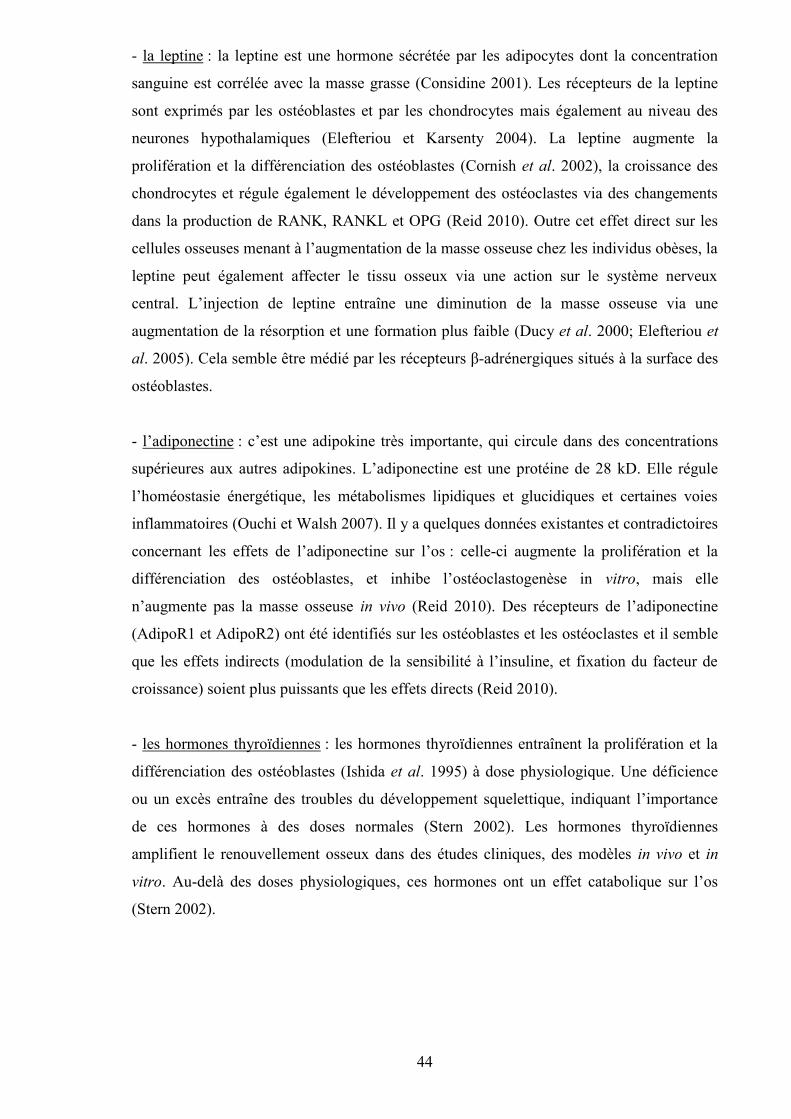
44
- la leptine : la leptine est une hormone sécrétée par les adipocytes dont la concentration
sanguine est corrélée avec la masse grasse (Considine 2001). Les récepteurs de la leptine
sont exprimés par les ostéoblastes et par les chondrocytes mais également au niveau des
neurones hypothalamiques (Elefteriou et Karsenty 2004). La leptine augmente la
prolifération et la différenciation des ostéoblastes (Cornish et al. 2002), la croissance des
chondrocytes et régule également le développement des ostéoclastes via des changements
dans la production de RANK, RANKL et OPG (Reid 2010). Outre cet effet direct sur les
cellules osseuses menant à l’augmentation de la masse osseuse chez les individus obèses, la
leptine peut également affecter le tissu osseux via une action sur le système nerveux
central. L’injection de leptine entraîne une diminution de la masse osseuse via une
augmentation de la résorption et une formation plus faible (Ducy et al. 2000; Elefteriou et
al. 2005). Cela semble être médié par les récepteurs β-adrénergiques situés à la surface des
ostéoblastes.
- l’adiponectine : c’est une adipokine très importante, qui circule dans des concentrations
supérieures aux autres adipokines. L’adiponectine est une protéine de 28 kD. Elle régule
l’homéostasie énergétique, les métabolismes lipidiques et glucidiques et certaines voies
inflammatoires (Ouchi et Walsh 2007). Il y a quelques données existantes et contradictoires
concernant les effets de l’adiponectine sur l’os : celle-ci augmente la prolifération et la
différenciation des ostéoblastes, et inhibe l’ostéoclastogenèse in vitro, mais elle
n’augmente pas la masse osseuse in vivo (Reid 2010). Des récepteurs de l’adiponectine
(AdipoR1 et AdipoR2) ont été identifiés sur les ostéoblastes et les ostéoclastes et il semble
que les effets indirects (modulation de la sensibilité à l’insuline, et fixation du facteur de
croissance) soient plus puissants que les effets directs (Reid 2010).
- les hormones thyroïdiennes : les hormones thyroïdiennes entraînent la prolifération et la
différenciation des ostéoblastes (Ishida et al. 1995) à dose physiologique. Une déficience
ou un excès entraîne des troubles du développement squelettique, indiquant l’importance
de ces hormones à des doses normales (Stern 2002). Les hormones thyroïdiennes
amplifient le renouvellement osseux dans des études cliniques, des modèles in vivo et in
vitro. Au-delà des doses physiologiques, ces hormones ont un effet catabolique sur l’os
(Stern 2002).
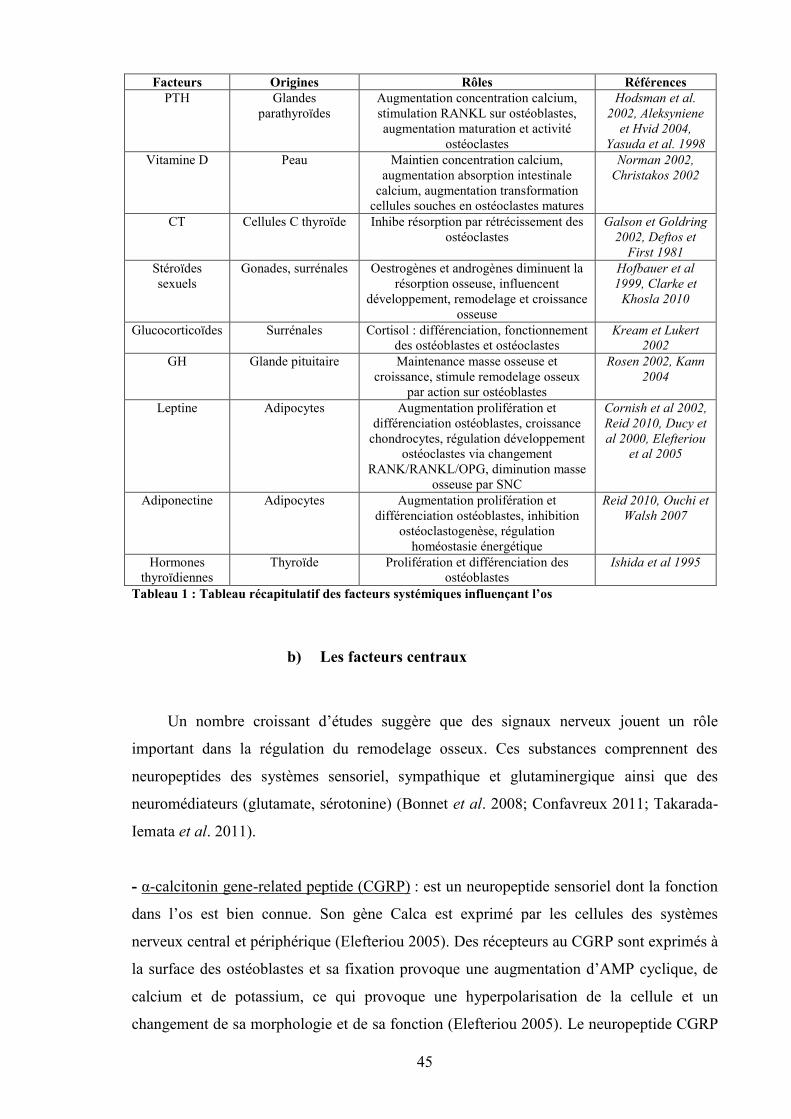
45
Facteurs Origines Rôles RéférencesPTH Glandes
parathyroïdesAugmentation concentration calcium,stimulation RANKL sur ostéoblastes,augmentation maturation et activité
ostéoclastes
Hodsman et al.2002, Aleksyniene
et Hvid 2004,Yasuda et al. 1998
Vitamine D Peau Maintien concentration calcium,augmentation absorption intestinale
calcium, augmentation transformationcellules souches en ostéoclastes matures
Norman 2002,Christakos 2002
CT Cellules C thyroïde Inhibe résorption par rétrécissement desostéoclastes
Galson et Goldring2002, Deftos et
First 1981Stéroïdessexuels
Gonades, surrénales Oestrogènes et androgènes diminuent larésorption osseuse, influencent
développement, remodelage et croissanceosseuse
Hofbauer et al1999, Clarke et
Khosla 2010
Glucocorticoïdes Surrénales Cortisol : différenciation, fonctionnementdes ostéoblastes et ostéoclastes
Kream et Lukert2002
GH Glande pituitaire Maintenance masse osseuse etcroissance, stimule remodelage osseux
par action sur ostéoblastes
Rosen 2002, Kann2004
Leptine Adipocytes Augmentation prolifération etdifférenciation ostéoblastes, croissance
chondrocytes, régulation développementostéoclastes via changement
RANK/RANKL/OPG, diminution masseosseuse par SNC
Cornish et al 2002,Reid 2010, Ducy etal 2000, Elefteriou
et al 2005
Adiponectine Adipocytes Augmentation prolifération etdifférenciation ostéoblastes, inhibition
ostéoclastogenèse, régulationhoméostasie énergétique
Reid 2010, Ouchi etWalsh 2007
Hormonesthyroïdiennes
Thyroïde Prolifération et différenciation desostéoblastes
Ishida et al 1995
Tableau 1 : Tableau récapitulatif des facteurs systémiques influençant l’os
b) Les facteurs centraux
Un nombre croissant d’études suggère que des signaux nerveux jouent un rôle
important dans la régulation du remodelage osseux. Ces substances comprennent des
neuropeptides des systèmes sensoriel, sympathique et glutaminergique ainsi que des
neuromédiateurs (glutamate, sérotonine) (Bonnet et al. 2008; Confavreux 2011; Takarada-
Iemata et al. 2011).
- α-calcitonin gene-related peptide (CGRP) : est un neuropeptide sensoriel dont la fonction
dans l’os est bien connue. Son gène Calca est exprimé par les cellules des systèmes
nerveux central et périphérique (Elefteriou 2005). Des récepteurs au CGRP sont exprimés à
la surface des ostéoblastes et sa fixation provoque une augmentation d’AMP cyclique, de
calcium et de potassium, ce qui provoque une hyperpolarisation de la cellule et un
changement de sa morphologie et de sa fonction (Elefteriou 2005). Le neuropeptide CGRP
46
stimule la prolifération des ostéoblastes, la synthèse de facteurs de croissance et de
cytokines, la synthèse du collagène et la formation osseuse (Elefteriou 2005). Il provoque
aussi la prolifération des colonies osseuses provenant des cellules stromales de la moelle.
Enfin, le CGRP pourrait aussi fonctionner comme un facteur autocrine car il est également
exprimé par les ostéoblastes (Drissi et al. 1997; Imai et Matsusue 2002). Le CGRP est un
inhibiteur puissant de la résorption osseuse. Cet effet a été démontré in vitro et in vivo
(Lerner 2002).
- Vasointestinal peptide P (VIP) : est un facteur neuromodulateur et neurotrophique prenant
part à la croissance neuronale, à la différenciation, à la survie et à la synthèse des
transmetteurs (Muller et al. 1995). Le VIP pourrait avoir un rôle important dans le contrôle
local de la formation des ostéoclastes car la destruction des nerfs exprimant le VIP induit
une augmentation de 50% des surfaces recouvertes par les ostéoclastes dans la calvaria et la
mandibule (Hill and Elde 1991). De plus, le VIP peut se fixer sur les ostéoclastes et inhiber
l’ostéoclastogenèse induite par la 1,25(OH)2-vitamine D3. In vitro, il affecte les protéines
de la matrice osseuse non collagénique (ostéocalcine, ostéonectine, ostéopontine) et donc la
formation osseuse (Lerner 2002).
- Substance P (SP) : est un autre neuropeptide très exprimé dans des petits neurones
sensoriels qui innervent l’os (Liu et al. 2007). Une étude menée avec de la capsaïne a
montré que les neurones sensibles à cette molécule contribuent à la maintenance de
l’intégrité de l’os trabéculaire. Les rats traités à la capsaïne montrent une perte de masse
osseuse, avec diminution de la formation et augmentation de la résorption, associée à une
destruction des neurones sensitifs positifs à la SP et au CGRP (Offley et al. 2005). Il a été
montré que la substance P augmente la différenciation des ostéoblastes, la formation des
colonies osseuses et la production d’AMP cyclique par les ostéoblastes (Jones et al. 2004).
- récepteurs β-adrénergiques : le récepteur β2AR est le principal récepteur adrénergique
fonctionnel à être exprimé par les ostéoblastes (Bonnet et al. 2008). Il appartient à la
famille des récepteurs à 7 domaines transmembranaires couplés aux protéines G (Bonnet et
al. 2008). L’activation des récepteurs βAR couplés aux protéines G active l’adénylyl
cyclase, qui augmente les niveaux intracellulaires d’AMPc (Bonnet et al. 2008).
L’augmentation d’AMPc active la protéine kinase A, qui peut phosphoryler une multitude
de cibles protéiques, comme les facteurs de transcription, les kinases et les récepteurs
membranaires. L’efficacité de ce système a déjà été démontrée sur les
ostéoblastes (Elefteriou 2005) : l’activation du récepteur β2AR diminue la formation
47
osseuse par les ostéoblastes. La stimulation du récepteur β2AR modifie également
l’expression de RANKL chez les ostéoblastes, stimulant indirectement la différenciation
des ostéoclastes (Elefteriou et al. 2005).
- Neuropeptide Y (NPY) : est l’un des neuropeptides les plus répandus, avec une forte
expression dans l’hypothalamus (Driessler et Baldock 2010). Un modèle de souris KO pour
le récepteur Y2 (récepteur du NPY), a montré une augmentation généralisée de l’activité
des ostéoblastes dans l’os trabéculaire et cortical, sans modification de la résorption
osseuse (Baldock et al. 2002). De plus, des souris KO pour le ligand NPY ont montré un
phénotype d’anabolisme de l’os, similaire à celui observé chez les souris KO pour le
récepteur Y2, et non accompagné d’un changement de poids (Baldock et al. 2009).
- Neuromedine U (NMU) : est un neuropeptide exprimé dans les neurones de
l’hypothalamus et dans l’intestin grêle, et dont l’activité est régulée par l’activation du
système sympathique (Brighton et al. 2004; Driessler et Baldock 2010). Il a été montré que
NMU régule également la masse osseuse. En effet, les souris KO pour le NMU présentent
une augmentation de la formation et de la masse osseuse, due à des facteurs centraux, liés à
l’hypothalamus (Driessler and Baldock 2010; Sato et al. 2007). Le NMU et ses récepteurs
ne sont pas détectables dans l’os et l’activité des ostéoblastes in vitro n’est pas modifiée par
un traitement par le NMU (Driessler et Baldock 2010).
- la sérotonine : les ostéoblastes, les ostéocytes et les ostéoclastes expriment des récepteurs
de la sérotonine (Elefteriou 2005; Westbroek et al. 2001). Une étude menée in vitro sur des
ostéocytes et des ostéoblastes stimulés mécaniquement tend à montrer que le récepteur à la
sérotonine 5-HT serait impliqué dans la détection des charges mécaniques (Westbroek et
al. 2001). Des études montrent également un rôle de la sérotonine dans la régulation de la
formation osseuse (Ducy et Karsenty 2010) et dans le processus de réparation osseuse,
ainsi que dans la régulation de l’ostéoclastogenèse.
- le glutamate : le glutamate est un neurotransmetteur majeur dans le système nerveux
central. Les ostéoblastes, les ostéocytes et les ostéoclastes ont la structure moléculaire
nécessaire pour la réponse au glutamate (Hinoi et al. 2004; Mason 2004). Les ostéoblastes
contiennent des vésicules remplies de glutamate et expriment des transporteurs et des
récepteurs pour le glutamate (Patton et al. 1998). Le rôle fonctionnel du glutamate a été
montré in vitro sur des modèles cellulaires mais son fonctionnement in vivo n’est toujours
pas très bien élucidé (Skerry 2008).
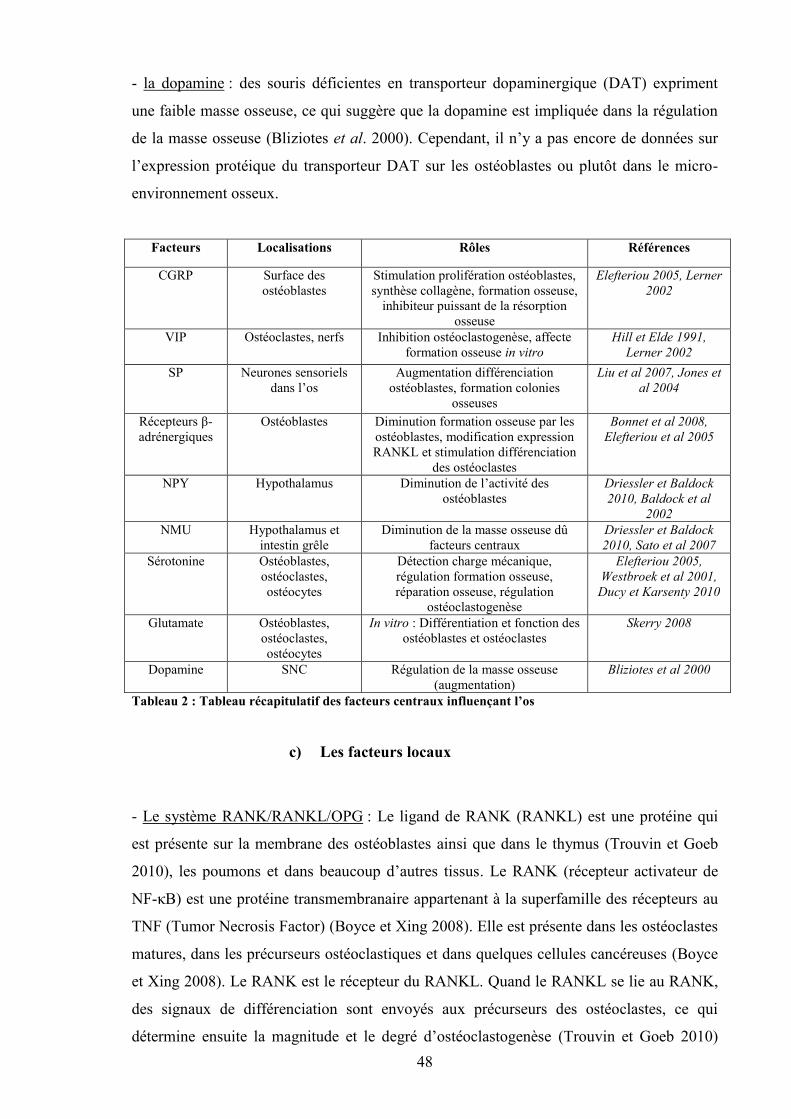
48
- la dopamine : des souris déficientes en transporteur dopaminergique (DAT) expriment
une faible masse osseuse, ce qui suggère que la dopamine est impliquée dans la régulation
de la masse osseuse (Bliziotes et al. 2000). Cependant, il n’y a pas encore de données sur
l’expression protéique du transporteur DAT sur les ostéoblastes ou plutôt dans le micro-
environnement osseux.
Facteurs Localisations Rôles Références
CGRP Surface desostéoblastes
Stimulation prolifération ostéoblastes,synthèse collagène, formation osseuse,
inhibiteur puissant de la résorptionosseuse
Elefteriou 2005, Lerner2002
VIP Ostéoclastes, nerfs Inhibition ostéoclastogenèse, affecteformation osseuse in vitro
Hill et Elde 1991,Lerner 2002
SP Neurones sensorielsdans l’os
Augmentation différenciationostéoblastes, formation colonies
osseuses
Liu et al 2007, Jones etal 2004
Récepteurs β-adrénergiques
Ostéoblastes Diminution formation osseuse par lesostéoblastes, modification expressionRANKL et stimulation différenciation
des ostéoclastes
Bonnet et al 2008,Elefteriou et al 2005
NPY Hypothalamus Diminution de l’activité desostéoblastes
Driessler et Baldock2010, Baldock et al
2002NMU Hypothalamus et
intestin grêleDiminution de la masse osseuse dû
facteurs centrauxDriessler et Baldock2010, Sato et al 2007
Sérotonine Ostéoblastes,ostéoclastes,ostéocytes
Détection charge mécanique,régulation formation osseuse,réparation osseuse, régulation
ostéoclastogenèse
Elefteriou 2005,Westbroek et al 2001,Ducy et Karsenty 2010
Glutamate Ostéoblastes,ostéoclastes,ostéocytes
In vitro : Différentiation et fonction desostéoblastes et ostéoclastes
Skerry 2008
Dopamine SNC Régulation de la masse osseuse(augmentation)
Bliziotes et al 2000
Tableau 2 : Tableau récapitulatif des facteurs centraux influençant l’os
c) Les facteurs locaux
- Le système RANK/RANKL/OPG : Le ligand de RANK (RANKL) est une protéine qui
est présente sur la membrane des ostéoblastes ainsi que dans le thymus (Trouvin et Goeb
2010), les poumons et dans beaucoup d’autres tissus. Le RANK (récepteur activateur de
NF-κB) est une protéine transmembranaire appartenant à la superfamille des récepteurs au
TNF (Tumor Necrosis Factor) (Boyce et Xing 2008). Elle est présente dans les ostéoclastes
matures, dans les précurseurs ostéoclastiques et dans quelques cellules cancéreuses (Boyce
et Xing 2008). Le RANK est le récepteur du RANKL. Quand le RANKL se lie au RANK,
des signaux de différenciation sont envoyés aux précurseurs des ostéoclastes, ce qui
détermine ensuite la magnitude et le degré d’ostéoclastogenèse (Trouvin et Goeb 2010)
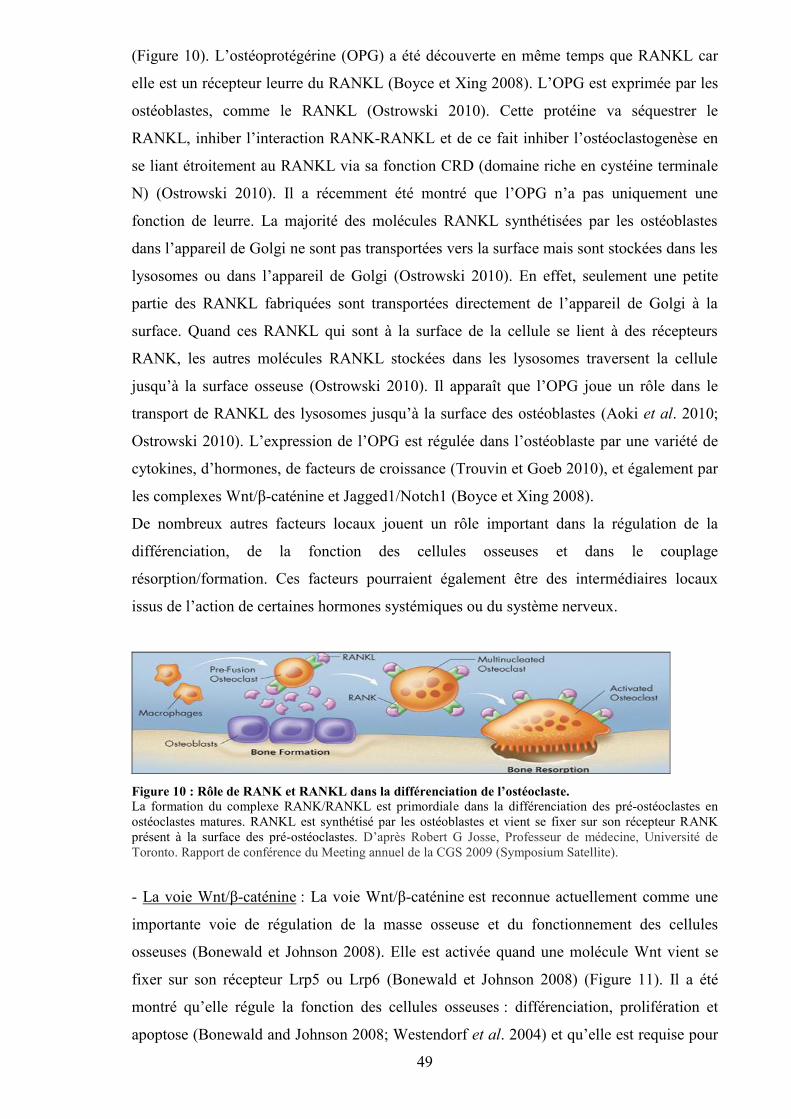
49
(Figure 10). L’ostéoprotégérine (OPG) a été découverte en même temps que RANKL car
elle est un récepteur leurre du RANKL (Boyce et Xing 2008). L’OPG est exprimée par les
ostéoblastes, comme le RANKL (Ostrowski 2010). Cette protéine va séquestrer le
RANKL, inhiber l’interaction RANK-RANKL et de ce fait inhiber l’ostéoclastogenèse en
se liant étroitement au RANKL via sa fonction CRD (domaine riche en cystéine terminale
N) (Ostrowski 2010). Il a récemment été montré que l’OPG n’a pas uniquement une
fonction de leurre. La majorité des molécules RANKL synthétisées par les ostéoblastes
dans l’appareil de Golgi ne sont pas transportées vers la surface mais sont stockées dans les
lysosomes ou dans l’appareil de Golgi (Ostrowski 2010). En effet, seulement une petite
partie des RANKL fabriquées sont transportées directement de l’appareil de Golgi à la
surface. Quand ces RANKL qui sont à la surface de la cellule se lient à des récepteurs
RANK, les autres molécules RANKL stockées dans les lysosomes traversent la cellule
jusqu’à la surface osseuse (Ostrowski 2010). Il apparaît que l’OPG joue un rôle dans le
transport de RANKL des lysosomes jusqu’à la surface des ostéoblastes (Aoki et al. 2010;
Ostrowski 2010). L’expression de l’OPG est régulée dans l’ostéoblaste par une variété de
cytokines, d’hormones, de facteurs de croissance (Trouvin et Goeb 2010), et également par
les complexes Wnt/β-caténine et Jagged1/Notch1 (Boyce et Xing 2008).
De nombreux autres facteurs locaux jouent un rôle important dans la régulation de la
différenciation, de la fonction des cellules osseuses et dans le couplage
résorption/formation. Ces facteurs pourraient également être des intermédiaires locaux
issus de l’action de certaines hormones systémiques ou du système nerveux.
Figure 10 : Rôle de RANK et RANKL dans la différenciation de l’ostéoclaste.La formation du complexe RANK/RANKL est primordiale dans la différenciation des pré-ostéoclastes enostéoclastes matures. RANKL est synthétisé par les ostéoblastes et vient se fixer sur son récepteur RANKprésent à la surface des pré-ostéoclastes. D’après Robert G Josse, Professeur de médecine, Université deToronto. Rapport de conférence du Meeting annuel de la CGS 2009 (Symposium Satellite).
- La voie Wnt/β-caténine : La voie Wnt/β-caténine est reconnue actuellement comme une
importante voie de régulation de la masse osseuse et du fonctionnement des cellules
osseuses (Bonewald et Johnson 2008). Elle est activée quand une molécule Wnt vient se
fixer sur son récepteur Lrp5 ou Lrp6 (Bonewald et Johnson 2008) (Figure 11). Il a été
montré qu’elle régule la fonction des cellules osseuses : différenciation, prolifération et
apoptose (Bonewald and Johnson 2008; Westendorf et al. 2004) et qu’elle est requise pour
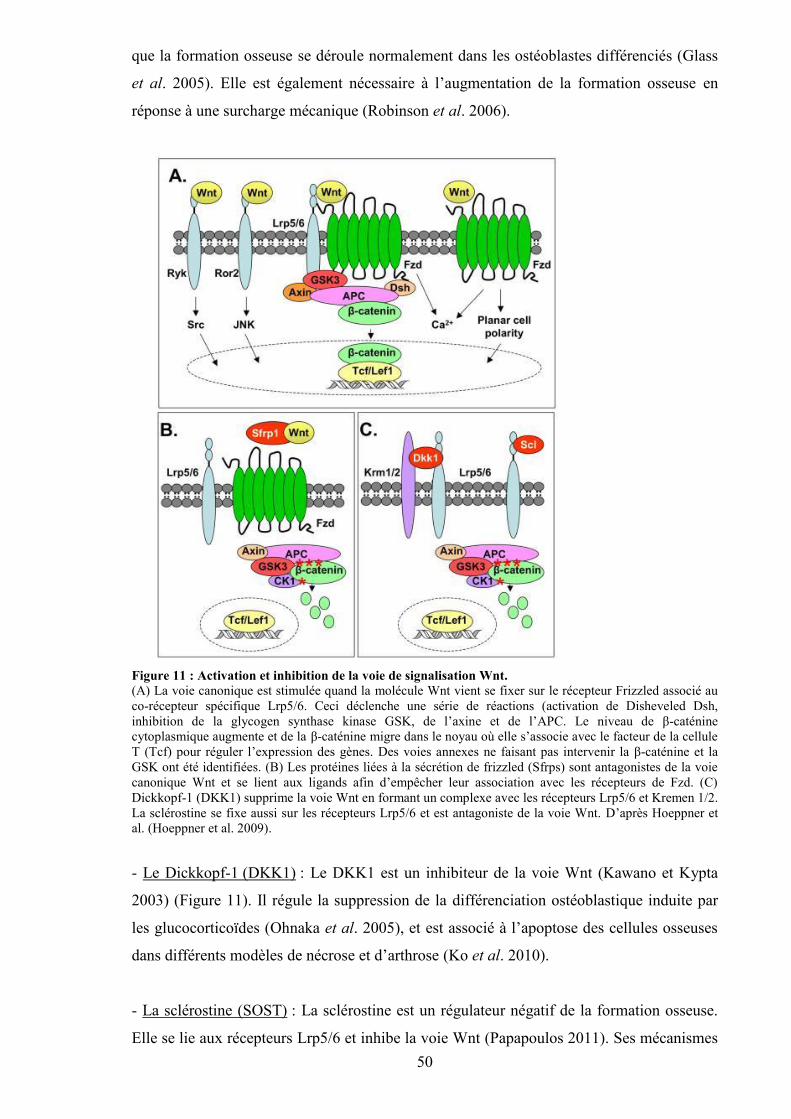
50
que la formation osseuse se déroule normalement dans les ostéoblastes différenciés (Glass
et al. 2005). Elle est également nécessaire à l’augmentation de la formation osseuse en
réponse à une surcharge mécanique (Robinson et al. 2006).
Figure 11 : Activation et inhibition de la voie de signalisation Wnt.(A) La voie canonique est stimulée quand la molécule Wnt vient se fixer sur le récepteur Frizzled associé auco-récepteur spécifique Lrp5/6. Ceci déclenche une série de réactions (activation de Disheveled Dsh,inhibition de la glycogen synthase kinase GSK, de l’axine et de l’APC. Le niveau de β-caténinecytoplasmique augmente et de la β-caténine migre dans le noyau où elle s’associe avec le facteur de la celluleT (Tcf) pour réguler l’expression des gènes. Des voies annexes ne faisant pas intervenir la β-caténine et laGSK ont été identifiées. (B) Les protéines liées à la sécrétion de frizzled (Sfrps) sont antagonistes de la voiecanonique Wnt et se lient aux ligands afin d’empêcher leur association avec les récepteurs de Fzd. (C)Dickkopf-1 (DKK1) supprime la voie Wnt en formant un complexe avec les récepteurs Lrp5/6 et Kremen 1/2.La sclérostine se fixe aussi sur les récepteurs Lrp5/6 et est antagoniste de la voie Wnt. D’après Hoeppner etal. (Hoeppner et al. 2009).
- Le Dickkopf-1 (DKK1) : Le DKK1 est un inhibiteur de la voie Wnt (Kawano et Kypta
2003) (Figure 11). Il régule la suppression de la différenciation ostéoblastique induite par
les glucocorticoïdes (Ohnaka et al. 2005), et est associé à l’apoptose des cellules osseuses
dans différents modèles de nécrose et d’arthrose (Ko et al. 2010).
- La sclérostine (SOST) : La sclérostine est un régulateur négatif de la formation osseuse.
Elle se lie aux récepteurs Lrp5/6 et inhibe la voie Wnt (Papapoulos 2011). Ses mécanismes
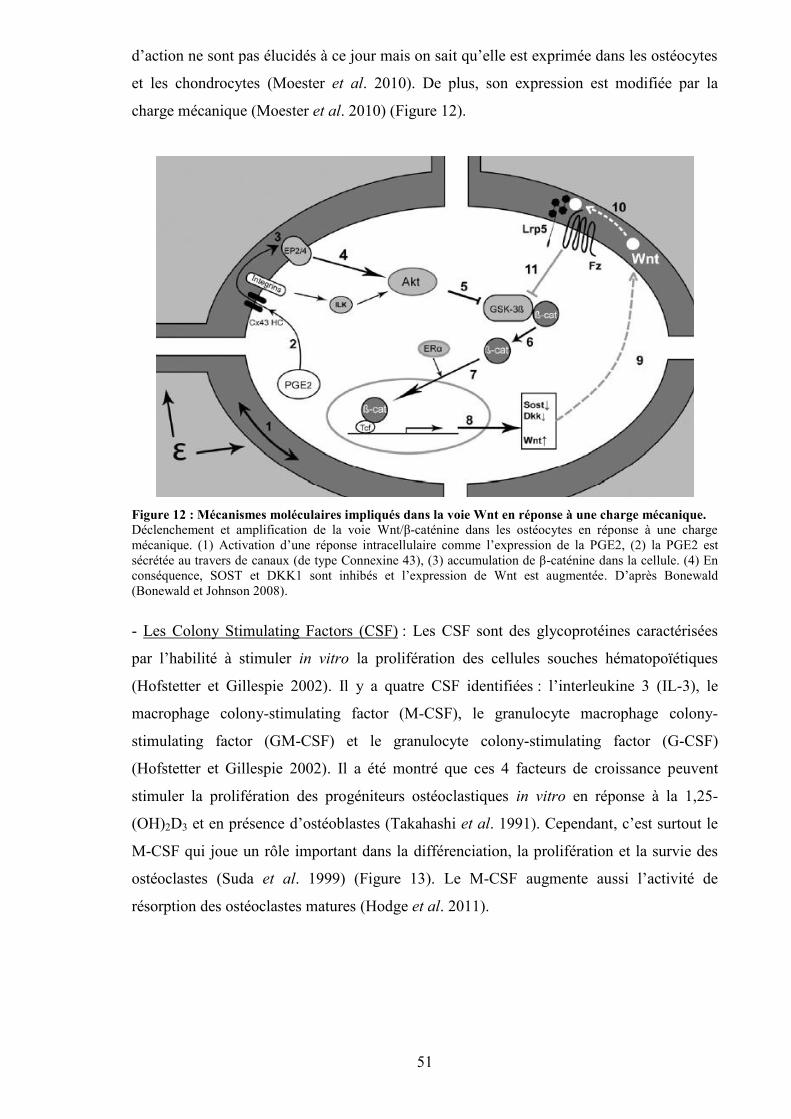
51
d’action ne sont pas élucidés à ce jour mais on sait qu’elle est exprimée dans les ostéocytes
et les chondrocytes (Moester et al. 2010). De plus, son expression est modifiée par la
charge mécanique (Moester et al. 2010) (Figure 12).
Figure 12 : Mécanismes moléculaires impliqués dans la voie Wnt en réponse à une charge mécanique.Déclenchement et amplification de la voie Wnt/β-caténine dans les ostéocytes en réponse à une chargemécanique. (1) Activation d’une réponse intracellulaire comme l’expression de la PGE2, (2) la PGE2 estsécrétée au travers de canaux (de type Connexine 43), (3) accumulation de β-caténine dans la cellule. (4) Enconséquence, SOST et DKK1 sont inhibés et l’expression de Wnt est augmentée. D’après Bonewald(Bonewald et Johnson 2008).
- Les Colony Stimulating Factors (CSF) : Les CSF sont des glycoprotéines caractérisées
par l’habilité à stimuler in vitro la prolifération des cellules souches hématopoïétiques
(Hofstetter et Gillespie 2002). Il y a quatre CSF identifiées : l’interleukine 3 (IL-3), le
macrophage colony-stimulating factor (M-CSF), le granulocyte macrophage colony-
stimulating factor (GM-CSF) et le granulocyte colony-stimulating factor (G-CSF)
(Hofstetter et Gillespie 2002). Il a été montré que ces 4 facteurs de croissance peuvent
stimuler la prolifération des progéniteurs ostéoclastiques in vitro en réponse à la 1,25-
(OH)2D3 et en présence d’ostéoblastes (Takahashi et al. 1991). Cependant, c’est surtout le
M-CSF qui joue un rôle important dans la différenciation, la prolifération et la survie des
ostéoclastes (Suda et al. 1999) (Figure 13). Le M-CSF augmente aussi l’activité de
résorption des ostéoclastes matures (Hodge et al. 2011).
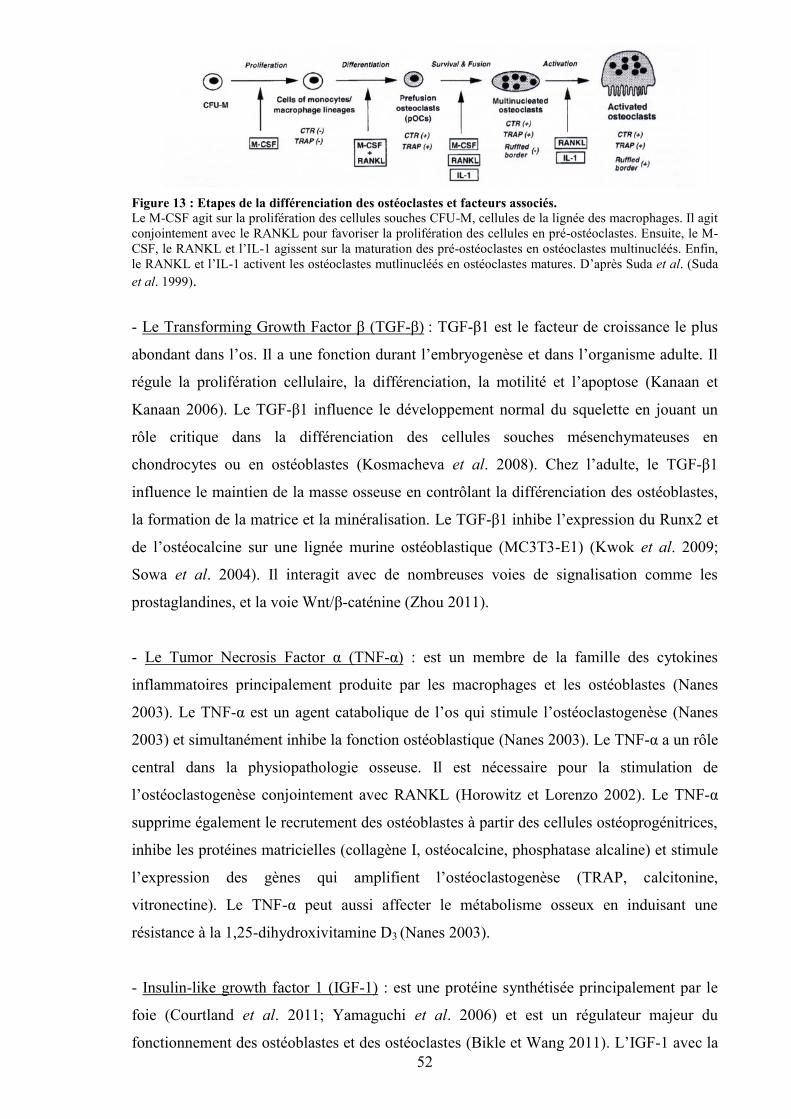
52
Figure 13 : Etapes de la différenciation des ostéoclastes et facteurs associés.Le M-CSF agit sur la prolifération des cellules souches CFU-M, cellules de la lignée des macrophages. Il agitconjointement avec le RANKL pour favoriser la prolifération des cellules en pré-ostéoclastes. Ensuite, le M-CSF, le RANKL et l’IL-1 agissent sur la maturation des pré-ostéoclastes en ostéoclastes multinucléés. Enfin,le RANKL et l’IL-1 activent les ostéoclastes mutlinucléés en ostéoclastes matures. D’après Suda et al. (Sudaet al. 1999).
- Le Transforming Growth Factor β (TGF-β) : TGF-β1 est le facteur de croissance le plus
abondant dans l’os. Il a une fonction durant l’embryogenèse et dans l’organisme adulte. Il
régule la prolifération cellulaire, la différenciation, la motilité et l’apoptose (Kanaan et
Kanaan 2006). Le TGF-β1 influence le développement normal du squelette en jouant un
rôle critique dans la différenciation des cellules souches mésenchymateuses en
chondrocytes ou en ostéoblastes (Kosmacheva et al. 2008). Chez l’adulte, le TGF-β1
influence le maintien de la masse osseuse en contrôlant la différenciation des ostéoblastes,
la formation de la matrice et la minéralisation. Le TGF-β1 inhibe l’expression du Runx2 et
de l’ostéocalcine sur une lignée murine ostéoblastique (MC3T3-E1) (Kwok et al. 2009;
Sowa et al. 2004). Il interagit avec de nombreuses voies de signalisation comme les
prostaglandines, et la voie Wnt/β-caténine (Zhou 2011).
- Le Tumor Necrosis Factor α (TNF-α) : est un membre de la famille des cytokines
inflammatoires principalement produite par les macrophages et les ostéoblastes (Nanes
2003). Le TNF-α est un agent catabolique de l’os qui stimule l’ostéoclastogenèse (Nanes
2003) et simultanément inhibe la fonction ostéoblastique (Nanes 2003). Le TNF-α a un rôle
central dans la physiopathologie osseuse. Il est nécessaire pour la stimulation de
l’ostéoclastogenèse conjointement avec RANKL (Horowitz et Lorenzo 2002). Le TNF-α
supprime également le recrutement des ostéoblastes à partir des cellules ostéoprogénitrices,
inhibe les protéines matricielles (collagène I, ostéocalcine, phosphatase alcaline) et stimule
l’expression des gènes qui amplifient l’ostéoclastogenèse (TRAP, calcitonine,
vitronectine). Le TNF-α peut aussi affecter le métabolisme osseux en induisant une
résistance à la 1,25-dihydroxivitamine D3 (Nanes 2003).
- Insulin-like growth factor 1 (IGF-1) : est une protéine synthétisée principalement par le
foie (Courtland et al. 2011; Yamaguchi et al. 2006) et est un régulateur majeur du
fonctionnement des ostéoblastes et des ostéoclastes (Bikle et Wang 2011). L’IGF-1 avec la
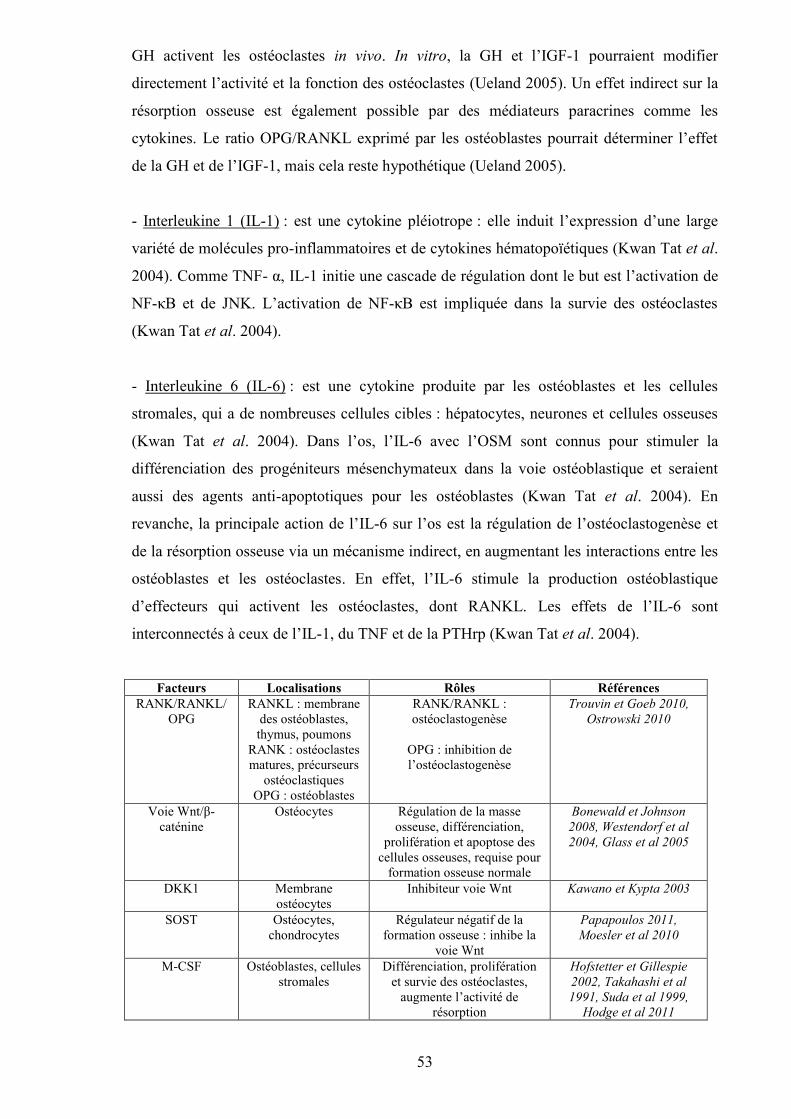
53
GH activent les ostéoclastes in vivo. In vitro, la GH et l’IGF-1 pourraient modifier
directement l’activité et la fonction des ostéoclastes (Ueland 2005). Un effet indirect sur la
résorption osseuse est également possible par des médiateurs paracrines comme les
cytokines. Le ratio OPG/RANKL exprimé par les ostéoblastes pourrait déterminer l’effet
de la GH et de l’IGF-1, mais cela reste hypothétique (Ueland 2005).
- Interleukine 1 (IL-1) : est une cytokine pléiotrope : elle induit l’expression d’une large
variété de molécules pro-inflammatoires et de cytokines hématopoïétiques (Kwan Tat et al.
2004). Comme TNF- α, IL-1 initie une cascade de régulation dont le but est l’activation de
NF-κB et de JNK. L’activation de NF-κB est impliquée dans la survie des ostéoclastes
(Kwan Tat et al. 2004).
- Interleukine 6 (IL-6) : est une cytokine produite par les ostéoblastes et les cellules
stromales, qui a de nombreuses cellules cibles : hépatocytes, neurones et cellules osseuses
(Kwan Tat et al. 2004). Dans l’os, l’IL-6 avec l’OSM sont connus pour stimuler la
différenciation des progéniteurs mésenchymateux dans la voie ostéoblastique et seraient
aussi des agents anti-apoptotiques pour les ostéoblastes (Kwan Tat et al. 2004). En
revanche, la principale action de l’IL-6 sur l’os est la régulation de l’ostéoclastogenèse et
de la résorption osseuse via un mécanisme indirect, en augmentant les interactions entre les
ostéoblastes et les ostéoclastes. En effet, l’IL-6 stimule la production ostéoblastique
d’effecteurs qui activent les ostéoclastes, dont RANKL. Les effets de l’IL-6 sont
interconnectés à ceux de l’IL-1, du TNF et de la PTHrp (Kwan Tat et al. 2004).
Facteurs Localisations Rôles RéférencesRANK/RANKL/
OPGRANKL : membrane
des ostéoblastes,thymus, poumons
RANK : ostéoclastesmatures, précurseurs
ostéoclastiquesOPG : ostéoblastes
RANK/RANKL :ostéoclastogenèse
OPG : inhibition del’ostéoclastogenèse
Trouvin et Goeb 2010,Ostrowski 2010
Voie Wnt/β-caténine
Ostéocytes Régulation de la masseosseuse, différenciation,
prolifération et apoptose descellules osseuses, requise pour
formation osseuse normale
Bonewald et Johnson2008, Westendorf et al2004, Glass et al 2005
DKK1 Membraneostéocytes
Inhibiteur voie Wnt Kawano et Kypta 2003
SOST Ostéocytes,chondrocytes
Régulateur négatif de laformation osseuse : inhibe la
voie Wnt
Papapoulos 2011,Moesler et al 2010
M-CSF Ostéoblastes, cellulesstromales
Différenciation, proliférationet survie des ostéoclastes,
augmente l’activité derésorption
Hofstetter et Gillespie2002, Takahashi et al1991, Suda et al 1999,
Hodge et al 2011
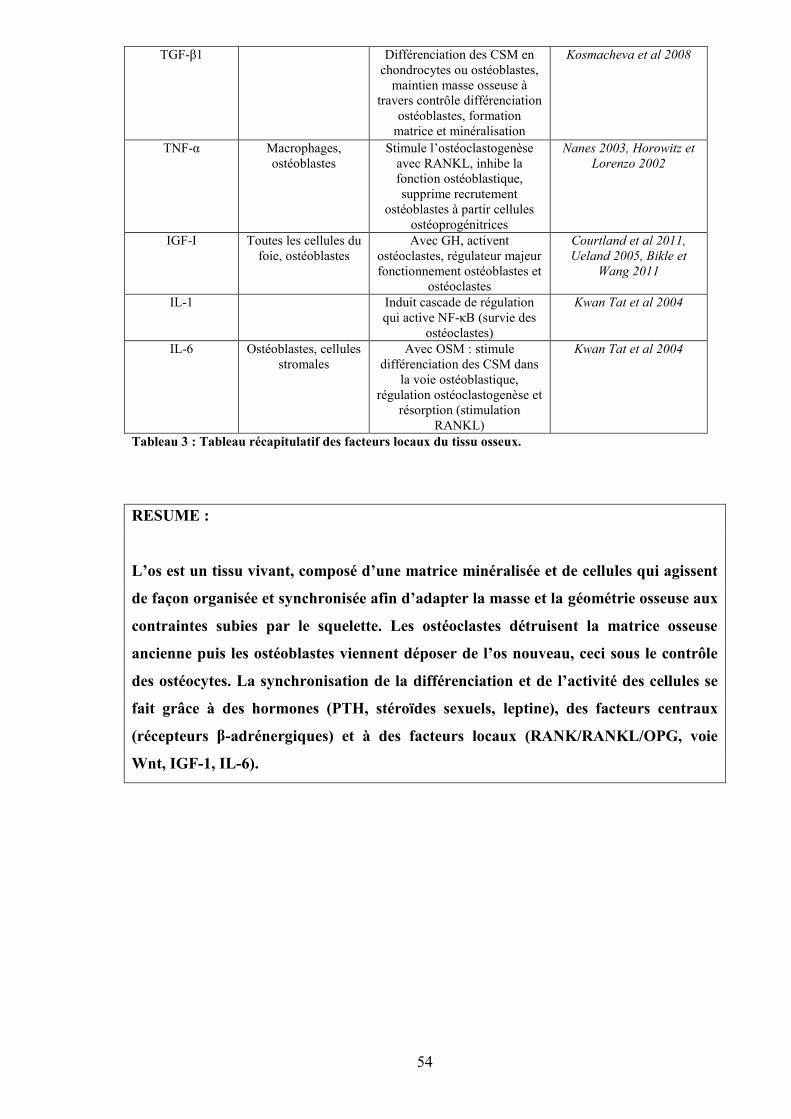
54
TGF-β1 Différenciation des CSM enchondrocytes ou ostéoblastes,
maintien masse osseuse àtravers contrôle différenciation
ostéoblastes, formationmatrice et minéralisation
Kosmacheva et al 2008
TNF-α Macrophages,ostéoblastes
Stimule l’ostéoclastogenèseavec RANKL, inhibe lafonction ostéoblastique,supprime recrutement
ostéoblastes à partir cellulesostéoprogénitrices
Nanes 2003, Horowitz etLorenzo 2002
IGF-I Toutes les cellules dufoie, ostéoblastes
Avec GH, activentostéoclastes, régulateur majeurfonctionnement ostéoblastes et
ostéoclastes
Courtland et al 2011,Ueland 2005, Bikle et
Wang 2011
IL-1 Induit cascade de régulationqui active NF-κB (survie des
ostéoclastes)
Kwan Tat et al 2004
IL-6 Ostéoblastes, cellulesstromales
Avec OSM : stimuledifférenciation des CSM dans
la voie ostéoblastique,régulation ostéoclastogenèse et
résorption (stimulationRANKL)
Kwan Tat et al 2004
Tableau 3 : Tableau récapitulatif des facteurs locaux du tissu osseux.
RESUME :
L’os est un tissu vivant, composé d’une matrice minéralisée et de cellules qui agissent
de façon organisée et synchronisée afin d’adapter la masse et la géométrie osseuse aux
contraintes subies par le squelette. Les ostéoclastes détruisent la matrice osseuse
ancienne puis les ostéoblastes viennent déposer de l’os nouveau, ceci sous le contrôle
des ostéocytes. La synchronisation de la différenciation et de l’activité des cellules se
fait grâce à des hormones (PTH, stéroïdes sexuels, leptine), des facteurs centraux
(récepteurs β-adrénergiques) et à des facteurs locaux (RANK/RANKL/OPG, voie
Wnt, IGF-1, IL-6).
55
II. TECHNIQUES D’EVALUATION DU TISSU OSSEUX
L’évaluation du statut osseux est nécessaire pour prédire les risques de fractures et
caractériser certaines pathologies. Elle permet également de mesurer l’efficacité de
différents médicaments ou d’observer la dégradation du tissu osseux suite à certains
facteurs environnementaux dont la consommation d’alcool. Les principaux paramètres du
tissu osseux analysés sont la densité minérale osseuse, la structure du tissu osseux
(microarchitecture) et la résistance de l’os (propriétés biomécaniques). Nous discuterons
dans ce chapitre des différentes techniques disponibles actuellement et utilisées pour
analyser l’évolution de ces variables sur des modèles animaux utilisés dans la recherche sur
l’ostéoporose.
A. Caractérisation quantitative de la masse et de la densité osseuses
1. Dual X-ray Absorptiométrie (DXA)
La DXA a été développée chez l’homme et a rapidement été adaptée à l’animal grâce
à des logiciels haute résolution. La DXA est la méthode la plus couramment utilisée chez
l’animal pour mesurer le contenu minéral osseux (CMO) et la densité minérale osseuse
(DMO : contenu rapporté à la surface) (Bonnet et al. 2005a; Lespessailles et al. 2009;
Nishiguchi et al. 2000; Nyquist et al. 2002). Elle est également l’outil qui permet
actuellement de diagnostiquer le risque fracturaire chez la femme et est utilisée pour
évaluer l’efficacité des traitements anti-ostéoporotiques (El Maghraoui et Roux 2008). La
précision des mesures de DXA dépend du positionnement de l’animal et de l’habileté de
l’opérateur à définir une même région en utilisant des points de repères anatomiques,
lorsqu’il s’agit d’analyser une région précise du squelette. La DXA est un examen rapide
(3-4 min pour un corps entier de rat), précis et reproductible sur n’importe quel type d’os in
vivo ou ex vivo lorsque l’os est immergé dans du liquide physiologique pour mimer les
tissus mous (Nagy et al. 2001). Les coefficients de variation sont d’environ 0.6% à 2.2%.
Le CMO et le poids de cendre sont très corrélés, que ce soit in vivo ou après excision
(r2>0.99) (Nagy et al. 2001). La DXA est suffisamment précise pour détecter des
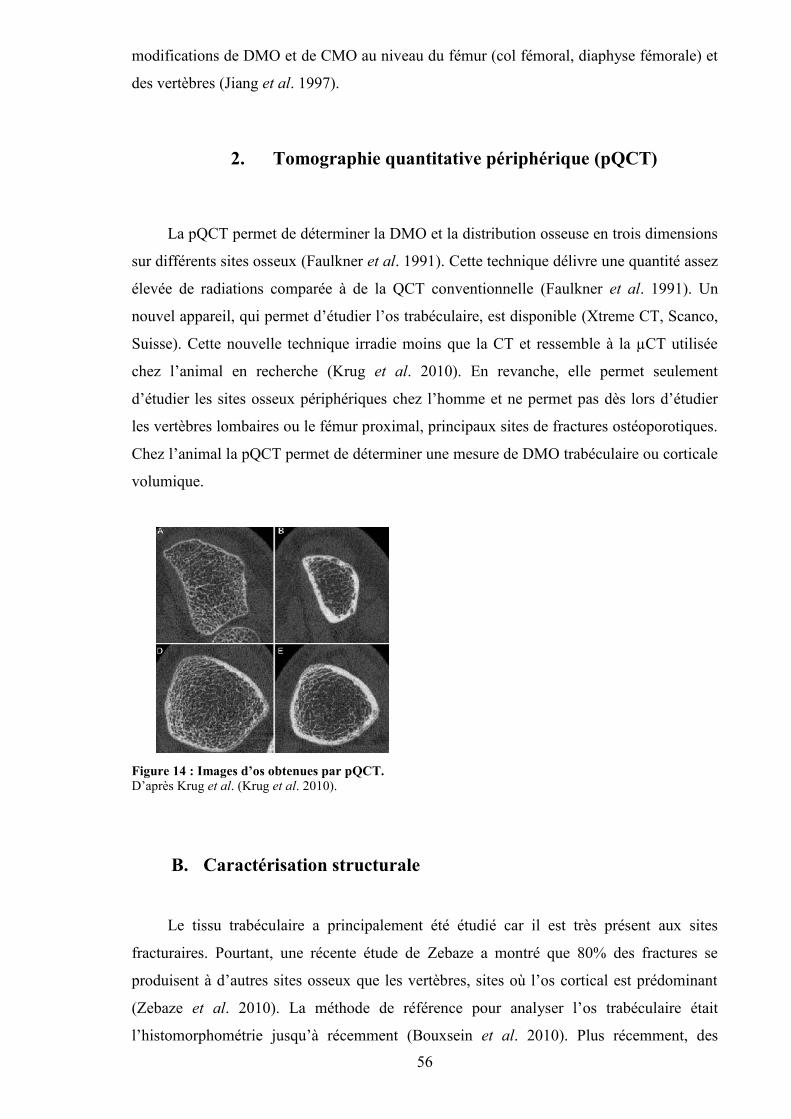
56
modifications de DMO et de CMO au niveau du fémur (col fémoral, diaphyse fémorale) et
des vertèbres (Jiang et al. 1997).
2. Tomographie quantitative périphérique (pQCT)
La pQCT permet de déterminer la DMO et la distribution osseuse en trois dimensions
sur différents sites osseux (Faulkner et al. 1991). Cette technique délivre une quantité assez
élevée de radiations comparée à de la QCT conventionnelle (Faulkner et al. 1991). Un
nouvel appareil, qui permet d’étudier l’os trabéculaire, est disponible (Xtreme CT, Scanco,
Suisse). Cette nouvelle technique irradie moins que la CT et ressemble à la µCT utilisée
chez l’animal en recherche (Krug et al. 2010). En revanche, elle permet seulement
d’étudier les sites osseux périphériques chez l’homme et ne permet pas dès lors d’étudier
les vertèbres lombaires ou le fémur proximal, principaux sites de fractures ostéoporotiques.
Chez l’animal la pQCT permet de déterminer une mesure de DMO trabéculaire ou corticale
volumique.
Figure 14 : Images d’os obtenues par pQCT.D’après Krug et al. (Krug et al. 2010).
B. Caractérisation structurale
Le tissu trabéculaire a principalement été étudié car il est très présent aux sites
fracturaires. Pourtant, une récente étude de Zebaze a montré que 80% des fractures se
produisent à d’autres sites osseux que les vertèbres, sites où l’os cortical est prédominant
(Zebaze et al. 2010). La méthode de référence pour analyser l’os trabéculaire était
l’histomorphométrie jusqu’à récemment (Bouxsein et al. 2010). Plus récemment, des
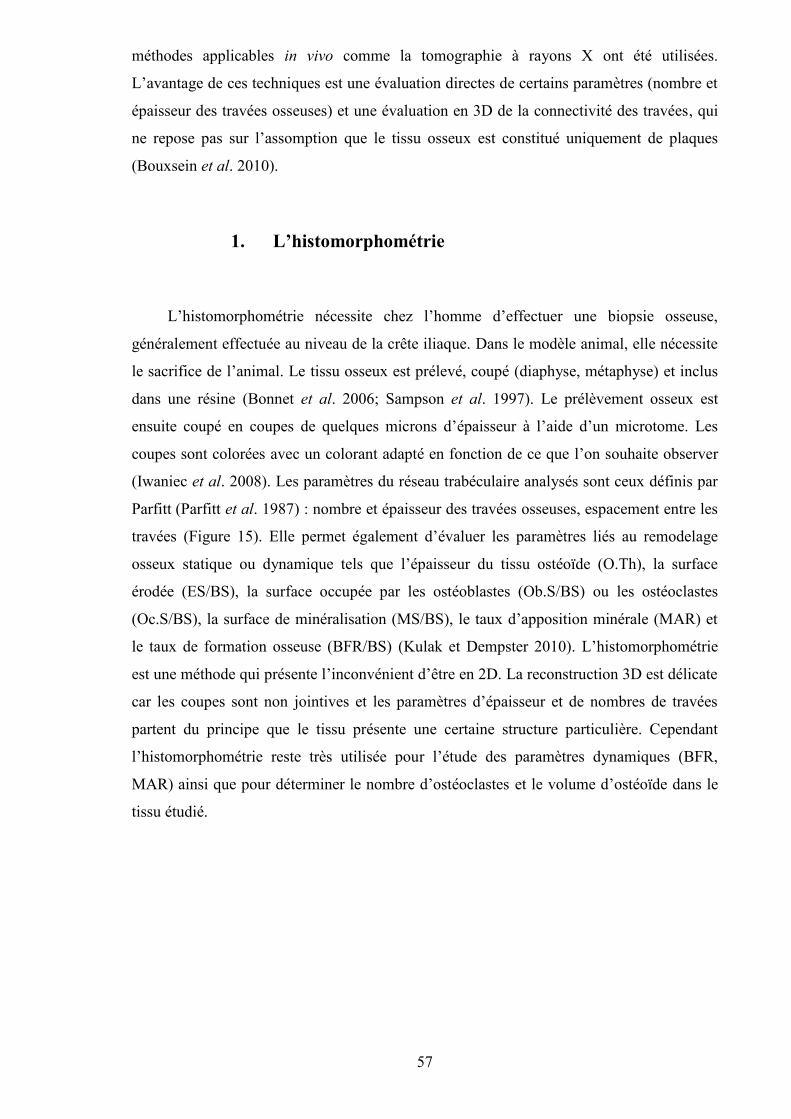
57
méthodes applicables in vivo comme la tomographie à rayons X ont été utilisées.
L’avantage de ces techniques est une évaluation directes de certains paramètres (nombre et
épaisseur des travées osseuses) et une évaluation en 3D de la connectivité des travées, qui
ne repose pas sur l’assomption que le tissu osseux est constitué uniquement de plaques
(Bouxsein et al. 2010).
1. L’histomorphométrie
L’histomorphométrie nécessite chez l’homme d’effectuer une biopsie osseuse,
généralement effectuée au niveau de la crête iliaque. Dans le modèle animal, elle nécessite
le sacrifice de l’animal. Le tissu osseux est prélevé, coupé (diaphyse, métaphyse) et inclus
dans une résine (Bonnet et al. 2006; Sampson et al. 1997). Le prélèvement osseux est
ensuite coupé en coupes de quelques microns d’épaisseur à l’aide d’un microtome. Les
coupes sont colorées avec un colorant adapté en fonction de ce que l’on souhaite observer
(Iwaniec et al. 2008). Les paramètres du réseau trabéculaire analysés sont ceux définis par
Parfitt (Parfitt et al. 1987) : nombre et épaisseur des travées osseuses, espacement entre les
travées (Figure 15). Elle permet également d’évaluer les paramètres liés au remodelage
osseux statique ou dynamique tels que l’épaisseur du tissu ostéoïde (O.Th), la surface
érodée (ES/BS), la surface occupée par les ostéoblastes (Ob.S/BS) ou les ostéoclastes
(Oc.S/BS), la surface de minéralisation (MS/BS), le taux d’apposition minérale (MAR) et
le taux de formation osseuse (BFR/BS) (Kulak et Dempster 2010). L’histomorphométrie
est une méthode qui présente l’inconvénient d’être en 2D. La reconstruction 3D est délicate
car les coupes sont non jointives et les paramètres d’épaisseur et de nombres de travées
partent du principe que le tissu présente une certaine structure particulière. Cependant
l’histomorphométrie reste très utilisée pour l’étude des paramètres dynamiques (BFR,
MAR) ainsi que pour déterminer le nombre d’ostéoclastes et le volume d’ostéoïde dans le
tissu étudié.
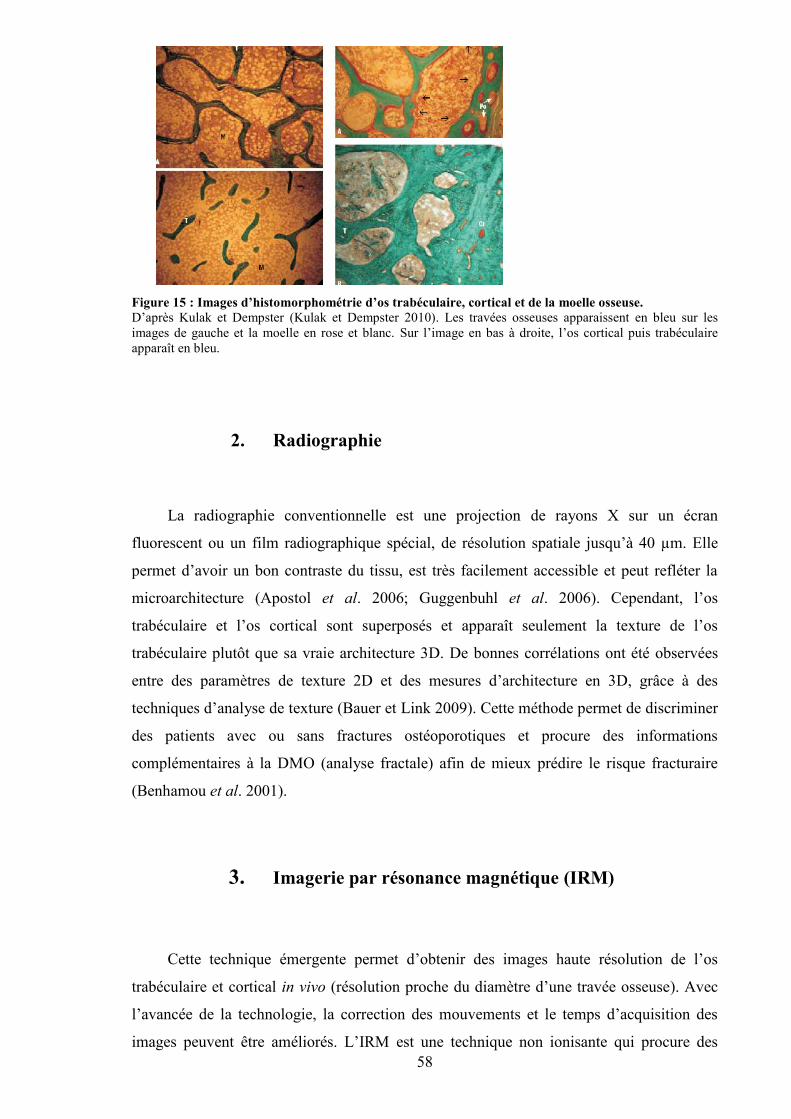
58
Figure 15 : Images d’histomorphométrie d’os trabéculaire, cortical et de la moelle osseuse.D’après Kulak et Dempster (Kulak et Dempster 2010). Les travées osseuses apparaissent en bleu sur lesimages de gauche et la moelle en rose et blanc. Sur l’image en bas à droite, l’os cortical puis trabéculaireapparaît en bleu.
2. Radiographie
La radiographie conventionnelle est une projection de rayons X sur un écran
fluorescent ou un film radiographique spécial, de résolution spatiale jusqu’à 40 µm. Elle
permet d’avoir un bon contraste du tissu, est très facilement accessible et peut refléter la
microarchitecture (Apostol et al. 2006; Guggenbuhl et al. 2006). Cependant, l’os
trabéculaire et l’os cortical sont superposés et apparaît seulement la texture de l’os
trabéculaire plutôt que sa vraie architecture 3D. De bonnes corrélations ont été observées
entre des paramètres de texture 2D et des mesures d’architecture en 3D, grâce à des
techniques d’analyse de texture (Bauer et Link 2009). Cette méthode permet de discriminer
des patients avec ou sans fractures ostéoporotiques et procure des informations
complémentaires à la DMO (analyse fractale) afin de mieux prédire le risque fracturaire
(Benhamou et al. 2001).
3. Imagerie par résonance magnétique (IRM)
Cette technique émergente permet d’obtenir des images haute résolution de l’os
trabéculaire et cortical in vivo (résolution proche du diamètre d’une travée osseuse). Avec
l’avancée de la technologie, la correction des mouvements et le temps d’acquisition des
images peuvent être améliorés. L’IRM est une technique non ionisante qui procure des
59
images 3D très intéressantes des structures du corps et peut donc être utilisée en clinique
(Bauer et Link 2009). Le principe est d’utiliser les protons présents en grande quantité dans
notre organisme pour visualiser les organes. En IRM conventionnelle, le tissu osseux
engendre un signal faible et apparaît en foncé, à cause de la faible quantité de protons et à
une durée de relaxation très rapide, comme la plupart des tissus solides. Les images d’IRM
nécessitent un post traitement afin de pouvoir discriminer le signal du tissu osseux de celui
très important renvoyé par la moelle osseuse. Des informations sur la structure, la
topologie, l’orientation des travées osseuses, l’épaisseur et la porosité corticale peuvent être
extraite de ce post traitement des images (Goldenstein et al. 2009; Krug et al. 2010) (Figure
16). Cette technique est intéressante pour l’étude des interactions entre muscle et os, et
pour l’étude des métastases et des tumeurs osseuses (Schmidt et al. 2007). Cependant, le
rapport signal sur bruit, la difficulté de seuillage et le coût de l’appareil en font une
technique peu utilisée chez le petit animal.
Figure 16 : Images obtenues par IRM.D’après Krug et al. (Krug et al. 2010).
4. Micro tomographie à rayons X (µCT)
La µCT a été la première technique non invasive utilisée pour révéler la vraie
architecture de l’os trabéculaire (Bauer et Link 2009). Elle a été utilisée par de nombreux
chercheurs pour étudier l’os trabéculaire à différents sites osseux, en relation avec les
propriétés mécaniques. Elle a été validée chez le petit animal (Lima et al. 2008) et elle est
devenue la technique de référence pour mesurer la microarchitecture chez les petits
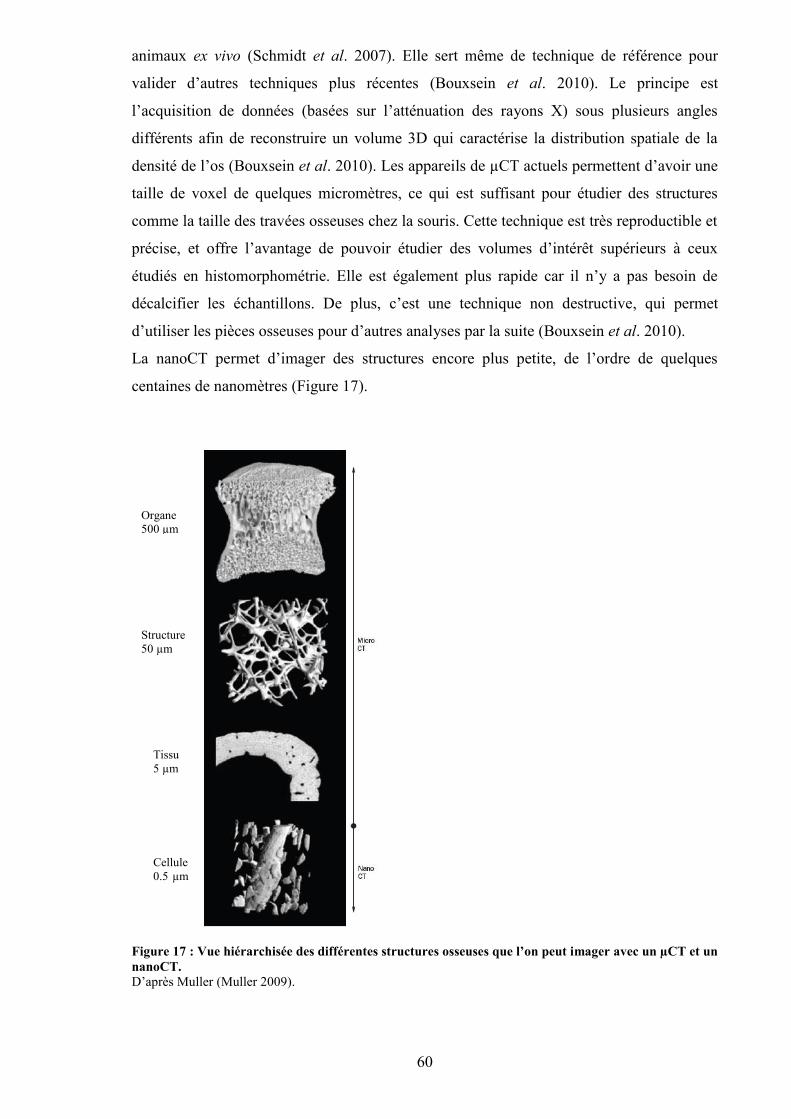
60
animaux ex vivo (Schmidt et al. 2007). Elle sert même de technique de référence pour
valider d’autres techniques plus récentes (Bouxsein et al. 2010). Le principe est
l’acquisition de données (basées sur l’atténuation des rayons X) sous plusieurs angles
différents afin de reconstruire un volume 3D qui caractérise la distribution spatiale de la
densité de l’os (Bouxsein et al. 2010). Les appareils de µCT actuels permettent d’avoir une
taille de voxel de quelques micromètres, ce qui est suffisant pour étudier des structures
comme la taille des travées osseuses chez la souris. Cette technique est très reproductible et
précise, et offre l’avantage de pouvoir étudier des volumes d’intérêt supérieurs à ceux
étudiés en histomorphométrie. Elle est également plus rapide car il n’y a pas besoin de
décalcifier les échantillons. De plus, c’est une technique non destructive, qui permet
d’utiliser les pièces osseuses pour d’autres analyses par la suite (Bouxsein et al. 2010).
La nanoCT permet d’imager des structures encore plus petite, de l’ordre de quelques
centaines de nanomètres (Figure 17).
Figure 17 : Vue hiérarchisée des différentes structures osseuses que l’on peut imager avec un µCT et unnanoCT.D’après Muller (Muller 2009).
Cellule0.5 µm
Tissu5 µm
Structure50 µm
Organe500 µm
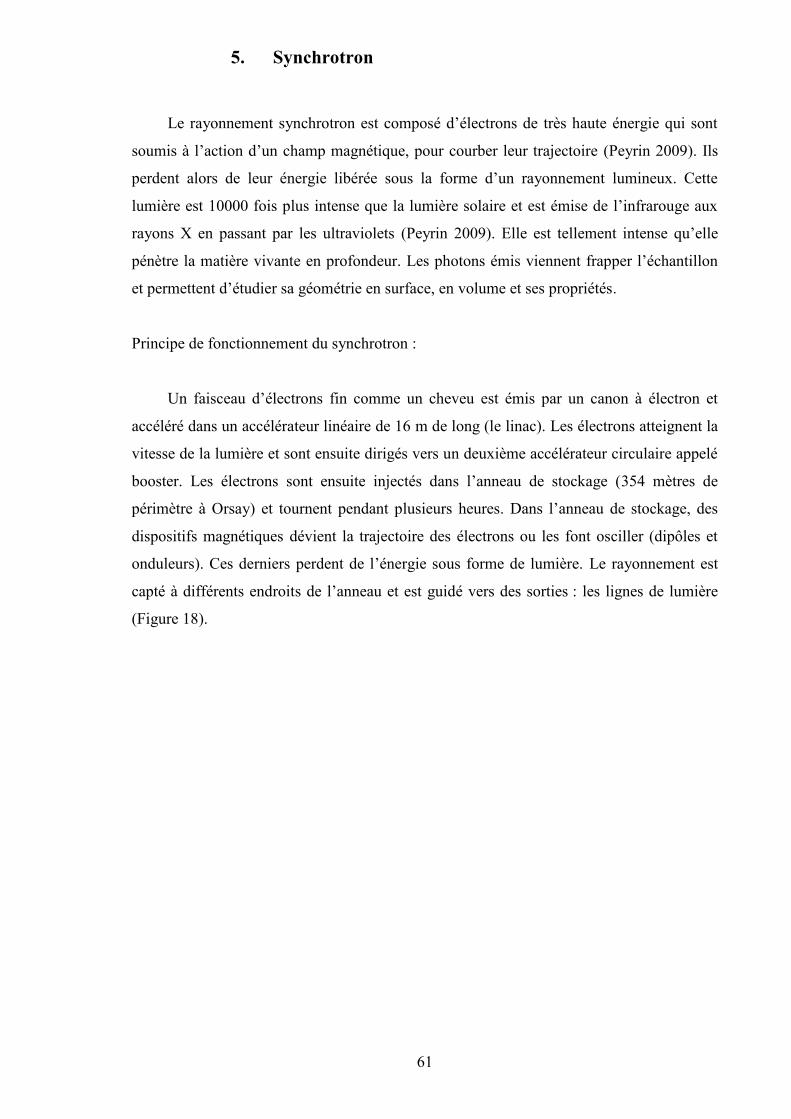
61
5. Synchrotron
Le rayonnement synchrotron est composé d’électrons de très haute énergie qui sont
soumis à l’action d’un champ magnétique, pour courber leur trajectoire (Peyrin 2009). Ils
perdent alors de leur énergie libérée sous la forme d’un rayonnement lumineux. Cette
lumière est 10000 fois plus intense que la lumière solaire et est émise de l’infrarouge aux
rayons X en passant par les ultraviolets (Peyrin 2009). Elle est tellement intense qu’elle
pénètre la matière vivante en profondeur. Les photons émis viennent frapper l’échantillon
et permettent d’étudier sa géométrie en surface, en volume et ses propriétés.
Principe de fonctionnement du synchrotron :
Un faisceau d’électrons fin comme un cheveu est émis par un canon à électron et
accéléré dans un accélérateur linéaire de 16 m de long (le linac). Les électrons atteignent la
vitesse de la lumière et sont ensuite dirigés vers un deuxième accélérateur circulaire appelé
booster. Les électrons sont ensuite injectés dans l’anneau de stockage (354 mètres de
périmètre à Orsay) et tournent pendant plusieurs heures. Dans l’anneau de stockage, des
dispositifs magnétiques dévient la trajectoire des électrons ou les font osciller (dipôles et
onduleurs). Ces derniers perdent de l’énergie sous forme de lumière. Le rayonnement est
capté à différents endroits de l’anneau et est guidé vers des sorties : les lignes de lumière
(Figure 18).
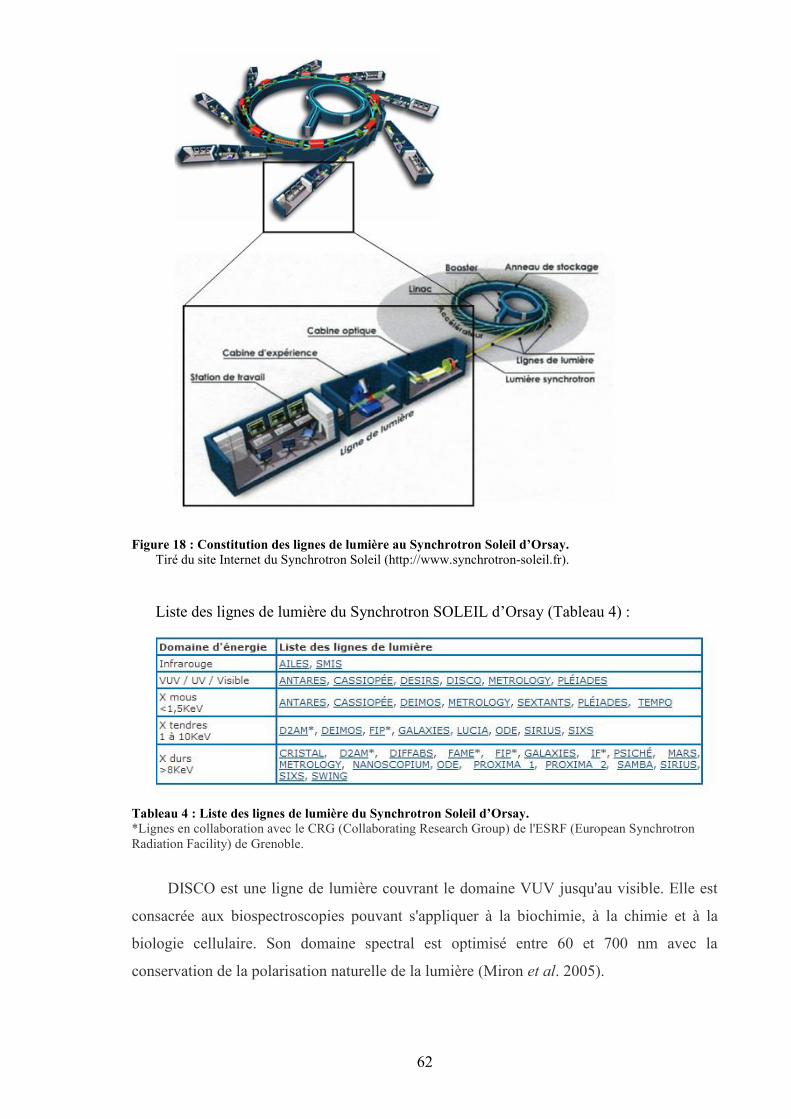
62
Figure 18 : Constitution des lignes de lumière au Synchrotron Soleil d’Orsay.Tiré du site Internet du Synchrotron Soleil (http://www.synchrotron-soleil.fr).
Liste des lignes de lumière du Synchrotron SOLEIL d’Orsay (Tableau 4) :
Tableau 4 : Liste des lignes de lumière du Synchrotron Soleil d’Orsay.*Lignes en collaboration avec le CRG (Collaborating Research Group) de l'ESRF (European SynchrotronRadiation Facility) de Grenoble.
DISCO est une ligne de lumière couvrant le domaine VUV jusqu'au visible. Elle est
consacrée aux biospectroscopies pouvant s'appliquer à la biochimie, à la chimie et à la
biologie cellulaire. Son domaine spectral est optimisé entre 60 et 700 nm avec la
conservation de la polarisation naturelle de la lumière (Miron et al. 2005).
63
La ligne LUCIA (Ligne Utilisée pour la Caractérisation par Imagerie et Absorption)
est dédiée à des expériences de micro-absorption X (μXAS) et de micro-fluorescence
(μXRF) dans le domaine des rayons X dits "tendres" (0.8-8 kev). Elle permet d'appliquer
ces deux techniques non destructives à la mesure d'échantillons hétérogènes, de réaliser des
cartographies élémentaires à l'échelle du spot de photons, et de décrire l'environnement
local autour de ces éléments.
SMIS est une des deux lignes de spectroscopie infrarouge de SOLEIL. La spécificité
de cette ligne de lumière est de fournir une source de haute brillance dans la région
spectrale 1-100 microns, avec une optimisation de la détection dans la région 2.5-100
microns. Cette source est couplée à un microscope infrarouge (Dumas et al. 2007).
L’avantage de cette technique est qu’elle permet d’améliorer le rapport signal/bruit de
l’image tout en réduisant le temps d’acquisition par rapport à un micro-CT (Peyrin 2009). Il
existe seulement 47 grands instruments dans le monde, ce qui en fait un outil très
intéressant pour la recherche mais dont l’accès est limité.
C. Caractérisation biomécanique
1. Ultrasons
Les ultrasons ont été récemment introduits comme technique non invasive
d’évaluation du statut osseux dans l’ostéoporose chez l’homme. Cette technique ne
nécessite pas l’utilisation d’un rayonnement ionisant. La fréquence d’atténuation des
ultrasons (broadband ultrasound attenuation, BUA) peut être évaluée au calcanéum et la
vitesse du son (speed of sound, SOS) peut être estimée au calcanéum et à la rotule. Les
ultrasons peuvent être utilisés pour mesurer différents déterminants de la résistance osseuse
(Faulkner et al. 1991). L’élasticité osseuse est liée au SOS et plusieurs études in vitro ont
observé une association entre la densité et le BUA (Breban et al. 2010). Cette technique est
prometteuse en clinique car elle coûte peu chère et n’est pas irradiante. Elle commence à
être validée pour l’appréhension du risque de fractures ostéoporotiques (Albanese et al.
2011; Barkmann et al. 2010). Cependant, les ultrasons sont peu utilisés chez l’animal
(Mehta et al. 2001).
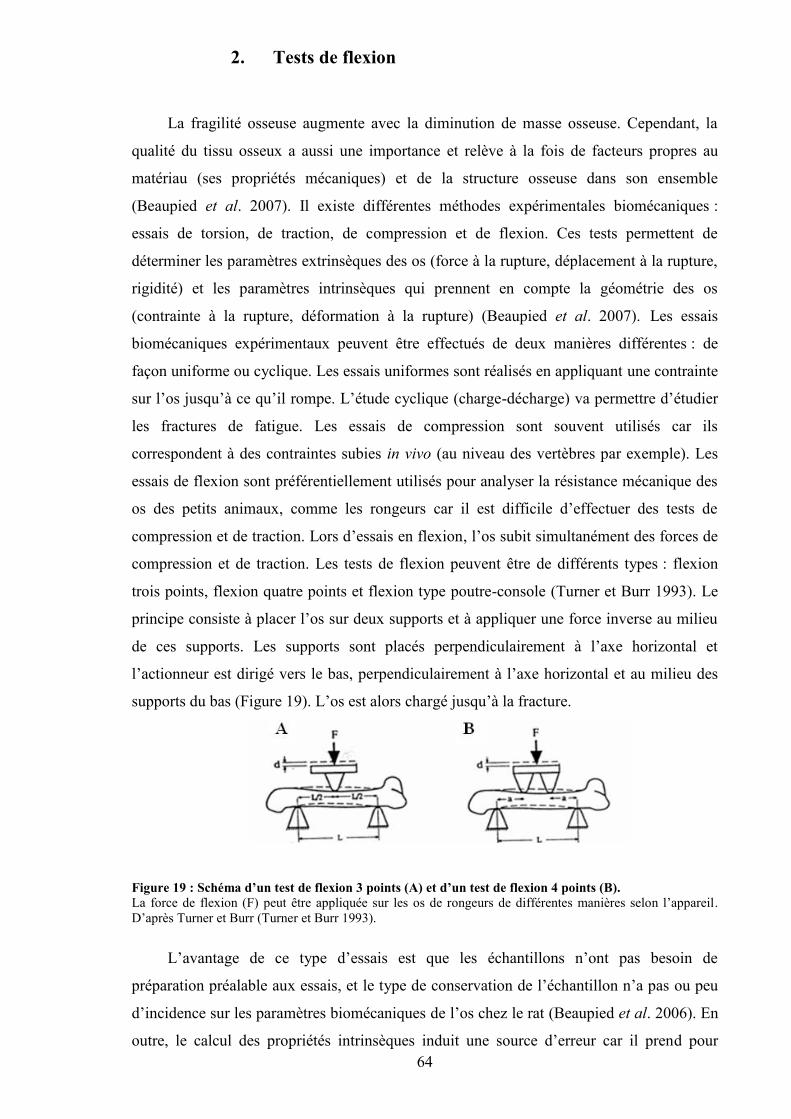
64
2. Tests de flexion
La fragilité osseuse augmente avec la diminution de masse osseuse. Cependant, la
qualité du tissu osseux a aussi une importance et relève à la fois de facteurs propres au
matériau (ses propriétés mécaniques) et de la structure osseuse dans son ensemble
(Beaupied et al. 2007). Il existe différentes méthodes expérimentales biomécaniques :
essais de torsion, de traction, de compression et de flexion. Ces tests permettent de
déterminer les paramètres extrinsèques des os (force à la rupture, déplacement à la rupture,
rigidité) et les paramètres intrinsèques qui prennent en compte la géométrie des os
(contrainte à la rupture, déformation à la rupture) (Beaupied et al. 2007). Les essais
biomécaniques expérimentaux peuvent être effectués de deux manières différentes : de
façon uniforme ou cyclique. Les essais uniformes sont réalisés en appliquant une contrainte
sur l’os jusqu’à ce qu’il rompe. L’étude cyclique (charge-décharge) va permettre d’étudier
les fractures de fatigue. Les essais de compression sont souvent utilisés car ils
correspondent à des contraintes subies in vivo (au niveau des vertèbres par exemple). Les
essais de flexion sont préférentiellement utilisés pour analyser la résistance mécanique des
os des petits animaux, comme les rongeurs car il est difficile d’effectuer des tests de
compression et de traction. Lors d’essais en flexion, l’os subit simultanément des forces de
compression et de traction. Les tests de flexion peuvent être de différents types : flexion
trois points, flexion quatre points et flexion type poutre-console (Turner et Burr 1993). Le
principe consiste à placer l’os sur deux supports et à appliquer une force inverse au milieu
de ces supports. Les supports sont placés perpendiculairement à l’axe horizontal et
l’actionneur est dirigé vers le bas, perpendiculairement à l’axe horizontal et au milieu des
supports du bas (Figure 19). L’os est alors chargé jusqu’à la fracture.
Figure 19 : Schéma d’un test de flexion 3 points (A) et d’un test de flexion 4 points (B).La force de flexion (F) peut être appliquée sur les os de rongeurs de différentes manières selon l’appareil.D’après Turner et Burr (Turner et Burr 1993).
L’avantage de ce type d’essais est que les échantillons n’ont pas besoin de
préparation préalable aux essais, et le type de conservation de l’échantillon n’a pas ou peu
d’incidence sur les paramètres biomécaniques de l’os chez le rat (Beaupied et al. 2006). En
outre, le calcul des propriétés intrinsèques induit une source d’erreur car il prend pour
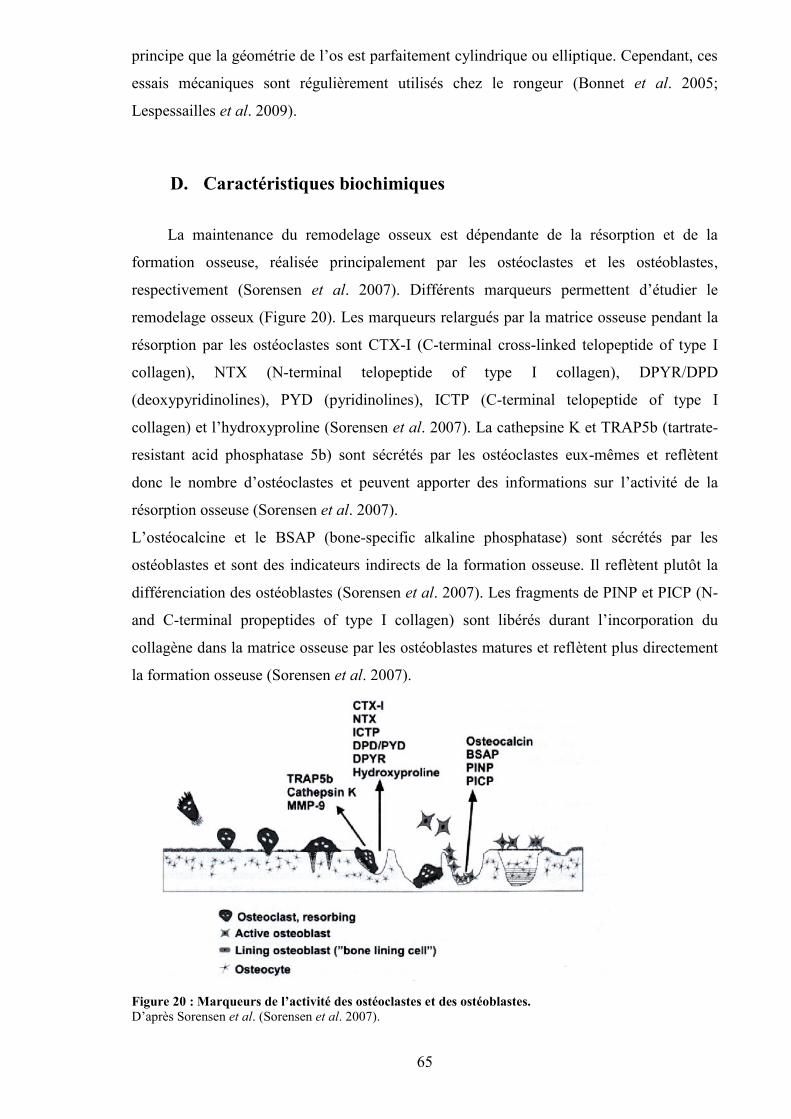
65
principe que la géométrie de l’os est parfaitement cylindrique ou elliptique. Cependant, ces
essais mécaniques sont régulièrement utilisés chez le rongeur (Bonnet et al. 2005;
Lespessailles et al. 2009).
D. Caractéristiques biochimiques
La maintenance du remodelage osseux est dépendante de la résorption et de la
formation osseuse, réalisée principalement par les ostéoclastes et les ostéoblastes,
respectivement (Sorensen et al. 2007). Différents marqueurs permettent d’étudier le
remodelage osseux (Figure 20). Les marqueurs relargués par la matrice osseuse pendant la
résorption par les ostéoclastes sont CTX-I (C-terminal cross-linked telopeptide of type I
collagen), NTX (N-terminal telopeptide of type I collagen), DPYR/DPD
(deoxypyridinolines), PYD (pyridinolines), ICTP (C-terminal telopeptide of type I
collagen) et l’hydroxyproline (Sorensen et al. 2007). La cathepsine K et TRAP5b (tartrate-
resistant acid phosphatase 5b) sont sécrétés par les ostéoclastes eux-mêmes et reflètent
donc le nombre d’ostéoclastes et peuvent apporter des informations sur l’activité de la
résorption osseuse (Sorensen et al. 2007).
L’ostéocalcine et le BSAP (bone-specific alkaline phosphatase) sont sécrétés par les
ostéoblastes et sont des indicateurs indirects de la formation osseuse. Il reflètent plutôt la
différenciation des ostéoblastes (Sorensen et al. 2007). Les fragments de PINP et PICP (N-
and C-terminal propeptides of type I collagen) sont libérés durant l’incorporation du
collagène dans la matrice osseuse par les ostéoblastes matures et reflètent plus directement
la formation osseuse (Sorensen et al. 2007).
Figure 20 : Marqueurs de l’activité des ostéoclastes et des ostéoblastes.D’après Sorensen et al. (Sorensen et al. 2007).
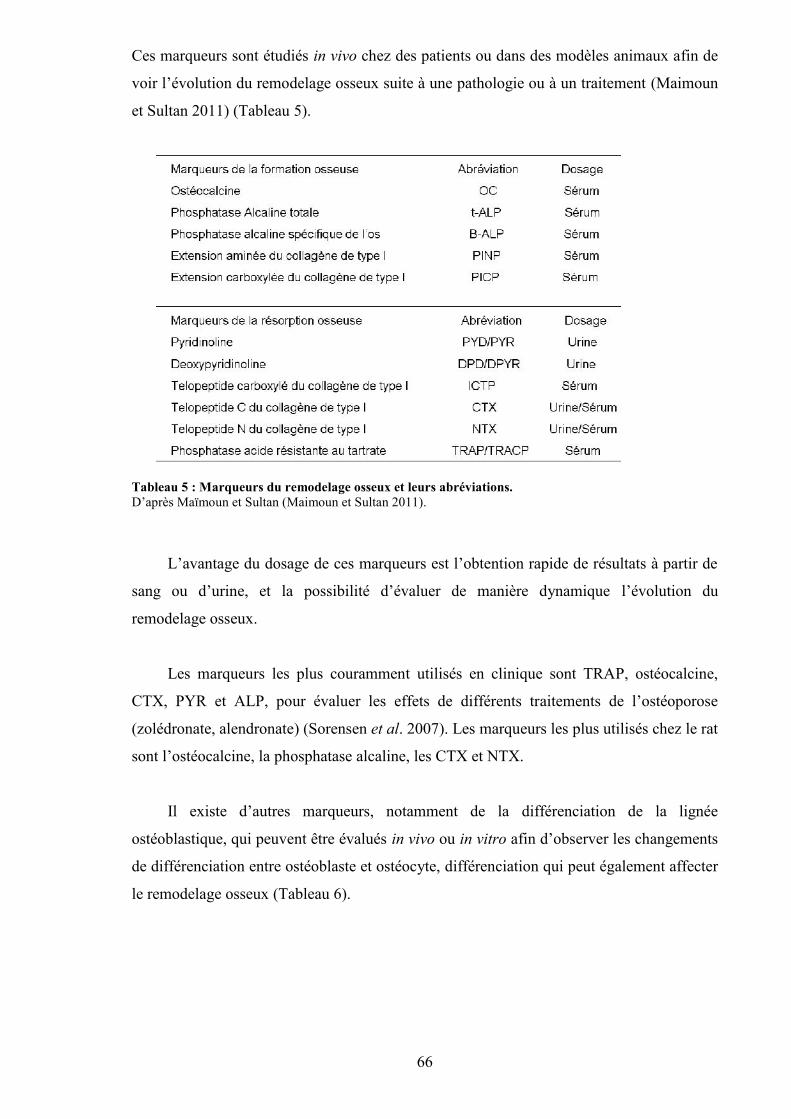
66
Ces marqueurs sont étudiés in vivo chez des patients ou dans des modèles animaux afin de
voir l’évolution du remodelage osseux suite à une pathologie ou à un traitement (Maimoun
et Sultan 2011) (Tableau 5).
Tableau 5 : Marqueurs du remodelage osseux et leurs abréviations.D’après Maïmoun et Sultan (Maimoun et Sultan 2011).
L’avantage du dosage de ces marqueurs est l’obtention rapide de résultats à partir de
sang ou d’urine, et la possibilité d’évaluer de manière dynamique l’évolution du
remodelage osseux.
Les marqueurs les plus couramment utilisés en clinique sont TRAP, ostéocalcine,
CTX, PYR et ALP, pour évaluer les effets de différents traitements de l’ostéoporose
(zolédronate, alendronate) (Sorensen et al. 2007). Les marqueurs les plus utilisés chez le rat
sont l’ostéocalcine, la phosphatase alcaline, les CTX et NTX.
Il existe d’autres marqueurs, notamment de la différenciation de la lignée
ostéoblastique, qui peuvent être évalués in vivo ou in vitro afin d’observer les changements
de différenciation entre ostéoblaste et ostéocyte, différenciation qui peut également affecter
le remodelage osseux (Tableau 6).
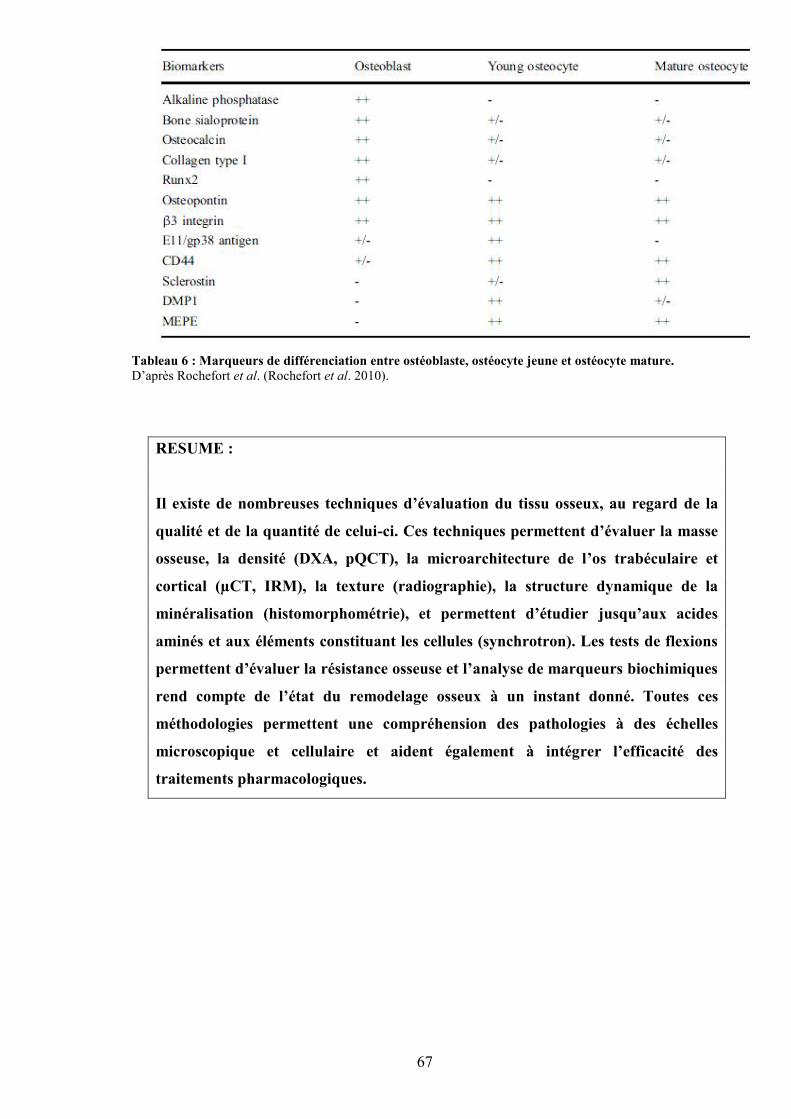
67
Tableau 6 : Marqueurs de différenciation entre ostéoblaste, ostéocyte jeune et ostéocyte mature.D’après Rochefort et al. (Rochefort et al. 2010).
RESUME :
Il existe de nombreuses techniques d’évaluation du tissu osseux, au regard de la
qualité et de la quantité de celui-ci. Ces techniques permettent d’évaluer la masse
osseuse, la densité (DXA, pQCT), la microarchitecture de l’os trabéculaire et
cortical (µCT, IRM), la texture (radiographie), la structure dynamique de la
minéralisation (histomorphométrie), et permettent d’étudier jusqu’aux acides
aminés et aux éléments constituant les cellules (synchrotron). Les tests de flexions
permettent d’évaluer la résistance osseuse et l’analyse de marqueurs biochimiques
rend compte de l’état du remodelage osseux à un instant donné. Toutes ces
méthodologies permettent une compréhension des pathologies à des échelles
microscopique et cellulaire et aident également à intégrer l’efficacité des
traitements pharmacologiques.
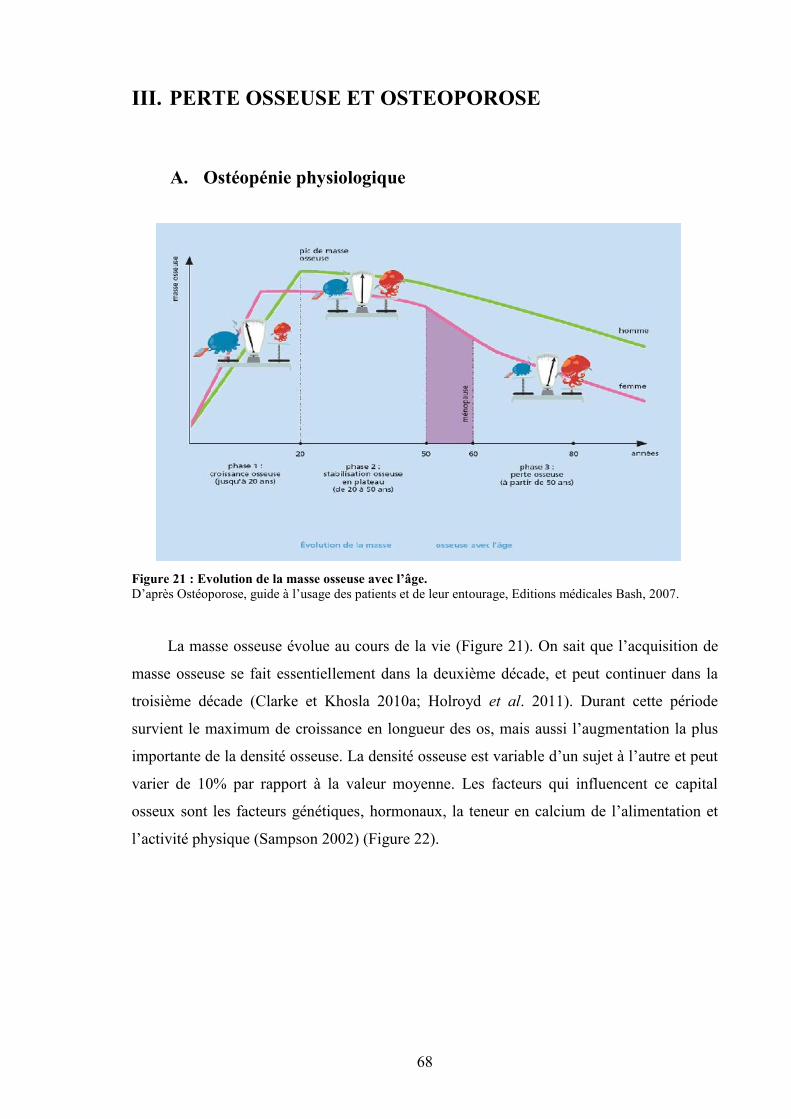
68
III. PERTE OSSEUSE ET OSTEOPOROSE
A. Ostéopénie physiologique
Figure 21 : Evolution de la masse osseuse avec l’âge.D’après Ostéoporose, guide à l’usage des patients et de leur entourage, Editions médicales Bash, 2007.
La masse osseuse évolue au cours de la vie (Figure 21). On sait que l’acquisition de
masse osseuse se fait essentiellement dans la deuxième décade, et peut continuer dans la
troisième décade (Clarke et Khosla 2010a; Holroyd et al. 2011). Durant cette période
survient le maximum de croissance en longueur des os, mais aussi l’augmentation la plus
importante de la densité osseuse. La densité osseuse est variable d’un sujet à l’autre et peut
varier de 10% par rapport à la valeur moyenne. Les facteurs qui influencent ce capital
osseux sont les facteurs génétiques, hormonaux, la teneur en calcium de l’alimentation et
l’activité physique (Sampson 2002) (Figure 22).
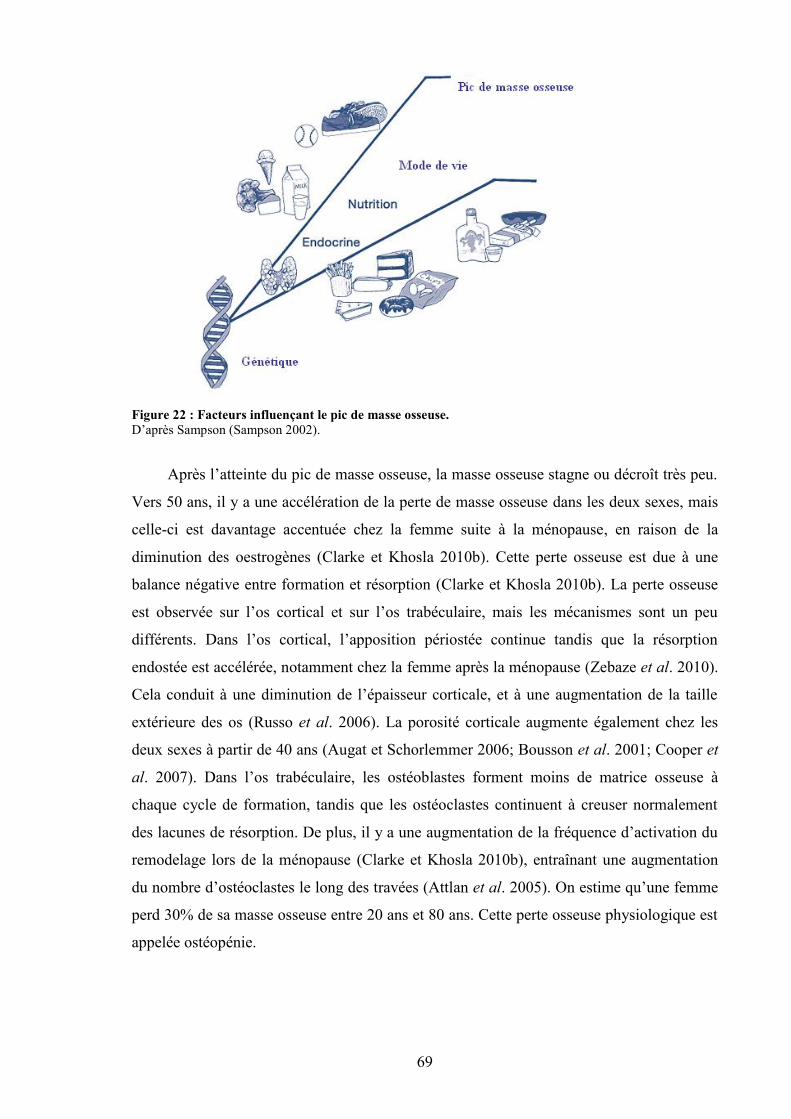
69
Figure 22 : Facteurs influençant le pic de masse osseuse.D’après Sampson (Sampson 2002).
Après l’atteinte du pic de masse osseuse, la masse osseuse stagne ou décroît très peu.
Vers 50 ans, il y a une accélération de la perte de masse osseuse dans les deux sexes, mais
celle-ci est davantage accentuée chez la femme suite à la ménopause, en raison de la
diminution des oestrogènes (Clarke et Khosla 2010b). Cette perte osseuse est due à une
balance négative entre formation et résorption (Clarke et Khosla 2010b). La perte osseuse
est observée sur l’os cortical et sur l’os trabéculaire, mais les mécanismes sont un peu
différents. Dans l’os cortical, l’apposition périostée continue tandis que la résorption
endostée est accélérée, notamment chez la femme après la ménopause (Zebaze et al. 2010).
Cela conduit à une diminution de l’épaisseur corticale, et à une augmentation de la taille
extérieure des os (Russo et al. 2006). La porosité corticale augmente également chez les
deux sexes à partir de 40 ans (Augat et Schorlemmer 2006; Bousson et al. 2001; Cooper et
al. 2007). Dans l’os trabéculaire, les ostéoblastes forment moins de matrice osseuse à
chaque cycle de formation, tandis que les ostéoclastes continuent à creuser normalement
des lacunes de résorption. De plus, il y a une augmentation de la fréquence d’activation du
remodelage lors de la ménopause (Clarke et Khosla 2010b), entraînant une augmentation
du nombre d’ostéoclastes le long des travées (Attlan et al. 2005). On estime qu’une femme
perd 30% de sa masse osseuse entre 20 ans et 80 ans. Cette perte osseuse physiologique est
appelée ostéopénie.
70
B. Ostéoporose
1. Définition
L’ostéoporose est une maladie généralisée du squelette, caractérisée par une baisse de
densité osseuse et des altérations de la microarchitecture trabéculaire osseuse, conduisant à
une fragilité osseuse exagérée et donc à un risque élevé de fracture (Nuti et al. 2009).
L’ostéoporose est définie par l’analyse de la densité minérale osseuse par
absorptiométrie radiologique à double énergie et calcul du T-score (Mauck et Clarke 2006).
Le T-score représente le nombre d’écart-type par rapport à la densité minérale osseuse
moyenne de la population de référence à l’âge du pic de masse osseuse (adulte jeune)
(Mauck et Clarke 2006). Un sujet ayant un T-score situé entre -1 et -2,5 déviation standard
est dit ostéopénique, et un sujet ayant un T-score inférieur à -2,5 est dit ostéoporotique
(Wylie 2010). Dans cette conception, l’ostéoporose est une maladie augmentant le risque
de fracture. Le risque de fracture est élevé, mais la fracture n’est qu’une complication de la
maladie.
2. Epidémiologie
Les fractures ostéoporotiques sont une source majeure de mortalité chez les personnes
âgées et sont également un problème économique pour nos sociétés (Mauck et Clarke
2006). De plus, le nombre de fractures ostéoporotiques va très certainement s’accroître en
raison de l’augmentation de l’espérance de vie de la population. En Europe, les
épidémiologistes prédisent que les personnes de plus de 80 ans, chez lesquels l’incidence
de fractures ostéoporotiques est la plus élevée, vont très certainement passer de 13 millions
à 44 millions en 2050 (Curran et al. 2010). En France, pratiquement une personne sur 3
aura plus de 60 ans en 2030, alors qu’elles n’étaient qu’une personne sur cinq en 2000.
La densité minérale osseuse diminue au cours du vieillissement. Les femmes ont plus
de fractures ostéoporotiques que les hommes (10.7/1000 personnes/an versus 5.7/1000
personnes/an), mais la mortalité est plus élevée chez les hommes que chez les femmes suite
à une fracture (Baudoin et al. 1996). En France, l’incidence de la fracture de la hanche
augmente avec l’âge : 40/10000 personnes/an chez les femmes âgées entre 50 et 80 ans, et
71
150/10000 personnes/an chez les femmes âgées de plus de 80 ans (Baudoin et al. 1996).
Dans une autre étude faite en 2001, les incidences de fractures de la hanche n’étaient pas
différentes entre hommes et femmes entre 45 et 65 ans, mais il y avait deux fois plus de
fractures chez les femmes après 66 ans (Maravic et al. 2005). Les fractures des vertèbres
sont sous-estimées car il est estimé qu’environ une femme sur trois seulement vient se faire
soigner. Dans une étude réalisée chez des femmes âgées de plus de 75 ans, 22% des
femmes avaient au moins une fracture vertébrale (Cooper et al. 1992). Concernant les
autres fractures, des études ont quantifié 35000 cas par an de fractures du poignet en France
chez les femmes âgées de plus de 50 ans, et plus de 33000 cas de fractures des membres
supérieurs chez des adultes de plus de 45 ans en 2001 (Maravic et al. 2005).
3. L’ostéoporose primitive
L’ostéoporose primitive (post-ménopausique) est la forme la plus fréquente
d’ostéoporose (Glaser et Kaplan 1997). L’ostéoporose primitive peut cependant être
rencontrée avant la ménopause, dans la période péri-ménopausique. Elle fait référence à la
privation oestrogénique en tant que facteur étiologique, en raison de la diminution de
l’activité ovarienne à la ménopause. Cela se traduit par une perte de tissu osseux,
notamment sur l’os trabéculaire (Mulvihill et al. 2008; Sornay-Rendu et al. 2009). Ainsi,
chez la femme, l’acquisition du pic de masse osseuse et la perte de masse osseuse liée à la
ménopause sont deux facteurs déterminants du risque fracturaire, après 50 ans (Bonjour et
al. 2009). Cependant, certains travaux ont montré l’importance des facteurs
environnementaux comme la pratique d’une activité physique régulière ou le type d’activité
professionnelle (Rasky et al. 1996).
4. Les ostéoporoses secondaires
Il y a de nombreux mécanismes menant à une ostéoporose secondaire (Glaser et
Kaplan 1997). Celle-ci est caractérisée par une faible masse osseuse avec des altérations de
la microarchitecture osseuse menant à un risque de fracture élevé, en présence d’une
pathologie déjà existante ou d’un traitement médical. Le diagnostic est difficile car les
causes sont diverses et cette pathologie peut atteindre à la fois des femmes pré-
ménopausées et des hommes (Attlan et al. 2005). Les principales causes d’ostéoporose
secondaire sont un excès de glucocorticoïdes, l’hyperparathyroïdie, la grossesse, un diabète
72
de type I, une déficience de GH, des pathologies gastro-intestinales, le VIH et certains
traitements interagissant avec l’absorption ou l’action de la vitamine D, du calcium, et du
phosphate (Hofbauer et al. 2010). A cela il faut rajouter l’anorexie mentale, l’aménorrhée
due à la pratique du sport de haut niveau, l’immobilisation, la thalassémie, la dépression,
etc.
L’ostéoporose masculine est plus rare que l’ostéoporose féminine (Kaufman et
Goemaere 2008), probablement en raison de la plus faible espérance de vie, de la taille plus
importante des os, et de la préservation de l’architecture trabéculaire après 50 ans. En
revanche, la mortalité est plus élevée chez l’homme que chez la femme dans les mois qui
suivent une fracture du fémur (Kaufman et Goemaere 2008). Chez l’homme, les
pathologies les plus impliquées dans l’ostéoporose secondaire sont l’hypercorticisme,
l’hypogonadisme, les maladies hépatho-digestives et l’intoxication alcoolo-tabagique
(Seeman 1997).
RESUME :
La masse osseuse évolue au cours de la vie : elle augmente progressivement jusque
vers 30 ans, puis stagne jusqu’à 50-55 ans. Après 50-55 ans, la masse osseuse
commence à décroître lentement chez les hommes, et plus rapidement chez les
femmes, en raison de la chute d’oestrogènes accompagnant la ménopause. Le capital
osseux peut être maximisé avant 30 ans en ayant une bonne hygiène de vie
(consommation de calcium, exercice physique). Cependant, certaines personnes
partent avec un capital de départ inférieur à d’autres. La diminution de la masse
osseuse peut devenir pathologique, si elle est trop importante et engendrer une
ostéoporose, pathologie caractérisée par une densité minérale osseuse très inférieure à
la moyenne et à une augmentation du risque de fractures. Les causes de l’ostéoporose
peuvent être la chute des oestrogènes (ostéoporose primitive), mais aussi
l’hypogonadisme, l’excès de corticoïdes et également l’abus d’alcool.
73
IV. ALCOOL ET PARAMETRES OSSEUX
L’alcool est connu pour favoriser les accidents de la route, augmenter les risques de
violence subie et engendrée (McCambridge et al. 2011). Les effets de l’alcool sont à la fois
psychiques et physiologiques. L’alcool engendre une augmentation de la dépression,
l’isolement, des problèmes familiaux et professionnels (Miller et al. 2000). Au niveau
physiologique, les effets de l’alcool sont surtout connus au niveau du foie (Gyamfi et Wan
2010; Lieber 1993).
Malheureusement, l’alcool touche beaucoup d’autres tissus, comme le tissu musculaire
(Preedy et al. 1999), et le tissu osseux (Turner 2000).
A. Métabolisme de l’alcool
1. Métabolisme
Les effets de l’alcool sur les différents tissus dépendent de sa concentration sanguine et de
la durée de celle-ci avant élimination. Après ingestion, l’alcool est facilement absorbé par
diffusion passive à travers les parois de l’estomac (20%), les parois du duodénum et de
l’intestin grêle (80%) (Manzo-Avalos et Saavedra-Molina 2010). L’élimination de
l’éthanol absorbé se fait principalement à travers le métabolisme (95-98%), tandis que des
petites fractions de la dose ingérée sont excrétées telles quelles par l’expiration (0.7%), la
sueur (0.1%) et l’urine (0.3%) (Manzo-Avalos et Saavedra-Molina 2010).
Chez un individu adulte non alcoolique, la majeure partie de la métabolisation de l’éthanol
se produit dans le foie, grâce à l’oxydation de l’éthanol par les enzymes alcool
déshydrogénase (ADH), aldéhyde déshydrogénase (ALDH), le cytochrome P450 2E1
(CYP2E1) et la catalase (Figure 23). Chez les personnes qui consomment de l’alcool de
façon modérée, l’éthanol est oxydé en acétaldéhyde par l’ADH dans le cytosol des
hépatocytes. Après quelques verres, cette enzyme est saturée. L’acétaldéhyde est ensuite
oxydé en acétate par l’ALDH dans les mitochondries (Figure 23). La forme activée de
l’acétate, l’acétyl CoA, est métabolisée, produisant des corps cétoniques, des acides
aminés, des acides gras et des stéroïdes (Agarwal 2001). Suite au cycle de Krebs, du CO2
et de l’eau sont formés, représentant les produits finaux de l’oxydation de l’éthanol. Chez
les consommateurs réguliers d’alcool, une deuxième voie est utilisée : le système
microsomal d’oxydation de l’éthanol (MEOS). Ce système fonctionne dans le réticulum
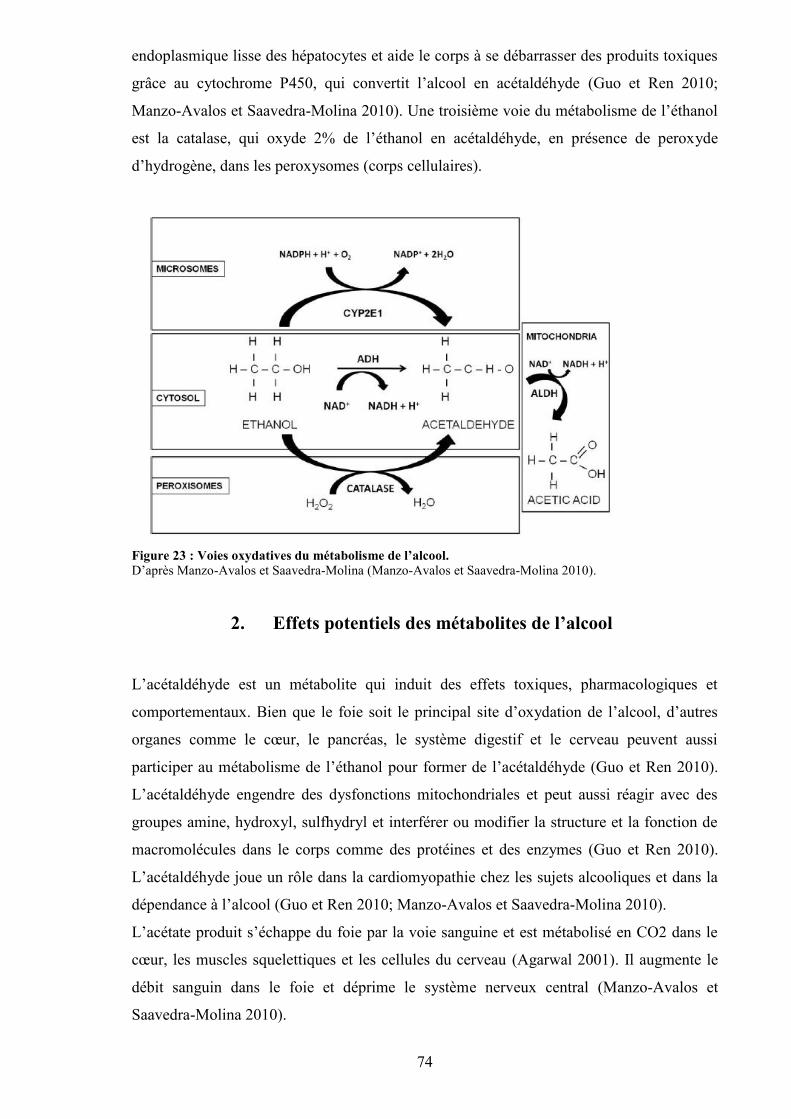
74
endoplasmique lisse des hépatocytes et aide le corps à se débarrasser des produits toxiques
grâce au cytochrome P450, qui convertit l’alcool en acétaldéhyde (Guo et Ren 2010;
Manzo-Avalos et Saavedra-Molina 2010). Une troisième voie du métabolisme de l’éthanol
est la catalase, qui oxyde 2% de l’éthanol en acétaldéhyde, en présence de peroxyde
d’hydrogène, dans les peroxysomes (corps cellulaires).
Figure 23 : Voies oxydatives du métabolisme de l’alcool.D’après Manzo-Avalos et Saavedra-Molina (Manzo-Avalos et Saavedra-Molina 2010).
2. Effets potentiels des métabolites de l’alcool
L’acétaldéhyde est un métabolite qui induit des effets toxiques, pharmacologiques et
comportementaux. Bien que le foie soit le principal site d’oxydation de l’alcool, d’autres
organes comme le cœur, le pancréas, le système digestif et le cerveau peuvent aussi
participer au métabolisme de l’éthanol pour former de l’acétaldéhyde (Guo et Ren 2010).
L’acétaldéhyde engendre des dysfonctions mitochondriales et peut aussi réagir avec des
groupes amine, hydroxyl, sulfhydryl et interférer ou modifier la structure et la fonction de
macromolécules dans le corps comme des protéines et des enzymes (Guo et Ren 2010).
L’acétaldéhyde joue un rôle dans la cardiomyopathie chez les sujets alcooliques et dans la
dépendance à l’alcool (Guo et Ren 2010; Manzo-Avalos et Saavedra-Molina 2010).
L’acétate produit s’échappe du foie par la voie sanguine et est métabolisé en CO2 dans le
cœur, les muscles squelettiques et les cellules du cerveau (Agarwal 2001). Il augmente le
débit sanguin dans le foie et déprime le système nerveux central (Manzo-Avalos et
Saavedra-Molina 2010).
75
3. Polymorphisme génétique
Il a été montré qu’il existe des différences génétiques dans la métabolisation de l’alcool
entre différents groupes ethniques. Des études ont identifié plusieurs différences sur des
gènes codant pour des enzymes liées au métabolisme de l’alcool (Guo et Ren 2010).
L’ADH2, l’ADH3 et l’ALDH2 ont vraisemblablement un rôle important dans les
différences génétiques liées au métabolisme de l’alcool et à sa consommation excessive
(Takeuchi et al. 2011). Une déficience dans l’expression ou l’activité de l’ALDH2 est
responsable de la coloration rouge du visage et de symptômes vasomoteurs suivant une
ingestion d’alcool (Guo et Ren 2010). De plus, une déficience dans l’activité enzymatique
de l’ALDH2 inhibe la formation d’acétate via l’acétaldéhyde (Kiyoshi et al. 2009). La
prévalence de l’allèle ALDH2*1 est associée avec l’alcoolisme tandis qu’une déficience en
ALDH2 due à une mutation sur le gène actif ALDH2*1 altère de manière significative la
concentration sanguine d’acétaldéhyde et modifie la vulnérabilité envers l’alcoolisme (Ren
2007). De plus, les individus portant l’allèle ADH2*2 montrent une facilité à la
métabolisation de l’alcool en raison d’une activité enzymatique plus élevée comparés à des
populations ayant l’allèle ADH2*1 (Guo et Ren 2010).
Des recherches ont rapporté que la fréquence des gènes ADH2*2 et ALDH2*2 est plus
faible chez les africains, les européens et les aborigènes australiens que chez les asiatiques
(incluant les chinois, les japonais et les coréens). L’allèle ALDH2*2 encode une sous-unité
inactive de l’ALDH2 et l’ALDH2 ne fonctionne plus quand elle comprend une sous-unité
inactive. Ceci explique pourquoi les asiatiques ne peuvent pas boire de grandes quantités
d’alcool comparés aux caucasiens (Guo et Ren 2010). D’autres études ont montré que les
personnes qui portent l’allèle ALDH2*2 sont très sensibles à de faibles doses d’alcool. Une
accumulation d’acétaldéhyde dans le sang chez ces personnes produit des effets
inconfortables comme une augmentation de la température de la peau, une baisse de la
pression artérielle, des nausées, etc. (Quertemont et Didone 2006).
76
4. Interactions entre hormones gonadiques et métabolismehépatique de l’alcool
Il a été démontré que les femmes sont plus enclines à développer des maladies liées à
l’alcool que les hommes (maladies du foie, cardiovasculaires et dommages au cerveau),
bien qu’elles consomment généralement moins d’alcool et sont moins souvent des grosses
consommatrices (Sato et al. 2001). Les différences de sensibilité entre femmes et hommes
peuvent être dues à plusieurs facteurs : la pharmacocinétique de l’alcool, qui induit une
concentration d’éthanol dans le sang supérieure chez la femme après ingestion, la
différence du taux d’élimination, la différence du métabolisme de l’éthanol dans le foie, et
bien sûr le rôle des hormones gonadiques (Sato et al. 2001). Il existe très peu d’études sur
les interactions entre hormones gonadiques et métabolisme hépatique de l’alcool. Il a été
montré que les androgènes suppriment l’activité de l’ADH dans le foie, ce qui est
probablement un mécanisme expliquant les plus faibles taux d’élimination de l’alcool chez
les femmes comparées aux hommes (Sato et al. 2001). Après castration, les taux
d’élimination de l’alcool augmentent chez le rat mâle.
5. Système nerveux central
L’alcool modifie le fonctionnement normal de la plupart des systèmes endocriniens. L’axe
hypothalamo-hypophyso-adrénergique (HPA) est stimulé, ce qui résulte en une
augmentation de l’hormone adénocorticotrope et des glucocorticoïdes, proportionnelle à la
dose ingérée. Cette augmentation est supérieure chez la femme par rapport à l’homme, et
est observée avec des consommations aigue et chronique d’alcool (Ronis et al. 2007).
L’axe HPA a un rôle important dans la dépendance et l’abstinence vis-à-vis de l’alcool.
L’abus d’alcool a des effets négatifs sur l’axe hypothalamo-hypophyso-gonadique chez
l’homme et la femme, entraînant des dysfonctionnements sexuels (Emanuele et Emanuele
1997) et bouleversant la sécrétion de l’hormone de croissance (GH) (Ronis et al. 2007).
77
B. Effets de l’alcool sur le métabolisme osseux : quelles doses pourquels effets ?
1. Consommation modérée
a) Densité minérale osseuse
L’alcool peut avoir des effets opposés sur l’os, si l’on ne prend pas garde de séparer
les effets d’une consommation modérée des effets d’une consommation excessive.
Certaines revues de la littérature relatent une amélioration surprenante de la masse osseuse
grâce à l’alcool (Feskanich et al. 1999; Jugdaohsingh et al. 2006; Orwoll et al. 1996). Dans
ces études, si nous étudions de près les volumes d’alcool consommés par les sujets, on
s’aperçoit que les consommations d’alcool sont modérées (75g d’alcool ou plus par
semaines dans l’étude de Feskanich et al., et environ 5000 verres durant une vie chez des
femmes âgées d’environ 74 ans dans l’étude de Orwoll et al.). La définition d’un verre
standard diffère selon les pays, mais la dose moyenne d’éthanol est comprise très souvent
entre 8g et 12g par verre (Jugdaohsingh et al. 2006). Des études récentes ont rapporté des
effets positifs sur le tissu osseux pour de faibles consommations d’alcool. Par exemple, le
groupe de Ilich et al. a trouvé que 8 g d’alcool par jour, principalement du vin, était corrélé
positivement à la DMO des vertèbres lombaires et du corps entier chez des femmes post-
ménopausées (Ilich et al. 2002). Dans l’étude de Ganry et al., des femmes post-
ménopausées qui buvaient de 11 à 29 g d’alcool par jour avaient des valeurs de DMO
supérieures à des femmes non consommatrices d’alcool au niveau du trochanter, tandis que
des consommations de 1-10 g/jour, ou supérieures ou égales à 30 g/jour n’augmentaient pas
la DMO (Ganry et al. 2000). Ces données suggèrent qu’une consommation modérée
d’alcool (1-3 verres par jour) chez des femmes âgées est associée à une augmentation de la
DMO à différents sites osseux tandis que des consommations élevées d’alcool peuvent être
néfastes pour le tissu osseux. Des observations similaires ont été faites chez des femmes
pré-ménopausées (Pedrera-Zamorano et al. 2009), chez des jumelles homozygotes
(Williams et al. 2005), chez des hommes (Tucker et al. 2009) ainsi que chez de jeunes
soldats (Venkat et al. 2009). Cependant, il semble que les différents breuvages alcoolisés
n’aient pas tous le même effet sur l’os. Plus de 2 verres de bière ou de vin augmentent la
DMO chez des femmes pré-ménopausées, post-ménopausées et chez des hommes tandis
que plus de 2 verres de liqueurs par jour diminuent la DMO chez l’homme (Pedrera-
78
Zamorano et al. 2009; Tucker et al. 2009). Cette différence pourrait être due aux autres
constituants présents dans le vin et la bière comme le silicone ou les polyphénols
(Jugdaohsingh et al. 2006).
Des résultats semblables ont été rapportés chez l’animal. Yamamoto et al. ont étudié
les effets de différentes doses d’éthanol chez des rates âgées de 4 semaines (Yamamoto et
al. 1997). Ils ont comparé un modèle d’alcoolisation modérée (5% d’éthanol dans de l’eau
disponible 2 heures par jour pendant 163 jours), à un modèle d’alcoolisation excessive (5%
d’éthanol à volonté pendant 163 jours). Le groupe modéré avait une DMO et des propriétés
mécaniques supérieures au groupe contrôle, tandis que le groupe buvant à volonté n’avait
pas de modifications des propriétés mécaniques et de la DMO comparées au groupe
contrôle (Yamamoto et al. 1997).
b) Remodelage osseux
L’augmentation de la DMO suivant une faible alcoolisation pourrait être expliquée
par un remodelage osseux ralenti. Une diminution des concentrations en ostéocalcine et en
NTx a été observée chez des patients alcooliques (Rapuri et al. 2000; Sripanyakorn et al.
2009). Très peu d’études ont analysé l’évolution des marqueurs du remodelage osseux
pendant une alcoolisation modérée, car la plupart ont analysé les marqueurs du remodelage
chez des patients alcooliques et la consommation d’alcool était étudiée durant toute la vie.
De plus, il a été rapporté que les marqueurs du remodelage ont une grande variabilité intra-
et inter-individuelle, et sont sensibles aux niveaux des hormones sexuelles, à
l’alimentation, et varient selon l’heure de la journée et la saison (Jugdaohsingh et al. 2006).
Fanti et al. ont montré un effet positif d’une faible consommation d’alcool (2.5% de
l’alimentation) sur le remodelage osseux chez des rates ovariectomisées (Fanti et al. 1997).
La résorption osseuse était diminuée sans changement de la formation osseuse chez les
femelles OVX tandis qu’il n’y avait pas de changement chez les rates SHAM.
79
2. Consommation excessive
a) Densité minérale osseuse
Chez l’homme, il a été montré qu’une consommation d’alcool excessive pendant de
nombreuses années diminue le CMO et la DMO (Turner 2000). La diminution de la DMO
a été observée à différents sites osseux : poignet, colonne, crête iliaque, trochanter (Alvisa-
Negrin et al. 2009; Diamond et al. 1989). En revanche, la sévérité de l’alcoolisation varie
selon les différentes études. Des études ont rapporté que trois à quatre verres d’alcool par
jour étaient délétères pour la DMO chez l’homme, mais les effets variaient selon le type
d’alcool (Hoidrup et al. 1999; Tucker et al. 2009). La quantité d’alcool ingérée ainsi que la
durée d’alcoolisation sont corrélées avec le degré de perte osseuse (Gonzalez-Calvin et al.
1993). Une étude récente de Malik et al. a montré une diminution de la DMO au niveau des
vertèbres lombaires et du fémur proximal chez les hommes, mais pas chez les femmes sous
activité ovarienne (Malik et al. 2009). Différents effets de l’alcool sur le tissu osseux en
fonction du sexe et des différences hormonales ont été rapportés également dans l’étude de
Hannan et al. (Hannan et al. 2000).
Chez le rat, les effets de l’alcool sur la DMO ont été étudiés dans les deux sexes, à
différents âges et en fonction de différentes doses d’alcool. Par exemple, un moindre gain
de DMO a été observé chez des rates âgées de 4 semaines en début d’étude, après 6
semaines d’alcoolisation (alcool représentant 35% de l’apport calorique journalier)
(Sampson et al. 1996). Le pic de masse osseuse était plus faible dans l’os trabéculaire et
cortical chez les rates alcoolisées. Une plus faible DMO au niveau du corps entier a été
observée chez des rats de 10 semaines après 6 semaines d’alcoolisation (15% de l’énergie
apportée par l’éthanol) (Nyquist et al. 1999). Il a également été observé que la limitation du
gain de DMO était plus importante chez les femelles que chez les mâles (36% de l’apport
calorique journalier pendant 6 semaines) (Nishiguchi et al. 2000).
80
b) Microarchitecture
La microarchitecture est un paramètre important dans la résistance osseuse, la qualité
du tissu osseux et la résistance osseuse (Ammann et Rizzoli 2003). Cependant elle est
difficile à évaluer chez l’homme. Des études dans les années 1980 rapportent une
diminution du volume et de l’épaisseur de l’os trabéculaire chez l’homme, après biopsie de
l’os iliaque (Chappard et al. 1991; De Vernejoul et al. 1983; Schnitzler et Solomon 1984).
Une diminution de l’épaisseur corticale et du volume trabéculaire a été décrite chez
des rats suite à un traitement alcoolique (36% des calories) (Sampson 1998b; Sampson et
al. 1997). Sakurama a observé une atrophie de l’os, un amincissement des travées et de l’os
cortical ainsi qu’une augmentation de la porosité corticale chez des souris alcoolisées (16%
d’éthanol durant 472 jours) (Sakurama 1998). Une diminution du nombre, de l’épaisseur
des travées, de la densité des connections a été rapportée chez le rat, ainsi qu’une
diminution de la masse d’os trabéculaire BV/TV (Maddalozzo et al. 2009; Trevisiol et al.
2007). D’autres études ont observées une diminution de la section corticale et du volume de
l’os cortical, ainsi qu’une diminution de l’épaisseur corticale, ce qui dénote une altération
de ce compartiment osseux (Broulik et al. 2010; Nishiguchi et al. 2000). Il semble d’après
certaines études que la perte (ou le moindre gain) d’os due à l’alcool soit plus important
dans l’os trabéculaire que dans l’os cortical (Chakkalakal et al. 2001; Wezeman et al.
2003).
c) Remodelage osseux
La plupart des études rapportent un découplage entre formation osseuse et résorption
chez les patients alcooliques : la formation est très souvent diminuée et la résorption
augmentée chez les patients alcooliques comparés à des patients contrôles (Alvisa-Negrin
et al. 2009; Gonzalez-Calvin et al. 1993; Nyquist et al. 1996). Il a été montré chez
l’homme que la diminution de la formation osseuse serait due à une inhibition de la
prolifération et de l’activité des ostéoblastes (Diamond et al. 1989; Sampson 1998a). La
concentration des marqueurs osseux peut varier suivant l’âge des patients (Bikle 1993), le
type de consommation (aigu versus chronique) (Sripanyakorn et al. 2009) et aussi suivant
l’abstinence avant la prise de sang (Laitinen et al. 1992). D’autres paramètres peuvent
81
également faire varier les concentrations des marqueurs du remodelage osseux chez les
patients alcooliques, comme le tabagisme, les déficiences éventuelles en vitamine D,
calcium et PTH, et l’état du foie (pancréatite, cirrhose).
En accord avec les études chez l’homme, des études chez l’animal ont également
observé une diminution de la formation osseuse à la suite d’un traitement alcoolisé (Broulik
et al. 2010; Dyer et al. 1998). Seule une étude de Sampson et al. n’a pas observé de
différence d’ostéocalcine entre des rates contrôles et des jeunes rates de 4 semaines (liquide
nutritif contenant 35% de l’AETQ provenant de l’alcool, ingéré pendant 2 à 8 semaines),
malgré la diminution de la DMO et du pic de masse osseuse (Sampson et al. 1996). Les
effets inhibiteurs de l’alcool sur la formation osseuse semblent être dépendants de la dose,
tout comme les effets de l’alcool sur la résorption osseuse (Turner et al. 2001). Dans
l’étude de Turner et al., le taux de formation osseuse (BFR) diminue au fur et à mesure que
la dose d’alcool augmente, tandis que le nombre d’ostéoclastes diminue avec la plus faible
dose d’alcool mais ne diffère plus du groupe contrôle quand les doses augmentent. Ces
données confirment qu’une faible consommation d’alcool peut réduire le remodelage
osseux tandis que des consommations excessives produisent un découplage du remodelage
osseux avec une réduction de la formation et un excès de résorption (Broulik et al. 2010;
Dai et al. 2000).
d) Résistance osseuse et fractures
Tandis qu’une faible consommation d’alcool n’est pas associée à une augmentation
du risque de fracture (Hoidrup et al. 1999), une consommation supérieure à 3 verres par
jour ou supérieure à 27 boissons par semaine chez l’homme et la femme constitue un risque
majeur de fracture (Berg et al. 2008; Hoidrup et al. 1999). Il a été démontré que les
fractures sont quatre fois plus fréquentes chez les patients alcooliques que chez des
contrôles du même âge (Kanis et al. 2009; Turner 2000). La faible masse osseuse observée
fréquemment chez les patients alcooliques est associée à l’augmentation du risque de
fracture (Turner 2000). Indépendamment des altérations osseuses, l’alcoolisme créé des
conditions qui favorisent les accidents et les chutes (Lucas 1987). Par exemple, une étude a
montré un risque de chute plus élevé chez des consommateurs d’alcool (plus de 14
boissons par semaine) comparé à des non buveurs (Cawthon et al. 2006). Comme souligné
par Turner (Turner 2000), les dossiers hospitaliers ne précisent pas toujours les causes des
fractures (traumatiques versus non traumatiques). Cela permettrait de savoir si
82
l’augmentation du nombre de fractures chez les patients alcooliques est due à une plus
faible DMO ou à un nombre plus fréquent de chutes (Turner 2000). Les gros
consommateurs d’alcool (100 à 460 g/jour) ont souvent des traumatismes du squelette et
des fractures vertébrales en dépit d’une DMO lombaire normale. De plus, ces patients sont
rarement au courant de fractures vertébrales antérieures (Peris et al. 1995). Cela est
confirmé par Gonzalez-Reimers et al. qui observent des fractures de côtes plus fréquentes
chez des sujets alcooliques comparés à des sujets sains (Gonzalez-Reimers et al. 2005). Les
fractures de côtes n’étaient pas corrélées aux valeurs de DMO, en revanche, une association
des fractures de côtes avec l’hygiène de vie des patients (tabagisme, habitudes alimentaires
irrégulières) a été observée. Ceci a été confirmé par Santori et al. (Santori et al. 2008). De
ce fait, les habitudes de vie et les traumatismes pourraient contribuer à l’incidence
fracturaire chez les sujets alcooliques et cela indépendamment de la DMO. De plus,
l’alcool augmente le temps de réparation des fractures (Nyquist et al. 1997) et augmente le
risque de complications (Chakkalakal 2005).
Chez l’animal, une diminution de la force maximale requise pour casser l’os a été observée
chez des rats et des rates nourris avec de l’alcool (8%) durant 4 et 6 semaines (Peng et al.
1988). Les auteurs ont aussi rapporté une corrélation inverse entre la force nécessaire pour
casser l’os et la dose d’éthanol ingérée. La rigidité osseuse, la force et l’énergie absorbée
jusqu’à fracture étaient significativement plus faibles chez des rates de 4 semaines (35%
des calories provenant de l’éthanol pendant 6 semaines) comparées à des animaux
contrôles ayant consommé autant de calories, dans l’étude de Hogan et al. (Hogan et al.
1997). Dans cette étude, la surface corticale n’était pas différente entre les rates alcoolisées
et les rates contrôles, suggérant que l’alcool diminue la résistance osseuse en modifiant la
qualité du tissu osseux.
Chakkalakal et al. ont étudié l’effet-dose de l’éthanol sur la réparation osseuse dans
un modèle de rat. Ils ont observé une moins bonne réparation osseuse chez des rats
alcoolisés à une dose de 36% (calories dérivées de l’éthanol) comparé à des rats contrôles :
l’os réparé était 24% moins résistant et les cendres étaient 14% moins denses (Chakkalakal
et al. 2005). En revanche, les paramètres étaient normaux chez les rats ayant consommé
une dose d’alcool de 26% (calories dérivées de l’éthanol). De nombreuses études ont
montré que l’alcool inhibe la formation osseuse sur des sites de réparations fracturaires
(Brown et al. 2002; Trevisiol et al. 2007).
83
e) Abstinence
Alvisa-Negrin et al. ont comparé 77 patients alcooliques (204 g d’alcool par jour en
moyenne pendant 28 ans) à des travailleurs sains (contrôles). L’abstinence des patients
alcooliques durant 6 mois était associée à une augmentation de la masse osseuse à
différents sites osseux (bras, bassin), et à une amélioration des concentrations
d’ostéocalcine et de vitamine D (Alvisa-Negrin et al. 2009). Les abstinents avaient une
masse osseuse augmentée, en comparaison avec les non abstinents qui continuaient à boire
et par la même, à perdre de l’os. Une augmentation rapide de l’ostéocalcine a été observée
par Pepersack et al. après 2 semaines d’abstinence chez des sujets alcooliques (Pepersack
et al. 1992). Cependant, il est difficile d’analyser les effets de l’abstinence car celle-ci
s’accompagne souvent par des changements d’autres facteurs pouvant influencer la masse
osseuse comme l’activité physique et de meilleures habitudes alimentaires. Malgré les
preuves que l’abstinence augmente la masse osseuse et les concentrations des marqueurs de
formation osseuse chez les gros consommateurs, le remodelage osseux peut être toujours
perturbé même 5 ans après l’arrêt de la prise d’alcool (Nyquist et al. 1996).
Chez l’animal, une abstinence de 90 jours suivant un traitement alcoolique entraîne
une augmentation de la DMO chez des rats adolescents, avec des paramètres de résistance
mécaniques qui redeviennent normaux (Wezeman et al. 1999). Des résultats similaires ont
été démontrés par d’autres équipes (Sampson and Spears 1999; Sibonga et al. 2007),
confirmant la réversibilité de certaines altérations osseuses dues à l’alcool.
3. Le binge drinking (intoxications alcooliques aigues etrépétées)
La consommation d’alcool a augmenté ces dernières années chez les adolescents et
les jeunes adultes (Miller et al. 2007; Schoberl et al. 2008; Slutske 2005). Elle se traduit
par l’apparition d’un nouveau mode d’alcoolisation chez les jeunes : le binge drinking
(intoxications alcooliques aigues et répétées en français). Une consommation alcoolique est
qualifiée de binge drinking lorsque cinq boissons ou plus sont ingérées à la suite par un
homme – et quatre boissons ou plus à la suite par une femme (Miller et al. 2007). Ces
pratiques sont responsables de nombreuses hospitalisations parmi les adolescents, victimes
84
d’intoxications alcooliques aigues. Selon une étude faite à l’hôpital de Leipzig, les patients
victimes d’intoxications alcooliques aigues ont augmenté de 171% entre 1998 et 2003. Sur
un total de 173 patients, 62 étaient inconscients, 2 étaient dans le coma et 3 ont dû être
ventilés (Schoberl et al. 2008). Le binge drinking est aussi pratiqué par les adultes mais il
est souvent masqué dans les questionnaires sur la consommation alcoolique. Une étude
nationale américaine qui a utilisé des sondages téléphoniques a rapporté que quand les
épisodes de binge drinking sont inclus à la consommation quotidienne d’alcool, le
pourcentage d’adultes gros consommateurs d’alcool augmente de 19% à 42%, selon la
méthode utilisée pour calculer le nombre de boisson par binge (Stahre et al. 2006). Dans
une étude de Wosje et Kalkwarf, la faible consommation d’alcool était bénéfique pour l’os
chez l’homme et la femme, mais pas le binge drinking (Wosje et Kalkwarf 2007). Le binge
drinking n’était pas associé à la DMO chez l’homme ni chez la femme. Compte tenu de la
nouveauté de cette pratique chez les adolescents, et du manque de données chez les adultes,
les effets du binge drinking sur le squelette humain ne sont pas encore connus à ce jour.
Des études récentes se sont penchées sur les effets du binge drinking chez l’animal.
Dans une première étude, Sampson et al. ont observé que le binge drinking (5% d’alcool
par gavage pendant 6 semaines) augmentait la longueur, le poids et la densité des os chez
des rates de 4 semaines lorsque l’alcool était administré 2 jours consécutifs par semaine,
mais aucun changement n’a été observé quand les rates étaient gavées 5 jours consécutifs
par semaine (Sampson et al. 1999). Un modèle de binge a été développé par Callaci et al.
avec des injections intra-péritonéales. Des doses de 20% d’alcool volume/volume (3 g/kg,
1 fois par jour) ont été administrées 4 jours consécutifs par semaine pendant 1, 2 ou 3
semaines (Callaci et al. 2004). Aucun effet n’a été observé après 1 et 2 semaines de
traitement. En revanche, après 3 semaines, les DMO du fémur distal et de la colonne
étaient significativement réduites, ainsi que la résistance à la compression des vertèbres
(Callaci et al. 2004). Le rapport BV/TV était diminué et l’espace inter travées augmenté.
De plus, les concentrations sériques de deoxypyridinoline, marqueur de la résorption,
étaient augmentées comparées aux contrôles (+205%). Ces résultats suggèrent que le binge
drinking peut affecter l’intégrité du squelette chez le rat après plusieurs cycles (3
semaines), en augmentant la résorption osseuse.
Un autre modèle de binge drinking a été testé par Callaci et al. Ils ont administré de
l’alcool (3 g/kg, i.p.) pendant 3 jours consécutifs par semaine, durant 1 ou 4 semaines chez
des rats adultes. Aucune perte osseuse n’a été constatée après 1 semaine, mais après 4
cycles de binge drinking, une diminution de 23% de la DMO de l’os trabéculaire et 17% de
la résistance à la compression vertébrale ont été observées comparées aux valeurs des
85
animaux contrôles (Callaci et al. 2009). L’expression des gènes relatifs aux marqueurs de
la formation osseuse (ostéocalcine et phosphatase alcaline) était significativement diminuée
après un épisode aigu de binge drinking (Callaci et al. 2009). Lauing et al. ont étudié les
effets de 30 jours d’abstinence sans alcool après des épisodes de binge chez des rats
adolescents. La DMO de l’os trabéculaire du tibia était diminuée de 25% après des
traitements de binge drinking chronique et aigu et la DMO de l’os trabéculaire des
vertèbres était réduite de 15% après un traitement de binge drinking chronique (Lauing et
al. 2008). La résistance à la compression des vertèbres était significativement diminuée de
31% après des épisodes de binge drinking et les concentrations sériques d’ostéocalcine
étaient diminuées après un traitement aigu de binge drinking. Après une période
d’abstinence, les valeurs de DMO du tibia sont revenues à la normale mais la DMO des
vertèbres est restée 15% en dessous des valeurs des contrôles.
Ces résultats montrent que le binge drinking possède à la fois des effets délétères à court
terme et à long terme sur le squelette des rongeurs. Les adolescents qui adoptent de tels
comportements pourraient avoir un plus faible pic de densité osseuse et augmenter le risque
plus tard d’avoir une pathologie osseuse (Lauing et al. 2008).
C. Mécanismes d’action de l’alcool sur l’os
L’alcool diminue le CMO et la DMO à la fois dans l’os trabéculaire et dans l’os
cortical, principalement en raison d’un ralentissement de la formation osseuse (Sampson
1998; Sampson et al. 1998). L’alcoolisme est une cause majeure d’ostéoporose secondaire
chez l’homme (Audran et al. 2004; Seeman 1997), et augmente le risque de fracture. Les
mécanismes d’action de l’éthanol sur l’os ne sont pas très bien connus. Toutefois, les
chercheurs pensent que l’éthanol agit à la fois de façon directe et indirecte sur le tissu
osseux (Maddalozzo et al. 2009).
1. Actions indirectes
a) Composition corporelle
La masse grasse et la masse maigre sont toutes deux diminuées chez les sujets
alcooliques (Gonzalez-Reimers et al. 2008; Maddalozzo et al. 2009), probablement en
86
raison de la restriction calorique observée dans la pathologie alcoolique (Maddalozzo et al.
2009). La masse grasse et la masse maigre sont corrélées à la DMO (Khosla et al. 1996;
Pluijm et al. 2001), bien que leur contribution à la DMO soit différente chez l’homme et
chez la femme (Visser et al. 1998). Les muscles jouent un rôle dans la stimulation
mécanique des os en réponse à un exercice (Robling 2009), tandis que la relation de la
masse grasse et du tissu osseux est médiée par des hormones sécrétées par les adipocytes
(leptine) (Reid 2008).
b) Système nerveux central
La sérotonine, ou 5-hydroxytryptamine (5-HT), est un neurotransmetteur dans le système
nerveux central. Elle est majoritairement présente dans l’organisme en qualité d’hormone
locale (intestins). Elle joue donc un double rôle d’hormone et de neuromédiateur du
système nerveux central. La sérotonine est générée à partir de la conversion du L-
tryptophane par la tryptophane hydroxylase (Tph) (Yadav et Karsenty 2009). Il a été
montré récemment que la leptine induit une signalisation dans les neurones
sérotoninergiques du tronc cérébral pour réguler la masse osseuse, l’appétit et la dépense
énergétique (Yadav et Karsenty 2009). Il semblerait également que le récepteur Lrp5 agisse
sur les cellules intestinales afin de contrôler la formation osseuse, via la synthèse de
sérotonine (Yadav et Ducy 2010). Plusieurs études ont montré un rôle de l’alcool sur la
régulation de la voie sérotoninergique, notamment en lien avec le stress lié à la dépendance
et à l’abstinence (Ballenger et al. 1979; Nesic et Duka 2008). De plus, il a été observé une
modification des concentrations de sérotonine et de tryptophane (Trp) suite à des
consommations d’alcool aigues ou chroniques (Badawy 2002). Aucune étude à notre
connaissance n’a été menée sur la régulation de la sérotonine en lien avec les effets de
l’alcool sur le tissu osseux, mais la voie sérotoninergique pourrait être liée aux
modifications de masse osseuse suite à une ingestion d’alcool.
Il a également été montré que la voie adrénergique peut réguler la masse osseuse. En effet,
la leptine peut agir sur des neurones de l’hypothalamus qui stimulent ensuite des fibres
nerveuses relâchant de la norepinephrine (NE). La NE se lie aux récepteurs adrénergiques
exprimés sur les ostéoblastes, inhibant leur activité de formation osseuse (Bonnet et al.
2008). De plus, la stimulation des neurones β-adrénergiques engendre la production de
RANKL par les ostéoblastes. Il a été rapporté que la consommation chronique d’alcool
altère le système beta-adrénergique chez le rat (Khanna et al. 2007; Utkan et al. 2001). Il
semblerait que les récepteurs beta-adrénergiques jouent un rôle dans les symptômes
87
aversifs liés à l’arrêt de l’alcool, puisque ceux-ci sont bloqués par des antagonistes des
récepteurs beta-adrénergiques comme le propanolol (Gilpin et Koob 2010). La NE serait
également impliquée dans le comportement lié à la prise d’alcool (Gilpin et Koob 2010). A
ce jour et à notre connaissance, il n’y a pas d’étude sur les effets de l’alcool sur le tissu
osseux qui ait également étudié le système beta-adrénergique mais au vue de la littérature
existante, cette voie pourrait médier les effets de l’alcool sur le tissu osseux.
c) Leptine
La leptine, protéine connue pour réguler l’appétit, diminue la masse osseuse via le
système nerveux central (Bonnet et al. 2005b). Le récepteur de cette hormone est richement
exprimé au niveau des neurones hypothalamiques et la liaison de la leptine à ce récepteur
active une voie de signalisation majeure dans l’hypothalamus, entraînant une augmentation
de la dépense énergétique et une diminution de la prise alimentaire menant à une perte de
poids (Elefteriou et Karsenty 2004). La liaison de la leptine à son récepteur sur les
neurones localisés dans l’hypothalamus active le système nerveux sympathique. Ce dernier
transmet un signal anti-ostéogénique via la noradrénaline aux ostéoblastes exprimant le
récepteur adrénergique beta 2 (Elefteriou et Karsenty 2004). Le mécanisme prépondérant
de l’inhibition de la formation osseuse par la leptine in vivo est central (Bonnet et al. 2008;
Elefteriou et Karsenty 2004). La leptine a également des effets anaboliques sur l’os en
périphérie en favorisant la différenciation des cellules souches vers la lignée ostéoblastique
(Cirmanova et al. 2008; Thomas et al. 1999). La consommation excessive d’alcool diminue
les concentrations de leptine chez l’homme et chez l’animal (Maddalozzo et al. 2009;
Otaka et al. 2007), diminue l’osteoblastogenèse et augmente l’adipogenèse simultanément
dans la moelle osseuse, modifiant la balance entre ostéogenèse et adipogenèse (Chen et al.
2010; Wang et al. 2003). En accord avec cela, une augmentation du marqueur de
l’adipogenèse PPARgamma et une diminution de l’ostéocalcine ont été observé in vitro sur
des cellules souches clonées provenant de la moelle osseuse chez des souris et sur des
cellules souches mésenchymateuses humaines cultivées avec de l’éthanol (Cui et al. 2006;
Ronis et al. 2011; Wezeman and Gong 2004).
88
d) Vitamine D et PTH
Certaines concentrations d’hormones sont modifiées chez les alcooliques, ce qui
pourrait interférer avec le métabolisme osseux. Par exemple, une insuffisance en vitamine
D (Alvisa-Negrin et al. 2009; Malik et al. 2009; Schnitzler et al. 2010) et des faibles taux
de PTH (Lindholm et al. 1991) ont été observés dans quelques études mais pas dans
d’autres (Laitinen et al. 1992; Sripanyakorn et al. 2009). Des injections de PTH chez des
rats soumis à un traitement alcoolique ont engendré une augmentation de la formation
osseuse, sans modification de l’adiposité médullaire (Howe et al. 2011). Chez les
alcooliques sévères, l’augmentation de l’excrétion de calcium dans les urines pourrait être
liée à ces changements hormonaux et à une modification du remodelage osseux. Etant
donné que la résorption osseuse est une source de calcium, elle pourrait être augmentée
pour pallier aux déficiences en calcium. En effet, plusieurs études ont observé une
augmentation de l’excrétion de calcium dans l’urine chez les sujets alcooliques sévères
(Gonzalez-Calvin et al. 1993). La parathormone est nécessaire pour que la vitamine D soit
efficace et la vitamine D a un effet positif sur l’activité et la différenciation des ostéoblastes
(Atkins et al. 2007). La consommation chronique d’alcool peut diminuer la concentration
sérique de vitamine D, résultant en une malabsorption du calcium par l’intestin, diminuant
ainsi les taux de calcium sériques (Griffiths et al. 1993). En revanche, il a été montré chez
l’homme que les effets de l’alcool sur le remodelage osseux ne sont pas dépendants de la
concentration en PTH (Sripanyakorn et al. 2009).
Les effets de l’alcool sur la vitamine D peuvent être liés à des causes indirectes comme la
malnutrition, qui est souvent associée à l’alcoolisme chronique, ou à une exposition plus
faible aux rayons du soleil, qui est la principale cause de déficience en vitamine D (Malik
et al. 2009). Des lésions du tissu hépatique pourraient aussi expliquer la déficience en
vitamine D, ce qui pourrait avoir un impact sur le tissu osseux, avec d’autres carences
hormonales (Rico 1990). Par exemple, dans le cas d’une déficience hépato-cellulaire,
l’hydroxylation de la 25 vitamine D est altérée, et cette altération pourrait aggraver les
effets de l’insuffisance en vitamine D.
89
e) Calcitonine
Une consommation modérée d’alcool pourrait augmenter la calcitonine, hormone qui
inhibe la résorption (Vantyghem et al. 2007) (Figure 24). Cela pourrait en partie expliquer
les effets bénéfiques d’une consommation modérée d’alcool observées auparavant chez les
femmes (Griffiths et al. 1993). Cependant, certaines études n’ont pas observé de variations
des concentrations de calcitonine avec l’alcool (Sripanyakorn et al. 2009). Il semble que la
calcitonine ne soit pas modifiée par une consommation chronique d’alcool, mais par une
consommation aigue (Sampson et al. 1998).
f) Stéroïdes sexuels
Certaines études ont rapporté une diminution de la testostérone chez des sujets
alcooliques (Diamond et al. 1989; Maneesh et al. 2006; Tentler et al. 1997) mais ce n’est
pas le cas pour toutes (Baran et al. 1980). Les études n’ont pas montré de diminution des
oestrogènes avec l’alcool (Purohit 2000), mais une diminution de l’oestradiol a été
rapportée chez la femme (Dorgan et al. 1994) et chez la rate (Shankar et al. 2006). De plus,
il est connu que de faibles niveaux d’oestradiol sont associés à une perte osseuse, via
l’augmentation de RANKL (Ronis et al. 2007). Une augmentation de l’oestrogène a été
observée suite à de faibles consommations d’alcool chez la femme, ce qui pourrait la
protéger de la perte osseuse (Chen et al. 2009; Jugdaohsingh et al. 2006).
g) Minéraux et Ions
D’autres facteurs pouvant contribuer à la perte osseuse sont les faibles concentrations
sériques en magnésium et phosphate observées chez les gros consommateurs d’alcool
(Griffiths et al. 1993; Turner 2000). En revanche, les changements de calcium, magnésium
et phosphate ne sont pas régulièrement observés dans toutes les études (Broulik et al. 2010;
Sampson et al. 1996). La diminution de magnésium pourrait modifier les taux de PTH ou
diminuer la réponse de l’os à la PTH (Schnitzler et al. 2010).
De nombreux facteurs de comorbidité sont associés à l’alcoolisme, comme le statut
nutritionnel, le tabagisme, l’absence d’activité physique, l’utilisation de drogues, diverses
90
pathologies hépatiques, qui peuvent influencer le métabolisme et entraîner des déficiences
en vitamines et minéraux (Chakkalakal 2005). Les alcooliques ont également fréquemment
des apports insuffisants en divers vitamines et minéraux (Hernandez et al. 1991).
2. Effets directs de l’alcool sur l’os
L’alcool pourrait également avoir des effets directs sur l’os (Malik et al. 2009;
Sampson et al. 1996; Turner 2000) (Figure 24). En effet, plusieurs études ont observé des
effets délétères de l’alcool sur la formation osseuse et la DMO en l’absence de
changements de concentrations des hormones anaboliques et calciotropes (Maddalozzo et
al. 2009; Sampson et al. 1998).
a) Ostéoblastes et ostéoclastes
Sun et al. (Sun et al. 2007) ont montré que l’éthanol peut inhiber la prolifération et la
fonction des ostéoblastes. Cette inhibition est accrue lorsque les ostéoblastes sont cultivés
avec restriction de sérum.
La suppression des compétences ostéogéniques des cellules dérivées de la moelle peut se
produire à différentes étapes : prolifération et différenciation des cellules souches,
progression de la lignée ostéoblastique jusqu’à maturation, fonction de l’ostéoblaste
mature, différenciation terminale en ostéocytes ou apoptose des ostéoblastes (Chakkalakal
2005). Giuliani et al. (Giuliani et al. 1999) ont rapporté que dans des cultures de cellules
prélevées dans la moelle osseuse de patients alcooliques, l’alcool et l’acétaldéhyde
induisent une suppression du recrutement des cellules dévouées à la lignée ostéoblastique,
ce qui n’est pas observé chez des individus sains du même âge. Il a également été rapporté
sur des cellules souches de moelle clonées que l’éthanol diminue l’ostéogenèse et
augmente l’adipogenèse (Cui et al. 2006; Wang et al. 2003). Une relation inverse entre
l’ostéogenèse et l’adipogenèse a été observée sur des cultures de cellules stromales de rat
(Beresford et al. 1992). L’altération de la différenciation ostéogénique des CSM a été
confirmée par Gong et Wezeman (Gong et Wezeman 2004). Ces résultats permettent de
mieux comprendre la diminution de la formation osseuse due à l’alcool. Une diminution de
la capacité des CSM à se différencier a été également observée chez des patients ayant une
nécrose de la tête fémorale induite par l’alcoolisme (Suh et al. 2005). Les CSM ont un
91
temps de différenciation plus long que chez des patients sains, mais la capacité à se
différencier en adipocytes n’est pas plus élevée que chez les contrôles.
Une autre étude a montré sur une lignée d’ostéoblastes provenant d’ostéosarcomes que
l’éthanol diminue la minéralisation à une dose de 10 mM tandis que la minéralisation est
complètement inhibée à une dose de 100 mM (Vignesh et al. 2006). A des doses plus
élevées (200 et 300 mM), le nombre de cellules était significativement diminué. Cependant,
ces doses sont des doses létales pour l’homme (Tableau 7). L’éthanol aurait donc des effets
inhibiteurs sur la prolifération, la minéralisation et la différenciation même à dose faible,
quand la durée du traitement est prolongée. Dans un dernier temps, une étude de Torricelli
et al. (Torricelli et al. 2007) a montré sur des ostéoblastes prélevés sur des rats exposés à
des vapeurs d’alcool de façon intermittente pendant 7 semaines que la prolifération des
ostéoblastes était plus affectée par l’éthanol qu’elle ne l’est par la chute d’oestrogènes
pendant la ménopause.
A notre connaissance, une seule étude s’est intéressée aux effets de l’alcool sur la
résorption in vitro (Cheung et al. 1995). Dans cette étude, des ostéoclastes prélevés sur des
poussins avant l’éclosion ont été cultivés avec différents pourcentages d’éthanol. La
résorption par les ostéoclastes était plus élevée sous l’influence de l’éthanol, et ce, même à
des concentrations rencontrées chez des buveurs occasionnels (Cheung et al. 1995). Cette
étude a montré que l’éthanol peut avoir des effets directs sur les ostéoclastes, ce qui
coïncide avec les observations faites chez l’homme (Bikle et al. 1993; Diez et al. 1994).
L’augmentation de l’ostéoclastogenèse due à l’alcool pourrait être médiée par des
cytokines. Une augmentation de l’expression de l’IL-6 et de RANKL a été observée chez
des souris soumises à un traitement alcoolisé (Chakkalakal 2005; Dai et al. 2000).
L’éthanol semble avoir un effet direct sur les ostéoclastes et les ostéoblastes.
Malheureusement et comme le souligne Turner (Turner 2000), il n’y a pas de modèles in
vitro permettant d’évaluer les effets de l’éthanol sur le couplage entre formation et
résorption osseuse.
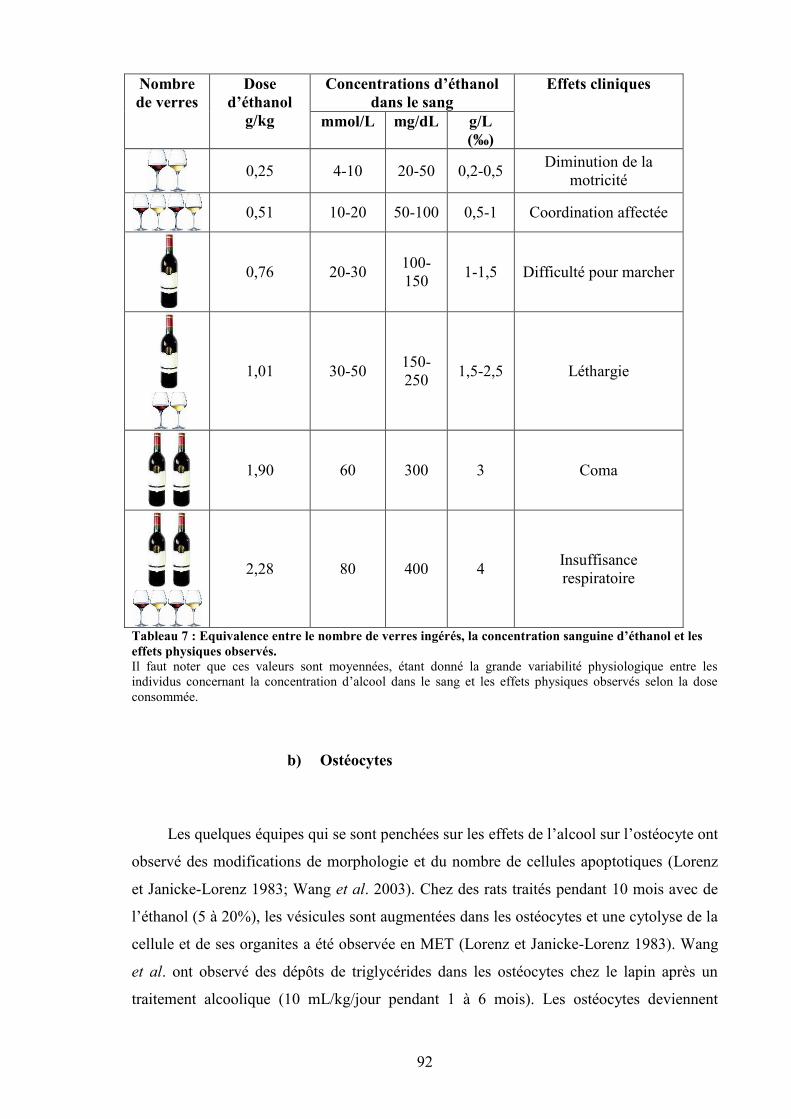
92
Concentrations d’éthanoldans le sang
Nombrede verres
Dosed’éthanol
g/kg mmol/L mg/dL g/L(‰)
Effets cliniques
0,25 4-10 20-50 0,2-0,5 Diminution de lamotricité
0,51 10-20 50-100 0,5-1 Coordination affectée
0,76 20-30 100-150 1-1,5 Difficulté pour marcher
1,01 30-50 150-250 1,5-2,5 Léthargie
1,90 60 300 3 Coma
2,28 80 400 4 Insuffisancerespiratoire
Tableau 7 : Equivalence entre le nombre de verres ingérés, la concentration sanguine d’éthanol et leseffets physiques observés.Il faut noter que ces valeurs sont moyennées, étant donné la grande variabilité physiologique entre lesindividus concernant la concentration d’alcool dans le sang et les effets physiques observés selon la doseconsommée.
b) Ostéocytes
Les quelques équipes qui se sont penchées sur les effets de l’alcool sur l’ostéocyte ont
observé des modifications de morphologie et du nombre de cellules apoptotiques (Lorenz
et Janicke-Lorenz 1983; Wang et al. 2003). Chez des rats traités pendant 10 mois avec de
l’éthanol (5 à 20%), les vésicules sont augmentées dans les ostéocytes et une cytolyse de la
cellule et de ses organites a été observée en MET (Lorenz et Janicke-Lorenz 1983). Wang
et al. ont observé des dépôts de triglycérides dans les ostéocytes chez le lapin après un
traitement alcoolique (10 mL/kg/jour pendant 1 à 6 mois). Les ostéocytes deviennent
93
pyknotiques et le nombre de lacunes vides augmente sous l’effet de l’alcool (Wang et al.
2003).
c) Stress oxydatif
Les produits issus du métabolisme de l’oxygène (espèces réactives oxygénées, ROS
en anglais) sont considérés comme étant responsables du vieillissement et de certaines
pathologies (Banfi et al. 2008; Syed and Ng 2010). Les ROS (peroxide d’hydrogène, anion
superoxide et radical hydroxyle) ont un effet délétère sur les lipides membranaires,
certaines protéines (récepteurs et enzymes) et les acides nucléiques (Silvain et Chagneau-
Derrode 2006). Les taux sériques d’enzymes antioxydantes et d’oxyde nitrique (NO) ont
été mesurés chez des patientes ostéoporotiques: la glutathion reductase est diminuée, tandis
que l’oxyde nitrique est plus abondant chez les femmes post-ménopausées ostéoporotiques
comparées aux non ostéoporotiques (Sendur et al. 2009). Une augmentation de l’oxyde
nitrique et une diminution des enzymes du système antioxydant (glutathion reductase et
glutathion peroxydase) ont également été observées chez des patients alcooliques (Maneesh
et al. 2006).
Chen et al. ont rapporté que l’éthanol induit l’expression et l’activité de Nox (enzyme
NADPH oxidase), augmentant la production de radicaux libres dans les ostéoblastes et
l’expression de RANKL, facteur favorisant l’ostéoclastogenèse (Chen et al. 2008).
Il a été montré que le stress oxydatif induit par l’éthanol accélère l’activation des voies
responsables de la sénescence dans l’ostéoblaste (Chen et al. 2009) tandis que
l’administration d’un antioxydant (N-acétylcysteine) est capable de bloquer la perte
osseuse due à l’alcool chez des rates après la période de lactation (Chen et al. 2010). Dans
cette étude, la perte osseuse induite par le stress oxydatif semble être médiée par la voie
Wnt.
De plus, un lien entre la concentration d’oxyde nitrique et l’apoptose des ostéocytes a été
rapporté (Tan et al. 2008).
d) Voie de signalisation Wnt
La voie Wnt est un régulateur important de la différenciation cellulaire dans plusieurs
types de cellules, y compris les ostéoblastes (Quarto et al. 2010). Cette voie de
signalisation est active lorsque la molécule Wnt se fixe à un co-receptor complexe, Lrp5 ou
94
Lrp6 (Bonewald et Johnson 2008). La beta-caténine a la capacité d’être accumulée dans le
cytoplasme et de transloquer dans le noyau afin de modifier la transcription d’un gène. De
cette façon, cette molécule peut réguler un nombre de gènes important dans la
différenciation, la prolifération, l’apoptose et l’activité des cellules osseuses (Bonewald et
Johnson 2008). Des données récentes identifient la voie Wnt/beta-caténine comme un
régulateur de la biologie des ostéocytes, lié à la capacité de l’os à s’adapter aux charges
mécaniques (Bonewald et Johnson 2008).
Chen et al. ont observé une diminution de la DMO chez des rates après lactation et
soumises à un traitement alcoolisé (12g/kg/jour). Dans le même temps la majeure partie des
composants de la voie Wnt étaient sous exprimés, l’ostéoblastogenèse était supprimée et
l’adipogenèse accrue (Chen et al. 2010). Toutes ces actions de l’éthanol étaient bloquées
quand un antioxydant était administré, suggérant que les effets de l’éthanol sur l’os
pourraient être médiés par la suppression de la voie Wnt, via une stimulation du stress
oxydatif (Chen et al. 2010). Une telle hypothèse semble cohérente avec les résultats de
Callaci et al. (Callaci et al. 2009).
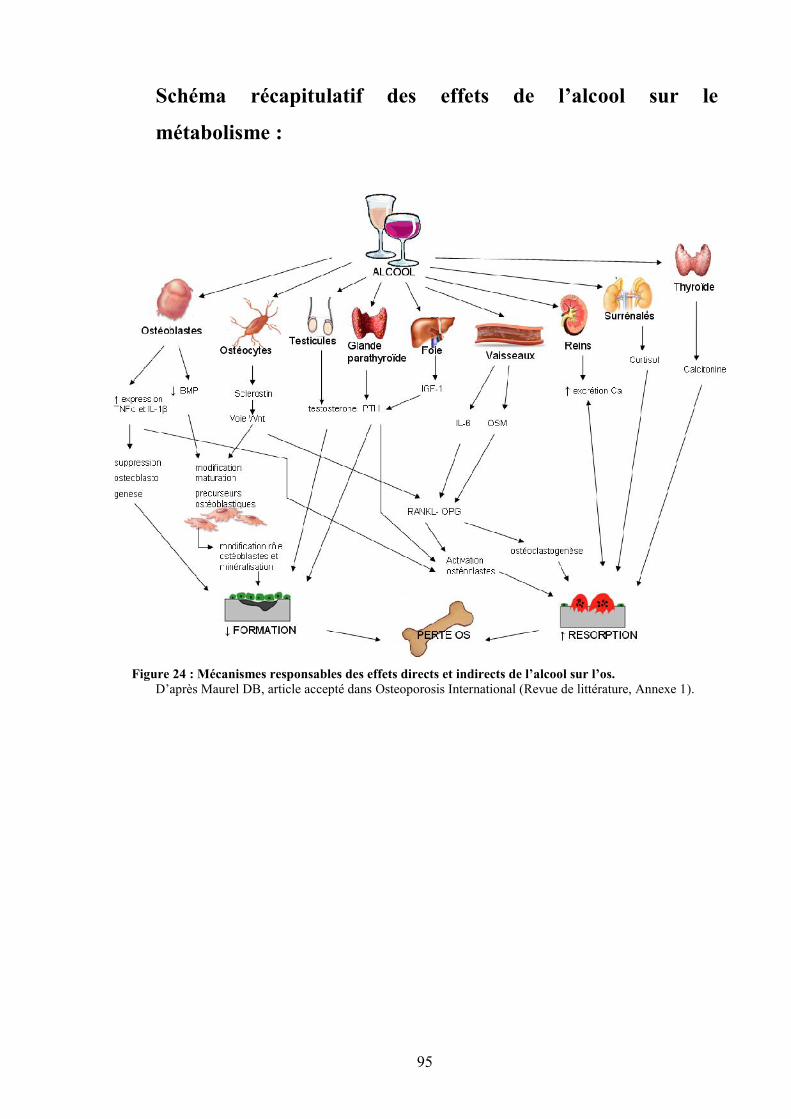
95
Schéma récapitulatif des effets de l’alcool sur le
métabolisme :
Figure 24 : Mécanismes responsables des effets directs et indirects de l’alcool sur l’os.D’après Maurel DB, article accepté dans Osteoporosis International (Revue de littérature, Annexe 1).
96
RESUME :
La consommation d’alcool peut avoir un effet bénéfique sur la densité minérale
osseuse, si elle est modérée (1-2 verres par jour). Au-delà de 2 verres par jour, les
effets de l’alcool sur l’os dépendent du sexe, du statut hormonal et du type
d’alcool. En revanche, dans le cas d’une consommation chronique abusive (10-20
verres par jour), l’alcool engendre une diminution de la densité minérale osseuse
et une augmentation du risque de fractures chez l’homme, signes d’une
ostéoporose secondaire. Cette diminution de densité est due à une diminution de
l’épaisseur des travées osseuses, ainsi qu’à une diminution de l’épaisseur corticale.
Le remodelage osseux est modifié par l’alcool et la balance entre résorption et
formation est modifiée en faveur de la résorption osseuse. Il semble que l’alcool ait
des effets directs sur les cellules osseuses, mais également des effets indirects sur
l’os via la composition corporelle et la leptine.
97
V. EXERCICE PHYSIQUE ET OS
A. Effets de l’exercice physique sur le métabolisme osseux
1. CMO et DMO
Les études concernant les effets de l’activité physique sur le système osseux
abondent. Nombreux sont les chercheurs qui ont comparé la DMO des sportifs et des non
sportifs afin d’essayer de comprendre comment la masse osseuse peut être influencée et
maximisée. Les enfants sportifs atteignent un pic de masse osseuse supérieur aux enfants
non sportifs (Valimaki et al. 1994). Les enfants les plus actifs ont également un CMO
supérieur comparés aux moins actifs (Bailey et al. 1999). Il a été montré à de nombreuses
reprises que les sportifs ont une DMO supérieure aux non sportifs du même âge (Alfredson
et al. 1997; Andreoli et al. 2001; Calbet et al. 1999). De plus, Delvaux et al. (Delvaux et al.
2001), Kontulainen et al. (Kontulainen et al. 2001) et Nordström et al. (Nordstrom et al.
2006) ont montré un effet positif de l’activité physique à long terme sur la masse osseuse
ainsi que sur la DMO, même après diminution de la quantité des entraînements. Dans
l’étude de Nordström et al. (Nordstrom et al. 2006), une diminution de la DMO a été
observée dans les 3 années qui ont suivies l’arrêt de l’entraînement intensif, chez d’anciens
hockeyeurs et joueurs de badminton. Toutefois, le bénéfice de cette activité physique
passée permettait aux sujets entraînés de conserver un capital osseux supérieur à des
individus contrôles non actifs au niveau du fémur et de l’humérus et ce, même 5 ans après
l’arrêt de la pratique intensive de leur activité.
Certaines activités professionnelles requièrent une dépense énergétique supérieure
comparées à d’autres, et génèrent également une charge mécanique sur l’os. D’après la
classification créée par Ainsworth et al. (Ainsworth et al. 1993; Ainsworth et al. 2000), la
dépense énergétique (évaluée en niveau d’intensité métabolique équivalente ou MET) liée à
des professions comme chauffeur-livreur ou agent en bâtiment équivaut à celle d’une
personne faisant un jogging (6-7 MET) ; tandis qu’un pompier a une dépense énergétique
comparable à des activités comme la boxe ou le roller (11-12 MET). Il a été rapporté que
même l’activité physique lié à la profession peut avoir un effet bénéfique sur la densité de
la colonne (Sinaki et al. 1998) tandis que des professions où l’on est assis toute la journée
peuvent entraîner une plus faible DMO (Weiss et al. 1998). En revanche, ces effets ont été
mis en évidence chez des individus se nourrissant normalement. Une étude a observé que la
98
malnutrition modifie les effets ostéogéniques de différents métiers sur l’os chez des
femmes indiennes pré-ménopausées (Shatrugna et al. 2008).
Dans une étude menée chez des rats mâles Sprague-Dawley, la longueur, le poids et
le volume du tibia et du fémur étaient significativement supérieurs dans le groupe exercice
(roue d’exercice) comparés au groupe contrôle (Newhall et al. 1991). Les DMO des rats du
groupe exercice étaient également significativement supérieures à celles des rats du groupe
contrôle. Yeh et al. (Yeh et al. 1993) ont observé une augmentation significative du
contenu minéral osseux dans le tibia et la fibula, ainsi qu’une augmentation de la densité
minérale osseuse au niveau des vertèbres pour le groupe exercice (tapis roulant) chez des
rates âgées de 14 mois après 9 semaines d’entraînement (5 fois/sem, 1 h/jour). Après 16
semaines d’entraînement, les courbes représentant les gains de CMO et de DMO au niveau
du tibia et de la fibula pour le groupe exercice étaient respectivement neuf et cinq fois
supérieures aux valeurs du groupe contrôle. Notomi et al. (Notomi et al. 2001) se sont
focalisés sur les effets de l’exercice physique volontaire (grimper à une tour de 2 m de
haut) chez des rats Sprague-Dawley âgés de 10 semaines. En l’espace de 4 semaines, la
formation d’os trabéculaire, le volume osseux, l’épaisseur d’os trabéculaire des vertèbres
lombaires et du tibia, et la DMO du tibia ont augmentés chez les groupes exercice. Après 8
semaines, l’augmentation du CMO et de la DMO dans le tibia et le fémur était significative
dans les groupes exercice par rapport aux trois autres groupes (sédentaires et baseline). En
revanche, ce n’était pas significatif au niveau des vertèbres lombaires.
2. Microarchitecture
Une étude a récemment analysé la microarchitecture du tibia grâce à des images faites
par IRM (imagerie à résonance magnétique) puis reconstruites avec un logiciel permettant
d’obtenir des données volumétriques. Dans cette étude, des gymnastes d’environ 20 ans
avaient une quantité d’os trabéculaire (BV/TV) et un nombre de travées (Tb.N) supérieurs
à des jeunes femmes sédentaires du même âge (Modlesky et al. 2008). L’espace entre les
travées (Tb.Sp) était inférieur chez les gymnastes comparées aux contrôles.
Chez le rat en croissance (4 semaines), un entraînement sur tapis roulant de 10
semaines a entraîné une augmentation de la quantité d’os trabéculaire (BV/TV), de
l’épaisseur trabéculaire (Tb.Th) et du nombre de travées osseuses (Tb.N) au niveau de la
métaphyse du fémur, comparé à des rats sédentaires du même âge (Joo et al. 2003). La
99
surface et la largeur d’os cortical étaient également améliorées. Des résultats similaires ont
été rapportés chez des rates également en croissance (32 jours) suite à 8 semaines
d’entraînement sous forme d’impacts. Les rats étaient lâchés de 45 cm de haut, 10 fois par
jours (Welch et al. 2008). La fraction d’os trabéculaire BV/TV était augmentée due à une
amélioration de l’épaisseur des travées osseuses (Tb.Th). L’épaisseur corticale était
également supérieure comparée au groupe contrôle, due à une diminution de la
circonférence endostéale. L’entraînement en résistance (sauts verticaux avec des vestes
lestées) permet également d’engendrer une augmentation des paramètres de
microarchitecture trabéculaire (BV/TV, Tb.Th) chez des rats adultes (6 mois) (Swift et al.
2010).
3. Effets sur le remodelage osseux
Les effets de l’exercice sur le remodelage osseux varient selon la durée, l’intensité, et
le type d’exercice, mais également selon la population (athlètes, sédentaires, personnes
âgées) (Maimoun et Sultan 2011). L’horaire du prélèvement de sang et le choix des
marqueurs biochimiques sont également à prendre en compte (Maimoun et Sultan 2011).
Des valeurs élevées d’ostéocalcine ont été observées chez des jeunes sportifs pratiquant
une activité générant des contraintes mécaniques importantes (haltérophilie, volley-ball)
(Karlsson et al. 1995; Maimoun and Sultan 2011). D’autres études ont rapporté que tout le
processus de remodelage osseux est accéléré chez les jeunes sportifs (Hetland et al. 1993).
Cela a été observé chez des athlètes (Hetland et al. 1993), des joueurs de football (Karlsson
et al. 2003), des décathloniens (Maimoun et al. 2008) et des judoka (Prouteau et al. 2006).
Cependant, deux études ont rapporté de faibles concentrations de marqueurs du remodelage
chez des athlètes femmes versus femmes sédentaires (Brahm et al. 1997; Ryan and Elahi
1998). Cela pourrait être dû au sexe et au statut hormonal (présence ou non de
menstruations) (Zanker et Swaine 1998). Chez des jeunes sédentaires, 5 à 8 semaines
d’entraînement en endurance améliore le remodelage osseux en faveur de la formation,
tandis qu’un entraînement en anaérobie ou en résistance entraîne une accélération du
remodelage osseux (Maimoun et Sultan 2011). Les effets sont plus disparates chez des
individus âgés (Maimoun et Sultan 2011). Il semble qu’un entraînement aigu n’ait pas
d’effet à court terme sur les marqueurs du remodelage osseux chez des sportifs et chez des
sujets sédentaires, âgés ou non (Maimoun et Sultan 2011).
Chez l’animal, il semble que des entraînements en résistance et en endurance
augmentent la formation osseuse et les surfaces de minéralisation (Iwamoto et al. 2004;
100
Swift et al. 2010). Cependant, comme chez l’homme, les données varient (Hagihara et al.
2005). Les effets dépendent du type d’exercice, du site osseux (Notomi et al. 2002; Notomi
et al. 2001), des animaux, de la durée et de l’intensité des sessions (Yingling et al. 2001).
4. Effets du type de pratique
Toutes les activités physiques n’ont pas le même impact sur le capital osseux. Chez
l’homme, Andreoli et al. (Andreoli et al. 2001) ont comparé la DMO de judoka, de
karatéka et de poloïstes (water-polo) : les judoka et les karatéka avaient une DMO
supérieure aux poloïstes. Cela est dû aux impacts et à la charge supportée par le squelette
lors de l’activité.
En effet, comme le précise Wolff (Wolff 1892), les os ont la capacité de s’adapter à la
charge à laquelle ils sont soumis. Si la charge augmente, l’os va devenir plus solide pour
résister à la nouvelle charge à laquelle il est dorénavant soumis. En revanche, si la charge
diminue, l’os va devenir plus fragile. Ginty et al. (Ginty et al. 2005) ont étudié les contenus
minéraux osseux de sportifs âgés de 16 à 18 ans en fonction du nombre d’impacts au sol
présents dans leurs activités respectives : le contenu minéral osseux est plus important chez
les sportifs pratiquant une activité à impacts (tennis, jogging, rugby, etc…). Ceci est
confirmé par l’étude de Nurmi-Lawton et al. (Nurmi-Lawton et al. 2004) chez de jeunes
gymnastes âgées de 8 à 17 ans : celles-ci avaient en moyenne, selon les différentes régions
du corps, un contenu minéral osseux supérieur de 24 à 51% et une DMO supérieure de 13 à
28% par rapport à des filles non sportives du même âge. Ces résultats sont la preuve que le
nombre d’impacts associés à l’activité physique a une importance considérable sur
l’adaptation osseuse qui découle de la pratique.
La pratique régulière d’une activité physique où l’on porte son propre poids génère
une amélioration du CMO et de la DMO. L’amélioration de ces paramètres osseux confère
aux os une plus grande résistance mécanique, notamment pour le fémur (Uusi-Rasi et al.
1998). De plus, le nombre et l’intensité des impacts dans un sport permettent de prédire les
changements au niveau de la géométrie osseuse puisque celle-ci s’adapte à l’exercice
(Vainionpaa et al. 2007; Wolff 1892).
Chez le rat, l’escalade verticale d’une tour permet d’améliorer le CMO et la DMO au
niveau du tibia et du fémur, mais pas au niveau des vertèbres lombaires (Notomi et al.
2001). L’exercice sur tapis roulant horizontal permet d’augmenter significativement le
101
CMO et la DMO du tibia, et la DMO au niveau vertébral (Yeh et al. 1993). Dans un dernier
temps, l’exercice sur une roue permet d’améliorer le CMO et la DMO au niveau tibial et
fémoral (Newhall et al. 1991). Des études comparatives ont été réalisées avec plusieurs
activités différentes. Notomi et al. (Notomi et al. 2000), ont étudié les os de rats âgés de 4
semaines, sédentaires ou pratiquant différentes activités : courses et sauts. Après 4
semaines, les rats du groupe saut montraient une augmentation de la masse et de la
résistance des vertèbres lombaires et du fémur, ainsi qu’une augmentation de la taille de la
section de ces os. En revanche, il n’y avait pas de changements pour les rats sédentaires et
pour ceux du groupe course. Huang et al. (Huang et al. 2003) ont comparé les os de rats
Wistar, âgés de 7 semaines. Les rats ont été partagés en 3 groupes : sédentaires, course et
natation. Les rats ont été entraînés 5 fois par semaine pendant 8 semaines. Après ces 8
semaines, les DMO des tibias des rats du groupe course étaient supérieures à celles des rats
du groupe natation. De plus, les propriétés mécaniques (énergie maximale jusqu’à rupture)
des tibias et des fémurs des groupes course et natation étaient meilleures que celles du
groupe sédentaire. En revanche, dans l’étude de Bourrin et al. (Bourrin et al. 1992), un
entraînement en « natation » durant une période de 5 semaines a induit une perte osseuse au
niveau des vertèbres lombaires et du fémur chez des rates âgées de 5 semaines. La charge
mécanique est donc un facteur important dans l’effet ostéogénique que peut induire un
exercice physique (Bourrin et al. 1992).
5. Effets de l’âge, du statut menstruel et du sexe
Dans une étude de Jacobson et al. (Jacobson et al. 1984), des femmes sportives, âgées
de 40 à 55 ans avaient un CMO supérieur à leurs collègues non sportives du même âge au
niveau des vertèbres lombaires. De la même manière, Van Langendonck et al. (Van
Langendonck et al. 2003) ont montré des effets osseux bénéfiques suite à la pratique de
sports à impacts chez des hommes âgés de 40 ans. Enfin, Vainionpää et al. (Vainionpaa et
al. 2007) ont observé un gain au niveau de la circonférence des os, de la résistance des os et
de l’épaisseur de l’os cortical chez des femmes âgées de 35 à 40 ans pratiquant une activité
physique depuis 12 mois.
Cependant, le statut menstruel et hormonal de la femme peut être modifié par
l’exercice chronique quand la dépense énergétique excède de beaucoup les apports
nutritionnels (Marcus et al. 1985; Williams et al. 2001). Il a été montré que le statut
menstruel a une influence majeure sur la réponse ostéogénique induite par l’exercice
(Guadalupe-Grau et al. 2009).
102
Dans les études de Newhall et al. (Newhall et al. 1991); Yeh et al. (Yeh et al. 1993)
et Notomi et al. (Notomi et al. 2001) chez le rat et la rate, les animaux étaient âgés
respectivement de 6 semaines, 14 mois et 10 semaines. Dans ces trois études, il a été
observé une amélioration du contenu minéral osseux et de la densité minérale osseuse au
niveau de certains sites osseux. Il semble que l’exercice physique ait un effet ostéogénique
sur le CMO et de la DMO quel que soit l’âge ou le sexe de l’animal.
6. Effets de l’exercice sur la résistance osseuse
Par consensus et surtout chez l’homme, les mesures de DMO sont utilisés afin
d’estimer la résistance osseuse et servent d’indicateur principal quant à la détermination du
risque de fracture (Melton et al. 1993). Les scientifiques travaillant sur « exercice et
fractures ostéoporotiques » recommandent aux patients de pratiquer une activité physique
avec beaucoup d’impacts au moins deux fois par semaines (Kemmler et Stengel 2011).
Cependant il n’y a pas de protocole bien défini. Une étude de Marques EA et al. (Marques
et al. 2011) consistant à entraîner des femmes âgées de 60 à 95 ans deux fois par semaine
en résistance, a montré une amélioration de la condition physique, de la force musculaire,
de la posture et de la DMO au col fémoral. Une seconde étude a permis de montrer qu’un
entraînement en résistance trois fois par semaine permettait d’augmenter la DMO au col
fémoral, mais pas au radius, preuve que l’exercice a un effet sur les os porteurs (Hamilton
et al. 2010; Heinonen et al. 1996).
Chez le rat, les techniques de flexion 3 points permettent de tester la résistance de l’os
jusqu’à rupture. Dans l’étude de Swift JM et al. (Swift et al. 2010), des entraînements avec
des charges moyennes ou élevées chez des rats mâles adultes ont permis tous les deux
d’augmenter la résistance du col fémoral de 30 et 37% comparés à des rats sédentaires. Un
entraînement sur tapis roulant durant 10 semaines a également permis d’améliorer la charge
maximale supportée par le fémur et la raideur chez de jeunes rats en croissance comparés à
des rats contrôles (Joo et al. 2003).
103
7. Limites de l’exercice physique sur l’anabolisme osseux
Si l’exercice a des effets positifs sur la maximisation du tissu osseux, il y a cependant
des limites. A titre d’exemple, la pratique intense d’activités physiques augmente le risque
de se faire des entorses et des fractures (Maffulli et al. 2011a; Newman et Newberg 2010).
Dans les sports à impacts, le risque de mauvais alignement des os après fracture existe au
niveau des articulations et les anciens athlètes peuvent développer de l’arthrose après une
blessure (Baker 1998; Maffulli et al. 2011a). Chez l’athlète jeune, les blessures dues au
sport peuvent créer des retards de croissance sur un membre, notamment lorsque le
cartilage de conjugaison est touché (Maffulli et al. 2011b).
Un phénomène appelé triade de l’athlète est aussi présent chez certaines sportives. Ce
phénomène comprend les troubles de l’alimentation, associés à des dysfonctions
hormonales et à une faible DMO (Pollock et al. 2010). Cette triade de l’athlète est observée
chez les sportives pratiquant une activité où la faible masse grasse est importante, comme
dans l’athlétisme et la danse (Doyle-Lucas et al. 2010; Nichols et al. 2006; Rauh et al.
2010; Russell et Misra 2010; Warren et Chua 2008). La balance énergétique négative
quotidienne entraîne une modification hormonale, qui à terme mène à une perte de masse
osseuse (Russell et Misra 2010) et peut conduire à une ostéopénie (Warren et Perlroth
2001).
Des pathologies spécifiques peuvent apparaître avec la pratique de certains sports à
long terme, comme la dégénération des disques inter-vertébraux chez les athlètes, la
spondylose (arthrose de la colonne vertébrale) chez les gymnastes, les lutteurs et les
plongeurs (Bono 2004).
Cependant, compte tenu des faibles pourcentages de blessures graves comparés aux
effets bénéfiques de la pratique d’une activité physique, celle-ci est encouragée chez
l’ensemble de la population, des enfants jusqu’aux personnes âgées (Maffulli et al. 2011b;
Olszynski et al. 2004; Rizzoli et al. 2009; Sinaki et al. 2010).
104
B. Mécanismes d’action de l’exercice physique sur l’os
1. La théorie du mécanostat de Frost
Si Wolff a lié la résistance osseuse aux fonctions mécaniques auxquels les os sont
soumis (Wolff 1892), Frost a été le premier à émettre une théorie détaillée sur la façon dont
les os porteurs s’adaptent pour maintenir leur propriétés mécaniques en réponse aux
modifications de l’environnement mécanique (Frost 1987). Frost a suggéré l’existence d’un
mécanisme de régulation dans l’os, capable de sentir les changements de charges
mécaniques placées sur l’os et de modifier la masse osseuse en conséquence afin de mieux
l’adapter aux nouvelles contraintes mécaniques. Frost a émis le postulat que plusieurs
seuils mécaniques contrôlent si de l’os doit être ajouté ou retiré du squelette. Frost a
suggéré qu’en dessous d’un certain seuil, l’os est résorbé afin de se débarrasser de l’excès
de masse. En revanche, au-dessus d’un certain seuil quand l’os est exposé à des charges
mécaniques plus importantes que les charges habituelles, il y a apposition d’os sur les
structures existantes afin d’augmenter la résistance osseuse (Frost 1987; Hughes et Petit
2010). Comme dans tout système de contrôle de l’homéostasie, la théorie du mécanostat
repose sur différents composants, incluant un stimulus, un mécanisme de détection capable
de détecter le stimulus et un mécanisme effecteur capable de ramener le système à
l’homéostasie.
Selon Frost, le stimulus de l’adaptation fonctionnelle de l’os était l’amplitude de la
contrainte. Depuis, de nombreuses études ont montré que d’autres mécanismes jouent un
rôle dans l’adaptation fonctionnelle de l’os, comme la fréquence des contraintes
mécaniques (Marcus 2002), le temps de repos entre chaque cycle de charge et la
distribution des contraintes à travers la structure osseuse (Skerry 2006).
Les effecteurs de cette théorie du mécanostat seraient les ostéoblastes et les ostéoclastes,
selon deux processus décrits par Frost : le modelage et le remodelage. Le modelage est
l’action indépendante des ostéoblastes et des ostéoclastes sur les surfaces osseuses où de
l’os nouveau est formé sur certaines surfaces et de l’os ancien est enlevé d’autres surfaces.
Le modelage affecte la taille et la forme des os. Le remodelage est un processus localisé,
qui est caractérisé par l’action couplée des ostéoclastes et des ostéoblastes, dans lequel les
ostéoclastes résorbent de l’os et où par la suite, les ostéoblastes forment de l’os puis le
minéralisent (Hattner et al. 1965; Hughes et Petit 2010). Le modelage et le remodelage sont
tous les deux responsables de la modification des propriétés mécanique des os, de leur
105
structure et de leur résistance aux charges. Pourtant, il reste des confusions par rapport aux
différents rôles de ces effecteurs dans des conditions comme la surcharge ou la moindre
charge (Hughes et Petit 2010).
Le mécanisme « sensitif » du mécanostat serait l’ostéocyte (Tatsumi et al. 2007). En effet,
plusieurs études ont observé une modification des ostéocytes suite à une augmentation de
charge (Keila et al. 2001; Robling et al. 2008; Turner et Robling 2004), menant à une
augmentation du recrutement des ostéoblastes, et à une augmentation de la formation
osseuse (via une diminution de la sclérostine et une augmentation de la voie Wnt/β-
catenine). La décharge a aussi un effet sur l’ostéocyte puisqu’il a été observé qu’elle
provoque une augmentation de l’apoptose des ostéocytes, facteur influençant
l’ostéoclastogenèse (Aguirre et al. 2006).
2. Relation muscle - os
De nombreuses études ont démontré la relation positive entre la masse musculaire et
la DMO. Cette corrélation a été montrée chez l’homme (Douchi et al. 2003) et chez la
femme pré-ménopausée (Bailey et Brooke-Wavell 2010). De la même façon, une
corrélation a été observée entre la perte de masse musculaire et la perte de masse osseuse
chez la femme post-ménopausée ostéoporotique (Genaro et al. 2010). En effet, la
contraction des muscles durant une activité entraîne une charge mécanique sur l’os, charge
qui est nécessaire au développement et au maintien de la masse osseuse (Gross et al. 2010).
De telles observations ont été confirmées par des études dans des modèles animaux
(Gross et al. 2010; Windahl et al. 2011).
3. Effet de l’exercice sur les hormones gonadotropes,somatotropes, corticotropes et sur les adipokines
Le tissu osseux s’adapte aux contraintes mécaniques, comme par exemple lors de la
pratique d’une activité physique régulière. Il est régulé par l’action de nombreuses
hormones, comme nous l’avons détaillé précédemment. Reprenons les effets connus de
l’exercice physique sur le métabolisme des hormones liées à l’os.
106
a) Axe somatotrope
La GH
L’exercice musculaire représente le stimulus physiologique le plus puissant de la
sécrétion de GH (Gibney et al. 2007). Cependant, de nombreux facteurs modulent la
réponse sécrétoire de la GH pendant l’exercice, comme l’intensité de l’exercice, l’effet de
l’entraînement, le sexe, l’âge, la composition corporelle et la nutrition (Duclos 2001;
Gibney et al. 2007). L’entraînement intense en endurance amplifie la pulsatilité de la GH.
La stimulation de la sécrétion de la GH liée à l’exercice se prolonge pendant la phase de
récupération. Une heure après l’arrêt d’un sprint, la concentration plasmatique de GH est
10 fois supérieure à celle mesurée au repos (Nevill et al. 1996). Il semble que les
concentrations basales de GH soient élevées chez les athlètes comparées à des individus
sédentaires (Sartorio et al. 2004a; Sartorio et al. 2004b). Felsing et al. (Felsing et al. 1992)
ont montré que les variations de sécrétion de GH étaient liées à des variations sécrétoires
hypophysaires.
L’IGF-I
L’exercice musculaire ne provoque pas de modifications significatives des
concentrations plasmatiques d’IGF-I libre lors d’exercices en résistance (Gibney et al.
2007; Kraemer et al. 1990; Milliken et al. 2003). En revanche, lors d’exercices en
endurance, la concentration plasmatique d’IGF-I totale augmente d’environ 10% à l’arrêt
d’un exercice de 10 min à forte intensité (80% de la VO2max), avec un retour aux valeurs
basales après 10 min de repos. Les valeurs d’IGF-I n’étaient pas modifiées par
l’entraînement chez des sprinters, triathlètes, coureurs de cross, cyclistes, skieurs,
hockeyeurs et nageurs dans l’étude de Sartorio et al. (Sartorio et al. 2004b).
107
b) Axe gonadotrope chez l’homme
La testostérone
Un exercice d’une durée de 20 min à 2 h augmente la concentration plasmatique de
testostérone. Cela a été montré chez des jeunes gymnastes (Jahreis et al. 1991) et chez des
hommes adultes pratiquant la marche, le jogging, le cyclisme ou la natation (Remes et al.
2004). Cette augmentation est due à une réduction de la clairance métabolique hépatique de
la testostérone (Duclos 2001). Quand l’exercice se prolonge (3-4h), l’augmentation
transitoire de la testostérone est suivie d’une diminution de la concentration plasmatique de
testostérone. Cette diminution est due à une diminution de la sécrétion hypothalamique de
GnRH (voie centrale) ainsi qu’à une diminution du nombre de récepteurs à la LH sur les
testicules (voie périphérique). L’entraînement régulier en résistance conduit à une
augmentation des concentrations plasmatiques de testostérone suite à une stimulation
hypothalamo-hypophysaire (Hakkinen et Pakarinen 1993). Plusieurs études ont rapportées
que l’entraînement régulier en endurance entraîne une diminution des concentrations
plasmatiques de testostérone (Duclos 2001).
c) Axe gonadotrope chez la femme
Chez la femme, un entraînement intense régulier peut conduire à des anomalies de la
fonction ovarienne allant jusqu’à l’aménorrhée dans les cas extrêmes. La fréquence de
l’aménorrhée varie entre 34% et 79% chez les danseuses de ballet, 26% chez les
marathoniennes et 12% chez les nageuses et les cyclistes (Warren 1999). Ces effets
délétères sont dus à l’hypothalamus qui modifie la pulsatilité de la GnRH, conduisant à une
diminution ou à une abolition de la pulsatilité de la LH (De Souza et al. 1998). Cela
pourrait être également dû à une plus faible sécrétion de FSH. Ces modifications de la
fonction ovarienne sont en rapport avec le métabolisme énergétique, et notamment aux
adaptations neuroendocrines d’une prise alimentaire insuffisante (Loucks et al. 1998).
L’aménorrhée de la sportive est due à une adaptation physiologique pour pallier à la
déficience d’apport nutritionnel suffisant au regard de la dépense énergétique quotidienne
(Laughlin et Yen 1996). En effet, certaines sportives comme les danseuses de ballet ont une
masse grasse inférieure à des filles sédentaires de leur âge (Donoso et al. 2010). La triade
108
de l’athlète est un phénomène bien connu chez la sportive de haut niveau. Ce phénomène
se caractérise par un trouble du cycle ovarien, une balance énergétique négative et une
faible DMO (Pollock et al. 2010). L’augmentation du cortisol et de la GH observée chez
ces sportives pourrait être une cascade d’adaptations de la glycorégulation dans le but de
conserver les protéines de l’organisme. La diminution de la GnRH observée chez ces
femmes serait régulée par la concentration en leptine, hormone sous le contrôle de la
balance énergétique et de la quantité de tissu adipeux (Caro et al. 1996). En effet, les
concentrations plasmatiques de leptine sont trois fois plus faibles chez ces athlètes que chez
des femmes sédentaires (Donoso et al. 2010).
d) Axe corticotrope : le cortisol
L’activation de l’axe corticotrope pendant l’exercice associe la production d’ACTH
par les cellules corticotropes hypophysaires à l’augmentation du cortisol plasmatique
(Duclos 2001). L’importance de la production de cortisol pendant l’exercice musculaire
dépend de l’intensité et de la durée de l’exercice (Scott et al. 2011). En effet,
l’augmentation de la concentration plasmatique d’ACTH est liée de façon linéaire au
pourcentage de VO2max atteint à l’exercice (Luger et al. 1987). Lors d’un exercice modéré
(60% VO2max), l’activation corticotrope s’observe après 1 heure d’exercice alors qu’elle
s’effectue après 10 minutes d’exercice intense (90% VO2max). Chez les sujets très
entraînés en endurance, il existe une modification du rétrocontrôle négatif exercé par les
glucocorticoïdes, probablement dans le but de répondre à une stimulation ultérieure
(Crewther et al. 2011). Il a par exemple été observé une abolition du cycle circadien du
cortisol chez des gymnastes de haut-niveau (Georgopoulos et al. 2011).
e) Hormones calciotropes
L’homéostasie du calcium et les taux d’hormones calciotropes sont modifiés par
l’exercice physique. En revanche, les variations de ces hormones dépendent de différents
paramètres tels que la durée de l’exercice, son intensité, ainsi que l’âge, le sexe et l’état
entraîné ou non des sujets.
109
La vitamine D
En général, les concentrations de 1,25 vitamine D sont augmentées chez des sportifs
pratiquant une activité nécessitant un anabolisme musculaire (athlètes, décathloniens,
femmes post-ménopausées suivant un entraînement en endurance) (Maimoun et Sultan
2009). Les concentrations de 1,25 vitamine D restent normales chez des cyclistes,
triathlètes et nageurs (Maimoun et Sultan 2009). Un mois d’exercice physique en résistance
augmente la 1,25 vitamine D de façon non significative chez des sujets sédentaires jeunes
(Tajima et al. 2000).
La PTH
Chez des personnes âgées, un entraînement de 6 semaines sur ergomètre à raison
d’une heure par jour et de 4 jours par semaine n’a pas modifié les concentrations de
calcium, de 1,25 vitamine D ni de PTH (Zerath et al. 1997). De même, la marche à vive
allure (50% VO2max) n’a pas modifié les concentrations de PTH chez des femmes post-
ménopausées (Thorsen et al. 1996). Les effets de l’exercice à court terme sont très
controversés et dépendent beaucoup du type d’exercice, et du niveau d’entraînement des
sujets (Brahm et al. 1997). Il a aussi été rapporté une différence des effets de l’exercice sur
la concentration de PTH selon le statut osseux des athlètes (Grimston et al. 1993). Chez les
athlètes, de nombreuses études ont montré une augmentation de la PTH suite à un exercice
n’excédant pas 60 minutes (Maimoun et Sultan 2009; Salvesen et al. 1994; Scott et al.
2011).
La calcitonine
L’exercice physique ne semble pas avoir d’effet sur les concentrations basales en
calcitonine (Maimoun et Sultan 2009; Thorsen et al. 1996). Seuls de minimes changements
ont été rapportés dans certaines études (Grimston et al. 1993).
110
f) Adipokines
La leptine
Les concentrations de leptine ne sont pas affectées par des exercices courts (moins de
60 min) chez l’homme ni chez la femme. De même, des protocoles d’entraînement courts
(inférieurs à 12 semaines) n’affectent pas les concentrations de leptine, à l’exception des
patients atteints de diabète de type 2 (Kraemer et al. 2002). Cependant, les protocoles
d’entraînement longs (supérieurs à 12 semaines) qui peuvent entraîner une diminution de la
masse grasse diminuent les concentrations de leptine (Kraemer et al. 2002). C’est le cas des
danseuses de ballet, qui ont une masse grasse beaucoup plus faible que des femmes
sédentaires et ont des concentrations de leptine diminuées significativement par rapport à
des femmes sédentaires (Donoso et al. 2010). La leptine est également diminuée lors de
phases de perte de poids volontaires liées à la pratique sportive, comme par exemple chez
les judoka dans la phase pré-compétition (Prouteau et al. 2006). Les concentrations en
leptine peuvent être diminuées après un exercice demandant une haute dépense énergétique
(plus de 800 Kcal) (Bouassida et al. 2010).
L’adiponectine
L’adiponectine, adipocytokine impliquée dans la régulation du métabolisme des
lipides et du glucose, ne semble pas être modifiée suite à un entraînement long (supérieur à
60 min) ni d’intensité modéré, mais serait modifiée suite à un exercice intense (Jurimae et
al. 2005). Cependant, les données concernant l’adiponectine et la durée d’un protocole
d’entraînement sont contradictoires (Kraemer et Castracane 2007). Il semble que la plupart
des protocoles améliorant la condition physique et la masse grasse pourrait diminuer la
leptine et augmenter les concentrations d’adiponectine (Bouassida et al. 2010; Kraemer et
Castracane 2007). Une étude a montré une augmentation d’adiponectine pendant la puberté
chez des jeunes danseuses de ballet (Donoso et al. 2010). De même, des valeurs élevées
d’adiponectine ont été observées chez des sportives aménorrhées, en combinaison avec une
faible masse grasse et une DMO inférieure à des sportives non aménorrhées (O'Donnell et
De Souza 2011).
111
C. Consommation d’alcool chez les sportifs
1. Généralités
La consommation d’alcool peut être associée à la pratique sportive (Gutgesell et
Canterbury 1999), et certaines études américaines et néo-zélandaises rapportent une
consommation d’alcool plus fréquente chez les sportifs que chez les non sportifs, surtout
dans les sports d’équipe comme le football et le baseball (Martens et al. 2006; Maughan
2006). Cela a été observé chez les femmes (Leichliter et al. 1998), chez les étudiants
sportifs de niveau élite mais non professionnels (Moore et Werch 2005; O'Brien et al.
2005) et également chez les sportifs professionnels (Dietze et al. 2008). Les épisodes de
binge drinking et les problèmes secondaires dus à l’alcool sont également plus fréquents
chez ces populations (Rainey et al. 1996; Tao et al. 2007). Certaines études rapportent
également un lien entre l’intensité et le niveau de pratique et la proportion d’étudiants
s’initiant à la consommation d’alcool (Aaron et al. 1995; Martens et al. 2006). Une étude
de Maughan (Maughan 2006) a rapporté que la consommation aigue d’alcool a un effet
négatif sur la performance sportive. La prise d’alcool s’accompagne d’une diminution du
contrôle moteur et d’une diminution du temps de réaction (Maughan 2006). La
consommation d’alcool atteindrait jusqu’à 19% de l’apport calorique total les jours de
match dans le cas du football, sachant que les joueurs consomment l’alcool plutôt après le
match (Maughan 2006).
Une consommation d’alcool supérieure à des sédentaires a également été observée
dans les sports d’endurance, où l’énergétique est important (Bethell et al. 1991; Blair et al.
1981; Gutgesell et al. 1996; Gutgesell et Timmerman 1998).
Cela pourrait s’expliquer par le fait que malgré la reconnaissance sociale liée à la
réussite sportive, le plaisir de pratiquer une activité physique, et la position sociale offerte
quelquefois aux athlètes, ceux-ci doivent gérer à la fois leur scolarité, les entraînements
collectifs et individuels, les suivis médicaux et les matches, avec la pression et l’anxiété qui
leur est associée. De ce fait, les étudiants athlètes vivent souvent dans un environnement
isolé du reste des étudiants, et sont moins enclin à participer à des activités non sportives
proposées sur les campus universitaires. Cette population évolue donc différemment des
étudiants lambda sur des plans émotionnels et psychologiques, ce qui a été observé dans le
112
cas de l’abus d’alcool (Martens et al. 2006). Il a également été observé que les sportifs
considérés comme leader de leur équipe buvaient plus et s’engageaient plus dans des gros
épisodes d’alcoolisation que leurs coéquipiers non leaders (Martens et al. 2006). En effet, il
semblerait que l’influence des coéquipiers soit importante dans ce type de comportement.
L’aspect compétitif développé par les sportifs de haut niveau pourrait aussi transférer à cet
autre comportement social, où l’aspect compétitif dans la tenue à l’alcool est observé,
notamment lorsque la consommation est réalisée devant des coéquipiers ou amis. Aux
Etats-Unis, le lien entre marques d’alcool (sponsors) et sport existe (Henriksen et al. 2008;
Maher et al. 2006). Certaines marques d’alcool possèdent également des équipes, qui
jouissent en retour de privilèges de consommation.
2. Effets sur l’os
Les effets d’une consommation d’alcool combinée à la pratique d’une activité
physique régulière sur l’os ne sont pas connus chez l’Homme et ont été très peu étudiés
chez l’animal. Une étude a montré chez le rat adulte (6 mois) que la sédentarité accentuait
les effets délétères de l’alcool sur l’os, quand elle était associée à une consommation
chronique d’alcool de 35% de l’apport calorique total (Hefferan et al. 2003). Les effets
inhibiteurs sur la formation osseuse étaient additifs, suggérant que la réduction de l’activité
physique chez les alcooliques peut être un facteur de comorbidité dans le cas de
l’ostéoporose. Une seconde étude, également chez le rat adulte (6 mois), a été réalisée dans
le but d’étudier un potentiel effet synergique de la consommation d’alcool et de l’exercice
dans l’augmentation de l’occurrence des fractures de fatigue (Reed et al. 2002). Après 16
semaines d’entraînement sur tapis roulant, les paramètres de microarchitecture de l’os
trabéculaire et cortical étaient inférieurs dans le groupe alcoolisé comparé au groupe
contrôle. En revanche, aucun effet favorable ou défavorable de l’exercice n’a été observé
chez les rats alcoolisés et entraînés. Il a été conclu de cette étude que la consommation
d’alcool peut très certainement augmenter le risque de blessures (fractures) durant la
pratique sportive.
113
RESUME :
Les effets bénéfiques de l’exercice sur le tissu osseux ont été régulièrement
démontrés : les activités physiques porteuses, où le squelette est soumis à des charges
mécaniques importantes ou à des impacts, engendrent une augmentation de la DMO.
Ceci a été montré chez les hommes et les femmes, de l’enfant à l’adulte senior, et
également dans des modèles animaux. Les effets de l’exercice semblent se maintenir
sur du long terme. Le mécanisme lié à l’adaptation de l’os par rapport à l’exercice
physique n’est pas entièrement connu. Il semblerait que la composition corporelle
joue un rôle important, notamment à travers les concentrations en adipokines. La GH
ainsi que d’autres hormones pourraient également relayer les effets de l’exercice sur
l’anabolisme osseux. Toutefois, les effets de l’exercice sur l’ostéocyte n’ont pas encore
été réellement étudiés.
De nombreuses études rapportent que la pratique d’une activité physique et la
consommation d’alcool sont liées. La consommation d’alcool serait même plus
importante chez les sportifs que chez les sédentaires. Cependant, aucune étude n’a
analysé les effets combinés d’une consommation chronique d’alcool et de la pratique
régulière d’une activité physique sur le tissu osseux, dans le but d’observer un
potentiel effet protecteur de l’exercice.
114
Nos hypothèses et objectifs
115
I. Introduction
La consommation chronique et excessive d’alcool a un effet catabolique sur l’os. Elle
entraîne une diminution de la DMO et du CMO (Broulik et al. 2010; Nyquist et al. 2002),
via des modifications de l’os trabéculaire et cortical (Sampson et al. 1997; Sampson et al.
1998), principalement dues à une inhibition de la formation osseuse (Diamond et al. 1989;
Sampson 1998). La conséquence de ces modifications est un risque accru de fracture
(Hernandez-Avila et al. 1991; Hoidrup et al. 1999), et une pathologie appelée ostéoporose
secondaire (Kaufman et Goemaere 2008; Seeman 1997). La dose à partir de laquelle la
consommation d’alcool entraîne des effets délétères sur l’os n’est pas définie à ce jour
et les modifications architecturales, notamment de porosité liée à l’effet-dose d’alcool
ne sont pas connues. De plus, si les modifications du nombre et de l’activité des
ostéoblastes et des ostéoclastes ont été étudiées suite à un traitement alcoolique (Cheung et
al. 1995; Dyer et al. 1998; Turner et al. 2001), les effets de l’alcoolisme sur les ostéocytes
sont encore peu élucidés, et personne n’a observé ces effets dans un modèle d’ostéopénie
alcoolique avérée. Le tissu osseux est sensible à de nombreux paramètres dont l’activité
physique (Sampson 2002). L’exercice physique régulier à un effet ostéogénique sur l’os,
chez l’homme et chez l’animal. De nombreuses études ont montré qu’une activité physique
en charge générant des impacts sur l’os, permet d’améliorer la densité minérale osseuse et
la résistance osseuse (Turner et Robling 2005; Young et al. 2007). L’activité physique est
d’ailleurs recommandée aux femmes post-ménopausées pour prévenir la perte de masse
osseuse et le développement de l’ostéoporose (Rizzoli et al. 2009; Sinaki et al. 2010).
Dans nos sociétés modernes, les jeunes adolescents et adultes, non sportifs et
sportifs, s’adonnent à un nouveau type de consommation alcoolique : le binge drinking
(Arvers et Choquet 1999; Moore et Werch 2005). Ce type de comportement peut dériver
vers une pathologie alcoolique. La pratique d’une activité physique chez ces personnes qui
s’alcoolisent régulièrement pourrait permettre de limiter les effets de l’alcool sur le tissu
osseux. A ce jour, il n’y a qu’une seule étude (Reed et al. 2002) qui a combiné la
consommation d’alcool (excessive) et une activité physique régulière pour observer les
effets combinés de ces deux types de facteurs environnementaux sur le tissu osseux.
116
II. Développement des hypothèses et objectifs dans lesdifférentes études
A. Etude 1
Suite à la revue de la littérature, nous avons souhaité tester les effets combinés d’une
consommation chronique modérée d’alcool associée à un exercice physique régulier sur le
métabolisme osseux d’animaux jeunes adultes. L’objectif de cette étude est de mimer un
début d’alcoolisation chronique modérée chez de jeunes adultes pratiquant une activité
physique régulière. Des analyses de densité et de microarchitecture osseuse ainsi qu’une
analyse de la résistance seront réalisées afin d’affirmer ou d’infirmer notre hypothèse d’un
effet délétère de l’alcool à dose modérée sur l’os, effet qui pourrait être diminué par la
pratique d’une activité physique concomitante. L’intérêt de cette étude est de montrer que
chez des sujets jeunes et actifs physiquement, l’activité physique peut avoir un effet
protecteur sur l’os et contrecarrer les effets délétères d’une consommation d’alcool
régulière et modérée.
Ainsi, notre hypothèse est qu’une pratique physique régulière chez des sujets peut
permettre de limiter la perte de masse musculaire ainsi que la diminution de la densité
osseuse, chez des sujets s’alcoolisant régulièrement.
B. Etude 2
Suite à l’étude 1, où la consommation d’alcool est modérée, l’objectif de l’étude 2 est
de tester les effets de trois différentes doses chroniques et élevées d’alcool sur le
métabolisme osseux chez le rat. En effet, la sensibilité du tissu osseux à l’alcoolisation
chronique n’a pas été testée avec un modèle proche de ce que l’on observe chez l’homme, à
savoir une boisson alcoolisée séparée de la nourriture. Les effets de l’alcool sur l’os cortical
ont également été peu étudiés, notamment au niveau de la microarchitecture osseuse.
Troisièmement il n’y a pas d’étude permettant de définir le seuil à partir duquel l’alcool a
un effet néfaste sur l’os. Trois doses d’alcool seront administrées à des animaux distincts et
comparés à un groupe contrôle. Notre hypothèse est que le groupe recevant la dose d’alcool
la plus faible n’aura pas beaucoup de changements au niveau des paramètres osseux,
contrairement aux doses plus élevées. Nous pensons également observer un effet-dose avec
une plus grande perte osseuse chez le groupe le plus alcoolisé.
117
C. Etude 3
Même s’il est admis depuis peu de temps que l’ostéocyte n’est pas une cellule inerte
et passive, les fonctions de cette cellule ne sont pas toutes connues. Des études récentes ont
montré que l’ostéocyte régirait la formation et la résorption osseuse, y compris lorsque
celle-ci devient apoptotique. Cependant, les effets de l’alcool sur l’ostéocyte ont été très
peu étudiés. Lorenz et Lorenz ont observé l’état des ostéocytes au microscope électronique
en transmission chez des rates alcoolisées et ont rapporté une modification de la
morphologie des ostéocytes (Lorenz et Janicke-Lorenz 1983). Une seconde étude chez le
lapin s’est intéressée au mécanisme lipidique dans l’ostéonécrose d’origine alcoolique et a
observé plus de lacunes ostéocytaires vides chez ces animaux (Wang et al. 2003). En
revanche l’évolution du tissu osseux n’a pas été caractérisée. Nous pensons qu’une
consommation chronique d’alcool a un effet sur l’ostéocyte, et que cet effet pourrait être lié
à ce que l’on observe au niveau de la densité minérale osseuse.
En utilisant les tibias des rats des groupes contrôles et alcool 35% v/v de l’étude 2,
l’objectif de l’étude 3 est d’analyser les effets d’une alcoolisation chronique sur la
morphologie 2D, 3D, et sur le pourcentage d’apoptose des ostéocytes sur des os d’animaux
préalablement alcoolisés. Nous comptons effectuer ces observations et quantifier les
changements grâce à différentes sortes d’expérimentations : marquage des coupes de tibia
puis microscopie en lumière blanche, en épifluorescence, électronique en transmission et
confocale. Nous pensons observer une modification de la morphologie des ostéocytes et
une augmentation de l’apoptose de ces cellules, comme rapportées précédemment par
Lorenz et Lorenz (1983) et par Wang et al. (2003) sur des modèles d’animaux non
ostéoporotiques.
D. Etude 4
Après l’étude des effets d’un traitement alcoolisé sur la morphologie des ostéocytes,
nous avons souhaité étudier la relation entre la DMO, la modification du métabolisme
lipidique et l’ostéocyte. Pour cela, nous allons réaliser des coupes de tibia de différentes
épaisseurs sur des échantillons de rats de l’étude 2 et allons observer les ostéocytes, la
moelle et les vaisseaux sanguins en microscopie électronique à transmission et en lumière
blanche après une coloration au bleu de toluidine. Le but de cette étude est de mettre en
118
évidence les mécanismes responsables de la modification des ostéocytes et de la diminution
de DMO suite à un traitement alcoolisé prolongé.
Nous pensons observer une modification du contenu lipidique de la moelle, corrélée à
l’apoptose des ostéocytes. Nous pensons que ces modifications sont corrélées à la
diminution de la DMO observée dans notre modèle d’ostéoporose d’origine alcoolique.
E. Etude 5
Après avoir observé les effets combinés d’une consommation modérée d’alcool et de
l’exercice physique sur le tissu osseux dans l’étude 1 et, après avoir défini quelle quantité
élevée d’alcool a un effet délétère sur le tissu osseux dans l’étude 2, notre objectif pour
cette étude est d’analyser les potentiels effets bénéfiques de l’activité physique sur des
animaux soumis à un traitement d’alcoolisation élevée. Personne dans la littérature n’a
mené d’étude pour essayer de montrer si l’exercice a un effet protecteur sur le tissu osseux
de sujets alcooliques. Pourtant, l’alcoolisme chronique est une des causes d’ostéoporose
secondaire chez l’homme et peut entraîner des fractures et accroître le risque de mortalité.
Si certaines thérapies peuvent améliorer la densité osseuse en cas d’ostéoporose, est-ce que
l’exercice physique régulier a un effet protecteur sur le risque de développer une
ostéoporose secondaire ? La présence de contraintes mécaniques lors d’une activité
physique a été rapportée comme un facteur favorisant l’augmentation de densité minérale
osseuse, chez des personnes saines. Est-ce que cela est suffisant pour contrebalancer les
effets de l’alcool ? C’est l’hypothèse de cette étude menée chez le rat mâle. Les rats seront
alcoolisés pendant 17 semaines et/ou entraînés durant 14 semaines puis le tissu osseux sera
analysé en termes de densité, microarchitecture, remodelage et résistance. Nous souhaitons
également observer les effets combinés au niveau de l’ostéocyte, dans le but d’observer une
augmentation de l’apoptose des ostéocytes avec l’alcool, augmentation qui serait limitée
par la pratique de l’exercice physique.
119
Matériels et méthodes
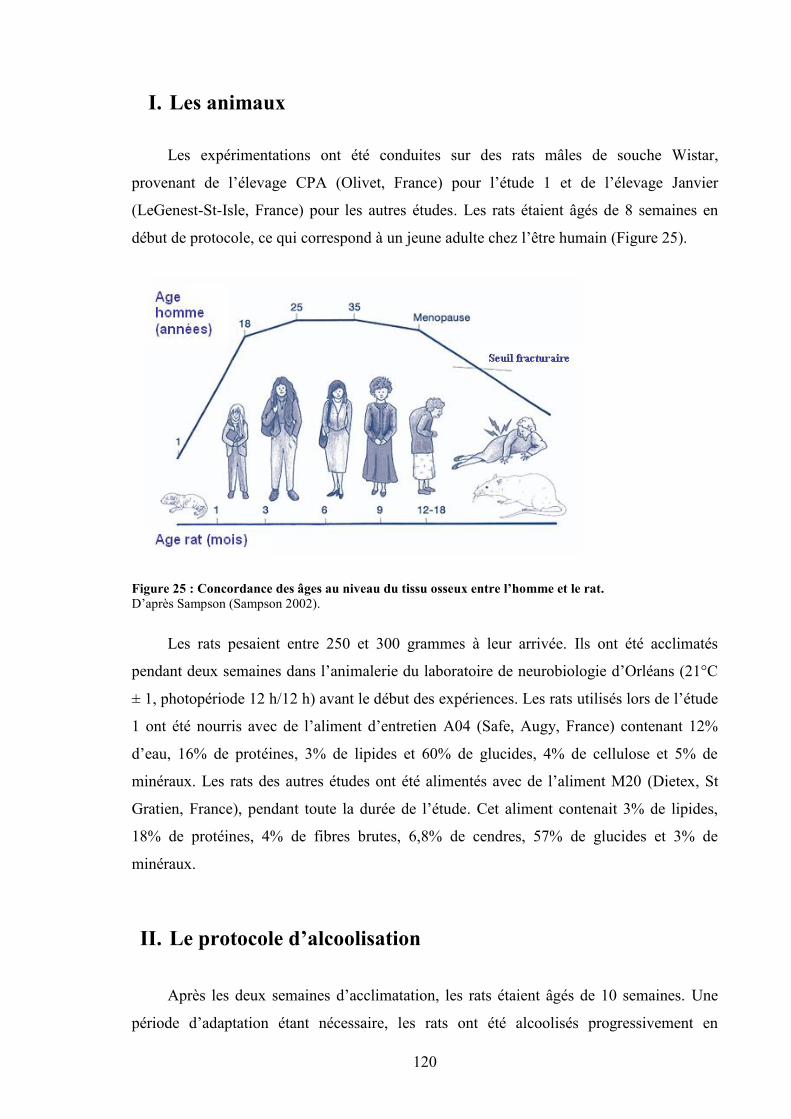
120
I. Les animaux
Les expérimentations ont été conduites sur des rats mâles de souche Wistar,
provenant de l’élevage CPA (Olivet, France) pour l’étude 1 et de l’élevage Janvier
(LeGenest-St-Isle, France) pour les autres études. Les rats étaient âgés de 8 semaines en
début de protocole, ce qui correspond à un jeune adulte chez l’être humain (Figure 25).
Figure 25 : Concordance des âges au niveau du tissu osseux entre l’homme et le rat.D’après Sampson (Sampson 2002).
Les rats pesaient entre 250 et 300 grammes à leur arrivée. Ils ont été acclimatés
pendant deux semaines dans l’animalerie du laboratoire de neurobiologie d’Orléans (21°C
± 1, photopériode 12 h/12 h) avant le début des expériences. Les rats utilisés lors de l’étude
1 ont été nourris avec de l’aliment d’entretien A04 (Safe, Augy, France) contenant 12%
d’eau, 16% de protéines, 3% de lipides et 60% de glucides, 4% de cellulose et 5% de
minéraux. Les rats des autres études ont été alimentés avec de l’aliment M20 (Dietex, St
Gratien, France), pendant toute la durée de l’étude. Cet aliment contenait 3% de lipides,
18% de protéines, 4% de fibres brutes, 6,8% de cendres, 57% de glucides et 3% de
minéraux.
II. Le protocole d’alcoolisation
Après les deux semaines d’acclimatation, les rats étaient âgés de 10 semaines. Une
période d’adaptation étant nécessaire, les rats ont été alcoolisés progressivement en
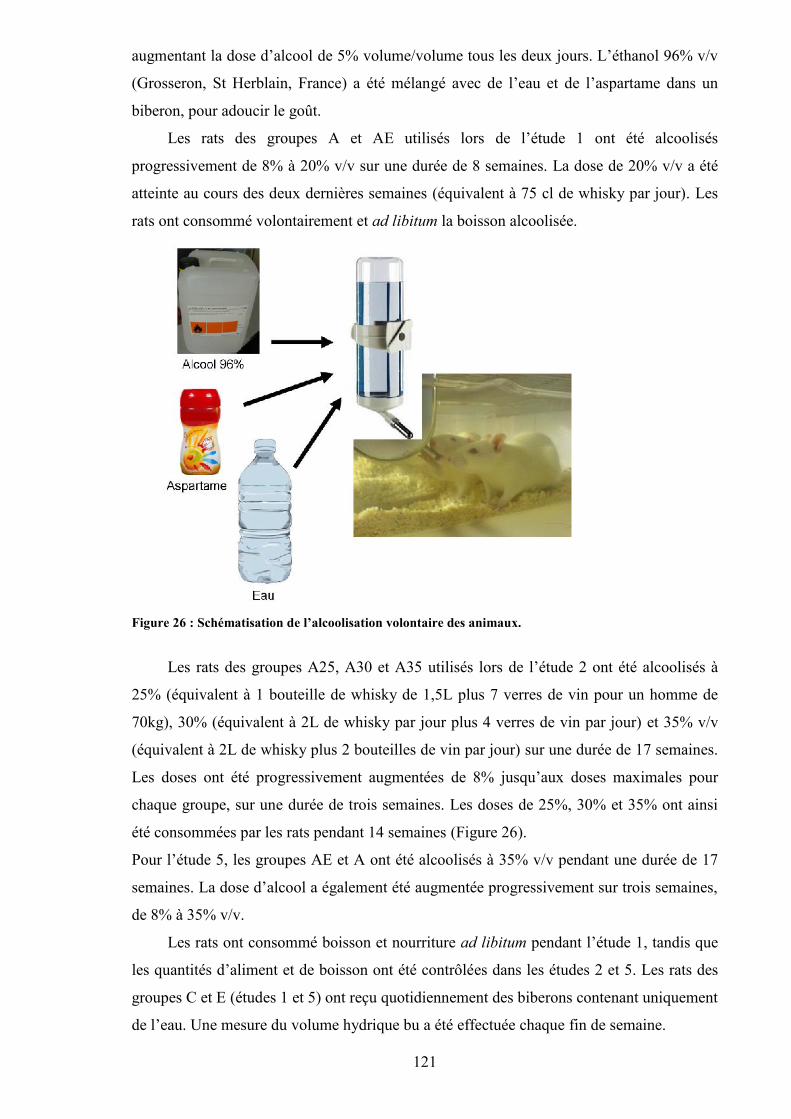
121
augmentant la dose d’alcool de 5% volume/volume tous les deux jours. L’éthanol 96% v/v
(Grosseron, St Herblain, France) a été mélangé avec de l’eau et de l’aspartame dans un
biberon, pour adoucir le goût.
Les rats des groupes A et AE utilisés lors de l’étude 1 ont été alcoolisés
progressivement de 8% à 20% v/v sur une durée de 8 semaines. La dose de 20% v/v a été
atteinte au cours des deux dernières semaines (équivalent à 75 cl de whisky par jour). Les
rats ont consommé volontairement et ad libitum la boisson alcoolisée.
Figure 26 : Schématisation de l’alcoolisation volontaire des animaux.
Les rats des groupes A25, A30 et A35 utilisés lors de l’étude 2 ont été alcoolisés à
25% (équivalent à 1 bouteille de whisky de 1,5L plus 7 verres de vin pour un homme de
70kg), 30% (équivalent à 2L de whisky par jour plus 4 verres de vin par jour) et 35% v/v
(équivalent à 2L de whisky plus 2 bouteilles de vin par jour) sur une durée de 17 semaines.
Les doses ont été progressivement augmentées de 8% jusqu’aux doses maximales pour
chaque groupe, sur une durée de trois semaines. Les doses de 25%, 30% et 35% ont ainsi
été consommées par les rats pendant 14 semaines (Figure 26).
Pour l’étude 5, les groupes AE et A ont été alcoolisés à 35% v/v pendant une durée de 17
semaines. La dose d’alcool a également été augmentée progressivement sur trois semaines,
de 8% à 35% v/v.
Les rats ont consommé boisson et nourriture ad libitum pendant l’étude 1, tandis que
les quantités d’aliment et de boisson ont été contrôlées dans les études 2 et 5. Les rats des
groupes C et E (études 1 et 5) ont reçu quotidiennement des biberons contenant uniquement
de l’eau. Une mesure du volume hydrique bu a été effectuée chaque fin de semaine.
122
Pour les études 2 et 5, la prise alimentaire a été mesurée et ajustée chaque semaine
afin que tous les groupes consomment le même nombre de calories, en tenant compte des
calories apportées par l’alcool (1mL d’alcool équivaut à 5,18 kcal).
III. Protocole d’entraînement sur tapis roulant
Pour les protocoles incluant l’activité physique, un tapis roulant comportant 10
couloirs a été utilisé. Ce tapis a été spécialement conçu pour l’entraînement de rat et a déjà
été utilisé et validé dans d’autres études (Bonnet et al. 2007a; Lespessailles et al. 2009). La
longueur des 10 couloirs était de 70 cm et la largeur de 10,5 cm. Des câbles non électrifiés
à l’arrière de chaque couloir permettaient à l’animal de se rendre compte qu’il devait courir
un peu plus vite. Le tapis avait une longueur totale de 3,25 m et était entraîné par un moteur
Siemens (250 V, 50 Hz). La vitesse était contrôlée à l’aide d’un boîtier à affichage
numérique, qui correspondait à la vitesse moteur du tapis. La vitesse réelle a été calculée en
début d’étude grâce à un chronomètre et à un repère placé sur le tapis. Un bouton d’arrêt
d’urgence était également présent sur le tapis, pour pouvoir l’arrêter rapidement au cas où
un rat se coincerait la queue ou une patte dans les câbles, afin de limiter le risque de
blessure.
Les rats des groupes entraînés ont été conditionnés au tapis roulant durant quatre jours
après la période d’acclimatation. Les rats ont été posés sur le tapis la première journée, sans
qu’il soit mis en marche. Le 2ème jour, le tapis a été utilisé pendant 10 min à une vitesse très
faible correspondant à une vitesse de marche. Les 3ème, 4ème et 5ème jours, la vitesse a été
augmentée progressivement et la durée d’entraînement est passée de 10 min à 20 min par
jour. Les entraînements ont eu lieu à la même heure, 5 fois par semaine, à raison de 40 à 45
min d’entraînement pour l’étude 1, et d’1 heure d’entraînement par jour pour l’étude 5.
La vitesse maximale aérobie (VMA), définie par Léger et Boucher comme un bon
reflet de l’aptitude physique, a été calculée au début des études (Leger et Boucher 1980).
La VMA représente la vitesse pour laquelle le sujet ou l’animal atteint sa consommation
d’oxygène maximale. Après 5 minutes d’échauffement à faible vitesse (7 m/min) pendant 5
min, la vitesse du tapis a été augmentée de 2 m/min toutes les 2 minutes, comme défini par
Boissiere et al. (Boissiere et al. 2008). La VMA correspond à la vitesse maximale où le rat
est capable de maintenir le rythme de course. Lorsque le rat touchait 5 fois de suite les
câbles à l’arrière et n’arrivait pas à ré accélérer, il était enlevé du tapis et la vitesse réelle du
tapis était notée (VMA).
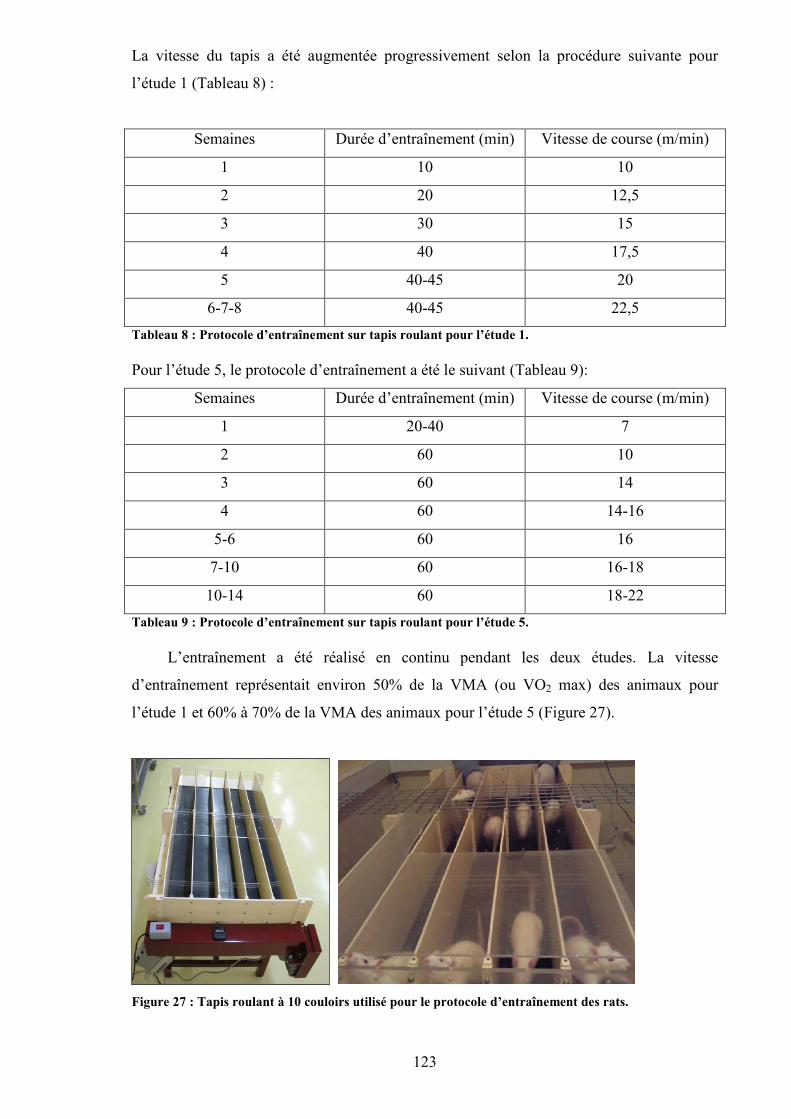
123
La vitesse du tapis a été augmentée progressivement selon la procédure suivante pour
l’étude 1 (Tableau 8) :
Semaines Durée d’entraînement (min) Vitesse de course (m/min)
1 10 10
2 20 12,5
3 30 15
4 40 17,5
5 40-45 20
6-7-8 40-45 22,5Tableau 8 : Protocole d’entraînement sur tapis roulant pour l’étude 1.
Pour l’étude 5, le protocole d’entraînement a été le suivant (Tableau 9):
Semaines Durée d’entraînement (min) Vitesse de course (m/min)
1 20-40 7
2 60 10
3 60 14
4 60 14-16
5-6 60 16
7-10 60 16-18
10-14 60 18-22Tableau 9 : Protocole d’entraînement sur tapis roulant pour l’étude 5.
L’entraînement a été réalisé en continu pendant les deux études. La vitesse
d’entraînement représentait environ 50% de la VMA (ou VO2 max) des animaux pour
l’étude 1 et 60% à 70% de la VMA des animaux pour l’étude 5 (Figure 27).
Figure 27 : Tapis roulant à 10 couloirs utilisé pour le protocole d’entraînement des rats.
124
IV. Mesures in vivo
A. Absorptiométrie biphotonique
Il existe plusieurs techniques non invasives pour quantifier la masse osseuse :
radiogramétrie, absorptiométrie simple et absoptiométrie biphotonique. Nous avons choisi
l’absorptiométrie biphotonique car cette technique a une bonne reproductibilité et permet
de distinguer les tissus minéralisés des tissus mous. Cette technique est couramment
utilisée pour mesurer le contenu minéral osseux (CMO) et la densité minérale osseuse
(DMO) dans les études actuelles.
1. Principe de l’absorptiométrie biphotonique
Cette technique consiste à faire passer au-dessus de la région du corps à étudier, un
tube contenant des émetteurs de photons (Figure 28). Un détecteur de photons est installé
de l’autre côté de l’os. Plus l’os est dense, moins nombreux sont les photons qui atteignent
le détecteur. L’absorption relative est calibrée pour exprimer la teneur en substance
minérale et la masse de l’os par unité de longueur. C'est un examen qui se pratique en
général chez la femme après la ménopause et chez toute personne souffrant d’une maladie
métabolique susceptible de provoquer une déminéralisation osseuse. Il a l’avantage d’être
rapide, indolore et ne nécessite chez l’homme aucune préparation. Notre appareil est
pourvu d’un logiciel adapté pour le petit animal. Chez l’animal, il est nécessaire
d’anesthésier les animaux afin qu’ils ne bougent pas. Après calibration, l’appareil est
capable de discerner la masse grasse et la masse maigre de l’os. C’est le cas également
lorsque l’appareil est adapté au petit animal, avec une étape de calibration de la machine
spécialement pour le petit animal. La reproductibilité de cet appareil pour les mesures de
DMO et CMO chez le rat a été testée précédemment dans notre laboratoire (Bonnet et al.
2005a).
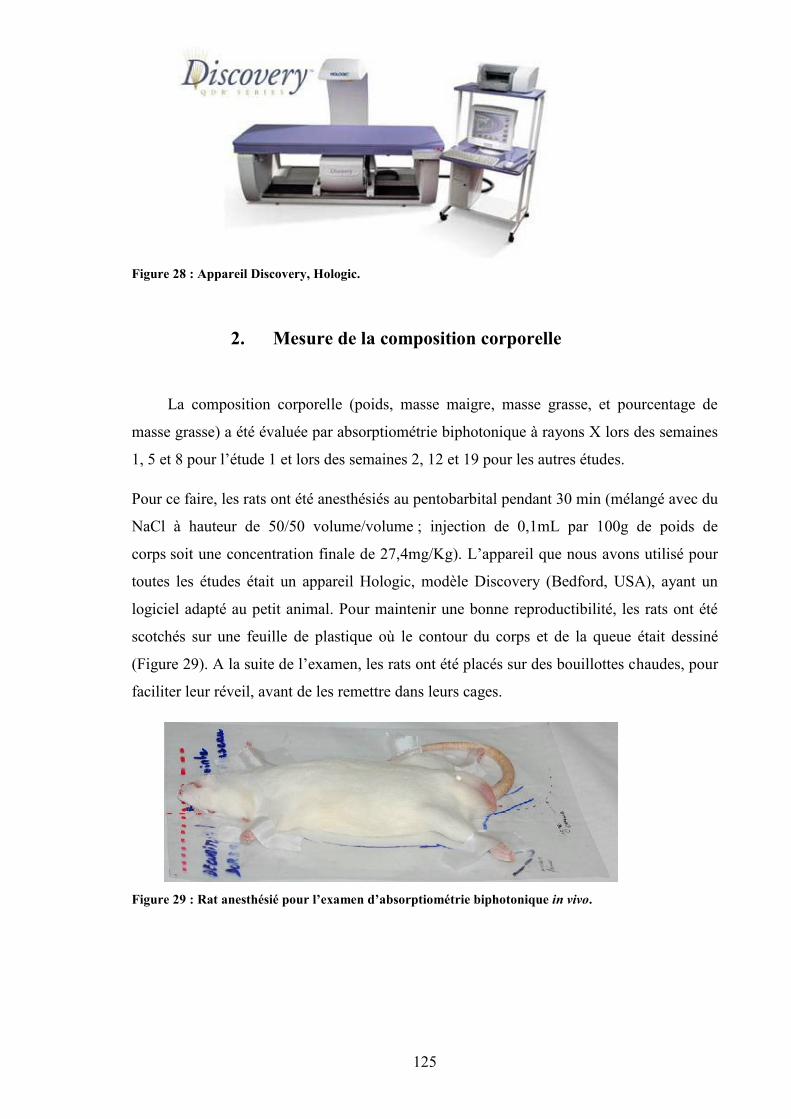
125
Figure 28 : Appareil Discovery, Hologic.
2. Mesure de la composition corporelle
La composition corporelle (poids, masse maigre, masse grasse, et pourcentage de
masse grasse) a été évaluée par absorptiométrie biphotonique à rayons X lors des semaines
1, 5 et 8 pour l’étude 1 et lors des semaines 2, 12 et 19 pour les autres études.
Pour ce faire, les rats ont été anesthésiés au pentobarbital pendant 30 min (mélangé avec du
NaCl à hauteur de 50/50 volume/volume ; injection de 0,1mL par 100g de poids de
corps soit une concentration finale de 27,4mg/Kg). L’appareil que nous avons utilisé pour
toutes les études était un appareil Hologic, modèle Discovery (Bedford, USA), ayant un
logiciel adapté au petit animal. Pour maintenir une bonne reproductibilité, les rats ont été
scotchés sur une feuille de plastique où le contour du corps et de la queue était dessiné
(Figure 29). A la suite de l’examen, les rats ont été placés sur des bouillottes chaudes, pour
faciliter leur réveil, avant de les remettre dans leurs cages.
Figure 29 : Rat anesthésié pour l’examen d’absorptiométrie biphotonique in vivo.
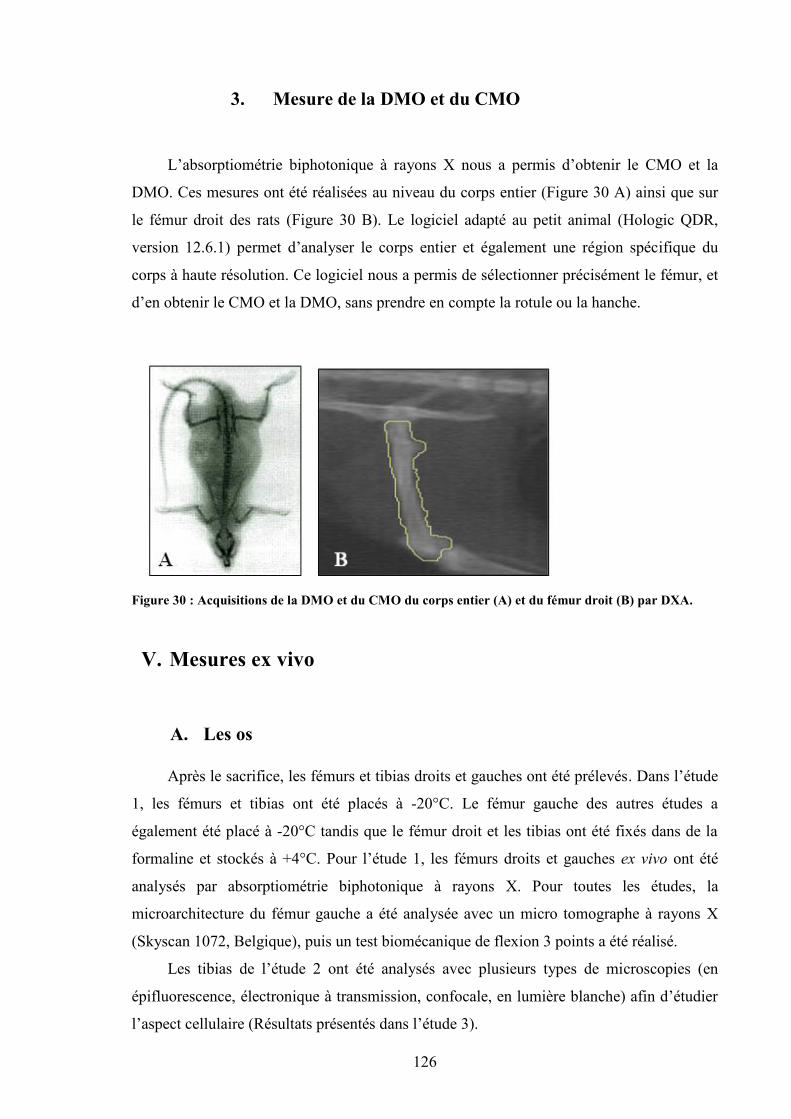
126
3. Mesure de la DMO et du CMO
L’absorptiométrie biphotonique à rayons X nous a permis d’obtenir le CMO et la
DMO. Ces mesures ont été réalisées au niveau du corps entier (Figure 30 A) ainsi que sur
le fémur droit des rats (Figure 30 B). Le logiciel adapté au petit animal (Hologic QDR,
version 12.6.1) permet d’analyser le corps entier et également une région spécifique du
corps à haute résolution. Ce logiciel nous a permis de sélectionner précisément le fémur, et
d’en obtenir le CMO et la DMO, sans prendre en compte la rotule ou la hanche.
Figure 30 : Acquisitions de la DMO et du CMO du corps entier (A) et du fémur droit (B) par DXA.
V. Mesures ex vivo
A. Les os
Après le sacrifice, les fémurs et tibias droits et gauches ont été prélevés. Dans l’étude
1, les fémurs et tibias ont été placés à -20°C. Le fémur gauche des autres études a
également été placé à -20°C tandis que le fémur droit et les tibias ont été fixés dans de la
formaline et stockés à +4°C. Pour l’étude 1, les fémurs droits et gauches ex vivo ont été
analysés par absorptiométrie biphotonique à rayons X. Pour toutes les études, la
microarchitecture du fémur gauche a été analysée avec un micro tomographe à rayons X
(Skyscan 1072, Belgique), puis un test biomécanique de flexion 3 points a été réalisé.
Les tibias de l’étude 2 ont été analysés avec plusieurs types de microscopies (en
épifluorescence, électronique à transmission, confocale, en lumière blanche) afin d’étudier
l’aspect cellulaire (Résultats présentés dans l’étude 3).
127
Nous avons choisi de prélever le fémur et le tibia car ils sont composés à la fois d’os
cortical et d’os trabéculaire, ce qui nous a permis d’analyser les effets de l’alcool et de
l’exercice sur ces deux types de tissus.
B. Le sang et les muscles
Le sang a été prélevé à la fin de toutes les études, par ponction intracardiaque et a été
recueilli dans des tubes héparinés, EDTA et des tubes secs pour analyser des marqueurs du
remodelage osseux, de l’inflammation du foie, du métabolisme lipidique et pour doser
l’alcoolémie. Immédiatement après le prélèvement, le sang a été centrifugé 10 min à 3500
rpm (rotations par minute, équivalent à 1400g environ) puis aliquoté et congelé à -80 °C.
De plus, des coupes de foie ont été réalisées sur les prélèvements de l’étude 2 dans le but de
détecter une éventuelle atteinte hépatique (stéatose, fibrose). Pour ce faire, les foies ont été
inclus dans de la paraffine, coupés avec un microtome puis colorés avec une solution de
type HES (Hématoxyline Eosine Safran). L’hématoxyline colore les noyaux et les
structures nucléaires en bleu-violet, l’éosine colore le cytoplasme en rose et le tissu
conjonctif est mis en évidence par la coloration jaune-orangée que lui donne le safran.
C. Mesure de la microarchitecture osseuse
Figure 31 : Micro tomographe à rayons X Skyscan 1072 (Belgique).
Principe de la micro tomographie à rayons X :
La micro tomographie à rayons X est une radiographie en 3 dimensions, à une très
petite échelle avec une grande résolution. Cela permet d’imager les structures internes d’un
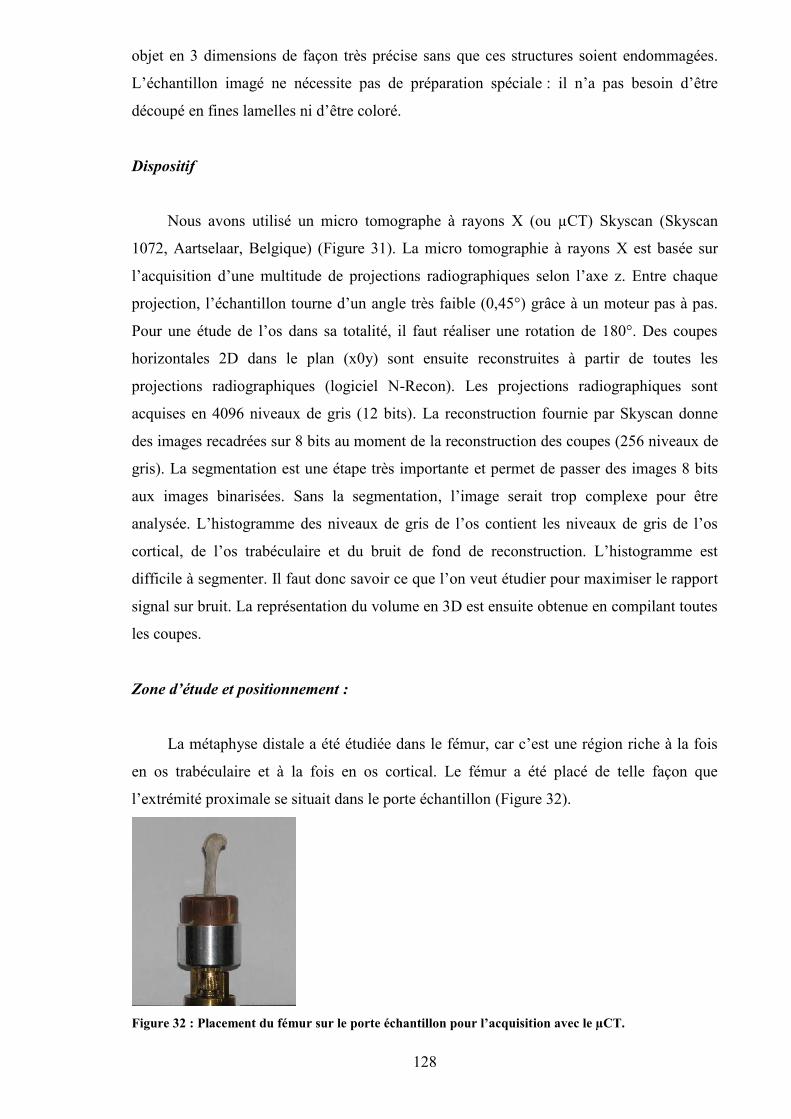
128
objet en 3 dimensions de façon très précise sans que ces structures soient endommagées.
L’échantillon imagé ne nécessite pas de préparation spéciale : il n’a pas besoin d’être
découpé en fines lamelles ni d’être coloré.
Dispositif
Nous avons utilisé un micro tomographe à rayons X (ou µCT) Skyscan (Skyscan
1072, Aartselaar, Belgique) (Figure 31). La micro tomographie à rayons X est basée sur
l’acquisition d’une multitude de projections radiographiques selon l’axe z. Entre chaque
projection, l’échantillon tourne d’un angle très faible (0,45°) grâce à un moteur pas à pas.
Pour une étude de l’os dans sa totalité, il faut réaliser une rotation de 180°. Des coupes
horizontales 2D dans le plan (x0y) sont ensuite reconstruites à partir de toutes les
projections radiographiques (logiciel N-Recon). Les projections radiographiques sont
acquises en 4096 niveaux de gris (12 bits). La reconstruction fournie par Skyscan donne
des images recadrées sur 8 bits au moment de la reconstruction des coupes (256 niveaux de
gris). La segmentation est une étape très importante et permet de passer des images 8 bits
aux images binarisées. Sans la segmentation, l’image serait trop complexe pour être
analysée. L’histogramme des niveaux de gris de l’os contient les niveaux de gris de l’os
cortical, de l’os trabéculaire et du bruit de fond de reconstruction. L’histogramme est
difficile à segmenter. Il faut donc savoir ce que l’on veut étudier pour maximiser le rapport
signal sur bruit. La représentation du volume en 3D est ensuite obtenue en compilant toutes
les coupes.
Zone d’étude et positionnement :
La métaphyse distale a été étudiée dans le fémur, car c’est une région riche à la fois
en os trabéculaire et à la fois en os cortical. Le fémur a été placé de telle façon que
l’extrémité proximale se situait dans le porte échantillon (Figure 32).
Figure 32 : Placement du fémur sur le porte échantillon pour l’acquisition avec le µCT.
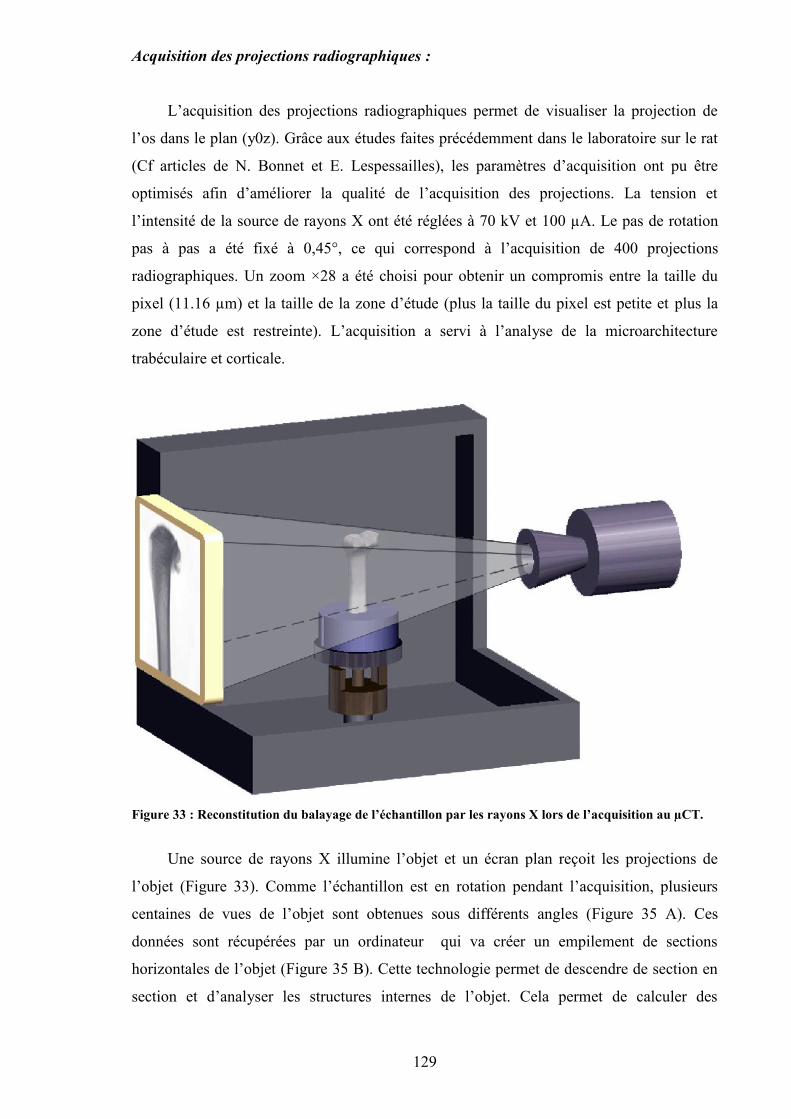
129
Acquisition des projections radiographiques :
L’acquisition des projections radiographiques permet de visualiser la projection de
l’os dans le plan (y0z). Grâce aux études faites précédemment dans le laboratoire sur le rat
(Cf articles de N. Bonnet et E. Lespessailles), les paramètres d’acquisition ont pu être
optimisés afin d’améliorer la qualité de l’acquisition des projections. La tension et
l’intensité de la source de rayons X ont été réglées à 70 kV et 100 µA. Le pas de rotation
pas à pas a été fixé à 0,45°, ce qui correspond à l’acquisition de 400 projections
radiographiques. Un zoom ×28 a été choisi pour obtenir un compromis entre la taille du
pixel (11.16 µm) et la taille de la zone d’étude (plus la taille du pixel est petite et plus la
zone d’étude est restreinte). L’acquisition a servi à l’analyse de la microarchitecture
trabéculaire et corticale.
Figure 33 : Reconstitution du balayage de l’échantillon par les rayons X lors de l’acquisition au µCT.
Une source de rayons X illumine l’objet et un écran plan reçoit les projections de
l’objet (Figure 33). Comme l’échantillon est en rotation pendant l’acquisition, plusieurs
centaines de vues de l’objet sont obtenues sous différents angles (Figure 35 A). Ces
données sont récupérées par un ordinateur qui va créer un empilement de sections
horizontales de l’objet (Figure 35 B). Cette technologie permet de descendre de section en
section et d’analyser les structures internes de l’objet. Cela permet de calculer des
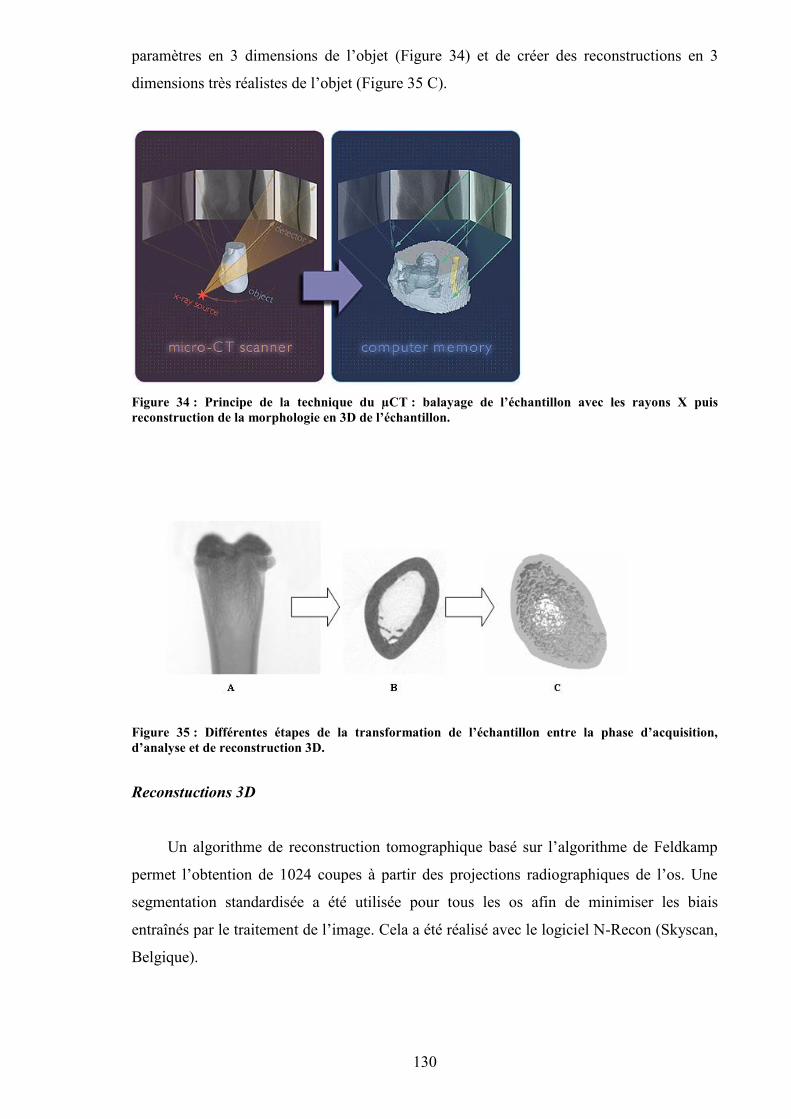
130
paramètres en 3 dimensions de l’objet (Figure 34) et de créer des reconstructions en 3
dimensions très réalistes de l’objet (Figure 35 C).
Figure 34 : Principe de la technique du µCT : balayage de l’échantillon avec les rayons X puisreconstruction de la morphologie en 3D de l’échantillon.
Figure 35 : Différentes étapes de la transformation de l’échantillon entre la phase d’acquisition,d’analyse et de reconstruction 3D.
Reconstuctions 3D
Un algorithme de reconstruction tomographique basé sur l’algorithme de Feldkamp
permet l’obtention de 1024 coupes à partir des projections radiographiques de l’os. Une
segmentation standardisée a été utilisée pour tous les os afin de minimiser les biais
entraînés par le traitement de l’image. Cela a été réalisé avec le logiciel N-Recon (Skyscan,
Belgique).
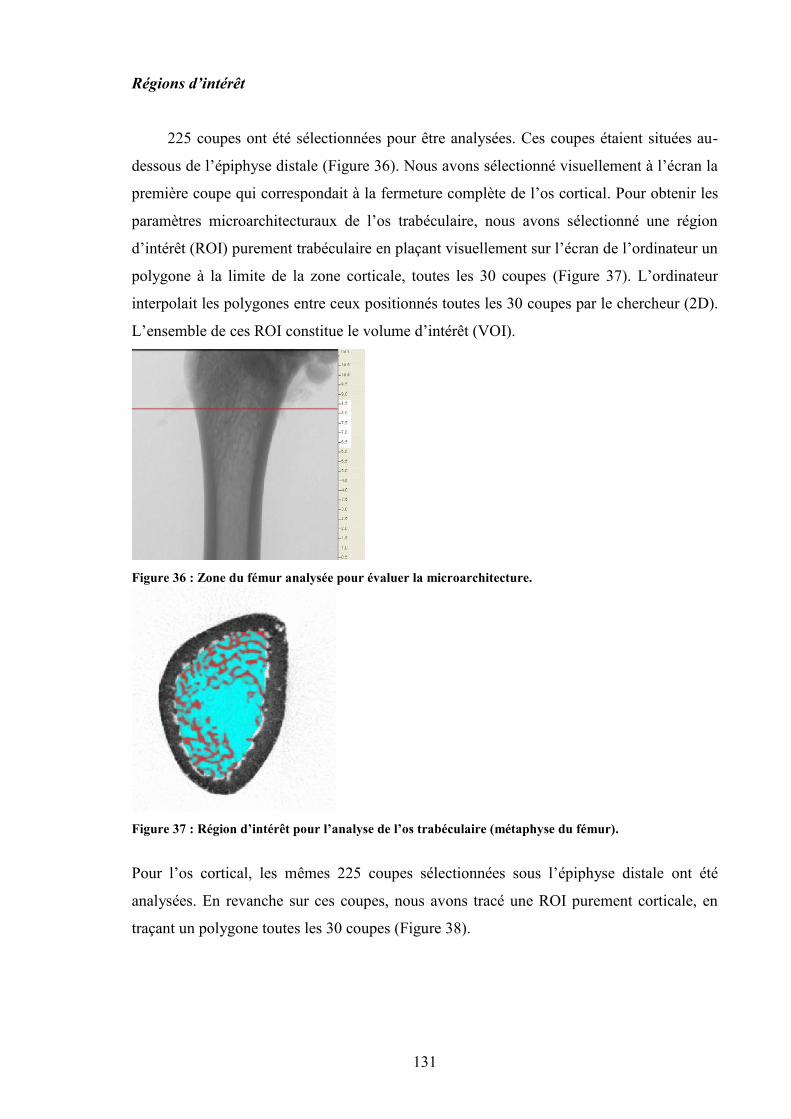
131
Régions d’intérêt
225 coupes ont été sélectionnées pour être analysées. Ces coupes étaient situées au-
dessous de l’épiphyse distale (Figure 36). Nous avons sélectionné visuellement à l’écran la
première coupe qui correspondait à la fermeture complète de l’os cortical. Pour obtenir les
paramètres microarchitecturaux de l’os trabéculaire, nous avons sélectionné une région
d’intérêt (ROI) purement trabéculaire en plaçant visuellement sur l’écran de l’ordinateur un
polygone à la limite de la zone corticale, toutes les 30 coupes (Figure 37). L’ordinateur
interpolait les polygones entre ceux positionnés toutes les 30 coupes par le chercheur (2D).
L’ensemble de ces ROI constitue le volume d’intérêt (VOI).
Figure 36 : Zone du fémur analysée pour évaluer la microarchitecture.
Figure 37 : Région d’intérêt pour l’analyse de l’os trabéculaire (métaphyse du fémur).
Pour l’os cortical, les mêmes 225 coupes sélectionnées sous l’épiphyse distale ont été
analysées. En revanche sur ces coupes, nous avons tracé une ROI purement corticale, en
traçant un polygone toutes les 30 coupes (Figure 38).
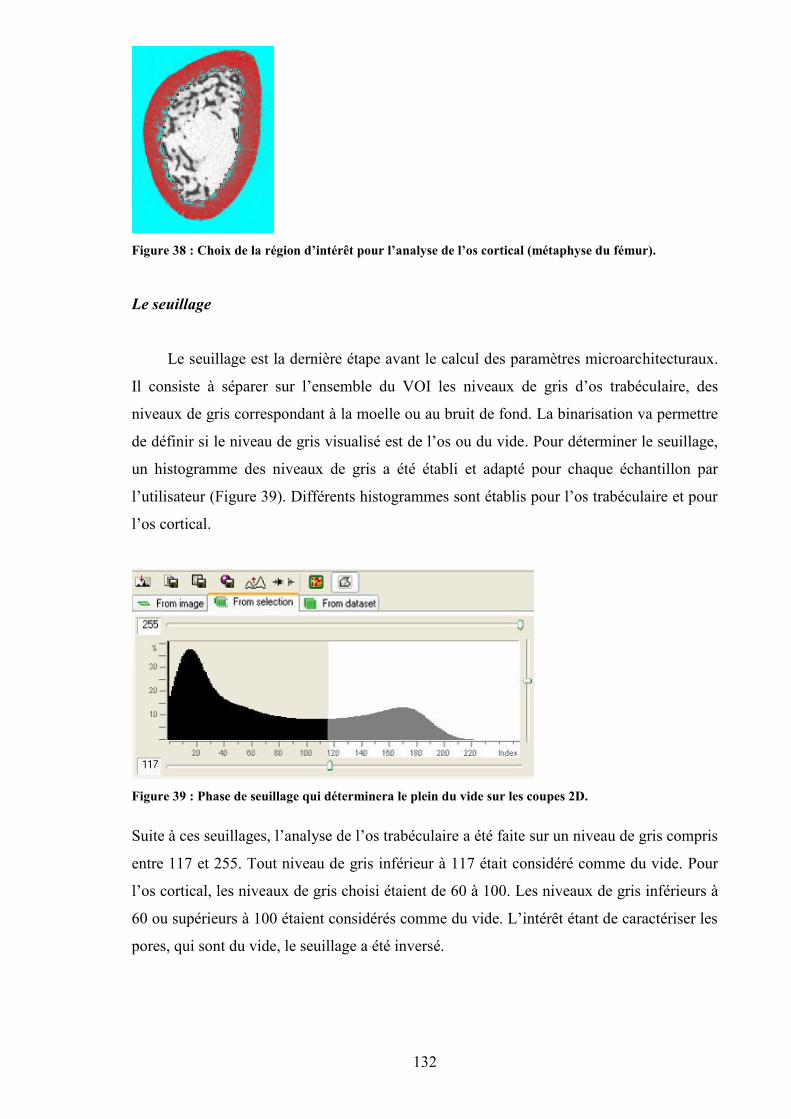
132
Figure 38 : Choix de la région d’intérêt pour l’analyse de l’os cortical (métaphyse du fémur).
Le seuillage
Le seuillage est la dernière étape avant le calcul des paramètres microarchitecturaux.
Il consiste à séparer sur l’ensemble du VOI les niveaux de gris d’os trabéculaire, des
niveaux de gris correspondant à la moelle ou au bruit de fond. La binarisation va permettre
de définir si le niveau de gris visualisé est de l’os ou du vide. Pour déterminer le seuillage,
un histogramme des niveaux de gris a été établi et adapté pour chaque échantillon par
l’utilisateur (Figure 39). Différents histogrammes sont établis pour l’os trabéculaire et pour
l’os cortical.
Figure 39 : Phase de seuillage qui déterminera le plein du vide sur les coupes 2D.
Suite à ces seuillages, l’analyse de l’os trabéculaire a été faite sur un niveau de gris compris
entre 117 et 255. Tout niveau de gris inférieur à 117 était considéré comme du vide. Pour
l’os cortical, les niveaux de gris choisi étaient de 60 à 100. Les niveaux de gris inférieurs à
60 ou supérieurs à 100 étaient considérés comme du vide. L’intérêt étant de caractériser les
pores, qui sont du vide, le seuillage a été inversé.
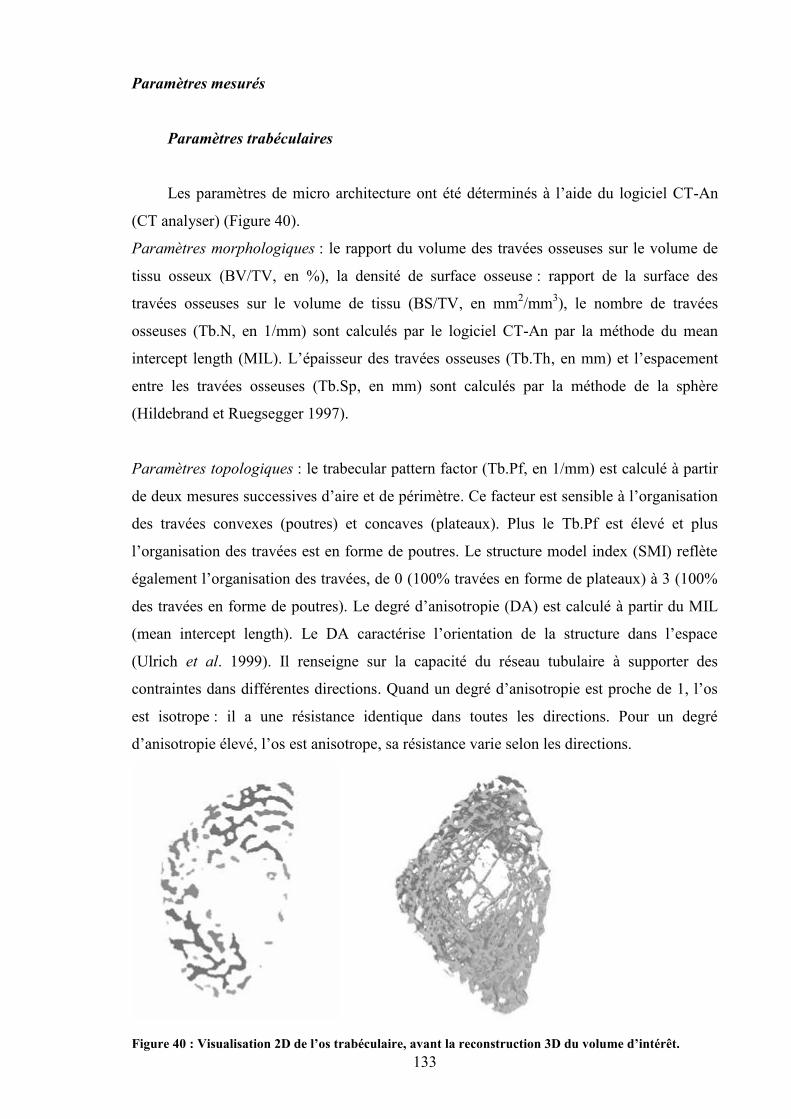
133
Paramètres mesurés
Paramètres trabéculaires
Les paramètres de micro architecture ont été déterminés à l’aide du logiciel CT-An
(CT analyser) (Figure 40).
Paramètres morphologiques : le rapport du volume des travées osseuses sur le volume de
tissu osseux (BV/TV, en %), la densité de surface osseuse : rapport de la surface des
travées osseuses sur le volume de tissu (BS/TV, en mm2/mm3), le nombre de travées
osseuses (Tb.N, en 1/mm) sont calculés par le logiciel CT-An par la méthode du mean
intercept length (MIL). L’épaisseur des travées osseuses (Tb.Th, en mm) et l’espacement
entre les travées osseuses (Tb.Sp, en mm) sont calculés par la méthode de la sphère
(Hildebrand et Ruegsegger 1997).
Paramètres topologiques : le trabecular pattern factor (Tb.Pf, en 1/mm) est calculé à partir
de deux mesures successives d’aire et de périmètre. Ce facteur est sensible à l’organisation
des travées convexes (poutres) et concaves (plateaux). Plus le Tb.Pf est élevé et plus
l’organisation des travées est en forme de poutres. Le structure model index (SMI) reflète
également l’organisation des travées, de 0 (100% travées en forme de plateaux) à 3 (100%
des travées en forme de poutres). Le degré d’anisotropie (DA) est calculé à partir du MIL
(mean intercept length). Le DA caractérise l’orientation de la structure dans l’espace
(Ulrich et al. 1999). Il renseigne sur la capacité du réseau tubulaire à supporter des
contraintes dans différentes directions. Quand un degré d’anisotropie est proche de 1, l’os
est isotrope : il a une résistance identique dans toutes les directions. Pour un degré
d’anisotropie élevé, l’os est anisotrope, sa résistance varie selon les directions.
Figure 40 : Visualisation 2D de l’os trabéculaire, avant la reconstruction 3D du volume d’intérêt.
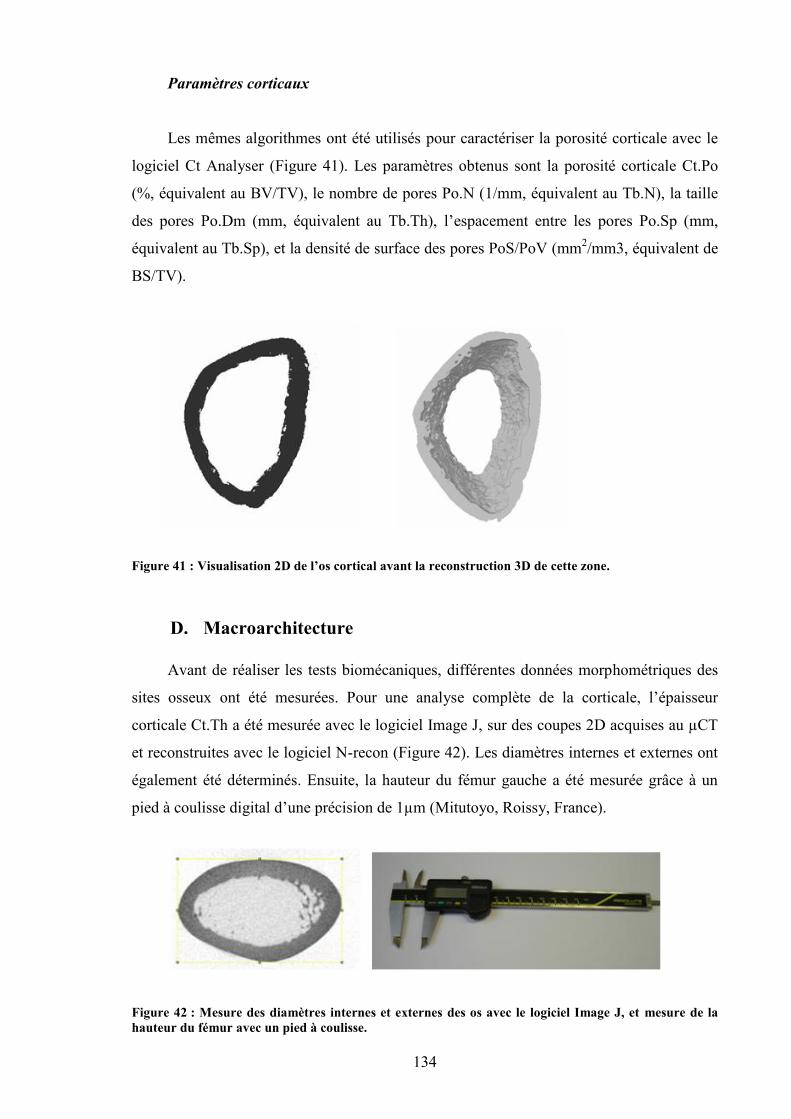
134
Paramètres corticaux
Les mêmes algorithmes ont été utilisés pour caractériser la porosité corticale avec le
logiciel Ct Analyser (Figure 41). Les paramètres obtenus sont la porosité corticale Ct.Po
(%, équivalent au BV/TV), le nombre de pores Po.N (1/mm, équivalent au Tb.N), la taille
des pores Po.Dm (mm, équivalent au Tb.Th), l’espacement entre les pores Po.Sp (mm,
équivalent au Tb.Sp), et la densité de surface des pores PoS/PoV (mm2/mm3, équivalent de
BS/TV).
Figure 41 : Visualisation 2D de l’os cortical avant la reconstruction 3D de cette zone.
D. Macroarchitecture
Avant de réaliser les tests biomécaniques, différentes données morphométriques des
sites osseux ont été mesurées. Pour une analyse complète de la corticale, l’épaisseur
corticale Ct.Th a été mesurée avec le logiciel Image J, sur des coupes 2D acquises au µCT
et reconstruites avec le logiciel N-recon (Figure 42). Les diamètres internes et externes ont
également été déterminés. Ensuite, la hauteur du fémur gauche a été mesurée grâce à un
pied à coulisse digital d’une précision de 1µm (Mitutoyo, Roissy, France).
Figure 42 : Mesure des diamètres internes et externes des os avec le logiciel Image J, et mesure de lahauteur du fémur avec un pied à coulisse.
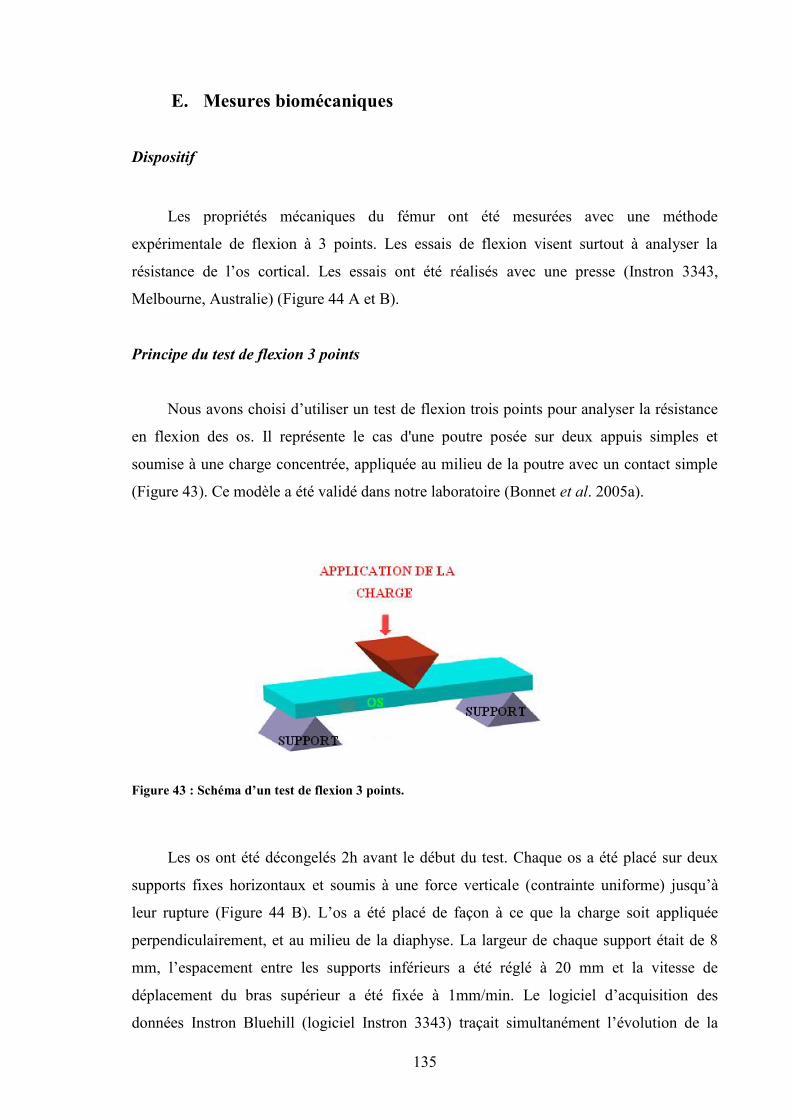
135
E. Mesures biomécaniques
Dispositif
Les propriétés mécaniques du fémur ont été mesurées avec une méthode
expérimentale de flexion à 3 points. Les essais de flexion visent surtout à analyser la
résistance de l’os cortical. Les essais ont été réalisés avec une presse (Instron 3343,
Melbourne, Australie) (Figure 44 A et B).
Principe du test de flexion 3 points
Nous avons choisi d’utiliser un test de flexion trois points pour analyser la résistance
en flexion des os. Il représente le cas d'une poutre posée sur deux appuis simples et
soumise à une charge concentrée, appliquée au milieu de la poutre avec un contact simple
(Figure 43). Ce modèle a été validé dans notre laboratoire (Bonnet et al. 2005a).
Figure 43 : Schéma d’un test de flexion 3 points.
Les os ont été décongelés 2h avant le début du test. Chaque os a été placé sur deux
supports fixes horizontaux et soumis à une force verticale (contrainte uniforme) jusqu’à
leur rupture (Figure 44 B). L’os a été placé de façon à ce que la charge soit appliquée
perpendiculairement, et au milieu de la diaphyse. La largeur de chaque support était de 8
mm, l’espacement entre les supports inférieurs a été réglé à 20 mm et la vitesse de
déplacement du bras supérieur a été fixée à 1mm/min. Le logiciel d’acquisition des
données Instron Bluehill (logiciel Instron 3343) traçait simultanément l’évolution de la
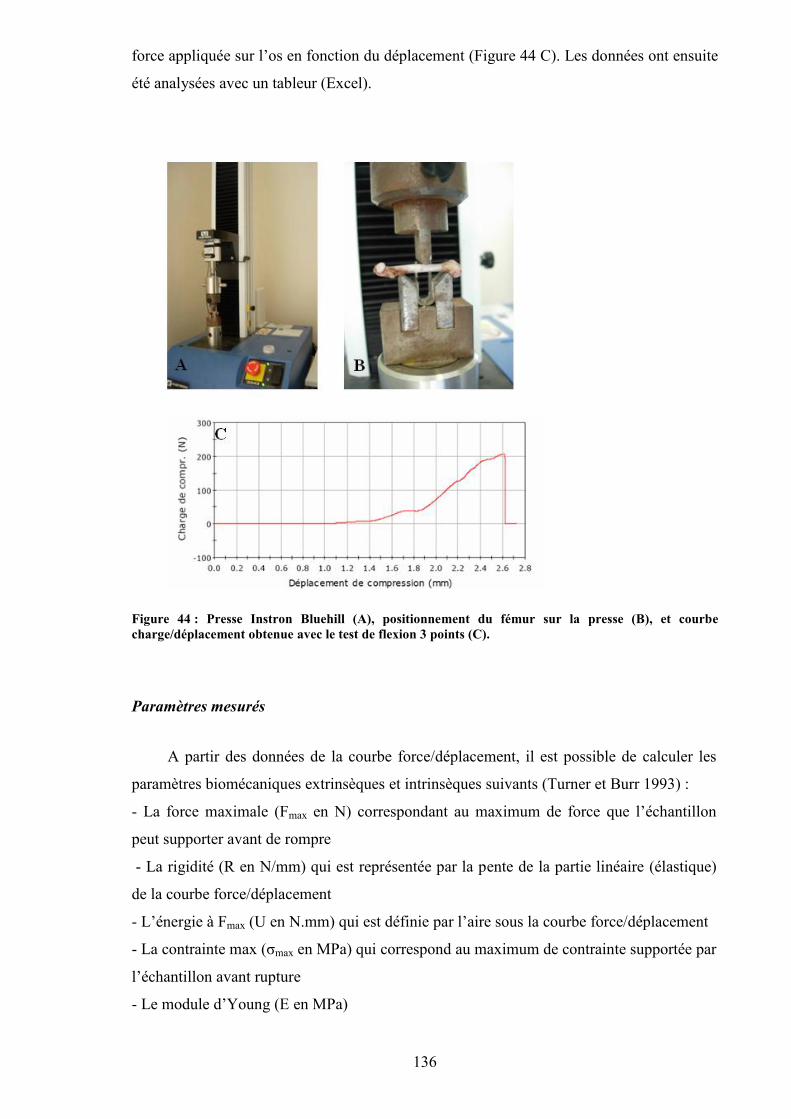
136
force appliquée sur l’os en fonction du déplacement (Figure 44 C). Les données ont ensuite
été analysées avec un tableur (Excel).
Figure 44 : Presse Instron Bluehill (A), positionnement du fémur sur la presse (B), et courbecharge/déplacement obtenue avec le test de flexion 3 points (C).
Paramètres mesurés
A partir des données de la courbe force/déplacement, il est possible de calculer les
paramètres biomécaniques extrinsèques et intrinsèques suivants (Turner et Burr 1993) :
- La force maximale (Fmax en N) correspondant au maximum de force que l’échantillon
peut supporter avant de rompre
- La rigidité (R en N/mm) qui est représentée par la pente de la partie linéaire (élastique)
de la courbe force/déplacement
- L’énergie à Fmax (U en N.mm) qui est définie par l’aire sous la courbe force/déplacement
- La contrainte max (σmax en MPa) qui correspond au maximum de contrainte supportée par
l’échantillon avant rupture
- Le module d’Young (E en MPa)
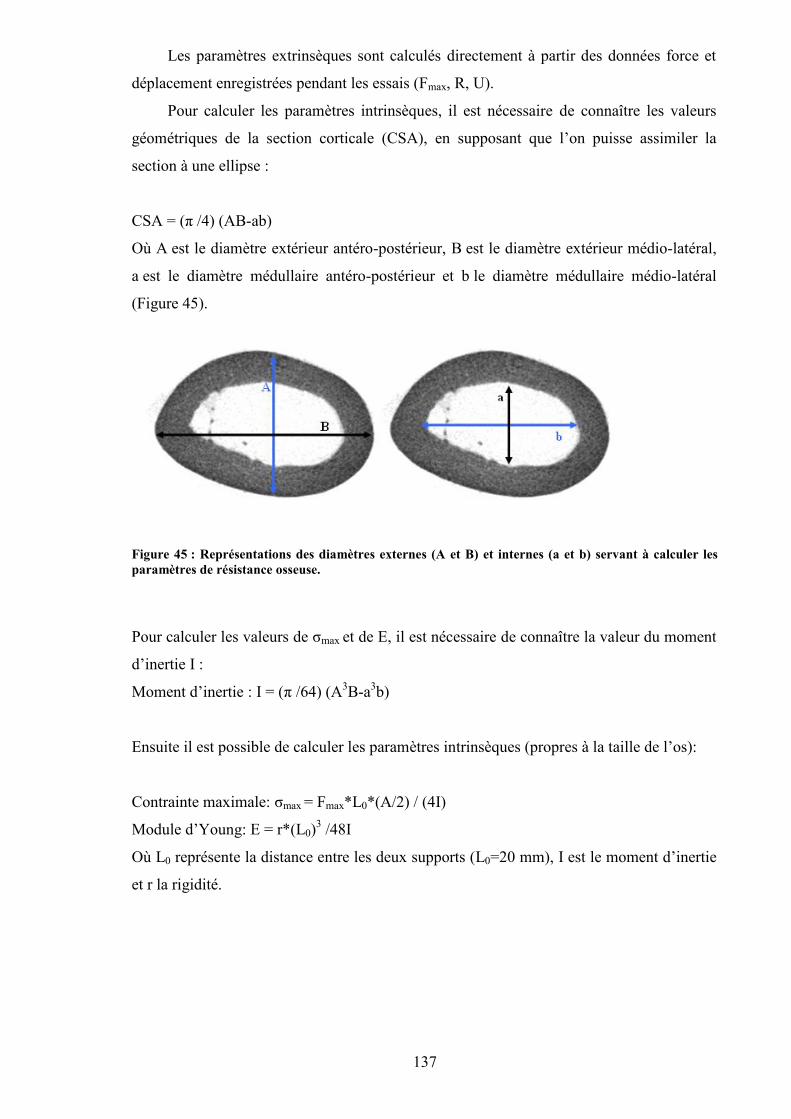
137
Les paramètres extrinsèques sont calculés directement à partir des données force et
déplacement enregistrées pendant les essais (Fmax, R, U).
Pour calculer les paramètres intrinsèques, il est nécessaire de connaître les valeurs
géométriques de la section corticale (CSA), en supposant que l’on puisse assimiler la
section à une ellipse :
CSA = (π /4) (AB-ab)
Où A est le diamètre extérieur antéro-postérieur, B est le diamètre extérieur médio-latéral,
a est le diamètre médullaire antéro-postérieur et b le diamètre médullaire médio-latéral
(Figure 45).
Figure 45 : Représentations des diamètres externes (A et B) et internes (a et b) servant à calculer lesparamètres de résistance osseuse.
Pour calculer les valeurs de σmax et de E, il est nécessaire de connaître la valeur du moment
d’inertie I :
Moment d’inertie : I = (π /64) (A3B-a3b)
Ensuite il est possible de calculer les paramètres intrinsèques (propres à la taille de l’os):
Contrainte maximale: σmax = Fmax*L0*(A/2) / (4I)
Module d’Young: E = r*(L0)3 /48I
Où L0 représente la distance entre les deux supports (L0=20 mm), I est le moment d’inertie
et r la rigidité.
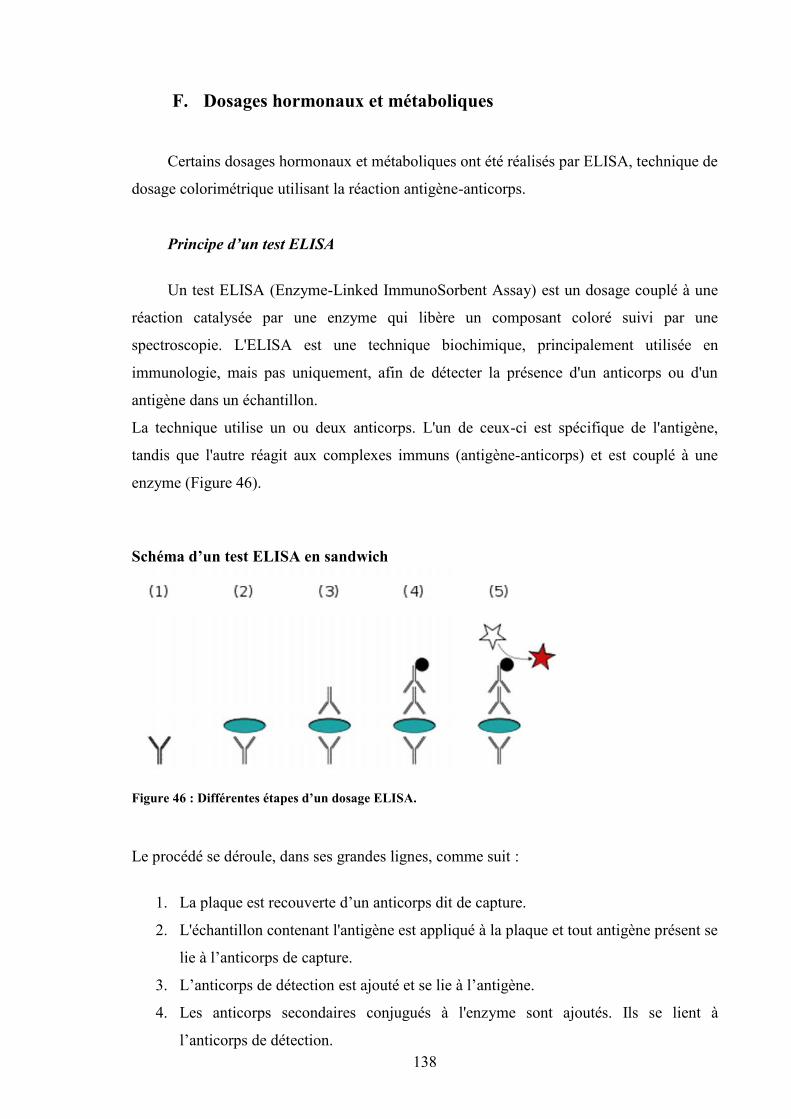
138
F. Dosages hormonaux et métaboliques
Certains dosages hormonaux et métaboliques ont été réalisés par ELISA, technique de
dosage colorimétrique utilisant la réaction antigène-anticorps.
Principe d’un test ELISA
Un test ELISA (Enzyme-Linked ImmunoSorbent Assay) est un dosage couplé à une
réaction catalysée par une enzyme qui libère un composant coloré suivi par une
spectroscopie. L'ELISA est une technique biochimique, principalement utilisée en
immunologie, mais pas uniquement, afin de détecter la présence d'un anticorps ou d'un
antigène dans un échantillon.
La technique utilise un ou deux anticorps. L'un de ceux-ci est spécifique de l'antigène,
tandis que l'autre réagit aux complexes immuns (antigène-anticorps) et est couplé à une
enzyme (Figure 46).
Schéma d’un test ELISA en sandwich
Figure 46 : Différentes étapes d’un dosage ELISA.
Le procédé se déroule, dans ses grandes lignes, comme suit :
1. La plaque est recouverte d’un anticorps dit de capture.
2. L'échantillon contenant l'antigène est appliqué à la plaque et tout antigène présent se
lie à l’anticorps de capture.
3. L’anticorps de détection est ajouté et se lie à l’antigène.
4. Les anticorps secondaires conjugués à l'enzyme sont ajoutés. Ils se lient à
l’anticorps de détection.
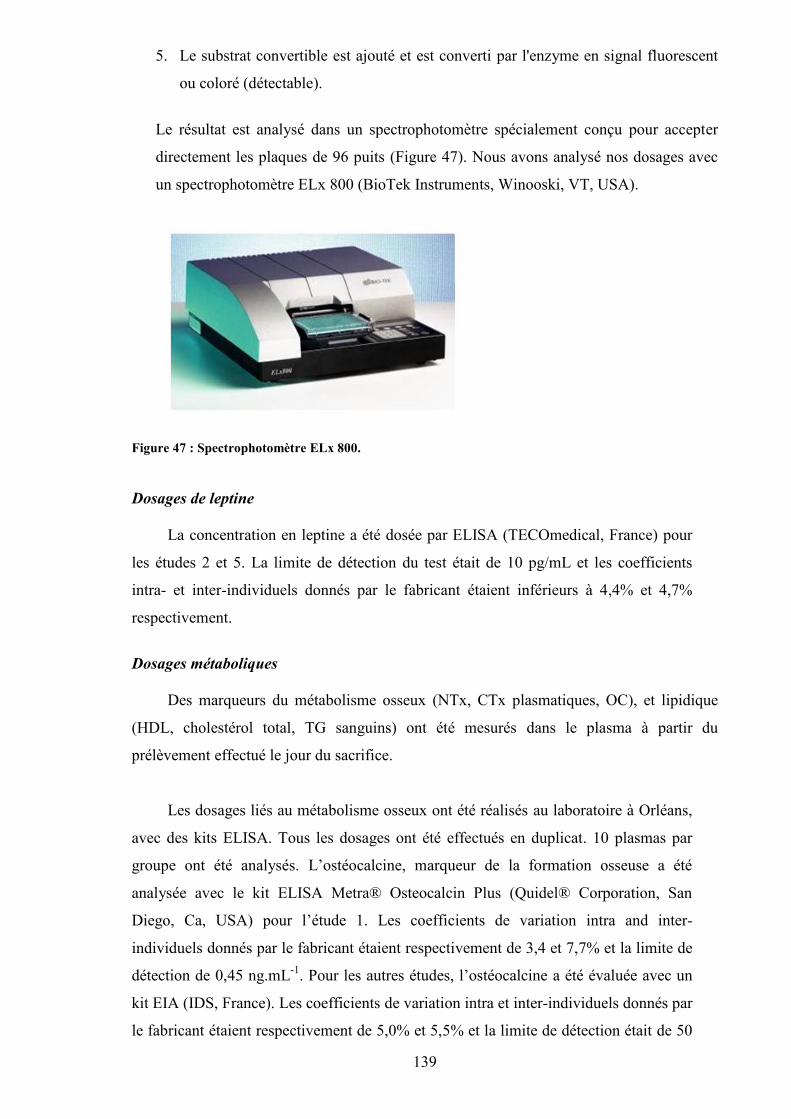
139
5. Le substrat convertible est ajouté et est converti par l'enzyme en signal fluorescent
ou coloré (détectable).
Le résultat est analysé dans un spectrophotomètre spécialement conçu pour accepter
directement les plaques de 96 puits (Figure 47). Nous avons analysé nos dosages avec
un spectrophotomètre ELx 800 (BioTek Instruments, Winooski, VT, USA).
Figure 47 : Spectrophotomètre ELx 800.
Dosages de leptine
La concentration en leptine a été dosée par ELISA (TECOmedical, France) pour
les études 2 et 5. La limite de détection du test était de 10 pg/mL et les coefficients
intra- et inter-individuels donnés par le fabricant étaient inférieurs à 4,4% et 4,7%
respectivement.
Dosages métaboliques
Des marqueurs du métabolisme osseux (NTx, CTx plasmatiques, OC), et lipidique
(HDL, cholestérol total, TG sanguins) ont été mesurés dans le plasma à partir du
prélèvement effectué le jour du sacrifice.
Les dosages liés au métabolisme osseux ont été réalisés au laboratoire à Orléans,
avec des kits ELISA. Tous les dosages ont été effectués en duplicat. 10 plasmas par
groupe ont été analysés. L’ostéocalcine, marqueur de la formation osseuse a été
analysée avec le kit ELISA Metra® Osteocalcin Plus (Quidel® Corporation, San
Diego, Ca, USA) pour l’étude 1. Les coefficients de variation intra and inter-
individuels donnés par le fabricant étaient respectivement de 3,4 et 7,7% et la limite de
détection de 0,45 ng.mL-1. Pour les autres études, l’ostéocalcine a été évaluée avec un
kit EIA (IDS, France). Les coefficients de variation intra et inter-individuels donnés par
le fabricant étaient respectivement de 5,0% et 5,5% et la limite de détection était de 50
140
ng.mL-1. La résorption osseuse a été analysée en étudiant la concentration plasmatique
en télopeptides du collagène de type II (CTx) pour l’étude 1 avec le kit ELISA
RatLapsTM ELISA (Nordic Bioscience, Herlev, Danemark). Les coefficients de
variation intra and inter-individuels donnés par le fabricant étaient respectivement de
9,2 et 14,9 % et la limite de détection était de 2,0 ng.mL-1. Les concentrations en N-
terminal télopeptide collagénique de type I (NTx) ont été étudiées dans les autres
études avec le kit Osteomark® (TECOmedical, France). Les coefficients de variation
intra- et inter-individuels donnés par le kit étaient 4,6 et 6,9% respectivement et la
limite de détection était 3,2 nM Equivalents Collagène Osseux/L (nM ECO/L).
Les concentrations plasmatiques en triglycérides, cholestérol et cholestérol HDL
ont été mesurées par enzymo colorimétrie dans le laboratoire de biochimie et
toxicologie du CHU de Poitiers. Les coefficients de variation étaient de 0,85% et la
limite de détection était de 0,05 mmol/L.
G. Analyse cellulaire par microscopie
Préparation des échantillons pour l’histologie
Après avoir été fixés entiers avec de la formaline pendant 4 jours, les tibias des rats
des études 3 et 5 ont été placés dans de l’éthanol 70% pendant une semaine puis dans de
l’éthanol 50%. Des coupes transversales d’une épaisseur d’environ 400 µm ont ensuite été
réalisées sur la partie supérieure de la diaphyse du tibia, avec un outil multifonction
rotatoire (Dremel 300, Dremel, USA). Les coupes ont été décalcifiées dans de l’EDTA 177
g/L, pH 7,0-7,3 (molarité 0,61 mol/L) (Osteosoft, Merck KGaA, Darmstadt, Allemagne)
pendant 24h avant d’être colorées. Deux coupes ont été marquées avec des anticorps
primaires et secondaires pour la microscopie en épifluorescence. D’autres coupes
transversales ont été préparées pour la microscopie à fond clair (protocole décrit ci-après).
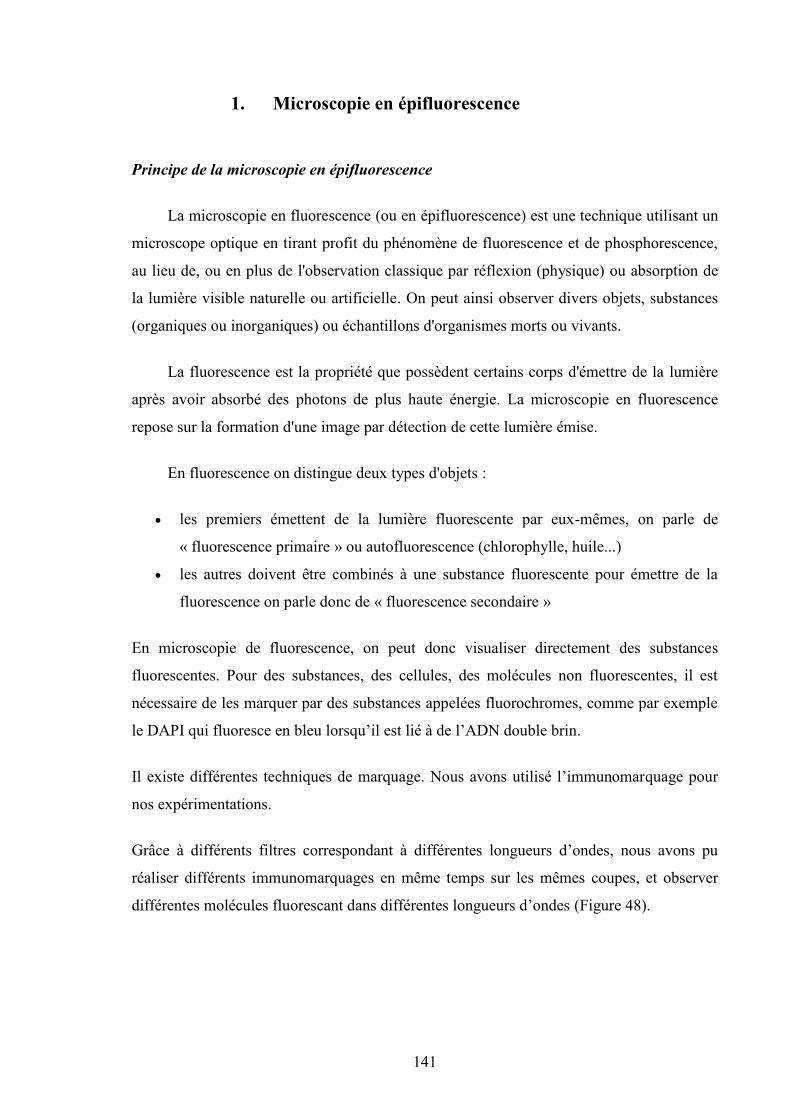
141
1. Microscopie en épifluorescence
Principe de la microscopie en épifluorescence
La microscopie en fluorescence (ou en épifluorescence) est une technique utilisant un
microscope optique en tirant profit du phénomène de fluorescence et de phosphorescence,
au lieu de, ou en plus de l'observation classique par réflexion (physique) ou absorption de
la lumière visible naturelle ou artificielle. On peut ainsi observer divers objets, substances
(organiques ou inorganiques) ou échantillons d'organismes morts ou vivants.
La fluorescence est la propriété que possèdent certains corps d'émettre de la lumière
après avoir absorbé des photons de plus haute énergie. La microscopie en fluorescence
repose sur la formation d'une image par détection de cette lumière émise.
En fluorescence on distingue deux types d'objets :
les premiers émettent de la lumière fluorescente par eux-mêmes, on parle de
« fluorescence primaire » ou autofluorescence (chlorophylle, huile...)
les autres doivent être combinés à une substance fluorescente pour émettre de la
fluorescence on parle donc de « fluorescence secondaire »
En microscopie de fluorescence, on peut donc visualiser directement des substances
fluorescentes. Pour des substances, des cellules, des molécules non fluorescentes, il est
nécessaire de les marquer par des substances appelées fluorochromes, comme par exemple
le DAPI qui fluoresce en bleu lorsqu’il est lié à de l’ADN double brin.
Il existe différentes techniques de marquage. Nous avons utilisé l’immunomarquage pour
nos expérimentations.
Grâce à différents filtres correspondant à différentes longueurs d’ondes, nous avons pu
réaliser différents immunomarquages en même temps sur les mêmes coupes, et observer
différentes molécules fluorescant dans différentes longueurs d’ondes (Figure 48).
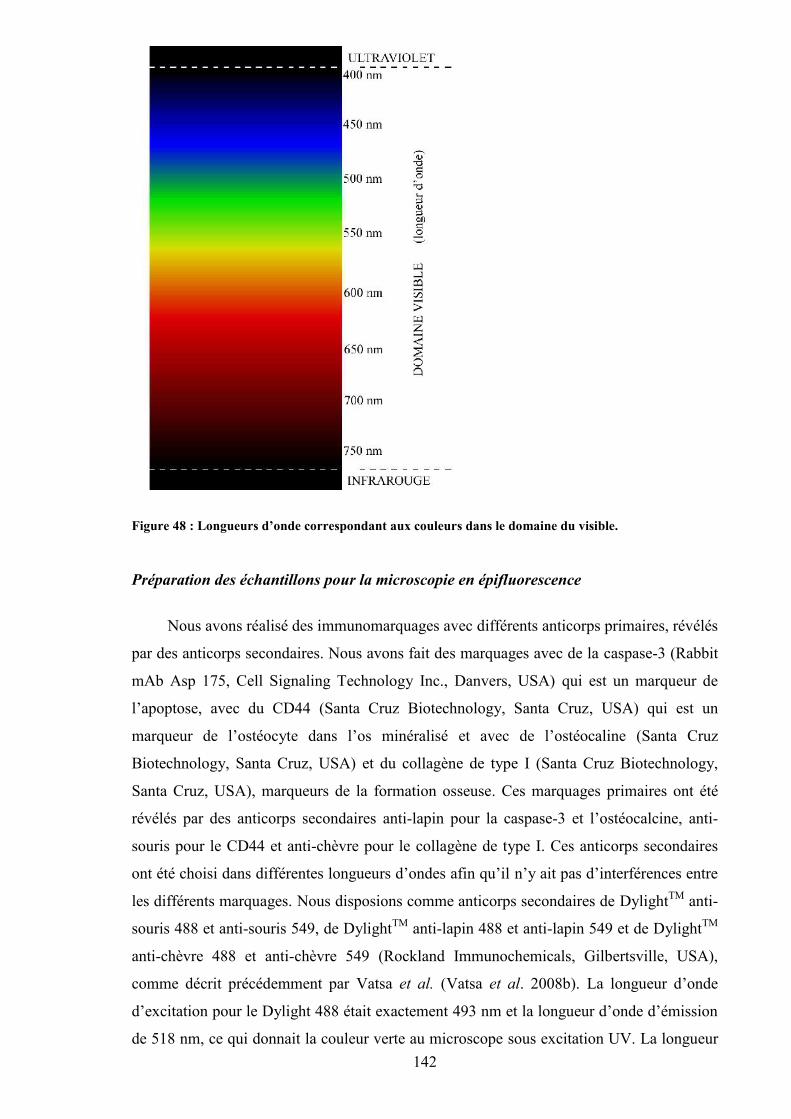
142
Figure 48 : Longueurs d’onde correspondant aux couleurs dans le domaine du visible.
Préparation des échantillons pour la microscopie en épifluorescence
Nous avons réalisé des immunomarquages avec différents anticorps primaires, révélés
par des anticorps secondaires. Nous avons fait des marquages avec de la caspase-3 (Rabbit
mAb Asp 175, Cell Signaling Technology Inc., Danvers, USA) qui est un marqueur de
l’apoptose, avec du CD44 (Santa Cruz Biotechnology, Santa Cruz, USA) qui est un
marqueur de l’ostéocyte dans l’os minéralisé et avec de l’ostéocaline (Santa Cruz
Biotechnology, Santa Cruz, USA) et du collagène de type I (Santa Cruz Biotechnology,
Santa Cruz, USA), marqueurs de la formation osseuse. Ces marquages primaires ont été
révélés par des anticorps secondaires anti-lapin pour la caspase-3 et l’ostéocalcine, anti-
souris pour le CD44 et anti-chèvre pour le collagène de type I. Ces anticorps secondaires
ont été choisi dans différentes longueurs d’ondes afin qu’il n’y ait pas d’interférences entre
les différents marquages. Nous disposions comme anticorps secondaires de DylightTM anti-
souris 488 et anti-souris 549, de DylightTM anti-lapin 488 et anti-lapin 549 et de DylightTM
anti-chèvre 488 et anti-chèvre 549 (Rockland Immunochemicals, Gilbertsville, USA),
comme décrit précédemment par Vatsa et al. (Vatsa et al. 2008b). La longueur d’onde
d’excitation pour le Dylight 488 était exactement 493 nm et la longueur d’onde d’émission
de 518 nm, ce qui donnait la couleur verte au microscope sous excitation UV. La longueur
143
d’onde d’excitation pour le Dylight 549 était précisément de 550 nm et la longueur
d’émission était de 568 nm, ce qui donnait la couleur rouge au microscope sous UV. Le
DAPI, marqueur nucléaire a été déposé sur les coupes juste avant de sceller les lames
concaves (Figure 49) et fluoresce en bleu.
Figure 49 : Lames concaves utilisées pour la microscopie en épifluorescence et la microscopie confocale.
Acquisition des images
Les images des ostéocytes en microscopie en épifluorescence ont été réalisées avec
une caméra Motic AE21 attachée à un microscope Microvision. Le zoom était de 10X.
Cinq régions d’intérêt (ROI) ont été imagées pour chaque rat (7 par groupe), à différents
endroits de l’os cortical. La taille de chaque ROI était d’environ 300000 µm2. Ainsi, la
taille totale d’os cortical analysé était de 1,5 mm2 pour chaque animal. Des images des
marquages avec la caspase-3, le CD44, l’ostéocalcine, le collagène de type I et le DAPI ont
été réalisées dans chaque ROI. Les images ont été analysées avec le logiciel Image J. Le
nombre de cellules marquées avec la caspase-3, le CD44, l’ostéocalcine, le collagène de
type I et le DAPI par mm2 dans chaque ROI a été calculé.
2. Microscopie en fond clair de l’os cortical
Préparation des coupes pour la microscopie à fond clair
10 rats (5 dans chacun des groupes de l’étude 3) ont servi à l’analyse en microscopie
à fond clair. Des morceaux de tibia ont été fixées dans de la paraffine et coupées au
microtome (1 micron d’épaisseur), au département des Microscopies de la faculté de
médecine de Tours. Les sections ont ensuite été colorées une minute à température
ambiante avec une solution standard de bleu de toluidine, comme décrit par Trump et al.
(Trump et al. 1961), avec modifications (Figure 50). Après cela, les sections ont été
séquentiellement lavées 20 sec dans de l’eau distillée, 20 sec dans de l’éthanol 96%, et
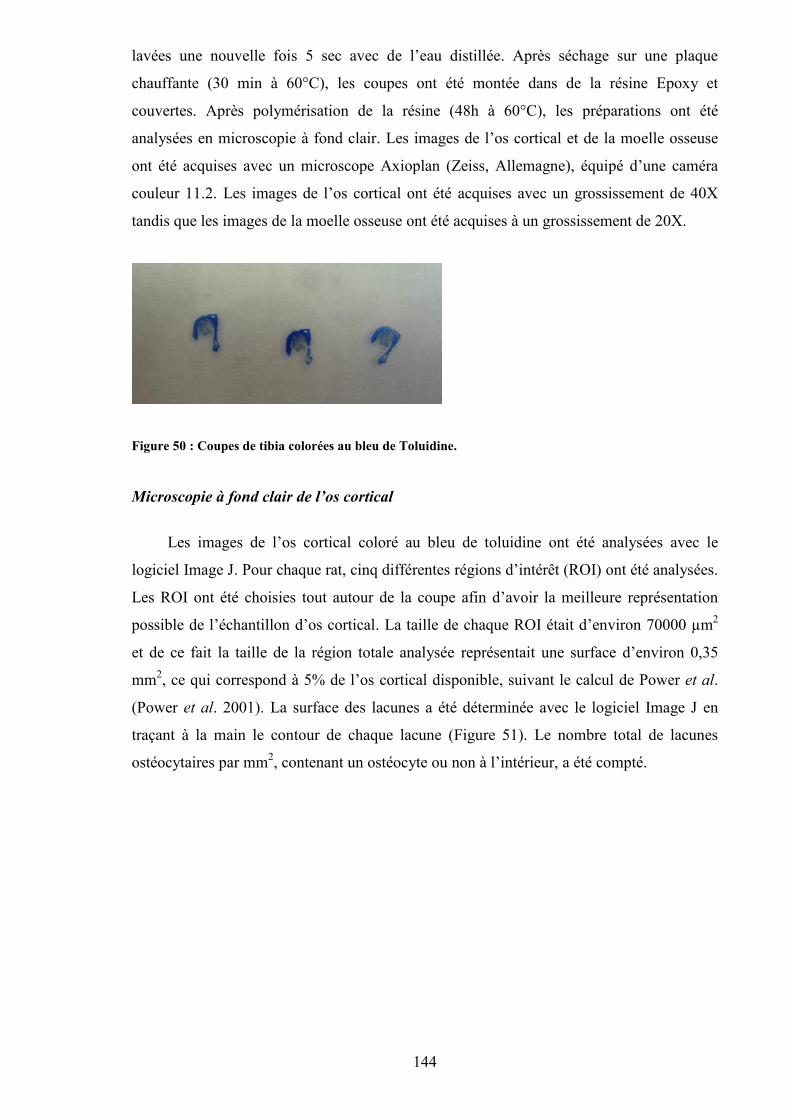
144
lavées une nouvelle fois 5 sec avec de l’eau distillée. Après séchage sur une plaque
chauffante (30 min à 60°C), les coupes ont été montée dans de la résine Epoxy et
couvertes. Après polymérisation de la résine (48h à 60°C), les préparations ont été
analysées en microscopie à fond clair. Les images de l’os cortical et de la moelle osseuse
ont été acquises avec un microscope Axioplan (Zeiss, Allemagne), équipé d’une caméra
couleur 11.2. Les images de l’os cortical ont été acquises avec un grossissement de 40X
tandis que les images de la moelle osseuse ont été acquises à un grossissement de 20X.
Figure 50 : Coupes de tibia colorées au bleu de Toluidine.
Microscopie à fond clair de l’os cortical
Les images de l’os cortical coloré au bleu de toluidine ont été analysées avec le
logiciel Image J. Pour chaque rat, cinq différentes régions d’intérêt (ROI) ont été analysées.
Les ROI ont été choisies tout autour de la coupe afin d’avoir la meilleure représentation
possible de l’échantillon d’os cortical. La taille de chaque ROI était d’environ 70000 µm2
et de ce fait la taille de la région totale analysée représentait une surface d’environ 0,35
mm2, ce qui correspond à 5% de l’os cortical disponible, suivant le calcul de Power et al.
(Power et al. 2001). La surface des lacunes a été déterminée avec le logiciel Image J en
traçant à la main le contour de chaque lacune (Figure 51). Le nombre total de lacunes
ostéocytaires par mm2, contenant un ostéocyte ou non à l’intérieur, a été compté.
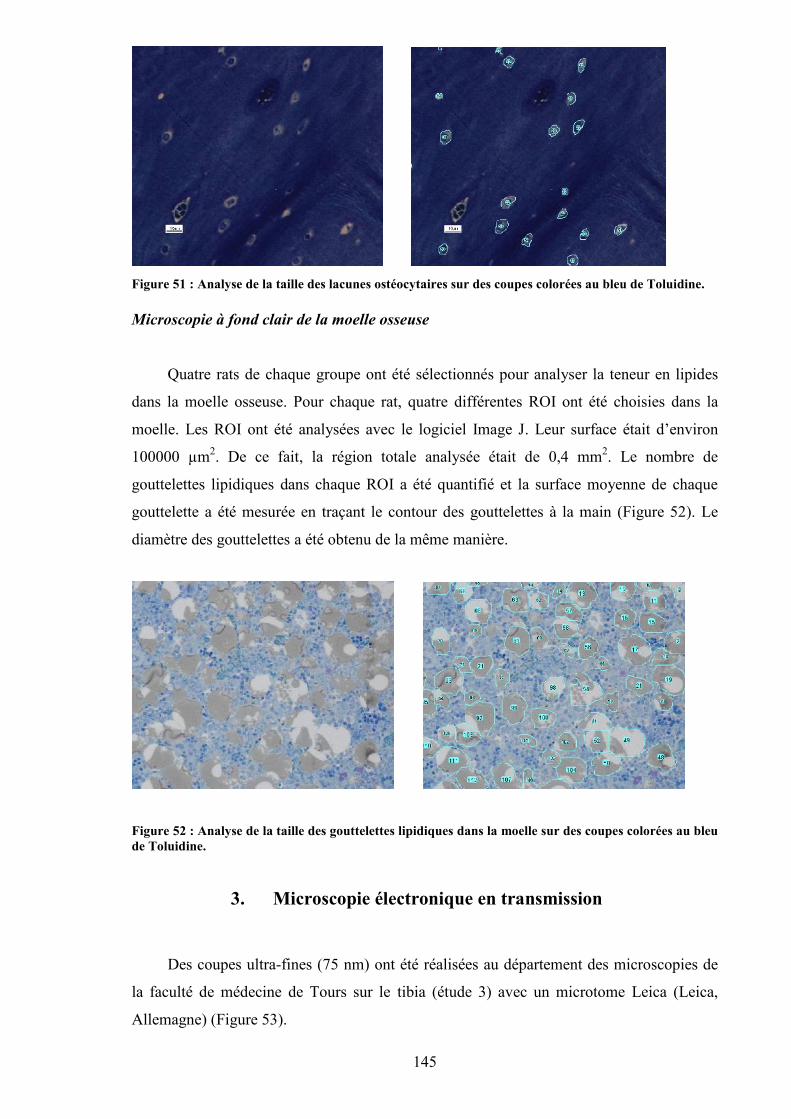
145
Figure 51 : Analyse de la taille des lacunes ostéocytaires sur des coupes colorées au bleu de Toluidine.
Microscopie à fond clair de la moelle osseuse
Quatre rats de chaque groupe ont été sélectionnés pour analyser la teneur en lipides
dans la moelle osseuse. Pour chaque rat, quatre différentes ROI ont été choisies dans la
moelle. Les ROI ont été analysées avec le logiciel Image J. Leur surface était d’environ
100000 µm2. De ce fait, la région totale analysée était de 0,4 mm2. Le nombre de
gouttelettes lipidiques dans chaque ROI a été quantifié et la surface moyenne de chaque
gouttelette a été mesurée en traçant le contour des gouttelettes à la main (Figure 52). Le
diamètre des gouttelettes a été obtenu de la même manière.
Figure 52 : Analyse de la taille des gouttelettes lipidiques dans la moelle sur des coupes colorées au bleude Toluidine.
3. Microscopie électronique en transmission
Des coupes ultra-fines (75 nm) ont été réalisées au département des microscopies de
la faculté de médecine de Tours sur le tibia (étude 3) avec un microtome Leica (Leica,
Allemagne) (Figure 53).
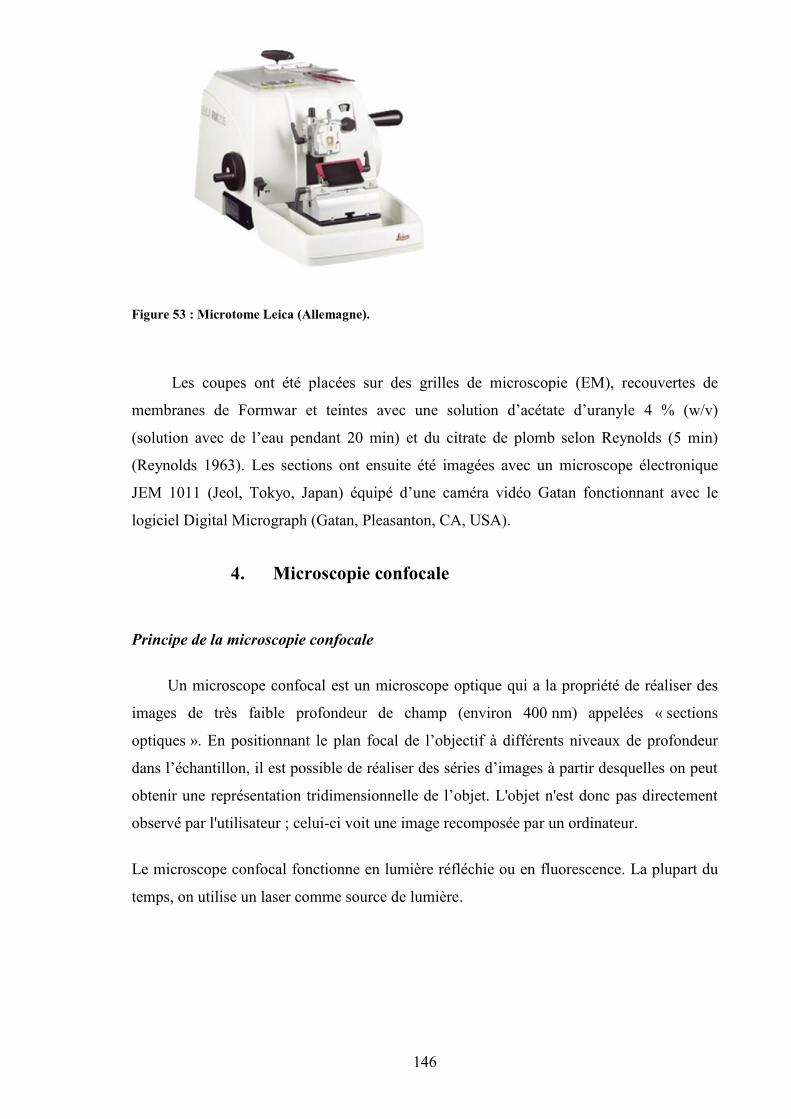
146
Figure 53 : Microtome Leica (Allemagne).
Les coupes ont été placées sur des grilles de microscopie (EM), recouvertes de
membranes de Formwar et teintes avec une solution d’acétate d’uranyle 4 % (w/v)
(solution avec de l’eau pendant 20 min) et du citrate de plomb selon Reynolds (5 min)
(Reynolds 1963). Les sections ont ensuite été imagées avec un microscope électronique
JEM 1011 (Jeol, Tokyo, Japan) équipé d’une caméra vidéo Gatan fonctionnant avec le
logiciel Digital Micrograph (Gatan, Pleasanton, CA, USA).
4. Microscopie confocale
Principe de la microscopie confocale
Un microscope confocal est un microscope optique qui a la propriété de réaliser des
images de très faible profondeur de champ (environ 400 nm) appelées « sections
optiques ». En positionnant le plan focal de l’objectif à différents niveaux de profondeur
dans l’échantillon, il est possible de réaliser des séries d’images à partir desquelles on peut
obtenir une représentation tridimensionnelle de l’objet. L'objet n'est donc pas directement
observé par l'utilisateur ; celui-ci voit une image recomposée par un ordinateur.
Le microscope confocal fonctionne en lumière réfléchie ou en fluorescence. La plupart du
temps, on utilise un laser comme source de lumière.
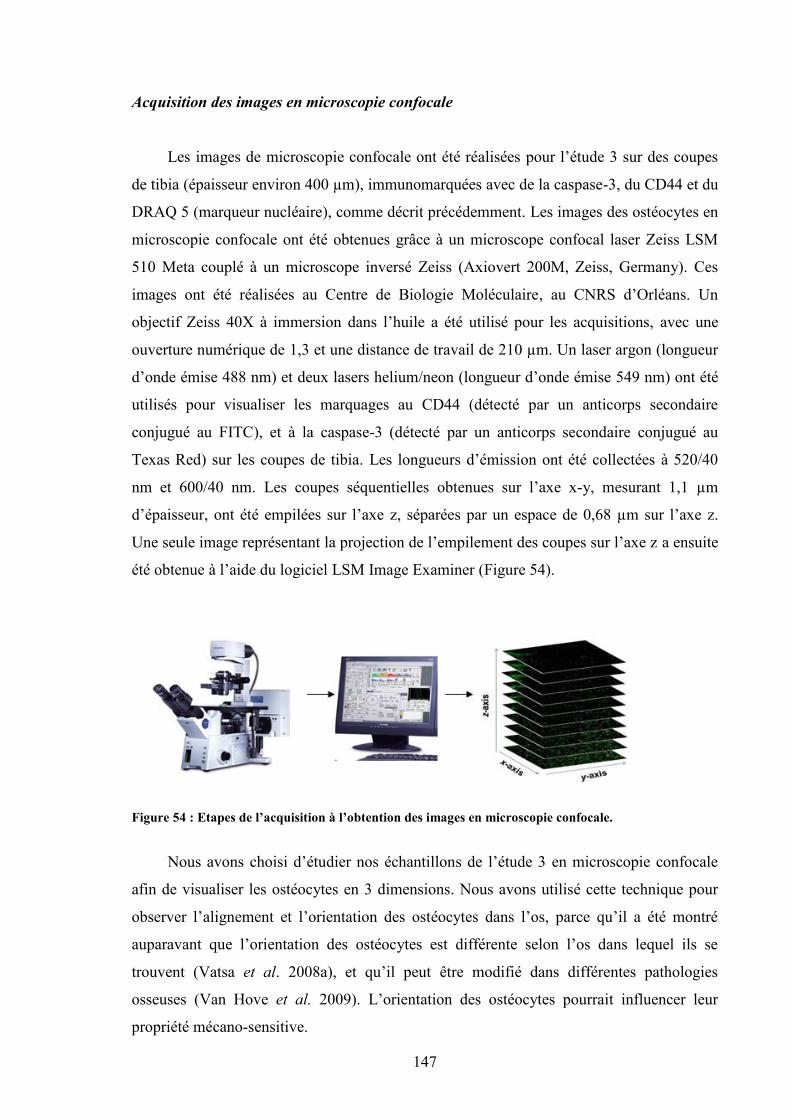
147
Acquisition des images en microscopie confocale
Les images de microscopie confocale ont été réalisées pour l’étude 3 sur des coupes
de tibia (épaisseur environ 400 µm), immunomarquées avec de la caspase-3, du CD44 et du
DRAQ 5 (marqueur nucléaire), comme décrit précédemment. Les images des ostéocytes en
microscopie confocale ont été obtenues grâce à un microscope confocal laser Zeiss LSM
510 Meta couplé à un microscope inversé Zeiss (Axiovert 200M, Zeiss, Germany). Ces
images ont été réalisées au Centre de Biologie Moléculaire, au CNRS d’Orléans. Un
objectif Zeiss 40X à immersion dans l’huile a été utilisé pour les acquisitions, avec une
ouverture numérique de 1,3 et une distance de travail de 210 µm. Un laser argon (longueur
d’onde émise 488 nm) et deux lasers helium/neon (longueur d’onde émise 549 nm) ont été
utilisés pour visualiser les marquages au CD44 (détecté par un anticorps secondaire
conjugué au FITC), et à la caspase-3 (détecté par un anticorps secondaire conjugué au
Texas Red) sur les coupes de tibia. Les longueurs d’émission ont été collectées à 520/40
nm et 600/40 nm. Les coupes séquentielles obtenues sur l’axe x-y, mesurant 1,1 µm
d’épaisseur, ont été empilées sur l’axe z, séparées par un espace de 0,68 µm sur l’axe z.
Une seule image représentant la projection de l’empilement des coupes sur l’axe z a ensuite
été obtenue à l’aide du logiciel LSM Image Examiner (Figure 54).
Figure 54 : Etapes de l’acquisition à l’obtention des images en microscopie confocale.
Nous avons choisi d’étudier nos échantillons de l’étude 3 en microscopie confocale
afin de visualiser les ostéocytes en 3 dimensions. Nous avons utilisé cette technique pour
observer l’alignement et l’orientation des ostéocytes dans l’os, parce qu’il a été montré
auparavant que l’orientation des ostéocytes est différente selon l’os dans lequel ils se
trouvent (Vatsa et al. 2008a), et qu’il peut être modifié dans différentes pathologies
osseuses (Van Hove et al. 2009). L’orientation des ostéocytes pourrait influencer leur
propriété mécano-sensitive.
148
VI. Statistiques
Les statistiques des études 1 à 5 ont été réalisées avec le logiciel Statview. Toutes les
données des paramètres osseux (DMO, microarchitecture, résistance osseuse) sont
exprimées sous forme de moyenne, plus ou moins l’écart-type (Sorensen et al.). Toutes les
données métaboliques sont exprimées sous forme de moyenne, plus ou moins l’erreur
standard à la moyenne (SEM).
La normalité de la distribution des valeurs pour chaque paramètre et pour chaque
groupe a été testée avec le test de Shapiro-Wilk. L’homogénéité des variances a été vérifiée
avec le test F de Fisher.
Quand les conditions de normalité et d’homogénéité étaient réunies, une ANOVA a
été menée. Lorsque les conditions de normalité et d’homogénéité n’étaient pas réunies, des
tests non paramétriques ont été choisis (un test de Kruskal-Wallis, suivi du test de Mann et
Whitney lorsqu’il existait des différences significatives).
Une ANOVA à deux voies a été menée pour étudier les effets combinés de l’alcool et
de l’exercice sur les paramètres osseux et la composition corporelle. Lorsqu’il y avait un
effet de l’exercice, de l’alcool ou un effet combiné alcool × exercice, une analyse post-hoc
a été menée (test de Tukey). Les corrélations ont été réalisées par le test de Spearman en
non paramétrique et par le test de Pearson en paramétrique. Pour l’ensemble des études, la
significativité est acceptée pour des valeurs de p strictement inférieures à 0,05.
149
ETUDE 1 : EFFETS COMBINES D’UNECONSOMMATION CHRONIQUE ET
MODEREE D’ALCOOL ET DE L’EXERCICEPHYSIQUE SUR LE METABOLISME
OSSEUX CHEZ LE RAT.
Cette étude a donné lieu à :
- la publication d’un article original :
Maurel DB, Boisseau N, Ingrand I, Dolleans E, Benhamou CL, Jaffré C. Combined effectsof chronic alcohol consumption and physical activity on bone health. Study in a rat model.European Journal of Applied Physiology (2011), 111(12):2931-40. IF (2010)= 2.214
- des présentations lors de congrès nationaux et internationaux :
Présentations orales :
Maurel DB, Boisseau N, Benhamou CL, Jaffré C. Alcoolisme et exercice physique : effetsd’une consommation chronique d’alcool sur le contenu minéral osseux, la masse osseuse,l’architecture osseuse et le métabolisme osseux chez le rat. Institut de RechercheScientifique sur les Boissons (IREB), Paris, Décembre 2008.
Maurel DB, Boisseau N, Dolleans E, Benhamou CL, Jaffré C. Alcoholism and exercise:effects of chronic alcohol consumption on bone mineral content, density, bone microarchitecture and bone remodelling in the rat. European Society for Biomedical Research onAlcoholism (ESBRA), Helsinki, Finlande, Juin 2009.
Communications affichées :
Maurel DB, Rochefort GY, Boisseau N, Benhamou CL, Jaffré C. Bone micro-architecture,mineral density and content in rats femurs after a period of chronic alcohol abuse.International Bone Densitometry Workshop (IBDW), Foggia, Italy, Juin 2008.
Maurel DB, Rochefort GY, Boisseau N, Lespessailles E, Benahmou CL, Jaffré C. Bonemetabolism, micro-architecture and densitometric measurement in rat femur after chronicalcohol consumption. American Society for Bone and Mineral Research (ASBMR),Montreal, Septembre 2008.> Proceeding publié dans JBMR 2008, M239-S432.
Maurel DB, Boisseau N, Benhamou CL, Jaffré C. Influence of endurance training on boneparameters in alcoholised rats. Pharmacologie, Physiologie et Thérapeuthique (P2T),Marseille, Avril 2009.
150
I. Introduction
Les jeunes consomment de plus en plus d’alcool dans nos sociétés modernes. Les
adolescents pratiquant une activité physique régulière ne font pas exception. Il a
notamment été rapporté une corrélation entre la pratique sportive en équipe et la
consommation d’alcool (Martens et al. 2006; Maughan 2006). Il a aussi été montré que les
sportifs de haut-niveau (sports collectifs) boivent de l’alcool de façon plus dangereuse que
les non sportifs et que les sportifs de sports individuels (Brenner et Swanik 2007; Ford
2007; Martens et al. 2006). Les effets bénéfiques d’une activité physique régulière sur la
DMO sont bien connus, notamment dans le cas d’activités à impacts (judo, gymnastique).
Elle entraîne un gain de DMO qui peut persister tout au long de la vie. Cependant, la
consommation chronique d’alcool peut avoir des effets délétères sur le tissu osseux
(Sampson et al. 1998; Turner 2000). Les effets combinés de la consommation chronique
d’alcool et de la pratique physique régulière sont peu connus. Une seule étude a analysé si
l’occurrence des fractures de fatigue était augmentée en combinant l’alcool à l’exercice,
dans un modèle de consommation abusive d’alcool (35% de l’apport énergétique total
quotidien - AETQ) chez le rat (Reed et al. 2002). Cette étude n’a pas pu mettre en évidence
d’effets de l’exercice sur le tissu osseux, mais a observé une diminution de la formation
osseuse, et de l’épaisseur des travées osseuses au niveau de la métaphyse du tibia suite à
l’absorption d’alcool.
II. Objectif étude 1
Le but de cette étude a été d’analyser les effets combinés d’une alcoolisation
chronique progressive modérée (jusqu’à 20% de l’AETQ) et d’un entraînement régulier,
afin d’étudier les possibles effets préventifs de l’exercice physique chez le rat.
III. Méthodologie spécifique
48 rats âgés de 8 semaines ont été répartis en 4 groupes. Les rats des groupes alcool
(A) et alcool+exercice (AE) ont été alcoolisés progressivement durant 6 semaines de 8%
volume/volume jusqu’à 20% volume/volume, dose ensuite consommée pendant 2
semaines. Les groupes exercice (E) et alcool+exercice (AE) ont été entraînés sur tapis
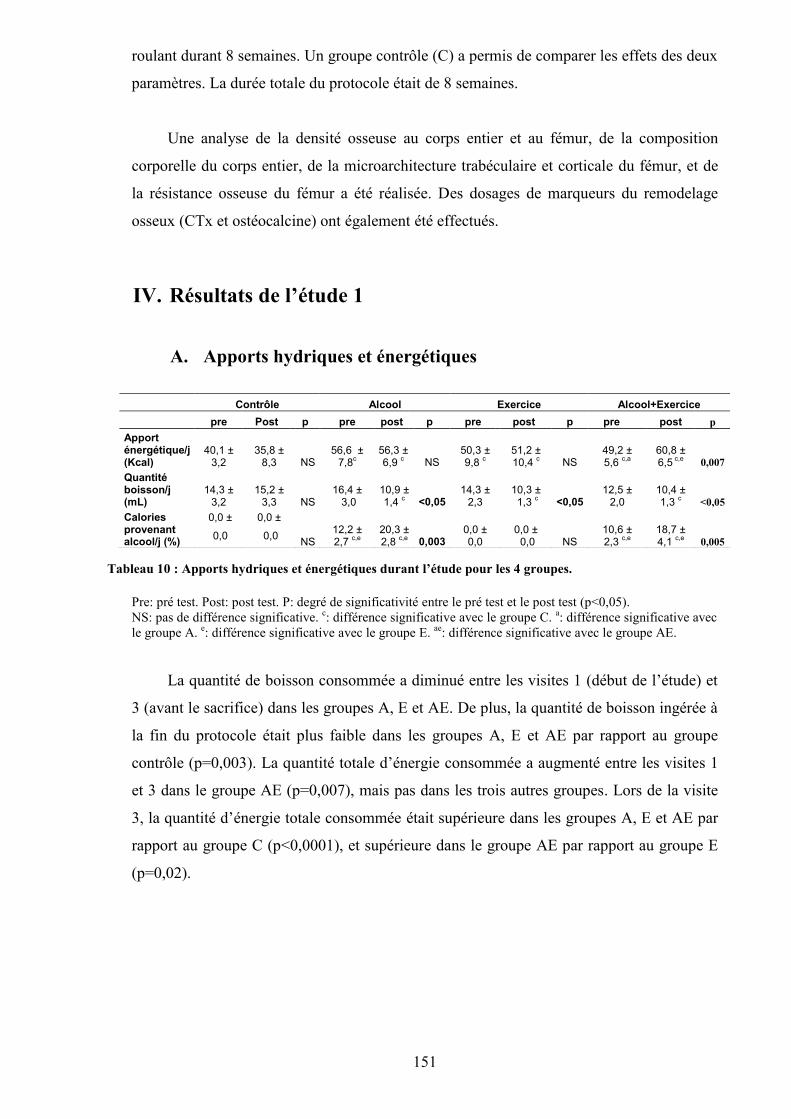
151
roulant durant 8 semaines. Un groupe contrôle (C) a permis de comparer les effets des deux
paramètres. La durée totale du protocole était de 8 semaines.
Une analyse de la densité osseuse au corps entier et au fémur, de la composition
corporelle du corps entier, de la microarchitecture trabéculaire et corticale du fémur, et de
la résistance osseuse du fémur a été réalisée. Des dosages de marqueurs du remodelage
osseux (CTx et ostéocalcine) ont également été effectués.
IV. Résultats de l’étude 1
A. Apports hydriques et énergétiques
Pre: pré test. Post: post test. P: degré de significativité entre le pré test et le post test (p<0,05).NS: pas de différence significative. c: différence significative avec le groupe C. a: différence significative avecle groupe A. e: différence significative avec le groupe E. ae: différence significative avec le groupe AE.
La quantité de boisson consommée a diminué entre les visites 1 (début de l’étude) et
3 (avant le sacrifice) dans les groupes A, E et AE. De plus, la quantité de boisson ingérée à
la fin du protocole était plus faible dans les groupes A, E et AE par rapport au groupe
contrôle (p=0,003). La quantité totale d’énergie consommée a augmenté entre les visites 1
et 3 dans le groupe AE (p=0,007), mais pas dans les trois autres groupes. Lors de la visite
3, la quantité d’énergie totale consommée était supérieure dans les groupes A, E et AE par
rapport au groupe C (p<0,0001), et supérieure dans le groupe AE par rapport au groupe E
(p=0,02).
Contrôle Alcool Exercice Alcool+Exercicepre Post p pre post p pre post p pre post p
Apporténergétique/j(Kcal)
40,1 ±3,2
35,8 ±8,3 NS
56,6 ±7,8c
56,3 ±6,9 c NS
50,3 ±9,8 c
51,2 ±10,4 c NS
49,2 ±5,6 c,a
60,8 ±6,5 c,e 0,007
Quantitéboisson/j(mL)
14,3 ±3,2
15,2 ±3,3 NS
16,4 ± 3,0
10,9 ±1,4 c <0,05
14,3 ±2,3
10,3 ± 1,3 c <0,05
12,5 ±2,0
10,4 ±1,3 c <0,05
Caloriesprovenantalcool/j (%)
0,0 ±
0,0
0,0 ±
0,0 NS12,2 ±2,7 c,e
20,3 ±2,8 c,e 0,003
0,0 ±0,0
0,0 ± 0,0 NS
10,6 ±2,3 c,e
18,7 ±4,1 c,e 0,005
Tableau 10 : Apports hydriques et énergétiques durant l’étude pour les 4 groupes.
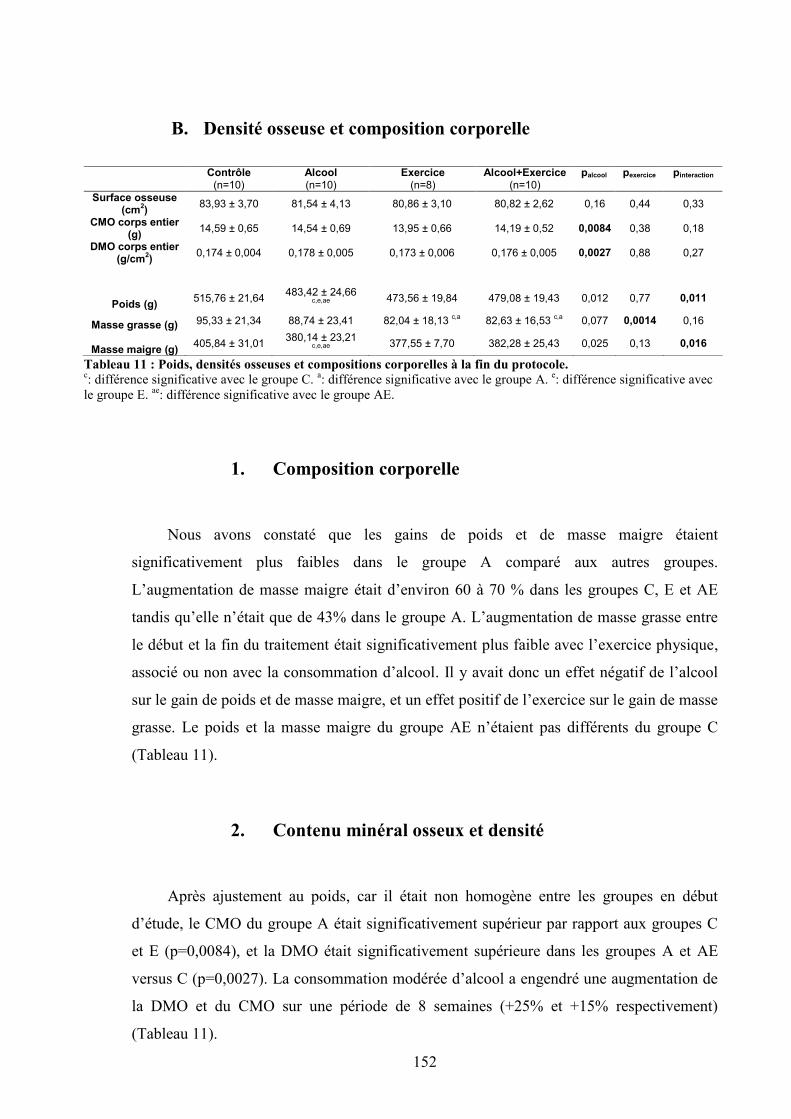
152
B. Densité osseuse et composition corporelle
Tableau 11 : Poids, densités osseuses et compositions corporelles à la fin du protocole.c: différence significative avec le groupe C. a: différence significative avec le groupe A. e: différence significative avecle groupe E. ae: différence significative avec le groupe AE.
1. Composition corporelle
Nous avons constaté que les gains de poids et de masse maigre étaient
significativement plus faibles dans le groupe A comparé aux autres groupes.
L’augmentation de masse maigre était d’environ 60 à 70 % dans les groupes C, E et AE
tandis qu’elle n’était que de 43% dans le groupe A. L’augmentation de masse grasse entre
le début et la fin du traitement était significativement plus faible avec l’exercice physique,
associé ou non avec la consommation d’alcool. Il y avait donc un effet négatif de l’alcool
sur le gain de poids et de masse maigre, et un effet positif de l’exercice sur le gain de masse
grasse. Le poids et la masse maigre du groupe AE n’étaient pas différents du groupe C
(Tableau 11).
2. Contenu minéral osseux et densité
Après ajustement au poids, car il était non homogène entre les groupes en début
d’étude, le CMO du groupe A était significativement supérieur par rapport aux groupes C
et E (p=0,0084), et la DMO était significativement supérieure dans les groupes A et AE
versus C (p=0,0027). La consommation modérée d’alcool a engendré une augmentation de
la DMO et du CMO sur une période de 8 semaines (+25% et +15% respectivement)
(Tableau 11).
Contrôle(n=10)
Alcool(n=10)
Exercice(n=8)
Alcool+Exercice(n=10)
palcool pexercice pinteraction
Surface osseuse(cm2) 83,93 ± 3,70 81,54 ± 4,13 80,86 ± 3,10 80,82 ± 2,62 0,16 0,44 0,33
CMO corps entier(g) 14,59 ± 0,65 14,54 ± 0,69 13,95 ± 0,66 14,19 ± 0,52 0,0084 0,38 0,18
DMO corps entier(g/cm2) 0,174 ± 0,004 0,178 ± 0,005 0,173 ± 0,006 0,176 ± 0,005 0,0027 0,88 0,27
Poids (g) 515,76 ± 21,64 483,42 ± 24,66c,e,ae 473,56 ± 19,84 479,08 ± 19,43 0,012 0,77 0,011
Masse grasse (g) 95,33 ± 21,34 88,74 ± 23,41 82,04 ± 18,13 c,a 82,63 ± 16,53 c,a 0,077 0,0014 0,16
Masse maigre (g) 405,84 ± 31,01 380,14 ± 23,21c,e,ae 377,55 ± 7,70 382,28 ± 25,43 0,025 0,13 0,016
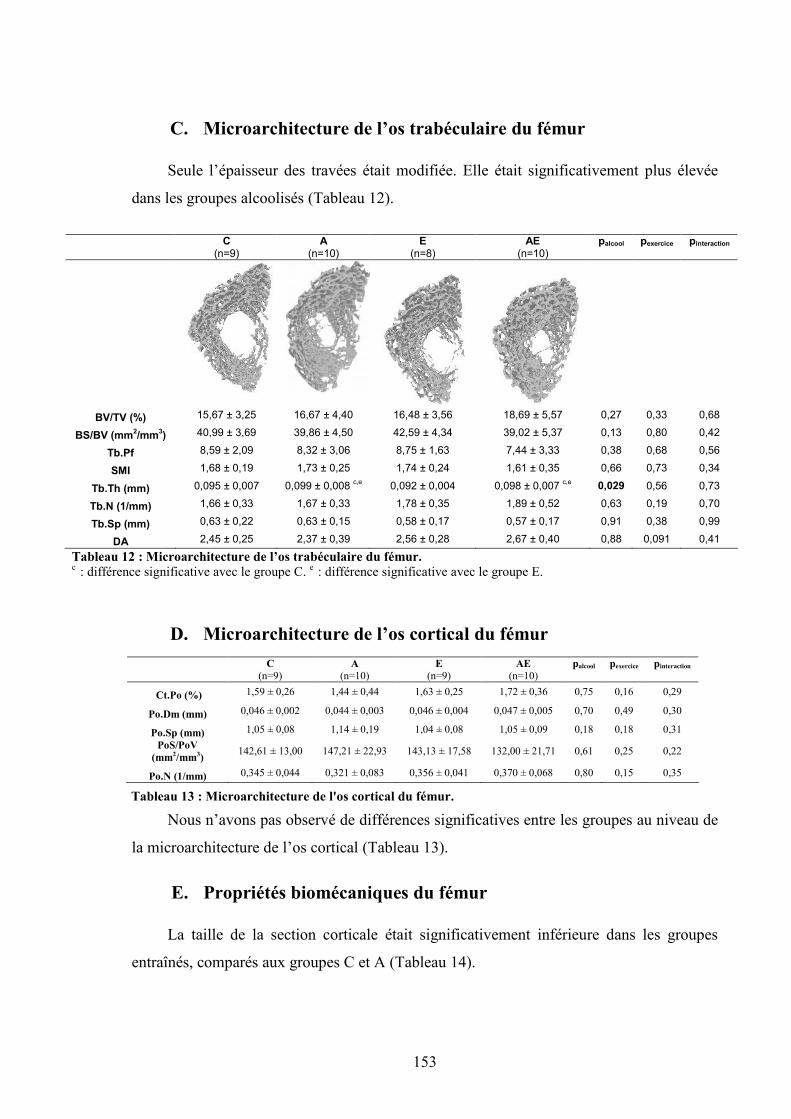
153
C. Microarchitecture de l’os trabéculaire du fémur
Seule l’épaisseur des travées était modifiée. Elle était significativement plus élevée
dans les groupes alcoolisés (Tableau 12).
C(n=9)
A(n=10)
E(n=8)
AE(n=10)
palcool pexercice pinteraction
BV/TV (%) 15,67 ± 3,25 16,67 ± 4,40 16,48 ± 3,56 18,69 ± 5,57 0,27 0,33 0,68
BS/BV (mm2/mm3) 40,99 ± 3,69 39,86 ± 4,50 42,59 ± 4,34 39,02 ± 5,37 0,13 0,80 0,42
Tb.Pf 8,59 ± 2,09 8,32 ± 3,06 8,75 ± 1,63 7,44 ± 3,33 0,38 0,68 0,56
SMI 1,68 ± 0,19 1,73 ± 0,25 1,74 ± 0,24 1,61 ± 0,35 0,66 0,73 0,34
Tb.Th (mm) 0,095 ± 0,007 0,099 ± 0,008 c,e 0,092 ± 0,004 0,098 ± 0,007 c,e 0,029 0,56 0,73
Tb.N (1/mm) 1,66 ± 0,33 1,67 ± 0,33 1,78 ± 0,35 1,89 ± 0,52 0,63 0,19 0,70
Tb.Sp (mm) 0,63 ± 0,22 0,63 ± 0,15 0,58 ± 0,17 0,57 ± 0,17 0,91 0,38 0,99
DA 2,45 ± 0,25 2,37 ± 0,39 2,56 ± 0,28 2,67 ± 0,40 0,88 0,091 0,41
Tableau 12 : Microarchitecture de l’os trabéculaire du fémur.c : différence significative avec le groupe C. e : différence significative avec le groupe E.
D. Microarchitecture de l’os cortical du fémur
Nous n’avons pas observé de différences significatives entre les groupes au niveau de
la microarchitecture de l’os cortical (Tableau 13).
E. Propriétés biomécaniques du fémur
La taille de la section corticale était significativement inférieure dans les groupes
entraînés, comparés aux groupes C et A (Tableau 14).
C(n=9)
A(n=10)
E(n=9)
AE(n=10)
palcool pexercice pinteraction
Ct.Po (%) 1,59 ± 0,26 1,44 ± 0,44 1,63 ± 0,25 1,72 ± 0,36 0,75 0,16 0,29
Po.Dm (mm) 0,046 ± 0,002 0,044 ± 0,003 0,046 ± 0,004 0,047 ± 0,005 0,70 0,49 0,30
Po.Sp (mm) 1,05 ± 0,08 1,14 ± 0,19 1,04 ± 0,08 1,05 ± 0,09 0,18 0,18 0,31PoS/PoV
(mm2/mm3) 142,61 ± 13,00 147,21 ± 22,93 143,13 ± 17,58 132,00 ± 21,71 0,61 0,25 0,22
Po.N (1/mm) 0,345 ± 0,044 0,321 ± 0,083 0,356 ± 0,041 0,370 ± 0,068 0,80 0,15 0,35
Tableau 13 : Microarchitecture de l'os cortical du fémur.
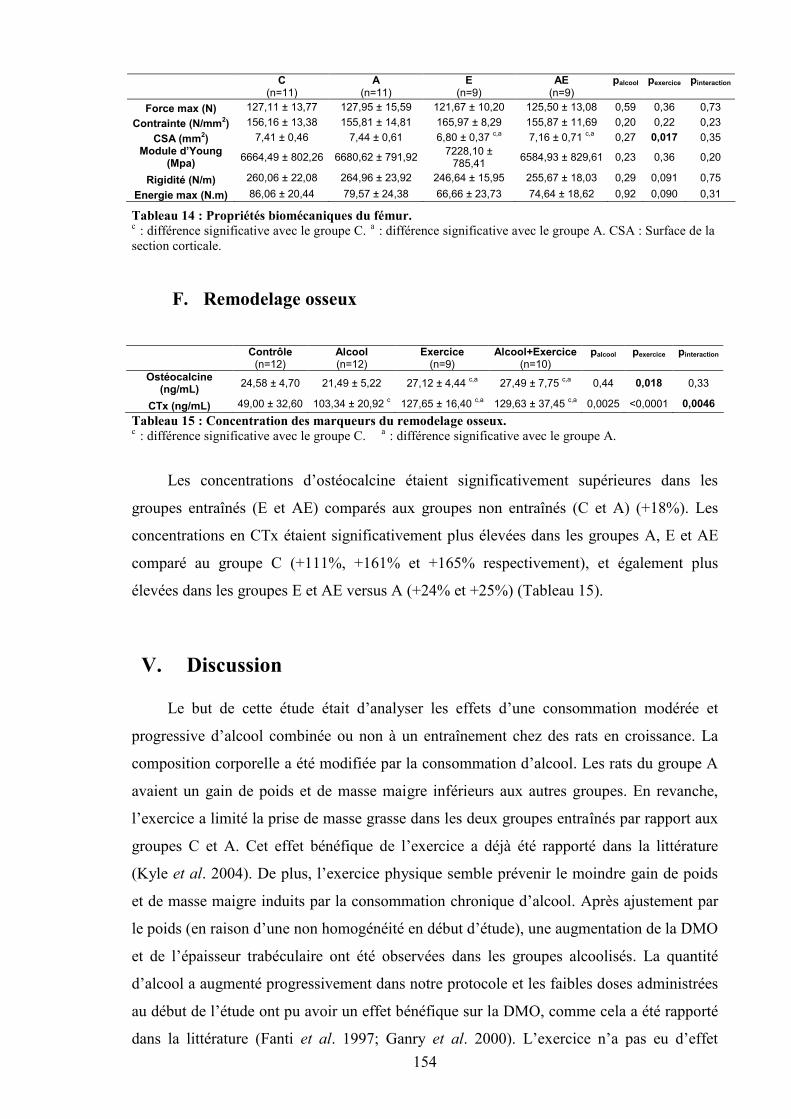
154
C(n=11)
A(n=11)
E(n=9)
AE(n=9)
palcool pexercice pinteraction
Force max (N) 127,11 ± 13,77 127,95 ± 15,59 121,67 ± 10,20 125,50 ± 13,08 0,59 0,36 0,73Contrainte (N/mm2) 156,16 ± 13,38 155,81 ± 14,81 165,97 ± 8,29 155,87 ± 11,69 0,20 0,22 0,23
CSA (mm2) 7,41 ± 0,46 7,44 ± 0,61 6,80 ± 0,37 c,a 7,16 ± 0,71 c,a 0,27 0,017 0,35Module d’Young
(Mpa) 6664,49 ± 802,26 6680,62 ± 791,92 7228,10 ±785,41 6584,93 ± 829,61 0,23 0,36 0,20
Rigidité (N/m) 260,06 ± 22,08 264,96 ± 23,92 246,64 ± 15,95 255,67 ± 18,03 0,29 0,091 0,75Energie max (N.m) 86,06 ± 20,44 79,57 ± 24,38 66,66 ± 23,73 74,64 ± 18,62 0,92 0,090 0,31
c : différence significative avec le groupe C. a : différence significative avec le groupe A. CSA : Surface de lasection corticale.
F. Remodelage osseux
Contrôle(n=12)
Alcool(n=12)
Exercice(n=9)
Alcool+Exercice(n=10)
palcool pexercice pinteraction
Ostéocalcine(ng/mL) 24,58 ± 4,70 21,49 ± 5,22 27,12 ± 4,44 c,a 27,49 ± 7,75 c,a 0,44 0,018 0,33
CTx (ng/mL) 49,00 ± 32,60 103,34 ± 20,92 c 127,65 ± 16,40 c,a 129,63 ± 37,45 c,a 0,0025 <0,0001 0,0046Tableau 15 : Concentration des marqueurs du remodelage osseux.c : différence significative avec le groupe C. a : différence significative avec le groupe A.
Les concentrations d’ostéocalcine étaient significativement supérieures dans les
groupes entraînés (E et AE) comparés aux groupes non entraînés (C et A) (+18%). Les
concentrations en CTx étaient significativement plus élevées dans les groupes A, E et AE
comparé au groupe C (+111%, +161% et +165% respectivement), et également plus
élevées dans les groupes E et AE versus A (+24% et +25%) (Tableau 15).
V. Discussion
Le but de cette étude était d’analyser les effets d’une consommation modérée et
progressive d’alcool combinée ou non à un entraînement chez des rats en croissance. La
composition corporelle a été modifiée par la consommation d’alcool. Les rats du groupe A
avaient un gain de poids et de masse maigre inférieurs aux autres groupes. En revanche,
l’exercice a limité la prise de masse grasse dans les deux groupes entraînés par rapport aux
groupes C et A. Cet effet bénéfique de l’exercice a déjà été rapporté dans la littérature
(Kyle et al. 2004). De plus, l’exercice physique semble prévenir le moindre gain de poids
et de masse maigre induits par la consommation chronique d’alcool. Après ajustement par
le poids (en raison d’une non homogénéité en début d’étude), une augmentation de la DMO
et de l’épaisseur trabéculaire ont été observées dans les groupes alcoolisés. La quantité
d’alcool a augmenté progressivement dans notre protocole et les faibles doses administrées
au début de l’étude ont pu avoir un effet bénéfique sur la DMO, comme cela a été rapporté
dans la littérature (Fanti et al. 1997; Ganry et al. 2000). L’exercice n’a pas eu d’effet
Tableau 14 : Propriétés biomécaniques du fémur.
OC
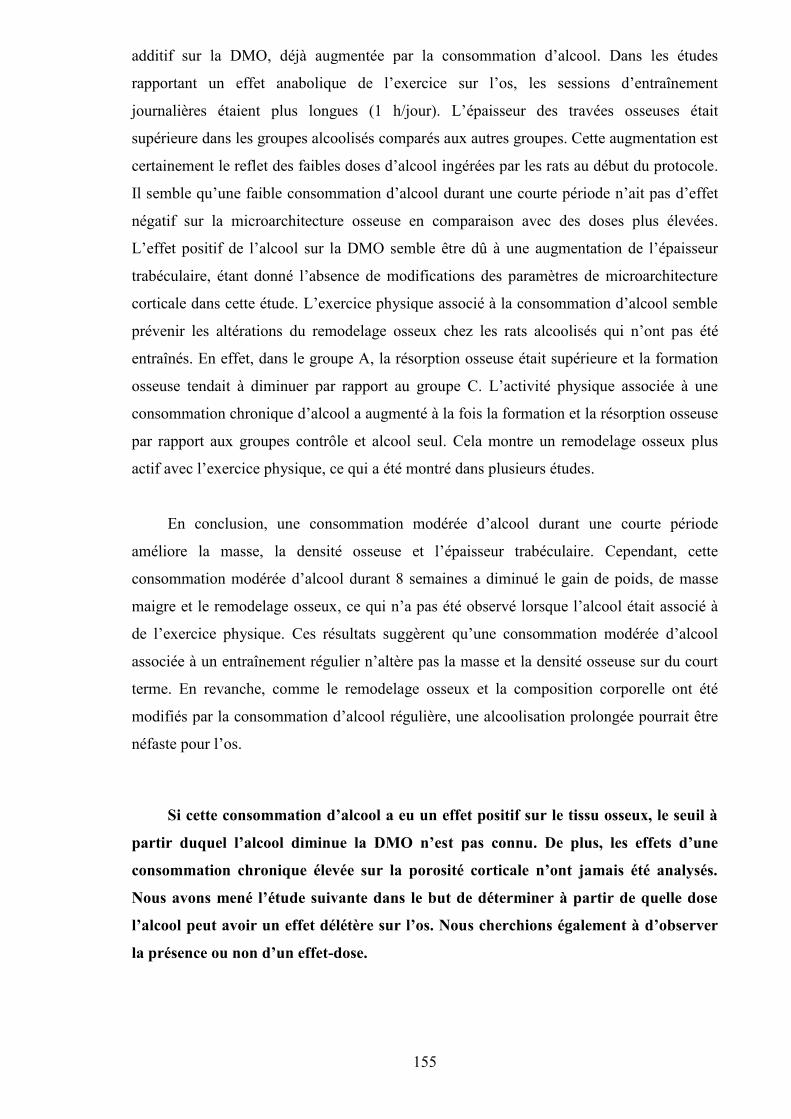
155
additif sur la DMO, déjà augmentée par la consommation d’alcool. Dans les études
rapportant un effet anabolique de l’exercice sur l’os, les sessions d’entraînement
journalières étaient plus longues (1 h/jour). L’épaisseur des travées osseuses était
supérieure dans les groupes alcoolisés comparés aux autres groupes. Cette augmentation est
certainement le reflet des faibles doses d’alcool ingérées par les rats au début du protocole.
Il semble qu’une faible consommation d’alcool durant une courte période n’ait pas d’effet
négatif sur la microarchitecture osseuse en comparaison avec des doses plus élevées.
L’effet positif de l’alcool sur la DMO semble être dû à une augmentation de l’épaisseur
trabéculaire, étant donné l’absence de modifications des paramètres de microarchitecture
corticale dans cette étude. L’exercice physique associé à la consommation d’alcool semble
prévenir les altérations du remodelage osseux chez les rats alcoolisés qui n’ont pas été
entraînés. En effet, dans le groupe A, la résorption osseuse était supérieure et la formation
osseuse tendait à diminuer par rapport au groupe C. L’activité physique associée à une
consommation chronique d’alcool a augmenté à la fois la formation et la résorption osseuse
par rapport aux groupes contrôle et alcool seul. Cela montre un remodelage osseux plus
actif avec l’exercice physique, ce qui a été montré dans plusieurs études.
En conclusion, une consommation modérée d’alcool durant une courte période
améliore la masse, la densité osseuse et l’épaisseur trabéculaire. Cependant, cette
consommation modérée d’alcool durant 8 semaines a diminué le gain de poids, de masse
maigre et le remodelage osseux, ce qui n’a pas été observé lorsque l’alcool était associé à
de l’exercice physique. Ces résultats suggèrent qu’une consommation modérée d’alcool
associée à un entraînement régulier n’altère pas la masse et la densité osseuse sur du court
terme. En revanche, comme le remodelage osseux et la composition corporelle ont été
modifiés par la consommation d’alcool régulière, une alcoolisation prolongée pourrait être
néfaste pour l’os.
Si cette consommation d’alcool a eu un effet positif sur le tissu osseux, le seuil à
partir duquel l’alcool diminue la DMO n’est pas connu. De plus, les effets d’une
consommation chronique élevée sur la porosité corticale n’ont jamais été analysés.
Nous avons mené l’étude suivante dans le but de déterminer à partir de quelle dose
l’alcool peut avoir un effet délétère sur l’os. Nous cherchions également à d’observer
la présence ou non d’un effet-dose.

156
Article 1
ORIGINAL ARTICLE
Combined effects of chronic alcohol consumption and physicalactivity on bone health: study in a rat model
Delphine B. Maurel • Nathalie Boisseau •
Isabelle Ingrand • Eric Dolleans •
Claude-Laurent Benhamou • Christelle Jaffre
Received: 30 September 2010 / Accepted: 8 March 2011
Springer-Verlag 2011
Abstract Chronic alcohol consumption may be deleteri-
ous for bone tissue depending on the amount of ethanol
consumed, whereas physical activity has positive effects on
bone. This study was designed to analyze the effects of
moderate alcohol consumption on bone in trained rats. 48
male Wistar rats were divided into four groups: control (C),
alcohol (A), exercise (E) and alcohol ? exercise (AE).
A and AE groups drank a solution composed of water
and ethanol. E and AE groups were trained for 2 months
(treadmill: 40 min/day, 5 times/week). Body composition
and bone mineral density (BMD) were assessed by dual
X-ray absorptiometry and microarchitectural parameters
using micro-computed tomography. Serum osteocalcin and
CTx were determined by ELISA assays. The body weight
and lean mass gain were lower in group A, while the fat
mass gain was lower in exercised groups. BMD and BMC
were higher with alcohol after body weight adjustment.
Trabecular thickness was significantly higher in AE and
A groups compared to C and E; cross-sectional area was
larger in A and C groups compared to AE and E. CTx
levels were higher in A compared to C and in AE and E
versus C and A. Osteocalcin levels were significantly
greater in AE and E groups versus C and A. In conclusion,
the light to moderate alcohol consumption over a short
period increased the trabecular thickness, BMC and BMD
in A and AE groups. However, we observed alterations in
bone remodeling and body composition with alcohol, at the
end of the protocol, which did not appear when alcohol was
combined to exercise.
Keywords Alcohol Exercise Bone remodeling Bone density Rats
Introduction
It is well known that regular physical activity limits the risk
of a number of critical health problems, including obesity,
heart disease, stroke, colon cancer, diabetes and osteopo-
rosis (Education 2000; Koo et al. 2010). For these reasons,
physical activity is encouraged throughout life. However,
in adolescents and young adults, there have been conflict-
ing findings regarding the relationship between sports
involvement, alcohol, tobacco and other drug consumption
(Davis et al. 1997; Ewing 1998; Garry and Morrissey 2000;
Rainey et al. 1996).
In non-professional athletes, sport participation among
adolescents and adults may be associated with significant
alcohol consumption (Garry and Morrissey 2000; Hoff-
mann 2006; Rainey et al. 1996). Different studies indicate
that total alcohol consumption is greater in male athletes
compared to their sedentary counterparts (Aaron et al.
1995) and appears more frequent in male than in female
athletes (Hoffmann 2006). Studies of non-professional elite
Communicated by Susan A. Ward.
D. B. Maurel E. Dolleans C.-L. Benhamou C. Jaffre
INSERM Unit 658, Caracterisation du Tissu Osseux par
Imagerie: Techniques et Applications, Hopital Porte Madeleine,
1 rue Porte Madeleine, BP 2439, 45032 Orleans Cedex 01,
France
N. Boisseau (&)
Laboratoire de Biologie des Activites Physiques et Sportives
(BAPS, EA 3533), 24 avenue des Landais, BP 26,
63177 Aubiere Cedex, France
e-mail: [email protected]
I. Ingrand
Epidemiologie et Biostatistique, INSERM CIC 802,
CHU de Poitiers, Universite de Poitiers, Poitiers, France
123
Eur J Appl Physiol
DOI 10.1007/s00421-011-1916-1
157
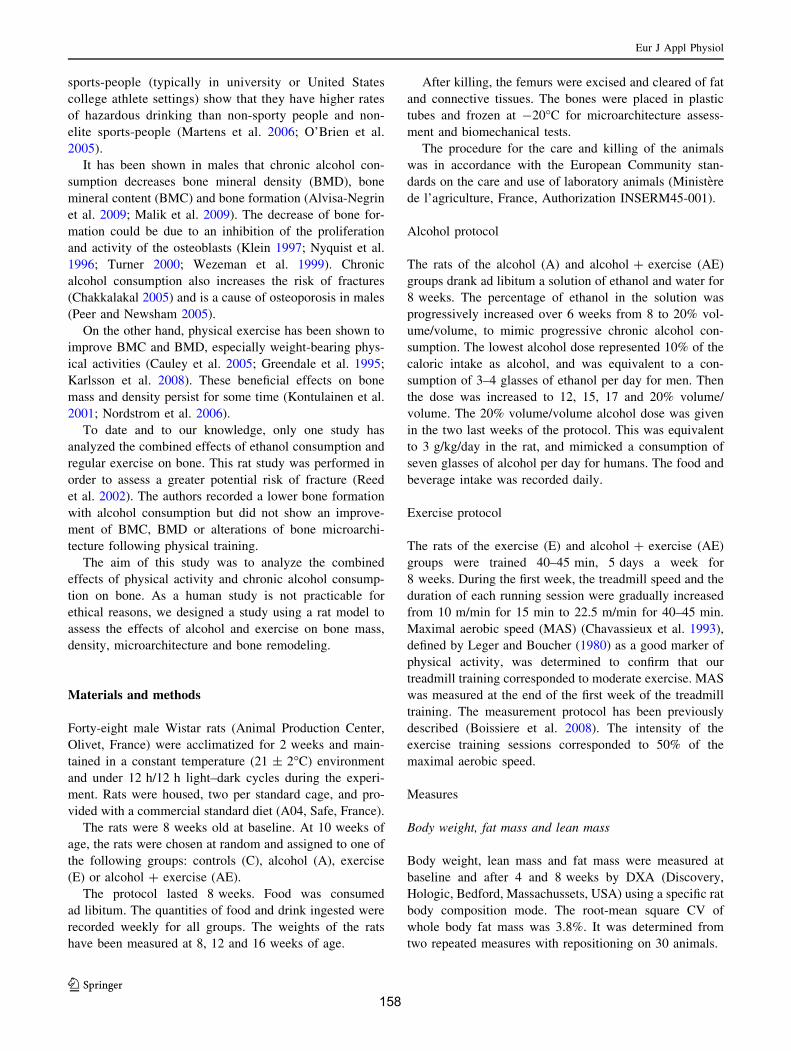
sports-people (typically in university or United States
college athlete settings) show that they have higher rates
of hazardous drinking than non-sporty people and non-
elite sports-people (Martens et al. 2006; O’Brien et al.
2005).
It has been shown in males that chronic alcohol con-
sumption decreases bone mineral density (BMD), bone
mineral content (BMC) and bone formation (Alvisa-Negrin
et al. 2009; Malik et al. 2009). The decrease of bone for-
mation could be due to an inhibition of the proliferation
and activity of the osteoblasts (Klein 1997; Nyquist et al.
1996; Turner 2000; Wezeman et al. 1999). Chronic
alcohol consumption also increases the risk of fractures
(Chakkalakal 2005) and is a cause of osteoporosis in males
(Peer and Newsham 2005).
On the other hand, physical exercise has been shown to
improve BMC and BMD, especially weight-bearing phys-
ical activities (Cauley et al. 2005; Greendale et al. 1995;
Karlsson et al. 2008). These beneficial effects on bone
mass and density persist for some time (Kontulainen et al.
2001; Nordstrom et al. 2006).
To date and to our knowledge, only one study has
analyzed the combined effects of ethanol consumption and
regular exercise on bone. This rat study was performed in
order to assess a greater potential risk of fracture (Reed
et al. 2002). The authors recorded a lower bone formation
with alcohol consumption but did not show an improve-
ment of BMC, BMD or alterations of bone microarchi-
tecture following physical training.
The aim of this study was to analyze the combined
effects of physical activity and chronic alcohol consump-
tion on bone. As a human study is not practicable for
ethical reasons, we designed a study using a rat model to
assess the effects of alcohol and exercise on bone mass,
density, microarchitecture and bone remodeling.
Materials and methods
Forty-eight male Wistar rats (Animal Production Center,
Olivet, France) were acclimatized for 2 weeks and main-
tained in a constant temperature (21 ± 2C) environment
and under 12 h/12 h light–dark cycles during the experi-
ment. Rats were housed, two per standard cage, and pro-
vided with a commercial standard diet (A04, Safe, France).
The rats were 8 weeks old at baseline. At 10 weeks of
age, the rats were chosen at random and assigned to one of
the following groups: controls (C), alcohol (A), exercise
(E) or alcohol ? exercise (AE).
The protocol lasted 8 weeks. Food was consumed
ad libitum. The quantities of food and drink ingested were
recorded weekly for all groups. The weights of the rats
have been measured at 8, 12 and 16 weeks of age.
After killing, the femurs were excised and cleared of fat
and connective tissues. The bones were placed in plastic
tubes and frozen at -20C for microarchitecture assess-
ment and biomechanical tests.
The procedure for the care and killing of the animals
was in accordance with the European Community stan-
dards on the care and use of laboratory animals (Ministere
de l’agriculture, France, Authorization INSERM45-001).
Alcohol protocol
The rats of the alcohol (A) and alcohol ? exercise (AE)
groups drank ad libitum a solution of ethanol and water for
8 weeks. The percentage of ethanol in the solution was
progressively increased over 6 weeks from 8 to 20% vol-
ume/volume, to mimic progressive chronic alcohol con-
sumption. The lowest alcohol dose represented 10% of the
caloric intake as alcohol, and was equivalent to a con-
sumption of 3–4 glasses of ethanol per day for men. Then
the dose was increased to 12, 15, 17 and 20% volume/
volume. The 20% volume/volume alcohol dose was given
in the two last weeks of the protocol. This was equivalent
to 3 g/kg/day in the rat, and mimicked a consumption of
seven glasses of alcohol per day for humans. The food and
beverage intake was recorded daily.
Exercise protocol
The rats of the exercise (E) and alcohol ? exercise (AE)
groups were trained 40–45 min, 5 days a week for
8 weeks. During the first week, the treadmill speed and the
duration of each running session were gradually increased
from 10 m/min for 15 min to 22.5 m/min for 40–45 min.
Maximal aerobic speed (MAS) (Chavassieux et al. 1993),
defined by Leger and Boucher (1980) as a good marker of
physical activity, was determined to confirm that our
treadmill training corresponded to moderate exercise. MAS
was measured at the end of the first week of the treadmill
training. The measurement protocol has been previously
described (Boissiere et al. 2008). The intensity of the
exercise training sessions corresponded to 50% of the
maximal aerobic speed.
Measures
Body weight, fat mass and lean mass
Body weight, lean mass and fat mass were measured at
baseline and after 4 and 8 weeks by DXA (Discovery,
Hologic, Bedford, Massachussets, USA) using a specific rat
body composition mode. The root-mean square CV of
whole body fat mass was 3.8%. It was determined from
two repeated measures with repositioning on 30 animals.
Eur J Appl Physiol
123158
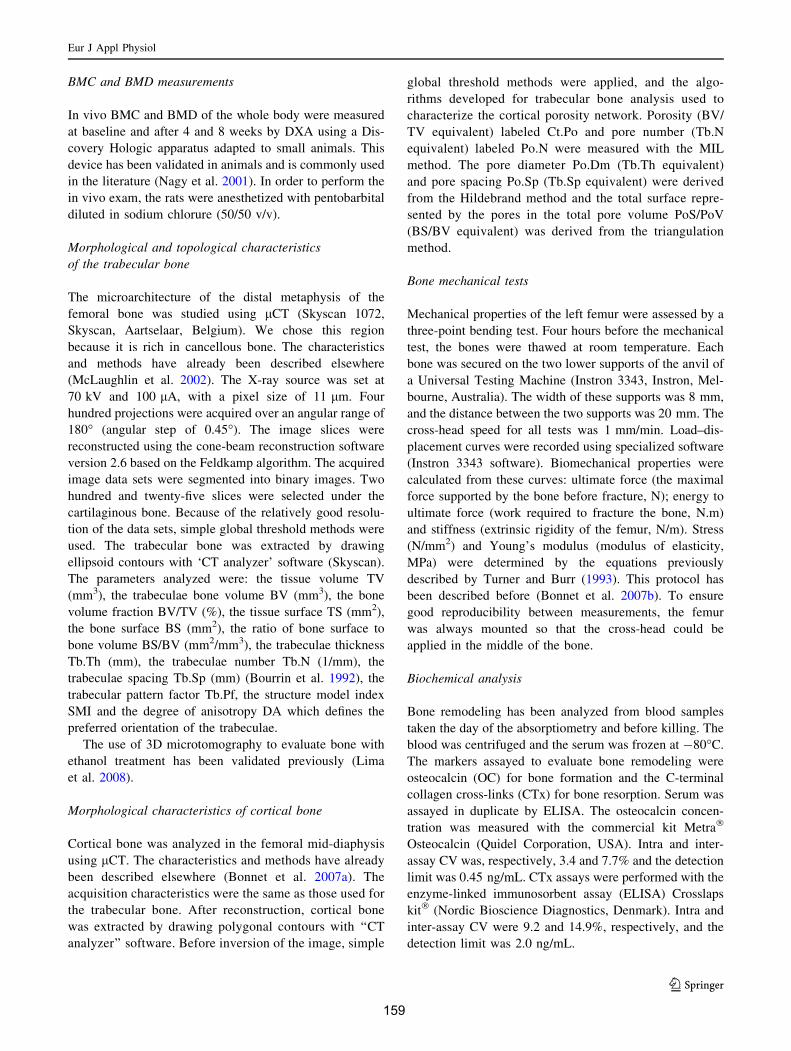
BMC and BMD measurements
In vivo BMC and BMD of the whole body were measured
at baseline and after 4 and 8 weeks by DXA using a Dis-
covery Hologic apparatus adapted to small animals. This
device has been validated in animals and is commonly used
in the literature (Nagy et al. 2001). In order to perform the
in vivo exam, the rats were anesthetized with pentobarbital
diluted in sodium chlorure (50/50 v/v).
Morphological and topological characteristics
of the trabecular bone
The microarchitecture of the distal metaphysis of the
femoral bone was studied using lCT (Skyscan 1072,
Skyscan, Aartselaar, Belgium). We chose this region
because it is rich in cancellous bone. The characteristics
and methods have already been described elsewhere
(McLaughlin et al. 2002). The X-ray source was set at
70 kV and 100 lA, with a pixel size of 11 lm. Four
hundred projections were acquired over an angular range of
180 (angular step of 0.45). The image slices were
reconstructed using the cone-beam reconstruction software
version 2.6 based on the Feldkamp algorithm. The acquired
image data sets were segmented into binary images. Two
hundred and twenty-five slices were selected under the
cartilaginous bone. Because of the relatively good resolu-
tion of the data sets, simple global threshold methods were
used. The trabecular bone was extracted by drawing
ellipsoid contours with ‘CT analyzer’ software (Skyscan).
The parameters analyzed were: the tissue volume TV
(mm3), the trabeculae bone volume BV (mm3), the bone
volume fraction BV/TV (%), the tissue surface TS (mm2),
the bone surface BS (mm2), the ratio of bone surface to
bone volume BS/BV (mm2/mm3), the trabeculae thickness
Tb.Th (mm), the trabeculae number Tb.N (1/mm), the
trabeculae spacing Tb.Sp (mm) (Bourrin et al. 1992), the
trabecular pattern factor Tb.Pf, the structure model index
SMI and the degree of anisotropy DA which defines the
preferred orientation of the trabeculae.
The use of 3D microtomography to evaluate bone with
ethanol treatment has been validated previously (Lima
et al. 2008).
Morphological characteristics of cortical bone
Cortical bone was analyzed in the femoral mid-diaphysis
using lCT. The characteristics and methods have already
been described elsewhere (Bonnet et al. 2007a). The
acquisition characteristics were the same as those used for
the trabecular bone. After reconstruction, cortical bone
was extracted by drawing polygonal contours with ‘‘CT
analyzer’’ software. Before inversion of the image, simple
global threshold methods were applied, and the algo-
rithms developed for trabecular bone analysis used to
characterize the cortical porosity network. Porosity (BV/
TV equivalent) labeled Ct.Po and pore number (Tb.N
equivalent) labeled Po.N were measured with the MIL
method. The pore diameter Po.Dm (Tb.Th equivalent)
and pore spacing Po.Sp (Tb.Sp equivalent) were derived
from the Hildebrand method and the total surface repre-
sented by the pores in the total pore volume PoS/PoV
(BS/BV equivalent) was derived from the triangulation
method.
Bone mechanical tests
Mechanical properties of the left femur were assessed by a
three-point bending test. Four hours before the mechanical
test, the bones were thawed at room temperature. Each
bone was secured on the two lower supports of the anvil of
a Universal Testing Machine (Instron 3343, Instron, Mel-
bourne, Australia). The width of these supports was 8 mm,
and the distance between the two supports was 20 mm. The
cross-head speed for all tests was 1 mm/min. Load–dis-
placement curves were recorded using specialized software
(Instron 3343 software). Biomechanical properties were
calculated from these curves: ultimate force (the maximal
force supported by the bone before fracture, N); energy to
ultimate force (work required to fracture the bone, N.m)
and stiffness (extrinsic rigidity of the femur, N/m). Stress
(N/mm2) and Young’s modulus (modulus of elasticity,
MPa) were determined by the equations previously
described by Turner and Burr (1993). This protocol has
been described before (Bonnet et al. 2007b). To ensure
good reproducibility between measurements, the femur
was always mounted so that the cross-head could be
applied in the middle of the bone.
Biochemical analysis
Bone remodeling has been analyzed from blood samples
taken the day of the absorptiometry and before killing. The
blood was centrifuged and the serum was frozen at -80C.
The markers assayed to evaluate bone remodeling were
osteocalcin (OC) for bone formation and the C-terminal
collagen cross-links (CTx) for bone resorption. Serum was
assayed in duplicate by ELISA. The osteocalcin concen-
tration was measured with the commercial kit Metra
Osteocalcin (Quidel Corporation, USA). Intra and inter-
assay CV was, respectively, 3.4 and 7.7% and the detection
limit was 0.45 ng/mL. CTx assays were performed with the
enzyme-linked immunosorbent assay (ELISA) Crosslaps
kit (Nordic Bioscience Diagnostics, Denmark). Intra and
inter-assay CV were 9.2 and 14.9%, respectively, and the
detection limit was 2.0 ng/mL.
Eur J Appl Physiol
123
159
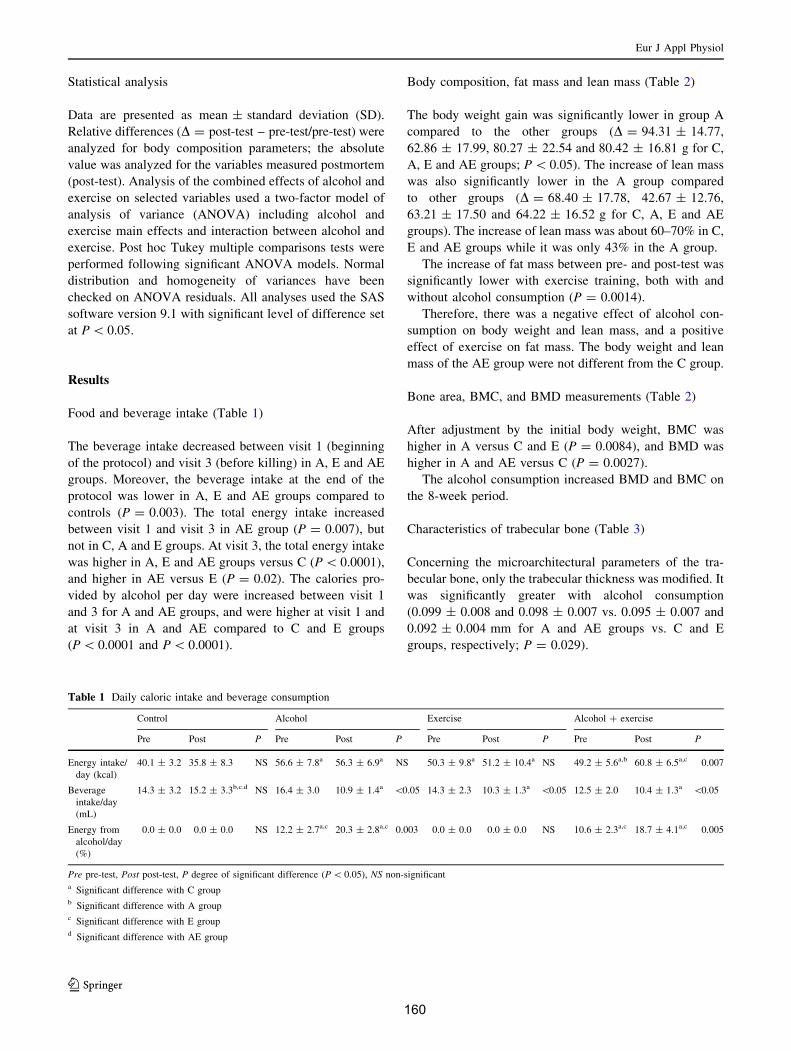
Statistical analysis
Data are presented as mean ± standard deviation (SD).
Relative differences (D = post-test – pre-test/pre-test) were
analyzed for body composition parameters; the absolute
value was analyzed for the variables measured postmortem
(post-test). Analysis of the combined effects of alcohol and
exercise on selected variables used a two-factor model of
analysis of variance (ANOVA) including alcohol and
exercise main effects and interaction between alcohol and
exercise. Post hoc Tukey multiple comparisons tests were
performed following significant ANOVA models. Normal
distribution and homogeneity of variances have been
checked on ANOVA residuals. All analyses used the SAS
software version 9.1 with significant level of difference set
at P \ 0.05.
Results
Food and beverage intake (Table 1)
The beverage intake decreased between visit 1 (beginning
of the protocol) and visit 3 (before killing) in A, E and AE
groups. Moreover, the beverage intake at the end of the
protocol was lower in A, E and AE groups compared to
controls (P = 0.003). The total energy intake increased
between visit 1 and visit 3 in AE group (P = 0.007), but
not in C, A and E groups. At visit 3, the total energy intake
was higher in A, E and AE groups versus C (P \ 0.0001),
and higher in AE versus E (P = 0.02). The calories pro-
vided by alcohol per day were increased between visit 1
and 3 for A and AE groups, and were higher at visit 1 and
at visit 3 in A and AE compared to C and E groups
(P \ 0.0001 and P \ 0.0001).
Body composition, fat mass and lean mass (Table 2)
The body weight gain was significantly lower in group A
compared to the other groups (D = 94.31 ± 14.77,
62.86 ± 17.99, 80.27 ± 22.54 and 80.42 ± 16.81 g for C,
A, E and AE groups; P \ 0.05). The increase of lean mass
was also significantly lower in the A group compared
to other groups (D = 68.40 ± 17.78, 42.67 ± 12.76,
63.21 ± 17.50 and 64.22 ± 16.52 g for C, A, E and AE
groups). The increase of lean mass was about 60–70% in C,
E and AE groups while it was only 43% in the A group.
The increase of fat mass between pre- and post-test was
significantly lower with exercise training, both with and
without alcohol consumption (P = 0.0014).
Therefore, there was a negative effect of alcohol con-
sumption on body weight and lean mass, and a positive
effect of exercise on fat mass. The body weight and lean
mass of the AE group were not different from the C group.
Bone area, BMC, and BMD measurements (Table 2)
After adjustment by the initial body weight, BMC was
higher in A versus C and E (P = 0.0084), and BMD was
higher in A and AE versus C (P = 0.0027).
The alcohol consumption increased BMD and BMC on
the 8-week period.
Characteristics of trabecular bone (Table 3)
Concerning the microarchitectural parameters of the tra-
becular bone, only the trabecular thickness was modified. It
was significantly greater with alcohol consumption
(0.099 ± 0.008 and 0.098 ± 0.007 vs. 0.095 ± 0.007 and
0.092 ± 0.004 mm for A and AE groups vs. C and E
groups, respectively; P = 0.029).
Table 1 Daily caloric intake and beverage consumption
Control Alcohol Exercise Alcohol ? exercise
Pre Post P Pre Post P Pre Post P Pre Post P
Energy intake/
day (kcal)
40.1 ± 3.2 35.8 ± 8.3 NS 56.6 ± 7.8a 56.3 ± 6.9a NS 50.3 ± 9.8a 51.2 ± 10.4a NS 49.2 ± 5.6a,b 60.8 ± 6.5a,c 0.007
Beverage
intake/day
(mL)
14.3 ± 3.2 15.2 ± 3.3b,c.d NS 16.4 ± 3.0 10.9 ± 1.4a \0.05 14.3 ± 2.3 10.3 ± 1.3a \0.05 12.5 ± 2.0 10.4 ± 1.3a \0.05
Energy from
alcohol/day
(%)
0.0 ± 0.0 0.0 ± 0.0 NS 12.2 ± 2.7a,c 20.3 ± 2.8a,c 0.003 0.0 ± 0.0 0.0 ± 0.0 NS 10.6 ± 2.3a,c 18.7 ± 4.1a,c 0.005
Pre pre-test, Post post-test, P degree of significant difference (P \ 0.05), NS non-significanta Significant difference with C groupb Significant difference with A groupc Significant difference with E groupd Significant difference with AE group
Eur J Appl Physiol
123
160
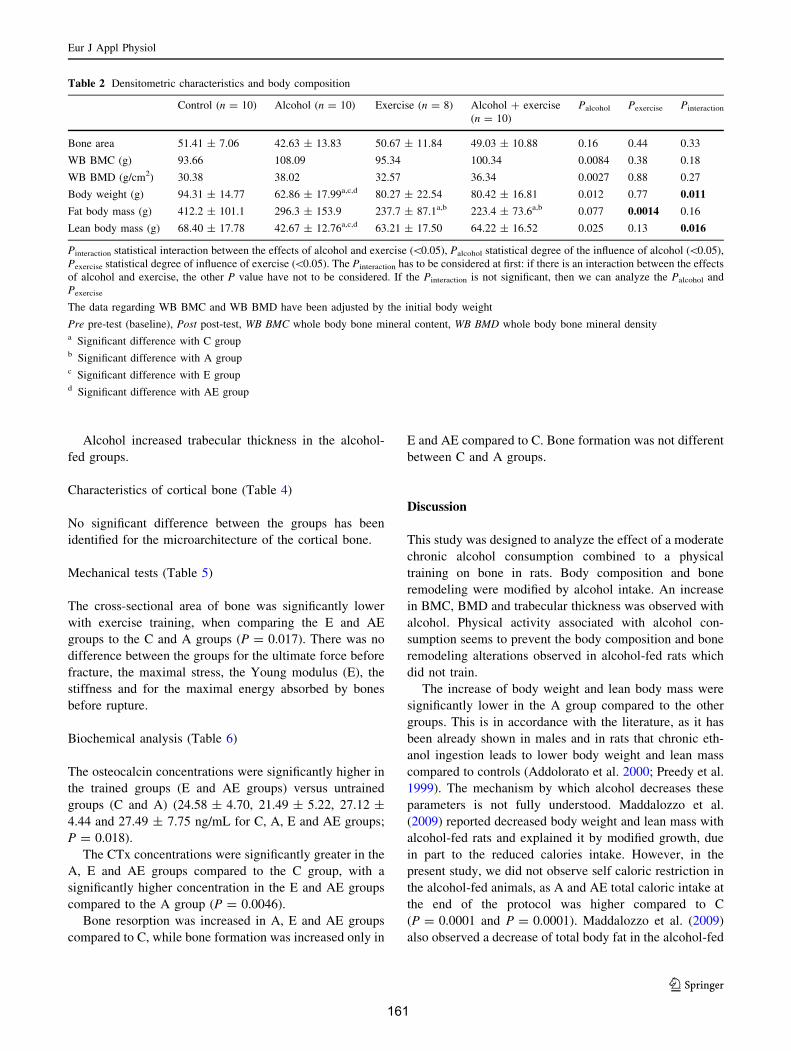
Alcohol increased trabecular thickness in the alcohol-
fed groups.
Characteristics of cortical bone (Table 4)
No significant difference between the groups has been
identified for the microarchitecture of the cortical bone.
Mechanical tests (Table 5)
The cross-sectional area of bone was significantly lower
with exercise training, when comparing the E and AE
groups to the C and A groups (P = 0.017). There was no
difference between the groups for the ultimate force before
fracture, the maximal stress, the Young modulus (E), the
stiffness and for the maximal energy absorbed by bones
before rupture.
Biochemical analysis (Table 6)
The osteocalcin concentrations were significantly higher in
the trained groups (E and AE groups) versus untrained
groups (C and A) (24.58 ± 4.70, 21.49 ± 5.22, 27.12 ±
4.44 and 27.49 ± 7.75 ng/mL for C, A, E and AE groups;
P = 0.018).
The CTx concentrations were significantly greater in the
A, E and AE groups compared to the C group, with a
significantly higher concentration in the E and AE groups
compared to the A group (P = 0.0046).
Bone resorption was increased in A, E and AE groups
compared to C, while bone formation was increased only in
E and AE compared to C. Bone formation was not different
between C and A groups.
Discussion
This study was designed to analyze the effect of a moderate
chronic alcohol consumption combined to a physical
training on bone in rats. Body composition and bone
remodeling were modified by alcohol intake. An increase
in BMC, BMD and trabecular thickness was observed with
alcohol. Physical activity associated with alcohol con-
sumption seems to prevent the body composition and bone
remodeling alterations observed in alcohol-fed rats which
did not train.
The increase of body weight and lean body mass were
significantly lower in the A group compared to the other
groups. This is in accordance with the literature, as it has
been already shown in males and in rats that chronic eth-
anol ingestion leads to lower body weight and lean mass
compared to controls (Addolorato et al. 2000; Preedy et al.
1999). The mechanism by which alcohol decreases these
parameters is not fully understood. Maddalozzo et al.
(2009) reported decreased body weight and lean mass with
alcohol-fed rats and explained it by modified growth, due
in part to the reduced calories intake. However, in the
present study, we did not observe self caloric restriction in
the alcohol-fed animals, as A and AE total caloric intake at
the end of the protocol was higher compared to C
(P = 0.0001 and P = 0.0001). Maddalozzo et al. (2009)
also observed a decrease of total body fat in the alcohol-fed
Table 2 Densitometric characteristics and body composition
Control (n = 10) Alcohol (n = 10) Exercise (n = 8) Alcohol ? exercise
(n = 10)
Palcohol Pexercise Pinteraction
Bone area 51.41 ± 7.06 42.63 ± 13.83 50.67 ± 11.84 49.03 ± 10.88 0.16 0.44 0.33
WB BMC (g) 93.66 108.09 95.34 100.34 0.0084 0.38 0.18
WB BMD (g/cm2) 30.38 38.02 32.57 36.34 0.0027 0.88 0.27
Body weight (g) 94.31 ± 14.77 62.86 ± 17.99a,c,d 80.27 ± 22.54 80.42 ± 16.81 0.012 0.77 0.011
Fat body mass (g) 412.2 ± 101.1 296.3 ± 153.9 237.7 ± 87.1a,b 223.4 ± 73.6a,b 0.077 0.0014 0.16
Lean body mass (g) 68.40 ± 17.78 42.67 ± 12.76a,c,d 63.21 ± 17.50 64.22 ± 16.52 0.025 0.13 0.016
Pinteraction statistical interaction between the effects of alcohol and exercise (\0.05), Palcohol statistical degree of the influence of alcohol (\0.05),
Pexercise statistical degree of influence of exercise (\0.05). The Pinteraction has to be considered at first: if there is an interaction between the effects
of alcohol and exercise, the other P value have not to be considered. If the Pinteraction is not significant, then we can analyze the Palcohol and
Pexercise
The data regarding WB BMC and WB BMD have been adjusted by the initial body weight
Pre pre-test (baseline), Post post-test, WB BMC whole body bone mineral content, WB BMD whole body bone mineral densitya Significant difference with C groupb Significant difference with A groupc Significant difference with E groupd Significant difference with AE group
Eur J Appl Physiol
123
161
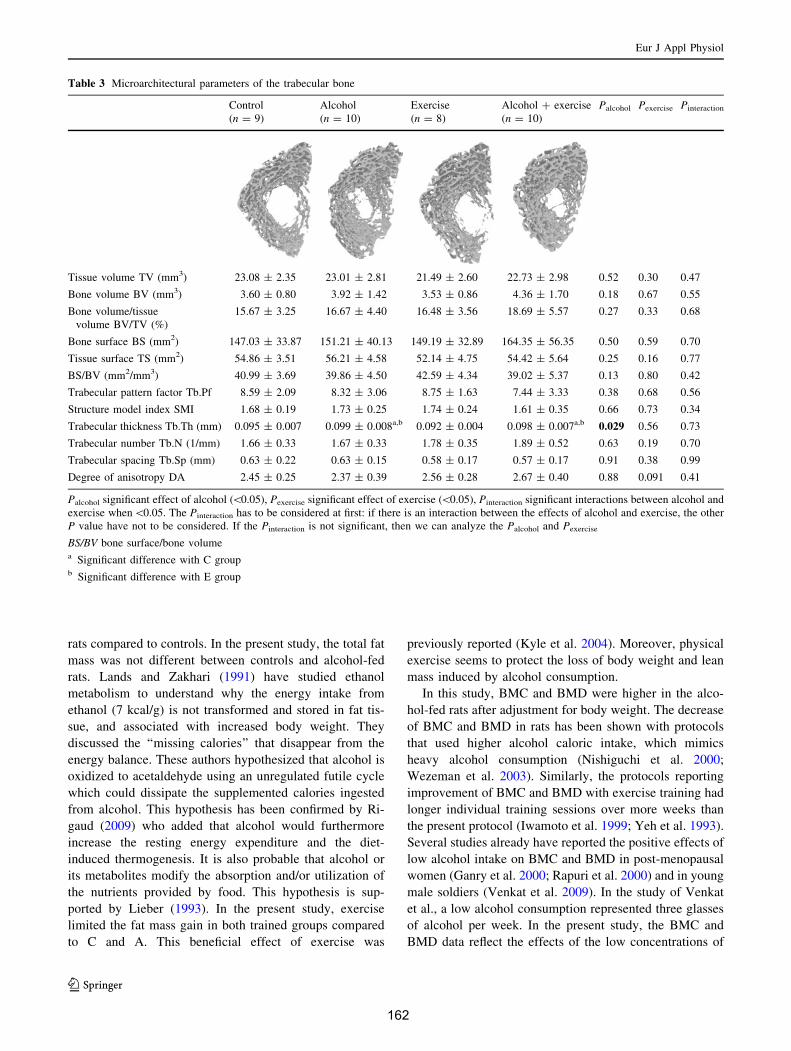
rats compared to controls. In the present study, the total fat
mass was not different between controls and alcohol-fed
rats. Lands and Zakhari (1991) have studied ethanol
metabolism to understand why the energy intake from
ethanol (7 kcal/g) is not transformed and stored in fat tis-
sue, and associated with increased body weight. They
discussed the ‘‘missing calories’’ that disappear from the
energy balance. These authors hypothesized that alcohol is
oxidized to acetaldehyde using an unregulated futile cycle
which could dissipate the supplemented calories ingested
from alcohol. This hypothesis has been confirmed by Ri-
gaud (2009) who added that alcohol would furthermore
increase the resting energy expenditure and the diet-
induced thermogenesis. It is also probable that alcohol or
its metabolites modify the absorption and/or utilization of
the nutrients provided by food. This hypothesis is sup-
ported by Lieber (1993). In the present study, exercise
limited the fat mass gain in both trained groups compared
to C and A. This beneficial effect of exercise was
previously reported (Kyle et al. 2004). Moreover, physical
exercise seems to protect the loss of body weight and lean
mass induced by alcohol consumption.
In this study, BMC and BMD were higher in the alco-
hol-fed rats after adjustment for body weight. The decrease
of BMC and BMD in rats has been shown with protocols
that used higher alcohol caloric intake, which mimics
heavy alcohol consumption (Nishiguchi et al. 2000;
Wezeman et al. 2003). Similarly, the protocols reporting
improvement of BMC and BMD with exercise training had
longer individual training sessions over more weeks than
the present protocol (Iwamoto et al. 1999; Yeh et al. 1993).
Several studies already have reported the positive effects of
low alcohol intake on BMC and BMD in post-menopausal
women (Ganry et al. 2000; Rapuri et al. 2000) and in young
male soldiers (Venkat et al. 2009). In the study of Venkat
et al., a low alcohol consumption represented three glasses
of alcohol per week. In the present study, the BMC and
BMD data reflect the effects of the low concentrations of
Table 3 Microarchitectural parameters of the trabecular bone
Control
(n = 9)
Alcohol
(n = 10)
Exercise
(n = 8)
Alcohol ? exercise
(n = 10)
Palcohol Pexercise Pinteraction
Tissue volume TV (mm3) 23.08 ± 2.35 23.01 ± 2.81 21.49 ± 2.60 22.73 ± 2.98 0.52 0.30 0.47
Bone volume BV (mm3) 3.60 ± 0.80 3.92 ± 1.42 3.53 ± 0.86 4.36 ± 1.70 0.18 0.67 0.55
Bone volume/tissue
volume BV/TV (%)
15.67 ± 3.25 16.67 ± 4.40 16.48 ± 3.56 18.69 ± 5.57 0.27 0.33 0.68
Bone surface BS (mm2) 147.03 ± 33.87 151.21 ± 40.13 149.19 ± 32.89 164.35 ± 56.35 0.50 0.59 0.70
Tissue surface TS (mm2) 54.86 ± 3.51 56.21 ± 4.58 52.14 ± 4.75 54.42 ± 5.64 0.25 0.16 0.77
BS/BV (mm2/mm3) 40.99 ± 3.69 39.86 ± 4.50 42.59 ± 4.34 39.02 ± 5.37 0.13 0.80 0.42
Trabecular pattern factor Tb.Pf 8.59 ± 2.09 8.32 ± 3.06 8.75 ± 1.63 7.44 ± 3.33 0.38 0.68 0.56
Structure model index SMI 1.68 ± 0.19 1.73 ± 0.25 1.74 ± 0.24 1.61 ± 0.35 0.66 0.73 0.34
Trabecular thickness Tb.Th (mm) 0.095 ± 0.007 0.099 ± 0.008a,b 0.092 ± 0.004 0.098 ± 0.007a,b 0.029 0.56 0.73
Trabecular number Tb.N (1/mm) 1.66 ± 0.33 1.67 ± 0.33 1.78 ± 0.35 1.89 ± 0.52 0.63 0.19 0.70
Trabecular spacing Tb.Sp (mm) 0.63 ± 0.22 0.63 ± 0.15 0.58 ± 0.17 0.57 ± 0.17 0.91 0.38 0.99
Degree of anisotropy DA 2.45 ± 0.25 2.37 ± 0.39 2.56 ± 0.28 2.67 ± 0.40 0.88 0.091 0.41
Palcohol significant effect of alcohol (\0.05), Pexercise significant effect of exercise (\0.05), Pinteraction significant interactions between alcohol and
exercise when\0.05. The Pinteraction has to be considered at first: if there is an interaction between the effects of alcohol and exercise, the other
P value have not to be considered. If the Pinteraction is not significant, then we can analyze the Palcohol and Pexercise
BS/BV bone surface/bone volumea Significant difference with C groupb Significant difference with E group
Eur J Appl Physiol
123
162
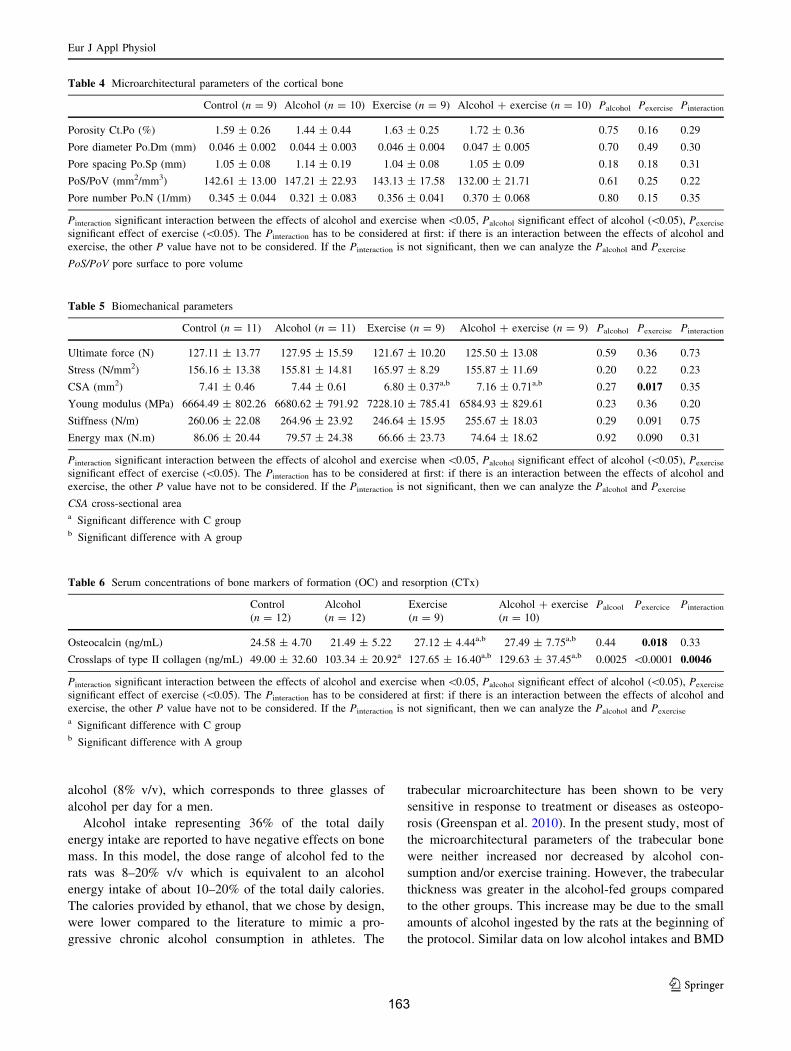
alcohol (8% v/v), which corresponds to three glasses of
alcohol per day for a men.
Alcohol intake representing 36% of the total daily
energy intake are reported to have negative effects on bone
mass. In this model, the dose range of alcohol fed to the
rats was 8–20% v/v which is equivalent to an alcohol
energy intake of about 10–20% of the total daily calories.
The calories provided by ethanol, that we chose by design,
were lower compared to the literature to mimic a pro-
gressive chronic alcohol consumption in athletes. The
trabecular microarchitecture has been shown to be very
sensitive in response to treatment or diseases as osteopo-
rosis (Greenspan et al. 2010). In the present study, most of
the microarchitectural parameters of the trabecular bone
were neither increased nor decreased by alcohol con-
sumption and/or exercise training. However, the trabecular
thickness was greater in the alcohol-fed groups compared
to the other groups. This increase may be due to the small
amounts of alcohol ingested by the rats at the beginning of
the protocol. Similar data on low alcohol intakes and BMD
Table 4 Microarchitectural parameters of the cortical bone
Control (n = 9) Alcohol (n = 10) Exercise (n = 9) Alcohol ? exercise (n = 10) Palcohol Pexercise Pinteraction
Porosity Ct.Po (%) 1.59 ± 0.26 1.44 ± 0.44 1.63 ± 0.25 1.72 ± 0.36 0.75 0.16 0.29
Pore diameter Po.Dm (mm) 0.046 ± 0.002 0.044 ± 0.003 0.046 ± 0.004 0.047 ± 0.005 0.70 0.49 0.30
Pore spacing Po.Sp (mm) 1.05 ± 0.08 1.14 ± 0.19 1.04 ± 0.08 1.05 ± 0.09 0.18 0.18 0.31
PoS/PoV (mm2/mm3) 142.61 ± 13.00 147.21 ± 22.93 143.13 ± 17.58 132.00 ± 21.71 0.61 0.25 0.22
Pore number Po.N (1/mm) 0.345 ± 0.044 0.321 ± 0.083 0.356 ± 0.041 0.370 ± 0.068 0.80 0.15 0.35
Pinteraction significant interaction between the effects of alcohol and exercise when \0.05, Palcohol significant effect of alcohol (\0.05), Pexercise
significant effect of exercise (\0.05). The Pinteraction has to be considered at first: if there is an interaction between the effects of alcohol and
exercise, the other P value have not to be considered. If the Pinteraction is not significant, then we can analyze the Palcohol and Pexercise
PoS/PoV pore surface to pore volume
Table 5 Biomechanical parameters
Control (n = 11) Alcohol (n = 11) Exercise (n = 9) Alcohol ? exercise (n = 9) Palcohol Pexercise Pinteraction
Ultimate force (N) 127.11 ± 13.77 127.95 ± 15.59 121.67 ± 10.20 125.50 ± 13.08 0.59 0.36 0.73
Stress (N/mm2) 156.16 ± 13.38 155.81 ± 14.81 165.97 ± 8.29 155.87 ± 11.69 0.20 0.22 0.23
CSA (mm2) 7.41 ± 0.46 7.44 ± 0.61 6.80 ± 0.37a,b 7.16 ± 0.71a,b 0.27 0.017 0.35
Young modulus (MPa) 6664.49 ± 802.26 6680.62 ± 791.92 7228.10 ± 785.41 6584.93 ± 829.61 0.23 0.36 0.20
Stiffness (N/m) 260.06 ± 22.08 264.96 ± 23.92 246.64 ± 15.95 255.67 ± 18.03 0.29 0.091 0.75
Energy max (N.m) 86.06 ± 20.44 79.57 ± 24.38 66.66 ± 23.73 74.64 ± 18.62 0.92 0.090 0.31
Pinteraction significant interaction between the effects of alcohol and exercise when \0.05, Palcohol significant effect of alcohol (\0.05), Pexercise
significant effect of exercise (\0.05). The Pinteraction has to be considered at first: if there is an interaction between the effects of alcohol and
exercise, the other P value have not to be considered. If the Pinteraction is not significant, then we can analyze the Palcohol and Pexercise
CSA cross-sectional areaa Significant difference with C groupb Significant difference with A group
Table 6 Serum concentrations of bone markers of formation (OC) and resorption (CTx)
Control
(n = 12)
Alcohol
(n = 12)
Exercise
(n = 9)
Alcohol ? exercise
(n = 10)
Palcool Pexercice Pinteraction
Osteocalcin (ng/mL) 24.58 ± 4.70 21.49 ± 5.22 27.12 ± 4.44a,b 27.49 ± 7.75a,b 0.44 0.018 0.33
Crosslaps of type II collagen (ng/mL) 49.00 ± 32.60 103.34 ± 20.92a 127.65 ± 16.40a,b 129.63 ± 37.45a,b 0.0025 \0.0001 0.0046
Pinteraction significant interaction between the effects of alcohol and exercise when \0.05, Palcohol significant effect of alcohol (\0.05), Pexercise
significant effect of exercise (\0.05). The Pinteraction has to be considered at first: if there is an interaction between the effects of alcohol and
exercise, the other P value have not to be considered. If the Pinteraction is not significant, then we can analyze the Palcohol and Pexercise
a Significant difference with C groupb Significant difference with A group
Eur J Appl Physiol
123
163
have already been reported in the literature (Ganry et al.
2000; Mukamal et al. 2007; Pedrera-Zamorano et al. 2009;
Rapuri et al. 2000; Venkat et al. 2009). It seems that a low
amount of alcohol over a short period of time does not
damage bone microarchitecture in contrast to higher
amounts. The positive effect of alcohol on BMD seems to
be due to an increase of the trabecular thickness. Therefore,
low to moderate amounts of alcohol ingested over a short
period may not be detrimental for bone in athletes. How-
ever, these data have to be interpreted with caution as it has
been previously reported that higher alcohol consumption
leads to a decrease of the trabecular bone architectural
parameters.
The cortical bone microarchitecture is increasingly
accepted as a major determinant of bone strength. The
results of the present study concerning the cortical mic-
roarchitecture and biomechanics support the hypothesis
that a low to moderate alcohol intake, over a short time
period, is not sufficient to modify cortical bone. Only the
cross-sectional area (CSA) was different between the study
groups and it was lower in E and AE groups. This suggests
that the cortical thickness may be thinner in the trained
groups and that the internal and external diameters may
have been modified. A decrease of the cortical bone area
and modification of endosteal and periosteal perimeters
have been reported in young female rats after alcohol
feeding (2–8 weeks, 35% of ethanol derived calories)
(Hogan et al. 1997). Hogan et al. also reported a decrease
of the CSA in young alcohol-fed female rats (35% ethanol-
derived calories), but no change in older animals. They
observed increased inside diameters values, which led to
decreased cortical thickness in alcohol-fed female rats at all
ages (Hogan et al. 1999). Therefore, a change in bone
shape may be observed following chronic alcohol con-
sumption. The lowest alcohol dose in the present study
(10–20% ethanol-derived calories) may have produced an
arrangement of bone shape in increasing slightly the cor-
tical thickness in the A group, while exercise may have
limited this effect in the AE group. Except the CSA change
in the present study, neither the cortical porosity nor the
bone resistance parameters were modified by alcohol or
exercise. It seems that the changes observed on bone
density with low to moderate alcohol intake are mainly due
to trabecular changes, at least in the AE group.
In this study, alcohol consumption affected both bone
formation and resorption. Bone resorption was increased
by alcohol and bone formation tended to decrease in
alcohol-fed rats as shown by the lower osteocalcin con-
centrations and the higher concentrations in CTx in group
A compared to group C. This means that alcohol alone
modified the coupling of bone remodeling in favor of bone
resorption. There are conflicting reports in the literature
concerning the effects of alcohol on bone turnover. Either
it is reported to decrease only bone formation (Dyer et al.
1998; Klein 1997) or to decrease bone formation and
increase bone resorption (Diez et al. 1994; Nyquist et al.
1996); or to increase only bone resorption (Cheung et al.
1995). In the present study, physical activity associated
with alcohol consumption increased both bone formation
and resorption compared to controls and alcohol alone
(osteocalcin and CTx concentrations greater in AE group
compared to C and A groups). This shows a higher bone
remodeling induced by exercise. This exercise-induced
increase of bone remodeling has previously been reported
and seems to be characteristic of high impact sports (Evans
et al. 2008; Maimoun et al. 2004). These data show that the
moderate alcohol consumption (20% at the end of the
study) has deleterious effects on bone remodeling in rats,
but that alcohol and exercise together increased both bone
formation and resorption compared to controls and alcohol
alone, as exercise alone does.
In conclusion, the low to moderate alcohol consumption
over a short period of time increased bone mass and density
slightly. The trabecular thickness was also increased in
both alcohol-fed groups. Low to moderate alcohol intake
for 8 weeks decreased body weight, lean mass and bone
remodeling, which was not observed when alcohol con-
sumption was combined to physical exercise. These results
suggest that light to moderate alcohol consumption asso-
ciated with regular physical exercise do not alter bone mass
and density in the short term. However, as bone remodeling
and body composition were altered following this pro-
gressive chronic alcohol consumption, longer periods of
alcohol intake may be detrimental to bone health.
Acknowledgments We would like to acknowledge Pr Nicola
L. Fazzalari for advice on the English corrections, Dr Armelle Basillais
and Dr Helene Beaupied for their technical help concerning the
microarchitecture and the biomechanics analysis. This work was
supported by a grant from IREB (Institut de Recherche sur les
Boissons). All the experiments comply with the current laws in
France.
Conflict of interest The authors declare that they have no conflict
of interest.
References
Aaron DJ, Dearwater SR, Anderson R, Olsen T, Kriska AM, Laporte
RE (1995) Physical activity and the initiation of high-risk health
behaviors in adolescents. Med Sci Sports Exerc 27:1639–1645
Addolorato G, Capristo E, Marini M, Santini P, Scognamiglio U,
Attilia ML, Messineo D, Sasso GF, Gasbarrini G, Ceccanti M
(2000) Body composition changes induced by chronic ethanol
abuse: evaluation by dual energy X-ray absorptiometry. Am J
Gastroenterol 95:2323–2327
Alvisa-Negrin J, Gonzalez-Reimers E, Santolaria-Fernandez F,
Garcia-Valdecasas-Campelo E, Valls MR, Pelazas-Gonzalez R,
Eur J Appl Physiol
123
164
Duran-Castellon MC, de Los Angeles G, omez-Rodriguez M
(2009) Osteopenia in alcoholics: effect of alcohol abstinence.
Alcohol Alcohol (Oxf Oxfords) 44:468–475
Boissiere J, Eder V, Machet MC, Courteix D, Bonnet P (2008)
Moderate exercise training does not worsen left ventricle
remodeling and function in untreated severe hypertensive rats.
J Appl Physiol 104:321–327
Bonnet N, Benhamou CL, Beaupied H, Laroche N, Vico L, Dolleans
E, Courteix D (2007a) Doping dose of salbutamol and exercise:
deleterious effect on cancellous and cortical bones in adult rats.
J Appl Physiol 102:1502–1509
Bonnet N, Bernard P, Beaupied H, Bizot JC, Trovero F, Courteix D,
Benhamou CL (2007b) Various effects of antidepressant drugs
on bone microarchitecture, mechanical properties and bone
remodeling. Toxicol Appl Pharmacol 221:111–118
Bourrin S, Ghaemmaghami F, Vico L, Chappard D, Gharib C,
Alexandre C (1992) Effect of a five-week swimming program
on rat bone: a histomorphometric study. Calcif Tissue Int 51:
137–142
Cauley JA, Fullman RL, Stone KL, Zmuda JM, Bauer DC, Barrett-
Connor E, Ensrud K, Lau EM, Orwoll ES (2005) Factors
associated with the lumbar spine and proximal femur bone
mineral density in older men. Osteoporos Int 16:1525–1537
Chakkalakal DA (2005) Alcohol-induced bone loss and deficient bone
repair. Alcohol Clin Exp Res 29:2077–2090
Chavassieux P, Serre CM, Vergnaud P, Delmas PD, Meunier PJ
(1993) In vitro evaluation of dose-effects of ethanol on human
osteoblastic cells. Bone Miner 22:95–103
Cheung RC, Gray C, Boyde A, Jones SJ (1995) Effects of ethanol on
bone cells in vitro resulting in increased resorption. Bone
16:143–147
Davis TC, Arnold C, Nandy I, Bocchini JA, Gottlieb A, George RB,
Berkel H (1997) Tobacco use among male high school athletes.
J Adolesc Health 21:97–101
Diez A, Puig J, Serrano S, Marinoso ML, Bosch J, Marrugat J,
Mellibovsky L, Nogues X, Knobel H, Aubia J (1994) Alcohol-
induced bone disease in the absence of severe chronic liver
damage. J Bone Miner Res 9:825–831
Dyer SA, Buckendahl P, Sampson HW (1998) Alcohol consumption
inhibits osteoblastic cell proliferation and activity in vivo.
Alcohol 16:337–341
Education (2000) Promoting better health for young people
through physical activity and sports (report). Secretary of Health
and Human Services and the Secretary of Education, Silver
Spring
Evans RK, Antczak AJ, Lester M, Yanovich R, Israeli E, Moran DS
(2008) Effects of a 4-month recruit training program on markers
of bone metabolism. Med Sci Sports Exerc 40:S660–S670
Ewing BT (1998) High school athletes and marijuana use. J Drug
Educ 28:147–157
Ganry O, Baudoin C, Fardellone P (2000) Effect of alcohol intake on
bone mineral density in elderly women: The EPIDOS Study
Epidemiologie de l’Osteoporose. Am J Epidemiol 151:773–780
Garry JP, Morrissey SL (2000) Team sports participation and risk-
taking behaviors among a biracial middle school population.
Clin J Sport Med 10:185–190
Greendale GA, Barrett-Connor E, Edelstein S, Ingles S, Haile R
(1995) Lifetime leisure exercise and osteoporosis. The Rancho
Bernardo study. Am J Epidemiol 141:951–959
Greenspan SL, Perera S, Recker R, Wagner JM, Greeley P, Gomberg
BR, Seaman P, Kleerekoper M (2010) Changes in trabecular
microarchitecture in postmenopausal women on bisphosphonate
therapy. Bone 46:1006–1010
Hoffmann JP (2006) Extracurricular activities, athletic participation,
and adolescent alcohol use: gender-differentiated and school-
contextual effects. J Health Soc Behav 47(3):275–290
Hogan HA, Sampson HW, Cashier E, Ledoux N (1997) Alcohol
consumption by young actively growing rats: a study of cortical
bone histomorphometry and mechanical properties. Alcohol Clin
Exp Res 21:809–816
Hogan HA, Groves JA, Sampson HW (1999) Long-term alcohol
consumption in the rat affects femur cross-sectional geometry
and bone tissue material properties. Alcohol Clin Exp Res
23:1825–1833
Iwamoto J, Yeh JK, Aloia JF (1999) Differential effect of treadmill
exercise on three cancellous bone sites in the young growing rat.
Bone 24:163–169
Karlsson MK, Nordqvist A, Karlsson C (2008) Physical activity
increases bone mass during growth. Food Nutr Res 52
Klein RF (1997) Alcohol-induced bone disease: impact of ethanol on
osteoblast proliferation. Alcohol Clin Exp Res 21:392–399
Kontulainen S, Kannus P, Haapasalo H, Sievanen H, Pasanen M,
Heinonen A, Oja P, Vuori I (2001) Good maintenance of
exercise-induced bone gain with decreased training of female
tennis and squash players: a prospective 5-year follow-up study
of young and old starters and controls. J Bone Miner Res
16:195–201
Koo BK, Han KA, Ahn HJ, Jung JY, Kim HC, Min KW (2010) The
effects of total energy expenditure from all levels of physical
activity vs. physical activity energy expenditure from moderate-
to-vigorous activity on visceral fat and insulin sensitivity in
obese Type 2 diabetic women. Diabet Med 27:1088–1092
Kyle UG, Genton L, Gremion G, Slosman DO, Pichard C (2004)
Aging, physical activity and height-normalized body composi-
tion parameters. Clin Nutr 23:79–88
Lands WE, Zakhari S (1991) The case of the missing calories. Am J
Clin Nutr 54:47–48
Leger L, Boucher R (1980) An indirect continuous running multistage
field test: the Universite de Montreal track test. Can J Appl Sport
Sci 5:77–84
Lieber CS (1993) Aetiology and pathogenesis of alcoholic liver
disease. Baillieres Clin Gastroenterol 7:581–608
Lima I, Rocha MS, Lopes RT (2008) Ethanol bone evaluation using
3D microtomography. Micron 39:617–622
Maddalozzo GF, Turner RT, Edwards CH, Howe KS, Widrick JJ,
Rosen CJ, Iwaniec UT (2009) Alcohol alters whole body
composition, inhibits bone formation, and increases bone
marrow adiposity in rats. Osteoporos Int 20:1529–1538
Maimoun L, Mariano-Goulart D, Couret I, Manetta J, Peruchon E,
Micallef JP, Verdier R, Rossi M, Leroux JL (2004) Effects of
physical activities that induce moderate external loading on bone
metabolism in male athletes. J Sports Sci 22:875–883
Malik P, Gasser RW, Kemmler G, Moncayo R, Finkenstedt G, Kurz
M, Fleischhacker WW (2009) Low bone mineral density and
impaired bone metabolism in young alcoholic patients without
liver cirrhosis: a cross-sectional study. Alcohol Clin Exp Res
33:375–381
Martens MP, Dams-O’Connor K, Beck NC (2006) A systematic
review of college student-athlete drinking: prevalence rates,
sport-related factors, and interventions. J Subst Abuse Treat
31:305–316
McLaughlin F, Mackintosh J, Hayes BP, McLaren A, Uings IJ,
Salmon P, Humphreys J, Meldrum E, Farrow SN (2002)
Glucocorticoid-induced osteopenia in the mouse as assessed by
histomorphometry, microcomputed tomography, and biochemi-
cal markers. Bone 30:924–930
Mukamal KJ, Robbins JA, Cauley JA, Kern LM, Siscovick DS (2007)
Alcohol consumption, bone density, and hip fracture among
older adults: the cardiovascular health study. Osteoporos Int
18:593–602
Nagy TR, Prince CW, Li J (2001) Validation of peripheral dual-
energy X-ray absorptiometry for the measurement of bone
Eur J Appl Physiol
123
165
mineral in intact and excised long bones of rats. J Bone Miner
Res 16:1682–1687
Nishiguchi S, Shiomi S, Tamori A, Habu D, Takeda T, Tanaka T,
Ochi H (2000) Effect of ethanol on bone mineral density of rats
evaluated by dual-photon X-ray absorptiometry. J Bone Miner
Metab 18:317–320
Nordstrom A, Olsson T, Nordstrom P (2006) Sustained benefits from
previous physical activity on bone mineral density in males.
J Clin Endocrinol Metab 91:2600–2604
Nyquist F, Ljunghall S, Berglund M, Obrant K (1996) Biochemical
markers of bone metabolism after short and long time ethanol
withdrawal in alcoholics. Bone 19:51–54
O’Brien KS, Blackie JM, Hunter JA (2005) Hazardous drinking in
elite New Zealand sportspeople. Alcohol Alcohol 40:239–241
Pedrera-Zamorano JD, Lavado-Garcia JM, Roncero-Martin R, Cald-
eron-Garcia JF, Rodriguez-Dominguez T, Canal-Macias ML
(2009) Effect of beer drinking on ultrasound bone mass in
women. Nutrition 25:1057–1063
Peer KS, Newsham KR (2005) A case study on osteoporosis in a male
athlete: looking beyond the usual suspects. Orthop Nurs 24:
193–199 (quiz 200–201)
Preedy VR, Reilly ME, Patel VB, Richardson PJ, Peters TJ (1999)
Protein metabolism in alcoholism: effects on specific tissues and
the whole body. Nutrition 15:604–608
Rainey CJ, McKeown RE, Sargent RG, Valois RF (1996) Patterns of
tobacco and alcohol use among sedentary, exercising, nonath-
letic, and athletic youth. J Sch Health 66:27–32
Rapuri PB, Gallagher JC, Balhorn KE, Ryschon KL (2000) Alcohol
intake and bone metabolism in elderly women. Am J Clin Nutr
72:1206–1213
Reed AH, McCarty HL, Evans GL, Turner RT, Westerlind KC (2002)
The effects of chronic alcohol consumption and exercise on the
skeleton of adult male rats. Alcohol Clin Exp Res 26:1269–1274
Rigaud D (2009) Alcohol and body weight? Rev Prat 59:75–78
Turner RT (2000) Skeletal response to alcohol. Alcohol Clin Exp Res
24:1693–1701
Turner CH, Burr DB (1993) Basic biomechanical measurements of
bone: a tutorial. Bone 14:595–608
Venkat KK, Arora MM, Singh P, Desai M, Khatkhatay I (2009) Effect of
alcohol consumption on bone mineral density and hormonal
parameters in physically active male soldiers. Bone 45:449–454
Wezeman FH, Emanuele MA, Emanuele NV, Moskal SF 2nd, Woods
M, Suri M, Steiner J, LaPaglia N (1999) Chronic alcohol
consumption during male rat adolescence impairs skeletal
development through effects on osteoblast gene expression,
bone mineral density, and bone strength. Alcohol Clin Exp Res
23:1534–1542
Wezeman FH, Juknelis D, Frost N, Callaci JJ (2003) Spine bone
mineral density and vertebral body height are altered by alcohol
consumption in growing male and female rats. Alcohol 31:87–92
Yeh JK, Aloia JF, Tierney JM, Sprintz S (1993) Effect of treadmill
exercise on vertebral and tibial bone mineral content and bone
mineral density in the aged adult rat: determined by dual energy
X-ray absorptiometry. Calcif Tissue Int 52:234–238
Eur J Appl Physiol
123166
167
ETUDE 2 : EFFETS DE 3 DIFFERENTESDOSES D’ALCOOL SUR LES PARAMETRES
OSSEUX CHEZ LE RAT
Cette étude a donné lieu à :
- la publication d’un article original :
Maurel DB, Boisseau N, Benhamou CL, Jaffré C. Cortical bone is more sensitive toalcohol dose effects than trabecular bone in the rat. Accepté dans Joint Bone Spine,Octobre 2011.
- une communication affichée en congrès :
Maurel DB, Boisseau N, Dolleans E, Pallu S, Rochefort GY, Benhamou CL, Jaffré C.Influence de différentes doses d’alcool sur le contenu, la densité minérale osseuse, et lamicroarchitecture osseuse chez le rat. Journées Françaises de Biologie des TissusMinéralisés (JFBTM), Nice, Mars 2009.
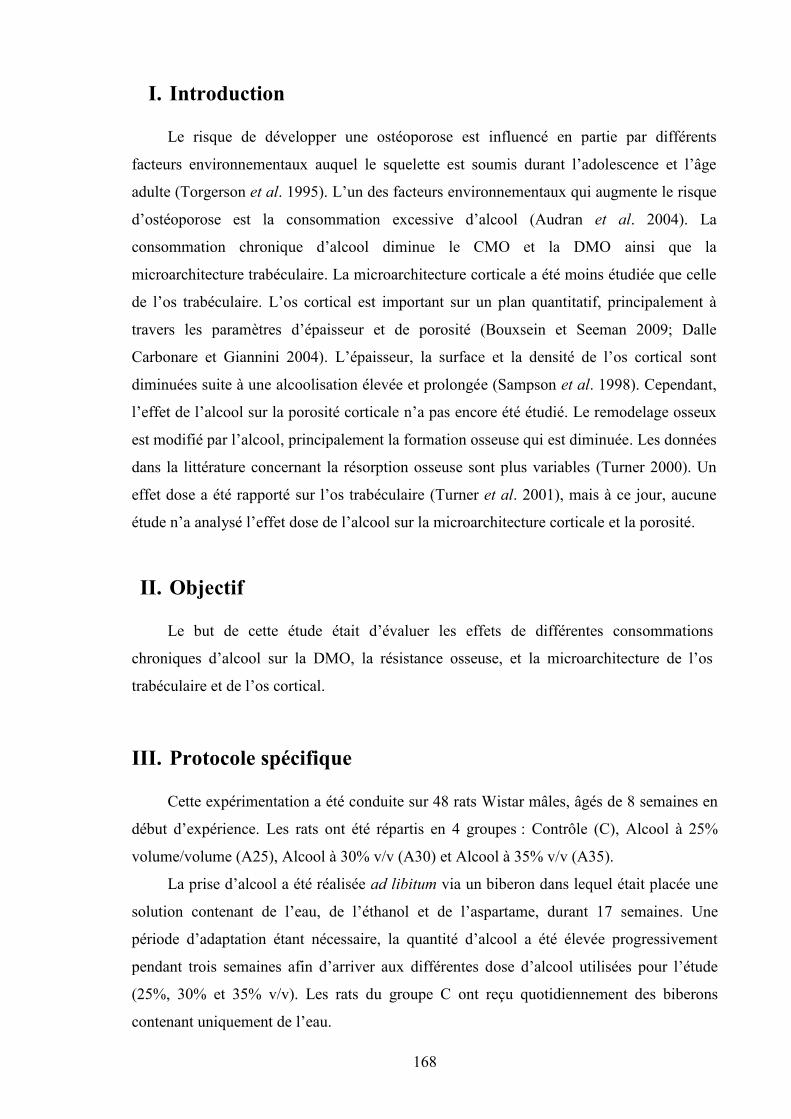
168
I. Introduction
Le risque de développer une ostéoporose est influencé en partie par différents
facteurs environnementaux auquel le squelette est soumis durant l’adolescence et l’âge
adulte (Torgerson et al. 1995). L’un des facteurs environnementaux qui augmente le risque
d’ostéoporose est la consommation excessive d’alcool (Audran et al. 2004). La
consommation chronique d’alcool diminue le CMO et la DMO ainsi que la
microarchitecture trabéculaire. La microarchitecture corticale a été moins étudiée que celle
de l’os trabéculaire. L’os cortical est important sur un plan quantitatif, principalement à
travers les paramètres d’épaisseur et de porosité (Bouxsein et Seeman 2009; Dalle
Carbonare et Giannini 2004). L’épaisseur, la surface et la densité de l’os cortical sont
diminuées suite à une alcoolisation élevée et prolongée (Sampson et al. 1998). Cependant,
l’effet de l’alcool sur la porosité corticale n’a pas encore été étudié. Le remodelage osseux
est modifié par l’alcool, principalement la formation osseuse qui est diminuée. Les données
dans la littérature concernant la résorption osseuse sont plus variables (Turner 2000). Un
effet dose a été rapporté sur l’os trabéculaire (Turner et al. 2001), mais à ce jour, aucune
étude n’a analysé l’effet dose de l’alcool sur la microarchitecture corticale et la porosité.
II. Objectif
Le but de cette étude était d’évaluer les effets de différentes consommations
chroniques d’alcool sur la DMO, la résistance osseuse, et la microarchitecture de l’os
trabéculaire et de l’os cortical.
III. Protocole spécifique
Cette expérimentation a été conduite sur 48 rats Wistar mâles, âgés de 8 semaines en
début d’expérience. Les rats ont été répartis en 4 groupes : Contrôle (C), Alcool à 25%
volume/volume (A25), Alcool à 30% v/v (A30) et Alcool à 35% v/v (A35).
La prise d’alcool a été réalisée ad libitum via un biberon dans lequel était placée une
solution contenant de l’eau, de l’éthanol et de l’aspartame, durant 17 semaines. Une
période d’adaptation étant nécessaire, la quantité d’alcool a été élevée progressivement
pendant trois semaines afin d’arriver aux différentes dose d’alcool utilisées pour l’étude
(25%, 30% et 35% v/v). Les rats du groupe C ont reçu quotidiennement des biberons
contenant uniquement de l’eau.
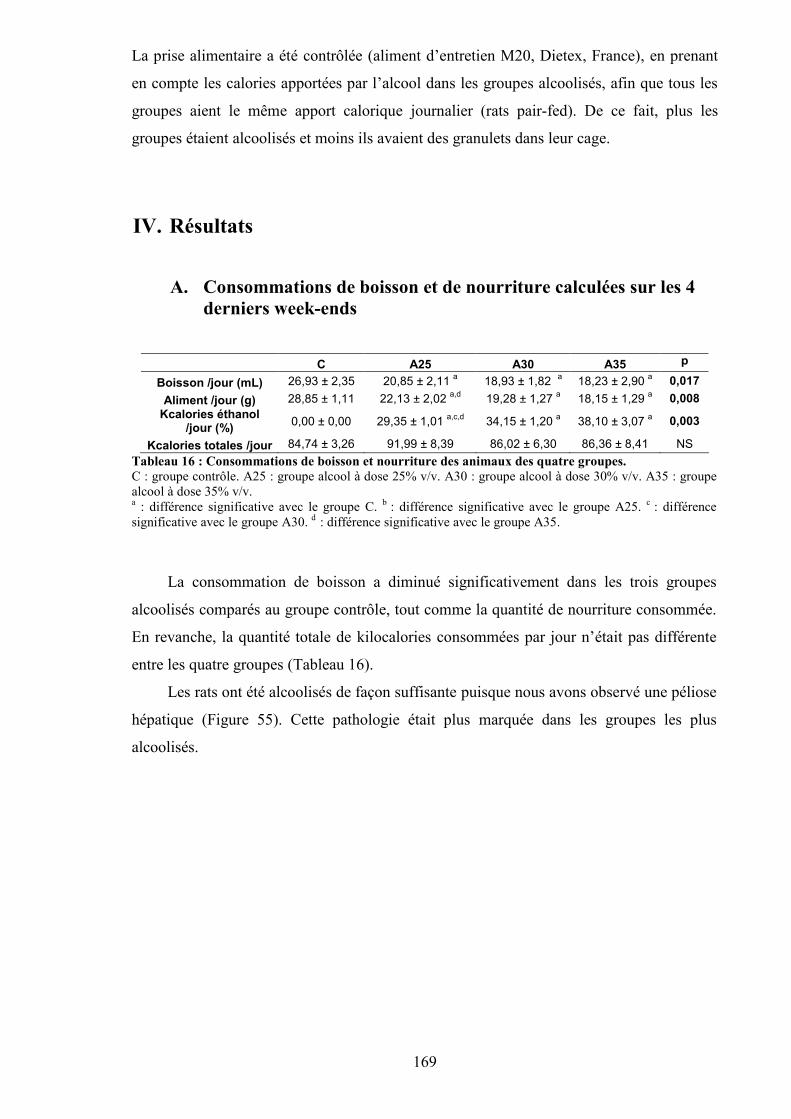
169
La prise alimentaire a été contrôlée (aliment d’entretien M20, Dietex, France), en prenant
en compte les calories apportées par l’alcool dans les groupes alcoolisés, afin que tous les
groupes aient le même apport calorique journalier (rats pair-fed). De ce fait, plus les
groupes étaient alcoolisés et moins ils avaient des granulets dans leur cage.
IV. Résultats
A. Consommations de boisson et de nourriture calculées sur les 4derniers week-ends
C A25 A30 A35 p
Boisson /jour (mL) 26,93 ± 2,35 20,85 ± 2,11 a 18,93 ± 1,82 a 18,23 ± 2,90 a 0,017Aliment /jour (g) 28,85 ± 1,11 22,13 ± 2,02 a,d 19,28 ± 1,27 a 18,15 ± 1,29 a 0,008
Kcalories éthanol/jour (%) 0,00 ± 0,00 29,35 ± 1,01 a,c,d 34,15 ± 1,20 a 38,10 ± 3,07 a 0,003
Kcalories totales /jour 84,74 ± 3,26 91,99 ± 8,39 86,02 ± 6,30 86,36 ± 8,41 NSTableau 16 : Consommations de boisson et nourriture des animaux des quatre groupes.C : groupe contrôle. A25 : groupe alcool à dose 25% v/v. A30 : groupe alcool à dose 30% v/v. A35 : groupealcool à dose 35% v/v.a : différence significative avec le groupe C. b : différence significative avec le groupe A25. c : différencesignificative avec le groupe A30. d : différence significative avec le groupe A35.
La consommation de boisson a diminué significativement dans les trois groupes
alcoolisés comparés au groupe contrôle, tout comme la quantité de nourriture consommée.
En revanche, la quantité totale de kilocalories consommées par jour n’était pas différente
entre les quatre groupes (Tableau 16).
Les rats ont été alcoolisés de façon suffisante puisque nous avons observé une péliose
hépatique (Figure 55). Cette pathologie était plus marquée dans les groupes les plus
alcoolisés.
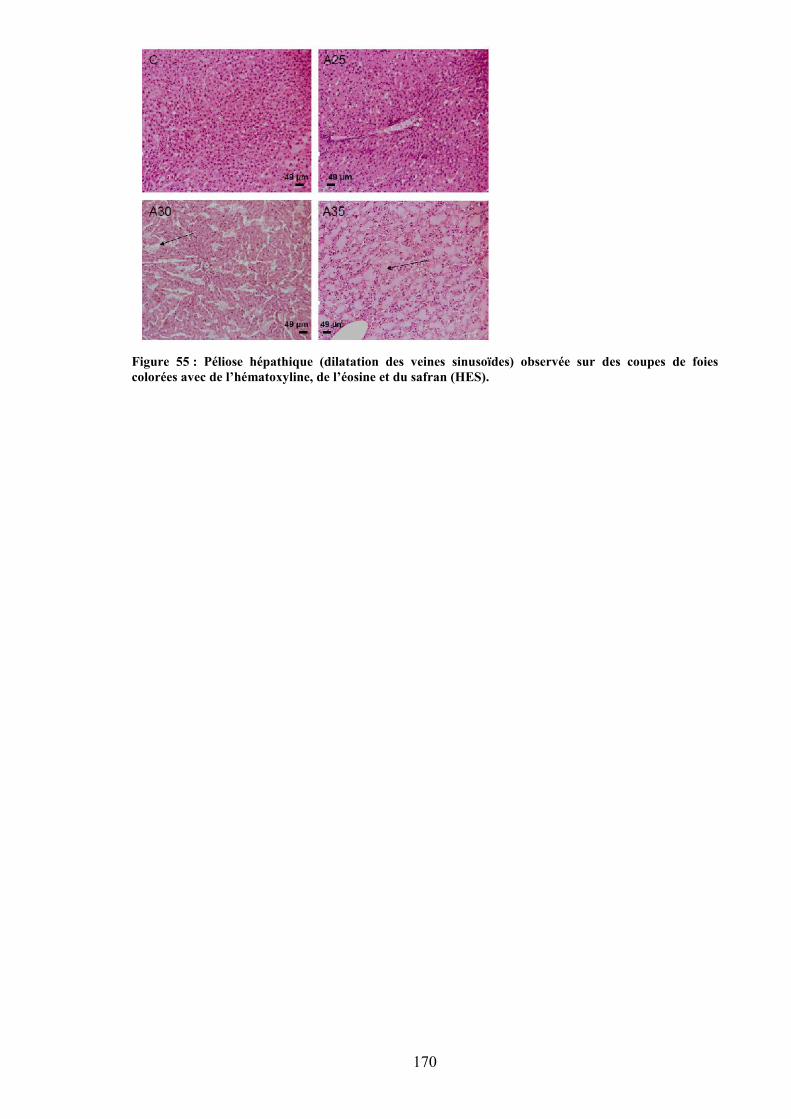
170
Figure 55 : Péliose hépathique (dilatation des veines sinusoïdes) observée sur des coupes de foiescolorées avec de l’hématoxyline, de l’éosine et du safran (HES).
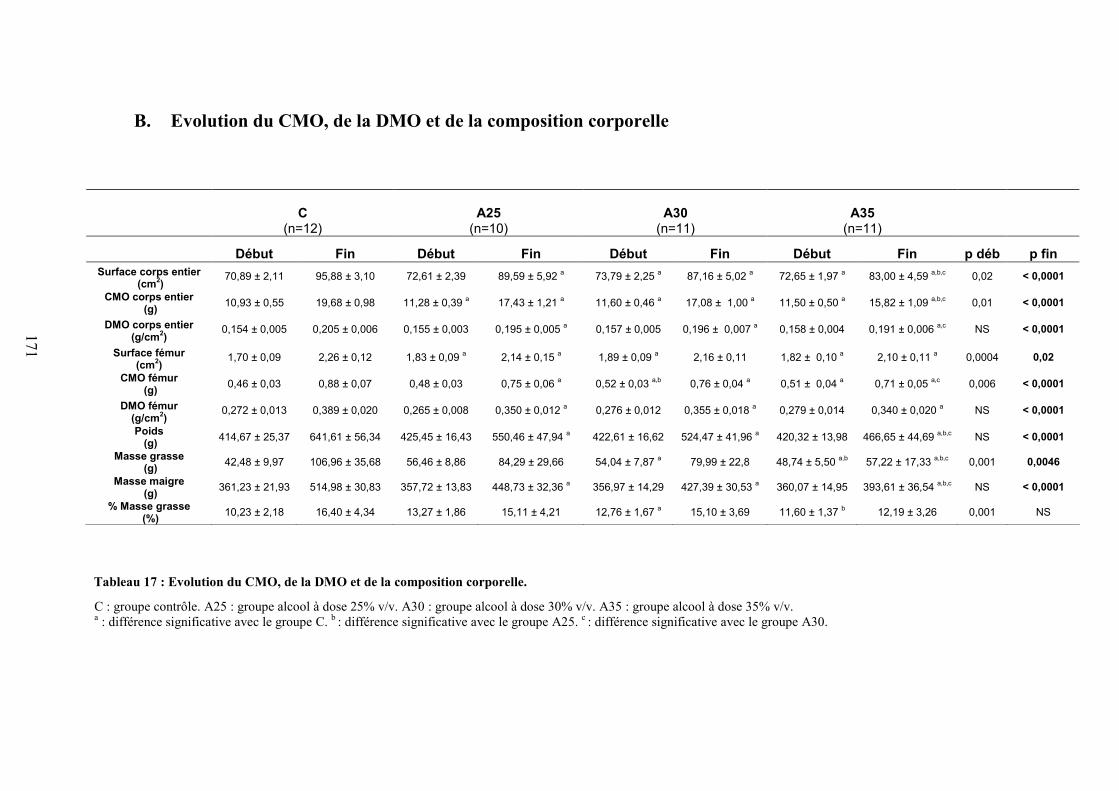
171
B. Evolution du CMO, de la DMO et de la composition corporelle
C : groupe contrôle. A25 : groupe alcool à dose 25% v/v. A30 : groupe alcool à dose 30% v/v. A35 : groupe alcool à dose 35% v/v.a : différence significative avec le groupe C. b : différence significative avec le groupe A25. c : différence significative avec le groupe A30.
C(n=12)
A25(n=10)
A30(n=11)
A35(n=11)
Début Fin Début Fin Début Fin Début Fin p déb p finSurface corps entier
(cm2)70,89 ± 2,11 95,88 ± 3,10 72,61 ± 2,39 89,59 ± 5,92 a 73,79 ± 2,25 a 87,16 ± 5,02 a 72,65 ± 1,97 a 83,00 ± 4,59 a,b,c 0,02 < 0,0001
CMO corps entier (g) 10,93 ± 0,55 19,68 ± 0,98 11,28 ± 0,39 a 17,43 ± 1,21 a 11,60 ± 0,46 a 17,08 ± 1,00 a 11,50 ± 0,50 a 15,82 ± 1,09 a,b,c 0,01 < 0,0001
DMO corps entier(g/cm2)
0,154 ± 0,005 0,205 ± 0,006 0,155 ± 0,003 0,195 ± 0,005 a 0,157 ± 0,005 0,196 ± 0,007 a 0,158 ± 0,004 0,191 ± 0,006 a,c NS < 0,0001
Surface fémur(cm2)
1,70 ± 0,09 2,26 ± 0,12 1,83 ± 0,09 a 2,14 ± 0,15 a 1,89 ± 0,09 a 2,16 ± 0,11 1,82 ± 0,10 a 2,10 ± 0,11 a 0,0004 0,02
CMO fémur (g) 0,46 ± 0,03 0,88 ± 0,07 0,48 ± 0,03 0,75 ± 0,06 a 0,52 ± 0,03 a,b 0,76 ± 0,04 a 0,51 ± 0,04 a 0,71 ± 0,05 a,c 0,006 < 0,0001
DMO fémur(g/cm2)
0,272 ± 0,013 0,389 ± 0,020 0,265 ± 0,008 0,350 ± 0,012 a 0,276 ± 0,012 0,355 ± 0,018 a 0,279 ± 0,014 0,340 ± 0,020 a NS < 0,0001
Poids (g) 414,67 ± 25,37 641,61 ± 56,34 425,45 ± 16,43 550,46 ± 47,94 a 422,61 ± 16,62 524,47 ± 41,96 a 420,32 ± 13,98 466,65 ± 44,69 a,b,c NS < 0,0001
Masse grasse (g) 42,48 ± 9,97 106,96 ± 35,68 56,46 ± 8,86 84,29 ± 29,66 54,04 ± 7,87 a 79,99 ± 22,8 48,74 ± 5,50 a,b 57,22 ± 17,33 a,b,c 0,001 0,0046
Masse maigre (g) 361,23 ± 21,93 514,98 ± 30,83 357,72 ± 13,83 448,73 ± 32,36 a 356,97 ± 14,29 427,39 ± 30,53 a 360,07 ± 14,95 393,61 ± 36,54 a,b,c NS < 0,0001
% Masse grasse (%) 10,23 ± 2,18 16,40 ± 4,34 13,27 ± 1,86 15,11 ± 4,21 12,76 ± 1,67 a 15,10 ± 3,69 11,60 ± 1,37 b 12,19 ± 3,26 0,001 NS
Tableau 17 : Evolution du CMO, de la DMO et de la composition corporelle.
172
Composition corporelle
Des différences significatives de masse grasse existaient entre les groupes avant le
début du protocole. De ce fait, les variations dues au protocole ont été analysées en calculant
les valeurs relatives, c'est-à-dire en tenant compte des différences déjà existantes à T1. Les
gains de poids, masse grasse et masse maigre étaient inférieurs pour les groupes A25, A30 et
A35 comparés à C. Le gain de poids était plus faible pour le groupe A35 versus A25 et A30,
et le gain de masse maigre était plus faible chez A35 versus A25 et A30, et chez A30 versus
A25 (Tableau 17).
CMO et DMO
Les différences relatives ont été calculées également pour le CMO et la DMO. Les gains de
CMO et de DMO du corps entier étaient significativement plus faibles chez les groupes A25,
A30 et A35 comparé à C et plus faible dans le groupe A35 comparé à A25 et A30. Le gain de
DMO au fémur était plus faible dans les trois groupes alcoolisés comparés à C, et plus faible
dans le groupe A35 comparé à A25 et A30. Après ajustement au poids et à la masse maigre, les
différences existaient toujours entre les quatre groupes pour le CMO et la DMO au niveau du
corps entier et du fémur (Tableau 17).
C. Microarchitecture trabéculaire
Le BS/BV était significativement supérieur dans les groupes A25 et A35 comparé au groupe C.
Le Tb.Th était significativement plus faible dans les groupes A25, A30 et A35 comparés au groupe C
(Tableau 18).
D. Microarchitecture corticale
Le Po.N était significativement supérieur dans les groupes A30 et A35 comparés au groupe C.
Le Ct.Po était significativement supérieur dans le groupe A35 comparé à C. Le PoS/CtV était
significativement augmenté dans les groupes A25, A30 et A35 vs C. L’épaisseur corticale était
significativement plus faible dans les deux axes pour les groupes A25, A30 et A35 comparés à C; et
plus faible dans le groupe A35 versus A25 et A30. Cela était dû à une augmentation du diamètre

173
interne du fémur. La longueur du fémur était significativement plus faible dans le groupe A35
comparé aux groupes C, A25 et A30 (Tableau 19).
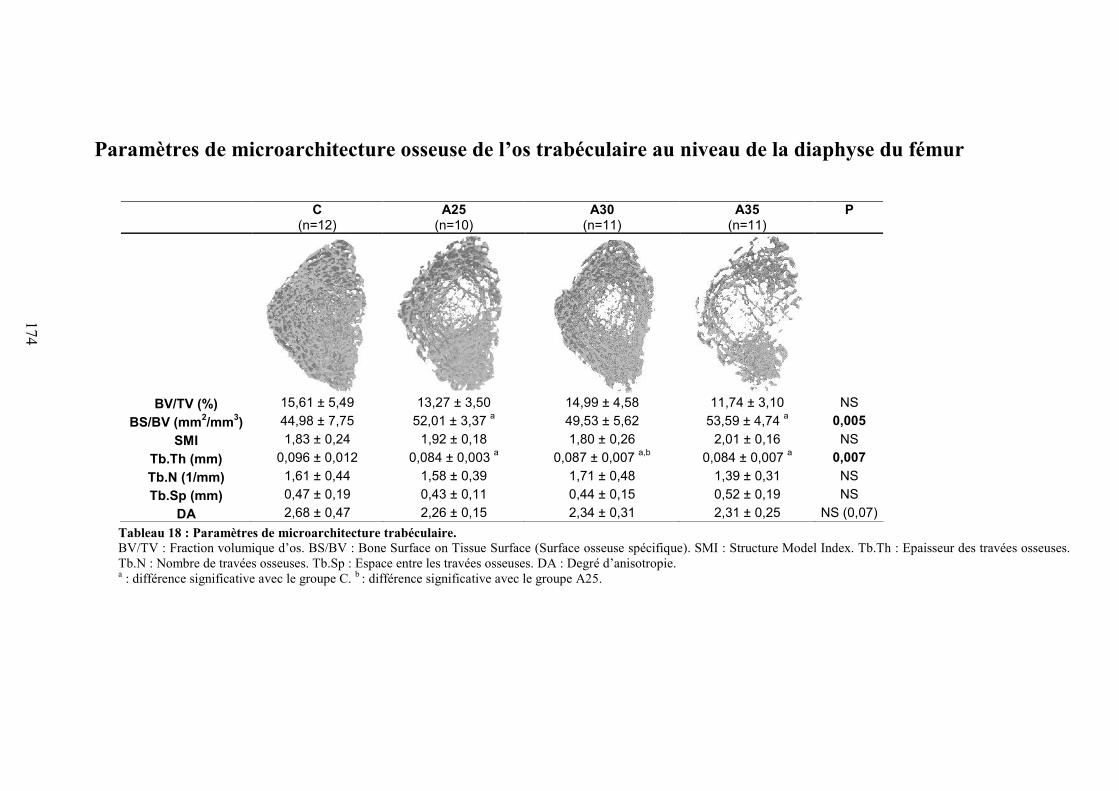
174
Paramètres de microarchitecture osseuse de l’os trabéculaire au niveau de la diaphyse du fémur
Tableau 18 : Paramètres de microarchitecture trabéculaire.BV/TV : Fraction volumique d’os. BS/BV : Bone Surface on Tissue Surface (Surface osseuse spécifique). SMI : Structure Model Index. Tb.Th : Epaisseur des travées osseuses.Tb.N : Nombre de travées osseuses. Tb.Sp : Espace entre les travées osseuses. DA : Degré d’anisotropie.a : différence significative avec le groupe C. b : différence significative avec le groupe A25.
C(n=12)
A25(n=10)
A30(n=11)
A35(n=11)
P
BV/TV (%) 15,61 ± 5,49 13,27 ± 3,50 14,99 ± 4,58 11,74 ± 3,10 NSBS/BV (mm2/mm3) 44,98 ± 7,75 52,01 ± 3,37 a 49,53 ± 5,62 53,59 ± 4,74 a 0,005
SMI 1,83 ± 0,24 1,92 ± 0,18 1,80 ± 0,26 2,01 ± 0,16 NSTb.Th (mm) 0,096 ± 0,012 0,084 ± 0,003 a 0,087 ± 0,007 a,b 0,084 ± 0,007 a 0,007Tb.N (1/mm) 1,61 ± 0,44 1,58 ± 0,39 1,71 ± 0,48 1,39 ± 0,31 NSTb.Sp (mm) 0,47 ± 0,19 0,43 ± 0,11 0,44 ± 0,15 0,52 ± 0,19 NS
DA 2,68 ± 0,47 2,26 ± 0,15 2,34 ± 0,31 2,31 ± 0,25 NS (0,07)
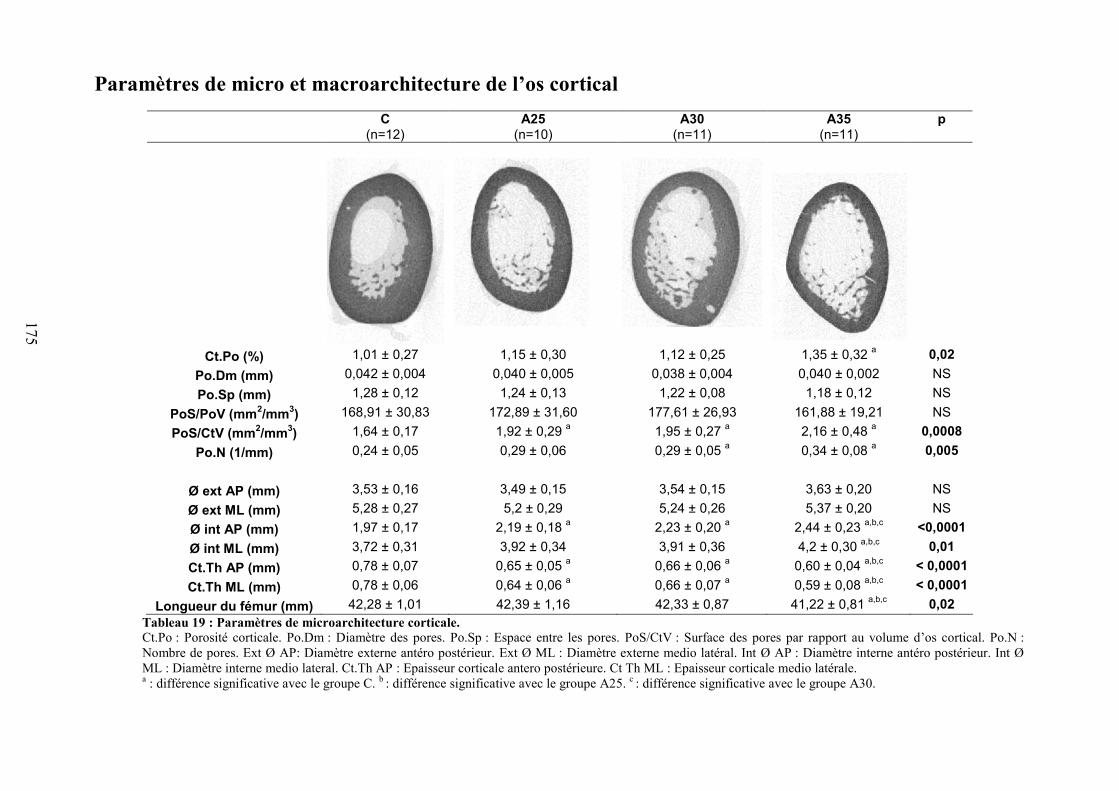
175
Paramètres de micro et macroarchitecture de l’os corticalC
(n=12)A25
(n=10)A30
(n=11)A35
(n=11)p
Ct.Po (%) 1,01 ± 0,27 1,15 ± 0,30 1,12 ± 0,25 1,35 ± 0,32 a 0,02Po.Dm (mm) 0,042 ± 0,004 0,040 ± 0,005 0,038 ± 0,004 0,040 ± 0,002 NSPo.Sp (mm) 1,28 ± 0,12 1,24 ± 0,13 1,22 ± 0,08 1,18 ± 0,12 NS
PoS/PoV (mm2/mm3) 168,91 ± 30,83 172,89 ± 31,60 177,61 ± 26,93 161,88 ± 19,21 NSPoS/CtV (mm2/mm3) 1,64 ± 0,17 1,92 ± 0,29 a 1,95 ± 0,27 a 2,16 ± 0,48 a 0,0008
Po.N (1/mm) 0,24 ± 0,05 0,29 ± 0,06 0,29 ± 0,05 a 0,34 ± 0,08 a 0,005
Ø ext AP (mm) 3,53 ± 0,16 3,49 ± 0,15 3,54 ± 0,15 3,63 ± 0,20 NSØ ext ML (mm) 5,28 ± 0,27 5,2 ± 0,29 5,24 ± 0,26 5,37 ± 0,20 NSØ int AP (mm) 1,97 ± 0,17 2,19 ± 0,18 a 2,23 ± 0,20 a 2,44 ± 0,23 a,b,c <0,0001Ø int ML (mm) 3,72 ± 0,31 3,92 ± 0,34 3,91 ± 0,36 4,2 ± 0,30 a,b,c 0,01Ct.Th AP (mm) 0,78 ± 0,07 0,65 ± 0,05 a 0,66 ± 0,06 a 0,60 ± 0,04 a,b,c < 0,0001Ct.Th ML (mm) 0,78 ± 0,06 0,64 ± 0,06 a 0,66 ± 0,07 a 0,59 ± 0,08 a,b,c < 0,0001
Longueur du fémur (mm) 42,28 ± 1,01 42,39 ± 1,16 42,33 ± 0,87 41,22 ± 0,81 a,b,c 0,02Tableau 19 : Paramètres de microarchitecture corticale.Ct.Po : Porosité corticale. Po.Dm : Diamètre des pores. Po.Sp : Espace entre les pores. PoS/CtV : Surface des pores par rapport au volume d’os cortical. Po.N :Nombre de pores. Ext Ø AP: Diamètre externe antéro postérieur. Ext Ø ML : Diamètre externe medio latéral. Int Ø AP : Diamètre interne antéro postérieur. Int ØML : Diamètre interne medio lateral. Ct.Th AP : Epaisseur corticale antero postérieure. Ct Th ML : Epaisseur corticale medio latérale.a : différence significative avec le groupe C. b : différence significative avec le groupe A25. c : différence significative avec le groupe A30.
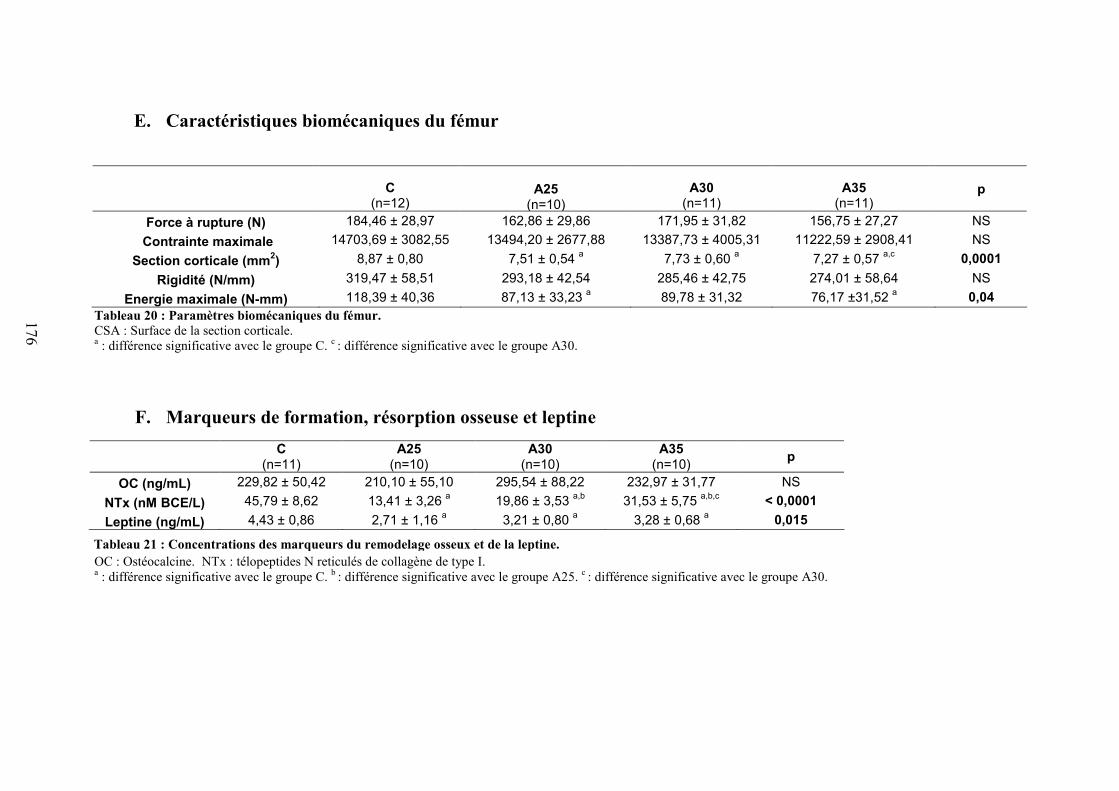
176
E. Caractéristiques biomécaniques du fémur
C(n=12)
A25(n=10)
(n=10)
A30(n=11)
A35(n=11)
p
Force à rupture (N) 184,46 ± 28,97 162,86 ± 29,86 171,95 ± 31,82 156,75 ± 27,27 NSContrainte maximale 14703,69 ± 3082,55 13494,20 ± 2677,88 13387,73 ± 4005,31 11222,59 ± 2908,41 NS
Section corticale (mm2) 8,87 ± 0,80 7,51 ± 0,54 a 7,73 ± 0,60 a 7,27 ± 0,57 a,c 0,0001Rigidité (N/mm) 319,47 ± 58,51 293,18 ± 42,54 285,46 ± 42,75 274,01 ± 58,64 NS
Energie maximale (N-mm) 118,39 ± 40,36 87,13 ± 33,23 a 89,78 ± 31,32 76,17 ±31,52 a 0,04Tableau 20 : Paramètres biomécaniques du fémur.CSA : Surface de la section corticale.a : différence significative avec le groupe C. c : différence significative avec le groupe A30.
F. Marqueurs de formation, résorption osseuse et leptine
OC : Ostéocalcine. NTx : télopeptides N reticulés de collagène de type I.a : différence significative avec le groupe C. b : différence significative avec le groupe A25. c : différence significative avec le groupe A30.
C(n=11)
A25(n=10)
A30(n=10)
A35(n=10) p
OC (ng/mL) 229,82 ± 50,42 210,10 ± 55,10 295,54 ± 88,22 232,97 ± 31,77 NSNTx (nM BCE/L) 45,79 ± 8,62 13,41 ± 3,26 a 19,86 ± 3,53 a,b 31,53 ± 5,75 a,b,c < 0,0001Leptine (ng/mL) 4,43 ± 0,86 2,71 ± 1,16 a 3,21 ± 0,80 a 3,28 ± 0,68 a 0,015
Tableau 21 : Concentrations des marqueurs du remodelage osseux et de la leptine.
177
Biomécanique
La section corticale (CSA) des os était significativement diminuée chez les trois groupes
alcoolisés comparés au groupe contrôle, et elle était également inférieure dans le groupe A35
comparé au groupe A30. L’énergie maximale absorbée par l’os était diminuée dans les
groupes A25 et A35 comparés au groupe C (Tableau 20).
Remodelage osseux et leptine
La concentration en NTx était significativement plus faible dans les groupes A25, A30,
et A35 vs C. Elle était aussi plus faible chez les rats appartenant aux groupes A25 vs A30 et
A35; et dans le groupe A30 vs A35. Il n’y avait pas de différence entre les groupes
concernant la concentration d’ostéocalcine. La concentration de leptine sérique était plus
faible dans les trois groupes alcoolisés comparés au groupe contrôle (Tableau 21).
G. Corrélations
La dose d’alcool consommée était inversement corrélée au gain de poids (r = -0,86,
p<0,0001), de masse maigre (r = -0,85, p<0,0001), de masse grasse (r = -0,67, p<0,0001), de
DMO au corps entier (r = -0,78, p<0,0001), et de CMO au corps entier (r = -0,82, p<0,0001).
Il y avait également une corrélation modérée entre la quantité de masse grasse et la leptine (r
= 0,43, p=0,01) et entre le poids et la leptine (r = 0,47, p=0,008). Nous avons observé une
corrélation significative entre la CSA et l’énergie maximale (r = 0,60, p<0,0001) et une forte
corrélation entre la CSA et l’épaisseur corticale (r = 0,80, p<0,0001).
178
V. Discussion
Il ressort de cette étude qu’une consommation excessive d’alcool sur une période de 17
semaines est associée à une altération de la microarchitecture corticale, et que ces effets sont
dose-dépendants.
Les trois doses d’alcool ont réduit le gain de CMO et de DMO au fémur et au corps
entier comparés au groupe contrôle. De plus, comme attendu, la dose d’alcool la plus élevée a
entraîné le plus faible gain de CMO et de DMO, comparés aux deux autres doses d’alcool.
Ces résultats montrent qu’une consommation élevée d’alcool consommée de façon chronique
a un effet délétère sur l’os et cela avec un effet-dose.
Les gains de poids, masse grasse et masse maigre étaient plus faibles dans les groupes
alcoolisés par rapport au groupe contrôle, ce qui a été observé chez l’Homme et l’animal. La
concentration en leptine était diminuée dans les groupes alcoolisés comparés au groupe
contrôle et pourrait concourir à diminuer la masse osseuse via un déclin de la différenciation
des CSM en ostéoblastes dans la moelle.
Le Tb.Th était diminué dans les trois groupes alcoolisés comparés au groupe contrôle,
mais il n’y avait pas de différences entre les groupes A25, A30 et A35 (pas d’effet-dose). Le
PoS.CtV était supérieur dans les groupes alcoolisés comparés au groupe contrôle. Le Po.N
dans l’os cortical était augmenté avec les doses 30% et 35% v/v, mais pas avec la dose 25%.
De plus, le Ct.Po était significativement supérieur au groupe contrôle seulement avec la dose
35% v/v. Ces données montrent un effet de l’alcool sur l’os cortical et mettent en évidence un
effet dose. Le Ct.Th était diminuée dans les groupes alcoolisés comparés au groupe contrôle,
et cette épaisseur variait selon la dose d’alcool ingérée. La longueur du fémur était diminuée
dans le groupe A35 seulement. L’énergie maximale était diminuée dans les groupes A25 et
A35 comparés au groupe C et était corrélée à la CSA (également inférieure).
En conclusion, la consommation excessive d’alcool ne diminue pas seulement la densité
et l’épaisseur trabéculaire, elle induit également une diminution de l’épaisseur corticale et
augmente la porosité. De plus, on note également une réelle augmentation de la toxicité de
l’alcool à partir de la dose 35% v/v, augmentant la porosité et diminuant la DMO et la
longueur du fémur.
Cette étude a permis de valider notre modèle d’ostéoporose d’origine alcoolique.
Nous avons observé une diminution de la DMO, liée à la fois à une diminution de
l’épaisseur trabéculaire, mais également de l’os cortical. Nous avons également montré
179
que l’alcool augmente le nombre de pores et la porosité corticale. Nous avons mis en
évidence un effet-dose de l’alcool sur la DMO, le nombre de pores, l’épaisseur corticale,
la longueur du fémur et sur l’énergie maximale. La dose 35% v/v était beaucoup plus
nocive pour les paramètres osseux que les deux autres doses. Après avoir défini quelle
dose engendre une réelle diminution de la masse osseuse, nous souhaitons analyser les
mécanismes plus fondamentaux responsables de cette perte osseuse. C’est l’objectif de
l’étude 3.

180
Article 2
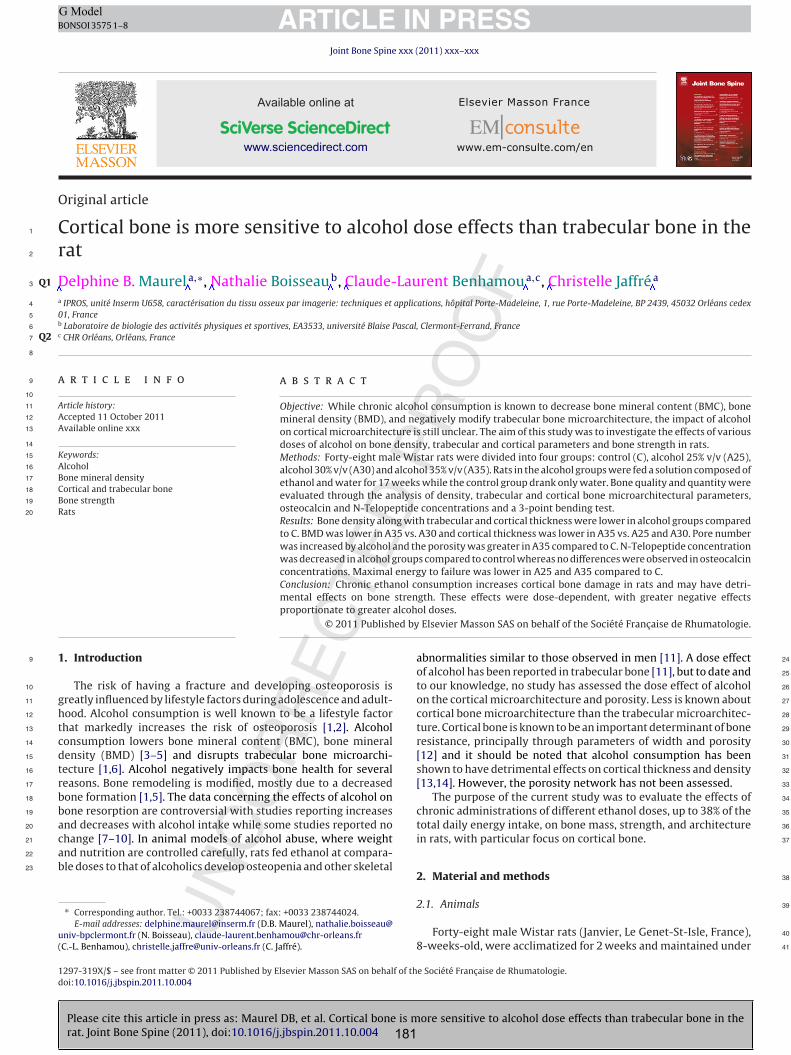
Please cite this article in press as: Maurel DB, et al. Cortical bone is more sensitive to alcohol dose effects than trabecular bone in therat. Joint Bone Spine (2011), doi:10.1016/j.jbspin.2011.10.004
ARTICLE IN PRESSG ModelBONSOI 3575 1–8
Joint Bone Spine xxx (2011) xxx–xxx
Available online at
www.sciencedirect.com
Original article
Cortical bone is more sensitive to alcohol dose effects than trabecular bone in therat
1
2
Delphine B. Maurela,∗, Nathalie Boisseaub, Claude-Laurent Benhamoua,c, Christelle JaffréaQ13
a IPROS, unité Inserm U658, caractérisation du tissu osseux par imagerie: techniques et applications, hôpital Porte-Madeleine, 1, rue Porte-Madeleine, BP 2439, 45032 Orléans cedex01, France
4
5b Laboratoire de biologie des activités physiques et sportives, EA3533, université Blaise Pascal, Clermont-Ferrand, France6c CHR Orléans, Orléans, FranceQ27
8
a r t i c l e i n f o9
10
Article history:11
Accepted 11 October 201112
Available online xxx13
14
Keywords:15
Alcohol16
Bone mineral density17
Cortical and trabecular bone18
Bone strength19
Rats20
a b s t r a c t
Objective: While chronic alcohol consumption is known to decrease bone mineral content (BMC), bonemineral density (BMD), and negatively modify trabecular bone microarchitecture, the impact of alcoholon cortical microarchitecture is still unclear. The aim of this study was to investigate the effects of variousdoses of alcohol on bone density, trabecular and cortical parameters and bone strength in rats.Methods: Forty-eight male Wistar rats were divided into four groups: control (C), alcohol 25% v/v (A25),alcohol 30% v/v (A30) and alcohol 35% v/v (A35). Rats in the alcohol groups were fed a solution composed ofethanol and water for 17 weeks while the control group drank only water. Bone quality and quantity wereevaluated through the analysis of density, trabecular and cortical bone microarchitectural parameters,osteocalcin and N-Telopeptide concentrations and a 3-point bending test.Results: Bone density along with trabecular and cortical thickness were lower in alcohol groups comparedto C. BMD was lower in A35 vs. A30 and cortical thickness was lower in A35 vs. A25 and A30. Pore numberwas increased by alcohol and the porosity was greater in A35 compared to C. N-Telopeptide concentrationwas decreased in alcohol groups compared to control whereas no differences were observed in osteocalcinconcentrations. Maximal energy to failure was lower in A25 and A35 compared to C.Conclusion: Chronic ethanol consumption increases cortical bone damage in rats and may have detri-mental effects on bone strength. These effects were dose-dependent, with greater negative effectsproportionate to greater alcohol doses.
© 2011 Published by Elsevier Masson SAS on behalf of the Société Française de Rhumatologie.
1. Introduction9
The risk of having a fracture and developing osteoporosis is10
greatly influenced by lifestyle factors during adolescence and adult-11
hood. Alcohol consumption is well known to be a lifestyle factor12
that markedly increases the risk of osteoporosis [1,2]. Alcohol13
consumption lowers bone mineral content (BMC), bone mineral14
density (BMD) [3–5] and disrupts trabecular bone microarchi-15
tecture [1,6]. Alcohol negatively impacts bone health for several16
reasons. Bone remodeling is modified, mostly due to a decreased17
bone formation [1,5]. The data concerning the effects of alcohol on18
bone resorption are controversial with studies reporting increases19
and decreases with alcohol intake while some studies reported no20
change [7–10]. In animal models of alcohol abuse, where weight21
and nutrition are controlled carefully, rats fed ethanol at compara-22
ble doses to that of alcoholics develop osteopenia and other skeletal23
∗ Corresponding author. Tel.: +0033 238744067; fax: +0033 238744024.E-mail addresses: [email protected] (D.B. Maurel), nathalie.boisseau@
univ-bpclermont.fr (N. Boisseau), [email protected](C.-L. Benhamou), [email protected] (C. Jaffré).
abnormalities similar to those observed in men [11]. A dose effect 24
of alcohol has been reported in trabecular bone [11], but to date and 25
to our knowledge, no study has assessed the dose effect of alcohol 26
on the cortical microarchitecture and porosity. Less is known about 27
cortical bone microarchitecture than the trabecular microarchitec- 28
ture. Cortical bone is known to be an important determinant of bone 29
resistance, principally through parameters of width and porosity 30
[12] and it should be noted that alcohol consumption has been 31
shown to have detrimental effects on cortical thickness and density 32
[13,14]. However, the porosity network has not been assessed. 33
The purpose of the current study was to evaluate the effects of 34
chronic administrations of different ethanol doses, up to 38% of the 35
total daily energy intake, on bone mass, strength, and architecture 36
in rats, with particular focus on cortical bone. 37
2. Material and methods 38
2.1. Animals 39
Forty-eight male Wistar rats (Janvier, Le Genet-St-Isle, France), 40
8-weeks-old, were acclimatized for 2 weeks and maintained under 41
1297-319X/$ – see front matter © 2011 Published by Elsevier Masson SAS on behalf of the Société Française de Rhumatologie.doi:10.1016/j.jbspin.2011.10.004
181
Original text:
Inserted Text
givenname
Original text:
Inserted Text
surname
Original text:
Inserted Text
givenname
Original text:
Inserted Text
surname
Original text:
Inserted Text
givenname
Original text:
Inserted Text
surname
Original text:
Inserted Text
givenname
Original text:
Inserted Text
surname
Please cite this article in press as: Maurel DB, et al. Cortical bone is more sensitive to alcohol dose effects than trabecular bone in therat. Joint Bone Spine (2011), doi:10.1016/j.jbspin.2011.10.004
ARTICLE IN PRESSG ModelBONSOI 3575 1–8
2 D.B. Maurel et al. / Joint Bone Spine xxx (2011) xxx–xxx
constant temperature (21 ± 2 C) and under 12 h/12 h light-dark42
cycles during the experiment. Rats were housed in pairs in standard43
cages and provided with a standard diet (M20, Dietex, France). At44
ten weeks of age, the rats were randomly assigned to one of the45
following groups: control (C), alcohol at 25% v/v (A25), alcohol at46
30% v/v (A30) and alcohol at 35% v/v (A35). The protocol lasted47
17 weeks. The rats of the A25, A30 and A35 groups drank a solu-48
tion composed of ethanol and water ad libitum. The percentage of49
ethanol in the solution was progressively increased over two weeks50
from 8% to the final concentration as specified for each group:51
25% v/v (7.3 g/kg/day; A25), 30% v/v (8.7 g/kg/day; A30) or 35% v/v52
(10.7 g/kg per day; A35). The food and drinking solutions were sep-53
arated in order to better mimic human consumption. The quantity54
of food eaten was controlled in order maintain isocaloric intakes55
across all groups, i.e., the more alcohol that was in the drinking56
solution, the less food the rats had available to them. The quanti-57
ties of food and drink solution ingested were recorded weekly for58
all groups.59
At the end of the study, all groups were killed by exsanguina-60
tions via cardiac puncture, following anesthesia with pentobarbital61
sodium (0.1 ml per 100 g of body weight). The left femur was62
excised, cleared of fat and connective tissues, placed in a soft tissue63
wipe and frozen at −20 C for the microarchitectural and biome-64
chanical investigations.65
2.2. Body weight, fat mass and lean mass66
Body weight was measured throughout the study. At age 1167
and 27 weeks, lean and fat mass were measured by DXA (Dis-68
covery, Hologic, Bedford, Massachussets, USA) using a specific69
‘small animal body composition’ mode. In order to perform the70
in vivo examination, the rats were anaesthetized with pentobar-71
bital diluted in sodium chloride (0.5 mL v/v). This apparatus is72
commonly used in small animals, and has been validated in our73
laboratory [15].74
2.3. Bone area, bone mineral content and bone mineral density75
measurements76
In vivo BMC and BMD of the left femur and whole body were77
measured at age 11 and 27 weeks by DXA using a Discovery Hologic78
apparatus adapted to small animals as described above.79
2.4. Morphological characteristics of the trabecular bone80
The microarchitecture of the metaphysis of the femoral bone81
was analyzed by high resolution CT (Skyscan 1072, Skyscan,82
Aartselaar, Belgium). We chose this subregion because it is rich83
in trabecular bone. The characteristics and methods used in our84
laboratory have previously been described [15]. The parameters85
analyzed were: the bone volume to tissue volume ratio (BV/TV,86
%), bone surface to bone volume BS/BV (mm2/mm3), the trabecu-87
lar thickness Tb.Th (mm), the trabecular number Tb.N (1/mm), the88
trabecular spaces Tb.Sp (mm) and the degree of anisotropy DA.89
2.5. Morphological characteristics of cortical bone90
Cortical bone of the femoral metaphysis was studied using CT,91
as described in Bonnet et al.’s study [15,16]. The acquisition char-92
acteristics were the same as those used for the trabecular bone. We93
obtained the porosity (Ct.Po, %), the pore number (Po.N, 1/mm), the94
pore diameter (Po.Dm, mm), the pore spacing (Po.Sp, mm), pore95
surface on volume (PoS/PoV, mm2/mm3) and the ratio of the pore96
surface to the cortical volume (PoS/CtV, mm2/mm3).97
2.6. Bone mechanical tests 98
Mechanical properties of the left femur were assessed by 99
a three-point bending test with a Universal Testing Machine 100
(Instron 3343, Instron, Melbourne, Australia). The method has been 101
described previously [17]. We analyzed ultimate force (N); energy 102
to ultimate force (N.m), stiffness (N.m) and ultimate stress (MPa). 103
The inner and outer diameters in both axes (ML and AP) were 104
assessed with the Image J software, utilizing the reconstructed 105
bone slices obtained by CT (Skyscan 1072, Skyscan, Aartselaar, 106
Belgium). 107
2.7. Biochemical analysis 108
Bone remodeling was analyzed by assaying biomarkers from 109
blood samples taken on the day of sacrifice. The blood was cen- 110
trifuged and the plasma was frozen at −80 C. To evaluate bone 111
remodeling we measured, in duplicate, osteocalcin concentra- 112
tion (bone formation) and the N-telopeptide of type I collagen 113
concentration (NTx, bone resorption) by immunoassay. Osteocal- 114
cin concentration was measured with the commercial Rat-MidTM115
Osteocalcin EIA kit, IDS, France, following manufacturer’s instruc- 116
tions. Intra and interassay CV were respectively 5.0% and 5.5% and 117
the detection limit was 50 ng.mL−1. NTx Osteomark assays were 118
performed with the enzyme-linked immunosorbent assay (ELISA) 119
Ntx Osteomark® (TECOmedical, France). Intra- and interassay CV 120
were 4.6 and 6.9% respectively and the detection limit was 3.2 nM 121
Bone Collagen Equivalents/L (BCE/L). Dickkopf-1 (DKK1) is an 122
antagonist of the Wnt/-catenin pathway. Therefore it can be used 123
as a negative marker of bone formation. We assessed DKK1 with the 124
Rat Dickkopf 1 Elisa kit (EIAabTM, Wuhan EIAab Science Co., Ltd., 125
Wuhan, China). The detection range was 62.5 pg/mL–00 pg/mL. 126
Serum leptin was measured by ELISA testing (m/r Leptin ELISA 127
Kit, TECOmedical, France) following manufacturer’s instructions, in 128
order to assess the evolution of blood concentrations with alcohol 129
intake and to establish whether any degree of correlation with body 130
composition could be detected. The sensitivity of the detection of 131
the assay was 10 pg/mL and intra-assay and inter-assay variation 132
coefficients were lower than 4.4% and 4.7% respectively. 133
2.8. Statistical analysis 134
Data are presented as mean ± standard deviation (SD) for all 135
bone parameters; and are presented as mean ± standard error of 136
the mean (SEM) for serum chemistry. The statistical analyses were 137
done using the Statview 1992–98 SAS software. Normal distribu- 138
tion (Gaussian) of the data was assessed with the Shapiro-Wilk test. 139
ANOVA and the Student t-test were used when the distribution 140
followed the normal law. Otherwise, Kruskal-Wallis and Mann & 141
Whitney tests were used. Spearman correlation and analysis for 142
covariances were also assessed with Statview software. Analyze of 143
covariance was calculated for BMD and BMC. BMD and BMC were 144
modeled as the dependent variables, while body weight, fat and 145
lean mass were treated as the independent variables. Significance 146
was determined as P ≤ 0.05. 147
3. Results 148
3.1. Food and beverage consumption 149
The spontaneous beverage intake decreased significantly in the 150
three alcohol-fed groups compared to controls (P = 0.0008). How- 151
ever, there was no significant difference in the total amount of 152
beverage consumed between A25, A30 and A35. The percentage of 153
calories derived from ethanol was significantly different between 154
the three alcohol-fed groups. It was significantly lower in the A25 155
182
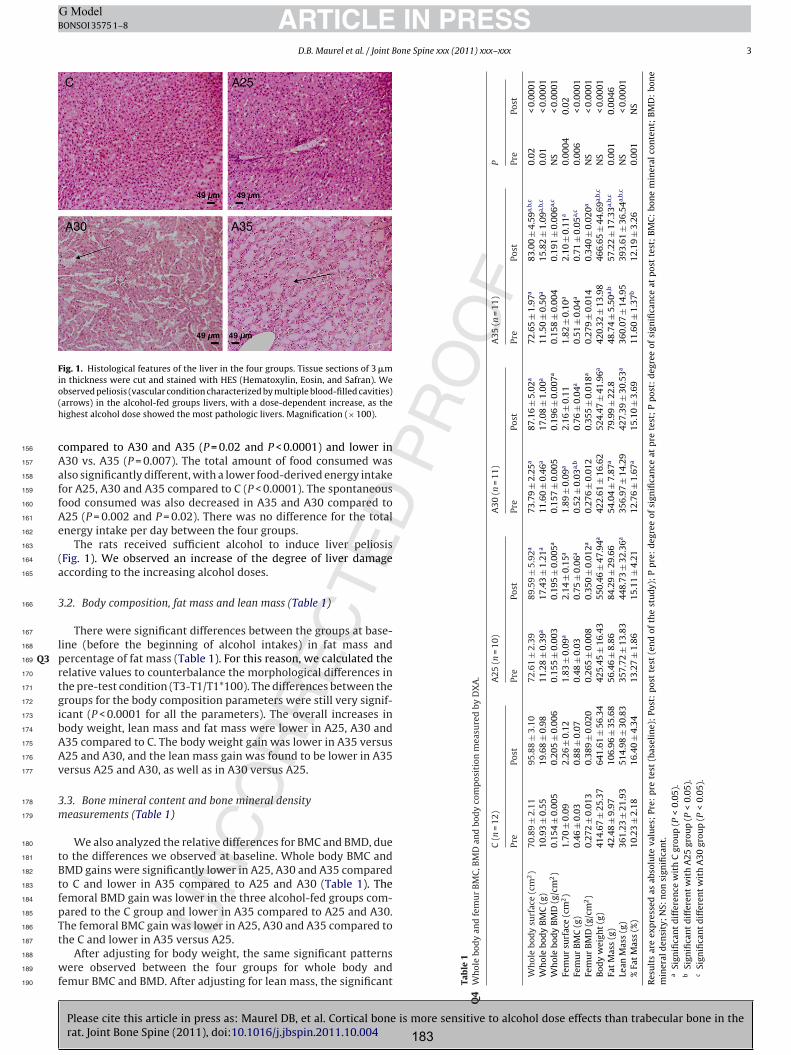
Please cite this article in press as: Maurel DB, et al. Cortical bone is more sensitive to alcohol dose effects than trabecular bone in therat. Joint Bone Spine (2011), doi:10.1016/j.jbspin.2011.10.004
ARTICLE IN PRESSG ModelBONSOI 3575 1–8
D.B. Maurel et al. / Joint Bone Spine xxx (2011) xxx–xxx 3
Fig. 1. Histological features of the liver in the four groups. Tissue sections of 3 min thickness were cut and stained with HES (Hematoxylin, Eosin, and Safran). Weobserved peliosis (vascular condition characterized by multiple blood-filled cavities)(arrows) in the alcohol-fed groups livers, with a dose-dependent increase, as thehighest alcohol dose showed the most pathologic livers. Magnification (× 100).
compared to A30 and A35 (P = 0.02 and P < 0.0001) and lower in156
A30 vs. A35 (P = 0.007). The total amount of food consumed was157
also significantly different, with a lower food-derived energy intake158
for A25, A30 and A35 compared to C (P < 0.0001). The spontaneous159
food consumed was also decreased in A35 and A30 compared to160
A25 (P = 0.002 and P = 0.02). There was no difference for the total161
energy intake per day between the four groups.162
The rats received sufficient alcohol to induce liver peliosis163
(Fig. 1). We observed an increase of the degree of liver damage164
according to the increasing alcohol doses.165
3.2. Body composition, fat mass and lean mass (Table 1)166
There were significant differences between the groups at base-167
line (before the beginning of alcohol intakes) in fat mass and168
percentage of fat mass (Table 1). For this reason, we calculated theQ3169
relative values to counterbalance the morphological differences in170
the pre-test condition (T3-T1/T1*100). The differences between the171
groups for the body composition parameters were still very signif-172
icant (P < 0.0001 for all the parameters). The overall increases in173
body weight, lean mass and fat mass were lower in A25, A30 and174
A35 compared to C. The body weight gain was lower in A35 versus175
A25 and A30, and the lean mass gain was found to be lower in A35176
versus A25 and A30, as well as in A30 versus A25.177
3.3. Bone mineral content and bone mineral density178
measurements (Table 1)179
We also analyzed the relative differences for BMC and BMD, due180
to the differences we observed at baseline. Whole body BMC and181
BMD gains were significantly lower in A25, A30 and A35 compared182
to C and lower in A35 compared to A25 and A30 (Table 1). The183
femoral BMD gain was lower in the three alcohol-fed groups com-184
pared to the C group and lower in A35 compared to A25 and A30.185
The femoral BMC gain was lower in A25, A30 and A35 compared to186
the C and lower in A35 versus A25.187
After adjusting for body weight, the same significant patterns188
were observed between the four groups for whole body and189
femur BMC and BMD. After adjusting for lean mass, the significant190 Tab
le1
Wh
ole
bod
yan
dfe
mu
rB
MC
,BM
Dan
dbo
dy
com
pos
itio
nm
easu
red
byD
XA
.Q
4
C(n
=12
)A
25(n
=10
)A
30(n
=11
)A
35(n
=11
)P
Pre
Post
Pre
Post
Pre
Post
Pre
Post
Pre
Post
Wh
ole
bod
ysu
rfac
e(c
m2)
70.8
9±
2.11
95.8
8±
3.10
72.6
1±
2.39
89.5
9±
5.92
a73
.79
±2.
25a
87.1
6±
5.02
a72
.65
±1.
97a
83.0
0±
4.59
a,b,
c0.
02<
0.00
01W
hol
ebo
dy
BM
C(g
)10
.93
±0.
5519
.68
±0.
9811
.28
±0.
39a
17.4
3±
1.21
a11
.60
±0.
46a
17.0
8±
1.00
a11
.50
±0.
50a
15.8
2±
1.09
a,b,
c0.
01<
0.00
01W
hol
ebo
dy
BM
D(g
/cm
2)
0.15
4±
0.00
50.
205
±0.
006
0.15
5±
0.00
30.
195
±0.
005a
0.15
7±
0.00
50.
196
±0.
007a
0.15
8±
0.00
40.
191
±0.
006a,
cN
S<
0.00
01Fe
mu
rsu
rfac
e(c
m2)
1.70
±0.
092.
26±
0.12
1.83
±0.
09a
2.14
±0.
15a
1.89
±0.
09a
2.16
±0.
111.
82±
0.10
a2.
10±
0.11
a0.
0004
0.02
Fem
ur
BM
C(g
)0.
46±
0.03
0.88
±0.
070.
48±
0.03
0.75
±0.
06a
0.52
±0.
03a,
b0.
76±
0.04
a0.
51±
0.04
a0.
71±
0.05
a,c
0.00
6<
0.00
01Fe
mu
rB
MD
(g/c
m2)
0.27
2±
0.01
30.
389
±0.
020
0.26
5±
0.00
80.
350
±0.
012a
0.27
6±
0.01
20.
355
±0.
018a
0.27
9±
0.01
40.
340
±0.
020a
NS
<0.
0001
Bod
yw
eigh
t(g
)41
4.67
±25
.37
641.
61±
56.3
442
5.45
±16
.43
550.
46±
47.9
4a42
2.61
±16
.62
524.
47±
41.9
6a42
0.32
±13
.98
466.
65±
44.6
9a,b,
cN
S<
0.00
01Fa
tM
ass
(g)
42.4
8±
9.97
106.
96±
35.6
856
.46
±8.
8684
.29
±29
.66
54.0
4±
7.87
a79
.99
±22
.848
.74
±5.
50a,
b57
.22
±17
.33a,
b,c
0.00
10.
0046
Lean
Mas
s(g
)36
1.23
±21
.93
514.
98±
30.8
335
7.72
±13
.83
448.
73±
32.3
6a35
6.97
±14
.29
427.
39±
30.5
3a36
0.07
±14
.95
393.
61±
36.5
4a,b,
cN
S<
0.00
01%
Fat
Mas
s(%
)10
.23
±2.
1816
.40
±4.
3413
.27
±1.
8615
.11
±4.
2112
.76
±1.
67a
15.1
0±
3.69
11.6
0±
1.37
b12
.19
±3.
260.
001
NS
Res
ult
sar
eex
pre
ssed
asab
solu
teva
lues
;Pr
e:p
rete
st(b
asel
ine)
;Po
st:
pos
tte
st(e
nd
ofth
est
ud
y);
Pp
re:
deg
ree
ofsi
gnifi
can
ceat
pre
test
;P
pos
t:d
egre
eof
sign
ifica
nce
atp
ost
test
;B
MC
:bo
ne
min
eral
con
ten
t;B
MD
:bo
ne
min
eral
den
sity
;N
S:n
onsi
gnifi
can
t.a
Sign
ifica
nt
dif
fere
nce
wit
hC
grou
p(P
<0.
05).
bSi
gnifi
can
td
iffe
ren
tw
ith
A25
grou
p(P
<0.
05).
cSi
gnifi
can
td
iffe
ren
tw
ith
A30
grou
p(P
<0.
05).
183
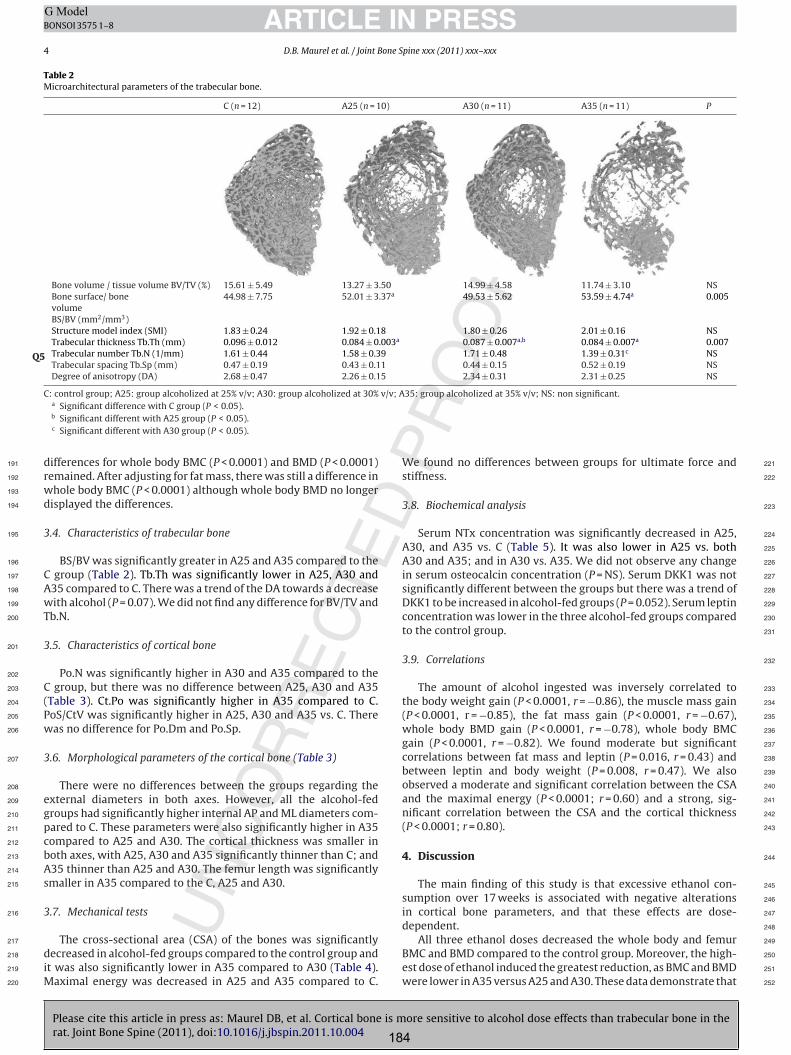
Please cite this article in press as: Maurel DB, et al. Cortical bone is more sensitive to alcohol dose effects than trabecular bone in therat. Joint Bone Spine (2011), doi:10.1016/j.jbspin.2011.10.004
ARTICLE IN PRESSG ModelBONSOI 3575 1–8
4 D.B. Maurel et al. / Joint Bone Spine xxx (2011) xxx–xxx
Table 2Microarchitectural parameters of the trabecular bone.
C (n = 12) A25 (n = 10) A30 (n = 11) A35 (n = 11) P
Bone volume / tissue volume BV/TV (%) 15.61 ± 5.49 13.27 ± 3.50 14.99 ± 4.58 11.74 ± 3.10 NSBone surface/ bonevolumeBS/BV (mm2/mm3)
44.98 ± 7.75 52.01 ± 3.37a 49.53 ± 5.62 53.59 ± 4.74a 0.005
Structure model index (SMI) 1.83 ± 0.24 1.92 ± 0.18 1.80 ± 0.26 2.01 ± 0.16 NSTrabecular thickness Tb.Th (mm) 0.096 ± 0.012 0.084 ± 0.003a 0.087 ± 0.007a,b 0.084 ± 0.007a 0.007Trabecular number Tb.N (1/mm) 1.61 ± 0.44 1.58 ± 0.39 1.71 ± 0.48 1.39 ± 0.31c NSQ5Trabecular spacing Tb.Sp (mm) 0.47 ± 0.19 0.43 ± 0.11 0.44 ± 0.15 0.52 ± 0.19 NSDegree of anisotropy (DA) 2.68 ± 0.47 2.26 ± 0.15 2.34 ± 0.31 2.31 ± 0.25 NS
C: control group; A25: group alcoholized at 25% v/v; A30: group alcoholized at 30% v/v; A35: group alcoholized at 35% v/v; NS: non significant.a Significant difference with C group (P < 0.05).b Significant different with A25 group (P < 0.05).c Significant different with A30 group (P < 0.05).
differences for whole body BMC (P < 0.0001) and BMD (P < 0.0001)191
remained. After adjusting for fat mass, there was still a difference in192
whole body BMC (P < 0.0001) although whole body BMD no longer193
displayed the differences.194
3.4. Characteristics of trabecular bone195
BS/BV was significantly greater in A25 and A35 compared to the196
C group (Table 2). Tb.Th was significantly lower in A25, A30 and197
A35 compared to C. There was a trend of the DA towards a decrease198
with alcohol (P = 0.07). We did not find any difference for BV/TV and199
Tb.N.200
3.5. Characteristics of cortical bone201
Po.N was significantly higher in A30 and A35 compared to the202
C group, but there was no difference between A25, A30 and A35203
(Table 3). Ct.Po was significantly higher in A35 compared to C.204
PoS/CtV was significantly higher in A25, A30 and A35 vs. C. There205
was no difference for Po.Dm and Po.Sp.206
3.6. Morphological parameters of the cortical bone (Table 3)207
There were no differences between the groups regarding the208
external diameters in both axes. However, all the alcohol-fed209
groups had significantly higher internal AP and ML diameters com-210
pared to C. These parameters were also significantly higher in A35211
compared to A25 and A30. The cortical thickness was smaller in212
both axes, with A25, A30 and A35 significantly thinner than C; and213
A35 thinner than A25 and A30. The femur length was significantly214
smaller in A35 compared to the C, A25 and A30.215
3.7. Mechanical tests216
The cross-sectional area (CSA) of the bones was significantly217
decreased in alcohol-fed groups compared to the control group and218
it was also significantly lower in A35 compared to A30 (Table 4).219
Maximal energy was decreased in A25 and A35 compared to C.220
We found no differences between groups for ultimate force and 221
stiffness. 222
3.8. Biochemical analysis 223
Serum NTx concentration was significantly decreased in A25, 224
A30, and A35 vs. C (Table 5). It was also lower in A25 vs. both 225
A30 and A35; and in A30 vs. A35. We did not observe any change 226
in serum osteocalcin concentration (P = NS). Serum DKK1 was not 227
significantly different between the groups but there was a trend of 228
DKK1 to be increased in alcohol-fed groups (P = 0.052). Serum leptin 229
concentration was lower in the three alcohol-fed groups compared 230
to the control group. 231
3.9. Correlations 232
The amount of alcohol ingested was inversely correlated to 233
the body weight gain (P < 0.0001, r = −0.86), the muscle mass gain 234
(P < 0.0001, r = −0.85), the fat mass gain (P < 0.0001, r = −0.67), 235
whole body BMD gain (P < 0.0001, r = −0.78), whole body BMC 236
gain (P < 0.0001, r = −0.82). We found moderate but significant 237
correlations between fat mass and leptin (P = 0.016, r = 0.43) and 238
between leptin and body weight (P = 0.008, r = 0.47). We also 239
observed a moderate and significant correlation between the CSA 240
and the maximal energy (P < 0.0001; r = 0.60) and a strong, sig- 241
nificant correlation between the CSA and the cortical thickness 242
(P < 0.0001; r = 0.80). 243
4. Discussion 244
The main finding of this study is that excessive ethanol con- 245
sumption over 17 weeks is associated with negative alterations 246
in cortical bone parameters, and that these effects are dose- 247
dependent. 248
All three ethanol doses decreased the whole body and femur 249
BMC and BMD compared to the control group. Moreover, the high- 250
est dose of ethanol induced the greatest reduction, as BMC and BMD 251
were lower in A35 versus A25 and A30. These data demonstrate that 252
184
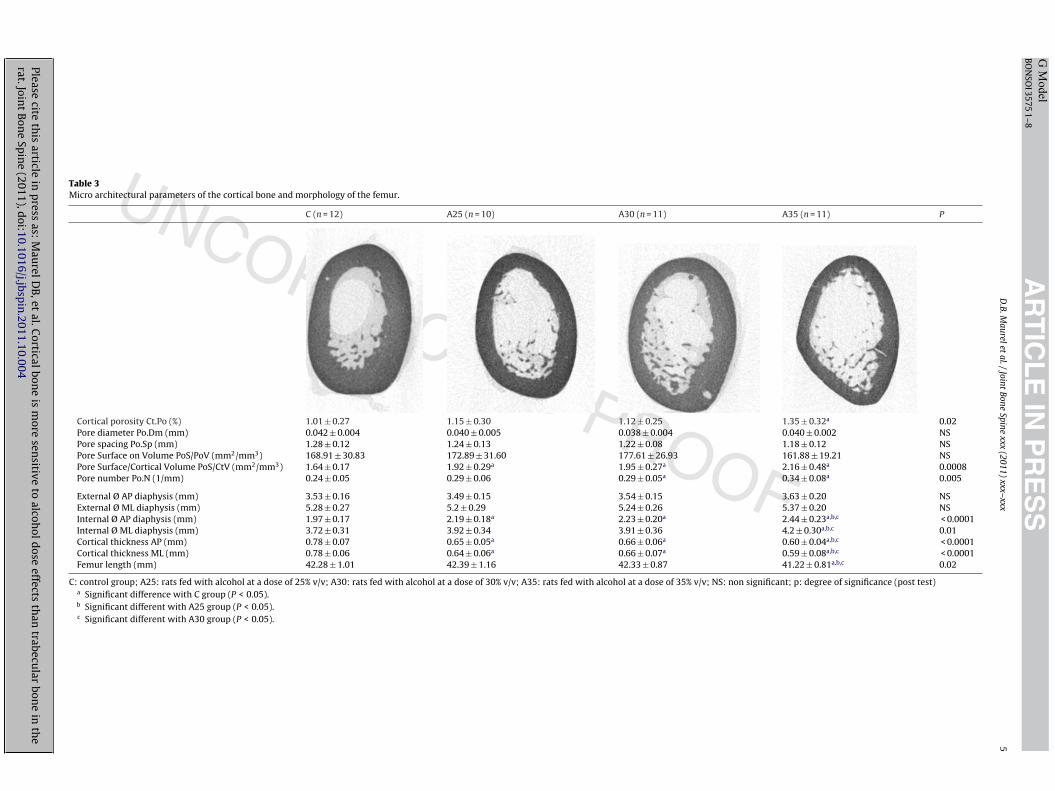
Pleasecite
this
articlein
press
as:M
aurelD
B,et
al.Corticalbon
eis
more
sensitive
toalcoh
oldose
effectsth
antrabecu
larbon
ein
the
rat.Joint
Bon
eSp
ine
(2011),doi:10.1016/j.jbsp
in.2011.10.004
AR
TIC
LE
IN P
RE
SS
G M
odelB
ON
SOI3575
1–8
D.B.M
aureletal./Joint
BoneSpine
xxx(2011)
xxx–xxx5
Table 3Micro architectural parameters of the cortical bone and morphology of the femur.
C (n = 12) A25 (n = 10) A30 (n = 11) A35 (n = 11) P
Cortical porosity Ct.Po (%) 1.01 ± 0.27 1.15 ± 0.30 1.12 ± 0.25 1.35 ± 0.32a 0.02Pore diameter Po.Dm (mm) 0.042 ± 0.004 0.040 ± 0.005 0.038 ± 0.004 0.040 ± 0.002 NSPore spacing Po.Sp (mm) 1.28 ± 0.12 1.24 ± 0.13 1.22 ± 0.08 1.18 ± 0.12 NSPore Surface on Volume PoS/PoV (mm2/mm3) 168.91 ± 30.83 172.89 ± 31.60 177.61 ± 26.93 161.88 ± 19.21 NSPore Surface/Cortical Volume PoS/CtV (mm2/mm3) 1.64 ± 0.17 1.92 ± 0.29a 1.95 ± 0.27a 2.16 ± 0.48a 0.0008Pore number Po.N (1/mm) 0.24 ± 0.05 0.29 ± 0.06 0.29 ± 0.05a 0.34 ± 0.08a 0.005
External Ø AP diaphysis (mm) 3.53 ± 0.16 3.49 ± 0.15 3.54 ± 0.15 3.63 ± 0.20 NSExternal Ø ML diaphysis (mm) 5.28 ± 0.27 5.2 ± 0.29 5.24 ± 0.26 5.37 ± 0.20 NSInternal Ø AP diaphysis (mm) 1.97 ± 0.17 2.19 ± 0.18a 2.23 ± 0.20a 2.44 ± 0.23a,b,c < 0.0001Internal Ø ML diaphysis (mm) 3.72 ± 0.31 3.92 ± 0.34 3.91 ± 0.36 4.2 ± 0.30a,b,c 0.01Cortical thickness AP (mm) 0.78 ± 0.07 0.65 ± 0.05a 0.66 ± 0.06a 0.60 ± 0.04a,b,c < 0.0001Cortical thickness ML (mm) 0.78 ± 0.06 0.64 ± 0.06a 0.66 ± 0.07a 0.59 ± 0.08a,b,c < 0.0001Femur length (mm) 42.28 ± 1.01 42.39 ± 1.16 42.33 ± 0.87 41.22 ± 0.81a,b,c 0.02
C: control group; A25: rats fed with alcohol at a dose of 25% v/v; A30: rats fed with alcohol at a dose of 30% v/v; A35: rats fed with alcohol at a dose of 35% v/v; NS: non significant; p: degree of significance (post test)a Significant difference with C group (P < 0.05).b Significant different with A25 group (P < 0.05).c Significant different with A30 group (P < 0.05).
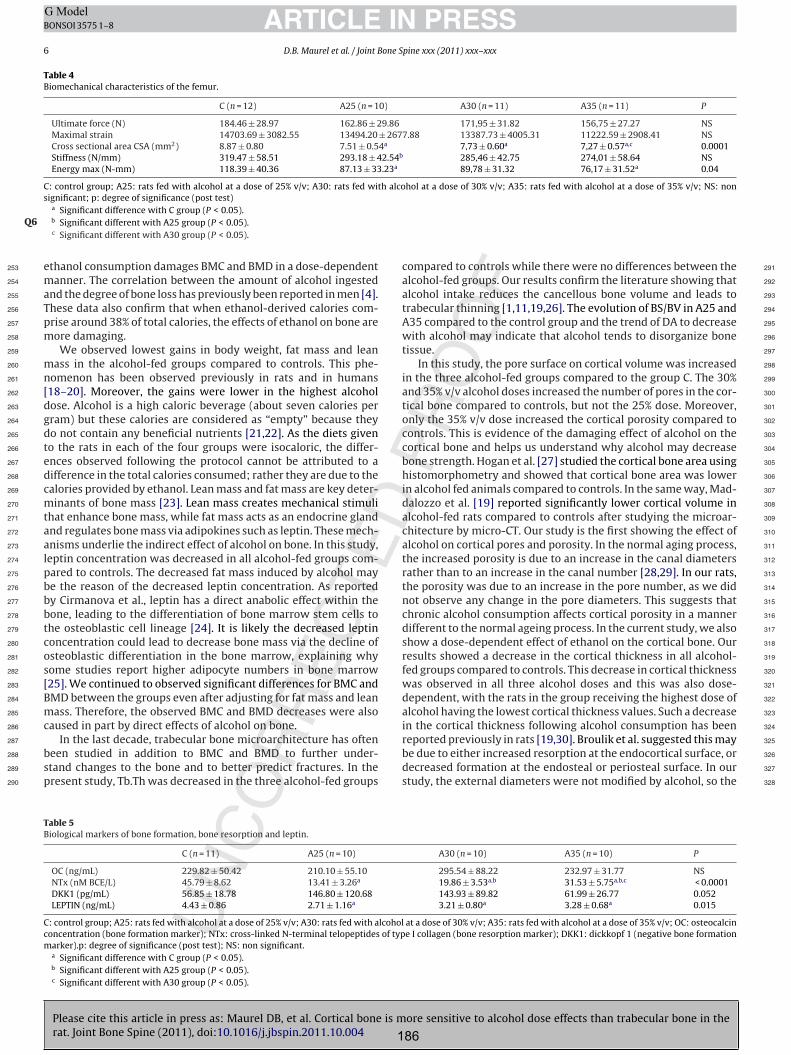
Please cite this article in press as: Maurel DB, et al. Cortical bone is more sensitive to alcohol dose effects than trabecular bone in therat. Joint Bone Spine (2011), doi:10.1016/j.jbspin.2011.10.004
ARTICLE IN PRESSG ModelBONSOI 3575 1–8
6 D.B. Maurel et al. / Joint Bone Spine xxx (2011) xxx–xxx
Table 4Biomechanical characteristics of the femur.
C (n = 12) A25 (n = 10) A30 (n = 11) A35 (n = 11) P
Ultimate force (N) 184.46 ± 28.97 162.86 ± 29.86 171,95 ± 31.82 156,75 ± 27.27 NSMaximal strain 14703.69 ± 3082.55 13494.20 ± 2677.88 13387.73 ± 4005.31 11222.59 ± 2908.41 NSCross sectional area CSA (mm2) 8.87 ± 0.80 7.51 ± 0.54a 7,73 ± 0.60a 7,27 ± 0.57a,c 0.0001Stiffness (N/mm) 319.47 ± 58.51 293.18 ± 42.54b 285,46 ± 42.75 274,01 ± 58.64 NSEnergy max (N-mm) 118.39 ± 40.36 87.13 ± 33.23a 89,78 ± 31.32 76,17 ± 31.52a 0.04
C: control group; A25: rats fed with alcohol at a dose of 25% v/v; A30: rats fed with alcohol at a dose of 30% v/v; A35: rats fed with alcohol at a dose of 35% v/v; NS: nonsignificant; p: degree of significance (post test)
a Significant difference with C group (P < 0.05).b Significant different with A25 group (P < 0.05).Q6c Significant different with A30 group (P < 0.05).
ethanol consumption damages BMC and BMD in a dose-dependent253
manner. The correlation between the amount of alcohol ingested254
and the degree of bone loss has previously been reported in men [4].255
These data also confirm that when ethanol-derived calories com-256
prise around 38% of total calories, the effects of ethanol on bone are257
more damaging.258
We observed lowest gains in body weight, fat mass and lean259
mass in the alcohol-fed groups compared to controls. This phe-260
nomenon has been observed previously in rats and in humans261
[18–20]. Moreover, the gains were lower in the highest alcohol262
dose. Alcohol is a high caloric beverage (about seven calories per263
gram) but these calories are considered as “empty” because they264
do not contain any beneficial nutrients [21,22]. As the diets given265
to the rats in each of the four groups were isocaloric, the differ-266
ences observed following the protocol cannot be attributed to a267
difference in the total calories consumed; rather they are due to the268
calories provided by ethanol. Lean mass and fat mass are key deter-269
minants of bone mass [23]. Lean mass creates mechanical stimuli270
that enhance bone mass, while fat mass acts as an endocrine gland271
and regulates bone mass via adipokines such as leptin. These mech-272
anisms underlie the indirect effect of alcohol on bone. In this study,273
leptin concentration was decreased in all alcohol-fed groups com-274
pared to controls. The decreased fat mass induced by alcohol may275
be the reason of the decreased leptin concentration. As reported276
by Cirmanova et al., leptin has a direct anabolic effect within the277
bone, leading to the differentiation of bone marrow stem cells to278
the osteoblastic cell lineage [24]. It is likely the decreased leptin279
concentration could lead to decrease bone mass via the decline of280
osteoblastic differentiation in the bone marrow, explaining why281
some studies report higher adipocyte numbers in bone marrow282
[25]. We continued to observed significant differences for BMC and283
BMD between the groups even after adjusting for fat mass and lean284
mass. Therefore, the observed BMC and BMD decreases were also285
caused in part by direct effects of alcohol on bone.286
In the last decade, trabecular bone microarchitecture has often287
been studied in addition to BMC and BMD to further under-288
stand changes to the bone and to better predict fractures. In the289
present study, Tb.Th was decreased in the three alcohol-fed groups290
compared to controls while there were no differences between the 291
alcohol-fed groups. Our results confirm the literature showing that 292
alcohol intake reduces the cancellous bone volume and leads to 293
trabecular thinning [1,11,19,26]. The evolution of BS/BV in A25 and 294
A35 compared to the control group and the trend of DA to decrease 295
with alcohol may indicate that alcohol tends to disorganize bone 296
tissue. 297
In this study, the pore surface on cortical volume was increased 298
in the three alcohol-fed groups compared to the group C. The 30% 299
and 35% v/v alcohol doses increased the number of pores in the cor- 300
tical bone compared to controls, but not the 25% dose. Moreover, 301
only the 35% v/v dose increased the cortical porosity compared to 302
controls. This is evidence of the damaging effect of alcohol on the 303
cortical bone and helps us understand why alcohol may decrease 304
bone strength. Hogan et al. [27] studied the cortical bone area using 305
histomorphometry and showed that cortical bone area was lower 306
in alcohol fed animals compared to controls. In the same way, Mad- 307
dalozzo et al. [19] reported significantly lower cortical volume in 308
alcohol-fed rats compared to controls after studying the microar- 309
chitecture by micro-CT. Our study is the first showing the effect of 310
alcohol on cortical pores and porosity. In the normal aging process, 311
the increased porosity is due to an increase in the canal diameters 312
rather than to an increase in the canal number [28,29]. In our rats, 313
the porosity was due to an increase in the pore number, as we did 314
not observe any change in the pore diameters. This suggests that 315
chronic alcohol consumption affects cortical porosity in a manner 316
different to the normal ageing process. In the current study, we also 317
show a dose-dependent effect of ethanol on the cortical bone. Our 318
results showed a decrease in the cortical thickness in all alcohol- 319
fed groups compared to controls. This decrease in cortical thickness 320
was observed in all three alcohol doses and this was also dose- 321
dependent, with the rats in the group receiving the highest dose of 322
alcohol having the lowest cortical thickness values. Such a decrease 323
in the cortical thickness following alcohol consumption has been 324
reported previously in rats [19,30]. Broulik et al. suggested this may 325
be due to either increased resorption at the endocortical surface, or 326
decreased formation at the endosteal or periosteal surface. In our 327
study, the external diameters were not modified by alcohol, so the 328
Table 5Biological markers of bone formation, bone resorption and leptin.
C (n = 11) A25 (n = 10) A30 (n = 10) A35 (n = 10) P
OC (ng/mL) 229.82 ± 50.42 210.10 ± 55.10 295.54 ± 88.22 232.97 ± 31.77 NSNTx (nM BCE/L) 45.79 ± 8.62 13.41 ± 3.26a 19.86 ± 3.53a,b 31.53 ± 5.75a,b,c < 0.0001DKK1 (pg/mL) 56.85 ± 18.78 146.80 ± 120.68 143.93 ± 89.82 61.99 ± 26.77 0.052LEPTIN (ng/mL) 4.43 ± 0.86 2.71 ± 1.16a 3.21 ± 0.80a 3.28 ± 0.68a 0.015
C: control group; A25: rats fed with alcohol at a dose of 25% v/v; A30: rats fed with alcohol at a dose of 30% v/v; A35: rats fed with alcohol at a dose of 35% v/v; OC: osteocalcinconcentration (bone formation marker); NTx: cross-linked N-terminal telopeptides of type I collagen (bone resorption marker); DKK1: dickkopf 1 (negative bone formationmarker).p: degree of significance (post test); NS: non significant.
a Significant difference with C group (P < 0.05).b Significant different with A25 group (P < 0.05).c Significant different with A30 group (P < 0.05).
186
Please cite this article in press as: Maurel DB, et al. Cortical bone is more sensitive to alcohol dose effects than trabecular bone in therat. Joint Bone Spine (2011), doi:10.1016/j.jbspin.2011.10.004
ARTICLE IN PRESSG ModelBONSOI 3575 1–8
D.B. Maurel et al. / Joint Bone Spine xxx (2011) xxx–xxx 7
decreased cortical thickness was due either to an increased endo-329
cortical resorption or to decreased endocortical formation, which330
is supported by our observations of an increase in the medullary331
cavity of the femur.332
A decrease of the femur length was observed only in A35. This333
was previously reported by Maddalozzo et al. [19] in 3-week-old334
and 9-week-old male Sprague-Dawley rats following a diet where335
ethanol represented 35% of the total caloric intake. In their study336
the decreased bone size was likely due to the self -imposed caloric337
restriction in alcohol-fed rats which consumed ad libitum. In our338
study, there was no daily caloric intake difference between the339
groups but the alcohol-fed rats consumed less food than the control340
rats. Thus, the decreased growth reported in that study may have341
been due to a restriction of nutrients from food as underlined by342
Maddalozzo or to specific action of ethanol and its metabolic use343
[21].344
In the present study the CSA of the alcohol-fed rats was signifi-345
cantly lower than controls. It was also significantly lower in the A35346
group compared to A30. This is explained by the decreased cortical347
thickness observed in the femur, as shown by the very strong cor-348
relation found between these two parameters. The decrease of the349
maximal energy absorbed by the femur found in A25 and A35 com-350
pared to C is interesting as it is correlated to the decrease of the CSA351
(P < 0.0001; r = 0.60). They may explain the reduced bone strength352
observed in alcoholics and show the importance of bone size and353
morphology in regards to bone strength. The maximal energy is354
potentially not significantly different in A30 group compared to C355
because the CSA is not decreased as much as for the other doses.356
Our results are consistent with the report by Kusy et al. [31] of a357
reduced mechanical strength of the femur following a four-week358
ethanol diet (8% w/v) in male and female rats.359
In our study, NTx concentrations were significantly lower in the360
alcohol-fed groups compared to the control group. NTx was also361
lower in the lowest doses compared to the highest dose. Moreover,362
we did not observe any change in bone formation. This is interest-363
ing because whilst the data concerning bone resorption is a little364
controversial, most of the studies that assess the effects of alcohol365
on bone reported a decrease in bone formation [19,30,32]. How-366
ever, Sampson et al. reported no change in serum osteocalcin levels367
following a 35% ethanol-derived caloric diet in young female rats368
[33]. The present data confirm the dose effect of alcohol, but the369
higher decrease of bone resorption in the lower alcohol doses is370
curious. Chronic alcohol consumption has been shown to decrease371
bone remodeling mainly with low alcohol doses (2.5% ethanol diet)372
[34,35]. A possible explanation might be that the bone remodeling373
process is not a continuous and regular one. As Turner highlights374
[10], there has been no longitudinal study on the effects of alco-375
hol on bone remodeling. Therefore, it cannot be excluded that376
there are periods of intense bone resorption followed by resting377
metabolic periods with little or no change in bone remodeling. Sec-378
ondly, according to Parfitt [36], bone formation and bone resorption379
must not be considered as two independent processes, but as cou-380
pled processes. Therefore, what is important is not the separated381
effects of alcohol on bone formation and resorption, but that alcohol382
changes and decelerates bone remodeling, which may affect nor-383
mal bone repair as shown with bisphosphonates [37]. There was a384
trend of DKK1 to be increased in the alcohol-fed groups compared385
to controls. DKK1 is an antagonist of the Wnt/-catenin pathway,386
which is a potential regulator responsible for directing mesenchy-387
mal stem cells to differentiate toward the osteoblastic lineage [38].388
An increase of DKK1 could be responsible for disturbed bone for-389
mation. This has been reported by Chen et al. following alcohol390
consumption in female rats [38].391
In conclusion, alcohol decreased not only bone density and392
trabecular bone, but it also induced negative changes in cortical393
thickness and porosity. In addition, there was a marked increase of394
the potency of alcohol at a dose of 35% v/v, which induced a greater 395
degree of damage to the cortical porosity, the femur length and the 396
BMD gain. Our findings suggest that chronic alcohol consumption 397
has a profound negative effect on the cortical bone, which adversely 398
affects bone strength. 399
Disclosure of interest 400
The authors declare that they have no conflicts of interest con- 401
cerning this article. 402
Acknowledgements 403
We would like to acknowledge the Institut de recherche sci- 404
entifique sur les Boissons (IREB, France) for its financial support, 405
Eric Dolléans, Gael Y Rochefort, Stéphane Pallu, Arnaud Boude- 406
not, and Leila Khacef for their technical help during sacrifices. We 407
acknowledge Jean-Jacques Beaubois and Dr Patrick Michenet from 408
the department of anatomopathology and cytogenetic at Orléans 409
Regional Hospital for their help with the liver staining and slices. 410
We thank Nicola L Fazzalari for helpful comments during the prepa- 411
ration of this manuscript. We also would like to acknowledge the 412
laboratory of neurobiology in Orléans for the housing of the rats. 413
References 414
[1] Diamond T, Stiel D, Lunzer M, et al. Ethanol reduces bone formation and may 415
cause osteoporosis. Am J Med 1989;86:282–8. 416
[2] Olszynski WP, Shawn Davison K, Adachi JD, et al. Osteoporosis in men: epi- 417
demiology, diagnosis, prevention, and treatment. Clin Ther 2004;26:15–28. 418
[3] Alvisa-Negrin J, Gonzalez-Reimers E, Santolaria-Fernandez F, et al. Osteopenia 419
in alcoholics: effect of alcohol abstinence. Alcohol Alcohol 2009;44:468–75. 420
[4] Gonzalez-Calvin JL, Garcia-Sanchez A, Bellot V, et al. Mineral metabolism, 421
osteoblastic function and bone mass in chronic alcoholism. Alcohol Alcohol 422
1993;28:571–9. 423
[5] Laitinen K, Lamberg-Allardt C, Tunninen R, et al. Bone mineral density and 424
abstention-induced changes in bone and mineral metabolism in noncirrhotic 425
male alcoholics. Am J Med 1992;93:642–50. 426
[6] De Vernejoul MC, Herve BJ, Gueris M, Hott J, Modrowski M, Kuntz D, Miravet D, 427
Ryckewaert LA. Evidence for defective osteoblastic function. A role for alcohol 428
and tobacco consumption in osteoporosis in middle-aged men. Clin Orthop 429
Relat Res 1982;179:107–15. 430
[7] Bikle DD, Stesin A, Halloran B, et al. Alcohol-induced bone disease: relationship 431
to age and parathyroid hormone levels. Alcohol Clin Exp Res 1993;17:690–5. 432
[8] Maurel DB, Boisseau N, Ingrand I, et al. Combined effects of chronic alcohol 433
consumption and physical activity on bone health. Study in a rat model. Eur J 434
Appl Physiol 2011;DOI: 10.1007/s00421-011-1916-1. 435
[9] Sripanyakorn S, Jugdaohsingh R, Mander A, et al. Moderate ingestion of alcohol 436
is associated with acute ethanol-induced suppression of circulating CTX in a 437
PTH-independent fashion. J Bone Miner Res 2009;24:1380–8. 438
[10] Turner RT. Skeletal response to alcohol. Alcohol Clin Exp Res 439
2000;24:1693–701. 440
[11] Turner RT, Kidder LS, Kennedy A, et al. Moderate alcohol consumption sup- 441
presses bone turnover in adult female rats. J Bone Miner Res 2001;16:589–94. 442
[12] Dalle Carbonare L, Giannini S. Bone microarchitecture as an important deter- 443
minant of bone strength. J Endocrinol Invest 2004;27:99–105. 444
[13] Hogan HA, Groves JA, Sampson HW. Long-term alcohol consumption in the rat 445
affects femur cross-sectional geometry and bone tissue material properties. 446
Alcohol Clin Exp Res 1999;23:1825–33. 447
[14] Sampson HW, Perks N, Champney TH, et al. Alcohol consumption inhibits bone 448
growth and development in young actively growing rats. Alcohol Clin Exp Res 449
1996;20:1375–84. 450
[15] Bonnet N, Benhamou CL, Brunet-Imbault B, et al. Severe bone alterations under 451
beta2 agonist treatments: bone mass, microarchitecture and strength analyses 452
in female rats. Bone 2005;37:622–33. 453
[16] Lotinun S, Evans GL, Bronk JT, et al. Continuous parathyroid hormone induces 454
cortical porosity in the rat: effects on bone turnover and mechanical properties. 455
J Bone Miner Res 2004;19:1165–71. 456
[17] Bonnet N, Beaupied H, Vico L, et al. Combined effects of exercise and propranolol 457
on bone tissue in ovariectomized rats. J Bone Miner Res 2007;22:578–88. 458
[18] Gonzalez-Reimers E, Garcia-Valdecasas-Campelo E, Santolaria-Fernandez F, 459
et al. Pro-inflammatory cytokines in stable chronic alcoholics: relationship with 460
fat and lean mass. Food Chem Toxicol 2007;45:904–9. 461
[19] Maddalozzo GF, Turner RT, Edwards CH, et al. Alcohol alters whole body com- 462
position, inhibits bone formation, and increases bone marrow adiposity in rats. 463
Osteoporos Int 2009;20:1529–38. 464
[20] Preedy VR, Reilly ME, Patel VB, et al. Protein metabolism in alcoholism: effects 465
on specific tissues and the whole body. Nutrition 1999;15:604–8. 466
187
Please cite this article in press as: Maurel DB, et al. Cortical bone is more sensitive to alcohol dose effects than trabecular bone in therat. Joint Bone Spine (2011), doi:10.1016/j.jbspin.2011.10.004
ARTICLE IN PRESSG ModelBONSOI 3575 1–8
8 D.B. Maurel et al. / Joint Bone Spine xxx (2011) xxx–xxx
[21] Lands WE, Zakhari S. The case of the missing calories. Am J Clin Nutr467
1991;54:47–8.468
[22] Lieber CS. Aetiology and pathogenesis of alcoholic liver disease. Baillieres Clin469
Gastroenterol 1993;7:581–608.470
[23] Pluijm SM, Visser M, Smit JH, et al. Determinants of bone mineral density471
in older men and women: body composition as mediator. J Bone Miner Res472
2001;16:2142–51.473
[24] Cirmanova V, Bayer M, Starka L, et al. The effect of leptin on bone: an evolving474
concept of action. Physiol Res 2008;57:S143–51.475
[25] Wang Y, Li Y, Mao K, et al. Alcohol-induced adipogenesis in bone and marrow:476
a possible mechanism for osteonecrosis. Clin Orthop Relat Res 2003:213–24.477
[26] Wezeman FH, Emanuele MA, Emanuele NV, et al. Chronic alcohol consumption478
during male rat adolescence impairs skeletal development through effects on479
osteoblast gene expression, bone mineral density, and bone strength. Alcohol480
Clin Exp Res 1999;23:1534–42.481
[27] Hogan HA, Sampson HW, Cashier E, et al. Alcohol consumption by young482
actively growing rats: a study of cortical bone histomorphometry and mechan-483
ical properties. Alcohol Clin Exp Res 1997;21:809–16.484
[28] Cooper DM, Thomas CD, Clement JG, et al. Age-dependent change in the485
3D structure of cortical porosity at the human femoral midshaft. Bone486
2007;40:957–65.487
[29] Thomas CD, Feik SA, Clement JG. Increase in pore area, and not pore density, is488
the main determinant in the development of porosity in human cortical bone.489
J Anat 2006;209:219–30.
[30] Broulik PD, Vondrova J, Ruzicka P, et al. The effect of chronic alcohol admin- 490
istration on bone mineral content and bone strength in male rats. Physiol Res 491
2010;59:599–604. 492
[31] Kusy RP, Hirsch PF, Peng TC. Influence of ethanol on stiffness, toughness, and 493
ductility of femurs of rats. Alcohol Clin Exp Res 1989;13:185–9. 494
[32] Dyer SA, Buckendahl P, Sampson HW. Alcohol consumption inhibits 495
osteoblastic cell proliferation and activity in vivo. Alcohol 1998;16: 496
337–41. 497
[33] Sampson HW, Chaffin C, Lange J, et al. Alcohol consumption by young actively 498
growing rats: a histomorphometric study of cancellous bone. Alcohol Clin Exp 499
Res 1997;21:352–9. 500
[34] Fanti P, Monier-Faugere MC, Geng Z, et al. Moderately high consumption of 501
ethanol suppresses bone resorption in ovariectomized but not in sexually intact 502
adult female rats. Alcohol Clin Exp Res 1997;21:1150–4. 503
[35] Rapuri PB, Gallagher JC, Balhorn KE, et al. Alcohol intake and bone metabolism 504
in elderly women. Am J Clin Nutr 2000;72:1206–13. 505
[36] Parfitt AM. The mechanism of coupling: a role for the vasculature. Bone 506
2000;26:319–23. 507
[37] Sellmeyer DE. Atypical fractures as a potential complication of long-term bis- 508
phosphonate therapy. JAMA 2010;304:1480–4. 509
[38] Chen JR, Lazarenko OP, Shankar K, et al. A role for ethanol-induced oxida- 510
tive stress in controlling lineage commitment of mesenchymal stromal 511
cells through inhibition of Wnt/beta-catenin signaling. J Bone Miner Res 512
2010;25:1117–27. 513
188
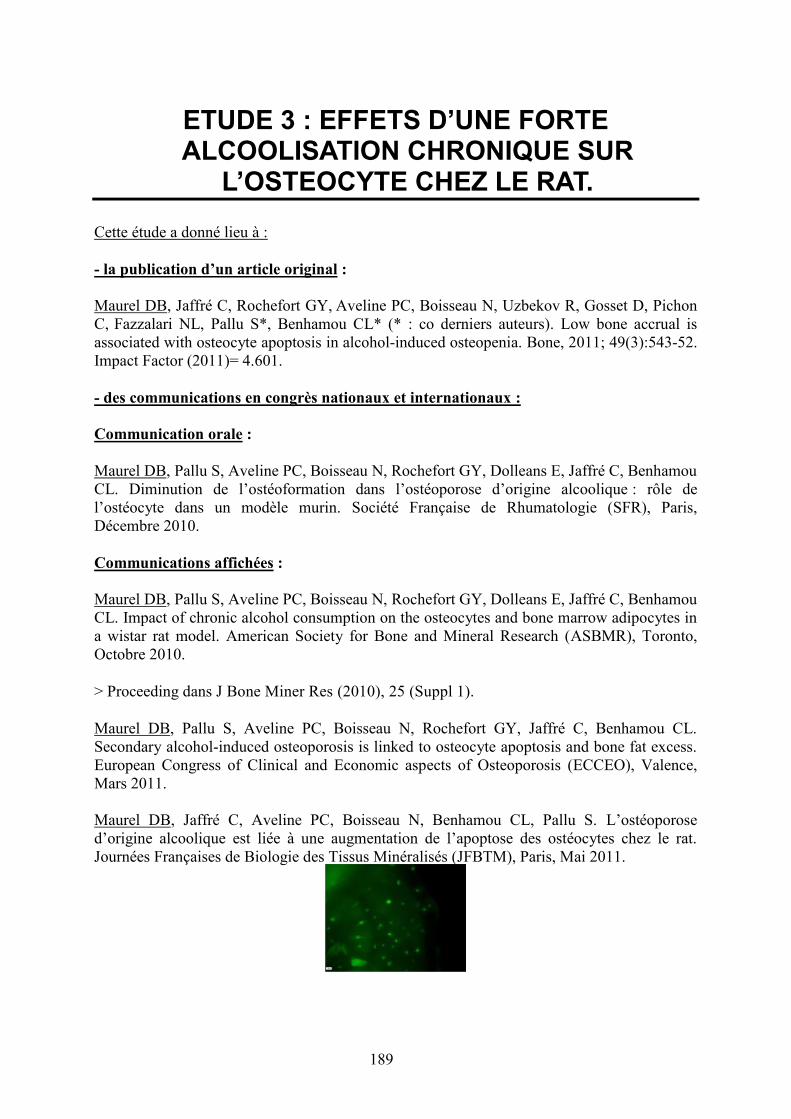
189
ETUDE 3 : EFFETS D’UNE FORTEALCOOLISATION CHRONIQUE SUR
L’OSTEOCYTE CHEZ LE RAT.
Cette étude a donné lieu à :
- la publication d’un article original :
Maurel DB, Jaffré C, Rochefort GY, Aveline PC, Boisseau N, Uzbekov R, Gosset D, PichonC, Fazzalari NL, Pallu S*, Benhamou CL* (* : co derniers auteurs). Low bone accrual isassociated with osteocyte apoptosis in alcohol-induced osteopenia. Bone, 2011; 49(3):543-52.Impact Factor (2011)= 4.601.
- des communications en congrès nationaux et internationaux :
Communication orale :
Maurel DB, Pallu S, Aveline PC, Boisseau N, Rochefort GY, Dolleans E, Jaffré C, BenhamouCL. Diminution de l’ostéoformation dans l’ostéoporose d’origine alcoolique : rôle del’ostéocyte dans un modèle murin. Société Française de Rhumatologie (SFR), Paris,Décembre 2010.
Communications affichées :
Maurel DB, Pallu S, Aveline PC, Boisseau N, Rochefort GY, Dolleans E, Jaffré C, BenhamouCL. Impact of chronic alcohol consumption on the osteocytes and bone marrow adipocytes ina wistar rat model. American Society for Bone and Mineral Research (ASBMR), Toronto,Octobre 2010.
> Proceeding dans J Bone Miner Res (2010), 25 (Suppl 1).
Maurel DB, Pallu S, Aveline PC, Boisseau N, Rochefort GY, Jaffré C, Benhamou CL.Secondary alcohol-induced osteoporosis is linked to osteocyte apoptosis and bone fat excess.European Congress of Clinical and Economic aspects of Osteoporosis (ECCEO), Valence,Mars 2011.
Maurel DB, Jaffré C, Aveline PC, Boisseau N, Benhamou CL, Pallu S. L’ostéoporosed’origine alcoolique est liée à une augmentation de l’apoptose des ostéocytes chez le rat.Journées Françaises de Biologie des Tissus Minéralisés (JFBTM), Paris, Mai 2011.
190
I. Introduction
La consommation excessive d’alcool entraîne des changements au niveau du
fonctionnement et du nombre d’ostéoblastes et d’ostéoclastes mais les effets de l’alcool sur
l’ostéocyte ne sont pas encore bien connus à ce jour. Il a été montré récemment que
l’ostéocyte est une cellule importante dans l’os et qu’elle régule la formation et la résorption
osseuse (Bonewald 2011). Une étude a montré qu’un traitement alcoolisé administré de façon
chronique chez la rate entraîne une modification de la morphologie des ostéocytes (Lorenz et
Janicke-Lorenz 1983). Une autre étude a observé chez le lapin une augmentation de
l’apoptose des ostéocytes ainsi qu’une augmentation du nombre de lacunes vides, dans un
modèle d’ostéonécrose (Wang et al. 2003). Cependant, aucune étude n’a analysé les effets de
l’alcool sur l’ostéocyte dans un modèle d’ostéoporose induite par la consommation d’alcool.
II. Objectif étude 3
Le but de cette étude était d’analyser les effets d’une consommation chronique d’alcool
sur la morphologie et l’apoptose des ostéocytes in situ, dans un modèle animal d’ostéoporose
induite par l’alcool.
III. Méthodologie spécifique
24 rats mâles Wistar ont été répartis en deux groupes : contrôle (C) ou alcool (A35). Les
rats du groupe alcool ont consommé une boisson alcoolisée (35% volume/volume) pendant
17 semaines, et les rats du groupe contrôle ont bu de l’eau. Le pourcentage d’alcool a été
augmenté progressivement de 3% tous les trois jours jusqu’à la concentration finale. La
nourriture était séparée de la boisson pour mimer une alcoolisation humaine et le nombre de
kilocalories a été ajusté par rapport au groupe A35 afin que les deux groupes consomment le
même nombre de kilocalories chaque jour. Cette population est la population de l’étude 2.
Une densitométrie a été réalisée avant le sacrifice afin de vérifier l’induction d’une
« ostéoporose » d’origine alcoolique. La microarchitecture de l’os cortical et trabéculaire a été
étudiée au fémur par microCT. Afin de vérifier l’alcoolisation des animaux, des coupes de
foie d’une épaisseur de 3 µm ont été réalisées post mortem et colorées au HES (hématoxyline-
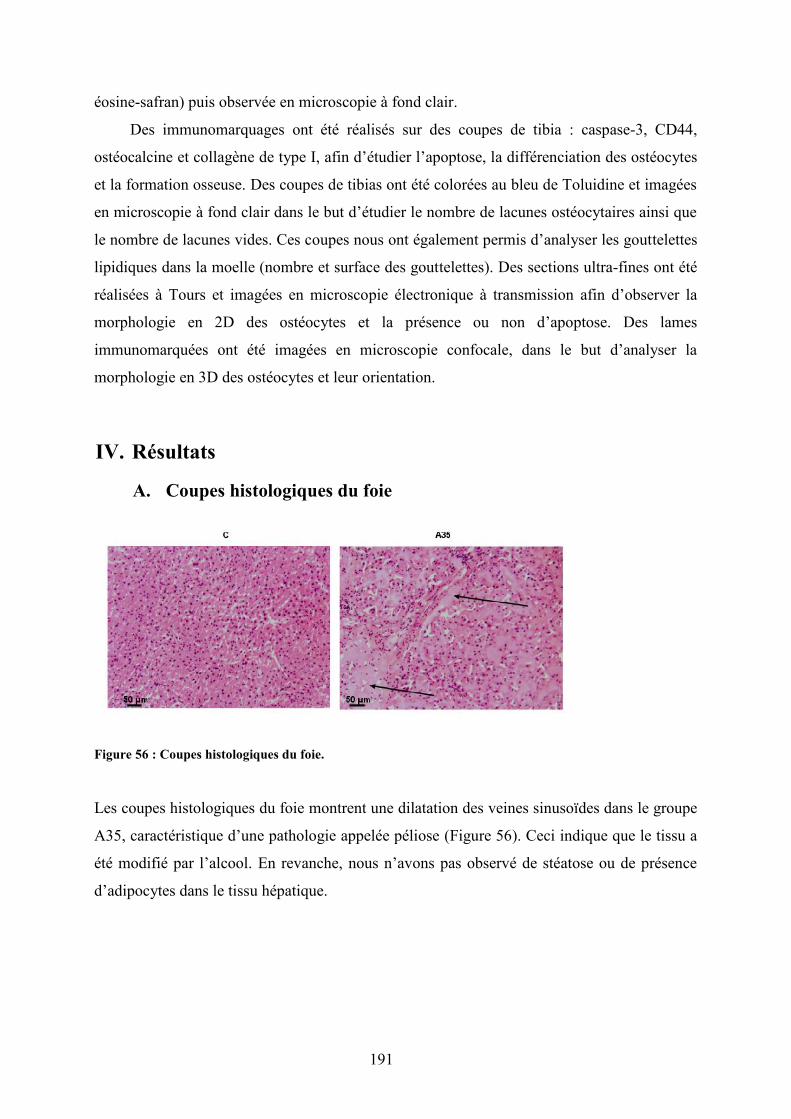
191
éosine-safran) puis observée en microscopie à fond clair.
Des immunomarquages ont été réalisés sur des coupes de tibia : caspase-3, CD44,
ostéocalcine et collagène de type I, afin d’étudier l’apoptose, la différenciation des ostéocytes
et la formation osseuse. Des coupes de tibias ont été colorées au bleu de Toluidine et imagées
en microscopie à fond clair dans le but d’étudier le nombre de lacunes ostéocytaires ainsi que
le nombre de lacunes vides. Ces coupes nous ont également permis d’analyser les gouttelettes
lipidiques dans la moelle (nombre et surface des gouttelettes). Des sections ultra-fines ont été
réalisées à Tours et imagées en microscopie électronique à transmission afin d’observer la
morphologie en 2D des ostéocytes et la présence ou non d’apoptose. Des lames
immunomarquées ont été imagées en microscopie confocale, dans le but d’analyser la
morphologie en 3D des ostéocytes et leur orientation.
IV. Résultats
A. Coupes histologiques du foie
Figure 56 : Coupes histologiques du foie.
Les coupes histologiques du foie montrent une dilatation des veines sinusoïdes dans le groupe
A35, caractéristique d’une pathologie appelée péliose (Figure 56). Ceci indique que le tissu a
été modifié par l’alcool. En revanche, nous n’avons pas observé de stéatose ou de présence
d’adipocytes dans le tissu hépatique.
192
B. DMO, composition corporelle et dosages biochimiques
Composition corporelle
Le poids, la masse maigre et la masse grasse étaient significativement plus faibles dans
le groupe A35 comparé au groupe C (Cf tableau 17 de l’étude 2).
CMO et DMO
Le CMO et la DMO au fémur et au corps entier étaient significativement plus faibles
dans le groupe A35 comparé au groupe contrôle (Cf tableau 17 de l’étude 2).
C. Microarchitecture trabéculaire et corticale
Microarchitecture trabéculaire
Les BV/TV et Tb.Th étaient significativement plus faibles dans le groupe A35 (Cf
tableau 18 de l’étude 2).
Microarchitecture corticale
Les PoS/CtV et Ct.Po étaient significativement supérieurs dans le groupe A35 comparé
au groupe C. Le Po.Sp était diminué dans le groupe A35 tandis que le Po.N était augmenté
chez le groupe A35 comparé au groupe C. Le Ct.Th était diminué dans le groupe A35 (p<
0,0001). Le diamètre interne était plus grand dans le groupe A35 comparé au groupe C. La
longueur du fémur était également inférieure dans le groupe A35 comparé au groupe contrôle
(Cf tableau 19 de l’étude 2).
193
D. Biochimie
Les concentrations en NTx étaient significativement plus faibles avec le traitement
alcoolisé. Les concentrations en TRAP étaient également diminuées de 27% avec l’alcool. La
leptine sérique était inférieure de 23% suite au traitement alcoolisé (Cf tableau 21 de l’étude 2
et article 3).
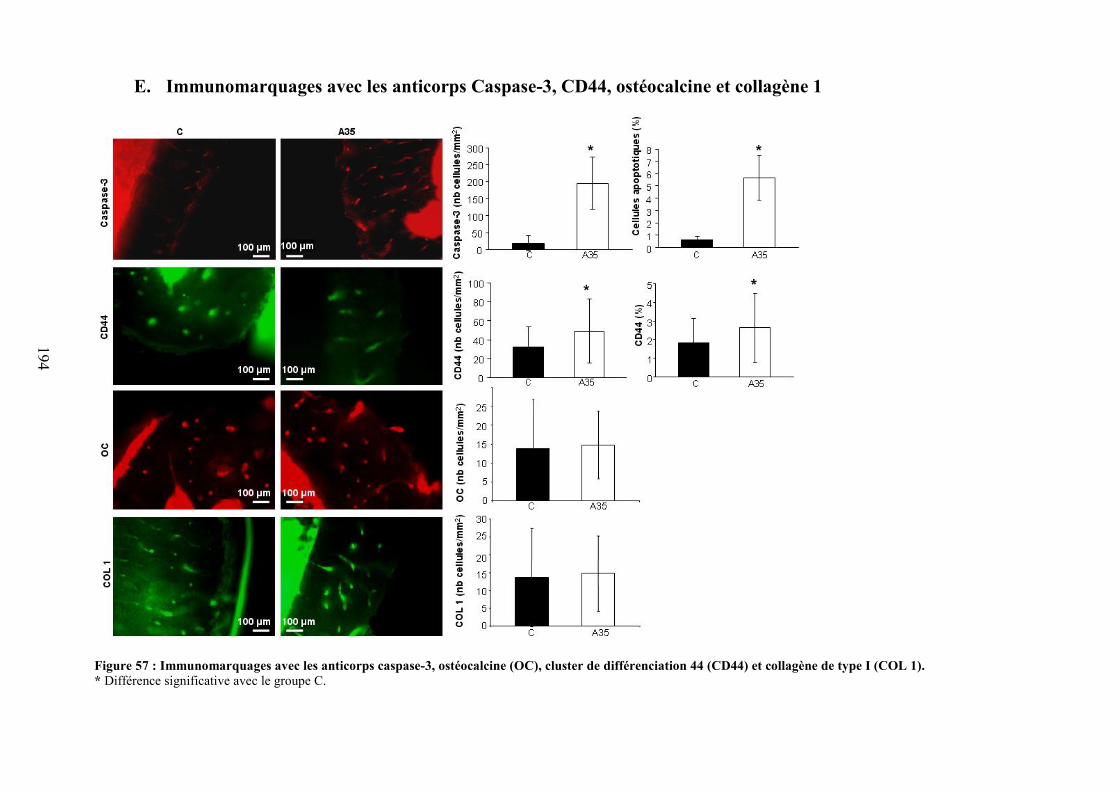
194
E. Immunomarquages avec les anticorps Caspase-3, CD44, ostéocalcine et collagène 1
Figure 57 : Immunomarquages avec les anticorps caspase-3, ostéocalcine (OC), cluster de différenciation 44 (CD44) et collagène de type I (COL 1).* Différence significative avec le groupe C.
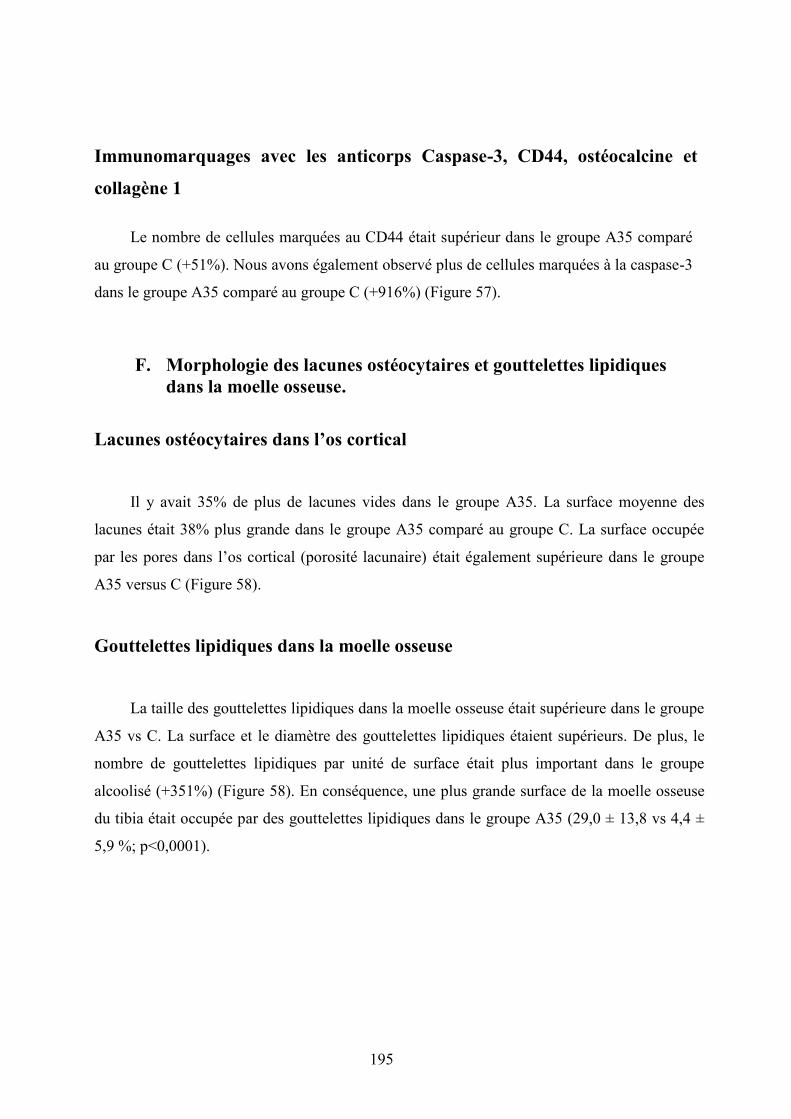
195
Immunomarquages avec les anticorps Caspase-3, CD44, ostéocalcine et
collagène 1
Le nombre de cellules marquées au CD44 était supérieur dans le groupe A35 comparé
au groupe C (+51%). Nous avons également observé plus de cellules marquées à la caspase-3
dans le groupe A35 comparé au groupe C (+916%) (Figure 57).
F. Morphologie des lacunes ostéocytaires et gouttelettes lipidiquesdans la moelle osseuse.
Lacunes ostéocytaires dans l’os cortical
Il y avait 35% de plus de lacunes vides dans le groupe A35. La surface moyenne des
lacunes était 38% plus grande dans le groupe A35 comparé au groupe C. La surface occupée
par les pores dans l’os cortical (porosité lacunaire) était également supérieure dans le groupe
A35 versus C (Figure 58).
Gouttelettes lipidiques dans la moelle osseuse
La taille des gouttelettes lipidiques dans la moelle osseuse était supérieure dans le groupe
A35 vs C. La surface et le diamètre des gouttelettes lipidiques étaient supérieurs. De plus, le
nombre de gouttelettes lipidiques par unité de surface était plus important dans le groupe
alcoolisé (+351%) (Figure 58). En conséquence, une plus grande surface de la moelle osseuse
du tibia était occupée par des gouttelettes lipidiques dans le groupe A35 (29,0 ± 13,8 vs 4,4 ±
5,9 %; p<0,0001).
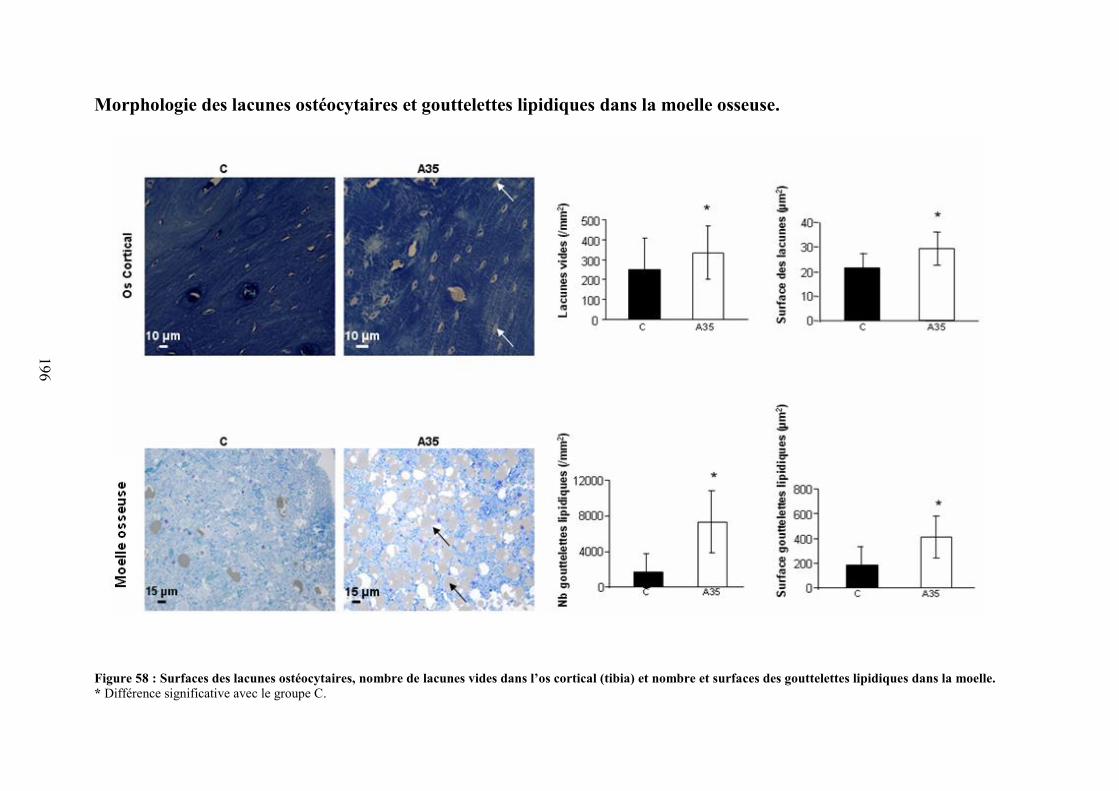
196
Morphologie des lacunes ostéocytaires et gouttelettes lipidiques dans la moelle osseuse.
Figure 58 : Surfaces des lacunes ostéocytaires, nombre de lacunes vides dans l’os cortical (tibia) et nombre et surfaces des gouttelettes lipidiques dans la moelle.* Différence significative avec le groupe C.
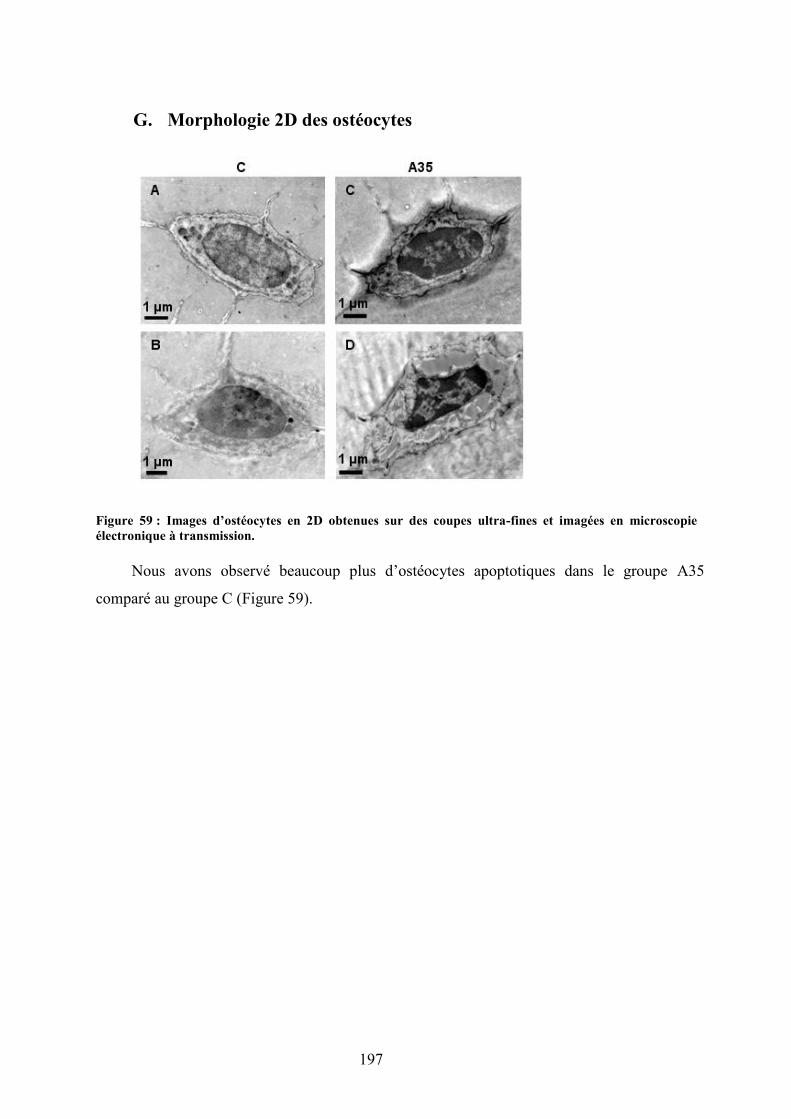
197
G. Morphologie 2D des ostéocytes
Figure 59 : Images d’ostéocytes en 2D obtenues sur des coupes ultra-fines et imagées en microscopieélectronique à transmission.
Nous avons observé beaucoup plus d’ostéocytes apoptotiques dans le groupe A35
comparé au groupe C (Figure 59).
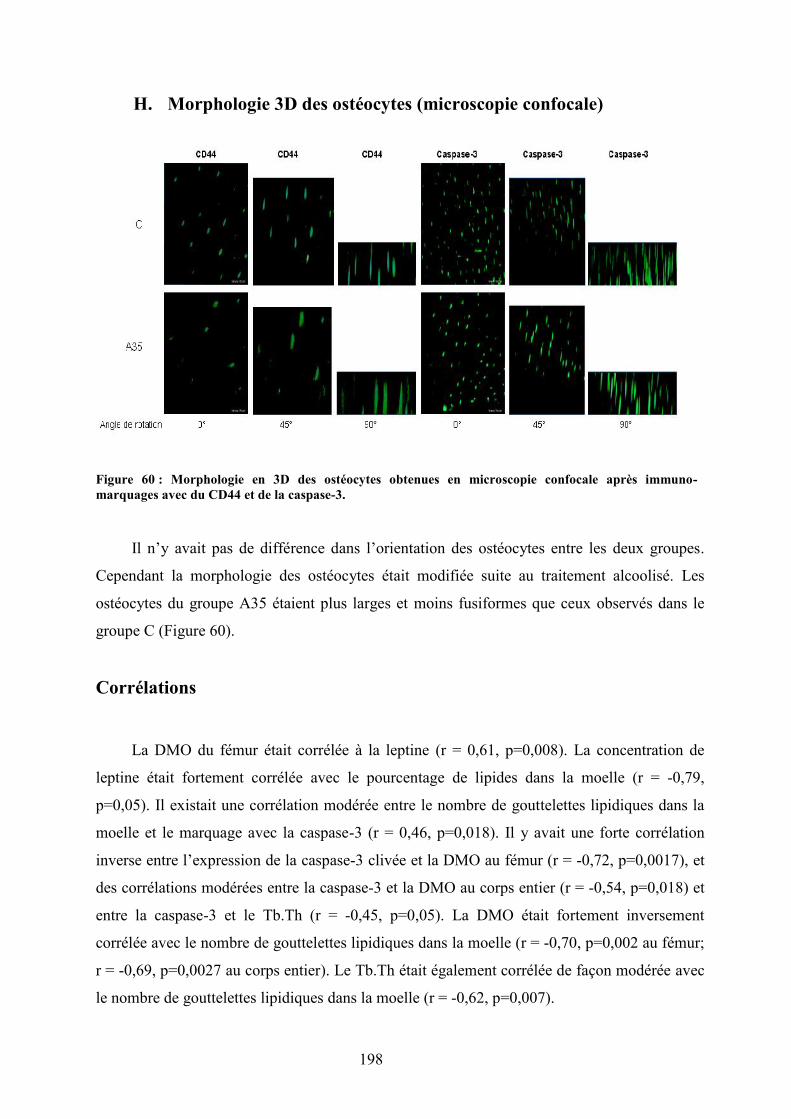
198
H. Morphologie 3D des ostéocytes (microscopie confocale)
Figure 60 : Morphologie en 3D des ostéocytes obtenues en microscopie confocale après immuno-marquages avec du CD44 et de la caspase-3.
Il n’y avait pas de différence dans l’orientation des ostéocytes entre les deux groupes.
Cependant la morphologie des ostéocytes était modifiée suite au traitement alcoolisé. Les
ostéocytes du groupe A35 étaient plus larges et moins fusiformes que ceux observés dans le
groupe C (Figure 60).
Corrélations
La DMO du fémur était corrélée à la leptine (r = 0,61, p=0,008). La concentration de
leptine était fortement corrélée avec le pourcentage de lipides dans la moelle (r = -0,79,
p=0,05). Il existait une corrélation modérée entre le nombre de gouttelettes lipidiques dans la
moelle et le marquage avec la caspase-3 (r = 0,46, p=0,018). Il y avait une forte corrélation
inverse entre l’expression de la caspase-3 clivée et la DMO au fémur (r = -0,72, p=0,0017), et
des corrélations modérées entre la caspase-3 et la DMO au corps entier (r = -0,54, p=0,018) et
entre la caspase-3 et le Tb.Th (r = -0,45, p=0,05). La DMO était fortement inversement
corrélée avec le nombre de gouttelettes lipidiques dans la moelle (r = -0,70, p=0,002 au fémur;
r = -0,69, p=0,0027 au corps entier). Le Tb.Th était également corrélée de façon modérée avec
le nombre de gouttelettes lipidiques dans la moelle (r = -0,62, p=0,007).
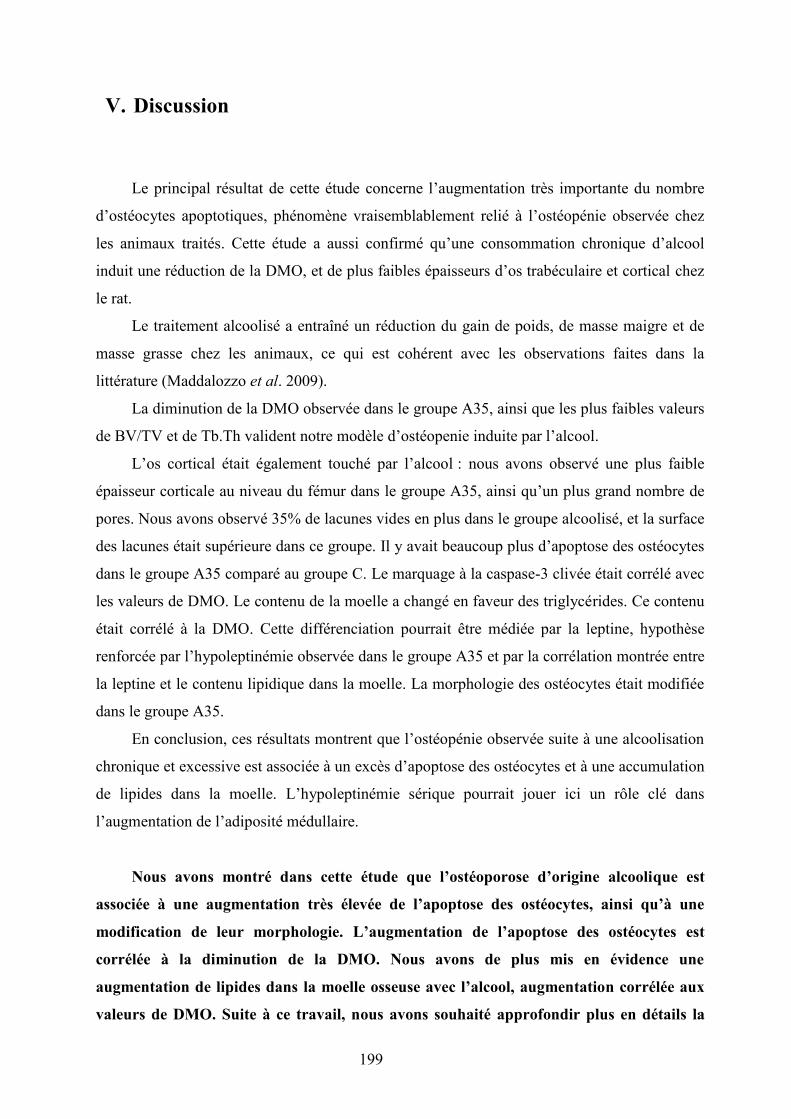
199
V. Discussion
Le principal résultat de cette étude concerne l’augmentation très importante du nombre
d’ostéocytes apoptotiques, phénomène vraisemblablement relié à l’ostéopénie observée chez
les animaux traités. Cette étude a aussi confirmé qu’une consommation chronique d’alcool
induit une réduction de la DMO, et de plus faibles épaisseurs d’os trabéculaire et cortical chez
le rat.
Le traitement alcoolisé a entraîné un réduction du gain de poids, de masse maigre et de
masse grasse chez les animaux, ce qui est cohérent avec les observations faites dans la
littérature (Maddalozzo et al. 2009).
La diminution de la DMO observée dans le groupe A35, ainsi que les plus faibles valeurs
de BV/TV et de Tb.Th valident notre modèle d’ostéopenie induite par l’alcool.
L’os cortical était également touché par l’alcool : nous avons observé une plus faible
épaisseur corticale au niveau du fémur dans le groupe A35, ainsi qu’un plus grand nombre de
pores. Nous avons observé 35% de lacunes vides en plus dans le groupe alcoolisé, et la surface
des lacunes était supérieure dans ce groupe. Il y avait beaucoup plus d’apoptose des ostéocytes
dans le groupe A35 comparé au groupe C. Le marquage à la caspase-3 clivée était corrélé avec
les valeurs de DMO. Le contenu de la moelle a changé en faveur des triglycérides. Ce contenu
était corrélé à la DMO. Cette différenciation pourrait être médiée par la leptine, hypothèse
renforcée par l’hypoleptinémie observée dans le groupe A35 et par la corrélation montrée entre
la leptine et le contenu lipidique dans la moelle. La morphologie des ostéocytes était modifiée
dans le groupe A35.
En conclusion, ces résultats montrent que l’ostéopénie observée suite à une alcoolisation
chronique et excessive est associée à un excès d’apoptose des ostéocytes et à une accumulation
de lipides dans la moelle. L’hypoleptinémie sérique pourrait jouer ici un rôle clé dans
l’augmentation de l’adiposité médullaire.
Nous avons montré dans cette étude que l’ostéoporose d’origine alcoolique est
associée à une augmentation très élevée de l’apoptose des ostéocytes, ainsi qu’à une
modification de leur morphologie. L’augmentation de l’apoptose des ostéocytes est
corrélée à la diminution de la DMO. Nous avons de plus mis en évidence une
augmentation de lipides dans la moelle osseuse avec l’alcool, augmentation corrélée aux
valeurs de DMO. Suite à ce travail, nous avons souhaité approfondir plus en détails la
200
relation entre DMO, apoptose des ostéocytes et métabolisme lipidique. C’est l’objectif de
l’étude 4.

201
Article 3
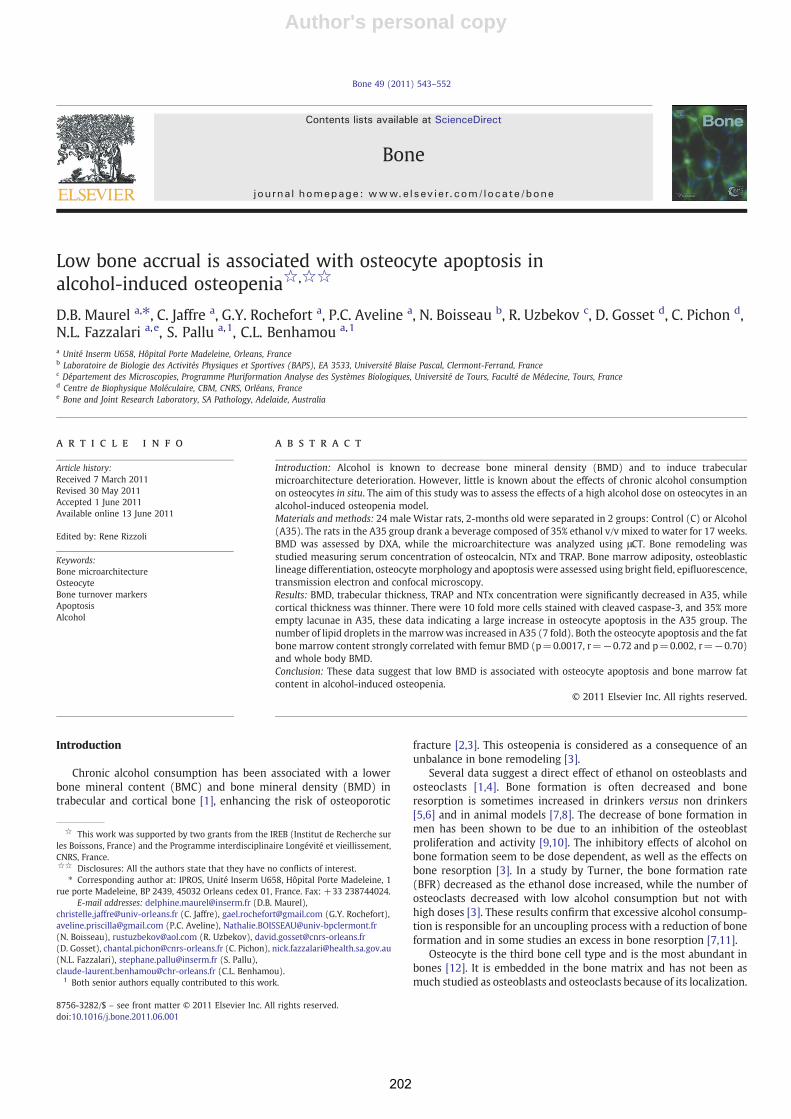
Author's personal copy
Low bone accrual is associated with osteocyte apoptosis inalcohol-induced osteopenia,
D.B. Maurel a,⁎, C. Jaffre a, G.Y. Rochefort a, P.C. Aveline a, N. Boisseau b, R. Uzbekov c, D. Gosset d, C. Pichon d,N.L. Fazzalari a,e, S. Pallu a,1, C.L. Benhamou a,1
a Unité Inserm U658, Hôpital Porte Madeleine, Orleans, Franceb Laboratoire de Biologie des Activités Physiques et Sportives (BAPS), EA 3533, Université Blaise Pascal, Clermont-Ferrand, Francec Département des Microscopies, Programme Pluriformation Analyse des Systèmes Biologiques, Université de Tours, Faculté de Médecine, Tours, Franced Centre de Biophysique Moléculaire, CBM, CNRS, Orléans, Francee Bone and Joint Research Laboratory, SA Pathology, Adelaide, Australia
a b s t r a c ta r t i c l e i n f o
Article history:Received 7 March 2011Revised 30 May 2011Accepted 1 June 2011Available online 13 June 2011
Edited by: Rene Rizzoli
Keywords:Bone microarchitectureOsteocyteBone turnover markersApoptosisAlcohol
Introduction: Alcohol is known to decrease bone mineral density (BMD) and to induce trabecularmicroarchitecture deterioration. However, little is known about the effects of chronic alcohol consumptionon osteocytes in situ. The aim of this study was to assess the effects of a high alcohol dose on osteocytes in analcohol-induced osteopenia model.Materials and methods: 24 male Wistar rats, 2-months old were separated in 2 groups: Control (C) or Alcohol(A35). The rats in the A35 group drank a beverage composed of 35% ethanol v/v mixed to water for 17 weeks.BMD was assessed by DXA, while the microarchitecture was analyzed using μCT. Bone remodeling wasstudied measuring serum concentration of osteocalcin, NTx and TRAP. Bone marrow adiposity, osteoblasticlineage differentiation, osteocyte morphology and apoptosis were assessed using bright field, epifluorescence,transmission electron and confocal microscopy.Results: BMD, trabecular thickness, TRAP and NTx concentration were significantly decreased in A35, whilecortical thickness was thinner. There were 10 fold more cells stained with cleaved caspase-3, and 35% moreempty lacunae in A35, these data indicating a large increase in osteocyte apoptosis in the A35 group. Thenumber of lipid droplets in the marrowwas increased in A35 (7 fold). Both the osteocyte apoptosis and the fatbone marrow content strongly correlated with femur BMD (p=0.0017, r=−0.72 and p=0.002, r=−0.70)and whole body BMD.Conclusion: These data suggest that low BMD is associated with osteocyte apoptosis and bone marrow fatcontent in alcohol-induced osteopenia.
© 2011 Elsevier Inc. All rights reserved.
Introduction
Chronic alcohol consumption has been associated with a lowerbone mineral content (BMC) and bone mineral density (BMD) intrabecular and cortical bone [1], enhancing the risk of osteoporotic
fracture [2,3]. This osteopenia is considered as a consequence of anunbalance in bone remodeling [3].
Several data suggest a direct effect of ethanol on osteoblasts andosteoclasts [1,4]. Bone formation is often decreased and boneresorption is sometimes increased in drinkers versus non drinkers[5,6] and in animal models [7,8]. The decrease of bone formation inmen has been shown to be due to an inhibition of the osteoblastproliferation and activity [9,10]. The inhibitory effects of alcohol onbone formation seem to be dose dependent, as well as the effects onbone resorption [3]. In a study by Turner, the bone formation rate(BFR) decreased as the ethanol dose increased, while the number ofosteoclasts decreased with low alcohol consumption but not withhigh doses [3]. These results confirm that excessive alcohol consump-tion is responsible for an uncoupling process with a reduction of boneformation and in some studies an excess in bone resorption [7,11].
Osteocyte is the third bone cell type and is the most abundant inbones [12]. It is embedded in the bone matrix and has not been asmuch studied as osteoblasts and osteoclasts because of its localization.
Bone 49 (2011) 543–552
This work was supported by two grants from the IREB (Institut de Recherche surles Boissons, France) and the Programme interdisciplinaire Longévité et vieillissement,CNRS, France. Disclosures: All the authors state that they have no conflicts of interest.
⁎ Corresponding author at: IPROS, Unité Inserm U658, Hôpital Porte Madeleine, 1rue porte Madeleine, BP 2439, 45032 Orleans cedex 01, France. Fax: +33 238744024.
E-mail addresses: [email protected] (D.B. Maurel),[email protected] (C. Jaffre), [email protected] (G.Y. Rochefort),[email protected] (P.C. Aveline), [email protected](N. Boisseau), [email protected] (R. Uzbekov), [email protected](D. Gosset), [email protected] (C. Pichon), [email protected](N.L. Fazzalari), [email protected] (S. Pallu),[email protected] (C.L. Benhamou).
1 Both senior authors equally contributed to this work.
8756-3282/$ – see front matter © 2011 Elsevier Inc. All rights reserved.doi:10.1016/j.bone.2011.06.001
Contents lists available at ScienceDirect
Bone
j ourna l homepage: www.e lsev ie r.com/ locate /bone
202
Author's personal copy
It was thought to be a passive cell but some recent studies attributeimportant roles to osteocytes such as the mechano-transductionactivity [13]. It is now understood that the osteocyte network isconnected to bone lining cells on the bone surface and with cellswithin the bone marrow [14]. One of the roles of the osteocyte isto send signals to prevent bone loss under normal conditions, orto induce bone loss in response to unloading, to conserve energy[15,16]. Osteocyte apoptosis has been shown to signal the triggeringof resorption [17,18]. It has also been shown that some proteinsexpressed in osteocytes can target osteoblasts to inhibit boneformation [19]. In patients with different bone pathologies such asosteopenia and osteopetrosis, osteocytes are associated with in-creased lacunar size and different 3D morphology compared toosteoarthritis osteocytes, whichmay reflect an adaptation in responseto environmental factors such as different external loading condi-tions [20]. For example, it has been shown that the administrationof glucocorticoids increases the lacunar size and induces the apoptosisof osteocytes (revealed by trypan blue, nuclear morphology orcaspase 3 activation) [21].
Recently, Vatsa et al. [22] have demonstrated differences inalignment of osteocytes between mouse fibulae and calvaria samples,and have underlined the possible role of multi-directional loadingin calvaria versus unidirectional loading in fibula in this differentanisotropy. Characterization and location of osteocytes in situ,especially their spatial relationships with the bone matrix, havebeen particularly difficult because the mineralizedmatrix of bone wasan impediment in the analysis of their fine structural details atthe subcellular level in situ. Nevertheless, combination of imaging byconfocal microscopy or classic photonic epifluorescent microscopyand recently developed live-cell staining with fluorescent markershave allowed evaluating details of the osteocyte cytoskeleton in situ[23]. It has been demonstrated that CD44, a transmembraneglycoprotein with cell–cell and cell–matrix adhesion functions couldbe a sensitive marker of the osteoblastic lineage differentiation inhumans [24,25].
Alcohol induces changes in the function of osteoblasts andosteoclasts [3,8,26] but little is known about the effects of alcoholon the osteocytes. We performed this study to analyze if chronicalcohol consumption elicits changes in osteocyte morphology andapoptosis in situ, in relation to the changes occurring in bone.
Materials and methods
Animals
Thirty four male Wistar rats (Elevage Janvier, Le Genet-St-Isle,France) were acclimatized for 2 weeks and maintained underconstant temperature (21±2 °C) and under 12 h/12 h light–darkcycles all along the experiment. The rats were housed two perstandard cage and provided with a commercial standard diet (M20,SDS, France).
Alcoholization treatment
The rats were 8 weeks old at baseline. They were not skeletallymature but skeletal maturity occurs late in rats (7 months old)compared to sexual maturity (2 months old) [27]. We wanted toapply our model of alcohol treatment in the young adult. The animalmodels used tomimic the effects of alcohol abuse on adult rats usuallytake rats after 4 weeks of age and look at the bones at the age of 7 or9 months old [1].
At ten weeks of age, 10 rats were anesthetized with pentobarbitalsodium and sacrificed by cardiac exsanguination, to get baseline boneremodeling data. The 24 other rats were randomly assigned to one ofthe two following groups: controls (C) or ethanol at 35% v/v (10.7 g ofethanol/kg of body weight) (A35). The protocol lasted 19 weeks. The
rats of the A35 group drank ad libitum a solution composed of ethanoland water for 17 weeks. The percentage of ethanol in the solutionbegan at 8% v/v and was progressively increased during three weeksof 3% v/v every three days to reach the final concentration of 35% v/v.The food and the beverage were separated to better mimic the humandrinking pattern. The quantity of food eaten and beverage drank wasweekly controlled in the alcohol-treated group and the amount oftotal calorie intake was matched in the control group having only thesolid food as a caloric supply, in order for the two groups to be pair-fed(as described by Sampson et al. [1]). We isolated randomly a pair ofrats from each group each week by individually housing the rats in acage and checking the consumption of each rat. If the consumptionwas too different, we changed the pair of rats in the cage and controlthem another time the week after. To check that rats have beensubmitted to the alcohol effects correctly, liver slices (thickness 3 μm)were cut, paraffin embedded, stained with hematoxilin-eosin-safran(HES) and observed with bright field microscopy (Fig. 1). In order toperform the in vivo analyses, the rats were anesthetized withpentobarbital diluted in sodium chlorure (50/50% v/v). The procedurefor the care and killing of the animals was in accordance with theEuropean Community standards on the care and use of laboratoryanimals and local ethic committee (Ministère de l'agriculture, France,Agreement number: INSERM45-001).
At the end of the study, the 24 rats were anesthetized withpentobarbital sodium (0.1 ml per 100 g of body weight) and thensacrificed by cardiac exsanguinations. Blood sample was collected andtibias were dissected free of connective and fat tissues and fixed in a4% v/v formalin solution.
Body fat mass and lean mass
At 10 and 19 weeks of age, body weight, lean and fat masses weremeasured in A35 and C groups by DXA (Discovery, Hologic, Bedford,Massachussets, USA) using a specific small animal body compositionmode calibrated with defined small animal phantom. This apparatusis commonly used in small animals and has been validated in ourlaboratory. The root-mean square CV of whole body fat mass was 3.8%and was determined from two repeated measures with repositioningon thirty animals.
BMC and BMD measurements
In vivo BMC and BMD of the left femur and whole body weremeasured in A35 and C at 10 and 19 weeks of age by DXA using aDiscovery Hologic apparatus adapted to small animals. The root-meansquare CV of in vivo whole body BMC and whole body BMD wererespectively 1.2% and 0.87% and were determined from two repeatedmeasures with repositioning on thirty animals.
Morphological and topological characteristics of the trabecular bone
The study endpoint microarchitecture of the metaphysis of thefemoral bone was studied post mortem using μCT (Skyscan 1072,Skyscan, Aartselaar, Belgium). We chose this subregion because it isrich in trabecular bone. The characteristics and methods have alreadybeen described elsewhere [28]. The X-ray source was set at 70 kV and100 μA, with an isotropic pixel size of 11 μm. Two hundred andtwenty-five slices were selected in the metaphysis under thecartilaginous bone. Simple global thresholding methods were used.The trabecular bone region of interest (ROI) was drawn with the freehand tool with “CT analyzer” software (Skyscan). The parametersanalyzed were: the bone volume fraction BV/TV (%), the trabeculaethickness Tb.Th (mm), and the trabeculae number Tb.N (1/mm) [29].
544 D.B. Maurel et al. / Bone 49 (2011) 543–552
203
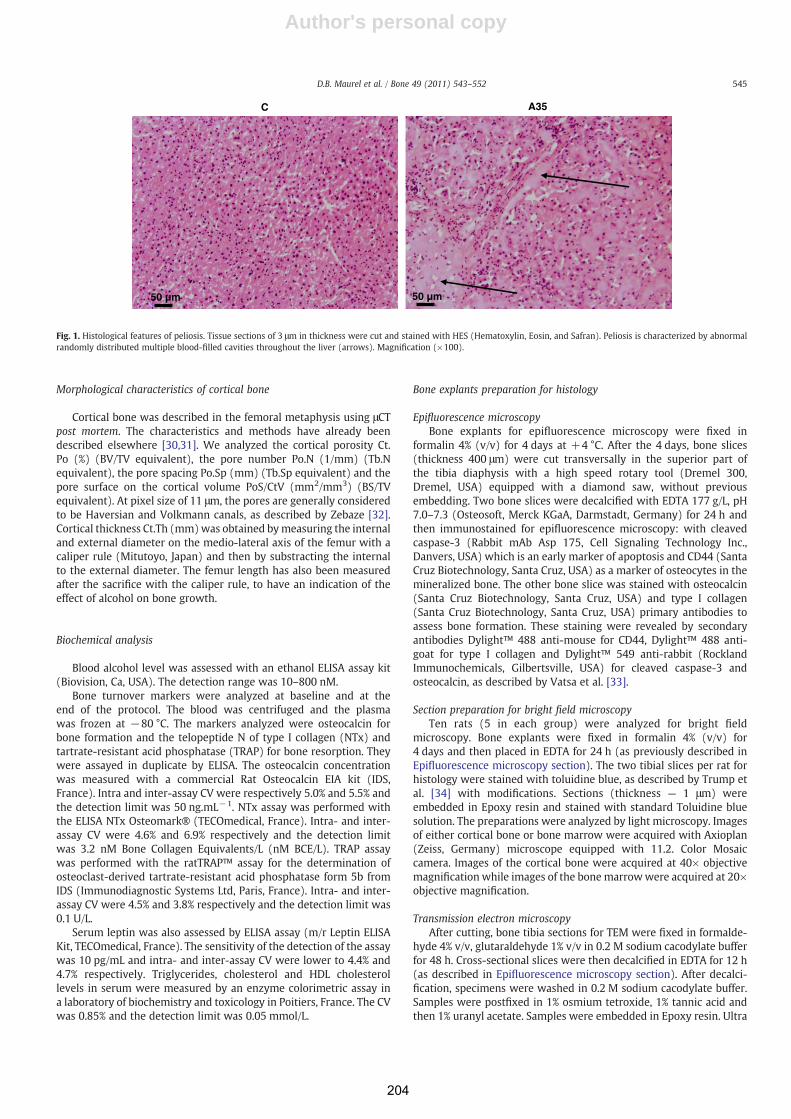
Author's personal copy
Morphological characteristics of cortical bone
Cortical bone was described in the femoral metaphysis using μCTpost mortem. The characteristics and methods have already beendescribed elsewhere [30,31]. We analyzed the cortical porosity Ct.Po (%) (BV/TV equivalent), the pore number Po.N (1/mm) (Tb.Nequivalent), the pore spacing Po.Sp (mm) (Tb.Sp equivalent) and thepore surface on the cortical volume PoS/CtV (mm2/mm3) (BS/TVequivalent). At pixel size of 11 μm, the pores are generally consideredto be Haversian and Volkmann canals, as described by Zebaze [32].Cortical thickness Ct.Th (mm)was obtained bymeasuring the internaland external diameter on the medio-lateral axis of the femur with acaliper rule (Mitutoyo, Japan) and then by substracting the internalto the external diameter. The femur length has also been measuredafter the sacrifice with the caliper rule, to have an indication of theeffect of alcohol on bone growth.
Biochemical analysis
Blood alcohol level was assessed with an ethanol ELISA assay kit(Biovision, Ca, USA). The detection range was 10–800 nM.
Bone turnover markers were analyzed at baseline and at theend of the protocol. The blood was centrifuged and the plasmawas frozen at −80 °C. The markers analyzed were osteocalcin forbone formation and the telopeptide N of type I collagen (NTx) andtartrate-resistant acid phosphatase (TRAP) for bone resorption. Theywere assayed in duplicate by ELISA. The osteocalcin concentrationwas measured with a commercial Rat Osteocalcin EIA kit (IDS,France). Intra and inter-assay CV were respectively 5.0% and 5.5% andthe detection limit was 50 ng.mL−1. NTx assay was performed withthe ELISA NTx Osteomark® (TECOmedical, France). Intra- and inter-assay CV were 4.6% and 6.9% respectively and the detection limitwas 3.2 nM Bone Collagen Equivalents/L (nM BCE/L). TRAP assaywas performed with the ratTRAP™ assay for the determination ofosteoclast-derived tartrate-resistant acid phosphatase form 5b fromIDS (Immunodiagnostic Systems Ltd, Paris, France). Intra- and inter-assay CV were 4.5% and 3.8% respectively and the detection limit was0.1 U/L.
Serum leptin was also assessed by ELISA assay (m/r Leptin ELISAKit, TECOmedical, France). The sensitivity of the detection of the assaywas 10 pg/mL and intra- and inter-assay CV were lower to 4.4% and4.7% respectively. Triglycerides, cholesterol and HDL cholesterollevels in serum were measured by an enzyme colorimetric assay ina laboratory of biochemistry and toxicology in Poitiers, France. The CVwas 0.85% and the detection limit was 0.05 mmol/L.
Bone explants preparation for histology
Epifluorescence microscopyBone explants for epifluorescence microscopy were fixed in
formalin 4% (v/v) for 4 days at +4 °C. After the 4 days, bone slices(thickness 400 μm) were cut transversally in the superior part ofthe tibia diaphysis with a high speed rotary tool (Dremel 300,Dremel, USA) equipped with a diamond saw, without previousembedding. Two bone slices were decalcified with EDTA 177 g/L, pH7.0–7.3 (Osteosoft, Merck KGaA, Darmstadt, Germany) for 24 h andthen immunostained for epifluorescence microscopy: with cleavedcaspase-3 (Rabbit mAb Asp 175, Cell Signaling Technology Inc.,Danvers, USA) which is an early marker of apoptosis and CD44 (SantaCruz Biotechnology, Santa Cruz, USA) as a marker of osteocytes in themineralized bone. The other bone slice was stained with osteocalcin(Santa Cruz Biotechnology, Santa Cruz, USA) and type I collagen(Santa Cruz Biotechnology, Santa Cruz, USA) primary antibodies toassess bone formation. These staining were revealed by secondaryantibodies Dylight™ 488 anti-mouse for CD44, Dylight™ 488 anti-goat for type I collagen and Dylight™ 549 anti-rabbit (RocklandImmunochemicals, Gilbertsville, USA) for cleaved caspase-3 andosteocalcin, as described by Vatsa et al. [33].
Section preparation for bright field microscopyTen rats (5 in each group) were analyzed for bright field
microscopy. Bone explants were fixed in formalin 4% (v/v) for4 days and then placed in EDTA for 24 h (as previously described inEpifluorescence microscopy section). The two tibial slices per rat forhistology were stained with toluidine blue, as described by Trump etal. [34] with modifications. Sections (thickness — 1 μm) wereembedded in Epoxy resin and stained with standard Toluidine bluesolution. The preparations were analyzed by light microscopy. Imagesof either cortical bone or bone marrow were acquired with Axioplan(Zeiss, Germany) microscope equipped with 11.2. Color Mosaiccamera. Images of the cortical bone were acquired at 40× objectivemagnification while images of the bone marrowwere acquired at 20×objective magnification.
Transmission electron microscopyAfter cutting, bone tibia sections for TEM were fixed in formalde-
hyde 4% v/v, glutaraldehyde 1% v/v in 0.2 M sodium cacodylate bufferfor 48 h. Cross-sectional slices were then decalcified in EDTA for 12 h(as described in Epifluorescence microscopy section). After decalci-fication, specimens were washed in 0.2 M sodium cacodylate buffer.Samples were postfixed in 1% osmium tetroxide, 1% tannic acid andthen 1% uranyl acetate. Samples were embedded in Epoxy resin. Ultra
C
50 µm 50 µm
A35
Fig. 1. Histological features of peliosis. Tissue sections of 3 μm in thickness were cut and stained with HES (Hematoxylin, Eosin, and Safran). Peliosis is characterized by abnormalrandomly distributed multiple blood-filled cavities throughout the liver (arrows). Magnification (×100).
545D.B. Maurel et al. / Bone 49 (2011) 543–552
204
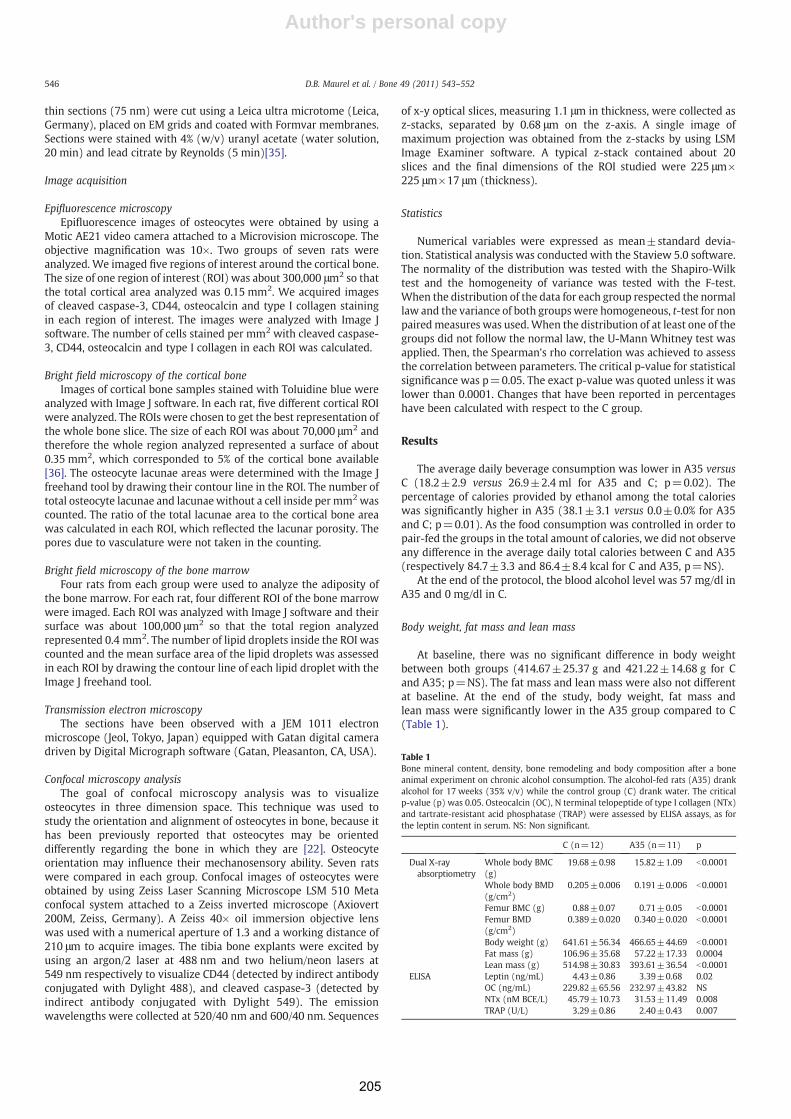
Author's personal copy
thin sections (75 nm) were cut using a Leica ultra microtome (Leica,Germany), placed on EM grids and coated with Formvar membranes.Sections were stained with 4% (w/v) uranyl acetate (water solution,20 min) and lead citrate by Reynolds (5 min)[35].
Image acquisition
Epifluorescence microscopyEpifluorescence images of osteocytes were obtained by using a
Motic AE21 video camera attached to a Microvision microscope. Theobjective magnification was 10×. Two groups of seven rats wereanalyzed. We imaged five regions of interest around the cortical bone.The size of one region of interest (ROI) was about 300,000 μm2 so thatthe total cortical area analyzed was 0.15 mm2. We acquired imagesof cleaved caspase-3, CD44, osteocalcin and type I collagen stainingin each region of interest. The images were analyzed with Image Jsoftware. The number of cells stained per mm2 with cleaved caspase-3, CD44, osteocalcin and type I collagen in each ROI was calculated.
Bright field microscopy of the cortical boneImages of cortical bone samples stained with Toluidine blue were
analyzed with Image J software. In each rat, five different cortical ROIwere analyzed. The ROIs were chosen to get the best representation ofthe whole bone slice. The size of each ROI was about 70,000 μm2 andtherefore the whole region analyzed represented a surface of about0.35 mm2, which corresponded to 5% of the cortical bone available[36]. The osteocyte lacunae areas were determined with the Image Jfreehand tool by drawing their contour line in the ROI. The number oftotal osteocyte lacunae and lacunaewithout a cell inside per mm2wascounted. The ratio of the total lacunae area to the cortical bone areawas calculated in each ROI, which reflected the lacunar porosity. Thepores due to vasculature were not taken in the counting.
Bright field microscopy of the bone marrowFour rats from each group were used to analyze the adiposity of
the bone marrow. For each rat, four different ROI of the bone marrowwere imaged. Each ROI was analyzed with Image J software and theirsurface was about 100,000 μm2 so that the total region analyzedrepresented 0.4 mm2. The number of lipid droplets inside the ROI wascounted and the mean surface area of the lipid droplets was assessedin each ROI by drawing the contour line of each lipid droplet with theImage J freehand tool.
Transmission electron microscopyThe sections have been observed with a JEM 1011 electron
microscope (Jeol, Tokyo, Japan) equipped with Gatan digital cameradriven by Digital Micrograph software (Gatan, Pleasanton, CA, USA).
Confocal microscopy analysisThe goal of confocal microscopy analysis was to visualize
osteocytes in three dimension space. This technique was used tostudy the orientation and alignment of osteocytes in bone, because ithas been previously reported that osteocytes may be orienteddifferently regarding the bone in which they are [22]. Osteocyteorientation may influence their mechanosensory ability. Seven ratswere compared in each group. Confocal images of osteocytes wereobtained by using Zeiss Laser Scanning Microscope LSM 510 Metaconfocal system attached to a Zeiss inverted microscope (Axiovert200M, Zeiss, Germany). A Zeiss 40× oil immersion objective lenswas used with a numerical aperture of 1.3 and a working distance of210 μm to acquire images. The tibia bone explants were excited byusing an argon/2 laser at 488 nm and two helium/neon lasers at549 nm respectively to visualize CD44 (detected by indirect antibodyconjugated with Dylight 488), and cleaved caspase-3 (detected byindirect antibody conjugated with Dylight 549). The emissionwavelengths were collected at 520/40 nm and 600/40 nm. Sequences
of x-y optical slices, measuring 1.1 μm in thickness, were collected asz-stacks, separated by 0.68 μm on the z-axis. A single image ofmaximum projection was obtained from the z-stacks by using LSMImage Examiner software. A typical z-stack contained about 20slices and the final dimensions of the ROI studied were 225 μm×225 μm×17 μm (thickness).
Statistics
Numerical variables were expressed as mean±standard devia-tion. Statistical analysis was conducted with the Staview 5.0 software.The normality of the distribution was tested with the Shapiro-Wilktest and the homogeneity of variance was tested with the F-test.When the distribution of the data for each group respected the normallaw and the variance of both groupswere homogeneous, t-test for nonpairedmeasures was used.When the distribution of at least one of thegroups did not follow the normal law, the U-Mann Whitney test wasapplied. Then, the Spearman's rho correlation was achieved to assessthe correlation between parameters. The critical p-value for statisticalsignificance was p=0.05. The exact p-value was quoted unless it waslower than 0.0001. Changes that have been reported in percentageshave been calculated with respect to the C group.
Results
The average daily beverage consumption was lower in A35 versusC (18.2±2.9 versus 26.9±2.4 ml for A35 and C; p=0.02). Thepercentage of calories provided by ethanol among the total calorieswas significantly higher in A35 (38.1±3.1 versus 0.0±0.0% for A35and C; p=0.01). As the food consumption was controlled in order topair-fed the groups in the total amount of calories, we did not observeany difference in the average daily total calories between C and A35(respectively 84.7±3.3 and 86.4±8.4 kcal for C and A35, p=NS).
At the end of the protocol, the blood alcohol level was 57 mg/dl inA35 and 0 mg/dl in C.
Body weight, fat mass and lean mass
At baseline, there was no significant difference in body weightbetween both groups (414.67±25.37 g and 421.22±14.68 g for Cand A35; p=NS). The fat mass and lean mass were also not differentat baseline. At the end of the study, body weight, fat mass andlean mass were significantly lower in the A35 group compared to C(Table 1).
Table 1Bone mineral content, density, bone remodeling and body composition after a boneanimal experiment on chronic alcohol consumption. The alcohol-fed rats (A35) drankalcohol for 17 weeks (35% v/v) while the control group (C) drank water. The criticalp-value (p) was 0.05. Osteocalcin (OC), N terminal telopeptide of type I collagen (NTx)and tartrate-resistant acid phosphatase (TRAP) were assessed by ELISA assays, as forthe leptin content in serum. NS: Non significant.
C (n=12) A35 (n=11) p
Dual X-rayabsorptiometry
Whole body BMC(g)
19.68±0.98 15.82±1.09 b0.0001
Whole body BMD(g/cm2)
0.205±0.006 0.191±0.006 b0.0001
Femur BMC (g) 0.88±0.07 0.71±0.05 b0.0001Femur BMD(g/cm2)
0.389±0.020 0.340±0.020 b0.0001
Body weight (g) 641.61±56.34 466.65±44.69 b0.0001Fat mass (g) 106.96±35.68 57.22±17.33 0.0004Lean mass (g) 514.98±30.83 393.61±36.54 b0.0001
ELISA Leptin (ng/mL) 4.43±0.86 3.39±0.68 0.02OC (ng/mL) 229.82±65.56 232.97±43.82 NSNTx (nM BCE/L) 45.79±10.73 31.53±11.49 0.008TRAP (U/L) 3.29±0.86 2.40±0.43 0.007
546 D.B. Maurel et al. / Bone 49 (2011) 543–552
205
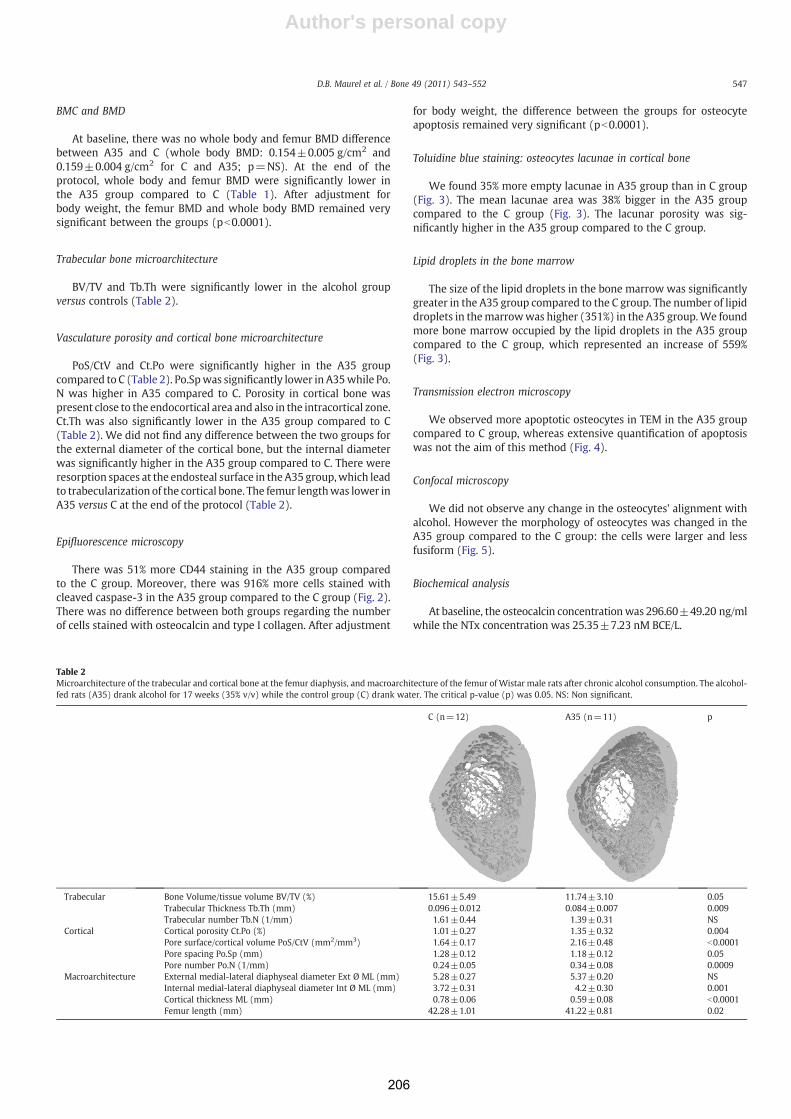
Author's personal copy
BMC and BMD
At baseline, there was no whole body and femur BMD differencebetween A35 and C (whole body BMD: 0.154±0.005 g/cm2 and0.159±0.004 g/cm2 for C and A35; p=NS). At the end of theprotocol, whole body and femur BMD were significantly lower inthe A35 group compared to C (Table 1). After adjustment forbody weight, the femur BMD and whole body BMD remained verysignificant between the groups (pb0.0001).
Trabecular bone microarchitecture
BV/TV and Tb.Th were significantly lower in the alcohol groupversus controls (Table 2).
Vasculature porosity and cortical bone microarchitecture
PoS/CtV and Ct.Po were significantly higher in the A35 groupcompared to C (Table 2). Po.Spwas significantly lower in A35while Po.N was higher in A35 compared to C. Porosity in cortical bone waspresent close to the endocortical area and also in the intracortical zone.Ct.Th was also significantly lower in the A35 group compared to C(Table 2). We did not find any difference between the two groups forthe external diameter of the cortical bone, but the internal diameterwas significantly higher in the A35 group compared to C. There wereresorption spaces at the endosteal surface in the A35 group,which leadto trabecularization of the cortical bone. The femur lengthwas lower inA35 versus C at the end of the protocol (Table 2).
Epifluorescence microscopy
There was 51% more CD44 staining in the A35 group comparedto the C group. Moreover, there was 916% more cells stained withcleaved caspase-3 in the A35 group compared to the C group (Fig. 2).There was no difference between both groups regarding the numberof cells stained with osteocalcin and type I collagen. After adjustment
for body weight, the difference between the groups for osteocyteapoptosis remained very significant (pb0.0001).
Toluidine blue staining: osteocytes lacunae in cortical bone
We found 35% more empty lacunae in A35 group than in C group(Fig. 3). The mean lacunae area was 38% bigger in the A35 groupcompared to the C group (Fig. 3). The lacunar porosity was sig-nificantly higher in the A35 group compared to the C group.
Lipid droplets in the bone marrow
The size of the lipid droplets in the bone marrow was significantlygreater in the A35 group compared to the C group. The number of lipiddroplets in themarrowwas higher (351%) in the A35 group.We foundmore bone marrow occupied by the lipid droplets in the A35 groupcompared to the C group, which represented an increase of 559%(Fig. 3).
Transmission electron microscopy
We observed more apoptotic osteocytes in TEM in the A35 groupcompared to C group, whereas extensive quantification of apoptosiswas not the aim of this method (Fig. 4).
Confocal microscopy
We did not observe any change in the osteocytes' alignment withalcohol. However the morphology of osteocytes was changed in theA35 group compared to the C group: the cells were larger and lessfusiform (Fig. 5).
Biochemical analysis
At baseline, the osteocalcin concentrationwas 296.60±49.20 ng/mlwhile the NTx concentration was 25.35±7.23 nM BCE/L.
Table 2Microarchitecture of the trabecular and cortical bone at the femur diaphysis, and macroarchitecture of the femur of Wistar male rats after chronic alcohol consumption. The alcohol-fed rats (A35) drank alcohol for 17 weeks (35% v/v) while the control group (C) drank water. The critical p-value (p) was 0.05. NS: Non significant.
C (n=12) A35 (n=11) p
Trabecular Bone Volume/tissue volume BV/TV (%) 15.61±5.49 11.74±3.10 0.05Trabecular Thickness Tb.Th (mm) 0.096±0.012 0.084±0.007 0.009Trabecular number Tb.N (1/mm) 1.61±0.44 1.39±0.31 NS
Cortical Cortical porosity Ct.Po (%) 1.01±0.27 1.35±0.32 0.004Pore surface/cortical volume PoS/CtV (mm2/mm3) 1.64±0.17 2.16±0.48 b0.0001Pore spacing Po.Sp (mm) 1.28±0.12 1.18±0.12 0.05Pore number Po.N (1/mm) 0.24±0.05 0.34±0.08 0.0009
Macroarchitecture External medial-lateral diaphyseal diameter Ext Ø ML (mm) 5.28±0.27 5.37±0.20 NSInternal medial-lateral diaphyseal diameter Int Ø ML (mm) 3.72±0.31 4.2±0.30 0.001Cortical thickness ML (mm) 0.78±0.06 0.59±0.08 b0.0001Femur length (mm) 42.28±1.01 41.22±0.81 0.02
547D.B. Maurel et al. / Bone 49 (2011) 543–552
206
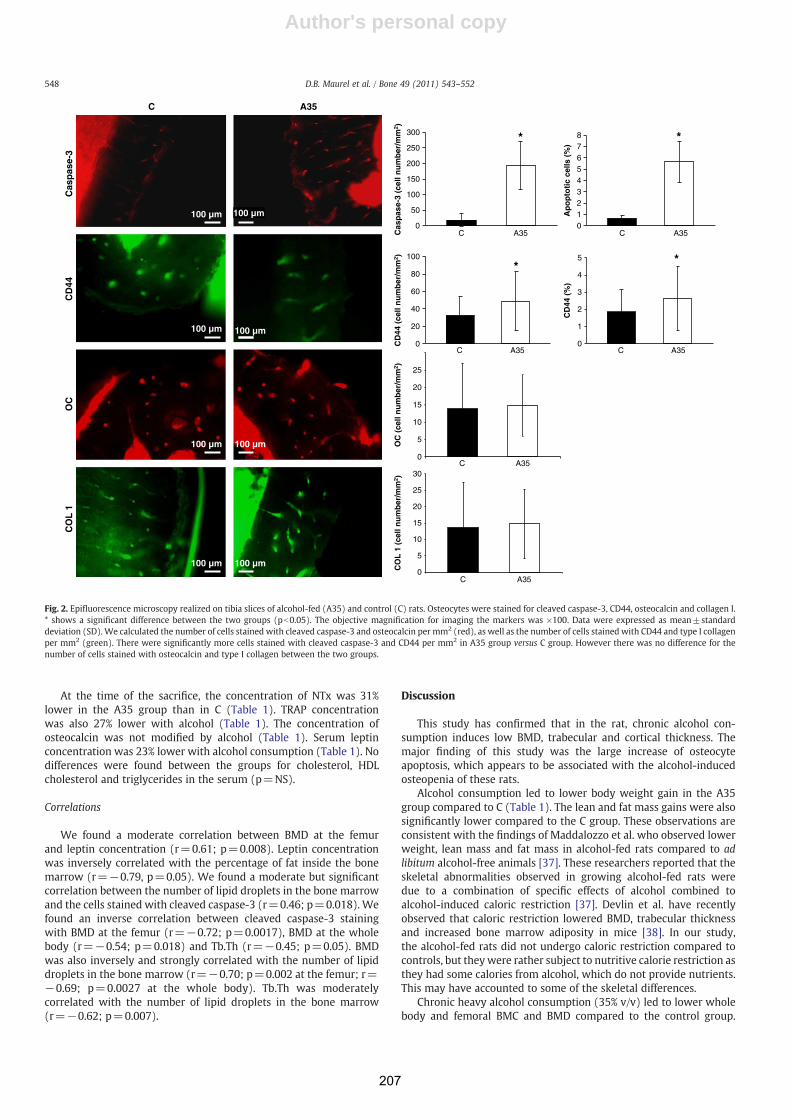
Author's personal copy
At the time of the sacrifice, the concentration of NTx was 31%lower in the A35 group than in C (Table 1). TRAP concentrationwas also 27% lower with alcohol (Table 1). The concentration ofosteocalcin was not modified by alcohol (Table 1). Serum leptinconcentration was 23% lower with alcohol consumption (Table 1). Nodifferences were found between the groups for cholesterol, HDLcholesterol and triglycerides in the serum (p=NS).
Correlations
We found a moderate correlation between BMD at the femurand leptin concentration (r=0.61; p=0.008). Leptin concentrationwas inversely correlated with the percentage of fat inside the bonemarrow (r=−0.79, p=0.05). We found a moderate but significantcorrelation between the number of lipid droplets in the bone marrowand the cells stained with cleaved caspase-3 (r=0.46; p=0.018). Wefound an inverse correlation between cleaved caspase-3 stainingwith BMD at the femur (r=−0.72; p=0.0017), BMD at the wholebody (r=−0.54; p=0.018) and Tb.Th (r=−0.45; p=0.05). BMDwas also inversely and strongly correlated with the number of lipiddroplets in the bone marrow (r=−0.70; p=0.002 at the femur; r=−0.69; p=0.0027 at the whole body). Tb.Th was moderatelycorrelated with the number of lipid droplets in the bone marrow(r=−0.62; p=0.007).
Discussion
This study has confirmed that in the rat, chronic alcohol con-sumption induces low BMD, trabecular and cortical thickness. Themajor finding of this study was the large increase of osteocyteapoptosis, which appears to be associated with the alcohol-inducedosteopenia of these rats.
Alcohol consumption led to lower body weight gain in the A35group compared to C (Table 1). The lean and fat mass gains were alsosignificantly lower compared to the C group. These observations areconsistent with the findings of Maddalozzo et al. who observed lowerweight, lean mass and fat mass in alcohol-fed rats compared to adlibitum alcohol-free animals [37]. These researchers reported that theskeletal abnormalities observed in growing alcohol-fed rats weredue to a combination of specific effects of alcohol combined toalcohol-induced caloric restriction [37]. Devlin et al. have recentlyobserved that caloric restriction lowered BMD, trabecular thicknessand increased bone marrow adiposity in mice [38]. In our study,the alcohol-fed rats did not undergo caloric restriction compared tocontrols, but theywere rather subject to nutritive calorie restriction asthey had some calories from alcohol, which do not provide nutrients.This may have accounted to some of the skeletal differences.
Chronic heavy alcohol consumption (35% v/v) led to lower wholebody and femoral BMC and BMD compared to the control group.
0
5
10
15
20
25
30
CO
L 1
(ce
ll n
um
ber
/mm
2 )
0
5
10
15
20
25
OC
(ce
ll n
um
ber
/mm
2 )
0
50
100
150
200
250
300
Cas
pas
e-3
(cel
l nu
mb
er/m
m2 )
012345678
Ap
op
toti
c ce
lls (
%)
0
20
40
60
80
100
CD
44 (
cell
nu
mb
er/m
m2 )
100 µm100 µm
100 µm 100 µm
C
Cas
pas
e-3
CD
44
*
C
*
*
0
1
2
3
4
5
CD
44 (
%)
*
OC
100 µm100 µm
100 µm100 µm
CO
L 1
A35
A35
C A35
C A35
C A35
C A35
C A35
Fig. 2. Epifluorescence microscopy realized on tibia slices of alcohol-fed (A35) and control (C) rats. Osteocytes were stained for cleaved caspase-3, CD44, osteocalcin and collagen I.* shows a significant difference between the two groups (pb0.05). The objective magnification for imaging the markers was ×100. Data were expressed as mean±standarddeviation (SD). We calculated the number of cells stained with cleaved caspase-3 and osteocalcin per mm2 (red), as well as the number of cells stained with CD44 and type I collagenper mm2 (green). There were significantly more cells stained with cleaved caspase-3 and CD44 per mm2 in A35 group versus C group. However there was no difference for thenumber of cells stained with osteocalcin and type I collagen between the two groups.
548 D.B. Maurel et al. / Bone 49 (2011) 543–552
207
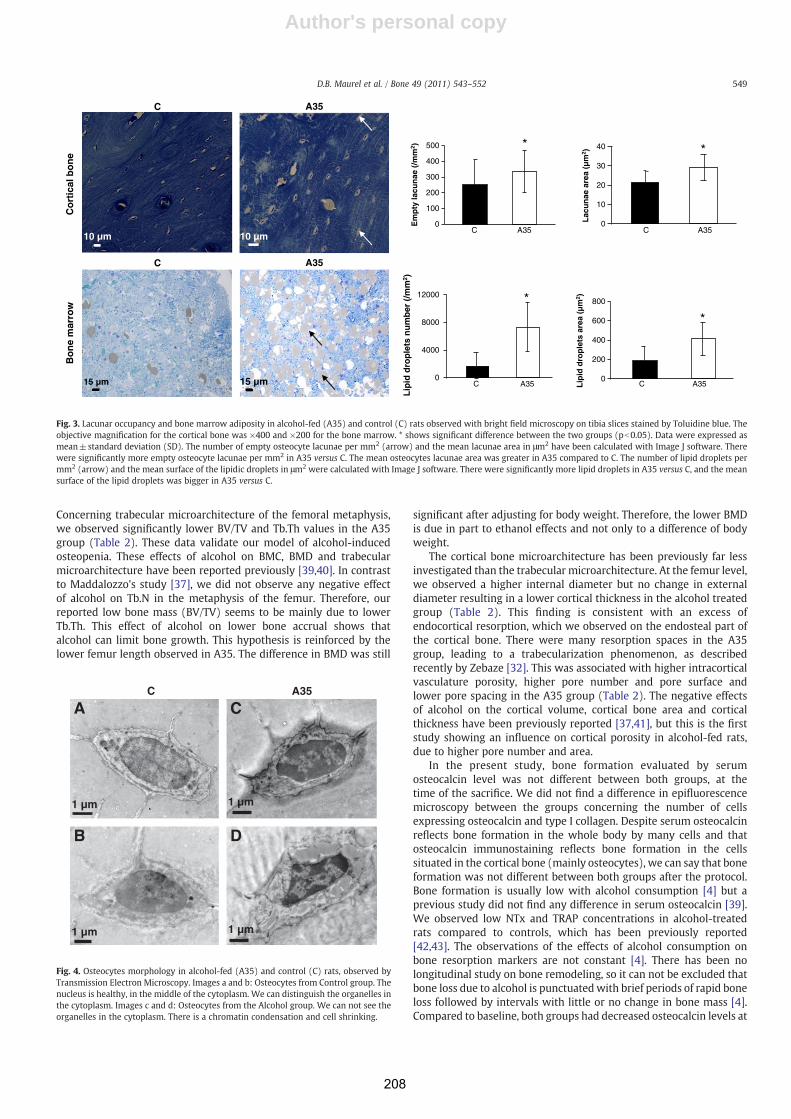
Author's personal copy
Concerning trabecular microarchitecture of the femoral metaphysis,we observed significantly lower BV/TV and Tb.Th values in the A35group (Table 2). These data validate our model of alcohol-inducedosteopenia. These effects of alcohol on BMC, BMD and trabecularmicroarchitecture have been reported previously [39,40]. In contrastto Maddalozzo's study [37], we did not observe any negative effectof alcohol on Tb.N in the metaphysis of the femur. Therefore, ourreported low bone mass (BV/TV) seems to be mainly due to lowerTb.Th. This effect of alcohol on lower bone accrual shows thatalcohol can limit bone growth. This hypothesis is reinforced by thelower femur length observed in A35. The difference in BMD was still
significant after adjusting for body weight. Therefore, the lower BMDis due in part to ethanol effects and not only to a difference of bodyweight.
The cortical bone microarchitecture has been previously far lessinvestigated than the trabecular microarchitecture. At the femur level,we observed a higher internal diameter but no change in externaldiameter resulting in a lower cortical thickness in the alcohol treatedgroup (Table 2). This finding is consistent with an excess ofendocortical resorption, which we observed on the endosteal part ofthe cortical bone. There were many resorption spaces in the A35group, leading to a trabecularization phenomenon, as describedrecently by Zebaze [32]. This was associated with higher intracorticalvasculature porosity, higher pore number and pore surface andlower pore spacing in the A35 group (Table 2). The negative effectsof alcohol on the cortical volume, cortical bone area and corticalthickness have been previously reported [37,41], but this is the firststudy showing an influence on cortical porosity in alcohol-fed rats,due to higher pore number and area.
In the present study, bone formation evaluated by serumosteocalcin level was not different between both groups, at thetime of the sacrifice. We did not find a difference in epifluorescencemicroscopy between the groups concerning the number of cellsexpressing osteocalcin and type I collagen. Despite serum osteocalcinreflects bone formation in the whole body by many cells and thatosteocalcin immunostaining reflects bone formation in the cellssituated in the cortical bone (mainly osteocytes), we can say that boneformation was not different between both groups after the protocol.Bone formation is usually low with alcohol consumption [4] but aprevious study did not find any difference in serum osteocalcin [39].We observed low NTx and TRAP concentrations in alcohol-treatedrats compared to controls, which has been previously reported[42,43]. The observations of the effects of alcohol consumption onbone resorption markers are not constant [4]. There has been nolongitudinal study on bone remodeling, so it can not be excluded thatbone loss due to alcohol is punctuatedwith brief periods of rapid boneloss followed by intervals with little or no change in bone mass [4].Compared to baseline, both groups had decreased osteocalcin levels at
0
100
200
300
400
500
Em
pty
lacu
nae
(/m
m2 ) *
0
10
20
30
40
Lac
un
ae a
rea
(µm
2 )L
ipid
dro
ple
ts a
rea
(µm
2 )
*
0
200
400
600
800
*
0
4000
8000
12000
Lip
id d
rop
lets
nu
mb
er (
/mm
2 )
*
C A35 C A35
C A35C A35
Co
rtic
al b
on
eB
on
e m
arro
w
10 µm 10 µm
15 µm 15 µm
C A35
C A35
Fig. 3. Lacunar occupancy and bone marrow adiposity in alcohol-fed (A35) and control (C) rats observed with bright field microscopy on tibia slices stained by Toluidine blue. Theobjective magnification for the cortical bone was ×400 and ×200 for the bone marrow. * shows significant difference between the two groups (pb0.05). Data were expressed asmean±standard deviation (SD). The number of empty osteocyte lacunae per mm2 (arrow) and the mean lacunae area in μm2 have been calculated with Image J software. Therewere significantly more empty osteocyte lacunae per mm2 in A35 versus C. The mean osteocytes lacunae area was greater in A35 compared to C. The number of lipid droplets permm2 (arrow) and the mean surface of the lipidic droplets in μm2 were calculated with Image J software. There were significantly more lipid droplets in A35 versus C, and the meansurface of the lipid droplets was bigger in A35 versus C.
C A35
1 µm
1 µm
A
B
C
D
1 µm
1 µm
Fig. 4. Osteocytes morphology in alcohol-fed (A35) and control (C) rats, observed byTransmission Electron Microscopy. Images a and b: Osteocytes from Control group. Thenucleus is healthy, in the middle of the cytoplasm. We can distinguish the organelles inthe cytoplasm. Images c and d: Osteocytes from the Alcohol group. We can not see theorganelles in the cytoplasm. There is a chromatin condensation and cell shrinking.
549D.B. Maurel et al. / Bone 49 (2011) 543–552
208
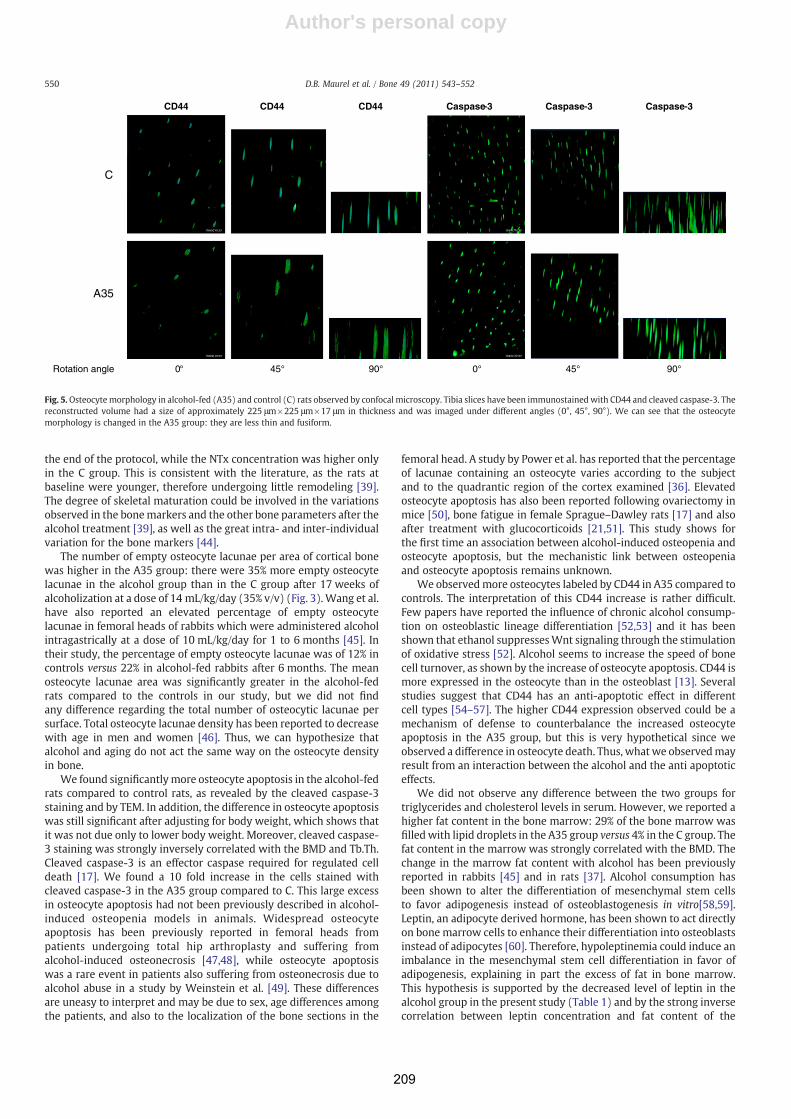
Author's personal copy
the end of the protocol, while the NTx concentration was higher onlyin the C group. This is consistent with the literature, as the rats atbaseline were younger, therefore undergoing little remodeling [39].The degree of skeletal maturation could be involved in the variationsobserved in the bonemarkers and the other bone parameters after thealcohol treatment [39], as well as the great intra- and inter-individualvariation for the bone markers [44].
The number of empty osteocyte lacunae per area of cortical bonewas higher in the A35 group: there were 35% more empty osteocytelacunae in the alcohol group than in the C group after 17 weeks ofalcoholization at a dose of 14 mL/kg/day (35% v/v) (Fig. 3). Wang et al.have also reported an elevated percentage of empty osteocytelacunae in femoral heads of rabbits which were administered alcoholintragastrically at a dose of 10 mL/kg/day for 1 to 6 months [45]. Intheir study, the percentage of empty osteocyte lacunae was of 12% incontrols versus 22% in alcohol-fed rabbits after 6 months. The meanosteocyte lacunae area was significantly greater in the alcohol-fedrats compared to the controls in our study, but we did not findany difference regarding the total number of osteocytic lacunae persurface. Total osteocyte lacunae density has been reported to decreasewith age in men and women [46]. Thus, we can hypothesize thatalcohol and aging do not act the same way on the osteocyte densityin bone.
We found significantlymore osteocyte apoptosis in the alcohol-fedrats compared to control rats, as revealed by the cleaved caspase-3staining and by TEM. In addition, the difference in osteocyte apoptosiswas still significant after adjusting for body weight, which shows thatit was not due only to lower body weight. Moreover, cleaved caspase-3 staining was strongly inversely correlated with the BMD and Tb.Th.Cleaved caspase-3 is an effector caspase required for regulated celldeath [17]. We found a 10 fold increase in the cells stained withcleaved caspase-3 in the A35 group compared to C. This large excessin osteocyte apoptosis had not been previously described in alcohol-induced osteopenia models in animals. Widespread osteocyteapoptosis has been previously reported in femoral heads frompatients undergoing total hip arthroplasty and suffering fromalcohol-induced osteonecrosis [47,48], while osteocyte apoptosiswas a rare event in patients also suffering from osteonecrosis due toalcohol abuse in a study by Weinstein et al. [49]. These differencesare uneasy to interpret and may be due to sex, age differences amongthe patients, and also to the localization of the bone sections in the
femoral head. A study by Power et al. has reported that the percentageof lacunae containing an osteocyte varies according to the subjectand to the quadrantic region of the cortex examined [36]. Elevatedosteocyte apoptosis has also been reported following ovariectomy inmice [50], bone fatigue in female Sprague–Dawley rats [17] and alsoafter treatment with glucocorticoids [21,51]. This study shows forthe first time an association between alcohol-induced osteopenia andosteocyte apoptosis, but the mechanistic link between osteopeniaand osteocyte apoptosis remains unknown.
We observedmore osteocytes labeled by CD44 in A35 compared tocontrols. The interpretation of this CD44 increase is rather difficult.Few papers have reported the influence of chronic alcohol consump-tion on osteoblastic lineage differentiation [52,53] and it has beenshown that ethanol suppressesWnt signaling through the stimulationof oxidative stress [52]. Alcohol seems to increase the speed of bonecell turnover, as shown by the increase of osteocyte apoptosis. CD44 ismore expressed in the osteocyte than in the osteoblast [13]. Severalstudies suggest that CD44 has an anti-apoptotic effect in differentcell types [54–57]. The higher CD44 expression observed could be amechanism of defense to counterbalance the increased osteocyteapoptosis in the A35 group, but this is very hypothetical since weobserved a difference in osteocyte death. Thus, what we observedmayresult from an interaction between the alcohol and the anti apoptoticeffects.
We did not observe any difference between the two groups fortriglycerides and cholesterol levels in serum. However, we reported ahigher fat content in the bone marrow: 29% of the bone marrow wasfilled with lipid droplets in the A35 group versus 4% in the C group. Thefat content in the marrow was strongly correlated with the BMD. Thechange in the marrow fat content with alcohol has been previouslyreported in rabbits [45] and in rats [37]. Alcohol consumption hasbeen shown to alter the differentiation of mesenchymal stem cellsto favor adipogenesis instead of osteoblastogenesis in vitro[58,59].Leptin, an adipocyte derived hormone, has been shown to act directlyon bone marrow cells to enhance their differentiation into osteoblastsinstead of adipocytes [60]. Therefore, hypoleptinemia could induce animbalance in the mesenchymal stem cell differentiation in favor ofadipogenesis, explaining in part the excess of fat in bone marrow.This hypothesis is supported by the decreased level of leptin in thealcohol group in the present study (Table 1) and by the strong inversecorrelation between leptin concentration and fat content of the
C
A35
CD44 CD44 CD44 Caspase-3 Caspase-3 Caspase-3
Rotation angle 0° 45° 90° 0° 45° 90°
Fig. 5.Osteocyte morphology in alcohol-fed (A35) and control (C) rats observed by confocal microscopy. Tibia slices have been immunostainedwith CD44 and cleaved caspase-3. Thereconstructed volume had a size of approximately 225 μm×225 μm×17 μm in thickness and was imaged under different angles (0°, 45°, 90°). We can see that the osteocytemorphology is changed in the A35 group: they are less thin and fusiform.
550 D.B. Maurel et al. / Bone 49 (2011) 543–552
209
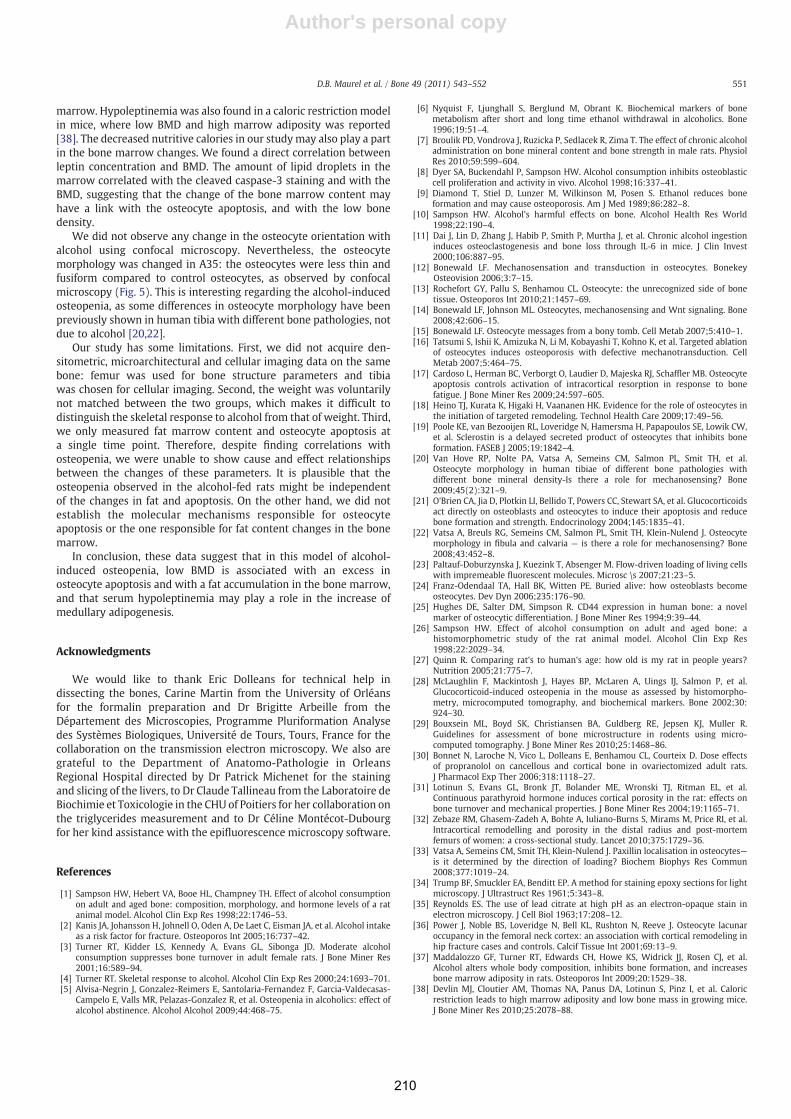
Author's personal copy
marrow. Hypoleptinemia was also found in a caloric restriction modelin mice, where low BMD and high marrow adiposity was reported[38]. The decreased nutritive calories in our studymay also play a partin the bone marrow changes. We found a direct correlation betweenleptin concentration and BMD. The amount of lipid droplets in themarrow correlated with the cleaved caspase-3 staining and with theBMD, suggesting that the change of the bone marrow content mayhave a link with the osteocyte apoptosis, and with the low bonedensity.
We did not observe any change in the osteocyte orientation withalcohol using confocal microscopy. Nevertheless, the osteocytemorphology was changed in A35: the osteocytes were less thin andfusiform compared to control osteocytes, as observed by confocalmicroscopy (Fig. 5). This is interesting regarding the alcohol-inducedosteopenia, as some differences in osteocyte morphology have beenpreviously shown in human tibia with different bone pathologies, notdue to alcohol [20,22].
Our study has some limitations. First, we did not acquire den-sitometric, microarchitectural and cellular imaging data on the samebone: femur was used for bone structure parameters and tibiawas chosen for cellular imaging. Second, the weight was voluntarilynot matched between the two groups, which makes it difficult todistinguish the skeletal response to alcohol from that of weight. Third,we only measured fat marrow content and osteocyte apoptosis ata single time point. Therefore, despite finding correlations withosteopenia, we were unable to show cause and effect relationshipsbetween the changes of these parameters. It is plausible that theosteopenia observed in the alcohol-fed rats might be independentof the changes in fat and apoptosis. On the other hand, we did notestablish the molecular mechanisms responsible for osteocyteapoptosis or the one responsible for fat content changes in the bonemarrow.
In conclusion, these data suggest that in this model of alcohol-induced osteopenia, low BMD is associated with an excess inosteocyte apoptosis and with a fat accumulation in the bone marrow,and that serum hypoleptinemia may play a role in the increase ofmedullary adipogenesis.
Acknowledgments
We would like to thank Eric Dolleans for technical help indissecting the bones, Carine Martin from the University of Orléansfor the formalin preparation and Dr Brigitte Arbeille from theDépartement des Microscopies, Programme Pluriformation Analysedes Systèmes Biologiques, Université de Tours, Tours, France for thecollaboration on the transmission electron microscopy. We also aregrateful to the Department of Anatomo-Pathologie in OrleansRegional Hospital directed by Dr Patrick Michenet for the stainingand slicing of the livers, to Dr Claude Tallineau from the Laboratoire deBiochimie et Toxicologie in the CHU of Poitiers for her collaboration onthe triglycerides measurement and to Dr Céline Montécot-Dubourgfor her kind assistance with the epifluorescence microscopy software.
References
[1] Sampson HW, Hebert VA, Booe HL, Champney TH. Effect of alcohol consumptionon adult and aged bone: composition, morphology, and hormone levels of a ratanimal model. Alcohol Clin Exp Res 1998;22:1746–53.
[2] Kanis JA, Johansson H, Johnell O, Oden A, De Laet C, Eisman JA, et al. Alcohol intakeas a risk factor for fracture. Osteoporos Int 2005;16:737–42.
[3] Turner RT, Kidder LS, Kennedy A, Evans GL, Sibonga JD. Moderate alcoholconsumption suppresses bone turnover in adult female rats. J Bone Miner Res2001;16:589–94.
[4] Turner RT. Skeletal response to alcohol. Alcohol Clin Exp Res 2000;24:1693–701.[5] Alvisa-Negrin J, Gonzalez-Reimers E, Santolaria-Fernandez F, Garcia-Valdecasas-
Campelo E, Valls MR, Pelazas-Gonzalez R, et al. Osteopenia in alcoholics: effect ofalcohol abstinence. Alcohol Alcohol 2009;44:468–75.
[6] Nyquist F, Ljunghall S, Berglund M, Obrant K. Biochemical markers of bonemetabolism after short and long time ethanol withdrawal in alcoholics. Bone1996;19:51–4.
[7] Broulik PD, Vondrova J, Ruzicka P, Sedlacek R, Zima T. The effect of chronic alcoholadministration on bone mineral content and bone strength in male rats. PhysiolRes 2010;59:599–604.
[8] Dyer SA, Buckendahl P, Sampson HW. Alcohol consumption inhibits osteoblasticcell proliferation and activity in vivo. Alcohol 1998;16:337–41.
[9] Diamond T, Stiel D, Lunzer M, Wilkinson M, Posen S. Ethanol reduces boneformation and may cause osteoporosis. Am J Med 1989;86:282–8.
[10] Sampson HW. Alcohol's harmful effects on bone. Alcohol Health Res World1998;22:190–4.
[11] Dai J, Lin D, Zhang J, Habib P, Smith P, Murtha J, et al. Chronic alcohol ingestioninduces osteoclastogenesis and bone loss through IL-6 in mice. J Clin Invest2000;106:887–95.
[12] Bonewald LF. Mechanosensation and transduction in osteocytes. BonekeyOsteovision 2006;3:7–15.
[13] Rochefort GY, Pallu S, Benhamou CL. Osteocyte: the unrecognized side of bonetissue. Osteoporos Int 2010;21:1457–69.
[14] Bonewald LF, Johnson ML. Osteocytes, mechanosensing and Wnt signaling. Bone2008;42:606–15.
[15] Bonewald LF. Osteocyte messages from a bony tomb. Cell Metab 2007;5:410–1.[16] Tatsumi S, Ishii K, Amizuka N, Li M, Kobayashi T, Kohno K, et al. Targeted ablation
of osteocytes induces osteoporosis with defective mechanotransduction. CellMetab 2007;5:464–75.
[17] Cardoso L, Herman BC, Verborgt O, Laudier D, Majeska RJ, Schaffler MB. Osteocyteapoptosis controls activation of intracortical resorption in response to bonefatigue. J Bone Miner Res 2009;24:597–605.
[18] Heino TJ, Kurata K, Higaki H, Vaananen HK. Evidence for the role of osteocytes inthe initiation of targeted remodeling. Technol Health Care 2009;17:49–56.
[19] Poole KE, van Bezooijen RL, Loveridge N, Hamersma H, Papapoulos SE, Lowik CW,et al. Sclerostin is a delayed secreted product of osteocytes that inhibits boneformation. FASEB J 2005;19:1842–4.
[20] Van Hove RP, Nolte PA, Vatsa A, Semeins CM, Salmon PL, Smit TH, et al.Osteocyte morphology in human tibiae of different bone pathologies withdifferent bone mineral density-Is there a role for mechanosensing? Bone2009;45(2):321–9.
[21] O'Brien CA, Jia D, Plotkin LI, Bellido T, Powers CC, Stewart SA, et al. Glucocorticoidsact directly on osteoblasts and osteocytes to induce their apoptosis and reducebone formation and strength. Endocrinology 2004;145:1835–41.
[22] Vatsa A, Breuls RG, Semeins CM, Salmon PL, Smit TH, Klein-Nulend J. Osteocytemorphology in fibula and calvaria — is there a role for mechanosensing? Bone2008;43:452–8.
[23] Paltauf-Doburzynska J, Kuezink T, Absenger M. Flow-driven loading of living cellswith impremeable fluorescent molecules. Microsc \s 2007;21:23–5.
[24] Franz-Odendaal TA, Hall BK, Witten PE. Buried alive: how osteoblasts becomeosteocytes. Dev Dyn 2006;235:176–90.
[25] Hughes DE, Salter DM, Simpson R. CD44 expression in human bone: a novelmarker of osteocytic differentiation. J Bone Miner Res 1994;9:39–44.
[26] Sampson HW. Effect of alcohol consumption on adult and aged bone: ahistomorphometric study of the rat animal model. Alcohol Clin Exp Res1998;22:2029–34.
[27] Quinn R. Comparing rat's to human's age: how old is my rat in people years?Nutrition 2005;21:775–7.
[28] McLaughlin F, Mackintosh J, Hayes BP, McLaren A, Uings IJ, Salmon P, et al.Glucocorticoid-induced osteopenia in the mouse as assessed by histomorpho-metry, microcomputed tomography, and biochemical markers. Bone 2002;30:924–30.
[29] Bouxsein ML, Boyd SK, Christiansen BA, Guldberg RE, Jepsen KJ, Muller R.Guidelines for assessment of bone microstructure in rodents using micro-computed tomography. J Bone Miner Res 2010;25:1468–86.
[30] Bonnet N, Laroche N, Vico L, Dolleans E, Benhamou CL, Courteix D. Dose effectsof propranolol on cancellous and cortical bone in ovariectomized adult rats.J Pharmacol Exp Ther 2006;318:1118–27.
[31] Lotinun S, Evans GL, Bronk JT, Bolander ME, Wronski TJ, Ritman EL, et al.Continuous parathyroid hormone induces cortical porosity in the rat: effects onbone turnover and mechanical properties. J Bone Miner Res 2004;19:1165–71.
[32] Zebaze RM, Ghasem-Zadeh A, Bohte A, Iuliano-Burns S, Mirams M, Price RI, et al.Intracortical remodelling and porosity in the distal radius and post-mortemfemurs of women: a cross-sectional study. Lancet 2010;375:1729–36.
[33] Vatsa A, Semeins CM, Smit TH, Klein-Nulend J. Paxillin localisation in osteocytes—is it determined by the direction of loading? Biochem Biophys Res Commun2008;377:1019–24.
[34] Trump BF, Smuckler EA, Benditt EP. A method for staining epoxy sections for lightmicroscopy. J Ultrastruct Res 1961;5:343–8.
[35] Reynolds ES. The use of lead citrate at high pH as an electron-opaque stain inelectron microscopy. J Cell Biol 1963;17:208–12.
[36] Power J, Noble BS, Loveridge N, Bell KL, Rushton N, Reeve J. Osteocyte lacunaroccupancy in the femoral neck cortex: an association with cortical remodeling inhip fracture cases and controls. Calcif Tissue Int 2001;69:13–9.
[37] Maddalozzo GF, Turner RT, Edwards CH, Howe KS, Widrick JJ, Rosen CJ, et al.Alcohol alters whole body composition, inhibits bone formation, and increasesbone marrow adiposity in rats. Osteoporos Int 2009;20:1529–38.
[38] Devlin MJ, Cloutier AM, Thomas NA, Panus DA, Lotinun S, Pinz I, et al. Caloricrestriction leads to high marrow adiposity and low bone mass in growing mice.J Bone Miner Res 2010;25:2078–88.
551D.B. Maurel et al. / Bone 49 (2011) 543–552
210

Author's personal copy
[39] Sampson HW, Chaffin C, Lange J, DeFee 2nd B. Alcohol consumption by youngactively growing rats: a histomorphometric study of cancellous bone. Alcohol ClinExp Res 1997;21:352–9.
[40] Sampson HW, Perks N, Champney TH, DeFee 2nd B. Alcohol consumption inhibitsbone growth and development in young actively growing rats. Alcohol Clin ExpRes 1996;20:1375–84.
[41] Hogan HA, Sampson HW, Cashier E, Ledoux N. Alcohol consumption by youngactively growing rats: a study of cortical bone histomorphometry and mechanicalproperties. Alcohol Clin Exp Res 1997;21:809–16.
[42] Bikle DD, Stesin A, Halloran B, Steinbach L, Recker R. Alcohol-induced bonedisease: relationship to age and parathyroid hormone levels. Alcohol Clin Exp Res1993;17:690–5.
[43] Sripanyakorn S, Jugdaohsingh R, Mander A, Davidson SL, Thompson RP, Powell JJ.Moderate ingestion of alcohol is associated with acute ethanol-inducedsuppression of circulating CTX in a PTH-independent fashion. J Bone Miner Res2009;24:1380–8.
[44] Jugdaohsingh R, O'Connell MA, Sripanyakorn S, Powell JJ. Moderate alcoholconsumption and increased bone mineral density: potential ethanol and non-ethanol mechanisms. Proc Nutr Soc 2006;65:291–310.
[45] Wang Y, Li Y, Mao K, Li J, Cui Q, Wang GJ. Alcohol-induced adipogenesis in boneand marrow: a possible mechanism for osteonecrosis. Clin Orthop Relat Res 2003:213–24.
[46] Parfitt AM. Life history of osteocytes: relationship to bone age, bone remodeling,and bone fragility. J Musculoskelet Neuronal Interact 2002;2:499–500.
[47] Calder JD, Buttery L, Revell PA, Pearse M, Polak JM. Apoptosis—a significant causeof bone cell death in osteonecrosis of the femoral head. J Bone Joint Surg Br2004;86:1209–13.
[48] Youm YS, Lee SY, Lee SH. Apoptosis in the osteonecrosis of the femoral head. ClinOrthop Surg 2010;2:250–5.
[49] Weinstein RS, Nicholas RW,Manolagas SC. Apoptosis of osteocytes in glucocorticoid-induced osteonecrosis of the hip. J Clin Endocrinol Metab 2000;85:2907–12.
[50] Emerton KB, Hu B, Woo AA, Sinofsky A, Hernandez C, Majeska RJ, et al. Osteocyteapoptosis and control of bone resorption following ovariectomy in mice. Bone2010;46:577–83.
[51] Kim HJ. New understanding of glucocorticoid action in bone cells. BMB Rep2010;43:524–9.
[52] Chen JR, Lazarenko OP, Shankar K, Blackburn ML, Badger TM, Ronis MJ. A role forethanol-induced oxidative stress in controlling lineage commitment of mesen-chymal stromal cells through inhibition of Wnt/beta-catenin signaling. J BoneMiner Res 2010;25:1117–27.
[53] Lin XH, Wu YB, Lin S, Zeng JW, Zeng PY, Wu JZ. Effects of volatile components andethanolic extract from Eclipta prostrata on proliferation and differentiation ofprimary osteoblasts. Molecules 2010;15:241–50.
[54] Allouche M, Charrad RS, Bettaieb A, Greenland C, Grignon C, Smadja-Joffe F.Ligation of the CD44 adhesionmolecule inhibits drug-induced apoptosis in humanmyeloid leukemia cells. Blood 2000;96:1187–90.
[55] Ayroldi E, Cannarile L, Migliorati G, Bartoli A, Nicoletti I, Riccardi C. CD44 (Pgp-1)inhibits CD3 and dexamethasone-induced apoptosis. Blood 1995;86:2672–8.
[56] Fujita Y, Kitagawa M, Nakamura S, Azuma K, Ishii G, Higashi M, et al. CD44signaling through focal adhesion kinase and its anti-apoptotic effect. FEBS Lett2002;528:101–8.
[57] Wittig BM, Johansson B, Zoller M, Schwarzler C, Gunthert U. Abrogation ofexperimental colitis correlates with increased apoptosis inmice deficient for CD44variant exon 7 (CD44v7). J Exp Med 2000;191:2053–64.
[58] Cui Q, Wang Y, Saleh KJ, Wang GJ, Balian G. Alcohol-induced adipogenesis in acloned bone-marrow stem cell. J Bone Joint Surg Am 2006;88(Suppl 3):148–54.
[59] Suh KT, Kim SW, Roh HL, YounMS, Jung JS. Decreased osteogenic differentiation ofmesenchymal stem cells in alcohol-induced osteonecrosis. Clin Orthop Relat Res2005:220–5.
[60] Cornish J, Callon KE, Bava U, Lin C, Naot D, Hill BL, et al. Leptin directly regulatesbone cell function in vitro and reduces bone fragility in vivo. J Endocrinol2002;175:405–15.
552 D.B. Maurel et al. / Bone 49 (2011) 543–552
211
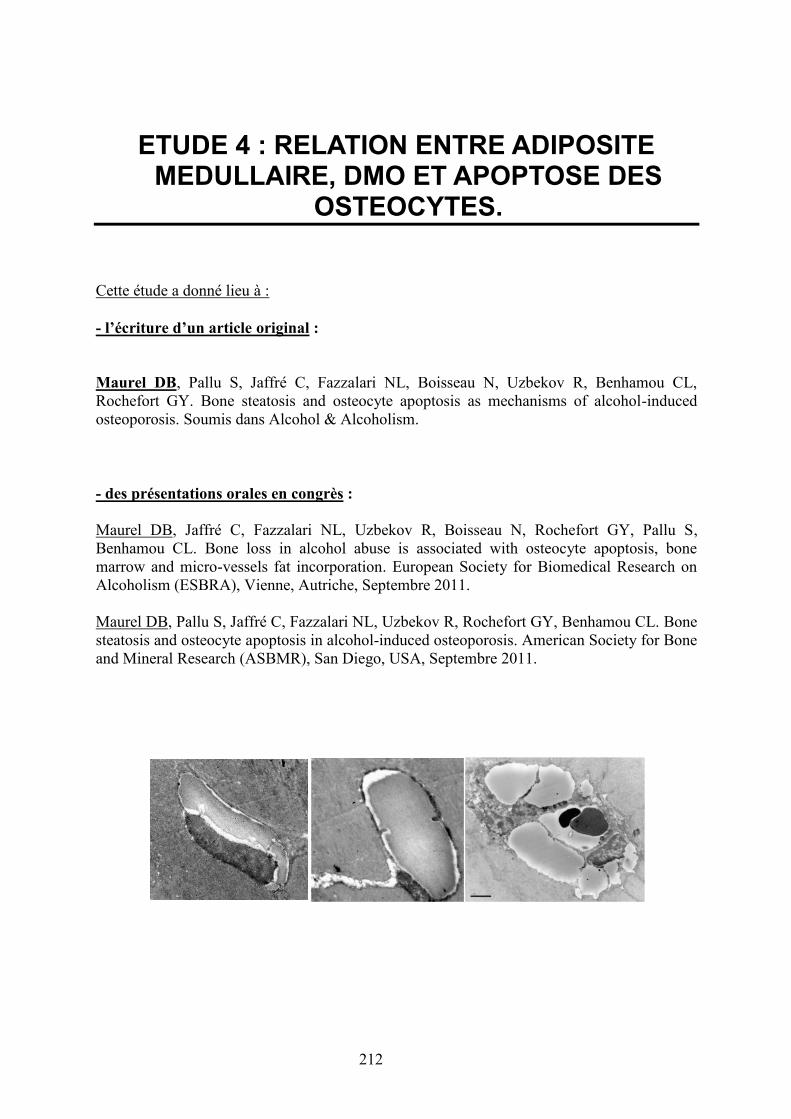
212
ETUDE 4 : RELATION ENTRE ADIPOSITEMEDULLAIRE, DMO ET APOPTOSE DES
OSTEOCYTES.
Cette étude a donné lieu à :
- l’écriture d’un article original :
Maurel DB, Pallu S, Jaffré C, Fazzalari NL, Boisseau N, Uzbekov R, Benhamou CL,Rochefort GY. Bone steatosis and osteocyte apoptosis as mechanisms of alcohol-inducedosteoporosis. Soumis dans Alcohol & Alcoholism.
- des présentations orales en congrès :
Maurel DB, Jaffré C, Fazzalari NL, Uzbekov R, Boisseau N, Rochefort GY, Pallu S,Benhamou CL. Bone loss in alcohol abuse is associated with osteocyte apoptosis, bonemarrow and micro-vessels fat incorporation. European Society for Biomedical Research onAlcoholism (ESBRA), Vienne, Autriche, Septembre 2011.
Maurel DB, Pallu S, Jaffré C, Fazzalari NL, Uzbekov R, Rochefort GY, Benhamou CL. Bonesteatosis and osteocyte apoptosis in alcohol-induced osteoporosis. American Society for Boneand Mineral Research (ASBMR), San Diego, USA, Septembre 2011.
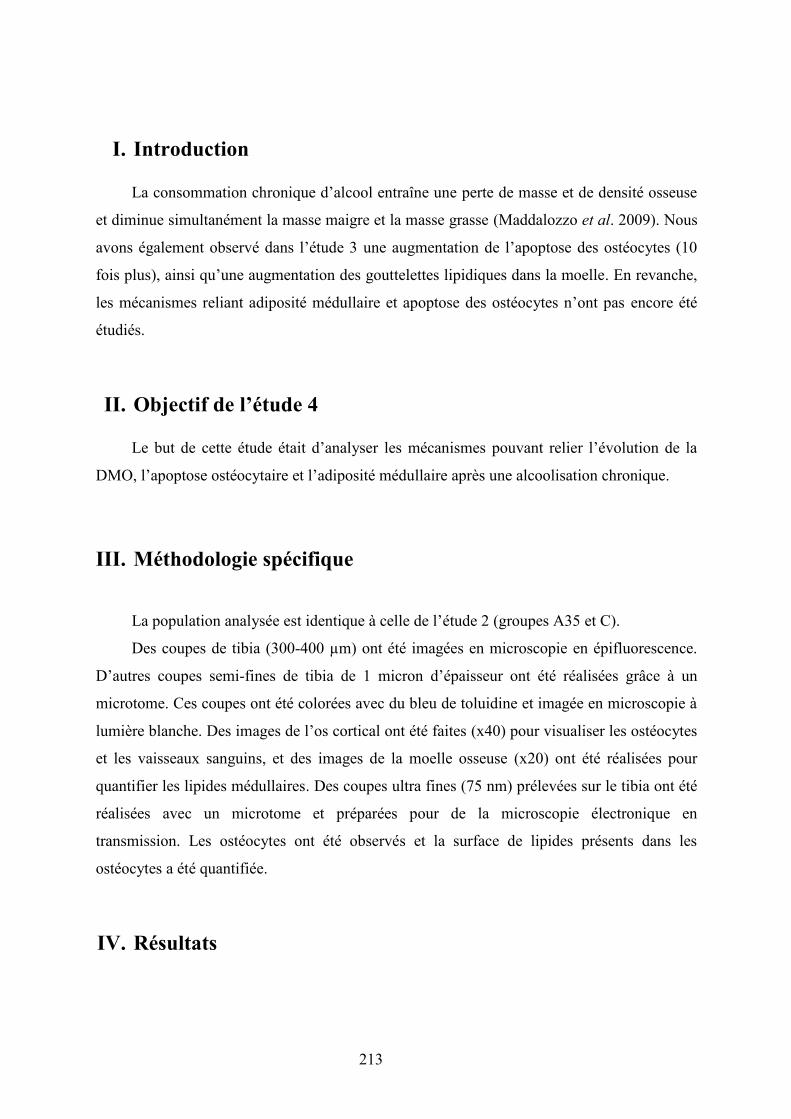
213
I. Introduction
La consommation chronique d’alcool entraîne une perte de masse et de densité osseuse
et diminue simultanément la masse maigre et la masse grasse (Maddalozzo et al. 2009). Nous
avons également observé dans l’étude 3 une augmentation de l’apoptose des ostéocytes (10
fois plus), ainsi qu’une augmentation des gouttelettes lipidiques dans la moelle. En revanche,
les mécanismes reliant adiposité médullaire et apoptose des ostéocytes n’ont pas encore été
étudiés.
II. Objectif de l’étude 4
Le but de cette étude était d’analyser les mécanismes pouvant relier l’évolution de la
DMO, l’apoptose ostéocytaire et l’adiposité médullaire après une alcoolisation chronique.
III. Méthodologie spécifique
La population analysée est identique à celle de l’étude 2 (groupes A35 et C).
Des coupes de tibia (300-400 µm) ont été imagées en microscopie en épifluorescence.
D’autres coupes semi-fines de tibia de 1 micron d’épaisseur ont été réalisées grâce à un
microtome. Ces coupes ont été colorées avec du bleu de toluidine et imagée en microscopie à
lumière blanche. Des images de l’os cortical ont été faites (x40) pour visualiser les ostéocytes
et les vaisseaux sanguins, et des images de la moelle osseuse (x20) ont été réalisées pour
quantifier les lipides médullaires. Des coupes ultra fines (75 nm) prélevées sur le tibia ont été
réalisées avec un microtome et préparées pour de la microscopie électronique en
transmission. Les ostéocytes ont été observés et la surface de lipides présents dans les
ostéocytes a été quantifiée.
IV. Résultats
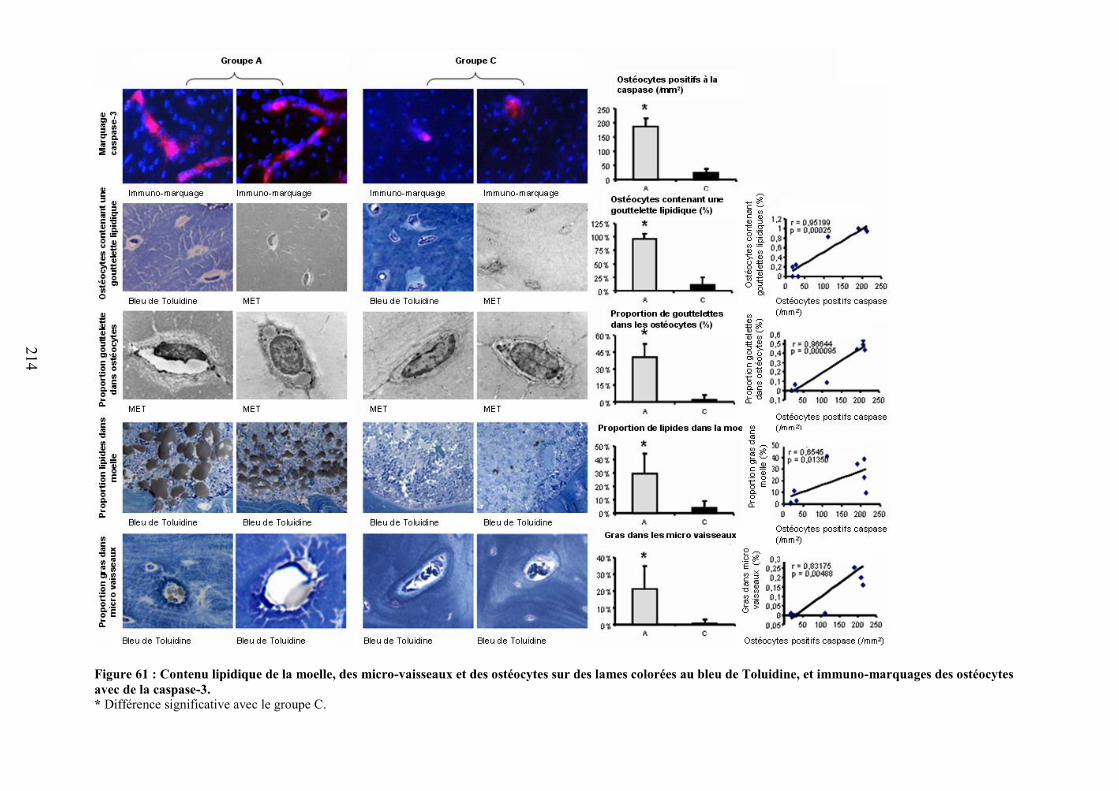
214
Figure 61 : Contenu lipidique de la moelle, des micro-vaisseaux et des ostéocytes sur des lames colorées au bleu de Toluidine, et immuno-marquages des ostéocytesavec de la caspase-3.* Différence significative avec le groupe C.
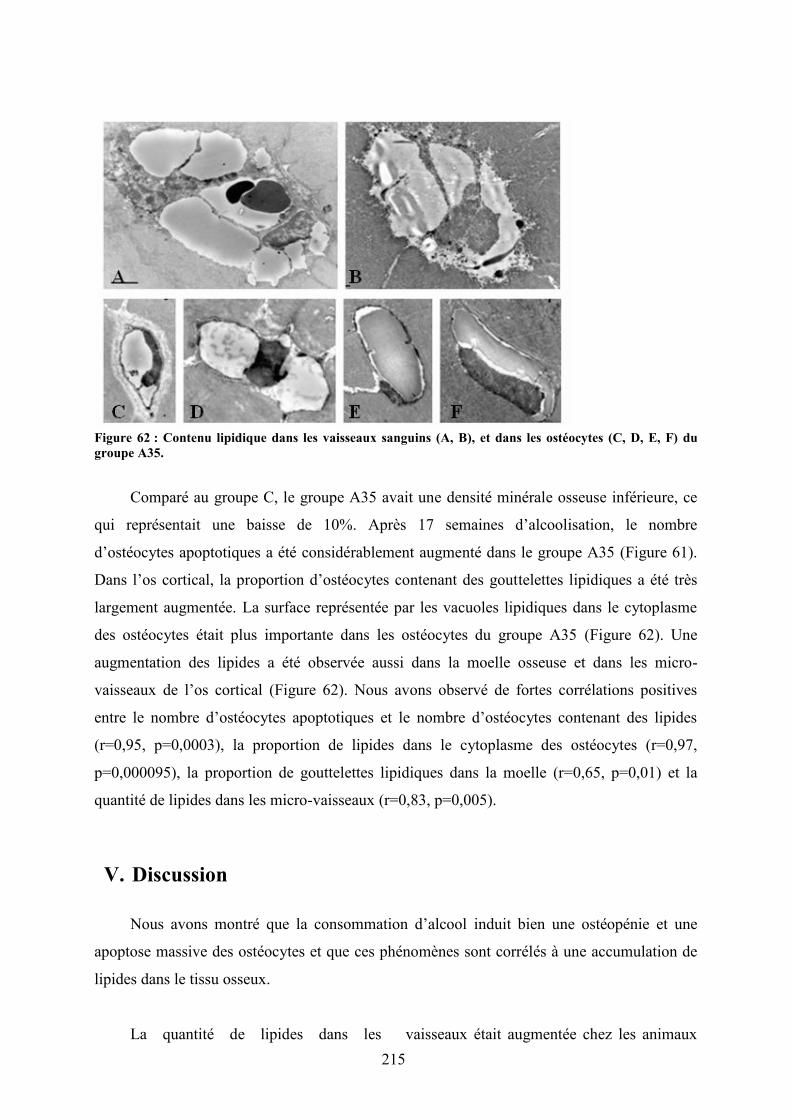
215
Figure 62 : Contenu lipidique dans les vaisseaux sanguins (A, B), et dans les ostéocytes (C, D, E, F) dugroupe A35.
Comparé au groupe C, le groupe A35 avait une densité minérale osseuse inférieure, ce
qui représentait une baisse de 10%. Après 17 semaines d’alcoolisation, le nombre
d’ostéocytes apoptotiques a été considérablement augmenté dans le groupe A35 (Figure 61).
Dans l’os cortical, la proportion d’ostéocytes contenant des gouttelettes lipidiques a été très
largement augmentée. La surface représentée par les vacuoles lipidiques dans le cytoplasme
des ostéocytes était plus importante dans les ostéocytes du groupe A35 (Figure 62). Une
augmentation des lipides a été observée aussi dans la moelle osseuse et dans les micro-
vaisseaux de l’os cortical (Figure 62). Nous avons observé de fortes corrélations positives
entre le nombre d’ostéocytes apoptotiques et le nombre d’ostéocytes contenant des lipides
(r=0,95, p=0,0003), la proportion de lipides dans le cytoplasme des ostéocytes (r=0,97,
p=0,000095), la proportion de gouttelettes lipidiques dans la moelle (r=0,65, p=0,01) et la
quantité de lipides dans les micro-vaisseaux (r=0,83, p=0,005).
V. Discussion
Nous avons montré que la consommation d’alcool induit bien une ostéopénie et une
apoptose massive des ostéocytes et que ces phénomènes sont corrélés à une accumulation de
lipides dans le tissu osseux.
La quantité de lipides dans les vaisseaux était augmentée chez les animaux
216
alcoolisés. Cette embolie partielle (20% de la lumière des vaisseaux) pourrait provoquer une
ischémie locale qui pourrait favoriser l’augmentation de l’apoptose des ostéocytes que nous
avons observée après le traitement. La proportion de lipides dans la moelle était supérieure
après le traitement. Cette hausse pourrait induire une hypertension à l’intérieur de l’os,
diminuant ainsi la perfusion du tissu osseux et obstruant en partie le système veineux. Les
images de MET ont révélé des vacuoles lipidiques dans les ostéocytes. Ces vacuoles
lipidiques pourraient compresser le noyau dans un coté du cytoplasme (observé en MET),
induisant une discontinuité de la membrane cellulaire et suivie par l’apoptose des ostéocytes
(mise en évidence par le marquage avec la capase-3 clivée). Généralement, il n’y a pas de
dépôt de lipides dans les ostéocytes. L’hypothèse la plus raisonnable pour expliquer
l’accumulation des lipides dans ces cellules serait que des composants lipidiques sortiraient
des vaisseaux sanguins où ils se sont accumulés anormalement suite à l’intoxication
alcoolique, et atteindraient les lacunes ostéocytaires via les canalicules. Une fois dans les
lacunes, ces molécules pourraient être dégradées en petites particules via un processus de
lipolyse et entrer dans les ostéocytes sous la forme d’acides gras. Ce processus “lipotoxique”
a été décrit dans plusieurs organes dont le foie. La présence de graisse dans les cellules non
dédiées à leur stockage peut causer un dysfonctionnement ou la mort de celles-ci
(Shimabukuro et al. 1998; Unger 2003).
Dans l’étude 4 nous avons montré dans le groupe alcoolisé qu’une forte proportion
d’ostéocytes contient des gouttelettes lipidiques. Cette incorporation de lipides dans les
ostéocytes est fortement corrélée avec l’augmentation de l’apoptose de ceux-ci. Nous
avons ensuite montré qu’il y avait également une incorporation de lipides dans les
vaisseaux, modification également hautement corrélée avec l’apoptose des ostéocytes.
Enfin, la quantité de lipides dans la moelle osseuse est corrélée avec l’apoptose des
ostéocytes. Il semble donc qu’il y ait une « stéatose » osseuse associée à l’ostéoporose
d’origine alcoolique. Ce processus est schématisé dans la figure 63.
Après avoir étudié les modifications potentiellement responsables de la diminution
de la DMO dans notre modèle, nous avons souhaité combiner l’exercice physique à la
consommation d’alcool, afin de montrer si oui ou non l’exercice peut prévenir les dégâts
de l’alcool sur l’os. C’est l’objet de l’étude qui suit (étude 5).
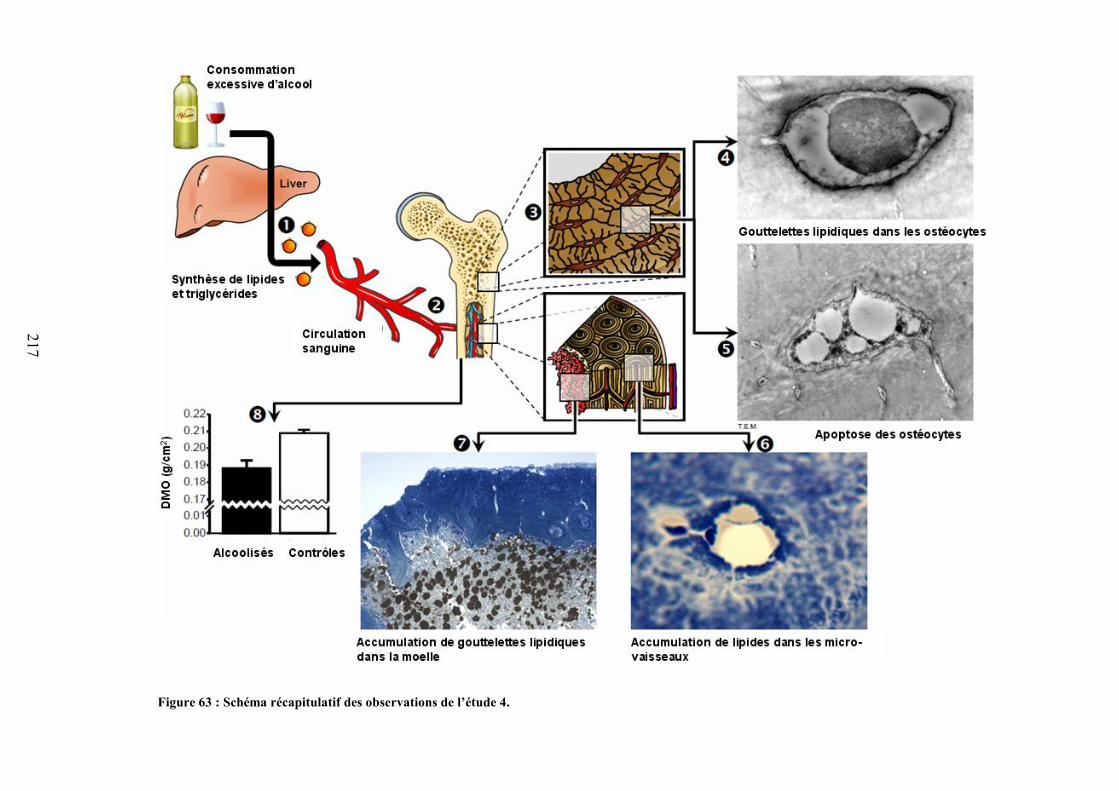
217
Figure 63 : Schéma récapitulatif des observations de l’étude 4.

218
Article 4
218
Osteocyte apoptosis and lipid infiltration as mechanisms of alcohol-induced bone loss
Running title: Osteocyte apoptosis & lipid infiltration
Authors:
Delphine B. Maurel1, Stéphane Pallu1, Christelle Jaffré1, Nicola L. Fazzalari1,2, Nathalie Boisseau3, Rustem Uzbekov4, Claude-Laurent Benhamou1, Gaël Y.
Rochefort1 1: Inserm Unit U658, Hospital Porte Madeleine, Orleans, France. 2: Bone and Joint Research Laboratory, SA Pathology, Adelaide, Australia. 3: BAPS, Blaise Pascal University, Clermont-Ferrand, France. 4: Department of Microscopy, François Rabelais University, Tours, France.
Authors e-mail addresses: [email protected]; [email protected];[email protected];
[email protected]; [email protected]; [email protected]; [email protected];
Corresponding author:
Gaël Y. ROCHEFORT, IPROS Unité Inserm U658, Hôpital Porte Madeleine, 1 rue Porte
Madeleine, BP 2439, 45032 Orléans cedex 01, France
Phone: (+33) 238 744 053
Fax: (+33) 238 744 024
E-mail address: [email protected]
Number of words in abstract: 118
Number of words in manuscript: 3975
Disclosures
All the authors state that they have no conflicts of interest.
219
Summary
We designed an in vivo study to assess the relationship between increase of
adiposity in the marrow and osteocyte apoptosis in the case of alcohol-induced bone loss.
After alcohol treatment, the number of apoptotic osteocytes was increased; lipid droplets
were accumulated within the osteocytes, the bone marrow and the cortical bone micro-
vessels. At last, we found an inverse correlation between BMD and osteocyte apoptosis
and strong significant correlations between osteocyte apoptotic number and lipid droplet
accumulation in osteocyte and bone micro-vessels. These data show that the alcohol-
induced bone loss is associated with osteocyte apoptosis and lipid accumulation in the bone
tissue. This lipid intoxication, or “bone steatosis”, is correlated to lipid accumulation in
bone marrow and blood micro-vessels.
Key words: Osteocyte; Apoptosis; Alcohol; Lipid; Bone marrow
220
Introduction
Alcoholism constitutes a worldwide major health concern and it is well known that
excessive alcohol consumption has catastrophic effects on many organs. In humans, it is
generally considered that mild alcoholics drink more than 40 g of alcohol per day (i.e. up to
a half bottle of wine per day, 15% of daily recommended caloric intake in man, 20% of
daily recommended caloric intake in woman), whereas severe alcoholics drink more than
100 g of alcohol per day (i.e. 35% of daily recommended caloric intake in man, 45% of
daily recommended caloric intake in woman) (Nyquist et al., 1996). Although liver
damage is the most prevalent affection, few organs escape unscathed. Chronic alcohol
consumption has a negative impact on bone health, and generally, it is considered that
alcohol inhibits bone turnover (Rapuri et al., 2000a; Turner et al., 2001), stimulates
calcitonin production (Rico, 1990) and reduces serum parathyroid hormone (Ilich et al.,
2002; Laitinen et al., 1992b; Rapuri et al., 2000b). Regarding bone mineral density and/or
bone fracture risk, alcohol has a bimodal effect depending on the dose ingested. In fact,
whereas moderate alcohol intake (1 glass of alcohol per day in women, 2 glasses of alcohol
per day for men) is associated with increased bone mineral density (Maurel et al., 2011;
Rapuri et al., 2000a), excessive chronic alcohol consumption is associated with bone loss
and increased fracture risk (Chakkalakal, 2005; Chakkalakal et al., 2005; Turner et al.,
2001). Alcohol has been reported to decrease the bone density of trabecular and cortical
bone compartments, and to decrease the elastic modulus and ultimate strength, due to an
imbalance of bone remodeling where osteoblast-supported bone formation is decreased
(Broulik et al., 2010; Hogan et al., 1999) and serum leptin is decreased (Maddalozzo et al.,
2009). Alcohol has been shown to decrease osteoblast proliferation, the number of
221
osteoblasts and osteoid formation (Klein et al., 1996; Schnitzler and Solomon, 1984), and
to modify bone metabolism resulting in osteopenia and osteoporosis (Laitinen et al.,
1992a). However, the detailed mechanisms responsible for this alcohol-induced bone loss
are not yet understood. As a result, the influence of alcohol on the morphology and
function of bone cells, such as osteocytes, has been poorly reported (Lorenz and Janicke-
Lorenz, 1983; Wang et al., 2003) and thus remains largely unknown.
Osteoporosis is considered as a disease of older women with the rate, pattern, and
determinants of bone loss well defined. However, although osteoporosis is also common in
men, far less information of the pathophysiology is available (Dennison et al., 1999; Smith,
2002). With the increasing global number of elderly people and the incidence of age-
specific fractures, the health burden due to fragility fractures will increase. The three major
causes of osteoporosis in men are excessive alcohol intake, long-term glucocorticoid
therapy, and hypogonadism (Bilezikian, 1999; Kurland et al., 1997). These account for
approximately 50% of all the cases of male osteoporosis (Kurland et al., 1997). Excessive
chronic alcohol intake (Turner et al., 2001) has been shown to produce various free
radicals, lipid peroxides, and oxidative stress on many organs (e.g. plasma, liver, intestine,
pancreas, brain, retina…), which leads to cell apoptosis and finally to cell death.
Triglyceride accumulation in bone marrow has been reported in alcohol-treated rodents
(Maddalozzo et al., 2009; Wezeman and Gong, 2001) as well as in aseptic osteonecrosis
(Rico, 1990), but the mechanisms responsible for these changes are incompletely
elucidated. In 2003, Wang et al. first observed intracellular fatty deposits in osteocytes of
previously alcohol-fed rabbits (10 mL/kg b.w. per day of 45% v/v alcohol, intragastrically,
i.e. around 30% of the daily caloric intake) (Wang et al., 2003). Concomitantly, they
222
observed lipid hypertrophy and proliferation of adipocytes in the bone marrow (Wang et
al., 2003).
Although a lot of study have already reported the impact of alcohol-feeding on bone
mineral density, bone mineral content, bone micro-architecture, bone remodeling, bone
strength and fractures (Hogan et al., 1999; Hogan et al., 1997; Sampson, 1998; Turner,
2000), no study has assessed the precise relationship between osteocyte apoptosis and lipid
deposits in bone. The aim of this study was to assess the causality between increase of
adiposity in the marrow, appearance of lipid droplets in osteocytes and osteocyte apoptosis
in the case of alcohol-induced osteopenia.
223
Materials & Methods
Animals
Twenty four 9 week old male Wistar rats (Elevage Janvier, Le Genet-St-Isle,
France) were acclimatized for 2 weeks and maintained in a controlled temperature (21 ±
2°C) environment and under 12h/12h light-dark cycles for the duration of the experiment.
The rats were housed two per standard cage and provided with a commercial standard diet
(M20, SDS, France). The procedures for the care and killing of the animals were in
accordance with the European Community standards on the care and use of laboratory
animals (Ministère de l’agriculture, France, Authorisation INSERM45-001).
Alcohol treatment
At eleven weeks of age, the rats were randomly assigned to one of the following
groups: Controls (group C) or Alcohol at 35% v/v (=10.7g/kg, .e. around 40% of daily
caloric intake (Martin et al., 1978)) (group A). The treatment protocol lasted 17 weeks.
The rats of the A group had access ad libitum to a solution composed of ethanol and water.
The percentage of alcohol in the solution began at 8% v/v and was progressively increased
over three weeks by 3% v/v every two to three days to reach the final concentration of 35%
v/v, which was used over a period of 14 weeks. The food and the beverage were separated
in order to better mimic the human drinking pattern. The quantity of food eaten was
controlled in the A group and the total calorie intake (including calories from ethanol) were
matched in the C group (pair-fed groups). The quantities of food and drink ingested were
recorded weekly for both groups. In order to perform the in vivo analyses, the rats were
anaesthetized with pentobarbital diluted in sodium chloride (50/50 v/v). At the end of the
224
study, all rats were anesthetized with pentobarbital sodium (0.1 ml per 100 g of body
weight) and then killed by cardiac exsanguinations. Blood samples were collected and
tibias were dissected free of connective and fat tissue and fixed in a 4% v/v formalin
solution. The procedure for the care and killing of the animals was in accordance with the
European Community standards on the care and use of laboratory animals. The study was
approved by a board institution and an ethics committee from the French Institute INSERM
(Institut National de la Santé et de la Recherche Médicale) and from the agriculture council
(Ministère de l’agriculture, France, approval ID: INSERM45-001).
Alcohol level measurement in blood
After collection, the blood was centrifuged and the plasma was frozen at -80°C.
Blood alcohol level was assessed with an ethanol ELISA assay kit (Biovision, Ca, USA).
The detection range was 10-800 nM.
Body fat mass, lean mass, BMC and BMD measurements by DXA
At the end of the protocol, lean mass, fat masse, bone mineral content (BMC) and
bone mineral density (BMD) were measured by dual-energy x-ray Absorptiometry DXA
(Discovery, Hologic, Bedford, Massachussets, USA) using a specific small animal body
composition mode calibrated with a defined small animal phantom. The root-mean square
CV were 3.8% for the whole body fat mass, 1.2% for the whole body lean mass, 1.2% for
the whole body BMC and 0.87% for the whole body BMD (Lespessailles et al., 2010).
225
Bone explant preparation for epifluorescence microscopy
Slices (thickness around 400 µm) were cut transversally in the superior part of the
tibia diaphysis with a high speed rotary tool (Dremel 300, Dremel, USA). Two bone slices
were immunostained for epifluorescence microscopy with cleaved-caspase-3 (Rabbit mAb
Asp 175, Cell Signaling Technology Inc., Danvers, USA) and revealed by a secondary
antibody DylightTM 488 or Dylight 549TM (Rockland Immunochemicals, Gilbertsville,
USA), as described by Vatsa et al. (Vatsa et al., 2008).
Epifluorescence images of osteocytes were obtained by using a Motic AE21 video
camera attached to a BA400 epifluorescent microscope (Motic, Hong Kong) equipped with
a halogen lamp and 3 fluorescent filters (460/50 nm, 535/40 nm and 630/60 nm). The
objective magnification was x10. Seven rats from each group were analyzed. Five regions
of interest around the cortical bone were chosen and imaged for analysis of caspase-3
immunostaining. The size of each region of interest was 300,000 µm2 so that the total
cortical surface analyzed represented 1.5 mm2. The images were analyzed with Image J
software to determine the number of caspase-3 positive stained cells.
Two bone slices were stained with Nile red fluorescent hydrophobic dye, based on
the published protocol by Fowler and Greenspan (Fowler and Greenspan, 1985). This Nile
red dye can specifically detect neutral ubiquitous lipid deposits that are usually not seen
with oil red O or other traditional fat stains (Fowler and Greenspan, 1985). A stock
solution of Nile red (1 mg/mL) was prepared in acetone and protected from light at 4°C. A
working Nile red solution was freshly made by the addition of 50 µL of the stock solution
to 10 mL of 75% glycerol, followed by a brisk mixing. A drop of this diluted Nile red
solution was added to the samples placed on concave slides and then the slides were
226
covered with a glass coverslip. After 5 min, the slice was examined by fluorescence
microscopy with an adapted fluorescent filter (630/60 nm). The objective magnification
was x40. Seven rats from each group were analyzed. Five regions of interest around the
cortical bone were chosen and imaged for analysis of Nile red staining. The size of each
region of interest was 30,000 µm2 so that the total cortical surface analyzed represented
0.15 mm2. The images were analyzed with Image J software to determine the number of
Nile red positive stained cells.
Section preparation, bright field microscopy and measurements
Slices (thickness around 400 µm) were cut transversally in the superior part of the
tibia diaphysis with a high speed rotary tool (Dremel 300, Dremel, USA), and then 1
micron thick sections were obtained using a microtome (Leica, Germany). Five rats from
each group were analyzed for bright field microscopy. Two tibial slices per rat were
stained with toluidine blue, with modifications as described by Trump et al. (Trump et al.,
1961). The 1 micron thick tissue preparations were analyzed by bright field microscopy.
Images of either cortical bone or bone marrow were acquired with an Axioplan (Zeiss,
Germany) bright field microscope equipped with a 11.2 Color Mosaic camera (Diagnostic
Instruments, USA). Images of the cortical bone were acquired at x40 objective
magnification while images of the bone marrow with lipid droplets colored in brown by
toluidine blue were acquired at x20 objective magnification. For each rat, four region of
interest (ROIs) were imaged. The ROIs were analyzed with Image J software and
measured about 0.1 mm2 so that the total region analyzed represented 0.4 mm2.
227
The luminal vessels surface area (transverse cross-section) inside each ROI of the
cortical bone and the intra-luminal lipid surface area of the corresponding vessels were
evaluated to estimate the lipid embolism proportion of bone micro-vessels (intra-luminal
lipid area over luminal vessel area, in %).
The surface area of lipid droplets inside each ROI of the bone marrow and the total
surface area of the corresponding bone marrow were determined to calculate the area
fraction of lipid droplets in the bone marrow (total lipid droplet area surface over total bone
marrow area surface, in %).
Transmission electron microscopy and measurements
After cutting, bone tibia sections for transmission electron microscopy were fixed in
formaldehyde 4% v/v, glutaraldehyde 1% v/v in 0.2M sodium cacodylate buffer for 48h.
Cross-sectional slices were then decalcified in EDTA for 12h. After decalcification,
specimens were washed in 0.2M sodium cacodylate buffer. Samples were post-fixed in 1%
osmium tetroxide, 1% tannic acid and then 1% uranyl acetate. Samples were embedded in
Epoxy resin. Ultra thin (75 nm) sections of the tibia were cut with a Leica ultra microtome
(Leica, Germany) from the 400µm thick slices, placed on EM grids, coated with Formwar
membranes and stained with 4 % w/v uranyl acetate (water solution, 20 min) and 1 % w/v
lead citrate (5 min). The sections were imaged with a JEM 1011 electron microscope (Jeol,
Tokyo, Japan) equipped with Gatan digital camera driven by Digital Micrograph software
(Gatan, Pleasanton, CA USA). For each osteocyte observed, the surface of the intracellular
lipid droplets and the cytoplasmic surface of the corresponding osteocyte were determined
to calculate the proportion of the lipid vacuolar surface area occupied within the osteocyte
228
cytoplasm area surface (%). The total number of osteocytes and the number of osteocytes
containing lipid droplets inside each ROI were counted to determine the overall proportion
of osteocytes that contained lipid droplets (in %). The surface of lipid droplets inside each
osteocyte and the corresponding osteocyte surface were evaluated to determine the
proportion of lipidic deposits in osteocytes (intra-osteocyte lipid area over osteocyte area,
in %).
Statistics
Statview software has been used for the data analysis. First, we used the Shapiro-
Wilks test to assess the normality of the data distribution. When the data normality was
confirmed, the Fisher’s F-test was used to evaluate the homogeneity of the group variances.
If the distribution was normal, Student’s t-test was used to evaluate group differences. If
the data was not normally distributed, non parametric tests were used (U test of Mann and
Whitney). Pearson linear correlations were calculated between parameters. The critical
level of significance was p < 0.05.
229
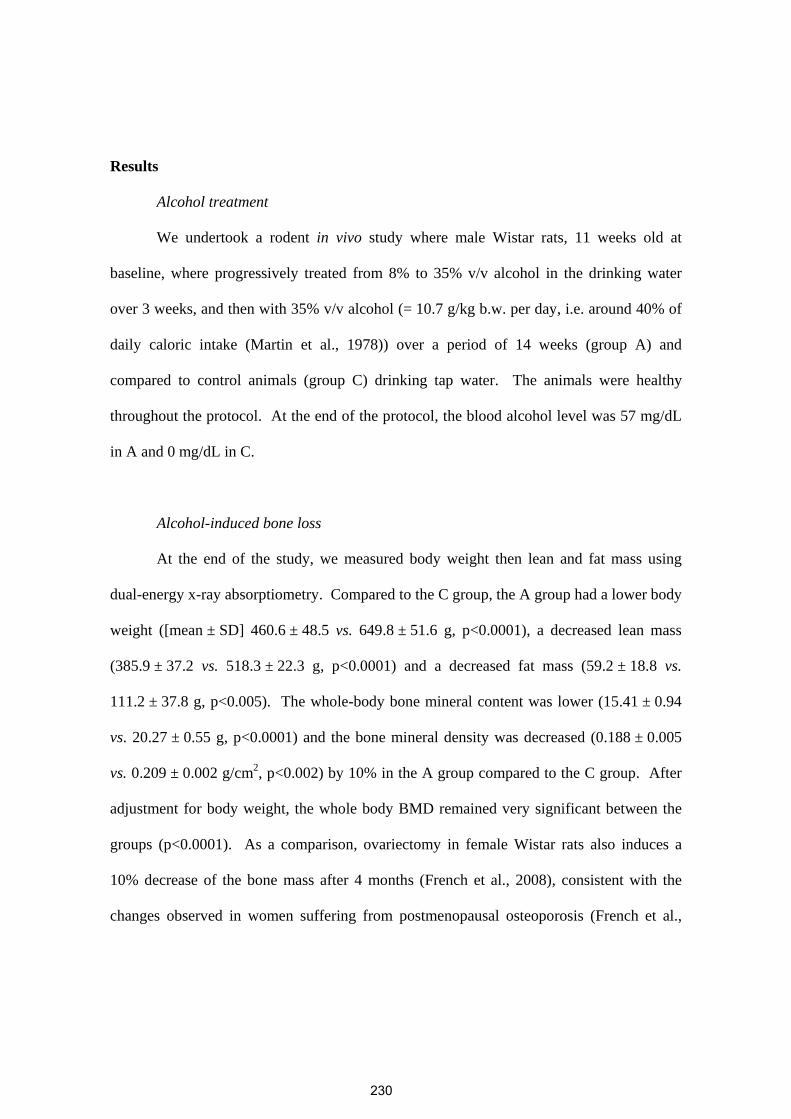
Results
Alcohol treatment
We undertook a rodent in vivo study where male Wistar rats, 11 weeks old at
baseline, where progressively treated from 8% to 35% v/v alcohol in the drinking water
over 3 weeks, and then with 35% v/v alcohol (= 10.7 g/kg b.w. per day, i.e. around 40% of
daily caloric intake (Martin et al., 1978)) over a period of 14 weeks (group A) and
compared to control animals (group C) drinking tap water. The animals were healthy
throughout the protocol. At the end of the protocol, the blood alcohol level was 57 mg/dL
in A and 0 mg/dL in C.
Alcohol-induced bone loss
At the end of the study, we measured body weight then lean and fat mass using
dual-energy x-ray absorptiometry. Compared to the C group, the A group had a lower body
weight ([mean ± SD] 460.6 ± 48.5 vs. 649.8 ± 51.6 g, p<0.0001), a decreased lean mass
(385.9 ± 37.2 vs. 518.3 ± 22.3 g, p<0.0001) and a decreased fat mass (59.2 ± 18.8 vs.
111.2 ± 37.8 g, p<0.005). The whole-body bone mineral content was lower (15.41 ± 0.94
vs. 20.27 ± 0.55 g, p<0.0001) and the bone mineral density was decreased (0.188 ± 0.005
vs. 0.209 ± 0.002 g/cm2, p<0.002) by 10% in the A group compared to the C group. After
adjustment for body weight, the whole body BMD remained very significant between the
groups (p<0.0001). As a comparison, ovariectomy in female Wistar rats also induces a
10% decrease of the bone mass after 4 months (French et al., 2008), consistent with the
changes observed in women suffering from postmenopausal osteoporosis (French et al.,
230
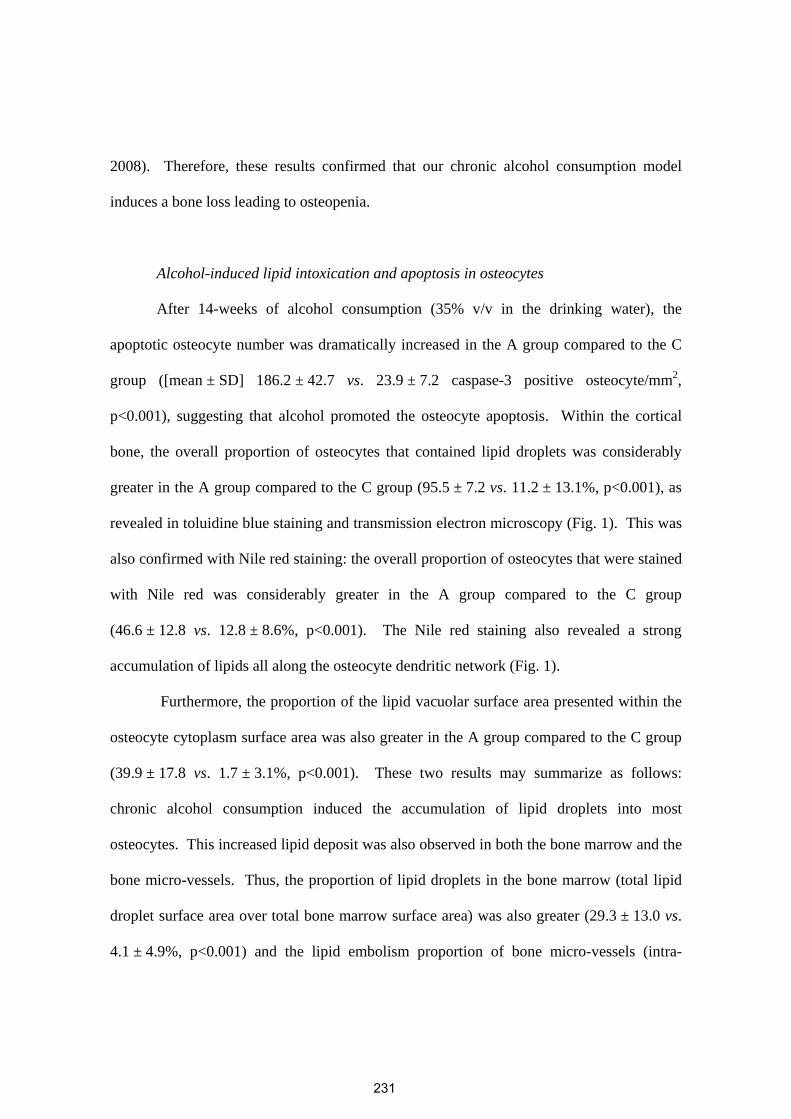
2008). Therefore, these results confirmed that our chronic alcohol consumption model
induces a bone loss leading to osteopenia.
Alcohol-induced lipid intoxication and apoptosis in osteocytes
After 14-weeks of alcohol consumption (35% v/v in the drinking water), the
apoptotic osteocyte number was dramatically increased in the A group compared to the C
group ([mean ± SD] 186.2 ± 42.7 vs. 23.9 ± 7.2 caspase-3 positive osteocyte/mm2,
p<0.001), suggesting that alcohol promoted the osteocyte apoptosis. Within the cortical
bone, the overall proportion of osteocytes that contained lipid droplets was considerably
greater in the A group compared to the C group (95.5 ± 7.2 vs. 11.2 ± 13.1%, p<0.001), as
revealed in toluidine blue staining and transmission electron microscopy (Fig. 1). This was
also confirmed with Nile red staining: the overall proportion of osteocytes that were stained
with Nile red was considerably greater in the A group compared to the C group
(46.6 ± 12.8 vs. 12.8 ± 8.6%, p<0.001). The Nile red staining also revealed a strong
accumulation of lipids all along the osteocyte dendritic network (Fig. 1).
Furthermore, the proportion of the lipid vacuolar surface area presented within the
osteocyte cytoplasm surface area was also greater in the A group compared to the C group
(39.9 ± 17.8 vs. 1.7 ± 3.1%, p<0.001). These two results may summarize as follows:
chronic alcohol consumption induced the accumulation of lipid droplets into most
osteocytes. This increased lipid deposit was also observed in both the bone marrow and the
bone micro-vessels. Thus, the proportion of lipid droplets in the bone marrow (total lipid
droplet surface area over total bone marrow surface area) was also greater (29.3 ± 13.0 vs.
4.1 ± 4.9%, p<0.001) and the lipid embolism proportion of bone micro-vessels (intra-
231
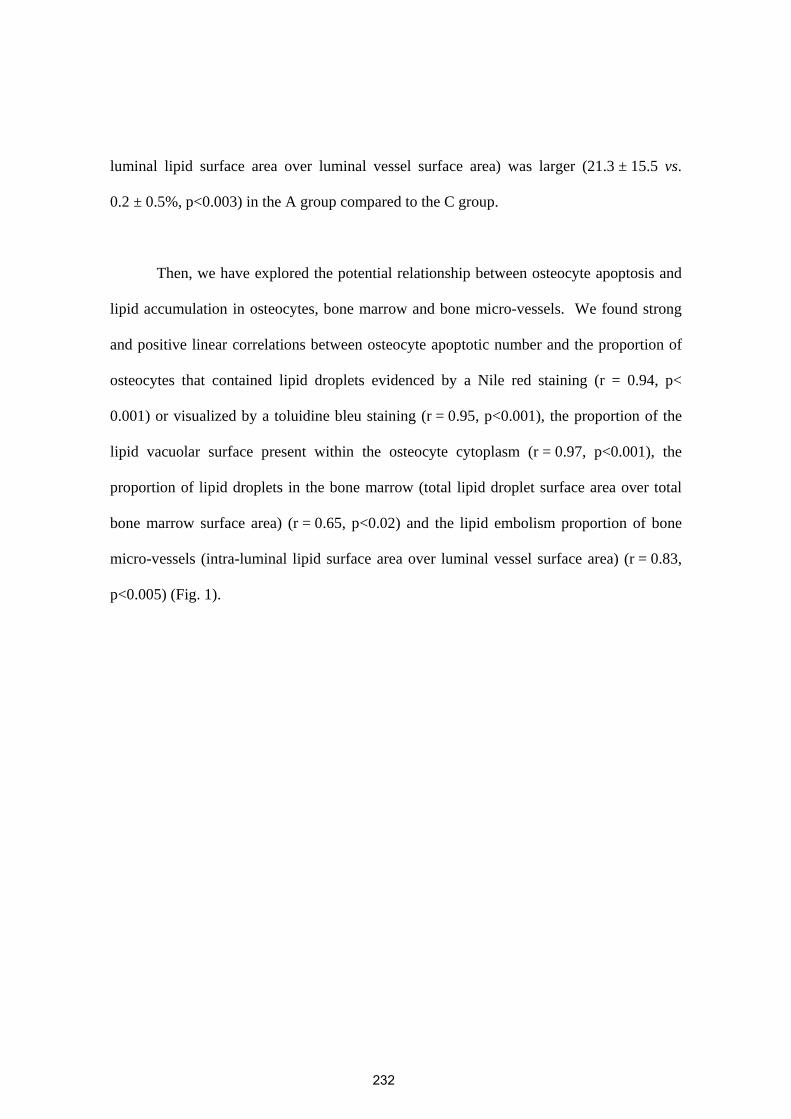
luminal lipid surface area over luminal vessel surface area) was larger (21.3 ± 15.5 vs.
0.2 ± 0.5%, p<0.003) in the A group compared to the C group.
Then, we have explored the potential relationship between osteocyte apoptosis and
lipid accumulation in osteocytes, bone marrow and bone micro-vessels. We found strong
and positive linear correlations between osteocyte apoptotic number and the proportion of
osteocytes that contained lipid droplets evidenced by a Nile red staining (r = 0.94, p<
0.001) or visualized by a toluidine bleu staining (r = 0.95, p<0.001), the proportion of the
lipid vacuolar surface present within the osteocyte cytoplasm (r = 0.97, p<0.001), the
proportion of lipid droplets in the bone marrow (total lipid droplet surface area over total
bone marrow surface area) (r = 0.65, p<0.02) and the lipid embolism proportion of bone
micro-vessels (intra-luminal lipid surface area over luminal vessel surface area) (r = 0.83,
p<0.005) (Fig. 1).
232
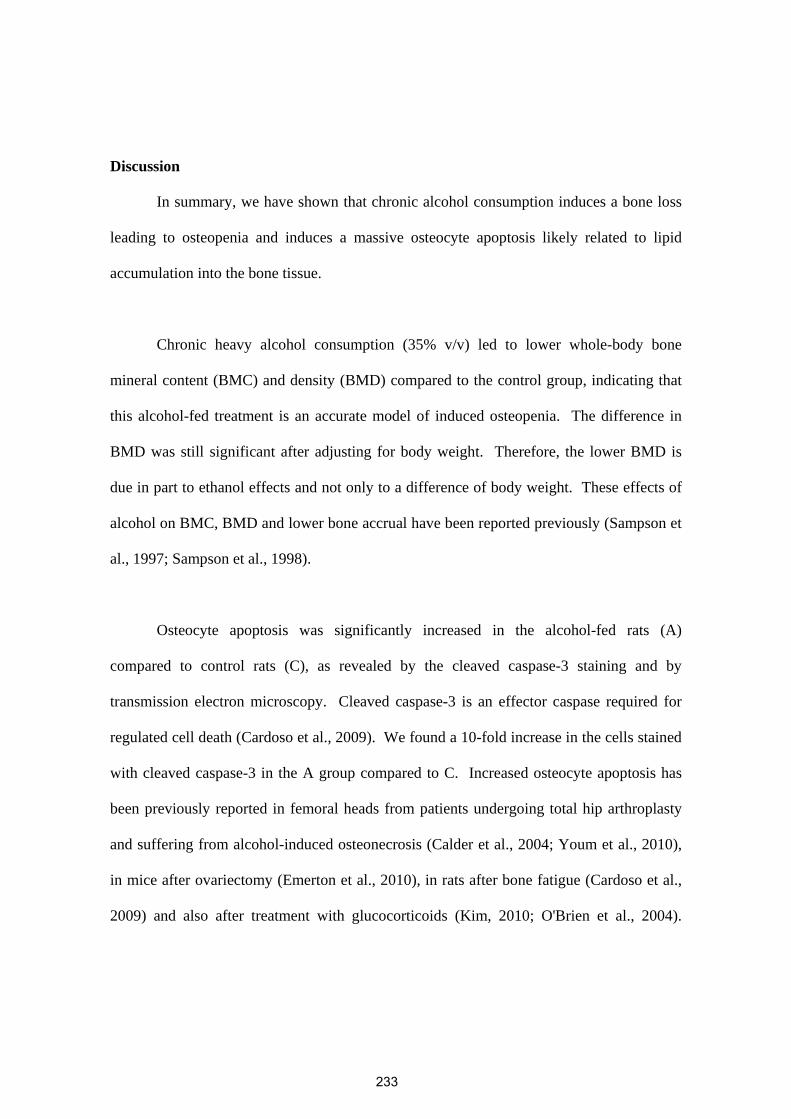
Discussion
In summary, we have shown that chronic alcohol consumption induces a bone loss
leading to osteopenia and induces a massive osteocyte apoptosis likely related to lipid
accumulation into the bone tissue.
Chronic heavy alcohol consumption (35% v/v) led to lower whole-body bone
mineral content (BMC) and density (BMD) compared to the control group, indicating that
this alcohol-fed treatment is an accurate model of induced osteopenia. The difference in
BMD was still significant after adjusting for body weight. Therefore, the lower BMD is
due in part to ethanol effects and not only to a difference of body weight. These effects of
alcohol on BMC, BMD and lower bone accrual have been reported previously (Sampson et
al., 1997; Sampson et al., 1998).
Osteocyte apoptosis was significantly increased in the alcohol-fed rats (A)
compared to control rats (C), as revealed by the cleaved caspase-3 staining and by
transmission electron microscopy. Cleaved caspase-3 is an effector caspase required for
regulated cell death (Cardoso et al., 2009). We found a 10-fold increase in the cells stained
with cleaved caspase-3 in the A group compared to C. Increased osteocyte apoptosis has
been previously reported in femoral heads from patients undergoing total hip arthroplasty
and suffering from alcohol-induced osteonecrosis (Calder et al., 2004; Youm et al., 2010),
in mice after ovariectomy (Emerton et al., 2010), in rats after bone fatigue (Cardoso et al.,
2009) and also after treatment with glucocorticoids (Kim, 2010; O'Brien et al., 2004).
233
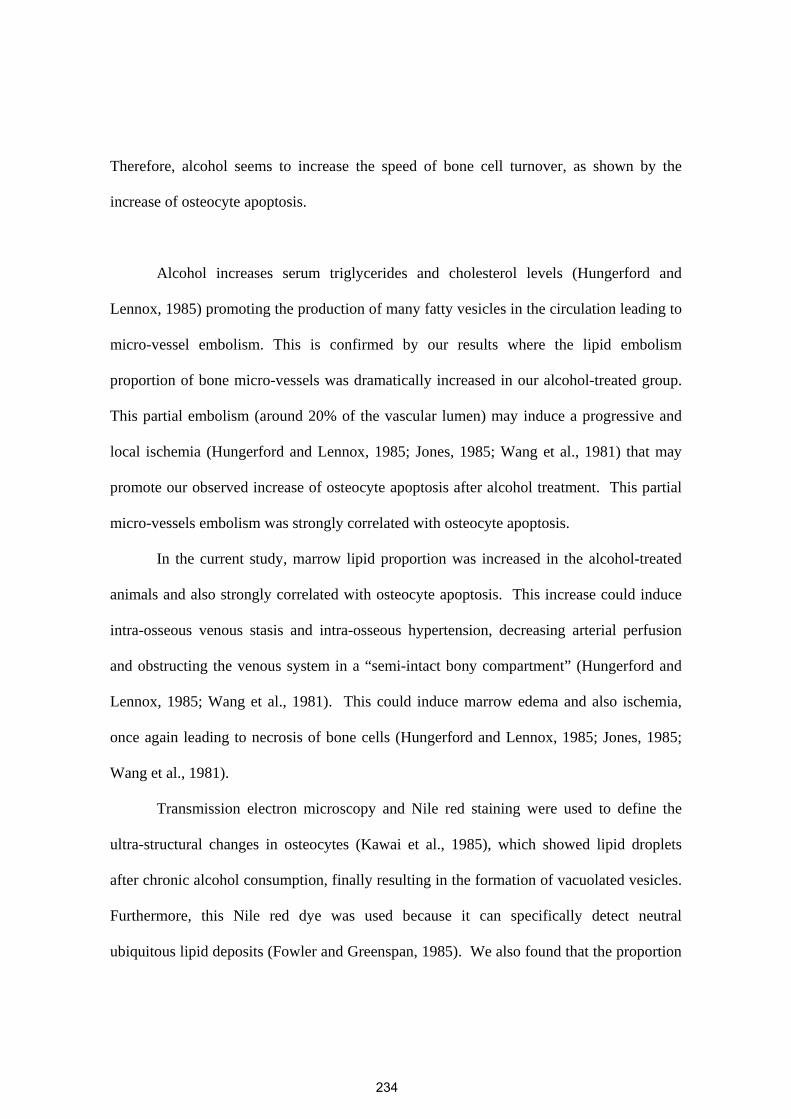
Therefore, alcohol seems to increase the speed of bone cell turnover, as shown by the
increase of osteocyte apoptosis.
Alcohol increases serum triglycerides and cholesterol levels (Hungerford and
Lennox, 1985) promoting the production of many fatty vesicles in the circulation leading to
micro-vessel embolism. This is confirmed by our results where the lipid embolism
proportion of bone micro-vessels was dramatically increased in our alcohol-treated group.
This partial embolism (around 20% of the vascular lumen) may induce a progressive and
local ischemia (Hungerford and Lennox, 1985; Jones, 1985; Wang et al., 1981) that may
promote our observed increase of osteocyte apoptosis after alcohol treatment. This partial
micro-vessels embolism was strongly correlated with osteocyte apoptosis.
In the current study, marrow lipid proportion was increased in the alcohol-treated
animals and also strongly correlated with osteocyte apoptosis. This increase could induce
intra-osseous venous stasis and intra-osseous hypertension, decreasing arterial perfusion
and obstructing the venous system in a “semi-intact bony compartment” (Hungerford and
Lennox, 1985; Wang et al., 1981). This could induce marrow edema and also ischemia,
once again leading to necrosis of bone cells (Hungerford and Lennox, 1985; Jones, 1985;
Wang et al., 1981).
Transmission electron microscopy and Nile red staining were used to define the
ultra-structural changes in osteocytes (Kawai et al., 1985), which showed lipid droplets
after chronic alcohol consumption, finally resulting in the formation of vacuolated vesicles.
Furthermore, this Nile red dye was used because it can specifically detect neutral
ubiquitous lipid deposits (Fowler and Greenspan, 1985). We also found that the proportion
234
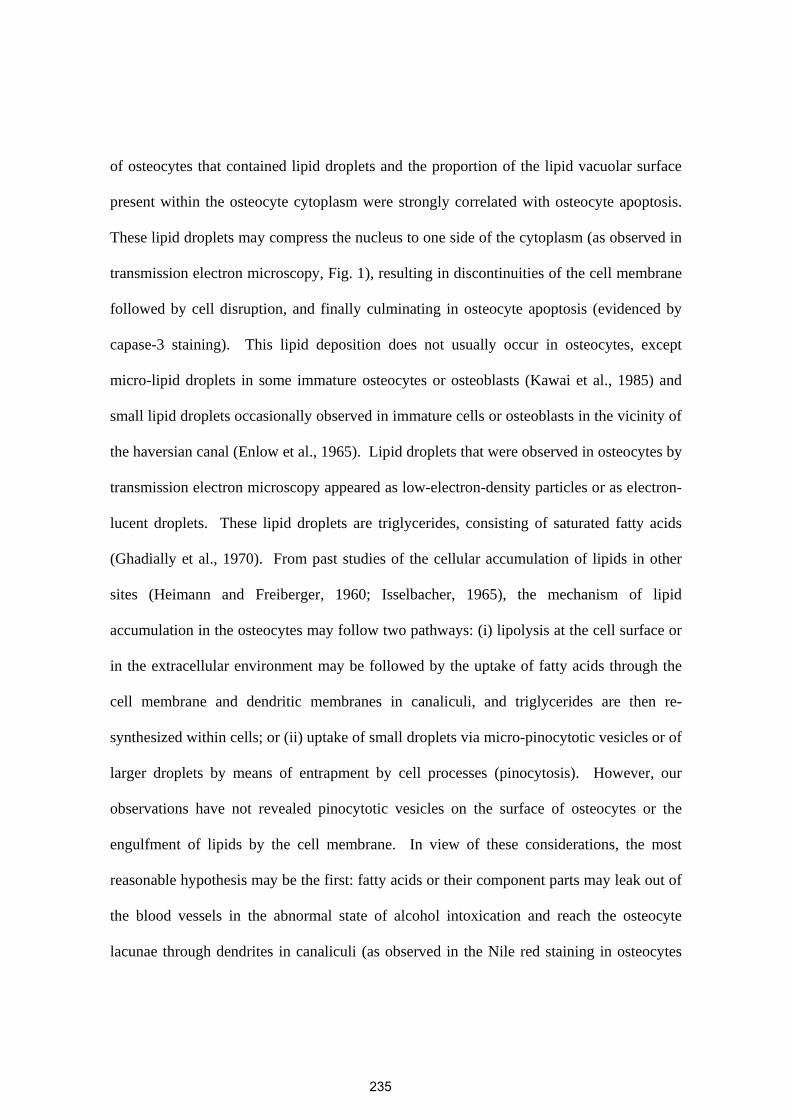
of osteocytes that contained lipid droplets and the proportion of the lipid vacuolar surface
present within the osteocyte cytoplasm were strongly correlated with osteocyte apoptosis.
These lipid droplets may compress the nucleus to one side of the cytoplasm (as observed in
transmission electron microscopy, Fig. 1), resulting in discontinuities of the cell membrane
followed by cell disruption, and finally culminating in osteocyte apoptosis (evidenced by
capase-3 staining). This lipid deposition does not usually occur in osteocytes, except
micro-lipid droplets in some immature osteocytes or osteoblasts (Kawai et al., 1985) and
small lipid droplets occasionally observed in immature cells or osteoblasts in the vicinity of
the haversian canal (Enlow et al., 1965). Lipid droplets that were observed in osteocytes by
transmission electron microscopy appeared as low-electron-density particles or as electron-
lucent droplets. These lipid droplets are triglycerides, consisting of saturated fatty acids
(Ghadially et al., 1970). From past studies of the cellular accumulation of lipids in other
sites (Heimann and Freiberger, 1960; Isselbacher, 1965), the mechanism of lipid
accumulation in the osteocytes may follow two pathways: (i) lipolysis at the cell surface or
in the extracellular environment may be followed by the uptake of fatty acids through the
cell membrane and dendritic membranes in canaliculi, and triglycerides are then re-
synthesized within cells; or (ii) uptake of small droplets via micro-pinocytotic vesicles or of
larger droplets by means of entrapment by cell processes (pinocytosis). However, our
observations have not revealed pinocytotic vesicles on the surface of osteocytes or the
engulfment of lipids by the cell membrane. In view of these considerations, the most
reasonable hypothesis may be the first: fatty acids or their component parts may leak out of
the blood vessels in the abnormal state of alcohol intoxication and reach the osteocyte
lacunae through dendrites in canaliculi (as observed in the Nile red staining in osteocytes
235
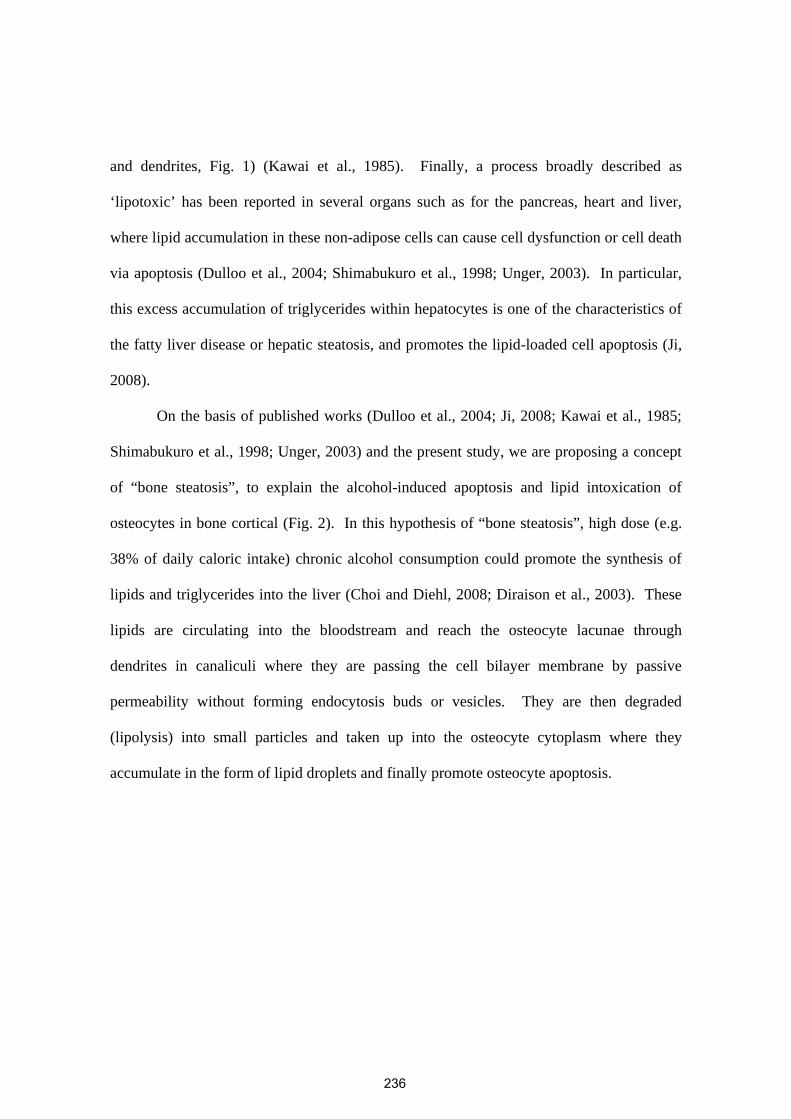
and dendrites, Fig. 1) (Kawai et al., 1985). Finally, a process broadly described as
‘lipotoxic’ has been reported in several organs such as for the pancreas, heart and liver,
where lipid accumulation in these non-adipose cells can cause cell dysfunction or cell death
via apoptosis (Dulloo et al., 2004; Shimabukuro et al., 1998; Unger, 2003). In particular,
this excess accumulation of triglycerides within hepatocytes is one of the characteristics of
the fatty liver disease or hepatic steatosis, and promotes the lipid-loaded cell apoptosis (Ji,
2008).
On the basis of published works (Dulloo et al., 2004; Ji, 2008; Kawai et al., 1985;
Shimabukuro et al., 1998; Unger, 2003) and the present study, we are proposing a concept
of “bone steatosis”, to explain the alcohol-induced apoptosis and lipid intoxication of
osteocytes in bone cortical (Fig. 2). In this hypothesis of “bone steatosis”, high dose (e.g.
38% of daily caloric intake) chronic alcohol consumption could promote the synthesis of
lipids and triglycerides into the liver (Choi and Diehl, 2008; Diraison et al., 2003). These
lipids are circulating into the bloodstream and reach the osteocyte lacunae through
dendrites in canaliculi where they are passing the cell bilayer membrane by passive
permeability without forming endocytosis buds or vesicles. They are then degraded
(lipolysis) into small particles and taken up into the osteocyte cytoplasm where they
accumulate in the form of lipid droplets and finally promote osteocyte apoptosis.
236
References
Bilezikian, JP (1999) Osteoporosis in men. J Clin Endocrinol Metab 84, 3431-3434. Broulik, PD, Vondrova, J, Ruzicka, P, Sedlacek, R and Zima, T (2010) The effect of
chronic alcohol administration on bone mineral content and bone strength in male rats. Physiol Res 59, 599-604.
Calder, JD, Buttery, L, Revell, PA, Pearse, M and Polak, JM (2004) Apoptosis--a significant cause of bone cell death in osteonecrosis of the femoral head. J Bone Joint Surg Br 86, 1209-1213.
Cardoso, L, Herman, BC, Verborgt, O, Laudier, D, Majeska, RJ and Schaffler, MB (2009) Osteocyte apoptosis controls activation of intracortical resorption in response to bone fatigue. J Bone Miner Res 24, 597-605.
Chakkalakal, DA (2005) Alcohol-induced bone loss and deficient bone repair. Alcohol Clin Exp Res 29, 2077-2090.
Chakkalakal, DA, Novak, JR, Fritz, ED et al. (2005) Inhibition of bone repair in a rat model for chronic and excessive alcohol consumption. Alcohol 36, 201-214.
Choi, SS and Diehl, AM (2008) Hepatic triglyceride synthesis and nonalcoholic fatty liver disease. Curr Opin Lipidol 19, 295-300.
Dennison, E, Eastell, R, Fall, CH, Kellingray, S, Wood, PJ and Cooper, C (1999) Determinants of bone loss in elderly men and women: a prospective population-based study. Osteoporos Int 10, 384-391.
Diraison, F, Moulin, P and Beylot, M (2003) Contribution of hepatic de novo lipogenesis and reesterification of plasma non esterified fatty acids to plasma triglyceride synthesis during non-alcoholic fatty liver disease. Diabetes Metab 29, 478-485.
Dulloo, AG, Antic, V and Montani, JP (2004) Ectopic fat stores: housekeepers that can overspill into weapons of lean body mass destruction. Int J Obes Relat Metab Disord 28 Suppl 4, S1-2.
Emerton, KB, Hu, B, Woo, AA et al. (2010) Osteocyte apoptosis and control of bone resorption following ovariectomy in mice. Bone 46, 577-583.
Enlow, DH, Conklin, JL and Bang, S (1965) Observations on the occurrence and the distribution of lipids in compact bone. Clin Orthop Relat Res 38, 157-169.
Fowler, SD and Greenspan, P (1985) Application of Nile red, a fluorescent hydrophobic probe, for the detection of neutral lipid deposits in tissue sections: comparison with oil red O. J Histochem Cytochem 33, 833-836.
French, DL, Muir, JM and Webber, CE (2008) The ovariectomized, mature rat model of postmenopausal osteoporosis: an assessment of the bone sparing effects of curcumin. Phytomedicine 15, 1069-1078.
Ghadially, FN, Mehta, PN and Kirkaldy-Willis, WH (1970) Ultrastructure of articular cartilage in experimentally produced lipoarthrosis. J Bone Joint Surg Am 52, 1147-1158.
Heimann, WG and Freiberger, RH (1960) Avascular necrosis of the femoral and humeral heads after high-dosage corticosteroid therapy. N Engl J Med 263, 672-675.
Hogan, HA, Groves, JA and Sampson, HW (1999) Long-term alcohol consumption in the rat affects femur cross-sectional geometry and bone tissue material properties. Alcohol Clin Exp Res 23, 1825-1833.
237
Hogan, HA, Sampson, HW, Cashier, E and Ledoux, N (1997) Alcohol Consumption by Young Actively Growing Rats: A Study of Cortical Bone Histomorphometry and Mechanical Properties. Alcoholism: Clinical and Experimental Research 21, 809-816.
Hungerford, DS and Lennox, DW (1985) The importance of increased intraosseous pressure in the development of osteonecrosis of the femoral head: implications for treatment. Orthop Clin North Am 16, 635-654.
Ilich, JZ, Brownbill, RA, Tamborini, L and Crncevic-Orlic, Z (2002) To drink or not to drink: how are alcohol, caffeine and past smoking related to bone mineral density in elderly women? J Am Coll Nutr 21, 536-544.
Isselbacher, KJ (1965) Metabolism and Transport of Lipid by Intestinal Mucosa. Fed Proc 24, 16-22.
Ji, C (2008) Dissection of endoplasmic reticulum stress signaling in alcoholic and non-alcoholic liver injury. J Gastroenterol Hepatol 23 Suppl 1, S16-24.
Jones, JP, Jr. (1985) Fat embolism and osteonecrosis. Orthop Clin North Am 16, 595-633. Kawai, K, Tamaki, A and Hirohata, K (1985) Steroid-induced accumulation of lipid in the
osteocytes of the rabbit femoral head. A histochemical and electron microscopic study. J Bone Joint Surg Am 67, 755-763.
Kim, HJ (2010) New understanding of glucocorticoid action in bone cells. BMB Rep 43, 524-529.
Klein, RF, Fausti, KA and Carlos, AS (1996) Ethanol inhibits human osteoblastic cell proliferation. Alcohol Clin Exp Res 20, 572-578.
Kurland, ES, Rosen, CJ, Cosman, F et al. (1997) Insulin-like growth factor-I in men with idiopathic osteoporosis. J Clin Endocrinol Metab 82, 2799-2805.
Laitinen, K, Lamberg-Allardt, C, Tunninen, R, Harkonen, M and Valimaki, M (1992a) Bone mineral density and abstention-induced changes in bone and mineral metabolism in noncirrhotic male alcoholics. Am J Med 93, 642-650.
Laitinen, K, Tahtela, R and Valimaki, M (1992b) The dose-dependency of alcohol-induced hypoparathyroidism, hypercalciuria, and hypermagnesuria. Bone Miner 19, 75-83.
Lespessailles, E, Jaffre, C, Rochefort, GY, Dolleans, E, Benhamou, CL and Courteix, D (2010) Exercise and zoledronic acid on lipid profile and bone remodeling in ovariectomized rats: a paradoxical negative association? Lipids 45, 337-344.
Lorenz, R and Janicke-Lorenz, J (1983) Electron microscopic observation on osteocytes of chronically alcoholized rats. Arch Orthop Trauma Surg 102, 118-122.
Maddalozzo, GF, Turner, RT, Edwards, CH et al. (2009) Alcohol alters whole body composition, inhibits bone formation, and increases bone marrow adiposity in rats. Osteoporos Int 20, 1529-1538.
Martin, JC, Martin, DC, Radow, B and Sigman, G (1978) Blood alcohol level and caloric intake in the gravid rat as a function of diurnal period, trimester, and vehicle. Pharmacol Biochem Behav 8, 421-427.
Maurel, DB, Boisseau, N, Benhamou, CL and Jaffre, C (2011) Alcohol and bone: review of dose effects and mechanisms. Osteoporos Int.
Nyquist, F, Ljunghall, S, Berglund, M and Obrant, K (1996) Biochemical markers of bone metabolism after short and long time ethanol withdrawal in alcoholics. Bone 19, 51-54.
238
O'Brien, CA, Jia, D, Plotkin, LI et al. (2004) Glucocorticoids act directly on osteoblasts and osteocytes to induce their apoptosis and reduce bone formation and strength. Endocrinology 145, 1835-1841.
Rapuri, PB, Gallagher, JC, Balhorn, KE and Ryschon, KL (2000a) Alcohol intake and bone metabolism in elderly women. Am J Clin Nutr 72, 1206-1213.
Rapuri, PB, Gallagher, JC, Balhorn, KE and Ryschon, KL (2000b) Smoking and bone metabolism in elderly women. Bone 27, 429-436.
Rico, H (1990) Alcohol and bone disease. Alcohol Alcohol 25, 345-352. Sampson, HW (1998) Effect of Alcohol Consumption on Adult and Aged Bone: A
Histomorphometric Study of the Rat Animal Model. Alcoholism: Clinical and Experimental Research 22, 2029-2034.
Sampson, HW, Chaffin, C, Lange, J and DeFee, B, 2nd (1997) Alcohol consumption by young actively growing rats: a histomorphometric study of cancellous bone. Alcohol Clin Exp Res 21, 352-359.
Sampson, HW, Hebert, VA, Booe, HL and Champney, TH (1998) Effect of alcohol consumption on adult and aged bone: composition, morphology, and hormone levels of a rat animal model. Alcohol Clin Exp Res 22, 1746-1753.
Schnitzler, CM and Solomon, L (1984) Bone changes after alcohol abuse. S Afr Med J 66, 730-734.
Shimabukuro, M, Zhou, YT, Levi, M and Unger, RH (1998) Fatty acid-induced beta cell apoptosis: a link between obesity and diabetes. Proc Natl Acad Sci U S A 95, 2498-2502.
Smith, MR (2002) Osteoporosis during androgen deprivation therapy for prostate cancer. Urology 60, 79-85; discussion 86.
Trump, BF, Smuckler, EA and Benditt, EP (1961) A method for staining epoxy sections for light microscopy. J Ultrastruct Res 5, 343-348.
Turner, RT (2000) Skeletal response to alcohol. Alcohol Clin Exp Res 24, 1693-1701. Turner, RT, Kidder, LS, Kennedy, A, Evans, GL and Sibonga, JD (2001) Moderate alcohol
consumption suppresses bone turnover in adult female rats. J Bone Miner Res 16, 589-594.
Unger, RH (2003) Minireview: weapons of lean body mass destruction: the role of ectopic lipids in the metabolic syndrome. Endocrinology 144, 5159-5165.
Vatsa, A, Breuls, RG, Semeins, CM, Salmon, PL, Smit, TH and Klein-Nulend, J (2008) Osteocyte morphology in fibula and calvaria --- is there a role for mechanosensing? Bone 43, 452-458.
Wang, GJ, Lennox, DW, Reger, SI, Stamp, WG and Hubbard, SL (1981) Cortisone-induced intrafemoral head pressure change and its response to a drilling decompression method. Clin Orthop Relat Res, 274-278.
Wang, Y, Li, Y, Mao, K, Li, J, Cui, Q and Wang, GJ (2003) Alcohol-induced adipogenesis in bone and marrow: a possible mechanism for osteonecrosis. Clin Orthop Relat Res, 213-224.
Wezeman, FH and Gong, Z (2001) Bone marrow triglyceride accumulation and hormonal changes during long-term alcohol intake in male and female rats. Alcohol Clin Exp Res 25, 1515-1522.
239
Youm, YS, Lee, SY and Lee, SH (2010) Apoptosis in the osteonecrosis of the femoral head. Clin Orthop Surg 2, 250-255.
240
Acknowledgements
We thank P.C. Aveline for the cleaved-caspase-3 staining realization; R. Uzbekov
and B. Arbeille from the Département des Microscopies, Programme Pluriformation
Analyse des Systèmes Biologiques, Université de Tours, Tours, France, for the toluidine
blue staining and transmission electron microscopy imaging; and D. Gosset from the
Plateforme de Cytométrie et d’Imagerie Cellulaire at the Centre de Biophysique
Moléculaire, CNRS, Orléans, France, for the confocal microscopy imaging. D.B. Maurel
is a PhD student at the Orléans University and is funded by the Région Centre, France.
G.Y. Rochefort is funded by the Industry Department, the Loiret General Council, and the
Région Centre, France. This work has been supported by grants from INSERM, Région
Centre, France, and Ireb (Institut de recherches scientifiques sur les boissons).
241
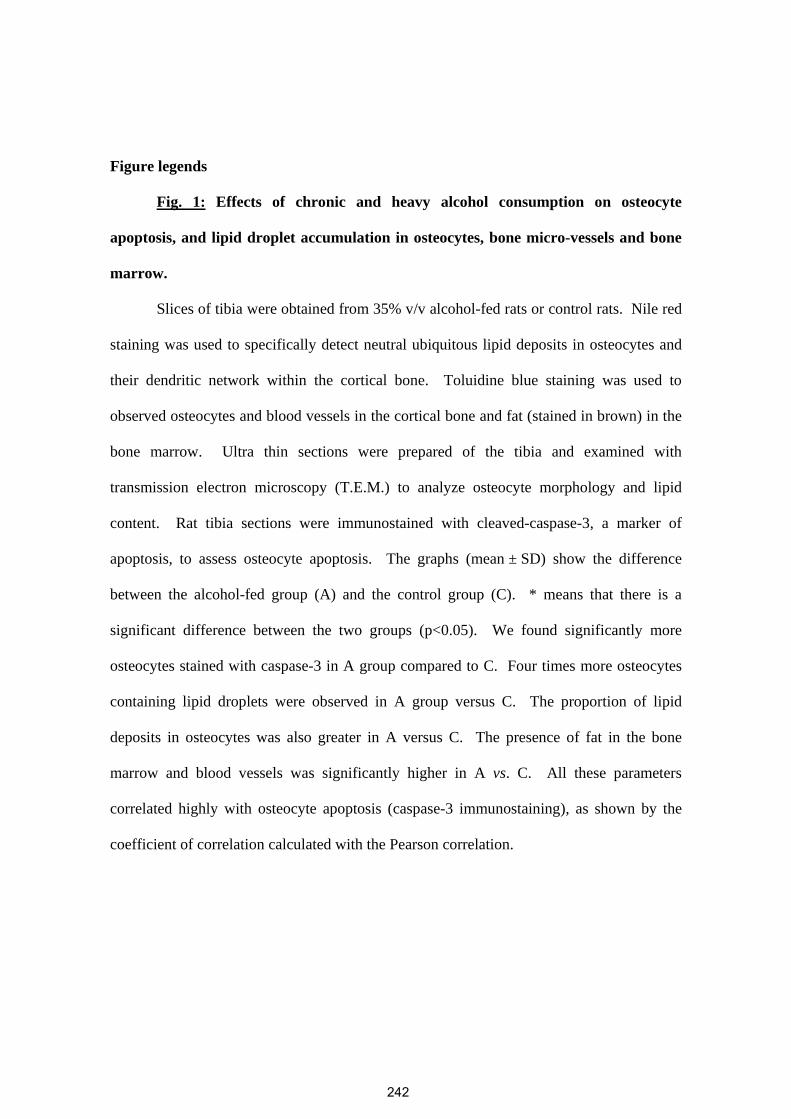
Figure legends
Fig. 1: Effects of chronic and heavy alcohol consumption on osteocyte
apoptosis, and lipid droplet accumulation in osteocytes, bone micro-vessels and bone
marrow.
Slices of tibia were obtained from 35% v/v alcohol-fed rats or control rats. Nile red
staining was used to specifically detect neutral ubiquitous lipid deposits in osteocytes and
their dendritic network within the cortical bone. Toluidine blue staining was used to
observed osteocytes and blood vessels in the cortical bone and fat (stained in brown) in the
bone marrow. Ultra thin sections were prepared of the tibia and examined with
transmission electron microscopy (T.E.M.) to analyze osteocyte morphology and lipid
content. Rat tibia sections were immunostained with cleaved-caspase-3, a marker of
apoptosis, to assess osteocyte apoptosis. The graphs (mean ± SD) show the difference
between the alcohol-fed group (A) and the control group (C). * means that there is a
significant difference between the two groups (p<0.05). We found significantly more
osteocytes stained with caspase-3 in A group compared to C. Four times more osteocytes
containing lipid droplets were observed in A group versus C. The proportion of lipid
deposits in osteocytes was also greater in A versus C. The presence of fat in the bone
marrow and blood vessels was significantly higher in A vs. C. All these parameters
correlated highly with osteocyte apoptosis (caspase-3 immunostaining), as shown by the
coefficient of correlation calculated with the Pearson correlation.
242
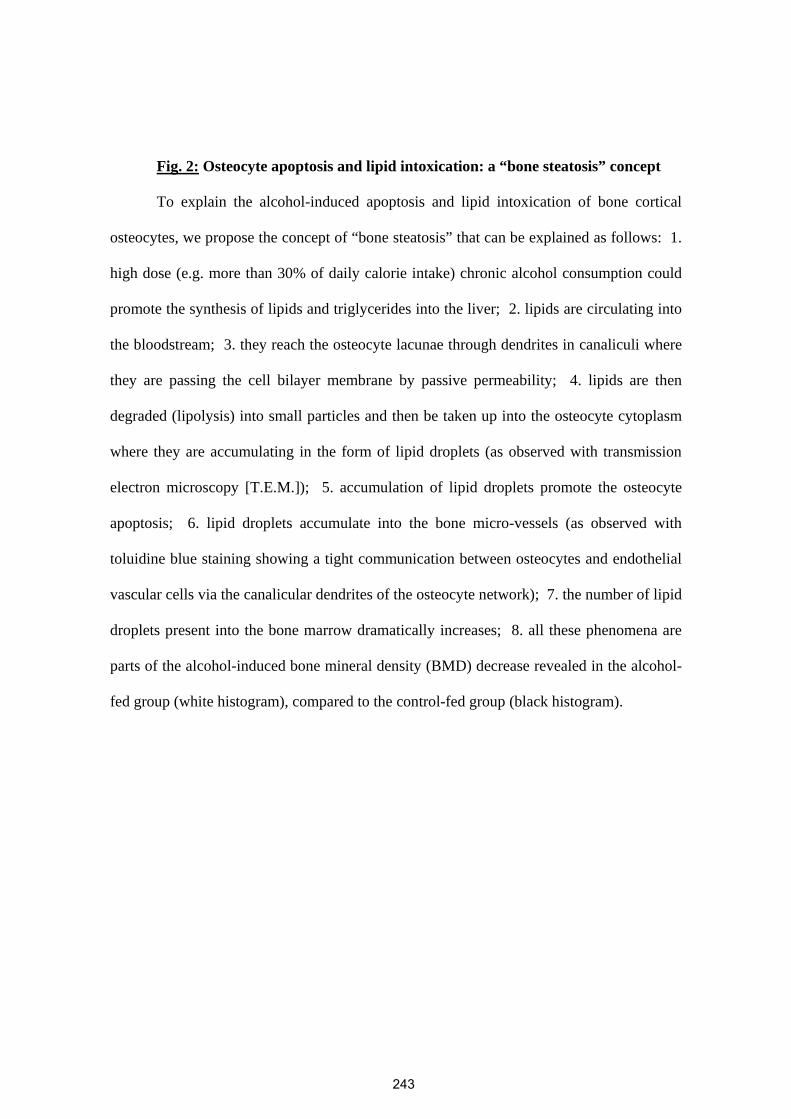
Fig. 2: Osteocyte apoptosis and lipid intoxication: a “bone steatosis” concept
To explain the alcohol-induced apoptosis and lipid intoxication of bone cortical
osteocytes, we propose the concept of “bone steatosis” that can be explained as follows: 1.
high dose (e.g. more than 30% of daily calorie intake) chronic alcohol consumption could
promote the synthesis of lipids and triglycerides into the liver; 2. lipids are circulating into
the bloodstream; 3. they reach the osteocyte lacunae through dendrites in canaliculi where
they are passing the cell bilayer membrane by passive permeability; 4. lipids are then
degraded (lipolysis) into small particles and then be taken up into the osteocyte cytoplasm
where they are accumulating in the form of lipid droplets (as observed with transmission
electron microscopy [T.E.M.]); 5. accumulation of lipid droplets promote the osteocyte
apoptosis; 6. lipid droplets accumulate into the bone micro-vessels (as observed with
toluidine blue staining showing a tight communication between osteocytes and endothelial
vascular cells via the canalicular dendrites of the osteocyte network); 7. the number of lipid
droplets present into the bone marrow dramatically increases; 8. all these phenomena are
parts of the alcohol-induced bone mineral density (BMD) decrease revealed in the alcohol-
fed group (white histogram), compared to the control-fed group (black histogram).
243
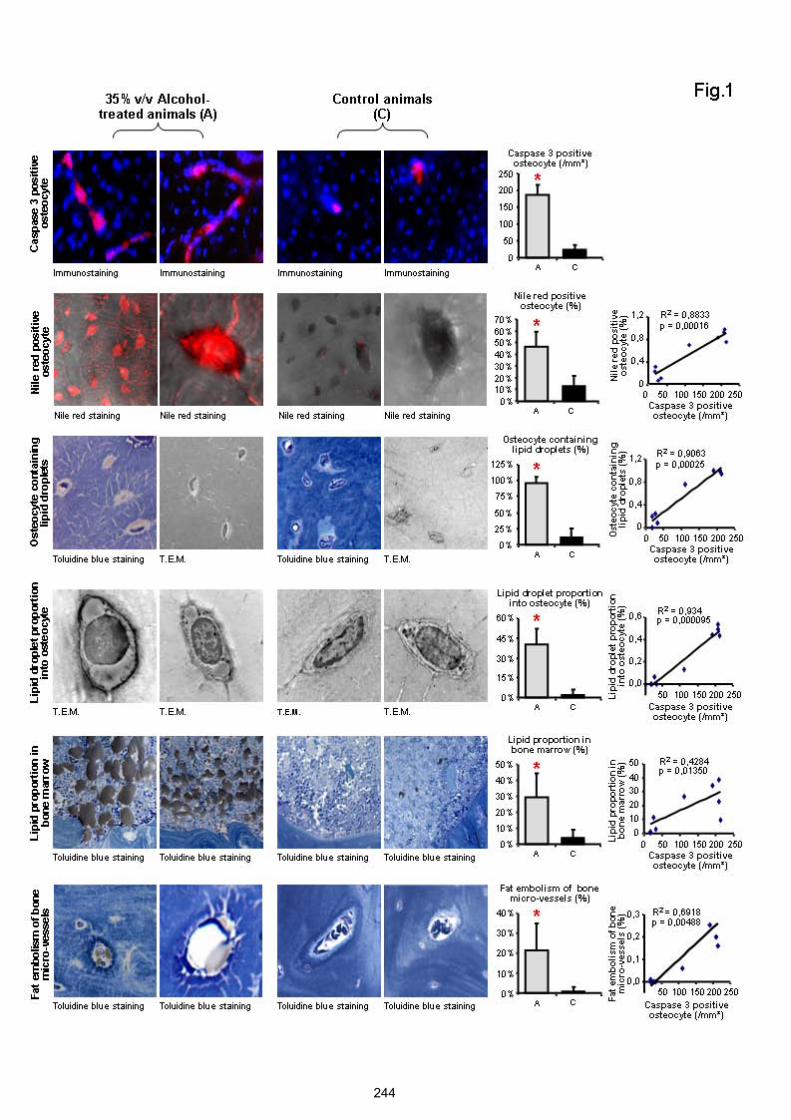
244
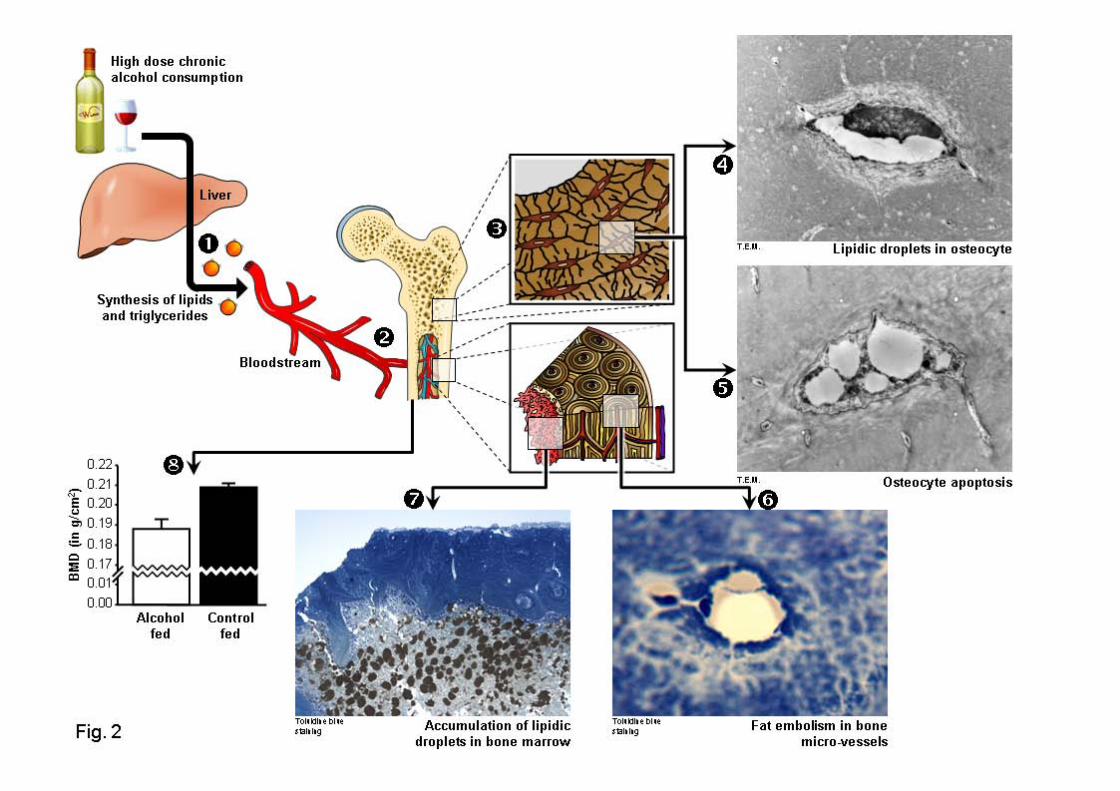
246
ETUDE 5 : ANALYSE DES EFFETS COMBINESD’UN ENTRAINEMENT ET D’UNE
CONSOMMATION EXCESSIVE D’ALCOOLSUR LE METABOLISME OSSEUX ET LES
OSTEOCYTES CHEZ LE RAT.
Cette étude a donné lieu à :
- l’écriture d’un article original :
Maurel DB, Boisseau N, Pallu S, Rochefort GY, Benhamou CL, Jaffré C. Regular exerciseprevents alcohol-induced osteoporosis and osteocyte apoptosis in rats. Soumis à Medicine &Science in Sports & Exercise, Septembre 2011.
- des communications affichées en congrès :
Maurel DB, Boisseau N, Dolleans E, Benhamou CL, Jaffré C. Beneficial effects of physicalactivity on bone loss induced by chronic alcoholism. International Society for BiomedicalResearch on Alcoholism (ISBRA), Paris, Septembre 2010.> Proceeding dans Alcoholism : Clinical and Experimental Research, Supplément Août 2010,Vol 34 (8).
Maurel DB, Jaffré C, Dolleans E, Boisseau N, Benhamou CL. Combined effects of exerciseand alcohol on bone status in rats. American Society for Bone and Mineral Research(ASBMR), Toronto, Octobre 2010.> Proceeding dans JBMR (2010), 25 (Suppl 1).
Maurel DB, Jaffré C, Boisseau N, Benhamou CL. Exercise prevents the alcohol-induced boneloss in the rat. European Congress of Clinical and Economic aspects of Osteoporosis(ECCEO), Valence, Mars 2011.
247
I. Introduction
Les effets négatifs d’une consommation excessive et chronique d’alcool sur le tissu
osseux sont bien connus (Sampson 1998; Turner 2000). A contrario, les effets bénéfiques
d’une pratique physique régulière sur l’os ont été démontrés (Notomi et al. 2002; Yeh et al.
1993). A notre connaissance, très peu d’études ont été menées sur les effets combinés de
l’alcool et de l’exercice sur l’os. Nous avons ainsi montré dans l’étude 1 qu’une
consommation modérée d’alcool pouvait induire un effet positif sur le tissu osseux et que cet
effet n’était pas majoré par l’ajout d’une activité physique. Par contre, il n’existe pas de
données concernant les effets combinés d’une pratique physique et d’une consommation
excessive d’alcool, dans le but de montrer un effet protecteur de l’exercice. De plus, ces effets
combinés n’ont jamais été étudiés sur l’ostéocyte. Pourtant, l’ostéocyte est une cellule clé tant
dans la réponse à l’alcoolisation que dans celle liée à l’activité physique (Tan et al. 2007;
Vezeridis et al. 2006; Wang et al. 2003).
II. But de l’étude
Le but de cette étude était d’analyser les effets combinés d’une consommation
chronique et excessive d’alcool (35% v/v) et d’un exercice physique régulier (1H par jour,
60-70% de la VMA) sur différents paramètres du tissu osseux (CMO, DMO,
microarchitecture trabéculaire et corticale, résistance osseuse, remodelage osseux) et sur
l’apoptose des ostéocytes chez le rat.
III. Méthodologie spécifique
48 rats mâles Wistar âgés de 8 semaines ont été aléatoirement répartis dans un des
groupes suivants : Contrôle (C), Alcool (A), Exercice (E) ou Alcool+Exercice (AE). Le
protocole a duré 19 semaines, dont 2 semaines d’acclimatation, 17 semaines d’alcoolisation
et/ou 14 semaines d’entraînement. Les rats des groupes A et AE ont été alcoolisés
progressivement jusqu’à une dose de 35% v/v. Les rats des groupes E et AE ont été entraînés
sur tapis roulant 1H par jour, 5 jours par semaine. Le CMO, la DMO et la composition
corporelle ont été évalués par DXA au corps entier (plus au fémur pour le CMO et la DMO),
la microarchitecture de l’os trabéculaire et cortical du fémur a été analysée par µCT et la
248
résistance osseuse avec un test de flexion 3 points. Une évaluation du remodelage osseux a
été faite via la concentration de deux marqueurs (ostéocalcine et NTx). Le nombre
d’ostéocytes apoptotiques a été évalué sur des coupes de tibia grâce à un immunomarquage
avec de la caspase-3 clivée, révélée par un anticorps secondaire fluorescent.
Dans un but éthique, afin de respecter les conseils donnés au niveau européen, les groupes C
et A sont les groupes de l’étude 2. Ceci a été fait dans le but de limiter le nombre d’animaux
sacrifiés. Les groupes E et AE ont été traités à postériori des groupes C et A. Cependant, les
conditions de température, de luminosité de l’animalerie, et l’alimentation ont été strictement
les mêmes. De plus, les examens réalisés avant le sacrifice (densitométrie) ont été réalisés
strictement à la même semaine du protocole pour tous les groupes.
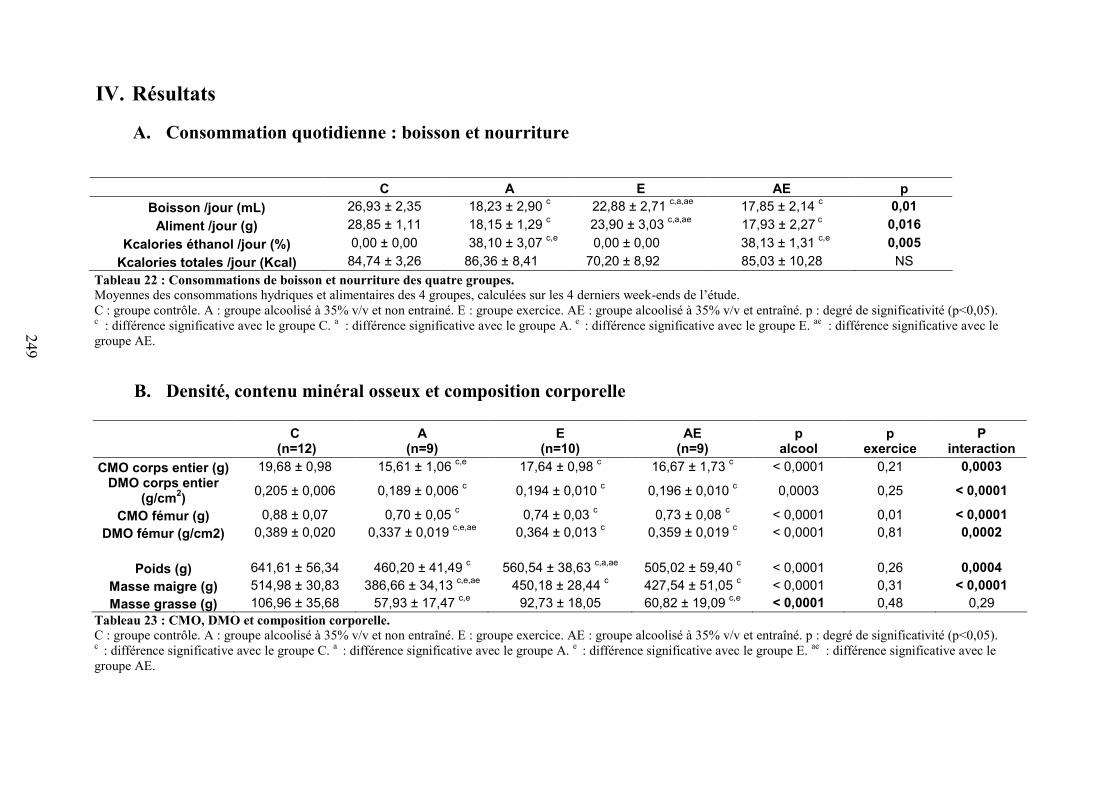
249
IV. Résultats
A. Consommation quotidienne : boisson et nourriture
Tableau 22 : Consommations de boisson et nourriture des quatre groupes.Moyennes des consommations hydriques et alimentaires des 4 groupes, calculées sur les 4 derniers week-ends de l’étude.C : groupe contrôle. A : groupe alcoolisé à 35% v/v et non entrainé. E : groupe exercice. AE : groupe alcoolisé à 35% v/v et entraîné. p : degré de significativité (p<0,05).c : différence significative avec le groupe C. a : différence significative avec le groupe A. e : différence significative avec le groupe E. ae : différence significative avec legroupe AE.
B. Densité, contenu minéral osseux et composition corporelle
C (n=12)
A(n=9)
E(n=10)
AE(n=9)
palcool
pexercice
Pinteraction
CMO corps entier (g) 19,68 ± 0,98 15,61 ± 1,06 c,e 17,64 ± 0,98 c 16,67 ± 1,73 c < 0,0001 0,21 0,0003DMO corps entier
(g/cm2) 0,205 ± 0,006 0,189 ± 0,006 c 0,194 ± 0,010 c 0,196 ± 0,010 c 0,0003 0,25 < 0,0001
CMO fémur (g) 0,88 ± 0,07 0,70 ± 0,05 c 0,74 ± 0,03 c 0,73 ± 0,08 c < 0,0001 0,01 < 0,0001DMO fémur (g/cm2) 0,389 ± 0,020 0,337 ± 0,019 c,e,ae 0,364 ± 0,013 c 0,359 ± 0,019 c < 0,0001 0,81 0,0002
Poids (g) 641,61 ± 56,34 460,20 ± 41,49 c 560,54 ± 38,63 c,a,ae 505,02 ± 59,40 c < 0,0001 0,26 0,0004Masse maigre (g) 514,98 ± 30,83 386,66 ± 34,13 c,e,ae 450,18 ± 28,44 c 427,54 ± 51,05 c < 0,0001 0,31 < 0,0001Masse grasse (g) 106,96 ± 35,68 57,93 ± 17,47 c,e 92,73 ± 18,05 60,82 ± 19,09 c,e < 0,0001 0,48 0,29
Tableau 23 : CMO, DMO et composition corporelle.C : groupe contrôle. A : groupe alcoolisé à 35% v/v et non entraîné. E : groupe exercice. AE : groupe alcoolisé à 35% v/v et entraîné. p : degré de significativité (p<0,05).c : différence significative avec le groupe C. a : différence significative avec le groupe A. e : différence significative avec le groupe E. ae : différence significative avec legroupe AE.
C A E AE pBoisson /jour (mL) 26,93 ± 2,35 18,23 ± 2,90 c 22,88 ± 2,71 c,a,ae 17,85 ± 2,14 c 0,01
Aliment /jour (g) 28,85 ± 1,11 18,15 ± 1,29 c 23,90 ± 3,03 c,a,ae 17,93 ± 2,27 c 0,016Kcalories éthanol /jour (%) 0,00 ± 0,00 38,10 ± 3,07 c,e 0,00 ± 0,00 38,13 ± 1,31 c,e 0,005
Kcalories totales /jour (Kcal) 84,74 ± 3,26 86,36 ± 8,41 70,20 ± 8,92 85,03 ± 10,28 NS
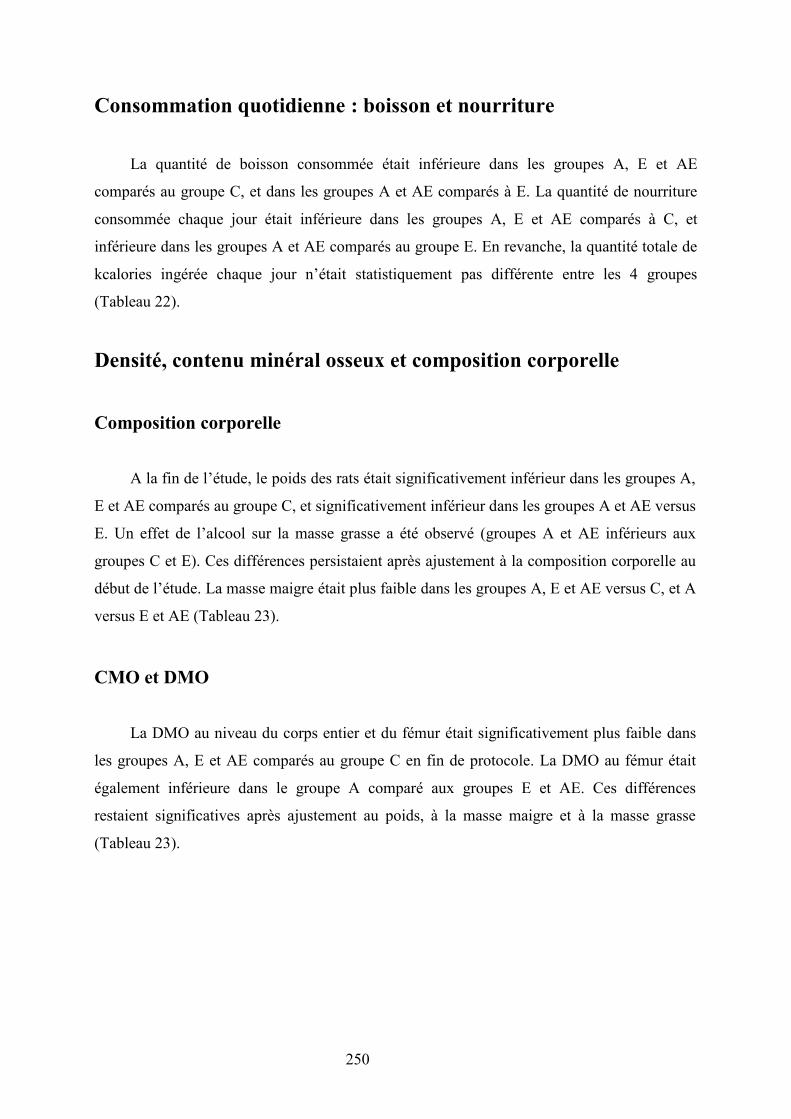
250
Consommation quotidienne : boisson et nourriture
La quantité de boisson consommée était inférieure dans les groupes A, E et AE
comparés au groupe C, et dans les groupes A et AE comparés à E. La quantité de nourriture
consommée chaque jour était inférieure dans les groupes A, E et AE comparés à C, et
inférieure dans les groupes A et AE comparés au groupe E. En revanche, la quantité totale de
kcalories ingérée chaque jour n’était statistiquement pas différente entre les 4 groupes
(Tableau 22).
Densité, contenu minéral osseux et composition corporelle
Composition corporelle
A la fin de l’étude, le poids des rats était significativement inférieur dans les groupes A,
E et AE comparés au groupe C, et significativement inférieur dans les groupes A et AE versus
E. Un effet de l’alcool sur la masse grasse a été observé (groupes A et AE inférieurs aux
groupes C et E). Ces différences persistaient après ajustement à la composition corporelle au
début de l’étude. La masse maigre était plus faible dans les groupes A, E et AE versus C, et A
versus E et AE (Tableau 23).
CMO et DMO
La DMO au niveau du corps entier et du fémur était significativement plus faible dans
les groupes A, E et AE comparés au groupe C en fin de protocole. La DMO au fémur était
également inférieure dans le groupe A comparé aux groupes E et AE. Ces différences
restaient significatives après ajustement au poids, à la masse maigre et à la masse grasse
(Tableau 23).
251
C. Paramètres de microarchitecture trabéculaire
C(n=12)
A(n=9)
E(n=10)
AE(n=9)
palcool
pexercice
p interaction
BV/TV (%) 15,61 ± 5,49 11,28 ± 3,05 12,28 ± 4,37 16,43 ± 3,86 0,95 0,52 0,005BS/BV (1/mm) 44,98 ± 7,75 54,46 ± 4,80 c,e,ae 40,38 ± 2,90 40,52 ± 4,26 0,009 < 0,0001 0,01
SMI 1,83 ± 0,24 2,04 ± 0,16 2,32 ± 0,31 c,a,ae 2,02 ± 0,23 0,54 0,004 0,003Tb.Th (mm) 0,096 ± 0,012 0,084 ± 0,007 c,e,ae 0,106 ± 0,005 c 0,101 ± 0,009 0,003 < 0,0001 0,23Tb.N (1/mm) 1,61 ± 0,44 1,34 ± 0,29 1,06 ± 0,52 c,ae 1,62 ± 0,31 0,27 0,29 0,003Tb.Sp (mm) 0,47 ± 0,19 0,54 ± 0,20 0,72 ± 0,28 0,54 ± 0,20 0,42 0,09 0,09
DA 2,68 ± 0,47 2,34 ± 0,26 2,63 ± 0,33 2,81 ± 0,69 0,60 0,16 0,08Tableau 24 : Paramètres de microarchitecure trabéculaire du fémur.BV/TV : volume occupé par l’os dans le volume de tissu étudié. BS/BV : rapport de la surface représentée par l’os dans le volume étudié. SMI : Structure Model Index.Tb.Th : épaisseur des travées osseuses. Tb.N : nombre de travées osseuses. Tb.Sp : taille des espaces entre les travées osseuses. DA : degré d’anisotropie.c : différence significative avec le groupe C. a : différence significative avec le groupe A. e : différence significative avec le groupe E. ae : différence significative avec legroupe AE.
252
Paramètres de microarchitecture trabéculaire
Le Tb.Th était inférieur dans le groupe A comparé aux groupes C, E et AE et supérieur
dans le groupe E comparé à C. Ceci montre un effet positif de l’exercice sur Tb.Th et un effet
négatif de l’alcool. Le Tb.N était inférieur dans le groupe E comparé aux groupes C et AE.
Ces différences persistaient après ajustement au poids, à la masse maigre et à la masse grasse
(Tableau 24).
D. Paramètres de macroarchitecture et microarchitecture corticale
Les Ct.Po et Po.N étaient significativement plus élevés dans le groupe A comparé à C, E
et AE. Le Po.Sp était plus faible dans les groupes E et AE comparés au groupe C. L’épaisseur
corticale étaient inférieure dans le groupe A comparé aux trois autres groupes, et ce dans les
deux axes. Ces différences persistaient toujours après ajustement aux paramètres de
composition corporelle (Tableau 25).
E. Paramètres biomécaniques
Il y avait un effet de l’exercice sur la contrainte maximale, qui était inférieure dans le
groupe A comparé aux groupes E et AE. La CSA était plus faible dans les groupes A, E et AE
comparés à C, et plus faible dans le groupe A comparé à E et AE. L’énergie maximale était
inférieure dans le groupe E versus C (Tableau 26).
F. Paramètres biochimiques
La concentration de NTx était inférieure dans les trois groupes A, E et AE par rapport
au groupe C, tandis que la concentration en OC était supérieure dans le groupe E comparé aux
groupes C, A et AE. La concentration de leptine plasmatique était plus faible dans le groupe
AE versus E (Tableau 27).
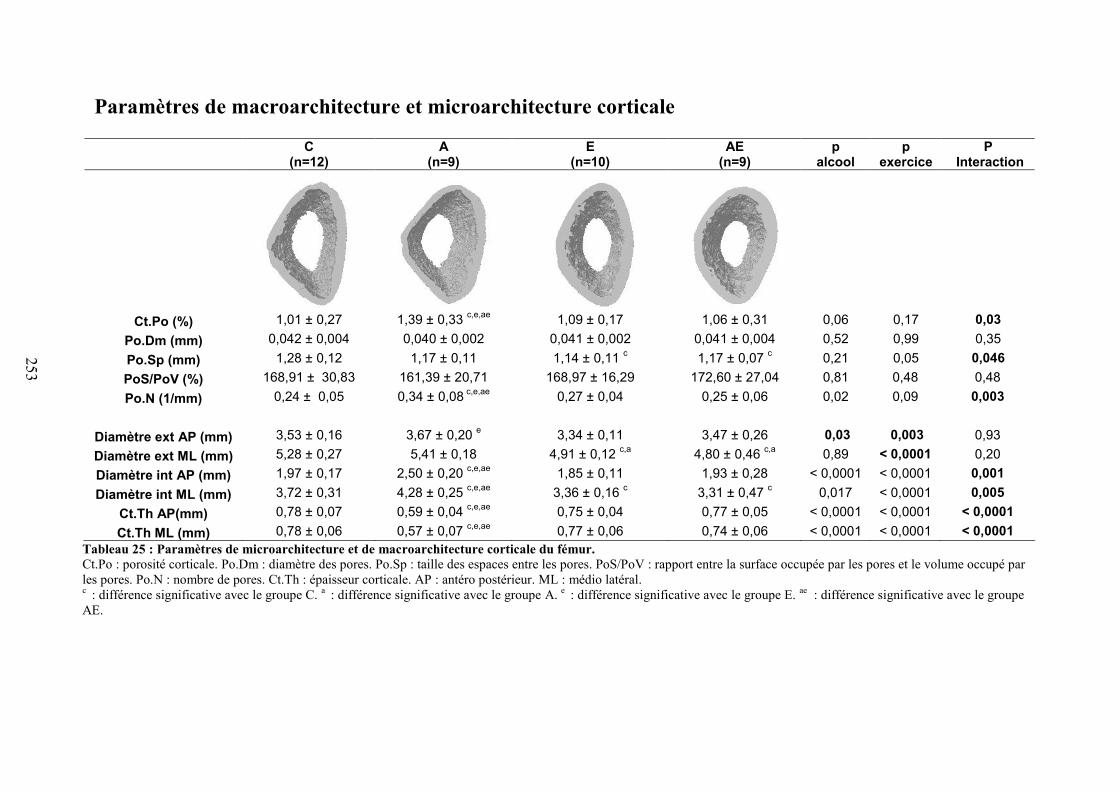
253
Paramètres de macroarchitecture et microarchitecture corticale
Tableau 25 : Paramètres de microarchitecture et de macroarchitecture corticale du fémur.Ct.Po : porosité corticale. Po.Dm : diamètre des pores. Po.Sp : taille des espaces entre les pores. PoS/PoV : rapport entre la surface occupée par les pores et le volume occupé parles pores. Po.N : nombre de pores. Ct.Th : épaisseur corticale. AP : antéro postérieur. ML : médio latéral.c : différence significative avec le groupe C. a : différence significative avec le groupe A. e : différence significative avec le groupe E. ae : différence significative avec le groupeAE.
C(n=12)
A(n=9)
E(n=10)
AE(n=9)
palcool
pexercice
PInteraction
Ct.Po (%) 1,01 ± 0,27 1,39 ± 0,33 c,e,ae 1,09 ± 0,17 1,06 ± 0,31 0,06 0,17 0,03Po.Dm (mm) 0,042 ± 0,004 0,040 ± 0,002 0,041 ± 0,002 0,041 ± 0,004 0,52 0,99 0,35Po.Sp (mm) 1,28 ± 0,12 1,17 ± 0,11 1,14 ± 0,11 c 1,17 ± 0,07 c 0,21 0,05 0,046PoS/PoV (%) 168,91 ± 30,83 161,39 ± 20,71 168,97 ± 16,29 172,60 ± 27,04 0,81 0,48 0,48Po.N (1/mm) 0,24 ± 0,05 0,34 ± 0,08 c,e,ae 0,27 ± 0,04 0,25 ± 0,06 0,02 0,09 0,003
Diamètre ext AP (mm) 3,53 ± 0,16 3,67 ± 0,20 e 3,34 ± 0,11 3,47 ± 0,26 0,03 0,003 0,93Diamètre ext ML (mm) 5,28 ± 0,27 5,41 ± 0,18 4,91 ± 0,12 c,a 4,80 ± 0,46 c,a 0,89 < 0,0001 0,20Diamètre int AP (mm) 1,97 ± 0,17 2,50 ± 0,20 c,e,ae 1,85 ± 0,11 1,93 ± 0,28 < 0,0001 < 0,0001 0,001Diamètre int ML (mm) 3,72 ± 0,31 4,28 ± 0,25 c,e,ae 3,36 ± 0,16 c 3,31 ± 0,47 c 0,017 < 0,0001 0,005
Ct.Th AP(mm) 0,78 ± 0,07 0,59 ± 0,04 c,e,ae 0,75 ± 0,04 0,77 ± 0,05 < 0,0001 < 0,0001 < 0,0001Ct.Th ML (mm) 0,78 ± 0,06 0,57 ± 0,07 c,e,ae 0,77 ± 0,06 0,74 ± 0,06 < 0,0001 < 0,0001 < 0,0001
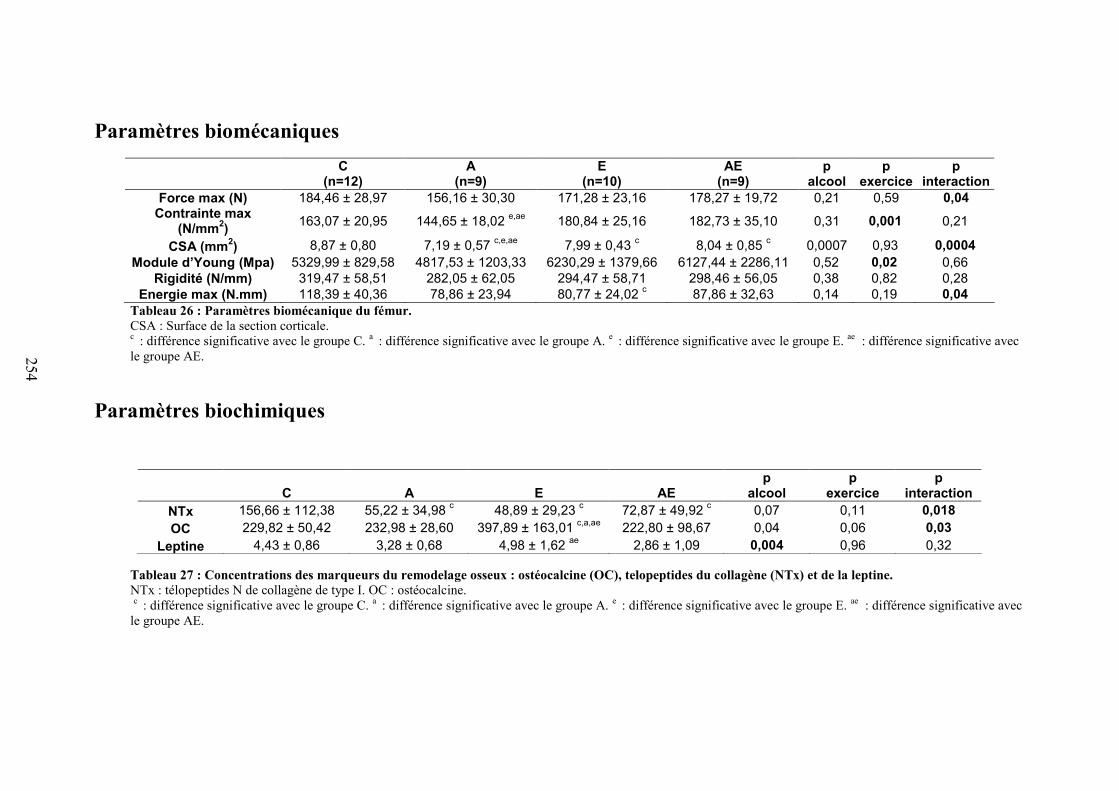
254
Paramètres biomécaniquesC
(n=12)A
(n=9)E
(n=10)AE
(n=9)p
alcoolp
exercicep
interactionForce max (N) 184,46 ± 28,97 156,16 ± 30,30 171,28 ± 23,16 178,27 ± 19,72 0,21 0,59 0,04
Contrainte max(N/mm2) 163,07 ± 20,95 144,65 ± 18,02 e,ae 180,84 ± 25,16 182,73 ± 35,10 0,31 0,001 0,21
CSA (mm2) 8,87 ± 0,80 7,19 ± 0,57 c,e,ae 7,99 ± 0,43 c 8,04 ± 0,85 c 0,0007 0,93 0,0004Module d’Young (Mpa) 5329,99 ± 829,58 4817,53 ± 1203,33 6230,29 ± 1379,66 6127,44 ± 2286,11 0,52 0,02 0,66
Rigidité (N/mm) 319,47 ± 58,51 282,05 ± 62,05 294,47 ± 58,71 298,46 ± 56,05 0,38 0,82 0,28Energie max (N.mm) 118,39 ± 40,36 78,86 ± 23,94 80,77 ± 24,02 c 87,86 ± 32,63 0,14 0,19 0,04
Tableau 26 : Paramètres biomécanique du fémur.CSA : Surface de la section corticale.c : différence significative avec le groupe C. a : différence significative avec le groupe A. e : différence significative avec le groupe E. ae : différence significative avecle groupe AE.
Paramètres biochimiques
Tableau 27 : Concentrations des marqueurs du remodelage osseux : ostéocalcine (OC), telopeptides du collagène (NTx) et de la leptine.NTx : télopeptides N de collagène de type I. OC : ostéocalcine.c : différence significative avec le groupe C. a : différence significative avec le groupe A. e : différence significative avec le groupe E. ae : différence significative avec
le groupe AE.
C A E AEp
alcoolp
exercicep
interactionNTx 156,66 ± 112,38 55,22 ± 34,98 c 48,89 ± 29,23 c 72,87 ± 49,92 c 0,07 0,11 0,018OC 229,82 ± 50,42 232,98 ± 28,60 397,89 ± 163,01 c,a,ae 222,80 ± 98,67 0,04 0,06 0,03
Leptine 4,43 ± 0,86 3,28 ± 0,68 4,98 ± 1,62 ae 2,86 ± 1,09 0,004 0,96 0,32
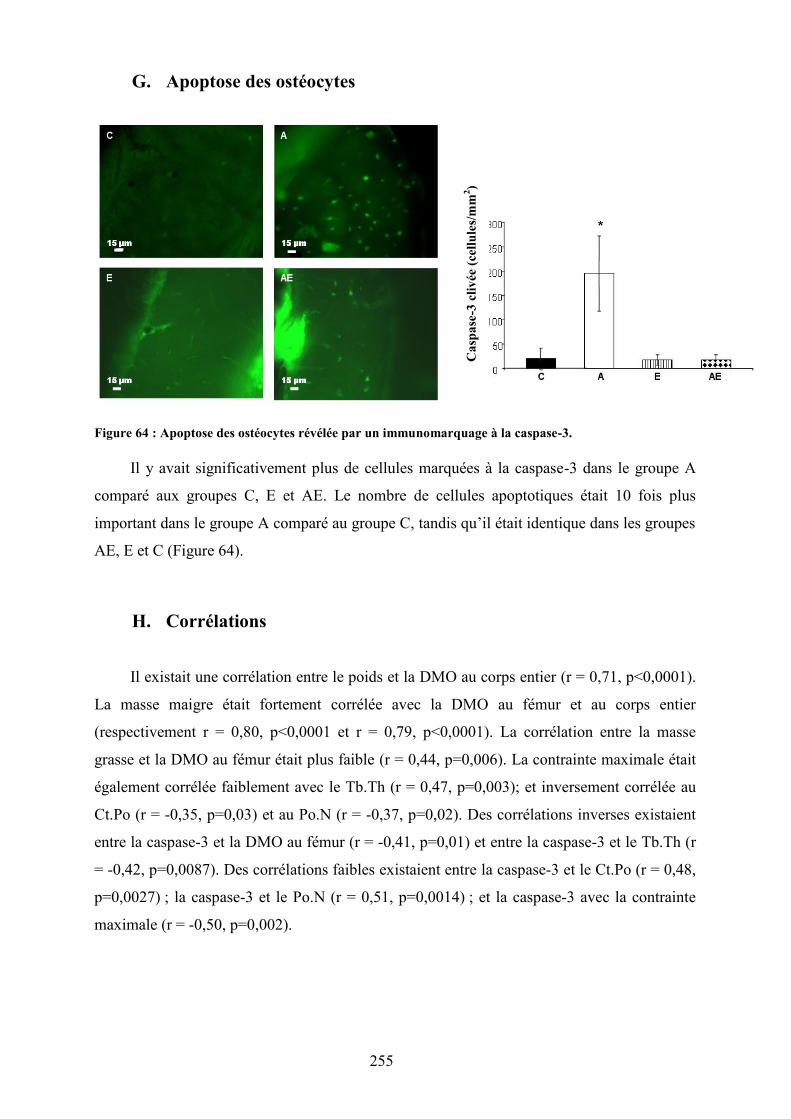
255
G. Apoptose des ostéocytes
Figure 64 : Apoptose des ostéocytes révélée par un immunomarquage à la caspase-3.
Il y avait significativement plus de cellules marquées à la caspase-3 dans le groupe A
comparé aux groupes C, E et AE. Le nombre de cellules apoptotiques était 10 fois plus
important dans le groupe A comparé au groupe C, tandis qu’il était identique dans les groupes
AE, E et C (Figure 64).
H. Corrélations
Il existait une corrélation entre le poids et la DMO au corps entier (r = 0,71, p<0,0001).
La masse maigre était fortement corrélée avec la DMO au fémur et au corps entier
(respectivement r = 0,80, p<0,0001 et r = 0,79, p<0,0001). La corrélation entre la masse
grasse et la DMO au fémur était plus faible (r = 0,44, p=0,006). La contrainte maximale était
également corrélée faiblement avec le Tb.Th (r = 0,47, p=0,003); et inversement corrélée au
Ct.Po (r = -0,35, p=0,03) et au Po.N (r = -0,37, p=0,02). Des corrélations inverses existaient
entre la caspase-3 et la DMO au fémur (r = -0,41, p=0,01) et entre la caspase-3 et le Tb.Th (r
= -0,42, p=0,0087). Des corrélations faibles existaient entre la caspase-3 et le Ct.Po (r = 0,48,
p=0,0027) ; la caspase-3 et le Po.N (r = 0,51, p=0,0014) ; et la caspase-3 avec la contrainte
maximale (r = -0,50, p=0,002).
Cas
pase
-3 c
livée
(cel
lule
s/mm
2 )
256
V. Discussion
Cette étude montre que les effets délétères d’une alcoolisation chronique sur les
paramètres osseux sont limités par l’activité physique.
Nous avons observé dans cette étude un plus faible poids, et des gains de masses
grasses, masses maigres et DMO plus faibles dans le groupe A comparé au groupe C, ce qui
confirme que notre modèle a bien induit une ostéopénie. Les effets de l’alcool chronique sur
ces paramètres sont connus, mais nous avons observé un effet protecteur de l’exercice sur la
masse maigre et la DMO du fémur des rats alcoolisés et entraînés. Les différences de DMO
observées étaient toujours significatives après ajustements au poids et à la masse maigre.
Dans cette étude, tous les groupes ont consommé le même nombre de kilocalories.
La consommation d’alcool a diminué significativement le Tb.Th dans le groupe A,
tandis que l’alcool combiné à l’exercice physique n’était pas associé à un plus faible Tb.Th.
Dans l’os cortical le nombre de pores et la porosité corticale étaient supérieurs dans le groupe
A comparé aux autres groupes. Ces données montrent que non seulement l’alcool a un effet
délétère sur l’os cortical et la porosité, mais que l’exercice contrebalance ces effets, comme le
montrent les plus faibles valeurs de Ct.Po et Po.N dans le groupe AE comparé au groupe A.
L’épaisseur corticale était également diminuée suite au traitement alcoolisé, modification que
nous n’avons pas observée quand l’alcool était combiné à un exercice régulier. Les fémurs
des rats du groupe AE résistaient à une contrainte maximale supérieure comparés aux fémurs
des animaux du groupe A. La contrainte maximale était corrélée avec les paramètres de
microarchitecture trabéculaire et corticale (Tb.Th et Ct.Po). Nous avons observé une apoptose
des ostéocytes plus élevée dans le groupe A comparé aux trois autres groupes. De plus, il
existait des corrélations entre la caspase-3 et la DMO, le Tb.Th, le Ct.Po et le Po.N.
L’exercice a prévenu l’augmentation de l’apoptose des ostéocytes.
En conclusion, une consommation excessive et chronique d’alcool diminue la DMO,
l’épaisseur de l’os trabéculaire et cortical, et engendre une augmentation de la porosité
corticale et de l’apoptose des ostéocytes. Quand un exercice régulier est associé à
l’alcoolisation, la DMO du fémur est significativement supérieure à celle observée chez les
rats alcoolisés sédentaires tandis que les paramètres de microarchitecture trabéculaire et
corticale et l’apoptose des ostéocytes ne sont pas différents du groupe contrôle. De ce fait,
une activité physique régulière prévient en partie les effets délétères de l’alcool dans ce
modèle murin d’ostéoporose secondaire, phénomène lié en parti à la quantité d’apoptose des
ostéocytes.

257
Article 5
258
REGULAR EXERCISE LIMITS ALCOHOL-INDUCED OSTEOPENIA IN THE RAT.
Delphine B. MAUREL1, Nathalie BOISSEAU2, Stéphane PALLU1,
Gaël Y. ROCHEFORT1, Claude-Laurent BENHAMOU1*, Christelle JAFFRE1*.
1 INSERM Unit U658, Characterization of bone tissue by imagery, Orleans Regional Hospital,
Orleans, France.
2 Blaise Pascal Clermont University, EA 3533, Laboratory of Physical Activity and Sport Biology,
Clermont-Ferrand, France.
* Both senior authors equally contributed to this work.
Corresponding author: Nathalie Boisseau. Blaise Pascal Clermont University, EA 3533,
Laboratory of Physical Activity and Sport Biology, Clermont-Ferrand, France.
E-mail address: [email protected]. Phone number: (+0033)
473405519. Fax number: (+0033) 473405062.
Running title: Exercise limits alcohol-induced osteopenia.
Funding: This work was funded in part by IREB (French Institute of Scientific Research on
the Alcoholic Beverages). No funding was received for this work from NIH, Wellcome Trust
or HHMI.
Disclosure: Delphine B. Maurel declares she has no disclosure. Nathalie Boisseau discloses
no professional relationships with companies or manufacturers who will benefit from the
results of the present study. Stephane Pallu has no disclosure. Gael Y Rochefort has no

259
disclosure. Claude-Laurent Benhamou has no professional relationships with companies who
will benefit from the results of the present study. Christelle Jaffre has no disclosure.
260
ABSTRACT
Introduction: Excessive alcohol consumption is known to be deleterious for bone tissue
whereas physical activity has positive effects on bone. This study was designed to analyze the
effects of regular physical exercise on bone parameters in chronic alcohol-fed rats.
Material and methods: 48 male Wistar rats were divided in 4 groups: Control(C), Alcohol(A),
Exercise(E) and Alcohol+Exercise(AE). A and AE groups drank a solution composed of
ethanol and water (35% volume/volume for 17 weeks). E and AE groups were submitted to
treadmill training for 14 weeks (60min/day, 5times/week). Bone mineral density (BMD) was
assessed by DXA, the trabecular and cortical microarchitectural parameters by microCT and
serum osteocalcin, NTx and leptin concentrations by ELISA assays. Bone mechanical
parameters were evaluated through mechanical testing. Osteocyte apoptosis in cortical bone
was analyzed with cleaved caspase-3 immunostaining.
Results: Alcohol-fed rats had significantly decreased body weight, fat mass and lean mass
compared to controls. BMD, trabecular and cortical thickness were significantly lower with
alcohol whereas porosity and pore number were higher. Exercise combined to alcohol
prevented the decreased µCT parameters, as AE values were similar to C values, and
significantly limited the BMD loss and low maximal stress compared to the A group.
Osteocyte apoptosis was increased in A compared to C, while it was similar in AE and C.
Cleaved caspase-3 staining was correlated with BMD, Tb.Th and Ct.Po.
Conclusion: Regular physical activity has beneficial effects on bone status in alcohol-fed rats.
In parallel, exercise prevents osteocyte apoptosis in alcohol-fed animals while alcohol alone
increases it dramatically.
Key words: alcohol, physical activity, micro architecture, bone density, osteocyte.
261
INTRODUCTION
Paragraph Number 1 The detrimental effects of alcohol abuse on the adult skeleton are well
established. Excessive chronic alcohol consumption results in bone loss and increases the risk
of osteoporosis (22). It also increases the risk of fracture and complications (11). Numerous
studies have been conducted in animal models to further elucidate the impact of ethanol on
bone. Lower total and vertebral bone mineral density (BMD) have been reported following
chronic ethanol administration in male and female rats (15% and 36% of the total energy
intake) (26). Peak bone mass in both trabecular and cortical bone was also decreased in young
growing rats. Chronic alcohol consumption lowers tibia length, vertebral body height, bone
growth, endosteal and periosteal formation, trabecular and cortical thickness (21). Several
studies reported that chronic alcohol consumption decreases bone resistance which in turn
increases the risk of fractures when bones are subject to large mechanical loadings (19). The
mineralization and apposition rates were also negatively modified by alcohol (31). Animal
models confirmed that the deleterious effects of alcohol observed on BMD and bone
morphology is due to a decrease in bone formation, characterized by an inhibition of the
osteoblastic proliferation and activity (13).
Paragraph Number 2 In contrast, exercise is generally known to induce beneficial effects on
the musculoskeletal system. The impact of physical activity on bone density depends on the
type of exercise, the intensity and frequency of training. The positive effects of weight-
bearing physical activities on bone have been well documented in the literature (3) and
exercise is recommended to prevent and as a treatment in primary osteoporosis in post-
menopausal women (34). The beneficial effects of physical activity on bone mass and density
have been shown to be long term (25).
262
Paragraph Number 3 The effects of alcohol or exercise have been assessed on bone
remodeling, together with osteoblast and osteoclast activities. However, little is known about
the effects of alcohol and exercise on the osteocyte. Osteocyte is the third bone cell, with
osteoblast and osteoclast. It has been thought for a long time to be a passive cell and has not
been studied extensively during the past because of its location inside the bone matrix (5).
Recently it has been shown that osteocyte plays a role in bone, especially in the
mechanotransduction (8). Indeed, the osteocyte senses the change of interstitial fluid flow
through the lacunar-canalicular network of bone and adapt bone mass to the loads applied to
bones (9). The osteocyte maintains bone mass by regulating osteoblast and osteoclast activity
(30), which has been reported in vitro. It has been shown that exercise maintains osteocyte
viability (15) while chronic alcohol consumption increases osteocyte apoptosis (24). To date,
no data exists concerning the potential interaction between alcohol and exercise on osteocyte
apoptosis.
Paragraph Number 4 In a previous study in our laboratory (23), we analyzed the combined
effects of moderate alcohol consumption and moderate exercise on rats’ skeleton. The
moderate alcohol treatment induced higher trabecular thickness and BMD, while we observed
a positive effect of exercise only on body composition (23). To date and to our knowledge,
very few studies have assessed the effects of high alcohol consumption combined to regular
physical activity on bone (28). The aim of this study was to point out the effects of regular
prolonged physical activity on bone mass, density, microarchitecture, bone remodeling as
well as on osteocyte apoptosis in a rat model of alcohol abuse, and to compare the evolution
of these bone parameters with those of sedentary chronic alcohol-fed rats.
263
MATERIAL AND METHODS
Paragraph Number 5 Forty-eight male Wistar rats (Elevage Janvier, Le Genest St Isle,
France) were acclimatized for 2 weeks and maintained under constant temperature (21±2°C)
and under 12h/12h light-dark cycles during the experiment. Rats were housed in groups of
two in standard cages and provided with a commercial standard diet (M20, Dietex, France).
The rats were 8 weeks old at baseline. They were not skeletally mature but we wanted to
apply our model of alcohol treatment to make a comparison with the young adult. The skeletal
growth is known to occur until 30-35 years old in the adult.
Paragraph Number 6 At ten weeks of age, the rats were allocated to one of the following
groups: Controls (C), Alcohol (A), Exercise (E) or Alcohol+Exercise (AE), in order to match
the body weight of the rats between the groups at baseline. The protocol lasted 19 weeks. The
quantities of food and drink ingested were controlled and recorded weekly for all groups. The
weights of the rats were measured at 8 and 27 weeks of age. At the end of the study, all
groups were anesthetized with pentobarbital and killed by a blood sample taking directly into
the heart. Soon after death, the femurs and tibias were excised and cleared of fat and
connective tissues. The left femur was placed in a soft tissue and frozen at -20°C for the
microarchitectural and biomechanical tests. The right tibia was fixed in formalin 4% v/v and
then demineralised (Osteosoft, Merck, Darmstadt, Germany) for epifluorescent microscopy.
The procedure for the care and killing of the animals was in accordance with the European
Community standards on the care and use of laboratory animals (Ministère de l’agriculture,
France, Authorisation INSERM45-001). It was also in adherence to ACSM animal care
standards.
264
Alcohol treatment
Paragraph Number 7 The rats of the Alcohol (A) and Alcohol+Exercise (AE) groups drank
ad libitum a solution composed of ethanol and water during 17 weeks. The percentage of
ethanol in the solution was progressively increased during three weeks from 5 % to 35 % v/v.
The food was given separately. The quantity of food eaten and beverage drank was weekly
controlled in the alcohol-treated groups and the amount of total calorie intake was matched in
the control and exercise groups having only the solid food as a caloric supply, in order for the
two groups to be pair-fed, as described by Sampson et al. (33). We isolated randomly a pair of
rats from each group each week by individually housing the rats in a cage and checking the
consumption of each rat. If the consumption was too different, we changed the pair of rats in
the cage and controlled them another time the following week.
Exercise protocol
Paragraph Number 8 Rats in the Exercise (E) and Alcohol+Exercise (AE) groups were
trained 5 days a week on a treadmill for 14 weeks. During the first week, the treadmill speed
and the duration of each running session were gradually increased from 5 m.min-1 to 9 m.min-
1 and from 15 min to 45 min per day. The second week of training, the speed was increased
from 10 m.min-1 to 20 m.min-1 and the duration of the training was 60 min per day. During
the 7 last weeks of training, the speed was increased from 9 to 14 m.min-1 during the first 30
minutes of the training session, and then the rats ran at a speed of 20 m.min-1 for the last 30
minutes of the training session. Maximal aerobic speed was determined at the beginning of
the training to confirm that our treadmill training corresponded to moderate intensity. The
measurement protocol has been described previously by Boissiere et al. (4). The intensities of
the exercise training sessions corresponded to 60 to 65% of the maximal aerobic speed of the
rats.
265
Measurements
Body composition
Paragraph Number 9 Body weight, lean and fat mass were measured by Dual X-ray
Absorptiometry (DXA, Discovery, Hologic, Bedford, Massachussets, USA) at baseline and at
the end of the protocol, using a specific rat body composition mode. In order to perform the in
vivo exam, the rats were anaesthetized with intra-peritoneal pentobarbital injection (CEVA
Santé Animale, Libourne, France) diluted in sodium chloride (0.1 mL injected/100g of body
weight).
BMC and BMD measurements
Paragraph Number 10 In vivo BMC and BMD of the whole body and the right femur were
analyzed at baseline and at the end of the protocol by DXA using a Discovery Hologic
apparatus adapted to small animals. This device has been validated in animals and is
commonly used in the literature.
Microarchitecture of the trabecular bone
Paragraph Number 11 The microarchitecture of the distal femur metaphysis was studied
using µCT (Skyscan 1072, Skyscan, Aartselaar, Belgium). We chose this subregion because it
is rich in cancellous bone. The characteristics and methods used in our laboratory have
already been described (6). The X-ray source was set at 80kV and 100µA, with a pixel size of
11.16µm. Four hundred projections were acquired over an angular range of 180° (angular
step of 0.45°). The image slices were reconstructed using the cone-beam reconstruction
software version 2.6 based on the Feldkamp algorithm. The registered data sets were
segmented into binary images. Two hundred and twenty-five slices were selected. Simple
global thresholding methods were used. The trabecular bone was extracted by drawing
266
ellipsoid contours with ‘CT analyzer” software (Skyscan). The parameters analyzed were the
bone volume to tissue volume (BV/TV), the bone surface on bone volume (BS/BV), the
trabecular thickness (Tb.Th), the trabecular number (Tb.N), the trabecular spacing (Tb.Sp),
the structure model index (SMI) and the degree of anisotropy (DA) which defines the
preferred orientation of the trabeculae.
Morphological characteristics of cortical bone
Paragraph Number 12 Cortical bone was analyzed in the distal femur metaphysis using
µCT. The characteristics and methods used have already been described (6). The acquisition
characteristics were the same as those used for the trabecular bone. After reconstruction,
cortical bone was extracted by drawing polygonal contours with “CT analyzer” software.
Before inversion of the image, simple global thresholding methods were applied, and the
algorithms developed for trabecular bone analysis were used to characterize the porosity
network. Porosity (Ct.Po) and pore number (Po.N) were measured with the MIL method. The
pore diameter (Po.Dm) and the pore spacing (Po.Sp) were derived from the Hildebrand
method and the total space occupied by the pores into the total volume (PoS/PoV) was
derived from the triangulation method. At pixel size of 11 μm, the pores are generally
considered to be Haversian and Volkmann canals, as described by Zebaze et al. (40).The
inner and outer diameters of the cortical bone in both axes (medio-lateral and antero-
posterior) were assessed with the Image J software, as well as the cortical thickness (Ct.Th),
using the reconstructed bone slices obtained by µCT (Skyscan 1072, Skyscan, Aartselaar,
Belgium).
267
Bone mechanical tests
Paragraph Number 13 Mechanical properties of the left femur were assessed by three-point
bending tests. Four hours before mechanical testing, the bones were thawed at room
temperature. Each bone was secured on the two lower supports of the anvil of a Universal
Testing Machine (Instron 3343, Instron, Melbourne, Australia). The width of these supports
was 8 mm, and the distance between the two supports was 20 mm. The cross-head speed for
all tests was 1 mm/minute. Load-displacement curves were recorded using specialized
software (Instron 3343 software). Biomechanical properties were calculated from these
curves: ultimate force (the maximal force supported by the bone before fracture, N); energy to
ultimate force (work energy required to fracture bone, N.mm) and stiffness (extrinsic rigidity
of the femur, N/mm). Ultimate stress (N/mm2) and Young’s modulus (modulus of elasticity,
MPa) were determined by the equations previously described by Turner and Burr (36). To
ensure good reproducibility between measurements, the femur was always mounted in order
to apply the cross-head in the middle of the bone.
Biochemical analysis
Paragraph Number 14 Bone turnover was analyzed from blood samples taken the day of
the absorptiometry prior to sacrifice. At the time of the sacrifice (7 month old), bone
remodeling becomes more predominant than bone modelling in bones of the posterior limbs
in the rat (20). The blood was centrifuged and the plasma was frozen at -80°C. The markers
studied to evaluate bone remodeling were osteocalcin (OC) for bone formation and the N-
terminal collagen cross-links (NTx) for bone resorption. Serum samples were assayed in
duplicate by ELISA. The osteocalcin concentration was measured with the Rat-MIDTM
Osteocalcin EIA kit (IDS, France). Intra and inter-assay CV were respectively 5 and 5.5 %
268
and the detection limit was 50.0 ng.mL-1. NTx assays were performed with the ELISA
Osteomark® NTX Serum kit (TECOmedical, France). Intra and inter-assay CV were 4.6 and
6.9 % respectively and the detection limit was 3.2 nM BCE/L. Serum leptin was assessed by
ELISA testing as well (m/r Leptin ELISA Kit, TECOmedical, France). The sensitivity of the
detection of the assay was 10 pg/mL and intra and inter-assay variation coefficients were
lower than 4.4% and 4.7% respectively.
Bone explants preparation for epifluorescence microscopy
Paragraph Number 15 After the sacrifice, the right tibia was placed in formalin 4% v/v for 4
days. Afterwards, it was rinsed in ethanol 50% for 1 week and then demineralised (Osteosoft,
Merck, Darmstadt, Germany) for 24 hours. Tibia slice (thickness 400 µm) was cut
transversally in the superior part of the tibia diaphysis with a high speed rotary tool (Dremel
300, Dremel, USA). The cortical bone slice was immunostained for epifluorescence
microscopy with cleaved caspase-3 (1/400, Rabbit mAb Asp 175, Cell Signaling Technology
Inc., Danvers, USA) which is a marker of apoptosis. This staining was revealed by secondary
antibodies anti-rabbit DylightTM 488 (Rockland Immunochemicals, Gilbertsville, USA), as
described by Vatsa et al. (38). Knowing that 90 to 95% of cortical bone cells are osteocytes,
we assumed that the cells stained with cleaved caspase-3 were osteocytes.
Image acquisition
Paragraph Number 16 Epifluorescence images of osteocytes were obtained by using a
Motic AE21 video camera attached to a Microvision microscope (Evry, France). The
objective magnification was 10x. Seven rats per group were analyzed. We imaged five
regions of interest (ROI) around the cortical bone. The size of one ROI was 300000 µm2 so
that the total cortical area analysed was 1.5 mm2. We acquired images of the cleaved caspase-
269
3 staining in each region of interest (ROI). The images were analysed with Image J software.
The number of cells stained per mm2 with cleaved caspase-3 in each ROI was calculated.
Statistical analysis
Paragraph Number 17 Data are presented as mean ± standard deviation for BMD,
microarchitecure parameters and biomechanical parameters and as mean ± standard error of
the mean for biochemical analysis, due to high inter-individual variability. To study the
influence of chronic alcohol consumption and physical exercise on measured parameters, a
two-way analysis of variance (Anova) was employed. The test of primary interest was the
interaction between alcohol and exercise, followed by Newman-Keuls post hoc test when
significant. Analysis of covariance were realised to deal with baseline differences.
Correlations were performed using Spearman test. We used the Statview software version 5.0
with a significant level of difference set at p < 0.05.
RESULTS
Food and beverage consumption (Table 1)
Paragraph Number 18 The amount of beverage consumed was significantly lower in A, E
and AE groups compared to the C group, and in A and AE compared to E. The percentage of
calories from the ethanol consumption per day was higher in A and AE groups compared to C
and E groups, and there was no difference between A and AE. The amount of food consumed
per day was lower in A, E and AE groups compared to C group, and lower in A and AE
versus E. However, the mean total amount of calories ingested per day was not significantly
different between the groups.
270
Body composition (Table 2)
Paragraph Number 19 At baseline, lean mass was higher in A versus AE (respectively
361.23 ± 21.93, 361.10 ± 15.88, 338.19 ± 16.83 and 346.24 ± 22.98 for C, A, AE and E; pexe=
0.005; palc=0.52). Fat mass was lower in C versus AE and E, and lower in A versus E
(respectively 42.48 ± 9.97, 48.61 ± 6.13, 54.24 ± 7.84 and 59.41 ± 10.17 for C, A, AE and E;
pexe=0.0003; palc=0.86). There was no difference in body weight (respectively 414.67 ± 25.37,
421.22 ± 14.68, 403.64 ± 20.44 and 416.89 ± 24.91 for C, A, AE and E; pexe= NS; palc=NS).
At the end of the protocol, the body weight was significantly lower in A, E and AE groups
compared to C, and significantly lower in A and AE versus E. The fat mass was significantly
lower in A and AE groups versus C and E, indicating an alcohol effect on this parameter.
These differences remained after adjustment to baseline values. The lean mass was lower in
A, E and AE groups versus C, and lower in A versus E and AE. There were interactions
between the effects of alcohol and exercise on body weight and lean mass (Table 2).
BMC and BMD measurements (Table 2)
Paragraph Number 20 At baseline, femur BMC was lower in the C group versus A and E,
while there was no difference for the femur BMD (respectively 0.272 ± 0.013, 0.279 ± 0.015,
0.275 ± 0.010 and 0.281 ± 0.013 for C, A, AE and E), the whole body BMC and BMD (WB
BMD: 0.154 ± 0.005, 0.159 ± 0.004, 0.157 ± 0.005 and 0.155 ± 0.005 respectively for C, A,
AE and E; pexe=0.81; palc=0.0496).
Paragraph Number 21 At the end of the protocol, whole body BMC was lower in A, E and
AE groups versus C, and in A versus E. Whole body BMD was significantly lower in A, E
and AE versus C. The femur BMC was significantly lower in A, E and AE groups versus C,
as well as the femur BMD. The femur BMD was also lower in A versus E and AE. These
271
differences remained significant after adjustment for lean mass and fat mass. There were
interactions between the effects of alcohol and exercise on whole body and femur BMC and
BMD (Table 2).
Microarchitecture of the trabecular bone (Table 3)
Paragraph Number 22 BS/BV was significantly higher in the A group versus C, E and AE,
while SMI was higher in E versus the three other groups. Tb.Th was significantly lower in A
versus C, E and AE and higher in E versus C. There was a positive effect of exercise and a
negative effect of alcohol on Tb.Th. Tb.N was lower in E versus C and AE. There were
interactions between alcohol treatment and exercise on BV/TV, BS/BV and Tb.N (Table 3).
Characteristics of the cortical bone (Table 4)
Paragraph Number 23 Ct.Po and Po.N were significantly higher in the A group versus C, E
and AE. Po.Dm was not different between the groups but Po.Sp was lower in E and AE
versus C. The external AP diameter was higher in A versus E and the external ML diameter
was lower in E and AE versus C and A. The internal AP diameter was higher in the A group
versus C, E and AE, as for the internal ML diameter, which was also lower in E and AE
versus C. We found a significantly lower cortical thickness in the A group versus C, E and
AE in both AP and ML axis. There were interactions of exercise and alcohol effects on Ct.Po,
Po.Sp, Po.N and Ct.Th.
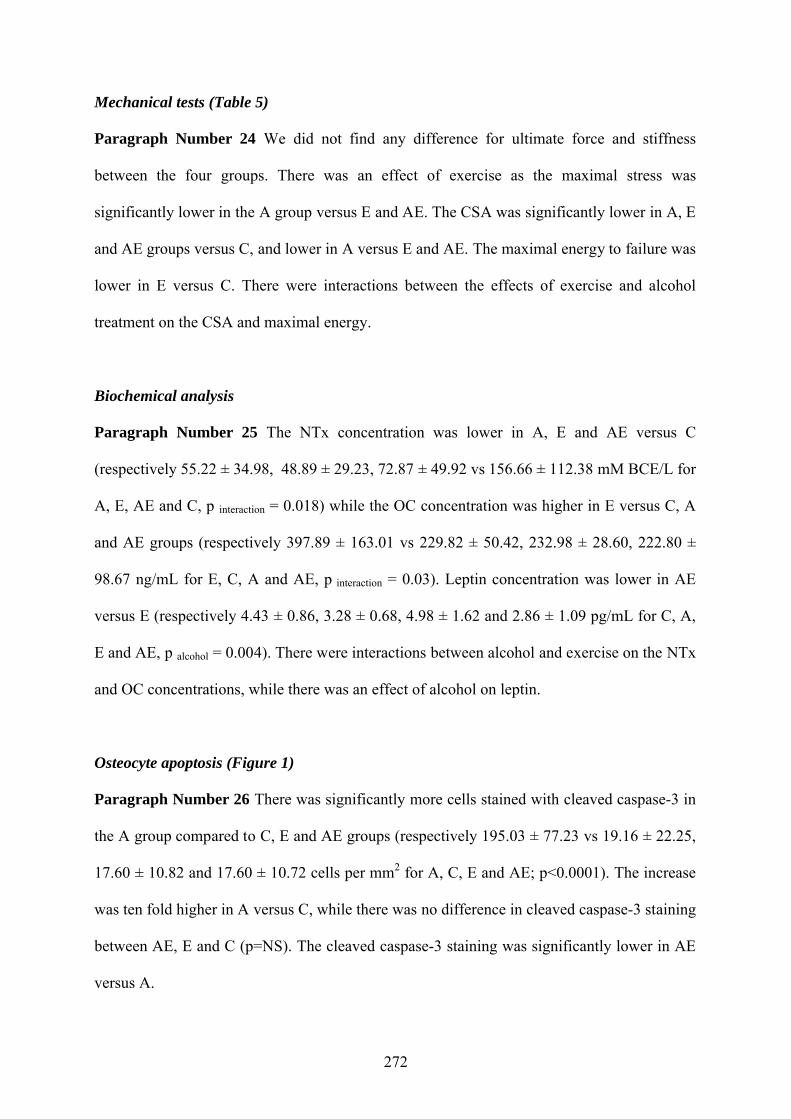
272
Mechanical tests (Table 5)
Paragraph Number 24 We did not find any difference for ultimate force and stiffness
between the four groups. There was an effect of exercise as the maximal stress was
significantly lower in the A group versus E and AE. The CSA was significantly lower in A, E
and AE groups versus C, and lower in A versus E and AE. The maximal energy to failure was
lower in E versus C. There were interactions between the effects of exercise and alcohol
treatment on the CSA and maximal energy.
Biochemical analysis
Paragraph Number 25 The NTx concentration was lower in A, E and AE versus C
(respectively 55.22 ± 34.98, 48.89 ± 29.23, 72.87 ± 49.92 vs 156.66 ± 112.38 mM BCE/L for
A, E, AE and C, p interaction = 0.018) while the OC concentration was higher in E versus C, A
and AE groups (respectively 397.89 ± 163.01 vs 229.82 ± 50.42, 232.98 ± 28.60, 222.80 ±
98.67 ng/mL for E, C, A and AE, p interaction = 0.03). Leptin concentration was lower in AE
versus E (respectively 4.43 ± 0.86, 3.28 ± 0.68, 4.98 ± 1.62 and 2.86 ± 1.09 pg/mL for C, A,
E and AE, p alcohol = 0.004). There were interactions between alcohol and exercise on the NTx
and OC concentrations, while there was an effect of alcohol on leptin.
Osteocyte apoptosis (Figure 1)
Paragraph Number 26 There was significantly more cells stained with cleaved caspase-3 in
the A group compared to C, E and AE groups (respectively 195.03 ± 77.23 vs 19.16 ± 22.25,
17.60 ± 10.82 and 17.60 ± 10.72 cells per mm2 for A, C, E and AE; p<0.0001). The increase
was ten fold higher in A versus C, while there was no difference in cleaved caspase-3 staining
between AE, E and C (p=NS). The cleaved caspase-3 staining was significantly lower in AE
versus A.
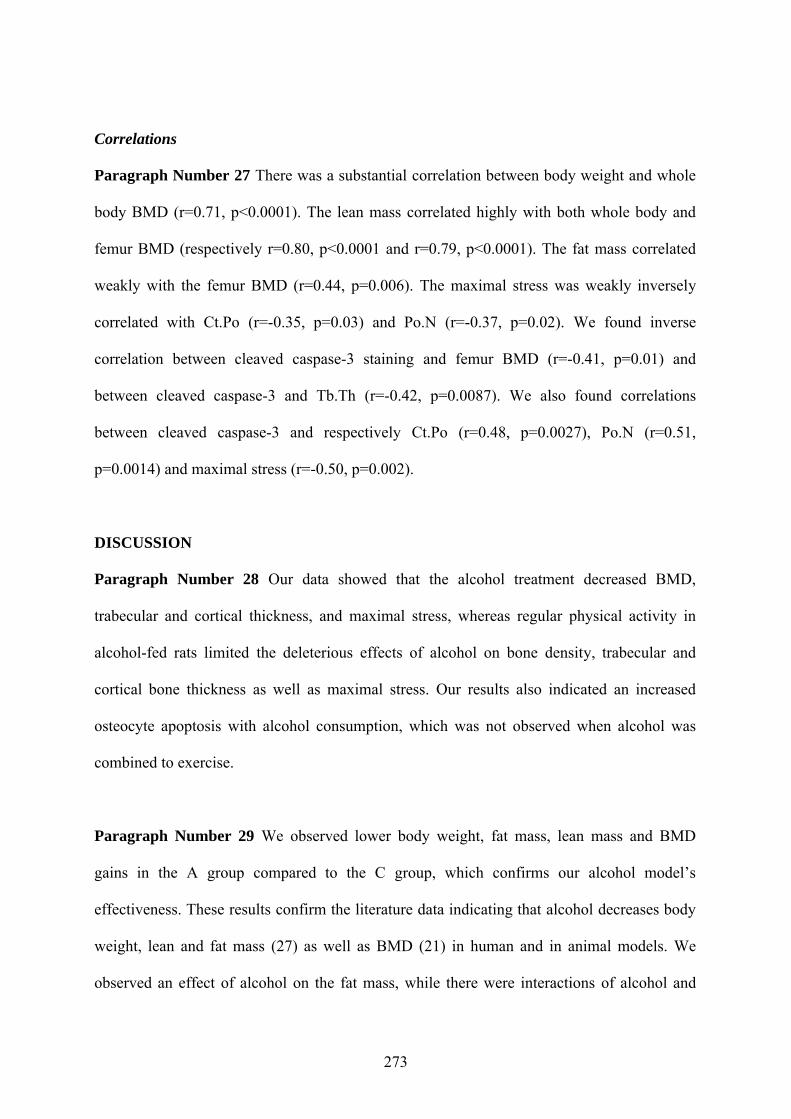
273
Correlations
Paragraph Number 27 There was a substantial correlation between body weight and whole
body BMD (r=0.71, p<0.0001). The lean mass correlated highly with both whole body and
femur BMD (respectively r=0.80, p<0.0001 and r=0.79, p<0.0001). The fat mass correlated
weakly with the femur BMD (r=0.44, p=0.006). The maximal stress was weakly inversely
correlated with Ct.Po (r=-0.35, p=0.03) and Po.N (r=-0.37, p=0.02). We found inverse
correlation between cleaved caspase-3 staining and femur BMD (r=-0.41, p=0.01) and
between cleaved caspase-3 and Tb.Th (r=-0.42, p=0.0087). We also found correlations
between cleaved caspase-3 and respectively Ct.Po (r=0.48, p=0.0027), Po.N (r=0.51,
p=0.0014) and maximal stress (r=-0.50, p=0.002).
DISCUSSION
Paragraph Number 28 Our data showed that the alcohol treatment decreased BMD,
trabecular and cortical thickness, and maximal stress, whereas regular physical activity in
alcohol-fed rats limited the deleterious effects of alcohol on bone density, trabecular and
cortical bone thickness as well as maximal stress. Our results also indicated an increased
osteocyte apoptosis with alcohol consumption, which was not observed when alcohol was
combined to exercise.
Paragraph Number 29 We observed lower body weight, fat mass, lean mass and BMD
gains in the A group compared to the C group, which confirms our alcohol model’s
effectiveness. These results confirm the literature data indicating that alcohol decreases body
weight, lean and fat mass (27) as well as BMD (21) in human and in animal models. We
observed an effect of alcohol on the fat mass, while there were interactions of alcohol and
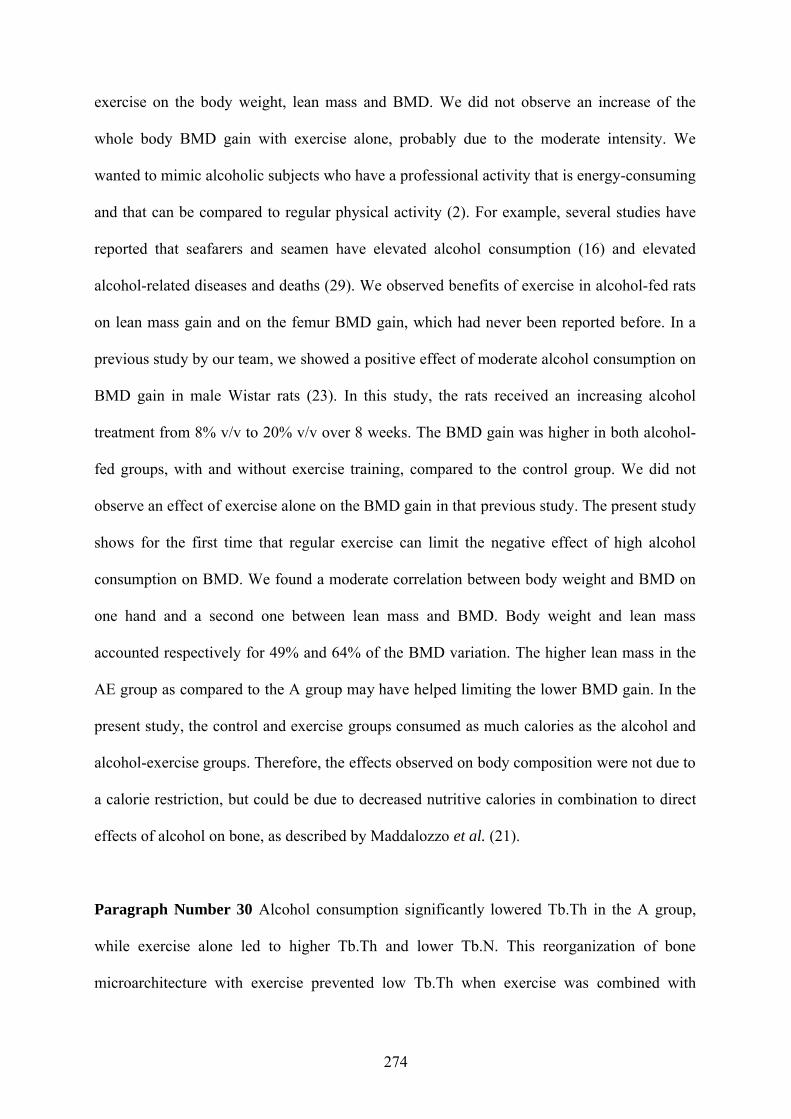
274
exercise on the body weight, lean mass and BMD. We did not observe an increase of the
whole body BMD gain with exercise alone, probably due to the moderate intensity. We
wanted to mimic alcoholic subjects who have a professional activity that is energy-consuming
and that can be compared to regular physical activity (2). For example, several studies have
reported that seafarers and seamen have elevated alcohol consumption (16) and elevated
alcohol-related diseases and deaths (29). We observed benefits of exercise in alcohol-fed rats
on lean mass gain and on the femur BMD gain, which had never been reported before. In a
previous study by our team, we showed a positive effect of moderate alcohol consumption on
BMD gain in male Wistar rats (23). In this study, the rats received an increasing alcohol
treatment from 8% v/v to 20% v/v over 8 weeks. The BMD gain was higher in both alcohol-
fed groups, with and without exercise training, compared to the control group. We did not
observe an effect of exercise alone on the BMD gain in that previous study. The present study
shows for the first time that regular exercise can limit the negative effect of high alcohol
consumption on BMD. We found a moderate correlation between body weight and BMD on
one hand and a second one between lean mass and BMD. Body weight and lean mass
accounted respectively for 49% and 64% of the BMD variation. The higher lean mass in the
AE group as compared to the A group may have helped limiting the lower BMD gain. In the
present study, the control and exercise groups consumed as much calories as the alcohol and
alcohol-exercise groups. Therefore, the effects observed on body composition were not due to
a calorie restriction, but could be due to decreased nutritive calories in combination to direct
effects of alcohol on bone, as described by Maddalozzo et al. (21).
Paragraph Number 30 Alcohol consumption significantly lowered Tb.Th in the A group,
while exercise alone led to higher Tb.Th and lower Tb.N. This reorganization of bone
microarchitecture with exercise prevented low Tb.Th when exercise was combined with
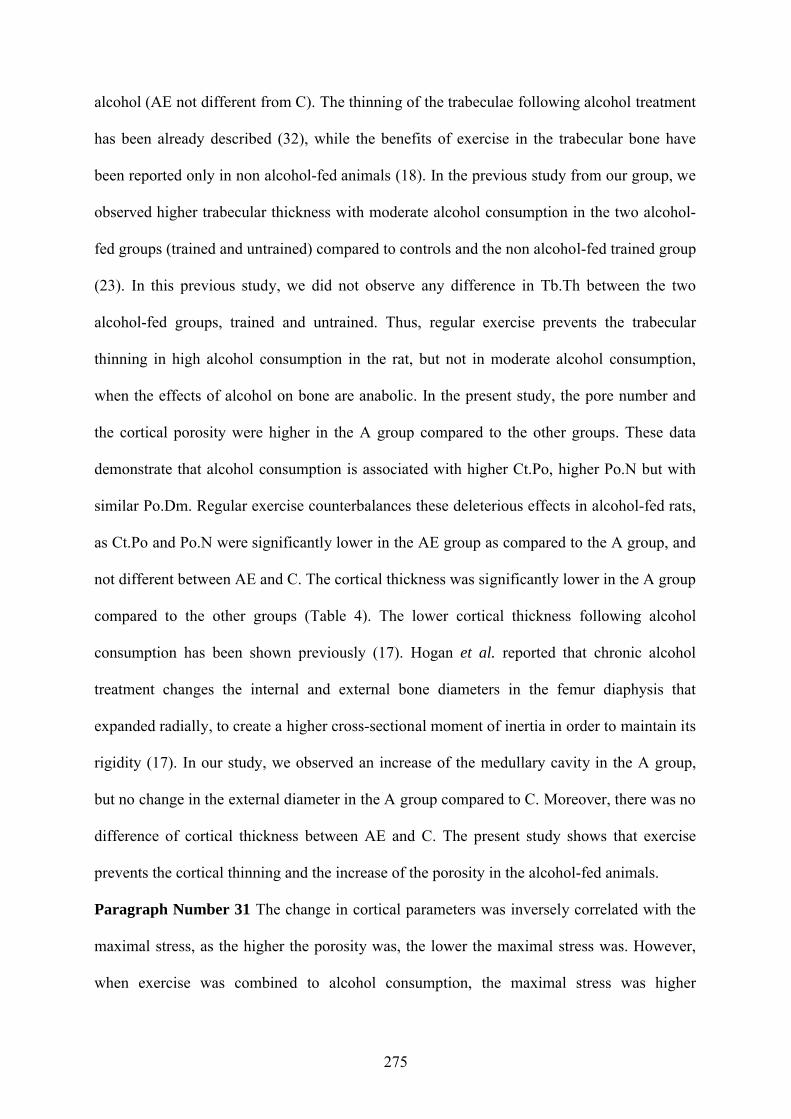
275
alcohol (AE not different from C). The thinning of the trabeculae following alcohol treatment
has been already described (32), while the benefits of exercise in the trabecular bone have
been reported only in non alcohol-fed animals (18). In the previous study from our group, we
observed higher trabecular thickness with moderate alcohol consumption in the two alcohol-
fed groups (trained and untrained) compared to controls and the non alcohol-fed trained group
(23). In this previous study, we did not observe any difference in Tb.Th between the two
alcohol-fed groups, trained and untrained. Thus, regular exercise prevents the trabecular
thinning in high alcohol consumption in the rat, but not in moderate alcohol consumption,
when the effects of alcohol on bone are anabolic. In the present study, the pore number and
the cortical porosity were higher in the A group compared to the other groups. These data
demonstrate that alcohol consumption is associated with higher Ct.Po, higher Po.N but with
similar Po.Dm. Regular exercise counterbalances these deleterious effects in alcohol-fed rats,
as Ct.Po and Po.N were significantly lower in the AE group as compared to the A group, and
not different between AE and C. The cortical thickness was significantly lower in the A group
compared to the other groups (Table 4). The lower cortical thickness following alcohol
consumption has been shown previously (17). Hogan et al. reported that chronic alcohol
treatment changes the internal and external bone diameters in the femur diaphysis that
expanded radially, to create a higher cross-sectional moment of inertia in order to maintain its
rigidity (17). In our study, we observed an increase of the medullary cavity in the A group,
but no change in the external diameter in the A group compared to C. Moreover, there was no
difference of cortical thickness between AE and C. The present study shows that exercise
prevents the cortical thinning and the increase of the porosity in the alcohol-fed animals.
Paragraph Number 31 The change in cortical parameters was inversely correlated with the
maximal stress, as the higher the porosity was, the lower the maximal stress was. However,
when exercise was combined to alcohol consumption, the maximal stress was higher
276
compared to untrained alcohol-fed animals, and not different from controls. Maximal stress is
an intrinsic parameter, as it takes the geometry of bone into account. The higher stress in the
AE group compared to the A group may be linked to the greater trabecular thickness in AE
versus A, or to higher bone quality in AE (lower pore number reported in AE vs A), as shown
by the correlations found between these parameters. Theses correlations showed that Ct.Po
and Po.N explains 9% and 7% of the variation respectively (see results section).
Paragraph Number 32 Maximal stress was also correlated with osteocyte apoptosis.
Cleaved caspase-3 is one of the key executioners of apoptosis. It is responsible of the
cleavage of many key proteins. Increased osteocyte apoptosis has been shown to occur
following ovariectomy in the rat (15) and following alcohol abuse in a rabbit model (39). In
the present study, we found significantly more cells stained with cleaved caspase-3 in the A
group compared to the other groups, while there was no difference between AE and C. In
addition, we found correlations between caspase-3 staining with the femur BMD, Tb.Th,
Ct.Po and Po.N: the osteocyte apoptosis explained more than 30% of the variation of these
parameters. Previous studies have demonstrated that osteocyte apoptosis is associated with a
decrease in bone strength (1). A study by Fonseca et al. (15) reported increased empty
osteocyte lacunae and increased intra cortical porosity following ovariectomy. Osteocyte
apoptosis has been shown to control the activation of intracortical resorption in response to
bone fatigue (10). Thus there is a link between osteocyte apoptosis and intracortical porosity,
as supported by the significant correlation between empty osteocyte lacunae and cortical
porosity found in the study of Cardoso et al. (10). In our study, osteocyte apoptosis was lower
in AE versus A, and this was associated with higher trabecular, cortical thickness and
maximal stress. Fonseca et al. recently demonstrated a decrease of empty osteocyte lacunae
and osteocyte apoptosis in female rats that have been trained following ovariectomy (15),
277
confirming the hypothesis that exercise may prevent bone loss by increasing osteocyte
survival. The exercise used by Fonseca et al. was voluntary running wheel while it was
treadmill training in our study, suggesting that both types of exercise may be efficient to limit
bone loss and stimulate osteocyte survival in bone pathologies. This confirms the in vitro
results with fluid flow and osteocyte survival (35).
Paragraph Number 33 We did not observe a decrease of bone formation marker and an
increase of bone resorption marker in the alcohol-fed groups, as previously reported (7, 13).
The literature data concerning bone turnover in rats after alcohol treatment is not
homogeneous (37). The bone turnover process may vary according to several factors as
calcium level and endocrine regulators linked to nutrition status (14). Moreover, there were
interactions between the effects of alcohol treatment and exercise. We observed a lower leptin
concentration in the AE group compared to the E group. This effect of alcohol has been
previously reported (21). This may be due to the lower fat mass in the AE group compared to
the E group, as leptin is a hormone produced by the adipocytes. Leptin has been shown to
enhance the differentiation of the marrow stem cells in favour of osteogenesis (12). The
higher leptin concentration in the E group could explain the higher serum osteocalcin
concentration observed in this group.
Paragraph Number 34 In conclusion, chronic heavy alcohol consumption lowered BMD
gain, trabecular and cortical thickness while promoting higher cortical porosity and osteocyte
apoptosis. When regular exercise was combined to the alcohol treatment, the low femur BMD
gain was limited compared to alcohol-fed untrained animals, whereas the trabecular and
cortical thickness decreases and the cortical porosity and the osteocyte apoptosis increases
were prevented (not different from the control group). Therefore, regular physical activity
278
limits the alcohol-induced bone damages in this rat model of secondary osteoporosis, which
seems to be linked to the degree of osteocyte apoptosis. Regular physical activity could limit
low BMD in excessive alcohol abuse by preserving bone thickness and preventing porosity.
This lifestyle may help limiting the risk of osteoporosis, a well known complication in
alcoholic subjects.
ACKNOWLEDGEMENTS
We would like to acknowledge Eric Dolleans for technical help during the dissection and
Priscilla C Aveline for helping with the immunostaining. This work has been funded in part
by IREB (Institut de Recherche scientifique sur les Boissons), France.
Disclosures: NONE.
279
REFERENCES
1. Aguirre JI, Plotkin LI, Stewart SA, Weinstein RS, Parfitt AM, Manolagas SC, and Bellido T. Osteocyte apoptosis is induced by weightlessness in mice and precedes osteoclast recruitment and bone loss. J Bone Miner Res. 2006; 21:605-15.
2. Ainsworth BE, Haskell WL, Leon AS, Jacobs DR, Jr., Montoye HJ, Sallis JF, and Paffenbarger RS, Jr. Compendium of physical activities: classification of energy costs of human physical activities. Med Sci Sports Exerc. 1993; 25:71-80.
3. Andreoli A, Monteleone M, Van Loan M, Promenzio L, Tarantino U, and De Lorenzo A. Effects of different sports on bone density and muscle mass in highly trained athletes. Med Sci Sports Exerc. 2001; 33:507-11.
4. Boissiere J, Eder V, Machet MC, Courteix D, and Bonnet P. Moderate exercise training does not worsen left ventricle remodeling and function in untreated severe hypertensive rats. J Appl Physiol. 2008; 104:321-7.
5. Bonewald LF. Osteocyte messages from a bony tomb. Cell Metab. 2007; 5:410-1.
6. Bonnet N, Beaupied H, Vico L, Dolleans E, Laroche N, Courteix D, and Benhamou CL. Combined effects of exercise and propranolol on bone tissue in ovariectomized rats. J Bone Miner Res. 2007; 22:578-88.
7. Broulik PD, Vondrova J, Ruzicka P, Sedlacek R, and Zima T. The effect of chronic alcohol administration on bone mineral content and bone strength in male rats. Physiol Res. 2010; 59:599-604.
8. Burger EH, and Klein-Nulend J. Mechanotransduction in bone--role of the lacuno-canalicular network. Faseb J. 1999; 13 Suppl:S101-12.
9. Burger EH, and Klein-Nulend J. Responses of bone cells to biomechanical forces in vitro. Adv Dent Res. 1999; 13:93-8.
10. Cardoso L, Herman BC, Verborgt O, Laudier D, Majeska RJ, and Schaffler MB. Osteocyte apoptosis controls activation of intracortical resorption in response to bone fatigue. J Bone Miner Res. 2009; 24:597-605.
11. Chakkalakal DA. Alcohol-induced bone loss and deficient bone repair. Alcohol Clin Exp Res. 2005; 29:2077-90.
12. Cornish J, Callon KE, Bava U, et al. Leptin directly regulates bone cell function in vitro and reduces bone fragility in vivo. J Endocrinol. 2002; 175:405-15.
280
13. Dyer SA, Buckendahl P, and Sampson HW. Alcohol consumption inhibits osteoblastic cell proliferation and activity in vivo. Alcohol. 1998; 16:337-41.
14. Evans RK, Antczak AJ, Lester M, Yanovich R, Israeli E, and Moran DS. Effects of a 4-month recruit training program on markers of bone metabolism. Med Sci Sports Exerc. 2008; 40:S660-70.
15. Fonseca H, Moreira-Goncalves D, Esteves JL, Viriato N, Vaz M, Mota MP, and Duarte JA. Voluntary Exercise has Long-Term In Vivo Protective Effects on Osteocyte Viability and Bone Strength Following Ovariectomy. Calcif Tissue Int.2011.
16. Fort E, Massardier-Pilonchery A, and Bergeret A. Psychoactive substances consumption in French fishermen and merchant seamen. Int Arch Occup Environ Health. 2010; 83:497-509.
17. Hogan HA, Groves JA, and Sampson HW. Long-term alcohol consumption in the rat affects femur cross-sectional geometry and bone tissue material properties. Alcohol Clin Exp Res. 1999; 23:1825-33.
18. Joo YI, Sone T, Fukunaga M, Lim SG, and Onodera S. Effects of endurance exercise on three-dimensional trabecular bone microarchitecture in young growing rats. Bone.2003; 33:485-93.
19. Kusy RP, Hirsch PF, and Peng TC. Influence of ethanol on stiffness, toughness, and ductility of femurs of rats. Alcohol Clin Exp Res. 1989; 13:185-9.
20. Lelovas PP, Xanthos TT, Thoma SE, Lyritis GP, and Dontas IA. The laboratory rat as an animal model for osteoporosis research. Comp Med. 2008; 58:424-30.
21. Maddalozzo GF, Turner RT, Edwards CH, Howe KS, Widrick JJ, Rosen CJ, and Iwaniec UT. Alcohol alters whole body composition, inhibits bone formation, and increases bone marrow adiposity in rats. Osteoporos Int. 2009; 20:1529-38.
22. Maurel DB, Boisseau N, Benhamou CL, and Jaffre C. Alcohol and bone: review of dose effects and mechanisms. Osteoporos Int. 2011.
23. Maurel DB, Boisseau N, Ingrand I, Dolleans E, Benhamou CL, and Jaffre C. Combined effects of chronic alcohol consumption and physical activity on bone health: study in a rat model. Eur J Appl Physiol. 2011.
24. Maurel DB, Jaffre C, Rochefort GY, et al. Low bone accrual is associated with osteocyte apoptosis in alcohol-induced osteopenia. Bone. 2011; 49:543-52.
25. Nordstrom A, Olsson T, and Nordstrom P. Sustained benefits from previous physical activity on bone mineral density in males. J Clin Endocrinol Metab. 2006; 91:2600-4.
281
26. Nyquist F, Duppe H, Obrant KJ, Bondeson L, and Nordsletten L. Effects of alcohol on bone mineral and mechanical properties of bone in male rats. Alcohol Alcohol. 2002; 37:21-4.
27. Preedy VR, Reilly ME, Patel VB, Richardson PJ, and Peters TJ. Protein metabolism in alcoholism: effects on specific tissues and the whole body. Nutrition. 1999; 15:604-8.
28. Reed AH, McCarty HL, Evans GL, Turner RT, and Westerlind KC. The effects of chronic alcohol consumption and exercise on the skeleton of adult male rats. Alcohol Clin Exp Res. 2002; 26:1269-74.
29. Roberts SE. Mortality from disease among seafarers in British merchant shipping (1976-1995). Int Marit Health. 2002; 53:43-58.
30. Rochefort GY, Pallu S, and Benhamou CL. Osteocyte: the unrecognized side of bone tissue. Osteoporos Int. 2010; 21:1457-69.
31. Sampson HW. Effect of alcohol consumption on adult and aged bone: a histomorphometric study of the rat animal model. Alcohol Clin Exp Res. 1998; 22:2029-34.
32. Sampson HW, Chaffin C, Lange J, and DeFee B, 2nd. Alcohol consumption by young actively growing rats: a histomorphometric study of cancellous bone. Alcohol Clin Exp Res. 1997; 21:352-9.
33. Sampson HW, Hebert VA, Booe HL, and Champney TH. Effect of alcohol consumption on adult and aged bone: composition, morphology, and hormone levels of a rat animal model. Alcohol Clin Exp Res. 1998; 22:1746-53.
34. Sinaki M, Pfeifer M, Preisinger E, et al. The role of exercise in the treatment of osteoporosis. Curr Osteoporos Rep. 2010; 8:138-44.
35. Tan SD, Bakker AD, Semeins CM, Kuijpers-Jagtman AM, and Klein-Nulend J. Inhibition of osteocyte apoptosis by fluid flow is mediated by nitric oxide. Biochem Biophys Res Commun. 2008; 369:1150-4.
36. Turner CH, and Burr DB. Basic biomechanical measurements of bone: a tutorial. Bone. 1993; 14:595-608.
37. Turner RT. Skeletal response to alcohol. Alcohol Clin Exp Res. 2000; 24:1693-701.
38. Vatsa A, Semeins CM, Smit TH, and Klein-Nulend J. Paxillin localisation in osteocytes--is it determined by the direction of loading? Biochem Biophys Res Commun. 2008; 377:1019-24.
282
39. Wang Y, Li Y, Mao K, Li J, Cui Q, and Wang GJ. Alcohol-induced adipogenesis in bone and marrow: a possible mechanism for osteonecrosis. Clin Orthop Relat Res.2003:213-24.
40. Zebaze RM, Ghasem-Zadeh A, Bohte A, et al. Intracortical remodelling and porosity in the distal radius and post-mortem femurs of women: a cross-sectional study. Lancet.2010; 375:1729-36.
283
Figure caption:
Fig. 1 Epifluorescence microscopy realised on tibia slices of control (C), alcohol-fed (A), exercised (E) and alcohol-fed exercised (AE) rats. Osteocytes were stained for cleaved caspase-3, a marker of apoptosis. We calculated the number of cells stained with cleaved caspase-3 per mm2. There were significantly more cells stained with cleaved caspase-3 in the A group versus C, E and AE groups. * indicates a significant difference with the other groups (p<0.05). The objective magnification for imaging the markers was x100. Data were expressed as mean ± standard deviation (SD)
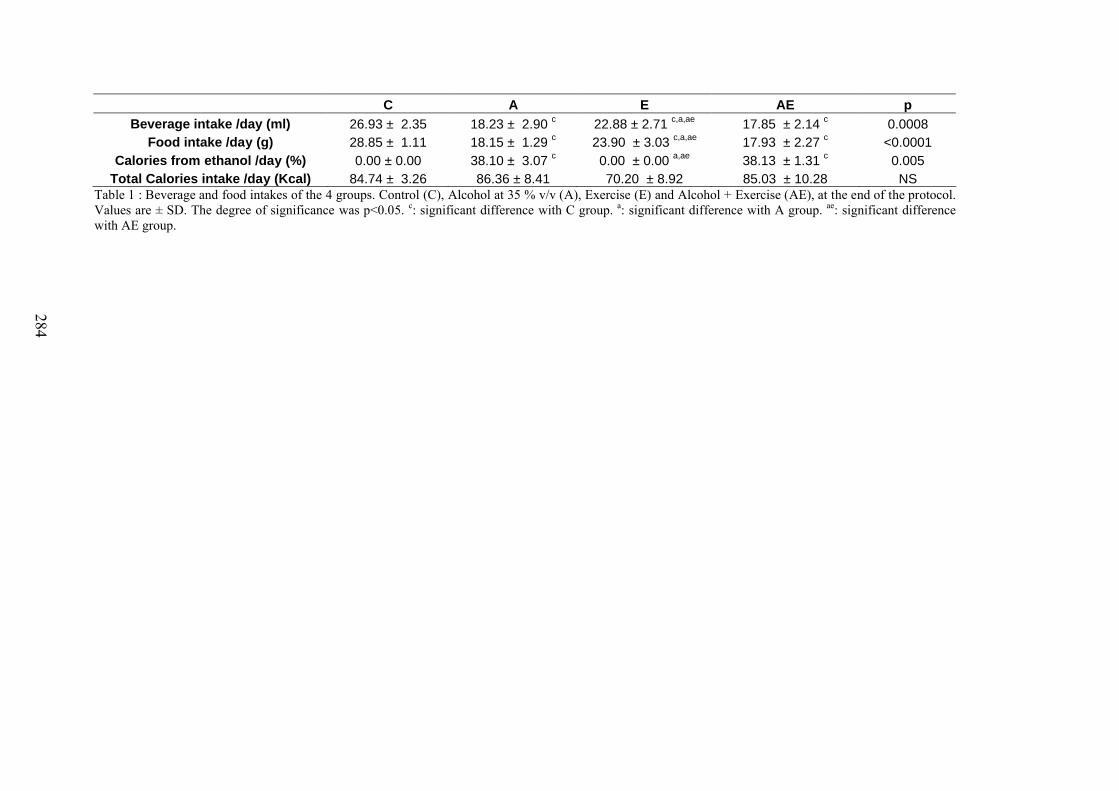
284
C A E AE p
Beverage intake /day (ml) 26.93 ± 2.35 18.23 ± 2.90 c 22.88 ± 2.71 c,a,ae 17.85 ± 2.14 c 0.0008Food intake /day (g) 28.85 ± 1.11 18.15 ± 1.29 c 23.90 ± 3.03 c,a,ae 17.93 ± 2.27 c <0.0001
Calories from ethanol /day (%) 0.00 ± 0.00 38.10 ± 3.07 c 0.00 ± 0.00 a,ae 38.13 ± 1.31 c 0.005Total Calories intake /day (Kcal) 84.74 ± 3.26 86.36 ± 8.41 70.20 ± 8.92 85.03 ± 10.28 NS
Table 1 : Beverage and food intakes of the 4 groups. Control (C), Alcohol at 35 % v/v (A), Exercise (E) and Alcohol + Exercise (AE), at the end of the protocol. Values are ± SD. The degree of significance was p<0.05. c: significant difference with C group. a: significant difference with A group. ae: significant difference with AE group.
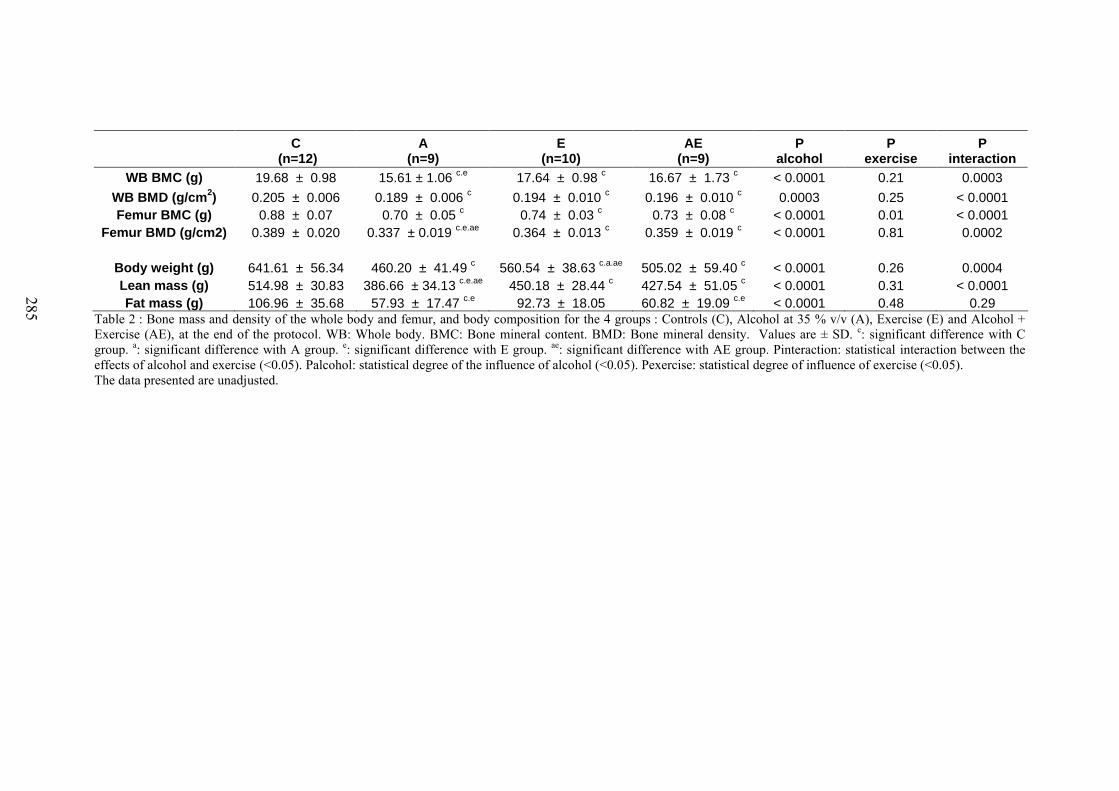
285
C (n=12)
A (n=9)
E (n=10)
AE (n=9)
P alcohol
P exercise
P interaction
WB BMC (g) 19.68 ± 0.98 15.61 ± 1.06 c.e 17.64 ± 0.98 c 16.67 ± 1.73 c < 0.0001 0.21 0.0003
WB BMD (g/cm2) 0.205 ± 0.006 0.189 ± 0.006 c 0.194 ± 0.010 c 0.196 ± 0.010 c 0.0003 0.25 < 0.0001Femur BMC (g) 0.88 ± 0.07 0.70 ± 0.05 c 0.74 ± 0.03 c 0.73 ± 0.08 c < 0.0001 0.01 < 0.0001
Femur BMD (g/cm2) 0.389 ± 0.020 0.337 ± 0.019 c.e.ae 0.364 ± 0.013 c 0.359 ± 0.019 c < 0.0001 0.81 0.0002
Body weight (g) 641.61 ± 56.34 460.20 ± 41.49 c 560.54 ± 38.63 c.a.ae 505.02 ± 59.40 c < 0.0001 0.26 0.0004Lean mass (g) 514.98 ± 30.83 386.66 ± 34.13 c.e.ae 450.18 ± 28.44 c 427.54 ± 51.05 c < 0.0001 0.31 < 0.0001Fat mass (g) 106.96 ± 35.68 57.93 ± 17.47 c.e 92.73 ± 18.05 60.82 ± 19.09 c.e < 0.0001 0.48 0.29
Table 2 : Bone mass and density of the whole body and femur, and body composition for the 4 groups : Controls (C), Alcohol at 35 % v/v (A), Exercise (E) and Alcohol + Exercise (AE), at the end of the protocol. WB: Whole body. BMC: Bone mineral content. BMD: Bone mineral density. Values are ± SD. c: significant difference with C group. a: significant difference with A group. e: significant difference with E group. ae: significant difference with AE group. Pinteraction: statistical interaction between the effects of alcohol and exercise (<0.05). Palcohol: statistical degree of the influence of alcohol (<0.05). Pexercise: statistical degree of influence of exercise (<0.05).The data presented are unadjusted.
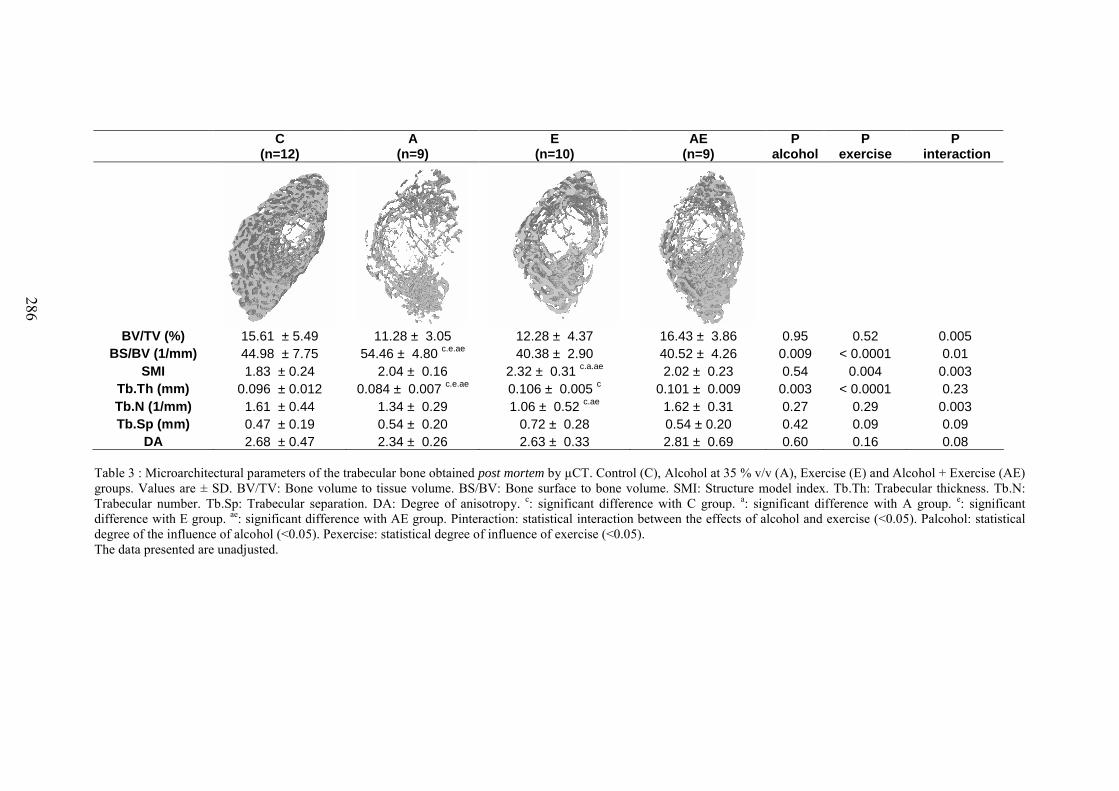
286
C(n=12)
A(n=9)
E(n=10)
AE(n=9)
Palcohol
P exercise
P interaction
BV/TV (%) 15.61 ± 5.49 11.28 ± 3.05 12.28 ± 4.37 16.43 ± 3.86 0.95 0.52 0.005BS/BV (1/mm) 44.98 ± 7.75 54.46 ± 4.80 c.e.ae 40.38 ± 2.90 40.52 ± 4.26 0.009 < 0.0001 0.01
SMI 1.83 ± 0.24 2.04 ± 0.16 2.32 ± 0.31 c.a.ae 2.02 ± 0.23 0.54 0.004 0.003Tb.Th (mm) 0.096 ± 0.012 0.084 ± 0.007 c.e.ae 0.106 ± 0.005 c 0.101 ± 0.009 0.003 < 0.0001 0.23Tb.N (1/mm) 1.61 ± 0.44 1.34 ± 0.29 1.06 ± 0.52 c.ae 1.62 ± 0.31 0.27 0.29 0.003Tb.Sp (mm) 0.47 ± 0.19 0.54 ± 0.20 0.72 ± 0.28 0.54 ± 0.20 0.42 0.09 0.09
DA 2.68 ± 0.47 2.34 ± 0.26 2.63 ± 0.33 2.81 ± 0.69 0.60 0.16 0.08
Table 3 : Microarchitectural parameters of the trabecular bone obtained post mortem by µCT. Control (C), Alcohol at 35 % v/v (A), Exercise (E) and Alcohol + Exercise (AE) groups. Values are ± SD. BV/TV: Bone volume to tissue volume. BS/BV: Bone surface to bone volume. SMI: Structure model index. Tb.Th: Trabecular thickness. Tb.N: Trabecular number. Tb.Sp: Trabecular separation. DA: Degree of anisotropy. c: significant difference with C group. a: significant difference with A group. e: significant difference with E group. ae: significant difference with AE group. Pinteraction: statistical interaction between the effects of alcohol and exercise (<0.05). Palcohol: statistical degree of the influence of alcohol (<0.05). Pexercise: statistical degree of influence of exercise (<0.05). The data presented are unadjusted.
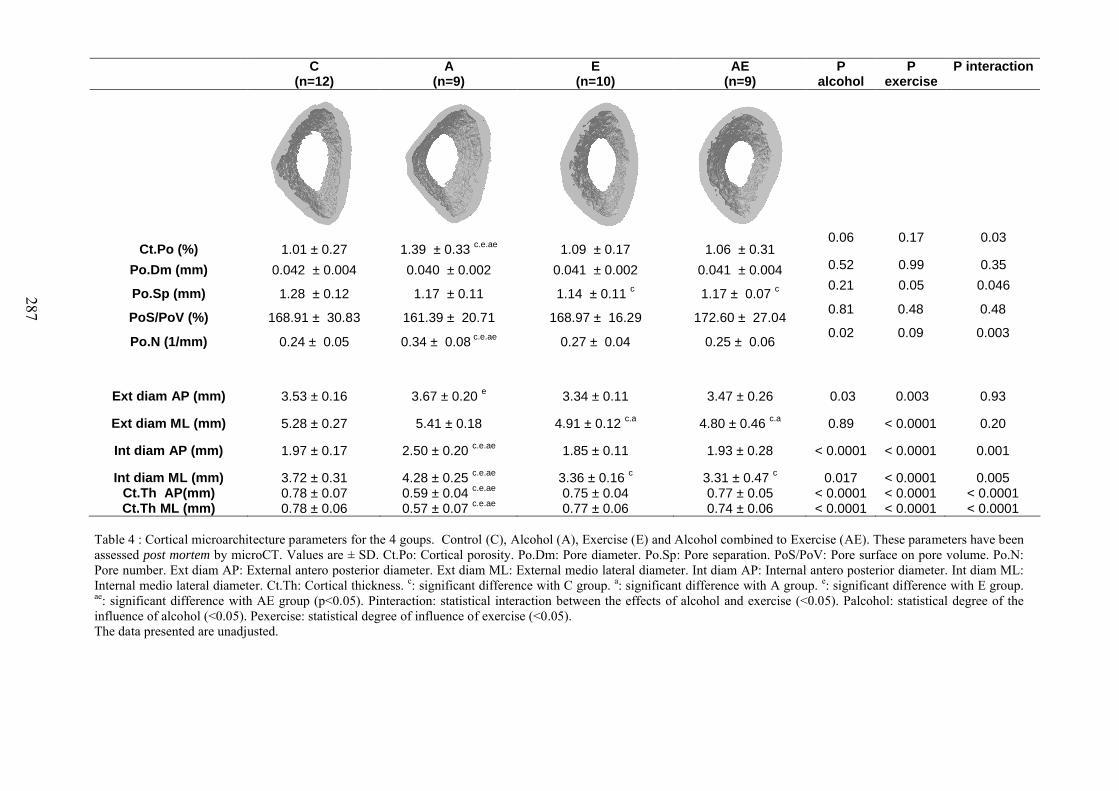
287
Table 4 : Cortical microarchitecture parameters for the 4 goups. Control (C), Alcohol (A), Exercise (E) and Alcohol combined to Exercise (AE). These parameters have been assessed post mortem by microCT. Values are ± SD. Ct.Po: Cortical porosity. Po.Dm: Pore diameter. Po.Sp: Pore separation. PoS/PoV: Pore surface on pore volume. Po.N: Pore number. Ext diam AP: External antero posterior diameter. Ext diam ML: External medio lateral diameter. Int diam AP: Internal antero posterior diameter. Int diam ML: Internal medio lateral diameter. Ct.Th: Cortical thickness. c: significant difference with C group. a: significant difference with A group. e: significant difference with E group. ae: significant difference with AE group (p<0.05). Pinteraction: statistical interaction between the effects of alcohol and exercise (<0.05). Palcohol: statistical degree of the influence of alcohol (<0.05). Pexercise: statistical degree of influence of exercise (<0.05). The data presented are unadjusted.
C(n=12)
A(n=9)
E(n=10)
AE(n=9)
Palcohol
Pexercise
P interaction
Ct.Po (%) 1.01 ± 0.27 1.39 ± 0.33 c.e.ae 1.09 ± 0.17 1.06 ± 0.310.06 0.17 0.03
Po.Dm (mm) 0.042 ± 0.004 0.040 ± 0.002 0.041 ± 0.002 0.041 ± 0.004 0.52 0.99 0.35
Po.Sp (mm) 1.28 ± 0.12 1.17 ± 0.11 1.14 ± 0.11 c 1.17 ± 0.07 c0.21 0.05 0.046
PoS/PoV (%) 168.91 ± 30.83 161.39 ± 20.71 168.97 ± 16.29 172.60 ± 27.040.81 0.48 0.48
Po.N (1/mm) 0.24 ± 0.05 0.34 ± 0.08 c.e.ae 0.27 ± 0.04 0.25 ± 0.060.02 0.09 0.003
Ext diam AP (mm) 3.53 ± 0.16 3.67 ± 0.20 e 3.34 ± 0.11 3.47 ± 0.26 0.03 0.003 0.93
Ext diam ML (mm) 5.28 ± 0.27 5.41 ± 0.18 4.91 ± 0.12 c.a 4.80 ± 0.46 c.a 0.89 < 0.0001 0.20
Int diam AP (mm) 1.97 ± 0.17 2.50 ± 0.20 c.e.ae 1.85 ± 0.11 1.93 ± 0.28 < 0.0001 < 0.0001 0.001
Int diam ML (mm) 3.72 ± 0.31 4.28 ± 0.25 c.e.ae 3.36 ± 0.16 c 3.31 ± 0.47 c 0.017 < 0.0001 0.005Ct.Th AP(mm) 0.78 ± 0.07 0.59 ± 0.04 c.e.ae 0.75 ± 0.04 0.77 ± 0.05 < 0.0001 < 0.0001 < 0.0001Ct.Th ML (mm) 0.78 ± 0.06 0.57 ± 0.07 c.e.ae 0.77 ± 0.06 0.74 ± 0.06 < 0.0001 < 0.0001 < 0.0001
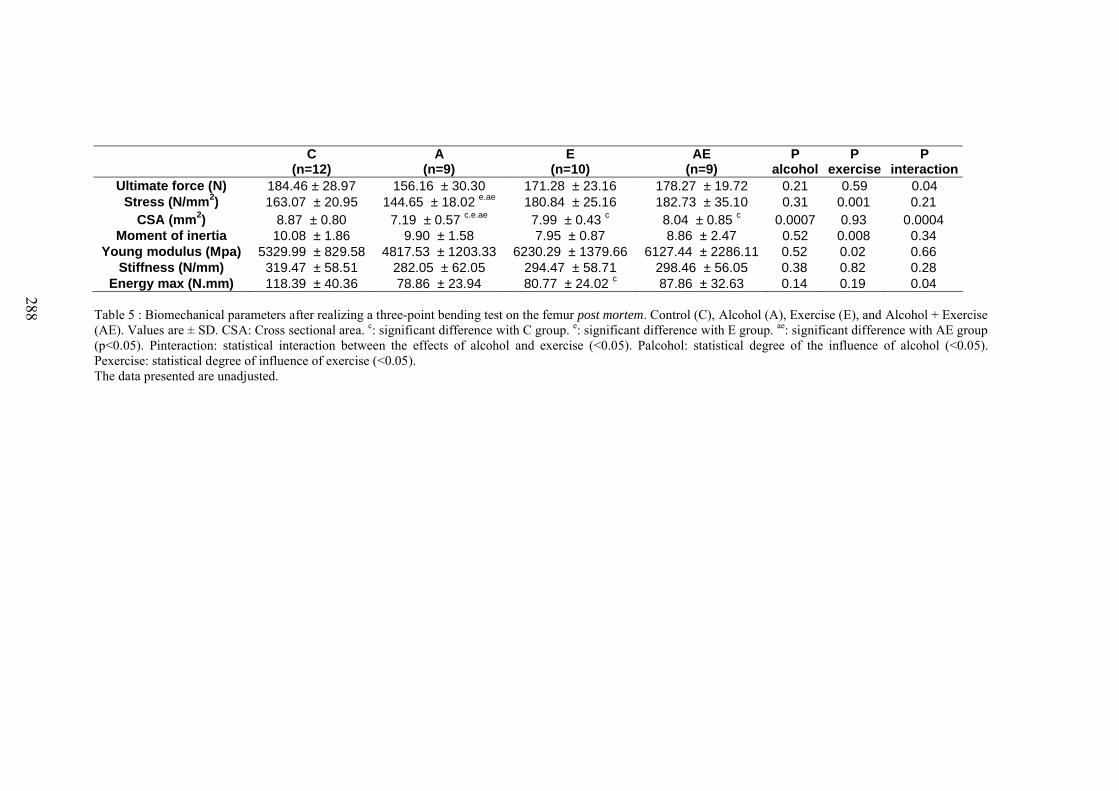
288
C(n=12)
A(n=9)
E(n=10)
AE(n=9)
Palcohol
Pexercise
Pinteraction
Ultimate force (N) 184.46 ± 28.97 156.16 ± 30.30 171.28 ± 23.16 178.27 ± 19.72 0.21 0.59 0.04Stress (N/mm2) 163.07 ± 20.95 144.65 ± 18.02 e.ae 180.84 ± 25.16 182.73 ± 35.10 0.31 0.001 0.21
CSA (mm2) 8.87 ± 0.80 7.19 ± 0.57 c.e.ae 7.99 ± 0.43 c 8.04 ± 0.85 c 0.0007 0.93 0.0004Moment of inertia 10.08 ± 1.86 9.90 ± 1.58 7.95 ± 0.87 8.86 ± 2.47 0.52 0.008 0.34
Young modulus (Mpa) 5329.99 ± 829.58 4817.53 ± 1203.33 6230.29 ± 1379.66 6127.44 ± 2286.11 0.52 0.02 0.66Stiffness (N/mm) 319.47 ± 58.51 282.05 ± 62.05 294.47 ± 58.71 298.46 ± 56.05 0.38 0.82 0.28
Energy max (N.mm) 118.39 ± 40.36 78.86 ± 23.94 80.77 ± 24.02 c 87.86 ± 32.63 0.14 0.19 0.04
Table 5 : Biomechanical parameters after realizing a three-point bending test on the femur post mortem. Control (C), Alcohol (A), Exercise (E), and Alcohol + Exercise (AE). Values are ± SD. CSA: Cross sectional area. c: significant difference with C group. e: significant difference with E group. ae: significant difference with AE group (p<0.05). Pinteraction: statistical interaction between the effects of alcohol and exercise (<0.05). Palcohol: statistical degree of the influence of alcohol (<0.05). Pexercise: statistical degree of influence of exercise (<0.05).The data presented are unadjusted.
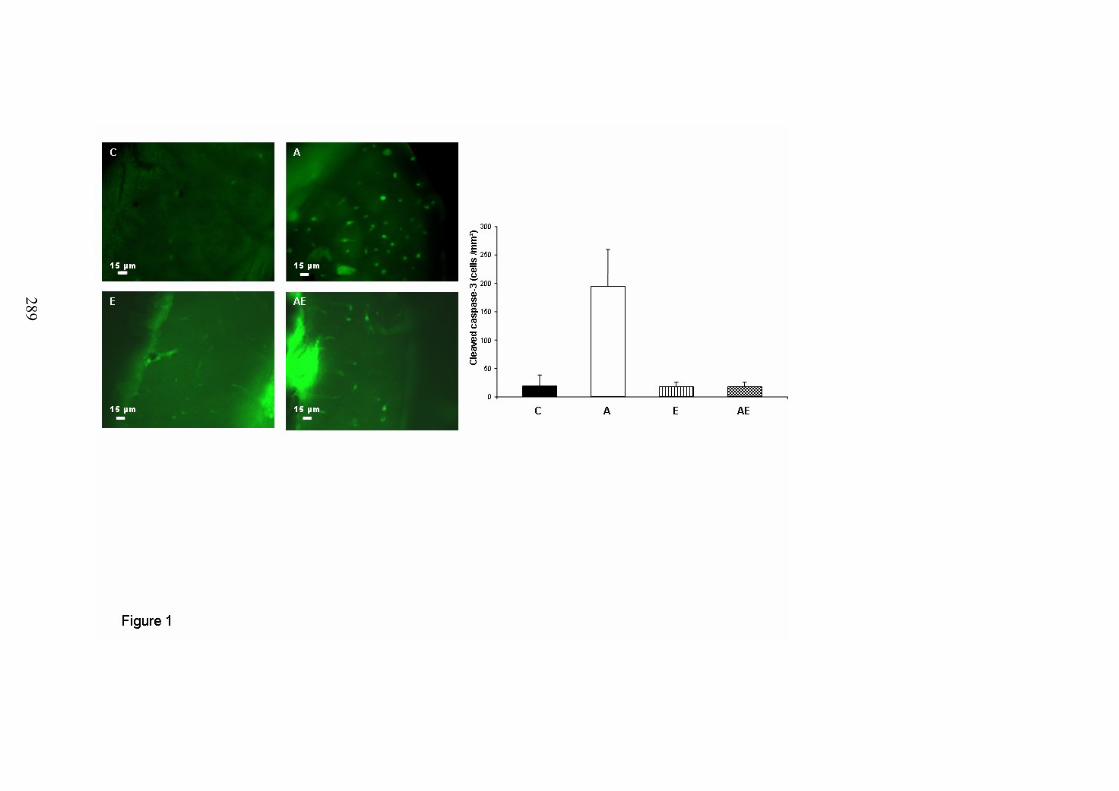
289

290
Discussion
291
Ce travail de thèse avait pour but d’étudier les effets d’une consommation chronique
d’alcool combinée ou non à une activité physique régulière sur les paramètres du tissu osseux
chez le rat.
Modèle animal
Nos études ont porté sur des animaux d’environ 250g en début d’expérimentation,
correspondant à de jeunes adultes. Le rat grandit toute sa vie, et particulièrement jusqu’à 10
mois, et se révèle donc être un bon modèle pour étudier les effets de l’alcool chez des jeunes
adultes lors de l’acquisition du pic de masse osseuse. Ce modèle (rats entre 2 mois et 7/10
mois) se retrouve régulièrement dans la littérature traitant des effets de l’alcool sur le système
osseux (Hogan et al. 1999; Sampson 1998).
Alcoolisation
Nous avons choisi un type d’alcoolisation qui se rapproche de l’alcoolisation humaine,
en séparant la boisson alcoolisée et la nourriture, et en alcoolisant les rats par biberon. Ce
type de protocole n’est pas nouveau (Baran et al. 1980; Broulik et al. 2010), mais est très peu
utilisé dans la littérature. En effet, les animaux alcoolisés de cette façon subissent une
diminution de la densité minérale osseuse associée à une modification de la composition
corporelle, tout comme le sujet alcoolique humain. Cependant, il est difficile dans ce modèle
de dissocier les effets directs des effets indirects de l’alcool (à travers la diminution de poids,
de masse grasse, etc.). Cela explique pourquoi la plupart des études utilisent une solution
nutritive alcoolisée, afin d’étudier les effets directs de l’alcool sur l’os (Chakkalakal et al.
2005; Hogan et al. 1997; Nishiguchi et al. 2000; Sampson et Spears 1999). Toutefois ces
études ne permettent pas d’étudier la relation entre os, masse grasse et lipides, facteurs
impliqués dans la régulation de la masse osseuse. Nous n’avons pas non plus souhaité
alcooliser nos animaux par gavage ou par injections car ce sont des procédés stressants qui
peuvent induire des modifications métaboliques. Les doses d’alcool utilisées dans les études 2
à 5 représentaient des doses d’alcool très élevées, mimant des alcoolisations chroniques
sévères. Toutefois, nos animaux ont reçus respectivement 29%, 34% et 38% des calories qui
provenaient de l’alcool durant le protocole, alors que chez les sujets alcooliques, le
pourcentage de calories apportées par l’alcool peut atteindre 66% (Lopez et al. 1991; Manari
et al. 2003).
292
Entraînement
Nous avons choisi d’entraîner nos animaux sur tapis roulant car c’est un exercice qui est
comparable à une activité humaine. De plus, les effets de ce type d’exercice sur l’os ont été
bien démontrés chez l’animal (Bonnet et al. 2007a; Lespessailles et al. 2009). Nous avons
entraîné nos animaux à une intensité de 60 à 70% de la vitesse maximale aérobie, ce qui
représente une intensité modérée, afin d’empêcher le surentraînement et les blessures. De
plus, nous avons choisi d’entraîner nos animaux 40 à 45 min par jour dans l’étude 1, puis 1h
par jour dans l’étude 5, car nous voulions mimer un entraînement modéré dans l’étude 1 et un
entraînement plus long dans l’étude 5. Des protocoles similaires ont été testés auparavant
dans la littérature (Bonnet et al. 2007b; Hagihara et al. 2005; Reed et al. 2002). Il a été
démontré qu’il faut un minimum de 5 jours par semaine pour induire un effet ostéogénique,
ce pourquoi nous avons entraîné nos animaux à cette fréquence. Cependant, il semble qu’un
entraînement de 40 à 45 min par jour durant 8 semaines ne soit pas suffisant pour augmenter
la DMO chez le rat.
Effet de l’alcool et de l’exercice physique sur les paramètres osseux
Nous avons pu mettre en évidence dans ce travail un effet bénéfique de la faible
consommation d’alcool sur le tissu osseux (densité et épaisseur trabéculaire). La dose
d’alcool administrée aux rats était progressivement augmentée durant 8 semaines afin de
mimer une alcoolisation croissante chez l’humain. Si les effets positifs d’une faible
consommation d’alcool ont été rapportés sur le tissu osseux (Ganry et al. 2000; Venkat et al.
2009), une dose modérée peut avoir des effets délétères, suivant l’âge, le sexe et le statut
hormonal du sujet (Hernandez-Avila et al. 1991; Tucker et al. 2009). Les effets d’une
augmentation progressive d’une consommation d’alcool sur le tissu osseux chez des jeunes
sujets actifs ne sont pas documentés. Notre étude indique que ces effets ne sont pas délétères
sur le tissu osseux à court terme (8 semaines) mais, compte tenu de l’évolution de la
composition corporelle et du remodelage osseux, il est toutefois probable qu’une
consommation à plus long terme entraînerait une diminution des paramètres de densité et de
volume d’os trabéculaire.
C’est ce que nous avons mis en évidence, sur un protocole de 17 semaines. Nous avons
observé un effet négatif de l’alcool consommé de façon chronique sur les paramètres osseux
(DMO, épaisseur trabéculaire, énergie maximale), et sur l’os cortical (épaisseur et nombre de
pores), ce qui n’avait jamais été montré auparavant. Nous avons montré qu’il existe un effet-
dose sur les paramètres osseux. L’effet-dose avait été montré sur l’épaisseur trabéculaire et la
293
résorption osseuse par Turner et al. (Turner et al. 2001), et sur la réparation osseuse par
Chakkalakal et al. (Chakkalakal et al. 2005). Nos travaux ont quant à eux permis de montrer
un effet-dose de l’alcool sur la DMO, la porosité corticale, l’épaisseur corticale et la longueur
du fémur, mais pas sur l’os trabéculaire. La dose 35% v/v apparaissait beaucoup plus délétère
que les autres doses, ce qui confirme l’intérêt de ce dosage (35-38% de l’AETQ) souvent
choisi dans la littérature pour juger sur des modèles animaux des effets de l’alcool sur l’os
(Dyer et al. 1998; Hogan et al. 1999; Sampson et al. 1997; Turner et al. 1987; Wezeman et
al. 2003).
Nous avons également mis en évidence une augmentation de l’apoptose des ostéocytes
dans l’os cortical, ainsi qu’une augmentation des lacunes ostéocytaires vides. Nous avons
montré de plus qu’il y avait une augmentation des lipides dans la moelle. Celle-ci était
corrélée avec l’hypoleptinémie présente dans le groupe alcoolisé, mais aussi avec l’apoptose
des ostéocytes et avec la DMO. L’apoptose des ostéocytes était également inversement
corrélé avec la DMO. De plus, la morphologie des ostéocytes était modifiée. Nos travaux ont
aussi indiqué une relation entre le contenu lipidique de la moelle, le contenu lipidique des
micro-vaisseaux, le contenu lipidique des ostéocytes et l’apoptose de ceux-ci. La présence de
gouttelettes lipidiques dans les ostéocytes avait précédemment été décrite par Kawai et
collaborateurs (Kawai et al. 1980; Kawai et al. 1985) dans des modèles d’ostéonécrose
idiopathique et induite par les glucocorticoïdes, et par Wang et collaborateurs (Wang et al.
2003) dans un modèle d’ostéonécrose lié à l’alcool. Cependant, la présence de lipides dans les
vaisseaux n’avait pas été rapportée, et aucune corrélation avec l’apoptose des ostéocytes
n’avait été montrée.
Suite à ce travail, nous avons montré que l’exercice appliqué à notre modèle
d’ostéoporose secondaire permet de limiter le faible gain de DMO, et permet de contrecarrer
les effets délétères de l’alcool sur les paramètres de microarchitecture trabéculaire et corticale
(Tb.Th, Ct.Po, Ct.Th) et la résistance osseuse (contrainte maximale). L’originalité de ce
travail porte sur l’effet protecteur de l’exercice sur l’apoptose des ostéocytes, apoptose qui est
corrélée avec la DMO, le Tb.Th et le Ct.Po. La pratique d’une activité physique régulière
permet donc de pallier en partie les effets de la consommation d’alcool chronique et excessive
chez le rat, probablement via une apoptose des ostéocytes normale, qui est corrélée avec les
paramètres de masse osseuse. Une étude a récemment observé des résultats similaires en
indiquant un effet protecteur de l’exercice sur l’apoptose des ostéocytes dans un modèle
d’ostéoporose induite par une ovariectomie (Fonseca et al. 2011).
294
Répercussions possibles chez l’homme
La consommation chronique d’alcool est délétère sur le tissu osseux au-delà d’un
certain seuil. Une fois ce seuil franchi, l’alcool mène à une diminution des paramètres osseux
avec un effet-dose. L’os trabéculaire et l’os cortical sont diminués par l’alcool, ce qui
implique que l’étude de ces deux types d’os est importante quant à l’analyse des effets de
l’alcool sur le tissu osseux. Nous avons montré dans ce travail que la pratique d’une activité
sportive prévient les effets de l’alcool sur l’épaisseur trabéculaire, corticale, l’énergie
maximale et l’apoptose des ostéocytes.
Cependant chez le sportif, s’il n’a pas été montré d’effet additif de la pratique sportive
associée à des faibles consommations d’alcool, bénéfiques pour le squelette, la densité
minérale osseuse semble être diminuée par une alcoolisation excessive, même combinée à un
exercice physique. De ce fait, combiner une alcoolisation régulière à une pratique physique
chez les sportifs peut mener à une fragilisation du tissu osseux et à une augmentation du
risque fracturaire sur du long terme.
Limites de ce travail
Ce travail a toutefois quelques limites. Premièrement, les animaux alcoolisés ont subi,
de par le modèle d’alcoolisation, une restriction nutritive. La diminution d’apport protéique et
glucidique dans les groupes alcoolisés a pu avoir un effet sur les paramètres osseux, comme
l’ont décrit Devlin et al. (Devlin et al. 2010). Dans cette optique, il aurait été intéressant
d’avoir un groupe contrôle qui ait consommé de la nourriture à volonté, pour ainsi juger des
effets de la restriction calorique sur les animaux alcoolisés ou non. Ce plan expérimental a
déjà été appliqué par Maddalozzo et al. (Maddalozzo et al. 2009), qui ont montré que l’alcool
a des effets sur l’os qui sont à la fois dépendants (composition corporelle) et indépendants
(formation osseuse, leptine, contenu lipidique de la moelle) de la restriction énergétique.
Deuxièmement, nous avons étudié les effets d’une alcoolisation chronique chez des
animaux en croissance, ce qui ne permet pas une comparaison avec l’homme adulte.
Toutefois, ce modèle animal est validé et couramment utilisé dans la recherche sur
l’ostéoporose (Lelovas et al. 2008).
Ensuite, nous n’avons pas réalisé de dosages pour quantifier les concentrations de RANKL et
OPG (différenciation des ostéoclastes), de la GH et de l’Igf-1, qui nous auraient permis
d’évaluer le fonctionnement métabolique du foie et d’évaluer ces marqueurs du
fonctionnement des ostéoblastes et des ostéoclastes.
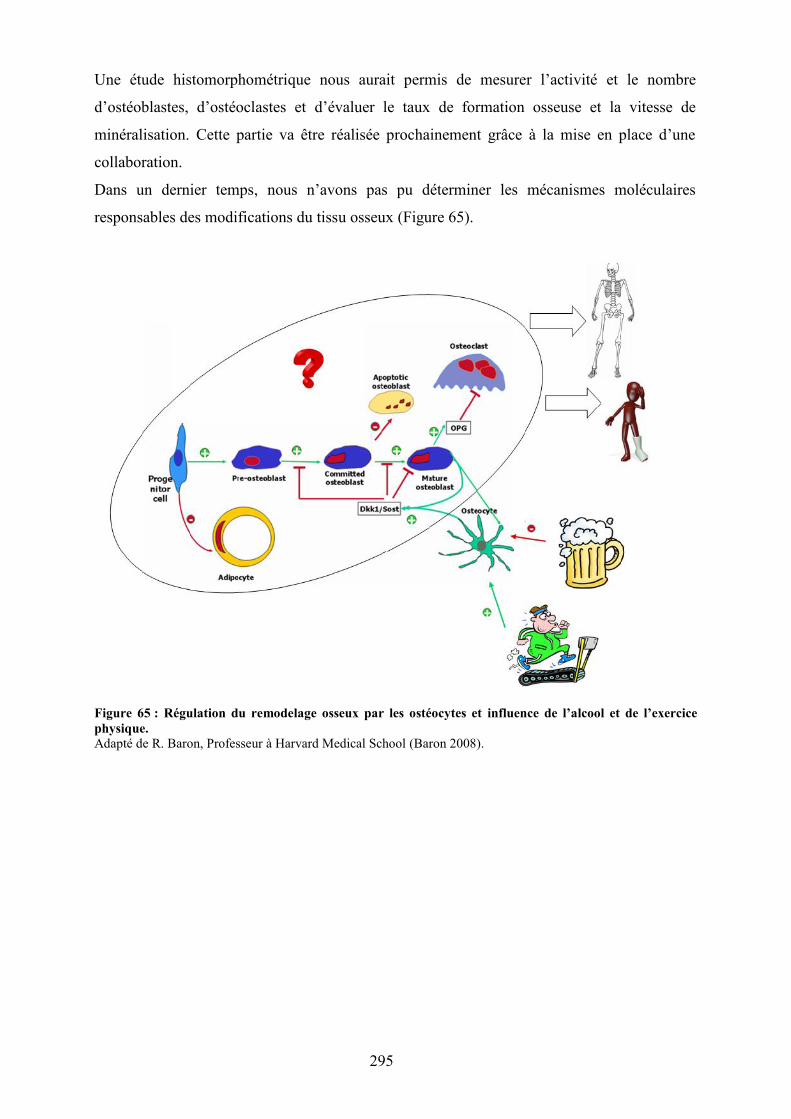
295
Une étude histomorphométrique nous aurait permis de mesurer l’activité et le nombre
d’ostéoblastes, d’ostéoclastes et d’évaluer le taux de formation osseuse et la vitesse de
minéralisation. Cette partie va être réalisée prochainement grâce à la mise en place d’une
collaboration.
Dans un dernier temps, nous n’avons pas pu déterminer les mécanismes moléculaires
responsables des modifications du tissu osseux (Figure 65).
Figure 65 : Régulation du remodelage osseux par les ostéocytes et influence de l’alcool et de l’exercicephysique.Adapté de R. Baron, Professeur à Harvard Medical School (Baron 2008).

296
Conclusion et perspectives
297
Ce travail a montré que la consommation d’alcool peut avoir un effet positif ou négatif
sur le tissu osseux, et cela en fonction de la dose ingérée. Ainsi plus la dose est importante,
plus les paramètres du tissu osseux sont affectés. La consommation chronique et excessive
d’alcool diminue l’épaisseur de l’os trabéculaire et cortical, menant à une diminution de la
DMO. Cette diminution de la DMO est également corrélée à une augmentation de l’apoptose
des ostéocytes. Il semble que la modification du métabolisme osseux soit liée à une
modification du métabolisme lipidique : concentration de leptine, et contenu lipidique des
vaisseaux, de la moelle osseuse et des ostéocytes.
En revanche, la combinaison d’un exercice physique à la consommation d’alcool
permet de limiter les effets sur la DMO et supprime les effets de l’alcool sur les autres
paramètres du tissu osseux, entre autres l’augmentation de l’apoptose des ostéocytes.
Suite à ce travail, de nouvelles questions se posent. Quels sont les mécanismes
moléculaires impliqués dans l’apoptose des ostéocytes, et quels signaux sont envoyés par les
ostéocytes pour communiquer avec les ostéoblastes et les ostéoclastes ? De plus, quel est le
rôle de l’exercice sur ces régulations ? Il semble que la voie Wnt avec ses récepteurs Lrp5/6
et ses inhibiteurs DKK1 et SOST soit impliquée dans la régulation de la formation osseuse
par les ostéocytes (Bonewald 2011; Poole et al. 2005). Cependant, la régulation de ces cibles
par l’exercice n’a pas été étudiée.
Callaci et al. (Callaci et al. 2009) ont évalué l’expression de différents gènes
(ostéocalcine, phosphatase alcaline, sclérostine, Igf-I, RANKL, OPG) chez des animaux ayant
subi un traitement mimant le binge drinking. Or, à notre connaissance, de telles analyses
n’ont jamais été réalisées avec des consommations chroniques d’alcool chez l’animal ou chez
l’homme. De ce fait, une PCR en temps réel et une quantification de l’expression des gènes
spécifiques de la voie Wnt, sous traitement alcoolisé, en ajoutant ou non le facteur
« exercice » seraient particulièrement intéressantes.
Les cibles à analyser sont celles spécifiques de la voie Wnt dans l’ostéocyte, et celles
ayant un rôle dans la mécano-transduction et dans la différenciation des CSM en ostéoblastes
ou en adipocytes (Tableau 28). En effet, il a été montré récemment que la voie Wnt est
impliquée dans la formation osseuse, et qu’elle est régulée par l’ostéocyte (Bonewald et
Johnson 2008). Or, la biologie de l’ostéocyte est modifiée par un traitement chronique
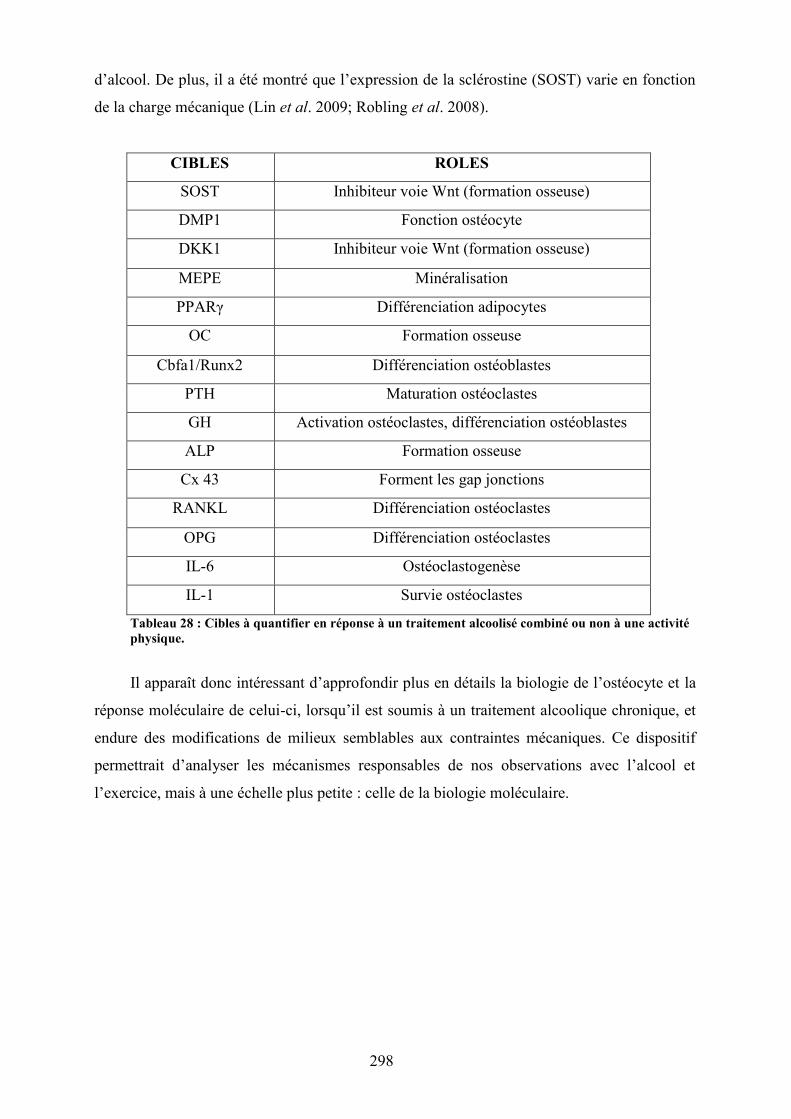
298
d’alcool. De plus, il a été montré que l’expression de la sclérostine (SOST) varie en fonction
de la charge mécanique (Lin et al. 2009; Robling et al. 2008).
CIBLES ROLES
SOST Inhibiteur voie Wnt (formation osseuse)
DMP1 Fonction ostéocyte
DKK1 Inhibiteur voie Wnt (formation osseuse)
MEPE Minéralisation
PPARγ Différenciation adipocytes
OC Formation osseuse
Cbfa1/Runx2 Différenciation ostéoblastes
PTH Maturation ostéoclastes
GH Activation ostéoclastes, différenciation ostéoblastes
ALP Formation osseuse
Cx 43 Forment les gap jonctions
RANKL Différenciation ostéoclastes
OPG Différenciation ostéoclastes
IL-6 Ostéoclastogenèse
IL-1 Survie ostéoclastes
Tableau 28 : Cibles à quantifier en réponse à un traitement alcoolisé combiné ou non à une activitéphysique.
Il apparaît donc intéressant d’approfondir plus en détails la biologie de l’ostéocyte et la
réponse moléculaire de celui-ci, lorsqu’il est soumis à un traitement alcoolique chronique, et
endure des modifications de milieux semblables aux contraintes mécaniques. Ce dispositif
permettrait d’analyser les mécanismes responsables de nos observations avec l’alcool et
l’exercice, mais à une échelle plus petite : celle de la biologie moléculaire.
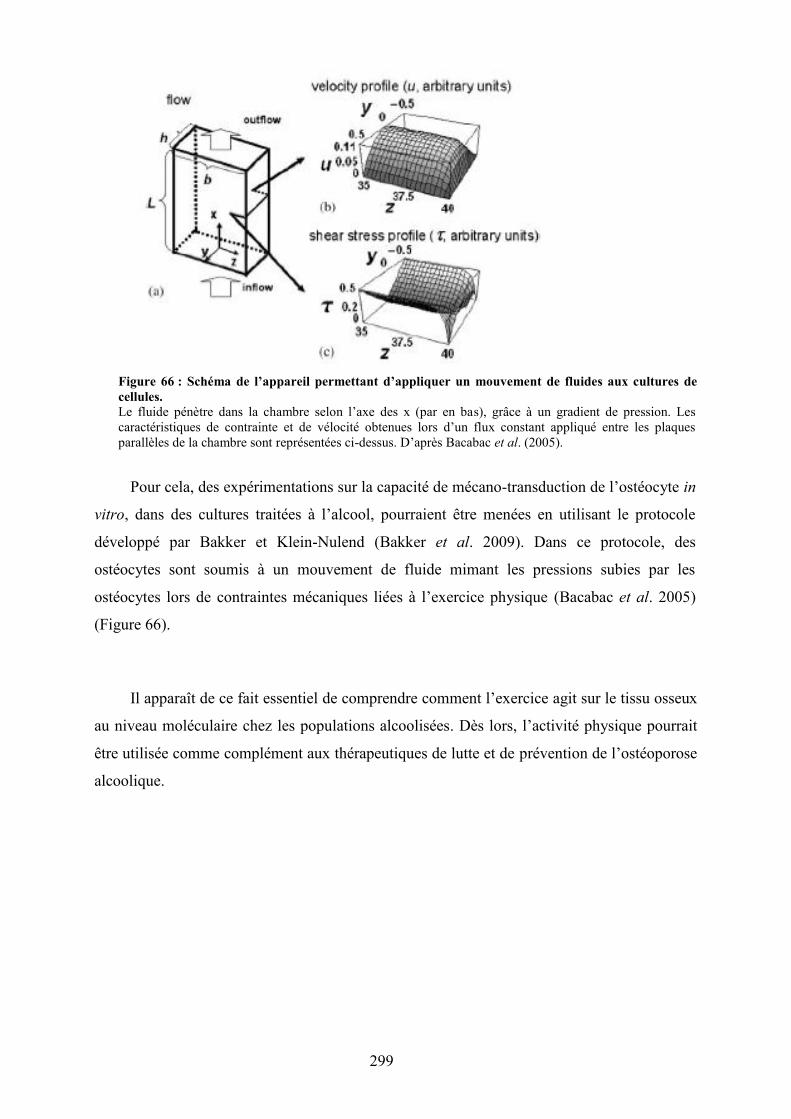
299
Figure 66 : Schéma de l’appareil permettant d’appliquer un mouvement de fluides aux cultures decellules.Le fluide pénètre dans la chambre selon l’axe des x (par en bas), grâce à un gradient de pression. Lescaractéristiques de contrainte et de vélocité obtenues lors d’un flux constant appliqué entre les plaquesparallèles de la chambre sont représentées ci-dessus. D’après Bacabac et al. (2005).
Pour cela, des expérimentations sur la capacité de mécano-transduction de l’ostéocyte in
vitro, dans des cultures traitées à l’alcool, pourraient être menées en utilisant le protocole
développé par Bakker et Klein-Nulend (Bakker et al. 2009). Dans ce protocole, des
ostéocytes sont soumis à un mouvement de fluide mimant les pressions subies par les
ostéocytes lors de contraintes mécaniques liées à l’exercice physique (Bacabac et al. 2005)
(Figure 66).
Il apparaît de ce fait essentiel de comprendre comment l’exercice agit sur le tissu osseux
au niveau moléculaire chez les populations alcoolisées. Dès lors, l’activité physique pourrait
être utilisée comme complément aux thérapeutiques de lutte et de prévention de l’ostéoporose
alcoolique.

300
Bibliographie
301
1. Aaron DJ, Dearwater SR, Anderson R, Olsen T, Kriska AM, Laporte RE (1995) Physicalactivity and the initiation of high-risk health behaviors in adolescents. Med Sci Sports Exerc27: 1639-1645
2. Agarwal DP (2001) Genetic polymorphisms of alcohol metabolizing enzymes. Pathologie-biologie 49: 703-709
3. Aguirre JI, Plotkin LI, Stewart SA, Weinstein RS, Parfitt AM, Manolagas SC, Bellido T(2006) Osteocyte apoptosis is induced by weightlessness in mice and precedes osteoclastrecruitment and bone loss. J Bone Miner Res 21: 605-615
4. Al-Dujaili SA, Lau E, Al-Dujaili H, Tsang K, Guenther A, You L (2011) Apoptoticosteocytes regulate osteoclast precursor recruitment and differentiation in vitro. Journal ofcellular biochemistry 112: 2412-2423
5. Aleksyniene R, Hvid I (2004) Parathyroid hormone--possible future drug for orthopedicsurgery. Medicina 40: 842-849
6. Amling M, Priemel M, Holzmann T, Chapin K, Rueger JM, Baron R, Demay MB (1999)Rescue of the skeletal phenotype of vitamin D receptor-ablated mice in the setting of normalmineral ion homeostasis: formal histomorphometric and biomechanical analyses.Endocrinology 140: 4982-4987
7. Ammann P, Rizzoli R (2003) Bone strength and its determinants. Osteoporos Int 14 Suppl3: S13-18
8. Andreoli A, Monteleone M, Van Loan M, Promenzio L, Tarantino U, De Lorenzo A (2001)Effects of different sports on bone density and muscle mass in highly trained athletes. MedSci Sports Exerc 33: 507-511
9. Arvers P, Choquet M (1999) Regional variations in alcohol use among young people inFrance. Epidemiological approach to alcohol use and abuse by adolescents and conscripts.Drug and alcohol dependence 56: 145-155
10. Attlan E, Audran M, Basse-Cathalinat B, Benhamou CL, Bergot C, Chapuis L, ChapurlatR, Cortet B, Dargent-Molina P, De Vernejoul MC, Drapier-Faure E, Fardellone P,Fechtenbaum J, Feron JM, Garnero P, Jeandel C, Kotzki PO, Limouzin-Lamothe MA,Marchandise X, Maugars Y, Meunier PJ, Orcel P, Ribot C, Roux C, Sabattier JP, Thomas T,Tremollieres F, Sutter B, Weryha G (2005) Ostéoporoses. Collection conduites, Rueil-Malmaison
302
11. Aubin JE, Turksen K (1996) Monoclonal antibodies as tools for studying the osteoblastlineage. Microscopy research and technique 33: 128-140
12. Audran M, Legrand E, Chappard D (2004) Osteoporosis in men. Rev Prat 54: 2127-2131
13. Augat P, Schorlemmer S (2006) The role of cortical bone and its microstructure in bonestrength. Age and ageing 35 Suppl 2: ii27-ii31
14. Bacabac RG, Smit TH, Cowin SC, Van Loon JJ, Nieuwstadt FT, Heethaar R, Klein-Nulend J (2005) Dynamic shear stress in parallel-plate flow chambers. Journal ofbiomechanics 38: 159-167
15. Badawy AA (2002) Tryptophan metabolism in alcoholism. Nutrition research reviews 15:123-152
16. Bailey CA, Brooke-Wavell K (2010) Association of body composition and musclefunction with hip geometry and BMD in premenopausal women. Annals of human biology37: 524-535
17. Bailey DA, McKay HA, Mirwald RL, Crocker PR, Faulkner RA (1999) A six-yearlongitudinal study of the relationship of physical activity to bone mineral accrual in growingchildren: the university of Saskatchewan bone mineral accrual study. J Bone Miner Res 14:1672-1679
18. Baker MM (1998) Anterior cruciate ligament injuries in the female athlete. Journal ofwomen's health / the official publication of the Society for the Advancement of Women'sHealth Research 7: 343-349
19. Bakker AD, Silva VC, Krishnan R, Bacabac RG, Blaauboer ME, Lin YC, MarcantonioRA, Cirelli JA, Klein-Nulend J (2009) Tumor necrosis factor alpha and interleukin-1betamodulate calcium and nitric oxide signaling in mechanically stimulated osteocytes. Arthritisand rheumatism 60: 3336-3345
20. Baldock PA, Sainsbury A, Couzens M, Enriquez RF, Thomas GP, Gardiner EM, HerzogH (2002) Hypothalamic Y2 receptors regulate bone formation. The Journal of clinicalinvestigation 109: 915-921
21. Ballenger JC, Goodwin FK, Major LF, Brown GL (1979) Alcohol and central serotoninmetabolism in man. Archives of general psychiatry 36: 224-227
22. Barak MM, Weiner S, Shahar R (2010) The contribution of trabecular bone to thestiffness and strength of rat lumbar vertebrae. Spine 35: E1153-1159
303
23. Baran DT, Teitelbaum SL, Bergfeld MA, Parker G, Cruvant EM, Avioli LV (1980) Effectof alcohol ingestion on bone and mineral metabolism in rats. The American journal ofphysiology 238: E507-510
24. Baron R (2008) Anatomy and ultrastructure of Bone - Histogenesis, Growth andRemodeling. In: Arnold A (ed) Diseases of Bone and Mineral Metabolism.Endotext.com2008
25. Baron R, Neff L, Louvard D, Courtoy PJ (1985) Cell-mediated extracellular acidificationand bone resorption: evidence for a low pH in resorbing lacunae and localization of a 100-kDlysosomal membrane protein at the osteoclast ruffled border. The Journal of cell biology 101:2210-2222
26. Baudoin C, Fardellone P, Thelot B, Juvin R, Potard V, Bean K, Sebert JL (1996) Hipfractures in France: the magnitude and perspective of the problem. Osteoporos Int 6 Suppl 3:1-10
27. Bauer JS, Link TM (2009) Advances in osteoporosis imaging. European journal ofradiology 71: 440-449
28. Beaupied H, Dupuis A, Arlettaz A, Brunet-Imbault B, Bonnet N, Jaffre C, Benhamou CL,Courteix D (2006) The mode of bone conservation does not affect the architecture and thetensile properties of rat femurs. Bio-medical materials and engineering 16: 253-259
29. Beaupied H, Lespessailles E, Benhamou CL (2007) Evaluation of macrostructural bonebiomechanics. Joint Bone Spine 74: 233-239
30. Bethell H, Jewell D, Burke P (1991) Medical hazards of a four-km fun run. British journalof sports medicine 25: 181-182
31. Bikle DD (1993) Alcohol-induced bone disease. World review of nutrition and dietetics73: 53-79
32. Bikle DD, Wang Y (2011) Insulin Like Growth Factor-I: A Critical Mediator of theSkeletal Response to Parathyroid Hormone. Current molecular pharmacology
33. Bilezikian JP, Khosla S, Riggs BL (2002) Estrogen effects on bone in the male skeleton.Principles og Bone Biology. Academic Press, New York, pp. 1467-1476
34. Blair SN, Ellsworth NM, Haskell WL, Stern MP, Farquhar JW, Wood PD (1981)Comparison of nutrient intake in middle-aged men and women runners and controls. Med SciSports Exerc 13: 310-315
304
35. Bliziotes M, McLoughlin S, Gunness M, Fumagalli F, Jones SR, Caron MG (2000) Bonehistomorphometric and biomechanical abnormalities in mice homozygous for deletion of thedopamine transporter gene. Bone 26: 15-19
36. Bloomfield SA (2010) Disuse osteopenia. Current osteoporosis reports 8: 91-97
37. Boissiere J, Eder V, Machet MC, Courteix D, Bonnet P (2008) Moderate exercise trainingdoes not worsen left ventricle remodeling and function in untreated severe hypertensive rats. JAppl Physiol 104: 321-327
38. Bonewald LF (2007) Osteocyte messages from a bony tomb. Cell metabolism 5: 410-411
39. Bonewald LF (2011) The amazing osteocyte. J Bone Miner Res 26: 229-238
40. Bonewald LF, Johnson ML (2008) Osteocytes, mechanosensing and Wnt signaling. Bone42: 606-615
41. Bonjour JP, Chevalley T, Ferrari S, Rizzoli R (2009) The importance and relevance ofpeak bone mass in the prevalence of osteoporosis. Salud publica de Mexico 51 Suppl 1: S5-17
42. Bonnet N, Beaupied H, Vico L, Dolleans E, Laroche N, Courteix D, Benhamou CL(2007a) Combined effects of exercise and propranolol on bone tissue in ovariectomized rats. JBone Miner Res 22: 578-588
43. Bonnet N, Benhamou CL, Beaupied H, Laroche N, Vico L, Dolleans E, Courteix D(2007b) Doping dose of salbutamol and exercise: deleterious effect on cancellous and corticalbones in adult rats. J Appl Physiol 102: 1502-1509
44. Bonnet N, Benhamou CL, Brunet-Imbault B, Arlettaz A, Horcajada MN, Richard O, VicoL, Collomp K, Courteix D (2005a) Severe bone alterations under beta2 agonist treatments:bone mass, microarchitecture and strength analyses in female rats. Bone 37: 622-633
45. Bonnet N, Courteix D, Benhamou CL (2005b) Leptin, central nervous system, and bone:influence of physical activity. Joint Bone Spine 72: 477-480
46. Bonnet N, Laroche N, Vico L, Dolleans E, Benhamou CL, Courteix D (2006) Doseeffects of propranolol on cancellous and cortical bone in ovariectomized adult rats. TheJournal of pharmacology and experimental therapeutics 318: 1118-1127
47. Bonnet N, Pierroz DD, Ferrari SL (2008) Adrenergic control of bone remodeling and itsimplications for the treatment of osteoporosis. Journal of musculoskeletal & neuronalinteractions 8: 94-104
305
48. Bono CM (2004) Low-back pain in athletes. The Journal of bone and joint surgery 86-A:382-396
49. Borba VZ, Manas NC (2010) The use of PTH in the treatment of osteoporosis. Arquivosbrasileiros de endocrinologia e metabologia 54: 213-219
50. Bouassida A, Chamari K, Zaouali M, Feki Y, Zbidi A, Tabka Z (2010) Review on leptinand adiponectin responses and adaptations to acute and chronic exercise. British journal ofsports medicine 44: 620-630
51. Bourrin S, Ghaemmaghami F, Vico L, Chappard D, Gharib C, Alexandre C (1992) Effectof a five-week swimming program on rat bone: a histomorphometric study. Calcified tissueinternational 51: 137-142
52. Bousson V, Meunier A, Bergot C, Vicaut E, Rocha MA, Morais MH, Laval-Jeantet AM,Laredo JD (2001) Distribution of intracortical porosity in human midfemoral cortex by ageand gender. J Bone Miner Res 16: 1308-1317
53. Bouxsein ML, Boyd SK, Christiansen BA, Guldberg RE, Jepsen KJ, Muller R (2010)Guidelines for assessment of bone microstructure in rodents using micro-computedtomography. J Bone Miner Res 25: 1468-1486
54. Bouxsein ML, Seeman E (2009) Quantifying the material and structural determinants ofbone strength. Best Pract Res Clin Rheumatol 23: 741-753
55. Boyce BF, Xing L (2008) Functions of RANKL/RANK/OPG in bone modeling andremodeling. Archives of biochemistry and biophysics 473: 139-146
56. Boyce BF, Xing L, Jilka RL, Bellido T, Weinstein RS, Parfitt AM, Manolagas SC (2002)Apoptosis in bone cells. Principles of Bone Biology. Academic Press, New York, pp. 151-168
57. Boyle WJ, Simonet WS, Lacey DL (2003) Osteoclast differentiation and activation.Nature 423: 337-342
58. Brahm H, Strom H, Piehl-Aulin K, Mallmin H, Ljunghall S (1997) Bone metabolism inendurance trained athletes: a comparison to population-based controls based on DXA, SXA,quantitative ultrasound, and biochemical markers. Calcified tissue international 61: 448-454
59. Breban S, Chappard C, Jaffre C, Khacef F, Briot K, Benhamou CL (2011) Positiveinfluence of long-lasting and intensive weight-bearing physical activity on hip structure ofyoung adults. J Clin Densitom 14: 129-137
306
60. Breban S, Padilla F, Fujisawa Y, Mano I, Matsukawa M, Benhamou CL, Otani T, LaugierP, Chappard C (2010) Trabecular and cortical bone separately assessed at radius with a newultrasound device, in a young adult population with various physical activities. Bone 46:1620-1625
61. Brenner J, Swanik K (2007) High-risk drinking characteristics in collegiate athletes. J AmColl Health 56: 267-272
62. Brighton PJ, Szekeres PG, Willars GB (2004) Neuromedin U and its receptors: structure,function, and physiological roles. Pharmacological reviews 56: 231-248
63. Bronner F (1992) Bone and calcium homeostasis. Neurotoxicology 13: 775-782
64. Broulik PD, Vondrova J, Ruzicka P, Sedlacek R, Zima T (2010) The effect of chronicalcohol administration on bone mineral content and bone strength in male rats. Physiologicalresearch / Academia Scientiarum Bohemoslovaca 59: 599-604
65. Burger EH, Klein-Nulend J (1999) Mechanotransduction in bone--role of the lacuno-canalicular network. Faseb J 13 Suppl: S101-112
66. Burger EH, Klein-Nulend J, van der Plas A, Nijweide PJ (1995) Function of osteocytes inbone--their role in mechanotransduction. The Journal of nutrition 125: 2020S-2023S
67. Callaci JJ, Himes R, Lauing K, Wezeman FH, Brownson K (2009) Binge alcohol-inducedbone damage is accompanied by differential expression of bone remodeling-related genes inrat vertebral bone. Calcified tissue international 84: 474-484
68. Callaci JJ, Juknelis D, Patwardhan A, Sartori M, Frost N, Wezeman FH (2004) Theeffects of binge alcohol exposure on bone resorption and biomechanical and structuralproperties are offset by concurrent bisphosphonate treatment. Alcoholism, clinical andexperimental research 28: 182-191
69. Caplan AI (1991) Mesenchymal stem cells. J Orthop Res 9: 641-650
70. Caro JF, Sinha MK, Kolaczynski JW, Zhang PL, Considine RV (1996) Leptin: the tale ofan obesity gene. Diabetes 45: 1455-1462
71. Chakkalakal DA (2005) Alcohol-induced bone loss and deficient bone repair. Alcoholism,clinical and experimental research 29: 2077-2090
72. Chakkalakal DA, Novak JR, Fritz ED, Mollner TJ, McVicker DL, Garvin KL, McGuireMH, Donohue TM (2005) Inhibition of bone repair in a rat model for chronic and excessivealcohol consumption. Alcohol (Fayetteville, NY 36: 201-214
307
73. Chambers TJ (2000) Regulation of the differentiation and function of osteoclasts. TheJournal of pathology 192: 4-13
74. Chambers TJ (2010) The birth of the osteoclast. Annals of the New York Academy ofSciences 1192: 19-26
75. Chappard D, Plantard B, Petitjean M, Alexandre C, Riffat G (1991) Alcoholic cirrhosisand osteoporosis in men: a light and scanning electron microscopy study. Journal of studieson alcohol 52: 269-274
76. Chavassieux P, Pastoureau P, Chapuy MC, Delmas PD, Meunier PJ (1993)Glucocorticoid-induced inhibition of osteoblastic bone formation in ewes: a biochemical andhistomorphometric study. Osteoporos Int 3: 97-102
77. Chen FH, Tuan RS (2008) Mesenchymal stem cells in arthritic diseases. Arthritis research& therapy 10: 223
78. Cheung RC, Gray C, Boyde A, Jones SJ (1995) Effects of ethanol on bone cells in vitroresulting in increased resorption. Bone 16: 143-147
79. Christakos S (2002) Vitamin D gene regulation. Principles of Bone Biology. AcademicPress, New York, pp. 573-586
80. Cirmanova V, Bayer M, Starka L, Zajickova K (2008) The effect of leptin on bone: anevolving concept of action. Physiological research / Academia Scientiarum Bohemoslovaca57 Suppl 1: S143-151
81. Clarke BL, Khosla S (2010a) Female reproductive system and bone. Archives ofbiochemistry and biophysics 503: 118-128
82. Clarke BL, Khosla S (2010b) Physiology of bone loss. Radiologic clinics of NorthAmerica 48: 483-495
83. Confavreux CB (2011) Bone: from a reservoir of minerals to a regulator of energymetabolism. Kidney international: S14-19
84. Considine RV (2001) Regulation of leptin production. Reviews in endocrine & metabolicdisorders 2: 357-363
85. Cooper C, Atkinson EJ, O'Fallon WM, Melton LJ, 3rd (1992) Incidence of clinicallydiagnosed vertebral fractures: a population-based study in Rochester, Minnesota, 1985-1989.J Bone Miner Res 7: 221-227
308
86. Cooper DM, Thomas CD, Clement JG, Turinsky AL, Sensen CW, Hallgrimsson B (2007)Age-dependent change in the 3D structure of cortical porosity at the human femoral midshaft.Bone 40: 957-965
87. Courtland HW, Elis S, Wu Y, Sun H, Rosen CJ, Jepsen KJ, Yakar S (2011) Serum IGF-1affects skeletal acquisition in a temporal and compartment-specific manner. PloS one 6:e14762
88. Crewther BT, Cook C, Cardinale M, Weatherby RP, Lowe T (2011) Two emergingconcepts for elite athletes: the short-term effects of testosterone and cortisol on theneuromuscular system and the dose-response training role of these endogenous hormones.Sports medicine (Auckland, NZ 41: 103-123
89. Curran D, Maravic M, Kiefer P, Tochon V, Fardellone P (2010) Epidemiology ofosteoporosis-related fractures in France: a literature review. Joint Bone Spine 77: 546-551
90. Dallas SL, Bonewald LF (2010) Dynamics of the transition from osteoblast to osteocyte.Annals of the New York Academy of Sciences 1192: 437-443
91. Dalle Carbonare L, Giannini S (2004) Bone microarchitecture as an important determinantof bone strength. Journal of endocrinological investigation 27: 99-105
92. De Souza MJ, Miller BE, Loucks AB, Luciano AA, Pescatello LS, Campbell CG, LasleyBL (1998) High frequency of luteal phase deficiency and anovulation in recreational womenrunners: blunted elevation in follicle-stimulating hormone observed during luteal-folliculartransition. The Journal of clinical endocrinology and metabolism 83: 4220-4232
93. De Vernejoul MC, Bielakoff J, Herve M, Gueris J, Hott M, Modrowski D, Kuntz D,Miravet L, Ryckewaert A (1983) Evidence for defective osteoblastic function. A role foralcohol and tobacco consumption in osteoporosis in middle-aged men. Clinical orthopaedicsand related research: 107-115
94. Deftos LJ, First BP (1981) Calcitonin as a drug. Annals of internal medicine 95: 192-197
95. DeLuca HF (1988) The vitamin D story: a collaborative effort of basic science andclinical medicine. Faseb J 2: 224-236
96. Devlin MJ, Cloutier AM, Thomas NA, Panus DA, Lotinun S, Pinz I, Baron R, Rosen CJ,Bouxsein ML (2010) Caloric restriction leads to high marrow adiposity and low bone mass ingrowing mice. J Bone Miner Res 25: 2078-2088
97. Diamond T, Stiel D, Lunzer M, Wilkinson M, Posen S (1989) Ethanol reduces boneformation and may cause osteoporosis. The American journal of medicine 86: 282-288
309
98. Dietze PM, Fitzgerald JL, Jenkinson RA (2008) Drinking by professional AustralianFootball League (AFL) players: prevalence and correlates of risk. The Medical journal ofAustralia 189: 479-483
99. Donoso MA, Munoz-Calvo MT, Barrios V, Garrido G, Hawkins F, Argente J (2010)Increased circulating adiponectin levels and decreased leptin/soluble leptin receptor ratiothroughout puberty in female ballet dancers: association with body composition and the delayin puberty. European journal of endocrinology / European Federation of Endocrine Societies162: 905-911
100. Douchi T, Kuwahata R, Matsuo T, Uto H, Oki T, Nagata Y (2003) Relative contributionof lean and fat mass component to bone mineral density in males. Journal of bone and mineralmetabolism 21: 17-21
101. Doyle-Lucas AF, Akers JD, Davy BM (2010) Energetic efficiency, menstrualirregularity, and bone mineral density in elite professional female ballet dancers. J Dance MedSci 14: 146-154
102. Drake MT, Srinivasan B, Modder UI, Ng AC, Undale AH, Roforth MM, Peterson JM,McCready LK, Riggs BL, Khosla S (2011) Effects of intermittent parathyroid hormonetreatment on osteoprogenitor cells in postmenopausal women. Bone 49: 349-355
103. Driessler F, Baldock PA (2010) Hypothalamic regulation of bone. Journal of molecularendocrinology 45: 175-181
104. Drissi H, Hott M, Marie PJ, Lasmoles F (1997) Expression of the CT/CGRP gene and itsregulation by dibutyryl cyclic adenosine monophosphate in human osteoblastic cells. J BoneMiner Res 12: 1805-1814
105. Duclos M (2001) Effects of physical training on endocrine functions. Annalesd'endocrinologie 62: 19-32
106. Ducy P, Karsenty G (2010) The two faces of serotonin in bone biology. The Journal ofcell biology 191: 7-13
107. Dumas P, Sockalingum GD, Sule-Suso J (2007) Adding synchrotron radiation to infraredmicrospectroscopy: what's new in biomedical applications? Trends in biotechnology 25: 40-44
108. Dunlop JW, Hartmann MA, Brechet YJ, Fratzl P, Weinkamer R (2009) New suggestionsfor the mechanical control of bone remodeling. Calcified tissue international 85: 45-54
310
109. Dyer SA, Buckendahl P, Sampson HW (1998) Alcohol consumption inhibits osteoblasticcell proliferation and activity in vivo. Alcohol (Fayetteville, NY 16: 337-341
110. Ebeling PR (1998) Osteoporosis in men. New insights into aetiology, pathogenesis,prevention and management. Drugs & aging 13: 421-434
111. El Maghraoui A, Roux C (2008) DXA scanning in clinical practice. Qjm 101: 605-617
112. Elefteriou F (2005) Neuronal signaling and the regulation of bone remodeling. Cell MolLife Sci 62: 2339-2349
113. Elefteriou F, Karsenty G (2004) Bone mass regulation by leptin: a hypothalamic controlof bone formation. Pathol Biol 52: 148-153
114. Emanuele N, Emanuele MA (1997) The endocrine system: alcohol alters criticalhormonal balance. Alcohol health and research world 21: 53-64
115. Eriksen EF (2010) Cellular mechanisms of bone remodeling. Reviews in endocrine &metabolic disorders 11: 219-227
116. Everts V, Delaisse JM, Korper W, Jansen DC, Tigchelaar-Gutter W, Saftig P, BeertsenW (2002) The bone lining cell: its role in cleaning Howship's lacunae and initiating boneformation. J Bone Miner Res 17: 77-90
117. Fanti P, Monier-Faugere MC, Geng Z, Cohen D, Malluche HH (1997) Moderately highconsumption of ethanol suppresses bone resorption in ovariectomized but not in sexuallyintact adult female rats. Alcoholism, clinical and experimental research 21: 1150-1154
118. Faulkner KG, Gluer CC, Majumdar S, Lang P, Engelke K, Genant HK (1991)Noninvasive measurements of bone mass, structure, and strength: current methods andexperimental techniques. Ajr 157: 1229-1237
119. Felsing NE, Brasel JA, Cooper DM (1992) Effect of low and high intensity exercise oncirculating growth hormone in men. The Journal of clinical endocrinology and metabolism75: 157-162
120. Ferretti M, Muglia MA, Remaggi F, Cane V, Palumbo C (1999) Histomorphometricstudy on the osteocyte lacuno-canalicular network in animals of different species. II. Parallel-fibered and lamellar bones. Italian journal of anatomy and embryology = Archivio italiano dianatomia ed embriologia 104: 121-131
311
121. Fonseca H, Moreira-Goncalves D, Esteves JL, Viriato N, Vaz M, Mota MP, Duarte JA(2011) Voluntary Exercise has Long-Term In Vivo Protective Effects on Osteocyte Viabilityand Bone Strength Following Ovariectomy. Calcified tissue international
122. Ford JA (2007) Alcohol use among college students: a comparison of athletes andnonathletes. Substance use & misuse 42: 1367-1377
123. Friedenstein AJ (1990) Osteogenic stem cells in the bone marrow. Bone Miner Res 7:243-272
124. Frost HM (1987) Bone "mass" and the "mechanostat": a proposal. The Anatomicalrecord 219: 1-9
125. Galson DL, Goldring SR (2002) Structure and molecular biology of the calcitoninreceptor. Principles of Bone Biology. Academic Press, New York, pp. 603-617
126. Ganry O, Baudoin C, Fardellone P (2000) Effect of alcohol intake on bone mineraldensity in elderly women: The EPIDOS Study. Epidemiologie de l'Osteoporose. Americanjournal of epidemiology 151: 773-780
127. Genaro PS, Pereira GA, Pinheiro MM, Szejnfeld VL, Martini LA (2010) Influence ofbody composition on bone mass in postmenopausal osteoporotic women. Archives ofgerontology and geriatrics 51: 295-298
128. Georgopoulos NA, Rottstein L, Tsekouras A, Theodoropoulou A, Koukkou E, MylonasP, Polykarpou G, Lampropoulou E, Iconomou G, Leglise M, Vagenakis AG, Markou KB(2011) Abolished circadian rhythm of salivary cortisol in elite artistic gymnasts. Steroids 76:353-357
129. Gibney J, Healy ML, Sonksen PH (2007) The growth hormone/insulin-like growthfactor-I axis in exercise and sport. Endocrine reviews 28: 603-624
130. Gilpin NW, Koob GF (2010) Effects of beta-adrenoceptor antagonists on alcoholdrinking by alcohol-dependent rats. Psychopharmacology 212: 431-439
131. Ginty F, Rennie KL, Mills L, Stear S, Jones S, Prentice A (2005) Positive, site-specificassociations between bone mineral status, fitness, and time spent at high-impact activities in16- to 18-year-old boys. Bone 36: 101-110
132. Glaser DL, Kaplan FS (1997) Osteoporosis. Definition and clinical presentation. Spine22: 12S-16S
312
133. Gokhale J, Robey P, Boskey A (eds) (2001) The biochemistry of bone, San Diego,Academic Press
134. Gong Z, Wezeman FH (2004) Inhibitory effect of alcohol on osteogenic differentiationin human bone marrow-derived mesenchymal stem cells. Alcoholism, clinical andexperimental research 28: 468-479
135. Griffiths HJ, Parantainen H, Olson P (1993) Alcohol and Bone Disorders. AlcoholHealth & Research World 17: 299-304
136. Grimston SK, Tanguay KE, Gundberg CM, Hanley DA (1993) The calciotropic hormoneresponse to changes in serum calcium during exercise in female long distance runners. TheJournal of clinical endocrinology and metabolism 76: 867-872
137. Gross TS, Poliachik SL, Prasad J, Bain SD (2010) The effect of muscle dysfunction onbone mass and morphology. Journal of musculoskeletal & neuronal interactions 10: 25-34
138. Guadalupe-Grau A, Fuentes T, Guerra B, Calbet JA (2009) Exercise and bone mass inadults. Sports medicine (Auckland, NZ 39: 439-468
139. Guo R, Ren J (2010) Alcohol and acetaldehyde in public health: from marvel to menace.International journal of environmental research and public health 7: 1285-1301
140. Gutgesell M, Canterbury R (1999) Alcohol usage in sport and exercise. Addictionbiology 4: 373-383
141. Gutgesell ME, Timmerman M, Keller A (1996) Reported alcohol use and behavior inlong-distance runners. Med Sci Sports Exerc 28: 1063-1070
142. Gutgesell ME, Timmerman MG (1998) Alcohol use and behaviors in women long-distance race participants reporting a history of bulimia and/or anorexia nervosa. The Journalof sports medicine and physical fitness 38: 142-148
143. Gyamfi MA, Wan YJ (2010) Pathogenesis of alcoholic liver disease: the role of nuclearreceptors. Exp Biol Med 235: 547-560
144. Hagihara Y, Fukuda S, Goto S, Iida H, Yamazaki M, Moriya H (2005) How many daysper week should rats undergo running exercise to increase BMD? Journal of bone and mineralmetabolism 23: 289-294
145. Hakkinen K, Pakarinen A (1993) Acute hormonal responses to two different fatiguingheavy-resistance protocols in male athletes. J Appl Physiol 74: 882-887
313
146. Hamilton CJ, Swan VJ, Jamal SA (2010) The effects of exercise and physical activityparticipation on bone mass and geometry in postmenopausal women: a systematic review ofpQCT studies. Osteoporos Int 21: 11-23
147. Hannan MT, Felson DT, Dawson-Hughes B, Tucker KL, Cupples LA, Wilson PW, KielDP (2000) Risk factors for longitudinal bone loss in elderly men and women: the FraminghamOsteoporosis Study. J Bone Miner Res 15: 710-720
148. Hattner R, Epker BN, Frost HM (1965) Suggested sequential mode of control of changesin cell behaviour in adult bone remodelling. Nature 206: 489-490
149. Hefferan TE, Kennedy AM, Evans GL, Turner RT (2003) Disuse exaggerates thedetrimental effects of alcohol on cortical bone. Alcoholism, clinical and experimental research27: 111-117
150. Heinonen A, Kannus P, Sievanen H, Oja P, Pasanen M, Rinne M, Uusi-Rasi K, Vuori I(1996) Randomised controlled trial of effect of high-impact exercise on selected risk factorsfor osteoporotic fractures. Lancet 348: 1343-1347
151. Henriksen L, Feighery EC, Schleicher NC, Fortmann SP (2008) Receptivity to alcoholmarketing predicts initiation of alcohol use. J Adolesc Health 42: 28-35
152. Hernandez-Avila M, Colditz GA, Stampfer MJ, Rosner B, Speizer FE, Willett WC(1991) Caffeine, moderate alcohol intake, and risk of fractures of the hip and forearm inmiddle-aged women. The American journal of clinical nutrition 54: 157-163
153. Hernandez ER, Revilla M, Rico H (1991) Total body bone mineral and pelvis bonemineral content as parameters of bone mass in men. A dual-energy X-ray absorptiometrystudy. Acta anatomica 142: 227-230
154. Hetland ML, Haarbo J, Christiansen C (1993) Low bone mass and high bone turnover inmale long distance runners. The Journal of clinical endocrinology and metabolism 77: 770-775
155. Hildebrand T, Ruegsegger P (1997) A new method for the model-independentassessment of thickness in the three-dimensional images. J Microsc 185: 67-75
156. Hinoi E, Takarada T, Yoneda Y (2004) Glutamate signaling system in bone. Journal ofpharmacological sciences 94: 215-220
157. Hodge JM, Collier FM, Pavlos NJ, Kirkland MA, Nicholson GC (2011) M-CSF PotentlyAugments RANKL-Induced Resorption Activation in Mature Human Osteoclasts. PloS one 6:e21462
314
158. Hodsman AB, Hanley DA, Watson PH, Fraher LJ (2002) Parathyroid hormone.Principles of Bone Biology. Academic Press, New York, pp. 1305-1324
159. Hoeppner LH, Secreto FJ, Westendorf JJ (2009) Wnt signaling as a therapeutic target forbone diseases. Expert opinion on therapeutic targets 13: 485-496
160. Hofbauer LC, Khosla S, Dunstan CR, Lacey DL, Spelsberg TC, Riggs BL (1999)Estrogen stimulates gene expression and protein production of osteoprotegerin in humanosteoblastic cells. Endocrinology 140: 4367-4370
161. Hofstetter W, Gillespie MT (2002) Colony-stimulating factors. Principles of BoneBiology. Academic Press, New York, pp. 943-959
162. Hogan HA, Groves JA, Sampson HW (1999) Long-term alcohol consumption in the rataffects femur cross-sectional geometry and bone tissue material properties. Alcoholism,clinical and experimental research 23: 1825-1833
163. Hogan HA, Sampson HW, Cashier E, Ledoux N (1997) Alcohol consumption by youngactively growing rats: a study of cortical bone histomorphometry and mechanical properties.Alcoholism, clinical and experimental research 21: 809-816
164. Hoidrup S, Gronbaek M, Gottschau A, Lauritzen JB, Schroll M (1999) Alcohol intake,beverage preference, and risk of hip fracture in men and women. Copenhagen Centre forProspective Population Studies. American journal of epidemiology 149: 993-1001
165. Holroyd C, Harvey N, Dennison E, Cooper C (2011) Epigenetic influences in thedevelopmental origins of osteoporosis. Osteoporos Int
166. Horowitz MC, Lorenzo JA (2002) Local regulators of bone. Principles of Bone Biology.Academic Press, New York, pp. 961-977
167. Howe KS, Iwaniec UT, Turner RT (2011) The effects of low dose parathyroid hormoneon lumbar vertebrae in a rat model for chronic alcohol abuse. Osteoporos Int 22: 1175-1181
168. Huang TH, Lin SC, Chang FL, Hsieh SS, Liu SH, Yang RS (2003) Effects of differentexercise modes on mineralization, structure, and biomechanical properties of growing bone. JAppl Physiol 95: 300-307
169. Hughes JM, Petit MA (2010) Biological underpinnings of Frost's mechanostatthresholds: the important role of osteocytes. Journal of musculoskeletal & neuronalinteractions 10: 128-135
315
170. Imai S, Kaksonen M, Raulo E, Kinnunen T, Fages C, Meng X, Lakso M, Rauvala H(1998) Osteoblast recruitment and bone formation enhanced by cell matrix-associatedheparin-binding growth-associated molecule (HB-GAM). The Journal of cell biology 143:1113-1128
171. Imai S, Matsusue Y (2002) Neuronal regulation of bone metabolism and anabolism:calcitonin gene-related peptide-, substance P-, and tyrosine hydroxylase-containing nervesand the bone. Microscopy research and technique 58: 61-69
172. Ishida H, Bellows CG, Aubin JE, Heersche JN (1995) Tri-iodothyronine (T3) anddexamethasone interact to modulate osteoprogenitor cell differentiation in fetal rat calvariacell cultures. Bone 16: 545-549
173. Iwaniec UT, Wronski TJ, Turner RT (2008) Histological analysis of bone. Methods inmolecular biology (Clifton, NJ 447: 325-341
174. Jacobson PC, Beaver W, Grubb SA, Taft TN, Talmage RV (1984) Bone density inwomen: college athletes and older athletic women. J Orthop Res 2: 328-332
175. Jahreis G, Kauf E, Frohner G, Schmidt HE (1991) Influence of intensive exercise oninsulin-like growth factor I, thyroid and steroid hormones in female gymnasts. Growthregulation 1: 95-99
176. Jiang Y, Zhao J, Genant HK, Dequeker J, Geusens P (1997) Long-term changes in bonemineral and biomechanical properties of vertebrae and femur in aging, dietary calciumrestricted, and/or estrogen-deprived/-replaced rats. J Bone Miner Res 12: 820-831
177. Jones KB, Mollano AV, Morcuende JA, Cooper RR, Saltzman CL (2004) Bone andbrain: a review of neural, hormonal, and musculoskeletal connections. The Iowa orthopaedicjournal 24: 123-132
178. Joo YI, Sone T, Fukunaga M, Lim SG, Onodera S (2003) Effects of endurance exerciseon three-dimensional trabecular bone microarchitecture in young growing rats. Bone 33: 485-493
179. Jugdaohsingh R, O'Connell MA, Sripanyakorn S, Powell JJ (2006) Moderate alcoholconsumption and increased bone mineral density: potential ethanol and non-ethanolmechanisms. The Proceedings of the Nutrition Society 65: 291-310
180. Jurimae J, Purge P, Jurimae T (2005) Adiponectin is altered after maximal exercise inhighly trained male rowers. European journal of applied physiology 93: 502-505
316
181. Kanaan RA, Kanaan LA (2006) Transforming growth factor beta1, bone connection.Med Sci Monit 12: RA164-169
182. Kanehisa J, Heersche JN (1988) Osteoclastic bone resorption: in vitro analysis of the rateof resorption and migration of individual osteoclasts. Bone 9: 73-79
183. Kann PH (2004) Clinical effects of growth hormone on bone: a review. Aging Male 7:290-296
184. Karlsson KM, Karlsson C, Ahlborg HG, Valdimarsson O, Ljunghall S (2003) Theduration of exercise as a regulator of bone turnover. Calcified tissue international 73: 350-355
185. Kaufman JM, Goemaere S (2008) Osteoporosis in men. Best practice & research 22:787-812
186. Kawai K, Maruno H, Watanabe Y, Hirohata K (1980) Fat necrosis of osteocytes as acausative factor in idiopathic osteonecrosis in heritable hyperlipemic rabbits. Clinicalorthopaedics and related research: 273-282
187. Kawai K, Tamaki A, Hirohata K (1985) Steroid-induced accumulation of lipid in theosteocytes of the rabbit femoral head. A histochemical and electron microscopic study. TheJournal of bone and joint surgery 67: 755-763
188. Kawano Y, Kypta R (2003) Secreted antagonists of the Wnt signalling pathway. Journalof cell science 116: 2627-2634
189. Keila S, Kelner A, Weinreb M (2001) Systemic prostaglandin E2 increases cancellousbone formation and mass in aging rats and stimulates their bone marrow osteogenic capacityin vivo and in vitro. The Journal of endocrinology 168: 131-139
190. Kemmler W, Stengel S (2011) Exercise and osteoporosis-related fractures: perspectivesand recommendations of the sports and exercise scientist. The Physician and sportsmedicine39: 142-157
191. Khanna D, Kan H, Fang Q, Xie Z, Underwood BL, Jain AC, Williams HJ, Finkel MS(2007) Inducible nitric oxide synthase attenuates adrenergic signaling in alcohol fed rats.Journal of cardiovascular pharmacology 50: 692-696
192. Kim HJ (2010) New understanding of glucocorticoid action in bone cells. BMB reports43: 524-529
317
193. Kiyoshi A, Weihuan W, Mostofa J, Mitsuru K, Toyoshi I, Toshihiro K, Kyoko K,Keiichi N, Iwao I, Hiroshi K (2009) Ethanol metabolism in ALDH2 knockout mice--bloodacetate levels. Legal medicine (Tokyo, Japan) 11 Suppl 1: S413-415
194. Klein-Nulend J, Bacabac RG, Mullender MG (2005) Mechanobiology of bone tissue.Pathologie-biologie 53: 576-580
195. Kontulainen S, Kannus P, Haapasalo H, Sievanen H, Pasanen M, Heinonen A, Oja P,Vuori I (2001) Good maintenance of exercise-induced bone gain with decreased training offemale tennis and squash players: a prospective 5-year follow-up study of young and oldstarters and controls. J Bone Miner Res 16: 195-201
196. Kosmacheva SM, Volk MV, Yeustratenka TA, Severin IN, Potapnev MP (2008) In vitrogrowth of human umbilical blood mesenchymal stem cells and their differentiation intochondrocytes and osteoblasts. Bulletin of experimental biology and medicine 145: 141-145
197. Kraemer RR, Castracane VD (2007) Exercise and humoral mediators of peripheralenergy balance: ghrelin and adiponectin. Exp Biol Med 232: 184-194
198. Kraemer RR, Chu H, Castracane VD (2002) Leptin and exercise. Exp Biol Med 227:701-708
199. Kraemer WJ, Marchitelli L, Gordon SE, Harman E, Dziados JE, Mello R, Frykman P,McCurry D, Fleck SJ (1990) Hormonal and growth factor responses to heavy resistanceexercise protocols. J Appl Physiol 69: 1442-1450
200. Kream BE, Lukert BP (2002) Clinical and basic aspects of glucocorticoid action in bone.Principles of Bone Biology. Academic Press, New York, pp. 723-740
201. Krug R, Burghardt AJ, Majumdar S, Link TM (2010) High-resolution imagingtechniques for the assessment of osteoporosis. Radiologic clinics of North America 48: 601-621
202. Kulak CA, Dempster DW (2010) Bone histomorphometry: a concise review forendocrinologists and clinicians. Arquivos brasileiros de endocrinologia e metabologia 54: 87-98
203. Kusec V, Virdi AS, Prince R, Triffitt JT (1998) Localization of estrogen receptor-alphain human and rabbit skeletal tissues. The Journal of clinical endocrinology and metabolism83: 2421-2428
318
204. Kwan Tat S, Padrines M, Theoleyre S, Heymann D, Fortun Y (2004) IL-6, RANKL,TNF-alpha/IL-1: interrelations in bone resorption pathophysiology. Cytokine & growth factorreviews 15: 49-60
205. Kwok S, Partridge NC, Srinivasan N, Nair SV, Selvamurugan N (2009) Mitogenactivated protein kinase-dependent inhibition of osteocalcin gene expression by transforminggrowth factor-beta1. Journal of cellular biochemistry 106: 161-169
206. Kyle UG, Genton L, Gremion G, Slosman DO, Pichard C (2004) Aging, physicalactivity and height-normalized body composition parameters. Clinical nutrition (Edinburgh,Scotland) 23: 79-88
207. Laughlin GA, Yen SS (1996) Nutritional and endocrine-metabolic aberrations inamenorrheic athletes. The Journal of clinical endocrinology and metabolism 81: 4301-4309
208. Lauing K, Himes R, Rachwalski M, Strotman P, Callaci JJ (2008) Binge alcoholtreatment of adolescent rats followed by alcohol abstinence is associated with site-specificdifferences in bone loss and incomplete recovery of bone mass and strength. Alcohol(Fayetteville, NY 42: 649-656
209. Leger L, Boucher R (1980) An indirect continuous running multistage field test: theUniversite de Montreal track test. Canadian journal of applied sport sciences 5: 77-84
210. Leichliter JS, Meilman PW, Presley CA, Cashin JR (1998) Alcohol use and relatedconsequences among students with varying levels of involvement in college athletics. J AmColl Health 46: 257-262
211. Lelovas PP, Xanthos TT, Thoma SE, Lyritis GP, Dontas IA (2008) The laboratory rat asan animal model for osteoporosis research. Comp Med 58: 424-430
212. Lerner UH (2002) Neuropeptidergic regulation of bone resorption and bone formation.Journal of musculoskeletal & neuronal interactions 2: 440-447
213. Lespessailles E, Jaffre C, Beaupied H, Nanyan P, Dolleans E, Benhamou CL, Courteix D(2009) Does exercise modify the effects of zoledronic acid on bone mass, microarchitecture,biomechanics, and turnover in ovariectomized rats? Calcified tissue international 85: 146-157
214. Lieber CS (1993) Aetiology and pathogenesis of alcoholic liver disease. Bailliere'sclinical gastroenterology 7: 581-608
215. Lima I, Rocha MS, Lopes RT (2008) Ethanol bone evaluation using 3Dmicrotomography. Micron 39: 617-622
319
216. Lin C, Jiang X, Dai Z, Guo X, Weng T, Wang J, Li Y, Feng G, Gao X, He L (2009)Sclerostin mediates bone response to mechanical unloading through antagonizing Wnt/beta-catenin signaling. J Bone Miner Res 24: 1651-1661
217. Liu D, Jiang LS, Dai LY (2007) Substance P and its receptors in bone metabolism.Neuropeptides 41: 271-283
218. Lopez DG, Pumarino H, Bustamante E, Oviedo S, Rios M (1991) Nutritional study ofalcoholics with specific reference to calcium and phosphorus. Revista medica de Chile 119:652-658
219. Lorenz R, Janicke-Lorenz J (1983) Electron microscopic observation on osteocytes ofchronically alcoholized rats. Archives of orthopaedic and traumatic surgery 102: 118-122
220. Loucks AB, Verdun M, Heath EM (1998) Low energy availability, not stress of exercise,alters LH pulsatility in exercising women. J Appl Physiol 84: 37-46
221. Lucas EG (1987) Alcohol in industry. British medical journal 294: 460-461
222. Luger A, Deuster PA, Kyle SB, Gallucci WT, Montgomery LC, Gold PW, Loriaux DL,Chrousos GP (1987) Acute hypothalamic-pituitary-adrenal responses to the stress of treadmillexercise. Physiologic adaptations to physical training. The New England journal of medicine316: 1309-1315
223. Maddalozzo GF, Turner RT, Edwards CH, Howe KS, Widrick JJ, Rosen CJ, Iwaniec UT(2009) Alcohol alters whole body composition, inhibits bone formation, and increases bonemarrow adiposity in rats. Osteoporos Int 20: 1529-1538
224. Madsen SH, Andreassen KV, Christensen ST, Karsdal MA, Sverdrup FM, Bay-JensenAC, Henriksen K (2011) Glucocorticoids exert context-dependent effects on cells of the jointin vitro. Steroids
225. Maffulli N, Longo UG, Gougoulias N, Caine D, Denaro V (2011a) Sport injuries: areview of outcomes. British medical bulletin 97: 47-80
226. Maffulli N, Longo UG, Spiezia F, Denaro V (2011b) Aetiology and prevention ofinjuries in elite young athletes. Medicine and sport science 56: 187-200
227. Maher A, Wilson N, Signal L, Thomson G (2006) Patterns of sports sponsorship bygambling, alcohol and food companies: an Internet survey. BMC public health 6: 95
228. Maimoun L, Sultan C (2009) Effect of physical activity on calcium homeostasis andcalciotropic hormones: a review. Calcified tissue international 85: 277-286
320
229. Maimoun L, Sultan C (2011) Effects of physical activity on bone remodeling.Metabolism: clinical and experimental 60: 373-388
230. Manari AP, Preedy VR, Peters TJ (2003) Nutritional intake of hazardous drinkers anddependent alcoholics in the UK. Addiction biology 8: 201-210
231. Manzo-Avalos S, Saavedra-Molina A (2010) Cellular and mitochondrial effects ofalcohol consumption. International journal of environmental research and public health 7:4281-4304
232. Marcus R (2002) Mechanisms of exercise effects on bone. Principles of Bone Biology.Academic Press, New York, pp. 1477-1488
233. Marcus R, Cann C, Madvig P, Minkoff J, Goddard M, Bayer M, Martin M, Gaudiani L,Haskell W, Genant H (1985) Menstrual function and bone mass in elite women distancerunners. Endocrine and metabolic features. Annals of internal medicine 102: 158-163
234. Marks SC, Hermey DC (1996) The structure and development of bone. . Principles ofBone Biology. Academic Press, New-York, pp. 3-34
235. Marks SC, Odgren PR (2002) The structure and development of the skeleton. .Principles of Bone Biology. Academic Press, New-York, pp. 3-34
236. Marques EA, Mota J, Machado L, Sousa F, Coelho M, Moreira P, Carvalho J (2011)Multicomponent training program with weight-bearing exercises elicits favorable bonedensity, muscle strength, and balance adaptations in older women. Calcified tissueinternational 88: 117-129
237. Martens MP, Dams-O'Connor K, Beck NC (2006) A systematic review of collegestudent-athlete drinking: Prevalence rates, sport-related factors, and interventions. J SubstAbuse Treat 31: 305-316
238. Martin TJ, Ng KW (1994) Mechanisms by which cells of the osteoblast lineage controlosteoclast formation and activity. Journal of cellular biochemistry 56: 357-366
239. Mason DJ (2004) The role of glutamate transporters in bone cell signalling. Journal ofmusculoskeletal & neuronal interactions 4: 128-131
240. Mauck KF, Clarke BL (2006) Diagnosis, screening, prevention, and treatment ofosteoporosis. Mayo Clinic proceedings 81: 662-672
241. Maughan RJ (2006) Alcohol and football. J Sports Sci 24: 741-748
321
242. McCambridge J, McAlaney J, Rowe R (2011) Adult consequences of late adolescentalcohol consumption: a systematic review of cohort studies. PLoS medicine 8: e1000413
243. Mehta SS, Antich PP, Daphtary MM, Bronson DG, Richer E (2001) Bone materialultrasound velocity is predictive of whole bone strength. Ultrasound in medicine & biology27: 861-867
244. Melton LJ, 3rd, Atkinson EJ, O'Fallon WM, Wahner HW, Riggs BL (1993) Long-termfracture prediction by bone mineral assessed at different skeletal sites. J Bone Miner Res 8:1227-1233
245. Miller BA, Wilsnack SC, Cunradi CB (2000) Family violence and victimization:treatment issues for women with alcohol problems. Alcoholism, clinical and experimentalresearch 24: 1287-1297
246. Miller JW, Naimi TS, Brewer RD, Jones SE (2007) Binge drinking and associated healthrisk behaviors among high school students. Pediatrics 119: 76-85
247. Miller SC, de Saint-Georges L, Bowman BM, Jee WS (1989) Bone lining cells: structureand function. Scanning microscopy 3: 953-960; discussion 960-951
248. Milliken LA, Going SB, Houtkooper LB, Flint-Wagner HG, Figueroa A, Metcalfe LL,Blew RM, Sharp SC, Lohman TG (2003) Effects of exercise training on bone remodeling,insulin-like growth factors, and bone mineral density in postmenopausal women with andwithout hormone replacement therapy. Calcified tissue international 72: 478-484
249. Miron S, Refregiers M, Gilles AM, Maurizot JC (2005) New synchrotron radiationcircular dichroism end-station on DISCO beamline at SOLEIL synchrotron for biomolecularanalysis. Biochimica et biophysica acta 1724: 425-431
250. Modlesky CM, Majumdar S, Dudley GA (2008) Trabecular bone microarchitecture infemale collegiate gymnasts. Osteoporos Int 19: 1011-1018
251. Moester MJ, Papapoulos SE, Lowik CW, van Bezooijen RL (2010) Sclerostin: currentknowledge and future perspectives. Calcified tissue international 87: 99-107
252. Moore MJ, Werch CE (2005) Sport and physical activity participation and substance useamong adolescents. J Adolesc Health 36: 486-493
253. Muller JM, Lelievre V, Becq-Giraudon L, Meunier AC (1995) VIP as a cell-growth anddifferentiation neuromodulator role in neurodevelopment. Molecular neurobiology 10: 115-134
322
254. Muller R (2009) Hierarchical microimaging of bone structure and function. Naturereviews 5: 373-381
255. Mulvihill BM, McNamara LM, Prendergast PJ (2008) Loss of trabeculae by mechano-biological means may explain rapid bone loss in osteoporosis. Journal of the Royal Society,Interface / the Royal Society 5: 1243-1253
256. Mundy GR (1996) Regulation of bone formation by bone morphogenetic proteins andother growth factors. Clinical orthopaedics and related research: 24-28
257. Nagy TR, Prince CW, Li J (2001) Validation of peripheral dual-energy X-rayabsorptiometry for the measurement of bone mineral in intact and excised long bones of rats.J Bone Miner Res 16: 1682-1687
258. Nanes MS (2003) Tumor necrosis factor-alpha: molecular and cellular mechanisms inskeletal pathology. Gene 321: 1-15
259. Nesbitt S, Nesbit A, Helfrich M, Horton M (1993) Biochemical characterization ofhuman osteoclast integrins. Osteoclasts express alpha v beta 3, alpha 2 beta 1, and alpha vbeta 1 integrins. The Journal of biological chemistry 268: 16737-16745
260. Nesic J, Duka T (2008) Effects of stress on emotional reactivity in hostile heavy socialdrinkers following dietary tryptophan enhancement. Alcohol and alcoholism (Oxford,Oxfordshire) 43: 151-162
261. Nevill ME, Holmyard DJ, Hall GM, Allsop P, van Oosterhout A, Burrin JM, Nevill AM(1996) Growth hormone responses to treadmill sprinting in sprint- and endurance-trainedathletes. European journal of applied physiology and occupational physiology 72: 460-467
262. Newhall KM, Rodnick KJ, van der Meulen MC, Carter DR, Marcus R (1991) Effects ofvoluntary exercise on bone mineral content in rats. J Bone Miner Res 6: 289-296
263. Newman JS, Newberg AH (2010) Basketball injuries. Radiologic clinics of NorthAmerica 48: 1095-1111
264. Nichols JF, Rauh MJ, Lawson MJ, Ji M, Barkai HS (2006) Prevalence of the femaleathlete triad syndrome among high school athletes. Archives of pediatrics & adolescentmedicine 160: 137-142
265. Nicolella DP, Moravits DE, Gale AM, Bonewald LF, Lankford J (2006) Osteocytelacunae tissue strain in cortical bone. Journal of biomechanics 39: 1735-1743
323
266. Nishiguchi S, Shiomi S, Tamori A, Habu D, Takeda T, Tanaka T, Ochi H (2000) Effectof ethanol on bone mineral density of rats evaluated by dual-photon X-ray absorptiometry.Journal of bone and mineral metabolism 18: 317-320
267. Nordstrom A, Olsson T, Nordstrom P (2006) Sustained benefits from previous physicalactivity on bone mineral density in males. The Journal of clinical endocrinology andmetabolism 91: 2600-2604
268. Norman AW (2002) 1alpha,25(OH)2 Vitamin D3. Principles of Bone Biology.Academic Press, New York, pp. 545-571
269. Notomi T, Okazaki Y, Okimoto N, Tanaka Y, Nakamura T, Suzuki M (2002) Effects oftower climbing exercise on bone mass, strength, and turnover in orchidectomized growingrats. J Appl Physiol 93: 1152-1158
270. Notomi T, Okimoto N, Okazaki Y, Tanaka Y, Nakamura T, Suzuki M (2001) Effects oftower climbing exercise on bone mass, strength, and turnover in growing rats. J Bone MinerRes 16: 166-174
271. Nurmi-Lawton JA, Baxter-Jones AD, Mirwald RL, Bishop JA, Taylor P, Cooper C, NewSA (2004) Evidence of sustained skeletal benefits from impact-loading exercise in youngfemales: a 3-year longitudinal study. J Bone Miner Res 19: 314-322
272. Nyquist F, Duppe H, Obrant KJ, Bondeson L, Nordsletten L (2002) Effects of alcohol onbone mineral and mechanical properties of bone in male rats. Alcohol and alcoholism(Oxford, Oxfordshire) 37: 21-24
273. Nyquist F, Halvorsen V, Madsen JE, Nordsletten L, Obrant KJ (1999) Ethanol and itseffects on fracture healing and bone mass in male rats. Acta orthopaedica Scandinavica 70:212-216
274. Nyquist F, Karlsson MK, Obrant KJ, Nilsson JA (1997) Osteopenia in alcoholics aftertibia shaft fractures. Alcohol and alcoholism (Oxford, Oxfordshire) 32: 599-604
275. Nyquist F, Ljunghall S, Berglund M, Obrant K (1996) Biochemical markers of bonemetabolism after short and long time ethanol withdrawal in alcoholics. Bone 19: 51-54
276. O'Brien KS, Blackie JM, Hunter JA (2005) Hazardous drinking in elite New Zealandsportspeople. Alcohol and alcoholism (Oxford, Oxfordshire) 40: 239-241
277. O'Donnell E, De Souza MJ (2011) Increased serum adiponectin concentrations inamenorrheic physically active women are associated with impaired bone health but not withestrogen exposure. Bone 48: 760-767
324
278. Olszynski WP, Shawn Davison K, Adachi JD, Brown JP, Cummings SR, Hanley DA,Harris SP, Hodsman AB, Kendler D, McClung MR, Miller PD, Yuen CK (2004)Osteoporosis in men: epidemiology, diagnosis, prevention, and treatment. Clinicaltherapeutics 26: 15-28
279. Ostrowski MC (2010) A new role for OPG: putting RANKL in its place. J Bone MinerRes 25: 1905-1906
280. Ouchi N, Walsh K (2007) Adiponectin as an anti-inflammatory factor. Clinica chimicaacta; international journal of clinical chemistry 380: 24-30
281. Oursler MJ, Cortese C, Keeting P, Anderson MA, Bonde SK, Riggs BL, Spelsberg TC(1991) Modulation of transforming growth factor-beta production in normal humanosteoblast-like cells by 17 beta-estradiol and parathyroid hormone. Endocrinology 129: 3313-3320
282. Pacifici R, Vannice JL, Rifas L, Kimble RB (1993) Monocytic secretion of interleukin-1receptor antagonist in normal and osteoporotic women: effects of menopause andestrogen/progesterone therapy. The Journal of clinical endocrinology and metabolism 77:1135-1141
283. Papapoulos SE (2011) Targeting sclerostin as potential treatment of osteoporosis. Annalsof the rheumatic diseases 70 Suppl 1: i119-122
284. Parfitt AM (1990) Bone-forming cells in clinical conditions. In: Hall BK (ed) Bone.Telford Press and CRC Press, Boca Raton, Florida, pp. 351-429
285. Parfitt AM (1994) Osteonal and hemi-osteonal remodeling: the spatial and temporalframework for signal traffic in adult human bone. Journal of cellular biochemistry 55: 273-286
286. Parfitt AM, Drezner MK, Glorieux FH, Kanis JA, Malluche H, Meunier PJ, Ott SM,Recker RR (1987) Bone histomorphometry: standardization of nomenclature, symbols, andunits. Report of the ASBMR Histomorphometry Nomenclature Committee. J Bone Miner Res2: 595-610
287. Patton AJ, Genever PG, Birch MA, Suva LJ, Skerry TM (1998) Expression of an N-methyl-D-aspartate-type receptor by human and rat osteoblasts and osteoclasts suggests anovel glutamate signaling pathway in bone. Bone 22: 645-649
288. Peng TC, Kusy RP, Hirsch PF, Hagaman JR (1988) Ethanol-induced changes inmorphology and strength of femurs of rats. Alcoholism, clinical and experimental research12: 655-659
325
289. Pepersack T, Fuss M, Otero J, Bergmann P, Valsamis J, Corvilain J (1992) Longitudinalstudy of bone metabolism after ethanol withdrawal in alcoholic patients. J Bone Miner Res 7:383-387
290. Perera B, Torabi M, Kay NS (2011) Alcohol use, related problems and psychologicalhealth in college students. International journal of adolescent medicine and health 23: 33-37
291. Peris P, Guanabens N, Monegal A, Suris X, Alvarez L, Martinez de Osaba MJ,Hernandez MV, Munoz-Gomez J (1995) Aetiology and presenting symptoms in maleosteoporosis. British journal of rheumatology 34: 936-941
292. Perney P, Rigole H, Blanc F (2008) Alcohol dependence: diagnosis and treatment. LaRevue de medecine interne / fondee 29: 297-304
293. Peyrin F (2009) Investigation of bone with synchrotron radiation imaging: from micro tonano. Osteoporos Int 20: 1057-1063
294. Pollock N, Grogan C, Perry M, Pedlar C, Cooke K, Morrissey D, Dimitriou L (2010)Bone-mineral density and other features of the female athlete triad in elite endurance runners:a longitudinal and cross-sectional observational study. International journal of sport nutritionand exercise metabolism 20: 418-426
295. Poole KE, van Bezooijen RL, Loveridge N, Hamersma H, Papapoulos SE, Lowik CW,Reeve J (2005) Sclerostin is a delayed secreted product of osteocytes that inhibits boneformation. Faseb J 19: 1842-1844
296. Power J, Noble BS, Loveridge N, Bell KL, Rushton N, Reeve J (2001) Osteocyte lacunaroccupancy in the femoral neck cortex: an association with cortical remodeling in hip fracturecases and controls. Calcified tissue international 69: 13-19
297. Preedy VR, Reilly ME, Patel VB, Richardson PJ, Peters TJ (1999) Protein metabolism inalcoholism: effects on specific tissues and the whole body. Nutrition (Burbank, Los AngelesCounty, Calif 15: 604-608
298. Price PA, Baukol SA (1980) 1,25-Dihydroxyvitamin D3 increases synthesis of thevitamin K-dependent bone protein by osteosarcoma cells. The Journal of biological chemistry255: 11660-11663
299. Prince CW, Butler WT (1987) 1,25-Dihydroxyvitamin D3 regulates the biosynthesis ofosteopontin, a bone-derived cell attachment protein, in clonal osteoblast-like osteosarcomacells. Collagen and related research 7: 305-313
326
300. Prouteau S, Benhamou L, Courteix D (2006) Relationships between serum leptin andbone markers during stable weight, weight reduction and weight regain in male and femalejudoists. European journal of endocrinology / European Federation of Endocrine Societies154: 389-395
301. Quarles LD (2008) Endocrine functions of bone in mineral metabolism regulation. TheJournal of clinical investigation 118: 3820-3828
302. Quarto N, Wan DC, Kwan MD, Panetta NJ, Li S, Longaker MT (2010) Origin matters:differences in embryonic tissue origin and Wnt signaling determine the osteogenic potentialand healing capacity of frontal and parietal calvarial bones. J Bone Miner Res 25: 1680-1694
303. Quertemont E, Didone V (2006) Role of acetaldehyde in mediating the pharmacologicaland behavioral effects of alcohol. Alcohol Res Health 29: 258-265
304. Raggatt LJ, Partridge NC (2010) Cellular and molecular mechanisms of boneremodeling. The Journal of biological chemistry 285: 25103-25108
305. Rainey CJ, McKeown RE, Sargent RG, Valois RF (1996) Patterns of tobacco andalcohol use among sedentary, exercising, nonathletic, and athletic youth. J Sch Health 66: 27-32
306. Rasky E, Stronegger WJ, Freidl W (1996) Risk of osteoporosis in women in 4 differentoccupational groups. Wiener klinische Wochenschrift 108: 163-168
307. Rauh MJ, Nichols JF, Barrack MT (2010) Relationships among injury and disorderedeating, menstrual dysfunction, and low bone mineral density in high school athletes: aprospective study. Journal of athletic training 45: 243-252
308. Reed AH, McCarty HL, Evans GL, Turner RT, Westerlind KC (2002) The effects ofchronic alcohol consumption and exercise on the skeleton of adult male rats. Alcoholism,clinical and experimental research 26: 1269-1274
309. Reichel H, Koeffler HP, Norman AW (1989) The role of the vitamin D endocrine systemin health and disease. The New England journal of medicine 320: 980-991
310. Reid IR (2008) Relationships between fat and bone. Osteoporos Int 19: 595-606
311. Reid IR (2010) Fat and bone. Archives of biochemistry and biophysics 503: 20-27
312. Remes T, Vaisanen SB, Mahonen A, Huuskonen J, Kroger H, Jurvelin JS, Penttila IM,Rauramaa R (2004) The association of bone metabolism with bone mineral density, serum sexhormone concentrations, and regular exercise in middle-aged men. Bone 35: 439-447
327
313. Ren J (2007) Acetaldehyde and alcoholic cardiomyopathy: lessons from the ADH andALDH2 transgenic models. Novartis Foundation symposium 285: 69-76; discussion 76-69,198-199
314. Rey G, Boniol M, Jougla E (2010) Estimating the number of alcohol-attributable deaths:methodological issues and illustration with French data for 2006. Addiction (Abingdon,England) 105: 1018-1029
315. Reynolds ES (1963) The use of lead citrate at high pH as an electron-opaque stain inelectron microscopy. The Journal of cell biology 17: 208-212
316. Rico H (1990) Alcohol and bone disease. Alcohol and alcoholism (Oxford, Oxfordshire)25: 345-352
317. Rizzoli R, Bruyere O, Cannata-Andia JB, Devogelaer JP, Lyritis G, Ringe JD, Vellas B,Reginster JY (2009) Management of osteoporosis in the elderly. Current medical research andopinion 25: 2373-2387
318. Robey PG (2002) Bone matrix proteoglycans and glycoproteins. Principles of BoneBiology. Academic Press, New York, pp. 225-237
319. Robling AG (2009) Is bone's response to mechanical signals dominated by muscleforces? Med Sci Sports Exerc 41: 2044-2049
320. Robling AG, Niziolek PJ, Baldridge LA, Condon KW, Allen MR, Alam I, Mantila SM,Gluhak-Heinrich J, Bellido TM, Harris SE, Turner CH (2008) Mechanical stimulation of bonein vivo reduces osteocyte expression of Sost/sclerostin. The Journal of biological chemistry283: 5866-5875
321. Rochefort GY, Pallu S, Benhamou CL (2010) Osteocyte: the unrecognized side of bonetissue. Osteoporos Int 21: 1457-1469
322. Ronis MJ, Wands JR, Badger TM, de la Monte SM, Lang CH, Calissendorff J (2007)Alcohol-induced disruption of endocrine signaling. Alcoholism, clinical and experimentalresearch 31: 1269-1285
323. Rosen CJ (2002) Growth hormone and insulin-like growth factor-I treatment formetabolic bone diseases. Prinicples of Bone Biology, New York, pp. 1441-1453
324. Russell M, Misra M (2010) Influence of ghrelin and adipocytokines on bone mineraldensity in adolescent female athletes with amenorrhea and eumenorrheic athletes. Medicineand sport science 55: 103-113
328
325. Russo CR, Lauretani F, Seeman E, Bartali B, Bandinelli S, Di Iorio A, Guralnik J,Ferrucci L (2006) Structural adaptations to bone loss in aging men and women. Bone 38: 112-118
326. Sakurama K (1998) Effects of long-term ethanol administration on the kidneys, bonesand muscles of mice. Nihon Arukoru Yakubutsu Igakkai zasshi = Japanese journal of alcoholstudies & drug dependence 33: 703-717
327. Salvesen H, Johansson AG, Foxdal P, Wide L, Piehl-Aulin K, Ljunghall S (1994) Intactserum parathyroid hormone levels increase during running exercise in well-trained men.Calcified tissue international 54: 256-261
328. Sampson HW (1998) Effect of alcohol consumption on adult and aged bone: ahistomorphometric study of the rat animal model. Alcoholism, clinical and experimentalresearch 22: 2029-2034
329. Sampson HW (2002) Alcohol and other factors affecting osteoporosis risk in women.Alcohol Res Health 26: 292-298
330. Sampson HW, Chaffin C, Lange J, DeFee B, 2nd (1997) Alcohol consumption by youngactively growing rats: a histomorphometric study of cancellous bone. Alcoholism, clinical andexperimental research 21: 352-359
331. Sampson HW, Gallager S, Lange J, Chondra W, Hogan HA (1999) Binge drinking andbone metabolism in a young actively growing rat model. Alcoholism, clinical andexperimental research 23: 1228-1231
332. Sampson HW, Hebert VA, Booe HL, Champney TH (1998) Effect of alcoholconsumption on adult and aged bone: composition, morphology, and hormone levels of a ratanimal model. Alcoholism, clinical and experimental research 22: 1746-1753
333. Sampson HW, Perks N, Champney TH, DeFee B, 2nd (1996) Alcohol consumptioninhibits bone growth and development in young actively growing rats. Alcoholism, clinicaland experimental research 20: 1375-1384
334. Sampson HW, Spears H (1999) Osteopenia due to chronic alcohol consumption byyoung actively growing rats is not completely reversible. Alcoholism, clinical andexperimental research 23: 324-327
335. Sartorio A, Agosti F, Marazzi N, Trecate L, Silvestri G, Lafortuna C, Cappa M, De PaloE, Faglia G, Corradini C, Cella S, Rigamonti A, Muller EE (2004a) Gender-, age-, bodycomposition- and training workload-dependent differences of GH response to a discipline-specific training session in elite athletes: a study on the field. Journal of endocrinologicalinvestigation 27: 121-129
329
336. Sartorio A, Marazzi N, Agosti F, Faglia G, Corradini C, De Palo E, Cella S, RigamontiA, Muller EE (2004b) Elite volunteer athletes of different sport disciplines may have elevatedbaseline GH levels divorced from unaltered levels of both IGF-I and GH-dependent bone andcollagen markers: a study on-the-field. Journal of endocrinological investigation 27: 410-415
337. Sato N, Lindros KO, Baraona E, Ikejima K, Mezey E, Jarvelainen HA, RamchandaniVA (2001) Sex difference in alcohol-related organ injury. Alcoholism, clinical andexperimental research 25: 40S-45S
338. Schmidt GP, Reiser MF, Baur-Melnyk A (2007) Whole-body imaging of themusculoskeletal system: the value of MR imaging. Skeletal radiology 36: 1109-1119
339. Schnatz PF, Marakovits KA, Dubois M, O'Sullivan DM (2011) Osteoporosis screeningand treatment guidelines: are they being followed? Menopause (New York, NY
340. Schnitzler CM, Mesquita JM, Shires R (2010) Cortical and trabecular bonemicroarchitecture and turnover in alcohol-induced chronic pancreatitis: a histomorphometricstudy. Journal of bone and mineral metabolism 28: 456-467
341. Schnitzler CM, Solomon L (1984) Bone changes after alcohol abuse. South Africanmedical journal = Suid-Afrikaanse tydskrif vir geneeskunde 66: 730-734
342. Schoberl S, Nickel P, Schmutzer G, Siekmeyer W, Kiess W (2008) Acute ethanolintoxication among children and adolescents. A retrospective analysis of 173 patientsadmitted to a university children hospital. Klinische Padiatrie 220: 253-258
343. Schoutens A, Laurent E, Poortmans JR (1989) Effects of inactivity and exercise on bone.Sports medicine (Auckland, NZ 7: 71-81
344. Scott JP, Sale C, Greeves JP, Casey A, Dutton J, Fraser WD (2011) The role of exerciseintensity in the bone metabolic response to an acute bout of weight-bearing exercise. J ApplPhysiol 110: 423-432
345. Seeman E (1997) Do men suffer with osteoporosis? Australian family physician 26: 135-143
346. Seeman E (2006) Osteocytes--martyrs for integrity of bone strength. Osteoporos Int 17:1443-1448
347. Sendur OF, Turan Y, Tastaban E, Serter M (2009) Antioxidant status in patients withosteoporosis: a controlled study. Joint Bone Spine 76: 514-518
330
348. Shimabukuro M, Zhou YT, Levi M, Unger RH (1998) Fatty acid-induced beta cellapoptosis: a link between obesity and diabetes. Proceedings of the National Academy ofSciences of the United States of America 95: 2498-2502
349. Sievanen H (2010) Immobilization and bone structure in humans. Archives ofbiochemistry and biophysics 503: 146-152
350. Siller-Jackson AJ, Burra S, Gu S, Xia X, Bonewald LF, Sprague E, Jiang JX (2008)Adaptation of connexin 43-hemichannel prostaglandin release to mechanical loading. TheJournal of biological chemistry 283: 26374-26382
351. Silvain C, Chagneau-Derrode C (2006) Metabolisme de l'ethanol. Hépathologie
352. Silvestrini G, Ballanti P, Sebastiani M, Leopizzi M, Di Vito M, Bonucci E (2008) OPGand RANKL mRNA and protein expressions in the primary and secondary metaphysealtrabecular bone of PTH-treated rats are independent of that of SOST. Journal of molecularhistology 39: 237-242
353. Sinaki M, Pfeifer M, Preisinger E, Itoi E, Rizzoli R, Boonen S, Geusens P, Minne HW(2010) The role of exercise in the treatment of osteoporosis. Current osteoporosis reports 8:138-144
354. Skerry TM (2006) One mechanostat or many? Modifications of the site-specific responseof bone to mechanical loading by nature and nurture. Journal of musculoskeletal & neuronalinteractions 6: 122-127
355. Skerry TM (2008) The role of glutamate in the regulation of bone mass and architecture.Journal of musculoskeletal & neuronal interactions 8: 166-173
356. Slutske WS (2005) Alcohol use disorders among US college students and their non-college-attending peers. Archives of general psychiatry 62: 321-327
357. Sorensen MG, Henriksen K, Schaller S, Karsdal MA (2007) Biochemical markers inpreclinical models of osteoporosis. Biomarkers 12: 266-286
358. Sornay-Rendu E, Boutroy S, Munoz F, Bouxsein ML (2009) Cortical and trabeculararchitecture are altered in postmenopausal women with fractures. Osteoporos Int 20: 1291-1297
359. Sowa H, Kaji H, Hendy GN, Canaff L, Komori T, Sugimoto T, Chihara K (2004) Meninis required for bone morphogenetic protein 2- and transforming growth factor beta-regulatedosteoblastic differentiation through interaction with Smads and Runx2. The Journal ofbiological chemistry 279: 40267-40275
331
360. Sripanyakorn S, Jugdaohsingh R, Mander A, Davidson SL, Thompson RP, Powell JJ(2009) Moderate ingestion of alcohol is associated with acute ethanol-induced suppression ofcirculating CTX in a PTH-independent fashion. J Bone Miner Res 24: 1380-1388
361. Stahre M, Naimi T, Brewer R, Holt J (2006) Measuring average alcohol consumption:the impact of including binge drinks in quantity-frequency calculations. Addiction (Abingdon,England) 101: 1711-1718
362. Stern PH (2002) Thyroid hormone and bone. Principles of bone biology. AcademicPress, New York, pp. 707-721
363. Suda T, Takahashi N, Udagawa N, Jimi E, Gillespie MT, Martin TJ (1999) Modulationof osteoclast differentiation and function by the new members of the tumor necrosis factorreceptor and ligand families. Endocrine reviews 20: 345-357
364. Swift JM, Gasier HG, Swift SN, Wiggs MP, Hogan HA, Fluckey JD, Bloomfield SA(2010) Increased training loads do not magnify cancellous bone gains with rodent jumpresistance exercise. J Appl Physiol 109: 1600-1607
365. Szulc P, Delmas PD (2002) Osteoporosis in the aged male. Presse Med 31: 1760-1769
366. Tajima O, Ashizawa N, Ishii T, Amagai H, Mashimo T, Liu LJ, Saitoh S, Tokuyama K,Suzuki M (2000) Interaction of the effects between vitamin D receptor polymorphism andexercise training on bone metabolism. J Appl Physiol 88: 1271-1276
367. Takahashi N, Udagawa N, Akatsu T, Tanaka H, Shionome M, Suda T (1991) Role ofcolony-stimulating factors in osteoclast development. J Bone Miner Res 6: 977-985
368. Takarada-Iemata M, Takarada T, Nakamura Y, Nakatani E, Hori O, Yoneda Y (2011)Glutamate preferentially suppresses osteoblastogenesis than adipogenesis through thecystine/glutamate antiporter in mesenchymal stem cells. Journal of cellular physiology 226:652-665
369. Takeuchi F, Isono M, Nabika T, Katsuya T, Sugiyama T, Yamaguchi S, Kobayashi S,Ogihara T, Yamori Y, Fujioka A, Kato N (2011) Confirmation of ALDH2 as a Major locus ofdrinking behavior and of its variants regulating multiple metabolic phenotypes in a Japanesepopulation. Circ J 75: 911-918
370. Tan SD, de Vries TJ, Kuijpers-Jagtman AM, Semeins CM, Everts V, Klein-Nulend J(2007) Osteocytes subjected to fluid flow inhibit osteoclast formation and bone resorption.Bone 41: 745-751
332
371. Tao FB, Xu ML, Kim SD, Sun Y, Su PY, Huang K (2007) Physical activity might not bethe protective factor for health risk behaviours and psychopathological symptoms inadolescents. J Paediatr Child Health 43: 762-767
372. Tatsumi S, Ishii K, Amizuka N, Li M, Kobayashi T, Kohno K, Ito M, Takeshita S, IkedaK (2007) Targeted ablation of osteocytes induces osteoporosis with defectivemechanotransduction. Cell metabolism 5: 464-475
373. Tezuka K, Takeshita S, Hakeda Y, Kumegawa M, Kikuno R, Hashimoto-Gotoh T (1990)Isolation of mouse and human cDNA clones encoding a protein expressed specifically inosteoblasts and brain tissues. Biochemical and biophysical research communications 173:246-251
374. Thorsen K, Kristoffersson A, Lorentzon R (1996) The effects of brisk walking onmarkers of bone and calcium metabolism in postmenopausal women. Calcified tissueinternational 58: 221-225
375. Tomkinson A, Gevers EF, Wit JM, Reeve J, Noble BS (1998) The role of estrogen in thecontrol of rat osteocyte apoptosis. J Bone Miner Res 13: 1243-1250
376. Torgerson DJ, Campbell MK, Reid DM (1995) Life-style, environmental and medicalfactors influencing peak bone mass in women. British journal of rheumatology 34: 620-624
377. Tortora GJ, Grabowski SR (1994) Principes d'anatomie et de physiologie. De BoeckUniversité, Anjou (Québec)
378. Trouvin AP, Goeb V (2010) Receptor activator of nuclear factor-kappaB ligand andosteoprotegerin: maintaining the balance to prevent bone loss. Clinical interventions in aging5: 345-354
379. Trump BF, Smuckler EA, Benditt EP (1961) A method for staining epoxy sections forlight microscopy. Journal of ultrastructure research 5: 343-348
380. Tucker KL, Jugdaohsingh R, Powell JJ, Qiao N, Hannan MT, Sripanyakorn S, CupplesLA, Kiel DP (2009) Effects of beer, wine, and liquor intakes on bone mineral density in oldermen and women. The American journal of clinical nutrition 89: 1188-1196
381. Turner CH, Burr DB (1993) Basic biomechanical measurements of bone: a tutorial. Bone14: 595-608
382. Turner CH, Robling AG (2004) Exercise as an anabolic stimulus for bone. Currentpharmaceutical design 10: 2629-2641
333
383. Turner CH, Robling AG (2005) Mechanisms by which exercise improves bone strength.Journal of bone and mineral metabolism 23 Suppl: 16-22
384. Turner RT (2000) Skeletal response to alcohol. Alcoholism, clinical and experimentalresearch 24: 1693-1701
385. Turner RT, Greene VS, Bell NH (1987) Demonstration that ethanol inhibits bone matrixsynthesis and mineralization in the rat. J Bone Miner Res 2: 61-66
386. Turner RT, Kidder LS, Kennedy A, Evans GL, Sibonga JD (2001) Moderate alcoholconsumption suppresses bone turnover in adult female rats. J Bone Miner Res 16: 589-594
387. Udagawa N, Takahashi N, Jimi E, Matsuzaki K, Tsurukai T, Itoh K, Nakagawa N,Yasuda H, Goto M, Tsuda E, Higashio K, Gillespie MT, Martin TJ, Suda T (1999)Osteoblasts/stromal cells stimulate osteoclast activation through expression of osteoclastdifferentiation factor/RANKL but not macrophage colony-stimulating factor: receptoractivator of NF-kappa B ligand. Bone 25: 517-523
388. Ueland T (2005) GH/IGF-I and bone resorption in vivo and in vitro. European journal ofendocrinology / European Federation of Endocrine Societies 152: 327-332
389. Ulrich D, van Rietbergen B, Laib A, Ruegsegger P (1999) The ability of three-dimensional structural indices to reflect mechanical aspects of trabecular bone. Bone 25: 55-60
390. Unger RH (2003) Minireview: weapons of lean body mass destruction: the role ofectopic lipids in the metabolic syndrome. Endocrinology 144: 5159-5165
391. Utkan T, Erden F, Yildiz F, Ozdemirci S, Ulak G, Gacar MN (2001) Chronic ethanolconsumption impairs adrenoceptor- and purinoceptor-mediated relaxations of isolated ratdetrusor smooth muscle. BJU international 88: 278-283
392. Uusi-Rasi K, Sievanen H, Vuori I, Pasanen M, Heinonen A, Oja P (1998) Associationsof physical activity and calcium intake with bone mass and size in healthy women at differentages. J Bone Miner Res 13: 133-142
393. Väänänen K, Zhao H (2002) Osteoclast function. Biology and mechanisms. Principlesof Bone Biology. Academic Press, New York
394. Vainionpaa A, Korpelainen R, Sievanen H, Vihriala E, Leppaluoto J, Jamsa T (2007)Effect of impact exercise and its intensity on bone geometry at weight-bearing tibia andfemur. Bone 40: 604-611
334
395. Valimaki MJ, Karkkainen M, Lamberg-Allardt C, Laitinen K, Alhava E, Heikkinen J,Impivaara O, Makela P, Palmgren J, Seppanen R, et al. (1994) Exercise, smoking, andcalcium intake during adolescence and early adulthood as determinants of peak bone mass.Cardiovascular Risk in Young Finns Study Group. BMJ (Clinical research ed 309: 230-235
396. Van der Rest M, Garrone R (1991) Collagen family of proteins. Faseb J 5: 2814-2823
397. Van Hove R, Nolte P, Vatsa A, Semeins C, Salmon P, Smit T, Klein-Nulend J (2009)Osteocyte morphology in human tibiae of different bone pathologies with different bonemineral density-Is there a role for mechanosensing? Bone 45(2): 321-329
398. Van Langendonck L, Lefevre J, Claessens AL, Thomis M, Philippaerts R, Delvaux K,Lysens R, Renson R, Vanreusel B, Vanden Eynde B, Dequeker J, Beunen G (2003) Influenceof participation in high-impact sports during adolescence and adulthood on bone mineraldensity in middle-aged men: a 27-year follow-up study. American journal of epidemiology158: 525-533
399. Vanderschueren D, Bouillon R (1995) Androgens and bone. Calcified tissueinternational 56: 341-346
400. Vantyghem MC, Danel T, Marcelli-Tourvieille S, Moriau J, Leclerc L, Cardot-BautersC, Docao C, Carnaille B, Wemeau JL, D'Herbomez M (2007) Calcitonin levels do notdecrease with weaning in chronic alcoholism. Thyroid 17: 213-217
401. Vatsa A, Breuls RG, Semeins CM, Salmon PL, Smit TH, Klein-Nulend J (2008a)Osteocyte morphology in fibula and calvaria --- is there a role for mechanosensing? Bone 43:452-458
402. Vatsa A, Semeins CM, Smit TH, Klein-Nulend J (2008b) Paxillin localisation inosteocytes--is it determined by the direction of loading? Biochemical and biophysicalresearch communications 377: 1019-1024
403. Venkat KK, Arora MM, Singh P, Desai M, Khatkhatay I (2009) Effect of alcoholconsumption on bone mineral density and hormonal parameters in physically active malesoldiers. Bone 45: 449-454
404. Venken K, Callewaert F, Boonen S, Vanderschueren D (2008) Sex hormones, theirreceptors and bone health. Osteoporos Int 19: 1517-1525
405. Verborgt O, Gibson GJ, Schaffler MB (2000) Loss of osteocyte integrity in associationwith microdamage and bone remodeling after fatigue in vivo. J Bone Miner Res 15: 60-67
335
406. Vezeridis PS, Semeins CM, Chen Q, Klein-Nulend J (2006) Osteocytes subjected topulsating fluid flow regulate osteoblast proliferation and differentiation. Biochemical andbiophysical research communications 348: 1082-1088
407. Visser M, Kiel DP, Langlois J, Hannan MT, Felson DT, Wilson PW, Harris TB (1998)Muscle mass and fat mass in relation to bone mineral density in very old men and women: theFramingham Heart Study. Appl Radiat Isot 49: 745-747
408. Wang Y, Li Y, Mao K, Li J, Cui Q, Wang GJ (2003) Alcohol-induced adipogenesis inbone and marrow: a possible mechanism for osteonecrosis. Clinical orthopaedics and relatedresearch: 213-224
409. Warren MP (1999) Health issues for women athletes: exercise-induced amenorrhea. TheJournal of clinical endocrinology and metabolism 84: 1892-1896
410. Warren MP, Chua AT (2008) Exercise-induced amenorrhea and bone health in theadolescent athlete. Annals of the New York Academy of Sciences 1135: 244-252
411. Warren MP, Perlroth NE (2001) The effects of intense exercise on the femalereproductive system. The Journal of endocrinology 170: 3-11
412. Weiss M, Yogev R, Dolev E (1998) Occupational sitting and low hip mineral density.Calcified tissue international 62: 47-50
413. Welch JM, Turner CH, Devareddy L, Arjmandi BH, Weaver CM (2008) High impactexercise is more beneficial than dietary calcium for building bone strength in the growing ratskeleton. Bone 42: 660-668
414. Westbroek I, van der Plas A, de Rooij KE, Klein-Nulend J, Nijweide PJ (2001)Expression of serotonin receptors in bone. The Journal of biological chemistry 276: 28961-28968
415. Wezeman FH, Juknelis D, Frost N, Callaci JJ (2003) Spine bone mineral density andvertebral body height are altered by alcohol consumption in growing male and female rats.Alcohol (Fayetteville, NY 31: 87-92
416. Williams FM, Cherkas LF, Spector TD, MacGregor AJ (2005) The effect of moderatealcohol consumption on bone mineral density: a study of female twins. Annals of therheumatic diseases 64: 309-310
417. Williams NI, Helmreich DL, Parfitt DB, Caston-Balderrama A, Cameron JL (2001)Evidence for a causal role of low energy availability in the induction of menstrual cycle
336
disturbances during strenuous exercise training. The Journal of clinical endocrinology andmetabolism 86: 5184-5193
418. Windahl SH, Andersson N, Borjesson AE, Swanson C, Svensson J, Moverare-Skrtic S,Sjogren K, Shao R, Lagerquist MK, Ohlsson C (2011) Reduced bone mass and musclestrength in male 5alpha-reductase type 1 inactivated mice. PloS one 6: e21402
419. Wiren KM, Orwoll ES (2002) Androgens - Receptor expression and steroid action inbone. Principles of Bone Biology. Academic Press, New York, pp. 757-772
420. Wolff J (1892) Das Gesetz der transformation der Knochen., Berlin
421. Wosje KS, Kalkwarf HJ (2007) Bone density in relation to alcohol intake among menand women in the United States. Osteoporos Int 18: 391-400
422. Wylie CD (2010) Setting a standard for a "silent" disease: defining osteoporosis in the1980s and 1990s. Studies in history and philosophy of biological and biomedical sciences 41:376-385
423. Yadav VK, Ducy P (2010) Lrp5 and bone formation : A serotonin-dependent pathway.Annals of the New York Academy of Sciences 1192: 103-109
424. Yadav VK, Karsenty G (2009) Leptin-dependent co-regulation of bone and energymetabolism. Aging 1: 954-956
425. Yamaguchi T, Kanatani M, Yamauchi M, Kaji H, Sugishita T, Baylink DJ, Mohan S,Chihara K, Sugimoto T (2006) Serum levels of insulin-like growth factor (IGF); IGF-bindingproteins-3, -4, and -5; and their relationships to bone mineral density and the risk of vertebralfractures in postmenopausal women. Calcified tissue international 78: 18-24
426. Yamamoto A, Sekino A, Tajima M, Nguyen VC, Ezawa I (1997) Effect of long-termalcohol administration on bone metabolism in rats. Journal of nutritional science andvitaminology 43: 369-375
427. Yang GQ, Lu ZH, Gu WJ, Du J, Guo QH, Wang XL, Ba JM, Dou JT, Mu YM, Lu JM(2011) Recurrent autoimmune hypophysitis successfully treated with glucocorticoids plusazathioprine: a report of three cases. Endocrine journal
428. Yeh JK, Aloia JF, Tierney JM, Sprintz S (1993) Effect of treadmill exercise on vertebraland tibial bone mineral content and bone mineral density in the aged adult rat: determined bydual energy X-ray absorptiometry. Calcified tissue international 52: 234-238
337
429. Yoshizawa T, Handa Y, Uematsu Y, Takeda S, Sekine K, Yoshihara Y, Kawakami T,Arioka K, Sato H, Uchiyama Y, Masushige S, Fukamizu A, Matsumoto T, Kato S (1997)Mice lacking the vitamin D receptor exhibit impaired bone formation, uterine hypoplasia andgrowth retardation after weaning. Nature genetics 16: 391-396
430. Young CM, Weeks BK, Beck BR (2007) Simple, novel physical activity maintainsproximal femur bone mineral density, and improves muscle strength and balance in sedentary,postmenopausal Caucasian women. Osteoporos Int 18: 1379-1387
431. Zanker CL, Swaine IL (1998) Bone turnover in amenorrhoeic and eumenorrhoeicwomen distance runners. Scandinavian journal of medicine & science in sports 8: 20-26
432. Zebaze RM, Ghasem-Zadeh A, Bohte A, Iuliano-Burns S, Mirams M, Price RI, MackieEJ, Seeman E (2010) Intracortical remodelling and porosity in the distal radius and post-mortem femurs of women: a cross-sectional study. Lancet 375: 1729-1736
433. Zerath E, Holy X, Douce P, Guezennec CY, Chatard JC (1997) Effect of endurancetraining on postexercise parathyroid hormone levels in elderly men. Med Sci Sports Exerc 29:1139-1145
434. Zhou S (2011) TGF-beta regulates beta-catenin signaling and osteoblast differentiationin human mesenchymal stem cells. Journal of cellular biochemistry 112: 1651-1660

338
Annexe
REVIEW
Alcohol and bone: review of dose effects and mechanisms
D. B. Maurel & N. Boisseau & C. L. Benhamou & C. Jaffre
Received: 24 March 2011 /Accepted: 19 August 2011# International Osteoporosis Foundation and National Osteoporosis Foundation 2011
Abstract Alcohol is widely consumed across the world. Itis consumed in both social and cultural settings. Untilrecently, two types of alcohol consumption were recog-nized: heavy chronic alcohol consumption or light con-sumption. Today, there is a new pattern of consumptionamong teenagers and young adults namely: binge drinking.Heavy alcohol consumption is detrimental to many organsand tissues, including bones, and is known to inducesecondary osteoporosis. Some studies, however, havereported benefits from light alcohol consumption on boneparameters. To date, little is known regarding the effects of
binge drinking on bone health. Here, we review the effects ofthree different means of alcohol consumption: light, heavy,and binge drinking. We also review the detailed literature onthe different mechanisms by which alcohol intake maydecrease bone mass and strength. The effects of alcohol onbone are thought to be both direct and indirect. The decreasein bone mass and strength following alcohol consumption ismainly due to a bone remodeling imbalance, with apredominant decrease in bone formation. Recent studies,however, have reported new mechanisms by which alcoholmay act on bone remodeling, including osteocyte apoptosis,oxidative stress, and Wnt signalling pathway modulation. Theroles of reduced total fat mass, increased lipid content in bonemarrow, and a hypoleptinemia are also discussed.
Keywords Alcohol consumption . Binge drinking .
Body composition . Bone density. Leptin . Osteocytes
Introduction
Alcohol is not an essential nutrient but is largely consumedaround the world. Heavy alcohol consumption has detrimentaleffects on the brain, liver, muscles, and also the skeleton [1].Chronic alcohol consumption is responsible for many deaths(75,000 Americans each year). In this review, we first assessthe skeletal effects of alcohol with respect to various levelsof alcohol consumption. There is speculation that lowalcohol consumption may increase bone mass and density,while heavy alcohol doses are reported to damage bone atvarious levels. In the second part, we review the mechanismsresponsible for these alcohol-induced skeletal effects.
C.L. Benhamou and C. Jaffre equally contributed to this work.
D. B. Maurel :C. L. BenhamouUnité INSERM U658: Caractérisation du Tissu Osseuxpar Imagerie: Techniques et Applications, CHR Orléans,45000 Orléans, France
N. BoisseauLaboratoire de Biologie des Activités Physiques et Sportives,Clermont Université, Université Blaise Pascal, EA 3533,BP 10448,63000 Clermont-Ferrand, France
C. JaffreLaboratoire Mouvement, Sport, Santé (M2S), EA 1274,Université de Rennes 2,35044 Rennes, France
D. B. Maurel (*)Unité INSERM U658, IPROS,Hôpital Porte Madeleine, 1 rue porte Madeleine, BP2439,45032 Orleans cedex 01, Francee-mail: [email protected]
Osteoporos IntDOI 10.1007/s00198-011-1787-7
339
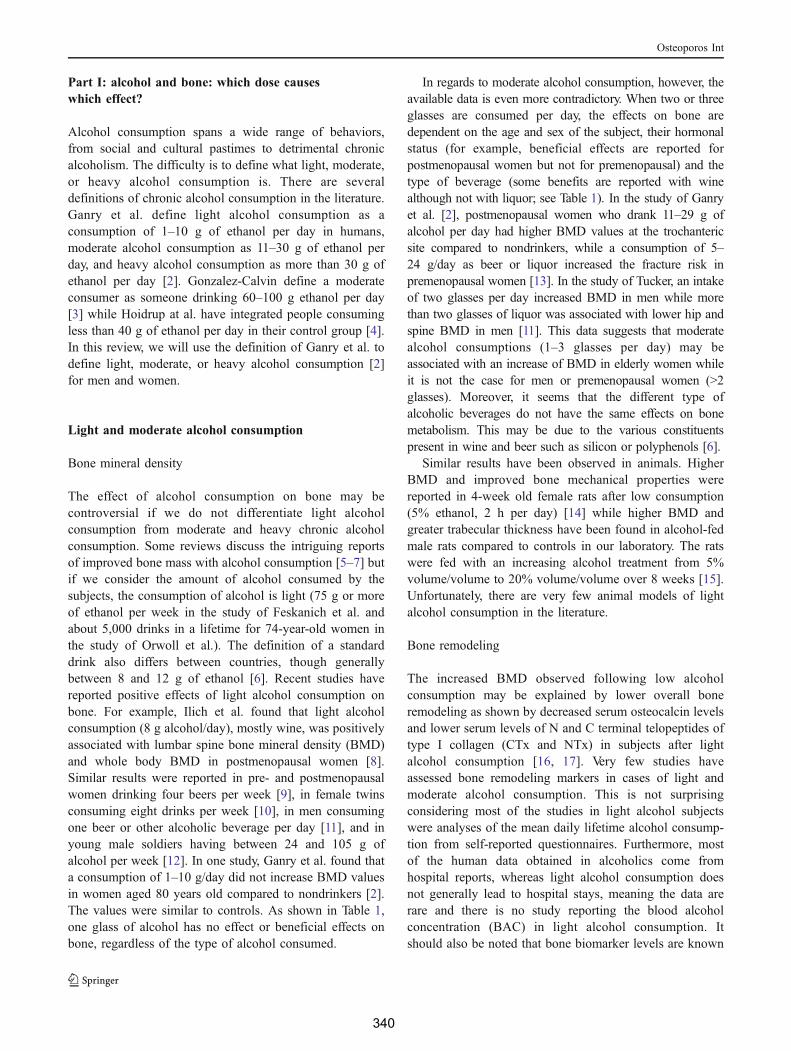
Part I: alcohol and bone: which dose causeswhich effect?
Alcohol consumption spans a wide range of behaviors,from social and cultural pastimes to detrimental chronicalcoholism. The difficulty is to define what light, moderate,or heavy alcohol consumption is. There are severaldefinitions of chronic alcohol consumption in the literature.Ganry et al. define light alcohol consumption as aconsumption of 1–10 g of ethanol per day in humans,moderate alcohol consumption as 11–30 g of ethanol perday, and heavy alcohol consumption as more than 30 g ofethanol per day [2]. Gonzalez-Calvin define a moderateconsumer as someone drinking 60–100 g ethanol per day[3] while Hoidrup at al. have integrated people consumingless than 40 g of ethanol per day in their control group [4].In this review, we will use the definition of Ganry et al. todefine light, moderate, or heavy alcohol consumption [2]for men and women.
Light and moderate alcohol consumption
Bone mineral density
The effect of alcohol consumption on bone may becontroversial if we do not differentiate light alcoholconsumption from moderate and heavy chronic alcoholconsumption. Some reviews discuss the intriguing reportsof improved bone mass with alcohol consumption [5–7] butif we consider the amount of alcohol consumed by thesubjects, the consumption of alcohol is light (75 g or moreof ethanol per week in the study of Feskanich et al. andabout 5,000 drinks in a lifetime for 74-year-old women inthe study of Orwoll et al.). The definition of a standarddrink also differs between countries, though generallybetween 8 and 12 g of ethanol [6]. Recent studies havereported positive effects of light alcohol consumption onbone. For example, Ilich et al. found that light alcoholconsumption (8 g alcohol/day), mostly wine, was positivelyassociated with lumbar spine bone mineral density (BMD)and whole body BMD in postmenopausal women [8].Similar results were reported in pre- and postmenopausalwomen drinking four beers per week [9], in female twinsconsuming eight drinks per week [10], in men consumingone beer or other alcoholic beverage per day [11], and inyoung male soldiers having between 24 and 105 g ofalcohol per week [12]. In one study, Ganry et al. found thata consumption of 1–10 g/day did not increase BMD valuesin women aged 80 years old compared to nondrinkers [2].The values were similar to controls. As shown in Table 1,one glass of alcohol has no effect or beneficial effects onbone, regardless of the type of alcohol consumed.
In regards to moderate alcohol consumption, however, theavailable data is even more contradictory. When two or threeglasses are consumed per day, the effects on bone aredependent on the age and sex of the subject, their hormonalstatus (for example, beneficial effects are reported forpostmenopausal women but not for premenopausal) and thetype of beverage (some benefits are reported with winealthough not with liquor; see Table 1). In the study of Ganryet al. [2], postmenopausal women who drank 11–29 g ofalcohol per day had higher BMD values at the trochantericsite compared to nondrinkers, while a consumption of 5–24 g/day as beer or liquor increased the fracture risk inpremenopausal women [13]. In the study of Tucker, an intakeof two glasses per day increased BMD in men while morethan two glasses of liquor was associated with lower hip andspine BMD in men [11]. This data suggests that moderatealcohol consumptions (1–3 glasses per day) may beassociated with an increase of BMD in elderly women whileit is not the case for men or premenopausal women (>2glasses). Moreover, it seems that the different type ofalcoholic beverages do not have the same effects on bonemetabolism. This may be due to the various constituentspresent in wine and beer such as silicon or polyphenols [6].
Similar results have been observed in animals. HigherBMD and improved bone mechanical properties werereported in 4-week old female rats after low consumption(5% ethanol, 2 h per day) [14] while higher BMD andgreater trabecular thickness have been found in alcohol-fedmale rats compared to controls in our laboratory. The ratswere fed with an increasing alcohol treatment from 5%volume/volume to 20% volume/volume over 8 weeks [15].Unfortunately, there are very few animal models of lightalcohol consumption in the literature.
Bone remodeling
The increased BMD observed following low alcoholconsumption may be explained by lower overall boneremodeling as shown by decreased serum osteocalcin levelsand lower serum levels of N and C terminal telopeptides oftype I collagen (CTx and NTx) in subjects after lightalcohol consumption [16, 17]. Very few studies haveassessed bone remodeling markers in cases of light andmoderate alcohol consumption. This is not surprisingconsidering most of the studies in light alcohol subjectswere analyses of the mean daily lifetime alcohol consump-tion from self-reported questionnaires. Furthermore, mostof the human data obtained in alcoholics come fromhospital reports, whereas light alcohol consumption doesnot generally lead to hospital stays, meaning the data arerare and there is no study reporting the blood alcoholconcentration (BAC) in light alcohol consumption. Itshould also be noted that bone biomarker levels are known
Osteoporos Int
340
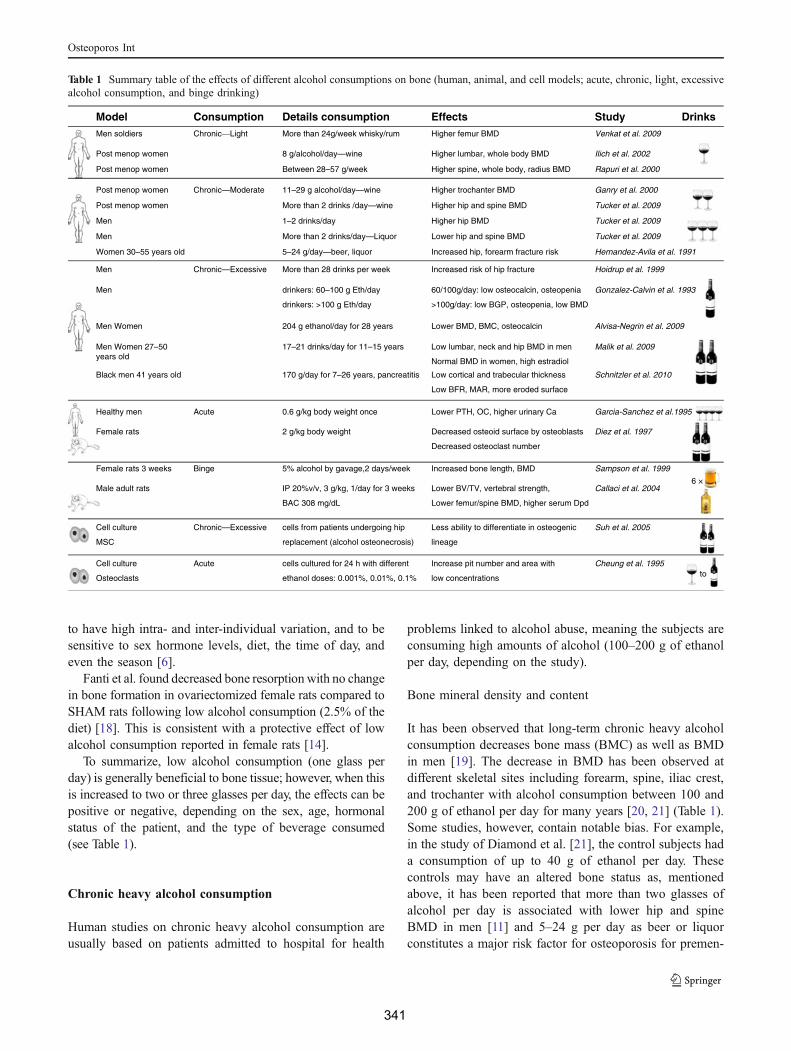
to have high intra- and inter-individual variation, and to besensitive to sex hormone levels, diet, the time of day, andeven the season [6].
Fanti et al. found decreased bone resorption with no changein bone formation in ovariectomized female rats compared toSHAM rats following low alcohol consumption (2.5% of thediet) [18]. This is consistent with a protective effect of lowalcohol consumption reported in female rats [14].
To summarize, low alcohol consumption (one glass perday) is generally beneficial to bone tissue; however, when thisis increased to two or three glasses per day, the effects can bepositive or negative, depending on the sex, age, hormonalstatus of the patient, and the type of beverage consumed(see Table 1).
Chronic heavy alcohol consumption
Human studies on chronic heavy alcohol consumption areusually based on patients admitted to hospital for health
problems linked to alcohol abuse, meaning the subjects areconsuming high amounts of alcohol (100–200 g of ethanolper day, depending on the study).
Bone mineral density and content
It has been observed that long-term chronic heavy alcoholconsumption decreases bone mass (BMC) as well as BMDin men [19]. The decrease in BMD has been observed atdifferent skeletal sites including forearm, spine, iliac crest,and trochanter with alcohol consumption between 100 and200 g of ethanol per day for many years [20, 21] (Table 1).Some studies, however, contain notable bias. For example,in the study of Diamond et al. [21], the control subjects hada consumption of up to 40 g of ethanol per day. Thesecontrols may have an altered bone status as, mentionedabove, it has been reported that more than two glasses ofalcohol per day is associated with lower hip and spineBMD in men [11] and 5–24 g per day as beer or liquorconstitutes a major risk factor for osteoporosis for premen-
Table 1 Summary table of the effects of different alcohol consumptions on bone (human, animal, and cell models; acute, chronic, light, excessivealcohol consumption, and binge drinking)
Model Consumption Details consumption Effects Study Drinks Men soldiers Chronic—Light More than 24g/week whisky/rum Higher femur BMD Venkat et al. 2009
Post menop women 8 g/alcohol/day—wine Higher lumbar, whole body BMD Ilich et al. 2002
Post menop women
Post menop women
Post menop women
Between 28–57 g/week Higher spine, whole body, radius BMD Rapuri et al. 2000
Chronic—Moderate 11–29 g alcohol/day—wine Higher trochanter BMD Ganry et al. 2000
More than 2 drinks /day—wine Higher hip and spine BMD Tucker et al. 2009
Men More than 2 drinks/day—Liquor Lower hip and spine BMD Tucker et al. 2009
Men 1–2 drinks/day Higher hip BMD Tucker et al. 2009
Women 30–55 years old 5–24 g/day—beer, liquor Increased hip, forearm fracture risk Hernandez-Avila et al. 1991
Men Women 204 g ethanol/day for 28 years Lower BMD, BMC, osteocalcin Alvisa-Negrin et al. 2009
Men Women 27–50years old
17–21 drinks/day for 11–15 years Low lumbar, neck and hip BMD in men Malik et al. 2009
Normal BMD in women, high estradiol
Black men 41 years old 170 g/day for 7–26 years, pancreatitis Low cortical and trabecular thickness Schnitzler et al. 2010
Low BFR, MAR, more eroded surface
Men drinkers: 60–100 g Eth/day 60/100g/day: low osteocalcin, osteopenia Gonzalez-Calvin et al. 1993
drinkers: >100 g Eth/day >100g/day: low BGP, osteopenia, low BMD
Healthy men Acute 0.6 g/kg body weight once Lower PTH, OC, higher urinary Ca Garcia-Sanchez et al.1995
Female rats 2 g/kg body weight Decreased osteoid surface by osteoblasts Diez et al. 1997
Decreased osteoclast number
Female rats 3 weeks Binge 5% alcohol by gavage,2 days/week Increased bone length, BMD Sampson et al. 1999
Male adult rats IP 20%v/v, 3 g/kg, 1/day for 3 weeks Lower BV/TV, vertebral strength, Callaci et al. 2004
BAC 308 mg/dL Lower femur/spine BMD, higher serum Dpd
Cell culture Chronic—Excessive cells from patients undergoing hip Less ability to differentiate in osteogenic Suh et al. 2005
MSC replacement (alcohol osteonecrosis) lineage
Cell culture Acute cells cultured for 24 h with different Increase pit number and area with Cheung et al. 1995
Osteoclasts ethanol doses: 0.001%, 0.01%, 0.1% low concentrations
Men Chronic—Excessive More than 28 drinks per week Increased risk of hip fracture Hoidrup et al. 1999
6 ×
to
Osteoporos Int
341
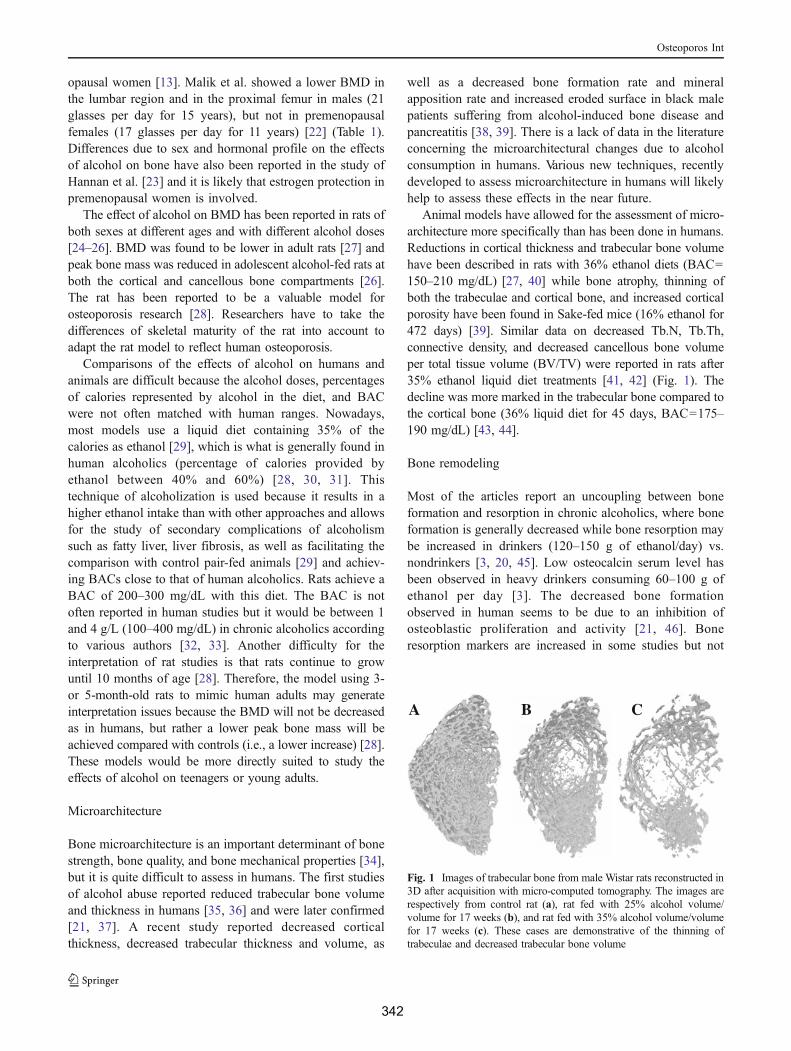
opausal women [13]. Malik et al. showed a lower BMD inthe lumbar region and in the proximal femur in males (21glasses per day for 15 years), but not in premenopausalfemales (17 glasses per day for 11 years) [22] (Table 1).Differences due to sex and hormonal profile on the effectsof alcohol on bone have also been reported in the study ofHannan et al. [23] and it is likely that estrogen protection inpremenopausal women is involved.
The effect of alcohol on BMD has been reported in rats ofboth sexes at different ages and with different alcohol doses[24–26]. BMD was found to be lower in adult rats [27] andpeak bone mass was reduced in adolescent alcohol-fed rats atboth the cortical and cancellous bone compartments [26].The rat has been reported to be a valuable model forosteoporosis research [28]. Researchers have to take thedifferences of skeletal maturity of the rat into account toadapt the rat model to reflect human osteoporosis.
Comparisons of the effects of alcohol on humans andanimals are difficult because the alcohol doses, percentagesof calories represented by alcohol in the diet, and BACwere not often matched with human ranges. Nowadays,most models use a liquid diet containing 35% of thecalories as ethanol [29], which is what is generally found inhuman alcoholics (percentage of calories provided byethanol between 40% and 60%) [28, 30, 31]. Thistechnique of alcoholization is used because it results in ahigher ethanol intake than with other approaches and allowsfor the study of secondary complications of alcoholismsuch as fatty liver, liver fibrosis, as well as facilitating thecomparison with control pair-fed animals [29] and achiev-ing BACs close to that of human alcoholics. Rats achieve aBAC of 200–300 mg/dL with this diet. The BAC is notoften reported in human studies but it would be between 1and 4 g/L (100–400 mg/dL) in chronic alcoholics accordingto various authors [32, 33]. Another difficulty for theinterpretation of rat studies is that rats continue to growuntil 10 months of age [28]. Therefore, the model using 3-or 5-month-old rats to mimic human adults may generateinterpretation issues because the BMD will not be decreasedas in humans, but rather a lower peak bone mass will beachieved compared with controls (i.e., a lower increase) [28].These models would be more directly suited to study theeffects of alcohol on teenagers or young adults.
Microarchitecture
Bone microarchitecture is an important determinant of bonestrength, bone quality, and bone mechanical properties [34],but it is quite difficult to assess in humans. The first studiesof alcohol abuse reported reduced trabecular bone volumeand thickness in humans [35, 36] and were later confirmed[21, 37]. A recent study reported decreased corticalthickness, decreased trabecular thickness and volume, as
well as a decreased bone formation rate and mineralapposition rate and increased eroded surface in black malepatients suffering from alcohol-induced bone disease andpancreatitis [38, 39]. There is a lack of data in the literatureconcerning the microarchitectural changes due to alcoholconsumption in humans. Various new techniques, recentlydeveloped to assess microarchitecture in humans will likelyhelp to assess these effects in the near future.
Animal models have allowed for the assessment of micro-architecture more specifically than has been done in humans.Reductions in cortical thickness and trabecular bone volumehave been described in rats with 36% ethanol diets (BAC=150–210 mg/dL) [27, 40] while bone atrophy, thinning ofboth the trabeculae and cortical bone, and increased corticalporosity have been found in Sake-fed mice (16% ethanol for472 days) [39]. Similar data on decreased Tb.N, Tb.Th,connective density, and decreased cancellous bone volumeper total tissue volume (BV/TV) were reported in rats after35% ethanol liquid diet treatments [41, 42] (Fig. 1). Thedecline was more marked in the trabecular bone compared tothe cortical bone (36% liquid diet for 45 days, BAC=175–190 mg/dL) [43, 44].
Bone remodeling
Most of the articles report an uncoupling between boneformation and resorption in chronic alcoholics, where boneformation is generally decreased while bone resorption maybe increased in drinkers (120–150 g of ethanol/day) vs.nondrinkers [3, 20, 45]. Low osteocalcin serum level hasbeen observed in heavy drinkers consuming 60–100 g ofethanol per day [3]. The decreased bone formationobserved in human seems to be due to an inhibition ofosteoblastic proliferation and activity [21, 46]. Boneresorption markers are increased in some studies but not
A B C
Fig. 1 Images of trabecular bone from male Wistar rats reconstructed in3D after acquisition with micro-computed tomography. The images arerespectively from control rat (a), rat fed with 25% alcohol volume/volume for 17 weeks (b), and rat fed with 35% alcohol volume/volumefor 17 weeks (c). These cases are demonstrative of the thinning oftrabeculae and decreased trabecular bone volume
Osteoporos Int
342
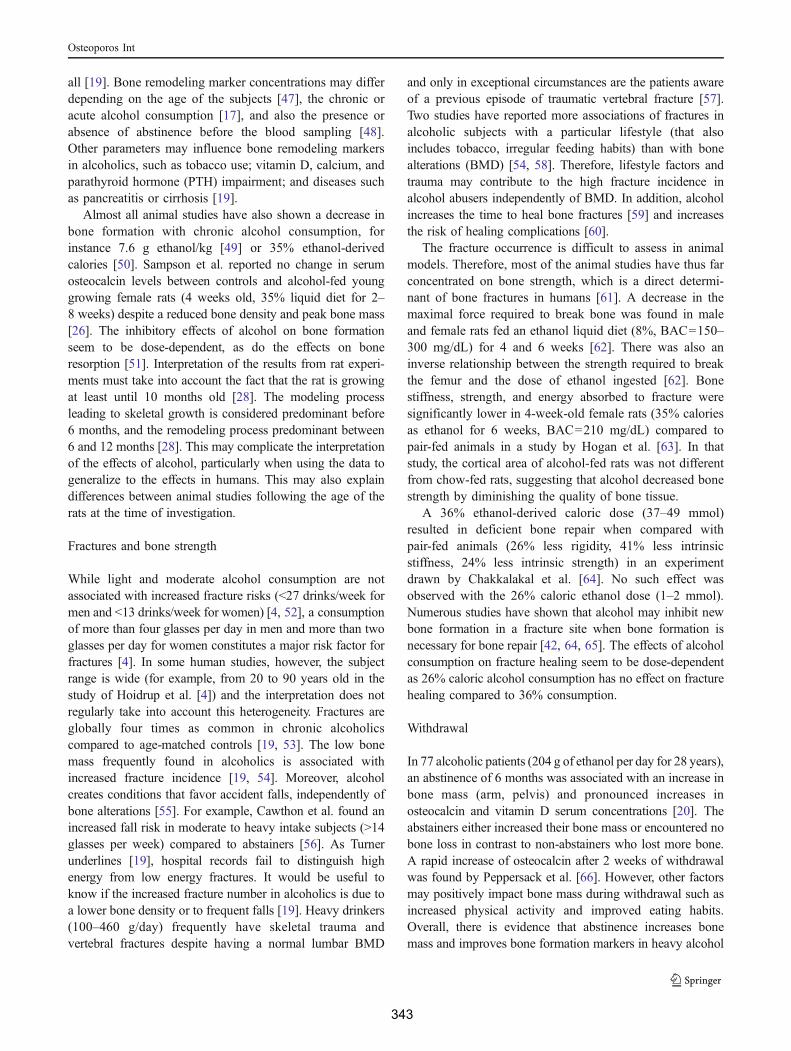
all [19]. Bone remodeling marker concentrations may differdepending on the age of the subjects [47], the chronic oracute alcohol consumption [17], and also the presence orabsence of abstinence before the blood sampling [48].Other parameters may influence bone remodeling markersin alcoholics, such as tobacco use; vitamin D, calcium, andparathyroid hormone (PTH) impairment; and diseases suchas pancreatitis or cirrhosis [19].
Almost all animal studies have also shown a decrease inbone formation with chronic alcohol consumption, forinstance 7.6 g ethanol/kg [49] or 35% ethanol-derivedcalories [50]. Sampson et al. reported no change in serumosteocalcin levels between controls and alcohol-fed younggrowing female rats (4 weeks old, 35% liquid diet for 2–8 weeks) despite a reduced bone density and peak bone mass[26]. The inhibitory effects of alcohol on bone formationseem to be dose-dependent, as do the effects on boneresorption [51]. Interpretation of the results from rat experi-ments must take into account the fact that the rat is growingat least until 10 months old [28]. The modeling processleading to skeletal growth is considered predominant before6 months, and the remodeling process predominant between6 and 12 months [28]. This may complicate the interpretationof the effects of alcohol, particularly when using the data togeneralize to the effects in humans. This may also explaindifferences between animal studies following the age of therats at the time of investigation.
Fractures and bone strength
While light and moderate alcohol consumption are notassociated with increased fracture risks (<27 drinks/week formen and <13 drinks/week for women) [4, 52], a consumptionof more than four glasses per day in men and more than twoglasses per day for women constitutes a major risk factor forfractures [4]. In some human studies, however, the subjectrange is wide (for example, from 20 to 90 years old in thestudy of Hoidrup et al. [4]) and the interpretation does notregularly take into account this heterogeneity. Fractures areglobally four times as common in chronic alcoholicscompared to age-matched controls [19, 53]. The low bonemass frequently found in alcoholics is associated withincreased fracture incidence [19, 54]. Moreover, alcoholcreates conditions that favor accident falls, independently ofbone alterations [55]. For example, Cawthon et al. found anincreased fall risk in moderate to heavy intake subjects (>14glasses per week) compared to abstainers [56]. As Turnerunderlines [19], hospital records fail to distinguish highenergy from low energy fractures. It would be useful toknow if the increased fracture number in alcoholics is due toa lower bone density or to frequent falls [19]. Heavy drinkers(100–460 g/day) frequently have skeletal trauma andvertebral fractures despite having a normal lumbar BMD
and only in exceptional circumstances are the patients awareof a previous episode of traumatic vertebral fracture [57].Two studies have reported more associations of fractures inalcoholic subjects with a particular lifestyle (that alsoincludes tobacco, irregular feeding habits) than with bonealterations (BMD) [54, 58]. Therefore, lifestyle factors andtrauma may contribute to the high fracture incidence inalcohol abusers independently of BMD. In addition, alcoholincreases the time to heal bone fractures [59] and increasesthe risk of healing complications [60].
The fracture occurrence is difficult to assess in animalmodels. Therefore, most of the animal studies have thus farconcentrated on bone strength, which is a direct determi-nant of bone fractures in humans [61]. A decrease in themaximal force required to break bone was found in maleand female rats fed an ethanol liquid diet (8%, BAC=150–300 mg/dL) for 4 and 6 weeks [62]. There was also aninverse relationship between the strength required to breakthe femur and the dose of ethanol ingested [62]. Bonestiffness, strength, and energy absorbed to fracture weresignificantly lower in 4-week-old female rats (35% caloriesas ethanol for 6 weeks, BAC=210 mg/dL) compared topair-fed animals in a study by Hogan et al. [63]. In thatstudy, the cortical area of alcohol-fed rats was not differentfrom chow-fed rats, suggesting that alcohol decreased bonestrength by diminishing the quality of bone tissue.
A 36% ethanol-derived caloric dose (37–49 mmol)resulted in deficient bone repair when compared withpair-fed animals (26% less rigidity, 41% less intrinsicstiffness, 24% less intrinsic strength) in an experimentdrawn by Chakkalakal et al. [64]. No such effect wasobserved with the 26% caloric ethanol dose (1–2 mmol).Numerous studies have shown that alcohol may inhibit newbone formation in a fracture site when bone formation isnecessary for bone repair [42, 64, 65]. The effects of alcoholconsumption on fracture healing seem to be dose-dependentas 26% caloric alcohol consumption has no effect on fracturehealing compared to 36% consumption.
Withdrawal
In 77 alcoholic patients (204 g of ethanol per day for 28 years),an abstinence of 6 months was associated with an increase inbone mass (arm, pelvis) and pronounced increases inosteocalcin and vitamin D serum concentrations [20]. Theabstainers either increased their bone mass or encountered nobone loss in contrast to non-abstainers who lost more bone.A rapid increase of osteocalcin after 2 weeks of withdrawalwas found by Peppersack et al. [66]. However, other factorsmay positively impact bone mass during withdrawal such asincreased physical activity and improved eating habits.Overall, there is evidence that abstinence increases bonemass and improves bone formation markers in heavy alcohol
Osteoporos Int
343
consumers, however, bone turnover may remain higher thannormal until 5 years postwithdrawal [45].
In one study, abstinence for 90 days following ethanolconsumption (36% alcohol consumption for 60 days) led to anincrease in femoral BMD in male adolescent rats, andmechanical parameters returned to normal values [67]. Similarresults have been demonstrated in other studies confirmingthe reversibility of alcohol-induced bone changes [68, 69].
Animal versus human studies
Most of the studies on the effects of heavy chronicalcoholic behavior on bone encounter bias as there areoften confounders and comorbidity factors among thepatients. The consumptions vary, the history of alcoholabuse and type of alcohol may also differ. Moreover, theremay be age, ethnicity, sex, and hormonal status differences.The comorbidity factors in men include tobacco smoke,sedentary lifestyles, impaired nutritional status, liver insuf-ficiency, depression, and drug association among others.The presence of liver disease may alter hormonal levels,rendering comparisons quite difficult. It is also difficult toassess an accurate report of the lifetime ethanol consump-tion in humans. Animal models have been developed asthey allow for the assessment of the effects of alcoholwithout confounders and comorbidity factors. Animalmodels are useful because they offer access to certainparameters, such as microarchitecture, and allow for studiesinvolving microscopy of bone cells and histomorphometry,which are difficult to obtain in human beings. Animalmodels are also easy to handle and allow for quick results,for example, after only several months, compared to yearsin human patients. On the other hand, the metabolic effectsin animals (and it should be noted that almost all animalstudies are in rodents) may differ from metabolic effects inhuman [28]. For example, sexual maturity occurs early inthe rat while the onset of skeletal maturity occurs late withlong-lasting growth.
In summary, heavy alcohol consumption leads toincreased risk of fracture via decreased BMD, alongsidepoor lifestyle habits. The bone alterations involve impair-ment in both trabecular and cortical bone and are related tothe uncoupling of bone remodeling.
Binge drinking
Animal models also have the benefit of permitting the analysisof atypical consumption such as binge drinking, whereas thisspecific data is not yet available for human bone.
Alcohol consumption is qualified as binge drinking whenfive or more standard drinks are ingested consecutively bymen and four or more drinks consecutively by women. Binge
drinking is not a new pattern of consumption. It is known tooccur among adults, but may be masked when self-reportingof alcohol consumption is the means of data collection [70].There is a lack of data concerning blood alcohol levelsachieved with binge drinking. In hospital admissions or inmortuary reports, blood alcohol levels in adults admitted foracute alcohol intoxication are between 2 and 4.6 g/L[71–73]. It is uncertain, however, if these values are due tobinge drinking, and they may not reflect the mean BAC inbinge drinkers as the cases in these reports were severe. In astudy by Savola et al., the BAC of 30-year-old men andwomen, admitted to hospital for trauma, ranged between 1and 2 g/L for frequent binge drinkers [33], which is similarto BAC observed in dependent drinkers. While bingedrinking is not a new phenomenon in adults, there has beena steady rise in binge drinking among adolescents over thelast decade. These drinking episodes are responsible formany hospital presentations of adolescents with acutealcohol intoxication (+171% between 1998 and 2003 inLeipzig hospital) [74]. Unfortunately, there is a notable lackof data on the BAC attained by children and teenagersfollowing binge drinking. One estimation posits a BAC ofbetween 0.8 and 1.39 g/L in boys aged 9–13 and girlsaged 9–17 after only three drinks [75]. The effects of bingedrinking on the human skeleton is not yet clear, since inadults it is masked by daily consumption and it is a relativelynew pattern of consumption in teenagers.
Different models have been developed in the rat tomimic binge drinking in humans. They consist of bolus oraldoses of alcohol given by gavage or injections for severaldays per week. The advantage of these forms of adminis-tration is that they allow the investigators to control theexact dosing of alcohol and to match volumes administeredacross all rats in all testing groups. Administering alcoholto rodents using these methods appears to accurately mimiclevels of high alcohol consumption such as those observedin alcoholics in a near-coma (2.8 g/L) [76]. The first modeldeveloped by Sampson et al. (5% alcohol by gavage, 2 daysper week for 7 weeks) in growing female rats (4 weeks old)increased bone length, bone weight, and BMD [77]. Thedose given by Sampson et al. to the rats was consideredequivalent to six beers consumed in a single day by a 63-kgwoman (1.14 g of ethanol/kg of body weight). A bingedrinking alcohol model was developed by Callaci et al.using intraperitoneal injections to administer 20% volume/volume alcohol/saline solution (3 g/kg, once daily) on fourconsecutive days for 1, 2, or 3 weeks. A dose of 3 g/kgrepresents 16–18 drinks for a 60-kg man. No effects wereobserved after 1 and 2 weeks of binge treatment butafter 3 weeks, lumbar spine and distal femoral BMDwere significantly reduced, as was vertebral compressivestrength. There was a decrease in BV/TV, bone area, and anincrease of trabecular separation [78]. Serum deoxypyridi-
Osteoporos Int
344
noline (a bone resorption marker) was significantly in-creased compared to controls (205%). These results suggestthat binge drinking in rats may affect bone integrity byincreasing bone resorption. Another model of binge alcoholconsumption tested by Callaci et al. (3 g/kg, i.p., 3consecutive days/week, for 1 or 4 weeks) in adult malerats confirmed these results [76]. The expression of boneformation marker genes (osteocalcin and alkaline phospha-tase) was also reduced after acute binge alcohol exposure[79]. Abstinence after a binge period in male adolescent ratsincreased tibia cancellous BMD which returned to normalvalues while vertebral BMD remained at 15% belowcontrol values [80].
These data show that binge drinking may trigger bothshort-term and long-term damages on the rat skeleton, inparticular, impairment of microarchitecture and BMD via achange of bone remodeling (increased resorption and de-creased formation). As a consequence, teenagers who engagein binge drinkingmay decrease their peak bonemass and be atrisk for later skeletal pathophysiologies.
Experimental design of alcoholization
Intraperitoneal injections and gavage are efficient methodsfor achieving high blood alcohol concentrations. However,these techniques are stressful for the animals and may leadto inflammation and necrosis of tissues (i.p. injections). It isdifficult to alcoholise the rats with these techniques for along time (several months) [29]. Moreover, the absorptionof alcohol with intraperitoneal injections is different fromthat in humans. Ethanol may be absorbed by peripheraltissue before it reaches the blood and it may be problematicto compare this method with human consumption. Thetechnique whereby ethanol is provided in a liquid dietallows the researchers to control the percentage of ethanolcontained in the diet and also the amount of nutrients in thediet. This technique is less stressful for the animals and isused by many researchers as it limits the risk of dehydrationamong the ethanol-fed rats. It is also useful to analyze onlythe effects of ethanol and not those of weight loss since therats fed with this diet do not incur weight loss compared tocontrols. The drawback of employing this technique is thatit does not mimic the human consumption pattern as theliquid and the food are mixed. Another model is a bottlewith water and alcohol, separated from the food [81]. Thisis the oldest technique of alcoholization [29]. The advan-tage of this technique is that it is easy to do and it mimicsthe human drinking pattern. The rats encounter physiologicchanges under alcohol that are comparable to those inhuman physiology (in particular, weight loss). The dis-advantages are that the rats may refrain from drinking andtherefore suffer from dehydration and achieve lower blood
alcohol levels [29]. Furthermore, the weight loss resultingmay hide the direct effects of ethanol on bone, when themechanism of action of ethanol on the skeleton is theprimary aim of the study.
Part II: mechanisms of action of chronic heavy alcoholconsumption on bone
The effects of ethanol on bone are well-known: it decreasesBMD and BMC in both cortical and trabecular bone, mainlyvia a decrease of bone formation. Overall, alcoholism is amajor cause of secondary osteoporosis in men and is well-known to increase fracture risk. Despite the fact that themechanisms of action of ethanol on bone are not completelyunderstood, they are thought to be both direct and indirect.
Indirect mechanisms of action
Body composition
Fat mass and lean mass are both decreased in alcohol abuse[41, 82]. This is likely due to caloric restriction [41]. Bothfat mass and lean mass are positively correlated with BMD[83, 84], although their contribution to BMD is different inmen and women [85]. Muscle forces play a role in generatingthe mechanical stimulus in exercise-induced bone gain [86],while the relationship of fat tissue to bone is mediated bybone active hormones secreted by adipocytes, in particular,leptin [87]. This may be an indirect pathway by whichalcohol leads to a decrease in BMD.
Leptin
Leptin is a 13-kDa protein secreted mainly by whiteadipose tissue that is involved in regulating food intakeand body weight. Leptin has been reported to be a regulatorof bone mass. Leptin is able to affect the central nervoussystem (CNS) as well as peripheral tissues: it decreasesbone mass through the CNS while also having an anaboliceffect on bone by driving stem cell differentiation to theosteoblastic cell lineage [88, 89]. Alcohol consumptiondecreases leptin concentrations in men and rats [41, 90, 91],as well as decreasing osteoblastogenesis and increasingadipogenesis concomitantly in the bone marrow, modifyingthe balance between osteogenesis and adipogenesis [92,93]. Consistent with this, an increase of the adipogenesisindicator PPARgamma and a decrease in osteocalcin havebeen observed in vitro on cloned bone marrow stem cellsfrom mice and on human mesenchymal stem cells culturedwith ethanol [94, 95]. These studies have also beenconfirmed by Ronis et al. [96].
Osteoporos Int
345
Growth hormone and insulin-like growth factor I
Growth hormone (GH) is a hormone that is an importantphysiologic regulator of bone growth. It also plays a role inthe regulation of bone remodeling in adults. GH treatmentof osteoblasts and chondrocytes leads to an increase in cellproliferation and differentiation in vitro [97] and suppressesbone marrow lipid accumulation [97]. Many of the actionsof GH on cells are mediated through insulin-like growthfactor I (IGF-I), and IGF-I is often decreased followingchronic alcohol consumption [41, 98]. It is likely that theeffects of alcohol on GH lead to a change in the balancebetween osteoblast and adipocyte differentiation. It hasbeen reported that alcohol impairs the effects of GH ontibial growth and trabecular bone formation [99].
Cell differentiation
Giuliani et al. reported that alcohol (at concentrations of 0.04–0.6%) and acetaldehyde (at concentrations of 0.004% and0.02%) induce suppression in the recruitment of cellscommitted to the osteoblast lineage in bone marrow culturesfrom alcoholics compared with age-matched healthy controls[100]. These concentrations are consistent with the serumethanol concentrations observed in humans (0.02–0.3%;Table 2). It has also been shown that alcohol treatment onbone marrow stem cells lines decreases osteogenesis andincreases adipogenesis at concentrations of 0.09, 0.15, and0.21 mol/L in a study by Cui et al. [94] and at concentrationsof 0.03, 0.09, and 0.15 mol/L in a study by Wang et al. [93].Despite the fact that the doses used by Cui et al. are lethal forhumans (Table 2), an inverse relationship between osteogen-esis and adipogenesis has been observed in rat stromalcultures [101]. Gong and Wezeman observed that alcohol(50 mmol alcohol in the culture medium) alters osteogenicdifferentiation in human bone-marrow-derived mesenchymalstem cell (MSC) cultures during lineage progression [102]which was confirmed by Rosa et al. with ethanol doses ofbetween 0.85 and 3.43 mmol [103]. This result providesfurther insight into alcohol-induced reduced bone formation.Similarly, a reduced ability of the MSC to differentiate intothe osteogenic lineage has been observed in cells frompatients with alcohol-induced osteonecrosis of the femoralhead compared to patients with femoral neck fractures withno history of alcohol consumption [104]. The human MSChad a significantly longer doubling time, less ability todifferentiate into osteoblasts but no greater adipogeniccapacity than controls.
Vitamin D and PTH
Some abnormalities in the hormonal levels have beenreported with alcoholism. These changes may indirectly
interfere with bone metabolism. For example, an insuffi-ciency in vitamin D [20, 22, 38] and a lower PTH levels[105] have been observed in some studies but not in others[17, 48]. Very recently, PTH injections in alcohol-fed ratshave been shown to increase the mineralizing perimeter/bone perimeter [106]. The anabolic actions of PTH on bonerequires IGF-I [107, 108], which is decreased by heavyalcohol consumption. PTH is involved in the activation ofvitamin D and vitamin D has a positive effect on osteoblastfunction and differentiation [109]. Chronic alcohol con-sumption can lead to a decrease in serum vitamin D levelsresulting in malabsorption of calcium from the intestine andleading to low levels of circulating serum calcium [110].Since bone resorption is source of calcium acquisition, itmay be increased; explaining why some studies reportedincreased resorption in severe alcoholics [3]. Low vitaminD levels in alcoholism may be related to reduced sunlightexposure, which is the main cause of vitamin D deficiency[22] or to liver lesions [111]. For example, in the case ofhepato-cellular deficiency, the hydroxylation of 25-vitaminD is impaired, and this impairment could worsen the effectsof vitamin D insufficiency (Fig. 2).
Calcitonin
Moderate alcohol consumption may increase calcitonin,which is a thyroid hormone that inhibits bone resorption[112]. This may explain the beneficial effects of moderatealcohol consumption sometimes observed in women [110](Fig. 2). However, some studies reported no change incalcitonin with alcohol [17].
Sex steroids
The level of testosterone has been reported to decrease withalcohol consumption in some studies [21, 113, 114] but not inothers [115]. A decrease of serum estradiol has been reportedin female alcoholics [116] and female rats treated withalcohol [117]. Low serum estradiol has been shown to be amajor factor of ethanol-induced bone loss via an increase inreceptor activator of NF-κB ligand (RANKL) expression[118]. In contrast, an increase in estrogen level has beenobserved in women drinking small amounts of alcohol[6, 119] and an increase in estradiol has been reported inmales with low alcohol consumption [12]. This may in partexplain the increased BMD observed in light drinkers.
Ions
Low levels of serum magnesium and phosphate have beenreported in heavy drinkers and could also contribute tobone loss [19, 110]. A change in calcium, magnesium, andphosphate, however, is not regularly reported in all the
Osteoporos Int
346
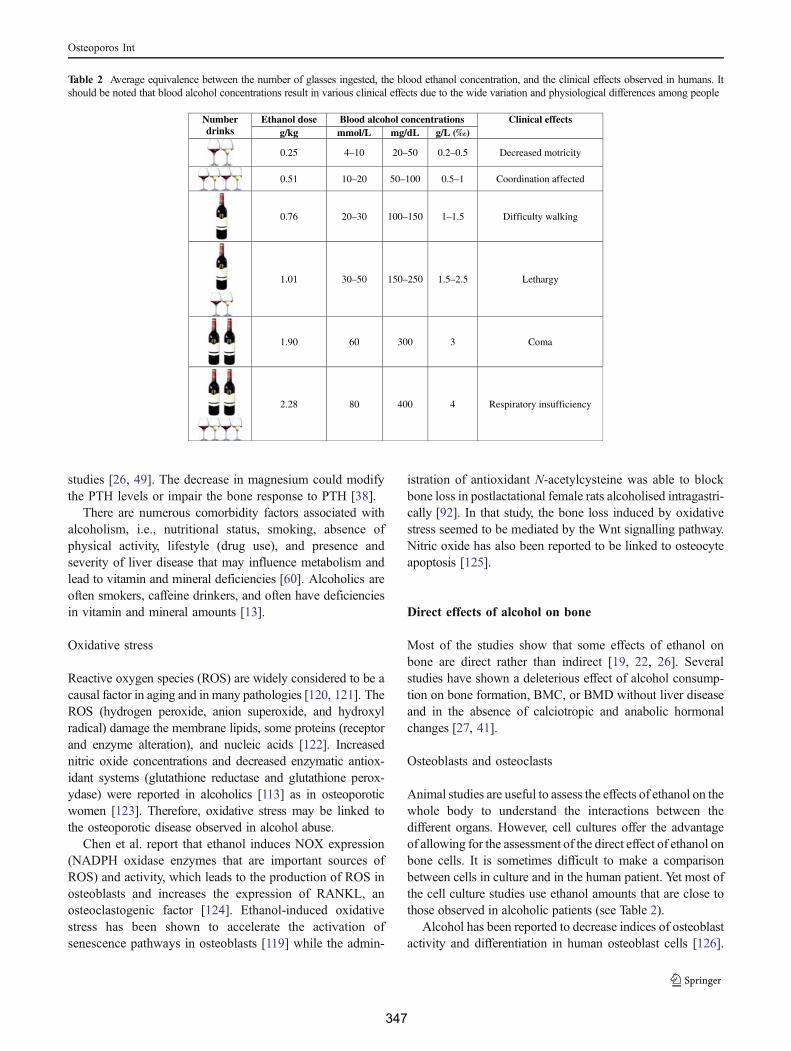
studies [26, 49]. The decrease in magnesium could modifythe PTH levels or impair the bone response to PTH [38].
There are numerous comorbidity factors associated withalcoholism, i.e., nutritional status, smoking, absence ofphysical activity, lifestyle (drug use), and presence andseverity of liver disease that may influence metabolism andlead to vitamin and mineral deficiencies [60]. Alcoholics areoften smokers, caffeine drinkers, and often have deficienciesin vitamin and mineral amounts [13].
Oxidative stress
Reactive oxygen species (ROS) are widely considered to be acausal factor in aging and in many pathologies [120, 121]. TheROS (hydrogen peroxide, anion superoxide, and hydroxylradical) damage the membrane lipids, some proteins (receptorand enzyme alteration), and nucleic acids [122]. Increasednitric oxide concentrations and decreased enzymatic antiox-idant systems (glutathione reductase and glutathione perox-ydase) were reported in alcoholics [113] as in osteoporoticwomen [123]. Therefore, oxidative stress may be linked tothe osteoporotic disease observed in alcohol abuse.
Chen et al. report that ethanol induces NOX expression(NADPH oxidase enzymes that are important sources ofROS) and activity, which leads to the production of ROS inosteoblasts and increases the expression of RANKL, anosteoclastogenic factor [124]. Ethanol-induced oxidativestress has been shown to accelerate the activation ofsenescence pathways in osteoblasts [119] while the admin-
istration of antioxidant N-acetylcysteine was able to blockbone loss in postlactational female rats alcoholised intragastri-cally [92]. In that study, the bone loss induced by oxidativestress seemed to be mediated by the Wnt signalling pathway.Nitric oxide has also been reported to be linked to osteocyteapoptosis [125].
Direct effects of alcohol on bone
Most of the studies show that some effects of ethanol onbone are direct rather than indirect [19, 22, 26]. Severalstudies have shown a deleterious effect of alcohol consump-tion on bone formation, BMC, or BMD without liver diseaseand in the absence of calciotropic and anabolic hormonalchanges [27, 41].
Osteoblasts and osteoclasts
Animal studies are useful to assess the effects of ethanol on thewhole body to understand the interactions between thedifferent organs. However, cell cultures offer the advantageof allowing for the assessment of the direct effect of ethanol onbone cells. It is sometimes difficult to make a comparisonbetween cells in culture and in the human patient. Yet most ofthe cell culture studies use ethanol amounts that are close tothose observed in alcoholic patients (see Table 2).
Alcohol has been reported to decrease indices of osteoblastactivity and differentiation in human osteoblast cells [126].
Table 2 Average equivalence between the number of glasses ingested, the blood ethanol concentration, and the clinical effects observed in humans. Itshould be noted that blood alcohol concentrations result in various clinical effects due to the wide variation and physiological differences among people
Number drinks
Ethanol dose Blood alcohol concentrations Clinical effects g/kg mmol/L mg/dL g/L (‰)
0.25 4–10 20–50 0.2–0.5 Decreased motricity
0.51 10–20 50–100 0.5–1 Coordination affected
0.76 20–30 100–150 1–1.5 Difficulty walking
1.01 30–50 150–250 1.5–2.5 Lethargy
1.90 60 300 3 Coma
2.28 80 400 4 Respiratory insufficiency
Osteoporos Int
347
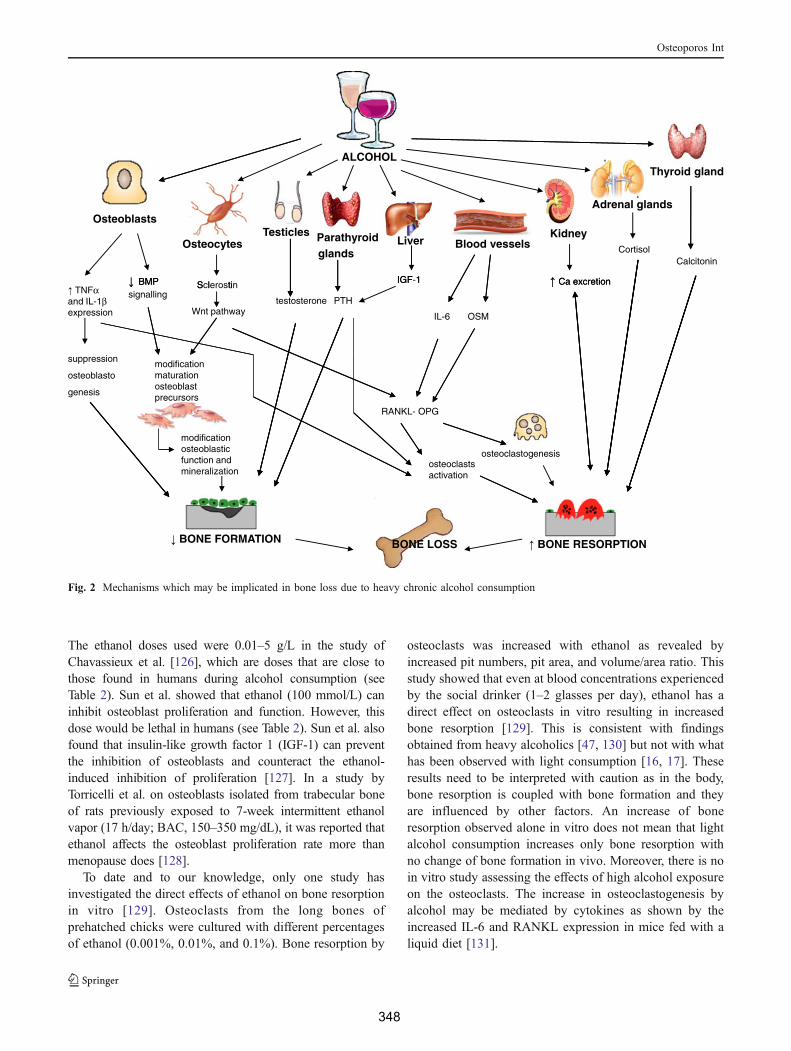
The ethanol doses used were 0.01–5 g/L in the study ofChavassieux et al. [126], which are doses that are close tothose found in humans during alcohol consumption (seeTable 2). Sun et al. showed that ethanol (100 mmol/L) caninhibit osteoblast proliferation and function. However, thisdose would be lethal in humans (see Table 2). Sun et al. alsofound that insulin-like growth factor 1 (IGF-1) can preventthe inhibition of osteoblasts and counteract the ethanol-induced inhibition of proliferation [127]. In a study byTorricelli et al. on osteoblasts isolated from trabecular boneof rats previously exposed to 7-week intermittent ethanolvapor (17 h/day; BAC, 150–350 mg/dL), it was reported thatethanol affects the osteoblast proliferation rate more thanmenopause does [128].
To date and to our knowledge, only one study hasinvestigated the direct effects of ethanol on bone resorptionin vitro [129]. Osteoclasts from the long bones ofprehatched chicks were cultured with different percentagesof ethanol (0.001%, 0.01%, and 0.1%). Bone resorption by
osteoclasts was increased with ethanol as revealed byincreased pit numbers, pit area, and volume/area ratio. Thisstudy showed that even at blood concentrations experiencedby the social drinker (1–2 glasses per day), ethanol has adirect effect on osteoclasts in vitro resulting in increasedbone resorption [129]. This is consistent with findingsobtained from heavy alcoholics [47, 130] but not with whathas been observed with light consumption [16, 17]. Theseresults need to be interpreted with caution as in the body,bone resorption is coupled with bone formation and theyare influenced by other factors. An increase of boneresorption observed alone in vitro does not mean that lightalcohol consumption increases only bone resorption withno change of bone formation in vivo. Moreover, there is noin vitro study assessing the effects of high alcohol exposureon the osteoclasts. The increase in osteoclastogenesis byalcohol may be mediated by cytokines as shown by theincreased IL-6 and RANKL expression in mice fed with aliquid diet [131].
ALCOHOLThyroid gland
Adrenal glands
CalcitoninCortisol
KidneyLiver
IGF-1 Ca excretion
Parathyroidglands
TesticlesOsteocytes
S l tiBMP
Osteoblasts
Blood vessels
IGF 1 Ca excretion
PTHtestosterone
Sclerostin
Wnt pathway
BMPsignalling TNFα
and IL-1βexpression IL-6 OSM
modification maturation osteoblast precursors
suppression
osteoblasto
genesis
RANKL- OPG
modification osteoblastic function and mineralization
osteoclastogenesisosteoclasts activation
BONE RESORPTION BONE FORMATION BONE LOSS
Fig. 2 Mechanisms which may be implicated in bone loss due to heavy chronic alcohol consumption
Osteoporos Int
348
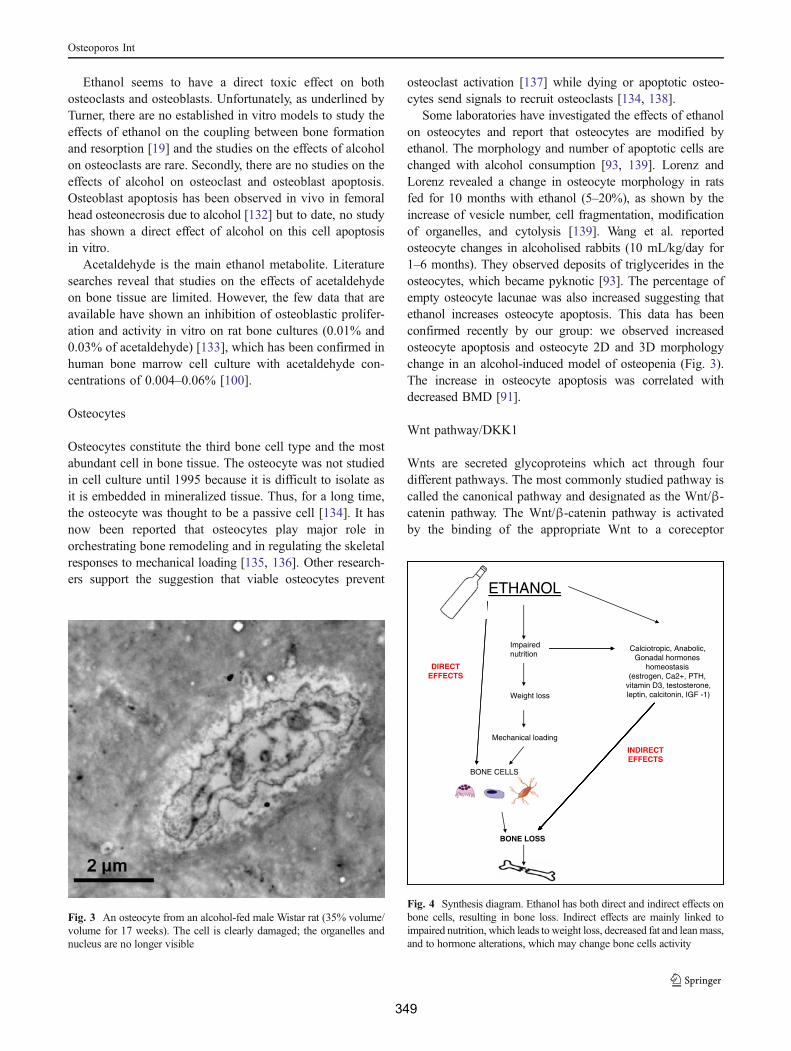
Ethanol seems to have a direct toxic effect on bothosteoclasts and osteoblasts. Unfortunately, as underlined byTurner, there are no established in vitro models to study theeffects of ethanol on the coupling between bone formationand resorption [19] and the studies on the effects of alcoholon osteoclasts are rare. Secondly, there are no studies on theeffects of alcohol on osteoclast and osteoblast apoptosis.Osteoblast apoptosis has been observed in vivo in femoralhead osteonecrosis due to alcohol [132] but to date, no studyhas shown a direct effect of alcohol on this cell apoptosisin vitro.
Acetaldehyde is the main ethanol metabolite. Literaturesearches reveal that studies on the effects of acetaldehydeon bone tissue are limited. However, the few data that areavailable have shown an inhibition of osteoblastic prolifer-ation and activity in vitro on rat bone cultures (0.01% and0.03% of acetaldehyde) [133], which has been confirmed inhuman bone marrow cell culture with acetaldehyde con-centrations of 0.004–0.06% [100].
Osteocytes
Osteocytes constitute the third bone cell type and the mostabundant cell in bone tissue. The osteocyte was not studiedin cell culture until 1995 because it is difficult to isolate asit is embedded in mineralized tissue. Thus, for a long time,the osteocyte was thought to be a passive cell [134]. It hasnow been reported that osteocytes play major role inorchestrating bone remodeling and in regulating the skeletalresponses to mechanical loading [135, 136]. Other research-ers support the suggestion that viable osteocytes prevent
osteoclast activation [137] while dying or apoptotic osteo-cytes send signals to recruit osteoclasts [134, 138].
Some laboratories have investigated the effects of ethanolon osteocytes and report that osteocytes are modified byethanol. The morphology and number of apoptotic cells arechanged with alcohol consumption [93, 139]. Lorenz andLorenz revealed a change in osteocyte morphology in ratsfed for 10 months with ethanol (5–20%), as shown by theincrease of vesicle number, cell fragmentation, modificationof organelles, and cytolysis [139]. Wang et al. reportedosteocyte changes in alcoholised rabbits (10 mL/kg/day for1–6 months). They observed deposits of triglycerides in theosteocytes, which became pyknotic [93]. The percentage ofempty osteocyte lacunae was also increased suggesting thatethanol increases osteocyte apoptosis. This data has beenconfirmed recently by our group: we observed increasedosteocyte apoptosis and osteocyte 2D and 3D morphologychange in an alcohol-induced model of osteopenia (Fig. 3).The increase in osteocyte apoptosis was correlated withdecreased BMD [91].
Wnt pathway/DKK1
Wnts are secreted glycoproteins which act through fourdifferent pathways. The most commonly studied pathway iscalled the canonical pathway and designated as the Wnt/β-catenin pathway. The Wnt/β-catenin pathway is activatedby the binding of the appropriate Wnt to a coreceptor
ETHANOL
Impairednutrition
Calciotropic, Anabolic,Gonadal hormones
homeostasisDIRECT (estrogen, Ca2+, PTH, EFFECTS
Weight lossvitamin D3, testosterone,leptin calcitonin IGF -1), ,
Mechanical loading
INDIRECT EFFECTS
BONE CELLS
BONE LOSS
Fig. 4 Synthesis diagram. Ethanol has both direct and indirect effects onbone cells, resulting in bone loss. Indirect effects are mainly linked toimpaired nutrition, which leads to weight loss, decreased fat and leanmass,and to hormone alterations, which may change bone cells activity
Fig. 3 An osteocyte from an alcohol-fed male Wistar rat (35% volume/volume for 17 weeks). The cell is clearly damaged; the organelles andnucleus are no longer visible
Osteoporos Int
349
complex involving Lrp5 or Lrp6 [140]. β-catenin has theability to accumulate in the cytoplasm and to translocateinto the nucleus to affect gene transcription. Therefore, itcan regulate a number of genes important in the differen-tiation, proliferation, apoptosis, and functionality of bonecells [140]. New emerging data identifies the Wnt/β–catenin pathway as a regulator of osteocyte biology, relatedto bone responsiveness to mechanical loading [140].
Chen et al. observed a decrease of BMD in postlactationalfemale rats following ethanol ingestion (12 g/kg/day). Inparallel, the major components of the Wnt signalling pathwaywere downregulated and osteoblastogenesis was suppressedwhile enhanced adipogenesis was observed [92]. All theseactions of ethanol were blocked by the antioxidant N-acetylcysteine. These results indicate that the effects ofethanol on bone mass may be due to a suppression of theWnt signalling pathway, through the stimulation of oxidativestress [92]. These data have been confirmed by Callaci et al.[76].
DKK1 is an antagonist of the Wnt pathway. It has beenshown to be upregulated by alcohol, which confirms that adecrease of theWnt pathway may be linked to the suppressionof bone formation observed with alcohol [92]. IncreasedDKK1 expression also seems to be associated to bone cellapoptosis [141].
Conclusion
The effects of alcohol consumption on bone are linked tothe dose ingested and the duration of consumption. Aconsumption of one drink per day for women and two formen is not deleterious for bone tissue whereas higherconsumption levels (2–4 drinks per day) can damage bonetissue, although the exact effects depend on the age, sex,and hormonal status of the consumer as well as the type ofalcoholic beverage. When more than four glasses per dayare consumed, the effects of alcohol on bone are deleteri-ous. Different mechanisms may be responsible for theeffects of ethanol on bone. First, the effects are thought tobe direct with changes on the number and activity of theosteoblasts and osteoclasts as well as an increase inosteocyte apoptosis. Secondly, the changes observed maybe modulated in part by the Wnt/DKK1 signalling pathwaydue to increased oxidative stress. Thirdly, the changes tocell differentiation may be responsible for low bone massand is associated with an increase of fat accumulation in thebone marrow. Lastly, the effects of alcohol consumption onbone may also be indirect via a decrease of calorie intakeand a change of body composition (Fig. 4). Furtherinvestigation is necessary as alcohol may change osteocytefunction but the effects of alcohol on osteocyte markers anddifferentiation genes such as Sost are almost unknown, as
the impact of alcohol consumption on osteoblast andosteoclast apoptosis.
As a public health message, the dose that should serve asa limit for bone health is one glass per day for women andtwo for men. More than two glasses per day may induce thenegative effects of alcohol on bone tissue.
Acknowledgments We would like to acknowledge Pr N.L. Fazzalarifrom the Bone and Joint Research Laboratory, SA Pathology in Adelaide,Australia for the for advice on the English corrections. We also want tothank Pr Rustem Uzbekov, from the Departement des Microscopies, atTours University, France, for imaging our bones by transmission electronmicroscopy.
Conflicts of interest None.
References
1. Schuckit MA (2009) Alcohol-use disorders. Lancet 373:492–5012. Ganry O, Baudoin C, Fardellone P (2000) Effect of alcohol
intake on bone mineral density in elderly women: the EPIDOSStudy. Epidemiologie de l’Osteoporose. Am J Epidemiol 151:773–780
3. Gonzalez-Calvin JL, Garcia-Sanchez A, Bellot V, Munoz-TorresM, Raya-Alvarez E, Salvatierra-Rios D (1993)Mineral metabolism,osteoblastic function and bone mass in chronic alcoholism. AlcoholAlcohol 28:571–579
4. Hoidrup S, Gronbaek M, Gottschau A, Lauritzen JB, Schroll M(1999) Alcohol intake, beverage preference, and risk of hip fracturein men and women. Copenhagen Centre for Prospective PopulationStudies. Am J Epidemiol 149:993–1001
5. Feskanich D, Korrick SA, Greenspan SL, Rosen HN, Colditz GA(1999) Moderate alcohol consumption and bone density amongpostmenopausal women. J Womens Health 8:65–73
6. Jugdaohsingh R, O’Connell MA, Sripanyakorn S, Powell JJ(2006) Moderate alcohol consumption and increased bonemineral density: potential ethanol and non-ethanol mechanisms.Proc Nutr Soc 65:291–310
7. Orwoll ES, Bauer DC, Vogt TM, Fox KM (1996) Axial bonemass in older women. Study of Osteoporotic Fractures ResearchGroup. Ann Intern Med 124:187–196
8. Ilich JZ, Brownbill RA, Tamborini L, Crncevic-Orlic Z (2002) Todrink or not to drink: how are alcohol, caffeine and past smokingrelated to bone mineral density in elderly women? J Am Coll Nutr21:536–544
9. Pedrera-Zamorano JD, Lavado-Garcia JM, Roncero-Martin R,Calderon-Garcia JF, Rodriguez-Dominguez T, Canal-Macias ML(2009) Effect of beer drinking on ultrasound bone mass in women.Nutrition 25:1057–1063
10. Williams FM, Cherkas LF, Spector TD, MacGregor AJ (2005)The effect of moderate alcohol consumption on bone mineraldensity: a study of female twins. Ann Rheum Dis 64:309–310
11. Tucker KL, Jugdaohsingh R, Powell JJ, Qiao N, Hannan MT,Sripanyakorn S, Cupples LA, Kiel DP (2009) Effects of beer,wine, and liquor intakes on bone mineral density in older menand women. Am J Clin Nutr 89:1188–1196
12. Venkat KK, Arora MM, Singh P, Desai M, Khatkhatay I (2009)Effect of alcohol consumption on bone mineral density andhormonal parameters in physically active male soldiers. Bone45:449–454
13. Hernandez ER, Revilla M, Rico H (1991) Total body bonemineral and pelvis bone mineral content as parameters of bone
Osteoporos Int
350
mass in men. A dual-energy X-ray absorptiometry study. ActaAnat 142:227–230
14. Yamamoto A, Sekino A, Tajima M, Nguyen VC, Ezawa I (1997)Effect of long-term alcohol administration on bone metabolismin rats. J Nutr Sci Vitaminol 43:369–375
15. Maurel DB, Boisseau N, Ingrand I, Dolleans E, Benhamou CL,Jaffre C (2011) Combined effects of chronic alcohol consumptionand physical activity on bone health. Study in a rat model. Eur JAppl Physiol Ahead Publ. doi:10.1007/s00421-011-1916-1
16. Rapuri PB, Gallagher JC, Balhorn KE, Ryschon KL (2000)Alcohol intake and bone metabolism in elderly women. Am JClin Nutr 72:1206–1213
17. Sripanyakorn S, Jugdaohsingh R, Mander A, Davidson SL,Thompson RP, Powell JJ (2009) Moderate ingestion of alcohol isassociated with acute ethanol-induced suppression of circulatingCTX in a PTH-independent fashion. J Bone Miner Res 24:1380–1388
18. Fanti P, Monier-Faugere MC, Geng Z, Cohen D, Malluche HH(1997) Moderately high consumption of ethanol suppresses boneresorption in ovariectomized but not in sexually intact adultfemale rats. Alcohol Clin Exp Res 21:1150–1154
19. Turner RT (2000) Skeletal response to alcohol. Alcohol Clin ExpRes 24:1693–1701
20. Alvisa-Negrin J, Gonzalez-Reimers E, Santolaria-Fernandez F,Garcia-Valdecasas-Campelo E, Valls MR, Pelazas-Gonzalez R,Duran-Castellon MC, de Los Angeles Gomez-Rodriguez M (2009)Osteopenia in alcoholics: effect of alcohol abstinence. AlcoholAlcohol 44:468–475
21. Diamond T, Stiel D, Lunzer M, Wilkinson M, Posen S (1989)Ethanol reduces bone formation and may cause osteoporosis.Am J Med 86:282–288
22. Malik P, Gasser RW, Kemmler G, Moncayo R, Finkenstedt G,Kurz M, Fleischhacker WW (2009) Low bone mineral densityand impaired bone metabolism in young alcoholic patients withoutliver cirrhosis: a cross-sectional study. Alcohol Clin Exp Res33:375–381
23. Hannan MT, Felson DT, Dawson-Hughes B, Tucker KL,Cupples LA, Wilson PW, Kiel DP (2000) Risk factors forlongitudinal bone loss in elderly men and women: the FraminghamOsteoporosis Study. J Bone Miner Res 15:710–720
24. Nishiguchi S, Shiomi S, Tamori A, Habu D, Takeda T, Tanaka T,Ochi H (2000) Effect of ethanol on bone mineral density of ratsevaluated by dual-photon X-ray absorptiometry. J Bone MinerMetab 18:317–320
25. Nyquist F, Halvorsen V, Madsen JE, Nordsletten L, Obrant KJ(1999) Ethanol and its effects on fracture healing and bone massin male rats. Acta Orthop Scand 70:212–216
26. Sampson HW, Perks N, Champney TH, DeFee B 2nd (1996)Alcohol consumption inhibits bone growth and development inyoung actively growing rats. Alcohol Clin Exp Res 20:1375–1384
27. Sampson HW, Hebert VA, Booe HL, Champney TH (1998)Effect of alcohol consumption on adult and aged bone:composition, morphology, and hormone levels of a rat animalmodel. Alcohol Clin Exp Res 22:1746–1753
28. Lelovas PP, Xanthos TT, Thoma SE, Lyritis GP, Dontas IA (2008)The laboratory rat as an animal model for osteoporosis research.Comp Med 58:424–430
29. Lieber CS, DeCarli LM, Sorrell MF (1989) Experimental methodsof ethanol administration. Hepatology 10:501–510
30. Addolorato G, Capristo E, Greco AV, Stefanini GF, Gasbarrini G(1997) Energy expenditure, substrate oxidation, and body compo-sition in subjects with chronic alcoholism: new findings frommetabolic assessment. Alcohol Clin Exp Res 21:962–967
31. Bunout D, Gattas V, Iturriaga H, Perez C, Pereda T, Ugarte G(1983) Nutritional status of alcoholic patients: it’s possible
relationship to alcoholic liver damage. Am J Clin Nutr 38:469–473
32. Hernandez-Munoz R, Ma XL, Baraona E, Lieber CS (1992)Method of acetaldehyde measurement with minimal artifactualformation in red blood cells and plasma of actively drinking subjectswith alcoholism. J Lab Clin Med 120:35–41
33. Savola O, Niemela O, Hillbom M (2004) Blood alcohol is thebest indicator of hazardous alcohol drinking in young adults andworking-age patients with trauma. Alcohol Alcohol 39:340–345
34. Ammann P, Rizzoli R (2003) Bone strength and its determinants.Osteoporos Int 14(Suppl 3):S13–18
35. de Vernejoul MC, Bielakoff J, Herve M, Gueris J, Hott M,Modrowski D, Kuntz D, Miravet L, Ryckewaert A (1983)Evidence for defective osteoblastic function. A role for alcoholand tobacco consumption in osteoporosis in middle-aged men. ClinOrthop Relat Res 179:107–115
36. Schnitzler CM, Solomon L (1984) Bone changes after alcoholabuse. S Afr Med J 66:730–734
37. Chappard D, Plantard B, Petitjean M, Alexandre C, Riffat G (1991)Alcoholic cirrhosis and osteoporosis in men: a light and scanningelectron microscopy study. J Stud Alcohol 52:269–274
38. Schnitzler CM, Mesquita JM, Shires R (2010) Cortical andtrabecular bone microarchitecture and turnover in alcohol-inducedchronic pancreatitis: a histomorphometric study. J Bone MinerMetab 28:456–467
39. Sakurama K (1998) Effects of long-term ethanol administration onthe kidneys, bones and muscles of mice. Nihon Arukoru YakubutsuIgakkai Zasshi 33:703–717
40. Sampson HW, Chaffin C, Lange J, DeFee B 2nd (1997) Alcoholconsumption by young actively growing rats: a histomorphometricstudy of cancellous bone. Alcohol Clin Exp Res 21:352–359
41. Maddalozzo GF, Turner RT, Edwards CH, Howe KS, Widrick JJ,Rosen CJ, Iwaniec UT (2009) Alcohol alters whole bodycomposition, inhibits bone formation, and increases bone marrowadiposity in rats. Osteoporos Int 20:1529–1538
42. Trevisiol CH, Turner RT, Pfaff JE, Hunter JC, Menagh PJ,Hardin K, Ho E, Iwaniec UT (2007) Impaired osteoinduction ina rat model for chronic alcohol abuse. Bone 41:175–180
43. Chakkalakal DA, Strates BS, Garvin KL, Novak JR, Fritz ED,Mollner TJ, McGuire MH (2001) Demineralized bone matrix asa biological scaffold for bone repair. Tissue Eng 7:161–177
44. Wezeman FH, Juknelis D, Frost N, Callaci JJ (2003) Spine bonemineral density and vertebral body height are altered by alcoholconsumption in growing male and female rats. Alcohol 31:87–92
45. Nyquist F, Ljunghall S, Berglund M, Obrant K (1996)Biochemical markers of bone metabolism after short and longtime ethanol withdrawal in alcoholics. Bone 19:51–54
46. Sampson HW (1998) Alcohol’s harmful effects on bone. AlcoholHealth Res World 22:190–194
47. Bikle DD (1993) Alcohol-induced bone disease. World Rev NutrDiet 73:53–79
48. Laitinen K, Lamberg-Allardt C, Tunninen R, Harkonen M,Valimaki M (1992) Bone mineral density and abstention-inducedchanges in bone and mineral metabolism in noncirrhotic malealcoholics. Am J Med 93:642–650
49. Broulik PD, Vondrova J, Ruzicka P, Sedlacek R, Zima T (2010)The effect of chronic alcohol administration on bone mineralcontent and bone strength in male rats. Physiol Res 59:599–604
50. Dyer SA, Buckendahl P, Sampson HW (1998) Alcohol consumptioninhibits osteoblastic cell proliferation and activity in vivo. Alcohol16:337–341
51. Turner RT, Kidder LS, Kennedy A, Evans GL, Sibonga JD(2001) Moderate alcohol consumption suppresses bone turnoverin adult female rats. J Bone Miner Res 16:589–594
52. Berg KM, Kunins HV, Jackson JL, Nahvi S, Chaudhry A, HarrisKA Jr, Malik R, Arnsten JH (2008) Association between alcohol
Osteoporos Int
351
consumption and both osteoporotic fracture and bone density.Am J Med 121:406–418
53. Kanis JA, Johansson H, Oden A, McCloskey EV (2009)Assessment of fracture risk. Eur J Radiol 71:392–397
54. Santori C, Ceccanti M, Diacinti D, Attilia ML, Toppo L,D’Erasmo E, Romagnoli E, Mascia ML, Cipriani C, PrastaroA, Carnevale V, Minisola S (2008) Skeletal turnover, bonemineral density, and fractures in male chronic abusers of alcohol.J Endocrinol Invest 31:321–326
55. Lucas EG (1987) Alcohol in industry. Br Med J 294:460–46156. Cawthon PM, Harrison SL, Barrett-Connor E, Fink HA, Cauley
JA, Lewis CE, Orwoll ES, Cummings SR (2006) Alcohol intakeand its relationship with bone mineral density, falls, and fracturerisk in older men. J Am Geriatr Soc 54:1649–1657
57. Peris P, Guanabens N, Monegal A, Suris X, Alvarez L, Martinez deOsaba MJ, Hernandez MV, Munoz-Gomez J (1995) Aetiology andpresenting symptoms in male osteoporosis. Br J Rheumatol34:936–941
58. Gonzalez-Reimers E, Garcia-Valdecasas-Campelo E, Santolaria-Fernandez F, Milena-Abril A, Rodriguez-Rodriguez E, Martinez-Riera A, Perez-Ramirez A, Aleman-Valls MR (2005) Rib fracturesin chronic alcoholic men: relationship with feeding habits, socialproblems, malnutrition, bone alterations, and liver dysfunction.Alcohol 37:113–117
59. Nyquist F, Karlsson MK, Obrant KJ, Nilsson JA (1997)Osteopenia in alcoholics after tibia shaft fractures. Alcohol Alcohol32:599–604
60. Chakkalakal DA (2005) Alcohol-induced bone loss and deficientbone repair. Alcohol Clin Exp Res 29:2077–2090
61. Melton LJ 3rd, Christen D, Riggs BL, Achenbach SJ, Muller R, vanLenthe GH, Amin S, Atkinson EJ, Khosla S (2010) Assessingforearm fracture risk in postmenopausal women. Osteoporos Int21:1161–1169
62. Peng TC, Kusy RP, Hirsch PF, Hagaman JR (1988) Ethanol-induced changes in morphology and strength of femurs of rats.Alcohol Clin Exp Res 12:655–659
63. Hogan HA, Sampson HW, Cashier E, Ledoux N (1997) Alcoholconsumption by young actively growing rats: a study of corticalbone histomorphometry and mechanical properties. Alcohol ClinExp Res 21:809–816
64. Chakkalakal DA, Novak JR, Fritz ED, Mollner TJ, McVicker DL,Garvin KL, McGuire MH, Donohue TM (2005) Inhibition of bonerepair in a rat model for chronic and excessive alcohol consumption.Alcohol 36:201–214
65. Brown EC, Perrien DS, Fletcher TW, Irby DJ, Aronson J, Gao GG,Hogue WJ, Skinner RA, Suva LJ, Ronis MJ, Hakkak R, BadgerTM, Lumpkin CK Jr (2002) Skeletal toxicity associated withchronic ethanol exposure in a rat model using total enteral nutrition.J Pharmacol Exp Ther 301:1132–1138
66. Pepersack T, Fuss M, Otero J, Bergmann P, Valsamis J, CorvilainJ (1992) Longitudinal study of bone metabolism after ethanolwithdrawal in alcoholic patients. J Bone Miner Res 7:383–387
67. Wezeman FH, Emanuele MA, Emanuele NV, Moskal SF 2nd,Woods M, Suri M, Steiner J, LaPaglia N (1999) Chronic alcoholconsumption during male rat adolescence impairs skeletal develop-ment through effects on osteoblast gene expression, bone mineraldensity, and bone strength. Alcohol Clin Exp Res 23:1534–1542
68. Sampson HW, Spears H (1999) Osteopenia due to chronicalcohol consumption by young actively growing rats is notcompletely reversible. Alcohol Clin Exp Res 23:324–327
69. Sibonga JD, Iwaniec UT, Shogren KL, Rosen CJ, Turner RT(2007) Effects of parathyroid hormone (1–34) on tibia in an adultrat model for chronic alcohol abuse. Bone 40:1013–1020
70. Stahre M, Naimi T, Brewer R, Holt J (2006) Measuring averagealcohol consumption: the impact of including binge drinks inquantity-frequency calculations. Addiction 101:1711–1718
71. Lamminpaa A (1991) Hospitalizations due to poisonings inFinland—1978–1984. J Toxicol Clin Toxicol 29:111–129
72. Menecier P, Girard A, Badila P, Rotheval L, Lefranc D,Menecier-Ossia L (2009) Acute alcoholic intoxication at thehospital: a clinical stake. A prospective study of 1 year in ageneral hospital. Rev Med Interne 30:316–321
73. Poikolainen K (1984) Estimated lethal ethanol concentrations inrelation to age, aspiration, and drugs. Alcohol Clin Exp Res 8:223–225
74. Schoberl S, Nickel P, Schmutzer G, Siekmeyer W, Kiess W(2008) Acute ethanol intoxication among children and adolescents.A retrospective analysis of 173 patients admitted to a universitychildren hospital. Klin Padiatr 220:253–258
75. Donovan JE (2009) Estimated blood alcohol concentrations forchild and adolescent drinking and their implications forscreening instruments. Pediatrics 123:e975–981
76. Callaci JJ, Himes R, Lauing K, Wezeman FH, Brownson K(2009) Binge alcohol-induced bone damage is accompanied bydifferential expression of bone remodeling-related genes in ratvertebral bone. Calcif Tissue Int 84:474–484
77. Sampson HW, Gallager S, Lange J, Chondra W, Hogan HA(1999) Binge drinking and bone metabolism in a young activelygrowing rat model. Alcohol Clin Exp Res 23:1228–1231
78. Callaci JJ, Juknelis D, Patwardhan A, Sartori M, Frost N,Wezeman FH (2004) The effects of binge alcohol exposure onbone resorption and biomechanical and structural properties areoffset by concurrent bisphosphonate treatment. Alcohol Clin ExpRes 28:182–191
79. Wezeman FH, Juknelis D, Himes R, Callaci JJ (2007) Vitamin Dand ibandronate prevent cancellous bone loss associated withbinge alcohol treatment in male rats. Bone 41:639–645
80. Lauing K, Himes R, Rachwalski M, Strotman P, Callaci JJ(2008) Binge alcohol treatment of adolescent rats followed byalcohol abstinence is associated with site-specific differences inbone loss and incomplete recovery of bone mass and strength.Alcohol 42:649–656
81. Gil-Martin E, Calvo P, Fernandez-Briera A (1998) Chronic alcohol-ization in rats by free-choice ingestion of a hydroalcoholic solution.Food Chem Toxicol 36:941–946
82. Gonzalez-Reimers E, Garcia-Valdecasas-Campelo E, Santolaria-Fernandez F, Sanchez-Perez MJ, Rodriguez-Rodriguez E, Gomez-Rodriguez MA, Vina-Rodriguez J (2008) Prognostic value ofnutritional status in alcoholics, assessed by double-energy X-rayabsorptiometry. Alcohol Alcohol 43:314–319
83. Khosla S, Atkinson EJ, Riggs BL, Melton LJ 3rd (1996)Relationship between body composition and bone mass in women.J Bone Miner Res 11:857–863
84. Pluijm SM, Visser M, Smit JH, Popp-Snijders C, Roos JC, LipsP (2001) Determinants of bone mineral density in older men andwomen: body composition as mediator. J BoneMiner Res 16:2142–2151
85. Visser M, Kiel DP, Langlois J, Hannan MT, Felson DT, Wilson PW,Harris TB (1998) Muscle mass and fat mass in relation to bonemineral density in very old men and women: the FraminghamHeartStudy. Appl Radiat Isot 49:745–747
86. Robling AG (2009) Is bone’s response to mechanical signalsdominated by muscle forces? Med Sci Sports Exerc 41:2044–2049
87. Reid IR (2008) Relationships between fat and bone. OsteoporosInt 19:595–606
88. Cirmanova V, Bayer M, Starka L, Zajickova K (2008) The effectof leptin on bone: an evolving concept of action. Physiol Res 57(Suppl 1):S143–151
89. Thomas T, Gori F, Khosla S, Jensen MD, Burguera B, Riggs BL(1999) Leptin acts on human marrow stromal cells to enhancedifferentiation to osteoblasts and to inhibit differentiation toadipocytes. Endocrinology 140:1630–1638
Osteoporos Int
352
90. Otaka M, Konishi N, Odashima M, Jin M, Wada I, Matsuhashi T,Ohba R, Watanabe S (2007) Effect of alcohol consumption onleptin level in serum, adipose tissue, and gastric mucosa. Dig DisSci 52:3066–3069
91. Maurel DB, Jaffre C, Rochefort GY, Aveline PC, Boisseau N,Uzbekov R, Gosset D, Pichon C, Fazzalari NL, Pallu S, BenhamouCL (2011) Low bone accrual is associated with osteocyte apoptosisin alcohol-induced osteopenia. Bone Ahead of Publ. doi:10.1016/j.bone.2011.06.001
92. Chen JR, Lazarenko OP, Shankar K, Blackburn ML, Badger TM,Ronis MJ (2010) A role for ethanol-induced oxidative stress incontrolling lineage commitment of mesenchymal stromal cellsthrough inhibition of Wnt/beta-catenin signaling. J Bone MinerRes 25:1117–1127
93. Wang Y, Li Y, Mao K, Li J, Cui Q, Wang GJ (2003) Alcohol-induced adipogenesis in bone and marrow: a possible mechanismfor osteonecrosis. Clin Orthop Relat Res 410:213–224
94. Cui Q, Wang Y, Saleh KJ, Wang GJ, Balian G (2006) Alcohol-induced adipogenesis in a cloned bone-marrow stem cell. J BoneJoint Surg Am 88(Suppl 3):148–154
95. Wezeman FH, Gong Z (2004) Adipogenic effect of alcohol onhuman bone marrow-derived mesenchymal stem cells. AlcoholClin Exp Res 28:1091–1101
96. Ronis MJ, Mercer K, Chen JR (2011) Effects of nutrition andalcohol consumption on bone loss. Curr Osteoporos Rep 9(2):53–59
97. Menagh PJ, Turner RT, Jump DB, Wong CP, Lowry MB, Yakar S,Rosen CJ, Iwaniec UT (2010) Growth hormone regulates thebalance between bone formation and bone marrow adiposity. JBone Miner Res 25:757–768
98. Wezeman FH, Gong Z (2001) Bone marrow triglycerideaccumulation and hormonal changes during long-term alcoholintake in male and female rats. Alcohol Clin Exp Res 25:1515–1522
99. Turner RT, Rosen CJ, Iwaniec UT (2010) Effects of alcohol onskeletal response to growth hormone in hypophysectomized rats.Bone 46:806–812
100. Giuliani N, Girasole G, Vescovi PP, Passeri G, Pedrazzoni M(1999) Ethanol and acetaldehyde inhibit the formation of earlyosteoblast progenitors in murine and human bone marrowcultures. Alcohol Clin Exp Res 23:381–385
101. Beresford JN, Bennett JH, Devlin C, Leboy PS, Owen ME(1992) Evidence for an inverse relationship between thedifferentiation of adipocytic and osteogenic cells in rat marrowstromal cell cultures. J Cell Sci 102(Pt 2):341–351
102. Gong Z, Wezeman FH (2004) Inhibitory effect of alcohol onosteogenic differentiation in human bone marrow-derived mes-enchymal stem cells. Alcohol Clin Exp Res 28:468–479
103. Rosa ML, Beloti MM, Prando N, Queiroz RH, de Oliveira PT,Rosa AL (2008) Chronic ethanol intake inhibits in vitro osteogen-esis induced by osteoblasts differentiated from stem cells. J ApplToxicol 28:205–211
104. Suh KT, Kim SW, Roh HL, Youn MS, Jung JS (2005) Decreasedosteogenic differentiation of mesenchymal stem cells in alcohol-induced osteonecrosis. Clin Orthop Relat Res 431:220–225
105. Lindholm J, Steiniche T, Rasmussen E, Thamsborg G, Nielsen IO,Brockstedt-Rasmussen H, Storm T, Hyldstrup L, Schou C (1991)Bone disorder in men with chronic alcoholism: a reversible disease?J Clin Endocrinol Metab 73:118–124
106. Howe KS, Iwaniec UT, Turner RT (2011) The effects of low doseparathyroid hormone on lumbar vertebrae in a rat model for chronicalcohol abuse. Osteoporos Int 22:1175–1181
107. Bikle DD, Sakata T, Leary C, Elalieh H, Ginzinger D, Rosen CJ,Beamer W, Majumdar S, Halloran BP (2002) Insulin-like growthfactor I is required for the anabolic actions of parathyroid hormoneon mouse bone. J Bone Miner Res 17:1570–1578
108. Wang Y, Nishida S, Boudignon BM, Burghardt A, Elalieh HZ,Hamilton MM, Majumdar S, Halloran BP, Clemens TL, Bikle DD(2007) IGF-I receptor is required for the anabolic actions ofparathyroid hormone on bone. J Bone Miner Res 22:1329–1337
109. Atkins GJ, Anderson PH, Findlay DM, Welldon KJ, Vincent C,Zannettino AC, O’Loughlin PD, Morris HA (2007) Metabolismof vitamin D3 in human osteoblasts: evidence for autocrine andparacrine activities of 1 alpha,25-dihydroxyvitamin D3. Bone40:1517–1528
110. Griffiths HJ, Parantainen H, Olson P (1993) Alcohol and bonedisorders. Alcohol Health Res World 17:299–304
111. Rico H (1990) Alcohol and bone disease. Alcohol Alcohol25:345–352
112. Vantyghem MC, Danel T, Marcelli-Tourvieille S, Moriau J, LeclercL, Cardot-Bauters C, Docao C, Carnaille B, Wemeau JL,D’Herbomez M (2007) Calcitonin levels do not decrease withweaning in chronic alcoholism. Thyroid 17:213–217
113. Maneesh M, Dutta S, Chakrabarti A, Vasudevan DM (2006)Alcohol abuse-duration dependent decrease in plasma testoster-one and antioxidants in males. Indian J Physiol Pharmacol50:291–296
114. Tentler JJ, LaPaglia N, Steiner J, Williams D, Castelli M, KelleyMR, Emanuele NV, Emanuele MA (1997) Ethanol, growthhormone and testosterone in peripubertal rats. J Endocrinol152:477–487
115. Baran DT, Teitelbaum SL, Bergfeld MA, Parker G, Cruvant EM,Avioli LV (1980) Effect of alcohol ingestion on bone and mineralmetabolism in rats. Am J Physiol 238:E507–510
116. Dorgan JF, Reichman ME, Judd JT, Brown C, Longcope C,Schatzkin A, Campbell WS, Franz C, Kahle L, Taylor PR (1994)The relation of reported alcohol ingestion to plasma levels ofestrogens and androgens in premenopausal women (Maryland,United States). Cancer Causes Control 5:53–60
117. Shankar K, Hidestrand M, Haley R, Skinner RA, Hogue W, JoCH, Simpson P, Lumpkin CK Jr, Aronson J, Badger TM, RonisMJ (2006) Different molecular mechanisms underlie ethanol-induced bone loss in cycling and pregnant rats. Endocrinology147:166–178
118. Ronis MJ, Wands JR, Badger TM, de la Monte SM, Lang CH,Calissendorff J (2007) Alcohol-induced disruption of endocrinesignaling. Alcohol Clin Exp Res 31:1269–1285
119. Chen JR, Lazarenko OP, Haley RL, Blackburn ML, Badger TM,Ronis MJ (2009) Ethanol impairs estrogen receptor signalingresulting in accelerated activation of senescence pathways,whereas estradiol attenuates the effects of ethanol in osteoblasts.J Bone Miner Res 24:221–230
120. Banfi G, Iorio EL, Corsi MM (2008) Oxidative stress, free radicalsand bone remodeling. Clin Chem Lab Med 46:1550–1555
121. Syed FA, Ng AC (2010) The pathophysiology of the agingskeleton. Curr Osteoporos Rep 8:235–240
122. Silvain C, Chagneau-Derrode C (2006) Metabolisme de l’ethanol.Hépathologie
123. Sendur OF, Turan Y, Tastaban E, Serter M (2009) Antioxidantstatus in patients with osteoporosis: a controlled study. JointBone Spine 76:514–518
124. Chen JR, Shankar K, Nagarajan S, Badger TM, Ronis MJ (2008)Protective effects of estradiol on ethanol-induced bone loss involveinhibition of reactive oxygen species generation in osteoblasts anddownstream activation of the extracellular signal-regulated kinase/signal transducer and activator of transcription 3/receptor activatorof nuclear factor-kappaB ligand signaling cascade. J Pharmacol ExpTher 324:50–59
125. Tan SD, Bakker AD, Semeins CM, Kuijpers-Jagtman AM, Klein-Nulend J (2008) Inhibition of osteocyte apoptosis by fluid flow ismediated by nitric oxide. Biochem Biophys Res Commun369:1150–1154
Osteoporos Int
353
126. Chavassieux P, Serre CM, Vergnaud P, Delmas PD, Meunier PJ(1993) In vitro evaluation of dose-effects of ethanol on humanosteoblastic cells. Bone Miner 22:95–103
127. Sun T, Deng Z, Zhu Y (2007) Effects of insulin-like growth factor 1on inhibition of osteoblastic proliferation and function by ethanol.Zhongguo Xiu Fu Chong Jian Wai Ke Za Zhi 21:1338–1341
128. Torricelli P, Fini M, Giavaresi G, Borsari V, Rimondini L,Rimondini R, Carrassi A, Giardino R (2007) Intermittent exposureto ethanol vapor affects osteoblast behaviour more severely thanestrogen deficiency does in vitro study on rat osteoblasts.Toxicology 237:168–176
129. Cheung RC, Gray C, Boyde A, Jones SJ (1995) Effects ofethanol on bone cells in vitro resulting in increased resorption.Bone 16:143–147
130. Diez A, Puig J, Serrano S, Marinoso ML, Bosch J, Marrugat J,Mellibovsky L, Nogues X, Knobel H, Aubia J (1994) Alcohol-induced bone disease in the absence of severe chronic liverdamage. J Bone Miner Res 9:825–831
131. Dai J, Lin D, Zhang J, Habib P, Smith P, Murtha J, Fu Z, Yao Z,Qi Y, Keller ET (2000) Chronic alcohol ingestion inducesosteoclastogenesis and bone loss through IL-6 in mice. J ClinInvest 106:887–895
132. Calder JD, Buttery L, Revell PA, Pearse M, Polak JM (2004)Apoptosis—a significant cause of bone cell death in osteonecrosisof the femoral head. J Bone Joint Surg Br 86:1209–1213
133. Hurley MM, Martin DL, Kream BE, Raisz LG (1990) Effects ofethanol and acetaldehyde on collagen synthesis, prostaglandinrelease and resorption of fetal rat bone in organ culture. Bone11:47–51
134. Bonewald LF (2011) The amazing Osteocyte. J Bone Miner Res26:229–238
135. Burger EH, Klein-Nulend J (1999) Responses of bone cells tobiomechanical forces in vitro. Adv Dent Res 13:93–98
136. Rochefort GY, Pallu S, Benhamou CL (2010) Osteocyte: theunrecognized side of bone tissue. Osteoporos Int 21:1457–1469
137. Tomkinson A, Gevers EF, Wit JM, Reeve J, Noble BS (1998)The role of estrogen in the control of rat osteocyte apoptosis. JBone Miner Res 13:1243–1250
138. Verborgt O, Tatton NA, Majeska RJ, Schaffler MB (2002)Spatial distribution of Bax and Bcl-2 in osteocytes after bonefatigue: complementary roles in bone remodeling regulation? JBone Miner Res 17:907–914
139. Lorenz R, Janicke-Lorenz J (1983) Electron microscopicobservation on osteocytes of chronically alcoholized rats. ArchOrthop Trauma Surg 102:118–122
140. Bonewald LF, Johnson ML (2008) Osteocytes, mechanosensingand Wnt signaling. Bone 42:606–615
141. Ko JY, Wang FS, Wang CJ, Wong T, Chou WY, Tseng SL (2010)Increased Dickkopf-1 expression accelerates bone cell apoptosisin femoral head osteonecrosis. Bone 46:584–591
Osteoporos Int
354
355
Delphine MAUREL
Consommation chronique d’alcool, exercice physique ettissu osseux : modifications densitométriques,
architecturales, biomécaniques et métaboliques chez le rat.
Résumé :
La consommation d’alcool a des effets sur le tissu osseux. L’alcoolisme est une des causesd’ostéoporose secondaire chez l’homme. Dans ce travail nous avons mené différentesexpérimentations chez le rat afin d’étudier les effets d’une consommation chronique d’alcool combinéeou non à un entraînement aérobie sur le tissu osseux. Nous avons montré qu’une faible dose d’alcooladministrée pendant une période courte peut avoir un effet positif sur la densité minérale osseuse etl’épaisseur trabéculaire. En revanche, la combinaison activité physique et consommation modéréed’alcool n’a pas d’effet additif sur la potentialisation du tissu osseux. Nous avons également démontréun effet dose de l’alcool indiquant des effets délétères majorés sur la densité minérale osseuse(DMO), la microarchitecture corticale et la résistance osseuse avec des apports croissants (25%, 30%et 35% v/v). La modification de DMO s’accompagne d’un changement de composition corporelle etd’une diminution de la leptine systémique. Cependant, le nombre d’adipocytes augmente dans lamoelle osseuse. Nous avons mis en évidence dans ce modèle d’ostéoporose secondaire due àl’alcool une augmentation de l’apoptose des ostéocytes, corrélée à la diminution de la DMO et àl’augmentation de l’adiposité médullaire. Nous avons de plus mis en évidence une incorporation delipides dans les ostéocytes, incorporation fortement corrélée à l’apoptose de ces cellules. Enfin, nosrésultats montrent qu’un exercice physique régulier combiné à une consommation chronique etexcessive d’alcool permet de prévenir les effets délétères de l’alcool sur les paramètres osseux(porosité corticale, épaisseur corticale) et limite la diminution de la DMO. Cette diminution estassociée à une régulation de l’apoptose des ostéocytes.
Mots clés: consommation chronique d’alcool, exercice physique, densité minérale osseuse,microarchitecture osseuse, résistance osseuse, composition corporelle, leptine, lipides, ostéocyte.
Chronic alcohol consumption, physical exercise and bone tissue:densitometric, microarchitectural, biomechanic and metabolic
changes in the rat.
Summary:
Heavy chronic alcohol consumption has deleterious effects on bone tissue. It is one of the majorcauses of secondary osteoporosis in men. In this work, we draw several experimentations to assessthe effects of chronic alcohol consumption on bone, combined or not to an aerobic training in the rat.We showed that light to moderate chronic alcohol consumption during a short time lead to an increaseof bone mineral density (BMD) and trabecular thickness, whith no additive effects of physical exerciseon bone tissue. When the alcohol doses were increased, we showed deleterious effects on BMD,microarchitecture, bone resistance with a dose effect with increasing alcohol doses (25%, 30% and35% v/v): the more alcohol was concentrated and the more the bone parameters were decreased. TheBMD decrease was associated with a change in body composition, and with a decrease in serumleptin. However, the number of lipid droplets in the bone marrow was increased dramatically. Wedemonstrated that there was a huge increase in osteocyte apoptosis with alcohol (35% v/v) in thisalcohol-induced osteoporosis model, which was correlated with BMD and bone marrow adiposity. Wehave also shown that there was lipid incorporation in bone micro vessels and in osteocytes, which wascorrelated with osteocyte apoptosis. Lastly, we showed that when regular exercise was associatedwith heavy chronic alcohol consumption, the bone parameters were normal (trabecular, corticalthickness, femur length) and the BMD was less decreased compared to alcohol-fed and sedentaryrats. These effects were associated with a regulation of osteocyte apoptosis.
Keywords: alcohol consumption, physical exercise, bone mineral density, bone microarchitecture,bone strength, body composition, leptin, fat, osteocyte.


![O. de Cazanove, S. Bourdin, « Programme Ignobilia Oppida Lucanorum », Chronique des activités archéologiques de l’École française de Rome [En ligne], Italie du Sud, mis en](https://static.fdokumen.com/doc/165x107/631a82c9d5372c006e038712/o-de-cazanove-s-bourdin-programme-ignobilia-oppida-lucanorum-chronique.jpg)