Conservation Biology for All
358
Conservation Biology for All EDITED BY: Navjot S. Sodhi Department of Biological Sciences, National University of Singapore AND *Department of Organismic and Evolutionary Biology, Harvard University (*Address while the book was prepared) Paul R. Ehrlich Department of Biology, Stanford University 1 1 © Oxford University Press 2010. All rights reserved. For permissions please email: [email protected]
-
Upload
khangminh22 -
Category
Documents
-
view
2 -
download
0
Transcript of Conservation Biology for All

Conservation Biologyfor All
EDITED BY:
Navjot S. SodhiDepartment of Biological Sciences, National University of Singapore AND *Department ofOrganismic and Evolutionary Biology, Harvard University (*Address while the book was prepared)
Paul R. EhrlichDepartment of Biology, Stanford University
1
1
© Oxford University Press 2010. All rights reserved. For permissions please email: [email protected]

3Great Clarendon Street, Oxford OX2 6DP
Oxford University Press is a department of the University of Oxford.It furthers the University's objective of excellence in research, scholarship,and education by publishing worldwide inOxford New YorkAuckland Cape Town Dar es Salaam Hong Kong KarachiKuala Lumpur Madrid Melbourne Mexico City NairobiNew Delhi Shanghai Taipei TorontoWith offices inArgentina Austria Brazil Chile Czech Republic France GreeceGuatemala Hungary Italy Japan Poland Portugal SingaporeSouth Korea Switzerland Thailand Turkey Ukraine Vietnam
Oxford is a registered trade mark of Oxford University Pressin the UK and in certain other countries
Published in the United Statesby Oxford University Press Inc., New York
# Oxford University Press 2010
The moral rights of the authors have been assertedDatabase right Oxford University Press (maker)
First published 2010Reprinted with corrections 2010
Available online with corrections, January 2011
All rights reserved. No part of this publication may be reproduced,stored in a retrieval system, or transmitted, in any form or by any means,without the prior permission in writing of Oxford University Press,or as expressly permitted by law, or under terms agreed with the appropriatereprographics rights organization. Enquiries concerning reproductionoutside the scope of the above should be sent to the Rights Department,Oxford University Press, at the address above
You must not circulate this book in any other binding or coverand you must impose the same condition on any acquirer
British Library Cataloguing in Publication DataData available
Library of Congress Cataloging in Publication Data
Data available
Typeset by SPI Publisher Services, Pondicherry, IndiaPrinted in Great Britainon acid-free paper byCPI Antony Rowe, Chippenham, Wiltshire
ISBN 978–0–19–955423–2 (Hbk.)ISBN 978–0–19–955424–9 (Pbk.)
3 5 7 9 10 8 6 4 2
Sodhi and Ehrlich: Conservation Biology for All. http://ukcatalogue.oup.com/product/9780199554249.do
© Oxford University Press 2010. All rights reserved. For permissions please email: [email protected]

Contents
Dedication xiAcknowledgements xiiList of Contributors xiiiForeword
Georgina Mace xvii
IntroductionNavjot S. Sodhi and Paul R. Ehrlich 1
Introduction Box 1: Human population and conservation (Paul R. Ehrlich) 2Introduction Box 2: Ecoethics (Paul R. Ehrlich) 3
1: Conservation biology: past and presentCurt Meine 7
1.1 Historical foundations of conservation biology 7Box 1.1: Traditional ecological knowledge and biodiversity conservation (Fikret Berkes) 8
1.2 Establishing a new interdisciplinary field 121.3 Consolidation: conservation biology secures its niche 151.4 Years of growth and evolution 16
Box 1.2: Conservation in the Philippines (Mary Rose C. Posa) 191.5 Conservation biology: a work in progress 21Summary 21Suggested reading 22Relevant websites 22
2: BiodiversityKevin J. Gaston 27
2.1 How much biodiversity is there? 272.2 How has biodiversity changed through time? 332.3 Where is biodiversity? 352.4 In conclusion 39
Box 2.1: Invaluable biodiversity inventories (Navjot S. Sodhi) 40Summary 41Suggested reading 41Revelant websites 42
3: Ecosystem functions and servicesCagan H. Sekercioglu 45
3.1 Climate and the Biogeochemical Cycles 453.2 Regulation of the Hydrologic Cycle 48
1
© Oxford University Press 2010. All rights reserved. For permissions please email: [email protected]

3.3 Soils and Erosion 503.4 Biodiversity and Ecosystem Function 51
Box 3.1: The costs of large-mammal extinctions (Robert M. Pringle) 52Box 3.2: Carnivore conservation (Mark S. Boyce) 54Box 3.3: Ecosystem services and agroecosystems in a landscape context (Teja Tscharntke) 55
3.5 Mobile Links 57Box 3.4: Conservation of plant-animal mutualisms (Priya Davidar) 58Box 3.5: Consequences of pollinator decline for the global food supply (Claire Kremen) 60
3.6 Nature’s Cures versus Emerging Diseases 643.7 Valuing Ecosystem Services 65Summary 66Relevant websites 67Acknowledgements 67
4: Habitat destruction: death by a thousand cutsWilliam F. Laurance 73
4.1 Habitat loss and fragmentation 734.2 Geography of habitat loss 73
Box 4.1: The changing drivers of tropical deforestation (William F. Laurance) 754.3 Loss of biomes and ecosystems 76
Box 4.2: Boreal forest management: harvest, natural disturbance, and climate change(Ian G. Warkentin) 80
4.4 Land‐use intensification and abandonment 82Box 4.3: Human impacts on marine ecosystems (Benjamin S. Halpern, Carrie V. Kappel,
Fiorenza Micheli, and Kimberly A. Selkoe) 83Summary 86Suggested reading 86Relevant websites 86
5: Habitat fragmentation and landscape changeAndrew F. Bennett and Denis A. Saunders 88
5.1 Understanding the effects of landscape change 885.2 Biophysical aspects of landscape change 905.3 Effects of landscape change on species 92
Box 5.1: Time lags and extinction debt in fragmented landscapes (Andrew F. Bennettand Denis A. Saunders) 92
5.4 Effects of landscape change on communities 965.5 Temporal change in fragmented landscapes 995.6 Conservation in fragmented landscapes 99
Box 5.2: Gondwana Link: a major landscape reconnection project (Andrew F. Bennettand Denis A. Saunders) 101
Box 5.3: Rewilding (Paul R. Ehrlich) 102Summary 104Suggested reading 104Relevant websites 104
6: OverharvestingCarlos A. Peres 107
6.1 A brief history of exploitation 1086.2 Overexploitation in tropical forests 110
vi CONTENTS
Sodhi and Ehrlich: Conservation Biology for All. http://ukcatalogue.oup.com/product/9780199554249.do
© Oxford University Press 2010. All rights reserved. For permissions please email: [email protected]

6.3 Overexploitation in aquatic ecosystems 1136.4 Cascading effects of overexploitation on ecosystems 115
Box 6.1: The state of fisheries (Daniel Pauly) 1186.5 Managing overexploitation 120
Box 6.2: Managing the exploitation of wildlife in tropical forests (Douglas W. Yu) 121Summary 126Relevant websites 126
7: Invasive speciesDaniel Simberloff 131
Box 7.1: Native invasives (Daniel Simberloff ) 131Box 7.2: Invasive species in New Zealand (Daniel Simberloff ) 132
7.1 Invasive species impacts 1337.2 Lag times 1437.3 What to do about invasive species 144Summary 148Suggested reading 148Relevant websites 148
8: Climate changeThomas E. Lovejoy 153
8.1 Effects on the physical environment 1538.2 Effects on biodiversity 154
Box 8.1: Lowland tropical biodiversity under global warming (Navjot S. Sodhi) 1568.3 Effects on biotic interactions 1588.4 Synergies with other biodiversity change drivers 1598.5 Mitigation 159
Box 8.2: Derivative threats to biodiversity from climate change (Paul R. Ehrlich) 160Summary 161Suggested reading 161Relevant websites 161
9: Fire and biodiversityDavid M. J. S. Bowman and Brett P. Murphy 163
9.1 What is fire? 1649.2 Evolution and fire in geological time 1649.3 Pyrogeography 165
Box 9.1: Fire and the destruction of tropical forests (David M. J. S. Bowman and Brett P. Murphy) 1679.4 Vegetation–climate patterns decoupled by fire 1679.5 Humans and their use of fire 170
Box 9.2: The grass-fire cycle (David M. J. S. Bowman and Brett P. Murphy) 171Box 9.3: Australia’s giant fireweeds (David M. J. S. Bowman and Brett P. Murphy) 173
9.6 Fire and the maintenance of biodiversity 1739.7 Climate change and fire regimes 176Summary 177Suggested reading 178Relevant websites 178Acknowledgements 178
CONTENTS vii
1
© Oxford University Press 2010. All rights reserved. For permissions please email: [email protected]
10: Extinctions and the practice of preventing themStuart L. Pimm and Clinton N. Jenkins 181
10.1 Why species extinctions have primacy 181Box 10.1: Population conservation (Jennifer B.H. Martiny) 182
10.2 How fast are species becoming extinct? 18310.3 Which species become extinct? 18610.4 Where are species becoming extinct? 18710.5 Future extinctions 19210.6 How does all this help prevent extinctions? 195Summary 196Suggested reading 196Relevant websites 196
11: Conservation planning and prioritiesThomas Brooks 199
11.1 Global biodiversity conservation planning and priorities 19911.2 Conservation planning and priorities on the ground 204
Box 11.1: Conservation planning for Key Biodiversity Areas in Turkey (Güven Eken,Murat Ataol, Murat Bozdo�gan, Özge Balkız, Süreyya _Isfendiyaro�g lu,Dicle Tuba Kılıç, and Yıldıray Lise) 209
11.3 Coda: the completion of conservation planning 213Summary 214Suggested reading 214Relevant websites 214Acknowledgments 215
12: Endangered species management: the US experienceDavid. S. Wilcove 220
12.1 Identification 220Box 12.1: Rare and threatened species and conservation planning in Madagascar
(Claire Kremen, Alison Cameron, Tom Allnutt, and AndriamandimbisoaRazafimpahanana) 221
Box 12.2: Flagship species create Pride (Peter Vaughan) 22312.2 Protection 22612.3 Recovery 23012.4 Incentives and disincentives 23212.5 Limitations of endangered species programs 233Summary 234Suggested reading 234Relevant websites 234
13: Conservation in human-modified landscapesLian Pin Koh and Toby A. Gardner 236
13.1 A history of human modification and the concept of “wild nature” 236Box 13.1: Endocrine disruption and biological diversity (J. P. Myers) 237
13.2 Conservation in a human‐modified world 24013.3 Selectively logged forests 24213.4 Agroforestry systems 243
viii CONTENTS
Sodhi and Ehrlich: Conservation Biology for All. http://ukcatalogue.oup.com/product/9780199554249.do
© Oxford University Press 2010. All rights reserved. For permissions please email: [email protected]

13.5 Tree plantations 245Box 13.2: Quantifying the biodiversity value of tropical secondary forests and exotic
tree plantations (Jos Barlow) 24713.6 Agricultural land 248
Box 13.3: Conservation in the face of oil palm expansion (Matthew Struebig,Ben Phalan, and Emily Fitzherbert) 249
Box 13.4: Countryside biogeography: harmonizing biodiversity and agriculture( Jai Ranganathan and Gretchen C. Daily) 251
13.7 Urban areas 25313.8 Regenerating forests on degraded land 25413.9 Conservation and human livelihoods in modified landscapes 25513.10 Conclusion 256Summary 257Suggested reading 257Relevant websites 258
14: The roles of people in conservationC. Anne Claus, Kai M. A. Chan, and Terre Satterfield 262
14.1 A brief history of humanity’s influence on ecosystems 26214.2 A brief history of conservation 262
Box 14.1: Customary management and marine conservation (C. Anne Claus, KaiM. A. Chan, and Terre Satterfield) 264
Box 14.2: Historical ecology and conservation effectiveness in West Africa (C. Anne Claus,Kai M. A. Chan, and Terre Satterfield) 265
14.3 Common conservation perceptions 265Box 14.3: Elephants, animal rights, and Campfire (Paul R. Ehrlich) 267
14.4 Factors mediating human‐environment relations 269Box 14.4: Conservation, biology, and religion (Kyle S. Van Houtan) 270
14.5 Biodiversity conservation and local resource use 27314.6 Equity, resource rights, and conservation 275
Box 14.5: Empowering women: the Chipko movement in India (Priya Davidar) 27614.7 Social research and conservation 278Summary 281Relevant websites 281Suggested reading 281
15: From conservation theory to practice: crossing the divideMadhu Rao and Joshua Ginsberg 284
Box 15.1: Swords into Ploughshares: reducing military demand for wildlife products(Lisa Hickey, Heidi Kretser, Elizabeth Bennett, and McKenzie Johnson) 285
Box 15.2: The World Bank and biodiversity conservation (Tony Whitten) 286Box 15.3: The Natural Capital Project (Heather Tallis, Joshua H. Goldstein,
and Gretchen C. Daily) 28815.1 Integration of Science and Conservation Implementation 290
Box 15.4: Measuring the effectiveness of conservation spending (Matthew Linkieand Robert J. Smith) 291
15.2 Looking beyond protected areas 292Box 15.5: From managing protected areas to conserving landscapes (Karl Didier) 293
CONTENTS ix
1
© Oxford University Press 2010. All rights reserved. For permissions please email: [email protected]
15.3 Biodiversity and human poverty 293Box 15.6: Bird nest protection in the Northern Plains of Cambodia (Tom Clements) 297Box 15.7: International activities of the Missouri Botanical Garden (Peter Raven) 301
15.4 Capacity needs for practical conservation in developing countries 30315.5 Beyond the science: reaching out for conservation 30415.6 People making a difference: A Rare approach 30515.7 Pride in the La Amistad Biosphere Reserve, Panama 30515.8 Outreach for policy 30615.9 Monitoring of Biodiversity at Local and Global Scales 306
Box 15.8: Hunter self-monitoring by the Isoseño-Guaranı´ in the BolivianChaco (Andrew Noss) 307
Summary 310Suggested reading 310Relevant websites 310
16: The conservation biologist’s toolbox – principles for the design and analysisof conservation studiesCorey J. A. Bradshaw and Barry W. Brook 313
16.1 Measuring and comparing ‘biodiversity’ 314Box 16.1: Cost effectiveness of biodiversity monitoring (Toby Gardner) 314Box 16.2: Working across cultures (David Bickford) 316
16.2 Mensurative and manipulative experimental design 319Box 16.3: Multiple working hypotheses (Corey J. A. Bradshaw and Barry W. Brook) 321Box 16.4: Bayesian inference (Corey J. A. Bradshaw and Barry W. Brook) 324
16.3 Abundance Time Series 32616.4 Predicting Risk 32816.5 Genetic Principles and Tools 330
Box 16.5: Functional genetics and genomics (Noah K. Whiteman) 33116.6 Concluding Remarks 333
Box 16.6: Useful textbook guides (Corey J. A. Bradshaw and Barry W. Brook) 334Summary 335Suggested reading 335Relevant websites 335Acknowledgements 336
Index 341
x CONTENTS
Sodhi and Ehrlich: Conservation Biology for All. http://ukcatalogue.oup.com/product/9780199554249.do
© Oxford University Press 2010. All rights reserved. For permissions please email: [email protected]

Dedication
NSS: To those who have or want to make the difference.PRE: To my mentors—Charles Birch, Charles Michener, and Robert Sokal.
1
© Oxford University Press 2010. All rights reserved. For permissions please email: [email protected]

Acknowledgements
NSS thanks the Sarah andDaniel Hrdy Fellowshipin Conservation Biology (Harvard University) andthe National University of Singapore for supportwhile this book was prepared. He also thanksNaomi Pierce for providing him with an office.PRE thanks Peter and Helen Bing, Larry Condon,
Wren Wirth, and the Mertz Gilmore Foundationfor their support.We thankMary Rose C. Posa, PeiXin, Ross McFarland, Hugh Tan, and Peter Ngfor their invaluable assistance. We also thankIan Sherman, Helen Eaton, and Carol Bestley atOxford University Press for their help/support.
Sodhi and Ehrlich: Conservation Biology for All. http://ukcatalogue.oup.com/product/9780199554249.do
© Oxford University Press 2010. All rights reserved. For permissions please email: [email protected]

List of Contributors
Tom AllnuttDepartment of Environmental Sciences, Policy andManagement, 137 Mulford Hall, University of Califor-nia, Berkeley, CA 94720-3114, USA.
Murat AtaolDo�ga Derne�g i, Hürriyet Cad. 43/12 Dikmen, Ankara,Turkey.
Özge BalkızDo�ga Derne�g i, Hürriyet Cad. 43/12 Dikmen, Ankara,Turkey.
Jos BarlowLancaster Environment Centre, Lancaster University,Lancaster, LA1 4YQ, UK.
Andrew F. BennettSchool of Life and Environmental Sciences, DeakinUniversity, 221 Burwod Highway, Burwood, VIC3125, Australia.
Elizabeth BennettWildlife Conservation Society, 2300 Southern Boule-vard., Bronx, NY 10464-1099, USA.
Fikret BerkesNatural Resources Institute, 70Dysart Road, Universityof Manitoba, Winnipeg MB R3T 2N2, Canada.
David BickfordDepartment of Biological Sciences, National Universityof Singapore, 14 Science Drive 4, Singapore 117543,Republic of Singapore.
David M. J. S. BowmanSchool of Plant Science, University of Tasmania, PrivateBag 55, Hobart, TAS 7001, Australia.
Mark S. BoyceDepartment of Biological Sciences, University ofAlberta, Edmonton, Alberta T6G 2E9, Canada.
Murat Bozdo�ganDo�ga Derne�g i, Hürriyet Cad. 43/12 Dikmen, Ankara,Turkey.
Corey J. A. BradshawEnvironment Institute, School of Earth and Environ-mental Sciences, University of Adelaide, South Aus-tralia 5005 AND South Australian Research andDevelopment Institute, P.O. Box 120, Henley Beach,South Australia 5022, Australia.
Barry W. BrookEnvironment Institute, School of Earth andEnvironmen-tal Sciences, University of Adelaide, South Australia5005, Australia.
Thomas BrooksCenter for Applied Biodiversity Science, ConservationInternational, 2011 Crystal Drive Suite 500, Arling-ton VA 22202, USA; World Agroforestry Center(ICRAF), University of the Philippines Los Baños,Laguna 4031, Philippines; AND School of Geographyand Environmental Studies, University of Tasmania,Hobart TAS 7001, Australia.
Alison CameronMax Planck Institute for Ornithology, Eberhard-Gwinner-Straße, 82319 Seewiesen, Germany.
Kai M. A. ChanInstitute for Resources, Environment and Sustainability,University of British Columbia, Vancouver, BritishColumbia V6T 1Z4, Canada.
C. Anne ClausDepartments of Anthropology and Forestry & Envi-ronmental Studies, Yale University,10 Sachem Street,New Haven, CT 06511, USA.
Tom ClementsWildlife Conservation Society, Phnom Penh, Cambodia.
1
© Oxford University Press 2010. All rights reserved. For permissions please email: [email protected]

Gretchen C. DailyCenter for Conservation Biology, Department of Biology,and Woods Institute, 371 Serra Mall, Stanford Univer-sity, Stanford, CA 94305-5020, USA.
Priya DavidarSchool of Life Sciences, PondicherryUniversity, Kalapet,Pondicherry 605014, India.
Karl DidierWildlife Conservation Society, 2300 Southern Boule-vard, Bronx, NY 10464-1099, USA.
Paul R. EhrlichCenter for Conservation Biology, Department of Biol-ogy, Stanford University, Stanford, CA 94305-5020,USA.
Güven EkenDo�ga Derne�g i, Hürriyet Cad. 43/12 Dikmen, Ankara,Turkey.
Emily FitzherbertInstitute of Zoology, Zoological Society of London,Regent’s Park, London, NW1 4RY, UK.
Toby A. GardnerDepartment of Zoology, University of Cambridge,Downing Street, Cambridge, CB2 3EJ, UK ANDDepartamento de Biologia, Universidade Federal deLavras, Lavras, Minas Gerais, 37200-000, Brazil.
Kevin J. GastonDepartment of Animal & Plant Sciences, Universityof Sheffield, Sheffield, S10 2TN, UK.
Joshua GinsbergWildlife Conservation Society, 2300 Southern Boule-vard, Bronx, NY 10464-1099, USA.
Joshua H. GoldsteinHuman Dimensions of Natural Resources, WarnerCollege of Natural Resources, Colorado State Univer-sity, Fort Collins, CO 80523-1480, USA.
Benjamin S. HalpernNational Center for Ecological Analysis andSynthesis, 735 State Street, Santa Barbara, CA93101, USA.
Lisa HickeyWildlife Conservation Society, 2300 Southern Boule-vard, Bronx, NY 10464-1099, USA.
Süreyya _Isfendiyaro�gluDo�ga Derne�g i, Hürriyet Cad. 43/12 Dikmen, Ankara,Turkey.
Clinton N. JenkinsNicholas School of the Environment, Duke University,Box 90328, LSRC A201, Durham, NC 27708, USA.
McKenzie JohnsonWildlife Conservation Society, 2300 Southern Boule-vard, Bronx, NY 10464-1099, USA.
Carrie V. KappelNational Center for Ecological Analysis and Synthe-sis, 735 State Street, Santa Barbara, CA 93101, USA.
Dicle Tuba KılıçDo�ga Derne�g i, Hürriyet Cad. 43/12 Dikmen, Ankara,Turkey.
Lian Pin KohInstitute of Terrestrial Ecosystems, Swiss Federal In-stitute of Technology (ETH Zürich), CHN G 74.2,Universitätstrasse 16, Zurich 8092, Switzerland.
Claire KremenDepartment of Environmental Sciences, Policy andManagement, 137 Mulford Hall, University of Cali-fornia, Berkeley, CA 94720-3114, USA.
Heidi KretserWildlife Conservation Society, 2300 Southern Boule-vard, Bronx, NY 10464-1099, USA.
William F. LauranceSmithsonian Tropical Research Institute, Apartado0843-03092, Balboa, Ancón, Republic of Panama.
Matthew LinkieFauna & Flora International, 4th Floor, Jupiter House,Station Road, Cambridge, CB1 2JD, UK.
Yıldıray LiseDo�ga Derne�g i, Hürriyet Cad. 43/12 Dikmen, Ankara,Turkey.
Thomas E. LovejoyThe H. John Heinz III Center for Science, Economicsand the Environment, 900 17th Street NW, Suite 700,Washington, DC 20006, USA.
Jennifer B. H. MartinyDepartment of Ecology and Evolutionary Biology,University of California, Irvine, CA 92697, USA.
xiv LIST OF CONTRIBUTORS
Sodhi and Ehrlich: Conservation Biology for All. http://ukcatalogue.oup.com/product/9780199554249.do
© Oxford University Press 2010. All rights reserved. For permissions please email: [email protected]

Curt MeineAldo Leopold Foundation/International CraneFoundation, P.O. Box 38, Prairie du Sac, WI53578, USA.
Fiorenza MicheliHopkins Marine Station, Stanford University, PacificGrove, CA 93950, USA.
Brett P. MurphySchool of Plant Science, University of Tasmania, Pri-vate Bag 55, Hobart, TAS 7001, Australia.
J. P. MyersEnvironmental Health Sciences, 421 E Park Street,Charlottesville VA 22902, USA.
Andrew NossProyecto Gestión Integrada de Territorios IndigenasWCS-Ecuador, Av. Eloy Alfaro N37-224 y CoremoApartado, Postal 17-21-168, Quito, Ecuador.
Daniel PaulySeas Around Us Project, University of British Colum-bia, Vancouver, British Columbia, V6T 1Z4, Canada.
Carlos A. PeresSchool of Environmental Sciences, University of EastAnglia, Norwich, NR4 7TJ, UK.
Ben PhalanConservation Science Group, Department of Zoology,University of Cambridge, Downing Street, Cam-bridge, CB2 3EJ, UK.
Stuart L. PimmNicholas School of the Environment, Duke University,Box 90328, LSRC A201, Durham, NC 27708, USA.
Mary Rose C. PosaDepartment of Biology, National University of Singa-pore, 14 Science Drive 4, Singapore 117543, Republicof Singapore.
Robert M. PringleDepartment of Biology, Stanford University, Stan-ford, CA 94305, USA.
Jai RanganathanNational Center for Ecological Analysis and Synthe-sis, 735 State Street, Suite 300 Santa Barbara, CA93109, USA.
Madhu RaoWildlife Conservation Society Asia Program 2300S. Blvd., Bronx, New York, NY 10460, USA.
Peter RavenMissouri Botanical Garden, Post Office Box 299, St.Louis, MO 63166-0299, USA.
Andriamandimbisoa RazafimpahananaRéseau de la Biodiversité de Madagascar, WildlifeConservation Society, Villa Ifanomezantsoa, Soavim-bahoaka, Boîte Postale 8500, Antananarivo 101, Ma-dagascar.
Terre SatterfieldInstitute for Resources, Environment and Sustainabil-ity, University of British Columbia, Vancouver, Brit-ish Columbia V6T 1Z4, Canada.
Denis A. SaundersCSIRO Sustainable Ecosystems, GPO Box 284, Can-berra, ACT 2601, Australia.
Cagan H. SekerciogluCenter for Conservation Biology, Department of Biology,Stanford University, Stanford, CA 94305-5020, USA.
Kimberly A. SelkoeNational Center for Ecological Analysis and Synthe-sis, 735 State Street, Santa Barbara, CA 93101, USA.
Daniel SimberloffDepartment of Ecology and Evolutionary Biology,University of Tennessee, Knoxville, TN 37996,USA.
Robert J. SmithDurrell Institute of Conservation and Ecology,University of Kent, Canterbury, Kent, CT2 7NR,UK.
Navjot S. SodhiDepartment of Biological Sciences, National Univer-sity of Singapore, 14 Science Drive 4, Singapore117543, Republic of Singapore AND Department ofOrganismic and Evolutionary Biology, Harvard Uni-versity, Cambridge, MA 02138, USA.
Matthew StruebigSchool of Biological & Chemical Sciences, QueenMary, University of London, Mile End Road, London,E1 4NS, UK.
LIST OF CONTRIBUTORS xv
1
© Oxford University Press 2010. All rights reserved. For permissions please email: [email protected]

Heather TallisThe Natural Capital Project, Woods Institute for theEnvironment, 371 Serra Mall, Stanford University,Stanford, CA 94305-5020, USA.
Teja TscharntkeAgroecology, University of Göttingen, Germany.
Kyle S. Van HoutanDepartment of Biology, O W Rollins Research Ctr,1st Floor, 1510 Clifton Road, Lab# 1112 EmoryUniversity AND Center for Ethics, 1531 DickeyDrive, Emory University, Atlanta, GA 30322,USA.
Peter VaughanRare, 1840 Wilson Boulevard, Suite 204, Arlington,VA 22201, USA.
Ian G. WarkentinEnvironmental Science – Biology, Memorial Univer-sity of Newfoundland, Corner Brook, Newfoundlandand Labrador A2H 6P9, Canada.
Noah K. WhitemanDepartment of Organismic and Evolutionary Biol-ogy, Harvard University, Cambridge, MA 02138,USA.
Tony WhittenThe World Bank, Washington, DC, USA.
David WilcoveDepartment of Ecology and Evolutionary Biology,Princeton University, Princeton, NJ 08544-1003,USA.
Douglas W. YuSchool of Biological Sciences, University of EastAnglia, Norwich, NR4 7TJ, UK.
xvi LIST OF CONTRIBUTORS
Sodhi and Ehrlich: Conservation Biology for All. http://ukcatalogue.oup.com/product/9780199554249.do
© Oxford University Press 2010. All rights reserved. For permissions please email: [email protected]

Foreword
2010 was named by the United Nations to be theInternational Year of Biodiversity, coincidingwith major political events that set the stage fora radical review of the way we treat our environ-ment and its biological riches. So far, the reportshave been dominated by reconfirmations thatpeople and their lifestyles continue to depletethe earth’s biodiversity. We are still vastly over-spending our natural capital and thereby depriv-ing future generations. If that were not badenough news in itself, there are no signs thatactions to date have slowed the rate of depletion.In fact, it continues to increase, due largely togrowing levels of consumption that provide in-creasingly unequal benefits to different groups ofpeople.
It is easy to continue to delve into the patternsand processes that lie at the heart of the problem.But it is critical that we also start to do everythingwe can to reverse all the damaging trends. Theseactions cannot and should not be just the respon-sibility of governments and their agencies. Itmust be the responsibility of all of us, includingscientists, wildlife managers, naturalists, and in-deed everyone who cares so that future genera-tions can have the same choices and the sameopportunity to marvel at and benefit from nature,as our generation has had. We all can be involvedin actions to improve matters, and making con-
servation biology relevant to and applicable byall is therefore a key task.
It is in this context that Navjot Sodhi and PaulEhlrich have contributed this important book.Covering all aspects of conservation biologyfrom the deleterious drivers, through to the im-pacts on people, and providing tools, techniques,and background to practical solutions, the bookprovides a resource for many different peopleand contexts. Written by the world’s leading ex-perts you will find clear summaries of the latestliterature on how to decide what to do, and thenhow to do it. Presented in clear and accessibletext, this book will support the work of manypeople. There are different kinds of conservationactions, at different scales, and affecting differentparts of the biosphere, all laid out clearly andconcisely.
There is something in here for everyone who is,or wishes to be, a conservation biologist. I amsure you will all be inspired and better informedto do something that will improve the prospectsfor all, so that in a decade or so, when the worldcommunity next examines the biodiversity ac-counts, things will definitely be taking a turn forthe better!
Georgina Mace CBE FRSImperial College London
18 November 2010
1
© Oxford University Press 2010. All rights reserved. For permissions please email: [email protected]
IntroductionNavjot S. Sodhi and Paul R. Ehrlich
Our actions have put humanity into a deep envi-ronmental crisis. We have destroyed, degraded,and polluted Earth’s natural habitats – indeed,virtually all of them have felt the influence ofthe dominant species. As a result, the vast major-ity of populations and species of plants and ani-mals – key working parts of human life supportsystems – are in decline, and many are alreadyextinct. Increasing human population size andconsumption per person (see Introduction Box1) have precipitated an extinction crisis – the“sixth mass extinction”, which is comparable topast extinction events such as the Cretaceous-Tertiary mass extinction 65 million years agothat wiped out all the dinosaurs except for thebirds. Unlike the previous extinction events,which were attributed to natural catastrophesincluding volcanic eruptions, meteorite impactand global cooling, the current mass extinctionis exclusively humanity’s fault. Estimates indicatethat numerous species and populations are cur-rently likely being extinguished every year. Butall is not lost – yet.
Being the dominant species on Earth, humanshave a moral obligation (see Introduction Box 2)to ensure the long-term persistence of rainfor-ests, coral reefs, and tidepools as well as sagua-ro cacti, baobab trees, tigers, rhinos, pandas,birds of paradise, morpho butterflies, and aplethora of other creatures. All these landmarksand life make this planet remarkable – ourimagination will be bankrupt if wild nature isobliterated – even if civilization could survivethe disaster. In addition to moral and aestheticreasons, we have a selfish reason to preservenature – it provides society with countless andinvaluable goods and absolutely crucial services
(e.g. food, medicines, pollination, pest control,and flood protection).
Habitat loss and pollution are particularlyacute in developing countries, which are of spe-cial concern because these harbor the greatestspecies diversity and are the richest centers ofendemism. Sadly, developing world conserva-tion scientists have found it difficult to afford anauthoritative textbook of conservation biology,which is particularly ironic, since it is thesecountries where the rates of habitat loss are high-est and the potential benefits of superior informa-tion in the hands of scientists and managers aretherefore greatest. There is also now a pressingneed to educate the next generation of conserva-tion biologists in developing countries, so thathopefully they are in a better position to protecttheir natural resources. With this book, we intendto provide cutting-edge but basic conservationscience to developing as well as developed coun-try inhabitants. The contents of this book arefreely available on the web.
Since ourmain aim is tomake up-to-date conser-vation knowledge widely available, we have invit-ed many of the top names in conservation biologytowrite on specific topics. Overall, this book repre-sents a project that the conservation communityhas deemed worthy of support by donations oftime and effort. None of the authors, includingourselves, will gain financially from this project.
It is our hope that this book will be of relevanceand use to both undergraduate and graduate stu-dents as well as scientists, managers, and person-nel in non-governmental organizations. The bookshould have all the necessary topics to become arequired reading for various undergraduate andgraduate conservation-related courses. English is
1
1
© Oxford University Press 2010. All rights reserved. For permissions please email: [email protected]

Introduction Box 1 Human population and conservationPaul R. Ehrlich
The size of the human population isapproaching 7 billion people, and its mostfundamental connection with conservation issimple: people compete with other animals,which unlike green plants cannot make theirown food. At present Homo sapiens uses,coopts, or destroys close to half of all the foodavailable to the rest of the animal kingdom (seeIntroduction Box 1 Figure). That means that, inessence, every human being added to thepopulation means fewer individuals can besupported in the remaining fauna.But human population growth does much
more than simply cause a proportional declinein animal biodiversity – since as you know, wedegrade nature in many ways besidescompeting with animals for food. Eachadditional person will have a disproportionatenegative impact on biodiversity in general. Thefirst farmers started farming the richest soilsthey couldfind andutilized the richest andmostaccessible resources first (Ehrlich and Ehrlich2005). Now much of the soil that people firstfarmed has been eroded away or paved over,and agriculturalists increasingly are forced toturn to marginal land to grow more food.Equally, deeper andpoorer oredepositsmust be
mined and smelted today, water and petroleummust come from lower quality sources, deeperwells, or (for oil) from deep beneath the oceanand must be transported over longer distances,all at ever‐greater environmental cost.The tasks of conservation biologists are made
more difficult by human population growth, asis readily seen in the I=PAT equation (Holdrenand Ehrlich 1974; Ehrlich and Ehrlich 1981).Impact (I) on biodiversity is not only a result ofpopulation size (P), but of that size multipliedby affluence (A) measured as per capitaconsumption, and that product multiplied byanother factor (T), which summarizes thetechnologies and socio‐political‐economicarrangements to service that consumption.More people surrounding a rainforest reservein a poor nation often means more individualsinvading the reserve to gather firewood orbush meat. More people in a rich country maymean more off‐road vehicles (ORVs) assaultingthe biota – especially if the ORV manufacturersare politically powerful and can successfullyfight bans on their use. As poor countries’populations grow and segments of thembecome more affluent, demand rises for meatand automobiles, with domesticated animals
continues
Introduction Box 1 Figure Human beings consuming resources. Photograph by Mary Rose Posa.continues
2 CONSERVATION BIOLOGY FOR ALL
Sodhi and Ehrlich: Conservation Biology for All. http://ukcatalogue.oup.com/product/9780199554249.do
© Oxford University Press 2010. All rights reserved. For permissions please email: [email protected]

Introduction Box 1 (Continued)
competing with or devouring native biota, carscausing all sorts of assaults on biodiversity, andboth adding to climate disruption. Globally, asa growing population demands greaterquantities of plastics, industrial chemicals,pesticides, fertilizers, cosmetics, and medicines,the toxification of the planet escalates,bringing frightening problems for organismsranging from polar bears to frogs (to saynothing of people!) (see Box 13.1).In sum, population growth (along with
escalating consumption and the use ofenvironmentally malign technologies) is a majordriver of the ongoing destruction ofpopulations, species, and communities that is asalient feature of the Anthropocene(Anonymous 2008). Humanity, as the dominantanimal (Ehrlich and Ehrlich 2008), simply outcompetes other animals for the planet’sproductivity, and often both plants and animalsfor its freshwater. While dealing with morelimited problems, it therefore behooves everyconservation biologist to put part of her timeinto restraining those drivers, including working
to humanely lower birth rates until populationgrowth stops and begins a slow decline toward asustainable size (Daily et al. 1994).
REFERENCES
Anonymous. (2008). Welcome to the Anthropocene.Chemical and Engineering News, 86, 3.
Daily, G. C. and Ehrlich, A. H. (1994). Optimum humanpopulation size. Population and Environment, 15,469–475.
Ehrlich, P. R. and Ehrlich, A. H. (1981). Extinction: thecauses and consequences of the disappearance ofspecies. Random House, New York, NY.
Ehrlich, P. R. and Ehrlich, A. H. (2005). One with Nineveh:politics, consumption, and the human future, (with newafterword). Island Press, Washington, DC.
Ehrlich, P. R. and Ehrlich, A. H. (2008). The DominantAnimal: human evolution and the environment. IslandPress, Washington, DC.
Holdren J. P. and Ehrlich, P. R. (1974). Human populationand the global environment. American Scientist, 62,282–292.
Introduction Box 2 EcoethicsPaul R. Ehrlich
The landethic simply enlarges theboundaries ofthe community to include soils, waters, plants,andanimals,orcollectively: the land….AldoLeo-pold (1949)
As you read this book, you should keep in mindthat the problem of conserving biodiversity isreplete with issues of practical ethics – agreed‐upon notions of the right or wrong of actualbehaviors (Singer 1993; Jamieson 2008). Ifcivilization is tomaintain the ecosystem services(Chapter 3) that can support a sustainablesociety and provide virtually everyone with areasonable quality of life, humanity will needto focus much more on issues with a significantconservation connection, “ecoethics”.Ultimately everything must be examined
from common “small‐scale” personalecoethical decisions to the ethics of power
wielded by large‐scale institutions that try (andsometimes succeed) to control broad aspects ofour global civilization. Those institutionsinclude governments, religions, transnationalcorporations, and the like. To ignore thesepower relations is, in essence, to ignore themost important large‐scale issues, such asconservation in the face of further humanpopulation growth and of rapid climate change– issues that demand global ethical discussion.Small‐scale ecoethical dilemmas are
commonly faced by conservation biologists.Should we eat shrimp in a restaurant when wecan’t determine its provenance? Should webecome more vegetarian? Is it legitimate to flyaround the world in jet aircraft to try andpersuade people to change a lifestyle thatincludes flying around the world in jet aircraft?How should we think about all the trees cut
continues
INTRODUCTION 3
1
© Oxford University Press 2010. All rights reserved. For permissions please email: [email protected]

Introduction Box 2 (Continued)
down to produce the books and articles we’vewritten? These sorts of decisions are poignantlydiscussed by Bearzi (2009), who calls forconservation biologists to think more carefullyabout their individual decisions and set a betterexample where possible. Some personaldecisions are not so minor – such as how manychildren to have. But ironically Bearzi does notdiscuss child‐bearing decisions, even thoughespecially in rich countries these are often themost conservation‐significant ethical decisionsan individual makes.Ecotourism is a hotbed of difficult ethical
issues, some incredibly complex, as shown inBox 14.3. But perhaps the most vexing ethicalquestions in conservation concern conflictsbetween the needs and prerogatives of peoplesand non‐human organisms. This is seen in issueslike protecting reserves from people, where inthe extreme some conservation biologists pleadfor strict exclusion of human beings(e.g. Terborgh 2004), and by the debates overthe preservation of endangered organisms andtraditional rights to hunt them. The latter isexemplified by complex aboriginal“subsistence” whaling issues (Reeves 2002).While commercial whaling is largelyresponsible for the collapse of many stocks,aboriginal whaling may threaten some of theremnants. Does one then side with the whalesor the people, to whom the hunts may be animportant part of their tradition? Preservingthe stocks by limiting aboriginal takes seemsthe ecoethical thing to do, since it allows fortraditional hunting to persist, which will nothappen if the whales go extinct. Tradition is atricky thing –coal mining or land developmentmay be family traditions, but ecoethically thoseoccupations should end.Perhaps most daunting of all is the task of
getting broad agreement from diverse cultureson ecoethical issues. It has been suggested thata world‐wide Millennium Assessment ofHuman Behavior (MAHB) be established to,among other things, facilitate discussion anddebate (Ehrlich and Kennedy 2005). My ownviews of the basic ecoethical paths that shouldbe pursued follow. Others may differ, but if wedon’t start debating ecoethics now, the currentethical stasis will likely persist.
• Work hard to humanely bring human popu-lation growth to a halt and start a slow decline.• Reduce overconsumption by the already richwhile increasing consumption by the needy
poor, while striving to limit aggregate con-sumption by humanity.• Start a global World War II type mobilizationto shift to more benign energy technologiesand thus reduce the chances of a world‐wideconservation disaster caused by rapid climatechange.• Judge technologies not just on what they dofor people but also to people and the organ-isms that are key parts of their life‐supportsystems.• Educate students, starting in kindergarten,about the crucial need to preserve biodiversityand expand peoples’ empathy not just to allhuman beings but also to the living elements inthe natural world.
Most conservation biologists view the task ofpreserving biodiversity as fundamentally one ofethics (Ehrlich and Ehrlich 1981). Nonetheless,long experience has shown that argumentsbased on a proposed ethical need to preserveour only known living relatives in the entireuniverse, the products of incredibleevolutionary sequences billions of years inextent, have largely fallen on deaf ears. Mostecologists have therefore switched toadmittedly risky instrumental arguments forconservation (Daily 1997). What proportion ofconservation effort should be put intopromoting instrumental approaches that mightbackfire or be effective in only the short ormiddle term is an ethical‐tactical issue.One of the best arguments for emphasizingthe instrumental is that they can at leastbuy time for the necessarily slowcultural evolutionary process ofchanging the norms that favor attention toreproducible capital and property rights tothe near exclusion of natural capital.Some day Aldo Leopold’s “Land Ethic”may become universal – until thenconservation biologists will face many ethicalchallenges.
REFERENCES
Bearzi, G. (2009). When swordfish conservation biologistseat swordfish. Conservation Biology, 23, 1–2.
Daily, G. C., ed. (1997). Nature’s services: societal depen-dence on natural ecosystems. Island Press, Washington,DC.
continues
Sodhi and Ehrlich: Conservation Biology for All. http://ukcatalogue.oup.com/product/9780199554249.do
© Oxford University Press 2010. All rights reserved. For permissions please email: [email protected]

kept at a level comprehensible to readers forwhom English is a second language.
The book contains 16 chapters, which are brief-ly introduced below:
Chapter 1. Conservation biology: past and present
In this chapter, Curt Meine introduces the disciplineby tracing its history. He also highlights the inter-disciplinary nature of conservation science.
Chapter 2. Biodiversity
Kevin J. Gaston defines biodiversity and lays out theobstacles to its better understanding in this chapter.
Chapter 3. Ecosystem functioning and services
In this chapter, Cagan H. Sekercioglu recapitulatesnatural ecosystem functions and services.
Chapter 4. Habitat destruction: death by athousand cuts
William F. Laurance provides an overview of con-temporary habitat loss in this chapter. He evaluatespatterns of habitat destruction geographically andcontrasts it in different biomes and ecosystems. Healso reviews some of the ultimate and proximatefactors causing habitat loss.
Chapter 5. Habitat fragmentation and landscapechange
Conceptual approaches used to understand conser-vation in fragmented landscapes are summarized inthis chapter by Andrew F. Bennett and Denis A.
Saunders. They also examine biophysical aspects oflandscape change, and how such change affects po-pulations, species, and communities.
Chapter 6. Overharvesting
Biodiversity is under heavy threat from anthropo-genic overexploitation (e.g. harvest for food or dec-oration or of live animals for the pet trade). Forexample, bushmeat or wild meat hunting is imperil-ing many tropical species as expanding human po-pulations in these regions seek new sources ofprotein and create potentially profitable new ave-nues for trade at both local and international levels.In this Chapter, Carlos A. Peres highlights the effectsof human exploitation of terrestrial and aquaticbiomes on biodiversity.
Chapter 7. Invasive species
Daniel Simberloff presents an overview of invasivespecies, their impacts andmanagement in this chapter.
Chapter 8. Climate change
Climate change is quickly emerging as a key issue inthe battle to preserve biodiversity. In this chapter,Thomas E. Lovejoy reports on the documented im-pacts of climate change on biotas.
Chapter 9. Fire and biodiversity
Evolutionary and ecological principles related toconservation in landscapes subject to regularfires are presented in this chapter by David M. J. S.Bowman and Brett P. Murphy.
Introduction Box 2 (Continued)
Ehrlich, P. R. and Ehrlich, A. H. (1981). Extinction: thecauses and consequences of the disappearance of spe-cies. Random House, New York, NY.
Ehrlich, P. R. and Kennedy, D. (2005). Millenniumassessment of human behavior: a challenge to scientists.Science, 309, 562–563.
Jamieson, D. (2008). Ethics and the environment: an in-troduction. Cambridge University Press, Cambridge, UK.
Leopold, A. (1949). Sand county almanac. Oxford Univer-sity Press, New York, NY.
Reeves, R. R. (2002). The origins and character of‘aboriginal subsistence’ whaling: a global review.Mammal Review, 32, 71–106.
Singer, P. (1993). Practical ethics. 2nd edn. University Press,Cambridge, UK.
Terborgh, J. (2004). Requiem for nature. Island Press,Washington, DC.
INTRODUCTION 5
1
© Oxford University Press 2010. All rights reserved. For permissions please email: [email protected]

Chapter 10. Extinctions and the practice ofpreventing them
Stuart L. Pimm and Clinton N. Jenkins explore whyextinctions are the critical issue for conservationscience. They also list a number of conservationoptions.
Chapter 11. Conservation planning and priorities
In this chapter, Thomas Brooks charts the history,state, and prospects of conservation planning andprioritization in terrestrial and aquatic habitats. Hefocuses on successful conservation implementationplanned through the discipline’s conceptual frame-work of vulnerability and irreplaceability.
Chapter 12. Endangered species management: theUS experience
In this chapter, David S. Wilcove focuses onendangered species management, emphasizing theUnited States of America (US) experience. Becausethe US has one of the oldest and possibly strongestlaws to protect endangered species, it provides anilluminating case history.
Chapter 13. Conservation in human-modifiedlandscapes
Lian Pin Koh and Toby A. Gardner discuss thechallenges of conserving biodiversity in degradedand modified landscapes with a focus on the tropi-cal terrestrial biome in this chapter. They highlightthe extent to which human activities have modifiednatural ecosystems and outline opportunities for
conserving biodiversity in human-modified land-scapes.
Chapter 14. The roles of people in conservationThe effective and sustainable protection of biodiver-sity will require that the sustenance needs of nativepeople are adequately considered. In this chapter, C.Anne Claus, Kai M. A. Chan, and Terre Satterfieldhighlight that understanding human activities andhuman roles in conservation is fundamental to effec-tive conservation.
Chapter 15. From conservation theory to practice:crossing the divide
Madhu Rao and Joshua Ginsberg explore theimplementation of conservation science in this chap-ter.
Chapter 16. The conservation biologist’s toolbox –principles for the design and analysis of conserva-tion studies
In this chapter, Corey J. A. Bradshaw and BarryW. Brook, discuss measures of biodiversity patternsfollowed by an overview of experimental design andassociated statistical paradigms. They also presentthe analysis of abundance time series, assessmentsof species’ endangerment, and a brief introductionto genetic tools to assess the conservation status ofspecies.
Each chapter includes boxes written by variousexperts describing additional relevant material,case studies/success stories, or personal perspec-tives.
6 CONSERVATION BIOLOGY FOR ALL
Sodhi and Ehrlich: Conservation Biology for All. http://ukcatalogue.oup.com/product/9780199554249.do
© Oxford University Press 2010. All rights reserved. For permissions please email: [email protected]

CHAP T E R 1
Conservation biology: pastand present1
Curt Meine
Our job is to harmonize the increasing kit ofscientific tools and the increasing recklessness inusing them with the shrinking biotas to whichthey are applied. In the nature of things we aremediators and moderators, and unless we canhelp rewrite the objectives of science we are pre-destined to failure.
—Aldo Leopold (1940; 1991)
Conservation in the old sense, of this or thatresource in isolation from all other resources, isnot enough. Environmental conservation basedon ecological knowledge and social understand-ing is required.
—Raymond Dasmann (1959)
Conservation biology is a mission-driven disci-pline comprising both pure and applied science.. . .We feel that conservation biology is a newfield, or at least a new rallying point for biologistswishing to pool their knowledge and techniquesto solve problems.—Michael E. Soulé and Bruce A. Wilcox (1980)
Conservation biology, though rooted in older sci-entific, professional, and philosophical traditions,gained its contemporary definition only in themid-1980s. Anyone seeking to understand thehistory and growth of conservation biology thusfaces inherent challenges. The field has formedtoo recently to be viewed with historical detach-ment, and the trends shaping it are still too fluidto be easily traced. Conservation biology’s practi-
tioners remain embedded within a process ofchange that has challenged conservation “in theold sense,” even while extending conservation’score commitment to the future of life, human andnon-human, on Earth.
There is as yet no comprehensive history ofconservation that allows us to understand thecauses and context of conservation biology’semergence. Environmental ethicists and histor-ians have provided essential studies of particularconservation ideas, disciplines, institutions, indi-viduals, ecosystems, landscapes, and resources.Yet we still lack a broad, fully integrated accountof the dynamic coevolution of conservation sci-ence, philosophy, policy, and practice (Meine2004). The rise of conservation biology marked anew “rallying point” at the intersection of thesedomains; exactly how, when, and why it did soare still questions awaiting exploration.
1.1 Historical foundations of conservationbiology
Since conservation biology’s emergence, com-mentary on (and in) the field has rightly empha-sized its departure from prior conservationscience and practice. However, the main “thread”of the field—the description, explanation, appre-ciation, protection, and perpetuation of biologicaldiversity can be traced much further back throughthe historical tapestry of the biological sciencesand the conservation movement (Mayr 1982;
1
Adapted from Meine, C., Soulé, M., and Noss, R. F. (2006). “A mission‐driven discipline”: the growth of conservation biology.Conservation Biology, 20, 631–651.
7
1
© Oxford University Press 2010. All rights reserved. For permissions please email: [email protected]

McIntosh 1985; Grumbine 1996; Quammen 1996).That thread weaves through related themes andconcepts in conservation, including wildernessprotection, sustained yield, wildlife protectionand management, the diversity-stability hypoth-esis, ecological restoration, sustainability, andecosystem health. By focusing on the thread itself,conservation biology brought the theme ofbiological diversity to the fore.
In so doing, conservation biology has recon-nected conservation to deep sources in Westernnatural history and science, and to cultural tradi-
tions of respect for the natural world both withinand beyond the Western experience (see Box 1.1and Chapter 14). Long before environmentalismbegan to reshape “conservation in the old sense”in the 1960s—prior even to the Progressive Eraconservation movement of the early 1900s—thefoundations of conservation biology were beinglaid over the course of biology’s epic advancesover the last four centuries. The “discovery ofdiversity” (to use Ernst Mayr’s phrase) was thedriving force behind the growth of biologicalthought. “Hardly any aspect of life is more
Box 1.1 Traditional ecological knowledge and biodiversity conservationFikret Berkes
Conservation biology is a discipline of Westernscience, but there are other traditions ofconservation in various parts of the world (seealso Chapter 14). These traditions are based onlocal and indigenous knowledge and practice.Traditional ecological knowledgemay bedefined as a cumulative body of knowledge,practice and belief, evolving by adaptiveprocesses and handed down throughgenerations by cultural transmission. It isexperiential knowledge closely related to a wayof life, multi‐generational, based on oraltransmission rather than book learning, andhencedifferent fromscience inanumberofways.Traditional knowledge does not always
result in conservation, just as science does notalways result in conservation. But there are anumber of ways in which traditionalknowledge and practice may lead toconservation outcomes. First, sacred grovesand other sacred areas areprotected through religious practice andenforced by social rules. UNESCO’s (the UnitedNations Educational, Scientific and CulturalOrganization) World Heritage Sites networkincludes many sacred sites, such as MachuPicchu in Peru. Second, many national parkshave been established at the sites of formersacred areas, and are based on the legacy oftraditional conservation. Alto Fragua IndiwasiNational Park in Colombia and Kaz DaglariNational Park in Turkey are examples. Third,new protected areas are being established atthe request of indigenous peoples as asafeguard against development. One exampleis the Paakumshumwaau Biodiversity Reserve in
James Bay, Quebec, Canada (see Box 1.1Figure). In the Peruvian Andes, the centre oforigin of the potato, the Quetchua peoplemaintain a mosaic of agricultural and naturalareas as a biocultural heritage site with some1200 potato varieties, both cultivated and wild.
Box 1.1 Figure Paakumshumwaau Biodiversity Reserve in JamesBay, Quebec, Canada, established at the request of the Cree Nationof Wemindji. Photograph by F. Berkes.
In some cases, high biodiversity is explainablein terms of traditional livelihood practices thatmaintain a diversity of varieties, species andlandscapes. For example, Oaxaca State inMexico exhibits high species richness despitethe absence of official protected areas. Thismay be attributed to the diversity of local andindigenous practices resulting in multi‐functional cultural landscapes. In many parts ofthe world, agroforestry systems that rely on thecultivation of a diversity of crops and treestogether (as opposed to modern
continues
8 CONSERVATION BIOLOGY FOR ALL
Sodhi and Ehrlich: Conservation Biology for All. http://ukcatalogue.oup.com/product/9780199554249.do
© Oxford University Press 2010. All rights reserved. For permissions please email: [email protected]

characteristic than its almost unlimited diversi-ty,” wrote Mayr (1982:133). “Indeed, there ishardly any biological process or phenomenonwhere diversity is not involved.”
This “discovery” unfolded as colonialism, theIndustrial Revolution, human population growth,expansion of capitalist and collectivist economies,and developing trade networks transformedhuman social, economic, political, and ecologicalrelationships ever more quickly and profoundly(e.g. Crosby 1986; Grove 1995; Diamond 1997).Technological change accelerated humanity’s ca-pacity to reshape the world to meet human needsand desires. In so doing, it amplified tensions alongbasic philosophical fault lines: mechanistic/organ-ic; utilitarian/reverential; imperialist/arcadian; re-ductionism/holism (Thomas et al. 1956; Worster1985). As recognition of human environmental im-pacts grew, an array of 19th century philosophers,scientists, naturalists, theologians, artists, writers,and poets began to regard the natural worldwithinan expanded sphere of moral concern (Nash 1989).
For example, Alfred Russel Wallace (1863) warnedagainst the “extinction of thenumerous formsof lifewhich the progress of cultivation invariably en-tails” and urged his scientific colleagues to assumethe responsibility for stewardship that came withknowledge of diversity.
The first edition of George Perkins Marsh’sMan and Nature appeared the following year. Inhis second chapter, “Transfer, Modification, andExtirpation of Vegetable and of Animal Species,”Marsh examined the effect of humans on bioticdiversity. Marsh described human beings as a“new geographical force” and surveyed humanimpacts on “minute organisms,” plants, insects,fish, “aquatic animals,” reptiles, birds, and“quadrupeds.” “All nature,” he wrote, “is linkedtogether by invisible bonds, and every organiccreature, however low, however feeble, howeverdependent, is necessary to the well-being of someother among the myriad forms of life with whichthe Creator has peopled the earth.”He concludedhis chapter with the hope that people might
Box 1.1 (Continued)
monocultures), seem to harbor high speciesrichness. There are at least three mechanismsthat help conserve biodiversity in the use ofagroforestry and other traditional practices:
• Land use regimes that maintain forestpatches at different successional stages con-serve biodiversity because each stage repre-sents a unique community. At the same time,such land use contributes to continued ecosys-tem renewal.• The creation of patches, gaps and mosaicsenhance biodiversity in a given area. In thestudy of landscape ecology, the principle is thatlow and intermediate levels of disturbanceoften increase biodiversity, as compared tonon‐disturbed areas.• Boundaries between ecological zones arecharacterized by high diversity, and the creationof new edges (ecotones) by disturbance en-hances biodiversity, but mostly of “edge‐loving”species. Overlaps and mixing of plant and ani-mal species produce dynamic landscapes.
The objective of formal protected areasis biodiversity conservation, whereastraditional conservation is often practicedfor livelihood and cultural reasons. Makingbiodiversity conservation relevant to most ofthe world requires bridging this gap, with anemphasis on sustainability, equity and adiversity of approaches. There is internationalinterest in community‐conserved areas as aclass of protected areas. Attention to time‐tested practices of traditional conservationcan help develop a pluralistic, moreinclusive definition of conservation, andbuild more robust constituencies forconservation.
SUGGESTED READING
Berkes, F. (2008). Sacred ecology, 2nd edn. Routledge,New York, NY.
CONSERVATION BIOLOGY: PAST AND PRESENT 9
1
© Oxford University Press 2010. All rights reserved. For permissions please email: [email protected]

“learn to put a wiser estimate on the works ofcreation” (Marsh 1864). Through the veil of 19th
century language, modern conservation biolo-gists may recognize Marsh, Wallace, and othersas common intellectual ancestors.
Marsh’s landmark volume appeared just as thepost-Civil War era of rampant resource exploita-tion commenced in the United States. A generationlater, Marsh’s book undergirded the ProgressiveEra reforms that gave conservation in the UnitedStates its modern meaning and turned it intoa national movement. That movement rodeTheodore Roosevelt’s presidency into public con-sciousness and across the American landscape.Conservationists in the Progressive Era were fa-mously split along utilitarian-preservationistlines. The utilitarian Resource Conservation Ethic,realized within new federal conservation agencies,was committed to the efficient, scientifically in-formed management of natural resources, to pro-vide “the greatest good to the greatest number forthe longest time” (Pinchot 1910:48). By contrast, theRomantic-Transcendental Preservation Ethic,overshadowed but persistent through the Progres-sive Era, celebrated the aesthetic and spiritualvalue of contact with wild nature, and inspiredcampaigns for the protection of parklands, refuges,forests, and “wild life.”
Callicott (1990) notes that both ethical campswere “essentially human-centered or ‘anthropo-centric’ . . . (and) regarded human beings orhuman interests as the only legitimate ends andnonhuman natural entities and nature as a wholeas means.”Moreover, the science upon which bothrelied had not yet experienced its 20th century re-volutions. Ecology had not yet united the scientificunderstanding of the abiotic, plant, and animalcomponents of living systems. Evolutionary biolo-gy had not yet synthesized knowledge of genetics,population biology, and evolutionary biology. Ge-ology, paleontology, and biogeography were justbeginning to provide a coherent narrative of thetemporal dynamics and spatial distribution of lifeon Earth. Although explicitly informed by the nat-ural sciences, conservation in the ProgressiveEra was primarily economic in its orientation, re-ductionist in its tendencies, and selective in itsapplication.
New concepts from ecology and evolutionarybiology began to filter into conservation and theresourcemanagement disciplines during the early20th century. “Proto-conservation biologists”from this period include Henry C. Cowles,whose pioneering studies of plant successionand the flora of the Indiana Dunes led him intoactive advocacy for their protection (Engel 1983);Victor Shelford, who prodded his fellow ecolo-gists to become active in establishing biologicallyrepresentative nature reserves (Croker 1991); Ar-thur Tansley, who similarly advocated establish-ment of nature reserves in Britain, and who in1935 contributed the concept of the “ecosystem”
to science (McIntosh 1985; Golley 1993); CharlesElton, whose text Animal Ecology (1927) providedthe foundations for a more dynamic ecologythrough his definition of food chains, food webs,trophic levels, the niche, and other basic concepts;JosephGrinnell, Paul Errington, OlausMurie, andother field biologists who challenged prevailingnotions on the ecological role and value of preda-tors (Dunlap 1988); and biologists who sought toplace national park management in the USA on asound ecological footing (Sellars 1997; Shafer2001). Importantly, the crisis of the Dust Bowl inNorth America invited similar ecological critiquesof agricultural practices during the 1930s (Worster1979; Beeman and Pritchard 2001).
By the late 1930s an array of conservation con-cerns—soil erosion, watershed degradation,urban pollution, deforestation, depletion of fish-eries and wildlife populations—brought academ-ic ecologists and resource managers closertogether and generated a new awareness of con-servation’s ecological foundations, in particularthe significance of biological diversity. In 1939Aldo Leopold summarized the point in a speechto a symbolically appropriate joint meeting of theEcological Society of America and the Society ofAmerican Foresters:
The emergence of ecology has placed theeconomic biologist in a peculiar dilemma:with one hand he points out the accumu-latedfindings of his search for utility, or lackof utility, in this or that species; with theother he lifts the veil from a biota
10 CONSERVATION BIOLOGY FOR ALL
Sodhi and Ehrlich: Conservation Biology for All. http://ukcatalogue.oup.com/product/9780199554249.do
© Oxford University Press 2010. All rights reserved. For permissions please email: [email protected]
so complex, so conditioned by interwovencooperations and competitions, that nomancan say where utility begins or ends. Nospecies can be ‘rated’ without the tongue inthe cheek; the old categories of ‘useful’ and‘harmful’ have validity only as conditionedby time, place, and circumstance. The onlysure conclusion is that the biota as awhole isuseful, and (the) biota includes not onlyplants and animals, but soils and waters aswell (Leopold 1991:266–67).
With appreciation of “the biota as a whole” camegreater appreciation of the functioning of ecolog-ical communities and systems (Golley 1993). ForLeopold and others, this translated into a redefi-nition of conservation’s aims: away from the nar-row goal of sustaining outputs of discretecommodities, and toward the more complexgoal of sustaining what we now call ecosystemhealth and resilience.
As conservation’s aims were thus being rede-fined, its ethical foundations were being recon-sidered. The accumulation of revolutionarybiological insights, combined with a generation’sexperience of fragmented policy, short-term eco-nomics, and environmental decline, yielded Leo-pold’s assertion of an Evolutionary-EcologicalLand Ethic (Callicott 1990). A land ethic, Leopoldwrote, “enlarges the boundaries of the communi-ty to include soils, waters, plants, and animals, orcollectively: the land”; it “changes the role ofHomo sapiens from conqueror of the land-commu-nity to plain member and citizen of it” (Leopold1949:204). These ethical concepts only slowlygained ground in forestry, fisheries management,wildlife management, and other resource man-agement disciplines; indeed, they are contentiousstill.
In the years following World War II, as con-sumer demands increased and technologiesevolved, resource development pressures grew.Resource managers responded by expandingtheir efforts to increase the yields of their particu-lar commodities. Meanwhile, the pace of scientificchange accelerated in disciplines across thebiological spectrum, frommicrobiology, genetics,systematics, and population biology to ecology,
limnology, marine biology, and biogeography(Mayr 1982). As these advances accrued, main-taining healthy connections between the basicsciences and their application in resource man-agement fields proved challenging. It fell to adiverse cohort of scientific researchers, inter-preters, and advocates to enter the public policyfray (including such notable figures as RachelCarson, Jacques-Yves Cousteau, Ray Dasmann,G. Evelyn Hutchinson, Julian Huxley, Eugeneand Howard Odum, and Sir Peter Scott). Manyof these had worldwide influence through theirwritings and students, their collaborations, andtheir ecological concepts and methodologies.Working from within traditional disciplines, gov-ernment agencies, and academic seats, they stoodat the complicated intersection of conservationscience, policy, and practice—a place that wouldcome to define conservation biology.
More pragmatically, new federal legislation inthe USA and a growing body of internationalagreements expanded the role and responsibilitiesof biologists in conservation. In the USA the Na-tional Environmental Policy Act (1970) requiredanalysis of environmental impacts in federal deci-sion-making. The Endangered Species Act (1973)called for an unprecedented degree of scientificinvolvement in the identification, protection, andrecovery of threatened species (see Chapter 12).Other laws that broadened the role of biologistsin conservation and environmental protection in-clude the Marine Mammal Protection Act (1972),the Clean Water Act (1972), the Forest and Range-land Renewable Resources Planning Act (1974),the National Forest Management Act (1976), andthe Federal Land Policy Management Act (1976).
At the international level, the responsibilities ofbiologists were also expanding in response to theadoption of bilateral treaties and multilateralagreements, including the UNESCO (United Na-tions Educational, Scientific and Cultural Organi-zation) Man and the Biosphere Programme(1970), the Convention on International Trade inEndangered Species of Wild Fauna and Flora(CITES) (1975), and the Convention on Wetlandsof International Importance (the “Ramsar Con-vention”) (1975). In 1966 the International Unionfor the Conservation of Nature (IUCN) published
CONSERVATION BIOLOGY: PAST AND PRESENT 11
1
© Oxford University Press 2010. All rights reserved. For permissions please email: [email protected]

it first “red list” inventories of threatened species.In short, the need for rigorous science input intoconservation decision-making was increasing,even as the science of conservation was changing.This state of affairs challenged the traditionalorientation of resource managers and researchbiologists alike.
1.2 Establishing a new interdisciplinaryfield
In the opening chapter of Conservation Biology: AnEvolutionary-Ecological Perspective, editorsMichaelSoulé and Bruce Wilcox (1980) described conser-vation biology as “a mission-oriented disciplinecomprising both pure and applied science.” Thephrase crisis-oriented (or crisis-driven) was soonadded to the list of modifiers describing theemerging field (Soulé 1985). This characterizationof conservation biology as a mission-oriented,crisis-driven, problem-solving field resonates withechoes of the past. The history of conservationand environmental management demonstratesthat the emergence of problem-solving fields (ornew emphases within established fields) invari-ably involves new interdisciplinary connections,new institutions, new research programs, andnew practices. Conservation biology would fol-low this pattern in the 1970s, 1980s, and 1990s.
In 1970 David Ehrenfeld published BiologicalConservation, an early text in a series of publicationsthat altered the scope, content, and direction ofconservation science (e.g. MacArthur and Wilson1963; MacArthur and Wilson 1967; MacArthur1972; Soulé and Wilcox 1980; CEQ 1980; Frankeland Soulé 1981; Schonewald-Cox et al. 1983; Harris1984; Caughley and Gunn 1986; Soulé 1986; Soulé1987a) (The journal Biological Conservation had alsobegun publication a year earlier in England). In hispreface Ehrenfeld stated, “Biologists are beginningto forge a discipline in that turbulent and vital areawhere biologymeets the social sciences and huma-nities”. Ehrenfeld recognized that the “acts of con-servationists are often motivated by stronglyhumanistic principles,” but cautioned that “thepractice of conservation must also have a firmscientific basis or, plainly stated, it is not likely to
work”. Constructing that “firm scientific basis”required—and attracted—researchers and practi-tioners from varied disciplines (including Ehren-feld himself, whose professional background wasin medicine and physiological ecology). The com-mon concern that transcended the disciplinaryboundaries was biological diversity: its extent, role,value, and fate.
By the mid-1970s, the recurring debates withintheoretical ecology over the relationship betweenspecies diversity and ecosystem stability wereintensifying (Pimm 1991; Golley 1993; McCann2000). Among conservationists the theme of di-versity, in eclipse since Leopold’s day, began tore-emerge. In 1951, renegade ecologists had cre-ated The Nature Conservancy for the purpose ofprotecting threatened sites of special biologicaland ecological value. In the 1960s voices for di-versity began to be heard within the traditionalconservation fields. Ray Dasmann, in A DifferentKind of Country (1968: vii) lamented “the prevail-ing trend toward uniformity” and made the case“for the preservation of natural diversity” and forcultural diversity as well. Pimlott (1969) detected“a sudden stirring of interest in diversity . . .Notuntil this decade did the word diversity, as anecological and genetic concept, begin to enter thevocabulary of the wildlife manager or land-useplanner.”Hickey (1974) argued that wildlife ecol-ogists and managers should concern themselveswith “all living things”; that “a scientificallysound wildlife conservation program” should“encompass the wide spectrum from one-celledplants and animals to the complex species we callbirds andmammals.”Conservation scientists andadvocates of varied backgrounds increasinglyframed the fundamental conservation problemin these new and broader terms (Farnham 2002).
As the theme of biological diversity gainedtraction among conservationists in the 1970s, thekey components of conservation biology began tocoalesce around it:
· Within the sciences proper, the synthesis ofknowledge from island biogeography and popula-tion biology greatly expanded understanding of thedistribution of species diversity and the phenomenaof speciation and extinction.
12 CONSERVATION BIOLOGY FOR ALL
Sodhi and Ehrlich: Conservation Biology for All. http://ukcatalogue.oup.com/product/9780199554249.do
© Oxford University Press 2010. All rights reserved. For permissions please email: [email protected]

· The fate of threatened species (both in situ andex situ) and the loss of rare breeds and plant germ-plasm stimulated interest in the heretofore neglected(and occasionally even denigrated) application ofgenetics in conservation.
· Driven in part by the IUCN red listing process,captive breeding programs grew; zoos, aquaria, andbotanical gardens expanded and redefined their roleas partners in conservation.
· Wildlife ecologists, community ecologists, andlimnologists were gaining greater insight into therole of keystone species and top-down interactionsin maintaining species diversity and ecosystemhealth.
· Within forestry, wildlife management, rangemanagement, fisheries management, and other ap-plied disciplines, ecological approaches to resourcemanagement gained more advocates.
· Advances in ecosystem ecology, landscape ecolo-gy, and remote sensing provided increasingly so-phisticated concepts and tools for land use andconservation planning at larger spatial scales.
· As awareness of conservation’s social dimensionsincreased, discussion of the role of values in sciencebecame explicit. Interdisciplinary inquiry gave rise toenvironmental history, environmental ethics, ecolog-ical economics, and other hybrid fields.
As these trends unfolded, “keystone indivi-duals” also had special impact. Peter Raven andPaul Ehrlich (to name two) made fundamentalcontributions to coevolution and populationbiology in the 1960s before becoming leadingproponents of conservation biology. MichaelSoulé, a central figure in the emergence of conser-vation biology, recalls that Ehrlich encouragedhis students to speculate across disciplines, andhad his students read Thomas Kuhn’s The Struc-ture of Scientific Revolutions (1962). The intellectualsyntheses in population biology led Soulé to adopt(around 1976) the term conservation biology for hisown synthesizing efforts.
For Soulé, that integration especially entailedthe merging of genetics and conservation (Soulé1980). In 1974 Soulé visited Sir Otto Frankel whileon sabbatical in Australia. Frankel approachedSoulé with the idea of collaborating on a volumeon the theme (later published as Conservation and
Evolution) (Frankel and Soulé 1981). Soulé’s workon that volume led to the convening of the FirstInternational Conference onConservation Biologyin September 1978. The meeting brought togetherwhat looked from the outside like “an odd assort-ment of academics, zoo-keepers, and wildlife con-servationists” (Gibbons 1992). Inside, however,the experience was more personal, among indivi-duals who had come together through important,andoftenvery personal, shifts in professional prio-rities. The proceedings of the 1978 conferencewerepublished asConservation Biology: An Evolutionary-Ecological Perspective (Soulé andWilcox 1980). Theconference and the book initiated a series of meet-ings and proceedings that defined the field for itsgrowing number of participants, as well as forthose outside the immediate circle (Brussard1985; Gibbons 1992).
Attention to the genetic dimension of conserva-tion continued to gain momentum into the early1980s (Schonewald-Cox et al. 1983). Meanwhile,awareness of threats to species diversity and causesof extinction was reaching a broader professionaland public audience (e.g. Ziswiler 1967; Iltis 1972;Terborgh 1974; Ehrlich andEhrlich 1981). In partic-ular, the impact of international development po-licies on the world’s species-rich, humid tropicalforests was emerging as a global concern. Fieldbiologists, ecologists, and taxonomists, alarmedby the rapid conversion of the rainforests—andwitnesses themselves to the loss of research sitesand study organisms—began to sound alarms (e.g.Gómez-Pompa et al. 1972; Janzen 1972). By theearly 1980s, the issue of rainforest destruction washighlighted through a surge of books, articles, andscientific reports (e.g. Myers 1979, 1980; NAS 1980;NRC 1982; see also Chapter 4).
During these years, recognition of the needs ofthe world’s poor and the developing world wasprompting new approaches to integrating conser-vation and development. This movement wasembodied in a series of international programs,meetings, and reports, including the Man and theBiosphere Programme (1970), the United NationsConference on the Human Environment held inStockholm (1972), and the World ConservationStrategy (IUCN 1980). These approaches eventu-ally came together under the banner of sustainable
CONSERVATION BIOLOGY: PAST AND PRESENT 13
1
© Oxford University Press 2010. All rights reserved. For permissions please email: [email protected]

development, especially as defined in the report ofthe World Commission on Environment and De-velopment (the “Brundtland Report”) (WCED1987). The complex relationship between devel-opment and conservation created tensions withinconservation biology from the outset, but alsodrove the search for deeper consensus and inno-vation (Meine 2004).
A Second International Conference on Conser-vation Biology convened at the University of Mi-chigan in May 1985 (Soulé 1986). Prior to themeeting, the organizers formed two committeesto consider establishing a new professional socie-ty and a new journal. A motion to organize theSociety for Conservation Biology (SCB) was ap-proved at the end of the meeting (Soulé 1987b).One of the Society’s first acts was to appointDavid Ehrenfeld editor of the new journal Conser-vation Biology (Ehrenfeld 2000).
The founding of SCB coincided with planningfor the National Forum on BioDiversity, heldSeptember 21–24, 1986 in Washington, DC. Theforum, broadcast via satellite to a nationaland international audience, was organized bythe US National Academy of Sciences andthe Smithsonian Institution. Although arrangedindependently of the process that led to SCB’screation, the forum represented a convergenceof conservation concern, scientific expertise, andinterdisciplinary commitment. In planning theevent, Walter Rosen, a program officer with theNational Research Council, began using a con-tracted form of the phrase biological diversity. Theabridged form biodiversity began its etymologicalcareer.
The forum’s proceedings were published as Bio-diversity (Wilson and Peter 1988). The wide impactof the forum and the book assured that the land-scape of conservation science, policy, and actionwould never be the same. For some, conservationbiology appeared as a new, unproven, and unwel-come kid on the conservation block. Its adherents,however, saw it as the culmination of trends longlatent within ecology and conservation, and as anecessary adaptation to new knowledge and agathering crisis. Conservation biology quicklygained its footing within academia, zoos and bo-tanical gardens, non-profit conservation groups,
resource management agencies, and internationaldevelopment organizations (Soulé 1987b).
In retrospect, the rapid growth of conservationbiology reflected essential qualities that set itapart from predecessor and affiliated fields:
· Conservation biology rests upon a scientific foun-dation in systematics, genetics, ecology, and evolu-tionary biology. As the Modern Synthesisrearranged the building blocks of biology, and newinsights emerged from population genetics, devel-opmental genetics (heritability studies), and islandbiogeography in the 1960s, the application ofbiology in conservation was bound to shift as well.This found expression in conservation biology’s pri-mary focus on the conservation of genetic, species,and ecosystem diversity (rather than those ecosys-tem components with obvious or direct economicvalue).
· Conservation biology paid attention to the entirebiota; to diversity at all levels of biological organiza-tion; to patterns of diversity at various temporal andspatial scales; and to the evolutionary and ecologicalprocesses that maintain diversity. In particular,emerging insights from ecosystem ecology, distur-bance ecology, and landscape ecology in the 1980sshifted the perspective of ecologists and conserva-tionists, placing greater emphasis on the dynamicnature of ecosystems and landscapes (e.g. Pickettand White 1985; Forman 1995).
· Conservation biology was an interdisciplinary,systems-oriented, and inclusive response to conser-vation dilemmas exacerbated by approaches thatwere too narrowly focused, fragmented, and exclu-sive (Soulé 1985; Noss and Cooperrider 1994).It provided an interdisciplinary home for those inestablished disciplines who sought new ways to or-ganize and use scientific information, and who fol-lowed broader ethical imperatives. It also reachedbeyond its own core scientific disciplines to incorpo-rate insights from the social sciences and humanities,from the empirical experience of resource managers,and from diverse cultural sources (Grumbine 1992;Knight and Bates 1995).
· Conservation biology acknowledged its status asan inherently “value-laden” field. Soulé (1985) as-serted that “ethical norms are a genuine part ofconservation biology.” Noss (1999) regarded this as
14 CONSERVATION BIOLOGY FOR ALL
Sodhi and Ehrlich: Conservation Biology for All. http://ukcatalogue.oup.com/product/9780199554249.do
© Oxford University Press 2010. All rights reserved. For permissions please email: [email protected]

a distinguishing characteristic, noting an “overarch-ing normative assumption in conservation bio-logy . . . that biodiversity is good and ought to bepreserved.” Leopold’s land ethic and related appealsto intergenerational responsibilities and the intrinsicvalue of non-human lifemotivated growing numbersof conservation scientists and environmental ethicists(Ehrenfeld 1981; Samson andKnopf 1982; Devall andSessions 1985; Nash 1989). This explicit recognitionof conservation biology’s ethical content stoodin contrast to the usual avoidance of such considera-tions within the sciences historically (McIntosh 1980;Barbour 1995; Barry and Oelschlaeger 1996).
· Conservation biology recognized a “close link-age” between biodiversity conservation and eco-nomic development and sought new ways toimprove that relationship. As sustainability becamethe catch-all term for development that sought toblend environmental, social, and economic goals,conservation biology provided a new venue at theintersection of ecology, ethics, and economics (Dalyand Cobb 1989). To achieve its goals, conservationbiology had to reach beyond the sciences and gener-ate conversations with economists, advocates, poli-cy-makers, ethicists, educators, the private sector,and community-based conservationists.
Conservation biology thus emerged in responseto both increasing knowledge and expandingdemands. In harnessing that knowledge andmeeting those demands, it offered a new,integrative, and interdisciplinary approach toconservation science.
1.3 Consolidation: conservation biologysecures its niche
In June 1987 more than 200 people attended thefirst annual meeting of the Society for Conserva-tion Biology in Bozeman, Montana, USA. Therapid growth of the new organization’s member-ship served as an index to the expansion of thefield generally. SCB tapped into the burgeoninginterest in interdisciplinary conservation scienceamong younger students, faculty, and conserva-tion practitioners. Universities established newcourses, seminars, and graduate programs. Scien-tific organizations and foundations adjusted their
funding priorities and encouraged those interest-ed in the new field. A steady agenda of confer-ences on biodiversity conservation broughttogether academics, agency officials, resourcemanagers, business representatives, internationalaid agencies, and non-governmental organiza-tions. In remarkably rapid order, conservationbiology gained legitimacy and secured a profes-sional foothold.
Not, however, without resistance, skepticism,and occasional ridicule. As the field grew, com-plaints came from various quarters. Conservationbiology was caricatured as a passing fad, a re-sponse to trendy environmental ideas (and mo-mentarily available funds). Its detractors regardedit as too theoretical, amorphous, and eclectic; toopromiscuously interdisciplinary; too enamored ofmodels; and too technique-deficient and data-poorto have any practical application (Gibbons 1992).Conservation biologists in North America wereaccused of being indifferent to the conservationtraditions of other nations and regions. Some sawconservation biology as merely putting “old winein a new bottle” and dismissing the rich experienceof foresters, wildlife managers, and other resourcemanagers (Teer 1988; Jensen and Krausman 1993).Biodiversity itself was just too broad, or confusing,or “thorny” a term (Udall 1991; Takacs 1996).
Such complaints made headlines within thescientific journals and reflected real tensionswithin resource agencies, academic departments,and conservation organizations. Conservation bi-ology had indeed challenged prevalent para-digms, and such responses were to be expected.Defending the new field, Ehrenfeld (1992: 1625)wrote, “Conservation biology is not defined by adiscipline but by its goal—to halt or repair theundeniable, massive damage that is being done toecosystems, species, and the relationships of hu-mans to the environment. . . .Many specialists in ahost of fields find it difficult, even hypocritical, tocontinue business as usual, blinders firmly inplace, in a world that is falling apart.”
Meanwhile, a spate of new and complex con-servation issueswere drawing increased attentionto biodiversity conservation. In North America,the Northern Spotted Owl (Strix occidentalis caur-ina) became the poster creature in deeply
CONSERVATION BIOLOGY: PAST AND PRESENT 15
1
© Oxford University Press 2010. All rights reserved. For permissions please email: [email protected]

contentious debates over the fate of remainingold-growth forests and alternative approaches toforestmanagement; the ExxonValdez oil spill andits aftermath put pollution threats and energypolicies on the front page; the anti-environmental,anti-regulatory “Wise Use” movement gained inpolitical power and influence; arguments overlivestock grazing practices and federal rangelandpolicies pitted environmentalists against ran-chers; perennial attempts to allow oil develop-ment within the Arctic National Wildlife Refugecontinued; and moratoria were placed on com-mercial fishing of depleted stocks of northerncod (Alverson et al. 1994; Yaffee 1994; Myerset al. 1997; Knight et al. 2002; Jacobs 2003).
At the international level, attention focused onthe discovery of the hole in the stratosphericozone layer over Antarctica; the growing scien-tific consensus about the threat of global warm-ing (the Intergovernmental Panel on ClimateChange was formed in 1988 and issued its firstassessment report in 1990); the environmentallegacy of communism in the former Soviet bloc;and the environmental impacts of internationalaid and development programs. In 1992, 172 na-tions gathered in Rio de Janeiro at the UnitedNations Conference on Environment and Devel-opment (the “Earth Summit”). Among the pro-ducts of the summit was the Convention onBiological Diversity. In a few short years, thescope of biodiversity conservation, science, andpolicy had expanded dramatically (e.g. McNeelyet al. 1990; Lubchenco et al. 1991).
To some degree, conservation biology had de-fined its own niche by synthesizing scientific dis-ciplines, proclaiming its special mission, andgathering together a core group of leading scien-tists, students, and conservation practitioners.However, the field was also filling a niche thatwas rapidly opening around it. It provided ameeting ground for those with converging inter-ests in the conservation of biological diversity. Itwas not alone in gaining ground for interdisci-plinary conservation research and practice. Itjoined restoration ecology, landscape ecology, ag-roecology, ecological economics, and other newfields in seeking solutions across traditional aca-demic and intellectual boundaries.
Amid the flush of excitement in establishingconservation biology, it was sometimes easy tooverlook the challenges inherent in the effort.Ehrenfeld (2000) noted that the nascent field was“controversy-rich.” Friction was inherent notonly in conservation biology’s relationship torelated fields, but within the field itself. Some ofthis was simply a result of high energy applied toa new endeavor. Often, however, this reflecteddeeper tensions in conservation: between sustain-able use and protection; between public and pri-vate resources; between the immediate needs ofpeople, and obligations to future generations andother life forms. Conservation biology would bethe latest stage on which these long-standing ten-sions would express themselves.
Other tensions reflected the special role thatconservation biology carved out for itself.Conservation biology was largely a product ofAmerican institutions and individuals, yet soughtto address a problem of global proportions (Meffe2002). Effective biodiversity conservation en-tailed work at scales from the global to the local,and on levels from the genetic to the species to thecommunity; yet actions at these different scalesand levels required different types of informa-tion, skills, and partnerships (Noss 1990). Profes-sionals in the new field had to be firmly groundedwithin particular professional specialties, yet con-versant across disciplines (Trombulak 1994; Noss1997). Success in the practice of biodiversity con-servation was measured by on-the-ground im-pact, yet the science of conservation biology wasobliged (as are all sciences) to undertake rigorousresearch and to define uncertainty (Noss 2000).Conservation biology was a “value-laden” fieldadhering to explicit ethical norms, yet sought toadvance conservation through careful scientificanalysis (Barry and Oelschlager 1996). These ten-sions within conservation biology were present atbirth. They continue to present importantchallenges to conservation biologists. They alsogive the field its creativity and vitality.
1.4 Years of growth and evolution
Although conservation biology has been anorganized field only since the mid-1980s, it is
16 CONSERVATION BIOLOGY FOR ALL
Sodhi and Ehrlich: Conservation Biology for All. http://ukcatalogue.oup.com/product/9780199554249.do
© Oxford University Press 2010. All rights reserved. For permissions please email: [email protected]

possible to identify and summarize at least sever-al salient trends that have shaped it since.
1.4.1 Implementation and transformation
Conservation biologists now work in a muchmore elaborate field than existed at the time ofits founding. Much of the early energy—and de-bate—in conservation biology focused on ques-tions of the genetics and demographics of smallpopulations, population and habitat viability,landscape fragmentation, reserve design, andmanagement of natural areas and endangeredspecies. These topics remain close to the core ofconservation biology, but the field has grownaround them. Conservation biologists now tendto work more flexibly, at varied scales and invaried ways. In recent years, for example, moreattention has focused on landscape permeabilityand connectivity, the role of strongly interactingspecies in top-down ecosystem regulation, andthe impacts of global warming on biodiversity(Hudson 1991; Lovejoy and Peters 1994; Souléand Terborgh 1999; Ripple and Beschta 2005;Pringle et al. 2007; Pringle 2008; see Chapters 5and 8).
Innovative techniques and technologies (suchas computer modeling and geographic informa-tion systems) have obviously played an impor-tant role in the growth of conservation biology.The most revolutionary changes, however, haveinvolved the reconceptualizing of science’s role inconservation. The principles of conservation biol-ogy have spawned creative applications amongconservation visionaries, practitioners, planners,and policy-makers (Noss et al. 1997; Adams 2005).To safeguard biological diversity, larger-scaleand longer-term thinking and planning had totake hold. It has done so under many rubrics,including: adaptation of the biosphere reserveconcept (Batisse 1986); the development of gapanalysis (Scott et al. 1993); the movement towardecosystem management and adaptive manage-ment (Grumbine 1994b; Salafsky et al. 2001;Meffe et al. 2002); ecoregional planning and anal-ogous efforts at other scales (Redford et al. 2003);and the establishment of marine protected areasand networks (Roberts et al. 2001).
Even as conservation biologists have honedtools for designing protected area networks andmanaging protected areas more effectively (seeChapter 11), they have looked beyond reserveboundary lines to the matrix of surroundinglands (Knight and Landres 1998). Conservationbiologists play increasingly important roles indefining the biodiversity values of aquatic eco-systems, private lands, and agroecosystems. Theresult is much greater attention to private landconservation, more research and demonstrationat the interface of agriculture and biodiversityconservation, and a growing watershed- andcommunity-based conservation movement. Con-servation biologists are now active across theentire landscape continuum, from wildlands toagricultural lands and from suburbs to cities,where conservation planning now meets urbandesign and green infrastructure mapping (e.g.Wang and Moskovits 2001; CNT and OpenlandsProject 2004).
1.4.2 Adoption and integration
Since the emergence of conservation biology, theconceptual boundaries between it and otherfields have become increasingly porous. Re-searchers and practitioners from other fieldshave come into conservation biology’s circle,adopting and applying its core concepts whilecontributing in turn to its further development.Botanists, ecosystem ecologists, marine biolo-gists, and agricultural scientists (among othergroups) were underrepresented in the field’searly years. The role of the social sciences in con-servation biology has also expanded within thefield (Mascia et al. 2003). Meanwhile, conserva-tion biology’s concepts, approaches, and findingshave filtered into other fields. This “permeation”(Noss 1999) is reflected in the number of biodi-versity conservation-related articles appearing inthe general science journals such as Science andNature, and in more specialized ecological andresource management journals. Since 1986 sever-al new journals with related content have ap-peared, including Ecological Applications (1991),the Journal of Applied Ecology (1998), the on-linejournal Conservation Ecology (1997) (now called
CONSERVATION BIOLOGY: PAST AND PRESENT 17
1
© Oxford University Press 2010. All rights reserved. For permissions please email: [email protected]

Ecology and Society), Frontiers in Ecology and theEnvironment (2003), and Conservation Letters(2008).
The influence of conservation biology is evenmore broadly evident in environmental design,planning, and decision-making. Conservationbiologists are now routinely involved in land-useand urban planning, ecological design, landscapearchitecture, and agriculture (e.g. Soulé 1991;Nas-sauer 1997; Babbitt 1999; Jackson and Jackson2002; Miller and Hobbs 2002; Imhoff and Carra2003;Orr 2004). Conservation biology has spurredactivity within such emerging areas of interest asconservation psychology (Saunders 2003) andconservation medicine (Grifo and Rosenthal1997; Pokras et al. 1997; Tabor et al. 2001; Aguirreet al. 2002). Lidicker (1998) noted that “conserva-tion needs conservation biologists for sure, but italso needs conservation sociologists, conservationpolitical scientists, conservation chemists, conser-vation economists, conservation psychologists,and conservation humanitarians.” Conservationbiology has helped tomeet this need by catalyzingcommunication and action among colleaguesacross a wide spectrum of disciplines.
1.4.3 Marine and freshwater conservationbiology
Conservation biology’s “permeation” has beenespecially notable with regard to aquatic ecosys-tems and marine environments. In response tolong-standing concerns over “maximum sus-tained yield” fisheries management, protectionof marine mammals, depletion of salmon stocks,degradation of coral reef systems, and other is-sues, marine conservation biology has emergedas a distinct focus area (Norse 1993; Boersma1996; Bohnsack and Ault 1996; Safina 1998;Thorne-Miller 1998; Norse and Crowder 2005).The application of conservation biology in marineenvironments has been pursued by a number ofnon-governmental organizations, includingSCB’s Marine Section, the Ocean Conservancy,the Marine Conservation Biology Institute, theCenter for Marine Biodiversity and Conservationat the Scripps Institution of Oceanography, the
Blue Ocean Institute, and the Pew Institute forOcean Science.
Interest in freshwater conservation biology hasalso increased as intensified human demandscontinue to affect water quality, quantity, distri-bution, and use. Conservationists have come toappreciate even more deeply the essential hydro-logical connections between groundwater, sur-face waters, and atmospheric waters, and theimpact of human land use on the health andbiological diversity of aquatic ecosystems (Leo-pold 1990; Baron et al. 2002; Glennon 2002; Huntand Wilcox 2003; Postel and Richter 2003). Con-servation biologists have become vital partnersin interdisciplinary efforts, often at the water-shed level, to steward freshwater as both anessential ecosystem component and a basichuman need.
1.4.4 Building capacity
At the time of its founding, conservation biologywas little known beyond the core group of scien-tists and conservationists who had created it.Now the field is broadly accepted and well repre-sented as a distinct body of interdisciplinaryknowledge worldwide. Several textbooks ap-peared soon after conservation biology gainedits footing (Primack 1993; Meffe and Carroll1994; Hunter 1996). These are now into their sec-ond and third editions. Additional textbookshave been published in more specialized subjectareas, including insect conservation biology(Samways 1994), conservation of plant biodiver-sity (Frankel et al. 1995), forest biodiversity(Hunter and Seymour 1999), conservation genet-ics (Frankham et al. 2002), marine conservationbiology (Norse and Crowder 2005), and tropicalconservation biology (Sodhi et al. 2007).
Academic training programs in conservationbiology have expanded and now exist around theworld (Jacobson 1990; Jacobson et al. 1995; Rodrí-guez et al. 2005). The interdisciplinary skills ofconservation biologists have found acceptancewithin universities, agencies, non-governmentalorganizations, and the private sector. Fundershave likewise helped build conservation biology’scapacity through support for students, academic
18 CONSERVATION BIOLOGY FOR ALL
Sodhi and Ehrlich: Conservation Biology for All. http://ukcatalogue.oup.com/product/9780199554249.do
© Oxford University Press 2010. All rights reserved. For permissions please email: [email protected]

programs, and basic research and field projects.Despite such growth,most conservation biologistswould likely agree that the capacity does not near-ly meet the need, given the urgent problems inbiodiversity conservation. Even the existing sup-port is highly vulnerable to budget cutbacks,changing priorities, and political pressures.
1.4.5 Internationalization
Conservation biology has greatly expanded itsinternational reach (Meffe 2002; Meffe 2003). The
scientific roots of biodiversity conservation areobviously not limited to one nation or continent(see Box 1.2). Although the international conser-vation movement dates back more than a centu-ry, the history of the science from an internationalperspective has been inadequately studied (Blan-din 2004). This has occasionally led to healthydebate over the origins and development of con-servation biology. Such debates, however, havenot hindered the trend toward greater interna-tional collaboration and representation withinthe field (e.g. Medellín 1998).
Box 1.2 Conservation in the PhilippinesMary Rose C. Posa
Conservation biology has been referred to as a“discipline with a deadline” (Wilson 2000). Asthe rapid loss and degradation of ecosystemsaccelerates across the globe, some scientistssuggest a strategy of triage—in effect, writingoff countries that are beyond help (Terborgh1999). But are there any truly lost causes inconservation?The Philippines is a mega‐biodiversity
country with exceptionally high levels ofendemism (~50% of terrestrial vertebrates and45–60% of vascular plants; Heaney andMittermeier 1997). However, centuries ofexploitation and negligence have pushed itsecosystems to their limit, reducing primaryforest cover [less than 3% remaining; FAO(Food and Agriculture Organization of theUnited Nations) 2005], decimating mangroves(>90% lost; Primavera 2000), and severelydamaging coral reefs (~5% retaining 75–100%live cover; Gomez et al. 1994), leading to a highnumber of species at risk of extinction [~21% ofvertebrates assessed; IUCN (International Unionfor Conservation of Nature and NaturalResources) 2006]. Environmental degradationhas also brought the loss of soil fertility,pollution, and diminished fisheriesproductivity, affecting the livelihood ofmillionsof rural inhabitants. Efforts to preservebiodiversity and implement soundenvironmental policies are hampered byentrenched corruption, weak governance andopposition by small but powerful interestgroups. In addition, remaining naturalresources are under tremendous pressure from
a burgeoning human population. ThePhilippines has thus been pegged as a topconservation “hotspot” for terrestrial andmarine ecosystems, and there are fears that itcould be the site of the first major extinctionspasm (Heaney and Mittermeier 1997; Myerset al. 2000; Roberts et al. 2002). Remarkably,and despite this precarious situation, there isevidence that hope exists for biodiversityconservation in the Philippines.Indication of the growing valuation of
biodiversity, sustainable development andenvironmental protection can be seen indifferent sectors of Philippine society. Stirringsof grassroots environmental consciousnessbegan in the 1970s, when marginalizedcommunities actively opposed unsustainablecommercial developments, blocking loggingtrucks, and protesting the construction of largedams (Broad and Cavanagh 1993). After the1986 overthrow of dictator Ferdinand Marcos,a revived democracy fostered the emergence ofcivil society groups focused on environmentalissues. The devolution of authority over naturalresources from central to local governmentsalso empowered communities to create andenforce regulations on the use of localresources. There are now laudable exampleswhere efforts by communities and non‐governmental organizations (NGOs) havemade direct impacts on conserving endangeredspecies and habitats (Posa et al. 2008).Driven in part by public advocacy, there has
also been considerable progress inenvironmental legislation. In particular, the
continues
CONSERVATION BIOLOGY: PAST AND PRESENT 19
1
© Oxford University Press 2010. All rights reserved. For permissions please email: [email protected]

Box 1.2 (Continued)
National Integrated Protected Areas SystemActprovides for stakeholder involvement inprotected area management, which has been akey element of success for various reserves.Perhaps the best examples of where people‐centered resource use and conservation havecome together are marine protected areas(MPAs) managed by coastal communities acrossthe country—a survey of 156 MPAs reportedthat 44.2% had good to excellent management(Alcala and Russ 2006).Last, but not least, there has been renewed
interest in biodiversity research in academia,increasing the amount and quality ofbiodiversity information (see Box 1.2 Figure).Labors of field researchers result in hundreds ofadditional species yet to be described, andsome rediscoveries of species thought to beextinct (e.g. Cebu flowerpecker Dicaeumquadricolor; Dutson et al. 1993). There areincreasing synergies and networks amongconservation workers, politicians, communityleaders, park rangers, researchers, local people,and international NGOs, as seen from thegrowth of the Wildlife Conservation Society ofthe Philippines, which has a diversemembership from all these sectors.
1980
0
20
40
60
Num
ber
of p
ublic
atio
ns
80
100
120
140
1985 1990Year
1995 2000 2005
Box 1.2 Figure Steady increase in the number of publications onPhilippine biodiversity and conservation, obtained from searchingthree ISI Web of Knowledge databases for the period 1980–2007.
While many daunting challenges remainespecially in the area of conservation ofpopulations (Chapter 10) and ecosystemsservices (Chapter 3), and there is no room for
complacency, that positive progress has beenmade in the Philippines—a conservation “worstcase scenario”—suggests that there aregrounds for optimism for biodiversityconservation in tropical countries worldwide.
REFERENCES
Alcala, A. C. and Russ, G. R. (2006). No‐take marinereserves and reef fisheries management in the Philip-pines: a new people power revolution. Ambio, 35,245–254.
Broad, R. and Cavanagh, J. (1993). Plundering paradise:the struggle for the environment in the Philippines.University of California Press, Berkeley, CA.
Dutson,G. C. L.,Magsalay, P.M., and Timmins, R. J. (1993).The rediscovery of the Cebu Flowerpecker Dicaeumquadricolor, with notes on other forest birds on Cebu,Philippines. Bird Conservation International, 3, 235–243.
FAO (Food and Agriculture Organization of the UnitedNations) (2005). Global forest resources assessment2005, Country report 202: Philippines. ForestryDepartment, FAO, Rome, Italy.
Gomez, E. D., Aliño, P. M., Yap, H. T., Licuanan, W. Y.(1994). A review of the status of Philippine reefs.MarinePollution Bulletin, 29, 62–68.
Heaney, L. and Mittermeier, R. A. (1997). The Philippines.In R. A. Mittermeier, G. P. Robles, and C. G. Mittermeier,eds Megadiversity: earth’s biologically wealthiestnations, pp. 236–255. CEMEX, Monterrey, Mexico.
IUCN (International Union for Conservation of Nature andNatural Resources) (2006). 2006 IUCN Red List ofthreatened species. www.iucnredlist.org.
Myers, N.,Mittermeier, R. A.,Mittermeier, C.G., da Fonseca,G. A. B., and Kent, J. (2000). Biodiversity hotspots forconservation priorities. Nature, 403, 853–858.
Posa, M. R. C., Diesmos, A. C., Sodhi, N. S., and Brooks,T. M. (2008). Hope for threatened biodiversity: lessonsfrom the Philippines. BioScience, 58, 231–240.
Primavera, J. H. (2000). Development and conservation ofPhilippine mangroves: Institutional issues. EcologicalEconomics, 35, 91–106.
Roberts, C. M., McClean, C. J., Veron, J. E. N., et al. (2002).Marine biodiversity hotspots and conservation prioritiesfor tropical reefs. Science, 295, 1280–1284.
Terborgh, J. (1999). Requiem for nature. Island Press,Washington, DC.
Wilson, E. O. (2000). On the future of conservation biology.Conservation Biology, 14, 1–3.
20 CONSERVATION BIOLOGY FOR ALL
Sodhi and Ehrlich: Conservation Biology for All. http://ukcatalogue.oup.com/product/9780199554249.do
© Oxford University Press 2010. All rights reserved. For permissions please email: [email protected]

This growth is reflected in the expanding institu-tional and membership base of the Society forConservation Biology. The need to reach acrossnational boundaries was recognized by the foun-ders of the SCB. From its initial issue ConservationBiology included Spanish translations of article ab-stracts. The Society has diversified its editorialboard, recognized the accomplishments of leadingconservation biologists from around the world,and regularly convened its meetings outside theUSA. A significant move toward greater interna-tional participation in the SCB camewhen, in 2000,the SCB began to develop its regional sections.
1.4.6 Seeking a policy voice
Conservation biology has long sought to definean appropriate and effective role for itself in shap-ing public policy (Grumbine 1994a). Most whocall themselves conservation biologists feel obli-gated to be advocates for biodiversity (Oden-baugh 2003). How that obligation ought to befulfilled has been a source of continuing debatewithin the field. Some scientists are wary of play-ing an active advocacy or policy role, lest theirobjectivity be called into question. Conversely,biodiversity advocates have responded to the ef-fect that “if you don’t use your science to shapepolicy, we will.”
Conservation biology’s inherent mix of scienceand ethics all but invited such debate. Far fromavoiding controversy, Conservation Biology’sfounding editor David Ehrenfeld built dialogueon conservation issues and policy into the journalat the outset. Conservation Biology has regularlypublished letters and editorials on the question ofvalues, advocacy, and the role of science in shapingpolicy. Conservation biologists have not achievedfinal resolution on the matter. Perhaps in the end itis irresolvable, a matter of personal judgment in-volving a mixture of scientific confidence levels,uncertainty, and individual conscience and re-sponsibility. “Responsibility” is the key word, asall parties to the debate seem to agree that advoca-cy, to be responsible, must rest on a foundation ofsolid science andmust be undertakenwith honestyand integrity (Noss 1999).
1.5 Conservation biology: a workin progress
These trends (and no doubt others) raise impor-tant questions for the future. Conservation biolo-gy has grown quickly in a few brief decades, yetmost conservation biologists would assert thatgrowth for growth’s sake is hardly justified. Asdisciplines and organizations become morestructured, they are liable to equate mere expan-sion with progress in meeting their missions (Eh-renfeld 2000). Can conservation biology sustainits own creativity, freshness, and vision? In itscollective research agenda, is the field asking,and answering, the appropriate questions? Is itperforming its core function—providing reliableand useful scientific information on biologicaldiversity and its conservation—in the most effec-tive manner possible? Is that information makinga difference? What “constituencies” need to bemore fully involved and engaged?
While continuing to ponder such questions, con-servation biologists cannot claim to have turnedback the threats to life’s diversity. Yet the fieldhas contributed essential knowledge at a timewhen those threats have continued to mount. Ithas focused attention on the full spectrum ofbiological diversity, on the ecological processesthat maintain it, on the ways we value it, and onsteps that can be taken to conserve it. It has broughtscientific knowledge, long-range perspectives, anda conservation ethic into the public and profession-al arenas in new ways. It has organized scientificinformation to inform decisions affecting biodiver-sity at all levels and scales. In so doing, it hashelped to reframe fundamentally the relationshipbetween conservation philosophy, science, andpractice.
Summary
· Conservation biology emerged in the mid-1980sas a new field focused on understanding, protecting,and perpetuating biological diversity at all scalesand all levels of biological organization.
· Conservation biology has deep roots in thegrowth of biology over several centuries, but its
CONSERVATION BIOLOGY: PAST AND PRESENT 21
1
© Oxford University Press 2010. All rights reserved. For permissions please email: [email protected]

emergence reflects more recent developments in anarray of biological sciences (ecology, genetics, evo-lutionary biology, etc.) and natural resource man-agement fields (forestry, wildlife and fisheriesmanagement, etc.).
· Conservation biology was conceived as a “mis-sion-oriented” field based in the biological sciences,but with an explicit interdisciplinary approach thatincorporated insights from the social sciences, hu-manities, and ethics.
· Since its founding, conservation biology hasgreatly elaborated its research agenda; built strongerconnections with other fields and disciplines; ex-tended its reach especially into aquatic and marineenvironments; developed its professional capacityfor training, research, and field application; becomean increasingly international field; and become in-creasingly active at the interface of conservation sci-ence and policy.
Suggested reading
· Farnham, T. J. (2007). Saving Nature’s Legacy: Origins ofthe Idea of Biological Diversity. Yale University Press,New Haven.
· Quammen, D. (1996). The Song of the Dodo: Island Bioge-ography in an Age of Extinctions. Simon and Schuster,New York.
· Meine, C. (2004). Correction Lines: Essays on Land,Leopold, and Conservation. Island Press, Washington, DC.
· Minteer, B. A. and Manning, R. E. (2003). ReconstructingConservation: Finding Common Ground. Island Press,Washington, DC.
Relevant website
· Society for Conservation Biology: http://www.conbio.org/
REFERENCES
Adams, J. S. (2005). The future of the wild: radical conservationfor a crowded world. Beacon Press, Boston, Massachusetts.
Aguirre, A. A., Ostfeld, R. S., Tabor, G. M., House, C., andPearl, M. C. (2002). Conservation medicine: ecological healthin practice. Oxford University Press, New York.
Alverson, W. S., Kuhlman, W., and Waller, D. M. (1994).Wild forests: conservation biology and public policy. IslandPress, Washington, DC.
Babbitt, B. (1999). Noah’s mandate and the birth of urbanbioplanning. Conservation Biology, 13, 677–678.
Barbour, M. G. (1995). Ecological fragmentation inthe Fifties. In W. Cronon, ed. Uncommon ground: towardreinventing nature, pp. 233–255.W.W.Norton, NewYork.
Baron, J. S., Poff, N. L., Angermeier, P. L., et al. (2002).Meeting ecological and societal needs for freshwater.Ecological Applications, 12, 1247–1260.
Barry, D. and Oelschlaeger, M. (1996). A science for surviv-al: values and conservation biology. Conservation Biology,10, 905–911.
Batisse, M. (1986). Developing and focusing the BiosphereReserve concept. Nature and Resources, 22, 2–11.
Beeman, R. S. and Pritchard, J. A. (2001). A green andpermanent land: ecology and agriculture in the twentiethcentury. University Press of Kansas, Lawrence, Kansas.
Blandin, P. (2004). Biodiversity, between science and ethics.In S. H. Shakir, and W. Z. A. Mikhail, eds Soil zoology forsustainable development in the 21st Century, pp. 17–49.Eigenverlag, Cairo, Egypt.
Boersma, P. D. (1996). Maine conservation: protecting theexploited commons. Society for Conservation BiologyNewsletter, 3, 1–6.
Boersma, P. D., Kareiva, P., Fagan, W. F., Clark, J. A., andHoekstra, J. M. (2001). How good are endangeredspecies recovery plans? BioScience, 51, 643–650.
Bohnsack, J. and Ault, J. (1996). Management strategies toconserve marine biodiversity. Oceanography, 9, 73–81.
Brussard, P. (1985). The current status of conservation biolo-gy. Bulletin of the Ecological Society of America, 66, 9–11.
Callicott, J. B. (1990). Whither conservation ethics? Conser-vation Biology, 4, 15–20.
Caughley, G. and Gunn, A. (1986). Conservation biology intheory and practice. Blackwell Science, Cambridge,Massachusetts.
CNT (Center For Neighborhood Technologies) and Open-lands Project (2004). Natural connections: green infrastruc-ture in Wisconsin, Illinois, and Indiana. (Online) Availableat http://www.greenmapping.org. (Accessed February2006).
CEQ (Council On Environmental Quality) (1980). Environ-mental quality—1980: the eleventh annual report of the CEQ.US Government Printing Office, Washington, DC.
Croker, R. A. (1991). Pioneer ecologist: the life and work ofVictor Ernest Shelford. Smithsonian Institution Press,Washington, DC.
Crosby, A. W. (1986). Ecological imperialism: the biologicalexpansion of Europe, 900–1900. Cambridge UniversityPress, New York.
22 CONSERVATION BIOLOGY FOR ALL
Sodhi and Ehrlich: Conservation Biology for All. http://ukcatalogue.oup.com/product/9780199554249.do
© Oxford University Press 2010. All rights reserved. For permissions please email: [email protected]

Daly, H. E. and Cobb, J. B. Jr. (1989). For the common good:redirecting the economy toward community, the environment,and a sustainable future. Beacon Press, Boston,Massachusetts.
Dasmann, R. (1959). Environmental conservation. JohnWileyand Sons, New York.
Dasmann, R. (1968). A different kind of country. Macmillan,New York.
Devall, B. and Sessions, G. (1985). Deep ecology: living as ifnature mattered. Peregrine Smith Books, Salt Lake City,Utah.
Diamond, J. M. (1997). Guns, germs, and steel: the fates ofhuman societies. Norton, New York.
Dunlap, T. R. (1988). Saving America’s wildlife: ecology andthe American mind, 1850–1990. Princeton UniversityPress, Princeton, New Jersey.
Ehrenfeld, D. W. (1970). Biological conservation. Holt, Rine-hard, and Winston, New York.
Ehrenfeld, D. W. (1981). The arrogance of humanism. OxfordUniversity Press, New York.
Ehrenfeld, D. W. (1992). Conservation biology: its originsand definition. Science, 255, 1625–26.
Ehrenfeld, D. (2000). War and peace and conservationbiology. Conservation Biology, 14, 105–112.
Ehrlich, P. and Ehrlich, A. (1981). Extinction: the causes andconsequences of the disappearance of species. RandomHouse, New York.
Elton, C. (1927). Animal Ecology. University of ChicagoPress, Chicago, Illinois.
Engel, R. J. (1983). Sacred sands: the struggle for community inthe Indiana Dunes. Wesleyan University Press, Middle-town, Connecticut.
Farnham, T. J. (2002). The concept of biological diversity:the evolution of a conservation paradigm. Ph.D. disser-tation, Yale University.
Forman, R. T. T. (1995). Land mosaics: the ecology of land-scapes and regions. Cambridge University Press,Cambridge, UK.
Frankel, O. H. and Soulé, M. E. (1981). Conservation andevolution. Cambridge University Press, Cambridge, UK.
Frankel, O. H., Brown, A. H. D., and Burdon, J. J. (1995).The conservation of plant biodiversity. CambridgeUniversity Press, New York.
Frankham, R., Briscoe, D. A., and Ballou, J. D. (2002).Introduction to conservation genetics. Cambridge Universi-ty Press, Cambridge, UK.
Gibbons, A. (1992). Conservation biology in the fast lane.Science, 255, 20–22.
Glennon, R. (2002). Water follies: groundwater pumping andthe fate of America’s fresh waters. Island Press, Washing-ton, DC.
Golley, F. B. (1993). A history of the ecosystem concept inecology: more than the sum of the parts. Yale UniversityPress, New Haven, Connecticut.
Gómez-Pompa, A., Vázquez-Yanes, C., and Guevara, S.(1972). The tropical rainforest: a non-renewable resource.Science, 177, 762–765.
Grifo, F. T. and Rosenthal, J., eds (1997). Biodiversity andhuman health. Island Press, Washington, DC.
Grove, R. H. (1995). Green imperialism: colonial expansion,tropical island Edens, and the origins of environmentalism,1600–1860. Cambridge University Press, Cambridge, UK.
Grumbine, R. E. (1992).Ghost bears: exploring the biodiversitycrisis. Island Press, Washington, DC.
Grumbine, R. E. (1994a). Environmental policy and biodiver-sity. Island Press, Washington, DC.
Grumbine, R. E. (1994b). What is ecosystem management?Conservation Biology, 8, 27–38.
Grumbine, R. E. (1996). Using biodiversity as a justificationfor nature protection in the U. S. Wild Earth, 6, 71–80.
Harris, L. D. (1984). The fragmented forest: island biogeogra-phy theory and the preservation of biotic diversity. Universityof Chicago Press, Chicago, Illinois.
Hickey, J. J. (1974). Some historical phases in wildlife con-servation. Wildlife Society Bulletin, 2, 164–170.
Hudson, W., ed. (1991). Landscape linkages and biodiversity.Island Press, Washington, DC.
Hunt, R. J. and Wilcox, D. A. (2003). Ecohydrology: whyhydrologists should care. Ground Water, 41, 289.
Hunter, M. (1996). Fundamentals of conservation biology.Blackwell Science, Cambridge, Massachusetts.
Hunter, M. L. and Seymour, R. S. (1999). Maintainingbiodiversity in forest ecosystems. Cambridge UniversityPress, Cambridge, UK.
Iltis, H. H. (1972). The extinction of species in the destruc-tion of ecosystems. American Biology Teacher, 34, 201–05.
Imhoff, D. and Carra, R. (2003). Farming with the wild: a newvision for conservation-based agriculture. Sierra ClubBooks, San Francisco, California.
IUCN (International Union For The Conservation OfNature) (1980).World conservation strategy: living resourceconservation for sustainable development. InternationalUnion for the Conservation of Nature, World ResourcesInstitute, World Wildlife Fund, Gland, Switzerland.
Jackson, D. L. and Jackson, L. L. (2002). The farm as naturalhabitat: reconnecting food systems with ecosystems. IslandPress, Washington, DC.
Jacobs, H. M. (2003). The politics of property rights at thenational level: signals and trends. Journal of the AmericanPlanning Association, 69, 181–189.
Jacobson, S. K. (1990). Graduate education in conservationbiology. Conservation Biology, 4, 431–440.
CONSERVATION BIOLOGY: PAST AND PRESENT 23
1
© Oxford University Press 2010. All rights reserved. For permissions please email: [email protected]

Jacobson, S. K., Vaughan, E., and Miller, S. (1995). Newdirections in conservation biology: graduate programs.Conservation Biology, 9, 5–17.
Janzen, D. H. (1972). The uncertain future of the tropics.Natural History, 81, 80–90.
Jensen, M. N. and Krausman, P. R. (1993). Conservationbiology’s literature: new wine or just a new bottle?Wildlife Society Bulletin, 21, 199–203.
Knight, R. L. and Bates, S. F., eds (1995). A new century fornatural resourcesmanagement. IslandPress,Washington,DC.
Knight, R. L. and Landres, P., eds (1998). Stewardship acrossboundaries. Island Press, Washington, DC.
Knight, R. L., Gilgert, W. C., and Marston, E., eds (2002).Ranching west of the 100th meridian: culture, ecology, andeconomics. Island Press, Washington, DC.
Kuhn, T. (1962). The structure of scientific revolutions.University of Chicago Press, Chicago, Illinois.
Leopold, A. (1940). The state of the profession. In S. L.Flader, and J. B. Callicott, eds The river of the mother ofGod and other essays by Aldo Leopold, pp. 276–280. Univer-sity of Wisconsin Press, Madison, Wisconsin.
Leopold, A. (1949). A sand county almanac and sketches hereand there. Oxford University Press, New York.
Leopold, A. (1991). The river of the mother of God and otheressays by Aldo Leopold. S. L. Flader and J. B. Callicott, edsUniversity of Wisconsin Press, Madison, Wisconsin.
Leopold, L. B. (1990). Ethos, equity, and the water resource.Environment, 32, 16–20, 37–42.
Lidicker, W. Z., Jr. (1998). Revisiting the human dimen-sion in conservation biology. Conservation Biology, 12,1170–1171.
Lovejoy, T. E. and Peters, R. L. (1994). Global warming andbiological diversity. Yale University Press, New Haven,Connecticut.
Lubchenco, J., Olson, A. M., Brubaker, L. B., et al. (1991).The sustainable biosphere initiative: an ecological re-search agenda. Ecology, 72, 371–412.
MacArthur, R. (1972). Geographical ecology: patterns in thedistribution of species. Princeton University Press, Prince-ton, New Jersey.
MacArthur, R. H. andWilson, E. O. (1963). An equilibriumtheory of insular zoogeography. Evolution, 17, 373–387.
MacArthur, R. H. and Wilson, E. O. (1967). The theoryof island biogeography. Princeton University Press, Prince-ton, New Jersey.
Marsh, G. P. (1864).Man and nature: or, physical geography asmodified by human action. D. Lowenthal, D., ed. 1965reprint. Harvard University Press, Cambridge,Massachusetts.
Mascia, M. B., Brosius, J. P., Dobson, T. A., et al. (2003).Conservation and the social sciences. ConservationBiology, 17, 649–650.
Mayr, E. (1982). The growth of biological thought: diversity,evolution, and inheritance. Harvard University Press,Cambridge, Massachusetts.
McCann, K. S. (2000). The diversity-stability debate.Nature, 405, 228–233.
McIntosh, R. P. (1980). The background and some currentproblems of theoretical ecology. Synthese, 43, 195–255.
McIntosh, R. P. (1985). The background of ecology: concept andtheory. Cambridge University Press, Cambridge, UK.
McNeely, J., Miller, K. R., Reid, W. V., Mittermeier, R. A.,andWerner, T. B. (1990). Conserving the World’s BiologicalDiversity. International Union for the Conservation ofNature, World Resources Institute, World WildlifeFund, Gland, Switzerland.
Medellín, R. A. (1998). True international collaboration:now or never. Conservation Biology, 12, 939–940.
Meffe, G. K. (2002). Going international. ConservationBiology, 16, 573–574.
Meffe, G. K. (2003). Toward further internationalization.Conservation Biology, 17, 1197–1199.
Meffe, G. K. and Carroll, R. (1994). Principles of conservationbiology. Sinauer Associates, Sunderland, Massachusetts.
Meffe, G. K., Nielsen, A. A., Knight, R. L., and Schenborn,D. A. (2002). Ecosystem management: adaptive, community-based conservation. Island Press, Washington, DC.
Meine, C. (2004). Correction lines: essays on land, Leopold, andconservation. Island Press, Washington, DC.
Miller, J. R., and Hobbs, R. J. (2002). Conservation wherepeople live and work. Conservation Biology, 16, 330–337.
Myers, N. (1979). The sinking ark: a new look at the problem ofdisappearing species. Pergamon Press, Oxford, England.
Myers, N. (1980).Conversion of tropical moist forests. NationalAcademy of Sciences, Washington, DC.
Myers, R. A., Hutchings, J. A., and Barrowman, N. J. (1997).Why do fish stocks collapse? The example of cod inAtlantic Canada. Ecological Applications, 7, 91–106.
Nash, R. (1989). The rights of nature: a history of environmentalethics. University ofWisconsin Press,Madison,Wisconsin.
Nassauer, J. (1997). Placing nature: culture and landscapeecology. Island Press, Washington, DC.
NAS (National Academy Of Sciences) (1980). Research prio-rities in tropical biology. National Academy of Sciences,Washington, DC.
NRC (National Research Council) (1982). Ecological aspectsof development in the humid tropics. National Academy ofSciences, Washington, DC.
Norse, E. A., ed. (1993). Global marine biological diversity: astrategy for building conservation into decision making.Island Press, Washington, DC.
Norse, E. A. and Crowder, L. B. (2005).Marine conservationbiology: the science of maintaining the sea’s biodiversity.Island Press, Washington, DC.
24 CONSERVATION BIOLOGY FOR ALL
Sodhi and Ehrlich: Conservation Biology for All. http://ukcatalogue.oup.com/product/9780199554249.do
© Oxford University Press 2010. All rights reserved. For permissions please email: [email protected]

Noss, R. F. (1990). Indicators for monitoring biodiversity: ahierarchical approach. Conservation Biology, 4, 355–364.
Noss, R. F. (1997). The failure of universities to produceconservation biologists. Conservation Biology, 11,1267–1269.
Noss, R. F. (1999). Is there a special conservation biology?Ecography, 22, 113–122.
Noss, R. F. (2000). Science on the bridge. Conservation Biol-ogy, 14, 333–335.
Noss, R. F. and Cooperrider, A. Y. (1994). Saving nature’slegacy: protecting and restoring biodiversity. Island Press,Washington, DC.
Noss, R. F., O’Connell, M. A., and Murphy, D. D. (1997).The science of conservation planning. Island Press,Washington, DC.
Odenbaugh, J. (2003). Values, advocacy, and conservationbiology. Environmental Values, 12, 55–69.
Orr, D. W. (2004). The nature of design: ecology, culture, andhuman intention. Oxford University Press, New York.
Pickett, S. T. A., and White, P. S. (1985). The ecology ofnatural disturbance and patch dynamics. Academic Press,Orlando, Florida.
Pimlott, D. H. (1969). The value of diversity. Transactions ofthe North American Wildlife and Natural Resources Confer-ence, 34, 265–280.
Pimm, S. L. (1991). The balance of nature? Ecological issues inthe conservation of species and communities. University ofChicago Press, Chicago, Illinois.
Pinchot, G. (1910). The fight for conservation. Doubleday,Page, and Company, New York.
Pokras, M., Tabor, G., Pearl, M., Sherman, D., and Epstein,P. (1997). Conservation medicine: an emerging field. InP. H. Raven, ed. Nature and human society: the quest for asustainable world, pp. 551–556. National Academy Press,Washington, DC.
Postel, S. and Richter, B. (2003). Rivers for life: managingwater for people and nature. Island Press, Washington, DC.
Primack, R. (1993). Essentials of conservation biology. SinauerAssociates, Sunderland, Massachusetts.
Pringle, R. M. (2008). Elephants as agents of habitat creationfor small vertebrates at patch scale. Ecology, 89, 26–33.
Pringle, R. M., Young, T. P., Rubenstein, D. I., andMccauly,D. J. (2007). Herbivore-initiated interaction cascades andtheir modulation by primary productivity in an Africansavanna. Proceedings of the National Academy of Sciences ofthe United States of America, 104, 193–197.
Quammen, D. (1996). The song of the dodo: island biogeogra-phy in an age of extinctions. Simon and Schuster, NewYork.
Redford, K. H., Coppolillo, P., Sanderson, E. W., et al.(2003). Mapping the conservation landscape. Conserva-tion Biology, 17, 116–131.
Ripple, W. J. and Beschta, R. L. (2005). Linking wolves andplants: Aldo Leopold on trophic cascades. BioScience, 55,613–621.
Roberts, C. M., Halpern, B., Palumbi, S. R., and Warner, R.R. (2001). Designing marine reserve networks: whysmall, isolated protected areas are not enough. Conserva-tion Biology in Practice, 2, 10–17.
Rodríguez, J. P., Simonetti, J. A., Premoli, A., and Marini,M. Â. (2005). Conservation in Austral and NeotropicalAmerica: building scientific capacity equal to the chal-lenges. Conservation Biology, 19, 969–972.
Safina, C. (1998). Song for the blue ocean. Henry Holt andCompany, New York.
Salafsky, N., Margoluis, R., and Redford, K. (2001). Adap-tive management: a tool for conservation practitioners. Biodi-versity Support Program, Washington, DC.
Samson, F. B. and Knopf, F. L. (1982). In search of a diver-sity ethic for wildlife management. Transactions of theNorth American Wildlife and Natural Resources Conference,47, 421–431.
Samways, M. J. (1994). Insect conservation biology. Chapmanand Hall, New York.
Saunders, C. (2003). The emerging field of conservationpsychology. Human Ecology Review, 10, 137–149.
Schonewald-Cox, C., Chambers, S. M., Macbryde, B., andThomas, L., eds (1983). Genetics and conservation: a refer-ence for managing wild animal and plant populations. Benja-min-Cummings, Menlo Park, California.
Scott, M. J., Davis, F., Cusuti, B., et al. (1993). GAP analysis:a geographic approach to protection of biological diver-sity. Wildlife Monographs, 123, 1–41.
Sellars, R. W. (1997). Preserving nature in the nationalparks: a history. Yale University Press, New Haven, Con-necticut.
Shafer, C. L. (2001). Conservation biology trailblazers:George Wright, Ben Thompson, and Joseph Dixon. Con-servation Biology, 15, 332–344.
Sodhi, N. S., Brook, B. W., and Bradshaw, C. J. A.(2007). Tropical conservation biology. Blackwell, Oxford,UK.
Soulé, M. E. (1980). Thresholds for survival: criteria formaintenance of fitness and evolutionary potential. InM. E. Soulé, and B. A. Wilcox, eds Conservation biology:an evolutionary-ecological perspective, pp. 151–170. SinauerAssociates, Sunderland, Massachusetts.
Soulé, M. E. (1985). What is conservation biology? BioSci-ence, 35, 727–734.
Soulé, M. E., ed. (1986). Conservation biology: the science ofscarcity and diversity. Sinauer Associates, Sunderland,Massachusetts.
Soulé, M. E., ed. (1987a). Viable populations for conservation.Cambridge University Press. Cambridge, UK.
CONSERVATION BIOLOGY: PAST AND PRESENT 25
1
© Oxford University Press 2010. All rights reserved. For permissions please email: [email protected]

Soulé, M. E. (1987b). History of the Society for Conserva-tion Biology: how and why we got here. ConservationBiology, 1, 4–5.
Soulé, M. E. (1991). Land use planning and wildlife main-tenance: guidelines for preserving wildlife in an urbanlandscape. Journal of the American Planning Association,57, 313–323.
Soulé, M. E. and Terborgh, J., eds (1999). Continental conser-vation: scientific foundations of regional reserve networks.Washington, DC., Island Press.
Soulé, M. E. and Wilcox, B. A., eds (1980). Conservationbiology: an evolutionary-ecological perspective. Sinauer,Sunderland, Massachusetts.
Tabor, G. M., Ostfeld, R. S., Poss, M., Dobson, A. P., andAguirre, A. A. (2001). Conservation biology and thehealth sciences. In M. E. Soulé and G. H. Orians, edsConservation biology: research priorities for the next decade,pp. 155–173. Island Press, Washington, DC.
Takacs, D. (1996). The idea of biodiversity: philosophies ofparadise. Johns Hopkins University Press, Baltimore,Maryland.
Teer, J. G. (1988). Review of Conservation biology: thescience of scarcity and diversity. Journal of Wildlife Man-agement, 52, 570–572.
Terborgh, J. (1974). Preservation of natural diversity:the problem of extinction prone species. BioScience, 24,715–722.
Thomas, W. L. Jr., Sauer, C. O., Bates, M., andMumford, L.(1956).Man’s role in changing the face of the Earth. Univer-sity of Chicago Press, Chicago, Illinois.
Thorne-Miller, B. (1998). The Living Ocean: Understandingand Protecting Marine Biodiversity, 2nd ed. Island Press,Washington, DC.
Trombulak, S. C. (1994). Undergraduate education and thenext generation of conservation biologists. ConservationBiology, 8, 589–591.
Udall, J. R. (1991). Launching thenatural ark.Sierra, 7, 80–89.Wallace, A. R. (1863). On the physical geography of theMalay Archipelago. Journal of the Royal GeographicalSociety of London, 33, 217–234.
Wang, Y. and Moskovits, D. K. (2001). Tracking fragmen-tation of natural communities and changes in land cover:applications of Landsat data for conservation in anurban landscape (Chicago Wilderness). ConservationBiology, 15, 835–843.
Wilson, E. O. and Peter, F. M., eds (1988). Biodiversity.National Academy Press, Washington, DC.
WCED (World Commission On Environment and Devel-opment) (1987). Our common future. Oxford UniversityPress, Oxford, UK.
Worster, D. (1979). Dust bowl: the southern plains in the1930s. Oxford University Press, New York.
Worster, D. (1985). Nature’s economy: a history of ecologicalideas. Cambridge University Press, Cambridge, UK.
Yaffee, S. L. (1994). The wisdom of the spotted owl: policylessons for a new century. Island Press, Washington,DC.
Ziswiler, V. (1967). Extinct and vanishing animals: a biolo-gy of extinction and survival. Springer-Verlag, NewYork.
26 CONSERVATION BIOLOGY FOR ALL
Sodhi and Ehrlich: Conservation Biology for All. http://ukcatalogue.oup.com/product/9780199554249.do
© Oxford University Press 2010. All rights reserved. For permissions please email: [email protected]

CHAP T E R 2
BiodiversityKevin J. Gaston
Biological diversity or biodiversity (the latter termis simply a contraction of the former) is the variety oflife, in all of its many manifestations. It is a broadunifying concept, encompassing all forms, levelsand combinations of natural variation, at all levelsof biological organization (Gaston and Spicer2004). A rather longer and more formal definitionis given in the international Convention onBiological Diversity (CBD; the definition isprovided in Article 2), which states that“‘Biological diversity’ means the variabilityamong living organisms from all sources includ-ing, inter alia, terrestrial, marine and other aquaticecosystems and the ecological complexes of whichthey are part; this includes diversitywithin species,between species and of ecosystems”. Whicheverdefinition is preferred, one can, for example,speak equally of the biodiversity of some givenarea or volume (be it large or small) of the land orsea, of the biodiversity of a continent or an oceanbasin, or of the biodiversity of the entire Earth.Likewise, one can speak of biodiversity at present,at a given time or period in the past or in the future,or over the entire history of life on Earth.
The scale of the variety of life is difficult, andperhaps impossible, for any of us truly to visua-lize or comprehend. In this chapter I first attemptto give some sense of the magnitude of biodiver-sity by distinguishing between different key ele-ments and what is known about their variation.Second, I consider how the variety of life haschanged through time, and third and finallyhow it varies in space. In short, the chapter will,inevitably in highly summarized form, addressthe three key issues of how much biodiversitythere is, how it arose, and where it can be found.
2.1 How much biodiversity is there?
Some understanding of what the variety of lifecomprises can be obtained by distinguishing be-tween different key elements. These are the basicbuilding blocks of biodiversity. For convenience,they can be divided into three groups: geneticdiversity, organismal diversity, and ecologicaldiversity (Table 2.1). Within each, the elementsare organized in nested hierarchies, with thosehigher order elements comprising lower order
Table 2.1 Elements of biodiversity (focusing on those levels that are most commonly used). Modified from Heywood and Baste(1995).
Ecological diversity Organismal diversity
Biogeographic realms Domains or KingdomsBiomes PhylaProvinces FamiliesEcoregions GeneraEcosystems SpeciesHabitats Genetic diversity Subspecies
Populations Populations PopulationsIndividuals Individuals
ChromosomesGenes
Nucleotides
27
1
© Oxford University Press 2010. All rights reserved. For permissions please email: [email protected]

ones. The three groups are intimately linked andshare some elements in common.
2.1.1 Genetic diversity
Genetic diversity encompasses the components ofthe genetic coding that structures organisms (nu-cleotides, genes, chromosomes) and variation inthe genetic make-up between individuals within apopulation and between populations. This is theraw material on which evolutionary processes act.Perhaps themostbasicmeasure of genetic diversityis genome size—the amount of DNA (Deoxyribo-nucleic acid) inone copyof a species’ chromosomes(also called the C-value). This can vary enormous-ly,withpublished eukaryote genome sizes rangingbetween 0.0023 pg (picograms) in the parasitic mi-crosporidium Encephalitozoon intestinalis and 1400pg in the free-living amoeba Chaos chaos (Gregory2008). These translate into estimates of 2.2 millionand 1369 billion base pairs (the nucleotides on op-posing DNA strands), respectively. Thus, even atthis level the scale of biodiversity is daunting. Cellsize tends to increase with genome size. Humanshave a genome size of 3.5 pg (3.4 billion base pairs).
Much of genome size comprises non-codingDNA, and there is usually no correlation betweengenome size and the number of genes coded. Thegenomes of more than 180 species have beencompletely sequenced and it is estimated that, forexample, there are around 1750 genes for the bacte-ria Haemophilus influenzae and 3200 for Escherichiacoli, 6000 for theyeastSaccharomyces cerevisiae, 19000for the nematode Caenorhabditis elegans, 13 500 forthe fruit flyDrosophila melanogaster, and�25 000 fortheplantArabidopsis thaliana, themouseMusmuscu-lus, brown rat Rattus norvegicus and human Homosapiens. There is strong conservatism of some genesacrossmuchof thediversityof life.Thedifferences ingenetic compositionof species giveus indications oftheir relatedness, and thus important informationasto how the history and variety of life developed.
Genes are packaged into chromosomes. Thenumber of chromosomes per somatic cell thusfar observed varies between 2 for the jumper antMyrmecia pilosula and 1260 for the adders-tonguefern Ophioglossum reticulatum. The ant species re-produces by haplodiploidy, in which fertilized
eggs (diploid) develop into females and unfertil-ized eggs (haploid) become males, hence the lat-ter have the minimal achievable singlechromosome in their cells (Gould 1991). Humanshave 46 chromosomes (22 pairs of autosomes,and one pair of sex chromosomes).
Within a species, genetic diversity is commonlymeasured in terms of allelic diversity (averagenumber of alleles per locus), gene diversity (het-erozygosity across loci), or nucleotide differences.Large populations tend to have more genetic di-versity than small ones, more stable populationsmore than those that wildly fluctuate, and popu-lations at the center of a species’ geographic rangeoften have more genetic diversity than those atthe periphery. Such variation can have a varietyof population-level influences, including on pro-ductivity/biomass, fitness components, behav-ior, and responses to disturbance, as well asinfluences on species diversity and ecosystemprocesses (Hughes et al. 2008).
2.1.2 Organismal diversity
Organismal diversity encompasses the full taxo-nomic hierarchy and its components, from indi-viduals upwards to populations, subspecies andspecies, genera, families, phyla, and beyond tokingdoms and domains. Measures of organismaldiversity thus include some of the most familiarexpressions of biodiversity, such as the numbersof species (i.e. species richness). Others should bebetter studied and more routinely employed thanthey have been thus far.
Starting at the lowest level of organismal diver-sity, little is known about how many individualorganisms there are at any one time, although thisis arguably an important measure of the quantityand variety of life (given that, even if sometimesonly in small ways, most individuals differ fromone another). Nonetheless, the numbers must beextraordinary. The global number of prokaryoteshas been estimated to be 4–6 x 1030 cells—manymillion times more than there are stars in thevisible universe (Copley 2002)—with a produc-tion rate of 1.7 x 1030 cells per annum (Whitman etal. 1998). The numbers of protists is estimated at104�107 individuals per m2 (Finlay 2004).
28 CONSERVATION BIOLOGY FOR ALL
Sodhi and Ehrlich: Conservation Biology for All. http://ukcatalogue.oup.com/product/9780199554249.do
© Oxford University Press 2010. All rights reserved. For permissions please email: [email protected]

Impoverished habitats have been estimated tohave 105 individual nematodes per m2, andmore productive habitats 106�107 per m2, possi-bly with an upper limit of 108 per m2; 1019 hasbeen suggested as a conservative estimate of theglobal number of individuals of free-living nema-todes (Lambshead 2004). By contrast, it hasbeen estimated that globally there may be less than1011 breeding birds at any one time, fewer than 17for every person on the planet (Gaston et al. 2003).
Individual organisms can be grouped into rela-tively independent populations of a species on thebasis of limited gene flow and some level of genet-ic differentiation (as well as on ecological criteria).The population is a particularly important ele-ment of biodiversity. First, it provides an impor-tant link between the different groups of elementsof biodiversity (Table 2.1). Second, it is the scale atwhich it is perhaps most sensible to consider lin-kages between biodiversity and the provision ofecosystem services (supporting services—e.g. nu-trient cycling, soil formation, primary production;provisioning services—e.g. food, freshwater,timber and fiber, fuel; regulating services—e.g.climate regulation, flood regulation, disease regu-lation, water purification; cultural services—e.g.aesthetic, spiritual, educational, recreational;MEA 2005). Estimates of the density of such po-pulations and the average geographic range sizesof species suggest a total of about 220 distinctpopulations per eukaryote species (Hughes et al.1997). Multiplying this by a range of estimates ofthe extant numbers of species, gives a global totalof 1.1 to 6.6 x 10⁹ populations (Hughes et al. 1997),one or fewer for every person on the planet. Theaccuracy of this figure is essentially unknown,with major uncertainties at each step of the calcu-lation, but the ease withwhich populations can beeradicated (e.g. through habitat destruction) sug-gests that the total is being eroded at a rapid rate.
People have long pondered one of the impor-tant contributors to the calculation of the totalnumber of populations, namely howmany differ-ent species of organisms there might be. Greatestuncertainty continues to surround the richness ofprokaryotes, and in consequence they are oftenignored in global totals of species numbers. Thisis in part variously because of difficulties in ap-
plying standard species concepts, in culturing thevast majority of these organisms and thereby ap-plying classical identification techniques, and bythe vast numbers of individuals. Indeed, depend-ing on the approach taken, the numbers of pro-karyotic species estimated to occur even in verysmall areas can vary by a few orders of magni-tude (Curtis et al. 2002; Ward 2002). The rate ofreassociation of denatured (i.e. single stranded)DNA has revealed that in pristine soils and sedi-ments with high organic content samples of 30 to100 cm3 correspond to c. 3000 to 11 000 differentgenomes, and may contain 104 different prokary-otic species of equivalent abundances (Torsviket al. 2002). Samples from the intestinal microbialflora of just three adult humans contained repre-sentatives of 395 bacterial operational taxonomicunits (groups without formal designation of tax-onomic rank, but thought here to be roughlyequivalent to species), of which 244 were previ-ously unknown, and 80% were from species thathave not been cultured (Eckburg et al. 2005). Like-wise, samples from leaves were estimated to har-bor at least 95 to 671 bacterial species from each ofnine tropical tree species, with only 0.5% com-mon to all the tree species, and almost all of thebacterial species being undescribed (Lambaiset al. 2006). On the basis of such findings, globalprokaryote diversity has been argued to comprisepossibly millions of species, and some have sug-gested it may be many orders of magnitude morethan that (Fuhrman and Campbell 1998; Dykhui-zen 1998; Torsvik et al. 2002; Venter et al. 2004).
Although much more certainty surrounds es-timates of the numbers of eukaryotic than pro-karyotic species, this is true only in a relative andnot an absolute sense. Numbers of eukaryoticspecies are still poorly understood. A wide vari-ety of approaches have been employed to esti-mate the global numbers in large taxonomicgroups and, by summation of these estimates,how many extant species there are overall.These approaches include extrapolations basedon counting species, canvassing taxonomic ex-perts, temporal patterns of species description,proportions of undescribed species in samples,well-studied areas, well-studied groups, species-abundance distributions, species-body size
BIODIVERSITY 29
1
© Oxford University Press 2010. All rights reserved. For permissions please email: [email protected]

distributions, and trophic relations (Gaston2008). One recent summary for eukaryotesgives lower and upper estimates of 3.5 and 108million species, respectively, and a working fig-ure of around 8 million species (Table 2.2). Basedon current information the two extremes seemrather unlikely, but the working figure at leastseems tenable. However, major uncertaintiessurround global numbers of eukaryotic speciesin particular environments which have beenpoorly sampled (e.g. deep sea, soils, tropicalforest canopies), in higher taxa which are ex-tremely species rich or with species which arevery difficult to discriminate (e.g. nematodes,arthropods), and in particular functional groupswhich are less readily studied (e.g. parasites). Awide array of techniques is now being employedto gain access to some of the environments thathave been less well explored, including ropeclimbing techniques, aerial walkways, cranesand balloons for tropical forest canopies, andremotely operated vehicles, bottom landers, sub-marines, sonar, and video for the deep ocean.Molecular and better imaging techniques arealso improving species discrimination. Perhapsmost significantly, however, it seems highlyprobable that the majority of species are para-sites, and yet few people tend to think aboutbiodiversity from this viewpoint.
Howmany of the total numbers of species havebeen taxonomically described remains surpris-ingly uncertain, in the continued absence of a
single unified, complete andmaintained databaseof valid formal names. However, probably about2 million extant species are regarded as beingknown to science (MEA 2005). Importantly, thistotal hides two kinds of error. First, there areinstances in which the same species is knownunder more than one name (synonymy). This ismore frequent amongst widespread species,which may show marked geographic variationin morphology, and may be described anew re-peatedly in different regions. Second, one namemay actually encompass multiple species (hom-onymy). This typically occurs because these spe-cies are very closely related, and look very similar(cryptic species), and molecular analyses may berequired to recognize or confirm their differences.Levels of as yet unresolved synonymy are un-doubtedly high in many taxonomic groups. In-deed, the actual levels have proven to be a keyissue in, for example, attempts to estimate theglobal species richness of plants, with the highlyvariable synonymy rate amongst the few groupsthat have been well studied in this regard makingdifficult the assessment of the overall level ofsynonymy across all the known species. Equally,however, it is apparent that cryptic speciesabound, with, for example, one species of neo-tropical skipper butterfly recently having beenshown actually to be a complex of ten species(Hebert et al. 2004).
New species are being described at a rateof about 13 000 per annum (Hawksworth and
Table 2.2 Estimates (in thousands), by different taxonomic groups, of the overall global numbers of extant eukaryotespecies. Modified from Hawksworth and Kalin‐Arroyo (1995) and May (2000).
Overall species
High Low Working figure Accuracy of working figure
‘Protozoa’ 200 60 100 very poor‘Algae’ 1000 150 300 very poorPlants 500 300 320 goodFungi 2700 200 1500 moderateNematodes 1000 100 500 very poorArthropods 101 200 2375 4650 moderateMolluscs 200 100 120 moderateChordates 55 50 50 goodOthers 800 200 250 moderate
Totals 107 655 3535 7790 very poor
30 CONSERVATION BIOLOGY FOR ALL
Sodhi and Ehrlich: Conservation Biology for All. http://ukcatalogue.oup.com/product/9780199554249.do
© Oxford University Press 2010. All rights reserved. For permissions please email: [email protected]
Kalin-Arroyo 1995), or about 36 species on theaverage day. Given even the lower estimates ofoverall species numbers this means that there islittle immediate prospect of greatly reducing thenumbers that remain unknown to science. This isparticularly problematic because the describedspecies are a highly biased sample of the extantbiota rather than the random one that might en-able more ready extrapolation of its properties toall extant species. On average, described speciestend to be larger bodied, more abundant andmore widespread, and disproportionately fromtemperate regions. Nonetheless, new species con-tinue to be discovered in even otherwise relative-ly well-known taxonomic groups. New extantfish species are described at the rate of about130–160 each year (Berra 1997), amphibian spe-cies at about 95 each year (from data in Frost2004), bird species at about 6–7 each year (VanRootselaar 1999, 2002), and terrestrial mammalsat 25–30 each year (Ceballos and Ehrlich 2009).Recently discovered mammals include marsu-pials, whales and dolphins, a sloth, an elephant,primates, rodents, bats and ungulates.
Given the high proportion of species that haveyet to be discovered, it seems highly likely thatthere are entire major taxonomic groups of organ-isms still to be found. That is, new examples ofhigher level elements of organismal diversity.This is supported by recent discoveries of possi-ble new phyla (e.g. Nanoarchaeota), new orders(e.g. Mantophasmatodea), new families (e.g. As-pidytidae) and new subfamilies (e.g. Martiali-nae). Discoveries at the highest taxonomic levelshave particularly served to highlight the muchgreater phyletic diversity of microorganismscompared with macroorganisms. Under one clas-sification 60% of living phyla consist entirely orlargely of unicellular species (Cavalier-Smith2004). Again, this perspective on the variety oflife is not well reflected in much of the literatureon biodiversity.
2.1.3 Ecological diversity
The third group of elements of biodiversity en-compasses the scales of ecological differencesfrom populations, through habitats, to ecosys-
tems, ecoregions, provinces, and on up to biomesand biogeographic realms (Table 2.1). This is animportant dimension to biodiversity not readilycaptured by genetic or organismal diversity, andin many ways is that which is most immediatelyapparent to us, giving the structure of the naturaland semi-natural world in which we live. How-ever, ecological diversity is arguably also the leastsatisfactory of the groups of elements of biodiver-sity. There are two reasons. First, whilst theseelements clearly constitute useful ways of break-ing up continua of phenomena, they are difficultto distinguish without recourse to what ultimate-ly constitute some essentially arbitrary rules. Forexample, whilst it is helpful to be able to labeldifferent habitat types, it is not always obviousprecisely where one should end and anotherbegin, because no such beginnings and endingsreally exist. In consequence, numerous schemeshave been developed for distinguishing betweenmany elements of ecological diversity, often withwide variation in the numbers of entities recog-nized for a given element. Second, some of theelements of ecological diversity clearly have bothabiotic and biotic components (e.g. ecosystems,ecoregions, biomes), and yet biodiversity is de-fined as the variety of life.
Much recent interest has focused particularlyon delineating ecoregions and biomes, principal-ly for the purposes of spatial conservationplanning (see Chapter 11), and there has thusbeen a growing sense of standardization of theschemes used. Ecoregions are large areal unitscontaining geographically distinct species as-semblages and experiencing geographically dis-tinct environmental conditions. Carefulmapping schemes have identified 867 terrestrialecoregions (Figure 2.1 and Plate 1; Olson et al.2001), 426 freshwater ecoregions (Abell et al.2008), and 232 marine coastal & shelf area ecor-egions (Spalding et al. 2007). Ecoregions can inturn be grouped into biomes, global-scale bio-geographic regions distinguished by unique col-lections of species assemblages and ecosystems.Olson et al. (2001) distinguish 14 terrestrialbiomes, some of which at least will be very fa-miliar wherever in the world one resides (tropi-cal & subtropical moist broadleaf forests;
BIODIVERSITY 31
1
© Oxford University Press 2010. All rights reserved. For permissions please email: [email protected]

tropical & subtropical dry broadleaf forests;tropical & subtropical coniferous forests; tem-perate broadleaf & mixed forests; temperate co-niferous forests; boreal forest/taiga; tropical &subtropical grasslands, savannas & shrublands;temperate grasslands, savannas & shrublands;flooded grasslands & savannas; montane grass-lands & shrublands; tundra; Mediterranean for-ests, woodlands & scrub; deserts & xericshrublands; mangroves).
At a yet coarser spatial resolution, terrestrialand aquatic systems can be divided into bio-geographic realms. Terrestrially, eight suchrealms are typically recognized, Australasia,Antarctic, Afrotropic, Indo-Malaya, Nearctic,Neotropic, Oceania and Palearctic (Olson et al.2001). Marine coastal & shelf areas have beendivided into 12 realms (Arctic, TemperateNorth Atlantic, Temperate Northern Pacific,Tropical Atlantic, Western Indo-Pacific, CentralIndo-Pacific, Eastern Indo-Pacific, TropicalEastern Pacific, Temperate South America,Temperate Southern Africa, Temperate Austra-lasia, and Southern Ocean; Spalding et al.2007). There is no strictly equivalent schemefor the pelagic open ocean, although one hasdivided the oceans into four primary units (Polar,
Westerlies, Trades and Coastal boundary), whichare then subdivided, on the basis principallyof biogeochemical features, into a further 12biomes (Antarctic Polar, Antarctic WesterlyWinds, Atlantic Coastal, Atlantic Polar, AtlanticTrade Wind, Atlantic Westerly Winds, IndianOcean Coastal, Indian Ocean Trade Wind, PacificCoastal, Pacific Polar, Pacific Trade Wind, PacificWesterly Winds), and then into a finer 51 units(Longhurst 1998).
2.1.4 Measuring biodiversity
Given the multiple dimensions and the complex-ity of the variety of life, it should be obvious thatthere can be no single measure of biodiversity(see Chapter 16). Analyses and discussions ofbiodiversity have almost invariably to be framedin terms of particular elements or groups of ele-ments, although this may not always be apparentfrom the terminology being employed (the term‘biodiversity’ is used widely and without explicitqualification to refer to only some subset of thevariety of life). Moreover, they have to be framedin terms either of “number” or of “heterogeneity”measures of biodiversity, with the former disre-garding the degrees of difference between the
Figure 2.1 The terrestrial ecoregions. Reprinted from Olson et al. (2001).
32 CONSERVATION BIOLOGY FOR ALL
Sodhi and Ehrlich: Conservation Biology for All. http://ukcatalogue.oup.com/product/9780199554249.do
© Oxford University Press 2010. All rights reserved. For permissions please email: [email protected]

occurrences of an element of biodiversity and thelatter explicitly incorporating such differences.For example, organismal diversity could be ex-pressed in terms of species richness, which is anumber measure, or using an index of diversitythat incorporates differences in the abundances ofthe species, which is a heterogeneity measure.The two approaches constitute different re-sponses to the question of whether biodiversityis similar or different in an assemblage in which asmall proportion of the species comprise most ofthe individuals, and therefore would predomi-nantly be obtained in a small sample of indivi-duals, or in an assemblage of the same totalnumber of species in which abundances aremore evenly distributed, and thus more specieswould occur in a small sample of individuals(Purvis and Hector 2000). The distinction be-tween number and heterogeneity measures isalso captured in answers to questions that reflecttaxonomic heterogeneity, for examplewhether theabove-mentioned group of 10 skipper butterfliesis as biodiverse as a group of five skipper speciesand five swallowtail species (e.g. Hendricksonand Ehrlich 1971).
In practice, biodiversity tends most commonlyto be expressed in terms of number measures oforganismal diversity, often the numbers of a giventaxonomic level, and particularly the numbers ofspecies. This is in large part a pragmatic choice.Organismal diversity is better documented andoftenmore readily estimated than is genetic diver-sity, and more finely and consistently resolvedthan much of ecological diversity. Organismaldiversity, however, is problematic inasmuch asthe majority of it remains unknown (and thusstudies have to be based on subsets), and preciselyhow naturally and well many taxonomic groupsare themselves delimited remains in dispute.Perhaps most importantly it also remains butone, and arguably a quite narrow, perspective onbiodiversity.
Whilst accepting the limitations of measuringbiodiversity principally in terms of organismaldiversity, the following sections on temporaland spatial variation in biodiversity will followthis course, focusing in many cases on speciesrichness.
2.2 How has biodiversity changedthrough time?
The Earth is estimated to have formed, by theaccretion through large and violent impacts ofnumerous bodies, approximately 4.5 billionyears ago (Ga). Traditionally, habitable worldsare considered to be those on which liquidwater is stable at the surface. On Earth, both theatmosphere and the oceans maywell have startedto form as the planet itself did so. Certainly, life isthought to have originated on Earth quite early inits history, probably after about 3.8–4.0 Ga, whenimpacts from large bodies from space are likely tohave declined or ceased. It may have originatedin a shallow marine pool, experiencing intenseradiation, or possibly in the environment of adeeper water hydrothermal vent. Because of thesubsequent recrystallisation and deformation ofthe oldest sediments on Earth, evidence for earlylife must be found in its metabolic interactionwith the environment. The earliest, and highlycontroversial, evidence of life, from such indirectgeochemical data, is from more than 3.83 billionyears ago (Dauphas et al. 2004). Relatively unam-biguous fossil evidence of life dates to 2.7 Ga(López-García et al. 2006). Either way, life hasthus been present throughout much of the Earth’sexistence. Although inevitably attention tends tofall on more immediate concerns, it is perhapsworth occasionally recalling this deep heritage inthe face of the conservation challenges of today.For much of this time, however, life comprisedPrecambrian chemosynthetic and photosyntheticprokaryotes, with oxygen-producing cyanobac-teria being particularly important (Labandeira2005). Indeed, the evolution of oxygenic photo-synthesis, followed by oxygen becoming a majorcomponent of the atmosphere, brought about adramatic transformation of the environmenton Earth. Geochemical data has been argued tosuggest that oxygenic photosynthesis evolvedbefore 3.7 Ga (Rosing and Frei 2004), althoughothers have proposed that it could not have arisenbefore c.2.9 Ga (Kopp et al. 2005).
These cyanobacteria were initially responsiblefor the accumulation of atmospheric oxygen. Thisin turn enabled the emergence of aerobically
BIODIVERSITY 33
1
© Oxford University Press 2010. All rights reserved. For permissions please email: [email protected]

metabolizing eukaryotes. At an early stage, eu-karyotes incorporated within their structure aer-obically metabolizing bacteria, giving rise toeukaryotic cells with mitochondria; all anaerobi-cally metabolizing eukaryotes that have beenstudied in detail have thus far been found tohave had aerobic ancestors, making it highlylikely that the ancestral eukaryote was aerobic(Cavalier-Smith 2004). This was a fundamentallyimportant event, leading to heterotrophic micro-organisms and sexual means of reproduction.Such endosymbiosis occurred serially, by simplerand more complex routes, enabling eukaryotes todiversify in a variety of ways. Thus, the inclusionof photosynthesizing cyanobacteria into a eu-karyote cell that already contained a mitochon-drion gave rise to eukaryotic cells with plastidsand capable of photosynthesis. This event alonewould lead to dramatic alterations in the Earth’secosystems.
Precisely when eukaryotes originated, whenthey diversified, and how congruent was thediversification of different groups remains un-clear, with analyses giving a very wide range ofdates (Simpson and Roger 2004). The uncertainty,which is particularly acute when attempting tounderstand evolutionary events in deep time, re-sults principally from the inadequacy of the fossilrecord (which, because of the low probabilities offossilization and fossil recovery, will always tendto underestimate the ages of taxa) and the diffi-culties of correctly calibrating molecular clocks soas to use the information embodied in geneticsequences to date these events. Nonetheless,there is increasing convergence on the idea thatmost known eukaryotes can be placed in one offive or six major clades—Unikonts (Opisthokontsand Amoebozoa), Plantae, Chromalveolates, Rhi-zaria and Excavata (Keeling et al. 2005; Roger andHug 2006).
Focusing on the last 600 million years, attentionshifts somewhat from the timing of key diversifi-cation events (which becomes less controversial)to how diversity per se has changed through time(which becomes more measurable). Arguably thecritical issue is how well the known fossil recordreflects the actual patterns of change that tookplace and how this record can best be analyzed
to address its associated biases to determine thoseactual patterns. The best fossil data are for marineinvertebrates and it was long thought that theseprincipally demonstrated a dramatic rise in diver-sity, albeit punctuated by significant periods ofstasis and mass extinction events. However, ana-lyses based on standardized sampling havemarkedly altered this picture (Figure 2.2). Theyidentify the key features of change in the numbersof genera (widely assumed to correlate with spe-cies richness) as comprising: (i) a rise in richnessfrom the Cambrian through to the mid-Devonian(�525–400 million years ago, Ma); (ii) a largeextinction in the mid-Devonian with no clear re-covery until the Permian (�400–300 Ma); (iii) alarge extinction in the late-Permian and again inthe late-Triassic (�250–200 Ma); and (iv) a rise inrichness through the late-Triassic to the present(�200–0 Ma; Alroy et al. 2008).
Whatever the detailed pattern of change in di-versity through time, most of the species thathave ever existed are extinct. Across a variety ofgroups (both terrestrial and marine), the bestpresent estimate based on fossil evidence is thatthe average species has had a lifespan (from itsappearance in the fossil record until the time itdisappeared) of perhaps around 1–10 Myr(McKinney 1997; May 2000). However, the varia-bility both within and between groups is verymarked, making estimation of what is the overallaverage difficult. The longest-lived species that iswell documented is a bryozoan that persistedfrom the early Cretaceous to the present, a periodof approximately 85 million years (May 2000). Ifthe fossil record spans 600 million years, totalspecies numbers were to have been roughly con-stant over this period, and the average life span ofindividual species were 1–10 million years, thenat any specific instant the extant species wouldhave represented 0.2–2% of those that have everlived (May 2000). If this were true of the presenttime then, if the number of extant eukaryote spe-cies numbers 8 million, 400 million might oncehave existed.
The frequency distribution of the numbers oftime periods with different levels of extinction ismarkedly right-skewed, with most periods hav-ing relatively low levels of extinction and a
34 CONSERVATION BIOLOGY FOR ALL
Sodhi and Ehrlich: Conservation Biology for All. http://ukcatalogue.oup.com/product/9780199554249.do
© Oxford University Press 2010. All rights reserved. For permissions please email: [email protected]

minority having very high levels (Raup 1994).The latter are the periods of mass extinctionwhen 75–95% of species that were extant are es-timated to have become extinct. Their signifi-cance lies not, however, in the overall numbersof extinctions for which they account (over thelast 500 Myr this has been rather small), but in thehugely disruptive effect they have had on thedevelopment of biodiversity. Clearly neither ter-restrial nor marine biotas are infinitely resilient toenvironmental stresses. Rather, when pushed be-yond their limits they can experience dramaticcollapses in genetic, organismal and ecologicaldiversity (Erwin 2008). This is highly significantgiven the intensity and range of pressures thathave been exerted on biodiversity by humankind,and which have drastically reshaped the naturalworld over a sufficiently long period in respect toavailable data that we have rather little concept ofwhat a truly natural system should look like(Jackson 2008). Recovery from past mass extinc-tion events has invariably taken place. But, whilstthis may have been rapid in geological terms, ithas nonetheless taken of the order of a few mil-
lion years (Erwin 1998), and the resultant assem-blages have invariably had a markedly differentcomposition from those that preceded a massextinction, with groups which were previouslyhighly successful in terms of species richnessbeing lost entirely or persisting at reducednumbers.
2.3 Where is biodiversity?
Just as biodiversity has varied markedly throughtime, so it also varies across space. Indeed, onecan think of it as forming a richly textured landand seascape, with peaks (hotspots) and troughs(coldspots), and extensive plains in between (Fig-ure 2.3 and Plate 2, and 2.4 and Plate 3; Gaston2000). Even locally, and just for particular groups,the numbers of species can be impressive, withfor example c.900 species of fungal fruiting bodiesrecorded from 13 plots totaling just 14.7 ha (hect-are) near Vienna, Austria (Straatsma and Krisai-Greilhuber 2003), 173 species of lichens on asingle tree in Papua New Guinea (Aptroot
500
0
200
400
Num
ber
of g
ener
a
600
800
Cm O S D C P Tr J K Pg Ng
400 300
Time (Ma)
200 100 0
Figure 2.2 Changes in generic richness of marine invertebrates over the last 600 million years based on a sampling‐standardized analysis of the fossilrecord. Ma, million years ago. Reprinted from Alroy et al. (2008) with permission from AAAS (American Association for the Advancement of Science).
BIODIVERSITY 35
1
© Oxford University Press 2010. All rights reserved. For permissions please email: [email protected]

1997), 814 species of trees from a 50 ha study plotin Peninsular Malaysia (Manokaran et al. 1992),850 species of invertebrates estimated to occur ata sandy beach site in the North Sea (Armoniesand Reise 2000), 245 resident species of birdsrecorded holding territories on a 97 ha plot inPeru (Terborgh et al. 1990), and >200 species ofmammals occurring at some sites in the Amazo-nian rain forest (Voss and Emmons 1996).
Although it remains the case that for no evenmoderately sized area do we have a comprehen-
sive inventory of all of the species that are present(microorganisms typically remain insufficientlydocumented even in otherwise well studiedareas), knowledge of the basic patterns has beendeveloping rapidly. Although long constrainedto data on higher vertebrates, the breadth of or-ganisms for which information is available hasbeen growing, with much recent work particular-ly attempting to determine whether microorgan-isms show the same geographic patterns as doother groups.
Figure 2.3 Global richness patterns for birds of (a) species, (b) genera, (c) families, and (d) orders. Reprinted from Thomas et al. (2008).
36 CONSERVATION BIOLOGY FOR ALL
Sodhi and Ehrlich: Conservation Biology for All. http://ukcatalogue.oup.com/product/9780199554249.do
© Oxford University Press 2010. All rights reserved. For permissions please email: [email protected]

2.3.1 Land and water
The oceans cover �340.1 million km2 (67%), theland �170.3 million km2 (33%), and freshwaters(lakes and rivers) �1.5 million km2 (0.3%; withanother 16 million km2 under ice and permanentsnow, and 2.6 million km2 as wetlands, soil waterand permafrost) of the Earth’s surface. It wouldtherefore seem reasonable to predict that theoceans would be most biodiverse, followed bythe land and then freshwaters. In terms of num-bers of higher taxa, there is indeed some evidencethat marine systems are especially diverse. Forexample, of the 96 phyla recognized by Margulisand Schwartz (1998), about 69 have marine repre-sentatives, 55 have terrestrial ones, and 60 havefreshwater representatives. However, of the spe-cies described to date only about 15% are marineand 6% are freshwater. The fact that life began inthe sea seems likely to have played an importantrole in explaining why there are larger numbersof higher taxa in marine systems than in terrestri-al ones. The heterogeneity and fragmentation ofthe land masses (particularly that associatedwith the breakup of the “supercontinent” of
Gondwana from �180 Ma) is important in ex-plaining why there are more species in terrestrialsystems than in marine ones. Finally, the extremefragmentation and isolation of freshwater bodiesseems key to why these are so diverse for theirarea.
2.3.2 Biogeographic realms and ecoregions
Of the terrestrial realms, the Neotropics is gener-ally regarded as overall being the most biodi-verse, followed by the Afrotropics and Indo-Malaya, although the precise ranking of thesetropical regions depends on the way in whichorganismal diversity is measured. For example,for species the richest realm is the Neotropics foramphibians, reptiles, birds and mammals, but forfamilies it is the Afrotropics for amphibians andmammals, the Neotropics for reptiles, and theIndo-Malayan for birds (MEA 2005). In parts,these differences reflect variation in the historiesof the realms (especially mountain uplift and cli-mate changes) and the interaction with the emer-gence and spread of the groups, albeit perhaps
Figure 2.4 Global species richness patterns of birds, mammals, and amphibians, for total, rare (those in the lower quartile of range size for eachgroup) and threatened (according to the IUCN criteria) species. Reprinted from Grenyer et al. (2006).
BIODIVERSITY 37
1
© Oxford University Press 2010. All rights reserved. For permissions please email: [email protected]

complicated by issues of geographic consistencyin the definition of higher taxonomic groupings.
The Western Indo-Pacific and CentralIndo-Pacific realms have been argued to be acenter for the evolutionary radiation of manygroups, and are thought to be perhaps the globalhotspot of marine species richness and endemism(Briggs 1999; Roberts et al. 2002). With a shelf areaof 6 570 000 km2, which is considered to be asignificant influence, it has more than 6000 spe-cies of molluscs, 800 species of echinoderms, 500species of hermatypic (reef forming) corals, and4000 species of fish (Briggs 1999).
At the scale of terrestrial ecoregions, the mostspeciose for amphibians and reptiles are in theNeotropics, for birds in Indo-Malaya, Neotropicsand Afrotropics, and for mammals in the Neo-tropics, Indo-Malaya, Nearctic, and Afrotropics(Table 2.3). Amongst the freshwater ecoregions,those with globally high richness of freshwaterfish include the Brahmaputra, Ganges, andYangtze basins in Asia, and large portions ofthe Mekong, Chao Phraya, and Sitang and Irra-waddy; the lower Guinea in Africa; and theParaná and Orinoco in South America (Abellet al. 2008).
2.3.3 Latitude
Perhaps the best known of all spatial patterns inbiodiversity is the general increase in species
richness (and some other elements of organismaldiversity) towards lower (tropical) latitudes.Several features of this gradient are of note:(i) it is exhibited in marine, terrestrial and fresh-waters, and by virtually all major taxonomicgroups, including microbes, plants, invertebratesand vertebrates (Hillebrand 2004; Fuhrman et al.2008); (ii) it is typically manifest whether biodi-versity is determined at local sites, across largeregions, or across entire latitudinal bands; (iii) ithas been a persistent feature of much of thehistory of life on Earth (Crane and Lidgard1989; Alroy et al. 2008); (iv) the peak of diversityis seldom at the equator itself, but seems often tobe displaced somewhat further north (often at�20–30�N); (v) it is commonly, though far fromuniversally, asymmetrical about the equator, in-creasing rapidly from northern regions to theequator and declining slowly from the equatorto southern regions; and (vi) it varies markedlyin steepness for different major taxonomicgroups with, for example, butterflies beingmore tropical than birds.
Although it attracts much attention in its ownright, it is important to see the latitudinal patternin species richness as a component of broaderspatial patterns of richness. As such, the mechan-isms that give rise to it are also those that give riseto those broader patterns. Ultimately, higher spe-cies richness has to be generated by some combi-nation of greater levels of speciation (a cradle of
Table 2.3 The five most species rich terrestrial ecoregions for each of four vertebrate groups. AT – Afrotropic, IM – Indo‐Malaya,NA – Nearctic, and NT–Neotropic. Data from Olson et al. (2001).
Amphibians Reptiles Birds Mammals
1 Northwestern Andeanmontane forests(NT)
Peten‐Veracruzmoist forests (NT)
Northern Indochinasubtropical forests (IM)
Sierra Madre de Oaxacapine‐oak forests (NT)
2 Eastern Cordillera realmontane forests(NT)
Southwest Amazonmoist forests (NT)
Southwest Amazon moistforests (NT)
Northern Indochinasubtropical forests(IM)
3 Napomoist forests (NT) Napo moist forests(NT)
Albertine Rift montaneforests (AT)
Sierra Madre Orientalpine‐oak forests (NA)
4 Southwest Amazonmoist forests (NT)
Southern Pacific dryforests (NT)
Central Zambezian Miombowoodlands (AT)
Southwest Amazonmoist forests (NT)
5 Choco‐Darien moistforests (NT)
Central Americanpine‐oak forests(NT)
Northern Acacia‐Commiphora bushlands &thickets (AT)
Central ZambezianMiombo woodlands(AT)
38 CONSERVATION BIOLOGY FOR ALL
Sodhi and Ehrlich: Conservation Biology for All. http://ukcatalogue.oup.com/product/9780199554249.do
© Oxford University Press 2010. All rights reserved. For permissions please email: [email protected]

diversity), lower levels of extinction (a museumof diversity) or greater net movements of geo-graphic ranges. It is likely that their relative im-portance in giving rise to latitudinal gradientsvaries with taxon and region. This said, greaterlevels of speciation at low latitudes and rangeexpansion of lineages from lower to higherlatitudes seem to be particularly important(Jablonski et al. 2006; Martin et al. 2007). Moreproximally, key constraints on speciation and ex-tinction rates and range movements are thoughtto be levels of: (i) productive energy, which influ-ence the numbers of individuals that can be sup-ported, thereby limiting the numbers of speciesthat can be maintained in viable populations;(ii) ambient energy, which influences mutationrates and thus speciation rates; (iii) climatic vari-ation, which on ecological time scales influencesthe breadth of physiological tolerances anddispersal abilities and thus the potential for pop-ulation divergence and speciation, and on evolu-tionary time scales influences extinctions (e.g.through glacial cycles) and recolonizations; and(iv) topographic variation, which enhances thelikelihood of population isolation and thus speci-ation (Gaston 2000; Evans et al. 2005; Clarke andGaston 2006; Davies et al. 2007).
2.3.4 Altitude and Depth
Variations in depth in marine systems and alti-tude in terrestrial ones are small relative to theareal coverage of these systems. The oceans aver-age c.3.8 km in depth but reach down to 10.9 km(Challenger Deep), and land averages 0.84 km inelevation and reaches up to 8.85 km (Mt. Everest).Nonetheless, there are profound changes in or-ganismal diversity both with depth and altitude.This is in large part because of the environmentaldifferences (but also the effects of area and isola-tion), with some of those changes in depth oraltitude of a few hundred meters being similarto those experienced over latitudinal distances ofseveral hundred kilometers (e.g. temperature).
In both terrestrial and marine (pelagic and ben-thic) systems, species richness across a wide vari-ety of taxonomic groups has been found
progressively to decrease with distance from sealevel (above or below) and to show a pronouncedhump-shaped pattern in which it first increasesand then declines (Angel 1994; Rahbek 1995;Bryant et al. 2008). The latter pattern tendsto become more apparent when the effects ofvariation in area have been accounted for, and isprobably the more general, although in eithercase richness tends to be lowest at the mostextreme elevations or depths.
Microbial assemblages can be found at consid-erable depths (in some instances up to a few kilo-meters) below the terrestrial land surface and theseafloor, often exhibiting unusual metabolic cap-abilities (White et al. 1998; D’Hondt et al. 2004).Knowledge of these assemblages remains, how-ever, extremely poor, given the physical chal-lenges of sampling and of doing so withoutcontamination from other sources.
2.4 In conclusion
Understanding of the nature and scale of biodi-versity, of how it has changed through time, andof how it varies spatially has developed immea-surably in recent decades. Improvements in thelevels of interest, the resources invested and theapplication of technology have all helped. In-deed, it seems likely that the basic principlesare in the main well established. However,much remains to be learnt. The obstacles arefourfold. First, the sheer magnitude and com-plexity of biodiversity constitute a huge chal-lenge to addressing perhaps the majority ofquestions that are posed about it, and one thatis unlikely to be resolved in the near future.Second, the biases of the fossil record and theapparent variability in rates of molecular evolu-tion continue to thwart a better understanding ofthe history of biodiversity. Third, knowledge ofthe spatial patterning of biodiversity is limitedby the relative paucity of quantitative samplingof biodiversity over much of the planet. Finally,the levels and patterns of biodiversity arebeing profoundly altered by human activities(see Box 2.1 and Chapter 10).
BIODIVERSITY 39
1
© Oxford University Press 2010. All rights reserved. For permissions please email: [email protected]

Box 2.1 Invaluable biodiversity inventoriesNavjot S. Sodhi
This chapter defines biodiversity. Due tomassive loss of native habitats around theglobe (Chapter 4), biodiversity is rapidly beingeroded (Chapter 10). Therefore, it is critical tounderstand which species will survive humanonslaught and which will not. We also need tocomprehend the composition of newcommunities that arise after the loss ordisturbance of native habitats. Such adetermination needs a “peek” into the past.That is, which species were present before thehabitat was disturbed. Perhaps naturalists inthe 19th and early 20th centuries did notrealize that they were doing a great service tofuture conservation biologists by publishingspecies inventories. These historic inventoriesare treasure troves—they can be used asbaselines for current (and future) species lossand turnover assessments.Singapore represents a worst‐case scenario in
tropical deforestation. This island (540 km2) haslost over 95% of its primary forests since 1819.Comparing historic and modern inventories,Brook et al. (2003) could determine losses invascular plants, freshwater decapodcrustaceans, phasmids, butterflies, freshwaterfish, amphibians, reptiles, birds, and mammals.They found that overall, 28% of original specieswere lost in Singapore, probably due todeforestation. Extinctions were higher
(34–43%) in butterflies, freshwater fish, birds,and mammals. Due to low endemism inSingapore, all of these extinctions likelyrepresented population than speciesextinctions (see Box 10.1). Using extinction datafrom Singapore, Brook et al. (2003) alsoprojected that if the current levels ofdeforestation in Southeast Asia continue,between 13–42% of regional populations couldbe lost by 2100. Half of these extinctions couldrepresent global species losses.Fragments are becoming a prevalent feature
inmost landscapes around theglobe (Chapter 5).Very little is known about whether fragmentscan sustain forest biodiversity over the long‐term. Using an old species inventory, Sodhi et al.(2005) studied the avifaunal change over 100years (1898–1998) in a four hectare patch of rainforest in Singapore (SingaporeBotanicGardens).Over this period, many forest species (e.g. greenbroadbill (Calyptomena viridis); Box 2.1 Figure)were lost, and replaced with introduced speciessuch as the house crow (Corvus splendens). By1998, 20% of individuals observed belonged tointroduced species, with more native speciesexpected to be extirpated from the site in thefuture through competition and predation. Thisstudy shows that small fragments decline in theirvalue for forest birds over time.
Box 2.1 Figure Green broadbill. Photograph by Haw Chuan Lim.continues
40 CONSERVATION BIOLOGY FOR ALL
Sodhi and Ehrlich: Conservation Biology for All. http://ukcatalogue.oup.com/product/9780199554249.do
© Oxford University Press 2010. All rights reserved. For permissions please email: [email protected]

Summary
· Biodiversity is the variety of life in all of its manymanifestations.
· This variety can usefully be thought of in terms ofthree hierarchical sets of elements, which capturedifferent facets: genetic diversity, organismal diver-sity, and ecological diversity.
· There is by definition no single measure of biodi-versity, although two different kinds of measures(number and heterogeneity) can be distinguished.
· Pragmatically, and rather restrictively, biodiver-sity tends in the main to be measured in terms ofnumber measures of organismal diversity, and espe-cially species richness.
· Biodiversity has been present for much of thehistory of the Earth, but the levels have changeddramatically and have proven challenging to docu-ment reliably.
· Biodiversity is variably distributed acrossthe Earth, although some marked spatial gra-dients seem common to numerous higher taxonomicgroups.
· The obstacles to an improved understanding ofbiodiversity are: (i) its sheer magnitude and com-plexity; (ii) the biases of the fossil record and theapparent variability in rates of molecular evolution;(iii) the relative paucity of quantitative samplingover much of the planet; and (iv) that levels andpatterns of biodiversity are being profoundly al-tered by human activities.
Suggested reading
· Gaston, K. J. and Spicer, J. I. (2004). Biodiversity: anintroduction, 2nd edition. Blackwell Publishing, Oxford,UK.
Box 2.1 (Continued)
The old species inventories not only help inunderstanding species losses but also helpdetermine the characteristics of species that arevulnerable to habitat perturbations. Koh et al.(2004) compared ecological traits (e.g. bodysize) between extinct and extant butterflies inSingapore. They found that butterflies speciesrestricted to forests and those which had highlarval host plant specificity were particularlyvulnerable to extirpation. In a similar study, buton angiosperms, Sodhi et al. (2008) foundthat plant species susceptible to habitatdisturbance possessed traits such asdependence on forests and pollination bymammals. These trait comparison studies mayassist in understanding underlyingmechanisms that make species vulnerable toextinction and in preemptive identificationof species at risk from extinction.The above highlights the value of species
inventories. I urge scientists and amateursto make species lists every time they visit asite. Data such as species numbers should
also be included in these as such can beused to determine the effect of abundanceon species persistence. All these checklistsshould be placed on the web for widedissemination. Remember, like antiques,species inventories become more valuablewith time.
REFERENCES
Brook, B. W., Sodhi, N. S., and Ng, P. K. L. (2003).Catastrophic extinctions follow deforestation inSingapore. Nature, 424, 420–423.
Koh, L. P., Sodhi, N. S., and Brook, B. W. (2004). Predictionextinction proneness of tropical butterflies. ConservationBiology, 18, 1571–1578.
Sodhi, N.S., Lee, T. M., Koh, L. P., and Dunn, R. R.(2005). A century of avifaunal turnover in a smalltropical rainforest fragment. Animal Conservation,8, 217–222.
Sodhi, N. S., Koh, L. P., Peh, K. S.‐H. et al. (2008).Correlates of extinction proneness in tropical angios-perms. Diversity and Distributions, 14, 1–10.
BIODIVERSITY 41
1
© Oxford University Press 2010. All rights reserved. For permissions please email: [email protected]

· Groombridge, B. and Jenkins, M. D. (2002).World atlas ofbiodiversity: earth’s living resources in the 21st century.University of California Press, London, UK.
· Levin, S. A., ed. (2001). Encyclopedia of biodiversity, Vols.1–5. Academic Press, London, UK.
· MEA (millennium Ecosystem Assessment) (2005). Eco-systems and human well-being: current state and trends,Volume 1. Island Press, Washington, DC.
· Wilson, E. O. (2001). The diversity of life, 2nd edition.Penguin, London, UK.
Relevant website
· Convention on Biological Diversity: http://www.cbd.int/
REFERENCES
Abell, R., Thieme, M. L., Revenga, C., et al. (2008). Fresh-water ecoregions of the world: a new map of biogeo-graphic units for freshwater biodiversity conservation.BioScience, 58, 403–414.
Alroy, J., Aberhan, M., Bottjer, D. J., et al. (2008). Phanero-zoic trends in the global diversity of marine inverte-brates. Science, 321, 97–100.
Angel, M. V. (1994). Spatial distribution of marine organ-isms: patterns and processes. In P. J. Edwards, R. M.Mayand N. R. Webb, eds Large-scale ecology and conservationbiology, pp. 59–109. Blackwell Scientific, Oxford.
Aptroot, A. (1997). Species diversity in tropical rainforestascomycetes: lichenized versus non-lichenized; folicolousversus corticolous. Abstracta Botanica, 21, 37–44.
Armonies, W. and Reise, K. (2000). Faunal diversity acrossa sandy shore. Marine Ecology Progress Series, 196, 49–57.
Berra, T. M. (1997). Some 20th century fish discoveries.Environmental Biology of Fishes, 50, 1–12.
Briggs, J. C. (1999). Coincident biogeographic patterns:Indo-west Pacific ocean. Evolution, 53, 326–335.
Bryant, J. A., Lamanna, C., Morlon, H., Kerkhoff, A. J.,Enquist, B. J., and Green, J. L. (2008). Microbes on moun-tainsides: contrasting elevational patterns of bacterialand plant diversity. Proceedings of the National Academyof Sciences of theUnited States of America, 105, 11505–11511.
Cavalier-Smith, T. (2004). Only six kingdoms of life. Pro-ceedings of the Royal Society of London B, 271, 1251–1262.
Ceballos, G. and Ehrlich, P. R. (2009). Discoveries of newmammal species and their implications for conservationand ecosystemservices.Proceedings of theNational Academyof Sciences of the United States of America, 106, 3841–3846.
Clarke, A. and Gaston, K. J. (2006). Climate, energy anddiversity. Proceedings of the Royal Society of London SeriesB, 273, 2257–2266.
Copley, J. (2002). All at sea. Nature, 415, 572–574.Crane, P. R. and Lidgard, S. (1989). Angiosperm diversifi-cation and paleolatitudinal gradients in Cretaceousfloristic diversity. Science, 246, 675–678.
Curtis, T. P., Sloan, W. T., and Scannell, J. W. (2002).Estimating prokaryotic diversity and its limits. Proceed-ings of the National Academy of Sciences of the United Statesof America, 99, 10494–10499.
Dauphas, N., van Zuilen, M., Wadhwa, M., Davis, A. M.,Marty, B., and Janney, P. E. (2004). Clues from Fe isotopevariations on the origin of early archaen BIFs fromGreenland. Science, 306, 2077–2080.
Davies, R. G., Orme, C. D. L., Storch, D., et al. (2007).Topography, energy and the global distribution of birdspecies richness. Proceedings of the Royal Society of LondonB, 274, 1189–1197.
D’Hondt, S., J�rgensen, B. B., Miller, D. J., et al. (2004).Distributions of microbial activities in deep subseafloorsediments. Science, 306, 2216–2221.
Dykhuizen, D. E. (1998). Santa Rosalia revisited: Why arethere so many species of bacteria? Antonie van Leeuwen-hoek, 73, 25–33.
Eckburg, P. B., Bik, E. M., Bernstein, C. N., et al. (2005).Diversity of the human intestinal microbial flora. Science,308, 1635–1638.
Erwin, D. H. (1998). The end and the beginning: recoveriesfrom mass extinctions. Trends in Ecology and Evolution,13, 344–349.
Erwin, D. H. (2008). Extinction as the loss of evolutionaryhistory. Proceedings of the National Academy of Sciencesof the United States of America, 105 (Suppl. 1), 11520–11527.
Evans,K. L.,Warren, P.H., andGaston, K. J. (2005). Species-energy relationships at the macroecological scale: areview of the mechanisms. Biological Reviews, 80, 1–25.
Finlay, B. J. (2004). Protist taxonomy: an ecological perspec-tive. Philosophical Transactions of the Royal Society ofLondon B, 359, 599–610.
Frost, D. R. (2004). Amphibian species of the world: an onlinereference. [Online database] http://research.amnh.org/herpetology/amphibia/index.php. Version 3.0 [22August 2004]. American Museum of Natural History,New York.
Fuhrman, J. A. and Campbell, L. (1998). Microbial micro-diversity. Nature, 393, 410–411.
Fuhrman, J. A., Steele, J. A., Schwalbach, M. S., Brown,M. V., Green, J. L., and Brown, J. H. (2008). A latitudinaldiversity gradient in planktonic marine bacteria. Proceed-ings of the National Academy of Sciences of the United Statesof America, 105, 7774–7778.
42 CONSERVATION BIOLOGY FOR ALL
Sodhi and Ehrlich: Conservation Biology for All. http://ukcatalogue.oup.com/product/9780199554249.do
© Oxford University Press 2010. All rights reserved. For permissions please email: [email protected]
Gaston, K. J. (2000). Global patterns in biodiversity.Nature,405, 220–227.
Gaston, K. J. (2008). Global species richness. In S.A. Levin,ed. Encyclopedia of biodiversity. Academic Press, SanDiego, California.
Gaston, K. J., Blackburn, T. M., and Klein Goldewijk, K.(2003). Habitat conversion and global avian biodiversityloss. Proceedings of the Royal Society of London B, 270,1293–1300.
Gaston, K. J. and Spicer, J. I. (2004). Biodiversity: anintroduction. 2nd edn. Blackwell Publishing, Oxford, UK.
Gould, S. J. (1991). Bully for brontosaurus: reflections in natu-ral history. Hutchinson Radius, London, UK.
Gregory, T. R. (2008). Animal genome size database. [Online]http://www.genomesize.com.
Grenyer, R., Orme, C. D. L., Jackson, S. F. et al. (2006). Theglobal distribution and conservation of rare andthreatened vertebrates. Nature, 444, 93–96.
Hawksworth, D. L. and Kalin-Arroyo, M. T. (1995).Magnitude and distribution of biodiversity. In V. H.Heywood, ed. Global biodiversity assessment, pp.107–199. Cambridge University Press, Cambridge, UK.
Hebert, P. D. N., Penton, E. H., Burns, J. M., Janzen, D. H.,and Hallwachs, W. (2004). Ten species in one: DNA bar-coding reveals cryptic species in the neotropical skipperbutterfly Astraptes fulgerator. Proceedings of the NationalAcademy of Sciences of the United States of America, 101,14812–14817.
Hendrickson, J. A. and Ehrlich, P. R. (1971). An expandedconcept of “species diversity”. Notulae Naturae, 439: 1–6.
Heywood, V. H. and Baste, I. (1995). Introduction. In V. H.Heywood, ed. Global biodiversity assessment, pp. 1–19.Cambridge University Press, Cambridge, UK.
Hillebrand, H. (2004). On the generality of the latitudinaldiversity gradient. American Naturalist, 163, 192–211.
Hughes, A. R., Inouye, B. D., Johnson,M. T. J., Underwood,N., and Vellend, M. (2008). Ecological consequences ofgenetic diversity. Ecology Letters, 11, 609–623.
Hughes, J. B., Daily, G. C., and Ehrlich, P. R. (1997).Population diversity: its extent and extinction. Science,278, 689–692.
Jablonski, D., Roy, K., and Valentine, J. W. (2006). Out ofthe tropics: evolutionary dynamics of the latitudinaldiversity gradient. Science, 314, 102–106.
Jackson, J. B. C. (2008). Ecological extinction and evolutionin the brave new ocean. Proceedings of the National Acade-my of Sciences of the United States of America, 105 (Suppl. 1),11458–11465.
Keeling, P. J., Burger,G.,Durnford,D.G., et al. (2005). The treeof eukaryotes. Trends in Ecology and Evolution, 20, 670–676.
Kopp, R. E., Kirschvink, J. L., Hilburn, I. A., andNash, C. Z.(2005). The Paleoproterozoic snowball Earth: A climate
disaster triggered by the evolution of oxygenicphotosynthesis. Proceedings of the National Academy ofSciences of the United States of America, 102, 11131–11136.
Labandeira, C. C. (2005). Invasion of the continents: cya-nobacterial crusts to tree-inhabiting arthropods. Trendsin Ecology and Evolution, 20, 253–262.
Lambais, M. R., Crowley, D. E., Cury, J. C., Büll, R. C., andRodrigues, R. R. (2006). Bacterial diversity in treecanopies of the Atlantic Forest. Science, 312, 1917.
Lambshead, P. J. D. (2004). Marine nematode biodiversity.In Z. X. Chen, S. Y. Chen and D. W. Dickson, edsNematology: advances and perspectives Vol. 1: Nematodemorphology, physiology and ecology, pp. 436–467. CABIPublishing, Oxfordshire, UK.
Longhurst, A. (1998). Ecological geography of the sea.Academic Press, San Diego, California.
López-García, P., Moreira, D., Douzery, E., et al. (2006).Ancient fossil record and early evolution (ca. 3.8 to 0.5Ga). Earth, Moon and Planets, 98, 247–290.
Manokaran, N., La Frankie, J. V., Kochummen, K. M., et al.(1992). Stand table and distribution of species in the50-ha research plot at Pasoh Forest Reserve. ForestResearch Institute Malaysia, Research Data, 1, 1–454.
Margulis, L. and Schwartz, K. V. (1998). Five kingdoms: anillustrated guide to the phyla of life on earth, 3rd edn W. H.Freeman & Co., New York.
Martin, P. R., Bonier, F., and Tewksbury, J. J. (2007).Revisiting Jablonski (1993): cladogenesis and rangeexpansion explain latitudinal variation in taxonomicrichness. Journal of Evolutionary Biology, 20, 930–936.
May, R. M. (2000). The dimensions of life on earth. InP. H. Raven and T. Williams, edsNature and Human Socie-ty, pp. 30–45. National Academy Press, Washington, DC.
McKinney, M. L. (1997). Extinction vulnerability and selec-tivity: combining ecological and paleontological views.Annual Review of Ecology and Systematics, 28, 495–516.
MEA (Millennium Ecosystem Assessment) (2005). Ecosys-tems and human well-being: current state and trends, Volume1. Island Press, Washington, DC.
Olson, D. M., Dinerstein, E., Wikramanayake, E. D., et al.(2001). Terrestrial ecoregions of the world: a new map oflife on earth. BioScience, 51, 933–938.
Purvis, A. and Hector, A. (2000). Getting the measure ofbiodiversity. Nature, 405, 212–219.
Rahbek, C. (1995). The elevational gradient of speciesrichness: a uniform pattern? Ecography, 18, 200–205.
Raup, D. M. (1994). The role of extinction in evolution.Proceedings of the National Academy of Sciences of the UnitedStates of America, 91, 6758–6763.
Roberts, C. M., McClean, C. J., Veron, J. E. N., et al. (2002)Marine biodiversity hotspots and conservation prioritiesfor tropical reefs. Science, 295, 1280–1284.
BIODIVERSITY 43
1
© Oxford University Press 2010. All rights reserved. For permissions please email: [email protected]

Roger, A. J. and Hug, L. A. (2006). The origin and diversifi-cation of eukaryotes: problems with molecular phyloge-nies and molecular clock estimation. PhilosophicalTransactions of the Royal Society of London B, 361,1039–1054.
Rosing, M. T. and Frei, R. (2004). U-rich Archaean sea-floorsediments from Greenland - indications of >3700 Maoxygenic photosynthesis. Earth and Planetary ScienceLetters, 217, 237–244.
Simpson, A. G. B. and Roger, A. J. (2004). The real ‘king-doms’ of eukaryotes. Current Biology, 14, R693–R696.
Spalding,M. D., Fox, H. E., Allen, G. R., et al. (2007). Marineecoregions of the world: a bioregionalisation of coastaland shelf areas. BioScience, 57, 573–583.
Straatsma, G. and Krisai-Greilhuber, I. (2003). Assemblagestructure, species richness, abundance and distributionof fungal fruit bodies in a seven year plot-based surveynear Vienna. Mycological Research, 107, 632–640.
Terborgh, J., Robinson, S. K., Parker, T. A. III, Munn, C. A.,and Pierpont, N. (1990). Structure and organizationof an Amazonian forest bird community. EcologicalMonographs, 60, 213–238.
Thomas, G. H., Orme, C. D., Davies, R. G., et al. (2008).Regional variation in the historical components of globalavian species richness. Global Ecology and Biogeography,17, 340–351.
Torsvik, V., Øvreås, L., and Thingstad, T. F. (2002). Pro-karyotic diversity-magnitude, dynamics, and controllingfactors. Science, 296, 1064–1066.
van Rootselaar, O. (1999). New birds for the world:species discovered during 1980–1999. Birding World, 12,286–293.van Rootselaar, O. (2002). New birds for the world:species described during 1999–2002. Birding World,15, 428–431.
Venter, J. C., Remington, K., Heidelberg, J. F., et al. (2004).Environment genome shotgun sequencing of theSargasso Sea. Science, 304, 66–74.
Voss, R. S. and Emmons, L. H. (1996).Mammalian diversityin Neotropical lowland rainforests: a preliminaryassessment. Bulletin of the American Museum of NaturalHistory, 230, 1–115.
Ward, B. B. (2002). How many species of prokaryotes arethere? Proceedings of the National Academy of Sciences of theUnited States of America, 99, 10234–10236.
White, D. C., Phelps, T. J., and Onstott, T. C. (1998). What’sup down there? Current Opinion in Microbiology,1, 286–290.
Whitman, W. B., Coleman, D. C., and Wiebe, W. J. (1998).Prokaryotes: the unseen majority. Proceedings of theNational Academy of Sciences of the United States of America,95, 6578–6583.
44 CONSERVATION BIOLOGY FOR ALL
Sodhi and Ehrlich: Conservation Biology for All. http://ukcatalogue.oup.com/product/9780199554249.do
© Oxford University Press 2010. All rights reserved. For permissions please email: [email protected]

CHAP T E R 3
Ecosystem functions and servicesCagan H. Sekercioglu
In our increasingly technological society, peoplegive little thought to how dependent they are onthe proper functioning of ecosystems and thecrucial services for humanity that flow fromthem. Ecosystem services are “the conditionsand processes through which natural ecosystems,and the species that make them up, sustain andfulfill human life” (Daily 1997); in other words,“the set of ecosystem functions that are useful tohumans” (Kremen 2005). Although people havebeen long aware that natural ecosystems helpsupport human societies, the explicit recognitionof “ecosystem services” is relatively recent(Ehrlich and Ehrlich 1981a; Mooney and Ehrlich1997).
Since the entire planet is a vast network ofintegrated ecosystems, ecosystem services rangefrom global to microscopic in scale (Table 3.1;Millennium Ecosystem Assessment 2005a).Ecosystems purify the air and water, generateoxygen, and stabilize our climate. Earth wouldnot be fit for our survival if it were not for plantsthat have created and maintained a suitable at-mosphere. Organisms decompose and detoxifydetritus, preventing our civilization from beingburied under its own waste. Other species help tocreate the soils on which we grow our food, andrecycle the nutrients essential to agriculture. Myr-iad creatures maintain these soils, play key rolesin recycling nutrients, and by so doing help tomitigate erosion and floods. Thousands of animalspecies pollinate and fertilize plants, protect themfrom pests, and disperse their seeds. And ofcourse, humans use and trade thousands ofplant, animal and microorganism species forfood, shelter, medicinal, cultural, aesthetic andmany other purposes. Although most people
may not know what an ecosystem is, the properfunctioning of the world’s ecosystems is critical tohuman survival, and understanding the basics ofecosystem services is essential. Entire volumeshave been written on ecosystem services (Nation-al Research Council 2005; Daily 1997), culminat-ing in a formal, in-depth, and global overview byhundreds of scientists: the Millennium EcosystemAssessment (2005a). It is virtually impossible to listall the ecosystem services let alone the naturalproducts that people directly consume, sothis discussion presents a brief introduction toecosystem function and an overview of criticalecosystem services.
3.1 Climate and the Biogeochemical Cycles
Ecosystem services start at the most fundamentallevel: the creation of the air we breathe and thesupply and distribution of water we drink.Through photosynthesis by bacteria, algae,plankton, and plants, atmospheric oxygen ismostly generated and maintained by ecosystemsand their constituent species, allowing humansand innumerable other oxygen-dependent organ-isms to survive. Oxygen also enables the atmo-sphere to “clean” itself via the oxidation ofcompounds such as carbon monoxide (Sodhiet al. 2007) and another form of oxygen in theozone layer, protects life from the sun’s carcino-genic, ultraviolet (UV) rays.
Global biogeochemical cycles consist of “thetransport and transformation of substances inthe environment through life, air, sea, land, andice” (Alexander et al. 1997). Through these cycles,the planet’s climate, ecosystems, and creatures
45
1
© Oxford University Press 2010. All rights reserved. For permissions please email: [email protected]

Table 3.1 Ecosystem services, classified according to the Millennium Ecosystem Assessment (2003), and their ecosystem service providers. ‘Functionalunits’ refer to the unit of study for assessing functional contributions (∫ik) of ecosystem service providers; spatial scale indicates the scale(s) of operationof the service. Assessment of the potential to apply this conceptual framework to the service is purposefully conservative and is based on the degree towhich the contributions of individual species or communities can currently be quantified (Kremen 2005).
ServiceEcosystem service providers/trophic level Functional units Spatial scale
Potential to applythis conceptualframework forecological study
Aesthetic, cultural All biodiversity Populations,species,communities,ecosystems
Local‐global Low
Ecosystem goods Diverse species Populations,species,communities,ecosystems
Local‐global Medium
UV protection Biogeochemical cycles, micro‐organisms, plants
Biogeochemicalcycles,functionalgroups
Global Low
Purificationof air
Micro‐organisms, plants Biogeochemicalcycles,populations,species,functionalgroups
Regional‐global
Medium (plants)
Flood mitigation Vegetation Communities,habitats
Local‐regional Medium
Drought mitigation Vegetation Communities,habitats
Local‐regional Medium
Climate stability Vegetation Communities,habitats
Local‐global Medium
Pollination Insects, birds, mammals Populations,species,functionalgroups
Local High
Pest control Invertebrate parasitoids andpredators and vertebrate predators
Populations,species,functionalgroups
Local High
Purification of water Vegetation, soil micro‐organisms,aquatic micro‐organisms, aquaticinvertebrates
Populations,species,functionalgroups,communities,habitats
Local‐regional Medium to high*
Detoxification anddecomposition ofwastes
Leaf litter and soil invertebrates, soilmicro‐organisms, aquatic micro‐organisms
Populations,species,functionalgroups,communities,habitats
Local‐regional Medium
Soil generation andsoil fertility
Leaf litter and soil invertebrates, soilmicro‐organisms, nitrogen‐fixingplants, plant and animalproduction of waste products
Populations,species,functionalgroups
Local Medium
Seed dispersal Ants, birds, mammals Populations,species,functionalgroups
Local High
* Waste‐water engineers ‘design’ microbial communities; in turn, wastewater treatments provide ideal replicated experimentsfor ecological work (Graham and Smith 2004 in Kremen 2005).

are tightly linked. Changes in one component canhave drastic effects on another, as exemplified bythe effects of deforestation on climatic change(Phat et al. 2004). The hydrologic cycle is onethat most immediately affects our lives and it istreated separately below.
As carbon-based life forms, every single organ-ism on our planet is a part of the global carboncycle. This cycle takes place between the four mainreservoirs of carbon: carbon dioxide (CO2) in theatmosphere; organic carbon compounds withinorganisms; dissolved carbon in water bodies; andcarbon compounds inside the earth as part of soil,limestone (calcium carbonate), and buried organicmatter like coal, natural gas, peat, and petroleum(Alexander et al. 1997). Plants play a major role infixing atmospheric CO2 through photosynthesisand most terrestrial carbon storage occurs in foresttrees (Falkowski et al. 2000). The global carboncycle has been disturbed by about 13% comparedto the pre-industrial era, as opposed to 100% ormore for nitrogen, phosphorous, and sulfur cycles(Falkowski et al. 2000). Given the dominance ofcarbon in shaping life and in regulating climate,however, this perturbation has already beenenough to lead to significant climate change withworse likely to come in the future [IPCC (Intergov-ernmental Panel on Climate Change) 2007].
Because gases like CO2, methane (CH4), andnitrous oxide (N2O) trap the sun’s heat, especiallythe long-wave infrared radiation that’s emitted bythe warmed planet, the atmosphere creates a nat-ural “greenhouse” (Houghton 2004). Without thisgreenhouse effect, humans and most other organ-isms would be unable to survive, as the globalmean surface temperature would drop from thecurrent 14� C to –19� C (IPCC 2007). Ironically,the ever-rising consumption of fossil fuels duringthe industrial age and the resultant increasingemission of greenhouse gases have created theopposite problem, leading to an increase in themagnitude of the greenhouse effect and a conse-quent rise in global temperatures (IPCC 2007).Since 1750, atmospheric CO2 concentrationshave increased by 34% (Millennium EcosystemAssessment 2005a) and by the end of this century,average global temperature is projected to rise by1.8�–6.4� C (IPCC 2007). Increasing deforestation
and warming both exacerbate the problem as for-est ecosystems switch from being major carbonsinks to being carbon sources (Phat et al. 2004;IPCC 2007). If fossil fuel consumption and defor-estation continue unabated, global CO2 emissionsare expected to be about 2–4 times higher than atpresent by the year 2100 (IPCC 2007). As climateand life have coevolved for billions of years andinteract with each other through various feedbackmechanisms (Schneider and Londer 1984), rapidclimate change would have major consequencesfor the planet’s life-support systems. There arenow plans under way for developed nations tofinance the conservation of tropical forests in thedeveloping world so that these forests can contin-ue to provide the ecosystem service of acting ascarbon sinks (Butler 2008).
Changes in ecosystems affect nitrogen, phos-phorus, and sulfur cycles as well (Alexander et al.1997; Millennium Ecosystem Assessment 2005b;Vitousek et al. 1997). Although nitrogen in itsgaseous form (N2) makes up 80% of the atmo-sphere, it is only made available to organismsthrough nitrogen fixation by cyanobacteria inaquatic systems and on land by bacteria andalgae that live in the root nodules of lichens andlegumes (Alexander et al. 1997). Eighty milliontons of nitrogen every year are fixed artificiallyby industry to be used as fertilizer (MillenniumEcosystem Assessment 2005b). However, the ex-cessive use of nitrogen fertilizers can lead to nu-trient overload, eutrophication, and eliminationof oxygen in water bodies. Nitrogen oxides,regularly produced as a result of fossil fuel com-bustion, are potent greenhouse gases thatincrease global warming and also lead to smog,breakdown of the ozone layer, and acid rain(Alexander et al. 1997). Similarly, although sulfuris an essential element in proteins, excessivesulfur emissions from human activities lead tosulfuric acid smog and acid rain that harms peo-ple and ecosystems alike (Alexander et al. 1997).
Phosphorous (P) scarcity limits biological nitro-gen fixation (Smith 1992). In many terrestrial eco-systems, where P is scarce, specialized symbioticfungi (mycorrhizae) facilitate P uptake by plants(Millennium Ecosystem Assessment 2005b). Eventhough P is among the least naturally available of
1
© Oxford University Press 2010. All rights reserved. For permissions please email: [email protected]
ECOSYSTEM FUNCTIONS AND SERVICES 47

major nutrients, use of phosphorous in artificialfertilizers and runoff from animal husbandryoften also leads to eutrophication in aquatic sys-tems (Millenium Ecosystem Assessment 2005b).The mining of phosphate deposits and their addi-tion to terrestrial ecosystems as fertilizers repre-sents a six fold increase over the natural rate ofmobilization of P by the weathering of phosphaterock and by plant activity (Reeburgh 1997).P enters aquatic ecosystems mainly through ero-sion, but no-till agriculture and the use of hedge-rows can substantially reduce the rate of thisprocess (MilleniumEcosystemAssessment 2005a).
3.2 Regulation of the Hydrologic Cycle
One of the most vital and immediate services ofecosystems, particularly of forests, rivers andwetlands, is the provisioning and regulation ofwater resources. These services provide a vastrange of benefits from spiritual to life-saving,illustrated by the classification of hydrologic ser-vices into five broad categories by Brauman et al.
(2007): improvement of extractive water supply,improvement of in-stream water supply, waterdamage mitigation, provision of water-relatedcultural services, and water-associated support-ing services (Figure 3.1). Although 71% of theplanet is covered by water, most of this is seawa-ter unfit for drinking or agriculture (Postel et al.1996). Fresh water not locked away in glaciersand icecaps constitutes 0.77% of the planet’swater (Shiklomanov 1993). To provide sufficientfresh water to meet human needs via industrialdesalination (removing the salt from seawater)would cost US$3 000 billion per year (Postel andCarpenter 1997).
Quantity, quality, location, and timing of waterprovision determine the scale and impact ofhydrologic services (Brauman et al. 2007). Theseattributes can make the difference between wateras a blessing (e.g. drinking water) or a curse (e.g.floods). Water is constantly redistributed throughthe hydrologic cycle. Fresh water comes downas precipitation, collects in water bodies or isabsorbed by the soil and plants. Some of thewater flows unutilized into the sea or seeps into
(what the ecosystem does)
Local climate interactions Quantity(surface and ground water
storage and flow)
Quality(pathogens, nutrients,
salinity, sediment)
Location(ground/surface,
up/downstream, in/out ofchannel)
Timing(peak flows, base flows,
velocity)
Water use by plants
Environmental filtration
Soil stabilization
Chemical and biologicaladditions/subtractions
Soil development
Ground surfacemodification
Surface flow path alteration
River bank development
Control of flow speed
Short-and long-term waterstorage
Seasonality of water use
Ecohydrologic process(direct effect of the ecosystem)
Hydrologic attribute(what the beneficiary receives)
Hydrologic service
water for municipal,agricultural, commercial,
industrial, thermoelectric powergeneration uses
Diverted water supply:
water for hydropower,recreation, transportation,supply of fish and other
freshwater products
In situ water supply:
water for hydropower,recreation, transportation,supply of fish and other
freshwater products
Water damage mitigation:
provision of religious,educational, tourism values
Spiritual and aesthetic:
Water and nutrients to supportvital estuaries and otherhabitats, preservation of
options
Supporting:
Figure 3.1 The effects of hydrological ecosystem processes on hydrological services. Reprinted from Brauman et al. (2007).
Sodhi and Ehrlich: Conservation Biology for All. http://ukcatalogue.oup.com/product/9780199554249.do
© Oxford University Press 2010. All rights reserved. For permissions please email: [email protected]
48 CONSERVATION BIOLOGY FOR ALL

underground aquifers where it can remain formillennia unless extracted by people; mining this“fossil” groundwater is often unsustainable and isa serious problem in desert regions like Libya(Millennium Ecosystem Assessment 2005c). Thecycle is completed when water vapor is releasedback into the atmosphere either through evapora-tion from land and water bodies or by being re-leased from plants (transpiration) and otherorganisms. Rising environmental temperaturesare expected to increase evaporation and conse-quent precipitation in some places and raise thelikelihood of droughts and fires in other places,both scenarios that would have major conse-quences for the world’s vegetation (Wright2005). These changes in turn can lead to furtherclimatic problems, affecting agriculture and com-munities worldwide. Ecosystems, particularlyforests, play major roles in the regulation of thehydrologic cycle and also have the potential tomoderate the effects of climate change. Tropicalforests act as heat and humidity pumps, transfer-ring heat from the tropics to the temperate zonesand releasing water vapor that comes back asrain (Sodhi et al. 2007). Extensive tropical defores-tation is expected to lead to higher temperatures,reduced precipitation, and increased frequency ofdroughts and fires, all of which are likely to reducetropical forest cover in a positive feedback loop(Sodhi et al. 2007).
Forest ecosystems alone are thought to regulateapproximately a third of the planet’s watershedson which nearly five billion people rely (Millen-nium Ecosystem Assessment 2005c). With in-creasing human population and consequentwater pollution, fresh water is becoming an in-creasingly precious resource, especially in aridareas like the Middle East, where the scarcity ofwater is likely to lead to increasing local conflictsin the 21st century (Klare 2001; Selby 2005).Aquatic ecosystems, in addition to being vitalsources of water, fish, waterfowl, reeds, andother resources, also moderate the local climateand can act as buffers for floods, tsunamis, andother water incursions (Figure 3.1). For example,the flooding following Hurricane Katrina wouldhave done less damage if the coastal wetlandssurrounding New Orleans had had their original
extent (Day et al. 2007). The impact of the 24December 2004 tsunami in Southeast Asiawould have been reduced if some of the hard-est-hit areas had not been stripped of their man-grove forests (Dahdouh-guebas et al. 2005;Danielsen et al. 2005). These observations supportanalytical models in which thirty “waru” trees(Hibiscus tiliaceus) planted along a 100 m by1 meter band reduced the impact of a tsunamiby 90% (Hiraishi and Harada 2003), a solutionmore effective and cheaper than artificial barriers.
Hydrologic regulation by ecosystems beginswith the first drop of rain. Vegetation layers,especially trees, intercept raindrops, which grad-ually descend into the soil, rather than hitting itdirectly and leading to erosion and floods. Byintercepting rainfall and promoting soil develop-ment, vegetation can modulate the timing offlows and potentially reduce flooding. Flood mit-igation is particularly crucial in tropical areaswhere downpours can rapidly deposit enormousamounts of water that can lead to increased ero-sion, floods, and deaths if there is little naturalforest to absorb the rainfall (Bradshaw et al. 2007).Studies of some watersheds have shown that na-tive forests reduced flood risks only at smallscales, leading some hydrologists to question di-rectly connecting forest cover to flood reduction(Calder and Aylward 2006). However, in the firstglobal-scale empirical demonstration that forestsare correlated with flood risk and severity indeveloping countries, Bradshaw et al. (2007) esti-mated that a 10% decrease in natural forest areawould lead to a flood frequency increase between4% and 28%, and to a 4–8% increase in total floodduration at the country scale. Compared to natu-ral forests, however, afforestation programs orforest plantations may not reduce floods, or mayeven increase flood volume due to road construc-tion, soil compaction, and changes in drainageregimes (Calder and Aylward 2006). Non-nativeplantations can do more harm than good, partic-ularly when they reduce dry season water flows(Scott et al. 2005).
Despite covering only 6% of the planet’s sur-face, tropical forests receive nearly half of theworld’s rainfall, which can be as much as 22 500mm during five months of monsoon season in
1
© Oxford University Press 2010. All rights reserved. For permissions please email: [email protected]
ECOSYSTEM FUNCTIONS AND SERVICES 49
India (Myers 1997). In Southeast Asia, an intactold-growth dipterocarp forest intercepts at least35% of the rainfall, while a logged forest inter-cepts less than 20%, and an oil palm (Elaeis spp.)plantation intercepts only 12% (Ba 1977). As aconsequence, primary forest can moderate sea-sonal extremes in water flow and availability bet-ter than more intensive land uses like plantationforestry and agriculture. For example, primaryforest in Ivory Coast releases three to five timesas much water at the end of the dry season com-pared to a coffee plantation (Dosso 1981). How-ever, it is difficult to make generalizations abouthydrologic response in the tropics. For example,local soil and rainfall patterns can result in a65-fold variation in tropical natural sedimentationrates (Bruijnzeel 2004). This underlines the impor-tance of site-specific studies in the tropics, butmost hydrologic studies of ecosystems havetaken place in temperate ecosystems (Braumanet al. 2007).
3.3 Soils and Erosion
Without forest cover, erosion rates skyrocket, andmany countries, especially in the tropics, loseastounding amounts of soil to erosion. World-wide, 11 million km2 of land (the area of USAand Mexico combined) are affected by high ratesof erosion (Millennium Ecosystem Assessment2005b). Every year about 75 billion tons of soilare thought to be eroded from terrestrial ecosys-tems, at rates 13–40 times faster than the averagerate of soil formation (Pimentel and Kounang1998). Pimentel et al. (1995) estimated that in thesecond half of the 20th century about a third of theworld’s arable land was lost to erosion. Thismeans losing vital harvests and income (Myers1997), not to mention losing lives to malnutritionand starvation. Soil is one of the most critical butalso most underappreciated and abused elementsof natural capital, one that can take a few years tolose and millennia to replace. A soil’s character isdetermined by six factors: topography, the natureof the parent material, the age of the soil, soilorganisms and plants, climate, and human activi-ty (Daily et al. 1997). For example, in the tropics,
farming can result in the loss of half the soilnutrients in less than a decade (Bolin and Cook1983), a loss that can take centuries to restore. Inarid areas, the replacement of native deep-rootedplants with shallow-rooted crop plants can leadto a rise in the water table, which can bring soilsalts to the surface (salinization), cause waterlog-ging, and consequently result in crop losses(Lefroy et al. 1993).
Soil provides six major ecosystem services(Daily et al. 1997):
· Moderating the hydrologic cycle.
· Physical support of plants.
· Retention and delivery of nutrients to plants.
· Disposal of wastes and dead organic matter.
· Renewal of soil fertility.
· Regulation of major element cycles.
Every year enough rain falls to cover the planetwith one meter of water (Shiklomanov 1993), butthanks to soil’s enormouswater retention capacity,most of this water is absorbed and graduallyreleased to feed plants, underground aquifers,and rivers. However, intensive cultivation, by low-ering soil’s organic matter content, can reduce thiscapacity, leading to floods, erosion, pollution, andfurther loss of organic matter (Pimentel et al. 1995).
Soil particles usually carry a negative charge,which plays a critical role in delivering nutrientcations (positively-charged ions) like Ca2þ, Kþ,Naþ, NH4þ, and Mg2þ to plants (Daily et al.1997). To deliver these nutrients without soilwould be exceedingly expensive as modern hy-droponic (water-based) systems cost more thanUS$250 000 per ha (Canada’s Office of UrbanAgriculture 2008; Avinash 2008). Soil is also criti-cal in filtering and purifying water by removingcontaminants, bacteria, and other impurities(Fujii et al. 2001). Soils harbor an astounding di-versity of microorganisms, including thousandsof species of protozoa, antibiotic-producing bac-teria (which produce streptomycin) and fungi(producing penicillin), as well as myriad inverte-brates, worms and algae (Daily et al. 1997). Theseorganisms play fundamental roles in decompos-ing dead matter, neutralizing deadly pathogens,and recycling waste into valuable nutrients. Justthe nitrogen fixed by soil organisms like
Sodhi and Ehrlich: Conservation Biology for All. http://ukcatalogue.oup.com/product/9780199554249.do
© Oxford University Press 2010. All rights reserved. For permissions please email: [email protected]
50 CONSERVATION BIOLOGY FOR ALL
Rhizobium bacteria amounts to about 100 millionmetric tonsperyear (Schlesinger 1991). Itwould costat least US$320 billon/year to replace natural nitro-gen fertilization with fertilizers (Daily et al. 1997).
As the accelerating release of CO2, N2O (NitrousOxide), methane and other greenhouse gases in-creasingly modifies climate (IPCC 2007), the soil’scapacity to store these molecules is becoming evenmore vital. Per area, soil stores 1.8 times the carbonand 18 times the nitrogen that plants alone canstore (Schlesinger 1991). For peatlands, soil carbonstorage can be 10 times greater than that stored bythe plants growing on it and peatland fires releasemassive amounts of CO2 into the atmosphere(Page and Rieley 1998).
Despite soil’s vital importance, 17% of theEarth’s vegetated land surface (Oldeman 1998)or 23% of all land used for food production[FAO (Food and Agriculture Organization of theUnited Nations) 1990] has experienced soil deg-radation since 1945. Erosion is the best-knownexample of the disruption of the sedimentarycycle. Although erosion is responsible for releas-ing nutrients from bedrock and making themavailable to plants, excessive wind and watererosion results in the removal of top soil, the lossof valuable nutrients, and desertification. The di-rect costs of erosion total about US$250 billion peryear and the indirect costs (e.g. siltation, obsoles-cence of dams, water quality declines) approxi-mately $150 billion per year (Pimentel et al.1995). Sufficient preventive measures would costonly 19% of this total (Pimentel et al. 1995).
The loss of vegetative cover increases the ero-sional impact of rain. In intact forests, most rainwater does not hit the ground directly and treeroots hold the soil together against being washedaway (Brauman et al. 2007), better than in loggedforest or plantations (Myers 1997) where roadscan increase erosion rates (Bruijnzeel 2004). Theexpansion of farming and deforestation havedoubled the amount of sediment dischargedinto the oceans. Coral reefs can experience highmortality after being buried by sediment dis-charge (Pandolfi et al. 2003; Bruno and Selig2007). Wind erosion can be particularly severe indesert ecosystems, where even small increases invegetative cover (Hupy 2004) and reduced tillage
practices (Gomes et al. 2003) can lessen wind ero-sion substantially. Montane areas are especiallyprone to rapid erosion (Milliman and Syvitski1992), and revegetation programs are critical insuch ecosystems (Vanacker et al. 2007). Interest-ingly, soil carbon buried in deposits resultingfrom erosion, can produce carbon sinks that canoffset up to 10% of the global fossil fuel emissionsof CO2 (Berhe et al. 2007). However, erosion alsolowers soil productivity and reduces the organiccarbon returned to soil as plant residue (Gregor-ich et al. 1998). Increasing soil carbon capacity by5–15% through soil-friendly tillage practices notonly offsets fossil-fuel carbon emissions by aroughly equal amount but also increases cropyields and enhances food security (Lal 2004).An increase of one ton of soil carbon pool indegraded cropland soils may increase crop yieldby 20 to 40 kilograms per ha (kg/ha) for wheat,10 to 20 kg/ha for maize, and 0.5 to 1 kg/ha forcowpeas (Lal 2004).
3.4 Biodiversity and Ecosystem Function
The role of biodiversity in providing ecosystemservices is actively debated in ecology. The diver-sity of functional groups (groups of ecologicallyequivalent species (Naeem and Li 1997)), is asimportant as species diversity, if notmore so (Kre-men 2005), and in most services a few dominantspecies seem to play the major role (Hooper et al.2005). However, many other species are criticalfor ecosystem functioning and provide “insur-ance” against disturbance, environmental change,and the decline of the dominant species (Tilman1997; Ricketts et al. 2004; Hobbs et al. 2007). As formany other ecological processes, it was CharlesDarwinwho first wrote of this, noting that severaldistinct genera of grasses grown together wouldproduce more plants and more herbage than asingle species growing alone (Darwin 1872).Many studies have confirmed that increased bio-diversity improves ecosystem functioning inplant communities (Naeem and Li 1997; Tilman1997). Different plant species capture differentresources, leading to greater efficiency and higherproductivity (Tilman et al. 1996). Due to the
1
© Oxford University Press 2010. All rights reserved. For permissions please email: [email protected]
ECOSYSTEM FUNCTIONS AND SERVICES 51

Box 3.1 The costs of large‐mammal extinctionsRobert M. Pringle
When humans alter ecosystems, largemammalsare typically the first species to disappear. Theyare hunted for meat, hides, and horns; they areharassed and killed if they pose a threat; theyrequire expansive habitat; and they aresusceptible to diseases, such as anthrax,rinderpest, and distemper, that are spread bydomestic animals. Ten thousand years ago,humans played at least a supporting, if notleading, role in extinguishing most of the largemammals in the Americas and Australia. Overthe last 30 years, we have extinguished manylarge‐mammal populations (and currentlythreaten many more) in Africa and Asia—thetwo continents that still support diverseassemblages of these charismatic creatures.The ecological and economic consequences
of losing large‐mammal populations varydepending on the location and the ecologicalrole of the species lost. The loss of carnivoreshas induced trophic cascades: in the absence oftop predators, herbivores can multiply anddeplete the plants, which in turn drives downthe density and the diversity of other species(Ripple and Beschta 2006). Losing largeherbivores and their predators can have theopposite effect, releasing plants andproducing compensatory increases in thepopulations of smaller herbivores (e.g.rodents: Keesing 2000) and their predators(e.g. snakes: McCauley et al. 2006). Suchincreases, while not necessarily detrimentalthemselves, can have unpleasant consequences(see below).Many species depend on the activities of
particular large mammal species. Certaintrees produce large fruits and seeds apparentlyadapted for dispersal by large browsers(Guimarães et al. 2008). Defecation by largemammals deposits these seeds and providesfood for many dung beetles of varying degrees ofspecialization. In East Africa, the disturbancecaused by browsing elephants creates habitatfor tree‐dwelling lizards (Pringle 2008), whilethe total loss of large herbivores dramaticallyaltered the character of an ant‐plant symbiosis viaa complex string of species interactions(Palmer et al. 2008).
Box 3.1 Figure 1 White-footed mice (Peromyscus leucopus, shownwith an engorged tick on its ear) are highly competent reservoirs for Lymedisease. When larger mammals disappear, mice often thrive, increasingdisease risk. Photograph courtesy of Richard Ostfeld Laboratory.
Box 3.1 Figure 2 Ecotourists gather around a pair of lions inTanzania’s Ngorongoro Crater. Ecotourism is one of the mostpowerful driving forces for biodiversity conservation, especially intropical regions where money is short. But tourists must be managedin such a way that they do not damage or deplete the very resourcesthey have traveled to visit. Photograph by Robert M. Pringle
These examples and others suggest that theloss of large mammals may precipitateextinctions of other taxa and the relationshipsamong them, thus decreasing the diversity ofboth species and interactions. Conversely,protecting the large areas needed to conservelarge mammals may often serve to conserve thegreater diversity of smaller organisms—theso‐called umbrella effect.The potential economic costs of losing large
mammals also vary from place to place. Becausecontinues
Sodhi and Ehrlich: Conservation Biology for All. http://ukcatalogue.oup.com/product/9780199554249.do
© Oxford University Press 2010. All rights reserved. For permissions please email: [email protected]
52 CONSERVATION BIOLOGY FOR ALL
“sampling-competition effect” the presence ofmore species increases the probability of havinga particularly productive species in any givenenvironment (Tilman 1997). Furthermore, differ-ent species’ ecologies lead to complementary re-source use, where each species grows best under aspecific range of environmental conditions, anddifferent species can improve environmental con-ditions for other species (facilitation effect; Hoop-er et al. 2005). Consequently, the more complex anecosystem is, the more biodiversity will increaseecosystem function, as more species are needed tofully exploit the many combinations of environ-mental variables (Tilman 1997). More biodiverseecosystems are also likely to be more stable andmore efficient due to the presence of more path-ways for energy flow and nutrient recycling
(Macarthur 1955; Hooper et al. 2005; Vitousekand Hooper 1993; Worm et al. 2006).
Greenhouse and field experiments have con-firmed that biodiversity does increase ecosystemproductivity, while reducing fluctuations in pro-ductivity (Naeem et al. 1995; Tilman et al. 1996).Although increased diversity can increase thepopulation fluctuations of individual species, di-versity is thought to stabilize overall ecosystemfunctioning (Chapin et al. 2000; Tilman 1996) andmake the ecosystem more resistant to perturba-tions (Pimm 1984). These hypotheses have beenconfirmed in field experiments, where species-rich plots showed less yearly variation in produc-tivity (Tilman 1996) and their productivity duringa drought year declined much less than species-poor plots (Tilman and Downing 1994). Because
Box 3.1 (Continued)
cattle do not eat many species of woody plants,the loss of wildlife from rangelands can result inbush encroachment and decreased pastoralprofitability. Because some rodents and theirparasites are reservoirs and vectors of varioushuman diseases, increases in rodent densitiesmay increase disease transmission (Ostfeld andMills 2007; Box 3.1 Figure 1). Perhaps mostimportantly, because large mammals form thebasis of an enormous tourism industry, the lossof these species deprives regions of animportant source of future revenue and foreignexchange (Box 3.1 Figure 2).Arguably, the most profound cost of losing
large mammals is the toll that it takes on ourability to relate to nature. Being largemammalsourselves, we find it easier to identify andsympathize with similar species—they behavein familiar ways, hence the term “charismaticmegafauna.” While only a handful of largemammal species have gone globally extinct inthe past century, we are dismantling manyspecies population by population, pushingthem towards extinction. At a time when wedesperately need to mobilize popular supportfor conservation, the loss over the next 50 yearsof even a few emblematic species—great apesin central Africa, polar bears in the arctic,
rhinoceroses in Asia—could deal a cripplingblow to efforts to salvage the greater portionof biodiversity.
REFERENCES
Guimarães, P. R. J., Galleti, M., and Jordano, P. (2008).Seed dispersal anachronisms: rethinking the fruitsextinct megafauna ate. PloS One, 3, e1745.
Keesing, F. (2000). Cryptic consumers and the ecology ofan African savanna. BioScience, 50, 205–215.
McCauley, D. J., Keesing, F., Young, T. P., Allan, B. F., andPringle, R. M. (2006). Indirect effects of large herbivores onsnakes in an African savanna. Ecology, 87, 2657–2663.
Ostfeld, R. S., and Mills, J. N. (2007). Social behavior,demography, and rodent‐borne pathogens. In J. O.Wolff and P. W. Sherman, eds Rodent societies,pp. 478–486. University of Chicago Press, Chicago, IL.
Palmer, T. M., Stanton, M. L., Young, T. P., et al. (2008).Breakdown of an ant‐plant mutualism follows the loss oflarge mammals from an African savanna. Science, 319,192–195.
Pringle, R. M. (2008). Elephants as agents of habitat creationfor small vertebrates at the patch scale. Ecology, 89,26–33.
Ripple, W. J. and Beschta, R. L. (2006). Linking a cougardecline, trophic cascade, and catastrophic regime shift inZion National Park. Biological Conservation, 133, 397–408.
1
© Oxford University Press 2010. All rights reserved. For permissions please email: [email protected]
ECOSYSTEM FUNCTIONS AND SERVICES 53

Box 3.2 Carnivore conservationMark S. Boyce
Predation by carnivores can alter preypopulation abundance and distribution, andthese predator effects have been shown toinfluence many aspects of community ecology.Examples include the effect of sea otters thatkill and eat sea urchins reducing theirabundance and herbivory on the kelp foreststhat sustain diverse near‐shore marinecommunities of the North Pacific. Likewise,subsequent to wolf (see Box 3.2 Figure)recovery in Yellowstone National Park (USA),elk have become preferred prey of wolvesresulting in shifts in the distribution andabundance of elk that has released vegetationfrom ungulate herbivory with associatedincreases in beavers, song birds, and otherplants and animals.Yet, carnivore conservation can be very
challenging because the actions of carnivoresoften are resented by humans. Carnivoresdepredate livestock or reduce abundance ofwildlife valued by hunters thereby coming intodirect conflict with humans. Some larger speciesof carnivores can prey on humans. Every year,people are killed by lions in Africa, children arekilled bywolves in India, and people are killed ormauled by cougars and bears in western NorthAmerica (see also Box 14.3). Retaliation is
Box 3.2 Figure Grey wolf (Canis lupus). Photograph from www.all-about-wolves.com.
invariably swift and involves killing thoseindividuals responsible for the depredation, butfurthermore such incidents of humanpredation usually result in fear‐drivenmanagement actions that seldom consider theecological significance of the carnivores inquestion.Another consideration that often plays a
major role in carnivore conservation is publicopinion. Draconian methods for predatorcontrol, including aerial gunning and poisoningof wolves by government agencies, typicallymeets with fierce public opposition. Yet, somelivestock ranchers and hunters lobby to havethe carnivores eradicated. Rural people whoare at risk of depredation losses from carnivoresusually want the animals controlled oreliminated, whereas tourists and broaderpublics usually push for protection of thecarnivores.Most insightful are programs that change
human management practices to reduce theprobability of conflict. Bringing cattle intoareas where they can be watched duringcalving can reduce the probability that bears orwolves will kill the calves. Ensuring thatgarbage is unavailable to bears and otherlarge carnivores reduces the risk thatcarnivores will become habituated tohumans and consequently come into conflict.Livestock ranchers can monitor their animalsin back‐country areas and can dispose ofdead animal carcasses to reduce the risk ofdepredation. Killing those individuals thatare known to depredate livestock can bean effective approach because individualssometimes learn to kill livestock whereasmost carnivores in the population take onlywild prey. Managing recreational access toselected trails and roads can be an effectivetool for reducing conflicts between largecarnivores and people. Finding sociallyacceptable methods of predator control whilstlearning to live in proximity with largecarnivores is the key challenge for carnivoreconservation.
Sodhi and Ehrlich: Conservation Biology for All. http://ukcatalogue.oup.com/product/9780199554249.do
© Oxford University Press 2010. All rights reserved. For permissions please email: [email protected]
54 CONSERVATION BIOLOGY FOR ALL

more species do better at utilizing and recyclingnutrients, in the long-term, species-rich plots arebetter at reducing nutrient losses and maintain-ing soil fertility (Tilman et al. 1996; Vitousek andHooper 1993).
Although it makes intuitive sense that the spe-cies that dominate in number and/or biomass aremore likely to be important for ecosystem func-tion (Raffaelli 2004; Smith et al. 2004), in somecases, even rare species can have a role, for
Box 3.3 Ecosystem services and agroecosystems in a landscape contextTeja Tscharntke
Agroecosystems result from the transformationof natural ecosystems to promote ecosystemservices, which are defined as benefits peopleobtain from ecosystems (MEA 2005). Majorchallenges in managing ecosystem services arethat they are not independent of each otherand attempts to optimize a single service (e.g.reforestation) lead to losses in other services(e.g. food production; Rodriguez et al. 2006).Agroecosystems such as arable fields andgrasslands are typically extremely openecosystems, characterized by high levels ofinput (e.g. labour, agrochemicals) and output(e.g. food resources), while agriculturalmanagement reduces structural complexityand associated biodiversity.The world’s agroecosystems deliver a number
of key goods and services valued by society suchas food, feed, fibre, water, functionalbiodiversity, and carbon storage. These servicesmay directly contribute to human well‐being,for example through food production, or justindirectly through ecosystem processes such asnatural biological control of crop pests(Tscharntke et al. 2007) or pollination of crops(Klein et al. 2007). Farmers are mostlyinterested in the privately owned, marketablegoods and services, while they may alsoproduce public goods such as aestheticlandscapes or regulated water levels. Findingwin‐win solutions that serve both privateeconomic gains in agroecosystems and publiclong‐term conservation in agriculturallandscapes is often difficult (but see Steffan‐Dewenter et al. 2007). The goal of long‐lastingecosystem services providing sustainablehuman well‐being may become compromisedby the short‐term interest of farmers inincreasing marketable services, but incentives
may encourage environment friendlyagriculture. This is why governmentsimplement payment‐for‐ecosystem serviceprograms such as the agri‐environmentschemes in the European Community or theChinese programs motivated by large floods onthe Yangtze River (Tallis et al. 2008).In addition, conservation of most services
needs a landscape perspective. Agriculturalland use is often focused on few species andlocal processes, but in dynamic, human‐dominated landscapes, only a diversity ofinsurance species may guarantee resilience, i.e.the capacity to re‐organize after disturbances(see Box 3.3 Figure). Biodiversity and associatedecosystem services can be maintained only incomplex landscapes with a minimum of near‐natural habitat (in central Europe roughly 20%)supporting a minimum number of speciesdispersing across natural and managed systems(Tscharntke et al. 2005). For example, pollenbeetles causing economically meaningfuldamage in oilseed rape (canola) are naturallycontrolled by parasitic wasps in complex butnot in simplified landscapes. Similarly, highlevels of pollination and yield in coffee andpumpkin depend on a high diversity of beespecies, which is only available inheterogeneous environments. The landscapecontext may be even more important for localbiodiversity and associated ecosystem servicesthan differences in local management, forexample between organic and conventionalfarming or between crop fields with or withoutnear‐natural field margins, because theorganisms immigrating into agroecosystemsfrom the landscape‐wide species pool maycompensate for agricultural intensification at alocal scale (Tscharntke et al. 2005).
continues
1
© Oxford University Press 2010. All rights reserved. For permissions please email: [email protected]
ECOSYSTEM FUNCTIONS AND SERVICES 55

Box 3.3 (Continued)
Disturbance
d)
Bio
logi
cal c
ontr
ol
Dec
reas
ing
land
scap
eco
mpl
exit
y
Num
ber
of s
peci
es
a)
b)
Y
Y
b
a
Yb
a
b
a
c) f)
e)
Box 3.3 Figure Hypothesized responses to disturbance on ecosystem services such as biological control and pollination by native naturalenemies and pollinators in different landscapes, showing how beta diversity (a‐c) and recover of biological control and pollination afterdisturbance (d‐f) change with landscape heterogeneity. Adapted from Tscharntke et al. (2007). a) and d) Intensely used monotonous landscapewith a small available species pool, giving a low general level of ecosystem services, a greater dip in the service after a disturbance and anecosystem that is unable to recover. b) and e) Intermediate landscape harboring slightly higher species richness, rendering deeper dip and slowerreturn from a somewhat lower maximum level of biological control or pollination after a disturbance. c) and f) Heterogeneous landscapewith large species richness, mainly due to the higher beta diversity, rendering high maximum level of the service, and low dip and quickreturn after a disturbance.
The turnover of species among patches (thedissimilarity of communities creating high betadiversity, in contrast to the local, patch‐levelalpha diversity) is the dominant driver oflandscape‐wide biodiversity. Beta diversityreflects the high spatial and temporalheterogeneity experienced by communities at alandscape scale. Pollinator or biocontrol speciesthat donot contribute to the service inonepatchmay be important in other patches, providingspatial insurance through complementaryresource use (see Box 3.3 Figure). Sustainingecosystem services in landscapes depends on a
high beta diversity coping with the spatial andtemporal heterogeneity in a real world underGlobal Change.
REFERENCES
Klein, A.‐M., Vaissière, B. E., Cane. J. H., et al. (2007).Importance of pollinators in changing landscapes forworld crops. Proceedings of the Royal Society of LondonB, 274, 303–313.
MEA (2005). Millenium Ecosystem Assessment. IslandPress, Washington, DC.
continues
Sodhi and Ehrlich: Conservation Biology for All. http://ukcatalogue.oup.com/product/9780199554249.do
© Oxford University Press 2010. All rights reserved. For permissions please email: [email protected]
56 CONSERVATION BIOLOGY FOR ALL

example, in increasing resistance to invasion(Lyons and Schwartz 2001). A keystone speciesis one that has an ecosystem impact that is dis-proportionately large in relation to its abundance(Hooper et al. 2005; Power et al. 1996; see Boxes3.1, 3.2, and 5.3). Species that are not thought of as“typical” keystones can turn out to be so, some-times in more ways than one (Daily et al. 1993).Even though in many communities only a fewspecies have strong effects, the weak effects ofmany species can add up to a substantial stabiliz-ing effect and seemingly “weak” effects overbroad scales can be strong at the local level (Ber-low 1999). Increased species richness can “insure”against sudden change, which is now a globalphenomenon (Parmesan and Yohe 2003; Rootet al. 2003). Even though a few species maymake up most of the biomass of most functionalgroups, this does not mean that other species areunnecessary (Walker et al. 1999). Species may actlike the rivets in an airplane wing, the loss of eachunnoticed until a catastrophic threshold is passed(Ehrlich and Ehrlich 1981b).
As humanity’s footprint on the planet increasesand formerly stable ecosystems experience con-stant disruptions in the form of introduced spe-cies (Chapter 7), pollution (Box 13.1), climatechange (Chapter 8), excessive nutrient loads,fires (Chapter 9), and many other perturbations,the insurance value of biodiversity has become
increasingly vital over the entire range of habitatsand systems, from diverse forest stands seques-tering CO2 better in the long-term (Bolker et al.1995; Hooper et al. 2005; but see Tallis and Kar-eiva 2006) to forest-dwelling native bees’ coffeepollination services increasing coffee productionin Costa Rica (Ricketts et al. 2004; also see Box3.3). With accelerating losses of unique species,humanity, far from hedging its bets, is movingever closer to the day when we will run out ofoptions on an increasingly unstable planet.
3.5 Mobile Links
“Mobile links” are animal species that providecritical ecosystem services and increase ecosys-tem resilience by connecting habitats and ecosys-tems as they move between them (Gilbert 1980;Lundberg and Moberg 2003; Box 3.4). Mobilelinks are crucial for maintaining ecosystem func-tion, memory, and resilience (Nystrm and Folke2001). The three main types of mobile links: ge-netic, process, and resource links (Lundberg andMoberg 2003), encompass many fundamentalecosystem services (Sekercioglu 2006a, 2006b).Pollinating nectarivores and seed dispersing fru-givores are genetic links that carry genetic mate-rial from an individual plant to another plant orto a habitat suitable for regeneration, respectively
Box 3.3 (Continued)
Rodriguez, J. J., Beard, T. D. Jr, Bennett, E. M., et al. (2006).Trade‐offs across space, time, and ecosystem services.Ecology and Society, 11, 28 (online).
Steffan‐Dewenter, I., Kessler, M., Barkmann, J., et al.(2007). Tradeoffs between income, biodiversity, andecosystem functioning during tropical rainforest con-version and agroforestry intensification. Proceedings ofthe National Academy of Sciences of the United Statesof America, 104, 4973–4978
Tallis, H., Kareiva, P., Marvier, M., and Chang, A. (2008).An ecosystem services framework to support both
practical conservation and economic development.Proceedings of the National Academy of Sciences of theUnited States of America, 105, 9457–9464.
Tscharntke, T., Klein, A.‐M., Kruess, A., Steffan‐Dewen-ter, I, and Thies, C. (2005). Landscape perspectives onagricultural intensification and biodiversity ‐ ecosystemservice management. Ecology Letters, 8, 857–874.
Tscharntke, T., Bommarco, R., Clough, Y., et al. (2007).Conservation biological control and enemydiversity on a landscape scale. Biological Control,43, 294–309.
1
© Oxford University Press 2010. All rights reserved. For permissions please email: [email protected]
ECOSYSTEM FUNCTIONS AND SERVICES 57

Box 3.4 Conservation of plant‐animal mutualismsPriya Davidar
Plant‐animal mutualisms such as pollinationand seed dispersal link plant productivity andecosystem functioning, andmaintain gene flowin plant populations. Insects, particularly bees,are the major pollinators of wild and cropplants worldwide, whereas vertebrates such asbirds and mammals contributedisproportionately to dispersal of seeds. About1200 vertebrate and 100 000 invertebratespecies are involved in pollination (Roubik1995; Buchmann and Nabhan 1996). Pollinatorsare estimated to be responsible for 35% ofglobal crop production (Klein et al. 2007) andfor 60–90% of the reproduction of wild plants(Kremen et al. 2007). It is estimated that feraland managed honey bee colonies havedeclined by 25% in the USA since the 1990s,and globally about 200 species of wildvertebrate pollinators might be on the verge ofextinction (Allen‐Wardell et al. 1998). Thewidespread decline of pollinators andconsequently pollination services is a cause forconcern and is expected to reduce cropproductivity and contribute towards loss ofbiodiversity in natural ecosystems (Buchmannand Nabhan 1996; Kevan and Viana 2003).Habitat loss, modification and theindiscriminate use of pesticides are cited asmajor reasons for pollinator loss (Kevan andViana 2003). This alarming trend has led to thecreation of an “International Initiative for theConservation and Sustainable use ofPollinators” as a key element under theConvention on Biodiversity, and theInternational Union for the Conservation ofNature has a task force on declining pollinationin the Survival Service Commission.Frugivores tend to be less specialized than
pollinators sincemanyanimals include somefruitin their diet (Wheelwright and Orians 1982).Decline of frugivores from overhunting and lossof habitat, can affect forest regeneration(Wright et al. 2007a). Hunting pressuredifferentially affects recruitment of species,where seeds dispersed by game animalsdecrease, and small non‐game animals and by
abioticmeans increase in the community (Wrightet al. 2007b).Habitat fragmentation is another process that
can disrupt mutualistic interactions by reducingthe diversity and abundance of pollinators andseed dispersal agents, and creating barriers topollen and seed dispersal (Cordeiro and Howe2001, 2003; Aguilar et al. 2006).Plant‐animal mutualisms formwebs or
networks that contribute to the maintenance ofbiodiversity. Specialized interactions tend to benested within generalized interactions wheregeneralists interact morewith each other than bychance, whereas specialists interact withgeneralists (Bascompte and Jordano 2006).Interactions are usually asymmetric, where onepartner ismoredependenton theother thanvice‐versa. These characteristics allow for thepersistence of rare specialist species. Habitat lossand fragmentation (Chapters 4 and 5), hunting(Chapter 6) and other factors can disruptmutualistic networks and result in loss ofbiodiversity. Models suggest that structurednetworks are less resilient to habitat loss thanrandomly generated communities (Fortuna andBascompte 2006).Therefore maintenance of contiguous forests
and intact functioning ecosystems is needed tosustain mutualistic interactions such aspollination and seed dispersal. For agriculturalproduction, wild biodiversity needs to bepreserved in the surrounding matrix topromote native pollinators.
REFERENCES
Aguilar, R., Ashworth, L., Galetto, L., and Aizen, M. A.(2006). Plant reproductive susceptibility to habitat frag-mentation: review and synthesis through a meta‐analy-sis. Ecology Letters 9, 968–980.
Allen‐Wardell, G., Bernhardt, P., Bitner, R., et al. (1998).The potential consequences of pollinator declines on theconservation of biodiversity and stability of food cropyields. Conservation Biology, 12, 8–17.
Bascompte, J. and Jordano, P. (2006). The structure ofplant‐animal mutualistic networks. In M. Pascual and
continues
Sodhi and Ehrlich: Conservation Biology for All. http://ukcatalogue.oup.com/product/9780199554249.do
© Oxford University Press 2010. All rights reserved. For permissions please email: [email protected]
58 CONSERVATION BIOLOGY FOR ALL

(Box 3.4). Trophic process links are grazers, suchas antelopes, and predators, such as lions, bats,and birds of prey that influence the populationsof plant, invertebrate, and vertebrate prey (Boxes3.1 and 3.2). Scavengers, such as vultures, arecrucial process links that hasten the decomposi-tion of potentially disease-carrying carcasses(Houston 1994). Predators often provide naturalpest control (Holmes et al. 1979). Many animals,such as fish-eating birds that nest in colonies, areresource links that transport nutrients in theirdroppings and often contribute significant re-sources to nutrient-deprived ecosystems (Ander-son and Polis 1999). Some organisms likewoodpeckers or beavers act as physical processlinkers or “ecosystem engineers” ( Jones et al.1994). By building dams and flooding largeareas, beavers engineer ecosystems, create newwetlands, and lead to major changes in speciescomposition (see Chapter 6). In addition to con-suming insects (trophic linkers), many wood-peckers also engineer their environment andbuild nest holes later used by a variety of otherspecies (Daily et al. 1993). Through mobile links,distant ecosystems and habitats are linked to and
influence one another (Lundberg and Moberg2003). The long-distance migrations of manyspecies, such as African antelopes, songbirds,waterfowl, and gray whales (Eschrichtius robustus)are particularly important examples of criticalmobile links. However, many major migrationsare disappearing (Wilcove 2008) and nearlytwohundredmigratory bird species are threatenedor near threatened with extinction (Sekercioglu2007).
Dispersing seeds is among the most importantfunctions of mobile links. Vertebrates are the mainseed vectors for flowering plants (Regal 1977; Tiff-ney and Mazer 1995), particularly woody species(Howe and Smallwood 1982; Levey et al. 1994;Jordano 2000). This is especially true in the tropicswhere bird seed dispersal may have led to theemergence of flowering plant dominance (Regal1977; Tiffney and Mazer 1995). Seed dispersal isthought to benefit plants in three major ways(Howe and Smallwood 1982):
· Escape from density-dependent mortality causedby pathogens, seed predators, competitors, and her-bivores (Janzen-Connell escape hypothesis).
Box 3.4 (Continued)
J. Dunne, eds Ecological networks, pp. 143–159. OxfordUniversity Press, Oxford, UK.
Buchmann, S. L. and Nabhan, G. P. (1996). The forgottenpollinators. Island Press, Washington, DC.
Cordeiro, N. J. and Howe, H. F. (2001). Low recruitment oftrees dispersed by animals in African forest fragments.Conservation Biology, 15, 1733–1741.
Cordeiro, N. J. and Howe, H. F. (2003). Forest fragmenta-tion severs mutualism between seed dispersers and anendemic African tree. Proceedings of the NationalAcademy of Sciences of the United States of America,100, 14052–14056.
Fortuna, M. A. and Bascompte, J. (2006). Habitat loss andthe structure of plant‐animal mutualistic networks.Ecology Letters, 9, 281–286.
Kevan, P. G. and Viana, B. F. (2003). The global decline ofpollination services. Biodiversity, 4, 3–8.
Klein, A‐M., Vaissiere, B. E., Cane, J. H., et al. (2007).Importance of pollinators in changing landscapes for
world crops. Proceedings of the Royal Society of LondonB, 274, 303–313.
Kremen, C., Williams, N. M., Aizen, M. A., et al. (2007).Pollination and other ecosystem services produced bymobile organisms: a conceptual framework for theeffects of land‐use change. Ecology Letters, 10, 299–314.
Roubik, D. W. (1995). Pollination of cultivated plants in thetropics. Bulletin 118. FAO, Rome, Italy.
Wheelwright, N. T. and Orians, G. H. (1982). Seed dispersalby animals: contrasts with pollen dispersal, problems ofterminology, and constraints on coevolution. AmericanNaturalist, 119, 402–413.
Wright, S. J., Hernandez, A., and Condit, R. (2007a). Thebushmeat harvest alters seedling banks by favoringlianas, large seeds and seeds dispersed by bats, birdsand wind. Biotropica, 39, 363–371.
Wright, S. J., Stoner, K. E., Beckman, N., et al. (2007b). Theplight of large animals in tropical forests and the conse-quences for plant regeneration.Biotropica,39, 289–291.
1
© Oxford University Press 2010. All rights reserved. For permissions please email: [email protected]
ECOSYSTEM FUNCTIONS AND SERVICES 59

· Chance colonization of favorable but unpredict-able sites via wide dissemination of seeds.
· Directed dispersal to specific sites that are partic-ularly favorable for establishment and survival.
Although most seeds are dispersed over shortdistances, long-distance dispersal is crucial (Cainet al. 2000), especially over geological time scalesduringwhich some plant species have been calcu-lated to achieve colonization distances 20 timeshigher than would be possible without vertebrateseed dispersers (Cain et al. 2000). Seed dispersersplay critical roles in the regeneration and restora-tion of disturbed and degraded ecosystems (Wun-derle 1997; Chapter 6), including newly-formedvolcanic soils (Nishi and Tsuyuzaki 2004).
Plant reproduction is particularly pollination-limited in the tropics relative to the temperatezone (Vamosi et al. 2006) due to the tropics great-er biodiversity, and up to 98% of tropical rain-forest trees are pollinated by animals (Bawa1990). Pollination is a critical ecosystem functionfor the continued persistence of the most biodi-verse terrestrial habitats on Earth. Nabhan andBuchmann (1997) estimated that more than 1200vertebrate and about 289 000 invertebrate speciesare involved in pollinating over 90% of floweringplant species (angiosperms) and 95% of foodcrops. Bees, which pollinate about two thirds of
the world’s flowering plant species and threequarters of food crops (Nabhan and Buchmann1997), are the most important group of pollina-tors (Box 3.3). In California alone, their servicesare estimated to be worth $4.2 billion (Braumanand Daily 2008). However, bee numbers world-wide are declining (Nabhan and Buchmann 1997)(Box 3.5). In addition to the ubiquitous Europeanhoneybee (Apis mellifera), native bee species thatdepend on natural habitats also provide valuableservices to farmers, exemplified by Costa Ricanforest bees whose activities increase coffee yieldby 20% near forest fragments (Ricketts et al. 2004).
Some plant species mostly depend on a single(Parra et al. 1993) or a few (Rathcke 2000) pollinatorspecies. Plants are more likely to be pollinator-lim-ited than disperser-limited (Kelly et al. 2004) and asurvey of pollination experiments for 186 speciesshowed that about half were pollinator-limited(Burd 1994). Compared to seed dispersal, pollina-tion is more demanding due to the faster ripeningrates and shorter lives of flowers (Kelly et al. 2004).Seed disperser and pollinator limitation are oftenmore important in island ecosystems with fewerspecies, tighter linkages, and higher vulnerabilityto disturbance and introduced species. Islandplantspecies are more vulnerable to the extinctions oftheir pollinators since many island plants have lost
Box 3.5 Consequences of pollinator decline for the global food supplyClaire Kremen
Both wild and managed pollinators havesuffered significant declines in recent years.Managed Apis mellifera, the most importantsource of pollination services for crops aroundthe world, have been diminishing around theglobe (NRC 2006), particularly in the US wherecolony numbers are now at < 50% of their 1950levels. In addition, major and extensive colonylosses have occurred over the past several yearsin North America and Europe, possibly due todiseases as well as other factors (Cox‐Fosteret al. 2007; Stokstad 2007), causing shortagesand rapid increases in the price of pollinationservices (Sumner and Boriss 2006). These recenttrends in honey bee health illustrate the
extreme risk of relying on a single pollinator toprovide services for the world’s crop species.Seventy‐five percent of globally importantcrops rely on animal pollinators, providing upto 35% of crop production (Klein et al. 2007).At the same time, although records are sorely
lacking for most regions, comparisons of recentwith historical (pre‐1980) records haveindicated significant regional declines in speciesrichness of major pollinator groups (bees andhoverflies in Britain; bees alone in theNetherlands) (Biesmeijer et al. 2006). Largereductions in species richness and abundance ofbees have also been documented in regions ofhigh agricultural intensity in California’s
continues
Sodhi and Ehrlich: Conservation Biology for All. http://ukcatalogue.oup.com/product/9780199554249.do
© Oxford University Press 2010. All rights reserved. For permissions please email: [email protected]
60 CONSERVATION BIOLOGY FOR ALL
Box 3.5 (Continued)
Central Valley (Kremen et al. 2002; Klein andKremen unpublished data). Traits associatedwith bee, bumble bee and hoverfly declines inEurope included floral specialization, slower(univoltine) development and lower dispersal(non‐migratory) species (Biesmeijer et al. 2006;Goulson et al. 2008). Specialization is alsoindicated as a possible correlate of localextinction in pollinator communities studiedacross a disturbance gradient in Canada;communities in disturbed habitat containedsignificantly more generalized species thanthose associated with pristine habitats (Takiand Kevan 2007). Large‐bodied bees weremoresensitive to increasing agriculturalintensification in California’s Central Valley,and ominously, bees with the highest per‐visitpollination efficiencies were also most likely togo locally extinct with agriculturalintensification (Larsen et al. 2005).Thus, in highly intensive farming regions,
such as California’s Central Valley, thatcontribute comparatively large amounts toglobal food production (e.g. 50% of the worldsupply of almonds), the supply of native beepollinators is lowest in exactly the regionswhere the demand for pollination services ishighest. Published (Kremen et al. 2002) andrecent studies (Klein et al. unpublished data)clearly show that the services provided by wildbee pollinators are not sufficient to meet thedemand for pollinators in these intensiveregions; such regions are instead entirelyreliant on managed honey bees for pollinationservices. If trends towards increasedagricultural intensification continue elsewhere(e.g. as in Brazil, Morton et al. 2006), thenpollination services from wild pollinators arehighly likely to decline in other regions(Ricketts et al. 2008). At the same time, globalfood production is shifting increasingly towardsproduction of pollinator‐dependent foods(Aizen et al. 2008), increasing our need formanaged and wild pollinators yet further.Global warming, which could cause mis‐matches between pollinators and the plantsthey feed upon, may exacerbate pollinatordecline (Memmott et al. 2007). For these
reasons, we may indeed face more seriousshortages of pollinators in the future.
A recent, carefully analyzed, global assessmentof the economic impact of pollinator loss (e.g.total loss of pollinators worldwide) estimates ourvulnerability (loss of economic value) at Euro 153billion or 10% of the total economic value ofannual crop production (Gallai et al. 2009).Although total loss of pollination services is bothunlikely to occur and to causewidespread famineif it were to occur, it potentially has both seriouseconomic and human health consequences. Forexample, some regions of the world producelarge proportions of the world’s pollinator‐dependent crops—such regions wouldexperience more severe economic consequencesfrom the loss of pollinators, although growersand industries would undoubtedly quicklyrespond to these changes in a variety of wayspassing the principle economic burden on toconsumers globally (Southwick and Southwick1992; Gallai et al. 2009). Measures of the impactson consumers (consumer surplus) are of the sameorder of magnitude (Euro 195–310 billion basedon reasonable estimates for price elasticities,Gallai et al. 2009) as the impact on total economicvalue of crop production. Nutritionalconsequences may be more fixed and moreserious than economic consequences, due to thelikely plasticity of responses to economic change.Pollinator‐dependent crop species supplynotonlyup to 35% of crop production by weight (Kleinet al. 2007), but also provide essential vitamins,nutrients and fiber for a healthy diet and providediet diversity (Gallai et al. 2009; Kremen et al.2007). The nutritional consequences of totalpollinator loss for human health have yet to bequantified; however food recommendations forminimal daily portions of fruits and vegetablesare well‐known and already often not met indiets of both developed and underdevelopedcountries.
REFERENCES
Aizen, M. A., Garibaldi, L. A., Cunningham, S. A., andKlein, A. M. (2008). Long‐term global trends in cropyield and production reveal no current pollination
continues
1
© Oxford University Press 2010. All rights reserved. For permissions please email: [email protected]
ECOSYSTEM FUNCTIONS AND SERVICES 61

their ability to self-pollinate and have becomecompletely dependent on endemic pollinators(Cox and Elmqvist 2000). Pollination limitationdue to the reduced species richness of pollinatorson islands likeNewZealand andMadagascar (Far-wig et al. 2004) can significantly reduce fruit setsand probably decrease the reproductive success ofdioecious plant species.
Predators are important trophic process linksand can control the populations of pest species.Formillennia, agricultural pests have been compet-ing with people for the food and fiber plants thatfeed and clothe humanity. Pests, particularly her-bivorous insects, consume 25–50% of humanity’s
crops every year (Pimentel et al. 1989). In the USalone, despite the US$25 billion spent on pesticidesannually (Naylor and Ehrlich 1997), pests destroy37% of the potential crop yield (Pimentel et al.1997). However, many pests have evolved resis-tance to the millions of tons of synthetic pesticidesprayed each year (Pimentel and Lehman 1993),largely due to insects’ short generation times andtheir experience with millions of years of coevolu-tion with plant toxins (Ehrlich and Raven 1964).Consequently, these chemicals poison the environ-ment (Carson 1962), lead to thousands of wildlifefatalities every year, and by killing pests’ naturalenemies faster than the pests themselves, often lead
Box 3.5 (Continued)
shortage but increasing pollinator dependency. CurrentBiology, 18, 1572–1575.
Biesmeijer, J. C., Roberts, S. P. M., Reemer, M., et al. (2006).Parallel declines in pollinators and insect‐pollinatedplants inBritain and the Netherlands. Science, 313, 351–354.
Cox‐Foster, D. L., Conlan, S., Holmes, E. C., et al. (2007).A metagenomic survey of microbes in honey bee colonycollapse disorder. Science, 318, 283–287.
Gallai, N., Salles, J.‐M., Settele, J., and Vaissière, B. E.(2009). Economic valuation of the vulnerability of worldagriculture confronted with pollinator decline. Ecologi-cal Economics, 68, 810–821.
Goulson, D., Lye, G. C., and Darvill, B. (2008). Decline andconservation of bumblebees. Annual Review of Ento-mology, 53, 191–208.
Klein, A. M., Vaissièrie, B., Cane, J. H., et al. (2007).Importance of crop pollinators in changing landscapesfor world crops. Proceedings of the Royal Society ofLondon B, 274, 303–313.
Kremen, C., Williams, N. M., and Thorp, R. W. (2002). Croppollination from native bees at risk from agricultural inten-sification. Proceedings of theNational Academyof Sciencesof the United States of America, 99, 16812–16816.
Kremen, C., Williams, N. M., Aizen, M. A., et al. (2007).Pollination and other ecosystem services produced bymobile organisms: a conceptual framework for theeffects of land‐use change. Ecology Letters, 10, 299314.
Larsen, T. H., Williams, N. M., and Kremen, C. (2005). Extinc-tion order and altered community structure rapidly disruptecosystem functioning. Ecology Letters, 8, 538–547.
Memmott, J., Craze, P. G., Waser, N. M., and Price,M. V. (2007). Global warming and the disruptionof plant‐pollinator interactions. Ecology Letters,10, 710–717.
Morton, D. C., DeFries, R. S., Shimabukuro, Y. E., et al.,(2006). Cropland expansion changes deforestation dy-namics in the southern Brazilian Amazon. Proceedingsof the National Academy of Sciences of the UnitedStates of America, 103, 14637–14641.
NRC (National Research Council of the NationalAcademies) (2006). Status of Pollinators in NorthAmerica. National Academy Press,Washington, DC.
Ricketts, T. H., Regetz, J., Steffan‐Dewenter, I., et al.(2008) Landscape effects on crop pollination services:are there general patterns? Ecology Letters,11, 499–515.
Southwick, E. E. and Southwick, L. Jr. (1992). Estimating theeconomic value of honey bees (Hymenoptera: Apidae) asagricultural pollinators in the United States. Journal ofEconomic Entomology, 85, 621–633.
Stokstad, E. (2007). The case of the empty hives. Science,316, 970–972.
Sumner, D. A. and Boriss, H. (2006). Bee‐conomics and theleap in pollination fees. Giannini Foundation of Agricul-tural Economics Update, 9, 9–11.
Taki, H. and Kevan, P. G. (2007). Does habitat lossaffect the communities of plants and insects equallyin plant‐pollinator interactions? Preliminary findings.Biodiversity and Conservation, 16, 3147–3161.
Sodhi and Ehrlich: Conservation Biology for All. http://ukcatalogue.oup.com/product/9780199554249.do
© Oxford University Press 2010. All rights reserved. For permissions please email: [email protected]
62 CONSERVATION BIOLOGY FOR ALL

to the emergence of new pest populations (Naylorand Ehrlich 1997). As a result, the value of naturalpest control has been increasingly recognizedworldwide, some major successes have beenachieved, and natural controls now form a corecomponent of “integrated pest management”(IPM) that aims to restore the natural pest-predatorbalance in agricultural ecosystems (Naylor andEhrlich 1997).
Species that provide natural pest control rangefrom bacteria and viruses to invertebrate andvertebrate predators feeding on insect and rodentpests (Polis et al. 2000; Perfecto et al. 2004; Seker-cioglu 2006b). For example, a review by Holmes(1990) showed that reductions in moth and but-terfly populations due to temperate forest birdswas mostly between 40–70% at low insect densi-ties, 20–60% at intermediate densities, and 0–10%at high densities. Although birds are not usuallythought of as important control agents, aviancontrol of insect herbivores and consequent re-ductions in plant damage can have importanteconomic value (Mols and Visser 2002). Take-kawa and Garton (1984) calculated avian controlof western spruce budworm in northern Wa-shington State to be worth at least US$1820/km2/year. To make Beijing greener for the 2008Olympics without using chemicals, entomolo-gists reared four billion parasitic wasps to getrid of the defoliating moths in less than threemonths (Rayner 2008). Collectively, natural ene-mies of crop pests may save humanity at least US$54 billion per year, not to mention the criticalimportance of natural controls for food securityand human survival (Naylor and Ehrlich 1997).Promoting natural predators and preserving theirnative habitat patches like hedgerows and forestsmay increase crop yields, improve food security,and lead to a healthier environment.
Often underappreciated are the scavengingand nutrient deposition services of mobile links.Scavengers like vultures rapidly get rid of rottingcarcasses, recycle nutrients, and lead other ani-mals to carcasses (Sekercioglu 2006a). Besidestheir ecological significance, vultures are particu-larly important in many tropical developingcountries where sanitary waste and carcass dis-posal programs may be limited or non-existent
(Prakash et al. 2003) and where vultures contrib-ute to human and ecosystem health by getting ridof refuse (Pomeroy 1975), feces (Negro et al. 2002),and dead animals (Prakash et al. 2003).
Mobile links also transport nutrients from onehabitat to another. Some important examples aregeese transporting terrestrial nutrients to wetlands(Post et al. 1998) and seabirds transferring marineproductivity to terrestrial ecosystems, especially incoastal areas and unproductive island systems(Sanchez-pinero and Polis 2000). Seabird drop-pings (guano) are enriched in important plant nu-trients such as calcium, magnesium, nitrogen,phosphorous, and potassium (Gillham1956).Mur-phy (1981) estimated that seabirds around theworld transfer 104 to 105 tons of phosphorousfrom sea to land every year. Guano also providesan important source of fertilizer and income tomany people living near seabird colonies.
Scavengers and seabirds provide good exam-ples of how the population declines of ecosystemservice providers lead to reductions in their ser-vices (Hughes et al. 1997). Scavenging and fish-eating birds comprise the most threatened avianfunctional groups, with about 40% and 33%, re-spectively, of these species being threatened ornear threatened with extinction (Sekerciogluet al. 2004). The large declines in the populationsof many scavenging and fish-eating species meanthat even if none of these species go extinct, theirservices are declining substantially. Seabird lossescan trigger trophic cascades and ecosystem shifts(Croll et al. 2005). Vulture declines can lead to theemergence of public health problems. In India,Gyps vulture populations declined as much as99% in the 1990s (Prakash et al. 2003). Vulturescompete with feral dogs, which often carry rabies.As the vultures declined between 1992 and 2001,the numbers of feral dogs increased 20-fold at agarbage dump in India (Prakash et al. 2003). Mostof world’s rabies deaths take place in India (WorldHealthOrganization 1998) and feral dogs replacingvultures is likely to aggravate this problem.
Mobile links, however, can be double-edgedswords and can harm ecosystems and human po-pulations, particularly in concert with humanrelated poor land-use practices, climate change,and introduced species. Invasive plants can spread
1
© Oxford University Press 2010. All rights reserved. For permissions please email: [email protected]
ECOSYSTEM FUNCTIONS AND SERVICES 63

via native and introduced seed dispersers (Larosaet al. 1985; Cordeiro et al. 2004). Land use changecan increase the numbers of mobile links that dam-age distant areas, such as when geese overloadwetlands with excessive nutrients (Post et al.1998). Climate change can lead to asynchronies ininsect emergence and their predators timing ofbreeding (Both et al. 2006), and in flowering andtheir pollinators lifecycles (Harrington et al. 1999)(Chapter 8).
Mobile links are often critical to ecosystem func-tioning as sources of “external memory” that pro-mote the resilience of ecosystems (Scheffer et al.2001). More attention needs to be paid to mobilelinks in ecosystem management and biodiversityconservation (Lundberg andMoberg 2003). This isespecially the case for migrating species that facecountless challenges during their annual migra-tions that sometimes cover more than 20 000 kilo-meters (Wilcove 2008). Some of the characteristicsthat make mobile links important for ecosystems,such as high mobility and specialized diets, alsomake them more vulnerable to human impact.Protecting pollinators, seed dispersers, predators,scavengers, nutrient depositors, and other mobilelinksmust be a top conservation priority to preventcollapses in ecosystem services provided by thesevital organisms (Boxes 3.1–3.5).
3.6 Nature’s Cures versus EmergingDiseases
While many people know about how plants pre-vent erosion, protectwater supplies, and “clean theair”, how bees pollinate plants or how owls reducerodent activity, many lesser-known organisms notonly have crucial ecological roles, but also produceunique chemicals and pharmaceuticals that canliterally save people’s lives. Thousands of plantspecies are used medically by traditional, indige-nous communities worldwide. These peoples’ eth-nobotanical knowledge has led to the patenting, bypharmaceutical companies, of more than a quarterof all medicines (Posey 1999), although the indige-nous communities rarely benefit from these pa-tents (Mgbeoji 2006). Furthermore, the eroding oftraditions worldwide, increasing emigration from
traditional, rural communities to urban areas, anddisappearing cultures and languagesmean that thepriceless ethnobotanical knowledge of many cul-tures is rapidly disappearing in parallel with theimpending extinctions of many medicinal plantsdue to habitat loss and overharvesting (Millenni-um Ecosystem Assessment 2005a). Some of therainforest areas that are being deforested fastest,like the island of Borneo, harbor plant species thatproduce active anti-HIV (Human Immunodefi-ciency Virus) agents (Chung 1996; Jassim andNaji 2003). Doubtlessly, thousands more usefuland vital plant compounds await discovery in theforests of the world, particularly in the biodiversetropics (Laurance 1999; Sodhi et al. 2007).However,without an effective strategy that integrates com-munity-based habitat conservation, rewardingof local ethnobotanical knowledge, and scientificresearch on these compounds, many species, thelocal knowledge of them, and the priceless curesthey offer will disappear before scientists discoverthem.
Aswithmany of nature’s services, there is a flipside to the medicinal benefits of biodiversity,namely, emerging diseases ( Jones et al. 2008).The planet’s organisms also include countlessdiseases, many of which are making the transi-tion to humans as people increasingly invade thehabitats of the hosts of these diseases and con-sume the hosts themselves. Three quarters ofhuman diseases are thought to have their originsin domestic or wild animals and new diseases areemerging as humans increase their presence informerly wilderness areas (Daily and Ehrlich1996; Foley et al. 2005). Some of the deadliestdiseases, such as monkeypox, malaria, HIV andEbola, are thought to have initially crossed fromcentral African primates to the people whohunted, butchered, and consumed them (Hahnet al. 2000; Wolfe et al. 2005; Rich et al. 2009).Some diseases emerge in ways that show thedifficulty of predicting the consequences of dis-turbing ecosystems. The extensive smoke fromthe massive 1997–1998 forest fires in SoutheastAsia is thought to have led to the fruiting failureof many forest trees, forcing frugivorous bats toswitch to fruit trees in pig farms. The bats, whichhost the Nipah virus, likely passed it to the pigs,
Sodhi and Ehrlich: Conservation Biology for All. http://ukcatalogue.oup.com/product/9780199554249.do
© Oxford University Press 2010. All rights reserved. For permissions please email: [email protected]
64 CONSERVATION BIOLOGY FOR ALL

from which the virus made the jump to people(Chivian 2002). Another classic example fromSoutheast Asia is the Severe Acute RespiratorySyndrome (SARS). So far having killed 774 peo-ple, the SARS coronavirus has been recently dis-covered in wild animals like the masked palmcivet (Paguma larvata) and raccoon dog (Nyctereu-teus procyonoides) that are frequently consumedby people in the region (Guan et al. 2003). SARS-like coronaviruses have been discovered in bats(Li et al. 2005) and the virus was probably passedto civets and other animals as they ate fruitspartially eaten and dropped by those bats (JamieH. Jones, personal communication). It is probablethat SARS made the final jump to people throughsuch animals bought for food in wildlife markets.
The recent emergence of the deadly avian influ-enza strain H5N1 provides another good example.Even though there are known to be at least 144strains of avian flu, only a few strains kill people.However, some of the deadliest pandemics havebeen among these strains, including H1N1, H2N,and H3N2 (Cox and Subbarao 2000). H5N1, thecause of the recent bird flu panic, has a 50% fatalityrate and may cause another human pandemic.At low host densities, viruses that become toodeadly, fail to spread. It is likely that raising do-mestic birds in increasingly higher densities led tothe evolution of higher virulence in H5N1, as itbecame easier for the virus to jump to anotherhost before it killed its original host. There is alsoa possibility that increased invasion of wildernessareas by people led to the jump ofH5N1 fromwildbirds to domestic birds, but that is yet to be proven.
Malaria, recently shown to have jumped fromchimpanzees to humans (Rich et al. 2009), is per-haps the best example of a resurging disease thatincreases as a result of tropical deforestation(Singer and Castro 2001; Foley et al. 2005; Ya-suoka and Levins 2007). Pearson (2003) calculat-ed that every 1% increase in deforestation in theAmazon leads to an 8% increase in the populationof the malaria vector mosquito (Anopheles dar-lingi). In addition, some immigrants colonizingdeforested areas brought new sources of malaria(Moran 1988) whereas other immigrants comefrom malaria-free areas and thus become idealhosts with no immunity (Aiken and Leigh 1992).
Collectively, the conditions leading to and result-ing from tropical deforestation, combined withclimate change, human migration, agriculturalintensification, and animal trafficking create theperfect storm for the emergence of new diseasesas well as the resurgence of old ones. In the face ofrapid global change, ecologically intact and rela-tively stable communities may be our best weap-on against the emergence of new diseases.
3.7 Valuing Ecosystem Services
Ecosystems and their constituent species providean endless stream of products, functions, and ser-vices that keep our world running and make ourexistence possible. To many, even the thought ofputting a price tag on services like photosynthesis,purification of water, and pollination of food cropsmay seem like hubris, as these are truly pricelessservices without which not only humans, but mostof lifewouldperish.Adistinguished economist putit best in response to a seminar at the USA FederalTrade Commission, where the speaker down-played the impact of global warming by sayingagriculture and forestry “accounted for only threepercentoftheUSgrossnationalproduct”.Theecon-omist’s responsewas: “Whatdoes this genius thinkwe’re going to eat?” (Naylor and Ehrlich 1997).
Nevertheless, in our financially-driven world,we need to quantify the trade-offs involved inland use scenarios that maximize biodiversity con-servation and ecosystem services versus scenariosthat maximize profit from a single commodity.Without such assessments, special interests repre-senting single objectives dominate the debate andsideline the integration of ecosystem services intothe decision-making process (Nelson et al. 2009).Valuing ecosystem services is not an end in itself,but is the first step towards integrating these ser-vices into public decision-making and ensuring thecontinuity of ecosystems that provide the services(Goulder and Kennedy 1997; National ResearchCouncil 2005; Daily et al. 2009). Historically, eco-system services have been mostly thought of asfree public goods, an approach which has too fre-quently led to the “tragedy of the commons”where vital ecosystem goods like clean water
1
© Oxford University Press 2010. All rights reserved. For permissions please email: [email protected]
ECOSYSTEM FUNCTIONS AND SERVICES 65

have been degraded and consumed to extinction(Daily 1997). Too often, ecosystem services havebeen valued, if at all, based on “marginal utility”(Brauman and Daily 2008). When the service (likecleanwater) is abundant, themarginal utility of oneadditional unit can be as low as zero. However, asthe servicebecomesmore scarce, themarginalutilityof each additional unit becomes increasingly valu-able (Goulder and Kennedy 1997). Using the mar-ginal value for a service when it is abundantdrastically underestimates the value of the serviceas it becomes scarcer. As Benjamin Franklin wrylyobserved, “When thewell’s dry,weknow theworthof water.”
As the societal importance of ecosystem servicesbecomes increasingly appreciated, there has beena growing realization that successful applicationof this concept requires a skilful combination ofbiological, physical, and social sciences, as well asthe creation of newprograms and institutions. Thescientific community needs to help develop thenecessary quantitative tools to calculate the valueof ecosystem services and to present them to thedecision makers (Daily et al. 2009). A promisingexample is the InVEST (Integrated Valuation ofEcosystem Services and Tradeoffs) system(Daily et al. 2009; Nelson 2009) developed by theNatural Capital Project (www.naturalcapital.org;see Box 15.3). However, good tools are valuableonly if they are used. A more difficult goal isconvincing the private and public sectors toincorporate ecosystem services into their deci-sion-making processes (Daily et al. 2009). Never-theless, with the socio-economic impacts andhuman costs of environmental catastrophes,such as Hurricane Katrina, getting bigger andmore visible, and with climate change and relatedcarbon sequestration schemes having reacheda prominent place in the public consciousness,the value of these services and the necessity ofmaintaining them has become increasingly main-stream.
Recent market-based approaches such as pay-ments for Costa Rican ecosystem services, wet-land mitigation banks, and the Chicago ClimateExchange have proven useful in the valuation ofecosystem services (Brauman and Daily 2008).Even though the planet’s ecosystems, the biodi-
versity they harbor, and the services they collec-tively provide are truly priceless, market-basedand other quantitative approaches for valuingecosystem services will raise the profile of nat-ure’s services in the public consciousness, inte-grate these services into decision-making, andhelp ensure the continuity of ecosystem contribu-tions to the healthy functioning of our planet andits residents.
Summary
· Ecosystem services are the set of ecosystem func-tions that are useful to humans.
· These services make the planet inhabitable bysupplying and purifying the air we breathe and thewater we drink.
· Water, carbon, nitrogen, phosphorus, and sulfurare the major global biogeochemical cycles. Disrup-tions of these cycles can lead to floods, droughts,climate change, pollution, acid rain, and many otherenvironmental problems.
· Soils provide critical ecosystem services, especial-ly for sustaining ecosystems and growing foodcrops, but soil erosion and degradation are seriousproblems worldwide.
· Higher biodiversity usually increases ecosystemefficiency and productivity, stabilizes overall eco-system functioning, and makes ecosystems moreresistant to perturbations.
· Mobile link animal species provide critical eco-system functions and increase ecosystem resilienceby connecting habitats and ecosystems throughtheir movements. Their services include pollination,seed dispersal, nutrient deposition, pest control, andscavenging.
· Thousands of species that are the components ofecosystems harbor unique chemicals and pharma-ceuticals that can save people’s lives, but traditionalknowledge of medicinal plants is disappearing andmany potentially valuable species are threatenedwith extinction.
· Increasing habitat loss, climate change, settle-ment of wild areas, and wildlife consumption facili-tate the transition of diseases of animals to humans,and other ecosystem alterations are increasing theprevalence of other diseases.
Sodhi and Ehrlich: Conservation Biology for All. http://ukcatalogue.oup.com/product/9780199554249.do
© Oxford University Press 2010. All rights reserved. For permissions please email: [email protected]
66 CONSERVATION BIOLOGY FOR ALL

· Valuation of ecosystem services and tradeoffshelps integrate these services into public decision-making and can ensure the continuity of ecosystemsthat provide the services.
Relevant websites
· Millennium Ecosystem Assessment: http://www.mil-lenniumassessment.org/
· Intergovernmental Panel on Climate Change: http://www.ipcc.ch/
· Ecosystem Marketplace: http://www.ecosystemmar-ketplace.com/
· United States Department of Agriculture, Forest ServiceWebsite on Ecosystem Services: http://www.fs.fed.us/ecosystemservices/
· Ecosystem Services Project: http://www.ecosystemser-vicesproject.org/index.htm
· Natural Capital Project: http://www.naturalcapital-project.org
· Carbon Trading: http://www.carbontrading.com/
Acknowledgements
I am grateful to Karim Al-Khafaji, Berry Brosi, Paul R.Ehrlich, Jamie H. Jones, Stephen Schneider, Navjot Sodhi,Tanya Williams, and especially Kate Brauman for theirvaluable comments. I thank the Christensen Fund fortheir support of my conservation and ecology work.
REFERENCES
Aiken, S. R. and Leigh, C. H. (1992). Vanishing rain forests.Clarendon Press, Oxford, UK.
Alexander, S. E., Schneider, S. H., and Lagerquist, K.(1997). The interaction of climate and life. In G. C.Daily, ed. Nature’s Services, pp. 71–92. Island Press,Washington DC.
Anderson, W. B. and Polis, G. A. (1999). Nutrient fluxesfrom water to land: seabirds affect plant nutrient statuson Gulf of California islands. Oecologia, 118, 324–32.
Avinash, N. (2008). Soil no bar: Gujarat farmers going hi-tech. The Economic Times, 24 July.
Ba, L. K. (1977). Bio-economics of trees in native Malayanforest. Department of Botany, University of Malaya,Kuala Lumpur.
Bawa, K. S. (1990). Plant-pollinator interactions in TropicalRain-Forests. Annual Review of Ecology and Systematics,21, 399–422.
Berhe, A. A., Harte, J., Harden, J. W., and Torn, M. S.(2007). The significance of the erosion-induced terrestrialcarbon sink. BioScience, 57, 337–46.
Berlow, E. L. (1999). Strong effects of weak interactions inecological communities. Nature, 398, 330–34.
Bolin, B. and Cook, R. B., eds (1983). The major biogeochemi-cal cycles and their interactions. Wiley, New York.
Bolker, B.M., Pacala, S.W., Bazzaz, F.A., Canham,C.D., andLevin, S. A. (1995). Species diversity and ecosystem re-sponse to carbon dioxide fertilization: conclusions from atemperate forest model. Global Change Biology, 1, 373–381.
Both, C., Bouwhuis, S., Lessells, C. M., and Visser, M. E.(2006). Climate change and population declines in along-distance migratory bird. Nature, 441, 81–83.
Bradshaw, C. J. A., Sodhi, N. S., Peh, K. S.-H., and Brook, B.W. (2007). Global evidence that deforestation amplifiesflood risk and severity in the developing world. GlobalChange Biology, 13, 2379–2395.
Brauman, K. A., and G. C. Daily. (2008). Ecosystemservices. In S. E. Jorgensen and B. D. Fath, ed. HumanEcology, pp. 1148–1154. Elsevier, Oxford, UK.
Brauman, K. A., Daily, G. C., Duarte, T. K., andMooney, H. A. (2007). The nature and value of ecosys-tem services: an overview highlighting hydrologicservices. Annual Review of Environment and Resources,32, 67–98.
Bruijnzeel, L. A. (2004). Hydrological functions of tropicalforests: not seeing the soil for the trees? AgricultureEcosystems and Environment, 104, 185–228.
Bruno, J. F. and Selig, E. R. (2007). Regional decline of coralcover in the Indo-Pacific: timing, extent, and subregionalcomparisons. PLoS One, 2, e711.
Burd, M. (1994). Bateman’s principle and plant reproduc-tion: the role of pollen limitation in fruit and seed set.Botanical Review, 60, 81–109.
Butler, R. (2008). Despite financial chaos, donors pledge$100Mfor rainforest conservation.http://news.mongabay.com/2008/1023-fcpf.html.
Cain, M. L., Milligan, B. G., and Strand, A. E. (2000). Long-distance seed dispersal in plant populations. AmericanJournal of Botany, 87, 1217–1227.
Calder, I. R. and Aylward, B. (2006). Forest and floods:Moving to an evidence-based approach to watershedand integrated flood management. Water International,31, 87–99.
Canada’s Office of Urban Agriculture (2008).Urban agricul-ture notes. City Farmer, Vancouver, Canada.
Carson, R. (1962). Silent Spring. Houghton Mifflin, Boston,MA.
1
© Oxford University Press 2010. All rights reserved. For permissions please email: [email protected]
ECOSYSTEM FUNCTIONS AND SERVICES 67

Chapin, F. S., Zavaleta, E. S., Eviner, V. T., et al. (2000).Consequences of changing biodiversity. Nature, 405,234–242.
Chivian, E. (2002). Biodiversity: its importance to humanhealth. Center for Health and the Global Environment,Harvard Medical School, Cambridge, MA.
Chung, F. J. (1996). Interests and policies of the state ofSarawak, Malaysia regarding intellectual property rightsfor plant derived drugs. Journal of Ethnopharmacology, 51,201–204.
Cordeiro, N. J., D. A. G. Patrick, B. Munisi, and V. Gupta.(2004). Role of dispersal in the invasion of an exotic treein an East African submontane forest. Journal of TropicalEcology, 20: 449–457.
National Research Council (2005).Valuing ecosystem service:toward better environmental decision-making. The NationalAcademies Press, Washington, DC.
Cox, N.J. and Subbarao, K. (2000). Global epidemiology ofinfluenza: past and present.
Cox, P. A. and Elmqvist, T. (2000). Pollinator extinction inthe Pacific islands. Conservation Biology, 14, 1237–1239.
Croll, D. A., Maron, J. L., Estes, J. A., et al. (2005). Intro-duced predators transform subarctic islands from grass-land to tundra. Science, 307, 1959–1961.
Dahdouh-Guebas, F., Jayatissa, L. P., DiNitto, D., et al. (2005).How effective were mangroves as a defence against therecent tsunami? Current Biology, 15, R443–R447.
Daily, G. C., ed. (1997). Nature’s services: societal dependenceon natural ecosystems. Island Press, Washington, DC.
Daily, G. C. and Ehrlich, P. R. (1996). Global change andhuman susceptibility to disease. Annual Review of EnergyEnvironment, 21, 125–144.
Daily, G. C., Ehrlich, P. R., and Haddad, N. M. (1993).Double keystone bird in a keystone species complex.Proceedings of the National Academy of Sciences of the UnitedStates of America, 90, 592–594.
Daily, G. C., Matson, P. A., and Vitousek, P. M. (1997).Ecosystem services supplied by soil. In G. C. Daily, ed.Nature Services: societal dependence on natural ecosystems,pp. 113–132. Island Press, Washington, DC.
Daily, G. C., Polasky, S., Goldstein, J., et al. (2009). Ecosys-tem services in decision-making: time to deliver. Fron-tiers in Ecology and the Environment, 7, 21–28.
Danielsen, F., S�rensen, M. K., Olwig, M. F., et al. (2005).The Asian tsunami: a protective role for coastal vegeta-tion. Science, 310, 643.
Darwin, C. R. (1872). The origin of species. 6th London ednThompson & Thomas, Chicago, IL.
Day, J. W., Boesch, D. F., Clairain, E. J., et al. (2007). Resto-ration of the Mississippi Delta: Lessons from HurricanesKatrina and Rita. Science, 315, 1679–1684.
Dosso, H. (1981). The Tai Project: land use problems in atropical forest. Ambio, 10, 120–125.
Ehrlich, P. and Ehrlich, A. (1981a). Extinction: the causes andconsequences of the disappearance of species. BallantineBooks, New York, NY.
Ehrlich, P. R. and Ehrlich, A. H. (1981b). The rivet poppers.Not Man Apart, 2, 15.
Ehrlich, P. R. and Mooney, H. M. (1983). Extinction,substitution and ecosystem services. BioScience, 33,248–254.
Ehrlich, P. R. and Raven, P. H. (1964). Butterflies andplants: a study in coevolution. Evolution, 18, 586–608.
Falkowski, P., Scholes, R. J., Boyle, E., et al. (2000). Theglobal carbon cycle: a test of our knowledge of earth asa system. Science, 290, 291–296.
FAO. (1990). Soilless culture for horticultural crop production.FAO, Rome, Italy.
Farwig, N., Randrianirina, E. F., Voigt, F. A., et al. (2004).Pollination ecology of the dioecious tree Commiphoraguillauminii in Madagascar. Journal of Tropical Ecology,20, 307–16.
Foley, J. A., Defries, R., Asner, G. P., et al. (2005). Globalconsequences of land use. Science, 309, 570–574.
Fujii, S., Somiya, I., Nagare, H., and Serizawa, S.(2001). Water quality characteristics of forest riversaround Lake Biwa. Water Science and Technology, 43,183–192.
Gilbert, L. E. (1980). Food web organization and the con-servation of Neotropical diversity. In M. E. Soulé, andB. A. Wilcox, eds Conservation Biology: an evolutionary-ecological perspective, pp. 11–33. Sinauer Associates, Sun-derland, MA.
Gillham, M. E. (1956). The ecology of the PembrokeshireIslands V: manuring by the colonial seabirds and mam-mals with a note on seed distribution by gulls. Journal ofEcology, 44, 428–454.
Gomes, L., Arrue, J. L., Lopez, M. V., et al. (2003). Winderosion in a semiarid agricultural area of Spain: theWELSONS project. Catena, 52, 235–256.
Goulder, L. H. and Kennedy, D. (1997). Valuing ecosystemservices: philosophical bases and empirical methods. InG. C. Daily, edNature’s Services: societal dependence on natu-ral ecosystems, pp. 23–47. Island Press, Washington, DC.
Gregorich, E. G., Greer, K. J., Anderson, D. W., andLiang, B. C. (1998). Carbon distribution and losses:erosion and deposition effects. Soil and Tillage Research47, 291–02.
Guan, Y., Zheng, B. J., He, Y. Q., et al. (2003). Isolationand characterization of viruses related to the SARS corona-virus from animals in Southern China. Science, 302,276–278.
Sodhi and Ehrlich: Conservation Biology for All. http://ukcatalogue.oup.com/product/9780199554249.do
© Oxford University Press 2010. All rights reserved. For permissions please email: [email protected]
68 CONSERVATION BIOLOGY FOR ALL

Hahn, B. H., G. M. Shaw, K. M. De Cock, and P. M. Sharp.(2000). AIDS as a zoonosis: scientific and public healthimplications. Science, 287, 607–614.
Harrington, R., Woiwod, I., and Sparks, T. (1999). Climatechange and trophic interactions. Trends in Ecology andEvolution, 14, 146–150.
Hiraishi, T. and Harada, K. (2003). Greenbelt tsunami pre-vention in South-Pacific Region. Report of the Port andAirport Research Institute, 42, 3–5, 7–25.
Hobbs, R. J., Yates, S. and Mooney, H. A. (2007). Long-termdata reveal complex dynamics in grassland in relation toclimate anddisturbance.EcologicalMonographs,77, 545–568.
Holmes, R. T. (1990). Ecological and evolutionary impactsof bird predation on forest insects: an overview. In M. L.Morrison, C. J. Ralph, J. Verner, and J. R. Jehl, Jr, edsAvian Foraging: theory, methodology, and applications, pp.6–13. Allen Press, Lawrence, KS.
Holmes, R. T., Schultz, J. C., and Nothnagle, P. (1979). Birdpredation on forest insects - an exclosure experiment.Science, 206, 462–463.
Hooper, D. U., Chapin, F. S., Ewel, J. J., et al. (2005). Effectsof biodiversity on ecosystem functioning: a consensus ofcurrent knowledge. Ecological Monographs, 75, 3–5.
Houghton, J. (2004). Global Warming: the complete briefing.Cambridge University Press, Cambridge, UK.
Houston, D. C. (1994). Family Cathartidae (NewWorld vul-tures). In J. del Hoyo, A. Elliott, and J. Sargatal, eds Hand-book of the Birds of the World (Vol. 2): New World Vultures toGuineafowl, pp. 24–41. Lynx Ediciones, Barcelona, Spain.
Howe, H. F. and J. Smallwood. (1982). Ecology of seeddispersal. Annual Review of Ecology and Systematics, 13,201–228.
Hughes, J. B., Daily, G. C., and Ehrlich, P. R. (1997). Popu-lation diversity, its extent and extinction. Science, 278,689–692.
Hupy, J. P. (2004). Influence of vegetation cover and crusttype on wind-blown sediment in a semi-arid climate.Journal of Arid Environments, 58, 167–179.
IPCC (2007). Fourth Assessment Report: Climate Change 2007,The Physical Science Basis. Cambridge University Press,Cambridge, UK.
Jassim, S. A. A. and Naji, M. A. (2003). Novel antiviralagents: a medicinal plant perspective. Journal of AppliedMicrobiology, 95, 412–427.
Jones, C. G., Lawton, J. H., and Shachak, M. (1994). Organ-isms as ecosystem engineers. Oikos, 69, 373–86.
Jones, K. E., Patel, N. G., Levy, M. A., et al. (2008). Globaltrends in emerging infectious diseases. Nature, 451,990–994.
Jordano, P. (2000). Fruits and frugivory. In M. Fenner,ed. Seeds: the ecology of regeneration in plant communities,pp. 125–165. CAB International, New York, NY.
Kelly,D., Ladley, J. J., andRobertson, A.W. (2004). Is dispers-al easier than pollination? Two tests in new Zealand Lor-anthaceae. New Zealand Journal of Botany, 42, 89–103.
Klare M. T. (2001). Resource wars: the new landscape of globalconflict. New York, NY. Henry Holt.
Kremen, C. (2005). Managing ecosystem services: what dowe need to know about their ecology? Ecology Letters, 8,468–479.
Lal, R. (2004). Soil carbon sequestration impacts on globalclimate change and food security.Science, 304, 1623–1627.
Larosa, A. M., Smith, C.W., and Gardner, D. E. (1985). Roleof alien and native birds in the dissemination of firetree(Myrica-faya Ait-Myricaceae) and associated plants inHawaii. Pacific Science, 39, 372–378.
Laurance, W. F. (1999). Reflections on the tropical defores-tation crisis. Biological Conservation, 91, 109–117.
Lefroy, E., Hobbs, R., and Scheltma, M. (1993). Reconcil-ing agriculture and nature conservation: toward a res-toration strategy for the Western Australia wheatbelt.In D. Saunders, R. Hobbs, and P. Ehrlich, eds Recon-struction of fragmented ecosystems: global and regionalperspectives, pp. 243–257. Surrey Beattie & Sons, Chip-ping Norton, NSW, Australia.
Levey, D. J., Moermond, T. C., and Denslow, J. S. (1994).Frugivory: an overview. In L. A. McDade, K. S. Bawa,H. A. Hespenheide, and G. S. Hartshorn, eds La Selva:ecology and natural history of a Neotropical Rain Forest,pp.282–294. University of Chicago Press, Chicago.
Li, W. D., Shi, Z. L., Yu, M., et al. (2005). Bats are naturalreservoirs of SARS-like coronaviruses. Science, 310,676–679.
Lundberg, J. and Moberg, F. (2003). Mobile link organismsand ecosystem functioning: implications for ecosystemresilience and management. Ecosystems, 6, 87–98.
Lyons, K. G. and Schwartz, M. W. (2001). Rare species lossalters ecosystem function - invasion resistance. EcologyLetters, 4, 358–65.
MacArthur, R. H. (1955). Fluctuations of animal popula-tions and a measure of community stability. Ecology, 36,533–536.
Mgbeoji, I. (2006). Global biopiracy: patents, plants, and indig-enous knowledge. Cornell University Press, Ithaca, NY.
Millennium Ecosystem Assessment (2005a). Ecosystems andhumanwell-being: synthesis. Island Press,Washington, DC.
Millennium Ecosystem Assessment. (2005b). Nutrient cy-cling. World Resources Institute, Washington, DC.
Millennium Ecosystem Assessment. (2005c). Fresh water.World Resources Institute, Washington, DC.
Milliman, J. D. and Syvitski, J. P. M. (1992). Geomorphictectonic control of sediment discharge to the ocean - theimportance of small mountainous rivers. Journal of Geol-ogy, 100, 525–544.
1
© Oxford University Press 2010. All rights reserved. For permissions please email: [email protected]
ECOSYSTEM FUNCTIONS AND SERVICES 69

Mols, C. M. M. and Visser, M. E. (2002). Great tits canreduce caterpillar damage in apple orchards. Journal ofApplied Ecology, 39, 888–899.
Mooney, H. A. and Ehrlich, P. R. (1997). Ecosystem ser-vices: a fragmentary history. In G. C. Daily, ed. Nature’sServices: societal dependence on natural ecosystems,pp. 11–19. Island Press, Washington, DC.
Moran, E. F. (1988). Following the Amazonian Highways.In J. S. D. A. C. Padoch, ed. People of the rain forest,pp. 155–162. University of California Press, Berkeley,CA.
Murphy, G. I. (1981). Guano and the anchovetta fishery.Research Management Environment Uncertainty, 11, 81–106.
Myers, N. (1997). The world’s forests and their ecosystemservices. In G. C. Daily, ed. Nature’s Services: societaldependence on natural ecosystems, pp. 215–235. IslandPress, Washington, DC.
Nabhan, G. P. and Buchmann, S. L. (1997). Servicesprovided by pollinators. In G. C. Daily, ed. Nature’sServices: societal dependence on natural ecosystems,pp. 133–150. Island Press, Washington, DC.
Naeem, S. and Li, S. (1997). Biodiversity enhances ecosys-tem reliability. Nature, 390, 507–509.
Naeem, S., Thompson, L. J., Lawler, S. P., Lawton, J. H.,and Woodfin, R. M. (1995). Empirical evidence that de-clining species diversity may alter the performance ofterrestrial ecosystems. Philosophical Transactions of theRoyal Society B, 347, 249–262.
Naylor, R. and Ehrlich, P. R. (1997). Natural pest controlservices and agriculture. In G. C. Daily, ed. Nature’sServices: societal dependence on natural ecosystems, pp.151–174. Island Press, Washington, DC.
Negro, J. J., Grande, J. M., Tella, J. L., et al. (2002). Coproph-agy: An unusual source of essential carotenoids - ayellow-faced vulture includes ungulate faeces in its dietfor cosmetic purposes. Nature, 416, 807–808.
Nelson, E., Mendoza, G., Regetz, J., et al. (2009). Modelingmultiple ecosystem services and tradeoffs at landscapescales. Frontiers in Ecology and the Environment, 7, 4–11.
Nishi, H. and Tsuyuzaki, S. (2004). Seed dispersal andseedling establishment of Rhus trichocarpa promoted bya crow (Corvus macrorhynchos) on a volcano in Japan.Ecography, 27, 311–22.
Nystrm, M. and Folke, C. (2001). Spatial resilience of coralreefs. Ecosystems, 4, 406–417.
Oldeman, L. R. (1998). Soil degradation: a threat to food secu-rity? International Soil Reference and Information Center(ISRIC), Wageningen, Netherlands.
Page, S. E. and Rieley, J. O. (1998). Tropical peatlands: Areview of their natural resource functions with particularreference to Southwest Asia. International Peat Journal, 8,95–106.
Pandolfi, J. M., Bradbury, R. H., Sala, E., et al. (2003).Global trajectories of the long-term decline of coral reefecosystems. Science, 301, 955–958.
Parmesan, C. and Yohe, G. (2003). A globally coherentfingerprint of climate change impacts across natural sys-tems. Nature, 421, 37–42.
Parra, V., Vargas, C. F., and Eguiarte, L. E. (1993). Repro-ductive biology, pollen and seed dispersal, and neigh-borhood size in the hummingbird-pollinated Echeveriagibbiflora (Crassulaceae). American Journal of Botany, 80,153–159.
Pearson, H. (2003). Lost forest fuels malaria. Nature Sci-ence Update 28 November.
Perfecto, I., Vandermeer, J. H., Bautista, G. L., et al. (2004).Greater predation in shaded coffee farms: the role ofresident Neotropical birds. Ecology, 85, 2677–2681.
Phat, N. K., Knorr, W., and Kim, S. (2004). Appropriatemeasures for conservation of terrestrial carbon stocks -analysis of trends of forest management in SoutheastAsia. Forest Ecology and Management, 191, 283–299.
Pimentel, D. and Kounang, N. (1998). Ecology of soil ero-sion in ecosystems. Ecosystems, 1, 416–426.
Pimentel, D. and Lehman, H. eds. (1993). The pesticidequestion: environment, economics, and ethics. Chapmanand Hall, New York, NY.
Pimentel, D., Mclaughlin, L., Zepp, A., et al. (1989). Envi-ronmental and economic impacts of reducing U.S. agri-cultural pesticide use. Handbook of Pest Management inAgriculture, 4, 223–278.
Pimentel, D., Harvey, C., Resosudarmo, P., et al. (1995).Environmental and economic costs of soil erosion andconservation benefits. Science, 267, 1117–1123.
Pimentel, D., Wilson, C., McCullum, C., et al. (1997). Eco-nomic and environmental benefits of biodiversity. Bio-Science, 47, 747–757.
Pimm, S. L. (1984). The complexity and stability of ecosys-tems. Nature, 307, 321–26.
Polis, G. A., Sears, A. L. W., Huxel, G. R., Strong, D. R., andMaron, J. (2000). When is a trophic cascade a trophiccascade? Trends in Ecology and Evolution, 15, 473–475.
Pomeroy, D. E. (1975). Birds as scavengers of refuse inUganda. Ibis, 117, 69–81.
Posey, D. A. E. (1999). Cultural and spiritual values of biodi-versity. Intermediate Technology Publications, UnitedNations Environment Programme, London, UK.
Post, D. M., Taylor, J. P., Kitchell, J. F., et al. (1998). The roleof migratory waterfowl as nutrient vectors in a managedwetland. Conservation Biology, 12, 910–920.
Postel, S. and Carpenter, S. (1997). Freshwater ecosystemservices. In G. C. Daily, ed. Nature’s Services: societaldependence on natural ecosystems, pp.195–214. IslandPress, Washington, DC.
Sodhi and Ehrlich: Conservation Biology for All. http://ukcatalogue.oup.com/product/9780199554249.do
© Oxford University Press 2010. All rights reserved. For permissions please email: [email protected]
70 CONSERVATION BIOLOGY FOR ALL

Postel, S. L., Daily, G. C., and Ehrlich, P. R. (1996). Humanappropriation of renewable fresh water. Science, 271,785–788.
Power, M. E., Tilman, D., Estes, J. A., et al. (1996).Challenges in the quest for keystones. BioScience, 46,609–620.
Prakash, V., Pain, D. J., Cunningham, A. A., et al. (2003).Catastrophic collapse of Indian White-backed Gyps ben-galensis and Long-billed Gyps indicus vulture popula-tions. Biological Conservation, 109, 381–90.
Raffaelli, D. (2004). How extinction patterns affect ecosys-tems. Science, 306, 1141–1142.
Rathcke, B. J. (2000). Hurricane causes resource and polli-nation limitation of fruit set in a bird-pollinated shrub.Ecology, 81, 1951–1958.
Rayner, R. (2008). Bug Wars. New Yorker. Conde Nast,New York.
Reeburgh, W. (1997). Figures summarizing the global cy-cles of biogeochemically important elements. Bulletin ofEcological Society of America, 78, 260–267.
Regal, P. J. (1977). Ecology and evolution of flowering plantdominance. Science, 196, 622–629.
Rich, S. M., Leendertz, F. H., Xu, G., et al. (2009). The originof malignant malaria. Proceedings of the National Academyof Sciences of the United States of America, in press.
Ricketts, T. H., Daily, G. C., Ehrlich, P. R., andMichener, C.D. (2004). Economic value of tropical forest to coffeeproduction. Proceedings of the National Academy of Sciencesof the United States of America, 101, 12579–12582.
Root, T. L., Price, J. T., Hall, K. R., et al. (2003). Fingerprintsof global warming on wild animals and plants. Nature,421, 57–60.
Sanchez-Pinero, F. and Polis, G. A. (2000). Bottom-updynamics of allochthonous input: direct and indirecteffects of seabirds on islands. Ecology, 81, 3117–132.
Scheffer, M., Carpenter, S., Foley, J. A., Folke, C., andWalker, B. (2001). Catastrophic shifts in ecosystems. Na-ture, 413, 591–596.
Schlesinger, W. H. (1991). Biogeochemistry: an analysis ofglobal change. Academic Press, San Diego, CA.
Schneider, S. H. and Londer, R. (1984). The coevolutionof climate and life. Sierra Club Books, San Francisco, CA.
Scott, D., Bruijnzeel, L., and Mackensen, J. (2005). Thehydrological and soil impacts of forestation in the tro-pics. In M. Bonnell and L. Bruijnzeel, eds Forests, waterand people in the humid tropics, pp. 622–651. CambridgeUniversity Press, Cambridge, UK.
Sekercioglu, C. H. (2006a). Ecological significance of birdpopulations. In J. del Hoyo, A. Elliott, and D. A. Christie,eds Handbook of the Birds of the World, volume 11, pp.15–51. Lynx Edicions, Barcelona, Spain.
Sekercioglu, C. H. (2006b). Increasing awareness of avianecological function. Trends in Ecology and Evolution, 21,464–471.
Sekercioglu, C. H. (2007). Conservation ecology: areatrumps mobility in fragment bird extinctions. CurrentBiology, 17, R283–R286.
Sekercioglu, C. H., Daily, G. C., and Ehrlich, P. R. (2004).Ecosystem consequences of bird declines. Proceedings ofthe National Academy of Sciences of the United States ofAmerica, 101, 18042–18047.
Selby, J. (2005). The geopolitics of water in the Middle East:fantasies and realities. ThirdWorld Quarterly, 26, 329–349.
Shiklomanov, I. A. (1993). World’s freshwater resources. InP. E. Gleick, ed. Water in crisis: a guide to the world’sfreshwater resources, pp. 13–24. Oxford University Press,New York, NY.
Singer, B. H., and M. C. De Castro. (2001). Agriculturalcolonization andmalaria on the Amazon frontier. Annalsof the New York Academy of Sciences, 954, 184–222.
Smith, M. D., Wilcox, J. C., Kelly, T., and Knapp, A. K.(2004). Dominance not richness determines invasibilityof tallgrass prairie. Oikos, 106, 253–262.
Smith, V. H. (1992). Effects of nitrogen:phosphorus supplyratios on nitrogen fixation in agricultural and pastoralsystems. Biogeochemistry, 18, 19–35.
Sodhi, N. S., Brook, B. W., and Bradshaw, C. J. A. (2007).Tropical conservation biology.Wiley-Blackwell, Boston,MA.
Takekawa, J. Y. and Garton, E. O. (1984). How much is anevening grosbeak worth? Journal of Forestry, 82, 426–428.
Tallis, H. M. and Kareiva, P. (2006). Shaping global envi-ronmental decisions using socio-ecological models.Trends in Ecology and Evolution, 21, 562–568.
Tiffney, B. H. and Mazer, S. J. (1995). Angiosperm growthhabit, dispersal and diversification reconsidered. Evolu-tionary Ecology, 9, 93–117.
Tilman, D. (1996). Biodiversity: population versus ecosys-tem stability. Ecology, 77, 350–63.
Tilman, D. (1997). Biodiversity and ecosystem functioning.In G. C., Daily ed. Nature’s Services: societal dependence onnatural ecosystems, pp.93–112. IslandPress,WashingtonDC.
Tilman, D. and Downing, J. A. (1994). Biodiversity andstability of grasslands. Nature, 367, 363–65.
Tilman, D., Wedin, D., and Knops, J. (1996). Productivityand sustainability influenced by biodiversity in grass-land ecosystems. Nature, 379, 718–720.
Vamosi, J. C., Knight, T. M., Steets, J. A., et al. (2006).Pollination decays in biodiversity hotspots. Proceedingsof the National Academy of Sciences of the United States ofAmerica, 103, 956–961.
Vanacker, V., Von Blanckenburg, F., Govers, G., et al.(2007). Restoring dense vegetation can slow mountain
1
© Oxford University Press 2010. All rights reserved. For permissions please email: [email protected]
ECOSYSTEM FUNCTIONS AND SERVICES 71

erosion to near natural benchmark levels. Geology, 35,303–06.
Vitousek, P. M. and Hooper, D. U. (1993). Biological diver-sity and terrestrial ecosystem productivity. In D. E.Schulze, and H. A. Mooney, eds Biodiversity and ecosys-tem function, pp. 3–14. Springer-Verlag, Berlin, Germany.
Vitousek, P. M., Aber, J. D., Howard, R. W., et al. (1997).Human alteration of the global nitrogen cycle: sourcesand consequences. Ecological Applications, 7, 737–750.
Walker, B., Kinzig, A., and Langridge, J. (1999). Plant attri-bute diversity, resilience, and ecosystem function: thenature and significance of dominant and minor species.Ecosystems, 2, 95–113.
Wilcove, D. S. (2008). No way home: the decline of theworld’s great animal migrations. Island Press, Washing-ton, DC.
Wolfe, N. D., Daszak, P., Kilpatrick, A. M., and Burke, D. S.(2005). Bushmeat hunting deforestation, and prediction
of zoonoses emergence. Emerging Infectious Diseases, 11,1822–1827.
World Health Organization. (1998). World Survey forRabies No. 34. World Health Organization, Geneva,Switzerland.
Worm, B., Barbier, E. B., Beaumont, N., et al. (2006). Im-pacts of biodiversity loss on ocean ecosystem services.Science, 314, 787–790.
Wright, S. J. (2005). Tropical forests in a changing environ-ment. Trends in Ecology and Evolution, 20, 553–560.
Wunderle, J. M. (1997). The role of animal seed dispersalin accelerating native forest regeneration on de-graded tropical lands. Forest Ecology and Management,99, 223–235.
Yasuoka, J., and R. Levins. (2007). Impact of deforestationand agricultural development on Anopheline ecologyand malaria epidemiology. American Journal of TropicalMedicine and Hygiene, 76, 450–460.
Sodhi and Ehrlich: Conservation Biology for All. http://ukcatalogue.oup.com/product/9780199554249.do
© Oxford University Press 2010. All rights reserved. For permissions please email: [email protected]
72 CONSERVATION BIOLOGY FOR ALL

CHAP T E R 4
Habitat destruction: deathby a thousand cutsWilliam F. Laurance
Humankind has dramatically transformed muchof the Earth’s surface and its natural ecosystems.This process is not new—it has been ongoing formillennia—but it has accelerated sharply over thelast two centuries, and especially in the last sev-eral decades.
Today, the loss and degradation of natural ha-bitats can be likened to a war of attrition. Manynatural ecosystems are being progressively razed,bulldozed, and felled by axes or chainsaws, untilonly small scraps of their original extent survive.Forests have been hit especially hard: the globalarea of forests has been reduced by roughly halfover the past three centuries. Twenty-five nationshave lost virtually all of their forest cover, andanother 29 more than nine-tenths of their forest(MEA 2005). Tropical forests are disappearingat up to 130 000 km2 a year (Figure 4.1)—roughly50 football fields a minute. Other ecosystemsare less imperiled, and a few are even recover-ing somewhat following past centuries of overex-ploitation.
Here I provide an overview of contemporaryhabitat loss. Other chapters in this book descr-ibe the many additional ways that ecosystemsare being threatened—by overhunting (Chapter6), habitat fragmentation (Chapter 5), and climatechange (Chapter 8), among other causes—butmy emphasis here is on habitat destructionper se. I evaluate patterns of habitat destructiongeographically and draw comparisons amongdifferent biomes and ecosystems. I then considersome of the ultimate and proximate factors thatdrive habitat loss, and how they are changingtoday.
4.1 Habitat loss and fragmentation
Habitat destruction occurs when a natural habitat,such as a forest or wetland, is altered so dramati-cally that it no longer supports the species it origi-nally sustained. Plant and animal populations aredestroyed or displaced, leading to a loss of biodi-versity (see Chapter 10). Habitat destruction isconsidered the most important driver of speciesextinction worldwide (Pimm and Raven 2000).
Few habitats are destroyed entirely. Very often,habitats are reduced in extent and simultaneouslyfragmented, leaving small pieces of original habi-tat persisting like islands in a sea of degradedland. In concert with habitat loss, habitat frag-mentation is a grave threat to species survival(Laurance et al. 2002; Sekercioglu et al. 2002;Chapter 5).
Globally, agriculture is the biggest cause of hab-itat destruction (Figure 4.2). Other human activ-ities, such as mining, clear-cut logging, trawling,andurban sprawl, alsodestroy or severely degradehabitats. In developing nations, where most habi-tat loss is now occurring, the drivers of environ-mental change have shifted fundamentally inrecent decades. Instead of being caused mostly bysmall-scale farmers and rural residents, habitatloss, especially in the tropics, is now substantiallydriven by globalization promoting intensive agri-culture and other industrial activities (see Box 4.1).
4.2 Geography of habitat loss
Some regions of the Earth are far more affected byhabitat destruction than others. Among the most
73
1
© Oxford University Press 2010. All rights reserved. For permissions please email: [email protected]

imperiled are the so-called “biodiversity hotspots”,which contain high species diversity, many locallyendemic species (those whose entire geographicrange is confined to a small area), and which havelost at least 70% of their native vegetation (Myerset al. 2000). Many hotspots are in the tropics. TheAtlantic forests of Brazil and rainforests of WestAfrica, both of which have been severely reduced
and degraded, are examples of biodiversity hot-spots. Despite encompassing just a small fraction(<2%) of the Earth’s land surface, hotspots maysustain over half of the world’s terrestrial species(Myers et al. 2000).
Many islands have also suffered heavy habitatloss. For instance, most of the original naturalhabitat has already been lost in Japan, New
Figure 4.1 The aftermath of slash‐and‐burn farming in central Amazonia. Photograph by W. F. Laurance.
Figure 4.2 Extent of land area cultivated globally by the year 2000. Reprinted from MEA (2005).
74 CONSERVATION BIOLOGY FOR ALL
Sodhi and Ehrlich: Conservation Biology for All. http://ukcatalogue.oup.com/product/9780199554249.do
© Oxford University Press 2010. All rights reserved. For permissions please email: [email protected]

Box 4.1 The changing drivers of tropical deforestationWilliam F. Laurance
Tropical forests are being lost today at analarming pace. However, the fundamentaldrivers of tropical forest destruction havechanged in recent years (Rudel 2005; Butlerand Laurance 2008). Prior to the late1980s, deforestation was generally causedby rapid human population growth indeveloping nations, in concert withgovernment policies for ruraldevelopment. These included agriculturalloans, tax incentives, and road construction.Such initiatives, especially evident incountries such as Brazil and Indonesia,promoted large influxes of colonistsinto frontier areas and often causeddramatic forest loss.More recently, however, the impacts of rural
peoples on tropical forests seem to bestabilizing (see Box 4.1 Figure). Althoughmany tropical nations still have considerablepopulation growth, strong urbanizationtrends (except in Sub‐Saharan Africa) meanthat rural populations are growing moreslowly, and are even declining in someareas. The popularity of large‐scale frontier‐colonization programs has also waned.If such trends continue, they could beginto alleviate some pressures on forestsfrom small‐scale farming, hunting, andfuel‐wood gathering (Wright and Muller‐landau 2006).
(a)(a)(a)
(b)(b)(b)
Box 4.1 Figure Changing drivers of deforestation: Small‐scalecultivators (a) versus industrial road construction (b) in Gabon,central Africa. Photograph by W. F. Laurance.
At the same time, globalized financialmarkets and a worldwide commodity boom arecreating a highly attractive environment forthe private sector. Under these conditions,large‐scale agriculture—crops, livestock, andtree plantations—by corporations and wealthylandowners is increasingly emerging as thebiggest direct cause of tropical deforestation(Butler and Laurance 2008). Surging demandfor grains and edible oils, driven by the globalthirst for biofuels and rising standards of livingin developing countries, is also spurring thistrend. In Brazilian Amazonia, for instance,large‐scale ranching has exploded in recentyears, with the number of cattle more thantripling (from 22 to 74 million head) since 1990(Smeraldi and May 2008), while industrial soyfarming has also grown dramatically.
Other industrial activities, especially logging,mining, and petroleum development, are alsoplaying a critical but indirect role in forestdestruction (Asner et al. 2006; Finer et al. 2008).These provide a key economic impetus for forestroad‐building (see Box 4.1 Figure), which in turnallows influxes of colonists, hunters, and minersinto frontier areas, often leading to rapid forestdisruption and cycles of land speculation.
continues
HABITAT DESTRUCTION: DEATH BY A THOUSAND CUTS 75
1
© Oxford University Press 2010. All rights reserved. For permissions please email: [email protected]

Zealand, Madagascar, the Philippines, and Java(WRI 2003). Other islands, such as Borneo, Suma-tra, and New Guinea, still retain some originalhabitat but are losing it at alarming rates (Curranet al. 2004; MacKinnon 2006).
Most areas of high human population densityhave suffered heavy habitat destruction. Suchareas include much of Europe, eastern NorthAmerica, South and Southeast Asia, the MiddleEast, West Africa, Central America, and the Ca-ribbean region, among others. Most of the biodi-versity hotspots occur in areas with high humandensity (Figure 4.3) and many still have rapidpopulation growth (Cincotta et al. 2000). Humanpopulations are often densest in coastal areas,many of which have experienced considerablelosses of both terrestrial habitats and nearbycoral reefs. Among others, coastal zones in Asia,northern South America, the Caribbean, Europe,and eastern North America have all suffered se-vere habitat loss (MEA 2005).
Finally, habitat destruction can occur swiftly inareas with limited human densities but rapidlyexpanding agriculture. Large expanses of theAmazon, for example, are currently being clearedfor large-scale cattle ranching and industrialsoy farming, despite having low population den-sities (Laurance et al. 2001). Likewise, in somerelatively sparsely populated areas of SoutheastAsia, such as Borneo, Sumatra, and New Guinea,forests are being rapidly felled to establish oil-
palm or rubber plantations (MacKinnon 2006;Laurance 2007; Koh and Wilcove 2008; see Box13.3). Older agricultural frontiers, such as those inEurope, eastern China, the Indian Subcontinent,and eastern and midwestern North America,often have very little native vegetation remaining(Figure 4.2).
4.3 Loss of biomes and ecosystems
4.3.1 Tropical and subtropical forests
A second way to assess habitat loss is by contrast-ing major biomes or ecosystem types (Figure 4.4).Today, tropical rainforests (also termed tropicalmoist and humid forests) are receiving the greatestattention, because they are being destroyedso rapidly and because they are the most biologi-cally diverse of all terrestrial biomes. Of the rough-ly 16 million km2 of tropical rainforest thatoriginally existed worldwide, less than 9 millionkm2 remains today (Whitmore 1997; MEA 2005).The current rate of rainforest loss is debated, withdifferent estimates ranging from around 60 000km2 (Achard et al. 2002) to 130 000 km2 per year(FAO 2000). Regardless of which estimate one ad-heres to, rates of rainforest loss are alarminglyhigh.
Rates of rainforest destruction vary consider-ably among geographic regions. Of the world’sthree major tropical regions, Southeast Asian for-ests are disappearing most rapidly in relative
Box 4.1 (Continued)
REFERENCES
Asner, G. P., Broadbent, E., Oliveira, P., Keller, M., Knapp,D., and Silva, J. (2006). Condition and fate of loggedforests in the Amazon. Proceedings of the NationalAcademy of Sciences of the United States of America.103, 12947–12950.
Butler, R. A. and Laurance, W. F. (2008). New strategiesfor conserving tropical forests. Trends in Ecology andEvolution, 23, 469–72.
Finer, M., Jenkins, C., Pimm, S., Kean, B., and Rossi, C.(2008). Oil and gas projects in the western Amazon:
threats to wilderness, biodiversity, and indigenouspeoples. PLoS One, doi:10.1371/journal.pone.0002932.
Rudel, T. K. (2005). Changing agents of deforestation:from state‐initiated to enterprise driven processes,1970–2000. Land Use Policy, 24, 35–41.
Smeraldi, R. and May, P. H. (2008). The cattle realm:a new phase in the livestock colonization ofBrazilian Amazonia. Amigos da Terra, AmazôniaBrasileira, São Paulo, Brazil.
Wright, S. J. and Muller‐Landau, H. C. (2006). Thefuture of tropical forest species. Biotropica, 38,287–301.
76 CONSERVATION BIOLOGY FOR ALL
Sodhi and Ehrlich: Conservation Biology for All. http://ukcatalogue.oup.com/product/9780199554249.do
© Oxford University Press 2010. All rights reserved. For permissions please email: [email protected]

terms (Figure 4.5), while the African and NewWorld tropics have somewhat lower rates of per-cent-annual forest loss (Sodhi et al. 2004). Suchaverages, however, disguise important smaller-scale variation. In the New World tropics, for ex-ample, the Caribbean, MesoAmerican, and An-dean regions are all suffering severe rainforestloss, but the relative deforestation rate for the re-
gion as a whole is buffered by the vastness of theAmazon. Likewise, in tropical Africa, forest loss issevere in West Africa, montane areas of EastAfrica, and Madagascar, but substantial foreststill survives in the Congo Basin (Laurance 1999).
Other tropical and subtropical biomes havesuffered even more heavily than rainforests(Figure 4.4). Tropical dry forests (also known as
Fraction of potential area converted (%)
–10 0 10 20 30 40 50 60
Loss by 1950
Mediterranean forests,woodlands, and scrub
Temperate foreststeppe and woodlandTemperate broadleaf
and mixed forestTropical and sub-tropical
dry broadleaf forestsFlooded grasslands
and savannasTropical and sub-tropical
grasslands, savannas,and shrublands
Tropical and sub-tropicalconiferous forests
Montane grasslandsand shrublands
Tropical and sub-tropicalmoist broadleaf forests
Temperateconiferous forests
Boreal forests
Tundra Loss between 1950 and 1990Projected loss by 2050
70 80 90 100
Deserts
Figure 4.4 Estimated losses of major terrestrial biomes prior to 1950 and from 1950 to 1990, with projected losses up to 2050. Reprinted fromMEA (2005).
Figure 4.3 Human population density in 1995 within 25 recognized biodiversity hotspots (numbered 1‐25) and three major tropical wildernesses(labeled A‐C). Reprinted from Cincotta et al. 2000 © Nature Publishing Group.
HABITAT DESTRUCTION: DEATH BY A THOUSAND CUTS 77
1
© Oxford University Press 2010. All rights reserved. For permissions please email: [email protected]

monsoonal or deciduous forests) have been se-verely reduced, in part because they are easierto clear and burn than rainforests. For instance,along Central America’s Pacific coast, much lessthan 1% of the original dry forest survives. Lossesof dry forest have been nearly as severe in Mada-gascar and parts of Southeast Asia (Laurance1999; Mayaux et al. 2005).
Mangrove forests, salt-tolerant ecosystems thatgrow in tropical and subtropical intertidal zones,have also been seriously reduced. Based oncountries for which data exist, more than a thirdof all mangroves were lost in the last few decadesof the 20th century (MEA 2005). From 1990 to2000, over 1% of all mangrove forests were lostannually, with rates of loss especially high inSoutheast Asia (Mayaux et al. 2005). Such lossesare alarming given the high primary productivityof mangroves, their key role as spawning andrearing areas for economically important fishand shrimp species, and their importance forsheltering coastal areas from destructive stormsand tsunamis (Danielsen et al. 2005).
4.3.2 Temperate forests and woodlands
Some ecosystems have suffered even worse de-struction than tropical forests. Mediterranean for-
ests and woodlands, temperate broadleaf andmixed forests, and temperate forest-steppe andwoodlands have all suffered very heavy losses(Figure 4.4), given the long history of humansettlement in many temperate regions. By 1990more than two-thirds of Mediterranean forestsand woodlands were lost, usually because theywere converted to agriculture (MEA 2005). In theeastern USA and Europe (excluding Russia), old-growth broadleaf forests (>100 years old) havenearly disappeared (Matthews et al. 2000), al-though forest cover is now regenerating inmany areas as former agricultural lands are aban-doned and their formerly rural, farming-basedpopulations become increasingly urbanized.
In the cool temperate zone, coniferous forestshave been less severely reduced than broadleafand mixed forests, with only about a fifth beinglost by 1990 (Figure 4.4). However, vast expansesof coniferous forest in northwestern North Amer-ica, northern Europe, and southern Siberia arebeing clear-felled for timber or pulp production.As a result, these semi-natural forests are con-verted from old-growth to timber-production for-ests, which have a much-simplified standstructure and species composition. Large expansesof coniferous forest are also burned each year(Matthews et al. 2000).
Figure 4.5 Tropical rainforests in Southeast Asia are severely imperiled, as illustrated by this timber operation in Indonesian Borneo. Photograph byW. F. Laurance.
78 CONSERVATION BIOLOGY FOR ALL
Sodhi and Ehrlich: Conservation Biology for All. http://ukcatalogue.oup.com/product/9780199554249.do
© Oxford University Press 2010. All rights reserved. For permissions please email: [email protected]

4.3.3 Grasslands and deserts
Grasslands and desert areas have generally suf-fered to a lesser extent than forests (Figure 4.4).Just 10–20% of all grasslands, which include thesavannas of Africa (Figure 4.6), the llano and cer-rado ecosystems of South America, the steppes ofCentral Asia, the prairies of North America, andthe spinifex grasslands of Australia, have beenpermanently destroyed for agriculture (Whiteet al. 2000; Kauffman and Pyke 2001). About athird of the world’s deserts have been convertedto other land uses (Figure 4.4). Included in thisfigure is the roughly 9 million km2 of seasonallydry lands, such as the vast Sahel region of Africa,that have been severely degraded via desertifica-tion (Primack 2006).
Although deserts and grasslands have notfared as badly as some other biomes, certain re-gions have suffered very heavily. For instance,less than 3% of the tallgrass prairies of NorthAmerica survive, with the remainder havingbeen converted to farmland (White et al. 2000).In southern Africa, large expanses of dryland arebeing progressively desertified from overgrazingby livestock (MEA 2005). In South America, morethan half of the biologically-rich cerrado savannas,which formerly spanned over 2 million km2, havebeen converted into soy fields and cattle pastures
in recent decades, and rates of loss remain veryhigh (Klink and Machado 2005).
4.3.4 Boreal and alpine regions
Boreal forests are mainly found in broad conti-nental belts at the higher latitudes of NorthAmerica and Eurasia. They are vast in Siberia,the largest contiguous forest area in the world,as well as in northern Canada. They also occur athigh elevations in more southerly areas, such asthe European Alps and Rocky Mountains ofNorth America. Dominated by evergreen coni-fers, boreal forests are confined to cold, moistclimates and are especially rich in soil carbon,because low temperatures and waterlogged soilsinhibit decomposition of organic material (Mat-thews et al. 2000).
Habitat loss in boreal forests has historicallybeen low (Figure 4.4; Box 4.2). In Russia, howev-er, legal and illegal logging activity has grownrapidly, with Siberia now a major source of tim-ber exports to China, the world’s largest timberimporter. In Canada, nearly half of the borealforest is under tenure for wood production. Inaddition, fire incidence is high in the borealzone, with perhaps 100 000 km2 of boreal forestburning each year (Matthews et al. 2000).
Figure 4.6 African savannas are threatened by livestock overgrazing and conversion to farmland. Photograph by W. F. Laurance.
HABITAT DESTRUCTION: DEATH BY A THOUSAND CUTS 79
1
© Oxford University Press 2010. All rights reserved. For permissions please email: [email protected]

Like boreal forests, tundra is a vast ecosystem(spanning 9–13 million km2 globally) that hasbeen little exploited historically (Figure 4.4)(White et al. 2000). Unlike permafrost areas, tun-dra ecosystems thaw seasonally on their surface,becoming important wetland habitats for water-fowl and other wildlife. Other boreal habitats,
such as taiga grasslands (Figure 4.7), have alsosuffered little loss. However, all boreal ecosystemsare vulnerable to global warming (see Chapter 8;Box 4.2). Boreal forests, in particular, could declineif climatic conditions become significantly warm-er or drier, leading to an increased frequency orseverity of forest fires (see Box 4.2, Chapter 9).
Box 4.2 Boreal forest management: harvest, natural disturbance, and climate changeIan G. Warkentin
Until recently, the boreal biome has largely beenignored in discussions regarding the globalimpacts of habitat loss through diminishingforest cover. Events in tropical regions during thepast four decades were far more critical due tothe high losses of forest and associated species(Dirzo andRaven2003).While there are ongoingconcerns about tropical forest harvest, theimplications of increasing boreal forestexploitation now also need to be assessed,particularly in the context of climate change.(Bradshaw et al. 2009) Warnings suggest thatforestmanagers shouldnot overlook the servicesprovided by the boreal ecosystem, especiallycarbon storage (Odling‐Smee 2005). Rangingacross northern Eurasia and North America, theboreal biome constitutes one third of all currentforest cover on Earth and is home to nearly halfof the remaining tracts of extensive, intactforests. Nearly 30% of the Earth’s terrestrialstored carbon is held here, and the boreal maywell havemore influence onmeanannual globaltemperature than any other biome due to itssunlight reflectivity (albedo) properties andevapotranspiration rates (Snyder et al. 2004).Conversion of North America’s boreal forest to
other land cover types has been limited (e.g. <3%in Canada; Smith and Lee 2000). In Finland andSweden forest cover has expanded during recentdecades, buthistoric activities extensively reducedand modified the region’s boreal forests forcommercial purposes, leaving only a smallproportion as natural stands (Imbeau et al. 2001;see Box 4.2 Figure). Conversely, there has been arapid expansion of harvest across boreal Russiaduring the past 10–15 years leading to broadshifts from forest to other land cover types (MEA2005). Forest cover loss across European Russia isassociated with intensive harvest, mineralexploitation and urbanization, while in SiberianRussia the combination of logging and a sharp
rise in human‐ignited fires has led to a 2.3%annual decrease in forest cover (Achard et al.2006, 2008).
Box 4.2 Figure An example of harvesting in the Boreal forest.Photograph by Greg Mitchell.
The biggest challenge for boreal managersmay come from the warmer and drier weather,with a longer growing season, that climatechange models predict for upper‐latitudeecosystems (IPCC 2001). The two major driversof boreal disturbance dynamics (fire and insectinfestation) are closely associated with weatherconditions (Soja et al. 2007) and predicted to beboth more frequent and intense over the nextcentury (Kurz et al. 2008); more human‐ignitedfires are also predicted as access to the forestexpands (Achard et al. 2008). Increased harvest,fire and insect infestations will raise the rates ofcarbon loss to the atmosphere, but climatemodels also suggest that changes to albedo andevapotranspiration due to these disturbanceswill offset the lost carbon stores (Bala et al.2007)—maintaining large non‐forested borealsites potentially may cool the global climatemore than the carbon storage resulting fromreforestation at those sites. However, tomanage the boreal forest based solely on one
continues
80 CONSERVATION BIOLOGY FOR ALL
Sodhi and Ehrlich: Conservation Biology for All. http://ukcatalogue.oup.com/product/9780199554249.do
© Oxford University Press 2010. All rights reserved. For permissions please email: [email protected]

In addition, tundra areas will shrink as borealforests spread north.
4.3.5 Wetlands
Although they do not fall into any single biometype, wetlands have endured intense habitat de-struction in many parts of the world. In the USA,for instance, over half of all wetlands have been
destroyed in the last two centuries (Stein et al.2000). From 60–70% of all European wetlandshave been destroyed outright (Ravenga et al.2000). Many developing nations are nowsuffering similarly high levels of wetland loss,particularly as development in coastal zones ac-celerates. As discussed above, losses of mangroveforests, which are physiologically specialized forthe intertidal zone, are also very high.
Box 4.2 (Continued)
ecosystem service would be reckless. Forexample, many migratory songbirds thatdepend upon intact boreal forest stands forbreeding also provide critical services such asinsect predation, pollen transport and seeddispersal (Sekercioglu 2006) in habitatsextending from boreal breeding grounds, tomigratory stopovers and their winter homesin sub‐tropical and tropical regions. Thusboreal forest managers attempting to meetclimate change objectives (or any other singlegoal) must also consider the potential costsfor biodiversity and the multiple services atrisk due to natural and human‐associatedchange.
REFERENCES
Achard, F., Mollicone, D., Stibig, H.‐J., et al. (2006). Areasof rapid forest‐cover change in boreal Eurasia. ForestEcology and Management, 237, 322–334.
Achard, F. D., Eva, H. D., Mollicone, D., and Beuchle, R.(2008). The effect of climate anomalies and humanignition factor on wildfires in Russian boreal forests.Philosophical Transactions of the Royal Society ofLondon B, 363, 2331–2339.
Bala, G., Caldeira, K., Wickett, M., et al. (2007). Combinedclimate and carbon‐cycle effects of large‐scale defores-tation. Proceedings of the National Academy of Sciencesof the United States of America, 104, 6550–6555.
Bradshaw, C. J. A.,Warkentin, I. G., and Sodhi, N. S. (2009).Urgent preservation of boreal carbon stocks and biodi-versity. Trends in Ecology and Evolution, 24, 541–548.
Dirzo, R. and Raven, P. H. (2003). Global state of biodi-versity and loss. Annual Review of Environment andResources, 28, 137–167
Imbeau, L., Mönkkönen, M., and Desrochers, A. (2001).Long‐term effects of forestry on birds of theeastern Canadian boreal forests: a comparisonwith Fennoscandia. Conservation Biology, 15,1151–1162.
IPCC (Intergovernmental Panel on Climate Change)(2001). Climate change 2001: the scientific basis.Contribution of Working Group I to the ThirdAssessment Report of the Intergovernmental Panelon Climate Change. Cambridge University Press,New York, NY.
Kurz, W. A., Stinson, G., Rampley, G. J., Dymond, C. C.,and Neilson, E. T. (2008). Risk of natural disturbancesmakes future contribution of Canada’s forests to theglobal carbon cycle highly uncertain. Proceedings of theNational Academy of Sciences of the United States ofAmerica, 105, 1551–1555.
MEA (Millennium Ecosystem Assessment) (2005).Ecosystems and human well‐being: synthesis. IslandPress, Washington, DC.
Odling‐Smee, L. (2005). Dollars and sense. Nature, 437,614–616.
Sekercioglu, C. H. (2006). Increasing awareness of avianecological function. Trends in Ecology and Evolution, 21,464–471.
Smith, W. and Lee, P., eds (2000). Canada’s forests at acrossroads: an assessment in the year 2000. WorldResources Institute, Washington, DC.
Snyder, P. K., Delire, C., and Foley, J. A. (2004).Evaluating the influence of different vegetationbiomes on the global climate. Climate Dynamics,23, 279–302.
Soja, A. J., Tchebakova, N. M., French, N. H. F., et al.(2007). Climate‐induced boreal forest change:Predictions versus current observations. Global andPlanetary Change, 56, 274–296.
HABITAT DESTRUCTION: DEATH BY A THOUSAND CUTS 81
1
© Oxford University Press 2010. All rights reserved. For permissions please email: [email protected]

4.4 Land-use intensificationand abandonment
Humans have transformed a large fraction of theEarth’s land surface (Figure 4.2). Over the pastthree centuries, the global extent of cropland hasrisen sharply, from around 2.7 to 15 million km2,mostly at the expense of forest habitats (Turneret al. 1990). Permanent pasturelands are evenmore extensive, reaching around 34 million km2
by the mid-1990s (Wood et al. 2000). The rate ofland conversion has accelerated over time: forinstance, more land was converted to croplandfrom 1950 to 1980 than from 1700 to 1850 (MEA2005).
Globally, the rate of conversion of natural ha-bitats has finally begun to slow, because landreadily convertible to new arable use is now inincreasingly short supply and because, in temper-ate and boreal regions, ecosystems are recovering
somewhat. Forest cover is now increasing in east-ern and western North America, Alaska, westernand northern Europe, eastern China, and Japan(Matthews et al. 2000; MEA 2005, Figure 4.4).During the 1990s, for instance, forest cover roseby around 29 000 km2 annually in the temperateand boreal zones, although roughly 40% of thisincrease comprised forest plantations of mostlynon-native tree species (MEA 2005). Despite par-tial recovery of forest cover in some regions(Wright and Muller-Landau 2006), conversionrates for many ecosystems, such as tropical andsubtropical forests and South American cerradosavanna-woodlands, remain very high.
Because arable land is becoming scarce whileagricultural demands for food and biofuel feed-stocks are still rising markedly (Koh and Ghazoul2008), agriculture is becoming increasingly inten-sified in much of the world. Within agriculturalregions, a greater fraction of the available land isactually being cultivated, the intensity of cultiva-tion is increasing, and fallow periods are decreas-ing (MEA 2005). Cultivated systems (where over30% of the landscape is in croplands, shiftingcultivation, confined-livestock production, orfreshwater aquaculture) covered 24% of the glob-al land surface by the year 2000 (Figure 4.2).
Thus, vast expanses of the earth have been al-tered by human activities. Old-growth forests havediminished greatly in extent in many regions, es-pecially in the temperate zones; for instance, atleast 94% of temperate broadleaf forests havebeen disturbed by farming and logging (Primack2006).Other ecosystems, such as coniferous forests,are being rapidly converted from old-growth tosemi-natural production forests with a simplifiedstand structure and species composition. Forestcover is increasing in parts of the temperate andboreal zones, but the new forests are secondaryand differ from old-growth forests in species com-position, structure, and carbon storage. Yet otherecosystems, particularly in the tropics, are beingrapidlydestroyed anddegraded. For example,ma-rine ecosystems have been heavily impacted byhuman activities (see Box 4.3).
The large-scale transformations of landcover described here consider only habitat lossper se. Of the surviving habitat, much is being
Figure 4.7 Boreal ecosystems, such as this alpine grassland in NewZealand, have suffered relatively little habitat loss but are particularlyvulnerable to global warming. Photograph by W. F. Laurance.
82 CONSERVATION BIOLOGY FOR ALL
Sodhi and Ehrlich: Conservation Biology for All. http://ukcatalogue.oup.com/product/9780199554249.do
© Oxford University Press 2010. All rights reserved. For permissions please email: [email protected]
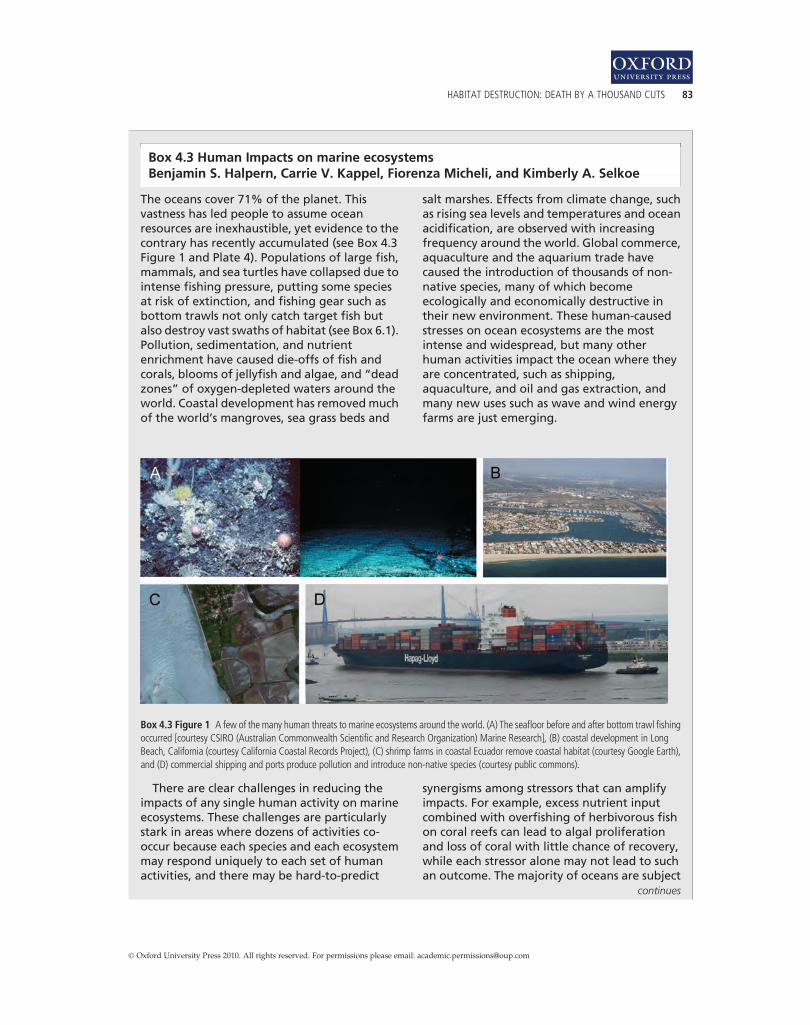
Box 4.3 Human Impacts on marine ecosystemsBenjamin S. Halpern, Carrie V. Kappel, Fiorenza Micheli, and Kimberly A. Selkoe
The oceans cover 71% of the planet. Thisvastness has led people to assume oceanresources are inexhaustible, yet evidence to thecontrary has recently accumulated (see Box 4.3Figure 1 and Plate 4). Populations of large fish,mammals, and sea turtles have collapsed due tointense fishing pressure, putting some speciesat risk of extinction, and fishing gear such asbottom trawls not only catch target fish butalso destroy vast swaths of habitat (see Box 6.1).Pollution, sedimentation, and nutrientenrichment have caused die‐offs of fish andcorals, blooms of jellyfish and algae, and “deadzones” of oxygen‐depleted waters around theworld. Coastal development has removedmuchof the world’s mangroves, sea grass beds and
salt marshes. Effects from climate change, suchas rising sea levels and temperatures and oceanacidification, are observed with increasingfrequency around the world. Global commerce,aquaculture and the aquarium trade havecaused the introduction of thousands of non‐native species, many of which becomeecologically and economically destructive intheir new environment. These human‐causedstresses on ocean ecosystems are the mostintense and widespread, but many otherhuman activities impact the ocean where theyare concentrated, such as shipping,aquaculture, and oil and gas extraction, andmany new uses such as wave and wind energyfarms are just emerging.
Box 4.3 Figure 1 A few of the many human threats to marine ecosystems around the world. (A) The seafloor before and after bottom trawl fishingoccurred [courtesy CSIRO (Australian Commonwealth Scientific and Research Organization) Marine Research], (B) coastal development in LongBeach, California (courtesy California Coastal Records Project), (C) shrimp farms in coastal Ecuador remove coastal habitat (courtesy Google Earth),and (D) commercial shipping and ports produce pollution and introduce non‐native species (courtesy public commons).
There are clear challenges in reducing theimpacts of any single human activity on marineecosystems. These challenges are particularlystark in areas where dozens of activities co‐occur because each species and each ecosystemmay respond uniquely to each set of humanactivities, and there may be hard‐to‐predict
synergisms among stressors that can amplifyimpacts. For example, excess nutrient inputcombined with overfishing of herbivorous fishon coral reefs can lead to algal proliferationand loss of coral with little chance of recovery,while each stressor alone may not lead to suchan outcome. The majority of oceans are subject
continues
HABITAT DESTRUCTION: DEATH BY A THOUSAND CUTS 83
1
© Oxford University Press 2010. All rights reserved. For permissions please email: [email protected]

Box 4.3 (Continued)
to at least three different overlapping humanstressors, with most coastal areas experiencingover a dozen, especially near centers ofcommerce like the ports of Los Angeles andSingapore.Thefirst comprehensivemap of the impacts of
17 different types of human uses on the globaloceans provides information on wherecumulative human impacts tomarineecosystemsaremost intense (Halpern et al. 2008; see Box 4.3Figure 2 and Plate 5). The map shows that over40% of the oceans are heavily impacted and lessthan 4% are relatively pristine (see Box 4.3
Table). The heaviest impacts occur in the NorthSea and East and South China Seas, whereindustry, dense human population, and a longhistory of ocean use come together. The leastimpacted areas are small and scatteredthroughout the globe, with the largest patchesat the poles and the Torres Strait north ofAustralia. Several of the countrieswhose seas aresignificantly impacted, including the UnitedStates and China, have huge territorial holdings,suggesting both a responsibility and anopportunity to make a significant difference inimproving ocean health.
Very Low Impact (<2.4) Medium Impact (5.7–9.0) High Impact (12.3–15.5)
Low Impact (2.4–5.7) Medium High Impact (9.0–12.3) Very High Impact (>15.5)
Box 4.3 Figure 2 Global map of the cumulative human impact on marine ecosystems, based on 20 ecosystem types and 17 different humanactivities. Grayscale colors correspond to overall condition of the ocean as indicated in the legend, with cumulative impact score cutoff values foreach category of ocean condition indicated.
continues
84 CONSERVATION BIOLOGY FOR ALL
Sodhi and Ehrlich: Conservation Biology for All. http://ukcatalogue.oup.com/product/9780199554249.do
© Oxford University Press 2010. All rights reserved. For permissions please email: [email protected]

Box 4.3 (Continued)
Box 4.3 Table The amount of marine area within the Exclusive Economic Zone (EEZ) of countries that is heavily impacted. Countries are listedin order of total marine area within a country’s EEZ (including territorial waters) and includes a selection of countries chosen for illustrativepurposes. Global statistics are provided for comparison. Data are drawn from Halpern et al. (2008).
Country %of global ocean area Impact Category
VeryLow Low Medium
Medium‐
High HighVeryHigh
GLOBAL 100% 3.7% 24.5% 31.3% 38.2% 1.8% 0.5%Largest EEZsUnited States 3.3% 2.0% 9.1% 21.5% 62.1% 4.4% 0.7%France 2.8% 0.2% 36.7% 40.1% 21.6% 0.9% 0.4%Australia 2.5% 3.7% 26.4% 42.3% 26.3% 1.0% 0.3%Russia 2.1% 22.5% 30.8% 32.3% 13.5% 0.6% 0.3%United Kingdom 1.9% 0.3% 25.2% 36.0% 29.0% 6.5% 3.0%Indonesia 1.7% 2.3% 32.0% 42.4% 18.0% 3.0% 2.1%Canada 1.5% 22.8% 18.4% 25.8% 26.5% 5.5% 1.0%Japan 1.1% 0.0% 0.9% 9.7% 76.2% 9.9% 3.2%Brazil 1.0% 3.1% 17.1% 32.4% 44.8% 2.1% 0.5%Mexico 0.9% 1.2% 29.1% 32.7% 35.5% 1.2% 0.3%India 0.6% 0.1% 7.3% 32.9% 51.4% 6.8% 1.5%China 0.2% 0.0% 24.5% 5.7% 27.2% 20.1% 22.5%
SMALLER EEZsGermany 0.02% 0.4% 43.7% 2.4% 34.6% 14.4% 4.4%Iceland 0.21% 0.0% 0.4% 10.1% 58.4% 26.3% 4.8%Ireland 0.11% 0.0% 0.2% 2.2% 50.3% 40.8% 6.6%Italy 0.15% 0.0% 3.5% 15.5% 64.5% 11.8% 4.7%Netherlands 0.04% 0.0% 18.6% 3.6% 68.8% 7.7% 1.5%Sri Lanka 0.15% 0.0% 2.5% 8.6% 45.0% 37.2% 6.7%Thailand 0.08% 0.4% 21.9% 42.6% 22.1% 9.6% 3.4%Vietnam 0.18% 1.1% 21.0% 26.7% 35.7% 10.2% 5.4%
Complex but feasible managementapproaches are needed to address thecumulative impacts of human activities on theoceans. Comprehensive spatial planning ofactivities affecting marine ecosystems, or oceanzoning, has already been adopted andimplemented in Australia’s Great Barrier Reefand parts of the North Sea, with the goal ofminimizing the overlap and potential synergiesof multiple stressors. Many countries, includingthe United States, are beginning to adoptEcosystem‐Based Management (EBM)approaches that explicitly address cumulativeimpacts and seek to balance sustainable use ofthe oceans with conservation and restoration
of marine ecosystems. Ultimately, it is now clearthat marine resources are not inexhaustibleand that precautionary, multi‐sector planningof their use is needed to ensure long‐termsustainability of marine ecosystems and thecrucial services they provide.
REFERENCES
Halpern, B. S., Walbridge, S., Selkoe, K. A., et al. (2008). Aglobal map of human impact on marine ecosystems.Science, 319, 948–952.
HABITAT DESTRUCTION: DEATH BY A THOUSAND CUTS 85
1
© Oxford University Press 2010. All rights reserved. For permissions please email: [email protected]

degraded in various ways—such as by habitatfragmentation, increased edge effects, selectivelogging, pollution, overhunting, altered fireregimes, and climate change. These forms ofenvironmental degradation, as well as the impor-tant environmental services these ecosystems pro-vide, are discussed in detail in subsequentchapters.
Summary
· Vast amounts of habitat destruction have alreadyoccurred. For instance, about half of all global forestcover has been lost, and forests have virtually van-ished in over 50 nations worldwide.
· Habitat destruction has been highly unevenamong different ecosystems. From a geographic per-spective, islands, coastal areas, wetlands, regionswith large or growing human populations, andemerging agricultural frontiers are all sustainingrapid habitat loss.
· From a biome perspective, habitat loss has beenvery high in Mediterranean forests, temperate for-est-steppe and woodland, temperate broadleaf for-ests, and tropical coniferous forests. Otherecosystems, particularly tropical rainforests, arenow disappearing rapidly.
· Habitat destruction in the temperate zone peakedin the 19th and early 20th centuries. Although con-siderable habitat loss is occurring in some temperateecosystems, overall forest cover is now increasingfrom forest regeneration and plantation establish-ment in some temperate regions.
· Primary (old-growth) habitats are rapidly dimin-ishing across much of the earth. In their place, avariety of semi-natural or intensively managed eco-systems are being established. For example, al-though just two-tenths of the temperate coniferousforests have disappeared, vast areas are being con-verted from old-growth to timber-production for-ests, with a greatly simplified stand structure andspecies composition.
· Boreal ecosystems have suffered relativelylimited reductions to date but are especially vulner-able to global warming. Boreal forests could becomeincreasingly vulnerable to destructive fires if futureconditions become warmer or drier.
Suggested reading
· Sanderson, E.W., Jaiteh, M., Levy, M., Redford, K., Wan-nebo, A., and Woolmer, G. (2002). The human footprintand the last of the wild. BioScience, 52, 891–904.
· Sodhi, N.S., Koh, L P., Brook, B.W., and Ng, P. (2004).Southeast Asian biodiversity: an impending catastro-phe. Trends in Ecology and Evolution, 19, 654–660.
· MEA. (2005). Millennium Ecosystem Assessment. Ecosys-tems and Human Well-Being: Synthesis. Island Press, Wa-shington, DC.
· Laurance, W.F. and Peres, C. A., eds. (2006). EmergingThreats to Tropical Forests. University of Chicago Press,Chicago.
Relevant websites
· Mongabay: http://www.mongabay.com.
· Forest Protection Portal: http://www.forests.org.
· The Millennium Ecosystem Assessment synthesis re-ports: http://www.MAweb.org.
REFERENCES
Achard, F., Eva, H., Stibig, H., Mayaux, P., Gallego, J.,Richards, T., and Malingreau, J.-P. (2002). Determinationof deforestation rates of the world’s humid tropicalforests. Science, 297, 999–1002.
Cincotta, R. P., Wisnewski, J., and Engelman, R. (2000).Human population in the biodiversity hotspots. Nature,404, 990–2.
Curran, L. M., Trigg, S., McDonald, A., et al. (2004). Low-land forest loss in protected areas of Indonesian Borneo.Science, 303, 1000–1003.
Danielsen, F., S�rensen, M. K., Olwig, M. F. et al. (2005).The Asian Tunami: A protective role for coastal vegeta-tion. Science, 310, 643.
FAO (Food and Agriculture Organization Of The UnitedNations) (2000). Global forest resource assessment 2000—main report. FAO, New York.
Kauffman, J. B. andPyke, D.A. (2001). Range ecology, globallivestock influences. In S. Levin, ed. Encyclopedia of biodi-versity 5, pp. 33–52.AcademicPress, SanDiego,California.
Klink, C. A. andMachado, R. B. (2005). Conservation of theBrazilian cerrado. Conservation Biology, 19, 707–713.
Koh, L. P. and Ghazoul, J. (2008). Biofuels, biodiversity,and people: understanding the conflicts and finding op-portunities. Biological Conservation, 141, 2450–2460.
Koh, L. P. and Wilcove, D. S. (2008). Is oil palm agriculturereallydestroyingbiodiversity.ConservationLetters, 1, 60–64.
86 CONSERVATION BIOLOGY FOR ALL
Sodhi and Ehrlich: Conservation Biology for All. http://ukcatalogue.oup.com/product/9780199554249.do
© Oxford University Press 2010. All rights reserved. For permissions please email: [email protected]

Laurance, W. F. (1999). Reflections on the tropical defores-tation crisis. Biological Conservation, 91, 109–117.
Laurance, W. F. (2007). Forest destruction in tropical Asia.Current Science, 93, 1544–1550.
Laurance, W. F., Albernaz, A., and Da Costa, C. (2001). Isdeforestation accelerating in the Brazilian Amazon? En-vironmental Conservation, 28, 305–11.
Laurance, W. F., Lovejoy, T., Vasconcelos, H., et al. (2002).Ecosystem decay of Amazonian forest fragments: a 22-year investigation. Conservation Biology, 16, 605–618.
MacKinnon, K. (2006). Megadiversity in crisis: politics,policies, and governance in Indonesia’s forests. In W. F.Laurance and C. A. Peres, eds Emerging threats to tropicalforests, pp. 291–305. University of Chicago Press, Chicago,Illinois.
Matthews, E., Rohweder, M., Payne, R., and Murray, S.(2000). Pilot Analysis of Global Ecosystems: Forest Ecosys-tems. World Resources Institute, Washington, DC.
Mayaux, P., Holmgren, P., Achard, F., Eva, H., Stibig, H.-J.,and Branthomme, A. (2005). Tropical forest cover changein the 1990s andoptions for futuremonitoring.PhilosophicalTransactions of the Royal Society of London B, 360, 373–384.
MEA (Millenium Ecosystem Assessment) (2005). Ecosys-tems and human well-being: synthesis. Island Press, Wa-shington, DC.
Myers, N., Mittermeier, R., Mittermeier, C., Fonseca, G.,and Kent, J. (2000). Biodiversity hotspots for conserva-tion priorities. Nature, 403, 853–858.
Pimm, S. L. and Raven, P. (2000). Biodiversity: Extinctionby numbers. Nature, 403, 843–845.
Primack, R. B. (2006). Essentials of conservation biology, 4thedn. Sinauer Associates, Sunderland, Massachusetts.
Ravenga, C., Brunner, J., Henninger, N., Kassem, K., andPayne, R. (2000). Pilot analysis of global ecosystems:
wetland ecosystems. World Resources Institute,Washington, DC.
Sekercioglu C. H., Ehrlich, P. R., Daily, G. C., Aygen, D.,Goehring, D., and Sandi, R. (2002). Disappearance ofinsectivorous birds from tropical forest fragments. Pro-ceedings of the National Academy of Sciences of the UnitedStates of America, 99, 263–267.
Sodhi, N. S., Koh, L. P., Brook, B. W., and Ng, P. (2004).Southeast Asian biodiversity: an impending disaster.Trends in Ecology and Evolution, 19, 654–660.
Stein, B. A., Kutner, L. and Adams, J., eds (2000). Preciousheritage: the status of biodiversity in the United States.Oxford University Press, New York.
Turner, B. L., Clark,W. C., Kates, R., Richards, J., Mathews J.,andMeyer,W., eds (1990).The earth as transformed by humanaction: global and regional change in the biosphere over the past300 years. Cambridge University Press, Cambridge, UK.
White, R. P., Murray, S., and Rohweder, M. (2000) Pilotanalysis of global ecosystems: grassland ecosystems. WorldResources Institute, Washington, DC.
Whitmore, T. C. (1997). Tropical forest disturbance,disappearance, and species loss. In Laurance,W. F. and R. O. Bierregaard, eds Tropical forest Remnants:ecology, management, and conservation of fragmentedcommunities, pp. 3–12. University of Chicago Press,Chicago, Illinois.
Wood, S., Sebastian, K., and Scherr, S. J. (2000). Pilot analy-sis of global ecosystems: agroecosystems. World ResourcesInstitute, Washington, DC.
WRI (World Resources Institute) (2003). World resources2002–2004: decisions for the earth: balance, voice, andpower. World Resources Institute, Washington, DC.
Wright, S. J. andMuller-Landau, H. C. (2006). The future oftropical forest species. Biotropica, 38, 287–301.
HABITAT DESTRUCTION: DEATH BY A THOUSAND CUTS 87
1
© Oxford University Press 2010. All rights reserved. For permissions please email: [email protected]

CHAP T E R 5
Habitat fragmentation and landscapechangeAndrew F. Bennett and Denis A. Saunders
Broad-scale destruction and fragmentation ofnative vegetation is a highly visible resultof human land-use throughout the world (Chap-ter 4). From the Atlantic Forests of South Americato the tropical forests of Southeast Asia, and inmany other regions on Earth, much of the originalvegetation now remains only as fragmentsamidst expanses of land committed to feedingand housing human beings. Destruction andfragmentation of habitats are major factors inthe global decline of populations and species(Chapter 10), the modification of native plant andanimal communities and the alteration of ecosys-tem processes (Chapter 3). Dealing with thesechanges is among the greatest challenges facingthe “mission-orientated crisis discipline” of conser-vation biology (Soulé 1986; see Chapter 1).
Habitat fragmentation, by definition, is the“breaking apart” of continuous habitat, such astropical forest or semi-arid shrubland, into dis-tinct pieces. When this occurs, three interrelatedprocesses take place: a reduction in the totalamount of the original vegetation (i.e. habitatloss); subdivision of the remaining vegetationinto fragments, remnants or patches (i.e. habitatfragmentation); and introduction of new forms ofland-use to replace vegetation that is lost. Thesethree processes are closely intertwined such thatit is often difficult to separate the relative effect ofeach on the species or community of concern.Indeed, many studies have not distinguished be-tween these components, leading to concerns that“habitat fragmentation” is an ambiguous, or evenmeaningless, concept (Lindenmayer and Fischer2006). Consequently, we use “landscape change”to refer to these combined processes and “habitat
fragmentation” for issues directly associated withthe subdivision of vegetation and its ecologicalconsequences.
This chapter begins by summarizing the con-ceptual approaches used to understand conserva-tion in fragmented landscapes. We then examinethe biophysical aspects of landscape change, andhow such change affects species and commu-nities, posing two main questions: (i) what arethe implications for the patterns of occurrence ofspecies and communities?; and (ii) how doeslandscape change affect processes that influencethe distribution and viability of species and com-munities? The chapter concludes by identifyingthe kinds of actions that will enhance the conser-vation of biota in fragmented landscapes.
5.1 Understanding the effectsof landscape change
5.1.1 Conceptual approaches
The theory of island biogeography (MacArthurand Wilson 1967) had a seminal influence in sti-mulating ecological and conservation interest infragmented landscapes. This simple, elegantmodel highlighted the relationship between thenumber of species on an island and the island’sarea and isolation. It predicted that species rich-ness on an island represents a dynamic balancebetween the rate of colonization of new species tothe island and the rate of extinction of speciesalready present. It was quickly perceived thathabitat isolates, such as forest fragments, couldalso be considered as “islands” in a “sea” of de-veloped land and that this theory provided a
88
Sodhi and Ehrlich: Conservation Biology for All. http://ukcatalogue.oup.com/product/9780199554249.do
© Oxford University Press 2010. All rights reserved. For permissions please email: [email protected]
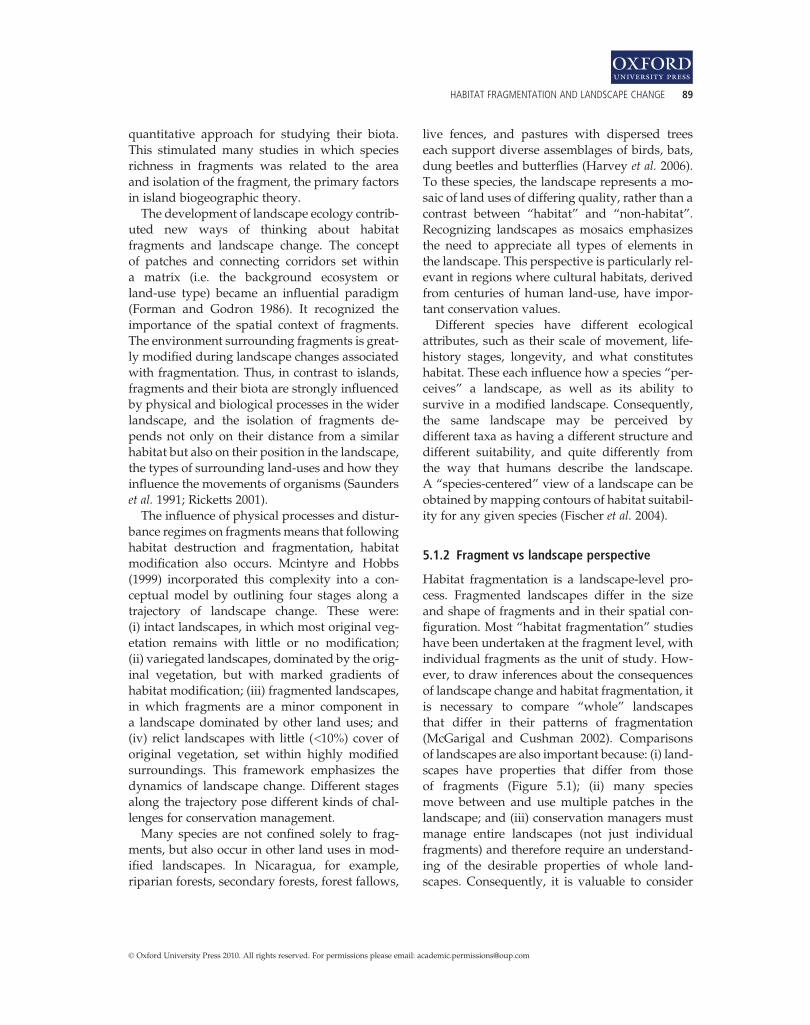
quantitative approach for studying their biota.This stimulated many studies in which speciesrichness in fragments was related to the areaand isolation of the fragment, the primary factorsin island biogeographic theory.
The development of landscape ecology contrib-uted new ways of thinking about habitatfragments and landscape change. The conceptof patches and connecting corridors set withina matrix (i.e. the background ecosystem orland-use type) became an influential paradigm(Forman and Godron 1986). It recognized theimportance of the spatial context of fragments.The environment surrounding fragments is great-ly modified during landscape changes associatedwith fragmentation. Thus, in contrast to islands,fragments and their biota are strongly influencedby physical and biological processes in the widerlandscape, and the isolation of fragments de-pends not only on their distance from a similarhabitat but also on their position in the landscape,the types of surrounding land-uses and how theyinfluence the movements of organisms (Saunderset al. 1991; Ricketts 2001).
The influence of physical processes and distur-bance regimes on fragments means that followinghabitat destruction and fragmentation, habitatmodification also occurs. Mcintyre and Hobbs(1999) incorporated this complexity into a con-ceptual model by outlining four stages along atrajectory of landscape change. These were:(i) intact landscapes, in which most original veg-etation remains with little or no modification;(ii) variegated landscapes, dominated by the orig-inal vegetation, but with marked gradients ofhabitat modification; (iii) fragmented landscapes,in which fragments are a minor component ina landscape dominated by other land uses; and(iv) relict landscapes with little (<10%) cover oforiginal vegetation, set within highly modifiedsurroundings. This framework emphasizes thedynamics of landscape change. Different stagesalong the trajectory pose different kinds of chal-lenges for conservation management.
Many species are not confined solely to frag-ments, but also occur in other land uses in mod-ified landscapes. In Nicaragua, for example,riparian forests, secondary forests, forest fallows,
live fences, and pastures with dispersed treeseach support diverse assemblages of birds, bats,dung beetles and butterflies (Harvey et al. 2006).To these species, the landscape represents a mo-saic of land uses of differing quality, rather than acontrast between “habitat” and “non-habitat”.Recognizing landscapes as mosaics emphasizesthe need to appreciate all types of elements inthe landscape. This perspective is particularly rel-evant in regions where cultural habitats, derivedfrom centuries of human land-use, have impor-tant conservation values.
Different species have different ecologicalattributes, such as their scale of movement, life-history stages, longevity, and what constituteshabitat. These each influence how a species “per-ceives” a landscape, as well as its ability tosurvive in a modified landscape. Consequently,the same landscape may be perceived bydifferent taxa as having a different structure anddifferent suitability, and quite differently fromthe way that humans describe the landscape.A “species-centered” view of a landscape can beobtained by mapping contours of habitat suitabil-ity for any given species (Fischer et al. 2004).
5.1.2 Fragment vs landscape perspective
Habitat fragmentation is a landscape-level pro-cess. Fragmented landscapes differ in the sizeand shape of fragments and in their spatial con-figuration. Most “habitat fragmentation” studieshave been undertaken at the fragment level, withindividual fragments as the unit of study. How-ever, to draw inferences about the consequencesof landscape change and habitat fragmentation, itis necessary to compare “whole” landscapesthat differ in their patterns of fragmentation(McGarigal and Cushman 2002). Comparisonsof landscapes are also important because: (i) land-scapes have properties that differ from thoseof fragments (Figure 5.1); (ii) many speciesmove between and use multiple patches in thelandscape; and (iii) conservation managers mustmanage entire landscapes (not just individualfragments) and therefore require an understand-ing of the desirable properties of whole land-scapes. Consequently, it is valuable to consider
HABITAT FRAGMENTATION AND LANDSCAPE CHANGE 89
1
© Oxford University Press 2010. All rights reserved. For permissions please email: [email protected]

the consequences of landscape change at both thefragment and landscape levels.
5.2 Biophysical aspects of landscapechange
5.2.1 Change in landscape pattern
Landscape change is a dynamic process. A series of“snapshots” at intervals through time (Figure 5.2)illustrates the pattern of change to the originalvegetation. Characteristic changes along a timetrajectory include: (i) a decline in the total area offragments; (ii) a decrease in the size of many frag-ments (large tracts become scarce, small fragmentspredominate); (iii) increased isolation of fragmentsfrom similar habitat; and (iv) the shapes of frag-ments increasingly become dominated by straightedges comparedwith the curvilinear boundaries ofnatural features such as rivers. For small fragmentsand linear features such as fencerows, roadsidevegetation, and riparian strips, the ratio of perime-ter length to area is high, resulting in a large pro-portion of “edge” habitat. An increase in theoverall proportion of edge habitat is a highly influ-ential consequence of habitat fragmentation.
At the landscape level, a variety of indices havebeen developed to quantify spatial patterns, but
many of these are intercorrelated, especially withthe total amount of habitat remaining in the land-scape (Fahrig 2003). Several aspects of the spatialconfiguration of fragments that usefully distinguishbetween different landscapes include: (i) the degreeof subdivision (i.e. number of fragments), (ii) theaggregation of habitat, and (iii) the complexity offragment shapes (Figure 5.3).
Some kinds of changes are not necessarily evi-dent from a time-series sequence. Landscapechange is not random: rather, disproportionatechange occurs in certain areas. Clearing of vegeta-tion ismore common in flatter areas at lower eleva-tions and on the more-productive soils. Such areasare likely to retain fewer, smaller fragments of orig-inal vegetation, whereas larger fragments are morelikely to persist in areas less suitable for agriculturalor urban development, such as on steep slopes,poorer soils, or regularly inundated floodplains.This has important implications for conservationbecause sites associated with different soil typesand elevations typically support different sets ofspecies. Thus, fragments usually represent a biasedsample of the former biota of a region. There also isa strong historical influence on landscape changebecause many fragments, and the disturbance re-gimes they experience, are a legacy of past landsettlement and land-use (Lunt and Spooner 2005).Land-usehistory can be an effective predictor of thepresent distribution of fragments and ecosystemcondition within fragments. It is necessary to un-derstand ecological processes and changes in thepast in order to manage for the future.
5.2.2 Changes to ecosystem processes
Removal of large tracts of native vegetationchanges physical processes, such as those relatingto solar radiation and the fluxes of wind andwater(Saunders et al. 1991). The greatest impact on frag-ments occurs at their boundaries; small remnantsand those with complex shapes experience thestrongest “edge effects”. For example, the micro-climate at a forest edge adjacent to cleared landdiffers from that of the forest interior in attributessuch as incident light, humidity, ground and airtemperature, and wind speed. In turn, these phys-ical changes affect biological processes such as
Individual fragmentssizeshapecore areavegetation typeisolation
Whole landscapescompositional gradientsdiversity of land-usesnumber of fragmentsaggregationstructural connectivity
b)a)
Figure 5.1 Comparison of the types of attributes of a) individualfragments and b) whole landscapes.
90 CONSERVATION BIOLOGY FOR ALL
Sodhi and Ehrlich: Conservation Biology for All. http://ukcatalogue.oup.com/product/9780199554249.do
© Oxford University Press 2010. All rights reserved. For permissions please email: [email protected]
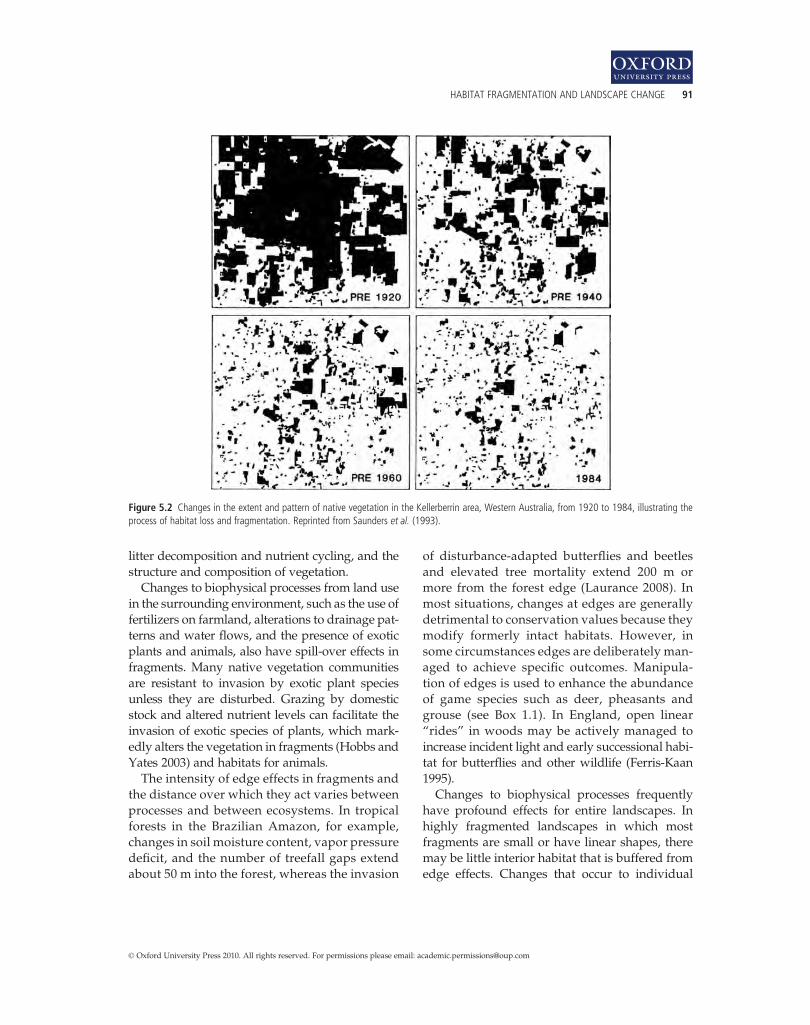
litter decomposition and nutrient cycling, and thestructure and composition of vegetation.
Changes to biophysical processes from land usein the surrounding environment, such as the use offertilizers on farmland, alterations to drainage pat-terns and water flows, and the presence of exoticplants and animals, also have spill-over effects infragments. Many native vegetation communitiesare resistant to invasion by exotic plant speciesunless they are disturbed. Grazing by domesticstock and altered nutrient levels can facilitate theinvasion of exotic species of plants, which mark-edly alters the vegetation in fragments (Hobbs andYates 2003) and habitats for animals.
The intensity of edge effects in fragments andthe distance over which they act varies betweenprocesses and between ecosystems. In tropicalforests in the Brazilian Amazon, for example,changes in soil moisture content, vapor pressuredeficit, and the number of treefall gaps extendabout 50 m into the forest, whereas the invasion
of disturbance-adapted butterflies and beetlesand elevated tree mortality extend 200 m ormore from the forest edge (Laurance 2008). Inmost situations, changes at edges are generallydetrimental to conservation values because theymodify formerly intact habitats. However, insome circumstances edges are deliberately man-aged to achieve specific outcomes. Manipula-tion of edges is used to enhance the abundanceof game species such as deer, pheasants andgrouse (see Box 1.1). In England, open linear“rides” in woods may be actively managed toincrease incident light and early successional habi-tat for butterflies and other wildlife (Ferris-Kaan1995).
Changes to biophysical processes frequentlyhave profound effects for entire landscapes. Inhighly fragmented landscapes in which mostfragments are small or have linear shapes, theremay be little interior habitat that is buffered fromedge effects. Changes that occur to individual
Figure 5.2 Changes in the extent and pattern of native vegetation in the Kellerberrin area, Western Australia, from 1920 to 1984, illustrating theprocess of habitat loss and fragmentation. Reprinted from Saunders et al. (1993).
HABITAT FRAGMENTATION AND LANDSCAPE CHANGE 91
1
© Oxford University Press 2010. All rights reserved. For permissions please email: [email protected]

fragments accumulate across the landscape.Changes to biophysical processes such as hydro-logical regimes can also affect entire landscapes.In the Western Australian wheatbelt (Figure 5.2),massive loss of native vegetation has resulted in arise in the level of groundwater, bringing storedsalt (NaCl) to the surface where it accumulatesand reduces agricultural productivity and trans-forms native vegetation (Hobbs 1993).
5.3 Effects of landscape change on species
Species show many kinds of responses to habitatfragmentation: some are advantaged and in-crease in abundance, while others decline andbecome locally extinct (see Chapter 10). Under-standing these diverse patterns, and the processesunderlying them, is an essential foundation forconservation. Those managing fragmented
Box 5.1 Time lags and extinction debt in fragmented landscapesAndrew F. Bennett and Denis A. Saunders
Habitat destruction and fragmentation resultin immediately visible and striking changes tothe pattern of habitat in the landscape.However, the effects of these changes on thebiota take many years to be expressed: there isa time‐lag in experiencing the fullconsequences of such habitat changes. Long‐lived organisms such as trees may persist formany decades before disappearing withoutreplacement; small local populations of animalsgradually decline before being lost; andecological processes in fragments are sensitiveto long‐term changes in the surroundings.Conservation managers cannot assume thatspecies currently present in fragmentedlandscapes will persist there. Many fragmentsand landscapes face impending extinctions,even though there may be no further change infragment size or the amount of habitat in thelandscape. We are still to pay the ‘extinctiondebt’ for the consequences of past actions.Identifying the duration of time‐lags and
forecasting the size of the extinction debt forfragmented landscapes is difficult. The clearestinsights come from long‐term studies thatdocument changes in communities. For example,large nocturnal marsupials were surveyed inrainforest fragments inQueensland, Australia, in1986–87 and again 20 years later in 2006–07(Laurance et al. 2008). At the time of the firstsurveys, when fragments had been isolated for20–50 years, the fauna differed markedly fromthat in extensive rainforest. Over the subsequent20 years, even further changes occurred.Notably, the species richness in fragments had
10
1
2
3
Spec
ies
rich
ness
4
5
6
7
10Area (ha)
100 1000
Box 5.1 Figure A change in the species‐area relationship formammals in rainforest fragments in Queensland, Australia, between1986 (filled circles) and 2006 (open circles) illustrates a time‐lag inthe loss of species following fragmentation. Data from Lauranceet al. (2008).
declined further (see Box 5.1 Figure), with mostdeclines in the smaller fragments. By 2006–07,one species, the lemuroid ringtail possum(Hemibelideus lemuroides), was almost totallyabsent from fragments and regrowth forestsalong streams and its abundance in thesehabitats was only 0.02% of that in intact forest(Laurance et al. 2008).
REFERENCES
Laurance, W. F., Laurance, S. G., and Hilbert, D. W. (2008).Long‐term dynamics of a fragmentedrainforest mammal assemblage. Conservation Biology,22, 1154–1164.
92 CONSERVATION BIOLOGY FOR ALL
Sodhi and Ehrlich: Conservation Biology for All. http://ukcatalogue.oup.com/product/9780199554249.do
© Oxford University Press 2010. All rights reserved. For permissions please email: [email protected]
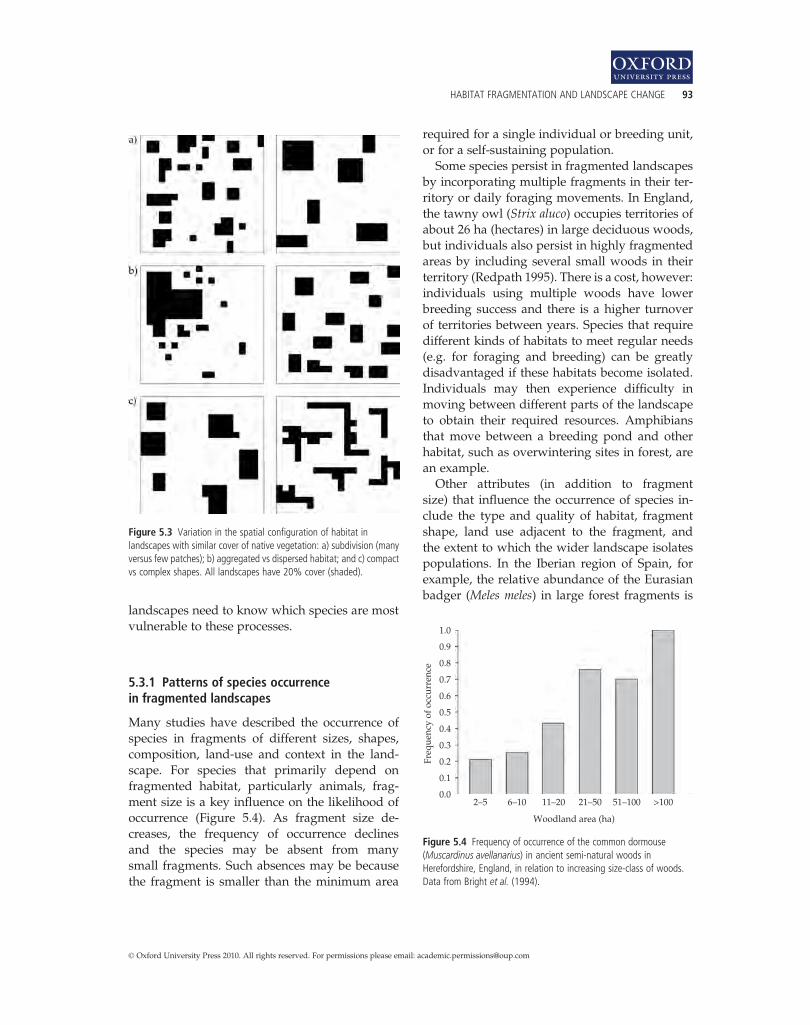
landscapes need to know which species are mostvulnerable to these processes.
5.3.1 Patterns of species occurrencein fragmented landscapes
Many studies have described the occurrence ofspecies in fragments of different sizes, shapes,composition, land-use and context in the land-scape. For species that primarily depend onfragmented habitat, particularly animals, frag-ment size is a key influence on the likelihood ofoccurrence (Figure 5.4). As fragment size de-creases, the frequency of occurrence declinesand the species may be absent from manysmall fragments. Such absences may be becausethe fragment is smaller than the minimum area
required for a single individual or breeding unit,or for a self-sustaining population.
Some species persist in fragmented landscapesby incorporating multiple fragments in their ter-ritory or daily foraging movements. In England,the tawny owl (Strix aluco) occupies territories ofabout 26 ha (hectares) in large deciduous woods,but individuals also persist in highly fragmentedareas by including several small woods in theirterritory (Redpath 1995). There is a cost, however:individuals using multiple woods have lowerbreeding success and there is a higher turnoverof territories between years. Species that requiredifferent kinds of habitats to meet regular needs(e.g. for foraging and breeding) can be greatlydisadvantaged if these habitats become isolated.Individuals may then experience difficulty inmoving between different parts of the landscapeto obtain their required resources. Amphibiansthat move between a breeding pond and otherhabitat, such as overwintering sites in forest, arean example.
Other attributes (in addition to fragmentsize) that influence the occurrence of species in-clude the type and quality of habitat, fragmentshape, land use adjacent to the fragment, andthe extent to which the wider landscape isolatespopulations. In the Iberian region of Spain, forexample, the relative abundance of the Eurasianbadger (Meles meles) in large forest fragments is
2–50.0
0.1
0.2
0.3
0.4
Freq
uenc
y of
occ
urre
nce
0.5
0.6
0.7
0.8
0.9
1.0
6–10 11–20
Woodland area (ha)
21–50 51–100 >100
Figure 5.4 Frequency of occurrence of the common dormouse(Muscardinus avellanarius) in ancient semi‐natural woods inHerefordshire, England, in relation to increasing size‐class of woods.Data from Bright et al. (1994).
Figure 5.3 Variation in the spatial configuration of habitat inlandscapes with similar cover of native vegetation: a) subdivision (manyversus few patches); b) aggregated vs dispersed habitat; and c) compactvs complex shapes. All landscapes have 20% cover (shaded).
HABITAT FRAGMENTATION AND LANDSCAPE CHANGE 93
1
© Oxford University Press 2010. All rights reserved. For permissions please email: [email protected]

significantly influenced by habitat quality andforest cover in the wider landscape (Virgos2001). In areas with less than 20% forest cover,badger abundance in forests was most influencedby isolation (i.e. distance to a potential sourcearea >10 000 ha), whereas in areas with 20–50%cover, badgers were most influenced by the qual-ity of habitat in the forest fragments.
A key issue for conservation is the relativeimportance of habitat loss versus habitat frag-mentation (Fahrig 2003). That is, what is the rela-tive importance of how much habitat remains inthe landscape versus how fragmented it is? Studiesof forest birds in landscapes in Canada and Aus-tralia suggest that habitat loss and habitat frag-mentation are both significant influences,although habitat loss generally is a stronger influ-ence for a greater proportion of species (Trczinskiet al. 1999; Radford and Bennett 2007). Important-ly, species respond to landscape pattern in differ-ent ways. In southern Australia, the maininfluence for the eastern yellow robin (Eopsaltriaaustralis) was the total amount of wooded coverin the landscape; for the grey shrike-thrush (Col-luricincla harmonica) it was wooded cover togeth-er with its configuration (favoring aggregatedhabitat); while for the musk lorikeet (Glossopsittaconcinna) the influential factor was not woodedcover, but the configuration of habitat and diver-sity of vegetation types (Radford and Bennett2007).
5.3.2 Processes that affect species in fragmentedlandscapes
The size of any population is determined by thebalance between four parameters: births, deaths,immigration, and emigration. Population size isincreased by births and immigration of indivi-duals, while deaths and emigration of individualsreduce population size. In fragmented land-scapes, these population parameters are influ-enced by several categories of processes.
Deterministic processesMany factors that affect populations in fragmen-ted landscapes are relatively predictable in theireffect. These factors are not necessarily a direct
consequence of habitat fragmentation, but arisefrom land uses typically associated with subdivi-sion. Populations may decline due to deaths ofindividuals from the use of pesticides, insecti-cides or other chemicals; hunting by humans;harvesting and removal of plants; and construc-tion of roads with ensuing road kills of animals.For example, in Amazonian forests, subsistencehunting by people compounds the effects of for-est fragmentation for large vertebrates such as thelowland tapir (Tapir terrestris) and white-lippedpeccary (Tayassu pecari), and contributes to theirlocal extinction (Peres 2001).
Commonly, populations are also affected byfactors such as logging, grazing by domesticstock, or altered disturbance regimes that modifythe quality of habitats and affect populationgrowth. For example, in Kibale National Park, anisolated forest in Uganda, logging has resulted inlong-term reduction in the density of groups of theblue monkey (Cercopithecus mitza) in heavilylogged areas: in contrast, populations of blackand white colobus (Colobus guereza) are higher inregrowth forests than in unlogged forest (Chap-man et al. 2000). Deterministic processes are partic-ularly important influences on the status of plantspecies in fragments (Hobbs and Yates 2003).
IsolationIsolation of populations is a fundamental conse-quence of habitat fragmentation: it affects localpopulations by restricting immigration and emi-gration. Isolation is influenced not only by thedistance between habitats but also by the effectsof human land-use on the ability of organisms tomove (or for seeds and spores to be dispersed)through the landscape. Highways, railway lines,and water channels impose barriers to move-ment, while extensive croplands or urban devel-opment create hostile environments for manyorganisms to move through. Species differ insensitivity to isolation depending on their typeof movement, scale of movement, whether theyare nocturnal or diurnal, and their response tolandscape change. Populations of one speciesmay be highly isolated, while in the same land-scape individuals of another species can movefreely.
94 CONSERVATION BIOLOGY FOR ALL
Sodhi and Ehrlich: Conservation Biology for All. http://ukcatalogue.oup.com/product/9780199554249.do
© Oxford University Press 2010. All rights reserved. For permissions please email: [email protected]

Isolation affects several types of movements,including: (i) regular movements of individualsbetween parts of the landscape to obtaindifferent requirements (food, shelter, breedingsites); (ii) seasonal or migratory movements ofspecies at regional, continental or inter-continen-tal scales; and (iii) dispersal movements (immi-gration, emigration) between fragments, whichmay supplement population numbers, increasethe exchange of genes, or assist recolonization ifa local population has disappeared. In WesternAustralia, dispersal movements of the blue-breasted fairy-wren (Malurus pulcherrimus) areaffected by the isolation of fragments (Brookerand Brooker 2002). There is greater mortality ofindividuals during dispersal in poorly connectedareas than in well-connected areas, with this dif-ference in survival during dispersal being a keyfactor determining the persistence of the speciesin local areas.
For many organisms, detrimental effects ofisolation are reduced, at least in part, by habitatcomponents that enhance connectivity in thelandscape (Saunders and Hobbs 1991; Bennett1999). These include continuous “corridors” or“stepping stones” of habitat that assist move-ments (Haddad et al. 2003), or human land-uses(such as coffee-plantations, scattered trees in pas-ture) that may be relatively benign environmentsfor many species (Daily et al. 2003). In tropicalregions, one of the strongest influences on thepersistence of species in forest fragments is theirability to live in, or move through, modified“countryside” habitats (Gascon et al. 1999; Seker-cioglu et al. 2002).
Stochastic processesWhen populations become small and isolated,they become vulnerable to a number of stochastic(or chance) processes that may pose little threat tolarger populations. Stochastic processes includethe following.
· Stochastic variation in demographic parameterssuch as birth rate, death rate and the sex ratio ofoffspring.
· Loss of genetic variation, which may occur due toinbreeding, genetic drift, or a founder effect from a
small initial population size. A decline in geneticdiversity may make a population more vulnerableto recessive lethal alleles or to changing environ-mental conditions.
· Fluctuations in the environment, such as varia-tion in rainfall and food sources, which affect birthand death rates in populations.
· Small isolated populations are particularly vul-nerable to catastrophic events such as flood, fire,drought or hurricanes. A wildfire, for example,may eliminate a small local population whereas inextensive habitats some individuals survive andprovide a source for recolonization.
5.3.3 Metapopulations and the conservationof subdivided populations
Small populations are vulnerable to local extinc-tion, but a species has a greater likelihood ofpersistence where there are a number of localpopulations interconnected by occasional move-ments of individuals among them. Such a setof subdivided populations is often termed a “me-tapopulation” (Hanski 1999). Two main kinds ofmetapopulation have been described (Figure 5.5).A mainland-island model is where a large main-land population (such as a conservation reserve)provides a source of emigrants that disperseto nearby small populations. The mainland pop-ulation has a low likelihood of extinction, where-as the small populations become extinct relativelyfrequently. Emigration from the mainlandsupplements the small populations, introducesnew genetic material and allows recolonizationshould local extinction occur. A second kind ofmetapopulation is where the set of interactingpopulations are relatively similar in size and allhave a likelihood of experiencing extinction (Fig-ure 5.5b). Although colonization and extinctionmay occur regularly, the overall population per-sists through time.
The silver-spotted skipper (Hesperia comma), arare butterfly in the UK, appears to function asa metapopulation (Hill et al. 1996). In 1982, but-terflies occupied 48 of 69 patches of suitablegrassland on the North Downs, Surrey. Over thenext 9 years, 12 patches were colonized and sevenpopulations went extinct. Those more susceptible
HABITAT FRAGMENTATION AND LANDSCAPE CHANGE 95
1
© Oxford University Press 2010. All rights reserved. For permissions please email: [email protected]

to extinction were small isolated populations,whereas the patches more likely to be colonizedwere relatively large and close to other largeoccupied patches.
The conservation management of patchily-distributed species is likely to be more effective bytaking a metapopulation approach than by focus-ing on individual populations. However, “realworld” populations differ from theoretical models.Factors such as the quality of habitat patches andthe nature of the landmosaic throughwhichmove-ments occur are seldom considered in theoreticalmodels, which emphasize spatial attributes (patcharea, isolation). For example, in a metapopulationof the Bay checkerspot butterfly (Euphydryas edithabayensis) in California, USA, populations in topo-graphically heterogeneous fragments were lesslikely to go extinct than those that were in topo-graphically uniform ones. The heterogeneityprovided some areas of suitable topoclimate eachyear over a wide range of local climates (Ehrlichand Hanski 2004).
There also is much variation in the structureof subdivided populations depending on thefrequency of movements between them. Atone end of a gradient is a dysfunctional meta-population where little or no movement oc-curs; while at the other extreme, movementsare so frequent that it is essentially a singlepatchy population.
5.4 Effects of landscape changeon communities
5.4.1 Patterns of community structurein fragmented landscapes
For many taxa—birds, butterflies, rodents, rep-tiles, vascular plants, and more—species richnessin habitat fragments is positively correlated withfragment size. This is widely known as thespecies-area relationship (Figure 5.6a). Thus,when habitats are fragmented into smaller pieces,species are lost; and the likely extent of this losscan be predicted from the species-area relation-ship. Further, species richness in a fragment typi-cally is less than in an area of similar size withincontinuous habitat, evidence that the fragmenta-tion process itself is a cause of local extinction.However, the species-area relationship does notreveal which particular species will be lost.
Three explanations given for the species-arearelationship (Connor and McCoy 1979) are thatsmall areas: (i) have a lower diversity of habitats;(ii) support smaller population sizes and thereforefewer species can maintain viable populations;and (iii) represent a smaller sample of the originalhabitat and so by chance are likely to have fewerspecies than a larger sample. While it is difficult todistinguish between these mechanisms, the mes-sage is clear: when habitats are fragmented intosmaller pieces, species are lost.
Figure 5.5 Diagrammatic representation of two main types of metapopulation models: a) a mainland‐island metapopulation and b) metapopulationwith similar‐sized populations. Habitats occupied by a species are shaded, unoccupied habitat fragments are clear, and the arrows indicate typicalmovements. Reprinted from Bennett (1999).
96 CONSERVATION BIOLOGY FOR ALL
Sodhi and Ehrlich: Conservation Biology for All. http://ukcatalogue.oup.com/product/9780199554249.do
© Oxford University Press 2010. All rights reserved. For permissions please email: [email protected]

Factors other than area, such as the spatial andtemporal isolation of fragments, landmanagementor habitat quality may also be significant predic-tors of the richness of communities in fragments.In Tanzania, for example, the number of forest-understory bird species in forest fragments (from0.1 to 30 ha in size) was strongly related to frag-ment size, as predicted by the species-area rela-tionship (Newmark 1991). After taking fragmentsize into account, further variation in species rich-ness was explained by the isolation distance ofeach fragment from a large source area of forest.
Species show differential vulnerability tofragmentation. Frequently, species with more-
specialized ecological requirements are thoselost from communities in fragments. In severaltropical regions, birds that follow trails of armyants and feed on insects flushed by the ants in-clude specialized ant-following species andothers that forage opportunistically in this way.In rainforest in Kenya, comparisons of flocks ofant-following birds between a main forest andforest fragments revealed marked differences(Peters et al. 2008). The species richness and num-ber of individuals in ant-following flocks werelower in fragments, and the composition of flocksmore variable in small fragments and degradedforest, than in the main forest. This was a conse-quence of a strong decline in abundance of fivespecies of specialized ant-followers in fragments,whereas the many opportunistic followers(51 species) were little affected by fragmentation(Peters et al. 2008).
The way in which fragments are managed is aparticularly important influence on the composi-tion of plant communities. In eastern Australia,for example, grassy woodlands dominated bywhite box (Eucalyptus albens) formerly coveredseveral million hectares, but now occur as smallfragments surrounded by cropland or agricultur-al pastures. The species richness of native under-story plants increases with fragment size, asexpected, but tree clearing and grazing by domes-tic stock are also strong influences (Prober andThiele 1995). The history of stock grazing has thestrongest influence on the floristic composition inwoodland fragments: grazed sites have a greaterinvasion by weeds and a more depauperate na-tive flora.
The composition of animal communities infragments commonly shows systematic changesin relation to fragment size. Species-poor commu-nities in small fragments usually support a subsetof the species present in larger, richer fragments(Table 5.1). That is, there is a relatively predict-able change in composition with species“dropping out” in an ordered sequence in succes-sively smaller fragments (Patterson and Atmar1986). Typically, rare and less common speciesoccur in larger fragments, whereas those presentin smaller fragments are mainly widespread andcommon. This kind of “nested subset” pattern
00
10
20
Num
ber
of s
peci
es
30
40
50
10 20 30Area (ha)
40 50 60
00
10
20
Num
ber
of s
peci
es
30
40
50
60
10 20 30Tree cover (%)
40 50 60
Figure 5.6 Species‐area relationships for forest birds: a) in forestfragments of different sizes in eastern Victoria, Australia (data from Loyn1997); b) in 24 landscapes (each 100 km2) with differing extent ofremnant wooded vegetation, in central Victoria, Australia (data fromRadford et al. 2005). The piecewise regression highlights a thresholdresponse of species richness to total extent of wooded cover.
HABITAT FRAGMENTATION AND LANDSCAPE CHANGE 97
1
© Oxford University Press 2010. All rights reserved. For permissions please email: [email protected]

has been widely observed: for example, in butter-fly communities in fragments of lowland rainfor-est in Borneo (Benedick et al. 2006).
At the landscape level, species richness has fre-quently been correlated with heterogeneity in thelandscape. This relationship is particularly rele-vant in regions, such as Europe, where humanland-use has contributed to cultural habitats thatcomplement fragmented natural or semi-naturalhabitats. In the Madrid region of Spain, the overallrichness of assemblages of birds, amphibians, rep-tiles and butterflies in 100 km2 landscapes isstrongly correlated with the number of differentland-uses in the landscape (Atauri and De Lucio2001). However, where the focus is on the com-munity associated with a particular habitat type(e.g. rainforest butterflies) rather than the entireassemblage of that taxon, the strongest influenceon richness is the total amount of habitat in thelandscape. For example, the richness of woodland-dependent birds in fragmented landscapes insouthern Australia was most strongly influencedby the total extent of wooded cover in each 100km2 landscape, with a marked threshold around10% cover below which species richness declinedrapidly (Figure 5.6b) (Radford et al. 2005).
5.4.2 Processes that affect community structure
Interactions between species, such as predation,competition, parasitism, and an array of mutual-isms, have a profound influence on the structure
of communities. The loss of a species or a changein its abundance, particularly for species that in-teract with many others, can have a marked effecton ecological processes throughout fragmentedlandscapes.Changes to predator-prey relationships, for ex-
ample, have been revealed by studies of the level ofpredation on birds’ nests in fragmented landscapes(Wilcove 1985). An increase in the amount of forestedge, a direct consequence of fragmentation, in-creases the opportunity for generalist predatorsassociated with edges or modified land-uses toprey on birds that nest in forest fragments. In Swe-den, elevated levels of nest predation (on artificialeggs in experimental nests) were recorded in agri-cultural land and at forest edges compared withthe interior of forests (Andrén and Angelstam1988). Approximately 45% of nests at the forestedge were preyed upon compared with less than10% at distances >200 m into the forest. At thelandscape scale, nest predation occurred at a great-er rate in agricultural and fragmented forest land-scapes than in largely forested landscapes (Andrén1992). The relative abundance of different corvidspecies, the main nest predators, varied in relationto landscape composition. The hooded crow(Corvus corone cornix) occurred in greatest abun-dance in heavily cleared landscapes and was pri-marily responsible for the greater predationpressure recorded at forest edges.
Many mutualisms involve interactions be-tween plants and animals, such as occurs in thepollination of flowering plants by invertebrates,birds or mammals. A change in the occurrence orabundance of animal vectors, as a consequence offragmentation, can disrupt this process. For manyplant species, habitat fragmentation has a nega-tive effect on reproductive success, measured interms of seed or fruit production, although therelative impact varies among species (Aguilaret al. 2006). Plants that are self-incompatible(i.e. that depend on pollen transfer from anotherplant) are more susceptible to reduced reproduc-tive success than are self-compatible species. Thisdifference is consistent with an expectation thatpollination by animals will be less effective insmall and isolated fragments. However, pollina-tors are a diverse group and they respond to
Table 5.1 A diagrammatic example of a nested subset pattern ofdistribution of species (A–J) within habitat fragments (1–9).
Species Fragments
1 2 3 4 5 6 7 8 9A + + + + + + + +B + + + + + + +C + + + + + + +D + + + + + +E + + + + + +F + +G + + +H + +I + + +J +
98 CONSERVATION BIOLOGY FOR ALL
Sodhi and Ehrlich: Conservation Biology for All. http://ukcatalogue.oup.com/product/9780199554249.do
© Oxford University Press 2010. All rights reserved. For permissions please email: [email protected]

fragmentation in a variety of ways (Hobbs andYates 2003).
Changes in ecological processes in fragmentsand throughout fragmented landscapes are com-plex and poorly understood. Disrupted interac-tions between species may have flow-on effectstomany other species at other trophic levels. How-ever, the kinds of changes to species interactionsand ecological processes vary between ecosystemsand regions because they depend on the particularsets of species that occur. In parts of North Ameri-ca, nest parasitism by the brown-headed cowbird(Molothrus ater) has a marked effect on bird com-munities in fragments (Brittingham and Temple1983); while in eastern Australia, bird commu-nities in small fragments may be greatly affectedby aggressive competition from the noisy miner(Manorina melanocephala) (Grey et al. 1997). Both ofthese examples are idiosyncratic to their region.They illustrate the difficulty of generalizing theeffects of habitat fragmentation, and highlight theimportance of understanding the consequences oflandscape change in relation to the environment,context and biota of a particular region.
5.5 Temporal change in fragmentedlandscapes
Habitat loss and fragmentation do not occur in asingle event, but typically extend over many dec-ades. Incremental changes occur year by year asremaining habitats are destroyed, reduced in size,or further fragmented (Figure 5.2). Landscapesare also modified through time as the humanpopulation increases, associated settlements ex-pand, and new forms of land use are introduced.
In addition to such changes in spatial pattern,habitat fragmentation sets in motion ongoingchanges within fragments and in the interactionsbetween fragments and their surroundings.When a fragment is first isolated, species richnessdoes not immediately fall to a level commensu-rate with its long-term carrying capacity; rather, agradual loss of species occurs over time—termed“species relaxation”. That is, there is a time-lag inexperiencing the full effects of fragmentation(see Box 5.1). The rate of change is most rapid in
smaller fragments, a likely consequence of thesmaller population sizes of species and the great-er vulnerability of such fragments to external dis-turbances. For example, based on a sequence ofsurveys of understory birds in tropical forest frag-ments at Manaus, Brazil, an estimate of the timetaken for fragments to lose half their species wasapproximately 5 years for 1 ha fragments, 8 yearsfor 10 ha fragments, and 12 years for a 100 hafragment (Ferraz et al. 2003).
Ecological processes within fragments also ex-perience ongoing changes in the years after isola-tion because of altered species interactions andincremental responses to biophysical changes.One example comes from small fragments oftropical dry forest that were isolated by risingwater in a large hydroelectric impoundmentin Venezuela (Terborgh et al. 2001). On small(< 1 ha) and medium (8–12 ha) fragments, isola-tion resulted in a loss of large predators typical ofextensive forest. Seed predators (small rodents)and herbivores (howler monkeys Alouatta senicu-lus, iguanas Iguana iguana, and leaf-cutter ants)became hyperabundant in these fragments, withcascading effects on the vegetation. Comparedwith extensive forest, fragments experienced re-duced recruitment of forest trees, changes in veg-etation composition, and dramatically modifiedfaunal communities, collectively termed an “eco-logical meltdown” (Terborgh et al. 2001).
5.6 Conservation in fragmentedlandscapes
Conservation of biota in fragmented landscapesis critical to the future success of biodiversityconservation and to the well-being of humans.National parks and dedicated conservation re-serves are of great value, but on their own aretoo few, too small, and not sufficiently represen-tative to conserve all species. The future status ofa large portion of Earth’s biota depends onhow effectively plants and animals can be main-tained in fragmented landscapes dominated byagricultural and urban land-uses. Further, thepersistence of many species of plants and animalsin these landscapes is central to maintaining
HABITAT FRAGMENTATION AND LANDSCAPE CHANGE 99
1
© Oxford University Press 2010. All rights reserved. For permissions please email: [email protected]

ecosystem services that sustain food production,clean water, and a sustainable living environmentfor humans. Outlined below are six kinds of ac-tions necessary for a strategic approach to conser-vation in fragmented landscapes.
5.6.1 Protect and expand the amount of habitat
Many indicators of conservation status, such aspopulation sizes, species richness, and the occur-rence of rare species, are positively correlatedwith the size of individual fragments or the totalamount of habitat in the landscape. Consequent-ly, activities that protect and expand natural andsemi-natural habitats are critical priorities inmaintaining plant and animal assemblages (seealso Chapter 11). These include measures that:
· Prevent further destruction and fragmentation ofhabitats.
· Increase the size of existing fragments and thetotal amount of habitat in the landscape.
· Increase the area specifically managed for conser-vation.
· Give priority to protecting large fragments.
All fragments contribute to the overall amountand pattern of habitat in a landscape; consequent-ly, incremental loss, even of small fragments, hasa wider impact.
5.6.2 Enhance the quality of habitats
Measures that enhance the quality of existinghabitats and maintain or restore ecological pro-cesses are beneficial. Such management actionsmust be directed toward specific goals relevantto the ecosystems and biota of concern. Theseinclude actions that:
· Control degrading processes, such as the inva-sion of exotic plants and animals.
· Manage the extent and impact of harvesting nat-ural resources (e.g. timber, firewood, bushmeat).
· Maintain natural disturbance regimes and theconditions suitable for regeneration and establish-ment of plants.
· Provide specific habitat features required by par-ticular species (e.g. tree hollows, rock crevices,“specimen” rainforest trees used by rainforestbirds in agricultural countryside).
5.6.3 Manage across entire landscapes
Managing individual fragments is rarely effectivebecause even well managed habitats can be de-graded by land uses in the surrounding environ-ment. Further, many species use resources fromdifferent parts of the landscape; and the patternand composition of land uses affect the capacityof species to move throughout the landscape.Two broad kinds of actions relating to the widerlandscape are required:
· Manage specific issues that have degrading im-pacts across the boundaries of fragments, such aspest plants or animals, soil erosion, sources of pollu-tion or nutrient addition, and human recreationalpressure.
· Address issues that affect the physical environ-ment and composition of the land mosaic acrossbroad scales, such as altered hydrological regimesand the density of roads and other barriers.
5.6.4 Increase landscape connectivity
Measures that enhance connectivity and createlinked networks of habitat will benefit the conser-vation of biota in fragmented landscapes. Con-nectivity can be increased by providing specificlinkages, such as continuous corridors or step-ping stones, or by managing the entire mosaic toallow movements of organisms. Actions that en-hance connectivity include:
· Protecting connecting features already present,such as streamside vegetation, hedges and livefences.
· Filling gaps in links or restoring missing connec-tions.
· Maintaining stepping-stone habitats for mobilespecies (such as migratory species).
· Retaining broad habitat links between conserva-tion reserves.
· Developing regional and continental networks ofhabitat (see Boxes 5.2 and 5.3).
100 CONSERVATION BIOLOGY FOR ALL
Sodhi and Ehrlich: Conservation Biology for All. http://ukcatalogue.oup.com/product/9780199554249.do
© Oxford University Press 2010. All rights reserved. For permissions please email: [email protected]

Box 5.2 Gondwana Link: a major landscape reconnection projectDenis A. Saunders and Andrew F. Bennett
In many locations throughout the world,conservation organizations and communitygroups are working together to protect andrestore habitats as ecological links betweenotherwise‐isolated areas. These actions are apractical response to the threats posed byhabitat destruction and fragmentation and areundertaken at a range of scales, from local tocontinental. Gondwana Link, in south‐westernAustralia, is one such example of an ambitiousplan to restore ecological connectivity andenhance nature conservation across a largegeographic region.
The southwest region of Australia is one ofthe world’s 34 biodiversity “hotspots”. It isparticularly rich in endemic plant species. Theregion has undergone massive changes overthe past 150 years as a result of developmentfor broadscale agricultural cropping andraising of livestock. Over 70% of the area ofnative vegetation has been removed. Theremaining native vegetation consists ofthousands of fragments, most of which are lessthan 100 ha. Many areas within the regionhave less than 5–10% of their originalvegetation remaining.
continues
Box 5.2 Figure Diagrammatic representation of the Gondwana Link in south‐west Western Australia. Shaded areas indicate remnantnative vegetation.
continues
HABITAT FRAGMENTATION AND LANDSCAPE CHANGE 101
1
© Oxford University Press 2010. All rights reserved. For permissions please email: [email protected]

Box 5.2 (Continued)
This massive removal of native vegetationhas led to a series of changes to ecologicalprocesses, producing a wide range of problemsthat must be addressed. Without some form ofremedial action, over 6 million hectares of land(30% of the region’s cleared land) will becomesalinized over the next 50 years, over 50% ofvegetation on nature reserves will bedestroyed, around 450 endemic species of plantwill become extinct, over half of all bird speciesfrom the region will be adversely affected, andno potable surface water will be available inthe region because of water pollution by salt.Addressing the detrimental ecological
consequences involves the revegetation, withdeep‐rooted trees and shrubs, of up to 40% ofcleared land in the region. Gondwana Link is anambitious conservation project involvingindividuals, local, regional and national groupsaddressing these detrimental ecologicalconsequences. The objective of Gondwana Linkis to restore ecological connectivity acrosssouth‐western Australia. The aim is to provideecological connections from the tall wet forestsof the southwest corner of the state to the drywoodland in the arid interior. This will involveprotecting and replanting native vegetationalong a “living link” that stretches over 1000km from the wettest corner of WesternAustralia into the arid zone (see Box 5.2 Figure
and Plate 6). It also involves protecting andmanaging the fragments of native vegetationthat they are reconnecting.The groups believe that by increasing
connectivity and restoring key habitats theywill enable more mobile species that aredependent on native vegetation to move safelybetween isolated populations. This shouldreduce the localized extinctions of species fromisolated fragments of native vegetation that ishappening at present. Gondwana Link shouldalso allow species to move as climaticconditions change over time. The revegetationshould also have an impact on the hydrologicalregime by decreasing the amount of waterentering the ground water, and reduce thequantity of sediment and pollution fromagriculture entering the river and estuarinesystems.In addition to addressing environmental
issues the project is speeding up thedevelopment of new cultural and economicways for the region’s human population toexist sustainably.
Relevant website
• Gondwana Link: http://gondwanalink.org/index.html.
Box 5.3 RewildingPaul R. Ehrlich
Some conservation scientists believe that theultimate cure for habitat loss andfragmentation that is now spreading likeecological smallpox over Earth is a radical formof restoration, called rewilding in NorthAmerica. The objective of rewilding is to restoreresilience and biodiversity by re‐connectingsevered habitats over large scales and by
facilitating the recovery of strongly interactivespecies, including predators. Rewilding is thegoal of the “Wildlands Network,” an effort ledby Michael Soulé and Dave Foreman (Foreman2004). The plan is to re-connect relativelyundisturbed, but isolated areas of NorthAmerica, into extensive networks in whichlarge mammals such as bears, mountain lions,
continues
102 CONSERVATION BIOLOGY FOR ALL
Sodhi and Ehrlich: Conservation Biology for All. http://ukcatalogue.oup.com/product/9780199554249.do
© Oxford University Press 2010. All rights reserved. For permissions please email: [email protected]

Box 5.3 (Continued)
wolves, elk, and even horses and elephants(which disappeared from North America only11 000 years ago) can roam free and resumetheir important ecological roles in ecosystemswhere conflict with humans would be minimal.Rewilding would restore landscape linkages—employing devices from vegetated overpassesover highways to broad habitat corridors—allowing the free movement of fauna and floraand accommodation to climate change. Thecooperation of government agencies andwilling landowners would eventually createfour continental scale wildways (formerlycalled MegaLinkages):
Pacific Wildway: From southern Alaskathrough the Coast Range of British Col-umbia, the Cascades, and the Sierra Ne-vada to the high mountains of northernBaja California.
Spine of the Continent Wildway: Fromthe Brooks Range of Alaska through theRocky Mountains to the uplands of West-ern Mexico.
Atlantic Wildway: From the CanadianMaritime south, mostly through theAppalachians to Okefenokee and theEverglades.
Arctic-Boreal Wildway: Northern NorthAmerica from Alaska through the Canadi-an arctic/subarctic to Labrador with an ex-tension into the Upper Great Lakes.
Many critical ecological processes aremediated by larger animals and plants, andthe recovery, dispersal, and migration of thesekeystone and foundation species (species thatare critical in maintaining the structure ofcommunities disproportionately more thantheir relative abundance) is essential if natureis to adapt to stresses such a climate changeand habitat loss caused by energydevelopment, sprawl, and the proliferation ofroads. Rewilding will help restore ecosystemsin the Wildways to structural and functional
states more like those that prevailed beforeindustrial society accelerated thetransformation of the continent. Similarrewilding projects on other continents arenow in the implementation stage—as in the“Gondwana Link” in Australia (see Box 5.2).The possible downsides to rewilding includethe spread of some diseases, invasive species,and fires and the social and economicconsequences of increased livestockdepredation caused by large, keystonepredators (as have accompanied wolfreintroduction programs) (Maehr et al.2001). Careful thought also is needed aboutthe size of these Wildways; to be sure theyare large enough for these species to againpersist in their “old homes”. Nonetheless, itseems clear that such potential costs ofrewilding would be overwhelmed by theecological and economic-cultural benefits thatwell designed and monitored reintroductionscould provide.
REFERENCES AND SUGGESTED READING
Donlan, J. C., Berger, J., Bock, C. E., et al. (2006). Pleisto-cene rewilding: an optimistic agenda for twenty-firstcentury conservation. American Naturalist, 168,660–681.
Foreman, D. (2004). Rewilding North America: a visionfor conservation in the 21st Century. Island Press,Washington, DC.
Maehr, D. S., Noss, R. F., and Larkin, J. L., eds (2001). Largemammal restoration: ecological and sociological chal-lenges in the 21st centuary. Island Press, Washington,DC.
Soulé, M. E. and Terborgh, J. (1999). Continental conser-vation: scientific foundations of regional reserve net-works. Island Press, Washington, DC.
Soulé, M. E., Estes, J. A., Miller, B., and Honnold, D. L.(2005). Highly interactive species: conservationpolicy, management, and ethics. BioScience, 55,168–176.
HABITAT FRAGMENTATION AND LANDSCAPE CHANGE 103
1
© Oxford University Press 2010. All rights reserved. For permissions please email: [email protected]

5.6.5 Plan for the long term
Landscape change is ongoing. Over the long-term, incremental destruction and fragmenta-tion of habitats have profound consequencesfor conservation. Long-term planning is re-quired to sustain present conservation valuesand prevent foreclosure of future options.Actions include:
· Using current knowledge to forecast the likelyconsequences if ongoing landscape change occurs.
· Developing scenarios as a means to consider al-ternative future options.
· Developing a long-term vision, shared by thewider community, of land use and conservationgoals for a particular region.
5.6.6 Learn from conservation actions
Effective conservation in fragmented landscapesdemands that we learn from current managementin order to improve future actions. Several issuesinclude:
· Integrating management and research to moreeffectively evaluate and refine conservation mea-sures.
· Monitoring the status of selected speciesand ecological processes to evaluate the longer-term outcomes and effectiveness of conservationactions.
Summary
· Destruction and fragmentation of habitats aremajor factors in the global decline of species, themodification of native plant and animal commu-nities and the alteration of ecosystem processes.
· Habitat destruction, habitat fragmentation (orsubdivision) and new forms of land use are closelyintertwined in an overall process of landscapechange.
· Landscape change is not random: dispropor-tionate change typically occurs in flatter areas,at lower elevations and on more-productive soils.
· Altered physical processes (e.g. wind and waterflows) and the impacts of human land-use have a
profound influence on fragments and their biota,particularly at fragment edges.
· Different species have different ecological attri-butes (such as scale of movement, life-history stages,what constitutes habitat) which influence how aspecies perceives a landscape and its ability to sur-vive in modified landscapes.
· Differences in the vulnerability of species to land-scape change alter the structure of communities andmodify interactions between species (e.g. pollina-tion, parasitism).
· Changes within fragments, and between frag-ments and their surroundings, involve time-lags be-fore the full consequences of landscape change areexperienced.
· Conservation in fragmented landscapes can beenhanced by: protecting and increasing the amountof habitat, improving habitat quality, increasingconnectivity, managing disturbance processes inthe wider landscape, planning for the long term,and learning from conservation actions undertaken.
Suggested reading
Forman, R. T. T. (1995). Land mosaics. The ecology of land-scapes and regions. Cambridge University Press, Cam-bridge, UK.
Hobbs, R. J. and Yates, C. J. (2003). Turner Review No. 7.Impacts of ecosystem fragmentation on plant popula-tions: generalising the idiosyncratic. Australian Journalof Botany, 51, 471–488.
Laurance, W. F. and Bierregard, R. O., eds (1997). Tropicalforest remnants: ecology, management, and conservation offragmented communities. University of Chicago Press,Chicago, Illinois.
Lindenmayer, D. B. and Fischer, J. (2006). Habitat fragmen-tation and landscape change. An ecological and conservationsynthesis. CSIRO Publishing, Melbourne, Australia.
Relevant websites
· Sustainable forest partnerships: http://sfp.cas.psu.edu/fragmentation/fragmentation.html.
· Smithsonian National Zoological Park, MigratoryBird Center: http://nationalzoo.si.edu/ConservationAndScience/ MigratoryBirds/Research/Forest_Fragmentation/default.cfm.
104 CONSERVATION BIOLOGY FOR ALL
Sodhi and Ehrlich: Conservation Biology for All. http://ukcatalogue.oup.com/product/9780199554249.do
© Oxford University Press 2010. All rights reserved. For permissions please email: [email protected]

· United States Department of Agriculture, ForestService: http://nationalzoo.si.edu/ConservationAndScience/MigratoryBirds/Research/Forest_Fragmentation/default.cfm.
· Mongabay: http://www.mongabay.com.
REFERENCES
Aguilar, R., Ashworth, L., Galetto, L., and Aizen, M. A.(2006). Plant reproductive susceptibility to habitat frag-mentation: review and synthesis through a meta-analy-sis. Ecology Letters, 9, 968–980.
Andrén, H. (1992). Corvid density and nest predation inrelation to forest fragmentation: a landscape perspective.Ecology, 73, 794–804.
Andrén, H. and Angelstam, P. (1988). Elevated predationrates as an edge effect in habitat islands: experimentalevidence. Ecology, 69, 544–547.
Atauri, J. A. and De Lucio, J. V. (2001). The role of land-scape structure in species richness distribution of birds,amphibians, reptiles and lepidopterans in Mediterra-nean landscapes. Landscape Ecology, 16, 147–159.
Benedick, S., Hill, J. K., Mustaffa, N., et al. (2006). Impacts ofrainforest fragmentation on butterflies in northern Bor-neo: species richness, turnover and the value of smallfragments. Journal of Applied Ecology, 43, 967–977.
Bennett, A. F. (1999). Linkages in the landscape. The role ofcorridors and connectivity in wildlife conservation. IUCN-The World Conservation Union, Gland, Switzerland.
Bright, P. W., Mitchell, P., and Morris, P. A. (1994). Dor-mouse distribution: survey techniques, insular ecologyand selection of sites for conservation. Journal of AppliedEcology, 31, 329–339.
Brittingham, M. and Temple, S. (1983). Have cowbirdscaused forest songbirds to decline? BioScience, 33, 31–35.
Brooker, L. and Brooker, M. (2002). Dispersal and popula-tion dynamics of the blue-breasted fairy-wren, Maluruspulcherrimus, in fragmented habitat in the Western Aus-tralian wheatbelt. Wildlife Research, 29, 225–233.
Chapman, C. A., Balcomb, S. R., Gillespie, T. R., Skorupa,J. P., and Struhsaker, T. T. (2000). Long-term effects oflogging on African primate communities: a 28 year com-parison from Kibale National Park, Uganda. Conserva-tion Biology, 14, 207–217.
Connor, E. F. and Mccoy, E. D. (1979). The statistics andbiology of the species-area relationship. American Natu-ralist, 113, 791–833.
Daily, G.C., Ceballos, G., Pacheco, J., Suzán, G., and Sán-chez-Azofeifa, A. (2003). Countryside biogeography ofneotropical mammals: conservation opportunities in ag-
ricultural landscapes of Costa Rica. Conservation Biology,17, 1814–1826.
Ehrlich, P. and Hanski, I., eds (2004). On the wings of check-erspots: A model system for population biology. Oxford Uni-versity Press, Oxford, UK.
Fahrig, L. (2003). Effects of habitat fragmentation on biodi-versity.Annual Review of Ecology and Systematics, 34, 487–515.
Ferraz, G., Russell, G. J., Stouffer, P. C., Bierregaard, R. O.,Pimm, S. L., and Lovejoy, T. E. (2003). Rates of speciesloss from Amazonian forest fragments. Proceedingsof the National Academy of Sciences, United States ofAmerica, 100, 14069–14073.
Ferris-Kaan, R. (1995). Management of linear habitats forwildlife in British forests. In D. A. Saunders, J. L. Craig,and E. M. Mattiske, eds Nature conservation 4: the role ofnetworks, pp. 67–77. Surrey Beatty and Sons, ChippingNorton, Australia.
Fischer, J., Lindenmayer, D. B., and Fazey, I. (2004). Ap-preciating ecological complexity: habitat contours as aconceptual landscape model. Conservation Biology, 18,1245–1253.
Forman, R. T. T. and Godron, M. (1986). Landscape ecology.John Wiley and Sons, New York.
Gascon, C., Lovejoy, T. E., Bierregaard, R. O., Malcolm,J. R., Stouffer, P. C., Vasconcelos, H. L., Laurance,W. F., Zimmerman, B., Tocher, M., and Borges,S. (1999). Matrix habitat and species richness in tropicalforest remnants. Biological Conservation, 91, 223–229.
Grey, M. J., Clarke, M. F., and Loyn, R. H. (1997). Initialchanges in the avian communities of remnant eucalyptwoodlands following reduction in the abundance ofnoisy miners, Manorina melanocephala. Wildlife Research,24, 631–648.
Haddad, N. M., Bowne, D. R., Cunningham, A., Danielson,B. J., Levey, D. J., Sargent, S., and Spira, T. (2003). Corri-dors use by diverse taxa. Ecology, 84, 609–615.
Hanski, I. (1999).Metapopulation ecology. Oxford UniversityPress, Oxford, UK.
Harvey, C. A., Medina, A., Sanchez, D., et al. (2006). Pat-terns of animal diversity in different forms of tree coverin agricultural landscapes. Ecological Applications, 16,1986–1999.
Hill, J. K., Thomas, C. D., and Lewis, O. T. (1996). Effects ofhabitat patch size and isolation on dispersal by Hesperiacomma butterflies: implications for metapopulationstructure. Journal of Animal Ecology, 65, 725–735.
Hobbs, R. J. (1993). Effects of landscape fragmentation onecosystem processes in the Western Australian wheat-belt. Biological Conservation, 64, 193–201.
Hobbs, R. J. and Yates, C. J. (2003). Turner Review No. 7.Impacts of ecosystem fragmentation on plant
HABITAT FRAGMENTATION AND LANDSCAPE CHANGE 105
1
© Oxford University Press 2010. All rights reserved. For permissions please email: [email protected]

populations: generalising the idiosyncratic. AustralianJournal of Botany, 51, 471–488.
Laurance, W. F. (2008). Theory meets reality: how habitatfragmentation research has transcended island biogeo-graphic theory. Biological Conservation, 141, 1731–1744.
Lindenmayer, D. B. and Fischer, J. (2006). Habitat fragmen-tation and landscape change. An ecological and conservationsynthesis. CSIRO Publishing, Melbourne, Australia.
Loyn, R. H. (1987). Effects of patch area and habitat on birdabundances, species numbers and tree health in fragmen-ted Victorian forests. In D. A. Saunders, G. W. Arnold, A.A. Burbidge, and A. J. M. Hopkins, eds Nature conserva-tion: the role of remnants of native vegetation, pp. 65–77.Surrey Beatty and Sons, Chipping Norton, Australia.
Lunt, I. D. and Spooner, P. G. (2005). Using historicalecology to understand patterns of biodiversity in frag-mented agricultural landscapes. Journal of Biogeography,32, 1859–1873.
MacArthur, R. H. and Wilson, E. O. (1967). The theory ofisland biogeography. Princeton University Press, Prince-ton, New Jersey.
McGarigal, K. and Cushman, S. A. (2002). Comparativeevaluation of experimental approaches to the study ofhabitat fragmentation effects. Ecological Applications, 12,335–345.
McIntyre, S. and Hobbs, R. (1999). A framework for con-ceptualizing human effects on landscapes and its rele-vance to management and research models. ConservationBiology, 13, 1282–1292.
Newmark, W. D. (1991). Tropical forest fragmentation andthe local extinction of understory birds in the EasternUsambara Mountains, Tanzania. Conservation Biology, 5,67–78.
Patterson, B. D. and Atmar, W. (1986). Nested subsets andthe structure of insular mammalian faunas and archipe-lagoes. Biological Journal of the Linnean Society, 28, 65–82.
Peres, C. A. (2001). Synergistic effects of subsistence hunt-ing and habitat fragmentation on Amazonian forest ver-tebrates. Conservation Biology, 15, 1490–1505.
Peters, M. K., Likare, S., and Kraemar, M. (2008). Effects ofhabitat fragmentation and degradation onflocks ofAfricanant-following birds. Ecological Applications, 18, 847–858.
Prober, S. M. and Thiele, K. R. (1995). Conservation of thegrassy white box woodlands: relative contributions ofsize and disturbance to floristic composition and diver-sity of remnants.Australian Journal of Botany, 43, 349–366.
Radford, J. Q. and Bennett, A. F. (2007). The relative impor-tance of landscape properties for woodland birds inagricultural environments. Journal of Applied Ecology, 44,737–747.
Radford, J. Q., Bennett, A. F., and Cheers, G. J. (2005).Landscape-level thresholds of habitat cover for wood-land-dependent birds. Biological Conservation, 124,317–337.
Redpath, S. M. (1995). Habitat fragmentation and the indi-vidual: tawny owls Strix aluco in woodland patches.Journal of Animal Ecology, 64, 652–661.
Ricketts, T. H. (2001). The matrix matters: effective isola-tion in fragmented landscapes. The American Naturalist,158, 87–99.
Saunders, D. A. and Hobbs, R. J., eds (1991). Nature conser-vation 2: The role of corridors. Surrey Beatty & Sons, Chip-ping Norton, New South Wales.
Saunders, D. A., Hobbs, R. J., and Arnold, G. W. (1993). TheKellerberrinproject on fragmented landscapes: a reviewofcurrent information. Biological Conservation, 64, 185–192.
Saunders, D. A., Hobbs, R. J., and Margules, C. R. (1991).Biological consequences of ecosystem fragmentation: areview. Conservation Biology, 5, 18–32.
Sekercioglu, C. H., Ehrlich, P. R., Daily, G. C., Aygen, D.,Goehring, D., and Sandi, R. F. (2002). Disappearance ofinsectivorous birds from tropical forest fragments. Pro-ceedings of the National Academy of Sciences of the UnitedStates of America, 99, 263–267.
Soulé, M. E. (1986). Conservation biology and the “realworld”. In M. E. Soule, ed. Conservation biology. Thescience of scarcity and diversity, pp. 1–12. Sinauer Associ-ates, Sunderland, Massachusetts.
Terborgh, J., Lopez, L., Nunez V. P., et al. (2001). Ecologicalmeltdown in predator-free forest fragments. Science, 294,1923–1926.
Trzcinski, M. K., Fahrig, L., and Merriam, G. (1999). Inde-pendent effects of forest cover and fragmentation on thedistribution of forest breeding birds. Ecological Applica-tions, 9, 586–593.
Virgos, E. (2001). Role of isolation and habitat quality inshaping species abundance: a test with badgers (Melesmeles L.) in a gradient of forest fragmentation. Journal ofBiogeography, 28, 381–389.
Wilcove, D. S. (1985). Nest predation in forest tractsand the decline of migratory songbirds. Ecology, 66,1211–1214.
106 CONSERVATION BIOLOGY FOR ALL
Sodhi and Ehrlich: Conservation Biology for All. http://ukcatalogue.oup.com/product/9780199554249.do
© Oxford University Press 2010. All rights reserved. For permissions please email: [email protected]

CHAP T E R 6
OverexploitationCarlos A. Peres
In an increasingly human-dominated world,where most of us seem oblivious to the liquida-tion of Earth’s natural resource capital (Chapters3 and 4), exploitation of biological populationshas become one of the most important threatsto the persistence of global biodiversity. Manyregional economies, if not entire civilizations,have been built on free-for-all extractive indus-tries, and history is littered with examples ofboom-and-bust economic cycles following theemergence, escalation and rapid collapse of un-sustainable industries fuelled by raw renewableresources. The economies of many modernnation-states still depend heavily on primary ex-tractive industries, such as fisheries and logging,and this includes countries spanning nearly theentire spectrum of per capita Gross NationalProduct (GNP), such as Iceland and Cameroon.
Human exploitation of biological commoditiesinvolves resource extraction from the land, fresh-water bodies or oceans, so that wild animals,plants or their products are used for a wide vari-ety of purposes ranging from food to fuel, shelter,fiber, construction materials, household and gar-den items, pets, medicines, and cosmetics. Over-exploitation occurs when the harvest rate of anygiven population exceeds its natural replacementrate, either through reproduction alone in closedpopulations or through both reproduction andimmigration from other populations. Many spe-cies are relatively insensitive to harvesting, re-maining abundant under relatively high rates ofofftake, whereas others can be driven to localextinction by even the lightest levels of offtake.Fishing, hunting, grazing, and logging are classicconsumer-resource interactions and in naturalsystems such interactions tend to come into equi-librium with the intrinsic productivity of a given
habitat and the rates at which resources are har-vested. Furthermore, efficiency of exploitation byconsumers and the highly variable intrinsic resil-ience to exploitation by resource populations mayhave often evolved over long periods. Central tothese differences are species traits such as thepopulation density (or stock size), the per capitagrowth rate of the population, spatial diffusionfrom other less harvested populations, and thedirection and degree to which this growth re-sponds to harvesting through either positive ornegative density dependence. For example, manylong-lived and slow-growing organisms are par-ticularly vulnerable to the additive mortality re-sulting from even the lightest offtake, especially ifthese traits are combined with low dispersal ratesthat can inhibit population diffusion from adja-cent unharvested source areas, should these beavailable. These species are often threatened byoverhunting in many terrestrial ecosystems, un-sustainable logging in tropical forest regions, cac-tus “rustling” in deserts, overfishing in marineand freshwater ecosystems, or many other formsof unsustainable extraction. For example, over-hunting is the most serious threat to large verte-brates in tropical forests (Cunningham et al. 2009),and overexploitation, accidental mortality andpersecution caused by humans threatens approx-imately one-fifth (19%) of all tropical forest verte-brate species for which the cause of decline hasbeen documented [Figure 6.1; IUCN (Internation-al Union for Conservation of Nature) 2007].
Overexploitation is the most important causeof freshwater turtle extinctions (IUCN 2007) andthe third-most important for freshwater fish ex-tinctions, behind the effects of habitat loss andintroduced species (Harrison and Stiassny 1999).Thus, while population declines driven by habitat
107
© Oxford University Press 2010. All rights reserved. For permissions please email: [email protected]
1

loss and degradation quite rightly receive a greatdeal of attention from conservation biologists(MEA 2006), we must also contend with the spec-ter of the ‘empty’ or ‘half-empty’ forests, savan-nahs, wetlands, rivers, and seas, even if thephysical habitat structure of a given ecosystemremains otherwise unaltered by other anthropo-genic processes that degrade habitat quality (seeChapter 4). Overexploitation also threatens frogs:with Indonesia the main exporter of frog legs formarkets in France and the US (Warkentin et al.2009). Up to one billion wild frogs are estimatedto be harvested every year for human consump-tion (Warkentin et al. 2009).
I begin this chapter with a consideration ofwhy people exploit natural populations, includ-ing the historical impacts of exploitation on wildplants and animals. This is followed by a reviewof effects of exploitation in terrestrial and aquaticbiomes. Throughout the chapter, I focus on tropi-cal forests and marine ecosystems because manyplant and animal species in these realms havesuccumbed to some of the most severe and leastunderstood overexploitation-related threats topopulation viability of contemporary times. I
then explore impacts of exploitation on both tar-get and non-target species, as well as cascadingeffects on the ecosystem. This leads to a reflectionat the end of this chapter of resource managementconsiderations in the real-world, and the clashesof culture between those concerned with eitherthe theoretical underpinnings or effective policysolutions addressing the predicament of speciesimperiled by overexploitation.
6.1 A brief history of exploitation
Our rapacious appetite for both renewable andnon-renewable resources has grown exponential-ly from our humble beginnings—when earlyhumans exerted an ecological footprint no largerthan that of other large omnivorous mammals—to currently one of the main driving forces inreorganizing the structure of many ecosystems.Humans have subsisted on wild plants and ani-mals since the earliest primordial times, and mostcontemporary aboriginal societies remain pri-marily extractive in their daily quest for food,medicines, fiber and other biotic sources of raw
0 2000 4000 6000
Number of tropical forest species
Total
Bird
Amphibian
Mammal
8000 10000 12000
Figure 6.1 Importance of threats to tropical forest terrestrial vertebrate species other than reptiles, which have not yet been assessed. Horizontal barsindicate the total number of species occurring in tropical forests; dark grey bars represent the fraction of those species classified as vulnerable,endangered, critically endangered or extinct in the wild according to the IUCN (2007) Red List of Threatened Species (www.iucnredlist.org). Dark slicesin pie charts indicate the proportion of species for which harvesting, accidental mortality or persecution by humans is the primary cause of populationdeclines.
108 CONSERVATION BIOLOGY FOR ALL
© Oxford University Press 2010. All rights reserved. For permissions please email: [email protected]
Sodhi and Ehrlich: Conservation Biology for All. http://ukcatalogue.oup.com/product/9780199554249.do

materials to produce a wide range of utilitarianand ornamental artifacts. Modern hunter-gath-erers and semi-subsistence farmers in tropicalecosystems, at varying stages of transition to anagricultural economy, still exploit a large numberof plant and animal populations.
By definition, exploited species extant todayhave been able to co-exist with some backgroundlevel of exploitation. However, paleontologicalevidence suggests that prehistoric peoples havebeen driving prey populations to extinction longbefore the emergence of recorded history. Thelate Paleolithic archaeology of big-game huntersin several parts of the world shows the sequentialcollapse of their majestic lifestyle. Flint spear-heads manufactured by western European Cro-Magnons became gradually smaller as theyshifted down to ever smaller kills, ranging insize from mammoths to rabbits (Martin 1984).Human colonization into previously people-freeislands and continents has often coincided with arapid wave of extinction events resulting from thesudden arrival of novel consumers. Mass extinc-tion events of large-bodied vertebrates in Europe,parts of Asia, North and South America, Mada-gascar, and several archipelagos have all beenattributed to post-Pleistocene human overkill(Martin andWright 1967; Steadman 1995; McKin-ney 1997; Alroy 2001). These are relatively wellcorroborated in the (sub)fossil record but manymore obscure target species extirpated by archaichunters will remain undetected.
In more recent times, exploitation-induced ex-tinction events have also been common as Europe-an settlers wielding superior technology greatlyexpanded their territorial frontiers and introducedmarket and sport hunting. One example is thedecimation of the vast North American buffalo(bison; Bison bison) herds. In the 1850s, tens ofmillions of these ungulates roamed the GreatPlains in herds exceeding those ever known forany other megaherbivore, but by the century’sclose, the bison was all but extinct. Another exam-ple is the extirpation of monodominant stands ofPau-Brasil legume trees (Caesalpinia echinata, Legu-minosae-Mimosoidae) from eastern Brazil, asource of red dye and hardwood that gave Brazilits name. These were once extremely abundant
and formed dense clusters along 3000 km of coast-al Atlantic forest. This species sustained the firsttrade cycle between the new Portuguese colonyand European markets and was relentlesslyexploited from 1500 to 1875when it finally becameeconomically extinct (Dean 1996). Today, speci-mens of Pau-Brasil trees are largely confined toherbaria, arboreta and a few private collections.The aftershock of modern human arrival is stillbeing felt in many previously inaccessible tropicalforest frontiers, such as those in parts of Amazo-nia, where greater numbers of hunters wieldingfirearms are emptying vast areas of its harvest-sensitive megafauna (Peres and Lake 2003).
In many modern societies, the exploitativevalue of wildlife populations for either subsis-tence or commercial purposes has been graduallyreplaced by recreational values including bothconsumptive and non-consumptive uses. In1990, over 20 million hunters in the United Statesspent over half a billion days afield in pursuit ofwild game, and hunting licenses finance vastconservation areas in North America. In 2006,~87.5 million US residents spent ~US$122.3 bil-lion in wildlife-related recreational activities, in-cluding ~US$76.6 billion spent on fishing and/orhunting by 33.9 million people (US Census Bu-reau 2006). Some 10% of this total is spent hunt-ing white-tailed deer alone (Conover 1997).Consumptive uses of wildlife habitat are there-fore instrumental in either financing or justifyingmuch of the conservation acreage available in the21st century from game reserves in Africa, Aus-tralia and North America to extractive reserves inAmazonia, to the reindeer rangelands of Scandi-navia and the saiga steppes of Mongolia.
Strong cultural or social factors regulating re-source choice often affect which species are taken.For example, while people prefer to hunt large-bodied mammals in tropical forests, feedingtaboos and restrictions can switch “on or off”depending on levels of game depletion (Ross1978) as predicted by foraging theory. This isconsistent with the process of de-tabooing speciesthat were once tabooed, as the case of brocketdeer among the Siona-Secoya (Hames and Vick-ers 1982). However, several studies suggest thatcultural factors breakdown and play a lesser role
OVEREXPLOITATION 109
© Oxford University Press 2010. All rights reserved. For permissions please email: [email protected]
1
when large-bodied game species become scarce,thereby forcing discriminate harvesters to be-come less selective (Jerozolimski and Peres 2003).
6.2 Overexploitation in tropical forests
6.2.1 Timber extraction
Tropical deforestation is driven primarily byfrontier expansion of subsistence agricultureand large development programs involving re-settlement, agriculture, and infrastructure(Chapter 4). However, animal and plant popula-tion declines are typically pre-empted by hunt-ing and logging activity well before the coup degrâce of deforestation is delivered. It is estimatedthat between 5 and 7 million hectares of tropicalforests are logged annually, approximately68-79% of the area that was completely defor-ested each year between 1990 and 2005 [FAO(Food and Agriculture Organization of theUnited Nations) 2007]. Tropical forests accountfor ~25% of the global industrial wood produc-tion worth US$400 billion or ~2% of the globalgross domestic product [WCFSD (World Com-mission on Forests and Sustainable Develop-ment) 1998]. Much of this logging activityopens up new frontiers to wildlife and non-tim-ber resource exploitation, and catalyses the tran-sition into a landscape dominated by slash-and-burn and large-scale agriculture.
Few studies have examined the impacts of se-lective logging on commercially valuable timberspecies and comparisons among studies are lim-ited because they often fail to employ comparablemethods that are adequately reported. The bestcase studies come from the most valuable timberspecies that have already declined in much oftheir natural ranges. For instance, the highly se-lective, but low intensity logging of broadleafmahogany (Swietenia macrophylla), the most valu-able widely traded Neotropical timber tree, isdriven by the extraordinarily high prices in inter-national markets, which makes it lucrative forloggers to open-up even remote wildernessareas at high transportation costs. Mechanizedextraction of mahogany and other prime timberspecies impacts the forest by creating canopy
gaps and imparting much collateral damage dueto logging roads and skid trails (Grogan et al.2008). Mahogany and other high-value tropicaltimber species worldwide share several traitsthat predispose them to commercial extirpation:excellent pliable wood of exceptional beauty;natural distributions in forests experiencingrapid conversion rates; low-density populations(often <1 tree/ha); and life histories generallycharacterized as non-pioneer late secondary,with fast growth rates, abiotic seed dispersal,and low-density seedlings requiring canopy dis-turbance for optimal seedling regenerationin the understory (Swaine and Whitmore 1988;Sodhi et al. 2008).
One of the major obstacles to implementing asustainable forestry sector in tropical countries isthe lack of financial incentives for producers tolimit offtakes to sustainable levels and invest inregeneration. Economic logic often dictates thattrees should be felled whenever their rate of vol-ume increment drops below the prevailing inter-est rate (Pearce 1990). Postponing harvest beyondthis point would incur an opportunity cost be-cause profits from logging could be invested at ahigher rate elsewhere. This partly explains whymany slow-growing timber species from tropicalforests and savannahs are harvested unsustain-ably (e.g. East African Blackwood (Dalbergia mel-anoxylon) in the Miombo woodlands of Tanzania;Ball 2004). This is particularly the case where landtenure systems are unstable, and where there areno disincentives against ‘hit-and-run’ operationsthat mine the resource capital at one site andmove on to undepleted areas elsewhere. This isclearly shown in a mahogany study in Boliviawhere the smallest trees felled are ~40 cm indiameter, well below the legal minimum size(Gullison 1998). At this size, trees are increasingin volume at about 4% per year, whereas realmahogany price increases have averaged at only1%, so that a 40-cm mahogany tree increases invalue at about 5% annually, slowing down as thetree becomes larger. In contrast, real interest ratesin Bolivia and other tropical countries are often>10%, creating a strong economic incentive toliquidate all trees of any value regardless of re-source ownership.
110 CONSERVATION BIOLOGY FOR ALL
© Oxford University Press 2010. All rights reserved. For permissions please email: [email protected]
Sodhi and Ehrlich: Conservation Biology for All. http://ukcatalogue.oup.com/product/9780199554249.do

6.2.2 Tropical forest vertebrates
Humans have been hunting wildlife in tropicalforests for over 100 000 years, but the extent ofconsumption has greatly increased over the lastfew decades. Tropical forest species are huntedfor local consumption or sales in distant marketsas food, trophies, medicines and pets. Exploitationof wild meat by forest dwellers has increased dueto changes in hunting technology, scarcity of alter-native protein, larger numbers of consumers, andgreater access infrastructure. Recent estimates ofthe annual wild meat harvest are 23 500 tons inSarawak (Bennett 2002), up to 164 692 tons in theBrazilian Amazon (Peres 2000), and up to 3.4 mil-lion tons in Central Africa (Fa and Peres 2001).Hunting rates are already unsustainably highacross vast tracts of tropical forests, averaging six-fold the maximum sustainable harvest in CentralAfrica (Fa et al. 2001). Consumption is both by ruraland urban communities, who are often at the endof long supply chains that extend into many re-mote areas (Milner-Gulland et al. 2003). The rapidacceleration in tropical forest defaunation due tounsustainable hunting initially occurred in Asia(Corlett 2007), is now sweeping through Africa,and is likely to move into the remotest parts ofthe neotropics (Peres and Lake 2003), reflectinghuman demographics in different continents.
Hunting for either subsistence or commerce canprofoundly affect the structure of tropical forestvertebrate assemblages, as revealed by both vil-lage-based kill-profiles (Jerozolimski and Peres2003; Fa et al. 2005) and wildlife surveys in huntedand unhunted forests. This can be seen in the resid-ual game abundance at forest sites subjected tovarying degrees of hunting pressure, where over-hunting often results in faunal biomass collapses,mainly through declines and local extinctions oflarge-bodied species (Bodmer 1995; Peres 2000).Peres and Palacios (2007) provide the first system-atic estimates of the impact of hunting on the abun-dances of a comprehensive set of 30 reptile, bird,and mammal species across 101 forest sites scat-tered widely throughout the Amazon Basin andGuianan Shield. Considering the 12 most harvest-sensitive species, mean aggregate population bio-mass was reduced almost eleven-fold from 979.8
kg/km2 in unhunted sites to only 89.2 kg/km2 inheavily hunted sites (see Figure 6.2). In Kilum Ijim,Cameroon, most large mammals, includingelephants, buffalo, bushbuck, chimpanzees, leo-pards, and lions, have been lost as a result of hunt-ing (Maisels et al. 2001). In Vietnam, 12 largevertebrate species have become virtually extinctover the last five decades primarily due to hunting(Bennett and Rao 2002). Pangolins and severalother forest vertebrate species are facing regional-scale extinction throughout their range acrosssouthern Asia [Corlett 2007, TRAFFIC (The Wild-life Trade Monitoring Network) 2008], largely asa result of trade, and over half of all Asian freshwa-ter turtle species are considered Endangered dueto over-harvesting (IUCN 2007).
In sum, game harvest studies throughout thetropics have shown that most unregulated, com-mercial hunting for wild meat is unsustainable(Robinson and Bennett 2000; Nasi et al. 2008),and that even subsistence hunting driven bylocal demand can severely threaten many medi-um to large-bodied vertebrate populations, withpotentially far-reaching consequences to otherspecies. However, persistent harvesting ofmulti-species prey assemblages can often lead topost-depletion equilibrium conditions in whichslow-breeding, vulnerable taxa are eliminatedand gradually replaced by fast-breeding robusttaxa that are resilient to typical offtakes. For ex-ample, hunting inWest African forests could nowbe defined as sustainable from the viewpoint ofurban bushmeat markets in which primarily ro-dents and small antelopes are currently traded,following a series of historical extinctions of vul-nerable prey such as primates and large ungu-lates (Cowlishaw et al. 2005).
6.2.3 Non-timber forest products
Non-timber forest products (NTFPs) arebiological resources other than timber which areextracted from either natural or managed forests(Peters 1994). Examples of exploited plant pro-ducts include fruits, nuts, oil seeds, latex, resins,gums, medicinal plants, spices, dyes, ornamentalplants, and raw materials such as firewood,
OVEREXPLOITATION 111
© Oxford University Press 2010. All rights reserved. For permissions please email: [email protected]
1

Desmoncus climbing palms, bamboo and rattan.The socio-economic importance of NTFP harvestto indigenous peoples cannot be underestimated.Many ethnobotanical studies have catalogued thewide variety of useful plants (or plant parts) har-vested by different aboriginal groups throughoutthe tropics. For example, the Waimiri-Atroari In-dians of central Amazonia make use of 79% of thetree species occurring in a single 1 ha terra firmeforest plot (Milliken et al. 1992), and 1748 of the~8000 angiosperm species in the Himalayan re-gion spanning eight Asian countries are usedmedicinally and many more for other purposes(Samant et al. 1998).
Exploitation of NTFPs often involves partial orentire removal of individuals from the popula-tion, but the extraction method and whethervital parts are removed usually determine the
mortality level in the exploited population. Tra-ditional NTFP extractive practices are oftenhailed as desirable, low-impact economic activ-ities in tropical forests compared to alternativeforms of land use involving structural distur-bance such as selective logging and shifting agri-culture (Peters et al. 1989). As such, NTFPexploitation is usually assumed to be sustainableand a promising compromise between biodiversi-ty conservation and economic development undervarying degrees of market integration. The implic-it assumption is that traditional methods of NTFPexploitation have little or no impact on forest eco-systems and tend to be sustainable because theyhave been practiced over many generations. How-ever, virtually any form of NTFP exploitation intropical forests has an ecological impact. The spa-tial extent and magnitude of this impact depends
–100 –50 0Change in mean population density from non-hunted to hunted areas (%)
Tayassu pecariAteles spp.
Tapirus terrestrisLagothrix spp.
Mitu/Crax spp.Aburria pipile
Chiropotes spp.Alouatta seniculus
Dasyprocta spp.Cebus apella
Callithrix spp.Mazama gouazoupira
Geochelone spp.Myoprocta spp.
Pecari tajacuPsophia spp.
Callicebus torquatusCrypturellus spp.
Mazama americanaTinamus spp.
Cebus albifronsOdontophorus spp.
Penelope spp.Saimiri spp.Pithecia spp.
Cebuella pygmaeaCallicebus moloch
Cacajao spp.Saguinus fuscicollis
Saguinus mystax
50 100 150
Figure 6.2 Changes in mean vertebrate population density (individuals/km2) between non‐hunted and hunted neotropical forest sites (n = 101),including 30 mammal, bird, and reptile species. Forest sites retained in the analysis had been exposed to different levels of hunting pressure butotherwise were of comparable productivity and habitat structure. Species exhibiting higher density in hunted sites (open bars) are either small‐bodiedor ignored by hunters; species exhibiting the most severe population declines (shaded bars) were at least halved in abundance or driven to localextinction in hunted sites (data from Peres and Palacios 2007).
112 CONSERVATION BIOLOGY FOR ALL
© Oxford University Press 2010. All rights reserved. For permissions please email: [email protected]
Sodhi and Ehrlich: Conservation Biology for All. http://ukcatalogue.oup.com/product/9780199554249.do

on the accessibility of the resource stock, the floris-tic composition of the forest, the nature and inten-sity of harvesting, and the particular species orplant part under exploitation.
Yet few studies have quantitatively assessedthe demographic viability of plant populationssourcing NTFPs. One exception are Brazil nuts(Bertholletia excelsa, Lecythidaceae) which com-prise the most important wild seed extractiveindustry supporting millions of Amazonian for-est dwellers for either subsistence or income. Thiswild seed crop is firmly established in exportmarkets, has a history of ~200 years of commer-cial exploitation, and comprises one of the mostvaluable non-timber extractive industries in trop-ical forests anywhere. Yet the persistent collectionof B. excelsa seeds has severely undermined thepatterns of seedling recruitment of Brazil nuttrees. This has drastically affected the age struc-ture of many natural populations to the pointwhere persistently overexploited stands havesuccumbed to a process of senescence and demo-graphic collapse, threatening this cornerstoneof the Amazonian extractive economy (Pereset al. 2003).
A boom in the use of homeopathic remediessustained by over-collecting therapeutic and aro-matic plants is threatening at least 150 species ofEuropean wild flowers and plants and drivingmany populations to extinction (Traffic 1998).Commercial exploitation of the Pau-Rosa or rose-wood tree (Aniba rosaeodora, Lauraceae), whichcontains linalol, a key ingredient in luxury per-fumes, involves a one-off destructive harvestingtechnique that almost invariably kills the tree.This species has consequently been extirpatedfrom virtually its entire range in Brazilian Ama-zonia (Mitja and Lescure 2000). Channel 5® andother perfumes made with Pau-Rosa fragrancegained wide market demand decades ago, butthe number of processing plants in Brazil fellfrom 103 in 1966 to fewer than 20 in 1986, dueto the dwindling resource base. Yet French per-fume connoisseurs have been reluctant to acceptreplacing the natural Pau-Rosa fragrance withsynthetic substitutes, and the last remaining po-pulations of Pau-Rosa remain threatened. Thesame could be argued for a number of NTFPs
for which the harvest by destructive practicesinvolves a lethal injury to whole reproductiveindividuals. What then is the impact of NTFPextraction on the dynamics of natural popula-tions? How does the impact vary with the lifehistory of plants and animals harvested? Are cur-rent extraction rates truly sustainable? These arekey questions in terms of the demographic sus-tainability of different NTFP offtakes, which willultimately depend on the ability of the resourcepopulation to recruit new seedlings either contin-uously or in sporadic pulses while being sub-jected to a repeated history of exploitation.
Unguarded enthusiasm for the role of NTFPexploitation in rural development partly stemsfrom unrealistic economic studies reporting highmarket values. For example, Peters et al. (1989)reported that the net-value of fruit and latex ex-traction in the Peruvian Amazon was US$6330/ha. This is in sharp contrast with a Mesoamericanstudy that quantified the local value of foods,construction materials, and medicines extractedfrom the forest by 32 indigenous Indian house-holds (Godoy et al. 2000). The combined value ofconsumption and sale of forest goods rangedfrom US$18 to US$24 ha�1 yr�1, at the lowerend of previous estimates (US$49 - US$1 089ha�1 yr�1). NTFP extraction thus cannot be seenas a panacea for rural development and in manystudies the potential value of NTFPs is exagger-ated by unrealistic assumptions of high discountrates, unlimited market demands, availability oftransportation facilities and absence of productsubstitution.
6.3 Overexploitation in aquaticecosystems
Marine biodiversity loss, largely through over-fishing, is increasingly impairing the capacity ofthe world’s oceans to provide food, maintainwater quality, and recover from perturbations(Worm et al. 2006). Yet marine fisheries provideemployment and income for 0.2 billion peoplearound the world, and fishing is the mainstay ofthe economy of many coastal regions; 41 millionpeople worked as fishers or fish farmers in 2004,
OVEREXPLOITATION 113
© Oxford University Press 2010. All rights reserved. For permissions please email: [email protected]
1

operating 1.3 million decked vessels and 2.7 mil-lion open boats (FAO 2007). An estimated 14million metric tons of fuel was consumed by thefish-catching sector at a cost equivalent to US$22billion, or ~25% of the total revenue of the sector.In 2004, reported catches from marine and inlandcapture fisheries were 85.8 million and 9.2 milliontons, respectively, which was worth US$84.9 bil-lion at first sale. Freshwater catches taken everyyear for food have declined recently but on aver-age 500 000 tons are taken from the Mekong riverin South-East Asia; 210 000 tons are taken fromthe Zaire river in Africa; and 210 000 tons of fishare taken from the Amazon river in South Ameri-ca. Seafood consumption is still high and rising inthe First World and has doubled in China withinthe last decade. Fish contributes to, or exceeds50% of the total animal protein consumption inmany countries and regions, such as Bangladesh,Cambodia, Congo, Indonesia, Japan or the Brazi-lian Amazon. Overall, fish provides more than2.8 billion people with ~20% or more of theiraverage per capita intake of animal protein. Theoscillation of good and bad years in marine fish-eries can also modulate the protein demand fromterrestrial wildlife populations (Brashares et al.2004). The share of fish in total world animalprotein supply amounted to 16% in 2001 (FAO2004). These ‘official’ landing statistics tend toseverely underestimate catches and total valuesdue to the enormous unrecorded contribution ofsubsistence fisheries consumed locally.
Although the world’s oceans are vast (see Box4.3), most seascapes are relatively low-productiv-ity, and 80% of the global catch comes from only~20% of the area. Approximately 68% of theworld’s catch comes from the Pacific and north-east Atlantic. At current harvest rates, most of theeconomically important marine fisheries world-wide have either collapsed or are expected tocollapse. Current impacts of overexploitationand its consequences are no longer locally nested,since 52% of marine stocks monitored by the FAOin 2005 were fully exploited at their maximumsustainable level and 24% were overexploited ordepleted, such that their current biomass is muchlower than the level that would maximize theirsustained yield (FAO 2007). The remaining one-
quarter of the stocks were either underexploitedor moderately exploited and could perhaps pro-duce more (Figure 6.3).
The Brazilian sardine (Sardinella brasiliensis) is aclassic case of an overexploited marine fishery.In the 1970s hey-day of this industry, 200 000tons were captured in southeast Brazil aloneevery year, but landings suddenly plummeted to<20 000 tons by 2001. Despite new fishing regula-tions introduced following its collapse, it is un-clear whether southern Atlantic sardine stockshave shown any sign of recovery. With the possi-ble exception of herring and related species thatmature early in life and are fished with highlyselective equipment, many gadids (e.g. cod, had-dock) and other non-clupeids (e.g. flatfishes) haveexperienced little, if any, recovery in asmuch as 15years after 45–99% reductions in reproductivebiomass (Hutchings 2000).Worse still, an analysisof 147 populations of 39 wild fish species con-cluded that historically overexploited species,such as North Sea herring, became more proneto extreme year-on-year variation in numbers,rendering them vulnerable to economic or demo-graphic extinction (Minto et al. 2008).
Marine fisheries are an underperforming glob-al asset—yields could be much greater if theywere properly managed. The difference betweenthe potential and actual net economic benefitsfrom marine fisheries is in the order of US$50billion per year—equivalent to over half the
19750
10
20
30
Perc
enta
ge o
f sto
cks
asse
ssed
40
50
60
1980 1985 1990Year
1995 2000 2005
Fully exploitedUnderexploited to moderately exploitedOverexploited, depleted or recovering
Figure 6.3 Global trends in the status of world marine fish stocksmonitored by FAO from 1974 to 2006 (data from FAO 2007).
114 CONSERVATION BIOLOGY FOR ALL
© Oxford University Press 2010. All rights reserved. For permissions please email: [email protected]
Sodhi and Ehrlich: Conservation Biology for All. http://ukcatalogue.oup.com/product/9780199554249.do

value of the global seafood trade (World Bank2008). The cumulative economic loss to the globaleconomy over the last three decades is estimatedto be approximately US$2 trillion, and in manycountries fishing operations are buoyed up bysubsidies, so that the global fishery economy tothe point of landing is already in deficit.
Commercial fishing activities disproportion-ately threaten large-bodied marine and fresh-water species (Olden et al. 2007). This results infishermen fishing down the food chain, targetingever-smaller pelagic fish as they can no longercapture top predatory fish. This is symptomaticof the now widely known process of ‘fishingdown marine food webs’ (see Box 6.1). Such se-quential size-graded exploitation systems alsotake place in multi-species assemblages huntedin tropical forests (Jerozolimski and Peres et al2003). In the seas, overexploitation threatens thepersistence of ecologically significant populationsof many large marine vertebrates, includingsharks, tunas and sea turtles. Regional scale po-pulations of large sharks worldwide have de-clined by 90% or more, and rapid declinesof >75% of the coastal and oceanic NorthwestAtlantic populations of scalloped hammerhead,white, and thresher sharks have occurred in thepast 15 years (Baum et al. 2003; Myers and Worm2003; Myers et al. 2007). Much of this activity isprofligate and often driven by the surging globaldemand for shark fins. For example, in 1997 line-fishermen captured 186 000 sharks in southernBrazil alone, of which 83% were killed and dis-carded in open waters following the removal ofthe most lucrative body parts (C.M. Vooren, pers.comm.). Of the large-bodied coastal species af-fected by this trade, several have virtually disap-peared from shallow waters (e.g. greynursesharks, Carcharias taurus). Official figures showthat 131 tons of shark fins, corresponding to US$2.4 million, were exported from Brazil to Asia in2007.
Finally, we know rather little about ongoingextinction processes caused by harvesting. Forexample, from a compilation of 133 local, regionaland global extinctions of marine fish populations,Dulvy et al. (2003) uncovered that exploitationwas the main cause of extinctions (55% of all
populations), but these were only reported aftera median 53-year lag following their real-timedisappearance. Some 80% of all extinctions wereonly discovered through historical comparisons;e.g. the near-extinction of large skates on bothsides of the Atlantic was only brought to theworld’s attention several decades after the de-clines have occurred.
6.4 Cascading effects of overexploitationon ecosystems
All extractive systems in which the overharvestedresource is one or more biological populations,can lead to pervasive trophic cascades and otherunintended ecosystem-level consequences tonon-target species. Most hunting, fishing, andcollecting activities affect not only the primarytarget species, but also species that are taken ac-cidentally or opportunistically. Furthermore, ex-ploitation often causes physical damage to theenvironment, and has ramifications for other spe-cies through cascading interactions and changesin food webs.
In addition, overexploitation may severelyerode the ecological role of resource populationsin natural communities. In other words, over-exploited populations need not be entirely extir-pated before they become ecologically extinct. Incommunities that are “half-empty” (Redford andFeinsinger 2001), populations may be reduced tosufficiently low numbers so that, although stillpresent in the community, they no longer interactsignificantly with other species (Estes et al. 1989).Communities with reduced levels of species in-teractions may become pale shadows of their for-mer selves. Although difficult to measure, severedeclines in large vertebrate populations may re-sult in multi-trophic cascades that may profound-ly alter the structure of marine ecosystems suchas kelp forests, coral reefs and estuaries (Jacksonet al. 2001), and analogous processes may occur inmany terrestrial ecosystems. Plant reproductionin endemic island floras can be severely affectedby population declines in flying foxes (pteropo-did fruit bats) that serve as strong mutualists aspollinators and seed dispersers (Cox et al. 1991).
OVEREXPLOITATION 115
© Oxford University Press 2010. All rights reserved. For permissions please email: [email protected]
1

In some Pacific archipelagos, several species maybecome functionally extinct, ceasing to effectivelydisperse large seeds long before becoming rare(McConkey and Drake 2006). A key agenda forfuture research will involve understanding thenon-linearities between functional responses tothe numeric abundance of strong interactors re-duced by exploitation pressure and the quality ofecological services that depleted populations canperform. For example, what is the critical densityof any given exploited population below which itcan no longer fulfill its community-wide ecologi-cal role?
In this section I concentrate on poorly knowninteraction cascades in tropical forest and marineenvironments, and discuss a few examples ofhow apparently innocuous extractive activitiestargeted to one or a few species can drasticallyaffect the structure and functioning of these ter-restrial and aquatic ecosystems.
6.4.1 Tropical forest disturbance
Timber extraction in tropical forests is widelyvariable in terms of species selectivity, but evenhighly selective logging can trigger major ecolog-ical changes in the understory light environment,forest microclimate, and dynamics of plant regen-eration. Even reduced-impact logging (RIL) op-erations can generate enough forest disturbance,through elevated canopy gap fracture, to greatlyaugment forest understory desiccation, dry fuelloads, and fuel continuity, thereby breaching theforest flammability threshold in seasonally-dryforests (Holdsworth and Uhl 1997; Nepstad et al.1999; Chapter 9). During severe dry seasons,often aggravated by increasingly frequent conti-nental-scale climatic events, extensive groundfires initiated by either natural or anthropogenicsources of ignition can result in a dramaticallyreduced biomass and biodiversity value of previ-ously unburnt tropical forests (Barlow and Peres2004, 2008). Despite these undesirable effects,large-scale commercial logging that is unsustain-able at either the population or ecosystem levelcontinues unchecked in many tropical forest fron-tiers (Curran et al. 2004; Asner et al. 2005). Yetsurface fires aggravated by logging disturbance
represent one of the most powerful mechanismsof functional and compositional impoverishmentof remaining areas of tropical forests (Cochrane2003), and arguably the most important climate-mediated phase shift in the structure of tropicalecosystems (see also Chapters 8 and 9).
6.4.2 Hunting and plant community dynamics
Although the direct impacts of defaunationdriven by overhunting can be predicted to somedegree, higher-order indirect effects on commu-nity structure remain poorly understood sinceRedford’s (1992) seminal paper and may haveprofound, long-term consequences for the persis-tence of other taxa, and the structure, productivi-ty and resilience of terrestrial ecosystems(Cunningham et al. 2009). Severe population de-clines or extirpation of the world’s megafaunamay result in dramatic changes to ecosystems,some of which have already been empiricallydemonstrated, while others have yet to be docu-mented or remain inexact.
Large vertebrates often have a profound im-pact on food webs and community dynamicsthrough mobile-linkage mutualisms, seed preda-tion, and seedling and sapling herbivory. Plantcommunities in tropical forests depleted of theirmegafauna may experience pollination bottle-necks, reduced seed dispersal, monodominanceof seedling cohorts, altered patterns of seedlingrecruitment, other shifts in the relative abundanceof species, and various forms of functional com-pensation (Cordeiro and Howe 2003; Peres andRoosmalen 2003; Wang et al. 2007; Terborgh et al.2008; Chapter 3). On the other hand, the net ef-fects of large mammal defaunation depends onhow the balance of interactions are affected bypopulation declines in both mutualists (e.g. high-quality seed dispersers) and herbivores (e.g. seedpredators) (Wright 2003). For example, signifi-cant changes in population densities in wildpigs (Suidae) and several other ungulates androdents, which are active seed predators, mayhave a major effect on seed and seedling survivaland forest regeneration (Curran and Webb 2000).
Tropical forest floras are most dependent onlarge-vertebrate dispersers, with as many as
116 CONSERVATION BIOLOGY FOR ALL
© Oxford University Press 2010. All rights reserved. For permissions please email: [email protected]
Sodhi and Ehrlich: Conservation Biology for All. http://ukcatalogue.oup.com/product/9780199554249.do

97% of all tree, woody liana and epiphyte speciesbearing fruits and seeds that are morphologicallyadapted to endozoochorous (passing through thegut of an animal) dispersal (Peres and Roosmalen2003). Successful seedling recruitment in manyflowering plants depends on seed dispersal ser-vices provided by large-bodied frugivores (Howeand Smallwood 1982), while virtually all seedsfalling underneath the parent’s canopy succumbto density-dependent mortality—caused by fun-gal attack, other pathogens, and vertebrate andinvertebrate seed predators (see review in Carsonet al. 2008).
A growing number of phytodemographic stud-ies have examined the effects of large-vertebrateremoval. Studies examining seedling recruitmentunder different levels of hunting pressure (or dis-perser abundance) reveal very different out-comes. At the community level, seedling densityin overhunted forests can be indistinguishable,greater, or less than that in the undisturbedforests (Dirzo and Miranda 1991; Chapman andOnderdonk 1998; Wright et al. 2000), but the con-sequences of increased hunting pressure to plantregeneration depends on the patterns of deple-tion across different prey species. In persistentlyhunted Amazonian forests, where large-bodiedprimates are driven to local extinction or severelyreduced in numbers (Peres and Palacios 2007),the probability of effective dispersal of large-seeded endozoochorous plants can decline byover 60% compared to non-hunted forests(Peres and Roosmalen 2003). Consequently,plant species with seeds dispersed by vulnerablegame species are less abundant where huntersare active, whereas species with seeds dis-persed by abiotic means or by small frugivoresignored by hunters are more abundant in theseedling and sapling layers (Nuñez-Iturriand Howe 2007; Wright et al. 2007; Terborghet al. 2008). However, the importance of dispers-al-limitation in the absence of large frugivoresdepends on the degree to which their seed dis-persal services are redundant to any givenplant species (Peres and Roosmalen 2003). Fur-thermore, local extinction events in large-bodiedspecies are rarely compensated by smaller speciesin terms of their population density, biomass,
diet, and seed handling outcomes (Peres and Dol-man 2000).
Large vertebrates targeted by hunters oftenhave a disproportionate impact on communitystructure and operate as “ecosystem engineers”(Jones et al. 1994; Wright and Jones 2006), eitherperforming a key landscaping role in terms ofstructural habitat disturbance, or as mega-herbi-vores that maintain the structure and relativeabundance of plant communities. For example,elephants exert a major role in modifying vegeta-tion structure and composition as herbivores,seed dispersers, and agents of mortality formany small trees (Cristoffer and Peres 2003).Two similar forests with or without elephantsshow different succession and regeneration path-ways, as shown by long-term studies in Uganda(Sheil and Salim 2004). Overharvesting of severalother species holding a keystone landscaping rolecan lead to pervasive changes in the structure andfunction of ecosystems. For example, the decima-tion of North American beaver populations bypelt hunters following the arrival of Europeansprofoundly altered the hydrology, channel geo-morphology, biogeochemical pathways and com-munity productivity of riparian habitats (Naimanet al. 1986).
Mammal overhunting triggers at least two ad-ditional potential cascades: the secondary extir-pation of dependent taxa and the subsequentdecline of ecological processes mediated by asso-ciated species. For instance, overhunting can se-verely disrupt key ecosystem processes includingnutrient recycling and secondary seed dispersalexerted by relatively intact assemblages of dungbeetles (Coleoptera: Scarabaeinae) and other co-prophagous invertebrates that depend on largemammals for adult and larval food resources(Nichols et al. 2009).
6.4.3 Marine cascades
Apart from short-term demographic effects suchas the direct depletion of target species, there isgrowing evidence that fishing also contributes toimportant genetic changes in exploited popula-tions. If part of the phenotypic variation of targetspecies is due to genetic differences among
OVEREXPLOITATION 117
© Oxford University Press 2010. All rights reserved. For permissions please email: [email protected]
1

individuals then selective fishing will cause ge-netic changes in life-history traits such as agesand sizes at maturity (Law 2000). The geneticeffects of fishing are increasingly seen as a long-term management issue, but this is not yet man-aged proactively as short-term regulations tendto merely focus on controlling mortality. Howev-er, the damage caused by overfishing extendswell beyond the main target species with pro-found effects on: (i) low-productivity species inmixed fisheries; (ii) non-target species; (iii) foodwebs; and (iv) the structure of oceanic habitats.
Low-productivity species in mixed fisheriesMany multi-species fisheries are relatively unse-lective and take a wide range of species that varyin their capacity to withstand elevated mortality.This is particularly true in mixed trawl fisherieswhere sustainable mortality rates for a produc-tive primary target species are often unsustain-able for species that are less productive, such asskates and rays, thereby leading to widespreaddepletion and, in some cases, regional extinctionprocesses. Conservation measures to protect un-productive species in mixed fisheries are alwayscontroversial since fishers targeting more produc-tive species will rarely wish to sacrifice yield inorder to spare less productive species.
BycatchesMost seafood is captured by indiscriminate meth-ods (e.g. gillnetting, trawl netting) that haul inlarge numbers of incidental captures (termed by-catches) of undesirable species, which numerical-ly may correspond to 25–65% of the total catch.These non-target pelagic species can become en-tangled or hooked by the same fishing gear, re-
sulting in significant bycatch mortality of manyvulnerable fish, reptile, bird and mammal popu-lations, thereby comprising a key managementissue for most fishing fleets (Hall et al. 2000). Forexample, over 200 000 loggerhead (Caretta caretta)and 50 000 leatherback turtles (Dermochelys coria-cea) were taken as pelagic longline bycatch in2000, likely contributing to the 80–95% declinesfor Pacific loggerhead and leatherback popula-tions over two decades (Lewison et al. 2004).While fishing pressure on target species relatesto target abundance, fishing pressure on bycatchspecies is likely insensitive to bycatch abundance(Crowder and Murawski 1998), and may there-fore result in “piggyback” extinctions. Bycatcheshave been the focus of considerable societal con-cern, often expressed in relation to the welfare ofindividual animals and the status of their popula-tions. Public concerns over unacceptable levels ofmortality of large marine vertebrates (e.g. seaturtles, seabirds, marine mammals, sharks) havetherefore led to regional bans on a numberof fishing methods and gears, including longdrift-nets.
Food websOverfishing can create trophic cascades in marinecommunities that can cause significant declines inspecies richness, and wholesale changes in coast-al food webs resulting from significant reductionsin consumer populations due to overfishing(Jackson et al. 2001). Predators have a fundamen-tal top-down role in the structure and function ofbiological communities, and many large marinepredators have declined by >90% of their base-line population levels (Pauly et al. 1998; Myersand Worm 2003; see Box 6.1). Fishing affects
Box 6.1 The state of fisheriesDaniel Pauly
Industrial, or large-scale and artisanal, or small-scale marine fisheries, generate, at the onset ofthe 21st century, combined annual catches of120–140 million tons, with an ex-vessel value ofabout US$100 billion. This is much higher thanofficially reported landings (80–90 milliontons), which do not account for illegal,unreported and undocumented (IUU) catches
(Pauly et al. 2002). IUU catches include, forexample, the fish discarded by shrimp trawlers(usually 90% of their actual catch), the catch ofhigh sea industrial fleets operating under flagsof convenience, and the individually small catchby millions of artisanal fishers (includingwomen and children) in developing countries,which turns out to be very high in the
continues
118 CONSERVATION BIOLOGY FOR ALL
© Oxford University Press 2010. All rights reserved. For permissions please email: [email protected]
Sodhi and Ehrlich: Conservation Biology for All. http://ukcatalogue.oup.com/product/9780199554249.do

Box 6.1 (Continued)
aggregate, but still goes unreported bynational governments and internationalagencies.This global catch, which, depending on the
source, is either stagnating or slowly declining, isthe culmination of the three-pronged expansionoffisheries which occurred following the SecondWorld War: (i) an offshore/depth expansion,resulting from the depletion of shallow-water,inshore stocks (Morato et al. 2006); (ii) ageographic expansion, as the fleets ofindustrialized countries around the NorthAtlantic and in East Asia, faced with depletedstocks in their home waters, shifted theiroperations toward lower latitudes, and thenceto the southern hemisphere (Pauly et al. 2002);and (iii) a taxonomic expansion, i.e. capturingand marketing previously spurned species ofsmaller fish and invertebrates to replace thediminishing supply of traditionally targeted,larger fish species (Pauly et al. 1998; seeBox 6.1 Figure).In the course of these expansions, fishing
effort grew enormously, especially that ofindustrial fleets, which are, overall, 3–4 timeslarger than required. This is, among otherthings, a result of the US$30–34 billion they
Box 6.1 Figure Schematic representation of the process, nowwidely known as ‘fishing down marine food webs’, by which fisheriesfirst target the large fish, then, as these disappear, move on tosmaller species of fish and invertebrates, lower in the food web. Inthe process, the functioning of marine ecosystems is profoundlydisrupted, a process aggravated by the destruction of the bottomfauna by trawling and dredging.
receive annually as government subsidies,which now act to keep fleets afloat that haveno fish to exploit (Sumaila et al. 2008). Inaddition to representing a giant waste ofeconomic resources, these overcapitalizedfishing fleets have a huge, but long‐neglectedimpact on their target species, on non‐targetedspecies caught as by‐catch, and on the marineecosystems in which all species are embedded.Also, these fleets emit large amounts of carbondioxide; for example trawlers nowadays oftenburn several tons of diesel fuel for every ton offish landed (and of which 80% is water), andtheir efficiency declines over time because ofdeclining fish stocks (Tyedmers et al. 2005).Besides threatening the food security of
numerous developing countries, for example inWest Africa, these trends endanger marinebiodiversity, and especially the continuedexistence of the large, long‐lived species thathave sustained fisheries for centuries (Wormet al. 2006).Thegoodnews is thatweknowinprinciplehow
toavoidtheovercapitalizationoffisheriesandthecollapse of their underlying stocks. Thiswouldinvolve, besides an abolition of capacity‐enhancing subsidies (e.g. tax‐free fuel, loanguarantees for boat purchases (Sumaila et al.2008), the creation of networks of largemarineprotected areas, and the reductionoffishingeffort in the remaining exploited areas,mainlythroughthecreationofdedicatedaccessprivilege(e.g. for adjacent small scalefisher communities),such as to reduce the “race forfish”.Also, the measures that will have to be taken
to mitigate climate change offer the prospectof a reduction of global fleet capacity (via areduction of their greenhouse gas emissions).This may lead to more attention being paid tosmall‐scale fisheries, so far neglected, butwhose adjacency to the resources they exploit,and use of fuel‐efficient, mostly passive gear,offers a real prospect for sustainability.
REFERENCES
Morato, T., Watson, R., Pitcher, T. J., and Pauly, D. (2006).Fishing down the deep. Fish and Fisheries, 7, 24–34.
continues
OVEREXPLOITATION 119
© Oxford University Press 2010. All rights reserved. For permissions please email: [email protected]
1
predator-prey interactions in the fished commu-nity and interactions between fish and other spe-cies, including predators of conservation interestsuch as seabirds and mammals. For example,fisheries can compete for the prey base of seabirdsand mammals. Fisheries also produce discardsthat can provide significant energy subsidies es-pecially for scavenging seabirds, in some casessustaining hyper-abundant populations. Currentunderstanding of food web effects of overfishingis often too poor to provide consistent and reli-able scientific advice.
Habitat structureOverfishing is a major source of structural distur-bance in marine ecosystems. The very act of fish-ing, particularly with mobile bottom gear,destroys substrates, degrades habitat complexity,and ultimately results in the loss of biodiversity(see Box 4.3). These structural effects are com-pounded by indirect effects on habitat that occurthrough removal of ecological or ecosystem en-gineers (Coleman and Williams 2002). Many fish-ing gears contact benthic habitats during fishingand habitats such as coral reefs are also affectedby changes in food webs. The patchiness of im-pacts and the interactions between types of gearsand habitats are critical to understanding the sig-nificance of fishing effects on habitats; differentgears have different impacts on the same habitatand different habitats respond differently to thesame gear. For some highly-structured habitatssuch as deep water corals, recovery time is soslow that only no fishing would be realisticallysustainable (Roberts et al. 2006).
6.5 Managing overexploitation
This chapter has repeatedly illustrated examplesof population declines induced by overexploita-tion even in the face of the laudable goals ofimplementing conservation measures in the real-world. This section will conclude with some com-ments about contrasts between theory and prac-tice, and briefly explore some of the most severeproblems and management solutions that canminimize the impact of harvesting on the integri-ty of terrestrial and marine ecosystems.
Unlike many temperate countries where regu-latory protocols preventing overexploitationhave been developed through a long and repeat-ed history of trial and error based on ecologicalprinciples and hard-won field biology, popula-tion management prescriptions in the tropics aretypically non-existent, unenforceable, and lackthe personnel and scientific foundation onwhich they can be built. The concepts of gamewardens, bag limits, no-take areas, hunting orfishing licenses, and duck stamps are completelyunfamiliar to the vast majority of tropical subsis-tence hunters or fishers (see Box 6.2). Yet theseresource users are typically among the poorestrungs in society and often rely heavily on wildanimal populations as a critical protein compo-nent of their diet. In contrast, countries with astrong tradition in fish and wildlife managementand carefully regulated harvesting policy in pri-vate and public areas, may include sophisticatedlegislation encompassing bag limits on the ageand sex of different target species, as well as re-strictions on hunting and fishing seasons and
Box 6.1 (Continued)
Pauly, D., Christensen, V., Dalsgaard, J., Froese, R., andTorres, F. C. Jr. (1998). Fishing down marine food webs.Science, 279, 860–863.
Pauly, D., Christensen, V., Guénette, S., et al. (2002).Towards sustainability in world fisheries. Nature, 418,689–695.
Sumaila, U. R., Teh, L., Watson, R., Tyedmers, P., andPauly, D. (2008). Fuel price increase, subsidies, overca-
pacity, and resource sustainability. ICES Journal ofMarine Science, 65, 832–840.
Tyedmers, P., Watson, R., and Pauly, D. (2005). Fuelingglobal fishing fleets. AMBIO: a Journal of the HumanEnvironment, 34, 635–638.
Worm, B., Barbier, E. B., Beaumont, N., et al. (2006).Impacts of biodiversity loss on ocean ecosystem services.Science, 314, 787–790.
120 CONSERVATION BIOLOGY FOR ALL
© Oxford University Press 2010. All rights reserved. For permissions please email: [email protected]
Sodhi and Ehrlich: Conservation Biology for All. http://ukcatalogue.oup.com/product/9780199554249.do

Box 6.2 Managing the exploitation of wildlife in tropical forestsDouglas W. Yu
Hunting threatens the persistence of tropicalwildlife, their ecological functions, such as seeddispersal, and the political will to maintainforests in the face of alternative land‐useoptions. However, game species are importantsources of protein and income for millions offorest dwellers and traders of wildlife (Peres2000; Bulte and van Kooten 2001; Milner‐Gulland et al. 2003; Bennett et al. 2007; thischapter).Policy responses to the overexploitation of
wildlife can be placed into two classes: (i)demand‐side restrictions on offtake, to increasethe cost of hunting, and (ii) the supply‐sideprovisioning of substitutes, to decrease thebenefit of hunting (Bulte and Damania 2005;Crookes and Milner‐Gulland 2006). Restrictionson offtake vary from no‐take areas, such asparks, to various partial limits, such as reducingthe density of hunters via private propertyrights, and establishing quotas and bans onspecific species, seasons, or hunting gear, likeshotguns (Bennett et al. 2007). Where there arecommercial markets for wildlife, restrictions canalso be applied down the supply chain in theform of market fines or taxes (Clayton et al.1997; Damania et al. 2005). Finally, somewildlife products are exported for use asmedicines or decoration and can be subjectedto trade bans under the aegis of the Conventionon International Trade in Endangered Species(CITES) (Stiles 2004; Bulte et al. 2007; VanKooten 2008).Bioeconomic modeling (Ling and Milner‐
Gulland 2006) of a game market in Ghanahas suggested that imposing large fines onthe commercial sale of wild meat shouldbe sufficient to recover wildlife populations,even in the absence of forest patrols(Damania et al. 2005). Fines reduce expectedprofits from sales, so hunters should shiftfrom firearms to cheaper but less effectivesnares and consume more wildlife at home.The resulting loss of cash income shouldencourage households to reallocate labortoward other sources of cash, such asagriculture.
Offtake restrictions are, however, less usefulin settings where governance is poor, such thatfines are rarely expected and incursions into no‐take areas go unpunished, or where subsistencehunting is the norm, such as over much of theAmazon Basin (Peres 2000). In the latter case,markets for wild meat are small or nonexistent,and human populations are widely distributed,exacerbating the already‐difficult problem ofmonitoring hunting effort in tropical forests(Peres and Terborgh 1995; Peres and Lake 2003;Ling and Milner‐Gulland 2006). Moreover, thelargest classes of Amazonian protected areasare indigenous and sustainable developmentreserves (Nepstad et al. 2006; Peres andNascimento 2006), within which inhabitantshunt legally.Such considerations are part of the
motivation for introducing demand‐sideremedies, such as alternative sources of protein.The logic is that local substitutes (e.g. fish fromaquaculture) should decrease demand for wildmeat and allow the now‐excess labor devotedto hunting to be reallocated to competingactivities, such as agriculture or leisure.However, the nature of the substitute and
the structure of the market matter greatly. Ifthe demand‐side remedy instead takes theform of increasing the opportunity cost ofhunting by, for example, raising theprofitability of agriculture, it is possible thattotal hunting effort will ultimately increase,since income is fungible and can be spent onwild meat (Damania et al. 2005). Higherconsumer demand also raises market prices andcan trigger shifts to more effective but moreexpensive hunting techniques, like guns (Bulteand Horan 2002; Damania et al. 2005). Moregenerally, efforts to provide alternativeeconomic activities are likely to be inefficientand amount to little more than ‘conservationby distraction’ (Ferraro 2001; Ferraro andSimpson 2002).In many settings, the ultimate consumers are
not the hunters, and demand‐side remediescould take the form of educational programsaimed at changing consumer preferences or,
continues
OVEREXPLOITATION 121
© Oxford University Press 2010. All rights reserved. For permissions please email: [email protected]
1

Box 6.2 (Continued)
alternatively, of wildlife farms (e.g. crocodilianranches) that are meant to compete with anddepress the price of wild‐caught terrestrialvertebrates. The latter strategy could, however,lead to perverse outcomes if the relevantmarket is dominated by only a few suppliers,who have the power to maintain high prices byrestricting supply to market (Wilkie et al. 2005;Bulte and Damania 2005; Damania and Bulte2007). Then, the introduction of a farmedsubstitute can, in principle, induce intenseprice‐cutting competition, which wouldincrease consumer demand and lead to morehunting and lower wildlife stocks. Also, farmedsubstitutes can undermine efforts to stigmatizethe consumption of wildlife products,increasing overall demand. Given these caveats,the strategy of providing substitutes for wildlifemight best be focused on cases where thesubstitute is different from and clearly superiorto the wildlife product, as is the case for Viagraversus aphrodisiacs derived from animal parts(von Hippel and von Hippel 2002).Ultimately, given the large numbers of rural
dwellers, the likely persistence of wildlifemarkets of all kinds, and the great uncertaintiesthat remain embedded in our understanding ofthe ecology and economics of wildlifeexploitation, any comprehensive strategy toprevent hunting from driving wildlifepopulations extinct must include no‐take areas(Bennett et al. 2007)—the bigger the better.The success of no‐take areas will in turn dependon designing appropriate enforcementmeasures for different contexts, from nationalparks to indigenous reserves and workingforests to community‐based management(Keane et al. 2008).A potential approach is to use the economic
theory of contracts and asymmetricinformation (Ferraro 2001, 2008; Damania andHatch 2005) to design a menu of incentives andpunishments that deters hunting in designatedno‐take areas, given that hunting is a hiddenaction. In the above bioeconomic model inGhana (Damania et al. 2005), hidden huntingeffort is revealed in part by sales in markets,which can be monitored, and the imposition ofa punishing fine causes changes in the behaviorof households that result ultimately in highergame populations.
It should also be possible to employ positiveincentives in the form of payments forecological services (Ferraro 2001; Ferraro andSimpson 2002; Ferraro and Kiss 2002). Forexample, in principle, the state might pay localcommunities in return for abundant wildlife asmeasured in regular censuses. In practice,however, the high stochasticity of such amonitoring mechanism, and the problem offree riders within communities, might make thismechanism unworkable. Alternatively, in thecase of landscapes that still contain vast areas ofhigh animal abundance, such as in many parksthat host small human populations, a strategythat takes advantage of the fact that central‐place subsistence hunters are distance limited isappropriate (Ling and Milner‐Gulland 2008;Levi et al. 2009). The geographic distribution ofsettlements is then an easily monitored proxyfor the spatial distribution of hunting effort. Asa result, economic incentives to promotesettlement sedentarism, which can range fromdirect payments to the provision of publicservices such as schools, would also limit thespread of hunting across a landscape.
REFERENCES
Bennett, E., Blencowe, E., Brandon, K., et al. (2007).Hunting for consensus: Reconciling bushmeat harvest,conservation, and development policy in west and cen-tral Africa. Conservation Biology, 21, 884–887.
Bulte, E. H. and Damania, R. (2005). An economic assess-ment of wildlife farming and conservation. ConservationBiology, 19, 1222–1233.
Bulte, E. H. and Horan, R. D. (2002). Does human popula-tion growth increase wildlife harvesting? An economicassessment. Journal of Wildlife Management, 66,574–580.
Bulte, E. H. and van Kooten, G. C. (2001). State interven-tion to protect endangered species: why history and badluck matter. Conservation Biology, 15, 1799–1803.
Bulte, E. H., Damania, R., and Van Kooten, G. C. (2007).The effects of one‐off ivory sales on elephant mortality.Journal of Wildlife Management, 71, 613–618.
Clayton, L., Keeling, M., and Milner‐Gulland, E. J. (1997).Bringing home the bacon: a spatial model of wild pighunting in Sulawesi, Indonesia. Ecological Application,7, 642–652.
Crookes, D. J. andMilner‐Gulland, E. J. (2006). Wildlife andeconomic policies affecting the bushmeat trade: a
continues
© Oxford University Press 2010. All rights reserved. For permissions please email: [email protected]
Sodhi and Ehrlich: Conservation Biology for All. http://ukcatalogue.oup.com/product/9780199554249.do

capture technology. Despite the economic valueof wildlife (Peres 2000; Chardonnet et al. 2002;Table 6.1), terrestrial and aquatic wildlife inmany tropical countries comprise an ‘invisible’commodity and local offtakes often proceed un-restrained until the sudden perception that theresource stock is fully depleted. This is reflectedin the contrast between carefully regulated andunregulated systems where large numbers ofhunters may operate. For example, Minnesota
hunters sustainably harvest over 700 000 wildwhite-tailed deer (Odocoileus virginianus) everyyear, whereas Costa Rica can hardly sustain anannual harvest of a few thousand without push-ing the same cervid species, albeit in a differentfood environment, to local extinction (D. Janzen,pers. comm.).
An additional widespread challenge in manag-ing any diffuse set of resources is presented whenresources (or the landscape or seascape which
Box 6.2 (Continued)
framework for analysis. South African Journal of WildlifeResearch, 36, 159–165.
Damania, R. and Bulte, E. H. (2007). The economics ofwildlife farming and endangered species conservation.Ecological Economics, 62, 461–472.
Damania, R. and Hatch, J. (2005). Protecting Eden: marketsor government? Ecological Economics, 53, 339–351.
Damania, R., Milner‐Gulland, E. J., and Crookes, D.J.(2005). A bioeconomic analysis of bushmeat hunting.Proceedings of Royal Society of London B, 272, 259–266.
Ferraro, P. J. (2001). Global habitat protection: limitation ofdevelopment interventions and a role for conservationperformance payments. Conservation Biology, 15,990–1000.
Ferraro, P. J. (2008). Asymmetric information and contractdesign for payments for environmental services. Ecolog-ical Economics, 65, 810–821.
Ferraro, P. J. and Kiss, A. (2002). Direct payments to con-serve biodiversity. Science, 298, 1718–1719.
Ferraro, P. J. and Simpson, R. D. (2002). The cost‐effec-tiveness of conservation payments. Land Economics, 78,339–353.
Keane, A., Jones, J. P. G., Edwards‐Jones, G., andMilner‐Gulland, E. (2008). The sleeping policeman:understanding issues of enforcement andcompliance in conservation. Animal Conservation,11, 75–82.
Levi, T., Shepard, G. H., Jr., Ohl‐Schacherer, J., Peres, C. A.,and Yu, D.W. (2009). Modeling the long‐term sustain-ability of indigenous hunting in Manu National Park,Peru: Landscape‐scale management implications forAmazonia. Journal of Applied Ecology, 46, 804–814.
Ling, S. andMilner‐Gulland, E. J. (2006). Assessment of thesustainability of bushmeat hunting based on dynamicbioeconomic models. Conservation Biology, 20,1294–1299.
Ling, S. and Milner‐Gulland, E. (2008). When does spatialstructure matter in models of wildlife harvesting? Journalof Applied Ecology, 45, 63–71.
Milner‐Gulland, E., Bennett, E. & and the SCB 2002 AnnualMeetingWild Meat Group (2003). Wild meat: the biggerpicture. Trends in Ecology and Evolution, 18, 351–357.
Nepstad, D., Schwartzman, S., Bamberger, B., et al. (2006).Inhibition of Amazon deforestation and fire by parks andindigenous lands. Conservation Biology, 20, 65–73.
Peres, C. A. (2000). Effects of subsistence hunting onvertebrate community structure in Amazonian forests.Conservation Biology, 14, 240–253.
Peres, C. A. and Lake, I. R. (2003). Extent of nontimberresource extraction in tropical forests: accessibility togame vertebrates by hunters in the Amazon basin.Conservation Biology, 17, 521–535.
Peres, C. A. and Nascimento, H. S. (2006). Impact of gamehunting by the Kayapo of south‐eastern Amazonia: im-plications for wildlife conservation in tropical forest in-digenous reserves. Biodiversity and Conservation,15, 2627–2653.
Peres, C. A. and Terborgh, J. W. (1995). Amazonian naturereserves: an analysis of the defensibility status of existingconservation units and design criteria for the future.Conservation Biology, 9, 34–46.
Stiles, D. (2004). The ivory trade and elephant conserva-tion. Environmental Conservation, 31, 309–321.
von Hippel, F. and von Hippel, W. (2002). Sex drugs andanimal parts: will Viagra save threatened species?Environmental Conservation, 29, 277–281.
Van Kooten, G. C. (2008). Protecting the African elephant:A dynamic bioeconomic model of ivory trade. BiologicalConservation, 141, 2012–2022.
Wilkie, D. S., Starkey, M., Abernethy, K. et al. (2005). Roleof prices and wealth in consumer demand for bushmeatin Gabon, Central Africa. Conservation Biology, 19, 1–7.
OVEREXPLOITATION 123
© Oxford University Press 2010. All rights reserved. For permissions please email: [email protected]
1

they occupy) have no clear ownership. This iswidely referred to as the ‘tragedy of the com-mons’ (Hardin 1968) in which open-access exploi-tation systems lead to much greater rates ofexploitation than are safe for the long-term sur-vival of the population. This is dreadful for boththe resource and the consumers, because eachuser is capturing fewer units of the resourcethan they could if they had fewer competitors.Governments often respond by providing per-verse subsidies that deceptively reduce costs,hence catalyzing a negative spiral leading to fur-ther overexploitation (Repetto and Gillis 1988).The capital invested in many extractive industriessuch as commercial fisheries and logging opera-tions cannot be easily reinvested, so that exploi-ters have few options but to continue harvestingthe depleted resource base. Understandably, thisleads to resistance against restrictions on exploi-tation rates, thereby further exacerbating the pro-blems of declining populations. In fact,exploitation can have a one-way ratchet effect,with governments propping up overexploitationwhen populations are low, and supporting in-vestment in the activity when yields are high.
Laws against the international wildlife andtimber trade have often failed to prevent suppliessourced from natural populations from reachingtheir destination, accounting for an estimated US$292.73 billion global market, most of it ac-counted for by native timber and wild fisheries(see Table 6.1). Global movement of animals forthe pet trade alone has been estimated at ~350million live animals, worth ~US$20 billion peryear (Roe 2008; Traffic 2008). At least 4561 extantbird species are used by humans, mainly as petsand for food, including >3337 species traded in-ternationally (Butchart 2008). Some 15 to 20 mil-lion wild-caught ornamental fish are exportedalive every year through Manaus alone, a largecity in the central Amazon (Andrews 1990).
Regulating illegal overharvesting of exorbitant-priced resource populations—such as elephantivory, rhino horn, tiger bone or mahoganytrees—presents an additional, and often insur-mountable, challenge because the rewards ac-crued to violators often easily outweigh theenforceable penalties or the risks of being caught.
For example, giant bluefin tuna (Thunnus thyn-nus), which are captured illegally by commercialand recreational fishers assisted by high-techgear, may be the most valuable animal on theplanet, with a single 444-pound bluefin tunasold wholesale in Japan a few years ago for US$173 600! In fact, a ban on harvesting of somehighly valuable species has merely spawneda thriving illegal trade. After trade in all fivespecies of rhino was banned, the black rhino be-came extinct in at least 18 African countries[CITES (Convention on International Trade inEndangered Species) 2008]. The long-term suc-cess of often controversial bans on wildlife tradedepends on three factors. First, prohibition ontrade must be accompanied by a reduction indemand for the banned products. Trade in catand seal skins was crushed largely because ethi-cal consumer campaigns destroyed demand atthe same time as trade bans cut the legal supply.
Table 6.1 Total estimated value of the legal wildlife trade worldwide in2005 (data from Roe 2008).
CommodityEstimated value(US$ millon)
Live animalsPrimates 94Cage birds 47Birds of prey 6Reptiles (incl. snakes and turtles) 38Ornamental fish 319
Animal products for clothingor ornaments
Mammal furs and fur products 5000Reptile skins 338Ornamental corals and shells 112Natural pearls 80Animal products for food
(excl. fish)Game meat 773Frog legs 50Edible snails 75
Plant productsMedicinal plants 1300Ornamental plants 13 000Fisheries food products (excl.
aquaculture)81 500
Timber 190 000Total $292.73 bill
124 CONSERVATION BIOLOGY FOR ALL
© Oxford University Press 2010. All rights reserved. For permissions please email: [email protected]
Sodhi and Ehrlich: Conservation Biology for All. http://ukcatalogue.oup.com/product/9780199554249.do

Second, bans may curb legal trade, which oftenprovides an economic incentive to maintain wild-life or their habitat. Some would therefore arguethey undermine conservation efforts and mayeven create incentives to eliminate them. TheAmerican bison was doomed partly because itsrangelands became more valuable for rearing cat-tle (Anderson and Hill 2004). Third, internationaltrade agreements must be supported by govern-ments and citizens in habitat-countries, ratherthan only conscious consumers in wealthy na-tions. But even well-meaning management pre-scriptions involving wildlife trade can becompletely misguided bringing once highlyabundant target species to the brink of extinction.The 97% decline of saiga antelopes (from >1 mil-lion to <30 000) in the steppes of Russia andKazakhstan over a 10-year period has been partlyattributed to conservationists actively promotingexports of saiga (Saiga tatarica) horn to the Chi-nese traditional medicine market as a substitutefor the horn of endangered rhinos. In October2002, saiga antelopes were finally placed on theRed List of critically endangered species follow-ing this population crash (Milner-Gulland et al.2001). In sum, rather few happy stories can betold of illegal wildlife commerce resulting in thesuccessful recovery of harvested wild popula-tions. However, these tend to operate through a‘stick-and-carrot’ approach at more than one link-age of the chain, controlling offtakes at the source,the distribution and transport by intermediatetraders, and/or finally the consumer demand atthe end-point of trade networks. In fact, success-ful management of any exploitation system willinclude enforceable measures ranging from de-mand-side disincentives to supply-side incen-tives (see Box 6.2), with the optimal balancebetween penalties on bad behavior or rewardson good behavior being highly context-specific.
Faced with difficulties of managing many semi-subsistence exploitation systems, such as small-scale fisheries and bushmeat hunting, conserva-tion biologists are increasingly calling for morerealistic control measures that manipulate thelarge-scale spatial structure of the harvest. Onesuch method includes no-take areas, such as wild-life sanctuaries and marine protected areas
(MPAs) that can be permanently or temporarilyclosed-off to maximize game and fish yields. Pro-tection afforded by these spatial restrictions allowspopulations to increase through longer lifespansand higher reproductive success. Recovery of ani-mal biomass inside no-take areas increases harvestlevels in surrounding landscapes (or seascapes),and as stocks build up, juveniles and adults caneventually spill over into adjacent areas (e.g. Ro-berts et al. 2001). However, the theoretical andempirical underpinnings of marine reserves haveadvanced well beyond their terrestrial counter-parts. Several typical life history traits of marinespecies such as planktonic larval dispersal arelacking in terrestrial game species, which differwidely in the degree to which surplus animalscan colonize adjacent unharvested areas. Howev-er, many wild meat hunters may rely heavily onspillovers from no-take areas. A theoretical analy-sis of tapir hunting in Peruvian Amazonia showedthat a source area of 9300 km2 could sustain typi-cal levels of hunting in a 1700 km2 sink, if dispersalwas directed towards that sink (Bodmer 2000). Thedegree to which source-sink population dynamicscan inform real-world management problems re-mains at best an inexact science. In tropical forests,for example, we still lack basic data on the dispers-al rate of most gamebird and large mammal spe-cies. Key management questions thus include thepotential and realized dispersal rate of target spe-cies mediated by changes in density, the magni-tude of the spillover effect outside no-take areas,how large these areas must be and still maintainaccessible hunted areas, and what landscape con-figuration of no-take and hunted areas wouldwork best. It is also critical to ensure that no-takeareas are sufficiently large to maintain viable po-pulations in the face of overharvesting and habitatloss or degradation in surrounding areas (Peres2001; Claudet et al. 2008). In addition to obviousdifferences in life-history between organisms inmarine and terrestrial systems, applying marinemanagement concepts to forest reserves may beproblematic due to differences in the local socio-political context in which no-take areas need to beaccepted, demarcated and implemented (seeChapter 11). In particular, we need a better under-standing of the opportunity costs in terms of
OVEREXPLOITATION 125
© Oxford University Press 2010. All rights reserved. For permissions please email: [email protected]
1

income and livelihoods lost from communityactivities, such as bushmeat hunting and timberextraction, from designating no-take areas.
Finally, conservation biologists and policy-ma-kers who bemoan our general state of data scarcityare akin to fiddlers while Rome burns. Althoughmore fine-tuning data are still needed on the life-history characteristics and population dynamics ofexploited populations, we already have a reason-ably good idea ofwhat controlmeasures need to beimplemented in many exploitation systems.Whether qualitative or quantitative restrictionsare designed by resource managers seeking yieldquotas based on economic optima or more preser-vationist views supporting more radical reduc-tions in biomass extraction, control measures willusually involve reductions in harvest capacity andmortality in exploited areas, ormore and larger no-take areas (Pauly et al. 2002). Eradication of per-verse subsidies to unsustainable extractive indus-tries would often be a win-win option leading tostock recovery andhappier days for resource users.Co-management agreements with local commu-nities based on sensible principles can also workprovided we have the manpower and rural exten-sion capacity to reach out to many source areas(Chapters 14 and 15). Ultimately, however, uncon-trolled exploitation activities worldwide cannot beregulated unless we can count on political will andenforcement of national legislation prescribing sus-tainable management of natural resources, whichare so often undermined by weak, absent, or cor-rupt regulatory institutions.
Summary
· Human exploitation of biological commoditiesinvolves resource extraction from the land, fresh-water bodies or oceans, so that wild animals,plants or their products are used for a wide vari-ety of purposes.· Overexploitation occurs when the harvest rateof any given population exceeds its natural re-placement rate.· Many species are relatively insensitive to har-vesting, remaining abundant under relatively high
rates of offtake, whereas others can be driven tolocal extinction by even the lightest levels of offtake.· This chapter reviews the effects of overexploi-tation in terrestrial as well as aquatic biomes.Options to manage resource exploitation arealso discussed.
Relevant websites
·Bushmeat Crisis Task Force: http://www.bushmeat.org/portal/server.pt.
·Bioko Biodiversity Protection Program: http://www.bioko.org/conservation/hunting.asp.
·Wildlife Conservation Society: http://www.wcs.org/globalconservation/Africa/bushmeat.
REFERENCES
Alroy, J. (2001). A multispecies overkill simulation of thelate Pleistocenemegafaunal mass extinction. Science, 292,1893-1896.
Anderson, T. L. and Hill, P. J. (2004). The Not So Wild, WildWest: Property Rights on the Frontier. Stanford UniversityPress, Stanford, CA.
Andrews, C. (1990). The ornamental fish conservation.Journal of Fish Biology, 37, 53–59.
Asner, G. P., Knapp, D. E., Broadbent, E. N. et al. (2005).Selective Logging in the Brazilian Amazon. Science, 310,480–482.
Ball, S. M. J. (2004). Stocks and exploitation of East Africanblackwood: a flagship species for Tanzania’s Miombowoodlands. Oryx, 38, 1–7.
Barlow, J. and Peres, C. A. (2004). Ecological responses toEl Niño-induced surface fires in central Amazonia: man-agement implications for flammable tropical forests.Philosophical Transactions of the Royal Society of London B,359, 367–380.
Barlow, J. and Peres, C. A. (2008). Fire-mediated diebackand compositional cascade in an Amazonian forest. Phil-osophical Transactions of the Royal Society of London B, 363,1787–1794.
Baum, J. K., Myers, R. A., Kehler, D. G. et al. (2003). Col-lapse and conservation of shark populations in theNorthwest Atlantic. Science, 299, 389–392.
Bennett, E. L. (2002). Is there a link between wild meat andfood security? Conservation Biology, 16, 590–592
Bennett, E. L. and Rao, M. (2002). Hunting and wildlife tradein tropical and subtropical Asia: identifying gaps and
126 CONSERVATION BIOLOGY FOR ALL
© Oxford University Press 2010. All rights reserved. For permissions please email: [email protected]
Sodhi and Ehrlich: Conservation Biology for All. http://ukcatalogue.oup.com/product/9780199554249.do

developing strategies. Unpublished report of the WildlifeConservation Society, Bangkok, Thailand.
Bodmer, R. E. (1995). Managing Amazonian wildlife:biological correlates of game choice by detribalized hun-ters. Ecological Applications, 5, 872–877.
Bodmer, R. (2000). Integrating hunting and protected areasin the Amazon. In N. Dunstone and A. Entwistle, edsFuture priorities for the conservation of mammals: has thePanda had its day? pp. 277–290, Cambridge UniversityPress, Cambridge, UK.
Brashares, J., Arcese, P., Sam, M. K., et al. (2004). Bushmeathunting, wildlife declines, and fish supply in WestAfrica. Science, 306, 1180–1183.
Butchart, S. M. (2008). Red List Indices to measure thesustainability of species use and impacts of invasivealien species. Bird Conservation International, 18, 245–262
Carson, W. P., Anderson, J. T., Leigh, E. G., and Schnitzer,S. A. (2008). Challenges associated with testing and fal-sifying the Janzen–Connell hypothesis: A review andcritique. In S Schnitzer and W Carson, eds Tropical forestcommunity ecology, pp. 210–241. Blackwell Scientific,Oxford, UK.
Chapman, C. A. and Onderdonk, D. A. (1998). Forestswithout primates: primate/plant codependency. Ameri-can Journal of Primatology, 45, 127–141.
Chardonnet, P., des Clers, B., Fischer, J., et al. (2002). Thevalue of wildlife. Revue Scientifique et Technique OfficeIntational Des Épizooties, 21, 15–51.
CITES (2008). Convention on International Tradein Endangered Species of Wild Fauna and Flora.UNEP-WCMC Species Database: CITES-Listed Species.http://www.cites.org/eng/resources/species.html. Ac-cessed 7 January, 2009.
Claudet, J., Osenberg, C. W., Benedetti-Cecchi, L., et al.(2008) Marine reserves: size and age do matter. EcologyLetters, 11, 481–489
Cochrane, M. A. (2003). Fire science for rainforests. Nature,421, 913–919.
Coleman, F.c. and Williams, S. L. (2002). Overexploitingmarine ecosystem engineers: potential consequences forbiodiversity. Trends in Ecology and Evolution, 17, 40–44.
Conover, M. R. (1997). Monetary and intangible valuationof deer in the United States. Wildlife Society Bulletin, 25,298–305.
Cordeiro, N. J. and Howe, H. F. (2003). Forest fragmenta-tion severs mutualism between seed dispersers and anendemic African tree. Proceedings of the National Academyof Sciences of the United States, 100, 14052–14056.
Corlett, R. T. (2007). The impact of hunting on the mam-malian fauna of tropical Asian forests. Biotropica, 39,292–303.
Cowlishaw, G., Mendelson, S., and Rowcliffe, J. M. (2005).Evidence for post-depletion sustainability in a maturebushmeat market. Journal of Applied Ecology, 42, 460–468.
Cox, P. A., Elmqvist, T., Pierson, E. D., and Rainey, W. E.(1991). Flying foxes as strong interactors in South PacificIsland ecosystems: a conservation hypothesis. Conserva-tion Biology, 5, 448–454.
Cristoffer, C. and Peres, C. A. (2003). Elephants vs. butter-flies: the ecological role of large herbivores in the evolu-tionary history of two tropical worlds. Journal ofBiogeography, 30, 1357–1380.
Crowder, L. B. and Murawski, S. A. (1998). Fisheries by-catch: implications for management. Fisheries, 23, 8–15.
Cunningham, A., Bennett, E., Peres, C. A., and Wilkie, D.(2009). The empty forest revisited. Conservation Biology,in review.
Curran, L. M. andWebb, C. O. (2000). Experimental tests ofthe spatiotemporal scale of seedpredation inmast-fruitingDipterocarpaceae. Ecological Monographs, 70, 129–148.
Curran, L. M., Trigg, S. N., Mcdonald, A. K., et al. (2004).Lowland forest loss in protected areas of IndonesianBorneo. Science, 303, 1000–1003.
Dean, W. (1996). A Ferro e Fogo, 2nd edn. Companhia dasLetras, Rio de Janeiro, Brazil.
Dirzo, R. and Miranda A. (1991). Altered patterns of her-bivory and diversity in the forest understory: a casestudy of the possible consequences of contemporarydefaunation. In P. W. Price, T. M. Lewinsohn, G. W.Fernandes, and W. W. Benson WW, eds Plant-animalinteractions: evolutionary ecology in tropical and temperateregions, pp. 273–287. New York: JohnWiley & Sons, NewYork, NY.
Dulvy, N. K., Sadovy, Y., and Reynolds, J. D. (2003).Extinction vulnerability in marine populations. Fishand Fisheries, 4, 25–64.
Estes, J. A., Duggins, D. O., and Rathbun, G. B. (1989). Theecology of extinctions in kelp forest communities. Con-servation Biology, 3, 252–264.
Fa, J. E. and Peres, C. A. (2001). Game vertebrate extractionin African and Neotropical forests: an intercontinentalcomparison. In: J. D. Reynolds, G. M. Mace, K. H. Red-ford and J.G. Robinson, eds Conservation of exploited spe-cies, pp. 203–241. Cambridge University Press,Cambridge, UK.
Fa, J. E, Peres, C. A., and Meeuwig, J. (2001). Bushmeatexploitation in tropical forests: an intercontinental com-parison. Conservation Biology, 16, 232–237.
Fa, J. E., Ryan, S. F., and Bell, D. J. (2005). Hunting vulner-ability, ecological characteristics and harvest rates ofbushmeat species in afrotropical forests. Biological Con-servation, 121, 167–176.
OVEREXPLOITATION 127
© Oxford University Press 2010. All rights reserved. For permissions please email: [email protected]
1

FAO. (2004). The state of world fisheries and aquaculture 2004.Food and Agriculture Organization of the UnitedNations, Rome.
FAO. (2007). State of the World’s Forests. Food and Agri-culture Organization of the United Nations, Italy, Rome.
Godoy, R., Wilkie, D., Overman, H., et al. (2000). Valuationof consumption and sale of forest goods from a CentralAmerican rain forest. Nature, 406, 62–63.
Grogan, J., Jennings, S. B., Landis, R. M., et al. (2008). Whatloggers leave behind: impacts on big-leaf mahogany(Swietenia macrophylla) commercial populations andpotential for post-logging recovery in the BrazilianAmazon. Forest Ecology and Management, 255, 269–281
Gullison R. E. (1998). Will bigleaf mahogany be conservedthrough sustainable use? In E. J. Milner-Gulland andR. Mace, eds Conservation of biological resources,pp. 193–205. Blackwell Publishing, Oxford, UK.
Hall, M. A., Alverson, D. L., and Metuzals, K. I. (2000).Bycatch: problems and solutions. Marine Pollution Bulle-tin, 41, 204–219.
Hames, R. B. and Vickers,W.t. (1982). Optimal diet breadththeory as a model to explain variability in Amazonianhunting. American Ethnologist, 9, 358–378.
Hardin, G. (1968). The tragedy of the commons. Science,162, 1243–1248.
Harrison, I. J. and Stiassny, M. L. J. (1999). The quiet crisis.A preliminary listing of the freshwater fishes of theworld that are extinct or ‘missing in action’. In R. D. E.MacPhee, ed. Extinctions in near time, pp. 271–331.Kluwer Academic/Plenum Publishers, New York, USA.
Holdsworth, A. R. and Uhl, C. (1997). Fire in Amazonianselectively logged rain forest and the potential for firereduction. Ecological Applications, 7, 713–725.
Howe, H. F. and Smallwood, J. (1982). Ecology of seeddispersal. Annual Review of Ecology and Systematics, 13,201–218.
Hutchings, J. A. (2000). Collapse and recovery of marinefishes. Nature, 406, 882–885.
IUCN. (2007). IUCNRed List of Threatened Species [www.iucnredlist.org]. International Union for Conservation ofNature and Natural Resources, Cambridge, UK.
Jackson, J. B. C., Kirby, M. X., Berger, W. H., et al. (2001).Historical overfishing and the recent collapse of coastalecosystems. Science, 293, 629–638.
Jerozolimski, A. and Peres, C. A. (2003). Bringing home thebiggest bacon: a cross-site analysis of the structure ofhunter-kill profiles in Neotropical forests. Biological Con-servation, 111, 415–425.
Jones, C. G., Lawton, J. H., and Shachak, M. (1994). Organ-isms as ecosystem engineers. Oikos, 69, 373–386.
Law, R. (2000). Fishing, selection, and phenotypic evolu-tion. Journal of Marine Science, 57, 659–668.
Lewison, R. L., Freeman, S. A., and Crowder, L. B. (2004).Quantifying the effects of fisheries on threatened species:the impact of pelagic longlines on loggerhead and leath-erback sea turtles. Ecology Letters, 7, 221–231.
Maisels, F., Keming, E., Kemei, M., and Toh, C. (2001). Theextirpation of large mammals and implications for mon-tane forest conservation: the case of the Kilum-Ijim For-est, North-west Province, Cameroon. Oryx, 35, 322–334.
Martin, P. S. (1984). Prehistoric overkill: the global model.In P. S. Martin and R. G. Klein, eds Quaternary extinc-tions: a prehistoric revolution, pp. 354–403. University ofArizona Press, Tucson, AZ.
Martin, P. S. and Wright, H. E., Jr., eds (1967). Pleistoceneextinctions: the search for a cause. Yale University Press,New Haven, CN.
McConkey, K. R. and Drake, D. R. (2006). Flying foxescease to function as seed dispersers long before theybecome rare. Ecology, 87, 271–276.
McKinney, M. L. (1997). Extinction vulnerability and selec-tivity: combining ecological and paleontological views.Annual Review of Ecology and Systematics, 28, 495–516.
MEA. (2006). Millennium Ecosystem Assessment. http://www.millenniumassessment.org/en/. Accessed No-vember 10, 2008.
Milliken, W., Miller, R. P., Pollard, S. R., and Wandelli, E.V. (1992). Ethnobotany of the Waimiri-Atroari Indians ofBrazil. Royal Botanic Gardens, Kew, UK.
Milner-Gulland, E. J., Kholodova, M. V., Bekenov, A., et al.(2001). Dramatic declines in saiga antelope populations.Oryx, 35, 340–345.
Milner-Gulland, E. J., Bennett, E. L., and The SCB 2002Annual Meeting Wild Meat Group. (2003). Wild meat –the bigger picture. Trends in Ecology and Evolution, 18,351–357.
Minto, C., Myers, R. A., and Blanchard, W. (2008). Survivalvariability and population density in fish populations.Nature, 452, 344–347.
Mitja, D. and Lescure, J.-P. (2000). Madeira para perfume:qual será o destino do pau-rosa? A Floresta em Jogo: o Extra-tivismo na Amazônia Central. Editora UNESP, ImprensaOficial do Estado, São Paulo, Brazil.
Myers, R. A. and Worm, B. (2003). Rapid worldwide deple-tion of predatory fish communities. Nature, 423, 280–283.
Myers, R. A., Baum, J. K., Shepherd, T. D., et al. (2007).Cascading effects of the loss of apex predatory sharksfrom a coastal ocean. Science, 315, 1846–1850.
Naiman, R. J., Melillo, J. M., and Hobbie, J. E. (1986).Ecosystem alteration of boreal forest streams by beaver(Castor canadensis). Ecology, 67, 1254–1269.
Nasi, R., Brown, D., Wilkie, D., et al. (2008). Conservationand use of wildlife-based resources: the bushmeat crisis. Sec-retariat of the Convention on Biological Diversity,
128 CONSERVATION BIOLOGY FOR ALL
© Oxford University Press 2010. All rights reserved. For permissions please email: [email protected]
Sodhi and Ehrlich: Conservation Biology for All. http://ukcatalogue.oup.com/product/9780199554249.do

Montreal, and Center for International Forestry Research(CIFOR), Bogor. Technical Series no. 33.
Nepstad, D. C., Verıssimo, A., Alencar, A., et al. (1999).Large-scale impoverishment of Amazonian forests bylogging and fire. Nature, 398, 505–508.
Nichols, E., Gardner, T. A., Peres, C. A., and Spector,S. (2009). Co-declining mammals and dung beetles: animpending ecological cascade. Oikos, 118, 481–487.
Nuñez-Iturri, G., and Howe, H. F. (2007). Bushmeat andthe fate of trees with seeds dispersed by large primates ina lowland rainforest in western Amazonia. Biotropica, 39,348–354.
Olden, J. D., Hogan, Z. S., and Zanden, M. J. V. (2007).Small fish, big fish, red fish, blue fish: size-biased extinc-tion risk of the world’s freshwater and marine fishes.Global Ecology and Biogeography, 16, 694–701.
Pauly, D., Christensen, V., Dalsgaard, J., and Froese,R. (1998). Fishing down marine food webs. Science, 279,860–863.
Pauly, D., Christensen, V., Guenette, S., et al. (2002).Towards sustainability in world fisheries. Nature, 418,689–695.
Pearce, P. (1990). Introduction to forestry economics. Univer-sity of British Columbia Press, Vancouver, Canada.
Peres, C. A. (2000). Effects of subsistence hunting on verte-brate community structure in Amazonian forests. Con-servation Biology, 14, 240–253.
Peres, C. A. (2001). Synergistic effects of subsistence hunt-ing and habitat fragmentation on Amazonian forest ver-tebrates. Conservation Biology, 15, 1490–1505.
Peres, C. A. and Dolman, P. (2000). Density compensationin neotropical primate communities: evidence from 56hunted and non-hunted Amazonian forests of varyingproductivity. Oecologia, 122, 175–189.
Peres, C. A. and Lake, I. R. (2003). Extent of nontimberresource extraction in tropical forests: accessibility togame vertebrates by hunters in the Amazon basin. Con-servation Biology, 17, 521–535.
Peres, C. A. and van Roosmalen, M. (2003). Patterns ofprimate frugivory in Amazonia and the Guianan shield:implications to the demography of large-seeded plantsin overhunted tropical forests. In D. Levey, W. Silva andM. Galetti, eds Seed dispersal and frugivory: ecology, evolu-tion and conservation, pp. 407–423. CABI International,Oxford, UK.
Peres C. A. and Palacios, E. (2007). Basin-wide effects ofgame harvest on vertebrate population densities in Am-azonian forests: implications for animal-mediated seeddispersal. Biotropica, 39, 304–315.
Peres, C. A., Baider, C., Zuidema, P. A., et al. (2003). Demo-graphic threats to the sustainability of Brazil nutexploitation. Science, 302, 2112–2114.
Peters, C. M. (1994). Sustainable harvest of non-timberplant resources in tropical moist forest:an ecologicalprimer. Biodiversity Support Program, Washington,DC.
Peters, C. M., Gentry, A. H., and Mendelsohn, R. (1989).Valuation of an Amazonian rainforest. Nature, 339,655–656.
Redford, K. H. (1992). The empty forest. BioScience, 42,412–422.
Redford, K. H. and P. Feinsinger. (2001). The half-emptyforest: sustainable use and the ecology of interactions.In J.D. Reynolds, G.M. Mace, K.H. Redford andJ.G. Robinson, eds Conservation of exploited species,pp. 370–399. Cambridge University Press, Cam-bridge, UK.
Repetto, R. and Gillis, M., eds (1988). Public policies and themisuse of forest resources. Cambridge University Press,Cambridge, UK.
Roberts, C. M., Bohnsack, J. A., Gell, F., et al. (2001). Effectsof marine reserves on adjacent fisheries. Science, 294,1920–1923.
Roberts, J. M, Wheeler, A. J, and Freiwald, A. (2006). Reefsof the deep: the biology and geology of cold-water coralecosystems. Science, 312, 543–547.
Robinson, J. G. and Bennett, E. L., eds (2000). Hunting forsustainability in tropical forests. Columbia UniversityPress, New York.
Roe, D. (2008). Trading Nature. A report, with case studies, onthe contribution of wildlife trade management to sustainablelivelihoods and the Millennium Development Goals. TRAF-FIC International and WWF International.
Ross, E. B. (1978). Food taboos, diet, and hunting strategy:the adaptation to animals in Amazon cultural ecology.Current Anthropology, 19, 1–36.
Samant, S. S., Dhar, U., and Palni, L. M. S. (1998).Medicinalplants of Indian Himalaya: diversity distribution potentialvalues. G. B. Pant Institute of Himalayan Environmentand Development, Almora, India.
Sheil, D. and Salim, A. (2004). Forest trees, elephants, stemscars and persistence. Biotropica, 36, 505–521.
Sodhi, N. S., Koh, L. P., Peh, K. S.-H., et al. (2008). Corre-lates of extinction proneness in tropical angiosperms.Diversity and Distributions, 14, 1–10.
Steadman, D. A. (1995). Prehistoric extinctions of Pacificislands birds: biodiversity meets zooarcheology. Science,267, 1123–1131.
Swaine, M. D. and Whitmore, T. C. (1988). On the defini-tion of ecological species groups in tropical rain forests.Vegetatio, 75, 81–86.
Terborgh, J., Nunez-Iturri, G., Pitman, N. C. A., et al. (2008).Tree recruitment in an empty forest. Ecology, 89, 1757–1768.
OVEREXPLOITATION 129
© Oxford University Press 2010. All rights reserved. For permissions please email: [email protected]
1

TRAFFIC. (1998). Europe’s medicinal and aromatic plants:their use, trade and conservation. TRAFFIC International,Cambridge, UK.
TRAFFIC. (2008). What’s driving the wildlife trade? A reviewof expert opinion on economic and social drivers of the wildlifetrade and trade control efforts in Cambodia, Indonesia, LaoPDR and Vietnam. World Bank, Washington, DC.
USCensusBureau. (2006).2006National survey offishing, hunt-ing, and wildlife-associated recreation. U.S. Department of theInterior, Fish andWildlife Service, and U.S. Department ofCommerce, USCensus Bureau, Shepherdston,WV.
Wang, B. C., Leong, M. T., Smith, T. B., and Sork, V. L.(2007). Hunting of mammals reduces seed removal anddispersal from the Afrotropical tree, Antrocaryon klainea-num (Anacardiaceae). Biotropica, 39, 340–347.
Warkentin, I. G., Bickford, D., Sodhi, N. S., and Bradshaw,C. J. A. (2009). Eating frogs to extinction. ConservationBiology, 23, 1056–1059.
WCFSD. (1998). Final Report on Forest Capital. World Com-mission of Forests and Sustainable Development., Cam-bridge University Press, Cambridge, UK.
World Bank. (2008). The sunken billions: the economic justifi-cation for fisheries reform. Agriculture and Rural Develop-ment Department. The World Bank and Food andAgriculture Organization, Washington, DC.
Worm, B., Barbier, E. B., Beaumont, N., et al. (2006).Impacts of biodiversity loss on ocean ecosystem services.Science, 314, 787–790.
Wright, J. P. and Jones, C. G. (2006). The concept of organ-isms as ecosystem engineers ten years on: progress, lim-itations and challenges. BioScience, 56, 203–209.
Wright, S. J. (2003). The myriad effects of hunting forvertebrates and plants in tropical forests. Perspectives inPlant Ecology, Evolution and Systematics, 6, 73–86.
Wright, S. J., Zeballos, H., Dominguez, I., et al. (2000).Poachers alter mammal abundance, seed dispersaland seed predation in a Neotropical forest. ConservationBiology, 14, 227–239.
Wright, S. J., Hernandez, A., and Condit, R. (2007).The bushmeat harvest alters seedling banks by favoringlianas, large seeds and seeds dispersed by bats, birdsand wind. Biotropica, 39, 363–371.
130 CONSERVATION BIOLOGY FOR ALL
© Oxford University Press 2010. All rights reserved. For permissions please email: [email protected]
Sodhi and Ehrlich: Conservation Biology for All. http://ukcatalogue.oup.com/product/9780199554249.do

CHAP T E R 7
Invasive speciesDaniel Simberloff
An invasive species is one that arrives (oftenwithhuman assistance) in a habitat it had not previ-ously occupied, then establishes a populationand spreads autonomously. Species invasionsare one of the main conservation threats todayand have caused many species extinctions. Thegreat majority of such invasions are by speciesintroduced from elsewhere, although some na-tive species have become invasive in newly occu-pied habitats (see Box 7.1). In some areas of the
world—especially islands (see Box 7.2)—intro-duced species comprise a large proportion of allspecies. For instance, for the Hawaiian islands,almost half the plant species, 25% of insects, 40%of birds, and most freshwater fishes are intro-duced, while the analogous figures for Floridaare 27% of plant species, 8% of insects, 5% ofbirds, and 24% of freshwater fishes. Not all intro-duced species become invasive, however. Manyplant species imported as ornamentals persist in
Box 7.1 Native invasivesDaniel Simberloff
Although the great majority of invasive speciesare introduced, occasionally native plantspecies have become invasive, spreadingrapidly into previously unoccupied habitats.These invasions fall into two categories, bothinvolving human activities. In the first, a nativespecies that is rather restricted in range andhabitat is supplemented with introductionsfrom afar that have new genotypes, and thenew genotypes, or recombinants involving thenew genotypes, become invasive. An examplein North America is common reed (Phragmitesaustralis), which was present for at leastthousands of years and is probably native, butwhich spread widely, became much morecommon, and began occupying more habitatsbeginning in the mid‐ nineteenth century. Thisinvasion is wholly due to the introduction ofOld World genotypes at that time, probably insoil ballast (Saltonstall 2002). Similarly, reedcanarygrass (Phalaris arundinacea), native toNorth America but previously uncommon,became highly invasive in wetland habitats
with the introduction of European genotypesas a forage crop in the 19th century (Lavergneand Molofsky 2007).The second category of native invasives arises
from human modification of the environment.For instance, in western Europe, the grassElymus athericus, previously a minorcomponent of high intertidal vegetation,began spreading seaward because of increasednitrogen in both aerial deposition and runoff,and it now occupies most of the intertidal inmany areas (Valéry et al. 2004). The plantapparently uses the nitrogen to increase itstolerance or regulation of salt. In variousregions of the western United States, Douglasfir (Pseudotsuga menziesii) and several othertree species have invaded grasslands andshrublands as a result of fire suppression,increased grazing by livestock, or both. Naturalfire had precluded them, and when fire wassuppressed, livestock served the same role(Simberloff 2008). By contrast, Virginia pine(Pinus virginiana) in the eastern United States
continues
131
1
© Oxford University Press 2010. All rights reserved. For permissions please email: [email protected]

Box 7.1 (Continued)
invaded serpentine grasslands when fires weresuppressed and long‐time grazing practiceswere restricted (Thiet and Boerner 2007).
REFERENCES
Lavergne, S. and Molofsky, J. (2007). Increased geneticvariation and evolutionary potential drive the success ofan invasive grass. Proceedings of the National Academyof Sciences of the United States of America, 104,3883–3888.
Saltonstall, K. (2002). Cryptic invasion by a non‐nativegenotype of the common reed, Phragmites australis,into North America. Proceedings of the National Acad-
emy of Sciences of the United States of America, 99,2445–2449.
Simberloff, D. (2008). Invasion biologists and the biofuelsboom: Cassandras or colleagues? Weed Science, 56,867–872.
Thiet, R. K and Boerner, R. E. J. (2007). Spatial patternsof ectomycorrhizal fungal inoculum in arbuscular my-corrhizal barrens communities: implications forcontrolling invasion by Pinus virginiana. Mycorrhiza, 17,507–517.
Valéry, L., Bouchard, V., and Lefeuvre, J.‐C. (2004).Impact of the invasive native species Elymus athericuson carbon pools in a salt marsh. Wetlands,24, 268–276.
Box 7.2 Invasive species in New ZealandDaniel Simberloff
Many islands have been particularly afflicted byintroduced species, even large islands such asthose comprising New Zealand (Allen and Lee2006). New Zealand had no native mammals,except for three bat species but now has 30introduced mammals. Among these, severalare highly detrimental to local fauna and/orflora. The Australian brushtail possum(Trichosurus vulpecula; Box 7.2 Figure) nownumbers in the millions and destroysbroadleaved native trees, eating bird eggs andchicks as well. Pacific and Norway rats are alsodevastating omnivores that particularly plaguenative birds. Introduced carnivores—the stoat(Mustela erminea), weasel (M. nivalis), ferret(M. furo), and hedgehog (Erinaceus europaeus)—are all widespread and prey on variouscombinations of native birds, insects, skinks,geckos, and an endemic reptile (Sphenodonpunctatus). Many ungulates have beenintroduced, of which European red deer(Cervus elaphus) is most numerous. Tramplingand grazing by ungulates has greatly damagednative vegetation in some areas. Feral pigs (Susscrofa) are now widespread in forest and scrubhabitats, and their rooting causes erosion,reduces populations of some plant species, and
changes nutrient cycling by mixing organic andmineral layers of the soil. Of 120 introducedbird species, 34 are established. To some extentthey probably compete with native birds andprey on native invertebrates, but their impact ispoorly studied and certainly not nearly assevere as that of introduced mammals.European brown trout (Salmo trutta) arewidely established and have caused the localextirpation of a number of fish species.Among the estimated 2200 established
introduced invertebrate species in
Box 7.2 Figure Brushtail possum. Photograph by Rod Morris.
continues
132 CONSERVATION BIOLOGY FOR ALL
Sodhi and Ehrlich: Conservation Biology for All. http://ukcatalogue.oup.com/product/9780199554249.do
© Oxford University Press 2010. All rights reserved. For permissions please email: [email protected]

gardenswith human assistance but cannot estab-lish in less modified habitats. The fraction of in-troduced species that establish and spread is amatter under active research, but for some organ-isms it can be high. For example, half of thefreshwater fish, mammal, and bird species intro-duced from Europe to North America or vice-versa have established populations, and ofthese, more than half became invasive (Jeschkeand Strayer 2005).
Invasive species can produce a bewilderingarray of impacts, and impacts often depend oncontext; the same introduced species can haveminimal effects on native species and ecosys-tems in one region but can be devastatingsomewhere else. Further, the same species canaffect natives in several different ways simul-taneously. However, a good way to begin tounderstand the scope of the threat posed bybiological invasions is to classify the maintypes of impacts.
7.1 Invasive species impacts
7.1.1 Ecosystem modification
The greatest impacts of invasive species entailmodifying entire ecosystems, because such mod-ifications are likely to affect most of the originallyresident species. Most obviously, the physicalstructure of the habitat can be changed. For in-stance, in Tierra del Fuego, introduction of a fewNorth American beavers (Castor canadensis) in1946 has led to a population now over 50 000,and in many areas they have converted forests ofsouthern beech (Nothofagus spp.) to grass- andsedge-dominated meadows (Lizarralde et al.2004). In the Florida Everglades, introduced Aus-tralian paperbark (Melaleuca quinquenervia) treeshave effected the opposite change, from grass-and sedge-dominated prairies to nearly mono-specific paperbark forests (Schmitz et al. 1997).In parts of Hawaii, Asian and American man-grove species have replaced beach communities
Box 7.2 (Continued)
New Zealand, German wasps (Vespulagermanica) and common wasps (V. vulgaris)have probably had the most impact, especiallyby monopolizing the honeydew produced bynative scale insects that had supported severalnative bird species, including the kaka (Nestormeridionalis), the tui (Prosthemaderanovaeseelandiae), and the bellbird (Anthornismelanura).About 2100 species of introduced plants are
now established in New Zealand,outnumbering native species. Several treespecies introduced about a century ago arenow beginning to spread widely, the lagcaused by the fact that trees have long lifecycles. Most of the introduced plants in NewZealand, including trees, invade largely orwholly when there is some sort of disturbance,such as land‐clearing or forestry. However,once established, introduced plants have insome instances prevented a return to theoriginal state after disturbance stopped. NewZealand also has relatively few nitrogen‐fixing
plant species, and even these have beenoutcompeted by introduced nitrogen‐fixerssuch as gorse (Ulex europaeus), Scotch broom(Cytisus scoparius), and tree lupine (Lupinusarboreus). As in other areas (see above), inparts of New Zealand these nitrogen‐fixershave, by fertilizing the soil, favored certainnative species over others and have induced aninvasional meltdown by allowing otherintroduced plant species to establish.Given the enormous number of introduced
species invading New Zealand and the manysorts of impacts these have generated, it is notsurprising that New Zealand enacted the firstcomprehensive national strategy to address theentire issue of biological invasions, theBiosecurity Act of 1993.
REFERENCE
Allen, R. B. and Lee, W. G., eds (2006). Biological invasionsin New Zealand. Springer, Berlin, Germany.
INVASIVE SPECIES 133
1
© Oxford University Press 2010. All rights reserved. For permissions please email: [email protected]

of herbs and small shrubs with tall mangroveforests (Allen 1998).
Introduced plant species can modify an entireecosystem by overgrowing and shading out nativespecies. South American water hyacinth (Eichhor-nia crassipes) now covers parts of Lake Victoria inAfrica (Matthews and Brand 2004a), many lakesand rivers in the southeastern United States(Schardt 1997), and various waterbodies in Asiaand Australia (Matthews and Brand 2004b), oftensmothering native submersed vegetation. Vastquantities of rotting water hyacinth, and conse-quent drops in dissolved oxygen, can also affectmany aquatic animal species. Similar overgrowthoccurs in the Mediterranean Sea, where Caulerpataxifolia (Figure 7.1), an alga from the tropicalsouthwest Pacific Ocean, replaces seagrass mea-dows over thousands of hectares, greatly changingthe animal community (Meinesz 1999).
A new species of cordgrass (Spartina anglica)arose in England in the late nineteenth century byhybridization between a native cordgrass and anintroduced North American species. The new spe-cies invaded tidal mudflats and, trapping muchmore sediment, increased elevation and convertedmudflats to badly drained, dense saltmarsheswithdifferent animal species (Thompson 1991). The hy-brid species was later introduced to New Zealandand the state of Washington with similar impacts.
Introduced species can change entireecosystems by changing the fire regime (seeChapter 9). The invasion of the Florida Ever-glades by Australian paperbark trees, notedabove, is largely due to the fact that paperbarkcatches fire easily and produces hotter fires thanthe grasses and sedges it replaces. The oppositetransformation, from forest to grassland, canalso be effected by a changed fire regime. InHawaii, African molassesgrass (Melinis minuti-flora) and tropical American tufted beardgrass(Schizachyrium condensatum) have replaced na-tive-dominated woodland by virtue of increasedfire frequency and extent (D’Antonio and Vitou-sek 1992).
Introduced plants can change entire ecosys-tems by modifying water or nutrient regimes. AtEagle Borax Spring in California, Mediterraneansalt cedars (Tamarix spp.) dried up a large marsh(McDaniel et al. 2005), while in Israel, Australianeucalyptus trees were deliberately introduced todrain swamps (Calder 2002). By fertilizing nitro-gen-poor sites, introduced nitrogen-fixing plantscan favor other exotic species over natives. On thegeologically young, nitrogen-poor volcanic is-land of Hawaii, firetree (Morella faya), a nitro-gen-fixing shrub from the Azores, createsconditions that favor other introduced speciesthat previously could not thrive in the low-nutrient
Figure 7.1 Caulerpa taxifolia. Photograph by Alex Meinesz.
134 CONSERVATION BIOLOGY FOR ALL
Sodhi and Ehrlich: Conservation Biology for All. http://ukcatalogue.oup.com/product/9780199554249.do
© Oxford University Press 2010. All rights reserved. For permissions please email: [email protected]

soil and disfavor native plants that had evolved totolerate such soil (Vitousek 1986).
Pathogens that eliminate a previously domi-nant plant can impact an entire ecosystem. Inthe first half of the twentieth century, Asian chest-nut blight (Cryphonectria parasitica) rippedthrough eastern North America, effectively elim-inating American chestnut (Castanea dentata), atree that had been common from Georgiathrough parts of Canada and comprised at least30% of the canopy trees in many forests (William-son 1996). This loss in turn led to substantialstructural changes in the forest, and it probablygreatly affected nutrient cycling, because chest-nut wood, high in tannin, decomposes slowly,while the leaves decompose very rapidly (Ellisonet al. 2005). Chestnut was largely replaced by oaks(Quercus spp.), which produce a recalcitrant litter.Because this invasion occurred so long ago, fewof its effects were studied at the time, but it isknown that at least seven moth species host-spe-cific to chestnut went extinct (Opler 1978). Suchpathogens are also threats to forest industriesfounded on introduced species as well as natives,as witness the vast plantations in Chile of NorthAmerican Monterrey pine (Pinus radiata) nowthreatened by recently arrived Phytophthora pini-folia (Durán et al. 2008).
7.1.2 Resource competition
In Great Britain, the introduced North Americangray squirrel (Sciurus carolinensis) forages fornuts more efficiently than the native red squirrel(Sciurus vulgaris), leading to the decline of thelatter species (Williamson 1996). The sameNorth American gray squirrel species has re-cently invaded the Piedmont in Italy and isspreading, leading to concern that the red squir-rel will also decline on the mainland of Europeas it has in Britain (Bertolino et al. 2008). Thehouse gecko (Hemidactylus frenatus) from South-east Asia and parts of Africa has invaded manyPacific islands, lowering insect populations thatserve as food for native lizards, whose popula-tions have declined in some areas (Petren andCase 1996).
7.1.3 Aggression and its analogs
The red imported fire ant (Solenopsis invicta) fromsouthern South America has spread through thesoutheastern United States and more recently hasinvaded California. It attacks other ant species itencounters, and in disturbed habitats (whichcomprise much of the Southeast) this aggressionhas caused great declines in populations of nativeant species (Tschinkel 2006). The Argentine ant(Linepithema humile), also native to South Ameri-ca, similarly depresses populations of native antspecies in the United States by attacking them(Holway and Suarez 2004). The Old Worldzebra mussel (Dreissena polymorpha; Figure 7.2),spreading throughout much of North America,threatens the very existence of a number of nativefreshwater bivalve species, primarily by settlingon them in great number and suturing theirvalves together with byssal threads, so that theysuffocate or starve (Ricciardi et al. 1998). Al-though plants do not attack, they have an analo-gous ability to inhibit other species, by producingor sequestering chemicals. For example, the Afri-can crystalline ice plant (Mesembryanthemum crys-tallinum) sequesters salt, and when leaves fall anddecompose, the salt remains in the soil, renderingit inhospitable to native plants in California thatcannot tolerate such high salt concentrations(Vivrette and Muller 1977). Diffuse knapweed(Centaurea diffusa) from Eurasia and spottedknapweed (C. stoebe) from Europe are bothmajor invaders of rangelands in the AmericanWest. One reason they dominate native rangeplants in the United States is that they produce
Figure 7.2 Zebra mussel. Photograph by Tony Ricciardi.
INVASIVE SPECIES 135
1
© Oxford University Press 2010. All rights reserved. For permissions please email: [email protected]

root exudates that are toxic to native plants (Call-away and Ridenour 2004). An invasive intro-duced plant can also dominate a native speciesby interfering with a necessary symbiont of thenative. For instance, many plants have estab-lished mutualistic relationships with arbuscularmycorrhizal fungi, in which the fungal hyphaepenetrate the cells of the plants’ roots and aidthe plants to capture soil nutrients. Garlic mus-tard (Alliaria petiolata) from Europe, Asia, andNorth Africa is a highly invasive species in theground cover of many North American wood-lands and floodplains. Root exudates of garlicmustard, which does not have mycorrhizal as-sociates, are toxic to arbuscular mycorrhizalfungi found in North American soils (Callawayet al. 2008).
7.1.4 Predation
One of the most dramatic and frequently seenimpacts of introduced species is predation onnative species. Probably the most famous casesare of mammalian predators such as the ship rat(Rattus rattus), Norway rat (R. norvegicus), Pacificrat (R. exulans), small Indian mongoose (Herpestesauropunctatus), and stoat (Mustela erminea) intro-duced to islands that formerly lacked such spe-cies. In many instances, native bird species, nothaving evolved adaptations to such predators,
nested on the ground andwere highly susceptibleto the invaders. Introduced rats, for example,have caused the extinction of at least 37 speciesand subspecies of island birds throughout theworld (Atkinson 1985). The brown tree snake(Boiga irregularis; Figure 7.3), introduced toGuam from New Guinea in cargo after WorldWar II, has caused the extinction or local extirpa-tion of nine of the twelve native forest bird spe-cies on Guam and two of the eleven native lizardspecies (Lockwood et al. 2007). For these nativespecies, an arboreal habitat was no defenseagainst a tree-climbing predator. Another famousintroduced predator that has wreaked havoc withnative species is the Nile perch (Lates niloticus),deliberately introduced to Lake Victoria in the1950s in the hope that a fishery would be estab-lished to provide food and jobs to local commu-nities (Pringle 2005). Lake Victoria is home of oneof the great evolutionary species radiations, thehundreds of species of cichlid fishes. About halfof them are now extinct because of predation bythe perch, and several others are maintained onlyby captive rearing (Lockwood et al. 2007).
Many predators have been deliberately intro-duced for “biological control” of previously in-troduced species (see below), and a number ofthese have succeeded in keeping populations ofthe target species at greatly reduced levels. Forinstance, introduction of the Australian vedalia
Figure 7.3 Brown tree snake. Photograph by Gad Perry.
136 CONSERVATION BIOLOGY FOR ALL
Sodhi and Ehrlich: Conservation Biology for All. http://ukcatalogue.oup.com/product/9780199554249.do
© Oxford University Press 2010. All rights reserved. For permissions please email: [email protected]

ladybeetle (Rodolia cardinalis) in 1889 controlledAustralian cottony-cushion scale (Icerya purchasi)on citrus in California (Caltagirone and Doutt1989). However, some predators introduced forbiological control have attacked non-target spe-cies to the extent of causing extinctions. One ofthe worst such disasters was the introduction ofthe rosy wolf snail (Euglandina rosea), native toCentral America and Florida, to many Pacificislands to control the previously introducedgiant African snail (Achatina fulica). The predatornot only failed to control the targeted prey (whichgrows to be too large for the rosy wolf snail toattack it) but caused the extinction of over 50species of native land snails (Cowie 2002). Thesmall Indian mongoose, implicated as the solecause or a contributing cause in the extinction ofseveral island species of birds, mammals, andfrogs, was deliberately introduced to all theseislands as a biological control agent for intro-duced rats (Hays and Conant 2006). The mosqui-tofish (Gambusia affinis) from Mexico and CentralAmerica has been introduced to Europe, Asia,Africa, Australia, and many islands for mosquitocontrol. Its record on this score is mixed, andthere is often evidence that it is no better thannative predators at controlling mosquitoes. How-ever, it preys on native invertebrates and smallfishes and in Australia is implicated in extinctionof several fish species (Pyke 2008).
7.1.5 Herbivory
Introduced herbivores can devastate the flora ofareas lacking similar native species, especially onislands. Goats (Capra aegagrus hircus) introducedto the island of St. Helena in 1513 are believed tohave eliminated at least half of �100 endemicplant species before botanists had a chance torecord them (Cronk 1989). European rabbits (Or-yctolagus cuniculus) introduced to islands world-wide have devastated many plant populations,often by bark-stripping and thus killing shrubsand seedling and sapling trees. Rabbits also oftencause extensive erosion once vegetation has beendestroyed (Thompson and King 1994). Damageto forests and crop plants by introduced herbi-vores is often staggering. For instance, the South
American cassava mealybug (Phenacoccus mani-hoti), invading extensive cassava-growing partsof Africa, often destroys more than half the cropyield (Norgaard 1988), while in the UnitedStates, the Russian wheat aphid (Diuraphisnoxia) caused US$600 million damage in justthree years (Office of Technology Assessment1993). In forests of the eastern United States, theEuropean gypsy moth (Lymantria dispar) causeda similar amount of damage in only one year(Office of Technology Assessment 1993). In highelevation forests of the southern AppalachianMountains, the Asian balsam woolly adelgid(Adelges piceae) has effectively eliminated thepreviously dominant Fraser fir tree (Rabenoldet al. 1998), while throughout the eastern UnitedStates the hemlock woolly adelgid (A. tsugae) iskilling most hemlock trees, which often formeddistinct moist, cool habitats amidst other treespecies (Ellison et al. 2005).
Plant-eating insects have been successful inmany biological control projects for terrestrialand aquatic weeds. For instance, in Africa’sLake Victoria, a massive invasion of water hya-cinth was brought under control by introductionof two South American weevils, Neochetina eich-horniae and N. bruchi (Matthews and Brand2004a); these have also been introduced to attackwater hyacinth in tropical Asia (Matthews andBrand 2004b). The South American alligator-weed flea beetle (Agasicles hygrophila) has mini-mized the invasion of its South American hostplant (Alternanthera philoxeroides) in Florida (Cen-ter et al. 1997) and contributed greatly to itscontrol in slow-moving water bodies in Asia(Matthews and Brand 2004b). A particularly fa-mous case was the introduction of the SouthAmerican cactus moth (Cactoblastis cactorum) toAustralia, where it brought a massive invasion ofprickly pear cactus (Opuntia spp.) under control(Zimmermann et al. 2001). In probably the firstsuccessful weed biological control project, a Bra-zilian cochineal bug (Dactylopius ceylonicus) vir-tually eliminated the smooth prickly pear(Opuntia vulgaris) from India (Doutt 1964). In1913, the same insect was introduced to SouthAfrica and effectively eliminated the same plant(Doutt 1964).
INVASIVE SPECIES 137
1
© Oxford University Press 2010. All rights reserved. For permissions please email: [email protected]
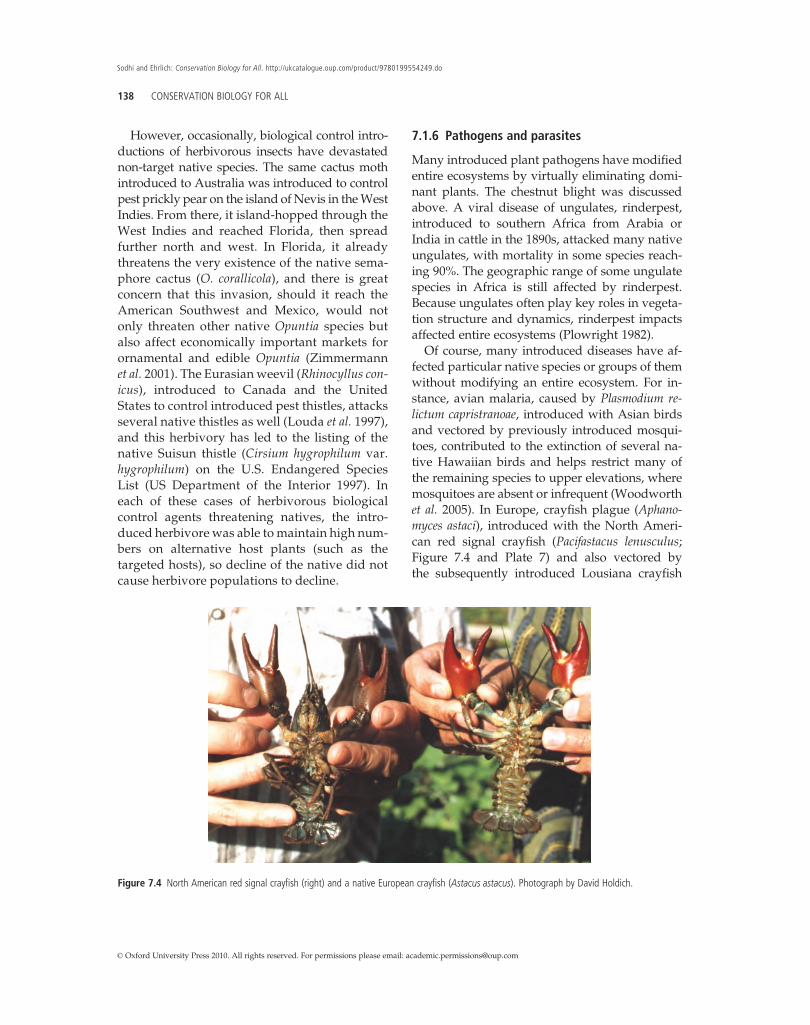
However, occasionally, biological control intro-ductions of herbivorous insects have devastatednon-target native species. The same cactus mothintroduced to Australia was introduced to controlpest prickly pear on the island of Nevis in theWestIndies. From there, it island-hopped through theWest Indies and reached Florida, then spreadfurther north and west. In Florida, it alreadythreatens the very existence of the native sema-phore cactus (O. corallicola), and there is greatconcern that this invasion, should it reach theAmerican Southwest and Mexico, would notonly threaten other native Opuntia species butalso affect economically important markets forornamental and edible Opuntia (Zimmermannet al. 2001). The Eurasian weevil (Rhinocyllus con-icus), introduced to Canada and the UnitedStates to control introduced pest thistles, attacksseveral native thistles as well (Louda et al. 1997),and this herbivory has led to the listing of thenative Suisun thistle (Cirsium hygrophilum var.hygrophilum) on the U.S. Endangered SpeciesList (US Department of the Interior 1997). Ineach of these cases of herbivorous biologicalcontrol agents threatening natives, the intro-duced herbivore was able to maintain high num-bers on alternative host plants (such as thetargeted hosts), so decline of the native did notcause herbivore populations to decline.
7.1.6 Pathogens and parasites
Many introduced plant pathogens have modifiedentire ecosystems by virtually eliminating domi-nant plants. The chestnut blight was discussedabove. A viral disease of ungulates, rinderpest,introduced to southern Africa from Arabia orIndia in cattle in the 1890s, attacked many nativeungulates, with mortality in some species reach-ing 90%. The geographic range of some ungulatespecies in Africa is still affected by rinderpest.Because ungulates often play key roles in vegeta-tion structure and dynamics, rinderpest impactsaffected entire ecosystems (Plowright 1982).
Of course, many introduced diseases have af-fected particular native species or groups of themwithout modifying an entire ecosystem. For in-stance, avian malaria, caused by Plasmodium re-lictum capristranoae, introduced with Asian birdsand vectored by previously introduced mosqui-toes, contributed to the extinction of several na-tive Hawaiian birds and helps restrict many ofthe remaining species to upper elevations, wheremosquitoes are absent or infrequent (Woodworthet al. 2005). In Europe, crayfish plague (Aphano-myces astaci), introduced with the North Ameri-can red signal crayfish (Pacifastacus lenusculus;Figure 7.4 and Plate 7) and also vectored bythe subsequently introduced Lousiana crayfish
Figure 7.4 North American red signal crayfish (right) and a native European crayfish (Astacus astacus). Photograph by David Holdich.
138 CONSERVATION BIOLOGY FOR ALL
Sodhi and Ehrlich: Conservation Biology for All. http://ukcatalogue.oup.com/product/9780199554249.do
© Oxford University Press 2010. All rights reserved. For permissions please email: [email protected]

(Procambarus clarkii), has devastated native Euro-pean crayfish populations (Goodell et al. 2000).The European fish parasite Myxosoma cerebralis,which causes whirling disease in salmonid fishes,infected North American rainbow trout (Oncor-hynchus mykiss) that had been previously intro-duced to Europe and were moved freely amongEuropean sites after World War II. Subsequently,infected frozen rainbow trout were shipped toNorth America, and the parasite somehow gotinto a trout hatchery in Pennsylvania, fromwhich infected rainbow trout were shipped tomany western states. In large areas of the West,most rainbow trout contracted the disease andsport fisheries utterly collapsed (Bergersen andAnderson 1997). Introduced plant parasites cangreatly damage agriculture. For example, parasit-ic witchweed (Striga asiatica) from Africa reachedthe southeastern United States after World WarII, probably arriving on military equipment. Itinflicts great losses on crops that are grasses (in-cluding corn) and has been the target of a lengthy,expensive eradication campaign (Eplee 2001).
Introduction of vectors can also spread not onlyintroduced pathogens (e.g. the mosquitoes vector-ing avian malaria in Hawaii) but also native ones.For example, the native trematode Cyathocotylebushiensis, an often deadly parasite of ducks, hasreached new regions along the St. Lawrence Riverrecently as its introduced intermediate host, theEurasian faucet snail (Bithynia tentaculata), has in-vaded (Sauer et al. 2007). Introduced parasites orpathogens and vectors can interact in complicatedways to devastate a native host species. Chinesegrass carp (Ctenopharyngodon idella) infected withthe Asian tapeworm Bothriocephalus acheilognathiwere introduced to Arkansas in 1968 to controlintroduced aquatic plants and spread to the Mis-sissippi River. There the tapeworm infected nativefishes, including a popular bait fish, the red shiner(Notropis lutrensis). Fishermen or bait dealers thencarried infected red shiners to the Colorado River,from which by 1984 they had reached a Utahtributary, the Virgin River. In the Virgin River,the tapeworm infected and killed many woundfin(Plagopterus argentissimus), a native minnow al-ready threatened by dams and water diversionprojects (Moyle 1993).
Parasites and pathogens have also been usedsuccessfully in biological control projects againstintroduced target hosts. For instance, the SouthAmerican cassava mealybug in Africa, discussedabove, has been partly controlled by an introducedSouth American parasitic wasp, Epidinocarsis lopezi(Norgaard 1988), while the European yellow clo-ver aphid (Therioaphis trifolii), a pest of both cloverand alfalfa, is controlled in California by threeintroduced parasitic wasps, Praon palitans, Trioxysutilis, and Aphelinus semiflavus (Van Den Boschet al. 1964). The New World myxoma virus, intro-duced to mainland Europe (where the Europeanrabbit is native) and Great Britain and Australia(where the rabbit is introduced), initially causeddevastating mortality (over 90%). However, theinitially virulent viral strains evolved to be morebenign, while in Great Britain and Australia,rabbits evolved to be more resistant to the virus.Mortality has thus decreased in each successiveepidemic (Bartrip 2008).
7.1.7 Hybridization
If introduced species are sufficiently closelyrelated to native species, they may be able tomate and exchange genes with them, and a suffi-cient amount of genetic exchange (introgression)can so change the genetic constitution of the na-tive population that we consider the original spe-cies to have disappeared—a sort of geneticextinction. This process is especially to be fearedwhen the invading species so outnumbers thenative that a native individual is far more likelyto encounter the introduced species than a nativeas a prospective mate. The last gasp of a fishnative to Texas, Gambusia amistadensis, entailedthe species being hybridized to extinctionthrough interbreeding with introduced mosquitofish G. amistadensis (Hubbs and Jensen 1984),while several fishes currently on the United StatesEndangered Species List are threatened at leastpartly by hybridization with introduced rainbowtrout. The North American mallard (Anas platyr-hynchos), widely introduced as a game bird, inter-breeds extensively with many congeneric speciesand threatens the very existence of the endemicNewZealand greyduck (A. superciliosa superciliosa)
INVASIVE SPECIES 139
1
© Oxford University Press 2010. All rights reserved. For permissions please email: [email protected]

and the Hawaiian duck (A. wyvilliana), as well as,perhaps, the yellowbilled duck (A. undulata) andthe Cape shoveller (A. smithii) in Africa (Rhymerand Simberloff 1996, Matthews and Brand 2004a).European populations of the white-headed duck(Oxyura leucocephala) restricted to Spain, arethreatened by hybridization and introgressionwith North American ruddy ducks (O. jamaicensis)(Muñoz-Fuentes et al. 2007). The latter had beenintroduced years earlier to Great Britain simply asan ornamental; they subsequently crossed theChannel, spread through France, and reachedSpain.
Availability and increasing sophistication ofmolecular genetic techniques has led to the rec-ognition that hybridization and introgressionbetween introduced and native species is farmore common than had been realized. Suchhybridization can even lead to a new species.In the cordgrass (Spartina) case discussedabove, occasional hybrids were initially sterile,until a chromosomal mutation (doubling ofchromosome number) in one of them produceda fertile new polyploid species, which becamehighly invasive (Thompson 1991). A similar caseinvolves Oxford ragwort (Senecio squalidus), ahybrid of two species from Italy, introducedto the Oxford Botanical Garden ca. 1690. S. squa-lidus escaped, first spread through Oxford, andthen during the Industrial Revolution throughmuch of Great Britain along railroad lines,producing sterile hybrids with several nativeBritish species of Senecio. A chromosomal muta-tion (doubling of chromosome number) of ahybrid between S. squalidus and S. vulgaris(groundsel) produced the new polyploid speciesS. cambrensis (Welsh groundsel) (Ashton andAbbott 1992).
It is possible for hybridization to threaten aspecies even when no genetic exchange occurs.Many populations of the European mink (Mustelalutreola) are gravely threatened by habitat de-struction. North America mink (M. vison), widelyintroduced in Europe to foster a potential fur-bearing industry, have escaped and establishedmany populations. In some sites, many femaleEuropean mink hybridize with male Americanmink, which become sexually mature and active
before the European mink males. The Europeanmink females subsequently abort the hybrid em-bryos, so no genes can be exchanged between thespecies, but these females cannot breed againduring the same season, a severe handicap to asmall, threatened population (Maran and Hentto-nen 1995).
7.1.8 Chain reactions
Some impacts of introduced species on nativesentail concatenated chains of various interactions:species A affecting species B, then species B af-fecting species C, species C affecting species D,and so forth. The spread of the Asian parasitictapeworm from Arkansas ultimately to infect thewoundfin minnow (Plagopterus argentissimus) inUtah is an example. However, chains can be evenmore complex, almost certainly unforeseeable.An example involves the devastation of Europe-an rabbit populations in Britain by New Worldmyxoma virus, described above. Caterpillars ofthe native large blue butterfly (Maculina arion) inGreat Britain required development in under-ground nests of the native ant Myrmica sabuleti.The ant avoids nesting in overgrown areas, whichfor centuries had not been problematic because ofgrazing and cultivation. However, changing landuse patterns and decreased grazing led to a situa-tion in which rabbits were the main species main-taining suitable habitat for the ant. When thevirus devastated rabbit populations, ant popula-tions declined to the extent that the large bluebutterfly was extirpated from Great Britain (Rat-cliffe 1979). In another striking chain reaction,landlocked kokanee salmon (Oncorhynchusnerka), were introduced to Flathead Lake, Mon-tana in 1916, replacing most native cutthroattrout (O. clarki) and becoming the main sportfish. The kokanee were so successful that theyspread far from the lake, and their spawningpopulations became so large that they attractedlarge populations of bald eagles (Haliaeetus leuco-cephalus), grizzly bears (Ursus arctos horribilis),and other predators. Between 1968 and 1975,opossum shrimp (Mysis relicta), native to largedeep lakes elsewhere in North America and inSweden, were introduced to three lakes in the
140 CONSERVATION BIOLOGY FOR ALL
Sodhi and Ehrlich: Conservation Biology for All. http://ukcatalogue.oup.com/product/9780199554249.do
© Oxford University Press 2010. All rights reserved. For permissions please email: [email protected]

upper portion of the Flathead catchment in orderto increase production of kokanee; the shrimpdrifted downstream into Flathead Lake by 1981and caused a sharp, drastic decline in populationsof cladocerans and copepods they preyed on.However, the kokanee also fed on these prey,and kokanee populations fell rapidly, in turncausing a precipitous decline in local bald eagleand grizzly bear numbers (Spencer et al. 1991;Figure 7.5).
7.1.9 Invasional meltdown
An increasing number of studies of invasioneffects have pointed to a phenomenon called“invasional meltdown” in which two or moreintroduced species interact in such a way thatthe probability of survival and/or the impact ofat least one of them is enhanced (Simberloff andVon Holle 1999). In the above example of anintroduced faucet snail (Bithynia tentaculata), vec-toring a native trematode parasite of ducks andthereby expanding the trematode’s range, a re-cent twist is the arrival of a European trematode(Leyogonimus polyoon). Bithynia also vectors thisspecies, which has turned out also to be lethal toducks (Cole and Friend 1999). So in this instance,
the introduced snail and the introduced trema-tode combine to produce more mortality in ducksthan either would likely have accomplishedalone. This is but one of myriad instances of melt-down.
Sometimes introduced animals either pollinateintroduced plants or disperse their seeds. Forinstance, figs (Ficus spp.) introduced to Floridahad until ca. 20 years ago remained where theywere planted, the species unable to spread be-cause the host-specific fig wasps that pollinatethe figs in their native ranges were absent, sothe figs could not produce seeds. That situationchanged abruptly upon the arrival of the fig-wasps of three of the fig species, which nowproduce seeds. One of them, F. microcarpa, hasbecome an invasive weed, its seeds dispersed bybirds and ants (Kauffman et al. 1991). On theisland of La Réunion, the red-whiskered bulbul(Pycnonotus jocosus), introduced from Asia viaMauritius, disperses seeds of several invasiveintroduced plants, including Rubus alceifolius,Cordia interruptus, and Ligustrum robustrum,which have become far more problematic sincethe arrival of the bulbul (Baret et al. 2006). TheAsian common myna (Acridotheres tristis) was in-troduced to the Hawaiian islands as a biological
McDonald Creek
Flathead Lake
kokaneesalmon
copepod
opossum shrimp
lake trout
cladoceran
phytop-lankton
Figure 7.5 Shrimp stocking, salmon collapse, and eagle displacement. Reprinted from Spencer et al. (1991) © American Institute of BiologicalSciences.
INVASIVE SPECIES 141
1
© Oxford University Press 2010. All rights reserved. For permissions please email: [email protected]

control for pasture insects but has ended up dis-persing one of the worst weeds, New World Lan-tana camara, throughout the lowlands and eveninto some native forests (Davis et al. 1993). Also inHawaii, introduced pigs selectively eat and there-by disperse several invasive introduced plantspecies, and by rooting and defecating they alsospread populations of several introduced inverte-brates, while themselves fattening up on intro-duced, protein-rich European earthworms(Stone 1985).
Habitat modification by introduced plants canlead to a meltdown process with expanded and/or accelerated impacts. As noted above, the nitro-gen-fixing Morella faya (firetree) from the Azoreshas invaded nitrogen-deficient volcanic regionsof the Hawaiian Islands. Because there are nonative nitrogen-fixing plants, firetree is essential-ly fertilizing large areas. Many introduced plantsestablished elsewhere in Hawaii had been unableto colonize these previously nutrient-deficientareas, but their invasion is now facilitated by theactivities of firetree (Vitousek 1986). In addition,firetree fosters increased populations of intro-duced earthworms, and the worms increase therate of nitrogen burial from firetree litter, thusenhancing the effect of firetree on the nitrogencycle (Aplet 1990). Finally, introduced pigs andan introduced songbird (the Japanese white-eye,Zosterops japonicus) disperse the seeds of the fire-tree (Stone and Taylor 1984, Woodward et al.1990). In short, all these introduced species createa complex juggernaut of species whose jointinteractions are leading to the replacement ofnative vegetation.
Large, congregating ungulates can interactwith introduced plants, pathogens, and evenother animals in dramatic cases of invasionalmeltdown. For instance, Eurasian hooved live-stock devastated native tussock grasses in NorthAmerican prairie regions but favored Eurasianturfgrasses that had coevolved with such animalsand that now dominate large areas (Crosby 1986).In northeastern Australia, the Asian water buffalo(Bubalus bubalis), introduced as a beast of burdenand for meat, damaged native plant communitiesand eroded stream banks. The Central AmericanshrubMimosa pigra had been an innocuous minor
component of the vegetation in the vicinity of thetown of Darwin, but the water buffalo, openingup the flood plains, created perfect germinationsites of Mimosa seedlings, and in many areas na-tive sedgelands became virtual monocultures ofM. pigra. The mimosa in turn aided the waterbuffalo by protecting them from aerial hunters(Simberloff and Von Holle 1999).
Aquatic plants and animals can also facilitateone another. In North America, the introducedzebra mussel filters prodigious amounts ofwater, and the resulting increase in water clarityfavors certain plants, including the highly inva-sive Eurasian watermilfoil (Myriophyllum spica-tum). The milfoil then aids the mussel byproviding a settling surface and facilitates themovement of the mussel to new water bodieswhen fragments of the plant are inadvertentlytransported on boat propellers or in water (Sim-berloff and Von Holle 1999).
Some instances of invasional meltdown arisewhen one introduced species is later reunitedwith a coevolved species through the subsequentintroduction of the latter. The fig species and theirpollinating fig wasps in Florida are an example;the coevolved mutualism between the wasps andthe figs is critical to the impact of the fig invasion.However, meltdown need not be between coe-volved species. The water buffalo from Asia andMimosa pigra from Central America could nothave coevolved, nor could the Asian myna andthe New World Lantana camara in Hawaii.
7.1.10 Multiple effects
Many introduced species have multiple directand indirect effects on native species, harmingsome and favoring others at the same time. Forexample, the round goby (Neogobius melanosto-mus), an Old World fish that arrived in ballastwater, is widely recognized in the North Ameri-can Great Lakes as a harmful invader, feeding onnative invertebrates and eggs and larvae of sev-eral native fishes. It also competes for food andspace with other native fish species. However, theround goby also feeds on the harmful zebra mus-sel and related quagga mussel (Dreissena bugen-sis), although the impact on their populations is
142 CONSERVATION BIOLOGY FOR ALL
Sodhi and Ehrlich: Conservation Biology for All. http://ukcatalogue.oup.com/product/9780199554249.do
© Oxford University Press 2010. All rights reserved. For permissions please email: [email protected]

not known. It also now is by far the main foodsource for the threatened endemic Lake Eriewater snake (Nerodia sipedon insularum), constitut-ing over 92% of all prey consumed. Further,snakes that feed on the goby grow faster andachieve large size, which may well decrease pre-dation on the snake and increase population size(King et al. 2006). On balance, almost all observerswould rather not have the round goby in thisregion, but it is well to bear in mind the complex-ity of its impacts.
7.2 Lag times
Introduced species may be innocuous in theirnew homes for decades or even centuries beforeabruptly increasing in numbers and range to gen-erate major impacts. The case of the hybrid cord-grass Spartina anglica, discussed above, is anexcellent example. The introduced progenitor,North American S. alterniflora, had been presentin Great Britain at least since the early nineteenthcentury and had even hybridized with the nativeS. maritima occasionally, but the hybrids were allsterile until one underwent a chromosomal mu-tation ca. 1891, producing a highly invasive weed(Thompson 1991). Brazilian pepper (Schinus tere-binthifolius) had been present in Florida since themid-nineteenth century as isolated individualtrees, but it became invasive only when it beganto spread rapidly ca. 1940 (Ewel 1986). Giant reed(Arundo donax) was first introduced from theMediterranean region to southern California inthe early nineteenth century as a roofing materialand for erosion control, and it remained restrictedin range and unproblematic until the mid-twenti-eth century, when it spread widely, becoming afire hazard, damaging wetlands, and changingentire ecosystems (Dudley 2000). The Caribbeanbrown anole lizard (Anolis sagrei) first appearedin Florida in the nineteenth century, but it wasrestricted to extreme south Florida until the1940s, when its range began an expansion thataccelerated in the 1970s, ultimately to cover mostof Florida (Kolbe et al. 2004).
Many such invasion lags remain mysterious.For instance, the delay for giant reed in California
has yet to be explained. In other instances, achange in the physical or biotic environment canaccount for a sudden explosion of a formerlyrestricted introduced species. The spread of Bra-zilian pepper in Florida after a century of harm-less presence was caused by hydrologicalchanges—draining farmland, various flood con-trol projects, and lowering of the water table foragricultural and human use. As described earlier,the sudden invasion by long-present figs in southFlorida was spurred by the arrival of pollinatingfig wasps. In some instances, demography of aspecies dictates that it cannot build up populationsizes rapidly even if the environment is suitable;trees, for example, have long life cycles and manydo not begin reproducing for a decade or more.
As genetic analysis has recently rapidly ex-panded with the advent of various moleculartools, it appears that some, and perhaps many,sudden expansions after a lag phase occur be-cause of the introduction of new genotypes to apreviously established but restricted population.The brown anole population in Florida was aug-mented in the twentieth century by the arrival ofindividuals from different parts of the nativerange, so that the population in Florida now hasfar more genetic diversity than is found in anynative population. It is possible that the rapidrange expansion of this introduction resultsfrom introductions to new sites combined withthe advent of new genotypes better adapted tothe array of environmental conditions found inFlorida (Kolbe et al. 2004). The northward rangeexpansion of European green crab (Carcinus mae-nas) along the Atlantic coast of North Americawas produced by the introduction of new, cold-tolerant genotypes into the established popula-tion (Roman 2006).
An improved understanding of lag times is im-portant in understanding how best to managebiological invasions (Boggs et al. 2006). It is notfeasible to attempt active management (see nextsection) of all introduced species—there are sim-ply too many. Typically in each site we focus onthose that are already invasive or that we suspectwill become invasive from observations else-where. However, if some currently innocuous es-tablished introduced species are simply biological
INVASIVE SPECIES 143
1
© Oxford University Press 2010. All rights reserved. For permissions please email: [email protected]

time bombs waiting to explode when the rightconditions prevail in the future, the existing ap-proach clearly will not suffice.
7.3 What to do about invasive species
By far the best thing to do about invasive intro-duced species is to keep them out in the firstplace. If we fail to keep them out and they estab-lish populations, the next possibility is to attemptto find them quickly and perhaps to eradicatethem. If they have already established andbegun to spread widely, we may still try to eradi-cate them, or we can instead try to keep theirpopulations at sufficiently low levels that theydo not become problems.
7.3.1 Keeping them out
Introductions can be either planned (deliberate)or inadvertent, and preventing these two classesinvolves somewhat different procedures. In eachinstance, prevention involves laws, risk analyses,and border control. For planned introductions,such as of ornamental plants or new sport fishor game species, the lawwould be either a “whitelist,” a “black list,” or some combination of thetwo. A white list is a list of species approved forintroduction, presumably after some risk analysisin which consideration is given to the features ofthe species intended for introduction and the out-come in other regions where it has been intro-duced. The most widely used risk analysescurrently include versions of the AustralianWeed Risk Assessment, which consists of a seriesof questions about species proposed for introduc-tion and an algorithm for combining the answersto those questions to give a score, for which thereis a threshold above which a species cannot beadmitted (Pheloung et al. 1999). A black list is alist of species that cannot be admitted under anycircumstances, and for which no further risk anal-ysis is needed. Examples of black lists include theUnited States Federal Noxious Weed list and ashort list of animals forbidden for entry to the USunder the Lacey Act.
For such lists to be effective, the risk analyseshave to be accurate enough, and the lists suffi-ciently large, that the great majority of speciesthat would become invasive are actually identi-fied as such and placed on black lists or kept offwhite lists. There are grave concerns that neithercriterion is met. For instance, the black list of theLacey Act is very short, and many animal speciesthat have a high probability of becoming invasiveif introduced are not on the list. The risk assess-ment tools, on the other hand, all yield somepercentage of false negatives—that is, species as-sessed as unlikely to cause harm, therefore eligi-ble for a white list, when in fact they will becomeharmful. Much active research (e.g. Kolar andLodge 2002) is aimed at improving the accuracyof risk analyses—especially lowering the rate offalse negatives while not inflating the rate of falsepositives (species judged likely to become inva-sive when, in fact, they would not).
For inadvertent introductions, one must firstidentify pathways by which they occur (Ruizand Carlton 2003). For instance, many marineorganisms are inadvertently carried in ballastwater (this is probably how the zebra musselentered North America). Insects stow away onornamental plants or agricultural products. TheAsian longhorned beetle (Anoplophora glabripen-nis), a dangerous forest pest, hitchhiked to NorthAmerica in untreated wooden packing materialfrom Asia, while snails have been transportedworldwide on paving stones and ceramics. TheAsian tiger mosquito (Aedes albopictus) arrived inthe United States in water transported in usedtires. Once these pathways have been identified,their use as conduits of introduction must berestricted. For ballast water, for example, waterpicked up as ballast in a port can be exchangedwith water from the open ocean to lower thenumber of potential invaders being transported.For insects and pathogens carried in wood, heatand chemical treatment may be effective. For ag-ricultural products, refrigeration, and/or fumiga-tion are often used. The general problem is thateach of these procedures entails a cost, and therehas historically been opposition to imposing suchcosts on the grounds that they interfere with freetrade and make goods more expensive. Thus it
144 CONSERVATION BIOLOGY FOR ALL
Sodhi and Ehrlich: Conservation Biology for All. http://ukcatalogue.oup.com/product/9780199554249.do
© Oxford University Press 2010. All rights reserved. For permissions please email: [email protected]

remains an uphill battle to devise and to imple-ment regulations sufficiently stringent that theyconstrict these pathways.
Whatever the regulations in place for both de-liberate and unplanned introductions, inspec-tions at ports of entry are where they come intoplay, and here a variety of detection technologiesare available and improvements are expected.Trained sniffer dogs are commonplace in portsinmany countries, and various sorts of machinery,including increasingly accurate X-ray equipment,are widely in use (Baskin 2002). Although technol-ogies have improved to aid a port inspector toidentify a potential invader once it has beendetected, in many nations these are not employedbecause of expense or dearth of qualified staff.Also, improved detection and identification cap-abilities are only half of the solution to barring theintroduction of new species either deliberately orby accident (as for example, in dirt on shoes, or inuntreated food). The other half consists of penaltiessufficiently severe that people fear the conse-quences if they are caught introducing species.Many nations nowadays have extensive publicityat ports of entry, on planes and ships, and some-times even in popular media, that combine educa-tional material about the many harmful activitiesof invasive species and warnings about penaltiesfor importing them.
7.3.2 Monitoring and eradication
The key to eradicating an introduced species be-fore it can spread widely is an early warning-rapid response system, and early warning re-quires an ongoing monitoring program. Becauseof the great expense of trained staff, few if anynations adequately monitor consistently for allsorts of invasions, although for specific habitats(e.g. waters in ports) or specific groups of species(e.g. fruit fly pests of agriculture) intensive ongo-ing monitoring exists in some areas. Probably themost cost-effective way to improve monitoring isto enlist the citizenry to be on the lookout forunusual plants or animals and to know whatagency to contact should they see something(see Figure 7.6 and Plate 8). Such efforts entailpublic education and wide dissemination in pop-
ular media and on the web, but they can yieldenormous benefits. For instance, the invasion ofthe Asian longhorned beetle to the Chicago re-gion was discovered by a citizen gathering fire-wood who recognized the beetle from newsreports and checked his identification on a stateagency website. This early warning and a quick,aggressive response by authorities led to success-ful regional extirpation of this insect after a five-year campaign. Similarly, the invasion in Califor-nia of the alga Caulerpa taxifolia was discoveredprobably within a year of its occurrence by adiver who had seen publicity about the impactof this species in the Mediterranean. This discov-ery led to successful eradication after a four-yeareffort, and citizens have been alerted to watch forthis and other non-native algal species in bothMediterranean nations and California.
Many introduced species have been successful-ly eradicated, usually when they are found earlybut occasionally when they have already estab-lished widespread populations. The keys to suc-cessful eradication have been as follows;(i) Sufficient resources must be available to seethe project through to completion; the expense offinding and removing the last few individualsmay exceed that of quickly ridding a site of themajority of the population; (ii) Clear lines of au-thority must exist so that an individual or agencycan compel cooperation. Eradication is, by itsnature, an all-or-none operation that can be sub-verted if a few individuals decide not to cooper-ate (for instance, by forbidding access to privateproperty, or forbidding the use of a pesticide orherbicide); (iii) The biology of the target organismmust be studied well enough that a weak point inits life cycle is identified; and (iv) Should theeradication succeed, there must be a reasonableprospect that reinvasion will not occur fairlyquickly.
In cases where these criteria have been met,successful eradications are numerous. Many areon islands, because they are often small andbecause reinvasion is less likely, at least forisolated islands. Rats have been eradicatedfrom many islands worldwide; the largest todate is 113 km2. Recently, large, longstandingpopulations of feral goats and pigs have been
INVASIVE SPECIES 145
1
© Oxford University Press 2010. All rights reserved. For permissions please email: [email protected]

Figu
re7.6
Maryland’saquatic
invasivespecies.PostercourtesyoftheMaryland
Departm
ento
fNaturalResources.
146 CONSERVATION BIOLOGY FOR ALL
Sodhi and Ehrlich: Conservation Biology for All. http://ukcatalogue.oup.com/product/9780199554249.do
© Oxford University Press 2010. All rights reserved. For permissions please email: [email protected]

eradicated from Santiago Island (585 km2) in theGalapagos (Cruz et al. 2005). The giant Africansnail has been successfully eradicated from sitesin both Queensland and Florida (Simberloff2003). Even plants with soil seed banks havebeen eradicated, such as sand bur (Cenchrus echi-natus) from 400 ha Laysan Island (Flint and Re-hkemper 2002). When agriculture or publichealth are issues, extensive and expensive eradi-cation campaigns have been undertaken andhave often been successful, crowned by the glob-al eradication of smallpox. The African mosquito(Anopheles gambiae), vector of malaria, was era-dicated from a large area in northeastern Brazil(Davis and Garcia 1989), and various speciesof flies have been eradicated from many largeregions, especially in the tropics (Klassen 2005).The pasture weed Kochia scoparia was eradicatedfrom a large area of Western Australia (Randall2001), and the witchweed eradication campaignin the southeastern United States mentionedabove is nearing success. These successes sug-gest that, if conservation is made a high enoughpriority, large-scale eradications purely for con-servation purposes may be very feasible.
A variety of methods have been used in thesecampaigns: males sterilized by X-rays for fruit-flies, chemicals for Anopheles gambiae and for rats,hunters and dogs for goats. Some campaigns thatprobably would have succeeded were stoppedshort of their goals not for want of technologicalmeans but because of public objections to usingchemicals or to killing vertebrates. A notable ex-ample is the cessation, because of pressure fromanimal-rights groups, of the well-planned cam-paign to eradicate the gray squirrel before itspreads in Italy (Bertolino and Genovese 2003).
7.3.3 Maintenance management
If eradication is not an option, many available tech-nologies may limit populations of invasive speciesso that damage is minimized. There are three mainmethods—mechanical or physical control, chemicalcontrol, and biological control. Sometimes thesemethods can be combined, especially mechanicaland chemical control. In South Africa, the invasiveAustralian rooikrans tree (Acacia cyclops) can be
effectively controlled by mechanical meansalone—cutting and pulling roots—so long as suffi-cient labor is available (MatthewsandBrand2004a).Sometimes chemical control alone can keep apest atlow numbers. The Indian house crow (Corvus splen-dens), is an aggressive pest in Africa, attacking na-tive birds, competing with them for food, preyingon localwildlife, stripping fruit trees, and evendive-bombing people and sometimes stealing food fromyoung children. It can be controlled by a poison,Starlicide, so long as the public does not object(Matthews and Brand 2004a).Many invasive plantshave been kept at acceptable levels by herbicides.For instance, in Florida, water hyacinth was drasti-cally reduced and subsequently managed by use ofthe herbicide 2,4-D, combined with some mechani-cal removal (Schardt 1997). For lantana in SouthAfrica, a combination of mechanical and chemicalcontrol keeps populationsminimized in some areas(Matthews and Brand 2004a). A SouthAfrican pub-lic works program, Working for Water, has hadgreat success usingphysical,mechanical, and chem-ical methods to clear thousands of hectares of landof introducedplants that useprodigious amounts ofwater, such as mesquite (Prosopis spp.) and severalspecies ofAcacia (Matthews and Brand 2004a). Sim-ilarly, in the Canadian province of Alberta, Norwayrats have been kept at very low levels for manyyears by a combination of poisons and hunting bythe provincial Alberta Rat Patrol (Bourne 2000).
However, long-term use of herbicides and pes-ticides often leads to one ormore problems. First isthe evolution of resistance in the target species, sothat increasing amounts of the chemical have to beused even on a controlled population. This hashappened recently with the use of the herbicideused to control AsianHydrilla verticillata in Florida(Puri et al. 2007), and it is a common phenomenonin insect pests of agriculture. A second, relatedproblem is that chemicals are often costly, andthey can be prohibitively expensive if used overlarge areas. Whereas the market value of an agri-cultural productmay be perceived as large enoughto warrant such great expense, it may be difficultto convince a government agency that it is worthcontrolling an introduced species affecting conser-vation values that are not easily quantified. Final-ly, chemicals often have non-target impacts,
INVASIVE SPECIES 147
1
© Oxford University Press 2010. All rights reserved. For permissions please email: [email protected]

including human health impacts. The decline ofraptor populations as DDT residues caused thineggshells is a famous example (Lundholm 1997).Many later-generation herbicides and pesticideshave few if any non-target impacts when usedproperly, but expense may still be a major issue.
These problems with pesticides have led togreat interest in the use of classical biological con-trol—deliberate introduction of a natural enemy(predator, parasite, or disease) of an introducedpest. This is the philosophy of fighting fire withfire. Although only a minority of well-plannedbiological control projects actually end upcontrolling the target pest, those that have suc-ceeded are often dramatically effective and con-ferred low-cost control in perpetuity. For instance,massive infestations ofwater hyacinth in the SepikRiver catchment of New Guinea were well con-trolled by introduction of the two South Americanweevils that had been used for this purpose inLake Victoria, Neochetina eichhorniae and N. bruchi(Matthews and Brand 2004b). A recent success onthe island of St. Helena is the control of a tropicalAmerican scale insect (Orthezia insignis) that hadthreatened the existence of the endemic gumwoodtree (Commidendrum robustum). A predatory SouthAmerican lady beetle (Hyperaspis pantherina) nowkeeps the scale insect population at low densities(Booth et al. 2001). Even when a biological controlagent successfully controls a target pest at one site,it may fail to do so elsewhere. The same two wee-vils that control water hyacinth in New Guineaand Lake Victoria had minimal effects on the hya-cinth in Florida, even though they did manage toestablish populations (Schardt 1997).
However, in addition to the fact that mostbiological control projects have not panned out,several biological control agents have attackednon-target species and even caused extinctions—the cases involving the cactusmoth, rosywolf snail,small Indian mongoose, mosquitofish, and thistle-eating weevil have been mentioned earlier. In gen-eral, problems of this sort have been associatedwith introduced biological control agents such asgeneralized predators that are not specialized touse the specific target host. However, even speciesthat are restricted to a single genus of host, such asthe cactus moth, can create problems.
Summary
• Invasive species cause myriad sorts of conserva-tion problems, many of which are complicated,some of which are subtle, and some of which arenot manifested until long after a species is intro-duced.• The best way to avoid such problems is to preventintroductions in the first place or, failing that, to findthem quickly and eradicate them.• However, many established introduced speciescan be managed by a variety of technologies sothat their populations remain restricted and theirimpacts are minimized.
Suggested reading
Baskin, Y. (2002). A plague of rats and rubbervines. IslandPress, Washington, DC.
Davis, M. A. (2009). Invasion biology. Oxford UniversityPress, Oxford.
Elton, C. E. (1958). The ecology of invasions by animals andplants. Methuen, London (reprinted by University ofChicago Press, 2000).
Lockwood, J. L., Hoopes, M. F., andMarchetti, M. P. (2007).Invasion ecology. Blackwell, Malden, Massachusetts.
Van der Weijden, W., Leewis, R., and Bol, P. (2007).Biological globalisation. KNNV Publishing, Utrecht, theNetherlands.
Relevant websites
• World Conservation Union Invasive Species SpecialistGroup: http://www.issg.org/index.html.
• National Invasive Species Council of the United States:http://www.invasivespecies.gov.
• National Agriculture Library of the United States:http://www.invasivespeciesinfo.gov.
• European Commission: http://www.europe‐aliens.org.
REFERENCES
Allen, J. A. (1998). Mangroves as alien species: the case ofHawaii. Global Ecology and Biogeography Letters, 7, 61–71.
148 CONSERVATION BIOLOGY FOR ALL
Sodhi and Ehrlich: Conservation Biology for All. http://ukcatalogue.oup.com/product/9780199554249.do
© Oxford University Press 2010. All rights reserved. For permissions please email: [email protected]

Aplet, G. H. (1990). Alteration of earthworm communitybiomass by the alienMyrica faya in Hawaii.Oecologia, 82,411–416.
Ashton, P. A. and Abbott, R. J. (1992). Multiple origins andgenetic diversity in the newly arisen allopolyploidspecies, Senecio cambrensis Rosser (Compositae). Heredity,68, 25–32.
Atkinson I. A. E. (1985). The spread of commensal speciesof Rattus to oceanic islands and their effects on islandavifaunas. In P.J. Moors, ed. Conservation of island birds,pp. 35–81. International Council of Bird ConservationTechnical Publication No.3.
Baret, S., Rouget, M., Richardson, D.M., et al. (2006). Cur-rent distribution and potential extent of the most inva-sive alien plant species on La Réunion (Indian Ocean,Mascarene islands). Austral Ecology, 31, 747–758.
Bartrip, P. W. J. (2008).Myxomatosis: A history of pest controland the rabbit. Macmillan, London.
Baskin, Y. (2002). A plague of rats and rubbervines. IslandPress, Washington, DC.
Bergersen, E. P. and Anderson, D. E. (1997). The distribu-tion and spread of Myxobolus cerebralis in the UnitedStates. Fisheries, 22, 6–7.
Bertolino, S. and Genovese, P. (2003). Spread andattempted eradication of the grey squirrel (Sciurus caro-linensis) in Italy, and consequences for the red squirrel(Sciurus vulgaris) in Eurasia. Biological Conservation, 109,351–358.
Bertolino, S., Lurz, P. W. W., Sanderson, R., and Rushton,S. P. (2008). Predicting the spread of the American greysquirrel (Sciurus carolinensis) in Europe: A call for a co-ordinated European approach. Biological Conservation,141, 2564–2575.
Boggs, C., Holdren, C. E., Kulahci, I. G., et al. (2006).Delayed population explosion of an introduced butter-fly. Journal of Animal Ecology, 75, 466–475.
Booth, R. G., Cross, A. E., Fowler, S. V., and Shaw, R.H.(2001). Case study 5.24. Biological control of an insect tosave an endemic tree on St. Helena. In R. Wittenberg andM. J. W. Cock, eds Invasive alien species: A toolkit of bestprevention and management practices, p. 192. CAB Interna-tional, Wallingford, UK.
Bourne, J. (2000). A history of rat control in Alberta. AlbertaAgriculture, Food and Rural Development, Edmonton.
Calder, I. R. (2002). Eucalyptus, water and the environ-ment. In J. J. W. Coppen, ed. Eucalyptus. The genus Euca-lyptus, pp. 36–51. Taylor and Francis, New York.
Callaway, R. M. and Ridenour, W. M. (2004). Novel weap-ons: Invasive success and the evolution of increasedcompetitive ability. Frontiers in Ecology and the Environ-ment, 2, 436–443.
Callaway, R. M., Cipollini, D., Barto, K., et al. (2008). Novelweapons: invasive plant suppresses fungal mutualismsin America but not in its native Europe. Ecology, 89,1043–1055.
Caltagirone L. E. and Doutt, R. L. (1989). The history of theVedalia beetle importation to California and its impact onthe development of biological control. Annual Review ofEntomology, 34, 1–16.
Center, T. D., Frank, J. H., and Dray, F. A. Jr. (1997).Biological control. In D. Simberloff, D. C. Schmitz, andT. C. Brown, eds Strangers in paradise. Impact and manage-ment of nonindigenous species in Florida, pp. 245–263.Island Press, Washington, DC.
Cole, R. A. and Friend, M. (1999). Miscellaneousparasitic diseases. In M. Friend and J. C. Franson, edsField manual of wildlife diseases, pp. 249–262. U.S. Geolog-ical Survey, Biological Resources Division, NationalWildlife Health Center, Madison, Wisconsin.
Cowie, R. H. (2002). Invertebrate invasions on Pacific is-lands and the replacement of unique native faunas: asynthesis of the land and freshwater snails. BiologicalInvasions, 3, 119–136.
Cronk, Q. C. B. (1989). The past and present vegetation ofSt Helena. Journal of Biogeography, 16, 47–64.
Crosby, A. W. (1986). Ecological imperialism. The biologicalexpansion of Europe, 900–1900. Cambridge UniversityPress, Cambridge.
Cruz, F., Donlan, C. J., Campbell, K., and Carrion, V.(2005). Conservation action in the Galápagos: feral pig(Sus scrofa) eradication from Santiago Island. BiologicalConservation, 121, 473–478.
D’Antonio, C. M. and Vitousek, P. M. (1992). Biological inva-sions by exotic grasses, the grass/fire cycle, andglobal change. Annual Review of Ecology and Systematics,23, 63–87.
Davis, C. J., Yoshioka, E., and Kageler, D. (1993). Biologicalcontrol of lantana, prickly pear, and hamakua pamakanein Hawai’i: a review and update. In C.P. Stone, C. W.Smith, and J. T. Tunison, eds Alien plant invasions innative ecosystems of Hawaii, pp. 411–431. University ofHawaii Press, Honolulu.
Davis, J. R. and Garcia, R. (1989). Malaria mosquito inBrazil. In D. L. Dahlsten and R. Garcia, eds Eradicationof exotic pests, pp. 274–283. Yale University Press, NewHaven, Connecticut.
Doutt, R. L. (1964). The historical development ofbiological control. In P. DeBach, ed. Biological control ofinsect pests and weeds, pp. 21–42. Chapman and Hall,London.
Dudley, T. L. (2000). Arundo donax L. In C. C. Bossard, J. M.Randall, and M. C. Hoshovsky, eds Invasive plants of
INVASIVE SPECIES 149
1
© Oxford University Press 2010. All rights reserved. For permissions please email: [email protected]

California’s wildlands, pp. 53–58. University of CaliforniaPress, Berkeley, California.
Durán, A., Gryzenhout, M., Slippers, B., et al. (2008). Phy-tophthora pinifolia sp. nov. associated with a serious nee-dle disease of Pinus radiata in Chile. Plant Pathology, 57,715–727.
Ellison, A. M., Bank, M. S., Clinton, B. D., et al. (2005). Lossof foundation species: consequences for the structureand dynamics of forested ecosystems. Frontiers in Ecologyand the Environment, 9, 479–486.
Eplee, R. E. (2001). Case study 2.10. Co-ordination of witch-weed eradication in the U.S.A. In R.Wittenberg andM. J.W. Cock, eds Invasive alien species: A toolkit of best preven-tion and management practices, p. 36. CAB International,Wallingford, UK.
Ewel, J. J. (1986). Invasibility: Lessons from south Florida.In H. A. Mooney and J. A. Drake, eds Ecology of biologicalinvasions of North America and Hawaii, pp. 214–230.Springer-Verlag, New York.
Flint, E. and Rehkemper, C. (2002). Control and eradicationof the introduced grass, Cenchrus echintus, at LaysanIsland, Central Pacific Ocean. In C. R. Veitch and M. N.Clout, eds Turning the tide: the eradication of invasive spe-cies, pp. 110–115. IUCN SSC Invasive Species SpecialistGroup. IUCN, Gland, Switzerland.
Goodell, K., Parker, I. M., and Gilbert, G. S. (2000).Biological impacts of species invasions: Implications forpolicy makers. In National Research Council (US), Incor-porating science, economics, and sociology in developing san-itary and phytosanitary standards in international trade, pp.87–117. National Academy Press, Washington, DC.
Hays, W. T. and Conant, S. (2006). Biology and impacts ofPacific Islands invasive species. 1. A worldwide reviewof effects of the small Indian mongoose, Herpestes javani-cus (Carnivora: Herpestidae). Pacific Science, 61, 3–16.
Holway, D.A. and Suarez, A.V. (2004). Colony structurevariation and interspecific competitive ability in the in-vasive Argentine ant. Oecologia, 138, 216–222.
Hubbs, C. and Jensen, B. L. (1984). Extinction of Gambusiaamistadensis, an endangered fish. Copeia, 1984, 529–530.
Jeschke, J. M. and Strayer, D. L. (2005). Invasion successof vertebrates in Europe and North America. Proceedingsof the National Academy of Sciences of the United States ofAmerica, 102, 7198–7202.
Kauffman, S., McKey, D. B., Hossaert-McKey, M., andHorvitz, C. C. (1991). Adaptations for a two-phase seeddispersal system involving vertebrates and ants in ahemiepiphytic fig (Ficus microcarpa: Moraceae). AmericanJournal of Botany, 78, 971–977.
King, R. B., Ray, J. M., and Stanford, K. M. (2006). Gorgingon gobies: beneficial effects of alien prey on a threatenedvertebrate. Canadian Journal of Zoology, 84, 108–115.
Klassen, W. (2005). Area-wide integrated pest manage-ment and the sterile insect technique. In V. A. Dyck,J. Hendrichs and A. S. Robinson, eds Sterile insect tech-nique. Principles and practice in area-wide integratedpest management, pp. 39–68. Springer, Dordrecht, theNetherlands.
Kolar, C. S. and Lodge, D. M. (2002). Ecological predictionsand risk assessment for alien fishes in North America.Science, 298, 1233–1236.
Kolbe, J. J., Glor, R. E., Schettino, L. R., Lara, A. C., Larson,A., and Losos, J.B. (2004). Genetic variation increasesduring biological invasion by a Cuban lizard. Nature,431, 177–181.
Lizarralde. M., Escobar, J., andDeferrari, G. (2004). Invaderspecies in Argentina: a review about the beaver (Castorcanadensis) population situation on Tierra del Fuego eco-system. Interciencia, 29, 352–356.
Lockwood, J. L., Hoopes, M. F., andMarchetti, M. P. (2007).Invasion ecology. Blackwell, Malden, Massachusetts.
Louda, S. M., Kendall, D., Connor, J., and Simberloff,D. (1997). Ecological effects of an insect introducedfor the biological control of weeds. Science, 277,1088–1090.
Lundholm, C. E. (1997). DDE-Induced eggshell thinning inbirds. Comparative Biochemistry and Physiology Part C:Pharmacology, Toxicology and Endocrinology, 118, 113–128.
Maran, T. and Henttonen, H. (1995). Why is the Europeanmink (Mustela lutreola) disappearing?—A review ofthe process and hypotheses. Annales Zoologici Fennici,32, 47–54.
Matthews, S. and Brand, K. (2004a). Africa invaded. GlobalInvasive Species Programme, Cape Town, South Africa.
Matthews, S. and Brand, K. (2004b). Tropical Asia invaded.Global Invasive Species Programme, Cape Town, SouthAfrica.
McDaniel, K. C., DiTomaso, J. M., and Duncan, C. A.(2005). Tamarisk or saltcedar, Tamarix spp. In J. K.Clark and C. L. Duncan, eds Assessing the economic, envi-ronmental and societal losses from invasive plants on range-land and wildlands, pp. 198–222. Weed Science Society ofAmerica, Champaign, Illinois.
Meinesz, A. (1999).Killer algae. University of Chicago Press,Chicago.
Moyle, P. B. (1993). Fish: An enthusiast’s guide. University ofCalifornia Press, Berkeley.
Muñoz-Fuentes, V., Vilà, C., Green, A. J., Negro, J., andSorenson, M. D. (2007). Hybridization between white-headed ducks and introduced ruddy ducks in Spain.Molecular Ecology, 16, 629–638.
Norgaard, R. B. (1988). The biological control of cassavamealybug in Africa. American Journal of Agricultural Eco-nomics, 70, 366–371.
150 CONSERVATION BIOLOGY FOR ALL
Sodhi and Ehrlich: Conservation Biology for All. http://ukcatalogue.oup.com/product/9780199554249.do
© Oxford University Press 2010. All rights reserved. For permissions please email: [email protected]

Office of Technology Assessment (US Congress). (1993).Harmful non-indigenous species in the United States. OTA-F-565. US Government Printing Office, Washington, DC.
Opler, P. A. (1978). Insects of American chestnut: possibleimportance and conservation concern. In J. McDonald,ed. The American chestnut symposium, pp. 83–85. WestVirginia University Press, Morgantown, West Virginia.
Petren, K. and Case, T. J. (1996). An experimental demon-stration of exploitation competition in an ongoing inva-sion. Ecology, 77, 118–132.
Pheloung, P. C., Williams, P. A., and Halloy, S. R. (1999).A weed risk assessment model for use as a biosecuritytool evaluating plant introductions. Journal of Environ-mental Management, 57, 239–251.
Plowright, W. (1982). The effects of rinderpest and rinder-pest controlon wildlife in Africa. Symposia of the Zoologi-cal Society of London, 50, 1–28.
Pringle, R. M. (2005). The origins of the Nile perch in LakeVictoria. BioScience, 55, 780–787.
Puri, A., MacDonald, G. E., and Haller, W. T. (2007). Sta-bility of fluridone-resistant hydrilla (Hydrilla verticillata)biotypes over time. Weed Science, 55, 12–15.
Pyke, G. H. (2008). Plague minnow or mosquito fish? Areview of the biology and impacts of introduced Gambu-sia species. Annual Review of Ecology, Evolution, and Sys-tematics, 39, 171–191.
Rabenold, K. N., Fauth, P. T., Goodner, B. W., Sadowski,J. A., and Parker, P. G. (1998). Response of avian com-munities to disturbance by an exotic insect in spruce-firforests of the southern Appalachians. Conservation Biolo-gy, 12, 177–189.
Randall, R. (2001). Case study 5.5. Eradication of a deliber-ately introduced plant found to be invasive. In R. Wit-tenberg and M. J. W. Cock, eds Invasive alien species: Atoolkit of best prevention and management practices, p. 174.CAB International, Wallingford, UK.
Ratcliffe, D. (1979). The end of the large blue butterfly.NewScientist, 8, 457–458.
Rhymer, J. and Simberloff, D. (1996). Extinction by hybri-dization and introgression Annual Review of Ecology andSystematics, 27, 83–109.
Ricciardi, A., Neves, R. J., and Rasmussen, J. B. (1998).Impending extinctions of North American freshwatermussels (Unionoida) following the zebra mussel (Dreis-sena polymorpha) invasion. Journal of Animal Ecology, 67,613–619.
Roman, J. (2006). Diluting the founder effect: cryptic inva-sions expand a marine invader’s range. Proceedings of theRoyal Society of London B, 273, 2453–2459.
Ruiz, G. M. and Carlton, J. T., eds (2003). Invasive species.Vectors and management strategies. Island Press, Washing-ton, DC.
Sauer, J. S., Cole, R. A., and Nissen, J. M. (2007). Findingthe exotic faucet snail (Bithynia tentaculata): Investigationof waterbird die-offs on the upper Mississippi RiverNational Wildlife and Fish Refuge. US Geological SurveyOpen-File Report 2007–1065, US Geological Survey, Wa-shington, DC.
Schardt, J. D. (1997). Maintenance control. In D. Simberloff,D. C. Schmitz, and T. C. Brown, eds Strangers in paradise.Impact and management of nonindigenous species in Florida,pp. 229–243. Island Press, Washington, DC.
Schmitz, D. C., Simberloff, D., Hofstetter, R. H., Haller, W.,and Sutton, D. (1997). The ecological impact of nonindig-enous plants. In D. Simberloff, D. C. Schmitz, and T. C.Brown, eds Strangers in paradise. Impact and managementof nonindigenous species in Florida, pp. 39–61. Island Press,Washington, DC.
Simberloff, D. (2003). How much information on popula-tion biology is needed to manage introduced species?Conservation Biology, 17, 83–92.
Simberloff, D. and Von Holle, B. (1999). Positive interac-tions of nonindigenous species: invasional meltdown?Biological Invasions, 1, 21–32.
Spencer C. N., McClelland, B. R., and Stanford, J. A. (1991).Shrimp stocking, salmon collapse, and eagle displace-ment. BioScience, 41, 14–21.
Stone, C. P. (1985). Alien animals in Hawai’i’s native eco-systems: toward controlling the adverse effects of intro-duced vertebrates. In C. P. Stone and J. M. Scott, edsHawai’i’s terrestrial ecosystems: Preservation and manage-ment, pp. 251–297. University of Hawaii, Honolulu,Hawaii.
Stone, C. P. and Taylor, D. D. (1984). Status of feral pigmanagement and research in Hawaii Volcanoes Nation-al Park. Proceedings of the Hawaii Volcanoes National ParkScience Conference, 5, 106–117.
Thompson, H. V. and King, C. M., eds (1994). The Europeanrabbit. The history and ecology of a successful colonizer.Oxford University Press, Oxford.
Thompson, J. D. (1991). The biology of an invasive plant:What makes Spartina anglica so successful? BioScience, 41,393–401.
Tschinkel, W. R. (2006). The fire ants. Harvard UniversityPress, Cambridge, Massachusetts.
US Department of the Interior (Fish and Wildlife Service).(1997). Endangered and threatened wildlife and plants;Determination of Endangered status for two tidal marshplants—Cirsium hydrophilum var. hydrophilum (SuisunThistle) and Cordylanthus mollis ssp. mollis (Soft Bird’s-Beak) from the San Francisco Bay area of California. 50CFR Part 17. Federal Register, 62, 61916–61921.
Van Den Bosch, R., Schlinger, E. I., Dietrick, E. J., Hall, J. C.,and Puttler, B. (1964). Studies on succession,
INVASIVE SPECIES 151
1
© Oxford University Press 2010. All rights reserved. For permissions please email: [email protected]

distribution, and phenology of imported parasites ofTherioaphis trifolii (Monell) in southern California. Ecolo-gy, 45, 602–621.
Vitousek, P. (1986). Biological invasions and ecosystemproperties: can species make a difference? InH. A. Mooney and J. A. Drake, eds Ecology of biologicalinvasions of North America and Hawaii, pp. 163–176.Springer, New York.
Vivrette, N. J. and Muller, C. H. (1977). Mechanism ofInvasion and Dominance of Coastal Grassland by Me-sembryanthemum crystallinum Ecological Monographs,47, 301–318.
Williamson, M. (1996). Biological invasions. Chapman andHall, London, UK.
Woodward, S. A., Vitousek, P. M., Matson, K., Hughes, F.,Benvenuto, K., and Matson, P. (1990). Use of the exotictree Myrica faya by native and exotic birds in Hawai’iVolcanoes National Park. Pacific Science, 44, 88–93.
Woodworth, B. L., Atkinson, C. T., LaPointe, D. A., et al.(2005). Host population persistence in the face of intro-duced vector-borne disease: Hawaii amakihi and avianmalaria. Proceedings of the National Academy of Sciences ofthe United States of America, 102, 1531–1536.
Zimmermann, H. G., Moran, V. C., and Hoffmann, J. H.(2001). The renowned cactus moth, Cactoblastis cactorum(Lepidoptera: Pyralidae): Its natural history and threat tonative Opuntia floras in Mexico and the United States ofAmerica. Florida Entomologist, 84, 543–551.
152 CONSERVATION BIOLOGY FOR ALL
Sodhi and Ehrlich: Conservation Biology for All. http://ukcatalogue.oup.com/product/9780199554249.do
© Oxford University Press 2010. All rights reserved. For permissions please email: [email protected]

CHAP T E R 8
Climate changeThomas E. Lovejoy
In 1896 Swedish physicist Arrhenius asked anew and important question, namely why isthe temperature of the Earth so suitable for hu-mans and other forms of life? From that emergedthe concept of the greenhouse effect, namely thatthe concentrations of various atmospheric gases[e.g. carbon dioxide (CO2), methane, nitrousoxide, chlorofluorocarbons; also called green-house gasses] was such that some of the radiantheat received from the sun is trapped, renderingthe earth a considerably warmer planet than itotherwise would be. Arrhenius even did a man-ual calculation of the effect of doubling the pre-industrial level of CO2. His results are preciselywhat the supercomputer models of Earth’s cli-mate predict. We are well on the way towardthat CO2 concentration, having started at pre-industrial levels of 280 ppm (parts per million).Current atmospheric levels are 390 ppm of CO2,and are increasing at a rate above the worst casescenario of the Intergovernmental Panel for Cli-mate Change (IPCC) (Canadell et al. 2007).
Modern science is able to study past climate, sowe now know that the last 10 000 years were aperiod of unusual stability in the global climate.This probably has been extremely beneficial tothe human species for that period includes allour recorded history as well as the origins ofagriculture and of human settlements. It is easyto conclude that the entire human enterprise isbased on a freak stretch of relatively unchangingclimatic conditions.
A bit less obvious is the realization that ecosys-tems have adjusted to that stable climate also sothey – as well as the benefits society receives inecosystem goods and services (see Chapter 3) –are vulnerable to climate change as well. Indeed,it is rapidly becoming clear that the natural world
is as – or more – sensitive to climate than any-thing else society is concerned about.
The current levels of greenhouse gas concentra-tion have already led to an overall rise in globaltemperature of 0.75 degree Celsius (see Figure8.1). In addition, because there is a lag betweenattaining a concentration level and the conse-quent trapping of heat energy, the planet is slatedfor an additional 0.5 degree (for a total of 1.25degrees Celsius) even if greenhouse gas concen-trations were to cease to increase immediately.
This chapter highlights the effects of human-inducedclimate changeonEarth’sphysical environ-ments and biodiversity. Possible mitigation optionsof this predicament are also briefly discussed.
8.1 Effects on the physical environment
Already there are widespread changes in thephysical environment, primarily involving thesolid and liquid phases of water. Northern hemi-sphere lakes are freezing later in the autumn andthe ice is breaking up earlier in the spring. Gla-ciers are in retreat in most parts of the world, andthose on high peaks in the tropics like MountKilimanjaro (Tanzania) are receding at a ratethat they will likely cease to exist in 15 years(UNEP 2007). The melt rate of Greenland glaciersis increasing and the seismic activity they gener-ate is accelerating.
Arctic sea ice is retreating at unprecedentedrates, as would be predicted by the increasedheat absorption capacity of dark open water ascompared to reflective ice. This represents a posi-tive feedback, namely the more dark water re-places what had been reflecting ice the moreheat is absorbed and the more the Earth warms.
153
1
© Oxford University Press 2010. All rights reserved. For permissions please email: [email protected]
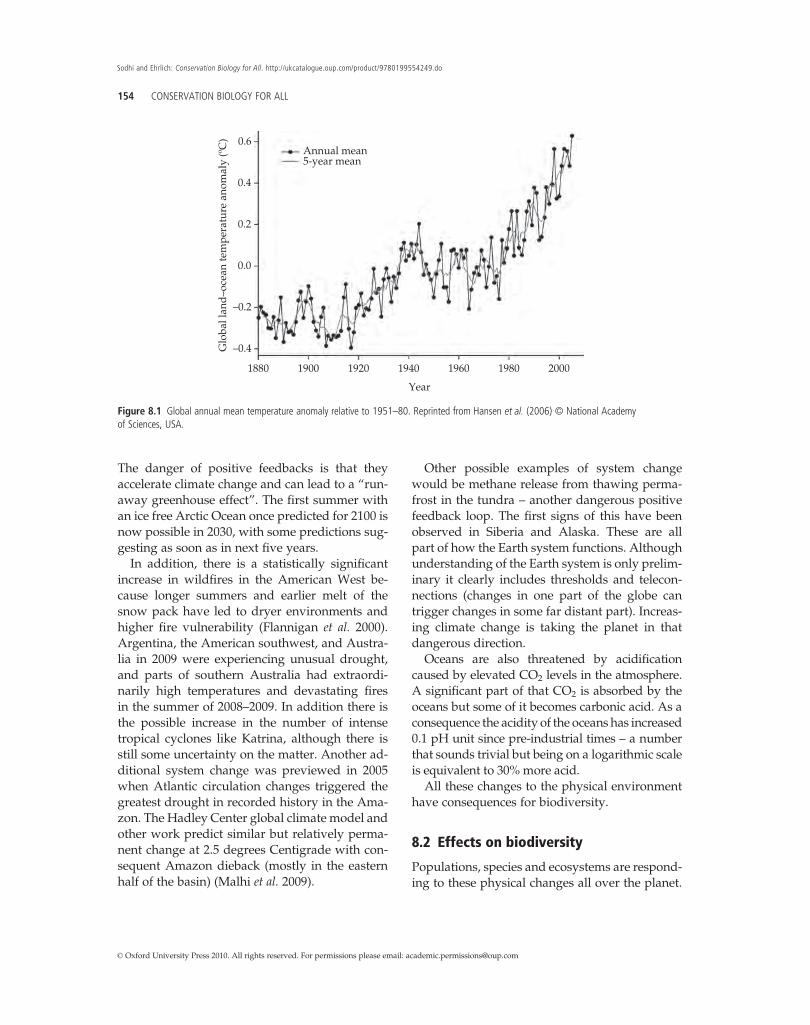
The danger of positive feedbacks is that theyaccelerate climate change and can lead to a “run-away greenhouse effect”. The first summer withan ice free Arctic Ocean once predicted for 2100 isnow possible in 2030, with some predictions sug-gesting as soon as in next five years.
In addition, there is a statistically significantincrease in wildfires in the American West be-cause longer summers and earlier melt of thesnow pack have led to dryer environments andhigher fire vulnerability (Flannigan et al. 2000).Argentina, the American southwest, and Austra-lia in 2009 were experiencing unusual drought,and parts of southern Australia had extraordi-narily high temperatures and devastating firesin the summer of 2008–2009. In addition there isthe possible increase in the number of intensetropical cyclones like Katrina, although there isstill some uncertainty on the matter. Another ad-ditional system change was previewed in 2005when Atlantic circulation changes triggered thegreatest drought in recorded history in the Ama-zon. The Hadley Center global climate model andother work predict similar but relatively perma-nent change at 2.5 degrees Centigrade with con-sequent Amazon dieback (mostly in the easternhalf of the basin) (Malhi et al. 2009).
Other possible examples of system changewould be methane release from thawing perma-frost in the tundra – another dangerous positivefeedback loop. The first signs of this have beenobserved in Siberia and Alaska. These are allpart of how the Earth system functions. Althoughunderstanding of the Earth system is only prelim-inary it clearly includes thresholds and telecon-nections (changes in one part of the globe cantrigger changes in some far distant part). Increas-ing climate change is taking the planet in thatdangerous direction.
Oceans are also threatened by acidificationcaused by elevated CO2 levels in the atmosphere.A significant part of that CO2 is absorbed by theoceans but some of it becomes carbonic acid. As aconsequence the acidity of the oceans has increased0.1 pH unit since pre-industrial times – a numberthat sounds trivial but being on a logarithmic scaleis equivalent to 30%more acid.
All these changes to the physical environmenthave consequences for biodiversity.
8.2 Effects on biodiversity
Populations, species and ecosystems are respond-ing to these physical changes all over the planet.
1880
–0.4
–0.2
0.0
Glo
bal l
and
–oce
an te
mpe
ratu
re a
nom
aly
(ºC
)0.2
0.4
0.6
1900 1920
Annual mean5-year mean
1940
Year
1960 1980 2000
Figure 8.1 Global annual mean temperature anomaly relative to 1951–80. Reprinted from Hansen et al. (2006) © National Academyof Sciences, USA.
154 CONSERVATION BIOLOGY FOR ALL
Sodhi and Ehrlich: Conservation Biology for All. http://ukcatalogue.oup.com/product/9780199554249.do
© Oxford University Press 2010. All rights reserved. For permissions please email: [email protected]

Many species are changing the timing of their lifehistories (phenology) (Root et al. 2003; Parmesan2006). Wherever there are good records in thenorthern hemisphere many plant species areflowering earlier in the spring as in central Eng-land (Miller-rushing and Primack 2008). Similar-ly, animal species are changing the timing in theirlife cycles, such as tree swallows (Tachycineta bi-color) nesting and laying their eggs earlier (Dunnand Winkler 1999). Some species are changingtheir migration times and in North America, onehummingbird species has ceased to migrate (Par-mesan 2006).
In addition, the geographical distribution ofsome species is changing. In western NorthAmerica, the change both northward and up-ward in altitude of Edith’s checkerspot butterfly(Euphydryas editha) is well documented (Parme-san 2006). In Europe, many butterfly species havemoved northward as well, including the sootycopper (Heodes tityrus), which now occurs andbreeds in Estonia (Parmesan et al. 1999).
There is considerable change among Arcticspecies because so many life histories are tied tothe ice which decreased dramatically both in areaand thickness in 2007 and 2008. The polar bear(Ursus maritimus) is the best known by far withstress/decline being observed in a number of thepopulations (Stirling et al. 1999). Many bird spe-cies feed on the Arctic cod (Arctogadus glacialis), aspecies that occurs near the edge and just underthe ice. Nesting seabirds like the black guillemot(Cepphus grylle) fly from their nests on land to theedge of the ice to feed and return to feed theiryoung. So as the distance to the edge of the iceincreases, there is a point at which the trip is toogreat and first the individual nest, then eventual-ly the seabird colony fails.
Species that occur at high altitudes will, as aclass, be very vulnerable to climate change simplybecause as they move upslope to track their re-quired conditions, they ultimately will have nofurther up to go. The American pika (Ochotonaprinceps), a lagomorph species with a fascinatingharvesting aspect to its natural history, is a primeexample. It is comprised of roughly a dozen popu-lations in different parts of the Rocky Mountainsthat we can anticipate will wink out one by one.
Temperature increase also will be greater inhigh latitudes and particularly in the northernhemisphere where there is more terrestrial sur-face. Climate change of course is not only abouttemperature it is also about precipitation. On landthe two most important physical parameters fororganisms are temperature and precipitation. Inaquatic ecosystems the two most important aretemperature and pH. Drying trends are alreadyaffecting Australia, the Argentine pampas, theAmerican southwest and the prairie potholeregion of the upper Midwest northward intoCanada. Prairie potholes are a critical landscapefeature supporting the great central flyway ofmigratory birds in North America.
For well known species such as the sugarmaple (Acer saccharum), the environmental re-quirements are fairly well known so it is possibleto model how the geography of those require-ments is likely to change along with climate. Inthis case all the major climate models show thatat double pre-industrial levels of greenhousegases, the distribution of this species – so char-acteristic of the northeastern United States thatits contribution to fall foliage is the basis of asignificant tourism industry –will move north toCanada. While the tourism and the appeal ofmaple sugar and syrup are not significant ele-ments of the northeast US economy, they aresignificant with respect to a sense of place, andare partly why these states have taken a leader-ship role on climate change. In the mid-Atlanticstates, the Baltimore oriole (Icterus galbula) willno longer occur in Baltimore due to climate-driven range shift.
In the northern oceans there are changes inplankton (small organisms drifting along theocean currently) and fish distributions. The eelgrass (Zostera marina) communities of the greatNorth American estuary, the Chesapeake Bay,have a sensitive upper temperature limit. Accord-ingly, the southern boundary has been movingsteadily northward year after year (http://www.chesapeakebay.net/climatechange.aspx). Simi-larly, plankton populations have been movingnorthwards in response to water temperature in-crease (Dybas 2006). This trend, for example, hasresulted in low plankton densities around
CLIMATE CHANGE 155
1
© Oxford University Press 2010. All rights reserved. For permissions please email: [email protected]

Scotland, likely reducing the densities of plank-ton-eating fish and bird species there (Dybas2006).
Changes have been observed not only in theArctic and temperate regions but also in the tro-pics (see Box 8.1). There are more than 60 verte-brate species endemic to Australia’s rainforestsincluding the grey-headed robin (Heteromyias al-bispecularis) and the ringtail possum (Pseudo-cheirus peregrinus). With climate change theamount of suitable habitat available for them
shrinks dramatically such that at 5 degrees Centi-grade increase most are doomed to extinction(Shoo et al. 2005). The Monteverde cloud forestin Costa Rica, an ecosystem type almost entirelydependent on condensation from clouds formoisture has been encountering more frequentdry days as the elevation at which clouds formhas risen. Nest predators like toucans are movingup into the cloud forest from the dry tropicalforest below (Pounds et al. 1999). The charismaticgolden toad (Bufo periglenes) of Monteverde could
Box 8.1 Lowland tropical biodiversity under global warmingNavjot S. Sodhi
Global warming may drive species polewardor towards higher elevations. However, howtropical species, particularly those occupyinglowlands, will respond to global warmingremains poorly understood. Because thelatitudinal gradient in temperature levels offto a plateau between the Tropic of Cancerand the Tropic of Capricorn, latitudinal rangeshifts are not likely for species confined tothe tropics. This leaves upslope range shiftsas the primary escape route for tropicalspecies already living near their thermallimit. One scenario is that tropical lowlandbiodiversity may decline with globalwarming, because there is no “species pool”to replace lowland species that migrate tohigher elevations. Colwell et al. (2008)speculated on the effects of projected globalwarming on lowland biotas by usingrelatively large datasets of plants and insectsfrom Costa Rica. Data on the distribution of1902 species of epiphytes, understoryrubiaceous plants, geometrid moths, andants were collected from a transect thattraversed from sea level to 2900 m elevation.Colwell et al. (2008) developed a graphicmodel of elevational range shifts in thesespecies under climatic warming. Assuming600‐m upslope shifts with 3.2°C temperateincrease over the next century, theyestimated that 53% of species will becandidates for lowland biotic attrition(decline or disappearance in the lowlands)
and 51% will encounter the spatial gapsbetween their current and projected ranges(Box 8.1 Figure). A number of these specieswill likely face both challenges. Authorscautioned that their local‐level data mayhave underestimated regional elevationranges and must, in this regard, beconsidered as a worst case scenario.However, it is also plausible that their resultsrepresent a best case scenario, consideringthat other drivers such as habitat loss, fire,overharvesting and invasive species cansynergistically drive species to decline andextinction (Brook et al. 2008).
Epiphytes0.0
0.2
0.4
Prop
orti
on o
f spe
cies
0.6
0.8
Biotic attritionRange-shift gapsExtinction
1.0
Rubiaceae Moths Ants
Box 8.1 Figure Proportion of species projected to be affected byglobal warming. Data for the analysis were collected from a lowlandelevational transect in Costa Rica. Proportion sums are greater thanone because a species may have more than one response. Reprintedfrom Colwell et al. (2008).
continues
156 CONSERVATION BIOLOGY FOR ALL
Sodhi and Ehrlich: Conservation Biology for All. http://ukcatalogue.oup.com/product/9780199554249.do
© Oxford University Press 2010. All rights reserved. For permissions please email: [email protected]
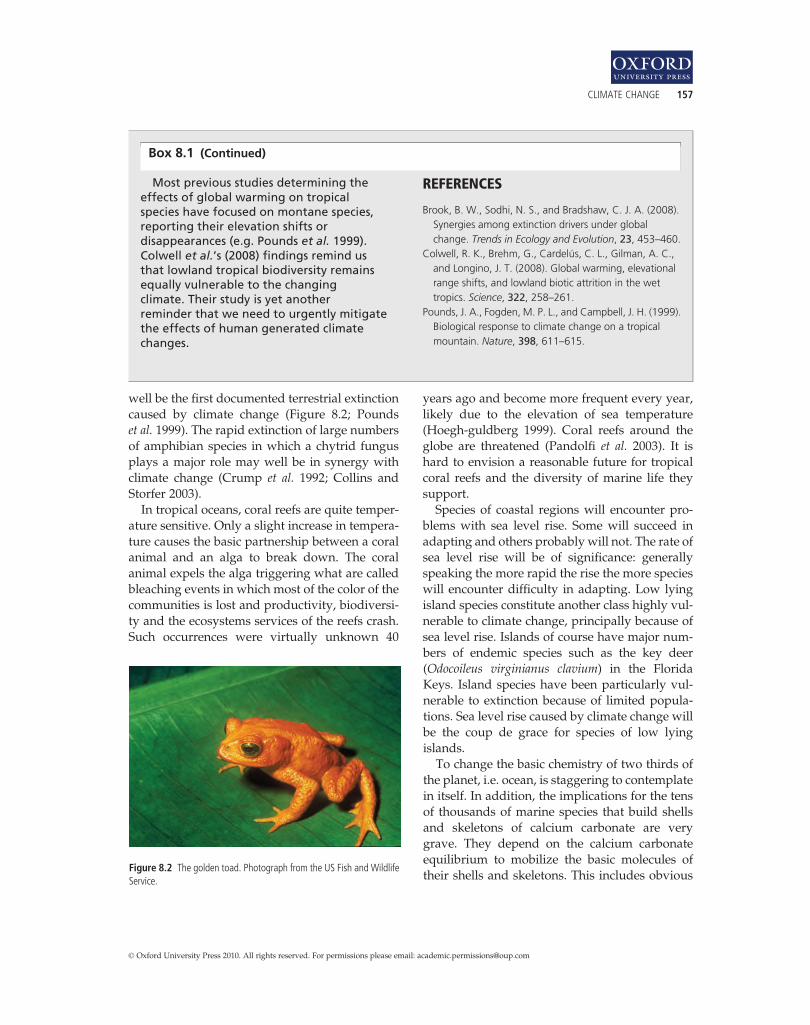
well be the first documented terrestrial extinctioncaused by climate change (Figure 8.2; Poundset al. 1999). The rapid extinction of large numbersof amphibian species in which a chytrid fungusplays a major role may well be in synergy withclimate change (Crump et al. 1992; Collins andStorfer 2003).
In tropical oceans, coral reefs are quite temper-ature sensitive. Only a slight increase in tempera-ture causes the basic partnership between a coralanimal and an alga to break down. The coralanimal expels the alga triggering what are calledbleaching events in which most of the color of thecommunities is lost and productivity, biodiversi-ty and the ecosystems services of the reefs crash.Such occurrences were virtually unknown 40
years ago and become more frequent every year,likely due to the elevation of sea temperature(Hoegh-guldberg 1999). Coral reefs around theglobe are threatened (Pandolfi et al. 2003). It ishard to envision a reasonable future for tropicalcoral reefs and the diversity of marine life theysupport.
Species of coastal regions will encounter pro-blems with sea level rise. Some will succeed inadapting and others probably will not. The rate ofsea level rise will be of significance: generallyspeaking the more rapid the rise the more specieswill encounter difficulty in adapting. Low lyingisland species constitute another class highly vul-nerable to climate change, principally because ofsea level rise. Islands of course have major num-bers of endemic species such as the key deer(Odocoileus virginianus clavium) in the FloridaKeys. Island species have been particularly vul-nerable to extinction because of limited popula-tions. Sea level rise caused by climate change willbe the coup de grace for species of low lyingislands.
To change the basic chemistry of two thirds ofthe planet, i.e. ocean, is staggering to contemplatein itself. In addition, the implications for the tensof thousands of marine species that build shellsand skeletons of calcium carbonate are verygrave. They depend on the calcium carbonateequilibrium to mobilize the basic molecules oftheir shells and skeletons. This includes obvious
Box 8.1 (Continued)
Most previous studies determining theeffects of global warming on tropicalspecies have focused on montane species,reporting their elevation shifts ordisappearances (e.g. Pounds et al. 1999).Colwell et al.’s (2008) findings remind usthat lowland tropical biodiversity remainsequally vulnerable to the changingclimate. Their study is yet anotherreminder that we need to urgently mitigatethe effects of human generated climatechanges.
REFERENCES
Brook, B. W., Sodhi, N. S., and Bradshaw, C. J. A. (2008).Synergies among extinction drivers under globalchange. Trends in Ecology and Evolution, 23, 453–460.
Colwell, R. K., Brehm, G., Cardelús, C. L., Gilman, A. C.,and Longino, J. T. (2008). Global warming, elevationalrange shifts, and lowland biotic attrition in the wettropics. Science, 322, 258–261.
Pounds, J. A., Fogden, M. P. L., and Campbell, J. H. (1999).Biological response to climate change on a tropicalmountain. Nature, 398, 611–615.
Figure 8.2 The golden toad. Photograph from the US Fish and WildlifeService.
CLIMATE CHANGE 157
1
© Oxford University Press 2010. All rights reserved. For permissions please email: [email protected]

organisms like mollusks and vertebrates but alsotiny plankton like pteropods (tiny snails withtheir “foot” modified to flap like a wing to main-tain them in the water column). At a certain pointof increasing acidity the shells of such organismswill go into solution while they are still alive.Effects have been seen already at the base of thefood chain in the North Atlantic and off of Alaska.
Freshwater species will be affected as well.They all have characteristic temperature rangesthat will be affected by climate change. Cold-water species like trout and the many species ofthe food chains on which they depend will nolonger be able to survive in many places wherethey occur today (Allan et al. 2005).
These kinds of changes are relatively minorripples in the living world but are occurring vir-tually everywhere. Nature is on the move andthis no longer is a matter of individual examplesbut is statistically robust. And this is with only0.75 degrees Celsius increase in global tempera-ture with at least that much and probably more instore by century’s end. The first projection ofwhat double pre-industrial levels of CO2 mightportend for the biota estimated extinction of18–35% of all species (Thomas et al. 2004) – arange confirmed by the 2007 report of the Intergov-ernmental Panel on Climate Change (IPCC 2007).
With more climate change, the impacts uponand response of biological diversity will changequalitatively and become more complex andharder to manage. Climate change of course isnothing new in the history of life on Earth. Gla-ciers came and went on a major scale in thenorthern and temperate latitudes in the lasthundreds of thousands of years. Species wereable to move and track their required climaticconditions without much loss of biological diver-sity. The difference today is that the landscapeswithin which species would move in response toclimate change have been highly modified byhuman activity through deforestation, agricultur-al conversion, wetland drainage and the like.Landscapes have been converted into obstaclecourses for dispersing organisms. Former Nation-al Zoo Director Michael Robinson stated that spe-cies would move but “Philadelphia will be in theway”. Basically these landscapes will result in
substantial extinction if they remain in their cur-rent condition.
A second difference is that we know from stud-ies of past response to climate change thatbiological communities do not move as a unit, butrather it is the individual species that move each atits own rate and in its own direction. The conse-quence is that ecosystems as we know them willdisassemble and the surviving species will assem-ble into new ecosystem configurations that largelydefy the ability to foresee. Certainly that was thecase as species moved in Europe after the last re-treat of the glaciers (Hewitt andNichols 2005). Themanagement challenge to respond to this is there-fore hard to understand let alone plan to address.
We also know that in contrast to the climatechange models run on super computers thatchange will be neither linear nor gradual. Weknow there have been discontinuities in the phys-ical climate system in the past. For example theglobal conveyor belt – the gigantic ocean currentthat distributes heat around the globe – has shutdown in the past. Equally disturbing, abruptthreshold change is already occurring in ecosys-tems. Bleaching in coral reef systems is clearly anexample in the oceans (see above).
8.3 Effects on biotic interactions
Relationships between two species can dependon relatively precise timing. Sometimes thetiming mechanism of one is based on day lengthand the other on temperature and has workedwell because of the relative climate stability. Theseabird nesting-Arctic Cod coupling is just suchan example and under climate change leads to“decoupling” (see above). The Arctic hare (Lepusarcticus), for example, changes from a white win-ter pelage that camouflages it in wintry whitelandscapes to a brownish pelage that blends intothe vegetation after the snow and ice disappear.As spring thaw advances earlier with climatechange, Arctic hares become vulnerable to preda-tors as they are conspicuously white in no longerwintry landscapes.
Similarly, in terrestrial ecosystems thresholdchange is occurring in coniferous forests in
158 CONSERVATION BIOLOGY FOR ALL
Sodhi and Ehrlich: Conservation Biology for All. http://ukcatalogue.oup.com/product/9780199554249.do
© Oxford University Press 2010. All rights reserved. For permissions please email: [email protected]

North America and Europe as climate change tipsthe balance in favor of native pine bark beetles.Milder winters allow more to overwinter andlonger summers permit an additional generationof beetles. The consequence is vast stretches offorest in which 70% of the trees have been killed.It is an enormous forest management and firemanagement problem, and being withoutknown precedent it is not clear how these ecosys-tems will respond. Yet more, there are the firstsigns of system change, i.e., change on yet agreater scale.
8.4 Synergies with other biodiversitychange drivers
Climate change will also have synergistic effectswith other kinds of environmental problems suchas invasive species (Chapter 7). The emerald ashborer (Agrilus planipennis), an Asian species, iscausing major mortality of American ash trees(Fraxinus americana) – from which baseball batsare manufactured – from the mid-west to Mid-Atlantic States (http://www.emeraldashborer.info/). The borer is over wintering in greaternumbers because of milder winters and has alonger active boring season because of longersummers. Another example will be the impactof the introduced bird malaria vector mosquitowhich causes mortality in most species of theendemic Hawaiian honeycreepers (see Figure12.4). Of the surviving honeycreeper speciesmost of the vulnerable ones persist only abovean altitude – the mosquito line – above which thetemperature is too low for the mosquitoes. Withclimate change the mosquito line will move upand the area safe for honeycreepers diminishes(Pratt 2005).
8.5 Mitigation
All of this bears on probably the most criticalenvironmental question of all time, namely atwhat point is climate change “dangerous”, i.e.,where should it be limited. For a long time con-servationists asserted that 450 ppm of CO2
(roughly equivalent to 2 degrees Centigrade
warming) should be the limit beyond which it isdangerous. This means limiting peak concentra-tion levels to as low a figure as possible andseeking ways to draw CO2 out of the atmosphereto return to a lower ppm as soon as possible. It isclear that the grave risk and urgency of climatechange has not been recognized (Sterman 2008;Solomon et al. 2009). The IPCC (2007) synthesisreport suggests 450 ppm of CO2 itself is danger-ous. Remember, the earth is 0.75 degree warmerthan pre-industrial times with another 0.5 alreadyin the pipeline. Yet at 0.75 ecosystem thresholdchange is already occurring.
The last time the Earth was two degrees Centi-grade warmer, sea level was four to six metershigher. The current changes in Arctic sea ice, theaccelerating melting of the Greenland ice sheet,together with major ecosystem disruption all sug-gest that 350 ppm of CO2 is the level above whichit is not “safe”. That is James Hansen’s conclusionas a climate scientist. The insights emerging aboutbiological diversity and ecosystems are conver-gent with 350 ppm. Yet atmospheric CO2 is at 390ppm and climbing at rates beyond the worst caseprojections.
This means the agenda for “adaptation” – touse the climate convention’s terminology – is in-deed urgent. Conservation strategies need revi-sion and amplification and the conservationbiology of adaptation is a rapidly developingfield. Restoring natural connections in the envi-ronment will facilitate the movement of organ-isms as they respond to changing climate (Box8.2). Reducing other stresses on ecosystems re-duces the probability of negative synergies withclimate change. Downscaled climate projectionsto one square kilometer, for example, or similarwill provide managers with useful data formaking needed decisions.
While existing protected areas will no longer befulfilling their original purpose, e.g., Joshua trees(Yucca brevifolia) will no longer exist inside of theJoshua Tree National Park, they will have thenew value of being the safe havens from whichspecies can move and create the new biogeo-graphic pattern. That together with the need fornew protected areas for the new locations of im-portant biodiversity plus the need for natural
CLIMATE CHANGE 159
1
© Oxford University Press 2010. All rights reserved. For permissions please email: [email protected]

connections between natural areas, clearly meanthat more conservation is needed not less.
Simultaneously, the “mitigation” agenda – touse the convention’s term for limiting the growthof greenhouse gas concentrations in the atmo-sphere – becomes amatter of huge global urgencybecause the greater the climate change the moredifficult is adaptation. Transforming the energybase for human society is the dominant center of
mitigation, but biology and conservation play asignificant role as well (Box 8.2).
Tropical deforestation (see Chapter 4) plays animportant role in greenhouse gas emissions: liter-ally 20% of annual emissions come from the de-struction of biomass, principally tropicaldeforestation and burning (IPCC 2007). In thecurrent rank order of emitting nations afterChina and the United States are Indonesia and
Box 8.2 Derivative threats to biodiversity from climate changePaul R. Ehrlich
Besides the obvious direct impacts onbiodiversity, climate disruption will have manyother effects. For instance, if climatologists arecorrect, humanity is likely to be faced with amillennium or more of continuously changingpatterns of precipitation that likely in itself willbe devastating for biodiversity (Solomon et al.2009). But those changes will also requirehumanity to continually reconstruct water‐handling and food‐producing infrastructurearound the globe. New dams, canals, andpipelines will need to be built, often withdevastating impacts on stream and riverecosystems. Lakes behind new dams will floodterrestrial habitats, and changing river flowswill have impacts on estuaries and coral reefs,among the most productive of marineenvironments. Reefs are especially sensitive tothe siltation that often accompanies majorupstream construction projects.Changing water flows means that new areas
will be cleared for crop agriculture andsubjected to grazing, as old areas becomeunproductive. Roads and pipelines willdoubtless need to be built to service newagricultural areas. What the net effects ofthese shifts will mean is almost impossible toestimate, especially where old areas may beavailable for rewilding (Box 5.3). It is also likelythat warming will open much of the Arctic tocommerce, with an accompanying increase inthe construction of infrastructure – ports,roads, towns, and so on.Human society in response to growing
climatic problems will also begin to reviseenergy‐mobilizing infrastructure across the
planet. Large areas of desert may be claimedby solar‐energy capturing devices. Windturbines are likely to dot landscapes andsome near‐shore seascapes. New high‐speedrail lines may be constructed, naturalecosystems may be plowed under to plantcrops for conversion to biofuels (Box 13.3).This is already happening with deforestationin the Amazon now accelerating in responseto demand for biofuel crops. Expandingfarming operations are also destroying theprairie pothole ecosystem of the northernplains of North America (http://www.abcbirds.org/newsandreports/stories/080226_biofuels.html). That is critical habitat for many birdpopulations, among other fauna, includingducks much in demand by duck hunters whohave in the past proven to be allies ofconservationists.All of these changes will cause multitudes of
populations, and likely many species, todisappear, so that conservation biologistsshould be consulted on each project, andsociety should be made very aware as soon aspossible of the potential conflicts betweenhuman and natural capital inherent in revisionof water, energy, and transport infrastructure.
REFERENCES
Solomon, S., Plattner, G‐K., Knuttic R., and Friedlingsteind,P. (2009). Irreversible climate change due to carbondioxide emissions. Proceedings of the National Academyof Sciences of the United States of America, 106,1704–1709.
160 CONSERVATION BIOLOGY FOR ALL
Sodhi and Ehrlich: Conservation Biology for All. http://ukcatalogue.oup.com/product/9780199554249.do
© Oxford University Press 2010. All rights reserved. For permissions please email: [email protected]

Brazil because of their deforestation. There is nowgathering effort to include “Reductions in Emis-sions from Deforestation and Degradation”(¼ REDD) as part of the negotiations. Obviouslythere are multiple benefits in doing so in reduc-tion of emissions (and thus atmospheric concen-tration levels), biodiversity benefits andecosystem services (Chapter 3). There are techni-cal problems in monitoring and measuring aswell as issues about “leakage” – when protectionof one forest simply deflects the deforestation toanother – but none of it seems intractable.
All greenhouse gas emissions involve the re-lease of solar energy trapped by photosynthesiswhether ancient (fossil fuels) or present defores-tation and other ecosystem degradation. Thatraises the important question of what role biologyand biodiversity might play in removing some ofthe CO2 accumulated in the atmosphere. Twice inthe history of life on earth high levels of CO2
concentrations had been reduced to levels on theorder of pre-industrial. The first was associatedwith the origin of land plants and the second withthe expansion of angiosperms (Beerling 2007).This suggests substantial potential if the bio-sphere is managed properly.
In the past three centuries, terrestrial ecosystemshave lost 200 billion tons of carbon and perhapsmore depending on hard to estimate losses of soilcarbon. What is clear is that to the extent thatterrestrial ecosystems can be restored, a substantialamount of carbon could be withdrawn from theatmosphere rather than lingering for a hundred toa thousand years. If that number is 160 billion tonsof carbon, it probably equates to reducing atmo-spheric concentrations of it by 40 ppm.
This would be tantamount to planetary engi-neering with ecosystems – essentially a regreen-ing of what Beerling (2007) terms the EmeraldPlanet. All other planetary or geo-engineeringschemes have potential negative consequences,and only deal with temperature to the total ne-glect of ocean acidification (Lovelock and Rapley2007; Shepherd et al. 2007). This takes the agendabeyond forests to all terrestrial ecosystems,grasslands, wetlands, and even agro-ecosys-tems. Essentially it is conservation on a plane-tary scale: managing the living planet to make
the planet more habitable for humans and allforms of life.
Summary
· Massive releases of greenhouse gasses by hu-mans have altered the climate.
· Rapid global warming is responsible for abioticchanges such as receding of glaciers and increase inwildfires.
· Increased CO2 concentrations in the atmospherehave acidified the oceans.
· Populations, species, and ecosystems are re-sponding to these climatic conditions.
· Urgent actions are needed to reverse the climaticchanges.
Suggested reading
Lovejoy, T. E. and Hannah, L., eds (2005). Climate changeand biodiversity. Yale University Press, New Haven, CT.
Relevant websites
• Intergovernmental Panel on Climate Change: http://www.ipcc.ch/.
• Nature reports on climate change: http://www.nature.com/climate/index.html.
• United States Environmental Protection Agency:http://www.epa.gov/climatechange/.
REFERENCES
Allan, J. D., Palmer, M. E., and Poff, N. L. (2005). Climatechange and freshwater ecosystem. In T. E. Lovejoy andL. Hannah, eds Climate change and biodiversity, pp. 274–290. Yale University Press, New Haven, CT.
Beerling, D. (2007). The emerald planet: how plant’s changedEarth’s history. Oxford University Press, Oxford, UK.
Canadell, J. G., Quéré, C. L., Raupach, M. R., et al. (2007).Contributions to accelerating atmospheric CO2 growthfrom economic activity, carbon intensity, and efficiencyof natural sinks. Proceedings of the National Academy ofSciences of the United States of America, 104, 18866–18870.
Collins, J. P. and Storfer, A. (2003). Global amphibian de-cline: sorting the hypotheses. Diversity and Distributions,9, 89–98.
CLIMATE CHANGE 161
1
© Oxford University Press 2010. All rights reserved. For permissions please email: [email protected]

Crump, M. L., Hensley, F. R., and Clark, K. L. (1992).Apparent decline of the golden toad: underground orextinct? Copia, 1992, 413–420.
Dunn, P. O. andWinkler, D.W. (1999). Climatic change hasaffected breeding date of tree swallows throughoutNorth America. Proceedings of the Royal Society of LondonB, 266, 2487–2490.
Dybas, C. L. (2006). On collision course: ocean planktonand climate change. BioScience, 56, 642–646.
Flannigan, M. D., Stocks, B. J., and Wotton, B. M. (2000).Climate change and forest fires. The Science of the TotalEnvironment, 262, 221–229.
Hansen, J., Sato, M., and Ruedy, R. (2006). Global temp-erature change. Proceedings of the National Academy ofSciences of the United States of America, 103, 14288–14293.
Hewitt, G. M. and Nichols, R. A. (2005). Genetic and evo-lutionary impacts of climate change. In T. E. Lovejoyand L. Hannah, eds Climate change and biodiversity,pp. 176–192. Yale University Press, New Haven, CT.
Hoegh-Guldberg, O. (1999). Climate change, coral bleach-ing and the future of world’s coral reefs.Marine Freshwa-ter Research, 50, 839–866.
IPCC. (2007). Climate Change 2007 – impacts, adaptation andvulnerability. CambridgeUniversity Press,Cambridge,UK.
Lovelock, J. E. and Rapley, C. G. (2007). Ocean pipes couldhelp the Earth to cure itself. Nature, 449, 403.
Malhi, Y., Aragão, L. E. O. C., Galbraith, D., et al. (2009).Exploring the likelihood and mechanism of a climate-change-induced dieback of the Amazon rainforest. Pro-ceedings of the National Academy of Sciences of the UnitedStates of America, in press.
Miller-Rushing, A. and Primack, R. B. (2008). Global warm-ing and flowing times in Thoreau’s Concord: a commu-nity perspective. Ecology, 89, 332–341.
Pandolfi, J. M., Bradbury, R. H., Sala, E., et al. (2003). Globaltrajectory of the long-term decline in coral reef ecosys-tems. Science, 301, 955–958.
Parmesan, C. (2006). Ecological and evolutionaryresponses to recent climate change. Annual Review ofEcology, Evolution and Systematics, 37, 637–669.
Parmesan, C., Ryrholm, N., Stefanescu, C., et al. (1999).Poleward shifts in geographic ranges of butterfly speciesassociated with regional warming. Nature, 399, 579–583.
Pounds, J. A., Fodgen, M. P. L., and Campbell, J. H. (1999).Biological response to climate change on a tropicalmountain. Nature, 398, 611–615.
Pratt, D. H. (2005). Hawaiian honeycreepers. Oxford Univer-sity Press, Oxford, UK.
Root, T. L, Price, J. T., Hall, K. R., et al. (2003). Fingerprintsof global warming on wild animals and plants. Nature,421, 57–60.
Shepherd, J., Iglesias-rodriguez, D., and Yool, A. (2007).Geo-engineering might cause, not cure, problems. Na-ture, 449, 781.
Shoo, L. P., Williams, S. E., and Hero, J.-M. (2005). Climatewarming and the rainforest birds of the Australian wettropics: using abundance data as a sensitivity predictorof change in total population. Biological Conservation, 125,335–343.
Solomon, S., Plattner, G.-S., Knutti, R., and Friedlingstein,P. (2009). Irrevesible climate change due to carbon dioxideemissions. Proceedings of the National Academy of Sciences ofthe United States of America, 106, 1704–1709.
Sterman, J. D. (2008). Risk communication on climate:mental models and mass balance. Science, 322, 532–533.
Stirling, I., Lunn, N. J., and Iacozza, J. (1999). Long-termpopulation trends in population ecology of polar bearsin western Hudson Bay in relation to climate change.Arctic, 52, 294–306.
Thomas, C. D., Cameron, A., Green, R. E., et al. (2004).Extinction risk from climate change. Nature, 427,145–148.
United Nations Environment Programme (UNEP). (2007).Global outlook for ice & snow. UNEP, Nairobi, Kenya.
162 CONSERVATION BIOLOGY FOR ALL
Sodhi and Ehrlich: Conservation Biology for All. http://ukcatalogue.oup.com/product/9780199554249.do
© Oxford University Press 2010. All rights reserved. For permissions please email: [email protected]
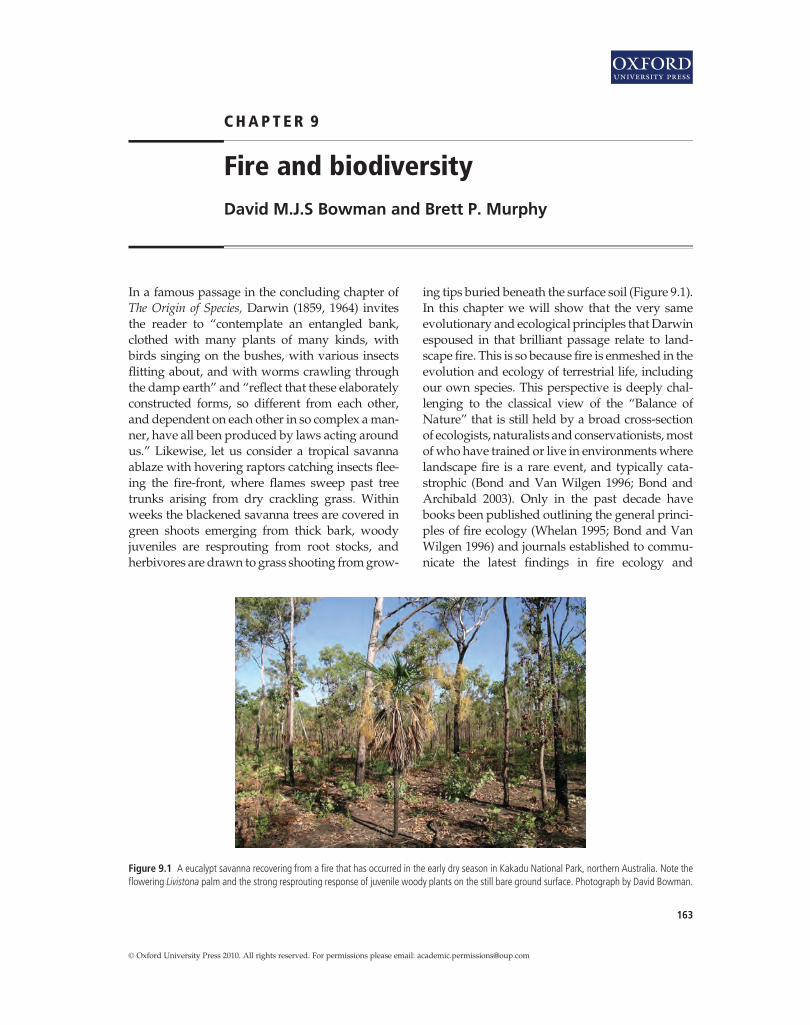
CHAP T E R 9
Fire and biodiversityDavid M.J.S Bowman and Brett P. Murphy
In a famous passage in the concluding chapter ofThe Origin of Species, Darwin (1859, 1964) invitesthe reader to “contemplate an entangled bank,clothed with many plants of many kinds, withbirds singing on the bushes, with various insectsflitting about, and with worms crawling throughthe damp earth” and “reflect that these elaboratelyconstructed forms, so different from each other,and dependent on each other in so complex aman-ner, have all been produced by laws acting aroundus.” Likewise, let us consider a tropical savannaablaze with hovering raptors catching insects flee-ing the fire-front, where flames sweep past treetrunks arising from dry crackling grass. Withinweeks the blackened savanna trees are covered ingreen shoots emerging from thick bark, woodyjuveniles are resprouting from root stocks, andherbivores are drawn to grass shooting fromgrow-
ing tips buried beneath the surface soil (Figure 9.1).In this chapter we will show that the very sameevolutionary and ecological principles thatDarwinespoused in that brilliant passage relate to land-scape fire. This is so because fire is enmeshed in theevolution and ecology of terrestrial life, includingour own species. This perspective is deeply chal-lenging to the classical view of the “Balance ofNature” that is still held by a broad cross-sectionof ecologists, naturalists and conservationists,mostof who have trained or live in environments wherelandscape fire is a rare event, and typically cata-strophic (Bond and Van Wilgen 1996; Bond andArchibald 2003). Only in the past decade havebooks been published outlining the general princi-ples of fire ecology (Whelan 1995; Bond and VanWilgen 1996) and journals established to commu-nicate the latest findings in fire ecology and
Figure 9.1 A eucalypt savanna recovering from a fire that has occurred in the early dry season in Kakadu National Park, northern Australia. Note theflowering Livistona palm and the strong resprouting response of juvenile woody plants on the still bare ground surface. Photograph by David Bowman.
163
© Oxford University Press 2010. All rights reserved. For permissions please email: [email protected]
1

wildfire management (see http://www.firecology.net and http://www.iawfonline.org).
9.1 What is fire?
At the most basic level fire can be considered aphysiochemical process that rapidly releases ener-gy via the oxidation of organic compounds, andcan be loosely considered as “anti-photosynthesis”.This physiochemical process if often summarizedin a classic “fire triangle”made up of the three keyfactors to cause combustion: oxygen, fuel and igni-tions (Whelan 1995; Pyne 2007). Atmospheric oxy-gen levels create a “window” that controls fireactivity because ignitions are constrained by atmo-spheric oxygen (Scott and Glasspool 2006). Firecannot occur when levels fall below 13% of theatmosphere at sea level, and under the currentoxygen levels (21%) fire activity is limited by fuelmoisture, yet at 35% even moist fuels willburn. Because of substantial fluctuations in atmo-spheric oxygen, fire risk has changed significantlythrough geological time. In the Permian Period(between 290 and 250 million years ago) for exam-ple, oxygen levelswere substantially higher than atpresent and even moist giant moss (lycopod) for-ests would have been periodically burnt (Scott andGlasspool 2006). However, fire in the biosphereshould not be considered merely a physicochemi-cal process but rather a fundamental biogeochemi-cal process. Fires instantaneously link biomasswith the atmosphere by releasing heat, gases (nota-bly water vapor), and the geosphere by releasingnutrients andmaking soils more erodible and thuschanging the nutrient content of streams and rivers(hydrosphere). Fire is therefore quite unlike othernatural disturbances, such as floods and cyclones,given the complex web of interactions and numer-ous short and long-range feedbacks. Some ecolo-gists have suggested that landscape fires should beconsidered as being “biologically constructed”,and have drawn parallels with herbivory (Bondand Keeley 2005) or decomposition (Pyne 2007).Such tight coupling between fire and life bedevilssimple attribution of cause and effect, and raisesfascinating questions about the potential coevolu-tion of fire and life.
9.2 Evolution and fire in geological time
There is evidence from the fossil record thatwildfires started to occur soon after vegetationestablished on the land surface (about 420 millionyears ago) (Scott and Glasspool 2006). The longhistory of exposure of terrestrial life to fire leadsto the idea that fire is an important evolutionaryfactor, and more controversially, that fire and lifehave coevolved (Mutch 1970). While gainingsome support from modeling (Bond and Midgley1995), this is difficult to prove because adapta-tions to fire cannot be unambiguously identifiedin the fossil record. For example, in many fire-prone environments, seeds are often contained inwoody fruits that only open after a fire event, afeature known as serotiny. However, woody fruitsmay also be a defense against seed predators suchas parrots, and seeds are released once mature,irrespective of fire (Bowman 2000). In most casesit is impossible to know if fossilized woody fruitsare truly serotinous, thuswoody fruit occurrence isnot clear evidence of an adaptation to fire. Muchcare is required in the attribution of fire adapta-tions. For example, microevolution can result inswitching from possible fire-adaptations, such asthe serotinous state. More problematic for under-standing the evolution of flammability, Schwilkand Kerr (2002) have proposed a hypothesis theycall “genetic niche-hiking” that flammable traitsmay spread without any “direct fitness benefit ofthe flammable trait”.
Insights into the evolution of flammabilityhave been gained by tracking the emergence ofhighly fire-adapted lineages such as Eucalyptus.Eucalypts are renowned for their extraordinarilyprolific vegetative recovery of burnt trunks viaepicormic buds (Figure 9.2). Recently, Burrows(2002) has shown that eucalypt epicormics areanatomically unique. Unlike other plant lineages,which have fully developed dormant buds on thetrunks, eucalypts, have strips of “precursor” cellsthat span the cambium layer that, given the rightcues, develop rapidly into epicormic buds. Theadvantage of this system is that should the trunkbe severely burnt the tree retains the capacity todevelop epicormic buds from cells protected inthe cambium. The molecular phylogeny of
164 CONSERVATION BIOLOGY FOR ALL
© Oxford University Press 2010. All rights reserved. For permissions please email: [email protected]
Sodhi and Ehrlich: Conservation Biology for All. http://ukcatalogue.oup.com/product/9780199554249.do

eucalypts, dated using the fossil record, suggeststhat this trait existed before the “bloodwood”eucalypt clade split off from other eucalyptssome 30 million years ago, given that it occursin both these lineages. Such an ancient feature tothe lineage suggests that eucalypts had devel-oped a vegetative response to landscape fire,which appears to have become more common inthe Australian environment associated with a dryclimate and nutrient impoverished soils. This in-terpretation is concordant with the fresh insightsabout the evolution of the Australian biotaderived from numerous molecular phylogeniesof quintessentially Australian plants and animals(Bowman and Yeates 2006).
9.3 Pyrogeography
Satellite sensors have revolutionized our under-standing of fire activity from landscape to globalscales. Global compilations of satellite data havedemonstrated the occurrence of landscape fire onevery vegetated continent, yet the incidence offire is not random across the globe (Justice et al.2003). Fire has predictable features regardinghow it spreads across landscapes and the fre-quency and season of occurrence. Such predict-ability has lead to the idea of the “fire regime”.
Key aspects of the fire regime include types offuels consumed (e.g. grass vs. canopies), spatialpattern (area burnt and shape), and consequences(severity relative to impacts on the vegetationand/or soils) (Gill 1975; Bond and Keeley 2005).For example, savanna fires are often of low inten-sity and high frequency (often annual), while for-est fires are often of low frequency (once everyfew centuries) andveryhigh intensity. Fire regimesare part of the habitat template that organizes thegeographic distribution of biodiversity, and, inturn, species distributions influence the spread offire. Some authors have even applied “habitat suit-ability modeling” to predict where fire is mostlikely to occur at the global to local level.
Fire activity is strongly influenced by climatevariability. Fire managers have developed empiri-cal relationships that combine climate data, such asthe intensity of antecedent moisture deficit, windspeed, relative humidity, and air temperature, tocalculate fire danger (see http://www.firenorth.org.au). Mathematical models combining such cli-mate data with fuel loads and topography havebeen developed to predict how a fire may behaveas it spreads across a landscape (Cary et al. 2006).The spread of fire is also strongly influenced byvegetation type (Figure 9.3). For example, grassyenvironments carry fire frequently because of therapid accumulation of fuel while rainforests burn
Figure 9.2 Prolific epicormic sprouts on a recently burnt tall eucalypt forest in eastern Tasmania. Photograph by David Bowman.
FIRE AND BIODIVERSITY 165
© Oxford University Press 2010. All rights reserved. For permissions please email: [email protected]
1

infrequently because of microclimates that keepfuels moist under all but drought conditions. Cli-mate cycles such as the El Niño Southern Oscilla-tion (ENSO) also strongly influencefire activity. Forexample, fire activity typically increases in arid en-vironments after a wet period because of the build-up of fine fuels. Conversely, fire activity increasesafter a long drought period in moist forests.
The satellite record has been extraordinarilyuseful in understanding fire activity in highlyfire prone environments (see http://www.cfa4wd.org/information/Forest_FDI.htm). Yetthe limited time-depth of this record may maskthe occurrence of infrequent fire events that occurin long-lived fire-prone vegetation such as theboreal forests of Canada and Siberia. Under-standing the “fire regimes” of long-lived forestslike those of the boreal zone demands historicalreconstruction such as dendrochronology (tree-ring analysis) to determine the timing of “standreplacing fires” which initiate a cohort of regen-eration to replace the burnt forest. Statistical anal-ysis of forest stand-age structures can be used todetermine the inter-fire intervals (Johnson andGutsell 1994). Dendrochronology has also beenused to date precisely past fire events by identify-ing injuries to growth rings (fire scars) on thetrunks on long-lived trees (Swetnam 1993).
The study by Sibold et al. (2006) captures manyof the above complexities in understanding fireextent and occurrence. They combined tree ringanalyses and geographic information systems(GIS) techniques to identify the influence of vege-tation type and structure, elevation and aspect,and regional climate influences on fire activity inthe Rocky Mountains National Park, Colorado,USA. Their analysis identified the primary impor-tance of ENSO for fire activity, yet this climaticeffect was modulated by landscape setting andvegetation type. Over the 400-year record, fireactivity was common in the dry, low elevationslopes that support fire-prone lodgepole pine(Pinus contorta) forests but at higher elevationthere were large areas of long unburnt mesicspruce-fir (Picea engelmannii) forest. On the moistwestern side of the mountain range were fewer,but larger, fires compared to the drier easternsides of the mountain range. This exampleshows that while climate is a driver of fire risk,the linkage between fire, climate and vegetation iscomplex, frustrating simple attribution of “causeand effect”. Finally, human fire usage has a pro-found effect on fire activity, disturbing “natural”fire regimes. For example, tropical rainforests arecurrently being transformed to pasture by burn-ing (see Box 9.1) yet in some environments, like
Figure 9.3 Landscape scale patterns of fire spread in southwestern Tasmania. Fire spread is controlled by topography, vegetation, and the meteorologicalconditions that prevailed at the time of the fire creating strongly non‐random patterns of burnt and unburnt areas. Photograph by David Bowman.
166 CONSERVATION BIOLOGY FOR ALL
© Oxford University Press 2010. All rights reserved. For permissions please email: [email protected]
Sodhi and Ehrlich: Conservation Biology for All. http://ukcatalogue.oup.com/product/9780199554249.do

the forests of thewesternUSA,firemanagers haveeffectively eliminated fire from some fire pronelandscapes.
9.4 Vegetation–climate patternsdecoupled by fire
A classic view of plant geography is that vegeta-tion and climate are closely coupled. RecentlyBond et al. (2005) challenged this view by asking
the question of whether the vegetation of theEarth is significantly influenced by landscapefire. The approach they took was via dynamicglobal vegetation models (DGVMs), which arecomputer simulations of vegetation based onphysiological principles. The effect of landscapefire on global vegetation patterns is implicit inDGVMs because they include “fire modules”that introduce frequent disturbances to modeledvegetation patterns and processes. Such modulesare necessary in order to recreate actual
Box 9.1 Fire and the destruction of tropical forestsDavid M. J. S. Bowman and Brett P. Murphy
Each year, extensive areas of tropical forest areunintentionally burnt by anthropogenic fires,and are severely degraded or destroyed as aresult (see Chapter 4). Enormous conflagrationscan occur in response to drought eventsassociated with ENSO, most notably theIndonesian fires of 1997–1998, which burntaround 8 million hectares of forest (Cochrane2003). Until recent decades, most tropicalforests experienced fires very infrequently,with fire return intervals in the order ofcenturies, although it is now clear that firefrequency has increased dramatically in thepast few decades. Current human land‐useactivities promote forest fires by fragmenting(see Chapter 5) and degrading forests andproviding ignition sources, which wouldotherwise be rare. These three factors can actsynergistically to initiate a series of positivefeedbacks that promote the massive tropicalforest fires that have become common inrecent decades (see Box 9.1 Figure). Forestedges tend to be much more susceptible to firethan forest cores, because they tend to bemoredesiccated by wind and sun, have higher ratesof tree mortality and hence, woody fuelaccumulation and grassy fuel loads tend to behigher. The result is that fire frequency tends toincrease with proximity to a forest edge, suchthat highly fragmented forests have high firefrequencies. Forests degraded by selectivelogging are also at risk of fire due to theirreduced canopy cover, which allows the forestto become desiccated and light to penetrate
Decreased canopy cover
Increased amount of edgeIncreased desiccationIncreased tree mortalityIncreased fuel loads
Increased desiccationIncreased grassy fuels
LoggingDeforestation
Forest degradation
Forest fire
DroughtClimate change
Fragmentation
Box 9.1 Figure The synergistic effects of habitat fragmentationand degradation on the occurrence of tropical forest fires. Adaptedfrom Cochrane (2003).
and encourage grass growth. The wastebiomass from logging operations can alsodramatically elevate fuel loads. Similarly,forests degraded by an initial fire tend to bemore susceptible to repeat fires, furtherenhancing the feedback loop.The negative impacts of frequent, intense
fires on tropical forest biodiversity are likely tobe enormous, given the existing threats posedby the direct effects of deforestation (Chapter4) and overharvesting (Chapter 6). Intense fireseasily kill a large proportion of tropical foresttree species, and repeated fires can beespecially detrimental to species regeneratingvegetatively or from seed. Generally, repeatedfires lead to a loss of primary forest tree species,with these replaced by an impoverished set ofpioneer species (Barlow and Peres 2008). Theeffects of fire on forest animals are less well
continues
FIRE AND BIODIVERSITY 167
© Oxford University Press 2010. All rights reserved. For permissions please email: [email protected]
1
vegetation patterns. Bond et al. (2005) found thata world without fire had very different vegetationzones compared with the actual vegetation geog-raphy. For example, when fire was “switchedoff”, dense (>80%) tree cover increased from27% to 56% of the vegetated Earth surface andmore than half (52%) of the current global distri-bution of tropical savannas were transformed toangiosperm-dominated forests. The core messageof this analysis is that fire causes the “decou-pling” of vegetation patterns from climate.
Arguably the most well known decoupling ofvegetation and climate concerns the geographicdistribution of forest and savanna. Savannas areamong the most fire-prone biomes on Earth, andare characterized by varying mixtures of both treeand grass biomass. The question of how both trees
and grasses can coexist in the long-term has longpuzzled savanna ecologists. Conventional ecolog-ical theory of plant succession suggests that highlyproductive savannas are unstable and shouldgradually progress toward closed canopy forest.While it seems that in less productive savannas,such as in low rainfall areas, tree biomass is indeedconstrained by the limitation of resources, such aswater, recent research suggests that in more pro-ductive savannas, recurrent disturbance plays animportant role in maintaining a tree–grass balance(Sankaran et al. 2005). Given the high flammabilityof savannas, it seems that disturbance due to fire isof particular importance.
The most widely accepted explanation of howfrequent fires limit tree biomass in savannas as-sumes that a “tree demographic-bottleneck”
Box 9.1 (Continued)
understood, although studies following the1997–1998 Indonesian fires suggest severeimpacts on many groups, especially thosereliant on fruit‐trees and arthropodcommunities in leaf litter (Kinnaird and O’Brien1998). On Borneo, endangered orangutan(Pongo pygmaeus) populations suffereddeclines of around 33% following the1997–1998 fires (Rijksen and Meijaard 1999).In many tropical regions, climate change is
expected to exacerbate forest fires. There isevidence that extreme weather events, such asthe ENSO droughts that triggered the 1997–1998 Indonesian fires, and tropical storms, maybecome more frequent (Timmermann et al.1999; Mann and Emanuel 2006). Additionally,we can expect strong positive feedbacksbetween forest fire occurrence and climatechange, because tropical forest fires result inenormous additions of greenhouse gases to theatmosphere, leading to even more rapidclimate change. For example, the 1997–1998Indonesian fires released 0.8‐2.6 Gt of carbon tothe atmosphere, equivalent to 13–40% ofglobal emissions due to burning fossil fuels,making a large contribution to the largestrecorded annual increase in atmospheric CO2
concentration (Page et al. 2002).
REFERENCES
Barlow, J. and Peres, C. A. (2008). Fire‐mediated diebackand compositional cascade in an Amazonian forest.Philosophical Transactions of the Royal Society ofLondon B, 363, 1787–1794.
Cochrane, M. A. (2003). Fire science for rainforests.Nature, 421, 913–919.
Kinnaird, M. F. and O’Brien, T. G. (1998). Ecological effectsofwildfire on lowland rainforest in Sumatra.ConservationBiology, 12, 954–956.
Rijksen, H. D. and Meijaard, E. (1999). Our vanishing rela-tive: the status of wild orang‐utans at the close of thetwentieth century. Tropenbos Publications, Wagenin-gen, the Netherlands.
Mann, M. E. and Emanuel, K. A. (2006). Atlantic hurricanetrends linked to climate change. Eos, Transactions of theAmerican Geophysical Union, 87, doi:10.1029/2006EO240001.
Page, S. E., Siegert, F., Rieley, J. O., Boehm, H. D. V., Jaya,A., and Limin, S. (2002). The amount of carbon releasedfrom peat and forest fires in Indonesia during 1997.Nature, 420, 61–65.
Timmermann, A., Oberhuber, J., Bacher, A., Esch,M., Latif, M., and Roeckner, E. (1999). IncreasedEl Niño frequency in a climate model forcedby future greenhouse warming. Nature,398, 694–697.
168 CONSERVATION BIOLOGY FOR ALL
© Oxford University Press 2010. All rights reserved. For permissions please email: [email protected]
Sodhi and Ehrlich: Conservation Biology for All. http://ukcatalogue.oup.com/product/9780199554249.do

occurs. It is accepted that fire frequency controlsthe recruitment of savanna trees, particularly thegrowth of saplings into the tree layer. Unlikemature trees, saplings are too short in stature toavoid fire-damage and unlike juveniles, if theyare damaged they cannot rapidly return to theirprevious size from root stocks (Hoffman andSolbrig 2003). Thus saplings must have the abili-ty to tolerate recurrent disturbance until theyhave sufficient reserves to escape through a dis-turbance-free “recruitment window” into thecanopy layer where they suffer less fire damage.Recurrent disturbance by fire can stop savannatree populations from attaining maximal treebiomass by creating bottlenecks in the transitionof the relatively fire-sensitive sapling stage to thefire tolerant tree stage (Sankaran et al. 2004). Inthe extreme case, a sufficient frequency of burn-ing can result in the loss of all trees and thecomplete dominance of grass. Conversely, fireprotection can ultimately result in the recruit-ment of sufficient saplings to result in a closedcanopy forest.
Large herbivores may also interact with fireactivity because high levels of grazing typicallyreduce fire frequency, and this can enable woody
plants to escape the “fire trap”, and increase indominance (Sankaran et al. 2004; Werner 2005).For example, extensive woody plant encroach-ment has occurred in mesic grassland and savan-na in Queensland, Australia, and has beenattributed to cattle grazing and changed fire re-gimes (Crowley and Garnett 1998). This trend canbe reversed by reduced herbivory coupled withsustained burning—a methodology used by pas-toralists to eliminate so called “woody weeds”from overgrazed savannas. Bond and Archibald(2003) suggest that in southern African savannasthere is a complex interplay between fire frequen-cy and herbivory. Heavily grazed savannassupport short grass “lawns”, dominated byspecies in the sub-family Chloridioideae, whichdo not burn. These lawns support a diversity oflarge grazers including white rhino (Ceratother-ium simum), wildebeest (Connochaetes spp.), impa-la (Aepyceros melampus), warthog (Phacochoerusafricanus), and zebra (Equus spp.) (Figure 9.4).Under less intense grazing, these lawns canswitch to supporting bunch grass, in the sub-family Andropogoneae, which support a less di-verse mammal assemblage adapted to gazing tallgrasses, such as African buffalo (Syncerus caffer).
Figure 9.4 Zebra and wildebeest grazing on a ‘lawn’ in a humid savanna in Hluhluwe‐Umfolozi Park, South Africa. Bond and Archibald (2003)suggest that intense grazing by African mammals may render savannas less flammable by creating mosaics of lawns that increase the diversity of thelarge mammal assemblage. Large frequent fires are thought to switch the savannas to more flammable, tall grasses with a lower diversity of largemammals. Photograph by David Bowman. See similar Figure 4.6.
FIRE AND BIODIVERSITY 169
© Oxford University Press 2010. All rights reserved. For permissions please email: [email protected]
1

The high biomass of the bunch grasslands renderthese systems highly flammable. Bond and Archi-bald (2003) propose a model where frequent largefires can result in a loss of lawns from a landscapewith corresponding declines in mammal diversi-ty. The mechanism for this is that resprouting bygrasses following fire causes a lowering in overallgrazing pressure across the landscape. Fully un-derstanding the drivers of the expansion ofwoody vegetation into rangelands, including therole of fire and herbivory, remains a major eco-logical challenge (see http://ag.arizonal.edu/re-search/archer/research/biblio1.html).
How savanna vegetation evolved is unclear.Some authors suggest that falling atmospheric car-bon dioxide (CO2) concentrationsmay have stimu-lated the development of grasses that nowdominate tropical savannas (Bond et al. 2003).Tropical savanna grasses have the C4 photosyn-thetic pathway that is highly productive in hot,wet climates, and under low CO2 concentrationsthese grasses have a physiological advantage overwoody vegetation that has the C3 photosyntheticpathway. The production of large quantities offine and well-aerated fuels may have greatlyincreased the frequency of landscape fire disad-vantaging woody plants and promoting furthergrassland expansion. The development of mon-soon climates might have also been as importanta driver as low atmospheric concentrations of CO2
(Keeley and Rundel 2003). The monsoon climate isparticularly fire-prone because of the characteristicalternation of wet and dry seasons. Thewet seasonallows rapid accumulation of grass fuels, while thedry season allows these fuels to dry out and be-come highly flammable. Furthermore, the dry sea-son tends to be concluded by intense convectivestorm activity that produces high densities oflightning strikes (Bowman 2005).
9.5 Humans and their use of fire
Our ancestors evolved in tropical savannas andthis probably contributed to our own species’mas-tery of fire. Indeed, humans can be truly describedas a fire keystone species given our dependence onfire; there is no known culture that does not rou-
tinely use fire. For example, the Tasmanian Abor-igines always carried fire with them, as it was anindispensable tool to survive the cold wet environ-ment (Bowman 1998). The expansion of humansthroughout the world must have significantlychanged the pattern of landscape burning by eitherintentionally setting fire to forests to clear them oraccidentally starting fires. How prehistoric humanfire usage changed landscape fire activity and eco-system processes remains controversial and thisissue has become entangled in a larger debateabout the relative importance of humans vs. cli-mate change in driving the late Pleistocene mega-faunal extinctions (Barnosky et al. 2004; Burney andFlannery 2005). Central to this debate is theAborig-inal colonization of Australia that occurred some40 000 years ago. Some researchers believe thathuman colonization caused such substantialchanges tofire regimes and vegetation distributionpatterns that the marsupial megafauna weredriven to extinction. This idea has recently beensupported by the analysis of stable carbon isotopes(d13C) in fossil eggshells of emus and the extinctgiant flightless bird Genyornis newtoni in the LakeEyre Basin of central Australia. Miller et al. (2005a)interpreted these results as indicating that sus-tained Aboriginal landscape burning during colo-nization in the late Pleistocene caused thetransformation of the central Australian landscapefrom a drought-adapted mosaic of trees, shrubs,and nutritious grasslands to the modern fire-adapted desert scrub. Further, climate modelingsuggests that the switch from high to low leaf-area-index vegetation may explain the weak pene-tration of the Australian summer monsoon in thepresent, relative to previous periods with similarclimates (known as “interglacials”) (Miller et al.2005b).
Yet despite the above evidence for catastrophicimpacts following human colonization of Austra-lia, it is widely accepted that at the time of Euro-pean colonization Aboriginal fire managementwas skilful and maintained stable vegetation pat-terns (Bowman 1998). For example, recent studiesin the savannas of Arnhem Land, northern Aus-tralia, show that areas under Aboriginal firemanagement are burnt in patches to increase kan-garoo densities (Figure 9.5; Murphy and Bowman
170 CONSERVATION BIOLOGY FOR ALL
© Oxford University Press 2010. All rights reserved. For permissions please email: [email protected]
Sodhi and Ehrlich: Conservation Biology for All. http://ukcatalogue.oup.com/product/9780199554249.do

2007). Further, there is evidence that the cessationof Aboriginal fire management in the savannashas resulted in an increase in flammable grassbiomass and associated high levels of fire activityconsistent with a “grass–fire cycle” (see Box 9.2).It is unrealistic to assume that there should onlybe one uniform ecological impact from indige-nous fire usage. Clearly working out how indige-nous people have influenced landscapes
demands numerous studies, in order to detectlocal-scale effects and understand the underlying“logic” of their landscape burning practices (e.g.Murphy and Bowman 2007). Also of prime im-portance is study of the consequences of prehis-toric human colonization of islands such as NewZealand. In this case, there is clear evidence ofdramatic loss of forest cover and replacementwith grasslands (McGlone 2001).
Box 9.2 The grass–fire cycleDavid M. J. S. Bowman and Brett P. Murphy
D’Antonio and Vitousek (1992) described afeedback between fire and invasive grassesthat has the capacity to radically transformwoodland ecosystems, a process they describedas the “grass–fire cycle”. The cycle begins withinvasive grasses establishing in nativevegetation, increasing the abundance ofquick‐drying and well‐aerated fine fuels thatpromote frequent, intense fires. While theinvasive grasses recover rapidly from these firesvia regeneration from underground buds orseeds, woody plants tend to decrease inabundance. In turn, this increases theabundance of the invasive grasses, furtherincreasing fire frequency and intensity. The lossof woody biomass can also result in driermicroclimates, further adding momentum tothe grass–fire cycle. Eventually the grass–firecycle can convert a diverse habitat with manydifferent species to grassland dominated by afew exotics.The consequences of a grass–fire cycle for
ecosystem function can be enormous. Theincrease in fire frequency and intensity canresult in massive losses of carbon, both directly,via combustion of live and dead biomass, andindirectly, via the death of woody plants andtheir subsequent decomposition orcombustion. For example, invasion ofcheatgrass (Bromus tectorum) in the GreatBasin of the United States and theestablishment of a grass–fire cycle has led to aloss of 8 Mt of carbon to the atmosphere and islikely to result in a further 50 Mt loss in comingdecades (Bradley et al. 2006). During fires,nitrogen is also volatilized and lost in smoke,
while other nutrients, such as phosphorus, aremade more chemically mobile and thussusceptible to leaching. Thus, nutrient cyclesare disrupted, with a consequent decline inoverall stored nutrients for plants. This changecan further reinforce the grass–fire cyclebecause the fire‐loving grasses thrive on thetemporary increase in the availability ofnutrients.
An example of an emerging grass–fire cycle isprovided by the tropical savannas of northernAustralia, where a number of African grassescontinue to be deliberately spread as improvedpasture for cattle. Most notably, gamba grass(Andropogon gayanus) rapidly invades savannavegetation, resulting in fuel loads more thanfour times that observed in non‐invadedsavannas (Rossiter et al. 2003). Such fuel loadsallow extremely intense savanna fires, resultingin rapid reductions in tree biomass (see Box 9.2Figure). The conversion of a savanna woodland,with a diverse assemblage of native grasses, toa grassland monoculture is likely to haveenormous impacts on savanna biodiversity asgamba grass becomes established over largetracts of northern Australia. Despite the widelyacknowledged threat posed by gamba grass, itis still actively planted as a pasture species inmany areas. Preventing further spread ofgamba grass must be a management priority,given that, once established, reversing a grassfire–cycle is extraordinarily difficult. This isbecause woody juveniles have little chance ofreaching maturity given the high frequency ofintense fires and intense competition fromgrasses.
continues
FIRE AND BIODIVERSITY 171
© Oxford University Press 2010. All rights reserved. For permissions please email: [email protected]
1

Agricultural expansion is often enabled byusing fire as a tool to clear forests, a pattern thathas occurred since the rise of civilization. Current-ly, this process is occurringmost in the tropics. Thefire-driven destruction of forests has been studiedin close detail in the Amazon Basin, and is char-
acterized by an ensemble of positive feedbacksgreatly increasing the risk of fires above theextremely low background rate (Cochrane et al.1999; Cochrane 2003; see Box 9.1). Recurrent burn-ing can therefore trigger a landscape-level trans-formation of tropical rainforests into flammable
Box 9.2 (Continued)
Box 9.2 Figure An example of a grass‐fire cycle becomingestablished in northern Australian savannas. African gamba grass ishighly invasive and promotes enormously elevated fuel loads andhigh intensity fires, resulting in a rapid decline in woody species.Photograph by Samantha Setterfield.
REFERENCES
Bradley, B. A., Houghtonw, R. A., Mustard, J. F.,and Hamburg, S. P. (2006). Invasive grassreduces aboveground carbon stocks in shrublandsof the Western US. Global Change Biology, 12,1815–1822.
D’Antonio, C. M. and Vitousek, P. M. (1992). Biologicalinvasions by exotic grasses, the grass/fire cycle, andglobal change. Annual Review of Ecology and System-atics, 23, 63–87.
Rossiter, N. A., Setterfield, S. A., Douglas, M. M.,and Hutley, L. B. (2003). Testing the grass‐firecycle: alien grass invasion in the tropical savannasof northern Australia. Diversity and Distributions,9, 169–176.
Figure 9.5 Traditional land management using fire is still practiced by indigenous people in many parts of northern and central Australia. Recentwork in Arnhem Land suggests that skilful fire management results in a fine‐scale mosaic of burnt patches of varying age, which is thought tobe critically important for maintaining populations of many small mammals and granivorous birds. Photograph by Brett Murphy.
172 CONSERVATION BIOLOGY FOR ALL
© Oxford University Press 2010. All rights reserved. For permissions please email: [email protected]
Sodhi and Ehrlich: Conservation Biology for All. http://ukcatalogue.oup.com/product/9780199554249.do

scrub and savanna, exacerbated by the establish-ment of a “grass–fire cycle” (see Box 9.2).
9.6 Fire and the maintenanceof biodiversity
9.6.1 Fire-reliant and fire-sensitive species
Many species in fire-prone landscapes are notonly fire tolerant, but depend on fire to completetheir life-cycles and to retain a competitive edgein their environment. Such species typicallybenefit from the conditions that prevail follow-ing a fire, such as increased resource availabilityassociated with the destruction of both livingand dead biomass, nutrient-rich ash, and high
light conditions (see Box 9.3). For example, fireis critically important for the regeneration ofmany plant species of the fire-prone heath com-munities typical of the world’s Mediterraneanclimates (e.g. South African fynbos, southwest-ern Australian kwongan, Californian chaparral).Many species in these communities have deeplydormant seeds that only germinate followingfire, when normally limited resources, such aslight and nutrients, are abundant. Many hard-seeded heath species, especially Acacia speciesand other legumes, are stimulated to germinateby heat, while many others are stimulated bychemicals in smoke (Bell et al. 1993; Brown1993). Other species in these communities typi-cally only flower following a fire (e.g. Denhamand Whelan 2000).
Box 9.3 Australia’s giant fireweedsDavid M.J.S Bowman and Brett P. Murphy
Australian botanists have been remarkablyunsuccessful in reaching agreement as to whatconstitutes an Australian rainforest (Bowman2000). The root of this definitional problem lieswith the refusal to use the term “rainforest” inthe literal sense, which would involve includingthe tall eucalypt forests that occur in Australia’shigh rainfall zones (see Box 9.3 Figure). This isdespite the fact that the originator of the term,German botanist Schimper, explicitly includedeucalypts in his conception of rainforest. Thereason why eucalypt forests are excluded fromthe term “rainforest” by Australians is thatthese forests require fire disturbance toregenerate, in contrast to true rainforests thatare comparatively fire‐sensitive. Typically,infrequent very intense fires kill all individualeucalypts, allowing prolific regeneration fromseed to occur, facilitated by the removal of thecanopy and creation of a nutrient‐rich bed ofash. Without fire, regeneration from seed doesnot occur, resulting in very even‐aged stands ofmature eucalypts.The gigantic (50–90 m tall) karri (Eucalyptus
diversicolor) forests of southwestern Australiaunderscore the complexity of the term
“rainforest” in Australia. These forests grow ina relatively high rainfall environment (>1100mm per annum) with a limited summerdrought of less than three months duration.Elsewhere in Australia, such a climatewould support rainforest if protected fromfire. However, in southwestern Australiathere are no continuously regeneratingand fire intolerant rainforest species tocompete with karri, although geologicaland biogeographic evidence point to theexistence of rainforest in the distant past.The cause of this disappearance appearsto be Tertiary aridification and theaccompanying increased occurrence oflandscape fire. For example, a pollen corefrom 200 km north of Perth shows that by2.5 million years ago the modern characterof the vegetation, including charcoalevidence of recurrent landscape fires,had established in this region, althoughsome rainforest pollen (such as Nothofagusand Phyllocladus) indicates thatrainforest pockets persisted in thelandscape at this time (Dodson andRamrath 2001).
continues
FIRE AND BIODIVERSITY 173
© Oxford University Press 2010. All rights reserved. For permissions please email: [email protected]
1

Even within fire-prone landscapes, there maybe species and indeed whole communities thatare fire-sensitive. Typically these occur in partsof the landscape where fire frequency or severityis low, possibly due to topographic protection.For example, when fire sensitive rainforest com-munities occur within a flammable matrix ofgrassland and savanna, as throughout much ofthe tropics, they are often associated with rockygorges, incised gullies (often called “gallery for-
ests”), and slopes on the lee-side of “fire-bearing”winds (Bowman 2000). Several factors lead to thisassociation: fires burn more intensely up hill, es-pecially if driven by wind; rocks tend to limit theamount of grassy fuel that can accumulate; deepgorges are more humid, reducing the flammabili-ty of fuels; and high soil moisture may lead tohigher growth rates of the canopy trees, increas-ing their chances of reaching maturity, or a fire-resistant size, between fires.
Box 9.3 (Continued)
The gigantic size of karri and a regenerationstrategy dependent upon fire disturbance,including mass shedding of tiny seeds with
Box 9.3 Figure Giant Eucalyptus regnans tree in southern Tasmania.The life‐cycle of these trees depends upon infrequent fire to enableseedling establishment. Without fire a dense temperate Nothofagusrainforest develops because of the higher tolerance of rainforestseedlings to low light conditions. Photograph by David Bowman.
limited reserves onto ashbeds, suggestsconvergent evolution with other, distantlyrelated, eucalypts such as mountain ash(E. regnans) in southeastern Australianand E. grandis in northeastern and easternAustralia. Such convergence suggests thatall have been exposed to similar naturalselection pressures and have evolved tocompete with rainforest species by usingfire as an agent of inter‐specific competition(e.g. Bond and Midgley 1995). Theextraordinary diversity of the genus Eucalyptusand convergent evolution of traits suchas gigantism in different lineages in thisclade, and similar patterns of diversificationin numerous other taxonomic groups, leadsto the inescapable conclusion that fire hadbeen an integral part of the Australianenvironment for millions of years beforehuman colonization. Aborigines, therefore,learnt to live with an inherently flammableenvironment.
REFERENCES
Bowman, D. M. J. S. (2000). Australian rainforests: islandsof green in a sea of fire. Cambridge University Press,Cambridge, UK.
Bond, W. J. and Midgley, J. J. (1995). Kill thy neighbor—anindividualistic argument for the evolution of flammability.Oikos, 73, 79–85.
Dodson, J. R. and Ramrath, A. (2001). An Upper Pliocenelacustrine environmental record from south‐WesternAustralia—preliminary results. PalaeogeographyPalaeoclimatology Palaeoecology, 167, 309–320.
174 CONSERVATION BIOLOGY FOR ALL
© Oxford University Press 2010. All rights reserved. For permissions please email: [email protected]
Sodhi and Ehrlich: Conservation Biology for All. http://ukcatalogue.oup.com/product/9780199554249.do

Somewhat counter-intuitively, many fire-sensi-tive species in fire-prone landscapes are favoredby moderate frequencies of low intensity fires,especially if they are patchy. Such fires greatlyreduce fuel loads and thus the likelihood oflarge, intense fires. In addition, because low in-tensity fires are typically more patchy than highintensity fires, they tend to leave populations offire-sensitive species undamaged providing aseed source for regeneration. Such an example isprovided by the decline of the fire-sensitive en-demic Tasmanian conifer King Billy pine (Athro-taxis selaginoides) following the cessation ofAboriginal landscape burning (Brown 1988;http://www.anbg.gov.au/fire ecology/fire-and-biodiversity.html). The relatively high frequency oflow-intensity fires under the Aboriginal regime ap-pears to have limited the occurrence of spatiallyextensive, high intensity fires. Under the Europeanregime, no deliberate burning took place, so thatwhen wildfires inevitably occurred, often startedby lightning, they were large, intense, and rapidlydestroyedvast tracts ofKingBilly pine.Over the lastcentury, about 30% of the total coverage of KingBilly pine has been lost.
A similar situation has resulted in the decline ofthe cypress pine (Callitris intratropica) in northernAustralian savannas (Bowman and Panton 1993).Cypress pine is a fire-sensitive conifer foundacross much of tropical Australia. Mature treeshave thick bark and can survive mild but notintense fires, and if stems are killed it has verylimited vegetative recovery. Seedlings cannot sur-vive even the coolest fires. Thus, it is aptly de-scribed as an “obligate seeder”. Populations ofcypress pine can survive mild fires occurringevery 2–8 years, but not frequent or more intensefires because of the delay in seedlings reachingmaturity and the cumulative damage of fires toadults. Cessation of Aboriginal land managementhas led to a decline of cypress pine in much of itsformer range, and it currently persists only in rain-forest margins and savanna micro-sites such as inrocky crevasses or among boulders or drainagelines that protect seedlings from fire (Figure 9.6).Fire sensitive species such as King Billy pine andcypress pine are powerful bio-indicators of alteredfire regimes because changes in their distribution,
density, and stand structure signal departure fromhistorical fire regimes.
9.6.2 Fire and habitat complexity
A complex fire regime can create habitat com-plexity for wildlife by establishing mosaics ofdifferent patch size of regenerating vegetationfollowing fires. Such habitat complexity providesa diversity of microclimates, resources, and shel-ter from predators. It is widely believed that thecatastrophic decline of mammal species in centralAustralia, where clearing of native vegetation foragriculture has not occurred, is a direct conse-quence of the homogenization of fine-scale habi-tat mosaics created by Aboriginal landscapeburning. This interpretation has been supportedby analysis of “fire scars” from historical aerialphotography and satellite imagery. For example,Burrows and Christensen (1991) compared firescars present in Australia’s Western Desert in1953, when traditional Aboriginal people still oc-cupied the region, with those present in 1986,when the area had become depopulated of its
Figure 9.6 Recently killed individuals of cypress pine (Callitrisintratopica), a conifer that is an obligate seeder. Changes in fire regimefollowing the breakdown of traditional Aboriginal fire managementhave seen a population crash of this species throughout its range innorthern Australia. Photograph by David Bowman.
FIRE AND BIODIVERSITY 175
© Oxford University Press 2010. All rights reserved. For permissions please email: [email protected]
1

original inhabitants. In 1953, the study areacontained 372 fire scars with a mean area of 34ha, while in 1986, the same area contained a sin-gle fire scar, covering an area of 32 000 ha. Clear-ly, the present regime of large, intense andinfrequent fires associated with lightning strikeshas obliterated the fine-grained mosaic of burntpatches of varying ages that Aboriginal peoplehad once maintained (Burrows et al. 2006). Thecessation of Aboriginal landscape burning in cen-tral Australia has been linked to the range con-traction of some mammals such as the rufoushare-wallaby (Lagorchestes hirsutus) (Lundie-jen-kins 1993). Recent research in northern Austra-lia’s tropical savannas, where small mammalsand granivorous birds are in decline, also pointsto the importance of unfavorable fire regimes thatfollowed European colonization (Woinarski et al.2001). A prime example is the decline of the par-tridge pigeon (Geophaps smithii). This bird is par-ticularly vulnerable to changes in fire regimebecause it is feeds and nests on the ground andhas territories of less than 10 ha. Their preferredhabitat is a fine-grained mosaic of burnt and un-burnt savanna, where it feeds on seeds on burntground but nests and roosts in unburnt areas(Fraser et al. 2003). Aboriginal landscape burninghas been shown to produce such a fine-grainedmosaic (Bowman et al. 2004).
9.6.3 Managing fire regimes for biodiversity
The contrasting requirements of different speciesand communities within fire-prone landscapeshighlights the difficulties faced by those manag-ing fire regimes for biodiversity conservation.How does one manage for fire-reliant and fire-sensitive species at the same time? Lessons canclearly be learnt from traditional hunter-gatherersocieties that extensively used, and in some casesstill use,fire as a landmanagement tool.While it isunlikely that the enormous complexity of tradi-tional fire use can ever be fully encapsulated infire regimes imposed by conservation managers,it is clear that spatial and temporal complexity ofthe regimemust bemaximized to ensure themax-imum benefits to biodiversity. Clearly, in the caseof fire regimes designed for biodiversity conser-
vation, one size can’t fit all. The quest for sustain-able fire regimes demands trialing approachesand monitoring outcomes while balancing biodi-versity outcomes against other priorities such asprotection of life and property. This quest forcontinuous improvement in land managementhas been formalized in a process known as “adap-tive management”. This iterative process is mostapplicable when faced with high levels of uncer-tainty, and involves continually monitoring andevaluating the outcomes of management actions,and modifying subsequent actions accordingly.
9.7 Climate change and fire regimes
There is mounting concern that the frequency andintensity of wildfires may increase in response toglobal climate change (see Chapter 8), due to thegreater incidence of extreme fire weather. Whilethe effect is likely to vary substantially on a globalscale, regions that are likely to experience sub-stantial increases in temperature and reductionsin rainfall are also likely to experience moreextreme fire weather. Indeed, such a trend isalready apparent in southeastern Australia(Lucas et al. 2007) and the western United States(Westerling et al. 2006).
In addition to the effects of climate change, anincrease in atmospheric CO2 concentration is like-ly to affect the abundance and composition of fuelloads, and hence the frequency and intensity offires. Elevated CO2 concentration is likely to in-crease plant productivity, especially that of spe-cies utilizing the C3 photosynthetic pathway(mainly woody plants and temperate grasses),such that there have been suggestions that fuelproduction will increase in the future (Ziska et al.2005). Further, elevated CO2 concentration maylower the nitrogen content of foliage, slow-ing decomposition and resulting in heavier fuelbuild up (Walker 1991). However, to state that anincrease in CO2 concentration will increase fuelloads, and hence fire frequency and intensity, islikely to be a gross over-generalization; the effectsof elevated CO2 are in fact likely to vary substan-tially between biomes. For example, in tropicalsavannas, it is likely that increases in CO2
176 CONSERVATION BIOLOGY FOR ALL
© Oxford University Press 2010. All rights reserved. For permissions please email: [email protected]
Sodhi and Ehrlich: Conservation Biology for All. http://ukcatalogue.oup.com/product/9780199554249.do

concentration will strongly favor woody plants,especially trees, at the expense of grasses andother herbaceous plants (Bond and Midgley2000). A shift from highly flammable grassyfuels to fuels based on woody plants is likely toreduce fire frequency and intensity in savannas.Indeed, Bond and Archibald (2003) have arguedthat managers should consider increasing fire fre-quencies to counteract the increase in growthrates of savanna trees that would result in highertree densities due to a weakening of the “treedemographic bottle-neck”. In contrast, in morearid biomes where fire occurrence is strongly lim-ited by antecedent rainfall (Allan and Southgate2002), an increase in productivity is indeed likelyto increase the frequency with which fires canoccur with a corresponding decrease in woodycover.
Climate change is set to make fire managementeven more complicated, given that climatechange simultaneously changes fire risk, ecosys-tem function, and the habitat template for mostorganisms, including invasive species. A recentreport by Dunlop and Brown (2008) discussingthe impact of climate change on nature reservesin Australia succinctly summarizes the problemconservation biologists now face. They write:
“The question is how should we respond tothe changing fire regimes? Efforts to main-tain ‘historic’ fire regimes through hazardreduction burning and vigorous fire sup-pression may be resource intensive, of limit-ed success, and have a greater impact onbiodiversity than natural changes in re-gimes. It might therefore be more effectiveto allow change and manage the conse-quences. The challenge is to find a way todo this while ensuring some suitable habitatis available for sensitive species, and simul-taneously managing the threat to urbanareas, infrastructure, and public safety.”
Again this demands an adaptive managementapproach, the key ingredients of which include: (i)clear stated objectives; (ii) comprehensive firemapping programs to track fire activity across thelandscape; (iii) monitoring the population of biodi-versity indicator species and/or condition and
extent of habitats; and (iv) rigorous evaluation ofthe costs and benefits ofmanagement interventions.
An important concept is “thresholds of potentialconcern” which predefines acceptable changes inthe landscape in response to different fire regimes(Bond and Archibald 2003). Bradstock and Kenny(2003) provided an example of this approach forassessing the effect of inter-fire interval on speciesdiverse scherophyll vegetation in the Sydney re-gion of southeastern Australia. This vegetationsupports a suite of species that are obligate seederswhose survival is held in a delicate balance by fire-frequency. Fire intervals that are shorter than thetime required formaturation of plant species resultin local extinction because of the absence of seedswhile longer fire intervals also ultimately result inregeneration failure because adults die and seed-banks become exhausted. Bradstock and Kenny(2003) found that to sustain the biodiversity ofsclerophyll vegetation, fire intervals between 7and 30 years are required. Monitoring is requiredto ensure that the majority of the landscape doesnot move outside these “thresholds of potentialconcern”.
Fire management is set to remain a thorny issuefor conservation biologists given the need to devisefire regimes to achieve multiple outcomes that onthe one hand protect life and property and on theother maintain biodiversity and ecosystem ser-vices. The accelerating pace of global environmen-tal change, of which climate change is but onecomponent, makes the quest for sustainable firemanagement bothmore critical andmore complex.The current quest for ecologically sustainable firemanagement can draw inspiration from indige-nous societies that learnt to coexist with fire tocreate ecologically sustainable and biodiverselandscapes (also see Box 1.1). Modern solutionswill undoubtedly be science based and use space-age technologies such as satellites, global position-ing systems, computer models and the web.
Summary
· TheEarth has a longhistory of landscapefire given:(i) the evolution of terrestrial carbon based vegetation;(ii) levels of atmospheric oxygen that are sufficient to
FIRE AND BIODIVERSITY 177
© Oxford University Press 2010. All rights reserved. For permissions please email: [email protected]
1

support the combustion of both living and dead or-ganic material; and (iii) abundant and widespreadignitions from lightning, volcanoes and humans.
· There is a clear geographic pattern of fire activityacross the planet reflecting the combined effects ofclimate, vegetation type and human activities. Mostfire activity is concentrated in the tropical savannabiome.
· Fire activity shows distinct spatial and temporalpatterns that collectively can be grouped into “fireregimes”. Species show preferences for different fireregimes and an abrupt switch in fire regime canhave a deleterious effect on species and in extremesituations, entire ecosystems. A classic example ofthis is the establishment of invasive grasses, whichdramatically increase fire frequency and intensitywith a cascade of negative ecological consequences.
· Climate change presents a new level of complexityfor fire management and biodiversity conservationbecause of abrupt changes in fire risk due to climatechange and simultaneous stress on species. Further,elevated atmospheric CO2 concentration may resultin changes in growth and fuel production due tochanges in growth patterns, water use efficiencyand allocation of nutrients.
· Numerous research challenges remain in under-standing the ecology and evolution of fire including:(i) whether flammability changes in response to nat-ural selection; (ii) how life-history traits of bothplants and animals are shaped by fire regimes; and(iii) how to manage landscape fire in order to con-serve biodiversity.
Suggested reading
· Bond, W. J. and Van Wilgen, B. W. (1996). Fire andplants. Chapman and Hall, London, UK.
· Bowman, D. M. J. S. (2000). Australian rainforests: islandsof green in a land of fire. Cambridge University Press,Cambridge, UK.
· Flannery, T. F. (1994). The future eaters: an ecologicalhistory of the Australasian lands and people. Reed Books,Chatswood, New South Wales, Australia.
· Whelan, R. J. (1995). The ecology of fire. Cambridge Uni-versity Press, Melbourne, Australia.
· Gill, A. M., Bradstock, R. A., and Williams, J. E. (2002).Flammable Australia: the fire regimes and biodiversity of acontinent. Cambridge University Press, Cambridge, UK.
· Pyne, S. J. (2001). Fire: a brief history. University of Wa-shington Press, Seattle.
Relevant websites
· Online journal of the Association for Fire Ecology:http://www.firecology.net.
· International Journal of Wildland Fire, journal of theInternational Association of Wildland Fire: http://www.iawfonline.org.
· North Australian Fire Information: http://www.fire-north.org.au.
· Forest Fire Danger Meter: http://www.cfa4wd.org/information/Forest_FDI.htm.
· Proliferation of woody plants in grasslands and savan-nas – a bibliography: http://ag.arizonal.edu/research/archer/research/biblio1.html.
· How fires affect biodiversity: http://www.anbg.gov.au/fire_ecology/fire-and-biodiversity.html.
· Kavli Institute of Theoretical Physics Miniconference:Pyrogeography and Climate Change (May 27–30,2008): http://online.itp.ucsb.edu/online/pyrogeo_c08.
Acknowledgements
The Kavli Institute for Theoretical Physics Mini-conference: Pyrogeography and Climate Change meeting(http://online.itp.ucsb.edu/online/pyrogeo_c08) helped usorganize our thinking. We thank the co-convener of thatmeeting, Jennifer Balch, for commenting on this chapter.An Australian Research Council grant (DP0878177) sup-ported this work.
REFERENCES
Allan, G. E. and Southgate, R. I. (2002). Fire regimes in thespinifex landscapes of Australia. In R. A. Bradstock, J. E.Williams, andM. A. Gill, eds Flammable Australia: the FireRegimes and Biodiversity of a Continent, pp. 145–176. Cam-bridge University Press, Cambridge, UK.
Barnosky, A. D., Koch, P. L., Feranec, R. S., Wing, S. L., andShabel, A. B. (2004). Assessing the causes of Late Pleisto-cene extinctions on the continents. Science, 306, 70–75.
Bell, D. T., Plummer, J. A., and Taylor, S. K. (1993). Seedgermination ecology in southwestern Western Australia.Botanical Review, 59, 24–73.
178 CONSERVATION BIOLOGY FOR ALL
© Oxford University Press 2010. All rights reserved. For permissions please email: [email protected]
Sodhi and Ehrlich: Conservation Biology for All. http://ukcatalogue.oup.com/product/9780199554249.do

Bond, W. J. and Archibald, S. (2003). Confronting complex-ity: fire policy choices in South African savanna parks.International Journal of Wildland Fire, 12, 381–389.
Bond, W. J. and Keeley, J. E. (2005). Fire as a global ‘herbi-vore’: the ecology and evolution of flammable ecosys-tems. Trends in Ecology and Evolution, 20, 387–394.
Bond, W. J. and Midgley, J. J. (1995). Kill thy neighbor—anindividualistic argument for the evolution of flammabil-ity. Oikos, 73, 79–85.
Bond, W. J. and Midgley, G. F. (2000). A proposed CO2-controlled mechanism of woody plant invasion in grass-lands and savannas. Global Change Biology, 6, 865–869.
Bond, W. J, and Van Wilgen, B. W. (1996). Fire and plants.Chapman and Hall, London, UK.
Bond, W. J., Midgley, G. F., and Woodward, F. I. (2003).The importance of low atmospheric CO2 and fire inpromoting the spread of grasslands and savannas.GlobalChange Biology, 9, 973–982.
Bond, W. J., Woodward, F. I., and Midgley, G. F. (2005).The global distribution of ecosystems in a world withoutfire. New Phytologist, 165, 525–538.
Bowman, D. M. J. S. (1998). The impact of Aboriginallandscape burning on the Australian biota. New Phytolo-gist, 140, 385–410.
Bowman, D. M. J. S. (2000). Australian rainforests: islands ofgreen in a sea of fire. Cambridge University Press, Cam-bridge, UK.
Bowman, D. M. J. S. (2005). Understanding a flammableplanet—climate, fire and global vegetation patterns.NewPhytologist, 165, 341–345.
Bowman, D. M. J. S. and Panton, W. J. (1993). Decline ofCallitris intratropica Baker, R.T. and Smith, H.G. in theNorthern Territory—implications for pre-European andpost-European colonization fire regimes. Journal of Bioge-ography, 20, 373–381.
Bowman, D. M. J. S. and Yeates, D. (2006). A remarkablemoment in Australian biogeography. New Phytologist,170, 208–212.
Bowman, D. M. J. S., Walsh, A., and Prior, L. D. (2004).Landscape analysis of Aboriginal fire management inCentral Arnhem Land, north Australia. Journal of Bioge-ography, 31, 207–223.
Bradstock, R. A. and Kenny, B. J. (2003). An application ofplant functional types to fire management in a conserva-tion reserve in southeastern Australia. Journal of Vegeta-tion Science, 14, 345–354.
Brown, M. J. (1988). The distribution and conservation of KingBilly pine. Forestry Commission of Tasmania, Hobart,Tasmania, Australia.
Brown, N. A. C. (1993). Promotion of germination of fyn-bos seeds by plant-derived smoke. New Phytologist, 123,575–583.
Burney, D. A. and Flannery, T. F. (2005). Fifty millennia ofcatastrophic extinctions after human contact. Trends inEcology and Evolution, 20, 395–401.
Burrows, G. E. (2002). Epicormic strand structure in Ango-phora, Eucalyptus and Lophostemon (Myrtaceae)—im-plications for fire resistance and recovery. NewPhytologist, 153, 111–131.
Burrows, N. D. and Christensen, P. E. S. (1991). A survey ofAboriginal fire patterns in the Western Desert of Austra-lia. In S.C. Nodvin, and T.A. Waldrop, eds 1991. Fire andThe Environment: ecological and cultural perspectives,pp. 297–305. Proceedings of an International Sympo-sium; 1990 March 20–24; Gen. Tech. rep. SE-69. Ashe-ville, NC: U.S. Dept. of Agriculture, Forest Service,Southeastern Forest Experiment Station. Knoxville, TN.
Burrows, N. D., Burbidge, A. A., Fuller, P. J., and Behn,G. (2006). Evidence of altered fire regimes in the WesternDesert regime of Australia. Conservation Science WesternAustralia, 5, 272–284.
Cary, G. J., Keane, R. E., Gardner, R. H., et al. (2006).Comparison of the sensitivity of landscape-fire-succes-sional models to variation in terrain, fuel pattern, climateand weather. Landscape Ecology, 21, 121–137.
Cochrane, M. A. (2003). Fire science for rainforests. Nature,421, 913–919.
Cochrane, M. A., Alencar, A., Schulze, M. D. et al. (1999).Positive feedbacks in the fire dynamic of closed canopytropical forests. Science, 284, 1832–1835.
Crowley, G. M. and Garnett, S. T. (1998). Vegetationchanges in the grasslands and grassy woodlands ofeast-central Cape York Peninsula, Australia. Pacific Con-servation Biology, 4, 132–148.
Darwin, C. (1859, 1964). On the origin of species. HarvardUniversity Press, Cambridge, Massachusetts.
Denham, A. J. and Whelan, R. J. (2000). Reproductiveecology and breeding system of Lomatia silaifolia (Protea-ceae) following a fire. Australian Journal of Botany, 48,261–269.
Dunlop, M. and Brown, P. R. (2008). Implications of climatechange for Australia’s national reserve system: a preliminaryassessment. Australian Government, Department of Cli-mate Change, Canberra, Australia.
Fraser, F., Lawson, V., Morrison, S., Christopherson, P.,Mcgreggor, S., and Rawlinson, M. (2003). Fire manage-ment experiment for the declining partridge pigeon, Ka-kadu National Park. Environmental Management andRestoration, 4, 94–102.
Gill, A. M. (1975). Fire and the Australia flora: a review.Australian Forestry, 38, 4–25.
Hoffmann,W. A. and Solbrig, O. T. (2003). The role of topkillin the differential response of savanna woody species tofire. Forest Ecology and Management, 180, 273–286.
FIRE AND BIODIVERSITY 179
© Oxford University Press 2010. All rights reserved. For permissions please email: [email protected]
1

Johnson, E. A. and Gutsell, S. L. (1994). Fire frequencymodels, methods and interpretations.Advances in Ecolog-ical Research, 25, 239–287.
Justice, C. O., Smith, R., Gill, A. M., and Csiszar, I. (2003). Areview of current space-based fire monitoring inAustraliaand the GOFC/GOLD program for international coordi-nation. International Journal of Wildland Fire, 12, 247–258.
Keeley, J. E. and Rundel, P. W. (2003). Evolution of CAMand C4 carbon-concentrating mechanisms. InternationalJournal of Plant Sciences, 164, S55–S77.
Lucas, C., Hennessey, K., Mills, G., and Bathols, J. (2007).Bushfire weather in Southeast Australia: recent trends andprojected climate change impacts. Consultancy reportprepared for the Climate Institute of Australia by theBushfire CRC and Australian Bureau of Meteorology.
Lundie-Jenkins, G. (1993). Ecology of the rufous hare-wallaby, Lagorchestes hirsutus Gould (Marsupialia:Macropodidae), in the Tanami Desert, Northern Territo-ry. I. Patterns of habitat use. Wildlife Research, 20,457–476.
McGlone, M. S. (2001). The origin of the indigenous grass-lands of southeastern South Island in relation to pre-human woody ecosystems. New Zealand Journal of Ecolo-gy, 25, 1–15.
Miller, G. H., Fogel, M. L., Magee, J. W., Gagan, M. K.,Clarke, J. S., and Johnson, B. J. (2005a). Ecosystem col-lapse in Pleistocene Australia and a human role in mega-faunal extinction. Science, 309, 287–290.
Miller, G.H.,Mangan, J., Pollard,D., Thompson, S., Felzer, B.,and Magee, J. (2005b). Sensitivity of the Australian Mon-soon to insolation and vegetation: implications for humanimpact on continental moisture balance.Geology, 33, 65–68.
Murphy, B. P. and Bowman, D. M. J. S. (2007). The interde-pendence of fire, grass, kangaroos and Australian Abor-igines: a case study from central Arnhem Land, northernAustralia. Journal of Biogeography, 34, 237–250.
Mutch, R. W. (1970). Wildland fires and ecosystems—ahypothesis. Ecology, 51, 1046–1051.
Pyne, S. J. (2007). Problems, paradoxes, paradigms: trian-gulating fire research. International Journal of WildlandFire, 16, 271–276.
Sankaran, M., Ratnam, J., and Hanan, N. P. (2004). Tree-grass coexistence in savannas revisited—insights froman examination of assumptions and mechanisms in-voked in existing models. Ecology Letters, 7, 480–490.
Sankaran, M., Hanan, N. P., Scholes, R. J., et al. (2005).Determinants of woody cover in African savannas. Na-ture, 438, 846–849.
Schwilk, D.W. and Kerr, B. (2002). Genetic niche-hiking: analternative explanation for the evolution of flammability.Oikos, 99, 431–442.
Scott, A. C. and Glasspool, I. J. (2006). The diversification ofPaleozoic fire systems and fluctuations in atmosphericoxygen concentration. Proceedings of the National Academyof Sciences United States of America, 103, 10861–10865.
Sibold, J. S., Veblen, T. T., and Gonzalez, M. E. (2006).Spatial and temporal variation in historic fire regimesin subalpine forests across the Colorado Front Range inRocky Mountain National Park, Colorado, USA. Journalof Biogeography, 33, 631–647.
Swetnam, T. W. (1993). Fire history and climate change inGiant Sequoia groves. Science, 262, 885–889.
Walker, B. H. (1991). Ecological consequences of atmo-spheric and climate change. Climatic Change, 18, 301–316.
Werner, P. A. (2005). Impact of feral water buffalo and fireon growth and survival of mature savanna trees: anexperimental field study in Kakadu National Park,northern Australia. Austral Ecology, 30, 625–647.
Westerling, A. L., Hidalgo, H. G., Cayan, D. R., and Swet-nam, T. W. (2006). Warming and earlier spring increasewestern US forest wildfire activity. Science, 313, 940–943.
Whelan, R. J. (1995). The ecology of fire. Cambridge Univer-sity Press, Cambridge, UK.
Woinarski, J. C. Z., Milne, D. J., and Wanganeen, G. (2001).Changes in mammal populations in relatively intactlandscapes of Kakadu National Park, Northern Territo-ry, Australia. Austral Ecology, 26, 360–370.
Ziska, L. H., Reeves, J. B., and Blank, B. (2005). The impactof recent increases in atmospheric CO2 on biomass pro-duction and vegetative retention of Cheatgrass (Bromustectorum): implications for fire disturbance.Global ChangeBiology, 11, 1325–1332.
180 CONSERVATION BIOLOGY FOR ALL
© Oxford University Press 2010. All rights reserved. For permissions please email: [email protected]
Sodhi and Ehrlich: Conservation Biology for All. http://ukcatalogue.oup.com/product/9780199554249.do

CHAP T E R 1 0
Extinctions and the practiceof preventing themStuart L. Pimm and Clinton N. Jenkins
In this chapter, we will outline why we considerspecies extinction to be the most important prob-lem conservation science must address. Speciesextinction is irreversible, is progressing at a highrate and is poised to accelerate. We outline theglobal features of extinctions — how fast andwhere they occur. Such considerations shouldguide global allocation of conservation efforts;they do to some extent, though the priorities ofsome global conservation organizations leavemuch to be desired.
We conclude by asking how to go from theseinsights to what tools might be used in a practicalway. That requires a translation from scales ofabout 1 million km2 to mere tens of km2 atwhich most conservation actions take place.Brooks (Chapter 11) considers this topic in somedetail, and we shall add only a few comments.Again, the match between what conservation de-mands and common practice is not good.
10.1 Why species extinctions haveprimacy
“Biodiversity” means three broad things (NorseandMcManus 1980; Chapter 2): (i) there is diversitywithin a species— usually genetic-based, but with-in our own species, there is a large, but rapidlyshrinking cultural diversity (Pimm 2000); (ii) thediversity of species themselves, and; (iii) the diver-sity of the different ecosystems they comprise.
The genetic diversity within a species is hugelyimportant as an adaptation to local conditions.Nowhere is this more obvious than in the differ-ent varieties of crops, where those varieties are
the source of genes to protect crops from disease.Genetic uniformity can be catastrophic — thefamous example is the potato famine in Irelandin the 1840s.
We simply do not know the genetic diversity ofenough species for it to provide a practicalmeasurefor mapping diversity at a large scale. There is,however, a rapidly increasing literature on studiesof the genetic diversity of what were once thoughtto be single species and are now known to beseveral. These studies can significantly alter ouractions, pointing as they sometimes do toprevious-ly unrecognized species that need our attention.
Martiny (Box 10.1) argues for the importance ofdistinct populations within species, where the di-versity is measured simply geographically. Sheargues, inter alia, that the loss of local populationsmeans the loss of the ecosystem services speciesprovide locally. She does not mention that, in theUSA at least, “it’s the law.” Population segments,such as the Florida panther (Puma concolor coryi) orgrizzly bears (Ursus arctos horribilis) in the conti-nental USA are protected under the EndangeredSpecies Act (see Chapter 12) as if they were fullspecies. Indeed, the distinction is likely not clearto the average citizen, but scientific committees(National Research Council 1995) affirmMartiny’spoint and the public perception. Yes, it’s importantto havepanthers in Florida, and grizzly bears in thecontinental USA, not just somewhere else.
That said, species extinction is irreversible in away that population extinction is not. Some specieshave been eliminated across much of their rangesand later restored. And some of these flourished—
turkeys in the eastern USA, for example. Aldo Leo-pold’s dictum applies: the first law of intelligent
181
1
© Oxford University Press 2010. All rights reserved. For permissions please email: [email protected]

Box 10.1 Population conservationJennifer B. H. Martiny
Although much of the focus of biodiversityconservation concentrates on speciesextinctions, population diversity is a keycomponent of biodiversity. Imagine, forinstance, that no further species are allowed togo extinct but that every species is reduced tojust a single population. The planet would beuninhabitable for human beings, becausemanyof the benefits that biodiversity confers onhumanity are delivered through populationsrather than species. Furthermore, the focus onspecies extinctions obscures the extent of thebiodiversity crisis, because populationextinction rates are orders of magnitude higherthan species extinction rates.When comparing species versus population
diversity, it is useful to define populationdiversity as the number of populations in anarea. Delimiting the population unitsthemselves is more difficult. Historically,populations can be defined bothdemographically (by abundance, distribution,and dynamics) and genetically (by the amountof genetic variation within versus betweenintraspecific groups). Luck et al. (2003) alsopropose that populations be defined forconservation purposes as “service‐providingunits” to link population diversity explicitly tothe ecosystem services that they provide.The benefits of population diversity include all
the reasons for saving species diversity andmore(Hughes et al. 1998). In general, the greater thenumber of populations within a species, themore likely that a species will persist; thus,population diversity is directly linked to speciesconservation. Natural ecosystems are composedof populations of various species; as such systemsare disrupted or destroyed, the benefits thatthose ecosystems provide are diminished. Thesebenefits include aesthetic values, such as thefirsthand experience of observing a bird speciesin the wild or hiking in an old growth forest.Similarly, many of the genetic benefits thatbiodiversity confers to humanity, such as thediscovery and improvement of pharmaceuticalsand agricultural crops, are closely linked topopulation diversity. For instance, genetically
uniform strains of the world’s three major crops(rice, wheat, and maize) are widely planted;therefore, population diversity among wild croprelatives is a crucial source of genetic material toresist diseases and pests.Perhaps the most valuable benefit of
population diversity is the delivery ofecosystem services such as the purification of airand water, detoxification and decompositionof wastes, generation and maintenance of soilfertility, and the pollination of crops andnatural vegetation (see Chapter 3). Theseservices are typically provided by localbiodiversity; for a region to receive thesebenefits, populations that carry out theecosystem services need to exist nearby. Forinstance, native bee populations delivervaluable pollination services to agriculture butonly to fields within a few kilometers of thepopulations’ natural habitats (Kremen et al.2002; Ricketts et al. 2004).Estimates of population extinctions due to
human activities, although uncertain, are muchhigher than species extinctions. Using a modelof habitat loss that has previously been appliedto species diversity, it is estimated that millionsof populations are going extinct per year(Hughes et al. 1997). This rate is three orders ofmagnitude higher than that of speciesextinction. Studies on particular taxa confirmthese trends; population extinctions areresponsible for the range contractions ofextant species of mammals and amphibians(Ceballos and Ehrlich 2002; Wake andFreedenberg 2008).
REFERENCES
Ceballos, G. and Ehrlich, P. R. (2002). Mammal populationlosses and the extinction crisis. Science, 296, 904–907.
Hughes, J. B., Daily, G. C., and Ehrlich, P. R. (1997). Pop-ulation diversity: Its extent and extinction. Science, 278,689–692.
Hughes, J. B., Daily, G. C., and Ehrlich, P. R. (1998). Pop-ulation diversity and why it matters. In P. H. Raven, ed.Nature and human society, pp. 71–83. National Acade-my Press, Washington, DC.
continues
182 CONSERVATION BIOLOGY FOR ALL
Sodhi and Ehrlich: Conservation Biology for All. http://ukcatalogue.oup.com/product/9780199554249.do
© Oxford University Press 2010. All rights reserved. For permissions please email: [email protected]

tinkering is to keep every cog and wheel (Leopold1993). So long as there is one population left, how-ever bleak the landscapes from which it is missing,there is hope. Species extinction really is forever—and, as we shall soon present, occurring at unprec-edented rates.
There are also efforts to protect large-scale eco-systems for their intrinsic value. For example, inNorthAmerica, theWildlands Project has as one ofits objectives connecting largely mountainous re-gions from Yellowstone National Park (roughly42oN) to the northern Yukon territory (roughly64oN)—areas almost 3000 km away (Soulé andTerborgh 1999). A comparably heroic program inAfrica is organized by the Peace Parks Foundation(Hanks 2003). It has already succeeded in connect-ing some of the existing network of already largenational parks in southern Africa particularlythrough transboundary agreements. These effortsproceed with little regard to whether they containspecies at risk of extinction, but with the clearunderstanding that if one does maintain ecosys-tems at such scales then the species within themwill do just fine. Indeed, for species that need verylarge areas to survive—wilddogand lion inAfrica— such areas may hold the only hope for savingthese species in the long-term.
10.2 How fast are species becomingextinct?
There are �10 000 species of birds and we knowtheir fate better than any other comparably sized
group of species. So we ask first: at what rate arebirds becoming extinct? Thenwe ask: how similarare other less well-known taxa?
To estimate the rate of extinctions, we calculatethe extinction rate as the number of extinctions peryear per species or, to make the numbers morereasonable, per million species-years — MSY(Pimm et al. 1995; Pimm and Brooks 2000). Withthe exception of the past five mass extinctionevents, estimates from the fossil record suggestthat across many taxa, an approximate back-ground rate is one extinction per million species-years, (1 E/MSY) (Pimm et al. 1995). Thismeansweshould observe one extinction in any samplewherethe sum of all the years over all the species underconsideration is one million. If we consider a mil-lion species, we should expect one extinction peryear. Follow the fates of 10 000 bird species andweshould observe just one extinction per 100 years.
10.2.1 Pre-European extinctions
On continents, the first contact with modernhumans likely occurred �15 000 years ago in theAmericas and earlier elsewhere — too far back toallow quantitative estimates of impacts on birds.The colonization of oceanic islands happenedmuch more recently. Europeans were not thefirst trans-oceanic explorers. Many islands in thePacific and Indian Oceans received their firsthuman contact starting 5000 years ago andmany only within the last two millennia (Stead-man 1995; Gray et al. 2009).
Box 10.1 (Continued)
Kremen, C., Williams, N. M., and Thorp, R. W.(2002). Crop pollination from native bees at riskfrom agricultural intensification. Proceedings ofthe National Academy of Sciences of theUnited States of America, 99,16812–16816.
Luck, G. W., Daily, G. C., and Ehrlich, P. R. (2003). Popu-lation diversity and ecosystem services. Trends in Ecologyand Evolution, 18, 331–336.
Ricketts, T. H., Daily, G. C., Ehrlich, P. R., andMichener, C. D.(2004). Economic value of tropical forest to coffee pro-duction. Proceedings of theNational Academyof Sciencesof the United States of America, 101, 12579–12582.
Wake, D. B. and Greenburg, V. T. (2008). Are we in themidst of the sixth mass extinction? A view from theworld of amphibians. Proceedings of the NationalAcademy of Sciences of the United States of America,105, 11466–11473.
EXTINCTIONS AND THE PRACTICE OF PREVENTING THEM 183
1
© Oxford University Press 2010. All rights reserved. For permissions please email: [email protected]

Counting the species known to have and esti-mated to have succumbed to first contact sug-gests that between 70 and 90 endemic specieswere lost to human contact in the Hawaiian Is-lands alone, from an original terrestrial avifaunaestimated to be 125 to 145 species (Pimm et al.1994). Comparable numbers emerge from similarstudies across the larger islands of the Polynesianexpansion (Pimm et al. 1994). One can also recre-ate the likely species composition of Pacificislands given what we know about how largean island must be to support a species of (say)pigeon and the geographical span of islands thatpigeons are known to have colonized. Curnuttand Pimm (2001) estimated that in addition tothe �200 terrestrial bird species taxonomists de-scribed from the Pacific islands from completespecimens, �1000 species fell to first contactwith the Polynesians.
Species on other oceanic islands are likely tohave suffered similar fates within the last 1500years. Madagascar lost 40% of its large mammalsafter first human contact, for example (Simons1997). The Pacific extinctions alone suggest oneextinction every few years and extinctions else-where would increase that rate. An extinctionevery year is a hundred times higher than back-ground (100 E/MSY) and, as we will soonshow, broadly comparable to rates in the last fewcenturies.
10.2.2 Counting historical extinctions
Birdlife International produces the consensus listof extinct birds (BirdLife International 2000) and aregularly updated website (Birdlife International2006). The data we now present come from Pimmet al. (2006) and website downloads from thatyear. In 2006, there were 154 extinct or presumedextinct species and 9975 bird species in total. Theimplied extinction rate is �31 E/MSY — onedivides the 154 extinctions by 506 years timesthe 9975 species (� 5 million species-years) onthe assumption that these are the bird extinctionssince the year 1500, when European explorationbegan in earnest. (They exclude species knownfrom fossils, thought to have gone before 1500.)
As Pimm et al. (2006) emphasize, the count ofextinctions over a little more than 500 years hasan unstated assumption that science has followedthe fates of all the presently known species of birdover all these years. Scientific description thoughonly began in the 1700s, increased through the1800s, and continues to the present. Linnaeusdescribed many species that survive to the pres-ent and the Alagoas curassow (Mitu mitu) thatbecame extinct in the wild �220 years later. Bycontrast, the po’o uli (Melamprosops phaeosoma),described in 1974, survived a mere 31 years afterits description. If one sums all the years that aspecies has been known across all species, thetotal is only about 1.6 million species-years andthe corresponding extinction rate is � 85 E/MSY,that is, slightly less than one bird extinction peryear. This still underestimates the true extinctionrate for a variety of reasons (Pimm et al. 2006).
10.2.3 Extinction estimates for the 21st century
Birdlife International (2006) lists 1210 bird speciesin various classes of risk of extinction, that com-bined we call, “threatened,” for simplicity. Themost threatened class is “critically endangered.”Birdlife International (2006) list 182 such species,including the 25 species thought likely to havegone extinct but for conservation actions. Formany of these species there are doubts abouttheir continued existence. For all of these species,expert opinion expects them to become extinctwith a few decadeswithout effective conservationto protect them. Were they to expire over the next30 years, the extinction ratewould be 5 species peryear or 500 E/MSY. If the nearly 1300 threatenedor data deficient species were to expire over thenext century, the average extinction rate wouldexceed 1300 E/MSY. This is an order of magni-tude increase over extinctions-to-date.
Such calculations suggest that species extinc-tion rates will now increase rapidly. Does thismake sense, especially given our suggestion thatthe major process up to now, the extinction onislands, might slow because those species sensi-tive to human impacts have already perished?Indeed, it does, precisely because of a rapid in-crease in extinction on continents where there
184 CONSERVATION BIOLOGY FOR ALL
Sodhi and Ehrlich: Conservation Biology for All. http://ukcatalogue.oup.com/product/9780199554249.do
© Oxford University Press 2010. All rights reserved. For permissions please email: [email protected]

have been few recorded extinctions to date. Tofully justify that, we must examine what weknow about the global extinction process. First,however, we consider whether these results forbirds seem applicable to other taxa.
10.2.4 Other taxa: what we don’t know maymake a very large difference
Birds play an important part in this chapter be-cause they are well-known and that allows a dee-per understanding of the processes of extinctionthan is possible with other taxa (e.g. Pimm et al.1993). That said, birds constitute only roughly onethousandth of all species. (Technically, of eukary-ote species, that is excluding bacteria and viruses.)Almost certainly, what we know for birds greatlyunderestimates the numbers of extinctions of othertaxa, both past andpresent, for a variety of reasons.
On a percentage basis, a smaller fraction ofbirds are presently deemed threatened thanmam-mals, fish, and reptiles, according to IUCN’s Red-list (www.iucnredlist.org), or amphibians (Stuartet al. 2004). For North America, birds are the sec-ond least threatened of 18 well-known groups(The Nature Conservancy 1996). Birds may alsobe intrinsically less vulnerable than other taxabecause of their mobility, which often allowsthem to persist despite substantial habitat de-struction. Other explanations are anthropogenic.
Because of the widespread and active interestin birds, the recent rates of bird extinctions are farlower than we might expect had they notreceived special protection (Pimm et al. 2006;Butchart et al. 2006). Millions are fond of birds,which are major ecotourism attractions (Chapter3). Many presently endangered species surviveentirely because of extraordinary and expensivemeasures to protect them.
The most serious concern is that while birdtaxonomy is nearly complete, other taxa are farfrom being so well known. For flowering plantsworldwide, 16% are deemed threatened amongthe �300 000 already described taxonomically(Walter and Gillett 1998). Dirzo and Raven(2003) estimate that about 100 000 plant speciesremain to be described. First, the majority of thesewill likely already be rare, since a local distribu-
tion is one of the principal factors in theirescaping detection so far. Second, they are alsocertainly likely to be deemed threatened with ex-tinction since most new species, in addition tobeing rare, live in tropical forests that are rapidlyshrinking. We justify these two assumptionsshortly.
Suppose we take Dirzo and Raven’s estimate atface value. Then one would add the roughly 48000 threatened species to the 100 000 as-yet un-known, but likely also threatened species, for atotal of 148 000 threatened species out of 400 000plants — or 37% of all plants.
With Peter Raven, we have been exploringwhether his and Dirzo’s estimate is reasonable.It comes from what plant taxonomists think arethe numbers as-yet unknown. It is a best guess—and it proves hard to confirm. If it were roughlycorrect, we ought to see a decline in the numbersof species described each year — because fewerand fewer species are left undiscovered.
Consider birds again: Figure 10.1 shows the“discovery curve” — the number of species de-scribed per year. It has an initial spike with Lin-naeus, then a severe drop (until Napoleone diBuonaparte was finally eliminated as a threat toworld peace) and then a rapid expansion to about1850. As one might expect, the numbers of newspecies then declined consistently, indicating thatthe supply of unknown species was drying up.That decline was not obvious, however, until agood half of all the species had been described (asshown by the graph of the cumulative number ofspecies described.)
Interestingly, since 1950 there have been almost300 new bird species added and the numbers peryear have been more or less constant (Figure 10.1)Of these, about 10%were extinct when described,some found as only remains, others reassess-ments of older taxonomy. Of the rest, 27% arenot endangered, 16% are near-threatened, 9%have insufficient data to classify, but 48% arethreatened or already extinct. Simply, even forwell-studied birds, there is a steady trickle ofnew species each year and most are threatened.Of course, we may never describe some bird spe-cies if their habitats are destroyed before scien-tists find them.
EXTINCTIONS AND THE PRACTICE OF PREVENTING THEM 185
1
© Oxford University Press 2010. All rights reserved. For permissions please email: [email protected]

Now consider the implications for plants: planttaxonomy has rapidly increased the number ofknown species since about 1960, when moderngenetic techniques became available. For example,there are�30 000 species of orchids, but C. A. Luer(http://openlibrary.org/a/OL631100A) and othertaxonomists havedescribednearly800 species fromEcuador alone since 1995 — and there are likelysimilar numbers from other species-rich tropicalcountries! There is no decline in the numbers ofnew species — no peak in the discovery curve asthere is for birds around 1850.
Might Dirzo and Raven have seriously under-estimated the problem given that the half-waypoint for orchids might not yet have been reached?If orchids are typical, then there could be literallyhundreds of thousands of species of as-yet un-known plants. By analogy to birds, most have tinygeographical ranges, live in places that are underimmediate threat of habitat loss, and are in immi-nent danger of extinction. The final caveat for birdsapplies here, a fortiori. Many plants will never bedescribed because human actionswill destroy them(and their habitats) before taxonomists find them.
Well, Peter Raven (pers. comm., January 2009)argues that orchids might not be typical of other
plants being under-collected. They are a groupfor which international laws make their exportdifficult, while their biology means they areoften not in flower when found and so must bepropagated. All this demands that we estimatenumbers of missing taxa generally and, wheneverpossible, where they are likely to be.
Ceballos and Ehrlich (2009) have recently ex-amined these issues for mammals, a groupthought to be well-known. In fact, taxonomistsdescribed more than 400 mammal species since1993 — �10% of the total. Most of these newspecies live in areas where habitats are beingdestroyed and over half have small geographicalranges. As we show below, the combination ofthese two powerful factors predicts the numbersof species on the verge of extinction.
10.3 Which species become extinct?
Of the bird extinctions discussed, more than 90%have been on islands. Comparably large percen-tages of extinctions of mammals, reptiles, landsnails, and flowering plants have been on islandstoo. So, will the practice of preventing extinctionsimply be a matter of protecting insular forms?
The answer is an emphatic “no” because thesingle most powerful predictor of past and likelyfuture extinctions is the more general “rarity” —
not island living itself. Island species are rare be-cause island life restricts their range. Continentalspecies of an equivalent level of rarity — verysmall geographical ranges — may not have suf-fered extinction yet, but they are disproportion-ately threatened with extinction. Quite againstexpectation, island species (and those that live inmontane areas) are less likely to be threatened atrange sizes smaller than 100 000 km2 (Figure 10.2).
Certainly, species on islands may be suscepti-ble to introduced predators and other enemies,but they (and montane species) have an offsettingadvantage. They tend to be much more abundantlocally than species with comparable range sizesliving on continents.
Local rarity is a powerful predictor of threat inits own right. While species with large rangestend to be locally common, there are obvious
Figure 10.1 Number of bird species described per year and thecumulative number of known bird species. Data from Pimm et al. 2006.
186 CONSERVATION BIOLOGY FOR ALL
Sodhi and Ehrlich: Conservation Biology for All. http://ukcatalogue.oup.com/product/9780199554249.do
© Oxford University Press 2010. All rights reserved. For permissions please email: [email protected]

exceptions—large carnivores, for example. Suchspecies are at high risk. Manne and Pimm (2001)and Purvis et al. (2000) provide statistical analysesof birds and mammals, respectively, that expandon these issues. None of this is in any waysurprising. Low total population size, whetherbecause of small range, local rarity or both,exacerbated in fragmented populations and in
those populations that fluctuate greatly fromyear-to-year (Pimm et al. 1988), likely brings po-pulations to the very low numbers from whichthey cannot recover.
Given this importance of range size and localabundance, we now turn to the geography ofspecies extinction.
10.4 Where are species becoming extinct?
10.4.1 The laws of biodiversity
There are at least seven “laws” to describe thegeographical patterns of where species occur. By“law,” we mean a general, widespread pattern,that is, one found across many groups of speciesand many regions of the world. Recall that Wal-lace (1855) described the general patterns of evo-lution in his famous “Sarawak Law” paper. (Hewould uncover natural selection, as the mecha-nism behind those laws, a few years later, inde-pendently of Darwin.) Wallace reviews theempirical patterns and then concludes:
LAW 1. ’the following law may be deduced fromthese [preceding] facts:— Every species has come intoexistence coincident both in space and time with a pre-existing closely allied species’.
0.0
0.1
0.2
0.3
Pro
por
tion
of
thre
aten
ed s
pec
ies
0.4
0.5
0.6
0.7Lowland speciesIsland species
Geographical range size
100–1,0001,001–10,000
10,001–100,000
100,001–1000,000
1,000,001–10,000,000
10,,000,001–100,000,000
Figure 10.2 The proportion of bird species in the Americas that arethreatened declines as the size of a species’ geographical range increases.While more than 90% of all extinctions have been on islands, for rangesless than 100 000 km2, island species are presently less likely to bethreatened with future extinction. Simplified from Manne et al. (1999).
1800
1600
1400
1200
AmphibiansSuboscine birdsOsscine birdsNon-passeringe birdsMammals
1000
800
600
400
200
0100 1000 10000 100000
Area (km2)1000000 10000000
0
1000
2000
3000
Am
phib
ians
Bir
ds
and
mam
mal
s
4000
5000
6000
Figure 10.3 Cumulative numbers of species with increasing size of geographical range size (in km2) for amphibians (worldwide; right hand scale),and mammals and three groups of bird species (for North and South America; left hand scale). Note that area is plotted on a log scale.
EXTINCTIONS AND THE PRACTICE OF PREVENTING THEM 187
1
© Oxford University Press 2010. All rights reserved. For permissions please email: [email protected]

There are other generalities, too.LAW 2. Most species’ ranges are very small; few are
very large.Figure 10.3 shows cumulative distributions of
range sizes for amphibians (worldwide) and forthe mammals and three long-isolated lineages ofbirds in the Americas. The ranges are highlyskewed. Certainly there are species with verylarge ranges — some greater than 10 millionkm2, for example. Range size is so stronglyskewed, however, that (for example) over half ofall amphibian species have ranges smaller than�6000 km2. The comparable medians for the
other taxa range from �240 000 km2 (mammals)to �570 000 km2 (non-passerine birds).
LAW 3. Species with small ranges are locally scarce.There is a well-established relationship across
many geographical scales and groups of speciesthat links a species’ range to its local abundance(Brown 1984). The largest-scale study is that ofManne and Pimm (2001) who used data on birdspecies across South America (Parker et al. 1996).The latter use an informal, if familiar method toestimate local abundances. A species is “common”if one is nearly guaranteed to see it in a day’sfieldwork, then “fairly common,” “uncommon”
Low : 1
High : 85SubOscine richness
Low : 1
High : 215SubOscine richness
Low : 1
High : 72Oscine richness
Low : 1
High : 142Oscine richness
Figure 10.4 Numbers of sub‐oscine and oscine passerine birds, showing all species (at left) and those with geographical ranges smaller than the median.
188 CONSERVATION BIOLOGY FOR ALL
Sodhi and Ehrlich: Conservation Biology for All. http://ukcatalogue.oup.com/product/9780199554249.do
© Oxford University Press 2010. All rights reserved. For permissions please email: [email protected]

down to “rare” — meaning it likely takes severaldays of fieldwork to find one even in the appropri-ate habitat. Almost all bird species with rangesgreater than 10 million km2 are “common,” whilenearly a third of species with ranges of less than 10000 km2 are “rare” and very few are “common.”
LAW 4. The number of species found in an area ofgiven size varies greatly and according to some com-mon factors.
Figure 10.4 shows the numbers of all species(left hand side) and of those species with smallerthan the median geographic range (right handside) for sub-oscine passerine birds (whichevolved in South America when it was geograph-ically isolated) and oscine passerines (whichevolved elsewhere.) Several broad factors are ap-parent, of which three seem essential (Pimm andBrown 2004).
Geological historyThe long geographical isolation of South Americathat ended roughly 3 million years ago allowedsuboscine passerines to move into North Americaacross the newly formed Isthmus of Panama. Thesuboscines, nonetheless, have not extensively co-lonized North America and there are no smallranged suboscines north of Mexico.
Ecosystem typeForests hold more species than do drier or colderhabitats, even when other things (latitude, forexample) are taken into consideration. Thus, east-ern North American deciduous forests hold morespecies than the grasslands to their west, whilethe tropical forests of the Amazon and the south-east Atlantic coast of South America have morespecies than in the drier, cerrado habitats thatseparate them.
Geographical constraintsExtremes, such as high latitudes have fewer spe-cies, but interestingly — if less obvious — so toodo peninsulas such as Baja California and Florida.Colwell et al. (2004) show there must be geo-graphical constraints — by chance alone, therewill be more species in the middle than at theextremes, given the observed distribution of geo-graphical range sizes.
LAW 5. Species with small ranges are often geo-graphically concentrated and . . .
LAW 6 . . . those concentrations are generally notwhere the greatest numbers of species are found.They are, however, often in the same general placesin taxa with different origins.
Since the results on species extinction tell usthat the most vulnerable species are those withsmall geographical ranges, we should explorewhere such species occur. The simplest expecta-tion is that they will simply mirror the pattern ofall species. That is, where there are more species,there will be more large-ranged, medium-ranged,and small-ranged species. Reality is strikinglydifferent (Curnutt et al. 1994; Prendergast et al.1994)!
Figure 10.4 shows that against the patterns forall species, small-ranged species are geographi-cally concentrated, and not merely mirrored.Moreover, the concentrations of small-rangedspecies are, generally, not where the greatestnumbers of species are. Even more intriguing, asFigure 10.4 also shows, is that the concentrationsare in similar places for the two taxa despite theirvery different evolutionary origins. Maps of amphi-bians (Pimm and Jenkins 2005) and mammals(unpublished data) show these patterns to begeneral ones. At much coarser spatial resolution,they mirror the patterns for plants (Myers et al.2000).
These similarities suggest common processesgenerate small-ranged species that are differentfrom species as a whole.
Island effectsLikely it is that islands — real ones surroundedbywater and “montane” islands of high elevationhabitat surrounded by lowlands — provide theisolation needed for species formation. Figure10.4 shows that it is just such places wheresmall-ranged species are found.
Glaciation historyThis is not a complete explanation, for somemountains — obviously those in the westernUSA and Canada — do not generate unusualnumbers of small ranged species. Or perhapsthey once did and those species were removedby intermittent glaciation.
EXTINCTIONS AND THE PRACTICE OF PREVENTING THEM 189
1
© Oxford University Press 2010. All rights reserved. For permissions please email: [email protected]

Finally, there are simply anomalies: the Appa-lachian mountains of the eastern USA generateconcentrations of small-ranged salamander spe-cies, but not birds or mammals. The mountains ofwestern North America generate concentrationsof small-ranged mammals but not birds.
10.4.2 Important consequences
Several interesting consequences emerge.
· The species at greatest risk of extinction are con-centrated geographically and, broadly, such speciesin different taxa are concentrated into the sameplaces. As argued previously, similar processesmay create similar patterns across different taxa.This is of huge practical significance for it meansthat conservation efforts can be concentrated inthese special places. Moreover, priorities set forone taxonomic group may be sensible for someothers, at least at this geographical scale.
· A second consequence of these laws is far moreproblematical. Europe and North America havehighly distorted selections of species. While mostspecies have small ranges and are rare withinthem, these two continents have few species, veryfew species indeed with small ranges, and thoseranges are not geographically concentrated. Anyconservation priorities based on European andNorth American experiences are likely to be poorchoices when it comes to preventing extinctions, apoint to which we shall return.
10.4.3 Myers’ Hotspots
By design, we have taken a mechanistic approachto draw a conclusion that extinctions will concen-trate where there are many species with smallranges — other things being equal. Other thingsare not equal of course and the other importantdriver is human impact.
Figure 10.5 shows the distribution of threatenedspecies of birds in The Americas. The concentra-tion is in the eastern coast of South America, aplace that certainly houses many species withsmall geographical ranges, but far from beingthe only place with such concentrations. What
makes this region so unfortunately special is theexceptional high levels of habitat destruction.
Myers approached these topics from a “topdown” perspective, identifying 10 and later 25areas with more than 1000 endemic plants(Myers 1988, 1990; Myers et al. 2000). There areimportant similarities in the map of these areas(Figure 10.6) to the maps of Figure 10.4 (whichonly consider the Americas.) Central America,the Andes, the Caribbean, and the AtlanticCoast forests of South America stand out in bothmaps. California and the cerrado of Brazil (drier,inland forest) are important for plants, but notbirds.
Myers added the second — and vital criterion— that these regions have less than 30% of theirnatural vegetation remaining. Myers’ idea is avery powerful one. It creates the “number of
Threatened species
High : 58
Low : 1
Figure 10.5 The number of species of birds threatened with extinctionin the Americas.
190 CONSERVATION BIOLOGY FOR ALL
Sodhi and Ehrlich: Conservation Biology for All. http://ukcatalogue.oup.com/product/9780199554249.do
© Oxford University Press 2010. All rights reserved. For permissions please email: [email protected]

small ranged species times habitat loss equalsextinction” idea with another key and surprisinginsight. What surprises is that there are few ex-amples of concentrations of small-ranged speciesthat do not also meet the criterion of having lost70% of more of their natural habitat. The island ofNew Guinea is an exception. Hotspots have dis-proportionate human impact measured in otherways besides their habitat loss. Cincotta et al.(2000) show that hotspots have generally higherhuman population densities and that almost all ofthem have annual population growth rates thatare higher (average ¼ 1.6% per annum) than theglobal average (1.3¼ per annum).
10.4.4 Oceanic biodiversity
Concerns about the oceans are usually expressedin terms of over-exploitation of relatively wide-spread, large-bodied and so relatively rare species(Chapter 6)— suchasSteller’s sea cow(Hydrodamalisgigas) and various whale populations. That said,given what we know about extinctions on the land,whereelsewouldwelookforextinctionsintheoceans?
As for the land, oceanic inventories are likelyvery incomplete. For example, there are morethan 500 species of the lovely and medically im-portant genus of marine snail, Conus. Of the 316species of Conus from the Indo-Pacific region,Röckel et al. (1995) find that nearly 14% weredescribed in the 20 years before their publication.There is no suggestion in the discovery curve thatthe rate of description is declining.
The first step would be to ask whether the lawswe present apply to the oceans. We can do so usingthe data that Roberts et al. (2002) present geographi-cally on species of lobster,fish,molluscs, and corals.Figure 10.7 shows the size of their geographicalranges, along with the comparable data for birds.Expressed as the cumulative percentages of specieswith given range sizes, (not total numbers of speciesas Figure 10.3), the scaling relationships are remark-ably similar. For all but corals, the data show that asubstantial fraction of marine species have verysmall geographical ranges. The spatial resolutionof these data is coarse — about 1 degree latitude/longitude or �10 000 km2 — and likely overesti-mates actual ranges.Many of the species depend on
Figure 10.6 The 25 hotspots as defined by Myers et al. 2000 (in black). The map projection is by Buckminster Fuller (who called it Dymaxion). It hasno “right way” up and neither does the planet, of course.
EXTINCTIONS AND THE PRACTICE OF PREVENTING THEM 191
1
© Oxford University Press 2010. All rights reserved. For permissions please email: [email protected]

coral reefs, for example, that cover only a smallfraction of the area within the 1-degree latitude/longitude cell where a species might occur.
The interesting generality here is that there arelarge fractions of marine species with very smallgeographical ranges — just as there are on land.The exception are the corals, most of which ap-pear to occupy huge geographical ranges. Evenhere, this may be more a reflection of the state ofcoral taxonomy than of nature itself.
Roberts et al. (2002) also show that the other lawsapply. Species-rich places are geographically con-centrated in the oceans (Figure 10.8). They furthershow that as with the land, a small number of areashave high concentrations of species with smallranges and they are often not those places with thegreatest number of species. Certainly, the islandsbetweenAsia andAustralia havebothmany speciesandmany species with small ranges. But concentra-tions of small range species also occur in the islandssouth of Japan, the Hawaiian Islands, and the Gulfof California — areas not particularly rich in totalspecies. Finally, Bryant et al. (1998) do for reefs whatMyers did for the land— and show that areas withconcentrations of small-ranged species are oftenparticularly heavily impacted by human actions.
Were we to look for marine extinctions, it wouldbe where concentrations of small-ranged species
collide with unusually high human impacts. Giventhat the catalogue of Conus species is incomplete,that many have small geographical ranges, andthose occur in areaswhere reefs are being damaged,it seems highly unlikely to us that as few as fourConus species (<1%) are threatened with extinctionas IUCN suggest (www.iucnredlist.org).
10.5 Future extinctions
10.5.1 Species threatened by habitat destruction
The predominant cause of bird species endanger-ment is habitat destruction (BirdLife International2000). It is likely to be so for other taxa too. Whilelarge tracts of little changed habitat remain world-wide, most of the planet’s natural ecosystems havebeen replaced or fragmented (Pimm 2001). Somespecies have benefited from those changes, butlarge numbers have not. The most importantchanges are to forests, particularly tropical forestsfor these ecosystems house most of the world’sbird species (and likely other taxa as well). Wenow show that the numbers of extinctions pre-dicted by a simple quantitative model matchwhat we expect from the amount of forest lost.We then extend these ideas tomore recently defor-ested areas to predict the numbers of species likely
Range size (km2)104
0
20
40
Cum
ulat
ive
perc
enta
ge o
f spe
cies
60
BirdsLobstersFishesMolluscsCorals80
100
105 106 107 108
Figure 10.7 The cumulative number of species of marine organisms (lobsters, fishes, molluscs, and corals) with birds for comparison (data fromRoberts et al. 2002). Unlike Figure 10.3, these are scaled to 100% of the total number of species.
192 CONSERVATION BIOLOGY FOR ALL
Sodhi and Ehrlich: Conservation Biology for All. http://ukcatalogue.oup.com/product/9780199554249.do
© Oxford University Press 2010. All rights reserved. For permissions please email: [email protected]

to become extinct eventually. The observed num-bers of threatened species match those predictions,suggesting that we understand the mechanismsgenerating the predicted increase in extinction rate.
Rarity — either through small range size orlocal scarcity — does not itself cause extinction.Rather, it is how human impacts collide withsuch susceptibilities. As Myers reminds us, ex-tinctions will concentrate where human actionsimpact concentrations of small ranged species.Without such concentrations, human impactswill have relatively little effect. The eastern USAprovides a case history.
10.5.2 Eastern North America: high impact,few endemics, few extinctions
Europeans settled Eastern North America in theearly 1600s and moved inland from the mid-1700s, settling the prairie states in the late 1800s.Along the way, they cleared most of the decidu-ous forest at one time or another. Despite thismassive deforestation, only four species of landbirds became extinct — the Carolina parakeet(Conuropsis carolinensis), passenger pigeon (Ecto-pistes migratorius), ivory-billed woodpecker (Cam-pephilus principalis), and Bachman’s warbler(Vermivora bachmanii) — out of a total of about160 forest species.
Pimm and Askins (1995) considered why sofew species were lost, despite such extensivedamage. They considered a predictive model ofhow many species should be lost as a function ofthe fraction of habitat lost. This model followsfrom the familiar species-area law that describesthe number of species found on islands in relationto island area. There is an obvious extension tothat law that posits that as area is reduced (fromAo to An) then the original number of species Sowill shrink to Sn in a characteristic way.
LAW 7. The fraction of species (Sn/So) remainingwhen human actions reduce the area of original habitatAo to An is (An/Ao)
0.25.We call this a law because we now show it to
hold across a variety of circumstances.First, Pimm and Askins noticed that while few
forests were uncut, the deforestation was not si-multaneous. European colonists cleared forestsalong the eastern seaboard, then moved acrossthe Appalachians and then into the lake states.When settlers realized they could grow crops inthe prairies, the eastern forests began to recover.At the low point, perhaps half of the forest re-mained. Applying the formula, the region shouldhave retained 84% of its species and so lost 16%.Now 16% of 160 species is �26 species and that isclearly not the right answer.
Second, Pimm and Askins posed the obviousthought-experiment: how many species should
Species ofCoral Reef Organisms
1251 – 15001001 – 1250751 – 1000501 – 750251 – 5001 – 250
Figure 10.8 Species richness of coral reef organisms (data from Roberts et al. 2002).
EXTINCTIONS AND THE PRACTICE OF PREVENTING THEM 193
1
© Oxford University Press 2010. All rights reserved. For permissions please email: [email protected]

have been lost if all the forest was cleared? Theanswer is not 160, because most of those specieshave ranges outside of eastern North America —
some across the forests of Canada, others in thewestern USA, some down into Mexico. Theywould survive elsewhere, even if all the forestwere cut. Indeed only 30 species have sufficientlysmall ranges to be endemic to the region and so atrisk if all the forest were lost. Applying the for-mulae to these one predicts that there would be4.8 species at risk— surprisingly close to the rightanswer, given that another eastern species, thered-cockaded woodpecker (Picoides borealis), isthreatened with extinction!
Simply, that there were so few extinctions —
and so few species at risk — is largely a conse-quence of there being so few species with smallranges. So what happens when there are manyspecies with small ranges?
10.5.3 Tropical areas with high impact, manyendemics, and many species at risk
Case histories comparing how many species arethreatened with extinction with how many arepredicted to become extinct using Law 7 includebirds in the Atlantic coast forest of Brazil (Brooksand Balmford 1996), birds and mammals in insu-lar southeast Asia (Brooks et al. 1997; Brooks et al.1999a), plants, invertebrates, and vertebrates ofSingapore (Brook et al. 2003), and birds, mam-mals, amphibians, reptiles, and plants across the25 biodiversity “hotspots” thatwe now introduce.
These studies, by choice, look at areas wherethere are many species with small geographicalranges, for the number of predicted extinctionsdepends linearly on the number of such species.But notice that Law 7 implies a highly non-linearrelationship to the amount of habitat destruction.Losing the first half of eastern North America’sforests resulted in a predicted loss of 16% of itsspecies. Losing the remaining half would haveexterminated the remaining 84%! The studiesthe previous paragraph cites looked at areaswith far more extensive habitat destruction thaneastern North America.
Pimm and Raven (2000) applied this recipe toeach of the 25 hotspots using the statistics on
endemic bird species, original area, and the pres-ent area of remaining natural vegetation. Thisprovides a best-case scenario of what habitatmight remain. They predicted that �1700 speciesof birds should be lost eventually. Species canobviously linger in small habitat fragments fordecades before they expire — as evidenced bythe rediscovery of species thought extinct for upto a century. They suggest that bird extinctionsamong doomed species have a half-life of �50years (Brooks et al. 1999b; Ferraz et al. 2003). Soperhaps three quarters of these species— 1250—will likely go extinct this century — a numbervery similar to the number Birdlife considers tobe at risk.
These estimates of extinction rates (�1000 E/MSY) come from human actions to date. Two ex-trapolations are possible. The worst-case scenariofor the hotspots assumes that the only habitats thatwill remain intact will be the areas currently pro-tected. This increases the prediction of number ofextinctions to 2200 (Pimm and Raven 2000). Thesecond adds in species from areas not alreadyextensively deforested. If present trends continue,large remaining areas of tropical forest that housemany species (such as the Amazon, the Congo,and Fly basin of New Guinea) will have extinctionrates that exceed those in the hotspots by mid-century. For example, the Amazon basin is oftenignored as a concentration of vulnerable speciesbecause its �300 endemic bird species are foundacross �5 million km2. At current rates of defores-tation, most of the Amazon will be gone bymid-century. There are plans for infrastructuredevelopment that would accelerate that rate offorest clearing (Laurance et al. 2001). If this wereto happen, then many of the Amazon’s specieswill become threatened or go extinct.
10.5.4 Unexpected causes of extinction
There are various unexpected causes of extinctionand they will add to the totals suggested fromhabitat destruction. The accidental introductionof the brown tree snake (Boiga irregularis) toGuam eliminated the island’s birds in a coupleof decades (Savidge 1987; Wiles et al. 2003). In theoceans, increases in long-line fisheries (Tuck et al.
194 CONSERVATION BIOLOGY FOR ALL
Sodhi and Ehrlich: Conservation Biology for All. http://ukcatalogue.oup.com/product/9780199554249.do
© Oxford University Press 2010. All rights reserved. For permissions please email: [email protected]

2003) are a relatively new and very serious threatto three-quarters of the 21 albatross species (Bird-life International 2006).
10.5.5 Global change and extinction
Finally, one of the most significant factors in theextinction of species will undoubtedly be climatechange (see Chapter 8), a factor not included inany of the estimates presented above. Thomaset al. (2004) estimate that climate change threatens15–37% of species within the next 50 years de-pending on which climate scenario unfolds. Evenmore species are at risk if one looks to climatechanges beyond 50 years. More detailed, regionalmodeling exercises in Australia (Williams et al.2003) and South Africa (Erasmus et al. 2002)have led to predictions of the extinction of manyspecies with narrowly-restricted ranges duringthis or longer intervals.
The critical question is whether these extinc-tions, which are predominantly of small-rangedspecies, are the same as those predicted fromhabitat destruction or whether they are addition-al (Pimm 2008). In many cases, they are certainlythe latter.
For example, the Atlantic coast humid forestsof Brazil have the greatest numbers of bird spe-cies at risk of extinction within the Americas(Manne et al. 1999). The current threat comesfrom the extensive clearing of lowland forest.Upland forests have suffered less. Rio de JaneiroState has retained relatively more of its forests —23% survives compared to <10% for the region asa whole. Less than 10% of the forest below 200 mremains though, whereas some 84% of the forestremains above 1300 m. It is precisely the speciesin these upper elevations that are at risk fromglobal warming, for they have no higher eleva-tions into which to move when the climatewarms. These upland, restricted-range specieswill suffer the greatest risk from global warming,not the lowland species that are already at risk.Thus, the effects of direct habitat destruction andglobal warming are likely to be additive.
How large an additional threat is global warm-ing? For NewWorld passerine birds, a quarter live1000 m above sea-level. Detailed modeling can
certainly provide predictions of which speciesare at most risk (Sekercioglu et al. 2008), but thebasic concerns are clear. If that fraction of speciesin mountains is typical of other taxa and otherplaces, then a quarter of those species are at risk— a very substantial addition to species alreadythreatened with extinction (Pimm 2008).
10.6 How does all this help preventextinctions?
Thus far, we have guided the reader to areas ofroughly one million km2 — many orders of mag-nitude larger than the tens or at best hundreds ofkm2 at which practical conservation actions un-fold. Brooks (Chapter 11) considers formal toolsfor setting more local conservation priorities. Wehave rarely used such approaches in our work,though we understand the need for them.
This chapter establishes a recipe for conserva-tion action that transcends scales. One can quiteliterally zoom in on Figure 10.5 to find out exactlywhere the greatest concentrations of threatenedspecies are and, moreover, plot their ranges onmaps of remaining forest. Our experiences areshaped by two places where our operationalarm, www.savingspecies.org, has worked todate: the Atlantic Coastal Forest of Brazil andthe island of Madagascar.
We have told this story in detail elsewhere(Harris et al. 2005; Jenkins 2003; Pimm and Jen-kins 2005; Jenkins and Pimm 2006). For the Amer-icas, we start with the species map of Figure 10.5(but much enlarged). This shows the very highestconcentration of threatened species to be in theState of Rio de Janeiro— an area of �40 000 km2.At that point, what compels us most strongly issatellite imagery that shows what forest remains— not ever more detail about where species arefound. There is not much forest — and very littleindeed of the lowland forest remains. And thatforest is in fragments.
Whatever conservation we do here is driven bythese facts. We do not worry about the issues ofcapturing as many species in a given area (Pimmand Lawton 1998), and then write philosophicalpapers about weighting species because of their
EXTINCTIONS AND THE PRACTICE OF PREVENTING THEM 195
1
© Oxford University Press 2010. All rights reserved. For permissions please email: [email protected]

various “values” — taxonomic distinctiveness,for example. We do not fret about whether ourpriorities for birds match those for orchids forwhich we have only crude range information(Pimm 1996) or nematodes about which weknow even less. What few remaining fragmentsremain will be the priorities for every taxon.
The practical solution is obvious too. The landbetween isolated forests needs to be brought intoprotection and reforested. That is exactly what wehave helped our Brazilian colleagues achieve(www.micoleao.org.br). Connecting isolated for-est fragments by reforesting them in areas rich insmall-ranged species is an effective and cheapway of preventing extinctions. We commendthis solution to others.
Summary
· Extinctions are irreversible, unlike many otherenvironmental threats that we can reverse.
· Current and recent rates of extinction are 100times faster than the background rate, while futurerates may be 1000 times faster.
· Species most likely to face extinction are rare; rareeither because they havevery small geographic rangesor have a low population density with a larger range.
· Small-ranged terrestrial vertebrate species tend tobe concentrated in a few areas that often do not holdthe greatest number of species. Similar patternsapply to plants and many marine groups.
· Extinctions occurmost oftenwhen human impactscollide with the places having many rare species.
· While habitat loss is the leading cause of extinc-tions, global warming is expected to cause extinc-tions that are additive to those caused by habitat loss.
Suggested reading
Brooks, T. M., Pimm, S. L., and Oyugi. J. O. (1999). TimeLag between deforestation and bird extinction in tropicalforest fragments. Conservation Biology, 13, 1140–1150.
Ferraz, G., Russell, G. J., Stouffer, P C., Bierregaard, R. O.,Pimm, S. L., and Lovejoy, T. E. (2003). Rates of speciesloss from Amazonian forest fragments. Proceedings of theNational Academy of Sciences of the United States of America,100, 14069–14073.
Manne, L. L, Brooks, T. M., and Pimm S. L. (1999). Relativerisk of extinction of passerine birds on continents andislands. Nature, 399, 258–261.
Myers, N., Mittermeier, R. A., Mittermeier, C. G., Fonseca,G. A. B., and Kent, J. (2000). Biodiversity hotspots forconservation priorities. Nature, 403, 853–858.
Pimm S. L. (2001). The World According to Pimm: A ScientistAudits the Earth. McGraw–Hill, New York, NY.
Pimm, S. L. and Askins, R. (1995). Forest losses predict birdextinctions in eastern North America. Proceedings of theNational Academy of Sciences of the United States of America,92, 9343–9347.
Pimm, S. L. and C. Jenkins. (2005). Sustaining the variety ofLife. Scientific American, September, 66–73.
Relevant web sites
· BirdLife International, Data Zone: http://www.birdlife.org/datazone.
· Threatened amphibians: http://www.globalamphi-bians.org.
· The IUCN Red List: http://www.iucnredlist.org.
· Saving species: http://savingspecies.org.
REFERENCES
BirdLife International (2000). Threatened Birds of the World.LynxEdicions andBirdLife International, Cambridge,UK.
Birdlife web site (2006). http://www.birdlife.org.Brook, B. W., Sodhi, N. S., and Ng, P. K. L. (2003). Cata-strophic extinctions follow deforestation in Singapore.Nature, 424, 420–423.
Brooks, T. and Balmford, A. (1996). Atlantic forest extinc-tions, Nature, 380, 115.
Brooks, T. M., Pimm, S. L., and Collar, N. J. (1997). Defor-estation predicts the number of threatened birds in insu-lar southeast Asia. Conservation Biology, 11, 382–384.
Brooks, T. M., Pimm, S. L., Kapos V., and RaviliousC. (1999a). Threat from deforestation to montane andlowland birds and mammals in insular Southeast Asia.Journal of Animal Ecology, 68, 1061–1078.
Brooks, T. M., Pimm, S. L., and Oyugi. J. O. (1999b). Timelag between deforestation and bird extinction in tropicalforest fragments. Conservation Biology, 13, 1140–1150.
Brown, J. H. (1984). On the relationship between abun-dance and distribution of species. The American Natural-ist, 124, 255–279.
196 CONSERVATION BIOLOGY FOR ALL
Sodhi and Ehrlich: Conservation Biology for All. http://ukcatalogue.oup.com/product/9780199554249.do
© Oxford University Press 2010. All rights reserved. For permissions please email: [email protected]
Bryant, D., Burke, L., McManus, J., and Spalding, M. (1998).Reefs at risk: a map-based indicator of the threats to the world’scoral reefs. Joint publication by World Resources Institute,International Center for LivingAquatic ResourcesManage-ment, World Conservation Monitoring Centre, and UnitedNations Environment Programme, Washington, DC.
Butchart S. H. M, Stattersfield A, and Collar, N. (2006).How many bird extinctions have we prevented? Oryx,40, 266–278.
Ceballos, G and Ehrlich, P. R. (2009). Discoveries of newmammal species and their implications for conservationand ecosystem services.Proceedings of theNational Academyof Sciences of the United States of America, 106, 3841–3846.
Cincotta, R. P., Wisnewski, J., and Engelman, R. (2000).Human population in the biodiversity hotspots. Nature404, 990–992.
Colwell, R. K., Rahbek,C., andGotelli, N. J. (2004). Themid-domain effect and species richness patterns: what havewe learned so far? The American Naturalist, 163, E1–E23.
Curnutt, J. and Pimm S. L. (2001). How many bird speciesin Hawai’i and the Central Pacific before first contact? InJ. M. Scott, S. Conant and C. van Riper III, eds Evolution,ecology, conservation, and management of Hawaiian birds: avanishing avifauna, pp. 15–30. Studies in Avian Biology22, Allen Press Inc., Lawrence, KS.
Curnutt, J., Lockwood, J., Luh, H.-K., Nott, P., and Russell,G. (1994).Hotspots and species diversity.Nature 367, 326.
Dirzo R. and Raven P. (2003). Global state of biodiversityloss. Annual Reviews in Environment and Resources, 28,137–167.
Erasmus, B. F. N., van Jaarsveld, A. S., Chown, S. L.,Kshatriya, M., and Wessels, K. (2002). Vulnerability ofSouth African animal taxa to climate change. GlobalChange Biology, 8, 679–693.
Ferraz, G., Russell, G. J., Stouffer, P. C., Bierregaard, R. O.,Pimm, S. L., and Lovejoy, T. E. (2003). Rates of speciesloss from Amazonian forest fragments. Proceedings of theNational Academy of Sciences of the United States of America,100, 14069–14073.
Gray, R.D., Drummond, A. J., and Greenhill, S. J. (2009).Language phylogenies reveal expansion pulses andpauses in Pacific Settlment. Science, 323, 479–483.
Hanks, J. (2003). Transfrontier Conservation Areas (TFCAs)in Southern Africa: their role in conserving biodiversity,socioeconomic development and promoting a culture ofpeace. Journal of Sustainable Forestry, 17, 121–142.
Harris, G. M., Jenkins, C. N., and Pimm, S. L. (2005).Refining biodiversity conservation priorities. Conserva-tion Biology, 19, 1957–1968.
Jenkins, C. N. (2003). Importância dos remanescentes deMata Atlântica e dos corredores ecológicos para a pre-servação e recuperação da avifauna do estado do Rio de
Janeiro. Chapter in Índice de Qualidade dos Municípios– Verde II. Fundação CIDE, 2003, Rio de Janeiro, Brazil.
Jenkins, C. N. and Pimm S.L. (2006). Definindo Prioridadesde Conservação em um Hotspot de BiodiversidadeGlobal (Defining conservation priorities in a global bio-diversity hotspot). Chapter in Biologia da Conservação:Essências. RiMa Editora, São Carlos, SP. Rocha, C.F.D.;H.G. Bergallo; M. Van Sluys & M.A.S. Alves. (Orgs.).
Laurance, W. F., Cochrane, M. A., Bergen, S., Fearnside,P. M., Delamonica, P., Barber, C., D’Angelo, S., andFernandes, T. (2001). The future of the Brazilian Ama-zon. Science, 291, 438–439.
Leopold, A. (1993). Round River. Oxford University Press,Oxford, UK.
Manne, L. L. and Pimm, S. L. (2001). Beyond eight forms ofrarity: which species are threatened and which will benext? Animal Conservation, 4, 221–230.
Manne, L. L, Brooks, T. M., and Pimm S. L. (1999). Relativerisk of extinction of passerine birds on continents andislands. Nature, 399, 258–261.
Myers, N. (1988). Threatened biotas: ‘hotspots’ in tropicalforests. The Environmentalist, 8, 1–20.
Myers, N. (1990). The biodiversity challenge: expandedhotspots analysis. The Environmentalist, 10, 243.
Myers, N., Mittermeier, R. A., Mittermeier, C. G., Fonseca,G. A. B., and Kent, J. (2000). Biodiversity hotspots forconservation priorities. Nature, 403, 853–858.
National Research Council (1995). Science and theEndangered Species Act. National Academy Press, Wa-shington, DC.
Norse, E. A. andMcManus, R. E. (1980). Ecology and livingresources: biological diversity. In Environmental quality1980: the eleventh annual report of the Council on Environ-mental Quality, pp. 31–80. Council on EnvironmentalQuality, Washington, DC.
Parker, T. A., III., Stotz, D. F., and Fitzpatrick, J. W. (1996).Ecological and distributional databases for neotropicalbirds. In D. F. Stotz, T. A. Parker, J. W. Fitzpatrick andD. Moskovits, eds Neotropical birds: ecology and conserva-tion, pp.113-436. University of Chicago Press, Chicago, IL.
Pimm, S. L. (1996). Lessons from a kill. Biodiversity andConservation, 5, 1059–1067.
Pimm, S. L. (2000). Biodiversity is us. Oikos, 90, 3–6.Pimm S. L. (2001). The World According to Pimm: A ScientistAudits the Earth. McGraw–Hill, New York, NY.
Pimm, S. L. (2008). Biodiversity: climate change or habitatloss — which will kill more species? Current Biology, 18,117–119.
Pimm, S. L. and Askins, R. (1995). Forest losses predict birdextinctions in eastern North America. Proceedings of theNational Academy of Sciences of the United States of America,92, 9343–9347.
EXTINCTIONS AND THE PRACTICE OF PREVENTING THEM 197
1
© Oxford University Press 2010. All rights reserved. For permissions please email: [email protected]

Pimm, S. L. and Brooks, T. M. (2000). The Sixth Extinction:How large, how soon, and where? In P. Raven, ed.Natureand Human Society: the quest for a sustainable world,pp. 46–62. National Academy Press, Washington, DC.
Pimm, S. L. and Brown, J. H. (2004). Domains of diversity.Science, 304, 831–833.
Pimm, S. L. and C. Jenkins. (2005). Sustaining the variety ofLife. Scientific American, September, 66–73.
Pimm, S. L. and Lawton. J. H. (1998). Planning for biodi-versity. Science, 279, 2068–2069.
Pimm, S. L. and Raven, P. (2000). Extinction by numbers.Nature 403, 843–845.
Pimm, S. L., Jones, H. L., and J. M. Diamond. (1988). Onthe risk of extinction. The American Naturalist, 132,757–785.
Pimm, S. L., Diamond, J., Reed, T. R., Russell, G. J., andVerner, J. (1993). Times to extinction for small popula-tions of large birds. Proceedings of the National Academy ofSciences of the United States of America, 90, 10871–10875.
Pimm, S. L., Moulton M. P., and Justice J. (1994). Birdextinctions in the central Pacific. Philosophical Transac-tions of the Royal Society B, 344, 27–33.
Pimm, S. L., Raven, P., Peterson, A., Sekercioglu, C. H., andEhrlich P. R. (2006). Human impacts on the rates ofrecent, present, and future bird extinctions. Proceedingsof the National Academy of Sciences of the United States ofAmerica, 103, 10941–10946.
Pimm, S. L., Russell, G. J., Gittleman, J. L., and Brooks T. M.(1995). The future of biodiversity. Science, 269, 347–350.
Prendergast, J. R., Quinn, R. M., Lawton, J. H., Eversham,B. C., and Gibbons, D. W. (1994). Rare species, the coin-cidence of diversity hotspots and conservation strate-gies. Nature, 365, 335–337.
Purvis, A., Gittleman, J. L., Cowlishaw, G., and Mace,G. (2000). Predicting extinction risk in declining species.Proceedings of the Royal Society of London B, 267, 1947–1952.
Roberts C. M., McClean, C. J., Veron, J. E., et al. (2002).Marine biodiversity hotspots and conservation prioritiesfor tropical reefs. Science 295, 1280–1284.
Röckel, D., Korn, W., and Kohn A. J. (1995). Manual of theLiving Conidae, Vol 1. Springer-Verlage, New York, NY.
Savidge, J. A. (1987). Extinction of an island forest avifaunaby an introduced snake. Ecology, 68, 660–668.
Sekercioglu, C. H., Schneider, S. H., Fay, J. P., and Loarie,S. R. (2008). Climate change, elevational range shifts, andbird extinctions. Conservation Biology, 22, 140–150.
Simons E. L. (1997). Lemurs: old and new. In S. M. Good-man and B. D. Patterson, eds Natural change and humanimpact in Madagascar, pp. 142–156. Smithsonian Institu-tion Press, Washington, DC.
Soulé, M. E. and Terborgh, J., eds (1999). ContinentalConservation: Scientific Foundations of Regional ReserveNetworks. Island Press, Washington, DC.
Steadman D. W. (1995). Prehistoric extinctions of Pacificisland birds: biodiversity meets zooarcheology. Science,267, 1123–1131.
Stuart S. N., Chanson J. S., Cox N. A., et al. (2004). Statusand trends of amphibian declines and extinctions world-wide. Science 306, 1783–1786.
The Nature Conservancy (1996). TNC Priorities forConservation: 1996 Annual Report Card for U.S. Plantand Animal Species. The Nature Conservancy, Arlington,VA.
Thomas, C. D., Cameron, A., and Green, R. E., et al. (2004).Extinction risk from climate change.Nature 427, 145–148.
Tuck G. N., Polacheck T., and Bulman C. M. (2003). Spatio-temporal trends of longline fishing effort in the SouthernOcean and implications for seabird bycatch. BiologicalConservation, 114, 1–27.
Wallace, A. R. (1855). On the law which has regulated theintroduction of new species. Annals and Magazine of Nat-ural History, September 1855.
Walter K. S. and Gillett H. J., eds (1998). 1997 IUCN Red Listof Threatened Plants. IUCN, Gland, Switzerland.
Wiles G. J., Bart J., Beck R. E., and Aguon C. F. (2003).Impacts of the brown tree snake: patterns of declineand species persistence in Guam’s avifauna. ConservationBiology, 17, 1350–1360.
Williams, S. E., Bolitho, E. E., and Fox, S. (2003). Climatechange in Australian tropical rainforests: an impendingenvironmental catastrophe Proceedings of the Royal Socie-ty of London B., 270, 1887–1892.
198 CONSERVATION BIOLOGY FOR ALL
Sodhi and Ehrlich: Conservation Biology for All. http://ukcatalogue.oup.com/product/9780199554249.do
© Oxford University Press 2010. All rights reserved. For permissions please email: [email protected]

CHAP T E R 1 1
Conservation planning and prioritiesThomas Brooks
Maybe the first law of conservation science shouldbe that human population—which of course drivesboth threats to biodiversity and its conservation—isdistributed unevenly around the world (Cincottaet al. 2000). This parallels a better-known first lawof biodiversity science, that biodiversity itself is alsodistributed unevenly (Gaston 2000; Chapter 2).Were it not for these two patterns, conservationwould not need to be planned or prioritized. Aconservation investment in one place would havethe same effects as that in another. As it is, though,the contribution of a given conservation investmenttowards reducing biodiversity loss varies enor-mously over space. This recognition has led to theemergence of the sub-discipline of systematic con-servation planning within conservation biology.
Systematic conservation planning now datesback a quarter-century to its earliest contributions(Kirkpatrick 1983). A seminal review by Margulesand Pressey (2000) established a firm conceptualframework for the sub-discipline, parameterizedalong axes derived from the two aforementionedlaws. Variation in threats to biodiversity (and re-sponses to these) can be measured as vulnerability(Pressey and Taffs 2001), or, put another way, thebreadth of options available over time to conserve agiven biodiversity feature before it is lost. Mean-while, the uneven distribution of biodiversity canbe measured as irreplaceability (Pressey et al. 1994),the extent of spatial options available for the conser-vation of a givenbiodiversity feature.Analternativemeasure of irreplaceability is complementarity—thedegree to which the biodiversity value of a givenarea adds to thevalueof anoverall networkof areas.
This chapter charts the history, state, and pro-spects of conservation planning and prioritiza-tion, framed through the lens of vulnerability
and irreplaceability. It does not attempt to becomprehensive, but rather focuses on the bound-ary between theory and practice,where successfulconservation implementation has been explicitlyplanned from the discipline’s conceptual frame-work of vulnerability and irreplaceability. Inother words, the work covered here has success-fully bridged the “research–implementation gap”(Knight et al. 2008). The chapter is structured byscale. Its first half addresses global scale planning,which has attracted a disproportionate share ofthe literature since Myers’ (1988) pioneering “hot-spots” treatise. The remainder of the chaptertackles conservation planning and prioritizationon the ground (and in the water). This in turn isorganized according to three levels of increasingecological and geographic organization: from spe-cies, through sites, to seascapes and landscapes.
11.1 Global biodiversity conservationplanning and priorities
Most conservation is parochial—many peoplecare most about what is in their own backyard(Hunter and Hutchinson 1994). As a result,maybe 90% of the �US$6 billion global conserva-tion budget originates in, and is spent in, econom-ically wealthy countries (James et al. 1999).Fortunately, this still leaves hundreds of millionsof dollars of globally flexible conservation invest-ment that can theoretically be channeled to wher-ever would deliver the greatest benefit. The bulkof these resources are invested through multilat-eral agencies [in particular, the Global Environ-ment Facility (GEF) (www.gefweb.org)], bilateraldonors, and non-governmental organizations.Where should they be targeted?
199
1
© Oxford University Press 2010. All rights reserved. For permissions please email: [email protected]

11.1.1 History and state of the field
Over the last two decades, nine major templatesof global terrestrial conservation priorities havebeen developed by conservation organizations, toguide their own efforts and attract further atten-tion (Figure 11.1 and Plate 9; Brooks et al. 2006).Brooks et al. (2006) showed that all nine templatesfit into the vulnerability/irreplaceability frame-work, although in a variety of ways (Figure 11.2and Plate 10). Specifically, two of the templatesprioritize regions of high vulnerability, as “reac-tive approaches”, while three prioritized regionsof low vulnerability, as “proactive approaches”.The remaining four are silent regarding vulnera-bility. Meanwhile, six of the templates prioritizeregions of high irreplaceability; the remain-ing three do not incorporate irreplaceability.To understand these global priority-settingapproaches, it is important to examine the metricsof vulnerability and irreplaceability that theyuse, and the spatial units among which they pri-oritize.
Wilson et al.’s (2005) classification recognizesfour types of vulnerability measures: environ-mental and spatial variables, land tenure,threatened species, and expert opinion. All fiveof the global prioritization templates thatincorporated vulnerability did so using the firstof these measures, specifically habitat extent.Four of these utilized proportionate habitat loss,which is useful as a measure of vulnerabilitybecause of the consistent relationship betweenthe number of species in an area and the size ofthat area (Brooks et al. 2002). However, it is animperfect metric, because it is difficult to assess inxeric and aquatic systems, it ignores threats suchas invasive species and hunting, and it is retro-spective rather than predictive (Wilson et al.2005). The “frontier forests” approach (Bryantet al. 1997) uses absolute forest cover as ameasure, although this is only dubiously reflec-tive of vulnerability (Innes and Er 2002). Beyondhabitat loss, one template also incorporates landtenure, as protected area coverage (Hoekstra et al.2005), and two incorporate human population
CE
CPD
HBWA FF
MC
BH EBA
G200
LW
Figure 11.1 Maps of the nine global biodiversity conservation priority templates (reprinted from Brooks et al. 2006): CE, crisis ecoregions (Hoekstraet al. 2005); BH, biodiversity hotspots (Mittermeier et al. 2004); EBA, endemic bird areas (Stattersfield et al. 1998); CPD, centers of plant diversity(WWF and IUCN 1994–7); MC, megadiversity countries (Mittermeier et al. 1997); G200, global 200 ecoregions (Olson and Dinerstein 1998); HBWA,high‐biodiversity wilderness areas (Mittermeier et al. 2003); FF, frontier forests (Bryant et al. 1997); and LW, last of the wild (Sanderson et al. 2002a).With permission from AAAS (American Association for the Advancement of Science).
200 CONSERVATION BIOLOGY FOR ALL
Sodhi and Ehrlich: Conservation Biology for All. http://ukcatalogue.oup.com/product/9780199554249.do
© Oxford University Press 2010. All rights reserved. For permissions please email: [email protected]

density (Mittermeier et al. 2003; Sanderson et al.2002a).
The most common measure of irreplaceabilityis plant endemism, used by four of the templates,with a fifth (Stattersfield et al. 1998) using birdendemism. The logic behind this is that the moreendemic species in a region, themore biodiversitylost if the region’s habitat is lost (although, strict-ly, any location with even one endemic species isirreplaceable). Data limitations have restrictedthe plant endemism metrics to specialist opinionestimates, and while this precludes replication orformal calculation of irreplaceability (Brummittand Lughadha 2003), subsequent tests havefound these estimates accurate (Krupnick andKress 2003). Olson and Dinerstein (1998) addedtaxonomic uniqueness, unusual phenomena, andglobal rarity of major habitat types as measures ofirreplaceability, although with little quantifica-tion. Although species richness is popularly buterroneously assumed to be important in prioriti-zation (Orme et al. 2005), none of the approachesrelies on this. This is because species richness isdriven by common, widespread species, and somisses exactly those species most in need of con-servation ( Jetz and Rahbek 2002).
One of the priority templates uses countries as itsspatial unit (Mittermeier et al. 1997). The remainingeight utilize spatial units based on biogeography,
one using regions defined a posteriori from the dis-tributions of restricted-range bird species (Statters-field et al. 1998), and the other seven using units like“ecoregions”, defined a priori (Olson et al. 2001).This latter approach brings ecological relevance,but also raises problems because ecoregions varyin size, and because they themselves have no re-peatable basis (Jepson andWhittaker 2002). The useof equal area grid cells would circumvent theseproblems, but limitations on biodiversity data com-pilation so far have prevented their general use.Encouragingly, some initial studies (Figure 11.3)for terrestrial vertebrates (Rodrigues et al. 2004b)and, regionally, for plants (Küper et al. 2004) showconsiderable correspondence with many of thetemplates (da Fonseca et al. 2000).
What have been the costs and benefits of globalpriority-setting? The costs can be estimated to lie inthe low millions of dollars, mainly in the form ofstaff time. The benefits are hard to measure, butlarge. Themost tractablemetric, publication impact,reveals thatMyers et al. (2000), the benchmarkpaperon hotspots, was the single most cited paper inthe ISI Essential Science Indicators category “Envi-ronment/Ecology” for the decade preceding2005. Much more important is the impact thatthese prioritization templates have had on resourceallocation.Myers (2003) estimated that over the pre-ceding 15 years, the hotspots concept had focused
Vulnerability
BA Proactive Reactive Proactive Reactive
HBWA BHEBA, CPDMC, G200
CEFFLWIr
rep
lace
abil
ity
Figure 11.2 Global biodiversity conservation priority templates placed within the conceptual framework of irreplaceability and vulnerability (reprintedfrom Brooks et al. 2006). Template names follow the Figure 11.1 legend. (A) Purely reactive (prioritizing high vulnerability) and purely proactive(prioritizing low vulnerability) approaches. (B) Approaches that do not incorporate vulnerability as a criterion (all prioritize high irreplaceability). Withpermission from AAAS (American Association for the Advancement of Science).
CONSERVATION PLANNING AND PRIORITIES 201
1
© Oxford University Press 2010. All rights reserved. For permissions please email: [email protected]

US$750 million of globally flexible conservationresources. Entire funding mechanisms have beenestablished to reflect global prioritization, such asthe US$150 million Critical Ecosystem PartnershipFund (www.cepf.net) and theUS$100million Glob-al Conservation Fund (web.conservation.org/xp/gef); and the ideas have been incorporated into theResource Allocation Framework of the Global Envi-ronment Facility, the largest conservation donor.
11.1.2 Current challenges and future directions
Six major research fronts can be identified for theassessment of global biodiversity conservationpriorities (Mace et al. 2000; Brooks et al. 2006).
First, it remains unclear the degree to whichpriorities set using data for one taxon reflect prio-rities for others, and, by extension, whether prio-rities for well-known taxa like vertebrates andplants reflect those for the poorly-known, mega-diverse invertebrates, which comprise the bulkof life on earth. Lamoreux et al. (2006), for exam-ple, found high congruence between conserva-tion priorities for terrestrial vertebrate species.In contrast, Grenyer et al. (2006) reported lowcongruence between conservation priorities formammals, birds, and amphibians. However, thisresult was due to exclusion of unoccupied cells;when this systematic bias is corrected, the samedata actually show remarkably high congruence
Figure 11.3 Incorporating primary biodiversity data in global conservation priority‐setting (reprinted from Brooks et al. 2006). Global conservationprioritization templates have been based almost exclusively on bioregional classification and specialist opinion, rather than primary biodiversity data. Suchprimary datasets have recently started to become available under the umbrella of the IUCN Species Survival Commission (IUCN2007), and they allow progressivetesting and refinement of templates. (A) Global gap analysis of coverage of 11 633 mammal, bird, turtle, and amphibian species (�40% of terrestrialvertebrates) in protected areas (Rodrigues et al. 2004a). It shows unprotected half‐degree grid cells characterized simultaneously by irreplaceability values of atleast 0.9 on a scale of 0–1, and of the top 5% of values of an extinction risk indicator based on the presence of globally threatened species (Rodrigues et al.2004b). (B) Priorities for the conservation of 6269 African plant species (�2% of vascular plants) across a 1‐degree grid (Küper et al. 2004). These are the 125grid cells with the highest product of range‐size rarity (a surrogate for irreplaceability) of plant species distributions and mean human footprint (Sanderson et al.2002a). Comparison of these twomaps, and between them and Fig. 11.2, reveals a striking similarity among conservation priorities for vertebrates and those forplants, in Africa.
202 CONSERVATION BIOLOGY FOR ALL
Sodhi and Ehrlich: Conservation Biology for All. http://ukcatalogue.oup.com/product/9780199554249.do
© Oxford University Press 2010. All rights reserved. For permissions please email: [email protected]

(Rodrigues 2007). More generally, a recent reviewfound that positive (although rarely perfect) sur-rogacy is the norm for conservation prioritiesbetween different taxa; in contrast, environmentalsurrogates rarely function better than random (Fig-ure 11.4 and Plate X; Rodrigues and Brooks 2007).
While surrogacy may be positive withinbiomes, none of the conservation prioritizationtemplates to date have considered freshwater ormarine biodiversity, and at face value one mightexpect that conservation priorities in aquatic sys-tems would be very different from those on land(Reid 1998). Remarkably, two major studies fromthe marine environment suggest that there mayin fact be some congruence between conservationpriorities on land and those at sea. Roberts et al.(2002), found that 80% of their coral hotspots,although restricted to shallow tropical reef sys-tems, were adjacent to Myers et al. (2000) terres-trial hotspots. More recently, Halpern et al. (2008)measured and mapped the intensity of pressureson the ocean (regardless of marine biodiversity);the pressure peaks on their combined map aresurprisingly close to biodiversity conservationpriorities on land (the main exception being the
North Sea) (see also Box 4.3). While much workremains in marine conservation prioritization,and that for freshwater biodiversity has barelyeven begun, these early signs suggest that theremay be some geographic similarity in conserva-tion priorities even between biomes.
Another open question is the extent to whichconservation priorities represent not just currentdiversity but also evolutionary history. Forprimates and carnivores globally, Sechrest et al.(2002) showed that biodiversity hotspots hold adisproportionate concentration of phylogeneticdiversity, with the ancient lineages of Madagascara keydriver of this result (Spathelf andWaite 2007).By contrast, Forest et al. (2007) claimed to find thatincorporating botanical evolutionary history forthe plants of the Cape Floristic hotspot substantial-ly altered the locations of conservation priorities.Using simulations, Rodrigues et al. (2005) arguedthat phylogeny will only make a difference to con-servation prioritization under specific conditions:where very deep lineages endemics are endemic tospecies-poor regions. Addressing the questionglobally across entire classes remains an importantresearch priority.
Species accumulation index (SAI)–0.6
0
5
10
Per
cen
tage
of
test
s
15
20
Cross–taxon
Environmental
25
–0.5 –0.4 –0.3 –0.2 –0.1 0 0.1 0.2 0.3 0.4 0.5 0.6 0.7 0.8 0.9 1.0
Figure 11.4 Frequency distribution of values of a species accumulation index (SAI) of surrogate effectiveness for comparison between tests onterrestrial cross‐taxon and on environmental surrogates; the SAI has a maximum value of 1 (perfect surrogacy), and indicates random surrogacy when ithas a value of 0, and surrogacy worse than random when it is negative (reprinted from Rodrigues and Brooks 2007).
CONSERVATION PLANNING AND PRIORITIES 203
1
© Oxford University Press 2010. All rights reserved. For permissions please email: [email protected]

Even if existing conservation priorities captureevolutionary history well, this does not necessar-ily mean that they capture evolutionary process.Indeed, a heterodox view proposes that theyoung, rapidly speciating terminal twigs of phy-logenetic trees should be the highest conservationpriorities (Erwin 1991)—although some worksuggests that existing conservation priority re-gions are actually priorities for both ancient andyoung lineages (Fjeldså and Lovett 1997). Othersargue that much speciation is driven from ecoton-al environments (Smith et al. 1997) and that theseare poorly represented in conservation prioritiza-tion templates (Smith et al. 2001). The verdict isstill out.
The remaining research priorities for globalconservation prioritization concern intersectionwith human values. Since the groundbreakingassessment of Costanza et al. (1997), much workhas been devoted to the measurement of ecosys-tem service value—although surprisingly little toprioritizing its conservation (but see Ceballos andEhrlich 2002). Kareiva and Marvier (2003) sug-gested that existing global biodiversity conserva-tion priorities are less important than otherregions for ecosystem service provision. Turneret al. (2007), by contrast, showed considerablecongruence between biodiversity conservationpriority and potential ecosystem service value,at least for the terrestrial realm. Moreover, thatthere is correspondence of both conservationpriorities and ecosystem service value withhuman population (Balmford et al. 2001) and pov-erty (Balmford et al. 2003) suggests that biodiver-sity conservation may be delivering ecosystemservices where people need them most.
Maybe the final frontier of global priority-setting is the incorporation of cost of conservation.This is important, because conservation costs perunit area vary over seven orders of magnitude,but elusive, because they are hard to measure(Polasky 2008). Efforts over the last decade, how-ever, have begun to develop methods for estimat-ing conservation cost ( James et al. 1999, 2001;Bruner et al. 2004). These have in turn allowedassessment of the impact of incorporating costsinto conservation prioritization—with initial in-dications suggesting that this makes a substantial
differencewithin regions (Ando et al. 1998;Wilsonet al. 2006), across countries (Balmford et al. 2000),and globally (Carwardine et al. 2008). Further, andencouragingly, it appears that incorporation ofcosts may actually decrease the variation in con-servation priorities caused by consideration ofdifferent biodiversity datasets, at least at the glob-al scale (Bode et al. 2008). The development of afine-scale, spatial, global estimation of conserva-tion costs is therefore an important priority forglobal conservation prioritization.
11.2 Conservation planning and prioritieson the ground
For all of the progress of global biodiversity conser-vation priority-setting, planning at much finerscales is necessary to allow implementation on theground or in the water (Mace et al. 2000; Whittakeret al. 2005; Brooks et al. 2006). Madagascar can andshould attract globally flexible conservation re-sources because it is a biodiversity hotspot, forexample, but this does not inform the question ofwhere within the island these resources should beinvested (see Box 12.1). Addressing this questionrequires consideration of three levels of ecologicalorganization—species, sites, and sea/landscapes—addressed in turn here.
11.2.1 Species level conservation planningand priorities
Many consider species the fundamental unit ofbiodiversity (Wilson 1992). Conversely, avoidingspecies extinction can be seen as the fundamentalgoal of biodiversity conservation, because whileall of humanity’s other impacts on the Earth canbe repaired, species extinction, Jurassic Park fan-tasies notwithstanding, is irreversible. It is fitting,then, that maybe the oldest, best-known, andmost widely used tool in the conservationist’stoolbox informs conservation planning at the spe-cies level. This is the IUCN Red List ofThreatened Species (www.iucnredlist.org).
History and state of the fieldThe IUCN Red List now dates back nearly 50years, with its first volumes published in the
204 CONSERVATION BIOLOGY FOR ALL
Sodhi and Ehrlich: Conservation Biology for All. http://ukcatalogue.oup.com/product/9780199554249.do
© Oxford University Press 2010. All rights reserved. For permissions please email: [email protected]
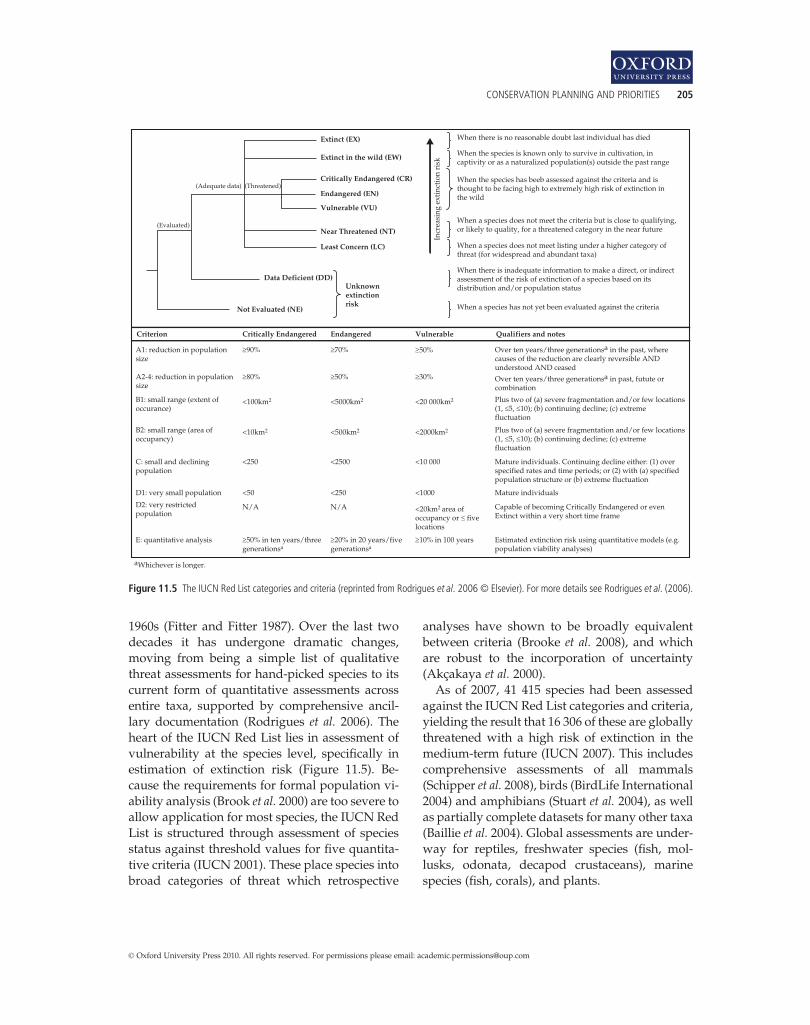
1960s (Fitter and Fitter 1987). Over the last twodecades it has undergone dramatic changes,moving from being a simple list of qualitativethreat assessments for hand-picked species to itscurrent form of quantitative assessments acrossentire taxa, supported by comprehensive ancil-lary documentation (Rodrigues et al. 2006). Theheart of the IUCN Red List lies in assessment ofvulnerability at the species level, specifically inestimation of extinction risk (Figure 11.5). Be-cause the requirements for formal population vi-ability analysis (Brook et al. 2000) are too severe toallow application for most species, the IUCN RedList is structured through assessment of speciesstatus against threshold values for five quantita-tive criteria (IUCN 2001). These place species intobroad categories of threat which retrospective
analyses have shown to be broadly equivalentbetween criteria (Brooke et al. 2008), and whichare robust to the incorporation of uncertainty(Akçakaya et al. 2000).
As of 2007, 41 415 species had been assessedagainst the IUCN Red List categories and criteria,yielding the result that 16 306 of these are globallythreatened with a high risk of extinction in themedium-term future (IUCN 2007). This includescomprehensive assessments of all mammals(Schipper et al. 2008), birds (BirdLife International2004) and amphibians (Stuart et al. 2004), as wellas partially complete datasets for many other taxa(Baillie et al. 2004). Global assessments are under-way for reptiles, freshwater species (fish, mol-lusks, odonata, decapod crustaceans), marinespecies (fish, corals), and plants.
Extinct (EX)
Extinct in the wild (EW)
Critically Endangered (CR)(Adequate data) (Threatened)
(Evaluated)
When there is no reasonable doubt last individual has died
When the species is known only to survive in cultivation, incaptivity or as a naturalized population(s) outside the past range
When the species has beeb assessed against the criteria and is thought to be facing high to extremely high risk of extinction inthe wild
When a species does not meet the criteria but is close to qualifying,or likely to quality, for a threatened category in the near future
When a species does not meet listing under a higher category ofthreat (for widespread and abundant taxa)
When there is inadequate information to make a direct, or indirectassessment of the risk of extinction of a species based on itsdistribution and/or population status
When a species has not yet been evaluated against the criteria
Endangered (EN)
Vulnerable (VU)
Vulnerable
<20 000km2
<2000km2
Over ten years/three generationsa in the past, wherecauses of the reduction are clearly reversible ANDunderstood AND ceased
Over ten years/three generationsa in past, futute orcombination
Mature individuals. Continuing decline either: (1) overspecified rates and time periods; or (2) with (a) specifiedpopulation structure or (b) extreme fluctuation
Capable of becoming Critically Endangered or evenExtinct within a very short time frame
Estimated extinction risk using quantitative models (e.g.population viability analyses)
Plus two of (a) severe fragmentation and/or few locations(1, £5, £10); (b) continuing decline; (c) extremefluctuation
Plus two of (a) severe fragmentation and/or few locations(1, £5, £10); (b) continuing decline; (c) extremefluctuation
<500km2
<5000km2<100km2
<10km2
<250
<50
N/A
E: quantitative analysis
aWhichever is longer.
D2: very restrictedpopulation
D1: very small population
C: small and decliningpopulation
B2: small range (area ofoccupancy)
B1: small range (extent ofoccurance)
A2-4: reduction in populationsize
A1: reduction in populationsize
N/A
<10 000
<1000<250
<2500
<20km2 area ofoccupancy or £ fivelocations
³50%
³50%
³70%³90%
³80% ³30%
Qualifiers and notes
Incr
easi
ng e
xtin
ctio
n ri
sk
Near Threatened (NT)
Least Concern (LC)
Unknownextinctionrisk
Data Deficient (DD)
Not Evaluated (NE)
EndangeredCritically EndangeredCriterion
³20% in 20 years/fivegenerationsa
³50% in ten years/threegenerationsa
³10% in 100 years
Mature individuals
Figure 11.5 The IUCN Red List categories and criteria (reprinted from Rodrigues et al. 2006 © Elsevier). For more details see Rodrigues et al. (2006).
CONSERVATION PLANNING AND PRIORITIES 205
1
© Oxford University Press 2010. All rights reserved. For permissions please email: [email protected]

It is worth a short digression here concerningirreplaceability at the species level, where phylo-genetic, rather than geographic, space providesthe dimension over which irreplaceability can bemeasured. A recent study by Isaac et al. (2007) haspioneered the consideration of this concept of“phylogenetic irreplaceability” alongside theIUCN Red List to derive species-by-species con-servation priorities. A particularly useful applica-tion of this approach may prove to be inprioritizing efforts in ex situ conservation.
The benefits of the IUCNRed List are numerous(Rodrigues et al. 2006), informing site conservationplanning (Hoffmann et al. 2008), environmentalimpact assessment (Meynell 2005), national policy(De Grammont and Cuarón 2006), and inter-governmental conventions (Brooks and Kennedy2004), as well as strengthening the conservationconstituency through the workshops process.Data from the assessments for mammals, birds,amphibians, and freshwater species to date sug-gest that aggregate costs for the IUCN Red Listprocess average around US$200 per species, in-cluding staff time, data management, and, in par-ticular, travel andworkshops. This cost is expectedto decrease as the process moves into assessmentsof plant and invertebrate species, because thesetaxa have many fewer specialists per species thandovertebrates (Gaston andMay 1992).However, itis expected that the benefits of the process will alsodecrease for invertebrate taxa, because the propor-tion of data deficiency will likely rise compared tothe current levels for vertebrate groups (e.g.�23%for amphibians: Stuart et al. 2004). However, asampled Red List approach is being developed toallow inexpensive insight into the conservationstatus of even the megadiverse invertebrate taxa(Baillie et al. 2008).
Current challenges and future directionsThe main challenge facing the IUCN Red List isone of scientific process: how to expand the RedList’s coverage in the face of constraints of taxo-nomic uncertainty, data deficiency, lack of capac-ity, and demand for training (Rodrigues et al.2006). Some of the answer to this must lie incoordination of the IUCN Red List with nationalred listing processes, which have generated data
on thousands of species not yet assessed globally(Rodriguez et al. 2000). To this end, IUCN havedeveloped guidelines for sub-global applicationof the Red List criteria (Gärdenfors et al. 2001), butmuch work is still needed to facilitate the dataflow between national and global levels.
One specific scientific challenge worth high-lighting here is the assessment of threats drivenby climate change. Climate change is now widelyrecognized as a serious threat to biodiversity(Thomas et al. 2004). However, it hard to applythe Red List criteria against climate changethreats, especially for species with short genera-tion times (Akçakaya et al. 2006), because climatechange is rather slow-acting (relative to the timescale of the Red List criteria). Research is under-way to address this limitation.
11.2.2 Site level conservation planningand priorities
With 16 306 species known to be threatened withextinction, threat rates increasing by the year(Butchart et al. 2004), and undoubtedly manythousands of threatened plants and invertebratesyet to be assessed, the task of biodiversity conser-vation seems impossibly daunting. Fortunately, itis not necessary to conserve these thousands ofspecies one at a time. Examination of thosethreatened species entries on the Red List forwhich threats are classified reveals that habitatdestruction is the overwhelming driver, threaten-ing 90% of threatened species (Baillie et al. 2004).The logical implication of this is that the corner-stone of conservation action must be conservingthe habitats in which these species live—estab-lishing protected areas (Bruner et al. 2001). Thisimperative for protecting areas is not new, ofcourse—it dates back to the roots of conservationitself—but analyses of the World Database onProtected Areas show that there are now 104791 protected areas worldwide covering 12% ofthe world’s land area (Chape et al. 2005). Despitethis, however, much biodiversity is still whollyunrepresented within protected areas (Rodrigueset al. 2004a). The Programme of Work on Pro-tected Areas of the Convention on Biological Di-versity (www.cbd.int/protected) therefore calls
206 CONSERVATION BIOLOGY FOR ALL
Sodhi and Ehrlich: Conservation Biology for All. http://ukcatalogue.oup.com/product/9780199554249.do
© Oxford University Press 2010. All rights reserved. For permissions please email: [email protected]

for gap analysis to allow planning of “compre-hensive, effectively managed, and ecologicallyrepresentative” protected area systems. Howcan such planning best take place?
History and state of the fieldBroadly, approaches to planning protected areasystems can be classified into four groups. Theoldest is ad hoc establishment, which often in-creases protected area coverage with minimalvalue for biodiversity (Pressey and Tully 1994).The 1990s saw the advent of the rather moresuccessful consensus workshop approach, whichallowed for data sharing and stake-holder buy-in,and certainly represented a considerable advanceover ad hoc approaches (Hannah et al. 1998). How-ever, the lack of transparent data and criteria stilllimited the reliability of workshop-based site con-servation planning. Meanwhile, developments intheory (Margules and Pressey 2000) and ad-vances in supporting software (e.g. Marxan;www.uq.edu.au/marxan), led to large scale ap-plications of wholly data-driven conservationplanning, most notably in South Africa (Cowlinget al. 2003). However, the black-box nature ofthese applications led to limited uptake in conser-vation practice, which some have called the “re-search–implementation gap” (Knight et al. 2008).
To overcome these limitations, the trend inconservation planning for implementation onthe ground is now towards combining data-driven with stakeholder-driven techniques(Knight et al. 2007; Bennun et al. 2007). This ap-proach actually has a long history in bird conser-vation, with the first application of “importantbird areas” dating back to the work of OsieckandMörzer Bruyns (1981). This “site-specific syn-thesis” (Collar 1993–4) of bird conservation datahas gained momentum to the point where impor-tant bird area identification is now close to beingcomplete worldwide (BirdLife International2004). Over the last decade, the approach hasbeen extended to numerous other taxa (e.g.plants: Plantlife International 2004), and thencegeneralized into the “key biodiversity areas” ap-proach (Eken et al. 2004). Several dozen countrieshave now completed key biodiversity area iden-tification as part of their commitment towards
national gap analysis under the Convention onBiological Diversity’s Programme of Work onProtected Areas (e.g. Madagascar: Figure 11.6;Turkey: Box 11.1), and a comprehensive guidancemanual published to support this work (Lan-ghammer et al. 2007). Furthermore, all of theworld’s international conservation organizations,and many national ones, have come together asthe Alliance for Zero Extinction (AZE), to identifyand implement action for the very highest prio-rities for site-level conservation (Ricketts et al.2005, Figure 11.7 and Plate 12).
The key biodiversity areas approach, in align-ment with the conceptual framework for conser-vation planning (Margules and Pressey 2000), isbased on metrics of vulnerability and irreplace-ability (Langhammer et al. 2007). Their vulnera-bility criterion is derived directly from the IUCNRed List, through the identification of sites regu-larly holding threshold populations of oneor more threatened species. The irreplaceability
protected KBA
non-protected KBA
Figure 11.6 Location and protection status of the Key BiodiversityAreas (KBAs) of Madagascar (reprinted from Langhammer et al. 2007).
CONSERVATION PLANNING AND PRIORITIES 207
1
© Oxford University Press 2010. All rights reserved. For permissions please email: [email protected]

criterion is based on regular occurrence at a site ofa significant proportion of the global populationof a species. This is divided into sub-criteria torecognize the various situations under which thiscould occur, namely for restricted range species,species with clumped distributions, congregatorypopulations (species that concentrate during aportion of their life cycle), source populations,and biome-restricted assemblages. The relianceon occurrence data undoubtedly causes omissionerrors (where species occur in unknown sites)and hence the approach overestimates irreplace-ability. These omission errors could in theorybe reduced by use of modeling or extrapolationtechniques, but these instead yield dangerouscommission errors, which could lead to extinctionthrough a species wrongly considered to be safelyrepresented (Rondinini et al. 2006). Where suchtechniques are of proven benefit is in identifyingresearch priorities (as opposed to conservationpriorities) for targeted field surveys (Raxworthyet al. 2003).
To facilitate implementation and gap analysis,key biodiversity areas are delineated based on ex-isting land management units, such as protectedareas, indigenous or community lands, privateconcessions or ranches, and military or other pub-lic holdings (Langhammer et al. 2007). Importantly,this contrasts with subdivision of the entire land-scape into, for example, grid cells, habitat types, orwatersheds.While grid cells have the advantage ofanalytical rigor, and habitats and watersheds de-liver ecological coherence, these spatial units are ofminimal relevance to the stakeholders on whomconservation on the ground fundamentally de-pends. Indeed, the entire key biodiversity areasprocess is designed to build the constituency forlocal conservation, while following global stan-dards and criteria (Bennun et al. 2007). The costsand benefits of site conservation planning ap-proaches have yet to be fully evaluated, but someearly simulation work suggests that the benefits ofincorporation of primary biodiversity data arelarge (Balmford and Gaston 1999).
Current challenges and future directionsThree important challenges can be discerned asfacing site level conservation planning. The first
stems from the fact that most applications ofthese approaches to date come from fragmentedhabitats—it often proves difficult to identify sitesof global biodiversity conservation significance inregions that retain a wilderness character, forinstance, in the Amazon (Mittermeier et al.2003). Under such circumstances, the omissionerrors attendant on use of occurrence data (be-cause of very low sampling density) combinewith difficulty in delineating sites (because ofoverlapping or non-existent land tenure). Theseproblems can, and indeed must, be overcome bydelineating very large key biodiversity areas,which is still a possibility in such environments(e.g. Peres 2005).
The second challenge facing site level conser-vation planning is its extension to aquatic envir-onments. Human threats to both freshwater andmarine biodiversity are intense, but species as-sessments in these biomes are in their infancy(see above), seriously hampering conservationplanning. Difficulties of low sampling densityand delineation are also challenging for conserva-tion planning below the water, as in wildernessregions on land. Nevertheless, initial scoping sug-gests that the application of the key biodiversityareas approach will be desirable in both freshwa-ter (Darwall and Vié 2005) and marine (Edgaret al. 2008a) environments, and proof-of-conceptfrom the Eastern Tropical Pacific shows that it isfeasible (Edgar et al. 2008b).
The third research front for the key biodiversityareas approach is prioritization (Langhammer et al.2007)—once sites have been identified and deli-neated as having global biodiversity conservationsignificance, which should be assigned the mosturgent conservation action? This requires the mea-surement not just of irreplaceability and speciesvulnerability, but also of site vulnerability (Bennunet al. 2005). This is because site vulnerability inter-acts with irreplaceability: where irreplaceability ishigh (e.g., in AZE sites), the most threatened sitesare priorities, whilewhere irreplaceability is lower,the least vulnerable sites shouldbe prioritized. Thisis particularly important in considering resilience(i.e. low vulnerability) of sites in the face of climatechange. Aswith global prioritization (see above), itis also important to strive towards incorporating
208 CONSERVATION BIOLOGY FOR ALL
Sodhi and Ehrlich: Conservation Biology for All. http://ukcatalogue.oup.com/product/9780199554249.do
© Oxford University Press 2010. All rights reserved. For permissions please email: [email protected]

Box 11.1 Conservation planning for Key Biodiversity Areas in TurkeyGüven Eken, Murat Ataol, Murat Bozdog�an, Özge Balkız, Süreyya I_sfendiyarog�lu,Dicle Tuba Kılıç, and Yıldıray Lise
An impressive set of projects has already beencarried out to map priority areas forconservation in Turkey. These include threeinventories of Important Bird Areas (Ertan et al.1989; Magnin and Yarar 1997; Kılıç and Eken2004), amarine turtle areas inventory (Yerli andDemirayak 1996), and an Important PlantAreas inventory (Özhatay et al. 2003). Theseprojects, collectively, facilitated on‐the‐ground site conservation in Turkey and drewattention to gaps in the present protectedareas network.We used the results of these projects as inputs
to identify the Key Biodiversity Areas (KBAs) ofTurkey, using standard KBA criteria across eighttaxonomic groups: plants, dragonflies,butterflies, freshwaterfish, amphibians, reptiles,birds, and mammals. As a result of this study, aninventory of two volumes (1112 pages) waspublished in Turkish fully documenting thecountry’s KBAs (Eken et al. 2006).
Unprotected KBAs
0 50 100 200 300 400km
Protected KBAs
Box 11.1 Figure The 294 KBAs (Key Biodiversity Areas) of global importance identified in Turkey. While 146 incorporate protected areas(light), this protection still covers <5% of Turkey’s land area. The remaining 148 sites (dark) are wholly unprotected.
We used the framework KBA criteriadeveloped by Eken et al. (2004) and assessed 10214 species occurring in Turkey against thesecriteria. Two thousand two hundred and fortysix species triggered one or more KBA criteria.These include 2036 plant species (out of 8897 inTurkey; 23%), 71 freshwater fish (of 200; 36%),36 bird (of 364; 10%), 32 reptile (of 120; 27%),28 mammal (of 160; 18%), 25 butterfly (of 345;7%), 11 amphibian (of 30; 37%), and 7dragonfly (of 98; 7%) species. Then, we assessedall available population data against each KBAcriterion and its threshold to select KBAs.
We identified 294 KBAs qualifying on one ormore criteria at the global scale (Box 11.1 Figureand Plate 11). Two KBAs met the criteria forseven taxon groups, while 11 sites met them forsix and 18 for five taxon groups. The greatestnumber of sites, 94, met the KBA criteria for twotaxon groups, while 86 sites (29%) triggered thecriteria for one taxon group only.
continues
1
© Oxford University Press 2010. All rights reserved. For permissions please email: [email protected]

cost of conservation. Given these complexities,considerable promise may lie in adaptingconservation planning software to the purpose ofprioritizing among conservation actions across keybiodiversity areas.
11.2.3 Sea/landscape level conservationplanning and priorities
The conservation community has more than 40years experience with conservation planning at
the species level, and more than 20 at the sitelevel. However, the recent growth of the field oflandscape ecology (Turner 2005) sounds awarningthat while species and site planning are essentialfor effective biodiversity conservation, they are notsufficient. Why not, and how, then, can conserva-tion plan beyond representation, for persistence?
History and state of the fieldThe first signs that conserving biodiversity inisolated protected areas might not ensure
Box 11.1 (Continued)
The greatest number of sites, 223, wasselected based on the criteria for plants,followed by reptiles and birds with 108 and 106sites selected respectively. For other groups,smaller numbers of sites triggered the KBAcriteria at the global scale: 95 KBAs wereselected for mammals, 66 for butterflies, 61 forfreshwater fish, and 29 each for amphibiansand dragonflies. The number of sites selectedfor plants is actually rather low, given the highnumber of plant species in Turkey which triggerthe KBA criteria. This can be explained by theoverlapping distributions of restricted‐rangeand threatened plants. The other taxon groupshave relatively greater numbers of sites. Forinstance, the seven dragonfly species triggeredthe KBA criteria for 29 sites. One exception isthe freshwater fish, which, like plants, havehighly overlapping ranges.Large scale surface irrigation, drainage, and
dam projects form the most significant threatsto Turkey’s nature. Irrigation and drainageprojects affect 74% of the KBAs and dams havean effect on at least 49%. Inefficient use ofwater, especially in agriculture, is the rootcause of these threats. A total of 40 billion m3
of water is channeled annually to agriculture(75%), industry (10%), and domestic use (15%),but 50–90% of water used for agriculture is lostduring the transportation from dams to arableland. As a result of these threats, wetlands andassociated grasslands are Turkey’s mostthreatened habitat types. At least five wetlandKBAs (Esmekaya Marshes, Hotamıs Marshes,Sultan Marshes, Ereg� li Plain, and Seyfe Lake)
have been lost entirely over the last decade,and other sites have lost at least 75% of theirarea during the same period.Less than 5% of the surface area of Turkey’s
KBAs is legally protected, and so this should beexpanded rapidly and strategically. Steppehabitats, river valleys, and Mediterraneanscrublands are particularly poorly covered bythe current network of protected areas.Wildlife Development Reserves, Ramsar Sitesand, in the future, Natura 2000 Sites, wouldlikely be appropriate protected area categoriesfor this expansion.
REFERENCES
Eken, G., Bennun, L., Brooks, T. M., et al. (2004). Keybiodiversity areas as site conservation targets. Bio-Science, 54, 1110–1118.
Eken, G., Bozdog�an, M., I_sfendiyarog� lu, S., Kılıç, D. T., andLise, Y. (2006). Türkiye’nin önemli dog�a alanları. Dog�aDerneg� i, Ankara, Turkey.
Ertan,A.,Kılıç,A.,andKasparek,M. (1989).Türkiye’ninönemlikusalanları.Dog�alHayatıKorumaDerneg� iandInternationalCouncil for Bird Preservation, Istanbul, Turkey.
Kılıç, D. T. and Eken, G. (2004). Türkiye’nin önemli kusalan-ları – 2004 güncellemesi. Dog�a Derneg� i, Ankara, Turkey.
Magnin, G. and Yarar, M. (1997). Important bird areas inTurkey. Dog�al Hayatı Koruma Derneg� i, Istanbul, Turkey.
Özhatay, N., Byfield, A., and Atay, S. (2003). Türkiye’ninönemli bitki alanları. WWF‐Türkiye, Istanbul, Turkey.
Yerli, S. and Demirayak, F. (1996). Türkiye’de denizkaplum-bag�aları ve üreme kumsalları üzerine bir deg�erlendirme.Dog�al Hayatı Koruma Derneg� i, Istanbul, Turkey.
Sodhi and Ehrlich: Conservation Biology for All. http://ukcatalogue.oup.com/product/9780199554249.do
© Oxford University Press 2010. All rights reserved. For permissions please email: [email protected]

persistence came from evidence of long-term ex-tinctions of mammal species from North Ameri-can national parks (Newmark 1987). Over thefollowing decade, similar patterns were uncov-ered across many taxa, unfolding over the time-scale of decades-to-centuries, for megadiversetropical ecosystems in Latin America (e.g. Robin-son 1999), Africa (e.g. Brooks et al. 1999), and Asia(e.g. Brook et al. 2003). Large-scale experiments,most notably the Manaus Biological Dynamics ofForest Fragments project, provide increasinglyrefined evidence (Bierregaard et al. 2001). Themechanisms determining persistence—or extinc-tion—in individual sites spans the full spectrumfrom the genetic scale (Saccheri et al. 1998; seeChapters 2 and 16) through populations (Lenset al. 2002) and communities (Terborgh et al. 2001),to the level of ecosystem processes across entirelandscapes (Saunders et al. 1991; see Chapter 5).
The first recommendations of how conserva-tion planning might address persistence at land-scape scales were generic design criteria for theconnectivity of protected areas (Diamond 1975).Conservation agencies were quick to pick up theconcept, and over the last twenty years a number
of large scale conservation corridors have beendesigned (Crooks and Sanjayan 2006), for exam-ple, the “Yellowstone to Yukon” (Raimer andFord 2005) and Mesoamerican Biological Corri-dor (Kaiser 2001). There is no doubt that theimplementation of corridors benefits biodiversity(Tewksbury et al. 2002). However, the establish-ment of generic corridors has also been criticized,in that they divert conservation resources fromhigher priorities in protected area establishment,and, even worse, have the potential to increasethreats, such as facilitating the spread of disease,invasive, or commensal species (Simberloff et al.1992).
Given these concerns, there has been a shifttowards specification of the particular objectivesfor any given corridor (Hobbs 1992). A promisingavenue of enquiry here has been to examine theneeds of “landscape species”which require broadscale conservation (Sanderson et al. 2002b). Boydet al. (2008) have generalized this approach, re-viewing the scales of conservation required for allthreatened terrestrial vertebrate species (Figure11.8 and Plate 13). They found that 20% (793) ofthese threatened species required urgent broad
Figure 11.7 Map of 595 sites of imminent species extinction (reprinted from Ricketts et al. 2005). Yellow sites are either fully protected or partiallycontained within declared protected areas (n = 203 and 87, respectively), and red sites are completely unprotected or have unknown protection status(n = 257 and 48, respectively). In areas of overlap, unprotected (red) sites are mapped above protected (yellow) sites to highlight the more urgentconservation priorities.
CONSERVATION PLANNING AND PRIORITIES 211
1
© Oxford University Press 2010. All rights reserved. For permissions please email: [email protected]

scale conservation action, with this result varyingsignificantly among taxa (Figure 11.9). They alsoasked why each of these species required broadscale conservation. This yielded the surprisingfinding that while only 43% of these 793 specieswere “area-demanding” and so required corri-dors for movement, no less than 72% were de-pendent on broad scale ecological processesacting across the landscape (15% require both).In this light, recent work in South Africa to pio-neer techniques for incorporating ecosystem pro-cesses into conservation planning is likely to beparticularly important (Rouget et al. 2003, 2006).
Current challenges and future directionsAs at the species and site levels, the incorporationof broad scale targets into conservation planningin aquatic systems lags behind the terrestrial envi-ronment. Given the regimes of flows and currentsinherent in rivers and oceans, the expectation isthat broad scale conservation will be even moreimportant in freshwater (Bunn and Arthington2002) and in the sea (Roberts 1997) than it is on
land. Boyd et al.’s (2008) results are consistentwiththis, with 74% of threatened marine tetrapodsrequiring broad scale conservation, and 38% infreshwater, and only 8% on land (Figure 11.9).This said, some recent work suggests that marinelarval dispersal occurs over much narrower scalesthan previously assumed (Jones et al. 1999) and sothere is no doubt that site level conservation willremain of great importance in the water as well ason land (Cowen et al. 2006).
A second research front for sea/landscape con-servation planning concerns dynamic threats. Re-cent work has demonstrated that changes in thenature and intensity of threats over time haveimportant consequences for the prioritization ofconservation actions among sites (Turner andWilcove 2006). Such dynamism introduces partic-ular complications when considered at the land-scape scale, the implications of which are onlyjust beginning to be addressed (Pressey et al.2007). Climate change is one such threat thatwill very likely require extensive landscape scaleresponse (Hannah et al. 2002), and may be even
A
C D
B
Figure 11.8 Scale requirements for the conservation of globally threatened species in the short‐ to medium term (reprinted from Boyd et al. 2008).(A, dark green) Species best conserved at a single site (e.g. Eleutherodactylus corona); (B, pale green) Species best conserved at a network of sites(e.g. black lion‐tamarin Leontopithecus chrysopygus); (C, dark blue) Species best conserved at a network of sites complemented by broad‐scaleconservation action (e.g. leatherback turtle Dermochelys cariacea); (D, pale blue) Species best conserved through broad‐scale conservation action(e.g. Indian vulture Gyps indicus). Photographs by S. B. Hedges (A), R.A. Mittermeier (B), O. Langrand (C), and A. Rahmani (D).
212 CONSERVATION BIOLOGY FOR ALL
Sodhi and Ehrlich: Conservation Biology for All. http://ukcatalogue.oup.com/product/9780199554249.do
© Oxford University Press 2010. All rights reserved. For permissions please email: [email protected]

more serious in freshwater (Roessig et al. 2004)and the ocean (Xenopoulos et al. 2005) (see Chap-ter 8).
Maybe the largest open research challenge forsea/landscape conservation planning is to movefrom maintaining current biodiversity towardsrestoring biodiversity that has already been lost(Hobbs and Norton 1996). Natural processes ofsuccession provide models of how this can pro-ceed most effectively (Dobson et al. 1997). How-ever, restoration is much more expensive andmuch less likely to succeed than is preservationof biodiversity before impacts occur, and so ex-plicit planning towards the specific biodiversitytargeted to be restored is essential (Miller andHobbs 2007). Given these costs and challenges,most efforts to date target very tightly con-strained ecosystems that, as restoration proceeds,are then managed at site scales—wetlands are thebest example (Zedler 2000). A few ambitiousplans for landscape level restoration have alreadybeen developed (Stokstad 2008). Moreover, the
current explosive growth in markets for carbonas mechanisms for climate change mitigation willlikely make the restoration of forest landscapesincreasingly viable in the near future (Laurance2008). Ultimately, planning should move fromsimple restoration to designing landscapes thatallow the sustainability of both biodiversity andhuman land uses, envisioned as “countryside bio-geography” (Daily et al. 2001) or “reconciliationecology” (Rosenzweig 2003).
11.3 Coda: the completionof conservation planning
The research frontiers outlined in this chapter areformidable, but conservation planning is never-theless a discipline with its completion in sight. Itis not too far of a stretch to imagine a day wheretop-down global prioritization and bottom-upconservation planning come together. Such a vi-sion would encompass:
Mammals
Mar
ine
Fres
hwat
erT
erre
stri
al
BirdsTortoises
and turtles
N=27 N=725N=1001N=1030
N=12 N=82 N=92 N=969
N=0N=6N=88N=25
Amphibians
Figure 11.9 Percentages of globally threatened species requiring different scales of conservation in the short‐ to medium term (reprinted from Boydet al. 2008). Dark green = species best conserved at a single site; pale green = species best conserved at a network of sites; dark blue = species bestconserved at a network of sites complemented by broad‐scale conservation action; pale blue = species best conserved through broad‐scaleconservation action. The totals exclude species insufficiently known to assess the appropriate scale required. Relative size of pies corresponds to thenumber of species in each taxon/biome combination.
CONSERVATION PLANNING AND PRIORITIES 213
1
© Oxford University Press 2010. All rights reserved. For permissions please email: [email protected]

· The completion and continuous updating ofIUCN Red List assessments of all vertebrate andplant species, plus selected invertebrate groups.
· Iterative identification of key biodiversity areas,based on these data, representing the full set of sitesof global biodiversity conservation significance.
· Measurement and mapping of the continuousglobal surface of seascape and landscape scale eco-logical processes necessary to retain these speciesand sites into the future.
· Continuous measurement and mapping of thethreats to these species, sites, and sea/landscapes,and of the costs and benefits of conserving them.
· Free, electronic, continuously updated access tothese datasets, and to tools for their interpretation,planning, and prioritization.
A particularly important characteristic of sucha vision is its iterative nature. As knowledge ofbiodiversity increases, threats and costs change,and conservation is implemented successfully (ornot) it is crucial that mechanisms exist to capturethese changing data, because changes to any oneof these parameters will likely impinge on conser-vation planning across the board.
Under such a vision, it would be possible, at anygiven point in time, tomaximize the overall benefitsof a conservation investment at any scale, fromex situmanagement of a particular species, throughgap analysis by anational protected areas agency, toinvestment of globally flexible resources by institu-tions like the GEF. Given the pace of advance inconservation planning over the last 20 years, it ispossible that such a vision is achievable within thecoming few decades. Its realization will providegreat hope for maintaining as much of the life withwhich we share our planet as possible.
Summary
· Conservation planning and prioritization are es-sential, because both biodiversity and human popu-lation (and hence threats to biodiversity and costsand benefits of conservation) are distributed highlyunevenly.
· Great attention has been invested into global bio-diversity conservation prioritization on land overthe last two decades, producing a broad consensus
that reactive priority regions are concentrated in thetropical mountains and islands, and proactive prio-rities in the lowland tropical forests.
· Major remaining research fronts for global biodiver-sity conservation prioritization include the examina-tion of cross-taxon surrogacy, aquatic priorities,phylogenetic history, evolutionary process, ecosystemservices, and costs of conservation.
· Maybe the most important tool for guiding con-servation on the ground is the IUCN Red List ofThreatened Species, which assesses the extinctionrisk of 41 415 species against quantitative categoriesand criteria, and provides data on their distribu-tions, habitats, threats, and conservation responses.
· The predominant threat to biodiversity is the de-struction of habitats (Chapter 4), and so the primaryconservation response must be to protect theseplaces through safeguarding key biodiversity areas.
· While protecting sites is essential for biodiversityconservation, persistence in the long term also re-quires the conservation of those landscape and sea-scape level ecological processes that maintainbiodiversity.
Suggested reading
· Boyd, C., Brooks, T. M., Butchart, S. H. M., et al. (2008).Scale and the conservation of threatened species. Con-servation Letters, 1, 37–43.
· Brooks, T. M., Mittermeier, R. A., da Fonseca, G. A. B.,et al. (2006). Global biodiversity conservation priorities.Science, 313, 58–61.
· Eken, G., Bennun, L., Brooks, T. M., et al. (2004). Keybiodiversity areas as site conservation targets. BioSci-ence, 54, 1110–1118.
· Margules, C. R. and Pressey, R. L. (2000). Systematicconservation planning. Nature, 405, 243–253.
· Rodrigues, A. S. L., Pilgrim, J. D., Lamoreux, J. F., Hoff-mann, M., and Brooks, T. M. (2006). The value of theIUCN Red List for conservation. Trends in Ecology andEvolution, 21, 71–76.
Relevant websites
· BirdLife International Datazone: http://www.birdlife.org/datazone.
· IUCN Red List of Threatened Species: http://www.iucnredlist.org.
214 CONSERVATION BIOLOGY FOR ALL
Sodhi and Ehrlich: Conservation Biology for All. http://ukcatalogue.oup.com/product/9780199554249.do
© Oxford University Press 2010. All rights reserved. For permissions please email: [email protected]

· World Database on Protected Areas: http://www.wdpa.org.
· Alliance for Zero Extinction: http://www.zeroextinc-tion.org.
Acknowledgments
Many thanks to Güven Eken, Murat Ataol, Murat Boz-gog�an, Özge Balkiz, Süreyya _Isfendiyarog� lu, Dicle TubaKiliç, and Yildiray Lise for contributing the box, DaveKnox, Ana Rodrigues, and Will Turner for help, and Nav-jot Sodhi and Paul Ehrlich for inviting me to write thischapter.
REFERENCES
Akçakaya, H. R., Ferson, S., Burgman, M. A., Keith, D. A.,Mace, G. M., and Todd, C. R. (2000). Making consistentIUCN classifications under uncertainty. Conservation Bi-ology, 14, 1001–1013.
Akçakaya,H. R., Butchart, S.H.M.,Mace,G.M., Stuart, S.N.,and Hilton-Taylor, C. (2006). Use and misuse of the IUCNRed List Criteria in projecting climate change impacts onbiodiversity. Global Change Biology, 12, 2037–2043.
Ando, A., Camm, J., Polasky, S., and Solow, A. (1998).Species distributions, land values, and efficient conser-vation. Science, 279, 2126–2128.
Baillie, J. E. M., Bennun, L. A., Brooks, T. M. et al. (2004).A global species assessment. IUCN-The World Conserva-tion Union, Gland, Switzerland.
Baillie, J. E. M., Collen, B., Amin, R., et al. (2008). Towardsmonitoring global biodiversity. Conservation Letters, 1,18–26.
Balmford, A. and Gaston, K. J. (1999). Why biodiversitysurveys are good value. Nature, 398, 204–205.
Balmford, A., Gaston, K. J., Rodrigues, A. S. L., and James,A. (2000). Integrating costs of conservation into interna-tional priority setting. Conservation Biology, 14, 597–605.
Balmford, A., Moore, J., Brooks, T., et al. (2001). Conserva-tion conflicts across Africa. Science, 291, 2616–2619.
Balmford, A., Gaston, G. J., Blyth, S., James, A., and Kapos,V. (2003). Global variation in conservation costs, conser-vation benefits, and unmet conservation needs. Proceed-ings of the National Academy of Sciences of the United Statesof America, 100, 1046–1050.
Bennun, L., Matiku, P., Mulwa, R., Mwangi, S., and Buck-ley, P. (2005). Monitoring Important Bird Areas in Africa:towards a sustainable and scaleable system. Biodiversityand Conservation, 14, 2575–2590.
Bennun, L., Bakarr, M., Eken, G., and Fonseca, G. A. B. da(2007). Clarifying the Key Biodiversity Areas approach.BioScience, 57, 645.
Bierregaard, R., Lovejoy, T. E., Gascon, C., and Mesquita,R., eds (2001). Lessons from Amazonia: The Ecology andConservation of a Fragmented Forest. Yale UniversityPress, Newhaven, CT.
BirdLife International (2004). State of the world’s birds2004—indicators for our changing world. BirdLife Interna-tional, Cambridge, UK.
Bode, M., Wilson, K. A., Brooks, T. M., et al. (2008). Cost-effective global conservation spending is robust totaxonomic group. Proceedings of the National Academyof Sciences of the United States of America, 105, 6498–6501.
Boyd, C., Brooks, T. M., Butchart, S. H. M., et al. (2008).Scale and the conservation of threatened species. Conser-vation Letters, 1, 37–43.
Brook, B. W., O’Grady, J. J., Chapman, A. P., Burgman, M.A., Akçakaya, H. R., and Frankham, R. (2000). Predictiveaccuracy of population viability analysis in conservationbiology. Nature, 404, 385–387.
Brook, B. W., Sodhi, N. S., and Ng, P. K. L. (2003). Cata-strophic extinctions follow deforestation in Singapore.Nature, 424, 420–423.
Brooke, M. de L., Butchart, S. H. M., Garnett, S. T., Crow-ley, G. M., Mantilla-Beniers, N. B. and Stattersfield, A. J.(2008). Rates of movement of threatened bird speciesbetween IUCN Red List categories and toward extinc-tion. Conservation Biology, 22, 417–427.
Brooks, T. and Kennedy, E. (2004). Biodiversity barom-eters. Nature, 431, 1046–1047.
Brooks, T. M., Pimm, S. L., and Oyugi, J. O. (1999). Timelag between deforestation and bird extinction intropical forest fragments. Conservation Biology, 13,1140–1150.
Brooks, T. M., Mittermeier, R. A., Mittermeier, C. G., et al.(2002). Habitat loss and extinction in the hotspots ofbiodiversity. Conservation Biology, 16, 909–923.
Brooks, T. M., Mittermeier, R. A., da Fonseca, G. A. B., et al.(2006). Global biodiversity conservation priorities.Science, 313, 58–61.
Brummitt, N. and Lughadha, E. N. (2003). Biodiversity:where’s hot and where’s not? Conservation Biology, 17,1442–1448.
Bruner, A. G., Gullison, R. E., Rice, R. E., and da Fonseca,G.A.B. (2001). Effectiveness of parks in protecting tropi-cal biodiversity. Science, 291, 125–128.
Bruner, A. G., Gullison, R. E., and Balmford, A. (2004).Financial costs and shortfalls of managing and expand-ing protected-area systems in developing countries. Bio-Science, 54, 1119–1126.
CONSERVATION PLANNING AND PRIORITIES 215
1
© Oxford University Press 2010. All rights reserved. For permissions please email: [email protected]
Bryant, D., Nielsen, D., and Tangley, L. (1997). Last frontierforests: ecosystems and economies on the edge. World Re-sources Institute, Washington, DC.
Bunn, S. and Arthington, A. (2002). Basic principles and eco-logical consequences of altered flow regimes for aquaticbiodiversity. Environmental Management, 30, 492–507.
Butchart, S. H. M., Stattersfield, A. J., Bennun, L. A., et al.(2004). Measuring Global Trends in the Status of Biodiver-sity: Red List Indices for Birds. PLoS Biology, 2(12), e383.
Carwardine, J., Wilson, K. A., Ceballos, G., et al. (2008).Cost-effective priorities for global mammal conserva-tion. Proceedings of the National Academy of Sciences of theUnited States of America, 105, 11446–11450.
Ceballos, G. and Ehrlich, P. R. (2002). Mammal populationlosses and the extinction crisis. Science, 296, 904–907.
Chape, S., Harrison, J., Spalding, M., and Lysenko, I.(2005). Measuring the extent and effectiveness of pro-tected areas as an indicator for meeting global biodiver-sity targets. Philosophical Transactions of the Royal Societyof London B, 360, 443–455.
Cincotta, R. P., Wisnewski, J., and Engelman, R. (2000).Human population in the biodiversity hotspots. Nature,404, 990–992.
Collar, N. J. (1993–4). RedData Books, action plans, and theneed for site-specific synthesis. Species, 21–22, 132–133.
Costanza, R., d’Arge, R., Groot, R. d., et al. (1997). Thevalue of the world’s ecosystem services and natural cap-ital. Nature, 387, 253–260.
Cowen, R. K., Paris, C. B., and Srinivasan, A. (2006). Scaling ofconnectivity in marine populations. Science, 311, 522–527.
Cowling, R. M. and Heijnis, C. E. (2001). Broad HabitatUnits as biodiversity entities for conservation planningin the Cape Floristic Region. South African Journal ofBotany, 67, 15–38.
Cowling,R.M., Pressey,R. L., Rouget,M., andLombard,A.T.(2003). A conservation plan for a global biodiversityhotspot – the Cape Floristic Region, South Africa. BiologicalConservation, 112, 191–216.
Crooks, K. R. and Sanjayan, M. (2006). Connectivity conser-vation. Cambridge University Press, Cambridge, UK.
Daily, G. C., Ehrlich, P. R., and Sanchez-Azofeifa, A. (2001).Countryside biogeography: Utilization of human-domi-nated habitats by the avifauna of southern Costa Rica.Ecological Applications, 11, 1–13.
Darwall, W. R. T. and Vié, J. C. (2005). Identifying impor-tant sites for conservation of freshwater biodiversity:extending the species-based approach. Fisheries Manage-ment and Ecology, 12, 287–293.
da Fonseca, G. A. B., Balmford, A., Bibby, C., et al. (2000).Following Africa’s lead in setting priorities. Nature, 405,393–394.
De Grammont, P. C. and Cuarón, A. D. (2006). An evaluationof threatened species categorization systems used on theAmerican continent. Conservation Biology, 20, 14–27.
Diamond, J. M. (1975). The island dilemma: lessons ofmodern biogeographic studies for the design of naturalreserves. Biological Conservation, 7, 129–146.
Dobson, A. P., Bradshaw, A. D., and Baker, A. J. M. (1997).Hopes for the future: restoration ecology and conserva-tion biology. Science, 277, 515–522.
Edgar, G. J., Langhammer, P. F., Allen, G., et al. (2008a).Key Biodiversity Areas as globally significant target sitesfor the conservation of marine biological diversity.Aquatic Conservation: Marine and Freshwater Ecosystems,18, 955–968.
Edgar, G. J., Banks, S., Bensted-Smith, R., et al. (2008b).Conservation of threatened species in the GalapagosMarine Reserve through identification and protectionof marine key biodiversity areas. Aquatic Conservation:Marine and Freshwater Ecosystems, 18, 969–983.
Eken, G., Bennun, L., Brooks, T. M., et al. (2004). Keybiodiversity areas as site conservation targets. BioScience,54, 1110–1118.
Erwin, T. L. (1991). An evolutionary basis for conservationstrategies. Science, 253, 750–752.
Fitter, R. and Fitter, M. (1987). The road to extinction: pro-blems of categorizing the status of taxa threatened with ex-tinction. IUCN, Gland, Switzerland.
Fjeldså, J. and Lovett, J. C. (1997). Geographical patterns ofold and young species in African forest biota: the signifi-cance of specific montane areas as evolutionary centres.Biodiversity and Conservation, 6, 325–346.
Forest, F., Grenyer, R., Rouget, M., et al. (2007). Preservingthe evolutionary potential of floras in biodiversity hot-spots. Nature, 445, 757–760.
Gärdenfors, U., Hilton-Taylor, C., Mace, G. M., and Rodri-guez, J. P. (2001). The application of IUCN Red List criteriaat regional levels. Conservation Biology, 15, 1206–1212.
Gaston, K. J. (2000). Global patterns in biodiversity.Nature,405, 222–227.
Gaston, K. J. and May, R. M. (1992). Taxonomy of taxono-mists. Nature, 356, 281–282.
Grenyer, R., Orme, C. D. L., Jackson, S. F., et al. (2006).Global distribution and conservation of rare andthreatened vertebrates. Nature, 444, 93–96.
Halpern, B. S., Walbridge, S., Selkoe, K. A., et al. (2008). Aglobal map of human impact on marine ecosystems.Science, 319, 948–952.
Hannah, L., Rakotosamimanana, B., Ganzhorn, J., et al.(1998). Participatory planning, scientific priorities, andlandscape conservation in Madagascar. EnvironmentalConservation, 25, 30–36.
216 CONSERVATION BIOLOGY FOR ALL
Sodhi and Ehrlich: Conservation Biology for All. http://ukcatalogue.oup.com/product/9780199554249.do
© Oxford University Press 2010. All rights reserved. For permissions please email: [email protected]

Hannah, L., Midgely, G. F., Lovejoy, T., et al. (2002). Con-servation of biodiversity in a changing climate. Conser-vation Biology, 16, 264–268.
Hobbs, R. J. (1992). The role of corridors in conservation—solution or bandwagon. Trends in Ecology and Evolution,7, 389–392.
Hobbs, R. J. and Norton, D. A. (1996). Towards a concep-tual framework for restoration ecology. Restoration Ecol-ogy, 4, 93–110.
Hoekstra, J. M., Boucher, T. M., Ricketts, T. H., andRoberts, C. (2005). Confronting a biome crisis: globaldisparities of habitat loss and protection. Ecology Letters, 8,23–29.
Hoffmann, M., Brooks, T. M., da Fonseca, G. A. B., et al.(2008). The IUCN Red List and conservation planning.Endangered Species Research, doi:10.3354/esr99987.
Hunter Jr., M. L. and Hutchinson, A. (1994). The virtuesand shortcomings of parochialism: conserving speciesthat are locally rare, but globally common. ConservationBiology, 8, 1163–1165.
Innes, J. L. and Er, K. B. H. (2002). The questionable utilityof the frontier forest concept. BioScience, 52, 1095–1109.
IUCN (International Union for the Conservation of Nature)(2001). IUCN Red List categories and criteria – version 3.1.IUCN, Gland, Switzerland.
IUCN (International Union for the Conservation of Nature)(2007). 2007 IUCN Red List of threatened species. IUCN,Gland, Switzerland.
Isaac, N. J. B., Turvey, S. T., Collen, B., Waterman, C.,and Baillie, J. E. M. (2007). Mammals on the EDGE:conservation priorities based on threat and phylogeny.PLoS One, 2, e296.
James, A., Gaston, K., and Balmford, A. (1999). Balancingthe Earth’s accounts. Nature, 401, 323–324.
James, A., Gaston, K., and Balmford, A. (2001). Can weafford to conserve biodiversity? BioScience, 51, 43–52.
Jepson, P. and Whittaker, R. J. (2002). Ecoregions incontext: a critique with special reference to Indonesia.Conservation Biology, 16, 42–57.
Jetz, W. and Rahbek, C. (2002). Geographic range size anddeterminants of avian species richness. Science, 297,1548–1551.
Jones, G. P., Milicich, M. J., Emslie, M. J., and Lunow,C. (1999). Self-recruitment in a coral reef fish population.Nature, 402, 802–804.
Kaiser, J. (2001). Bold corridor project confronts politicalreality. Science, 293, 2196–2199.
Kareiva, P. and Marvier, M. (2003). Conserving biodiversi-ty coldspots. American Scientist, 91, 344–351.
Kirkpatrick, J. B. (1983). An iterative method for establishingpriorities for the selection of nature reserves – an examplefrom Tasmania. Biological Conservation, 25, 127–134.
Knight, A. T., Smith, R. J., Cowling, R. M., et al. (2007).Improving the Key Biodiversity Areas approach for ef-fective conservation planning. BioScience, 57, 256–261.
Knight, A. T., Cowling, R. M., Rouget, M., Balmford, A.,Lombard, A. T., and Campbell, B.M. (2008). Knowingbut not doing: selecting conservation priority areas andthe research–implementation gap. Conservation Biology,22, 610–617.
Krupnick, G. A. and Kress, W. J. (2003). Hotspots andecoregions: a test of conservation priorities using taxo-nomic data. Biodiversity and Conservation, 12, 2237–2253.
Küper, W., Sommer, J. H., Lovett, J. C., et al. (2004). Africa’shotspots of biodiversity redefined. Annals of the MissouriBotanical Garden, 91, 525–535.
Lamoreux, J. F., Morrison, J. C., Ricketts, T. H., et al. (2006).Global tests of biodiversity concordance and the impor-tance of endemism. Nature, 440, 221–214.
Langhammer, P. F., Bakarr, M. I., Bennun, L. A., et al.(2007). Identification and gap analysis of key biodiversityareas: targets for comprehensive protected area systems.IUCNWorld Commission on Protected Areas Best Prac-tice Protected Area Guidelines Series No. 15. IUCN,Gland, Switzerland.
Laurance, W. F. (2008) Can carbon trading save vanishingforests? BioScience, 58, 286–287.
Lens, L., Van Dongen, S., Norris, K., Githiru, M., andMatthysen, E. (2002). Avian persistence in fragmentedrainforest. Science, 298, 1236–1238.
Mace, G. M., Balmford, A., Boitani, L., et al. (2000). It’s timeto work together and stop duplicating conservation ef-forts. Nature, 405, 393.
Margules, C. R. and Pressey, R. L. (2000). Systematic con-servation planning. Nature, 405, 243–253.
Meynell, P.-J. (2005). Use of IUCN Red Listing process as abasis for assessing biodiversity threats and impacts inenvironmental impact assessment. Impact Assessment andProject Appraisal, 23, 65–72.
Miller, J. R. andHobbs, R. J. (2007). Habitat restoration—dowe know what we’re doing? Restoration Ecology, 15,382–390.
Mittermeier, R. A., Robles Gil, P., and Mittermeier, C. G.(1997). Megadiversity. Cemex, Mexico.
Mittermeier, R. A., Mittermeier, C. G., Brooks, T. M., et al.(2003). Wilderness and biodiversity conservation. Pro-ceedings of the National Academy of Sciences of the UnitedStates of America, 100, 10309–10313.
Mittermeier, R. A., Robles Gil, P., Hoffmann, M., et al.(2004). Hotspots: revisited. Cemex, Mexico.
Myers, N. (1988). Threatened biotas: “hot spots” in tropicalforests. The Environmentalist, 8, 187–208.
Myers, N. (2003). Biodiversity hotspots revisited. BioSci-ence, 53, 916–917.
CONSERVATION PLANNING AND PRIORITIES 217
1
© Oxford University Press 2010. All rights reserved. For permissions please email: [email protected]

Myers, N., Mittermeier, R. A., Mittermeier, C. G., da Fon-seca, G. A. B., and Kent, J. (2000). Biodiversity hotspotsfor conservation priorities. Nature, 403, 853–858.
Newmark, W. D. (1987). Mammalian extinctions in west-ern North American parks: a land-bridge island perspec-tive. Nature, 325, 430–432.
Olson, D. M. and Dinerstein, E. (1998). The Global 200: arepresentation approach to conserving the Earth’s mostbiologically valuable ecoregions. Conservation Biology,12, 502–515.
Olson, D. M., Dinerstein, E., Wikramanayake, E. D., et al.(2001). Terrestrial ecoregions of the world: A newmap oflife on Earth. BioScience, 51, 933–938.
Orme, C. D. L, Davies, R. G., Burgess, M., et al. (2005).Global hotspots of species richness are not congruentwith endemism or threat. Nature, 436, 1016–1019.
Osieck, E. R. and Mörzer Bruyns, M. F. (1981). Importantbird areas in the European community. International Coun-cil for Bird Preservation, Cambridge, UK.
Peres, C. A. (2005). Why we need megareserves in Amazo-nia. Conservation Biology, 19, 728–733.
Plantlife International (2004). Identifying and protecting theworld’s most important plant areas: a guide to implementingtarget 5 of the global strategy for plant conservation. PlantlifeInternational, Salisbury, UK.
Polasky, S. (2008). Why conservation planning needs socio-economic data. Proceedings of the National Academy ofSciences of the United States of America, 105, 6505–6506.
Pressey, R. L. and Taffs, K. H. (2001). Scheduling conserva-tion action in production landscapes: priority areas inwestern New South Wales defined by irreplaceabilityand vulnerability to vegetation loss. Biological Conserva-tion, 100, 355–376.
Pressey, R. L. and Tully, S. L. (1994). The cost of ad hocreservation—a case-study in western New South Wales.Australian Journal of Ecology, 19, 375–384.
Pressey, R. L., Johnson, I. R., and Wilson, P. D. (1994).Shades of irreplaceability—towards a measure of thecontribution of sites to a reservation goal. Biodiversityand Conservation, 3, 242–262.
Pressey, R. L., Cabeza, M., Watts, M. E., Cowling, R. M., andWilson, K. (2007). Conservation planning for a changingworld. Trends in Ecology and Evolution, 22, 583–592.
Raimer, F. and Ford, T. (2005). Yellowstone to Yukon (Y2Y)—one of the largest international wildlife corridors. Gaia-Eco-logical Perspectives for Science and Society, 14, 182–185.
Raxworthy, C. J., Martinez-Meyer, E., Horning, N., et al.(2003). Predicting distributions of known and unknownreptile species in Madagascar. Nature, 426, 837–841.
Reid, W. V. (1998). Biodiversity hotspots. Trends in Ecologyand Evolution, 13, 275–280.
Ricketts, T. H., Dinerstein, E., Boucher, T., et al. (2005).Pinpointing and preventing imminent extinctions. Pro-ceedings of the National Academy of Sciences of the UnitedStates of America, 102, 18497–18501.
Roberts, C. M. (1997). Connectivity and management ofCaribbean coral reefs. Science, 278, 1454–1457.
Roberts, C. M., McClean, C. J., Veron, J. E. N., et al. (2002).Marine biodiversity hotspots and conservation prioritiesfor tropical reefs. Science, 295, 1280–1284.
Robinson, W. D. (1999). Long-term changes in the avifaunaof Barro Colorado Island, Panama, a tropical forest iso-late. Conservation Biology, 13, 85–97.
Rodrigues, A. S. L. (2007). Effective global conservationstrategies. Nature, 450, e19.
Rodrigues, A. S. L. and Brooks, T. M. (2007). Shortcuts forbiodiversity conservation planning: the effectiveness ofsurrogates. Annual Review of Ecology, Evolution, and Sys-tematics, 38, 713–737.
Rodrigues, A. S. L., Andelman, S. J., Bakarr,M. I., et al. (2004a).Effectiveness of the global protected area network in repre-senting species diversity.Nature, 428, 640–643.
Rodrigues, A. S. L., Akçakaya, H. R., Andelman, S. J., et al.(2004b). Global gap analysis – priority regions for ex-panding the global protected area network. BioScience,54, 1092–1100.
Rodrigues, A. S. L., Brooks, T. M., and Gaston, K. J. (2005).Integrating phylogenetic diversity in the selection ofpriority areas for conservation: does it make a differ-ence? In A. Purvis, J. L. Gittleman, and T. M. Brooks,eds Phylogeny and conservation, pp. 101–119. CambridgeUniversity Press, Cambridge, UK.
Rodrigues, A. S. L., Pilgrim, J. D., Lamoreux, J. F., Hoff-mann, M., and Brooks, T. M. (2006). The value of theIUCN Red List for conservation. Trends in Ecology andEvolution, 21, 71–76.
Rodríguez, J. P., Ashenfelter, G., Rojas-Suárez, F., Fernández,J. J. G., Suárez, L., and Dobson, A. P. (2000). Local data arevital to worldwide conservation.Nature, 403, 241.
Roessig, J. M., Woodley, C. M., Cech, J. J., and Hansen, L. J.(2004). Effects of global climate change on marine andestuarine fishes and fisheries. Reviews in Fish Biology andFisheries, 14, 251–275.
Rondinini, C., Wilson, K. A., Boitani, L., Grantham, H., andPossingham, H. P. (2006). Tradeoffs of different types ofspecies occurrence data for use in systematic conserva-tion planning. Ecology Letters, 9, 1136–1145.
Rosenzweig, M. L. (2003).Win-win ecology. Oxford Univer-sity Press, Oxford, UK.
Rouget, M., Cowling, R. M., Pressey, R. L., and Richardson,D. M. (2003). Identifying spatial components of ecologi-cal and evolutionary processes for regional conservation
218 CONSERVATION BIOLOGY FOR ALL
Sodhi and Ehrlich: Conservation Biology for All. http://ukcatalogue.oup.com/product/9780199554249.do
© Oxford University Press 2010. All rights reserved. For permissions please email: [email protected]

planning in the Cape Floristic Region, South Africa.Diversity and Distributions, 9, 191–210.
Rouget, M., Cowling, R. M., Lombard, A. T., Knight, A. T.,and Kerley, G. I. H. (2006). Designing regional-scalecorridors for pattern and process. Conservation Biology,20, 549–561.
Saccheri, I., Kuussaari, M., Kankare, M., Vikman, P., For-telius, W., and Hanski, I. (1998). Inbreeding and extinc-tion in a butterfly metapopulation. Nature, 392, 491–494.
Sanderson, E. W., Jaiteh, M., Levy, M. A., Redford, K. H.,Wannebo, A. V., and Woolmer, G. (2002a). The humanfootprint and the last of the wild. BioScience, 52, 891–904.
Sanderson, E. W., Redford, K. H., Vedder, A., Coppolillo,P. B., and Ward, S. E. (2002b). A conceptual model forconservation planning based on landscape species re-quirements. Landscape and Urban Planning, 58, 41–56.
Saunders, D. A., Hobbs, R. J., and Margules, C. R. (1991).Biological consequences of ecosystem fragmentation: areview. Conservation Biology, 5, 18–32.
Schipper, J., Chanson, J. S., Chiozza, F., et al. (2008). Thestatus of the world’s land and marine mammals: diver-sity, threat, and knowledge. Science, 322, 225–230.
Sechrest, W., Brooks, T. M., da Fonseca, G. A. B., et al.(2002). Hotspots and the conservation of evolutionaryhistory. Proceedings of the National Academy of Sciences ofthe United States of America, 99, 2067–2071.
Simberloff, D., Farr, J. A., Cox, J., and Mehlman, D. W.(1992). Movement corridors – conservation bargains orpoor investments? Conservation Biology, 6, 493–504.
Smith, T. B., Wayne, R. K., Girman, D. J., and Bruford, M.W. (1997). A role for ecotones in generating rainforestbiodiversity. Science, 276, 1855–1857.
Smith, T. B., Kark, S., Schneider, C. J., Wayne, R. K., andMoritz, C. (2001). Biodiversity hotspots and beyond: theneed for preserving environmental transitions. Trends inEcology and Evolution, 16, 431.
Spathelf, M. andWaite, T. A. (2007). Will hotspots conserveextra primate and carnivore evolutionary history?Diver-sity and Distributions, 13, 746–751.
Stattersfield, A. J., Crosby, M. J., Long, A. J., and Wege, D.C. (1998). Endemic bird areas of the world: priorities forbiodiversity conservation. BirdLife International, Cam-bridge, UK.
Stokstad, E. (2008). Big land purchase triggers review ofplans to restore Everglades. Science, 321, 22.
Stuart, S. N., Chanson, J. S., Cox, N. A., et al. (2004). Statusand trends of amphibian declines and extinctions world-wide. Science, 306, 1783–1786.
Terborgh, J., Lopez, L., Nuñez, P. et al. (2001). Ecologicalmeltdown in predator-free forest fragments. Science, 294,1923–1926.
Tewksbury, J. J., Levey, D. J., Haddad, N. M., et al. (2002).Corridors affect plants, animals, and their interactions infragmented landscapes. Proceedings of the National Academyof Sciences of the United States of America, 99, 12923–12926.
Thomas, C. D., Cameron, A., Green, R. E., et al. (2004). Extinc-tion risk from climate change.Nature, 427, 145–148.
Turner, M. G. (2005). Landscape ecology: what is the stateof the science? Annual Review of Ecology, Evolution, andSystematics, 36, 319–344.
Turner, W. R. and Wilcove, D. S. (2006). Adaptive decisionrules for the acquisition of nature reserves. ConservationBiology, 20, 527–537.
Turner, W. R., Brandon, K., Brooks, T. M., Costanza, R., daFonseca, G. A. B., and Portela, R. (2007). Global conser-vation of biodiversity and ecosystem services. BioScience,57, 868–873.
Whittaker, R. J., Araújo, M. B., Jepson, P., Ladle, R. J.,Watson, J. E. M., and Willis, K. J. (2005). Conservationbiogeography: assessment and prospect. Diversity andDistributions, 11, 3–23.
Wilson, E. O. (1992). The diversity of life. Belknap, Cam-bridge, Massachusetts.
Wilson, K., Pressey, R. L., Newton, A., Burgman, M., Pos-singham, H., and Weston, C. (2005). Measuring and in-corporating vulnerability in conservation planning.Environmental Management, 35, 527–543.
Wilson, K. A., McBride, M. F., Bode, M., and Possingham,H. P. (2006). Prioritizing global conservation efforts.Nature, 440, 337–340.
WWF (World Wildlife Fund) and IUCN (InternationalUnion for the Conservation of Nature) (1994–7). Centresof plant diversity: a guide and strategy for their conservation.World Wide Fund for Nature, Gland, Switzerland.
Xenopoulos, M. A., Lodge, D. M., Alcamo, J., Marker, M.,Schulze, K., and Van Vuuren, D. P. (2005). Scenarios offreshwater fish extinctions from climate change andwater withdrawal. Global Change Biology, 11, 571–564.
Zedler, J. B. (2000). Progress in wetland restoration ecolo-gy. Trends in Ecology and Evolution, 15, 402–407.
CONSERVATION PLANNING AND PRIORITIES 219
1
© Oxford University Press 2010. All rights reserved. For permissions please email: [email protected]

CHAP T E R 1 2
Endangered species management: theUS experienceDavid S. Wilcove
To many people around the world, the conserva-tion of endangered species is synonymous withthe conservation of biodiversity. Ecologists, ofcourse, understand that biodiversity encom-passes far more than endangered species, but itis nonetheless true that endangered species areamong the most visible and easily understoodsymbols of the ongoing loss of biodiversity (seeChapter 10). The protection of such species is apopular and important part of efforts to sustainthe earth’s natural diversity (see Box 12.1).
The process of conserving endangered speciescan be divided into three phases: (i) identifica-tion—determining which species are in dangerof extinction; (ii) protection—determining andimplementing the short-term measures neces-sary to halt a species’ slide to extinction; and(iii) recovery—determining and implementingthe longer-term measures necessary to rebuildthe population of the species to the point atwhich it is no longer in danger of extinction.
Many countries today have laws or programsdesigned to protect endangered species, althoughthe efficacy of these efforts varies widely. Mostfollow the identification/protection/recoveryparadigm. One of the oldest and strongest lawsis the United States’ Endangered Species Act(ESA), which was passed in 1973 and has servedas a template for many other nations. In thischapter, I shall focus on the three phases ofendangered species management, emphasizingthe US experience. My reason for emphasizingthe US is not because I believe it has done a betterjob of protecting its endangered species thanother countries. Rather, I am most familiar withconservation efforts in the US. Moreover, because
the US has one of the oldest and strongest laws onthe books to protect endangered species, it pro-vides a useful case history.
My discussion is admittedly incomplete and, tosome extent, idiosyncratic. Endangered speciesprograms, especially those that impose restric-tions on human activities, are invariably contro-versial, and that controversy results in muchdiscussion and debate. The ESA, for example,has been the subject of many books, scientificarticles, and popular articles; it has been debatedin the halls of Congress and in town halls acrossthe nation; and it has been litigated numeroustimes in the courts. Complete coverage of all ofthe issues associated with endangered species inthe US or any other large country is simply notpossible in a single book chapter. For that reason,I have chosen to review a subset of issues that arelikely to be of interest to both scientists and deci-sion-makers in countries with active programs toconserve endangered species.
12.1 Identification
12.1.1 What to protect
A fundamental question that quickly arises whenscientists and decision-makers discussendangered wildlife is what exactly should beconserved (see Box 12.2). Protection efforts canbe directed at species, subspecies, or popula-tions, with important tradeoffs. If, for example,protection is extended to subspecies and popula-tions, the total number of plants and animals thatare deemed in need of protection is likely toincrease dramatically, resulting in greater
220
Sodhi and Ehrlich: Conservation Biology for All. http://ukcatalogue.oup.com/product/9780199554249.do
© Oxford University Press 2010. All rights reserved. For permissions please email: [email protected]

Box 12.1 Rare and threatened species and conservation planning in MadagascarClaireKremen,AlisonCameron, TomAllnutt, andAndriamandimbisoaRazafimpahanana
The fundamental challenge of reserve design ishow tomaximize biodiversity conservation givenarea constraints, competing land uses and thatextinction risk is already high for many species,even without further habitat loss. Madagascar isone of the world’s highest priorities forconservation (Brooks et al. 2006) with endemismexceeding 90% for many plant and animalgroups (Goodman and Benstead 2005). Recently,the President of Madagascar set the target forhabitat protection at 10% of the land surface,representing a tripling of the region to beprotected. This provided an unparalleledopportunity to protect Madagascar’sbiodiversity. To aid the government in siteselection, we used a “systematic conservationplanning” approach (Margules and Pressey 2000)to identify regions that would protect as manyspecies as possible, especially geographically rareand threatened species, within that 10% target.We obtained occurrence data for 2315
endemic species of plants, lemurs, frogs, geckos,butterflies and ants (see Box 12.1 Figure 1). Weutilized a spatial prioritization decision‐supporttool (Zonation: Moilanen et al. 2005), and inputmodels of species distributions (for 829 species)and point data for the remaining species (toorare to model, designated RTS for rare targetspecies). The Zonation algorithm preferentiallyselects the best habitat for geographically rare(range‐restricted) species. In addition, bysupplying weights based on past habitat loss, weinstructed Zonation to favor species that hadsuffered large range loss within the past 50 years(threatened species). In this manner, our decisionsupport tool picked regions that not onlyrepresented all of the species in our analysis, butalso identified the habitats most important togeographically rare and/or threatened species.We ran Zonation in three ways: (i) for each of
the six taxonomic groups alone; (ii) for all groupstogether; and (iii) for all groups together, afterfirst selecting existing protected areas, totaling6.3% of the country. We then assessed how wellthe selected regions for each Zonation runprotected rare and threatened species bydetermining what proportions of their habitats(for modeled species) or occurrence points (forRTS species) were included. We also comparedZonation’s selections based on all taxa (run ii
Box 12.1 Figure 1 Mantella cowanii, a critically endangered frogof Madagascar. It is one of the species that was used by Kremenet al. (2008) to determine priority sites for protection in Madagascar.Photograph by F. Andreone.
above) against the actual protected areas, from2.9% area in 2002 to 6.3% area in 2006.When individual taxonomic groups were
utilized to define priority regions (run i), theregions selected by Zonation provided superiorprotection for members of the taxon itself, butrelatively poor protection for species in othergroups. It was therefore more efficient toutilize an analysis based on all taxonomicgroups together (run ii). Comparing thisanalysis to the regions that had already beenset aside showed that, on an area by area basis,Zonation selected regions that significantlyincreased the inclusion of habitat forgeographically rare and threatened species. Inaddition, we found that the trajectory foraccumulating species and habitat areas from2002 to 2006 would be insufficient to protectall species within the area target, but thatcareful selection of the last 3.7% (Run iii) couldgreatly improve both representation of allspecies and the selection of habitat for thegeographically rare and threatened species(Kremen et al. 2008).Subsequently, this analysiswasusedalongwith
other conservation inputs (Key BiodiversityAnalyses, Important Bird Areas, and others; seeChapter 11) to justify the final regions forprotection totaling 6.4 million hectares (Box 12.1Figure 2, black zones totaling just over 10%), andserved to designate an additional 5.3 million
continues
ENDANGERED SPECIES MANAGEMENT: THE US EXPERIENCE 221
1
© Oxford University Press 2010. All rights reserved. For permissions please email: [email protected]

Box 12.1 (Continued)
hectares as important conservation regionssubject to an inter‐ministerial decree limiting
Limit Region
Existing and New Protected AreasPriority SitesSensitive Sites
50 0 50 100 150 Kilometers
Antsiranana
Toamasina
FianarantsoaFianarantsoa
AntananarivoAntananarivo
Fianarantsoa
Toliara
Antananarivo
Mahajanga
N
W E
S
Box 12.1 Figure 2 This map portrays the Inter‐Ministry decree ofOctober 2008 delineating the new and existing protected areas(black), the priority biodiversity areas where no new mining permitsmay be issued (grey) and the sensitive biodiversity sites (light grey),which will be subject to environmental impact assessment prior topermission of forestry or mining activities. See also Figure 11.6.
mining activities. No new mining permits willbe issued in the highest priority zones (greyzones), and the remaining areas (light greyzones) will be subject to strict control (e.g.following Environmental Impact Assessment).The rare target species, in particular, wereutilized to define these zones, in particularthe 505 species currently known from onlya single site. Furthermore, as a significantproportion of these priority zones containexisting mining permits (14% of theexisting parks and highest priority areas),the Zonation result is an ideal tool fornegotiating trade‐offs or swaps betweenmining and protected areas.
REFERENCES
Brooks, T. M., Mittermeier, R. A., da Fonseca, G. A. B.,et al. (2006). Global biodiversity conservation priorities.Science, 313, 58–61.
Goodman, S. and Benstead, J. (2005). Updated estimatesof biotic diversity and endemism for Madagascar. Oryx,39, 73–77.
Kremen, C., Cameron, A., Moilanen, A., et al.(2008). Aligning conservation priorities across taxain Madagascar with high‐resolution planning tools.Science, 320, 222–226.
Margules, C.R. and Pressey, R. L. (2000).Systematic conservation planning. Nature,405, 243–253.
Moilanen, A., Franco, A. M. A., Early, R. I., et al.(2005). Prioritizing multiple‐use landscapes forconservation: methods for large multi‐speciesplanning problems. Proceedings of theRoyal Society of London B, 272,1885–1891.
222 CONSERVATION BIOLOGY FOR ALL
Sodhi and Ehrlich: Conservation Biology for All. http://ukcatalogue.oup.com/product/9780199554249.do
© Oxford University Press 2010. All rights reserved. For permissions please email: [email protected]

demands for funding and, potentially, more con-flicts with landowners, developers, and otherresource users. On the other hand, it has beenargued that populations should be the funda-mental unit of biodiversity protection (see Box10.1), since it is populations of plants andanimals that provide the ecosystem services
essential to human welfare (Hughes et al. 1997;Chapter 3).
A second consideration relates to geographicscale. Should the frame of reference for decidingwhether or not a species is endangered be theentire world (the species’ global status), a partic-ular country (its national status), or a particular
Box 12.2 Flagship species create PridePeter Vaughan
Rare: Rare is a non‐governmental organizationwhose mission is “to conserve imperiled speciesand ecosystems around the world by inspiringpeople to care about and protect nature” (seeChapter 15). Rare’s Pride program utilizes socialmarketing to educate and motivate peoplewho live in, or adjacent to, areas of highbiodiversity to adopt new behaviors that eitherprotect, or are less damaging to, the localenvironment.Social marketing: Many commercial
marketers “brand” their companies and/orproducts using symbols, such as Pillsbury’s“doughboy”, or Apple Computer’s “bittenapple.” Similarly, Pride brands its socialmarketing campaigns using “flagship” species.While concepts such as ecosystem andbiodiversity are central to Rare’s overallconservation strategies, they are complex andfail to evoke the emotional response that isrequired to motivate behavior change amongmost people. The purpose of a flagship is tocreate a simple, instantly recognizable symbolthat evokes a positive emotional responseamong members of the target audience. AsMckenzie‐Mohr (2008) states “All persuasiondepends upon capturing attention. Withoutattention, persuasion is impossible.Communications can be made more effectiveby ensuring that they are vivid, personal andconcrete.” A good flagship evokes feelings oftrust, affection, and above all for Rare, a senseof Pride in the local environment. Pride of placeis a powerful emotion that canmotivate peopleto change their behaviors and empower themto take environmental action.
What makes a good flagship? Unlike theconcepts of “keystone”, “indicator”,“umbrella”, and “endangered” species, whichall have ecological or conservation implications,flagship species are chosen for their marketingpotential (Walpole and Leader‐Williams 2002).The key characteristics of flagship species are(based on Karavanov 2008):
• Be charismatic or appealing to the targetaudience; no slugs, worms, or mosquitoes!• Be local or endemic to symbolize theuniqueness of the conservation target area tofoster a sense of local pride.• Be representative of the conservation targetarea by living in its habitat or ecosystem.• Have no negative perceptions among localpeople, such as being a crop pest, beingdangerous, or have existing cultural connota-tions that detract from or compete with thecampaign’s conservation messages.
How are flagships chosen? Flagship speciesare chosen through a lengthy process thatincludes input from local stakeholders,interviews with local experts, and results fromsurveys of the local human population. Thisprocess ensures that flagships have therequisite characteristics outlined above.
How are flagships used? Flagship species areused in most of the marketing materialsproduced during a Pride campaign, includingbillboards, posters, puppet shows, songs,videos, etc. such that they become ubiquitousin the community. Although flagship speciesare non‐human, they become symbolicmembers of the local community, which
continues
ENDANGERED SPECIES MANAGEMENT: THE US EXPERIENCE 223
1
© Oxford University Press 2010. All rights reserved. For permissions please email: [email protected]

Box 12.2 (Continued)
confers on them the credibility they need inorder to be perceived as trustworthy sources ofinformation. The flagship species serves as boththe “face” of the campaign and as a“spokesperson” for the campaign’s messages.This “opinion leadership role” activates thesocial diffusion networks that exist in allsocieties by stimulating interpersonalcommunication among members of the targetaudience, a key step in the behavior changeprocess (Rogers 1995, Vaughan and Rogers2000).Rare’s flagship species: Among Rare’s first
71 campaigns, 59% chose a bird, 16% chose amammal, and 11% chose a reptile to be theirflagships species, but campaigns have alsoused fish, insects, crustaceans, amphibians,and plants. About half of the chosen specieswere endemic to the country or region, butonly about 8% have been listed asendangered or critically endangered by IUCN.Because flagship species play such a prominentrole in Pride campaigns, knowledge aboutthem can serve as markers for campaignexposure and impact. For example, duringthe Pride campaign in Laos (Vannalath2006), awareness among the campaign’starget audience of the great hornbill(Buceros bicornis; Box 12.2 Figure) increasedfrom 61% to 100%; the percentage ofrespondents who know that the hornbill is indanger of extinction increased from 22% to77%; the percentage who knew that huntingor capturing the hornbill is prohibitedincreased from 31% to 90%; and thepercentage that identified “cutting down theforest” as one of the greatest threats to thehornbill increased from 17% to 65%. Inaddition to increasing knowledge, improvingattitudes, and changing personalbehavior, Pride campaigns have been creditedwith contributing to the creation ofprotected areas, enactment of new laws andregulations, and the preservation ofendangered species (Jenks et al. 2010). Centralto all of these efforts has been the use offlagship species.
Box 12.2 Figure Pride campaign flagship mascot representing thegreat hornbill in Laos. Photograph by R. Godfrey.
REFERENCES
Jenks, B., Vaughan, P. W., and Butler, P. J. (2010). TheEvolution of Rare Pride: Using Evaluation to DriveAdaptive Management in a Biodiversity ConservationOrganization. Journal of Evaluation and ProgramPlanning Special Edition on Environmental EducationEvaluation, in press.
Karavanov, A. (2008). Campaign design ‐ Including workplanning and monitoring. Rare Pride LeadershipDevelopment Program, Rare, Arlington, VA.
Mckenzie‐Mohr, D. (2008). http://www.graduationpledge.org/Downloads/CBSM.pdf (page 4) accessed December15, 2008.
Rogers, E. M. (1995). Diffusion of innovations, 4th ed. TheFree Press, New York, NY.
Vannalath, S. (2006). Final Report, Rare Pride Campaign inNam Kading National Protected Area, Lao PeoplesDemocratic Republic, Rare Diploma in Conservation Edu-cation, University of Kent at Canterbury, United Kingdom.Wildlife Conservation Society and Rare, Arlington, VA.
Vaughan, P. W. and Rogers, E. M. (2000). A staged modelof communication effects: Evidence from an entertain-ment‐education radio drama in Tanzania. The Journal ofHealth Communication, 5, 203–227.
Walpole, M. J. and Leader‐Williams, N. (2002). Tourismand flagship species in conservation. Biodiversity andConservation, 11, 543–547.
224 CONSERVATION BIOLOGY FOR ALL
Sodhi and Ehrlich: Conservation Biology for All. http://ukcatalogue.oup.com/product/9780199554249.do
© Oxford University Press 2010. All rights reserved. For permissions please email: [email protected]

state, county, or municipality (its local status)?For example, the northern saw-whet owl (Aego-lius acadicus) is widely distributed across thenorthern and western United States and in partsof Mexico. It is not in danger of extinction. Butwithin the US, the State of Maryland considersthe northern saw-whet owl to be an endangeredspecies; Maryland is at the southeastern periph-ery of the owl’s range and the bird is quite rarethere. Conservationists continue to debate thewisdom of expending scarce resources on theprotection of peripheral or isolated populationsof otherwise common species. Yet such popula-tions are often a source of pride to the citizens of agiven region, and they may contain unique allelesthat contribute to the overall genetic diversity ofthe species.
A third consideration is whether to extend pro-tection to all types of endangered organisms or tolimit such efforts to particular groups, such asvertebrates or vascular plants. Proponents of ex-clusion argue that it is impossible to identify andprotect all of the imperiled species in any largearea (see below), and that by targeting a few,select groups, it should be possible to protectthe habitats of many other species. Althoughsome studies have supported this notion, othershave not.
Within the US, the ESA addresses these issuesin the following ways: it allows for the protectionof species and subspecies of plants and animals(including invertebrate animals). In the case ofvertebrates only, it also allows for the protectionof distinct population segments. In the early yearsof the ESA, the US Fish and Wildlife Service, theagency charged with protecting imperiled wild-life, allowed populations to be defined on thebasis of political borders. Thus, bald eagles (Ha-liaeetus leucocephalus) in the coterminous 48 states(but not those living in Alaska or Canada) wereadded to the endangered list when their numbersplummeted due to pesticide poisoning. More re-cently, the Fish and Wildlife Service has turnedaway from using political borders to delineatevertebrate populations and has insisted thatsuch populations be discrete ecological entitiesin order to be eligible for inclusion on theendangered list. An example of the latter would
be some of the salmon runs in the Pacific North-west that have been added to the endangeredspecies list in recent years. To qualify for listing,a given run must show significant genetic, demo-graphic, or behavioral differences from other runsof the same species.
One aspect of the ESA’s identification processmerits special attention. The law explicitly statesthat the decision to add a plant or animal to theendangered species list must be based “solely onthe basis of the best scientific and commercialdata . . . ” (Endangered Species Act, Section 4(b)(1)(A)). In other words, whether or not a species isendangered is treated as a purely scientific ques-tion. Political considerations are not allowed tointerfere with the identification phase (althoughin practice they sometimes do, leading to nastylegal battles).
12.1.2 Criteria for determining whether a speciesis endangered
How does one know that a given species is indanger of extinction? Biologists typically lookfor data that indicate vulnerability: a small popu-lation size, a declining population, ongoing lossesof habitat (see Chapter 4), etc. In some cases,those data are combined with models to yieldshort and long-term projections of populationviability (see Chapter 16); in other cases, wherenot enough data exist to construct good models,the determination is based on expert opinion.
Needless to say, different experts weighing dif-ferent factors are likely to come to different con-clusions as to which species are in trouble.Resources may be wasted on plants and animalsthat are not really endangered, while other,gravely imperiled species go unprotected. Theneed for a more transparent, standardized wayto assess the status of species led the InternationalUnion for Conservation of Nature (IUCN) todevelop a set of quantitative guidelines in 1994,now known as the Red List categories and cri-teria. These guidelines enable scientists to assignany plant or animal to one of six categories (Ex-tinct, Extinct in the Wild, Critically Endangered,Endangered, Vulnerable, Near Threatened) basedon factors such as range size, amount of occupied
ENDANGERED SPECIES MANAGEMENT: THE US EXPERIENCE 225
1
© Oxford University Press 2010. All rights reserved. For permissions please email: [email protected]

habitat, population size, trends in populationsize, or trends in the amount of habitat (www.iucnredlist.org/static/categories_crtiteria). Theoriginal Red List categories and criteria were de-signed to determine the global status of species,but conservation biologists subsequently havedeveloped guidelines for applying those criteriato individual nations, states, provinces, etc.
The ESA, however, is notably vague in definingwhat constitutes a species at risk of extinction.It establishes two categories of risk, endangeredand threatened, and defines an endangered spe-cies as “any species which is in danger of extinc-tion throughout all or a significant portion of itsrange” and a threatened species as “any specieswhich is likely to become an endangered specieswithin the foreseeable future throughout all or asignificant portion of its range” (Endangered Spe-cies Act, Sections 3(6) and 3(19)). In practice, mostplants and animals have not been added to theUS endangered species list until they were closeto extinction. A study published in 1993 (Wilcoveet al. 1993) showed that the median total popula-tion size of a vertebrate at time of listing was 1075individuals; the median number of surviving po-pulations was two. For invertebrate animals, themedian total population size was less than 1000individuals, and the number of surviving popu-lations was three. In the case of plants, the medi-an total population size was less than 120individuals, and the number of surviving popu-lations was four. One obvious consequence ofwaiting until species are so rare before protectingthem is that recovery becomes far more difficult,if not impossible, to achieve.
12.2 Protection
In order to develop an effective protection planfor endangered species, one needs to know aminimum of two things: (i) What threats do thespecies in question face?; and (ii) Where do thosespecies occur? Knowledge of the threats will de-termine protection and recovery efforts, whileknowledge of the location and, in particular, theland ownership, will guide the choice of conser-vation strategy.
12.2.1 What are the threats?
Understanding the threats facing endangeredspecies is complicated due to four factors:(i) threatsmay vary from taxon to taxon; the thingsthat imperil freshwater fish, for example, may notnecessarily be the things that imperil terrestrialmammals; (ii) threats may vary geographically,depending on economics, technology, human de-mography, land-use patterns and social customsin different areas; (iii) threats may change overtime, again in response to technological, economic,social, or demographic factors; and (iv) for all but ahandful of groups (e.g. birds, mammals, amphi-bians), scientists simply do not know enoughabout most species to determine which ones areimperiled and why they are imperiled.
For three groups—birds, mammals, and am-phibians—the IUCN has determined the conser-vation status of virtually all extant and recentlyextinct species (Baillie et al. 2004). These dataprovide the best global overview of threats toendangered species (Figure 12.1). With respectto birds and amphibians, habitat destruction isby far the most pervasive threat: over 86% ofbirds and 88% of amphibians classified by IUCNas globally imperiled are threatened to some de-gree by habitat destruction. Agriculture and log-ging are the most widespread forms of habitatdestruction (see Chapter 4). Overexploitationfor subsistence or commerce contributed to theendangerment of 30% of imperiled birds but only6% of amphibians (see Chapter 6). Alien specieswere a factor in the decline of 30% of imperiledbirds and 11% of amphibians (see Chapter 7).Pollution affected 12% of imperiled birds and4% of amphibians (see Box 13.1). Disease, whichis often linked to pollution or habitat destruction,was a threat to 5% of birds and 17% of amphi-bians. Surprisingly, few species were identified asbeing threatened by human-caused climatechange, perhaps because most threats are identi-fied after the fact (see Chapter 8). However,Thomas et al. (2004) modeled the response oflocalized species of various taxa to climatechange and concluded that 15–37% of themcould be destined for extinction by 2050, makingclimate change potentially a grave threat.
226 CONSERVATION BIOLOGY FOR ALL
Sodhi and Ehrlich: Conservation Biology for All. http://ukcatalogue.oup.com/product/9780199554249.do
© Oxford University Press 2010. All rights reserved. For permissions please email: [email protected]
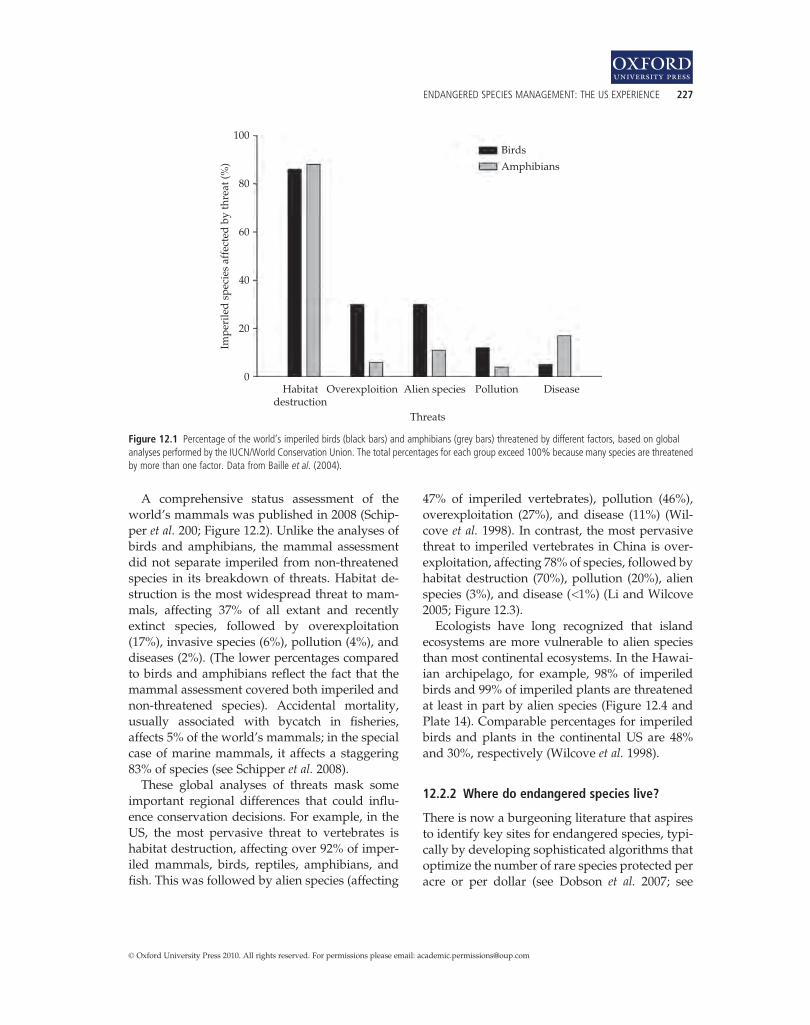
A comprehensive status assessment of theworld’s mammals was published in 2008 (Schip-per et al. 200; Figure 12.2). Unlike the analyses ofbirds and amphibians, the mammal assessmentdid not separate imperiled from non-threatenedspecies in its breakdown of threats. Habitat de-struction is the most widespread threat to mam-mals, affecting 37% of all extant and recentlyextinct species, followed by overexploitation(17%), invasive species (6%), pollution (4%), anddiseases (2%). (The lower percentages comparedto birds and amphibians reflect the fact that themammal assessment covered both imperiled andnon-threatened species). Accidental mortality,usually associated with bycatch in fisheries,affects 5% of the world’s mammals; in the specialcase of marine mammals, it affects a staggering83% of species (see Schipper et al. 2008).
These global analyses of threats mask someimportant regional differences that could influ-ence conservation decisions. For example, in theUS, the most pervasive threat to vertebrates ishabitat destruction, affecting over 92% of imper-iled mammals, birds, reptiles, amphibians, andfish. This was followed by alien species (affecting
47% of imperiled vertebrates), pollution (46%),overexploitation (27%), and disease (11%) (Wil-cove et al. 1998). In contrast, the most pervasivethreat to imperiled vertebrates in China is over-exploitation, affecting 78% of species, followed byhabitat destruction (70%), pollution (20%), alienspecies (3%), and disease (<1%) (Li and Wilcove2005; Figure 12.3).
Ecologists have long recognized that islandecosystems are more vulnerable to alien speciesthan most continental ecosystems. In the Hawai-ian archipelago, for example, 98% of imperiledbirds and 99% of imperiled plants are threatenedat least in part by alien species (Figure 12.4 andPlate 14). Comparable percentages for imperiledbirds and plants in the continental US are 48%and 30%, respectively (Wilcove et al. 1998).
12.2.2 Where do endangered species live?
There is now a burgeoning literature that aspiresto identify key sites for endangered species, typi-cally by developing sophisticated algorithms thatoptimize the number of rare species protected peracre or per dollar (see Dobson et al. 2007; see
100
80
60
40
20
0Habitat
destructionOverexploition Alien species
Threats
Pollution Disease
Birds
Amphibians
Impe
rile
d s
peci
es a
ffec
ted
by
thre
at (%
)
Figure 12.1 Percentage of the world’s imperiled birds (black bars) and amphibians (grey bars) threatened by different factors, based on globalanalyses performed by the IUCN/World Conservation Union. The total percentages for each group exceed 100% because many species are threatenedby more than one factor. Data from Baille et al. (2004).
ENDANGERED SPECIES MANAGEMENT: THE US EXPERIENCE 227
1
© Oxford University Press 2010. All rights reserved. For permissions please email: [email protected]

40
30
20
Spec
ies
affe
cted
by
thre
at (%
)
10
0Habitat
destructionOver-
exploitationInvasivespecies
Pollution Disease
Threats
Accidentalmortality
Figure 12.2 Percentage of the world’s mammals threatened by different factors, based on a global analysis by Schipper et al. (2008). Note that thisanalysis covered both threatened and unthreatened species; as such, the data include threats to species that are not yet at risk of extinction, unlikeFigure 12.1.
100
80
60
Impe
rile
d s
peci
es a
ffec
ted
by
thre
at (%
)
40
20
0Habitat
lossOver exploitation Pollution Alien species
ChinaUnited States
Threats
Disease
Figure 12.3 Percentage of imperiled vertebrates in China and the USA threatened by different factors. Reprinted from Li and Wilcove (2005)© American Institute of Biological Sciences.
228 CONSERVATION BIOLOGY FOR ALL
Sodhi and Ehrlich: Conservation Biology for All. http://ukcatalogue.oup.com/product/9780199554249.do
© Oxford University Press 2010. All rights reserved. For permissions please email: [email protected]

Chapter 11). In this section I shall focus on thesimpler issue of land ownership: does the speciesin question occur on publicly owned (federal orstate government) land or private land? In theUS, at least, land ownership patterns are aprime consideration in devising effective protec-tion and recovery strategies, given that approxi-mately 60% of land in the US is privately owned.
In the most authoritative assessment of landownership and endangered species in the US,Groves et al. (2000) estimate that private landsharbor populations of more than half of thenation’s imperiled species; if one focuses exclu-sively on those imperiled species that have madeit onto the official federal list, that value rises totwo-thirds. Approximately one-quarter of alldocumented populations of federally protectedendangered species occur on privately ownedland. This figure almost certainly underestimatesthe degree to which private lands are importantto endangered species because many landownersare reluctant to allow biologists to come ontotheir property to look for rare plants and animals.
12.2.3 Protection under the ESA
An effective law or program for endangered spe-cies must, at a minimum, be capable of protectingessential habitat, halting overexploitation, andslowing the spread of harmful alien species. Inthe US at least, it must also extend to both publicand private lands.
In the US, once a species has been added to theofficial list of threatened and endangered species(making it a “listed species”), it is protected tovarying degrees on both publicly-owned and pri-vately-owned lands. Federal agencies, for exam-ple, are prohibited from engaging in, authorizing,or funding any activities that may jeopardize thesurvival and recovery of a listed species, includ-ing activities that damage or destroy importanthabitats. Depending on circumstances, suchactivities can range from timber cutting in thenational forests to the construction of federally-funded dams or the allocation of funds for theconstruction of interstate highways. Federalagencies are required to consult with the USFish and Wildlife Service, the agency chargedwith administering the ESA, prior to undertakingany activities that may harm listed species. Thisconsultation requirement minimizes the risk thatthese other agencies will ignore the needs of im-periled species in the course of their day-to-dayoperations. Typically, the US Fish and WildlifeService will work with other government agen-cies to modify projects so they no longer pose athreat to listed species or, if such modificationsare impractical, to develop a mitigation plan thatcompensates for any harm to a listed species.
Private citizens are prohibited from harminglisted animals. This includes direct harm, suchas shooting or trapping, as well as indirectharm, such as habitat destruction. Listed plants,on the other hand, are not afforded protection onprivate lands unless the activity in question (e.g.filling a wetland) requires a federal permit forsome other reason. This distinction between ani-mals and plants dates back to English commonlaw and does not have any ecological basis.
The decision to extend the ESA’s reach to theactivities of private citizens was revolutionary atthe time, and it has been the source of consider-able controversy ever since. When the ESA origi-nally was passed in 1973, the prohibition onharming a listed species was absolute. But thisrigid requirement had an unfortunate conse-quence: Landowners refused to discuss theirendangered-species issues with the US Fish andWildlife Service because they knew the agencycould only say “no,” and the US Fish andWildlife
Figure 12.4 Akohekohe (Palmeria dolei), an endangered Hawaiianhoneycreeper. Like many Hawaiian honeycreepers, it is endangered by acombination of habitat destruction and diseases transmitted byintroduced mosquitoes. Photograph by Jaan Lepson.
ENDANGERED SPECIES MANAGEMENT: THE US EXPERIENCE 229
1
© Oxford University Press 2010. All rights reserved. For permissions please email: [email protected]

Service turned a blind eye to the activities ofprivate landowners because it feared a politicalbacklash if it slavishly enforced the law. Thus,paradoxically, the law was too strong to protectendangered species effectively. In 1982, the USCongress modified the ESA so that private land-owners could obtain permits from the US Fishand Wildlife Service to engage in activities harm-ful to listed species provided the landowners de-veloped a plan to minimize and mitigate theimpacts of those activities, “to the maximum ex-tent practicable.” This change to the law, whilecontroversial, probably averted a much greaterweakening of the ESA down the road.
For both federal agencies and private citizensthere is also an exemption process that permitsimportant activities to go forward notwithstand-ing their impact on endangered species. It is re-served for cases where the project in questioncannot be modified or mitigated so as to avoidjeopardizing the survival and recovery of a listedspecies. Because the exemption process is compli-cated, time-consuming, and politically charged, ithas been very rarely used. Instead, the vast ma-jority of conflicts are resolved through consulta-tions with the US Fish and Wildlife Service andmodifications to the proposed projects.
Finally, it should be noted thatwhile the ESA canprevent a landowner from undertaking activitiesthat are harmful to a listed species (e.g. habitatdestruction), it is doubtful that it can compel anindividual to take affirmative steps to improve thewell-being of a listed species, for example by re-moving an invasive plant that is choking out thehabitat of an endangered bird. This is an importantlimitation of laws, such as the ESA, that focus onprohibiting harmful activities; they may not be ef-fective at dealingwithmore passive threats, such asinvasive species or diseases. I return to this issue inmy discussion of recovery programs (see below).
12.3 Recovery
12.3.1 Recovery planning
Recovery aims to secure the long-term future of thespecies, to rebuild its populations, restore its habi-tat, or reduce the threats such that it no longer is in
danger of extinction andno longer requires extraor-dinary conservation measures. That process de-mands a careful balancing of science, economics,and sociology (see Chapter 14). For example, scien-tific tools like population viability analysis can beused to figure out how many populations must beprotected, how large those populations should be,and how they must be distributed across the land-scape in order to sustain the species in question(Chapter 16). Restoration ecology can be used todetermine how to rehabilitate degraded habitats soas to increase the numbers and distributions ofendangered species (see Chapter 13). But securingthe cooperation of landowners in the targeted areasor obtaining the necessary funding to implementthe restoration plan requires careful considerationof economics, politics, and social customs. All thesesteps need to be integrated in order to recover anendangered species.
In the US, the ESA requires that recovery plansbe developed for all listed species. Those plansshould, in theory, spell out the steps necessary toensure that a given species is no longer in dangerof extinction as well as provide a budgetfor achieving that goal. One might assume thatrecovery plans play a pivotal role in endangeredspecies management in the US but, in fact, theyrarely do. Part of the problem is that the plans arenot legally binding documents. Moreover, ac-cording to several studies (Clark et al. 2002; Hoek-stra et al. 2002), the plans often fail to make gooduse of available biological data for the purposes ofdeveloping quantitative recovery goals and out-lining recovery actions. In addition, many planslack adequate information on the threats facingendangered species or fail to link recovery actionsto specific threats. And still others fail to set out ascientifically sound monitoring protocol fordetecting changes in the status of species or asses-sing the impacts of recovery actions. In short, therecovery planning process has failed to deliver thesort of guidance needed to move species backfrom the brink of extinction.
12.3.2 The management challenge
In theory, the goal of endangered species man-agement is to undertake a series of steps that
230 CONSERVATION BIOLOGY FOR ALL
Sodhi and Ehrlich: Conservation Biology for All. http://ukcatalogue.oup.com/product/9780199554249.do
© Oxford University Press 2010. All rights reserved. For permissions please email: [email protected]
eliminate the threats to the species in questionand result in healthy populations that no longerrequire special protection or attention. And yetthese sorts of success stories—sometimes termed“walk-away-species” because conservationistsare able to walk away from them—will be fewand far between. Instead, most endangered spe-cies are likely to require intensive managementand protection for the indefinite future. The rea-sons are three-fold.
First, the leading cause of species endangermentworldwide is habitat loss (Chapter 4). If, as a resultof this problem, species are reduced to living insmall, fragmented patches of habitat, they are likelyto remain at high risk of extinction until such timeas more suitable habitat is created via ecologicalrestoration. In places where human demands forland are great (e.g. southern California), there maybe no practical way for conservation organizationsor government agencies to acquire land for restora-tion. Moreover, even if the land is available, it cantake decades, even centuries, to restore certaintypes of ecosystems, such as old-growth forests—if those ecosystems can be restored to anythingresembling their pre-industrial state [see HobbsandHarris (2001) for a discussion of key conceptualissues in ecological restoration; also Box 5.3].
Second, many species live in ecosystems thatare maintained by natural disturbances such asfires and floods. Examples of such ecosystemsinclude longleaf pine forests in the SoutheasternUnited States and riparian forests in the South-western United States. As people dam rivers,clear native vegetation to build homes andfarms, and settle those ecosystems, they disruptor eliminate the natural disturbances. The resultis a growing roster of endangered species forwhich overt habitat destruction is compoundedby the elimination of the natural disturbancesthat were essential to maintaining the habitat.Given that people are unlikely to allow wildfiresor floods to reappear in places where these forceshave been “tamed,” the only way to ensure thesurvival of disturbance-dependent species is tomimic the disturbances by using techniquessuch as prescribed fire, controlled releases ofwater from dams, or direct manipulation of thevegetation. In short, a growing number of species
will not survive without constant human inter-vention.
Third, more and more species are becomingendangered by the spread of alien, invasive spe-cies. Inmost cases, scientists have noway to elimi-nate or permanently control the invasive species.Indeed, most attempts at biological control, suchas introducing a predator or pathogen of the harm-ful alien, prove unsuccessful or, worse yet, end upharming other native species (Simberloff andStiling 1996). Consequently, the usual recourse isto control invasive species by pulling them up,poisoning them, hunting them, or trapping them.Since these activities must be repeated wheneverthe population of the alien species rebounds, thereis little prospect of declaring victory and “walkingaway.”
Wilcove and Chen (1998) estimate that 60% ofthe species protected or proposed for protectionunder the ESA are threatened to some degree byalien species or fire suppression. For virtually allof these species, ongoing management of theirhabitats will be necessary to ensure their long-term survival. Wilcove and Chen (1998) furthernote that the longer the necessary management isdelayed, the greater the risk of extinction of rarespecies and the greater the cost when the neces-sary management is finally performed. For exam-ple, Tamarix, an invasive woody plant, dominatesriparian areas in the Southwestern US unless it iscontrolled via herbicides and cutting. In placeswhere Tamarix has been allowed to grow formany years, the cost of removal can be as highas US$675 per acre in the first year, droppingbelow US$10 per acre in the second year.Subsequent maintenance requires an expenditureof under US$10 per acre every two to three years.We can think of endangered species managementas having two cost components: an accrued debtreflecting a deferred maintenance problem thatarises from inadequate management efforts inthe past and an annual payment reflecting thenecessary upkeep of properly managed habitats.
Scott et al. (2005) recommend that recovery beviewed as a continuum of states. At one extremeare the species that can survive in the wild withessentially no active management once keythreats have been eliminated or enough habitat
ENDANGERED SPECIES MANAGEMENT: THE US EXPERIENCE 231
1
© Oxford University Press 2010. All rights reserved. For permissions please email: [email protected]

has been protected. At the other extreme are spe-cies that can persist in the wild, but only if peopleactively manage their habitats or control theircompetitors, predators, etc. A simple recovered/not recovered dichotomy, as exists under theESA, does not reflect the complexity of contem-porary conservation.
12.4 Incentives and disincentives
Policy tools to conserve endangered species canbe divided into two categories: incentives anddisincentives. An example of an incentive wouldbe a cash payment to a landowner for maintain-ing the habitat of an endangered species. An ex-ample of a disincentive would be a fine or jailsentence for harming an endangered species;this latter approach is the one taken by the ESA.
Conservationists have longdebated themerits ofthe two approaches. Theoretically, with unlimitedfinancial resources, it should be possible to protectand restore endangered species without incurringmuch opposition. Landowners or resource userswho stand to lose money or opportunities due torestrictions on development could be “bought off”at whatever price they demand. It’s an appealingscenario but also a deeply unrealistic one. Conser-vation programs are chronically under-funded.Moreover, at least in the US, some of the regionsof the country with the highest concentrations ofimperiled species are also regions with some of thehighest real estate prices (e.g. San Francisco Bayregion; Ando et al. 1998), a congruence that wouldquickly break the budget of any incentives pro-gram. Fines and jail sentences are thus used todeter developers from destroying the habitat ofendangered golden-cheeked warblers (Dendroicachrysoparia) in the US or poachers from killingblack rhinoceroses (Diceros bicornis) in many Afri-can countries. These types of laws, however, areeffective only if they are enforced, i.e., if violatorsfeel there is a non-trivial chance theywill be caughtand punished.
Unfortunately, penalties sometime force peo-ple to engage in activities that are counterproduc-tive for conservation. Consider the case ofthe red-cockaded woodpecker (Picoides borealis).
This woodpecker is restricted to mature, openpine forests in the southeastern US. A combina-tion of residential development and short-rotation forestry resulted in the elimination ofmost of the old-growth pine forests in the South-east and led the US Fish and Wildlife Service toplace the woodpecker on the endangered list in1970. This action ultimately resulted in protectionof much of the woodpecker’s remaining habitat.However, reports began to trickle in of land-owners cutting down stands of young pine treesbecause they were afraid that red-cockadedwoodpeckers would colonize their property ifthe trees got much older. The landowners knewthat once the woodpeckers arrived, their ability tocut down the trees at a later date could be severe-ly restricted; they reasoned that cutting the treesnow would ensure the woodpeckers never ar-rived. Similar fears prevented some landownersfrom participating in recovery efforts for red-cockaded woodpeckers and other endangeredspecies. Why go out of one’s way to restore habi-tat for endangered species if doing so could resultin restrictions on the use of one’s property?
To remedy this situation, the federal govern-ment implemented a program known as “safeharbor” in 1995. Under this program, the govern-ment assures landowners who engage in volun-tary activities that benefit endangered species thatthey will not incur additional regulatory restric-tions as a result of their good deeds. In otherwords, a landowner who restores a part of herproperty to benefit an endangered species—andagrees tomaintain the restored habitat for a certainperiod of time—will be given permission to undothose improvements (i.e. develop the property) ata later date, notwithstanding the fact thatendangered species may now reside there. Thereasoning is that without such assurances, thelandowner would never engage in the beneficialaction in thefirst place. In some cases, governmentagencies or private conservation organizationshave provided financial assistance to landownersto cover some or all of the costs of habitat restora-tion. To date, landowners have enrolled over 1.5million hectares in the safe harbor program(www.edf.org), benefiting a wide variety ofendangered species, from Houston toads (Bufo
232 CONSERVATION BIOLOGY FOR ALL
Sodhi and Ehrlich: Conservation Biology for All. http://ukcatalogue.oup.com/product/9780199554249.do
© Oxford University Press 2010. All rights reserved. For permissions please email: [email protected]
houstonensis) to northern aplomado falcons (Falcofemoralis septentrionalis) to Utah prairie dogs (Cy-nomys parvidens).
Fee-hunting is another interesting and contro-versial incentives program that has been used inparts of Africa to raise revenues and build localsupport for wildlife conservation. A limited num-ber of licenses to hunt game animals are sold,with a portion of the revenues being returned tothe local communities on whose land the huntingoccurs. The goal of such programs is to give thesecommunities an economic incentive to conservewildlife, including animals such as lions (Pantheraleo) and African elephants (Loxodonta africana)that can be harmful to crops or dangerous topeople (Corn and Fletcher 1997).
Both disincentives and incentives play importantroles in endangered species conservation. Disincen-tives are most useful in the protection phase as ameans to discourage killing of endangered speciesor further destruction of their habitats. Incentivesare useful in the recovery phase as a means toencourage landowners to restore habitats.
12.5 Limitations of endangeredspecies programs
Many conservation biologists believe that a focuson endangered species is misplaced. They arguethat the sheer number of species at risk makes aspecies-by-species approach impractical or evenfutile. Thus, conservation efforts would be moreefficient and successful if they were focused at thelevel of whole ecosystems and landscapes, ratherthan individual species.
The US experience highlights the extreme diffi-culty of identifying and protecting even a fractionof a country’s imperiled species, even when thatcountry is wealthy. To date, only about 15% of theknown species in the US have been studied insufficient detail to determine their conservationstatus (i.e. which species are in danger of extinc-tion). Embedded in this figure is a tremendousvariance between groups, reflecting a predictablebias in favor of vertebrates. Thus, the status ofalmost 100% of the mammals, birds, reptiles,amphibians, and freshwater fishes is known; in
contrast, fewer than 4% of invertebrate specieshave been assessed (Wilcove and Master 2005).
Among the species that have been assessed byexperts, over 4800 are considered possibly ex-tinct, critically imperiled, or imperiled; a strongcase can be made that all of them merit federalprotection under the ESA. Yet as of November2008, less than a third of these species had beenadded to the federal endangered species list.Adding a species to the federal list is a time-consuming and often controversial process.Moreover, the US Fish and Wildlife Service ischronically under-funded and under-staffed.One can only imagine how much more difficultthe situation must be in most of the developingcountries in the tropics, where the total number ofspecies at risk is far greater, yet resources forconservation are far fewer. Hence, it does seemreasonable to conclude that a species-by-speciesapproach to conservation inevitably will leavemany imperiled plants and animals unprotectedand vulnerable to further losses.
Nonetheless, it would be dangerous to assumethat endangered species conservation is a pooruse of conservation resources. First, efforts toprotect particular endangered species, especiallythose with large territories or home ranges (e.g.northern spotted owl, Strix occidentalis caurina),often result in de facto protection for otherendangered species that share the same ecosys-tem. By choosing the right species to focus on,conservationists can improve the efficiency oftheir efforts. Second, many conservationistswould argue that an essential goal of ecosystemor landscape conservation should be to protect allof the constituent species within that system, in-cluding the endangered ones. Moreover, certainecosystems, such as the Florida scrub or Hawai-ian rainforests, have such high concentrations ofendangered species that there is little practicaldifference between conservation programsaimed at endangered species and those aimed atthe ecosystem as a whole. Finally, and perhapsmost importantly, endangered species have al-ways enjoyed tremendous support from the pub-lic. Species such as the whooping crane (Grusamericana), giant panda (Ailurapoda melanoleuca),golden lion tamarin (Leontopithacus rosalia), and
ENDANGERED SPECIES MANAGEMENT: THE US EXPERIENCE 233
1
© Oxford University Press 2010. All rights reserved. For permissions please email: [email protected]

black rhinoceros have inspired millions of peoplearound the world to care about biodiversity.While it may be impossible to identify and pro-tect each and every species that humanity hasbrought to the brink of extinction, there will al-ways be many that we care deeply about andcannot afford to lose.
Summary
· Endangered species conservation has threephases: identification, protection, and recovery.
· Protection can be directed toward species, sub-species, or populations. There are important eco-nomic and ecological trade-offs associated withprotecting subspecies and populations.
· Consistent, quantitative criteria for determiningthe status of species have been developed by IUCN.
· Protection of endangered species requires accu-rate knowledge of the threats to those species, thelocation of existing populations, and land owner-ship patterns.
· Recovery of many endangered species will re-quire continual, active management of the habitator continual efforts to control populations of alienspecies.
· Incentives may be needed to entice people toparticipate in recovery programs.
Suggested reading
Goble, D. D., Scott, J. M., and Davis, F. W. (2006). The en-dangered species act at thirty. Volume 1. Island Press,Washington, DC.
Wilcove, D. S. and Chen, L. Y. (1998). Management co-sts for endangered species. Conservation Biology, 12,1405–1407.
Wilcove, D. S., Rothstein, D., Dubow, J. A., et al. (1998).Quantifying threats to imperiled species in the Un-ited States. BioScience, 48, 607–615.
Relevant websites
· US Fish and Wildlife Service, Endangered Species Pro-gram: http://www.fws.gov/endangered/.
· A list of endangered species: http://www.iucnredlist.org/.
REFERENCES
Ando, A., Camm, J., Polasky, S., and Solow, A. (1998).Species distributions, land values, and efficient conser-vation. Science, 279, 2126–2128.
Baille, J. E. M., Hilton-Taylor, C., and Stuart, S. N., eds(2004). IUCN Red List of threatened species: a globalspecies assessment. IUCN, Gland, Switzerland.
Clark, J. A., Hoekstra, J. M., Boersma, P. D., and Kareiva, P.(2002). Improving U.S. Endangered Species Act recoveryplans: key findings and recommendations of the SCBrecovery plan project. Conservation Biology, 16, 1510–1519.
Corn, M. L. and Fletcher, S. R. (1997). African elephantissues: CITES and CAMPFIRE. Congressional ResearchService Report 97–752 ENR. Available online at http://digital.library.unt.edu/govdocs/crs/permalink/meta-crs-388:1 (accessed 9 November 2008).
Dobson, A., Turner, W. R., and Wilcove, D. S. (2007). Con-servation biology: unsolved problems and their policyimplications. In R. May and A. McLean, eds. Theoreticalecology: principles and applications, pp, 172–189. Third edi-tion. Oxford University Press, Oxford, UK.
Groves, C.R., Kutner, L. S., Stoms, D. M., et al. (2000).Owning up to our responsibilities. In B.A. Stein, L.S.Kutner, and J.S. Adams, eds Precious heritage: the statusof biodiversity in the United States, pp, 275–300. OxfordUniversity Press, Oxford, UK.
Hobbs, R. J. and Harris, J. A. (2001) Restoration ecology:repairing the earth’s ecosystems in the new millennium.Restoration Ecology, 9, 239–246.
Hoekstra, J. M., Clark, J. A., Fagan,W. F., and Boersma, P. D.(2002). A comprehensive review of Endangered SpeciesAct recovery plans. Ecological Applications, 12, 630–640.
Hughes, J. B.,Daily,G.C., andEhrlich, P.R. (1997). Populationdiversity: its extent and extinction. Science, 278, 689–692.
Li, Y. andWilcove, D. S. (2005). Threats to vertebrate speciesin China and the United States. BioScience, 55, 147–153.
Schipper, J., Chanson, J. S., Chiozza, F. et al. (2008). Thestatus of the world’s land and marine mammals: diver-sity, threat, and knowledge. Science, 322, 225–230.
Scott, J. M., Goble, D. D., Wiens, J. A., et al. (2005). Recoveryof imperiled species under the Endangered Species Act:the need for a new approach. Frontiers in Ecology and theEnvironment, 3, 383–389.
Simberloff, D. and Stiling, P. (1996). Risks of species intro-duced for biological control. Biological Conservation, 78,185–192.
234 CONSERVATION BIOLOGY FOR ALL
Sodhi and Ehrlich: Conservation Biology for All. http://ukcatalogue.oup.com/product/9780199554249.do
© Oxford University Press 2010. All rights reserved. For permissions please email: [email protected]

Thomas, C.D., Cameron, A., Green, R. E., et al. (2004).Extinction risk from climate change.Nature, 427, 145–148.
Wilcove, D. S. and Chen, L. Y. (1998). Management costs forendangered species. Conservation Biology, 12, 1405–1407.
Wilcove, D. S. and Master, L. L. (2005). How manyendangered species are there in the United States?Frontiers in Ecology and the Environment, 3, 414–420.
Wilcove, D. S., McMillan, M., and Winston, K. C. (1993).What exactly is an endangered species? An analysis ofthe U.S. endangered species list: 1985–1991. ConservationBiology, 7, 87–93.
Wilcove, D. S., Rothstein, D., Dubow, J. A., et al. (1998).Quantifying threats to imperiled species in the UnitedStates. BioScience, 48, 607–615.
ENDANGERED SPECIES MANAGEMENT: THE US EXPERIENCE 235
1
© Oxford University Press 2010. All rights reserved. For permissions please email: [email protected]

CHAP T E R 1 3
Conservation in human-modifiedlandscapesLian Pin Koh and Toby A. Gardner
In the previous two chapters, we learn about theimportance and difficulties of prioritizing areasfor conservation (Chapter 11), and the manage-ment of endangered species in these habitats(Chapter 12). In this chapter, we discuss the chal-lenges of conserving biodiversity in degradedand modified landscapes with a focus on thetropical terrestrial biome, which is undergoingrapid deforestation and habitat degradation(Chapter 4) and contains an untold diversity ofrare and endemic species that are in urgent needof conservation attention. We first highlight theextent to which human activities have modifiednatural ecosystems, and how these changes arefundamental in defining ongoing conservationefforts around the world. We then outline oppor-tunities for conserving biodiversity within thedominant types of human land-use, includinglogged forests, agroforestry systems, monocul-ture plantations, agricultural lands, urban areas,and regenerating land. We also highlight thehighly dynamic nature of modified landscapesand the need to recognize important human de-velopment benefits that can be derived from con-servation action in these areas.
13.1 A history of human modificationand the concept of “wild nature”
Efforts to improve human welfare have led tolandscapes and ecosystems worldwide being do-mesticated to enhance food supplies and reduceexposure to natural dangers (Kareiva et al. 2007).As a consequence there are few places left onearth that have escaped some form of obvious
human impact (see Chapter 4) that can have neg-ative effects on biodiversity. This is especially sobecause human beings have released toxic syn-thetic organic chemicals, many of which are en-docrine disrupters (Box 13.1), that are nowdistributed from pole to pole.
Although few data are available on changes tothe extent and condition of many habitats, re-gions and ecosystems, what we do know is that,with few exceptions, changes that are currentlyunderway are negative, anthropogenic in origin,ominously large and often accelerating (Balmfordand Bond 2005). For example, the conversion offorests to agricultural land continues at a rate ofapproximately 13 million hectares per year, andthe last global assessment classified a full two-thirds of the world’s forests as having been mod-ified by human impacts (FAO 2006).
Some ecologists have gone so far as to considerthat the traditional concept of an intact ecosystemis obsolete, and instead propose a classificationsystem based on global patterns of human interac-tion with ecosystems, demonstrating that much ofthe world currently exists in the form of different“anthropogenic biomes” (Figure 13.1 and Plate 15;Ellis and Ramankutty 2008). For many types ofecosystems, large areas of intact vegetation simplyno longer exist, as is the case of the Atlantic foresthotspot of Brazil which has been reduced, exceptfor a few conservation units, to a fragmented net-work of very small remnants (< 100 ha), mainlycomposed of secondary forest, and immersed inagricultural or urban matrices (Ribeiro et al. 2009).
Even when we turn to areas that at first appearto be undisturbed by human impact, the bound-aries between “pristine” and “degraded” can
236
© Oxford University Press 2010. All rights reserved. For permissions please email: [email protected]
Sodhi and Ehrlich: Conservation Biology for All. http://ukcatalogue.oup.com/product/9780199554249.do

Box 13.1 Endocrine disruption and biological diversityJ. P. Myers
Since the beginning of the IndustrialRevolution, over 80 000 new chemicals haveentered commerce and hence the biosphere.These are compounds for which no organismhas any evolutionary history and hence noopportunity to evolve over generations anymetabolic protections against potential harm.Depending upon how they are used and upon
their chemical characteristics, they have dispersedwidely, many globally. For example, whalesfeeding hundreds of feet beneath the surface ofthe mid‐Atlantic accumulate brominated flameretardants from their prey. Bark of mature treesfrom virtually any forest in the world containspesticides and industrial pollutants, even thoughthey may be thousands of miles from the source.Penguins in the Antarctic store persistent organicpollutants that have been carried to the Antarcticby atmospheric transport and stored for decadesin glacial snow but that are now being liberatedby global warming. Seemingly pristine cloudforest in Costa Rica is more contaminated by thepesticides used on lowland banana plantationsthan forest adjacent to the bananas, because thepesticides volatilize in the lowland but are carrieddownwind and upward into the mountains,where they condense because of lowertemperatures.Decades of toxicological research focused on
the effects of high exposures, whichunquestionably can be serious, indeed directlylethal. Over the past 20 years, however, researchhas emerged revealing that this approach totoxicology was blind to serious effects that stemfrom the ability of some contaminants tointerfere with hormones, altering geneexpression, even at extremely low doses. Theseeffects, deemed ‘endocrine disruption’ haveforced toxicologists to rethinkhowtheyassess riskand have raised a wide array of questions abouthow contaminants may be affecting thebiosphere in unexpected ways, since hormonesregulate a wide array of biological functions inboth plants and animals. Moreover, the signalingsystems used by the endocrine system are highlyconserved evolutionarily, operating in essentiallythe same ways in fish and mammals despite 300million years of evolutionary separation. Hence
the sudden and unprecedented arrival ofhundreds, if not thousands, of chemicals capableof disrupting hormone action and novel to bodychemistry is a source of concern.
Three key discoveries lie at the center of thisrevolution in toxicology. First, hormones – andcontaminants that behave like hormones – cancause completely different effects at differentlevels of exposure. This is because the suite ofgenes up‐ or down‐regulated by a hormone canvary dramatically as the concentration of thehormone varies. And at high levels, thehormone (or a hormone‐like contaminant) canbe overtly toxic, shutting down geneexpression altogether. Hence all of the teststhat toxicologists have run that assume highdose testing will catch low dose effects areinvalid. Compounds judged to be safe based ondata from high dose testing may not be. Some,widely used in commerce, clearly are not.
Second, changes in gene expression as anorganism is developing—in the womb, as an egg,as a larvae or a tadpole, etc—can have lifelongconsequences, affecting virtually every system ofthe body, including altering fertility, immunesystem function, neurological competency (andthus behavior), etc. Frogs in suburban Florida areless likely to be feminized than frogs inagricultural Florida, where endocrine‐disruptingagricultural chemicals are used. Frogs exposed astadpoles to a mixture of pesticides die frombacterial meningitis when adult, from a commonbacteria easily resisted by control animals.
Third, individuals vary significantly in theircapacity to metabolize these compounds andresist their effects. Specific variants of genes aremore, or less, effective at safely metabolizing acontaminant and rendering it harmless. Inpeople, for example, there is at least a 40‐folddifference in capacity to metabolizeorganophosphate pesticides.
This is the stuff of Darwin…heritabledifferences among individuals that alterreproductive success…but it is happening topeople and biodiversity at a pace that may beunprecedented in the history of most, if not allspecies. Hundreds, if not more, of compoundscapable of altering gene expression at low levels
continues
CONSERVATION IN HUMAN-MODIFIED LANDSCAPES 237
© Oxford University Press 2010. All rights reserved. For permissions please email: [email protected]
1

Box 13.1 (Continued)
of exposure have been introduced into thebiosphere in fewer than 200 years. They alterfertility, cognition, immune and cardiovascularfunction, and more. The inescapable prediction,clearly speculative but highly plausible, is that thispast 200 years has been a period of remarkable, ifnot unprecedented speed in the molecularevolution of life on earth.Documented effects extend to interactions
among species as well. For example, severalenvironmental estrogens decrease the efficacy ofcommunication betweenRhizobiumbacteria andtheir leguminaceous hosts, reducing nitrogenfixation. One widely used herbicide, atrazine,both increases the likelihood that ponds willcontain large numbers of trematode parasites,which cause limb deformities in frogs, it alsoundermines the frog’s immune defenses againsttrematode infections.These emerging discoveries have come as
surprises to traditional toxicology, because theyraise questions aboutmany chemicals in commonuse that based on traditional approaches hadbeen deemed safe. For conservation biologists,they offer competing hypotheses to test againstother interpretations. For example, is thedisappearance of the golden toad (Bufoperiglenes) from Costa Rica a result of globalwarming? Or have the pesticides now known tobe present in significant concentrations in CostaRican cloud forests undermined their viability?What is the role of contaminant‐reduced immunesystem function in fungal‐caused deaths in frogs,clearly an important factor in amphibianextinctions? Is the chytrid fungus new? Or arefrogs less able to withstand infestation? Was thelake trout extinction in the Great Lakes the resultof lampreys and over‐fishing, or because dioxinsediment loads became so heavy that 100%of frydied? Have impairments by endocrine disruptersin the ability of young salmon to switch theirosmoregulation from fresh water to salt waterwhen they reach the ocean in their firstdownstreammigration contributed to salmonpopulation declines along the Pacific coast? Aredeclines in Chesapeake Bay oysters and crabs aresult of invertebrate vulnerability to endocrine‐disrupting contaminants? Is the relationshipbetween coral and their symbiotic algaedisrupted by contamination?Does this contributeto coral bleaching?
In the most elegant experimental field test todate of population‐level effects of endocrinedisruptors, Kidd et al. (2007) contaminated alake in western Ontario with an activeingredient of birth control pills (17alpha‐ethynylestradiol), maintaining thecontaminant’s concentration at 5–6 parts pertrillion for two years. This concentration is justabove levels typically found in sewage effluentand also in surface waters. The treatment ledinitially to delayed sexual development offathead minnows in the lake. By the secondyear they observed that somemales had eggs intheir testes (ova‐testis). And by the end of theseventh year, long after the treatments werehalted, very few individuals were left. Thepopulation had crashed. There are manyreports of ova‐testis in fresh water fishpopulations from around the world.How large a role endocrine disruption plays in
biodiversity declines isn’t yet clear, because fewconservation biologists have included thesemechanisms in the suite of hypotheses theirstudies are designed to test. The solutions tobiodiversity declines caused by endocrinedisruption will contrast sharply with those frommore conventional forces. No harvest zones andartificial reefs, for example, will prove futile ifshellfish declines are caused by chemicalcontamination. Hence in the search for tools tomaintain biodiversity, it is imperative thatconservation biologists’ science widens toincorporate these effects.
Relevant website
• Synopses of new studies on endocrine disruption:http://tinyurl.com/a6puq7.
REFERENCE AND SUGGESTED READING
Colborn, T., Dumanoski, D., and Myers, J. P. (1996). Ourstolen future. Dutton, New York, NY.
Cook, P. M., Robbins, J. A., Endicott, D. D., et al. (2003).Effects of aryl hydrocarbon receptor‐mediated early lifestage toxicity on Lake Trout populations in Lake Ontarioduring the 20th century. Environmental Science andTechnology, 37, 3864–3877.
Dally, G. L., Lei, Y. D., Teixeira, C., et al. (2007). Accumu-lation of current‐use pesticides in Neotropical montane
continues
238 CONSERVATION BIOLOGY FOR ALL
© Oxford University Press 2010. All rights reserved. For permissions please email: [email protected]
Sodhi and Ehrlich: Conservation Biology for All. http://ukcatalogue.oup.com/product/9780199554249.do

quickly become blurred on closer inspection. Ar-chaeological and paleoecological studies over thelast two decades suggest that many contempo-rary pristine habitats have in fact undergonesome form of human disturbance in the past(Figure 13.2 and Plate 16; Willis et al. 2005; Willisand Birks 2006; see Chapter 14).
For example, the Upper Xingu region of Brazilcomprises one of the largest contiguous tracts oftropical rainforest in the Amazon today. Emergingarchaeological evidence suggests that parts of thisregion had been densely populated withpre-European human settlements (circa �1250 to�1600 A.D.), and that extensive forests underwentlarge-scale transformation to agricultural areas
and urbanized centres (Heckenberger et al. 2003;Willis et al. 2004). Much of the lowland rainforestsof the Congo basin had similarly experienced ex-tensive human habitation, forest clearance, andagricultural activities between �3000 and �1600years ago, as evidenced by extensive finds of stonetools, oil palm nuts, charcoal horizons (subsoillayers of charcoal), banana phytoliths (silica bodiesfound in plants preserved in sediments), and pot-tery fragments (Mbida et al. 2000; White 2001).Many further examples of extensive pre-Europeandisturbance have been found in areas that conser-vationists today frequently describe as “pristine”or “intact”, including Southeast Asia, Papua NewGuinea and Central America (Willis et al. 2004).
Box 13.1 (Continued)
forests. Environmental Science and Technology, 41,1118–1123.
Gore, A. C. (2007). Introduction to endocrine‐disruptingchemicals. In A.C. Gore, ed. Endocrine‐disrupting che-micals: From basic research to clinical practice, pp. 3–8.Humana Press, New Jersey.
Kidd, K. A., Blanchfield, P. J., Mills, K. H., et al. (2007).Collapse of a fish population after exposure to a
synthetic estrogen. Proceedings of the NationalAcademy of Science of the United States of America,104, 8897–8901.
Welshons, W. V., Nagel, S. C., and vom Saal, F. S. (2006).Large effects from small exposures: III. Endocrinemechanisms mediating effects of bisphenol A atlevels of human exposure. Endocrinology, 147,S56–S69.
RangelandsCroplands
Villages
Dense settlements
Wildlands
Forested
41: Residential
31: Residential irrigated
21: Rice
11: Urban
12: Dense
22: Irrigated23: Cropped & pastoral24: Pastoral25: Rainfed26: Rainfed mosaic
32: Residential rainfed
33: Populated irrigated
34: Populated rainfed
35: Remote
61: Wild forests
51: Populated
52: Remote
62: Sparse trees
63: Barren
42: Populated
43: Remote
settlements
Figure 13.1 Anthropogenic biomes. Global land‐cover analysis reveals that that less than a quarter of the Earth’s ice‐free land can still be consideredas wild. Biomes displayed on the map are organized into groups and are ranked according to human population density. Reprinted from Ellis andRamankutty (2008).
CONSERVATION IN HUMAN-MODIFIED LANDSCAPES 239
© Oxford University Press 2010. All rights reserved. For permissions please email: [email protected]
1

Inmost of these cases, forest regeneration followedthe abandonment of human settlements and agri-cultural activities resulting in the old-growthstands that are regarded as pristine today.
13.2 Conservation in a human-modifiedworld
How does all this evidence of historical and on-going human modification of the natural worldrelate to efforts to conserve biological diversitytoday? There are at least two very profound im-plications.
First, the sheer extent to which we have domi-nated the biosphere (terrestrial, freshwater, andmarine) (Ehrlich and Ehrlich 2008) means that wehave no choice but to integrate conservation ef-forts with other human activities. It is broadlyaccepted that strictly protected areas provide anecessary yet grossly inadequate component of a
broader strategy to safeguard the future of theworld’s biota. Gap analyses show that approxi-mately one quarter of the world’s threatened spe-cies live outside protected areas (Rodrigues et al.2004; Chapter 11), and that most of the world’sterrestrial ecoregions fall significantly short of the10% protection target proposed by the IUCN(Figure 13.3 and Plate 17; Schmitt et al. 2009).Even where they exist, the integrity of protectedareas is often threatened by encroachment andillegal extraction in areas that are undergoingwidespread deforestation (Pedlowski et al. 2005),and management of neighboring areas is vital toensuring their long-term viability (Wittemyeret al. 2008; Sodhi et al. 2008).
Second, evidence of historical recovery in areasthat once hosted high levels of human activityillustrates that while long-time scales are ofteninvolved, the biotic impacts of many types ofdisturbance might not be completely irreversible.
Central Amazonia
Upper Xingu River Region
Lowland Congo Basin
New Georgia
Gabon
Southern Thailand
Papua New Guinea
Anthropogenic“terra preta” soilsfrom 3500 years ago
Intensive management ofthe landscape started1250 to 1600 A.D.
Stone tools, oil palm nuts,banana phytoliths, andpottery fragmentsfrom 3000 to 1600 years ago
“Virgin” rainforestis 150 years old
Iron–working furnacesfrom 961 B.C.
Prehistoric arboricultureand land managementfrom 8000 years ago
Agriculture from7000 years ago
Figure 13.2 Evidence of human modification of “pristine” tropical rainforest. Archaeological and paleoecological studies suggest that rainforests inthe Amazon basin, the Congo basin, and Southeast Asia have regenerated from disturbance by prehistoric human settlements. Reprinted from Williset al. (2004) with permission from AAAS (American Association for the Advancement of Science).
240 CONSERVATION BIOLOGY FOR ALL
© Oxford University Press 2010. All rights reserved. For permissions please email: [email protected]
Sodhi and Ehrlich: Conservation Biology for All. http://ukcatalogue.oup.com/product/9780199554249.do

Nea
rcti
c
Pal
earc
tic Afr
otro
pic
An
tarc
tic
Per
cen
tage
for
est a
rea
pro
tect
ed:
Ind
o-M
alay A
ust
rala
sia
Oce
ania
Neo
trop
ic
Und
er th
e 10
% T
arge
t10
% –
25%
25%
– 5
0%50
% –
100
%N
ot c
onsi
der
ed fo
rest
ed (U
nder
0.1
% fo
rest
cov
er)
Rob
inso
n Pr
ojec
tion
Figu
re13
.3Distributionofthepercentage
ofprotectedforestarea
withinWWFecoregions.The
highestlevelsofprotectioncanbe
seen
inparts
ofAu
stralia,the
Amazon,Southeast
Asia,and
Alaska.N
otableareaso
flow
protectioninclu
detheCongoBasin
inCentralAfrica
andNorthernBorealforests.Blacklinesindicatebiogeographicrealms.Whiteareasindicate
noforestcover.ReprintedfromSchm
ittet
al.(2009).
© Oxford University Press 2010. All rights reserved. For permissions please email: [email protected]
1

It is clear therefore, that partially modified land-scapes are an important and valuable asset forbiodiversity conservation, and should not beoverlooked by biologists and conservationists,and abandoned to yet further levels of intensifi-cation.
Against this backdrop of necessity and hope, itis self-evident that the future of much of theworld’s biodiversity depends on the effectivemanagement of human-modified systems (Daily2001; Lindenmayer and Franklin 2002; Bawa et al.2004). To face up to this challenge conservationbiology needs to adopt a research perspectivethat incorporates human activities as integralcomponents of ecosystems, and place a strongemphasis on understanding the coupled social-ecological dynamics of modified lands (Palmeret al. 2004; Sayer and Maginnis 2005).
Ultimately conservation biologists need toimprove their understanding of how differenttypes of human land-use may confer differentbenefits for conservation. To what extent canmodified land-uses support viable populationsof native species, and help ensure the long-termviability of isolated remnants of undisturbed veg-etation? Understanding which native species canmaintain viable populations in modified land-scapes, and under what management regimes, isone of the greatest challenges currently facingconservation biologists (Fischer and Linden-mayer 2007; Sekercioglu et al., 2007; Sodhi 2008;Chazdon et al.2009a). While it is generally accept-ed that the conversion of primary habitat forintensive agriculture inevitably leads to dramaticlosses in biodiversity (Donald 2004; Sodhiet al. 2009), more information is certainly needed.Conservation biologists are particularly uncertainof the extent to which more structurally andfloristically complex land-uses such as secondaryand agroforests can conserve native biotas(e.g. Dunn 2004; Gardner et al. 2007), althoughmixed agricultural landscapes can be more hos-pitable to forest birds than once suspected (Dailyet al. 2001; Ranganathan et al. 2008). In the rest ofthis chapter we briefly outline the biodiversityprospects that exist within different land-use sys-tems, focusing in particular on forested land-scapes in the tropics.
13.3 Selectively logged forests
As of 2005, approximately one third of theworld’s forests—a total of 1.3 billion hectares—were designated primarily for timber production(FAO 2006). In 2006, member nations of the Inter-national Tropical Timber Organization (ITTO) ex-ported over 13 million cubic meters of tropicalnon-coniferous logs worth US$2.1 billion, makinga substantial contribution to the economies ofthese nations (ITTO 2007). Logging activity onthis massive scale has resulted in huge areas offorest being degraded following the selective re-moval of high-value trees, and the collateral dam-age associated with tree felling and extraction.Asner et al. (2005) estimated that in the BrazilianAmazon between 1999 and 2002 the area of rain-forest annually degraded by logging is approxi-mately the same as that which is clear-felled foragriculture (between 12 and 19 million hecatres).
Although all logging activity has a negativeimpact on the structure and composition of theforest, the severity of this impact depends on thelogging intensity, including the number of treesremoved per ha, length of the rotation time, andsite management practices. The density of felledtrees varies among regions and managementregimes from as few as one tree every severalhas (e.g. mahogany, Swietenia macrophylla inSouth America) to more than 15/ha in lowlanddipterocarp forests of Southeast Asia (Fimbel et al.2001). In the last few decades Reduced ImpactLogging (RIL) techniques have been developedthat involve careful planning and controlled har-vesting (e.g. preliminary inventories, roadplanning, directional felling) to greatly minimizedeleterious impacts (Fimbel et al. 2001; Putz et al.2008).
Differences in how forests are managed deter-mine the extent to which logging negatively af-fects wildlife, with impacts felt through changesto the structure and composition of the forestenvironment, including alterations in tree sizestructure, a shift towards early successional veg-etation, changes in composition of fruiting trees,fragmentation of the canopy, soil compaction,and alteration of aquatic environments. In gener-al, broad patterns of wildlife response can be
242 CONSERVATION BIOLOGY FOR ALL
© Oxford University Press 2010. All rights reserved. For permissions please email: [email protected]
Sodhi and Ehrlich: Conservation Biology for All. http://ukcatalogue.oup.com/product/9780199554249.do

explained by differences in the intensity of log-ging activity as well as the amount of recoverytime elapsed before a study was conducted (Putzet al. 2001).
While there is no available evidence of anyspecies having been driven extinct by selectivelogging there are abundant data showingmarkedpopulation declines and local extinctions in awide range of species groups (Fimbel et al. 2001;Meijaard and Sheil 2008). Arboreal vertebratesappear to be particularly badly affected throughthe loss of nesting and food resources. BothThiollay (1995) and Sekercioglu (2002) reportedlosses of approximately 30% of forest dependentbirds from logged areas in Sumatra and Uganda,respectively. Felton et al. (2003) reported depletednumbers of adult orangutans (Pongo borneo) inselectively logged peat forest in Kalimantan, Bor-neo, compared to neighboring intact sites. Batsalso appear to be especially sensitive to evenlow levels of logging as changes in canopy coverand understory foliage density have knock-oneffects on foraging and echolocation strategies(e.g. Peters et al. 2006).
Nevertheless, for many taxa the impacts ofselective logging are far less severe, even underconventional management regimes. For example,Lewis (2001) found that logging at a density of sixstems per hectare had little effect on the diversityand structure of butterfly assemblages in Belize,while Meijaard and Sheil (2008) concluded thatonly a few terrestrial mammal species haveshown marked population declines following log-ging in Borneo. These studies suggest that differentspecies groups exhibit significantly different re-sponses to logging impacts depending on theirlife-history strategies and resource requirements.Within any one group it is invariably the forestdependent and specialist species that decline,while generalist and omnivorous species are unaf-fected or even increase in abundance anddiversity.
For most of the world we lack detailed infor-mation on the extent to which specific manage-ment practices can enhance levels of biodiversityin managed natural forests. Nevertheless, manybest practice general guidelines do exist, which, ifimplemented more broadly, could greatly im-prove the value of logged forests for wildlife
(Fimbel et al. 2001; Lindenmayer et al. 2006;Meijaard and Sheil 2008). These guidelinesinclude stand-level practices such as the retentionof structural complexity (including dead wood),long-rotation times, maintenance of canopycover, and fire control and timber removal tech-niques. In addition many landscape scale mea-sures can greatly improve the value of loggedforests for conservation, including the designa-tion of no-take areas, careful road design andmaintenance of landscape connectivity with in-tact corridors and riparian buffers (Gillies andSt Clair 2008).
More work is urgently needed to prescribestrategies for effective biodiversity conservationin managed forests. Despite receiving criticismfrom conservation biologists on the adequacy ofcriteria to support conservation, timber certifica-tion authorities such as the Forest StewardshipCouncil (www.fsc.org) offer a promising ap-proach to improving the responsibility of forestmanagement standards.
13.4 Agroforestry systems
Agroforestry is a summary term for practices thatinvolve the integration of trees and other woodyperennials into crop farming systems through theconservation of existing trees, their active plant-ing and tending, or the tolerance of natural regen-eration in fallow areas (Schroth et al. 2004). Itsmain purpose is to diversify production forincreased social, economic and environmentalbenefits, and has attracted increasing attentionfrom scientists working at the interface betweenintegrated natural resource management and bio-diversity conservation, especially in tropicalcountries (Schroth et al. 2004; Scherr andMcNeely2007). Farmers in many traditional agriculturalsystems have maintained or actively includedtrees as parts of the landscape for thousands ofyears to provide benefits such as shade, shelter,animal and human food (McNeely 2004).
Although many different definitions exist todefine different agroforestry systems, here wehighlight two broad categories; complex agrofor-estry and home-gardens (Scales and Marsden
CONSERVATION IN HUMAN-MODIFIED LANDSCAPES 243
© Oxford University Press 2010. All rights reserved. For permissions please email: [email protected]
1

2008). Complex agroforestry is an extension of theswidden agriculture system where tree seedlingsare co-planted with annual crops and left infallow (e.g. rattan), or maintained in an annual-perennial association (e.g. damar-coffee). After25–50 years the trees are felled and the cycleis repeated. Home-gardens are small areas of ag-ricultural land located near to houses that arecultivated with a mixture of annuals and peren-nials, including trees and shrubs. They aresemi-permanent and typically more intensivelymanaged than complex agroforests. Because oftheir high levels of floristic diversity and complexvegetation, agroforests represent a mid-point inforest structural integrity between monocultureplantations and primary forest (Figure 13.4;Schroth and Harvey 2007).
Agroforestry can benefit biodiversity conserva-tion in three ways; the provision of suitable habi-tat for forest species in areas that have suffered
significant historical deforestation, the provisionof a landscape matrix that permits the movementof species among forest remnants, and the provi-sion of livelihoods for local people which may inturn relieve pressure on remaining areas of pri-mary forest (see also Chapter 14). In areas of thetropics that have lost the majority of old-growthforest the dominant near-forest vegetation is fre-quently comprised of some form of agro-forestry,highlighting the importance of these systemsfor conservation in some regions, includingshade-coffee in Central America, shade-cacao inthe Atlantic Forest of Brazil, jungle rubberin the Sumatran lowlands, and home-gardensin countries across the world.
The majority of studies that have examined thebiodiversity value of agroforestry systems havefound that although some species are invariablylost following conversion of native habitat, alarge proportion of the original fauna and florais maintained when compared tomore intensifiedagricultural land-uses (Ranganathan et al. 2008).In reviewing the results of 36 studies Bhagwatet al. (2008) found that agroforestry systems con-sistently hosted more than two-thirds of the spe-cies found in reserves, while patterns of similarityin species composition between agroforest plotsand areas of native forest ranged from 25% (her-baceous plants) to 65% (mammals). Although ex-isting studies have not revealed any clear patternregarding which groups of species are unlikely tobe conserved within agroforestry systems, it ap-pears that rare and range-restricted species areoften those that suffer the greatest declines fol-lowing forest conversion, while those that in-crease in abundance are often open-habitat andgeneralist taxa (Scales and Marsden 2008). How-ever, even species that are usually only found inareas of native vegetation may use agroforests tomove between forest remnants, as is the case fortwo species of sloth in Costa Rica that frequentlyuse shade-cacao plantations as a source of foodand resting sites (Vaughan et al. 2007).
Differences in the amount of biodiversity that isretained in different agroforestry systems canoften be explained by differences in the intensityof past and present management regimes(Bhagwat et al. 2008). For example, the effect of
Figure 13.4 Shade‐coffee plantation in the Western Ghats, India.Photograph by M. O. Anand.
244 CONSERVATION BIOLOGY FOR ALL
© Oxford University Press 2010. All rights reserved. For permissions please email: [email protected]
Sodhi and Ehrlich: Conservation Biology for All. http://ukcatalogue.oup.com/product/9780199554249.do

management intensification on biodiversity isclearly demonstrated by the marked loss of forestspecies following the simplification of shade-cof-fee plantations and a decrease in the density anddiversity of shade trees (Figure 13.5; reviewed byPhilpott et al. 2008).
Despite the potential value of agroforestry sys-tems for biodiversity, it is important to recognizekey limitations in their contribution towardslong-term conservation strategies. First, the abili-ty of agroforestry systems to maintain a signifi-cant proportion of the regional biota depends onthe maintenance of sufficient areas of naturalhabitat, both to support highly sensitive species(Schroth and Harvey 2007) and to provide sourcepopulations (Anand et al. 2008). By encompassingsufficient areas of native forest within an agrofor-estry landscape it is possible to ensure the persis-tence of a large number of species for very longtime periods, as recently demonstrated by Ran-ganathan et al. (2008) who reported the presenceof more than 90% of the regional forest avifaunain arecanut (Areca catechu) production systemsthat have been cultivated for more than 2000
years in the Western Ghats, India. Second, appro-priate regulations on hunting and resource ex-traction are vital to ensure that keystonevertebrate and plant species are not depletedfrom otherwise diverse systems. Finally, andmost importantly, agroforestry systems can onlysurvive with the support of market incentivesand favorable land-use policies that maintainviable livelihoods of local people, and preventconversion to more intensified land-uses (Steffan-Dewenter et al. 2007).
13.5 Tree plantations
As for agroforestry systems, tree plantations havethe potential to make an important contributionto biodiversity conservation for two key reasons:(i) they may more closely reflect the structuralcomplexity of native forest than many moreintensive production land-uses; and (ii) theyoccupy a large area of once-forested land inmany parts of the world. The total area of theplantation forest estate in 2005 was about 109
AntsRC
–0.50
–0.40
–0.30
–0.20
Stan
dar
diz
ed s
peci
es c
hang
e–0.10
–0.00
0.10
0.20
TP CP
NS NS
forest speciesall species
SM SunBirds
RC TP CP SM Sun
Figure 13.5 Standardized change in species richness for ants and birds in coffee sites compared with nearby forests from 18 datasets in theNeotropics. Error bars are bootstrapped 95% CIs (Confidence Intervals). Points below zero show species loss relative to forests, and points above zeroshow significant increases in species richness compared with forests. Error bars that do not overlap zero show significantly higher or lower richness incoffee habitats compared with forests (NS, points not significantly different from zero). Habitat abbreviations: RC, rustic coffee; TP, traditionalpolyculture coffee; CP, commercial polyculture coffee; SM, shade monoculture coffee; Sun, sun coffee. Reprinted from Philpott et al. (2008).
CONSERVATION IN HUMAN-MODIFIED LANDSCAPES 245
© Oxford University Press 2010. All rights reserved. For permissions please email: [email protected]
1

million hectares, and is continuing to increase byapproximately 2.5 million hectares per year (FAO2006). In the tropics alone, the total coverage ofplantation forestry increased from approximately17 million hectares in 1980 to 70 million hectaresin 2000 (FAO 2006). As demands for timber andwood fiber continue to increase around theworld, it is highly likely that these upward trendswill persist or even accelerate.
Many tree plantations have been traditionallylabeled as “green deserts”, and are presumed orfound to be hostile to native species and largelydevoid of wildlife (Kanowski et al. 2005; Sodhiet al. 2009). However, closer inspection of avail-able data indicates that while it is certainly truethat some intensively managed plantation mono-cultures offer very little value to biodiversity (e.g.oil palm in Southeast Asia; Koh and Wilcove2007, 2008, 2009; Koh 2008a, b), other plantationsystems may provide valuable species habitat,even for some threatened and endangered taxa(Hartley 2002; Carnus et al. 2006). This apparentcontradiction is explained in part by marked dif-ferences in the levels of biodiversity that can besupported by different types of plantation. Forexample there is a stark contrast in the conserva-tion value of industrial monocultures of exoticspecies that often have little or no intrinsic valuefor native forest species, compared with complexmulti-species plantations that encompass rem-nants of native vegetation and are managed as amosaic of differently aged stands (Hartley 2002;Lindenmayer and Hobbs 2004; Kanowski et al.2005). However, a second reasonwhymany plan-tations are incorrectly presumed to be biologicaldeserts is that human perceptions of habitat qual-ity are often distinct from how native speciesthemselves perceive the landscape (Lindenmayeret al. 2003). Although few comprehensive androbust field studies have been conducted to ex-amine the conservation value of plantations,those that exist suggest that under certain condi-tions the numbers of species inhabiting theseareas may be greater than expected. For example,a very thorough study in north-east BrazilianAmazonia found that Eucalyptus plantationscontained nearly half of the regional forestfauna, although it is very unlikely that all of
these taxa could maintain viable populations inthe absence of large areas of neighboring primaryforest (Barlow et al. 2007; see Box 13.2).
The value of a given plantation forest for conser-vation is partly determined by how it is managed.For example, at the stand level, many studies havefound that faunal diversity in tree plantations isstrongly influenced by the maintenance of struc-tural attributes such as snags and deadwood, andthe tolerance of succession by native plant speciesin the understory (Hartley 2002). More floristicallyand structurally complex plantations providemore resources for many forest species (e.g. fruitfeeding butterflies; Barlow et al. 2008). At the land-scape scale, spatial heterogeneity in stand man-agement and age has been shown to be a keyfactor in determining the overall level of diversitywithin a givenplantation forest (Lindenmayer andHobbs 2004; Lindenmayer et al. 2006).
However, the true conservation value of a plan-tation depends upon the comparisonwith alterna-tive land-uses that may otherwise exist in its place(Kanowski et al. 2005; Brockerhoff et al. 2008).Clearly there is a net loss of biodiversity if planta-tions replace native forest. There is also a net lossof regional biodiversity if plantations are grownon areas of natural grassland, as seen in manyareas of southern Africa. However, if plantationsrepresent the “lesser evil” and prevent land frombeing converted to croplands or pasture, or havebeen grown on areas of degraded land, then theirimportance for biodiversity may be significant. Inareas where very little native vegetation remainsplantation forests may provide the last refuge forendemic species, such as the case of the criticallyendangered ground beetle (Holcaspis brevicula) inNew Zealand which is only known from Pinusplantations (Brockerhoff et al. 2005).
Ultimately, the extent to which plantations canbe managed to enhance biodiversity dependsupon the level of economic cost incurred by re-sponsible management strategies, and the avail-ability of market incentives to offset such costs.Some minor improvements in management tech-nique may generate some conservation benefitswith little loss in productivity (Hartley 2002) butour knowledge of the economic-conservationtrade-offs implicit in major changes to stand and
246 CONSERVATION BIOLOGY FOR ALL
© Oxford University Press 2010. All rights reserved. For permissions please email: [email protected]
Sodhi and Ehrlich: Conservation Biology for All. http://ukcatalogue.oup.com/product/9780199554249.do

Box 13.2 Quantifying the biodiversity value of tropical secondary forests and exotictree plantationsJos Barlow
Ecologists and conservation scientists have foundit difficult tomake an accurate assessment of theconservation value of secondary and plantationforests in the tropics. Many studies have beenconducted in small forest blocks, and may beinfluenced by the presence of transient speciesmoving between patches of adjacent old‐growth forest. Furthermore, studies are oftenbeset by a variety of methodologicalshortcomings. As a result, there is littleconsistency in their results, and studies maysystematically overestimate the conservationvalue of non‐primary forests (Gardner et al.2007).
Trees and lianas
Grasshoppers
Birds
Moths
Small mammals
Lizards
Dung beetles
Epegeic arachnids
Leaf litter amphibians
Bats
Fruit-feeding butterflies
Fruit flies
Scavenger flies
Large mammals
Orchid bees
0.0 0.2 0.4 0.6Proportion of primary forest species
0.8 1.0
Box 13.2 Figure The proportion of primary forest species that were also recorded in 14‐19 year old native second growth (grey bars) and4–6 year old Eucalyptus plantations (white bars) in the Brazilian Amazon. The bars are split by a line that indicates the decrease in theproportion of primary forest species when occasional species (those that were recorded only once in each of the non‐primary forests) areremoved from the comparison.
Many of these potential methodologicalshortcomings were addressed by a recentcomprehensive study that utilized a quasi‐experimental landscape mosaic that resultedfrom a large‐scale attempt to implement fast‐growing tree monocultures in the BrazilianAmazon in the 1970s. In 2004, a largeinternational team of researchers attempted toquantify the biodiversity that persists in primaryforests, 4–5 year old Eucalyptus plantations and14–19 year old native second‐growth (Barlowet al. 2007). They sampled 15 different groups ofbiodiversity, including most of the terrestrialvertebrates, a wide range of invertebrates, and
continues
© Oxford University Press 2010. All rights reserved. For permissions please email: [email protected]
1

landscape management regimes is poor. An alter-native to more ecologically sensitive managementwithin individual plantations which also deservesfurther research attention is to adopt a land sparingapproach, where intensified silviculture in onearea generates sufficient revenue to “spare” otherlands for conservation (e.g. Cyranoski 2007; seenext section).
13.6 Agricultural land
The human population is expected to increasefrom 6 billion today to 8–10 billion by 2050
(Cohen 2003). Global demand for agriculturalproducts is predicted to grow even faster dueto rising demand for food and higher qualityfood (e.g. meat), as well as for bioenergycrops used in biofuel production (UN 2005;Scherr and McNeely 2008). It has been estimatedthat feeding a population of 9 billion peoplewould require the conversion of another billionhectares of natural habitats to croplands (Tilmanet al. 2001), which will almost certainly increasethe risks of extinction already faced by numerousspecies worldwide (see Boxes 13.3 and Introduc-tion Box 1).
Box 13.2 (Continued)
the trees and lianas (see Box 13.2 Figure). Theresearchers spent >18 200 person hourscollecting specimens in the field and identifyingthem in the laboratory, and recorded 61 325individuals and identified 1442 species.Their results provide a clear message
regarding the unique value of primary or old‐growth forests. Averaging across all taxa,secondary forests and Eucalyptus plantationsheld only 59%and 47%of the species that wererecorded in the old‐growth forests, respectively.These results should be interpreted as a bestcase scenario, as the wider landscape wasdominated by old‐growth forests, maximizingrecolonization opportunities for primary forestspecies. Furthermore, many primary forestspecies were recorded just once within the non‐primary habitats, and the presence of singleindividuals is unlikely to represent a speciesability to persist in these regenerating forests.Removing these occasional species from theresults reduces the estimated value of non‐primary habitats for most taxa (Box 13.2 Figure)to an average of 46% of species for second‐growth and 39% for plantations.This research was unique as it allows us to
make a robust comparison between theresponses of different taxa across the sameland‐use gradient. This shows that theestimated value of non‐primary forests is muchhigher for highly mobile taxa such as orchidbees, large mammals, and bats (see Box 13.2Figure), which includemanymobile species that
fly tens of kilometers each day, and perceivelandscape and habitat quality at a very large‐scale. There was also a marked differenceamong taxa in the kinds of species that come todominate these non‐primary forests. Forexample, more than 60% of the species ofbirds, grasshoppers and moths that wererecorded in secondary forests were neverrecorded in old‐growth forests. These taxacontrast with the orchid bees, fruit flies andlarge mammals, for which most of the speciesrecorded in secondary forests (more than 75%)were also recorded in primary forests. Thesedata illustrate an important point about theconsequences of land‐use change; the speciespersisting in anthropogenic habitats can beeither composed of a subset of the speciesfound in primary forests, or like birds, they maybe wide‐ranging generalists that have invadedfrom open habitats, riparian vegetation, andeven urban areas.
REFERENCES AND SUGGESTED READING
Barlow, J., Gardner, T. A., Araujo, I. S., et al. (2007).Quantifying the biodiversity value of tropical primary,secondary and plantation forests. Proceedings of theNational Academy of Science of the United States ofAmerica, 104, 18555–18560.
Gardner, T. A., Barlow, J., Parry, L. T. W., and Peres, C. A.(2007). Predicting the Uncertain Future of TropicalForest Species in a Data Vacuum. Biotropica, 39, 25–30.
248 CONSERVATION BIOLOGY FOR ALL
© Oxford University Press 2010. All rights reserved. For permissions please email: [email protected]
Sodhi and Ehrlich: Conservation Biology for All. http://ukcatalogue.oup.com/product/9780199554249.do

Box 13.3 Conservation in the face of oil palm expansionMatthew Struebig, Ben Phalan, and Emily Fitzherbert
The African oil palm (Elaeis guineensis) is one ofthe world’s most rapidly expanding crops, andhas the highest yields and largest market shareof all oil crops. While cultivation has historicallyfocused in Malaysia and Indonesia, oil palm isincreasingly grown across the lowlands of othercountries in Southeast Asia, Latin America andCentral Africa. Expansion is driven by largecompanies and smallholders responding toglobal demand for vegetable oil (mainly fromIndonesia, India and China), and the growingbiofuel markets of the European Union. Withhigh demand, and strong overlap betweenareas suitable for oil palm and those ofendemic‐rich tropical forests, expansion posesan increasing threat to biodiversity.
The few studies available show that oil palmis a poor substitute habitat for the majority oftropical forest species, particularly those ofconservation concern. On average only 15% ofspecies recorded in primary forest are found inoil palm plantations (Box 13.3 Figure), evenfewer than in most other tree crops. Plantationassemblages are typically dominated by a fewabundant generalists (e.g. macaques), alieninvasives (e.g. crazy ants), pests (e.g. rats), andtheir predators (e.g. pythons). Oil palm is amajor contributor to deforestation in a fewcountries, although its role is sometimesobscured by ambiguous land‐tenure laws andits links with other enterprises (e.g. timberprofits are used to offset plantationestablishment costs in Indonesia).
lizard0
1
2
Oil palm vs. Primary forest
birds forestbirds
bats primates ants bees beetles
shared with forestnot shared with forestunknown proportion shared
Forest equivalence
moths forestbutterflies
isopods
Box 13.3 Figure The biodiversity impact of converting forests to plantations is shown by comparing species richness in oil palm relative toprimary forest. The species richness of oil palm is presented as a proportion of forest richness such that equal species richness is 1. Eachcolumn contains a study of one taxon and shows the proportion of oil palm species shared and those not shared with forest. One study of beesfound fewer species in forests than oil palm, but might have underestimated forest species richness because the canopy was not sampled.
In response to consumer concerns aboutdeforestation, the Roundtable for SustainablePalm Oil (RSPO) was formed from industry‐NGO(non‐governmental organization)
collaboration in 2003. Under this schememembers commit to environmental and socialstandards for responsible palm oil production,including an assurance that no forests of High
continues
CONSERVATION IN HUMAN-MODIFIED LANDSCAPES 249
© Oxford University Press 2010. All rights reserved. For permissions please email: [email protected]
1

What can conservation biologists do to miti-gate the threat from agricultural expansion? Thisproblem has traditionally been framed as a zero-sum game—agricultural production will takeaway land that would otherwise be used for bio-diversity conservation, and vice versa. More re-cently however, researchers have suggested that“countryside biogeography” (also known as“win-win ecology” or “reconciliation ecology”)should be a key consideration in practical conser-vation (Dale et al. 2000; Daily et al. 2001; Millerand Hobbs 2002; Daily 2003; Rosenzweig 2003).
Proponents of countryside biogeography arguethat because a large proportion of the planet isalready dominated by humans and what littleremains of pristine habitats will not be sufficientfor the long-term survival of many species, con-servation planning should include mitigationmeasures that enable human activities to proceedwith minimum displacement of native species(Rosenzweig 2003, see Box 13.4).
In the context of agricultural expansion, it isoften the case that after natural habitats havebeen converted, what remains is an agriculturalmosaic—forest fragments in a matrix of produc-tion systems (Vandermeer and Perfecto 2007).Both theoretical and empirical ecological re-search over the past decade has shown thatspecies survival in such fragmented landscapesdepends on the size and isolation of fragments,
as well as the permeability of the interveningmatrix to the movement of organisms (Hanski1999; Stratford and Stouffer 1999; Vandermeerand Carvajal 2001; Perfecto and Vandermeer2002; Chapter 5).
To enhance the survivability of native speciesin an agricultural mosaic, two approaches may bepursued. The first approach is to intensify agri-cultural production to increase overall yieldwhile avoiding further cropland expansion anddeforestation (Balmford et al. 2005; Green et al.2005). This “land sparing” approach, though con-ceptually straightforward, remains controversialamong the conservation community. Critics haveargued that the ecological impacts of intensivefarming often extend over a wider area than theland so farmed (Matson and Vitousek 2006). In-tensive farming would require more irrigation,and fertilizer and pesticide inputs, which woulddivert water away from downstream ecosystemsand species, and result in greater pollution. Fur-thermore, intensifying agricultural productioncould lead to extensive land use by displacingpeople to other forested areas or by providingthe economic incentives for migration into thearea (Matson and Vitousek 2006).
A second approach is to focus on improvingthe quality of the matrix to make it more hospita-ble for habitat generalist species that are able toutilize it, and be less of a barrier to the migration
Box 13.3 (Continued)
Conservation Value (http://www.hcvnetwork.org/) will be cleared for plantations. However,certification is not yet a panacea. Unless landplanning is expanded to regional assessments,biodiversity losses outside of RSPO‐memberplantations will continue; certification risksremaining a niche market, with mainly olderplantations exporting to responsible buyers,while demand from others is filled by newerplantations pushing into forests.Conservation science is needed to inform oil
palm policies, but it is not enough tounderstand only the biodiversity impacts ofplantations. The real challenge is for
conservation scientists to translate theirfindings into better land planning and forestprotection strategies, whilst accounting forsocial, economic and political realities.
SUGGESTED READING
Fitzherbert, E. B., Struebig, M. J., Morel, A., et al. (2008).How will oil palm expansion affect biodiversity? Trendsin Ecology and Evolution, 23, 538–545.
Koh, L. P. and Wilcove, D. S. (2008). Is oil palm agriculturereally destroying tropical biodiversity? ConservationLetters, 1, 60–64.
250 CONSERVATION BIOLOGY FOR ALL
© Oxford University Press 2010. All rights reserved. For permissions please email: [email protected]
Sodhi and Ehrlich: Conservation Biology for All. http://ukcatalogue.oup.com/product/9780199554249.do

Box 13.4 Countryside biogeography: harmonizing biodiversity and agricultureJai Ranganathan and Gretchen C. Daily
With human impacts expected to intensifyrapidly (e.g. Tilman et al. 2001), the future ofbiodiversity cannot be separated from thefuture of people. Although protected areas arecentral to conservation strategy, they alone areunlikely to ensure survival of more than a tinyfraction of Earth’s biodiversity (e.g. Rosenweig2003). Here we discuss the scope for expandingconservation strategy to include thecountryside: active and fallow agriculturalplots, gardens and pasture, plantation ormanaged forest, and remnants of nativevegetation in landscapes otherwise devotedprimarily to human activities (Daily et al. 2001).Little is known about the capacity of thecountryside to support native species,particularly in the tropics, where the majorityof the Earth’s species are found (Wilson andPeter 1988).We summarize information on the best‐
studied groups—birds, mammals, and insects—in well‐studied systems in Mesoamerica. On thequestion of what fraction of native species cansurvive in countryside, the answer appears tobe about 50% or more, though abundance ofmany species is low (Estrada et al. 1997; Dailyet al. 2001; Daily et al. 2003; Horner‐Devineet al. 2003). Three landscape characteristicsstand out as important in conferring a survivaladvantage to native species in the countryside.First, species richness is considerably higher inthe vicinity of large remnants of relativelyintact forest, suggesting that many species thatoccur in the countryside can persist only in thenearby presence of that native forest (Estradaet al. 1997; Rickets et al. 2001; Perfecto andVandermeer 2002; Sekercioglu et al. 2007).Second, the presence of native vegetation inhuman‐dominated habitat (in the form ofliving fences, windbreaks, and remnant trees)facilitates persistence (Estrada et al. 1994;Estrada et al. 2000; Hughes et al. 2002; Harveyet al. 2004). Third, the intensity of agriculture ina landscape is negatively correlated with thatlandscape’s conservation potential (Bignal andMcCraken 1996; Green et al. 2005).The question of which attributes of native
species confer an advantage in the countrysidehas perhaps been best studied in birds, where ahigh population growth rate and the ability todisperse through open habitat greatly increasesthe chance of occurrence in the countryside(Sekercioglu et al. 2002; Pereira et al. 2004).Additionally, the conversion of forest to
agriculture severely impacts forest‐interior birdspecies; in one case the cause seemed to be adecrease in available nesting habitat (Lindelland Smith 2003).It is uncertain if high levels of native diversity
can be maintained over the long term(centuries to millennia), as almost all of thecountryside under study has been undercultivation for less than a century (at least inrecent centuries). A possible indication of thelong‐term prospects can be found within theWestern Ghats mountain range, India, wherehigh levels of bird diversity have beenmaintained in a low‐intensity agriculturallandscape, despite >2000 years of continuousagricultural use (Ranganathan et al. 2008, seeBox 13.4 Figures 1 and 2). Though tentative,these results show that conservationinvestments in countryside may pay off forbiodiversity in the long term.
Intactforest
0
10
20
30
Tot
al b
ird
spe
cies
ric
hnes
s
40
A 50a a a a b
Productionforest
Areca-nut
Land cover
Cashew Shrub
Intactforest
0
5
10
15
20
Fore
st b
ird
s sp
ecie
s ri
chne
ss 25
30
35B a b b c d
Productionforest
Areca–nut
Land cover
Cashew Shrub
Box 13.4 Figure 1 Patterns of bird species richness within anagricultural landscape on the fringes of the Western Ghats, India,where land use patterns help to maintain avian diversity (reprintedfrom Ranganathan et al. 2008). There are five major land covers inthe landscape: forest (itself divided into relatively pristine “intact
continues© Oxford University Press 2010. All rights reserved. For permissions please email: [email protected]
1
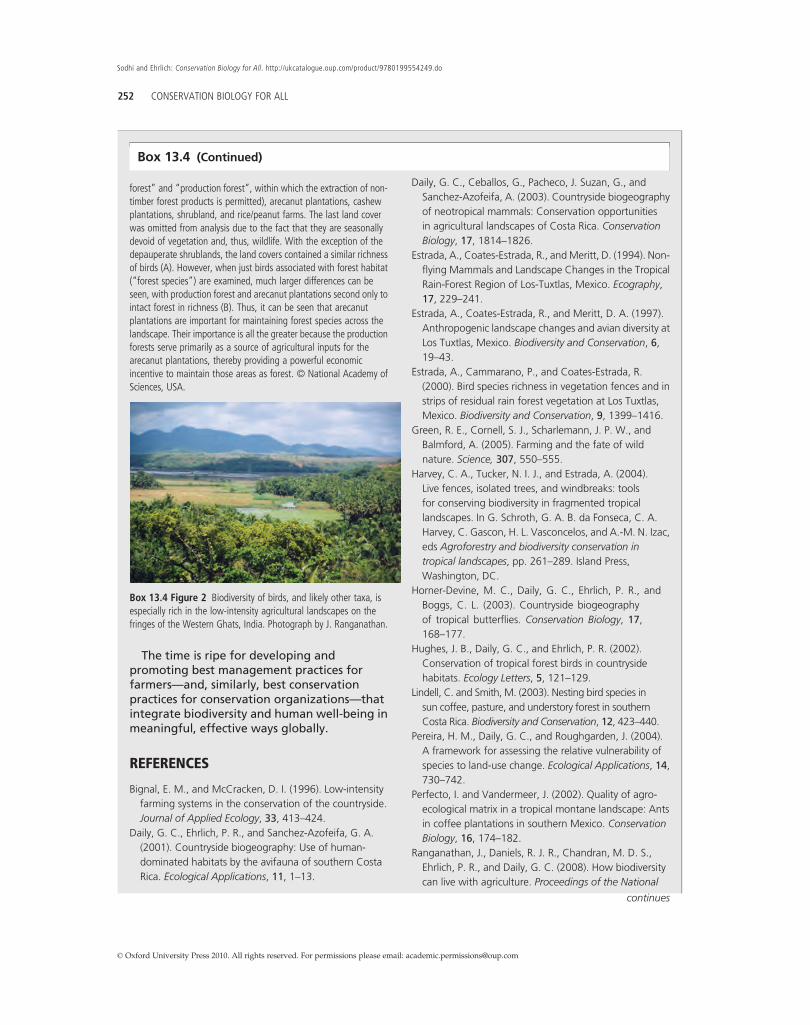
Box 13.4 (Continued)
forest” and “production forest”, within which the extraction of non‐timber forest products is permitted), arecanut plantations, cashewplantations, shrubland, and rice/peanut farms. The last land coverwas omitted from analysis due to the fact that they are seasonallydevoid of vegetation and, thus, wildlife. With the exception of thedepauperate shrublands, the land covers contained a similar richnessof birds (A). However, when just birds associated with forest habitat(“forest species”) are examined, much larger differences can beseen, with production forest and arecanut plantations second only tointact forest in richness (B). Thus, it can be seen that arecanutplantations are important for maintaining forest species across thelandscape. Their importance is all the greater because the productionforests serve primarily as a source of agricultural inputs for thearecanut plantations, thereby providing a powerful economicincentive to maintain those areas as forest. © National Academy ofSciences, USA.
Box 13.4 Figure 2 Biodiversity of birds, and likely other taxa, isespecially rich in the low‐intensity agricultural landscapes on thefringes of the Western Ghats, India. Photograph by J. Ranganathan.
The time is ripe for developing andpromoting best management practices forfarmers—and, similarly, best conservationpractices for conservation organizations—thatintegrate biodiversity and human well‐being inmeaningful, effective ways globally.
REFERENCES
Bignal, E. M., and McCracken, D. I. (1996). Low‐intensityfarming systems in the conservation of the countryside.Journal of Applied Ecology, 33, 413–424.
Daily, G. C., Ehrlich, P. R., and Sanchez‐Azofeifa, G. A.(2001). Countryside biogeography: Use of human‐dominated habitats by the avifauna of southern CostaRica. Ecological Applications, 11, 1–13.
Daily, G. C., Ceballos, G., Pacheco, J. Suzan, G., andSanchez‐Azofeifa, A. (2003). Countryside biogeographyof neotropical mammals: Conservation opportunitiesin agricultural landscapes of Costa Rica. ConservationBiology, 17, 1814–1826.
Estrada, A., Coates‐Estrada, R., andMeritt, D. (1994). Non‐flying Mammals and Landscape Changes in the TropicalRain‐Forest Region of Los‐Tuxtlas, Mexico. Ecography,17, 229–241.
Estrada, A., Coates‐Estrada, R., and Meritt, D. A. (1997).Anthropogenic landscape changes and avian diversity atLos Tuxtlas, Mexico. Biodiversity and Conservation, 6,19–43.
Estrada, A., Cammarano, P., and Coates‐Estrada, R.(2000). Bird species richness in vegetation fences and instrips of residual rain forest vegetation at Los Tuxtlas,Mexico. Biodiversity and Conservation, 9, 1399–1416.
Green, R. E., Cornell, S. J., Scharlemann, J. P. W., andBalmford, A. (2005). Farming and the fate of wildnature. Science, 307, 550–555.
Harvey, C. A., Tucker, N. I. J., and Estrada, A. (2004).Live fences, isolated trees, and windbreaks: toolsfor conserving biodiversity in fragmented tropicallandscapes. In G. Schroth, G. A. B. da Fonseca, C. A.Harvey, C. Gascon, H. L. Vasconcelos, and A.‐M. N. Izac,eds Agroforestry and biodiversity conservation intropical landscapes, pp. 261–289. Island Press,Washington, DC.
Horner‐Devine, M. C., Daily, G. C., Ehrlich, P. R., andBoggs, C. L. (2003). Countryside biogeographyof tropical butterflies. Conservation Biology, 17,168–177.
Hughes, J. B., Daily, G. C., and Ehrlich, P. R. (2002).Conservation of tropical forest birds in countrysidehabitats. Ecology Letters, 5, 121–129.
Lindell, C. and Smith, M. (2003). Nesting bird species insun coffee, pasture, and understory forest in southernCosta Rica. Biodiversity and Conservation, 12, 423–440.
Pereira, H. M., Daily, G. C., and Roughgarden, J. (2004).A framework for assessing the relative vulnerability ofspecies to land‐use change. Ecological Applications, 14,730–742.
Perfecto, I. and Vandermeer, J. (2002). Quality of agro-ecological matrix in a tropical montane landscape: Antsin coffee plantations in southern Mexico. ConservationBiology, 16, 174–182.
Ranganathan, J., Daniels, R. J. R., Chandran, M. D. S.,Ehrlich, P. R., and Daily, G. C. (2008). How biodiversitycan live with agriculture. Proceedings of the National
continues
252 CONSERVATION BIOLOGY FOR ALL
© Oxford University Press 2010. All rights reserved. For permissions please email: [email protected]
Sodhi and Ehrlich: Conservation Biology for All. http://ukcatalogue.oup.com/product/9780199554249.do

of forest specialist species between forest frag-ments (Vandermeer and Perfecto 2007). The goalis to increase the permeability of the matrix,which is critical for the long-term persistence ofmetapopulations and metacommunities (Hanski1999; Stratford and Stouffer 1999; Vandermeerand Carvajal 2001; Chapter 5).
13.7 Urban areas
Urban areas represent an extreme case in the spec-trum of human-modified land uses. Unlike theother forms of habitat modification discussedabove, urbanization often irreversibly replaces nat-ural habitats with persistent artificial ones, result-ing in long-term impacts on many native species(Stein et al. 2000). Despite the rapid rate at whichurban sprawl is occurring worldwide, urban ecol-ogy has received relatively little attention fromconservation biologists (Miller and Hobbs 2002).This can be attributed to the traditional focus ofconservation research on “natural” ecosystemssuch as old-growth forests (Fazey et al. 2005).
As the trend of rapid economic growth con-tinues in the tropics, urban areas will likely beincreasingly ubiquitous in the tropics. An obvi-ous research agenda, therefore, is to understandthe response of tropical species to urbanization
and to develop effective measures for their con-servation. We ideally would want to be able toexcise a tropical country, allow it to fulfill itseconomic potential and experience the associatedlandscape changes within a greatly acceleratedtime frame, and use this natural laboratory tostudy what species survive, where they persistand how they are able to do so. The island nationof Singapore in tropical Southeast Asia representsjust such an ecological worst case scenario (Sodhiet al. 2004).
Koh and Sodhi (2004) studied butterfly diversityin Singapore, and found that forest reserves hadhigher species richness than secondary forest frag-ments and urban manmade parks (Figure 13.6).They attributed this to the larger areas of forestreserves and greater floristic complexity (com-pared to the other habitats they studied), whichcan sustain larger populations of species withlower risks of extinction, and contain greater diver-sities of microhabitats with myriad ecologicalniches that can support more species (MacArthurand Wilson 1963, 1967; Simberloff 1974; Lauranceet al. 2002). Koh and Sodhi further explained thatthe last remaining tracts of old-growth vegetationin forest reserves can provide the unique microcli-matic conditions such as a closed canopy, andspecific larval host plants vital to the persistenceof specialist butterfly species.
Box 13.4 (Continued)
Academy of Sciences of the United States of America,105, 17852–17854.
Ricketts, T. H., Daily, G. C., Ehrlich, P. R., and Fay,J. P. (2001). Countryside biogeography of mothsin a fragmented landscape: Biodiversity in nativeand agricultural habitats. Conservation Biology, 15,378–388.
Rosenzweig, M. L. (2003). Win‐win ecology:how the earth’s species can survive in the midst ofhuman enterprise. Oxford University Press, Oxford,UK.
Sekercioglu, C. H., Ehrlich, P. R., Daily, G. C., Aygen,D., Goehring, D., and Sandi, R. F. (2002). Disap-
pearance of insectivorous birds from tropical forestfragments. Proceedings of the National Academyof Sciences of the United States of America, 99,263–267.
Sekercioglu, C. H., Loarie, S. R., Brenes, F. O., Ehrlich, P. R.,and Daily, G. C. (2007). Persistence of forest birds in theCosta Rican agricultural countryside. Conservation Biol-ogy, 21, 482–494.
Tilman, D., Fargione, J., Wolff, B., et al. (2001). Forecastingagriculturally driven global environmental change.Science, 292, 281–284.
Wilson, E. O. and Peter, F. M., eds (1988). Biodiversity.National Academy Press, Washington, DC.
CONSERVATION IN HUMAN-MODIFIED LANDSCAPES 253
© Oxford University Press 2010. All rights reserved. For permissions please email: [email protected]
1

A second important finding of Koh and Sodhi’sstudy was that urban parks adjoining forests weremore diverse than secondary forest fragments.This was likely due to the prevalence of numerousornamental flowering plants cultivated in theseurban parks, which can support resident butterflyspecies adapted to an open canopy, as well asspecies from adjacent forests that forage in theseparks. Indeed, the authors reported that both thenumber of potential larval host-plant species andthe amount of surrounding forest cover were sta-tistically significant predictors of butterfly speciesrichness in urban parks.
Koh and Sodhi’s study has two key conserva-tion lessons: first, in highly urbanized tropicallandscapes the least human-disturbed land usesare likely also most valuable for preserving thenative biodiversity, and should therefore begiven the highest conservation priority; second,with a good understanding of the biology of or-ganisms, it is possible to enhance the conserva-tion value of manmade habitats within human-modified landscapes. Although urban landscapesrepresent the worst case scenario in ecosystemmanagement we are increasingly faced with thetask of conserving species in such “unnatural”environments. Therefore, it is crucial that moreresearch be focused on developing viable strate-gies for the effective conservation of biodiversityin urban landscapes.
13.8 Regenerating forests on degradedland
In most areas of the world, secondary forestsregenerate naturally on abandoned agriculturalland if human disturbance declines. Followingcenturies of human disturbance, the total areaof regenerating forest is now enormous (millionsof hectares). Indeed, for parts of the world thathave suffered widespread historical deforestationsecondary forests comprise the majority of re-maining forest area (e.g. east coast of the USA,much of Western Europe, and areas of highhuman population density like Singapore). Inthe tropics secondary regrowth together with de-graded old-growth forests (e.g. through logging,fire, fragmentation) comprise roughly half ofthe world’s remaining tropical forest area(ITTO 2002).
Understanding the potential importance ofthese large areas of secondary forest for conser-vation has attractedmuch research attention fromecologists and conservation biologists, as well asconsiderable controversy. For example, Wrightand Muller-Landau (2006) recently proposedthat the regeneration of secondary forests in de-graded tropical landscapes is likely to avert thewidely anticipated mass extinction of native for-est species. However, other researchers havehighlighted serious inadequacies in the quantity
Figure 13.6 Urban manmade park in Singapore.Photograph by Lian Pin Koh.
254 CONSERVATION BIOLOGY FOR ALL
© Oxford University Press 2010. All rights reserved. For permissions please email: [email protected]
Sodhi and Ehrlich: Conservation Biology for All. http://ukcatalogue.oup.com/product/9780199554249.do

and quality of species data that underpin thisclaim, casting doubt on the potential for second-ary forest to serve as a “safety net” for tropicalbiodiversity (Brook et al. 2006; Gardner et al.2007).
In perhaps the only quantitative summary ofbiodiversity responses to forest regeneration todate, Dunn (2004) analyzed data from 39 tropicaldata sets and concluded that species richness ofsome faunal assemblages can recover to levelssimilar to mature forest within 20–40 years, butthat recovery of species composition is likely totake substantially longer. The recovery of biodi-versity in secondary forests varies strongly be-tween different species groups depending ontheir life histories with species responses general-ly falling into three categories (Bowen et al. 2007):(i) species that decline in abundance or are absentfrom regrowth due to specialist habitat require-ments; (ii) old-growth forest species that benefitfrom altered conditions in regenerating forest andincrease in abundance or distribution; and(iii) open-area species that invade regeneratingareas to exploit newly available resources. Theseconclusions are mirrored by the results the com-prehensive Jari study in north-east Brazil thatfound that 41% of old-growth vertebrate and in-vertebrate species were lacking from secondaryforests of 12–18 years of age, and that speciesresponses varied strongly among and within tax-onomic groups (see Box 13.2).
The general lack of data and the context depen-dent nature of existing studies on biodiversityrecovery in secondary forests severely limit ourability to make general predictions about the po-tential for species conservation in tropical second-ary forests (Chazdon et al. 2009b). However, wecan conclude that secondary forests are likely tobe more diverse the more closely they reflect thestructural, functional, and compositional proper-ties of mature forest and are set within a favorablelandscape context (Chazdon 2003; Bowen et al.2007). In particular, the conservation of old-growth species in secondary forests will bemaximized in areas where extensive tracts ofold-growth forest remain within the widerregion, older secondary forests have persisted,post-conversion land-use was of limited duration
and low intensity, post-abandonment anthropo-genic disturbance is relatively low, seed dispers-ing fauna are protected, and old-growth forestsare close to abandoned sites (Chazdon et al.2009b).
The conservation value of a secondary forestshould increase over time as old-growth speciesaccumulate during forest recovery, but older sec-ondary forests are poorly studied and long-termdatasets are lacking. Existing chronosequencestudies of regenerating forests demonstrate thatbiotic recovery occurs over considerably longertime scales than structural recovery, and that re-establishment of certain species and functionalgroup composition can take centuries or millen-nia (de Walt et al. 2003; Liebsch et al. 2008). How-ever, for much of the world, secondary forestsexist in highly dynamic landscape mosaics andare invariably clear-felled within one or two dec-ades, thereby greatly limiting the opportunity forthese forests to develop into older successionalstands that are of higher value for conservation(Chazdon et al. 2009b).
Despite this uncertainty, regeneration repre-sents the only remaining conservation option formany regions of the world that have sufferedsevere historical deforestation. An estimated 350million hectares of the tropics are classified asdegraded due to poor management (Maginnisand Jackson 2005). While the natural recovery ofthis land is not inevitable there is encouragingevidence that judicious approaches to reforesta-tion can greatly facilitate the regeneration processand enhance the prospects of biodiversity inmodified landscapes (Chazdon 2008).
13.9 Conservation and human livelihoodsin modified landscapes
Modified and degraded landscapes around theworld are not only of vital importance for biodi-versity conservation, but are also home tomillions of the world’s poorest people. This isespecially true in tropical countries where areasof high species richness and endemism frequent-ly overlap with centers of human populationdensity (e.g. sub-Saharan Africa; Balmford et al.
CONSERVATION IN HUMAN-MODIFIED LANDSCAPES 255
© Oxford University Press 2010. All rights reserved. For permissions please email: [email protected]
1

2001). It is estimated that the livelihoods of atleast 300 million rural poor in tropical countriesdepend upon degraded or secondary forests(ITTO 2002). For impoverished communities bio-diversity is about the basic human needs ofeating, staying healthy, and finding shelter(see Chapter 14). Furthermore, it is local peoplethat ultimately decide the fate of their localenvironments, even if the decisions they makefall within a wider political, social and economiccontext (Sodhi et al. 2006, 2008; Ghazoul 2007;Chapter 14).
These facts make it clear that human liveli-hoods and poverty concerns need to receive
high priority in the conservation agenda if weare to develop management strategies for agricul-tural and modified landscapes that are not onlyviable into the long term, but are also socially just(Perfecto and Vandermeer 2008; Chapter 14). Rec-ognition of this broader challenge has led to callsfor a “pro-poor” approach to conservation (Kai-mowitz and Sheil 2007). However, developingsuch an approach and successfully reconcilingthe interdependent objectives of poverty allevia-tion and biodiversity conservation is far fromtrivial. Opportunities for much-sought after“win-win” solutions (Rosenzweig 2003) areoften hard if not impossible to achieve whenfaced by real-world trade-offs between economicand conservation goals, especially in the short-term. However, with careful planning and goodscience there is significant potential for synergiesin achieving development and biodiversity bene-fits in the management of modified landscapes(Figure 13.7; Lamb et al. 2005).
The greatest difficulty in developing a pro-poorapproach to biodiversity conservation lies in thefact that the structure and dynamics of humancommunities, and their interactions with the localenvironment, varies significantly across differentparts of the world. There are no silver bullet, “offthe shelf” solutions that can be successfully ap-plied to any situation. Instead individual man-agement strategies for individual landscapesneed to be developed with explicit recognitionof the socioeconomic, political, and ecologicalcontext within which they are embedded (Os-trom 2007). Furthermore, it is not enough to ac-commodate development considerations that dono more than secure livelihood levels at subsis-tence levels. Local guardians of modified land-scapes have the right to develop managementstrategies that generate higher economic returnsthat can raise them out of poverty (Ghazoul2007).
13.10 Conclusion
The challenge of safeguarding the future oftropical forest species is daunting. Spatial andtemporal patterns of biodiversity in modified
Optimal benefits
5
6
71
4
3
2
Biodiversity
Fina
ncia
l and
live
lihoo
d b
enef
its
Figure 13.7 Balancing trade‐offs betwen human livelihoods andbiodiversity conservation in reforestation projects. Arrows representalterative reforestation methods. Traditional monoculture plantations ofexotic species (arrow 1) mostly generate just financial benefits, whereasrestoration using methods that maximize diversity and enhancebiodiversity (arrow 2) yields few direct financial benefits to landowners,at least in the short term. Protecting forest regrowth (arrow 3) generatesimprovements in both biodiversity and livelihoods, although themagnitude of the benefits depends on the population density ofcommercially or socially important species; these can be increased byenrichment of secondary forest with commercially attractive species(arrow 4). Restoration in landscapes where poverty is commonnecessitates attempting both objectives simultaneously. But, in manysituations, it may be necessary to give initial priority to forms ofreforestation that improve financial benefits, such as woodlots andagroforestry systems (arrow 5). In subsequent rotations, this balancemight change over time (moving to arrow 6 and later to arrow 7 byusing a greater variety of species). There may be greater scope forachieving multiple objectives by using several of these options atdifferent locations across the landscape. Reproduced with permissionfrom Lamb et al. (2005).
256 CONSERVATION BIOLOGY FOR ALL
© Oxford University Press 2010. All rights reserved. For permissions please email: [email protected]
Sodhi and Ehrlich: Conservation Biology for All. http://ukcatalogue.oup.com/product/9780199554249.do

landscapes are the product of interacting humanand ecological processes that vary strongly be-tween different land-use systems and among re-gions, and have effects that may take years tobecome fully manifest (Gardner et al. 2009). Con-servation biologists have little option but to tacklethis challenge head-on as very few, if any tropicalforest species exist in isolation from human inter-ference. Perhaps the most important conclusionto emerge from biodiversity research in modifiedlandscapes is that different human land-uses canhave enormously different implications for con-servation. In this chapter we have shown that abroad gradient of structural complexity and spe-cies diversity exists from lightly logged produc-tion forests at one end to intensive arable andpastoral systems and semi-urban landscapes atthe other. We have also highlighted how respon-sible management strategies at local and land-scape scales can greatly enhance opportunitiesfor biodiversity conservation in these systems.Throughout we have drawn attention to some ofthe real world economic and social considerationsthat will determine the success of any attempts toimplement improved conservation strategies inthe real world.
To truly understand the prospects for conserva-tion in modified landscapes, we need to increaseour emphasis on the study of biodiversity inman-aged land-use systems (Chazdon et al. 2009a). Keyknowledge gaps remain in our understanding ofthe long-term viability of native species in differ-ent land-uses (Sodhi 2008), and how patterns ofspecies persistence are influenced by differencesin the composition and configuration of entirelandscapes. Increasingly severe levels of environ-mental degradation in modified landscapesacross the worldmeans that the costs and benefitsof ecological restoration are deserving of particu-lar research attention. There is also an urgent needfor an improved understanding of the interactionbetween people and their local environment inhuman-modified systems, including the impor-tance of ecosystem services (see Chapter 3) andopportunities for generating livelihood benefitsfrom conservation activities.
If it is to be successful, the conservation re-search agenda in modified landscapes needs tobe effective at incorporating new tools and ap-proaches, both conceptual and analytical, thathave the potential to bridge the divide betweentheory and practice and translate policies intoeffective field implementation (Chazdon et al.2009a; Gardner et al. 2009). Key to achieving suc-cess and developing sustainable managementstrategies is the ability to build participatory andmultidisciplinary approaches to research andmanagement that involve not only conservationbiologists, but also agroecologists, agronomists,farmers, indigenous peoples, rural social move-ments, foresters, social scientists, and land man-agers (see Chapter 14).
Summary
· Given that approximatelyonequarter of theworld’sthreatened species live outside protected areas, andthat the integrity of protected areas where theyexist is often threatened, we need to integrate conser-vation efforts with other human activities.
· Recent studies demonstrate there are importantopportunities for conserving biodiversity within thedominant types of human land-use, includinglogged forests, agroforestry systems, monocultureplantations, agricultural lands, urban areas, and re-generating land.
· It is the local people that ultimately decide thefate of their local environments, even if the decisionsthey make fall within a wider political, social, andeconomic context.
· Key to achieving success and developing sustain-able management strategies is the ability to build par-ticipatoryandmultidisciplinary approaches to researchand management that involve not only conservationbiologists, but also agroecologists, agronomists,farmers, indigenous peoples, rural social movements,foresters, social scientists, and land managers.
Suggested reading
Barlow, J., Gardner, T. A., Araujo, I. S., et al. (2007). Quan-tifying the biodiversity value of tropical primary,
CONSERVATION IN HUMAN-MODIFIED LANDSCAPES 257
© Oxford University Press 2010. All rights reserved. For permissions please email: [email protected]
1

secondary and plantation forests. Proceedings of the Na-tional Academy of Sciences of the United States of America,104, 18555–18560.
Dunn, R. R. (2004). Recovery of faunal communities duringtropical forest regeneration. Conservation Biology, 18,302–309.
Gardner, T., Barlow, J., Chazdon, R., et al. (2009). Prospectsfor tropical forest biodiversity in a human-modifiedworld. Ecology Letters, 12, 561–582.
Koh, L. P. (2008). Can oil palm plantations be made morehospitable for forest butterflies and birds? Journal of Ap-plied Ecology 45, 1002–1009.
Relevant website
· Mongabay: http://www.mongabay.com
REFERENCES
Anand, M., Krishnaswamy, J., and Das, A. (2008). Proxim-ity to forests drives bird conservation value of coffeeplantations: implications for certification. EcologicalApplications, 18, 1754–1763.
Asner, G. P., Knapp, D. E., Broadbent, E. N., Oliveira, P. J.C., Keller, M., and Silva, J. N. (2005). Selective logging inthe Brazilian Amazon. Science, 310, 480–482.
Balmford, A. and Bond, W. (2005). Trends in the state ofnature and their implications for human well-being.Ecology Letters, 8, 1218–1234.
Balmford, A., Moore, J. L., Brooks, T. et al. (2001). Conser-vation conflicts across Africa. Science, 291, 2616–2619.
Balmford, A., Green, R. E., and Scharlemann, J. P. W.(2005). Sparing land for nature: exploring the potentialimpact of changes in agricultural yield on the area need-ed for crop production. Global Change Biology, 11,1594–1605.
Barlow, J., Gardner, T. A., Araujo, I. S., et al. (2007). Quan-tifying the biodiversity value of tropical primary, sec-ondary and plantation forests. Proceedings of the NationalAcademy of Sciences of the United States of America, 104,18555–18560.
Bawa,K. S.,Kress,W. J.,Nadkarni,N.M., et al. (2004). Tropicalecosystems into the 21st century. Science, 306, 227–228.
Bhagwat, S. A.,Willis, K. J., Birks,H. J. B., andWhittaker, R. J.(2008). Agroforestry: a refuge for tropical biodiversity?Trends in Ecology and Evolution, 23, 261–267.
Bowen, M. E., McAlpine, C. A., House, A. P. N., and Smith,G. C. (2007). Regrowth forests on abandoned agricultur-al land: A review of their habitat values for recoveringforest fauna. Biological Conservation, 140, 273–296.
Brockerhoff, E. G., Berndt, L. A., and Jactel, H. (2005). Roleof exotic pine forests in the conservation of the criticallyendangered New Zealand ground beetle Holcaspis brevi-cula (Coleoptera: Carabidae). New Zealand Journal of Ecol-ogy, 29, 37–43.
Brockerhoff, E. G., Jactel, H., Parrotta, J. A., Quine, C. P.,and Sayer, J. (2008). Plantation forests and biodiversity:oxymoron or opportunity? Biodiversity and Conservation,17, 925–951.
Brook, B. W., Bradshaw, C. J. A., Koh, L. P., and Sodhi, N.S. (2006). Momentum drives the crash: mass extinction inthe tropics. Biotropica, 38, 302–305.
Carnus, J. M., Parrotta, J., Brockerhoff, E., et al. (2006).Planted forests and biodiversity. Journal of Forestry, 104,65–77.
Chazdon, R. L. (2003). Tropical forest recovery: legacies ofhuman impact and natural disturbances. Perspectives inPlant Ecology Evolution and Systematics, 6, 51–71.
Chazdon, R. L. (2008). Beyond Deforestation: RestoringForests and Ecosystem Services on Degraded Lands.Science, 320, 1458–1460.
Chazdon, R. L., Harvey, C. A., Oliver, K., et al. (2009a).Beyond Reserves: A Research Agenda for ConservingBiodiversity in Human-modified Tropical Landscapes.Biotropica, 41, 142–153.
Chazdon, R. L., Peres, C. A., Dent, A. (2009b). Where arethe wild things? Assessing the potential for species con-servation in tropical secondary forests Conservation Biol-ogy (in Press).
Cohen, J. E. (2003). Human population: the next halfcentury. Science, 302, 1172–1175.
Cyranoski, D. (2007). Logging: the new conservation.Nature, 446, 608–610.
Daily, G. C. (2001). Ecological forecasts. Nature, 411,245–245.
Daily, G. C. (2003). Time to rethink conservation strategy.Science, 300, 1508–1509.
Daily, G. C., Ehrlich, P. R., and Sanchez-Azofeifa, A. (2001).Countryside biogeography: Utilization of human-dominated habitats by the avifauna of southern CostaRica. Ecological Applications, 11, 1–13.
Dale, V. H., Brown, S., Haeuber, R. A., et al. (2000). Ecolog-ical principles and guidelines for managing the use ofland. Ecological Applications, 10, 639–670.
DeWalt, S. J., Maliakal, S. K., and Denslow, J. S. (2003).Changes in vegetation structure and compositionalong a tropical forest chronosequence: implications forwildlife. Forest Ecology and Management, 182, 139–151.
Donald, P. F. (2004). Biodiversity impacts of some agricul-tural commodity production systems. Conservation Biolo-gy, 18, 17–37.
258 CONSERVATION BIOLOGY FOR ALL
© Oxford University Press 2010. All rights reserved. For permissions please email: [email protected]
Sodhi and Ehrlich: Conservation Biology for All. http://ukcatalogue.oup.com/product/9780199554249.do

Dunn, R. R. (2004). Recovery of faunal communities duringtropical forest regeneration. Conservation Biology, 18,302–309.
Ehrlich, P. R. and Ehrlich, A. H. (2008). The DominantAnimal: Human Evolution and the Environment. IslandPress, Washington, DC.
Ellis, E. C. and Ramankutty, N. (2008). Putting people inthe map: anthropogenic biomes of the world. Frontiers inEcology and the Environment, 6, 439–447.
FAO (Food and Agriculture Organization of the United Na-tions) (2006).Global forest resources assessment 2005: progresstowards sustainable forest management. FAO, Rome, Italy.
Fazey, I., Fischer, J., and Lindenmayer, D. B., (2005). Whatdo conservation biologists publish? Biological Conserva-tion, 124, 63–73.
Felton, A. M., Engstrom, L. M., Felton, A., and Knott, C. D.(2003). Orangutan population density, forest structureand fruit availability in hand-logged and unloggedpeat swamp forests in West Kalimantan, Indonesia.Biological Conservation, 114, 91–101.
Fimbel, R. A., Grajal, A., and Robinson, J. G., eds (2001).The cutting edge. Conserving wildlife in logged tropicalforests. Colombia University, New York, NY.
Fischer, J. and Lindenmayer, B. D. 2007. Landscape modi-fication and habitat fragmentation: a synthesis. GlobalEcology and Biogeography, 16, 265–280.
Gardner, T. A., Barlow, J., Parry, L. T. W., and Peres, C. A.(2007). Predicting the uncertain future of tropical forestspecies in a data vacuum. Biotropica, 39, 25–30.
Gardner, T. A., Barlow, J., Chazdon, R. L., et al. (2009).Prospects for tropical forest biodiversity in a human-modified world. Ecology Letters, 12, 561–582.
Ghazoul, J. (2007). Placing humans at the heart of conser-vation. Biotropica, 39, 565–566.
Gillies, C. S. and St Clair, C. C. (2008). Riparian corridorsenhance movement of a forest specialist bird in fragmen-ted tropical forest. Proceedings of the National Academy ofSciences of the United States of America, 105, 19774–19779.
Green, R. E., Cornell, S. J., Scharlemann, J. P. W., andBalmford, A. (2005). Farming and the fate of wild nature.Science, 307, 550–555.
Hanski, I. (1999).Metapopulation ecology. Oxford UniversityPress, Oxford, UK.
Hartley, M. J. (2002). Rationale andmethods for conservingbiodiversity in plantation forests. Forest Ecology andMan-agement, 155, 81–95.
Heckenberger, M. J., Kuikuro, A., Kuikuro, U. T., et al.(2003). Amazonia 1492: Pristine forest or cultural park-land? Science, 301, 1710–1714.
ITTO (International Tropical Timber Association) (2002).ITTO guidelines for the restoration, management and rehabil-itation of degraded and secondary tropical forests. ITTO Poli-
cy Development Series No. 13, International TropicalTimber Organization.
ITTO (International Tropical Timber Association) (2007).Annual Review and Assessment of the World Timber Situa-tion 2007. ITTO, Yokohama, Japan.
Kaimowitz, D. and Sheil, D. (2007). Conserving what andfor whom? Why conservation should help meet basichuman needs in the tropics. Biotropica, 39, 567–574.
Kanowski, J., Catterall, C. P., and Wardell-Johnson, G. W.(2005). Consequences of broadscale timber plantations forbiodiversity in cleared rainforest landscapes of tropicaland subtropical Australia. Forest Ecology and Management,208, 359–372.
Kareiva, P., Watts, S., McDonald, R., and Boucher, T.(2007). Domesticated nature: shaping landscapes andecosystems for human welfare. Science, 316, 1866–1869.
Koh, L. P. (2008a). Birds defend oil palms from herbivorousinsects. Ecological Applications 18, 821–825.
Koh, L. P. (2008b). Can oil palm plantations be made morehospitable for forest butterflies and birds? Journal ofApplied Ecology 45, 1002–1009.
Koh, L. P., and Sodhi, N. S. (2004). Importance of reserves,fragments and parks for butterfly conservation in a tropi-cal urban landscape. Ecological Applications, 14, 1695–1708.
Koh, L. P. andWilcove, D. S. (2007). Cashing in palm oil forconservation. Nature 448, 993–994.
Koh, L. P. and Wilcove, D. S. (2008). Is oil palm agriculturereally destroying tropical biodiversity? ConservationLetters 1, 60–64.
Koh, L. P. and Wilcove, D. S. (2009). Oil palm: disinforma-tion enables deforestation. Trends in Ecology and Evolution24, 67–68.
Lamb, D., Erskine, P. D., and Parrotta, J. A. (2005). Resto-ration of degraded tropical forest landscapes. Science,310, 1628–1632.
Laurance, W. F., Lovejoy, T. E., Vasconcelos, H. L., et al.(2002). Ecosystem decay of Amazonian forest fragments:a 22-year investigation. Conservation Biology, 16, 605–618.
Lewis, O. T. (2001). Effect of experimental selective log-ging on tropical butterflies. Conservation Biology, 15,389–400.
Liebsch, D., Marques, M. C. M., and Goldenberg, R. (2008).How long does the Atlantic Rain Forest take to recoverafter a disturbance? Changes in species composition andecological features during secondary succession.Biological Conservation, 141, 1717–1725.
Lindenmayer, D. B. and Franklin, J. F. (2002). Conservingbiodiversity: a comprehensive multiscaled approach. IslandPress, Washington, DC.
Lindenmayer, D. B. and Hobbs, R. J. (2004). Fauna conser-vation in Australian plantation forests – a review.Biological Conservation, 119, 151–168.
CONSERVATION IN HUMAN-MODIFIED LANDSCAPES 259
© Oxford University Press 2010. All rights reserved. For permissions please email: [email protected]
1

Lindenmayer, D. B., McIntyre, S., and Fischer, J. (2003).Birds in eucalypt and pine forests: landscape alterationand its implications for researchmodels of faunal habitatuse. Biological Conservation, 110, 45–53.
Lindenmayer, D. B., Franklin, J. F., and Fischer, J. (2006).General management principles and a checklist of stra-tegies to guide forest biodiversity conservation. BiologicalConservation, 131, 433–445.
MacArthur, R. H. andWilson, E. O. (1963). An equilibriumtheory of insular zoogeography. Evolution, 17, 373–387.
MacArthur, R. H. and Wilson, E. O. (1967). The theory ofisland biogeography. Princeton University Press, Prince-ton, New Jersey.
Maginnis, S. and Jackson, W. (2005). Balancing restorationand development. ITTO Tropical Forest Update, Interna-tional Tropical Timber Organization. 15/2, 4–6.
Matson, P. A. and Vitousek, P. M. (2006). Agriculturalintensification: will land spared from farming be landspared for nature? Conservation Biology, 20, 709–710.
Mbida, C. M., Van Neer, W., Doutrelepont, H., and Vry-daghs, L. (2000). Evidence for banana cultivation andanimal husbandry during the First Millennium BC inthe forest of Southern Cameroon. Journal of ArchaeologicalScience, 27, 151–162.
McNeely, J. A. (2004). Nature vs. nurture: managing rela-tionships between forests, agroforestry and wild biodi-versity. Agroforestry Systems, 61, 155–165.
Meijaard, E. and Sheil, D. (2008). The persistence and con-servation of Borneo’s mammals in lowland rain forestsmanaged for timber: observations, overviews andopportunities. Ecological Restoration, 23, 21–34.
Miller, J. R. and Hobbs, R. J. (2002). Conservation wherepeople live and work. Conservation Biology, 16, 330–337.
Ostrom, E. (2007). A diagnostic approach for going beyondpanaceas. Proceedings of the National Academy of Sciences ofthe United States of America, 104, 15181–15187.
Palmer, M., Bernhardt, E., Chornesky, E., et al. (2004).Ecology for a crowded planet. Science, 304, 1251–1252.
Pedlowski, M. A., Matricardi, E. A. T., Skole, D., et al.(2005). Conservation units: a new deforestation frontierin the Amazonian state of Rondonia, Brazil. Environmen-tal Conservation, 32, 149–155.
Perfecto, I. and Vandermeer, J. (2002). The quality of agro-ecological matrix in a tropical montane landscape: antsin coffee plantations in southern Mexico. ConservationBiology, 16, 174–182.
Perfecto, I. and Vandermeer, J. (2008). Biodiversity conser-vation in tropical agroecosystems. Annals of the New YorkAcademy of Science, 1134, 173–200.
Peters, S. L., Malcolm, J. R., and Zimmerman, B. L. (2006).Effects of selective logging on bat communities in thesoutheasternAmazon.ConservationBiology, 20, 1410–1421.
Philpott, S. M., Arendt, W. J., Armbrecht, I., et al. I (2008).Biodiversity loss in Latin American coffee landscapes:review of the evidence on ants, birds, and trees. Conser-vation Biology, 22, 1093–1105.
Putz, F. E., Blate, G. M., Redford, K. H. Fimbel, R., andRobinson, J. (2001). Tropical forest management andconservation of biodiversity: an overview. ConservationBiology, 15, 7–20.
Putz, F. E., Sisk, P., Fredericksen, T., and Dykstra, D.(2008). Reduced-impact logging: Challenges and oppor-tunities. Forest Ecology and Management, 256, 1427–1433.
Ranganathan, J., Daniels, R. J. R., Chandran, M. D. S.,Ehrlich, P., and Daily. G. C. (2008). Sustaining biodiver-sity in ancient tropical countryside. Proceedings of theNational Academy of Sciences of the United States of America,105, 17852–17854.
Ribeiro, M. C., Metzger, J. P., Martensen, A. C., Ponzoni, F.,and Hirota, M. M. (2009). Brazilian Atlantic forest: howmuch is left and how is the remaining forest distributed?Implications for conservation. Biological Conservation, 142,1141–1153.
Rodrigues, A. S. L., Andelman, S. J., Bakarr, M. I., et al.(2004). Effectiveness of the global protected area networkin representing species diversity. Nature, 428, 640–643.
Rosenzweig, M. L. (2003). Win-win ecology: how the earth’sspecies can survive in the midst of human enterprise. OxfordUniversity Press, New York.
Sayer, J. and Maginnis, S., eds (2005). Forests in landscapes:ecosystem approaches to sustainability. Earthscan, London.
Scales, B. R. andMarsden, S. J. (2008). Biodiversity in small-scale tropical agroforests: a review of species richnessand abundance shifts and the factors influencing them.Environmental Conservation, 35, 160–172.
Scherr, S. J. and McNeely, J. A., eds (2007). Farming withnature: the science and practice of ecoagriculture. IslandPress, Washington, DC.
Scherr, S. J. and McNeely, J. A. (2008). Biodiversity conser-vation and agricultural sustainability: towards anew paradigm of ‘ecoagriculture’ landscapes. Philosophi-cal Transactions of the Royal Society of London B, 363,477–494.
Schmitt, C. B., Belokurov, A., Besançon C., et al. (2009).Global Ecological Forest Classification and Forest ProtectedArea Gap Analysis. Analyses and recommendations in view ofthe 10% target for forest protection under the Convention onBiological Diversity (CBD). 2nd revised edn Freiburg Uni-versity Press, Freiburg, Germany.
Schroth, G. and Harvey, C. A. (2007). Biodiversity conser-vation in cocoa production landscapes: an overview.Biodiversity and Conservation, 16, 2237–2244.
Schroth, G., da Fonseca, G. A. B., Harvey, C. A., Gascon,C., Vasconcelos, and Izac, A.-M. N., eds (2004).
260 CONSERVATION BIOLOGY FOR ALL
© Oxford University Press 2010. All rights reserved. For permissions please email: [email protected]
Sodhi and Ehrlich: Conservation Biology for All. http://ukcatalogue.oup.com/product/9780199554249.do
Agroforestry and biodiversity conservation in tropical land-scapes. Island Press, Washington, DC.
Sekercioglu, C. H. (2002). Effects of forestry practices onvegetation structure and bird community of Kibale Na-tional Park,Uganda.Biological Conservation, 107, 229–240.
Sekercioglu, C. H., Loarie, S. R., Ruiz-Gutierrez, V., OviedoBrenes, F., Daily, G. C., and Ehrlich, P. R. (2007). Persis-tence of forest birds in tropical countryside ConservationBiology 21, 482–494.
Simberloff, D. S. (1974). Equilibrium theory of island bio-geography and ecology. Annual Review of Ecology andSystematics, 5, 161–182.
Sodhi, N. S. (2008). Tropical biodiversity loss and people –a brief review. Basic and Applied Ecology, 9, 93–99.
Sodhi, N. S., Koh, L. P., Brook. B. W., and Ng, P. K. L.(2004). Southeast Asian biodiversity: an impending dis-aster. Trends in Ecology and Evolution, 19, 654–660.
Sodhi, N. S., Brooks, T. M., Koh, L. P. Koh et al. (2006).Biodiversity and human livelihood crises in the MalayArchipelago. Conservation Biology, 20, 1811–1813.
Sodhi, N. S., Acciaioli, G., Erb, M., and Tan, A. K.-J., eds(2008). Biodiversity and human livelihoods in protected areas:case studies from the Malay Archipelago. CambridgeUniversity Press, Cambridge, UK.
Sodhi, N. S., Lee, T. M., Koh, L. P., and & Brook, B. W.(2009). A meta-analysis of the impact of anthropogenicforest disturbance on Southeast Asia’s biotas. Biotropica,41, 103–109.
Steffan-Dewenter, I., Kessler, M., Barkmann, J., et al. (2007).Tradeoffs between income, biodiversity, and ecosystemfunctioning during tropical rainforest conversion andagroforestry intensification. Proceedings of the NationalAcademy of Sciences of the United States of America, 104,4973–4978.
Stein, B.A., Kutner, L. S., and Adams, J. S. (2000). Preciousheritage. Oxford University Press, Oxford, UK.
Stratford, J. A. and Stouffer, P. C. (1999). Local extinctionsof terrestrial insectivorous birds in a fragmented land-
scape near Manaus, Brazil. Conservation Biology, 13,1416–1423.
Thiollay, J. M. (1995). The role of traditional agroforests inthe conservation of rain-forest bird diversity in Sumatra.Conservation Biology, 9, 335–353.
Tilman, D., Fargione, J., and Wolff, B., et al. (2001). Fore-casting agriculturally driven global environmentalchange. Science, 292, 281–284.
UN (United Nations) (2005). Halving hunger: it can be done.Earthscan, London, UK.
Vandermeer, J. and Carvajal, R. (2001). Metapopulationdynamics and the quality of the matrix. The AmericanNaturalist, 158, 211–220.
Vandermeer, J. and Perfecto, I. (2007). The agriculturalmatrix and a future paradigm for conservation. Conser-vation Biology, 21, 274–277.
Vaughan, C., Ramirez, O., Herrera, G., and Guries, R.(2007). Spatial ecology and conservation of two slothspecies in a cacao landscape in limon, Costa Rica. Biodi-versity and Conservation, 16, 2293–2310.
White, L. J. T. (2001). The African rain forest: climate andvegetation. In W. Weber, L. J. T. White, A. Vedder, andL. Naughton-Treves, eds African rain forest ecology andconservation: an interdisciplinary perspective, pp. 3–29. YaleUniversity Press, New Haven, CT.
Willis, K. J. and Birks, H. J. B. (2006). What is natural? Theneed for a long-term perspective in biodiversity conser-vation. Science, 314, 1261–1265.
Willis, K. J., Gillson, L., and Brncic, T. M. (2004). How“virgin” is virgin rainforest? Science, 304, 402–403.
Willis, K. J., Gillson, L., Brncic, T.M., andFigueroa-Rangel, B.L. (2005). Providing baselines for biodiversitymeasurement.Trends in Ecology and Evolution, 20, 107–108.
Wittemyer, G., Elsen, P, Bean, W. T., Burton, C. O., andBrashares, J. S. (2008). Accelerated human populationgrowth at protected area edges. Science, 321, 123–126.
Wright, S. J. andMuller-Landau, H. C. (2006). The future oftropical forest species. Biotropica, 38, 207–301.
CONSERVATION IN HUMAN-MODIFIED LANDSCAPES 261
© Oxford University Press 2010. All rights reserved. For permissions please email: [email protected]
1

CHAP T E R 1 4
The roles of people in conservationC. Anne Claus, Kai M. A. Chan, and Terre Satterfield
The study of human beings in conservation isoften eclipsed by the study of threatened speciesand their environments. This is surprising giventhat conservation activities are human activities,and that the very need for conservation arises outof human actions. In this chapter, we begin withthe premise that understanding human activitiesand human roles in conservation is fundamentalto effective conservation. Specifically, we addressthe following:
· Conservation history: how has conservationchanged since its inception?
· Common conservation perceptions: how do con-servationists characterize the relationship betweenhuman beings and the environment, and how havethese perceptions influenced the trajectory of con-servation?
· Organizational institutions: What factors mediatethe relationship between human beings and theirenvironments? What implications do these havefor conservation?
· Biodiversity conservation and local resource use:in what ways do we conserve our environments?
· Equity, rights, and resources: how do we under-stand conservation-induced change?
· Social research in conservation: how do socialscience and humanities studies inform conservationpractice?
14.1 A brief history of humanity’sinfluence on ecosystems
Human beings have influenced Earth’s ecosys-tems for many millennia (see Chapter 13). SinceHomo sapiens migrated out of East Africa in thelate Pleistocene, we have subsequently fannedout to inhabit virtually every terrestrial environ-
ment on this planet. From high altitudes to highlatitudes, people have adapted culturally, techno-logically, and biologically to diverse landscapes.Just as coevolution and coadaptation occuramong plants and animals in ecosystems, so toodo they occur between humans and other com-ponents of ecosystems around the world. We arecrucial elements of ecosystems, and for better orworse, we help shape the environment of whichwe are a part.
14.2 A brief history of conservation
Indigenous and local people have practiced con-servation possibly for hundreds of thousands ofyears (see Box 1.1). The Western conservationmovement, however, has arisen over the past150 years. We briefly address the history of themodern conservation movement here (see alsoChapter 1). In its earliest period, a concern forbiodiversity was not a dominant motivating fac-tor of this movement. Rather most historians linkmodern conservation to writings of romantic andtranscendentalist philosophers, and to the oftenviolent colonizing of indigenous peoples in theAmericas (White and Findley 1999), Africa (Neu-mann 2004), and worldwide (Grove 1996).
Environmental historians in the United Stateslocate the origins of conservation with the writ-ings of early ecologists and the advocacy of keythinkers in the latter half of the nineteenth centu-ry. As early as 1864, George Perkins Marsh pub-lished a remarkable book, Man and Nature, basedin part on his observations of the depletion of thewoods near his American home. Criticizing thecultivated gardens idealized by the Jeffersoniantradition, and deeming them an agent of
262
Sodhi and Ehrlich: Conservation Biology for All. http://ukcatalogue.oup.com/product/9780199554249.do
© Oxford University Press 2010. All rights reserved. For permissions please email: [email protected]

destruction, he outlined the impact of logging onwatersheds, water supply, salmon runs, andflooding (Robbins 1985). At the same time, JohnMuir, Ralph Waldo Emerson, and Henry DavidThoreau came to be known for their highly influ-ential transcendentalist philosophy, which con-templated nature’s capacity for spiritual healing.This philosophy in particular is closely associatedwith early efforts at wilderness preservation. Vasttracks of land were integral to this view of nature,and this idea sparked the establishment of preser-vationist nature parks worldwide.
Several key policy initiatives ensured both alarge legacy of public lands and a national parksystem in the United States and elsewhere. Thatso much “public” land was available for nationalparks was the product of two often ignored factsin the history of conservation. The first was thereservation system or the forced removal of ab-original populations onto vastly reduced andparceled “reservation” lands, and the secondwas the rise in sedentary settlements. Much ofthis forced removal from what would becomepublic and park land was made possible by theepidemics of disease amongst aboriginal popula-tions that followed contact with Europeans(Stevens 1997). In the Americas, virtually allgroups succumbed to successive waves of diseaseoutbreaks, especiallymeasles and small pox, intro-duced by “discoverers” (possibly as early as theVikings and certainly by Western European ex-plorers of Christopher Columbus’ time) and byearly settlers. Where disease did not decimate po-pulations, peoplewere forcibly removed from con-servation areas in the Americas, Australia, Africa,and Asia. The conservation movement becamemore complex in the early 1900swith the advocacyof forester Gifford Pinchot, who insisted that con-servation shift from primarily preservationist tothat of resourcemanagement, or “sustained yield”.
In 1960, the first of a set of legislative actsmeant to represent both conservation and indus-trial interests was introduced. Under pressurefrom environmentalists and recreationists, theUS federal government came out with a newmission statement: The Multiple Use SustainedYield Act, 1960. Multiple uses incorporatedoutdoor recreation, range, timber, watershed,
wildlife, and fishing interests. This early inscrip-tion of multiple uses for multiple people fol-lowed two events singularly important tomodern environmentalism: Aldo Leopold’s pro-motion of his “land ethic”, which emphasizedthe biota’s role in ethics (e.g. “A thing is rightwhen it tends to preserve the integrity, stabilityand beauty of the biotic community. It is wrongwhen it tends otherwise”; from the Sand CountyAlmanac, 1949); and the work of Rachel Carson(1962). A marine biologist, Carson publishedwhat has been called the basic book of NorthAmerica’s environmental revolution—SilentSpring. Its stirring argument exposed the actualand potential consequences of using the insecti-cide DDT (dichloro-diphenyl-trichloroethane),although even with DDT the social, environmen-tal, and medical landscape is a complicated one.Regardless, Carson’s work continues to be high-ly relevant to our understanding of biologicalprocesses, is cited in the inspirational biogra-phies of environmentalists, and has spurreddozens of environmental groups into action. Inretrospect, it is evident that what are todaycalled “environmentalist ideas” coalescedaround this time. While we have used the USas an example, it is the case that environmental-ist ideas appeared independently but nonethe-less concurrently in many parts of the world (seeBox 1.2). This has led in part to the establishmentof international conservation organizations,some of which originated in the developedworld but all of which act in conjunction withpartners worldwide. Examples of the larger andmore well known such organizations include theWorld Wide Fund for Nature (WWF), The Na-ture Conservancy, and the International Unionfor Conservation of Nature (IUCN).
International conservation organizations havethus become particularly active in the advocacyfor and the establishment and management ofconservation areas worldwide. All of these philo-sophies of conservation are now evident in themultitude of conservation interventions acrossthe planet. Box 14.1 illustrates how customarymanagement and Western conservation areintegrated to achieve conservation goals in thePacific.
THE ROLES OF PEOPLE IN CONSERVATION 263
1
© Oxford University Press 2010. All rights reserved. For permissions please email: [email protected]

Box 14.1 Customary management and marine conservationC. Anne Claus, Kai M. A. Chan, and Terre Satterfield
Can traditional management strategies andmarine conservation be integrated? Cinner andAswani (2007) set out to uncover thecommensurability of these divergent resourcemanagement strategies in the Pacific.Customary management in marine systemsrefers to a generational, culturally embedded,dynamic system for regulating natural resourceuse. Cinner and Aswani first review studies onthe ecological impacts of customarymanagement. While more research is clearlyneeded on this topic, the available literaturepoints to species‐specific benefits, often on asmall spatial scale. Viewing the smaller scale ofcustomary practices in light of current socialand economic threats, Cinner and Aswanisuggest that customary management must bepaired with marine conservation in order toproduce ecological successes.There are similarities in customary and
marine conservation traditions. Cinner andAswani define six types of restrictions present inboth systems:
• Spatial (such as temporary ritualistic reefclosures, or marine protected areas).• Temporal (fishing bans on the Sabbath, orclosed seasons).• Gear (bans on harvesting technologies, orgear prohibitions).• Effort (gender restriction on access to specificareas, or licensing).• Species (class restrictions on particular speciesconsumption, or species‐specific bans).• Catch (avoidance of waste, or quotas).
In spite of these resemblances, there aredifferences in the scale, concept, and intent ofthese two types of marine resourcemanagement. For example, in customarymanagement, fishing bans may regularly belifted to provide food for feasts. Therefore fishmay be conserved but they are also harvested atregular intervals, pointing to a difference inconcept between the two systems (in marineconservation fishing bans are generallyconsidered permanent). Additionally,customary management in the Pacific is oftenembedded in ceremonies and traditions.
“Although resources may be consciouslyimproved by these practices, conservation inthe Western sense may be simply a by‐productof other economic, spiritual, or social needs”(Ruttan in Cinner and Aswani).
Cinner and Aswani point out how hybridsystems have been socially successful inVanuatu and the Western Solomon Islands.They summarize some principles for hybridcustomary and marine conservationmanagement systems:
• Approaches should echo local socioeconomicand cultural conditions.• Planning and implementation shouldintegrate both scientific and local knowledgesystems.• Strategies should be appropriate for varyingsocial and ecological processes• Management should provide flexible legalcapacity.• Planners and implementers should recognizethat hybrid systems may not always beappropriate.• Hybrid management should embrace theutilitarian nature of customary systems as wellas its ecosystem benefits.
Finally, Cinner and Aswani caution thatsocioeconomic transformations such aspopulation increase, technological change,urbanization, and the adoption of new legalsystems can drastically and rapidly changecustomary management systems. How thesesystems are impacted by such changes variesdepending on the heterogeneity of customaryinstitutions and the scale of socioeconomicchange. Cinner and Aswani conclude byendorsing hybrid management systems fortheir potential to encourage complianceamongst communities involved in creatingthem.
REFERENCE
Cinner, J. E. and Aswani, S. (2007). Integrating customarymanagement into marine conservation. BiologicalConservation, 140, 201–216.
264 CONSERVATION BIOLOGY FOR ALL
Sodhi and Ehrlich: Conservation Biology for All. http://ukcatalogue.oup.com/product/9780199554249.do
© Oxford University Press 2010. All rights reserved. For permissions please email: [email protected]

14.3 Common conservation perceptions
Observe Figure 14.1. You may see either a youngwoman or an old woman (hint: the chin of theyoung woman is the nose of the old woman).The lines remain the same, but their meaningchanges based on your perception, the processby which you translate information intoorganized understanding. People constructmeaning based on perceptions arising throughtheir experiences. Since human beings have abroad range of experience, perception is alsohighly variable, and it is based on these percep-tions that people act. In conservation, peoplecomport themselves in accordance with observa-tions they make about the state of a given eco-system (for example, by hunting species theyperceive as abundant and avoiding species thatseem scarce). Similarly, conservationists base re-source management strategies on their percep-tions of local resource use. This whirlwind ofperceptions can often lead to misperceptions.These misperceptions can also be enhanced byunequal relations of power within and betweeninternational organizations and local people.This can result, for instance, in such things asunnecessary burdens placed on local peoples.Box 14.2 contains a case study showing howsuch burdens can be placed on livelihoods as aresult of both misperceptions and inequities.
That is, the necessity for conservation oftenarises out of a misperception about the abun-dance of resources, which leads to excessive ex-traction. For conservationists who seek to alter
Figure 14.1 An optical illusion illustrates how the human brainperceives objects differently.
Box 14.2 Historical ecology and conservation effectiveness in West AfricaC. Anne Claus, Kai M. A. Chan, and Terre Satterfield
How does faulty perception lead to misguidedconservation policies? Fairhead and Leach(1996) explore this question in the forest‐savanna transition zone of Guinea. Thislandscape is unique because amidst the openwoodland savanna exist patches of dense semi‐deciduous rain forest. Conservationists andpolicy makers viewed these forest patches aseither relics of a more extensive original forestor as a relatively stable pattern of vegetation.Regardless of the viewpoint taken on the forestpatches, policy makers agreed that local peoplewere contributing to their destruction. This
supposed deforestation encouraged strict firerestrictions. At one point the punishment forsetting a fire was the death penalty!By using new historical data sets combined
with oral histories of vegetation use, remotesensing data, archival research, andethnographic fieldwork, Fairhead and Leachdemonstrate that local human activitiesactually encouraged the formation of forestpatches. Originally created around villages toprovide fire and wind protection, the forestpatches also provided resources forconsumption and use. People enriched the
continues
THE ROLES OF PEOPLE IN CONSERVATION 265
1
© Oxford University Press 2010. All rights reserved. For permissions please email: [email protected]

human action, understanding that perceptionsand power differ is critical.
Here we discuss conservation in the sense ofconservation biology, the science of understand-ing Earth’s biological diversity for the sake of itsprotection. We refer to conservationists as peoplewho identify themselves as practitioners or advo-cates of wild living resource conservation. Localresource users are people who live in close prox-imity to, and derive their livelihoods from, natu-ral resources. Local resource users may beindigenous people, long-standing immigrantcommunities, or new residents. Like conserva-tionists, they may represent homogeneous com-munities or encompass diverse ethnic groups. Itis of course possible that conservationists mayalso be local resource users and vice-versa. Asconservationists interact with local resourceusers around the world, they make consideredjudgments, as well as erroneous assumptions,about the relationship that human beings havewith their environment (e.g. Sundberg 1998).In the past, conservationists have broadly char-acterized local resource users alternately as both
enemies of and saviors of the environment – andthe complexity of those ethical relationships areexplored in Box 14.3.
Fundamental to these binary depictions areideas of nature as a pristine wilderness. Imagesof this sort helped spur the modern conservationmovement, and are still pervasive in conservationmarketing. Wilderness is imagined “as a remnantof the world as it was before man appeared, as itwas when water was fit to drink and air was fit tobreathe” (Caufield 1990). These ideas rest on aperceived separation between humans and na-ture, a sentiment that appeals to many NorthAmericans (Cronon 1995). Some conservationistsassume that in order to conserve a system itshould be restored to this idealized human-freestate. Anthropologists, archaeologists, and histor-ical ecologists have increasingly found that evenlandscapes that were once considered pristinehave had considerable human influence (seeChapter 13). North America at the time of Euro-pean contact, for example, has been depicted inliterature and films as a vast wilderness. In reali-ty, archaeological evidence and historical
Box 14.2 (Continued)
forest patches by managing soil fertility andfire. While the focus of local interest in theforest patches has changed since thenineteenth century from village defense tocoffee production to timber for logging, theyhave been cultivated consciously andunconsciously by local resource users. And,contrary to the commonly accepted perception,remote sensing and photo analysisdemonstrate that forest cover actuallyincreased during the past century.So what were the consequences of the
misguided forest policy? Because they assumedthat locals were deforesting the landscape,policy makers excluded local resource usersfrom resource management. Policies curbedearly season grass burning, creating thepotential for destructive natural fires in the dryseason. The perception that locals were toblame for deforestation ultimately impacted
their livelihoods and created an acrimoniousconservation climate.Fairhead and Leach point out that the policy
makers, due to their initial assumptions aboutthe role of local resource users in deforestation,did not question the accuracy of historicalvegetation records. The authors thereforeadvocate mixed historical and satellite datacollection methods for reconstructinghistorically accurate pictures of vegetationpatterns on which to base conservation policy.Their study illustrates how perceptions cannegatively impact society and the environment.
REFERENCE
Fairhead, J. and Leach, M. (1996). Enriching the landscape:social history and the management of transition ecologyin the forest‐savanna mosaic of the Republic of Guinea.Africa, 66, 14–36.
266 CONSERVATION BIOLOGY FOR ALL
Sodhi and Ehrlich: Conservation Biology for All. http://ukcatalogue.oup.com/product/9780199554249.do
© Oxford University Press 2010. All rights reserved. For permissions please email: [email protected]

Box 14.3 Elephants, animal rights, and CampfirePaul R. Ehrlich
A conservation success story is that elephantpopulations have recently rebounded overmuch of Africa. That has fueled a heateddebate over whether or not it is ethical to cullthe herds (http://news.bbc.co.uk/2/hi/africa/7262951.stm). On one hand the giant beastscan be serious agricultural pests; on the other,animal rights activists and many other naturelovers are offended by the killing of thesecharismatic and intelligent animals. Like manyof today’s ecoethical dilemmas, this one is noteasy to resolve (I do not wish to get into theanimal rights debate here. For intelligentdiscussion of these issues, see Singer 1975;Midgley 1983; Jamieson 1999. Although Isometimes disagree with Peter Singer’sconclusions on a variety of issues, sometimesemotionally rather than intellectually, I alwaysfind him a clear thinker). There are ways toattain needed population reductions otherthan culling, including relocation andcontraception. But suitable areas into which tointroduce elephants are growing scarce, andusing contraceptives is difficult except in smallparks and is more complicated and expensivethan shooting. Animal rights groups areproperly (in my view) concerned about crueltyto elephants, and the plight of young elephantsorphaned when their mothers are killed isespecially heart‐rending. Furthermoreimmature elephants who have witnessedculling seem to suffer from somethingresembling Post‐Traumatic Stress Disorder thatfrequently causes them to become very violent.But overpopulation of elephants can lead bothto problems of sustainability for them and tocollisions with another overpopulated speciesthat has the capability of destroying them.A similar elephant controversy took place in
the 1990s – one demonstrating the extremecomplexity of the ecoethical issues inconservation – centered around theZimbabwean Campfire (Communal AreasManagement Program for IndigenousResources) program, partially funded by USAID(United States Agency for InternationalDevelopment) (Smith and Duffy 2003). The
Campfire program was designed to build thecapacity of local populations tomanage naturalresources, including game for hides, meat,sport hunting, and photographic tourism. Thesituation can be briefly summarized. Elephantherds outside of parks and reserves werecapable of decimating a family’s livelihood inan hour by destroying its garden plot. That ledto defensive killing of marauding animals bylocal people. Rogue elephants were alsoresponsible for hundreds of human deaths eachyear (http://findarticles.com/p/articles/mi_m1594/is_n4_v9/ai_20942049/pg_1).Defensive killing was accelerating a declinealready under way in elephant herds because ofpoaching.
Campfire supported the return of elephantherds to the control of local communities andthe issuing of some 100–150 elephant huntinglicenses per year for community lands. Thelicenses to shoot an elephant were sold to sporthunters for US$12 000–15 000 each. RuralDistrict Councils determined how the fundswere spent. Herds grew dramatically in thehunting areas because poaching wassuppressed by the elephants’ new “owners,”local people got more money and suffered lessdamage because marauders were targeted,and it seemed to many that it was a win‐winsituation. But the Humane Society of the U.S.(HSUS) objected, saying that the intelligent andcharismatic elephants should never be killed byhunters, and animal rights groups lobbied toget funding stopped (http://digital.library.unt.edu/govdocs/crs/permalink/meta‐crs‐388:1).
The issue was further clouded by argumentsover how much of Campfire’s motivation wascentered on reopening the ivory trade (partlysanctioned by CITES) and its impact onelephants outside of Zimbabwe, and onwhether a switch to entirely photographicsafaris (a trend then well under way) would notbe equally effective in protecting herds.
More recently, despite the shocks of acessation of international funding and thedeterioration of the political situation inZimbabwe, the conservation benefits of
continues
THE ROLES OF PEOPLE IN CONSERVATION 267
1
© Oxford University Press 2010. All rights reserved. For permissions please email: [email protected]

accounts reveal that the Americas were extensive-ly populated by millions of indigenous peopleswho extensively altered their surroundings(Denevan 1993; Ruddiman 2005). In fact, “scien-tific findings indicate that virtually every part ofthe globe, from the boreal forests to the humidtropics, has been inhabited, modified, or man-aged throughout our human past . . .Althoughthey may appear untouched, many of the lastrefuges of wilderness our society wishes to pro-tect are inhabited and have been so for millennia”(Gomez-Pompa and Kaus 1992). And historicalecologists have demonstrated how these changeshave had profound and lasting effects on popula-tions and ecosystems, which should influence ourcurrent conservation strategies (e.g. Janzen andMartin 1982; Jackson et al. 2001). In short, there isno such thing as wilderness.
Did the activities of indigenous people threatenthe environment? Conservationists’ perception ofpeople has long been that they are largely threatsto biodiversity. Mitigating those threats is viewedas important to maintaining and recovering bio-diversity. Often conservation organizations sys-tematically identify threats long before theirsocial causes are identified. Many social scientistssee environmentally destructive behavior assymptomatic of broader societal issues, whichcan be obscured by the hasty labeling of localresource users as threats to biodiversity. Whilehuman activities can indeed threaten biodiversi-ty, an exaggerated emphasis on curbing beha-viors that are harmful can stand in the way ofpromoting those that are beneficial to conserva-tion. Ultimately, local resource users are alsoconservation agents.
Box 14.3 (Continued)
Campfire remained remarkably robust (Balintand Mashinya 2008) – although their presentstatus is in doubt. The situation emphasizes theneed to keep the ethics of the “big picture”always in mind, and to pay attention to factorssuch as “political endemism” – organismsfound in only a single nation which, if poor,may not be able to adequately protect them(Ceballos and Ehrlich 2002).The Campfire controversy highlights the
ethical conflict between those who believe thekey conservation issue is maintaining healthywildlife populations and those concernedprimarily about the rights of individual animalsand who decry the “utilization” or“commodification” of nature – “wise use” or“multiple use” as discussed in the text. Much asI personally hate to see elephants hunted, inthis case I tend to come down on the side of theCampfire program. It seems more ethical togive local people a beneficial stake inmaintaining the herds instead of permittingtheir extermination than it does to avoid the“unethical” killing of individuals by richhunting enthusiasts. I also think it is moreethical to consider the non‐charismatic animalsand plants that, as I have seen in the field, can
be laid waste by elephant overpopulation, evenwhile some organisms can be dependent onnormal elephant activities (e.g. Pringle 2008).Others may, of course, have a different ethicalcompass.
REFERENCES
Balint, P. and Mashinya, J. (2008). Campfire duringZimbabwe’s national crisis: local impacts and broaderimplications for community‐based wildlife manage-ment. Society and Natural Resources, 21, 783–796.
Ceballos, G. and Ehrlich, P. R. (2002). Mammal populationlosses and the extinction crisis. Science, 296, 904–907.
Jamieson, D., ed. (1999). Singer and his critics. Blackwell,Oxford, UK.
Midgley, M. (1983). Animals and why they matter.University of Georgia Press, Athens, GA.
Pringle, R. M. (2008). Elephants as agents of habitatcreation for small vertebrates at the patch scale. Ecology,89, 26–33.
Singer, P. (1975). Animal liberation: a new ethics for ourtreatment of animals. New York Review Books, NewYork, NY.
Smith, M. and Duffy, R. (2003). The ethics of tourismdevelopment. Routledge, London, UK.
268 CONSERVATION BIOLOGY FOR ALL
Sodhi and Ehrlich: Conservation Biology for All. http://ukcatalogue.oup.com/product/9780199554249.do
© Oxford University Press 2010. All rights reserved. For permissions please email: [email protected]

An opposing view suggests that local or indig-enous people live in harmony with nature. AsRedford (1991) points out, some researchers andconservationists have idealized the relationshipindigenous people have with their environments.They have subscribed to the myth of the “ecolo-gically noble savage”, which asserts that indige-nous people naturally live in harmony with theenvironment and have developed superior sys-tems of resource management (or “traditionalecological knowledge”) that should be adoptedby conservationists.
“Indians walked softly and hurt the land-scape hardly more than the birds andsquirrels, and their brush and bark hutslast hardly longer than those of wood rats,while their enduringmonuments, exceptingthose wrought on the forests by fires theymade to improve their hunting grounds,vanish in a few centuries”.
This quote by John Muir, an American natural-ist, exemplifies this attitude. In reality, the rela-tionship of local or indigenous people with theirenvironments is variable. The Miwok whomMuir refers to above burned, pruned, and selec-tively harvested their lands to create the highlymanaged Yosemite landscapes that Muir saw(Anderson in Nabhan 1998:160). Another exam-ple comes from a closed tropical forest zone inSouth Asia. For centuries, the practice of swiddencultivation (alternately known as shifting, orslash and burn) brought about ideal habitat con-ditions for herbivores that do not typically inhab-it this forest zone. Deer, elephants, and rhinoswere drawn to grasslands and edge habitats cre-ated by swidden fallows. More generally, by al-tering terrestrial vegetation, human activity haschanged soil structure, water availability, wild-life, and possibly the global climate system forhundreds of millennia (Westbroek et al. 1993; seeChapter 8). Critiques of the ecologically noblesavage myth point out that some indigenous cul-tures have reverent environmental behaviors,and others have eroded their resource base.Such “good user/bad user” judgment is oftencounter-productive, especially as standards aremore a product of popular imaginations than
they are true to the human and ecological his-tories involved (cf. Fairhead and Leach 1996).But this is not to say that there are not practiceswe might learn from as well as those that haveturned out to be destructive. Swidden agricul-ture, for example, can be environmentally de-structive if practiced partially (Conklin 1975). Itwould also be a mistake to assume that all indig-enous people are naturally stewards of their en-vironments, any more than are any peoples.Primarily, then, it is important to remember thatthe ecologically-noble savage myth is, more oftenthan not, reductionist and potentially misleadsconservation activities (Buege 1996).
The final important point is to recognize andunderstand practices on the ground, in their his-torical context. To critique the ecologically noblesavage myth is not to say that long-term indige-nous or local residents do not develop an exten-sive body of knowledge related to species andecosystem relationships. They certainly do.Knowledge borne of sustained practice and trialand error is often instructive to conservation. Notall indigenous or local people have developed orretained these bodies of knowledge, but wherethis knowledge does exist it can be critical to, andin effect be, the conservation effort most needed.
14.4 Factors mediating human-environment relations
Perceptions also arise from, and concurrentlyshape, our worldviews. Often, institutions director mediate those worldviews. Cultural, political,and economic institutions are powerful socialforces that dynamically impact the environment,as coevolution of social institutions and ecologi-cal systems occurs in interesting and often unpre-dictable ways. For example, agriculture in NorthAmerica traditionally involved cultivation ofmany crops. The advent of mechanical agricul-ture made monoculture agriculture more effi-cient. This social change led to increased use ofpesticides, since fewer natural predators visit sin-gle variety crop fields. Monoculture fields pro-duced less fertile soil and increased soil erosion.These ecosystem changes required specialized
THE ROLES OF PEOPLE IN CONSERVATION 269
1
© Oxford University Press 2010. All rights reserved. For permissions please email: [email protected]

upkeep and changes in the organization ofhuman labor on large, consolidated farms. Thisecosystem change led to further social changes ineconomic institutions. Subsistence-based agricul-ture increasingly gave way to a surplus market-based system. These social and ecologicalchanges also impacted worldviews as agricultur-alists believed that technological advances wouldcontinue to increase crop yields and make foodproduction more efficient.
Social institutions operate at multiple scales.They are dynamic and mutually reinforcing, asthe discussion of one agricultural ecosystem illus-trates. A general understanding of the followingthree institutions provides a framework for un-derstanding human behavior.
14.4.1 Cultural
Culture is a dynamic system of collectively sharedsymbols, meanings, and norms – the nongeneticinformation possessed by a society. People areborn into cultural settings, which help shapetheir perceptions of the world around them. Forexample, societies that believe guardian spiritsreside in forestswill often takemeasures to protectthose forests; likewise societies that believe thatecosystems are naturally held in balancemight dolittle to actively conserve their resources. These
belief systems are often called “worldviews”. So-cieties share some worldviews, or systemsthrough which they interpret information andthen consequently act. Within societies many in-terpretations of reality coexist, depending on anindividual’s gender, age, occupation, or educationlevel. Understanding these perceptions helps toexplain why individuals act in particular ways intheir environments (Marten 2001).
Many traditional societies and human ecologistsshare a common perception of nature, that every-thing on earth is connected (for example, the NuuChah Nulth of Vancouver Island say “Hishuk ishtswalk,” which means, “Everything is one and allis interconnected”). This worldview asserts thatthe actions humans take have consequences innature. Human ecologists are inclined to focus onthe details of these consequences. Another com-mon worldview sees nature as benign, and pre-sumes that as long as people do not alter theenvironment too much, she will not harm them(Marten 2001). It is not uncommon to hold contra-dictoryworldviews at the same time. For example,one’s religious beliefs may encourage humandomination over nature, while one’s academicfield may view humans as just one part of abroader environment (Box 14.4 further explicatesthe role of religion in conservation biology).Together with values and norms, worldviews
Box 14.4 Conservation, biology, and religionKyle S. Van Houtan
Conservation is said to be a worthy cause for avariety of reasons. The great wildernessevangelist John Muir advocated naturepreservation by describing its majesty. Forestswere “sparkling and shimmering, covering hillsand swamps, rocky headlands and domes, everbravely aspiring and seeking the sky” (Muir andCronon 1997). When she warned of the threatsof pesticide pollution, Rachel Carson invokedpeaceableness. Her landmark Silent Spring(1962) opens with: “There was once a town…where all life seemed to live in harmony with itssurroundings.” And in describing the perils ofhuman overpopulation Paul Ehrlich pleads for
justice. His The Population Bomb (1968) assertsthat enjoying nature and breathing clean airare “inalienable rights.” Often, however, sucharguments forget their deep roots in religioustraditions. For centuries, religious practicescarried the torch of virtue and moral guidance.So it seems appropriate that science andreligion might partner in the work ofconservation (see Clements et al. 2009). Yettoday both religion and science face a numberof complaints from conservation.
Some Christians, for example, rationalizeenvironmental destruction based on theirinterpretation of human dominion. Their view
continues
270 CONSERVATION BIOLOGY FOR ALL
Sodhi and Ehrlich: Conservation Biology for All. http://ukcatalogue.oup.com/product/9780199554249.do
© Oxford University Press 2010. All rights reserved. For permissions please email: [email protected]

Box 14.4 (Continued)
holds humans to be superior above all theEarth’s creatures and therefore baptizesindustrial development and economic growth.Any environmental regulation that limitshuman enterprise then becomes the enemy ofdivine order. Other religious beliefs maintainthat the path of history culminates inapocalyptic fury. Such sects do not regardecological preservation because they believethe planet is destined for destruction.But science is not safe from ecological
criticism either. The scientific revolution, someargue, institutionalized ecological destructionby linking experimentation, knowledge, andpolitical power. Scientists then claimed theircraft to be the new means to master humanlimits. It was the great empiricist Francis Bacon,after all, who dreamed a society where nature’ssecrets were tortured from her. Critics contendthat modern science has inherited an insatiablecuriosity and lacks the capacity to restrain itself,working alongside government agencies andeconomic corporations in a united program toexploit the biosphere. Mountains become“natural resources,” ancient forests are seen as“agriculture,” rivers of fish are “stocks,” andhuman communities become the “labor force.”The question then should not be how
religion and conservation biology can combineforces (Box 14.4 Figure). This might forget theecological complaints against science andreligion, which are very real and must be takenseriously. A different approach would be tocultivate the virtues conservation requires. Thewisdom to know the virtues from thecounterfeits that have been passed down to usrequires the practical intelligence and witnessof those who practice them. It is the scientistswho know science best. And it is from withinreligious traditions where religions are mostfaithfully judged. Knowledge in both traditionsis social and must be vigorously encouraged.People who have a foot in both a scientific anda religious tradition might be especiallyimportant here. They may see more clearly thetransgressions that produce the ecologicalcrisis. They may know more than most thevirtues that conservation requires.
Box 14.4 Figure Nature is the context for virtue in many religioustraditions. Saint Jerome, a father of the early Christian Church, iscommonly depicted as a desert ascetic, pulling a thorn from alion’s paw. The upper left image in the painting suggests Jerome isdrawn to the wilderness for healing and renewal, the same reasonthe lion is drawn to him. (Saint Jerome and the Lion. Roger vander Weyden. Reprinted with permission from The Detroit Instituteof Arts).
REFERENCES AND SUGGESTED READING
Berry, W. (1977). The unsettling of America: culture andagriculture. Sierra Club Books. San Francisco, CA.
Carson, R. (1962). Silent spring. Houghton Mifflin, Boston,MA.
Clements, R., Foo, R., Othman, S., et al. (2009). Islam,turtle conservation and coastal communites. Conserva-tion Biology, 23, 516–517.
Ehrlich, P. R. (1968). The population bomb. A Sierra Club‐Ballantine Book, New York, NY.
Lodge, D. M. and Hamlin C. (2006). Religion and the newecology. University of Notre Dame Press, Notre Dame, IN.
Muir, J. and Cronon, W. (1997). Nature writings. Library ofAmerica, New York, NY.
Northcott, M. S. (1996). The environment and Christianethics. Cambridge University Press, Cambridge UK.
continues
THE ROLES OF PEOPLE IN CONSERVATION 271
1
© Oxford University Press 2010. All rights reserved. For permissions please email: [email protected]

underlie resource management systems, and formthe basis for decision-making and action.
An example from Papua New Guinea illus-trates how culture impacts conservation interven-tions (West 2006). Noticing the decline in birds ofparadise, an international conservation organiza-tion set out to save these species from extinction.Since conservationists saw the importance ofthese birds for the ecosystem and local communi-ty, they believed the local resource users wouldreadily comply with their project. Unbeknownstto the conservationists, when they asked the localvillagers to engage in conservation actions, theywere entering into a complex exchange relation-ship. Villagers expected not only medicine, tech-nology, and tourism development, but anongoing reciprocal relationship by which the vil-lagers would continue to protect species in ex-change for ongoing assistance in any number ofareas that are usually the purview of government.Fundamental cultural misunderstandings such asthis undermine conservation interventions, lead-ing to disappointment and project disintegration.
14.4.2 Political
Political systems are a set of institutions that gov-ern a particular territory or population. Thesesystems are not to be confused with politics, orthe maneuvering for power (though politicsheavily influence whether conservation initia-tives will be carried out). Political institutionscan be distinguished by degree of power concen-tration, level of formality, global to local scale,and normative characteristics. Conservation in-terventions often require the reinforcement ofpolicy by multiple political systems at different
scales. A small-scale conservation intervention,for example, may draw on traditional authority,the national environmental ministry, an interna-tional NGO (non-governmental organization),and global trade policies to achieve its goals.While there are a range of political systems thatimpact conservation efforts, we focus on politicalprocesses, or governance here. Governance refersto a set of regulatory processes and mechanismsthrough which the state, communities, businessesand NGOs act (Lemos and Agrawal 2006).
In addition to compensation and clarification onland tenure and access (see Equity, ResourceRights, and Conservation section below), partici-pation in governance has been critical to establish-ing good relationships between conservationistsand local resource users (Zerner 2003). This shar-ing of resource management, sometimes referredto as co-management, more equitably distributesauthority between local people, stakeholders,state-level political systems, and conservation or-ganizations involved (Brechin et al. 2002). Thereis considerable controversy over when, where,and to what extent co-management should beendorsed. Some worry that co-management andconsideration of local concerns are dangerous,over-riding the maintenance of biodiversity,whereas others call for increased equity for indig-enous and local communities. These debatesshould be contemplated in light of the fact thatpolitical and economic institutions are the pro-ducts of a contestation for power between varioussectors of a population, and that historically thisstruggle has resulted in entrenchment of institu-tions that favor the powerful. That is, conservationmust often arise through institutions that arethemselves considerably inequitable.
Box 14.4 (Continued)
Tucker, M. E. and Grim J., eds (1997–2003). Religions ofthe world and ecology (Vols. I–IX). Harvard UniversityPress, Cambridge, MA.
Van Houtan, K. S. (2006). Conservation as virtue: a scien-tific and social process for conservation ethics. Conser-vation Biology, 20, 1367–1372.
272 CONSERVATION BIOLOGY FOR ALL
Sodhi and Ehrlich: Conservation Biology for All. http://ukcatalogue.oup.com/product/9780199554249.do
© Oxford University Press 2010. All rights reserved. For permissions please email: [email protected]

Further, the degree to which co-management isin fact shared management, with equitable distri-butions of positions of power and decisionmakingacross the governing body (e.g. a park’s manage-ment board) is hotly debated. Generally, however,it is assumed that genuine or bona fide systems ofco-management include multiple opportunitiesfor participation; equitable control over decisionsand outcomes; the existence of governing bodiesthat are truly representative of those with recog-nized rights and/or local populations more broad-ly; and capacity building for the realization oftasks and responsibilities (McKean 2000).
Where co-management is not desirable or feasi-ble, political scientists and other social researchershave uncovered a number of principles for design-ing effective conservation governance (Ostrom2008). These vary greatly depending on local cir-cumstances. Governance processes that have beeneffective in a range of case studies include partici-patory decision-making, the presence of enforce-ment and conflict resolution mechanisms, andflexible management. Cultural variations in imple-menting these design principles lead to innumera-ble governance arrangements.
In the Comoros Islands, devolution of manage-ment rights to the local resource users increasedparticipation in marine protected area (MPA) de-cision-making. Ultimately, the resource users de-cided to limit outside use of the MPA byrestricting certain types of fishing gear (Granekand Brown 2005). Local resource users set limitson resource extraction through the regulatoryprocess of governance.
14.4.3 Economic
In every society goods and services have values.These goods are distributed in networks thatrange from household to international scales.It would be difficult to find a society today thatis not affected by the worldwide economy, how-ever. The structure of the global economy impactsresource use in surprising ways. We illustrate thishere via the “hamburger connection”.
The 1980s brought worldwide consciousness ofAmazonian deforestation. Clearing land for cattlewas the main driver of local deforestation, yet
cattle ranches in this area were less lucrative,and less destructive, than cash cropping. So whydid people engage in this labor-intensive activity?Researchers traced the political economy of Am-azonian deforestation and found that internation-al consumers were implicated in this destruction(Leduc 1985). The Brazilian government and theWorld Bank blamed deforestation on local swid-den cultivators, yet Leduc illustrates how Brazi-lian and international development policy wasactually at fault. These institutions encouragedthe conversion of rainforest to pasture land byproviding tax cuts and perverse incentives forcattle ranchers. Leduc finds that it was the wealthof European consumers and Brazilian cattle ran-chers, not the poverty of local resource users,which drove Amazonian deforestation.
The global economy supplied goods to feedEurope’s desire for hamburger, impacting envi-ronmental degradation thousands of miles away.
Increasing population, decreasing householdsize, and especially the associated rise in consump-tion, negatively impact resource use (see Introduc-tion Box 1). Yet some researchers have highlightedhow poorly executed global distribution networksare equally implicated in resource destruction.Awareness of these large-scale economic forces isimportant for unraveling local resource use pat-terns. Household economic characteristics are alsosignificant in designing conservation interven-tions. Figure 14.2 relates household economic fac-tors to conservation strategies.
Given the diversity of cultural, political, andeconomic institutions and their variable localmanifestations, there can be no worldwide con-servation program. However, there are similarconservation strategies that have been implemen-ted around the world. We turn now to the rolethat local resource users play in these commonconservation strategies.
14.5 Biodiversity conservationand local resource use
Conservation interventions that focus more ex-clusively on biodiversity are now pervasive, andmost focus on ameliorating threats to species and
THE ROLES OF PEOPLE IN CONSERVATION 273
1
© Oxford University Press 2010. All rights reserved. For permissions please email: [email protected]

systems (see Chapter 15). According to analysesbased on identified threats for species listedas threatened or endangered, the five greatestthreats to imperiled terrestrial species are habitatloss (Chapter 4), overexploitation (Chapter 6), pol-lution, non-native species (Chapter 7), and disease,with the order of importance varying greatlybetween USA and China (Wilcove et al. 1998; Liand Wilcove 2005). Marine, estuarine, and coastalspecies in the USA are threatened by many of thesame and some additional threats, such as waterdiversion, increased human presence, vesselinteraction, and climate change (Kappel 2005).Although climate change was missing from thethreats to terrestrial species in the studies above,it is increasingly recognized as a rising direct andindirect threat in all systems (Chapter 8).
Local resource users may be positively and/ornegatively impacted by conservation. They maysee, for instance, an increase in income due toecotourism, or a decrease in fish catch concurrentwith the opening of a marine protected area.Their health may suffer with the decline ofresource access, or the gazetting of a protectedarea may privilege their resource rights over
those of regional loggers. In short, there is nosimple answer to the question of how local re-source users are integrated into and impacted byconservation.
Conservation interventions, too, can be under-taken by a variety of actors from local to globalscales. Some actors include governments andgovernment agencies, NGOs, corporations, com-munities, and individual stakeholders. These ac-tors address conservation from a diversity ofangles, such as law, policy, management of wild-life and ecosystems, or individual actions [forexample, through direct payments for conserva-tion-friendly behavior (Ferarro and Kiss 2002)].Table 14.1 outlines some conservation interven-tions that involve local resource users, and thepotential positive and negative impacts of thoseinterventions. Anticipating potential impacts ofconservation interventions may also make themmore robust and, ultimately, more sustainable(Chan et al. 2007).
Conservation that involves local resource usersdoes not adopt a similar form worldwide.Table 14.2 compares protected area policies fromNepal, Brazil, and Australia to illustrate the
householdeconomic
level
conservationresponse
complicating factors
no surplus subsistence some assets land owners
build responsibleentrepreneurshipand stewardship
of resources
projects that provideextra income that
does not risk regularincome sources
need for low-riskprojects that build
on in-kindinvestments and
economic security
essential needsmust come first;
trust may be low;no conservation
buy–in
refugee status insecure land tenure government tax policy absentee landlords
Figure 14.2 Economic site characteristics and conservation initiatives: points to take into consideration. Adapted from Russell and Harshbarger(2003). Teasing out relevant factors that determine one conservation intervention over another is challenging. This figure presents one elementconsidered in conservation planning: income. Where income is a defining factor in conservation planning, the conservation response may derive fromthe household economic level. We also present a few factors that complicate this simplistic view of an appropriate conservation response.
274 CONSERVATION BIOLOGY FOR ALL
Sodhi and Ehrlich: Conservation Biology for All. http://ukcatalogue.oup.com/product/9780199554249.do
© Oxford University Press 2010. All rights reserved. For permissions please email: [email protected]

diversity of local involvement in one particularconservation strategy, protected areas. Local re-source users may not want to be involved in allaspects of conservation management (as was thecase in Kakadu National Park, Australia). Ethicalimperatives direct the extent and manner of con-sulting local resource users. We turn to these now.
14.6 Equity, resource rights,and conservation
Questions of rights and equity have recentlyemerged as paramount to the practice of conser-vation and are in part the by-product of severalyears of debate between social scientists and
Table 14.1 This table presents the orthodox view of how local resource users impact their environments, and how they in turn are impacted byconservation interventions. A deeper analysis might ask questions such as; who is responsible for the degradation, overexploitation, etc. in columnthree? Does the conservation strategy disproportionately affect local resource users? Are the strategies in column one responsive to the threatspresented in column three?
Strategy Impact on local resource users Response to…
Protected area Limits entry, extraction, and use of designated area Habitat loss and degradation,overexploitation
Zoning Designates areas where local resources may beextracted
Habitat loss and degradation,overexploitation
Purchase of water/land rights Transfers ownership or use rights to/from locals Water diversions, overexploitationEcotourism Brings outside investment to local businesses,
employment in service industryMultiple threats
Community‐based naturalresource management
Formal encoding of local monitoring and managingresource extraction
Multiple threats
Direct payments for ecosystemservices
Payment received for successfully maintaining localresources
Overexploitation, habitat loss anddegradation, pollution
Integrated conservation anddevelopment projects
Development of small‐scale economic initiatives thatincorporate sustainable resource use
Multiple threats
Table 14.2 Three examples of variations in local involvement in protected areas (from Claus, unpublished data). The three national parks presentedhere involve local resource users in conservation policy and implementation. As park policies are implemented in myriad ways, this empiricalcomparison accentuates the differing degree and nature of local conservation involvement.
Do policies allow…
Sagarmatha NationalPark, Nepal
Rio Ouro Preto ExtractiveReserve, Brazil
Kakadu NationalPark, Australia
Continued subsistence use 3 3 3
Formalized policy consultation 3
Sharing of entrance fees 3 3
Co‐management 3 3
Integration of local resource managementregimes
3 3 3
Local land ownership 3via enclaves 3
Training/integration into managementstructure
3Limited 3in local organizations only 3
Establishment of organizations withsubstantial local representation
3 3 3
Power to determine land useTechnical assistance regarding resource
management3 3 3
THE ROLES OF PEOPLE IN CONSERVATION 275
1
© Oxford University Press 2010. All rights reserved. For permissions please email: [email protected]

conservation biologists (Chapin 2004). Critical tothese debates is both a recognition that rightsheretofore ignored need be recognized, ad-dressed, and integrated into conservation (in-cluding those pertaining to access, use rights,and compensation in the event of their loss),and that justice and equity more broadly needto become a cornerstone principle in the ad-vancement of conservation and the maintenanceof biodiversity.
Rights refer to a bundle of entitlements or per-missions assigned to or affiliated with a group orpopulation. These rights may be individually orcollectively held, and they include the right to
tenure and/or ownership, the maintenance oflivelihood security and resource access (such asthe ability, for instance, to reduce the impact ofdamage-causing animals on the periphery of pro-tected areas), and the right to be involved in thegovernance of both these rights and the lands orwaters with which they are associated. Box 14.5provides an example of how asserting rights canlead to the protection of forests.
It is often difficult for conservation officials tounderstand the histories of peoples that may havepreceded a park or protected area. It is nonethe-less important to recognize that many rights-based systems are formalized in treaties; in titles
Box 14.5 Empowering women: the Chipko movement in IndiaPriya Davidar
Rural societies depend on natural resources forfuel, fodder, food, medicine, and constructionmaterials. Women play an important role in thecollection, use and sale of forest products such asfuel‐wood and fodder to meet householdrequirements, thereby enhancing the economicsecurity of their households (Wickramasinghe2005). Fuel‐wood is an important source ofdomestic energy for rural households in tropicalcountries and women are often involved in theharvesting and sale of fuel‐wood collected fromthe forest (Gera 2002). Commercialization offorestry operations and deforestation thereforeadversely affect the livelihoods of poorer forestdependent households. The Chipko movementis one case in point, where rural women andchildren fought back against timber operations.Chipko means “to embrace” or “to hug” andthe concept of saving trees from felling byembracing them is old in Indian culture. Thefirst recorded instance of such action was in1604 among the Bishnois community inRajastan when two Bishnoi women, Karmaand Gora, sacrificed their lives in an effort toprevent the felling of Khejri (Prosopiscineraria) trees.The Chipko agitation began in 1971 in the
Uttaranchal in the Himalayas, as a grass rootsGandhian movement to assert the rights of thelocal communities over forest produce(Berreman 1985; Joshi 1982). During British
rule, the Himalayan forests were heavilyexploited for timber, particularly during thetwo world wars. Commercial exploitationcontinued with India’s independence.Deforestation led to soil erosion and landslides,destroying crops and houses. Women had towalk longer distances to collect fuel‐wood andfodder. Women’s participation in themovement can be traced to a remote hill towncalled Reni where a contractor in 1973 wasgiven a permit to fell about 3000 trees for asporting goods store. When the woodcuttersappeared, the men had been called away forother tasks. The alarm was sounded and awidow in her 50s, Gaura Devi, collected twenty‐seven women and children and rushed into theforest to protect the trees. After threats andaltercations from the woodcutters, the womenwould not back off, and then embraced thetrees, as a consequence of which thewoodcutters backed off (see Box 14.5 Figure).This movement spread to many areas in thisregion, and village women saved around 100000 trees from being cut. The movement wascharacterized by de‐centralized and locallyautonomous activism by local communities, ledmostly by village women. Following this, thegovernment was forced to abolish the privatecontract system of felling and in 1975 the UttarPradesh Forest Corporation was set up toperform this function.
continues
276 CONSERVATION BIOLOGY FOR ALL
Sodhi and Ehrlich: Conservation Biology for All. http://ukcatalogue.oup.com/product/9780199554249.do
© Oxford University Press 2010. All rights reserved. For permissions please email: [email protected]

bought and exchanged in markets; or informal tothe extent that they are based in traditional orindigenous systems wherein some flexibility ofrules is to be expected. Treaties, however formal,may be recognized and intrinsic to rights or theymay be largely ignored. Great variability of treatyor claim-based rights exists across nation states,and most of those with significant implicationsfor protected areas follow recent court decisionsin their “home” nation states such as those inAustralia (the Mabo decision) and Canada (Del-gamuukw; Haida-Taku; Tsilhqot’in). Conversely,
informal systems of rights tend to be oral (thoughnot exclusively so) and tied to local systems ofkinship, governance and decision-making. Forinstance, a group may distribute rights to tradi-tional territories or specific fishing grounds to alineage (rights passed through the matriline, pa-triline, or both), but that same system may allowfor considerable room to negotiate temporaryrights. Overall, it is crucial to understand formaland informal as well as long-standing andephemeral systems of rights in any communitywith which conservation organizations engage.
Box 14.5 (Continued)
Box 14.5 Figure A demonstration of the Chipko movement.Photograph courtesy of The Right Livelihood Award.
The Chipko Movement had two elements:one section concentrated on protecting
existing forests from being logged and theother focused on promoting reforestationand developing sustainable villageproduction systems based on forests andagroforestry. The latter were led by ShriChand Prasad Bhatt, one of the originalorganizers of the Chipko movement whoprovided a unified vision and leadership tothe movement. Bhatt worked closely withthe village women and encouraged them toassert their environmental rights. In 1987Chipko was chosen for a “Right LivelihoodAward,” known as the “alternate Nobel”prize honor. The honor was rightlydeserved for this small movementdominated by women that became a call tosave forests.
REFERENCES
Berreman, G. (1985). Chipko: Nonviolent direct action tosave the Himalayas. South Asian Bulletin, 5, 8–13.
Gera, P. (2002). Women’s role and contribution to forestbased livelihoods. HRDC (Human Rights and Documen-tation Center), UNESCO, New Delhi, India.
Joshi, G. (1982). The Chipko movement and women. PUCLbulletin, September.
Wickramasinghe, A. (2005). Gender relations beyond farmfences: reframing the spatial context of local forest live-lihoods. In L. Nelson and J. Seager, eds A female com-panion to feminist geography, pp. 434–445. BlackwellPublishing, Oxford, UK.
THE ROLES OF PEOPLE IN CONSERVATION 277
1
© Oxford University Press 2010. All rights reserved. For permissions please email: [email protected]

Given the above-mentioned history of coloni-alisms closely linked to the establishment ofmany protected areas, in many cases peoples’rights have been lost or dispossessed. Recogni-tion, restitution, equitable compensation, and thesettling of land claims noted above, is necessaryfor the (re-) establishment of good relations be-tween parks and people (Colchester 2004).
The principle of equity (fair distribution of ben-efits) permeates many of the above considera-tions regarding eviction or restrictions onresource use. Debates about compensation forthe dispossession of lands or co-managementsuggest that a more equitable world is necessaryfor effective conservation. Further, the struggle tosustain biodiversity may involve justice (the prin-ciple or ideal of right action) or equity as assignedto extant peoples, future generations, and nonhu-man organisms. In order to consider justice, onemust also ask: justice for whom? Utilitarian ap-proaches consider justice done when the greatestgood is done, in the aggregate across a number ofstakeholders, and many of these stakeholdersmight be very distant from the protected areasin question. Whereas much of the above discus-sion suggests that it is proximate peoples, withstanding or legitimate claims to rights, whom arethe appropriate focus for conservation. This isparticularly so as those who enjoy the benefitsof conservation may not be those who suffer itscosts. Considering justice then requires us to askthe identities and condition of peoples most af-fected or impacted by a decision (Rawls 1999).For the purposes of conservation, rights, and jus-tice, the point here is not to defend a particularapproach, but to assert that justice should involvea fair distribution of rights, responsibilities, costs,and benefits. “And when actions have impactswith unfair distribution, justice requires appro-priate restitution” (Chan and Satterfield 2007).At the heart of much of the controversy aboutjustice and conservation is the incongruenceamongst the intended stakeholders (those whoare affected by a decision in a morally relevantway) (Chan et al. 2007). Whereas conservationistsconsider non-human organisms—and sometimesalso species, ecosystems, and inanimate compo-nents of the environment—to have rights or to be
deserving of moral consideration, critics of con-servation frequently focus first and foremost orexclusively on human beings. If we are to makeheadway in controversial settings for conserva-tion, we will require an ethical framework thatallows us to consider our obligations to the non-human world alongside those to fellow humanbeings (Sodhi et al. 2008). Such an applied “glob-al” environmental ethic is elusive, however, andso in-situ ones can and should suffice.
Conservation often also requires changing localbehavior, resource access or livelihoods. This so-cial engineering serves biodiversity, yet biodiver-sity itself is not a value-neutral concept. Thebiodiversity concept is rooted in what a particulargroup of people view as “ideal nature”, andplaces value on what cultural practices are goodor bad. Where biodiversity conservation clasheswith local environmental values, it is necessary toconsider the implicit prescriptions of ideal con-servation-oriented behavior that underlie the dis-tribution of benefits from conservation projects.An extreme example is the complete exclusion oflocal people from protected areas, but subtlermeasures such as the acceptance of hunting withspears instead of guns displays underlying as-sumptions about how people should interactwith their environments. Acting justly requiresrecognizing one’s assumptions and the behaviorjudgments that arise from them. Only then is itpossible to prescribe appropriate conservationbehavior (Chan and Satterfield 2007). Biodiversi-ty conservation depends on solutions that aresocially just, and attentive to rights where theyexist formally and informally. As a society, weshould strive for sustainable economic develop-ment and socially as well as ecologically sustain-able conservation—for its global and futurebenefits and for its own sake—in harmony withthe cultural, social, and economic well-being oflocal peoples.
14.7 Social research and conservation
One of the anomalies of modern ecology is that itis the creation of two groups, each of which seemsbarely aware of the existence of the other. The one
278 CONSERVATION BIOLOGY FOR ALL
Sodhi and Ehrlich: Conservation Biology for All. http://ukcatalogue.oup.com/product/9780199554249.do
© Oxford University Press 2010. All rights reserved. For permissions please email: [email protected]

studies the human community almost as if it werea separate entity, and calls its findings sociology,economics and history. The other studies theplant and animal community and comfortablyrelegates the hodge-podge of politics to the liberalarts. The inevitable fusion of the two lines ofthought will, perhaps, constitute the outstandingadvance of the present century
—Aldo Leopold (1935 in Meine and Knight 1999)
As Aldo Leopold suggests, integrating under-standing of human and other natural systems iscrucial for conservation success. Social disciplineslike history, ethics, policy and business studies,and the social sciences provide insights into con-servation implementation, from formulatingplans to enacting them on the ground (see Figure14.3 for a conceptual diagram of how these dis-ciplines interact). Examples of social research inconservation include clarifying resource use pat-terns, mapping socio-political territories, and un-covering regional resource tenure institutions.
Yet, social research in conservation is underva-lued. There are a number of reasons conservationfails to appreciate social research. Firstly, socialresearch takes time, and conservation moves at a
rapid pace. Secondly, when funds are limited, asthey nearly always are, biological research takesprecedence. Thirdly, conservation organizationsare most often staffed by natural scientists, whomay feel that simply because they are human theyunderstand human behavior. As Russell andHarshbarger (2003) point out, anyone with fieldexperience can collect social data. However, ittakes considerable training and practice to collectgood social data and to interpret those data inmeaningful ways. Finally, disciplinary tensions be-tween natural and social scientists complicatecross-disciplinary work. They frequently differ inworldviews, with natural scientists more likely tosee (other) people as threats to biodiversity andsocial researchers more likely to see (local) peopleas autonomous agents worthy of respect andsovereignty.
Given the serious consequences of failedconservation projects—for the environment aswell as for future conservation initiatives—conservation organizations are increasinglyturning to social researchers to answer socialproblems. Social researchers are well placed toanswer questions surrounding lack of buy-into conservation initiatives, why people engagein particular environmental behaviors, or what
Law, Policy,Business
Humanities
SocialSciences
Natural Sciences
EcologicalProduction Function
Ecosystem Services
Ecosystems
Human Impacts
Decisions
HumanBehaviour
Policy
Valuation
Valuation
Value
Incentives,Institutions
Figure 14.3 The study of conservation of biodiversity in functioning ecosystems has been largely pursued separately in diverse academic disciplines.Effective conservation requires an integrated understanding of how people’s decisions influence ecosystems, how ecosystems produce services forpeople, how those services are valued by people, how those values translate into policies, and how those policies result in human actions. This requiresan integration of diverse fields, natural and social.
THE ROLES OF PEOPLE IN CONSERVATION 279
1
© Oxford University Press 2010. All rights reserved. For permissions please email: [email protected]

Table 14.3 Social research and conservation. This table draws on resources available on the Society for Conservation Biology’s Social ScienceWorking Group webpage (www.conbio.org/sswg).
Discipline Definition
Prevalentconservation‐
relevant methods
Traditionalunit ofanalysis
Sample conservationcontribution and case study
Anthropology The scientific andhumanistic study ofthe human species:present and pastbiological, linguistic,and cultural variations.
Ethnography, discourseanalysis, participantobservation,excavation/paleological coring
Community Analyzing cultural context ofconservation interventiondetermines differences betweenlocal and outsider perceptions ofconservation projects, andassociated biodiversityimplications (West 2006).
Business,Management
The study of corporateaction and theeffective operation oforganizations.
Simulation andanalytical modeling
Individual,Firm, NGO
Understanding how corporationsand other organizations respondto circumstances fosters moreeffective conservationinterventions; effectivemanagement approachesimprove operation ofconservation organizations(Stoneham et al. 2003).
Economics The study of theallocation of resourcesunder scarcity: howwe behave whenusing resources (e.g.time, money) withinsufficient quantity tosatisfy all users.
Econometrics,simulation andanalytical modeling
Individual,Firm &State
Incorporating conservation costsinto strategy planning phaseresults in larger biological gainsthan when costs are ignored(Naidoo et al. 2006).
Ethics The study of right andwrong actions basedon normative premisesand logical argument.
Inductive/deductivereasoning
Individual ‐Earth
Exploring the competing valuesunderlying people’s actions andpotential policies can fostermutual understanding amongstakeholders and agreement overappropriate decisions (Chan andSatterfield 2007).
Geography The study of humanactivity, culture,politics and economicswithin its spatial andenvironmentalcontext.
GIS, remote sensing,spatial analysis,geostatistics
Community ‐Earth
Using participatory GIS integratesdiverse stakeholder knowledgeto clarify spatial aspects oflandscape level environmentalchange (Balram et al. 2004).
History The reconstruction andanalysis of past eventsof importance to thehuman race.
Text and media analysis Individual ‐Earth
Understanding sequences of pastevents and their possible causes(both events and social contexts)suggests how present‐dayconservation actions may unfoldand be received (Turner 2006).
Law The study of laws andpolicies, their origins,implementation,judicial interpretation,and enforcement.
Policy and law analysis Region, State,Nation, andbetweenthese
Understanding legal and judicialprocesses improves efforts toimplement new legislation andregulations, and to use existingones in court processes (e.g.lawsuits) (Thompson 2001).
280 CONSERVATION BIOLOGY FOR ALL
Sodhi and Ehrlich: Conservation Biology for All. http://ukcatalogue.oup.com/product/9780199554249.do
© Oxford University Press 2010. All rights reserved. For permissions please email: [email protected]

social pressures encourage environmental deg-radation. As social research disciplines vary inmethodology, scale, and scope of data collec-tion, they have different contributions to thefield of conservation. Table 14.3 details thesedisciplines and research they undertake thatinforms conservation action.
Summary
· Conservation is inherently a social processoperating in a social context. As such, conservation-ists will benefit from a nuanced understanding ofpeople’s perceptions and behaviors as individualsand in organizations and institutions.
· While there is no easy recipe for how local re-source users should participate in modern conserva-tion initiatives, attentiveness to resource rights andequity are critical in every conservation project.
· A successful conservation movement will effec-tively integrate the natural sciences and diversefields of social research.
Relevant websites
· Society for Conservation Biology’s Social Science Work-ing Group: http://www.conbio.org/workinggroups/sswg/.
· Advancing Conservation in a Social Context: http://www.tradeoffs.org/static/index.php.
· Conservation and Society Interdisciplinary Journal:http://www.conservationandsociety.org/.
Suggested reading
Chan, K. M. A. and Satterfield, T. (2007). Justice, equity,and biodiversity. In S. Levin, G. C., Daily, and R. K.Colwell, eds The Encyclopedia of Biodiversity Online Update1. Elsevier, Oxford, UK.
Colchester, M. (2004). Conservation policy and indigenouspeoples. Environmental Science and Policy, 7, 145–153.
REFERENCES
Balram, S., Suzana, D. E., and Dragicevic, S. (2004). A col-laborative GIS method for integrating local and technical
Political Science The study ofgovernments, publicpolicies, and politicalprocesses, systems,and behavior.
Text analysis, scenariomodeling,comparativestatistics
State Presenting framework forunderstanding and designingcompensation schemes forresource rights acquisition/lossdue to protected areaestablishment (Mascia and Claus2009).
Psychology The study of humanthought, feeling andbehavior in order tounderstand behaviorand promote humanwelfare.
Controlledexperimentation,psychoanalysis,brain scanning,computationalmodeling
Individual ‐Smallgroup
Researching the relationshipbetween values andenvironmental behavior to informenvironmental message framingin the USA (Schultz and Zelezny2003).
Sociology The study of societies,particularly socialrelations,stratification, andinteraction.
Social networkanalysis, contentanalysis, longitudinalstudies
Community ‐Nation
Researching a collaborativewatershed planning effort that,through creating social capital,led to cooperative conservationamongst participants (Salamonet al. 1998).
THE ROLES OF PEOPLE IN CONSERVATION 281
1
© Oxford University Press 2010. All rights reserved. For permissions please email: [email protected]

knowledge in establishing biodiversity conservationpriorities. Biodiversity and Conservation, 13, 1195–1208.
Brechin, S., Wilshusen, P., Fortwangler, C., and West, P. C.(2002). Beyond the square wheel: Toward a more com-prehensive understanding of biodiversity conservationas social and political process. Society and NaturalResources, 15, 41–64.
Buege, D. J. (1996). The ecologically noble savage. Environ-mental Ethics, 18, 71–88.
Carson, R. (1962). Silent Spring. Houghton Mifflin, Boston,MA.
Caufield, C. (1990). The ancient forest. The New Yorker, 14May 1990, 46–84.
Chan, K. M. A. and Satterfield, T. (2007). Justice, equity,and biodiversity. In S. Levin, G. C., Daily, andR. K. Colwell, eds The Encyclopedia of Biodiversity OnlineUpdate 1. Elsevier Ltd, Oxford.
Chan, K. M. A., Pringle, R. M., Janganathan, J., et al. (2007).When agendas collide: Human welfare and biologicalconservation. Conservation Biology, 21, 59–68.
Chapin, M. (2004). A Challenge to Conservationists. WorldWatch Magazine, November/December 2004, 17–31.
Colchester, M. (2004). Conservation policy and indigenouspeoples. Environmental Science and Policy, 7, 145–153.
Conklin, H. (1975). Hanunoo agriculture. Forestry Develop-ment Paper. Food and Agriculture Organization of theUnited Nations, Rome, Italy.
Cronon, W. (1995). The trouble with wilderness; or gettingback to the wrong nature. In W. Cronon, ed. Uncommonground: Rethinking the human place in nature. W. W. Nor-ton and Company, New York, NY.
Denevan, W. (1992). The pristine myth—the landscape ofAmerica in 1492. Annals of the Association of AmericanGeographers, 82, 369–385.
Fairhead, J. and Leach, M. (1996). Enriching the landscape:social history and the management of transition ecologyin the forest-savanna mosaic of the Republic of Guinea.Africa, 66, 14–36.
Ferraro, P. J., and Kiss, A. (2002). Direct payments to con-serve biodiversity. Science, 298, 1718–1719.
Gomez-pompa, A. and Kaus, A. (1992). Taming the wilder-ness myth. BioScience, 42, 271–279.
Granek, E. F. and Brown, M. A. (2005). Co-managementapproach to marine conservation in Moheli, ComorosIslands. Conservation biology, 19, 1724–1732.
Grove, R. H. (1996). Green imperialism, colonial expansion,tropical island edens and the origins of environmentalism1600–1860. Cambridge University Press, Cambridge, UK.
Jackson, J. B. C., Kirby, M. S., and Berger, W. H. (2001).Historical overfishing and the recent collapse of coastalecosystems. Science, 293, 629–638.
Janzen, D. H. and Martin, D. H. (1982). Neotropical ana-chronisms: the fruits the gomphotheres ate. Science, 215,19–27.
Kappel, C. V. (2005). Losing pieces of the puzzle: threatsto marine, estuarine, and diadromous species. Frontiersin Ecology and the Environment, 3, 275–282.
Leduc, G. (1985). The political economy of tropical defores-tation. In H. J. Leonard, ed. The political economy of envi-ronmental abuse in the third world. Holmes and Meier,New York, NY.
Lemos, M. C., and Agrawal, A. (2006). Environmentalgovernance. Annual Review of Environment and Resources,31, 297–325.
Leopold, A. (1949). A sand county almanac and sket-ches here and there. Oxford University Press, New York,NY.
Li, Y. M. and Wilcove, D. S. (2005). Threats to vertebratespecies in China and the United States. Bioscience, 55,147–153.
Mascia, M. and Claus, C. A. (2009). A property rightsapproach to understanding human displacement fromprotected areas: the case of marine protected areas.Conservation Biology, 23, 16–23.
Marsh, G. P. (1864). Man and nature. Harvard UniversityPress, Cambridge, MA (1965; annotated reprint of the1864 original).
Marten, G. (2001). Human ecology, Earthscan PublicationsLtd., UK.
McKean, M. A. (2000). Common property: what is it, whatis it good for, and what makes it work. In C. C. Gibson,M. A. McKean and E. Ostrom, eds People and forests:communities, institutions, and governance. MIT Press,Cambridge, MA.
Meine, C. and Knight, R. L., eds (1999). The essential AldoLeopold: quotations and commentaries. University ofWisconsin Press, Madison, WI.
Nabhan G. (1998). Cultures of habitat, Counterpoint,Washington, DC.
Naidoo, R., Balmford, A., Ferraro, P. J., Polasky, S., Rick-etts, T. H., and Rouget, M. (2006). Integrating economiccosts into conservation planning. Trends in Ecology andEvolution, 21, 681–687.
Neumann, R. (2004). Moral and discursive geographies inthe war for biodiversity in Africa. Political Geography, 23,813–837.
Ostrom, E. (2008). The challenge of common-poolresources. Environment, 50, 8–20.
Rawls, J. (1999). A theory of justice. Harvard UniversityPress, Cambridge, MA.
Redford, K. (1991). The ecologically noble savage. CulturalSurvival Quarterly, 15, 46–48.
282 CONSERVATION BIOLOGY FOR ALL
Sodhi and Ehrlich: Conservation Biology for All. http://ukcatalogue.oup.com/product/9780199554249.do
© Oxford University Press 2010. All rights reserved. For permissions please email: [email protected]

Robbins, W. (1985). The social context of forestry: thePacific Northwest in the Twentieth Century. WesternHistorical Quarterly, 16, 413–427.
Ruddiman W. F. (2005). Plows, plagues, and petroleum: howhumans took control of climate. Princeton University Press,Princeton, NJ.
Russell, D. and Harshbarger, C. (2003). Groundwork forcommunity-based conservation, Altamira Press, Lanham,ML.
Salamon, S., Farnsworth, R. L., and Rendziak, J. A. (1998).Is locally led conservation planning working? A farmtown case study. Rural Sociology, 63, 214–234.
Schultz, P. W. and Zelezny, L. (2003). Reframing environ-mental messages to be congruent with American values.Human Ecology Review, 10, 126–136.
Stevens, S. (1997). Conservation through cultural survival:Indigenous peoples and protected areas. Island Press,Washington, DC.
Stoneham, G., Chaudhri, V., Ha, A., and Strappazzon, L.(2003). Auctions for conservation contracts: an empiricalexamination of Victoria’s BushTender trial. AustralianJournal of Agricultural and Resource Economics, 47,477–500.
Sodhi, N. S., Acciaioli, G., Erb, M. and Tan, A. K.-J., eds(2008). Biodiversity and human livelihoods in protected areas:
case studies from the Malay Archipelago. CambridgeUniversity Press, Cambridge, UK.
Sundberg, J. (1998). NGO landscapes in the Maya Bio-sphere Reserve, Guatemala. Geographical Review, 88,388–412.
Thompson, B. H. J. (2001). Providing biodiversiy throughpolicy diversity. Idaho Law Review, 38, 355–384.
Turner, J. M. (2006). Conservation science and forest servicepolicy for roadlessareas.ConservationBiology,20, 713–722.
West, P. (2006). Conservation is our government now: thepolitics of ecology in Papua New Guinea, Duke UniversityPress, Durham, NC.
Westbroek, P., Collins, M. J., Jansen, J. H. F., and Talbot, L.M. (1993). World archaeology and global change: didour ancestors ignite the Ice Age? World Archaeology, 25,122–133.
White, R. and Findley, J., eds (1999). Power and place in theNorth American West. University of Washington Press,Seattle, WA.
Wilcove, D. S., Rothstein, D., Dubow, J., Phillips, A., andLosos, E. (1998). Quantifying threats to imperiled speciesin the United States. BioScience, 48, 607–615.
Zerner, C, ed. (2003). Culture and the question of rights:forests, coasts, and seas in Southeast Asia. Duke UniversityPress, Durham, NC.
THE ROLES OF PEOPLE IN CONSERVATION 283
1
© Oxford University Press 2010. All rights reserved. For permissions please email: [email protected]

CHAP T E R 1 5
From conservation theory to practice:crossing the divideMadhu Rao and Joshua Ginsberg
Conservation biology is continually developingnew tools and concepts that contribute to ourunderstanding of populations, species and eco-systems (Chapter 1). The science underpinningthe field has undoubtedlymade rapid strides gen-erating more effective methods to document bio-diversity, monitor species and habitats. Scientistshave developed comprehensive priority settingexercises to help determine where and what toconserve in on-going attempts to identify whichfactors would best serve as the basis for triage forspecies and ecosystems (Wilson et al. 2007; Chap-ter 11). They arewell positioned to track the loss ofspecies and ecosystems in broad patterns even ifprecise details are not always available (Chapter10). However applying the science effectively re-quires the efforts of conservation biologists com-bined with a diversity of other actors, most ofwhom are non-biologists and include local andindigenous communities, civil servants at all le-vels of government, environmental consultants,park managers, environmental lobbyists, privateindustry, and even themilitary (Box 15.1; Chapter14). This amorphous group of practitioners willpursue a diverse set of activities which includeputting up or taking down fences (literal and me-taphorical), lobbying politicians, buying land, ne-gotiating with members of local and indigenouscommunities, tackling invasive species problems,guarding against poachers andmanaging off-takeof plants and animals.
There are many pressing challenges facingpractical conservation. Forces affecting biodiver-sity in different ecosystems have altered over thepast two decades. For instance, the nature oftropical forest destruction has changed from
being dominated by rural farmers to currentlybeing driven substantially by major industriesand economic globalization, with timber opera-tions, oil and gas development, large-scale farm-ing and exotic-tree plantations being the mostfrequent causes of forest loss (see Chapter 4).A direct result of these changes is the need forengaging not just conservation minded indivi-duals and organizations, but those in the largest,and most influential, of the world’s corporationsand multilateral institutions (Box 15.2). In addi-tion, the changes in those factors driving loss–and in the scale of loss – requires that we diversifyour approaches, and focus not just on biodiversi-ty, but on the whole issue of those goods andservices that natural systems provide for us(Daily 1997, Woodwell 2002; Box 15.3). Globalthreats, and opportunities, such as climatechange (Chapter 8), are forcing conservationpractitioners to work at a variety of scales tobetter integrate these challenges (Bonan 2008).Conservation science must meet the continuallychanging nature of threats to biodiversity (Butlerand Laurance 2008); conservation biologistsand practitioners need to design and leveragesolutions in response to these global changes inthreat.
Not only is the practice of conservation gettingmore complicated, but it has a stronger globalpresence, and increasingly large expenditures(Cobb et al. 2007). As a result, implementingagencies and specifically conservation organiza-tions are being held to a higher standard in mon-itoring and evaluating their conservation success,and failure (Wells et al. 1999; Ferraro and Patta-nayak 2006; see also Box 15.4). Another issue that
284
Sodhi and Ehrlich: Conservation Biology for All. http://ukcatalogue.oup.com/product/9780199554249.do
© Oxford University Press 2010. All rights reserved. For permissions please email: [email protected]

Box 15.1 Swords into ploughshares: reducing military demand for wildlife productsLisa Hickey, Heidi Kretser, Elizabeth Bennett, and McKenzie Johnson
Illegal trade in wild animals and plants is one ofthe greatest threats to populations of manyspecies. The impacts are diverse, and the directimpact in reducing wildlife populations is wellstudied, and often noted (Robinson andBennett 2000; Bennett 2005). Indirect effects –including the global movement of emerginginfectious diseases (Karesh et al. 2005) pose adifferent, but equally compelling case for bettermanagement of such trade. The economicimperatives are great as well, with currentestimates of the value of illicit trade (estimatedat US$6 billion; Warchol 2004) second only tonarcotics and arms trafficking. Legal trade isclearly occurring at a much higher level (on theorder of US$150 billion per year) if trade incommodities such as timber and ocean fish areincluded in these studies (Warchol 2004), butthis also produces a significant threat since legaltrade in many species is unsustainable.US military personnel have a long‐term
presence abroad, including in countries of greatbiodiversity importance. These personnel andaffiliates have significant buying power thatinfluences local markets, including the ability todrive the demand for wildlife products. TheAfghanistan Biodiversity Project funded byUSAID (United States Agency for InternationalDevelopment) and implemented by theWildlifeConservation Society (WCS) has found that USsoldiers serving in Afghanistan are primarybuyers of illegal wildlife products there,including big cat skins and other types oftrophies. WCS has initiated a program focusedon education and awareness‐raising to reducepurchasing of wildlife products by the USmilitary, and protect American soldiers fromserious penalties related to the import of illegalwildlife. WCS, in conjunction with theDepartment of State, traveled to Bagram AirBase, the largest military base in Afghanistan, toeducate soldiers on issues related to illegal tradein wild species. Military Police (MPs) receivedinstruction on issues of biodiversity inAfghanistan andhow to identify threatened andendangered Afghan species. The partnershipbetween Bagramcustoms officials andWCS aimsto reduce illegal buying of wildlife products bysoldiers, and MPs have already shown an adept
ability to identify and seize prohibited wildspecies before they leave the base, as well asenthusiasm to collaborate on the program.
To further address the demand for wildlifeproducts by US military personnel, WCS iscomplementing its work in Afghanistan byworking with the military in the US. As part ofthis effort WCS ran a booth at Safety Day, inFort Drum, to raise awareness about illegalwildlife trade for both pre and post‐deployment troops. A survey conducted at FortDrum as part of this effort indicated that fewerthan 12% of soldiers (n = 371) had heard ofCITES, yet more than 40% had either purchasedwildlife products while overseas or seen othermembers of the military purchase these items(Kretser, unpublished data).
To increase its effectiveness in working onwildlife trade issues with the military, WCS isplanning to develop a template approach tobegin addressing wildlife trade within allbranches of the military. Activities include thedevelopment of pocket cards and playingcards for soldiers as well as handouts andpower point slides for incorporation intomilitary‐run environmental training includingofficer training, pre‐departure briefings, andin‐theater briefings. The playing cards willcommunicate information about wildlife,wildlife products, and legal concernspertaining to wildlife of Iraq andAfghanistan.
REFERENCES
Bennett, E. L. (2005). Consuming wildlife in the tropics. InS. Guynup, ed. State of the Wild 2006: a global portraitof wildlife, wildlands, and oceans, pp. 106–113. IslandPress, Washington, DC.
Karesh, W. B., Cook, R. A., Bennett, E. L., and Newcomb, J.(2005). Wildlife trade and global disease emergence.Emerging Infectious Diseases, 11, 1000–1002.
Robinson, J. G. and Bennett, E. L., eds (2000). Hunting forsustainability in tropical forests. Columbia UniversityPress, New York, NY.
Warchol, G. L. (2004). The Transnational Illegal WildlifeTrade. Criminal Justice Studies, 17, 57–73.
FROM CONSERVATION THEORY TO PRACTICE: CROSSING THE DIVIDE 285
1
© Oxford University Press 2010. All rights reserved. For permissions please email: [email protected]

Box 15.2 The World Bank and biodiversity conservationTony Whitten
The World Bank is well known as adevelopment agency providing bothconcessionary credits and commercial‐rateloans to governments to reduce poverty, but isless well known as a leader in biodiversityconservation. In fact, the biodiversity portfoliohas grown steadily, especially since 1992 whenfunding from the Global Environment Facility(GEF) became available. In the last ten years theWorld Bank approved 598 projects that fully orpartially supported biodiversity conservationand sustainable use (see Box 15.2 Figure). Theseare being executed in 122 countries andthrough 52 multi‐country efforts and includeactivities in almost all terrestrial and coastalhabitats, although more than half of allprojects are directed towards the conservationof different types of forests. Many of thesehabitats provide critical ecosystem services andcan be an important buffer to climate change,providing low‐cost options for adaptation andmitigation actions. During the last 20 years, theWorld Bank has committed almost US$3.5billion in loans and GEF resources, andleveraged US$2.7 billion in co‐financing,resulting in a total investment portfolio forbiodiversity exceeding US$6 billion. Protected‐area projects account for more than half of theinvestments, but the Bank is increasinglyseeking to mainstream biodiversity inproduction landscapes, especially where GEF‐funded activities can be integrated within Banklending.Partner governments have borrowed just
over 31% of the US$6 billion, whereas grantscomprise 25%, mostly facilitated throughBank‐executed GEF projects, as well as throughtrust funds, and carbon financing. Theremaining 44% represents co‐financing andparallel financing, and global initiatives, suchas the IFC Small and Medium Enterprise Fund,the Critical Ecosystems Partnership Fund, CoralReef Targeted Research, and projects fundedunder the World Bank‐NetherlandsPartnership Program’s Forests and Biodiversitywindows.
Box 15.2 Figure These villagers on Buton, Sulawesi (Indonesia),are members of a cooperative within a village which has developed aconservation agreement vowing not to encroach into the naturalforest and not to hunt wildlife, with sanctions for members who goagainst the agreement. In return they get access to high prices fortheir cashews (Anacardium sp.) which became the world’s firstFairtrade cashews. This World Bank project is executed by OperationWallacea ‐ see www.opwall.com and www.lambusango.com.
The scale and variety of Bank financingmechanisms provide many opportunities tointegrate biodiversity concerns intodevelopment assistance, to address the rootcauses of biodiversity loss, and to develop localcapacity and interest. The Bank’s leadershipand coordinating role within the donorcommunity can help to promote biodiversityconservation within national sustainabledevelopment agendas. As well as being a majorfunding source for biodiversity projects indeveloping countries, the Bank is also a sourceof technical knowledge and expertise, and hasthe convening power to facilitate participatorydialogue between governments and otherrelevant stakeholders.In addition to the biodiversity projects
themselves, each and every World Bank projectis subjected to a ‘safeguard review’ to ensurethat they meet the requirements of the variouspolicies it has on, for example, environmentalassessment, resettlement, indigenous peoples,international waterways, physical cultural
continues
286 CONSERVATION BIOLOGY FOR ALL
Sodhi and Ehrlich: Conservation Biology for All. http://ukcatalogue.oup.com/product/9780199554249.do
© Oxford University Press 2010. All rights reserved. For permissions please email: [email protected]

is increasingly taking the forefront in the applica-tion of conservation science to conservation prac-tice is the often real, and sometimes, perceived,conflicting mandates of biodiversity conservationand poverty alleviation. While there are, clearly,situations in which development can facilitateconservation efforts, it cannot be assumed thateconomic development will automatically leadto conservation benefits (Redford and Sanderson2003). Furthermore, we cannot impose theworld’s development needs on the relativelysmall (approximately 10%) part of the land sur-face that constitutes protected areas and doing soposes significant, and perhaps insurmountable,challenges to the effective management of theseareas to achieve global biodiversity goals. Thevalue of protected areas – and their costs to localand indigenous people – has often been framed asone of opposition – with protected areas seen bysome as depriving local and indigenous peoplesof resources, by others as potentially beneficial(Sodhi et al. 2008). As one would expect, the reali-ty is that such relationships are complex, andoften locally specific (Upton et al. 2008) and theproblem is more subtle (see for instance West andBrockington (2006) for a more detailed discussionof some of the effects). That parks may actuallybenefit the rural poor and serve as an attractantwith human growth at their boundaries is both an
argument for such areas, and flags a concern fortheir future conservation. The much contestedrelationship between parks and people will con-tinue to stimulate both better analysis of the real-ity of such conflict, and provoke the design ofinnovative approaches for reconciliation betweenhuman needs and biodiversity conservation(Sodhi et al. 2006).
The technical and financial capacity for biodi-versity conservation is significantly limited in de-veloping economies harboring high levels ofbiodiversity (for example, most tropicalcountries). Such human resource deficits havebeen at the root of the changes in the way thatconservation NGOs (Non-governmental Organi-zations), local governments, and internationaldonors have implemented conservation projectsover the last four decades (Cobb et al. 2007).Effectively tackling this issue – and empoweringboth local and national governments and institu-tions – will require visionary and far-sightedapproaches that are able to justify investment ofscarce resources to long-term capacity buildingobjectives in the face of immediate conservationproblems.
The gap between conservation science and itsapplication has been long acknowledged (Balm-ford et al. 1998) and there are numerous effortsdirected at bridging it (Sutherland et al. 2004).
Box 15.2 (Continued)
property – and natural habitats (World Bank1998). The last of these is an important tool bywhich biodiversity concerns are integrated intoimproved project design because the policyforbids the Bank supporting projects involvingthe significant conversion of natural habitatsunless there are no feasible alternatives for theproject and its sites, and unless comprehensiveanalysis demonstrates that overall benefitsfrom the project outweigh the environmentalcosts. Likewise the Bank will not approve aproject that would involve the significantconversion or degradation of a gazetted orapproved protected area. Mitigation foranticipated project impacts on biodiversity
might include conservation offsets oradditional species protection.For further information and details of
projects, see Mackinnon et al. (2008) andwww.worldbank.org/biodiversity.
REFERENCES
Mackinnon, K., Sobrevila, C. and Hickey, V. (2008).Biodiversity, climate change,and adaptation: nature‐based solutions from the World Bank portfolio. TheWorld Bank, Washington, DC.
World Bank (1998). Operational Policy 4.04: naturalhabitats. The World Bank, Washington, DC.
FROM CONSERVATION THEORY TO PRACTICE: CROSSING THE DIVIDE 287
1
© Oxford University Press 2010. All rights reserved. For permissions please email: [email protected]

Box 15.3 The Natural Capital ProjectHeather Tallis, Joshua H. Goldstein, and Gretchen C. Daily
The vision of the Millennium EcosystemAssessment is a world in which people andinstitutions appreciate natural systems and thebiodiversity that constitutes their principalworking parts as vital assets, recognize thecentral roles these assets play in supportinghuman well‐being, and routinely incorporatetheir material and intangible values intodecision‐making. This vision has now caughtfire, fueled by innovations worldwide – frompioneering local leaders to the belly ofgovernment bureaucracy, and from traditionalcultures to a new experimental wing ofGoldman Sachs – a giant investment bankingfirm (Daily and Ellison 2002; Bhagwat andRutte 2006; Kareiva and Marvier 2007; Ostrom2007; Goldman et al. 2008). China, forinstance, is investing over 700 billion yuan inecosystem service payments over 1998–2010(in early 2009, US$ 1.0 = 6.85 yuan) (Liu et al.2008).The aim of the Natural Capital Project is to
act on this vision and mainstream ecosystemservices into everyday decisions around theworld. Launched in October 2006, the Projectis a unique partnership among StanfordUniversity, The Nature Conservancy, andWorld Wildlife Fund, working together withmany other institutions (www.naturalcapitalproject.org). Its core mission is toalign economic forces with conservation by: (i)developing tools that make incorporatingnatural capital into decisions easy; (ii)demonstrating the power of these tools inimportant, contrasting places; and (iii)engaging leaders globally.Making conservation mainstream requires
turning the valuation of ecosystem services intoeffective policy and finance mechanisms – aproblem no one has solved on a large scale.A key challenge remains that, relative to otherforms of capital, assets embodied in ecosystemsare often poorly understood, scarcelymonitored, typically undervalued, andundergoing rapid degradation (Daily et al.2000; Heal 2000; Balmford et al. 2002; MEA2003; NRC 2005; Mäler et al. 2008). Often theimportance of ecosystem services is recognized
only upon their loss, such as in the wake ofHurricane Katrina (Chambers et al. 2007).To help address this challenge, we have
developed a software system for integratedvaluation of ecosystem services and tradeoffs(InVEST; Nelson et al. 2009). This tool informsmanagers and policy makers about the impactsof alternative resource management choices onthe economy, human well‐being and theenvironment, in an integrated way.Examples of urgent questions that InVEST
can help answer include:
• Which parts of a landscape provide thegreatest carbon sequestration, biodiversity,and tourism values?• Where would reforestation achieve thegreatest downstream water quality benefits?• How would agricultural expansion, climatechange and population growth affect a down-streamcity’s drinkingwater supply orflood risk?
InVEST is designed for use as part of an activedecision‐making process. The first phase of theapproach involves working with decisionmakers and other stakeholders to identifycritical management decisions and to developscenarios to project how the provision ofservices might change in response to thosedecisions as well as to changing climate orpopulation. Basedon these scenarios, amodularset of models quantifies and maps ecosystemservices in a flexible way. The outputs of thesemodels provide decision makers with maps andother information about costs, benefits,tradeoffs, and synergies of alternativeinvestments in ecosystem service provision.InVEST is now being used inmajor resource
decisions in Bolivia, Brazil, China, Colombia,Ecuador, Mexico, Peru, Tanzania, and the UnitedStates (California, Hawaii, Oregon, andWashington; see Box 15.3 Figure). The tool hasproven useful with stakeholders as diverse asnational governments, private landowners andcorporations, and increasing demand for the toolindicates that the time is ripe for ecosystemservice thinking to change the face ofmanagement across sectors and around theglobe.
continues
288 CONSERVATION BIOLOGY FOR ALL
Sodhi and Ehrlich: Conservation Biology for All. http://ukcatalogue.oup.com/product/9780199554249.do
© Oxford University Press 2010. All rights reserved. For permissions please email: [email protected]

Box 15.3 (Continued)
LULC Categories
Biofuels Scenario: Sugarcane Ethanol
Change from CurrentLandscape
Carbon Storage (tC/ha) Water Quality (relative score)
Current Landscape
(A) Land Use / Land Cover Maps
(B) Changes in Ecosystem Service Provision
Agriculture
Exotic grasses, shrubs, forest
Developed
Island of O’ahu
Native shrublands and forest
Sugarcane (for scenario)
Decrease
No Change
Increase
Box 15.3 Figure Application of InVEST to a planning region on the Island of O'ahu, Hawaii. The parcel covers approximately 10 500 ha frommountaintop to the sea, including 800 ha of developed rural community lands along the coast, 3600 ha of agricultural lands further inland, and6100 ha of rugged forested lands in the upper part of the watershed. While many of the agricultural fields have been fallow for over a decade,stakeholders are exploring using the fields to grow sugarcane for ethanol biofuel (among other options). InVEST was used to assess how thisland‐use change scenario would affect the ecosystem services of water quality and carbon storage. Part (A) shows land use/land cover (LULC)maps for the current landscape and the sugarcane ethanol scenario. Part (B) shows the projected changes for water quality and carbon stock.The dominant effect is a decrease in service provision relative to the current landscape. Water quality decreases by 44.2%, driven by increasedfertilizer application on the fallow fields returned to crop production. Taking advantage of next‐generation sugarcane breeds, however, couldgreatly reduce these impacts. Carbon stock decreases by 12.6%, which is due to clearing of woody exotic species that grew while the fields werenot in production. This “carbon debt” (Fargione et al. 2008) could be repaid through time by using sugarcane ethanol to offset more carbonintensive fuel sources. The information generated from this InVEST analysis elucidates ecosystem service tradeoffs apparent in undertakingbiofuel production, which can inform land use decisions alongside economic and other benefits not shown here. Furthermore, the analysis helpsland managers identify where to focus efforts, spatially for each ecosystem service, to improve management practices. See also Figure 3.1.
continues
FROM CONSERVATION THEORY TO PRACTICE: CROSSING THE DIVIDE 289
1
© Oxford University Press 2010. All rights reserved. For permissions please email: [email protected]

These efforts are based on the assumption thateffective conservation is dependent not only onscience catching up with the dynamic aspects of achanging world (Chapter 13) but also on conser-vation practice catching up with science (Presseyet al. 2007). There is a recognized need to integratethe activities of conservation biologists (and otherconservation minded scientists) with those ofpractitioners, with conservation biologists inter-acting more frequently with practitioners and thelatter better documenting their actions (Suther-land et al. 2004). This chapter provides a glimpseinto the realm of practical conservation with ex-amples and case studies to illustrate some of thediverse approaches that are being implementedto conserve biodiversity and how these ap-
proaches benefit from, and offer opportunitiesto, the science that underlies them.
15.1 Integration of Science andConservation Implementation
A good example of integrating conservation sci-ence with implementation is a project that isbeing undertaken in South Africa (Balmford2003). Richard Cowling and his colleagues havesuccessfully attempted to build the input of deci-sion-makers and local people into scientificallyrigorous conservation planning for the Cape Flo-ristic Region in South Africa (Cowling andPressey 2003; Cowling et al. 2003; Pressey et al.
Box 15.3 (Continued)
REFERENCES
Balmford, A., Bruner, A., Cooper, P., et al. (2002). Eco-nomic reasons for conserving wild nature. Science, 297,950–953.
Bhagwat, S. A. and Rutte, C. (2006). Sacred groves:potential for biodiversity management Frontiers inEcology and the Environment, 4, 519–524.
Chambers, J. Q., Fisher, J. I., Zeng, H., et al. (2007).Hurricane Katrina’s carbon footprint on U.S. Gulf Coastforests. Science, 318, 1107.
Daily, G. C. and Ellison, K. (2002). The new economy ofnature: the quest to make conservation profitable. IslandPress, Washington, DC.
Daily, G. C., Söderqvist, T., Aniyar, S., et al. (2000). Thevalue of nature and the nature of value. Science, 289,395–396.
Fargione, J., Hill, J., Tilman, D., Polasky, S., and Hawthorne,P. (2008). Land clearing and the biofuel carbon debt.Science, 319, 1235–1238.
Goldman, R. L., Tallis, H., Kareiva, P., and Daily, G. C.(2008). Field evidence that ecosystem service projectssupport biodiversity and diversify options. Proceedingsof the National Academy of Sciences of the UnitedStates of America, 105, 9445–9448.
Heal, G. (2000). Nature and the marketplace: capturingthe value of ecosystem services. Island Press,Washington, DC.
Kareiva, P. and Marvier, M. (2007). Conservation for thepeople. Scientific American, 297, 50–57.
Liu, J., Li, S., Ouyang, Z., et al. (2008). Ecological andsocioeconomic effects of China’s policies for ecosystemservices. Proceedings of the National Academy ofSciences of the United States of America, 105,9489–9494.
MEA (millennium Ecosystem Assessment). (2003).Ecosystems and human well‐being: a framework forassessment. Island Press, Washington, DC.
Mäler, K‐G., Aniyar, S., and Jansson, Å. (2008). Accountingfor ecosystem services as a way to understand therequirements for sustainable development. Proceedingsof the National Academy of Sciences of the UnitedStates of America, 105, 9501–9506.
Nelson, E., Mendoza, G., Regetz, J., et al. (2009). Modelingmultiple ecosystem services, biodiversity conservation,commodity production, and tradeoffs at landscapescales. Frontiers in Ecology and the Environment, 7,4–11.
NRC (National Research Council). (2005). Valuingecosystem services: toward better environmentaldecision‐making. National Academies Press, Washing-ton, DC.
Ostrom, E. (2007). A diagnostic approach for goingbeyond panceas. Proceedings of the National Academyof Sciences of the United States of America, 104,15181–15187.
290 CONSERVATION BIOLOGY FOR ALL
Sodhi and Ehrlich: Conservation Biology for All. http://ukcatalogue.oup.com/product/9780199554249.do
© Oxford University Press 2010. All rights reserved. For permissions please email: [email protected]

Box 15.4 Measuring the effectiveness of conservation spendingMatthew Linkie and Robert J. Smith
Conservationists can only develop cost‐effective strategies by evaluating the success oftheir past efforts. However, few programsmeasure project performance adequately: mostcarry out no assessment at all or rely ondescriptive analyses that cannot distinguishbetween the confounding effects of differentcovariates. In response, Ferraro and Pattanayak(2006) have presented a counterfactual designfor determining conservation success. Thisinvolves comparing similar sampling units, e.g.villages, people or forest patches, which receiveconservation intervention (the treatmentgroup) with those that do not (the controlgroup). Here, we describe two studies that haveused this approach to evaluate conservationeffectiveness.
Case study 1
Linkie et al. (2008) studied a US$19 millionproject that ran from 1997–2002 in and aroundKerinci Seblat National Park, Sumatra. Part ofthis project involved spending US$1.5 millionon development schemes within 65 villages(the treatment) that border the park, in returnfor the villagers signing agreements to stop theillegal clearance of their forest (see Box 15.4Figure). Thus, determining the success of thisstrategy involved measuring subsequent vil-lage deforestation rates. However, deforesta-tion patterns are often explained by covariatesrelating to accessibility, such as proximity toroads, and some project villages were chosenfor logistical or political reasons. Linkie et al.accounted for the influence of these differentfactors by using a propensity score matchingtechnique. This approach used data on tensocio‐economic and biophysical covariatesfrom a village profile dataset to identify thefactors that best predicted forest loss, and toidentify the 65 non‐project villages (the con-trol) that most closely matched the projectvillages in terms of these factors. Deforestationrates between these two groups were then
compared and no difference was found, show-ing that project participation had no effect. Incontrast, a questionnaire survey conducted bythe project found stronger conservationsupport in project villages than non‐projectvillages, and on this basis alone the projectmight have been considered a success.
Box 15.4 Figure Small scale logging in Sumatra (Indonesia).Photograph by Jeremy Holden.
Case study 2
Andam et al. (2008) evaluated the effective-ness of protected areas (PAs) in avoidingdeforestation in Costa Rica. They also used apropensity score matching technique to identi-fy similar unprotected areas (the control) thatmost closely matched the PAs (the treatment),based on similarities of accessibility and landuse opportunities. From 1960–1997, the PAswere found to avoid about 10% of thedeforestation that was predicted to haveoccurred if they had not been present. Inaddition, Andam et al. tested a commonlyused method for evaluating PA effectiveness,which compares deforestation in PAs againstthat in adjacent unprotected areas. Suchcomparisons can be problematic because PAstend to be located on land that is less
continues
FROM CONSERVATION THEORY TO PRACTICE: CROSSING THE DIVIDE 291
1
© Oxford University Press 2010. All rights reserved. For permissions please email: [email protected]

2007). The Cape Floristic Region, covering 90 000km2 of the south-west tip of Africa, contains over9000 species of plants and is globally recognizedfor its biological significance (Davis et al. 1994;Olson and Dinerstein 1998; Stattersfield et al.1998; Myers et al. 2000). Over 1400 of the plantspecies found here are Red Data Book listed andnearly 70% are endemic to the region. Conversionto intensive agriculture, forestry, urbanization,infestation with alien plants and widespreadgrazing are key threats in the region with 22%of all land protected in conservation areas (onlyhalf in statutory reserves) and 75% in privateownership (Balmford 2003).
Against this backdrop of escalating threats, de-clining institutional capacity, and a biologicallyunrepresentative reserve system, a project knownas the Cape Action Plan for the Environment(CAPE) was launched (Cowling and Pressey2003). The project has since expanded into a 20-year implementation program addressing threebroad themes: (i) the protection of biodiversityin priority areas; (ii) the promotion of its sustain-able use; and (iii) the strengthening of local insti-tutions and capacity. From its inception, theproject engaged not only the statutory agenciesthat would ultimately be responsible for imple-
mentation, but also land-owners, local commu-nities and the non-governmental sector. Buildingthese partnerships early on enabled a diversity oflocal actors and external practitioners to workwith planners in developing broad project goalsand strategies. The approach of integrating theinvolvement of stakeholders and practitionerswith scientifically rigorous planning not onlyearned the project credibility with external do-nors but the resulting wide ownership of theconservation plan has been crucial to its ongoingimplementation (Balmford 2003).
15.2 Looking beyond protected areas
During the past century, the standard practice forsafeguarding biodiversity (Chapter 2) and reduc-ing the rate of biodiversity loss has been the es-tablishment of protected areas (Lovejoy 2006).The steady and significant increase in the areaprotected and number of protected areas createdover the past three to four decades has been ac-companied by an evolution of protected areasfrom being small refuges for particular speciesto the protection of entire ecosystems. But evenlarge protected areas can be inadequate to ensure
Box 15.4 (Continued)
accessible and less suitable for agriculture andtherefore has a lower risk of clearance. Thiswas illustrated by their results, which showedthat not controlling for these confoundingeffects led to a threefold over‐estimation ofdeforestation reduction within the PAs.These two case studies illustrate the impor-
tance of using statistically robust approachesfor measuring conservation success. Such anapproach should be widely adopted, as itprovides vital information for donors, policydevelopers and managers. However, this willdepend in part on developing a conservationculture that discusses and learns from failure,instead of hiding it from scrutiny (Knight2006).
REFERENCES
Andam,K. S., Ferraro, P. J., Pfaff, A., Sanchez‐Azofeifa,G.A.,and Robalino, J. A. (2008). Measuring the effectiveness ofprotected area networks in reducing deforestation. Pro-ceedings of the National Academy of Sciences of theUnited States of America, 105, 16089–10694.
Ferraro, P. J. and Pattanayak, S. K. (2006). Moneyfor nothing? A call for empirical evaluation ofbiodiversity conservation investments. PLoS Biology, 4,482–488.
Knight, A. T. (2006). Failing but learning: writing thewrongs after Redford and Taber. Conservation Biology,20, 1312–1314.
Linkie, M., Smith, R. J., Zhu, Y., et al. (2008). Evaluatingbiodiversity conservation around a large Sumatranprotected area. Conservation Biology, 22, 683–690.
292 CONSERVATION BIOLOGY FOR ALL
Sodhi and Ehrlich: Conservation Biology for All. http://ukcatalogue.oup.com/product/9780199554249.do
© Oxford University Press 2010. All rights reserved. For permissions please email: [email protected]

the persistence of some wildlife populations,particularly large carnivores (Woodroffe andGinsberg 1998). Furthermore, biodiversity con-servation, or the preservation of ecological integri-ty, are only two reasons for establishing andmaintaining protected areas. Other goals may re-late to sustainable development, poverty allevia-tion, peace and social equity. The disparate andoften conflicting global mandates for protectedareas pose the greatest challenge for the designand implementation of effective conservation stra-tegies. The need for reconciliation of conflictingmandateswilldrive thedesignand implementationof innovative approaches to management, gover-nance,financing andmonitoring of protected areas,all of whichwill directly and indirectly impact theireffectiveness in conserving biodiversity.
One such approach involves the design of stra-tegies aimed at managing protected areas as com-ponents of a larger landscape. Given that wildlife,ecological processes and human activities oftenspill across the boundaries of protected areas,conservation that is focused solely within thelimits of protected areas is often faced with diffi-cult challenges. The management of protectedareas therefore cannot occur in isolation fromthe surrounding human- dominated landscapes.Box 15.5 provides a description of a landscape
approach to conservation where protected areasare managed as one component of a larger con-servation landscape that is traversed by land useswhere biodiversity conservation is not the prima-ry objective (see Box 5.3). The entire field of coun-tryside biogeography, of course, focuses on thiskey issue (see Box 13.4).
15.3 Biodiversity and human poverty
There is a considerable degree of spatial overlapof poverty, inequality and biodiversity with highlevels of biodiversity occurring in some of theworld’s poorest countries (McNeely and Scherr2001). The creation of protected areas in order torestrict the use of biodiversity in such countriestherefore has impacts on communities and otheruser groups who benefit economically from di-rectly utilizing biodiversity or converting theland to a more profitable form of use such asoil palm plantations. Protected areas establishedto conserve biodiversity in regions of high pov-erty are under tremendous pressure to serve thedual purpose of economic development andbiodiversity conservation. Consequently, thereis much contention surrounding the relationshipbetween protected areas, people and economic
Box 15.5 From managing protected areas to conserving landscapesKarl Didier
The Ewaso Ecosystem is a vast (40 000 km2) anddiverse savanna region in central Kenya. It isrelatively intact, with most of its biodiversityand all of its megafauna still present, includingelephants (Loxodonta africana), lions (Pantheraleo), giraffe (Giraffa camelopardalis reticulate),the endangered African wild dog (Lycaonpictus), and the last populations of the criticallyendangered Grevy’s zebra (Equus grevyi). Therelative intactness of the Ewaso is owed, inlarge part, to a large network of protectedareas covering 6000 km2 (~15% of the region),including national parks and reserves, andprovincial forest reserves (see Box 15.5 Figure
and Plate 18). However, even with so much ofthe land in protected areas, conservation goalshave yet to bemet: populations of some speciesremain dangerously low (e.g., <300 wild dogs),many other biological species and communitiesare threatened with imminent decline due toincreasing habitat fragmentation (Chapter 5)and conflict beyond the boundaries of theprotected area network (e.g., elephants; seeBox 14.3), and basic ecosystem services (Chapter3), such as production of clean water, arethreatened by land development (e.g., loggingand agriculture) (Chapter 4) and climatechange (Chapter 8).
continues
FROM CONSERVATION THEORY TO PRACTICE: CROSSING THE DIVIDE 293
1
© Oxford University Press 2010. All rights reserved. For permissions please email: [email protected]

Box 15.5 (Continued)
Provincial border
National park
National reserve
Forest reserveConservancy/group ranch
Group ranchPrivate ranch(often wildlife friendly)
Government ranch
Private farm
Pastoral area
Army training area
In government trust
Box 15.5 Figure The biodiversity of the Ewaso ecosystem in central Kenya is relatively intact due in large part to a strong set of protectedareas. However, even these are not sufficient to preserve the patterns and processes of biodiversity and to reach conservation objectives. To doso, conservationists are working in the complex matrix of land uses beyond the protected areas, with a vast array of stakeholders, and usingactions that benefit both people and biodiversity.
Why protected areas are not enough?
In the Ewaso and in most areas around theglobe, there are two reasons why protectedarea creation is an incomplete strategy tomeet the conservation objectives. First, pro-
tected areas, whether they cover 5 or 50% ofa region, simply cannot represent the enor-mous array of biodiversity out there. Existingprotected area networks tend to be biasedtoward representing a small subset of species,
continues
294 CONSERVATION BIOLOGY FOR ALL
Sodhi and Ehrlich: Conservation Biology for All. http://ukcatalogue.oup.com/product/9780199554249.do
© Oxford University Press 2010. All rights reserved. For permissions please email: [email protected]

Box 15.5 (Continued)
such as large mammals, and fail to representother taxa well, such as plants. This isespecially true in western Africa (see Gardneret al. 2007).Second, even for the elements ofbiodiversity that are represented (i.e. occur atleast once) in protected areas, their long‐termpersistence is rarely ensured by managementof the protected area alone. The problem isthat both biodiversity and the threats tobiodiversity move freely across protected areaboundaries. For example, elephants and wilddogs in the Ewaso rely on habitats andcorridors well beyond protected areas, bring-ing them into conflict with humans. Also,although many threats have their sourceoutside of protected areas, like pollutionadded to the Ewaso River by flower farmersor wandering livestock, they manage todirectly impact biodiversity inside parks. Miti-gation of such threats cannot be achieved bypark management alone, and expansion ofprotected areas is untenable. To ensure thatecosystem services are maintained and thatviable and functional populations (i.e., atappropriate densities) of species persist, con-servation practitioners need to work beyondpark boundaries, into the surrounding hu-man‐dominated matrix.
Defining a “landscape” for conservationpractitioners
The term “landscape” has been defined as “aheterogeneous land area composed of acluster of interacting ecosystems that is re-peated in similar form throughout” (Formanand Godron 1986) or “an area that is spatiallyheterogeneous in at least one factor of inter-est” (Turner et al. 2001). These are interestingfrom a theoretical perspective, but are not veryuseful for a park manager or conservationpractitioner. An alternative definition of a“landscape” for conservation practitionerscould be ‘an area sufficient in size, composi-tion, and configuration of land elements (e.g.,habitats, management types) to support thelong‐term persistence and functioning of all
conservation features of interest, includingecological communities and processes, ecosys-tem services, and functional populations ofspecies’.
Most frequently, this kind of landscapewill beheterogeneous in many aspects, including hu-man land uses, ecosystems or ecological commu-nities, political units, and management units. Inthe Ewaso, the “landscape” includes protectedareas, private lands, villages, community‐ownedlands, untenured lands, parts of at least 10districts, and a diversity of habitats that includerivers, montane forests, acacia savanna andmoorlands (see Box 15.5 Figure). A typical land-scapewill also includeadiversityof stakeholders.In the Ewaso, this includes local ranch ownersand farmers, non‐governmental developmentorganizations [e.g. CARE (Cooperative for Assis-tance and Relief Everywhere)], powerful“county councils” who control large commu-nity‐owned areas, industrial‐scale flower farm-ers often from Europe, and poor, nomadicpastoralists who graze their livestock on tractsof government‐owned land. While defining theboundaries and users of a landscape are difficulttasks, implementation of conservation activitiesat the landscape scale presents an enormouschallenge.
Implementing landscape conservation
Conservation at landscape scales requires, firstand foremost, that practitioners engage com-munities and landowners and implement activ-ities that meet their needs while improving thesituation for biodiversity. In the Ewaso, severalorganizations such as the Laikipia WildlifeForum (LWF) and the Northern RangelandsTrust (NRT) spend much of their resourcesworking outside the boundaries of protectedareas, with community‐owned ranches andconservancies. For example, NRT helps commu-nities obtain formal land ownership from theKenyan government. Once this occurs, theyimplement a suite of activities to help commu-nities generate sustainable income and im-prove conditions for biodiversity. For example,
continues
FROM CONSERVATION THEORY TO PRACTICE: CROSSING THE DIVIDE 295
1
© Oxford University Press 2010. All rights reserved. For permissions please email: [email protected]

development, with conservationists and thoseconcerned with human welfare locked in debate(West and Brockington 2006; Vermeulen andSheil 2007; Robinson 2007). Conservationistsargue that environmental regulations are essen-tial to ensure the sustainability of the planet’sbiological systems and the health and welfareof people, especially local people, and that pro-tected areas are an indispensable tool in thatregulatory toolbox (Peres 1995; Kramer et al.1997; Brandon et al. 1998; Terborgh 1999). Somesocial advocates, on the other end of the spec-trum, contest the establishment and manage-ment of protected areas, and support the beliefs
that: (i) only initiatives related to poverty allevi-ation will lead to successful biodiversity conser-vation since poverty is the root cause ofenvironmental destruction (Duraiappah 1998;Ravnborg 2003); and (ii) Protected areas havebeen frequently established at the expense oflocal communities (in and around protectedareas) through displacement and dispossession,and are responsible for perpetuating poverty bythe continued denial of access to land and otherresources (Ghimire and Pimbert 1997; Colchester2004). In addition, others contend that even ifparks do generate economic value, the distribu-tion of these benefits is so skewed against poor
Box 15.5 (Continued)
NRT helps pastoralists on community‐runranches improve their access to livestockmarkets. Improved market access means thatowners receive a higher price per head, canreduce total number of livestock on their lands,and, therefore, improve rangeland quality forwildlife. NRT and LWF also help local commu-nities develop ecotourism enterprises, whichsupplement local incomes, make owners lesssusceptible to the vagaries of livestock man-agement, and gives them incentive to conservebiodiversity. A further example of conservationaction outside protected area boundaries is thework being done by organizations under thebanner of the Laikipia Elephant Project (seealso Boxes 5.3 and 13.4). This project aims todecrease incidents of crop raiding by elephantsin several ways, including providing farmerswith “early warning systems”, training themhow to plant and sell chili peppers (a crop thatelephants hate and which is valuable oninternational markets), or even training peopleto make paper out of elephant dung. Asconservation in the Ewaso demonstrates, toimplement landscape‐scale conservation prac-titioners need an expanded set of tools andskills. Just to name a few, they need skills in theecological and social sciences, law, business andfinance, facilitation and negotiation, conserva-tion planning, zoning, geographic information
systems, remote sensing, and fund raising.While the creation and management of pro-tected areas will remain a cornerstonestrategy for biodiversity conservation, there isan increasing need for traditional strategiesto be augmented with new tools andapproaches to implement landscape scale con-servation.
REFERENCES AND SUGGESTED READING
Forman, R. T. T. and Gordon, M. (1986). Landscapeecology. John Wiley, New York, NY.
Gardner, T. A., Caro, T., Fitzherbert, E.B., Banda, T., andLalbhai, P. (2007). Conservation value of multiple useareas in East Africa. Conservation Biology, 21,1516–1525.
Gaston, K. J., Pressey, R. L., and Margules, C. M. (2002).Persistence and vulnerability: retaining biodiversity in thelandscape and in protected areas. Journal of Biosciences,27, 361–384.
Poiani, K. A., Richter, B. D., Anderson, M. G., and Richter,H. E. (2000). Biodiversity conservation at multiple scales:Functional sites, landscapes, and networks. BioScience,50, 133–146.
Turner, M. G., Gardner, R. H., and O’Neill, R. V. (2001).Landscape ecology in theory and practice. Springer‐Verlag, New York, NY.
296 CONSERVATION BIOLOGY FOR ALL
Sodhi and Ehrlich: Conservation Biology for All. http://ukcatalogue.oup.com/product/9780199554249.do
© Oxford University Press 2010. All rights reserved. For permissions please email: [email protected]

rural people that the role of parks in local devel-opment is negligible, and they neither justlycompensate for lost property and rights nor con-tribute to poverty alleviation (Brockington 2003;McShane 2003).
In an analysis of programmatic interventionsaimed at achieving both biodiversity conserva-tion and poverty alleviation, Agrawal and Red-ford (2006) indicate that there is basic lack ofevidence on the extent to which the two goalscan be simultaneously achieved. While the roleof poverty in destroying biodiversity in poorcountries is indisputable, one should never losesight of the overwhelming role that the rich,through their overconsumption, play in extin-guishing life forms all over the Earth (Ehrlichand Ehrlich 2005).
Identifying win-win strategies that simulta-neously benefit biodiversity and people con-
tinues to dominate the agenda of researchersandpractitioners alike and the integrationofpover-ty alleviation and biodiversity conservation goalshas been approached in variousways. Biodiversityuse may not be able to alleviate poverty, but mayhavean important role in sustaining the livelihoodsof the poor, and preventing further impoverish-ment (Angelsen and Wunder 2003). Furthermore,while the vast majority of the world’s poor live insemi urban areas, significant progress in povertyalleviationwillnotbeaffectedbymostconservationactivities (Redford et al. 2008). Biodiversity-richtropical forests subject to high deforestation ratesnonetheless harbor some of the poorest, most re-moteandpoliticallydisenfranchisedforestdwellersoffering distinct opportunities for joint conserva-tion and development initiatives, and have drawnadvocates for newapproaches to “pro-poor conser-vation” (Kaimowitz and Sheil 2007).
Box 15.6 Bird nest protection in the Northern Plains of CambodiaTom Clements
Cambodia is identified by many globalassessments as a conservation priority: forexample it lies within the Indo‐Burma hotspot(Myers et al. 2000) and contains four of theGlobal 200 Ecoregions (Olson and Dinerstein1998). Although it does not support highspecies diversity, Cambodia is of particularimportance for conservation because itcontains some of the largest remainingexamples of habitats that previously spreadacross much of Indochina and Thailand, whichstill support almost intact species assemblages.Many of these species are listed as GloballyThreatened by IUCN due to significant declineselsewhere in their range. Following therestoration of peace in Cambodia in 1993,conservation strategies have primarily focusedon the establishment of Protected Areas (PAs).These PAs generally have a small number ofpoorly paid staff with limited capacity orinfrastructure, i.e. they are ‘paper parks’ (Wilkieet al. 2001). Moreover, PAs usually containexisting human settlements, in some caseswith >10 000 people, whose rights arerespected under law but with varying degreesof implementation. Such a situation is notuncommon: 70% of a non‐random sample of
global PAs contained people, and 54% hadresidents who contested the ownership ofsome percentage of the PA area (Bruner et al.2001). Since limited site information wasavailable when PAs were declared many areasof importance for biodiversity conservation lieoutside the system, emphasizing theimportance of adopting a landscape approach.This requires tools to engage local communitiesin conservation (see Chapter 14).
In the 1980s and 90s Integrated Conservationand Development Projects (ICDPs) were apopular methodology for combining the needsof local communities with conservation, bothinside and outside of PAs. However, there isvery little evidence of conservation success(Wells et al. 1999; Chape 2001; Ferraro and Kiss2002; Linkie et al. 2008). One of the principlereasons suggested for this failure is that thelinkages between project activities (benefits)and biodiversity conservation were weak, i.e.benefits were not contingent on conservationoutcomes. Ferraro and Kiss (2002) havetherefore proposed that communityconservation interventions would be moreeffective if they concentrated on initiativeswhere these linkages are much stronger. ‘Direct
continues
FROM CONSERVATION THEORY TO PRACTICE: CROSSING THE DIVIDE 297
1
© Oxford University Press 2010. All rights reserved. For permissions please email: [email protected]

Box 15.6 (Continued)
payments’ and ‘conservation easements’ areactually much more accepted in the USA andEurope and have been recently established inother countries such as Costa Rica (Zbinden andLee 2004). This section describes a directpayment scheme established by the WildlifeConservation Society (WCS), an internationalnon‐governmental organization, in Cambodia.The scheme is evaluated against some of theoriginal claims made by Ferraro and Kiss (2002),specifically that direct payments schemeswould be simpler to implement and thereforehave: (i) efficient institutional arrangements;(ii) be cost‐effective; and (iii) deliver substantialdevelopment benefits, in addition to theconservation benefits.
Methods
The Northern Plains support probably thelargest breeding global population of giant ibis(scientific names in tables) (Critically Endan-gered), a species known from only a handful ofrecords in the 1900s until it was rediscovered in2000 by WCS in the area. Some of the onlyknownnesting sites inmainlandAsia of anotherCritically Endangered species – white‐shoul-dered ibis – are also located in the NorthernPlains. These two ibises are amongst the mostendangered bird species in the world. In addi-tion, the Northern Plains supports breedingpopulations of three Critically Endangeredvulture species – white‐rumped, slender‐billed,and red‐headed vultures – and eight species oflarge waterbirds: greater adjutant, lesser adju-tant, white‐winged duck, sarus crane, Orientaldarter, black‐necked stork, and woolly‐neckedstork. This unique assemblage of nine globallythreatened large bird species means that theNorthern Plains is of exceptional importance forconservation.The primary immediate threat toall these birds is collection of nest contents bylocal people, often for sale to middlemen whotrade with Thai and Lao border markets. This isespecially true for both adjutant species and thesarus cranes – the latter is known to fetch a highmarket price (>US$100 in Thailand). The collec-tion is mostly done by people from localcommunities, who then re‐sell the eggs and
chicks on to middlemen. The Bird nest Protec-tion Program was launched in 2002 by WCS inorder to locate,monitor and protect the nestingsites. Initially the research, protection andmonitoring was undertaken by WCS staff andrangers. However increasingly it has been dis-covered that a much greater number of nestscan be found and successfully protected byworking in cooperation with the local commu-nities, who were originally the principal threat.Under the program, local people are offered areward of up to US$5 for reporting nests, andare then employed to monitor and protect thebirds until the chicks successfully fledge. Theprotection teams are regularly visited every oneto two weeks by community rangers employedby WCS and WCS monitoring staff to check onthe status of the nests and for the purposes ofresearch and data collection. The programoperates year‐round, as some species nest inthe dry season and others during the wetseason. It started in four pilot villages in 2002at one site and was extended to a second site in2004. By 2007 it was operating in >15 villages. In2003 and 2004 nest protectors were paid US$2/day at the end of the month, assuming that thenest went undisturbed during that period. In2005 the payment system was changed follow-ing community consultations to US$1/day forprotecting the nest with a bonus $1/day pro-vided if the chick(s) successfully fledged. Thepayment values were based on an acceptabledaily wage, rather than compensating for theopportunity cost of not collecting, which wouldbe much greater. Local people were concernedabout natural predation, and it was decidedthat payments would still be made in thesecases.
Results and Conclusions
The scheme has been extremely successful (seeBox 15.6 Table 1), protecting over 1200 nests ofglobally threatened or near‐threatened speciessince 2002, including 416 nests in 2007–8. Thenumbers of nests monitored and protectedhave increased by an average of 36% each yearsince 2004. Most of this increase is due togreater numbers of sarus crane, vultures (three
continues
298 CONSERVATION BIOLOGY FOR ALL
Sodhi and Ehrlich: Conservation Biology for All. http://ukcatalogue.oup.com/product/9780199554249.do
© Oxford University Press 2010. All rights reserved. For permissions please email: [email protected]

Box 15.6 (Continued)
species), white‐shouldered ibis, Oriental darter,and lesser adjutant being found, suggestingthat persecution and nest collection were themain factors limiting populations of thesespecies. Local awareness regarding the impor-tance of bird conservation has substantiallyimproved, with an almost complete cessationof collection activity at one site, and significantreductions at the other. The direct paymentsscheme has therefore been very effective atdelivering conservation results.Reviewing the first of the claims of Ferraro
and Kiss (2002), the scheme involves a verysimple institutional arrangement: with con-tracts made directly between WCS and theprotectors without involving any other institu-tion. Under Cambodian Law collection of bird
nests contents is actually strictly illegal, butGovernment authorities are not directly in-volved in the scheme, although they doparticipate in regular reviews of results. Thescheme therefore reinforces national law byproviding an incentive to villagers not tocollect bird nests, but not fully compensatingfor the opportunity cost.
A detailed breakdown of the paymentsmade in the 2005–6, 2006–7 and 2007–8seasons is given in Box 15.6 Table 2. The totalcost to WCS of the program is around US$25000 per year, with an average cost of $60–$120per nest protected. The average cost hasdeclined as the number of nests has increased,partly because monitoring costs can be sharedbetween adjacent sites and also due to the
continues
Box 15.6 Table 1 Bird Nest Protection Program: Nests Protected, 2002‐2008.In some cases nests were protected but there is no data available.‘‐’ indicates species that were probably present, but were not protected in that year. Initially the program started at one sites and operated in twosites from 2004. Numbers found have grown by 36% per year since 2004.
Species Global Status
2002‐3(1 site only)
2003‐4(1 site only)
2004‐5(2 sites)
2005‐6(2 sites)
2006‐7(2 sites)
2007‐8(2 sites)
Nests(Colonies)
Nests(Colonies)
Nests(Colonies)
Nests(Colonies)
Nests(Colonies)
Nests(Colonies)
White shoulderedIbis Pseudibisdavisonii
Critical 1 1 2 3 4 6
Giant Ibis Pseudibisgigantea
Critical ‐ 5 27 28 28 29
Sarus Crane Grusantigone
Vulnerable ‐ 6 19 29 37 54
Vulture spp.(Sarcogyps calvus& Gyps spp.)
Critical ‐ ‐ 1 4 5 5
Black‐necked StorkEphippiorhynchusasiaticus
Near‐threatened
‐ ‐ ‐ 2 3 2
Oriental DarterAnhingamelanogaster
Near‐threatened
13 ‐ ‐ ‐ 26(1) 33(1)
Greater AdjutantLeptoptilusdubius
Endangered ‐ (present, nodata)
21(2) 17(2) 18(2) 10(2)
Lesser AdjutantLeptoptilusjavanicus
Vulnerable ‐ 34(5) 97(16) 134(15) 221(22) 277(27)
Totals, both sites 14 46+ 166 219 342 416
FROM CONSERVATION THEORY TO PRACTICE: CROSSING THE DIVIDE 299
1
© Oxford University Press 2010. All rights reserved. For permissions please email: [email protected]

Box 15.6 (Continued)
greater number of nests at colonies. Of thecost of the program, 69–78% of paymentswent directly to local people, with the remain-ing expenditure being monitoring costs in-curred by WCS. The program is therefore verycost‐effective, with an overhead of only 22–31%, substantially less than other conservationapproaches (Ferraro and Kiss 2002). Averagepayments per family are around US$120/year,with considerable variation depending uponhow long people were employed. Some in-dividuals are specialist protectors, switchingspecies depending on the season and receivingcontinual employment for several months. Theamounts paid, sometimes >US$400/individual,are substantial in villages where annual cashincomes are $200–$350/year. Evaluations haveshown that this money is used to pay forclothes, schooling, housing improvements andto enhance food security. The scheme there-fore does provide substantial developmentbenefits, although these are not a primaryobjective of the program. It is also very popularwith villagers because they are able to decidefor themselves how to spend the money (i.e.benefits are not in‐kind).The initial scheme was based upon ‘payments
for work’ (i.e. US$2/day) rather than ‘paymentsfor success’. This led toperverse situationswhereWCSwas perceived as an employer with respon-sibility for protectors’ well‐being, whilst the
protectors shared little of the risk and were notresponsible for the final outcome. In 2005 thepaymentsystemwaschangedto increasetheriskshared by the protectors. That is, they are paid$1/day for theirworkand$1/day for resultsuponsuccessful fledging. This revisedpayment systemdelegates decision‐making to local people, whoare probably more familiar with the situationandmore aware of threats.Payments are also entirely dependent on
money raised annually by WCS, although thescheme is relatively inexpensive in comparisonwiththesubstantial conservationbenefits.How-ever, given the extreme level of threat to manyof these species, with average population sizes<20pairs per sitewhen the schemewas initiated,these were judged acceptable risks. In the long-er‐term financing could become more sustain-able through direct sponsorship, for examplethrough websites or exhibits in zoos. One risk isthat collection would resume if the paymentscheme was stopped.The bird nests protection scheme is linked to a
community‐based ecotourism program. Underthis, communities receive rights to locally man-age ecotourism enterprises in exchange foractiveprotectionof thebiodiversity that touristscome to see. The ecotourism enterprises employadditional groups within the communities,includingmoremarginal groups such as womenand poorer households, reinforcing the value ofthe birds. In addition, as the community enter-prises become more empowered they havebegun to take over local payments for bird nestprotection, funded from tourism receipts. Thisprovides a long‐term sustainable financingmechanism for the initiative.
REFERENCES
Bruner, A. G., Gullison, R. E., and Rice, R. E. (2001).Effectiveness of parks in protecting tropical biodiversity.Science, 291, 125–128.
Chape, S. (2001). An overview of integrated approaches toconservation and community development in the LaoPeople’s Democratic Republic. Parks, 11, 24–32.
continues
Box 15.6 Table 2 Bird Nest Protection Program: Costs, 2005‐2008.WCS, Wildlife Conservation Society. Currency in US dollars.
2005‐6 2006‐7 2007‐8
Local Payments $ 19850 $ 19119 $ 17434(%) (78%) (74%) (69%)Nest Protection
Payments$ 12597 $ 11248 $ 9786
Community Rangers $ 7253 $ 7871 $ 7648WCS Monitoring $ 5603 $ 6800 $ 7747(%) (22%) (26%) (31%)Expenses $ 2506 $ 3640 $ 4192Salaries $ 3098 $ 3160 $ 3555Total $ 25453 $ 25918 $ 25180Nests Protected 219 342 416Average Cost/Nest $ 116.22 $ 75.78 $ 60.53
300 CONSERVATION BIOLOGY FOR ALL
Sodhi and Ehrlich: Conservation Biology for All. http://ukcatalogue.oup.com/product/9780199554249.do
© Oxford University Press 2010. All rights reserved. For permissions please email: [email protected]

Increasingly, conservation practitioners try toprovide incentives to individuals and usergroups to prevent the degradation of biodiver-sity. These incentives lie on a spectrum fromindirect to direct with respect to their linkwith conservation objectives (Ferraro and Kiss2002). The least direct approaches includesupport for the use and marketing of extractedbiological products (e.g. logging, non-timberforest product extraction, hunting) and subsi-dies for reduced impact land and resource use
(e.g. sustainable agriculture). Performance basedpayments for biodiversity conservation repre-sents one of the most direct approaches ofproviding incentives. Box 15.6 outlines anexample of this approach that has been imple-mented to conserve endangered bird species inCambodia.
The evolving relationship between parks andpeople will continue to dominate internationaland national dialogues on biodiversity conserva-tion and stimulate the evolution of innovative
Box 15.7 International activities of the Missouri Botanical GardenPeter H. Raven
The Missouri Botanical Garden (MBG) is theoldest botanical garden in the United States,established in 1859. Modern botanical gardenswere first developed in Europe in the early1500s as adjuncts to schools of medicine, sincethe physicians the medical schools trained hadto be able to recognize those kinds of plantsthat would be effective in treating theirpatients. Consequently, botanical gardens areoften associated with universities: they havecarried out research on plants over the years,as they still do at the present time. During theera of colonization, the colonial powers oftenestablished botanical gardens as places wherethey could grow and investigate what crops ofeconomic value might be useful in thatparticular area. The botanical gardens inSydney, Singapore and Bogor are examples ofinstitutions of this kind that have survived
from the nineteenth century. Botanicalgardens came from very different beginningsfrom zoos, which started as carnivals anddisplays, became permanent facilities underfirst royal and later municipal or statepatronage, and are not historically connectedwith universities. In the modern era, bothbotanical gardens and zoos have recognizedtheir common interest in conservation, sincethe organisms in their care often arebecoming increasingly rare in nature. Thekinds of research collections, herbaria, libraries,and associated databases that are associatedwith comprehensive botanical gardens are notmirrored in the holdings of zoos. Such researchcollections of both plants and animals arefound as part of the holdings of naturalhistory museums, including those inuniversities.
continues
Box 15.6 (Continued)
Ferraro, P. J., and Kiss, A. (2002). Direct paymentsto conserve biodiversity. Science, 298,1718–1719.
Linkie, M., Smith, R. J., Zhu, Y., et al. (2008). Evaluatingbiodiversity conservation around a larger Sumatranprotected area. Conservation Biology, 22, 683–690.
Myers, N., Mittermeier, R. A., Mittermeier, C. G., et al.(2000). Biodiversity hotspots for conservation priorities.Nature, 403, 853–858.
Olson, D. M. and Dinerstein, E. (1998). The Global 200: arepresentation approach to conserving the Earth’s mostbiologically valuable ecoregions. Conservation Biology,12, 502–515.
Wells, M., Guggenheim, S., Khan, A., Wardojo, W.,and Jepson, P. (1999). Investiging in biodiversity:a review of Indonesia’s integrated conservation anddevelopment projects. Directions in developmentseries. World Bank, Indonesia and Pacific IslandsCountry Department, Washington, DC.
Wilkie, D. S., Carpenter, J. F., and Zhang, Q. (2001). Theunder‐financing of protected areas in the Congo Basin:so many parks and so little willingness‐to‐pay. Biodiver-sity and Conservation, 10, 691–709.
Zbinden, S., and Lee, D. R. (2004). Paying for Environ-mental Services: an analysis of participation in CostaRica’s PSA program. Word Development, 33, 255–272.
FROM CONSERVATION THEORY TO PRACTICE: CROSSING THE DIVIDE 301
1
© Oxford University Press 2010. All rights reserved. For permissions please email: [email protected]

Box 15.7 (Continued)
The research program of the MissouriBotanical Garden, which initially was centeredon the central United States and eventuallyspread to the Pacific Coast and into Mexico, hassince thefirst part of the twentieth century beenlargely devoted to the tropics. A comprehensiveaccount of the plants of Panamá begun in 1927was completed in 1981. From this base, theresearch program of the garden spread north tosouthern Mexico and south throughout SouthAmerica, to Africa, especially Madagascar; toChina, Vietnam, Lao, and Cambodia, and toNewCaledonia. Our style has often resulted in thepreparation of comprehensive databases, andwe are pushing increasingly towards a state inwhich all of the information about plants wouldbe on the web and available for use or revisiondirectly. Over a third of the plants of the world,more than 100 000 species, are being treatedthrough one or more of the projects of theMissouri Botanical Garden.Since the 1970s, the Garden’s program has
been organized around the activities ofbotanists resident in individual countries whoseplants we are studying. We decided early onthat it would not be possible to investigate theplants of any area thoroughly enough bymeans of intermittent expeditions and that wewould be far more able to help in buildinginstitutions and training people if we lived onthe ground with them. Thus our work inNicaragua was based on Doug Stevens’residence of 11 years in the country, starting inthe 1970s, that lead to the formation ofsubstantial library and herbarium resources,and has, then and subsequently, resulted in thetraining of dozens of Nicaraguan botanists andconservationists. Through our continuinginteractions with the government and manyvisits since, we have been able to do a greatdeal not only in technical botany but moreimportantly in building institutions throughcollaboration and by keeping in touch withindividuals in our fields of study. Conservationand sustainability have become landmarks ofour long‐term intentions. In Peru, for example,empowering the Yanesha, indigenous peoplewho want to use their resources sustainably,has been a major effort that continues to thepresent. Similar efforts are underway inEcuador and Bolivia, and of course they are
complementary in building knowledge of theplants of a particular region. In Costa Rica,resident MBG botanist Barry Hammelcollaborates with the National Institute ofBiodiversity (INBio) and the Museo Nacional inthe production of a Manual Flora of the Plantsof Costa Rica, one of the countries in theNeotropics where the most varied andcomprehensive biological research is beingconducted – we are sure that our manual willfill a gap by providing complete and up‐to‐dateinformation on all kinds of plants found in thecountry.In Madagascar, where MBG has been active
for more than 30 years, we maintain a staff ofmore than 50 people, all but oneMalagasy, andmany trained in our joint Masters’ degreeprograms with the University of Antananarivo.We are preparing a comprehensive, highlyrevised database on all theplants of the country,and finding about a third more kinds than hadbeen recorded earlier, so that this island, whichis about 50% larger than California, may behome to more than 13 000 species of plants.More than 90% of these are found nowhereelse, and more than 80% of the naturalvegetation in Madagascar has been destroyed,so that our team is literally engaged in a raceagainst time, finding the places where plantsgrow and determining which are most criticalfor conservation. By Presidential Decree, theamountof preserved land in the country is beinggreatly increased at present, and it is of keyimportance tomake the best choices concerningwhat should be set aside. The sustainability ofcertain communities, such as Mahabo, is beingenhanced through collaboration with theScandellaris Center of the Business School atWashington University in St. Louis, so that poorpeople may have alternatives to simply takingproducts unsustainably from an ever‐diminishing forest – the key to biologicalconservation on a large scale.The world will achieve sustainability only if
efforts of this kind are repeated everywhereand the local efforts are united as a basis forcommon action. Along with sister institutionssuch as the Royal Botanic Gardens, Kew, andThe New York Botanical Garden, we arecontributing what we can toward the solutionof our common challenge.
302 CONSERVATION BIOLOGY FOR ALL
Sodhi and Ehrlich: Conservation Biology for All. http://ukcatalogue.oup.com/product/9780199554249.do
© Oxford University Press 2010. All rights reserved. For permissions please email: [email protected]

approaches for reconciliation (Koh and Wilcove2007). Solutions for capturing opportunities thatsimultaneously protect biodiversity and reducepoverty, often boil down to improving institu-tions and governance, but there are no easy gen-eralizations (Chomitz 2007).
15.4 Capacity needs for practicalconservation in developing countries
In many developing economies with rich tropicalbiodiversity, government agencies responsiblefor the management of protected areas lack thenecessary technical capacity to stem biodiversityloss effectively. These gaps in capacity occur at alllevels, from the need for direct managementof natural resources, to the compliance require-ments of multilateral agreements (Steiner et al.2003). At the ground level, managers of naturalresources including biodiversity within protectedareas often have limited access to the vast anddynamic body of knowledge and tools in conser-vation science. There is an urgent and critical needto transfer the advances in conservation science toindividuals and institutions in biodiversity-richcountries. Building the capacity needed to imple-ment conservation strategies and apply conserva-tion principles represents one of the greatestchallenges facing the field of conservation biology(Rodriguez et al. 2006).
Increasing capacity in applied conservation iscomplex: it involves not only the training of in-service conservation professionals but also the en-hancement of university graduate and undergrad-uate programs that will generate a cadre of futureconservation professionals. In order to be effectivein thefield of conservation, graduates of such train-ing programs need relevant multidisciplinaryknowledge and practical skills such as problem-solving and conflict resolution to tackle the com-plexities of biological and societal issues that char-acterize applied conservation (Noss 1997).
The urgency of the biodiversity crisis coupledwith the general scarcity of funds and short projecttimelines make on-the-job training of individualsthe most common approach to tackle the lack ofcapacity.NGOs for instance,workwith individuals
on specific projects and attempt to build capacitythat is often quite specialized. However, a longer-term approach to building capacity would neces-sarily involve targeting relevant programs at uni-versitiesandprofessional traininginstitutions.Lackof financial resources and educational infrastruc-ture are key limitations facing universities with re-gard to training for conservation. Addressing theseissueswill requireconcerted investment infinancialand human capacity, but important initiatives areunderway to begin this process.
StronglinkagesbetweeninternationalNGOsandacademic/professional institutions in countriessuch as Lao PDR are often key to provide fieldtraining opportunities in applied conservation re-search and management. Organizations such aszoological societies, natural history museums, andbotanical gardens (see Box 15.7) are increasinglyengaged in long-term conservation and capacitybuilding efforts. In certain situations, such linkagesmaybetheonlymeansforstudentsaswellasstaffofnatural resource management agencies to gainvaluablefieldexperience inprojectdesignandman-agement tocomplement theoreticalknowledgeandskills theymay have acquired in the classroom.
For instance, the Network of ConservationEducators and Practitioners (NCEP, http://ncep.amnh.org), a project led by the Center forBiodiversity and Conservation of the AmericanMuseum of Natural History, aims to improvetraining in conservation biology through innova-tive educational materials and methods that di-rectly target teachers of conservation biology.NCEP is a global initiative, currently active inBolivia, Lao PDR, Madagascar, Mexico, Myan-mar, Peru, Rwanda, the United States and Viet-nam. The project seeks to create and make widelyavailable a variety of resources to teach biodiver-sity conservation, and develop networks and re-source centers to increase mentoring and trainingopportunities in biodiversity conservation world-wide. A central goal of the project is to increaseteachers’ and trainers’ access to high quality andfree of cost teaching materials. To meet this goal,NCEP develops collaborations with partner insti-tutions and individuals including conservationpractitioners to develop a series of multi-compo-nent teaching resources called modules adapted
FROM CONSERVATION THEORY TO PRACTICE: CROSSING THE DIVIDE 303
1
© Oxford University Press 2010. All rights reserved. For permissions please email: [email protected]

for local use. For example, in the Lao People’sDemocratic Republic (Lao PDR), a densely forest-ed, land-locked country with high levels of biodi-versity in Southeast Asia, NCEP established apartnership with The Wildlife Conservation Soci-ety and the National University of Laos (NUoL)to help develop the capacity of trainers in thescience and forestry faculties to teach topicsin conservation biology to undergraduates.Most young professionals employed in naturalresource research and management agenciesin the country today have graduated from thescience or forestry faculties at the NUoL. Thesefaculties have a critical need for up-to-date rele-vant materials in the Lao language for teachingbiodiversity conservation principles.
Local adaptation is an important feature of theNCEP project, empowering in-country partnersand making the materials immediately usefulfor faculty, students, and professionals who arealready working in or associated with the fieldof biodiversity conservation. The project alsofound it useful to couple module training with ap-plied research for students and faculty atfield sites.The applied research served to reinforce learningand comprehension of new biodiversity conserva-tion topics and terms in addition to providing criti-cal exposure to real-world conservation.
A second phase of the NCEP project in Lao PDRinvolvesbuilding the capacityofuniversity trainersto teach relevant aspects of applied conservation toprotected area managers from seven National Pro-tected Areas across the country. During this pro-cess, conservation science principles and casestudies of applied conservation approaches will beadapted to make them more accessible to instruc-tors to use as training materials for protected areamanagers who could apply those principles toachieve conservation results on the ground.
Capacity building activities can consume vastresources, potentially diverting already limitedconservation funds away from other, more imme-diate conservation problems that involve direct ac-tions at the site-level to reduce threats (for example,monitoringandenforcement).Moreover, justifyinginvestment in capacity building activities is some-timeschallengedbythedifficulties involvedinmea-suring success in the short-term. Yet, building
capacity is vital to a longer-term vision of enablingresponsible stewardship of biodiversity.
15.5 Beyond the science: reaching outfor conservation
Globally, a key challenge to achieving conserva-tion goals is the need to capture the interestof local people in a manner that stimulatescooperation and positive conservation actions(Brewer 2002). This need, sometimes defined asa form of social marketing, is a compelling reasonfor conservation biologists to work more closelywith local communities to mobilize supportfor conservation through better informed andcarefully designed outreach (Johns 2003).The process of involving local communities livingadjacent to threatened species and their habitatshelps build a constituency that is more aware ofits role either as part of the problem or some-times, as part of the solution, in a protected area(Steinmetz et al. 2006). This awareness is crucialto the effective implementation of conservationstrategies. Field-based research outreach andpartnership programs facilitate a two-way dia-logue: local participants learn firsthand whatscientists do, how they do it, and why they do itand by working with local communities, scien-tists can learn how local residents relate to thethreatened species and habitats they study.
In the Thung Yai Naresuan Wildlife Sanctuary(3622 km2) in western Thailand, commercialhunting contributed heavily to extensive popula-tion declines for most species and subsistencehunting was locally significant for some carni-vores, leaf monkeys (Presbytis sp.), and deer.Workshops with local communities clarifiedwhich species were at highest risk of local extinc-tion, where the most threatened populationswere, and the causes of these patterns. Scientists,protected area managers and local peopleworked together to assess wildlife declines andjointly define and understand the scale of theproblem during workshops. As a result, localpeople and sanctuary managers increased com-munication, initiated joint monitoring and patrol-ling, and established wildlife recovery zones.
304 CONSERVATION BIOLOGY FOR ALL
Sodhi and Ehrlich: Conservation Biology for All. http://ukcatalogue.oup.com/product/9780199554249.do
© Oxford University Press 2010. All rights reserved. For permissions please email: [email protected]

While conflict between local people and the parkauthorities has not completely disappeared, thereis interest to work together on wildlife issues(Steinmetz et al. 2006).
15.6 People making a difference: A Rareapproach
Recognizing the important role that communitiescan play in conservation, a US based conservationorganization known as Rare has adopted a mis-sion to “conserve imperiled species and ecosys-tems around the world by inspiring people tocare about and protect nature” (www.rareconser-vation.org; see Box 12.2). Rare fulfills this missionby addressing some of the most pressing needs ofthe global conservation movement. Rare trainsand mentors local conservation leaders in theuse of proven outreach tools, builds partnershipsto leverage their investments and evaluate les-sons learned to continuously improve the prac-tice of conservation.
Rare’s flagship program for constituency build-ing is known as the Rare Pride campaign (Box12.2). A hybrid of traditional education and pri-vate sector marketing strategies, Rare Pride cam-paigns inspire people who live in the world’smost biodiverse places to take pride in their nat-ural heritage and embrace conservation. Pridecampaign managers are local conservationistswho make two year commitments to inspire en-vironmental protection at every level in theircommunities. Campaign managers are trainedby the organization during a university-basedprogram in social marketing culminating in aMaster’s degree in Communications for Conser-vation from the University of Texas (El Paso).
Pride campaigns utilize a charismatic flagshipspecies, like the Saint Lucia parrot or the Philip-pine cockatoo, which becomes a symbol of localpride and acts as a messenger to build support forneeded behavior changes for habitat and wildlifeprotection. Marketing tools such as billboards,posters, songs, music videos, sermons, comicbooks, and puppet shows make conservationmessages positive, compelling, relevant, and funfor the community. Campaigns aim to generate
an increased sense of pride and public steward-ship that goes beyond mere awareness-raising.Pride campaigns involve and engage several seg-ments of the community: teachers, business andreligious leaders, elected officials, and the aver-age citizen. Rare Pride is currently being em-ployed on a global scale, and has beensuccessfully replicated by partner organizationsin over 40 countries.
15.7 Pride in the La Amistad BiosphereReserve, Panama
ThefarmingtownofCerroPunta,withapopulationof 7000, lies at the gateway to a forest corridorbetween Barú Volcano National Park in Panamaand La Amistad Biosphere Reserve shared withCostaRicathatencompassesoneofthe largest tractsof undisturbed rainforest inoneof themost biologi-cally diverse regions in the world. The corridorbetween the two parks is important for the move-mentofglobally significant species includingocelot(Leopardus pardalis), puma (Puma concolor), Baird’stapir (Tapirus bairdii), white-faced capuchin mon-key (Cebus capucinus), and theResplendentQuetzal(Pharomachrus mocinno). The land is under threat.Themildclimateandrichvolcanicsoil creates fertileconditions that include fourgrowing seasonsayearfor agricultural crops. Consequently, Cerro Puntaproduces 80% of all the vegetables grown in Pana-ma(population3.2million).Cropsarecultivatedonthe steepmountainsideswithout any terraces caus-ing heavy erosion during the rainy season. Giventhe farmers’ heavy reliance on synthetic chemicalpesticides and fertilizers, erosion and run-off fromthe cultivated slopes leads to downstream waterpollution with deleterious health impacts for resi-dents. Furthermore, the erosion slowly forces farm-ers to clear more land for new fields, closer andcloser to the two parks and the corridor betweenthem.Inaddition tothe threatofagriculturalexpan-sion, there is persistent pressure to build roads orhighways through the La Amistad Biosphere re-serveasexploitationforcoalandminerals increases.Deforestation, cattle ranching, hunting, and com-mercial extraction are also serious threats to thePark’s rich flora and fauna.
FROM CONSERVATION THEORY TO PRACTICE: CROSSING THE DIVIDE 305
1
© Oxford University Press 2010. All rights reserved. For permissions please email: [email protected]

LaAmistad needed a strong constituency lobby-ing for conservation, as well as significant changein community farmingmethods. LuisOlmedoSan-chez Samudio, a Sunday school teacher from afarming family in Cerro Punta, knew that creatingreal change in his community would require adramatically different approach. Sanchez Samudiocompleted Rare’s program at the University ofGuadalajara in Mexico to learn how to implementa full scale Pride social marketing campaign in LaAmistad. The Fundacion para el Desarrollo Inte-gral del Corregimiento de Cerro Punta (FUNDIC-CEP), with Sanchez Samudio on their staff, alliedwith Rare and one of the biggest InternationalNGOs, The Nature Conservancy, in this effort.Sanchez undertook the formidable task of reachingout to radio stations, schools, fairs, and the farmersthemselves in a relentless effort to change decades-old customs and attitudes. Panama’s ResplendentQuetzal was chosen to serve as the campaign’sflagship species and used to talk about a range ofconservation issues. Named “Quelly”, an image ofthe Resplendent Quetzal appears on all campaignmaterials, reminding people of the importance ofhabitat protection. After several months of forma-tive research, including surveys and focus groupswith local farmers, Sanchez Samudio launched hiscampaignwith over 30 outreach vehicles includingposters, advertisements, bumper stickers, radioshows, mascots, classroom visits, sermons, work-shops, festivals, and much more. Sanchez encour-aged farmers to adopt sustainable agriculturalpracticeswhile garnering support from clergymen,legislators and other relevant sources. Post cam-paign surveydata tomeasure effectiveness showedthat 52% of the respondents were aware of thebenefits of living near a protected area, up fromjust 15%at the beginningof the campaign; 85%saidthey were ready to petition the government forbetter controls of agricultural chemicals, up from61% at the beginning. Other indicators, such aswhether respondents knew of alternatives to agri-cultural chemicals, remained flat at around 30%.Promoting alternatives became the central focus ofSanchez’ follow-upefforts to conserve theLaAmis-tad Biosphere Reserve—his local pride. To learnmore about Rare’s social marketingmethodologiesfor conservation, visit www.rareconservation.org.
15.8 Outreach for policy
While local communities and protected area offi-cials are important targets for outreach activities,an equally challenging need is for scientists andpractitioners to engage in outreach that influencespolicy goals (Noss 2007). However there is ac-knowledged lack of clarity regarding advocacy inconservationbiologywhich influences theabilityofconservation biologists to effectively direct theirexpertise to policy decisions (Chan et al. 2005,2008). At the core of this debate is the degree towhich conservation biologists honor their commit-ment to the inherent value of biodiversity.
Given that scientists are still trained almost en-tirely in research methods, not public communica-tion or policy intervention (Lovejoy 1989), there issome fear that engagement inpublic education andpolicy intervention can reduce credibility (Block-stein 2002). One thread of this debate is based onthe need to relinquish commitment to the inherentvalue of biodiversitywhile another thread suggeststhat conservationbiologists should explicitly advo-cate for values (e.g. biodiversity) and are obligatedto step well beyond research to recommend solu-tions to policy goals (Chan 2008).
15.9 Monitoring of Biodiversity at Localand Global Scales
Monitoring is critically essential to determine theextent towhich protected areas are effective in con-serving biodiversity or achieving other manage-ment objectives. Monitoring that providesassessment of threats in amanner that allowsman-agers to respond effectively, is central to good con-servationmanagement (see Chapter 16). Danielsenet al. (2000) define ‘monitoring’ as data samplingwhich is: (i) repeated at certain intervals of time formanagement purpose; (ii) replicable over an ex-tended time frame; and (iii) focuses on rates andmagnitude of change. Monitoring helps identifypriority areas for research and conservation, andto quantify the response of plant and animal popu-lations to disturbance and management interven-tions. Countries contracting to the Convention onBiological Diversity are obliged to monitor
306 CONSERVATION BIOLOGY FOR ALL
Sodhi and Ehrlich: Conservation Biology for All. http://ukcatalogue.oup.com/product/9780199554249.do
© Oxford University Press 2010. All rights reserved. For permissions please email: [email protected]

Box 15.8 Hunter self‐monitoring by the Isoseño‐Guaranı´ in the Bolivian ChacoAndrew Noss
The 34 400 km2 Kaa‐Iya del Gran ChacoNational Park (KINP) in Bolivia was created in1995 to protect the Gran Chaco’s naturalresources and the traditional use areas of theindigenous residents surrounding it, theIsoseño‐Guaraní, Chiquitano and Ayoreo (and agroup of non‐contacted Ayoreo living withinit). It is the largest dry forest protected area inthe world, and contains high levels of biologicaldiversity, particularly mammals, with at least 10endemic mammal taxa, most notably theChacoan guanaco (Lama guanicoe voglii ) andthe Chacoan peccary (Catagonus wagneri)(Ibisch and Me´rida 2003). KINP is the firstprotected area in South America co‐managedby an indigenous organization, the Capitanı´adel Alto y Bajo Isoso (CABI) which is the politicalauthority representing the 10 000 Isoseño‐Guaranı´ inhabitants of the Isoso. Isoseñolivelihoods are based on agriculture, livestock,hunting, fishing and permanent and seasonalwage labor. Prior to the creation of the KINP,most of the 23 Isoso communities had legaltitles of their lands as community landscovering an area of 650 km2, encompassingsettlements, farming, and livestock lands. In1997, based on their historical occupation ofthe area over the past 300 years, CABI formallydemanded 19 000 km2 as a ‘Tierra Comunitariade Orı´gen’ or TCO adjacent to, but notoverlapping, the KINP. Principal threats to boththe TCO and KINP include illegal settlementsand inappropriate management of land andnatural resources with the conversion of Chacoforests to soybean farms and extensive cattleranches (overstocking, no management offorage, minimal veterinary care), sport huntingby city‐based hunters, and large‐scale regionalinfrastructure programs that includeinternational gas pipelines and highways.Like other indigenous groups, many
traditional beliefs and local practices amongthe Isoseño influence their hunting behaviorsto favor wildlife conservation. A hunter mustfollow certain rules in order to retain the favorof the spirits that guard wildlife. For example,hunters should not hunt young animals, huntexcessively or beyond family needs, or mistreatanimals by wounding them and allowing themto escape. Additional local practices that favor
wildlife conservation include seasonal rotationof hunting areas that respond to seasonalmovements of animals according to availabilityof food, as well as the accessibility of differentareas, no hunting of certain vulnerable species(primates, guanacos) and the substitution ofother activities (such as fishing and farming) tohunting in particular seasons. Seeking tointegrate these traditional beliefs and localknowledge of wildlife with political/administrative requirements and scientificmanagement, in 1996 a joint team of aninternational NGO, the Wildlife ConservationSociety, and CABI personnel initiated a wildlifeand hunting monitoring program in the 23Isoseño communities. The principal objectiveswere to: (i) determine whether subsistence(armadillos, peccaries, brocket deer, tapir) andcommercial (parrots, tegu lizards) hunting byIsoseño communities was sustainable;(ii) generatemanagement recommendations toensure that hunting would be sustainable inthe indigenous territory, thereby reducingpotential pressure on the KINP; and(iii) consolidate the concepts and practices ofwildlife management together with huntersand communities (Painter and Noss 2000). Theprincipal method to estimate hunting offtakeswas a hunter self‐monitoring program withvoluntary participation: hunters carried datasheets with them on hunting excursions torecord information on the hunt and on anycaptured animals, and they collected specimens(skulls/jawbones, stomach contents, fetuses) ofhunted animals. Community hunting monitorsassisted the hunters to record, collect andanalyze the data for the entire community on amonthly basis (Noss et al. 2003, 2004).
The communities selected Isoseñoparabiologists and hunting monitors, themajority with an elementary and some withhigh school education. Following an initial sixmonth volunteer period, those who expressedthe most interest and initiative were hired bythe program.Monitors (seven to ten individualseach living and working in their homecommunity) were hunters hired part‐time tosupport the recording of hunting data incommunities (by encouraging hunters toparticipate in the self‐monitoring program, and
continues
FROM CONSERVATION THEORY TO PRACTICE: CROSSING THE DIVIDE 307
1
© Oxford University Press 2010. All rights reserved. For permissions please email: [email protected]

Box 15.8 (Continued)
by periodically collecting information fromhunters in their community). Parabiologists (sixto eight individuals working in their homecommunity or other research sites in the Isoso)were hired full‐time to support wildliferesearch according to their individualspecialization. Through field courses andpractical experience, these Isoseño techniciansbegan to assume greater responsibility fordesigning and implementing researchprograms with hunters.Hunter self‐monitoring (100–150 hunters per
month) combined with monthly activity recordsfor potential hunters (7637 observed hunter‐months) permitted estimations of total offtakesof subsistence game species for 1996–2003, aswell as catch‐per‐unit‐effort over the same timeperiod. These data showed considerablefluctuations from year to year and no decliningtrends that would suggest over‐hunting.Experience from the monitoring project
suggested that even simple approaches such ashunter self‐monitoring or line transect surveysrequiredconsiderableeffortbybothproject staffand volunteers in order to provide sufficientinformation for management interventions.Thus, precise and detailed population densityestimatesaredifficult toobtain in situationswitha large number of species and/or large studyareas such as the Isoso with only basic tools andnon‐professional personnel.Ideally, adaptive management would include
continuous population monitoring over longtime periods using selected indicator speciesassemblages, detailed studies of ecologicalprinciples and processes, and studies ofpopulation trends in sink and source areas(Kremen et al. 1994; Hill et al. 2003). Suchdetailed monitoring is prohibitively complexand expensive not only for territories under thejurisdiction of indigenous peoples but also formost protected areas in general.Instead, it may be more useful to consider
adaptive management in a broader contextfocusing on fundamental requirements forinformed decision‐making. Assuming thatcommunal decision‐making is the key, detailedscientific information and sophisticated analyses
may not be as important as ensuring that: (i)information familiar to resource managers isused; and (ii) participatory methods provide theinputs and framework for discussion (see alsoDanielsen et al. 2005). Hunter self‐monitoringprovides a means to engage large numbers ofcommunity members in data collection. Bygenerating the data themselves, people becomeconscious of underlying problems, for exampleperceived or actual over‐hunting of a certainspecies, and can thus think about solutions toaddress the problems. In turn, reflectionprocesses may lead to preliminary managementaction that can be consolidated in an adaptivemanagement process. Approaches thatintegrate traditional customs and knowledgewith scientific methods, bringing togethercommunity members with specialists can havepositive outcomes for conservation (Becker et al.2005; Townsend et al. 2005). In the Isoso case,this integration took place at several levels. At afirst level, community members indicatedthrough discussions the most important gamespecies and described hunting practices andtraditions regarding wildlife management. Inturn, through hunter self‐monitoring andobservation of hunting activities, huntersthemselves and trained community members(parabiologists and monitors) confirmed andquantified what hunters did in practice. Strongtraditional authority structure and communityorganization, a favorable legal/institutionalframework, the ability of governmentauthorities to appropriately implement theirresponsibilities, and financial and technicalsupport from private partners to the processwere all important determinants of effectiveengagement of communities in this wildlifemonitoring program.This box is adapted from Noss et al. (2005).
REFERENCES
Becker, C. D., Agreda, A., Astudillo, E., Constantino,M., and Torres P. (2005). Community‐basedsurveys of fog capture and biodiversity monitoringat Loma Alta, Ecuador enhance social capital and
continues
308 CONSERVATION BIOLOGY FOR ALL
Sodhi and Ehrlich: Conservation Biology for All. http://ukcatalogue.oup.com/product/9780199554249.do
© Oxford University Press 2010. All rights reserved. For permissions please email: [email protected]

biodiversity (Article 7.b), and donors increasinglydemand accountability and quantifiable achieve-ments in return for their assistance. Given thatbiodiversity conservation is one of the keyobjectives of protected areas, the developmentof biodiversity monitoring systems for protectedareas now attracts a significant proportionof the international funding for biodiversity conser-vation.
However, conflicts between the scientific idealsand practical realities of monitoring influence theimplementation and effectiveness of monitoringsystems. For instance, most practitioners agreethat in an ideal world, monitoring programswould always be spatially and temporally com-prehensive, rigorous in their treatment of sam-pling error, and sustainable over the time scalesnecessary to examine population and communitylevel processes (Yoccoz et al. 2001). Nevertheless,monitoring of biodiversity and resource use inthe real world is often costly and hard to sustain,especially in developing countries, where finan-cial resources are limited. Moreover, such moni-toring can be logistically and technically difficult,and is often perceived to be irrelevant by resource
managers and local stakeholders. Many suggestthe need to identify some middle ground be-tween the need for scientific rigor and goals forprogram sustainability. Practitioners disagreeabout whether such a balance exists, and theissue has become a source of debate. At the centreof this debate is the fact that where suggestions orexamples of ‘appropriate’monitoring in develop-ing countries exist, they generally are unprovenin their ability to detect ‘true’ trends. On the onehand, poor statistical power and bias may turnoverly simplistic monitoring schemes into wastesof time and precious resources – yet equallywasteful are programs so intensive they cannotbe sustained long enough to address questionsfundamental to effective management (Yoccozet al. 2001, 2003; Danielsen et al. 2003; Chapter16). Box 15.8 examines the issue of biologicalmonitoring within the context of a communitywildlife management program in the Kaa IyaDel Gran Chaco in Bolivia.
The technicalandstatisticalproblemsofmonitor-ing at a local level are relatively benign when com-pared to the problems of tackling monitoring at aglobal scale. Under the terms of an agreement
Box 15.8 (Continued)
institutional cooperation. Biodiversity Conservation, 14,2695–2707.
Danielsen, F., Burgess, N., and Balmford, A. (2005). Mon-itoring matters: examining the potential of locally‐basedapproaches. Biodiversity Conservation, 14, 2507–2542.
Hill, K., McMillan, G., and Farin, A. R. (2003). Hunting‐related changes in game encounter rates from 1994 to2001 in the Mbaracayu´ Reserve, Paraguay. Conserva-tion Biology, 17, 1312–1323.
Ibisch, P. and Me´rida, G. (2003). Biodiversidad: la riquezade Bolivia. Estado de conocimien to y conservacion.Fundación Amigos de la Naturaleza, Santa Cruz, CA.
Kremen, C., Merenlender, A. M., and Murphy, D. D.(1994). Ecological monitoring: a vital need for integratedconservation and development programs in the tropics.Conservation Biology, 8, 388–397.
Noss, A. J., Cue´llar, E., and Cue´llar, R. L. (2003). Hunter self‐monitoringas a basis for biological research: data from theBolivian Chaco.Mastozoologı´ a Neotropical, 10, 49–67.
Noss, A. J., Cue´llar, E., and Cue´llar, R.l. (2004). Anevaluation of hunter self‐ monitoring in the BolivianChaco. Human Ecology, 32, 685–702.
Noss, A. J., Oetting, I., and Cuéllar, R. L. (2005). Hunterself‐monitoring by the Isoseño‐Guaraní in theBolivian Chaco. Biodiversity Conservation, 14,2679–2693.
Painter, M. and Noss, A. (2000). La conservacio´n defauna con organizaciones comunales: experienciacon el pueblo Izocen˜ o en Bolivia. In E. Cabrera,C. Mercolli and R. Resquin, eds Manejo de faunasilvestre en Amazonı´ a y Latinoame´ rica.pp. 167–180. CITES Paraguay, Fundacio´ n MoisesBertoni, University of Florida, Asuncio´ n,Paraguay.
Townsend, W. R., Borman, A. R., Yiyoguaje, E., andMendua, L. (2005). Cofa´ n Indians’ monitoring offreshwater turtles in Za´ balo, Ecuador. Biodiversityand Conservation, 14, 2743–2755.
FROM CONSERVATION THEORY TO PRACTICE: CROSSING THE DIVIDE 309
1
© Oxford University Press 2010. All rights reserved. For permissions please email: [email protected]

signed at the Johannesburg Summit on SustainableDevelopment in 2002, 190 countries committed to“asignificant reduction” in thecurrentrateof lossofbiodiversity.But thechallengesofestimatingglobalrates of loss are enormous (summarized by Balm-ford et al. 2005), and as the target of 2010 is ap-proached, most indicators developed inevitablyinvolve the use of indirect or surrogate data onhabitat loss, protected area overlays with knownpatterns of biodiversity or with targeted studies ofwell known vertebrate taxa.
In thisbrief reviewwehave touchedonanumberof the challenges in translatingconservationscienceinto practical, field based conservation actions.Conservation action lags behind conservation sci-ence for a number of reasons. Inevitably, there willbe time lags in thedissemination andapplication ofnew ideas to real world situations, and the way inwhich theory informs practice will not always beclear at the outset. But there will also be gaps be-tween the interests and needs of conservation prac-titioners, and the issues and areas of intellectualpursuit that are valued by academic departments,and institutional science donors.
Summary
· Integrating the inputs of decision-makers andlocal people into scientifically rigorous conservationplanning is a critically important aspect of effectiveconservation implementation.
· Protected areas represent an essential componentof approaches designed to conserve biodiversity.However, given that wildlife, ecological processesand human activities often spill across the bound-aries of protected areas, designing strategies aimedat managing protected areas as components of larg-er human-dominated landscapes will be necessaryfor their successful conservation.
· Identifying strategies that simultaneously benefitbiodiversity conservation and economic develop-ment is a challenge that remains at the forefront ofapplied conservation. Biodiversity use may not beable to alleviate poverty, but may have an importantrole in sustaining the livelihoods of the poor, andpreventing further impoverishment. Strong institu-tions and good governance are prerequisites forsuccessful conservation interventions.
· Capacity needs for practical conservation in de-veloping countries occur at many levels from skillsneeded for management of natural resources to thecompliance requirements of multilateral agree-ments. Filling gaps in capacity involves a diversityof approaches from on-the-job training of indivi-duals to restructuring academic and professionaltraining programs. Prioritizing capacity needs isvital to a longer-term vision of enabling responsiblestewardship of biodiversity.
· The engagement of local communities inplanning and implementation is critical for effectiveconservation. Carefully designed social marketingapproaches have proved to be successful in captur-ing the interest of local people while achieving con-servation goals.
· Monitoring is a central tenet of good conservationmanagement. Conflicts between the scientific idealsand practical realities of monitoring influence the im-plementationandeffectivenessofmonitoringsystems.
· Many of the key issues and barriers to effectiveconservation that face conservation biologists areinherently political and social, not scientific. Thusefforts to close the gap between conservation biolo-gists and conservation practitioners who take actionon the ground will require unprecedented collabo-ration between ecologists, economists, statisticians,businesses, land managers and policy-makers.
Suggested readingFerraro, P. J. and Pattanayak, S. K. (2006). Money for noth-ing? A call for empirical evaluation of biodiversity con-servation investments. PLoS Biology, 4, 482–488.
Pressey, R. L., Cabeza, M., Watts, M. E., et al. (2007). Con-servation planning in a changing world. Trends in Ecolo-gy and Evolution, 22, 583–592.
Terborgh, J. (1999). Requiem for nature. Island Press,Washington, DC.
Relevant websites
· Cape Action Plan for the Environment (CAPE): http://www.capeaction.org.za/
· Centre for Evidence-based conservation: http://www.cebc.bangor.ac.uk/ and http://www.conservationevi-dence.com/
· Network of Conservation Educators and Practitioners:http://ncep.amnh.org
310 CONSERVATION BIOLOGY FOR ALL
Sodhi and Ehrlich: Conservation Biology for All. http://ukcatalogue.oup.com/product/9780199554249.do
© Oxford University Press 2010. All rights reserved. For permissions please email: [email protected]

· RARE: www.rareconservation.org
· Living Landscapes: http://www.wcslivinglandscapes.com/
· Natural Capital Project: www.naturalcapitalproject.org
REFERENCES
Agrawal, A. and Redford, K. H. (2006). Poverty, devel-opment, and biodiversity conservation: Shooting inthe dark? Wildlife Conservation Society Working Paper,26, 1-48.
Angelsen, A. and Wunder, S. (2003). Exploring the forest-poverty link: key concepts, issues, and research implications.CIFOR (Center for International Forestry Research)Occasional Paper No. 40. Bogor, Indonesia.
Balmford, A., Mace, G. M., and Ginsberg, J. R. (1998). Thechallenges to conservation in a changing world: puttingprocesses on the map. In G. M. Mace, A. Balmford, andJ. R. Ginsberg, eds Conservation in a Changing World.pp. 1–28. Cambridge University Press, Cambridge, UK.
Balmford, A. (2003). Conservation planning in the realworld: South Africa shows the way. Trends in Ecologyand Evolution, 18, 435–438.
Balmford, A., Crane, P., Dobson, A. P., Green, R. E., andMace, G.M. (2005). The 2010 challenge: data availability,information needs, and extraterrestrial insights.Philosoph-ical Transactions of the Royal Society B, 360, 221–228.
Blockstein, D. E. (2002). How to lose your political virginitywhile keeping your scientific credibility. BioScience, 52,91–96.
Bonan, G. B. (2008). Forests and climate change: forcings,feedbacks, and the climate benefits of forests. Science,320, 1444–1449.
Brandon, K., Redford, K. and Sanderson, S., eds (1998).Parks in peril: people, politics, and protected areas. IslandPress, Washington, DC.
Brewer, C. (2002). Outreach and partnership programs forconservation education where endangered species con-servation and research occur.Conservation Biology 16, 5–6.
Brockington, D. (2003). Injustice and conservation: is localsupport necessary for sustainable protected areas? PolicyMatters, 12, 22–30.
Butler, R. F. and Laurance, W. F. (2008). New strategies forconserving tropical forests.Trends inEcology andEvolution,23, 469–472.
Chan, K. M. A. (2008). Value and advocacy in conservationbiology: crisis discipline or discipline in crisis? Conserva-tion Biology, 22, 1–3.
Chan, K. M. A., Higgins, P. A. T., and Porder, S. (2005).Protecting science from abuse requires a broader form ofoutreach. PLoS Biology, 3, 1177–1178.
Chomitz, K. (2007). At loggerheads? Agricultural expansion,poverty reduction, and environment in the tropical forests.The World Bank, Washington, DC.
Cobb, S., Ginsberg, J. R., Thomsen, J. (2007). Conservationin the tropics: evolving roles for governments, interna-tional donors and non-government organizations. InD. Macdonald and K. Service, eds Key topics in conserva-tion biology, pp. 145–155. Blackwell Scientific, Oxford, UK.
Colchester, M. (2004). Conservation policy and indigenouspeoples. Cultural Survival Quarterly, 28, 17–22.
Cowling, R. M. and Pressey, R. L. (2003). Introduction tosystematic conservation planning in the Cape FloristicRegion. Biological Conservation, 112, 1–13.
Cowling, R. M., Pressey, R. L., Rouget, M., and Lombard,A. T. (2003). A conservation plan for a global biodiversi-ty hotspot - the Cape Floristic Region, South Africa.Biological Conservation, 112, 191–216.
Daily, G. C., ed (1997). Nature’s services: societal dependenceon natural ecosystems. Island Press, Washington, DC.
Danielsen F., Balete, D. S., Poulsen, M. K., et al. (2000).A simple system for monitoring biodiversity in pro-tected areas of a developing country. Biodiversity andConservation, 9, 1671–1705.
Danielsen F., Mendoza, M. M., Alviola, P., et al. (2003).Biodiversity monitoring in developing countries: whatare we trying to achieve? Oryx, 37, 407–409.
Davis, S. D., Heywood, V. H., and Hamilton, A. C., eds(1994). Centres of Plant Diversity. A Guide and Strategy fortheir Conservation. Vol. 1. Europe, Africa, South WestAsia and The Middle East. WWF and IUCN, IUCNPublications Unit, Cambridge, UK.
Duraiappah, A. K. (1998). Poverty and environmentaldegradation: a review and analysis of the nexus. WorldDevelopment, 26, 2169–2179.
Ehrlich, P. R. and Ehrlich, A. H. (2005). One with Nineveh:politics, consumption, and the human future, (with newafterword). Island Press, Washington, DC.
Ferraro, P. J. and Kiss, A. (2002). Direct Payments toConserve Biodiversity. Science, 298, 1718–1719.
Ferraro, P. J. and Pattanayak, S. K. (2006). Money fornothing? A call for empirical evaluation of biodiversityconservation investments. PLoS Biology, 4, 482–488.
Ghimire, K. B. and Pimbert, M. P. (1997). Social change andconservation: environmental politics and impacts of nationalparks and protected areas. Earthscan, London, UK.
ICEM (International Centre for Environmental Manage-ment). (2003). Lessons learned in Cambodia, Lao PDR,Thailand and Vietnam. Review of Protected Areas andDevelopment in the Lower Mekong River Region, In-dooroopilly, Queensland, Australia.
Johns,D.M. (2003).Growth,Conservation, and theNecessityofNewAlliances.Conservation Biology, 17, 1229–1237.
FROM CONSERVATION THEORY TO PRACTICE: CROSSING THE DIVIDE 311
1
© Oxford University Press 2010. All rights reserved. For permissions please email: [email protected]

Kaimowitz, D. and D. Sheil. (2007). Conserving what andfor whom? Why conservation should help meet basichuman needs in the tropics. Biotropica, 39, 567–574.
Koh, L. P., and Wilcove, D. S. (2007). Cashing in palm oilfor conservation. Nature, 448, 993–994.
Kramer, R., C. van Schaik, and J. Johnson, eds (1997). Laststand: protected areas and the defense of tropical biodiversity.Oxford University Press, Oxford, UK.
Lovejoy, T. (1989). The obligations of a biologist. Conserva-tion Biology, 3, 329–330.
Lovejoy, T. (2006). Protected areas: a prism for a changingworld. Trends in Ecology and Evolution, 21, 329–333.
McNeely, J. and Scherr, S. J. (2001). Common ground commonfuture: how ecoagriculture can help feed the world and savewild biodiversity. IUCN Washington, DC.
McShane, T. O. (2003). Protected areas and poverty. PolicyMatters, 12, 52–53.
Myers, N., Mittermeier, R. A., Mittermeir, C. G., et al.(2000). Biodiversity hotspots for conservation. Nature,403, 853–858.
Noss, R. F. (1997). The failure of universities to produceconservation biologists. Conservation Biology, 11,1267–1269.
Noss, R. F. (2007). Values are a good thing in conservationbiology.Conservation Biology, 21, 18–20.
Olson, D. M. and Dinerstein, E. (1998). The Global 200: arepresentation approach to conserving the earth’s mostbiologically valuable ecoregions. Conservation Biology,12, 502–515.
Peres, C. A. (1995). Indigenous reserves and natureconservation in Amazonian forests. In D. Ehrenfield,ed. Readings from conservation biology: the social dimension,pp. 25–57. Blackwell Science, Cambridge, MA.
Pressey, R. L., Cabeza, M., Watts, M. E., et al. (2007).Conservation planning in a changing world. Trends inEcology and Evolution, 22, 583–592.
Ravnborg, H. M. (2003). Poverty and environmental deg-radation in the Nicaraguan hillsides. World Development31, 1933–1946.
Redford, K. H and Sanderson S. E. (2003). Contestedrelationships between biodiversity conservation andpoverty alleviation. Oryx, 37, 389–390.
Redford, K. H., Levy, M. A., Sanderson, E. W., and deSherbinin, A. (2008). What is the role for conservationorganizations in poverty alleviation in the world’s wildplaces? Oryx, 42, 516–528.
Robinson, J. (2007). Recognizing differences and establish-ing clear-eyed partnerships: a response to Vermeulen andSheil.Oryx, 41, 443–444.
Rodriguez, J. P., Rodriguez- Clark, K. M., Oliveira-Miranda,M. A., et al. (2006). Professional capacity building:
the missing agenda in conservation priority setting.Conservation Biology, 20, 1341.
Sodhi, N. S., Brooks, T. M., Koh, L. P., et al. (2006). Biodiver-sity and human livelihood crises in the Malay Archipela-go. Conservation Biology, 20, 1811–1813.
Sodhi, N. S., Acciaioli, G., Erb, M., and Tan, A. K.-J., eds(2008). Biodiversity and human livelihoods in protected areas:case studies from the Malay Archipelago. CambridgeUniversity Press, Cambridge, UK.
Stattersfield, A. J., Crosby, M. J., Long, A. J., and Wedge,D. C. eds (1998). Endemic Bird Areas of the World. BirdLifeConservation Series 7. BirdLife International, Cambridge,UK.
Steiner, A., Kimball, L. A., and Scanlon, J. (2003). Globalgovernance for the environment and the role of Multilat-eral Environmental Agreements in conservation. Oryx,37, 227–237.
Steinmetz, R., Chutipong, W., and Seuaturien, N. (2006).Collaborating to conserve large mammals in SoutheastAsia. Conservation Biology, 20, 1391–1401.
Sutherland, W. J., Pullin, A. S., Dolman, P. M., and Knight,T. M. (2004). The need for evidence-based conservation.Trends in Ecology and Evolution, 19, 305–308.
Terborgh, J. (1999). Requiem for nature. Island Press,Washington, DC.
Upton, C., Ladle, R., Hulme, D., Jiang, T., Brockington, D.,andAdams,W.M. (2008).Arepoverty andprotected areaestablishment linked at a national scale?Oryx, 42, 19–25.
Vermeulen, S. and Sheil, D. (2007). Partnerships for tropicalconservation. Oryx, 41, 434–440.
Wells, M., Guggenheim, S., Khan, A., Wardojo, W., andJepson. P. (1999). Investing in biodiversity. a review ofIndonesia’s Integrated Conservation and DevelopmentProjects. World Bank, Washington, DC.
West, P. and Brockington, D. (2006). An anthropologicalperspective on some unexpected consequences ofprotected areas. Conservation Biology, 20, 609–616.
Wilson K.A., Underwood E. C., Morrison S. A., et al. (2007).Conserving biodiversity efficiently: What to do, whereand when. PLoS Biology, 5, 1851–1861.
Woodroffe, R. and Ginsberg, J. R. (1998). Edge effects andthe extinction of populations inside protected areas.Science, 280, 2126–2128.
Woodwell, G. M. (2002). On purpose in science, conserva-tion and government. Ambio, 31, 432–436.
Yoccoz, N. G., Nichols, J. D., and Boulinier, T. (2001). Moni-toring of biological diversity in pace and time. Trends inEcology and Evolution, 16, 446–453.
Yoccoz, N.G., Nichols, J. D., and Boulinier, T. (2003).Monitoring of biological diversity – a response toDanielsen et al. Oryx, 37, 410.
312 CONSERVATION BIOLOGY FOR ALL
Sodhi and Ehrlich: Conservation Biology for All. http://ukcatalogue.oup.com/product/9780199554249.do
© Oxford University Press 2010. All rights reserved. For permissions please email: [email protected]

CHAP T E R 1 6
The conservation biologist’stoolbox – principles for the designand analysis of conservation studiesCorey J. A. Bradshaw and Barry W. Brook
“Conservation biology” is an integrative branch ofbiological science in its own right (Chapter 1); yet,it borrows from most disciplines in ecology andEarth systems science; it also embraces genetics,dabbles in physiology and links to veterinary sci-ence and human medicine. It is also a mathemati-cal science because nearly all measures arequantified and must be analyzed mathematicallyto tease out pattern from chaos; probability theoryis one of the dominant mathematical disciplinesconservation biologists regularly use. As rapidhuman-induced global climate change (Chapter8) becomes one of the principal concerns for allbiologists charged with securing and restoringbiodiversity, climatology is now playing a greaterrole. Conservation biology is also a social science,touching on everything from anthropology, psy-chology, sociology, environmental policy, geogra-phy, political science, and resource management(Chapter 14). Because conservation biology dealsprimarilywith conserving life in the face of anthro-pogenically induced changes to the biosphere, italso contains an element of economic decisionmaking (Chapter 14). This is a big toolbox indeed,so we cannot possibly present all aspects here. Wetherefore focus primarily in this chapter on theecological components of conservation biology(i.e. we concentrate on the biology per se).
Conservation biology, and the natural sciencesin particular, require simplified abstractions, ormodels, of the real world to make inferencesregarding the implications of environmentalchange. This is because ecosystems are inherentlycomplex networks of species interactions, physical
constraints and random variation due to stochastic(random) environmental processes. The conserva-tion biologist’s analytical toolbox therefore com-prises methods that mainly serve to simplify thecomplexity of the real world such that it is under-standable and (partially) predictable. The quantifi-cation of these relationships – from the effects ofhabitat loss on biodiversity (Chapter 4) to the im-plications of small population size for extinctionrisk (Chapter 10) – is the backbone of analyticalconservation biology and evidence-based decisionmaking. Without quantified relationships androbust measures of associated uncertainty, recom-mendations to improve biodiversity’s plight viamanagement intervention or policy change aredoomed to fail.
Even though we have chosen to focus on thetechniques dealing with the biological data in theconservation realm, we can by no means be com-prehensive; there are simply too many ideas, me-trics, tests, paradigms, philosophies and nuancesto present within a single chapter of this book.However, we have striven to compile a compendi-um of the major approaches employed along witha list of the best textbook guides andpeer-reviewedscientific papers providing the detail necessary fortheir implementation.We first presentmeasures ofbiodiversity patterns followed by a general discus-sion of experimental design and associated statisti-cal paradigms. We then introduce the analysis ofabundance time series followed by assessments ofspecies’ fate risks. The final section is a brief intro-duction to genetic tools used to assess a species’conservation status. Although issues of reserve
313
1
© Oxford University Press 2010. All rights reserved. For permissions please email: [email protected]

design and their associated algorithms are an es-sential part of the conservation biologist’s toolbox,they have beendiscussed in detail elsewhere in thisbook (Chapter 11) and so do not feature in thischapter.
16.1 Measuring and comparing‘biodiversity’
Chapter 2 provides an excellent overview of thesomewhat nebulous concept of ‘biodiversity’ anda brief mention of how it can be measured, andChapter 11 introduces the concept of ‘surrogacy’(simplified measures of biodiversity patterns) inconservation planning. Here we develop theseconcepts further with particular emphasis onpractical ways to obtain comparable and mean-ingful metrics over space and time. It should benoted that regardless of the logistic constraints,biological consideration and statistical minutiaedriving the choice of a particular set of metricsfor biodiversity, one must not forget to considerthe cost-benefit ratio of any selected method(Box 16.1) or the difficulties and challenges ofworking across cultures (Box 16.2).
16.1.1 Biodiversity indices
It is simply impossible tomeasure every formof life(Chapter 2), regardless of the chosenmetric or focaltaxon, due to the sheer number of species and thedifficulty of sampling many of the Earth’s habitats(e.g. ocean depths and tropical forest canopies).Weare therefore required to simplify our measure-ments into tractable, quantifiable units thatcan be compared across time and space. The sim-plest and perhaps easiest way to do this has tradi-tionally been to use organism-based metrics thatcount, in one way or another, the number of ‘dis-tinct’ species in a defined area. Species richnessis therefore the base currency used for most biodi-versity assessments, but it can be complicatedby adjusting for relative abundance, uniqueness,representativeness, spatial scale or evolutionaryhistory.
Asmentioned above, a direct count of the num-ber of species within a defined area is known asspecies richness (S). Species richness can be cor-rected for total abundance (number of indivi-duals) to produce the diversity index betterknown as Simpson’s Diversity Index ð1� DÞ(Simpson 1949):
Box 16.1 Cost effectiveness of biodiversity monitoringToby A. Gardner
There is a shortage of biological datawith whichto meet some of the primary challenges facingconservation, including the design of effectiveprotected area systems and the development ofresponsible approaches to managingagricultural and forestry landscapes. This datashortage is caused by chronic under‐funding ofconservation science, especially in the species‐rich tropics (Balmford and Whitten 2003), andthe high financial cost and logistical difficultiesofmulti‐taxafield studies.Wemust therefore bejudicious in identifying the most appropriatespecies groups for addressing a particularobjective. Such focal groups are varyinglytermed ‘surrogates’ or ‘indicators’. However,indicators are often chosen subjectively on thebasis of anecdotal evidence, ‘expert’ opinion,and ease of sampling. This common approachhas resulted in finite resources being wasted on
the collection of superficial (including the‘record everything’mantra) andunrepresentative biodiversity data that may beof only limited value. This failing threatens toerode the credibility of conservation science tofunding bodies and policy makers.To maximize the utility of biodiversity
monitoring, it should adhere to the concepts ofreturn on investment, and value for money. Inessence this means that field‐workers need toplan around two main criteria in selecting whichspecies to sample: (i) what types of data areneeded to tackle the objective in hand; and(ii) feasibility of sampling different candidatespecies groups. Practical considerations shouldinclude the financial cost of surveying, butalso the time and expertise needed to conducta satisfactory job. Species groups that satisfy
continues
314 CONSERVATION BIOLOGY FOR ALL
Sodhi and Ehrlich: Conservation Biology for All. http://ukcatalogue.oup.com/product/9780199554249.do
© Oxford University Press 2010. All rights reserved. For permissions please email: [email protected]

1� D∧ ¼ SS
i¼1niðni � 1ÞNðN � 1Þ
where S ¼ the number of species, N ¼ the totalnumber of individual organisms, and ni ¼ thenumber of individuals of species i. The unique-
ness of species in a sample can be incorporatedby using indices of evenness (also known as equi-tability), of which Shannon’s Index (H; also knownmistakenly as the Shannon-Weaver index, or cor-rectly as the Shannon-Weiner index) is the mostcommon:
Box 16.1 (Continued)
both demands can be thought of as having a‘high performance’.Using a large database from work in the
Brazilian Amazon, Gardner et al. (2008) recentlypresented a framework and analytical approachfor selecting such high performance indicatortaxa. The objective of that study was to providerepresentative and reliable information on theecological consequences of converting tropicalrainforest to Eucalyptus plantations or fallowsecondary regeneration. An audit wasconducted of the cost (in money and time) ofsampling 14 groups of animals (vertebrates andinvertebrates) across a large, managed, lowlandforest landscape. Notably, survey costs varied bythree orders of magnitude and comparingstandardised costs with the indicator value ofeach taxonomicgroup clearly demonstrated thatbirds and dung beetles (Coleoptera:Scarabaeinae) are high‐performance groups –they provide the most amount of valuableinformation for the least cost. By contrast, othergroups like small mammals and large mothsrequired a large investment for little return (seeBox 16.1 Figure). The fact that both birds anddung beetles are well‐studied and performimportant ecological functions gives furthersupport to their value for biodiversitymonitoring and evaluation. This importantfinding will help conservation biologists inprioritising the study of the effects ofdeforestation on land‐use change in theAmazon, allowing them to design cost‐effectivefield expeditions thatwill deliver themost usefulinformation for the money available.Finally when planning biodiversity surveys it is
also important to consider how the data may beused to address ancillary objectives that mayensure an even greater return on investment.
One example is the opportunity to synthesiseinformation frommany small‐scale monitoringprograms to provide robust nation‐wideassessments of the status of biodiversity withoutneeding to implement independent studies. Abetter understanding of the distribution ofspecies in threatenedecosystemswill improveourability to safeguard the future of biodiversity.Wecannot afford to waste the limited resources wehave available to achieve this fundamental task.
Birds
Dung beetles
Small mammalsMoths
Standardised sampling cost ($)0
0
5
10
15
Ind
icat
or p
erfo
rman
ce (%
ind
icat
or s
peci
es o
f tot
al)
20
25
30
35
40
2000 4000 6000 8000
Box 16.1 Figure Cost effectiveness of different species groups forindicating habitat change in a multi‐purpose forest landscape inBrazilian Amazonia.
REFERENCES
Balmford, A. and Whitten, T. (2003). Who should pay fortropical conservation, and how could the costs be met?Oryx, 37, 238–250.
Gardner, T. A., Barlow, J., Araujo, I. S., et al. (2008). Thecost‐effectiveness of biodiversity surveys in tropical for-ests. Ecology Letters, 11, 139–150.
THE CONSERVATION BIOLOGIST TOOLBOX – PRINCIPLES FOR THE DESIGN AND ANALYSIS OF CONSERVATION STUDIES 315
1
© Oxford University Press 2010. All rights reserved. For permissions please email: [email protected]

Box 16.2 Working across culturesDavid Bickford
Establishing conservation projects in countrieswith cultures and languages that are differentfrom your own can be both daunting andchallenging. Without proper thoughtfulness,openness, flexibility, and (most importantly)humour, these projects fail for reasons that areoften difficult to distil. All conservation projectsinvolve a mix of stakeholders (local people,scientists, conservation practitioners,governmental and public administrators,educators, community leaders, etc.) that mayhave widely different expectations andresponsibilities for the project. Having workedon both successful and failed projects with adiversity of people in nine countries and sixlanguages, much of what I have learned can besummed up in two simple yet powerful ideasfor all stakeholders: clear communication andequity. The two are intricately linked.Clear communication is an ideal often sought
after, yet rarely achieved. No matter the socio‐cultural context, a common denominator oftransparency is necessary for a successfulconservation project. Having stakeholdersexplicitly state their intentions, desires andgoals is a good start. It also helps elicittraditional or anecdotal knowledge that can beuseful in formal analysis (e.g. as Bayesian priors,see Box 16.4). Methods, benefits, andresponsibilities should be outlined and agreedupon, as well as limits of what objective(s) eachstakeholder perceives as ‘bare minimum’. Acommon pitfall is an inability for leaders tocommunicate effectively (for many and sundryreasons), re‐enforcing top‐down stereotypes.Lateral communication (peer‐to‐peer) can bemore effective and avoids many constraintsimposed by translating among differentlanguages or cultures, effectively levelling theplaying field and enabling everyone toparticipate (at least for heuristic purposes).Activities that enhance transparentcommunication include small group discussions,workshops, regular and frequentmeetings, project site visits and even informalgatherings such as shared meals orrecreational activities.Almost all social hierarchies involve some
component of conflict based around inequity.
People want to balance their personal costs andbenefits relative to others’. Conservationprojects should, wherever possible, bridge gapsand narrow divides by developing equitablyamong stakeholders. By alleviating largedisparities in cost:benefit ratios, responsibilities,and expectations between differentstakeholders, the project will become moreefficient because there will be less conflictbased on inequity. Equity will evolve andchange, with stakeholders adapting to behavefairly in a transparent system. In general, teamswill reward members who treat othersunselfishly and promote the overall goals of thegroup.To achieve such a framework of open
communication and equity, impartialleadership and long periods of interpersonalrelationship building are often required. Ashackneyed as they seem, capacity‐buildingexercises, when done correctly, are excellentmechanisms of sharing information andbuilding the competency to use it. Engagingand training local or regional counterparts is anoutstanding method for ensuring clearercommunication and promoting fairness,instead of forcing information from the top‐down and expecting results to emerge from thebottom‐up. Further links between transparencyand equity can be realised through ‘hands‐on’applications instead of just talking aboutconcepts. Leaders should participate at alllevels, learning the most menial tasksassociated with the project (e.g. anadministrator should go and catch frogs for amonitoring project).In the broadest terms, working across
cultures is a high risk‐high rewardsystem. Although there are complex obstacles,the ultimate litmus for biodiversityconservation might be our ability to learn andwork together across cultures to preservenature.
SUGGESTED READING
Reed, M.S. (2008). Stakeholder participation for environ-mental management: a literature review. BiologicalConservation, 141, 2417–2431.
316 CONSERVATION BIOLOGY FOR ALL
Sodhi and Ehrlich: Conservation Biology for All. http://ukcatalogue.oup.com/product/9780199554249.do
© Oxford University Press 2010. All rights reserved. For permissions please email: [email protected]

H 0 ¼Xs
i¼1
ni
Nlog e
ni
N
� �
The index provides a measure of the amount ofdisorder in a system, such that communities withmore unique species have higher H (a systemwith S = 1, by this definition, is perfectly orderedbut has no diversity). Most of these measuresassume a random sampling of species within acommunity, but this assumption is often violated(Pielou 1966). When sampling is done withoutreplacement, then indices such as Brillouin’s Hare recommended:
H ¼ 1
Nlog
N !
n1!n2!n3. . .
� �
However, where representativeness is un-known, then rarefaction or resampling can beused to standardize samples from different areasor periods to a comparable metric (Krebs 1999).This includes inferring the total diversity of acommunity by using a statistical model to predictunobserved data (unsampled species). Of course,the measures presented here are the basic foun-dations of species diversity indices, but there aremyriad variants thereof, many assumptions thatcan be tested and adjusted for, and different dis-tributions that may be more or less importantunder particular circumstances. For an excellentoverview of these issues, we recommend thereader refers to Krebs (1999).
16.1.2 Scale
Interpretation of the indices and their variantsdescribed above depend on the scale of measure-ment. Whittaker (1972) introduced the conceptsof alpha (a), beta (b), and gamma (g) diversity tomeasure and compare biodiversity patterns overvarious spatial scales. a (local) diversity refers tothe quantification of species richness, etc. within aparticular area or ecosystem, whereas b diversity(differentiation) is the difference in the metricbetween ecosystems. In other words, b diversityis a measure of species uniqueness between areas,so as b diversity increases, locations differ morefrom one another and sample a smaller propor-
tion of the total species richness occurring in thewider region (Koleff et al. 2003).
Whittaker (1972) sensibly recommended that bdiversity (Whittaker’s bw) should be measured asthe proportion by which the species richness of aregion exceeds the average richness of a singlelocality within that region:
bw ¼ S
�a¼ ða þ b þ cÞ
ð2aþbþcÞ2
where S = the total number of species recordedfor all sites (regional richness) and the averagenumber of species found within sites (local rich-ness), a ¼ the number of species in common inboth sites (e.g. for a simple two-site comparison),b ¼ the number of species in site 1, and c ¼ thenumber of species in site 2. Since then, however,many other variants of the metric have been pro-posed. These include comparisons along spatialor environmental gradients, between patches ofsimilar habitats, and the degree of similarity be-tween sites (see references in Koleff et al. 2003).Indeed, Koleff et al. (2003) reviewed 24 differentmeasures of b diversity and categorized theminto four main groups: measures of (i) continuity(similarity in species composition among sites)and loss (fewer species relative to focal sites);(ii) species richness gradients; (iii) continuityonly; and (iv) gain and loss. Not only is therelack of agreement on the most appropriate mea-sure to use, there is also variation in the pattern ofscaling applied. As such, Koleff et al. (2003) sug-gested that one should use measures that exhibitthe homogeneity property (i.e. the measure isindependent of the total number of species aslong as the proportions comprising the differentcomponents are constant) and that when mea-sures reveal different patterns of variation whenbased on absolute and proportional species num-bers, both types should be examined.
g diversity is otherwise known as “geographic-scale species diversity” (Hunter 2002), whichmeans it is used as a measure of overall diversityfor the different constituent ecosystems of a re-gion. This metric becomes particularly valuableto explain broad-scale (regional or continental)patterns of species relative to local (site-specific)indices. Indeed, there are two theoretical types of
THE CONSERVATION BIOLOGIST TOOLBOX – PRINCIPLES FOR THE DESIGN AND ANALYSIS OF CONSERVATION STUDIES 317
1
© Oxford University Press 2010. All rights reserved. For permissions please email: [email protected]

relationships hypothesized for local versus re-gional species richness (Figure 16.1). Most data-sets support the existence of a proportionalrelationship between local and regional richness(Type I), albeit local richness always tends to beless than regional (Gaston 2000). It appears thatType II relationships (local richness reachingan asymptote) are rare because local assemblagesdo not seem to become saturated as one mightexpect from ecological mechanisms such asdensity dependence, parasitism and predation(Gaston 2000).
16.1.3 Surrogacy
An important goal of conservation biology,which deals with a world of limited resourcesand options, is to protect areas that have relative-ly higher biodiversity than surrounding areas.Prioritizing areas for conservation, however,does not always require a complete descriptionof a site’s biodiversity, but merely relative mea-sures of differences among them (Margules et al.2002) described using a representative taxonomicsubset. The quest for a simple estimator, a surro-gate (i.e. the number, distribution or pattern ofspecies in a particular taxon in a particular areathought to indicate a much wider array of taxa)that is sufficiently related to the biodiversity pa-
rameter of interest is an essential tool in conser-vation planning (see Chapter 11).
Unfortunately, there is no consensus regardingwhich surrogates are best for what purposesamong ecosystems –many problems with currentsurrogate approaches remain. For instance, focus-ing only on a set of species-rich sites may selectonly a single habitat type with similar species inall areas, thus many rare species may be excludedfrom protection (Margules and Pressey 2000).Many methods to overcome these problemshave been developed based on multivariatemeasures of biodiversity (e.g. multi-taxa inci-dence matrices) or reserve-selection algorithms(e.g. Sarkar and Margules. 2002). Advances havebeen made with recent work (Mellin et al. Inreview) examining surrogate effectiveness in themarine realm. It was shown that higher-taxa sur-rogates (taxonomic levels such as order, family orgenus acting as a surrogate for some lower taxo-nomic level such as species) outperform cross-taxa (one taxon is used as a surrogate for anotherat the same taxonomic resolution) and subset-taxa (diversity in one taxonomic group is takenas representative of the entire community) surro-gates. Likewise, surrogacy was least effective atbroad (> 100 km) spatial scales.
16.1.4 Similarity, dissimilarity, and clustering
Although indices of biodiversity take on differentaspects of species richness, abundance, evennessand scale, there are many relatively simple tech-niques available for comparing samples of spe-cies and individuals among sites. Most indices ofsimilarity (> 25 types exist – Krebs 1999) aresimple descriptors that do not lend themselveseasily to measures of uncertainty (e.g. confidenceintervals; although resampling methods can pro-vide an index of parameter uncertainty), so theirapplication is generally exploratory. There aretwo broad classes of similarity: (i) binary; and(ii) quantitative. Binary measures are applied topresence-absence data (i.e. does a species exist ina defined area?) and can be compared amongsites using contingency tables using metrics suchas Jaccard’s similarity, Sorren’s similarity, simplematching, or Baroni-Urbani and Buser
Regional species richness
Loc
al s
peci
es r
ichn
ess
Type II
Type I
Local richness =regional richness
Figure 16.1 Hypothesized relationship between local and regionalspecies richness (number of species). Type I occurs where local richnessis proportional to, but less than, regional richness; Type II demonstratessituations where local richness asymptotes regardless of how muchregional richness increases. Reprinted from Gaston (2000).
318 CONSERVATION BIOLOGY FOR ALL
Sodhi and Ehrlich: Conservation Biology for All. http://ukcatalogue.oup.com/product/9780199554249.do
© Oxford University Press 2010. All rights reserved. For permissions please email: [email protected]

coefficients (see Krebs 1999). Of course, somemethod to assess the probability of missing spe-cies in presence-absence surveys should also beapplied to account for insufficient sampling effort(e.g. MacKenzie et al. 2002).
Quantitative indices require some aspect of in-dividual abundance to be assessed such as thenumber of individuals, biomass, cover or produc-tivity. Distance dissimilarity indices using abun-dance data instead of species richness can beapplied to the same binary indices listed above.Alternatively Euclidean, Manhattan, Canberra orBray-Curtis distances between samples can becalculated using relative abundance measures be-tween sites (see Krebs 1999). Simple correlationcoefficients such as Pearson product-moment,Spearman’s rank and Kendall’s t can also beused in certain situations to compare sites, butthese tend to be insensitive to additive or propor-tional differences between community samples(Romesburg 1984) and they depend strongly onsample size (generally, n > 30 is sufficient for areliable characterization of the relationship).
When many focal communities are sampled,some form of cluster analysis may be warranted.Cluster analysis refers to any technique thatbuilds classifications, but there is no preferredmethod given that the choice depends on thetype of data being compared. Some considera-tions for choice include whether the data are:(i) hierarchical (e.g. taxonomic classifications) orreticulate (overlapping classifications); (ii) divi-sive (sample divided into classes) or agglomera-tive (fine to coarse resolution); (iii) monothetic(groups distinguished by a single attribute) orpolythetic (many attribute-based); or (iv) qualita-tive (binary) or quantitative (distance measures)(see Krebs 1999 for an overview).
16.1.5 Multivariate approaches
When the principal aim of a conservation study isto quantify the relationships between a largenumber ofmeasurements, whether they be of spe-cies, individuals or abiotic predictors of ecologicalpatterns, some form of multivariate analysis isusually required. Over thirty different multivari-ate techniques have been designed for various
applications (Pérez et al. 2008), each with theirown particular strengths and weaknesses. Ordi-nation describes those methods that summarizemultivariate information in a low-dimensionalscatter diagram where points represent samplesand distances among them are proportional totheir similarity measured, for example, by Euclid-ean distance, Bray-Curtis or other indices. Com-mon techniques include eigen-based principalcomponents analysis (PCA) or correspondenceanalysis (CA) and distance-based multidimen-sional scaling (MDS), cluster analysis or polarordination that provide coefficients quantifyingthe relative contribution of component variablesto the reduced-dimension principal axes.
Such multivariate approaches are useful forvisualizing patterns that would otherwise be dif-ficult or impossible to discern in multidimension-al space, such as ecologically related speciesassemblages or trophic guilds. They can alsosummarize the principal gradients of variationwithin and among communities and condenseabiotic and other potential explanatory variables(e.g. climate, soil conditions, vegetation structure,chemistry, etc.) into simple gradients themselvesthat may be used as correlates to explain varia-tion in species or community patterns. Their dis-advantage is that they cannot be used to test therelative likelihood of alternative hypotheses, maynot appropriately reflect statistical power andeffect size, and if applied incautiously, can bemisused to mine data for phantom ‘patterns’that on closer examination turn out to be randomnoise or system-specific peculiarities.
16.2 Mensurative and manipulativeexperimental design
Conservation biology typically deals with assess-ments of previous environmental degradationand the quantification of its effects on biodiversi-ty patterns. Another major aim is to design waysof preserving existing, relatively intact commu-nities through management intervention (e.g. re-serve design, control of harvest). Conservationbiologists also devote a large proportion of theirefforts to quantifying the most efficient and
THE CONSERVATION BIOLOGIST TOOLBOX – PRINCIPLES FOR THE DESIGN AND ANALYSIS OF CONSERVATION STUDIES 319
1
© Oxford University Press 2010. All rights reserved. For permissions please email: [email protected]

effective methods for restoring degraded habitatsto some semblance of previous ecological func-tion. These three principal aims, and the logisticalconstraints on large-scale system manipulations,generally preclude the use of strict experimentaldesign and control – there are simply too manyextenuating variables modifying species patternsto control, and the systems of interest are gener-ally too expensive to apply meaningful manipu-lations such as those which typify medicalexperimentation.
There are some notable exceptions to this rule,such as replicated microcosm experiments exam-ining the processes of extinction in rapidly repro-ducing invertebrate populations. For example,the frequency of extinction times under condi-tions of low and high environmental variability(Drake 2006), the persistence probability of popu-lations exposed to various spatial configurationsof refugia and intensities of harvest (Fryxell et al.2006) and the implications for extinction risk ofchaotic and oscillatory behavior in populations(Belovsky et al. 1999; Hilker and Westerhoff2007), have all been successfully examined incontrolled laboratory settings. Other well-known manipulations at broader spatial scales(albeit with far less experimental control) includeexamining the effects of forest fragmentationon species diversity (Laurance et al. 2002),controlling the size and configuration of agricul-tural plots to test bee pollination success (Brosiet al. 2008), examining the effects of landscapecomposition on the initial dispersal success ofjuvenile amphibians (Rothermel and Semlitsch2002), determining the effects of inbreeding de-pression on individual survival (Jimenez et al.1994), measuring arthropod responses in tropicalsavannas exposed to repeated catchment-scale prescribed burning (Andersen and Müller2000) and the many applications of Before-After-Control-Impact (BACI) experimental designs todetect point-source changes to systems (Under-wood 1994).
The above notwithstanding, most conservationstudies rely mainly on quantifying existing pat-terns (observational studies) or take advantage ofexisting gradients or measurable differences inhabitat quality or type to infer mechanisms. This
latter category is sometimes referred to as men-surative experimentation because it does not ex-plicitly control for confounding variables(Hurlbert 1984). There has been plenty of discus-sion on this topic over the past twenty or soyears (Hurlbert 1984; Krebs 1991; Hargroveand Pickering 1992; Oksanen 2001; Hurlbert2004; Oksanen 2004), but it is now acceptedamong most conservation biologists that tomake strong inferences on biological patternsand mechanisms, multiple lines of evidence,from observational, mensurative and manipula-tive experiments, are all required at various spa-tial and temporal scales (Brook et al. 2008).
16.2.1 Hypothesis testing
The classic scientific approach adopts the conceptof falsifiability (Popper 1959) – that is, demonstrat-ing that a mechanism or phenomenon is not true(null hypothesis) by controlling all other plausi-ble determinants except the one of interest andreplicating the experiment sufficiently to avoidspurious patterns that may arise simply bychance (see section below). This is still a coreaspect of science because it reduces the chanceof making subjective interpretations of the datacollected. This is the philosophical basis for themajority of the statistical techniques used by nat-ural scientists; we attempt to discern pattern fromthe ‘noise’ in natural systems using theory toestimate the probability that our observationscould have been derived merely by chance.
Neyman-Pearson null hypothesis testing(NHT) begins with the assertion that no differ-ences exist between experimental units (null hy-pothesis), with the implicit view that if the null isunsupported by the data, then one or more ‘alter-native’ hypotheses must therefore be plausible(although these are not explicitly evaluated).Classic statistical theory that has been developedaround the NHT approach provides methods toestimate the chance of making an error whenrejecting the null hypothesis (Type I or a error);in other words, this is the probability of conclud-ing that there is a difference (or effect) when infact, there is none. The flip side to this is thatclassic NHT tests do not provide an estimate of
320 CONSERVATION BIOLOGY FOR ALL
Sodhi and Ehrlich: Conservation Biology for All. http://ukcatalogue.oup.com/product/9780199554249.do
© Oxford University Press 2010. All rights reserved. For permissions please email: [email protected]
the probability of making an error when failing toreject the null hypothesis (known as Type II or berror) – this is essentially the chance one con-cludes there is no difference (or effect) when infact, there is. Various a priori and a posteriorimeth-ods exist to estimate Type II errors (more precise-ly, the power of a statistical test taken as 1 – Type IIerror), with the latter depending on three princi-pal elements: sample size (see below), magnitudeof the difference one is attempting to detect (effectsize) and the total variance associated with themeasure used (see Gerrodette 1987; Osenberget al. 1994; Steidl et al. 1997; Thomas 1997; Thomas& Krebs 1997; Thompson et al. 2000 for moredetail on power analyses).
The disconnect between these two estimates ofhypothesis-conclusion error, the implicit confla-tion of effect size and sample size, as well as theambiguity related to just how much chance ofmaking an error is acceptable (i.e. the moribundand bankrupt concept of statistical ‘significance’beyond some arbitrary threshold), have formedfor decades some of the main arguments against
using NHT (reviewed in Elliott and Brook 2007,see also Burnham and Anderson 2002; Lukacset al. 2007). This is especially true in the ecologicaland psychological sciences, which are typicallyrestricted to observational studies and subject toextensive variability. The alternative approachescan be classed into the general category of multi-ple working hypotheses (MWH), including best-model selection and multimodal inference(Box 16.3). MWH approaches are now becomingrecognized as providing the most logical andobjective approaches to assess conservation is-sues because they explicitly consider uncertaintyin the underlying models used to abstract the realworld, rather than relying on simple and arbi-trarily assessed ‘yes-or-no’ conclusions typical ofthe NHT paradigm.
16.2.2 Sample size
Regardless of the statistical paradigm invoked oranalysis method applied, perhaps the least con-troversial requirement of good scientific inference
Box 16.3 Multiple working hypothesesCorey J. A. Bradshaw and Barry W. Brook
Science is, at its core, all about evaluating thesupport for different ideas – workinghypotheses – about how the world works.Because they never reflect the totality of real‐world effects, any such hypothesis can beconsidered a model. But how to decide whatideas have support and which ones should bediscarded?A traditional approach has been to set up
some null model (which states that there is nochange or measureable effect in a variable ofinterest), and then proceed to evaluatewhether the data conform to this model. Thisusually involves the arbitrary selection of athreshold probability of making Type I errors(i.e. failing to reject a null hypothesis when it istrue) to conclude so‐called ‘significance’ ofeffect. This line of reasoning still pervades mostprobabilitistic sciences today. Yet many havecalled for the abandonment of such subjectivestatistical practices (Burnham and Anderson
2004; Lukacs et al. 2007) in favour of a conceptoriginally forwarded in 1890 by Thomas C.Chamberlin known as multiple workinghypotheses (Elliott and Brook 2007). The idea isrelatively simple – instead of considering asingle (null) hypothesis and testing whether thedata can falsify it in favour of some alternative(which is not directly tested), the use of multipleworking hypotheses does not restrict thenumber of models considered to abstract thesystem under investigation. In fact, theapproach can specifically accommodate thesimultaneous comparison of hypotheses insystems where it is common to find multiplefactors influencing the observations made (suchas complex ecological systems). This is alsoparticularly applicable to conservation biologybecause experimental manipulation is oftentechnically difficult or ethically unreasonable.The basic approach is to construct models
(abstractions of complex systems) that
continues
THE CONSERVATION BIOLOGIST TOOLBOX – PRINCIPLES FOR THE DESIGN AND ANALYSIS OF CONSERVATION STUDIES 321
1
© Oxford University Press 2010. All rights reserved. For permissions please email: [email protected]

Box 16.3 (Continued)
represent combinations of hypothesesconstructed to explain variation in the metric ofinterest. Models (plausible hypotheses) thencan be ranked or compared on the basis ofrelative evidential support, using methods thattend to reinforce the principle of parsimony(the simplest combination of factors providingthe strongest explanatory power) via their biascorrection terms. Model comparison basedon information theory (usually assessedusing Aikaike’s information criterion– AIC – when conforming to maximumlikelihood approaches – Box 16.4) immediatelysupposes that all models are false because theyrepresent incomplete approximations of thetruth (Elliott and Brook 2007). Weighting AICsthen can be used as a means to assess therelative distance to ‘truth’ by approximatingKullback‐Leibler information loss (i.e.measuring the relative distance betweenconceptual reality and the abstraction underconsideration). The Bayesian informationcriterion (BIC) is a dimension‐consistent form ofmodel comparison that provides a measure ofthe weight of evidence relative to other models(the Bayes factor – see Box 16.4), assuminguninformative prior information. As samplesizes increase, BIC approaches the estimation ofthe dimension of a ‘true’model (not necessarilyembedded in the model set) with a probability= 1 (Burnham and Anderson 2004). Here thetrue model is one which captures main effectsbut ignores minor (tapering) influences.It is generally accepted that AIC performs
well when sample sizes are small (and AIC itselfcan be corrected to account for small samples),but it is a priori weighted to favour morecomplex models when tapering effects(biologically important signals that characterisefull truth but defy reductionism) are present(Link and Barker 2006). When the aim is todetermine the most important variablesexplaining variation in some measured‘response’, BIC is recommended, especiallywhen sample sizes are large (Link and Barker2006). When prediction is the goal, AIC‐basedrankings are preferred.
Multimodel inference is gaining increasingpopularity in conservation biology because itembraces the concept of multiple workinghypotheses to describe complex systems.Rather than choose a single ‘best’ model (ornot even test alternative models, as per nullhypothesis testing), multimodel inference ismade on the basis of all models in the a prioricandidate set; here, each model’s prediction isweighted by its relative support from the data(e.g. AIC weights or Bayesian posteriorprobabilities – see Box 16.4) (Burnham andAnderson 2002; Burnham and Anderson 2004;Elliott and Brook 2007). Thus, multimodelinference is advantageous because it accountsfor uncertainty in the underlying choice ofmodels used to describe the system ofinterest, it permits inference from differentmodels simultaneously, and it allows forunconditional ranking of the relativecontribution of variables tested (Elliott andBrook 2007). Of course, no inference is madeon models/variables not included in the apriori model set.The cases where null hypothesis testing can
be justified (see Johnson and Omland 2004;Stephens et al. 2005; Stephens et al. 2007) arerare in conservation biology for the reasonsdescribed above (system complexity, lack ofexperimentation potential). It is our opinionthat the multiple working hypothesesapproach, even for relatively simpleassessments of effect, should embrace thephilosophy of estimating the strength ofevidence and avoid the pitfalls associatedwith arbitrary Type I error probabilitythresholds. This can be usefully done even fora comparison of a null model to a singlealternative, using evidence factors (the ratioof AIC or BIC weights of the two models – aconcept akin to Bayesian odds ratios) and ispreferable to a classic null hypothesis testbecause the likelihood of the alternativemodel is explicitly evaluated.The basic formulae for the most common
model‐ranking criteria (AIC, AICc, QAIC and BIC)are provided below:
continues
322 CONSERVATION BIOLOGY FOR ALL
Sodhi and Ehrlich: Conservation Biology for All. http://ukcatalogue.oup.com/product/9780199554249.do
© Oxford University Press 2010. All rights reserved. For permissions please email: [email protected]

in conservation biology is obtaining measure-ments from as many representative and unbiasedunits (individuals, plots, habitats, ecosystems,etc.) as possible. The main reason for obtaininglarge sample sizes is that when one measuresonly a few units, the chance of obtaining a goodestimate of the central tendency (e.g. mean ormedian), variance (i.e. the spread of true values),or distribution (i.e. shape of the frequency distri-bution of units such as Normal, binomial,
log-Normal, etc. and extreme values which char-acterize the tails of distributions) of a parameter islow. Without good estimates of such parameters,the ability to tease pattern and noise apart be-comes increasingly intractable.
There are no rules of thumb for ‘adequate’sample sizes because they depend on the hypoth-esis being tested, the inherent variability of themeasures chosen and the temporal or spatialscales examined. The most useful generalization
Box 16.3 (Continued)
AIC ¼ � 2L þ 2k
where AIC ¼ Akaike’s information criterion,k ¼ number of model parameters and L ¼ themaximised log-likelihood function for theestimated model (MLE). Note that the varianceterm of a statistical model, when estimated(e.g. in a Gaussian model), is a parameter.
AICc ¼ AIC þ 2kðk þ 1Þn� k � 1
where AICc ¼ AIC corrected for small samplesize and n ¼ sample size.
QAIC ¼ 1
c2L þ 2k
where QAIC ¼ quasi-AIC and c ¼ the varianceinflation factor (when data are over-dispersed).This is commonly used in capture-mark-recapture model assessments (see White andBurnham 1999). The small-sample version ofQAIC (QAICc) is calculated the sameway as AICc.The Bayesian information criterion (BIC) iscalculated as:
�2logepðxjkÞ � BIC ¼ � 2L þ klogen
where x ¼ observed data and P(xjk) ¼ thelikelihood of x given k which is the same as theMLE used in AIC.
REFERENCES
Burnham, K. P. and D. R. Anderson. (2002). Modelselection and multimodel inference: a practical
information-theoretical approach. 2nd edn. Springer-Verlag, New York, NY.
Burnham, K. P. and Anderson, D. R. (2004). UnderstandingAIC and BIC in model selection. Sociological Methodsand Research, 33, 261–304.
Elliott, L. P. and Brook, B. W. (2007). Revisiting Chamber-lain: multiple working hypotheses for the 21st Century.Bioscience, 57, 608–614.
Johnson, J. and Omland, K. (2004). Model selection inecology and evolution. Trends in Ecology and Evolution,19, 101–108.
Link, W. A. and Barker, R. J. (2006). Model weights and thefoundations of multimodel inference. Ecology, 87,2626–2635.
Lukacs, P. M., Thompson, W. L., Kendall, W. L., Gould,W. R., Doherty, P. F., Burnham, K. P., and Anderson,D. R. (2007). Concerns regarding a call forpluralism of information theory and hypothesistesting. Journal of Applied Ecology,44, 456–460.
Stephens, P. A., Buskirk, S. W., Hayward, G. D., and DelRio, C. M. (2005). Information theory and hypothesistesting: a call for pluralism. Journal of Applied Ecology,42, 4–12.
Stephens, P. A., Buskirk, S. W., Hayward, G. D., anddel Rio, C. M. (2007). A call for statisticalpluralism answered. Journal of Applied Ecology,44, 461–463.
White, G. C. and Burnham, K. P. (1999). Program MARK:survival estimation from populations of marked animals.Bird Study, 46 (Supplement), 120–138.
THE CONSERVATION BIOLOGIST TOOLBOX – PRINCIPLES FOR THE DESIGN AND ANALYSIS OF CONSERVATION STUDIES 323
1
© Oxford University Press 2010. All rights reserved. For permissions please email: [email protected]

is that there is no substitute for adequate sam-pling – more representative samples will inevita-bly provide more power to discern patterns(Caughley and Gunn 1996). While we generallyrecommend against using classic power tests(see Krebs 1999 for examples) because of theirreliance on the NHT paradigm, there are techni-ques that can be applied to estimate adequateminimum sample size, and the sensitivity of in-formation-theoretic and Bayesian methods(Boxes 16.3 and 16.4) to power can be evaluated
in various ways. First, resampling can be used toassess to what extent sampling should continue,but this generally requires a moderately largeinitial sample. The basic approach is to resample(with replacement) observations from a distribu-tion at incrementing subsample sizes (Manly1997). The sample size at which the desired mag-nitude of effect can be detected then becomes theminimum target for future studies applying thesame metric. These are typically known as satura-tion or rarefaction curves (Heck et al. 1975). Other
Box 16.4 Bayesian inferenceCorey J. A. Bradshaw and Barry W. Brook
The most common statistical theoryunderpinning conservation (indeed, mostecological) research today is still likelihood‐based; i.e. the likelihood of observing the dataat hand based on the expected frequency (froma probability density function) that such datawould be observed if the same procedure ofdata collection was repeated many times(McCarthy 2007). Maximum likelihood istherefore the optimisation process that choosesthe model parameters that make the data themost likely relative to other parameter values.The process implicitly assumes no priorinformation on the relevant parameters, withthe maximum likelihood estimate coincidingwith the most probable values of thatdistribution. The approach essentially askswhatis the probability of observing the data giventhat the assumed model structure (hypothesis)is correct?An alternative approach is the Bayesian
paradigm, which instead asks: what is theprobability the model/hypothesis is true giventhe data? Bayes’ theorem states that theprobability of A occurring given that B hasoccurred is equal to the probability that both Aand B occur divided by the probability of Boccurring. Reframing A as a (or set of)parameter estimate y and B as the datacollected (x), then
PðθjxÞ ¼ PðxjθÞPðθÞPðxÞ
where P(y|x) = the posterior probability ofobtaining y given x, and P(y) = the prior
probability of y and P(x) is the probabilityof the data – a scaling constant (usuallyderived numerically). Thus, P(y) quantifiesthe available knowledge about y prior tocollecting x. This can often take the formof information collected during otherstudies that quantify the distribution (e.g.mean and standard deviation) of y. Notonly does the incorporation of priorinformation follow the spirit of scientificreasoning and logic (i.e. if A and B, then C)(McCarthy 2007), it generally provideshigher certainty in parameter estimatesbecause the model is not starting fromscratch (no information). Other advantagesof Bayesian approaches include: (i) errorsare not assumed to follow any particulardistribution, so departures from assumeddata distributions are less problematic thanin maximum likelihood‐based models; (ii)Markov Chain Monte Carlo (MCMC)numerical optimisation (a computer‐intensive method) is more flexible thanmaximum likelihood approaches becausethere is less of a tendency to become miredin local minima; and (iii) model parametersare assumed to be variable (i.e. adistribution), not fixed (a point value).The most commonly used software to
implement Bayesian models is the freelyavailable WinBUGS (Windows Bayesianinference Using Gibbs Sampling – www.mrc‐bsu.cam.ac.uk/bugs), which includes afriendly graphical user interface (GUI).While exceedingly popular, certain aspectsof the software make it somewhat
continues
324 CONSERVATION BIOLOGY FOR ALL
Sodhi and Ehrlich: Conservation Biology for All. http://ukcatalogue.oup.com/product/9780199554249.do
© Oxford University Press 2010. All rights reserved. For permissions please email: [email protected]

rules of thumb on sufficient sample sizes haveemerged from the statistical literature based onassumptions regarding the underlying distribu-tion of the observations (Krebs 1999), the width ofBayesian posterior credibility intervals comparedto the prior distributions, or on experience fromprevious studies.
16.2.3 Replication and controls
One of the most common errors made whendesigning conservation studies is insufficientor biased replication. Replication essentiallymeans repetition of the experiment (Krebs1999) and is another type of sample size. In-sufficient replication will inflate the estimatesof error associated with any metric, so thestatistical power to detect differences (or ef-fects) even when present declines with reducedreplication. Biased sampling will distort ourability to make inferences about population-level differences on the basis of finite samples.Replication is also essential to avoid the intru-sion of chance events; for example, the com-parison of only two sites experiencing differentintensities of modification may be invalidatedbecause some variable other than the onebeing tested (e.g. soil type instead of habitatquality) may drive the differences observed in,say, species richness. Only by replicating thesampling unit sufficiently will the chance ofspurious events occurring be reduced.
It is important though to ensure that the appro-priate statistical unit is replicated. In the aboveexample, increasing the number of sub-samplesin each of the two sites does not solve the problemof insufficient replication – the basic unit of com-parison is still the ‘site’. This is known as pseudo-replication because it may appear that increasedeffort leads to greater replication of the sampledunit, when in reality it is simply the reproductionof non-independent samples (see Hurlbert 1984;Underwood 1994; Krebs 1999).Without true inde-pendence among sampling units, estimates of var-iance, and hence, the power to detect differences(or effects), are downwardly biased, leading tohigher probabilities of making Type II errors. An-other form of pseudoreplication can occur whendesigns do not account for temporal autocorrela-tion among samples or repeat sampling of thesame unit (e.g. multiple measures from the sameanimal that has been recaptured repeatedly). Ifsequential samples within plots are taken overtime, there is a high probability that measurestherein will be correlated. There are many experi-mental designs and statistical tests that can taketemporal autocorrelation into account (e.g.Mulleret al. 1992; Cnaan et al. 1997; Krebs 1999; Gueor-guieva and Krystal 2004; Ryan 2007).
Another rule often broken by conservation biol-ogists is the failure to incorporate some kind ofcontrol in their experimental (manipulative ormen-surative) design. A control is an experimental unitthat receives no direct treatment. In conservationterms, these could be, for example, sites that have
Box 16.4 (Continued)
cumbersome to implement, such as therequirement to re‐initialise parametersettings whenever models are re‐run. Analternative interface that is based on thesame basic language is the BRugs library(R interface to R2WinBUGS) in the Rprogramming language (R DevelopmentCore Team 2008 – also free, open sourcesoftware). BRugs is a command‐based,object‐orientated implementationthat can be re‐run repeatedly without
having to reset parameter valueseach time.
REFERENCES
McCarthy, M.A. (2007). Bayesian methods forecology. Cambridge University Press,Cambridge, UK.
R Development Core Team (2008). R: A language andenvironment for statistical computing. R Foundation forStatistical Computing, Vienna, Austria.
THE CONSERVATION BIOLOGIST TOOLBOX – PRINCIPLES FOR THE DESIGN AND ANALYSIS OF CONSERVATION STUDIES 325
1
© Oxford University Press 2010. All rights reserved. For permissions please email: [email protected]

not been changed (degraded) in a particular way,areas without invasive species (i.e. the ‘treatment’being the presence of the invasive species), or siteswhere no re-introductions of native species haveoccurred.While gradient studies looking for corre-lations between well-known predictors of biodi-versity patterns (e.g. forest fragment areaexplaining variation in species richness; Lauranceet al. 2002) do not necessarily require ‘controls’ (e.g.contiguous forest patches of equivalent size) be-cause the relationships are so well-established,any study attempting some form of manipulativeormensurative experimental inferenceMUSThavecontrols (note that controlsmust also be replicated)(Krebs 1999). This applies particularly to the Be-fore-After-Control-Impact (BACI) design – con-temporaneous ‘controls’ are essential to be able todetect any differences (or effects) (Underwood1994; Krebs 1999).
16.2.4 Random sampling
The complexities of experimental design cannotbe treated sufficiently in this chapter; however,one last element that applies to all forms of exper-imental design is the concept of randomization.Randomization refers to the process of placing arandom spatial or temporal order on the samplingdesign such that each unit measures statisticallyindependent values. While complete randomiza-tion is not always possible (nor entirely desirablein cases of stratified random sampling – e.g. Krebs1999) for many conservation studies, one shouldalways strive to maximize sample randomizationwherever andwhenever possible. The key point isto ensure that your sample is representative of thepopulation parameters about which you aretrying to make inference – this is the fundamentaltheoretical tenet of statistical sampling theory.
16.3 Abundance Time Series
if species are the currency of biodiversity assess-ments, then counts of individuals represent theprincipal unit for population dynamics modelsused to assess conservation risk (see followingsection). The restrictions imposed on comprehen-
sive biodiversity assessment by the sheer numberof species on Earth (Chapter 2) also apply to thequantification of population dynamics for singlespecies – there are simply too many species to beable to obtain detailed demographic data (e.g.survival, fertility, dispersal, etc. ) for the majorityof them to build population models (see follow-ing section). Therefore, many types of phenomeno-logical model have been developed to dealwith sequential censuses (time series) of absoluteor relative population size. Phenomenological sim-ply means that the dynamical properties thesemodels emulate represent the end-point phenome-non of total population size (number of indivi-duals at any given point in time), that is, theemergent property of various mechanisms suchas birth, death, reproduction and dispersal.Therefore, phenomenological models applied toabundance time series are restricted in their ca-pacity to explain ecological mechanisms, but theycertainly provide fertile ground for testing broadhypotheses, describing gross population behav-ior, and making predictions about populationchange (provided mechanisms remain constant).
One of the commonest and simplest questionsconservation biologists ask is whether a popula-tion is trending or stationary. Indeed, one of themain criteria used by the World ConservationUnion (IUCN) to define a population or speciesas threatened (i.e. either Vulnerable, Endangeredor Critically Endangered) on its Red List (www.iucnredlist.org) is its rate of decline. As such,reliably determining both the direction of thetrend (i.e. if declining, to highlight conservationconcern, or if increasing, to indicate successful re-covery) and quantifying the rate of change, are cen-tral goals of conservation biology. While it mayseem superficially straightforward to determineat least the direction of population’s abundancetrend, factors such as the difficulty in censusingthe population (counting all individuals),measure-ment (observation) error, and the presence ofhigh seasonal variance in abundancedue tonormalenvironmental stochasticity (variation), are com-mon real-world challenges that can make conclu-sions of population trajectory uncertain.
Many statistical tools have been developed todeal with these problems, including traditional
326 CONSERVATION BIOLOGY FOR ALL
Sodhi and Ehrlich: Conservation Biology for All. http://ukcatalogue.oup.com/product/9780199554249.do
© Oxford University Press 2010. All rights reserved. For permissions please email: [email protected]

NHT power analyses to detect trends (e.g. Gerrod-ette 1987; see also Gerrodette 1993 for associatedsoftware), nonlinear models (e.g. Fewster et al.2000) and the simultaneous application ofmultipletime series models (Box 16.3) applied to relativeabundance counts to determine the direction oftrend and strength of feedbacks (e.g. McMahonet al. 2009). We certainly recommend the multipleworking hypotheses approach (Box 16.3) whenquerying abundance time series, but argue thatmuch more mathematical development and em-pirical testing is required on this topic.
Trending, or nonstationary populations maybe driven by exogenous influences (“changes inthe environment that affect population change,but are not themselves influenced by popula-tion numbers” – Turchin 2003) and/or by en-dogenous influences (“dynamical feedbacksaffecting population numbers, possibly involv-ing time lags” – Turchin 2003). It is of courseimportant to determine the interplay betweensuch drivers (Bradshaw 2008) because eithermay dominate at certain times or on certainstages of the population, or short-term trendsmay simply represent periods of re-equilibra-tion of longer-term cycles that are not readilyapparent when sampling over too few timeintervals relative to the scale of disturbance orthe species’ generation length.
The development of population dynamicsmodels in ecology dates back to the early 19th
century (Pearl 1828; Verhulst 1838) and has de-veloped in the intervening 180 years into an ex-pansive discipline in its own right, dealing withthe many and complex ways in which organismsinteract within and among populations and spe-cies. We cannot possibly provide a summary ofall the relevant components of time series analy-sis here (for an excellent overview with workedexamples, see Turchin 2003), but we do highlightsome of the essential basics.
An important component of extinction models isthe presence of density feedback, because thestrength and form of such endogenous influencescan strongly affect predictions of extinction risk (seebelow) (Philippi et al. 1987; Ginzburg et al. 1990). Insituations where detailed measurements of theways in which population density modifies demo-
graphic processes are unavailable, phenomenologi-calmodels applied to abundance time series can stillprovide some direction. The idea that populationstend tofluctuate around an equilibrium abundance,encapsulated by the general logistic (S-shapedcurve) model (Turchin 2003), was generalized fortime series by Ricker’s model (Ricker 1954) wherethe rate of population change (r):
r ¼ log eNtþ1
Nt
� �
(N is the discrete population size estimate at timet), can be expressed as a simple linear function ofNt declining from an intrinsic (maximum) growthrate (rm):
r ¼ rm 1� Nt
K
� �� �
When r is positive, the population is growing;above carrying capacity (K), the population de-clines. Here, the environment’s K is assumed toimpose some upper limit to total abundance.There are many variants and complications ofthis basic model, and even more debates regard-ing its role in explaining complex populationdynamics; however, we argue this basic modelhas been instrumental in defining some of themore important theoretical elements of popula-tion dynamics applied to questions of sustain-able harvest and extinction risk. Indeed, Turchin(2003) goes as far as to call it a fundamental‘law’ of population ecology.
In real-world situations, the negative influence ofdensity on population rate of change is likely toapplymainly to the regionaroundcarryingcapacityand be of less importance for small populationsbelow their minimum viable population size (seebelow). For instance, as populations decline, indivi-duals may lose average fitness due to phenomenasuch as inbreeding depression (see Genetic Toolssection below), reduced cooperative anti-predatorbehavior (e.g. flocking or herding), reduced mateavailability, and the loss or degradation of coopera-tive breeding effort (Courchamp et al. 2008). Thus,density feedback at these small population sizes canbe positive, and this is generally known as an Alleeeffect (Allee 1931). Although the phenomenologicalevidence for Allee effects using abundance time
THE CONSERVATION BIOLOGIST TOOLBOX – PRINCIPLES FOR THE DESIGN AND ANALYSIS OF CONSERVATION STUDIES 327
1
© Oxford University Press 2010. All rights reserved. For permissions please email: [email protected]

series is sparse –mainly because obtaining observa-tions at low densities is logistically challenging andobservation error tends to be inflated when detec-tion probabilities are low – there are somemodels that can be applied, such as the Ricker-Alleemodel:
r ¼ rm 1� Nt
K
� �Nt � A
K
� �
whereA represents the critical lower Allee thresh-old abundance below which positive feedbackbegins. For a comprehensive discussion of Alleeeffects, see Courchamp et al. (2008) and Berec et al.(2007).
16.4 Predicting Risk
A longstanding goal in conservation biology ispredicting the risk a species, community or eco-system faces when humans change the environ-ment. Questions such as: How many individualsare required for a population to have a high chanceof persisting in the future? What species are mostsusceptible to human-induced changes to the environ-ment? Are some species more likely to become invasivethan others? and What types of species are requiredto maintain ecosystem function? pervade the con-servation literature from purely theoretical tohighly applied perspectives. Not only do thesequestions require substantial data to provide re-alistic direction, the often arbitrary choice of thedegree of risk (defined as a probability of, forexample, becoming threatened, invasive, or fall-ing below a predefined population size), can addsubjectivity to the assessment.
16.4.1 Cross-taxa approaches
The ranking of species’ life history traits (e.g.evolved characteristics such as generation time,mean body mass, reproductive potential; ecolog-ical attributes such as dispersal capacity, nicheconstraints) and environmental contexts, whichtogether predict a species’ response to environ-mental change, has received considerable atten-tion in recent years (e.g. Bennett and Owens 1997;Owens and Bennett 2000; Purvis et al. 2000; Kolar
and Lodge 2001; Heger and Trepl 2003; Brooket al. 2006; Pimm et al. 2006; Bielby et al. 2008;Bradshaw et al. 2008; Sodhi et al. 2008a, b, 2009).Determining which traits lead to higher extinc-tion or invasion risk, for instance, is importantfor prioritizing management to eradicate harm-ful invasive species or recover threatened taxa(Bradshaw et al. 2008). Developing simple predic-tive generalizations (‘rules’) for categorizingpoorly studied species into categories of relativerisk (proneness) thus becomes a tool to assistin the efficient allocation of finite conservationresources.
There is now good correlative evidence thatparticular combinations of life history and eco-logical characteristics (e.g. organism size, dispers-al capacity, geographic range, and otherreproductive, dispersal, morphological and phys-iological attributes) influence a species’ risk ofbecoming extinct or invasive, with the strengthof effect depending on the spatial scale of mea-surement, environmental context, and rate ofchange of the forcing factor (e.g. deforestation orclimate change) (Bradshaw et al. 2008). Much ofthis evidence is derived from three main types ofmodels: generalized linear mixed-effects models(e.g. Brook et al. 2006; Bradshaw et al. 2008; Sodhiet al. 2008a, c), generalized estimating equations(Bielby et al. 2008) and phylogenetically indepen-dent contrasts (e.g. Bennett and Owens 1997;Owens and Bennett 2000; Purvis et al. 2000). Theprincipal reason why these complex models mustbe used instead of simple correlations is becauseof the confounding effects of shared evolutionarytraits when making cross-species comparisons(Felsenstein 1985). In other words, because spe-cies are related hierarchically according to theirphylogeny (evolutionary relationships and com-mon ancestry), they are not strictly independentstatistical units, and so their relationships shouldbe taken into account.
Linear mixed-effects models (Pinheiro and Bates2000) take phylogeny inferred from Linnaean tax-onomy into account by using a nested structure inthe random effect component of the model (Black-burn and Duncan 2001); once the variance compo-nent due to correlated relationships is taken(partially) into account, the residual variation can
328 CONSERVATION BIOLOGY FOR ALL
Sodhi and Ehrlich: Conservation Biology for All. http://ukcatalogue.oup.com/product/9780199554249.do
© Oxford University Press 2010. All rights reserved. For permissions please email: [email protected]

be attributed to fixed effects (e.g. life history traits)of hypothetical interest. Generalized estimatingequations are similar to mixed-effects models, butthe parameters are estimated by taking correla-tions among observations into account (Paradisand Claude 2002). Phylogenetically independentcontrasts (PIC) compute the differences in scoresbetween sister clades and rescale the variance as afunction of evolutionary branch length (Purvis2008). The PIC approach (and its many variants –see Purvis et al. 2005; Purvis 2008) is useful, but hasbeen criticized because of: (i) its sensitivity to errorsin estimated phylogenetic distance (Ramon andTheodore 1998); (ii) incorrect treatment of extinc-tion risk as an evolved trait (Putland 2005); (iii)overestimation of differences between closelyrelated species (Ricklefs and Starck 1996); (iv) re-quirement of a complete phylogeny; (v) inability todeal with categorical variables; and (vi) its restric-tion of using the NHT framework (Blackburn andDuncan 2001; Bradshaw et al. 2008). Despite thesecriticisms, no onemodeling approach is superior inall situations, sowe recommend several techniquesbe applied where possible.
16.4.2 Population viability analyses
When the goal is to estimate risk to a single spe-cies or population instead of evolved life historiesthat may expose species to some undesirablestate, then the more traditional approach is todo a population viability analysis (PVA). PVAbroadly describes the use of quantitative methodsto predict a population’s extinction risk (Morrisand Doak 2002). Its application is wide andvaried, tackling everything from assessment ofrelative risk for alternative management options(e.g. Allendorf et al. 1997; Otway et al. 2004; Brad-shaw et al. 2007), estimating minimum viablepopulation sizes required for long-term persis-tence (e.g. Traill et al. 2007 and see sectionbelow), identifying the most important life stagesor demographic processes to conserve or manip-ulate (e.g. Mollet and Cailliet 2002), setting ade-quate reserve sizes (e.g. Armbruster and Lande1993), estimating the number of individualsrequired to establish viable re-introduced popu-lations (e.g. South et al. 2000), setting harvest
limits (e.g. Bradshaw et al. 2006), ranking poten-tial management interventions (e.g. Bradshawet al. in press), to determining the number andgeographical structure of subpopulations re-quired for a high probability of persistence (e.g.Lindenmayer and Possingham 1996).
The approaches available to do PVAs are asvaried as their applications, but we define herethe main categories and their most common uses:(i) count-based; (ii) demographic; (iii) metapopu-lation; and (iv) genetic. A previous section out-lined the general approaches for the analysis ofpopulation dynamics and the uses of abundancetime series in conservation biology; count-basedPVAs are yet another application of basic abun-dance (either total or relative) surveys. Briefly, thedistribution of population growth rates on thelogarithmic scale, constructed from a (ideally)long time series (or multiple populations) ofabundance estimates, provides an objectivemeans of projecting long-term population trajec-tories (either declining, increasing, or stable) andtheir variances. The basic premise is that, given aparticular current population size and a mini-mum acceptable value below which the popula-tion is deemed to have gone quasi-extinct (i.e. notcompletely extinct, but where generally too fewindividuals remain for the population to be con-sidered viable in the long term), the mean long-term population growth rate and its associatedvariance enables the calculation of the probabilityof falling below the minimum threshold. Whilethere are many complications to this basic ap-proach (e.g. accounting for substantial measure-ment error, catastrophic die-offs, environmentalautocorrelation, density feedback and demo-graphic fluctuations (e.g. uneven sex ratio – foran overview, see Morris and Doak 2002), themethod is a good first approximation if the onlydata available are abundance time series. A recentextension to the approach, based on the multipleworking hypotheses paradigm (Box 16.3), hasbeen applied to questions of sustainable harvest(Bradshaw et al. 2006).
A more biologically realistic, yet data-intensiveapproach, is the demographic PVA. Count-basedPVAs essentially treat all individuals as equals –that is, equal probabilities of dying, reproducing
THE CONSERVATION BIOLOGIST TOOLBOX – PRINCIPLES FOR THE DESIGN AND ANALYSIS OF CONSERVATION STUDIES 329
1
© Oxford University Press 2010. All rights reserved. For permissions please email: [email protected]

and dispersing. In reality, because populationsare usually structured into discernable and differ-entiated age, sex, reproductive and developmentstages (amongst others), demographic PVAscombine different measured (or assumed) vitalrates that describe the probability of performingsome demographic action (e.g. surviving, breed-ing, dispersing, growing, etc.). Vital rates are ide-ally estimated using capture-mark-recapture(CMR) models implemented in, for example, pro-gram MARK (White and Burnham 1999), butsurrogate information from related species orallometry (body mass relationships) may also beused. The most common method of combiningthese different life stages’ vital rates into a singlemodel is the population projection matrix. Whilethere are many complicated aspects to these,they allow for individuals in a population to ad-vance through sequential life stages and performtheir demographic actions at specified rates.Using matrix algebra (often via computer simula-tion), static, stochastic and/or density-modifiedmatrices are multiplied by population vectors(stage-divided population abundance) to projectthe population into the future. The reader is re-ferred to the comprehensive texts by Caswell(2001) and Morris and Doak (2002) for all thegory details. Freely or commercially availablesoftware packages such as VORTEX (www.vor-tex9.org) or RAMAS (www.ramas.com) can dosuch analyses.
Metapopulations are networks of spatially sepa-rated sub-populations of the same species that areconnected by dispersal (see Chapter 5). A meta-population can be thought of as a “population ofpopulations” (Levins 1969) or a way of realistical-ly representing patches of high habitat suitabilitywithin a continuous landscape. In ways thatare analogous to the structuring of individualswithin a single population, metapopulations‘structure’ sub-populations according to habitatquality, patch size, isolation and various othermeasures. The mathematical and empirical devel-opment of metapopulation theory has burgeonedsince the late 1990s (see Hanski 1999) and hasbeen applied to assessments of regional extinc-tion risk for many species (e.g. Carlson and Eden-hamn 2000; Molofsky and Ferdy 2005; Bull et al.
2007). For a recent review of the application ofmetapopulation theory in large landscapes, seeAkçakaya and Brook (2008).
Although genetic considerations are not nearlyas common in PVAs as they perhaps should be(see more in the following section, and the bookby Frankham et al. 2002 for a detailed overview),there is a growing body of evidence to suggestthat the subtle determinants of extinction arestrongly influenced by genetic deteriorationonce populations become small (Spielman et al.2004; Courchamp et al. 2008). The most commonapplication of genetics in risk assessment hasbeen to estimate a minimum viable population size– the smallest number of individuals required fora demographically closed population to persist(at some predefined ‘large’ probability) for some(mainly arbitrary) time into the future (Shaffer1981). In this context, genetic considerations aregrowing in perceived importance. Genetically vi-able populations are considered to be those largeenough to avoid inbreeding depression (reducedfitness due to inheritance of deleterious allelesby descent), prevent the random accumulationor fixation of deleterious mutations (genetic driftand mutational meltdown), and maintain evolu-tionary potential (i.e. the ability to evolve whenpresented with changing environmental condi-tions; see following section). The MVP size re-quired to retain evolutionary potential is theequilibrium population size where the loss ofquantitative genetic variation due to small popu-lation size (genetic drift) is matched by increasingvariation due to mutation (Franklin 1980). Ex-panded detail on the methods for calculating ge-netically effective population sizes and a reviewof the broad concepts involved in genetic stochas-ticity can be found in Frankham et al. (2002) andTraill et al. (2009). The next section gives moredetails.
16.5 Genetic Principles and Tools
The previous sections of this chapter have fo-cused primarily on the organismic or higher tax-onomic units of biodiversity, but ignored the sub-organism (molecular) processes on which
330 CONSERVATION BIOLOGY FOR ALL
Sodhi and Ehrlich: Conservation Biology for All. http://ukcatalogue.oup.com/product/9780199554249.do
© Oxford University Press 2010. All rights reserved. For permissions please email: [email protected]

Box 16.5 Functional genetics and genomicsNoah K. Whiteman
Conservation genetics has influenced the fieldof conservation biology primarily by yieldinginsight into the provenance of individuals andthe ecological and evolutionary relationshipsamong populations of threatened species. Asilluminated in the section on genetic diversity,conservation genetics studies rely primarily ongenomic data obtained from regions of thegenome that are neutral with respect to theforce of natural selection (neutral markers).Conservation biologists are also interested inobtaining information on functional (adaptive)differences between individuals andpopulations, typically to ask whether there isevidence of local adaptation (Kohn et al. 2006).Adaptive differences are context‐dependentfitness differences between individuals and areultimately due to differences betweenindividuals in gene variants (alleles) at one ormultiple loci, resulting in differences inphenotype. These phenotypic differences arealways the result of gene‐environmentinteractions and can only be understood in thatlight. However, unraveling the associationbetween particular nucleotide substitutionsand phenotype is challenging even for scientistswho study genetic model systems.Adaptive differences between individuals
and populations are difficult to identify at themolecular genetic level (see also Chapter 2).This is typically because genomic resources arenot available for most species. However, with aset of unlinked molecular markers scatteredthroughout the genome, such asmicrosatellites, it is possible to identifycandidate loci of adaptive significance that arephysically linked to these markers. If thefrequency of alleles at these loci is significantlygreater or less than the expectation based onan equilibrium between migration and geneticdrift, one can infer that this locus might haveexperienced the effects of natural selection.These analyses are often referred to as outlieranalyses and aim to find genes linked to neutralmarkers that are more (or less) divergedbetween individuals and populations than thebackground (neutral) divergence (Beaumont
2005). Despite the immediate appeal of thesestudies, moving from identification of outlierloci to identification of the function of thatlocus and the individual nucleotide differencesunderlying that trait is a difficult task.The genomics revolution is now enabling
unprecedented insight into the molecular basisof fitness differences between individuals.Completed genome sequences of hundreds ofplants and animals are available or in progressand next generation sequencing technology israpidly increasing the number of species thatwillbecome genomically characterized. Massivelyparallel sequencing technology is enabling therapid characterization of entire genomes andtranscriptomes (all of the expressed genes in agenome) at relatively low cost. Currently,sequence reads from these technologies are, onaverage, <500 base pairs in length and sotraditional Sanger sequencing still outperformsmassively parallel technology at the level of theindividual read. Digital gene expression (whereall of the expressed genes are sequenced andcounted; Torres et al. 2008) and microarrayanalysis allows one to study differences in globalgene expression without a priori information onthe identity of genes used in the analysis. Singlenucleotide polymorphism (SNP) analysis is likelyto be an effective tool in identifying loci andindividual substitutions that are associated withdifferences in trait values between individuals,even when pedigree information andheritabilities of traits are not available, as is thecase for most threatened species.Although there is considerable debate over
the relative importance of cis regulatorymutations (in non-coding sequences flankingprotein-coding genes) versus structuralmutations (in protein coding genes) in themolecular basis of phenotypic evolution acrossspecies, methods are best developed fordetecting a signature of selection at codonswithin protein-coding genes. In this case, aconservation biologist may be interested inknowingwhat loci andwhat codons within thatgene have experienced positive, adaptiveselection. The redundancy of the DNA code
continues
THE CONSERVATION BIOLOGIST TOOLBOX – PRINCIPLES FOR THE DESIGN AND ANALYSIS OF CONSERVATION STUDIES 331
1
© Oxford University Press 2010. All rights reserved. For permissions please email: [email protected]

evolution itself operates. As such, no review ofthe conservation biologist’s toolbox would becomplete without some reference to the hugearray of molecular techniques now at our dispos-able used in “conservation genetics” (Box 16.5).Below is a brief primer of the major concepts.
Conservation genetics is the discipline dealingwith the genetic factors that affect extinction riskand the methods one can employ to minimizethese risks (Frankham et al. 2002). Frankham etal. (2002) outlined 11 major genetic issues that thediscipline addresses: (i) inbreeding depression’snegative effects on reducing reproduction andsurvival; (ii) loss of genetic diversity; (iii) reduction
in gene flow among populations; (iv) genetic drift;(v) accumulation and purging of deleterious muta-tions; (vi) genetic adaptation to captivity and itsimplications for reintroductions; (vii) resolvinguncertainties of taxonomic identification; (viii)defining management units based on genetic ex-change; (ix) forensics (species identification anddetection); (x) determining biological processesrelevant to species management; and (xi) out-breeding depression. All these issues can be as-sessed by extracting genetic material [e.g. DNA(deoxyribonucleic acid), RNA (ribonucleic acid)]from tissue sampled from live or dead indivi-duals (see Winchester and Wejksnora 1995 for a
Box 16.5 (Continued)
means that in protein‐coding genes, nucleotidesubstitutions are either synonymous – theamino acid coded by the codon remains thesame, or non‐synonymous – the correspondingamino acid changes. Comparing the rates ofnon‐synonymous/synonymous substitutions(the o rate ratio) of a gene between species canprovide evidence of whether that gene or locusis under selection (Yang 2003). A variety ofmethods are available to estimate o ratios for agiven gene tree. When o <1, purifying selectionis inferred because non‐synonymoussubstitutions are deleterious with respect tofitness; when o = 1, neutral evolution is inferredbecause there is no difference in fitnessbetween non‐synonymous and synonymoussubstitutions; and when o >1, positive selectionis inferred because non‐synonymoussubstitutions are favored by natural selection.In their most general form, o ratios areaveraged across all nucleotide sites, butbecause non‐synonymous rates are often quitevariable across a gene, o values can also beestimated for individual codons. While it ispossible to test for significant differencesamong o values, the most conservativeinterpretation holds that adaptive evolutionhas occurred only when o values are >1.However, even when o values are >1,demographic forces can elevate o ratios if thereis an imbalance between genetic drift and
purifying selection. Because several non‐mutually exclusive factors can affect o ratios,comparisons using these data, which are alwaysonly correlative in nature, need to beinterpreted with caution.The genomics research horizon is
rapidly changing all areas of biology andconservation biology is no exception.A new arsenal of genomic and analyticaltools is now available for conservationbiologists interested in identifying adaptivedifferences between individuals andpopulations that will complement traditionalneutral marker studies in managing wildlifepopulations.
REFERENCES
Beaumont, M. A. (2005). Adaptation and speciation:what can Fst tell us? Trends in Ecology and Evolution, 20,435–440.
Kohn, M. K., Murphy, W. J., Ostrander, E. A., and Wayne,R. K. (2006). Genomics and conservation genetics.Trends in Ecology and Evolution, 21, 629–637.
Torres, T. T., Metta, M., Ottenwälder, B., and Schlötterer,C. (2008). Gene expression profiling by massively parallelsequencing. Genome Research, 18, 172–177.
Yang, Z. (2003) Adaptive molecular evolution. In D. J.Balding, M. Bishop and C. Cannings, eds Handbook ofStatistical Genetics, pp. 229–254, John Wiley and Sons,New York, NY.
332 CONSERVATION BIOLOGY FOR ALL
Sodhi and Ehrlich: Conservation Biology for All. http://ukcatalogue.oup.com/product/9780199554249.do
© Oxford University Press 2010. All rights reserved. For permissions please email: [email protected]

good introduction to the array of methods used todo this).
Of these 11 themes, the first three are perhapsthe most widely applicable elements of conserva-tion genetics, and so deserve special mentionhere. Inbreeding depression can be thought of asan Allee effect because it exacerbates reductionsin average individual fitness as population sizebecomes small. Inbreeding is the production ofoffspring by related individuals resulting fromself-fertilization (e.g. the extreme case of ‘selfing’in plants) or by within-‘family’ (e.g. brother-sis-ter, parent-offspring, etc.) matings. In these cases,the combination of related genomes during fertil-ization can result in reductions in reproductionand survival, and this is known as inbreedingdepression. There are several ways to measureinbreeding: (i) the inbreeding coefficient (F) mea-sures the degree of parent relatedness derivedfrom a pedigree analysis (strictly – the probabilitythat an allele is common among two breedingindividuals by descent); (ii) the averageinbreeding coefficient is the F of all individualsin a population; and (iii) inbreeding relative torandom breeding compares the average related-ness of parents to what one would expect if thepopulation was breeding randomly.
The amount of genetic diversity is the extent ofheritable variation available among all indivi-duals in a population, species or group of species.Heterozygosity is the measure of the frequency ofdifferent of alleles [alternative forms of the samesegment of DNA (locus) that differ in DNA basesequence] at the same gene locus among indivi-duals and is one of the main ways genetic diver-sity is measured. Populations with few alleleshave generally had their genetic diversity re-duced by inbreeding as a result of recent popula-tion decline or historical bottlenecks. Populationsor species with low genetic diversity thereforehave a narrower genetic template from which todraw when environments change, and so theirevolutionary capacity to adapt is generallylower than for those species with higher geneticvariation.
Habitat fragmentation is the process of habitatloss (e.g. deforestation) and isolation of ‘frag-ments’, and is one of the most important direct
drivers of extinction due to reductions in habitatarea and quality (Chapter 5). Yet because frag-mentation also leads to suitable habitats for par-ticular species assemblages becoming isolatedpockets embedded within (normally) inhospita-ble terrain (matrix), the exchange of individuals,and hence, the flow of their genetic material, isimpeded. Thus, even though the entire popula-tion may encompass a large number of indivi-duals, their genetic separation via fragmentationmeans that individuals tend to breed less ran-domly and more with related conspecifics, thusincreasing the likelihood of inbreeding depres-sion and loss of genetic diversity. For a morecomprehensive technical demonstration and dis-cussion of these issues, we recommend the readerrefers to Frankham et al. (2002).
16.6 Concluding Remarks
The multidisciplinarity of conservation biologyprovides an expansive source of approaches, bor-rowed from many disciplines. As such, this inte-grative science can appear overwhelming or evenintimidating to neophyte biologists, especiallyconsidering that each approach discussed here(and many more we simply did not have spaceto describe) is constantly being reworked, im-proved, debated and critiqued by specialists.But do not despair! The empirical principles ofconservation biology (again, focusing here onthe ‘biology’ aspect) can be broadly categorizedinto three major groups: (i) measuring speciesand abundance; (ii) correlating these to indicesof environmental change; and (iii) estimatingrisk (e.g. of extinction). Almost all of the ap-proaches described herein, and their myriad var-iants and complications, relate in some way tothese aims. The specific details and choices de-pend on: (i) data quality; (ii) spatial and temporalscale; (iii) system variability; and (iv) nuance ofthe hypotheses being tested.
When it comes to the choice of a particularstatistical paradigm in which to embed thesetechniques, whether it be null hypothesis test-ing or multiple working hypotheses (Box 16.3),likelihood-based or Bayesian inference (Box
THE CONSERVATION BIOLOGIST TOOLBOX – PRINCIPLES FOR THE DESIGN AND ANALYSIS OF CONSERVATION STUDIES 333
1
© Oxford University Press 2010. All rights reserved. For permissions please email: [email protected]

16.4), is to some extent open to personalchoice. We have been forthright regardingour particular preferences (we consider multi-ple working hypotheses to be generally superi-or to null hypothesis testing, and Bayesianoutperforming likelihood-based inference), butthere are no hard-and-fast rules. In generalterms though, we recommend that conserva-tion biologists must at least be aware of thefollowing principles for any of their chosenanalyses:
· Adequate and representative replication of theappropriate statistical unit of measure should beplanned from the start.
· The high probability that results will vary de-pending on the spatial and temporal scale of inves-tigation must be acknowledged.
· Choosing a single model to abstract the complex-ities of ecological systems is generally prone to over-simplification (and often error of interpretation).
· Formal incorporation of previous data is a goodway of reducing uncertainty and building on pastscientific effort in a field where data are inevitablychallenging to obtain; and
· Multiple lines of evidence regarding a specificconclusion will always provide stronger inference,more certainty and better management and policyoutcomes for the conservation of biodiversity.
This chapter represents the briefest of glimpsesinto the array of techniques at the disposal ofconservation biologists. We have attempted toprovide as much classic and recent literature toguide the reader toward more detailed informa-tion, and in this spirit have provided a list of what
Box 16.6 Useful Textbook GuidesCorey J. A. Bradshaw and Barry W. Brook
It is not possible to provide in‐depthmathematical, experimental or analytical detailfor the approaches summarised in this chapter.So instead we provide here a list of importanttextbooks that do this job. The list is notexhaustive, but it will give emerging andestablished conservation biologists a solidquantitative background on the issuesdiscussed in this chapter – as well as manymore.
SUGGESTED READING
Bolker, B. M. (2008). Ecological models and data in R.Princeton University Press, Princeton, NJ.
Burnham, K. P. and Anderson, D. R. (2002).Model selectionand multimodal inference: a practical information‐theo-retic approach. 2nd edn. Springer‐Verlag, New York, NY.
Caswell, H. (2001). Matrix population models: construc-tion, analysis, and interpretation. 2nd edn. Sinauer As-sociates, Inc., Sunderland, MA.
Caughley, G. and Gunn, A. (1996). Conservation biology intheory and practice. Blackwell Science, Cambridge, MA.
Clark, J. S. (2007). Models for ecological data: an intro-duction. Princeton University Press, Princeton, NJ.
Ferson, S. and Burgman, M., eds (2002). Quantitative meth-ods for conservation biology. Springer, New York, NY.
Frankham, R., Ballou, J. D., and Briscoe, D. A. (2002).Introduction to conservation genetics. Cambridge Uni-versity Press, Cambridge, UK.
Krebs, C. J. (1999). Ecological methodology. 2nd edn.Benjamin Cummings, Upper Saddle River, NJ.
Krebs, C. J. (2009). Ecology: the experimental analysis ofdistribution and abundance. 6th edn. Benjamin Cum-mings, San Francisco, CA.
Lindenmayer, D. and Burgman, M. (2005). Practical con-servation biology. CSIRO (Australian CommonwealthScientific and Industrial Research Organization) Publish-ing, Collingwood, Australia.
McCallum, H. (2000). Population parameters: estimationfor ecological models. Blackwell Science, Oxford, UK.
McCarthy, M. A. (2007). Bayesian methods for ecology.Cambridge University Press, Cambridge, UK.
Millspaugh, J. J. and Thompson, F. R. I., eds (2008).Modelsfor planning wildlife conservation in large landscapes.Elsevier, New York, NY.
Morris, W. F. and Doak, D. F. (2002). Quantitative conser-vation biology: theory and practice of population viabil-ity analysis. Sinauer Associates, Sunderland, MA.
Turchin, P. (2003). Complex population dynamics: a theo-retical/empirical synthesis. Princeton University Press,Princeton, NJ.
334 CONSERVATION BIOLOGY FOR ALL
Sodhi and Ehrlich: Conservation Biology for All. http://ukcatalogue.oup.com/product/9780199554249.do
© Oxford University Press 2010. All rights reserved. For permissions please email: [email protected]
we consider to be some of the better textbookguides which provide an expanded treatment ofthe different techniques considered (Box 16.6). Aparting recommendation – nomatter how sophis-ticated the analysis, the collection of rigorousdata using well-planned approaches will alwaysprovide the best scientific outcomes.
Summary
· Conservation biology is a highly multidisciplin-ary science employing methods from ecology, Earthsystems science, genetics, physiology, veterinary sci-ence, medicine, mathematics, climatology, anthropol-ogy, psychology, sociology, environmental policy,geography, political science, and resource manage-ment. Herewe focus primarily on ecological methodsand experimental design.
· It is impossible to census all species in an ecosys-tem, so many different measures exist to comparebiodiversity: these include indices such as speciesrichness, Simpson’s diversity, Shannon’s index andBrouillin’s index.Many variants of these indices exist.
· The scale of biodiversity patterns is important toconsider for biodiversity comparisons: a (local), b (be-tween-site), and g (regional or continental) diversity.
· Often surrogate species – the number, distri-bution or pattern of species in a particular taxonin a particular area thought to indicate a muchwider array of taxa – are required to simplifybiodiversity assessments.
· Many similarity, dissimilarity, clustering, andmultivariate techniques are available to comparebiodiversity indices among sites.
· Conservation biology rarely uses completelymanipulative experimental designs (althoughthere are exceptions), with mensurative (basedon existing environmental gradients) and obser-vational studies dominating.
· Two main statistical paradigms exist for com-paring biodiversity: null hypothesis testing andmultiple working hypotheses – the latter paradigmis more consistent with the constraints typical ofconservation data and so should be invoked whenpossible. Bayesian inferential methods generallyprovide more certainty when prior data exist.
· Large sample sizes, appropriate replication andrandomization are cornerstone concepts in all con-servation experiments.
· Simple relative abundance time series (sequen-tial counts of individuals) can be used to infer morecomplex ecological mechanisms that permit the esti-mation of extinction risk, population trends, andintrinsic feedbacks.
· The risk of a species going extinct or becominginvasive can be predicted using cross-taxonomiccomparisons of life history traits.
· Population viability analyses are essential toolsto estimate extinction risk over defined periodsand under particular management interventions.Many methods exist to implement these, includingcount-based, demographic, metapopulation, andgenetic.
· Many tools exist to examine how genetics affectsextinction risk, of which perhaps the measurementof inbreeding depression, gene flow among popula-tions, and the loss of genetic diversity with habitatdegradation are the most important.
Suggested reading
See Box 16.6.
Relevant websites
· Analytical and educational software for risk as-sessment: www.ramas.com.
· Population viability analysis software: www.vor-tex9.org.
· Ecological Methodology software–Krebs (1999):www.exetersoftware.com/cat/ecometh/eco-methodology.html.
· Capture-mark-recapture analysis software:http://welcome.warnercnr.colostate.edu/gwhite/mark/mark.htm.
· Analysis of data from marked individuals: www.phidot.org.
· Open-source package for statistical computing:www.r-project.org.
· Open-source Bayesian analysis software: www.mrc-bsu.cam.ac.uk/bugs/.
THE CONSERVATION BIOLOGIST TOOLBOX – PRINCIPLES FOR THE DESIGN AND ANALYSIS OF CONSERVATION STUDIES 335
1
© Oxford University Press 2010. All rights reserved. For permissions please email: [email protected]

Acknowledgements
We thank T. Gardner, D. Bickford, C. Mellin andS. Herrando-Pérez for contributions and assistance.
REFERENCES
Akçakaya, H. R. and Brook, B. W. (2008). Methods fordetermining viability of wildlife populations in largelandscapes. In Models for Planning Wildlife Conservationin Large Landscapes (eds J. J. Millspaugh & F. R. I. Thomp-son), pp. 449–472. Elsevier, New York, NY.
Allee, W. C. (1931). Animal Aggregations: A Study in GeneralSociology. University of Chicago Press, Chicago, IL
Allendorf, F. W., Bayles, D., Bottom, D. L., et al. (1997).Prioritizing Pacific salmon stocks for conservation. Con-servation Biology, 11, 140–152.
Andersen, A. N. and Müller, W. J. (2000). Arthropod re-sponses to experimental fire regimes in an Australiantropical savannah: ordinal-level analysis. Austral Ecolo-gy, 25, 199–209.
Armbruster, P. and Lande, R. (1993). A population via-bility analysis for African elephant (Loxodonta africana):how big should reserves be? Conservation Biology, 7,602–610.
Belovsky, G. E., Mellison, C., Larson, C., and Van Zandt,P. A. (1999). Experimental studies of extinction dynam-ics. Science, 286, 1175–1177.
Bennett, P. M. and Owens, I. P. F. (1997). Variation in extinc-tion risk among birds: chance or evolutionary predisposi-tion? Proceedings of the Royal Society of London B, 264,401–408.
Berec, L., Angulo, E., and Courchamp, F. (2007). MultipleAllee effects and population management. Trends inEcology and Evolution, 22, 185–191.
Bielby, J., Cooper, N., Cunningham, A. A., Garner,T. W. J., and Purvis, A. (2008). Predicting susceptibilityto future declines in the world’s frogs. Conservation Let-ters, 1, 82–90.
Blackburn, T. M. and Duncan, R. P. (2001). Establishmentpatterns of exotic birds are constrained by non-randompatterns in introduction. Journal of Biogeography, 28, 927–939.
Bradshaw, C. J. A. (2008). Having your water and drinkingit too – resource limitation modifies density regulation.Journal of Animal Ecology, 77, 1–4.
Bradshaw, C. J. A., Fukuda, Y., Letnic, M. I., and Brook,B. W. (2006). Incorporating known sources of uncertain-ty to determine precautionary harvests of saltwater cro-codiles. Ecological Applications, 16, 1436–1448.
Bradshaw, C. J. A., Mollet, H. F., andMeekan, M. G. (2007).Inferring population trends for the world’s largest fishfrom mark-recapture estimates of survival. Journal ofAnimal Ecology, 76, 480–489.
Bradshaw,C. J. A., Giam, X., Tan,H. T.W., Brook, B.W., andSodhi, N. S. (2008). Threat or invasive status in legumes isrelated to opposite extremes of the same ecological and lifehistory attributes. Journal of Ecology, 96, 869–883.
Bradshaw, C. J. A., Peddemors, V. M., McAuley, R. B., andHarcourt, R. G. in press. Population viability of Austra-lian grey nurse sharks under fishing mitigation and cli-mate change. Marine Ecology Progress Series.
Brook, B. W., Traill, L. W., and Bradshaw, C. J. A. (2006).Minimum viable population size and global extinctionrisk are unrelated. Ecology Letters, 9, 375–382.
Brook, B. W., Sodhi, N. S., and Bradshaw, C. J. A. (2008).Synergies among extinction drivers under global change.Trends in Ecology and Evolution, 25, 453–460.
Brosi, B. J., Armsworth, P. R., and Daily, G. C. (2008).Optimal design of agricultural landscapes for pollinationservices. Conservation Letters, 1, 27–36.
Bull, J. C., Pickup, N. J., Pickett., B., Hassell, M. P., andBonsall, M. B. (2007). Metapopulation extinction riskis increased by environmental stochasticity and assem-blage complexity. Proceedings of the Royal Society of Lon-don B, 274, 87–96.
Burnham, K. P. and Anderson, D. R. (2002). ModelSelection and Multimodal Inference: A Practical Informa-tion-Theoretic Approach. 2nd edn Springer-Verlag,New York, NY.
Carlson, A. and Edenhamn, P. (2000). Extinction dynamicsand the regional persistence of a tree frogmetapopulation.Proceedings of the Royal Society of London B, 267, 1311–1313.
Caswell, H. (2001). Matrix Population Models: Construction,Analysis, and Interpretation. 2nd edn Sinauer Associates,Inc., Sunderland, MA.
Caughley, G. and Gunn, A. (1996). Conservation biology intheory and practice. Blackwell Science, Cambridge, MA.
Cnaan, A., Laird, N. M., and Slasor, P. (1997). Using thegeneral linear mixed model to analyse unbalanced re-peated measures and longitudinal data. Statistics in Med-icine, 16, 2349–2380.
Courchamp, F., Lud�ek, B., and Gascoigne, B. (2008) Alleeeffects in ecology and conservation. Oxford UniversityPress, Oxford, UK.
Drake, J. M. (2006). Extinction times in experimental popu-lations. Ecology, 87, 2215–2220.
Elliott, L. P. and Brook, B. W. (2007). Revisiting Chamber-lain: multiple working hypotheses for the 21st Century.BioScience, 57, 608–614.
Felsenstein, J. (1985). Phylogenies and the comparativemethod. American Naturalist, 70, 115.
336 CONSERVATION BIOLOGY FOR ALL
Sodhi and Ehrlich: Conservation Biology for All. http://ukcatalogue.oup.com/product/9780199554249.do
© Oxford University Press 2010. All rights reserved. For permissions please email: [email protected]

Fewster, R. M., Buckland, S. T., Siriwardena, G. M., Baillie,S. R., and Wilson, J. D. (2000). Analysis of populationtrends for farmland birds using generalized additivemodels. Ecology, 81, 1970–1984.
Frankham, R., Ballou, J. D., and Briscoe, D. A. (2002).Introduction to conservation genetics. Cambridge Universi-ty Press, Cambridge, UK.
Franklin, I. R. (1980). Evolutionary change in small popula-tions. In Conservation biology: An evolutionary-ecologicalperspective (eds M.E. Soule & B.A. Wilcox), pp. 135–149.Sinauer, Sunderland, MA.
Fryxell, J. M., Lynn, D. H., and Chris, P. J. (2006). Harvestreserves reduce extinction risk in an experimental micro-cosm. Ecology Letters, 9, 1025–1031.
Gaston, K. J. (2000). Global patterns in biodiversity.Nature,405, 220–227.
Gerrodette, T. (1987). A power analysis for detectingtrends. Ecology, 68, 1364–1372.
Gerrodette, T. (1993). TRENDS: Software for a poweranalysis of linear regression. Wildlife Society Bulletin, 21,515–516.
Ginzburg, L. R., Ferson, S., and Akçakaya, H. R. (1990).Reconstructibility of density dependence and the conser-vative assessment of extinction risks. Conservation Biolo-gy, 4, 63–70.
Gueorguieva, R. and Krystal, J. H. (2004). Move overANOVA: progress in analyzing repeated-measuresdata and its reflection in papers published in theArchives of General Psychiatry. Archives of General Psy-chiatry, 61, 310–317.
Hanski, I. (1999). Metapopulation Ecology. Oxford Universi-ty Press, Oxford, UK.
Hargrove, W. W. and Pickering, J. (1992). Pseudoreplica-tion: a sine qua non for regional ecology. Landscape Ecolo-gy, 6, 251–258.
Heck, K. L., van Belle, G., and Simberloff, D. (1975). Explicitcalculation of the rarefaction diversity measurement andthe determination of sufficient sample size. Ecology,56, 1459–1461.
Heger, T. and Trepl, L. (2003). Predicting biological inva-sions. Biological Invasions, 5, 313–321.
Hilker, F. M. and Westerhoff, F. H. (2007). Preventingextinction and outbreaks in chaotic populations. Ameri-can Naturalist, 170, 232–241.
Hunter, M. (2002). Fundamentals of Conservation Biology.2nd edn Blackwell Science, Malden, MA.
Hurlbert, S. H. (1984). Pseudoreplication and the designof ecological field experiments. Ecological Monographs,54, 187–211.
Hurlbert, S. H. (2004). On misinterpretations of pseudore-plication and related matters: a reply to Oksanen. Oikos,104, 591–597.
Jimenez, J. A., Hughes, K. A., Alaks, G., Graham, L., andLacy, R. C. (1994). An experimental study of inbreedingdepression in a natural habitat. Science, 266, 271–273.
Kolar, C. S. and Lodge, D. M. (2001). Progress in invasionbiology: predicting invaders. Trends in Ecology and Evo-lution, 16, 199–204.
Koleff, P., Gaston, K. J., and Lennon, J. J. (2003). Measuringbeta diversity for presence-absence data. Journal ofAnimal Ecology, 72, 367–382.
Krebs, C.J. (1991). The experimental paradigm and long-term population studies. Ibis, 133, 3–8.
Krebs, C. J. (1999). Ecological Methodology. 2nd ednBenjamin Cummings, Upper Saddle River, NJ.
Laurance, W. F., Lovejoy, T. E., Vasconcelos, H. L., et al.(2002). Ecosystem decay of Amazonian forest fragments:a 22-year investigation. Conservation Biology, 16, 605–618.
Levins, R. (1969). Some demographic and genetic conse-quences of environmental heterogeneity for biologicalcontrol.“ Bulletin of the Entomological Society ofAmerica. Bulletin of the Ecological Society of America,15, 237–240.
Lindenmayer, D. B. and Possingham, H. P. (1996). Rankingconservation and timber management options for lead-beater’s possum in southeastern Australia using popula-tion viability analysis. Conservation Biology, 10, 235–251.
Lukacs, P. M., Thompson, W. L., Kendall, W. L., et al.(2007). Concerns regarding a call for pluralism of infor-mation theory and hypothesis testing. Journal of AppliedEcology, 44, 456–460.
MacKenzie, D. I., Nichols, J. D., Lachman, G. B., et al.(2002). Estimating site occupancy rates when detectionprobabilities are less than one. Ecology, 83, 2248–2255.
Manly, B. F. J. (1997). Randomization, Bootstrap and MonteCarlo Methods in Biology.Chapman andHall, London, UK.
Margules, C. R. and Pressey, R. L. (2000). Systematicconservation planning. Nature, 405, 243–253.
Margules, C. R., Pressey, R. L., and Williams, P. H. (2002).Representing biodiversity: data and procedures for iden-tifying priority areas for conservation. Journal of Bios-ciences, 27, 309–326.
McMahon, C. R., Bester, M. N., Hindell, M. A., Brook,B. W., and Bradshaw, C. J. A. (2009). Shifting trends:detecting environmentally mediated regulation in long-lived marine vertebrates using time-series data. Oecolo-gia, 159, 69–82.
Mellin, C., Delean, S., Caley, M. J., et al. in press. Determin-ing the effectiveness of biological surrogates for predict-ing marine biodiversity patterns. Ecological Applications.
Mollet, H. F. and Cailliet, G. M. (2002). Comparative pop-ulation demography of elasmobranchs using life historytables, Leslie matrices and stage-based matrix models.Marine and Freshwater Research, 53, 503–516.
THE CONSERVATION BIOLOGIST TOOLBOX – PRINCIPLES FOR THE DESIGN AND ANALYSIS OF CONSERVATION STUDIES 337
1
© Oxford University Press 2010. All rights reserved. For permissions please email: [email protected]

Molofsky, J. and Ferdy, J.-B. (2005). Extinction dynamicsin experimental metapopulations. Proceedings of the Na-tional Academy of Sciences of the United States of America,102, 3726–3731.
Morris, W. F. and Doak, D. F. (2002).Quantitative Conserva-tion Biology: Theory and Practice of Population ViabilityAnalysis. Sinauer Associates, Sunderland, MA.
Muller, K. E., LaVange, L. M., Sharon Landesman,R., and Ramey, C. T. (1992). Power calculations for gen-eral linear multivariate models including repeated mea-sures applications. Journal of the American StatisticalAssociation, 87, 1209–1226.
Oksanen, L. (2001). Logic of experiments in ecology: ispseudoreplication a pseudoissue? Oikos, 94, 27–38.
Oksanen, L. (2004). The devil lies in details: reply to StuartHurlbert. Oikos, 104, 598–605.
Osenberg, C. W., Schmitt, R. J., Holbrook, S. J., Abu-Saba,K. E., and Flegal, A. R. (1994). Detection of environmen-tal impacts: natural variability, effect size, and poweranalysis. Ecological Applications, 4, 16–30.
Otway,N.M., Bradshaw, C. J. A., andHarcourt, R.G. (2004).Estimating the rate of quasi-extinction of the Australiangrey nurse shark (Carcharias taurus) population using de-terministic age- and stage-classifiedmodels.Biological Con-servation, 119, 341–350.
Owens, I. P. F. and Bennett, P. M. (2000). Ecological basisof extinction risk in birds: habitat loss versus humanpersecution and introduced predators. Proceedings of theNational Academy of Sciences of the United States of America,97, 12144–12148.
Paradis, E. and Claude, J. (2002). Analysis of comparativedata using generalized estimating equations. Journal ofTheoretical Biology, 218, 175–185.
Pearl, R. (1828). The rate of living, being an account of someexperimental studies on the biology of life duration. AlfredA. Knopf, New York, NY.
Pérez, S. H., Baratti, M., and Messana, G. (2008). Subterra-nean ecological research and multivariate statistics:a review (1945–2006). Journal of Cave and Karst Studies,70, in press.
Philippi, T. E., Carpenter, M. P., Case, T. J., and Gilpin, M.E. (1987). Drosophila population dynamics: chaos andextinction. Ecology, 68, 154–159.
Pielou, E. C. (1966). The measurement of diversity in dif-ferent types of biological collections. Journal of TheoreticalBiology, 13, 131–144.
Pimm, S., Raven, P., Peterson, A., Sekercioglu, C. H., andEhrlich, P. R. (2006). Human impacts on the rates ofrecent, present, and future bird extinctions. Proceedingsof the National Academy of Sciences of the United States ofAmerica, 103, 10941–10946.
Pinheiro, J. C. and Bates, D. M. (2000). Statistics and Com-puting. Mixed-Effects Models in S and S-Plus. Springer-Verlag, New York, NY.
Popper, K. R. (1959). The logic of scientific discovery. Routle-dge, London, UK.
Purvis, A. (2008). Phylogenetic approaches to the study ofextinction. Annual Review of Ecology, Evolution, and Sys-tematics, 39, 301–319.
Purvis, A., Gittleman, J. L., Cowlishaw, G., and Mace,G. M. (2000). Predicting extinction risk in decliningspecies. Proceedings of the Royal Society of London B, 267,1947–1952.
Purvis, A., Gittleman, J. L., and Brooks, T., eds (2005)Phylogeny and conservation. Cambridge University Press,Cambridge, UK.
Putland, D. (2005). Problems of studying extinction risks.Science, 310, 1277.
Ramon, D.-U. and Theodore, G., Jr. (1998). Effects ofbranch length errors on the performance of phylogeneti-cally independent contrasts. Systematic Biology, 47,654–672.
Ricker, W. E. (1954). Stock and recruitment. Journal of theFisheries Research Board of Canada, 11, 559–623.
Ricklefs, R. E. and Starck, J. M. (1996). Applications ofphylogenetically independent contrasts: a mixed prog-ress report. Oikos, 77, 167–172.
Romesburg, H. C. (1984). Cluster Analysis for Researchers.Lifetime Learning Publications, Belmont, CA.
Rothermel, B. B. and Semlitsch, R. D. (2002). An experi-mental Investigation of landscape resistance of forestversus old-field habitats to emigrating juvenile amphi-bians. Conservation Biology, 16, 1324–1332.
Ryan, T. P. (2007). Modern experimental design. Wiley-Inter-science, Hoboken, NJ.
Sarkar, S. and Margules, C. (2002). Operationalizing biodi-versity for conservation planning. Journal of Biosciences,27, 299–308.
Shaffer, M. L. (1981). Minimumpopulation sizes for speciesconservation. BioScience, 31, 131–134.
Simpson, E. H. (1949). Measurement of diversity. Nature,163, 688.
Sodhi, N. S., Bickford, D., Diesmos, A. C., et al. (2008a).Measuring the meltdown: drivers of global amphibianextinction and decline. PLoS One, 3, e1636.
Sodhi, N. S., Brook, B. W., and Bradshaw, C. J. A. (2009).Causes and consequences of species extinctions. InS. A. Levin, ed. The Princeton Guide to Ecology, pp.514–520. Princeton University Press, Princeton, NJ.
Sodhi, N. S., Koh, L. P., Peh, K. S.-H., et al. (2008b). Corre-lates of extinction proneness in tropical angiosperms.Diversity and Distributions, 14, 1–10.
338 CONSERVATION BIOLOGY FOR ALL
Sodhi and Ehrlich: Conservation Biology for All. http://ukcatalogue.oup.com/product/9780199554249.do
© Oxford University Press 2010. All rights reserved. For permissions please email: [email protected]

South,A., Rushton, S., andMacdonald,D. (2000). Simulatingthe proposed reintroduction of the European beaver(Castor fiber) to Scotland. Biological Conservation, 93,103–116.
Spielman, D., Brook, B. W., and Frankham, R. (2004). Mostspecies are not driven to extinction before genetic factorsimpact them. Proceedings of the National Academy ofSciences of the United States of America, 101, 15261–15264.
Steidl, R. J., Hayes, J. P., and Schauber, E. (1997). Statisticalpower analysis in wildlife research. Journal of WildlifeManagement, 61, 270–279.
Thomas, L. (1997). Retrospective power analysis. Conserva-tion Biology, 11, 276–280.
Thomas, L. and Krebs, C. J. (1997). A review of statisticalpower analysis software. Bulletin of the Ecological Societyof America, 78, 128–139.
Thompson, P. M., Wilson, B., Grellier, K., and Hammond,P. S. (2000). Combining power analysis and populationviability analysis to compare traditional and precaution-ary approaches to conservation of coastal cetaceans.Con-servation Biology, 14, 1253–1263.
Traill, L. W., Bradshaw, C. J. A., and Brook, B. W. (2007).Minimum viable population size: a meta-analysis of 30
years of published estimates. Biological Conservation, 139,159–166.
Traill, L. W., Brook, B. W., Frankham, R., and Bradshaw,C. J. A. (2010). Pragmatic population viability targets ina rapidly changing world. Biological Conservation, 143,28–34.
Turchin, P. (2003). Complex population dynamics: a theoreti-cal/empirical synthesis. Princeton University Press, Prince-ton, NJ.
Underwood, A. J. (1994). On beyond BACI: sampling de-signs that might reliably detect environmental distur-bances. Ecological Applications, 4, 3–15.
Verhulst, P. F. (1838). Notice sur la loi que la populationpoursuit dans son accroissement. Correspondance mathé-matique et physique, 10, 113–121.
White, G. C. and Burnham, K. P. (1999). Program MARK:survival estimation from populations of marked ani-mals. Bird Study, 46 (Supplement), 120–138.
Whittaker, R. H. (1972). Evolution and measurement ofspecies diversity. Taxon, 21, 213–251.
Winchester, A. M. and Wejksnora, P. J. (1995). LaboratoryManual of Genetics. 4th edn McGraw-Hill, New York,NY.
THE CONSERVATION BIOLOGIST TOOLBOX – PRINCIPLES FOR THE DESIGN AND ANALYSIS OF CONSERVATION STUDIES 339
1
© Oxford University Press 2010. All rights reserved. For permissions please email: [email protected]

Index*
*Intuitive topic coverage in chapters is not included here
A. smithii, 140A. superciliosa superciliosa, 139A. tsugae, 137A. undulata, 140A. wyvilliana, 140Acacia, 147, 173Acacia cyclops, 147Acer saccharum, 155Achatina fulica, 137Acridotheres tristis, 141adders-tongue fern, 28Adelges piceae, 137Aedes albopictus, 144Aegolius acadicus, 225Aepyceros melampus, 169African buffalo, 169African elephant, 233African molassesgrass, 134African mosquito, 147Agasicles hygrophila, 137Agrilus planipennis, 159Ailurapoda melanoleuca, 233Alagoas curassow, 184Alliaria petiolata, 136alligatorweed flea beetle, 137Alouatta seniculus, 99Alternanthera philoxeroides, 137American ash tree, 159American bison, 125American chestnut, 135American pika, 155American tufted beardgrass, 134Anas platyrhynchos, 139Aniba rosaeodora, 113Anolis sagrei, 143Anopheles darlingi, 65Anopheles gambiae, 147Anoplophora glabripennis, 144Aphanomyces astaci, 138Aphelinus semiflavus, 139Arabidopsis thaliana, 28Arctic cod, 155, 158Arctic hare, 158
Arctogadus glacialis, 155Areca catechu, 245arecanut, 245Argentine ant, 135Arundo donax, 143Asian chestnut blight, 135Asian parasitic tapeworm, 140Asian tapeworm, 139Athrotaxis selaginoides, 175Australian eucalyptus trees, 134Australian paperbark, 133, 134Australian rooikrans tree, 147avian influenza, 65
Bachman’s warbler, 193Baird’s tapir, 305bald eagle, 140, 225balsam woolly adelgid, 137Baltimore oriole, 155Bay checkerspot butterfly, 96Bertholletia excelsa, 113Bison bison, 109Bithynia, 141Bithynia tentaculata, 139, 141black and white colobus
monkey, 94black guillemot, 155black rhinoceros, 124, 232, 234blue monkey, 94blue-breasted fairy-wren, 95Boiga irregularis, 136, 194Bothriocephalus acheilognathi, 139Brazil nuts, 113Brazilian pepper, 143Brazilian sardine, 114broadleaf mahogany, 110, 242brown anole lizard, 143brown tree snake, 136, 194brown-headed cowbird, 99Bubalus bubalis, 142Bufo houstonensis, 232–233Bufo periglenes, 156bushmeat, 59, 100, 111, 225
C. stoebe, 135C3 photosynthesis, 170, 176C4 photosynthesis, 170Cactoblastis cactorum, 137cactus moth, 138, 148Caenorhabditis elegans, 28Caesalpinia echinata, 109Callitris intratropica, 175Campephilus principalis, 193cape shoveller, 140Capra aegagrus hircus, 137Carcharias taurus, 115Carcinus maenas, 143Caretta caretta, 118Carolina parakeet, 193carolinensis, 193Carson, Rachel, 11, 263cassava mealybug, 137, 139Castanea dentata, 135Castor canadensis, 133Caulerpa taxifolia, 134, 145Cebus capucinus, 305Cenchrus echinatus, 147Centaurea diffusa, 135Cepphus grylle, 155Ceratotherium simum, 169Cercopithecus mitza, 94Chaos chaos, 28chlorofluorocarbons, 153chytrid fungus, 157Cirsium hygrophilum var. hygrophilum,
138climate change, 16, 37, 47, 57, 153, 170,
195, 206, 226, 274, 284CO2 (carbon dioxide), 47, 51, 153, 161,
170, 178cochineal bug, 137Colluricincla harmonica, 94Colobus guereza, 94Commidendrum robustum, 148common myna, 141Connochaetes spp., 169Conus, 192
1
© Oxford University Press 2010. All rights reserved. For permissions please email: [email protected]

Convention on International Trade inEndangered Species of WildFauna and Flora (CITES), 11, 124
coral reefs, 76, 157, 160, 192, 193cordgrass, 134, 140Cordia interruptus, 141Corvus corone, 98cowpeas, 51crayfish plague, 138Cryphonectria parasitica, 135cryptic species, 30crystalline ice plant, 135Ctenopharyngodon idella,.cutthroat trout, 140Cyathocotyle bushiensis, 139Cynomys parvidens, 233cypress pine, 175
Dactylopius ceylonicus, 137Dalbergia melanoxylon, 110Darwin, Charles, 51, 163DDT (dichloro-diphenyl-
trichloroethane), 148, 263Dendroica chrysoparia, 232Dermochelys coriacea, 118Desmoncus, 112Diceros bicornis, 232diffuse knapweed, 135dipterocarp, 50Diuraphis noxia, 137diversity-stability hypothesis, 8Dreissena bugensis, 142Dreissena polymorpha, 135Drosophila melanogaster, 28dung beetles, 117
East African blackwood, 110eastern yellow robin, 94ecological diversity, 31, 33economics of conservation, 15, 16,
52, 55, 61, 63, 112, 199, 233,246, 256
economics of conservation, 55ecoregions, 31, 32, 201, 240Ectopistes migratorius, 193Edith’s checkerspot butterfly, 155eel grass, 155Ehrenfeld, David, 12Eichhornia crassipes, 134emerald ash borer, 159Emerson, Ralph Waldo, 263Encephalitozoon intestinalis, 28Endangered Species Act (ESA), 11,
181, 220, 225endemism, 1, 38, 201, 255Eopsaltria australis, 94Epidinocarsis lopezi, 139
Equus spp., 169Escherichia coli, 28ethics of conservation, 15, 21, 279ethnobotany, 64Eucalyptus, 164, 246Eucalyptus albens, 97Euglandina rosea, 137Euphydryas editha, 155Euphydryas editha bayensis, 96Eurasian badger, 93Eurasian weevil, 138European green crab, 143European mink, 140European rabbit, 140European rabbits, 137Evolutionary-Ecological Land
Ethic, 11extinction, 60, 63, 95, 107, 137, 148, 156,
181, 225, 327local, 107, 117, 123mass, 1, 34, 35, 109, 183, 254
F. microcarpa, 141Falco femoralis septentrionalis, 233faucet snail, 139, 141Ficus spp., 141fig wasps, 143figs, 142fire ant, 135firetree, 134, 142Florida panther, 181flying foxes (pteropodid fruit bats), 115Franklin, Benjamin, 66Fraser fir tree, 137Fraxinus americana, 159
G. amistadensis, 139Gambusia affinis, 137Gambusia amistadensis, 139garlic mustard, 136genetic diversity, 28, 95, 181,
208, 333Genyornis newtoni, 170Geophaps smithii, 176giant African snail, 137, 147giant bluefin tuna, 124giant panda, 233giant reed, 143Global Environment Facility (GEF),
199, 202Glossopsitta concinna, 94goats, 137golden lion tamarin, 233golden toad, 156golden-cheeked warblers, 232grass carp, 139grey shrike-thrush, 94
grey-headed robin, 156greynurse sharks, 115grizzly bear, 141, 181ground beetle, 246groundsel, 140Grus americana, 233gumwood tree, 148Gyps vulture, 63gypsy moth, 137
Haemophilus influenzae, 28Haliaeetus leucocephalus, 140, 225Hawaiian duck, 140Hawaiian honeycreepers, 159Hemidactylus frenatus, 135hemlock woolly adelgid, 137Heodes tityrus, 155Herpestes auropunctatus, 136Hesperia comma, 95heterogeneity, 32, 33Heteromyias albispecularis, 156Hibiscus tiliaceus, 49HIV, 64Holcaspis brevicula, 246homonymy, 30hooded crow, 98hotspots (biodiversity), 77, 194, 200,
203, 204house gecko, 135Houston toads, 232howler monkeys, 99humile, 135Hydrilla verticillata, 147Hydrodamalis gigas, 191Hyperaspis pantherina, 148
Icerya purchasi, 137Icterus galbula, 155Iguana iguana, 99iguanas, 99impala, 169implementing policy, 17, 19Indian house crow, 147Indian mongoose, 136Intergovernmental Panel on Climate
Change (IPCC), 16, 47, 153,158, 161
International Union for Conservationof Nature (IUCN), 225, 263
redlist, 185, 192, 204, 226, 234, 326irreplaceability, 200, 201island biogeography, 12, 14, 88,
186, 204ivory-billed woodpecker, 193
Jacques-Yves Cousteau, 11Japanese white-eye, 142
342 INDEX
Sodhi and Ehrlich: Conservation Biology for All. http://ukcatalogue.oup.com/product/9780199554249.do
© Oxford University Press 2010. All rights reserved. For permissions please email: [email protected]

Joshua trees, 159jumper ant, 28
kangaroo, 170key deer, 157keystone species, 57King Billy pine, 175Kochia scoparia, 147kokanee salmon, 140
lady beetle, 137, 148Lagorchestes hirsutus, 176Lake Erie water snake, 143landscape ecology, 210Lantana camara, 142large blue butterfly, 140Lates niloticus, 136latitudinal species gradient, 39leaf monkeys, 304leaf-cutter ants, 99leatherback turtle, 118Leontopithacus rosalia, 233Leopardus pardalis, 305Leopold, Aldo, 3, 4, 10, 181,
263, 279Lepus arcticus, 158Leyogonimus polyoon, 141Ligustrum robustrum, 141Linnaean taxonomy, 328Linnaeus, Carl, 184, 185lion, 233lodgepole pine, 166loggerhead turtle, 118longhorned beetle, 144Lousiana crayfish, 138lowland tapir, 160, 213Loxodonta africana, 233Lymantria dispar, 137
M. vison, 140Maculina arion, 140maize, 51malaria, 65, 147
avian, 138, 139, 159Malurus pulcherrimus, 95mangrove trees, 49Mangroves, 78Manorina melanocephala, 99marine conservation, 18, 203,
264Marsh, George Perkins, 9, 262masked palm civet, 65Mayr, Ernst, 8Mediterranean salt cedars, 134Melaleuca quinquenervia, 133Melamprosops phaeosoma, 184Meles meles, 93
Melinis minutiflora, 134Mesembryanthemum crystallinum, 135mesic spruce-fir, 166mesquite, 147metacommunity, 253metapopulation, 95, 253, 330methane, 47, 153Michael Soulé, 12Millennium Ecosystem Assessment,
45Mimosa pigra, 142Mitu mitu, 184Molothrus ater, 99Monterrey pine, 135Morella faya, 134, 142mosquito fish, 137, 148Muir, John, 263, 269Mus musculus, 28musk lorikeet, 94Mustela erminea, 136Myriophyllum spicatum, 142Myrmecia pilosula, 28Myrmica sabuleti, 140Mysis relicta, 140myxoma virus, 139, 140Myxosoma cerebralis, 139
N. bruchi, 137, 148National Environmental Policy Act, 11Neochetina eichhorniae, 137, 148Neogobius melanostomus, 142Nerodia sipedon insularum, 143Network of Conservation Educators
and Practitioners (NCEP), 303New Zealand grey duck, 139Nile perch, 136nitrogen, 47, 51, 134, 142, 176nitrous oxide, 47, 153noisy miner, 99North America mink, 140North American beaver, 59, 117,
133North American buffalo, 109North American gray squirrel, 135North American mallard, 139northern aplomado falcons, 233northern saw-whet owl, 225northern spotted owl, 15, 233Norway rats, 136, 147Nothofagus spp, 133Notropis lutrensis, 139Nyctereuteus procyonoides, 65
O. clarki, 140O. corallicola, 138O. jamaicensis, 140oaks, 135
ocelot, 305Ochotona princeps, 155Odocoileus virginianus, 123Odocoileus virginianus clavium, 157oil palm, 50, 239Oncorhynchus mykiss, 139Oncorhynchus nerka, 140Ophioglossum reticulatum, 28opossum shrimp, 140Opuntia spp., 137Opuntia vulgaris, 137orangutan, 243organismal diversity, 28, 31, 33Orthezia insignis, 148Oryctolagus cuniculus, 137Oxford ragwort, 140Oxyura leucocephala, 140
Pacifastacus lenusculus, 138Pacific rat, 136Paguma larvata, 65Panthera leo, 233parasitic wasp, 139parasitic witchweed, 139partridge pigeon, 176passenger pigeon, 193Pau-Brasil legume tree, 109Pau-Rosa, 113pet trade, 124Phacochoerus africanus, 169pharmaceuticals, 64Pharomachrus mocinno, 305Phenacoccus manihoti, 137Philippine cockatoo, 305philosophy of conservation, 148phosphorous, 47, 63phylogenetic irreplaceability, 206Phytophthora pinifolia, 135Picea engelmannii, 166Picoides borealis, 232Pinchot, Gifford, 263Pinus contorta, 166Pinus radiata, 135Plagopterus argentissimus, 139, 140Plasmodium relictum capristranoae, 138po’o uli, 184polar bear, 155pollinators, 56, 60, 98, 115Pongo borneo, 243population biology, 10Praon palitans, 139Presbytis sp., 304prickly pear cactus, 137Procambarus clarkii, 139Prosopis spp., 147Pseudocheirus peregrinus, 156pteropods, 158
INDEX 343
1
© Oxford University Press 2010. All rights reserved. For permissions please email: [email protected]

puma, 305Puma concolor, 305Puma concolor coryi, 181Pycnonotus jocosus, 141
quagga mussel, 142Quercus spp., 135
R. exulans, 136R. norvegicus, 136raccoon dog, 65rain forest conservation, 36rainbow trout, 139Rare, 305Pride campaign, 305
Rattus norvegicus, 28Rattus rattus, 136red shiner, 139red signal crayfish, 138red squirrel, 135red-cockaded woodpecker, 232reduced impact logging (RIL),
116, 242red-whiskered bulbul, 141resplendent quetzal, 306Rhinocyllus conicus, 138Rhizobium, 51rinderpest, 138ringtail possum, 156Rodolia cardinalis, 137Roosevelt, Theodore, 10rosy wolf snail, 137round goby, 142Rubus alceifolius, 141ruddy duck, 140rufous hare-wallaby, 176
S. alterniflora, 143S. cambrensis, 140S. squalidus, 140Saccharomyces cerevisiae, 28saiga antelope, 125Saiga tatarica, 125Saint Lucia parrot, 305sand bur, 147Sardinella brasiliensis, 114SARS, 65scale insect, 148Scarabaeinae, 117Schinus terebinthifolius, 143Schizachyrium condensatum, 134Sciurus carolinensis, 135
Sciurus vulgaris, 135Sciurus. vulgaris, 135semaphore cactus, 138Senecio, 140Senecio squalidus, 140Shannon’s Index, 315ship rat, 136silver-spotted skipper, 95skipper butterflies, 30, 33smooth prickly pear, 137Society for Conservation Biology
(SCB), 14Solenopsis invicta, 135sooty copper, 155Soulé, Michael E., 12South American water
hyacinth, 134South American weevils, 137southern beech, 133Spartina, 140Spartina anglica, 134, 143spatial conservation planning, 31species complex, 142species richness, 28, 30, 33, 57, 62, 201,
314, 317spotted knapweed, 135Steller’s sea cow, 191stoat, 136Stochastic processes, 95Striga asiatica, 139Strix aluco, 93Strix occidentalis caurina, 15, 233sugar maple, 155Suidae, 116Suisun thistle, 138sulfur, 47surrogacy, 203, 314, 318sustained yield, 8swallowtail butterflies, 33Swietenia macrophylla, 110, 242Syncerus caffer, 169synonymy, 30
Tachycineta bicolor, 155Tamarix, 231Tamarix spp., 134Taprius terrestris, 94Tapirus bairdii, 305tawny owl, 93Tayassu pecari, 94temperate forest conservation, 78, 176The Nature Conservancy, 12
Therioaphis trifolii, 139Thoreau, Henry David, 263Thunnus thynnus, 124tiger mosquito, 144tragedy of the commons, 65, 124tree swallows, 155trematode, 139, 141Trioxys utilis, 139tropical forest conservation, 13, 47, 49,
73, 76, 78, 82, 111, 116, 156, 185,254, 284, 297
urban planning, 18, 253Ursus arctos horribilis, 140, 181Ursus maritimus, 155Utah prairie dogs, 233
Vermivora bachmanii, 193
Wallace, Alfred Russel, 9, 187warthog, 169waru trees, 49water buffalo, 142water hyacinth, 134, 147, 148watermilfoil, 142weevils, 148Welsh groundsel, 140wheat, 51wheat aphid, 137whirling disease, 139white box tree, 97white rhino, 169white-faced capuchin monkey, 305white-headed duck, 140white-lipped peccary, 94white-tailed deer, 109, 123whooping crane, 233Wilcox, Bruce A., 7, 18wild pigs, 116wildebeest, 169wilderness conservation, 8, 110, 208,
263, 266, 268woundfin minnow, 140
yellow clover aphid, 139yellowbilled duck, 140Yucca brevifolia, 159
zebra, 169zebra mussel, 135, 142Zostera marina, 155Zosterops japonicus, 142
344 INDEX
Sodhi and Ehrlich: Conservation Biology for All. http://ukcatalogue.oup.com/product/9780199554249.do
© Oxford University Press 2010. All rights reserved. For permissions please email: [email protected]