Conjugated fatty acids and methane production by rumen microbes when incubated with linseed oil...
10
ORIGINAL ARTICLE Conjugated fatty acids and methane production by rumen microbes when incubated with linseed oil alone or mixed with fish oil and/or malate Xiang Z. LI, 1 * Qing S. GAO, 1 * Chang G. YAN, 1 Seong H. CHOI, 2 Jong S. SHIN 3 and Man K. SONG 2 1 Department of Animal Science, Yanbian University, Yanji, China; 2 Department of Animal Science, Chungbuk National University, Cheong-ju, Chungbuk and 3 Department of Animal Life Science, Kangwon National University, Chunchoen, Korea ABSTRACT We hypothesized that manipulating metabolism with fish oil and malate as a hydrogen acceptor would affect the biohydrogenation process of α-linolenic acid by rumen microbes. This study was to examine the effect of fish oil and/or malate on the production of conjugated fatty acids and methane (CH4) by rumen microbes when incubated with linseed oil. Linseed oil (LO), LO with fish oil (LO-FO), LO with malate (LO-MA), or LO with fish oil and malate (LO-FO-MA) was added to diluted rumen fluid, respectively. The LO-MA and LO-FO-MA increased pH and propionate concentration compared to the other treatments. LO-MA and LO-FO-MA reduced CH4 production compared to LO. LO-MA and LO-FO-MA increased the contents of c9,t11-conjugated linoleic acid (CLA) and c9,t11,c15-conjugated linolenic acid (CLnA) compared to LO. The content of malate was rapidly reduced while that of lactate was reduced in LO-MA and LO-FO-MA from 3 h incubation time. The fold change of the quantity of methanogen related to total bacteria was decreased at both 3 h and 6 h incubation times in all treatments compared to the control. Overall data indicate that supplementation of combined malate and/or fish oil when incubated with linseed oil, could depress methane generation and increase production of propionate, CLA and CLnA under the conditions of the current in vitro study. Key words: CLA, CLnA, fish oil, linseed oil, malate, methane. INTRODUCTION Methane (CH4) emission from domestic ruminants is considered as the second most important greenhouse gas (Wuebbles & Hayhoe 2002). Therefore, reducing CH4 emission from these animals can save gross feed energy (Johnson et al. 1993) and the global environ- ment as well. Theoretically, CH4 production in the rumen can be reduced by decreasing hydrogen (H2) production (Asanuma et al. 1999). This can be achieved by adding hydrogen acceptors readily avail- able for rumen microbes. Malate, an intermediate in the dicarboxylic acid pathway, has been identified to act as a H2 acceptor, and widely identified as decreasing methane emission with increased propionate (Castillo et al. 2004; Li et al. 2009). Fish oil has also been reported to increase rumen propionate (C3) concen- tration (Keady & Mayne 1999; Wachira et al. 2000) and was suggested as a potent rumen methane inhibi- tor (Fievez et al. 2003). Both conjugated linoleic acid (CLA) and conjugated linolenic acid (CLnA) are intermediates of the incom- plete hydrogenation of polyunsaturated fatty acids in the rumen (Bauman et al. 1999). CLA has stirred many researchers’ interests due to its beneficial effects on health. High levels of linoleic acid (C 18:2) and linolenic acid (C18:3) in the form of oilseeds or oils are known to enhance the CLA content in the milk fat of cows (Loor et al. 2005), fat tissue of sheep (Choi et al. 2006, 2007; Wang et al. 2006) and rumen fluid (Wang et al. 2002a). On the other hand, CLnA is a similar intermediate but from linolenic acid (Hafoot & Hazlewood 1988), the Correspondence: Man K. Song, Department of Animal Science, Chungbuk National University, Cheong-ju, Chungbuk 361-763, Korea. (Email: [email protected]) *Both authors contributed equally. Received 23 January 2014; accepted for publication 5 October 2014. Animal Science Journal (2015) ••, ••–•• doi: 10.1111/asj.12354 © 2015 Japanese Society of Animal Science
Transcript of Conjugated fatty acids and methane production by rumen microbes when incubated with linseed oil...
O R I G I N A L A R T I C L E
Conjugated fatty acids and methane production byrumen microbes when incubated with linseed oil aloneor mixed with fish oil and/or malate
Xiang Z. LI,1* Qing S. GAO,1* Chang G. YAN,1 Seong H. CHOI,2 Jong S. SHIN3 and Man K. SONG2
1Department of Animal Science, Yanbian University, Yanji, China; 2Department of Animal Science, ChungbukNational University, Cheong-ju, Chungbuk and 3Department of Animal Life Science, Kangwon NationalUniversity, Chunchoen, Korea
ABSTRACT
We hypothesized that manipulating metabolism with fish oil and malate as a hydrogen acceptor would affect the
biohydrogenation process of α-linolenic acid by rumen microbes. This study was to examine the effect of fish oil and/or
malate on the production of conjugated fatty acids and methane (CH4) by rumen microbes when incubated with linseed
oil. Linseed oil (LO), LO with fish oil (LO-FO), LO with malate (LO-MA), or LO with fish oil and malate (LO-FO-MA) was added
to diluted rumen fluid, respectively. The LO-MA and LO-FO-MA increased pH and propionate concentration compared to
the other treatments. LO-MA and LO-FO-MA reduced CH4 production compared to LO. LO-MA and LO-FO-MA increased
the contents of c9,t11-conjugated linoleic acid (CLA) and c9,t11,c15-conjugated linolenic acid (CLnA) compared to LO. The
content of malate was rapidly reduced while that of lactate was reduced in LO-MA and LO-FO-MA from 3 h incubation
time. The fold change of the quantity of methanogen related to total bacteria was decreased at both 3 h and 6 h
incubation times in all treatments compared to the control. Overall data indicate that supplementation of combined malate
and/or fish oil when incubated with linseed oil, could depress methane generation and increase production of propionate,
CLA and CLnA under the conditions of the current in vitro study.
Key words: CLA, CLnA, fish oil, linseed oil, malate, methane.
INTRODUCTIONMethane (CH4) emission from domestic ruminants isconsidered as the second most important greenhousegas (Wuebbles & Hayhoe 2002). Therefore, reducingCH4 emission from these animals can save gross feedenergy (Johnson et al. 1993) and the global environ-ment as well. Theoretically, CH4 production in therumen can be reduced by decreasing hydrogen (H2)production (Asanuma et al. 1999). This can beachieved by adding hydrogen acceptors readily avail-able for rumen microbes. Malate, an intermediate inthe dicarboxylic acid pathway, has been identified toact as a H2 acceptor, and widely identified as decreasingmethane emission with increased propionate (Castilloet al. 2004; Li et al. 2009). Fish oil has also beenreported to increase rumen propionate (C3) concen-tration (Keady & Mayne 1999; Wachira et al. 2000)and was suggested as a potent rumen methane inhibi-tor (Fievez et al. 2003).
Both conjugated linoleic acid (CLA) and conjugatedlinolenic acid (CLnA) are intermediates of the incom-plete hydrogenation of polyunsaturated fatty acids inthe rumen (Bauman et al. 1999). CLA has stirred manyresearchers’ interests due to its beneficial effects onhealth. High levels of linoleic acid (C18:2) and linolenicacid (C18:3) in the form of oilseeds or oils are known toenhance the CLA content in the milk fat of cows (Looret al. 2005), fat tissue of sheep (Choi et al. 2006, 2007;Wang et al. 2006) and rumen fluid (Wang et al. 2002a).On the other hand, CLnA is a similar intermediate butfrom linolenic acid (Hafoot & Hazlewood 1988), the
Correspondence: Man K. Song, Department of AnimalScience, Chungbuk National University, Cheong-ju,Chungbuk 361-763, Korea. (Email: [email protected])*Both authors contributed equally.Received 23 January 2014; accepted for publication 5October 2014.
bs_bs_banner
Animal Science Journal (2015) ••, ••–•• doi: 10.1111/asj.12354
© 2015 Japanese Society of Animal Science
chemical structure of which is confirmed (Destaillatset al. 2005). C9,t11,c15-CLnA has been tentativelyidentified as the most common intermediate producedin the first step of the bio-hydrogenation process oflinolenic acid as a model substrate by the action of theenzyme Δ12-cis, Δ11-trans isomerase in the rumen(Kepler & Tove 1967). However, little information hasbeen released on diet manipulation to biohy-drogenation intermediates of α-linolenic acid andCLnA production by rumen microbes.
Manipulating ruminal fermentation to reducemethane emission and to suppress the extensivebiohydrogenation process of unsaturated fatty acidswould benefit ruminants, the environment andhuman health. Extensive studies relating to individualfactors influencing the production of CLA and CH4
have been conducted. However, limited informationon the associated effect of unsaturated fatty acid,propionate enhancer (malate) and fish oil on produc-tion of conjugated fatty acids (CLA and CLnA) andmethane by rumen microbes has been released. There-fore, the objectives of the present study were toexamine the supplementing effects of malate and fishoil on CLA, CLnA production and methane generationwhen incubated with linseed oil in vitro.
MATERIALS AND METHODSPreparation of culture solution andits incubationThe rumen content was obtained at 2 h after the morningfeeding (08.00 hours) from the middle part of the rumen ofthree ruminally fistulated Holstein cows fed with 7 kg/day ofcommercial concentrate (4.9 kg; Deahan Feed Co., Ltd.,Incheon, Korea) for growing cattle and rice straw (2.1 kg) ona dry matter (DM) basis twice daily in equal volumes. Similarweight of the rumen content from each animal was mixedand the mixed rumen content was blended with a Waringblender (Fisher Scientific, Catalog no. 14–509-1, Waltham,MA, USA) for 20 seconds to detach the bacteria from the feedparticles, and was then strained through 12 layers of muslinto remove the feed particles. Gaseous CO2 was flushed intothe strained rumen fluid for 30 sec.
The solution for the batch culture was prepared by mixing45 mL strained rumen fluid with 45 mL McDougall’s artifi-cial saliva (McDougall 1948) under flushing of CO2. A total of120 mg linseed oil mixed with 0.48 g albumin fragments asemulsifier was dissolved in 1 mL distilled water and then wasadded to a 90 mL diluted rumen fluid (LO) in a 150-mLbottle. In addition, 120 mg linseed oil with 24 mg fish oil(LO-FO), 120 mg linseed oil with 24 mmol/L malate (DL-malic acid, M0875, 980 g/kg, LO-MA; Sigma-Aldrich, St.Louis, MO, USA), or 120 mg linseed oil with 24 mg fish oiland 24 mmol/L malate (LO-FO-MA) was added to thediluted rumen fluid. The culture solution with 0.48 galbumin fragments was also prepared for incubation(Control). A mixed feed (1.2 g) consisting of 0.84 g concen-trate and 0.36 g ground alfalfa hay (DM basis) was added tothe culture solution of each treatment. The bottles were thensealed with butyl rubber stoppers under a flushing of CO2,tightly covered with aluminum caps, and then incubated
anaerobically in a shaking incubator (VS-8480SR; Vision Sci-entific, Daejeon, Korea) up to 12 h at 39°C. The shakingspeed of the incubator was 135 rpm/min. The culture solu-tion was incubated simultaneously (five treatments, fourincubation times, two replicates per incubation time) inbatches and this incubation was repeated three times undersimilar conditions. The chemical composition of feeds addedto the culture solution is shown in Table 1, and the fatty acidprofiles of rumen fluid, feeds and supplemented oils areshown in Table 2.
Fermentation characteristicsThe incubation was terminated by taking the bottles out ofthe incubator at the indicated times of 1, 3, 6 and 12 h. ThepH of the culture solution was measured when each incuba-tion was terminated. The culture solution was kept frozen at−20°C for ammonia-N, volatile fatty acid (VFA) and fattyacids until analyzed. DM of feeds was determined by dryingat 135°C for 4 h followed by equilibration in a desiccator(AOAC 1995, Method 930.15). The AOAC (1995) proce-dures were also used to determine the contents of ash(Method 942.05), crude protein (CP, Method 984.13) andether extract (EE, Method 920.39) in feeds. Neutral deter-gent fiber (αNDF) of feeds was determined, as described byVan Soest et al. (1991), with addition of heat stable α amylase(Sigma A3306) to the ND (neutral detergent). Ammonia-Nconcentration was determined by the method of Fawcettand Scott (1960) using an ultraviolet-visible (UV/VIS)spectrophotometer (Optizen 3220UV; Mecasys Co. Ltd,Daejeon, Korea). The culture solution (0.8 mL) collectedfrom an incubation bottle for the VFA analysis was mixedwith 0.2 mL phosphoric acid (250 mL/L) and 0.2 mL pivalicacid solution (20 g/L) as the internal standard. The VFAconcentration was determined by a gas chromatograph (GC,HP5890 series II; Hewlett Packard Co., Palo Alto, CA, USA)equipped with a flame ionization detector (FID). The oventemperature for VFA analysis was 120°C, and the tempera-tures of the injector and detector were maintained at 170°Cand 200°C, respectively. A 30-m fused silica capillary column(HP-FFAP, 19091F-112, 0.32 mm internal diameter (i.d.);Agilent Technologies, Palo Alto, CA, USA) was used. Theidentification was carried out by the external standardmethod following injection of a VFA standard (Supelco47058, WSFA-4, Sigma-Aldrich, St Louis, MO, USA) ofknown concentration. The quantification was carried out byinternal standard method. The total gas production was alsomeasured at incubation times of 1, 3, 6, 9 and 12 h from theheadspace of culture bottles through the three-way stopcockusing a 50-mL glass syringe connected to a needle. Thecollected gas was transferred to a 4-mL vacuum tube andanalyzed for CH4 by a GC (HP5890 series II; Hewlett PackardCo.) equipped with FID. The gas (100 μL) was injectedinto the GC using the gas-tight syringe (Hamilton 81265;
Table 1 Chemical composition of feed added to the culturesolution (dry matter (DM) basis)
Compound Concentrate Alfalfa
Dry matter (DM), % 92.23 93.67Crude protein (CP), % of DM 15.18 13.51Ester extract (EE), % of DM 4.18 3.12Neutral detergent fiber, % of DM 38.73 56.23Crude ash, % of DM 6.71 8.71
2 X. Z. LI et al.
© 2015 Japanese Society of Animal Science Animal Science Journal (2015) ••, ••–••
Hamilton Bonaduz AG Shanghai Rep. Office, China). Theoven temperature for CH4 analysis was 40°C, and tempera-tures of injector and detector were maintained at 200°C. A30-m fused silica capillary column (HP-MOLESIE, 19091P-MS4, 0.32 mm i.d.; Agilent Technologies, Santa Clara, CA,USA) was used. The peak was identified and quantified usingstandard CH4 gas (999.9 g/kg; Deokyang Ltd. Daejeon,Korea).
Analyses of fatty acid methyl estersLipids in the mixed culture solution, including substrate feedparticles, were extracted using Folch’s solution (Folch et al.1957). Methylation of fatty acid followed the method ofLepage and Roy (1986) prior to injecting into a GC (6890N;Agilent Technologies) equipped with a 100-m fused silicacapillary column (Supelco SPTM-2560, 0.25 mm i.d.;Supelco Inc., Bellefonte, PA, USA). Injector and detectortemperatures were 240°C and 250°C, respectively. The splitratio was 1:100. The oven temperature was set at 140°C for2 min; it was increased to 240°C at a rate of 4°C/min andmaintained at this temperature for 40 min. C9,t11-CLA(91396; Fluka, Milwaukee, WI, USA), t10,c12-CLA (94594;Fluka) isomers were used to identify and quantify each CLAisomers. Other FA standards were obtained from Supelco Co.(18919-1AMP). Tridecanoic acid (C13:0, T0502; Sigma) wasused as an internal standard and all CLA isomers and otherFAs in the rumen fluid were quantified using FA standards.A standard mixture of equimolar levels as determined byboth GC and silver-ion high-performance liquid chromatog-raphy (Ag-HPLC) of CLnA (c9, t11, c15-C18:3, 75 wt %) waskindly provided by Prof. Chouinard (Sherbrooke, Quebec,Canada). The quantification of c9, t11, c15-C18:3 wasadjusted by the peak response of linolenic acid (Gervais &Chouinard 2008).
Determination of malate andlactate concentrationAnother 1 mL culture solution collected from incubatedbottles for the malate and lactate analysis was deproteinizedwith 1 mL sulfosalicylic acid (100 g/L) and then centrifuged(13 000 × g, 20 min). The supernatant was filtered with aMillipore syringe driven filter unit (Hydrophilic PTEE 0.45um, Millipore, Billerica, MA, USA) and transferred to auto-sampler vials (1.5 mL; Agilent). Malate and lactate in culturesolution were analyzed by a HPLC system (HPLC, Acme9000; Yonglin Co., Anyang, Gyeonggi-do, Korea) equippedwith a ternary pump delivery system, UV/VIS detector, andcolumn (Inertsil C8, Cat. no. 5020-01201, 5 μm,150 × 4.6 mm I.D.; Varian, Inc., Palo Alto, CA, USA). Efflu-ent (0.1 mol/L NH4H2PO4, pH 2.5 by H3PO4, 100:0) waschosen as a mobile phase at a flow rate of 0.7 mL/min. Oventemperature was 40°C. The separated organic acids weremonitored at 210 nm. The peak was identified and quanti-fied using standard malate and lactate (980 g/kg; JunseiChemical Co., Ltd, Tokyo, Japan).
Bacterial DNA extraction and realtime PCRTwo milliliters fluid of each bottle were sampled and totalgenomic DNA was extracted by the method of Stahl et al.(1988). The DNA was then detected by real-time PCR withspecific primer pairs of total bacteria and methanogen(Table 3). The threshold cycle (Ct) value represents the cyclenumber at which sample fluorescence rises above the back-ground to a statistically significant degree. The reactions wereconducted according to the protocol of the DyNAmo SYBRgreen quantitative PCR kit containing modified Tbr DNApolymerase, SYBR Green, optimized PCR buffer, 2.5 mmol/L
Table 2 Fatty acid composition (g/100 g fatty acid) in rumen fluid, feed and oils added to the culture solution
Fatty acids Rumen fluid Feed† Linseed oil Fish oil
Dodecanoic acid (C12:0) 3.67 8.95 ND NDMyristic acid (C14:0) 2.82 2.98 0.03 8.89Palmitic acid (C16:0) 22.72 18.18 5.63 27.90Palmitoleic acid (C16:1) 0.23 0.24 0.07 8.75Stearic acid (C18:0) 53.61 3.10 3.19 5.42Oleic acid (C18:1) 11.92 19.90 22.28 28.80Linoleic acid (C18:2) 2.14 38.96 13.80 4.85Linolenic acid (C18:3) 0.08 5.72 54.79 2.44Eicosapentaenoic acid (C20:5) 0.03 0.01 ND 3.49Docosahexaenoic acid (C22:6) 0.01 0.02 ND 1.51Other fatty acids 3.28 2.30 0.22 7.95
†Feed consists of 0.84 g concentrates and 0.36 g ground alfalfa hay (dry matter).ND, not detected.
Table 3 Primer sequences and annealing temperature conditions used for real time RT-PCR
Genes Primer sequence Annealingtemperature
References
Total bacteria F: 5′-CGGCAACGAGCGCAACCC-3′R: 5′-CCATTGTAGCACGTGTAGCC-3′
60°C Makkar Harinder andMcSweeney (2005)
Methanogens F: 5′-TTCGGTGGATCDCARAGRGC-3′R: 5′-GBARGTCGWAWCCGTAGAATCC-3′
60°C Denman et al. (2007)
OILS AND MALATE ON CLA, CLnA AND METHANE 3
© 2015 Japanese Society of Animal ScienceAnimal Science Journal (2015) ••, ••–••
MgCl2, and deoxynucleotide triphosphate (dNTP) mixincluding deoxyuridine triphosphate (dUTP) (Finnzymes Oy,Espoo, Finland). PCR was performed as: one cycle at 95°C fora 10 s for initial denaturation, followed by 40 cycles consist-ing of amplification and quantification program (95°C for30 s, 60°C for 30 s, 72°C for 30 s with a single fluorescencemeasurement), melting curve program (65°C-95°C, with aheating rate of 0.2°C/s and a continuous fluorescence meas-urement), and finally a cooling step to 4°C. Fluorescencedata were acquired after the extension step during PCR reac-tions containing SYBR Green. Thereafter, PCR products wereanalyzed by generating a melting curve. The relative quan-tification of methanogen was analyzed by the 2ddCt method(Livak & Schmittgen 2001).
Statistical analysisAll the data were analyzed using the GLM procedure of SAS(SAS 1985) according to the model:
y S O eijkl i j k k l ijkl= + + + + +μ τ α( )
where, Уijkl is dependent variable, μ is the overall mean, τi isthe treatment effect (i = 1–5), Sj is the run effect (j = 1–3), Ok
is the kth incubation time and α(k)l is the random effect ofreplicated observation (l = 1,2). The significances amongmeans for all variables by incubation time were compared byS-N-K’s test (Steel & Torrie 1980). Differences among meanswith P < 0.05 were accepted as representing statistically sig-nificant differences.
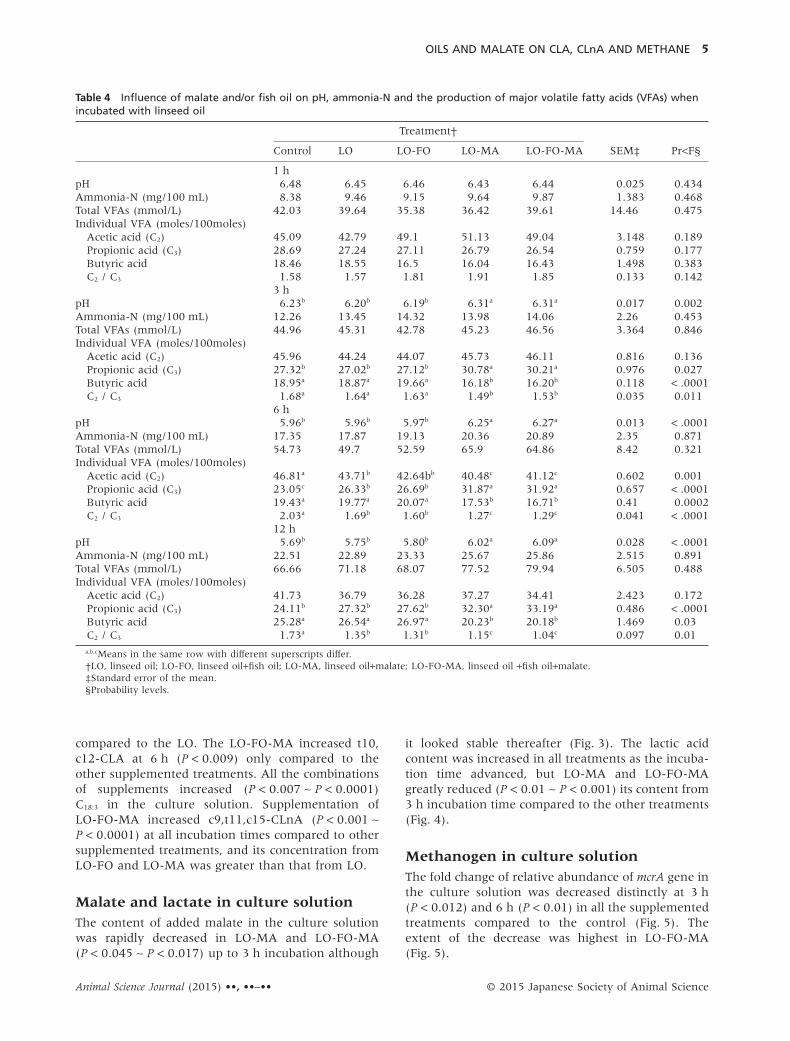
RESULTSFermentation characteristics andmethane production by rumen microbesThe pH of the culture solution was decreased for alltreatments with the incubation time (Table 4). TheLO-MA and LO-FO-MA increased pH levels at 3 h(P < 0.002), 6 h (P < 0.0001), and 12 h (P < 0.0001)incubation times compared to the other treatments.Linseed oil and fish oil alone did not influence the pHof the culture solution. The concentrations ofammonia-N and total VFA in the culture solution forall treatments were increased as the incubation timeadvanced, but no differences were found among treat-ments (Table 4). However, LO-MA and LO-FO-MAslightly increased the total VFA concentration from 6 hto 12 h incubation. Proportions of acetic acid (C2) andbutyric acid were not influenced by supplements butthe LO-MA and LO-MA-FO increased (P < 0.05)propionate (C3) proportion, thus resulting in adecreased C2/C3 ratio (P < 0.01) from 3 h incubationtime compared to other treatments. Interactionsbetween treatment and incubation time were foundfor pH (P < 0.0001), ammonia-N (P < 0.013), C2
(P < 0.009), C3 (P < 0.0001), butyrate (P < 0.0006) andC2/C3 (P < 0.0001), and the interactions mostlyoccurred at incubation times between 1 h and 3 h.
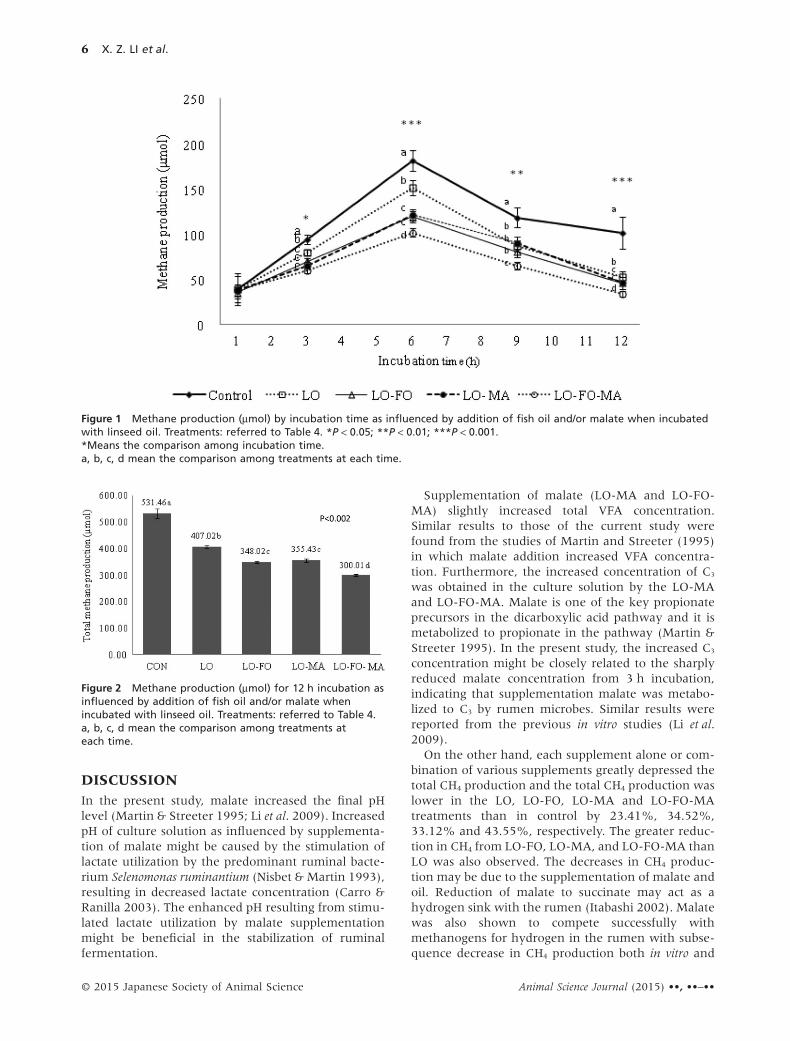
Linseed oil alone or in combination with othersupplements reduced (P < 0.05 ∼ P < 0.001) CH4
production at most incubation times (Fig. 1). The totalCH4 generated for 12 h incubation was greatlydecreased (P < 0.002) in LO, LO-FO, LO-MA, andLO-FO-MA treatments compared to the control(Fig. 2).
C18-fatty acids profile in culture solutionThe concentrations of stearic acid (C18:0) andlinolelaidate (c6-C18:2) in the culture solution wereincreased as incubation time advanced (Table 5). Inaddition, the concentration of oleic acid (c9-C18:1) wasincreased up to 6 h incubation and that of elaidic acid(t9-C18:1) was increased at 3 h and 6 h incubation timesfor all treatments. Trans vaccenic acid (t11-C18:1)tended to further increase while trans linoleate (t6-C18:2) in the culture solution was slightly decreased atthe 12 h incubation. The concentration of the sum ofCLA isomers (c9, t11-CLA and t10, c12-CLA) wasincreased at an early incubation time (1 h) but wasdecreased thereafter for all treatments. The concentra-tion of α-linolenic acid (C18:3) was greatly decreased upto 6 h incubation time.
As expected, the supplementation of linseed oilincreased the concentration of each C18-fatty acid inthe culture solution for all incubation times comparedto the control (Table 5). The concentration of C18:0 wasincreased (P < 0.006) in LO-MA and LO-MA-FO at 1 hincubation time compared to other treatments, whileits concentration from LO was higher (P < 0.004 ∼P < 0.001) than those of other treatments at 3 h incu-bation time. The highest (P < 0.002) concentration oft9-C18:1was observed from LO-MA-FO at 3 h, and itwas increased in LO-FO and LO-FO-MA at 6 h(P < 0.001) and in LO-FO, LO-MA and LO-FO-MA at12 h (P < 0.0001) compared to those in other treat-ments. The concentration of c9-C18:1 was lower(P < 0.005 ∼ P < 0.0001) at all incubation times for thecontrol than for the other treatments which were notstatistically different. The LO increased (P < 0.001 ∼P < 0.0001) the concentration of t11-C18:1 compared tothose of other supplemented treatments from 3 hincubation time. However, no differences were foundamong fish oil- and/or malate-supplemented treat-ments. The supplementation of oils also increased theconcentration of t6-C18:2 (P < 0.05 ∼ P < 0.002) andc6-C18:2 (P < 0.05 ∼ P < 0.0007) from 3 h incubationtime compared to the control. The concentrations oftotal CLA and both CLA isomers (c9,t11-CLA andt10,c12-CLA) were also increased by all supplements.The LO-FO-MA increased (P < 0.0008 ∼ P < 0.0001)the total CLA concentration at all incubation timescompared to other supplemented treatments. Moreo-ver, its higher concentration was obtained from LO-FOand LO-MA than from LO. The LO-FO-MA increased(P < 0.01 ∼ P < 0.0001) c9,t11-CLA for all incubationtimes compared to other supplemented treatments. Inaddition, LO-FO or LO-MA increased its concentration
4 X. Z. LI et al.
© 2015 Japanese Society of Animal Science Animal Science Journal (2015) ••, ••–••
compared to the LO. The LO-FO-MA increased t10,c12-CLA at 6 h (P < 0.009) only compared to theother supplemented treatments. All the combinationsof supplements increased (P < 0.007 ∼ P < 0.0001)C18:3 in the culture solution. Supplementation ofLO-FO-MA increased c9,t11,c15-CLnA (P < 0.001 ∼P < 0.0001) at all incubation times compared to othersupplemented treatments, and its concentration fromLO-FO and LO-MA was greater than that from LO.
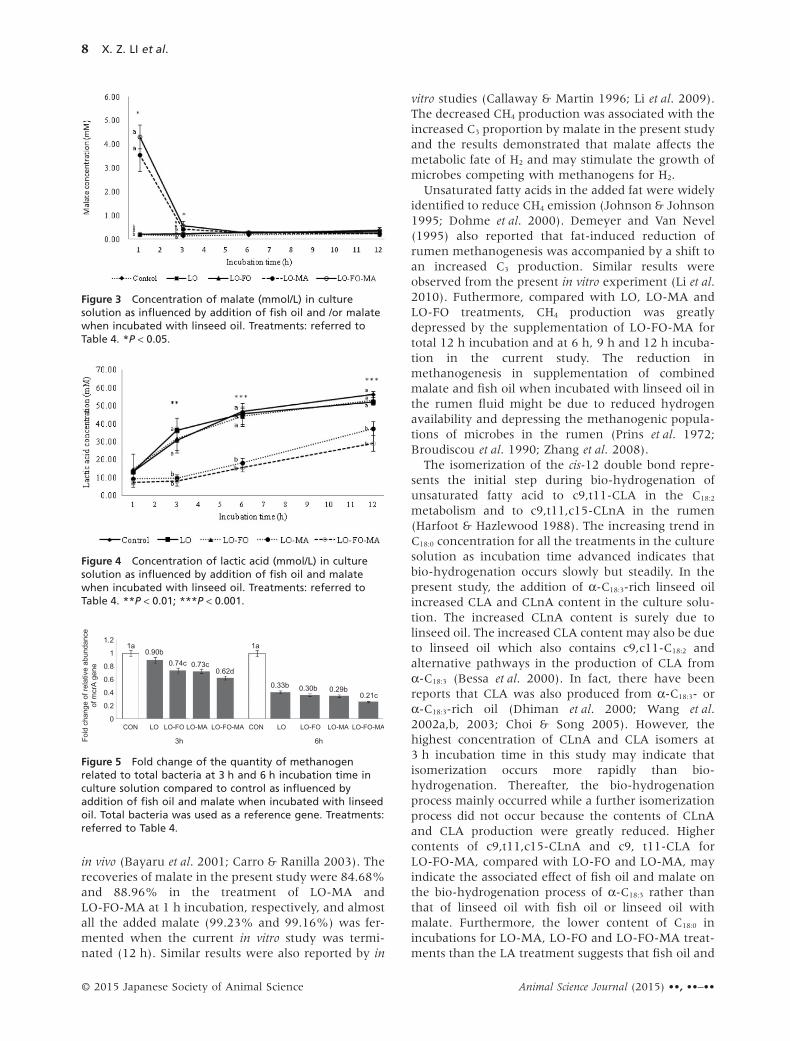
Malate and lactate in culture solutionThe content of added malate in the culture solutionwas rapidly decreased in LO-MA and LO-FO-MA(P < 0.045 ∼ P < 0.017) up to 3 h incubation although
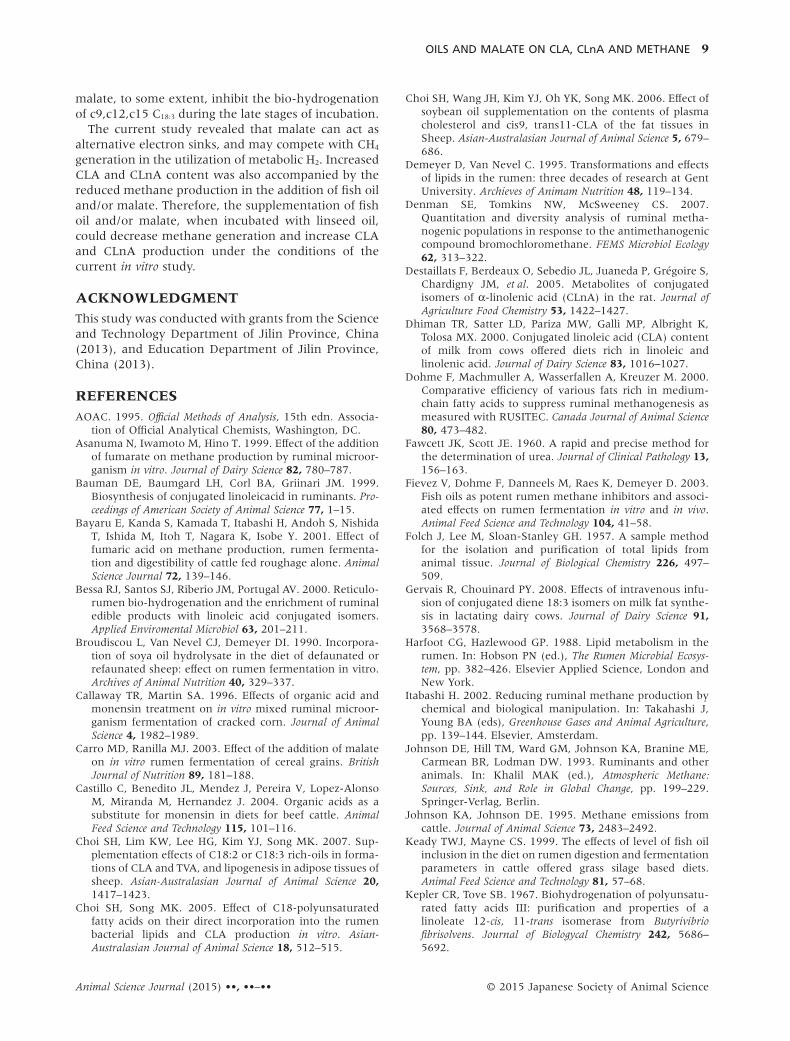
it looked stable thereafter (Fig. 3). The lactic acidcontent was increased in all treatments as the incuba-tion time advanced, but LO-MA and LO-FO-MAgreatly reduced (P < 0.01 ∼ P < 0.001) its content from3 h incubation time compared to the other treatments(Fig. 4).
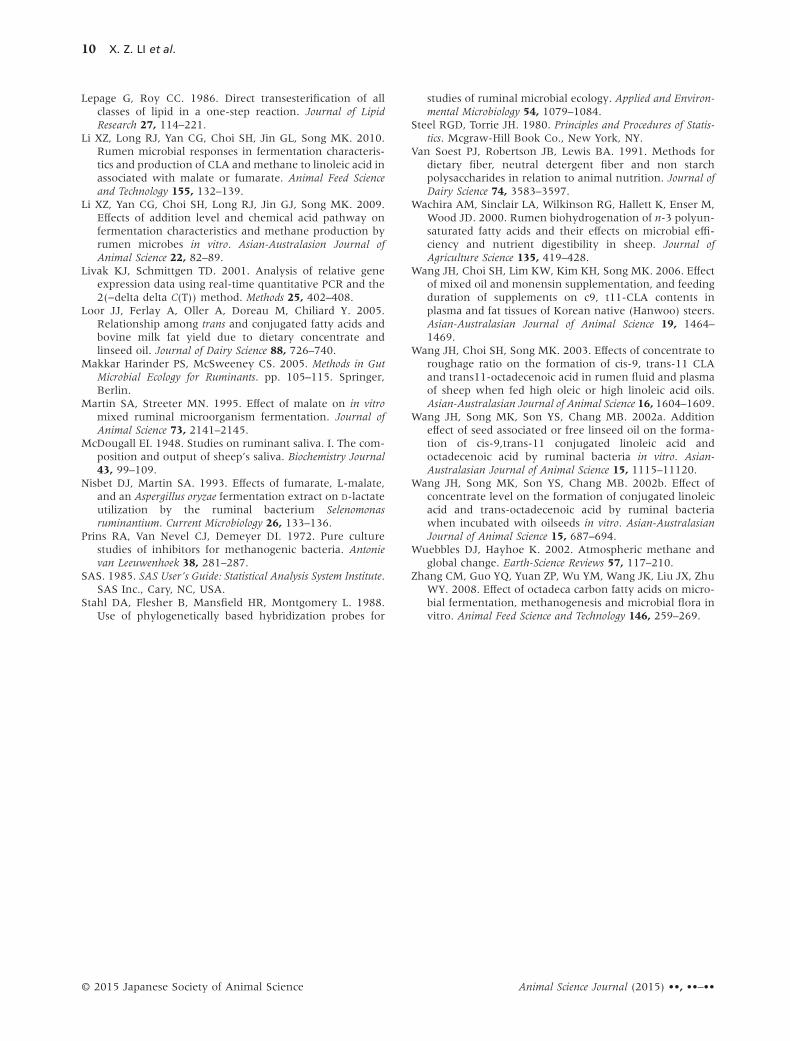
Methanogen in culture solutionThe fold change of relative abundance of mcrA gene inthe culture solution was decreased distinctly at 3 h(P < 0.012) and 6 h (P < 0.01) in all the supplementedtreatments compared to the control (Fig. 5). Theextent of the decrease was highest in LO-FO-MA(Fig. 5).
Table 4 Influence of malate and/or fish oil on pH, ammonia-N and the production of major volatile fatty acids (VFAs) whenincubated with linseed oil
Treatment†
Control LO LO-FO LO-MA LO-FO-MA SEM‡ Pr<F§
1 hpH 6.48 6.45 6.46 6.43 6.44 0.025 0.434Ammonia-N (mg/100 mL) 8.38 9.46 9.15 9.64 9.87 1.383 0.468Total VFAs (mmol/L) 42.03 39.64 35.38 36.42 39.61 14.46 0.475Individual VFA (moles/100moles)
Acetic acid (C2) 45.09 42.79 49.1 51.13 49.04 3.148 0.189Propionic acid (C3) 28.69 27.24 27.11 26.79 26.54 0.759 0.177Butyric acid 18.46 18.55 16.5 16.04 16.43 1.498 0.383C2 / C3 1.58 1.57 1.81 1.91 1.85 0.133 0.142
3 hpH 6.23b 6.20b 6.19b 6.31a 6.31a 0.017 0.002Ammonia-N (mg/100 mL) 12.26 13.45 14.32 13.98 14.06 2.26 0.453Total VFAs (mmol/L) 44.96 45.31 42.78 45.23 46.56 3.364 0.846Individual VFA (moles/100moles)
Acetic acid (C2) 45.96 44.24 44.07 45.73 46.11 0.816 0.136Propionic acid (C3) 27.32b 27.02b 27.12b 30.78a 30.21a 0.976 0.027Butyric acid 18.95a 18.87a 19.66a 16.18b 16.20b 0.118 < .0001C2 / C3 1.68a 1.64a 1.63a 1.49b 1.53b 0.035 0.011
6 hpH 5.96b 5.96b 5.97b 6.25a 6.27a 0.013 < .0001Ammonia-N (mg/100 mL) 17.35 17.87 19.13 20.36 20.89 2.35 0.871Total VFAs (mmol/L) 54.73 49.7 52.59 65.9 64.86 8.42 0.321Individual VFA (moles/100moles)
Acetic acid (C2) 46.81a 43.71b 42.64bb 40.48c 41.12c 0.602 0.001Propionic acid (C3) 23.05c 26.33b 26.69b 31.87a 31.92a 0.657 < .0001Butyric acid 19.43a 19.77a 20.07a 17.53b 16.71b 0.41 0.0002C2 / C3 2.03a 1.69b 1.60b 1.27c 1.29c 0.041 < .0001
12 hpH 5.69b 5.75b 5.80b 6.02a 6.09a 0.028 < .0001Ammonia-N (mg/100 mL) 22.51 22.89 23.33 25.67 25.86 2.515 0.891Total VFAs (mmol/L) 66.66 71.18 68.07 77.52 79.94 6.505 0.488Individual VFA (moles/100moles)
Acetic acid (C2) 41.73 36.79 36.28 37.27 34.41 2.423 0.172Propionic acid (C3) 24.11b 27.32b 27.62b 32.30a 33.19a 0.486 < .0001Butyric acid 25.28a 26.54a 26.97a 20.23b 20.18b 1.469 0.03C2 / C3 1.73a 1.35b 1.31b 1.15c 1.04c 0.097 0.01a,b,cMeans in the same row with different superscripts differ.†LO, linseed oil; LO-FO, linseed oil+fish oil; LO-MA, linseed oil+malate; LO-FO-MA, linseed oil +fish oil+malate.‡Standard error of the mean.§Probability levels.
OILS AND MALATE ON CLA, CLnA AND METHANE 5
© 2015 Japanese Society of Animal ScienceAnimal Science Journal (2015) ••, ••–••
DISCUSSIONIn the present study, malate increased the final pHlevel (Martin & Streeter 1995; Li et al. 2009). IncreasedpH of culture solution as influenced by supplementa-tion of malate might be caused by the stimulation oflactate utilization by the predominant ruminal bacte-rium Selenomonas ruminantium (Nisbet & Martin 1993),resulting in decreased lactate concentration (Carro &Ranilla 2003). The enhanced pH resulting from stimu-lated lactate utilization by malate supplementationmight be beneficial in the stabilization of ruminalfermentation.
Supplementation of malate (LO-MA and LO-FO-MA) slightly increased total VFA concentration.Similar results to those of the current study werefound from the studies of Martin and Streeter (1995)in which malate addition increased VFA concentra-tion. Furthermore, the increased concentration of C3
was obtained in the culture solution by the LO-MAand LO-FO-MA. Malate is one of the key propionateprecursors in the dicarboxylic acid pathway and it ismetabolized to propionate in the pathway (Martin &Streeter 1995). In the present study, the increased C3
concentration might be closely related to the sharplyreduced malate concentration from 3 h incubation,indicating that supplementation malate was metabo-lized to C3 by rumen microbes. Similar results werereported from the previous in vitro studies (Li et al.2009).
On the other hand, each supplement alone or com-bination of various supplements greatly depressed thetotal CH4 production and the total CH4 production waslower in the LO, LO-FO, LO-MA and LO-FO-MAtreatments than in control by 23.41%, 34.52%,33.12% and 43.55%, respectively. The greater reduc-tion in CH4 from LO-FO, LO-MA, and LO-FO-MA thanLO was also observed. The decreases in CH4 produc-tion may be due to the supplementation of malate andoil. Reduction of malate to succinate may act as ahydrogen sink with the rumen (Itabashi 2002). Malatewas also shown to compete successfully withmethanogens for hydrogen in the rumen with subse-quence decrease in CH4 production both in vitro and
Figure 1 Methane production (μmol) by incubation time as influenced by addition of fish oil and/or malate when incubatedwith linseed oil. Treatments: referred to Table 4. *P < 0.05; **P < 0.01; ***P < 0.001.*Means the comparison among incubation time.a, b, c, d mean the comparison among treatments at each time.
Figure 2 Methane production (μmol) for 12 h incubation asinfluenced by addition of fish oil and/or malate whenincubated with linseed oil. Treatments: referred to Table 4.a, b, c, d mean the comparison among treatments ateach time.
6 X. Z. LI et al.
© 2015 Japanese Society of Animal Science Animal Science Journal (2015) ••, ••–••
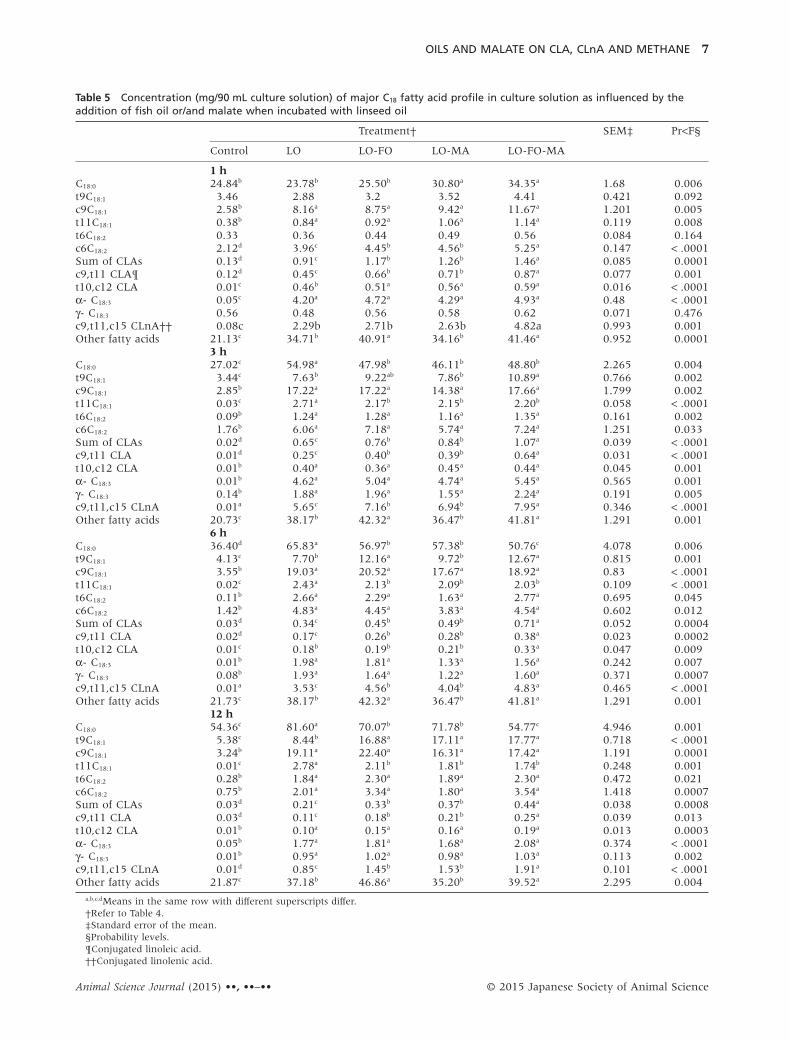
Table 5 Concentration (mg/90 mL culture solution) of major C18 fatty acid profile in culture solution as influenced by theaddition of fish oil or/and malate when incubated with linseed oil
Treatment† SEM‡ Pr<F§
Control LO LO-FO LO-MA LO-FO-MA
1 hC18:0 24.84b 23.78b 25.50b 30.80a 34.35a 1.68 0.006t9C18:1 3.46 2.88 3.2 3.52 4.41 0.421 0.092c9C18:1 2.58b 8.16a 8.75a 9.42a 11.67a 1.201 0.005t11C18:1 0.38b 0.84a 0.92a 1.06a 1.14a 0.119 0.008t6C18:2 0.33 0.36 0.44 0.49 0.56 0.084 0.164c6C18:2 2.12d 3.96c 4.45b 4.56b 5.25a 0.147 < .0001Sum of CLAs 0.13d 0.91c 1.17b 1.26b 1.46a 0.085 0.0001c9,t11 CLA¶ 0.12d 0.45c 0.66b 0.71b 0.87a 0.077 0.001t10,c12 CLA 0.01c 0.46b 0.51a 0.56a 0.59a 0.016 < .0001α- C18:3 0.05c 4.20a 4.72a 4.29a 4.93a 0.48 < .0001γ- C18:3 0.56 0.48 0.56 0.58 0.62 0.071 0.476c9,t11,c15 CLnA†† 0.08c 2.29b 2.71b 2.63b 4.82a 0.993 0.001Other fatty acids 21.13c 34.71b 40.91a 34.16b 41.46a 0.952 0.0001
3 hC18:0 27.02c 54.98a 47.98b 46.11b 48.80b 2.265 0.004t9C18:1 3.44c 7.63b 9.22ab 7.86b 10.89a 0.766 0.002c9C18:1 2.85b 17.22a 17.22a 14.38a 17.66a 1.799 0.002t11C18:1 0.03c 2.71a 2.17b 2.15b 2.20b 0.058 < .0001t6C18:2 0.09b 1.24a 1.28a 1.16a 1.35a 0.161 0.002c6C18:2 1.76b 6.06a 7.18a 5.74a 7.24a 1.251 0.033Sum of CLAs 0.02d 0.65c 0.76b 0.84b 1.07a 0.039 < .0001c9,t11 CLA 0.01d 0.25c 0.40b 0.39b 0.64a 0.031 < .0001t10,c12 CLA 0.01b 0.40a 0.36a 0.45a 0.44a 0.045 0.001α- C18:3 0.01b 4.62a 5.04a 4.74a 5.45a 0.565 0.001γ- C18:3 0.14b 1.88a 1.96a 1.55a 2.24a 0.191 0.005c9,t11,c15 CLnA 0.01a 5.65c 7.16b 6.94b 7.95a 0.346 < .0001Other fatty acids 20.73c 38.17b 42.32a 36.47b 41.81a 1.291 0.001
6 hC18:0 36.40d 65.83a 56.97b 57.38b 50.76c 4.078 0.006t9C18:1 4.13c 7.70b 12.16a 9.72b 12.67a 0.815 0.001c9C18:1 3.55b 19.03a 20.52a 17.67a 18.92a 0.83 < .0001t11C18:1 0.02c 2.43a 2.13b 2.09b 2.03b 0.109 < .0001t6C18:2 0.11b 2.66a 2.29a 1.63a 2.77a 0.695 0.045c6C18:2 1.42b 4.83a 4.45a 3.83a 4.54a 0.602 0.012Sum of CLAs 0.03d 0.34c 0.45b 0.49b 0.71a 0.052 0.0004c9,t11 CLA 0.02d 0.17c 0.26b 0.28b 0.38a 0.023 0.0002t10,c12 CLA 0.01c 0.18b 0.19b 0.21b 0.33a 0.047 0.009α- C18:3 0.01b 1.98a 1.81a 1.33a 1.56a 0.242 0.007γ- C18:3 0.08b 1.93a 1.64a 1.22a 1.60a 0.371 0.0007c9,t11,c15 CLnA 0.01a 3.53c 4.56b 4.04b 4.83a 0.465 < .0001Other fatty acids 21.73c 38.17b 42.32a 36.47b 41.81a 1.291 0.001
12 hC18:0 54.36c 81.60a 70.07b 71.78b 54.77c 4.946 0.001t9C18:1 5.38c 8.44b 16.88a 17.11a 17.77a 0.718 < .0001c9C18:1 3.24b 19.11a 22.40a 16.31a 17.42a 1.191 0.0001t11C18:1 0.01c 2.78a 2.11b 1.81b 1.74b 0.248 0.001t6C18:2 0.28b 1.84a 2.30a 1.89a 2.30a 0.472 0.021c6C18:2 0.75b 2.01a 3.34a 1.80a 3.54a 1.418 0.0007Sum of CLAs 0.03d 0.21c 0.33b 0.37b 0.44a 0.038 0.0008c9,t11 CLA 0.03d 0.11c 0.18b 0.21b 0.25a 0.039 0.013t10,c12 CLA 0.01b 0.10a 0.15a 0.16a 0.19a 0.013 0.0003α- C18:3 0.05b 1.77a 1.81a 1.68a 2.08a 0.374 < .0001γ- C18:3 0.01b 0.95a 1.02a 0.98a 1.03a 0.113 0.002c9,t11,c15 CLnA 0.01d 0.85c 1.45b 1.53b 1.91a 0.101 < .0001Other fatty acids 21.87c 37.18b 46.86a 35.20b 39.52a 2.295 0.004
a,b,c,dMeans in the same row with different superscripts differ.†Refer to Table 4.‡Standard error of the mean.§Probability levels.¶Conjugated linoleic acid.††Conjugated linolenic acid.
OILS AND MALATE ON CLA, CLnA AND METHANE 7
© 2015 Japanese Society of Animal ScienceAnimal Science Journal (2015) ••, ••–••
in vivo (Bayaru et al. 2001; Carro & Ranilla 2003). Therecoveries of malate in the present study were 84.68%and 88.96% in the treatment of LO-MA andLO-FO-MA at 1 h incubation, respectively, and almostall the added malate (99.23% and 99.16%) was fer-mented when the current in vitro study was termi-nated (12 h). Similar results were also reported by in
vitro studies (Callaway & Martin 1996; Li et al. 2009).The decreased CH4 production was associated with theincreased C3 proportion by malate in the present studyand the results demonstrated that malate affects themetabolic fate of H2 and may stimulate the growth ofmicrobes competing with methanogens for H2.
Unsaturated fatty acids in the added fat were widelyidentified to reduce CH4 emission (Johnson & Johnson1995; Dohme et al. 2000). Demeyer and Van Nevel(1995) also reported that fat-induced reduction ofrumen methanogenesis was accompanied by a shift toan increased C3 production. Similar results wereobserved from the present in vitro experiment (Li et al.2010). Futhermore, compared with LO, LO-MA andLO-FO treatments, CH4 production was greatlydepressed by the supplementation of LO-FO-MA fortotal 12 h incubation and at 6 h, 9 h and 12 h incuba-tion in the current study. The reduction inmethanogenesis in supplementation of combinedmalate and fish oil when incubated with linseed oil inthe rumen fluid might be due to reduced hydrogenavailability and depressing the methanogenic popula-tions of microbes in the rumen (Prins et al. 1972;Broudiscou et al. 1990; Zhang et al. 2008).
The isomerization of the cis-12 double bond repre-sents the initial step during bio-hydrogenation ofunsaturated fatty acid to c9,t11-CLA in the C18:2
metabolism and to c9,t11,c15-CLnA in the rumen(Harfoot & Hazlewood 1988). The increasing trend inC18:0 concentration for all the treatments in the culturesolution as incubation time advanced indicates thatbio-hydrogenation occurs slowly but steadily. In thepresent study, the addition of α-C18:3-rich linseed oilincreased CLA and CLnA content in the culture solu-tion. The increased CLnA content is surely due tolinseed oil. The increased CLA content may also be dueto linseed oil which also contains c9,c11-C18:2 andalternative pathways in the production of CLA fromα-C18:3 (Bessa et al. 2000). In fact, there have beenreports that CLA was also produced from α-C18:3- orα-C18:3-rich oil (Dhiman et al. 2000; Wang et al.2002a,b, 2003; Choi & Song 2005). However, thehighest concentration of CLnA and CLA isomers at3 h incubation time in this study may indicate thatisomerization occurs more rapidly than bio-hydrogenation. Thereafter, the bio-hydrogenationprocess mainly occurred while a further isomerizationprocess did not occur because the contents of CLnAand CLA production were greatly reduced. Highercontents of c9,t11,c15-CLnA and c9, t11-CLA forLO-FO-MA, compared with LO-FO and LO-MA, mayindicate the associated effect of fish oil and malate onthe bio-hydrogenation process of α-C18:3 rather thanthat of linseed oil with fish oil or linseed oil withmalate. Furthermore, the lower content of C18:0 inincubations for LO-MA, LO-FO and LO-FO-MA treat-ments than the LA treatment suggests that fish oil and
Figure 3 Concentration of malate (mmol/L) in culturesolution as influenced by addition of fish oil and /or malatewhen incubated with linseed oil. Treatments: referred toTable 4. *P < 0.05.
Figure 4 Concentration of lactic acid (mmol/L) in culturesolution as influenced by addition of fish oil and malatewhen incubated with linseed oil. Treatments: referred toTable 4. **P < 0.01; ***P < 0.001.
1.2
1
0.8
1a 1a0.90b
0.33b 0.30b 0.29b0.21c
0.74c 0.73c0.62d
0.6
Fol
d ch
ange
of r
elat
ive
abun
danc
eof
mcr
A g
ene
0.4
0.2
0
3h 6h
CON LO LO-FO LO-MA LO-FO-MA CON LO LO-FO LO-MA LO-FO-MA
Figure 5 Fold change of the quantity of methanogenrelated to total bacteria at 3 h and 6 h incubation time inculture solution compared to control as influenced byaddition of fish oil and malate when incubated with linseedoil. Total bacteria was used as a reference gene. Treatments:referred to Table 4.
8 X. Z. LI et al.
© 2015 Japanese Society of Animal Science Animal Science Journal (2015) ••, ••–••
malate, to some extent, inhibit the bio-hydrogenationof c9,c12,c15 C18:3 during the late stages of incubation.
The current study revealed that malate can act asalternative electron sinks, and may compete with CH4
generation in the utilization of metabolic H2. IncreasedCLA and CLnA content was also accompanied by thereduced methane production in the addition of fish oiland/or malate. Therefore, the supplementation of fishoil and/or malate, when incubated with linseed oil,could decrease methane generation and increase CLAand CLnA production under the conditions of thecurrent in vitro study.
ACKNOWLEDGMENTThis study was conducted with grants from the Scienceand Technology Department of Jilin Province, China(2013), and Education Department of Jilin Province,China (2013).
REFERENCESAOAC. 1995. Official Methods of Analysis, 15th edn. Associa-
tion of Official Analytical Chemists, Washington, DC.Asanuma N, Iwamoto M, Hino T. 1999. Effect of the addition
of fumarate on methane production by ruminal microor-ganism in vitro. Journal of Dairy Science 82, 780–787.
Bauman DE, Baumgard LH, Corl BA, Griinari JM. 1999.Biosynthesis of conjugated linoleicacid in ruminants. Pro-ceedings of American Society of Animal Science 77, 1–15.
Bayaru E, Kanda S, Kamada T, Itabashi H, Andoh S, NishidaT, Ishida M, Itoh T, Nagara K, Isobe Y. 2001. Effect offumaric acid on methane production, rumen fermenta-tion and digestibility of cattle fed roughage alone. AnimalScience Journal 72, 139–146.
Bessa RJ, Santos SJ, Riberio JM, Portugal AV. 2000. Reticulo-rumen bio-hydrogenation and the enrichment of ruminaledible products with linoleic acid conjugated isomers.Applied Enviromental Microbiol 63, 201–211.
Broudiscou L, Van Nevel CJ, Demeyer DI. 1990. Incorpora-tion of soya oil hydrolysate in the diet of defaunated orrefaunated sheep: effect on rumen fermentation in vitro.Archives of Animal Nutrition 40, 329–337.
Callaway TR, Martin SA. 1996. Effects of organic acid andmonensin treatment on in vitro mixed ruminal microor-ganism fermentation of cracked corn. Journal of AnimalScience 4, 1982–1989.
Carro MD, Ranilla MJ. 2003. Effect of the addition of malateon in vitro rumen fermentation of cereal grains. BritishJournal of Nutrition 89, 181–188.
Castillo C, Benedito JL, Mendez J, Pereira V, Lopez-AlonsoM, Miranda M, Hernandez J. 2004. Organic acids as asubstitute for monensin in diets for beef cattle. AnimalFeed Science and Technology 115, 101–116.
Choi SH, Lim KW, Lee HG, Kim YJ, Song MK. 2007. Sup-plementation effects of C18:2 or C18:3 rich-oils in forma-tions of CLA and TVA, and lipogenesis in adipose tissues ofsheep. Asian-Australasian Journal of Animal Science 20,1417–1423.
Choi SH, Song MK. 2005. Effect of C18-polyunsaturatedfatty acids on their direct incorporation into the rumenbacterial lipids and CLA production in vitro. Asian-Australasian Journal of Animal Science 18, 512–515.
Choi SH, Wang JH, Kim YJ, Oh YK, Song MK. 2006. Effect ofsoybean oil supplementation on the contents of plasmacholesterol and cis9, trans11-CLA of the fat tissues inSheep. Asian-Australasian Journal of Animal Science 5, 679–686.
Demeyer D, Van Nevel C. 1995. Transformations and effectsof lipids in the rumen: three decades of research at GentUniversity. Archieves of Animam Nutrition 48, 119–134.
Denman SE, Tomkins NW, McSweeney CS. 2007.Quantitation and diversity analysis of ruminal metha-nogenic populations in response to the antimethanogeniccompound bromochloromethane. FEMS Microbiol Ecology62, 313–322.
Destaillats F, Berdeaux O, Sebedio JL, Juaneda P, Grégoire S,Chardigny JM, et al. 2005. Metabolites of conjugatedisomers of α-linolenic acid (CLnA) in the rat. Journal ofAgriculture Food Chemistry 53, 1422–1427.
Dhiman TR, Satter LD, Pariza MW, Galli MP, Albright K,Tolosa MX. 2000. Conjugated linoleic acid (CLA) contentof milk from cows offered diets rich in linoleic andlinolenic acid. Journal of Dairy Science 83, 1016–1027.
Dohme F, Machmuller A, Wasserfallen A, Kreuzer M. 2000.Comparative efficiency of various fats rich in medium-chain fatty acids to suppress ruminal methanogenesis asmeasured with RUSITEC. Canada Journal of Animal Science80, 473–482.
Fawcett JK, Scott JE. 1960. A rapid and precise method forthe determination of urea. Journal of Clinical Pathology 13,156–163.
Fievez V, Dohme F, Danneels M, Raes K, Demeyer D. 2003.Fish oils as potent rumen methane inhibitors and associ-ated effects on rumen fermentation in vitro and in vivo.Animal Feed Science and Technology 104, 41–58.
Folch J, Lee M, Sloan-Stanley GH. 1957. A sample methodfor the isolation and purification of total lipids fromanimal tissue. Journal of Biological Chemistry 226, 497–509.
Gervais R, Chouinard PY. 2008. Effects of intravenous infu-sion of conjugated diene 18:3 isomers on milk fat synthe-sis in lactating dairy cows. Journal of Dairy Science 91,3568–3578.
Harfoot CG, Hazlewood GP. 1988. Lipid metabolism in therumen. In: Hobson PN (ed.), The Rumen Microbial Ecosys-tem, pp. 382–426. Elsevier Applied Science, London andNew York.
Itabashi H. 2002. Reducing ruminal methane production bychemical and biological manipulation. In: Takahashi J,Young BA (eds), Greenhouse Gases and Animal Agriculture,pp. 139–144. Elsevier, Amsterdam.
Johnson DE, Hill TM, Ward GM, Johnson KA, Branine ME,Carmean BR, Lodman DW. 1993. Ruminants and otheranimals. In: Khalil MAK (ed.), Atmospheric Methane:Sources, Sink, and Role in Global Change, pp. 199–229.Springer-Verlag, Berlin.
Johnson KA, Johnson DE. 1995. Methane emissions fromcattle. Journal of Animal Science 73, 2483–2492.
Keady TWJ, Mayne CS. 1999. The effects of level of fish oilinclusion in the diet on rumen digestion and fermentationparameters in cattle offered grass silage based diets.Animal Feed Science and Technology 81, 57–68.
Kepler CR, Tove SB. 1967. Biohydrogenation of polyunsatu-rated fatty acids III: purification and properties of alinoleate 12-cis, 11-trans isomerase from Butyrivibriofibrisolvens. Journal of Biologycal Chemistry 242, 5686–5692.
OILS AND MALATE ON CLA, CLnA AND METHANE 9
© 2015 Japanese Society of Animal ScienceAnimal Science Journal (2015) ••, ••–••
Lepage G, Roy CC. 1986. Direct transesterification of allclasses of lipid in a one-step reaction. Journal of LipidResearch 27, 114–221.
Li XZ, Long RJ, Yan CG, Choi SH, Jin GL, Song MK. 2010.Rumen microbial responses in fermentation characteris-tics and production of CLA and methane to linoleic acid inassociated with malate or fumarate. Animal Feed Scienceand Technology 155, 132–139.
Li XZ, Yan CG, Choi SH, Long RJ, Jin GJ, Song MK. 2009.Effects of addition level and chemical acid pathway onfermentation characteristics and methane production byrumen microbes in vitro. Asian-Australasion Journal ofAnimal Science 22, 82–89.
Livak KJ, Schmittgen TD. 2001. Analysis of relative geneexpression data using real-time quantitative PCR and the2(−delta delta C(T)) method. Methods 25, 402–408.
Loor JJ, Ferlay A, Oller A, Doreau M, Chiliard Y. 2005.Relationship among trans and conjugated fatty acids andbovine milk fat yield due to dietary concentrate andlinseed oil. Journal of Dairy Science 88, 726–740.
Makkar Harinder PS, McSweeney CS. 2005. Methods in GutMicrobial Ecology for Ruminants. pp. 105–115. Springer,Berlin.
Martin SA, Streeter MN. 1995. Effect of malate on in vitromixed ruminal microorganism fermentation. Journal ofAnimal Science 73, 2141–2145.
McDougall EI. 1948. Studies on ruminant saliva. I. The com-position and output of sheep’s saliva. Biochemistry Journal43, 99–109.
Nisbet DJ, Martin SA. 1993. Effects of fumarate, L-malate,and an Aspergillus oryzae fermentation extract on D-lactateutilization by the ruminal bacterium Selenomonasruminantium. Current Microbiology 26, 133–136.
Prins RA, Van Nevel CJ, Demeyer DI. 1972. Pure culturestudies of inhibitors for methanogenic bacteria. Antonievan Leeuwenhoek 38, 281–287.
SAS. 1985. SAS User’s Guide: Statistical Analysis System Institute.SAS Inc., Cary, NC, USA.
Stahl DA, Flesher B, Mansfield HR, Montgomery L. 1988.Use of phylogenetically based hybridization probes for
studies of ruminal microbial ecology. Applied and Environ-mental Microbiology 54, 1079–1084.
Steel RGD, Torrie JH. 1980. Principles and Procedures of Statis-tics. Mcgraw-Hill Book Co., New York, NY.
Van Soest PJ, Robertson JB, Lewis BA. 1991. Methods fordietary fiber, neutral detergent fiber and non starchpolysaccharides in relation to animal nutrition. Journal ofDairy Science 74, 3583–3597.
Wachira AM, Sinclair LA, Wilkinson RG, Hallett K, Enser M,Wood JD. 2000. Rumen biohydrogenation of n-3 polyun-saturated fatty acids and their effects on microbial effi-ciency and nutrient digestibility in sheep. Journal ofAgriculture Science 135, 419–428.
Wang JH, Choi SH, Lim KW, Kim KH, Song MK. 2006. Effectof mixed oil and monensin supplementation, and feedingduration of supplements on c9, t11-CLA contents inplasma and fat tissues of Korean native (Hanwoo) steers.Asian-Australasian Journal of Animal Science 19, 1464–1469.
Wang JH, Choi SH, Song MK. 2003. Effects of concentrate toroughage ratio on the formation of cis-9, trans-11 CLAand trans11-octadecenoic acid in rumen fluid and plasmaof sheep when fed high oleic or high linoleic acid oils.Asian-Australasian Journal of Animal Science 16, 1604–1609.
Wang JH, Song MK, Son YS, Chang MB. 2002a. Additioneffect of seed associated or free linseed oil on the forma-tion of cis-9,trans-11 conjugated linoleic acid andoctadecenoic acid by ruminal bacteria in vitro. Asian-Australasian Journal of Animal Science 15, 1115–11120.
Wang JH, Song MK, Son YS, Chang MB. 2002b. Effect ofconcentrate level on the formation of conjugated linoleicacid and trans-octadecenoic acid by ruminal bacteriawhen incubated with oilseeds in vitro. Asian-AustralasianJournal of Animal Science 15, 687–694.
Wuebbles DJ, Hayhoe K. 2002. Atmospheric methane andglobal change. Earth-Science Reviews 57, 117–210.
Zhang CM, Guo YQ, Yuan ZP, Wu YM, Wang JK, Liu JX, ZhuWY. 2008. Effect of octadeca carbon fatty acids on micro-bial fermentation, methanogenesis and microbial flora invitro. Animal Feed Science and Technology 146, 259–269.
10 X. Z. LI et al.
© 2015 Japanese Society of Animal Science Animal Science Journal (2015) ••, ••–••