Conflict Induced Migration and its Impact on Land Resources ...
12
Journal of Environment and Earth Science www.iiste.org ISSN 2224-3216 (Paper) ISSN 2225-0948 (Online) Vol.4, No.18, 2014 43 Conflict Induced Migration and its Impact on Land Resources in Plateau State, Nigeria Elijah A. Akintunde 1,2* Ruth A. Jambol 2 1.Department of Geography, University of Ibadan, Oyo state, Nigeria 2.Department of Geography and Planning, University of Jos, P. O BOX 2084, Plateau State, Nigeria * E-mail of the corresponding author: [email protected] Abstract The study assessed the Impact of conflict induced migration on the environment in Plateau State, Nigeria, through a combination of both the Geographic Information System and the SPSS to analyze the satellite images and the population data for the internally displaced persons in the area. It related the images of the area for 4 different years in the last decade; the year just before the crises began (2000), the second after two major conflicts (2006), the third after the fourth major conflict (2010) and finally, a projection of the area in the year 2020.From the image analyses and the correlations, a significant positive relationship was discovered to be present between conflict and environmental degradation (r= 0.84, at p<0.05) and the correlation ascertaining the relationship between migration and the depletion of land resources shows that the more the mobility of conflict displaced migrants the less the land resources become in the destination areas, and the less the migration the more the land resources with (r= -0.45, at p<0.05). The Markov Chain analysis and cellular automata analysis forecast showed that by the year 2020, in Jos, Plateau State, Nigeria, there will be increased demand and pressure on land resources; which will show up in forms of declining crop production, biodiversity loss, degradation of land quality and quantity, and competition for land. Little accessible forest cover will remain; the deforestation will lead to a catastrophic increase in soil erosion and loss of productive land through accelerated landslide incidence, and a possible disruption of the normal hydrological cycle. Furthermore, by this time the built up area would have taken over about 80% of the total area while the land resources will only be found in 20% of the total area. Keywords: Conflict, Migration, Resources, Land, Degradation, Plateau State Crises. 1. INTRODUCTION The last decade in the once peaceful state of Plateau, Nigeria has been characterized by sectarian violence and conflicts which have left thousands of people dead and many more injured and displaced. Many sojourners have had to move from conflict areas to new areas of perceived calm. Consequently, this population displacement has impelled the victim population either moving to another area or going to resettle in camps, tents and places of perceived safety. A lot of times, these victims have had to settle in forest reserves like the Fulde pastoralists resettled in a Forest Reserve in Bauchi State in June 2003 (Blench 2003). This resettlement of displaced persons has to a large extent affected the destination environment; especially the land resources of these areas. Due to the enormity of the variables that make up the environment, one aspect of the environment will be considered in this study; this will be with respect to land resources. For the purpose of this study, land resources will include vegetal cover (trees and forests), agricultural lands, and mountains. This study will employ satellite imageries to examine the destination of these migrants, such that, the extent which the area has been degraded by settlers and the rate at which this has taken place will be determined. It will require a comparative image analysis of the area before the last decade and the year 2010. This study seeks to identify the unfavorable impact the intra urban migration of people could have on the environment and on land resources in the destinations of migrants. Cassels, (2006) opined that a theoretical discussion on when and how migration, or migrants, may exert negative impacts on the environment can lead to well-planned empirical studies and ultimately how to mitigate negative impacts. Therefore, the impact of migration on the land resources in the destinations of migrants is a very important and timely topic as well. The impacts of these conflicts as discovered by this study have left indelible prints on the state especially the state capital, Jos. These impacts span much more than the loss of lives and properties; they have significantly led to the depletion of land resources in the destination of displaced migrants. For the purpose of this study; migration will be considered as induced by violence and crises, this type of migration in light of the classification by Guinness (2008), and the National Geographic society 2005, is referred to as impelled/imposed/reluctant migration, a migration that takes place under perceived threat, either human or physical but with an element of choice which is usually lacking in forced migration. De Souza et al (2003), explained that such war induced migration push agricultural workers off their lands, forests degraded; eventually damaging the local ecosystems and also implying that there will be a requirement for additional land for food income, housing roads and other infrastructure. Harrison and Pearce added that high rates of migration denote a serious environmental crisis in the receiving end (Harrison and Pearce 2000 pp 87).
-
Upload
khangminh22 -
Category
Documents
-
view
2 -
download
0
Transcript of Conflict Induced Migration and its Impact on Land Resources ...

Journal of Environment and Earth Science www.iiste.org
ISSN 2224-3216 (Paper) ISSN 2225-0948 (Online)
Vol.4, No.18, 2014
43
Conflict Induced Migration and its Impact on Land Resources in
Plateau State, Nigeria
Elijah A. Akintunde1,2*
Ruth A. Jambol2
1.Department of Geography, University of Ibadan, Oyo state, Nigeria
2.Department of Geography and Planning, University of Jos, P. O BOX 2084, Plateau State, Nigeria
* E-mail of the corresponding author: [email protected]
Abstract
The study assessed the Impact of conflict induced migration on the environment in Plateau State, Nigeria,
through a combination of both the Geographic Information System and the SPSS to analyze the satellite images
and the population data for the internally displaced persons in the area. It related the images of the area for 4
different years in the last decade; the year just before the crises began (2000), the second after two major
conflicts (2006), the third after the fourth major conflict (2010) and finally, a projection of the area in the year
2020.From the image analyses and the correlations, a significant positive relationship was discovered to be
present between conflict and environmental degradation (r= 0.84, at p<0.05) and the correlation ascertaining the
relationship between migration and the depletion of land resources shows that the more the mobility of conflict
displaced migrants the less the land resources become in the destination areas, and the less the migration the
more the land resources with (r= -0.45, at p<0.05). The Markov Chain analysis and cellular automata analysis
forecast showed that by the year 2020, in Jos, Plateau State, Nigeria, there will be increased demand and
pressure on land resources; which will show up in forms of declining crop production, biodiversity loss,
degradation of land quality and quantity, and competition for land. Little accessible forest cover will remain; the
deforestation will lead to a catastrophic increase in soil erosion and loss of productive land through accelerated
landslide incidence, and a possible disruption of the normal hydrological cycle. Furthermore, by this time the
built up area would have taken over about 80% of the total area while the land resources will only be found in
20% of the total area.
Keywords: Conflict, Migration, Resources, Land, Degradation, Plateau State Crises.
1. INTRODUCTION
The last decade in the once peaceful state of Plateau, Nigeria has been characterized by sectarian violence and
conflicts which have left thousands of people dead and many more injured and displaced. Many sojourners have
had to move from conflict areas to new areas of perceived calm. Consequently, this population displacement has
impelled the victim population either moving to another area or going to resettle in camps, tents and places of
perceived safety. A lot of times, these victims have had to settle in forest reserves like the Fulde pastoralists
resettled in a Forest Reserve in Bauchi State in June 2003 (Blench 2003). This resettlement of displaced persons
has to a large extent affected the destination environment; especially the land resources of these areas.
Due to the enormity of the variables that make up the environment, one aspect of the environment will
be considered in this study; this will be with respect to land resources. For the purpose of this study, land
resources will include vegetal cover (trees and forests), agricultural lands, and mountains.
This study will employ satellite imageries to examine the destination of these migrants, such that, the
extent which the area has been degraded by settlers and the rate at which this has taken place will be determined.
It will require a comparative image analysis of the area before the last decade and the year 2010. This study
seeks to identify the unfavorable impact the intra urban migration of people could have on the environment and
on land resources in the destinations of migrants. Cassels, (2006) opined that a theoretical discussion on when
and how migration, or migrants, may exert negative impacts on the environment can lead to well-planned
empirical studies and ultimately how to mitigate negative impacts. Therefore, the impact of migration on the
land resources in the destinations of migrants is a very important and timely topic as well.
The impacts of these conflicts as discovered by this study have left indelible prints on the state
especially the state capital, Jos. These impacts span much more than the loss of lives and properties; they have
significantly led to the depletion of land resources in the destination of displaced migrants.
For the purpose of this study; migration will be considered as induced by violence and crises, this type
of migration in light of the classification by Guinness (2008), and the National Geographic society 2005, is
referred to as impelled/imposed/reluctant migration, a migration that takes place under perceived threat, either
human or physical but with an element of choice which is usually lacking in forced migration. De Souza et al
(2003), explained that such war induced migration push agricultural workers off their lands, forests degraded;
eventually damaging the local ecosystems and also implying that there will be a requirement for additional land
for food income, housing roads and other infrastructure. Harrison and Pearce added that high rates of migration
denote a serious environmental crisis in the receiving end (Harrison and Pearce 2000 pp 87).

Journal of Environment and Earth Science www.iiste.org
ISSN 2224-3216 (Paper) ISSN 2225-0948 (Online)
Vol.4, No.18, 2014
44
The movement and resettlements that have been the outcome of the conflicts in Jos have led to the
unprecedented erection of residential structures and the emergence of new settlements at the study area. This
mobility of persons, establishments of settlements and growth of communities have led to the modification of the
immediate environment. Slowly but gradually, deforestation turned thick vegetation into bare fields and
residential homes, houses were erected on former farmlands and animals inhabiting these areas were killed while
others escaped farther into the yet to be colonized wild for temporary safety.
With the incidence and resurgence of the ethno religious conflicts in the state, more and more people
are compelled to move from potentially danger imminent areas to these emerging settlements. This implies that
more trees will be cut, more farmlands converted to residential homes, more vegetation depleted, more plant and
animal species destroyed and more mountain configurations modified.
More closely, the study area was before the last decade covered with green grass, trees, mountains and a
very sparse population. The area was equally cultivated for agriculture, but the turn of events during the last
decade has led to the conversion of the area into residential buildings making the vegetation cover today
diminutive, a miniature of what it used to be. With the wave of violence and crises globally, this study is thus
timely as it can provide an explanation to what impacts conflicts have on the land resources in the environment
especially in the destinations of migrants displaced during such crises.
1.1 STUDY AREA
Plateau state was created in February 3, 1976. It is located beautifully in the center of the country. It lies
between latitude 8024'north and Longitude 8
032' and 10°38' east. The figures recently published by the Nigeria
National Bureau of Statistics indicate that the population of the state based on the 2006 census was 3,178,712
persons, 1,592,033 males and 1,583,579 females. Plateau state has an area of about 26,899 Sq.km and shares
common boundaries with Benue, Nassarawa, Kaduna, Taraba, Bauchi and Gombe States. Plateau State has the
most striking physical features in Nigeria with the High lands rising from 1,200 meters above sea level at the low
lands to a peak of 1,829 meters above sea level.
Jos the study area is the state capital and is made up of Jos north, Jos South and Jos East, and the area to
be studied is a strip along these Local Governments precisely the enclosure between the coordinates of E8052’
44.6” N90 56” 49” and E8
0 55’ 11.7” N9
0 54’ 37” The total population of the area from the 2006 Census is
821,618 persons with Jos North comprising 429,300, Jos East 85,602 and Jos South 306,716 people. The other
Local Government Areas of plateau state include: Barkin Ladi, Bassa, Bokkos, Kanam, Kanke, Langtang North,
Langtang South, Mangu, Mikang, Pankshin, Quan ‘pan, Riyom, Shendam and Wase.
Figure 1. Nigeria showing Plateau State.
.
Meters
Legend
Nigeria
NIGER
BORNO
YOBE
TARABA
BAUCHI
OYO
KEBBI
KOGI
KADUNA
KWARA
BENUE
EDO
ADAMAWA
ZAMFARA
SOKOTO
KANO
JIGAWA
PLATEAU
KATSINA
OGUN
DELTA
ONDO
GOMBE
NASSARAWA
FCT
OSUN
IMO
EKITI
CROSS RIVER
RIVERS
ENUGU
ABIA
BAYELSA
EBONYI
AKWA IBOM
LAGOS ANAMBR
A
15°0'0"E
15°0'0"E
14°0'0"E
14°0'0"E
13°0'0"E
13°0'0"E
12°0'0"E
12°0'0"E
11°0'0"E
11°0'0"E
10°0'0"E
10°0'0"E
9°0'0"E
9°0'0"E
8°0'0"E
8°0'0"E
7°0'0"E
7°0'0"E
6°0'0"E
6°0'0"E
5°0'0"E
5°0'0"E
4°0'0"E
4°0'0"E
3°0'0"E
3°0'0"E
16°0'0"N
16°0'0"N
15°0'0"N
15°0'0"N
14°0'0"N
14°0'0"N
13°0'0"N
13°0'0"N
12°0'0"N
12°0'0"N
11°0'0"N
11°0'0"N
10°0'0"N
10°0'0"N
9°0'0"N
9°0'0"N
8°0'0"N
8°0'0"N
7°0'0"N
7°0'0"N
6°0'0"N
6°0'0"N
5°0'0"N
5°0'0"N
4°0'0"N
4°0'0"N
3°0'0"N
3°0'0"N
2°0'0"N
2°0'0"N
2 0 2 1
Plateau State

Journal of Environment and Earth Science www.iiste.org
ISSN 2224-3216 (Paper) ISSN 2225-0948 (Online)
Vol.4, No.18, 2014
45
Figure 2. Plateau State Showing Study Area. 1.2 Materials and Methods
The study used primary and secondary sources for the needed data. The primary data included direct
measurement of coordinates from the field and reconnaissance survey, Satellite imageries of the area, that
depicted the study area before the last decade, the year 2000, 2006 and another for 2010. This was because the
major conflicts under consideration occurred between 2001 and 2010. These images were used to identify the
status of the area before settlers migrated to the area and what is currently present in the area. The sources of
data used include the following:
Geographic Positioning System (GPS) was used for measurement of geographical coordinates and
ground truthing of the area. Images from the Google earth were equally used to ascertain selected areas within
the sample; the table below summarizes the data source and types.
Table 1. Data Types and Sources
S/N DATA TYPE DATE OF
PRODUCTION
SCALE SOURCE
1 Landsat Image
Landsat Image
12-10-2000
17-11-2006
28.5m TM
28.5m ETM+
NCRS
NCRS
2 Land use/land cover
Vegetation map.
2000 1:1,495, 389
(view scale)
Plateau state ministry of
Lands/survey
3 Google Earth Image 2000, 2006 and
2010
1m
Internet
4 Crises displacement and
settlement data
- - Center for Peace and Conflict
Resolution in Jos
5 Displacement reports and data - - Nigeria Human Rights Watch
6 Settlement and displacement
data
- - Displacement Monitoring
Center, Norway
Geo-referencing Properties of the Images
The geo-referencing properties of 2000, 2006 and 2010 were resampled to the same geo-referencing properties.
Referencing system: UTM-31
Reference units: m
Unit distance: 1
Minimum X: 1150070.296
Maximum X: 1145591.302
Minimum Y: 1101261.377
Maximum Y: 1105638.767
Wase
Kanam
Bassa
Shendam
Mangu
Bokkos
Qua'an Pan
Pankshin
Kanke
Riyom
Jos East
Mikang
Barkin Ladi
Langtang South
Jos South
Jos North
Langtang North
10°30'0"E
10°30'0"E
10°0'0"E
10°0'0"E
9°30'0"E
9°30'0"E
9°0'0"E
9°0'0"E
8°30'0"E
8°30'0"E
10°0'0"N
10°0'0"N
9°30'0"N
9°30'0"N
9°0'0"N
9°0'0"N
8°30'0"N
8°30'0"N
Legend
Study Area
0 3
0 6
0 9
0 12
0 1
5 Kilometers

Journal of Environment and Earth Science www.iiste.org
ISSN 2224-3216 (Paper) ISSN 2225-0948 (Online)
Vol.4, No.18, 2014
46
Min Value: 1
Max Value: 5
1.2.1 SOFTWARE USED
Basically, the softwares used for this project include a combination of the following;
i. ERDAS IMAGINE 9.1 – This was used for displaying, processing and
enhancement of the image. This was also used for the development of land use land cover classes
(Supervised Classification).
ii. ArcGIS 9.3 – This was used to vectorize the Jos region from the whole Plateau State admin and
local government maps. Clipping the study area from the composite landsat images was also
done in ArcGIS environment. Area calculations for the various Land use classes was carried out
in ArcGIS environment, it was likewise used to compliment the display of the data.
iii. IDRISI ANDES – Change detection analysis and Projection of the study area were executed
using this software.
iv. MICROSOFT WORD 2010 – was used basically for the presentation of the research.
v. SPSS 17 – This statistical package was used to perform statistical analyses and test the
postulated hypotheses.
vi. Microsoft Excel - This was used in computing figures, produce tables and plot charts.
Table 2. Classification Scheme, a Modification of FORMECU 1995
LAND USE/LAND COVER TYPES DESCRIPTION
Settlement / Bare Surface Areas that have been populated with permanent residents or
covered with
Scanty grass and exposed rocks, and bare lands.
Shrub land / Farmland Complex An area of land covered mainly with shrubby plants and crops
Forest / Vegetation An area of land covered with mature trees and other plants
growing close together.
Water Body Areas covered with water such as dams and rivers.
1.2.2 Sampling Procedure and Technique
The choice of the sample comes as a result of the peculiarity of this study, such that the site is one of the sites
that was once characterized by numerous land resources but has over time due to the series of crises been
modified by resettlements of the displaced persons and migrants from crises prone areas. The choice also comes
from the fact that the study area is located in Jos the state capital where the crises have predominated in the last
10 years.
Similarly, Episodes of mass killing and destruction have occurred in Jos in 2001, 2002, 2008 and 2010
(Higazi, 2011). It is therefore upon this basis that a systematic sampling has been carried out using 3 images. The
selection of the images was done such that the first image of the area showed how the study area was before the
crises began in the last decade i.e. year 2000, the second is the 2006 image, which was chosen in view of the two
major conflicts that have occurred within this time frame from the year 2000. The final image is that of the year
2010, also chosen against the background of the 2 major conflicts that characterized the time frame from the year
2006 to 2010.
1.3 RESULTS AND FINDINGS
Recent studies that reflect the global rate of land resource degradation show that something has to be done to
salvage the rapid loss of land resources. Much more assertively and as proven empirically from recent studies as
well as this; over twenty-four per cent of the land area has been degrading over the last 25 years, directly
affecting the livelihoods of 1.5 billion people Bai et al (2008). Land degradation is not an immediate impact that
can easily be measured within a short period, as explained by Bai et al (2008).

Journal of Environment and Earth Science www.iiste.org
ISSN 2224-3216 (Paper) ISSN 2225-0948 (Online)
Vol.4, No.18, 2014
47
Table 3. Land Use and Resource Distribution (2000, 2006, 2010)
Land Cover
Types
Study area 2000
(m2)
Area
(%)
Study area 2006
(m2)
Area
(%)
Study area 2010
(m2)
Area
(%)
Farm land 6673408 35.430 3985072 21.157 3073280 16.316
Built Up Area 10559696 56.062 13998320 74.318 15077104 80.046
Open Space 148960 0.791 144256 0.766 97216 0.516
Water Body 36064 0.191 0 0.000 0 0.000
Thick
Vegetation 1417472 7.525 707952 3.759 588000 3.122
Total 18835600 100 18835600 100 18835600 100
(Trend) Percentage change = Observed change * 100
Sum of change
The table above shows the numerical extent of change that has taken place in the area from the 2000. It
is observed that between the year 2000 and 2006, farmlands reduced by 14%, and by another 4% between 2006
and 2010. The implication of this is that after a few years, there will be little or no lands to cultivate anymore
within the study area. Consequently, agricultural food production will be affected and that will equally reflect in
the output as well as cost of living in this area.
Significant reduction can also be seen in the amount of water body in this area. To begin with, in the
entire area being considered, the water body present is relatively small (36,064 m2), which explains why by the
year 2006, no trace of this water parches can be seen. The emerging structures and the dire human need for water
has gradually but completely obliterated the amount of water in this area. What this also portrays is the reduction
in the irrigation farming practiced along streams in some part of the study area.
The shrink in the vegetal cover of the area is equally significant, about half of the vegetation in the area
was lost between 2000 and 2006; 1417472 m2 in 2000 and 707952 m
2 in 2006. Deforestation was massive within
this period and there was an encroachment of farming activities into this area. This is also reflected in the image
such that by 2010, evidence of terrace farming could be seen as large portions of the mountains were cultivated.
0
2000
4000
6000
8000
10000
12000
14000
16000
18000
20000
Size
in C
ells
Farm land Built Up
Area
Open
Space
Water Body Thick
Vegetation
Land Cover Types
2000
2006
2010
Figure 3. Land Use and Resource Distribution (2000, 2006, 2010)
The graph above shows the decline and increase in the amount of resources and use of the land in Jos.
The rate of decline and increase between 2000 and 2006 is relatively higher than that of 2006 and 2010. The
reason being that the time frame and the number of conflicts between the periods being considered are not the
same. Also depicted is the replacement of all the land resources by the built up area at a very rapid rate.
The 2000 satellite image below shows that in the year 2000, precisely the preceding year before the
crisis in the last decade (2001 – 2010), the study area within Jos had a large expanse of numerous land resources,
ranging from the thick vegetation, to the green grassy fields, the beautiful mountains and some parches of water
bodies. Though the water body in this region is relatively small, only constituting 36, 064 m2. The thick
vegetation especially in the Tagir Zangam, Lamingo and Shere Hills areas provided habitation for animals like
monkeys, snakes, alligators, rabbits, birds and many other species of animals. In the past, these animals

Journal of Environment and Earth Science www.iiste.org
ISSN 2224-3216 (Paper) ISSN 2225-0948 (Online)
Vol.4, No.18, 2014
48
occasionally wonder into the township and back, but nothing of that sought is visible again.
Figure 4. Land Use and Resource Distribution of Jos (2000)
The thick forest provided trees for fuel wood for many of the women who resided around these areas,
while few hunters are often seen returning with their fortunes of kills from their traps and hunting escapades. The
mountains had their original configurations and served as habitat for many living organisms. Occasionally
tourists visit the site for tourism. From the image above, along the Lamingo, Tagir, Eto Baba areas, a lot of
farming activities took place; these areas are made up of vast arable land resource used for cultivation and many
of the dwellers where primarily farmers. However a shadow of this is the reflection at the wake of the other side
of two conflicts.
Figure 5. Land Use and Resource Distribution of Jos (2006)
! [
! [
! [
! [
! [
! [
! [
Odus
Lamingo Eto Baba
Shere Hills
Tagir Zangam
Ring road
Township
Bauchi Rd/ Farin gada
8 .884520
8 .884520
8 .892944
8 .892944
8 .901368
8 .901368
8 .909792
8 .909792
8 .918216
8 .918216
9 .913360
9 .913360
9 .921515
9 .921515
9 .929670
9 .929670
9 .937825
9 .937825
9 .945980
9 .945980
825 0 825 412.5 Meters
.
Legend ! [ Major
locations Farmland Built-up Area Open Space Water Body Thick Vegetation

Journal of Environment and Earth Science www.iiste.org
ISSN 2224-3216 (Paper) ISSN 2225-0948 (Online)
Vol.4, No.18, 2014
49
Figure 6. Land Use and Resource Distribution of Jos (2010)
The table below gives a breakdown of the number of conflicts experienced in the last 10 years and the number of
impelled migrants as recorded by the Human Rights watch, Norwegian Refugee Council and the international
center for internally displaced persons.
Table 4. Major conflicts and Impelled migrants in Jos from 2000 to 2010
Years of major conflict incidence in
Jos Plateau State
Number of Impelled
migrants in Jos
2001 60000
2002 3000
2008 25000
2010 18000
Source: Human Rights watch, Norwegian Refugee Council and the International Center for Internally
Displaced Persons.
Between 2001 and 2010, a total of 5 major conflicts have occurred in Jos and a total of 106,000 persons
have had to move from their initial place of residence to new areas within Jos.
By 2006, 2 conflicts have occurred as explained in the literature review, one at 2001 and another in
2004, with a mild one in 2002. Satellite images analyzed shortly after the 2001 conflicts did not show marked
differences in the extent of land resources; this owes to the fact that many victims of the conflicts thought the
2001 conflict was the first and the last of its kind hence they could return back to where they were displaced
from. Sadly however, the conflicts kept resurging and so victims had to look for other alternative places for their
safety.
These areas under this study where considered to be relatively peaceful and largely dominated by a
single religious group, for this reason it provided refuge for those who were displaced both on the short and long
term. Like the image above shows, people began settling and erecting their structures in these places.
What this portended for the area was that by the end of 2006, as the image shows in areas around Shere
hills and areas above Odus, Lamingo, Mazah, lots of the farmlands were converted to homes and residents of
individuals, while the thick vegetations were replaced by agricultural lands, the trees in these areas were
massively exploited, making the once upon a time vegetated area to become shrubby and exposed; with large
expanse being used for agriculture.
The effect of this on the biodiversity no doubt is very significant as species of different organisms were
rapidly lost while others sought refuge farther into the wild. Many streams and flowing rivers got dried up due to
! [
! [
! [
! [
! [
! [
! [
Odus
Lamingo Eto Baba
Shere Hills Tagir Zangam
Ring road
Township
Bauchi Rd/ Farin gada
8 .884520
8 .884520
8 .892944
8 .892944
8 .901368
8 .901368
8 .909792
8 .909792
8 .918216
8 .918216
9
.913360
9
.913360
9
.921515
9
.921515
9
.929670
9
.929670
9
.937825
9
.937825
9
.945980
9
.945980
825 0 825 412.5 Meters
.
Legend ! [ Major locations
Farmland
Built-up Area
Open Space
Water Body
Thick Vegetation
Journal of Environment and Earth Science www.iiste.org
ISSN 2224-3216 (Paper) ISSN 2225-0948 (Online)
Vol.4, No.18, 2014
50
interception by unplanned erected structures and because of the demand on water by the ever increasing
population in the area.
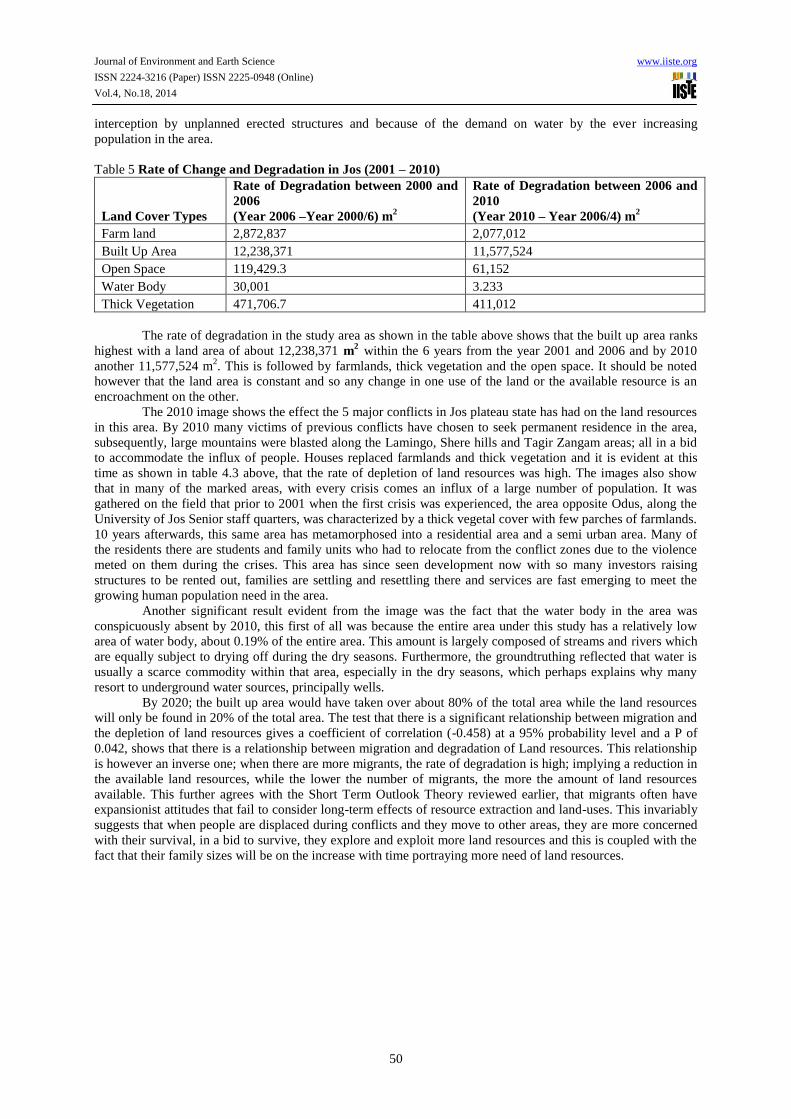
Table 5 Rate of Change and Degradation in Jos (2001 – 2010)
Land Cover Types
Rate of Degradation between 2000 and
2006
(Year 2006 –Year 2000/6) m2
Rate of Degradation between 2006 and
2010
(Year 2010 – Year 2006/4) m2
Farm land 2,872,837 2,077,012
Built Up Area 12,238,371 11,577,524
Open Space 119,429.3 61,152
Water Body 30,001 3.233
Thick Vegetation 471,706.7 411,012
The rate of degradation in the study area as shown in the table above shows that the built up area ranks
highest with a land area of about 12,238,371 m2
within the 6 years from the year 2001 and 2006 and by 2010
another 11,577,524 m2. This is followed by farmlands, thick vegetation and the open space. It should be noted
however that the land area is constant and so any change in one use of the land or the available resource is an
encroachment on the other.
The 2010 image shows the effect the 5 major conflicts in Jos plateau state has had on the land resources
in this area. By 2010 many victims of previous conflicts have chosen to seek permanent residence in the area,
subsequently, large mountains were blasted along the Lamingo, Shere hills and Tagir Zangam areas; all in a bid
to accommodate the influx of people. Houses replaced farmlands and thick vegetation and it is evident at this
time as shown in table 4.3 above, that the rate of depletion of land resources was high. The images also show
that in many of the marked areas, with every crisis comes an influx of a large number of population. It was
gathered on the field that prior to 2001 when the first crisis was experienced, the area opposite Odus, along the
University of Jos Senior staff quarters, was characterized by a thick vegetal cover with few parches of farmlands.
10 years afterwards, this same area has metamorphosed into a residential area and a semi urban area. Many of
the residents there are students and family units who had to relocate from the conflict zones due to the violence
meted on them during the crises. This area has since seen development now with so many investors raising
structures to be rented out, families are settling and resettling there and services are fast emerging to meet the
growing human population need in the area.
Another significant result evident from the image was the fact that the water body in the area was
conspicuously absent by 2010, this first of all was because the entire area under this study has a relatively low
area of water body, about 0.19% of the entire area. This amount is largely composed of streams and rivers which
are equally subject to drying off during the dry seasons. Furthermore, the groundtruthing reflected that water is
usually a scarce commodity within that area, especially in the dry seasons, which perhaps explains why many
resort to underground water sources, principally wells.
By 2020; the built up area would have taken over about 80% of the total area while the land resources
will only be found in 20% of the total area. The test that there is a significant relationship between migration and
the depletion of land resources gives a coefficient of correlation (-0.458) at a 95% probability level and a P of
0.042, shows that there is a relationship between migration and degradation of Land resources. This relationship
is however an inverse one; when there are more migrants, the rate of degradation is high; implying a reduction in
the available land resources, while the lower the number of migrants, the more the amount of land resources
available. This further agrees with the Short Term Outlook Theory reviewed earlier, that migrants often have
expansionist attitudes that fail to consider long-term effects of resource extraction and land-uses. This invariably
suggests that when people are displaced during conflicts and they move to other areas, they are more concerned
with their survival, in a bid to survive, they explore and exploit more land resources and this is coupled with the
fact that their family sizes will be on the increase with time portraying more need of land resources.
Journal of Environment and Earth Science www.iiste.org
ISSN 2224-3216 (Paper) ISSN 2225-0948 (Online)
Vol.4, No.18, 2014
51
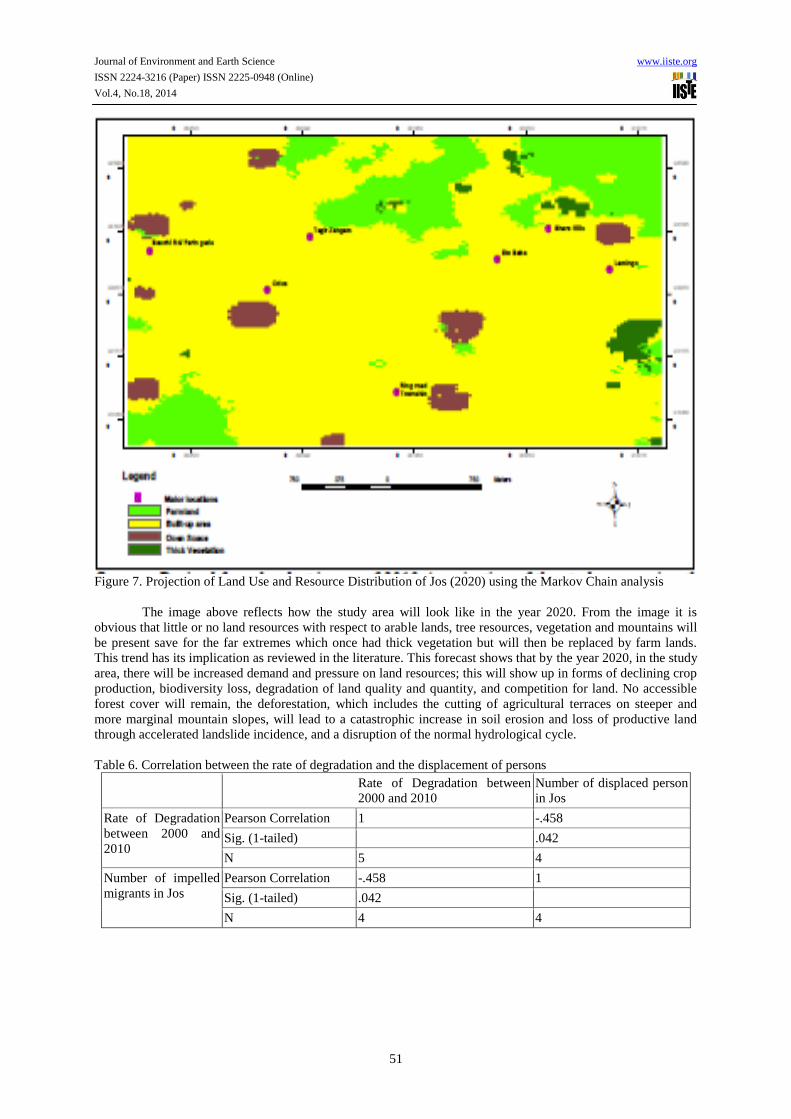
Figure 7. Projection of Land Use and Resource Distribution of Jos (2020) using the Markov Chain analysis
The image above reflects how the study area will look like in the year 2020. From the image it is
obvious that little or no land resources with respect to arable lands, tree resources, vegetation and mountains will
be present save for the far extremes which once had thick vegetation but will then be replaced by farm lands.
This trend has its implication as reviewed in the literature. This forecast shows that by the year 2020, in the study
area, there will be increased demand and pressure on land resources; this will show up in forms of declining crop
production, biodiversity loss, degradation of land quality and quantity, and competition for land. No accessible
forest cover will remain, the deforestation, which includes the cutting of agricultural terraces on steeper and
more marginal mountain slopes, will lead to a catastrophic increase in soil erosion and loss of productive land
through accelerated landslide incidence, and a disruption of the normal hydrological cycle.
Table 6. Correlation between the rate of degradation and the displacement of persons
Rate of Degradation between
2000 and 2010
Number of displaced person
in Jos
Rate of Degradation
between 2000 and
2010
Pearson Correlation 1 -.458
Sig. (1-tailed) .042
N 5 4
Number of impelled
migrants in Jos
Pearson Correlation -.458 1
Sig. (1-tailed) .042
N 4 4

Journal of Environment and Earth Science www.iiste.org
ISSN 2224-3216 (Paper) ISSN 2225-0948 (Online)
Vol.4, No.18, 2014
52
0
2000000
4000000
6000000
8000000
10000000
12000000
14000000
16000000
Farm
land
Built Up A
rea
Ope
n Spa
ce
Wate
r Bod
y
Thick
Veg
etat
ion
Land Cover Types
Are
a (
m s
q)
Study area 2000 (m2)
Study area 2006 (m2)
Study area 2010 (m2)
Figure 8. Land Use and Resource Distribution of Jos (2000 - 2010)
The chart above reflects the various attributes being considered and how each of these has changed in
the last 10 years. A decrease can clearly be observed in the amount of farmlands, Open space, water body and
vegetation. While an increase is seen in the expanse of the built up area, the increase is such that it can only
expand into the other land resources, the relationship can be said to be an inverse relationship, an increase in
built up areas leads to a decrease in the other land resources.
There is also a relationship between the incidence of conflicts and the rate of land resource depletion.
The correlation below shows that there is a significantly high relationship between incidence of conflicts and the
rate of land resource degradation. The coefficient of correlation is 0.998 with a significant value of 0.002. This
illustrates that as the number of conflicts increase, there is a greater risk of land resource degradation such that
increase in conflicts lead to increase in the number of forced migrants consequently; this increases the rate of
land resource depletion. Furthermore, what this result suggests is that if more conflicts occur in the future, the
risk of losing more land resources is imminent
Table 7. Correlation between the rate of degradation and the rate of degradation
Control Variables
Rate of Degradation
between 2000 and 2006
Rate of Degradation
between 2006 and
2010
incidence of
conflicts in
Jos
Rate of Degradation
between 2000 and
2006
Correlation 1.000
.
0
.998
.002
2
Significance (2-tailed)
df
Rate of Degradation
between 2006 and
2010
Correlation .998
.002
2
1.000
.
0
Significance (2-tailed)
df
Table 8. Transition Probability Table
Farm land Built Up Area Open Space Water Body Thick Vegetation
Farm land 0.2411 0.6912 0.002 0 0.0657
Built Up Area 0.1188 0.8302 0.0461 0 0.0049
Open Space 0.145 0.7521 0.1029 0 0
Water Body 0.1739 0.5 0 0 0.3261
Thick Veg. 0.7053 0.2017 0 0 0.0931
The transition probability matrix records the probability that each land cover category will change to
another category. This matrix is produced by the multiplication of each column in the transition probability
matrix by the number of cells of corresponding land use in the later image. The Markov Chain analysis helps in

Journal of Environment and Earth Science www.iiste.org
ISSN 2224-3216 (Paper) ISSN 2225-0948 (Online)
Vol.4, No.18, 2014
53
its derivation. These numbers show the probabilities that a land cell will be in the different categories at a
sufficient distant point in time, this is presented in the table above.
The rows represent the older land cover categories and the column represents the newer categories.
Although this matrix can be used as a direct input for specification of the prior probabilities in maximum
likelihood classification of the remotely sensed imagery, for this study however it is used in predicting land use /
land cover of the study area in 2020. The table above shows the Transitional Probability table derived from the
land use land cover map of 2000 and 2010. Row categories represent the land resources and land use classes in
2010 whilst column categories represent 2020 classes. As seen from the table, farmlands have a 0.2411
probability of remaining farmland and a 0.6912 probability of changing into a built up area in 2020. This
therefore shows an undesirable change (reduction), with a probability of change which is much higher than
stability, implying that there is a higher possibility of farmlands converting into built up areas. An intriguing
reflection on the probability table is the fact that water bodies could metamorphous into thick vegetation with a
probability of 0.3261in the study area by the year 2020. In the same vane, by that same 2020, all the open spaces
would have been obliterated.
1.4 THEORETICAL IMPLICATIONS OF FINDINGS
Seizing a base from the theories earlier reviewed, what these findings portend is a contextual conformity to the
theories adopted for this research. To start with, the Catastrophe theory, models the situation of Jos before the
series of conflicts in Jos. Where there was peaceful existence between over 50 different tribal groups for so many
years, before the residents reached the hostility stage stated in this theory, where values and interests began to
differ. Usually when this stage is reached, an actor has an aggression toward other actors. Within an actor, each
individual record their hostilities toward other individuals and actors, the actors in this case are the various
interest groups and religious groups who could not resolve their differences through peaceful dialogues but had
to resort to violent means. After conflicts broke out in the state, there was a safety and security need for the
residents, especially those where the conflicts are most dominant. During this period, what preoccupies the
minds of the victims is their safety and security needs. It is at this point that the Maslow’s hierarchy of needs
comes to play and we are interested in the second stage of the hierarchy where victims sought for their safety
needs. This theory transits then into the Ravenstein’s Push and Pull Model. At this stage victims of the conflicts
in Jos, were confronted with the choice to move and where to move to in order for their safety to be ensured. The
conflicts became the push factors while the perceived place of safety i.e the destination became the pull factor.
Some of the characteristics of these forced migrants in Jos, conformed to a number of the assumptions of the
Ravenstein model. These include the fact that
Most of the migrants travelled only a short distance.
The migration occurred in steps, this is because people first sought safety in security camps, before
moving to reside with family and friends and finally settling within the perceived safe areas.
Each migration flow produced a movement in the opposite direction ("counter flow").
Most migrants are adults.
The other two theories are the Short Term outlook theory and the Resource depletion model. In
conformity to the Short Term Outlook Theory and the Resource Depletion model, in a bid to survive and be
comfortable, residents of Jos who were displaced during the conflicts having moved and resettled at the peri-
urban areas of Jos, they explored and exploited all the available resources within their immediate environment.
Over time, these resources got exhausted and there was a need to expand outward into areas that have not been
exploited. Eventually, this led to a progressive increase of human population who have come to resettle in that
region as well as an increase in the extent to which these resources are depleted within that area.
1.5 CONCLUSION
At this point it is imperative to know that long and sustained human settlement in the absence of resource
management systems has led to an acute depletion of natural resources, particularly arable land and forests. If the
reality that Ethiopia faced a few decades ago is to be avoided in Jos, and indeed, conflict torn regions, more
proactive actions need to be taken by individuals at all levels of the government at ensuring the preservation of
the rapidly dwindling resources slipping off our finger tips. For the Horn of the Africa region, its inhabitants
endured a series of famines, at least 4 major ones since the 1970s and these are closely linked to the depletion of
land resources.
The reason for all these emphases is so that prompt actions can be taken in Plateau state and other
conflict torn societies so as to avoid their plunging into an unpalatable predicament of declining size of
landholdings, decrease in; arable lands, food grains, livestock feed, habitats of organism, biodiversity loss,
deforestation and the ultimate hazard of climate change and global warming among other numerous hazards.

Journal of Environment and Earth Science www.iiste.org
ISSN 2224-3216 (Paper) ISSN 2225-0948 (Online)
Vol.4, No.18, 2014
54
A school teacher once said, “The single act of cutting down trees is an automatic reduction in a life.” By
implication, the act of degrading land resources irrespective of how little or insignificant it may seem has a
negative impact on the interaction in the cosmos, the effect which may not be immediate is more often than not
gradual and critical; hence, a need for more informed action and multi-stakeholder cooperation; to preserve and
hand down to posterity a good amount if not all, the many resources that were once handed down to this
generation.
REFERENCES
Bai, Z. G. Dent, D. Olsson, L. L. & Schaepman, M. E. (2008) Review Article Proxy global assessment of land
degradation. The Authors, Journal compilation (2008) British Society of Soil Science, Soil Use and
Management. Vol 24, 223–234.
Blench, R. Dendo, M. (2003). Migration’ The City Is Our Farm’ Nigeria: Drivers Of Change Component Three
– Output 30, Prepared For DFID, Nigeria 8, Guest Road Cambridge CB1 2AL United Kingdom.
Http://Www.Rogerblench.Info/RBOP.Htm. 8 - 12.
Cassels, S. (2006). Livelihoods, and the Environment, Panel Contribution to the PERN Cyber seminar on Rural
Household Micro-Demographics, Center for Studies in Demography and Ecology, University of Washington. 1
– 3.
De Souza, R.M. Williams, J.S. and Meyerson, F.A.B. (2003). Critical Links: Population, Health, and the
Environment, population bulletin Vol 58, No 3, a publication of the population reference bureau. 8 – 12.
Guinness, P. and Nagle, G. (2008). Advanced Geography Concepts and Cases, Revised edition. Hodder
Education part of Hachette Livre UK. 31 – 36
Harrison, P. and Pearce, F. (2000). America Association for the advancement of science AAA Atlas of &
Environment, University of California Press. Ltd, London England. 43 -47.
Higazi A. (2011). The Jos Crisis: A Recurrent Nigerian Tragedy, Discussion Paper No. 2, January 2011: 1 – 35.