Confirming the Three-Factor Structure of the Disgust Scale—Revised in Eight Countries
23
http://jcc.sagepub.com Journal of Cross-Cultural Psychology DOI: 10.1177/0022022108328918 2009; 40; 234 Journal of Cross-Cultural Psychology and Anne Schienle Jonathan Haidt, Timo J. Hursti, Sumio Imada, Silvia Koller, Francesco Mancini, Andrew C. Page Bunmi O. Olatunji, Melanie W. Moretz, Dean McKay, Fredrik Bjorklund, Peter J. de Jong, Countries Confirming the Three-Factor Structure of the Disgust ScaleRevised in Eight http://jcc.sagepub.com/cgi/content/abstract/40/2/234 The online version of this article can be found at: Published by: http://www.sagepublications.com On behalf of: International Association for Cross-Cultural Psychology can be found at: Journal of Cross-Cultural Psychology Additional services and information for http://jcc.sagepub.com/cgi/alerts Email Alerts: http://jcc.sagepub.com/subscriptions Subscriptions: http://www.sagepub.com/journalsReprints.nav Reprints: http://www.sagepub.com/journalsPermissions.nav Permissions: http://jcc.sagepub.com/cgi/content/refs/40/2/234 Citations at UNIV OF VIRGINIA on March 22, 2009 http://jcc.sagepub.com Downloaded from
-
Upload
independent -
Category
Documents
-
view
0 -
download
0
Transcript of Confirming the Three-Factor Structure of the Disgust Scale—Revised in Eight Countries
http://jcc.sagepub.com
Journal of Cross-Cultural Psychology
DOI: 10.1177/0022022108328918 2009; 40; 234 Journal of Cross-Cultural Psychology
and Anne Schienle Jonathan Haidt, Timo J. Hursti, Sumio Imada, Silvia Koller, Francesco Mancini, Andrew C. Page
Bunmi O. Olatunji, Melanie W. Moretz, Dean McKay, Fredrik Bjorklund, Peter J. de Jong, Countries
Confirming the Three-Factor Structure of the Disgust Scale�Revised in Eight
http://jcc.sagepub.com/cgi/content/abstract/40/2/234 The online version of this article can be found at:
Published by:
http://www.sagepublications.com
On behalf of:
International Association for Cross-Cultural Psychology
can be found at:Journal of Cross-Cultural Psychology Additional services and information for
http://jcc.sagepub.com/cgi/alerts Email Alerts:
http://jcc.sagepub.com/subscriptions Subscriptions:
http://www.sagepub.com/journalsReprints.navReprints:
http://www.sagepub.com/journalsPermissions.navPermissions:
http://jcc.sagepub.com/cgi/content/refs/40/2/234 Citations
at UNIV OF VIRGINIA on March 22, 2009 http://jcc.sagepub.comDownloaded from
Confirming the Three-Factor Structure of the Disgust Scale–Revised in Eight Countries
Bunmi O. OlatunjiVanderbilt University
Melanie W. MoretzDean McKayFordham University
Fredrik BjorklundLund University
Peter J. de JongUniversity of Groningen
Jonathan HaidtUniversity of Virginia
Timo J. HurstiUppsala University
Sumio ImadaHiroshima-Shudo University
Silvia KollerUniversidade Federal de Rio Grande do Sul
Francesco ManciniScuola di Psicoterapia Cognitiva, Associazione di Psicologia Cognitiva
Andrew C. PageUniversity of Western Australia
Anne SchienleUniversity of Graz
The current study evaluates the factor structure of the Disgust Scale–Revised (DS-R) in eight countries: Australia, Brazil, Germany, Italy, Japan, the Netherlands, Sweden, and the United States (N = 2,606). Confirmatory factor analysis is used to compare two different models of the DS-R and to investigate the invariance of the factor structure of the DS-R across countries and gender. A three-factor solution consisting of three different but interrelated disgust factors (a 12-item core disgust factor, an 8-item animal-reminder disgust factor, and a 5-item contamination disgust factor) best accounted for the data in all countries except the Netherlands. Relative to the United States, the three-factor solution is invariant in Australia, Brazil, and Japan but not in Germany, Italy, the Netherlands, and Sweden. The three-factor solution is also invariant across gender in most countries. The implications of these cross-cultural findings for promoting a more valid and reliable assessment of disgust dimensions, as assessed by the DS-R, are discussed.
234
Journal of Cross-Cultural Psychology
Volume 40 Number 2March 2009 234-255
© 2009 SAGe Publications10.1177/0022022108328918
http://jccp.sagepub.comhosted at
http://online.sagepub.com
at UNIV OF VIRGINIA on March 22, 2009 http://jcc.sagepub.comDownloaded from

Olatunji et al. / Disgust Scale–Revised 235
Keywords: Disgust Scale–Revived; disgust sensitivity; cross-culture; factor structure
Multidisciplinary research over the last 2 decades has elucidated the important role of dis-gust in various social and clinical contexts (Olatunji & Sawchuk, 2005). For example,
there is now experimental evidence suggesting that some moral judgments are significantly influenced by the experience of disgust (Wheatley & Haidt, 2005). Additionally, the experience of disgust has been implicated in the development of various psychological disorders, particu-larly contamination-based obsessive–compulsive disorder (OCD; Olatunji, Lohr, Sawchuk, & Tolin, 2007). Darwin (1872/1965) first noted that disgust “refers to something revolting, prima-rily in relation to the sense of taste, as actually perceived or vividly imagined; and secondarily to anything which causes a similar feeling, through the sense of smell, touch and even of eye-sight” (p. 253). However, more recent definitions of disgust have gone beyond its phylogenetic origins of the rejection of bad-tasting foods (Rozin & Fallon, 1987). Contemporary models regard disgust as a multidimensional emotion that functions as an oral defense at its core but has evolved to serve as a reminder of our animal origins, maintain interpersonal boundaries, and influence our sense of morality and social order (Rozin, Haidt, & McCauley, 2000).
Given its diverse implications, the development of a reliable and valid measure of indi-vidual differences in disgust is of central importance. The Disgust Scale (DS; Haidt, McCauley, & Rozin, 1994) is currently the most widely used measure of disgust (Olatunji & Sawchuk, 2005) and was developed with a specific goal, “to ascertain the kinds or domains of experience in which Americans experience disgust’’ (Haidt et al., 1994, p. 702). The DS assesses how disgusting specific experiences are across eight domains, including food that has spoiled or is culturally unacceptable; animals that are slimy or live in dirty conditions; body products including body odors and feces, mucus, and so on; body enve-lope violations, or mutilation of the body; death and dead bodies; sex involving culturally deviant sexual behavior; hygiene, or violations of culturally expected hygiene practices; and sympathetic magic, which involves stimuli without infectious qualities of their own that either resemble contaminants (e.g., feces-shaped candy) or were once in contact with con-taminants (e.g., a sweater worn by an ill person).
The DS and its subscales have proven to have predictive utility in a variety of research contexts. For example, research with the DS has shown that disgust levels vary significantly during pregnancy in a manner that compensates for maternal and fetal vulnerability to dis-ease (Fessler, eng, & Navarrete, 2005). Colostomy patients with higher scores on the DS have also been found to report higher levels of feeling stigmatized, which negatively pre-dicts colostomy adjustment and well-being (Smith, Loewenstein, Rozin, Sherriff, & Ubel, 2007). Research on psychopathology has also yielded significant positive relationships between disgust, as assessed by the DS, and spider phobia (Tolin, Lohr, Sawchuk, & Lee, 1997), blood-injection-injury (BII) phobia (Sawchuk, Lohr, Tolin, Lee, & Kleinknecht, 2000), eating disorders (Troop, Treasure, & Serpell, 2002), and hypochondriasis (Davey & Bond, 2006). Furthermore, there is evidence that some DS subscales (i.e., envelope Violations, Death) are uniquely associated with some clinical symptoms (i.e., BII phobia) suggesting that the subscales have predictive utility (de Jong & Merckelbach, 1998).
Authors’ Note: Address correspondence to Bunmi O. Olatunji, Department of Psychology, Vanderbilt University, 301 Wilson Hall, 111 21st Avenue South, Nashville, TN 37203.
at UNIV OF VIRGINIA on March 22, 2009 http://jcc.sagepub.comDownloaded from

236 Journal of Cross-Cultural Psychology
Despite the widespread use of the DS, some important questions about its psychometric properties remain. The available psychometric research indicates that the DS total score has good reliability and validity (Olatunji & Cisler, in press). However, support for the eight-factor structure of the DS has not consistently been found. For example, Haidt and col-leagues (1994) conducted a principal components analysis of the matrix of intercorrelations of the DS items and found 10 factors with eigenvalues greater than 1.00. Varimax rotation of seven factors led to an interpretable solution in which both Death and envelope Violation items loaded high on the first factor, suggesting that these two domains might be better conceptualized as one. A second principal components analysis of the matrix of item inter-correlations in an independent sample revealed 11 factors with eigenvalues greater than 1.00. Although there was no rotation that was fully interpretable, all rotations from 3 through 11 factors revealed a first factor in which Death and envelope Violation items loaded high. This wide variation in factor analytic findings suggests that the factor solutions for the DS are unstable and require more structured evaluations.
One study using confirmatory factor analysis (CFA) did find that the eight-factor model of the DS provided satisfactory fit to the data, significantly better than alternative one-factor and five-factor models (Björklund & Hursti, 2004). However, poor reliability for the eight DS subscales has consistently been reported in the literature (i.e., food, α = .34, .27; animals, α = .47, .45; body products, α = .55, .49; sex, α = .51, .52; body envelope violations, α = .60, .63; death, α = .59, .61; hygiene, α = .46, .42; and sympathetic magic, α = .44, .45; Haidt et al., 1994). In fact, the poor reliability of the DS subscales led its developers to conclude that “the alpha reliabilities of the eight domain subscales are not high enough for interpretation of individual patterns of subscale scores” (Haidt et al., 1994, p. 711). Despite this cautionary note, inferences made based on the DS subscales have been reported in the literature (de Jong, Peters, & Vanderhallen, 2002; Fessler & Navarrete, 2005; Olatunji, Sawchuk, Lohr, & de Jong, 2004; Tolin, Woods, & Abramowitz, 2006).
Although the DS shows considerable promise, refinement of its underlying factor structure in order to yield reliable and interpretable subscales is clearly warranted. Olatunji and col-leagues (2007) conducted a converging set of analyses evaluating the item properties and factor structure of the DS. After conducting a series of analyses, these authors recommended removal of seven problematic items (i.e., items that detracted from performance of the DS). Removing these items resulted in an abbreviated DS (DS-R), and CFA revealed three distinct factors of the revised measure: core, animal-reminder, and contamination disgust. These three new disgust factors generally yielded more acceptable internal consistency estimates (α > .70). The three factors were also consistent with theoretical models of the structure of disgust outlined in the literature. Rozin et al. (2000) described core disgust as primarily a food-rejection response centered on oral incorporation of offensive stimuli (i.e., rotting foods). They described animal-reminder disgust as any stimulus or behavior that reminds humans of their animalness and their animal origins (i.e., violations of the body envelope). Rozin and colleagues also observed that direct or indirect contact with others can elicit dis-gust resulting in interpersonal disgust. One key component of interpersonal disgust is disease probability, which bears a striking similarity to the new DS-R contamination disgust factor.
The refinement of the DS may make it more suitable for research purposes in clinical and applied settings. Although the new three-factor model of the DS-R appears to be more reliable and coincides with established theoretical models of disgust (Rozin et al., 2000), the fit of the three-factor model has not yet been replicated. More important, evidence for
at UNIV OF VIRGINIA on March 22, 2009 http://jcc.sagepub.comDownloaded from
Olatunji et al. / Disgust Scale–Revised 237
the three-factor model of the DS-R exclusively relied on relatively homogenous samples from the United States. Although the DS was developed to examine the experience of dis-gust in the United States (Haidt et al., 1994), it has become the measure of choice for assessing disgust in several countries (Olatunji & Cisler, in press). Consequently, examina-tion of the validity of the three-factor model of the DS-R in countries other than the United States is clearly needed to inform the growing worldwide interest in the psychological assessment of disgust. Such multinational studies will allow researchers to better under-stand the relative consistencies and inconsistencies of the nature of disgust between diverse populations using a psychometrically sound instrument.
The major aim of the current study was to further investigate the factor structure and struc-tural equivalence of the DS-R in multiple countries by means of CFA. Drawing on recent work (Olatunji et al., 2007), we examine the fit of a three-factor model of the DS-R consisting of core, animal-reminder, and contamination disgust. Cultural factors affect the stability of the underlying structure of personality traits, making cross-cultural equivalence of such traits difficult to find (Matsumoto & Yoo, 2007; Rossier, 2005). However, evidence of equivalence of the three-factor model in multiple countries would support a universal structure of disgust that could serve as the basis for making more meaningful cross-cultural comparisons. Haidt and colleagues (1994) observed that domains of disgust elicitors all have in common that they remind us of our animality and, especially, of our mortality. Furthermore, de Jong et al. (2002) noted that processes associated with magical thinking (i.e., sympathetic magical laws of contagion and similarity) cut across the different domains of disgust. This suggests that all stimuli that come to elicit disgust may converge to form a coherent unidimensional construct that is marked by either reminders of animal origins or magical thinking. Therefore, the current study examined the fit of the three-factor model of the DS-R relative to a one-factor model. Because the DS-R was designed for general use, the underlying assumption is that it measures the same constructs across males and females. However, gender has been found to influence disgust reactions (Simpson, Carter, Anthony, & Overton, 2006). Thus, it is necessary to evaluate measurement invariance of the DS-R before assuming that it is equiva-lent between males and females. Accordingly, the current study provided an opportunity to also examine the possibility of differences in the factor structure of the DS-R across gender.
Method
Participants
Participants were volunteers from eight countries: Australia, Brazil, Germany, Italy, Japan, the Netherlands, Sweden, and the United States (See author affiliations for location of data collection). In total, there were 2,606 volunteers. All of the participants in the present study were nonclinical participants. Table 1 provides age and gender information for each country.
Measure
The original 32-item DS was administered to all participants (Haidt et al., 1994). However, we analyzed only the 25 items that comprise the three subscales (a 12-item Core Disgust subscale, an 8-item Animal-Reminder Disgust subscale, and a 5-item Contamination
at UNIV OF VIRGINIA on March 22, 2009 http://jcc.sagepub.comDownloaded from
238 Journal of Cross-Cultural Psychology
Disgust subscale) of the DS-R (Olatunji et al., 2007). These items include 13 true/false items (scored 0 or 1) and 12 items that are rated on a 3-point scale (scored 0, 0.5, 1) with regard to the extent that participants find the experience not disgusting at all, slightly dis-gusting, or very disgusting. Two of the true/false items are reverse scored. For each respondent, two scores were calculated: a mean of the 13 true/false items and a mean of the 12 items on a 3-point scale. A total score for overall disgust sensitivity may be calculated by calculating the mean of these two scores (scores thus range from 0 to 1). The DS-R has demonstrated a high degree of internal consistency and adequate convergent and discrimi-nant validity (Olatunji et al., 2007).
Procedure
Across all sites, participants received the original 32-item DS as a one- or two-page ques-tionnaire.1 Participants tested at universities completed the scale in large groups, generally during classes. Those tested in hospital or applied settings completed the DS individually.
Data Analytic Strategy
CFA of the DS-R. CFA was conducted on the 25-item DS-R using LISReL 8.80 (Jöreskog & Sörbom, 2006), and two competing models of interest were estimated. A PReLIS system file containing the raw data served as the input data. In the unidimensional model, all 25 DS-R items were loaded onto a latent disgust variable, whereas in the three-factor model depicted in Figure 1, DS-R items were a priori loaded onto either a core disgust, animal-reminder disgust, or contamination disgust latent factor based on the results of Olatunji et al. (2007). These two models involved the same 25 manifest indicators of the DS-R. The first indicator for each latent variable was constrained to a factor loading of 1 to serve as a reference variable and set the metric. The following criteria were used to test the models’ fit: the root mean square error of approximation (RMSeA), with values less than .08 indicative of an acceptable fit and values less than .05 indicative of a good fit (McDonald & Ho, 2002), and the comparative fit index (CFI), with values close to .95 indicative of a good fit (Hu & Bentler, 1999).
Table 1 Demographic Characteristics and Internal Consistency for the Disgust Scale–Revised (DS-R) for Each Country
Country N % Female Mean Age (SD) DS-R α
Australia 646 71.5 18.86 (4.51) .80Brazil 217 80.2 22.64 (3.68) .82Germany 221 55.2 26.51 (5.97) .75Italy 219 79.0 24.99 (8.23) .80Japan 251 56.2 18.82 (1.04) .77Netherlands 260 84.2 19.62 (1.87) .68Sweden 338 49.4 28.17 (11.70) .78
N = 451; %female = 50.9; mean age (sd) = 25.79 (11.16); ds-r a = .81 sNote. N = Sample Size; SD = standard deviation
at UNIV OF VIRGINIA on March 22, 2009 http://jcc.sagepub.comDownloaded from

Olatunji et al. / Disgust Scale–Revised 239
Invariance of the three-factor model of the DS-R. Because the U.S. sample in this study represents the “mainstream sample” for which the DS-R was developed (Haidt et al., 1994), the U.S. sample was the comparison group throughout the country invariance analyses. That is, each country was compared with the United States but (to avoid making 28 comparisons) not with the other countries. A multiple group CFA was conducted to determine whether the three-factor structure of the DS-R is invariant across countries and across gender. Three increasingly restrictive tests of measurement invariance were conducted. First, a test of config-ural invariance was conducted that specifies that the factor structure (i.e., the pattern of free and fixed factor loadings imposed on the items) of the DS-R has to be equivalent across groups (Horn & McArdle, 1992; Stein, Lee, & Jones, 2006). Consistent with suggested procedures
Figure 1The Hypothesized Three-Factor Model of the Disgust Scale–Revised
1: Seeing a cockroach in someone else’s housedoesn't bother me.
2: It bothers me to hear someone clear a throatfull of mucous. 6: Even if I was hungry, I would not drink a bowl of my favorite soup if it had been stirredby a used but thoroughly washed flyswatter.
7: I might be willing to try eating monkey meat,under some circumstances.
8: It would bother me to see a rat run across mypath in a park.
9: If I see someone vomit, it makes me sick to mystomach.
15: You see maggots on a piece of meat in an outdoor garbage pail.
14: You see someone put ketchup on vanilla icecream, and eat it.
16: While you are walking through a tunnel undera railroad track, you smell urine.
20: You are about to drink a glass of milk whenyou smell that it is spoiled.
21: You are walking barefoot on concrete, andyou step on an earthworm.
24: You discover that a friend of yours changes underwear only once a week.
3: it would bother me to be in a science class, andto see a human hand preserved in a jar.
4: I would go out of my way to avoid walking through a graveyard.
10: It would not upset me at all to watch a person with a glass eye take the eye out of the socket.
11: It would bother me tremendously to touch a dead body.
13: It would bother me to sleep in a nice hotelroom if I knew that a man had died of a heartattack in that room the night before.
17: Your friend’s pet cat dies, and you have to pick up the dead body with your bare hands.
22: You see a man with his intestines exposed after an accident.
23: You accidentally touch the ashes of a personwho has been cremated.
5: I never let any part of my body touch the toiletseat in public restrooms.
12: I probably would not go to my favoriterestaurant if I found out that the cook had a cold.
19: A friend offers you a piece of chocolate shaped like dog-doo. 25: As part of a sex education class, you are required to inflate a new unlubricated condom,using your mouth.
Core
Animal Reminder
Contamination
18: You take a sip of soda, and then realize thatyou drank from the glass that an acquaintance ofyours had been drinking from.
at UNIV OF VIRGINIA on March 22, 2009 http://jcc.sagepub.comDownloaded from
240 Journal of Cross-Cultural Psychology
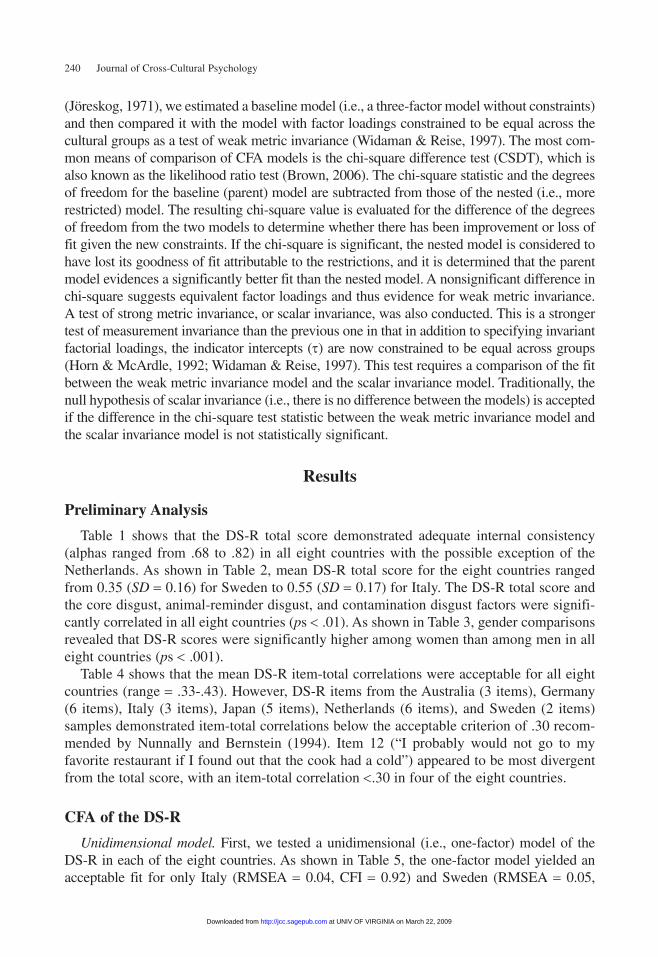
(Jöreskog, 1971), we estimated a baseline model (i.e., a three-factor model without constraints) and then compared it with the model with factor loadings constrained to be equal across the cultural groups as a test of weak metric invariance (Widaman & Reise, 1997). The most com-mon means of comparison of CFA models is the chi-square difference test (CSDT), which is also known as the likelihood ratio test (Brown, 2006). The chi-square statistic and the degrees of freedom for the baseline (parent) model are subtracted from those of the nested (i.e., more restricted) model. The resulting chi-square value is evaluated for the difference of the degrees of freedom from the two models to determine whether there has been improvement or loss of fit given the new constraints. If the chi-square is significant, the nested model is considered to have lost its goodness of fit attributable to the restrictions, and it is determined that the parent model evidences a significantly better fit than the nested model. A nonsignificant difference in chi-square suggests equivalent factor loadings and thus evidence for weak metric invariance. A test of strong metric invariance, or scalar invariance, was also conducted. This is a stronger test of measurement invariance than the previous one in that in addition to specifying invariant factorial loadings, the indicator intercepts (τ) are now constrained to be equal across groups (Horn & McArdle, 1992; Widaman & Reise, 1997). This test requires a comparison of the fit between the weak metric invariance model and the scalar invariance model. Traditionally, the null hypothesis of scalar invariance (i.e., there is no difference between the models) is accepted if the difference in the chi-square test statistic between the weak metric invariance model and the scalar invariance model is not statistically significant.
Results
Preliminary Analysis
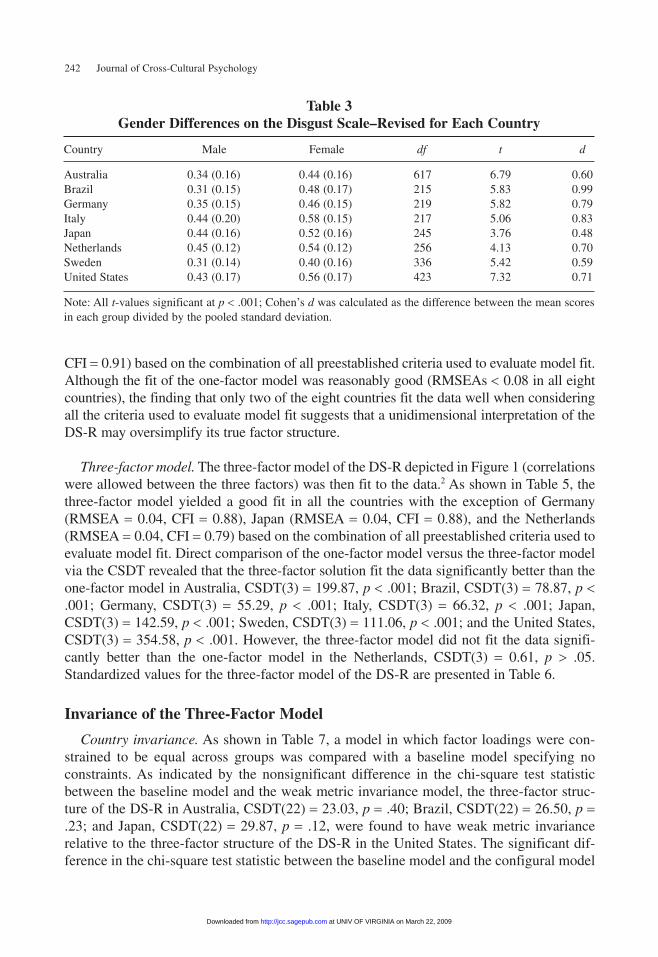
Table 1 shows that the DS-R total score demonstrated adequate internal consistency (alphas ranged from .68 to .82) in all eight countries with the possible exception of the Netherlands. As shown in Table 2, mean DS-R total score for the eight countries ranged from 0.35 (SD = 0.16) for Sweden to 0.55 (SD = 0.17) for Italy. The DS-R total score and the core disgust, animal-reminder disgust, and contamination disgust factors were signifi-cantly correlated in all eight countries (ps < .01). As shown in Table 3, gender comparisons revealed that DS-R scores were significantly higher among women than among men in all eight countries (ps < .001).
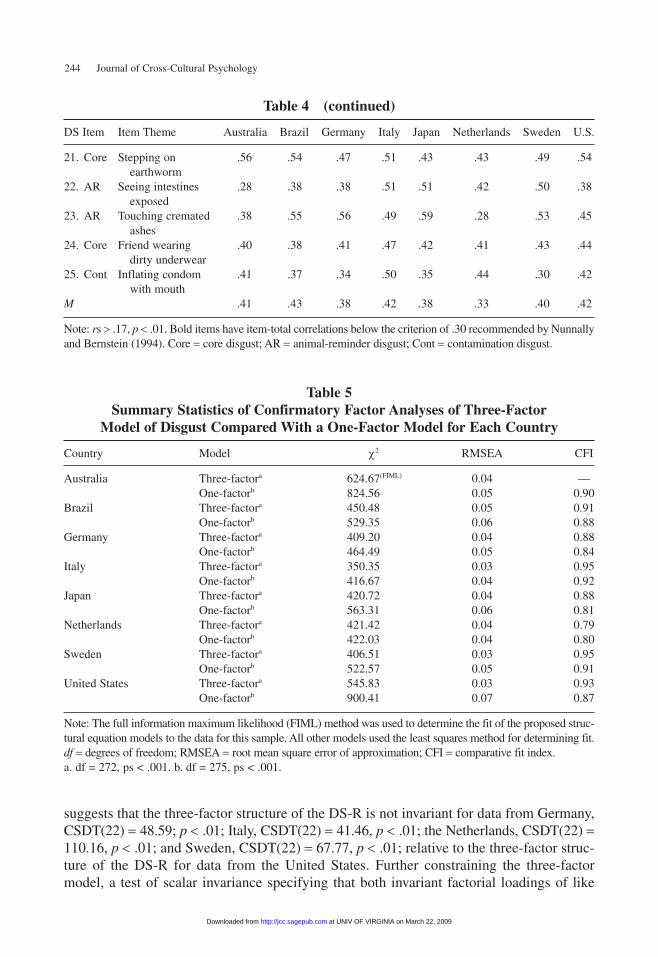
Table 4 shows that the mean DS-R item-total correlations were acceptable for all eight countries (range = .33-.43). However, DS-R items from the Australia (3 items), Germany (6 items), Italy (3 items), Japan (5 items), Netherlands (6 items), and Sweden (2 items) samples demonstrated item-total correlations below the acceptable criterion of .30 recom-mended by Nunnally and Bernstein (1994). Item 12 (“I probably would not go to my favorite restaurant if I found out that the cook had a cold”) appeared to be most divergent from the total score, with an item-total correlation <.30 in four of the eight countries.
CFA of the DS-R
Unidimensional model. First, we tested a unidimensional (i.e., one-factor) model of the DS-R in each of the eight countries. As shown in Table 5, the one-factor model yielded an acceptable fit for only Italy (RMSeA = 0.04, CFI = 0.92) and Sweden (RMSeA = 0.05,
at UNIV OF VIRGINIA on March 22, 2009 http://jcc.sagepub.comDownloaded from

Olatunji et al. / Disgust Scale–Revised 241
Table 2Means, Standard Deviations, and Pearson Correlation Coefficients of the
Disgust Scale–Revised (DS-R) and Its Three Factors for Each Country
Country Core AR Cont Mean (SD)
AustraliaDS-R total .80 .83 .67 0.41 (0.16)Core — .54 .34 0.55 (0.19)AR — .28 0.49 (0.25)Cont — 0.19 (0.19)
BrazilDS-R total .81 .82 .80 0.44 (0.18)Core — .57 .47 0.59 (0.19)AR — .41 0.49 (0.23)Cont — 0.25 (0.24)
GermanyDS-R total .78 .79 .65 0.41 (0.15)Core — .49 .28 0.55 (0.18)AR — .20 0.43 (0.23)Cont — 0.26 (0.19)
ItalyDS-R total .82 .85 .73 0.55 (0.17)Core — .54 .44 0.64 (0.21)AR — .42 0.60 (0.25)Cont — 0.41 (0.17)
JapanDS-R total .72 .78 .67 0.49 (0.16)Core — .42 .26 0.60 (0.18)AR — .19 0.56 (0.27)Cont — 0.30 (0.23)
NetherlandsDS-R total .73 .80 .76 0.52 (0.12)Core — .46 .31 0.57 (0.14)AR — .36 0.39 (0.17)Cont — 0.61 (0.18)
SwedenDS-R total .80 .82 .67 0.35 (0.16)Core — .54 .35 0.43 (0.18)AR — .25 0.43 (0.24)Cont — 0.20 (0.20)
United StatesDS-R total .81 .75 .75 0.50 (0.18)Core — .48 .45 0.61 (0.20)AR — .24 0.55 (0.25)Cont — 0.33 (0.26)
Note: All correlations significant at p < .01; Core = core disgust; AR = animal-reminder disgust; Cont = contamination disgust.
at UNIV OF VIRGINIA on March 22, 2009 http://jcc.sagepub.comDownloaded from
242 Journal of Cross-Cultural Psychology
CFI = 0.91) based on the combination of all preestablished criteria used to evaluate model fit. Although the fit of the one-factor model was reasonably good (RMSeAs < 0.08 in all eight countries), the finding that only two of the eight countries fit the data well when considering all the criteria used to evaluate model fit suggests that a unidimensional interpretation of the DS-R may oversimplify its true factor structure.
Three-factor model. The three-factor model of the DS-R depicted in Figure 1 (correlations were allowed between the three factors) was then fit to the data.2 As shown in Table 5, the three-factor model yielded a good fit in all the countries with the exception of Germany (RMSeA = 0.04, CFI = 0.88), Japan (RMSeA = 0.04, CFI = 0.88), and the Netherlands (RMSeA = 0.04, CFI = 0.79) based on the combination of all preestablished criteria used to evaluate model fit. Direct comparison of the one-factor model versus the three-factor model via the CSDT revealed that the three-factor solution fit the data significantly better than the one-factor model in Australia, CSDT(3) = 199.87, p < .001; Brazil, CSDT(3) = 78.87, p < .001; Germany, CSDT(3) = 55.29, p < .001; Italy, CSDT(3) = 66.32, p < .001; Japan, CSDT(3) = 142.59, p < .001; Sweden, CSDT(3) = 111.06, p < .001; and the United States, CSDT(3) = 354.58, p < .001. However, the three-factor model did not fit the data signifi-cantly better than the one-factor model in the Netherlands, CSDT(3) = 0.61, p > .05. Standardized values for the three-factor model of the DS-R are presented in Table 6.
Invariance of the Three-Factor Model
Country invariance. As shown in Table 7, a model in which factor loadings were con-strained to be equal across groups was compared with a baseline model specifying no constraints. As indicated by the nonsignificant difference in the chi-square test statistic between the baseline model and the weak metric invariance model, the three-factor struc-ture of the DS-R in Australia, CSDT(22) = 23.03, p = .40; Brazil, CSDT(22) = 26.50, p = .23; and Japan, CSDT(22) = 29.87, p = .12, were found to have weak metric invariance relative to the three-factor structure of the DS-R in the United States. The significant dif-ference in the chi-square test statistic between the baseline model and the configural model
Table 3Gender Differences on the Disgust Scale–Revised for Each Country
Country Male Female df t d
Australia 0.34 (0.16) 0.44 (0.16) 617 6.79 0.60 Brazil 0.31 (0.15) 0.48 (0.17) 215 5.83 0.99Germany 0.35 (0.15) 0.46 (0.15) 219 5.82 0.79Italy 0.44 (0.20) 0.58 (0.15) 217 5.06 0.83Japan 0.44 (0.16) 0.52 (0.16) 245 3.76 0.48Netherlands 0.45 (0.12) 0.54 (0.12) 256 4.13 0.70Sweden 0.31 (0.14) 0.40 (0.16) 336 5.42 0.59United States 0.43 (0.17) 0.56 (0.17) 423 7.32 0.71
Note: All t-values significant at p < .001; Cohen’s d was calculated as the difference between the mean scores in each group divided by the pooled standard deviation.
at UNIV OF VIRGINIA on March 22, 2009 http://jcc.sagepub.comDownloaded from

Olatunji et al. / Disgust Scale–Revised 243
Table 4Disgust Scale–Revised Item-Total Correlations for Each Country
DS Item Item Theme Australia Brazil Germany Italy Japan Netherlands Sweden U.S.
1. Core Seeing cockroach .39 .35 .36 .33 .30 .24 .33 .35 in house 2. Core Seeing mucus .50 .37 .38 .42 .33 .32 .30 .42 3. AR Seeing severed .42 .52 .40 .44 .52 .41 .51 .43 hand in jar 4. AR Walking through .39 .37 .28 .37 .44 .38 .25 .44 graveyard 5. Cont Touching toilet .44 .39 .27 .36 .26 .41 .30 .38 in public restroom 6. Core Drinking soup .49 .46 .36 .47 .45 .40 .47 .39 stirred with clean flyswatter 7. Core eating monkey .45 .43 .42 .29 .42 .30 .34 .44 meat 8. Core Seeing rat run .57 .42 .40 .38 .44 .09 .38 .48 across path 9. Core Seeing someone .38 .46 .30 .39 .42 .29 .40 .43 vomit 10. AR Seeing glass .28 .31 .31 .39 .46 .32 .42 .39 eye being removed11. AR Touching dead .39 .54 .61 .47 .45 .36 .52 .54 body12. Cont Going to .47 .49 .23 .17 .28 -.01 .34 .34 restaurant and cook has cold 13. AR Sleeping in a .24 .46 .44 .50 .45 .43 .53 .45 dead person’s room 14. Core eating vanilla .26 .39 .29 .42 .23 .41 .33 .39 ice cream with ketchup15. Core Seeing maggots .36 .40 .45 .50 .32 .27 .53 .39 on piece of meat16. Core Smelling urine .43 .48 .43 .60 .37 .33 .43 .5217. AR Picking up a .48 .46 .53 .53 .45 .30 .56 .54 dead cat18. Cont Drinking from .43 .47 .29 .28 .28 .33 .28 .31 the glass of an acquaintance19. Cont eating chocolate .44 .53 .36 .45 .31 .34 .32 .45 shaped like dog-doo20. Core Drinking spoiled .52 .44 .24 .40 .19 .37 .31 .31 milk
at UNIV OF VIRGINIA on March 22, 2009 http://jcc.sagepub.comDownloaded from
244 Journal of Cross-Cultural Psychology
Table 4 (continued)
DS Item Item Theme Australia Brazil Germany Italy Japan Netherlands Sweden U.S.
21. Core Stepping on .56 .54 .47 .51 .43 .43 .49 .54 earthworm22. AR Seeing intestines .28 .38 .38 .51 .51 .42 .50 .38 exposed23. AR Touching cremated .38 .55 .56 .49 .59 .28 .53 .45 ashes24. Core Friend wearing .40 .38 .41 .47 .42 .41 .43 .44 dirty underwear25. Cont Inflating condom .41 .37 .34 .50 .35 .44 .30 .42 with mouthM .41 .43 .38 .42 .38 .33 .40 .42
Note: rs > .17, p < .01. Bold items have item-total correlations below the criterion of .30 recommended by Nunnally and Bernstein (1994). Core = core disgust; AR = animal-reminder disgust; Cont = contamination disgust.
Table 5Summary Statistics of Confirmatory Factor Analyses of Three-Factor
Model of Disgust Compared With a One-Factor Model for Each Country
Country Model χ2 RMSeA CFI
Australia Three-factora 624.67(FIML) 0.04 — One-factorb 824.56 0.05 0.90Brazil Three-factora 450.48 0.05 0.91 One-factorb 529.35 0.06 0.88Germany Three-factora 409.20 0.04 0.88 One-factorb 464.49 0.05 0.84Italy Three-factora 350.35 0.03 0.95 One-factorb 416.67 0.04 0.92Japan Three-factora 420.72 0.04 0.88 One-factorb 563.31 0.06 0.81Netherlands Three-factora 421.42 0.04 0.79 One-factorb 422.03 0.04 0.80Sweden Three-factora 406.51 0.03 0.95 One-factorb 522.57 0.05 0.91United States Three-factora 545.83 0.03 0.93 One-factorb 900.41 0.07 0.87
Note: The full information maximum likelihood (FIML) method was used to determine the fit of the proposed struc-tural equation models to the data for this sample. All other models used the least squares method for determining fit. df = degrees of freedom; RMSeA = root mean square error of approximation; CFI = comparative fit index.a. df = 272, ps < .001. b. df = 275, ps < .001.
suggests that the three-factor structure of the DS-R is not invariant for data from Germany, CSDT(22) = 48.59; p < .01; Italy, CSDT(22) = 41.46, p < .01; the Netherlands, CSDT(22) = 110.16, p < .01; and Sweden, CSDT(22) = 67.77, p < .01; relative to the three-factor struc-ture of the DS-R for data from the United States. Further constraining the three-factor model, a test of scalar invariance specifying that both invariant factorial loadings of like
at UNIV OF VIRGINIA on March 22, 2009 http://jcc.sagepub.comDownloaded from
Olatunji et al. / Disgust Scale–Revised 245
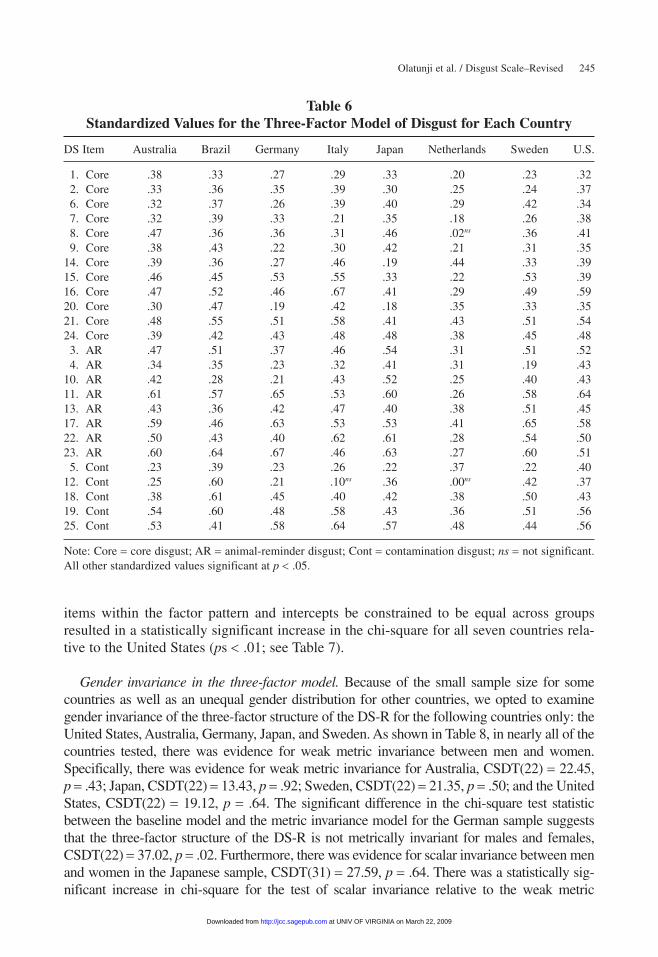
items within the factor pattern and intercepts be constrained to be equal across groups resulted in a statistically significant increase in the chi-square for all seven countries rela-tive to the United States (ps < .01; see Table 7).
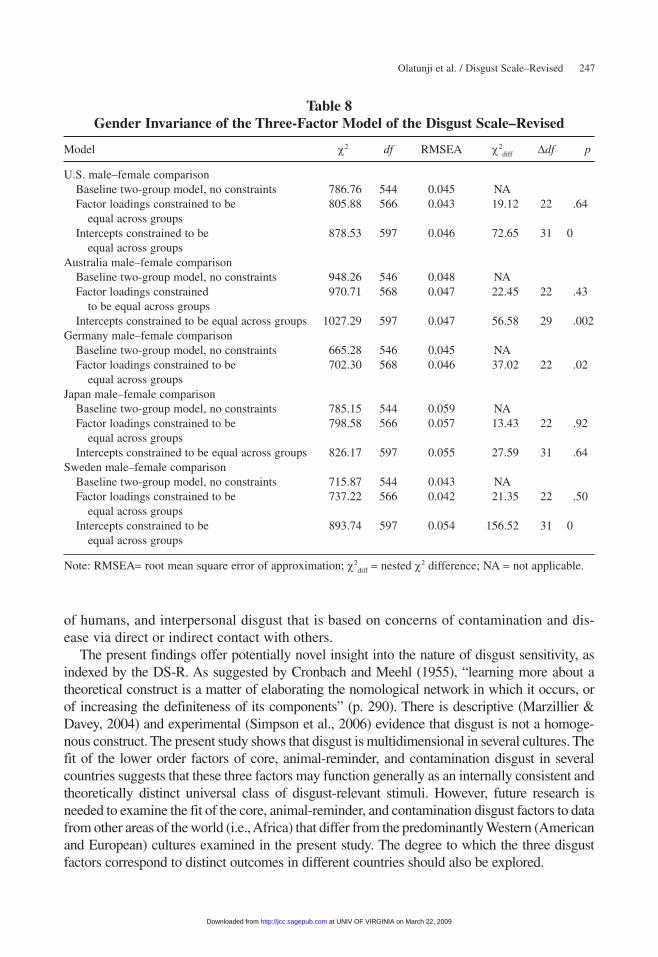
Gender invariance in the three-factor model. Because of the small sample size for some countries as well as an unequal gender distribution for other countries, we opted to examine gender invariance of the three-factor structure of the DS-R for the following countries only: the United States, Australia, Germany, Japan, and Sweden. As shown in Table 8, in nearly all of the countries tested, there was evidence for weak metric invariance between men and women. Specifically, there was evidence for weak metric invariance for Australia, CSDT(22) = 22.45, p = .43; Japan, CSDT(22) = 13.43, p = .92; Sweden, CSDT(22) = 21.35, p = .50; and the United States, CSDT(22) = 19.12, p = .64. The significant difference in the chi-square test statistic between the baseline model and the metric invariance model for the German sample suggests that the three-factor structure of the DS-R is not metrically invariant for males and females, CSDT(22) = 37.02, p = .02. Furthermore, there was evidence for scalar invariance between men and women in the Japanese sample, CSDT(31) = 27.59, p = .64. There was a statistically sig-nificant increase in chi-square for the test of scalar invariance relative to the weak metric
Table 6Standardized Values for the Three-Factor Model of Disgust for Each Country
DS Item Australia Brazil Germany Italy Japan Netherlands Sweden U.S.
1. Core .38 .33 .27 .29 .33 .20 .23 .32 2. Core .33 .36 .35 .39 .30 .25 .24 .37 6. Core .32 .37 .26 .39 .40 .29 .42 .34 7. Core .32 .39 .33 .21 .35 .18 .26 .38 8. Core .47 .36 .36 .31 .46 .02ns .36 .41 9. Core .38 .43 .22 .30 .42 .21 .31 .3514. Core .39 .36 .27 .46 .19 .44 .33 .3915. Core .46 .45 .53 .55 .33 .22 .53 .3916. Core .47 .52 .46 .67 .41 .29 .49 .5920. Core .30 .47 .19 .42 .18 .35 .33 .3521. Core .48 .55 .51 .58 .41 .43 .51 .5424. Core .39 .42 .43 .48 .48 .38 .45 .48 3. AR .47 .51 .37 .46 .54 .31 .51 .52 4. AR .34 .35 .23 .32 .41 .31 .19 .4310. AR .42 .28 .21 .43 .52 .25 .40 .4311. AR .61 .57 .65 .53 .60 .26 .58 .6413. AR .43 .36 .42 .47 .40 .38 .51 .4517. AR .59 .46 .63 .53 .53 .41 .65 .5822. AR .50 .43 .40 .62 .61 .28 .54 .5023. AR .60 .64 .67 .46 .63 .27 .60 .51 5. Cont .23 .39 .23 .26 .22 .37 .22 .4012. Cont .25 .60 .21 .10ns .36 .00ns .42 .3718. Cont .38 .61 .45 .40 .42 .38 .50 .4319. Cont .54 .60 .48 .58 .43 .36 .51 .5625. Cont .53 .41 .58 .64 .57 .48 .44 .56
Note: Core = core disgust; AR = animal-reminder disgust; Cont = contamination disgust; ns = not significant. All other standardized values significant at p < .05.
at UNIV OF VIRGINIA on March 22, 2009 http://jcc.sagepub.comDownloaded from
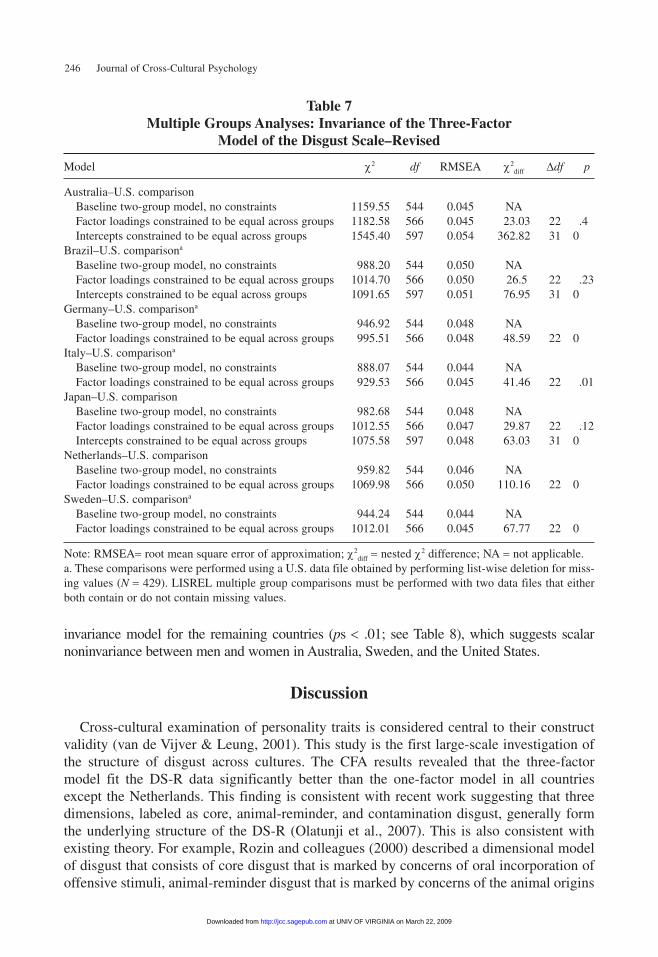
246 Journal of Cross-Cultural Psychology
Table 7Multiple Groups Analyses: Invariance of the Three-Factor
Model of the Disgust Scale–Revised
Model χ2 df RMSeA χ2diff ∆df p
Australia–U.S. comparison Baseline two-group model, no constraints 1159.55 544 0.045 NA Factor loadings constrained to be equal across groups 1182.58 566 0.045 23.03 22 .4 Intercepts constrained to be equal across groups 1545.40 597 0.054 362.82 31 0Brazil–U.S. comparisona
Baseline two-group model, no constraints 988.20 544 0.050 NA Factor loadings constrained to be equal across groups 1014.70 566 0.050 26.5 22 .23 Intercepts constrained to be equal across groups 1091.65 597 0.051 76.95 31 0Germany–U.S. comparisona
Baseline two-group model, no constraints 946.92 544 0.048 NA Factor loadings constrained to be equal across groups 995.51 566 0.048 48.59 22 0Italy–U.S. comparisona
Baseline two-group model, no constraints 888.07 544 0.044 NA Factor loadings constrained to be equal across groups 929.53 566 0.045 41.46 22 .01Japan–U.S. comparison Baseline two-group model, no constraints 982.68 544 0.048 NA Factor loadings constrained to be equal across groups 1012.55 566 0.047 29.87 22 .12 Intercepts constrained to be equal across groups 1075.58 597 0.048 63.03 31 0Netherlands–U.S. comparison Baseline two-group model, no constraints 959.82 544 0.046 NA Factor loadings constrained to be equal across groups 1069.98 566 0.050 110.16 22 0Sweden–U.S. comparisona
Baseline two-group model, no constraints 944.24 544 0.044 NA Factor loadings constrained to be equal across groups 1012.01 566 0.045 67.77 22 0
Note: RMSeA= root mean square error of approximation; χ2diff = nested χ2 difference; NA = not applicable.
a. These comparisons were performed using a U.S. data file obtained by performing list-wise deletion for miss-ing values (N = 429). LISReL multiple group comparisons must be performed with two data files that either both contain or do not contain missing values.
invariance model for the remaining countries (ps < .01; see Table 8), which suggests scalar noninvariance between men and women in Australia, Sweden, and the United States.
Discussion
Cross-cultural examination of personality traits is considered central to their construct validity (van de Vijver & Leung, 2001). This study is the first large-scale investigation of the structure of disgust across cultures. The CFA results revealed that the three-factor model fit the DS-R data significantly better than the one-factor model in all countries except the Netherlands. This finding is consistent with recent work suggesting that three dimensions, labeled as core, animal-reminder, and contamination disgust, generally form the underlying structure of the DS-R (Olatunji et al., 2007). This is also consistent with existing theory. For example, Rozin and colleagues (2000) described a dimensional model of disgust that consists of core disgust that is marked by concerns of oral incorporation of offensive stimuli, animal-reminder disgust that is marked by concerns of the animal origins
at UNIV OF VIRGINIA on March 22, 2009 http://jcc.sagepub.comDownloaded from
Olatunji et al. / Disgust Scale–Revised 247
of humans, and interpersonal disgust that is based on concerns of contamination and dis-ease via direct or indirect contact with others.
The present findings offer potentially novel insight into the nature of disgust sensitivity, as indexed by the DS-R. As suggested by Cronbach and Meehl (1955), “learning more about a theoretical construct is a matter of elaborating the nomological network in which it occurs, or of increasing the definiteness of its components” (p. 290). There is descriptive (Marzillier & Davey, 2004) and experimental (Simpson et al., 2006) evidence that disgust is not a homoge-nous construct. The present study shows that disgust is multidimensional in several cultures. The fit of the lower order factors of core, animal-reminder, and contamination disgust in several countries suggests that these three factors may function generally as an internally consistent and theoretically distinct universal class of disgust-relevant stimuli. However, future research is needed to examine the fit of the core, animal-reminder, and contamination disgust factors to data from other areas of the world (i.e., Africa) that differ from the predominantly Western (American and european) cultures examined in the present study. The degree to which the three disgust factors correspond to distinct outcomes in different countries should also be explored.
Table 8Gender Invariance of the Three-Factor Model of the Disgust Scale–Revised
Model χ2 df RMSeA χ2diff ∆df p
U.S. male–female comparison Baseline two-group model, no constraints 786.76 544 0.045 NA Factor loadings constrained to be 805.88 566 0.043 19.12 22 .64 equal across groups Intercepts constrained to be 878.53 597 0.046 72.65 31 0
equal across groupsAustralia male–female comparison Baseline two-group model, no constraints 948.26 546 0.048 NA Factor loadings constrained 970.71 568 0.047 22.45 22 .43
to be equal across groups Intercepts constrained to be equal across groups 1027.29 597 0.047 56.58 29 .002Germany male–female comparison Baseline two-group model, no constraints 665.28 546 0.045 NA Factor loadings constrained to be 702.30 568 0.046 37.02 22 .02
equal across groupsJapan male–female comparison Baseline two-group model, no constraints 785.15 544 0.059 NA Factor loadings constrained to be 798.58 566 0.057 13.43 22 .92
equal across groups Intercepts constrained to be equal across groups 826.17 597 0.055 27.59 31 .64Sweden male–female comparison Baseline two-group model, no constraints 715.87 544 0.043 NA Factor loadings constrained to be 737.22 566 0.042 21.35 22 .50
equal across groups Intercepts constrained to be 893.74 597 0.054 156.52 31 0
equal across groups
Note: RMSeA= root mean square error of approximation; χ2diff = nested χ2 difference; NA = not applicable.
at UNIV OF VIRGINIA on March 22, 2009 http://jcc.sagepub.comDownloaded from

248 Journal of Cross-Cultural Psychology
The present findings also show that the three disgust dimensions are significantly related. This provides support for the notion that all disgust domains share a common underlying psychological feature (Haidt et al., 1994). However, the DS was developed in the United States and has been subsequently translated into several different languages (Olatunji & Cisler, in press). Although some stimuli that elicit disgust (i.e., feces) are similar across cultures (Curtis, & Biran, 2001; Davey et al., 1998), a central concern is for any measure is its portability to different cultures, where discrepancies may emerge that manifest as impor-tant differences in the underlying structure of the construct (Ritsher, Struening, Hellman, & Guardino, 2002). Consequently, evaluating structural equivalence across cultures is an impor-tant step in examining the general validity of the three-factor model of the DS-R (van de Vijver & Leung, 1997). The present findings showed that the three-factor structure of the DS-R in Australia, Brazil, and Japan had weak metric invariance relative to the three- factor structure of the DS-R in the United States. However, the three-factor structure of the DS-R was not invariant for data from Germany, Italy, the Netherlands, and Sweden.
Although the three-factor structure of the DS-R best accounted for the data in the different countries, the present findings suggest that the three-factor structure is not equally stable across cultures. The instability of the three-factor structure of the DS-R across the countries not sur-prising. Indeed, it has been noted that culturally specific factors will affect the stability of underlying structure of various measures of emotion and personality traits (Matsumoto & Yoo, 2007; Rossier, 2005). Although the scale metrics were found not to be the same for all the countries sampled when compared with the United States, the factor loadings of the three-factor structure of the DS-R based on data from the United States were generally similar to those of data from Australia, Brazil, and Japan but not Germany, Italy, the Netherlands, and Sweden. These analyses suggest that the DS-R items represent three latent constructs to which they contribute equally in some countries. However, in Germany, Italy, the Netherlands, and Sweden, some items of the DS-R do not appear to provide equivalent measurement of the core, animal-reminder, and contamination disgust latent constructs. This interpretation of these find-ings is in line with prior research. For example, although disgust reactions to unusual sexual practices are related to animal-reminder disgust among U.S. participants, this does not appear to be the case among participants from the Netherlands (Olatunji, Sawchuk, de Jong, & Lohr, 2006).
It has been shown that there are important cross-language differences in the meaning of dis-gust (Haidt, Rozin, McCauley, & Imada, 1997), and one major source of variation arises from cultural differences in conceptions of disgust toward the body and its products (Shweder, Mahapatra, & Miller, 1987). The noninvariance of the three-factor model of the DS-R may reflect true cross-cultural differences in the structure and meaning of disgust in respondents from Germany, Italy, the Netherlands, and Sweden when compared with U.S. respondents. Interestingly, unique interpretations of disgust may be attributable to regional effects, because invariance was not found in the european countries. For example, the German word for disgust, Ekel, may have a different semantic range. The meaning of Ekel (etymologically) is “what pro-vokes/leads to vomiting.” Thus, it is quite similar to the theoretical meaning of disgust (bad taste). However, there is evidence that among participants in the United States, the common understanding of the word disgust reflects a combination of the conceptual meanings of disgust and anger whereas the slang term “grossed out” more closely captures the theoretical meaning of disgust (Nabi, 2002). The Swedish word for disgust appears to be related to Ekel, yet this is
at UNIV OF VIRGINIA on March 22, 2009 http://jcc.sagepub.comDownloaded from
Olatunji et al. / Disgust Scale–Revised 249
not so for the Dutch word for disgust. So the lack of invariance in the structure of disgust may be related to important differences in Germanic culture, rather than the language per se. There is evidence that disgust responses largely reflect social influence and cultural shaping (Bixler & Floyd, 1997; Rozin & Fallon, 1987). For example, although spiders are often appraised as dis-gusting in Western cultures, in many other areas of the world (e.g., Indo-China, the Caribbean, and Africa) spiders are eaten as a delicacy (Bristowe, 1932, 1945). Different cultural factors (i.e., language, social institutions, urbanization) in conjunction with variability in cultural beliefs may account for the noninvariance of the three-factor model of the DS-R in some countries.
Applying the three-factor structure of the DS-R based on data from the United Stated to data from other countries represents an etic approach. Future investigations may wish to assume a more emic (i.e., cultural-specific) approach in examining the extent to which the three-factor structure represents the underlying structure of the DS-R in other countries. The importance of using an emic approach in the assessment of disgust is best captured by the linguist Anna Wierzbicka (1986):
One of the most interesting and provocative ideas that have been put forward in the relevant literature is the possibility of identifying a set of fundamental human emotions, universal, discrete, and presumably innate. . . . I experience a certain unease when reading claims of this kind. . . . How is it that these emotions are all so neatly identified by means of english words? For example, Polish do not have a word exactly corresponding to the english word disgust. What if psychologists working on the “fundamental emotions” happened to be native speakers of Polish rather than english? (p. 584)
Specific sample characteristics in the present study may also account for the noninvari-ance of the three-factor model in Germany, the Netherlands, and Sweden. examination of DS-R item-level differences may also provide some insight into the distinctiveness of data from Germany, the Netherlands, and Sweden. examination of the standardized factor load-ings of the three-factor model outlined in Table 6 shows that 4 to 13 items from Germany, the Netherlands, and Sweden data loaded <.30 onto the respective three factors, whereas only 0 to 3 items from Australia, Brazil, Japan, and the United States loaded <.30 onto the respective three factors. This suggests that the items that constitute the core, animal- reminder, and contamination disgust factors in some countries (Germany, the Netherlands, Sweden) are not equally related to the same group of items in the United States.
Prior research has highlighted important gender differences in disgust, with women consistently reporting higher levels than men (Olatunji, Sawchuk, Arrindell, & Lohr, 2005). The present findings revealed that the previously reported gender difference in disgust is also observed in many different countries. Given the robust gender differences in disgust, the present study also examined the invariance of the three-factor structure of the DS-R across gender. The findings revealed that the three-factor structure of the DS-R evidenced weak metric invariance in samples of men and women from Australia, Japan, Sweden, and the United States. These findings suggest that the group of items that represent the core, animal-reminder, and contamination disgust factors represent a set of constructs that seem to be equally viable across gender in different countries.
The present study also highlights important areas of further refinement of the DS. For example, item-total correlations for Item 12 (“I probably would not go to my favorite restau-rant if I found out that the cook had a cold”) and Item 18 (“You take a sip of soda, and then
at UNIV OF VIRGINIA on March 22, 2009 http://jcc.sagepub.comDownloaded from
250 Journal of Cross-Cultural Psychology
realize that you drank from the glass that an acquaintance of yours had been drinking from”) appear to be problematic as indicated by an item-total correlation below the criterion of .30 recommended by Nunnally and Bernstein (1994) in four of the eight countries sampled. These two items assess basic rules of disgust appraisal labeled “the laws of sympathetic magic” (Rozin & Nemeroff, 1990). The first rule, the law of contagion, dictates that the prop-erties of one object are transferred by contact to another and remain after contact is broken. The second rule, law of similarity, dictates that things that are similar in some properties are felt to be fundamentally similar or even identical (Haidt et al., 1997). Although Items 12 and 18 appear to assess the laws of sympathetic magic or an irrational understanding of how contagion is transmitted which may be related to disgust, the low item-total correlation in four countries suggests that these items deviate from the experience of disgust in some countries. In some countries, these items may more directly be related to concerns of improbable con-tamination rather then disgust per se.
The contamination disgust factor consists of Items 12 and 18; thus, the low item-total cor-relation of these items may have implications for the psychometric integrity and distinctiveness of the contamination disgust factor. In fact, it is possible that core and contamination disgust factors may not be separable in some cultures given the conceptual overlap of avoidance of contaminants either orally (core disgust) or via contact (contamination disgust). Although the three-factor solution appears to fit the DS-R data generally well, invariance of the three-factor solution was only observed for some countries. To continue to justify claims for the three- factor solution, it will be necessary to rule out translation artifacts on the DS-R (which to our view was adequately done in the present study) because there are important cross-language differences in the semantic domains of words for disgust (Haidt et al., 1997). Nonetheless, further research is needed to investigate the replicability and correlates of culture-specific fac-tors. It also will be useful to explore other psychometric properties of the DS-R in different countries, including test–retest reliability, criterion validity, and incremental predictive validity. Additionally, the use of more behaviorally oriented methods of disgust assessment that is more cross-culturally stable (i.e., facial expressions) may provide a useful avenue to further explore possible cross-cultural similarities and differences on the convergence of self-reported disgust across multiple dimensions and disgust-relevant behavioral outputs.
There has been a recent emergence of research interest on the role of disgust sensitivity in the anxiety disorders (Olatunji & Sawchuk, 2005). Although research has begun to address cross-cultural issues in the assessment of some anxiety disorder risk factors (e.g., anxiety sensitivity; Zvolensky et al., 2003), such research on disgust sensitivity is notice-ably absent in the literature. It may be useful for future research to address the extent to which specific dimensions of disgust sensitivity relate to typical and culturally specific manifestations of anxiety pathology. Core disgust (oral incorporation), animal-reminder disgust (mortality defense), and contamination disgust (disease avoidance) appear to be governed by distinct behavioral inhibition systems. Accordingly, core disgust, animal- reminder disgust, and contamination disgust should be differentially related to specific anxiety disorder symptoms (de Jong & Merckelbach, 1998). Preliminary cross-cultural research has shown that OCD-related contamination fear among participants from the Netherlands is best predicted by core and animal-reminder disgust, whereas OCD-related contamination fear among participants from the United States is best predicted by only core disgust (Sawchuk, Olatunji, & de Jong, 2006). It remains to be seen whether a differential
at UNIV OF VIRGINIA on March 22, 2009 http://jcc.sagepub.comDownloaded from

Olatunji et al. / Disgust Scale–Revised 251
pattern of associations between the disgust dimensions and anxiety disorder symptoms is observed in other countries. Finally, research that addresses how disgust sensitivity facili-tates the transition from normal functioning to anxiety pathology in different countries will be an important next step (Davey, Bickerstaffe, & MacDonald, 2006).
Disgust has been conceptualized as one of the basic, universal emotions that may be elabo-rated into complex emotional reactions that vary from one culture to the next (Oatley & Johnson-Laird, 1987). These findings demonstrate that the underlying factor structure of the DS-R in several different countries is best captured by a three-factor solution. Although initially developed for participants in the United States, the DS-R appears to have some utility across cultures. Such a universal structure for disgust may have important implications for understand-ing the intersection of human emotion and culture. For example, theories of disgust developed in Western empirical traditions may be applicable to other cultural context. This is not to say that cross-cultural factors do affect the structural integrity of disgust. Perhaps a more parsimoni-ous view is that there may be culture-specific modulations of content that are appraised with disgust (particularly in Germanic countries) that converge around a universal theme.
The present investigation illustrates the factorial structure of disgust but does not neces-sary encompass the full range of possible disgust dimensions. For example, the present findings do not address the morality dimension of disgust, which may vary in content and structure across cultures (Haidt et al., 1997; Scherer, 1997). Another limitation of the cur-rent study is that only the DS-R was administered, which places limitations on the psycho-metric information that may be obtained from the present study. Nonetheless, this study serves as an important reference point for future research aimed at elucidating issues related to disgust sensitivity across cultures.
Notes
1. For the non-english-speaking countries in the present investigation, translation of the DS from english to the native language was made by the following methods. Brazil: The DS was translated into Portuguese by a bilingual fellow, and an independent bilingual fellow translated it back into english. Both versions were com-pared, and both translators had a high agreement (100%). Germany: The DS was translated into German by A. Schienle. Subsequently, the German DS-R was translated back into english by an independent translator, a native english speaker. This process was checked to make sure that both english versions were comparable, which was the case. Italy: DS was translated into Italian by two bilingual clinical psychologists, for one of which english was the second language and Italian the first and vice versa for the other translator. The translators made the translation, in a first phase, independently one from the other, and in a second phase, they shared and reviewed the translations. Very minor differences were found between the two translations and were solved with a discus-sion between the translators. Japan: The DS was translated into Japanese by S. Imada. Back-translation was conducted by an independent investigator, and recommended adjustments were made. Netherlands: the DS was translated into Dutch by P. de Jong and colleagues. Although a backward translation procedure was not used for the measure used in the present study, a recent back-translation resulted in a satisfactory outcome. Sweden: The DS was translated into Swedish by a professional translator. One change was made to the scale: The word cock-roach in one item was changed into mjölbagge (mealworm, Tenebrio molitor) because cockroaches are rarely seen in Swedish homes. A bilingual (english and Swedish) graduate student in psychology then independently translated the Swedish version back to english. and both versions were judged to be remarkably similar.
2. The missing data in these samples constrained the analysis to the FIML method in LISReL, and therefore, access to some of the popular types of fit indices was limited. Although we were not able to obtain several popular goodness-of-fit indices, FIML estimation has been shown to be a good analysis procedure. enders and Bandalos (2001) demonstrated that FIML estimation is the best option for analyzing data sets with missing values, yielding more unbiased and efficient estimates than list-wise deletion, pair-wise deletion, and similar response pattern imputation.
at UNIV OF VIRGINIA on March 22, 2009 http://jcc.sagepub.comDownloaded from

252 Journal of Cross-Cultural Psychology
References
Bixler, R. D. & Floyd, M. F. (1997). Nature is scary, disgusting, and uncomfortable. Environment and Behavior, 29, 443-467.
Björklund, F., & Hursti, T. J (2004). A Swedish translation and validation of the Disgust Scale: A measure of disgust sensitivity. Scandinavian Journal of Psychology, 45, 279-284.
Bristowe, W. S. (1932). Insects and other invertebrates for human consumption in Siam. Transactions of the Entymological Society of London, 80, 387-404.
Bristowe, W. S. (1945). Spider superstitions and folklore. Transactions of the Connecticut Academy for Arts and Science, 36, 53-90.
Brown, T. A. (2006). Confirmatory factor analysis for applied research. New York: Guilford.Cronbach, L., & Meehl, P. (1955). Construct validity in psychological tests, Psychological Bulletin, 52, 281-302.Curtis, V., & Biran, A. (2001). Dirt, disgust, and disease. Perspectives in Biology and Medicine, 44, 17–31.Darwin, C. (1965). The expression of the emotions in man and animals. Chicago: University of Chicago Press.
(Original work published 1872)Davey, G. C. L., Bickerstaffe, S., & MacDonald, B. (2006). experienced disgust causes a negative interpretation
bias: A causal role for disgust in anxious psychopathology. Behaviour Research and Therapy, 44, 1375-1384.
Davey, G. C. L., & Bond, N. (2006). Using controlled comparisons in disgust psychopathology research: The case of disgust, hypochondriasis and health anxiety. Journal of Behavior Therapy and Experimental Psychiatry, 37, 4-15.
Davey, G. C. L., McDonald, A., S., Hirisave, U., Prabhu, G. G., Iwawaki, S., Jim, C. I., et al. (1998). A cross-cultural study of animal fears. Behaviour Research and Therapy, 36, 735-750.
de Jong, P. J., & Merckelbach, H. (1998). Blood-injection-injury phobia and fear of spiders: Domain specific individual differences in disgust sensitivity. Personality and Individual Differences, 24, 153-158.
de Jong, P. J., Peters, M., & Vanderhallen, I. (2002). Disgust and disgust sensitivity in spider phobia: Facial eMG in response to spider and oral disgust imagery. Journal of Anxiety Disorders, 16, 477-493.
enders, C. K., & Bandalos, D. L. (2001). The relative performance of full information maximum likelihood estimation for missing data in structural equation models. Structural Equation Modeling, 8, 430-457.
Fessler, D. M. T., eng, S. J., & Navarrete, C. D. (2005). elevated disgust sensitivity in the first trimester of pregnancy: evidence supporting the compensatory prophylaxis hypothesis. Evolution and Human Behavior, 26, 344-351.
Fessler, D. M. T., & Navarrete, C. D. (2005). The effect of age on death disgust: Challenges to terror manage-ment perspectives. Evolutionary Psychology, 3, 279-296.
Haidt, J., McCauley, C., & Rozin, P. (1994). Individual differences in sensitivity to disgust: A scale sampling seven domains of disgust elicitors. Personality and Individual Differences, 16, 701-713.
Haidt, J., Rozin, P., McCauley, C., & Imada, S. (1997). Body, psyche, and culture: The relationship between disgust and morality. Psychology and Developing Societies, 9, 107-131.
Horn, J. L., & McArdle, J. J. (1992). A practical and theoretical guide to measurement invariance in aging research. Experimental Aging Research, 18, 117-144.
Hu, L., & Bentler, P. M. (1999). Cutoff criteria for fit indexes in covariance structure analysis: Conventional criteria versus new alternatives. Structural Equation Modeling, 6, 1-55.
Jöreskog, K. G. (1971). Statistical analysis of sets of congeneric tests. Psychometrika, 56, 109-133.Jöreskog, K. G., & Sörbom, D. (2006). LISREL for Windows [computer software]. Lincolnwood, IL: Scientific
Software International.Marzillier, S. L., & Davey, G. C. L. (2004). The emotional profiling of disgust-eliciting stimuli: evidence for
primary and complex disgusts. Cognition and Emotion, 18, 313-336.Matsumoto, D., & Yoo, S. H. (2007). Methodological considerations in the study of emotion across cultures. In
J. A. Coan, & J. J. B. Allen (eds.), Handbook of emotion elicitation and assessment, 332-348. New York: Oxford Press.
McDonald, R. P., & Ho, M. R. (2002). Principles and practice in reporting structural equation analyses. Psychological Methods, 7, 64-82.
at UNIV OF VIRGINIA on March 22, 2009 http://jcc.sagepub.comDownloaded from

Olatunji et al. / Disgust Scale–Revised 253
Nabi, R. N. (2002). The theoretical versus the lay meaning of disgust: Implications for emotion research. Cognition and Emotion, 16, 695-703.
Nunnally, J., & Bernstein, I. (1994). Psychometric theory. New York: McGraw-Hill.Oatley, K., & Johnson-Laird, P. N. (1987). Towards a cognitive theory of emotions. Cognition and Emotion, 1,
29-50.Olatunji, B. O., & Cisler, J. M. (in press). Disgust sensitivity: psychometric overview and operational definition.
In B. O. Olatunji & D. McKay (eds.). Disgust and its disorders: Theory, assessment, and treatment. Washington, DC: American Psychological Association.
Olatunji, B. O., Lohr, J. M., Sawchuk, C. N., & Tolin, D. F. (2007). Multimodal assessment of disgust in con-tamination-related obsessive-compulsive disorder. Behaviour Research and Therapy, 45, 263-276.
Olatunji, B. O., & Sawchuk, C. N. (2005). Disgust: Characteristic features, social implications, and clinical manifestations. Journal of Social and Clinical Psychology, 24, 932-962.
Olatunji, B. O., Sawchuk, C. N., Arrindell, W. A, & Lohr, J. M. (2005). Disgust sensitivity as a mediator of the sex differences in contamination fears. Personality and Individual Differences, 38, 713-722.
Olatunji, B. O., Sawchuk, C. N., de Jong, P. J., & Lohr, J. M. (2006). The structural relation between disgust sensitivity and blood-injection-injury fears: A cross-cultural comparison of U.S. and Dutch data. Journal of Behavior Therapy and Experimental Psychiatry, 37, 16-29.
Olatunji, B. O., Sawchuk, C. N., Lohr, J. M., & de Jong, P. J. (2004). Disgust domains in the prediction of contamination fear. Behaviour Research and Therapy, 42, 93-104.
Olatunji, B. O., Williams, N. L., Tolin, D. F., Sawchuk, C. N., Abramowitz, J. S., Lohr, J. M., et al. (2007). The Disgust Scale: Item analysis, factor structure, and suggestions for refinement. Psychological Assessment, 19, 281-297.
Ritsher, J. B., Struening, e. L., Hellman, F., & Guardino, M. (2002). Internal validity of an anxiety disorder screening instrument across five ethnic groups. Psychiatry Research, 111, 199-213.
Rossier, J. (2005). A review of the cross-cultural equivalence of frequently used personality inventories. International Journal for Education and Vocational Guidance, 5, 175-188.
Rozin, P., & Fallon, A. e. (1987). A perspective on disgust. Psychological Review, 94, 32-41.Rozin, P., Haidt, J., & McCauley, C. R. (2000). Disgust. In M. Lewis & J. M. Haviland (eds.), Handbook of
emotions, 637-653. New York: Guilford. Rozin, P., & Nemeroff, C. (1990). The laws of sympathetic magic: A psychological analysis of similarity and
contagion. In J. W. Stigler, R. A. Shweder, & G. Herdt (eds.), Cultural psychology: Essays on comparative human development, 205-232. New York: Cambridge University Press.
Sawchuk, C. N., Lohr, J. M., Tolin, D. F., Lee, T. C., & Kleinknecht, R. A. (2000). Disgust sensitivity and contamina-tion fears in spider and blood-injection-injury phobias. Behaviour Research and Therapy, 38, 753-762.
Sawchuk, C. N., Olatunji, B. O., & de Jong, P. J. (2006). Disgust domains in the prediction of contamination fear: A comparison of Dutch and US Samples. Anxiety, Stress and Coping, 19, 397-407.
Scherer, K. R. (1997). Profiles of emotion-antecedent appraisal: Testing theoretical predictions across cultures. Cognition and Emotion, 11, 113-150.
Simpson, J., Carter, S., Anthony, S., & Overton, P. (2006). Is disgust a homogenous emotion? Motivation and Emotion, 30, 31-41.
Smith, D. M., Loewenstein, G., Rozin, P., Sherriff, R. L., & Ubel, P. A. (2007). Sensitivity to disgust, stigma, and adjustment to life with a colostomy. Journal of Research in Personality, 41, 787-803.
Shweder, R. A., Mahapatra, M., & Miller, J. (1987). Culture and moral development. In J. Kagan & S. Lamb (eds.), The emergence of morality in young children, 1-83. Chicago: University of Chicago Press.
Stein, J. A., Lee, J. W., & Jones, P. S. (2006). Assessing cross-cultural differences through use of multiple-group invariance analyses. Journal of Personality Assessment, 87, 249-258.
Tolin, D. F., Lohr, J. M., Sawchuk, C. N., & Lee, T. C. (1997). Disgust and disgust sensitivity in blood- injection-injury and spider phobia. Behaviour Research and Therapy, 35, 949-953.
Tolin, D. F., Woods, C. M., & Abramowitz, J. S. (2006). Disgust sensitivity and obsessive-compulsive symp-toms in a nonclinical sample. Journal of Behavior Therapy and Experimental Psychiatry, 37, 30-40.
Troop, N. A., Treasure, J. L., & Serpell, L. (2002). A further exploration of disgust in eating disorders. European Eating Disorders Review, 10, 218-226.
at UNIV OF VIRGINIA on March 22, 2009 http://jcc.sagepub.comDownloaded from

254 Journal of Cross-Cultural Psychology
van de Vijver, F. J. R., & Leung, K. (1997). Methods and data analysis for cross-cultural research. Newbury Park, CA: Sage.
van de Vijver, F. J. R., & Leung, K. (2001). Personality in cultural context: Methodological issues. Journal of Personality, 69, 1007-1031.
Wheatley, T., & Haidt, J. (2005). Hypnotically induced disgust makes moral judgments more severe. Psychological Science, 16, 780-784.
Widaman, K. F., & Reise, S. P. (1997). exploring the measurement invariance of psychological instruments: Applications in the substance abuse domain. In K. J. Bryant & M. Windle (eds.), The science of prevention: Methodological advance from alcohol and substance abuse research (pp. 281-324). Washington, DC: American Psychological Association.
Wierzbicka, A. (1986). Human emotions: Universal or culture-specific? American Anthropologist, 88, 584-594.
Zvolensky, M. J., Arrindell, W. A., Taylor, S., Sandin, B., Cox, B. J., Stewart, S. H., et al. (2003). Anxiety sen-sitivity in six countries. Behaviour Research and Therapy, 41, 841-859.
Bunmi O. Olatunji, PhD, is assistant professor of psychology (A&S) and a member of the Vanderbilt Kennedy Center for Research on Human Development. His research examines the role of basic emotions as they relate to the assessment, etiology, and maintenance of anxiety-related disorders. A current focus of his work is on the role of disgust in specific anxiety disorders.
Melanie W. Moretz is a graduate student in the department of psychology at Fordham University. She has assisted in recent investigations on the role of disgust in obsessive compulsive disorder and is also interested in the role of disgust in other disorders.
Dean McKay, PhD, ABPP, is associate professor in the Department of Psychology at Fordham University in Bronx, New York. His research has focused primarily on obsessive–compulsive disorder (OCD), body dysmor-phic disorder, and hypochondriasis and their link to OCD, and the role of disgust in psychopathology.
Fredrik Bjorklund, PhD, is assistant professor in the Department of Psychology at Lund University. His research has focused primarily on the link between disgust and moral judgment.
Peter J. de Jong, PhD, is professor in the Department of Clinical and Developmental Psychology at University of Groningen. The general aim of his research program is to improve description, causal understanding, and treatment of particular psychological disorders.
Jonathan Haidt, PhD, is associate professor in the Department of Psychology at the University of Virginia. His research examines morality and the moral emotions, such as elevation, awe, gratitude, and admiration. He specifically examines how these emotions develop and how morality varies across cultures. He is also interested in how “intuitive ethics” differentially motivate liberals and conservatives.
Timo J. Hursti, DrMedScc, examines general mechanisms of chemotherapy-induced nausea and vomiting as well as factors explaining the individual variation in these side effects. The study methods include assessments of personality and psychological well-being, neuroendocrinological factors, and brain function.
Sumio Imada is a professor in the Department of Psychology at Hiroshima-Shudo University. His research examines the intersection of odor and perception. His research has also examined cross-cultural issues related to disgust.
Silvia Koller is a professor of psychology at the Instituto de Psicologia, Universidade Federal do Rio Grande do Sul. Her research examines culturally specific strength characteristics associated with families in Brazil. The focus of this research is on familism and familial interdependence, the role of the extended family, cooperative and prosocial tendencies, a collective orientation, and the closing gender gap. She also has research interests on the role of disgust in moral judgment.
at UNIV OF VIRGINIA on March 22, 2009 http://jcc.sagepub.comDownloaded from

Olatunji et al. / Disgust Scale–Revised 255
Francesco Mancini is clinic director at the Scuola di Psicoterapia Cognitiva. His research examines the role of emotion in obsessive–compulsive disorder (OCD). His recent research has examined the relationship between guilt and cognitive vulnerabilities for OCD.
Andrew C. Page, PhD, is an associate professor in the School of Psychology at the University of Western Australia. His research examines ways to deliver effective and efficient psychological services. His research also examines how thought suppression is involved in anxiety and depression and how best to treat the negative effects. He is interested in the anxiety disorders, especially blood-injury phobia, and the best ways to reduce phobic avoidance.
Anne Schienle is professor and head of clinical and health psychology at the University of Graz. She is prima-rily interested in the psychophysiological and neural correlates of emotion in the context of specific anxiety disorders. Her recent research has examined the neural substrates of disgust and anxiety disorders that are highly related to disgust.
at UNIV OF VIRGINIA on March 22, 2009 http://jcc.sagepub.comDownloaded from