Converging Identities, Emerging Discourses: Muslim Female ...
A Taxometric Study of the Latent Structure of Disgust Sensitivity:Converging Evidence for Dimensionality
Bunmi O. OlatunjiVanderbilt University
Joshua J. Broman-FulksAppalachian State University
Disgust sensitivity has recently been implicated as a specific vulnerability factor for several anxiety-related disorders. However, it is not clear whether disgust sensitivity is a dimensional or categoricalphenomenon. The present study examined the latent structure of disgust by applying three taxometricprocedures (maximum eigenvalue, mean above minus below a cut, and latent-mode factor analysis) todata collected from 2 large nonclinical samples on 2 different measures of disgust sensitivity. Disgustsensitivity in the first sample (n � 1,153) was operationalized by disgust reactions to food, animals, bodyproducts, sex, body envelope violations, death, hygiene, and sympathetic magic, as assessed by theDisgust Sensitivity Scale (J. Haidt, C. McCauley, & P. Rozin, 1994). Disgust Sensitivity Scale indicatorsof core, animal reminder, and contamination disgust were also examined in the 1st sample. Disgustsensitivity in the 2nd independent sample (n � 1,318) was operationalized by disgust reactions toanimals, injections and blood draws, mutilation and death, rotting foods, and odors, as assessed by theDisgust Emotion Scale (R. A. Kleinknecht, E. E. Kleinknecht, & R. M. Thorndike, 1997). Results acrossboth samples provide converging evidence that disgust sensitivity is best conceptualized as a dimensionalconstruct, present to a greater or lesser extent in all individuals. These findings are discussed in relationto the conceptualization and assessment of disgust sensitivity as a specific dimensional vulnerability forcertain anxiety and related disorders.
Keywords: disgust sensitivity, Disgust Scale, Disgust Emotion Scale, dimensional, taxometric
Disgust sensitivity (DS), defined as a predisposition towardexperiencing disgust (de Jong & Merckelbach, 1998; Olatunji &Sawchuk, 2005), has been described as a genetically based per-sonality trait that operates as a specific vulnerability factor forcertain disorders (Muris, 2006). Indeed, numerous descriptive andexperimental studies have now implicated DS in the developmentof spider phobia (de Jong & Merckelbach, 1998; de Jong & Muris,2002; de Jong, Peters, & Vanderhallen, 2002; Merckelbach, deJong, Arntz, & Schouten, 1993; Mulkens, de Jong, & Merckel-bach, 1996; Sawchuk, Lohr, Tolin, Lee, & Kleinknecht, 2000;Tolin, Lohr, Sawchuk, & Lee, 1997; Woody, McLean, & Klassen,2005) and blood–injection–injury (BII) phobia (de Jong & Mer-ckelbach, 1998; Olatunji, Arrindell, & Lohr, 2005; Olatunji, Saw-chuk, de Jong, & Lohr, 2006; Olatunji, Williams, Sawchuk, &Lohr, 2006; Page, 2003; Sawchuk, Lohr, Lee, & Tolin, 1999;Sawchuk, Lohr, Westendorf, Meunier, & Tolin, 2002; Tolin et al.,1997). Although it has been suggested that the relation between DSand specific phobias is illusory and mediated by negative affect(i.e., Thorpe & Salkovskis, 1998), recent studies have indicated
that DS possesses a specific relation with spider phobia and BIIphobia that is not accounted for by negative affect and thereforemay constitute a specific risk factor for these phobic conditions(Muris, Merckelbach, Schmidt, & Tierney, 1999; Olatunji, 2006;Olatunji, Sawchuk, Lohr, & Patten, in press).
Theoretical accounts consider DS as a personality trait thatfunctions to facilitate avoidance of stimuli that may communicateuncleanliness, contamination, and the potential for disease (Match-ett & Davey, 1991; Olatunji & Sawchuk 2005; Woody & Teach-man, 2000). Accordingly, research findings have begun to alsoimplicate DS in the etiology of contamination-based obsessive–compulsive disorder (OCD; Mancini, Gragnani, & D’Olimpio,2001; Olatunji, Sawchuk, Lohr, & de Jong, 2004; Olatunji, Tolin,Huppert, & Lohr, 2005; Schienle, Stark, Walter, & Vaitl, 2003;Thorpe, Patel, & Simonds, 2003; Woody & Tolin, 2002). In fact,recent neuroimaging studies suggest that the neurocircuits (e.g.,the anterior insular cortex) involved in DS are relevant to OCDand, in particular, contamination obsessions and washing compul-sions (Husted, Shapira, & Goodman, 2006). The relation betweenDS and contamination-based OCD also appears to be unique andunaccounted for by symptoms of fear, anxiety, and depression(Olatunji, Lohr, Sawchuk, & Tolin, 2007; Olatunji, Sawchuk,Arrindell, & Lohr, 2005; Tolin, Woods, & Abramowitz, 2006).Research on the role of DS in OCD has recently been extended tohealth anxiety and hypochondriasis. For example, Davey and Bond(2006) found highly significant correlations between DS and mea-sures of hypochondriasis and health anxiety, even when levels oftrait anxiety were controlled for.
DS also appears to play a role in the development and mainte-nance of eating disorders, given that several derivatives of disgust
Bunmi O. Olatunji, Department of Psychology, Vanderbilt University;Joshua J. Broman-Fulks, Department of Psychology, Appalachian StateUniversity.
We are grateful to Jonathan Abramowitz, Randolph Arnau, BradleyGreen, Jeffrey Lohr, David Marcus, Craig Sawchuk, David Tolin, andCarol Woods for assistance with this study.
Correspondence concerning this article should be addressed to BunmiO. Olatunji, Department of Psychology, Vanderbilt University, 301 WilsonHall, 111 21st Avenue South, Nashville, TN 37203. E-mail:[email protected]
Psychological Assessment Copyright 2007 by the American Psychological Association2007, Vol. 19, No. 4, 437–448 1040-3590/07/$12.00 DOI: 10.1037/1040-3590.19.4.437
437
(e.g., shame) are commonly associated with foods (Phillips, Se-nior, Fahy, & David, 1998; Rozin & Fallon, 1987; Troop, Murphy,Bramon, & Treasure, 2000). Although empirical studies investi-gating the proposed association between DS and eating disordershave been limited, interesting findings have been generated fromthis sparse literature. First, measures of DS correlate positivelywith eating disorder symptoms in women (Davey, Buckland, Tan-tow, & Dallos, 1998). Furthermore, when researchers comparedsamples with and without eating disorders, significant group dif-ferences emerge on DS toward food, the physical body, and bodilyproducts (Davey et al., 1998; Troop et al., 2000; Troop, Treasure,& Serpell, 2002). Finally, women in remission from an eatingdisorder showed significant reductions in bodily focused DS incomparison to women who continued to meet diagnostic criteria(Troop et al., 2002).
The current literature suggests that DS may play an etiologicalrole in anxiety-related disorders that involve the protection of theself from physical and/or psychological contamination (Olatunji &Sawchuk, 2005). In many ways, the notion that DS operates as aspecific vulnerability for certain anxiety disorders parallels thegrowing body of literature implicating anxiety sensitivity (the fearof anxiety and anxiety-related sensations; Reiss & McNally, 1985)as a risk factor for the development of panic disorder and otheranxiety pathology (McNally, 2002). Like anxiety sensitivity andmany other personality risk factors, DS has traditionally beenconceptualized as an individual-differences variable that exists inall persons, varying between individuals by degree rather thankind. To date, researchers have operated from the assumption thatthe latent structure of DS is dimensional (Haidt, McCauley, &Rozin, 1994), and theoretical (Rozin, Haidt, & McCauley, 2000)and empirical work have provided supportive evidence that DS is,indeed, a multifaceted construct (Olatunji, Williams, Lohr, &Sawchuk, 2005).
To our knowledge, researchers have yet to directly test theaccuracy of the assumption that DS is continuous. There aretheoretical reasons why DS may be categorical rather than contin-uous. For example, the experience of disgust is adaptive in that itfunctions to prevent infection and disease (Olatunji et al., 2004).Sensitivity to disgust-related cues may then serve to warn theorganism to internal and external sources of contamination. Itremains unclear how an evolutionarily adaptive process, normallydistributed in the general population, comes to operate as riskfactors for specific disorders (Berstein et al., 2007). One possibilityis that aversive learning experiences or certain gene–environmental interactions may qualitatively change the adaptivefunction of DS to become dysfunctional, consequently facilitatingthe developmental separation of DS into unique and distinct cat-egories. It may then be theoretically and practically useful toconceptualize one category of DS as a normative form of DS andthe other as a vulnerability-conferring form of DS (i.e., conferringrisk for specific disorders). Indeed, recent basic laboratory re-search has shown that once associative learning of disgust occurs,it is often highly resistant to extinction (Olatunji, Forsyth, &Cherian, 2007). This resistance to extinction may thereby facilitateand maintain the taxonic split between adaptive and maladaptivelatent forms of DS. The maladaptive latent form of DS may thenbe viewed as a highly potent agent that is necessary but may not besufficient for causing a certain psychological disorder (e.g.,contamination-based OCD).
There are also empirical reasons why DS may be categoricalrather than continuous. Although not without debate, there is somerecent evidence that anxiety sensitivity (a risk factor for panicdisorder and other anxiety disorders), a related construct that hasbeen shown to interact with DS in predicting symptoms ofcontamination-based OCD (Cisler, Reardon, Williams, & Lohr,2007), may be categorical (Bernstein et al., 2007). Furthermore,using hierarchical agglomerative cluster analysis to categorizedisgust-evoking stimuli, Marzillier and Davey (2004) found threedistinct clusters, corresponding to (a) nondisgust or “disgust-irrelevant” items; (b) “primary” disgust items, which included arange of disgust-relevant items characterized by their ability toelicit fear of oral incorporation and of one’s animal origin; and (c)“complex” disgusts, consisting mainly of behaviors or activitiesthat are considered to be socially or morally unacceptable. Al-though cluster analysis is a limited method of detecting latentdiscontinuity, the identification of disgust clusters may be viewedas indirect evidence for a taxonic model of disgust. Moreover,some researchers have elected to dichotomize DS by means ofarbitrary cutoff scores (e.g., individuals scoring in the upper thirdand the lower third on a measure of DS), treating DS, at least onthe level of manifest measurement, as a categorical variable (e.g.,Schienle, Stark, & Vaitl, 2001). The simultaneous measurement ofDS as a continuous and dichotomous construct in the currentliterature raises questions as to whether the latent structure of DSis categorical (i.e., taxonic) or dimensional.
A taxon is a nonarbitrary latent category whose members arequalitatively distinct from nonmembers (Haslam, 2003). Natureand society are known to contain numerous taxa, including chem-ical elements, biological species, and occupational categories. Incontrast, nontaxonic phenomena, such as age, temperature, orheight, are characterized by continuous or dimensional latent struc-ture. Taxometrics is a branch of applied mathematics designedspecifically to discern the latent structure (i.e., categorical vs.continuous distribution) of phenomena by evaluating whether thenumerical relations among various indicators of a conjecturedtaxon fit a pattern consistent with a naturally occurring class or acontinuous dimension (Meehl & Golden, 1982; Waller & Meehl,1998). Taxometric procedures have a long history in the literature(e.g., Meehl, 1973) and have been used effectively to identify thelatent structure of numerous clinical phenomena, including bothdimensional (e.g., posttraumatic stress reactions; Broman-Fulks etal., 2006) and taxonic constructs (e.g., schizotypy; Lenzenweger &Korfine, 1992). However, these procedures have only recentlybeen applied to the study of the latent structure of anxiety disorderrisk factors. For example, there is now evidence that worry, a riskfactor for and core symptom of generalized anxiety disorder, isdimensional (A. M. Ruscio, Borkovec, & Ruscio, 2001). In con-trast, the findings of several recent studies of anxiety sensitivityhave described this construct as a categorical, or taxonic, clinicalsyndrome (e.g., Bernstein, Zvolensky, Kotov, et al., 2006; Bern-stein, Zvolensky, Stewart, Comeau, & Leen-Feldner, 2006; Bern-stein, Zvolensky, Weems, Stickle, & Leen-Feldner, 2005;Schmidt, Kotov, Lerew, Joiner, & Ialongo, 2005). Thus, thereappear to be both categorical and continuous risk factors for thedevelopment of anxiety disorders.
Although DS has been gaining increased recognition as a ge-netically based risk factor for certain phobias, contamination-basedOCD, and perhaps even health anxiety–hypochondriasis and eat-
438 OLATUNJI AND BROMAN-FULKS

ing disorders (e.g., Muris, 2006; Olatunji & Sawchuk, 2005), thelatent structure of DS remains unclear. If DS is, indeed, a riskfactor for such anxiety-related conditions, it is of critical impor-tance to extend work on the underlying structure of this constructbeyond factor and cluster analytic investigations. Research exam-ining the latent structure of DS could advance knowledge relatingto the selection of measures that are consistent with the true latentstructure of DS (i.e., disperse scores broadly and discriminateeffectively in all areas of the DS dimension vs. sorting individualsat an optimal level in DS in an attempt to maximize valid classi-fications). Identifying the latent structure of DS may also help toinform etiological models. Specifically, taxonic latent structure issuggestive of a discrete etiological source, such as a particulargene, brain disorder, environmental stressor, or particular interac-tion of such variables. In contrast, dimensional structure implies anadditive or graded etiology (i.e., it is multiply determined). Thus,with regard to DS, a dimensional latent structure would suggestthat various environmental-related and person-specific factors(e.g., conditioning event, behavioral inhibition) may be importantin determining the etiology of DS.
The overarching goal of the present study was to examine thelatent structure of DS using a series of taxometric procedures.Although the latent structures of various fear- and anxiety-relatedphenomena have been examined in the research literature (e.g.,Bernstein, Zvolensky, Kotov, et al., 2006; Kotov, Schmidt, Lerew,& Joiner, 2005), with both taxonic and dimensional findings, asimilar analysis has yet to be extended to indexes of disgust. Thereis some suggestive evidence from factor analytic studies that DS isa multifaceted construct that may be best conceptualized as adimensional construct (Haidt et al., 1994; Olatunji, Williams, etal., 2005). Therefore, it was hypothesized that multiple taxometricprocedures would yield a continuous solution of DS across twolarge independent samples using two different measures of the DSconstruct.
Method
Participants
Participants consisted of two large independent samples ofundergraduate students. Participants in the first sample, who com-pleted the Disgust Sensitivity Scale (DSS; Haidt et al., 1994) were1,153 male (n � 264) and female (n � 859) undergraduatesrecruited from two large southern universities. DSS completersranged in age from 18 to 52 (M � 19.25, SD � 2.55). The secondindependent sample of participants completed the Disgust EmotionScale (DES; Kleinknecht, Kleinknecht, & Thorndike, 1997) andconsisted of 1,318 undergraduates from a large southern univer-sity. DES completers consisted predominately of women (n � 884,86%) and ranged in age from 18 to 52 (M � 20.67, SD � 4.78).Participants received course credit in exchange for their participa-tion.
Measure
The DSS (Haidt et al., 1994) assesses sensitivity to sevendomains of potential disgust-eliciting stimuli (i.e., food; animals;body products; sex; body envelope violations, e.g., body piercing;death; and hygiene) and levels of sympathetic magic (i.e., beliefs
about the transmission of contagion). On the basis of a well-articulated and empirically supported theory of disgust (Rozin &Fallon, 1987; Rozin et al., 2000), the eight subscales of the DSScan be divided into three theoretically meaningful and more reli-able domains of disgust. Core disgust, consisting of the food,animals, and body products subscales, serves primarily as a food-rejection response and centers on the avoidance or oral incorpo-ration of disgusting stimuli. Animal reminder disgust, consisting ofthe sex, body envelope violations, and death subscales, reflectsstimuli that remind us of our animalness and our animal origins.Last, interpersonal or contamination disgust, consisting of thehygiene and sympathetic magic subscales, is marked by strange-ness, disease, and contagion potency. Prior research has providedevidence for the validity of this classification of the eight subscalesof the DSS. For example, de Jong and Merckelbach (1998) foundthat core disgust was specifically related to spider fear, whereasanimal reminder was specifically related to BII fears. The 32-itemDSS includes 16 true–false items and 16 items that are rated on a3-point scale. The 32 items assess the extent to which participantsfind the experience not disgusting at all, slightly disgusting, orvery disgusting. Three of the true–false items are reverse scored.Each of the eight subscales of the DSS contains 4 items: 2true–false items and 2 Likert-type items. Haidt et al. (1994) sug-gested that researchers may calculate a total score for overall DSby summing responses to the 32 items. Internal consistency of theDSS ranges between .80 and .87 (Haidt et al., 1994).
The DES (Kleinknecht et al., 1997) is a 30-item scale measuringfive domains of DS: animals, injections and blood draws, mutila-tion and death, rotting foods, and odors. Participants are asked torate their degree of disgust or repugnance if they were to beexposed to each item, using a 5-point Likert scale ranging from0 � no disgust or repugnance at all to 4 � extreme disgust orrepugnance. One may calculate a total score for DS by summingresponses to the 30 items. Olatunji, Sawchuck, de Jong, and Lohr(2007) provided evidence for the psychometric properties of theDES in two independent studies of nonclinical participants. In theirstudy, the total DES score demonstrated excellent internal consis-tency (� � .91). Studies have also presented supportive evidencefor the convergent validity of the DES (e.g., Kleinknecht et al.,1997).
Procedure
Sample 1 participants completed the DSS via an Internet site orin groups of 8–12 individuals as part of a larger questionnairebattery. Sample 2 participants completed the DES in groups of5–10 individuals as part of a larger questionnaire battery.
Data Analytic Strategy
Instead of traditional statistical significance testing, a multiplehurdles consistency testing approach is recommended as part ofthe taxometric method to protect against spurious results (Meehl,1995; Waller & Meehl, 1998). If a latent taxon exists, the resultsof multiple independent taxometric procedures should converge insupport of a taxon. In accordance with this recommendation, thepresent study used three independent taxometric procedures—maximum eigenvalue (MAXEIG), mean above minus below a cut(MAMBAC), and latent-mode factor analysis (L-Mode)—to ana-
439TAXOMETRIC STUDY OF DISGUST
lyze the latent structure of DS as measured by two well-establishedmeasures: the DSS and the DES. Following is a brief explanationof the mathematical rationale behind each taxometric procedure.
MAXEIG. MAXEIG (Waller & Meehl, 1998) is a multivariateextension of the frequently used maximum covariance procedure(Meehl & Yonce, 1996). MAXEIG calculates and plots eigenval-ues from all remaining indicators across successive intervals of aninput indicator. Each indicator serves as the input indicator on oneanalysis, resulting in one MAXEIG plot per indicator. If a taxon ispresent, data typically yield plots with peaked curves. In contrast,dimensional data tend to produce relatively flat plots.
MAMBAC. The MAMBAC (Meehl & Yonce, 1994) proce-dure is based on the assumption that if two discrete groups exist(i.e., taxon and nontaxon), mean differences between groups willoccur on valid indicators of group membership. When mean dif-ferences are plotted as a function of one variable, taxonic con-structs tend to produce peaked plots at the point that best differ-entiates the two groups, whereas dimensional constructs tend toproduce relatively flat or bowl-shaped plots.
L-Mode. L-mode (Waller & Meehl, 1998) involves a factoranalysis on all candidate indicators and plots the distribution ofscores on the first principal factor. If the construct under investi-gation is taxonic, a bimodal distribution of factor scores will beevident. In contrast, if the variable is dimensional, factor scoreswill be unimodally distributed.
The algorithms used to perform the MAXEIG, MAMBAC, andL-Mode analyses were obtained from J. Ruscio (2006). One ad-vantage of the Ruscio programs is that they simultaneously createsimulated taxonic and dimensional data plots based on data thathave similar distributional characteristics (e.g., skew, kurtosis,sample size) to the empirical data (J. Ruscio, Haslam, & Ruscio,2006; J. Ruscio, Ruscio, & Meron, 2007). One can then use thesimulations to aid in the interpretation of the empirical data plotsby comparing the experimental data plots with the simulateddimensional and taxonic plots. Simulations were created withalgorithms detailed in J. Ruscio (2007). Simulated dimensionaldata were created via an iterative procedure that matches the exactdistributions of all indicators, including their skew, kurtosis, anddiscrete values. In contrast, we generated simulated taxonic datasets by employing a fallible criterion variable, denoting the puta-tive class membership of each case, to isolate taxon and comple-ment distributions. The same iterative procedure was then em-ployed to create simulated taxon and complement distributions,which were merged to produce the simulated data set for the
taxonic case. In the present study, cases were sorted into putativetaxon and nontaxon membership according to Bayes’s theorem inMAXEIG, the grand mean base rate estimate in MAMBAC, andthe nearest mode in L-Mode. Although some researchers havevoiced concerns over the use of sample-specific simulations andthe programs that generate them (Beach, Amir, & Bau, 2005), arecent reanalysis of the data presented evidence to support theiruse in taxometric research (J. Ruscio & Marcus, 2007).
Indicator Selection
Due to the large volume of analyses that would be involved ifeach of the 32 DSS items and 30 DES items were used asindividual indicators, composite indicators were derived from theDSS and DES based on prior factor analytic studies and empiri-cally supported theoretical models (Bjorklund & Hursti, 2004;Olatunji, Sawchuk, de Jong, & Lohr, 2007; Rozin et al., 2000).Specifically, research has indicated that the DSS assesses DSacross eight categories (food, animals, body products, sex, bodyenvelope violations, death, hygiene, and sympathetic magic),which can be further divided into three domains (core, animalreminder, and contamination disgust), whereas the DES measuresDS across five categories (animals, injections and blood draws,mutilation and death, rotting foods, and odors). Items loading oneach of these categories or domains were summed to create threesets of indicators representing the eight DSS subfactors (DSS-8;see Table 1 for descriptive statistics), three DSS domains (DSS-3;see Table 2 for descriptive statistics), and five DES subfactors (seeTable 3 for descriptive statistics). The creation of summed indi-cators has the advantage of yielding more reliable indicators thanwould be obtained if individual item responses were used asindicators. Summation of the items loading on each of the DSS-8subscales created indicators with an 8-point range (i.e., 0–4 with0.5 intervals), whereas summation of the DSS-3 items producedindicators with 0- to 24-point ranges, depending on the subscale.Summation of the DES items generated indicators with a rangeof 24.
It is generally recommended that indicators should be uncorre-lated within the proposed taxon and complement classes (i.e., havelow nuisance covariance; Meehl & Yonce, 1994). Thus, meanwithin-group correlations for the DSS-8, DSS-3, and DES indica-tors were examined. As noted above, cases were sorted intoputative taxon and nontaxon membership via Bayes’s theorem inMAXEIG, the grand mean base rate estimate in MAMBAC, and
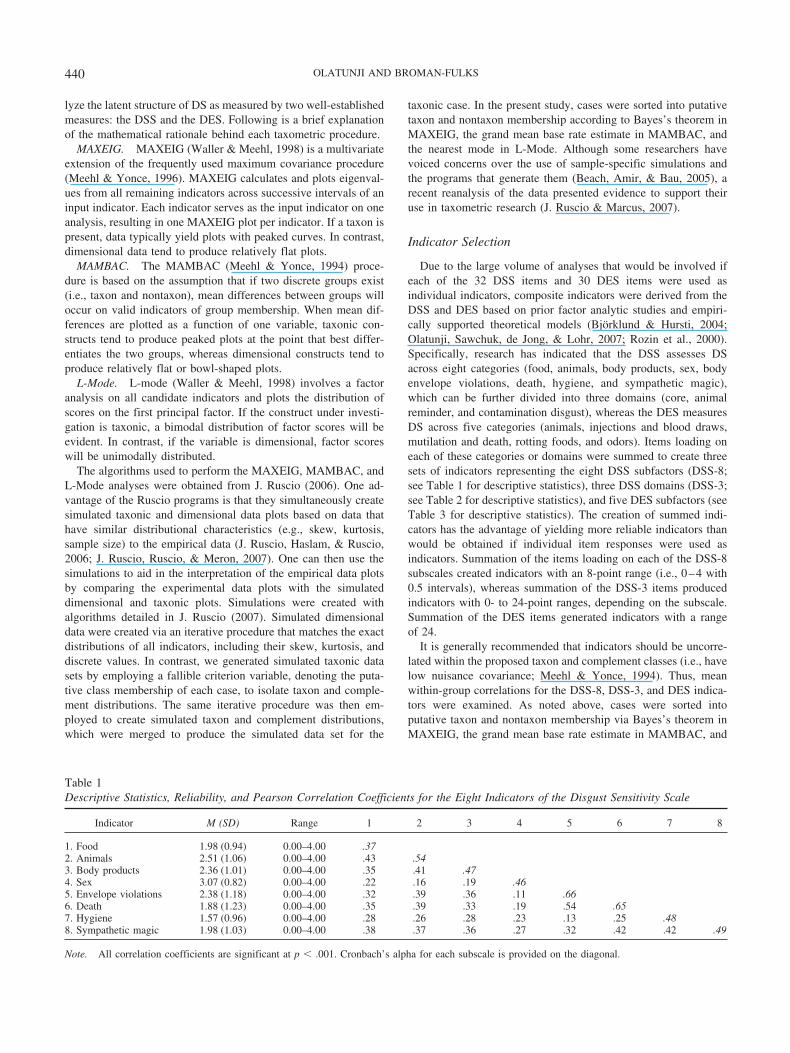
Table 1Descriptive Statistics, Reliability, and Pearson Correlation Coefficients for the Eight Indicators of the Disgust Sensitivity Scale
Indicator M (SD) Range 1 2 3 4 5 6 7 8
1. Food 1.98 (0.94) 0.00–4.00 .372. Animals 2.51 (1.06) 0.00–4.00 .43 .543. Body products 2.36 (1.01) 0.00–4.00 .35 .41 .474. Sex 3.07 (0.82) 0.00–4.00 .22 .16 .19 .465. Envelope violations 2.38 (1.18) 0.00–4.00 .32 .39 .36 .11 .666. Death 1.88 (1.23) 0.00–4.00 .35 .39 .33 .19 .54 .657. Hygiene 1.57 (0.96) 0.00–4.00 .28 .26 .28 .23 .13 .25 .488. Sympathetic magic 1.98 (1.03) 0.00–4.00 .38 .37 .36 .27 .32 .42 .42 .49
Note. All correlation coefficients are significant at p � .001. Cronbach’s alpha for each subscale is provided on the diagonal.
440 OLATUNJI AND BROMAN-FULKS
the nearest mode in L-Mode. Nuisance covariances were found tobe low for the DSS-8 (taxon group � 0.08, nontaxon group �0.06), DSS-3 (taxon group � 0.11, nontaxon group � 0.09), andDES (taxon group � 0.18, nontaxon group � 0.19). As is prefer-able, indicator correlations among the total samples were substan-tially higher for the DSS-8 (M � 0.31), DSS-3 (M � 0.49), andDES (M � 0.49). Additionally, it is generally recommended thatindicators possess high degrees of validity. Previous research hasfound that indicator validities of one standard deviation or greaterare sufficient for taxometric research (Meehl & Golden, 1982).Indicators used in the present study were found to be valid,1 withmean separations of 1.38, 1.76, and 1.60 standard deviations forthe DSS-8, DSS-3, and DES indicators, respectively. Furthermore,skew was low among the DSS-8 (M � �0.11), DSS-3 (M ��0.48), and DES (M � 0.78) indicators. Thus, the indicatorsutilized in the present research were deemed appropriate for taxo-metric analysis.
Results
Suitability Test
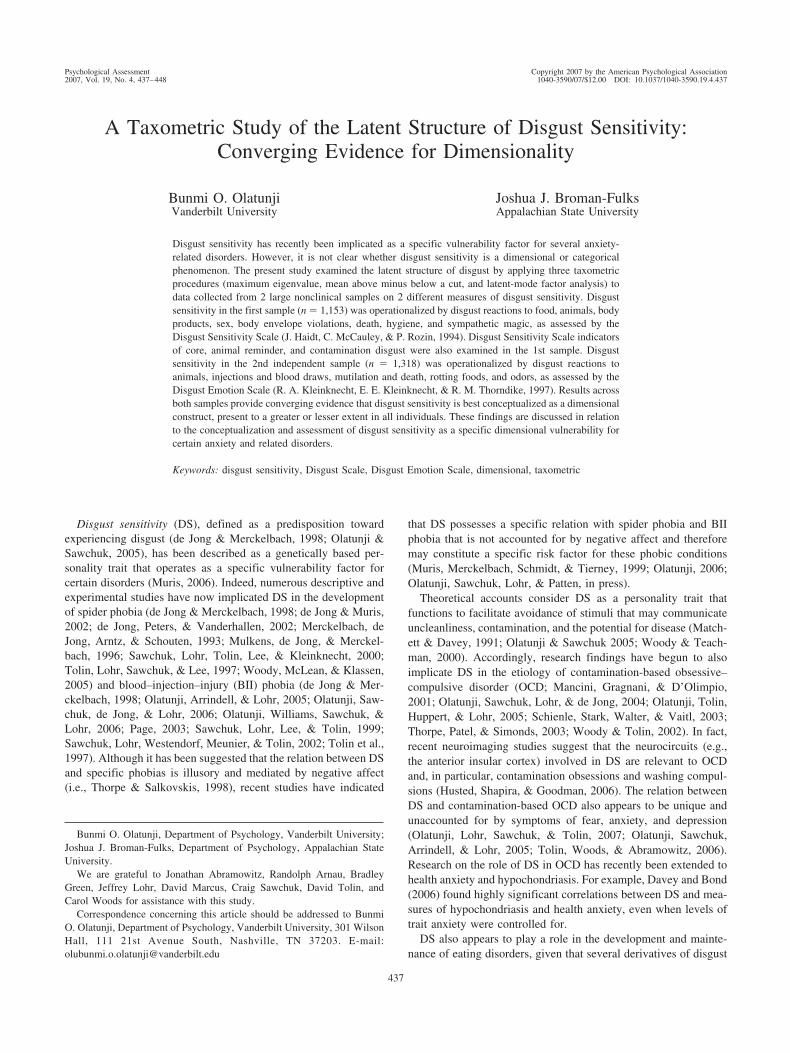
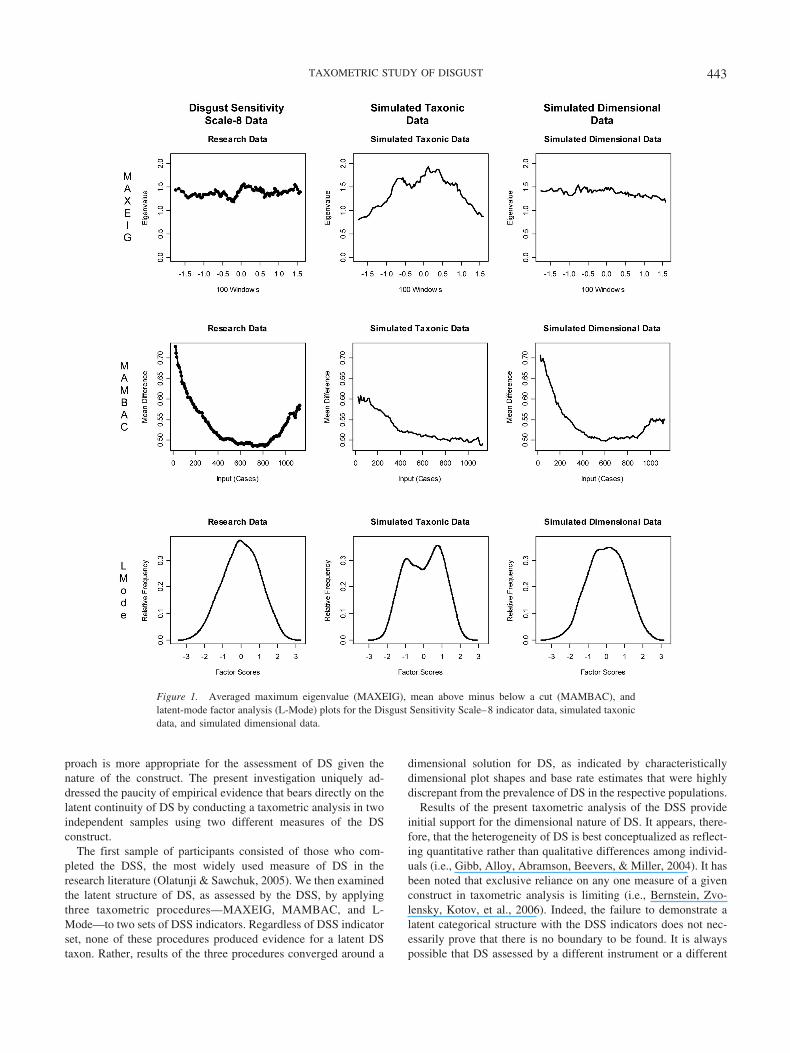
Previous research has suggested that for data to be consideredsuitable for taxometric analysis, the plots generated from thesimulated taxonic and dimensional data should be clearly distin-guishable from one another (J. Ruscio et al., 2006, 2007). That is,if taxonic and dimensional data are generated to simulate theresearch data and the output plots from the simulations are notdifferentiable (i.e., both sets look taxonic or both sets appeardimensional), then it is unlikely that the data will be able toprovide a clear answer regarding taxonicity. As a preliminary testof the suitability of the present research data for conducting ataxometric analysis of DS, we examined the simulated taxonic anddimensional plots generated on the basis of the research data.Results indicated that the simulated taxonic and dimensional dataplots were clearly distinguishable from each other for all MAX-EIG, MAMBAC, and L-Mode analyses (see Figures 1, 2, and 3).Thus, the present data passed the initial suitability test and weresubmitted to taxometric analysis.
DSS-8 Indicator Results
MAXEIG analyses were run first with the DSS-8 indicators. Alleight of the resulting MAXEIG plots for the DSS-8 indicatorsfailed to demonstrate any peaks that would be consistent with ataxon. Rather, all plots were relatively flat, with minor fluctuations
around a mean eigenvalue, thus favoring a dimensional solution.2
To reduce the quantity of graphical output, we present only theaveraged plot for each taxometric procedure. Thus, the results ofthe MAXEIG procedure provide initial support for a dimensionallatent structure underlying DS.
As noted above, taxometric procedures rely on replication offindings across independent procedures to ensure accuracy ofresults (Meehl, 1995). Thus, even though the MAXEIG proceduresupplied evidence for a dimensional structure, MAMBAC analyseswere conducted as an additional measure of consistency. The eightDSS-8 indicators produced 56 MAMBAC plots, none of whichdemonstrated a distinctive taxonic peak. Rather, all of the MAM-BAC plots were relatively flat or demonstrated the characteristi-cally dimensional concave shape. Thus, MAMBAC results providefurther evidence for a dimensional solution for DS.
L-Mode was run as a third measure of consistency. UnlikeMAXEIG and MAMBAC, L-Mode generates a single data plotregardless of the number of indicators. Results of the L-Modeprocedure clearly favored a dimensional solution. Specifically, theL-Mode plot based on the empirical data demonstrated a unimodaldistribution, whereas taxonic data generally evidence two distinctpeaks (a bimodal distribution). Thus, the L-Mode results comple-ment the findings of MAXEIG and MAMBAC, which, takentogether, provide consistent evidence for a dimensional latentstructure for DS.
DSS-3 Indicator Results
As noted above, although there is factor analytic evidence insupport of the existence of the eight facets of DS (i.e., Bjorklund& Hursti, 2004), theoretical formulations and empirical evidenceindicate that the DSS also consists of three general domains of DSthat correspond to core, animal reminder, and contamination dis-gust (i.e., Rozin et al., 2000). In addition to the low reliability ofthe DSS-8 indicators (see Table 1), which has also been reportedin other studies (i.e., Haidt et al., 1994), two of the DSS-8 indi-cators failed to meet the minimum validity criteria. Thus, to ensure
1 Two of the original DSS-8 indicators (representing the Sex and Hy-giene subscales) did not meet the minimum validity criteria (one standarddeviation). These indicators were dropped, and taxometric analyses werererun. Results were nearly identical to those that included these twoindicators. In addition, taxometric analyses were run both with and withoutthe inclusion of the indicator associated with the Sympathetic Magicsubscale of the DSS because of the questionable association betweensympathetic magic and DS. Again, results were nearly identical to thosethat included all eight indicators. Thus, to reduce confusion and easeinterpretability of findings, all figures and tables include all eight of theoriginal DSS indicators.
2 We both examined and rated plots. In addition, three external consult-ants, who were experienced taxometricians, were recruited to evaluate theshape of the plots. Raters were also provided with a copy of the simulateddimensional and taxonic plots to assist in their ratings. It should be notedthat not all of the MAMBAC taxonic simulations evidenced clear peaks,and thus, even though the simulated taxonic and dimensional plots wereclearly distinguishable, raters were encouraged to exercise caution in usingMAMBAC simulations to aid in their interpretation of the MAMBACplots. All five examiners were in perfect agreement in rating the MAXEIG,MAMBAC, and L-Mode plots produced by the DSS-8, DSS-3, and DESdata sets as indicative of a latent dimension.
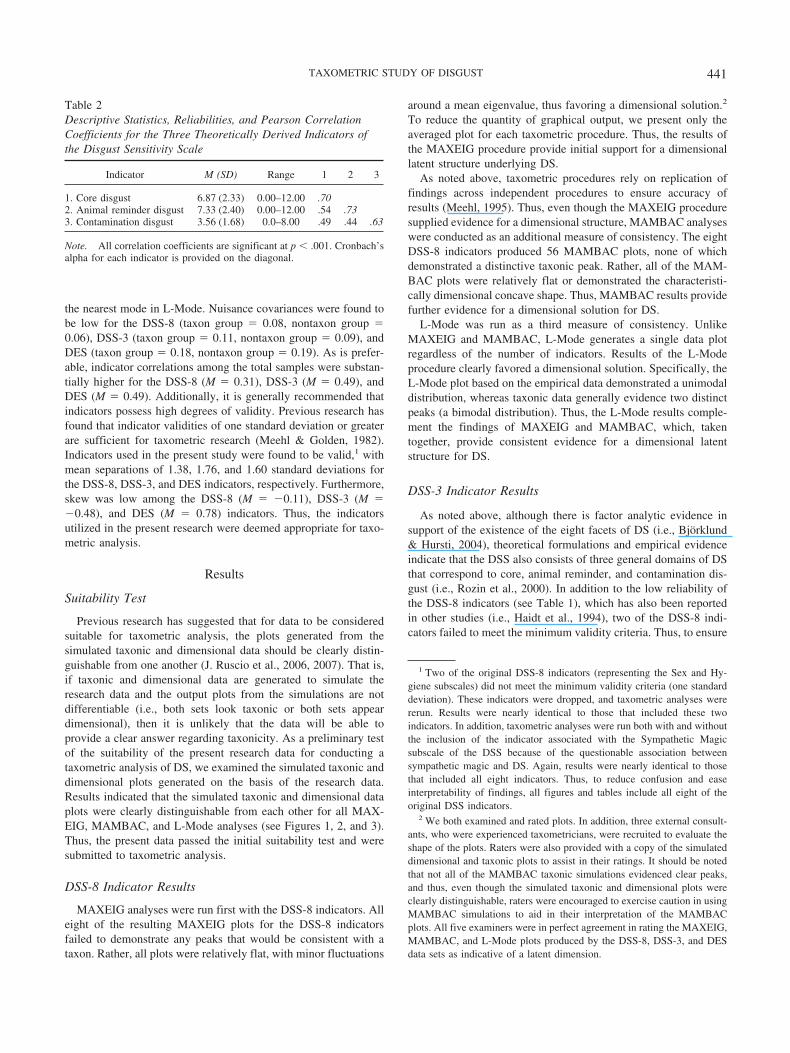
Table 2Descriptive Statistics, Reliabilities, and Pearson CorrelationCoefficients for the Three Theoretically Derived Indicators ofthe Disgust Sensitivity Scale
Indicator M (SD) Range 1 2 3
1. Core disgust 6.87 (2.33) 0.00–12.00 .702. Animal reminder disgust 7.33 (2.40) 0.00–12.00 .54 .733. Contamination disgust 3.56 (1.68) 0.0–8.00 .49 .44 .63
Note. All correlation coefficients are significant at p � .001. Cronbach’salpha for each indicator is provided on the diagonal.
441TAXOMETRIC STUDY OF DISGUST
that the dimensional findings for the DSS-8 were not simply due tothe psychometric properties of the indicators, we conducted sep-arate MAXEIG, MAMBAC, and L-Mode analyses using indica-tors derived from the three-factor solution. The three DSS-3 indi-cators were more reliable (see Table 2) and demonstrated higherdegrees of validity in comparison with the DSS-8 indicators, withall DSS-3 indicators showing separations of greater than one anda half standard deviations.
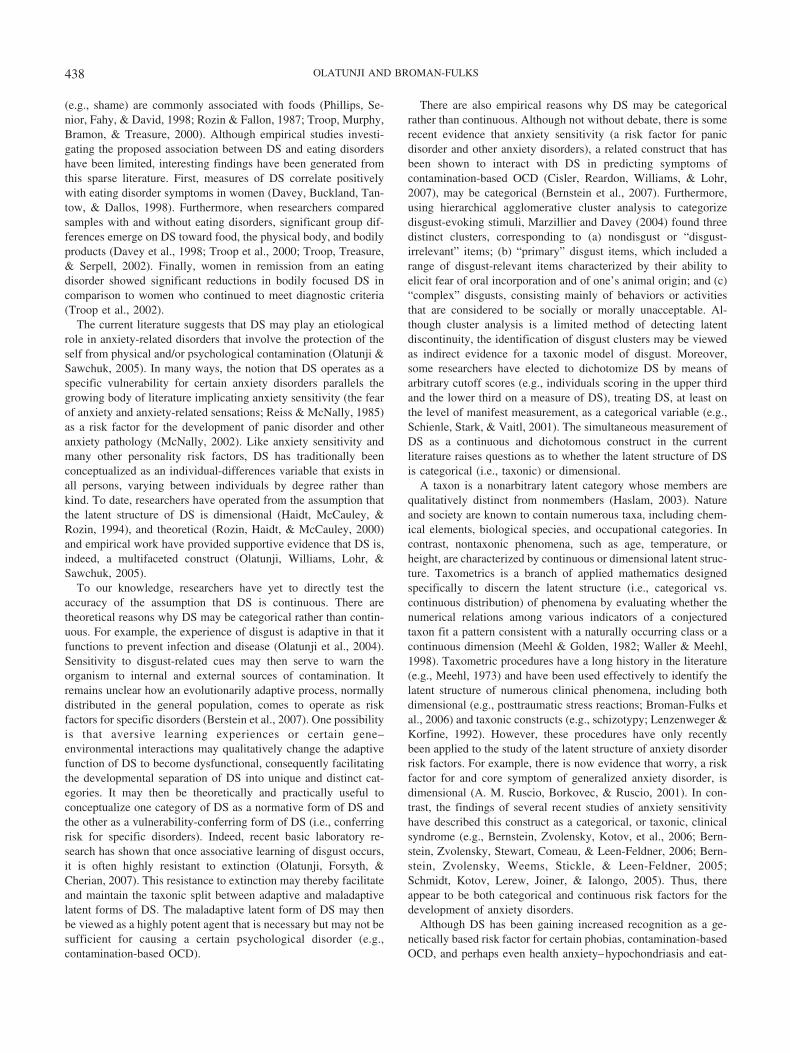
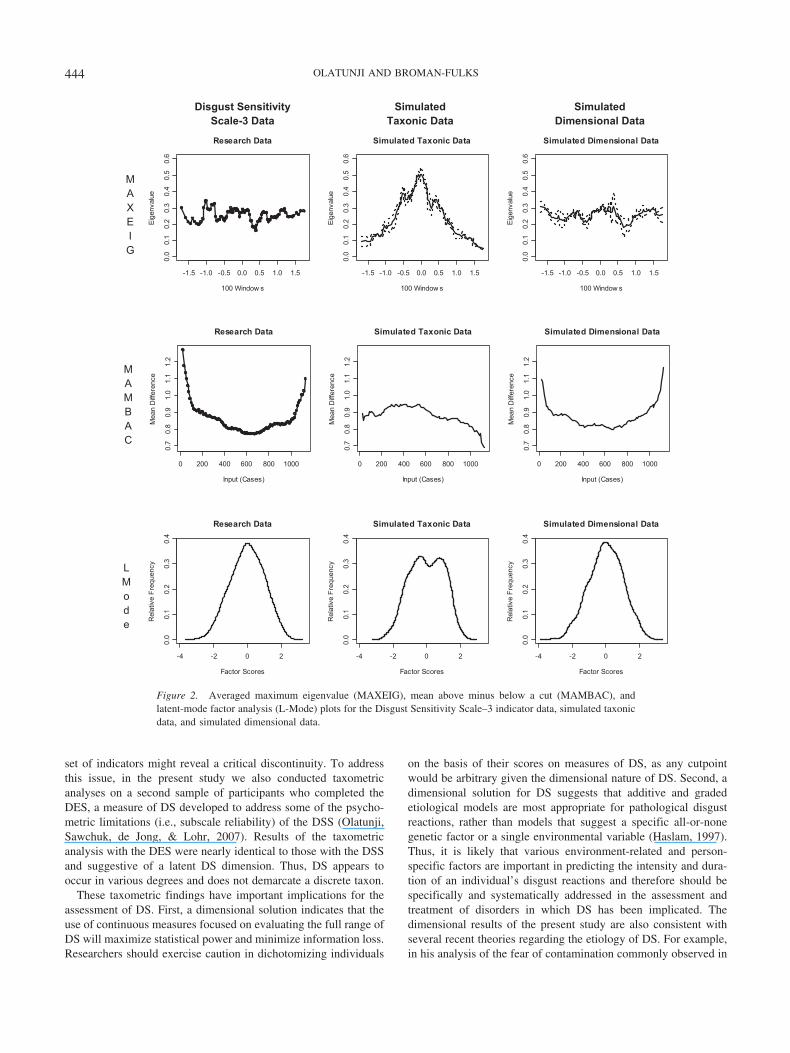
The application of the MAXEIG procedure to the DSS-3 datagenerated three plots, all of which were relatively flat, with minorfluctuations around a mean eigenvalue. Refer to Figure 2 for theaveraged MAXEIG, MAMBAC, and L-Mode curves generatedwith the DSS-3 data. Similarly, the MAMBAC procedure pro-duced six plots with the characteristically dimensional bowl shape.Furthermore, results of the L-Mode procedure revealed a clearlyunimodal distribution. Thus, the collective results of the DSS-3analyses were consistent with those of the DSS-8 data in support-ing a dimensional DS solution.
DES Results
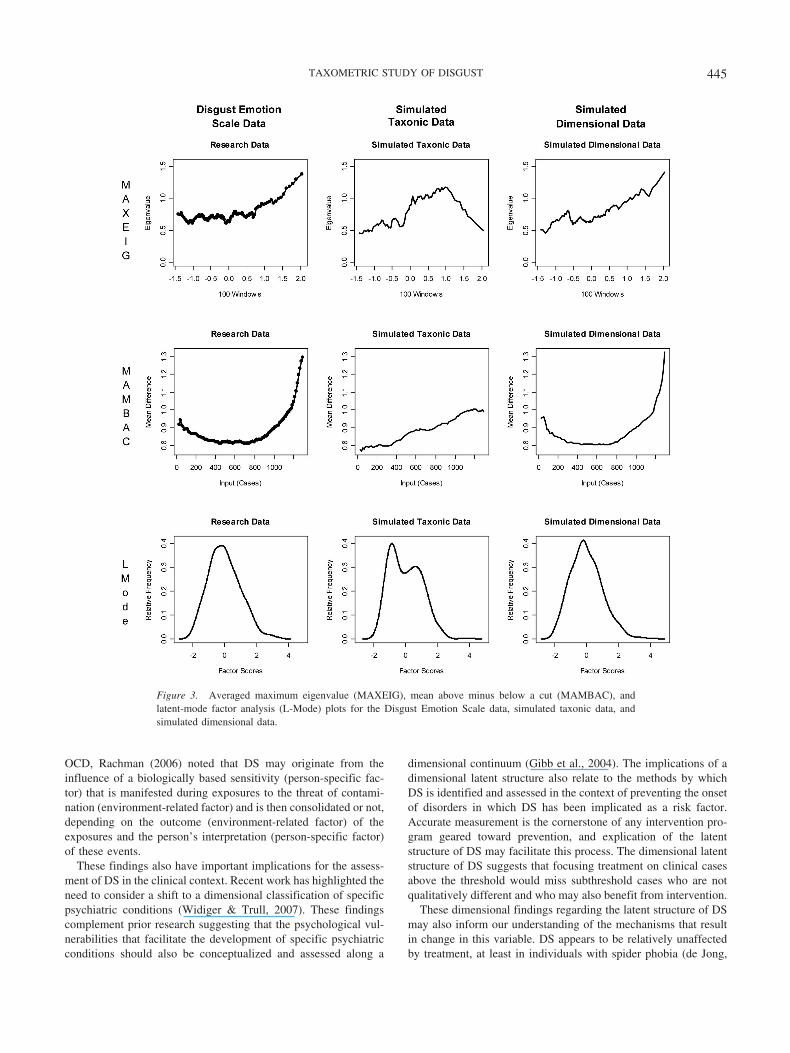
As an additional measure of consistency, MAXEIG, MAM-BAC, and L-Mode were also applied to a separate measure ofDS—the DES. Five indicators derived from the DES were sub-mitted to the MAXEIG procedure first. Results indicated fiverelatively flat MAXEIG plots, none of which evidenced any peaksthat were typical of a taxon. See Figure 3 for the averagedMAXEIG, MAMBAC, and L-Mode curves based on the DES data.Similarly, MAMBAC analyses of the DES data generated 20 plots,none of which evidenced any peaks that were consistent with ataxon, thus providing further evidence for a dimensional solution.L-Mode was the final consistency test conducted on the DES data.The resulting factor plot revealed a single peak, which is charac-teristic of dimensional data. Thus, the results of MAXEIG, MAM-BAC, and L-Mode analyses of the DES data provide convergentevidence in support of a latent DS dimension.
Sample-Specific Simulations
As noted above, simulated taxonic and dimensional data withsimilar distributional characteristics to the research data can begenerated compared with the results produced by the research data.As can be seen in Figures 1–3, the averaged MAXEIG, MAM-BAC, and L-Mode curves generated by the DSS-8, DSS-3, andDES data closely resembled the simulated dimensional plots. Incontrast, the simulated MAXEIG plots generated distinct peaksthat were absent in the data plots. Furthermore, the simulated
taxonic plots produced by MAMBAC showed cusps, whereas thetaxonic L-Mode plots demonstrated clear bimodal distributionsthat were also missing from the empirical data and simulateddimensional plots. Thus, the sample-specific simulations provideadditional support for a dimensional DS structure.
Base Rate Estimates
In addition to producing plots that can be visually examined forlatent structure, each MAXEIG, MAMBAC, and L-Mode analysisalso estimates the base rate of the proposed taxon (if one exists).Base rate estimates generated by each MAXEIG, MAMBAC, andL-Mode plot produced by the DSS-8, DSS-3, and DES data wereexamined. Table 4 depicts the means and standard deviations ofthe base rate estimates produced by each of the three taxometricprocedures. Inspection of the base rate estimates revealed that themajority of these estimates were substantially higher than wouldbe theoretically expected on the basis of the documented relationbetween DS and the prevalence of various forms of associatedpsychopathology. Furthermore, the base rate estimates demon-strated considerable variability. Thus, when these base rate esti-mates are considered in combination with the consistentlydimensional-shaped plots produced by several mathematically dis-tinct taxometric procedures, the results of the present study arestrongly supportive of dimensional structure.
Discussion
Researchers have begun to implicate DS as a potential riskfactor for a range of anxiety and related disorders, including spiderphobia (de Jong et al., 2002), BII phobia (Olatunji, Lohr, Sawchuk,& Westendorf, 2005; Page, 2003), contamination-based OCD(Olatunji et al., 2004), health anxiety and hypochondriasis (Davey& Bond, 2006), and eating disorders (Troop et al., 2002). DS is agenetically based personality trait that may operate as a specificrisk for anxiety disorders in a similar fashion as anxiety sensitivity(i.e., Muris, 2006). Recent taxometric research has begun to ex-amine the structure of anxiety sensitivity, with findings fromseveral published studies appearing suggestive of taxonic latentstructure (e.g., Bernstein, Zvolensky, Stewart, et al., 2006; Bern-stein et al., 2005). However, the latent structure of DS has yet tobe examined in a similar fashion. The absence of data directlyspeaking to the underlying latent structure of DS is somewhatconcerning, as many studies have operated under the assumptionthat DS is either dimensional (i.e., Haidt et al., 1994; Olatunji,Williams, et al., 2005) or categorical (i.e., Schienle et al., 2001),with no empirical evidence to inform researchers on which ap-
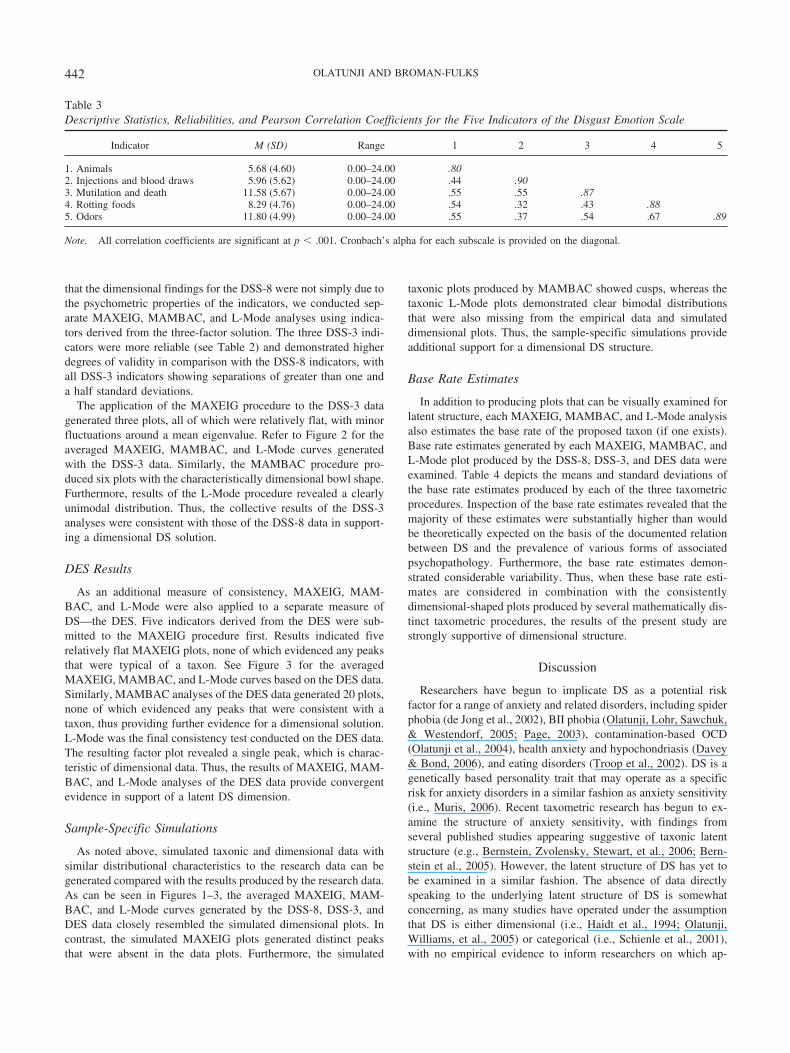
Table 3Descriptive Statistics, Reliabilities, and Pearson Correlation Coefficients for the Five Indicators of the Disgust Emotion Scale
Indicator M (SD) Range 1 2 3 4 5
1. Animals 5.68 (4.60) 0.00–24.00 .802. Injections and blood draws 5.96 (5.62) 0.00–24.00 .44 .903. Mutilation and death 11.58 (5.67) 0.00–24.00 .55 .55 .874. Rotting foods 8.29 (4.76) 0.00–24.00 .54 .32 .43 .885. Odors 11.80 (4.99) 0.00–24.00 .55 .37 .54 .67 .89
Note. All correlation coefficients are significant at p � .001. Cronbach’s alpha for each subscale is provided on the diagonal.
442 OLATUNJI AND BROMAN-FULKS
proach is more appropriate for the assessment of DS given thenature of the construct. The present investigation uniquely ad-dressed the paucity of empirical evidence that bears directly on thelatent continuity of DS by conducting a taxometric analysis in twoindependent samples using two different measures of the DSconstruct.
The first sample of participants consisted of those who com-pleted the DSS, the most widely used measure of DS in theresearch literature (Olatunji & Sawchuk, 2005). We then examinedthe latent structure of DS, as assessed by the DSS, by applyingthree taxometric procedures—MAXEIG, MAMBAC, and L-Mode—to two sets of DSS indicators. Regardless of DSS indicatorset, none of these procedures produced evidence for a latent DStaxon. Rather, results of the three procedures converged around a
dimensional solution for DS, as indicated by characteristicallydimensional plot shapes and base rate estimates that were highlydiscrepant from the prevalence of DS in the respective populations.
Results of the present taxometric analysis of the DSS provideinitial support for the dimensional nature of DS. It appears, there-fore, that the heterogeneity of DS is best conceptualized as reflect-ing quantitative rather than qualitative differences among individ-uals (i.e., Gibb, Alloy, Abramson, Beevers, & Miller, 2004). It hasbeen noted that exclusive reliance on any one measure of a givenconstruct in taxometric analysis is limiting (i.e., Bernstein, Zvo-lensky, Kotov, et al., 2006). Indeed, the failure to demonstrate alatent categorical structure with the DSS indicators does not nec-essarily prove that there is no boundary to be found. It is alwayspossible that DS assessed by a different instrument or a different
Figure 1. Averaged maximum eigenvalue (MAXEIG), mean above minus below a cut (MAMBAC), andlatent-mode factor analysis (L-Mode) plots for the Disgust Sensitivity Scale–8 indicator data, simulated taxonicdata, and simulated dimensional data.
443TAXOMETRIC STUDY OF DISGUST
set of indicators might reveal a critical discontinuity. To addressthis issue, in the present study we also conducted taxometricanalyses on a second sample of participants who completed theDES, a measure of DS developed to address some of the psycho-metric limitations (i.e., subscale reliability) of the DSS (Olatunji,Sawchuk, de Jong, & Lohr, 2007). Results of the taxometricanalysis with the DES were nearly identical to those with the DSSand suggestive of a latent DS dimension. Thus, DS appears tooccur in various degrees and does not demarcate a discrete taxon.
These taxometric findings have important implications for theassessment of DS. First, a dimensional solution indicates that theuse of continuous measures focused on evaluating the full range ofDS will maximize statistical power and minimize information loss.Researchers should exercise caution in dichotomizing individuals
on the basis of their scores on measures of DS, as any cutpointwould be arbitrary given the dimensional nature of DS. Second, adimensional solution for DS suggests that additive and gradedetiological models are most appropriate for pathological disgustreactions, rather than models that suggest a specific all-or-nonegenetic factor or a single environmental variable (Haslam, 1997).Thus, it is likely that various environment-related and person-specific factors are important in predicting the intensity and dura-tion of an individual’s disgust reactions and therefore should bespecifically and systematically addressed in the assessment andtreatment of disorders in which DS has been implicated. Thedimensional results of the present study are also consistent withseveral recent theories regarding the etiology of DS. For example,in his analysis of the fear of contamination commonly observed in
Disgust Sensitivity Simulated SimulatedScale-3 Data Taxonic Data Dimensional Data
-1.5 -1.0 -0.5 0.0 0.5 1.0 1.5
0.0
0.1
0.2
0.3
0.4
0.5
0.6
Research Data
100 Window s
MAXEI
Eig
enva
lue
-1.5 -1.0 -0.5 0.0 0.5 1.0 1.5
0.0
0.1
0.2
0.3
0.4
0.5
0.6
Simulated Taxonic Data
100 Window s
Eig
enva
lue
-1.5 -1.0 -0.5 0.0 0.5 1.0 1.5
0.0
0.1
0.2
0.3
0.4
0.5
0.6
Simulated Dimensional Data
100 Window s
Eig
enva
lue
0 200 400 600 800 1000
0.7
0.8
0.9
1.0
1 .1
1.2
Research Data
Input (Cases)
Mea
n D
iffer
ence
0 200 400 600 800 1000
0.7
0.8
0.9
1.0
1.1
1.2
Simulated Taxonic Data
Input (Cases)
Mea
n D
iffer
ence
0 200 400 600 800 1000
0.7
0.8
0.9
1.0
1 .1
1.2
Simulated Dimensional Data
Input (Cases)
Mea
n D
iffer
enc e
-4 -2 0 2
0.0
0.1
0.2
0.3
0.4
Research Data
Factor Scores
Rel
ativ
e F
requ
ency
-4 -2 0 2
0.0
0.1
0.2
0.3
0.4
Simulated Taxonic Data
Factor Scores
Rel
ativ
e F
requ
e ncy
-4 -2 0 2
0.0
0.1
0.2
0.3
0.4
Simulated Dimensional Data
Factor Scores
Rel
ativ
e F
requ
ency
G
MAMBAC
LMode
Figure 2. Averaged maximum eigenvalue (MAXEIG), mean above minus below a cut (MAMBAC), andlatent-mode factor analysis (L-Mode) plots for the Disgust Sensitivity Scale–3 indicator data, simulated taxonicdata, and simulated dimensional data.
444 OLATUNJI AND BROMAN-FULKS
OCD, Rachman (2006) noted that DS may originate from theinfluence of a biologically based sensitivity (person-specific fac-tor) that is manifested during exposures to the threat of contami-nation (environment-related factor) and is then consolidated or not,depending on the outcome (environment-related factor) of theexposures and the person’s interpretation (person-specific factor)of these events.
These findings also have important implications for the assess-ment of DS in the clinical context. Recent work has highlighted theneed to consider a shift to a dimensional classification of specificpsychiatric conditions (Widiger & Trull, 2007). These findingscomplement prior research suggesting that the psychological vul-nerabilities that facilitate the development of specific psychiatricconditions should also be conceptualized and assessed along a
dimensional continuum (Gibb et al., 2004). The implications of adimensional latent structure also relate to the methods by whichDS is identified and assessed in the context of preventing the onsetof disorders in which DS has been implicated as a risk factor.Accurate measurement is the cornerstone of any intervention pro-gram geared toward prevention, and explication of the latentstructure of DS may facilitate this process. The dimensional latentstructure of DS suggests that focusing treatment on clinical casesabove the threshold would miss subthreshold cases who are notqualitatively different and who may also benefit from intervention.
These dimensional findings regarding the latent structure of DSmay also inform our understanding of the mechanisms that resultin change in this variable. DS appears to be relatively unaffectedby treatment, at least in individuals with spider phobia (de Jong,
Figure 3. Averaged maximum eigenvalue (MAXEIG), mean above minus below a cut (MAMBAC), andlatent-mode factor analysis (L-Mode) plots for the Disgust Emotion Scale data, simulated taxonic data, andsimulated dimensional data.
445TAXOMETRIC STUDY OF DISGUST
Andrea, & Muris, 1997; de Jong, Vorage, & van den Hout, 2000).However, very little is known about the processes that underlie theresistance of DS to extinction. It may be informative to assess DSin the context of its dimensional taxometric properties duringclinical intervention to better understand that nature of change-related processes (or lack thereof). This future line of researchshould be informed by the present findings of a dimensional latentstructure of DS, which implies that therapeutic change is bestthought of as a gradual decline and not as a distinct change frompathology to normality. Accordingly, clinical assessment duringtreatment outcome research may be maximized by sampling of DSduring multiple time points.
The current taxometric study exhibited a number of strengths,such as the inclusion of large samples, the use of multiple mea-sures of the DS construct, and the use of multiple taxometricprocedures to evaluate the replicability of the results. However,inferences on the basis of these findings should be made in thecontext of the study limitations. Indeed, one limitation of this studyis that the search for taxonicity of DS was limited by the indicatorsthat were chosen to represent it (Widiger, 2001). Although theindicators that were chosen were based on empirically informedstudies of the psychometric properties of the DSS and DES, it ispossible that the dimensional results were due, in part, to the DSindicators chosen. Future investigations would benefit from repli-cation of the present findings with alternative measures of DS (i.e.,the Disgust Propensity and Sensitivity Scale—Revised; van Over-veld, de Jong, Peters, Cavanagh, & Davey, 2006) as well as testingof additional manifest indicators of DS derived from alternativemethods. Such methods may target DS as assessed by behavioralavoidance (Olatunji, Lohr, Sawchuk, & Tolin, 2007), informationprocessing (Charash & McKay, 2002), or psychophysiology(Stark, Walter, Schienle, & Vaitl, 2005). Such a multimethodapproach to manifest indicators may provide further validation ofdimensionality as well as promote psychometric refinement of theassessment of DS as it relates to anxiety and related disorders.
Another potential limitation of the present study was the exclu-sive use of an undergraduate sample, which may limit the gener-alizability of the taxometric findings. Although it is theoreticallyimportant to evaluate the latent structure of DS in clinical samples,it is equally important to examine it in nonclinical samples todetermine which approach (categorical vs. dimensional) is appro-priate for assessing individuals who may be at risk for developinganxiety and related problems. Although examination of the latentstructure of DS in the context of a restricted range (i.e., only
clinical samples) could limit the inferences that can be drawn, itcould be argued that these dimensional findings were due to theuse of nonclinical participants whose DS levels were not particu-larly high. However, this is unlikely, as the present samples evi-denced a wide degree of DS, including participants whose DSlevels would be considered in the clinical range. For example,Woody and Tolin (2002) reported a mean of 22.12 (SD � 4.86) onthe DSS for patients with contamination-based OCD, and approx-imately 21% of our sample was above this mean. Furthermore,Olatunji, Lohr, Willems, and Sawchuk (2006) reported a mean of62.43 (SD � 17.84) on the DES for participants scoring in theclinical range on a measure of contamination-based OCD, andapproximately 17% of our sample was above this mean. Therefore,it appears unlikely that the current results were due to the exclusivereliance on nonclinical DS data.
In conclusion, the present study used taxometrics to examine thelatent structure of DS. Multiple taxometric procedures providedconvergent evidence supporting a dimensional conceptualizationof DS, indicating that DS is present to a greater or lesser degree inall individuals. An important area for future research is to examinewhether there is a point on the continuum at which the strength ofthe relationship between DS and symptoms of specific disorders issignificantly stronger. Although this study was thorough in itsanalyses, it is, to the best of our knowledge, the first taxometricanalysis of DS, and thus our dimensional findings require replica-tion in multiple contexts. For example, previous research hasconsistently observed that women report significantly higher levelsof DS than men (Olatunji, Sawchuk, Arrindell, & Lohr, 2005).Although it is possible that gender may not qualitatively changeDS, future studies with sufficiently large independent samples formeaningful comparisons might explore the extent to which thetaxometrics of DS vary as a function of gender. Operating underthe assumption that DS is, indeed, a universal risk factor for certainanxiety and related disorders, future studies might also extend thetaxometric analysis of DS to diverse cross-cultural populations. Inaddition to informing our understanding of the nature of DSbetween cultures, future research along these lines may also haveimportant theoretical and clinical implications for anxiety andrelated disorders in which DS has been implicated.
References
Beach, S. R. H., Amir, N., & Bau, J. J. (2005). Can sample-specificsimulations help detect low base-rate taxonicity? Psychological Assess-ment, 17, 446–461.
Bernstein, A., Zvolensky, M. J., Kotov, R., Arrindell, W. A., Taylor, S.,Sandin, B., et al. (2006). Taxonicity of anxiety sensitivity: A multi-national analysis. Journal of Anxiety Disorders, 20, 1–22.
Bernstein, A., Zvolensky, M. J., Norton, P. J., Schmidt, N. B., Taylor, S.,Forsyth, J. P., et al. (2007). Taxometric and factor analytic models ofanxiety sensitivity: Integrating approaches to latent structural research.Psychological Assessment, 19, 74–87.
Bernstein, A., Zvolensky, M. J., Stewart, S. H., Comeau, M. N., &Leen-Feldner, E. W. (2006). Anxiety sensitivity taxonicity across genderamong youth. Behaviour Research and Therapy, 44, 679–698.
Bernstein, A., Zvolensky, M. J., Weems, C., Stickle, T., & Leen-Feldner,E. (2005). Taxonicity of anxiety sensitivity: An empirical test amongyouth. Behaviour Research and Therapy, 43, 1131–1155.
Bjorklund, F., & Hursti, T. J. (2004). A Swedish translation and validationof the Disgust Scale: A measure of disgust sensitivity. ScandinavianJournal of Psychology, 45, 279–284.
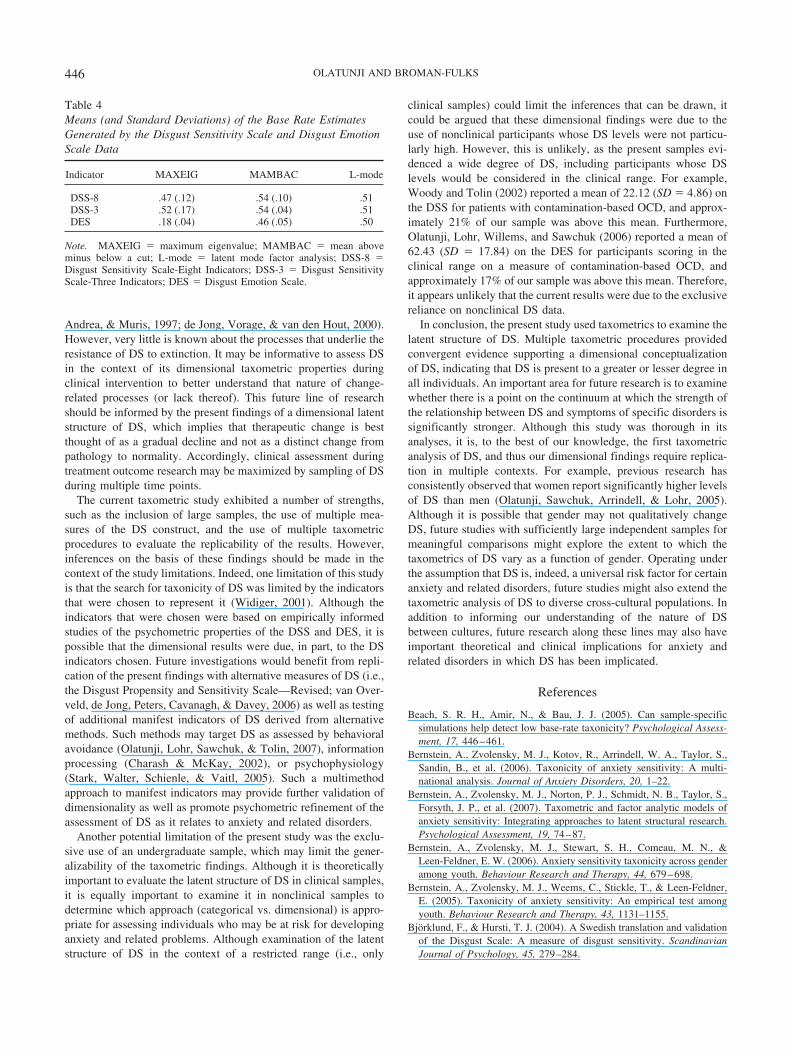
Table 4Means (and Standard Deviations) of the Base Rate EstimatesGenerated by the Disgust Sensitivity Scale and Disgust EmotionScale Data
Indicator MAXEIG MAMBAC L-mode
DSS-8 .47 (.12) .54 (.10) .51DSS-3 .52 (.17) .54 (.04) .51DES .18 (.04) .46 (.05) .50
Note. MAXEIG � maximum eigenvalue; MAMBAC � mean aboveminus below a cut; L-mode � latent mode factor analysis; DSS-8 �Disgust Sensitivity Scale-Eight Indicators; DSS-3 � Disgust SensitivityScale-Three Indicators; DES � Disgust Emotion Scale.
446 OLATUNJI AND BROMAN-FULKS

Broman-Fulks, J. J., Ruggiero, K. J., Kilpatrick, D. G., Resnick, H. S.,Green, B. A., & Saunders, B. E. (2006). Taxometric investigation ofposttraumatic stress disorder: Data from two nationally representativesamples. Behavior Therapy, 37, 364–380.
Charash, M., & McKay, D. (2002). Attention bias for disgust. Journal ofAnxiety Disorders, 16, 529–541.
Cisler, J., Reardon, J., Williams, N., & Lohr, J. M. (2007). Anxietysensitivity and disgust sensitivity interact to predict contamination fears.Personality and Individual Differences, 42, 935–946.
Davey, G. C., L. & Bond, N. (2006). Using controlled comparisons indisgust psychopathology research: The case of disgust, hypochondriasisand health anxiety. Journal of Behavior Therapy and ExperimentalPsychiatry, 37, 4–15.
Davey, G. C. L., Buckland, G., Tantow, B., & Dallos, R. (1998). Disgustand eating disorders. European Eating Disorders Review, 6, 201–211.
de Jong, P. J., Andrea, H., & Muris, P. (1997). Spider phobia in children:Disgust and fear before and after treatment. Behaviour Research andTherapy, 35, 559–562.
de Jong, P. J., & Merckelbach, H. (1998). Blood-injection-injury phobiaand fear of spiders: Domain specific individual differences in disgustsensitivity. Personality and Individual Differences, 24, 153–158.
de Jong, P. J., & Muris, P. (2002). Spider phobia: Interaction of disgust andperceived likelihood of involuntary physical contact. Journal of AnxietyDisorders, 16, 51–65.
de Jong, P. J., Peters, M., & Vanderhallen, I. (2002). Disgust and disgustsensitivity in spider phobia: Facial EMG in response to spider and oraldisgust imagery. Journal of Anxiety Disorders, 16, 477–493.
de Jong, P. J., Vorage, I., & van den Hout, M. A. (2000). Countercondi-tioning in the treatment of spider phobia: Effects on disgust, fear andvalence. Behaviour Research and Therapy, 38, 1055–1069.
Gibb, B. E., Alloy, L. B., Abramson, L. Y., Beevers, C. G., & Miller, I. W.(2004). Cognitive vulnerability to depression: A taxometric analysis.Journal of Abnormal Psychology, 113, 81–89.
Haidt, J., McCauley, C., & Rozin, P. (1994). Individual differences insensitivity to disgust: A scale sampling seven domains of disgust elici-tors. Personality and Individual Differences, 16, 701–713.
Haslam, N. (1997). Evidence that male sexual orientation is a matter ofdegree. Journal of Personality and Social Psychology, 73, 862–870.
Haslam, N. (2003). Categorical versus dimensional models of mentaldisorder: The taxometric evidence. Australian and New Zealand Journalof Psychiatry, 37, 696–704.
Husted, D., Shapira, N., & Goodman, W. (2006). The neurocircuitry ofobsessive– compulsive disorder and disgust. Progress in Neuro-Psychopharmacology and Biological Psychiatry, 30, 389–399.
Kleinknecht, R. A., Kleinknecht, E. E., & Thorndike, R. M. (1997). Therole of disgust and fear in blood and injection-related fainting symptoms:A structural equation model. Behaviour Research and Therapy, 35,1075–1087.
Kotov, R., Schmidt, N. B., Lerew, D. R., & Joiner, T. E. (2005). Latentstructure of anxiety: Taxometric exploration. Psychological Assessment,17, 369–374.
Lenzenweger, M. F., & Korfine, L. (1992). Confirming the latent structureand base rate of schizotypy: A taxometric analysis. Journal of AbnormalPsychology, 101, 567–571.
Mancini, F., Gragnani, A., & D’Olimpio, F. (2001). The connection be-tween disgust and obsessions and compulsions in a non-clinical sample.Personality and Individual Differences, 31, 1173–1180.
Marzillier, S. L., & Davey, G. C. L. (2004). The emotional profiling ofdisgust-eliciting stimuli: Evidence for primary and complex disgusts.Cognition & Emotion, 18, 313–336.
Matchett, G., & Davey, G. C. (1991). A test of a disease-avoidance modelof animal phobias. Behaviour Research and Therapy, 29, 91–94.
McNally, R. J. (2002). Anxiety sensitivity and panic disorder. BiologicalPsychiatry, 52, 938–946.
Meehl, P. E. (1973). MAXCOV-HITMAX: A taxonomic search methodfor loose genetic syndromes. In P. E. Meehl (Ed.), Psychodiagnosis:Selected papers (pp. 200–224). Minneapolis: University of MinnesotaPress.
Meehl, P. E. (1995). Bootstraps taxometrics: Solving the classificationproblem in psychopathology. American Psychologist, 50, 266–275.
Meehl, P. E., & Golden, R. R. (1982). Taxometric methods. In J. N.Butcher & P. C. Kendall (Eds.), The handbook of research methods inclinical psychology (pp. 127–181). New York: Wiley.
Meehl, P. E., & Yonce, L. J. (1994). Taxometric analysis: I. Detectingtaxonicity with two quantitative indicators using means above and belowa sliding cut (MAMBAC procedure). Psychological Reports, 74, 1059–1274.
Meehl, P. E., & Yonce, L. J. (1996). Taxometric analysis: II. Detectingtaxonicity using covariance of two quantitative indicators in successiveintervals of a third indicator (MAXCOV procedure). PsychologicalReports, 78, 1091–1227.
Merckelbach, H., de Jong, P., Arntz, A., & Schouten, E. (1993). The roleof evaluative learning and disgust sensitivity in the etiology and treat-ment of spider phobia. Advances in Behaviour Research and Therapy,15, 243–255.
Mulkens, S. A., de Jong, P. J., & Merckelbach, H. (1996). Disgust andspider phobia. Journal of Abnormal Psychology, 105, 464–468.
Muris, P. (2006). The pathogenesis of childhood anxiety disorders: Con-siderations from a developmental psychopathology perspective. Inter-national Journal of Behavioral Development, 30, 5–11.
Muris, P., Merckelbach, H., Schmidt, H., & Tierney, S. (1999). Disgustsensitivity, trait anxiety and anxiety disorders symptoms in normalchildren. Behaviour Research and Therapy, 37, 953–961.
Olatunji, B. O. (2006). Evaluative learning and emotional responding tofearful and disgusting stimuli in spider phobia. Journal of AnxietyDisorders, 20, 858–876.
Olatunji, B. O., Arrindell, W., & Lohr, J. M. (2005). Can the sex differ-ences in disgust sensitivity account for the sex differences in blood-injection-injury fears? Personality and Individual Differences, 39, 61–71.
Olatunji, B. O., Forsyth, J. P., & Cherian, A. (2007). Evaluative condi-tioning of disgust: A sticky form of relational learning that is resistant toextinction. Journal of Anxiety Disorders, 21, 820–834.
Olatunji, B. O., Lohr, J. M., Sawchuk, C. N., & Tolin, D. F. (2007).Multimodal assessment of disgust in contamination-related obsessivecompulsive disorder. Behaviour Research and Therapy, 45, 263–276.
Olatunji, B. O., Lohr, J. M., Sawchuk, C. N., & Westendorf, D. (2005).Using facial expressions as CSs and fearsome and disgusting pictures asUCSs: Affective responding and evaluative learning of fear and disgustin BII phobia. Journal of Anxiety Disorders, 19, 539–555.
Olatunji, B. O., Lohr, J. M., Willems, J. L., & Sawchuk, C. N. (2006).Expectancy bias for disgust and emotional responding in contamination-related obsessive-compulsive disorder. Anxiety, Stress, and Coping, 19,383–396.
Olatunji, B. O., & Sawchuk, C. N. (2005). Disgust: Characteristic features,social implications, and clinical manifestations. Journal of Social andClinical Psychology, 24, 932–962.
Olatunji, B. O., Sawchuk, C. N., Arrindell, W. A., & Lohr, J. M. (2005).Disgust sensitivity as a mediator of the sex differences in contaminationfears. Personality and Individual Differences, 38, 713–722.
Olatunji, B. O., Sawchuk, C. N., de Jong, P. J., & Lohr, J. M. (2006). Thestructural relation between disgust sensitivity and blood-injection-injuryfears: A cross-cultural comparison of U.S. and Dutch data. Journal ofBehavior Therapy and Experimental Psychiatry, 37, 16–29.
Olatunji, B. O., Sawchuk, C. N., de Jong, P. J., & Lohr, J. M. (2007).Disgust sensitivity and anxiety disorder symptoms: Psychometric prop-erties of the Disgust Emotions Scale. Journal of Psychopathology andBehavioral Assessment, 29, 115–124.
447TAXOMETRIC STUDY OF DISGUST
Olatunji, B. O., Sawchuk, C. N., Lohr, J. M., & de Jong, P. J. (2004).Disgust domains in the prediction of contamination fear. BehaviourResearch and Therapy, 42, 93–104.
Olatunji, B. O., Sawchuk, C. N., Lohr, J. M., & Patten, K. (2007). Fear anddisgust responding to heterogeneous blood-injection-injury stimuli.Journal of Psychopathology and Behavioral Assessment, 29, 1–8.
Olatunji, B. O., Tolin, D. F., Huppert, J., & Lohr, J. M. (2005). The relationbetween fearfulness, disgust sensitivity and religious obsessions in anon-clinical sample. Personality and Individual Differences, 38, 891–902.
Olatunji, B. O., Williams, N. L., Lohr, J. M., & Sawchuk, C. N. (2005).The structure of disgust: Domain specificity in relation to contaminationideation and excessive washing. Behaviour Research and Therapy, 43,1069–1086.
Olatunji, B. O., Williams, N. L., Sawchuk, C. N., & Lohr, J. M. (2006).Disgust, anxiety, and fainting symptoms in blood-injection-injury fears:A structural model. Journal of Anxiety Disorders, 20, 23–41.
Page, A. C. (2003). The role of disgust in faintness elicited by blood andinjection stimuli. Journal of Anxiety Disorders, 17, 45–58.
Phillips, M. L., Senior, C., Fahy, T., & David, A. S. (1998). Disgust—theforgotten emotion of psychiatry. British Journal of Psychiatry, 173,373–375.
Rachman, S. (2006). Fear of contamination: Assessment and treatment.New York: Oxford University Press.
Reiss, S., & McNally, R. J. (1985). Expectancy model of fear. In S. Reiss& R. R. Bootzin (Eds.), Theoretical issues in behavior therapy (pp.107–121). San Diego, CA: Academic Press.
Rozin, P., & Fallon, A. E. (1987). A perspective on disgust. PsychologicalReview, 94, 23–41.
Rozin, P., Haidt, J., & McCauley, C. R. (2000). Disgust. In M. Lewis &J. M. Haviland (Eds.), Handbook of emotions (pp. 575–594). New York:Guilford Press.
Ruscio, A. M., Borkovec, T. D., & Ruscio, J. (2001). A taxometricinvestigation of the latent structure of worry. Journal of AbnormalPsychology, 110, 413–422.
Ruscio, J. (2006). Documentation of program code to perform taxometricanalyses and simulate comparison data in the R language. RetrievedNovember 1, 2006, from http://www.taxometricmethod.com/TaxProg%206–9-07.R
Ruscio, J. (2007). Taxometric programs for the R computing environment:User’s manual. Retrieved from http://www.taxometricmethod.com/TaxProgManual%207–5-07.pdf
Ruscio, J., Haslam, N., & Ruscio, A. M. (2006). Introduction to thetaxometric method: A practical guide. Mahwah, NJ: Erlbaum.
Ruscio, J., & Marcus, D. K. (2007). Detecting small taxa using simulatedcomparison data: A reanalysis of Beach, Amir, and Bau’s (2005) data.Psychological Assessment, 19, 241–246.
Ruscio, J., Ruscio, A. M., & Meron, M. (2007). Applying the bootstrap totaxometric analysis: Generating empirical sampling distributions to helpinterpret results. Multivariate Behavioral Research, 42, 349–386.
Sawchuk, C. N., Lohr, J. M., Lee, T. C., & Tolin, D. F. (1999). Exposureto disgust-evoking imagery and information processing biases in blood-injection-injury phobia. Behaviour Research and Therapy, 37, 249–257.
Sawchuk, C. N., Lohr, J. M., Tolin, D. F., Lee, T. C., & Kleinknecht, R. A.(2000). Disgust sensitivity and contamination fears in spider and blood-injection-injury phobias. Behaviour Research and Therapy, 38, 753–762.
Sawchuk, C. N., Lohr, J. M., Westendorf, D. H., Meunier, S. A., & Tolin,
D. F. (2002). Emotional responding to fearful and disgusting stimuli inspecific phobics. Behaviour Research and Therapy, 40, 1031–1046.
Schienle, A., Stark, R., & Vaitl, D. (2001). Evaluative conditioning: Apossible explanation for the acquisition of disgust responses? Learningand Motivation, 32, 65–83.
Schienle, A., Stark, R., Walter, B., & Vaitl, D. (2003). The connectionbetween disgust sensitivity and blood-related fears, faintness symptoms,and obsessive-compulsiveness in a non-clinical sample. Anxiety, Stress,and Coping, 16, 185–193.
Schmidt, N. B., Kotov, R., Lerew, D. R., Joiner, T. E., & Ialongo, N. S.(2005). Evaluating latent discontinuity in cognitive vulnerability topanic: A taxometric investigation. Cognitive Therapy and Research, 29,673–690.
Stark, R., Walter, B., Schienle, A., & Vaitl, D. (2005). Psychophysiologicalcorrelates of disgust and disgust sensitivity. Journal of Psychophysiol-ogy, 19, 50–60.
Thorpe, S. J., Patel, S. P., & Simonds, L. M. (2003). The relationshipbetween disgust sensitivity, anxiety and obsessions. Behaviour Researchand Therapy, 41, 1397–1409.
Thorpe, S. J., & Salkovskis, P. M. (1998). Studies on the role of disgust inthe acquisition and maintenance of specific phobias. Behaviour Re-search and Therapy, 36, 877–893.
Tolin, D. F., Lohr, J. M., Sawchuk, C. N., & Lee, T. C. (1997). Disgust anddisgust sensitivity in blood-injection-injury and spider phobia. Behav-iour Research and Therapy, 35, 949–953.
Tolin, D. F., Woods, C. M., & Abramowitz, J. S. (2006). Disgust sensi-tivity and obsessive-compulsive symptoms in a nonclinical sample.Journal of Behavior Therapy and Experimental Psychiatry, 37, 30–40.
Troop, N. A., Murphy, F., Bramon, E., & Treasure, J. L. (2000). Disgustsensitivity in eating disorders: A preliminary investigation. InternationalJournal of Eating Disorders, 27, 446–451.
Troop, N. A., Treasure, J. L., & Serpell, L. (2002). A further explorationof disgust in eating disorders. European Eating Disorders Review, 10,218–226.
van Overveld, M., de Jong, P. J., Peters, M. L., Cavanagh, K., & Davey,G. C. L. (2006). Disgust propensity and disgust sensitivity: Separateconstructs that are differentially related to specific fears. Personality andIndividual Differences, 41, 1241–1252.
Waller, N. G., & Meehl, P. E. (1998). Multivariate taxometric procedures:Distinguishing types from continua. Newbury Park, CA: Sage.
Widiger, T. A. (2001). What can be learned from taxometric analyses.Clinical Psychology: Science and Practice, 8, 528–533.
Widiger, T., A. & Trull, T. J. (2007). Plate tectonics in the classification ofpersonality disorder: Shifting to a dimensional model. American Psy-chologist, 62, 71–83.
Woody, S. R., McLean, C., & Klassen, T. (2005). Disgust as a motivatorof avoidance of spiders. Journal of Anxiety Disorders, 19, 461–475.
Woody, S. R., & Teachman, B. A. (2000). Intersection of disgust and fear:Normative and pathological views. Clinical Psychology: Science andPractice, 7, 291–311.
Woody, S. R., & Tolin, D. F. (2002). The relationship between disgustsensitivity and avoidant behavior: Studies of clinical and nonclinicalsamples. Journal of Anxiety Disorders, 16, 543–559.
Received December 6, 2006Revision received April 4, 2007
Accepted July 27, 2007 �
448 OLATUNJI AND BROMAN-FULKS
Copyright © 2022 FDOKUMEN