Effect of dimensionality and estimation on the performance of gaussian classifiers
12
Pattern Recognition Vol, 12, pp. 115-126. 0031-3203/80/0601-0115 $02.00/0 Pergamon Press Ltd. 1980. Printed in Great Britain. ,(" Pattern Recognition Society. EFFECT OF DIMENSIONALITY AND ESTIMATION ON THE PERFORMANCE OF GAUSSIAN CLASSIFIERS T. S. EL-SHEIKH and A. G. WACKER Department of Electrical Engineering, University of Saskatchewan, Saskatoon, Saskatchewan S7N 0W0 Canada (Received 15 June 1979; received for publication 7 September 1979) Abstract - The measurement dimensionality, which maximizes the average (over possible training sets) probability of correct classification (P,,), is investigated for the equiprobable two-class Gaussian problem with known common covarianee matrix. The Bayes minimumerror classificationrule, in which the estimated (sample) mean vectors are used in place of the true mean vectors, is the classification rule considered. A basic question investigated is the variation, with dimensionality, in the Mahalanobis distance (between the underlying distributions) required to keep P,, constant. Numerical results are plotted for several cases. Analytical results are obtained which relate the rate of variation of the Mahalanobis distance with dimensionality and the corresponding asymptotic behaviour of Pc,- Results for more highly structured problems, involving specificcovarianee matrices, show that in some cases increasing correlation between the measurements yields higher values of Pc,. Approximate expressions are derived relating Pc,, dimensionality, training sample size and the structure of the underlying probability density. Pattern classification Multivariate Gaussian distribution Average probability of correct classification Bayes classification rule Maximum likelihood estimation Mahalanobis distance Design sample Peaking phenomenon Optimum number of measurements Correlation coefficient i. INTRODUCTION of correct classification is an increasing function of the measurement dimensionality. In many pattern classification systems, such as target Chandrasckaran and Jain Isl considered a corn- recognition and fault diagnosis, only a small number of bination of the above cases. Again it has been con- design vectors are available to estimate the parameters eluded that Bayes probability of correct classification of the class-conditional densities. In practice, quite is a monotone increasing function with dimcnsionality often the performance of a classifier based on csti- for fixed quantization, but peaks with increasing mated densities improves up to a point, then starts quantization for fixed dimcnsionality. deteriorating as further measurements are added. This For the case of statistically independent measure- indicates the existence of an optimal number of ments, Chandrasckaran and Jain (6) discussed asymp- measurements when the number of training vectors is totic results as the dimensionality tends to infinity small, while the number of training data vectors remains This phenomenon has been considered by many fixed and finite. They derived general conditions under authors.II 9~ Hughes~lb mathematically demonstrated which, they claimed, it can be guaranteed that the the existence of this phenomenon in context of a peaking phenomenon does not occur, and the correct collection of problems and a Bayesian model in which classification probability kceps increasing to a value no specific assumptions are made about the de- of unity as the dimcnsionality tends to infinity. These pendence or lack of it betwcen any measurements. The conditions have been shown by Van Ness (~ to be measurements are quantized to n levels and the prior insufficient and not valid in general. His rcsults distributions over the parameter simplices, which indicate that perfect discrimination for Bayes-type define the collection of problems, arc assumed to be decision rules may or may not be obtained as the uniform. He has shown that for finite design sample dimcnsionality tends to infinity with independent co- sizes and known prior class probabilities, the mean ordinates. This depends on the"degree of separation" probability of correct classification reaches a maxi- provided by the variables being added. Additional mum as the value of the quantization complexity n is sufficient conditions for the claims made by Chandra- increased, sekaran and Jain ¢6~ to be truc arc discussed in more On the other hand, Chandrasckaran ~4~ considered a recent papersF" s~ parametric case in which the measurements are vectors Waller and Jain ~9~ considered a model which in- of N class-conditionally independent binary-valued volvcs binary measurements which are first-order random variables for each set of values of the para- nonstationary Markov dependent. They have shown meters. A uniform prior distribution is assumed for the that while the performance of their model falls between parameters. He has shown that the Bayes probability the performances of Hughes' modePX) and thc model of P~ 123 A 115
-
Upload
independent -
Category
Documents
-
view
3 -
download
0
Transcript of Effect of dimensionality and estimation on the performance of gaussian classifiers
Pattern Recognition Vol, 12, pp. 115-126. 0031-3203/80/0601-0115 $02.00/0 Pergamon Press Ltd. 1980. Printed in Great Britain. ,(" Pattern Recognition Society.
EFFECT OF DIMENSIONALITY AND ESTIMATION ON THE PERFORMANCE OF GAUSSIAN CLASSIFIERS
T. S. EL-SHEIKH and A. G. WACKER
Department of Electrical Engineering, University of Saskatchewan, Saskatoon, Saskatchewan S7N 0W0 Canada
(Received 15 June 1979; received for publication 7 September 1979)
Abstract - The measurement dimensionality, which maximizes the average (over possible training sets) probability of correct classification (P,,), is investigated for the equiprobable two-class Gaussian problem with known common covarianee matrix. The Bayes minimum error classification rule, in which the estimated (sample) mean vectors are used in place of the true mean vectors, is the classification rule considered. A basic question investigated is the variation, with dimensionality, in the Mahalanobis distance (between the underlying distributions) required to keep P,, constant. Numerical results are plotted for several cases. Analytical results are obtained which relate the rate of variation of the Mahalanobis distance with dimensionality and the corresponding asymptotic behaviour of Pc,- Results for more highly structured problems, involving specific covarianee matrices, show that in some cases increasing correlation between the measurements yields higher values of Pc,. Approximate expressions are derived relating Pc,, dimensionality, training sample size and the structure of the underlying probability density.
Pattern classification Multivariate Gaussian distribution Average probability of correct classification Bayes classification rule Maximum likelihood estimation Mahalanobis distance Design sample Peaking phenomenon Optimum number of measurements Correlation coefficient
i. INTRODUCTION of correct classification is an increasing function of the measurement dimensionality.
In many pattern classification systems, such as target Chandrasckaran and Jain Isl considered a corn- recognition and fault diagnosis, only a small number of bination of the above cases. Again it has been con- design vectors are available to estimate the parameters eluded that Bayes probability of correct classification of the class-conditional densities. In practice, quite is a monotone increasing function with dimcnsionality often the performance of a classifier based on csti- for fixed quantization, but peaks with increasing mated densities improves up to a point, then starts quantization for fixed dimcnsionality. deteriorating as further measurements are added. This For the case of statistically independent measure- indicates the existence of an optimal number of ments, Chandrasckaran and Jain (6) discussed asymp- measurements when the number of training vectors is totic results as the dimensionality tends to infinity small, while the number of training data vectors remains
This phenomenon has been considered by many fixed and finite. They derived general conditions under authors.II 9~ Hughes~lb mathematically demonstrated which, they claimed, it can be guaranteed that the the existence of this phenomenon in context of a peaking phenomenon does not occur, and the correct collection of problems and a Bayesian model in which classification probability kceps increasing to a value no specific assumptions are made about the de- of unity as the dimcnsionality tends to infinity. These pendence or lack of it betwcen any measurements. The conditions have been shown by Van Ness (~ to be measurements are quantized to n levels and the prior insufficient and not valid in general. His rcsults distributions over the parameter simplices, which indicate that perfect discrimination for Bayes-type define the collection of problems, arc assumed to be decision rules may or may not be obtained as the uniform. He has shown that for finite design sample dimcnsionality tends to infinity with independent co- sizes and known prior class probabilities, the mean ordinates. This depends on the"degree of separation" probability of correct classification reaches a maxi- provided by the variables being added. Additional mum as the value of the quantization complexity n is sufficient conditions for the claims made by Chandra- increased, sekaran and Jain ¢6~ to be truc arc discussed in more
On the other hand, Chandrasckaran ~4~ considered a recent papersF" s~ parametric case in which the measurements are vectors Waller and Jain ~9~ considered a model which in- of N class-conditionally independent binary-valued volvcs binary measurements which are first-order random variables for each set of values of the para- nonstationary Markov dependent. They have shown meters. A uniform prior distribution is assumed for the that while the performance of their model falls between parameters. He has shown that the Bayes probability the performances of Hughes' modePX) and thc model of
P~ 12 3 A 115
116 T.S. EL-SHEIKH and A. G. WACKER
Chandrasekaran, (4) the qualitative nature of the re- familiesoffunctions relating the Mahalanobisdistance lationships which they obtained are similar to those and the number of measurements. Section V deals with derived for independent binary measurements. Their the same phenomenon for three different structures of results also indicate that independence of measure- the common covariance matrix. ments is not a necessary condition either for the
absence of the peaking phenomenon or for perfect 11. EXPECTED PROBABILITY OF CORRECT discrimination. CLASSIFICATION
It has been shown by Van Campenhout "°) and Waller and Jain (t~) that the peaking behaviour of the In this section the two-class problem, where each Bayes risk in the classification problems discussed observation vector belongs to one of two classes C~ or. above(1.2, s. 6) can be attributed to a lack ofcompara- C2, is considered. The a priori probabilities, P(Ct) and bility of the statistical models that are being con- P(C2),ofthe two classes are assumed to be known and sidered. According to their claims there is no con- equal. Moreover it is assumed that the underlying tradiction between this peaking effect of the Bayes risk class-conditional density functions, p(X [Ct) and p(X and the common-sense heuristic that predicts better [C2), are multivariate Gaussians with common N x N performance when more information is available, covariance matrix X and mean vectors Mt and M2. It However, for suboptimal decision rules, the peaking of is well known that if all the parameters of the class- the correct classification probability might be present, conditional density functions are known, then the even in the case of statistically comparable models, decision rule which achieves maximum probability of
Models leading to very optimistic results have been correct classification of an observation vector, X, presented for classification based on an infinite sample is"7~: set. Optical character recognition is an example of X,X-~(Mt _ M2 ) a situation in which the designer has, potentially, a
large, essentiallyinfinitesampleset. Representativeof _ t2(M~ + M2) ,F- I (Mt _ M2) >c O , x ~ f C ~ (1 ) optimistic results are those presented by GaffeY (12), v - , Albrecht "3) and Chu. (t4~ The first reference "2~ as-
where X" is the transpose of the vector X and £ - ~ is the sumes multivariate Gaussian distributions. Its results
inverse of the covariance matrix £. are sharper than those presented by Chu (t*~ which are
In most practical situations, all the parameters are more general since they do not invoke the Gaussian
not known but a set of observation vectors (design assumption. However, Chu (v*) assumes independent variables. Albrecht (t 3) evaluates bounds for the error vectors) are available from each class. For this case, the rate of independent, Gaussian variables. These re- optimal procedure which maximizes the probability of ferenees derive conditions whereby the probability of correct classification averaged over all possible sam- correct classification can be made arbitrarily close to pies of specified size, is a Bayes procedure for unity as the number of variables increases, distributions with unknown parameter values. (2) This
procedure requires the knowledge of the prior distri- Recent papers by Van Ness and Simpson (15) and butions on the parameters. Since prior distributions on
Raudys (t6) report on simulation results which de- the parameters are often not known and the Bayes monstrate the dependence of probability of correct procedure is computationally fairly complex, it is classification on the number of measurements, the
common to use simpler suboptimal procedures. One number of available training vectors, and the corn-
such commonly used procedure is to replace the true plexity of the classification procedures when the class-
values of the parameters, in the decision rule given in conditional densities are multivariate Gaussian. How- ever, they do not give any explicit relationship between (1), by their maximum likelihood estimates. The these quantities, resulting statistic, proposed by Anderson, tta) will be
denoted by IV. It is assumed throughout this paper that The objective of this paper is to investigate the
the common covariance matrix is known and con- peaking phenomenon for two-class multivariate Gaus- sian distributions. The covariance matrices of the two sequently only the class mean vectors need to be
estimated. Thus if K design vectors are available from classes are assumed to be equal and known. Approx- each class, then the maximum likelihood estimate of a imate relationships are derived relating the prob- ability of correct classification, the number of mean vector Mi is calculated as follows:
measurements, the number of available design vectors 1 K ~=tY l.i) i = 1,2, (2) and the structure of the underlying probability AT/~ = ~ = -J
distributions. In Section II, both exact and approximate ex- where _jY~9 refers to thej th design vector from class C~.
pressions are presented for the expected probability of For the above model, the statistic W reduces to
correct recognition. In Section III the minimal increase w = X'X-'(M~- M,)- ~(M~+ ~2)'X-~(M~ - M2) in the Mahalanobis distance between the underlying
distributions, required to justify increasing the number The decision rule would be to choose C t if and only of measurements, is calculated. In Section IV, the if W > 0. The exact distribution of this statistic and an peaking phenomenon is investigated in detail for two expression for the associated average probability of
Performance of Gaussian classifiers 1 1 7
misclassification were calculated by John. (19" 2o~ Using approximates the distribution of the cube root of a John's result the expected probability of correct classi- noncentral chisquare variable. Thus it is expected that fication is the approximation involved in (4) is of the same order
as that involved in assuming that the cube root of a Pc, = 1 - e -~ ' + ~'-'} noncentral chisquare variable has the normal distri-
bution. It is also expected that Pc, from (4) asymptoti- C, ~, 2" 2 s callyconverges to the exact value.
x ~ z., x 1_.~2 ll ,2(~N + s, ½N + r), (3) In order to gain confidence in the approximate r = O s=0
expression (4), it has been compared with the exact where expression using numerical computations. This corn-
K I- 1 -]2x2 parison was carried out for N = 1 (maximum error~ 21 = 8-1_1 ~ . j ~'N and for values of tS~ and K between 1 and 10. Within
this region of comparison the error was always less = aafi2, than 3.5~o. It has been noted that for this region of
comparison expression (4) always gave larger values and for Pc, than expression (3). Since this region of
K I 1 -]2x2 comparison is the most interesting region, expression 22 = 1 +. , ./7--7-W~| ,,N (4) can be used with confidence to approximate (3) for ~L x/1 -r ,~x_l all practical purposes.
= a262, The approximate expression (4) is very simple for numerical computations but the argument u given in
where t5 s is the Mahalanobis distance between the (5)is inconvenient for analytical studies. Therefore this underlying N-dimensional densities given by argument has been approximated by a much simpler
tS~, = (M 2 - M 1 )' y~- I (M: - M 1 ), expression. This approximation is reasonably accurate for values of N, K and 62 such that 2;q/N << 1, i = 1
and where N is the number of measurements. In (3) the and 2, and large values of N. The resulting expression symbol l~(p, q) stands for the incomplete beta function, asymptotically approaches (5) as N tends to 7_. The
f~ objective of this approximation is mainly to derive F(p + q) zp_l( 1 _ z)q_ldz.
lx(p'q) = F(p)F(q-----~ qualitative and asymptotic results. To simplify expression (51, consider separately each
The above expression for Pc, is inconvenient for term in this expression. For the denominator, the numerical evaluation particularly when N and/or K terms r713(1 + b~), i = 1 or 2, can be shown to vary are large. For this reason John derived an approximate with N approximately as N - 1:3 Thus the denomi- expression for the expected probability of misclassifi- ni ter can be approximated by 6N -~'6. For the cation. His approximation is based on the fact that (2 ~ numerator, the second term can be shown to be much if Z 'z has a non-central chisquare distribution with f smaller than the first term and consequently can be degrees of freedom and noncentrality parameter equal neglected. Thus the following expression results for the to ~, then the variable (Z'2/r) l/a where r = f + 22, has argument u approximately a normal distribution with mean 1 3N~[ ( .~)13 ( 2,~. 1 ~1'3~ - 2 ( l + b ) / 9 r a n d v a r i a n c e 2 ( l + b ) / 9 r . (Here b stands u = - 1 + - 1 + ~ - 3 (6) for 22/r.) From the results of Abdel-Aty t2~ it can be
shown that the difference between the two distri- This expression can be approximated further by butions approaches zero as r approaches ~ . Thus Pc, expanding the terms given in (3) can be approximated by
Pc ,= 1-~b(u), (4) 1 + - - , f o r i = 1 and2,
where ~b(u) is defined as and keeping only three terms. This is again valid only 1 f " for values of N, K and 62 such that 2k.jN << 1, i = 1
t~(u) = ~n ~J e -~:/2 dx, and 2. Thus the following expression results for u
and
9{r~ 3 - r~, 3} + 2{rj-2/a(1 + b2) - r~-: 3(1 + bl)~
u = x / ~ x/r~" L'3(1 + bz) + r~ ~ 3(1 + b~) (5) ]
with 3 ri --- N + 22 i i = 1, 2,
bi -- 22flri i = 1, 2. 3 ~[_[ '2~(a2_al)_~ .fiE. ~(a242 a2~ 6~.] U = - - ~ X / ~ , - - - - ( 7 )
Expression (4) results from integrating the difference 1 , N2J between two normal density functions each of which
118 T.S. EL-SHEIKH and A. G. WACKER
The above expressions can be used to calculate Pc, required to keep Pc, constant, decreases as K and/or 62 for arbitrary N. For N = 1, the following exact increase. On the other hand if both 6x 2 and K are kept expression was derived by John ~2°~ to calculate Pc,. constant, the required rate of increase of 62./62, to keep
Pc, constant decreases with N. This can be explained P~ = 1 - ~b(-a)~b(b) -~b(a)~b(-b), (8) by noting that the increase in estimation error due to
where adding a measurement is more for small N than for a = 61 , v / - ~ , large N.
Although the curves shown in Fig. l(a, b and c) cover most of the practical region, an explicit ex- b = 6t/2x//2K/(2K + 1). pression between the value 6~., the design sample size
In this paper, the exact expression (3) is used for and the number of measurements would be useful. numerical computations for values of N, K and 62, Thus if in expression (7), u is set to a constant value A such that 21 and 22 are moderate. For these values the which corresponds to the required value of Pc,, then expression is reasonably fast and rapidly convergent, solving (7) yields the followingvalue of 6~. to maintain For larger values of N, the approximate expression (4) constant Pc, is used since at these values, expression (3) is com- putat ional lycomplexandexpression(4) i s v e r y a c - 2 3 N I i _ / l + 8 ( a 2 + a l ~ _ ~ N ] . ( 9 ) curate. For eachcombination ofvaluesofKand 6~,the 6N = ~a 1 + a-~2 3\a2 - at,/ value of N above which the approximate expression could be used is determined by comparison of the exact The required value of Pc, can be calculated for the and approximate expressions. For N = 1, the exact given values of 62 and K at N = 1 using the exact expression (8) is used instead of (3). For analytical expression (8). Thus the corresponding value of A can studies, expression (7) is used in the following sections, be calculated by substituting this value of Pc, in (4). It is used generally for qualitative and asymptotic Since A is always negative, (9) can only be used for results. It is also used for quantitative results but for values of N such that large N and small K and/or 6~. Whenever quantitative results are derived using this expression, the same 8(al + a2)l A [ / [ 3 v / N ( a 2 - al)] calculations are carried out numerically and the is smaller than one. For these values, the error in 62 differences between the analytical and numerical re- calculated from (9) is always less than 5%. For suits are also calculated, example, if K --- 10 and 62 = 2, N must be larger than
25 in order for [A [ to achieve the above inequality. IlL NECESSARY INCREASE IN 6~, TO KEEP P,, C O N S T A N T For other values of N that do not achieve the
inequality, (6) can be used to find the necessary values It has been noted in practice that the performance of of 62 to maintain constant P~,. This can be done by
a classification procedure utilizing estimates may setting u in (6) to a constant value A which depends on deteriorate as the number of measurements is arbit- the required value of Pc, as explained above. The rarily increased. A designer of a classification pro- resulting equation can only be solved by iteration as cedure is often interested in knowing whether adding a follows : new measurement would improve the performance of
calculatehiS procedure. Thus the objective in this section is t O t h e minimal increase in 62 with dimensio- 6N2 = N : F - 2 A ( 2--~-2 ~[_~--~ + 1 + 2a~)1'313" '" - 1}.(10)
nality that is necessary to keep Pc, constant. The addition of another measurement can at best be As an initial approximation for 62 in (10) the value of justified if the increase in 62 exceeds this minimal value. 62-1 can be used provided it was previously calcu- The calculations are carried out both numerically, lated. The solution for 62 by iteration proved to be using the exact expression (3) and analytically using rapidly convergent and reasonably accurate for the expression (7). region of values of 62 and K mentioned before (the
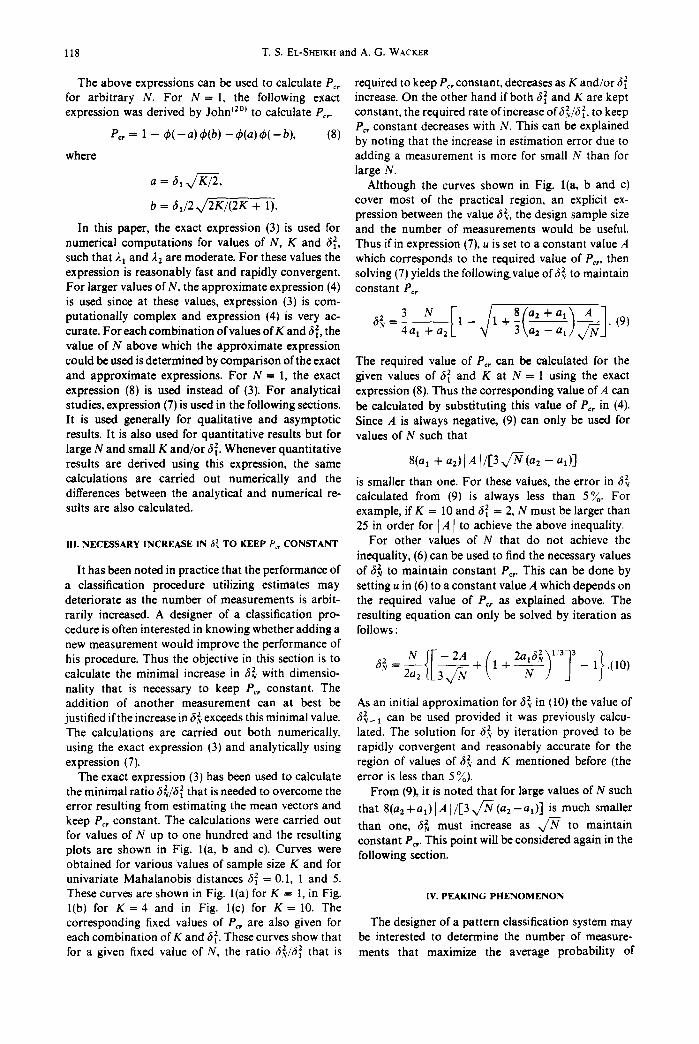
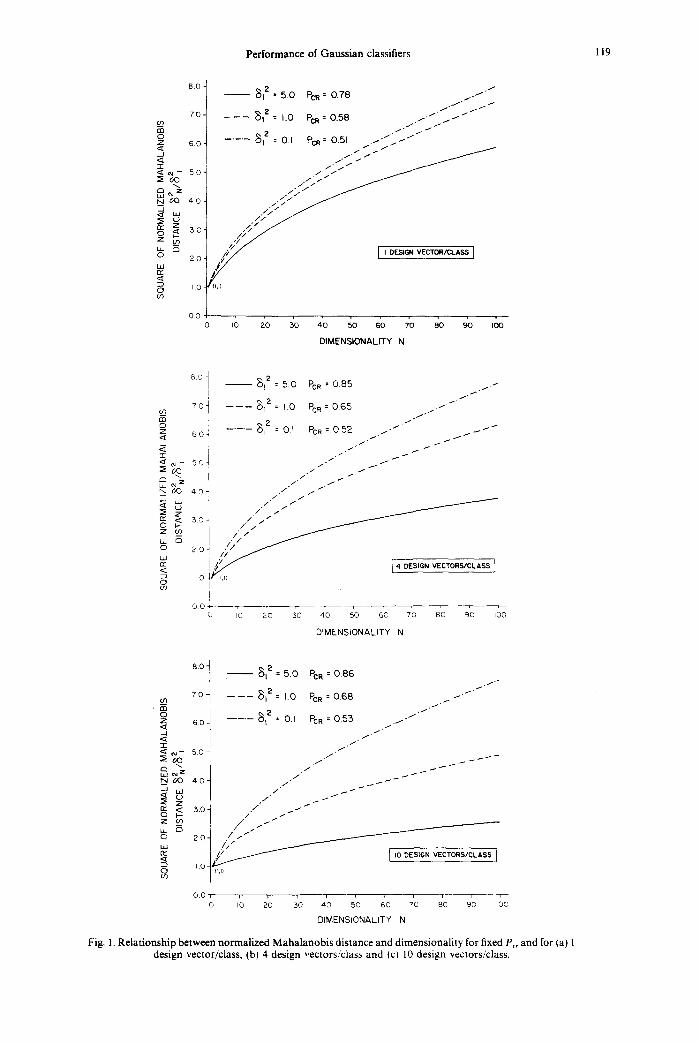
The exact expression (3) has been used to calculate error is less than 5 %). the minimal ratio 62/62 that is needed to overcome the From (9), it is noted that for large values of N such error resulting from estimating the mean vectors and that 8(a2 + al) 1.4 I/I-3 v/N (a2 - a t ) ] is much smaller keep Pc, constant. The calculations were carried out than one, 62 must increase as w/N to maintain for values of N up to one hundred and the resulting constant P,,. This point will be considered again in the plots are shown in Fig. l(a, b and c). Curves were following section. obtained for various values of sample size K and for univariate Mahalanobis distances 6~ = 0.1, 1 and 5. These curves are shown in Fig. l(a) for K = I, in Fig. IV. PEAKING PHENOMENON l(b) for K = 4 and in Fig. l(c) for K = 10. The corresponding fixed values of Pc, are also given for The designer of a pattern classification system may each combination of K and 62. These curves show that be interested to determine the number of measure-
6v/6~ that is ments that maximize the average probability of for a given fixed value of N, the ratio z 2
Performance of Gaussian classifiers 119
12 --~ B0. - - 8 = 5.0 PCR = O.78 / t " . / - /
to 70- ~I z = 1.0 PCR : 0.58 / ' / ' ~ ' / / ' ' ~ ' ~ /
/
m
O . . . . . 81 :~ : 0.I PCR : O.51 /'/'/~// Z 6 0 <~ . i / " . , I J / . / -r / . /
N - 5.0 / / / :E (x3 . / , ~
I " / / r'~ Z . / / - - / / ~% 40 ../
~ o © 20
0 (/3 O0 , - . , , , , , , ,
o ~o 20 30 40 50 60 70 BO 90 IO0
DIMENSIONALITY N
8oJ i __$z=50 PCR:085 ...-
?c~l - - - - - ~ I z = IO P c R : 0 6 5 09 /
12 zO 604 . . . . . ~ : 0.I PCR : 0 52 . i " I f ~ ' ~
I i / . I
_ OC) 40~ ./'/ /" /./ i "/
Z G") 1 / / .- ~ i /// / o 2o~ i>I/ ~"r~ i / . [ 1 <~ i ~ 4 DESIGN VECTORS/CLASS
D ~o4 g ! !
OOJ 0 10 20 ~0 40 50 60 70 80 90 i O 0
DIMENSIONALITY N
7 o - 8 I.O PcR = 0,68 ~ ~ ' ~
. . . . . ~i 2 0,I PCR : 05,% O Z 6.0 - . 1 " <I: , / / / /
'~ 50
~ / i / / ~ f ~ r r Z 3.0 0 k- / / / ~ I LL ~ " I " 0 2.O- / ' - ' ~ " bJ /~ / ~: ~ I0 DESIGN VECTORS/CLASS ] z::) I . O -
0.0 "~
DIMENSIONALITY N
Fig. 1. Relationship between normalized Mahalanobis distance and dimensionality for fixed P~, and for (a) l design vector/class, (bl 4 design vectors/class and (c) 10 design vectors/class.
120 T.S. EL-SHEIKH and A. G. WACKER
correct classification for his procedure. He can then IO00
decide whether he should add more measurements to his classification system depending on the cost of so0
8~ z : 5.0 gathering and processing these added measurements. Thus in this section the peaking phenomenon is 2oo' \ t - - - - 8 . z : Lo investigated for two families of functions which relate ~ ,o0 \ 32 and N, without assuming any specific form for the ~ \ . . . . . 8~ z : O l mean vectors or the common covariance matrix. In the >- 5o \ v.-
first family 62 approaches infinity as N ---, x while 62 .<'z z reaches a finite value as N ---, ~ for the other family. _o 2o tt~
For these two families, the opt imal number of z k\ \ \ ,,, ,o I ' OES,GN V~CrOR~CLASS I measurements, Nop,, is calculated numerically, using ~ ' expressions (3) and (4). In addi t ion to this, appro- _j 5 ~,\\ \ ximate analytical expressions are derived in order to ~_~- .'"'.%,, explain the functional forms of the plots of Nop t ~ 2 " ' x obta ined numerically. Since the analytical expressions , . . asymptot ical ly approach the exact expressions as z o z4 so s2 s6 40
N ~ ~ , these expressions are used to obtain asym- R ptotic results for the behaviour of Pc,. In the following, the two families mentioned above are considered in
I000 J 1 detail. 1. It is assumed that the Maha lanobis distance soo 8l z : 5.0
monotonical ly increases with N and approaches in- 11\ finity as N --, ~_ as follows : ~ 2o0 1.0
32 = fi2N ' l /e ' , (11) ~ IO0
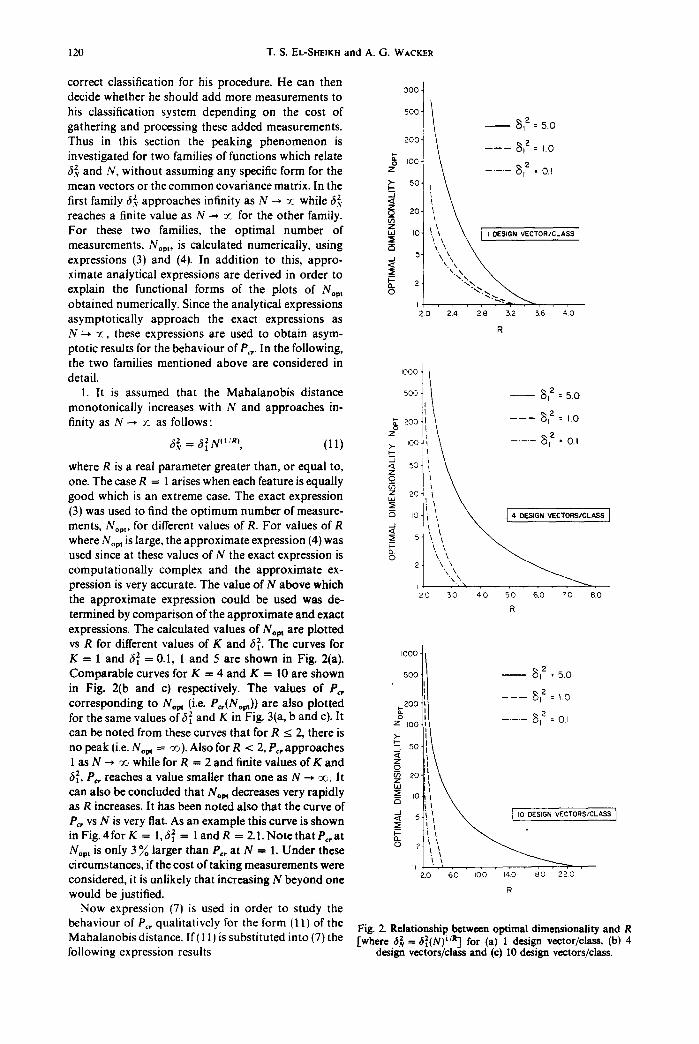
where R is a real parameter greater than, o r e q u a l t o , o sol' ~ one. The case R = 1 arises when each feature is equally ~ z0 good which is an extreme case. The exact expression ~ II ~' ~ - - - - (3) was used to find the op t imum number of measure- ~ qo ~i \ \ [ 4 0~s,G, VectoRS,CLASS ] ments, Nopt, for different values of R. For values of R ,~ [ i \ ~ " - - - where Nop, is large, the approximate expression (4) was ~ 5] \ \\\ ~ used since at these values of N the exact expression is o~ '~. computa t ional ly complex and the approximate ex- 21 \.\~\, ~ pression is very accurate. The value of N above which
, ,
the approximate expression could be used was de- zo s o 4 0 5 0 610 7 0 8.0 termined by compar ison of the approx imate and exact R expressions. The calculated values of N o p t a r e plot ted vs R for different values of K and 62. The curves for /
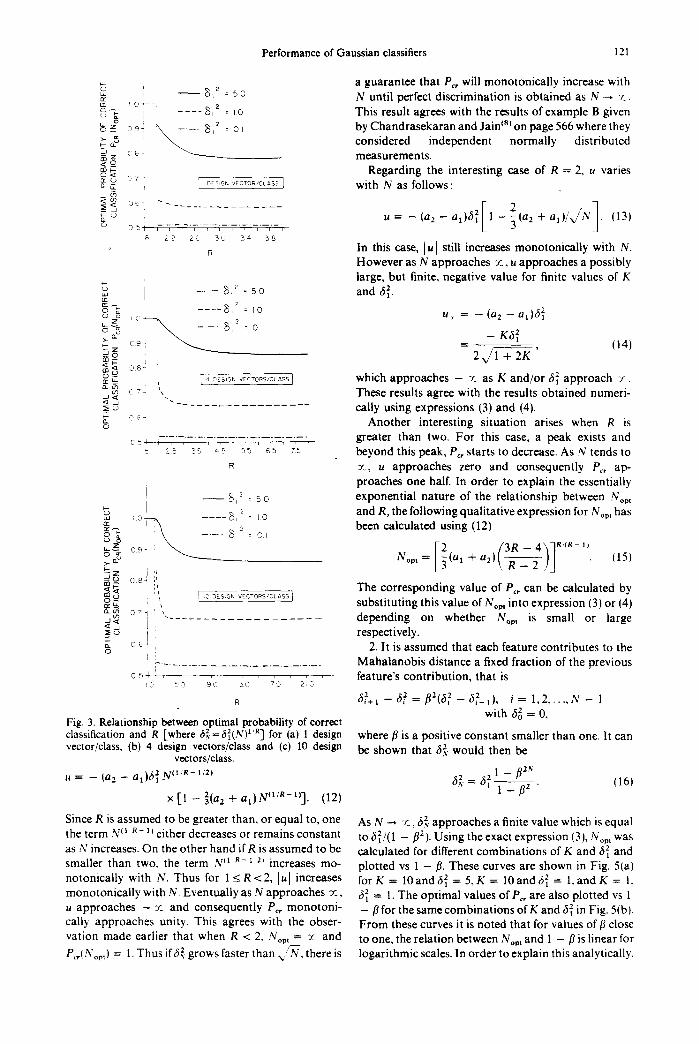
K = 1 and 32 =0 .1 , 1 and 5 are shown in Fig. 2(a). I°°°]/ Comparab le curves for K = 4 and K = 10 are shown 5°011|1 __ 81z : 5.0 in Fig. 2(b and c) respectively. The values of P~, corresponding to Nop, (i.e. P~,(Nom)) are also plot ted ~zoo]t,l - - - ~tz : ~.0
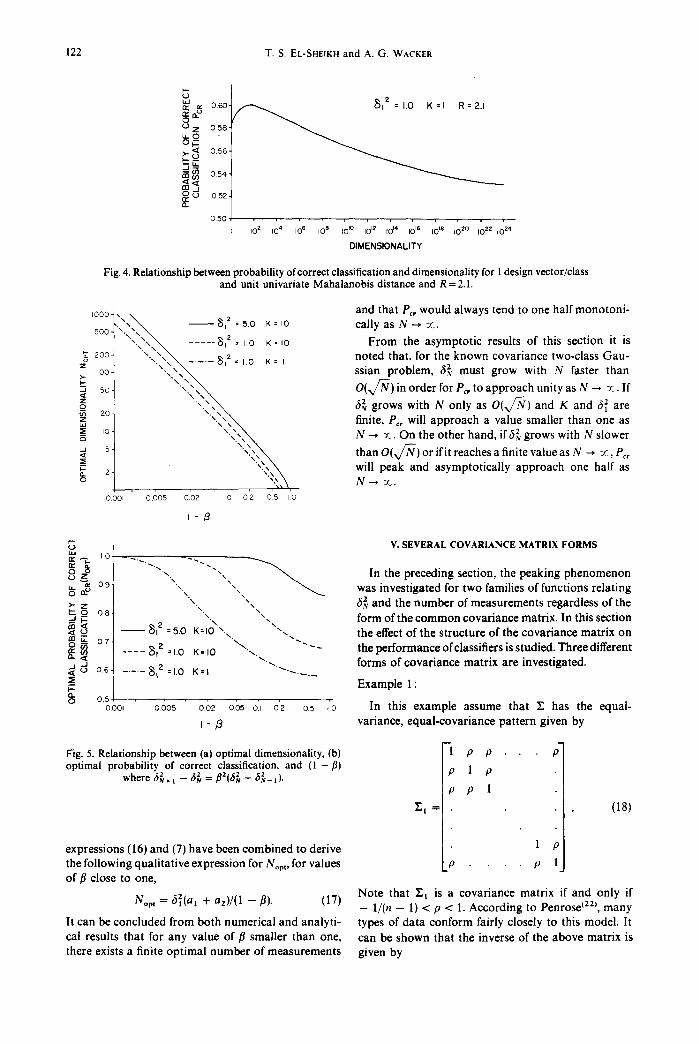
o I for the same values of(f [ and K in Fig. 3(a, b and c). It z ,oo~i / . . . . . 8 ,2 : o, can be noted from these curves that for R < 2, there is >- III l-- no peak (i.e. No, t = ~ ) . Also for R < 2, P~, approaches 3 5o 1 as N --* l~l while for R = 2 and finite values of K and ~ 612, P~, reaches a value smaller than one as N --* oc. It ~ 2o can also be concluded that Nop t decreases very rapidly :~ I(9 as R increases. It has been noted also that the curve of a
l 2 ORS/CLASS ] P,, vs N is very flat. As an example this curve is shown ~ 5 _ _ _ _ in F ig .4 fo r K = 1,62 = l a n d R = 2.1. No te that P~, a t o_~- Nop t is only 3 % larger than P,, at N = 1. Under these o 2 circumstances, if the cost of taking measurements were ., . . . . . . . . . . . . considered, it is unlikely that increasing N beyond one 2 lO 60 IO0 140 180 ZZlO would be justified. R
Now expression (7) is used in order to study the
behaviour of Pc, quali tat ively for the form (11) of the Fig. 2. Relationship betw~n optimal dimensionality and R Mahalanobisd is tance . l f ( l l j i s s u b s t i t u t e d i n t o ( 7 ) t h e ]where 3~ =(f{(N) i4t] for (a) l design vector/class, (b) 4 following expression results design vectors/class and (¢) I0 design vectors/class.
Performance of Gaussian classifiers 121
a guarantee that Pc, will monotonical ly increase with '! - - 3) 2 : 5o N until perfect discrimination is obtained as N ~ 7..
tZ ! 0 " - 8 "~ i . . . . 8,2 . ~o This result agrees with the results of example B given b z o 9i \ - - - - 8,2 : o ~ by Chandrasekaran and Jain (s) on page 566 where they
~ ~ considered independent normally distributed ~ measurements. ~ 7i Regarding the interesting case of R = 2, u varies
Q- ,T I ' D~s,c~ ~E~TO~<C~SS I with N as follows :
~ u = - ( a 2 - a l ) ~ 1 - ( a 2 + a l ) / . (13) 0 5 i U " 7 - ; - ' 7 " - 7 - ; - ' T " - - " ? - - , ' - ,
i8 22 26 30 34 3 8
R In this case, ]u I still increases monotonically with N. However as N approaches :c, u approaches a possibly large, but finite, negative value for finite values of K
t S, 2 = 50 and 612.
~ c- - . ----s, ~ ~o . . = - ( ~ - ~ , ) 6 ~ . . . . o ,
~-°- oes ~ - K 6 ~ (14) ~_o 2, , /1 + 2K C~( j ~ ° - r ~ .... G~ ~c~o~s~=~ss] which approaches - r_ as K and/or 62 approach -x. .~ < -- , . These results agree with the results obtained numeri-
~ cally using expressions (3) and (4). c~ - ' Another interesting situation arises when R is c ~ J 7 7 - - - ? - - 7 ~ - - . - ; - - . - ; - . - . greater than two. For this case, a peak exists and
2~ 3~ ~ ~ 6~ ~ beyond this peak, P,, starts to decrease. A s N t e n d s t o R ~ , u approaches zero and consequently P~, ap-
proaches one half. In order to explain the essentially i . - - S,~ : s o exponential nature of the relationship between No~ ,
t ~ o k . . . . 5. ~ = t o and R, the following quali tat ive expression for No~, has ~o'~ . . . . 8 ' : o , been calculated using (12)
" ' Nora [~ (3Rl(_2-4]]m" ' - ' ) ffz~ 0,-- ~ ~ = (a, + a z ) \ _-w---w-/_] (15)
Z 4 ~o
~ o ~ !~ The corresponding value of P,, can be calculated by 0 ~ tO DESIGN V~CTORS/CLASS ~. ~ ~ , substituting this value of Nora into expression (3) or (4) o . t o
[, - . . . . . . . depending on whether No~t is small or large , ~ 0 ~ : ,
~' i respectively. E o ~ i . 2. It is assumed that each feature contributes to the o I :' Mahalanobis distance a fixed fraction of the previous
0 ~ i : . . . . . . . . . . . feature's contribution, that is !0 50 9C, 130 170 21,2,
R 6~+, - -6~ =/32(6~--f i~_, ) , i = 1,2 . . . . . N - - I with 602 = 0,
Fig. 3. Relationship between optimal probability of correct 6,.=6~(N) ] for (a) 1 design where/3 is a positive constant smaller than one. It can classification and R ['where z z ~,R
vector/class, (b) 4 design vectors/class and (c) 10 design be shown that 6 2. would then be vectors/class.
u = - (a2 - a a ) f ] N ( t ~ - ~ ' 2 ) 62. = (5:1 - / 3 ~ "
x [ l - Z~(a~ + ax)N(U~- ' ) ] . (12) ' I - /3~ " (16)
Since R is assumed to be greater than, or equal to, one As N -* :c, 62 approaches a finite value which is equal the term N (~ ~ - ~) either decreases or remains constant to 6~x/(l - /32) . Using the exact expression (3), No~t was as N increases. On the other hand if R is assumed to be calculated for different combinat ions of K and 6~ and smaller than two, the term N (~ ~- x ~) increases mo- plotted vs I - ft. These curves are shown in Fig. 5(a) notonically with N. Thus for l < R < 2 , lu[ increases fo rK = 10and6~ = 5 , K = 10and62 = 1,and K = 1, monotonical ly with N. Eventually as N approaches ~ , 6~ = 1. The optimal values of P , are also plotted vs 1 u approaches - :t_ and consequently P~, monoton i - - 3 for the same combinat ions of K and 6~ in Fig. 5(b). cally approaches unity. This agrees with the obser- F r o m these curves it is noted that for values of 3 close vation made earlier that when R < 2, Nora = Z and to one, the relation between Nora and 1 - 3 is linear for
• 2 ~ • Pc).{ Nor)t) = l. Thus ff6 v grows faster than v < N. there ~s logari thmic scales. In order to explain this analytically.
122 T . S . EL-SHEIKH and A. G. WACKER
0.50 I . . . . . . . . . . . . I 102 104 IO s 108 I0 ~0 I012 I014 IO is I0 Is 10 20 IO 2;~ 1024
D I M E N S I O N A L I T Y
Fig. 4. Relationship between probability of correct classification and dimensionality for I design vector/class and unit univariate Mahalanobis distance and R=2.1.
~o00-, \ ~ z K ~- and that Pc, would always tend to one ha l fmonoton i - • . ~ ~, =5.o = u c a l l y a s N - - * ~ .
50°. " - . 5 , \ ~ , , . ~ \ \ ~ . . . . . ~, = i.o K=,O From the asymptotic results of this section it is
2 0 ° ' , . , , , \ ~ ~ . ~ . ' \ . . . . . 8~ = I.o K = I noted that. for the known covariance two-class Gau- z ~oo. " . \ \ . . \ ssian problem, 6 2 must grow with N faster than
~- \ \ ' ~ x ~ O(x/N ) in order for P~, to approach unity as N --* ~ . If z o \ . ~ 62 grows with N only as O(x//-N) and K and 6~ are
~0 \\~?,N, x finite, P~, will approach a value smaller than one as N ---, ~_. On the other hand, if52 grows with N slower
51 "~"~x~.~.~ than O ( x / ~ ) or if it reaches a finite value as N --, ~ , P c ,
will peak and asymptotically approach one half as 2 ~
O001 O.OO5 002 0] 0 2 0 5 IO
r - B
t--- V. SEVERAL COVARIANCE MATRIX FORMS (D t,~ IO
8 z -.. -, In the preceding section, the peaking phenomenon ~ o9 ~,. "~ , ~ was investigated for two families of functions relating
~- \ "~ 6~ and the number of measurements regardless of the ~- ~ 0 8 \ \ ~" form of the common covariance matrix. In this section ,.-I ~,~ "x. x x
~ , T 0 7 . K = I 0 " " . \ . \ " . u 8~ 2 = 5.0 " ~ the effect of the structure of the covariance matrix on
~ ' ~ . . . . 8v z = I.o K = IO "'-... - performance the of classifiers is studied. Three different .~
~ ' ~ forms of covariance matrix are investigated. ~ d o6 . . . . . . a~z=l .o K=l " - ~ . . . .
--- Example 1 : I'-
O 0 5 ooo~ o.oo5 oo2 o.o5 o.~ oz o.5 ~o In this example assume that E has the equal-
I - / 3 variance, equal-covariance pattern given by
Fig. 5. Relationship between (a) optimal dimensionality, (b) -1 p p ; optimal probability of correct classification, and ( 1 - fl)
w h e r e 6~+ t _ 6~ = f l z (6~ _ 6~_~)" p 1 p p p 1
Y.~ = (18)
expressions (16) and (7) have been combined to derive 1 p the following qualitative expression for Nopt, for values p . . . . p 1 of fl close to one,
Note that [ t is a covariance matrix if and only if Nop t = 5Z(at + a2)/(l - fl). (17)
- 1 / ( n - I) < p < 1. According to Penrose t22), many It can be concluded from both numerical and analyti- types of data conform fairly closely to this model. It cal results that for any value of fl smaller than one, can be shown that the inverse of the above matrix is there exists a finite optimal number of measurements given by
Performance of Gaussian classifiers 123
-a b b b" positive or negative. For th i scase ,~(N)changeswi th N in many ways depending on the signs of the individual
b a components of M 2 - M~. Since it is not possible to Zi- 1 1 study the effect of the correlation on the performance
= 1 ~ ' for all the possible values of ~(N), an example is given to show that the variation of 6~, with N, greatly
a b depends on a(N). The example in Table 1 shows how
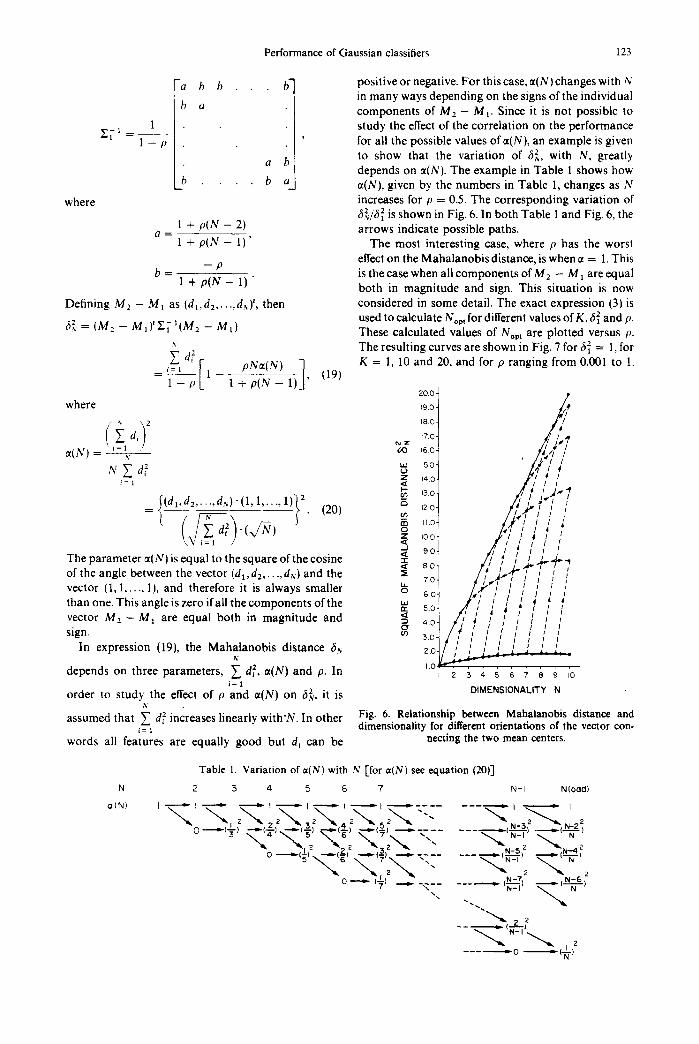
b . . . . b a ~(N), given by the numbers in Table 1, changes as N where increases for p = 0.5. The corresponding variation of
2 2 6~./61 is shown in Fig. 6. In both Table 1 and Fig. 6, the 1 + p(N - 2) arrows indicate possible paths. 1 2 = 1 + p(N - 1) ' The most interesting case, where p has the worst
effect on the Mahalanobis distance, is when ~ = 1. This - p b = is the case when all components of M : - M a are equal
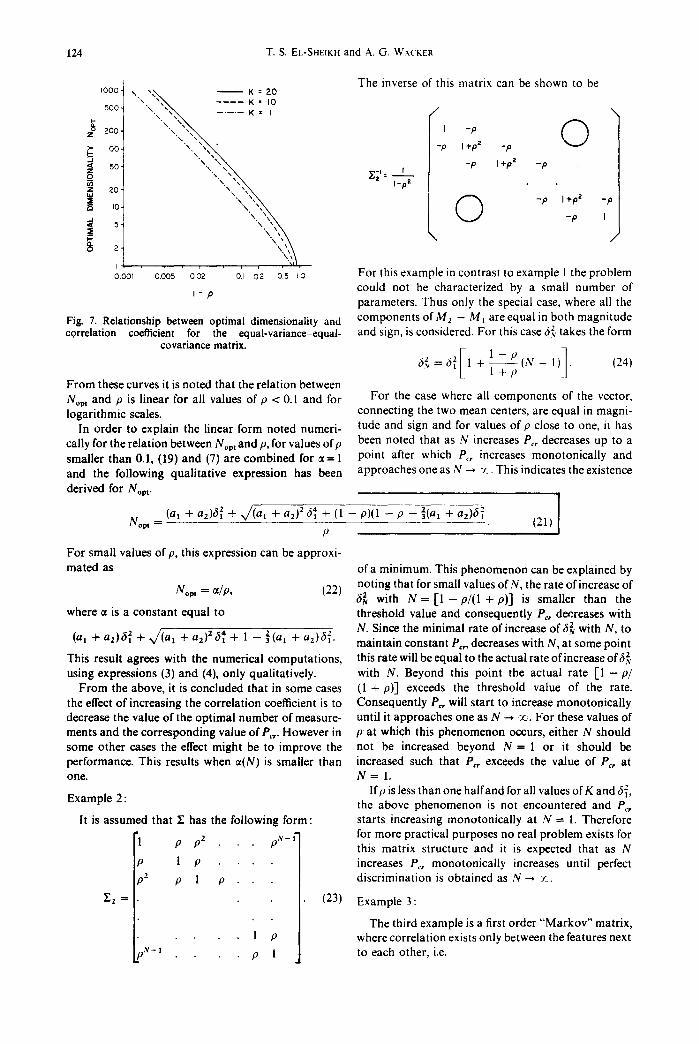
1 + p(N - 1) " both in magni tude and sign. This situation is now
d ' Defining M2 - M~ as (dl, d: . . . . , ,~.), then considered in some detail. The exact expression (3) is used to calculate Nop t for different values of K, 61 and p.
fit. = (M2 - M lJ 'E[~(M2 - M l) These calculated values of Nap t a re plotted versus p.
The resulting curves are shown in Fig. 7 for fi i = 1, for ~ d ~ [ PN=(N) 1 K = 1 , 1 0 a n d 2 0 , a n d f o r p r a n g i n g f r o m 0 . 0 0 1 t o l .
_ i = 1 1 , ( 1 9 )
1 - p l + p ( N - 1) 2 0 0 /
where 190. /¢ ~ ) 2 18.0
d~ ~o . ,( ' , ~ f = ( N ) ~= 1 7x~ ,6 o. ' " = , ,~,,// t
,,v ~, d ~, ~8 '~° Z ~4 0
1 [ I I J ~=1 ~ 13.o A : / J ~ 7
: - ,:' t-, 1 2 , 0 ,¢ t ~' t t (dl , d2 . . . . . dN)" (1, 1 . . . . . 1) (20)
d .(~/-~) ~ ,,o / , : , / : : ; z Io.o .l,,'t / ,J ! .' < , ( ~ ! t' l ! " 80 / ' ; t / ! I
The parameter ~(N) is equal to the square of the cosine . 8o z;/.,' ,"_.;.' , .#÷-r
of the angle between the vector (dl,d2 . . . . . d~,) and the ~ /r.i / - "~'I'" [ [ ~o / L - f ' l I ; I ; vector (1,1 . . . . . 1), and therefore it is always smaller ~ 60 / , ,~ / ] / / j ]
thanone . T h i s a n g l e i s z e r o i f a l l t h e c o m p o n e n t s o f t h e ~ 50 i f -~ /, ~ ! ~ ~ ~ vector M 2 - M 1 are equal both in magnitude and ~ / , ' ~ ~ : / / / / sign. o 40 / i ' / i J ! ! ! I I I I I I I
In expression (19), the Mahalanobis distance &,,~ z o f !' I / .i i , , , t~' / i •
1.0¢ ' r , . . . . . . . . depends on three parameters, ~ d ~ , ~ ( N ) and p. In 2 s 4 5 6 7 s 9 to i = 1
order to study the effect of p and ~t(N) on 6~, it is DIMENSIONALITY N .,<
Fig. 6. Relationship between Mahalanobis distance and assumed that ~ d~ increases linearly with'N. In other dimensionality for different orientations of the vector con-
i = 1 words all features are equally good but d~ can be necting the two mean centers.
Table 1. Variation of a(N) with N [for n(N) see equation (20)]
N I 2 5 4 5 6 7 N- I N(odd)
: . . . . . , _ _ , -- ?- - -L
- - ) --e,,,-(-~-) .-. , .~(,~) . " ' ~ ' t ~ ~ ~ N-3 N-2
o--.-,-~, ..._ _.~: . . . . . ,_~,,, ~__..~_~,
124 T.S. EL-SHEIKH and A. G. WACKER
The inverse of this matrix can be shown to be I000- \ , x "%'% - - KK = = 2010 500- \.,. "~N~, N ..... K = I / \
E "\ \, z ° 200- 'x.\ ",,, I -p
~- Ioo- "\ ",, " - p I +pZ _p
z 50- 'x ", I -P I+P2 -P
" \ ' x . ~ ~ \ \, \x\ I-P2 20- \, ~ i to. 0 - P I+PZ - P
5- - p I
o oof o.oo5 oo2 oJ o2 o5 ~o For this examplein contrast to example 1 theproblem could not be characterized by a small number of I - p parameters. Thus only the special case, where all the
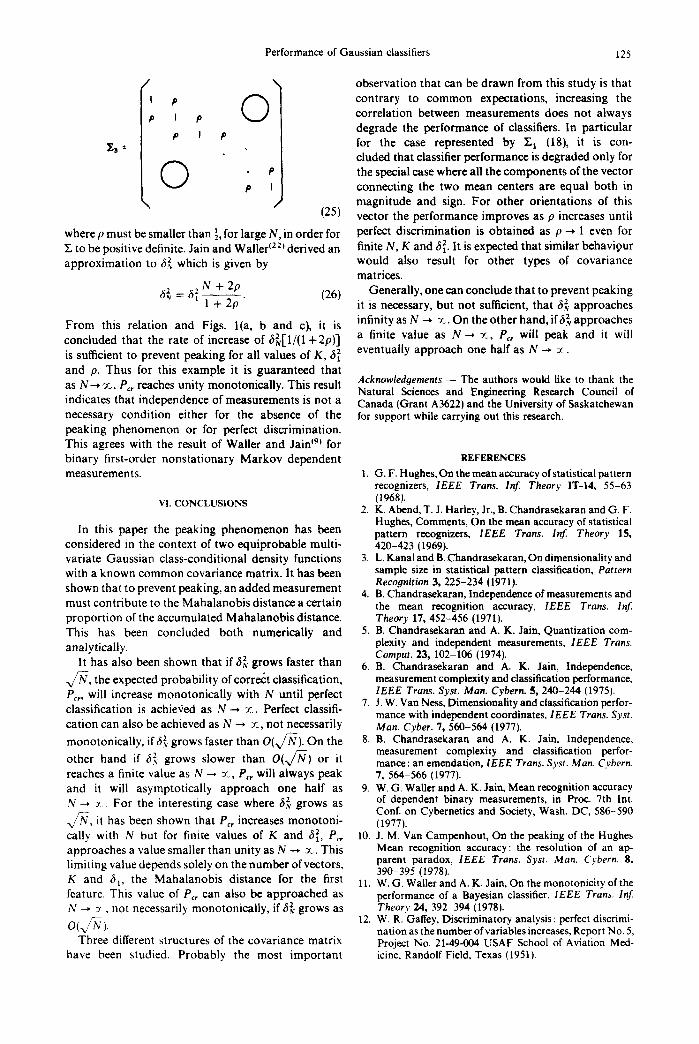
Fig. 7. Relationship between optimal dimensionality and components of M z - M I are equal in both magnitude correlation coefficient for the equal-variance-equal- and sign, is considered. For this case fzv takes the form
covariance matrix.
[ 1 1 - P ( N _ 1) . (24) 62. 62 l + l + p _
From these curves it is noted that the relation between Nora and p is linear for all values of p < 0.1 and for For the case where all components of the vector, logarithmic scales, connecting the two mean centers, are equal in magni-
In order to explain the linear form noted numeri- tude and sign and for values of p close to one, it has cally for the relation between Nopt and p, for values of p been noted that as N increases Pc, decreases up to a smaller than 0.1, (19) and (7) are combined for at= 1 point after which P,., increases monotonically and and the following qualitative expression has been approaches one as N --, -J_. This indicates the existence
derived for Nop r . !
(al + az)62 + x/(al + az)2 6~ + (1 - p)(1 - p - ](a 1 + az)6 ~ (21) I Nopt
I P
For small values of p, this expression can be approxi-
mated as of a minimum. This phenomenon can be explained by noting that for small values of N, the rate of increase of
Nop t = at~p, (22) 6~ with N = [ 1 - p/(1 + p)] is smaller than the where at is a constant equal to threshold value and consequently Pc, decreases with
(a t + a2)612 + J ( u I + a2) 2 6~ + 1 - 2(a t + a2)~21 . N. Since the minimal rate of increase ofh~ with N, to maintain constant Pc,, decreases with N, at some point
This result agrees with the numerical computations, this rate will be equal to the actual rate of increase off ] using expressions (3) and (4), only qualitatively, with N. Beyond this point the actual rate [1 - p~
From the above, it is concluded that in some cases (1 + p)] exceeds the threshold value of the rate. the effect of increasing the correlation coefficient is to Consequently Pc, will start to increase monotonically decrease the value of the optimal number of measure- until it approaches one as N --, vc. For these values of ments and the corresponding value of Pc,- However in p at which this phenomenon occurs, either N should some other cases the effect might be to improve the not be increased beyond N = 1 or it should be performance. This results when at(N) is smaller than increased such that Pc, exceeds the value of P,, at one. N = 1.
lfp is less than one halfand for all values of K and 6~, Example 2: the above phenomenon is not encountered and Pc,
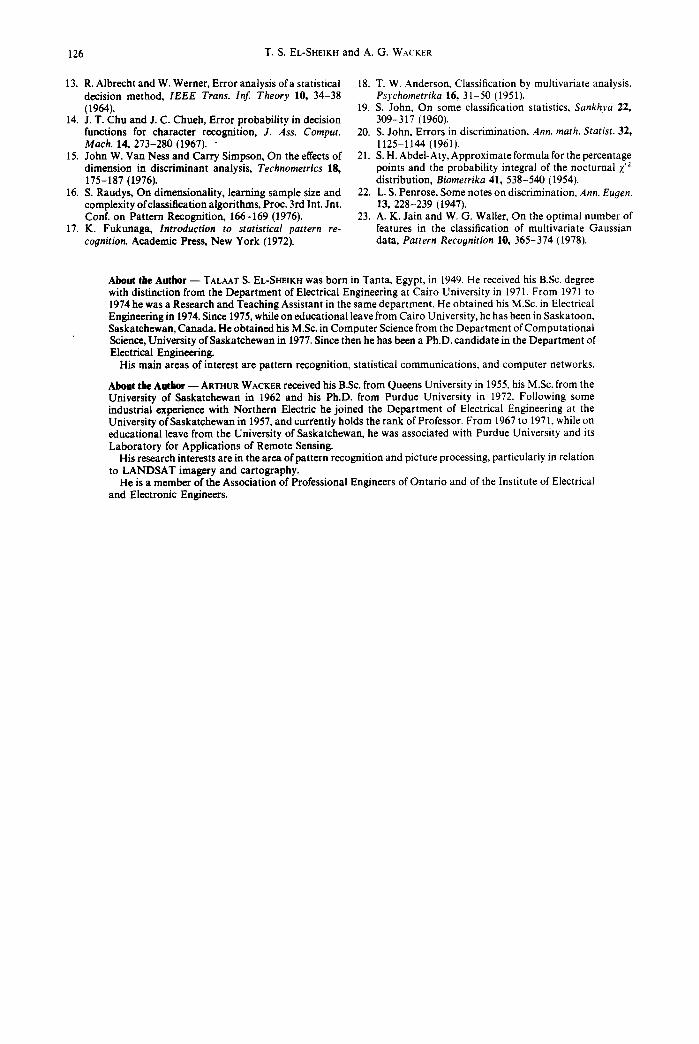
it is assumed that Z has the following form: starts increasing monotonically at N --- 1. Therefore "l p p2 p,~,_ £ for more practical purposes no real problem exists for
this matrix structure and it is expected that as N p 1 p . . . . increases P,, monotonically increases until perfect p2 p 1 p discrimination is obtained as N--* -.c.
v' z = (23) Example 3:
The third example is a first order "Markov" matrix, 1 p where correlation exists only between the features next
'~-1 p 1 to each other, i.e.
Performance of Gaussian classifiers 125
/ \ observation that can be drawn from this study is that I p ~ contrary to common expectations, increasing the p I p ~ correlation between measurements does not always
p I p degrade the performance of classifiers. In particular r.~ • for the case represented by 2; 1 (18), it is con-
cluded that classifier performance is degraded only for Q P the special case where all the components of the vector
p I connecting the two mean centers are equal both in magnitude and sign. For other orientat ions of this
(25) vector the performance improves as p increases until
where p must be smaller than [, for large N, in order for perfect discrimination is obtained as p ~ 1 even for 5z to be positive definite. Jain and Waller ~2~ derived an finite N, K and c52. It is expected that similar behavi9ur approximation to ,53, which is given by would also result for other types of covariance
matrices. 62 = c52 N + 2____p_p. (26) Generally, one can conclude that to prevent peaking
1 + 2p it is necessary, but not sufficient, that tS~, approaches
From this relation and Figs. l(a, b and c), it is infinity a s N - - , :r_.On the o therhand , i f ~ a p p r o a c h e s concluded that the rate of increase of fi~[1/(1 +2p) ] a finite value as N ~ ~ , Pc, will peak and it will is sufficient to prevent peaking for all values of K, 62 eventually approach one half as N --* ~ .
and p. Thus for this example it is guaranteed that as N---, ~c, Pc, reaches unity monotonically. This result Acknowledgements - - The authors would like to thank the
Natural Sciences and Engineering Research Council of indicates that independence of measurements is not a Canada (Grant A3622) and the University of Saskatchewan necessary condit ion either for the absence of the for support while carrying out this research. peaking phenomenon or for perfect discrimination. This agrees with the result of Waller and Jain ~9~ for binary first-order nonsta t ionary Markov dependent REFERENCES measurements. 1. G.F. Hughes, On the mean accuracy of statistical pattern
recognizers, IEEE Trans. Inf. Theory IT-14, 55-63
VI. CONCLUSIONS (1968). 2. K. Abend, T. J. Harley, Jr., B. Chandrasekaran and G. F.
Hughes, Comments, On the mean accuracy of statistical In this paper the peaking phenomenon has been pattern recognizers, IEEE Trans. Inf. Theory 15,
considered in the context of two equiprobable multi- 420-423 (1969). variate Gaussian class-conditional density functions 3. L. Kanal and B. Chandrasekaran, On dimensionality and with a known common covariance matrix. It has been sample size in statistical pattern classification, Pattern
Recognition 3, 225-234 (1971). shown that to prevent peaking, an added measurement 4. B. Chandrasekaran, Independence of measurements and must contribute to the Mahalanobis distance a certain the mean recognition accuracy, IEEE Trans. Inf. proport ion of the accumulated Mahalanobis distance. Theory 17, 452-456 (1971). This has been concluded both numerically and 5. B. Chandrasekaran and A. K. Jain, Quantization corn- analytically, plexity and independent measurements, IEEE Trans.
Comput. 23, 102-106 (1974). It has also been shown that if tS~, grows faster than 6. B. Chandrasekaran and A. K. Jain, Independence,
x /N, the expected probabili ty of correct classification, measurement complexity and classification performance, P~,, will increase monotonical ly with N until perfect IEEE Trans. Syst. Man. Cybern. 5, 240-244 (1975). classification is achiex~ed as N ~ ~ . Perfect classifi- 7. J.W. Van Ness, Dimensionality and classification perfor-
mance with independent coordinates. IEEE Trans. Syst. cation can also be achieved as N ~ 7"~, not necessarily Man. Cyber. 7, 560-564 (1977). monotonically, if62 grows faster than O ( x / ~ ). On the 8. B. Chandrasekaran and A. K. Jain, Independence,
, measurement complexity and classification perfor- other hand if 6g grows slower than O ( x / ~ ) or it mance: an emendation, lEEE Trans. Syst. Man. Cybern. reaches a finite value as N --~ :r, Per will always peak 7, 564-566 (1977). and it will asymptotically approach one half as 9. W.G. Waller and A. K. Jain, Mean recognition accuracy N ---, ~,. For the interesting case where tS~, grows as of dependent binary measurements, in Prec. 7th Int.
Conf. on Cybernetics and Society, Wash. DC, 586-590 x ~ , it has been shown that P~, increases monotoni - (1977). cally with N but for finite values of K and c52, P~, 10. J. M. Van Campenhout, On the peaking of the Hughes approaches a value smaller than unity as N ~ ~ . This Mean recognition accuracy: the resolution of an ap- limiting value depends solely on the number of vectors, parent paradox, IEEE Trans. Syst. Man. Cybern. 8,
390-395 (1978). K and c5~, the Mahalanobis distance for the first 11. W'G 'Wal l e randA 'K ' Ja in 'On them°n° t °n ic i ty° f the feature. This value of P~, can also be approached as performance of a Bayesian classifier, IEEE Trans. Inf. N -~ ~ , not necessarily monotonical ly, if c5~. grows as Theory 24, 392-394 (1978). O(x/ '~ ). 12. W. R. Galley, Discriminatory analysis: perfect discrimi-
nation as the number of variables increases, Report No. 5 Three different structures of the covariance matrix Project No. 21-49-004 USAF School of Aviation Med-
have been studied. Probably the most impor tant icine, RandolfField, Texas (1951).
126 T.S. EL-SHEIKH and A. G. WACKER
13. R. Albrecht and W. Werner, Error analysis of a statistical 18. T. W. Anderson, Classification by multivariate analysis. decision method, IEEE Trans. Inf. Theory 10, 34-38 Psychometrika 16, 31-50 (1951). (1964). 19. S. John, On some classification statistics, Sankhyd 22,
14. J. T. Chu and J. C. Chueh, Error probability in decision 309-317 0960). functions for character recognition, J. Ass. Comput. 20. S. John, Errors in discrimination, Ann. math. Statist. 32, Mach. 14, 273-280 (1967). " 1125-1144 (1961).
15. John W. Van Ness and Carry Simpson, On the effects of 21. S. H. Abdel-Aty, Approximate formula for the percentage dimension in discriminant analysis, Technometrics 18, points and the probability integral of the nocturnal Z '2 175-187 (1976). distribution, Biometrika 41, 538-540 (1954}.
16. S. Raudys, On dimensionality, learning sample size and 22. L.S. Penrose, Some notes on discrimination, Ann. Eugen. complexity of classification algorithms, Proc. 3rd Int. Jnt. 13, 228-239 (1947). Conf. on Pattern Recognition, 166-169 (1976). 23. A. K. Jain and W. G. Waller, On the optimal number of
17. K. Fukunaga, Introduction to statistical pattern re- features in the classification of multivariate Gaussian cognition. Academic Press, New York (1972). data, Pattern Recoonition 10, 365-374 (1978).
About the Author - - TALAAT S. EL-SHEIKH was born in Tanta, Egypt, in 1949. He received his B.Sc. degree with distinction from the Department of Electrical Engineering at Cairo University in 1971. From 1971 to 1974 he was a Research and Teaching Assistant in the same department. He obtained his M.Sc. in Electrical Engineering in 1974. Since 1975, while on educational leave from Cairo University, he has been in Saskatoon, Saskatchewan, Canada. He obtained his M.Sc. in Computer Science from the Department of Computational Science, University of Saskatchewan in 1977. Since then he has been a Ph.D. candidate in the Department of Electrical Engineering.
His main areas of interest are pattern recognition, statistical communications, and computer networks.
About the Author - - AgTHUa WACKER received his B.Sc. from Queens University in 1955, his M.Sc. from the University of Saskatchewan in 1962 and his Ph.D. from Purdue University in 1972. Following some industrial experience with Northern Electric he joined the Department of Electrical Engineering at the University of Saskatchewan in 1957, and currently holds the rank of Professor. From 1967 to 1971, while on educational leave from the University of Saskatchewan, he was associated with Purdue University and its Laboratory for Applications of Remote Sensing.
His research interests are in the area of pattern recognition and picture processing, particularly in relation to LANDSAT imagery and cartography.
He is a member of the Association of Professional Engineers of Ontario and of the Institute of Electrical and Electronic Engineers.