Concomitant Notch activation and p53 deletion trigger epithelial-to-mesenchymal transition and...
15
ARTICLE Received 9 Apr 2014 | Accepted 15 Aug 2014 | Published 8 Oct 2014 Concomitant Notch activation and p53 deletion trigger epithelial-to-mesenchymal transition and metastasis in mouse gut Maia Chanrion 1,2, *, Inna Kuperstein 1,3, *, Ce ´dric Barrie `re 1,2 , Fatima El Marjou 1,2 , David Cohen 1,3 , Danijela Vignjevic 1,2 , Lev Stimmer 1,2 , Perrine Paul-Gilloteaux 1,4 , Ivan Bie `che 5,6 , Silvina Dos Reis Tavares 1,2 , Giuseppe-Fulvio Boccia 1,2,z , Wulfran Cacheux 7 , Didier Meseure 7 , Silvia Fre 1,8,9 , Loredana Martignetti 1,3 , Patricia Legoix-Ne ´ 10 , Elodie Girard 1,3 , Luc Fetler 1,11 , Emmanuel Barillot 1,3 , Daniel Louvard 1,2 , Andreı ¨ Zinovyev 1,3, ** & Sylvie Robine 1,2, ** Epithelial-to-mesenchymal transition-like (EMT-like) is a critical process allowing initiation of metastases during tumour progression. Here, to investigate its role in intestinal cancer, we combine computational network-based and experimental approaches to create a mouse model with high metastatic potential. Construction and analysis of this network map depicting molecular mechanisms of EMT regulation based on the literature suggests that Notch activation and p53 deletion have a synergistic effect in activating EMT-like processes. To confirm this prediction, we generate transgenic mice by conditionally activating the Notch1 receptor and deleting p53 in the digestive epithelium (NICD/p53 / ). These mice develop metastatic tumours with high penetrance. Using GFP lineage tracing, we identify single malignant cells with mesenchymal features in primary and metastatic tumours in vivo. The development of such a model that recapitulates the cellular features observed in invasive human colorectal tumours is appealing for innovative drug discovery. DOI: 10.1038/ncomms6005 OPEN 1 Institut Curie, Centre de Recherche, Paris 75248, France. 2 CNRS UMR 144, Paris 75248, France. 3 Inserm, U900, Paris 75248, France. 4 Cell and Tissue Imaging Facility, PICT-IBiSA, CNRS, UMR 144, Paris 75248, France. 5 Inserm U735, Ho ˆpital Rene ´ Huguenin, 92210 Saint-Cloud, France. 6 Institut Curie, Ho ˆpital Rene ´ Huguenin, 35 rue Dailly, 92210 Saint-Cloud, France. 7 Institut Curie, Centre Hospitalier, Paris 75248, France. 8 CNRS UMR3215, Paris 75248, France. 9 Inserm U934, Paris 75248, France. 10 Next-Generation Sequencing Platform, Institut Curie, Paris 75248, France. 11 CNRS UMR168, Paris 75248, France. * M.C. and I.K. are co-first authors. ** A.Z. and S.R. are co-last authors. z In memory of our PhD student Giuseppe-Fulvio Boccia. Correspondence and requests for materials should be addressed to D.L. (email: [email protected]). NATURE COMMUNICATIONS | 5:5005 | DOI: 10.1038/ncomms6005 | www.nature.com/naturecommunications 1 & 2014 Macmillan Publishers Limited. All rights reserved.
Transcript of Concomitant Notch activation and p53 deletion trigger epithelial-to-mesenchymal transition and...

ARTICLE
Received 9 Apr 2014 | Accepted 15 Aug 2014 | Published 8 Oct 2014
Concomitant Notch activation and p53 deletiontrigger epithelial-to-mesenchymal transition andmetastasis in mouse gutMaia Chanrion1,2,*, Inna Kuperstein1,3,*, Cedric Barriere1,2, Fatima El Marjou1,2, David Cohen1,3,
Danijela Vignjevic1,2, Lev Stimmer1,2, Perrine Paul-Gilloteaux1,4, Ivan Bieche5,6, Silvina Dos Reis Tavares1,2,
Giuseppe-Fulvio Boccia1,2,z, Wulfran Cacheux7, Didier Meseure7, Silvia Fre1,8,9, Loredana Martignetti1,3,
Patricia Legoix-Ne10, Elodie Girard1,3, Luc Fetler1,11, Emmanuel Barillot1,3, Daniel Louvard1,2, Andreı Zinovyev1,3,**
& Sylvie Robine1,2,**
Epithelial-to-mesenchymal transition-like (EMT-like) is a critical process allowing initiation of
metastases during tumour progression. Here, to investigate its role in intestinal cancer, we
combine computational network-based and experimental approaches to create a mouse
model with high metastatic potential. Construction and analysis of this network map
depicting molecular mechanisms of EMT regulation based on the literature suggests that
Notch activation and p53 deletion have a synergistic effect in activating EMT-like processes.
To confirm this prediction, we generate transgenic mice by conditionally activating the Notch1
receptor and deleting p53 in the digestive epithelium (NICD/p53� /� ). These mice develop
metastatic tumours with high penetrance. Using GFP lineage tracing, we identify single
malignant cells with mesenchymal features in primary and metastatic tumours in vivo. The
development of such a model that recapitulates the cellular features observed in invasive
human colorectal tumours is appealing for innovative drug discovery.
DOI: 10.1038/ncomms6005 OPEN
1 Institut Curie, Centre de Recherche, Paris 75248, France. 2 CNRS UMR 144, Paris 75248, France. 3 Inserm, U900, Paris 75248, France. 4 Cell and TissueImaging Facility, PICT-IBiSA, CNRS, UMR 144, Paris 75248, France. 5 Inserm U735, Hopital Rene Huguenin, 92210 Saint-Cloud, France. 6 Institut Curie,Hopital Rene Huguenin, 35 rue Dailly, 92210 Saint-Cloud, France. 7 Institut Curie, Centre Hospitalier, Paris 75248, France. 8 CNRS UMR3215, Paris 75248,France. 9 Inserm U934, Paris 75248, France. 10 Next-Generation Sequencing Platform, Institut Curie, Paris 75248, France. 11 CNRS UMR168, Paris 75248,France. * M.C. and I.K. are co-first authors. ** A.Z. and S.R. are co-last authors. z In memory of our PhD student Giuseppe-Fulvio Boccia. Correspondence andrequests for materials should be addressed to D.L. (email: [email protected]).
NATURE COMMUNICATIONS | 5:5005 | DOI: 10.1038/ncomms6005 | www.nature.com/naturecommunications 1
& 2014 Macmillan Publishers Limited. All rights reserved.
Tumour metastasis, the main cause of death in cancerpatients, is a multi-step process in which tumour cells exittheir original tissue, migrate to distant locations and
survive in new microenvironments1,2. This plasticity results fromthe accumulation of genetic mutations, epigenetic modificationsand involves a reversible biological process, the epithelial-to-mesenchymal transition-like (EMT-like)3. The EMT is initiatedby key transcription factors, including SNAIL, SLUG, TWIST,ZEB1 and ZEB2 regulating downstream targets transcription.This leads to E-cadherin (ECAD) loss4,5, epithelial cellscytoskeleton disorganization, cell adhesion complexes loss andelongated fibroblast phenotype acquisition accompanied byvimentin, fibronectin or a-smooth muscle actin (a-SMA)expression6.
EMT is important during embryonic development for theformation of body plan and the differentiation of tissues andorgans7. Data from human solid cancers, cell culture andxenograft systems show that an EMT-like phenotype leads topoor clinical outcomes and enhances cell invasiveness andmigration8–11. A spontaneous squamous cell carcinoma mousemodel has demonstrated the requirement of EMT-like in tumourmetastasis in vivo12. However, while the significance of the EMT-like process during tumour progression is accepted, the fulldemonstration of its existence in cancer is still debated owing tothe difficulty in distinguishing normal resident stromal cells frompathological mesenchymal cells originating from malignantepithelial cells through an EMT-like process3.
In colorectal cancer (CRC), 25% of patients present with overtmetastases; additional 25–35% of patients will develop metastasesduring disease progression13, thereby making CRC anappropriate model to study EMT-like processes. Despite theexistence of knowledge of the mutational landscape initiatingCRC, the mechanisms of disease progression related to EMT arepoorly understood. To study the role of EMT in diseaseprogression, a lineage tracing strategy with tissue specificity isneeded. Such approach has been applied to describe EMT-likephenotype in pancreatic cancer14. However, epithelial lineagetracing experiments have been performed neither in a mousemodel of metastatic colon cancer with liver metastases15 nor inother metastatic models with activated KRAS and TGFBR2deletion16 or activated KRAS and PTEN loss17. Therefore, theearliest events preceding the appearance of metastases could notbe captured in these mouse models, thus leaving an open questionabout direct involvement of such mutations in EMT-likeinduction.
The aim of our study was to generate a mouse modeldeveloping invasive intestinal cancer with high penetrance,allowing in vivo dissection of molecular mechanisms in EMTand metastasis. We use a computational biology approach forrationalizing the choice of such a combination of moleculartargets that would trigger the EMT-like and metastatic pheno-type. Systematic literature study allows assembling EMT regula-tion signalling network followed by network structural analysis. Itis predicted that p53 loss and Notch activation should havesynergistic effect on the EMT-like phenotype induction.
To validate this hypothesis, we create a transgenic mousemodel expressing a constitutively active Notch1 receptor in a p53-deleted background, specifically in the digestive epithelium.Importantly, green fluorescent protein (GFP) expression linkedto the Notch1 receptor activation allows lineage tracing ofepithelial tumour cells during cancer progression and invasion.These mice develop digestive tumours with dissemination ofEMT-like epithelial malignant cells to the lymph nodes, liver andperitoneum and generation of distant metastases. These trans-genic mice represent an appropriate in vivo model to study theEMT-like process of malignant cells from the primary tumour to
metastasis. We confirm the presence of EMT-like cells expressingthe EMT-inducer ZEB1 but not the epithelial marker ECAD inhuman invasive primary CRC and metastases.
ResultsSignalling network reconstruction and analysis. The re-activation of developmental mechanisms in tumour cells isbelieved to govern the EMT-like processes that lead to celldissemination3. In order to achieve early EMT-like with
Notchpathway
p53family
Apoptosis
Proliferation
Slug
Zeb1
Zeb2
Twist1
Snail
EMT inducers
WNTpathway
Tumour Micro-environment
gene RNA Protein
EMT inducers
Notch
NICD p63/p73 p53
miRNA
WNTpathway
p53 family
DNA damage
a
b
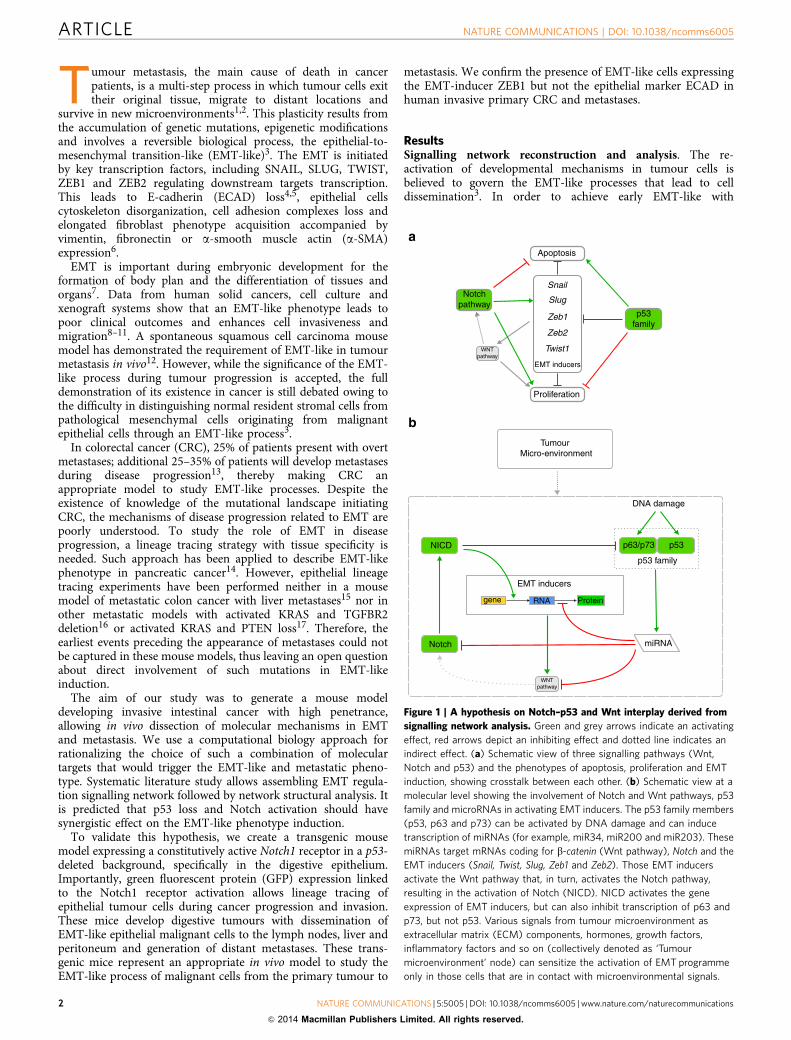
Figure 1 | A hypothesis on Notch–p53 and Wnt interplay derived from
signalling network analysis. Green and grey arrows indicate an activating
effect, red arrows depict an inhibiting effect and dotted line indicates an
indirect effect. (a) Schematic view of three signalling pathways (Wnt,
Notch and p53) and the phenotypes of apoptosis, proliferation and EMT
induction, showing crosstalk between each other. (b) Schematic view at a
molecular level showing the involvement of Notch and Wnt pathways, p53
family and microRNAs in activating EMT inducers. The p53 family members
(p53, p63 and p73) can be activated by DNA damage and can induce
transcription of miRNAs (for example, miR34, miR200 and miR203). These
miRNAs target mRNAs coding for b-catenin (Wnt pathway), Notch and the
EMT inducers (Snail, Twist, Slug, Zeb1 and Zeb2). Those EMT inducers
activate the Wnt pathway that, in turn, activates the Notch pathway,
resulting in the activation of Notch (NICD). NICD activates the gene
expression of EMT inducers, but can also inhibit transcription of p63 and
p73, but not p53. Various signals from tumour microenvironment as
extracellular matrix (ECM) components, hormones, growth factors,
inflammatory factors and so on (collectively denoted as ‘Tumour
microenvironment’ node) can sensitize the activation of EMT programme
only in those cells that are in contact with microenvironmental signals.
ARTICLE NATURE COMMUNICATIONS | DOI: 10.1038/ncomms6005
2 NATURE COMMUNICATIONS | 5:5005 | DOI: 10.1038/ncomms6005 | www.nature.com/naturecommunications
& 2014 Macmillan Publishers Limited. All rights reserved.

dissemination in multiple organs, we have explored early inducersof the EMT programme. Since the single transgenic mousemutants currently described never developed distant metastasis,we hypothesized that reactivation of EMT programme requiresaffecting activity of several genes that can interact in a synergicmanner. To identify combination of genes that could beresponsible for the induction of EMT-like phenotype, wesystematically revised the existing literature and pathwaydatabases for mechanisms inducing EMT. This information wasgathered together into a comprehensive map of signallinginvolved in EMT regulation (see Methods section). The mapdepicts the mechanisms of EMT regulation by p53, Notch, AKTand MAPK (downstream signalling of Ras), Wnt, transforminggrowth factor-b signalling and miRNAs. Important regulators ofdifferentiation, apoptosis and proliferation have been included todepict the crosstalk between these regulatory circuits and theircompetition with the EMT programme (Supplementary Fig. 1A).Interactive online version of the map accompanied by detaileddescription of the molecular mechanisms and the comprehensivelist of references can be found at https://navicell.curie.fr/pages/signalling_network_emt_regulation_description.html.
We performed structural analysis and simplification of theEMT network (Supplementary Fig. 1B,C; see Methods section)that highlighted the following EMT network organizationprinciples, which is in agreement with current EMT under-standing: (1) five EMT transcription factors SNAIL, SLUG,TWIST, ZEB1 and ZEB2 that have partially overlapping sets ofdownstream target genes can activate the EMT-like pro-gramme18. (2) These key EMT transcription factors are undercontrol of several upstream mechanisms: they are directlyinduced at the transcriptional level by the activated form ofNotch, NICD19, but are downregulated at the translational levelby several miRNAs (namely, mir200, mir34, mir203 and mir192)that are under transcriptional control of p53 family genes20.Interestingly, some key EMT transcription factors can inhibitmicroRNAs, in this way sustaining their own activation21,22.(3) According to the network structure, all five key EMTtranscription factors should be activated ensuring simultaneousactivation of EMT-like programme genes and downregulatingmiRNAs. In addition, the EMT key inducers also inhibitapoptosis18 and reduce proliferation23. (4) The activity of Wntpathway is stimulated by transcriptional activation of the genecoding for b-catenin protein by Notch-induced TWIST or SNAI1(ref. 24). The Wnt pathway, in turn, can induce the expression ofNotch pathway factors, creating a positive feedback loop25. Inagreement with other studies, the Wnt pathway does not directlyinduce EMT, but helps to maintain it24. (5) Components of theWnt and Notch pathways are negatively regulated by miRNAsinduced by the p53 family (p53, p63 and p73). The balancebetween the effect of positive (Notch and Wnt) and negative (p53,p63 and p73 mediated by miRNAs) regulatory circuits on EMTinducers dictates the possibility of EMT phenotype.
In order to clarify the interplay between Wnt, Notch and p53pathways, we performed network complexity reduction up to coreregulators of EMT, apoptosis and proliferation that werepreserved through all levels of reduction (SupplementaryFig. 1B,C; see Methods section). The reduced network has beenused for comparison between the wild-type (WT) cells and allpossible combinations of single and double mutants for Wntpathway, Notch and p53 for achieving EMT-like phenotype.
Network analysis shows that the loss of function of p53 alonecan be compensated by p63/p73, inducing the same set ofmicroRNAs and, thus, inhibiting EMT. Activated p63/p73 mayinduce apoptosis in the rare situations when p53� /� cells start toundergo EMT (Fig. 1 and Supplementary Fig. 2). This model mayexplain the non-invasive sporadic tumours in p53� /� mice26.
This prediction is also supported by latest observation in theBrafV637E, where p53 does not affect early stages of BrafV637E-induced tumorigenesis but has an important role in invasivenessprevention27.
In the Notch gain-of-function mutants, transcriptional activa-tion of EMT inducers may be counterbalanced by p53-activatedmicroRNAs at the translational level, possibly explaining the lackof invasive tumours in the NICD mice28,29 (Fig. 1 and Supple-mentary Fig. 2).
In Apc heterozygous loss-of-function mutants (considered asApc� /� in this study), increased activation of the Wnt pathwaymight lead to activation of the Notch pathway. However, the p53/63/73 family controls Wnt and Notch signals via microRNAs.Therefore, an EMT phenotype is not predicted in this mutant,recapitulating the experimental results30.
We show that an EMT-like phenotype cannot result from anyof the single mutants; therefore, we investigated this process indouble mutants. We predict that in Apc� /� /p53� /� doublemutant, Wnt activation does not induce EMT, because p63/p73induced microRNAs can still inhibit the Wnt and Notch pathway(Fig. 1 and Supplementary Fig. 2).
When Notch is activated in an Apc� /� background, cellproliferation is increased as has been observed in the micemodels29. At the same time, EMT is inhibited by the microRNAexpression induced by p53 (Fig. 1 and Supplementary Fig. 2),resulting in non-invasiveness. This explains the observed absenceof metastases in NICD/Apc� /� mice29.
Finally, in NICD/p53� /� double mutant, other members ofp53 family cannot rescue the function of p53 anymore asconstitutively activated Notch inhibits the activity of both p63and p73 (ref. 31). NICD activates the transcription of the EMTkey inducers and inhibits the production of microRNAs bysuppressing p63/p73 in the context of p53� /� . Notch and p53have opposite effects on EMT inducers, and overexpression ofNICD and knocking-out p53 should have synergetic effect.Furthermore, EMT inducers may activate the Wnt pathway,possibly resulting in a positive feedback loop that will amplifyNotch activation and maintain an EMT-like programme.
Therefore, our computational analysis of the signallingnetwork leads to the prediction that the simultaneous activationof Notch and loss of p53 can promote an EMT-like phenotype.
Development of a conditional mouse model of digestive cancer.We generated mutant mice expressing NICD in the intestinalepithelium, in a conditional invalidation of p53, usingvillin-CreERT2 tamoxifen-dependent intestine-specific recombi-nation26,32,33. Association of GFP expression with NICD allowstracing of epithelial cells after recombination.
We first analysed NICD or p53� /� single-mutant mice andrevealed that neither the loss of p53 nor the activation of Notchalone has an effect in promoting invasive tumours in agreementwith the computational predictions and previous data29,34,35.Despite relatively long lifespans, only three animals in each group(n¼ 20) developed adenocarcinomas after 9 months withoutmetastatic progression (Fig. 2a,b).
Remarkably, 38% of double-mutant NICD/p53� /� micedeveloped tumours 5 months post induction, which werediagnosed as adenoma (42%) or adenocarcinoma (58%). Allmice developed adenocarcinomas 15 months post induction(Fig. 2b). Compared with the single mutants, NICD/p53� /�
mice show a drastic increase in adenocarcinoma-related death(Fig. 2a), with an average of five tumours per animal. Thetumours were predominantly located in the jejunum, ileum andrarely in the colon, and had a cystic appearance with irregularsurfaces, and infiltrated the adjacent mesentery and fat tissue
NATURE COMMUNICATIONS | DOI: 10.1038/ncomms6005 ARTICLE
NATURE COMMUNICATIONS | 5:5005 | DOI: 10.1038/ncomms6005 | www.nature.com/naturecommunications 3
& 2014 Macmillan Publishers Limited. All rights reserved.

(Fig. 2c). Pathologically, tumours were classified as moderately orpoorly differentiated (59.3% of total tumours) with completeinvasion of the intestinal wall (Fig. 2d) characterized bymuscularis and adipocyte infiltration. In addition, 56.7% of themost aggressive carcinomas had a moderate or severe
desmoplastic stroma containing small groups of invadingepithelial cells called budding cells (Supplementary Table 1).
Analysis of 30 compound mutant mice showed that 23.3%presented lymph node infiltration and 10% had liver metastasesproving the capacity to disseminate in NICD/p53� /� tumours.
Bulk Muscularis infiltration Adipocyte infiltration Desmoplasia
Primary tumour LN metastasis Liver metastasis Peritoneum carcinomatosis
100 μm
40 μm40 μm40 μm40 μm
100
80
60
Sur
viva
l (%
)
40
20
05 10
Time after tamoxifen induction (months)15 20
T2Np53T2p53T2N
100
80
60
Tum
our
inta
ke (
%)
40
20
03:5 5:7 7:9 9:11 11:13 13:15 15:18 +18
Time after tamoxifen induction (months)
T2Np53T2p53T2N
ARTICLE NATURE COMMUNICATIONS | DOI: 10.1038/ncomms6005
4 NATURE COMMUNICATIONS | 5:5005 | DOI: 10.1038/ncomms6005 | www.nature.com/naturecommunications
& 2014 Macmillan Publishers Limited. All rights reserved.

Fifty percent of the animals developed peritoneal carcinomatosis,with cancer cells infiltrating several tissues, including liver, spleen,diaphragm, mesentery and the abdominal wall. The histologicalcharacteristics of the 67 examined metastases revealed patternsresembling the primary tumours, including poor differentiationand moderate reactive stroma (Fig. 2e and SupplementaryTable 1). The intestinal origin of the cancer cells from theprimary and secondary organs was confirmed by their GFPexpression (Fig. 2f). Importantly, liver and lymph nodemetastases and peritoneal carcinomatosis are common implanta-tion environments for metastases in patients with advanced CRC,demonstrating that the NICD/p53� /� mutant mice efficientlymimic the metastatic spreading of the human disease.
The Wnt pathway is known as the ) gatekeeper * in thesequence of CRC mutation in human36. As readout of Wntactivation in our mouse model, we showed the occurrence ofnuclear b-catenin mainly at the invasive front of the primarytumour and in secondary sites (Fig. 2g). The b-catenin target geneFascin1 (ref. 37) was also overexpressed in the primary tumoursand in metastases, but was absent in the normal epithelium(Supplementary Fig. 3A). In addition, other canonical Wnt targetgenes, c-Myc, Ccnd1 and Lgr5 were significantly overexpressed intotal extracts of primary tumours compared with normal adjacenttissues (Supplementary Fig. 3B–D). Finally, by genomesequencing, we searched for mutations in four important Wntfactors (Ctnnb1, Apc, Axin2 and Gsk3b) comparing genesequences in tumours versus normal tissue. In two of the eightindividual NICD/p53� /� pairs of samples, we detected 2individual single-nucleotide variations in the exon 3 of theCtnnb1 gene that correspond to the same frequency of hotspot mutations in the human CRC38. We also detected a stop gainmutation in the exon 16 of the Apc gene corresponding to amutation described in human (Supplementary Fig. 3E). Takentogether, these results showed that the Wnt pathway is activatedin some NICD/p53� /� primary tumours and their metastases.
Concomitant activation of Notch and Wnt pathways triggersintestinal cell proliferation29 that may provide an explanation fortumour initiation in this mouse model. However, regarding thenumerous reports already published on digestive cancerinitiation, we have not deciphered further the molecularmechanism responsible for the Wnt pathway activation, butspecifically used our mouse model to study later steps of tumourprogression and invasion30,39.
EMT-like and invasion phenotype in NICD/p53� /� tumours.To test computationally derived hypothesis of synergistic NICD/p53 effect, we quantified the relative expression of 84 transcriptsinvolved in EMT in tumours versus normal tissues. The majorityof these genes were regulated as predicted, indicating activation ofan EMT-like programme in the tumours (P value¼ 0.06;Supplementary Fig. 1A and Supplementary Table 2).
We then compared the morphological and molecular featuresof the EMT-like process at the cellular level. In the desmoplasia of
primary tumours, budding and single, potentially invasive cellswere found (Fig. 2d). The observation of this cell type in thesurrounding stroma suggests the existence of an EMT-likeprocess. However, it is neither possible to discern the spatialboundaries of individual invasive cells nor determine theirepithelial or mesenchymal origin by studying fixed, stained tissue.
We therefore opted to study thick sections of live NICD/p53� /� adenocarcinomas using two-photon microscopy andused GFP expression to track the fate of intestinal epithelialcancer cells in the tumours (Fig. 3a). While the majority of theprimary tumours was GFP positive, we also observed numerousclusters and strings of GFP-positive epithelial cells further awayfrom the primary tumour mass, lying in between thick collagenbundles, which suggested the presence of invading cancer cells(Fig. 3b,c). Importantly, we also illustrated the presence ofisolated single GFP-positive cells exiting the tumour mass(Fig. 3d).
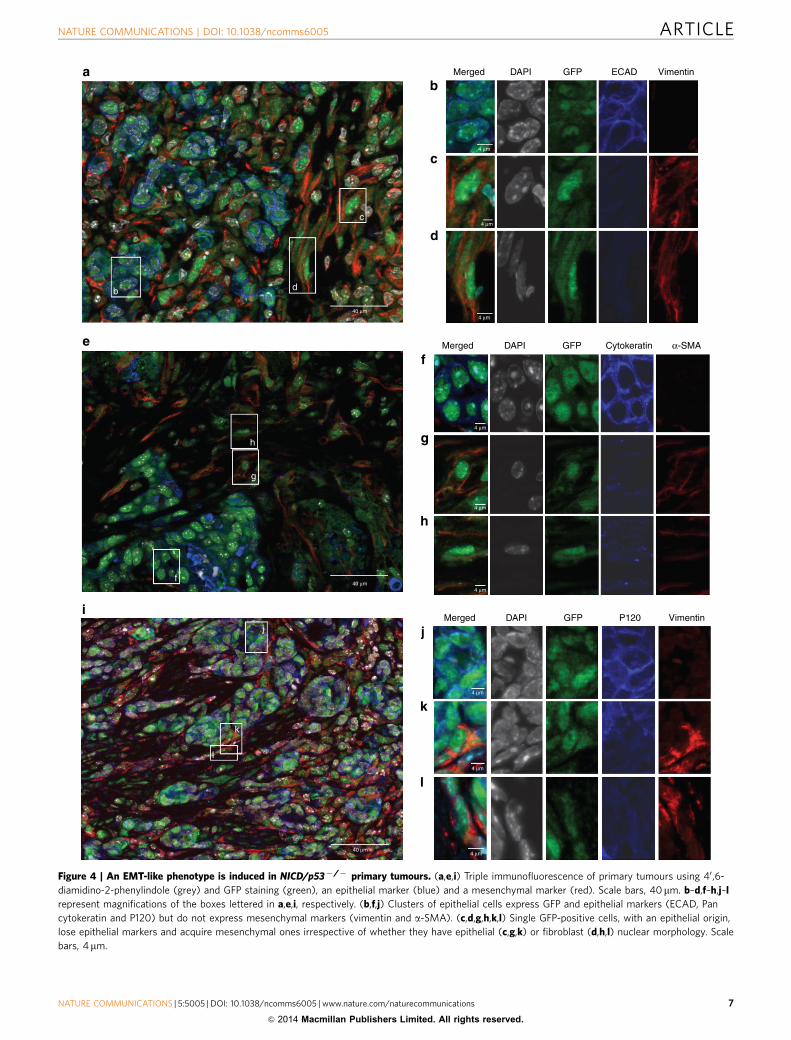
To further characterize the invading tumour cells from theprimary tumour, we performed GFP lineage tracing in combina-tion with the analysis of mesenchymal and epithelial markers bytriple immunofluorescence staining (Fig. 4a,e,i). As expected,GFP-positive cells formed clusters (Fig. 4b,f,j), had an epithelialnuclear morphology and exclusively expressed epithelial markerssuch as ECAD (Fig. 4b), cytokeratin (Fig. 4f) and P120 (Fig. 4j).Interestingly, we observed that GFP-positive cells (Fig. 4c,g,k)detaching from the epithelial cluster lost their epithelial markersECAD (Fig. 4c), Pan cytokeratin (Fig. 4g) and P120 (Fig. 4k), andacquired mesenchymal markers such as vimentin (Fig 4c,k) ora-SMA (Fig. 4g). Their nuclei, however, still had an epithelial-likemorphology (Fig. 4c,g,k). At a later stage of morphologicaltransition, we also observed GFP-positive cells with extended andelongated shapes exclusively expressing mesenchymal markers(Fig. 4d,h,l). Most of the GFP-positive cells in the desmoplasticarea were still epithelial as they express ECAD (78%) orcytokeratin (81%), while B20% of GFP-positive cells acquired amesenchymal phenotype as indicated by vimentin or a-SMAexpression. The acquisition of the mesenchymal phenotypecharacterized by vimentin or SMA expressing cells among GFP-positive cells highlights the significant negative correlationbetween vimentin and ECAD expressions (w2 test, Po0.0001)or between SMA and cytokeratin expressions (w2 test, Po0.0001)(Fig. 5c). The characteristic elongated shape of the nucleus wasalso observed in single GFP-positive cells in living tissue slices(Fig. 3d, insert). Notably, we observed a strong nuclear b-cateninstaining in cells exiting the primary tumour (Fig. 2g), therebyconfirming our predictions that EMT inducers participate in theWnt pathway activation. In addition, the mesenchymal markerN-cadherin was also acquired in tumour cells invading thedesmoplastic area (Fig. 5a). Together, these results demonstratethe existence of epithelial GFP-positive cells that have undergonea complete EMT-like transition with a full mesenchymalphenotype.
To further characterize the changes that are responsible for anEMT-like process in NICD/p53� /� tumour cells, we analysed
Figure 2 | Characterization of NICD/p53� /� primary tumours and metastases. (a) Kaplan–Meier analysis of NICD/p53� /� mice and their single
transgenic littermates NICD (pink) and p53� /� (green) over a period of 2 years. The triple transgenic mice (blue) are all dead by 15 months with gut
adenocarcinoma, whereas control littermates (pink and green) are dying after 15 months. (b) Tumour intake in the intestinal tract of NICD/p53� /� cohort
mice and their relative control littermates at different time points after tamoxifen induction. NICD/p53� /� mice (blue) develop intestinal adenocarcinoma
faster and with a higher penetrance than control littermates (pink and green). (c) Macroscopic view of a primary invasive adenocarcinoma located in the
jejunum of a NICD/p53� /� mouse. Scale bar, 1 cm. (d) haematoxylin and eosin staining (H&E) staining on paraffin-embedded primary tumour from
NICD/p53� /� mice, representing main features of the tumour. Cancer cells are invading all layers of normal tissue to reach the serosa. We suspect that
elongated, single cancer cells are present in desmoplastic areas. Scale bar, 40 mm. (e) H&E and (f) nuclear GFP stainings showing primary tumour, lymph
node and liver metastases, and peritoneal carcinomatosis in NICD/p53� /� compound mice. Notice the nonspecific staining due to autofluorescence in the
surrounding tumour tissue of lymph node (LN) or liver metastasis and peritoneum carcinomatosis. Scale bars, 40mm. (g) Immunohistochemical staining of
b-catenin showing its nuclear delocalization in cancer cells and its overexpression at the tumour front. Scale bars, 40mm.
NATURE COMMUNICATIONS | DOI: 10.1038/ncomms6005 ARTICLE
NATURE COMMUNICATIONS | 5:5005 | DOI: 10.1038/ncomms6005 | www.nature.com/naturecommunications 5
& 2014 Macmillan Publishers Limited. All rights reserved.

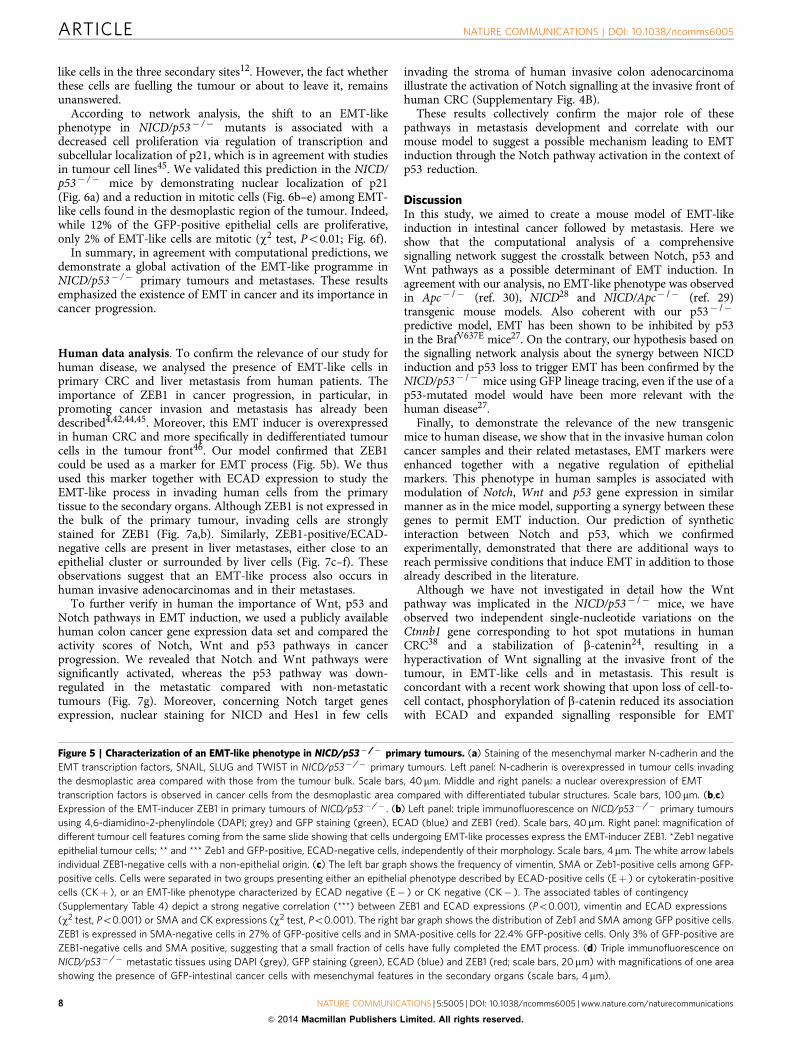
the expression of the EMT inducers, Slug, Snail, Twist and Zeb1(refs 40–44). The four of the EMT inducers were upregulatedin the primary tumours compared with normal tissue(Supplementary Table 2). Immunohistochemistry showed thatwhile SLUG, SNAIL and TWIST were not expressed in thenuclei of cells present in the non-invasive area, they wereexpressed specifically in nuclei of cells in the invadingdesmoplastic area in which EMT-like cells were found (Fig. 5a).For ZEB1 expression, we were able to use the triple immunos-taining approach (Fig. 5b) to show that although ZEB1 was notexpressed in epithelial tumour cells (indicated by * in Fig. 5b), itwas induced in isolated GFP-positive, ECAD-negative cells,independently of their morphology (indicated by ** and ***in Fig. 5b). Notably, GFP-negative cells with mesenchymalphenotypes are not necessary marked by ZEB1 (indicated by ***in Fig. 5b labelled with arrow). Interestingly, quantification
of ZEB1- and ECAD-positive and -negative cells amongGFP-positive cells highlights the significant negative correlationbetween ZEB1 and ECAD expressions (Po0.0001) (Fig. 5c, leftpanel). Analysis of ZEB1 and a-SMA among the GFP-positivecells indicate that half of the ZEB1-positive cells are also a-SMApositive, whereas only a small fraction of a-SMA-positive cells areZEB1 negative, thereby suggesting a fully completed EMT process(Fig. 5c, right panel).
For further analysis of the dynamics of EMT-like cells, weevaluated the expressions of ZEB1 and ECAD in the invadedlymph node, liver and peritoneal carcinomatosis (Fig. 5d). Whilethe vast majority of metastatic cancer cells have an epithelialfeature by expressing ECAD but not ZEB1, cells with an EMT-like phenotype also existed. The presence of ZEB1-positiveECAD-negative cells arising from intestinal epithelial tumoursconfirmed previous work on the conserved cell plasticity of EMT-
2
3
6
4 1 2 3
4 5 6
5
1
Figure 3 | Ex vivo analysis of tumour slices by two-photon microscopy. (a) Ex vivo tumour slice from NICD/p53� /� mice observed by two-photon
microscopy and represented as mosaic of 9�9 connected tiles. Epithelial cells have GFP-positive nuclei (green), second harmonic generation (SHG, pink)
reveals the presence of collagen I. Insets represent higher magnification of several tumour areas (1–3 tumour bulk; 4–6 invasive areas). Scale bar, 100mm.
(b–d) Several examples of ex vivo tumour slices from NICD/p53� /� mice. Epithelial cells (GFP-positive nuclei, green), collagen I (SHG, pink), all cells
(membrane dye, FM 4-64, blue). Images are taken from a Z-stack with 6mm between planes. (b) Invasive front of the tumour. Note that stromal cells
surround cancer cells. (c) Cancer cells invading stroma as clusters and strings parallel to the collagen fibres. (d) Cluster and single cancer cells invading
collagen-rich stroma. Single cancer cells are labelled with white arrowheads. Inset, higher magnification of individual cancer cell with elongated nucleus.
Scale bar, 100mm.
ARTICLE NATURE COMMUNICATIONS | DOI: 10.1038/ncomms6005
6 NATURE COMMUNICATIONS | 5:5005 | DOI: 10.1038/ncomms6005 | www.nature.com/naturecommunications
& 2014 Macmillan Publishers Limited. All rights reserved.
Merged
4 μm
4 μm
4 μm
4 μm
4 μm
4 μm
4 μm
4 μm
4 μm40 μm
DAPI GFP ECAD Vimentin
Merged DAPI GFP Cytokeratin α-SMA
Merged DAPI GFP P120 Vimentin
40 μm
40 μm
b d
c
h
g
f
j
k
l
Figure 4 | An EMT-like phenotype is induced in NICD/p53� /� primary tumours. (a,e,i) Triple immunofluorescence of primary tumours using 40 ,6-
diamidino-2-phenylindole (grey) and GFP staining (green), an epithelial marker (blue) and a mesenchymal marker (red). Scale bars, 40mm. b–d,f–h,j–l
represent magnifications of the boxes lettered in a,e,i, respectively. (b,f,j) Clusters of epithelial cells express GFP and epithelial markers (ECAD, Pan
cytokeratin and P120) but do not express mesenchymal markers (vimentin and a-SMA). (c,d,g,h,k,l) Single GFP-positive cells, with an epithelial origin,
lose epithelial markers and acquire mesenchymal ones irrespective of whether they have epithelial (c,g,k) or fibroblast (d,h,l) nuclear morphology. Scale
bars, 4mm.
NATURE COMMUNICATIONS | DOI: 10.1038/ncomms6005 ARTICLE
NATURE COMMUNICATIONS | 5:5005 | DOI: 10.1038/ncomms6005 | www.nature.com/naturecommunications 7
& 2014 Macmillan Publishers Limited. All rights reserved.
like cells in the three secondary sites12. However, the fact whetherthese cells are fuelling the tumour or about to leave it, remainsunanswered.
According to network analysis, the shift to an EMT-likephenotype in NICD/p53� /� mutants is associated with adecreased cell proliferation via regulation of transcription andsubcellular localization of p21, which is in agreement with studiesin tumour cell lines45. We validated this prediction in the NICD/p53� /� mice by demonstrating nuclear localization of p21(Fig. 6a) and a reduction in mitotic cells (Fig. 6b–e) among EMT-like cells found in the desmoplastic region of the tumour. Indeed,while 12% of the GFP-positive epithelial cells are proliferative,only 2% of EMT-like cells are mitotic (w2 test, Po0.01; Fig. 6f).
In summary, in agreement with computational predictions, wedemonstrate a global activation of the EMT-like programme inNICD/p53� /� primary tumours and metastases. These resultsemphasized the existence of EMT in cancer and its importance incancer progression.
Human data analysis. To confirm the relevance of our study forhuman disease, we analysed the presence of EMT-like cells inprimary CRC and liver metastasis from human patients. Theimportance of ZEB1 in cancer progression, in particular, inpromoting cancer invasion and metastasis has already beendescribed4,42,44,45. Moreover, this EMT inducer is overexpressedin human CRC and more specifically in dedifferentiated tumourcells in the tumour front46. Our model confirmed that ZEB1could be used as a marker for EMT process (Fig. 5b). We thusused this marker together with ECAD expression to study theEMT-like process in invading human cells from the primarytissue to the secondary organs. Although ZEB1 is not expressed inthe bulk of the primary tumour, invading cells are stronglystained for ZEB1 (Fig. 7a,b). Similarly, ZEB1-positive/ECAD-negative cells are present in liver metastases, either close to anepithelial cluster or surrounded by liver cells (Fig. 7c–f). Theseobservations suggest that an EMT-like process also occurs inhuman invasive adenocarcinomas and in their metastases.
To further verify in human the importance of Wnt, p53 andNotch pathways in EMT induction, we used a publicly availablehuman colon cancer gene expression data set and compared theactivity scores of Notch, Wnt and p53 pathways in cancerprogression. We revealed that Notch and Wnt pathways weresignificantly activated, whereas the p53 pathway was down-regulated in the metastatic compared with non-metastatictumours (Fig. 7g). Moreover, concerning Notch target genesexpression, nuclear staining for NICD and Hes1 in few cells
invading the stroma of human invasive colon adenocarcinomaillustrate the activation of Notch signalling at the invasive front ofhuman CRC (Supplementary Fig. 4B).
These results collectively confirm the major role of thesepathways in metastasis development and correlate with ourmouse model to suggest a possible mechanism leading to EMTinduction through the Notch pathway activation in the context ofp53 reduction.
DiscussionIn this study, we aimed to create a mouse model of EMT-likeinduction in intestinal cancer followed by metastasis. Here weshow that the computational analysis of a comprehensivesignalling network suggest the crosstalk between Notch, p53 andWnt pathways as a possible determinant of EMT induction. Inagreement with our analysis, no EMT-like phenotype was observedin Apc� /� (ref. 30), NICD28 and NICD/Apc� /� (ref. 29)transgenic mouse models. Also coherent with our p53� /�
predictive model, EMT has been shown to be inhibited by p53in the BrafV637E mice27. On the contrary, our hypothesis based onthe signalling network analysis about the synergy between NICDinduction and p53 loss to trigger EMT has been confirmed by theNICD/p53� /� mice using GFP lineage tracing, even if the use of ap53-mutated model would have been more relevant with thehuman disease27.
Finally, to demonstrate the relevance of the new transgenicmice to human disease, we show that in the invasive human coloncancer samples and their related metastases, EMT markers wereenhanced together with a negative regulation of epithelialmarkers. This phenotype in human samples is associated withmodulation of Notch, Wnt and p53 gene expression in similarmanner as in the mice model, supporting a synergy between thesegenes to permit EMT induction. Our prediction of syntheticinteraction between Notch and p53, which we confirmedexperimentally, demonstrated that there are additional ways toreach permissive conditions that induce EMT in addition to thosealready described in the literature.
Although we have not investigated in detail how the Wntpathway was implicated in the NICD/p53� /� mice, we haveobserved two independent single-nucleotide variations on theCtnnb1 gene corresponding to hot spot mutations in humanCRC38 and a stabilization of b-catenin24, resulting in ahyperactivation of Wnt signalling at the invasive front of thetumour, in EMT-like cells and in metastasis. This result isconcordant with a recent work showing that upon loss of cell-to-cell contact, phosphorylation of b-catenin reduced its associationwith ECAD and expanded signalling responsible for EMT
Figure 5 | Characterization of an EMT-like phenotype in NICD/p53� /� primary tumours. (a) Staining of the mesenchymal marker N-cadherin and the
EMT transcription factors, SNAIL, SLUG and TWIST in NICD/p53� /� primary tumours. Left panel: N-cadherin is overexpressed in tumour cells invading
the desmoplastic area compared with those from the tumour bulk. Scale bars, 40mm. Middle and right panels: a nuclear overexpression of EMT
transcription factors is observed in cancer cells from the desmoplastic area compared with differentiated tubular structures. Scale bars, 100 mm. (b,c)
Expression of the EMT-inducer ZEB1 in primary tumours of NICD/p53� /� . (b) Left panel: triple immunofluorescence on NICD/p53� /� primary tumours
using 4,6-diamidino-2-phenylindole (DAPI; grey) and GFP staining (green), ECAD (blue) and ZEB1 (red). Scale bars, 40 mm. Right panel: magnification of
different tumour cell features coming from the same slide showing that cells undergoing EMT-like processes express the EMT-inducer ZEB1. *Zeb1 negative
epithelial tumour cells; ** and *** Zeb1 and GFP-positive, ECAD-negative cells, independently of their morphology. Scale bars, 4 mm. The white arrow labels
individual ZEB1-negative cells with a non-epithelial origin. (c) The left bar graph shows the frequency of vimentin, SMA or Zeb1-positive cells among GFP-
positive cells. Cells were separated in two groups presenting either an epithelial phenotype described by ECAD-positive cells (Eþ ) or cytokeratin-positive
cells (CKþ ), or an EMT-like phenotype characterized by ECAD negative (E� ) or CK negative (CK� ). The associated tables of contingency
(Supplementary Table 4) depict a strong negative correlation (***) between ZEB1 and ECAD expressions (Po0.001), vimentin and ECAD expressions
(w2 test, Po0.001) or SMA and CK expressions (w2 test, Po0.001). The right bar graph shows the distribution of Zeb1 and SMA among GFP positive cells.
ZEB1 is expressed in SMA-negative cells in 27% of GFP-positive cells and in SMA-positive cells for 22.4% GFP-positive cells. Only 3% of GFP-positive are
ZEB1-negative cells and SMA positive, suggesting that a small fraction of cells have fully completed the EMT process. (d) Triple immunofluorescence on
NICD/p53� /� metastatic tissues using DAPI (grey), GFP staining (green), ECAD (blue) and ZEB1 (red; scale bars, 20mm) with magnifications of one area
showing the presence of GFP-intestinal cancer cells with mesenchymal features in the secondary organs (scale bars, 4 mm).
ARTICLE NATURE COMMUNICATIONS | DOI: 10.1038/ncomms6005
8 NATURE COMMUNICATIONS | 5:5005 | DOI: 10.1038/ncomms6005 | www.nature.com/naturecommunications
& 2014 Macmillan Publishers Limited. All rights reserved.

% Of GFP-positive cells (n= 268)
0 20 40
SMA– Zeb +Zeb –
SMA+ Zeb +Zeb –
ZEB1
E +
E –
********
****
n= 663
n= 691
0 50 100
SMA
VIM
CK +CK –
E +E –
% Of GFP-positive cells
***
**
*
*
4 μm
40 μm
4 μm 4 μm
** ***
n= 457
4 μm 4 μm 4 μm
N-cadherinD
esm
opla
stic
are
a
Prim
ary
tum
our
Mer
ged
DA
PI
GF
PE
CA
DZ
EB
1
LN metasisLiver metastasis
DAPI GFP ECAD ZEB1 DAPI GFP ECAD
Peritoneum carcinosis
Tum
our
bulk
SLUG SNAIL TWIST
ZEB1
40 μm 100 μm 100 μm
100 μm 100 μm 100 μm40 μm
20 μm
a
b
c
d
NATURE COMMUNICATIONS | DOI: 10.1038/ncomms6005 ARTICLE
NATURE COMMUNICATIONS | 5:5005 | DOI: 10.1038/ncomms6005 | www.nature.com/naturecommunications 9
& 2014 Macmillan Publishers Limited. All rights reserved.

induction47. How the Wnt pathway is precisely activated inNICD/p53� /� tumours was not directly investigated, althoughbased on the network analysis we hypothesize that the Wntpathway is regulated by Notch during the induction of EMTprogramme. While some papers indicate a negative regulation ofb-catenin by Notch48, other works suggest an activation of theWnt signalling through Notch-dependent EMT inducers24. TheWnt pathway, in turn, can induce the expression of Notchpathway factors, in this way creating a positive feedback loop25.
We have previously reported the effects associated with Notchactivation on the onset of colorectal tumour development29.In this study, we have extended our previous observations
and shown a crucial role for Notch signals during later stagesof cancer progression as illustrated by Hes1 staining in NICD/p53� /� tumours (Supplementary Fig. 4A). While Notchsignalling is downregulated in the bulk of adenocarcinomascompared with adenomas, the importance of this signallingpathway in the latter stage of tumour development has alreadybeen proposed by the Taketo’s group49. However, furthercharacterization may be required to determine whether Aesaffects CRCs through Notch or other signalling pathways. Notchactivation could be achieved through several distinct mechanisms,such as epigenetic control of positive or negative regulators of theNotch pathway, eventually leading to more active Notch
Normal
P21
Bulk Desmoplastic area
Merged DAPI GFP ECAD Phospho-H3
d c
e
Percentage of pH3-positive cells (n= 77)
0 10 20
E+
E–
**
4 μm
4 μm
4 μm
40 μm
Figure 6 | EMT-like cells are not proliferative. (a) Immunohistochemical staining of P21 in NICD/p53� /� primary tumours, showing nuclear P21
expression in cancer cells at the tumour front. This feature is emphasized in cancer cells invading the desmoplastic area. Scale bars, 100 mm. (b) Triple
immunofluorescence on NICD/p53� /� primary tumours using 40,6-diamidino-2-phenylindole (grey), GFP staining (green), ECAD (blue) and phospho-H3
(red). Scale bars, 40 mm. (c–e) Magnification of different tumour cell features coming from the same slide showing some epithelial cells in clusters (c) or
fibroblasts (e) in division whether EMT-like cells are quiescent (d). Scale bars, 4mm. (f) Proportion of pH3-positive cells among GFP-positive cells. Among
GFP-positive cells, 12% of cells with an epithelial morphology as defined by ECAD positivity (Eþ ; n¼ 585) are proliferative, while only 2% of ECAD-
negative cells (E� ; n¼ 274) express pH3 (full contingency table indicates dependency w2 test, Po0.0001, **). This indicates that cells undergoing EMT-
like are less proliferative.
Figure 7 | EMT signalling activation in human samples with CRC. (a–f) Double immunofluorescence on human samples with CRC using ZEB1 (red) and
ECAD (green). (a) CRC primary tumour and (c,e) liver metastasis, showing ZEB1-positive/ECAD-negative cells invading the desmoplastic area in primary
tumour and in liver metastasis. Numbers on a,c,e indicate different cell types observed on the slide as follows: 1 for colorectal primary (in a) or metastatic
cells (in c), 2 for stroma cells and 3 for hepatocytes. Scale bars, 20mm. Magnifications from the boxes b,d,f are also represented in b,d,f single 40 ,6-
diamidino-2-phenylindole, ECAD and ZEB1 staining. ZEB1-positive cells (labelled with an arrowhead) in the liver metastasis are either observed next to
colorectal tumour cells (d) or surrounded by hepatic tissue (f). Scale bars, 4mm. (g) The activity scores computed for the Notch, p53 and Wnt pathways in
human colon cancer samples from Tumour Cancer Genome Atlas data set. The data points represent primary tumour samples grouped as non-metastatic
(blue) and metastatic (red) according to the observation of distant metastases. The bottom and top of the box correspond to the first and third quartiles of
the activity score values, and the band inside the box represents the median. P values are calculated using the two-sample t-test between the two groups.
ARTICLE NATURE COMMUNICATIONS | DOI: 10.1038/ncomms6005
10 NATURE COMMUNICATIONS | 5:5005 | DOI: 10.1038/ncomms6005 | www.nature.com/naturecommunications
& 2014 Macmillan Publishers Limited. All rights reserved.

signalling. Regarding its regulation, it has recently been shown incolon cancer stem cells that a complex Notch regulation by mir34or Numb was implicated in cell fate decision50. Despite this
microRNA-regulated mechanism, how Notch signalling ismodulated during tumour progression and in invasionspecifically in colon is still under investigation. Notch has been
Liver metastasis
Metastatic status
P = 0.008P = 0.004WntP53
P = 0.009
0.2
0.1
0.0
Act
ivity
sco
re
–0.1
–0.2
M0 M1 M0 M1 M1M0
Notch
Liver metastasis
Non Metastatic
Metastatic
b
2
1
Primary tumour DAPI ECAD ZEB1
d
3
f
3 2
2 1
4 μm
NATURE COMMUNICATIONS | DOI: 10.1038/ncomms6005 ARTICLE
NATURE COMMUNICATIONS | 5:5005 | DOI: 10.1038/ncomms6005 | www.nature.com/naturecommunications 11
& 2014 Macmillan Publishers Limited. All rights reserved.
shown in many cancers to have a role as a direct regulator ofmajor EMT transcription factors SNAIL, SLUG, TWIST, ZEB1,and ZEB2 (refs 19, 40, 51) that consequently triggers an EMT-likeprogramme. In turn, SNAIL and TWIST stabilize b-catenin24.Important components of Wnt and Notch pathways arenegatively regulated by miRNAs induced by members of thep53 family (p53, p63 and p73)52. Thus, the balance betweenpositive (Notch and Wnt) and negative (p53, p63, p73 andmiRNAs) regulatory circuits on EMT inducers will dictate theresulting phenotype. Our transgenic mouse model represents anexcellent model for understanding the balance of the Notch, Wntand p53 molecular mechanisms and other signalling pathways toinduce EMT in colon cancer.
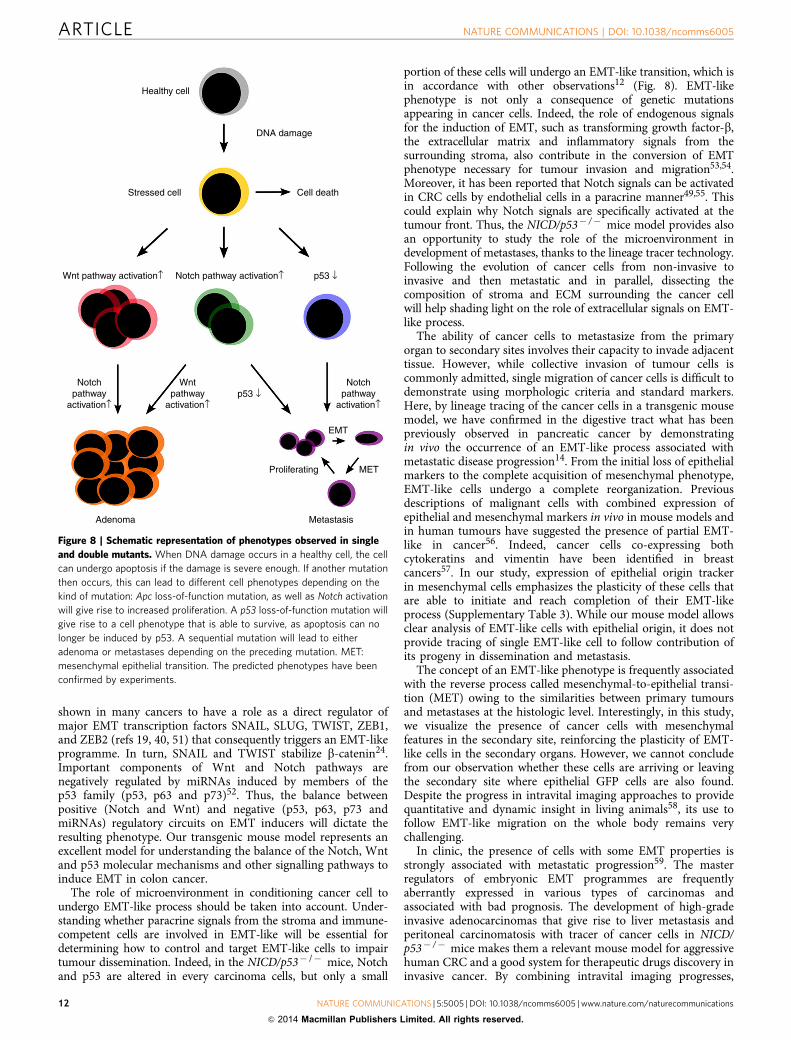
The role of microenvironment in conditioning cancer cell toundergo EMT-like process should be taken into account. Under-standing whether paracrine signals from the stroma and immune-competent cells are involved in EMT-like will be essential fordetermining how to control and target EMT-like cells to impairtumour dissemination. Indeed, in the NICD/p53� /� mice, Notchand p53 are altered in every carcinoma cells, but only a small
portion of these cells will undergo an EMT-like transition, which isin accordance with other observations12 (Fig. 8). EMT-likephenotype is not only a consequence of genetic mutationsappearing in cancer cells. Indeed, the role of endogenous signalsfor the induction of EMT, such as transforming growth factor-b,the extracellular matrix and inflammatory signals from thesurrounding stroma, also contribute in the conversion of EMTphenotype necessary for tumour invasion and migration53,54.Moreover, it has been reported that Notch signals can be activatedin CRC cells by endothelial cells in a paracrine manner49,55. Thiscould explain why Notch signals are specifically activated at thetumour front. Thus, the NICD/p53� /� mice model provides alsoan opportunity to study the role of the microenvironment indevelopment of metastases, thanks to the lineage tracer technology.Following the evolution of cancer cells from non-invasive toinvasive and then metastatic and in parallel, dissecting thecomposition of stroma and ECM surrounding the cancer cellwill help shading light on the role of extracellular signals on EMT-like process.
The ability of cancer cells to metastasize from the primaryorgan to secondary sites involves their capacity to invade adjacenttissue. However, while collective invasion of tumour cells iscommonly admitted, single migration of cancer cells is difficult todemonstrate using morphologic criteria and standard markers.Here, by lineage tracing of the cancer cells in a transgenic mousemodel, we have confirmed in the digestive tract what has beenpreviously observed in pancreatic cancer by demonstratingin vivo the occurrence of an EMT-like process associated withmetastatic disease progression14. From the initial loss of epithelialmarkers to the complete acquisition of mesenchymal phenotype,EMT-like cells undergo a complete reorganization. Previousdescriptions of malignant cells with combined expression ofepithelial and mesenchymal markers in vivo in mouse models andin human tumours have suggested the presence of partial EMT-like in cancer56. Indeed, cancer cells co-expressing bothcytokeratins and vimentin have been identified in breastcancers57. In our study, expression of epithelial origin trackerin mesenchymal cells emphasizes the plasticity of these cells thatare able to initiate and reach completion of their EMT-likeprocess (Supplementary Table 3). While our mouse model allowsclear analysis of EMT-like cells with epithelial origin, it does notprovide tracing of single EMT-like cell to follow contribution ofits progeny in dissemination and metastasis.
The concept of an EMT-like phenotype is frequently associatedwith the reverse process called mesenchymal-to-epithelial transi-tion (MET) owing to the similarities between primary tumoursand metastases at the histologic level. Interestingly, in this study,we visualize the presence of cancer cells with mesenchymalfeatures in the secondary site, reinforcing the plasticity of EMT-like cells in the secondary organs. However, we cannot concludefrom our observation whether these cells are arriving or leavingthe secondary site where epithelial GFP cells are also found.Despite the progress in intravital imaging approaches to providequantitative and dynamic insight in living animals58, its use tofollow EMT-like migration on the whole body remains verychallenging.
In clinic, the presence of cells with some EMT properties isstrongly associated with metastatic progression59. The masterregulators of embryonic EMT programmes are frequentlyaberrantly expressed in various types of carcinomas andassociated with bad prognosis. The development of high-gradeinvasive adenocarcinomas that give rise to liver metastasis andperitoneal carcinomatosis with tracer of cancer cells in NICD/p53� /� mice makes them a relevant mouse model for aggressivehuman CRC and a good system for therapeutic drugs discovery ininvasive cancer. By combining intravital imaging progresses,
Healthy cell
Stressed cell Cell death
p53 ↓
p53 ↓
Notch pathway activation↑
Adenoma Metastasis
Wnt pathway activation↑
Notchpathway
activation↑
Notchpathway
activation↑
EMT
METProliferating
Wntpathway
activation↑
DNA damage
Figure 8 | Schematic representation of phenotypes observed in single
and double mutants. When DNA damage occurs in a healthy cell, the cell
can undergo apoptosis if the damage is severe enough. If another mutation
then occurs, this can lead to different cell phenotypes depending on the
kind of mutation: Apc loss-of-function mutation, as well as Notch activation
will give rise to increased proliferation. A p53 loss-of-function mutation will
give rise to a cell phenotype that is able to survive, as apoptosis can no
longer be induced by p53. A sequential mutation will lead to either
adenoma or metastases depending on the preceding mutation. MET:
mesenchymal epithelial transition. The predicted phenotypes have been
confirmed by experiments.
ARTICLE NATURE COMMUNICATIONS | DOI: 10.1038/ncomms6005
12 NATURE COMMUNICATIONS | 5:5005 | DOI: 10.1038/ncomms6005 | www.nature.com/naturecommunications
& 2014 Macmillan Publishers Limited. All rights reserved.

colonoscopy engineering and the role of EMT-like cells in cancerprogression, cancer therapy targeting EMT-like tumour cellscould be conveniently tested in our mouse model.
MethodsEthics statement. All mice were kept in the Curie Institute-specified pathogen-free animal area for mouse breeding and experimental purpose (facility licence no,B75-05-18) under the authority of the Institute’s veterinarian Virginie Dangles-Marie. The care and use of animals used in this facility is strictly applying toEuropean and national regulation for the protection of vertebrate animals used forexperimental and other scientific purposes (Directive 86/609 and 2010/63).
Transgenic mouse models. All mice used in this work have been previouslydescribed: villin-CreERT2 mice32, p53 mice (referred as p53� /� )26 and the Rosa-N1ic mice (referred as NICD)33. These strains crossed for 410 generations to reachan isogenic C57BL/6 background that have been used to generate the p53� /� ,NICD and NICD/p53� /� compound mice. Genotyping of littermates wasperformed using the primers listed in Supplementary Information. Special care wastaken to eliminate compound mice with a double copy of the villin-CreERT2transgene. Four-week-old mice, including all control mice, were injectedintraperitoneally with tamoxifen (50 mg kg� 1 of animal body weight) for 5consecutive days.
Every 2 months, at least five littermates from each compound mouse line werekilled and macroscopically analysed to evaluate tumour development. Survivalprobabilities were estimated by Kaplan–Meier analysis, according to ethicalcommittee guidelines, considering the presence or absence of adenocarcinoma asan event at the death of the animal. Deep macroscopic and microscopic analyseswere performed on tumours and metastases from these animals.
Genotyping of littermates was performed using the following primers: forNotch, N5: 50-AAAGTCGCTCTGAGTTGTTAT-30 , N3: 50-GAAAGACCGCGAAGAGTTTG-30 and Rosa: 50-TAAGCCTGCCCAGAAGACTC-30. N5 andRosa or N5 and N3 primers detect presence of WT or NICD, respectively. Thepresence of the Cre recombinase is detected using Cre (F): 50-CAAGCCTGGCTCGACGGCC-30 and Cre (R): 50-CGCGAACATCTTCAGGTTCT-30 . The use ofP53 (F): 50-CACAAAAACAGGTTAAACCCAG-30 and P53 (R): 50-AGCACATAGGAGGCAGAGAC-30 primers allows amplification of a 288-pb fragment in caseof WT P53 or a 370-pb fragment when P53 is floxed.
Construction of the signalling network. The signalling network map of EMTregulation was manually constructed and based on curated information extractedfrom the literature retrieved from the PubMed database. The map is assembledusing the CellDesigner tool60 and the Systems Biology Graphical Notation61
standard for representing molecular biology mechanisms. The software creates astructured network representation in Systems Biology Markup Language, suitablefor further computational analysis62. Corresponding references and specific notesannotate each entity of the map.
Literature selection rules. The rules for literature selection are the following: first5–10 review articles in the field were chosen for extracting the consensus pathwaysand regulations accepted in the field and for approaching to the literature suggestedin these review. This allowed us to construct the ‘backbone’ of the network mapand to define the boundaries of pathways coverage. Further, information fromoriginal papers, preferably most recent studies, is analysed and added to enlargeand enrich the map. The decision about adding a biochemical mechanism to themap has to be supported by at least two independent studies performed in differentteams. Further, the coherence of the signalling network map has been verified bychecking that they predict observed phenotypes of single and double mutants thathave already been described in experimental models.
Our map of the signalling network of EMT regulation is based on informationextracted from 135 scientific papers (http://navicell.curie.fr/pages/signalling_network_emt_regulation_description.html).
Signalling network map content. The signalling network map contains about 400chemical species representing proteins and their modifications, molecular com-plexes, RNAs, miRNAs, genes, phenotypes and regulatory influences formed byB400 biochemical reactions. The map contains regulatory circuits connected tophenotypes such as proliferation, apoptosis and EMT, and others. The content ofthe map has been validated by comparison with the map derived from the Inge-nuity database using as inputs Notch, p53, Wnt, apoptosis, EMT and proliferation.The Notch–p53–Wnt signalling network can be explored interactively at http://navicell.curie.fr/pages/signalling_network_emt_regulation_description.html, usingNaviCell, an online tool for navigating large signalling maps63.
Structural analysis of signalling network. Analysis of the map was performedusing the BiNoM plugin in Cytoscape64. Path analysis and node neighbourhoodstudy were carried out for extracting major signalling paths that affect EMT,proliferation and apoptosis phenotypes, and for conversion of the signalling
network model into an influence diagram. We performed a complexity reductionof the influence diagram in four steps, each decreasing the level of details toproduce reduced network models (Supplementary Fig. 2). This reduction allowedus to eliminate those factors on the map that did not affect studied phenotypes, tounderstand organization principles of the map and to find core paths on thenetwork preserved through all reduction levels. In this way, the regulatory patternsrecapitulating the signalling mechanisms regulating three phenotypes wereidentified, and single and double mutants were analysed using the reduced models.Reduced models of level 3 and 4 were used for illustrating molecular phenotypes inWT and mutant cells.
Histology and immunohistochemistry staining and analysis. Freshly dissectedintestinal tumours and metastases were either fixed in 4% neutral-buffered paraf-ormaldehyde for 2 h and paraffin embedded, or snap-frozen in cooled isopentane.Paraffin sections (4 mm) were either haematoxylin and eosin stained for histologicalanalysis or subjected to immunostaining. An experienced veterinary pathologistperformed histological analyses on tissues from 30 NICD/p53� /� mice (103primary tumours and 67 metastases). For staining, paraffin-embedded sampleswere deparaffinized and rehydrated before being subjected to antigen retrieval with10 mM boiling sodium citrate, pH 6, for 20 min. For immunohistochemistry,endogenous peroxidase were then blocked by a 1.5% H2O2 in PBS treatment for20 min. Slides were then incubated for 1 h with a nonspecific binding blockingsolution (5% normal bovine serum in PBS) followed by the corresponding primaryantibody, overnight at 4 �C. For immunohistochemistry, samples were incubatedwith biotinylated-conjugated secondary antibodies for 45 min followed by incu-bation with ABC for 30 min (Elite) and visualized using DAB peroxidase substratekit (Vector Labs). Slides were then counterstained with haematoxylin and mountedin polymount xylene (Polysciences). For immunofluorescence, slides were incu-bated with fluorochrome-conjugated secondary antibody and 40,6-diamidino-2-phenylindole for 1 h and mounted in Vectashield medium (Vector Labs). Repre-sentative images from immunofluorescence and immunohistochemistry stainingswere acquired using an Apotome system with a � 40 water Plan-Apochromat lens(Zeiss, Jena, Germany) or an epifluorescence microscope (Nikon, C-HGFIE),respectively. All images were further processed and pseudo-coloured using ImageJ(National Institutes of Health).
A special staining protocol was performed for b-catenin staining, as previouslydescribed. Briefly, Tris-EDTA, pH 9, solution was used for antigen retrieval andperoxidase blocking was achieved in buffer containing 15 mM NaN3, 50 mMNa2HPO4, 20 mM citric acid and 1.5% H2O2.
Antibody references and working dilution were used as follow: ECAD (BD-610182, 1/400), vimentin (CS-5741, 1/300), GFP (ab 13970, 1/300), Pan cytokeratin(Dako ZO622, 1/200), a-SMA (Sigma A2547, 1/600), SLUG (CS-9585, 1/100),SNAIL (ab 85931, 1/100), TWIST (sc-15393, 1/100), ZEB1 (Euromedex 00419, 1/200), b-catenin (BD-610154, 1/50), FASCIN1 (Dako M3567, 1/50), P21 (ab 2961,1/150), phospho-H3 (Millipore 06570, 1/1000), NICD (sc-6014, 1/100) and HES1(Clinisciences D134-3, 1/50), P120 (BD-610133, 1/100), P53 (Dako DO-7, 1/200)and N-cadherin (Zymed 3B9, 1/100).
Image analysis. To quantify the triple immunofluorescence images presented inFigs 5 and 6, cells were counted in defined categories on the maximum intensityprojection of immunofluorescence image stacks, defining 2� 2 contingencytables (Supplementary Table 4). A total of 5–9 acquisitions were processed for eachcombination of immunofluorescence antibodies.
Test of significance of contingency tables were performed using the Prismsoftware with a w2-analysis.
Statistical analysis. Statistical analyses were performed with the Prism software.This leads to the quantification of the number of cells as a contingency tableassociated with a w2-analysis.
Two-photon imaging. A piece of intestine containing a tumour was isolated froman 8-month-old tamoxifen-injected NICD/p53� /� mouse. The intestinal explantwas flushed with PBS containing 1% penicillin/streptomycin and 0.5% gentamycin.For some experiments, explants were incubated for 15 min at room temperature in40 mg ml� 1 FM 4-64 FX dye (Invitrogen). The explant was filled with andembedded in 4% (wt/vol) low-melting agarose (Invitrogen) pre-warmed at 37 �C. Avibratome (Leica VT1000S) was used to slice the tumour into 500 mm sections witha velocity of 0.125 mm s� 1 and a vibration frequency of 70 Hz. The tissue wastransferred to a 35-mm tissue culture dish containing 2 ml of culture mediumDMEM-Glutamax (Gibco) supplemented with 1% penicillin/streptomycin, 2.5%fetal bovine serum, 0.25 U ml� 1 insulin (Sigma-Aldrich), 100mg ml� 1 transferrin(Holo, Human Plasma, Calbiochem) and 10 ng ml� 1 murine epidermal growthfactor (Peprotech). Tissue explant was maintained at 37 �C and imaged using two-photon laser-scanning microscopy using a LSM510 Meta (Zeiss) coupled to aMaiTaiDeepSee femtosecond laser (690–1,020 nm; Spectra-Physics, MountainView, CA, USA), using an Zeiss Achroplan � 40/NA (numerical aperture) 1.0water immersion objective. Fluorescence channels were recorded simultaneouslywith a 555-nm dichroic mirror in combination with 472/30 (second harmonicgeneration), 520/35 (GFP) and 585/40 (Tomato) band-pass filters. The excitation
NATURE COMMUNICATIONS | DOI: 10.1038/ncomms6005 ARTICLE
NATURE COMMUNICATIONS | 5:5005 | DOI: 10.1038/ncomms6005 | www.nature.com/naturecommunications 13
& 2014 Macmillan Publishers Limited. All rights reserved.

wavelength was 920 nm. Three-dimensional stacks were obtained for up to 250 mmpenetration depth at a step size of 3 mm. Standard contrast and intensity levels werefurther adjusted using Photoshop CS5 (Adobe).
Exome sequencing of four genes of the Wnt pathway. Genomic DNA wasisolated from paraffin-embedded tissue of eight different mice. Each intestinaltumour sample was sequenced using the Ion Torrent PGM technology and mat-ched with a control sample from liver or node. A dedicated sequencing paneltargeting the coding part of the genes Ctnnb1, Gsk3b, Axin2 and Apc was used.
Sequenced reads were then aligned of the mm10 reference genome using theTMAP software (v 3.6.3-1, Life Technologies). Around 80% of the reads werealigned on the targeted genes with a mean depth of coverage of � 1,500. Thecalling of somatic variants was performed using the pair of tumour and controlsamples using the Varscan software (v. 2.3.6; ref. 65). Finally, the list of variantswas annotated using the ANNOVAR software66 in order to facilitate theirfunctional interpretation.
Human samples. Sixteen invasive adenocarcinomas were obtained from theGastroenterology and Pathology Unit of the Curie Institute in Paris, with writtenconsent of the patients and approval of the local ethics committee. Patientsincluded in this study had developed synchronous or metachronous livermetastasis.
Quantification of pathway activities in human tumours. We used the publiclyavailable colon cancer gene expression data set from Tumour Cancer GenomeAtlas67 to compare the activities of Notch, Wnt and p53 pathways in metastaticand non-metastatic human colon tumour samples. Excluding rectum cancers fromthe original data set, we left with 121 colon cancer samples included in our analysis.Since single gene-based analysis did not show significant differential changes ingene expression of Wnt, b-catenin, Notch and p53 genes (data not shown), weanalysed the expression of their downstream targets recapitulated into a pathwayactivity score. The pathway activity score in a tumour sample was defined ascontribution of this sample into the first principal component computed for allsamples on the set of the pathway target genes, as it was done in ref. 68. MolecularSignature Database69 was used to select the sets of target genes for Notch and Wntpathways. Among several available gene sets, we chose the ones having the bestdifferential activity scoring between metastatic and non-metastatic samples forcomputing Notch and Wnt pathway activities. For computing the p53 pathwayactivity, we used a set of known p53 primary targets70.
RNA extraction and quantitative reverse transcription PCR. Total RNA fromsnap-frozen tissue was isolated using trizol extraction (Invitrogen). Extracted RNA(5mg) was reverse-transcribed with random primers following the manufacturer’sprotocol (Invitrogen, superscript). For the quantitative reverse transcription PCR,100 ng of cDNA was added in a reaction mix containing 0.25 mM of each primerin the LightCycler SybR green master mix (Roche, Diagnostics) with RNase-freewater adjusted to a total volume of 20 ml. The PCR programme included adenaturation step at 95 �C for 5 min followed by 40 cycles of 95 �C for 10 s, 60 �Cfor 30 s and 72 �C for 30 s. All reactions were performed in duplicate in 384-wellplates. The quantification was performed using the DDCt method, by comparingthe expression of the target gene in tumour versus normal tissue, relative to theendogenous reference, b2-microglobulin. Designed and validated primer pairs usedare the following pairs: Lgr5 (F) 50-CAAGCCATGACCTTGGCCCTG-30 and (R)50-TTTCCCAGGGAGTGGATTCTAT-30 ; c-Myc: (F) 50-AAGGCCCCCAAGGTAGTGA-30 and (R) 50-TCCAGAAGGGCTTCAATCTG-30 ; Ccnd1: (F) 50-CCCAACAACTTCCTCTCCTG-30 and (R) 50-TCCAGAAGGGCTTCAATCTG-30 ;b2-microglobulin: (F) 50-GCTATCCAGAAAACCCCTCAAA-30 and (R) 50-AGGCGGGTGGAACTGTGTT-30 .
Differential expression analysis of EMT genes. For EMT gene quantification, weused the mouse EMT ChIP PCR array from Qiagen (84 genes) and used theprotocols and analysis recommended by the manufacturer. After filtering outsignals of saturated intensity, we obtained gene expression measurements for fourtumour and four normal samples. Student’s t-test was performed for each gene toidentify significant changes in expression values between tumour and normalsamples. Results are represented by histograms of t-scores and P values of thet-tests. We identified 19 genes as being highly differentially expressed betweentumour and normal tissue with a fold change of at least 2 and Po0.1. Resultsobtained for each gene are reported in Supplementary Table 2. We highlighted thenodes of the map corresponding to the genes analysed in the EMT chip, colouringthem according to the t-test values.
We used the Fisher’s exact test to assess whether the t-score results obtained forpre-defined gene groups differ from each other. We pre-defined two gene groups,one with genes expected to be upregulated during EMT (Exp-EMT-up) and asecond one with genes expected to be downregulated during EMT (Exp-EMT-down). The third group includes all other genes for which we tested the differentialexpression between tumour samples and normal samples.
References1. Steeg, P. S. Tumor metastasis: mechanistic insights and clinical challenges.
Nat. Med. 12, 895–904 (2006).2. Valastyan, S. & Weinberg, R. A. Tumor metastasis: molecular insights and
evolving paradigms. Cell 147, 275–292 (2011).3. Kalluri, R. & Weinberg, R. A. The basics of epithelial-mesenchymal transition.
J. Clin. Invest. 119, 1420–1428 (2009).4. Peinado, H., Olmeda, D. & Cano, A. Snail, Zeb and bHLH factors in tumour
progression: an alliance against the epithelial phenotype? Nat. Rev. Cancer 7,415–428 (2007).
5. Casas, E. et al. Snail2 is an essential mediator of Twist1-induced epithelialmesenchymal transition and metastasis. Cancer Res. 71, 245–254 (2011).
6. Thiery, J. P., Acloque, H., Huang, R. Y. & Nieto, M. A. Epithelial-mesenchymaltransitions in development and disease. Cell 139, 871–890 (2009).
7. Thiery, J. P. & Sleeman, J. P. Complex networks orchestrate epithelial-mesenchymal transitions. Nature reviews. Mol. Cell Biol. 7, 131–142 (2006).
8. Yang, J. et al. Twist, a master regulator of morphogenesis, plays an essential rolein tumor metastasis. Cell 117, 927–939 (2004).
9. Morel, A. P. et al. EMT inducers catalyze malignant transformation ofmammary epithelial cells and drive tumorigenesis towards claudin-low tumorsin transgenic mice. PLoS Genet. 8, e1002723 (2012).
10. Nieto, M. A. The ins and outs of the epithelial to mesenchymal transition inhealth and disease. Annu. Rev. Cell Dev. Biol. 27, 347–376 (2011).
11. Celesti, G. et al. Presence of Twist1-positive neoplastic cells in the stroma ofchromosome-unstable colorectal tumors. Gastroenterology 145, 647–657 e615(2013).
12. Tsai, J. H., Donaher, J. L., Murphy, D. A., Chau, S. & Yang, J. Spatiotemporalregulation of epithelial-mesenchymal transition is essential for squamous cellcarcinoma metastasis. Cancer Cell 22, 725–736 (2012).
13. Van Cutsem, E. et al. Towards a pan-European consensus on the treatment ofpatients with colorectal liver metastases. Eur. J. Cancer 42, 2212–2221 (2006).
14. Rhim, A. D. et al. EMT and dissemination precede pancreatic tumor formation.Cell 148, 349–361 (2012).
15. Hung, K. E. et al. Development of a mouse model for sporadic and metastaticcolon tumors and its use in assessing drug treatment. Proc. Natl Acad. Sci. USA107, 1565–1570 (2010).
16. Trobridge, P. et al. TGF-beta receptor inactivation and mutant Kras induceintestinal neoplasms in mice via a beta-catenin-independent pathway.Gastroenterology 136, 1680–1688 e1687 (2009).
17. Davies, E. J., Marsh Durban, V., Meniel, V., Williams, G. T. & Clarke, A. R.PTEN loss and KRAS activation leads to the formation of serrated adenomasand metastatic carcinoma in the mouse intestine. J. Pathol. 233, 27–38 (2013).
18. Smit, M. A. & Peeper, D. S. Zeb1 is required for TrkB-induced epithelial-mesenchymal transition, anoikis resistance and metastasis. Oncogene 30,3735–3744 (2011).
19. Maier, H. J. et al. NF-kappaB promotes epithelial-mesenchymal transition,migration and invasion of pancreatic carcinoma cells. Cancer Lett. 295,214–228 (2010).
20. Knouf, E. C. et al. An integrative genomic approach identifies p73 and p63 asactivators of miR-200 microRNA family transcription. Nucleic Acids Res. 40,499–510 (2012).
21. Moes, M. et al. A novel network integrating a miRNA-203/SNAI1 feedbackloop which regulates epithelial to mesenchymal transition. PLoS ONE 7, e35440(2012).
22. Siemens, H. et al. miR-34 and SNAIL form a double-negative feedback loop toregulate epithelial-mesenchymal transitions. Cell Cycle 10, 4256–4271 (2011).
23. Liu, J. et al. Slug inhibits proliferation of human prostate cancer cells viadownregulation of cyclin D1 expression. Prostate 70, 1768–1777 (2010).
24. Li, J. & Zhou, B. P. Activation of beta-catenin and Akt pathways by Twist arecritical for the maintenance of EMT associated cancer stem cell-like characters.BMC Cancer 11, 49 (2011).
25. Peignon, G. et al. Complex interplay between beta-catenin signalling and Notcheffectors in intestinal tumorigenesis. Gut 60, 166–176 (2011).
26. Jonkers, J. et al. Synergistic tumor suppressor activity of BRCA2 and p53 in aconditional mouse model for breast cancer. Nat. Genet. 29, 418–425 (2001).
27. Rad, R. et al. A genetic progression model of Braf(V600E)-induced intestinaltumorigenesis reveals targets for therapeutic intervention. Cancer Cell 24,15–29 (2013).
28. Fre, S. et al. Notch signals control the fate of immature progenitor cells in theintestine. Nature 435, 964–968 (2005).
29. Fre, S. et al. Notch and Wnt signals cooperatively control cell proliferation andtumorigenesis in the intestine. Proc. Natl Acad. Sci. USA 106, 6309–6314(2009).
30. Fodde, R. et al. A targeted chain-termination mutation in the mouse Apc generesults in multiple intestinal tumors. Proc. Natl Acad. Sci. USA 91, 8969–8973(1994).
31. Dotto, G. P. Crosstalk of Notch with p53 and p63 in cancer growth control.Nat. Rev. Cancer 9, 587–595 (2009).
ARTICLE NATURE COMMUNICATIONS | DOI: 10.1038/ncomms6005
14 NATURE COMMUNICATIONS | 5:5005 | DOI: 10.1038/ncomms6005 | www.nature.com/naturecommunications
& 2014 Macmillan Publishers Limited. All rights reserved.
32. el Marjou, F. et al. Tissue-specific and inducible Cre-mediated recombinationin the gut epithelium. Genesis 39, 186–193 (2004).
33. Murtaugh, L. C., Stanger, B. Z., Kwan, K. M. & Melton, D. A. Notch signalingcontrols multiple steps of pancreatic differentiation. Proc. Natl Acad. Sci. USA100, 14920–14925 (2003).
34. Fazeli, A. et al. Effects of p53 mutations on apoptosis in mouse intestinal andhuman colonic adenomas. Proc. Natl Acad. Sci. USA 94, 10199–10204 (1997).
35. Halberg, R. B. et al. Tumorigenesis in the multiple intestinal neoplasia mouse:redundancy of negative regulators and specificity of modifiers. Proc. Natl Acad.Sci. USA 97, 3461–3466 (2000).
36. Kinzler, K. W. & Vogelstein, B. Lessons from hereditary colorectal cancer.Cell 87, 159–170 (1996).
37. Vignjevic, D. et al. Fascin, a novel target of beta-catenin-TCF signaling, isexpressed at the invasive front of human colon cancer. Cancer Res. 67,6844–6853 (2007).
38. Morin, P. J. et al. Activation of beta-catenin-Tcf signaling in colon cancer bymutations in beta-catenin or APC. Science 275, 1787–1790 (1997).
39. Janssen, K. P. et al. APC and oncogenic KRAS are synergistic in enhancing Wntsignaling in intestinal tumor formation and progression. Gastroenterology 131,1096–1109 (2006).
40. Sahlgren, C., Gustafsson, M. V., Jin, S., Poellinger, L. & Lendahl, U. Notchsignaling mediates hypoxia-induced tumor cell migration and invasion. Proc.Natl Acad. Sci. USA 105, 6392–6397 (2008).
41. Leong, K. G. et al. Jagged1-mediated Notch activation induces epithelial-to-mesenchymal transition through Slug-induced repression of E-cadherin. J. Exp.Med. 204, 2935–2948 (2007).
42. Brabletz, S. et al. The ZEB1/miR-200 feedback loop controls Notch signalling incancer cells. EMBO J. 30, 770–782 (2011).
43. Vallejo, D. M., Caparros, E. & Dominguez, M. Targeting Notch signalling bythe conserved miR-8/200 microRNA family in development and cancer cells.EMBO J. 30, 756–769 (2011).
44. Wellner, U. et al. The EMT-activator ZEB1 promotes tumorigenicity by repressingstemness-inhibiting microRNAs. Nat. Cell. Biol. 11, 1487–1495 (2009).
45. Vega, S. et al. Snail blocks the cell cycle and confers resistance to cell death.Genes Dev. 18, 1131–1143 (2004).
46. Spaderna, S. et al. A transient, EMT-linked loss of basement membranesindicates metastasis and poor survival in colorectal cancer. Gastroenterology131, 830–840 (2006).
47. Ulsamer, A. et al. Axin pathway activity regulates in vivo pY654-beta-cateninaccumulation and pulmonary fibrosis. J. Biol. Chem. 287, 5164–5172 (2012).
48. Kwon, C. et al. Notch post-translationally regulates beta-catenin protein instem and progenitor cells. Nat. Cell. Biol. 13, 1244–1251 (2011).
49. Sonoshita, M. et al. Suppression of colon cancer metastasis by Aes throughinhibition of Notch signaling. Cancer Cell 19, 125–137 (2011).
50. Bu, P. et al. A microRNA miR-34a-regulated bimodal switch targets notch incolon cancer stem cells. Cell Stem Cell 12, 602–615 (2013).
51. Katoh, M. Integrative genomic analyses of ZEB2: Transcriptional regulationof ZEB2 based on SMADs, ETS1, HIF1alpha, POU/OCT, and NF-kappaB.Int. J. Oncol. 34, 1737–1742 (2009).
52. Kim, N. H. et al. A p53/miRNA-34 axis regulates Snail1-dependent cancer cellepithelial-mesenchymal transition. J. Cell. Biol. 195, 417–433 (2011).
53. Calon, A. et al. Dependency of colorectal cancer on a TGF-beta-driven programin stromal cells for metastasis initiation. Cancer Cell 22, 571–584 (2012).
54. Condeelis, J. & Pollard, J. W. Macrophages: obligate partners for tumor cellmigration, invasion, and metastasis. Cell 124, 263–266 (2006).
55. Lu, J. et al. Endothelial cells promote the colorectal cancer stem cell phenotypethrough a soluble form of Jagged-1. Cancer Cell 23, 171–185 (2013).
56. Damonte, P., Gregg, J. P., Borowsky, A. D., Keister, B. A. & Cardiff, R. D. EMTtumorigenesis in the mouse mammary gland. Lab. Invest. 87, 1218–1226 (2007).
57. Prat, A. et al. Phenotypic and molecular characterization of the claudin-lowintrinsic subtype of breast cancer. Breast Cancer Res. 12, R68 (2010).
58. Giampieri, S. et al. Localized and reversible TGFbeta signalling switches breastcancer cells from cohesive to single cell motility. Nat. Cell. Biol. 11, 1287–1296(2009).
59. Zhang, Q. et al. Notch signal suppresses Toll-like receptor-triggeredinflammatory responses in macrophages by inhibiting extracellular signal-regulated kinase 1/2-mediated nuclear factor kappaB activation. J. Biol. Chem.287, 6208–6217 (2012).
60. Kitano, H., Funahashi, A., Matsuoka, Y. & Oda, K. Using process diagramsfor the graphical representation of biological networks. Nat. Biotechnol. 23,961–966 (2005).
61. Le Novere, N. et al. The Systems Biology Graphical Notation. Nat. Biotechnol.27, 735–741 (2009).
62. Hucka, M. et al. The systems biology markup language (SBML): a medium forrepresentation and exchange of biochemical network models. Bioinformatics19, 524–531 (2003).
63. Kuperstein, I. et al. NaviCell: a web-based environment for navigation, curationand maintenance of large molecular interaction maps. BMC Syst. Biol. 7, 100(2013).
64. Zinovyev, A., Viara, E., Calzone, L. & Barillot, E. BiNoM: a Cytoscapeplugin for manipulating and analyzing biological networks. Bioinformatics 24,876–877 (2008).
65. Koboldt, D. C. et al. VarScan 2: somatic mutation and copy number alterationdiscovery in cancer by exome sequencing. Genome Res. 22, 568–576 (2012).
66. Wang, K., Li, M. & Hakonarson, H. ANNOVAR: functional annotation ofgenetic variants from high-throughput sequencing data. Nucleic Acids Res. 38,e164 (2010).
67. Muzny, D. M. et al. Comprehensive molecular characterization of human colonand rectal cancer. Nature 487, 330–337 (2012).
68. Bild, A. H. et al. Oncogenic pathway signatures in human cancers as a guide totargeted therapies. Nature 439, 353–357 (2006).
69. Subramanian, A. et al. Gene set enrichment analysis: a knowledge-basedapproach for interpreting genome-wide expression profiles. Proc. Natl Acad.Sci. USA 102, 15545–15550 (2005).
70. Kannan, K. et al. DNA microarrays identification of primary and secondarytarget genes regulated by p53. Oncogene 20, 2225–2234 (2001).
AcknowledgementsWe thank all members of the animal house facility and in particular Stephanie Boissel;the Pict-IBiSA, especially O. Renaud, O. Leroy, T. Piolot and L. Sengmanivong; R. Pardo,A. Simon, C. Couderc and V. Marthiens for their help on the experiments; the InstitutCurie Bioinformatics platform at U900 and in particular Nicolas Servant, Alban Lermineand Severine Lair; F. Ubelmann for his contribution all along this study; and S. Arta-vanis-Tsakonas for fruitful discussion. High-throughput sequencing has been performedby the NGS platform of the Institut Curie, supported by the grants ANR-10-EQPX-03and ANR10-INBS-09-08 from the Agence Nationale de le Recherche (investissementsd’avenir) and by the Canceropole Ile-de-France. The Curie Institute Foundation, theInstitut National du Cancer, the Ligue Nationale contre le Cancer Comite de Paris andthe grant ‘Projet Incitatif et Collaboratif: Computational Systems Biology Approach forCancer’ from Institut Curie funded this work. M.C. was supported by the Fondation pourla Recherche Medicale. C.B was supported by the European Committee Oncodeath(037278). G.-F.B. was funded by a Marie Curie Fellowship (EuroCancer StemCellTraining Network). I.K., D.C., L.M., E.B. and A.Z. are members of the ComputationalSystems Biology of Cancer team, supported by ) La Ligue contre le cancer *.
Author contributionsE.B., D.L. and A.Z. conceived and designed the computational experiments. I.K., D.C.and A.Z. constructed the signalling network and performed the network structure ana-lysis. I.K. and D.C. contributed equally to the computational analysis. M.C., C.B., D.L.and S.R. conceived and designed the biological experiments. M.C., C.B., F.E.M., D.V.,I.B., S.D.R.T., G.-F.B. and P.L.-N., performed the biological experiments. W.C., D.M., S.F.and L.F. provided their expertise. M.C., C.B., F.E.M., D.V., L.S., L.M., E.G., P.P.-G., andS.R. analysed the image, microarray, NGS and public data. M.C., I.K., C.B., D.C., A.Z. andS.R. wrote the paper.
Additional informationSupplementary Information accompanies this paper at http://www.nature.com/naturecommunications
Competing financial interests: The authors declare no competing financial interests.
Reprints and permission information is available online at http://npg.nature.com/reprintsandpermissions/
How to cite this article: Chanrion, M. et al. Concomitant Notch activation and p53deletion trigger epithelial-to-mesenchymal transition and metastasis in mouse gut.Nat. Commun. 5:5005 doi: 10.1038/ncomms6005 (2014).
This work is licensed under a Creative Commons Attribution-NonCommercial-NoDerivs 4.0 International License. The images or
other third party material in this article are included in the article’s Creative Commonslicense, unless indicated otherwise in the credit line; if the material is not included underthe Creative Commons license, users will need to obtain permission from the licenseholder to reproduce the material. To view a copy of this license, visit http://creativecommons.org/licenses/by-nc-nd/4.0/
NATURE COMMUNICATIONS | DOI: 10.1038/ncomms6005 ARTICLE
NATURE COMMUNICATIONS | 5:5005 | DOI: 10.1038/ncomms6005 | www.nature.com/naturecommunications 15
& 2014 Macmillan Publishers Limited. All rights reserved.