ATLAS High-Level Trigger, Data Acquisition and Controls ...
196
ATLAS High-Level Trigger, Data Acquisition and Controls Technical Design Report ATLAS, Collaboration; Åkesson, Torsten; Eerola, Paula; Hedberg, Vincent; Jarlskog, Göran; Lundberg, Björn; Mjörnmark, Ulf; Smirnova, Oxana; Almehed, Sverker; et al. 2003 Link to publication Citation for published version (APA): ATLAS, C., Åkesson, T., Eerola, P., Hedberg, V., Jarlskog, G., Lundberg, B., Mjörnmark, U., Smirnova, O., Almehed, S., & et al. (2003). ATLAS High-Level Trigger, Data Acquisition and Controls Technical Design Report. (ATLAS Technical Design Reports; Vol. ATLAS TDR-016). CERN. Total number of authors: 10 General rights Unless other specific re-use rights are stated the following general rights apply: Copyright and moral rights for the publications made accessible in the public portal are retained by the authors and/or other copyright owners and it is a condition of accessing publications that users recognise and abide by the legal requirements associated with these rights. • Users may download and print one copy of any publication from the public portal for the purpose of private study or research. • You may not further distribute the material or use it for any profit-making activity or commercial gain • You may freely distribute the URL identifying the publication in the public portal Read more about Creative commons licenses: https://creativecommons.org/licenses/ Take down policy If you believe that this document breaches copyright please contact us providing details, and we will remove access to the work immediately and investigate your claim. Download date: 19. Apr. 2022
-
Upload
khangminh22 -
Category
Documents
-
view
1 -
download
0
Transcript of ATLAS High-Level Trigger, Data Acquisition and Controls ...

LUND UNIVERSITY
PO Box 117221 00 Lund+46 46-222 00 00
ATLAS High-Level Trigger, Data Acquisition and Controls Technical Design Report
ATLAS, Collaboration; Åkesson, Torsten; Eerola, Paula; Hedberg, Vincent; Jarlskog, Göran;Lundberg, Björn; Mjörnmark, Ulf; Smirnova, Oxana; Almehed, Sverker; et al.
2003
Link to publication
Citation for published version (APA):ATLAS, C., Åkesson, T., Eerola, P., Hedberg, V., Jarlskog, G., Lundberg, B., Mjörnmark, U., Smirnova, O.,Almehed, S., & et al. (2003). ATLAS High-Level Trigger, Data Acquisition and Controls Technical Design Report.(ATLAS Technical Design Reports; Vol. ATLAS TDR-016). CERN.
Total number of authors:10
General rightsUnless other specific re-use rights are stated the following general rights apply:Copyright and moral rights for the publications made accessible in the public portal are retained by the authorsand/or other copyright owners and it is a condition of accessing publications that users recognise and abide by thelegal requirements associated with these rights. • Users may download and print one copy of any publication from the public portal for the purpose of private studyor research. • You may not further distribute the material or use it for any profit-making activity or commercial gain • You may freely distribute the URL identifying the publication in the public portal
Read more about Creative commons licenses: https://creativecommons.org/licenses/Take down policyIf you believe that this document breaches copyright please contact us providing details, and we will removeaccess to the work immediately and investigate your claim.
Download date: 19. Apr. 2022

ATLASHigh-Level Trigger,Data Acquisitionand Controls
Technical Design ReportIssue: 1Revision: 1Reference: ATLAS TDR-016 Created: 12 November 2002Last modified: 3 July 2003Prepared By: ATLAS HLT/DAQ/DCS Group
ATLAS Technical Design ReportHigh-Level Trigger, Data Acquisition and Controls 30 June 2003
ii
All trademarks, copyright names and products referred to in this document are acknowledged as such.

ATLAS Technical Design ReportHigh-Level Trigger, Data Acquisition and Controls 30 June 2003
ATLAS Collaboration iii
ATLAS Collaboration
ArmeniaYerevan Physics Institute, Yerevan
AustraliaResearch Centre for High Energy Physics, Melbourne University, MelbourneUniversity of Sydney, Sydney
AustriaInstitut für Experimentalphysik der Leopold-Franzens-Universität Innsbruck, Innsbruck
Azerbaijan RepublicInstitute of Physics, Azerbaijan Academy of Science, Baku
Republic of BelarusInstitute of Physics, National Academy of Science, MinskNational Centre for Particle and High Energy Physics, Minsk
BrazilUniversidade Federal do Rio de Janeiro, COPPE/EE/IF, Rio de Janeiro
CanadaUniversity of Alberta, EdmontonUniversity of Carleton/C.R.P.P., CarletonGroup of Particle Physics, University of Montreal, MontrealDepartment of Physics, University of Toronto, TorontoSimon Fraser University, Burnaby, BCTRIUMF, VancouverDepartment of Physics, University of British Columbia, VancouverUniversity of Victoria, Victoria
CERNEuropean Organization for Nuclear Research (CERN), Geneva
ChinaJoint Cluster formed by IHEP Beijing, USTC Hefei, University of Nanjing and University of Shandong
Czech RepublicAcademy of Sciences of the Czech Republic, Institute of Physics and Institute for Computer Science,
PragueCharles University in Prague, Faculty of Mathematics and Physics, PragueCzech Technical University in Prague, Faculty of Nuclear Sciences and Physical Engineering, Faculty of
Mechanical Engineering, Prague
DenmarkNiels Bohr Institute, University of Copenhagen, Copenhagen
ATLAS Technical Design ReportHigh-Level Trigger, Data Acquisition and Controls 30 June 2003
iv ATLAS Collaboration
FranceLaboratoire d’Annecy-le-Vieux de Physique des Particules (LAPP), IN2P3-CNRS, Annecy-le-VieuxLaboratoire de Physique Corpusculaire, Université Blaise Pascal, IN2P3-CNRS, Clermont-FerrandLaboratoire de Physique Subatomique et de Cosmologie de Grenoble, IN2P3-CNRS Université Joseph
Fourier, GrenobleCentre de Physique des Particules de Marseille, IN2P3-CNRS, MarseilleLaboratoire de l’Accélérateur Linéaire, IN2P3-CNRS, OrsayLPNHE, Universités de Paris VI et VII, IN2P3-CNRS, ParisCommissariat à l’Energie Atomique (CEA), DSM/DAPNIA, Centre d’Etudes de Saclay, Gif-sur-Yvette
GeorgiaInstitute of Physics of the Georgian Academy of Sciences and Tbilisi State University, Tbilisi
GermanyPhysikalisches Institut, Universität Bonn, BonnInstitut für Physik, Universität Dortmund, DortmundFakultät für Physik, Albert-Ludwigs-Universität, FreiburgKirchhoff-Institut für Physik der Universität Heidelberg, HeidelbergInstitut für Physik, Universität Mainz, MainzLehrstuhl für Informatik V, Universität Mannheim, MannheimSektion Physik, Ludwig-Maximilian-Universität München, MunichMax-Planck-Institut für Physik, MunichFachbereich Physik, Universität Siegen, SiegenFachbereich Physik, Bergische Universität, Wuppertal
GreeceAthens National Technical University, AthensAthens University, AthensAristotle University of Thessaloniki, High Energy Physics Department and Department of Mechanical
Engineering, Thessaloniki
IsraelDepartment of Physics, Technion, HaifaRaymond and Beverly Sackler Faculty of Exact Sciences, School of Physics and Astronomy, Tel-Aviv
University, Tel-AvivDepartment of Particle Physics, The Weizmann Institute of Science, Rehovot
ItalyDipartimento di Fisica dell’Università della Calabria e I.N.F.N., CosenzaLaboratori Nazionali di Frascati dell’I.N.F.N., FrascatiDipartimento di Fisica dell’Università di Genova e I.N.F.N., GenovaDipartimento di Fisica dell’Università di Lecce e I.N.F.N., LecceDipartimento di Fisica dell’Università di Milano e I.N.F.N., MilanDipartimento di Scienze Fisiche, Università di Napoli ‘Federico II’ e I.N.F.N., NaplesDipartimento di Fisica Nucleare e Teorica dell’Università di Pavia e I.N.F.N., PaviaDipartimento di Fisica dell’Università di Pisa e I.N.F.N., PisaDipartimento di Fisica dell’Università di Roma I ‘La Sapienza’ e I.N.F.N., RomaDipartimento di Fisica dell’Università di Roma II ‘Tor Vergata’ e I.N.F.N., RomaDipartimento di Fisica dell’Università di Roma III ‘Roma Tre’ e I.N.F.N., RomaDipartimento di Fisica dell’Università di Udine, Gruppo collegato di Udine I.N.F.N. Trieste, Udine

ATLAS Technical Design ReportHigh-Level Trigger, Data Acquisition and Controls 30 June 2003
ATLAS Collaboration v
JapanHiroshima Institute of Technology, HiroshimaDepartment of Physics, Hiroshima University, Higashi-HiroshimaKEK, High Energy Accelerator Research Organisation, TsukubaDepartment of Physics, Faculty of Science, Kobe University, KobeDepartment of Physics, Kyoto University, KyotoKyoto University of Education, KyotoNagasaki Institute of Applied Science, NagasakiNaruto University of Education, NarutoDepartment of Physics, Faculty of Science, Okayama University, OkayamaDepartment of Computer Science, Ritsumeikan University, KusatsuDepartment of Physics, Faculty of Science, Shinshu University, MatsumotoInternational Center for Elementary Particle Physics, University of Tokyo, TokyoPhysics Department, Tokyo Metropolitan University, TokyoDepartment of Applied Physics System, Tokyo University of Agriculture and Technology, TokyoInstitute of Physics, University of Tsukuba, Tsukuba
MoroccoFaculté des Sciences Aïn Chock, Université Hassan II, Casablanca, and Université Mohamed V, Rabat
NetherlandsFOM - Institute SAF NIKHEF and University of Amsterdam/NIKHEFUniversity of Nijmegen/NIKHEF, Nijmegen
NorwayUniversity of Bergen, BergenUniversity of Oslo, Oslo
PolandHenryk Niewodniczanski Institute of Nuclear Physics, CracowFaculty of Physics and Nuclear Techniques of the University of Mining and Metallurgy, Cracow
PortugalLaboratório de Instrumentação e Física Experimental de Partículas (LIP), Lisbon, in collaboration with:
Faculdade de Ciências de Universidade de Lisboa (FCUL), University of Coimbra, University Católica-Figueira da Foz, and University Nova de Lisboa
RomaniaNational Institute for Physics and Nuclear Engineering, Institute of Atomic Physics, Bucharest
RussiaInstitute for Theoretical and Experimental Physics (ITEP), MoscowP.N. Lebedev Institute of Physics, MoscowMoscow Engineering and Physics Institute (MEPhI), MoscowMoscow State University, MoscowBudker Institute of Nuclear Physics (BINP), NovosibirskState Research Center of the Russian Federation - Institute for High Energy Physics (IHEP), ProtvinoPetersburg Nuclear Physics Institute (PNPI), Gatchina, St. Petersburg
JINRJoint Institute for Nuclear Research , Dubna
Republic of SerbiaInstitute of Physics, University of Belgrade, Belgrade
ATLAS Technical Design ReportHigh-Level Trigger, Data Acquisition and Controls 30 June 2003
vi ATLAS Collaboration
Slovak RepublicBratislava University, Bratislava, and Institute of Experimental Physics of the Slovak Academy of
Sciences, Kosice
SloveniaJozef Stefan Institute and Department of Physics, University of Ljubljana, Ljubljana
SpainInstitut de Física d’Altes Energies (IFAE), Universidad Autónoma de Barcelona, Bellaterra, BarcelonaPhysics Department, Universidad Autónoma de Madrid, MadridInstituto de Física Corpuscular (IFIC), Centro Mixto Universidad de Valencia - CSIC, Valencia and
Instituto de Microelectrónica de Barcelona, Bellaterra, Barcelona
SwedenFysika institutionen, Lunds universitet, LundRoyal Institute of Technology (KTH), StockholmUniversity of Stockholm, StockholmUppsala University, Department of Radiation Sciences, Uppsala
SwitzerlandLaboratory for High Energy Physics, University of Bern, BernSection de Physique, Université de Genève, Geneva
TaiwanInstitute of Physics, Academia Sinica, Taipei
TurkeyDepartment of Physics, Ankara University, AnkaraDepartment of Physics, Bogaziçi University, Istanbul
United KingdomSchool of Physics and Astronomy, The University of Birmingham, BirminghamCavendish Laboratory, Cambridge University, CambridgeDepartment of Physics and Astronomy, University of Glasgow, GlasgowDepartment of Physics, Lancaster University, LancasterDepartment of Physics, Oliver Lodge Laboratory, University of Liverpool, LiverpoolDepartment of Physics, Queen Mary and Westfield College, University of London, LondonDepartment of Physics, Royal Holloway, University of London, EghamDepartment of Physics and Astronomy, University College London, LondonDepartment of Physics and Astronomy, University of Manchester, ManchesterDepartment of Physics, Oxford University, OxfordRutherford Appleton Laboratory, Chilton, DidcotDepartment of Physics, University of Sheffield, Sheffield

ATLAS Technical Design ReportHigh-Level Trigger, Data Acquisition and Controls 30 June 2003
ATLAS Collaboration vii
United States of AmericaState University of New York at Albany, New YorkArgonne National Laboratory, Argonne, IllinoisUniversity of Arizona, Tucson, ArizonaDepartment of Physics, The University of Texas at Arlington, Arlington, TexasLawrence Berkeley Laboratory and University of California, Berkeley, CaliforniaPhysics Department of the University of Boston, Boston, MassachusettsBrandeis University, Department of Physics, Waltham, MassachusettsBrookhaven National Laboratory (BNL), Upton, New YorkUniversity of Chicago, Enrico Fermi Institute, Chicago, IllinoisNevis Laboratory, Columbia University, Irvington, New YorkDepartment of Physics, Duke University, Durham, North CarolinaDepartment of Physics, Hampton University, VirginiaDepartment of Physics, Harvard University, Cambridge, MassachusettsIndiana University, Bloomington, IndianaIowa State University, Ames, IowaUniversity of California, Irvine, CaliforniaMassachusetts Institute of Technology, Department of Physics, Cambridge, MassachusettsMichigan State University, Department of Physics and Astronomy, East Lansing, MichiganUniversity of Michigan, Department of Physics, Ann Arbor, MichiganDepartment of Physics, New Mexico University, Albuquerque, New MexicoNorthern Illinois University, DeKalb, IllinoisOhio State University, Columbus, OhioDepartment of Physics and Astronomy, University of OklahomaDepartment of Physics, University of Pennsylvania, Philadelphia, PennsylvaniaUniversity of Pittsburgh, Pittsburgh, PennsylvaniaDepartment of Physics and Astronomy, University of Rochester, Rochester, New YorkInstitute for Particle Physics, University of California, Santa Cruz, CaliforniaDepartment of Physics, Southern Methodist University, Dallas, TexasState University of New York at Stony Brook, New YorkTufts University, Medford, MassachusettsHigh Energy Physics, University of Illinois, Urbana, IllinoisDepartment of Physics, Department of Mechanical Engineering, University of Washington, Seattle,
WashingtonDepartment of Physics, University of Wisconsin, Madison, Wisconsin
ATLAS Technical Design ReportHigh-Level Trigger, Data Acquisition and Controls 30 June 2003
viii Acknowledgements
Acknowledgements
The Authors would like to thank all members of the ATLAS Collaboration, and especially themany who have contributed directly to the work described in this Technical Design Report andthose who provided feedback on draft versions of it. We would particularly like to thank theATLAS offline, detector and LVL1-trigger software groups, as well as the Data-Challenge teamand participating institutes, for their outstanding efforts in producing the software and dataused in this TDR. Special thanks are also due to the members of the Detector Interface Groupwho have helped enormously in our understanding of the detector requirements and con-straints.
We also wish to thank former members of the ATLAS TDAQ Collaboration who have helped toseed and develop ideas now incorporated into the architecture described in this document. Weacknowledge the support of the CERN Joint Controls Project (JCOP) for their contribution to theDCS system.
We would like to thank the many people who have helped in the editing and production of thisdocument. Particular thanks are due to Mario Ruggier for preparing the FrameMaker templateupon which this document is based and the DocSys group for their help in using it. We alsowarmly thank Susan Leach-O’Neale and Richard Cook for copy-editing the document, theCERN Desktop Publishing Service for their help in the organisation of publishing the docu-ment, and the CERN Printshop staff for their helpful, friendly and efficient service, as well asMme. Isabelle Marcastel for her work on designing the cover.
The participating institutes would like to express their gratitude to their support staff for theirinvaluable help in the design and prototyping work for the HLT/DAQ system.

ATLAS Technical Design ReportHigh-Level Trigger, Data Acquisition and Controls 30 June 2003
Contents ix
Contents
ATLAS Collaboration . . . . . . . . . . . . . . . . . . . . iii
Acknowledgements . . . . . . . . . . . . . . . . . . . . . viii
Part 1 Global View . . . . . . . . . . . . . . . . . . . . . . . 1
1 Overview . . . . . . . . . . . . . . . . . . . . . . . . . 31.1 Document overview . . . . . . . . . . . . . . . . . . . 31.2 Main system requirements . . . . . . . . . . . . . . . . . 4
1.2.1 Rate requirements and event-selection strategy . . . . . . . 41.2.2 Detector readout requirements . . . . . . . . . . . . . 41.2.3 Functional and operational requirements . . . . . . . . . 51.2.4 Requirements due to the long expected lifetime of ATLAS . . . 6
1.3 System components and functions . . . . . . . . . . . . . . 61.3.1 The Data Flow system . . . . . . . . . . . . . . . . 7
1.3.1.1 ROD-crate data acquisition . . . . . . . . . . . 71.3.2 The High-Level Trigger system. . . . . . . . . . . . . 71.3.3 The Online Software system . . . . . . . . . . . . . . 81.3.4 The Detector Control system . . . . . . . . . . . . . 9
1.4 Data types . . . . . . . . . . . . . . . . . . . . . . 91.5 Long-term issues and perspectives . . . . . . . . . . . . . . 111.6 Glossary . . . . . . . . . . . . . . . . . . . . . . . 121.7 References . . . . . . . . . . . . . . . . . . . . . . 12
2 Parameters . . . . . . . . . . . . . . . . . . . . . . . . 152.1 Detector readout parameters . . . . . . . . . . . . . . . . 152.2 Trigger and Data Flow parameters . . . . . . . . . . . . . . 182.3 Monitoring requirements . . . . . . . . . . . . . . . . . 192.4 Calibration requirements . . . . . . . . . . . . . . . . . 202.5 DCS parameters . . . . . . . . . . . . . . . . . . . . 212.6 References . . . . . . . . . . . . . . . . . . . . . . 22
3 System operations . . . . . . . . . . . . . . . . . . . . . . 233.1 Introduction . . . . . . . . . . . . . . . . . . . . . . 233.2 TDAQ states . . . . . . . . . . . . . . . . . . . . . . 233.3 The run . . . . . . . . . . . . . . . . . . . . . . . 24
3.3.1 Run definition . . . . . . . . . . . . . . . . . . 243.3.2 Categories of runs . . . . . . . . . . . . . . . . . 253.3.3 Operations during a run . . . . . . . . . . . . . . . 263.3.4 Transition between runs . . . . . . . . . . . . . . . 263.3.5 Operations outside a run . . . . . . . . . . . . . . . 28
3.4 Partitions and related operations. . . . . . . . . . . . . . . 283.5 Error-handling strategy . . . . . . . . . . . . . . . . . . 29
ATLAS Technical Design ReportHigh-Level Trigger, Data Acquisition and Controls 30 June 2003
x Contents
3.6 Databases and data categories . . . . . . . . . . . . . . . 303.7 References . . . . . . . . . . . . . . . . . . . . . . 31
4 Physics selection strategy . . . . . . . . . . . . . . . . . . . 334.1 Requirements . . . . . . . . . . . . . . . . . . . . . 334.2 Selection criteria . . . . . . . . . . . . . . . . . . . . 344.3 Physics objects for event selection . . . . . . . . . . . . . . 354.4 Trigger menu . . . . . . . . . . . . . . . . . . . . . 37
4.4.1 Physics triggers . . . . . . . . . . . . . . . . . . 384.4.2 Pre-scaled physics triggers . . . . . . . . . . . . . . 394.4.3 Exclusive physics triggers . . . . . . . . . . . . . . 404.4.4 Monitor and calibration triggers . . . . . . . . . . . . 414.4.5 Physics coverage . . . . . . . . . . . . . . . . . 42
4.5 Adapting to changes in running conditions . . . . . . . . . . . 434.6 Determination of trigger efficiencies . . . . . . . . . . . . . 444.7 References . . . . . . . . . . . . . . . . . . . . . . 46
5 Architecture . . . . . . . . . . . . . . . . . . . . . . . . 475.1 HLT/DAQ context . . . . . . . . . . . . . . . . . . . 475.2 HLT/DAQ functional analysis . . . . . . . . . . . . . . . 47
5.2.1 Functional decomposition . . . . . . . . . . . . . . 485.2.2 HLT/DAQ building blocks . . . . . . . . . . . . . . 495.2.3 HLT/DAQ interfaces . . . . . . . . . . . . . . . . 50
5.2.3.1 Interfaces to other parts of ATLAS . . . . . . . . 515.2.3.2 External interfaces . . . . . . . . . . . . . . 53
5.3 Architecture of the HLT/DAQ system . . . . . . . . . . . . 535.3.1 Architectural components . . . . . . . . . . . . . . 54
5.3.1.1 Detector readout . . . . . . . . . . . . . . 545.3.1.2 LVL2 . . . . . . . . . . . . . . . . . . 555.3.1.3 Event Builder. . . . . . . . . . . . . . . . 565.3.1.4 Event Filter . . . . . . . . . . . . . . . . 565.3.1.5 Online Software system . . . . . . . . . . . . 575.3.1.6 Detector Control System . . . . . . . . . . . . 58
5.3.2 Overall experimental control . . . . . . . . . . . . . 585.4 Partitioning . . . . . . . . . . . . . . . . . . . . . . 595.5 Implementation of the architecture . . . . . . . . . . . . . . 59
5.5.1 Overview . . . . . . . . . . . . . . . . . . . . 595.5.2 Categories of components . . . . . . . . . . . . . . 635.5.3 Custom components . . . . . . . . . . . . . . . . 63
5.5.3.1 The ELMB . . . . . . . . . . . . . . . . . 635.5.3.2 The ReadOut Link . . . . . . . . . . . . . . 635.5.3.3 The ROBIN . . . . . . . . . . . . . . . . 635.5.3.4 The Region-of-Interest Builder . . . . . . . . . . 64
5.5.4 ReadOut System . . . . . . . . . . . . . . . . . 645.5.5 Networks . . . . . . . . . . . . . . . . . . . . 655.5.6 Supervisory components . . . . . . . . . . . . . . . 66

ATLAS Technical Design ReportHigh-Level Trigger, Data Acquisition and Controls 30 June 2003
Contents xi
5.5.7 HLT processors . . . . . . . . . . . . . . . . . . 665.5.8 Event-building processors . . . . . . . . . . . . . . 665.5.9 Mass Storage . . . . . . . . . . . . . . . . . . . 675.5.10 Online farm . . . . . . . . . . . . . . . . . . . 675.5.11 Deployment . . . . . . . . . . . . . . . . . . . 67
5.6 Scalability and staging . . . . . . . . . . . . . . . . . . 685.7 References . . . . . . . . . . . . . . . . . . . . . . 70
6 Fault tolerance and error handling . . . . . . . . . . . . . . . . 716.1 Fault-tolerance and error-handling strategy . . . . . . . . . . . 716.2 Error definition and identification . . . . . . . . . . . . . . 726.3 Error-reporting mechanism . . . . . . . . . . . . . . . . 726.4 Error diagnosis and system-status verification . . . . . . . . . . 736.5 Error recovery . . . . . . . . . . . . . . . . . . . . . 736.6 Error logging and error browsing . . . . . . . . . . . . . . 746.7 Data integrity . . . . . . . . . . . . . . . . . . . . . 746.8 Fault-tolerance and failure strategy for hardware components . . . . 75
6.8.1 The source end of ReadOut Links . . . . . . . . . . . . 756.8.2 The ReadOut System . . . . . . . . . . . . . . . . 756.8.3 The RoI Builder . . . . . . . . . . . . . . . . . . 766.8.4 Network . . . . . . . . . . . . . . . . . . . . 766.8.5 Rack-mounted PCs . . . . . . . . . . . . . . . . . 77
6.9 Use Cases . . . . . . . . . . . . . . . . . . . . . . . 786.10 References . . . . . . . . . . . . . . . . . . . . . . 79
7 Monitoring . . . . . . . . . . . . . . . . . . . . . . . . 817.1 Overview . . . . . . . . . . . . . . . . . . . . . . . 817.2 Monitoring sources . . . . . . . . . . . . . . . . . . . 81
7.2.1 DAQ data-flow monitoring . . . . . . . . . . . . . . 817.2.1.1 Front-end and ROD monitoring . . . . . . . . . 817.2.1.2 DataFlow monitoring . . . . . . . . . . . . . 82
7.2.2 Trigger monitoring . . . . . . . . . . . . . . . . . 827.2.2.1 Trigger decision . . . . . . . . . . . . . . . 827.2.2.2 Operational monitoring . . . . . . . . . . . . 83
7.2.3 Network monitoring . . . . . . . . . . . . . . . . 857.2.4 Detector monitoring . . . . . . . . . . . . . . . . 86
7.3 Tools for monitoring . . . . . . . . . . . . . . . . . . . 877.3.1 Online Software services . . . . . . . . . . . . . . . 877.3.2 Computing resources for monitoring. . . . . . . . . . . 88
7.3.2.1 Workstations in SCX1 . . . . . . . . . . . . . 887.3.2.2 Monitoring in the Event Filter . . . . . . . . . . 887.3.2.3 Monitoring after the Event Filter . . . . . . . . . 897.3.2.4 Network requirements . . . . . . . . . . . . 89
7.4 Archiving monitoring data . . . . . . . . . . . . . . . . . 897.5 References . . . . . . . . . . . . . . . . . . . . . . 90
ATLAS Technical Design ReportHigh-Level Trigger, Data Acquisition and Controls 30 June 2003
xii Contents
Part 2 System Components . . . . . . . . . . . . . . . . . . . . 91
8 DataFlow . . . . . . . . . . . . . . . . . . . . . . . . . 938.1 Detector readout and event fragment buffering . . . . . . . . . 93
8.1.1 ROD crate data acquisition . . . . . . . . . . . . . . 938.1.2 ReadOut link . . . . . . . . . . . . . . . . . . . 948.1.3 ReadOut sub-system . . . . . . . . . . . . . . . . 96
8.1.3.1 High-Level Design . . . . . . . . . . . . . . 968.1.3.2 Design of the ROBIN . . . . . . . . . . . . . 978.1.3.3 Implementation and performance of the ROS . . . . 998.1.3.4 pROS . . . . . . . . . . . . . . . . . . 103
8.2 Boundary and interface to the LVL1 trigger . . . . . . . . . . . 1048.2.1 Region-of-interest builder . . . . . . . . . . . . . . 104
8.2.1.1 Implementation and performance . . . . . . . . 1048.3 Control and flow of event data to high-level triggers. . . . . . . . 106
8.3.1 Message passing . . . . . . . . . . . . . . . . . 1068.3.1.1 Control and event data messages . . . . . . . . . 1068.3.1.2 Ethernet . . . . . . . . . . . . . . . . . 1078.3.1.3 Design of the message passing component . . . . . 1108.3.1.4 Performance of the message passing. . . . . . . . 111
8.3.2 Data collection . . . . . . . . . . . . . . . . . . 1138.3.2.1 General overview . . . . . . . . . . . . . . 1138.3.2.2 RoI data collection . . . . . . . . . . . . . . 1138.3.2.3 Event building . . . . . . . . . . . . . . . 116
8.4 Summary. . . . . . . . . . . . . . . . . . . . . . . 1198.5 References . . . . . . . . . . . . . . . . . . . . . . 121
9 High-Level Trigger . . . . . . . . . . . . . . . . . . . . . 1259.1 HLT overview . . . . . . . . . . . . . . . . . . . . . 1259.2 LVL2 . . . . . . . . . . . . . . . . . . . . . . . . 127
9.2.1 Overview . . . . . . . . . . . . . . . . . . . . 1279.2.2 RoI Builder . . . . . . . . . . . . . . . . . . . 1279.2.3 LVL2 Supervisor . . . . . . . . . . . . . . . . . 1279.2.4 LVL2 Processors. . . . . . . . . . . . . . . . . . 128
9.2.4.1 L2PU . . . . . . . . . . . . . . . . . . 1299.2.4.2 PESA Steering Controller (PSC) . . . . . . . . . 1309.2.4.3 Interfaces with the Event Selection Software . . . . . 132
9.2.5 pROS . . . . . . . . . . . . . . . . . . . . . 1329.3 Event Filter . . . . . . . . . . . . . . . . . . . . . . 132
9.3.1 Overview . . . . . . . . . . . . . . . . . . . . 1339.3.2 Event Handler . . . . . . . . . . . . . . . . . . 133
9.3.2.1 Overview . . . . . . . . . . . . . . . . . 1339.3.2.2 Event Filter Dataflow . . . . . . . . . . . . . 1349.3.2.3 Processing Task . . . . . . . . . . . . . . . 1369.3.2.4 Detailed EF Validation tests. . . . . . . . . . . 138

ATLAS Technical Design ReportHigh-Level Trigger, Data Acquisition and Controls 30 June 2003
Contents xiii
9.4 HLT operation . . . . . . . . . . . . . . . . . . . . . 1399.4.1 Common aspects . . . . . . . . . . . . . . . . . 1399.4.2 LVL2 operation . . . . . . . . . . . . . . . . . . 1409.4.3 EF operation . . . . . . . . . . . . . . . . . . . 141
9.4.3.1 Scalability tests . . . . . . . . . . . . . . . 1419.5 Event Selection Software (ESS) . . . . . . . . . . . . . . . 141
9.5.1 Overview . . . . . . . . . . . . . . . . . . . . 1429.5.2 The Event Data Model sub-package . . . . . . . . . . . 1439.5.3 The HLT algorithms sub-package . . . . . . . . . . . . 144
9.5.3.1 The seeding mechanism . . . . . . . . . . . . 1459.5.4 The steering sub-package. . . . . . . . . . . . . . . 146
9.5.4.1 Implementation of the steering . . . . . . . . . . 1479.5.4.2 The Trigger Configuration . . . . . . . . . . . 1489.5.4.3 The LVL1 conversion . . . . . . . . . . . . . 1499.5.4.4 The Step Handler . . . . . . . . . . . . . . 1509.5.4.5 The Result Builder and the LVL2 Conversion . . . . . 1519.5.4.6 The Steering Monitoring . . . . . . . . . . . . 151
9.5.5 The Data Manager sub-package . . . . . . . . . . . . 1519.5.5.1 Implementation . . . . . . . . . . . . . . . 1519.5.5.2 The Raw Data Access . . . . . . . . . . . . . 153
9.6 Summary . . . . . . . . . . . . . . . . . . . . . . . 1549.7 References . . . . . . . . . . . . . . . . . . . . . . 154
10 Online Software . . . . . . . . . . . . . . . . . . . . . . 15710.1 Introduction . . . . . . . . . . . . . . . . . . . . . . 15710.2 The architectural model . . . . . . . . . . . . . . . . . . 15810.3 Information sharing . . . . . . . . . . . . . . . . . . . 159
10.3.1 Functionality of the Information Sharing Services . . . . . . 15910.3.1.1 Types of shared information . . . . . . . . . . 159
10.3.2 Performance and scalability requirements on Information Sharing 16010.3.3 Architecture of Information Sharing services . . . . . . . . 161
10.3.3.1 Information Service. . . . . . . . . . . . . . 16110.3.3.2 Error Reporting Service . . . . . . . . . . . . 16210.3.3.3 Online Histogramming Service. . . . . . . . . . 16210.3.3.4 Event Monitoring Service . . . . . . . . . . . 16310.3.3.5 Relation between Information Sharing services . . . . 164
10.3.4 Prototype evaluation . . . . . . . . . . . . . . . . 16410.3.4.1 Description of the current implementation . . . . . . 16410.3.4.2 Performance and scalability of current implementation . 16510.3.4.3 Use of Information Sharing services in TDAQ . . . . 165
10.4 Databases . . . . . . . . . . . . . . . . . . . . . . . 16610.4.1 Functionality of the databases . . . . . . . . . . . . . 166
10.4.1.1 Configuration Databases . . . . . . . . . . . . 16610.4.1.2 Online Bookkeeper . . . . . . . . . . . . . . 16710.4.1.3 Conditions Database interfaces. . . . . . . . . . 167
10.4.2 Performance and scalability requirements on the databases . . . 167
ATLAS Technical Design ReportHigh-Level Trigger, Data Acquisition and Controls 30 June 2003
xiv Contents
10.4.3 Architecture of databases . . . . . . . . . . . . . . 16810.4.3.1 Configuration Databases . . . . . . . . . . . . 16810.4.3.2 Online Bookkeeper . . . . . . . . . . . . . . 16910.4.3.3 Conditions Database interface . . . . . . . . . . 170
10.4.4 Prototype evaluation . . . . . . . . . . . . . . . . 17110.4.4.1 Configuration Databases . . . . . . . . . . . . 17110.4.4.2 Online Bookkeeper . . . . . . . . . . . . . . 172
10.5 Control . . . . . . . . . . . . . . . . . . . . . . . 17210.5.1 Control functionality . . . . . . . . . . . . . . . . 17210.5.2 Performance and scalability requirements on Control . . . . . 17310.5.3 Control architecture . . . . . . . . . . . . . . . . 173
10.5.3.1 User Interface . . . . . . . . . . . . . . . 17310.5.3.2 Supervision . . . . . . . . . . . . . . . . 17410.5.3.3 Verification . . . . . . . . . . . . . . . . 17510.5.3.4 Process, Access and Resource Management systems . . 175
10.5.4 Prototype evaluation . . . . . . . . . . . . . . . . 17610.5.4.1 Scalability and performance tests . . . . . . . . . 17610.5.4.2 Technology considerations . . . . . . . . . . . 177
10.6 Integration tests . . . . . . . . . . . . . . . . . . . . 17810.6.1 Online Software integration and large-scale performance tests . 17810.6.2 Event Filter Software tests involving the Online Software . . . 17810.6.3 Deployment in test beam. . . . . . . . . . . . . . . 179
10.7 References . . . . . . . . . . . . . . . . . . . . . . 180
11 Detector Control System . . . . . . . . . . . . . . . . . . . 18311.1 Introduction. . . . . . . . . . . . . . . . . . . . . . 18311.2 Organization of the DCS . . . . . . . . . . . . . . . . . 18311.3 Front-End system . . . . . . . . . . . . . . . . . . . . 184
11.3.1 Embedded local monitor board . . . . . . . . . . . . 18511.3.2 Other FE equipment . . . . . . . . . . . . . . . . 186
11.4 The Back-End system . . . . . . . . . . . . . . . . . . 18611.4.1 Functional hierarchy . . . . . . . . . . . . . . . . 18611.4.2 SCADA. . . . . . . . . . . . . . . . . . . . . 18811.4.3 PVSS-II . . . . . . . . . . . . . . . . . . . . . 18811.4.4 PVSS-II framework . . . . . . . . . . . . . . . . . 189
11.5 Integration of Front-end and Back-end . . . . . . . . . . . . 18911.5.1 OPC CANopen server. . . . . . . . . . . . . . . . 190
11.6 Read-out chain . . . . . . . . . . . . . . . . . . . . . 19011.6.1 Performance of the DCS readout chain . . . . . . . . . . 19111.6.2 Long-term operation of the read-out chain . . . . . . . . 193
11.7 Applications . . . . . . . . . . . . . . . . . . . . . 19311.8 Connection to DAQ . . . . . . . . . . . . . . . . . . . 194
11.8.1 Data transfer facility (DDC-DT) . . . . . . . . . . . . 19511.8.2 Message transfer facility (DDC-MT) . . . . . . . . . . . 19511.8.3 Command transfer facility (DDC-CT) . . . . . . . . . . 196
11.9 Interface to external systems . . . . . . . . . . . . . . . . 196

ATLAS Technical Design ReportHigh-Level Trigger, Data Acquisition and Controls 30 June 2003
Contents xv
11.9.1 LHC . . . . . . . . . . . . . . . . . . . . . . 19611.9.2 Magnet system . . . . . . . . . . . . . . . . . . 19711.9.3 CERN technical services . . . . . . . . . . . . . . . 19711.9.4 Detector Safety System . . . . . . . . . . . . . . . 198
11.10 References . . . . . . . . . . . . . . . . . . . . . . 198
12 Experiment control . . . . . . . . . . . . . . . . . . . . . 20112.1 Introduction . . . . . . . . . . . . . . . . . . . . . . 20112.2 Detector control . . . . . . . . . . . . . . . . . . . . 20112.3 TDAQ control . . . . . . . . . . . . . . . . . . . . . 202
12.3.1 Control of the DataFlow . . . . . . . . . . . . . . . 20412.3.2 HLT farm supervision . . . . . . . . . . . . . . . . 204
12.4 Control coordination . . . . . . . . . . . . . . . . . . . 20512.4.1 Operation of the LHC machine . . . . . . . . . . . . . 20512.4.2 Detector states . . . . . . . . . . . . . . . . . . 20612.4.3 Operation of the TDAQ states . . . . . . . . . . . . . 20712.4.4 Inter-relation of states . . . . . . . . . . . . . . . . 208
12.5 Control scenarios . . . . . . . . . . . . . . . . . . . . 20912.5.1 Operational data-taking phases . . . . . . . . . . . . 209
12.5.1.1 Initialization . . . . . . . . . . . . . . . . 20912.5.1.2 Preparation . . . . . . . . . . . . . . . . 21012.5.1.3 Data taking . . . . . . . . . . . . . . . . 21112.5.1.4 Stopping . . . . . . . . . . . . . . . . . 21112.5.1.5 Shutdown . . . . . . . . . . . . . . . . . 211
12.5.2 Control of a physics run . . . . . . . . . . . . . . . 21212.5.3 Calibration run . . . . . . . . . . . . . . . . . . 21312.5.4 Operation outside a run . . . . . . . . . . . . . . . 213
12.6 References . . . . . . . . . . . . . . . . . . . . . . 214
Part 3 System Performance . . . . . . . . . . . . . . . . . . . . . 217
13 Physics selection and HLT performance . . . . . . . . . . . . . . 21913.1 Introduction . . . . . . . . . . . . . . . . . . . . . . 21913.2 The LVL1 trigger simulation . . . . . . . . . . . . . . . . 220
13.2.1 Configuration of the LVL1 trigger . . . . . . . . . . . . 22213.2.2 The calorimeter trigger and its simulation . . . . . . . . . 22213.2.3 The RPC muon trigger and its simulation . . . . . . . . . 22613.2.4 The Muon-to-CTP interface and its simulation . . . . . . . 22813.2.5 The LVL1 CTP and its simulation . . . . . . . . . . . . 22813.2.6 Interface to the HLT . . . . . . . . . . . . . . . . 229
13.3 Common tools for online HLT selection . . . . . . . . . . . . 22913.3.1 Algorithmic view of the Event Selection Software . . . . . . 23013.3.2 Event Data Model components . . . . . . . . . . . . . 231
13.3.2.1 Event Data organization . . . . . . . . . . . . 231
ATLAS Technical Design ReportHigh-Level Trigger, Data Acquisition and Controls 30 June 2003
xvi Contents
13.3.2.2 Raw Data Model components . . . . . . . . . . 23213.3.2.3 Reconstruction Data Model components . . . . . . 232
13.3.3 HLT algorithms for LVL2 . . . . . . . . . . . . . . 23413.3.3.1 IDSCAN . . . . . . . . . . . . . . . . . 23413.3.3.2 SiTrack . . . . . . . . . . . . . . . . . . 23513.3.3.3 TRTLUT . . . . . . . . . . . . . . . . . 23613.3.3.4 TRTKalman . . . . . . . . . . . . . . . . 23613.3.3.5 T2Calo . . . . . . . . . . . . . . . . . . 23613.3.3.6 muFast . . . . . . . . . . . . . . . . . . 23713.3.3.7 muComb . . . . . . . . . . . . . . . . . 238
13.3.4 HLT algorithms for EF . . . . . . . . . . . . . . . 23813.3.4.1 xKalman++ . . . . . . . . . . . . . . . . 23913.3.4.2 iPatRec . . . . . . . . . . . . . . . . . . 24013.3.4.3 LArClusterRec . . . . . . . . . . . . . . . 24113.3.4.4 egammaRec . . . . . . . . . . . . . . . . 24113.3.4.5 MOORE . . . . . . . . . . . . . . . . . 241
13.4 Signatures, rates and efficiencies. . . . . . . . . . . . . . . 24213.4.1 Electron and photon selection . . . . . . . . . . . . . 243
13.4.1.1 HLT electron selection performance . . . . . . . . 24413.4.1.2 HLT algorithm optimization and LVL2–EF boundary. . 246
13.4.2 Muon selection . . . . . . . . . . . . . . . . . . 24713.4.2.1 The physics performance of LVL2 muon algorithms . . 24813.4.2.2 The physics performance of the EF muon algorithm . . 24913.4.2.3 The timing performance of the muon algorithms . . . 251
13.4.3 Tau/Jets/ETmiss selection . . . . . . . . . . . . . . 25313.4.3.1 The tau trigger . . . . . . . . . . . . . . . 25313.4.3.2 ETmiss trigger . . . . . . . . . . . . . . . 25813.4.3.3 Triggering on jets . . . . . . . . . . . . . . 260
13.4.4 b-tagging . . . . . . . . . . . . . . . . . . . . 26013.4.4.1 LVL2 track reconstruction for b-tagging selection . . . 26113.4.4.2 b-tagging algorithm . . . . . . . . . . . . . 26213.4.4.3 Results on single b-jet tagging . . . . . . . . . . 26213.4.4.4 Comparison with offline b-tagging . . . . . . . . 263
13.4.5 B-physics . . . . . . . . . . . . . . . . . . . . 26313.4.5.1 Di-muon triggers . . . . . . . . . . . . . . 26513.4.5.2 Hadronic final states . . . . . . . . . . . . . 26513.4.5.3 Muon–electron final states . . . . . . . . . . . 26713.4.5.4 Resource estimates . . . . . . . . . . . . . . 268
13.5 HLT output rates to offline . . . . . . . . . . . . . . . . 26813.6 Start-up scenario . . . . . . . . . . . . . . . . . . . . 271
13.6.1 LVL2 trigger and EF commissioning . . . . . . . . . . . 27113.7 References . . . . . . . . . . . . . . . . . . . . . . 272
14 Overall system performance and validation . . . . . . . . . . . . 27714.1 Introduction. . . . . . . . . . . . . . . . . . . . . . 27714.2 High-Level Trigger prototypes . . . . . . . . . . . . . . . 277

ATLAS Technical Design ReportHigh-Level Trigger, Data Acquisition and Controls 30 June 2003
Contents xvii
14.2.1 Scope of measurement and validation studies . . . . . . . 27714.2.2 Event selection in a LVL2 prototype . . . . . . . . . . . 278
14.2.2.1 Prototype and software configuration . . . . . . . 27814.2.2.2 Measurements . . . . . . . . . . . . . . . 27914.2.2.3 Conclusions and outlook . . . . . . . . . . . . 283
14.2.3 Event selection in an Event Filter prototype . . . . . . . . 28314.2.3.1 Integration of EFD with ATHENA data access services . 28414.2.3.2 Prototype and software configuration . . . . . . . 28414.2.3.3 Measurements . . . . . . . . . . . . . . . 28414.2.3.4 Conclusions . . . . . . . . . . . . . . . . 285
14.2.4 The HLT vertical slice . . . . . . . . . . . . . . . . 28614.3 HLT CPU requirements . . . . . . . . . . . . . . . . . . 28714.4 The 10% testbed . . . . . . . . . . . . . . . . . . . . 288
14.4.1 Description of the 10% testbed . . . . . . . . . . . . . 28914.4.1.1 Readout sub-systems . . . . . . . . . . . . . 28914.4.1.2 RoI data collection . . . . . . . . . . . . . . 29014.4.1.3 Event building . . . . . . . . . . . . . . . 29014.4.1.4 Simultaneous RoI collection and event building . . . . 291
14.4.2 Preliminary results . . . . . . . . . . . . . . . . . 29114.5 Functional tests and test beam . . . . . . . . . . . . . . . 294
14.5.1 System configuration . . . . . . . . . . . . . . . . 29414.5.2 Finite state machine transitions. . . . . . . . . . . . . 29414.5.3 Monitoring. . . . . . . . . . . . . . . . . . . . 29514.5.4 Fault tolerance . . . . . . . . . . . . . . . . . . 29514.5.5 Conclusions and outlook . . . . . . . . . . . . . . . 295
14.6 Modelling results . . . . . . . . . . . . . . . . . . . . 29514.6.1 Paper model . . . . . . . . . . . . . . . . . . . 29514.6.2 Computer model . . . . . . . . . . . . . . . . . 296
14.6.2.1 Results of testbed models. . . . . . . . . . . . 29714.6.2.2 Results of extrapolation of the at2sim testbed model . . 29814.6.2.3 Results of the full system Simdaq model . . . . . . 30114.6.2.4 Conclusion. . . . . . . . . . . . . . . . . 306
14.7 Technology tracking . . . . . . . . . . . . . . . . . . . 30914.7.1 Status and prospects . . . . . . . . . . . . . . . . 309
14.7.1.1 The personal computer market . . . . . . . . . . 30914.7.1.2 Operating systems . . . . . . . . . . . . . . 31014.7.1.3 Networking . . . . . . . . . . . . . . . . 310
14.8 References . . . . . . . . . . . . . . . . . . . . . . 312
Part 4 Organisation and Plan . . . . . . . . . . . . . . . . . . . . 315
15 Quality assurance and development process . . . . . . . . . . . . 31715.1 Quality assurance in TDAQ . . . . . . . . . . . . . . . . 31715.2 Hardware development and procurement . . . . . . . . . . . 317
ATLAS Technical Design ReportHigh-Level Trigger, Data Acquisition and Controls 30 June 2003
xviii Contents
15.2.1 Reviews . . . . . . . . . . . . . . . . . . . . 31715.2.2 Testing . . . . . . . . . . . . . . . . . . . . . 318
15.3 The Software Development Process . . . . . . . . . . . . . 31915.3.1 Inspection and Review . . . . . . . . . . . . . . . 31915.3.2 Experience. . . . . . . . . . . . . . . . . . . . 32015.3.3 The development phases . . . . . . . . . . . . . . . 320
15.3.3.1 Requirements . . . . . . . . . . . . . . . 32015.3.3.2 Architecture and Design . . . . . . . . . . . . 32115.3.3.3 Implementation . . . . . . . . . . . . . . . 32115.3.3.4 Component and integration testing . . . . . . . . 32215.3.3.5 Maintenance . . . . . . . . . . . . . . . . 322
15.3.4 The Development Environment . . . . . . . . . . . . 32215.4 Quality Assurance during deployment . . . . . . . . . . . . 323
15.4.1 Quality Assurance from early deployment . . . . . . . . 32315.4.2 Quality Assurance of operations during data taking . . . . . 323
15.5 References . . . . . . . . . . . . . . . . . . . . . . 324
16 Costing . . . . . . . . . . . . . . . . . . . . . . . . . 32516.1 System evolution and staging. . . . . . . . . . . . . . . . 32516.2 Costing of components . . . . . . . . . . . . . . . . . . 32616.3 Categories of expenditures. . . . . . . . . . . . . . . . . 32616.4 Expenditure profile and system cost . . . . . . . . . . . . . 327
17 Organization and resources . . . . . . . . . . . . . . . . . . 32917.1 Project organization . . . . . . . . . . . . . . . . . . . 32917.2 Resources . . . . . . . . . . . . . . . . . . . . . . 33117.3 References . . . . . . . . . . . . . . . . . . . . . . 331
18 Workplan and schedule . . . . . . . . . . . . . . . . . . . 33318.1 Schedule . . . . . . . . . . . . . . . . . . . . . . . 333
18.1.1 System hardware . . . . . . . . . . . . . . . . . 33318.1.2 System software . . . . . . . . . . . . . . . . . . 333
18.2 Post-TDR workplan . . . . . . . . . . . . . . . . . . . 33418.2.1 Online Software workplan . . . . . . . . . . . . . . 335
18.2.1.1 Technology evaluation . . . . . . . . . . . . 33518.2.1.2 New features . . . . . . . . . . . . . . . . 335
18.2.2 DataFlow workplan . . . . . . . . . . . . . . . . 33618.2.3 High-Level Trigger workplan . . . . . . . . . . . . . 33618.2.4 Detector Control System workplan . . . . . . . . . . . 337
18.2.4.1 Front-End . . . . . . . . . . . . . . . . . 33718.2.4.2 Back-End . . . . . . . . . . . . . . . . . 337
18.2.5 Other issues to be addressed . . . . . . . . . . . . . 33818.3 Commissioning . . . . . . . . . . . . . . . . . . . . 339
18.3.1 Detector commissioning . . . . . . . . . . . . . . . 33918.3.1.1 Tools for detector commissioning. . . . . . . . . 339
18.3.2 HLT/DAQ Commissioning . . . . . . . . . . . . . . 34118.3.2.1 Tools for HLT/DAQ commissioning . . . . . . . 341

ATLAS Technical Design ReportHigh-Level Trigger, Data Acquisition and Controls 30 June 2003
Contents xix
18.3.2.2 Preparations for HLT/DAQ commissioning . . . . . 34118.3.2.3 Sequence of HLT/DAQ commissioning. . . . . . . 341
18.4 References . . . . . . . . . . . . . . . . . . . . . . 343
Appendices . . . . . . . . . . . . . . . . . . . . . . . . 345
A Paper model results . . . . . . . . . . . . . . . . . . . . . 347A.1 Input . . . . . . . . . . . . . . . . . . . . . . . . 347A.2 Results . . . . . . . . . . . . . . . . . . . . . . . . 349A.3 References . . . . . . . . . . . . . . . . . . . . . . 351
B Glossary . . . . . . . . . . . . . . . . . . . . . . . . . 353B.1 Acronyms . . . . . . . . . . . . . . . . . . . . . . 353B.2 Definitions . . . . . . . . . . . . . . . . . . . . . . 358
C Participating Institutes . . . . . . . . . . . . . . . . . . . . 365C.1 Authors from participating institutes . . . . . . . . . . . . . 365C.2 Authors from non-participating institutes . . . . . . . . . . . 368
ATLAS Technical Design ReportHigh-Level Trigger, Data Acquisition and Controls 30 June 2003
xx Contents

Part 1
Global View

ATLAS Technical Design ReportHigh-Level Trigger, Data Acquisition and Controls 30 June 2003
1 Overview 3
1 Overview
1.1 Document overview
This Technical Design Report (TDR) for the High-level Trigger (HLT), Data Acquisition (DAQ)and Controls of the ATLAS experiment builds on the earlier documents published on these sys-tems: Trigger Performance Status Report [1-1], DAQ, EF, LVL2 and DCS Technical Progress Re-port [1-2], and HLT/DAQ/DCS Technical Proposal [1-3]. Much background and preparatorywork relevant to this TDR is referenced in the above documents. In addition, a large amount ofdetailed technical documentation has been produced in support of this TDR. These documentsare referenced in the appropriate places in the following chapters.
This section introduces the overall organization of the document. The following sections give anoverview of the principal system requirements and functions, as well as a brief description ofthe principal data types used in the TDAQ system.
The document has been organized into four parts:
• Part I — Global View
Chapters 2, 3 and 4 address the principal system and experiment parameters which de-fine the main requirements of the HLT, DAQ and Controls system. The global system op-erations, and the physics requirements and event selection strategy are also addressed.Chapter 5 defines the overall architecture of the system and analyses the requirements ofits principal components, while Chapters 6 and 7 address more specific fault-toleranceand monitoring issues.
• Part II — System Components
This part describes in more detail the principal components and functions of the system.Chapter 8 addresses the final prototype design and performance of the Data Flow compo-nent. These are responsible for the transport of event data from the output of the detectorRead Out Links (ROLs) via the HLT system (where event selection takes place) to massstorage. Chapter 9 explains the decomposition of the HLT into a second level trigger(LVL2) and an Event Filter (EF) component. It details the design of the data flow withinthe HLT, the specifics of the HLT system supervision, and the design and implementationof the Event Selection Software (ESS). Chapter 10 addresses the Online Software which isresponsible for the run control and DAQ supervision of the entire Trigger/DAQ (TDAQ)and detector systems during data taking. It is also responsible for miscellaneous servicessuch as error reporting, run parameter accessibility, and histogramming and monitoringsupport. Chapter 11 describes the Detector Control System (DCS), responsible for the con-trol and supervision of all the detector hardware and of the services and the infrastructureof the experiment. The DCS is also the interface point for information exchange betweenATLAS and the LHC accelerator. Chapter 12 draws together the various aspects of exper-iment control detailed in previous chapters and examines several use-cases for the overalloperation and control of the experiment, including: data-taking operations, calibrationruns, and operations required outside data-taking.
• Part III — System Performance
Chapter 13 addresses the physics selection. The tools used for physics selection are de-scribed along with the event-selection algorithms and their performance. Overall HLT
ATLAS Technical Design ReportHigh-Level Trigger, Data Acquisition and Controls 30 June 2003
4 1 Overview
output rates and sizes are also discussed. A first analysis of how ATLAS will handle thefirst year of running from the point of view of TDAQ is presented. Chapter 14 discussesthe overall performance of the HLT/DAQ system from various points of view, namely theHLT performance as evaluated in dedicated testbeds, the overall performance of theTDAQ system in a testbed of ~10% ATLAS size, and functional tests of the system in thedetector test-beam environment. Data from these various testbeds are also used to cali-brate a detailed discrete-event -simulation model of data flow in the full-scale system.
• Part IV — Organization and Planning
Chapter 15 discusses quality-assurance issues and explains the software-developmentprocess employed. Chapter 16 presents the system costing and staging scenario.Chapter 17 presents the overall organization of the project and general system-resourceissues. Chapter 18 presents the short-term HLT/DAQ work-plan for the next phase of theproject as well as the global development schedule up to LHC turn-on in 2007.
1.2 Main system requirements
This section presents some of the principal requirements on the HLT/DAQ system from severalpoints of view. The response to these requirements in terms of the system design is then pre-sented in the later chapters of the document.
1.2.1 Rate requirements and event-selection strategy
The LHC proton bunches will cross at a frequency of 40 MHz. At the machine’s design luminos-ity of 1 × 1034 cm−2 s−1, on average about 23 inelastic proton–proton collisions will be producedat each bunch crossing. The level-1 trigger (LVL1) [1-4] will make the first level of event selec-tion, reducing the initial event rate to less than about 75 kHz. Operation at up to about 100 kHzis possible with somewhat increased deadtime. The HLT must reduce the event rate further toO(100) Hz. Each selected event will have a total size of ~1.5 Mbyte giving a required storage ca-pability of a few hundred Mbyte/s.
The ATLAS baseline assumes a maximum LVL1 rate of 75 kHz. However, for the purposes ofthe system design and costing, a maximum LVL1 rate of 100 kHz has been assumed in this doc-ument, in order to ensure that if ATLAS decides to run at this LVL1 rate, that the HLT/DAQsystem will be able to handle it.
ATLAS aims to use inclusive triggers as much as possible in its physics-selection strategy in or-der to maximise its physics coverage and to be as open as possible to new and possibly un-fore-seen signatures. The configuration of the entire trigger system, including LVL1, must besufficiently flexible that one can easily change both algorithms and their thresholds betweendata-taking runs. The system also needs to be able to respond rapidly to the consequences ofchanges in the beam conditions in terms of performance and stability.
1.2.2 Detector readout requirements
The HLT/DAQ system is required to handle data coming in parallel from the detector readoutdrivers (RODs) over some 1600 point-to-point readout links (ROLs), each having a maximum

ATLAS Technical Design ReportHigh-Level Trigger, Data Acquisition and Controls 30 June 2003
1 Overview 5
bandwidth of 160 Mbyte/s. Taking into account estimates of the bandwidth that will be used byeach detector, the total readout bandwidth to be dealt with after the LVL1 trigger is more than~160 Gbyte/s. This number depends on the detector occupancy as well as the LVL1 trigger rateand will vary considerably according to the luminosity being delivered by the LHC. Other im-portant aspects bearing on the total readout bandwidth are the data compression and zero sup-pression schemes which are still under study in some of the detector systems. A more detaileddescription of the detectors’ readout parameters can be found in Chapter 2.
1.2.3 Functional and operational requirements
The TDAQ system must be designed and constructed in such a way as to provide ATLAS withhighly reliable and efficient data-taking and event-selection capabilities. The huge investmentin both financial and human resources for the ATLAS detector itself, and also for the LHC ma-chine, means that data-taking operations must be established and optimized as soon as possibleafter first collisions in the LHC in 2007, in order to capitalize on this investment.
From early stages in the development of the ATLAS HLT/DAQ system, elements of the system(in particular those concerned with data acquisition) have been used and tested in a test beamenvironment, providing the data acquisition functionality and performance needed for the de-tector data taking. A major effort has been made to minimize the functional divergence betweenthe system used at the test beam and that being developed for the final experiment. Apart fromproviding a real-life, albeit scaled down, testing facility for the HLT/DAQ system, this policyhas the advantage of familiarizing the detector communities in ATLAS with the HLT/DAQ sys-tem at an early stage. Some of the elements of the system (those closest to the detector readout,and their associated control and supervision functions) will be required by the detectors duringtheir commissioning phases, both above and below ground. Requiring that the detectors be ableto use and give feedback on the HLT/DAQ system well in advance of this, therefore offers con-siderable advantages both to TDAQ and to the detector communities in terms of easing the in-stallation and commissioning phase of the experiment.
An essential requirement on the HLT/DAQ system which will be particularly important in thecommissioning and installation phase is the ability to partition the system into several inde-pendent but fully-functional entities. It must be possible for several detectors and/or severalparts of a given detector to be triggered and to take data in parallel and independently of eachother. This is in order to facilitate and render as parallel as possible the detector debugging andcommissioning operations. During physics running, it will be necessary to have the capabilityto run a partition of an element of a given detector in test mode, to help track down a fault,while the rest of the ATLAS detector is taking data normally.
The DCS is an integral part of the TDAQ system and assumes a particular role in assuring thecoherent, safe operation and monitoring of all components of the ATLAS detector. Although itis highly integrated with other parts of the system, the DCS has the particular requirements ofbeing operational 24 hours a day, seven days a week and of being highly fault tolerant. Theprincipal elements of the DCS must be installed and commissioned in time for the first detectorcommissioning operations which will begin in early 2005. These elements must be able to oper-ate in a standalone mode i.e. without depending on other parts of the HLT/DAQ system beingavailable.
Constraints of floor space and cooling capacity, in particular in the underground experimentalcavern and adjoining service rooms, limit the number of racks available to the HLT/DAQ sys-tem. The proposed location of the HLT/DAQ racks is presented in Section 5.5.11.
ATLAS Technical Design ReportHigh-Level Trigger, Data Acquisition and Controls 30 June 2003
6 1 Overview
1.2.4 Requirements due to the long expected lifetime of ATLAS
The installation and commissioning phase of ATLAS [1-5] will take in excess of four years andthe experiment is expected to take data for fifteen years or more. This timescale puts a strongpremium on the requirement for a highly modular and cost-effective system design. This facili-tates the replacement or upgrading of specific elements of the system in a manner that will havelittle or no side effects on neighbouring elements.
Experience has shown that custom electronics is more difficult and expensive to maintain in thelong term than comparable commercial products. The use of commercial computing and net-work equipment, and the adoption of commercial protocol standards such as Ethernet, wherev-er appropriate and possible, is a requirement which will help us to maintain the system for thefull lifetime of the experiment. The adoption of widely-supported commercial standards andequipment at the outset will also enable us to benefit from future improvements in technologyby rendering equipment replacement and upgrade relatively transparent. An additional benefitof such an approach is the highly-competitive commercial market which offers high perform-ance at low cost.
1.3 System components and functions
In this section, the principal components andfunctions of the baseline HLT/DAQ systemare described very briefly in order to give thereader an overview of the system before pro-ceeding to the subsequent chapters where de-tailed descriptions are given. A schematicdiagram is presented in Figure 1-1. HLT/DAQcan be broken down into four principal sys-tems, namely:
• The Data Flow system — responsible forreceiving the detector data, serving of asubset of data to the HLT system, andtransporting the data for selected eventsto mass storage
• The HLT system — responsible for thepost-LVL1 event selection and filteringinvolving a rate reduction of a factor ofseveral hundred, and for the classifica-tion of all accepted events
• The Online system — responsible for allaspects of experiment and TDAQ opera-tion and control during data-taking, andduring testing and calibration runs
• The DCS — responsible for the coherentand safe operation of the ATLAS detec-tor, as well as the interface with externalsystems and services including the LHC itself.
Figure 1-1 Principal components of the Data Flowand HLT systems
Mass Storage
SFOs
SFIs
DFM
L2SVs
RoIB
LVL1
CALO MUON TRACKING
memoriespipelineFront−end
RODs
LVL2 & EB
Networks
ROB ROB
ROLs
RoIs
Detectors
ROSs
EF Farms
L2 Farms

ATLAS Technical Design ReportHigh-Level Trigger, Data Acquisition and Controls 30 June 2003
1 Overview 7
The Online system is implicitly understood to be connected to all elements in Figure 1-1, andthe DCS to all hardware elements which need to be monitored and controlled.
1.3.1 The Data Flow system
ATLAS decided early on to define the boundary between the detector readout and the data ac-quisition to be at the input of the Read Out Buffers (ROBs) [1-6]. The ROLs, for which there is anagreed ATLAS standard, transport data fragments of LVL1-accepted events from the detectors’RODs to the ROBs. The Read Out Systems (ROS’s) each contain several ROBs.
Requested data fragments from selected ROBs are served to the LVL2 trigger element of theHLT system. Event data fragments for LVL2-accepted events are then built, on the initiation ofthe Data Flow Manager (DFM), from the ROBs, across a switched Ethernet network, into a com-plete event by one of the ~100 Sub-Farm Interfaces (SFIs). The SFIs then serve the completeevents to the second element of the HLT system, the Event Filter (EF). Events selected by the EFfor final archiving in preparation for offline reconstruction and primary analysis are passed topermanent storage via the final element of the Data Flow system, the Sub-Farm Output (SFO).
Most of the element interconnection in the Data Flow system is done using standard GigabitEthernet network and switching technology. The maximum network bandwidth capacity re-quired for building events accepted by the LVL2 trigger is expected to be ~5 Gbyte/s, much lessthan the aggregate data rate into the RODs for events retained by LVL1.
1.3.1.1 ROD-crate data acquisition
The detector ROD crates contain a variety of modules, including: the RODs themselves, mod-ules used for control of the Front-end Electronics and for processing event data upstream of theRODs, as well as one or more ROD Crate Processors (RCPs). They may also contain reduced-functionality ROD prototypes in laboratory set-ups or at test beams. Each ROD Crate is con-nected by a local-area Ethernet network to one or more ROD Crate Workstations (RCWs).
The detector communities need common DAQ functionality at the level of the ROD Crate inseveral environments: in laboratory set-ups; for performing tests during assembly of their de-tectors; at test beams; and also in-situ at the experiment during commissioning and when run-ning with beam. The ROD-Crate DAQ [1-7] provides this functionality and is part of the HLT/DAQ system itself. It comprises all common software for operating one or more ROD Crates,and it runs inside the ROD Crate (on RCPs) as well as on the RCWs. It provides the functionali-ty for configuration and control, ROD emulation, monitoring, calibration at the level of the RODCrate, and event building across multiple ROD Crates. The system is described in more detail inChapter 8.
1.3.2 The High-Level Trigger system
The HLT system is comprised of the LVL2 trigger and the Event Filter. Although these will bothbe built using farms of standard PCs interconnected by Ethernet networks, they differ in severalimportant respects. A combination of high rejection power with fast, limited precision algo-rithms using modest computing power in LVL2, and modest rejection power with slower, highprecision algorithms using more extensive computing power in the EF is a cost-effective andflexible way to implement the HLT.
ATLAS Technical Design ReportHigh-Level Trigger, Data Acquisition and Controls 30 June 2003
8 1 Overview
The LVL2 trigger must work at the LVL1 accept rate with an average event treatment time of~10 ms. In order to operate within this time budget, the LVL2 trigger will use a sequence ofhighly optimized trigger selection algorithms which operate on only a fraction (typically ~2%)of the event data. The LVL1 trigger identifies regions in the detector where it has found interest-ing features, so-called Regions Of Interest (RoIs) [1-4]. The RoI Builder (RoIB) combines the RoIinformation from the various parts of the LVL1 trigger and passes it to the LVL2 Supervisor(L2SV). The L2SV allocates an event to one of the computing nodes in the LVL2 farm and trans-fers the RoI information for the event to the allocated processor (see Figure 1-1). These RoIs arethen used to seed the LVL2 algorithms. This enables the algorithms to select precisely the regionof the detector in which the interesting features reside and therefore the ROBs from which to re-quest the data for analysis. Data requests may be done several times per event by different HLTalgorithms that progressively refine the selection. At each stage in the processing an event maybe rejected. Each LVL2 processor can treat several events concurrently.
The LVL2 trigger decisions are communicated, via the L2SV, to the DFM for event deletion orbuilding. It should be noted that all the data for a given event are stored in the ROBs during theLVL2 processing and, for selected events, until the event building process is completed.
The Event Filter has to work at the LVL2 accept rate with an average event treatment time of~1 s. Compared to LV2, more sophisticated reconstruction and trigger algorithms, tools adaptedfrom those of the offline, and more complete and detailed calibration information are used herein making the selection. The EF receives fully built events from the SFI and so the entirety of thedata is available locally for analysis. All the selection processing for a given event is done in asingle processor of the EF processor farm. Events not selected by the EF are deleted and thoseaccepted are passed to the SFO for transmission to mass storage.
The scope, complexity, degree of generality, and precision of measured quantities (including pT,ET, and isolation variables) of the LVL2 and EF algorithms is different. The overall framework ofthe ESS in which they operate has been designed in such a way that all the algorithms may bedeveloped in the same (offline) development environment and have the same data-interfacedefinition. The detailed implementation of this interface is, however, different in each case. Thisapproach has the major advantage of having a high degree of development commonality andflexibility of scope across the spectrum of the HLT and the offline, as well as facilitating per-formance comparisons.
1.3.3 The Online Software system
The Online Software system is responsible for configuring, controlling, and monitoring theTDAQ system, but excludes any management, processing, or transportation of event data. It is aframework which provides the glue between the various elements of the DAQ, HLT and DCSsystems, and defines interfaces to those elements. It also includes information-distribution serv-ices and access to configuration and other meta-data databases.
An important part of the Online software is to provide the services that enable the TDAQ anddetector systems to start up and shut down. It is also responsible for the synchronization of thethe entire system, and the supervision of processes. Verification and diagnostics facilities helpwith the early detection of problems. The configuration services provide the framework forstoring the large amount of information required to describe the system topology, includinghardware and software components. During data taking, access is provided to monitoringtasks, histograms produced in the TDAQ system, and also the errors and diagnostics messages

ATLAS Technical Design ReportHigh-Level Trigger, Data Acquisition and Controls 30 June 2003
1 Overview 9
sent by different applications. One or more user interfaces display the available information andenable the user to configure and control the TDAQ system.
1.3.4 The Detector Control system
The DCS supervises all hardware of the experimental set-up, including all detector systems ofATLAS and the common experimental infrastructure. It also communicates with external sys-tems like the infrastructure services of CERN and most notably with the LHC accelerator.
Safety aspects are treated by DCS only at the least-severe level. This concerns mainly questionsof sequencing operations or requiring specific conditions to prevail before allowing certain pro-cedures to be executed. Tools for interlocks, both in hardware and in software, are also providedby DCS. Monitoring and prevention of situations which could cause major damage to the detec-tor or even endanger people’s lives are the responsibility of a dedicated Detector Safety System(DSS), and the CERN-wide safety and alarm system, respectively. DCS interacts with both ofthese systems.
All actions initiated by the operator and all errors, warnings, and alarms concerning the hard-ware of the detector are handled by DCS. It provides online status information to the level ofdetail required for global system operation. The interaction of detector experts with their detec-tor is also done via DCS. DCS continuously monitors all operational parameters, gives guidanceto the operator, and signals any abnormal behaviour. It must also have the capability to take ap-propriate action automatically if necessary and to bring the detector to a safe state.
Concerning the operation of the experiment, close interaction with the DAQ system is of primeimportance. Good-quality physics data requires detailed synchronization between the DAQsystem and DCS. Both systems are complementary in as far that the DAQ deals with the datadescribing a physics event (characterized by an event number), while DCS treats all data con-nected with the hardware of the detector related to the operational state of the detector whenthe data were taken (categorized by a time interval). The correlation between them is requiredfor offline analysis.
Some parts of the detector will operate continuously because any interruption is costly in timeor money, or may even be detrimental to the performance of that detector. Hence supervision byDCS is needed continuously. The DAQ system in contrast is required only when physics dataare taken or during specific monitoring, calibration, or testing runs. Therefore DCS needs com-plete operational independence. This must, however, not result in boundaries which limit func-tionality or performance. Therefore both DAQ and DCS share elements of a common softwareinfrastructure.
1.4 Data types
The TDAQ system has to deal with several broad classes of data which possess different charac-teristics. These classes are introduced here briefly and discussed in more detail later in the doc-ument.
• Detector control data
The DCS system will produce large amounts of system status and hardware-parameterdata at frequencies of up to of order 1 Hz. However, if the system being monitored is in a
ATLAS Technical Design ReportHigh-Level Trigger, Data Acquisition and Controls 30 June 2003
10 1 Overview
stable condition, it can be expected that these values will change little over periods of sev-eral hours or more. The important quantity to monitor in many cases will therefore bevariations of the values read rather than the values themselves, thus reducing the need totransport and store large quantities of very similar data across the DCS and online controlnetworks. A more detailed discussion of DCS data handling can be found in Chapter 11.
• Event data
Event data are those read out from the detectors following a trigger, with the addition ofthe data produced by the various stages of the trigger itself while processing the event.The detailed internal format of these data is defined by the characteristics of each detec-tor’s readout electronics. However, the data are surrounded by headers and trailers in a‘raw data event’ format that is common across the experiment [1-8]. Event data are repre-sented physically as a single stream of bytes, which is subsequently referred to as a‘bytestream’. Prior to their use in the HLT, bytestream data are reformatted and convertedinto quantities more suitable for the selection algorithms (see Chapter 9). Bytestream datafrom events accepted by the HLT will be stored in mass storage in preparation for theprompt reconstruction — the first step in the offline analysis. Event data are transportedby the Data Flow central network.
• Configuration data
These data are used to configure the TDAQ and detector systems in preparation for data-taking and they define the precise configuration of the system used for a particular run.Examples of this data type include electronics parameters and thresholds, module map-ping, software executables, network parameters, trigger parameters and thresholds, high-voltage values, etc. A given data-taking run is defined by an unique set of configurationdata. The run’s configuration data are stored in and accessed from a dedicated in-memorydatabase during data taking. Configuration data are transported over the Online controlnetwork.
• Conditions data
Conditions data include all data that are relevant for the complete analysis of any givenselection of event data and include data from some of the above categories. Conditionsdata will be stored for the lifetime of the experiment and are labelled by Interval-of-Valid-ity (IOV) tags. The conditions data for a given run will include all the configuration dataused for that run, the associated DCS data, detailed detector calibration data, magnet cal-ibration, etc. Conditions data will be produced and accessed in many different areas ofthe experiment, both online and offline. Conditions data in the TDAQ system are trans-ported over the DCS and Online control networks.
• Online statistics and monitoring data
This type of data will be produced in large quantities by both the detectors and the TDAQsystem during data taking. They are similar in some respects to DCS data in that in manycases, the monitoring and observation of the variation of parameters is more importantthan the parameter values themselves. This data type will be transported by both the cen-tral Data Flow network (in the case of data being sampled from the main event data flowfor monitoring purposes e.g. to produce detector wire-maps etc.) and the Online controlnetwork. This subject is addressed in detail in Chapter 7.

ATLAS Technical Design ReportHigh-Level Trigger, Data Acquisition and Controls 30 June 2003
1 Overview 11
1.5 Long-term issues and perspectives
A more detailed view of HLT/DAQ planning for the immediate future is described inChapter 18, but it is useful to set out the principal elements of the overall ATLAS planning here.In the current ATLAS installation schedule [1-5], the initial detector will be completed in De-cember 2006, ready for the first LHC collisions in April 2007. A cosmic ray run is planned in Au-tumn 2006. In its first year of operation, the target is for the LHC to attain a luminosity of2 × 1033 cm−2 s−1. The installation schedule of the HLT/DAQ system is dictated both by con-straints coming from the installation of the system itself, as well as by the detector installationand commissioning schedule. In particular, the needs of the detectors for HLT/DAQ servicesduring that time should be fulfilled.
The first elements of the HLT/DAQ system will be required by the detectors in early 2005, andthe ROD-crate DAQ system (Section 1.3.1.1) in late 2004. The required HLT/DAQ elements arethose directly involved in the initial detector readout, such as the ROBs, as well as some specificassociated software elements and the complete DCS system. These components are well ad-vanced, with in many cases final prototypes or production modules being available now or atthe latest by the end of 2003. The use of these elements in the ATLAS test beam has already beennoted as one important element in their development. Elements of the system further down thechain, in particular the HLT farms, their interconnections, and software will be required later.The description of these elements in this TDR documents the current status of development ofthe system. It is clearly desirable to purchase computing and network hardware as late as possi-ble, while being consistent with the ATLAS schedule, to benefit from the latest technological de-velopments. It is vital that maximum flexibility be kept in both the system schedule and designin order to facilitate this.
The increasing size and timescale of high-energy physics experiments means that their associat-ed software is becoming increasingly complex. The software will have to be maintained andsupported over periods of fifteen years or more by people who will come and go from the ex-periment on a much shorter timescale. In order to ease the long-term maintenance issues, a bigemphasis in HLT/DAQ is being given to the use of a well-defined and appropriate software-de-velopment process (see Chapter 15), to coherent error handling and fault tolerance (seeChapter 6), and to documentation.
The use of test beams to validate and test the designs and prototype implementations of ele-ments of the system has already been mentioned. However, this offers testing on a very smallscale compared to that of the final experiment (test-beam implementations typically have just afew VME-bus crates and their associated support services). Therefore, it is desirable to test thesystem also on testbeds which are as large as possible within budget constraints. Furthermore,experience shows that many performance and functionality issues will only appear when test-ing on larger prototypes and testbeds. Nevertheless these testbeds may only represent some10–20% of the final system size and so the extrapolation of measurements from them to the fullsystem via advanced modelling techniques is also a vital element in the overall system-designvalidation. Testbed and modelling results for the system are presented and discussed inChapter 14.
As mentioned at the beginning of this chapter, several design and technical documents precedethis TDR. Further design documents will be produced by ATLAS before the start of data taking,notably the offline computing TDR which is expected in some two years from now. The offlinecomputing TDR document will present a continuation and more complete analysis of some as-pects addressed already in this TDR. In particular it will further address the areas of the Event
ATLAS Technical Design ReportHigh-Level Trigger, Data Acquisition and Controls 30 June 2003
12 1 Overview
Selection Software and performance, the definition of and access to conditions (calibration) dataonline, and the architecture of the mass storage and prompt reconstruction system, which im-mediately follow the output of the EF.
1.6 Glossary
A complete glossary can be found in Appendix B. This section addresses a few general nomen-clature issues to assist the reader. For the purposes of this document, the following principaldefinitions are assumed:
• Detector — one of the several principal detectors of ATLAS such as the muon detector,the calorimeter detector, and tracking detector.
• The ATLAS Detector — the integrated complete set of detectors used to form the ATLASexperiment.
• Sub-detector — component parts of detectors such as a liquid argon calorimeter or themuon RPCs.
• System — the component systems of the TDAQ are the LVL1 trigger together with thosedefined in Section 1.3.
• Sub-system — the component parts of any of the above TDAQ systems, e.g., the LVL2trigger, the LVL1 muon trigger.
• TDAQ — comprises the LVL1 trigger, HLT and DAQ (including DCS).
• HLT/DAQ — the TDAQ excluding the LVL1 trigger.
1.7 References
1-1 ATLAS Collaboration, ATLAS Trigger Performance Status Report, CERN/LHCC/98-015 (1998)
1-2 ATLAS Collaboration, ATLAS DAQ, EF, LVL2 and DCS Technical Progress Report,CERN/LHCC/98-016 (1998)
1-3 ATLAS Collaboration, ATLAS High-Level Triggers, DAQ and DCS Technical Proposal,CERN/LHCC/2000-017 (2000)
1-4 ATLAS Collaboration, ATLAS Level-1 Trigger Technical Design Report, CERN/LHCC/98-014 (1998)
1-5 ATLAS Installation,http://cern.ch/Atlas/TCOORD/Activities/TcOffice/Scheduling/Installation/ATLASinstallation.html
1-6 ATLAS Trigger-DAQ Steering group, Trigger & DAQ Interfaces with Front-End Systems: Requirement Document version 2.0, ATLAS EDMS Note, ATL-D-ES-0013 (1998)https://edms.cern.ch/document/384600/
1-7 ROD Crate DAQ Task Force, Data Acquisition for the ATLAS Read-out Driver Crate (ROD Crate DAQ), ATLAS EDMS Note, ATL-D-ES-0007 (2002)https://edms.cern.ch/document/344713/

ATLAS Technical Design ReportHigh-Level Trigger, Data Acquisition and Controls 30 June 2003
1 Overview 13
1-8 C. Bee et al., The raw event format in the ATLAS Trigger & DAQ, ATLAS Internal Note, ATL-DAQ-98-129 (1998)
ATLAS Technical Design ReportHigh-Level Trigger, Data Acquisition and Controls 30 June 2003
14 1 Overview

ATLAS Technical Design ReportHigh-Level Trigger, Data Acquisition and Controls 30 June 2003
2 Parameters 15
2 Parameters
This chapter presents the parameters relevant to the HLT/DAQ system. These include the de-tector-readout and the trigger and Data Flow parameters needed for the correct dimensioningof the Data Flow system and for understanding the data volumes that will need to be stored.These are the subjects of the first two sections. Many of the parameter values have been extract-ed from a static model of the system that depends on certain input parameters such as the LVL1trigger rate. More details are given in Appendix A.
Other important parameters for the correct definition of the system are those coming from themonitoring and calibration requirements. These are discussed in the following two sections.
The last section is dedicated to the DCS parameters. The extent of configuration-data traffic forstart-up, configuration, and re-configuration of possible faulty elements, and the type of dataproduced are discussed.
2.1 Detector readout parameters
The ATLAS detector consists of three main detection systems: the Inner Detector, the Calorime-ters, and the Muon Spectrometer. These systems are divided into sub-detectors.
The Inner Detector consists of three sub-detectors: Pixels, SCT and TRT [2-1], [2-2]. The Pixelssub-detector consists of semiconductor detectors with pixel readout. It is divided into two end-caps, an innermost barrel ‘B-layer’, and two outer barrel layers. All are divided into φ regions.The SCT sub-detector is built from silicon microstrip detectors. It is sub-divided into two end-caps and a barrel part. The latter is sub-divided into two regions, one for positive and the otherfor negative η. The TRT sub-detector is a tracking detector built from straw tubes and radiator.It identifies highly-relativistic particles by means of transition radiation.
The ATLAS Calorimeters consist of a Liquid Argon System and a Tilecal System. The LAr Sys-tem comprises the barrel electromagnetic, endcap electromagnetic, endcap hadron, and forwardcalorimeters, which use liquid argon as active medium [2-3]. The barrel and two extended-bar-rel hadronic calorimeters, together form the Tilecal calorimeter. They use plastic scintillatortiles, read out via optical fibres and photomultipliers, as active medium and iron as absorber [2-4].
The Muon Spectrometer is divided into a barrel part and two endcaps. The barrel consists ofprecision chambers based on Monitored Drift Tubes (MDTs), and trigger chambers based on Re-sistive Plate Chambers (RPCs). The two endcaps contain both MDTs and another type of triggerchamber: Thin Gap Chambers (TGCs). Furthermore at large pseudo-rapidity and close to the in-teraction point, Cathode Strip Chambers (CSCs) are used in the forward regions [2-5].
The LVL1 is another source of data for the DAQ system — it provides intermediate and final re-sults from the trigger processing that is combined with the detector data to form the completeevent [2-6].
The organization of the ATLAS detector readout is specified in Table 2-1 in terms of partitions,data sources (the RODs), Read Out Links (ROLs), and Read Out Systems (ROS), assuming that amaximum of 12 ROLs can be connected to a single ROS sub-system. These numbers are almostfinal, but small changes may still occur due to further developments in the detector RODs. The
ATLAS Technical Design ReportHigh-Level Trigger, Data Acquisition and Controls 30 June 2003
16 2 Parameters
information in the table is based mainly on information provided by the sub-detector groupsduring the Third ATLAS ROD Workshop held in Annecy in November 2002 [2-7]. The parti-tions used coincide with the TTC partitions described in [2-6]. A ROD module, ROD crate, andROS are associated with a single partition. Each partition can function independently.
In the following, the official ATLAS coordinate system will be used, therefore the definitions ofthis system are briefly summarized [2-8].
The X axis is horizontal and points from the Interaction Point (IP) to the LHC ring centre. The Zaxis is parallel to the beam direction. The Y axis is perpendicular to X and to Z.
The φ angle is measured from the polar X axis with positive values in the anti-clockwise direc-tion. The pseudorapidity η is measured from the Y axis, positive towards Z-positive.
A and C are the labels used to identify the two sides of any ATLAS component with respect tothe pseudorapidity η = 0. They correspond to the convention of the two sides of the ATLAS cav-ern. If the Z axis is defined as the one along the beam direction, when looking from inside theLHC ring, the positive Z is in the left direction. The positive Z is identified as side A. The nega-tive Z is in the right direction and is identified as side C.
Table 2-1 The distribution of the RODs and ROS unit (assuming at maximum 12 ROLs per ROS unit)per detector per partition
Sub-detector Partition RODs
RODcrates ROLs ROS unit
ROLs perROS unit
Pixel
B Layer 44 3 44 4 3 × 12 + 8
Disks 12 1 12 1 1 × 12
Layer 1 + 2 38 + 26 4 38 + 26 6 5 × 12 + 4
SCT
Barrel A 22 2 22 2 1 × 12 + 10
Barrel C 22 2 22 2 1 × 12 + 10
Endcap A 24 2 24 2 2 × 12
Endcap C 24 2 24 2 2 × 12
TRT
Barrel A 32 3 32 3 2 × 12 + 8
Barrel C 32 3 32 3 2 × 12 + 8
Endcap A 84 7 84 7 7 × 12
Endcap C 84 7 84 7 7 × 12
LAr
EMBarrel A 56 4 224 19 18 × 12 + 8
EMBarrel C 56 4 224 19 18 × 12 + 8
EMEC A 35 3 138 12 11 × 12 + 6
EMEC C 35 3 138 12 11 × 12 + 6
FCAL 4 1 16 2 1 × 12 + 4
HEC 6 1 24 2 2 × 12

ATLAS Technical Design ReportHigh-Level Trigger, Data Acquisition and Controls 30 June 2003
2 Parameters 17
It is worth mentioning that the initial ATLAS detector will lack some components for initial datataking with the first LHC collisions in Spring 2007 because of funding limitations. The necessityof staging the detectors has an impact on the number of ROLs required in the initial period forsome detectors. The Pixel sub-detector will initially be missing Layer 1 [2-2], the TRT sub-detec-tor will initially not have the two end-cap ‘C’-wheels [2-1], and the CSC sub-detector will lackeight chambers per endcap [2-5]. In addition, for the LAr sub-detector the instrumentation ofthe RODs will be staged by using only half of the Digital Signal Processor (DSP) boards and re-arranging the ROD output to reduce by a factor two the number of ROLs [2-3]. This initial stag-ing scenario is summarized in Table 2-2.
Tilecal
Barrel A 8 1 16 2 1 × 12 + 4
Barrel C 8 1 16 2 1 × 12 + 4
Ext Barrel A 8 1 16 2 1 × 12 + 4
Ext Barrel C 8 1 16 2 1 × 12 + 4
MDT
Barrel A 48 4 48 4 4 × 12
Barrel C 48 4 48 4 4 × 12
Endcap A 48 4 48 4 4 × 12
Endcap C 48 4 48 4 4 × 12
CSCEndcap A 8 + 8 1 16 2 1 × 12 + 4
Endcap C 8 + 8 1 16 2 1 × 12 + 4
RPCBarrel A 16 1 16 2 1 × 12 + 4
Barrel C 16 1 16 2 1 × 12 + 4
TGCEndcap A 8 1 8 1 1 × 8
Endcap C 8 1 8 1 1 × 8
LVL1Trigger
MIROD 1 1 1
5 4 × 12 + 8
RoIa 6
2
6
CPa 4 16
JEPa 4 16
PPa 4 8 16
CTP 1 1 1
Total 33 960 90 1600 144
a. RoI, CP, JEP, and PP RODs belong to the LVL1 processing group (Calorimter).
Table 2-1 The distribution of the RODs and ROS unit (assuming at maximum 12 ROLs per ROS unit)per detector per partition
ATLAS Technical Design ReportHigh-Level Trigger, Data Acquisition and Controls 30 June 2003
18 2 Parameters
2.2 Trigger and Data Flow parameters
Table 2-3 presents an overview of typical values of data-transfer and request rates, and ofthroughput for a LVL1 rate of 100 kHz at start-up and design luminosity (we recall that the AT-LAS architecture supports a LVL1 accept rate of 75 kHz, upgradeable to 100 kHz). Detailed sim-ulation of the LVL1 trigger, with menu settings chosen to cover the ATLAS physics programme(see Chapter 4) within tight cost constraints, shows that the expected accept rate at LHC start-up luminosity (2 × 1033 cm−2 s−1) will be ~25 kHz (see Section 13.5), and that at design luminos-ity (1 × 1034 cm−2 s−1) it will be ~40 kHz. Note that there are very large uncertainties on theserate estimates mainly due to uncertainties on the underlying cross-sections and the backgroundconditions, but also from the model of the detector and the trigger used in the simulation. Asimulation of the LVL2 trigger at start-up luminosity indicates a mean rejection factor of ~30 rel-ative to LVL1 [2-9]. The numbers presented in the table are therefore estimates of the requireddesign and performance capabilities of the system, and allow for a ‘safety factor’ of 4 in theLVL1 accept rate for start-up luminosity, and 2.5 at design luminosity.
The data needed for the LVL2 trigger and the type of processing performed, depend on the Re-gions of Interest (RoIs) supplied by the LVL1 trigger. Each of the four different types of RoI(‘muon’, ‘electron/gamma’, ‘jet’, and ‘tau/hadron’) has its own characteristic type of process-ing. The processing consists of several steps and after each step a decision is taken on whetherdata from other sub-detectors within the RoI should be requested for further analysis. The datarates can be estimated with the help of information on the type, rate, sizes, and locations of theRoI, and on the mapping of the detector onto the ROLs. More details are provided inAppendix A.
The size of the HLT farms and the number of Sub-Farm Inputs (SFIs) have been estimated, as-suming the use of 8 GHz dual-CPU PCs for the LVL2 and EF processors, and 8 GHz single-CPUcomputer servers for the SFIs. At a LVL1 rate of 100 kHz, about 500 dual-CPU machines wouldbe needed for LVL2. About 50–100 SFIs would be required, assuming an input bandwidth per
Table 2-2 Number of RODs and ROLs for the initial and final ATLAS detector
Initial detector Final detector
Sub-detectorNumber of
RODsNumber of
ROLsNumber of
RODsNumber of
ROLs
Pixel 82 82 120 120
SCT 92 92 92 92
TRT 192 192 232 232
LAr 192 382 192 764
Tilecal 32 64 32 64
MDT 192 192 192 192
CSC 16 16 32 32
RPC 32 32 32 32
TGC 16 16 16 16
LVL1 24 56 24 56

ATLAS Technical Design ReportHigh-Level Trigger, Data Acquisition and Controls 30 June 2003
2 Parameters 19
SFI of ~60 Mbyte/s. For the Event Filter, approximately 1500 dual-CPU machines would beneeded for a ~3 kHz event-building rate and an average processing time of one second perevent. More details on these estimates are provided in Chapter 14 and its references.
2.3 Monitoring requirements
Monitoring may be done locally to the HLT/DAQ or detector systems, and/or remotely, whichwould require the transfer of event fragments on a sampling basis to remote analysis software.The concepts of sources and destinations of the monitoring traffic are introduced and a prelimi-nary list is reported in Table 2-4. Investigations are under way to identify the principal sourcesand destinations of monitoring traffic and the network traffic that monitoring data-transfer willgenerate.
The following sources of monitoring data can be identified:
• ROD crates (and LVL1 trigger crates)
• ROS
• SFI
• HLT processors (LVL2, EF).
Possible destinations are:
• Workstations, e.g. in the main Control Room (SCX1), dedicated to monitoring specificsub-systems.
Table 2-3 Typical values and rates in the HLT/DAQ system for a 100 kHz LVL1 trigger rate
Start-up luminosity Design luminosity
Average number of ROLs supplying data to LVL2 per LVL1 accept
17.9 16.2
Average number of groups of 12 ROLs supplying data toLVL2 per LVL1 accept
9.1 8.5
Maximum throughput requested per ROL (Mbyte/s) 8.9 8.4
Maximum LVL2 request rate for data from a single ROL (kHz)
7.4 6.3
Maximum throughput requested per group of 12 ROLsa
(Mbyte/s)70 68
Maximum LVL2 request rate per group of 12 ROLs (kHz) 21 19
Total LVL2 throughput (Gbyte/s) 1.6 1.5
Event Building rate (kHz) 3.0 3.5
Total Event Builder throughput (Gbyte/s) 3.6 5.3
a. Fragments of the same event input via different ROLs are assumed to be requested by a single messageand to be concatenated and output also as a single message.
ATLAS Technical Design ReportHigh-Level Trigger, Data Acquisition and Controls 30 June 2003
20 2 Parameters
• Online monitoring farm (possibly a sub-set of the EF Farm). Although the precise locationof this is not yet defined, monitoring results from the Online Monitoring farm will bemade available in the main ATLAS Control Room.
More details on monitoring during data taking can be found in Chapter 7 and in Ref. [2-6].
Table 2-4 summarizes the present knowledge of the relations between the sources and the desti-nations for monitoring. This is based on a survey where detector and physics groups wereasked to quantify their monitoring needs, details of which can be found in Ref. [2-7]. Some fig-ures for the expected traffic generated by monitoring are still missing, but the ones quoted hereshould be considered as a reasonable upper limit. The transport medium used for event frag-ments used for monitoring coming from the ROS is not yet clear. Most other monitoring datawill be transferred on the Control network (i.e. standard TCP/IP on Fast or Gigabit EthernetLAN).
2.4 Calibration requirements
The calibration of sub-detectors is another important source of data for the experiment. For eachsub-detector and each type of calibration, the data may flow from the front-end electronics,through the RODs, to the ROD Crate Controller or to the same Data Flow elements used duringthe normal data taking, i.e. to the ROS and up to the Sub-Farm Output.
The data volumes and bandwidths involved for each sub-detector calibration are still understudy and it is difficult at this stage to make a complete evaluation. Nevertheless a few exam-ples can be discussed.
The calibration procedures referred to in this section do not include the in situ calibration of thedetector with dedicated physics channels and cosmic rays, which are discussed elsewhere (seeRef. [2-10]).
An example of sub-detector electronics calibration is the LAr charge injection. This calibrationmakes use of special calibration boards to inject a known charge in the electronics. The data canbe processed in the LAr RODs and in this case only the result of the calibration, a few calculatedquantities and a few histograms, are transferred to storage via the ROD crate Processor (see
Table 2-4 Monitoring sources and destinations
Source
Destination ROD ROS SFI Trigger processors
Dedicated workstations
event fragments(~5 Mbyte/s)
event fragments O(100) Mbyte/s
operational monitor-ing, histograms, files, scalers, (O(1) Gbyte once per hour)
histograms (few Mbyte/s, surges of ~6 Gbyte every hour)
histograms (O(10) Mbyte/s)
histograms (O(2) Mbyte/s)
Online Farm
events
calibration data (size is not yet decided)
could also be done at the SFI level
calibration data (O(10) Mbyte once a day)
rejected events(≤ 1% of the total bandwidth)

ATLAS Technical Design ReportHigh-Level Trigger, Data Acquisition and Controls 30 June 2003
2 Parameters 21
Section 1.3.1.1). The amount of data produced has been estimated to be around 50 Mbyte. Thetime needed for a complete calibration is under study but it is approximately several minutes.There is a second mode of operation for this LAr calibration in which not only the results, butalso the time-samples are sent to the RODs. In this case a possible scenario consists of transfer-ring the data produced (about 50 Gbyte) via the ROLs and the DAQ chain to permanent stor-age, in the same way as physics data.
Most of the calibration procedures require dedicated runs, but some (e.g. the Tilecal laser cali-bration) can be performed during LHC empty bunches, while taking data in physics mode.Other sub-detector calibration systems do not interact with data acquisition and will make useof dedicated systems, e.g. the Tilecal radioactive source system, and the SCT and the MDTalignment systems [2-11].
2.5 DCS parameters
DCS deals with two categories of parameters: input parameters, which are used to set up boththe DCS itself and the detector hardware, and output parameters, which are the values of themeasurements and the status of the hardware of the experiment. The ATLAS-wide configura-tion database (ConfDB) will be used to store the first class, while parameters of the second classwill be stored in the ATLAS conditions database (CondDB).
Two different types of set-up parameters are needed by DCS: static data, defining hardware andsoftware of the DCS set-up, and variable data, describing the operation of the detector. The as-sociated data volume is large because of the very many separate systems and the very highnumber of elements to be configured, of the order of 250 000. However, a high data-transfer rateis not required as the operations are not time-critical and will normally be performed at low rateduring shutdown periods.
The variable data are used to configure the sub-detectors. Depending on the beam conditions ofthe LHC, different sets of operational parameters will be required for certain parts of the detec-tor. The different types of data-taking run also require different operational parameters. Allthese sets of dynamic configuration data are loaded at boot-up time into the relevant DCS sta-tion. This operation is therefore also not time-critical. During running of ATLAS, updates ofsub-sets may be needed. Hence access to the ConfDB is required at all times and it is importantto guarantee the consistency of the data between the database and the configuration running inthe sub-detector systems.
The output data of DCS are the measurements of the operational parameters of the detector andthe infrastructure of the experiment, as well as the conditions and status of systems external toATLAS (see Section 11.9), most notably the LHC accelerator. Much of these data are structuredin very small entities; they essentially consist of the triplet definition, time, and value. The up-date frequency can be tuned individually and many quantities need only be stored when theychange by more than a fixed amount. Nevertheless the total data volume is high and may reach1 Gbyte per day. These data can be sent to the CondDB asynchronously, i.e. they can be held forsmall periods of time within DCS.
ATLAS Technical Design ReportHigh-Level Trigger, Data Acquisition and Controls 30 June 2003
22 2 Parameters
2.6 References
2-1 ATLAS Collaboration, ATLAS Inner Detector Technical Design Report, CERN/LHCC/97-016 and 97-017 (1997)
2-2 ATLAS Collaboration, ATLAS Pixel Detector Technical Design Report, CERN/LHCC/98-013 (1998)
2-3 ATLAS Collaboration, ATLAS Liquid Argon Technical Design Report,CERN/LHCC/96-041 (1996)
2-4 ATLAS Collaboration, ATLAS Tile Calorimeter Technical Design Report,CERN/LHCC/96-042 (1996)
2-5 ATLAS Collaboration, ATLAS Muon Spectrometer Technical Design Report,CERN/LHCC/97-022 (1997)
2-6 ATLAS Collaboration, ATLAS Level-1 Trigger Technical Design Report, CERN/LHCC/98-014 (1998)
2-7 3rd ATLAS ROD Workshop, Annecy (2002)http://wwwlapp.in2p3.fr/ROD2002/http://agenda.cern.ch/age?a021794
2-8 ATLAS Collaboration, ATLAS Technical Coordination Technical Design Report,CERN/LHCC/99-001 (1999)
2-9 ATLAS High-Level Triggers, DAQ and DCS Technical Proposal, CERN/LHCC/2000-017 (2000)
2-10 Detector performance and physics commissioning with physics data,http://cern.ch/gianotti/commissioning.html
2-11 Detector Interface Group,http://cern.ch/Atlas/GROUPS/DAQTRIG/DIG

ATLAS Technical Design ReportHigh-Level Triggers, DAQ and DCS 30 June 2003
3 System operations 23
3 System operations
3.1 Introduction
This chapter describes how the TDAQ system will be used. While the operational aspects of theHLT/DAQ system during periods of data-taking are of prime importance, there are also opera-tional aspects related to those periods of time when the LHC machine is off which need to beconsidered.
This chapter begins by presenting a definition of what conditions have to be met in order forTDAQ to perform specific operations and how logical states are used to implement this. For ex-ample, what conditions have to be met in order to allow data-taking to begin.
Section 3.3 defines the details of the data taking period, and the run. In particular it discussesthe different types of run, what operations are defined during a run, and the transitions be-tween one run and another.
The requirement for the HLT/DAQ system to be partitionable, to support multiple concurrentruns on different parts of the detector, is discussed in Section 3.4. Finally, some issues related toerror handling strategy and databases are addressed.
3.2 TDAQ states
The high-level operation of the experiment, and the relationships between the main systems(the detector itself, the LHC machine, and the TDAQ system) are described in terms of logicaland functional states [3-1]. A given state will dictate what operations are allowed/disallowedwhile the system is in that state. For example, the operator will not be allowed to turn off highvoltages while the detector is taking data, whereas he will be allowed to stop data taking. Statesare also used to describe how systems relate one to another. The further development of theconcept of states, their refinement in terms of sub-states, and their detailed relationships are ad-dressed in Chapter 12.
Three principal states can be used to define the main operations of the TDAQ system:
• Initial. This state represents the case when TDAQ sub-systems are started up but idle. Itis the earliest state in which it is possible to send commands directly to the TDAQ controlelements. The only operations which are allowed are those which bring the overall sys-tem to a situation where data-taking can be performed (see below). The TDAQ systemmay also revert to this state in order to re-initialise significant parts of ATLAS.
• Configured. In this state the TDAQ system is ready, provided other conditions related tothe state of the detector or the LHC machine are met, to initiate a data taking session. Thismeans that the various components have been properly initialised. In some initialisationprocedures, the configured state may be reached by passing through one or several se-quentially-dependent intermediate states, for example, loading different layers of soft-ware into processors, configuring inter-dependent components, etc.
• Running. In this state the TDAQ system is data-taking.
ATLAS Technical Design ReportHigh-Level Triggers, DAQ and DCS 30 June 2003
24 3 System operations
For the purpose of the global operation of the experiment, two states of DCS are associated tothe detector:
• Ready: the detector can be used for data taking.
• Not_Ready: the detector cannot be used for data taking.
Three conditions can summarise, for TDAQ purposes, the state of the LHC machine:
• Non_Stable_Beam: the LHC machine is not in a condition which allows operation of theATLAS detector.
• Detector_Safe: the LHC machine is in a condition which allows safe operation of the de-tector, but beams are not available.
• Stable_Beam: the LHC machine is in a condition which allows safe operation of the detec-tor and beams are available.
Figure 3-1 Inter-relationships of the machine conditions, the detector state (via DCS) and TDAQstates. Stand-by is an internal DCS state representing the condition where the detectors’ high-voltage, for example, is not ramped-up.
3.3 The run
3.3.1 Run definition
A run is defined as a period of data taking in a partition of TDAQ (see Section 3.4) with a de-fined set of stable conditions [3-1].
Whilst it is difficult to give today an exhaustive list of run conditions whose change would forcethe starting of a new run, some examples are: the parameters defining or affecting the trigger se-lection quality (e.g. luminosity changes); the set of sub-detectors participating in the run, andthe operational parameters of sub-detectors. Modifications to any of the above items wouldforce a new run to be started. These run conditions are stored in the conditions database, whosecontents are saved to permanent storage prior to the start of a new run.
Figure 3-1 Inter-relationship of the machine condition and the detector, and TDAQ states
Get ready
Start physics data_takingOperator
OperatorOperator
LHC condition:Detector-safe
LHC condition:Detector-safe
DCS: Stand-byDCS: Stand-by DCS: ReadyDCS: Ready
TDAQ: ConfiguredTDAQ: Configured TDAQ: RunningTDAQ: Running
LHC condition: Stable Beam& Collisions
LHC condition: Stable Beam& Collisions

ATLAS Technical Design ReportHigh-Level Triggers, DAQ and DCS 30 June 2003
3 System operations 25
Many possible minor changes to the overall ATLAS configuration during data-taking wouldnot necessarily force a new run. For example, the removal or insertion of processors in the EF, orthe disabling of specific Front-End channels (insofar as the data quality is not adversely affect-ed)1. Such changes may not be recorded in the conditions database but rather in the electroniclogbook and possibly tagged into the event header (for example if a read out channel is disa-bled).
A run would not normally extend longer than the lifetime of an LHC coast.
A run number associates an event to a set of stable conditions recorded in the conditions data-base. The run number, generated centrally in the TDAQ system, is unique during the lifetime ofthe experiment. The proposed mechanism to tag events with the run number would distributethe run number, at the beginning of each run, to all the ROD crate controllers. The RODs wouldthen insert the run number into the event fragment header for each event.
Up to the event-building stage, an event is identified by an extended LVL1 event identifier(EL1ID, generated by the LVL1 trigger initially as a 24-bit number and extended to 32 bits). Dur-ing event building, an additional event identifier (Global Event Number – GID) is generated bythe DFM and inserted into the event’s header by the SFI.
3.3.2 Categories of runs
Several categories of run can be identified in ATLAS:
Physics run: to record selected event data for subsequent offline physics analysis. Physics runsinvolve all or part of the ATLAS detector, the TDAQ system, and the LHC in a stable_beam state.
Detector calibration with beam: to calibrate (part of) a sub-detector with data from LHC colli-sions. Participants to such runs are a sub-set of those for physics runs, namely a sub-set of thedetector (a sub-detector partition, a complete sub-detector or some combination of sub-detec-tors), the LHC machine in stable_beam condition, and a LVL1 trigger (the proper sub-set of theTTC system and the Local Trigger Processor for the sub-detector in question). A sub-set of theEF may also be used for running calibration software on event data.
Detector calibration without beams: this type of run includes the same participants as for de-tector calibration runs with beam. There are two main differences however: the LHC must be ina detector_safe state, i.e. such that the detector may be safely switched on, and (depending on therequirements of the detector being calibrated), TDAQ functions may or may not be required.DCS functions however would always be required.
Detector commissioning: a type of run, with or without beam, required to get a sub-detector orthe complete detector into an operational state. This may include cosmic ray runs. The HLT, aswell as the LVL1 CTP, may be part of a commissioning run, e.g. during the commissioningphase of the complete detector.
The above run categories address the way the TDAQ system is globally set-up for data taking.The possibility to calibrate detectors during physics runs is also required. This refers to the casewhere special triggers, such as calibration triggers are used by a sub-detector during empty
1. Clearly, if more than a certain number of read out channels are disabled, the data quality would be af-fected and the run would be stopped.
ATLAS Technical Design ReportHigh-Level Triggers, DAQ and DCS 30 June 2003
26 3 System operations
LHC bunches. These special triggers are marked with a specific calibration trigger type, and aredealt with accordingly by the TDAQ system: for example a calibration trigger is always accept-ed by LVL2 and may be routed, by the Event Builder, to a specific Event Filter sub-farm to betreated by dedicated software.
3.3.3 Operations during a run
This section discusses the principal operations (run control commands) associated to a data tak-ing run.
Start: when the TDAQ system is in the configured state (Section 3.2), the start command will bedistributed to all the appropriate TDAQ elements. Each element performs its own start se-quence and on successful completion moves to the running state. When all elements2 are in therunning state, the system as a whole enters the running state. At this point the LVL1 trigger is en-abled and events start to flow into the system.
Stop: when a stop command is issued, the LVL1 trigger is first disabled, then the stop commandis distributed to all other TDAQ elements. Each completes the handling of events still in the sys-tem in an orderly way. An ‘end of run’ summary block may be produced. When an element hascompleted its stop sequence, it enters the configured state. When all elements are in the configuredstate, the TDAQ system as a whole enters the configured state.
Pause: a pause command is used to interrupt data-taking in order to perform some (minor) op-eration on any part of the TDAQ system or the detector for which a new run is not required.When the command is issued, the LVL1 trigger is inhibited by raising a global busy signal. AllTDAQ elements are issued with a pause command although in most cases it will not be used toinitiate specific commands. The system completes the transition to the paused state as soon as allthe TDAQ elements have entered the paused state.
Continue: when the continue command is issued, all elements receive it and return to the run-ning state. TDAQ completes the transition to the running state immediately afterwards. Finally,the LVL1 trigger is released and data taking continues.
Pause and continue commands may also be issued automatically on the occurrence of specificpre-defined conditions
Abort: this command is reserved for specific cases which require the rapid termination of therun, unlike the stop command the TDAQ elements will not complete the processing of events intheir buffers. This command can only be issued by an operator or an expert system.
3.3.4 Transition between runs
Prior to the start of a run, or as the immediate consequence of a stop command, the LVL1 busysignal is asserted. The LVL1 busy is removed upon the transition to the running state (i.e. afterall TDAQ elements are in the running state. The completion of a run is also a process whichneeds synchronous local processing of all the TDAQ elements: they receive the stop command,
2. It may be envisaged that if a small number of LVL2 and/or EF processors fail to make the transition suc-cessfully, the LVL2 or EF could nevertheless be deemed to have successfully completed the transitionso as not to inhibit data taking because a few processors have malfunctioned.

ATLAS Technical Design ReportHigh-Level Triggers, DAQ and DCS 30 June 2003
3 System operations 27
complete the processing of the contents of their buffers, produce end of run statistics etc. andleave the running state.
In addition to the operations described above, a mechanism is necessary to determine when allprocessing of events in the terminating run has been completed. This mechanism cannot be partof the run control as it is tightly related to the flow of the event data in the detector front-endbuffers and in the TDAQ system. A timeout may be used for this purpose: a TDAQ element willconsider that the last event has been processed when it has received the stop command and ithas not received an event or event fragment for a certain pre-defined time (for example, a timeof order 10 s).
The transition between two runs includes two potentially time consuming processes:• completing the processing of the contents of all event buffers in the system: front-end
buffers, RODs, ROSs, LVL2 and EF nodes
• synchronisation of all the TDAQ controller elements required to complete the configured–running or running–configured transition.
Checkpoint: under certain conditions, the values of parameters such as LVL1 trigger masks,thresholds, and pre-scaling factors or certain sub-detector calibration and operating parametersmay need to change relatively often, maybe several times per LHC fill, each requiring a new runto be started. This may imply a significant down-time. Because of this, a more efficient way ofmarking events with a new run number while minimizing down-time has been studied.
The checkpoint transition, would be enabled during data taking. It could be triggered automati-cally by certain well-defined and minimal changes in detector or TDAQ conditions, or by an op-erator. It results in subsequent events being tagged with a new run number at the ROD level,but does not require the re-synchronisation (via run control start/stop commands) of all TDAQelements, thereby minimizing the system down-time due to the transition. Thus the mechanismis designed to handle moving to a new set of conditions where the change has a minimal impacton most elements of TDAQ.
The LVL1 trigger is inhibited upon entering the checkpoint transition and re-enabled prior tocompleting the checkpoint transition. The transition is active only for the time that it takes tochange the run number in the ROD crates and make whatever minor changes are required inthe detector or LVL1.
The main feature of the checkpoint transition is the fact that events that have already been accept-ed by LVL1 continue to flow in the system while the transition is active. Therefore a mechanismis needed for a TDAQ element to detect when the new run number has been set during a check-point so that, for example, the GID can be reset to zero by the DFM. The value of the run numberitself may be used for this purpose. A TDAQ element or monitoring programme recognises anew run whenever it receives an event fragment or complete event tagged with a different runnumber from that of the previous fragment or event.
The checkpoint transition has the potential to minimize the system down-time by minimizingthe time spent in run change operations when data taking conditions remain largely un-changed. However, it has several technical and synchronization implications which need to bestudied in more detail.
ATLAS Technical Design ReportHigh-Level Triggers, DAQ and DCS 30 June 2003
28 3 System operations
3.3.5 Operations outside a run
Outside a run, the operations of the TDAQ system fall into two main categories. Operationsperformed between runs (with or without the LHC machine on): such as initialization, for ex-ample loading firmware, configuration; for example setting up of application parameter values;and partition management. Operations during LHC shutdown periods such as running the sys-tem for calibration, commissioning and test purposes, and miscellaneous DCS operations.These operations are discussed in more detail in Chapter 12.
3.4 Partitions and related operations
The TDAQ system may be subdivided in several ways as follows, with each definitioncorresponding to a specific function [3-2].
• TTC Partition. A TTC partition comprises a part of the TTC system and thecorresponding part of the ROD-BUSY feedback tree. A TTC partition corresponds to asingle TTCvi module. A detailed description of TTC partitions can be found in Ref. [3-3].
• TDAQ resource. A TDAQ resource is a part of the system which can be individuallydisabled (masked), and possibly enabled, without stopping the data taking process. Asingle ROS and a single HLT processor are examples of TDAQ resources.
• TDAQ segment. A TDAQ segment is defined as a set of TDAQ system elements thatcan be configured and controlled3 independently from the rest of the TDAQ system. ATDAQ segment can be dynamically removed from / inserted into an active TDAQpartition without stopping the run. An EF sub-farm and a single ROD crate areexamples of TDAQ segments.
• TDAQ partition. This is a sub-set of the TDAQ system for the purpose of data taking.The full TDAQ functionality is available to a sub-set of the detector. A TDAQ partitioncorresponds to one or more TTC partitions.
The last three definitions introduce three independent concepts for the TDAQ system: resourcescan be disabled, segments can be removed and operated independently, and partitions are fullyfunctional TDAQ systems running on a sub-set of the ATLAS detector. There are elementswhich are neither a resource nor a segment, therefore the classification above does not define ahierarchy within ATLAS TDAQ. Furthermore the mapping of the above definitions onto thephysical system is still to be finalized.
A feature of TDAQ partitioning is the ability to run multiple, fully functional4, TDAQ partitionsconcurrently, each operating on sub-sets of the detector. There is a direct correspondencebetween TDAQ partitions and TTC partitions: these latter define how TDAQ is physicallypartitionable. For example the LAr sub-detector has six TTC partitions associated to it, hence nomore than six independent TDAQ partitions may be run concurrently on the LAr detector.
A global ATLAS TDAQ Partition is used for normal data-taking and this includes the entire sys-tem. A TDAQ Partition always includes FE elements of one or more sub-detectors in order to
3. i.e. the segment is capable of receiving commands from the TDAQ control system.
4. That is the complete functionality of the DAQ system is available to run a sub-set of the detector.

ATLAS Technical Design ReportHigh-Level Triggers, DAQ and DCS 30 June 2003
3 System operations 29
provide data5. A TDAQ Partition may stop at the level of one or more ROD crate(s) (ROD CrateDAQ), one ROS, one or more SFIs, or one or more EF sub-farms.
A TDAQ partition is a complete set of TDAQ components, complete in the sense that they resultin a system which is capable of data taking. TDAQ partitions may be:
• Defined: the process of relating together the required TDAQ components to obtain a co-herent system, including the definition of the sub-set of detector read-out associated tothe TDAQ partition. The definition process will ensure that each defined TDAQ partitioncontains all that is needed to take data. Definitions of different TDAQ partitions need notuse physically separate components: for example two TDAQ partitions may be defined toshare the same parts of TDAQ (e.g. the read-out or part of the EF farm).
• Activated: a defined TDAQ partition may be activated, this means that the TDAQ com-ponents associated to it are booked for use. In this case the system will check that theTDAQ partition being activated will not require any component which is already bookedby another active TDAQ partition. TDAQ partitions are required to be independent at thetime of activation.
• Deactivated: the booking of the TDAQ components associated to the TDAQ partition isreleased. Other TDAQ partitions needing those components may then be activated.
• Joined: the components from two (or more) defined TDAQ partitions can be merged to-gether in order to form a larger (i.e. including more sub-detectors) TDAQ partition.
• Split: the reverse operation to join.
The join and split operations do not affect other active TDAQ partitions.
3.5 Error-handling strategy
The TDAQ system consists of a large number of hardware and software elements. Severalthousand processors in total, each running several software processes. Today a model for theMean Time To Failure (MTTF) of the full TDAQ, or any of its components, is not available.However we assume that malfunctioning6 in a system of such a size may happen at a non-negligible rate. Given this, and the requirement of maximising the TDAQ up-time, we identifytwo broad classes of error which are respectively non-fatal or fatal for a data taking session.
• Non-fatal errors. A failure occurs in an element that, if removed from the system, willnot adversely affect the data-taking quality. It is the responsibility of the sub-system, towhich the element belongs, to remove the element transparently without stopping therun and to take action to reconfigure elements of the system as appropriate. Ifnecessary, subsequent events may be tagged with a ‘quality flag’ indicating that a non-vital element was missing when the event was taken. Examples of such elements are: asingle ROD or ROB (the removal of either would require tagging subsequent eventswith a quality flag), a LVL2 or an EF processor, or even an entire sub-farm (which donot require the quality flag).
5. In one exceptional case, that of a standalone DAQ partition (i.e. with no detector attached to it – for usefor local TDAQ testing), the TDAQ partition may include simulated input data instead of FE elements.
6. Hardware failure (e.g. a faulty fan, power supply, disk, etc.) or software failure (e.g. a process aborting).
ATLAS Technical Design ReportHigh-Level Triggers, DAQ and DCS 30 June 2003
30 3 System operations
• Fatal errors. A failure occurs in an element that is essential for data taking operations(e.g. the DFM or the RoIB). A failure in such an element may be considered to be fataleither directly or indirectly (e.g. a ROS which fails to respond may generate a largenumber of timeout errors in the LVL2 system, which could then degrade performanceof the latter). In this case the solution of simply removing the faulty element fromactive data-taking may not be applicable. Every effort has been made in thearchitecture presented in this TDR to minimize the number of such elements and todesign those which remain to a high degree of fault tolerance and robustness.
A more detailed discussion of fault tolerance and error-handling issues and the strategy to dealwith them can be found in Chapter 6.
3.6 Databases and data categories
The issue of databases is central to the whole TDAQ system, as they provide the means to per-manently record many different classes of data and to permanently store the data necessary toinitialize, configure and run the system. Database issues are discussed in detail in Section 10.4.As discussed in Section 1.4, there are a number of broad categories of data to be permanentlystored:
• Configuration data: information necessary for the configuration of TDAQ componentsand the related software, as well as the ATLAS detector hardware. The management ofthese data and of the configuration database which stores them, is the responsibility ofTDAQ. The configuration data are used prior to the start of a run, during the TDAQ ini-tialisation and configuration phases, and while the run is being started. The configurationdata are largely static during data-taking and will only be changed in the case of serioushardware and/or software problems. In this case, components which require the updatedinformation will be notified of the changes to be able to take appropriate action.
• Conditions data: data necessary for the reconstruction and analysis software (both offlineand online) as well as those concerning the detector behaviour (as recorded by DCS). Theprimary responsibility for these data and the conditions database which stores them restswith the offline computing group. TDAQ acts both as a consumer of the conditions data,for example, for the initialisation and configuration of the HLT processes, and as a pro-ducer, for example in the case of DCS and detector calibration procedures which bothproduce information (e.g. detector status) which has to be stored as conditions.
• Event data: the event data produced in the detector and selected by the trigger system.After being stored temporarily on local disks by the SFO (see Section 5.5.9), the data aresubsequently transferred (possibly asynchronously with respect to the data taking proc-ess) to the CERN mass storage system.
• Monitoring data: TDAQ performs operational monitoring (e.g. of TDAQ itself or of thedetectors) and event data quality monitoring. Results, for example, in the form of histo-grams, will be stored for later analysis and comparison in a dedicated database, possiblypart of the conditions database.
• Logbook data: the historical record of the data taking operations of the experiment. Adedicated database, the OBK has been developed for this purpose (see Section 10.4.1.2).
The number of potential data producers and consumers during data taking is of the order ofseveral thousands (from ROD crates to Event Filter processors). Each is expected to consume

ATLAS Technical Design ReportHigh-Level Triggers, DAQ and DCS 30 June 2003
3 System operations 31
and/or produce variable amounts of data (from few kbytes to ~100 Mbyte). A first estimate forsome elements of the system is shown in Table 3-1.
3.7 References
3-1 H. Burckhart et al., ATLAS TDAQ/DCS Global Issues Working Group, Run and States,ATLAS Internal Note, ATL-COM-DAQ-2003-003 (2003)
3-2 H. Burckhart et al., ATLAS TDAQ/DCS Global Issues Working Group, Partitioning,ATLAS Internal Note, ATL-COM-DAQ-2003-004 (2003)
3-3 ATLAS Level-1 Trigger Technical Design Report, CERN/LHCC/98-014 (1998)
Table 3-1 Estimates for configuration and conditions data volume required at initialisation time
Component NumberData volume at initialization
per componentOperational monitoring
data rate
ROD Crate 100 ~few Mbyte – detector dependent
O(1) kbyte
ROS 150 ~few kbyte O(1) kbyte
LVL2 Processor 500 ~50 Mbyte O(1) kbyte
EF Processor 1600 ~100 Mbyte O(1) kbyte
ATLAS Technical Design ReportHigh-Level Triggers, DAQ and DCS 30 June 2003
32 3 System operations

ATLAS Technical Design ReportHigh-Level Trigger, Data Acquisition and Controls 30 June 2003
4 Physics selection strategy 33
4 Physics selection strategy
This chapter provides an overview of the strategy for the online selection of events in ATLAS.The challenge faced at the LHC is to reduce the interaction rate of about 1 GHz at the design lu-minosity of 1 × 1034 cm−2 s−1 online by about seven orders of magnitude to an event rate ofO(100 Hz) going to mass storage. Although the emphasis in this document will be on the contri-bution of the HLT to the reduction in rate, the final overall optimization of the selection proce-dure also includes LVL1.
The first section describes the requirements defined by the physics programme of ATLAS. Thisis followed by a discussion of the approach taken for the selection at LVL1 and HLT. Next, abrief overview of the major selection signatures and their relation to the various detector com-ponents of ATLAS is given. Then, an overview of the various parts of the trigger menu for run-ning at an initial luminosity of 2 × 1033 cm−2 s−1 is presented, together with a discussion of theexpected physics coverage. The discussion in this chapter concentrates on the initial luminosityregime; the selection strategy for the design luminosity phase will crucially depend on the ob-servations and measurements during the first years of data taking. This is followed by a de-scription of how changes in the running conditions are going to be addressed, and finally ideasfor the strategy of determining trigger efficiencies from the data alone are presented.
Details on the implementation of the event-selection strategy, in terms of the software frame-work to perform the selection, can be found in Section 9.5. More information on selection-algo-rithm implementations and their performance in terms of signal efficiency and backgroundrejection are given in Chapter 13. Finally, Chapter 14 addresses the issue of system performanceof the online selection, presenting our current understanding of the resources (e.g. CPU time,network bandwidth) needed to implement the selection strategy presented in this chapter.
4.1 Requirements
The ATLAS experiment has been designed to cover the physics in proton–proton collisions witha centre-of-mass energy of 14 TeV at LHC. Amongst the primary goals are the understanding ofthe origin of electroweak symmetry breaking, which might manifest itself in the observation ofone or more Higgs bosons, and the search for new physics beyond the Standard Model. For thelatter it will be of utmost importance to retain sensitivity to new processes which may not havebeen modelled. The observation of new heavy objects with masses of O(1) TeV will involve veryhigh-pT signatures and should not pose any problem for the online selection. The challenge isthe efficient and unbiased selection of lighter objects with masses of O(100) GeV. In addition,precision measurements of processes within and beyond the Standard Model are to be made.These precision measurements will also provide important consistency tests for signals of newphysics. An overview of the variety of physics processes and the expected performance ofATLAS can be found in [4-1]. Most of the selection criteria used in the assessment of the physicspotential of ATLAS are based on the selection of at most a few high-pT objects, such as chargedleptons, photons, jets (with or without b-tagging), or other high-pT criteria such as missing andtotal transverse energy. Furthermore, ATLAS expects to take data during the heavy-ion runningof the LHC.
The online event-selection strategy has to define the proper criteria to cover efficiently the phys-ics programme foreseen for ATLAS, while at the same time providing the required reduction inevent rate at the HLT. Guidance on the choice of online selection criteria has been obtained from
ATLAS Technical Design ReportHigh-Level Trigger, Data Acquisition and Controls 30 June 2003
34 4 Physics selection strategy
the variety of analyses assessing the ATLAS physics potential, aiming for further simplificationto a very few, mostly inclusive, criteria.
Event selection at LHC faces a huge range incross-section values for various processes, asshown in Figure 4-1. The interaction rate isdominated by the inelastic part of the totalcross-section with a cross-section of about70 mb. The inclusive production of b-quarksoccurs with a cross-section of about 0.6 mb,corresponding to a rate of about 6 MHz for de-sign luminosity. It is worth noting that thecross-section for inclusive W production, in-cluding the branching ratio for the leptonicdecays to an electron or a muon, leads to a rateof about 300 Hz at design luminosity. The rateof some rare signals will be much smaller, e.g.the rate for the production of a Standard Mod-el Higgs boson with a mass of 120 GeV for therare-decay mode into two photons will be be-low 0.001 Hz. The selection strategy has to en-sure that such rare signals will not be missed,while at the same time reducing the outputrate of the HLT to mass storage to an accepta-ble value.
The online selection thus has to provide a veryefficient and unbiased selection, maintainingthe physics reach of the ATLAS detector. It should be extremely flexible in order to operate inthe challenging environment of the LHC, with up to about 23 inelastic events per bunch cross-ing at design luminosity. Furthermore, it has also to provide a very robust, and, where possible,redundant selection. It is highly desirable to reject fake events or background processes as earlyas possible in order to optimize the usage of the available resources. Presently the selection isbased on rather simple criteria, while at the same time making use of the ATLAS capabilities toreject most of the fake signatures for a given selection. It is, however, mandatory to have addi-tional tools such as exclusive criteria or more elaborate object definitions available for the onlineselection.
4.2 Selection criteria
In order to guarantee optimal acceptance to new physics within the current paradigm of parti-cle physics, we have taken an approach based on emphazising the use of inclusive criteria forthe online selection, i.e. having signatures mostly based on single- and di-object high-pT trig-gers. Here ‘high-pT’ refers to objects such as charged leptons with transverse momenta aboveO(10 GeV). The choice of the thresholds has to be made in such a way that a good overlap withthe reach of the Tevatron and other colliders is guaranteed, and there is good sensitivity to newlight objects, e.g. Higgs bosons. Enlarging this high-pT selection to complement the ATLASphysics potential requires access to signatures involving more exclusive selections, such as re-quiring the presence of several different physics objects or the use of topological criteria. A fur-
Figure 4-1 Cross-section and rates (for a luminosityof 1 × 1034 cm−2 s−1) for various processes in proton–(anti)proton collisions, as a function of the centre-of-mass energy.
0.1 1 1010-7
10-5
10-3
10-1
101
103
105
107
109
10-6
10-4
10-2
100
102
104
10
106
8
σjet(ETjet > √s/4)
LHCTevatron
σt
σHiggs(MH = 500 GeV)
σZ
σjet(ETjet > 100 GeV)
σHiggs(MH = 150 GeV)
σW
σjet(ETjet > √s/20)
σb
σtot
σ (
nb)
√s (TeV)
even
ts/s
ec f
or L
= 1
034 c
m-2 s
-1

ATLAS Technical Design ReportHigh-Level Trigger, Data Acquisition and Controls 30 June 2003
4 Physics selection strategy 35
ther example is the use of charged particles with transverse momenta of O(1 GeV) for theselection of b-hadron physics.
The selection at the HLT will in most cases be seeded by the information already obtained atLVL1 (i.e. Regions-of-Interest, RoIs) and will exploit the complementary features of the LVL2trigger and the EF selection. At LVL2, a fast rejection has to be achieved, using dedicated algo-rithms to meet the latency constraints. These algorithms will, in most cases, require only a fewper cent of the event data, thanks to the guidance of RoIs from LVL1. The selection signatureswill be refined at the EF, where the full event is available for analysis, using more precise anddetailed calibration and alignment parameters and having fewer constraints on the latency.Also the EF processing can profit from the results of the earlier trigger stages, for example, us-ing the results of LVL2 for seeding the EF processing. Furthermore, the EF will provide classifi-cation of the accepted events, in order to facilitate offline analyses. This might involve thereconstruction of further objects, which are not used for the event selection.
Although the selection will be predominantly based on simple and inclusive signatures to allowfor optimization at the analysis level, more refined selection tools have to be used in addition.These include the use of more elaborate algorithms, e.g. b-tagging of jets, and the application ofmore exclusive criteria, in order to enrich the available samples for certain physics processes, forexample. Furthermore, it is highly desirable to select events with several complementary crite-ria, in order to better control possible biases due to the online selection.
4.3 Physics objects for event selection
The ATLAS trigger relies on the concept of physics ‘objects’ (muons, electrons, jets, etc.). Candi-date objects are typically first identified and crudely reconstructed at LVL1. Processing in theHLT progressively refines the reconstruction, rejecting fake objects and improving the precisionon measured parameters such as ET.
The physics objects used in the HLT can be based on information from all sub-detectors of AT-LAS, at full granularity. As mentioned above, the difference in the reconstruction of these ob-jects between LVL2 and the EF refers mostly to the complexity of the algorithms interpreting theraw data, and on the level of detail and accuracy of the alignment and calibration informationused. The EF has the full event at its disposal to the search for these objects, although it is antic-ipated that the processing will typically be initiated using the detailed LVL2 result to seed thealgorithms.
ATLAS, as a multi-purpose detector, will have charged-particle tracking in the Inner Detectorcovering the pseudorapidity region of |η| < 2.5 inside a solenoidal magnetic field of 2 T andfine-grained calorimeter coverage for |η| < 2.4, especially in the electromagnetic compart-ments, which extends up to |η| < 3.2. The forward calorimeter completes the calorimetric cov-erage up to |η| of 4.9 for the measurement of missing transverse energy and forward jets. Thecoverage of the muon system extends up to |η| = 2.4 for the trigger chambers and up to|η| = 2.7 for the precision muon chambers. More details on the various components and theirexpected performance can be found in [4-1].
ATLAS Technical Design ReportHigh-Level Trigger, Data Acquisition and Controls 30 June 2003
36 4 Physics selection strategy
The following overview briefly summarizes the most important physics objects foreseen for usein the HLT. More details on the concrete implementation of the selection algorithms and theirexpected performance are given in Chapter 13.
• Electron (within |η| < 2.5): the selection criteria for electrons will include a detailedshower-shape analysis in the fine-grained electromagnetic compartments of the LAr calo-rimeters (within the range of |η| < 2.4), a search for high-pT tracks, and a match betweenthe clusters and tracks. Further refinement is possible via the identification and correcttreatment in case the electron has undergone Bremsstrahlung, the requirement of a transi-tion radiation signal from the transition radiation tracker (TRT), and the application ofisolation criteria.
• Photon (within |η| < 2.5): the selection of photons will also be based on a detailed calo-rimeter shower-shape analysis, including the requirement of isolation, and possibly onthe use of a veto against charged tracks, after it has been checked that the photon did notconvert in the material of the Inner Detector into an e+e- pair.
• Muon (within |η| < 2.4): the muon selection will in a first step make use of the externalmuon spectrometer to determine the muon momentum and charge. A refinement of thisinformation will then be obtained by searching for tracks in the Inner Detector andmatching and combining these candidates with the muon track segment. Isolation criteriamay also be applied, using, for example, information from the calorimeters.
• Tau (within |η| < 2.5): the selection of taus in their hadronic decay modes will use calo-rimeter shower-shape analysis to identify narrow hadronic jets. These can be matched toone or more tracks found in the Inner Detector. As above, isolation criteria may also beapplied, using, for example, information from the calorimeters.
• Jet (normally within |η| < 3.2): the jet selection will be based mostly on calorimeter infor-mation, which might be refined by including the information from matching chargedtracks. A search can also be made for jets in the forward calorimeter, covering3.2 < |η| < 4.9.
• b-tagged jet (within |η| < 2.5): the selection will start from jets already selected. The as-sociated tracks found in the Inner Detector are used to search, for example, for large val-ues of the impact parameters or for the presence of secondary vertices, and/or for soft(i.e. low-pT) leptons.
• (within |η| < 4.9): the definition of missing transverse energy will be based on thefull calorimeter data, allowing for improvements via the inclusion of information fromobserved muons.
• Total ΣET (within |η| < 4.9): again the calculation will be based on the full calorimeter in-formation, with additional corrections possible from reconstructed muons. An alternativedefinition of the total ΣET can be obtained using only reconstructed jets.
An example of an exclusive selection, which requires a complex approach, is the case of b-hadron physics. Here it is necessary to reconstruct online in a (semi-)exclusive way the b-hadron decay modes of interest. This requires the reconstruction and identification of low-pTcharged hadrons and leptons (electrons and muons), where guidance from LVL1 is not alwaysavailable with optimal efficiency. At LVL1 the trigger will demand the presence of at least onelow-pT muon.
ETmiss

ATLAS Technical Design ReportHigh-Level Trigger, Data Acquisition and Controls 30 June 2003
4 Physics selection strategy 37
4.4 Trigger menu
In this section, the present understanding of the trigger menu for running at an initial peak lu-minosity of 2 × 1033 cm−2 s−1 is presented. Distinction is made between different parts of thistrigger menu which are discussed separately:
• inclusive physics triggers — that form the backbone of the online selection and are chosento guarantee the coverage of a very large fraction of the ATLAS physics programme;
• pre-scaled physics triggers — that will extend the physics coverage for ATLAS, by hav-ing, for example, inclusive selections with lower thresholds to enlarge the kinematicreach, and provide samples for understanding background processes and detector per-formance;
• exclusive physics triggers — that will also extend the physics coverage for ATLAS; and
• dedicated monitor and calibration triggers — not already contained in one of the aboveitems, for improving the understanding of the performance of the ATLAS detector, basedon physics events not needed otherwise for physics measurements. Furthermore, specificselections might be used to monitor the machine luminosity.
The description of these four parts of the current trigger menu is followed by a discussion of thephysics coverage achieved, including indications about dependence of the acceptance for sever-al physics processes on the threshold values. A more detailed discussion of the various parts ofthe trigger menu can be found in [4-2].
The derivation of the trigger menus and the threshold values starts from the physics-analysisrequirements, followed by an assessment of the rejection capabilities at the various selectionstages, and finally taking into account estimates of the total HLT output bandwidth. This proce-dure is iterative in order to include existing information, e.g. from studies of the LVL1 trigger(see Ref. [4-3]), or from past studies of the HLT performance, as documented, for example, inRef. [4-4].
Not discussed in any detail in this document are possible trigger selections for the study ofvery-forward physics or heavy-ion interactions, as these additional aspects of the ATLAS phys-ics potential are presently only under investigation. The flexibility in the online selection will,however, allow these physics processes to be addressed. As the excellent capabilities of ATLASfor identifying high-pT signatures are expected to play an important role in the study of thesephysics processes (especially for the study of heavy-ion interactions), the selection strategy inthis document should be extremely useful for these environments as well.
It should be noted that the menus will evolve continuously, benefiting from a better under-standing of the detector, and the experience gained when commissioning the experiment. Fur-ther progress in the understanding of the Standard Model and future discoveries prior to thestart of the LHC might influence the contents of the trigger menu.
In the narrative that follows, labels of the form ‘NoXXi’ will be used to identify specific triggeritems. Here ‘N’ is the minimum number of objects required, and ‘o’ indicates the type of the se-lection (‘e’ for electron, ‘γ’ for photon, ‘µ’ for muon, ‘τ’ for a τ hadron, ‘j’ for jet, ‘b’ for a b-taggedjet, ‘xE’ for missing transverse energy, ‘E’ for total transverse energy, and ‘jE’ for the total trans-verse energy obtained using only jets). ‘XX’ gives the threshold in transverse energy (in units ofGeV), and ‘i’ indicates an isolation requirement. As an example, 2µ20i refers to the requirementof at least two muons, with an ET threshold of 20 GeV each, fulfilling isolation criteria. Thethresholds indicate the transverse-energy value above which the selection has good efficiency
ATLAS Technical Design ReportHigh-Level Trigger, Data Acquisition and Controls 30 June 2003
38 4 Physics selection strategy
for true objects of the specified type. The exact value for the efficiency obtained depends on theimplementation of the algorithm and the details of the criteria applied, examples of which aregiven in Chapter 13.
A comprehensive assessment of the expected rates for the trigger menu will be given inSection 13.5, both for LVL1 and for the HLT, including the expected total data rate for recordingthe accepted events to mass storage.
4.4.1 Physics triggers
Table 4-1 gives an overview of the major selection signatures needed to guarantee the physicscoverage for the initial running at a peak luminosity of 2 × 1033 cm−2 s−1.
A large part of the physics programme will rely heavily on the inclusive single- and di-leptontriggers, involving electrons and muons. Besides selecting events from Standard Model process-es — such as production of W and Z bosons, gauge-boson pairs, tt pairs, and the Higgs boson —they provide sensitivity to a very large variety of new physics possibilities, for example newheavy gauge bosons (W’, Z’), supersymmetric particles, large extra dimensions (via the Drell-
Table 4-1 Trigger menu, showing the inclusive physics triggers. The notation for the selection signatures andthe definition of the thresholds are explained in Section 4.4.
Selection signature Examples of physics coverage
e25i W → eν, Z → ee, top production, H → WW(*)/ZZ(*), W’,Z’
2e15i Z → ee, H → WW(*)/ZZ(*)
µ20i W → µν, Z → µµ, top production, H → WW(*)/ZZ(*), W’,Z’
2µ10 Z → µµ, H → WW(*)/ZZ(*)
γ60i direct photon production, H → γγ
2γ20i H → γγ
j400 QCD, SUSY, new resonances
2j350 QCD, SUSY, new resonances
3j165 QCD, SUSY
4j110 QCD, SUSY
τ60i charged Higgs
µ10 + e15i H → WW(*)/ZZ(*), SUSY
τ35i + xE45 qqH(ττ), W → τν, Z → ττ, SUSY at large tan β
j70 + xE70 SUSY
xE200 new phenomena
E1000 new phenomena
jE1000 new phenomena
2µ6 + µ+µ- + mass cuts rare b-hadron decays (B → µµX) and B → J/ψ (ψ')X

ATLAS Technical Design ReportHigh-Level Trigger, Data Acquisition and Controls 30 June 2003
4 Physics selection strategy 39
Yan di-lepton spectrum), and Higgs bosons in extensions of the Standard Model such as theMSSM. These triggers also select particle decays involving τ’s where the τ decays leptonically.
The inclusive single- and di-photon triggers will select a light Higgs boson via its decay H → γγas well as some exotic signatures (e.g. technicolour).
The coverage for supersymmetry is extended by using the jet + missing-transverse-energy sig-natures as well as multi-jet selections; the multi-jet selection is especially relevant in case of R-parity violation. The inclusive single- and di-jet triggers will, for example, be used in the searchfor new resonances decaying into two jets. Further sensitivity to supersymmetry at large valuesof tan β will be provided by signatures involving a hadronic τ selection.
Rare b-hadron decays and b-hadron decays involving final states with a J/ψ are selected by adi-muon signature (requiring opposite charges) and additional invariant-mass cuts.
4.4.2 Pre-scaled physics triggers
Table 4-2 shows a prototype for additional contributions to the trigger menu in the form of pre-scaled physics triggers. These triggers extend the physics coverage of the online selection by ex-tending the kinematic reach of various measurements towards smaller values, e.g. of thetransverse momentum in a process.
Table 4-2 Examples of additional pre-scaled physics triggers
Selection signature Examples of physics motivation
single jets (8 thresholds between 20 and 400 GeV) inclusive jet cross-section measurement
di-jets (7 thresholds between 20 and 350 GeV) di-jet cross-section measurements
three jets (6 thresholds between 20 and 165 GeV) multi-jet cross-section measurements
four jets (5 thresholds between 20 and 110 GeV) multi-jet cross-section measurements
single electrons (5–6 thresholds between 7 and 25 GeV) inclusive electron cross-section
di-electrons (2 thresholds between 5 and 15 GeV)
single muons (6 thresholds between 5 and 20 GeV) inclusive muon cross-section
di-muons (2 thresholds between 5 and 10 GeV)
single photons (7–8 thresholds between 7 and 60 GeV) inclusive photon cross-section
di-photons (2 thresholds between 7 and 20 GeV)
taus (4 thresholds between 25 and 60 GeV)
di-tau (2 thresholds between 25 and 35 GeV) Z → ττ selection
xE (5 thresholds between 45 and 200 GeV)
E (3 thresholds between 400 and 1000 GeV)
jE (3 thresholds between 400 and 1000 GeV)
filled-bunch-crossing random trigger minimum bias events, trigger efficiency
ATLAS Technical Design ReportHigh-Level Trigger, Data Acquisition and Controls 30 June 2003
40 4 Physics selection strategy
A typical example for the application of these trigger selections is the measurement of the jetcross-section over the full kinematic range, starting from the lowest achievable ET values up tothe region covered by the un-pre-scaled inclusive jet trigger. In addition, these pre-scaled trig-gers together, with the pre-scaled minimum bias selection, will be crucial in determining triggerefficiencies from the data, as discussed in Section 4.6.
The prescale factors to be applied to most of the selections shown in Table 4-2 will have to be de-termined on the basis of the desired statistical accuracy for the given application, taking into ac-count the total available data bandwidth and computing resources. The ET ranges for thethresholds should be seen as indicative only. The aim will be to cover the widest possible range,i.e. extending the coverage from the thresholds un-pre-scaled selections down to the lowest pos-sible ones for a given signature. The values of the prescale factors will evolve with time. Thesetriggers will be of particularly high importance in the early phases of the data taking after thestart-up of the LHC.
4.4.3 Exclusive physics triggers
A list of further selections using more exclusive criteria is presented in Table 4-3.
An example is the extension of the selection for b-hadron physics to involve more decay modes.As discussed in more detail in Ref. [4-1] and Ref. [4-4], ATLAS offers the possibility of perform-ing several measurements of CP-violation in the b-hadron system. The selection strategy relieson selecting bb production via the semi-muonic decay of one of the b-quarks, and then makinga (semi-)exclusive selection of the decays of interest based on reconstructing low-pT chargedparticles in the Inner Detector. The best efficiency would be achieved by reconstructing thetracks at LVL2 without guidance from LVL1. However, in view of resource limitations, RoI-driv-en reconstruction is also being considered.
For the first data taking, it will be essential that the full detector is read out to mass storage forall triggers in order to have the full spectrum of information available for offline studies. It is,however, envisaged that at a later stage some of the above pre-scaled triggers might no longerrequire recording of the full detector information, and thus more bandwidth could be madeavailable for further selection criteria.
Table 4-3 Examples of additional exclusive physics triggers
Selection signature Examples of physics motivation
e20i + xE25 W → eν
µ20 + γ10i lepton flavour violation
e/µ + jet
forward jet + xE invisible Higgs decays
b-jet (various multiplicities)
µ8 + B-decays b-hadron physics

ATLAS Technical Design ReportHigh-Level Trigger, Data Acquisition and Controls 30 June 2003
4 Physics selection strategy 41
4.4.4 Monitor and calibration triggers
The selection signatures presented in Table 4-1, Table 4-2 and Table 4-3 will provide a huge sam-ple of physics events which will be of extreme importance for the understanding and continu-ous monitoring of the detector performance. In particular, the leptonic decays of the copiously-produced Z bosons will be of great help. One will use Z → ee events to determine the absoluteenergy scale for electrons and to intercalibrate the electromagnetic parts of the calorimeter. Themuonic decay will set the absolute momentum scale, both in the Inner Detector and in themuon spectrometer. In addition, the inclusive electron and muon triggers will select tt eventsvia the semi-leptonic decay of one of the top quarks. This sample can be used to set the jet ener-gy scale, using di-jet decays of the W’s produced in the top quark decays, and also to determinethe b-tagging efficiency.
Large inclusive samples of muons are the starting point for the Inner Detector alignment; thesewill also be used to study energy loss in the calorimeters and to align the muon detectors. Largeinclusive samples of electrons will be used to understand the electromagnetic energy scale ofthe calorimeter, using the precise momentum measurements from the Inner Detector, and to un-derstand the energy–momentum matching between the Inner Detector and the calorimeter. Thecalorimeter inter-calibration, especially for the hadronic part, will benefit from inclusive (di-)jetsamples by making use of the energy-balance technique.
Further examples of specific monitor and calibration triggers are given in Table 4-4. The randomtrigger on unpaired bunch crossing will select bunch crossings, where only one of the two pack-ets is actually filled, and can thus be used to monitor beam-related backgrounds. The selectionof oppositely charged lepton pairs, with an invariant mass compatible with the Z-boson mass,and loose cuts (especially on the isolation, which should be in this case defined identical forelectrons and muons), will be an important control sample for the analyses where the contribu-tion from different (lepton) flavours needs to be compared.
Table 4-4 Examples of specific monitor and calibration triggers, based on physics events, which are not cov-ered in Table 4-1, Table 4-2 and Table 4-3
Selection signature Example for application
random trigger zero bias trigger
unpaired-bunch-crossing random trigger background monitoring
e25i loose cuts trigger monitoring
e25 trigger monitoring
µ20i loose cuts trigger monitoring
µ20 trigger monitoring
γ60i loose cuts trigger monitoring
γ60 trigger monitoring
τ60 loose cuts trigger monitoring
e+e− + Z mass, loose cuts monitor flavour subtraction
µ+µ− + Z mass, loose cuts monitor flavour subtraction
µ+µ− + Υ mass calibration
ATLAS Technical Design ReportHigh-Level Trigger, Data Acquisition and Controls 30 June 2003
42 4 Physics selection strategy
Monitor and calibration triggers provide examples of selections which do not always requirethe full detector information to be read out to mass storage. For some monitoring aspects, itcould be envisaged to record only the results of the processing of the event in the EF, and not tostore the raw data. However, it is anticipated that this would only be done after stable operationof the detector and the machine has been reached.
4.4.5 Physics coverage
In this section, examples will be given to indicate the sensitivity of the physics coverage to thethresholds used in the selection signatures. Indications on the redundancy achieved by the fullset of selection signatures proposed are also given.
As an example, the search for the Standard Model Higgs boson in the decay mode to H → bbwill be discussed, where H is produced in association with a tt pair. The proposed selection cri-teria for this mode involve the requirement of a lepton from the semi-leptonic decay of one ofthe top quarks. In Ref. [4-1], the study was based on the assumption of a lepton-pT threshold of20 GeV for both electrons and muons. Table 4-5 shows the impact of raising one or both of thesethresholds on the expected significance for signal observation.
Another example is the inclusive single-photon trigger, with a present threshold of 60 GeV. Thisselection can be used to search for technicolour via the production of a techni-omega, ωT, whichwould be detected via its decay ωT → γπ0
T → γbb. As shown in Ref. [4-1], for a massM(ωT) = 500 GeV, the offline analysis would make a cut on the photon transverse energy ofET(γ) > 50 GeV. This shows that a further raising of the single-photon threshold would impactthe discovery potential. In addition, the overlap with the Tevatron reach up to techni-omegamasses of about 400 GeV might not be assured.
Di-jet events will be used to search for new resonances decaying into two jets. The expectedreach [4-5] of the CDF Experiment at Tevatron for an integrated luminosity of 15 fb-1 shouldcover E6 di-quarks with masses up to 700 GeV, heavy W’/Z’ bosons with masses up to 850 GeV,techni-rho mesons, ρT, with masses up to 900 GeV, excited quarks q* with masses up to 950 GeV,and axigluons with masses up to 1250 GeV. The transverse-energy spectrum of the jets from thedecay of resonance with a mass in the range discussed above would lead to a Jacobian peak at350–630 GeV in ET. An inclusive single-jet trigger with ET > 400 GeV will not provide adequatecoverage for this kinematic region and needs to be supplemented by a di-jet trigger with lowerthresholds.
Further selections presently under study could enlarge the acceptance for some Higgs produc-tion and decay modes. The production of Higgs bosons via vector-boson fusion leads to thepresence of non-central low-pT jets that can be used as a tag. Requiring that two such jets bepresent in an event and that they are separated significantly in rapidity could allow, for exam-ple, the lepton pT thresholds to be lowered, and thus increase the significance for Higgs obser-
Table 4-5 Example of loss in significance for the associated production of ttH (for a Standard Model Higgsboson with a mass of 120 GeV) for an integrated luminosity of 30 fb-1
pT(e) > 20 GeV 25 GeV 30 GeV 30 GeV 35 GeV
pT(µ) > 20 GeV 20 GeV 20 GeV 40 GeV 25 GeV
1 0.98 0.96 0.92 0.92S B⁄

ATLAS Technical Design ReportHigh-Level Trigger, Data Acquisition and Controls 30 June 2003
4 Physics selection strategy 43
vation. A second, related example is the search for a Higgs boson with an invisible decay mode,where a trigger requirement of two tag jets and missing transverse energy could be used.
The overall optimization of the online selection will be refined until the first collisions are re-corded. Experience with the first real data might well force one to significantly revise this opti-mization and, in any case, it will have be refined continuously throughout the lifetime of theexperiment. The following aspects have to be taken into account:
• the evolving understanding of physics;
• the effect of the foreseen thresholds on the acceptance for known (and unknown) physicsprocesses;
• the rate of events after the selection (one should note that, even in the absence of fake sig-natures, there is a large rate of high-pT events that one would like to retain — e.g. W and Zleptonic decays);
• the inclusiveness of the selection (one should note that a more exclusive selection doesnot necessarily imply a significantly reduced output rate — selections for many finalstates will have to be considered in order to achieve good coverage); and
• the available resources for the online selection, and the subsequent offline storage andprocessing of the data.
Various possibilities are available to control the output rate of the HLT. These include changesto the threshold values, changes to, or introduction of, pre-scale factors, phasing in of more ex-clusive selections and, where possible, tightening of selection cuts in the physics-object defini-tion. Some of these schemas can also be applied at LVL1 in order to reduce the input rate to theHLT in case insufficient resources for the treatment the events are available.
It is important to keep in mind that less inclusive selections are targeted towards specific modelpredictions and are thus not desirable for unbiased searches for new physics. They will, howev-er, be useful to increase the accumulated statistics for specific processes, e.g. when thresholdsfor the inclusive selection will have to be raised further. The introduction of additional biases atthe trigger level due to less inclusive selection should be avoided where possible, since theymight influence the accuracy of various precision measurements.
4.5 Adapting to changes in running conditions
An efficient mechanism is needed to adapt the trigger menu to changes in the running and op-erational conditions of the experiment. These changes will include a decrease in the luminosityduring a coast, changes in machine-background conditions, and changes in detector perform-ance affecting the selection criteria. Procedures must be put in place to react to these changes ef-fectively and thus maintain a robust selection process. It is important to keep the correct historyof all changes to the trigger configuration; this will be done by changing the run number when-ever there is a significant change (see Section 3.3).
ATLAS Technical Design ReportHigh-Level Trigger, Data Acquisition and Controls 30 June 2003
44 4 Physics selection strategy
Luminosity changes
During a coast1 in the LHC (estimated duration up to ~14 hours) the luminosity may drop by afactor of two or more. To take advantage of the available bandwidth and processing power inthe HLT system, the trigger criteria should be adjusted to maintain an approximately constantevent rate in the HLT. This could be achieved by including more trigger selections in the triggermenu, by reducing prescale factors for selections with lower-pT thresholds, by adding more ex-clusive selections, or even by changing, i.e. lowering, the thresholds of the inclusive physicstriggers. In this way, the physics coverage of ATLAS will be extended during a coast. An exam-ple is the case of b-hadron physics, where the inclusive trigger menu discussed above forL = 2 × 1033 cm−2 s−1 is restricted to select only final states with at least two oppositely-chargedmuons. As the luminosity drops below the initial peak value, other decay modes (e.g. fullyhadronic or involving two low-pT electrons) could be added.
The sizeable change in luminosity during a coast will imply changes in the average number ofpile-up events present in the same bunch crossing, which might influence the optimal choice ofthreshold values (or isolation cuts) for various criteria in the definition of the selection objects.More studies are needed to assess whether simple changes of prescale factors are sufficient. It isimportant to have an accurate monitoring of the luminosity, which possibly requires additionaldedicated trigger selections.
Background conditions
One will have to foresee adjustments for changes in the operating conditions, such as suddenincreases in backgrounds or the appearance of hot channels, leading to certain triggers firing ata larger rate than is acceptable. Furthermore, machine-related backgrounds might increase sud-denly and impact on the rate for certain selection signatures. Possible remedies in this case willbe either to disable this selection or to significantly increase the prescale factor.
Mechanisms for adaptation
From an operational point of view, changes to pre-scale values must be simple and quick,whereas changes to threshold values might imply more complex re-initialization procedures.Changes in the prescale factors could be done dynamically in an automated fashion, however, itmight be preferable to perform these changes less frequently in order to simplify the calculationof integrated luminosities for cross-section measurements.
Other remarks
The above list of changes in conditions is obviously incomplete and there will be many outsidecauses for changes to a stable operation, to which the online selection has to react and adapt inorder to preserve the physics coverage of ATLAS.
4.6 Determination of trigger efficiencies
As far as possible, trigger efficiencies should be derived from the data. In this section, only afew basic ideas will be described, more details need to be worked out, e.g. addressing the statis-tical precision that can be obtained on the efficiency determination. No explicit distinction be-
1. A coast is the period when there is beam after a machine fill.

ATLAS Technical Design ReportHigh-Level Trigger, Data Acquisition and Controls 30 June 2003
4 Physics selection strategy 45
tween LVL1 and the HLT selections will be made, although the efficiency determination will bedone separately for each trigger (sub-)level as well as globally. Furthermore, the efficiency of theselection must be monitored carefully throughout the lifetime of ATLAS, which implies thatlow-threshold triggers, from which the efficiencies are calculated, have to be kept running withpre-scale factors set to provide sufficient statistical precision. In the following, a qualitativeoverview of various possible procedures is given. The emphasis will be on trying to determinethe efficiencies in several ways, in order to minimize systematic uncertainties.
Bootstrap procedure
One possibility is a ‘bootstrap’ procedure, starting off with a selection of minimum-bias eventsand using those to study the turn-on curve for very low-ET triggers on jets, electrons, photons,muons, and so on. Next, the turn-on curves for electron triggers with higher ET thresholds, forexample, are studied using samples of events selected by an electron trigger with the lower (andthus already understood) threshold. The same holds for all other object types.
Selection of objects by independent signatures
For the HLT, it will be possible to foresee selection of objects by independent signatures in orderto study the trigger efficiency of a particular step in the selection sequence, e.g. by selecting asample with high-pT inner-detector tracks in order to study the calorimeter or the muon triggerselections in more detail. Given the absence of a track trigger at LVL1, this will not be possiblefor the first stage of the selection.
Di-object samples
A further possibility is to use di-object samples which have been selected online by an inclusivesingle-object requirement and then reconstructed offline. These events can be used to study thetrigger response for the second object, which was not required for the online selection. Exam-ples of samples that can be used to study the lepton-trigger efficiences are Z → ll decays whichare plentifully produced, and also J/ψ → ll or the Υ → ll decays which might prove very usefulfor the region of lower transverse momenta. The same technique can be applied to events wherethe two objects are of different types. For example, events with Z → ll plus jets could be used tomeasure the efficiency of the jet trigger.
Required statistics
It cannot be emphasized enough that the amount of data needed to obtain a proper understand-ing of the online selection is not going to be negligible in the start-up phase and indeedthroughout the lifetime of ATLAS. However, it will play an important role in assuring the po-tential of the experiment for discoveries and precision physics measurements. A detailed as-sessment of the expected needs will be done in the next couple of years. In the present menusonly 10% of the total rate of the HLT is assigned to such triggers, which is smaller than the frac-tions used by current running experiments and might not be sufficient. During Tevatron Run I,as much as 30% of the accepted triggers at the second stage for CDF were pre-scaled physics(and calibration) triggers. In the case of D0, for the highest luminosities, about 20% of the trig-gers were pre-scaled and about 25% were monitoring and calibration triggers. Since D0 kept allthresholds fixed during a machine coast and only adjusted the pre-scale factors to always fill upthe available bandwidth, the fraction of pre-scaled triggers increased towards the end of coast,where it could make up to 90% of the total rate.
ATLAS Technical Design ReportHigh-Level Trigger, Data Acquisition and Controls 30 June 2003
46 4 Physics selection strategy
4.7 References
4-1 ATLAS Collaboration, Detector and Physics Performance Technical Design Report, CERN/LHCC/99-014 and 99-015 (1999)
4-2 T. Schoerner-Sadenius and S. Tapprogge (eds.), ATLAS Trigger Menus for the LHC Start-Up Phase, ATL-COM-DAQ-2003-007 (2003)
4-3 ATLAS Collaboration, Level-1 Trigger Technical Design Report, CERN/LHCC/98-014 (1998)
4-4 ATLAS Collaboration, High-Level Triggers, DAQ and DCS Technical Proposal, CERN/LHCC/2000-017 (2000)
4-5 CDF-II Collaboration, The CDF II Detector Technical Design Report, FERMILAB-Pub-96-390-E (1996)

ATLAS Technical Design ReportHigh-Level Trigger, Data Acquisition and Controls 30 June 2003
5 Architecture 47
5 Architecture
This chapter addresses the architecture of the ATLAS HLT/DAQ system. It starts with a de-scription of how the HLT/DAQ system is positioned with respect to both the other systems ofthe experiment and external systems such as the LHC machine and CERN technical services.This is followed by a description of the organization of the HLT/DAQ system in terms of thefunctions it provides and how they are organized in terms of sub-systems.
The system architecture, represented in terms of implementation-independent components,each associated to a specific function, and their relationships is then presented, together withthe mapping of the HLT/DAQ sub-systems onto the architecture. This generic architecture hasalso been used to evaluate the overall system cost, discussed in Chapter 16. Finally, the concreteimplementation (baseline) of the architecture is described.
5.1 HLT/DAQ context
The context diagram of the HLT/DAQ is shown in Figure 5-1. It illustrates the inter-relationsbetween the HLT/DAQ system seen as a whole and elements external to it that are directly re-lated to data acquisition and triggering. It also illustrates the type of data which is exchanged ineach case. The associated interfaces are introduced in Section 5.2.3, and discussed in more detailin Part 2 of the present document.
The LVL1 trigger provides LVL2 with RoI information needed to guide the LVL2 selection andprocessing; this interface is discussed in detail in Part 2. The TTC system [5-1] provides signalsassociated with events that are selected by the LVL1 trigger. RODs associated with the detectorsprovide event fragments for all events that are selected by the LVL1 trigger. In addition, theLVL1 system contains RODs that provide LVL1 trigger-decision data to be read out for the se-lected bunch crossings. The LVL1 trigger system, the TTC system and all the ROD systems needto be configured by the DAQ system, e.g. at the start of each run. These components are shownin Figure 5-1.
Interfaces to external systems are also illustrated in Figure 5-1. These connect to the LHC ma-chine, in order to exchange information on beam parameters with the detectors, to control volt-ages for example; to the experimental infrastructure, to monitor temperatures of racks forexample; and to the CERN technical infrastructure (such as the rack cooling water supply). TheTDAQ interface for all these external systems is the DCS. Also shown are the interfaces relatingto long-term storage of event data retained by the HLT prior to offline analysis, and non-eventdata which have to be stored such as alignment and calibration constants, configuration param-eters, etc.
5.2 HLT/DAQ functional analysis
This section analyses the HLT/DAQ system in terms of the basic functions required, the build-ing blocks and sub-systems that provide these functions, and their internal and external inter-faces.
ATLAS Technical Design ReportHigh-Level Trigger, Data Acquisition and Controls 30 June 2003
48 5 Architecture
5.2.1 Functional decomposition
The HLT/DAQ system provides the ATLAS experiment with the capability of moving the detec-tor data, e.g. physics events, from the detector to mass storage; selecting those events that are ofinterest for physics studies; and controlling and monitoring the whole experiment.
The following functions are identified:
• Detector readout: for events, i.e. bunch crossings, selected by the LVL1 trigger, the dataassociated with the relevant bunch crossing are passed through detector-specific modules(RODs) that arrange them in formatted event fragments before sending them on to theHLT/DAQ system. An event arriving at the input to the HLT/DAQ system, i.e. at theROBs, is therefore split into a number of fragments. Quantitatively, there are ~1600 RODseach of which sends one event fragment per event, i.e. at the LVL1 rate of up to 100 kHz.
• Movement of event data: event fragments buffered in the ROBs have to be moved to theHLT and, for selected events, to mass storage. This is a complex process that involvesmoving both small amounts (typically ~2% of the full event) of data per event at the LVL1trigger rate (data in RoIs for the LVL2 trigger) and the full event, i.e. ~1.5 Mbyte, at therate of the LVL2 trigger (few kHz).
• Event selection and storage: the HLT system is responsible for reducing the rate of events,and selecting those potentially of interest for offline analysis. Events selected by the HLTsystem are written to permanent storage for offline reconstruction and analysis. The datarate for selected events should not exceed a manageable level of a few hundred Mbyte/s.
Figure 5-1 Context diagram (DSS is Detector Safety System)
LHCmachine
CERNinfrastructure
Detectors Magnet DSS
Databases
Non−event data
MassStorageEvent data
DataLogging
RODSystemLVL1
Trigger
TTCSystem
High Level Trigger,Data Acquisition
and ControlsLVL1 TriggerSignal
Conditions
EventMonitoring
ControlMonitoring
MonitoringEvent
External Systems via DCS
Configuration
Configuration
for LVL2RoI Information
Configuration
Configuration
Configuration

ATLAS Technical Design ReportHigh-Level Trigger, Data Acquisition and Controls 30 June 2003
5 Architecture 49
• Controls: TDAQ and detector online control includes the capability to configure, operateand control the experiment (detector, infrastructure, TDAQ) during data taking, in testingand calibration runs, and also to control certain vital service systems that remain active inperiods when most of the detector and the LHC are shut down.
• Monitoring: online monitoring includes the capability to monitor the state and behaviour(operational monitoring), and the performance (detector and physics monitoring) of allparts of ATLAS both during physics data taking and when calibration and testing opera-tions are in progress.
5.2.2 HLT/DAQ building blocks
The HLT/DAQ system is designed to provide the above functions using the following buildingblocks:
• ROD crate DAQ. This is the building block that provides the data acquisition functionsfor a ROD crate. During detector commissioning, debugging, or testing it allows data tak-ing to be performed on a single ROD crate. It is itself built from the building blocks de-scribed in the following paragraphs and during normal experiment operations the RODcrate DAQ is operated as an integral part of the overall DAQ.
• Readout. The Readout is a building block associated to functions of detector readout andthe movement of event data. It provides for the receiving and buffering of event frag-ments coming from the RODs. The depth of the required buffers is determined by the du-ration of the LVL2 processing, plus the duration of event building (for events accepted byLVL2) and the time taken to remove1 the events from the system. In addition, the Readoutprovides a sub-set of the buffered event fragments to the LVL2 trigger and all2 event frag-ments to the event building.
It also provides the first stage in the HLT/DAQ where event fragments from more than asingle ROD can be coherently sampled (with respect to the EL1ID) for the provision ofMonitoring functionality.
• LVL2 processing. As outlined in Chapter 1, the LVL2 trigger uses the RoI mechanism [5-1]to selectively read out only the parts of each event that it needs to make the selection.Starting from RoI information supplied by the LVL1 trigger, appropriate event fragmentsare requested from the Readout and used to decide on the acceptance or rejection of theevent. Event fragments are requested on the basis of the LVL1 event identifier and the η−φ region. The selection proceeds in several steps (with several matching data requests)and an event is rejected if at any given step none of the algorithmic criteria for all availa-ble signatures are fulfilled.
• RoI Collection. This is the building block that, in conjunction with the Readout, providesthe movement of a sub-set of event data to the LVL2 processing. It maps the η−φ regioninto Readout identifiers, collects the event fragments from the Readout, and provides theLVL2 processing with the resulting single data structure representing the RoI data.
1. An event is removed from the ROS either if it is rejected by the LVL2 or following the completion of theevent building process for those events that were accepted by the LVL2.
2. It is also foreseen that the quantity of event fragments sent to the event building may depend on the typeof event.
ATLAS Technical Design ReportHigh-Level Trigger, Data Acquisition and Controls 30 June 2003
50 5 Architecture
• Event Builder. This building block provides, for those events passing the LVL2 processingselection criteria, for the movement of the event fragments out of the ROS. It builds, buff-ers, and formats a complete event as a single data structure. Following the building oper-ation, the EB subsequently provides the event to the Event Filter.
It is also the first stage in the HLT/DAQ where complete event fragments may be sam-pled for the provision of Monitoring functionality.
• Event Filter. This is the final level of event rate and data volume reduction. With the LVL2processing it provides the event selection functionality described in Section 5.2.1. It exe-cutes complex selection algorithms on complete events provided to it by the Event Build-ing. It also provides an additional point in the HLT/DAQ where complete events may beused for the purposes of monitoring.
• Controls. This is the building block that provides the configuration, control, and monitor-ing of the ATLAS experiment for and during the process of data taking. In conjunctionwith the Detector control and monitoring (see below) it provides the control functionality.
• Detector control and monitoring. The detector is brought to and maintained in an opera-tional state by this building block. It also performs the monitoring of the state of the de-tector using the information provided by detector sensors, e.g. flow meters andtemperature monitors. In addition it receives and monitors information provided to AT-LAS by external systems, e.g. the LHC machine, CERN technical infrastructure.
• Information services. This building block provides for the exchange of information be-tween the Controls building block and all other building blocks for the purposes of con-figuration, control, and monitoring. It provides information management, error handlingand, makes available event fragments, sampled by the Readout and Event Builder, for thepurpose of event-data-based operational monitoring of the detector.
• Databases. Like the Information services this is a building block that supports the Con-trols and Detector control and monitoring building blocks to provide the functionality ofconfiguration. It provides for the experiment’s configuration description and its access byall building blocks. In addition, it allows the recording and accessing of information per-taining to the experiment’s operation during data-taking.
5.2.3 HLT/DAQ interfaces
The HLT/DAQ system interfaces to a variety of other sub-systems inside ATLAS, as well as ex-ternal systems that are not under the experiment’s control. The following sub-sections describethese interfaces with particular reference to the systems being connected, the interface responsi-bilities, and the data exchanged across the interface. References to more detailed documentationon the interfaces, including data formats are also given.
The interfaces can be split into two classes, those to other systems in ATLAS, and those to exter-nal systems. Table 5-1 summarizes the characteristics of the former.

ATLAS Technical Design ReportHigh-Level Trigger, Data Acquisition and Controls 30 June 2003
5 Architecture 51
5.2.3.1 Interfaces to other parts of ATLAS
5.2.3.1.1 LVL1–LVL2 trigger interface
Although part of the TDAQ system, the LVL1 trigger is an external sub-system from the point ofview of the DAQ and the HLT components.
A direct interface from the LVL1 trigger is provided through the RoIB that receives data from allof the LVL1 sub-systems, the Calorimeter trigger, the Muon trigger and the CTP for events re-tained by LVL1. This information is combined on a per-event basis inside the RoIB, at the LVL1rate, and passed to the supervisor of the LVL2 system, the L2SV. The interface has to run at fullLVL1 speed, i.e. up to 100 kHz. The detailed specification of the LVL1–LVL2 interface is de-scribed in Ref. [5-2].
As mentioned above, there are RODs associated with the LVL1 trigger that receive detailed in-formation on the LVL1 processing, e.g. intermediate results, for the events that are selected. Thedata from the corresponding ROBs are included in the event that is built following a LVL2-ac-cept decision and is therefore accessible for the Event Filter processing. They could also be ac-cessed earlier by the LVL2 trigger.
Trigger control signals generated by the LVL1 trigger are interfaced to the rest of the TDAQ sys-tem, as well as to the detector readout systems, by the TTC system documented in detail inRef. [5-1].
5.2.3.1.2 Detector-specific triggers
For test beams, during integration, installation and commissioning, and also for calibrationruns, it will be necessary to trigger the DAQ for a sub-set of the full system, i.e. a partition, inde-pendent of the LVL1 CTP and LVL2, in parallel with other ongoing activities. Detectors are pro-vided with Local Trigger Processors (LTPs) [5-3] that offer the necessary common functions forsuch running independently of the LVL1 CTP. Triggers provided independently of the CTP arereferred to as detector-specific triggers. A DFM is needed for each partition to initiate the build-ing of partial events in that partition.
Table 5-1 Overview of interfaces between HLT/DAQ and other ATLAS systems
Interface Data Rate Data Volume Data Type
LVL1–LVL2 100 kHz ~1 kbyte/event RoI information
Detector-specific non-physics trigger
few kHz few words Trigger signals
LVL1 & Detector Front-ends
100 kHz ~150 Gbyte/s Raw data
Detector MonitoringTDAQ – detectors
few Hz few Mbyte/s Raw, processed, and control data
Conditions Database Intermittent ~100 Mbyte/run System status
Mass Storage Interface ~200 Hz ~300 Mbyte/s Raw data + LVL2 and EF results
ATLAS Technical Design ReportHigh-Level Trigger, Data Acquisition and Controls 30 June 2003
52 5 Architecture
Any detector-specific trigger will communicate via the TTC system with its correspondingDFM. The DFM component therefore requires a TTC input and a mode where it will work inde-pendently from LVL2. A back-pressure mechanism throttles the detector-specific trigger via theROD-busy tree.
5.2.3.1.3 Interface to the detector front-ends
The detector front-end systems provide the raw data for each event that LVL1 accepts. The de-tector side of the interface is the ROD, while the TDAQ side is the ROB. The connection betweenthe two is the ROL.
From the point of view of the detector, i.e. ROD, the interface follows the S-LINK specification([5-4]). Implementation details of the ROL can change as long as this specification is followed.All RODs support a standard mezzanine card to hold the actual interface, either directly or on arear-transition module. Data flow from the RODs to the ROBs, while only the link flow controlis available in the reverse direction.
This interface has to work at the maximum possible LVL1 accept rate, i.e. up to 100 kHz and at160 Mbyte/s.
5.2.3.1.4 TDAQ access to the Conditions Databases
The conditions databases are expected to come from an LHC Computing Grid applications areaproject, with any ATLAS-specific implementation supported by the Offline Software group. TheOnline Software system will provide interfaces to the conditions databases for all TDAQ sys-tems and detector applications that require them online. It remains to be studied how accessingthe conditions database will affect the HLT performance itself and how frequently such accesswill need to occur. This is an area that will be addressed in more detail in the Offline ComputingTDR which is currently planned to be published in 2005.
The conditions database will store all time-varying information of the ATLAS detector that is re-quired both for reconstructing and analysing the data offline and for analysing and monitoringthe time variation of detector parameters and performance. Components of the HLT/DAQ sys-tem will write information into the database and read from it. In most cases read access will oc-cur at configuration time, but the HLT may need to access the database more often.
5.2.3.1.5 Mass Storage
Events that have passed the EF will be written to mass storage. The design and support of themass storage service will be centrally provided at CERN. However, in the first step of data stor-age, the Sub Farm Output (SFO) component will stream data directly to files on local disks.These will be large enough to accommodate typically a day of autonomous ATLAS data-takingin the event of failures in the network connecting ATLAS to the CERN mass storage system, orpossible failures in the offline prompt reconstruction system. The event-data files are stored in astandard format (see Refs. [5-5] and [5-6]) and libraries are provided to read these files in offlineapplications. In normal running, data will be continuously sent from the local disk storage tothe CERN mass storage system.

ATLAS Technical Design ReportHigh-Level Trigger, Data Acquisition and Controls 30 June 2003
5 Architecture 53
5.2.3.2 External interfaces
5.2.3.2.1 Interface to the LHC machine, safety systems, and the CERN technical infrastructure
All communications between the LHC machine, the general safety systems, the CERN technicalinfrastructure, the detector safety system, the magnets, and the TDAQ are done via DCS, withthe exception of fast signals (such as the LHC 40 MHz clock and orbit signal) that are handled inthe LVL1 trigger. These communication mechanisms and interfaces are described in Chapter 11.
5.3 Architecture of the HLT/DAQ system
This section presents the global architecture of the ATLAS HLT/DAQ system. The architecturebuilds upon the work presented in previous documents that we have submitted to the LHCC:the ATLAS Technical Proposal [5-7], the DAQ, EF, LVL2 and DCS Technical Progress Report [5-8], and the HLT/DAQ/DCS Technical Proposal (TP) [5-9]. The architecture is further developedby the requirements and performance studies, design, and development of prototypes and theirexploitation in test beams, done since the TP. Table 5-2 summarizes the performance requiredfrom the different TDAQ system functions.
The numbers presented in this table are based on a 100 kHz LVL1 accept rate (we recall that theATLAS baseline assumes a LVL1 accept rate of 75 kHz, upgradeable to 100 kHz), and thereforerepresent an upper limit in the required design and performance capabilities of the system. De-tailed simulations of the LVL1 trigger (see Section 13.5) show that its accept rate at LHC start-upluminosity (2 × 1033 cm−2 s−1) will be ~25 kHz. Simulations of the HLT at this luminosity indi-cate a LVL2 rejection factor of ~30. This rejection has been linearly extrapolated to 100 kHz togive the numbers in the table. The rate at the output of the EF is, however, quoted as that ex-pected from the above simulations. The output capacity of the EF could be increased, but will belimited finally by offline data processing and storage capabilities.
The architecture is presented following the functional breakdown given in the previous sec-tions. The architectural components are described from the functional point of view, withoutreference to possible implementations at this stage. The baseline implementation of this archi-tecture is presented in Section 5.5.
Table 5-2 Required system performance capabilities for a 100 kHz LVL1 accept rate
Function Input requirements Output requirements
Detector readout ~1600 event fragments of size typically 1 kbyte at 100 kHz
Few per cent of input event fragments to LVL2 at 100 kHz;~1600 event fragments at ~3 kHz to EB
LVL2 Few per cent of event fragments at 100 kHz
100 kHz decision rate (~3 kHz accept rate)
EB ~1600 event fragments at ~3 kHz ~3 kHz and ~4.5 Gbyte/s
EF ~3 kHz and ~4.5 Gbyte/s ~200 Hz and ~300 Mbyte/s
ATLAS Technical Design ReportHigh-Level Trigger, Data Acquisition and Controls 30 June 2003
54 5 Architecture
5.3.1 Architectural components
Figure 5-2 depicts the architectural components defined in the following text.
5.3.1.1 Detector readout
The communication link from the detector readout units (RODs), to the ROBs is the ROL. EachROL carries one ROD fragment per event. The ROL must be able to transport data at a rateequal to the average event fragment size times the maximum LVL1 rate (possibly up to160 Mbyte/s). In the calculation, the ‘average event fragment size’ should be taken as the meanover LVL1 triggers for the ROD that sees the largest event fragments on average.
ROBs are the memory buffers located at the receiving end of the ROLs, there being one ROL as-sociated to one ROB. Several (typically two or four) ROBs are physically implemented on aROBIN card and several ROBINs can be located in a ROS — the number depending on the im-plementation option (see Section 5.5.4). The ROS and its component ROBs provide two func-tions: buffering of event data and serving requests for event data from the HLT.
Figure 5-2 General architectural components and their relations
Onl
ine
Dat
abas
e an
d In
form
atio
n S
ervi
ces
ControlsLink to
TD
AQ
and
Det
ecto
r C
ontr
ols
ServicesOnlineLink to
SFIs
DFM
L2SVs
RoIB
LVL2 & EB
Networks
LVL1 RODs
ROB ROB
L2Ps
Mass Storage
SFOs
OfflineConditionsDatabase Systems
External
EFNEFPs
ROSs
RoIs ROLs

ATLAS Technical Design ReportHigh-Level Trigger, Data Acquisition and Controls 30 June 2003
5 Architecture 55
The ROBINs are of a unique design used by all the ATLAS sub-detectors3. The detector eventfragments are sent from the RODs and stored in the ROBs. The ROBs buffer the event fragmentfor the time needed by LVL2 to reject or select the event, plus that needed by the EB to build se-lected events.
The ROS is the component for serving data from the ROBs to LVL2 and the EB. In order to re-duce the number of connections into the LVL2 and EB networks, it funnels a number of ROBsinto a single port for each network. This ROB multiplexing capability is known as the ROB–ROSmerging (RRM) function. The ROS also includes a software local controller of the online soft-ware (see Section 10.5), for the purpose of controlling data taking and local monitoring.
5.3.1.2 LVL2
The LVL2 trigger uses RoI information, provided by LVL1 via the RoIB, to request relevantevent fragments from the ROS’s (at the granularity of individual ROBs). Using these data, itproduces a decision on the event and delivers the decision together with data it produced dur-ing its algorithmic processing back to the Data Flow components.
The RoIB receives information from LVL1 following each LVL1 trigger, allocates a LVL2 Super-visor (L2SV - see below) for the event, and transmits aggregate LVL1 information, after format-ting, to the allocated supervisor. The RoIB will run at the rate of the LVL1 trigger. The L2SV thenassigns, according to a load-balancing algorithm, a LVL2 Processor (L2P) from a pool under itscontrol to process the event, and forwards the LVL1 information provided by the RoIB to anevent handling process, the LVL2 processing unit (L2PU), running on the L2P4. The L2PU, us-ing this LVL1 information, requests event fragments from the ROS, processes the RoI data, andmakes a decision to accept or reject the event. In the course of processing the event data, addi-tional requests for event fragments may be issued in several steps. The L2PU may, according toa pre-defined algorithm, decide to flag for accept, events which have in fact been rejected by thealgorithm processing. This would be done in order to monitor the LVL2 selection process eitherin the EF or offline. The L2PU may also effect any required prescaling of selected channels. Thefinal accept/reject decision is sent back to the L2SV. If an event is rejected, the decision is passedto the ROS via the DFM in order to remove the event from the ROBs. If an event is accepted, thedecision is forwarded to the DFM, which then initiates the event-building operation for theevent.
A switching network, the L2N (LVL2 Network) component, links the ROS’s, the L2SV, and theL2Ps. The L2Ps will be organized into sub-farms in a manner which optimizes the use of theL2N.
Online software local controllers are associated to the RoIB, the L2SVs, and L2P sub-farms forthe purpose of controlling and monitoring the LVL2 trigger.
3. Contrary to the ROD, which is a specialized detector-specific module, there is a single ROBIN imple-mentation for the whole experiment. RODs for the different detectors implement detector-dependentfunctions. For example, digital signal processing is implemented in the case of the LAr sub-detector.
4. The L2SV may also assign a given L2P on the basis of the LVL1 trigger type.
ATLAS Technical Design ReportHigh-Level Trigger, Data Acquisition and Controls 30 June 2003
56 5 Architecture
5.3.1.3 Event Builder
Events accepted by LVL2 are fully assembled and formatted in the EB’s destination nodes, theSFIs. The DFM component is informed by the L2SV of the LVL2 decision. For each acceptedevent, the DFM, according to a load-balancing algorithm and other selective allocation consid-erations (e.g. special triggers and monitoring - see below), allocates an SFI. For rejected eventsand for events that have been successfully built, the DFM initiates a procedure to clear theseevents from the ROSs.
When the LVL2 system is not in use, for example during a detector calibration run, the DFMprovides a LVL2-bypass mechanism. It is informed when new events are available for building,directly by the LVL1 CTP system or the Local Trigger Processor (see Section 5.2.3.1.2) of the de-tector being calibrated, via the TTC network. In the event of several TDAQ partitions being runin parallel, each running partition has a dedicated DFM for initiating event building within thatpartition.
The DFM has the additional capability to assign SFIs on the basis of pre-defined criteria, e.g.forced-accepted LVL2 events, special LVL1/LVL2 trigger types (as defined by the detector sys-tems) etc.
The SFI allocated by the DFM requests and receives event data from the ROSs then builds andformats the event in its memory. It notifies the DFM when a complete event has been built, cor-rectly or otherwise, e.g. when expected event fragments are missing. In the latter case, the SFIattempts corrective action, by trying to re-access the missing fragments. Built events are buff-ered in the SFIs in order to be served to the EF. For efficiency reasons, the SFI can build morethan one event in parallel.
A switching network, the EBN (Event Builder Network) component5, links ROSs, SFIs and theDFM. The network enables the building of events concurrently into all the SFIs at an overall rateof a few kilohertz.
Online software local controllers are associated to the DFM and SFIs for the purpose of control-ling and monitoring the event building.
5.3.1.4 Event Filter
The EF comprises a large farm of processors, the EFP components. Each EFP deals with com-plete events served by the SFIs, as opposed to the selected event data used by the LVL2 trigger.From the architectural point of view the EF is a general computing tool for analysis of completeevents — either events produced by the full ATLAS detector or the set of event data associatedto a detector partition. In fact, it is also envisaged to use all or part of the EF for offline comput-ing purposes, outside of ATLAS data-taking periods.
Each EFP runs an EF data flow control program (EFD) that receives built events from the SFIs.Several independent Processing Tasks (PTs) continuously process events allocated to them ondemand by the EFD. Using offline-like event reconstruction and selection algorithms, the PTprocesses the event and produces a final trigger decision. When a given PT has completed the
5. The logically separate LVL2 and EB networks (which fulfil two different functions) could be implement-ed on a single physical network; in particular, this might be the case in the early phase of the experimentwhen the full performance is not required.

ATLAS Technical Design ReportHigh-Level Trigger, Data Acquisition and Controls 30 June 2003
5 Architecture 57
processing of an event, it requests a new one to be transferred from an SFI via the EFD. Datagenerated by the PTs during processing are appended to the complete raw event, if accepted, bythe EFD. Accepted events are classified and moved to respective Sub-Farm Output buffers(SFOs), where they are written into local disk files. Completed files are accessed by a mass stor-age system for permanent storage (Section 5.2.3.1.5). Note that EFDs may send events to one ofseveral parallel SFO output streams for further dedicated analysis, e.g. express analysis, calibra-tion, debugging.
The EFPs are organized in terms of clusters or sub-farms, with each sub-farm being associatedto one or more SFI and SFO. The minimum granularity of EFPs as seen from partitions is thesub-farm. SFIs, SFOs and EFPs are interconnected via a switching network, the EFN (EF Net-work) component.
The EF sub-farms may also be used for purposes other than event triggering and classification.A sub-farm may be allocated to running detector calibration and monitoring procedures whichrequire events possessing specific characteristics. As discussed above, the DFM can assignevents to dedicated SFIs from which EF sub-farms can request those events for dedicated analy-ses.
Monitoring and control of the EF itself is performed by a number of local controllers that inter-face to the online system.
5.3.1.5 Online Software system
The Online Software system encompasses the software to configure, control, and monitor theTDAQ system (known as the TDAQ control system), but excludes the management, processing,and transportation of physics data. Examples of the online software services are local controlprocesses that interface to other TDAQ components, as noted above, general process manage-ment, run control, configuration data storage and access, monitoring, and histogramming facili-ties. A number of services are also provided to support the various types of informationexchange between TDAQ software applications. Information can be shared between applica-tions in the same sub-system, across different sub-systems, and between TDAQ systems and de-tectors.
TDAQ and detectors use the configuration databases to store the parameters and dependenciesthat describe their system topology and the parameters used for data-taking. The offline condi-tions databases are used to read and to store data that reflect the conditions under which theevent data were taken.
The software infrastructure integrates the online services with the rest of TDAQ into a coherentsoftware system. The hardware infrastructure comprises the Online Software Farm (OSF), thecomputers on which the services run, and an Online Software switching network (OSN) that in-terconnects the OSF with other TDAQ components. These include the DCS for control and in-formation exchange as well as detector components that require access to online softwarefacilities. The OSF will include machines dedicated to monitoring event data and database serv-ers that hold the software and firmware for all of the TDAQ system — there will be servers localto clusters of computers that perform a common function, as well as central, backup servers.
Online software, services, and infrastructure are described in detail in Chapter 10.
ATLAS Technical Design ReportHigh-Level Trigger, Data Acquisition and Controls 30 June 2003
58 5 Architecture
5.3.1.6 Detector Control System
The DCS has a high degree of independence from the rest of the HLT/DAQ system, being re-quired to be able to run at all times, even if HLT/DAQ is not available. At the level of detailsuitable for this chapter, the DCS is a single component, without internal structure. It is inter-faced to the rest of the system via the Online Software system. The interplay between DCS andTDAQ control is discussed in Section 5.3.2.
DCS is the only ATLAS interface with the LHC machine, with the exception of that for fast sig-nals (which is handled directly by the LVL1 system). A detailed definition and description ofthe DCS architecture, interfaces, and implementation is given in Chapter 11.
5.3.2 Overall experimental control
The overall control of ATLAS includes the monitoring and control of the operational parametersof the detector and of the experiment infrastructure, as well as the supervision of all processesinvolved in the event readout and selection. This control function is provided by a complemen-tary and coherent interaction between the TDAQ control system and the DCS. Whilst the TDAQcontrol is only required when taking data or during calibration and testing periods, the DCS hasto operate continuously to ensure the safe operation of the detector, and a reliable coordinationwith the LHC control system and essential external services. DCS control services are thereforeavailable for the sub-detectors at all times. The TDAQ control has the overall control duringdata-taking operations.
There is a two-way exchange of information between DCS and the TDAQ control via mecha-nisms defined and provided by the Online Software (see Chapter 10). DCS will report informa-
Figure 5-3 Logical experiment controls flow

ATLAS Technical Design ReportHigh-Level Trigger, Data Acquisition and Controls 30 June 2003
5 Architecture 59
tion about the status and readiness of various components that it controls and monitors to theOnline system. The Online system will provide both configuration information and issue com-mands related to run control to DCS. Figure 5-3 presents the logical experiment control flow. Inthe figure, the lines represent the bi-directional information exchange between the systems,while the arrows on the lines indicate the direction of the command flow. The TDAQ controland DCS actions are coordinated at the sub-detector level. Each sub-detector, as well as the HLTand Data Flow systems, has TDAQ control elements responsible for the data-taking control.DCS control elements, called the Back-End (BE), control the sub-detector Front-End (FE) andLVL1 trigger equipment. DCS also controls the hardware infrastructure common to all the de-tectors, the DCS-Common Infrastructure Controls (DCS-CIC). The interaction with the LHCmachine, which is explained in Chapter 11, and other external services is handled by DCS viathe Information Service (DCS-IS). Experiment control is addressed in more detail in Chapter 12.
5.4 Partitioning
As already discussed in Chapter 3, partitioning refers to the capability of providing the func-tionality of the complete TDAQ to a sub-set of the ATLAS detector; for example, the ability toread out all or part of a specific detector with a dedicated local trigger in one partition, while theother detectors are taking data in one or more independent partitions.
The definition of the detector sub-set defines which ROBs belong to the partition (because of theconnectivity between RODs and ROBs, and the fact that RODs are grouped into TTC parti-tions). For example, if a partition of the muon MDT chambers is required, the ROBs associatedto the MDT RODs will be contained in the partition. Downstream of the ROBs a partition is real-ised by assigning part of TDAQ (EBN, SFI, EF, OSF, and networking) to the partition — this is aresource-management issue. Some examples of TDAQ components that may have to be as-signed to a TDAQ partition are a sub-set of the ROBs, as mentioned above, and a sub-set of theSFIs. The precise resource allocation in a particular case will depend on what the partition is re-quired to do. For example, in order to calibrate an entire detector, all that detector’s allocatedROBs, a fraction of the event building bandwidth and several EF sub-farms as well as onlinesoftware control and monitoring functions may be required.
As regards the transport of the data to the allocated resources, the DFM allocates SFIs responsi-ble for event building from a sub-set of ROSs. In order for this to happen, in the case of parti-tions associated to non-physics runs (i.e. when there is no LVL2) but that require functionalitybeyond the ROS, the DFM must receive, via the TTC, the triggering information for the relevantpartition. Hence the need for full connectivity between the DFMs and the TTC partitions.
5.5 Implementation of the architecture
5.5.1 Overview
This section defines a concrete implementation for each of the architectural components de-scribed in the previous sections. The choices for what we call the baseline implementation havebeen guided by the following criteria:
• The existence of working prototypes.
ATLAS Technical Design ReportHigh-Level Trigger, Data Acquisition and Controls 30 June 2003
60 5 Architecture
• Performance measurements that either fulfil the final ATLAS specifications today or canbe safely extrapolated to the required performance on the relevant timescale (e.g. extrapo-lating CPU speed of PCs according to Moore’s law).
• The availability of a clear evolution and staging path from a small initial system for use intest beams, to the full ATLAS system for high-luminosity running.
• The overall cost-effectiveness of the implementation and the existence of a cost-effectivestaging scenario.
• The possibility to take advantage of future technological changes over the lifetime of theexperiment.
The proposed baseline implementation is a system that could be built with today’s technologyand achieves the desired performance. It is expected that technological advances in the areas ofnetworking and computing will continue at the current pace over the next few years; these willsimplify various aspects of the proposed architecture and its implementation. Optimization inthe area of the ROB I/O (see Section 5.5.4) remains to be performed prior to freezing details ofthe implementation.
By making use of Commercial Off-The-Shelf (COTS) components based on widely-supportedindustrial standards wherever possible, the architecture will be able to take advantage of anyfuture improvements from industry in a straightforward way. Only four custom components6
are foreseen in the final HLT/DAQ/DCS system as such: the DCS ELMB module; the RoIB, ofwhich only a single instance is needed; the ROL implementation; and the ROBIN, which imple-ments the ROL destination and the ROB functionality. Components of the TTC system are alsocustom elements but are common across the entire experiment (and indeed used in other LHCexperiments).
The component performance and overall system performance figures which help to justify theproposed implementation can be found in Part 3 of this document.
Figure 5-4 depicts the baseline implementation of the system. The Online Software system is im-plicitly understood to be connected to all elements in the figure, and the DCS to all hardware el-ements that need to be monitored and controlled. Table 5-3 lists the principal assumptions fromwhich the size of the implementation has been determined. Table 5-4 presents more details ofthe estimated size of the system; it lists the components that make up the baseline implementa-tion and, for each one, gives the number of units and the associated technology.
6. The ROL source cards and the ELMB (see Chapter 11) are custom components that are specified andproduced under the responsibility of the TDAQ project. However, these are integrated in the detectorsystems.

ATLAS Technical Design ReportHigh-Level Trigger, Data Acquisition and Controls 30 June 2003
5 Architecture 61
Figure 5-4 Baseline implementation of the Data Flow and High-Level Trigger
Table 5-3 Assumptions
Parameter Assumed value Comments
LVL1 rate 100 kHz HLT/DAQ designed at this LVL1 rate
Event size (maximum) 2 Mbyte Assumes maximum fragment size for all sub-detectors during normal high-luminosity running
Event size (average) 1.5 Mbyte Assumed average value
LVL2 rejection ~30 EB rate of 3.3 kHz
RoI data volume 2% of total event size Detector data within an RoI - average value
L2P rate (events/s) ~100 LVL2 decisions/s/processorAssume dual-CPU (8 GHz) machines
EFP rate (events/s) ~1 EF decisions/s/processorAssumed dual-CPU (8 GHz) machines
RoIB
L2SVs
LVL1
Mass Storage
DFM pROS
SW
RODs
SFOSFO
SFI SFI
SW
RO
BR
OB
RO
BR
OB
RO
BIN
RO
BR
OB
RO
BR
OB
RO
BIN
ROS
RoIs
ROLs
EBNL2N
CTRL
EFNL2P
EFP
ATLAS Technical Design ReportHigh-Level Trigger, Data Acquisition and Controls 30 June 2003
62 5 Architecture
Table 5-4 Baseline implementation and size at a 100 kHz LVL1 rate
ComponentNumber of elements Technology Comments
ROL ~1600 links Custom Follows S-Link specification.
ROBIN ~400 ROBINs Custom module One ROBIN multiplexes and buffers data from 4 ROLs.
ROSa
~60 switches~60 PCs
Gigabit EthernetIndustrial PC
10 (ROBINs) × 4 (uplinks) concentrating factor.PC houses ~10 ROLs.ROBINs are addressed individually via the concen-trator switch.
~150 PCs Industrial PC Multiplexes 3 ROBINs.Relays RoI requests to appropriate ROBIN.Builds super-fragment for the EB.
LVL2 Network ~650 portsb Gigabit Ethernet Connects ROS, L2P, L2SV, DFM.
EB Network ~250 ports Gigabit Ethernet Connects ROS, SFI, DFM.
RoIB 1 unit Custom Module
L2SV ~10 Dual-CPU PCc One L2SV every 10 kHz of LVL1 trigger rate.
DFM ~35 Dual-CPU PCc One per TTC partition.
L2P ~500 Dual-CPU PCc Run LVL2 selection algorithms.
SFI ~90 Dual-CPU PCc,d Build (and buffer) complete events.
EFP ~1600 Dual-CPU PCc Run EF selection algorithms.
EF Network ~1700 ports Gigabit Ethernet Connects SFI, EFP and SFO.
SFO ~30 Dual-CPU PCc
and ~1 Tbyte disk storage
Buffers events accepted by EF and stores them on permanent storage.
File Servers ~100 Dual-CPU PCc
with ~1 Tbyte of disk space
Holds copy of databases and software. Local to a group of functionally homogeneous elements (e.g. a group of EFP).
Databaseservers
~2 RAID based fileserver
Hold master copy of databases, initialization dataand down-loadable software.
Online farm ~50 Standard PCs Operates and monitors the experiment.Runs online services.
Local controlswitch
~100 Gigabit Ethernet Connects a group of ~30 elements (e.g. a LVL2 sub-farm) to the central control switch.
Central controlswitch
250 ports Gigabit Ethernet Connects online farm, local control switches, and other system elements.
a. The ROS row indicates the number of components for both the switch-based (top numbers in the row)and bus-based ROS (bottom numbers).
b. The size of connectivity for the LVL2 network. The actual size of the central switch will be greatly re-duced by the use of small concentrator switches (e.g. 5 L2Ps into a single central switch port).
c. Assume 8 GHz CPU clock rate.d. At 8 GHz clock speed, the SFI may require only a single-CPU PC.

ATLAS Technical Design ReportHigh-Level Trigger, Data Acquisition and Controls 30 June 2003
5 Architecture 63
5.5.2 Categories of components
The implementation calls for the use of a small number of categories of components, which areeither custom or commercial, as follows:
• Buffers. These are used to decouple the different parts of the system: detector readout,LVL2, EB and EF. Because of the parallelism designed into the system, buffers fulfillingthe same function, e.g. ROBs, operate concurrently and independently.
• Processors. These run event selection algorithms, monitor and control the system. Theyare typically organized in farms, i.e. groups of processors performing the same function.
• Supervisors. These are generally processors dedicated to coordinating concurrent activi-ties, in terms of assigning events to processors and buffers at the different levels: the LVL2trigger (supervised by the RoIB and L2SV units), the EB (supervised by the DFM) and theEF (supervised internally by its data flow control).
• Communication systems. These connect buffers and processors to provide a path fortransporting event data or a path to control and operate the overall system. Communica-tion systems are present at different locations in the system. Some of them provide a mul-tiplexing function, i.e. they concentrate a number of input links into a smaller number ofoutput links. Depending on how the architecture is physically realised, a multiplexer mayhave a physical implementation (e.g. a switch, or a bus) or not (viz. a one-to-one connec-tion, without multiplexing).
5.5.3 Custom components
5.5.3.1 The ELMB
The Embedded Local Monitor Board designed for use by the DCS system (see Chapter 11).
5.5.3.2 The ReadOut Link
The ROL will be implemented based on the S-LINK protocol [5-4]. It is discussed in detail inSection 8.1.2. The RODs will host the link source cards, either as mezzanines mounted directlyon the RODs or on rear-transition modules. The ROBINs, located near the RODs in USA15, willhost several link destination cards. About 1600 links will be needed.
5.5.3.3 The ROBIN
The ROBIN is implemented as a PCI board receiving data from a number of ROLs. Each ROBINhas a PCI interface and a Gigabit Ethernet output interface [5-10]. The high-speed input datapaths from the RODs are handled by an FPGA. The buffers (associated to each input ROL) willbe big enough to deal with the system latency (LVL2 decision time, time to receive the clearcommand after a LVL2 reject, and time to build the complete event following a LVL2 accept). APowerPC CPU is available on each ROBIN. The prototype ROBIN is currently implemented ona single PCI board implementing two input links. The final ROBIN design is expected to sup-port four ROL channels.
ATLAS Technical Design ReportHigh-Level Trigger, Data Acquisition and Controls 30 June 2003
64 5 Architecture
5.5.3.4 The Region-of-Interest Builder
The RoIB design is modular and scalable and is custom designed and built. It is described in de-tail in Ref. [5-11]. The link interface from LVL1 to the RoIB follows the S-LINK specification.There are inputs from eight different sources to the RoIB (Section 5.2.3.1.1). Data flow from theLVL1 system to the RoIB, with the link interface providing only flow control in the reverse di-rection. Asserting XOFF is the only way for the RoIB to stop the trigger. The output of the RoIBis sent via S-LINK (or possibly via Gigabit Ethernet) to one of the L2SV processors.
5.5.4 ReadOut System
The ROS is implemented as a rack-mounted PC. Each ROS contains several ROBINs, and hasconnections to the LVL2 and EB networks. Each ROBIN multiplexes up to four ROLs into a sin-gle physical output channel. The ROS multiplexes the ROBIN outputs onto the central LVL2and EB networks (the RRM function, see Section 5.3.1.1). The RRM multiplexing factor dependson the physical number of links between the ROS and each of the central networks. The maxi-mum factor can be calculated from external parameters, in particular the average RoI size, thepeak RoI fragment request rate per ROB, and the LVL2 rejection power.
The RRM function may be implemented in two different ways:
• The bus-based ROS — the ROS PC contains three ROBINs, each connected to its own PCI-bus and each having four ROL inputs to four ROBs, and one PCI output. This output isconnected to the ROS’s PCI-buses, which implement the RRM function. Requests, comingfrom LVL2 or the EB, for event fragments in the ROB, are handled directly by the ROS PCwhich aggregates the event fragments over its PCI-buses before dispatching them to theLVL2 or the EB. Gigabit Ethernet interfaces connect the ROS to the LVL2 and EB net-works.
• The switch-based ROS — the ROS PC houses typically 10 ROBINs, each having four ROLinputs to four ROBs, and one Gigabit Ethernet output. The RRM function is implementedtypically using a 10 x 4 Gigabit Ethernet switch, which concentrates the ROBIN outputsdirectly into four Gigabit Ethernet outputs: two for the LVL2 network and two for the EBnetwork7. The switch-based ROS is understood to include the switch as well as the PC.The ROS PC itself does not play any role in the process of transferring data between theROBs, and the LVL2 and EB. It is solely responsible via its PCI-bus for the physical hous-ing of the ROBINs, their initialization and control, and some monitoring functions.
Bus-based and switch-based ROSs are depicted in Figure 5-5. Preliminary studies have alreadybeen made on both implementation options, details can be found in Refs. [5-12] and [5-13]. Thecurrent ROBIN prototype allows access to the ROB data via both the PCI-bus and the GigabitEthernet interfaces. The optimization of the ROS architecture, as indicated previously, will bethe subject of post-TDR studies using this prototype. The final decision on an optimized designfor the ROS architecture will be taken based on the results of these studies on a timescale com-patible with the production of the ROBINs (see Chapter 18).
As noted above, the ROBINs, and therefore the ROSs will be located underground in the USA15cavern.
7. Whether one, two, or more outputs are used each to the EB & LVL2 networks will depend on how manyswitches are used to implement these networks.

ATLAS Technical Design ReportHigh-Level Trigger, Data Acquisition and Controls 30 June 2003
5 Architecture 65
5.5.5 Networks
All networks use Gigabit Ethernet technology despite the fact that in some cases, for examplefor the EFN, Fast Ethernet (100 Mbyte/s) would be sufficient to satisfy the requirements today.Considerations of overall network uniformity, technology evolution, and expected cost evolu-tion justify this choice.
Following the first level of ROB concentration in the ROS (see Section 5.5.4), the topology of theEB and LVL2 networks consists of central switches, connecting sources (i.e. ROSs) and destina-tions (e.g. SFIs and L2Ps). These central networks will, logically, be monolithic in the sense thateach network will connect to all of its sources and destinations. However, they may be physical-ly organized either in terms of large monolithic switches or in terms of combined small switch-es. The detailed network topology will be fixed at the time of implementation.
Given the number of L2Ps (typically ~500 dual CPUs), small concentrating switches are usedaround the L2Ps to reduce the number of ports on the central switches. This is possible since thebandwidth per processor is much less than Gigabit Ethernet link capacity.
The organization of the OSN reflects the organization of the online farm. It is hierarchical, withnetworks local to specific functional elements (e.g. an EF sub-farm) and up-links to a centralnetwork providing the full connectivity. Typically, the OSN will be organized in terms of small(~40 ports) switches, local to groups of components with common functions (e.g. L2Ps), whichconnect through a large (~200 ports) central switch.
The current baseline for the overall EF network is a set of small independent networks (EFNs)each connecting a set of EF nodes with a number of SFIs and SFOs. This scheme allows flexibili-ty in choosing the number of EF nodes for each cluster. The input rate capability can be in-creased by simply adding more SFI nodes to a given sub-farm. The EF network is organized intwo layers. The lower layer consists of EF nodes clustered via small switches (labelled ‘SW’ inFigure 5-4, ~20 ports). The higher layer connects together a number of these EF clusters to oneor more SFIs and SFOs via an EFN switch.
One possible network architecture implementation and topology, using the switch-based ROS(see Section 5.5.4) as an example, is given in Ref. [5-13].
Figure 5-5 Bus and switched based ROSs
PC BUS
CPU
PC BUS
CPU
SWITCH
RO
BIN
RO
BIN
RO
BIN
RO
BIN
PC PC
ROS ROS
Gigabit Ethernet
Gigabit Ethernet
ATLAS Technical Design ReportHigh-Level Trigger, Data Acquisition and Controls 30 June 2003
66 5 Architecture
5.5.6 Supervisory components
The LVSV and DFM supervisory components are implemented by high-performance, rack-mounted, dual-CPU PCs running Linux, connected to the EB and LVL2 networks. A customPCI-to-S-LINK interface or standard Gigabit Ethernet technology may be used to connect theL2SV to the RoIB, and standard Gigabit Ethernet technology to connect the L2SV to the rest ofthe system. The connection between the DFM and the TTC network has not been defined yet —it could be based, for example, on a network technology or on a dedicated PCI-to-TTC-receiverinterface.
Measurements done so far show that at the nominal LVL1 rate (100 kHz), only a small numberof L2SVs (~10) are required. One DFM is required for each active concurrent TDAQ partition(see Section 5.4) — this includes the main data-taking partition. All DFMs except for the onerunning the main data-taking partition will need to receive detector-specific triggers directly orindirectly from the relevant TTC partition. In the main partition, the DFM receives its inputfrom the L2SVs. The maximum foreseen number of partitions in ATLAS is 35. In practise, thenumber of active concurrent TDAQ partitions that require a DFM and in use at any time is like-ly to be less than this. A back-pressure mechanism will throttle the detector-specific trigger ratevia the ROD-busy tree if it becomes unmanageable.
5.5.7 HLT processors
LVL2 and EF processors will be normal rack-mounted PCs running Linux. Dual-CPU systemsare the most appropriate solution at the moment, although that may change in the future. Weestimate that there will be ~500 LVL2 processors and ~1600 EF processors in the final (100 kHz)system (assuming 8 GHz clock speed), but initial set-ups during commissioning, and for the in-itial data-taking when the luminosity will be below the LHC design luminosity, will be muchsmaller. LVL2 and EF processors are COTS components and can be replaced or added at anytime. Computing performance is more important than I/O capacity in the EF nodes.
Although 1U servers currently offer an attractive implementation for the farms, blade servers,which house hundreds of processors in a rack together with local switches, have a number ofpotential advantages, e.g. lower power requirements, higher density, and may offer a more at-tractive solution of sufficient maturity by the time the farms are purchased.
Studies are currently under way (see Ref. [5-14]) to investigate the possibility and implicationsof siting some EF sub-farms at locations outside CERN (e.g. at ATLAS institutes or computingcentres). This would have the advantage of being able to benefit from existing computingequipment, both during the initial phases of the experiment, when only a fraction of the EFequipment at CERN will have been purchased, and throughout the lifetime of the experimentfor non-critical applications such as data monitoring.
5.5.8 Event-building processors
The SFIs are again rack-mounted PCs running Linux. The event-building process requires alarge CPU capacity to handle the I/O load and the event assembly. Again dual-CPU systems arethe most cost-effective solution at the moment. The SFI components require no special hard-ware apart from a second Gigabit Ethernet interface that connects them to the EF network.Roughly 90 units are envisaged for the final system.

ATLAS Technical Design ReportHigh-Level Trigger, Data Acquisition and Controls 30 June 2003
5 Architecture 67
5.5.9 Mass Storage
The SFOs write events to the disks in a series of files, and provide buffering if the network con-nection to the CERN mass storage system is down. Assuming that the SFOs have to buffer ~1day of event data, with an average event size of 1.5 Mbyte per event at a rate of ~200 Hz, theywill need a total of ~26 Tbyte of disk storage. Today, relatively cheap PC servers can be boughtwith > 1 Tbyte of IDE disk storage. The SFOs will therefore consist of normal PCs, with a hous-ing that allows the addition of large disk arrays — approximately 30 units are assumed for thefinal system.
5.5.10 Online farm
The online farm provides diverse functions related to control, monitoring, supervision, and in-formation/data services. It will be organized hierarchically in terms of controllers and databaseservers local to the TDAQ functional blocks (for example the ROS or an EF sub-farm) and clus-ters of processors providing global functions (experiment control, general information services,central database servers).
The processors for experiment control and general information services will be standard PCs or-ganized in small farms of ~20 PCs each. Local file servers are also standard PCs, with the addi-tion of a large local disk storage (~1 Tbyte), while the central database servers are large fileservers with several TByte of RAID disk storage.
At the time of system initialization, quasi-simultaneous access to the configuration and condi-tions databases will be required by many hundreds of processes, in some cases requiringO(100) Mbyte data each. This calls for a high-performance in-memory database system and astructured organization of the database servers to spread the I/O load sufficiently widely thatthe system can be initialized and configured in a reasonable time. It is proposed to organize thedatabase infrastructure as follows:
• Local data servers: database servers that hold a copy of the conditions and configurationsdatabases to be accessed locally by an homogeneous sub-set of the system (e.g. an EF sub-farm). A copy of specific software and miscellaneous data that is to be downloaded intothe components in the sub-set is also held on the local server.
• Central server: a fault tolerant, redundant database server that holds the master copy ofthe TDAQ software and configuration as well as a copy of the conditions data. Local serv-ers are updated from the central server at appropriate intervals. The central server mayboth update and be updated by the central offline conditions database.
The control of database write access and synchronization – in particular in the case of condi-tions data where both online and offline clients may wish to write to the database at the sametime – is a complex problem that has not yet been addressed in detail. This issue will be studiedin common with the offline community as well as with other experiments with the aim of arriv-ing at a common solution.
5.5.11 Deployment
Functionally homogeneous components, e.g. EF processors, are organized in terms of standardATLAS sub-farm racks. Each rack contains, in addition to the computing components, a local
ATLAS Technical Design ReportHigh-Level Trigger, Data Acquisition and Controls 30 June 2003
68 5 Architecture
file server; a local online switch (to connect all the components to the online central switch); arack controller; and the necessary power and cooling distribution. We are investigating, withother LHC experiments, cooling systems for racks with horizontal air-flow suitable for rack-mounted PCs. The number of components per rack depends on the size of the racks. Table 5-5summarizes the organization of the different racks, the number of racks of a specified contentper function and their physical location.
5.6 Scalability and staging
The performance profile anticipated for the ATLAS TDAQ system between the detector installa-tion and the availability of the LHC nominal luminosity, is summarized in Table 5-6. It is ex-pressed as the required LVL1 rate in kilohertz.
The scalability of the TDAQ system is discussed on the basis of the above performance profile.
Prior to the ATLAS start-up, the TDAQ system will provide the full detector read out for thepurpose of commissioning the experiment and the cosmic run, and a minimal HLT system ap-propriate to fulfilling the requirements for this period (few kilohertz).
Table 5-5 Rack organization and location
Unit type Number of units Composition Location
ROS rack ~15 ~15 ROSsa
a. Each rack also contains a local online switch, a local file server, and a rack controller.
USA15 – underground
HLT rack ~20 for LVL2~80 for EF
~30 Processing Unitsa SDX 15 – surface50% of EF racks possibly located in the CERN computer centre
SFI rack 3–4 ~30 SFIs/racka SDX 15 – surface
SFO rack 6–7 ~5 SFO (+ Disk space)a SDX 15 – surface
Online rack 3 ~20–30 Processorsa SDX 15 – surface
Central switches 3 ~256 ports per switch SDX 15 – surface
Table 5-6 TDAQ required performance profile
Phase Date (TDAQ ready by) Performance (LVL1 rate)
ATLAS Commissioning 2005 N/Aa
a. Provide full detector read out but minimal HLT capability.
Cosmic-ray run 2006 N/Aa.
ATLAS start-up 2007 37.5 kHz
Full performance 2008 75 kHz
Final performance 2009 100 kHz

ATLAS Technical Design ReportHigh-Level Trigger, Data Acquisition and Controls 30 June 2003
5 Architecture 69
The detector readout system must be fully8 available at the time of the detector commissioning(i.e. in 2005) irrespective of the rate performance, since all parts of the detector must be connect-ed. In contrast, the processing power in the HLT depends on the maximum LVL1 rate that mustbe accepted. Since the LVL2 and EF farms, as well as SFIs, SFOs, etc, are implemented usingstandard computer equipment connected by Gigabit Ethernet networks, they can be extendedas financial resources become available.
The strategy is therefore the staging of the farms and associated networks. In the latter case, ad-ditional central switches (if a topology based on multiple central switches is chosen) or ports(for monolithic central switches) will be added to support the additional HLT nodes. The sameargument, although on a smaller scale, applies to SFIs and SFOs.
The scaling of the TDAQ system size, as afunction of the LVL1 trigger rate, is depicted inFigure 5-6 for the Event Builder (number ofSFIs and number of EBN ports), Figure 5-7 forthe LVL2 sub-system (number of L2Ps andnumber of L2N ports), and Figure 5-8 for theEvent Filter (number of EFPs and ports of theEvent Filter network).
8. Some 25% of the detector ROLs, corresponding to the part of the ATLAS detector which is staged, willnot be installed at the start-up of ATLAS but later: currently planned for 2008.
Figure 5-6 EB sub-system scaling Figure 5-7 LVL2 system scaling
0
50
100
150
200
250
300
0 20 40 60 80 100 120
LVL1 rate (kHz)
Nu
mb
er o
f co
mp
on
ents SFI
EBN ports
0
100
200
300
400
500
600
700
0 20 40 60 80 100 120
LVL1 rate (kHz)
Nu
mb
er o
f co
mp
on
ents
L2P
L2N ports
Figure 5-8 EF system scaling
0
200
400
600
800
1000
1200
1400
1600
1800
2000
0 20 40 60 80 100 120
LVL1 Rate (kHz)
Nu
mb
er o
f co
mp
on
ents
EFP
EFN ports
ATLAS Technical Design ReportHigh-Level Trigger, Data Acquisition and Controls 30 June 2003
70 5 Architecture
5.7 References
5-1 ATLAS Collaboration, Level-1 Trigger Technical Design Report, CERN/LHCC/98-014 (1998)
5-2 M. Abolins et al., Specification of the LVL1 / LVL2 trigger interface, ATLAS EDMS Note, ATL-D-ES-0003 (2002)http://edms.cern.ch/document/107485/
5-3 P. Farthouat et al., Proposal for a Local Trigger Processor, ATLAS EDMS Note, ATL-DA-ES-0033 (2003)http://edms.cern.ch/document/374560/
5-4 E. van der Bij et al., Recommendations of the Detector Interface Group - ROD Working Group,ATLAS EDMS Note, ATL-D-ES-0005 (2001)http://edms.cern.ch/document/332389/
5-5 C. Bee et al., The raw event format in the ATLAS Trigger & DAQ, ATLAS Internal Note, ATL-DAQ-98-129 (1998)
5-6 H.P. Beck and S. Gadomski, Event Storage Requirements, ATLAS EDMS Note, ATL-DQ-ES-0041 (2002)http://edms.cern.ch/document/391572/
5-7 ATLAS Collaboration, ATLAS: Technical proposal for a general-purpose pp experiment at the Large Hadron Collider at CERN, CERN/LHCC/94-43 (1994)
5-8 ATLAS Collaboration, DAQ, EF, LVL2 and DCS Technical Progress Report, CERN/LHCC/98-016 (1998)
5-9 ATLAS Collaboration, ATLAS High-Level Triggers, DAQ and DCS Technical Proposal, CERN/LHCC/2000-017 (2000)
5-10 ReadOut Sub-system, Summary of Prototype ROBins, ATLAS EDMS Note, ATL-DQ-ER-0001 (2003)http://edms.cern.ch/document/382933/
5-11 R.E. Blair et al., A Prototype ROI Builder for the Second Level Trigger of ATLAS Implemented in FPGA’s, ATLAS Internal Note, ATL-DAQ-99-016 (1999)
5-12 B. Gorini et al., ROS Test Report, in preparation
5-13 H.P. Beck et al., ATLAS TDAQ: A Network-based Architecture, ATLAS EDMS Note, ATL-DQ-EN-0014 (2002)https://edms.cern.ch/document/391592/
5-14 K. Korcyl et al., Network performance measurements as part of feasibility studies on moving part of the ATLAS Event Filter to off-site Institutes, 1st European Across Grids Conference, Universidad de Santiago de Compostela (2003)

ATLAS Technical Design ReportHigh-Level Trigger, Data Acquisition and Controls 30 June 2003
6 Fault tolerance and error handling 71
6 Fault tolerance and error handling
6.1 Fault-tolerance and error-handling strategy
Error handling and fault tolerance are concerned with the behaviour of the TDAQ system in thecase of failures of its components [6-1]. Failure, here, means the inability of a component, be ithardware or software, to perform its intended function.
The overall goal is to maximize system up-time, data-taking efficiency and data quality for the ATLASdetector. This is achieved by designing a robust system that will keep functioning even whenparts of it are not working properly.
Complete fault tolerance is a desired system property which does not imply that each compo-nent must be able to tolerate every conceivable kind of error. The best way for the system toachieve its overall goal may well be to simply reset or reboot a component which is in an errorstate. The optimal strategy depends on the impact that the faulty component has on data taking,the frequency of the error, and the amount of effort necessary to make the component more faulttolerant.
The fault-tolerance and error-handling strategy is based on a number of basic principles:
• The number of single points of failure in the design itself must be minimized. Where una-voidable, provide redundancy to quickly replace failing components. This might consistof spare parts of custom hardware or simply making sure that critical software processescan run on off-the-shelf hardware which can be easily replaced.
• Failing components must affect as little as possible the functioning of other components.
• Failures should be handled in a hierarchical way, where local measures are taken to cor-rect failures. Local recovery mechanisms will not make important decisions, e.g. to stopthe run, but pass the information on to higher levels.
• Errors are reported in a standardized way to make it easy to automate detection and han-dling of well-defined error situations (e.g. with an expert system).
• Errors are automatically logged and the record made available for later analysis if neces-sary. Where the error affects data quality the necessary information will be stored in theconditions database.
The following actions can be distinguished.
Error detection — describes how a component finds out about failures either in itself or neigh-bouring components. Errors are classified in a standardized way and may be transient or per-manent. A component should be able to recover from transient errors by itself once the cause ofthe error disappears.
Error response — describes the immediate action taken by the component when it detects an er-ror. This action will typically allow the component to keep working, maybe with reduced func-tionality. Applications which can sensibly correct errors that are generated internally or occur inhardware or software components they are responsible for should correct them directly. Inmany cases the component itself will not be able to take the action necessary to cure failures in a
ATLAS Technical Design ReportHigh-Level Trigger, Data Acquisition and Controls 30 June 2003
72 6 Fault tolerance and error handling
neighbouring component. Even if the component is unable to continue working, this should notbe a fatal error for the TDAQ system if it is not a single point of failure.
Error reporting — describes how failure conditions are reported to applications interested in theerror condition. The mechanism will be a standardized service which all components use. Thereceiver of the error message might be persons (like a member of the shift crew or an expert) oran automated expert system.
Error recovery — describes the process of bringing the faulty component back into a functioningstate. This might involve manual intervention by the shift crew, an expert, or an automated re-sponse initiated by the expert system. The timescale of this phase will typically be longer thanthe previous ones and can range from seconds to days (e.g. in the case of the replacement of apiece of hardware which requires access to controlled areas).
Error prevention — describes the measures to be taken to prevent the errors from being intro-duced in hardware or software. Good software engineering, the use of standards, training, test-ing, and the availability and use of diagnostic tools help in reducing the error level in the TDAQsystem.
6.2 Error definition and identification
In order to respond to error conditions it is important to have a clearly-defined TDAQ-wideclassification scheme that allows proper identification of errors. It is assumed that error condi-tions are detected by DataFlow applications, controllers, event-selection software, and monitor-ing tasks. These conditions may be caused by failures of hardware they control, of componentsthat they communicate with, or these may occur internally.
If the anomalous condition cannot be corrected immediately an error message is issued. Errormessages are classified according to severity. The classification is necessarily based on localjudgements; it is left to human/artificial intelligence to take further action, guided by the classi-fication and additional information provided by the applications that detect the errors.
Additional information consists of a unique TDAQ-wide identifier (note that status and returncodes, if used, are internal to the applications), determination of the source, and additional in-formation needed to repair the problem. Messages are directed to an Error-Reporting Service,never directly to the application that may be at the origin of the fault.
For successful fault management it is essential that correct issuing of error messages be enforcedin all TDAQ applications.
6.3 Error-reporting mechanism
Applications encountering a fault make use of an error-reporting facility to send an appropriatemessage to the TDAQ system. The facility is responsible for message transport, message filter-ing, and message distribution. Optional and mandatory attributes are passed with the messag-es. The facility allows receiving applications to request messages according to the error severityor other qualifiers, independent of origin of the messages. A set of commonly used qualifierswill be recommended. These can, for example, include the detector name, the failure type (e.g.hardware or software), or finer granularity indicators like ‘Gas’, ‘HV’ etc. Along with mandato-

ATLAS Technical Design ReportHigh-Level Trigger, Data Acquisition and Controls 30 June 2003
6 Fault tolerance and error handling 73
ry qualifiers like process name and id, injection date and time, and processor identification, theyprovide a powerful and flexible system logic for the filtering and distribution of messages.
Automatic message suppression at the sender level is foreseen to help avoid avalanches of mes-sages in the case of major system failures. A count on the suppressed messages is kept. Messagesuppression at the level of the message-reporting system is also possible.
An error-message database is foreseen to help with the standardization of messages includingtheir qualifiers. A help facility can be attached which allows the operator to get detailed advicefor the actions to be taken for a given failure.
6.4 Error diagnosis and system-status verification
Regular verification of the system status and its correct functioning will be a vital operation inhelping to avoid the occurrence of errors. A customizable diagnostics and verification frame-work will allow verification of the correct status of the TDAQ system before starting a run or be-tween runs, automatically or on request. It will make use of a suite of custom test programs,specific to each component type, in order to diagnose faults.
6.5 Error recovery
Error-recovery mechanisms describe the actions which are undertaken to correct any importanterrors that a component has encountered. The main goal is to keep the system in a running stateand minimize the consequences for data taking.
There will be a wide range of error-recovery mechanisms, depending on the sub-system and theexact nature of the failure. The overall principle is that the recovery from a failure should behandled as close as possible to the component where the failure occurred. This allows failures tobe dealt with in sub-systems without necessarily involving any action from other systems. Thisdecentralizes the knowledge required to react appropriately to a failure and it allows experts tomodify the error handling in their specific sub-system without having to worry about the conse-quences for the full system.
If a failure cannot be handled at a given level, it will be passed on to a higher level in a standard-ized way. While the higher level will not have the detailed knowledge to correct the error, it willbe able to take a different kind of action which is not appropriate at the lower level. For exam-ple, the higher level might be able to pause the run and draw the attention of the member of theshift crew to the problem, or it might take a subfarm out of the running system and proceedwithout it.
The actual reaction to a failure will depend strongly on the type of error. The same error condi-tion, for example timeouts on requests, may lead to quite different actions depending on thetype of component in which the error occurs. A list of possible reactions is given in Section 6.8.
Each level in the hierarchy will have different means to correct failures. Only the highest levelswill be able to pause data taking or to stop a run.
The functionality for automatic recovery by an expert system will be integrated into the hierar-chical structure of the TDAQ control framework and can optionally take automatic action for
ATLAS Technical Design ReportHigh-Level Trigger, Data Acquisition and Controls 30 June 2003
74 6 Fault tolerance and error handling
the recovery of a fault. It provides multi-level decentralized error handling and allows actionson failures at a low level. A knowledge base containing the appropriate actions to be taken willbe established at system installation time. Experience from integration tests and in test-beamoperation will initially provide the basis for such a knowledge base. Each supervision node cancontain rules customized to its specific role in the system.
6.6 Error logging and error browsing
Every reported failure will be logged in a local or central place for later retrieval and analysis.The time of occurrence and details on the origin of the failure will also be stored to help in deter-mining the cause and to build failure statistics, which should lead to the implementation of cor-rective actions and improvements of the system. Corresponding browsing tools will beprovided.
6.7 Data integrity
One of the major Use Cases for error handling and fault tolerance concerns the communicationbetween sources and and destinations in the system.
Given the size of the TDAQ systems, there is a significant possibility that at any given momentone of the sources of data may not be responding. Each element in the DataFlow can be general-ly seen as both a source and a destination.
Because of electronics malfunctioning, e.g. a fault in the power supply for a number of front-end channels, it may happen that a source temporarily stops sending data. In this case the beststrategy for the error handling is to have a destination that is able to understand, after a timeoutand possible retries (asking for data), that the source is not working. In this case the data frag-ment will be missing and the destination will build an empty fragment with proper flagging ofthe error in the event header. The destination will issue an error message.
There are cases of communications errors where there is no need for a timeout mechanism. Thisis, for example, the case of a ROL fault due to Link Down. The S-LINK protocol signals this sit-uation, the receiving ROS immediately spots it, builds an empty fragment, and reports the linkfault. A similar mechanism can also be envisaged for the FE electronics to ROD communicationthat is also established via point-to-point links.
There are many situations where a timeout mechanism is mandatory, for example when thecommunication between source and destination is using a switched network. In this case possi-ble network congestion may simulate a source fault (e.g. through packet loss). Switched net-works carrying event data at high rates are present between the ROS and the Event Building,the ROS and the LVL2, and the Event Building and the EF.
The choice of the correct timeout limits can only be made once the system is fully assembledwith the final number of nodes connected to the switches. Only then can the normal operationtiming be evaluated via dedicated measurements with real and simulated data. The systemtimeouts may have to be tuned differently when the system is used for physics and calibrationruns. For example, in calibration mode the time for getting a data fragment may be higher dueto the bigger amount of data to be transferred from a source to a destination.

ATLAS Technical Design ReportHigh-Level Trigger, Data Acquisition and Controls 30 June 2003
6 Fault tolerance and error handling 75
6.8 Fault-tolerance and failure strategy for hardware components
6.8.1 The source end of ReadOut Links
The ROL is implemented as an S-LINK [6-2] LSC mezzanine installed on the ROD module, orinstalled on the ROD rear transition module, or integrated into the ROD rear transition module.On the receiver end of the ROL, multiple S-LINK input channels are integrated onto a ROBINcard.
The ROL design uses small form-factor pluggable (SFP) [6-3] fibre optic transceiver modules. Inthe case of a failure of a fibre optic transceiver, a replacement part can therefore simply beplugged in from the front-panel, avoiding the need to power off the ROD crate or the ROS PC.The only implication is that fragments from the faulty ROL will be lost during the operation.Device qualification data from the fibre optic transceiver vendor indicates that fewer than 1.5%of the devices will fail over a 10 year period. Sufficient spare parts will be available for replace-ment.
In the case of a failure of an LSC mezzanine card or a ROD rear transition module, the crate willhave to be powered off, in order to replace the faulty cards. This will take about five minutes,not counting the time to shut down and reboot the ROD crate. It is difficult to estimate the fail-ure rate of the LSC mezzanine card or the ROD rear transition modules; however, it is expectedto be a rare occurrence and sufficient spares will be available for replacement.
In the case of a failure of one of the ROL input channels integrated on the ROBIN card, the com-plete card needs to be replaced, which implies a reboot of the ROS PC with the faulty card.Again this is expected to be a rare occurrence.
6.8.2 The ReadOut System
The ReadOut System (ROS) is the system that receives, buffers, and dispatches data fragmentscoming from the Readout links. The ROS is implemented as a number of individual units (up toaround 150). Each unit is composed of an industrial PC housing a number of ROBIN modules.
The ROBIN modules are custom PCI devices receiving data from a number of Readout links(between two and four according to the implementation options) and providing the buffering.The ROBIN boards are based on standard commercial components. Their failure rate is expect-ed to be very low, and detailed studies will be performed when the first prototypes are availa-ble.
In the case of a failure of a ROBIN module, the full ROS PC will need to be powered off. An ad-equate number of spare modules will be available to expedite repairs. The data of all the ROLsconnected to the ROS (at least 12) will be unreadable for the full intervention period. An alterna-tive intervention approach will be to dynamically mask out the ROBIN module from the ROS,thus losing only the data of the ROLs connected to the module, and to delay the module re-placement until the next natural pause in data taking. The intervention approach will have to bedecided on a case-by-case basis, according to the importance of the ROLs connected to thefaulty ROBIN module.
The PCs used to house the ROBIN modules will be commercial rack-mounted industrial PCs.The selection criteria for the PCs will require high reliability with such features as redundant
ATLAS Technical Design ReportHigh-Level Trigger, Data Acquisition and Controls 30 June 2003
76 6 Fault tolerance and error handling
power supplies. Every ROS unit is completely independent from the others. Thus the ROS sys-tem itself does not need to be reconfigured in the case of a failure with a particular unit/PC, andit can work with any number of missing PCs. However, any hardware intervention on a ROSPC will imply the loss of all the data from the connected ROLs, and the need to reconfigure theDAQ accordingly. For example, the TTC system will have to be reconfigured to ignore any busysignal coming from the RODs which were connected to the missing ROS. The replacement of afull ROS PC is expected to be, in the best case, at least one hour.
From the software point of view the ROS is being designed to have a lower failure rate than thehigh-level trigger applications to cause a negligible impact on data acquisition efficiency. In par-ticular the ROS software does not make use of any dynamic memory allocation scheme (allneeded memory is statically pre-allocated), to eliminate memory leaks. Moreover the communi-cation between the ROS and the HLT applications is based on a request-response, connection-less protocol, thus permitting the ROS to be insensitive to any problems occurring in the HLTapplications.
6.8.3 The RoI Builder
The LVL1 system produces details about the type and position of the RoIs for all acceptedevents. The RoI Builder combines and reformats the RoI data it receives from the LVL1 Triggerand passes the RoI information corresponding to each event accepted by LVL1 to a LVL2 Super-visor. The RoI Builder is a critical, unique component using custom hardware. It is a highlymodular system. It consists of two types of cards (input and builder cards). The cards and acontrolling PC will reside in a standard VMEbus crate. The card count is small for this system,but the cards are custom built. Since the system is critical for taking data, the cost of maintaininga substantial pool of replacements is low compared to the risk of not having adequate spares.The current plan is to include a reserve of spares and to run with some hot spares in the cratebeing used during data taking. If a builder board fails during data taking it can be replacedwith a hot spare by simply reconfiguring the system via the DAQ. It is expected that laboratoryspace at CERN will be set aside for repair and that a backup system (crate, builder, and inputboards) will be kept there in the event of more catastrophic whole system failure (e.g. a powersupply failure that causes damage to multiple components in the crate).
6.8.4 Network
The topology of the TDAQ networks is ‘star based’, using several large central switches, andmany concentrating switches, which are attached to the central switches using fibre GigabitEthernet links. A catastrophic failure of the central switches would stop the experiment, while afailure of a concentrating switch would lose part of the detector data or the processing farm at-tached to it.
Therefore, the central switches should have redundant power supplies, redundant CPU mod-ules, and a redundant or at least hot swappable switching matrix. If the switch line cards are nothot swappable, there should be a few (one or two) standby line cards, in order to minimize thedown time of the switch in the case of a line card failure. To ease technical support and availa-bility of spare parts, the central switches should be as similar as possible (ideally identical).
The use of multiple central switches in the Data Collection network improves the fault toler-ance. In the case of a total failure of one central switch, the system can still operate at a lower

ATLAS Technical Design ReportHigh-Level Trigger, Data Acquisition and Controls 30 June 2003
6 Fault tolerance and error handling 77
rate, until the failing switch is repaired or replaced. A concentrating switch failure does notbring down the entire network. If a ROS concentrating switch fails, then the corresponding partof the detector is unreadable, and one may decide to stop the experiment, or continue runningwith reduced detector coverage. If a processor farm concentrating switch (such as the L2PU orthe EF farms concentrating switches) fails, the corresponding farm will be excluded from thesystem configuration, and the system will continue to operate with a slightly lower processingcapacity. Failures in concentrating switches can be dealt with by keeping an adequate numberof spares and replacing the faulty units.
6.8.5 Rack-mounted PCs
The HLT/DAQ system will contain very large numbers of rack-mounted PCs. The reliability ofmodern PC hardware is generally high and particularly so for most rack-mounted PCs, as theseare aimed at server markets where reliability is given a higher priority than for individual desk-top machines. Indeed part of the cost premium of rack-mounted PCs is due to the greater caretaken over the choice of components, better cooling, and ease of maintenance when somethingdoes go wrong.
Nevertheless with so many machines, faults will be an issue both in the hardware and the soft-ware.
For the hardware the most likely issues will be disk faults, cooling problems, and power supplyfailures. During normal data taking many of the PCs should not be accessing disk data, indeedfor the most time-critical applications any such accesses risk a substantial downgrading of theperformance. For these machines disk access is required for booting the PC, for configuration ofthe applications, and for recording of the monitoring data. All of these could be done across thenetwork from a local file server (it is planned that each rack of PCs will have such a file server),but it remains to be seen whether this gives a better solution than using a local disk for some ofthe data accesses. Other machines require very high levels of disk access (the file servers, eventstore, etc), and for these RAID arrays are assumed. These not only reduce the susceptibility todisk errors, but also allow faulty drives to be replaced without stopping the host PC.
Cooling is a critical issue and several precautions are being elaborated. Studies are under way,in collaboration with the other LHC experiments, to investigate the efficiency of water-cooledheat exchangers (suitable for horizontal air-flow) to be placed at the back of the racks. All of thePCs will include on-board temperature sensors, and data from these will be monitored as partof the general farm management so that operator intervention can be requested if required. Inaddition the PCs include features to reduce the clock speed if over-heating occurs, if this is notsufficient the PC will shut down.
For the most critical PCs, redundant power supplies are foreseen. This includes the ROS PCs,the central file servers, and the DFM, since failures of any of these would cause a major impacton data taking. For the processors in the HLT farms where the failure of a single PC would leadto just a small reduction in data-rate, no such provision is planned. Should there be a power fail-ure to the building, only the file-servers and event store are planned to be on UPS so that thesemachines can be shut down in an orderly way, thus reducing the risk of corrupting the file sys-tem. Putting all of the machines onto UPS would reduce recovery time and avoid some hard-ware failures, but at the cost of a very large UPS system. Also the faster recovery time from apower failure would be of little benefit as it will take a while for the detector to be ready fordata-taking; during this time the bulk of the machines can be rebooted and reconfigured.
ATLAS Technical Design ReportHigh-Level Trigger, Data Acquisition and Controls 30 June 2003
78 6 Fault tolerance and error handling
All of the above hardware problems are likely to require operator intervention at some point,but the system is designed to minimize the impact of the failure and to make replacement of thefaulty components as simple as possible: ensuring, for example, that individual PCs can be re-moved from racks with minimal disturbance to cabling.
Faults due to software problems are likely to be much more frequent than hardware problems.Operating system (Linux) crashes should represent only a very small fraction of software errors,but care will be taken to ensure that these are not exacerbated by inadequate machine resources(e.g. insufficient memory, inadequate disk size for log files). Most software-related failures willbe in the applications or individual threads within applications.
6.9 Use Cases
In the following, a short list is given of possible errors and reactions at different levels (from in-side an application to system wide), and the impact on data taking.
• Symptom: Readout Link is down (LDOWN is active on S-LINK), status register and LEDsshow error.
• Action: Online Software should perform a reset of the ROL. If the ROL stays downafter reset, prepare to mask BUSY from the ROD in order to continue taking data.Warn the person on shift that the ROL has a fault.
• Impact: Data from the ROD connected to the ROL will be missing from the event.The ROS will produce empty ROB fragments with a specific error status flag.
• Symptom: Readout Link Data transmission error (bit set in trailing control word of frag-ment).
• Action: Flag the Event Fragment, increment the error counter in the ROS.
• Impact: The HLT will decide, depending on the type of error, whether to use or re-ject the fragment.
• Symptom: timeout for requests to a ROS inside a LVL2 node.
• Action: Retry a configurable number of times.
• Impact: Parts of an event might be missing. If not successful, the LVL2 trigger mightnot be able to run its intended algorithms and the event has to be force-accepted. Ifthe error persists, the data-taking efficiency might drop because the event buildingwill be busy with forced-accept events.
• Symptom: a dataflow component reports that a ROS times out repeatedly.
• Action: Pause the run, remotely reset the ROS component and if successful resumethe run. If not successful, inform all concerned components that this ROS is nolonger available and inform the higher level (who might decide to stop the run andtake other measures like calling an expert to re-configure the DAQ).
• Impact: Data missing in every event.
• Symptom: a L2SV event assignment to a LVL2 node times out.
• Action: Retry a configurable number of times. If this happens repeatedly, take thenode out of the L2SV’s scheduler list and report to a higher level.

ATLAS Technical Design ReportHigh-Level Trigger, Data Acquisition and Controls 30 June 2003
6 Fault tolerance and error handling 79
• Impact: Available LVL2 processing power reduced but it might be possible to re-connect the LVL2 node if the fault can be repaired. The failing event could be forci-bly accepted for more detailed offline analysis (as assigning the same event toanother LVL2 node could possibly bring this node down too).
• Symptom: none of the nodes in an EF subfarm can be reached via the network (e.g. in thecase of a switch failure).
• Action: Take all affected nodes out of any scheduling decisions (e.g. in the DFM) toprevent further timeouts. Inform higher level about the situation.
• Impact: Data-taking-rate capability is reduced.
• Symptom: HLT algorithm or data converter crashes (LVL2 or EB).
• Action: Similar to communications failure; the crashed node is temporarily takenout of the partition and brought back up again; the offending event is saved foroffline scrutiny. Repeated crashes of many nodes may be indicative of faulty soft-ware, possibly the result of running with a new version or an untested triggermenu. In this case the run may need to be stopped and more drastic action (revert-ing to an older software version or different trigger menu) is required.
• Impact: For sporadic errors the impact is similar to communications failure. The notunlikely case of running with faulty software leads to a longer loss due to change ofrun. The trigger may be less selective if one is forced to run with a reduced triggermenu.
As can be seen, the same error condition (e.g. timeouts for requests) leads to quite different ac-tions depending on the type of component. Each ROS is unique in that its failure leads to somenon-recoverable data loss. A LVL2 node on the other hand can be easily replaced with a differ-ent node of the same kind.
6.10 References
6-1 A. Bogaerts et. al., ATLAS TDAQ Fault Tolerance and Error Handling Policy and Recommendations, ATL-D-OR-0002 (2003)http://edms.cern.ch/document/392826/
6-2 O. Boyle et al., The S-LINK Interface Specification, (2001),http://edms.cern.ch/document/110828
6-3 Small Form-factor Pluggable (SFP) Transceiver MultiSource Agreement (MSA),http://schelto.com/SFP/SFP%20MSA.pdf
ATLAS Technical Design ReportHigh-Level Trigger, Data Acquisition and Controls 30 June 2003
80 6 Fault tolerance and error handling

ATLAS Technical Design ReportHigh-Level Trigger, Data Acquisition and Controls 30 June 2003
7 Monitoring 81
7 Monitoring
7.1 Overview
Fast and efficient monitoring is essential during data-taking periods as well as during the com-missioning of the detector. The quality of the data sent to permanent storage must be monitoredcontinuously. Any malfunctioning part of the experiment must be identified as soon as possible.The types of monitoring information may be events, fragments of events, or any other kind ofinformation (histograms, counters, status flags, etc.). These may come from the hardware, proc-essors, or network elements, either directly or via the DCS. Some malfunctions can be detectedby the observation of a single piece of information and could be performed at the source of theinformation. Infrastructure has to be provided to process the monitoring information and bringthe result to the end user (normally the shift crew).
The collection of monitoring information can be done at different places in the DataFlow part ofthe TDAQ system: ROD crate, ROS, and SFI. Additional monitoring information can be provid-ed by the LVL2 trigger and by the Event Filter since they will decode data, compute tracks andclusters. LVL2 and the EF will count relevant quantities for simple event statistics, for monitor-ing the functioning of the various trigger stages, and for tracking their selection power.
Monitoring information that is collected may be processed locally, e.g. in the ROD module, or indedicated processes running in the Event Filter. Additional processing may be done by a dedi-cated Online Monitoring Farm possibly also used for calibration activities. Results will be sentto the shift crew in the control room.
It is clear that monitoring cannot be precisely defined at this stage of the development of the ex-periment and should therefore be kept as flexible as possible. The ideas presented in this sectionare the result of a discussion that has started recently at the level of the whole ATLAS communi-ty [7-1], [7-2]. The ideas are bound to evolve during the preparation of the experiment, as wellas during its lifetime.
7.2 Monitoring sources
7.2.1 DAQ data-flow monitoring
7.2.1.1 Front-end and ROD monitoring
Here, sub-detector front-end electronics and ROD-module-specific monitoring is addressed. Itdeals with:
• Data integrity monitoring. Sampled event fragments must be collected at the level of theROD and sent to dedicated monitoring processes to check the consistency of the data andthe headers. Comparisons at the different levels of the transfers must be done. Use of theDataFlow network is preferred for this operation.
ATLAS Technical Design ReportHigh-Level Trigger, Data Acquisition and Controls 30 June 2003
82 7 Monitoring
• Operational monitoring. Throughput and similar information, scaler counters, histo-grams produced by the RODs must be transferred to the end user for further analysis viathe control network.
• Hardware monitoring, in cooperation with DCS. Additional monitoring of the hardware,not accessible to DCS (e.g. internal functioning of PCBs) may be provided at this level.
7.2.1.2 DataFlow monitoring
Here, it is DAQ-specific monitoring which is addressed. The same points as those listed in theprevious section will be addressed, at the level of the DataFlow (ROS, Event Builder, SFI, SFO):
• data integrity monitoring
• operational monitoring (throughput and similar, scaler histograms)
• hardware monitoring.
7.2.2 Trigger monitoring
7.2.2.1 Trigger decision
The general philosophy of the trigger decision monitoring is to re-evaluate the decision of eachtrigger level on samples of both accepted and rejected events in order to confirm the quality ofthe decision.
7.2.2.1.1 LVL1 decision
The LVL1 decision (for LVL1 accepts) is cross-checked when doing the LVL2 processing. In ad-dition, a pre-scaled sample of minimum-bias LVL1 triggers will be passed to dedicated process-ing tasks (possibly in a dedicated partition of the Event Filter or in an Online Monitoring Farm).
7.2.2.1.2 LVL2 decision
The LVL2 decision (for LVL2 accepts) is cross-checked when doing the EF processing and pre-scaled samples of events rejected at LVL2 will be passed to the EF. Detailed information on theprocessing in LVL2 is appended to the event (via the pROS) for accepted and force-acceptedevents. This will be available at the EF for further analysis.
7.2.2.1.3 EF decision
Detailed information will be appended to the event, for a sub-set of accepted and rejectedevents for further offline analysis.
7.2.2.1.4 Classification monitoring
For monitoring, classification is a very important output of both LVL2 and EF processing. It con-sists of a 128-bit bitmap that records which signatures in the trigger menu were passed. Histo-

ATLAS Technical Design ReportHigh-Level Trigger, Data Acquisition and Controls 30 June 2003
7 Monitoring 83
grams will be filled locally on the processors where the selection is performed. Considering theaccept rates of LVL2 for EF, and assuming a sampling rate of ~0.1 Hz, a 1 byte depth is sufficientfor the histograms. For both LVL2 and EF farms, the bandwidth for the transfer of the histo-grams is estimated to be ~3.5 kbyte/s.
7.2.2.1.5 Physics monitoring
In addition to classification monitoring, the simplest approach to monitoring the quality of thephysics that is sent to permanent storage is to measure the rates for some physics channels. Itcan be performed easily in the EF. A part of the result of these monitoring operations will be ap-pended to the event bytestream for offline analysis. Other data will be sent to the operator viathe standard Online Software media for an online analysis and display.
An interesting approach to the physics monitoring could consist of a set of pre-scaled physicstriggers with relaxed thresholds to monitor both the trigger decision and the effect of the triggersharpness. Further studies will be performed to explore this approach.
Histograms of the rates for every item of the trigger menu as a function of time will be recorded,with the relevant variables with which they must be correlated (e.g. the instantaneous luminos-ity). Such histograms can very quickly give evidence of any malfunctions, although their inter-pretation may be quite tricky.
Well-known physics channels will be monitored so that one will permanently compare the ob-served rates with the expected ones. The list of such channels will be established in collab-oration with the physics groups.
Information coming from the reconstruction algorithms executed for selection purposes in theEF may be of interest. One will monitor, for example, the number of tracks found in a given de-tector or the track quality at primary and secondary vertex on a per-event basis. There again, acomparison with reference histograms may be of great help in detecting malfunctioning. Phys-ics quantities will be monitored, e.g. mass-plots of W and Z, n-Jet rates, reconstructed vertex lo-cation, quality of muon-tracks, quality of calorimeter clusters, and quality of ID tracks. Input isrequired from offline reconstruction groups.
7.2.2.2 Operational monitoring
This section covers all aspects related to the ‘system’, e.g. the transportation of the events orevent fragments, the usage of computing resources, etc.
7.2.2.2.1 LVL1 operational monitoring
The integrity and correct operation of the LVL1 trigger hardware will be monitored by process-es running in trigger crate CPUs, and also by monitoring tasks in the Event Filter.
The LVL1 trigger is the only place where every bunch crossing is processed and where a crudepicture of the beam conditions can be found. For example, the calorimeter trigger fills histo-grams in hardware of the trigger-tower hit rates and spectra. This is done for every trigger tow-er and can quickly identify hot channels which, if necessary, can be suppressed. Hardwaremonitoring is used to check the integrity of links between different parts of the LVL1 trigger, e.g.between the calorimeter trigger preprocessor and the cluster and jet/energy-sum processors.
ATLAS Technical Design ReportHigh-Level Trigger, Data Acquisition and Controls 30 June 2003
84 7 Monitoring
The Central Trigger Processor (CTP) will be monitored mainly at the ROD level, using internalscalers and histograms. It will include beam monitoring, including scaling of the trigger inputson a bunch-to-bunch basis.
After the Event Builder, monitoring tasks, running in the Event filter or in a dedicated Monitor-ing Farm, will check for errors in the trigger processors on a sampling basis. This will be at alow rate, but will have high diagnostic power since details of the LVL1 caluclations can bechecked. Event Filter tasks will also produce various histograms of trigger rates, their correla-tion, and history.
7.2.2.2.2 LVL2 operational monitoring
The LVL2 selection software runs within the framework provided by the Data Collection (DC)in the L2PU. It will therefore use the DC infrastructure and hence the monitoring tools foreseenfor this system. The following relevant aspects of LVL2, will be monitored:
• trigger, data, and error rates
• CPU activity
• queue occupancies (load balancing).
Other valuable pieces of information for monitoring which could be performed by LVL2processing units are:
• LVL2 selectivity per LVL1 trigger type
• number of RoIs per RoI type
• RoI occupancies per sub-detector
• RoI specific hit-maps per sub-detector.
In contrast to these data which do not require much CPU power, the monitoring of the qualityof the data by LVL2 processors is not envisaged. Indeed, the available time budget is limited be-cause of the necessity to release data from the ROB. Monitoring a fraction of the events in theL2PU is not desirable since this would introduce large variations in LVL2 latencies as well aspossible points of weakness in the LVL2 system. The necessary monitoring of the LVL2 qualityis therefore delegated to the downstream monitoring facilities, i.e. the EF (or online monitoringfarm) and the offline analysis. One should, however, discuss very carefully the opportunity forthe L2PU to fill some histograms, possibly read at the end of the run, so that high statistics infor-mation is given. This information can not reasonably be obtained by using events selected byforced accepts on a pre-sampled basis. The evaluation of the extra CPU load for such operationsshould be made.
7.2.2.2.3 EF operational monitoring
The monitoring of the data flow in the Event Filter will be done primarily at the level of theEvent Filter data flow (EFD) process. Specific EFD tasks, part of the main data flow, will be incharge of producing relevant statistics in terms of throughput at the different levels of the dataflow. They have no connection with other processes external to EFD. The detailed list of infor-mation of interest for the end user has not yet been finalized and will continue to evolvethroughout the lifetime of the experiment.

ATLAS Technical Design ReportHigh-Level Trigger, Data Acquisition and Controls 30 June 2003
7 Monitoring 85
Among the most obvious parameters which are going to be monitored, one might quote:
• the number of events entering the Farm
• the number of events entering each sub-farm
• the number of events entering each processing host
• the number of events entering each processing task
• the number of events selected by each processing task, as a function of the physics chan-nels present in the trigger menu
• the same statistics as above at the level of the processing host, the sub-farm, and the Farm.
Other statistics may be of interest such as the size of the events, as a function of different param-eters (the time, the luminosity of the beam, and the physics channel).
The results of the data flow monitoring will be sent to the operator via standard Online Soft-ware media (e.g. IS or Histogram Service in the present implementation).
7.2.2.2.4 PESA SW operational monitoring
A first list of parameters which could be monitored for debugging purposes and comparisonwith modelling results can be given:
• time spent in each algorithm
• frequency at which each algorithm is called
• number of steps in the step sequencer before rejection
• info and debug messages issued by the PESA SW
• number of active input/output trigger elements.
Some of these points could be monitored during normal data taking.
Profiling tools, such as NetLogger for coarse measurements and TAU, have already been stud-ied in the context of LVL2, and their use on a larger scale will be considered by the PESA soft-ware team.
It is intended to make use of the ATHENA Histogramming service, which should therefore beinterfaced to the EF infrastructure. Some control mechanisms should be provided to configurethe various monitoring options and to operate on the histograms (e.g. to reset them after trans-fer).
7.2.3 Network monitoring
Monitoring the TDAQ network activity is essential during the data-taking period. A very largenumber of switches (several hundred) will be included in the network. Their management andmonitoring is crucial. A first experience has been gained with the testbed used for network anddata flow studies. Requirements are presented in [7-3].
Preliminary studies have been undertaken for tool evaluation. A first evaluation of the toolused by CERN-IT (Spectrum, from Aprisma) has been made. It has been found quite mature and
ATLAS Technical Design ReportHigh-Level Trigger, Data Acquisition and Controls 30 June 2003
86 7 Monitoring
it offers most of the expected functionality. Nice graphical interfaces are available giving an ac-curate and explicit view of the system (Figure 7-1). Extra work will be required to integrate thetool with the Online Software environment.
7.2.4 Detector monitoring
The detector monitoring can be done at different places in the DataFlow part of the TDAQ sys-tem: ROD Crate, ROS, and SFI. Moreover, additional monitoring can be provided by the LVL2trigger and by the Event Filter since these programs will decode data, compute tracks and clus-ters, count relevant quantities for simple event statistics, and monitor the functioning of the var-ious trigger levels and their selection power.
The ROD level is the first place where the monitoring of the data quality and integrity can beeasily done. The computing power provided, for example, by the DSPs installed directly on theROD board allows sophisticated calculations to be performed and histograms to be filled. Thesending of these histograms to analysis workstations will then be performed by the ROD crateCPU (using the Online Software tools running on this CPU).
Some detectors will need a systematic monitoring action at the beginning of the run to check theintegrity of the system. This concept has already been introduced at the test beam by the Pixelsub-detector. At the beginning of the run and at the end there are special events with start andend-of-run statistics. The need for this first check of the data at the ROD level is driven by thehuge amount of information. If monitored later, the back tracking of possible problems wouldbe complicated. The frequency of this activity, for normal operation, can be limited to the startand end of run.
Figure 7-1 Example of a user interface of the Spectrum tool

ATLAS Technical Design ReportHigh-Level Trigger, Data Acquisition and Controls 30 June 2003
7 Monitoring 87
Larger parts of the detector are available at the ROS level (compared to the ROD level), andmonitoring at this level is therefore considered as a potentially interesting facility. A correlationbetween ROS crates is not seen as necessary because such a correlation may be obtained at theSFI level. Event fragments sampled at the level of the ROS could be routed to dedicated work-stations operated by the shift crew.
When information from several detectors is needed, the natural place to monitor it is after theEvent Builder. The SFI is the first place were fully-assembled events are available. The monitor-ing at the level of the SFI is the first place in the data flow chain where the calorimeter, muonspectrometer, and LVL1 information are available. This can be used, for example, to cross-checkthe data for LVL1 calorimeter trigger towers against the more-precise, fine-granularity calorim-eter readout. Moreover at the SFI level a first correlation among sub-detectors is possible and isseen as extremely useful.
When the monitoring requires some reconstruction operations, it seems natural to try to savecomputing resources by re-using the results obtained for selection purposes and therefore to ex-ecute this activity in the framework of the EF. In addition, some detectors plan to perform mon-itoring at the level of event decoding, i.e. in the bytestream conversion service, and to fillhistograms during the reconstruction phase associated with the selection procedure in the EF.These histograms should be sent regularly to the shift operators and archived. More sophis-ticated monitoring operations might require longer execution times. However, since CPU pow-er available in the EF should be kept as a first priority for selection, it seems more efficient tohave a dedicated monitoring farm running beside the EF.
Finally, some monitoring activities such as calibration and alignment checks may require eventswith a special topology selected at the level of the Event Filter. For instance, the Inner Detectorgroup plans to perform the alignment of the tracking system online. This requires thousands ofselected events, to be either stored on a local disk or fed directly to the processing task. ThenCPU-intensive calculations are required to invert matrices which may be as large as30 000 × 30 000. With a cluster consisting of 16 PCs (as available in 2007, i.e. 8 GHz dual CPU PCwith 1 Gbyte of fast memory and a 64-bit floating point arithmetic unit), this can be completedin less than one hour. A very efficient monitoring of the tracker alignment can therefore be per-formed. Similar requirements are made by the Muon Spectrometer for the purpose of monitor-ing and calibration operations.
7.3 Tools for monitoring
This section describes where and how (i.e. with which tools) monitoring operations will be per-formed.
7.3.1 Online Software services
The Online Software (see Chapter 10) provides a number of services which can be used as amonitoring mechanism independent of the main data flow stream. The main responsibility ofthese services is to transport the monitoring data requests from the monitoring destinations tothe monitoring sources, and to transport the monitoring data back from the sources to the des-tinations.
There are four services provided for different types of monitoring information:
ATLAS Technical Design ReportHigh-Level Trigger, Data Acquisition and Controls 30 June 2003
88 7 Monitoring
• Event Monitoring Service — responsible for the transportation of physics events or eventfragments sampled from well-defined points in the data flow chain and delivered to anal-ysis applications. These will examine and analyse the data in order to monitor the state ofthe data acquisition and the quality of the physics data in the experiment.
• Information Service — responsible for the exchange of user-defined information betweenTDAQ applications and is aimed at being used for the operational monitoring. It can beused to monitor the status and various statistics data of the TDAQ sub-systems and theirhardware or software elements.
• Histogramming Service — a specialization of the Information Service with the aim oftransporting histograms. It accepts several commonly used histogram formats (ROOThistograms for example) as the type of information which can be sent from the monitor-ing sources to the destinations.
• Error Reporting Service — provides transportation of the error messages from the soft-ware applications which detect these errors to the applications responsible for their mon-itoring and handling.
Each service offers the most appropriate and efficient functionality for a given monitoring datatype and provides specific interfaces for both monitoring sources and destinations.
7.3.2 Computing resources for monitoring
7.3.2.1 Workstations in SCX1
It is foreseen to have several workstations in the the SCX1 Control Room near the experimentpit. These workstations will be owned and operated by the sub-detector crews who are on shift.They will receive, via the Ethernet network, the results coming from operations performed inROD crates and ROSs, as well as event fragments. Whether the network is a dedicated one orthe general-purpose one is still an open question. These workstations will perform subsequenttreatment such as histogram merging or event display. They may possibly delegate processingto machines in remote sites if available local CPU power is not sufficient. Results of monitoringoperations will be made available to the whole shift crew using the dedicated Online Softwareservices.
7.3.2.2 Monitoring in the Event Filter
From the beginning of the design of the EF, it has been foreseen to perform some monitoring ac-tivities there, in addition to the ones related directly to the selection operation. EF is indeed thefirst place in the data-selection chain where the full information about the events is available.Decisions from the previous levels of the trigger system can be checked for accepted events andfor those that would normally have been rejected, but were retained on the basis of a forced ac-cept. Information coming from the reconstruction phase, which generally requires a largeamount of CPU power, can rather easily be re-used, leading to large savings in terms of comput-ing resources.
Monitoring in the EF can be performed in different places:
• directly in the filtering tasks (which raises the problem of the robustness of the monitor-ing code) and,

ATLAS Technical Design ReportHigh-Level Trigger, Data Acquisition and Controls 30 June 2003
7 Monitoring 89
• in dedicated monitoring tasks running in the context of the Event Filter (here one shouldthink of passing the information gathered in the filtering task to take advantage of theCPU power already used).
As already stated, the first priority of the EF must be the selection procedure which should notbe jeopardized by introducing some CPU-intensive applications in the processing host. Moni-toring in the EF should therefore be reserved to light-weight applications which would profitmost from re-using pieces of information produced by EF Processing Tasks.
7.3.2.3 Monitoring after the Event Filter
In order to perform the CPU-intensive monitoring activities such as the ones described at theend of Section 7.2.4, a dedicated Online Farm should be provided. Such a farm is also necessaryto perform the various calibration tasks which do not require the full offline framework. Itwould be fed by events specially selected in the EF, as well as directly by the general DataFlowthrough one or more dedicated SFIs (so that it may receive events selected at previous stages ofthe data acquisition chain). Such specially selected events may be events rejected at LVL1 orLVL2 (on a pre-scaled basis), or events tagged for calibration purposes (physical as well as nonphysical events, e.g. generated by a pulser or corresponding to empty bunches).
If such an Online Farm were to be used, one would require that the Data Flow Manager be ableto route events towards specific SFIs according to a tag set at various levels of the data acquisi-tion chain (front end, LVL1, or LVL2). The DataFlow framework developed for the Event Filterseems to be well suited for the distribution of the events to the different applications. Moreover,a uniform approach for the EF and the Online Farm would bring some flexibility for the globalcomputing power usage. Indeed intensive monitoring is likely to be a higher priority duringcommissioning or debugging phases compared to physics quality, and conversely during thestable physics-data-taking phase. The size of this Online Farm is still to be evaluated.
7.3.2.4 Network requirements
An indication of the network requirement for the purpose of monitoring can be found inTable 2-4 of Chapter 2, which shows the quantity of monitoring data foreseen between the vari-ous sources and destination of this data.
7.4 Archiving monitoring data
Data which are produced by monitoring activities should be archived by some bookkeepingservice so that they can be cross-checked offline with more detailed analysis. One must alsostore events whose acceptance has been forced at any level of the selection chain. These eventsare necessary to evaluate precisely the acceptance of the trigger. Details of the archiving proce-dure will be established in cooperation with the Offline Computing group.
ATLAS Technical Design ReportHigh-Level Trigger, Data Acquisition and Controls 30 June 2003
90 7 Monitoring
7.5 References
7-1 B. Di Girolamo et al., Introduction to Monitoring in TDAQ, ATL-D-OR-0001 (2003)http://edms.cern.ch/document/382428/
7-2 B. Di Girolamo et al., ATLAS Monitoring Requirements, in preparation
7-3 M. Zurek, Network Management Requirements, ATL-DQ-ES-0045 (2002)http://edms.cern.ch/document/391577/

Part 2
System Components

ATLAS Technical Design ReportHigh-Level Trigger, Data Acquisition and Controls 30 June 2003
8 DataFlow 93
8 DataFlow
This chapter presents the results of studies that have been performed, using the final prototypeimplementations of the DataFlow components, to support the choice of the baseline DataFlowarchitecture presented in Chapter 5. Results of measurements are presented on the performanceof the main components and on the functionalities that they provide in collaboration: detectorreadout, message passing, RoI collection, and event building. The results of measurements arepresented in terms of sustained rates, e.g. the event-building rate, versus various system param-eters, e.g. the size of the system. The majority of the measurements were performed on a testbedwhose description is given in Section 14.2.2, where this was not the case, the testbed is de-scribed in the section presenting the results. The overall performance of the DataFlow is pre-sented in Section 14.2.2.
This chapter also presents details of the design and implementation of the DataFlow compo-nents, building upon the descriptions so far presented, see Chapter 5.
8.1 Detector readout and event fragment buffering
8.1.1 ROD crate data acquisition
ROD Crate DAQ (RCD) comprises all the software and hardware to operate one or more RODCrates and is deployed on the ROD Crate Processor (RCP)1 of the ROD Crate and a controllingPC [8-1]. It provides the functionality of configuration, control, and monitoring of one or moreROD crate systems independently of the rest of the DataFlow system. This fulfils the detectorcommunity’s requirements of operational independence during their commissioning and cali-bration procedures. This model also allows the timescale for the deployment and commission-ing of the DataFlow to be decoupled from that of the detector’s readout needs, seeSection 18.3.1. During normal experiment operations the same RCD is operated as an integralpart of the overall DAQ.
A block diagram of RCD is shown in Figure 8-1. Event data flows into the RODs via the FELsand out via the S-LINK. RCD provides for the sampling of ROD event fragments within thisflow. The sampling may be from a ROD, a set of RODs2 within the same crate, or one or moreROD crates. In addition to the sampling of ROD event fragments, RCD also provides for the re-trieval of the results of calibration procedures performed within the RODs. Subsequently thesampled data may be further analysed, recorded to mass storage, or, in the case of calibrationdata, written to the conditions database. The detector requirements on the sampling rate isO(1) Hz, see Ref. [8-1]. This non-demanding requirement allows the sampling from one or moreROD crates to be done over a LAN using TCP/IP, thus simplifying certain aspects of the designand implementation.
The framework of RCD is organized into four layers: hardware, operating system, low-levelservices, and high-level tasks. The latter are based on a skeleton that implements detector-inde-
1. The RCP is implemented by a Single board Computer (SBC).
2. The coherent sampling from one or more RODs depends on the implementation of the ROD.
ATLAS Technical Design ReportHigh-Level Trigger, Data Acquisition and Controls 30 June 2003
94 8 DataFlow
pendent functionality, and, for an identified set of functions, may be extended to meet detector-specific requirements.
RCD re-uses DataFlow and Online software where possible. The ROD Crate Controller is an ex-tension of the Local Controller developed for the ROS, see Section 8.1.3.1, and as such imple-ments all the functionality provided by the Online software for configuration, control, andmonitoring. In addition, other ROS software modules are used to provide the high-level taskskeleton and low-level services. A prototype system is being developed, now in conjunctionwith detector-specific developers, and a first distribution is scheduled for June 2003 [8-2].
8.1.2 ReadOut link
Sub-detectors transmit event data accepted by the LVL1 over FELs and use RODs to multiplexthe data. Each of the sub-detectors has different requirements and consequently the implemen-tation of the ROD varies between sub-detectors. The guidelines for designing the ROD are setout in the ‘Trigger & DAQ Interfaces with Front-End Systems: Requirement Document’ [8-3].The purpose of the ROL is to connect the sub-detectors to the TDAQ system and it is responsi-ble for transmitting error-free data from the output of the ROD to the input of the ROS, i.e. theROBIN.
The ROL requirements have been stable since the High-level Triggers, DAQ and DCS TechnicalProposal TP [8-4]:
• 32 bit data at 40.08 MHz, (~160 Mbyte/s)
• A control bit to identify the start and end of an event
• Xon/Xoff flow control
• Error detection, error rate < 10-12
• A maximum length of 300 m.
To ensure homogeneity, the output of the ROD is defined by the S-LINK specification [8-5]. Inaddition, the raw event format [8-6] defines the order and content of the information transmit-ted from the ROD. At the other end of the ROL, the ROS inputs are identical for all sub-detec-tors and also conform to the S-LINK standard.
Figure 8-1 Block diagram of the context and contents of ROD Crate DAQ
RCP
FELs
ROS
ROD Crate
config & control
ROD eventfragments
(RCW)Event samplingevent sample &
LAN
ROD Crate
config & control
calibration info.
Workstation calibration info.RODs
ROD eventfragments

ATLAS Technical Design ReportHigh-Level Trigger, Data Acquisition and Controls 30 June 2003
8 DataFlow 95
The S-LINK specification has been stable since 1996. It is an interface definition; it only defines aprotocol and recommends connector pin-out. As shown in Figure 8-2, the ROD end of the ROLis called the Link Source Card (LSC) and the receiver end, implemented by the ROBIN, the LinkDestination Card (LDC) and they are connected by optical fibres. Event data flow from the LSCto the LDC on the forward channel. Flow control information, i.e. the ROS can stop the RODsending data if input buffers are almost full, flows from the LDC to the LSC on the return chan-nel.
The DIG–ROD Working Group have also recommended that the LSC be placed on a mezzaninecard to facilitate support and upgradeability [8-7]. The form factor of these mezzanine cards isbased on the CMC [8-8] standard.
The LSC plugs onto the S-LINK connector on the ROD (or its associated rear transition card).For the forward channel, a Field Programmable Gate Array (FPGA) handles the protocol anddelivers words to a serial/deserializer (SERDES) chip which performs parallel-to-serial dataconversion and encoding. The output of the SERDES drives an optical transceiver that in turnfeeds the optical fibre. The operation of the receiving card, the LDC, is a mirror image of theLSC.
Various prototype implementations of the ROL have been built to prove the concept and meas-ure the performance. A previous version of the ROL, the ODIN, used a physical layer that wasbased on the Hewlett Packard G-LINKs (HDMP–1032/1034). These have also been used suc-cessfully in test-beams and eighty of these ROLs are being used in the COMPASS experiment.However, the maximum bandwidth is limited, by the G-LINK, to 128 Mbyte/s. Following hesecond ATLAS ROD Workshop [8-9], the requirements of the ROL were increased to160 Mbyte/s and a second version of this link was designed which used two G-LINKs chips perchannel. This raised the cost as two pairs of fibres and associated connectors are required.
Another recommendation of the ROD Working Group was to build a ROL that would use onlyone pair of fibres. This has been achieved by using 2.5 Gbit/s components in the current design,the High-speed Optical Link for ATLAS (HOLA) [8-10]. In this implementation a small FPGA,the EP20K30E APEX 20K, handles the S-LINK protocol. The SERDES chip is a Texas Instru-ments TLK2501 running at 2.5 Gbit/s for both the forward and the return channels (one percard). For the optical transceiver, the Small Form Factor Pluggable Multimode 850 nm 2.5 Gbit/s with LC Connectors is recommended, e.g. the Infineon V23818-N305-B57. The use of plugga-ble components allows the optical components to be changed in case of failure.
Figure 8-2 The relationship between the S-LINK and the ROL
ROD
LSC
S-LINK
Forward Channel
Return Channel
ROS
LDC
S-LINK
Readout Link
ROB
ATLAS Technical Design ReportHigh-Level Trigger, Data Acquisition and Controls 30 June 2003
96 8 DataFlow
Test equipment has been developed for the ROD/ROL/ROS. This includes an emulator thatcan be placed on the ROD to check that the ROD conforms to the S-LINK specification. Similar-ly, an emulator exists that can be placed on a ROS to emulate a ROL connection. The emulatorsallow ROD, ROL and ROS designs to be tested at full bandwidth and errors to be introduced ina controlled manner. The HOLA was produced and tested in 2002 and satisfies all requirementsof the ROL.
In addition, for the purposes of exploitation in laboratory test set-ups and in test-beams, i.e. fur-ther testing, cards exist which allow the ROL to be interfaced to the PCI Bus in a PC. Perform-ance measurements of this interface [8-11] have shown that data can be transferred into a PC at160 Mbyte/s using a single ROL input. Modifications to the firmware have allowed the emula-tion of an interface with four ROL inputs. Measurements using this emulator have demonstrat-ed a bandwidth of 450 Mbyte/s into a PC. The latest version of the interface, the FILAR (FourInput Links for ATLAS Readout), has been produced and tested in 2003. It incorporates fourROLs and could be used during the course of 2003 test-beams.
The purchase of LSC cards, in small quantities, is handled by the CERN stores. For quantities re-quired for ATLAS a tendering process will be initiated in 2003 thus ensuring the availability oflarger quantities during 2004. The production schedule will be adapted to the requirements ofthe sub-detectors. Those responsible have been asked by the DIG to provide estimates of quan-tities for the years up to the start of the LHC. Maintenance and short-term loans of equipmentwill be handled by CERN.
8.1.3 ReadOut sub-system
8.1.3.1 High-Level Design
The ROS has three major components: the ROBIN, the IOManager and the LocalController.Figure 8-3 shows the relationship between the three ROS components and other relevant HLT/DAQ components. A complete high-level design covering both the software and hardware as-pects of the prototype ROS can be found in Ref. [8-12], only a summary is presented here.
The ROBIN component provides the temporary buffering of the individual ROD event frag-ments produced by the RODs, it must receive ROD event fragments at the LVL1 accept rate, i.e.up to 100 kHz. All incoming ROD event fragments are subsequently buffered for the durationof the LVL2 trigger decision and, for approximately 3% of the events, the duration of the eventbuilding. In addition, it must provide ROD event fragments to the LVL2 trigger, and, for eventsaccepted by the LVL2 trigger, ROD event fragments to the event building.
Because of these requirements the baseline ROBIN is custom-designed and built. The design ofthe prototype is described in Section 8.1.3.2.
The IOManager is deployed in the bus-based ROS scenario. It services the requests for data bythe L2PUs and the SFIs. According to the criteria specified in the data request, the IOManagercollects one or more ROB fragments from one or more ROBINs, builds a ROS fragment andsends it to the destination specified in the original data request. The IOManager also receivesfrom the DFM the request to release buffer space occupied by ROD event fragments in the ROB-INs. This message is subsequently relayed to the ROBINs. So as to maximize the overall per-formance of the ROS, the design of the IOManager allows a number of data requests andreleases to be handled concurrently. This has proven to provide significant performance im-

ATLAS Technical Design ReportHigh-Level Trigger, Data Acquisition and Controls 30 June 2003
8 DataFlow 97
provements [8-13] and is achieved by implementing the IOManager as a multithreaded soft-ware process.
In the switch-based ROS scenario there is no IOManager as each ROBIN receives data requestand release messages directly from the L2PUs, SFIs and DFM via its direct connection to the Da-taFlow network.
The LocalController provides the interface between the ROS and the Online software. It config-ures, controls and monitors all components within a ROS. Monitoring covers both the opera-tional monitoring, e.g. buffer page utilization and queue size, and the provision of a sample ofthe event fragments flowing through the ROS for the purposes of detector monitoring. Thisfunctionality requires the use of Online services that are not subject to the same demanding per-formance requirements as the IOManager. Thus the LocalController separates the non perform-ant control, configuration and monitoring functionality from the more demanding datahandling functionality. The design of the LocalController is based on a generic framework en-capsulating ROS-specific functionality; thus allowing the generic LocalController to be re-usedwithin ROD crate DAQ.
8.1.3.2 Design of the ROBIN
As described in Chapter 5 the ROBIN is located at the boundary between the detectors and theROS. Its context diagram is shown in Figure 8-3. Within this context it provides the functionalityof:
• receiving ROD event fragments from the ROL
• buffering ROD event fragments
Figure 8-3 The main ROS components and their relationship with the other HLT/DAQ components
���������
���
���� �������
��������
���
��
�����������
��������
�����
�����
�����
������
�����
�����������
�������������
��������
�������������
�����
����������
ATLAS Technical Design ReportHigh-Level Trigger, Data Acquisition and Controls 30 June 2003
98 8 DataFlow
• sending ROD event fragments, on request, to the L2PUs and SFIs
• releasing buffer space, on request from the DFM.
The final prototype of this component, described here, takes into account the experience and re-sults of studies from previous prototyping studies [8-13], [8-14] and the requirements on it aredocumented in the ROS User Requirements Document [8-15]. Its complete design and imple-mentation are described in [8-16], [8-17] and [8-18].
Referring to Figure 8-4, the primary functions of the prototype ROBIN (receive, buffer, send andrelease) are mapped onto a small number of specialized building blocks. It supports two ROLs,the data from which are stored in a separate buffers. All functions related to the receiving ofROD event fragments from the ROLs, i.e. operations occurring at up to 100 kHz, are realized inan FPGA. A CPU is used to implement the functions of memory management, servicing of datarequests, and operational monitoring.
The baseline architecture allows I/O between the ROS and other DataFlow components to beperformed via two I/O paths. These I/O paths may be used exclusively or together. As de-scribed in Section 5.5.4, one of these scenarios is termed the bus-based ROS, while the other istermed the switch-based ROS. These terms reflect the fact that in each case data from a numberof ROBINs are collected exclusively via a PCI bus or an Ethernet switch.
To allow these two I/O scenarios to be further studied, the prototype ROBIN features both aPCI bus and a Gigabit Ethernet interface. The basic set of services, e.g. data request and clears,that the prototype ROBIN provides via these interfaces is defined via a single software interface[8-18], and those operations related to a specific I/O interface have been encapsulated in sepa-rate modules. The final ROBIN will have four ROLs and it is envisaged that its final design willbe realized by removing and not by adding functionality, e.g. all buffer management performedby the FPGA or the removal of the Ethernet interface. Studies will also be performed to
Figure 8-4 The schematic diagram of the final prototype ROBIN
RAMCPUFLASHCPLD
FPGA
BUFFER2
LINK2
BUFFER1
LINK1 MAC/PHY
BRIDGE
ROL1
ROL2
GE
PCI
JTAG
Main Data PathDF ControlManagementBoard Control
(DF-CORE)
RAM

ATLAS Technical Design ReportHigh-Level Trigger, Data Acquisition and Controls 30 June 2003
8 DataFlow 99
8.1.3.3 Implementation and performance of the ROS
The deployment of the bus-based ROS is shown in Figure 8-5. It consists of two types of nodes:a ROS PC and the prototype ROBIN. The former is a desktop PC running the Linux operatingsystem and has two Gigabit Ethernet connection to the DataFlow network and a Fast Ethernetconnection for the purpose of communication with the Online system. In addition, it has six64 bit / 33 MHz and 3.3 V PCI bus slots. These slots are used to host up to six prototype ROB-INs. The IOManager via the Message Passing interface (see Section 8.3.1.3) receives data re-quests and release messages, and returns ROS event fragments to the High-Level Triggercomponents.
Figure 8-6 shows the deployment of the switch-based ROS. Similarly to the bus-based ROS itconsists of two types of nodes: a ROS PC and the prototype ROBIN. However, in this case theROS PC node does not have a Gigabit Ethernet connection to the DataFlow network and is usedsolely for the purposes of configuration, control and monitoring. Data requests and clears arereceived directly by the ROBINs via its Gigabit network interface, i.e. without passing via theIOManager.
Measurements have been made on the performance of these two scenarios. However, the pro-duction schedule of the prototype ROBIN has not allowed the prototype ROBIN to be availablefor the measurements presented in this chapter. In its absence, measurements have been per-formed with emulators (simple hardware devices providing a subset, I/O, of the ROBIN func-tionality). For the bus-based ROS measurements the emulator was based on the MPRACE
Figure 8-5 The deployment of the bus-based ROS in the baseline DataFlow
��������������� ��
���������
�
� �
���������������� ���
� ���
� ���
� ���
��������
������
����
��������� ���� �����
� ����
����������
���������������
����������
� �������
��� �������
������������������
�����������
��������������
������� !����
� ��"�����
�����!�
�������#�����������
��$�$������ !����
�"�����
������ !����
�"�����
%%��&���''
ATLAS Technical Design ReportHigh-Level Trigger, Data Acquisition and Controls 30 June 2003
100 8 DataFlow
board [8-19]. These boards have the same physical PCI bus interface as the prototype ROBIN,and thus provide a very accurate emulation of the final device with respect to I/O over a PCIbus and can be programmed to emulate the buffering of data from four ROLs. However, theirinternal performance is limited to half the PCI bus throughput. For the switch-based ROS theGigabit Ethernet testers developed for the evaluation of Gigabit Ethernet have been used [8-20].Note that neither flavour of emulator receives ROD event fragments via S-LINK. ROS eventfragments are generated on request and sent to the requester via PCI bus or Gigabit Ethernet.
The main results obtained from studies of the bus-based scenario are presented here, while themain results of switch-based ROS measurements are presented in conjunction with the resultson RoI collection and event building, see Section 8.3.2.2 and Section 8.3.2.3. More detailed re-sults are documented elsewhere [8-21].
Figure 8-7 shows the set-up for the bus-based ROS testbed. In this testbed, an IOManager wasdeployed on a standard PC having a single 2.4 GHz Xeon processor and a PCI bus configura-tion including four 66 MHz / 64 byte PCI buses, running RedHat Linux 7.3. The PC wasequipped with three MPRACE boards, each emulating a ROBIN with four ROLs, giving a totalof twelve ROLs per ROS.
The testbed has been operated in a standalone configuration, where the IOManager generatedtriggers internally and the ROS fragments produced discarded, and in a configuration wherethe IOManager was receiving real data request messages from a test program via the networkand sending back the ROS fragments to the requesting process. The first configuration allowsthe measurement of the performance of the internal ROS operations (scheduling of concurrentdata requests, collection of data fragments from the PCI ROBINs, building combined data frag-ments). The second configuration includes the overhead of the network I/O associated with re-ceiving data requests and sending data fragments.
Figure 8-6 The deployment of the switch-based ROS
���
��������������� ��
��������
�
���������������������
�� ��
�� ��
�� ��
��������
�����������
������
����
��������������
������
�����������
����������
������������
�������� ����
��!����
��!����
���� ��
�������"� �#�
����������
���
��!����

ATLAS Technical Design ReportHigh-Level Trigger, Data Acquisition and Controls 30 June 2003
8 DataFlow 101
In the final ATLAS set-up, ROS modules will be exposed to a rate of EB data requests depend-ing on the LVL2 rejection power, and to different rates of RoI data requests depending on whichdetector channels they are connected to, see Appendix A. In addition to the data request mes-sages the ROS will receive messages containing the list of events that have to be removed fromits buffers.
The test procedure involved measuring the maximum LVL1 accept rate that a ROS could sus-tain as a function of the LVL2 rejection factor. The measurements have been carried out both foraverage and maximum RoI data request scenarios, referred to as ‘standard’ and ‘hotspot’ ROSin the remainder of this section.
The ROI data request rates and throughputs for standard and hotspot ROSs have been derivedfrom the paper model results presented in Appendix A. A standard ROS receives RoI data re-quests at a rate, in average, corresponding to ~12% of the LVL1 rate, each requesting one kilo-byte of data from a single ROL. A hotspot ROS instead will receive RoI data requests at a ratecorresponding to ~20% of the LVL1 rate, each requesting data from one or two ROLs, for a meanoutput fragment size of ~1.4 kbyte.
Figure 8-8 shows the maximum sustained LVL1 rate as a function of the fraction of acceptedevents, i.e. the inverse of the LVL2 rejection power, for both a standard ROS and a hotspot ROS.
It can be seen that for an accept percentage of 4%, i.e. a LVL2 reduction power of twenty-five, ahotspot ROS can sustain up to 78 kHz of LVL1 rate while a standard ROS can sustain up to94 kHz. It can also be observed that a standard ROS sustains a LVL1 accept rate of 75 kHz for anaccept fraction of up to ~6.5%, i.e. a LVL2 reduction power of sixteen. It should be noted that thenumber of hotspot ROSs is limited to a few units in the Electromagnetic Calorimeter.
Figure 8-7 The bus-based ROS performance testbed
������������
�����
�����
�����
�������
����� ��������� ���
����
����������
��������
���������
� ��������������
� ��������
����� ��������� ���
������������
���������
� ��������������
����������
������������
� ��������
����������
� �����
����������
�������������
��������� �������
!��"�����#������$����$����
%
�������������
�������� �������
ATLAS Technical Design ReportHigh-Level Trigger, Data Acquisition and Controls 30 June 2003
102 8 DataFlow
In Figure 8-9 the maximum sustainable LVL1 rate, as shown in Figure 8-8 for a hotspot ROS, iscompared to the internal performance of the ROS as measured running without network I/O.For the upper curve and for an accept percentage of 4%, the fragment flow from the MPRACEmodules is ~150 Mbyte/s and increases up to ~215 Mbyte/s for an accept percentage of 10%,confirming the observation that the PCI bus can be driven to data rates much larger than thoserequired for the final system.
Figure 8-8 The bus-based ROS sustained LVL1 rate as a function of the event-building rate for different valuesof the data volume requested by the LVL2 trigger
Figure 8-9 The bus-based ROS sustained LVL1 rate with and without network I/O
0
20
40
60
80
100
120
140
160
0 2 4 6 8 10 12
Percentage of LVL2 accepts
Ma
xim
um s
usta
ined
LV
L1 ra
te (k
Hz)
Hotspot ROS
Standard ROS
0
50
100
150
200
250
300
350
0 2 4 6 8 10 12
Percentage of LVL2 accepts
Max
imum
sus
tain
ed L
VL1
rate
(kH
z)
No network I/O
With network I/O (UDP)

ATLAS Technical Design ReportHigh-Level Trigger, Data Acquisition and Controls 30 June 2003
8 DataFlow 103
Figure 8-10 shows the results of a more complex test set-up where four bus-based ROSs, eachemulating the input from twelve ROLs, were connected through a Gigabit Ethernet switch to anumber of SFIs, requesting data as quickly as possible. One can observe that the ROSs reach asustained rate of ~7 kHz maximum performance when receiving requests for data from sevenSFIs. The maximum sustained event-building rate corresponds to a total data throughput fromthe four ROSs to the SFIs, of 450 Mbyte/s. In other words the bus-based ROS is able to drive itsoutput link to 110 Mbyte/s, i.e. almost the nominal link speed limit.
In summary, it has been shown that the bus-based ROS equipped with twelve ROLs on threeROBIN emulators meets the worst-case performance requirements and exceeds the require-ments by 20% in the normal case (standard ROS), with current off-the-shelf single-processorLinux PCs. The performance of the bus-based ROS, with real or emulated network traffic, is farfrom being limited by the PCI bus bandwidth and performance gains may be achieved in thenear future, due to improvement of PC Hardware, e.g. the replacing of today’s 2.4 GHz CPUswith the 4 GHz CPUs that are expected to be commonly available by the end of next year. Notethat the current schedule foresees the purchase of the ROS hardware in 2005, see Section 18.1.
In addition significant improvements in performance are expected from on-going software opti-mization studies: the use of new Linux kernels and/or thread libraries; possible software archi-tecture changes to exploit multi-processor machines; and the optimization of the high-levellayers of the message passing software.
8.1.3.4 pROS
The Pseudo-ROS receives the detailed result records of the L2PUs for accepted events and par-ticipates in the event-building process, such that the LVL2 detailed result appears within the fullevent record, see Section 9.2.5. As the name indicates, it provides ROS functionality specificallyfor the L2PU. As its input rate is given by the rate of LVL2 accepted events O(3) kHz and the es-timated size of the LVL2 detailed result is O(1) kbyte, it is purely a software process, on a PC, re-
Figure 8-10 The event-building rate sustained by four bus-based ROSs each emulating twelve ROLs, i.e a totalof 48 ROLs
0
1
2
3
4
5
6
7
8
0 2.5 5 7.5 10
Number of SFIs
Eve
nt b
uild
ing
rate
(kH
z)
450 Mbyte/s
ATLAS Technical Design ReportHigh-Level Trigger, Data Acquisition and Controls 30 June 2003
104 8 DataFlow
ceiving event fragments via an Ethernet connection. That is to say that unlike the ROS the I/Odemands do not warrant the deployment of a ROBIN. From the point of view of the SFI there isno difference between the pROS and the ROS and it is estimated that a single pseudo-ROS issufficient for the final system. The requirements and design of the pROS are described in Refs.[8-22] and [8-23].
8.2 Boundary and interface to the LVL1 trigger
The LVL2 trigger is seeded by the RoIs identified by the LVL1 trigger. The information fromLVL1 includes the selected trigger type and the details of where in η and ϕ the trigger objects(e/γ, µ, etc.) that caused the event to be accepted originated. The interface between the LVL1and LVL2 triggers has been specified [8-24] and is implemented by the RoIB component of theDataFlow.
Figure 8-11 shows the RoIB and its connections to the LVL1 system. The RoIs are input to theRoIB on eight separate links at event rates of up to 100 kHz. The main function of the RoIB is tocollect the individual RoIs for each LVL1 accept and produce a single data structure which itthen relays to the L2SV. To meet the rate requirements, the L2SV is implemented by a small,O(10), processor farm of PCs each of which runs a supervisor process. The RoIB ensures theflow of information between the LVL1 and DataFlow and is also an integral part of the LVL2trigger. In this section the design and performance of the prototype RoIB are presented.Section 9.2.2 presents those aspects relevant to the correct functioning of the LVL2 trigger, e.g.load balancing.
8.2.1 Region-of-interest builder
Referring to Figure 8-11, each major element of the LVL1 trigger system provides RoI fragmentsto the RoIB via a point-to-point link. The requirements of this link are equal to those of the ROLand it is therefore envisaged to use S-LINK for its implementation, see Section 8.1.2. In additionto the eight ROLs, a TTC input is also foreseen to allow for, particularly during the debuggingand commissioning phases, consistency checks of the extended L1ID contained in the receivedRoI fragments.
The maximum size of the RoI fragment received on each link, per LVL1 accept, is specified to be256 byte [8-24]. Additionally, the skew between the arrival time of RoI fragments is specified tobe less than one millisecond in the absence of flow control. Per LVL1 accept the RoIB assemblesthe RoI fragments into a RoI record and sends them to a supervisor processor. The selection ofsupervisor processor is governed by a load-balancing algorithm.
8.2.1.1 Implementation and performance
The baseline implementation of the RoIB is a VMEbus system which includes a SBC3 for inter-facing with the Online system for the purposes of configuration, control and monitoring. It iscomposed of two stages: input and assembly. The input stage consists of input cards that receiveand buffer the RoI fragments. Each input card is equipped to receive data from up to six ROLs,
3. The same SBC as used in the ROD crates.

ATLAS Technical Design ReportHigh-Level Trigger, Data Acquisition and Controls 30 June 2003
8 DataFlow 105
thus two cards are required in the final system. These cards subsequently send the RoI frag-ments to ‘builder cards’ in the assembly stage where the RoI fragments are assembled into RoIrecords. Per event, the RoI fragments are sent to all ‘builder cards’, the assignment of each eventto a specific builder card will be based on a token-passing mechanism between the builder cardsdeployed. Each builder card can service up to four supervisor processes. The number of buildercards within the system is not limited and is dictated by the rate that a supervisor process cansustain. The implementation of the baseline architecture foresees ten supervisor processes thusthree builder cards.
A prototype of the RoIB has been built and tested during the course of 1999. It was based on apair of 12U VMEbus cards, an input card capable of handling six S-LINK inputs, and a pair ofbuilder cards able to output to a pair of supervisor processes. This implementation utilized76 Altera 10K40 FPGAs and 8 10K50 FPGAs. The system and early performance measurementsare documented in Ref. [8-25].
Exploitation has shown that combining RoI fragments from several sources using an FPGA-based device is feasible and that a L2SV consisting of four 300 MHz Pentium II PCs was suffi-cient to receive the RoIB output rate of 100 kHz. Subsequent tests with prototypes of the muonCentral Trigger Processor interface and the Central Trigger Processor ROD modules of the LVL1system have made a start on debugging the component interfaces and have further demonstrat-ed that data input to RoIB could be achieved at the required rates [8-26].
Figure 8-11 The RoIB and its connections to the LVL1 system
LVL1 CalorimeterTrigger
LVL1 CalorimeterTrigger
(e/γ & τ/h) (jet & energy sum)
LVL1 MuonTrigger
LVL1 CentralTrigger processor
Input card Input card
builder card builder card...
TTC
Level 2 Supervisor
Controller
Online software
Config., Ctl& mon
RoI Builder
ATLAS Technical Design ReportHigh-Level Trigger, Data Acquisition and Controls 30 June 2003
106 8 DataFlow
8.3 Control and flow of event data to high-level triggers
8.3.1 Message passing
8.3.1.1 Control and event data messages
The flow of event data between components of the DataFlow system is achieved by the ex-change of control messages and subsequent event data messages. This is described in detail inRefs. [8-27] and [8-28], here only its major features are summarized. Figure 8-12 is a sequence di-agram describing the handling of an event by the DataFlow components.
The sequence commences with the reception by a supervisor process of the LVL1 Result, whichcontains the RoI information, from the RoIB. Using a load balancing algorithm the supervisorassigns the event to a L2PU for analysis.
Figure 8-12 A sequence diagram showing the interactions between DataFlow components
SFIROS/ROBDFM
SFI_FlowControl
1..n
L2PUL2SV
2a: L2PU_Data Request
pseudo ROS
3a: L2PU_LVL2Result
4a: L2SV_LVL2
2b: ROS/ROB_Fragment
sequential processing or t ime out
1..i
DFM_FlowControl
3b: pROS_Ack
wait EoE or t ime out
reassign time-out event
7: DFM_Clear
1a: L2SV_LVL1ResultRoIB
EF
wait LVL2 decision
or t ime out
1..i
4b: DFM_Ack
1b: L2PU_LVL2Decision
6a: SFI_DataRequest
6b: ROS_EventFragment
5a': DFM_SFIAssign
5b: SFI_EoE
Request and receive from all ROSs or
timeout1..n
Full event
1..n
1..n

ATLAS Technical Design ReportHigh-Level Trigger, Data Acquisition and Controls 30 June 2003
8 DataFlow 107
The L2PU receives the LVL1 Result from the L2SV and uses the contained RoI information toseed its processing, see Section 9.2.4. The sequential processing performed by the L2PU results,on average, in 1.6 RoI data requests per event. The selected ROS units service the request fordata by responding to the requesting L2PU with a ROS event fragment message. On reaching adecision as to whether the event should be accepted or rejected, the L2PU sends the LVL2 Deci-sion message to the supervisor process. In the case that the event is accepted for further process-ing by the EF, the L2PU also sends the detailed result of its analysis to the pROS.
The supervisor process receives the LVL2 Decision and forwards a group of them to the DFM. Ifno LVL2 decision is received within a pre-defined timeout, the supervisor process deems theevent to have been accepted by the L2PU and sends a LVL2 Decision to the DFM.
On reception of a group of LVL2 Decisions the DFM acts on each decision and in the case of anaccepted event, based on a load balancing algorithm, assigns an SFI to perform the building ofthe event. A group of Clear messages is multicast by the DFM to all ROSs for events, i.e. thoserejected by the LVL2 and those successfully built. This message contains the identifiers of eventstreated by the system.
The SFI builds the event by sequentially requesting event data from each ROS or ROBIN. Thechoice of sequentially building the event into the SFI using a request-response controls, i.e.shapes the traffic, the flow of Data messages towards the SFI. This removes the dependency onthe DataFlow network technology to provide peer-to-peer flow control. The full events built inthe SFI are subsequently sent to an EF subfarm for further processing.
Table 8-1 Summarizes the messages, in terms of rate and bandwidth, exchanged between theDataFlow component. The message rates and bandwidth can be handled by a wide range oflink technologies. The choice is dictated by price, long-term availability, support, inter-operabil-ity, and suitability for DataFlow. Ethernet in its varieties of 100 Mbit/s and 1000 Mbit/s is theprime candidate and has been evaluated for its suitability for exchange of control and eventdata messages.
8.3.1.2 Ethernet
Extensive studies have been performed of many Ethernet features leading to its adoption as thebaseline networking technology in the DataFlow. The features studied have included the char-acteristics of switches with respect to throughput, packet loss, latency, trunking and Media Ac-cess Control (MAC) address table size; Virtual Local Area Network (VLAN) implementation;Flow Control at different levels, i.e. across switch and between Ethernet nodes; Quality of Serv-ice (QoS); broadcast and multicast handling; inter-operability of switches from various vendors.
The results of studies of these features are reported in Ref. [8-29] and additional references tofurther studies performed on Ethernet can be found in Ref. [8-30]. Features of primary impor-tance to the baseline architecture have emerged to be switch throughput, latency, packet lossand, in the case of the switch based ROS, VLANs. The results of studies of these features aresummarized in this chapter.
8.3.1.2.1 Basic switch performance
Switches must meet the throughput requirements of the architecture with a minimum latencyand loss of Ethernet frames. The latter results in a degradation of the system’s performance as itimplies the implementation of timeouts and retries at the application level. Within a switch, the
ATLAS Technical Design ReportHigh-Level Trigger, Data Acquisition and Controls 30 June 2003
108 8 DataFlow
loss of frames may occur as a result of buffer overflow, therefore the larger the switches buffersthe smaller the probability of frame loss.
The frame loss and latency of a number of switches have been studied for different frame sizes,without flow control, loads (from 10% to 100% of the line speed), with Constant Bit Rate (CBR)or with Poisson inter-packet gap, using unicast, multicast and broadcast traffic.
Figure 8-13 shows the results of a test performed on two different switches, using raw Ethernetand maximum size frames. These measurements used 30 Gigabit Ethernet ports, each one send-ing unicast traffic to all the others with a negative exponential inter-packet gap. Switch 1 be-came saturated when the offered load exceeded 66% of the line speed. It can further be seen thata slight increase in latency is followed by packet loss, and a significant growth in latency occursonce the switches buffers become full. The second switch (Switch 2 in the figure) in this test per-formed better, almost achieving line speed.
Table 8-1 Average message rates and bandwidth per DataFlow component
Communicating components
Messagetype
Sender Receiver
CommentRate (kHz)
Bandwidth(Mbyte/s)
Rate (kHz)
Bandwidth(Mbyte/s)
LVL1 to RoIBa Data 12.5 26 12.5 26 RoI information
RoIBb to L2SV Data 33 26 10 20 RoI Record
L2SV to L2PU Data 10 20 0.2 0.4 RoI Record
L2PU to ROS Controlc 5 0.5 14 1.4
Data requestsd 10 1 5 0.5
ROS to a L2PU Datac 14 28 5 10
Event datad 5 5 10 10
L2PU to L2SV Control 0.2 0.05 10 1 LVL2 decision
L2PU to pROS Data 0.006 0.006 3 3 L2PU processing output
L2SV to DFM Control 0.1 0.04 100 0.4 LVL2 decision
DFM to a SFI Control 3 0.3 0.04 0.004 Assignment to an SFI
SFI to ROS Controlc 6 0.6 3 0.3
Data requestsd 66 6.6 3 0.3
ROS to a SFI Datac 3 36 6 66
Event datad 3 3 66 66
SFI to DFM Control 0.04 0.004 3 0.3 Indicates event built
DFM to ROSs Control 0.25 0.4 0.25 0.4 Clear events
SFI to EF Data 0.04 66 0.04 66 Event data
a. RoIB input portb. RoIB output portc. Bus-based ROSd. Switch-based ROS

ATLAS Technical Design ReportHigh-Level Trigger, Data Acquisition and Controls 30 June 2003
8 DataFlow 109
Similar measurements have also been performed using multicast and broadcast traffic. The re-sults show that switch performance is vendor specific and in some cases the maximum through-put is surprisingly low, i.e. less than 10% of the line speed. The avoidance of vendordependency is one of the reasons for the choice of unicast traffic (a request–response scenario)in the baseline architecture, see Section 8.3.1.1.
In summary, any switch that is to be deployed must operate below a saturation point to avoidlatency increase and the subsequent frame loss. This saturation point must be determined bymeasurement.
The problem of frame loss can be alleviated by the use of Ethernet flow control. However, thepropagation of flow control through a switch is manufacturer dependent and not covered bythe Ethernet flow control standard. The propagation of flow control assures a lossless frametransfer, but once congestion appears it may spread over large areas [8-29] leading to a degrada-tion of the switch’s overall throughput. In switchs that do not propagate flow control, frameloss will occur if the congestion cannot be absorbed by the switches internal buffers. However,in this case there is no spreading of congestion. Ethernet flow control helps prevent the over-flow of buffers within a switch and a network interface card, but it does not completely solvethe problem of frame loss as it can also occur when the kernel buffers used to receive framesfrom a network interface card also overflow. The prevention of frame loss at this level requiresthat flow control propagates back to, and be used by, the Linux kernel. This functionality is notcurrently foreseen to be implemented.
8.3.1.2.2 Virtual Local Area Network
The network topology of the proposed architecture using the switch-based ROS, see Section 5-5,contains network loops, see Figure 8-14, which are illegal in the use of Ethernet as they disturbthe MAC address tables for unicast frames and result in the continuous sending of multicastand broadcast messages (broadcast storms). In general the Spanning Tree Protocol (STP) is de-ployed to disable redundant links in a LAN so as to maintain a loop-free topology. In the pro-posed architecture a loop-free topology will be achieved by using two VLANs, one of eachassociated to the LVL2 and EB traffic. The extended header of the Ethernet frame may include aVLAN tag immediately after the Ethernet addresses allowing many logical LANs, i.e. VLANs,to coexist on the same physical LAN.
Figure 8-13 Switch measurements for unicast traffic, Poisson inter-packet gap, 1518 byteframes: (a) Frame loss; (b) Average latency
(a) Aggregated sent Traffic (Gpbs)
Pac
ket l
oss
(Gpb
s)
Switch 1Switch 2
(b) Aggregated sent Traffic (Gpbs)
Ave
rage
late
ncy
(µs)
Switch 1Switch 2
ATLAS Technical Design ReportHigh-Level Trigger, Data Acquisition and Controls 30 June 2003
110 8 DataFlow
The set-up shown in Figure 8-14 has been used to verify that VLANs eliminate illegal loops, andto ascertain whether the STP can be applied per VLAN. With the STP disabled, tests haveshown that VLANs ensured a loop-free topology. With the STP enabled, one of the links in theloop was disabled indicating that the STP is not implemented per VLAN, at least on the switch-es used in the tests.
In summary, if the STP cannot be applied per VLAN it can be disabled and VLANs alone usedto ensure a loop-free topology. Note there are indications that most forthcoming switches willimplement a STP that can be applied per VLAN.
Not only do VLANs ensure a loop-free topology, but they also provide additional features: theyrestrict flooding; provide containment of multicast and broadcast traffic; and provide supportfor QoS by means of the priority field within the VLAN tag.
8.3.1.3 Design of the message passing component
The requirements of the Message Passing layer are detailed in Ref. [8-31]. It is responsible forthe transfer of all control and event data messages between the DataFlow components. It im-poses no structure on the data that is to be exchanged and its implementation allows the trans-fer of data with a best-effort guarantee. No re-transmission or acknowledgement of data is doneby this layer allowing the API to be implemented over a wide range of technologies without im-posing an unnecessary overhead or the duplication of existing functionality. The API supportsthe sending of both unicast and multicast messages. The latter has to be emulated by the imple-mentation if it is not available, e.g. for TCP.
The design of the Message Passing layer [8-32] defines classes that allow the sending and receiv-ing of messages. The Node, Group and Address classes are used at configuration time to set-up allthe necessary internal connections. The Port class is the central interface for sending data. Alluser data has to be in part of a Buffer object to enable it to be sent or received from a Port. TheBuffer interface allows the addition of user-defined memory locations which are not under thecontrol of the Message Passing layer in order to avoid copying. The Provider class is an internalinterface from which different implementations have to inherit. Multiple Provider objects can
Figure 8-14 The VLAN Ethernet loop set-up. The potential loop appears in dashed line.
ROBROB
SFIL2PU
ROB switch ROB switch
LVL2 centralswitch
EB centralswitch
VLAN 2
VLAN 1,2VLAN 1,2
VLAN 2
VLAN1
VLAN1
STP

ATLAS Technical Design ReportHigh-Level Trigger, Data Acquisition and Controls 30 June 2003
8 DataFlow 111
be active at any given time. A Provider is basically the code to send and receive data over a giv-en protocol/technology, e.g. TCP, UDP or raw Ethernet.
8.3.1.4 Performance of the message passing
The prototype Message Passing layer interface has been implemented over raw Ethernetframes, UDP/IP and TCP/IP. The latter provides additional reliability compared to UDP andraw Ethernet. However, the appropriateness of TCP/IP for the traffic in the DataFlow is debata-ble [8-33]. Therefore, the applications and message flow have been designed to ensure the cor-rect system functioning when an unreliable technology is used, i.e UDP or raw Ethernet.
The raw Ethernet implementation adds message re-assembly on the receiver side to overcomethe restriction of the maximum message size being a single Ethernet frame restriction.
Internally all implementations support scatter/gather transmission and reception of data. Thisallows the building of a logical message out of a message header and additional user data thatdoes not need to be copied inside the application.
Extensive studies of the performance of the Message Passing layer have been performed [8-34].Here the performance is summarized by drawing a comparison with the performance that canbe obtained using standard Linux operating system primitives to stream messages between twoPCs, equipped with 2 GHz CPUs, and connected by a point-to-point Gigabit Ethernet link.
Figure 8-15 shows the CPU time to receive a message versus the received message size using theMessage Passing layer with raw Ethernet and UDP/IP; and using standard Linux operatingsystem primitives with raw Ethernet4 and UDP/IP. The results obtained for applications usingthe standard Linux operating system primitives, due to their simplicity, give the upper limits onthe performance that can be achieved with today’s versions of the Linux operating system andPCs.
The main feature is a step increase in the time to send a message of ~8 µs at the boundary ofmultiples of the Ethernet frame size. Within multiples of Ethernet frames, the time to send amessage varies by less than 1%. Up to message sizes of a single Ethernet frame there is no sig-nificant difference in performance between raw Ethernet and UDP/IP and the overhead in re-ceiving a message with Linux operating system primitives is measured to be ~14 µs. TheMessage Passing layer using raw Ethernet, compared to the performance using Linux operatingsystem primitives and UDP/IP, introduces an additional overhead of 8 µs to the CPU time re-quired to receive a message and this additional time is independent of the message size. TheCPU time required to receive a message using the Message Passing layer with UDP/IP increas-es, compared to that obtained with raw Ethernet. This divergence is due to the reassembling ofmessages performed in the IP layer.
The CPU time required by a process using the Message Passing layer with UDP/IP (running ona PC with a 2 GHz CPU and Linux kernel version 2.4.20) to receive a message has been catego-rized with respect to the operating system interrupt handling, the operating system protocolstack, and the Message Passing layer overhead. The results of this categorization are summa-rized in Table 8-2.
4. The measurements using raw Ethernet system primitives are limited to a maximum mes-sage size of 1460 byte, as no re-assembly of larger packets has been implemented.
ATLAS Technical Design ReportHigh-Level Trigger, Data Acquisition and Controls 30 June 2003
112 8 DataFlow
In summary, the CPU time required to receive a single Ethernet frame message is ~22 µs and formulti-Ethernet frame message the CPU time is ~14 µs per frame. Similar measurements per-formed for the sending of a message show [8-34] that the CPU time to send a single frame mes-sage is ~12 µs.
Over the past few years the CPU time to send and receive messages has decreased substantially.This is largely due to the improvements made in the Linux operating system, which are contin-uing to be made, e.g. interrupt coalescence, and should lead to proportional improvements inthe DataFlow Message Passing layer. The latter adds to the operating system overheads an ad-ditional overhead which decrease as CPU speed increases. It is also not excluded that this addi-tional overhead will further decrease as a result of improvements to the design of the MessagePassing layer.
Figure 8-15 The CPU time required to receive a message versus the length of the message
Table 8-2 Summary of the Message Passing performance with UDP/IP on a 2 GHz PC
Parameter Time (µs)
Operating system interrupt service 10
Operating system protocol stack 4
Message Passing overhead 8
Message size (kBytes)0 1 2 3 4 5 6 7 8 9 10 11
s)µC
PU
tim
e (
0
10
20
30
40
50
60
70
80
90
100
110
120
130
140
150
160
DC RawSockDC over UDP/IPUDP/IPRawSock

ATLAS Technical Design ReportHigh-Level Trigger, Data Acquisition and Controls 30 June 2003
8 DataFlow 113
8.3.2 Data collection
8.3.2.1 General overview
In the final phase of prototyping leading to the baseline architecture, the movement of eventdata within the DataFlow was designed and implemented as a single sub-system called the Da-taCollection. The requirements on this sub-system and a detailed description are given in Refs.[8-35] and [8-36]. It provides for the movement of the LVL1 RoIs to the L2PU (via the L2SV) andthe LVL2 result (decision and detailed result) to the Event Filter as well as the Event Buildingand feeding the complete events to the Event Filter. The DataCollection applications (L2SV,L2PU framework, DFM, pROS, SFI and SFO) are based on the design and implementation of aframework that provides a suite of common services: OS Abstraction Layer, Access to the con-figuration Database, Error Reporting, System Monitoring, Run Control and Message Passing.
Services are built from packages following a modular approach. Many of these packages consistonly of interfaces whose implementation is provided by other packages that can be changed atconfiguration or run-time. This clear separation between interfaces and implementations existsdown to the lowest levels, e.g. the thread interface and access to system clocks and timers. Ex-amples of the common interfaces are those required between the applications and the Onlinesoftware for the reporting of errors, access to the configuration database, and for control and op-erational monitoring. The Message Passing layer, described in Section 8.3.1.3, provides for acommon interface for the exchange of control and data messages.
The following sections present the performance of the RoI data collection and event-buildingfunctionality achieved using prototype implementations of the L2SV, L2PUs, pROS, DFM, SFIand SFO based on the DataCollection implementation.
In these performance tests the processors used to run the L2PU as well as the L2SV and ROSemulators were all dual Xeon CPUs of 2.2 GHz interconnected by Gigabit Ethernet.
8.3.2.2 RoI data collection
8.3.2.2.1 Design
The interactions between the RoIB, L2SVs, L2PUs, ROSs and pROS provides the functionality ofRoI data collection and were described in Section 8.3.1.1. The collection of RoI data is part of theoverall LVL2 functionality, whose detailed description is given in Chapter 9.
8.3.2.2.2 Performance
Each L2SV receives complete RoI information from the RoIB and provides it to one of its associ-ated L2PUs. Figure 8-16 shows the LVL1 rate sustained by a L2SV as a function of the number ofL2PUs to which it is associated. In this measurement the PC running the L2SV is also connectedto a Gigabit Ethernet switch on which a number of PCs are also connected, each of which wereexecuting the L2PU. The L2SV was not connected to a RoIB, instead it emulated the receiving ofevents from the RoIB. As can be seen from the figure, the L2SV can sustain a LVL1 accept rate of32 kHz when distributing RoI information to a single L2PU and the dependency on the numberof L2PUs is 1%. Thus, based on today’s prototype implementation and PCs, ten L2SVs are suffi-cient to support a LVL1 accept rate of 100 kHz.
ATLAS Technical Design ReportHigh-Level Trigger, Data Acquisition and Controls 30 June 2003
114 8 DataFlow
In the baseline architecture the rate at which a L2PU can collect RoI data will depend on the sizeof the RoI, the number of ROSs over which the RoI is distributed, and the number of workerthreads, see Section 9.2.4, that collect RoI data in parallel5.
Figure 8-17 shows the performance of a single L2PU as the inverse of the LVL1 accept rate sus-tained by a single L2PU versus the number of worker threads. In this measurement the L2PUcollects only the RoI data, i.e. it does not execute any LVL2 algorithm, and the RoI has a fixedsize of 16 kbyte. The different curves represent the RoI being collected from 2, 4, 8, or 16 ROSs.For example the upper curve represents the results of collecting a 16 kbyte RoI from twenty-twoROSs, each of which contributes 0.8 kbyte to the RoI.
The results indicate that the optimum number of worker threads, in this set-up, is approximate-ly three and is independent of the number of ROSs from which the RoI is being collected. In ad-dition, the results show that for the conditions of this measurement and for three workerthreads, the collection of RoI data contributes less than 10% to the average event processingtime of 10 ms.
The contribution of RoI data collection to the L2PU event processing time is also shown inFigure 8-18 as a function of the RoI size and the number of ROSs over which the RoI is distribut-ed.
The range of the measurements presented in Figure 8-18 corresponds to the currently expectedRoI sizes and their distribution over RoBs, e.g. an e/γ RoI in the Liquid Argon detector is ex-pected to be distributed over 13 to 16 ROBs and have a size of approximately 16 kbyte. It can beobserved from the measurement results that the time taken to collect RoI data contributes, in theworst case, less than 10% to the average event processing time budget of 10 ms.
The measurements so far presented have shown the rate at which a single L2PU, without algo-rithm execution, can collect RoI data. The achieved performance depends on the RoI size andthe number of ROBs from which the RoI must be collected. For the system, however, it is alsonecessary to demonstrate that when many L2PUs are requesting data at the same time from thesame set of ROSs the performance of the RoI collection does not degrade unacceptably. For thistest, L2PUs without algorithms were again used, although it should be noted that the requestrate for data per L2PU is much higher that it would be if algorithms were included. Thus, in
Figure 8-16 The L2SV sustained LVL1 accept rate versus the number of L2PUs
5. Each worker thread processes a different event.
20
24
28
32
36
40
0 4 8 12
Number of L2PUs
LVL1
eve
nt r
ate
(kH
z)

ATLAS Technical Design ReportHigh-Level Trigger, Data Acquisition and Controls 30 June 2003
8 DataFlow 115
these measurements, each L2PU generates more than ten times the normal request rate. Similar-ly, the requests are sent to a small number of ROSs, so that again it is important to ensure thatthe total request rate did not exceed the capability of the ROSs. The tests were run in a testbedconsisting of three L2SVs, four ROSs (as described in Section 8.1.3.3) and up to eleven L2PUs6.All the nodes in the testbed were PCs equipped with dual Xeon processors, clocked at 2.2 GHz,inter-connected via a Gigabit Ethernet switch. For this test each ROS was configured to contain
Figure 8-17 The inverse of the LVL1 accept rate sustained by an L2PU collecting a 16 kbyte RoI from 2, 4, 8,and 16 and ROSs versus the number of threads concurrently collecting RoI data
Figure 8-18 Summary of the performance of the RoI data collection for various combinations of RoI sizes andslices
0
100
200
300
400
500
600
700
800
900
0 2 4 6 8 10
Number of worker Threads
1/(
LV
L1
ra
te)
( Πs)
16x1KB8x2KB4x4KB2x8KB
0
100
200
300
400
500
600
700
800
900
1000
0 5 10 15 20 25 30 35
RoI Size (kbyte)
1/(
LV
L1
Rat
e)
(�
s)
1 ROB2 ROBs4 ROBs8 ROBs16 ROBs22 ROBs
ATLAS Technical Design ReportHigh-Level Trigger, Data Acquisition and Controls 30 June 2003
116 8 DataFlow
12 ROLs, to give a total of 48 ROLs across the four ROSs. For each request the L2PU chose oneof the 48 ROBs at random, and in the case of 6 ROBs/RoI and 24 ROBs/RoI requested the fol-lowing 5 and 23 ROBs respectively, wrapping round across the ROSs as necessary. Figure 8-19presents the results of these measurements. It shows the rate of events handled by each L2PUand the rate of requests to each ROS as a function of the number of L2PUs used in the testbedfor an RoI distributed over 1, 6 or 24 ROBs (with 1.5 kbyte/ROB).
The plot shows that the rate per ROB decreases as the number of L2PUs is increased, by ~20%for 1 ROB/RoI and ~40% for 24 ROBs/RoI. However, with 11 L2PUs in the test the request rateper ROS is 17 kHz for 1 ROB/RoI and 8 kHz for 24 ROBs/RoI, both much higher demands on aROS compared to the final system. In addition, the total RoI request rate in the small test set-upis already 70 kHz and 11 kHz for the two RoI sizes respectively. Given these extreme conditionsthe fall from scaling can be seen to be relatively modest, and it seems reasonable to assume thatwith more typical conditions a full-sized system will show acceptable scaling. This interpreta-tion is reinforced by the fact that running similar tests with the ROSs replaced by FPGA ROSemulators shows scaling within better than 10% over the same range of RoI data traffic.
8.3.2.3 Event building
8.3.2.3.1 Design
The interaction between the ROSs, the DFM and the SFIs which implements the event-buildingfunctionality is shown in Figure 8-12 and explained in Ref. [8-27]. Two scenarios concerning theinteraction between DataFlow components in event building are being studied:
• Push scenario: In this scenario, the DFM assigns an SFI and informs all ROSs, via a multi-cast mechanism, to send their associated event fragments to that SFI. The SFI acts as anopen receiver and builds the complete event out of the individual fragments received.
6. Each L2PU having two worker threads.
Figure 8-19 the event rate per L2PU and the request AND THE REQUEST RATE PER ROS VERSUS THENUMBER OF L2PUS
0
1
2
3
4
5
6
7
8
9
0 2 4 6 8 10 12 14 16 18
Number of L2PUs (2 threads)
Eve
nt r
ate
per
L2P
U (
kHz)
0
2
4
6
8
10
12
14
16
18
Req
uest
rat
e pe
r R
OS
(kH
z)
1 ROB/RoI (L2PU Hz)
6 ROBs/RoI (L2PU Hz)
24 ROBs/RoI (L2PU Hz)
1 ROB/RoI (ROS Hz)
6 ROBs/RoI (ROS Hz)
24 ROBs/RoI (ROS Hz)

ATLAS Technical Design ReportHigh-Level Trigger, Data Acquisition and Controls 30 June 2003
8 DataFlow 117
• Pull scenario: In this scenario, the DFM assigns an event to an SFI which in turn requestsfrom each ROS its event fragment via a unicast messages. The SFI receives from each ROSindividually an event fragment and builds the complete event.
There is no difference in the amount of messages being handled on the level of the DFM, theROSs, or the network, however, the amount of messages to be handled by an individual SFI isdoubled in case of the pull scenario, see Table 8-1.
Although a doubling of the message rate at the level of the SFIs may seem problematic, the pullscenario offers the advantage of controlling the flow of traffic it is receiving. In this mode an SFIat any given moment in time never requests more event fragments than it can handle, thus re-ducing the probability of congestion within the network and avoiding the loss of fragments inthe switch buffers, see Section 8.3.1.2.1.
In the case of the push scenario the amount of traffic entering the switching network is control-led by applying IP QoS. The latter has been implemented in the standard Linux kernel at the IPlevel removing the necessity of implementing traffic shaping at the level of the ROS application.IP QoS manages the flow of data by employing packet classification and packet schedulingtechniques. Packet classification, e.g. Class Base Queuing (CBQ), is used to classify incomingpackets into groups, while packet scheduler arranges the scheduling for outgoing packets ac-cording to a queueing method and the buffer management selected, e.g. Token Bucket Filter(TBF). Note that IP QoS as implemented by the Linux kernel is only performed in the messageoutput queues, while incoming packets continue to be accepted on a best-effort basis. It is alsoimportant to realize that packets are scheduled at best at the rate of the Linux kernel scheduler,which is a parameter that may be configured. As event building is to be performed at a rate of~3 kHz, packet scheduling should occur at least at the same rate for the traffic shaping to be ef-fective.
Detailed studies have been made on the use of IP QoS to avoid congestion in the network. Theresults of these studies are summarized in Section 8.3.2.3.3 and further details can be found inRef. [8-37].
8.3.2.3.2 Performance using the pull scenario
The building of events is performed by the DFM, SFI and ROSs and is the collecting of eventfragments of an event located in up to 1600 different buffers. This has to be performed at a rateof ~3 kHz. Detailed studies of the event building have been performed using prototype soft-ware, PCs, Ethernet switches and traffic generators, see Refs. [8-38], [8-39], only the principal re-sults are presented here.
The nominal event-building rate in the proposed architecture is ~3 kHz and commences withthe arrival of LVL2 decisions at the DFM. In the pull scenario, the DFM assigns the events to anSFI, receives notification when an event is built, and sends clears to the ROSs. The performanceof the DFM, the sustained event-building rate versus the number of SFIs, is shown in Figure 8-20 when the Message Passing layer uses UDP/IP and raw Ethernet. It can be seen that the pro-totype implementation of the DFM can sustain an event-building rate of at least ~20 kHz, al-most an order of magnitude greater than the required performance, and as expected a betterperformance is achieved when the raw Ethernet protocol is used. The different curves in the fig-ure also show the dependence of the DFM performance on the size of the LVL2 decision group.A better performance is achieved the more LVL2 decisions are grouped into a single message.However, the sustained event-building rate has a stronger dependency on the number of SFIs in
ATLAS Technical Design ReportHigh-Level Trigger, Data Acquisition and Controls 30 June 2003
118 8 DataFlow
the system. This dependency is attributed to the additional load on the DFM when handlingmore SFIs. However, in the case of a LVL2 decision group of 100, the receiving of additionalmessages determines the behaviour.
The event-building performance of the DataFlow is shown in Figure 8-21. This figure shows thesustained event rate as a function of the number of SFIs in the system, and for one to four ROLsper ROS7. The total size of the event built is 2.2 Mbyte and Ethernet flow control was not used.It can be seen that the sustained event-building rate increases linearly with respect to thenumber of SFIs in the system. In the case of four ROLs per ROS, every additional SFI increasesthe overall system performance by ~35 Hz while for a single ROL per ROS the system perform-ance increase by ~30 Hz.
It is worth noting that these measurements were performed without Ethernet flow control andin the case of four ROLS per ROS the sustained event-building rate reaches a limitation due tothe small buffer sizes of the Gigabit Ethernet switch that was used for these measurements andEthernet flow control not being used, i.e. the switch buffers start to overflow. Similar measure-ments performed with Ethernet Flow control applied restore the linear behaviour for four ROLsper ROS. In the case of a single ROL per ROS the performance is limited by the ROS emulatorsused in the measurement. Finally it should be noted that these measurements have been per-formed without the SFIs forwarding the built events to the EF. Other measurements, [8-39],have shown that when an SFI does forward the built events to the EF, the sustained event-build-ing rate decreases by ~ 30%. This decrease in performance is expected to be minimal on thetimescales of ATLAS due to the expected increase CPU power.
Figure 8-20 The DFM event-building rate versus the number of SFIs. Each SFI concurrently builds two events
7. In this measurement the ROS was emulated using custom hardware, see Section 8.1.3.3.

ATLAS Technical Design ReportHigh-Level Trigger, Data Acquisition and Controls 30 June 2003
8 DataFlow 119
8.3.2.3.3 Performance using the push scenario
The event-building performance with QoS applied at the IP level has been measured for thepush scenario [8-37] and the Linux kernel scheduling frequency set to ~4 kHz. The results ofthese studies are shown in Figure 8-22. It can be observed that in the case of the push scenariowithout QoS, packet loss occurs at the SFI when the message size exceeds 4 kbyte. With QoS ap-plied, packet loss is not observed when the QoS is used to limit the output bandwidth at the lev-el of the ROS to 40 Mbit/s.
In the conditions in which no packet loss occurs, the push scenario has a better performancethan the pull scenario due to the additional data control messages implied by the pull scenario.However, over the full range of ROS event fragment sizes being studied for event building, thepull scenario performs better.
The results, obtained on a small system, show that QoS as a shaping technique is not always ef-fective for event building in the range required. Whether these conclusions are applicable to thefull-sized system remains to be established. Enhancements in the performance of the pull sce-nario with QoS applied have still to be investigated.
8.4 Summary
The performance of the main DataFlow components has been presented. It has been shown thatthe prototype design and implementation of these components meets the requirements on thearchitecture and thus supports the choice of the baseline architecture as presented in Chapter 5.Notably, it has been demonstrated that the collection of RoI data, required by the LVL2 trigger,can be done within a time that contributes less than 10% to the overall time budget of the LVL2event processing. It has also been demonstrated that the performance of the RoI collection func-
Figure 8-21 The event-building rate versus the number of SFIs in the system, without Ethernet flow control
0
50
100
150
200
250
300
350
400
450
0 2 4 6 8 10 12
N umber of SFIs
Eve
nt b
uild
ing
rate
(H
z)1ROL/ROS
2ROLs/ROS4ROLs/ROS
30 Hz linear31 Hz linear
35 Hz linear
ATLAS Technical Design ReportHigh-Level Trigger, Data Acquisition and Controls 30 June 2003
120 8 DataFlow
tionality scales sufficiently to the rates required of the final system. Similarly, the event buildinghas been demonstrated to sufficiently scale, within the constraints of the testbed, to the per-formance requirements of the final system. Observed departures from linear scaling are largelydue to running the system in way that some components are operating at rates and bandwidthsbeyond that which will be demanded of them in the final system. Where this is not the case thedepartures from linearity have been understood and will be addressed in the final design andimplementation. Two scenarios for event building were presented leading to the conclusion thatthe scenario in which the SFI controls the flow of traffic to it results in a better overall perform-ance and avoid the overloading of network links. Results from initial measurements have beenshown on the respective performance of the bus- and switch-based ROSs. The relative merits ofthese two solutions will be further studied when the final prototype ROBIN becomes available.
Further measurements are required on larger testbeds inorder to confirm the results obtainedwith on the testbeds currently available and to enhance the reliability and predictability of sys-tem models, see Section 14.6.2.1.
Figure 8-22 The event-building (a) rate and (b) throughput as a function of event fragment size and differentQoS parameter values for the push scenario
1
2
3
4
5
6
Eve
nt-b
uild
ing
rate
(kH
z)
Push No QoS
Push QoS (20 Mbps)
Push QoS (40 Mbps)
Push QoS (50 Mbps)
Pull no QoS
0
20
40
60
80
100
120
140
0 2.5 5 7.5 10 12.5 15
ROB data size (kbyte)
SF
I th
roug
hput
(M
byte
/s)

ATLAS Technical Design ReportHigh-Level Trigger, Data Acquisition and Controls 30 June 2003
8 DataFlow 121
8.5 References
8-1 B. Di Girolamo et al., ROD Crate DAQ Task Force, Data Acquisition for the ATLAS Read-Out Driver Crate (ROD Crate DAQ), ATL-D-ES-0007 (2002)http://edms.cern.ch/document/344713
8-2 R. Spiwoks, Workplan for ROD Crate DAQ, ATL-D-MG-0001 (2002)http://edms.cern.ch/document/364357
8-3 Trigger & DAQ Interfaces with Front-End Systems: Requirement Document,ATL-D-ES-0013 (1998)https://edms.cern.ch/document/384600
8-4 ATLAS Collaboration, High-Level Triggers, DAQ and DCS Technical Proposal, CERN/LHCC/2000-017 (2000)
8-5 O. Boyle et al., The S-LINK interface Specification, (2001),http://edms.cern.ch/document/110828
8-6 C. Bee et al., The raw event format in the ATLAS Trigger & DAQ, ATLAS Internal Note,ATL-DAQ-98-129 (1998)
8-7 E. van der Bij et al., Recommendations of the Detector Interface Group - ROD Working Group,ATLAS EDMS Note, ATL-D-ES-0005 (2001)http://edms.cern.ch/document/332389
8-8 The CMC standard. Common Mezzanine Cards as defined in IEEE P1386/Draft 2.0 04-APR-1995, Standard for a Common Mezzanine Card Family: CMC (the CMC Standard).
8-9 The 2nd ATLAS ROD Workshop (2000)http://dpnc.unige.ch/atlas/rod00/rod00.html
8-10 A. Ruiz Garcia, HOLA Specification (2001),http://edms.cern.ch/document/330901
8-11 G. Lehmann et al., Procedures for Standalone ROD-ROL Testing, ATC-TD-EN-0007 (2001)http://edms.cern.ch/document/320873
8-12 B. Gorini, ROS Software Architecture Document, ATL-DQ-ES-0010 (2002)http://edms.cern.ch/document/364343
8-13 Readout sub-system test report (using DAQ -1.), in preparation.
8-14 ReadOut Sub-system, Summary of prototype RoBIns, ATL-DQ-ER-001 (2003)http://edms.cern.ch/document/382933
8-15 R.Cranfield et al., ROS Requirements, ATL-DQ-ES-0007 (2002)http://edms.cern.ch/document/356336
8-16 B. Green et al., RobIn TDR-Prototype HLDD, ATL-DQ-EN-0001 (2002)http://edms.cern.ch/document/356324
8-17 B. Green et al., RobIn TDR-Prototype DLDD, ATL-DQ-EN-0002 (2002)http://edms.cern.ch/document/356328
8-18 B. Green et al., RobIn TDR-Prototype Software Interface, ATL-DQ-EN-0003 (2002http://edms.cern.ch/document/356332
8-19 The MPRACE boardhttp://mp-pc53.informatik.uni-mannheim.de/fpga/
8-20 Gigabit Ethernet testers for ATLAS event building studies, in preparation.
ATLAS Technical Design ReportHigh-Level Trigger, Data Acquisition and Controls 30 June 2003
122 8 DataFlow
8-21 B. Gorini et al., ROS Test Report, in preparation.
8-22 A. Bogaerts et al., Pseudo-ROS Requirements, ATL-DQ-ES-0039 (2002)https://edm.cern.ch/document/391569
8-23 P. Werner, Pseudo-ROS Design Document, ATL-DQ-ES-0044 (2002)https://edm.cern.ch/document/391576
8-24 M. Abolins et al., Specification of the LVL1 / LVL2 trigger interface, ATL-D-ES-0003 (2002)http://edms.cern.ch/document/107485
8-25 R. Blair et al., A Prototype RoI Builder for the Second Level Trigger of ATLAS Implemented in FPGA's, ATLAS Internal Note, ATL-DAQ-99-016 (1999)
8-26 B.M. Barnett et al., Dataflow integration of the calorimeter trigger CPROD with the RoI Builder and the ROS, ATL-DA-ER-0016 (2001)http://edms.cern.ch/document/326682
8-27 H-P. Beck and C. Haeberli, High-Level Description of the Flow of Control and Data Messages for the ATLAS TDAQ Integrated Prototypes, ATL-DQ-ES-0028 (2002)http://edms.cern.ch/document/391514
8-28 H-P. Beck and F. Wickens, The Message Format used by DataCollection in the ATLAS TDAQ Integrated Prototype, ATL-DQ-ES-0035 (2002)http://edms.cern.ch/document/391557
8-29 M. Ciobotaru and S. Stancu, Networking Tests, in preparation.
8-30 Networking group activity, in preparation.
8-31 R. Hauser and H-P. Beck, Requirements for the Message Passing Layer,ATL-DQ-ES-0024 (2001)http://edms.cern.ch/document/391495
8-32 R. Hauser, Message Passing Interface in the Level-2 Reference Software, ATL-DQ-ES-0023 (2001)http://edms.cern.ch/document/391490
8-33 R.E. Hughes-Jones, The use of TCP/IP for Real-Time Messages in ATLAS Trigger/DAQ,ATL-DQ-EN-0015 (2003)http://edms.cern.ch/document/393752
8-34 P. Golonka, Linux network performance study for the ATLAS DataFlow System,ATL-DQ-TR-0001 (2003)http://edms.cern.ch/document/368844
8-35 R. Hauser and H-P. Beck, ATLAS TDAQ/DCS DataCollection Requirements,ATL-DQ-ES-0048 (2002)http://edms.cern.ch/document/391580
8-36 R. Hauser and H-P. Beck, ATLAS TDAQ/DCS DataCollection Architectural Design,ATL-DQ-ES-0046 (2002)http://edms.cern.ch/document/391578
8-37 Y. Yasu et. al., Summary of Studies on ATLAS DataCollection software with QoS,ATL-DQ-TR-0004 (2003)http://edms.cern.ch/document/38292
8-38 M. Gruwé and B. Di Girolamo, DataFlow performances measurements: the Event Building,ATL-DQ-TR-0002 (2003)http://edms.cern.ch/document/375101

ATLAS Technical Design ReportHigh-Level Trigger, Data Acquisition and Controls 30 June 2003
8 DataFlow 123
8-39 C. Haeberli et al., ATLAS DataCollection: Event Building Test Report,ATL-DQ-TR-0003 (2003)http://edms.cern.ch/document/382415
ATLAS Technical Design ReportHigh-Level Trigger, Data Acquisition and Controls 30 June 2003
124 8 DataFlow

ATLAS Technical Design ReportHigh-Level Trigger, Data Acquisition and Controls 30 June 2003
9 High-Level Trigger 125
9 High-Level Trigger
9.1 HLT overview
The High-level Trigger (HLT) contains the second and third stages of event selection. It com-prises three main parts: The LVL2 system, the Event Filter (EF), and the Event Selection Soft-ware (ESS). Section 9.2 describes the components of the LVL2 system, Section 9.3 describesthose for the EF, and Section 9.4 describes the operation of the LVL2 and EF systems. Althoughthe algorithms used at LVL2 and the EF are different, it has been decided to use a common soft-ware architecture for the event selection code across LVL2, EF and offline studies. This facili-tates use of common infrastructure (such as detector calibration and alignment data) andsimplifies offline studies and development of the HLT algorithms. The common ESS architec-ture is described in Section 9.5.
The basic structure of the HLT selection chain is shown in Figure 9-1 in a simplified form. Thestarting point for the HLT is the LVL1 Result. It contains the LVL1 trigger type and the informa-tion about primary RoIs that caused the LVL1 accept, plus secondary RoIs not used for the LVL1accept. Both types of RoIs are used to seed the LVL2 selection. The concept of seeded recon-struction is fundamental, particularly at LVL2 (apart from the special case of B-physics — seeSection 13.4.5).
The LVL2 Result provides a seed for the EF selection, thus playing a similar role for the EF asdoes the LVL1 Result for the LVL2. It will also be possible to seed the EF directly with the LVL1Result in order to study, for example, the LVL2 performance. The EF and the LVL2 Results, con-taining the physics signatures from the trigger menu that were satisfied and higher level recon-struction objects, will be appended to the raw event data.
Figure 9-1 The high-level trigger selection chain with the LVL2 and EF selection each seeded by the precedingtrigger
<<RawData>> LVL1Result
The EF Classification part of the Event Filter is not yet fully defined.
<<RawData>> LVL2Result
<<RawData>> EFResult
LVL2Selection
EFSelection
EFClassification
LVL1 Result contains information about
LVL1 Trigger Type and about primary and secondary
regions-of-interest
<<seeded by>>
<<seeded by>>
<<produces>>
<<produces>>
ATLAS Technical Design ReportHigh-Level Trigger, Data Acquisition and Controls 30 June 2003
126 9 High-Level Trigger
The EF classification is yet to be defined in detail. Possibilities considered include special selec-tions for calibration events and for new physics signatures, i.e. a discovery stream. The EF Re-sult can be used to assign tags to the events or even assign them to particular output streams.
The flow of data is as follows. Data for events accepted by the LVL1 trigger are sent from the de-tector front-end electronics to the ROSs, containing ~1600 ROBs. In parallel, information on thelocation of RoIs identified by LVL1 is sent to the LVL2 Supervisor to guide the LVL2 event selec-tion. Figure 9-2 shows the exchange of messages that are then used to perform the HLT process.
The LVL2 Supervisor sends the LVL1 Result to the L2PU, where the LVL2 selection is per-formed. Using the LVL1 Result as guidance, specialized LVL2 algorithms request a sub-set ofthe event data from the ROSs to perform the event selection. In this way only a few per cent ofthe event data need to be transferred to the LVL2 system — thus considerably reducing the net-work bandwidth required. For events accepted by LVL2, details are sent to the ROS (in the LVL2Result) to be included in the event. The L2PU send the LVL2 Decision back to the LVL2 Supervi-sor, which forwards them to the Event Builder. Within the Event Builder the SFI assembles eachaccepted event into a single record, including the LVL2 Result. The built event is then passed tothe EFP where offline algorithms are applied guided by information from the LVL1 and LVL2triggers to further refine the event selection. Events passing the EF are then passed to the SFOfor permanent storage and offline analysis.
Details of how the HLT system fits into the overall HLT/DAQ architecture have been given inChapter 5.
Figure 9-2 The exchange of messages between HLT Components
LVL2Supervisor
LVL2Processing Unit
ROS
EventBuilder
SFO
EFP
4:send(LVL2Decision)
2:LVL2Selection() 8:EFSelection()1:send
(LVL1R
esult)
3.2:send(LV
L2Decision
)
5.1:
Reque
st(Eve
ntFra
gmen
ts)
2.1:
Reque
st(E
vent
Fragm
ents)
3.1:
Send(
LVL2
Result
)
2.2:
Send(
Event
Fragm
ents
)
6:Send(E
vent)
7:Sen
d(Eve
nt)
5.2:
Send(
Event
Fragm
ents)
LVL2 Selection and EF Selection accepts or rejects the event.
(includes SFI)

ATLAS Technical Design ReportHigh-Level Trigger, Data Acquisition and Controls 30 June 2003
9 High-Level Trigger 127
9.2 LVL2
9.2.1 Overview
The LVL2 trigger provides the next stage of event selection after the hardware-based LVL1 trig-ger. It uses RoI guidance received from LVL1 to seed the validation and enhancement of theLVL1 trigger using selected full granularity event data. Components involved in the LVL2 proc-ess are the RoI Builder (RoIB), the LVL2 Supervisor (L2SV), the LVL2 Processors (L2P), the ROSand the pROS. The RoIB assembles the fragments of information from the different parts of theLVL1 trigger and transmits the combined record to a L2SV. The L2SV selects a L2P for the eventand sends the LVL1 information to that processor and then waits for the LVL2 Decision to be re-turned. The L2P runs the LVL2 event selection software, requesting event data as required fromthe ROSs and returns the LVL2 Decision to the L2SV. For events which are to be passed to the EFthe L2P also sends a more detailed LVL2 Result to the pROS to be included in the event to bebuilt. Details of the ROS and the DataFlow aspects of the gathering of data within an RoI forLVL2 are described in Chapter 8. Details specific to the LVL2 selection process of all of the othercomponents are given below.
9.2.2 RoI Builder
For each LVL1 accept the various parts of the LVL1 trigger send information on the trigger in-cluding the RoI positions and thresholds passed. The RoIB combines these fragments into a sin-gle record that is passed to a L2SV. In the baseline design each L2SV will see only a sub-set ofthe L2Ps, thus the choice of L2SV affects the load-balancing between L2Ps. This routing wouldnormally be on a round-robin basis, but busy L2SVs can be skipped and the design also allowsmore complex algorithms, including use of the LVL1 trigger type. A fuller description of theRoIB is given in Section 8.2.1.
9.2.3 LVL2 Supervisor
The LVL2 Supervisors (L2SVs) are a smallgroup of processors (of order 10) that super-vise the flow of events in LVL2 and mediatebetween the LVL2 system and the LVL1 sys-tem. In order to simplify farm managementand to keep software uniform the processorswill be similar to those used in the LVL2 farm,however, each Supervisor processor needs aninterface (S-LINK in the baseline architecture)to receive the data from the RoIB (seeSection 8.2.1). The L2SV application is basedon the Data Collection Framework describedin Section 8.3.2.
The context of the L2SV is indicated in Figure 9-3. The L2SV receives information on the LVL1trigger in a single record (LVL1 Data) from the RoIB. It selects a L2P for the event and passes theLVL1 Data to the L2PU (running in the L2P) in the LVL1 Result message. Once the L2PU has de-
Figure 9-3 Context of LVL2 Supervisor
RoI Builder
object
LVL1Result
Online s/w
Run Control,
LVL1Data LVL2Decision Group
LVL2Decision
LVL2 Supervisor
DFM
ConfigurationError Reporting,Monitor
L2PU
(L2SV)
ATLAS Technical Design ReportHigh-Level Trigger, Data Acquisition and Controls 30 June 2003
128 9 High-Level Trigger
cided whether the event should be accepted or rejected it passes back a LVL2 Decision message.If the decision is an accept or if the L2SV has collected a predetermined number of rejects, theLVL2 Decision Group message is sent to the DFM where the DFM coordinates clearing of thebuffers and readout to the EB.
In selecting a L2P the Supervisor exercises a load balancing function. Currently the Supervisoris designed to either select L2Ps from its available pool via a simple round-robin algorithm, orto examine the number of events queued and to assign the event to the least loaded processor.The L2SV can also use the LVL1 Trigger Type when selecting an L2P, this could be used to re-strict specific triggers types to a sub-set of the L2Ps, for example when debugging code for anew trigger. It is also foreseen to automatically accept certain classes of LVL1 triggers withoutinvolving the L2Ps, for example detector calibration events. This could be extended to provideunbiased samples to the EF.
The supervisor software is based on the Data Collection Framework described in Section 8.3.2.For normal data taking the LVL1 Data is received from the RoIB, but for diagnostic purposes theSupervisor can also retrieve LVL1 Data from a file or generate it internally.
For further details of the L2SVs see Section 8.3.1 and Section 8.3.2. Details of the Requirementsand Design of the L2SV are given in [9-1] and [9-2], respectively.
9.2.4 LVL2 Processors
The LVL2 selection is performed in a farm of processors, today assumed to be dual processorPCs, running at 8 GHz, in 1U rack-mounted format. The nominal budget allowed for the meanprocessing time for the LVL2 decision per event is ~10 ms. However, there will be large varia-tions from event to event, many events will be rejected in a single selection step in a significant-ly shorter time than the mean, whilst others will require several sequential steps, and a fewevents may take many times the mean latency. Each event is handled in a single processingnode, requesting selected event data from the ROSs for each RoI only when required by the al-gorithms. To maintain a high efficiency of processor utilization even when it is waiting for suchRoI event data, several events are processed in parallel in each processing node.
The processing is performed in a single application running on each node (i.e. PC host). The ap-plication has three main components: the L2PU; the PESA Steering Controller (PSC); and theESS. The L2PU handles the Data Flow with other parts of HLT/DAQ, including message pass-ing, configuration, control and supervision. The PSC runs inside the L2PU and provides the re-quired environment and services for the ESS. As the L2PU handles the communication with theL2SV and the ROSs, interfaces have to be provided for the various messages between the L2PUand the ESS. The PSC provides the interface for the LVL1 Result and returns the LVL2 Result(from which the LVL2 Decision is derived). The interface for the RoI event data to be retrievedfrom the ROS is provided separately and is described in Section 9.2.4.3.
The use of FPGA co-processors [9-3] has been studied for some CPU-intensive algorithms, forexample non-guided track finding in the inner detector [9-4]. For the current trigger menus,however, it has been found that their use is not justified and therefore they are not discussedfurther here.

ATLAS Technical Design ReportHigh-Level Trigger, Data Acquisition and Controls 30 June 2003
9 High-Level Trigger 129
9.2.4.1 L2PU
The design and implementation of the L2PU is based on the Data Collection Framework de-scribed in Section 8.3.2 from which it uses the following services: application control, initializa-tion and configuration, error reporting, application monitoring, message passing, and, for thepurpose of performance evaluation, the instrumentation. For further details of the L2PU designsee [9-5].
The L2PU communicates with the LVL2 Supervisor from which it receives the RoI information(originating from the LVL1 Trigger) and to which it returns the LVL2 Decision. RoI data (in theform of ROB Fragments) are requested from the ROSs, on instigation of the LVL2 Selection algo-rithms.
The actual selection algorithms run inside one out of several ‘Worker threads’, each processingone event. This multi-threaded approach has been chosen to avoid stalling the CPU when wait-ing for requested RoI data to arrive (from ROSs). This also allows efficient use of multi-CPUprocessors, but requires that LVL2 selection algorithms must be thread-safe. Specific guidelinesto LVL2 algorithm developers are given in [9-6]. Some asynchronous services (application mon-itoring, input of data) are also executed in separate threads.
The LVL2 event selection takes place inside the PSC which has a simple interface to the DataCollection framework: it receives the LVL1 RoI information (LVL1 Result) as input parameterand it returns the LVL2 Result. Figure 9-4 illustrates what happens for each event. The LVL2 Su-pervisor selects an L2PU and sends the LVL1 Result. This L2PU stores the received LVL1 Resultin a shared queue. When a Worker thread becomes available it unqueues an event, startsprocessing it and produces a LVL2 Result. Finally the LVL2 Decision is derived from the LVL2Result and returned to the LVL2 Supervisor. For positive decisions, the LVL2 Result is also sentto the pROS (see Section 8.1.3.4 and Section 9.2.5).
When selection algorithms require ROB data, the ‘ROB Data Provider’ is activated, which func-tions as shown in Figure 9-5. The ROB Data Collector takes a ‘list of RoBs’ as input parameterand returns a ‘list of ROB Fragments’. The ROB Data Collector takes care of sending out re-
Figure 9-4 Collaboration diagram showing the successive steps that are applied to each event received fromLVL1 leading to the LVL2 Decision
2:put(LVL1Result)
InputHandler
LVL2 Supervisor
Queue
1: LVL1 Result
objectWorker Thread
3:get()
pROS
9:LVL2 Result
10:LVL2 Decision
EventSelection Software
PESA Steering
Controller
6:LVL1 Result
7:LVL2Result
8:LVL2 Result
5:LVL1 Result
4:LVL1Result
ATLAS Technical Design ReportHigh-Level Trigger, Data Acquisition and Controls 30 June 2003
130 9 High-Level Trigger
quests for data to the appropriate ROSs, waits for all data to arrive, assembles the received ROSFragments into a list of ROB Fragments that are returned to the caller. As reported inSection 8.3.2.2 the performance for collecting RoI data from ROBs has been measured in test-beds. It exceeds by a large margin the required I/O capacity.
9.2.4.2 PESA Steering Controller (PSC)
The PESA Steering Controller (PSC) is the HLT component that interfaces the L2PU and theESS. The purpose of the PSC is threefold: to allow the L2PU to host and control selection soft-ware developed in the offline framework; to allow the algorithm steering software to be sharedwith the EF; and to provide a mechanism for transmitting the LVL1 and LVL2 Results betweenthe Data Flow system and the ESS.
The key to the PSC design is to place this interface where the functionality of the LVL2 DataFlow and ESS can be cleanly separated. The location chosen is the Finite State Machine (FSM) ofthe L2PU. The PSC is realized as a local ‘state-aware’ replica of the Data Collection’s FSM. Itthus provides the means for forwarding changes in the run control state from the LVL2 DataFlow software to the ESS. Since the ESS is being developed in the ATLAS offline framework,ATHENA [9-7], which is itself based on Gaudi [9-8], the PSC has been designed [9-9] to re-usethe framework interfaces defined in Gaudi.
Figure 9-6 illustrates the sequence of interactions of the PSC with the L2PU and the ESS. The fig-ure shows three states: Configure, Start, and Stop. During the Configure phase, configuration andconditions meta data are obtained from external databases via an HLT-online interface. Thesedata are then used to configure the ESS and all associated components. As Figure 9-6 (left)
Figure 9-5 Data Collection by the L2PU of the data within a list of ROBs, corresponding to an RoI
*send(ROSreply)
<ROBFragments>
preload(<ROBId>)
Receive Port
*ROSRequest
*[for all ROSs] build_request
*[for all ROSs] register_handler(ROSRequest::xid)
*[for all ROSs] send(ROSRequest)
*send(ROSrequest)
*send(ROSReply)
*[for all ROSs] handler_send(ROSReply)
[all ROSreplies received] signal(condition)
<ROBFragments>
collect(LVL1Id, <ROBId>)
Event Selection Software
*ROS
InputDis patcher
*Send Port
ROBData Collector
[all ROSReplies received] wait(condition)
ROBData Provider
ROS Mapper

ATLAS Technical Design ReportHigh-Level Trigger, Data Acquisition and Controls 30 June 2003
9 High-Level Trigger 131
shows, during this phase multiple Worker Threads are also set up. After a Start, the PSC re-ceives an ‘execute event’ directive with a LVL1 Result as an argument. The PSC then returns (af-ter execution of the ESS) the LVL2 Result directly to the L2PU.
An important aspect of this approach is that the LVL2 event handling is managed entirely bythe Data Collection framework. The PSC then does not need to interact directly with the inputthread, the L2SV, or with the pROS. The requests for event data fragments are hidden behindthe ROB Data Provider Service.
After a Stop, the PSC terminates algorithm execution. At this stage, run summary informationcan be produced for the selection process.
Since the ESS executes in multiple worker threads, the PSC must provide a thread-safe environ-ment. At the same time, and in order to provide an easy-to-use framework for offline develop-ers, the PSC must hide all technical details of thread handling and locks. Thread safety has beenimplemented in the PSC by using Gaudi’s name-based object and service bookkeeping system.Copies of components that need to be thread-safe are created in each worker thread with differ-ent labels. The labels incorporate the thread-ID of the worker thread, as obtained from the DataCollection software. The number of threads created by the Data Collection software is trans-ferred to the PSC, which transparently creates the number of required copies. In this scheme,the same configuration can be used in the offline and in the LVL2 environments; the thread-IDcollapses to null in the offline software.
After integrating the PSC with the Data Collection software, both performance and robustnesstests were carried out on a dual-processor 1.533 GHz Athlon machine (for details, see [9-9]). ThePSC ran for over 50 hours with three threads with an early version of the selection softwareprototype [9-10]. The prototype ran successfully on both single and dual-CPU machines, show-ing it to be thread-safe. A direct measurement of the PSC overhead yielded 13 µs per event, wellwithin the 10 ms nominal LVL2 budget.
Figure 9-6 The L2PU Finite State Machine (left) and the PESA Steering Controller (right)
UnLoad
UnConfig
Stop
Start
Config
Load
Worker Thread
Event Selection
Control
pROS
L2DecisionL2Result
L1Result
L2PU LVL2Supervisor
configure
start
stop
L1ResultL1Result
L2ResultL2Result
configureconfigure
unconfigureunconfigure
start
stop
unconfigure
Executes in concurrent threads
start
stop
EventSelectionSoftware
SteeringController
ATLAS Technical Design ReportHigh-Level Trigger, Data Acquisition and Controls 30 June 2003
132 9 High-Level Trigger
9.2.4.3 Interfaces with the Event Selection Software
In Figure 9-7 a package diagram is shown for the ESS running in the L2PU. The communicationwith external systems and sub-systems, including the L2SV and the ROS, are hidden from theESS. The ESS is initialized as shown in Figure 9-6. The PSC provides the ESS with the LVL1 Re-sult and requests the LVL2 selection. To provide the LVL2 Result the ESS needs to access ROBdata fragments and stored meta data. The ROB data requests are sent via the ROB Data Provid-er Service to the ROB Data Collector. Services are used to access meta data, these include the ge-ometry, conditions, and B-Field map information. Monitoring services include histogrammingand messaging.
9.2.5 pROS
For all events accepted by LVL2 (whether a normal accept, a forced accept or a pre-scale) detailsof the LVL2 processing (and the full LVL1 Result received from the Supervisor) are provided bythe LVL2 Processor for inclusion in the event. This information is sent via the network as a ROBfragment to the pROS, where it is stored pending a request from the Event Builder. When theevent is built the pROS is included with all the other ROSs — thus including the LVL2 Resultinto the built event, which is passed to the EF. A single such unit is sufficient for the size of LVL2Result foreseen (not exceeding a few kilobytes) as it only has to operate at the event buildingrate (~3 kHz). Further details of the pROS are given in Section 8.1.3.4.
9.3 Event Filter
The Event Filter (EF) is the third and last stage of the online selection chain. It makes use of thefull event information. It will use the offline framework (ATHENA) and the Event SelectionSoftware, that will execute filtering algorithms directly based on the offline reconstruction.
Figure 9-7 The dependencies of the Event Selection Software performing the LVL2 selection in the L2PU
<<sub-system>> LVL2ProcessingUnit
EventSelection Software
LVL2Monitoring Service
1..*
LVL2MetaData Service
1..*
PESASteering Controller
ROBData Provider Service
initialisation and processing of next
LVL1 Result, returns LVL2 Result
Histogramming and Messaging
Configuration, Geometry,Conditions,
B-Field Map
LVL2 Selection
1..*
ROBData Collector
ROB data requests to ROS
imports Athena/Gaudi

ATLAS Technical Design ReportHigh-Level Trigger, Data Acquisition and Controls 30 June 2003
9 High-Level Trigger 133
9.3.1 Overview
The functionality of the EF has been logically distributed between two main entities:
• the Event Handler (EH) performs the activities related to event selection. This includes:the data flow, both between the main DAQ system and the EF, and internally between dif-ferent parts of the EF; the framework to support various tasks including the ProcessingTasks (PT) where the ESS runs.
• the EF Supervisor handles the control operations, in coordination with the overall TDAQcontrol system. Its responsibilities include the monitoring of the EF. For further details seeSection 9.4 below.
The EF has been designed so that additional functions can be added without jeopardizing theselection activity. Examples of such extra activities are the global monitoring of the detectors ortasks related to alignment and calibration.
As described in Chapter 5, the baseline architecture of the EF relies on commodity components,namely PCs linked by Ethernet networks. A detailed description of the baseline architecture forEF may be found in [9-11]. The EF Farm is organized in independent sub-farms, in the baselineeach one connected to a different SFI. The possibility of dynamic routing between SFIs and sub-farms is also being considered. Several SFOs can be connected to a given sub-farm. A given SFOmay be accessed by different sub-farms. The proposed layout is shown on Figure 9-8.
9.3.2 Event Handler
9.3.2.1 Overview
A detailed list of requirements for the EH, based on analysis of the external constraints and usecases, can be found in [9-12].
Figure 9-8 Proposed layout for the EF Farm
EF
sub-farm
switch
EF node
EF node
EF node
Backend switch
EF
sub-farm
switch
EF node
EF node
EF node
SFI SFI
SFO
SFO
SFO
MGR
SFI ...
...
...
...
...
Gigabit Ethernet trunks
Gigabit Ethernet inside sub-farms
EF
sub-farm
switch
EF node
EF node
EF node
Backend switch
EF
sub-farm
switch
EF node
EF node
EF node
SFI SFI
SFO
SFO
SFO
MGR
SFI ...
...
...
...
ATLAS Technical Design ReportHigh-Level Trigger, Data Acquisition and Controls 30 June 2003
134 9 High-Level Trigger
The EH receives events from the SFIs. The events are distributed to Processing Tasks which runthe ESS. Information contained in the event header can be used to route events to specific PTs.Events selected for final storage will be sent to an SFO, which can be selected according to clas-sifications made in the PT, thus providing the possibility of dedicated output streams. Informa-tion created during the selection process will be appended to the events sent to permanentstorage.
The design of the EH is based on the following principles: data flow and data processing areseparated; the flow of events is data driven, i.e. there is no data flow manager to assign theevent to a specified target; data copying on a given processing node is avoided as much as pos-sible to save time and CPU resources.
Data movement between the different phases of the processing chain is provided by the EventFilter Dataflow process (EFD), while the processing is performed in independent ProcessingTasks. There is one EFD process per processing node (i.e. per PC of the EF farms). One or severalPTs can connect to the EFD at different stages of the processing chain. Event passing is made bya shared memory mapped file using a local disk for storage. Synchronization is maintained viamessages using UNIX sockets. Details can be found in [9-13] and [9-14].
9.3.2.2 Event Filter Dataflow
The processing of the events is decomposed into steps that can be configured dynamically. Eachstep provides a basic function: event input or output, event sorting, event duplication, internalprocessing (e.g. for monitoring purposes), external processing, etc.
The different stages of the process chain are implemented by ‘tasks’ to provide specific func-tionality. Examples are tasks providing the interface with the DAQ Data Flow; tasks to performinternal monitoring activity (e.g. counting the events which pass through); tasks to duplicateevents to send them in parallel towards different processing paths; tasks to sort events towardsdifferent data paths according to internal flags (e.g. the result of the reconstruction and selectionprocess). However, functions such as the event selection (using the ESS) and pre- or post-processing are performed in separate processes and so tasks are included to provide the inter-face from the EFD process to these external Processing Tasks. An example of an EFD implemen-tation, illustrating the use of these tasks, is given in Figure 9-9.
In this example, an Input Task makes the interface with the SFI. Events are counted in an InternalMonitoring Task. The External PT Task provides the interface for synchronization and communi-cation with PTs performing the event selection. Events which are accepted by the PT are thenduplicated. In one path, events are counted and passed to Output Tasks to be sent to permanentstorage. In the other path, on which prescaling may be applied, events are made available to dif-ferent monitoring tasks according to the tag they received during selection in the PT.
The Input Task maps events into shared memory. For efficiency, event data is not copied be-tween the processing steps, but pointers are passed to the different processing entities. The in-formation produced by the external PTs can be made available to other (monitoring) tasks bystoring it in the shared memory. The shared memory segment is mapped to a file which ensuresthat data is saved by the operating system in case of problems, e.g. a crash of the EFD process.When the EFD is restarted, events received from the Data Flow can be recovered from theshared memory. An automatic recovery procedure allows an event which has caused a crash ofthe PT to be reprocessed again. The PT crash is detected by the socket hang-up, and the event is

ATLAS Technical Design ReportHigh-Level Trigger, Data Acquisition and Controls 30 June 2003
9 High-Level Trigger 135
Figure 9-9 An example of an EFD implementation
Figure 9-10 Sequence diagram for the work distribution in the EFD
WorkAssignmentthread
Workqueue
task 1 task 2 task N
getWork()
(event, task 1)
processEvent(event)
task 2
processEvent(event)
processEvent(event)
task 3
NULL
...
ATLAS Technical Design ReportHigh-Level Trigger, Data Acquisition and Controls 30 June 2003
136 9 High-Level Trigger
tagged as having been already processed. If the event causes a second crash it is sent to a dedi-cated output channel.
The tasks are daisy chained with each task knowing the identity of the next task to execute forthe current event. The chaining mechanism is based on a Work Assignment thread which firstextracts an event from a Work Queue. Figure 9-10 shows the sequence diagram correspondingto this mechanism. The getWork() method returns an (Event pointer, Task pointer) pair fromthe Work queue. It then calls the processEvent method of the Task with the pointer to theEvent. After processing, the method returns the pointer to the next Task, or the NULL pointer ifit was the last task in the chain. This feature allows the dynamical configuration of the process-ing chain. New monitoring or diagnostic activities can easily be inserted into the flow of theevent treatment.
9.3.2.3 Processing Task
Processing Tasks run on every processing node as independent processes. They use the offlineframework ATHENA to run the Event Selection Software for the strategy described inChapter 4. The sequence diagram shown in Figure 9-11 shows the synchronization mechanismbetween the Event Selection Software and the framework provided by the Event Filter PT.
Event passing between PT and EFD is done via the shared memory described in the previoussection. Synchronization makes use of UNIX sockets. After having connected to the EFD proc-ess, the PT can request an event to the ‘External PT Task’. It receives a pointer to a read-only re-gion of shared memory. When processing is completed, PT returns an ‘EF decision’ to the
Figure 9-11 Sequence diagram for the interaction between the ESS and the EF PT. The shaded area indicatesthe parts running in the PT.
Control
execute
DataRequest
Data
nextEvent
*Event
EFDecision
*Event
<<start process>>
Athena EventSelectionSoftware
ROBData ProviderSvc
PTClient ExtPTsTaskEventFilter Dataflow
<<kill process>>
EFHandler OutputSvc
nextEventnextEvent
*Event
EFHandler InputSvc
EFResult
getEvent
EFResult
nextTask
connect
nextEvent
nextEventnextEvent
initialise
initialise<<start>>

ATLAS Technical Design ReportHigh-Level Trigger, Data Acquisition and Controls 30 June 2003
9 High-Level Trigger 137
External PT Task in EFD as a string. This EF decision is then used to decide which step will beexecuted next in the processing chain (event sent to permanent storage, deleted, used for moni-toring purposes, etc.). PT can request a writeable block in shared memory, where it can store ad-ditional information produced during processing. If the event is to be sent to permanentstorage, EFD will append this data to the raw event.
Inside the PT, communication with EFD is done via the ATHENA standard ROB Data ProviderService. The service uses the interface of the Byte Stream Input Service, which handlesreading of byte stream data. The converse process is handled by the Byte Stream OutputService. Concrete implementations are provided for input and output from and to the DataFlow system. Access to the event in the shared memory makes use of the standard Event For-mat Library [9-15]. The Byte Stream Output Service serializes the information producedby the PT in the shared memory and an EF sub-detector fragment is created following thestandard sub-detector structure in the event format for the byte stream data.
9.3.2.3.1 Interfaces with Event Selection Software
In Figure 9-12 a package diagram is shown for the ESS running in the EF Processing Task. TheEFD has an interface to the SFI and SFO. The pointer to the event is transmitted to the Process-ing Task running ATHENA, which performs the EF selection for the event. No equivalent of theROB Data Collector is needed by the processing task, because it is carried out after the eventbuilding. Instead, the input and output services allow access to the full event in shared memory.The dependencies on external systems and sub-systems are hidden from the ESS. It is foreseento run a single EF selection per Processing Task. The ESS has dependencies on interfaces to theMeta Data and Monitoring Services. The use of ATHENA as a common framework allows forthe same or similar interface definitions running offline or online.
Figure 9-12 Package diagram showing the dependencies of the Event Selection Software performing the EFselection in the Processing Task
<<sub-system>> EventHandler
Event Selection
EFMonitoring Service
1..*
EFMetaData Service
1..*
EventFilter Dataflow
initialisation and execution
Histogramming and Messaging
Trigger Configuration, Geometry, Conditions,
B-Field Map
EF Selection
PTClient
imports Athena/Gaudi
ROBData Provider Service
<<getEvent>>
ByteStream EFHandlerIOSvc
<<putEFResult>>
read (and write) access to event in
shared memory
Software
ATLAS Technical Design ReportHigh-Level Trigger, Data Acquisition and Controls 30 June 2003
138 9 High-Level Trigger
9.3.2.4 Detailed EF Validation tests
Extensive EF validation tests have been performed on PC-based clusters, in Pavia (the GRID-PVcluster) and at CERN (the MAGNI cluster). Details of these tests are given in [9-16]. The key re-sults relating to data flow are described below. Test results dealing with EF supervision are cov-ered in Chapter 12, whilst tests relating to the ESS are presented in Chapter 14.
9.3.2.4.1 EF data flow standalone performance
Two lightweight EFD and PT processes have been used to measure the overhead time of thecommunication between EFD and PT. The EFD process used contained a single External PT taskto provide the PT with dummy data. The PT performed the following sequence of actions: re-quest an event; map the event in the shared memory; send the dummy EF answer; unmap theevent. The measured time to perform this sequence is 80 µs on a dual processor Xeon at2.2 GHz. It does not depend on the size of the event. This overhead is negligible compared tothe nominal average processing time (of the order of 1 s).
9.3.2.4.2 EF data flow communication with the main DataFlow
To test the data throughput of the EFD a configuration was used with two external interfaces: anSFI providing dummy events of various sizes and an SFO receiving events (which it discardedimmediately). Some tests were run with all processes running on a single machine, other testshad the SFI and SFO running on separate machines. Several values were used for the accept-ance of the PT: 0% to give a measure of the SFI to EFD communication; 10%, the expected ac-ceptance of the final system; 100%, the figure used for the EF in the test beam environment,which represents the maximum load for the system.
The tests were performed in Pavia on a cluster of dual Xeon (2.2 GHz) machines connected byGigabit Ethernet and at CERN on a cluster of dual Pentium 3 (600 MHz) machines connected byFast Ethernet. The results are summarized in Figure 9-13 and Figure 9-14. For an event size of1.6 Mbyte the results when running the processes on a single machine of the Pavia cluster showthat the combined processing time is ~5 ms per event at 0% acceptance and just over twice this
Figure 9-13 EFD throughput measurements (with processes running on different machines)
0
10
20
30
40
50
60
70
80
90
0.1 1 10 100 1000 10000
Event Size (kbyte)
Mb
yte
/s
gridpv acceptance=10%
gridpv acceptance=100%
magni acceptance=10%
magni acceptance=100%

ATLAS Technical Design ReportHigh-Level Trigger, Data Acquisition and Controls 30 June 2003
9 High-Level Trigger 139
at 100%. Clearly, even without correcting for the time taken by the SFI and SFO, this is smallcompared to the expected average EF processing time. On the slower MAGNI cluster thesetimes become some four times longer, consistent with the processor speed. When the processesare run on a separate machine the throughput is limited by the network links between the ma-chines and reduces several fold. Nevertheless, even with Fast Ethernet the throughput is entire-ly adequate and with Gigabit Ethernet the available bandwidth is well in excess of thatrequired.
9.3.2.4.3 Robustness tests
To test the robustness of the EFD a configuration of an SFI, an SFO and the EFD, each on differ-ent machines of a 3-node cluster, was used. The processing node also included 4 PTs. The sys-tem was run for 10 days without problems and handled ~3 × 10⁹ dummy events. The testincluded randomly stopping and starting some of the PTs, which the EFD handled correctly,stopping and resuming delivery of events to the corresponding PT as required.
9.4 HLT operation
9.4.1 Common aspects
The operational analysis of the whole HLT has been described in a dedicated document [9-17]which describes in detail the expected functionality and gives uses cases for the operation. Usecases include start-up, run control, shutdown, steady running, and error conditions.
The HLT Supervision system is responsible for all aspects of software task management andcontrol in the HLT. Mandates of the supervision system include configuration of the HLT soft-ware processes, synchronizing the HLT processes with data-taking activities in the rest of theexperiment, monitoring the status of HLT processes e.g. checking that they are running, and re-starting crashed processes. The Supervision system must provide a user interface for the crewon shift. The interface must be as user friendly as possible while providing the tools for expert
Figure 9-14 EFD throughput measurements (with processes running on the same machine)
0
50
100
150
200
250
300
350
0.1 1 10 100 1000 10000
Event Size (kbyte)
Mb
yte
/s
gridpv acceptance=0%gridpv acceptance=10%gridpv acceptance=100%magni acceptance=0%magni acceptance=10%magni acceptance=100%
ATLAS Technical Design ReportHigh-Level Trigger, Data Acquisition and Controls 30 June 2003
140 9 High-Level Trigger
work during both the commissioning and steady operation phases. Both the LVL2 and the EFare implemented as hundreds of software processes running on large processor farms, split forreasons of practicality into a number of sub-farms. In view of this the supervision requirementsfor the two systems are very similar and an integrated HLT supervision system has been devel-oped. It has been implemented using services provided by the Online Software (seeChapter 10).
In addition to standard requirements on robustness and scalability, the design of the Supervi-sion system must be sufficiently flexible to cope with future evolution during the lifetime of theexperiment, especially when new hardware and software is used.
The Online Software configuration database is used to describe the HLT in terms of the softwareprocesses and hardware (processing nodes) of which it is comprised. The HLT supervision andcontrol system uses information stored in the Online Software configuration database to deter-mine which processes need to be started on which hardware and subsequently monitored andcontrolled. The smallest set of HLT elements, which can be configured and controlled independ-ently from the rest of the TDAQ system, is the sub-farm. This allows sub-farms to be dynamical-ly included/excluded from partitions during data-taking.
Synchronization with the rest of the TDAQ system is achieved using the Online Software runcontrol system. Each sub-farm has a local run controller, which will interface to the Online Soft-ware run control via a farm controller. The controller that collaborates with a sub-farm supervi-sor, which provides process management and monitoring facilities within the sub-farm. Thecontroller and supervisor cooperate to maintain the sub-farm in the best achievable state bykeeping each other informed about changes in supervision or run-control state and by takingappropriate actions, e.g. restarting crashed processes. Where possible, errors should be handledinternally within the HLT processes. Only when they cannot be handled internally should er-rors be sent to the supervision and control system for further consideration.
The overall supervision of LVL2 and EF is integrated in the HLT Supervision system describedin Section 12.3.2.
Software will also be required for farm management, i.e. hardware monitoring, operating sys-tem maintenance, code distribution on many different nodes, etc. However, given the common-alities with the requirements of many other farms and the increasing availability of suchsoftware elsewhere, it is planned to select the software to be used for this and how it is inter-faced to the Supervision system at a later date.
9.4.2 LVL2 operation
The configuration and control of the LVL2 applications in the LVL2 processors are handled bystandard Data Collection controllers. The Run Control hierarchy consists of a root top-level con-troller and one child controller per LVL2 sub-farm. It is convenient to configure the LVL2 Super-visors (which control the flow of events through the LVL2 farm, see Section 9.2.3) so that eachLVL2 sub-farm is associated with just one LVL2 Supervisor — although a single Supervisor maysend events to several sub-farms. Monitoring of the applications is performed in a parallel treestructure again with one monitor process per sub-farm. In contrast, however, for the Informa-tion Service a single IS server is used for all of the LVL2 processors.

ATLAS Technical Design ReportHigh-Level Trigger, Data Acquisition and Controls 30 June 2003
9 High-Level Trigger 141
9.4.3 EF operation
A detailed list of EF requirements can be found in [9-18], many are common with LVL2 as listedabove, however, some derive from remote EF sub-farms and the possibility of event monitoringand calibration tasks.
The EF Supervision also uses a tree-like structure following the baseline architecture describedin Section 9.3.1. The Run Control hierarchy consists of a root top-level controller and one childcontroller per sub-farm. All ancillary duties related to process management are performed by asupervisor server, local to each sub-farm. A local Information Sharing server allows the ex-change of information with other sub-systems.
9.4.3.1 Scalability tests
Scalability and performance tests, in the context of EF Supervision, have been performed on theASGARD cluster at ETH Zurich and on CERN-IT clusters. Detailed results are given in [9-19]and [9-20], respectively. On ASGARD, the supervision system had been implemented withJAVA Mobile Agents technology. It has been possible to control successfully 500 processors.However, the tested product, which was freeware, is now licensed and has therefore been dis-carded.
An implementation of the Supervision has been made using the tools provided by the OnlineSoftware group. This implementation has proved to be able to control some 1000 processors(running on 250 quad-board machines from the CERN-IT cluster). The execution times for theRun Control transitions do not depend strongly on the number of controlled nodes and are lessthan 3 s for configurations of a size varying between 50 and 250 nodes (see Section 10.6.2).
9.5 Event Selection Software (ESS)
The tasks of the Event Selection Software are ‘event selection’ and ‘event classification’. Abstractobjects representing candidates such as electrons, jets, muons, and J/ψ → e+e− are reconstruct-ed from event data by using a particular set of HLT algorithms and applying appropriate cuts.An event is selected if the reconstructed objects satisfy at least one of the physics signatures giv-en in the Trigger Menu. In both LVL2 and the EF events are rejected if they do not pass any ofthe specified selection criteria, which are designed to meet the signal efficiency and rate reduc-tion targets of the trigger. From a physics event selection point of view there is no preciseboundary between LVL2 and EF. Indeed, flexibility in setting the boundary is important to takeadvantage of the complementary features of these trigger stages.
The ESS comprises an infrastructure and the selection algorithms. The latter are to be providedeither by the PESA group or, in the case of the algorithms for the EF, by the offline reconstruc-tion group. Major parts of the trigger reconstruction will have to be based on offline reconstruc-tion algorithms. This is an important constraint for the design of the ESS.
In the HLT system the ESS will run in the software environments provided by the L2PU and bythe PT of the EF, as shown in Figure 9-7 and Figure 9-12, respectively. Hence the ESS needs tocomply with the online requirements such as thread safety, online system requirements andservices [9-6], as well as the online performance goals.
ATLAS Technical Design ReportHigh-Level Trigger, Data Acquisition and Controls 30 June 2003
142 9 High-Level Trigger
It is highly desirable though that the ESS is also able to run directly in the offline environmentATHENA [9-7] to facilitate development of algorithms, to study the boundary between LVL2and EF, and to allow performance studies for physics analysis. Therefore the ESS needs to com-ply with the control framework and services that are provided by the offline software architec-ture. For this reason the ATHENA framework was chosen as the framework to run the ESSinside the EF PT and in the modified form provided by the PESA Steering Controller inside theL2PU (see Section 9.2.4.3 and Section 9.3.2.3 above).
In the offline, the task of the ESS is to emulate the full online selection chain. Hence three so-called top-level ATHENA algorithms are required, namely the emulation of the LVL1 triggerand two instances of the Event Selection Software. The LVL1 trigger emulation provides theLVL1 Result. The first instance of the Event Selection Software is configured to execute the LVL2seeded by the LVL1 Result, the second to execute the EF selection seeded by the LVL2 Result.The details of the prototype implementation of the physics selection chain are given inChapter 13.
9.5.1 Overview
The design and implementation of the Event Selection Software is based on the requirementsand use cases documented in [9-21]. The current prototype implementation follows the analysisand conceptual design discussed in [9-22]. In the following an overview of the sub-system isgiven and the design and implementation of the basic concepts are discussed.
The ESS is subdivided into four sub-packages, as listed below. These are shown in Figure 9-15with the most important external software dependencies.
Figure 9-15 A package diagram of the Event Selection Software. Also shown are the dependencies of the sub-packages.
EventSelection Software
SteeringMonitoring
Service
1..*
MetaData Service
1..*ROBData
ProviderSvc
important external dependency, especially for Event Fliter
DataManager HLTAlgorithms
PESASteering Controller
EventDataModel
PTClient
<<import>>
OfflineEvent DataModel
OfflineAlgorithms
<<import>>
Storegate/ ByteStreamCnvSvc
<<import>>ByeSream
EFHandlerIOSvc
Event Filter only

ATLAS Technical Design ReportHigh-Level Trigger, Data Acquisition and Controls 30 June 2003
9 High-Level Trigger 143
• The Steering controls the selection software. It organizes the HLT algorithm processing inthe correct order, so that the required data is produced and the trigger decision is ob-tained. The Steering implements the interface to the PESA steering controller (when run-ning in the L2PU) and to the PT Client (when running in the EF). The same interfaces areused when running in the offline framework ATHENA.
• The event data is structured following the Event Data Model (EDM). The EDM covers alldata entities in the event and the relationships between them. The data entities span fromthe raw data in byte stream format (originating from the detector RODs), the LVL1 Result,and all other reconstruction entities up to the LVL2 and EF Results.
• The HLT Algorithms are used by the Steering to process the event and to obtain the dataon the basis of which the trigger decision is taken.
• The Data Manager handles all event data during the trigger processing. The current im-plementation is based on ATHENA Storegate [9-23] to provide the necessary infrastruc-ture for the EDM. The offline Byte Stream Conversion Service is used to implement theHLT algorithm access to the raw data. Different implementations of the ROB Data Provid-er Service are used for the LVL2, EF, and offline to access the ROB Fragments.
In summary, the EDM covers all event data entities and is used by the Steering, the HLT algo-rithms and the Data Manager to communicate information about the event. The HLT algo-rithms build up the event tree in the process of the reconstruction. The result is analysed by theSteering to obtain the trigger decision. The Data Manager supports the EDM. It provides themeans of accessing the event data and for developing it as the event is processed. The data ac-cess patterns reflect the needs of the HLT algorithms and of the Steering, and the constraints ofthe online systems. Raw data access by ‘Region’ is a requirement, especially for the LVL2. In thefollowing subsections more details are given of the Event Selection Software sub-packages.
9.5.2 The Event Data Model sub-package
The LVL2 and the EF selection are implemented as software triggers that select events by meansof reconstruction, guided by the RoI information provided by the LVL1 system. Therefore theorganization of the data classes and of the object relations are fundamental. The EDM of theEvent Selection Software is closely coupled to the offline EDM, especially because offline algo-rithms are the basis of the EF selection. The EDM is therefore being developed in close contactwith the offline EDM, detector, and reconstruction groups. Logically the EDM classes aregrouped into five sub-packages:
• Raw Data coming from the ROS and the trigger systems are in byte stream format. Thisincludes the LVL1 Result, the LVL2 and EF Results, as well as ROB Data from the sub-de-tectors and from the LVL1 system. Note that for a given sub-detector several Raw Dataformats might be used, e.g. different formats depending on the luminosity. This includesdifferent data content or compression schemes.
• The Raw Data Objects (RDOs) are an object representation of the raw data from the dif-ferent sub-detectors. In the trigger they are used only in the EF where they are created atinput to the reconstruction chain. In LVL2, however, creating these objects poses toomuch overhead and thus in LVL2 the Raw Data is converted directly to ReconstructionInput Objects (RIOs) described below.
• Features are all types of reconstruction data derived from the RDOs or from other fea-tures, with increasing levels of abstraction. This includes all offline reconstruction EDM
ATLAS Technical Design ReportHigh-Level Trigger, Data Acquisition and Controls 30 June 2003
144 9 High-Level Trigger
classes. They range from relatively simple RIOs (e.g. calibrated calorimeter cells and SCTclusters) up to reconstructed quantities such as tracks, vertices, electrons, or jets.
A detailed description of the implementation of the Raw Data formats, RDOs, and fea-tures for the current prototype are given in Section 13.3 and the associated references.
• MC Truth information. Together with the first three sub-packages of the EDM, the MonteCarlo truth is common to the Event Selection Software and the offline reconstruction. It isneeded primarily for debugging and performance studies.
• Trigger Related Data comprising RoI Objects, the LVL1(LVL2/EF) Trigger Type [9-24],Trigger Elements (TEs) and Signatures. A TE labels a set of Features and associates themwith a physical interpretation, such as a particle, missing energy or a jet. TEs are the ob-jects used by the Steering to guide the processing and to extract the trigger decision.
An important aspect of the EDM is the ability to navigate between different objects in the eventusing the relations between them. This is used during the HLT algorithm processing to analyseand develop the knowledge of the event. Examples of instances of EDM classes and their rela-tions are discussed in Section 9.5.3.1 in the context of the seeding mechanism.
9.5.3 The HLT algorithms sub-package
The task of the HLT algorithms is to analyse the Raw Data and to reconstruct parts of the eventaccording to the guidance from LVL1. This reconstructed data is used by the Steering to derivethe trigger decision. The LVL1 RoI-based approach implies a data-driven event reconstruction.Any HLT algorithm in a reconstruction sequence may be executed several times per event, oncefor each RoI. Therefore a modular architecture of the reconstruction code is necessary. The HLTalgorithms are structured into three parts:
• Data Preparation comprises algorithmic code to convert the Raw Data into objects thatare used as input to reconstruction, include format changes and calibration corrections.This task involves sub-detector-specific information, and hence sub-detector groups areresponsible for the implementation and maintenance of the code, taking the HLT require-ments into account. In the current design the organization of the Data Preparation is dif-ferent for LVL2 and the EF. The EF follows closely the offline reconstruction chain, wherethe Raw Data is first converted into RDOs and these are subsequently processed to obtainSCT Clusters or Calorimeter Cells. In LVL2 the Data Preparation goes in one step fromRaw Data to RIOs, thus avoiding the overhead of creating the RDOs.
The boundary between Data Preparation and subsequent Feature Extraction is not exact,but only Data Preparation algorithms use the Raw Data or Raw Data Objects.
• Feature Extraction algorithms operate on abstract Features and Trigger Related Data torefine the event information. Two types of algorithms are distinguished in the Feature ex-traction sub-package. Reconstruction Algorithms process Features and produce newtypes of Features, just like offline reconstruction algorithms. However, in the trigger, RoIObjects are used to restrict the processing to geometrical regions of the detector. To do thisTEs are used by the Steering to ‘seed’ the reconstruction algorithms. The seeding mecha-nism is discussed in the next subsection. The second type of algorithms are HypothesisAlgorithms. Their task is similar to particle identification. A hypothesis algorithm vali-dates the physics interpretation implied by the label of the TE based on the reconstructedFeatures. An example is the validation of an ‘electron’ matching a reconstructed Calorim-eter Cluster and a Track.

ATLAS Technical Design ReportHigh-Level Trigger, Data Acquisition and Controls 30 June 2003
9 High-Level Trigger 145
• A library of Algorithm Tools to carry out common tasks such as track-fitting or vertex-finding.
Overviews of Reconstruction Algorithms and Algorithm Tools implemented in the current ESSprototype are given in Section 13.3.3 and Section 13.3.4.
9.5.3.1 The seeding mechanism
Logically the trigger processing starts from a LVL1 RoI using predefined sequences of HLT al-gorithms. A so-called ‘Seeding mechanism’ is used to guide the reconstruction to those parts ofthe event relevant for preparing the trigger decision.
Figure 9-16 shows an example of the evolution of the tree of objects associated to one LVL1 RoIat different stages of the trigger processing. This example starts with an electromagnetic RoI Ob-ject from the LVL1 calorimeter trigger. In the first step shown in Figure 9-16(a) an input ‘EM’ TEthat uses the RoI Object is created for the Steering.
Starting from the input TE the first HLT reconstruction step attempts to validate the physics hy-pothesis of there being an electromagnetic cluster above a certain threshold. For this hypothesisthe Steering creates an output TE with the corresponding label. The output TE is linked to theinput TE by a ‘seeded by’ relation. The Steering then executes the cluster-finding HLT algo-rithm, giving it the output TE as an argument, to validate this output TE. The algorithm navi-gates via the ‘seeded by’ and ‘uses’ relations from the output TE to the input TE and then to the‘LVL1EM’ RoI Object to access information about the LVL1 RoI. The algorithm obtains η and φfrom the RoI and does its pattern recognition work. In the example it creates a CalorimeterCluster from a set of Calorimeter Cells. These objects are linked to the output TE to record theevent information associated with this RoI for later processing. Based on the reconstructedCluster the algorithm validates the hypothesis if all cuts are passed. The algorithm transmits the
Figure 9-16 Three diagrams showing fragments of the object tree associated to one RoI at different stages oftrigger processing
<<TriRelData>> EM:TriggerElement
uses <<TriRelData>> LVL1EM:RoIObjecta)
b)
c)
<<TriRelData>> EM:TriggerElement
uses
seeded by
<<TriRelData>> EMCluster:TriggerElement
<<TriRelData>> LVL1EM:RoIObject
<<Feature>> :CaloCluster
uses <<Feature>> :CaloCell
uses
<<TriRelData>> EM:TriggerElement
uses
seeded by
<<TriRelData>> EMCluster:TriggerElement
<<TriRelData>> LVL1EM:RoIObject
<<Feature>> :CaloCluster
uses <<Feature>> :CaloCell
uses
seeded by
<<TriRelData>> electron:TriggerElement
<<Feature>> :Track
uses <<Feature>> :Cluster
uses
1..*
1..*
1..*
ATLAS Technical Design ReportHigh-Level Trigger, Data Acquisition and Controls 30 June 2003
146 9 High-Level Trigger
result to the steering, by ‘activating’ the output TE in case of a positive decision. The Steering ig-nores all inactive TEs for further processing. The object tree at the end of the algorithm execu-tion is shown in Figure 9-16(b).
The next algorithm in the example looks for an electron track. It is seeded with a new output TElabelled ‘electron’. The algorithm navigates the full tree of data objects to access the necessaryinformation. To validate the ‘electron’ physics hypothesis it could use the precise position of thecalorimeter cluster to reconstruct a Track from a set of SCT Clusters. If a Track is found the ‘elec-tron’ hypothesis is validated and a TE is activated. The resulting object tree is shown inFigure 9-16(c).
The seeding mechanism needs to be general enough to cover all physics use cases. In Figure 9-17 a similar diagram to Figure 9-16(c) is shown for the case of a LVL2 B-physics trigger. Here,the new aspect is the inner detector full scan. In this use case once the initial ‘muon’ has beenvalidated a scan is made of the inner detector to reconstruct all tracks in the event. A TE ‘uses’the collection of Tracks and seeds, for example, an algorithm that reconstructs an exclusive B-decay into two pions. The result of this would be a TE called ‘B to PiPi’. This TE uses a B-mesonand is ‘seeded by’ the ‘Inner Detector Scan’ TE, as shown in the figure.
9.5.4 The steering sub-package
The Steering controls the HLT selection. It ‘arranges’ the HLT algorithm processing for theevent analysis in the correct order, so that the required data is produced and the trigger decisionis obtained. The Steering provides the interface to the PESA Steering Controller for running inthe L2PU and to the PT Client for running in the EF Processing Task (Figure 9-15). In the offlinethe Steering is a top-level ATHENA algorithm executed directly by the ATHENA event loopmanager.
The LVL2 and the EF selection is data driven, in that it builds on the result of the preceding trig-ger level. The Steering has to guide the HLT algorithm processing to the physics-relevant as-pects of the event. The Steering uses the seeding mechanism discussed in the previous sectionto restrict the reconstruction to the parts of the event corresponding to a given LVL1 RoI. Seenfrom the side of the Steering, the reconstruction of an event in the trigger is a process of refiningTEs, as was shown in Figure 9-16 and Figure 9-17.
Figure 9-17 A diagram showing a fragment of the event for the case of LVL2 B-Physics trigger reconstruction
<<TriRelData>> Muon6:TriggerElement
uses
seeded by
<<TriRelData>> Muon6Val:TriggerElement
<<TriRelData>> LVL1Muon6:RoIObject
<<Feature>> Muon:Track
uses <<Feature>> :DriftCircle
uses
seeded by
<<TriRelData>> InDetScan:TriggerElement
uses <<Feature>> :Track
seeded by
<<TriRelData>> BtoPiPi:TriggerElement
<<Feature>> :BMeson
uses
1..*
1..*
uses2

ATLAS Technical Design ReportHigh-Level Trigger, Data Acquisition and Controls 30 June 2003
9 High-Level Trigger 147
The ESS has to implement the physics selection strategy discussed in Chapter 4. The HLT selec-tion demands that an event matches at least one physics ‘Signature’. Each Signature is a combi-nation of abstract physical objects like ‘electrons’, ‘muons’, ‘jets’, or ‘missing energy’. It isusually requested that, for example, an electron has a minimal energy and is isolated from a jet.Translated into the ESS a Signature is simply a combination of required Trigger Elements withlabels like ‘e25i’. An example for such a menu of Signatures is given in Table 4-1.
Many of the Signatures discussed in Chapter 4 require more than one TE. In this case it is bene-ficial not to complete the validation of the TEs in turn, as a later one may fail at an early stage ofthe validation. Thus the Steering arranges the HLT algorithm processing in steps. At each step apart of the reconstruction chain is carried out, starting with the HLT algorithm giving the big-gest rejection. At the end of each step a decision is taken, whether the event can still possiblysatisfy the TE combination required in the Signature. This concept of ‘step processing’ ensuresthe earliest possible rejection of events.
9.5.4.1 Implementation of the steering
In Figure 9-18 a class diagram for the Steering sub-package is given. The Step Controller inher-its from the ATHENA Algorithm and is the interface to the PESA Steering Controller and the PTClient. It provides the necessary methods to configure the ESS at the beginning of a ‘RUN’, toexecute the LVL2 or EF selection on an event, and to end a ‘RUN’.
The task of the Trigger Configuration is to provide the Sequence and Menu Tables for the stepprocessing. This task is carried out during the initialization phase (before the start of a ‘RUN’),which is especially important for LVL2.
In LVL2 the Step Controller uses the LVL1 Conversion for each event to convert the LVL1 Re-sult (i.e. Raw Data) into RoI Objects and prepares the trigger selection by creating the TEs need-ed for the seeding mechanism, as was shown in Figure 9-16(a). In the EF the correspondingLVL2 Conversion translates the LVL2 Result to prepare the EF selection.
Figure 9-18 A class diagram for the Steering sub-package
collect monitoring info
StepController
TriggerConfiguration
StepHandler
StepSequencer
StepDecision
ResultBuilder
execute step processing
LVL2Conversionconvert
LVL2 Result
produce LVL2/EF Result
execute algorithms
produce decision
creates trigger tables
LVL1Conversionconvert
LVL1 Result
SteeringMonitoring
(Athena)Algorithm
ATLAS Technical Design ReportHigh-Level Trigger, Data Acquisition and Controls 30 June 2003
148 9 High-Level Trigger
The trigger processing of each event is performed by the Step Handler. For each step it uses theStep Sequencer to execute the HLT algorithm from the corresponding Sequences. The StepHandler executes the Step Decision to compare the result of the algorithmic processing, givenin terms of TEs, with the Signatures to decide whether or not to reject the event. The Step Han-dler continues to process subsequent steps until the event is rejected or all steps have been exe-cuted. The Result Builder produces the LVL2 or EF Results, depending on which HLT sub-system the Event Selection Software is running.
The Step Controller uses the Steering Monitoring at the end of the event processing to collectsummary information for monitoring purposes.
9.5.4.2 The Trigger Configuration
At initialization time the Trigger Configuration [9-25],[9-26] configures the ESS to execute theLVL2 or EF selection, depending on the sub-system the software is running in. The ATLAS trig-ger selection strategy is defined in terms of physics Signatures as given in Table 4-1. The TriggerConfiguration derives the configuration of the selection from this list of physics Signatures andfrom the list of available HLT algorithms that are implemented. A recursive algorithm is usedthat computes the full EF and LVL2 configuration in a top-down approach starting from the fi-nal Signatures. In this way a consistent configuration of both HLT selection levels is ensuredwhich logically connects LVL2 and EF. The configuration scheme will be extended in the futureto also cover the LVL1 configuration.
Technically the input to the Trigger Configuration are two XML files that are parsed [9-27] intoC++ objects. The first XML file contains the list of final physics Signatures in terms of TE labels,as shown in Table 4-1. The second XML file contains a list of available Sequences of HLT algo-rithms that can be used by the trigger. Each Sequence specifies the required input in terms ofTEs, the HLT algorithms to be executed for these seeds, and the hypothesis in terms of an out-put TE to be validated.
The recursive algorithm to calculate the full configuration is illustrated in Figure 9-19 using asan example a ‘2-electron’ Signature. The final physics Signature ‘2 × e20i’ requires two constitu-ent TEs ‘e20i’. Such a TE is the output of a Sequence, which is found in the Sequence list. In theexample the input TE of the matching Sequence is ‘e20’ and the Sequence contains an isolationalgorithm. Hence, in order to satisfy the final Signature ‘2 × e20i’ requires two ‘e20’ TEs in theprevious step or in other words, the derived Signature of ‘2 × e20’. The recursion is continueduntil the LVL1 input TEs are reached [corresponding to the RoI Objects as shown in Figure 9-16(a)]. In the example from Figure 9-19 this corresponds to four recursion steps.
The calculation is done for all final Signature in the full trigger menu and the resulting tables arecombined for each trigger step. Different Signatures may involve the same Algorithm or Se-quence in a given step. Hence the tables are processed to remove double entries. The boundarybetween LVL2 and EF is defined by associating Sequences in the input list to either of the twotrigger levels. This association is the basis for separating the EF and LVL2 in the output of theTrigger Configuration. Prescaling and forced accept rates are allowed for at the level of the Sig-natures.
The output is given in the form of pairs of Sequence Tables and Menu Tables for each triggerstep. The class diagram is shown in Figure 9-20. The tables contain the necessary information interms of TEs and HLT algorithms for the Steering to control the data-driven trigger processingas discussed in the following subsections.

ATLAS Technical Design ReportHigh-Level Trigger, Data Acquisition and Controls 30 June 2003
9 High-Level Trigger 149
9.5.4.3 The LVL1 conversion
At the start of the LVL2 event processing the LVL1 Result is converted into a form that is suita-ble for steering the step processing. The Step Controller calls the LVL1 Conversion to decode theLVL1 Result fragment (the output of the RoIB, see Section 13.2). In the fragment the RoI infor-mation is encoded into 32-bit words as defined in [9-24]. These words contain bit patterns iden-tifying, for example, the electronics channel from which the RoI came and the threshold passed.This information is uniquely related to the location of the RoI in η−φ space and to the thresholdvalue in GeV. To obtain the values the configuration of the LVL1 and sub-detector specific map-ping information must be used. The RoI Objects are then stored for further processing and for
Figure 9-19 Illustration of the recursive configuration of the selection for a ‘2-electron’ trigger
Figure 9-20 A class diagram for output of the Trigger Configuration, showing for each step a pair of a SequenceTable and a Menu Table
1..*
std::pair
T1,T2
MenuTableSequenceTable
1..*
<<TriRelData>>Signature
-m_Prescale : float -m_ForcedRate : float
<<TriRelData>>TriggerElement
-m_label : string
0..*
1..*
Sequence
1..*<<FeatureExtraction>>
HLTAlgorithm
-m_ParameterSet
1..*
one per step
seeds
output
required
ATLAS Technical Design ReportHigh-Level Trigger, Data Acquisition and Controls 30 June 2003
150 9 High-Level Trigger
each RoI Object a TE of the corresponding label is created to enable the seeding mechanism asshown in Figure 9-16(a).
9.5.4.4 The Step Handler
After the LVL1 Conversion (or in the EF the LVL2 Conversion) the Step Controller executes theStep Handler. In Figure 9-21 a sequence diagram is shown for the step-by-step processing of anevent by the Step Handler. Each step is configured by a pair of a Sequence Table and a Menu Ta-ble, as provided from the Trigger Configuration.
The Step Handler first executes the Step Sequencer, which controls the reconstruction part ofeach step. The Step Sequencer accesses the list of active input TEs from the previous step or theLVL1 Conversion for the first step. The list is compared to the required input TEs of each Se-quence in the Sequence Table. For all matching combination of TEs the Step Controller executesthe HLT algorithms in the corresponding Sequence. To implement the seeding mechanism dis-cussed in Section 9.5.3.1 it is necessary to created the output TE and the ‘seeded by’ relation tothe input TE and then pass the output TE as a seed to the HLT algorithm, as shown in Figure 9-21. The HLT algorithm has to validate the hypothesis of just this output TE. In the scheme cur-rently implemented the HLT algorithm signals a validated hypothesis by ‘activating’ the outputTE. It is important to note that for a given event the same algorithm Sequences can be executedmultiple times, but on different seeds, depending on the number of matching input TE combi-nations.
At the end of each step the Step Decision is run to decide whether, based on the result of theStep Sequencer the event is still accepted. The Step Decision compares the list of active outputTEs to the required TE combinations for the Signatures in the Menu Table of the step. For each
Figure 9-21 A sequence diagram for the Step Handler processing an event. For each step the Step Sequencerand the Step Decision are executed. No interaction with the store, etc., are shown.
StepHandler
exec (Sequence
Table)
Step Sequencer
HLT Algorithm
output: TE
input: TE
<<create>>
Step Decision
get active output TEs
[valid] set active
[notused] set deactive
decision:bool
set uses output TEs
exec (MenuTable)
satisfied: Signature
loop over Sequences
loop over Signatures
loop over steps
exec(output:TE)
get active input TEs
<<create>>
set seeded by input TE

ATLAS Technical Design ReportHigh-Level Trigger, Data Acquisition and Controls 30 June 2003
9 High-Level Trigger 151
matching TE combination the Step Decision creates a satisfied Signature object that ‘uses’ theseTEs. In the next step only those TEs that were used to satisfy a least one Signature are used forfurther processing, all others are discarded from the event by deactivating them. An event is ac-cepted for the step if at least one Signature was satisfied. The Step Handler continues processingthe next step either until the event is rejected by the Step Decision or until all steps are done, inwhich case the event is finally selected.
9.5.4.5 The Result Builder and the LVL2 Conversion
At the end of the LVL2 processing of an event, if the event was selected, the Result Builder pro-vides the information to seed the EF selection. In the current implementation this includes infor-mation about all satisfied Signatures, the associated TEs, and LVL1 RoIs. These are convertedinto a ROB fragment to be transferred via the pROS to the Event Builder. The structure is keptmodular to accommodate a variable number of accepted items and to allow changes.
At the beginning of the EF processing the Step Controller executes the LVL2 Conversion that re-trieves the LVL2 Result. It extracts the TE and RoI words to recreate the objects, including thenavigational links among them. Thereby it recreates a structure similar to that shown inFigure 9-16(a) as output of the LVL1 Conversion at the beginning of LVL2. The differences arethat the TEs are the active TEs of the final LVL2 step and the list of LVL1 RoIs is reduced to theones ‘used’ in the final decision. After the LVL2 Conversion the EF selection is controlled (andseeded) by the Step Handler in the same way as for LVL2, but using more sophisticated HLT al-gorithms.
9.5.4.6 The Steering Monitoring
Monitoring of the Steering has several aspects, the debug output of the HLT algorithms, thetiming, the rate monitoring, etc. Monitoring Services are used by the Event Selection Software topublish this information. The Steering Monitoring runs at the end of the event and analyses theevent in memory.
9.5.5 The Data Manager sub-package
The Data Manager sub-package provides the infrastructure to receive, store, and later accessdata while processing the event. The transient data store, which is used to implement the EventData Model, is thus the central part of this sub-package. The Data Manager also provides themeans for the Event Selection Software to implement the seeding mechanism and to access RawData in restricted geometrical Regions (‘retrieve by Region’). The Data Manager is the part ofthe ESS that is interfaced to the ROB Data Provider, as was shown in Figure 9-15 for the L2PU orfor the EF Processing Task, respectively.
9.5.5.1 Implementation
Storegate [9-23] is the part of the ATHENA infrastructure that provides the transient data store.It was originally designed to handle data for the offline reconstruction and analysis. Storegateprovides services for the client application, such as the functionality of a container with infra-structure for data storage, different patterns of data access, and memory management. It is alsothe part of ATHENA that supports persistency and implements the interface to the different I/
ATLAS Technical Design ReportHigh-Level Trigger, Data Acquisition and Controls 30 June 2003
152 9 High-Level Trigger
O services. Using the Storegate interface for the implementation of the Data Manger facilitatesthe use of offline software in the trigger. Initial timing measurements [9-10] have shown that theperformance of Storegate’s core services satisfies the EF and also the LVL2 requirements. ThusStoregate has been chosen to implement the Data Manager in the ESS. This choice allows forcommon interfaces for the HLT algorithm to access the data when running online in the triggeror offline for development purposes, as will be discussed in the following.
Figure 9-22 shows the main components of the Data Manager.
• Storegate, as the transient data store, holds the event data during the processing.
• A Region Selector that provides an efficient look-up of the Hash Identifiers of all Collec-tions of data that fall within a given geometrical Region of a sub-detector. A Region istypically defined in terms of η and φ by the RoI Objects provided by the LVL1 system.
• A Detector Container with RDO or RIO Collections for each sub-detector. The granulari-ty of the Collections are optimized for the HLT algorithm processing. For example, a Col-lection for the Pixel Detector contains the RDOs or RIOs (Clusters) in a ‘DetectorElement’, in this case a module. For the LAr a Collection contains all cells in a sampling ofa trigger tower. An HLT algorithm retrieves each required Collection from the DetectorContainer using a Hash Identifier.
• The Byte Stream Conversion Service that provides the means to access the ROB data, toconvert it and to provide the Collections of data. The Byte Stream Conversion Service isbased on the normal Storegate persistency mechanism [9-23], which is designed to re-trieve collections of objects from a persistent data source, i.e. a file or database. In the trig-ger context, however, this source is replaced by the ROB Data Provider to access the ROBFragments containing the detector information in serialized format. In LVL2 the ROBFragments have to be requested across the network and in the EF they are retrieved fromthe complete byte-stream event in memory.
Figure 9-22 The class diagram for the Data Manager sub-package
StoreGateByteStream
ConversionSvc
RegionSelector
TRT RegSel
LAr RegSel
MDT RegSel ...
Detector Container
TRT RDOCont
LAr RDOCont
MDT RDOCont ...
TRT RIOCont
LAr RIOCont
MDT RIOCont ...
Converter
TRT RDOCnv
LAr RDOCnv
MDT RDOCnv ...
TRT RIOCnv
LAr RIOCnv
MDT RIOCnv ...
holds
requests Collection request
coversion
provide Collection
Key2KeyStore
full functionality of a transient data store
navigation support for Seeding Mechanism

ATLAS Technical Design ReportHigh-Level Trigger, Data Acquisition and Controls 30 June 2003
9 High-Level Trigger 153
• The Converter uses Data Preparation algorithms (as discussed in Chapter 9.5.3) to con-vert the Raw Data of the ROB fragment into objects to be analysed by the HLT algorithms.The Converters are specific to the detector and the type of data (RDOs for EF or RIOs forLVL2) requested by the HLT algorithm.
• The Key to Key Store is a trigger-specific implementation of the object relations that areused for the seeding mechanism (Section 9.5.3.1). It supports the ‘seeded by’ and ‘uses’ re-lations of Trigger Elements, RoI Objects and other EDM information in a generic C++ waythat is also compatible with Storegate.
9.5.5.2 The Raw Data Access
The HLT Raw Data access follows the so-called ‘London Scheme’ [9-28], which uses the compo-nents described above. This scheme aims to keep data transfers and CPU time to a minimum byonly requesting and unpacking data as it is required; to encapsulate data access so that the algo-rithm does not have to deal with details such as the byte stream or ROB granularity, and so thatthe data source can be changed (LVL2, EF, offline emulation) with no impact on the algorithm.A sequence diagram of the HLT Raw Data access is shown in Figure 9-23. The HLT algorithmdefines the geometrical Region from which it needs data. Typically the HLT algorithm uses theposition of the LVL1 RoI and defines a region in terms of ∆η and ∆φ around it. The geometricalRegion is a general concept and is not confined to the original RoI information from LVL1: forexample, during the HLT algorithm processing as more refined information becomes availableit may be possible to use a more refined volume (e.g. allowing for track curvature) thereby re-ducing the amount of data to be analysed. The Region Selector [9-29] translates this abstract Re-gion into a list of Hash Identifiers to be used by the HLT algorithm to access the Collections ofRDO or RIO data. In the basic London Scheme the Region Selector merely returns the list ofHash Identifiers. However, for efficiency in the LVL2 environment, the Region Selector also pro-vides the list of ROB Fragments to be preloaded from the ROS via the ROB Data Provider. TheROB Data Provider caches the returned ROB fragments for later decoding. This optimizationsignificantly reduces the network latency for ROB data access in LVL2 (see Section 14.2.1).
Having received the list of Hash Identifiers from the Region Selector, the HLT algorithm re-trieves the Detector Container for the type of data it requires (for details see [9-30]). In the cur-rent prototype the EF requests RDO data and uses the full offline Data Preparation algorithmsto obtain the RIO information. The LVL2 directly requests the RIO data in order to avoid theoverhead of RDO creation. During the reconstruction process the HLT algorithm loops over thelist requesting the individual Collections from the Detector Container. The Detector Containertranslates the Hash Identifier into an Address of the Collection in Storegate. In the normal casethe Collection is not available and hence Storegate requests via its persistency mechanism theByte Stream Conversion Service to provide the Collection. The Service retrieves the correspond-ing ROB fragment from the ROB Data Provider and uses either the RDO or RIO Converter toconvert the data. The Collection is then stored in Storegate for possible subsequent requests andreturned to the HLT algorithm. In practice a ROB fragment contains the data for more than oneCollection. It is a matter of optimization either to decode only the requested part or to fully pre-pare the data of all collections in the first request.
It should be noted that in this scheme the encapsulation in the Region Selector of the translationfrom an abstract region to the detector identifiers hides the details of the detector geometryfrom the HLT algorithms. The Storegate persistency mechanism hides the details of the onlineRaw Data. Thus the scheme provides the means to use offline code in the trigger and to use anddevelop dedicated LVL2 algorithms in the offline environment.
ATLAS Technical Design ReportHigh-Level Trigger, Data Acquisition and Controls 30 June 2003
154 9 High-Level Trigger
9.6 Summary
This chapter has described the components used in the HLT event selection, with the main em-phasis on functional aspects and implementation. Some performance figures have been givenfor software components within the processors (the L2P and the EFP), but the overall systemperformance is largely determined by aspects outside of the scope of this chapter. For LVL2 amajor requirement has been achieving adequate performance for RoI Collection, results for this(both for a single L2P and when multiple L2Ps and additional event building capacity are add-ed) have been presented in Chapter 8 and show that this can be done using only a small part ofthe total LVL2 time budget. For the EF the movement of events through the system has alsobeen demonstrated with performance well within the limits required. However, the validationof the overall architecture also requires that realistic algorithms, including data conversion fromrealistic input data, can be supported with adequate performance in the software frameworkdescribed. The algorithms being developed for HLT, and their current performances, are de-scribed in Chapter 13. System tests of both LVL2 and the EF are described in Chapter 14.
9.7 References
9-1 J. Schlereth and M. LeVine, LVL2 Supervisor Requirements, ATL-DQ-ES-0025 (2001)http://edms.cern.ch/document/391501/
9-2 J. Schlereth, Level 2 Supervisor Design, ATL-DQ-ES-0049 (2002)http://edms.cern.ch/document/391581/
Figure 9-23 A sequence diagram showing the HLT Raw Data Access scheme
HLTAlgorithm
get Position
RoIObject Detector Container
StoreGateRegion Selector
retrieve(DetKey) : DetectorContainer
define Region
lookup(Detector,Region)
List<IdentifierHash>
ByteStream ConvSvc
ROBData Provider
Converter
retrieve(IdentifierHash)loop over List
get(CollKey) get
(Address) get(ROBId)
Fragment
convert(Fragment)
Collection<DataObjects>
Collection<DataObjects>
preload(list<ROBId>)

ATLAS Technical Design ReportHigh-Level Trigger, Data Acquisition and Controls 30 June 2003
9 High-Level Trigger 155
9-3 C. Hinkelbein et al., Prospects of FPGAs for the ATLAS LVL2 Trigger, ATLAS Internal Note, ATL-DAQ-2000-006 (1999)
9-4 A. Khomich et al., Timing measurements of some tracking algorithms and suitability of FPGA’s to improve the execution speed, ATLAS Internal Note, ATL-COM-DAQ-2003-006 (2003)
9-5 A. Bogaerts and F. Wickens, LVL2 Processing Unit Application Design, ATL-DH-ES-0009 (2001)http://edms.cern.ch/document/391554/
9-6 A. dos Anjos et al., Guidelines for offline preparation and testing of LVL2 code,http://www.cern.ch/steve.armstrong/algorithms/guidelines
9-7 Athena: User Guide and Tutorial,http://atlas.web.cern.ch/Atlas/GROUPS/SOFTWARE/OO/architecture/General/Tech.Doc/Manual/2.0.0-DRAFT/AthenaUserGuide.pdf
9-8 Gaudi Project,http://cern.ch/proj-gaudi/
9-9 S. González et al., Use of Gaudi in the LVL2 Trigger: The Steering Controller,ATL-DH-EN-0001 (2002)http://edms.cern.ch/document/371778/
9-10 A. Bogaerts et al., Initial LVL2 Tests with the Si Tree Algorithm, ATL-DH-TN-0001 (2003)http://edms.cern.ch/document/375305/
9-11 H.P. Beck et al., ATLAS TDAQ: A Network-based Architecture, ATL-DQ-EN-0014 (2002)http://edms.cern.ch/document/391592/
9-12 C. Bee et al., Event Handler Requirements, ATL-DH-ES-0003 (2002)http://edms.cern.ch/document/361786/
9-13 C. Meessen et al., Event Handler Functional Design Analysis, ATL-DH-ES-0005 (2002)http://edms.cern.ch/document/361808/
9-14 C. Bee et al., Event Handler Design, ATL-DH-ES-0007 (2002)http://edms.cern.ch/document/367089/
9-15 A. dos Anjos et al., The Event Format User Requirements Document, ATL-DQ-EN-0005 (2003)http://edms.cern.ch/document/383859/
9-16 F. Touchard et al., Event Filter Infrastructure Validation Tests, ATL-DH-TR-0004http://edms.cern.ch/document/391248/
9-17 F. Touchard et al., HLT Infrastructure Operational Analysis and Requirements to other sub-systems,ATL-DH-ES-0006 (2002)http://edms.cern.ch/document/363032/
9-18 C. Bee et al., Supervision Requirements, ATL-DH-ES-0004 (2002)http://edms.cern.ch/document/361792/
9-19 C. Bee et al., ATLAS Event Filter: Test Results for the Supervision Scalability at ETH Zurich,ATLAS Internal Note, ATL-DAQ-2002-006 (2001)
9-20 S. Wheeler et al., Test results for the EF Supervision, ATL-DH-TR-0001 (2003)http://edms.cern.ch/document/374118/
9-21 S. George et al., PESA high-level trigger selection software requirements, ATLAS Internal Note, ATL-DAQ-2001-005 (2001)
ATLAS Technical Design ReportHigh-Level Trigger, Data Acquisition and Controls 30 June 2003
156 9 High-Level Trigger
9-22 M. Elsing et al., Analysis and Conceptual Design of the HLT Selection Software, ATLAS Internal Note, ATL-DAQ-2002-013 (2002)
9-23 P. Calafiura et al., StoreGate: a Data Model for the ATLAS Software Architecture, Computing in High Energy and Nuclear Physics Conference, Beijing, 2001http://atlas.web.cern.ch/Atlas/GROUPS/SOFTWARE/OO/architecture/EventDataModel/Tech.Doc/StoreGate/Chep01.pdf
9-24 M. Abolins et al., Specification of the LVL1/LVL2 Trigger Interface, ATL-D-ES-0003 (2002)http://edms.cern.ch/document/107485/
9-25 T. Schoerner-Sadenius, TrigConfig: The HLT Configuration Package, ATLAS Internal Note, ATL-COM-DAQ-2002-019 (2002)
9-26 M. Elsing and T. Schoerner-Sadenius, Configuration of the ATLAS Trigger System, Computing in High Energy and Nuclear Physics Conference, San Diego, 2003
9-27 Xerces C++ Parser,http://xml.apache.org/xerces-c/
9-28 S. George, Design of the PESA core software Data Manager, ATL-DH-EN-0004 (2003)http://edms.cern.ch/document/390533/
9-29 A.G. Mello et al., Region-of-Interest Selection for ATLAS High Level Trigger and Offline Software Environments, ATLAS Internal Note,ATLAS-COM-DAQ-2003-005 (2003)
9-30 S. Armstrong et al., Algorithms for the ATLAS High Level Trigger, ATLAS Internal Note, ATL-DAQ-2003-002 (2003)

ATLAS Technical Design ReportHigh-Level Trigger, Data Acquisition and Controls 30 June 2003
10 Online Software 157
10 Online Software
10.1 Introduction
The Online Software encompasses the software to configure, control, and monitor the TDAQsystem but excludes the management, processing, and transportation of physics data. It is a cus-tomizeble framework which provides essentially the ‘glue’ that holds the various sub-systemstogether. It does not contain any elements that are detector specific as it is used by all the vari-ous configurations of the TDAQ and detector instrumentation. It co-operates with the othersub-systems and interfaces to the Detector Readout Crates, the Detector Control System, theLVL1 Trigger, the DataFlow, the High Level Trigger processor farms, the Offline Software, andto the human user as illustrated in Figure 10-1. It also provides the interface between the humanuser and the TDAQ system.
An important task of the Online Software is to provide services to marshal the TDAQ throughits start-up and shutdown procedures so that they are performed in an orderly manner. It is re-sponsible for the synchronization of the states of a run in the entire TDAQ system and for proc-ess supervision. These procedures are designed to take a minimum amount of time to execute inorder to reduce the overhead, since this affects the total amount of data that can be taken duringa data-taking period. Verification and diagnostic facilities help with early and efficient problemfinding. Configuration database services are provided for holding the large number of parame-ters which describe the system topology, hardware components, software components, and run-ning modes. During data taking, access is provided to monitoring information like statisticsdata, sampled data fragments to be analysed by monitoring tasks, histograms produced in theTDAQ system, and also to the errors and diagnostic messages sent by different applications.User interfaces display the status and performance of the TDAQ system and allow the user toconfigure and control the operation. These interfaces provide comprehensive views of the vari-ous sub-systems for different types of users and operations.
The Online Software distinguishes various types of user. The TDAQ Operator runs the TDAQSystem in the control room during a data-taking period; the TDAQ Expert has system-internal
Figure 10-1 Context diagram of the Online Software
TDAQ Operator
Detector
Offline Software
Online
Detector Control System
DataFlow
LVL1 Trigger
High Level Trigger
ATLAS TDAQ
Software
ATLAS Technical Design ReportHigh-Level Trigger, Data Acquisition and Controls 30 June 2003
158 10 Online Software
knowledge and can perform major changes to the configuration; the Sub-system Expert or Detec-tor Expert is responsible for the operation of a particular sub-system or detector; and TDAQ anddetector software applications use services provided by the Online Software via application inter-faces. These types of users are defined in detail in Appendix B. The user requirements to theOnline Software are collected and described in the corresponding document [10-1].
10.2 The architectural model
The Online Software architecture is based on a component model and consists of three high-lev-el components, called packages. Details of the architecture and a comprehensive set of use casesare described in [10-2]. Each of the packages is associated with a group of functions of the On-line Software. For each package, a set of services which it has to provide is defined. The servicesare clearly separated one from another and have well defined boundaries. For each service alow-level component, called a sub-package, is identified.
Each package is responsible for a clearly defined functional aspect of the whole system.
1. Control — contains sub-packages for the control of the TDAQ system and detectors. Con-trol sub-packages exist to support TDAQ system initialization and shutdown, to providecontrol command distribution, synchronization, error handling, and system verification.
2. Databases — contains sub-packages for configuration of the TDAQ system and detectors.Configuration sub-packages exist to support system configuration description and accessto it, record operational information during a run and access to this information. Thereare also boundary classes to provide read/write access to the conditions storage.
3. Information Sharing — contains classes to support information sharing in the TDAQ sys-tem. Information Sharing classes exist to report error messages, to publish states and sta-tistics, to distribute histograms built by the sub-systems of the TDAQ system anddetectors, and to distribute events sampled from different parts of the experiment’s dataflow chain.
The interaction between the Online Software packages is shown in Figure 10-2. The Controlmakes use of the Information Sharing and of the Databases packages. The Databases package isused to describe the system to be controlled. This includes in particular the configuration ofTDAQ Partitions, TDAQ Segments, and TDAQ Resources. The Information Sharing packageprovides the infrastructure to obtain and publish information on the status of the controlled sys-tem, to report and receive error messages, and to publish results for interaction with the opera-tor.The following sections describe these packages in more detail.
Figure 10-2 Internal interaction between the Online Software packages
Databases Control
Get Object
Get/Publish Information
Report/Receive Error
Select Configuration
Information
Subscribe to Data Changes
Sharing

ATLAS Technical Design ReportHigh-Level Trigger, Data Acquisition and Controls 30 June 2003
10 Online Software 159
10.3 Information sharing
There are several areas where information sharing is necessary in the TDAQ system: synchroni-zation between processes, error reporting, operational monitoring, physics event monitoring,etc. The Online Software provides a number of services which can be used to share informationbetween TDAQ software applications. This section will describe the architecture and prototypeimplementation of these services.
10.3.1 Functionality of the Information Sharing Services
Any TDAQ software application may produce information which is of interest for other TDAQapplications. In this section the application that produces information is called the InformationProvider, the application that reads information data is called Information Consumer, which in-dicates that it is a user of the information. Any TDAQ software application may be an Informa-tion Provider and an Information Consumer at the same time. The main responsibility of theInformation Sharing services is:
• transportation of the information from the Information Providers to the Information Con-sumers
• delivery of information requests (commands) from the Information Consumers to the In-formation Providers.
Figure 10-3 shows the main interactions which providers and consumers may have with the In-formation Sharing services.
10.3.1.1 Types of shared information
There are many types of information which can be shared between applications in the TDAQsystem. These types are significantly different in terms of the data size, update frequency, typeof access, number of providers and consumers, etc. In order to optimize the performance of theinformation sharing in a large and highly distributed TDAQ system a separate service for eachmajor class of the shared information is provided. Table 10-1 shows the main information typesalong with their most important characteristics.
Figure 10-3 Information Sharing in the TDAQ system
InformationConsumer
Information Provider
Informationdata
command
data
command
SharingServices
ATLAS Technical Design ReportHigh-Level Trigger, Data Acquisition and Controls 30 June 2003
160 10 Online Software
10.3.2 Performance and scalability requirements on Information Sharing
The performance and scalability requirements vary according to the type of the information.Table 10-2 shows the summary of these requirements for the main types of shared information.
The final ATLAS TDAQ system will contain O(103) processes. Each of them can produce errormessages and status information. The Information Consumers for the error messages are theapplications which log errors, analyse them, present them to the operator, or try to do a recov-ery. The consumers of the status information are the applications that monitor the status of aparticular component of the TDAQ system or detector, present this information to the operator,and possibly perform corrective actions when spotting problems. Therefore the InformationSharing services dealing with the errors and user-defined information have to be able to serveO(103) Information Producers and O(10) Information Consumers simultaneously.
Physics events (or event fragments) can be sampled from several hundred places in the dataflow chain. Events can be sampled at ROD crate level, at the ROS level, and at the SFI level. Inthe worst case, if events are monitored at all the possible points simultaneously, there will be ap-proximately the same number of Information Consumers for this information type.
The possible sources of histograms are ROD controllers, ROSs, SFIs, LVL2 sub-farms, and EFsub-farms. For each of these systems there are several applications which receive histograms inorder to present them to the operator, analyse, or store them. Therefore the Information Sharingservice dealing with histograms, must be able to handle several hundred Information Providersand several tens of Information Consumers simultaneously.
Table 10-1 Types of shared information
Information type Information structure Produced Accessed
Physics events (or event fragments)
vector of 4-byte integers on request on request
Error messages error id + description + optional qualifying attributes
when errors occur
via subscription
Histograms several widely used histogram formats (e.g. ROOT histograms)
always on request and via subscription
Status information user-defined always on request and via subscription
Table 10-2 Performance and scalability requirements for Information Sharing
Information typeInformation size (kbyte)
Update frequency (Hz)
Number of providers
Number of consumers
Physics events (or event fragments)
1.5–2.2 × 10³ 1–1000 O(102) O(102)
Error messages O(1) O(10) O(103) O(10)
Histograms O(10) O(1) O(102) O(10)
Status information O(1) O(1) O(103) O(10)

ATLAS Technical Design ReportHigh-Level Trigger, Data Acquisition and Controls 30 June 2003
10 Online Software 161
10.3.3 Architecture of Information Sharing services
The Online Software provides four services to handle different types of shared information.Each service offers the most appropriate and efficient functionality for a given information typeand provides specific interfaces for both Information Providers and Consumers. Figure 10-4shows the existing services.
The Inter Process Communication (IPC) is a basic communication service which is common toall the other Online Software services. It defines the high-level API for the distributed object im-plementation and for remote object location. Any distributed object in the Online Software serv-ices has common basic methods which are implemented in the IPC. In addition the IPCimplements partitioning, allowing several instances of the Online Software services to run indifferent TDAQ Partitions concurrently and fully independently.
10.3.3.1 Information Service
The Information Service (IS) allows software applications to exchange user-defined informa-tion. Figure 10-5 shows interfaces provided by the IS.
Any Information Provider can make his own information publicly available via the Publish in-terface and notify the IS about changes of the published information via the Update interface.Here there are two possibilities: the Information Provider does not implement the InfoProviderinterface, in which case it has to inform the IS about all the changes of the published informa-tion; the Information Provider does implement the InfoProvider interface, in which case it noti-
Figure 10-4 Information Sharing services
Figure 10-5 Information Service interfaces
Information Service
Error Reporting
Service
Event Monitoring
Service
Online Histogramming
Service
Inter Process Communication
<<interface>>InfoProvider
_______________
<<interface>>InfoConsumer
_______________
Command
Publish/UpdateGet Info
Information Consumer
Notify
Subscribe
Information Provider
Information Service
ATLAS Technical Design ReportHigh-Level Trigger, Data Acquisition and Controls 30 June 2003
162 10 Online Software
fies the IS about information changes only when it is explicitly requested by the IS via theCommand interface. Some other commands might be also possible, e.g. setting time interval forthe information updates.
There are also two types of Information Consumer. One can access the information on requestvia the Get Info interface, in which case it does not need to implement the InfoConsumer inter-face. The second type of Information Consumer implements the InfoConsumer interface, and isinformed about changes of the information for which it subscribed, via the Subscribe interface.
10.3.3.2 Error Reporting Service
The Error Reporting Service (ERS) provides transportation of the error messages from the soft-ware applications which detect these errors to the applications which are responsible for theirhandling. Figure 10-6 shows interfaces provided by the Error Reporting Service.
An Information Provider can send an error message to the ERS via the Send Error interface. Thisinterface can be used by any application which wants to report an error. In order to receive errormessages an Information Consumer has to implement the ErrorReceiver interface and providethe criteria that define the kind of messages it wants to receive. These criteria have to be passedto the ERS via the Subscribe interface.
10.3.3.3 Online Histogramming Service
The Online Histogramming Service (OHS) allows applications to exchange histograms. TheOHS is very similar to the Information Service. The difference is that the information which istransported from the Information Providers to the Information Receivers has a pre-defined for-mat. Figure 10-7 shows interfaces provided by the Online Histogramming Service.
The OHS sub-package also provides a human user interface in the form of an application. Thisapplication is called Histogram Display and can be used by the TDAQ operator to display avail-able histograms.
Figure 10-6 Error Reporting Service interfaces
<<interface>>ErrorReceiver
________________
Information Consumer
Notify
Subscribe
Error Reporting Service
Information Provider
Send Error

ATLAS Technical Design ReportHigh-Level Trigger, Data Acquisition and Controls 30 June 2003
10 Online Software 163
10.3.3.4 Event Monitoring Service
The Event Monitoring Service (EMS) is responsible for the transportation of physics events orevent fragments sampled from well-defined points in the data flow chain and delivered to anal-ysis applications. These will examine and analyse the data in order to monitor the state of thedata acquisition and the quality of the physics data in the experiment. Figure 10-8 shows themain interfaces provided by the Event Monitoring Service.
The application, which is able to sample events from a certain point of the data flow, has to im-plement the Event Sampler interface. When the Information Consumer requests samples ofevents from that point, the EMS system requests the Information Provider, via the Start Sam-pling interface, to start a sampling process. The Information Provider samples events and pro-vides them to the EMS via the Add Event interface. When there are no more InformationConsumers interested in event samples from that point of the data flow chain, the EMS requeststhe Information Provider via the Stop Sampling interface to stop the sampling process.
There are also two types of interface for the Information Consumer. One is a simple Get Eventinterface which allows a consumer to request event samples one by one according to need. This
Figure 10-7 Online Histogramming Service interfaces
Figure 10-8 Event Monitoring Service interfaces
<<interface>>HistoProvider
_______________
<<interface>>HistoReceiver
_______________
Send Command
Get Histo
Information Consumer
Update Histo
Subscribe
Information Provider
Online Histogramming
ServicePublish/
Update Histo
<<application>>Histogram Display
_________________
<<interface>>EventSampler
_______________
<<interface>>EventReceiver
________________
Start/Stop Sampling
Get Event
Information Consumer
Next Event
Subscribe
Information Provider
Event Monitoring Service
Add Event
<<application>>Event Dump
______________
ATLAS Technical Design ReportHigh-Level Trigger, Data Acquisition and Controls 30 June 2003
164 10 Online Software
interface will be used, for example, by the Event Dump application that implements a humanuser interface to the EMS system. A second interface is based on the subscription model. The In-formation Consumer can request the EMS system to supply the samples of events as soon asthey are sampled by the Information Provider. This interface is more suitable for the monitoringtasks which need to monitor events for a long period of time in order to accumulate the neces-sary statistics.
10.3.3.5 Relation between Information Sharing services
All the Information Sharing services described above have essential differences because theyhave to deal with different types of shared information. On the other hand, similarities can beidentified since they use common communication patterns, for example the subscribe/notifymechanism. The generic patterns are reused by different services whenever it is possible with-out loss of efficiency. For example, in the current implementation the Histogramming Service isimplemented on top of the more general Information Service. The Histogramming Service de-fines its own specific interfaces but reuses all the communication mechanisms provided by theIS.
10.3.4 Prototype evaluation
Prototype implementations exist for all the Information Sharing services. These prototypes aimto verify the suitability of the chosen design and the choice of implementation technology forthe final TDAQ system, and for use at the ATLAS test beam operations. This section contains adescription of the services implementation together with their performance and scalability testresults.
10.3.4.1 Description of the current implementation
Each service is implemented as a separate software package with both C++ and Java interfaces.It is possible to have several instances of each service running concurrently and fully independ-ently in different TDAQ partitions.
The Information Sharing services implementation is based on the Common Object Request Bro-ker Architecture (CORBA) [10-3] defined by the Object Management Group (OMG). CORBA isa vendor-independent industry standard for an architecture and infrastructure that computerapplications use to work together over networks. The most important features of CORBA areobject-oriented communication, inter-operability between different programming languagesand different operating systems, and object location transparency.
Currently the open source implementation of CORBA provided by the Xerox company is used.It is called Inter Language Unification (ILU) [10-4]. Several other CORBA implementations arecurrently being evaluated. These are TAO [10-5], MICO [10-6], omniORB [10-7], and ORBacus[10-8]. They provide interesting features which are missing in ILU. ILU can be replaced by an-other CORBA implementation without affecting the architecture and design of the InformationSharing services.

ATLAS Technical Design ReportHigh-Level Trigger, Data Acquisition and Controls 30 June 2003
10 Online Software 165
10.3.4.2 Performance and scalability of current implementation
Among the Information Sharing services, the most extensive tests have been performed for theInformation Service, which provides the most general facility for information sharing. The otherservices are implemented on the same technology and will offer the same level of performanceand scalability as the IS.
The testbed for the IS tests consisted of 216 dual-pentium PCs with processor frequencies from600 to 1000 MHz [10-9]. The IS server was set up on one dedicated machine. From one to five In-formation Providers were running on the other 200 machines. Each Information Provider pub-lished one information object at the start and then updated it once per second. The remaining 15machines were used to run 1, 5, 10 or 15 Information Consumers which subscribe for all the in-formation in the IS. Whenever an Information Provider changed the information, this new in-formation was transported to all the Information Consumers.
Figure 10-9 shows the average time for transporting information from one Information Providerto all the subscribed Information Consumers as a function of the number of Information Provid-ers, which were working concurrently.
The results of the tests show that a single IS server is able to handle one thousand InformationProviders and about 10 Information Consumers at the same time. The design of the IS allowsthe total load to be distributed among a number of independent IS servers. Thus, it will be nec-essary to run only a few (less then 10) IS servers in order to provide the required performancefor the final ATLAS TDAQ.
10.3.4.3 Use of Information Sharing services in TDAQ
Usage of the Information Sharing services as they are described above will be very similar tothat of the existing prototype implementations. These have been in use in various testbeds andtest beam activities and provide good examples for their use in the final TDAQ system. A typi-
Figure 10-9 Average time spent to transport one information object from one Information Provider to a numberof Information Consumers versus the number of concurrent Information Providers
200 400 600 800 10000
1
2
3
4
5
6
7
8
1 Consumer5 Consumers10 Consumers
15 Consumers
Number of Information Providers
time
(ms)
ATLAS Technical Design ReportHigh-Level Trigger, Data Acquisition and Controls 30 June 2003
166 10 Online Software
cal test beam configuration, which was exploited by the detectors, includes the Error ReportingService (called Message Reporting System (MRS) in the prototype implementation) and anumber of Information Services. In particular, the IS server for the Run Parameters was used todistribute the run parameters such as run number, run type, beam type, etc., which previouslyhad been defined by the operator, to system and user applications. An IS server specific for thedetector information was running and passed the status of the detector hardware such as RODs,LVL1 Modules, etc. to the operator during a run. The IS server for Data Flow parameters wasused to present the status of the data flow elements to the operator, and an IS server specific toDCS parameters passed important DCS parameters on. The test beam operator used the TDAQOnline Software user interface application called Integrated Graphical User Interface (IGUI) tointeract with the Information Sharing services. The IGUI application contains the message dis-play, which shows text messages sent by the TDAQ and detector applications via MRS. TheIGUI also includes the Data Flow panel, which displays the status of the data flow elements tothe operator, and the Run Parameters panel, from where the operator can define parameters forthe next run. In addition some detector teams implemented their own custom Java panels,which were integrated into the IGUI. These panels interacted with the various IS servers to fetchthe detector-specific information and displayed it to the operator. The Event Monitoring Servicewas extensively used during the test beams by all detector groups. They developed specific ap-plications, which conform to the EventSampler interface defined by the EMS. These applica-tions were running on the ROD crate controllers of each ROD crate. A variety of monitoringtasks, receiving the events, had been developed in the detector groups and were running ondedicated workstations. Monitoring tasks gathered statistics about the sampled events or dis-played the events to the operator. A very interesting application was developed in the TGCteam implementing an Online Event Display in Java, which receives events from the EMS anddisplays them in graphical form.
10.4 Databases
The TDAQ systems and detectors require several persistent services to access the description ofthe configuration used for the data taking as well as to store the conditions under which thedata were taken. The Online Software provides common solutions for such services taking intoaccount the requirements coming from the TDAQ systems and detectors.
10.4.1 Functionality of the databases
There are three main persistent services proposed by the Online Software:
• the Configuration Databases (ConfDBs) to provide the description of the system config-urations,
• the Online Bookkeeper (OBK) to log operational information and annotation,
• the Conditions Database interface to store and read conditions under which data were tak-en.
10.4.1.1 Configuration Databases
The ConfDBs are used to provide the overall description of the TDAQ systems and detectorhardware and software. They include the description of partitions defined for the system. The

ATLAS Technical Design ReportHigh-Level Trigger, Data Acquisition and Controls 30 June 2003
10 Online Software 167
hardware and software are described in a flexible way and parameterized in such a way the de-scribed configuration can be used for different types of runs.
The ConfDBs are organized in accordance with the hierarchy of the TDAQ system and detec-tors. They allow for each TDAQ system and detector to define their specific format of the data(i.e. the database schema), to define the data themselves, and to share the schema and the datawith others. They provide graphical user interfaces for the human user to browse the data andfor authorized human experts to modify the data. Data access libraries hide the technology usedfor the databases implementation and are used by any TDAQ or detector application to read theconfiguration description or to be notified in case of changes. An application started by an au-thorized expert can use the data access libraries to generate or to modify the data.
The ConfDBs provide an efficient mechanism for fast access to the configuration data for a largenumber of clients during data taking. They do not store the history of the data changes which isthe task of the OBK but provide archiving options. Configuration data which are important foroffline analysis must be stored in the Conditions Database.
10.4.1.2 Online Bookkeeper
The OBK is the system responsible for the online storage of relevant operational information,histograms, and the configuration description provided by the TDAQ systems and detectors. Itorganizes the stored data on a per-run basis and provides querying facilities.
The OBK provides a graphical user interfaces to allow human users to browse contents of therecorded information or append such information. The option for appending information islimited to authorized users. Similarly, the OBK provides programming interfaces for user appli-cations to browse the information or to append annotations.
10.4.1.3 Conditions Database interfaces
The TDAQ systems and the detectors use the Conditions Database to store conditions which areimportant for the offline reconstruction and analysis. The conditions data include parameterssuch as temperature, pressure, and voltage and vary with time. These conditions are storedwith a validity range which is typically expressed in time or run number and retrieved again us-ing the validity range as a key.
The Conditions Database is expected to come from an LHC Computing Grid [10-10] applica-tions area project, with any ATLAS-specific implementation supported by the Offline Softwaregroup. The Online Software system provides application programming interfaces for all TDAQsystems and detector applications, and mechanisms to ensure the required performance duringdata-taking runs.
10.4.2 Performance and scalability requirements on the databases
The performance and scalability requirements of the database services are strongly dependenton the strategies chosen by the TDAQ systems and detectors to transport the data to their appli-cations, to store the conditions, and to keep the operational data. For most TDAQ systems anddetectors, the number of estimated clients of the Configuration and of the Conditions Databasesis roughly equal to the number of local controllers (as explained in Section 10.5.3), which are es-
ATLAS Technical Design ReportHigh-Level Trigger, Data Acquisition and Controls 30 June 2003
168 10 Online Software
timated to be between 500 and 2000. For the Event Filter the situation is not yet defined and thenumber of database clients in the worst-case scenario can be O(103), if each processing taskneeds to receive the configuration description and conditions.
The database information can be split into a number of independent parts according to TDAQsystems and detectors. The complete description is required only by a few applications, whilemost others require access to only a small fraction of it. The typical database size which com-pletely describes all the necessary parameters of the TDAQ system or a detector for a physicsrun is about O(102) Mbyte. The DCS may produce up to 1 Gbyte of measured conditions perday.
The ConfDBs data are read once in preparation for data taking and an acceptable time to get thedescription for the whole system is of O(10) s. During physics data taking selected parts of thedatabases may be changed and an acceptable time to receive the changes by registered applica-tions is of O(1) s. During special calibration runs a considerable fraction of the data can changeand the maximum rate requested in this case is 10 Mbyte per hour.
10.4.3 Architecture of databases
10.4.3.1 Configuration Databases
The ConfDBs provide user and application programming interfaces.
Via a user interface the software developer defines the data object model (database schema) de-scribing the required configurations. The expert uses the interface to manage databases, to pop-ulate the system description, and to define configurations, which can subsequently be browsedby a user.
A TDAQ or detector application accesses the databases via data access libraries (DALs). A DALis generated by the software developer for the part of the object model which is relevant to hissub-system. It is based on a database schema to programming language mapping and relatedinstantiation of database objects as programming language objects. The user of a DAL neversees the low-level database management system (DBMS) and his code can be used withoutchanges for different database systems. The DAL is used by any process required to get the con-figuration description or to receive a notification in case of changes. The DAL is also used by anexpert process to produce the configuration data.
Figure 10-10 shows the main classes and interfaces provided by the ConfDB system and theirusers.
The ConfDB system contains the following classes:
• ConfDB Repository — defines low-level interfaces to manipulate the ConfDBs includingdatabase management by users who are granted the respective privileges, schema anddata definitions and notification subscription on data changes; it defines interfaces abovea DBMS used for implementation and hides any specific details, so any other ConfDBclasses must never use DBMS-specific methods directly;
• ConfDB UI (User Interface) — defines the user interface for object model definition, con-figurations definition, database browsing and population by human users;
• ConfDB DAL Generator — defines the interface to produce a DAL;

ATLAS Technical Design ReportHigh-Level Trigger, Data Acquisition and Controls 30 June 2003
10 Online Software 169
• ConfDB DAL — defines interfaces for configuration selection, reading and writing ofconfiguration objects, and subscription for notifications on data changes by user and ex-pert processes;
• ConfDB Data Monitor — defines interfaces to receive notification of changes.
10.4.3.2 Online Bookkeeper
The OBK provides several interfaces to its services, some of them are to be used by the humanuser, while others are APIs to allow interfacing with client applications. The access to these in-terfaces depends on the user’s (human or system actor) privileges.
The OBK uses as persistency backbone the Conditions and Time-Varying offline databases serv-ices. It counts on those services to provide the necessary means to store and retrieve coherentlydata that changes in time and of which there may exist several versions (e.g. configurations).Figure 10-11 shows the logical subdivision of the OBK system into abstract classes. Of the onesshown, the main ones are:
• OBK Repository — defines the basic methods to allow for storing, modifying, and read-ing of online log data, as well as the methods to set the OBK acquisition mode and also torequest log data from the several TDAQ processes providing them. It allows a human orsystem user to start or stop the acquisition of log data. In order to become a log data pro-vider a TDAQ application will have to contain the OBK Log Info Provider interface. Thisinterface allows a TDAQ application to accept subscriptions for log information from theOBK, as well as for the OBK to access log information in a TDAQ application;
Figure 10-10 Configuration Databases users and interfaces
ConfDB
User Process
Notify Data
RepositoryConfDB
DAL
<<interface>>ConfDB Data
Monitor
Changes
Subscribe DataChanges
Notify ObjectsChanges
Subscribe ObjectsChanges
SelectConfiguration
Get Object
Put Object
Expert Process
ConfDBUI
Get/PutData
Get Schema
Put Schema
ConfDB DALGenerator
<<produces>> DefineObject Model
SW Developer
Make DAL
User
Expert
DefineConfiguration
Browse
Put Object
ManageDBs
ATLAS Technical Design ReportHigh-Level Trigger, Data Acquisition and Controls 30 June 2003
170 10 Online Software
• OBK Browser — this is the class responsible for providing the necessary querying func-tionality for the OBK database. Since the data browsing and data annotation functions aretightly coupled, the class also includes functionality to add annotations to the database;
• OBK Administrator — the OBK Administrator class provides to the users, which aregranted the respective privileges, the functionality to alter (delete, move, rename) parts orall of the OBK database. These users are also given the possibility of changing the OBKacquisition mode (e.g. data sources, filters for the data sources).
Apart from the main classes depicted in Figure 10-11, the OBK architecture also includes fourother classes (not shown in the diagram for reasons of clarity). The OBK UI Browser and theOBK Browser API both inherit from the OBK Browser class and define the human client orient-ed and the application client oriented versions of that class. Similarly the OBK UI Administra-tor and the OBK Administrator API classes define the human client and application clientoriented versions of the OBK Administrator class.
10.4.3.3 Conditions Database interface
The user requirements for the ATLAS offline conditions and time-varying databases and theirarchitecture are not yet fully specified by the ATLAS user community. The Conditions Databaseinterface will provide additional functionality if required by TDAQ and detector users, beyondthe one provided by the Offline Software.
Figure 10-11 OBK users and interfaces
OBKBrowser User
User Process
OBKRepository
OfflineDBLibrary
OBKAdministrator
ExpertExpert Process
TDAQ Process
Define acquisition modeand administrate log data
Browse and annotatelog data
Start/Stop
Subscribe
Notify
Browse
Administrate
Set acquisition mode
Annotate
<<interface>>OBK Log Info
Provider
Get Info <<import>>
acquisition

ATLAS Technical Design ReportHigh-Level Trigger, Data Acquisition and Controls 30 June 2003
10 Online Software 171
10.4.4 Prototype evaluation
The main functions of the ConfDB and the OBK have been implemented and evaluated in theprototype of the Online Software. The main goals were its use during test beam operations, theintegration with other TDAQ sub-systems and detectors, and the evaluation of the suitability ofthe chosen technologies for the final system.
10.4.4.1 Configuration Databases
The prototype of the ConfDBs is implemented on top of the OKS [10-11] persistent in-memoryobject manager. It allows the storage of the database schema and data in multiple XML files.Several subsets can be combined to get a complete description. Access to the configuration de-scription can be made via a file system (C++ interface) and via a dedicated remote databaseserver built on top of ILU [10-4] and tested for C++ and Java interfaces.
Figure 10-12 presents the database test results obtained during the Online Software large-scaleand performance tests [10-9]. The options to read a realistic configuration via the AFS file sys-tem and from a remote database server were tested for the maximum available number ofnodes. The tests with direct concurrent access to the configuration via the common AFS file sys-tem showed good scalability and performance as presented in the first graph of Figure 10-12.Such an approach can be envisaged if a common file system is available. The second graph inFigure 10-12 presents the time necessary to read different sizes of information from one data-base server depending on the number of concurrently reading clients. The third graph inFigure 10-12 shows the time necessary to read one information object from one database serverfor the case where the read request by the clients is initiated synchronously and for the casewhere these requests are randomly distributed over one second. Given a particular situation,one can derive from the graphs the number of necessary database servers in the system depend-ing on the number of clients, timing requirements, data volume, and request synchronization.
The proposed architecture of the ConfDBs allows switching between implementation technolo-gies without affecting user code. Some other database technologies are being studied for possi-ble replacement of the ones used in the prototype, including relational databases with possibleobject extensions, and the Pool Of persistent Objects for LHC (POOL) [10-12] from the LHC Com-puting Grid (LCG) project [10-10].
Figure 10-12 Results of the databases performance and scalability tests
Number of clients (one per node)
Time (sec)
Reading 3 Mbyte of datavia AFS file system
10 40 70 160100 130 190 2200
10
20
30
40
50
Number of clients (one per node)
Time (min:sec)
Connect with database serverand read portion of objects
10 40 70 160100 130 190 2200:00
1:00
2:00
3:00
4:004 MB
200 kB
Number of clients (1...6 per node)
Time (sec)
Connect with database serverand read one object (2 kB)
200 400 600 1200800 10000
1
2
3
4
5 SynchronousDistributedwithin 1”
Updated
Cached
ATLAS Technical Design ReportHigh-Level Trigger, Data Acquisition and Controls 30 June 2003
172 10 Online Software
10.4.4.2 Online Bookkeeper
The prototype of the OBK was implemented on an OKS persistent in-memory object managerand MySQL [10-13] freeware implementation of a relational database management system. Theresults obtained during recent performance and scalability tests [10-9] have shown that the cur-rent MySQL implementation can reach a rate of 20 kbyte/s when storing monitoring data(100 bytes per data item) produced by up to 100 providers.
10.5 Control
The main task of the control package is to provide the necessary tools to perform the TDAQ sys-tem operation as described in Chapter 3, "System operations". It provides the functionality ofthe TDAQ Control as shown in the controls view in Chapter 5, "Architecture".
In addition, the package has the responsibility for the functions necessary for user interaction,process management, and access control in the computing environment.
10.5.1 Control functionality
Control encompasses software components responsible for the control and supervision of otherTDAQ systems and the detectors. The functions have been derived from the user requirementsand are:
• User Interaction: Interaction with the human user such as the operator or expert of theTDAQ system
• Initialization and shutdown: Operations for the initialization of TDAQ hardware andsoftware components are foreseen. The operational status of system components must beverified and the initialization of these components in the required sequence ensured. Sim-ilar considerations are required for the shutdown of the system.
• Run control: System commands have to be distributed to many hundreds of clients pro-grams. The control sub-package is responsible for the command distribution and the syn-chronization required between the TDAQ sub-systems and detectors.
• Error handling: Malfunctions can interrupt system operations or adversely affect thequality of physics data. It is the task of the control sub-package to identify such malfunc-tions. If required the system will then autonomously perform recovery operations and as-sist the operator with diagnostic information.
• Verification of System status: The control package is responsible for verifying the func-tioning of TDAQ configuration or any subset of it.
• Process Management: Process management functionality in a distributed environment isprovided.
• Resource Management: Management of shared hardware and software resources in thesystem is provided.
• Access Management: The control package provides a general Online Software safetyservice, responsible for TDAQ user authentication and the implementation of an accesspolicy for preventing non-authorized users corrupting TDAQ functionality.

ATLAS Technical Design ReportHigh-Level Trigger, Data Acquisition and Controls 30 June 2003
10 Online Software 173
10.5.2 Performance and scalability requirements on Control
The TDAQ system is a large and heterogeneous system composed of a large number of items tobe controlled. Typically these items are clustered and range from readout modules in VMEcrates to workstations within HLT computer farms. Such clusters are the preferred places to in-terface with the Online Software Control system. The number of these clusters is estimated to bein the range of 500–1000. To control these units the TDAQ control system is built in a hierarchi-cal and distributed manner. More detailed explanation can be found in Section 12.3.
10.5.3 Control architecture
The Control package is divided into a number of sub-packages as shown in Figure 10-13. Thefunctionality described in Section 10.5.1 has been distributed between several distinct sub-pack-ages:
• The User Interface (UI) for interaction with the operator
• The Supervision for the control of the data-taking session including initialization andshutdown, and for error handling
• The Verification for analysis of the system status
• The Process Management for the handling of processes in the distributed computing en-vironment
• The Resource Management for coordination of the access to shared resources
• The Access Management for providing authentication and authorization when necessary.
10.5.3.1 User Interface
The User Interface (UI) provides an integrated view of the TDAQ system to the operator andshould be the main interaction point. A flexible and extensible UI will be provided that can ac-
Figure 10-13 The organization of the control package
Control
TDAQ Operator
UI
SupervisionVerification
Access Mgmt
Process Mgmt
Resource Mgmt
ATLAS Technical Design ReportHigh-Level Trigger, Data Acquisition and Controls 30 June 2003
174 10 Online Software
commodate panels implemented by the detectors or TDAQ systems. Web-based technologieswill be used to give access to the system for off-site users.
10.5.3.2 Supervision
The Supervision sub-package realizes the essential functionality of the Control package. Thegeneric element is the controller. A system will generally contain a number of controllers organ-ized in a hierarchical tree, one controller being in control of a number of others in the systemwhile being controlled itself from a higher level controller. One top level controller, called theroot controller, will take the function of the overall control and coordination of the system. TheUser Interface sub-package provides all TDAQ control facilities to the Operator. These areshown as interfaces in Figure 10-14 and discussed below in more detail.
The Initialization and Shutdown is responsible for:• initialization of TDAQ hardware and software components, bringing the TDAQ
partition to the state in which it can accept Run commands
• re-initialization of a part of the TDAQ partition when necessary
• shutting the TDAQ partition down gracefully
• TDAQ process supervision
The Run Control is responsible for• controlling the Run by accepting commands from the user and sending commands to
TDAQ sub-systems
• analysing the status of controlled sub-systems and presenting the status of the whole TDAQ to the Operator
The Error Handling is concerned with• analysing run-time error messages coming from TDAQ sub-systems
• diagnosing problems, proposing recovery actions to the operator, or performing automatic recovery if requested
Figure 10-14 Interfaces of the Supervision and Verification sub-packages
Test
Local Controller
Initialization/Shutdown
Run Control
TDAQ sub-system
TDAQ Operator (via UI)Verify Functionality
TDAQ Expert
Policy/Knowledge
Supervision
Verification
Error Handling

ATLAS Technical Design ReportHigh-Level Trigger, Data Acquisition and Controls 30 June 2003
10 Online Software 175
Most of the above-defined functionality can reside in a so-called Local Controller and is extendedby specific policies which the TDAQ sub-systems and detector expert developers implement.The interface and policies of the Local Controller can be configured by the user using a Policy/Knowledge interface. In addition the supervision can profit from functionality provided by theVerification sub-system.
10.5.3.3 Verification
The Verification sub-package is responsible for the verification of the functioning of the TDAQsystem or any subset of it. It uses developer’s knowledge to organize tests in sequences, analysetest results, diagnose problems, and provide a conclusion about the functional state of TDAQcomponents.
A TDAQ sub-system developer implements and describes tests which are used to verify anysoftware or hardware component in a configuration. This includes also complex test scenarios,where the component functionality is verified by the simultaneous execution of processes onseveral hosts. The sub-system uses the Process Management sub-package for the execution oftests.
The verification sub-system provides access to its functionality via the Verify Functionality inter-face. The sub-system is built on specific tests that probe the functionality of the Online Software,TDAQ sub-system or Detector functionality. These tests connect by the Test interface to the veri-fication sub-system.
The Verification sub-package is used by the Supervision to verify the state of the TDAQ compo-nents during initialization or recovery operations. It can also be used directly by the Operatorvia the UI, as shown in Figure 10-14.
10.5.3.4 Process, Access and Resource Management systems
The Verification and Supervision sub-packages connect via interfaces to other Control sub-packages, as shown in Figure 10-15.
Figure 10-15 Interfaces of the Process Management, Resource Management and the Access Management
Start/Stop
Lock/Unlock
Authenticate
Authorize
MonitorProcess
Mgmt
Resource Mgmt
Access Mgmt
Verification
Supervision
UI
ATLAS Technical Design ReportHigh-Level Trigger, Data Acquisition and Controls 30 June 2003
176 10 Online Software
The Process Management provides basic process management functions in a distributed envi-ronment. These include starting, stopping, and monitoring processes on different TDAQ hosts.While its main users are the Supervision and Verification, it is also available for other user ap-plications. It avoids the overhead of standard operating system tools and allows the manage-ment of the large number of processes involved in the TDAQ system.
The Resource Management is concerned with the allocation of software and hardware resourc-es between running partitions. It is used by the Supervision and by the Process Management. Itprevents the operator from performing operations on resources which are allocated to other us-ers. This is of particular need during commissioning and testing phases, where many groupsare working independently and have to share resources.
The Access Management is a general Online Software safety service, responsible for TDAQuser authentication. It implements an access policy, in order to stop non-authorized personsfrom corrupting the TDAQ system and interfering with data taking. This applies in particular tosensitive areas like the access to configuration databases, access to process management, remoteaccess through the Web, etc. Apart from these cases, the limited access to the network at the ex-periment site is the main security measure.
10.5.4 Prototype evaluation
Prototype evaluations have been performed for a number of technologies. The initial choice wasbased on experience in previous experiments. Products were chosen that fit well in the pro-posed object-oriented software environment.
• A Run Control implementation is based on a State Machine model and uses the State Ma-chine compiler, CHSM [10-14], as underlying technology.
• A Supervisor is mainly concerned with process management. It has been built using theOpen Source expert system CLIPS [10-15].
• A verification system (DVS) performs tests and provides diagnosis. It is also based onCLIPS.
• A Java-based graphical User Interface (IGUI) is being used.
• Process Management and Resource Management are based on components which arepart of the current implementation of the Online Software packages.
10.5.4.1 Scalability and performance tests
A series of large-scale performance tests has been performed to investigate the behaviour of theprototype on systems of the size of the final TDAQ system [10-9]. In several iterations the be-haviour of the system was studied and limits were identified, the prototype was refined andtested until the successful operations of a system with a size in the required range was reached.Up to 1000 controllers and their applications were controlled reliably while meeting the per-formance requirements.
Of note is the synchronized distribution of commands within the system. A command is sent bythe root controller and propagates through the controller tree to the leaf controllers. These leafcontrollers interface between the overall online control system and the specific tasks to be per-formed in the TDAQ system. The time to distribute a command from the top level and to obtain

ATLAS Technical Design ReportHigh-Level Trigger, Data Acquisition and Controls 30 June 2003
10 Online Software 177
the confirmation from all controllers was measured. Figure 10-16 shows the time taken to per-form three successive state transitions for a three level control hierarchy for configurations inthe range of 10–1000 leaf controllers. A single transition takes about two seconds for 1000 con-trollers, a time well within expectations. In a real system each controller would perform its spe-cific actions during such a state transition taking between a few seconds and up to tens ofseconds. In relation to these values the overhead of the overall control system is small.
Also of note is the process control in the distributed system. To switch between various configu-rations, it will be necessary to start and stop many processes on many nodes. Although such anoperation is not performed during physics data-taking, it will be of importance during develop-ment and calibration. Figure 10-17 shows the time to start the processes for a system with up toa thousand controllers. Detailed descriptions and further test results can be found in [10-9].
10.5.4.2 Technology considerations
During the evaluation of the prototype several shortcomings of the current system were identi-fied. An important one is the lack of flexibility in the state machine implementation CHSM. Inthis context the expert system CLIPS [10-15] and related products were studied. The general-purpose nature of this product allows the various aspects of the supervision-like initialization,control, and error handling to be implemented. The knowledge base provides the basis for cus-tomizeble solutions, which can be specialized for different parts of the system. Another advan-tage is the extensibility of CLIPS. It can be interfaced easily with other components of theOnline Software system. Alternative products also under consideration are Jess [10-16], a simi-lar expert system implementation written in Java and a commercial alternative, Eclipse by Ha-ley Inc. [10-17].
Further alternatives have been investigated: SMI++ is a system that models the controlled do-main as a system of interacting state machines [10-18] and is in use at several HEP experiments.Another possibility would be the use of general-purpose scripting languages, such as Python[10-19]. While each of these approaches has its particular merits, the evaluation showed that theCLIPS-based solution is better suited for our environment and is the favoured implementationchoice.
Figure 10-16 Time to perform three TDAQ statetrannsitions for configurations in the range of O(10) toO(1000) controllers
Figure 10-17 Time to start the processes for configu-rations in the range of O(10) to O(1000) controllers
0
2
4
6
8
56 221 386 551 716 881 1046
Controllers
Tim
e [s
]
0
10
20
30
40
50
56 221 386 551 716 881 1046
Controllers
Tim
e [s
]
ATLAS Technical Design ReportHigh-Level Trigger, Data Acquisition and Controls 30 June 2003
178 10 Online Software
10.6 Integration tests
10.6.1 Online Software integration and large-scale performance tests
Major releases of the integrated Online Software System were tested in several test series start-ing in the year 2000. All the major components were included. For the most recent series of testsin January 2003 [10-9], 222 dual-pentium PCs of the CERN IT LXSHARE testbed were used.They were equipped with 600–1000 MHz Pentium III processors, 512–1024 Mbyte of memory,and were running the Linux RedHat 7.3 operating system.
The tests were aimed at verifying the overall functionality of the Online Software system on ascale similar to that of the final ATLAS installation (including up to 1000 leaf controllers) and atstudying the system performance aspects in detail. A number of performance measurements forthe Online Software components were also performed as a function of the system size. Detailsof these can be found in the component test descriptions on IS in Section 10.3.4.2, on Databasesin Section 10.4.4.1, and on Control aspects in Section 10.5.4.1.
The tests followed the sequence of steps which are necessary for TDAQ start-up, running, andshut-down actions. Realistic conditions for the Online Software infrastructure were simulatedby including additional traffic from monitoring activities in the detectors and sub-systems. Thistraffic included monitoring of statistical data and status information, error messages, histo-grams, and event data monitoring. Online Software specific aspects like the configuration andthe control sub-systems were studied. Various special-purpose controllers and infrastructureconfigurations were prepared to help identify possible shortcomings.
Different types of limitations were found in consecutive test cycle phases. After first havingovercome limitations due to design or implementation flaws, limits built into the underlyingcommunication software layer ILU and the underlying TCP/IP system configuration (e.g. themaximum number of allowed connections) were reached. Their discovery led to the develop-ment of specific solutions for the Online Software situation. Other limits concerned operatingsystem parameters and therefore required tuning of the operating system and the use of alterna-tive system calls to realize an Online Software system of the size of the final ATLAS system. Thesuccessful results showed that the current Online Software system already scales to the size ofthe final ATLAS system as shown in Section 10.5.4.1. Detailed studies of the results providedimportant feedback on the architecture and design in the context of the iterative developmentprocess. Optimization should reduce the demand on the operating system and provide addi-tional safety margins. Furthermore, error handling and fault tolerance aspects will have to beextended and the user interface adapted.
10.6.2 Event Filter Software tests involving the Online Software
The Event Filter is implemented as software processes running on a large processor farm whichfor reasons of practicality is split into a number of sub-farms. A prototype Event Filter supervi-sion system, responsible for all aspects of software task management and control in the EventFilter farm, was successfully implemented using services from the prototype implementation ofthe Online Software. The prototype uses the Online Software Configuration Database, RunControl system, and Supervisor.

ATLAS Technical Design ReportHigh-Level Trigger, Data Acquisition and Controls 30 June 2003
10 Online Software 179
The run controllers are arranged in a hierarchical tree with one run controller per sub-farmwhich collaborates with a sub-farm Supervisor to control and monitor the Event Filter processesin the sub-farm. The top-level of the hierarchy consists of a Supervisor which is responsible forcontrolling and monitoring the processes in the supervision infrastructure only (sub-farm RunControllers and sub-farm Supervisors) and a root Run Controller. Note that in the Online Soft-ware prototype only one Supervisor process would normally be used to start all processes de-scribed in the configuration database. For better scalability, the use of multiple Supervisors wastested. This has led to a much more scalable system which complies at least in part with the pro-posed future design of the Online Software to HLT interface [10-20].
The scalability of the prototype system was tested at the same time and using the same clusteras that used for the latest Online Software scalability tests described in Section 10.6.1. Two typesof configuration emulating Event Filter farms were studied:
• The total number of processing hosts was kept constant (~200) but split into differingnumbers of sub-farms (3, 8, 20).
• The number of sub-farms was kept constant (10) and the number of hosts per sub-farmwas varied (5, 10, 20).
Each sub-farm processing host ran two filtering tasks. In the largest configurations studied,more than 1000 processes were under the control of the prototype Event Filter Supervision sys-tem, representing about 10–20% of the EF system which will be used for the first ATLAS run.
Detailed results are given in [10-21]. All the configurations studied could be successfullylaunched, marshalled through the run control sequence, and shut down. The only operation re-quiring a non-negligible amount of time was the initialization of the online infrastructure. How-ever, this is done only once per data-taking period and therefore is not very significant.Nevertheless the Online Software team addressed it in the design presented above. All otherrun control transitions are performed in a reliable and sufficiently rapid way. Observed transi-tion times vary from 0.1 s to about 3 s, depending on the nature of the executed transition. Notethat these times are a combination of the Event Filter specific activities required at each transi-tion and implemented in the sub-farm Run Controllers, plus the Online Software overhead.Owing to the tree architecture of the control system, the transition times do not strongly dependon the number of controlled hosts. A limitation was found in the usage of the Configuration Da-tabase which should be better adapted to the use of a large number of similar, but not identical,devices: these devices are likely to be changed during data-taking activities (added to or re-moved from the configuration, for example, to cope with hardware failures) and this operationshould not interfere with the process of data taking. A dedicated user interface was developedto hide the complexity of the current implementation of the underlying configuration database.In the design of the configuration databases presented above in Section 10.4.3 most of the issuesraised here are already addressed. A closer integration of this user interface with that providedby the Online Software is foreseen.
Suggested modifications, as explained above, were taken into account in the design presentedearlier in this chapter and the Online Software is therefore quite adequate for the control of theEvent Filter.
10.6.3 Deployment in test beam
Major releases of the current Online Software have been in use in three test beam operation pe-riods since summer 2000. This allowed it to run under realistic conditions with the detectors
ATLAS Technical Design ReportHigh-Level Trigger, Data Acquisition and Controls 30 June 2003
180 10 Online Software
similar to the LHC ones and with physics triggers. Valuable feedback on the behaviour of theprototype software was gathered and has led to improvements in design and implementation.Details can be found in [10-22].
10.7 References
10-1 I. Alexandrov et al., Online Software Requirements, ATL-DQ-ES-0015 (2003)http://edms.cern.ch/document/388874/
10-2 I. Alexandrov et al., Online Software Architecture, ATL-DQ-ES-0014 (2003)http://edms.cern.ch/document/388865/
10-3 CORBA,http://www.omg.org/corba/
10-4 ILU,ftp://ftp.parc.xerox.com/pub/ilu/ilu.html
10-5 TAO,http://www.cs.wustl.edu/~schmidt/TAO.html
10-6 MICO,http://www.mico.org/
10-7 omniORB,http://omniorb.sourceforge.net/
10-8 ORBacus,http://www.iona.com/products/orbacus_home.htm
10-9 D. Burckhart-Chromek et al., ATLAS TDAQ Online Software Large Scale Performance Tests January 2003, ATL-DQ-TR-0012 (2003)http://edms.cern.ch/document/392827/
10-10 LHL Computing Grid Project (LCG),http://lcg.web.cern.ch/LCG
10-11 OKS Documentation, ATLAS DAQ Technical Note 033,http://atddoc.cern.ch/Atlas/DaqSoft/components/configdb/docs/oks-ug/2.0/pdf/OksDocumentation.pdf
10-12 POOL,http://lcgapp.cern.ch/project/persist/
10-13 MySQL,http://www.mysql.com/
10-14 P.J. Lucas, An Object-Oriented language system for implementing concurrent hierarchical, finite state machines, MS Thesis, University of Illinois (1993)
10-15 CLIPS,http://www.ghg.net/clips/CLIPS.html
10-16 Jess,http://herzberg.ca.sandia.gov/jess/
10-17 Eclipse, Rule based programming language and inference engine,see under ‘products’ on http://www.haley.com/
ATLAS Technical Design ReportHigh-Level Trigger, Data Acquisition and Controls 30 June 2003
10 Online Software 181
10-18 SMI++,http://cern.ch/smi/
10-19 Python,http://www.python.org/
10-20 D. Burckhart-Chromek et al., HLT Online Software Interface, ATL-D-ES-0009 (2002)http://edms.cern.ch/document/363702/
10-21 S. Wheeler et al., Test results for the EF Supervision, ATL-DH-TR-0001 (2003)http://edms.cern.ch/document/374118/
10-22 I. Alexandrov et al., Systems Integration and Deployment in Test Beam and Large Scale Tests,ATL-DQ-TR-0006 (2003)http://edms.cern.ch/document/390995/
ATLAS Technical Design ReportHigh-Level Trigger, Data Acquisition and Controls 30 June 2003
182 10 Online Software

ATLAS Technical Design ReportHigh-Level Trigger, Data Acquisition and Controls 30 June 2003
11 Detector Control System 183
11 Detector Control System
11.1 Introduction
The principal task of the DCS is to enable the coherent and safe operation of the ATLAS detec-tor. All actions initiated by the operator and all errors, warnings, and alarms concerning thehardware of the detector are handled by the DCS. For the operation of the experiment duringdata taking, a close interaction with the DAQ system is of prime importance. Safety aspects arenot the responsibility of DCS. They are addressed by a dedicated Detector Safety System (DSS)and the global CERN-wide safety system, both of which DCS communicates with.
A Joint Controls Project (JCOP) [11-1] has been set up at CERN to address common points ofcontrols for the four LHC experiments. Details of the scope and the responsibilities of JCOP areat present still being discussed.
The central part of DCS is described in this document and not the sub-detector-specific parts.The latter can be found in the relevant sub-detector TDRs. Central DCS comprises all HW andSW items needed for the global operation of the detector, i.e. starting from the equipment in thecontrol room down to the sub-detector Controls Station and also including the Common Infra-structure Controls, see Section 11.4.1. This reflects also the attribution of responsibilities to thecentral DCS team and to the sub-detector DCS teams.
In this chapter, first the architecture and the logical organization of DCS are explained. Then fol-lows a description of the different components and their interconnections. This leads to a dis-cussion of the full read-out chain and its performance. As examples, some areas of applicationof DCS in the experiment are given. Finally, the communication of DCS with DAQ and with sys-tems external to ATLAS is discussed. The utilization of the DCS, in combination with the Trig-ger and DAQ control, to provide the overall experiment control is described in Chapter 12.
11.2 Organization of the DCS
The functions and the scope of the DCS have been described in Chapter 1. In this section, the or-ganization of the DCS is described. The architecture of the DCS and the technologies used for itsimplementation are constrained by both the functional requirements and the environmental as-pects. The DCS consists of a distributed Back-End (BE) system running on PCs and of differentFront-End (FE) systems. The BE will be implemented with a commercial Supervisory ControlAnd Data Acquisition system (SCADA). The DCS FE instrumentation consists of a wide varietyof equipment, ranging from simple elements like sensors and actuators up to complex Front-End Controllers (FECs) for specialized tasks. The connection between FE and BE is provided byfieldbus or LAN.
The equipment of the DCS will be geographically distributed in three areas as schematicallyshown in Figure 11-1, namely the main control room SCX1 at the surface of the installations, theunderground electronics rooms USA15 and US15, and the cavern of the detector, UX15. USA15and US15 are equivalent except that the first is accessible to personnel during beam operationand the second is not. The SCADA components will be distributed over the main control andthe electronics rooms, while the FE equipment will be placed in USA15, US15, and UX15. The
ATLAS Technical Design ReportHigh-Level Trigger, Data Acquisition and Controls 30 June 2003
184 11 Detector Control System
relative independence of the operation of the sub-detectors leads to the hierarchical organiza-tion shown in Figure 11-1. In addition to the sub-detectors there is a part for Common Infra-structure Controls (CIC) that monitors services provided to the experiment as a whole, likeelectricity or ventilation. It also supervises equipment which is common to several sub-detec-tors like electronics racks.
The FE electronics in UX15 is exposed to a strong magnetic field of up to 1.5 tesla and to ioniz-ing radiation. The DCS FE equipment will be located outside of the calorimeters, where thedose rate is of the order of 1 gray/year or less. This permits the use of selected Commercial OffThe Shelf (COTS) components, which, however, have to be individually qualified for radiationfollowing the ‘ATLAS Policy on Radiation Tolerant Devices’ [11-2]. FE equipment which can notoperate under these conditions, like processor-based devices (e.g. FEC) or some types of powersupplies, has to be accommodated in the electronics rooms.
The BE system consists essentially of PCs and is organized in a tree-like structure with severallevels. It will be described in detail in Section 11.4. The highest level is situated in the controlroom provides all the tools needed for the integrated operation of the detector as a whole, likethe operator interface, the alarm system, and various servers. The workstations in the levels be-low provide the online data and command handling, and full standalone operation capabilityfor each sub-detector. This gives operational independence to the sub-detectors when needed,e.g. for commissioning, debugging, or calibration. The connection between all PCs of the BEover a LAN is part of the SCADA software.
11.3 Front-End system
The FE equipment connects directly to the detector hardware. It comprises sensors and actua-tors, digitizers, controllers and processors, commercial devices, and standalone computer-basedsystems. Concerning monitoring, the FE reads and digitizes values, processes them in some cas-es, and transfers the data to the BE. It also executes the commands that it receives from the BE.
Figure 11-1 Geographical deployment of the DCS
ElectronicRack
Local Area Network
Common Infrastructure
ServersOperation
Sensors Actuators
ELMB ELMBELMB
ELMB
Power Supply
CoolingInterlock
Box
TestTest
ELMB
Alarms
HVBarrel
HVBarrel
DetectorSub-system
Back-E
ndS
ystemF
ront-End
System
s
L < 50 m
SC
X1
US
A15
US
15U
X15
SC
X1
US
A15
US
15U
X15
Subdetector 1 Subdetector 2 Subdetector N…
FECFieldbus
HVFEC

ATLAS Technical Design ReportHigh-Level Trigger, Data Acquisition and Controls 30 June 2003
11 Detector Control System 185
The FE DCS of the sub-detectors is the responsibility of the sub-detector groups and is de-scribed in their TDRs. It consists of two categories of equipment, one being more general pur-pose and widely used in ATLAS, like the ELMB which will be explained in Section 11.3.1, andthe other being more specialized, i.e. used for a dedicated task (like the alignment system of theMuon Spectrometer), which will be mentioned in Section 11.3.2. The first class is described inthis TDR whereas for the second only the method and the point of connection to the BE is given.
The FE equipment is distributed over the whole volume of the detector with cable distances ofup to 150 m. Two conflicting aspects constrain the distribution underground. Because of the ra-diation level, the magnetic field, the space limitations, and the inaccessibility of UX15 duringbeam time, it is preferable to locate the equipment in the electronics rooms. However, the com-plexity, cost, and technical difficulties of laying analog cabling over such distances, and the dif-ficulties of transferring large amounts of digital data over long distances in such a harshenvironment, imply the digitization and compression of the data as early as possible. Thisshould be done on the detector in UX15 and only results of digitization, possibly with analysisof data and compression, should be transferred to USA15 or US15.
The harsh environment in the cavern limits the types of technologies that may be used. For datatransmission to the BE the CAN fieldbus [11-3] has been chosen amongst the CERN-recom-mended fieldbuses. CAN equipment is very robust, has excellent error detection and recovery,can be used over large distributed areas, does not use components sensitive to magnetic field,and has good support from industry.
11.3.1 Embedded local monitor board
An electronics module called Embedded Local Monitor Board (ELMB) [11-4] has been devel-oped for standard analog and digital input/output. No such commercial devices exist that canoperate in the hostile environment of the cavern. Also because of cost and space limitations(several 100 000 channels are needed) an optimized design was required.
The ELMB is a single, credit-card-sized electronics board that may either be embedded into cus-tom front-end equipment or be used in standalone mode. It comprises 64 high-precision analoginput channels of 16-bit accuracy and it provides 8 digital inputs, 8 digital outputs and 8 config-urable (either input or output) lines. Its serial port can drive additional devices like a digital-to-analog converter. As it has very low power consumption, it can be powered from the electronicsrooms via the fieldbus cable.
The firmware loaded into the ELMB includes instructions for both driving the input/outputfunctions and the communication over the CAN field bus using the higher level protocol,CANopen. Standard configuration software tools provide easy ‘plug and play’ functionality forthe user. The ELMB fulfils the majority of standard I/O requirements of the ATLAS sub-detec-tor applications in terms of functionality, accuracy, and stability. It has been tested and qualifiedto operate in the radiation and magnetic field environment present in UX15. Its error detectionand recovery procedures have been validated in long-term operations without manual inter-vention.
Typical applications of the ELMB are to directly read from/write to sensors and actuators, or tocontrol more complex devices like power supplies, gas devices, cooling systems, or whole de-tector elements like chambers. In the second class of applications, the ELMB is normally fullyintegrated in the device. In several cases, like the monitoring of the gas flow or the control of the
ATLAS Technical Design ReportHigh-Level Trigger, Data Acquisition and Controls 30 June 2003
186 11 Detector Control System
SCT power supply system, which require additional functionality like histogramming, special-ized ELMB software has been developed by the users, which replaces its standard firmware.
11.3.2 Other FE equipment
An effort is made to standardize FE devices like high-voltage units, low-voltage power sup-plies, racks, PLCs etc. As all four LHC experiments have similar requirements, such front-endequipment will be supported in the framework of JCOP. This includes generic tools and librar-ies for configuration, data readout into SCADA, and general supervision and operation. The gassystems also fall into this category of equipment.
Specialized, non-standard FE equipment like alignment and calibration systems is usually self-contained. Often large quantities of data have to be read and processed. The results are thentransmitted to DCS for further treatment, monitoring, and storage. Therefore for each such sys-tem a connection point and a protocol have to be defined. In many cases, this is TCP/IP over aLAN, but also dedicated drivers running in the BE will be used.
11.4 The Back-End system
The functionality of the BE system is two-fold. It acquires the data from the FE equipment and itoffers supervisory control functions, such as data processing and analysis, display, storage, andarchiving. It also provides handling of commands, messages, and alarms.
The BE system is organized hierarchically to map the natural structure of the experiment, i.e.sub-detectors, systems, and sub-systems. The BE hierarchy allows the dynamic splitting of theexperiment into independent partitions as defined in Section 3.4, which can be operated in stan-dalone or integrated mode. The operation of the different sub-detectors will be performed bymeans of Finite State Machines (FSMs), which will handle the states and transitions of the dif-ferent parts of the detector, as explained in Chapter 12. The coordination of the different parti-tions will be performed by means of commands and messages.
11.4.1 Functional hierarchy
In order to provide the required functionality, the BE system of the DCS will be organized func-tionally in three levels as shown in Figure 11-2. Overall operation of the detector can be per-formed at the level of the Global Control Stations (GCSs), while data processing and commandexecution are handled at the lower levels. Archiving of data and alarms, and logging of com-mands and incidents will be provided at every level. Remote access to a well-defined set of ac-tions to be performed by the two upper levels of the BE hierarchy will also be provided subjectto proper access authorization.
Global Control Stations
The overall control of the detector will be performed at the top level of the BE system, whichconsists of the Global Control Stations (GCSs). They provide high-level monitoring and controlof all sub-detectors, and of the technical infrastructure. Detailed control of the sub-detectors isprovided only at the next level, i.e. the Sub-detector Control Stations (SCSs) level. The functionsperformed by the GCSs are the following. They assemble all status information available and

ATLAS Technical Design ReportHigh-Level Trigger, Data Acquisition and Controls 30 June 2003
11 Detector Control System 187
present it to the operator in a hierarchical fashion. All anomalies of operation like warnings,alarms, etc. are collected, displayed, and archived. Actions from the operator like acknowledge-ment can be requested. The GCSs may trigger actions themselves or ask the operator to do so.Any parameter in the system can be inspected in real-time and its history can be displayed. Thisalso includes the browsing of log files. Pre-defined commands can be given to the sub-detectorsand to their sub-systems. Settings can be changed for selected parameters. The DCS InformationService (DCS_IS) handles the communication with external systems like the LHC accelerator,the CERN infrastructure, the magnets, and the DSS. Web access and database services will behandled by dedicated servers. Bi-directional data exchange between the DCS and the TDAQsystem will be possible at this level but commands from TDAQ will only be sent to the level be-low.
Sub-detector Control Stations
The SCSs form the middle level of the BE hierarchy. There will be one SCS per sub-detector andan additional SCS to handle the monitoring of the common infrastructure of the experiment, theCIC. The latter will be directly interfaced with the DCS_IS at the GCS level. It is also foreseen tohave a direct connection from the SCSs to the DCS_IS to provide the different sub-detectorswith the status of the external systems, as well as with the environmental parameters. All ac-tions on a given sub-detector that are possible from the GCSs are provided at this level as well.In addition, the SCS allows the full, local operation of the sub-detector by means of dedicatedgraphical interfaces. The SCSs handle the coordination of all sub-systems in the Local ControlStation (LCS) layer, and they are responsible for the validation of all commands, which are is-sued either by the GCS or from the TDAQ run control. They translate global commands, such asramping up a high-voltage system, into detailed commands, e.g. for the individual power sup-plies, and send these to the LCS layer below for execution. They assemble the overall status ofthe sub-detector and pass it on to the GCS and to TDAQ.
Local Control Stations
The bottom level of the BE hierarchy is constituted by the LCSs, which handle the low-levelmonitoring and control of the different systems and services of the detector. The organization ofthis level for a given sub-detector can be according to either geographical or functional criteria.
Figure 11-2 Hierarchical organization of the Back-End system of the DCS in three functional layers
DCS_IS
ATLAS
Global Control Stations
Subdetector Control Stations
Local Control Stations
CIC Pixel SCT TRT LAr Tile MDT TGC CSC RPC
LHC
CERN
Magnet
DSS
EC1 BL L1 L2 Cooling HV LVEC2
ATLAS Technical Design ReportHigh-Level Trigger, Data Acquisition and Controls 30 June 2003
188 11 Detector Control System
The former follows the topological composition of the sub-detector, i.e. barrel, end-cap, etc.,whereas the latter combines functions or services of the sub-detector in one LCS, like cooling,high-voltage gas, etc. It is important to note that although the gas system will be built by theCERN Gas Group, from the DCS point of view, gas systems are regarded as a sub-detector serv-ice since each sub-detector is responsible for the monitoring and control of all parameters rele-vant for operation. The LCS level of the hierarchy is directly interfaced to the FE system. Besidesthe readout and control of the equipment, it also performs calculations and fine calibration ofthe raw data from the FE and comparison of the values with preconfigured thresholds for thealarm handling. The stations placed at this level will execute the commands received from theSCS in the layer above and they can also execute autonomously predefined actions if required.
11.4.2 SCADA
SCADA systems are commercial software packages normally used for the supervision of indus-trial installations. They gather information from the FE layer, process these data, and presentthem to the operator.
Besides the basic functionalities like Human–Machine Interface (HMI), alarm handling, archiv-ing, trending, or access control, SCADA products also provide a set of interfaces to hardware,e.g. fieldbuses and PLCs, and to software, e.g. Application Program Interface (API) to commu-nicate with external applications, or connectivity to external data bases via the Open or JavaData Base Connectivity protocols (OBDC and JDBC, respectively).
SCADA products provide a standard framework for developing applications and lead in thisway to a homogeneous DCS. This also saves development and maintenance effort reducing thework for the sub-detector teams. In addition, they follow the evolution of the market, taking ad-vantage of advances in technology, like operating system or processor platforms.
11.4.3 PVSS-II
A major evaluation of SCADA products [11-5] was performed at CERN in the framework ofJCOP, which concluded with the selection of PVSS-II [11-6] from the company ETM. This prod-uct will be used for the implementation of the BE systems of the four LHC experiments.
PVSS-II is device-oriented, where variables that belong logically together, are combined in hier-archically structured data-points. For example, variables could be channels in a high-voltagecrate and grouped as such in a PVSS-II data-point. Device-oriented products adopt many prop-erties like inheritance and instantiation from object-oriented programming languages. Thesefeatures facilitate the partitioning and scalability of the application. PVSS-II includes a powerfulAPI. A driver development toolkit is also available to interface to custom applications or specialequipment.
PVSS-II is designed as a distributed system. The single tasks are performed by special programmodules called managers. The communication between them takes place according to the cli-ent–server model, using the TCP/IP protocol, and is entirely handled by PVSS-II. The internalcommunication mechanism of the product is entirely event-driven. This characteristic makesPVSS-II especially appropriate for detector control since systems that poll data values and sta-tus at fixed intervals present too big an overhead and have too long reaction times resulting inlack of performance.

ATLAS Technical Design ReportHigh-Level Trigger, Data Acquisition and Controls 30 June 2003
11 Detector Control System 189
The managers can be distributed over different PCs running either Microsoft Windows orLinux. The latter has been an important point in the selection of this product since the DAQ sys-tem of the ATLAS experiment is not being developed under Windows but under Linux and oth-er Unix flavours.
PVSS-II allows the supervisory software to be split into smaller applications communicatingover the network as imposed by the distribution of the DCS equipment over different locations.
The functionality provided by PVSS-II has been successfully tested in a number of test-beam ap-plications with various sub-detectors. Aspects like the scalability and the performance of theproduct are currently being addressed in different tests performed in collaboration with JCOP.
11.4.4 PVSS-II framework
PVSS-II has proven to be a good basis to build the LHC experiment controls. However, it lackssome functionality required for the control of high-energy physics detectors, and some generictools and libraries are needed to develop a homogeneous and coherent system. Therefore an en-gineering framework on top of PVSS-II is being developed in the context of JCOP. This compris-es a set of guidelines, tools, libraries, and components needed by all four LHC experiments.This framework will lead to a significant reduction in the development and maintenance workto be done by the sub-detector teams and to a more homogeneous system. It also addressesquestions of interoperability of the different components.
This framework includes programs to create the readout structure for standardized devicessuch as high-voltage systems and to configure them. Operational tools for displaying data oralarms are also in the scope of the framework, as well as drivers to connect commonly usedhardware and software.
The ELMB has been integrated into PVSS as a component of the JCOP framework in order to fa-cilitate the usability of the ELMB and to ensure the homogeneity of the SCADA software. TheELMB component provides all PVSS infrastructure needed to set up and to operate the ELMB. Italso comprises a so-called ‘top-down’ configuration tool, which handles the configuration of thesoftware interface of the ELMB to the BE.
Some services, tools, and even applications can be common for all PVSS-II stations in the BE.Examples are access to the conditions database, advanced data display, or the alarm system.These are also expected to be provided by this framework.
11.5 Integration of Front-end and Back-end
Several methods are possible for the connection between the BE and the FE systems:
• Dedicated driver: PVSS-II provides drivers for modbus devices, PROFIBUS, and someother hardware. It also contains a driver development toolkit that allows users to write adriver for their special hardware.
• OPC client–server connection: OPC [11-7], which is the abbreviation for ‘Object linkingand embedding for Process Control’, is a widely used industrial standard. Most commer-cial low- and high-voltage systems are supplied with an OPC server.
ATLAS Technical Design ReportHigh-Level Trigger, Data Acquisition and Controls 30 June 2003
190 11 Detector Control System
• DIM software: DIM, which is the abbreviation for ‘Distributed Information Manager’ hasbeen developed at CERN. It is a communication system for distributed and multi-plat-form environments and provides a network-transparent inter-process communicationlayer.
Because of its widespread usage and the good industrial support, OPC has been chosen as themain interface from SCADA to hardware devices. The main purpose of this standard is to pro-vide the mechanism for communicating with numerous data sources. OPC is based on theDCOM technology of Microsoft and hence requires the Windows operating system. The specifi-cation of this standard describes the OPC Objects and their interfaces implemented by the OPCserver. The architecture and specification of the interface was designed to facilitate clients inter-facing to a remote server. An OPC client can connect to more than one OPC Server, in turn anOPC Server can serve several OPC clients. Consequently all OPC objects are accessed throughinterfaces.
11.5.1 OPC CANopen server
CANopen, which is used by the ELMB, is a high-level protocol for CANbus communication.This protocol is widely used. CANopen standardizes the types of CANbus messages and de-fines the meaning of them. It allows the same software to manage CAN nodes of different typesand from different manufacturers. Several CANopen servers exist on the commercial market,but all of them are tailored to specific hardware interface cards and they provide only a subsetof the CANopen functionality required by the ELMB. For these reasons, an OPC CANopenserver has been developed to connect the ELMB to SCADA.
This OPC CANopen server works as the CANopen master of the bus, handling network man-agement tasks, node configuration, and data transmission to the OPC client. It consists of twoparts.
• The main part contains the OPC functions themselves. It implements all the OPC interfac-es and main loops. Any application interacts with this part through interfaces. TheCANopen OPC server transmits data to a client only on change, which results in a sub-stantial reduction of data traffic.
• The second part is hardware dependent. It communicates with the CANbus driver of theCAN interface card chosen and controls the CANopen devices.
Several buses with up to 127 nodes each, in accordance with the CANopen protocol, can be op-erated by this OPC CANopen server. The system topology in terms of networks and nodes perbus is modelled at start up time in the address space of the OPC CANopen server from a config-uration file created by the ELMB configuration tool mentioned in Section 11.4.4.
11.6 Read-out chain
The complete standard read-out chain [11-8] ranges from the I/O point, e.g. sensor or actuator,to the operator interface and is composed of the elements described above: ELMB, CANopenOPC Server, and PVSS-II. In addition to the data transfer, it also comprises tools to configureand to manage the bus. PVSS-II describes the system topology in terms of data-points organizedin a hierarchy. The data-points could be representations of a CANbus, ELMBs, or sensors. Thesedata-points are connected to the corresponding items in the OPC server in order to send the ap-

ATLAS Technical Design ReportHigh-Level Trigger, Data Acquisition and Controls 30 June 2003
11 Detector Control System 191
propriate CANopen message to the bus. In turn, when an ELMB sends a CANopen frame to thebus, the OPC server decodes it and sets the respective item in its address space, which transmitsthe information to a data-point in PVSS. The different elements of the read-out chain performthe functions described below.
The ELMB digitizes the analog inputs and drives the digital input and output lines. Differentsettings can be applied to the ADC, including choosing as data output format either raw countsor calibrated micro-volts. Data are sent either on request from the supervisor, or at predefinedintervals, or when they have changed. As the ELMB is in most cases exposed to ionizing radia-tion, its firmware checks also for possible radiation-induced errors (e.g. memory or registerchanges) and tries to correct them.
The OPC server transmits data together with quality information from the CANbus to PVSS-IIas soon as they have changed. It can optionally perform calculations, e.g. converting the datainto physical quantities in appropriate units.
The SCADA system applies the individual calibration procedures and compares the data withpre-defined thresholds. In this way warnings, alarms, and automatic actions are established.SCADA also archives the data and allows their visualization.
11.6.1 Performance of the DCS readout chain
Safe operation of ATLAS require the complete monitoring of the detector every few seconds. Inaddition, the average CANbus occupancy in normal operation is required to be kept well below50% in order to cope with higher bus loads in case of major problems with the equipment beingmonitored. In order to investigate the performance and the scalability of the DCS read-out chainup to the size required by ATLAS, a CANbus system consisting of six CANbuses with 32ELMBs each was set up [11-9].
The aim was to study the behaviour of the system in order to optimize the read-out parametersand to find the performance limits of such a read-out chain. These limits define the granularityof the system in terms of number of ELMBs per CANbus and the number of buses per PVSSsystem. In particular, the following was investigated.
• Remote powering of the ELMB nodes via the bus. The radiation levels in the detectorcavern force the power supplies to be placed in the underground electronics rooms.Therefore, the power for the nodes will have to be fed remotely via the CANbus withdistances of up to 150 m.
• Bus load, which determines the number of nodes per bus under normal operation. Thedata traffic on the bus has to be uniformly distributed over time in order to keep thebus load low. In ATLAS the bus occupancy should be kept well below 50%, evenduring peak times.
• Optimization of the work distribution amongst the different processing elements in theread-out chain. The functions to be performed by the ELMB, CANopen OPC server,and PVSS have to be evenly distributed to ensure adequate load of each of thesecomponents and to avoid bottle-necks.
• Optimization of the system performance by tuning the different software settings suchas the update rates for OPC and the read-out frequency.
• Determination of the overall read-out speed.
ATLAS Technical Design ReportHigh-Level Trigger, Data Acquisition and Controls 30 June 2003
192 11 Detector Control System
The set-up employed in the test is shown in Figure 11-3. The system of CANbuses was operatedfrom PVSS-II using the CANopen OPC server and the ATLAS final-choice CAN interface card[11-9]. The bus lengths were 350 m in all cases, in order to fulfil the ATLAS requirements with abroad margin. Up to 32 ELMBs were connected at the end of each CANbus. The total number ofchannels in this system was 12 288 analog inputs, 3072 digital outputs, and 1536 digital inputs.It is important to note that the number of channels in the set-up described here is comparable tothat of some large applications in ATLAS, e.g. some sub-detector’s low and high voltage sys-tems. During the test, the read-out rate was increased in order to push the system to the limit.When big bursts of data arrive at PVSS-II very rapidly, the different messages can be internallybuffered. Two different situations can be distinguished:
• ‘Steady run’, where all messages sent by the ELMBs to the bus are stored to the PVSS-II da-tabase and are processed in real time, i.e. no buffering takes place at the PVSS-II or OPClevel.
• ‘Avalanche run’, where the fastest possible read-out rate is maintained for a certain periodof time, typically a few minutes. Under these circumstances, although all messages are ar-chived to the PVSS database, the data flow is so high, that messages cannot be treated inreal time. They are buffered at the SCADA level, leading to an increase in the memory us-age. It is important to note that although long-term operation under these conditionswould not be possible, such a situation can occur in the case of major problems with theequipment being monitored. This can happen, for example, with a power cut, where allthe parameters change at the same time. The read-out system must be able to handle thisfor a short period of time and to recover from it.
On the system of Figure 11-3, a minimum read-out cycle of 30 s is needed to stay in ‘steady run’conditions. During an ‘avalanche run’, where buffering is allowed, a read-out cycle of 8 s can be
Figure 11-3 ELMB full branch test set-up
CANbus350 m
CAN Analyser
CANopen
PowerSupply
PVSS-II+
OPC Server
RAM 512 MB1.8 GHz
32 ELMB/bus
BUS_1
BUS_2
BUS_3
BUS_4
BUS_5
BUS_6
ELMB_1 ELMB_2 ELMB_30 ELMB_31 ELMB_32
ELMB_1 ELMB_2 ELMB_30 ELMB_31 ELMB_32
ELMB_1 ELMB_2 ELMB_30 ELMB_31 ELMB_32
ELMB_1 ELMB_2 ELMB_30 ELMB_31 ELMB_32
ELMB_1 ELMB_2 ELMB_30 ELMB_31 ELMB_32
ELMB_1 ELMB_2 ELMB_30 ELMB_31 ELMB_32

ATLAS Technical Design ReportHigh-Level Trigger, Data Acquisition and Controls 30 June 2003
11 Detector Control System 193
sustained for several minutes. The examination of the CPU usage showed that in both cases thelimitation is due to the work of the PVSS-II managers. These results indicate that the operationof the read-out is constrained by the performance of PVSS-II, i.e. by the PC performance. It hasto be pointed out that the situation described is the worst case possible. During normal opera-tion data will be sent only when they change, i.e. they are evenly distributed, and can be treatedin real time. Moreover, the performance can be improved by using a more powerful CPU and byattributing fewer channels to a station. In this way, the required read-out interval can beachieved.
11.6.2 Long-term operation of the read-out chain
The DCS has to operate without any interruption and hence must recover automatically fromany errors, including those induced by radiation. The long-term operation of the full read-outchain was tested with a number of ELMBs in a radiation environment similar in composition tothe one expected in the ATLAS cavern, though at a much greater dose-rate [11-10]. This environ-ment allows the testing of the various error recovery procedures implemented at the differentlevels of the read-out. A detailed description of the requirements to cope with the different ef-fects induced by the radiation on the ELMB electronics can be found in [11-4]. A CANbus ofmore than 100 m was connected to a PC running the standard read-out chain. The test ran per-manently for more than two months, which is equivalent to about 300 years of operation of anELMB at the expected ATLAS dose rate. The following precautions and recovery procedureswere implemented. The CAN controller in the ELMB ensures that messages are sent correctly tothe bus and will take any necessary action if errors are detected. Bit flips, which were observedat the ELMB by special test software, were also handled correctly by the ELMB firmware. TheOPC server ensures that all ELMBs on a bus are kept in the operational state by monitoring allmessages and sending a software reset when required. At the highest level, PVSS scripts wereutilized to detect an increase of the current consumption on the bus — which would be an indi-cation of damage by radiation — and to reset the ELMBs if communication was lost. Throughthis script the power supply for the bus was also controlled, allowing for hardware resets by cy-cling the power. The system ran stably without any user intervention for the total time of thetest.
11.7 Applications
The components and tools described above are used to build the applications that control andmonitor the experiment equipment. The applications for the supervision of the sub-detectorsare the responsibility of the sub-detector groups and are described in the relevant TDRs and in[11-11]. All equipment that does not belong directly to a sub-detector will be supervised by theSCS of the CIC, which is hierarchically situated at the level of a sub-detector. The CIC monitorsthe sub-systems described below.
All racks, both in the electronics rooms and in the cavern will contain a control unit based on theELMB. It monitors the basic operational parameters like temperature, air flow, cooling parame-ters, etc. and also user-defined parameters. Some racks will have the option of controlling theelectric power distribution. The crates housed in these racks usually have their own controls in-terface.
ATLAS Technical Design ReportHigh-Level Trigger, Data Acquisition and Controls 30 June 2003
194 11 Detector Control System
General environmental parameters like temperature, humidity, pressure, radiation level etc.will also be monitored by the CIC. Parameters of the primary cooling system also belong to thiscategory. The individual sub-detector cooling distribution systems, however, are supervised bythe corresponding sub-detector SCS.
All information collected is available to all other PVSS stations via the central DCS informationserver. A subset of it will also be transmitted to the DAQ.
11.8 Connection to DAQ
The communication between DAQ and DCS is very important for the coherent operation of thedetector and data acquisition. This is achieved through a synchronization of the two systems onmultiple levels. For this synchronization to be possible, the following types of information areexchanged between DAQ and DCS:
• bi-directional exchange of data, e.g. parameter values and status information;
• transmission of DCS messages to DAQ, e.g. alarms and error messages;
• sending of commands from DAQ to DCS and providing feedback about their execution.
The functionality of the DAQ–DCS Communication (DDC) package [11-12] has been split alongthe same lines as the data exchanges. The DDC software components are thus, Data Transfer(DDC-DT), Message Transfer (DDC-MT), and Command Transfer (DDC-CT). These compo-nents are described and their interfaces given in the following sub-sections.
The DDC design incorporates two fundamental concepts of major importance in ATLASTDAQ: the concept of partitioning, which implies that the DDC functionality has to be providedfor each TDAQ partition and work independently from other partitions; and the concept faulttolerance and error recovery, which for the DDC implies that if the communication with either aPVSS workstation or the DAQ is broken, it waits until they become available again and reestab-lishes the connection.
The DDC is developed on top of the interfaces to the Online Software (see Chapter 10) andPVSS described below. Their relationship is shown in Figure 11-4.
The DDC interface to DAQ is implemented using the following Online Software services: theInformation Service, which allows the sharing of run time information; the Error ReportingService, which distributes application messages; and the Run Control package, which uses aFSM to represent, control, and synchronize the states of TDAQ sub-systems within a partition.Also, DDC is configured using the Online Software Databases service. The DDC configurationincludes the set of parameters, messages, and commands to be exchanged between DAQ andDCS.
PVSS-II has a powerful API allowing full direct network access to the run-time database thatholds, for example, the DCS parameter values. This API is used as the DDC interface to DCS.
The prototype of the DDC package was used at test-beam during 2001 and 2002 and has beendemonstrated to work in a satisfactory and reliable manner.

ATLAS Technical Design ReportHigh-Level Trigger, Data Acquisition and Controls 30 June 2003
11 Detector Control System 195
11.8.1 Data transfer facility (DDC-DT)
The data exchange in both directions is implemented via the Information Service. The applica-tion keeps the data elements, i.e. the parameters of the systems, which are declared in the DDC-DT configuration, synchronized at both sides. DDC implements this functionality by using thesubscription mechanisms provided by DAQ and DCS. DDC also allows a single read of DCSdata on request. Figure 11-5 shows the interfaces being used.
11.8.2 Message transfer facility (DDC-MT)
The DCS message transfer to DAQ is implemented via the Error Reporting Service. The inter-faces used are shown in Figure 11-6. DCS messages defined in the DDC configuration, like high-voltage alarms or information messages, are sent to DAQ.
Figure 11-4 DDC package connecting DAQ and DCS
Figure 11-5 DDC data transfer interfaces
Figure 11-6 DDC message transfer interfaces
Trigger/DAQPartition
Detector/DCS
Vertical
Slice
PVSSSystem
OnlineSoftwareServices
DDCPackage
Configuration
DCS PVSSApplication
OnlineInform ationService
DDC DataTransfer
Notify
Subscribe
Getdata
Subscribe
Notify
Getdata
SetdataSetdata
DCS PVSSApplication
OnlineError
Reporting
DDCM essageTransfer
Notify
Subscribe
Send m essage
ATLAS Technical Design ReportHigh-Level Trigger, Data Acquisition and Controls 30 June 2003
196 11 Detector Control System
11.8.3 Command transfer facility (DDC-CT)
The DDC-CT sub-system, shown in Figure 11-7, is implemented as a dedicated run controller tobe included as a leaf in a TDAQ partition run control tree. Like any other TDAQ run controller,DDC-CT implements the TDAQ FSM. When a state transition is requested, the associated com-mand is then sent to the DCS and waits for its execution. The actions to be carried out for anycommand are the entire responsibility of the PVSS-II application. The DDC-CT state transitionis acknowledged only after the confirmation of the successful execution of the command on theDCS side. The mapping of the run control transitions onto commands for DCS is done in theDDC-CT configuration.
In addition, the DDC-CT allows for the asynchronous transmission of commands to the DCSwhich are not associated to transitions in the TDAQ FSM. These are called ‘non-transition’ com-mands and are implemented via the Information Service. Such a command may be issued atany time by any TDAQ application, including the parent run controller.
11.9 Interface to external systems
The term external system designates a system that has its own control system, and with whichATLAS has to interact. This communication will be handled by the DCS. The most notable ex-ample of such a system is the LHC accelerator.
The connection will support bi-directional information exchange and, in some cases, includesending and receiving of commands. This interface will be common for the four LHC experi-ments and it is expected to be developed in the framework of JCOP.
11.9.1 LHC
Data have to be transmitted in both directions between ATLAS and the LHC accelerator. Thefollowing are examples of data that the LHC has to provide to ATLAS:
• overall status of the accelerator, e.g. shutdown, filling, ramping, tuning, stable beams;
• beam parameters, e.g. energy, the different types of background, luminosities, beam posi-tions, beam sizes, and profiles;
Figure 11-7 DDC command transfer interfaces
DCS PVSSApplication
ParentRunController
DDCCom m andTransfer
Notify
Subscribe
Subscribe
RC-interface
Notify
Setdata
O nlineInform ationService
RC-interface

ATLAS Technical Design ReportHigh-Level Trigger, Data Acquisition and Controls 30 June 2003
11 Detector Control System 197
• ancillary parameters, e.g. collimator settings, magnet settings, and vacuum values up-stream and downstream of the experiment.
This information is used in ATLAS for the validation of commands going to the sub-detectors,for interlocks, for the operation of physics data taking as described in Section 12.4.3, and even-tually also for the offline physics analysis. These data will be logged by DCS.
Examples of data that ATLAS will send to the LHC are:
• various types and distribution of backgrounds as observed in the sub-detectors;
• luminosities measured and various trigger rates;
• beam positions measured by the ATLAS tracking sub-detectors;
• magnet status, since the solenoid especially may have an effect on the beams;
• status of the detector with respect to the possibility of injecting particles or dumpingbeam. Indeed the sub-detectors have to be in a state which is safe for these operations.
This information is needed for the general operation of the accelerator. Some of the data are par-ticularly important for the fine-tuning and optimization of the beams.
A complete list of all parameters to be exchanged is not yet available. In particular it has notbeen decided whether individual bunch information will be transmitted in this way. Althoughthe exchange of many of these parameters is needed only during data taking, a subset of this in-formation, like the backgrounds and radiation doses is needed for periods like machine devel-opment. This information is required regardless of the state that ATLAS is in. This is one mainreason why this communication will be handled by the DCS on the ATLAS side and not by theDAQ system.
11.9.2 Magnet system
It has been decided that all magnet systems of the four LHC experiments will be controlled bythe tools selected for the LHC magnets and cryogenics. Therefore the ATLAS magnets are con-sidered by DCS as an external system. Information exchange is foreseen in the same way as forthe LHC accelerator, except that no actions happen. The operational data from the ATLAS mag-nets like the magnetic field value, currents and status, will be analysed, displayed, and storedby DCS like any sub-detector parameter.
11.9.3 CERN technical services
The technical services around the ATLAS detector include cooling, ventilation, electricity distri-bution, environmental radiation monitoring, the CERN safety system, etc. ATLAS needs accessto some parameters of these services to ensure safe operating conditions for the sub-detectors.In particular it is essential to get early indications of problems with services like cooling. In suchcases DCS can take precautions in order to avoid possible damage to the detectors. In some cas-es automatic feedback from ATLAS about its needs and usage of the service may be required.
ATLAS Technical Design ReportHigh-Level Trigger, Data Acquisition and Controls 30 June 2003
198 11 Detector Control System
11.9.4 Detector Safety System
As previously mentioned, the DCS is responsible neither for the security of the personnel norfor the ultimate safety of the equipment. The former is the responsibility of the LHC-wide haz-ard detection systems, whereas the latter has to be guaranteed by hardware interlocks internalto the sub-detectors and by the DSS [11-13]. One of the main purposes of DSS is to provide thecorrelation amongst the sub-detectors and the experimental infrastructure as far as safety isconcerned. DSS consists of a front-end system with standalone capability, which is based onPLCs. A BE system, implemented by PVSS-II, provides supervisory functions, but it is not need-ed for the real-time operation. Bi-directional information exchange between DCS and DSS isprovided on the PVSS-II level. Actions are triggered only in one direction, from DSS to DCS. Inthis way, the DCS can not disturb the operation of the safety system, but early informationabout minor problems that the DSS may detect enables DCS to take corrective actions or to shutdown the problematic part of the detector before the problem escalates and DSS has to take ahigher level and maybe more drastic action.
11.10 References
11-1 A. Daneels and W. Salter, The LHC experiments Joint Controls Project, JCOP, ICALEPCS, Trieste, 1999
11-2 M. Dentan, ATLAS Policy on Radiation Tolerant Electronics – revision 2, ATC-TE-QA-0001 (2000)https://edms.cern.ch/document/113816/
11-3 CAN in Automation (CiA),http://www.can-cia.de/
11-4 B. Hallgren et al., The Embedded Local Monitor Board (ELMB) in the LHC Front-End I/O Control System, 7th Workshop on Electronics for LHC Experiments, Stockholm, 2001
11-5 A. Daneels and W. Salter, Selection and Evaluation of Commercial SCADA Systems for the Controls of the CERN LHC Experiments, ICALEPCS, Trieste, 1999
11-6 PVSS-II,http://www.pvss.com/
11-7 OLE for Process Control,http://www.opcfoundation.org/
11-8 H.J. Burckhart et al., Vertical Slice of the ATLAS Detector Control System, 7th Workshop on Electronics for LHC Experiments, Stockholm, 2001
11-9 F. Varela Rodriguez, Systems of ELMB Buses using the Kvaser PCI CAN card, ATLAS DCS Internal Note,DCS-IWN17 (2002)
11-10 H. Boterenbrood et al., Results of radiation tests of the ELMB (ATmega 128L) at the CERN TCC2 area, ATLAS DCS Internat Note, DCS-IWN16 (2002)
11-11 F. Varela Rodriguez, The Detector Control System of the ATLAS experiment: An application to the calibration of the modules of the Tile Hadron Calorimeter, PhD. Thesis, CERN-THESIS-2002-035 (2002)
11-12 H.J. Burckhart et al., Communication between Trigger/DAQ and DCS in ATLAS, Computing in High Energy and Nuclear Physics Conference, Beijing, 2001

ATLAS Technical Design ReportHigh-Level Trigger, Data Acquisition and Controls 30 June 2003
11 Detector Control System 199
11-13 S.M. Schmeling et al., The Detector Safety System for LHC Experiments, XIII IEEE-NPSS Real Time Conference, Montreal, 2003
ATLAS Technical Design ReportHigh-Level Trigger, Data Acquisition and Controls 30 June 2003
200 11 Detector Control System

ATLAS Technical Design ReportHigh-Level Trigger, Data Acquisition and Controls 30 June 2003
12 Experiment control 201
12 Experiment control
12.1 Introduction
The overall control of the ATLAS experiment includes the monitoring and control of the opera-tional parameters of the detector and of the experiment infrastructure, as well as the supervi-sion of all processes involved in the event readout. This functionality is provided by twoindependent, although complementary and interacting systems: control for trigger and DAQ(TDAQ control), and the detector control (implemented by DCS). The TDAQ control is incharge of controlling the hardware and software elements in TDAQ needed for data taking. TheDCS handles the control of the detector equipment and related infrastructure. The architectureof the overall system has already been discussed in Section 5.3. The DCS is based on a SCADAsystem PVSS-II [12-1], whereas the TDAQ control is based on the TDAQ Online Software de-scribed in Chapter 10. These systems perform different tasks and have different requirements.Whilst the TDAQ control is required only when taking data, the DCS has to operate continuous-ly to ensure the safe operation of the detector. The operation of the detector requires a high de-gree of coordination between these two systems and with the LHC machine. The interactionwith the LHC machine will be handled by the DCS as illustrated in Figure 5-3 and presented indetail in Chapter 11. The TDAQ system is in overall control of data-taking operations.
The general control of the experiment requires a flexible partitioning concept as described inSection 3.3.5, which allows for the operation of the sub-detectors in standalone mode, as re-quired for calibration or debugging, as well as for the integrated operation for concurrent datataking. The overall control strategy and the control operations of the various systems are de-scribed in this chapter. Furthermore, the required coordination of the various systems involvedin the scenarios for physics data taking and calibration modes, is discussed.
12.2 Detector control
The DCS system provides the flexibility to implement the partitioning concept of ATLAS. Thefinest granularity of the TDAQ system is given by the segmentation of the sub-detectors intoTTC zones [12-2] [12-3]. For this reason, the different sections of the sub-detectors will be logi-cally represented in the back-end software of the DCS (Section 11.4) by means of the controlunits, which will be operated as a Finite State Machine (FSM). A logical control unit models thebehaviour of a sub-detector or a system, e.g. the Pixel sub-detector or the high voltage system.Each control unit is characterized by its state. The control units are hierarchically organized in atree-like structure to reproduce the organization of the experiment in sub-detectors, sub-sys-tems, etc. as illustrated in Figure 12-1. The units may control a sub-tree consisting of other con-trol or device units. The device units are responsible for the direct monitoring and control of theequipment, i.e. they represent hardware devices like a high-voltage crate or a temperature sen-sor. According to this model, the DCS of the Tilecal, for example, may be described by a tree oflogical control units: the root logical unit controls the sub-detector itself and four independentchild units, which control the four sub-detector sections (two extended barrels, EBA and EBC,and the central barrel sections, BA and BC). The sub-detector control units are in charge of su-pervising the various device units. Each control unit has the capability to exchange informationor pass commands to other control units in the hierarchy. The flow of commands and informa-
ATLAS Technical Design ReportHigh-Level Trigger, Data Acquisition and Controls 30 June 2003
202 12 Experiment control
tion will only be vertical. Commands will flow downwards, whereas status and alarms will betransferred upwards in the hierarchy.
The control units will support different partitioning modes. Any control unit and, therefore, therelated sub-tree, may be excluded from the hierarchy and be operated in standalone mode fortesting, calibrations, or debugging of part of the system. In this case the detector can be operat-ed directly from the DCS control, whereas during physics data taking and calibration proce-dures, commands will be sent from the TDAQ control. Therefore a booking scheme that avoidsthe possibility of issuing conflicting commands must be provided. This mechanism will be de-veloped according to the recommendations of the JCOP Architecture Working Group [12-4].
12.3 TDAQ control
The TDAQ system is composed of a large number of hardware and software components thathave to operate in a coordinated fashion to provide for the data-taking functionality of the over-all system. The organization of the ATLAS detector into detectors and sub-detectors leads to ahierarchical organization of the control system. The basis of the TDAQ control is provided bythe Online Software, which is described in detail in Section 10.5.
The basic element for the control and supervision is a controller. The TDAQ control system iscomprised of a large number of controllers distributed in a hierarchical tree following the func-tional composition of the TDAQ system.
This hierarchy is illustrated in Figure 12-2. Four principle levels of control are shown. Addition-al levels can be added at any point in the hierarchy if needed. A top level controller named theroot controller has the overall control of the TDAQ system. It supervises the next level of control-lers in the hierarchy, the sub-detector controllers. It is the responsibility of the sub-detector con-troller to supervise the hardware and software components which belong to this sub-detector.
The next control level takes the responsibility for the supervision of the sections that correspondto the TTC partitions [12-5]. The leaf controllers on the lowest level, the so-called local controllers,are responsible for the control of physical hardware such as ROSs. All elements of the TDAQ
Figure 12-1 DCS logical architecture
TilecalTilecal
BABA BCBC EBCEBCEBAEBA
…… MDTMDT……
ATLASATLAS
PixelPixel
Dev1 Dev2 …
LVLVHVHV CoolingCooling
Dev1 Dev2 …
……HVHV ……
Legend
Control Unit
Device Unit

ATLAS Technical Design ReportHigh-Level Trigger, Data Acquisition and Controls 30 June 2003
12 Experiment control 203
system (e.g. ROSs, HLT farms etc.) employ the same type of controllers and follow a similarstructure, as discussed in Section 12.3.1 and Section 12.3.2.
A controller in the TDAQ system is characterized by its state (e.g. Running, Paused, Stopped etc.)given by the TDAQ state model described in Section 12.4.3. In any place of the hierarchy, achange of state may be initiated and synchronized from a given level of controller and sentdown to the next lowest level. Once the requested transition has been performed, status infor-mation is returned to the requesting controller. Possible error conditions are also reported back.
A controller framework provides the facilities to handle the described operations in a coherentway on all the controllers in the system. It also gives the necessary flexibility to the detector ex-pert to customize each controller to handle the individual tasks on the system under its control.These tasks may vary widely from initializing hardware readout to EF farm control. The infor-mation on the inter-relationship of the controllers and their responsibilities for a given partitionis detailed in the configuration database (Section 10.4.3).
Each controller is responsible for the initialization and the shutdown of software and hardwarecomponents in its domain. It is also responsible for passing commands to child controllers (con-trollers under its control) and for signalling its overall state to its parent. Of particular impor-tance is the synchronization necessary to start data-taking operations. This is performed byconsecutive coordinated transitions through a number of intermediate states until data taking isfinally started as described in Section 12.5.1. The shift operator drives the operations by issuingcommands to the root controller. The inverse series of transitions is traversed when data takingis stopped.
During the operational phases, each controller is responsible for the supervision of the opera-tion of elements under its direct control and for monitoring and handling any error conditions.In the case of a malfunction of a detector, for example, the controller can start corrective actionsand/or signal the malfunction by issuing error messages. Severe malfunctions that are beyondthe capabilities of a controller can be signalled by a state change to its parent (e.g. moving froma Running state to a Paused state). It is then the role of the parent controller to take further ac-tions depending on the circumstances of the malfunction.
The design of the control, supervision, and error handling functions is based on the use of acommon expert system. Specific controllers will use dedicated rules (information which tells the
Figure 12-2 Online Software control hierarchy
S u b - d 1S u b - d 1
S e c - 2S e c - 2 S e c - 3S e c - 3 . . .. . .S e c - 1S e c - 1
L o C t r lL o C t r l L o C t r lL o C t r l L o C t r lL o C t r lL o C t r lL o C t r l
…… S u b - d nS u b - d n……
R o o tR o o t
S u b - S y sS u b - S y s
S e c - nS e c - n
L o C t r lL o C t r l
S u b - d 1S u b - d 1
S e c - 2S e c - 2 S e c - 3S e c - 3 . . .. . .S e c - 1S e c - 1
L o C t r lL o C t r l L o C t r lL o C t r l L o C t r lL o C t r lL o C t r lL o C t r l
…… S u b - d nS u b - d n……
R o o tR o o t
S u b - S y sS u b - S y s
S e c - nS e c - n
L o C t r lL o C t r l
ATLAS Technical Design ReportHigh-Level Trigger, Data Acquisition and Controls 30 June 2003
204 12 Experiment control
controllers what to do in one of many defined situations) to perform their individual functionsand common rules to handle more general situations.
12.3.1 Control of the DataFlow
The DataFlow control handles all applications and hardware modules responsible for movingthe event data from the detector front-end electronics and LVL1 trigger to the HLT system. It in-cludes the control of the RoIB, the ROS, the Event Building and the SFOs. It also includes theoverall control of the detector ROD crates.
There are two types of local DataFlow controllers foreseen, both making use of the Online soft-ware infrastructure in the same way, as shown in Figure 12-2. The ROS controller is tailored forthe control of ROS software applications and hardware devices which do not themselves accessthe Online Software facilities. The Data Collection (DC) controller handles all other DataFlowapplications and is optimized for the control of collection of processors. A version of the latter isalso used for the control and supervision of the HLT and is described in Section 12.3.2. The oth-er type, the ROD crate controller, takes over the communication handling between the otherOnline software services, Information Sharing and Configuration Databases, and the hardwarethat it controls.
Both controllers can be deployed at different levels of the control hierarchy. As an example, aDC controller can be used as top controller for all event-building applications, as well as a con-troller for a group of them. The DataFlow controllers request information on the elements theysupervise from the configuration database. Their function is to initialize, configure, start, pauseand stop the hardware and software data-taking elements, to monitor the correct functioning ofthe system, to gather operational statistics information, and to perform local error handling forthose kinds of errors which cannot be handled locally, but do not need to be propagated furtherto higher control levels.
12.3.2 HLT farm supervision
The emphasis for HLT farm supervision is the synchronization and control of the HLT farms(LVL2 and EF) with that of the other TDAQ systems. An HLT farm is comprised of a set of sub-farms, each under supervision of a specific controller, as shown in Figure 12-3. These controllershave well-defined tasks in the control of the underlying processes running on the sub-farms.
A key overall design principle of the HLT has been to make the boundary between LVL2 and EFas flexible as possible in order to allow the system to be adapted easily to changes in the run-ning environment (luminosity, background conditions, etc.). Therefore a joint control and su-pervision system for the two sub-systems has been designed and developed.
The configuration database contains data describing the software processes and hardware(processing nodes) of which the HLT is comprised as well as a wide variety of set-up and con-figuration data for pre-defined data-taking scenarios. The HLT supervision and control systemuses these data to determine which processes need to be started on which hardware and subse-quently monitored and controlled. The smallest set of HLT elements that can be configured andcontrolled independently is the sub-farm. This allows sub-farms to be dynamically included/excluded from partitions during data-taking without stopping the run. Dedicated local run con-trollers supervise and control each HLT sub-farm, and report to an overall farm controller. This

ATLAS Technical Design ReportHigh-Level Trigger, Data Acquisition and Controls 30 June 2003
12 Experiment control 205
in turn condenses the information coming from each sub-farm and reports the global state ofthe farm (LVL2 farm or EF farm) to the run control. The controller also provides process man-agement and monitoring facilities within the sub-farm. An expert system will guide the actionsof the sub-farm controllers (e.g. spontaneously restarting crashed processes) so that it can main-tain the sub-farm in the most efficient data-taking condition.
Where possible, errors are handled internally within the HLT processes. Only when they cannotbe handled internally are errors sent to the supervision and control system for further treat-ment.
The Online Software services are used by the supervision system for monitoring purposes. Forexample, IS will be used to store state and statistical information that can then be displayed tothe operator or made available to other control elements. For example, the malfunction of morethan a pre-defined number of HLT sub-farms may precipitate the stopping of data-taking.
12.4 Control coordination
The control of the experiment depends on the interplay between three systems: the LHC ma-chine, the detector control, and the TDAQ control. For each of them, their instantaneous statusis expressed in terms of distinct logical states (e.g. Configured, Running, Stopped etc.). The statesof a given system are highly correlated to those of other systems and only certain combinationsof states are allowed at any given time. Some examples are given here:
• the LVL1 trigger will not be started unless there are circulating beams in the LHC;
• the LVL2 trigger will not been started if some parts of its configuration process failed;
• physics data taking will not start if the detector high-voltage has failed.
The definition of these states, of their interplay, and of what actions are to be taken in what cir-cumstances is a highly complex problem that will need the support of an advanced expert sys-tem.
12.4.1 Operation of the LHC machine
The phases of the LHC define a multitude of states [12-6] required for the internal functioningof the machine. A sub-set is of direct interest for the interaction with the experiment control, in
Figure 12-3 HLT farm control
S u b -F 3S u b -F 3 …… S u b -F 1S u b -F 1S u b -F 2S u b - F 2
F a r mF a r m
S u b - F 1S u b -F 1
T A p p 1T A p p 1 T A p p 2T A p p 2 T A p p 3T A p p 3 …… T A p p nT A p p n
C o n t ro l le r
T r ig g e r A p p l ic a t io n
L e g e n d
ATLAS Technical Design ReportHigh-Level Trigger, Data Acquisition and Controls 30 June 2003
206 12 Experiment control
particular those states and parameters that describe the condition of the beam with consequenc-es for the operation of the detector. Phases with stable beam and low background may indicatethat it is safe to bring the detector to the operational state for physics data-taking, whereas ab-normally high background conditions may dictate that the detectors be turned off for safety rea-sons.
The nominal main phases to consider for the LHC are the following.
• Filling — the beam is being transferred from the SPS into the LHC;
• Ramping — the beam is being accelerated up to its nominal energy;
• Squeezing — the beam is being prepared for physics;
• Collide — physics with stable beam;
• Dump, Ramp-down and Recover — restart states.
It will also be necessary to know if no beam is expected for a given time since these periods willbe used by the experiment to perform maintenance and test operations. The estimated durationof these periods is also of importance since the actions to be taken on the detector equipmentwill vary, e.g. HV reduction for short machine interventions or shutdown in case of major prob-lems.
12.4.2 Detector states
As shown in Section 12.2, the operation of the different sub-detectors will be controlled bymeans of FSMs. The FSM approach allows for sequencing and automation of operations and itsupports different types of operators and ownership, as well as the different partitioning modesof the detector. The FSM will handle the transition of the different parts of the detector throughinternal states and, together with the use of an expert system, will be vital in the coherent oper-ation of ATLAS.
Figure 12-4 shows an example of the internal HV states for a given sub-detector.
The sub-detector states are mainly determined by the status of the HV system. However, thestatus of the other systems like the cooling or low voltage systems, as well as of the external sys-tems will also be taken into account in the state of the sub-detectors.
Figure 12-4 Detector states and transitions
Stand-byStand-by
OFFOFF
HV Stage 1HV Stage 1
……
HV Stage NHV Stage N
ReadyReady
ErrorError
Configure
RampUP_1
…
RampUP_N
GetReady
RampDownReset
ResetReset
RecoverTurnOff
TurnOff
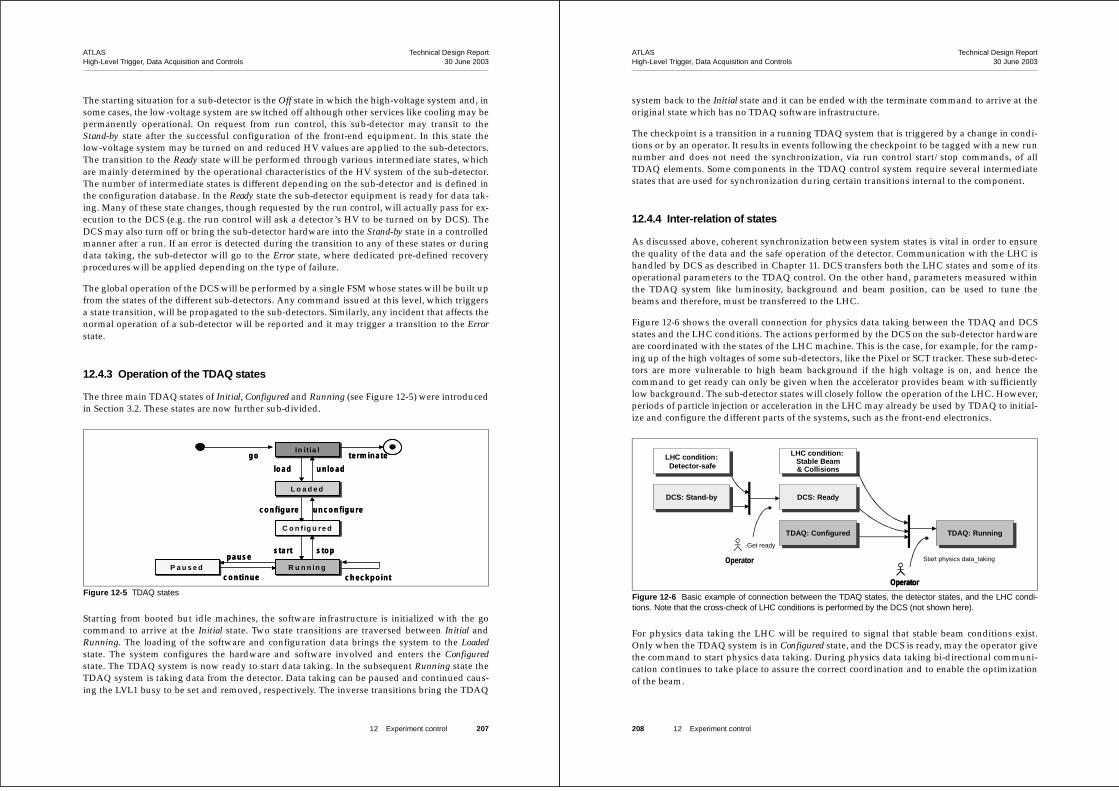
ATLAS Technical Design ReportHigh-Level Trigger, Data Acquisition and Controls 30 June 2003
12 Experiment control 207
The starting situation for a sub-detector is the Off state in which the high-voltage system and, insome cases, the low-voltage system are switched off although other services like cooling may bepermanently operational. On request from run control, this sub-detector may transit to theStand-by state after the successful configuration of the front-end equipment. In this state thelow-voltage system may be turned on and reduced HV values are applied to the sub-detectors.The transition to the Ready state will be performed through various intermediate states, whichare mainly determined by the operational characteristics of the HV system of the sub-detector.The number of intermediate states is different depending on the sub-detector and is defined inthe configuration database. In the Ready state the sub-detector equipment is ready for data tak-ing. Many of these state changes, though requested by the run control, will actually pass for ex-ecution to the DCS (e.g. the run control will ask a detector’s HV to be turned on by DCS). TheDCS may also turn off or bring the sub-detector hardware into the Stand-by state in a controlledmanner after a run. If an error is detected during the transition to any of these states or duringdata taking, the sub-detector will go to the Error state, where dedicated pre-defined recoveryprocedures will be applied depending on the type of failure.
The global operation of the DCS will be performed by a single FSM whose states will be built upfrom the states of the different sub-detectors. Any command issued at this level, which triggersa state transition, will be propagated to the sub-detectors. Similarly, any incident that affects thenormal operation of a sub-detector will be reported and it may trigger a transition to the Errorstate.
12.4.3 Operation of the TDAQ states
The three main TDAQ states of Initial, Configured and Running (see Figure 12-5) were introducedin Section 3.2. These states are now further sub-divided.
Starting from booted but idle machines, the software infrastructure is initialized with the gocommand to arrive at the Initial state. Two state transitions are traversed between Initial andRunning. The loading of the software and configuration data brings the system to the Loadedstate. The system configures the hardware and software involved and enters the Configuredstate. The TDAQ system is now ready to start data taking. In the subsequent Running state theTDAQ system is taking data from the detector. Data taking can be paused and continued caus-ing the LVL1 busy to be set and removed, respectively. The inverse transitions bring the TDAQ
Figure 12-5 TDAQ states
In it ia lIn itia l
L o a d e dL o a d e d
C o n fig u re dC o n f ig u re d
lo a d
u n c o n fig u re
s to p
u n lo a d
c o n fig u re
s ta rt
te rm in a teg o
P a u s e dP a u s e dc o n tin u e
p a u s e
c h e c k p o in tR u n n in gR u n n in g
In it ia lIn itia l
L o a d e dL o a d e d
C o n fig u re dC o n f ig u re d
lo a d
u n c o n fig u re
s to p
u n lo a d
c o n fig u re
s ta rt
te rm in a teg o
P a u s e dP a u s e dc o n tin u e
p a u s e
c h e c k p o in tR u n n in gR u n n in g
ATLAS Technical Design ReportHigh-Level Trigger, Data Acquisition and Controls 30 June 2003
208 12 Experiment control
system back to the Initial state and it can be ended with the terminate command to arrive at theoriginal state which has no TDAQ software infrastructure.
The checkpoint is a transition in a running TDAQ system that is triggered by a change in condi-tions or by an operator. It results in events following the checkpoint to be tagged with a new runnumber and does not need the synchronization, via run control start/stop commands, of allTDAQ elements. Some components in the TDAQ control system require several intermediatestates that are used for synchronization during certain transitions internal to the component.
12.4.4 Inter-relation of states
As discussed above, coherent synchronization between system states is vital in order to ensurethe quality of the data and the safe operation of the detector. Communication with the LHC ishandled by DCS as described in Chapter 11. DCS transfers both the LHC states and some of itsoperational parameters to the TDAQ control. On the other hand, parameters measured withinthe TDAQ system like luminosity, background and beam position, can be used to tune thebeams and therefore, must be transferred to the LHC.
Figure 12-6 shows the overall connection for physics data taking between the TDAQ and DCSstates and the LHC conditions. The actions performed by the DCS on the sub-detector hardwareare coordinated with the states of the LHC machine. This is the case, for example, for the ramp-ing up of the high voltages of some sub-detectors, like the Pixel or SCT tracker. These sub-detec-tors are more vulnerable to high beam background if the high voltage is on, and hence thecommand to get ready can only be given when the accelerator provides beam with sufficientlylow background. The sub-detector states will closely follow the operation of the LHC. However,periods of particle injection or acceleration in the LHC may already be used by TDAQ to initial-ize and configure the different parts of the systems, such as the front-end electronics.
For physics data taking the LHC will be required to signal that stable beam conditions exist.Only when the TDAQ system is in Configured state, and the DCS is ready, may the operator givethe command to start physics data taking. During physics data taking bi-directional communi-cation continues to take place to assure the correct coordination and to enable the optimizationof the beam.
Figure 12-6 Basic example of connection between the TDAQ states, the detector states, and the LHC condi-tions. Note that the cross-check of LHC conditions is performed by the DCS (not shown here).
Get ready
Start physics data_takingOperator
OperatorOperator
LHC condition:Detector-safe
LHC condition:Detector-safe
DCS: Stand-byDCS: Stand-by DCS: ReadyDCS: Ready
TDAQ: ConfiguredTDAQ: Configured TDAQ: RunningTDAQ: Running
LHC condition: Stable Beam& Collisions
LHC condition: Stable Beam& Collisions

ATLAS Technical Design ReportHigh-Level Trigger, Data Acquisition and Controls 30 June 2003
12 Experiment control 209
The TDAQ control is only partially coupled to the LHC and sub-detector states. State transitionsof the TDAQ system are not determined by the state of the LHC. However, changes of the LHCparameters observed in the detector, like the luminosity, may require actions on the DAQ sys-tem, like the change of the trigger menus.
The TDAQ system can generally be brought from the initial to the configured state while theLHC is ramping, squeezing, and preparing for physics, or while the DCS prepares the detectorfor data taking. A new run can be triggered at any time regardless of the state of the LHC or ofthe detector. Data read out may already start under poor beam conditions using only certainsub-detectors, like the calorimeters, while the high voltage of other detectors will still be set tostand-by. As soon as the safe operation of the remaining sub-detectors is possible, the DCS willprepare them for data taking and will communicate their availability to the TDAQ system. Atthis moment, the physics data taking may start.
Although some calibration procedures, for example with cosmic rays or with a radioactivesource, will be performed without beam, the communication and coordination with the LHCcontrol system is still needed in order to prevent dangerous operations from being engaged thatcould possibly damage the detector. For most TDAQ internal system tests no coordination withthe state of the other systems needs to take place.
12.5 Control scenarios
In this section, typical scenarios for the experiment control are presented. The first scenario de-scribes the actions required to drive the system from its initial dormant state to the Runningstate and back again. The control of the various types of runs such as physics and calibrationruns, introduced in Section 3.3, is then discussed. The procedures described rely on the ATLASpartitioning concept explained in Section 3.4 and Section 5.4.
12.5.1 Operational data-taking phases
The TDAQ states as described in Section 12.4 are traversed when the TDAQ system is runthrough initialization, preparation, data-taking, and shutdown phases. As the DCS is requiredto be always operational, in this scenario it is assumed that the DCS is in Stand-by state andready to connect to the rest of the system. During the operational phases, systems and sub-sys-tems perform a number of operations independent of each other. During the state transitions,actions specific to the sub-system like initializing software and hardware elements, loading soft-ware and parameters to hardware modules and configuring them, or starting processing tasks,are performed. Time-consuming operations are preferably performed during early state transi-tions. The aim is to prepare the TDAQ system to be ready for the start command such that therunning state can be entered with a minimum time-overhead.
12.5.1.1 Initialization
When initiating a data-taking session, the operations of the TDAQ system start from booted butidle CPUs. The operator selects a partition that is described in the configuration database or de-fines a new one. The process management and information distribution infrastructure, consist-ing of a number of servers in the distributed system (i.e. process managers, InformationServices, Error Message system), is started and initialized. The hardware and software elements
ATLAS Technical Design ReportHigh-Level Trigger, Data Acquisition and Controls 30 June 2003
210 12 Experiment control
of this TDAQ infrastructure are then verified to ensure that they are functioning correctly (forexample the servers are tested, the process managers are contacted and therefore the status oftheir host PCs and the network connection is verified). The sequence and synchronization of thestart-up operations follow the dependencies described in the configuration database. The On-line Software–DCS communication software is started and the communication between the sys-tems is initialized.
Once this TDAQ infrastructure is in place, the controllers and the application processes, whichare part of the configuration, are started. The process management is de-centralized and there-fore this can occur asynchronously. The data describing the selected partition are transmitted toDCS. The control communication with DCS is established. Having successfully finished thistransition, the TDAQ system is in the Initial state.
12.5.1.2 Preparation
Once in the initial state, the operator can begin to configure the system. This involves synchro-nizing the loading and configuring of all software applications and hardware elements that par-ticipate in the data-taking process.
The Loading transition, is used to initialize all the processing elements in the system including,for example, the loading of the configuration data into the various controllers. Subsequently,during the Configuring transition, the various elements of the system are configured accordingto the information obtained in the previous step, for example, the establishment of communica-tions channels between TDAQ elements such as the L2PUs and the L2SV, or the setting of hard-ware or software parameters.
The preparation of the sub-detector equipment for data taking involves the issuing of com-mands to DCS and the subsequent execution of defined control and initialization procedures.These commands can be associated to state transitions of the TDAQ controllers, or be asynchro-nous commands issued directly by the TDAQ operator or by standalone applications. The ac-tions are detector-specific and are defined in the configuration database. They are loaded intoDCS at initialization time. The different procedures to be performed on the equipment are pre-viously validated and are cross-checked with the states of the external systems and of the com-mon infrastructure to guarantee the integrity of the equipment. For example, the LHC musthave stable beam conditions and acceptable backgrounds before certain sub-detectors’ HV maybe turned on. In some cases, the execution of these procedures may take several minutes, de-pending on the actions to be taken. These actions on the detector equipment take place in paral-lel to the loading and configuring of the TDAQ elements.
The operations described so far may be time-consuming and should, if possible, be performedwell before the run start is required, e.g. while waiting for stable run conditions to occur. Thereadiness of the sub-detectors for data taking is reported to the run control by the DCS, whichwill then be in the Ready state. Generally speaking, the DCS must be in the Ready state for theoperator to be able to start a run. However, it is possible to start a run regardless of the state ofsome or all of the sub-detectors if required (e.g. in commissioning phases when not all the de-tectors are available). In some cases the TDAQ control may decide to take data without certainsub-detectors or sections of a given sub-detector. In this situation, the associated sub-detectorrun controllers are excluded from the DAQ partition used for data-taking and, consequently, nocommands will be issued on the sub-detector DCS, i.e. the sub-detector will remain in the de-fault state (Stand-by) while the other sub-detectors participate in the run.

ATLAS Technical Design ReportHigh-Level Trigger, Data Acquisition and Controls 30 June 2003
12 Experiment control 211
The readiness of the TDAQ system to take data is defined as the moment when the top-level runcontroller is in the Configured state. This implies that all the data-acquisition and trigger systemshave been booted, initialized, and configured correctly and are ready to receive event data.
12.5.1.3 Data taking
When the run is started by the operator, the LVL1 trigger is enabled and event data-taking oper-ations commence. If necessary, a run can be paused and resumed in an orderly manner with aminimum time overhead simply by inhibiting and enabling the LVL1 trigger. In specific circum-stances, such as the modification of one of a limited set of pre-defined run parameters (e.g. thebeam position), the checkpoint transition, as described in Section 3.3.4, can precipitate a changein run number without having to cycle through the full run-stop and run-start procedures. Theadvantage of this is to minimize the time required to take account of the possible change in val-ue of one or more of a fixed set of parameters.
Partitions comprising one or more TTC zones can be removed from the main data-taking parti-tion, for example in case of problems with a given detector element. To do this, first the LVL1trigger is inhibited. The detector element in question, together with its associated TDAQ re-sources (e.g. the ROBs associated to its RODs), is then marked as no longer forming part of themain data-taking partition. Finally the LVL1 trigger is re-enabled and data-taking can continue.The removed detector element can then be configured for standalone operations to allow thefaulty element to be identified, tested, and repaired. Once the element is functional again, it canbe re-attached to the main partition.
Depending on the system elements involved, the above actions may be able to be completedwithin a checkpoint transition, or they may necessitate the complete cycling through the run-stop and run-start procedures in order to re-configure the system correctly. Component failuresduring state transitions or while the system is in a given state that cannot be handled locally, arereported through the local controllers to the top level run control. This mechanism is introducedin Chapter 6 and described in Section 10.5.3.
12.5.1.4 Stopping
When the operator stops the run, the LVL1 trigger is inhibited and data taking is stopped. Thecontrol and application processes involved remain active. No changes on the DCS side are fore-seen, the sub-detectors remain in the Ready state and TDAQ in Configured state. Systems andsub-systems may perform different kinds of actions during the stopping transition as comparedto the pause transition.
12.5.1.5 Shutdown
On receipt of the shutdown command all applications and their controllers are stopped. Finallythe TDAQ software infrastructure is closed down in an orderly manner, leaving the systemavailable for a new data-taking session. If no further data taking is foreseen the Ramp Down orTurn Off commands are given to DCS in order to bring the detector to a safe state by rampingdown and switching off the low and high voltage applied to the sub-detectors.
ATLAS Technical Design ReportHigh-Level Trigger, Data Acquisition and Controls 30 June 2003
212 12 Experiment control
12.5.2 Control of a physics run
For physics data taking, the hierarchy of TDAQ controllers, including all sub-detectors, is ar-ranged in a single common partition. The information on the type of run is transferred to theDCS system to prepare the different sub-detectors for physics data taking as described in theprevious section. The successful execution of the appropriate DCS procedures to bring the sub-detectors to the Ready state, is then reported to the TDAQ system.
Figure 12-7 shows an example of the experiment control including the TDAQ control and theback-end system of the DCS. The TDAQ root controller holds the highest level of control. It con-nects to the detector controllers, the farm controllers for EF and LVL2, and the DF controllers asdescribed in Section 12.3. Each sub-detector controller supervises the controllers of its sectionsand also the controller that provides the connection to DCS for each sub-detector. The RODs aresupervised by their respective sub-detector section controller. In the following, it is assumedthat the DCS is in the Ready state and the TDAQ control is in the Running state.
The control of a physics run is driven by the TDAQ system, which acts as the master of the ex-periment control by issuing commands to the DCS by means of specialized controllers calledDDC_CT. There is one DDC_CT controller per sub-detector. Those controllers send commandsdirectly to the sub-detector control units on the DCS side. This communication model impliesthat the TDAQ system interacts directly with the DCS of the various sub-detectors. However, inthe case of DDC_CT connection failures the control of the sub-detectors is taken over by theDCS root control unit (called ATLAS in Figure 12-7) to ensure the safe operation of the detectorequipment.
During physics data taking, only a pre-defined set of high-level commands from the TDAQ sys-tem to the DCS, like the triggering of the sub-detector state transitions at the start or end of therun, is allowed. The command is logged and feedback on its execution is reported to the TDAQ
Figure 12-7 Experiment control indicating the control command flow between TDAQ and DCS that takes placeat each sub-detector level, as illustrated here for the TileCal sub-detector
D C SD C S
T ilecalT ilecal
E B -E B - B -B - B +B + E B +E B +
C oolC ool
…… L 1L 1D et1D et1
A T L A SA T L A S
L VL V
M agnetM agnet
L H CL H C
C E R NC E R N
D SSD SS
D CS_ISD CS_IS
C ICC IC
H VH VC oolC oo l
L VL VH VH V
C oo lC oo lL VL V
H VH VC oo lC ool
L VL VH VH V
TD A QTD A Q
T ileca lT ilecal
E B -E B - B -B - B +B + E B +E B +
…… L 1L 1D et1D et1
A T L A SA T L A S
D D C -C TD D C -C T
D FD F
R O D sR O D s R O D sR O D s R O D sR O D s R O D sR O D s
E FE F
L 2L 2
D D C -C TD D C -C T

ATLAS Technical Design ReportHigh-Level Trigger, Data Acquisition and Controls 30 June 2003
12 Experiment control 213
system. The TDAQ control system handles failures or timeouts from the DDC_CT in the sameway as from other controllers in the system.
Global error handling and recovery is provided by the Online system control described inSection 10.5. Severe problems, e.g. in the HV system of a certain sub-detector, are reported to theTDAQ system. Depending on the problem and on the faulty system element, the TDAQ controlmay decide to exclude this sub-detector from data taking and continue the run with the remain-ing detectors as described in the previous section. The run may continue if the readout of thedetector element in question is not considered vital for the given run.
HLT sub-farms can be removed from or added to the global farm control without disturbance ofdata-taking activity. Breakdown and replacements of individual sub-farm nodes are handledtransparently and each such operation is logged.
12.5.3 Calibration run
The calibration procedures envisaged in ATLAS take advantage of the flexible partitioning con-cept allowing for autonomous and parallel operations of the sub-detectors or even of differentelements of a given sub-detector. From the point of view of controls, three different types of cal-ibration can be identified:
• Procedures where only the control provided by the Online software system is required,such as the determination of the pedestals for zero suppression.
• Calibration runs entirely handled by the DCS such as the calibration of the cooling sys-tem, where the flow of the liquid is adjusted as a function of the temperature of the detec-tor.
• Calibration procedures requiring control from both systems. This is the case, for instance,of the calibration of the Tile Hadron Calorimeter with the radioactive caesium source,where the modules of the detector are scanned with the source under control of the DCS.The signal produced is read by the DAQ system and the information is used to adjust theHV applied to the PMTs of the readout system.
In the latter case, the control needs are similar to the functionality required for physics runs aspresented in the previous section. Figure 12-8 shows the example of the interplay between theTDAQ control and the DCS for calibration of the Tilecal detector. As for physics data taking,these calibration procedures are driven by the TDAQ control and commands follow the samepath. The main difference with respect to physics data taking, is the arrangement of the parti-tions. In the example presented in the figure, a TDAQ partition is defined for the standalone op-eration of the Tilecal sub-detector. It is important to note that although some calibrationprocedures are executed without beam or even without the control provided by the DCS, thecommunication with the LHC machine and other external systems must always be guaranteedsince this information is of crucial importance for the integrity of the sub-detectors and for thepreparation of the next run.
12.5.4 Operation outside a run
The states of the DCS and TDAQ outside a run are determined by the duration of the periodswithout data taking. As described in Chapter 3, during transitions between runs and short in-terruptions, the TDAQ system can be set to one of its intermediate states or be unavailable,
ATLAS Technical Design ReportHigh-Level Trigger, Data Acquisition and Controls 30 June 2003
214 12 Experiment control
while the DCS remains completely operational. If longer interruptions are foreseen, such as pe-riods of machine development, the HV applied to the sub-detectors is reduced and the detectorstates are set to Stand-by or Off.
During shut down periods and long intervals without data-taking, the TDAQ system is not nec-essarily operational although it may be available on demand for calibration and debugging pur-poses. In these periods a number of sub-detector services like the LAr cryogenics or ID coolingstay operational. The monitoring and control of the humidity and temperature of the electronicsracks, the supervision of the un-interruptible power supply system and of other detector specif-ic equipment are also performed. The ATLAS magnets are permanently switched on and there-fore the interface with the DCS must be continuously available. The radiation levels monitoredby the LHC machine must be accessible by the DCS at all times. For these reasons, the DCS is re-quired to be fully operational allowing, if necessary, the sub-detectors to operate without thesupport of the rest of the TDAQ system. Similarly, the interfaces between the DCS and the firealarm systems, the access security system and the DSS must be continuously operational.
12.6 References
12-1 PVSS-II,http://www.pvss.com/
12-2 ATLAS Collaboration, ATLAS High-Level Triggers, DAQ and DCS Technical Proposal,CERN/LHCC/2000-017 (2000)
12-3 ATLAS Collaboration, ATLAS Level-1 Trigger Technical Design Report,CERN/LHCC/98-014 (1998)
Figure 12-8 Detector standalone control mode, indicating the control command flow between TDAQ and DCSat the sub-detector level, as illustrated here for the TileCal sub-detector
DCSDCS
TilecalTilecal
EB-EB- B-B- B+B+ EB+EB+
CoolCool
L1L1
LVLV
M agnetM agnet
LHCLH C
CERNCERN
DSSDSS
DCS_ISDCS_IS
CICCIC
HVHVCoolCool
LVLVHVHV
CoolCoolLVLV
HVHVCoolCool
LVLVH VH V
TDAQTDAQ
TilecalT ilecal
EB-EB- B-B- B+B+ EB+EB+
DDC-CTDDC-CT
TileRootTileRoot
L1L1
RO DsRO Ds RO DsRO Ds RO DsRO Ds RODsRODs
DFDFEFEF
DDC-CTDDC-CT

ATLAS Technical Design ReportHigh-Level Trigger, Data Acquisition and Controls 30 June 2003
12 Experiment control 215
12-4 JCOP Architecture Working Group, Framework Design Proposal, CERN-JCOP-2000-06 (2000),http://cern.ch/itco/Projects-Services/JCOP/SubProjects/Architecture/pdf/HC7.0.pdf
12-5 Partitioning - Global issues working group document,http://cern.ch/atlas-project-tdaq-giwg/Documents/Documents.htm
12-6 LHC Operations project,http://lhcop.web.cern.ch/lhcop/
ATLAS Technical Design ReportHigh-Level Trigger, Data Acquisition and Controls 30 June 2003
216 12 Experiment control

Part 3
System Performance

ATLAS Technical Design ReportHigh-Level Trigger, Data Acquisition and Controls 30 June 2003
13 Physics selection and HLT performance 219
13 Physics selection and HLT performance
13.1 Introduction
A preliminary view of the online event-selection scheme and the corresponding physics cover-age was presented in the HLT, DAQ and DCS Technical Proposal (TP) [13-1]. Since then thestudies have evolved to cope with a new scenario for the start-up of the LHC machine and in re-sponse to funding constraints. The LHC start-up scenario has a target to deliver 10 fb−1 in oneyear, now assuming a peak luminosity per fill of 2 × 1033 cm−2 s−1, which is a factor of two high-er than assumed in the TP. At the same time as having to address this higher initial luminosity,financial resources from the HLT/DAQ project had to be re-assigned to meet urgent needs else-where in the experiment. As a consequence, the construction of the HLT/DAQ system will haveto be staged to match the available funding, so that only a reduced system will be available forthe initial running. These changes required a major revision of the Physics and Event SelectionArchitecture of the experiment, including new ideas for reducing event rates and sizes while re-taining as many as possible of the ATLAS physics goals. Needless to say, only the availability ofreal data will allow this proposal to find a final implementation and a fine tuning of the relativeweights of the selection signatures. However, it is important to be able to face this phase withthe most complete set of tools and a versatile selection architecture, in order to cope with the ob-vious unknowns that are likely to show up at the time of LHC start-up.
As described in Chapter 9, the High Level Trigger (HLT) system of the experiment is composedof two separate event-selection steps, LVL2 and the Event Filter (EF), each with distinctive andcomplementary features. A common denominator is that they will operate using software algo-rithms running on commercial computers to test hypotheses of particle identification and applyevent-selection criteria. LVL2 will do this with special-purpose algorithms that need to operatein about 10 ms and use only part of the detector information at full granularity, while the EFwill have the fully built events at its disposal and work with an execution time of the order of asecond. It is important to maintain a flexible scheme able to adapt easily to changes in machineconditions (e.g. luminosity or background rates). The modularity of the HLT will allow the im-plementation of different reduction steps at different stages.
An essential input to the HLT process is the seeding of the selection with the results from LVL1.When making performance studies for the HLT, a detailed simulation of the LVL1 result istherefore needed. This identifies the regions of the detector (Regions-of-Interest) where poten-tial candidates for interesting physics objects are found. This simulation, described inSection 13.2, allows for a realistic use of the information coming from LVL1, using the same al-gorithms and procedures that will be implemented in custom hardware in the experiment.
Given the commonalities between LVL2 and the EF, it was recognized that a coherent and or-ganized approach to the software components of the trigger was needed. The work presented inSection 13.3, which represents an important step forward with respect to the TP and is the resultof a large effort, has concentrated on this issue. Common tools have been developed for theevent selection, and common data-model components and methods have been identified thatcan be shared by different algorithms, in particular at LVL2. This approach will ease the imple-mentation of different selection schemes and also simplify the migration of algorithms betweentrigger levels.
ATLAS Technical Design ReportHigh-Level Trigger, Data Acquisition and Controls 30 June 2003
220 13 Physics selection and HLT performance
Another important point for new developments has been compliance with the updated detectorgeometry and with the format of the raw data as it will come from the ReadOut System. Thisimplies that the algorithms must operate starting from streams of bytes organized according tothe readout structure of each detector, in exactly the same way as in the real experiment. Thishas allowed one to study and understand the implications of converting these bytestreams tothe objects needed by algorithms in order to perform trigger selections, including making pre-liminary measurements of the computing time needed for these conversions.
In Section 13.4 the outcome of the present studies is presented. It should be noted that the de-tailed results on trigger rates and efficiencies presented in the TP and in related papers andpresentations are still considered a valid baseline approach. Present work has concentrated onimplementing a realistic approach to data handling and preparation for the algorithms and onassembling a proper set of software selection tools. Emphasis has been put on the selection ofelectrons and photons, both of which stem from an electromagnetic cluster identified at LVL1,and muons. For each of the electron/photon and muon event-selection ‘vertical slice’, a thor-ough implementation of the approach described above has been attempted. For events thatpassed the LVL1 selection, bytestream raw data organized according to the actual detector read-out format are used by LVL2 algorithms operating within the PESA Steering and Control frame-work (see Section 9.5). Simulated RoI information from LVL1 is used to initiate the LVL2processing. Trigger elements are built using detector information and used to test particle iden-tification hypotheses. For events retained by LVL2, the EF reconstruction and analysis are per-formed (the EF may or may not be seeded using the LVL2 result) and the final-selection result ismade available for offline use. Results on rejection against the dominant backgrounds and onthe efficiencies for typical signals are reported, as well as the rates deriving from each of the se-lections.
In order to span fully the ATLAS physics coverage, signatures involving jets, hadronic decays oftau leptons, large missing transverse energy, and also jets with b-quark content are needed, inaddition to the electron, photon and muon ones discussed above; these are also discussed inSection 13.4. As described in Chapter 4, spare online resources will be used for B-physics stud-ies, e.g. for luminosities below the peak one. Results are based on preliminary analyses of sam-ples of the order of 106 events and they will be extended in the near future to the larger samplesof several 107 events produced thanks to the effort of the ATLAS Data Challenge Group [13-2].
The global assessment of the event rates to be recorded for offline analysis, based on the presentknowledge for each signature, is made in Section 13.5. A sketch of issues related to the initialphase of the experiment, seen from the selection architecture point of view, is given inSection 13.6.
13.2 The LVL1 trigger simulation
An important ingredient for many HLT tests and studies is the simulation of the LVL1 trigger,the results of which serve as input to the HLT trigger processing. The ATLAS LVL1 trigger [13-3] is itself a complex system consisting of the calorimeter trigger, the muon trigger, and the Cen-tral Trigger Processor (CTP) that makes the final LVL1 event decision. Figure 13-1 gives an over-view of the LVL1 trigger; the various components mentioned in the figure will be explainedlater in this section except for the TTC system (trigger, timing and control), which has no equiv-alent in the simulation.

ATLAS Technical Design ReportHigh-Level Trigger, Data Acquisition and Controls 30 June 2003
13 Physics selection and HLT performance 221
The LVL1 trigger simulation is implemented in C++ in the ATLAS offline computing frame-work ATHENA. It relies heavily on the ATLAS offline data storage implementation, the so-called Transient Event Store (TES). The structure of the simulation follows closely the structureof the LVL1 trigger hardware. Figure 13-2 shows a package view of the LVL1 simulation. Thesimulation consists of packages simulating various hardware blocks: the resistive plate chamber(RPC) muon trigger (indicated by the package TrigT1RPC in Figure 13-2), the Muon-to-CTP In-terface (MuCTPI, package TrigT1Muctpi), the calorimeter trigger (package TrigT1Calo), and theCentral Trigger Processor (package TrigT1CTP). The LVL1 configuration (packageTrigT1Config) and the simulation of the Region-of-Interest Builder (package TrigT1RoIB) areprovided as additional packages. There are also packages for the definition of the LVL1 resultraw data object (package TrigT1Result), for classes used by more than one package (packageTrigT1Interfaces), and for the conversion of the LVL1 result into the hardware format, the so-called bytestream conversion (package TrigT1Result-bytestream). The various parts of the simu-lation shown in Figure 13-2 will be explained in the next sections. The simulation of the muontrigger in the endcaps, the signals for which are provided by the thin-gap chambers (packageTrigT1TGC), so far exists only as a standalone program and will not be discussed in detail in thisdocument.
The interfaces and data formats to be used in the simulation [13-4] were designed to follow asclosely as was practical the data formats used in the LVL1 trigger hardware that are document-ed in [13-5]. Additional information on the LVL1 simulation can be found in [13-6].
Figure 13-1 An overview of the ATLAS LVL1 trigger system. The Region-of-Interest Builder (RoIB) formally isnot a part of the LVL1 trigger. However, it is simulated together with the LVL1 trigger.
RoIB
calorimeters muon detectors
MuCTPI
trigger
RPCbarrel endcap
TGC
trigger
processorjet/energy
preprocessor
processorcluster
calo
rimet
er tr
igge
r
muon trigger
detector front−end
CTP
TTC
readoutL2 supervisor
ATLAS Technical Design ReportHigh-Level Trigger, Data Acquisition and Controls 30 June 2003
222 13 Physics selection and HLT performance
13.2.1 Configuration of the LVL1 trigger
The first task of the LVL1 trigger configuration package is to translate the trigger menu, i.e. thecollection of event signatures that LVL1 is supposed to trigger on, into something that the simu-lation of the CTP can understand and use in making the event decision based on logical combi-nations of the inputs delivered by the calorimeter and muon triggers. The LVL1 signatures, ortrigger items, are combinations of requirements (or trigger conditions) on the multiplicities of var-ious kinds of candidate objects found by the calorimeter and muon triggers in the event. (Seelater subsections for details about the calorimeter and muon triggers and their simulation.)
A simple example of a trigger item is ‘one (or more) electron/photon candidate(s) with trans-verse energy above 10 GeV and one (or more) muon candidate(s) with transverse momentumabove 15 GeV’. In a frequently used and obvious notation this reduces to ‘1EM10+1MU15’,where the string ‘EM’ (‘MU’) represents the electron/photon (muon) candidate, and the num-bers in front of and behind the string symbolize the required multiplicity and the requiredtransverse momentum, respectively. The combination of a string and a threshold value (like‘EM10’) is called a trigger threshold.
The second task of the LVL1 configuration package is to configure the simulation of the calorim-eter and muon triggers to deliver the information required to make the event decision using thetrigger menu, i.e. to deliver the multiplicities for the required trigger thresholds. For the exam-ple mentioned above, the calorimeter trigger has to be configured to deliver the multiplicity forthe threshold ‘EM10’, i.e. the number of electron/photon candidate objects with transverse mo-mentum above 10 GeV, to the CTP. It is obvious that the trigger menu and the trigger thresholdsfor the calorimeter and muon triggers have to be defined consistently. In particular, all thresh-olds used in the definition of any trigger condition in any trigger item must be delivered to theCTP by the calorimeter and muon triggers.
Both the trigger menu and the list of required trigger thresholds are defined using XML and areparsed into instances of C++ classes using the Xerces DOM API [13-7]. The parsing of the trig-ger menu creates an object that contains the information on how the CTP simulation has to dis-criminate the calorimeter and muon trigger inputs (trigger conditions) and what items have tobe built from these conditions. In addition, configuration objects for the calorimeter and muontriggers are created in the configuration process and are stored in the TES for later retrieval bythe calorimeter and muon trigger simulations. These objects contain the list of thresholds forwhich the sub-systems have to provide multiplicity information to the CTP simulation.
The LVL1 trigger configuration software is currently being adapted to also be able to configurethe LVL1 trigger hardware by deriving the necessary look-up table files and FPGA configura-tion files from the XML trigger menu and trigger threshold list. Such a common configurationscheme will allow for cross-checks between hardware and software.
13.2.2 The calorimeter trigger and its simulation
The LVL1 calorimeter trigger [13-8] searches for localized energy depositions in the calorimetersdue to electrons and photons (electromagnetic clusters), single hadrons and hadronic decays oftau leptons (narrow hadronic clusters), or jets (broader hadronic clusters). For each type of clus-ter, a number of programmable transverse-energy (ET) thresholds are provided. With the excep-tion of the jet clusters, isolation requirements can be imposed — these are implemented byapplying thresholds on isolation variables associated with the cluster. The multiplicities of the

ATLAS Technical Design ReportHigh-Level Trigger, Data Acquisition and Controls 30 June 2003
13 Physics selection and HLT performance 223
candidate objects of each type are counted for each threshold set, and the multiplicity values arepassed on to the CTP to be used in making the LVL1 event decision.
In addition to the local-energy triggers discussed above, the calorimeter trigger calculates glo-bal energy sums (total transverse energy and missing transverse energy) which are discriminat-ed against a number of programmable thresholds; the results of the threshold comparisons arealso passed to the CTP to be used in making the LVL1 event decision.
The calorimeter trigger uses signals from ~7200 trigger towers which are analog sums over cal-orimeter cells in the liquid-argon or scintillator-tile calorimeters. The trigger tower signals aredigitized in the preprocessor electronics, which also performs digital signal processing to calcu-late transverse energy and make bunch-crossing identification. The resulting data are passed onto two processor sub-systems. The Cluster Processor searches for electron/photon and tau/hadron candidates within 3200 trigger towers of granularity ∆η × ∆φ = 0.1 × 0.1 in each of theelectromagnetic and hadronic calorimeters in the pseudorapidity range |η| < 2.5. The Jet/En-ergy Processor searches for jets and makes the global energy sums using coarser (jet) elementsof granularity ∆η × ∆φ = 0.2 × 0.2 over a larger rapidity range (|η| < 3.2 in case of the jet trigger;|η| < 4.9 for forward jets and the energy-sum triggers). Note that it is the preprocessor thatsums the trigger towers, independently for the electromagnetic and hadronic calorimeters, toform the larger elements used in the Jet/Energy Processor.
In the electron/photon trigger a candidate object is defined by a local ET maximum in a regionof 2 × 2 trigger towers (electromagnetic plus hadronic), corresponding to a 0.2 × 0.2 region inη − φ space. Vetoes may be applied on the hadronic transverse energy in this region and/or onthe transverse energies in the rings of towers surrounding the 2 × 2 region in the electromagnet-
Figure 13-2 A package view of the LVL1 trigger simulation
ATLAS Technical Design ReportHigh-Level Trigger, Data Acquisition and Controls 30 June 2003
224 13 Physics selection and HLT performance
ic and hadronic calorimeters. The cluster thresholds are applied on the maximum transverse en-ergy in any edgewise-adjacent pair of electromagnetic-calorimeter trigger towers within thecentral 2 × 2 region. (See Refs. [13-3] and [13-9] for a more detailed description of the variouscalorimeter trigger algorithms.)
In addition to counting multiplicities of candidate objects, Regions-of-Interest (RoIs) are identi-fied and passed, via the Region-of-Interest Builder, to the LVL2 trigger for events that are re-tained by the LVL1 trigger. The RoIs, which contain information on the geographical location ofthe object in the calorimeters and on the ET thresholds passed, are used to seed the HLT event-selection process. More detailed information from the LVL1 calorimeter trigger is sent to theDAQ using standard readout links.
The LVL1 calorimeter trigger simulation is designed to reproduce in detail the functionality ofthe hardware, but it does not entirely duplicate the dataflow. The primary reason for this is effi-ciency — the hardware trigger will process large amounts of data in parallel, which does nottranslate well to offline simulation software.
Currently the simulation of the LVL1 calorimeter trigger starts from calorimeter cell energieswhich are summed to form tower energies. (A more complete simulation, which is in prepara-tion, will include details of the signal-processing chain from the calorimeters to the output ofthe preprocessor, but this is not yet available.) The cell energies, which can be taken from theATLAS fast simulation or from the detailed GEANT simulation of the calorimeters, are used tobuild, in a simplified geometrical approach, trigger tower signals to which calibration and agaussian noise can be applied. The tower data are passed to the Cluster Processor simulation(electron/photon and tau/hadron finding), and are summed into the coarser jet elements usedin the simulation of the Jet/Energy Processor (jet finding and calculation of energy sums).Theresults from the simulation of the calorimeter trigger are stored in the TES for later retrieval.These include the multiplicity outputs that are used by the CTP in making the event decision,and the details of candidate objects that are used to guide the LVL2 trigger processing (the sim-ulation of the output from the calorimeter trigger simulation to the DAQ has not yet been im-plemented). Note that the RoI data from the simulation of the calorimeter trigger are stored inthe same bytestream format as will be used in the hardware.
Figure 13-3 Single-electron trigger efficiency as a function of the electron transverse energy ET, using a17 GeV threshold for different scenarios. See text for details.
Electron pT (GeV)0 5 10 15 20 25 30 35 40 45 50
Eff
icie
ncy
0
0.2
0.4
0.6
0.8
1
No Noise
Design Luminosity

ATLAS Technical Design ReportHigh-Level Trigger, Data Acquisition and Controls 30 June 2003
13 Physics selection and HLT performance 225
The HLT steering software requires the RoIs to be given with coordinates in η − φ space and avalue (in GeV) of the ET threshold that was passed, not in terms of the LVL1 internal data for-mat (which reflects the details of the electronic implementation of the trigger). Software con-verters are provided to translate the raw 32-bit RoI data words [13-5] into objects, complete withmethods to return the required data.
An effort has been made to validate the performance of the calorimeter trigger simulation [13-10]. Here we present some examples of efficiency and rate results for the electron/photon trig-ger.
Figure 13-3 shows the electron trigger efficiency as a function of pT when requiring that the trig-ger cluster ET be greater than 17 GeV. The electrons used in this study came from simulatedZ → e+e− decays, and were required to be well isolated from other high-pT particles (to ensurethat the electron shower was responsible for the trigger) and restricted to a fiducial range|η| < 2.45. Results are shown without electronic noise or pile-up, and also at design luminosity(1 × 1034 cm−2 s−1) with electronic noise added. A sharp rise in the efficiency is observed aroundthe threshold value in both cases, with little degradation due to noise and pile-up.
The rate of the LVL1 electron/photon triggers is dominated by misidentified jets. Figure 13-4shows the estimated trigger rate for the single electron/photon trigger as a function of trans-verse-momentum threshold for a luminosity of 2 × 1033 cm−2 s−1. The upper and lower bandsgive the rate before and after applying the isolation requirements. The ET-threshold scale in theplot is defined so that the efficiency for selecting genuine electrons with transverse-energyequal to the quoted value is 95%. Figure 13-5 presents the rate for the electron/photon-pair trig-ger for the high-luminosity scenario of 1 × 1034 cm−2 s−1, without and with isolation.
We have compared the results obtained using the new object-orientated software against thosepresented in the LVL1 TDR [13-3] which were obtained using the previous FORTRAN-basedsoftware. The results were not expected to be identical since the studies used different versionof PYTHIA for the event generation, there have been significant changes to the detector model,and some changes have been made to the RoI-selection and isolation algorithms. Note also that
Figure 13-4 Electron/photon trigger rate versus ET threshold without (top) and with (bottom) isolation require-ments at low luminosity 2 × 1033 cm−2 s−1. See the text for details.
e/gamma pT (GeV)20 25 30 35 40 45 50 55 60 65 70
Incl
usi
ve R
ate
(kH
z)
10-1
1
10
102
ATLAS Technical Design ReportHigh-Level Trigger, Data Acquisition and Controls 30 June 2003
226 13 Physics selection and HLT performance
new simulation does not yet include the details of the signal-processing chain for the trigger-tower summation, digitization, and bunch-crossing identification. In general there is fair agree-ment between the old and new results. For example the estimated rates for the single electron/photon trigger for a luminosity of 2 × 1033 cm−2 s−1 agree with the earlier simulations to within20%. In view of the potential sensitivity of the isolation cuts to details of the trigger-tower simu-lation and to be conservative, we have based our estimates of event and data-rate requirementsfor the HLT/DAQ system on an extrapolation of the LVL1 TDR results.
13.2.3 The RPC muon trigger and its simulation
The barrel muon trigger (|η| < 1.05) uses information from six layers of Resisitive Plate Cham-ber (RPC) detectors that are organized in three stations [13-11]. The middle RPC station (RPC2)is called the pivot plane. The principle of the algorithm that finds muon candidates is as follows[13-12]: each hit found in the pivot plane is extrapolated to the innermost RPC station (RPC1)along a straight line through the interaction point, and a coincidence window is defined aroundthe point of intersection. Since muons are deflected in the magnetic field, the size of the coinci-dence window defines the pT threshold of the trigger. A low-pT muon candidate is found if thereis at least one hit in the coincidence window and if in at least one of the stations RPC1 and RPC2there are hits in both planes of the doublet. This condition must be satisfied for the measure-ments in the bending plane and also for those in the non-bending plane. If, in addition, there isa hit within a coincidence window in at least one of the two planes of the outermost stationRPC3, a high-pT candidate is found. Again the coincidence condition must be satisfied for themeasurements in the bending plane and also for those in the non-bending plane.
In the hardware implementation of the trigger, the algorithm is implemented using logic that isprogrammed to recognize valid patterns of hits in the RPCs. All pivot-plane hits are processedin parallel, allowing a trigger with a very short fixed latency. There are three independently pro-grammable thresholds for each of the low-pT and high-pT triggers. For each of the 64 sectors ofthe RPC trigger, up to two muon candidates can be selected and sent to the MuCTPI. If there aremore than two candidates in a sector, the two highest-pT candidates are retained and a flag indi-cates that additional candidates were suppressed.
Figure 13-5 Predicted trigger rates for electron pairs without (top) and with (bottom) isolation at high luminosity1 × 1034 cm−2 s−1. See the text for details.
Lower e/gamma pT (GeV)15 20 25 30 35 40 45 50 55 60
Pai
r T
rig
ger
Rat
e (k
Hz)
10-2
10-1
1
10
102

ATLAS Technical Design ReportHigh-Level Trigger, Data Acquisition and Controls 30 June 2003
13 Physics selection and HLT performance 227
The input to the simulation of the muon trigger logic was provided by a package that simulatesthe RPC detector system; this was done with the ATLSIM program. The muon detector layoutused for this simulation was version ‘P03’ [13-12]. The geometry of the RPC detectors and thestations built from them, as well as the positioning within the muon spectrometer, were repro-duced in great detail according to the latest engineering drawings. The material compositionand geometry of the single-RPC units were also correctly simulated. The simulation of the RPCdetector response was based on results obtained in test-beam experiments. The hits produced inthe simulation of charged particles crossing the RPC detectors were collected and stored in out-put files for use in downstream packages for the simulation of the trigger logic and also for theevent reconstruction.
The detector simulation stage is followed by a number of packages which, using ATHENA al-gorithms and services, simulate in detail the hardware core and the overall architecture of theLVL1 muon barrel trigger. The hardware simulation is built from a set of classes that reproduce,up to the level of the internal data registers, the behaviour of the basic hardware components:the Coincidence Matrix ASIC (CMA), the Pad Board, the Sector Logic and the ReadOut Driver.The detector data are first accessed by the CMA, in which the RPC digits are translated into bitsindicating which input channels fired. Channel masking, time alignment, and the introductionof an artificial dead time for the fired channels are possible, although not used yet in the presentimplementation. The outputs of the eight CMAs belonging to each Pad Board are collected andare searched for valid trigger coincidences in the r – z and r – φ views. The Sector Logic thenidentifies the two highest-pT muon candidates among all the candidates from all the Pad Boardsin the corresponding sector. The output of the Sector Logic, including the addresses and pTthreshold information for the RoIs, is finally stored in the transient event store of the ATHENAframework from where it can be retrieved by the MuCTPI simulation package. The CMAs sup-ply information also to the readout system; this data path is also simulated. The resulting dataare organized in a structure that follows exactly the one implemented in the hardware (i.e.bytestream format). This, together with software converters of the interpretation of thebytestream data, allows the use of the RPC data in LVL2 selection algorithms such as muFast([13-12] and [13-13]).
The architecture model takes care of connecting together the different simulated hardware com-ponents and of simulating the data flow in the RPC muon trigger. It is built using a data-drivenapproach: the event data are arranged in a hierarchical structure going from the RPC digits upto the Sector Logic output. Each level in the hierarchy corresponds to a complete processingstep of one hardware component, and the result of each step is available on demand. The ‘on-demand’ approach is very flexible and allows one to save processing time since simulation is re-quested only for the sectors that contain data.
The architecture simulation makes use of two services that describe the set-up of the trigger sys-tem: the geometry of the trigger chambers and the cabling of the hardware components. The ge-ometry service accesses the RPC engineering parameters via the AMDB database and builds amodel in which the chambers are organized in a suitable way for the LVL1 trigger (i.e. in triggerstations, building a continuous detector surface at fixed radius, and not as appendices of theMDT chambers as it is in the database). The cabling service provides the mapping between thetrigger components (RPC readout strips to CMA channels, CMAs to Pad Boards, and PadBoards to Sector Logic) and holds the configuration of the CMAs. This configuration dependson the muon pT thresholds that are required. The cabling data as well as the CMA configurationdata are read from ASCII files.
The packages that implement the architecture model also provide a fast simulation of the trig-ger logic that is completely disentangled from the hardware simulation and does not take the
ATLAS Technical Design ReportHigh-Level Trigger, Data Acquisition and Controls 30 June 2003
228 13 Physics selection and HLT performance
timing of signals into account. The main application of this fast simulation is inside the LVL2 se-lection algorithm muFast, where it is used to emulate the functionality of the LVL1 trigger.Some information on the performance of the RPC muon trigger can be found in [13-13] and [13-14].
13.2.4 The Muon-to-CTP interface and its simulation
The Muon-to-CTP Interface (MuCTPI, see Ref. [13-15]) receives up to two muon candidatesfrom each of the 208 sectors of the barrel (RPC) and endcap (TGC) muon triggers. From thesecandidates, the multiplicities of muons are calculated for up to six different muon pT thresholdsand sent to the CTP for use in making the trigger decision. If the event is retained by the LVL1trigger, RoI information on the muon candidates is sent via the Region-of-Interest Builder to theLVL2 trigger (if there are more than 16 candidates, the 16 highest-pT candidates are retained anda flag is set). More detailed information is sent on a separate link to the DAQ. The data sent toLVL2 and the DAQ conform to the standard ROD bytestream data format. The MuCTPI avoidsdouble-counting of muons that pass through more than one pivot plane, e.g. in the barrel–end-cap transition region.
The MuCTPI simulation follows the hardware scheme as closely as possible, down to the dataformats used in the hardware. The data flow is emulated using the same stages of processing asin the hardware, including the propagation of error and status bits. Access functions are provid-ed for every type of information available in the hardware. The simulation was originally devel-oped as a standalone program for testing the prototype MuCTPI hardware. It has recently beenported to the ATHENA framework and integrated with the simulation of the RPC trigger on theinput side, and with the simulations of the CTP and the RoIB on the output side. The output tothe readout is also simulated although this is not yet used within the LVL1 simulation efforts.
13.2.5 The LVL1 CTP and its simulation
The LVL1 trigger event decision is made in the Central Trigger Processor (CTP, see Ref. [13-16]and [13-17]) in the two-step procedure that was discussed above:
The multiplicities of candidate objects from the calorimeter and muon triggers for various pTthresholds are compared with the trigger conditions introduced in Section 13.2.1, checkingagainst simple multiplicity requirements. Depending on the inputs from the calorimeter andmuon trigger, each trigger condition takes a logical value TRUE or FALSE.
The trigger conditions (or rather their logical values) are combined using AND, OR and NOToperations to give complex trigger items. Each trigger item corresponds to a signature to be trig-gered on by LVL1 as defined in the trigger menu; gates and prescales can be applied to each in-dividual item. The LVL1 trigger result is the logical OR of all trigger items.
The logical relations between the conditions and the items on one side, and the conditions andthe input multiplicities on the other side, are provided by the LVL1 trigger configuration(Section 13.2.1). The CTP provides outputs to the RoIB and to the readout; the information thatis sent includes bit patterns for the input signals and for the trigger items before and after pres-cales and vetoes, as well as the final event-decision result.
In the currently existing prototype hardware implementation of the CTP, the CTP-D (‘D’ fordemonstrator, see Ref. [13-18] and [13-19]), the selection procedure is implemented using two

ATLAS Technical Design ReportHigh-Level Trigger, Data Acquisition and Controls 30 June 2003
13 Physics selection and HLT performance 229
look-up tables (LUT) to compute the trigger conditions and two programmable devices(CPLDs) for the combination of conditions to trigger items. The design of the final CTP is inprogress based on the use of large FPGAs.
The current CTP simulation follows closely the CTP-D design — conversion to the final CTP de-sign will be done in due course. First, the input multiplicities from the calorimeter trigger andMuCTPI simulations are collected. The multiplicities that are used in the trigger menu arechecked against the respective conditions (the conditions are taken from the C++ object repre-senting the trigger menu that is provided by the configuration step). The conditions are thencombined to trigger items in a recursive algorithm. All trigger items are passed through a pres-cale algorithm, and the logical OR of all items is formed, resulting in the LVL1 event decision(the LVL1 accept or L1A signal which can be expressed as 0 or 1, FALSE or TRUE). The dead-time algorithms that exist in the hardware have not yet been implemented in the simulation. Fi-nally, the CTP result object, which in content and format corresponds precisely to the oneprovided by the hardware, is formed and stored in the TES for later use by the RoIB.
13.2.6 Interface to the HLT
The interface between the LVL1 trigger and the HLT is the Region-of-Interest Builder (RoIB, seeRef. [13-20]). This device, which is formally part of the DataFlow system, collects the informa-tion relevant for LVL2 from the calorimeter and muon triggers and from the CTP. It combines allthe data into a single block which it then passes to the LVL2 supervisor assigned to the event inquestion. The LVL1 data are received in S-LINK format (four links from the calorimeter triggerCluster Processor, two from the calorimeter Jet/Energy Processor, and one each from theMuCTPI and the CTP). The RoIB has to operate at the highest foreseen LVL1 output rates with-out introducing additional deadtime.
The RoIB simulation picks up the information stored in the TES by the calorimeter trigger,MuCTPI and CTP simulations, and constructs a LVL1 result raw-data object (RDO). Convertersare provided for translating the bytestream format into objects that serve to seed the LVL2 trig-ger. These contain the value (in GeV) of the threshold that has been passed and the location ofthe RoI in η−φ space.
13.3 Common tools for online HLT selection
The HLT algorithms are the basic software components that provide results from which the trig-ger decision is derived. These algorithms operate within the context and environment of theEvent Selection Software (ESS) which was already discussed in Chapter 9. Section 13.3.1 pro-vides an overview and description of the ESS from the viewpoint of the HLT algorithms. Theobjects of a common Event Data Model, i.e. the objects that the algorithms exchange and manip-ulate, are described in Section 13.3.2. A description of the HLT algorithms intended to operatein the LVL2 environment is given in Section 13.3.3, while the algorithms for the EF are describedin Section 13.3.4.
ATLAS Technical Design ReportHigh-Level Trigger, Data Acquisition and Controls 30 June 2003
230 13 Physics selection and HLT performance
13.3.1 Algorithmic view of the Event Selection Software
Unlike their counterparts from the offline reconstruction, HLT algorithms must allow them-selves to be guided by the Steering of the Event Selection Software. The Steering is configuredwith sets of Sequence and Menu Tables and guides the HLT algorithm processing using so-called Trigger Elements. Trigger Elements characterize abstract physical objects with a label(e.g., ‘electron’, ‘jet’, or ‘EMRoI’) and effectively decouple the Steering of the trigger selectionfrom details of the reconstruction Event Data Model. The ESS uses the seeding mechanism (seeSection 9.5) to guide the HLT algorithm processing to those subsets of event data that corre-spond to the LVL1 RoIs.
The HLT trigger processing is data driven, because the set of LVL1 RoIs determines which of thepredefined Sequences are to be executed for this event. Each of the LVL1 RoI objects are associ-ated to a Trigger Element upon which the Steering acts. For each Trigger Element, the Steeringexecutes the required HLT algorithms as defined in the Sequence Table. Hence, it is possible thata given algorithm may be executed several times per event. This is fundamentally differentfrom the ‘Event Loop’ approach of the offline reconstruction paradigm where a given offline al-gorithm acts only once upon each event.
During the LVL2 trigger latency, event data remain within ROBs unless and until they are ac-tively requested. The LVL2 algorithms request and process only a small fraction of the event da-ta, leading to a very substantial reduction in the network and computation resources that wouldotherwise be required.
The first step in the process of obtaining data for a RoI is the conversion of a geometrical region(e.g. a cone with an extent η and φ) into Identifiers; this is accomplished with the HLT RegionSelector [13-21]. Presently these Identifiers are the IdentifierHashes used in the offline soft-ware. Each Identifier corresponds to a Detector Element in a sub-detector, e.g., a Pixel Moduleor a sampling of a LAr Trigger Tower. The Region Selector uses information from the detectordescription during its initialization phase to build a so-called EtaPhiMap for each layer (ordisk) of a sub-detector. This map is essentially a two-dimensional matrix in η and φ. Each ele-ment of the matrix consists of a list of Identifiers. An HLT Algorithm uses the Region Selectorinterface, which is the name of the sub-detector from which to request data (i.e. Pixel, SCT, TRT,LAr, Tile, MDT, RPC, CSC, or TGC) and the physical extent of the geometrical region, to requestthe list of identifiers. Given the vastly different designs of the sub-detectors, different proce-dures are used depending on the sub-detector.
Interactions with the Data Collection system are hidden from the HLT algorithm behind a call toStoregate. Within Storegate, sub-detector data are aggregated into collections within a container.Each collection is labelled with the Identifier corresponding to the Detector Element. Algo-rithms request event data from Storegate using the set of Identifiers obtained by the HLT Re-gion Selector. If the collections are already within Storegate, it returns them to the HLTalgorithm. If not, Storegate uses the Raw Data Access scheme (Chapter 9) to request the corre-sponding ROB data from the Data Collection system. A converter translates the Raw Data intoeither Raw Data Objects (RDOs) or, by invoking an Data Preparation algorithm, into Recon-struction Input Objects (RIOs). The obtained RDOs or RIOs are stored within the collectionswithin the Container within Storegate.

ATLAS Technical Design ReportHigh-Level Trigger, Data Acquisition and Controls 30 June 2003
13 Physics selection and HLT performance 231
13.3.2 Event Data Model components
During 2002 and 2003, there has been a substantial effort within the HLT, offline, and sub-detec-tor communities to establish a common Event Data Model (EDM). In Section 13.3.2.1 the con-cept of Detector Elements is discussed as an organizing and identifying principle for most EDMobjects. The raw-data model, which forms the present agreed organization of trigger objects andtheir relationship, is described in Section 13.3.2.2 and reconstruction data-model classes specificto LVL2 and EF algorithms are described in Section 13.3.2.3.
It is worth noting that a large amount of effort has been invested by ATLAS as a whole (TDAQ,offline and detector communities) in making as realistic as possible a simulation of the data thatthe HLT/DAQ will have to deal with. The detector response is simulated using a detailedGEANT3-based simulation of the ATLAS detectors. The simulation of the raw data includes theeffects of pile-up in the bunch crossing that gave rise to the LVL1 trigger, and also in otherbunch crossings nearby in time, with an average number of interactions per bunch crossing cho-sen according to the relevant luminosity scenario. Electronic noise is also included in the simu-lation. The ‘time-frame’ of digitized data (i.e. measurements in successive bunch crossings) arethen processed to reproduce in as much detail as possible the raw data as they will appear at theoutput of the Readout System. For example, in the LAr calorimeter digitizations from five suc-cessive bunch crossings are combined to extract measurements of energy, time, and quality. Inthe experiment, this signal processing will be performed at the level of the Readout Driver.
13.3.2.1 Event Data organization
Event Data [e.g., Raw Data Objects (RDOs) and Reconstruction Input Objects (RIOs)] are aggre-gated into collections corresponding to adjacent readout channels within the physical detector.These collections reside in Containers with collection Identifier labels corresponding to the unitof aggregation. For most sub-detectors, the organizing principle is that of the Detector Element.
In the Pixel detector a Detector Element is a module, equivalent to a single Silicon wafer; thereare 1744 such elements. For the SCT, a Detector Element is one side of a module, equivalent to abonded pair of wafers whose strips are oriented in a single direction (i.e. axial or stereo); thereare 8176 SCT Detector Elements. For the TRT no such direct correspondence to detector moduleexists. There are 19 008 TRT Detector Elements [13-22].
For the calorimeters, the concept of Detector Element is difficult to define. Instead, the organiz-ing principle for event data is that of the LVL1 Trigger Tower and sampling.
Within the barrel muon spectrometer an MDT Detector Element corresponds to one of the twomulti layer chambers in a station. For the LVL2, the RPC data is organized in Detector Elementsaccording to the LVL1 coincidence logic. A Detector Element is identified with the RPC pad as-sociated with the second station. For the EF, the RPC data is reorganized into a Detector Ele-ment for each station. A TGC Detector Element is one TGC η division, or chamber, in a TGCstation; there are 24 forward stations in a ring and 48 endcap stations in a ring, and there are 4rings at each end of the ATLAS detector. Finally, the CSC Detector Element is a single CSCchamber in a station. A CSC station typically has two multilayers.
ATLAS Technical Design ReportHigh-Level Trigger, Data Acquisition and Controls 30 June 2003
232 13 Physics selection and HLT performance
13.3.2.2 Raw Data Model components
Bytestream Raw Data are ROB-formatted data produced by the ATLAS detector or its simula-tion [13-22]. The format supports a set of hierarchical fragments, where only the bottom level,the ROD fragment, is defined by the sub-detector group. Although the format of the bytestreamhas not been completely finalized, the detector groups have implemented the Raw Data simula-tion according to the best available information.
A Raw Data Object (RDO) is uncalibrated Raw Data converted into an object representing a setof readout channels. Historically these data have been referred to as Digits. It is the representa-tion of Raw Data that is put into the Storegate and is potentially persistifiable.
The purpose of the RDO converters is dual: first a bytestream file can be created by taking theinformation from already created RDOs (in the transient store, from ZEBRA); second, abytestream file can be read by the converters to fill the RDOs (or the RIOs for LVL2). The sameconverters are used for decoding the Raw Data from the online Data Collection. Since the RDOsare a representation of the specific detector output, their content can change during the lifetimeof the sub-detectors.
A detailed description of the Raw Data Model components is available elsewhere [13-23].
13.3.2.3 Reconstruction Data Model components
Algorithms interact with Reconstruction Input Objects (RIOs) as opposed to RDOs. For eachsub-detector system, classes of RIOs have been defined and are described in the following sub-sections.
13.3.2.3.1 Inner Detector
For the Inner Detector the RIOs are organized into Detector Element collections.
The Pixel and SCT RIOs are Clusters. A Cluster in the Pixel detector is a two-dimensional groupof neighbouring readout channels in a Detector Element. A Cluster in the SCT is a one-dimen-sional group of neighbouring readout channels in a Detector Element. For Pixel and SCT, thereare currently two implementations of the Cluster class: one used for the EF and offline, and oneused for LVL2. The one used in the EF has Pixel and SCT sharing the same class. For LVL2 thereis a common structure for Pixel, SCT and TRT, but each sub-detector has its own concrete class.Both the LVL2 and EF sets of cluster classes contain a list of RDO identifiers from which thecluster is built. The number of member functions is limited in both set of classes and the mem-ber functions follow the Inner Detector Requirements [13-22].
At LVL2, Pixel and SCT RIOs are converted to 3-dimensional coordinates in the ATLAS globalcoordinate system using an HLT algorithm to create Space Points. These algorithms accept asinput a Container of Cluster Collections of the appropriate type and return a Container of SpacePoints.
For the Pixels, the creation of Space Points consists of combining the local coordinates of Clus-ters with information on the position and orientation of the Detector Element to give the globalcoordinates. The process for the SCT is more complicated since a single SCT detector providesonly a one-dimensional measurement. However, an SCT module, consisting of two detectors ina stereo-pair, provide two-dimensional information. One species of SCT Detector Element, phi-

ATLAS Technical Design ReportHigh-Level Trigger, Data Acquisition and Controls 30 June 2003
13 Physics selection and HLT performance 233
layer, has strips orientated parallel to the beam axis, the other, u or v layer, is rotated by± 40 mrad with respect to those of the phi-layer Detector Elements. The formation of SpacePoints consists of the following steps:
• Associate each phi-layer Cluster Collection1 with the corresponding stereo-layer ClusterCollection.
• For each pair of Collections (phi + stereo), take each phi-layer Cluster and search for asso-ciated stereo-layer Clusters. If there is more than one associated stereo layer Cluster, aSpace Point is formed for each one (in this case, at most one will be a correct measure-ment, the others will form ‘ghost’ points). If no associated stereo-layer hit is found, apoint is created from the phi-layer information alone.
• Calculate the second coordinate (z for the barrel, or R for the end-caps).
• Using information on the position and orientation of the Detector Element transform toglobal coordinates.
Note that for the LVL2 Space Points a simplifications is made in the interest of speed. No at-tempt is made to form Space Points from Tracks passing close to the edge of a module, wherethe corresponding stereo-layer Cluster is in a different module.
The TRT RIO gives the drift circle of a straw. Here, the same classes are used for LVL2, EF, andoffline. The granularity of the TRT RIO is the same as for the RDO: that of a straw, thus the RIOcontains an identifier which is the offline identifier for a straw. In the case of the RDO the strawinformation is uncalibrated, while in the case of the RIO the straw information is calibrated, i.e.the drift radius is calculated from the drift time. For the current prototype, the time–radiusfunction is the same for all straws, but in the future the parameters of the function will comefrom the Interval of Validity Service [13-24].
13.3.2.3.2 Calorimeters
For the Calorimeters, the RIOs are calibrated calorimeter cells (LAr and Tiles), the same as in theoffline reconstruction.
Both LAr and Tile have a common CaloCell base class which represents the measurement inthe calorimeters of energy, position, time, and quality. A CaloCell has been calibrated so thatit returns the physical energy deposit in the cell with units of GeV, but without any kind of leak-age corrections. Time is given in nanoseconds and refers to when the deposit occurred, relativeto the trigger; it should be consistent with zero for good hits. Quality reflects how well the inputto the system matched the signal model on which the algorithm is based.
13.3.2.3.3 Muon Spectrometer
For the barrel Muon Spectrometer it was found expedient to use in part RDOs instead of RIOsas input to the HLT muon-selection algorithms. The RDOs are organized inside Storegate inidentifiable collections and can be accessed in the same way as RIOs. For the MDTs, the RDOsand RIOs are ordered in collections that correspond each to an MDT Detector Element, i.e. anMDT chamber. Each RDO [13-25],[13-26],[13-27] contains the information of one MDT readoutchannel, i.e. one tube. The information is the time of the leading edge of the MDT pulse and the
1. There is a Cluster Collection per Detector Element.
ATLAS Technical Design ReportHigh-Level Trigger, Data Acquisition and Controls 30 June 2003
234 13 Physics selection and HLT performance
charge integrated over the first 20 ns. From this, the uncalibrated drift time can be calculated.The RIOs contain the calibrated drift time.
The definition of RPC RDOs is complicated by the fact that the RPCs are trigger chambers. Theirreadout is optimized for the LVL1 trigger task and does not reflect an easily identifiable geomet-rical structure such as an RPC chamber with its strips. Consequently, RPC RDOs are orderedfollowing the readout structure, by PADs and CMAs. Each RDO corresponds to a fired CMAchannel [13-28], [13-29]. The RDOs are organized in CMA objects, i.e. in collections correspond-ing to one CMA each. The CMA objects in turn are organized per PAD, i.e. in collections corre-sponding to one PAD each.
One RPC RIO corresponds to an RPC Detector Element. An RPC RIO contains the informationof a collection of RPC strips that fired. There is no simple correspondence between RPC stripsand RPC readout channels. In order to translate a fired RPC readout channel, which is a CMAreadout channel, into a RPC strip, a cable map and processing of the information of the CMAsfor the opposite view is required.
Corresponding class definitions are being developed for the TGC and CSC detectors.
13.3.3 HLT algorithms for LVL2
LVL2 is the most demanding step, in terms of required system performances (latency, datatransfer, etc.), of the HLT trigger selection. In the following the present view of the algorithmsneeded to implement LVL2 selection is given. It is worth while noticing that several options forusing detector information in the best possible way are taken into account, hence more than onealgorithm is available to accomplish a defined task. This will allow the implementation of a ro-bust, flexible and redundant selection scheme, which will be studied with present and futuresimulations.
13.3.3.1 IDSCAN
IDSCAN (see Refs. [13-30] and [13-31]) is a track-reconstruction package for LVL2. It takes as in-put Space Points found in the Pixel and SCT Detectors. A series of sub-algorithms (Z-Finder, HitFilter, Group Cleaner, Track Fitter) then process these inputs and output Tracks and the SpacePoints associated with them.
The Z-Finder determines the z-position of the primary interaction vertex. The algorithm assignsthe input hits to narrow φ-bins. For each bin it then extrapolates lines joining pairs of hits backto the beam line, entering in a histogram the z values obtained for all hit-pairs. After integratingover all φ-bins, it takes as the z-position of the primary vertex the histogram region with themost entries.
The Hit Filter finds groups of hits compatible with Tracks coming from the z position found bythe Z-Finder. It puts all hits into a histogram binned in φ and η. It then finds clusters of hitswithin this histogram. It creates a group of hits if such a cluster has hits in more than a givennumber of layers.
The groups of hits found by the Hit Filter are used by the Group Cleaner which splits them intoTracks and removes noise hits. Each triplet of hits forms a potential track for which pT, φ0, and

ATLAS Technical Design ReportHigh-Level Trigger, Data Acquisition and Controls 30 June 2003
13 Physics selection and HLT performance 235
d0 are calculated. It forms groups from these triplets with similar parameters, applying certainquality cuts. It accepts a track candidate if a group contains enough hits.
Finally, the Track Fitter verifies track candidates and calculates the track parameters by using afitting algorithm adapted from SCTKalman [13-32][13-33][13-34]. It returns a list of Space Pointson the Track, the Track parameters, and an error matrix.
13.3.3.2 SiTrack
SiTrack is a track-reconstruction package for LVL2 that extends and upgrades a previous algo-rithm called PixTrig. SiTrack takes Pixel and SCT Space Points as input, and outputs fitted re-constructed Tracks each storing pointers to the Space Points used to build it. SiTrack isimplemented as a single main algorithm SiTrack that executes a user-defined list of sub-algo-rithms (chosen among ST-Space Point Sorting, ST-Muon Vertex, ST-Track Seeding, and ST-ThreePoint Fit).
The ST-Space Point Sorting collects the Space Points coming from the Pixel and SCT detectorsand sorts them by module address, storing the result in a Standard Template Library (STL) map.This processing step is performed in order to speed up data access for the other reconstructionsub-algorithms.
The ST-Muon Vertex is a primary-vertex identification algorithm mostly suitable for low-lumi-nosity events with a high-pT muon signature. It is based on track reconstruction inside a LVL1muon RoI — the highest-pT track is assumed to be the muon candidate or, failing that, to comefrom the same primary interaction as the muon. The primary-vertex position along z is takenfrom the point of closest approach of the track to the beam line.
The ST-Track Seeding uses the sorted Space Point map and a Monte Carlo look-up table (MC-LUT) linking each B-layer Pixel module to modules belonging to other logical layers. It buildstrack seeds formed by two Space Points and fits them with a straight line; one or more logicallayers can be linked to the B-layer, the latter option being particularly useful if robustness to de-tector inefficiencies must be ensured. If the primary vertex has already been reconstructed byST-Muon Vertex, a fraction of fake track seeds can be rejected during their formation, applying acut on their z distance from the primary vertex.
If no vertex information is available, a histogram, whose resolution depends on the number ofseeds found, is filled with the z impact parameter of each seed. The z position for the primaryvertex is then determined from the position of the maximum in the histogram. This vertexingalgorithm, which can be operated in both RoI and full-scan modes, is best suited for high-lumi-nosity events containing many high-pT tracks (e.g., b-tagging). Independent cuts on r-φ and zimpact parameters are eventually applied to the reconstructed seeds to further reduce the fakefraction.
ST-Three Point Fit extends track seeds with a third Space Point; it uses a map (which is built us-ing Monte Carlo data) associating to each seed a set of module roads2 that the track could havehit when passing through the Pixel or SCT detectors. A subset of modules is extracted from eachroad according to a user-defined parameter relating to their ‘depth’ inside it (e.g., the user candecide to use modules at the beginning or in the middle of each road, etc.). Space Points from
2. A road is a list of modules ordered according to the radius at which they are placed starting from theinnermost one.
ATLAS Technical Design ReportHigh-Level Trigger, Data Acquisition and Controls 30 June 2003
236 13 Physics selection and HLT performance
the selected modules are then used to extend the seed, and candidate tracks are fitted with a cir-cle. Ambiguities (e.g., tracks sharing at least one Space Point) can be resolved on the basis of thetrack quality, to obtain an independent set of tracks that can be used for trigger selection or as aseed for further extrapolation.
13.3.3.3 TRTLUT
TRT-LUT is a LVL2 algorithm for track reconstruction in the TRT. It is described in detail else-where [13-35][13-36]. The algorithm takes as input Hits in the TRT. The algorithmic processingconsists of Initial Track Finding, Local-Maximum Finding, Track Splitting, Track Fitting and Fi-nal Selection. It outputs the Hits used and Tracks with their parameters.
During the Initial Track Finding a histogramming approach is employed. A two-dimensionalhistogram is constructed with bins in φ and Q/pT for the track parameters at the primary vertex(Q indicates the electric-charge sign). For each hit in the event, the contents for all φ and Q/pTbins consistent with the hit position are incremented. The bin corresponding to the true param-eters of a track will receive entries for all hits on that track. A very fast implementation of the al-gorithm is achieved by using a Look-Up Table (LUT) to obtain the list of bins associated withgiven hit. Having built the histogram, tracks can be found by Local Maximum Finding.
The Track Splitting stage of the algorithm analyses the pattern of hits associated to a track can-didate. By rejecting fake candidates composed of hits from several low-pT tracks, the track split-ting step results in an overall reduction by a factor of roughly two in the number of trackcandidates. For roads containing a good track candidate, it identifies and rejects any additionalhits from one or more other tracks. The result of the overall Track Splitting step is a candidatethat consists of a sub-set of the straws within a road.
The final step of TRT-LUT, Track Fitting and Final Selection, performs a fit in the r-φ (z-φ) planefor the barrel (end-caps) using a third-order polynomial to improve the measurement of φ andpT. Only the straw position is used (i.e. the drift-time information is not used). The track is as-sumed to come from the nominal origin. After the fit, a reconstructed pT threshold of 0.5 GeV isapplied.
13.3.3.4 TRTKalman
TRT-Kalman [13-37][13-38] is a package based on xKalman++ (see Section 13.3.4.1). The name isin fact a misnomer since the Kalman-filter component of xKalman++ is not used for the TRT; ahistogram search and least-squares fit is used instead.
13.3.3.5 T2Calo
T2Calo (see Refs. [13-39], [13-40], [13-41] and [13-42]) is a clustering algorithm for electromag-netic (EM) showers, seeded by the LVL1 EM trigger RoI positions [13-3]. This algorithm can se-lect isolated EM objects from jets using the cluster ET and shower-shape quantities.
The RIOs from which it starts are calibrated calorimeter cells (LAr or Tiles), as in the offline re-construction. The output is a LVL2-specific class containing the cluster energy and position, andthe shower-shape variables useful for the selection of EM showers.

ATLAS Technical Design ReportHigh-Level Trigger, Data Acquisition and Controls 30 June 2003
13 Physics selection and HLT performance 237
The first step in T2Calo is to refine the LVL1 position by finding the cell with highest energy inthe second sampling of the EM calorimeter. This position (η1, φ1) is later refined by calculatingthe energy-weighted-average position (ηc, φc) in a window of 3 × 7 cells (in η × φ) centredaround (η1, φ1), using as weights the energy in the second sampling. As described in Ref. [13-40], a number of parameters are calculated for use selecting EM clusters and rejecting back-ground due to jets:
• In sampling two, Rshapeη = E37 / E77 is calculated. The expression Enm stands for the ener-
gy deposited in a window of n × m around (η1, φ1).
• In sampling one, Rstripη = (E1st - E2nd) / (E1st + E2nd) is obtained in a window of
∆η × ∆φ = 0.125 × 0.2 around (ηc, φc). Here E1st and E2nd are the energies of the highestand second-highest local maxima found after summing over the two strips in φ for eachposition in η within the window. A local maximum is defined as a single strip with ener-gy greater than each of its two adjacent strips.
• The total energy E deposited in the EM calorimeter is calculated in a window of 3 × 7 cellsaround (η1, φ1), summing over all three samplings.
• Finally, the energy that leaks into the hadron calorimeter Ehad is calculated in a window ofsize ∆η × ∆φ = 0.2 × 0.2 around (ηc, φc).
13.3.3.6 muFast
The muFast algorithm is a standalone LVL2 tracking algorithm for the Muon Spectrometer. Pre-vious versions are described in detail elsewhere [13-13].
The algorithm is steered by the RoI given by the LVL1 Muon Trigger and uses both RPC andMDT measurements. At present this algorithm is limited to the barrel region and is based onfour sequential steps:
1. LVL1 emulation: pattern recognition in the MDT system is initiated by the RPC hits thatformed the LVL1 track candidate. The RoI information obtained directly from LVL1 (viathe RoI Builder) gives only the position of the track at the pivot plane. Details of the RPChits that made up the LVL1 track therefore have to be obtained by running a fast algo-rithm that repeats the basic logic of the LVL1selection.
2. Pattern recognition is performed using the RPC hits that made up the LVL1 track candi-date to define a road in the MDT chambers around the muon trajectory. MDT tubes lyingwithin the road are selected and a contiguity algorithm is applied to remove backgroundhits not associated with the muon track.
3. A straight-line track fit is made to the selected tubes (one per tube monolayer) withineach MDT station. For this procedure the drift-time measurements are used to exploit ful-ly the high measurement accuracy of the muon-tracking system. The track sagitta is thenevaluated by combining the measurements from the different stations.
4. A fast pT estimate is made using LUTs. The LUT encodes, as a function of η and φ, the lin-ear relationship between the measured sagitta and Q/pT.
The output of this algorithm is a measurement of the muon pT at the production point, togetherwith η and φ. The detailed description of the implementation of muFast in the trigger frame-work is given in Ref. [13-43].
ATLAS Technical Design ReportHigh-Level Trigger, Data Acquisition and Controls 30 June 2003
238 13 Physics selection and HLT performance
13.3.3.7 muComb
The combination of the features of tracks measured at LVL2 in the muon spectrometer and theInner Detector (ID) provides rejection power against decays in flight of charged pions and ka-ons (i.e. π+ → µν and K+ → µν), and of fake muon-spectrometer tracks composed of hits in-duced by the cavern background. In addition, the combination of the two measurementsimproves the momentum resolution of reconstructed muons over a large momentum range.
The matching of tracks between the muon spectrometer and the ID can be performed by extrap-olating the ID track to the muon detectors. The procedure needs to take into account the detec-tor geometry, the material distribution, and the inhomogeneity of the magnetic field. Anaccurate extrapolation would require the use of detailed geometry and magnetic-field databas-es, together with a fine tracking. All this would be expensive in terms of CPU time and thereforenot acceptable for the LVL2 trigger.
To provide a fast tracking procedure, the effects of the geometry, material, and magnetic fieldhave been parametrized using simple analytic functions of η and φ. The extrapolation of IDtracks to the entrance of the muon spectrometer is performed using straight-line extrapolationin two independent projections, the transverse and the longitudinal views, corrected for bend-ing in the magnetic field and energy-loss effects. In the transverse projection the ID track extrap-olation in φ is corrected as follows:
, 13-1
where α is related to the field integral, and accounts for the transverse-energy loss in the ma-terial of the calorimeter that is approximately independent of the track transverse momentum,pT. Both α and have been determined by fitting for simulated muons as a function of pT.It is found that ~ 1.5 GeV, i.e. about half of the transverse-energy loss of low-momentummuons, as naively expected. A similar approach has been followed for the extrapolation of thez-coordinate in the longitudinal view.
The matching is done using cuts on the residuals on the positions in the orthogonal coordinatesz and Rφ. For matching tracks the transverse momentum of the muon is estimated using aweighted average of the independent pT measurements in the muon spectrometer and the ID.For each combined track, a χ2 function is used to evaluate the quality of the pT matching. Recon-structed muons from π and K decays in flight often give high χ2 values (e.g. because the IDmeasures the hadron momentum while the muon spectrometer measures that of the muonwhich is lower) and thus can be rejected thanks to the excellent resolution of both the ID andmuon-spectrometer measurements.
13.3.4 HLT algorithms for EF
The baseline option for the selection at the Event Filter stage is to adopt algorithms from the of-fline software suite. This will allow the online selection to easily benefit from improvementsstemming from offline analyses and to avoid duplication of efforts. In the following, a prelimi-nary list of the presently available algorithms and their characteristics can be found, which havebeen used in the EF selections described in Section 13.4.
∆ϕ QαpT pT
0–------------------=
pT0
pT0 ∆ϕpT
0

ATLAS Technical Design ReportHigh-Level Trigger, Data Acquisition and Controls 30 June 2003
13 Physics selection and HLT performance 239
13.3.4.1 xKalman++
xKalman++ is a package for global pattern recognition and Track fitting in the Inner Detectorfor charged tracks with transverse momentum above 0.5 GeV. A more detailed description ofthis algorithm is available elsewhere [13-44].
The algorithm starts the track reconstruction in the TRT using a histogramming method or inthe Pixel and SCT detector layers using segment search.
The first reconstruction method outputs a set of possible track-candidate trajectories defined asan initial helix with a set of parameters and a covariance matrix. As a second step the helix isthen used to define a track road through the precision layers, where all the measured clustersare collected. xKalman++ attempts to find all possible helix trajectories within the initial roadand with a sufficient number of clusters.
The other method, where track finding starts in the Pixels or SCT, outputs a set of Space Pointsas an initial trajectory estimation. In the next step the Space Points serve as an input for the Ka-lman filter-smoother formalism that will add the information from the remaining precision lay-ers. Each reconstructed Track is then extrapolated into the TRT, where a narrow road can bedefined around the extrapolation result. All TRT Clusters together with the drift-time hits foundwithin this road are then included for the final track-finding and track-fitting steps.
There are three seeding mechanisms available in the offline environment: the reconstruction ofthe full event; the reconstruction of a region-of-interest; and (available soon) EM calorimeterseeding. In the HLT environment, used as an EF algorithm, xKalman++ will be seeded by theLVL2 result.
After the pattern-recognition and Track-fitting steps, xKalman++ stores the final Track candi-dates in a collection in Storegate. The Track candidate contains the following information:
• fit procedure used;
• helix parameters and their covariance matrix at the end-points of the filter procedure inthe precision layers (point on the trajectory closest to the vertex) and in the TRT (point onthe trajectory closest to calorimeter);
• total χ2 resulting from final fit procedure;
• list of all hits on track from all sub-detectors;
• total number of precision hits Np;
• total number of straw hits Ns, empty straws crossed Ne, and of drift-time hits Nt.
Furthermore, a track candidate is stored in the final output bank if it passes the following cuts:
• the number of precision hits is larger than 5 to 7;
• the ratio Ns/(Ns+Ne) is larger than 0.7 to 0.8;
• the ratio Nt/Ns is larger than 0.5 to 0.7;
• no track accepted previously has the same set of hits as the current one — this last cut re-moves full ghost tracks.
ATLAS Technical Design ReportHigh-Level Trigger, Data Acquisition and Controls 30 June 2003
240 13 Physics selection and HLT performance
13.3.4.2 iPatRec
iPatRec [13-45] is a pattern-recognition algorithm used in the Event Filter that searches fortracks starting from Space Point combinations. Pixel and SCT Space Points are used to formTrack candidates. Candidates are extrapolated to the TRT and drift-time hits are added. At theinitialization phase, iPatRec creates a geometry database describing the properties of each de-tector module in the precision tracker plus the module’s relationship to a simplified materialmodel. This model consists of material ‘layers’ assumed to be either concentric cylinders in thebarrel region or planes normal to the beam-axis in the end-cap regions. Additional ‘layers’ rep-resent the TRT detector, beam pipe and inert support/service material. Track-finding, follow-ing, and fitting procedures make extensive use of this database. Another initialization task is toparametrize the magnetic field to enable a fast propagation of track parameters between layers.
In the first step of event reconstruction, adjacent Raw Data channels are clustered, and SpacePoints are produced from these Clusters. Each Space Point is assigned to one of seven partitionsaccording to its distance from the beam intersection region. Within each partition the points areordered according to their azimuthal coordinate. The general procedure is to form Track candi-dates using Space Point combinations from three different partitions, subject to criteria on max-imum curvature and crude vertex region projectivity. Candidates then undergo a Track-Fitprocedure to give Track parameters with covariance at the point of closest approach to thebeam line (perigee parameters). The Track Follower algorithm propagates these parameters toform an intersect with error ellipse at each ‘layer’ in turn. Clusters from the traversed detectorsare associated to the Track. Final allocation of Clusters are taken after a further track-fit. Duringthis fit, energy loss and Coulomb scattering are taken into account by allocating a scatteringcentre (with associated extra fit parameters) to each ‘layer’ traversed. An active detector regiontraversed without an associated cluster is classified as a ‘hole’ and retained for material andquality information. Tracks with a fit probability greater than 0.001 and a maximum of threeholes are extrapolated to the TRT, where a histogramming technique is used to select the TRThits to be added to the Track. Tight cuts are made on the straw residual and on the ratio of foundto expected straws, in order to limit high-luminosity occupancy effects.
Tracks with clusters in the two innermost Pixel layers plus TRT association are called primaryTracks. Otherwise at most one hole is allowed: truncated Tracks start in the innermost layers butcannot be followed to the outermost layers or TRT; secondary Tracks start further out and arerequired to have TRT association. Various partition combinations are taken to maintain track-finding efficiency for the three types of Track even in the event of a higher than expected detec-tor inefficiency. To avoid track duplication, only candidates with two unallocated Space Pointsare initiated, and tracks sharing more than 50% of their Clusters are deemed ambiguous whenceonly the one with higher quality is retained.
To speed up the execution, a preliminary track-finding pass looks only for high-quality primaryTracks and finishes as soon as one is found. The vertex from this Track is then used to subdividethe Space Point partitions into projective slices, greatly reducing the combinatorial load. Im-pact-parameter criteria are adjusted according to the distance to the first cluster to ensure thereis no bias against b-, c- or s-particle decays. The code iterates to allow for several interaction ver-tices, very necessary at high luminosity, and reverts to a slower algorithm when no high-qualitytracks are found. A special fit procedure is available to better handle electron bremsstrahlung.This is invoked from the subsequent combined reconstruction for tracks associated to an EM-calorimeter cluster.

ATLAS Technical Design ReportHigh-Level Trigger, Data Acquisition and Controls 30 June 2003
13 Physics selection and HLT performance 241
13.3.4.3 LArClusterRec
LArClusterRec is the reconstruction package for electromagnetic clusters in the calorimeter; it isorganized in two steps as described below.
In the first step, towers are created by summing the cells of the electromagnetic calorimeter andthe pre-sampler in depth using a granularity of ∆η × ∆φ = 0.025 × 0.025 corresponding to thegranularity in the second sampling of the EM calorimeter. The inputs to the tower building arethe calibrated calorimeter cells produced by the package LArCellRec.
In the next step, a sliding-window algorithm is used. If a local maximum is found with total ETin the window above a given threshold, a cluster is created which is subsequently stored in thecluster container. To reconstruct the cluster, energy and position are calculated in a given win-dow.3 The cluster energy is corrected for η and φ modulations of the calorimeter response andfor leakage outside the cluster in a given window. In the region between the barrel and end-capcalorimeters, the cluster energy is in addition corrected for energy losses using the energy de-posit in the crack scintillators. The η position in the first and second sampling is corrected for s-shapes, the φ position is corrected for an offset: both of them are geometry effects.
13.3.4.4 egammaRec
EgammaRec is an algorithm designed to calculate quantities that can be used to separate elec-trons and photons from jets. To do so, electromagnetic-cluster and tracking information areused.
In the electromagnetic calorimeter electrons are narrow objects, while jets tend to have a broad-er profile. Hence, shower shapes can be used to reject jets. This is handled by the EM ShowerBuilder which calls a number of algorithms that calculate diverse quantities using informationfrom the first and second samplings of the electromagnetic calorimeter, as well the first sam-pling of the hadronic calorimeter.
Cluster and track information are combined in the Track Match Builder. For a given cluster alltracks are examined in a window around the cluster position. In case more than one track isfound, the one with the highest pT is retained. If the E/p ratio is 0.5 < E/p < 1.5, the track matchis successful. In the subsequent particle-identification step the information provided by egam-maRec can be used. In the case of an electron hypothesis, jets can be rejected by analysis of theEM shower shape, tight track-quality cuts, E/p matching, and the position match in η and φ di-rections between the Cluster and the Track. Photons can be selected by analysing the EM show-er shapes, using reconstruction of photon conversions in the Inner Detector, and, possibly, usinga Track veto for non-converted photons.
13.3.4.5 MOORE
MOORE is an offline track reconstruction package for the Muon Spectrometer. A detailed de-scription of MOORE is available elsewhere [13-46]. MOORE reconstructs tracks in the full ηrange (barrel+endcaps) of the muon spectrometer. However, we will restrict the description tothe barrel since at present only this region is included in the trigger chain (Muon vertical slice).
3. This window can be different from the one used for the sliding-window algorithm.
ATLAS Technical Design ReportHigh-Level Trigger, Data Acquisition and Controls 30 June 2003
242 13 Physics selection and HLT performance
In the standard offline configuration MOORE takes as input collections of digits or clusters in-side the muon spectrometer and outputs fitted reconstructed tracks whose parameters are ex-pressed at the first measured point inside the muon spectrometer. The reconstruction flow isdesegregated into sequential steps, and each step is driven by an algorithm module that buildspartial or final reconstruction objects. Each algorithm retrieves objects created by the previousmodules from Storegate and builds transient objects that are subsequently recorded in Storegatefrom where they are available for other algorithms. Data and algorithms are strictly separated:the algorithms should know the structure of the data objects that they are accessing or produc-ing, but the objects do not depend on the algorithms. The existence of only a dependence fromalgorithms to data and the flowing sequence of the reconstruction steps allows one to establishwhich algorithm will produce an object at run-time. At present the overall reconstruction startsfrom the searches of regions of activity performed in two consecutive steps: one searches for ac-tivity regions in the φ trigger hits from RPC and another performs the search on the r-z viewconsidering the precision hits of MDTs.
Inside the MDTs the drift distance is calculated from the drift time by applying various correc-tions to the simplest linear formula. These corrections concern the time of flight, the second co-ordinate and the propagation along the wire, and the Lorenz effect. The best Track segment ischosen form the possible four lines tangential to the drift circles. All the MDT segments of theouter station are combined with those of the Middle layer. The MDT hits in the segments arecombined with the RPC φ information, forming outer Track candidates. All the successfully fit-ted candidates are kept for further processing.
Each outer Track that is successfully reconstructed is subsequently used to associate inner-sta-tion MDT hits. A final track is defined as a collection of RPC hits and MDT hits successfully fit-ted from at least two layers. The parameters of the fitted Tracks are specified at the firstmeasured point inside the Muon Spectrometer. In order to be used for physics studies an ex-trapolation of the Track parameters to the production point is needed. To accomplish this task adifferent offline package, Muon Identification (MuId), is used. In MuID the multiple scatteringis parametrized as scattering planes in the calorimeters and the energy loss is evaluated fromthe calorimeter measurements or from a parametrization as a function of η and the muon mo-mentum. After a refit at the vertex the Track parameters are used for further analysis.
When dealing with data already selected by the trigger the first two steps can be substituted byad hoc makers that seed the track search in the regions selected by the trigger, by using the HLTRegion Selector. We refer to this way of executing as ‘seeded mode’. More details regarding theimplementation of the MOORE package in HLT are given in Ref. [13-47].
13.4 Signatures, rates and efficiencies
In the following subsections, we present a preliminary assessment of the physics performanceof the trigger using algorithms for LVL2 and EF applied to representative classes of final-states:electrons and photons; muons; jets, taus and missing transverse energy; b-jets; and B-physics.This broad classification stems from the physics goals of the ATLAS experiment, as explained inChapter 4 and in Ref. [13-48].
Whenever possible, realistic raw data formats have been used as a starting point for the HLTprocessing, using a very detailed simulation of the raw data as they will appear when accessedfrom the Read Out System. This is deemed to be extremely important since, as described in thefollowing, the steps that prepare the data for the algorithmic processing represent a sizeable

ATLAS Technical Design ReportHigh-Level Trigger, Data Acquisition and Controls 30 June 2003
13 Physics selection and HLT performance 243
fraction of the total computing time, even when using optimized data-preparation software. Wewould like to underline that this has been made possible thanks to the close collaboration be-tween the TDAQ and the Detector groups.
Steering control (as described in Section 9.5) has also been employed, highlighting the flexibleboundary between LVL2 and EF. Selection schemes are then derived, which contain the signa-tures used to decide whether or not to reject events.
In order to maximize the discovery potential, the selection schemes generally only use inclusivesignatures. With the exception of B-physics, exclusive reconstruction of particle decays is not re-quired and topological variables4 are not used in the selection, although this is technically feasi-ble both at LVL2 and in the EF (e.g. to select Z → l+l- decays exclusively).
It must be emphasized that system performance (e.g. minimizing execution time and volume ofdata needed) is a major requirement in implementing the HLT selection, to comply with theconstraints imposed by the online environment and available resources. In this chapter alsosome indication of the compliance with the requirements will be given for representative selec-tions. Since, obviously, system and physics performance are correlated, all results have been ob-tained after trying to optimize both simultaneously.
13.4.1 Electron and photon selection
In the present view of the ATLAS trigger menus, the inclusive electron and photon triggers areexpected to contribute an important fraction of the total high-pT trigger rate. After the selectionin LVL2 and the EF, the remaining rate will contain a significant contribution due to events fromStandard Model physics processes containing real isolated electrons or photons (b, c → eX,W → eν, Z → ee, direct-photon production, etc.). According to the general guidelines indicatedin Chapter 4, the identification of these trigger objects is made using only inclusive selection cri-teria.
The electron and photon triggers can be viewed as a series of selection steps of increasing com-plexity. At LVL1, electrons and photons are selected using calorimeter information on a reducedgranularity. After receiving the LVL1 electromagnetic (e.m.) trigger RoI positions, the LVL2 trig-ger performs a selection of isolated e.m. clusters using the full calorimeter granularity withinthe RoI of size ∆η × ∆φ=0.2 ×0.2. To calculate the cluster ET, the most up-to-date available cali-bration data are used (see Section 13.3.3.5). Electrons and photons are selected based on thecluster ET and shower-shape quantities that distinguish isolated e.m. objects from jets. A fur-ther, more refined calorimeter-based selection may classify the e.m. cluster as a candidate pho-ton trigger object. In the next step, electrons are identified by associating the e.m. cluster with atrack in the Inner Detector. In general, track candidates are found by independent searches inthe TRT and SCT/Pixel (‘Precision’) detectors in the region identified by the LVL1 RoI. Detailsof the different LVL2 tracking algorithms that are currently being studied are described inSection 13.3.3.1, Section 13.3.3.2, and Section 13.3.3.4. For the results presented in the next sec-tion, however, only IDscan (Section 13.3.3.1), has been used; work is in progress to evaluate theother algorithms. For electron candidates, matching in position and momentum between thetrack and the cluster is required. Electron candidates passing the LVL2 selection criteria are re-tained to be examined by the EF.
4. For example, variables such as invariant masses constructed by combining of several high-pT objects.
ATLAS Technical Design ReportHigh-Level Trigger, Data Acquisition and Controls 30 June 2003
244 13 Physics selection and HLT performance
In the EF, electrons are selected with a strategy very similar to that for LVL2 using informationfrom the calorimeters and the Inner Detector. For track reconstruction, results obtained withxKalman++ are presented below; work is in progress to evaluate the alternative track-recon-struction program iPatRec. First results show very similar behaviour between these two algo-rithms. The main differences with respect to LVL2 arise from the availability of calibration dataand the possibility to use more sophisticated reconstruction algorithms with access to the detec-tor data for the full event. This results in sharper thresholds and better background rejection. Inorder to avoid biases introduced by using different reconstruction algorithms for online and of-fline selection, the EF will select events using as far as possible the offline reconstruction algo-rithms. However, using the offline reconstruction in the EF implies that the offline algorithmsmust comply with the stricter EF requirements in terms of robustness and system performance.This has not yet been achieved, but work is in progress to change the algorithms accordingly.
The present study uses the currently available ATLAS offline reconstruction software (seeSection 13.3.4) as a prototype of the future EF code. The criteria used to identify electrons andphotons need to be softer in the EF than in the offline in order not to lose events prematurely. Inprevious EF studies [13-49], [13-50], the electron and photon selections used the same cuts as inthe offline selection, but did not use some ‘critical’ criteria. For example a track veto for non-converted photons is not applied at the EF level because it requires good control of the faketracks in the Inner Detector and thus a very good understanding of the tracking performance,especially in the presence of pile-up. A more realistic EF electron selection has been used for thestudies presented here.
In the following, the physics performance of the selection of electrons by the HLT is reviewed.Only the main performance issues are discussed — a more complete report on this work can befound in Ref. [13-51]. The results were obtained using the new framework as described inSection 9.5. Work is in progress to assess more fully the physics performance, including the pho-ton selection which will be reported on at a later stage. The system-performance aspects of theelectron selection are discussed briefly in Section 13.4.1.2. Note that the electron and photon se-lections presented here build on earlier studies [13-49],[13-50] and [13-52].
13.4.1.1 HLT electron selection performance
The performance of the electron and photon triggers has been estimated for single electrons andphotons, and for some standard physics channels (e.g. Z → ee, W → eν, H → 4e). The physicsperformance is characterized in terms of efficiency for the signal channel, and the rate expectedfor the selection. Here only the single-electron trigger is considered; for the two-object triggerssufficiently high-statistics datasets could not be reconstructed and analysed in time for the TDR.The efficiencies were obtained using fully-simulated events with single electrons, and the rateswere estimated with ~2 × 10⁶ fully-simulated di-jet events; pile-up was included correspondingto low and design luminosity (see Ref. [13-2]). A higher-statistics sample of 107 di-jets is availa-ble, but this still needs to be analysed.
The events were generated using PYTHIA 6.203 [13-53], [13-54]. It should be noted that com-pared with older studies the overall cross section for QCD di-jets with ET > 17 GeV has in-creased by 50% [13-55]. However, a comparison made using fast simulation [13-55] has shownthat, at the same time, the rate of isolated electrons has gone down by 50% due to a decrease inthe rate of electrons from b- and c-decays.
In constrast with previous studies a more up-to-date detector geometry has been used. An im-portant change is the amount of material in the Inner Detector that has increased significantly,

ATLAS Technical Design ReportHigh-Level Trigger, Data Acquisition and Controls 30 June 2003
13 Physics selection and HLT performance 245
in particular due to the support of the first b-layer. Therefore, bremsstrahlung effects for elec-trons have become more important, especially in the end-caps. In addition, a realistic magneticfield map is now used in the simulation instead of a constant solenoidal field of 2 T. This changeaffects the tracking performance in the end-caps. More details on the datasets that have beenproduced can be found in Ref. [13-2].
In general, events with electrons and photons are selected on the basis of single high-pT objectsor of pairs of somewhat lower-pT objects. The physics performance of the single-electron trig-gers is summarized below and documented in more detail in Ref. [13-10] and Ref. [13-51].
The currently achieved performance for the single isolated-electron HLT algorithms is summa-rized in Table 13-1 as a function of the main steps in the LVL2–EF trigger chain for the2 × 1033 cm−2 s−1 luminosity scenario. The trigger steps have been factorized by detector in or-der to show the rejection that each stage contributes to the trigger. It should be noted that thereare strong correlations between the different selection criteria.
The overall reduction in rate achieved by LVL2 is ~90 for a loss of efficiency of 13% with respectto LVL1. The additional rate reduction provided by the EF is a factor of about five for a furtherefficiency loss of ~10%. This shows the power of the two-tier HLT selection.
Compared with previous studies [13-1], the rate reduction at LVL2 was found to be almost iden-tical for the same electron pT. This is a useful cross-check and a significant achievement giventhe completely different selection-software architectures. It also gives us confidence that thenew software that became available only shortly before the submission of this document, isworking correctly. Moreover, comparing this to previous studies [13-1], we find the rate reduc-tion at LVL2 is almost identical: at the EF, the rate reduction is currently 4.6, compared to 5.2 asreported in [13-1]. These numbers still need to be understood better, and further optimizationand cross-checks are needed to ensure that the selection scheme does not reject too many ‘real’electrons prematurely.
As a cross-check of the above results, the electron efficiencies have also been extracted using ful-ly-simulated W → eν events. With respect to LVL1, efficiencies of (90.6 ± 0.8)% after LVL2 and(83.2 ± 1.0)% after EF have been obtained. The simulation included pile-up for a luminosity of2 × 1033 cm−2 s−1 and used W events in which the electron had pT >25 GeV at the generator lev-el. These efficiencies are slightly higher than the ones given in Table 13-1 for single electrons ofpT = 25 GeV. This is expected since the efficiency is better for electrons with pT well above the
Table 13-1 Performance of the single-electron HLT at 2 × 1033 cm−2 s−1, obtained in a preliminary study withthe new HLT software chain. The results are presented in a single sequence. ‘Matching’ refers to position andenergy–momentum matching between calorimeter clusters and reconstructed tracks (at LVL2 only precision-detector tracks are used in the present study). The efficiencies are given for single electrons of pT = 25 GeValready selected by LVL1, averaged over the full pseudorapidity range |η| < 2.5. For reference, the efficiency ofthe LVL1 selection is 95%. The rates are normalized to a LVL1 rate for e.m. clusters of ~12 kHz. Note that thequoted errors are statistical — as discussed in the text, there are very large systematic uncertainties on the rateestimates, e.g. from cross-section uncertainties.
Trigger Step Rate (Hz) Efficiency (%)
LVL2 Calo 2114 ± 48 95.9 ± 0.3
LVL2 Tracking 529 ± 24 88.0 ± 0.5
LVL2 Matching 137 ± 12 86.6 ± 0.6
EF Global 30 ± 5 79.0 ± 0.7
ATLAS Technical Design ReportHigh-Level Trigger, Data Acquisition and Controls 30 June 2003
246 13 Physics selection and HLT performance
threshold value than for those at the threshold value. Preliminary studies of the full offline elec-tron/jet separation analysis, which uses even more powerful selections than the ones we can ex-ploit at the EF, also confirm the rates and efficiencies found here.
The analysis of the performance of the single-electron trigger e30i at high luminosity is inprogress and the results are still very preliminary. First results using only the EF selection give arate of 165 Hz for an efficiency of ~72% with respect to LVL1. Further work is needed to opti-mize the signal efficiency and rate reduction, including also the LVL2 trigger.
Based on our previous experience, a reasonable target at the EF is to accept electrons with anoverall efficiency of about 80% w.r.t. LVL1 in order not to cut too hard on physics. From presentunderstanding we can conclude that, with an improved tuning of the different selection steps, afinal rate of ~40 Hz at 2 × 1033 cm−2 s−1 luminosity for at least 80% electron efficiency, as ob-tained in previous studies [13-56], is still valid using the new selection algorithms and updateddetector geometry, and allowing for the changes at generator level. The results are preliminaryand work is in progress to optimize and cross-check the current selection cuts. For example, thecuts will be tuned in a more optimized way as a function of pseudorapidity, and additional cri-teria such as isolation in the Inner Detector around the electron track are being studied.
13.4.1.2 HLT algorithm optimization and LVL2–EF boundary
A first assessment of the system performance has been made for LVL2 in view of its highly de-manding environment in terms of execution time and latencies for data transfers. The algorithmexecution times per RoI measured on a 2 GHz PC are ~2 ms for the calorimeter reconstructionusing T2Calo and ~3 ms for the track reconstruction using IDscan — note that the latter is onlycalled for RoIs retained after the calorimeter-cluster selection. The data-preparation code for thecalorimeters is currently being optimized to minimize the computing time per RoI. Timings ofless than 10 ms per RoI have been achieved on a 2 GHz PC, and efforts will continue to reducethis further.
It is worth noting that the evaluation mentioned above of the data-preparation time was onlypossible thanks to the realistic simulation of the raw data that the HLT will receive from the Re-adout System. It appears that the data-preparation time could be a very significant part of thetotal LVL2 processing time, even though it is restricted to the RoIs.
For the EF, we do not yet have results at the same level of detail as for LVL2, although it isplanned to make measurements for both data preparation and algorithmic processing. As an ex-ample of the preliminary results obtained so far, data preparation in the EF for the whole LArcalorimeter takes about 0.5 s on a 2 GHz PC. Results from the studies that are under way will bedocumented in future ATLAS notes.
The use of system resources in the electron HLT can be minimized by exploiting the modularityof the trigger. By ordering the trigger steps so that events are rejected as early as possible, boththe overall processing times and data transfer rates may be reduced. Factorizing the trigger-al-gorithm components also provides flexibility to move the rejection power from LVL2 to the EFor vice versa, to optimize efficiency of the physics selection, rejection of high-rate backgrounds,and use of system resources. These issues have been extensively studied in the past and are re-ported in Ref. [13-52].

ATLAS Technical Design ReportHigh-Level Trigger, Data Acquisition and Controls 30 June 2003
13 Physics selection and HLT performance 247
If the rate for a trigger item from any level inthe selection is too high, one can reduce it ei-ther by raising the ET threshold of the item orby tightening the selection criteria. However,this results in a loss in efficiency for physicssignals. The loss in physics may partly be re-covered by adding more exclusive trigger se-lections for the channels of interest, but thecontribution to the overall rate of these extraitems must be taken into account. There arelong-term ongoing studies, performed togeth-er with the ATLAS physics community, to as-sess the impact of such changes in order toprepare alternative scenarios.
As an example, Figure 13-6 illustrates the im-pact on the selection of W → eν events of rais-ing the threshold in the single-electron HLTselection at 2 × 1033 cm−2 s−1 (nominal thresh-old of 25 GeV). The impact on other physicssignal such as Z → ee, and H → 4e is dis-cussed in Ref. [13-51].
As illustrated above, the HLT strategy con-tains considerable flexibility. Various possibili-ties exist to adjust the balance between minimizing the required computing resources andmaximizing the physics performance. For many channels of interest, the selection scheme alsoprovides considerable redundancy. More details on the trigger selection strategy can be foundin [13-1] and in Chapter 4.
13.4.2 Muon selection
The main purpose of the high-level muon trigger is the accurate reconstruction of muon trackswithin RoIs indicated by the LVL1 muon trigger. LVL2 and the EF must reject low-pT muons (i.e.muons with pT below the threshold that are initially selected due to the limited resolution in thefirst trigger level), secondary muons produced in decays in flight of charged pions and kaons,and fake muon tracks composed of hits from the cavern background. The EF must be able to re-construct additional muons present in the event that were not reconstructed or selected by theLVL1 and LVL2 triggers.
Whilst the LVL1 trigger system uses only hits from the dedicated trigger detectors (RPCs in thebarrel and TGCs in the endcap), LVL2 and the EF have access to the full measurements of theMuon Spectrometer, in particular the data from the Monitored Drift Tubes (MDTs). This allowsvery good track reconstruction in the muon spectrometer. The high-background environment inthe muon spectrometer demands algorithms with robust and fast pattern recognition capable ofrejecting hits induced by the cavern background.
The tracks found in the LVL2 muon trigger are extrapolated for combination with measure-ments in the Inner Detector and the calorimeters. Matching between muon tracks measured in-dependently in the muon system and the Inner Detector selects prompt muons and rejectsmany fake and secondary muons. This is especially important for the B-physics trigger in low-
Figure 13-6 Efficiency to select W → eν events atLVL2 and in the EF as a function of the ET threshold inthe trigger menu at 2 × 1033 cm−2 s−1 luminosity. Onlyevents that passed the LVL1 selection and for whichthe electron has pT > 25 GeV at the generator levelhave been considered.
0
20
40
60
80
100
30 40 50
Trigger menu ET (GeV)E
ffici
ency
(%)
LVL2EF
ATLAS Technical Design ReportHigh-Level Trigger, Data Acquisition and Controls 30 June 2003
248 13 Physics selection and HLT performance
luminosity running, for which the selection of relatively low-pT prompt muon events is the firststage in B-physics trigger selections. The studies presented in this section are limited to the bar-rel region (|η| < 1) — future work will extend them for the full pseudorapidity range.
13.4.2.1 The physics performance of LVL2 muon algorithms
The physics performance of the LVL2 muontrigger algorithms was presented and dis-cussed in detail in [13-1]. The algorithm mu-Fast has been implemented in the newframework with no important changes in thecode used to reconstruct the muon tracks. Themain difference of the present version of thecode, compared with the one studied previ-ously, is the use of ‘LVL1 Emulation’ to identi-fy among the RPC hits the ones used by theLVL1 trigger to select muon candidates. Weexpect this to have very little impact on theoverall muon-reconstruction efficiencies atLVL2, and no effect at all on the muon pT reso-lution. The following summarizes the mostrelevant results obtained in the previous stud-ies [13-13].
Given the steeply-falling muon-pT spectrum, the rate of muons measured with transverse mo-menta above a given threshold depends strongly on the pT resolution of the reconstructedmuons that is therefore a critical parameter in the LVL2 trigger. The resolution of the muFast al-gorithm is shown as a function of pT in Figure 13-7. The resolution ranges between 4.0% and5.5% for muons in the pT interval 6 – 20 GeV. These results are comparable with the pT resolu-tion obtained by the offline muon reconstruction program MUONBOX [13-57].
Figure 13-7 The pT resolution of the muFast algorithm as a function of muon pT
3.53.75
44.254.5
4.755
5.255.5
5.756
0 20 40 60 80 100pT (GeV/c)
Res
olut
ion
%
only with secondarieswith cavern background x 1
(a/x) + (b*x) + c2 2 2√¬
Table 13-2 Total output rates [kHz] of the standaloneLVL2 muon trigger after application of the muFastalgorithm for the 6 GeV low-pT threshold at1 × 1033 cm−2 s−1 and 20 GeV threshold at the designluminosity.
Physics process low-pT high-pT
π/K decays 3.00 0.07
b decays 0.90 0.09
c decays 0.50 0.04
W→µν 0.003 0.02
cavern background negligible negligible
Total 4.40 0.22

ATLAS Technical Design ReportHigh-Level Trigger, Data Acquisition and Controls 30 June 2003
13 Physics selection and HLT performance 249
The total rates after this algorithm for 6 GeVand 20 GeV thresholds have been evaluatedby convolving the efficiency as a function of pTwith the muon differential cross-sections ofthe dominant muon-production processes. Ac-count was taken of the rejection provided bythe LVL1 selection. The rates after LVL2 areshown in Table 13-25.
The rates from π/K decays were calculated us-ing the predicted cross-sections from theDPMJET program; the rates would be lowerby about 50% if the PYTHIA prediction wereused instead. Preliminary studies of the trig-ger rate arising from the cavern backgroundhave been made using predictions of the cav-ern background from the FLUKA package.The probability that a fake LVL1 muon triggeris accepted by the LVL2 is below 10−2. Withthis upper limit it is safe to neglect the contri-bution from fake muons.
The implementation of muFast in the newsoftware framework has been used to recon-struct events with single muons ofpT = 20 GeV. Figure 13-8 shows the distribution of (1/pT-1/pT
true)/(1/pTtrue). The resolution is
4.0%, which is identical to the result obtained with muFast in the old implementation. This re-sult supports the expectation that the physics performance does not change with respect to theprevious results [13-13]. The implementation of the muComb algorithm in the new frameworkis still on-going. Also in this case the algorithm under implementation is the same one dis-cussed in [13-1]. We can therefore rely on the results already obtained. Figure 13-9 shows as afunction of the muon pT the efficiency for the combined (muon spectrometer plus inner detec-tor) reconstruction of prompt muons and of secondary muons from π/K decays in flight.
The requirement of good matching (i.e. z/φ and pT matching) between the muon-spectrometerand inner-detector tracks reduces contribution from π/K decays in flight to the low-pT triggerrate to 1.0 kHz: a factor three reduction compared to the rate after the muFast algorithm. Takinginto account the reduction in rate from the improved pT resolution for prompt muons, the totalrate after the muComb algorithm is 2.1 kHz for muons with pT > 6 GeV and |η| < 1. Note thatthese numbers are calculated for a luminosity of 1.0 × 1033 cm−2s−1.
13.4.2.2 The physics performance of the EF muon algorithm
The physics performance of the MOORE EF package has been evaluated with simulated single-muon samples, with no cavern background, in the pT range 3 – 1000 GeV. Here we have consid-ered a fully-wrapped version of the offline code that is completely equivalent, from the recon-
5. W → µν cross section found with PYTHIA for pTµ > 3 GeV and |ηµ| < 2.7 : 9.56 nb. This corresponds
to about 100 Hz at 1 × 1034 cm−2 s−1.
Figure 13-8 Transverse-momentum resolution (1/pT-1/pT
true)/(1/pTtrue) for 20 GeV muons reconstructed
with the muFast in the new selection framework (nocavern background). Tails arise from events withlarge-angle Coulomb scattering or from poor momen-tum reconstruction where delta-rays were emitted bythe muon.
1
10
10 2
10 3
-0.5 -0.4 -0.3 -0.2 -0.1 0 0.1 0.2 0.3 0.4 0.5
EntriesMeanRMSUDFLWOVFLW
8956 0.4973E-02 0.8745E-01
94.00 118.0
1042. / 94Constant 758.5Mean 0.9451E-02Sigma 0.4051E-01
Resolution on 1/pt
Cou
nts
mu+ , mu- having pt = 20 GeV
ATLAS Technical Design ReportHigh-Level Trigger, Data Acquisition and Controls 30 June 2003
250 13 Physics selection and HLT performance
struction point of view, to the offline version. This version does not support seeding of the tracksearch, e.g. by the results of the LVL2 trigger (see below).
Figure 13-10 shows the track-reconstructionefficiency as a function of muon-pT in the bar-rel region. The triangle-up symbols show theefficiency of the reconstruction in the muonspectrometer (‘MOORE’), while the triangle-down symbols show the efficiency of the re-construction after the track has been extrapo-lated to the interaction region (‘Muid’). Theenergy loss in the calorimeter has been para-metrized as a function of η and muon momen-tum. The loss of efficiency of ‘Muid’ at low-pTis due to the failure of the extrapolation ofmuons that exhibit in the spectrometer a trans-verse momentum of a few GeV. Muons withpT larger than 8 GeV are reconstructed with ef-ficiencies above 95%, which is equivalent tothe results from MUONBOX shown in [13-48],[13-57].
Figure 13-11 shows the muon pT resolution ofthe MOORE package in the standalone muonspectrometer and after extrapolation to the in-teraction vertex. Again, the results are consist-ent with earlier studies. The physics performance has been checked for a seeded [13-47] versionof the algorithm. We don’t expect significant differences with respect the full version, since thereconstruction and fitting methods are the same as the ones used by the offline package. This issupported by Figure 13-12 where the transverse-momentum resolution of the seeded version isshown for pT above 8 GeV. A more complete presentation of the MOORE physics performanceis given in Refs. [13-46] and [13-47].
Figure 13-9 The efficiency with respect to LVL1 of the combined (muon spectrometer plus inner detector)reconstruction at LVL2 for prompt muons and for muons from π/K decays in flight. The left-hand plot shows theefficiency of the standalone algorithm muFast and the right-hand plot shows the efficiency of the combinedmuon algorithm muComb.
0
0.2
0.4
0.6
0.8
1
0 5 10
Muon pT (GeV)
Effi
cien
cy µFAST
prompt µπ→µ
K→µ
Muon pT (GeV)
Effi
cien
cy combined µprompt µπ→µ
K→µ
0
0.2
0.4
0.6
0.8
1
0 5 10
Figure 13-10 Single-muon reconstruction efficiencyas a function of muon-pT in the barrel region; triangle-up: standalone reconstruction (MOORE); triangle-down: reconstruction at the nominal interaction vertexpoint.
0
0.1
0.2
0.3
0.4
0.5
0.6
0.7
0.8
0.9
1
1 10 102
103
Moore
Muid Standalone
Muon pT (GeV/c)
Effi
cien
cy
|η|< 1.05
0
0.1
0.2
0.3
0.4
0.5
0.6
0.7
0.8
0.9
1
1 10 102
103
Moore
Muid Standalone
Muon pT (GeV/c)
Effi
cien
cy
|η|< 1.05

ATLAS Technical Design ReportHigh-Level Trigger, Data Acquisition and Controls 30 June 2003
13 Physics selection and HLT performance 251
13.4.2.3 The timing performance of the muon algorithms
The muFast trigger algorithm has been bench-marked on a 2 GHz machine. The event sam-ple consisted of about 430 events with singlemuons in the barrel region of pT = 100 GeV,with and without simulation of the cavernbackground. As shown in Figure 13-13 the av-erage processing time of muFast is about1.0 ms per RoI with an r.m.s. of 0.2 ms, andwith no event taking more than 4.1 ms.
Figure 13-14 shows the strong correlation ofthe processing time with the amount of RPCactivity. The composition of this overall timingis shown in Figure 13-15 — as can be seen, theprocessing time is dominated by the ‘Level-1Emulation’ that contributes about 0.8 ms.
A very preliminary simulation of the cavernbackground has been made to check the ro-bustness and the latency of the selection algorithms. This background has been simulated as-suming the nominal luminosity 1 × 1034 cm−2 s−1 and boosting by a factor two the predictionsprovided by the GCALOR package [13-58]. In presence of the cavern background the muFasttiming increases by only about 100 µs. The data-preparation time has been evaluated on thesame sample of events. Without cavern background the total time is 3.4 ms; this increases to8.9 ms if the cavern background is added. The time has been found to depend linearly on themuon-hit multiplicity. This allows one to extrapolate the data-preparation time to more severebackground conditions. Considering a safety factor of five, the data-preparation time is expect-
Figure 13-11 Fully-wrapped version: transverse-momentum resolution as a function of the generatedmuon-pT
Figure 13-12 Seeded version: transverse-momentumresolution as a function of the generated pT
MooreMuid Standalone
|η|< 1.05
Muon pT (GeV/c)
p T r
esol
utio
n
0
0.025
0.05
0.075
0.1
1 10 102
103
MooreMuid Standalone
|η|< 1.05
Muon pT (GeV/c)
p T r
esol
utio
n
0
0.025
0.05
0.075
0.1
1 10 102
103
Figure 13-13 Processing time of muFast
0
20
40
60
80
100
0.5 1 1.5 2 2.5 3 3.5 4 4.5
EntriesMeanRMSUDFLWOVFLW
434 0.9742 0.1995 0.000 0.000
time (ms)
Cou
nts
µFast algo timing
ATLAS Technical Design ReportHigh-Level Trigger, Data Acquisition and Controls 30 June 2003
252 13 Physics selection and HLT performance
ed to increase to 22.5 ms, while the muFast algorithm processing time remains below 1.5 ms.Therefore, on a 2 GHz processor, the overall CPU time is expected to be below 25 ms.
The timing performance of the MOORE algorithm, for both seeded and fully-wrapped modes,has also been evaluated on a 2 GHz machine. The code was built in optimized mode. The eventsamples consisted of around 500 events each, fully simulated. Table 13-3 shows the average exe-cution times per event both for seeded and wrapped modes. The timing includes the procedureof extrapolation to the vertex of the reconstructed track. In these results a conservative approachhas been adopted where the timings include also the accesses to the data, the data preparation,and the region-selector accesses.
The general behaviour of the average execution time for the different samples is represented inFigure 13-16 for both seeded and wrapped mode. In order to show the impact of the extrapola-
Figure 13-14 Correlation between the muFastprocessing time and the number of the fired channelsin the RPC readout
Figure 13-15 Contributions to the muFast processingtime. The bar length shows the average processingtime; the RMS is given in ms.
Table 13-3 Summary of MOORE timing tests for single-muon events, without and with cavern background at1 × 1034 cm−2 s−1, showing the mean and the root-mean-square (RMS): (a) nominal background intensity, (b)twice the nominal background intensity
Sample Time (seeded mode) ms Time (wrapped mode barrel) ms
Mean RMS Mean RMS
8 GeV 86 69 80 63
20 GeV 65 36 66 43
50 GeV 68 68 68 51
100 GeV 71 60 76 69
300 GeV 75 60 81 88
100 GeV (a) 775 70 2800 600
100 GeV (b) 1500 600 3600 2800
0
20
40
60
80
100
120
0 0.25 0.5 0.75 1 1.25 1.5 1.75 2 2.25 2.5time (ms)
Fire
d C
MA
cha
nnel
s
Level-1 emulation
RPC track fit
MDT tube fetch
Tube contiguity
MDT fit
Sag measurement
Pt estimation
Monitoring
10-2
10-1
1time (ms)
RMS = 0.2
RMS = 0.006
RMS = 0.01
RMS = 0.002
RMS = 0.01
RMS = 0.001
Negligible
RMS = 0.009Monitoring
µFast

ATLAS Technical Design ReportHigh-Level Trigger, Data Acquisition and Controls 30 June 2003
13 Physics selection and HLT performance 253
tion to the vertex we have plotted the execution times for the track reconstruction inside theMuonSpectrometer (MOORE), the execution times for extrapolating the track to the vertex(MuID), and the sum of the two (total). The execution times are rather flat over the pT range an-alysed.The time for the whole reconstruction of single muon, including data access and datapreparation, is on average below 100 ms. For those events we do not expect a large differencerunning in wrapped and seeded mode, since the data set that is accessed is quite similar.
The points in Figure 13-16 were obtained by averaging only on events for each sample that reg-ister execution times below one second. In order to show the impact of events that register long-er execution times, we define a time efficiency as the ratio between the number of reconstructedtracks in one second and the number of Regions of Interest. The plot of time efficiency is shownin Figure 13-17 for both seeded and wrapped mode.
13.4.3 Tau/Jets/ETmiss selection
13.4.3.1 The tau trigger
A major Standard Model source of tau leptons in ATLAS will be the channels W → τν andZ → ττ. The tau lepton will also play a key role in the search for new physics. In the MSSM theheavy-scalar (H) and pseudo-scalar (A) Higgs boson decays to tau-pairs are strongly enhancedwith respect to the Standard Model Higgs boson case. Also, a key decay channel for the chargedHiggs boson is Η± → τν.
The identification of the hadronic decays of tau leptons is based on the selection of narrow iso-lated jets with low multiplicity in the tracking system. The shower isolation and shape are cal-culated for both the e.m. and hadronic calorimeters separately. The fraction of energy depositedby the tau jet in the e.m. calorimeter has a mean value around 60%. The hadronic shower isbroader in the hadronic calorimeter than in the e.m. calorimeter. Thus the jet information ob-
Figure 13-16 Average execution time (in ms) for dif-ferent pT values (in GeV), obtained with MOORE, withMuId standalone, and with both of them, in seededand wrapped mode.
Figure 13-17 Time efficiency for seeded and wrappedmode for different pT values
0
25
50
75
100
10 102
All SeededMoore SeededMuId Seeded
All WrappedMoore WrappedMuId Wrapped
Muon pT (Gev/c)
Mea
n T
ime
(mse
c)
0.97
0.98
0.99
1
10 102
Muon pT (Gev/c)
Tim
e E
ffici
ency
SeededWrapped
ATLAS Technical Design ReportHigh-Level Trigger, Data Acquisition and Controls 30 June 2003
254 13 Physics selection and HLT performance
tained from the e.m. calorimeter is more selective than that from the hadronic calorimeter. A de-tailed description of the tau trigger studies presented below is given elsewhere [13-59].
13.4.3.1.1 The LVL1 tau trigger
The motivation for a LVL1 tau calorimeter trigger is manifold, both in conjunction with elec-tron, muon, or missing-ET signatures to enhance Z, W or A/H coverage, and for calibrationpurposes. Narrow tau jets containing one (three) charged particles give rise to narrow isolatedenergy depositions in the calorimeters. It is envisaged that an isolation requirement will be avaluable part of the tau trigger at all levels.
The e/γ and τ/h LVL1 algorithms are described in detail elsewhere [13-1],[13-3]. The LVL1 τ/hcalorimeter trigger is based on a 4 × 4 array of ‘trigger towers’ in the electromagnetic andhadronic calorimeters (within the region |η| < 2.5) where the tower granularity is (0.1 × 0.1)∆η × ∆φ. A core ET is defined in the trigger algorithm as the sum of the electromagnetic andhadronic ET in a 2 × 2 trigger-tower region. The trigger algorithm is based on four elements —the trigger cluster(s), an e.m. isolation region, a hadronic isolation region, and an ‘RoI cluster’.
The distributions of the two isolation variables of the LVL1 τ/h trigger algorithm (in which thecluster-ET is measured in a region of 2 × 1 e.m. + 2 × 2 hadronic towers) are shown in the scatterplots of Figure 13-18 for simulated Z → τ+τ− events and QCD di-jet events. Looking at the corre-sponding projections, it is found that the EM isolation is more powerful than the hadronic one.In both plots a LVL1 algorithm has been employed with a core-ET threshold of 20 GeV. The cor-relation between the isolation ET values indicates that the hadronic isolation is of limited use inrejecting QCD jets. For example, the standalone tau trigger rate from QCD di-jets, at a luminos-ity of 1 × 1033 cm−2 s−1 and neglecting the effect of pile-up, for a core-ET of 20 GeV, a jet thresh-old of 20 GeV and an isolation cut at 10 GeV, would be about 19 kHz.
Figure 13-18 The hadronic isolation ET vs. the e.m. isolation ET (rings of 12 towers) for tau and QCD di-jetsusing the LVL1 trigger algorithm

ATLAS Technical Design ReportHigh-Level Trigger, Data Acquisition and Controls 30 June 2003
13 Physics selection and HLT performance 255
13.4.3.1.2 The High-Level tau trigger
The tau trigger utilizes the e/gamma slice tools described in Section 13.4.1. The signal selectionis tuned using events of the type Ζ → τ+τ-. Background evaluation is performed usingfully simulated di-jet events. The LVL2 studies involve the verification of the LVL1 decisionand, subsequently, tau identification using parameters that describe the shower shape in layersone and two of the e.m. calorimeters. The LVL2 variables used in a previous analysis [13-60],[13-61] could not be used in the present due to changes in the e/gamma software implementa-tion. Additional rejection of background jets can be achieved by using the information fromtracks associated to the tau RoI.
The LVL2 algorithm is applied to LVL1 tau RoIs. Loose LVL1 cuts are chosen for the study pre-sented here: a cluster ET in excess of 20 GeV is required, and the e.m. and hadronic isolationthresholds are set to 10 GeV. LVL2 jet calibration is applied to the cells within the LVL1 RoI win-dow. The energy-weighted position (∆ητ × ∆φτ) of the tau-jet candidate is computed from all cal-orimeter cells within the LVL1 window. The first part of the LVL2 algorithm is the confirmationof the LVL1 decision. In order to do this the LVL1 algorithm described above is repeated usingfine-grained cell information instead of the coarse-grain information available at LVL1.
As a first step, a check was made to ensure that LVL1 RoI coordinates are good approximationsof the LVL2 tau coordinates, by measuring the distance between LVL1 RoI and the associatedLVL2 cluster. After this successful check, for the LVL2 clusters associated with LVL1 RoIs, thenext step is to look at the LVL2 e/gamma calorimetric variables that have some power to selecttaus over QCD jets.
Three variables were identified to discriminate between τ-jets and the di-jet background. Theperformance of the algorithm as a function of the shower-shape variable R37 was examinedfirst. This variable is defined as the ratio of the ET contained in a 3 × 7-cell cluster to the ET in a7 × 7-cell cluster centred on the same seed cell, calculated for the second layer of the e.m. calo-rimeter (Section 13.3.3.5). The second variable studied, F12, is defined in the first layer of thee.m. calorimeter and functions as an isolation variable: where Emax1 and Emax2 are the highest and second highest strip energies, respectively, in thefirst layer of the e.m. calorimeter: this quantity is defined for each LVL2 cluster. It should be not-ed that the variables R37 and F12 are highly correlated. The third variable was Fe.m., the e.m frac-tion of the total energy.
The variable with the most power to select taus and reject QCD jets was found to be R37. Sincethe F12 variable is highly correlated with R37, it was not found possible to obtain useful further
Table 13-4 Trigger efficiencies for taus and for QCD jets, for different R37 cuts and the LVL1 trigger conditiondefined in the text. The right-hand column shows the corresponding standalone tau trigger rate based on QCDdi-jets with a PYTHIA generation threshold ET of 35 GeV.
Cut Tau efficiency QCD jet efficiency LVL1/2 tau trigger rate
wrt LVL1 accepts (%) wrt LVL1 accepts (%) using calorimetry (kHz)
R37 > 0.75 88 ± 1 71 ± 1 11.1 ± 0.2
R37 > 0.80 83 ± 1 59 ± 1 9.4 ± 0.2
R37 > 0.85 75 ± 1 44 ± 1 7.0 ± 0.2
R37 > 0.90 62 ± 1 26 ± 1 2.3 ± 0.2
F12 Emax1 Emax2–( ) Emax1 Emax2+( )⁄=
ATLAS Technical Design ReportHigh-Level Trigger, Data Acquisition and Controls 30 June 2003
256 13 Physics selection and HLT performance
improvements in tau efficiency and jet rejection using F12. Likewise, it was not possible to em-ploy Fe.m. to gain further QCD jet rejection whilst maintaining a good tau efficiency.
Three possible cuts in the R37 variable were studied: R37 > 0.75, 0.80, 0.85. These cuts were cho-sen to maintain a tau efficiency greater than 75%. Table 13-4 shows the efficiency for triggeringon Ζ → τ+τ- and QCD di-jets, along with the corresponding standalone tau trigger rate at LVL2estimated using QCD di-jets, for the three R37 cuts mentioned. The values are also given for ref-erence for R37 > 0.90, although this gives an unacceptably low efficiency for selecting taus. Thechosen set of LVL1 conditions, denoted 20-10-10, are the loose LVL1 cuts defined for theLVL1 study: in this case the core ET is 20 GeV and the e.m. and hadronic isolation thresh-olds are both 10 GeV.
Additional rejection of background QCD jets can be achieved by using the information fromtracks associated with the tau LVL1 RoI. The track information available at LVL2 was used to as-sociate Inner Detector tracks, found using the ‘IDscan’ algorithm, with the tau RoI by requiringthat ∆R between the track and the LVL2 tau cluster direction, associated with the tau LVL1 RoI,obeyed the relation ∆R < 0.3. The inner-detector track-multiplicity distributions obtained forΖ → τ+τ- and QCD di-jets are shown in Figure 13-19. The resulting LVL2 tau and QCD di-jet ef-ficiencies are shown in Table 13-5 for a few useful combinations of calorimeter and track-basedcuts.
13.4.3.1.3 Tau selection in the Event Filter
At the Event Filter stage, access to the complete, calibrated, event is possible for the first time. Inaddition, the tracking information has been further refined to reduce the number of spurioustrack segments and minimize tracking inefficiency. Thus, it is possible to refine the LVL2 deci-sion. Existing offline studies of tau/hadron identification and jet rejection [13-62], [13-63], [13-64] provide the basis for the EF trigger decision. Typical trigger criteria for tau/hadron jets withET > 30 GeV and |η| < 2.5 are as follows:
• The jet radius computed using only the e.m. cells contained in the jet Rem must obey theinequality: Rem < 0.07.
Table 13-5 The tau and QCD-jet efficiencies for various useful combinations of R37 and LVL2 track-multiplicitycuts, for the specified LVL1 trigger condition. The right-hand column shows the corresponding standalone tautrigger rate based on QCD di-jets with a PYTHIA generation threshold ET of 35 GeV.
Cuts Tau efficiency QCD di-jet efficiency Standalone tau/hadron
wrt LVL1 accepts (%) wrt LVL1 accepts (%) trigger rate (kHz)
LVL1: 20-10-10 15.6 ± 0.2
R37 > 0.8, #LVL2 tracks < 5
74 ± 1 34 ± 1 5.3 ± 0.2
R37 > 0.8, #LVL2 tracks < 4
70 ± 1 30 ± 1 4.7 ± 0.2
R37 > 0.9, #LVL2 tracks < 5
57 ± 1 18 ± 1 2.8 ± 0.2
R37 > 0.9, #LVL2 tracks < 4
54 ± 1 15 ± 1 2.3 ± 0.2

ATLAS Technical Design ReportHigh-Level Trigger, Data Acquisition and Controls 30 June 2003
13 Physics selection and HLT performance 257
• The difference between the ET contained in cones of sizes ∆R = 0.2 and ∆R = 0.1, normal-ized to the total jet ET, ∆ET must obey the inequality: ∆ET < 0.1 (isolation fraction).
• The number of reconstructed charge tracks pointing to the cluster (within a ∆R of 0.3) Ntris equal to one or three.
Other tau-identification variables that have been considered are the tau hadronic ET and a tau-likelihood variable included in the ‘Taurec’ reconstruction package in the ATHENA framework.The likelihood function uses simple analytical fits to the distributions of the variables men-tioned above, as well as the pT of the highest pT track. The variables mentioned above still havepower at the EF level to reject QCD jets whilst retaining an adequate efficiency for selectingtaus. An analysis of the rejection of QCD jets at the EF level is currently under way [13-59].
Figure 13-19 The top plots show the inner detector track multiplicities determined at LVL2 for Z Æ t+t- and QCDdi-jets. The bottom plots show the variation of the tau- and the jet-finding efficiency with upper cut on track mul-tiplicity.
ATLAS Technical Design ReportHigh-Level Trigger, Data Acquisition and Controls 30 June 2003
258 13 Physics selection and HLT performance
13.4.3.1.4 Jet rejection at LVL2 following a tau +ET-miss trigger
A method of improving the signal acceptance for final states involving taus, as well as retainingan acceptable trigger rate, is to combine the standalone tau trigger with an ET
miss trigger. The ef-fect of adding a LVL1 ET
miss requirement on standalone tau HLT rates is shown in Table 13-6 forone set of LVL2 trigger criteria and four trigger-threshold configurations: τ20 + xE25;τ20 + xE35; τ30 + xE25; and τ30 + xE35. As can be seen from the table the LVL1 ET
miss require-ment substantially enhances the jet rejection and thus reduces considerably the tau trigger ratecoming after LVL2.
13.4.3.2 ETmiss trigger
Missing transverse energy will provide a distinct and important signature for new physics atthe LHC. A precise and reliable measurement of ET
miss requires good calorimeter performanceand energy resolution, good linearity of response and hermetic coverage over a wide range ofpseudorapidity.
The ETmiss + jet trigger is an example of a trigger based on the combination of a global variable
(ETmiss) and localized RoIs in the detector. The bulk of the trigger rate will result from fluctua-
tions in the energy measurements of QCD jets, partly as the result of the presence of material infront of the calorimeters and in the regions between the various calorimetry sections. The maininstrumental effects arise from the difference in response between the various calorimeter tech-nologies and from the fact that the calorimetry is highly non-compensating.
The contribution of the EF to reducing the LVL1 ETmiss trigger rate should be important for
three main reasons. Firstly, accurate calorimeter calibration and inter-calibration are available[13-48]. Secondly, a separate calibration for cells between clusters can be utilized. Thirdly, thecell ET cutoff applied to suppress noise can be tuned accurately [13-65]. Initial studies of theET
miss + jet trigger rate used samples of QCD di-jets (from PYTHIA) made with both fast and
Table 13-6 Tau and QCD di-jet efficiencies for various LVL1 & LVL2 trigger criteria. In the right-hand column thecorresponding tau standalone LVL2 trigger rates are given including the LVL1 ET
miss requirement.
LVL1 Tau + ETmiss LVL2 Cuts LVL2 tau eff. LVL2 jet eff. LVL2 standalone tau
trigger (GeV) wrt LVL1 (%) wrt LVL1 (%) trigger rate (kHz)
τ(20-10-10) + xE25 - 29 ± 1 10 ± 1 1.56 ± 0.16
τ(20-10-10) + xE35 - 11 ± 1 1.9 ± 0.2 0.30 ± 0.03
τ(20-10-10) + xE25 R37 > 0.9 #LVL2 tracks < 5
15 ± 1 1.6 ± 0.2 0.25 ± 0.03
τ(20-10-10) + xE35 R37 > 0.9 #LVL2 tracks < 5
5.1 ± 0.2 0.5 ± 0.1 0.07 ± 0.01
τ(30-10-10) + xE25 - 43 ± 1 18 ± 1 0.85 ± 0.05
τ(30-10-10) + xE35 - 20 ± 1 4.3 ± 0.4 0.20 ± 0.02
τ(30-10-10) + xE25 R37 > 0.9 #LVL2 tracks < 5
23 ± 1 3.6 ± 0.4 0.17 ± 0.02
τ(30-10-10) + xE35 R37 > 0.9 #LVL2 tracks < 5
9.6 ± 0.5 1.2 ± 0.2 0.06 ± 0.02

ATLAS Technical Design ReportHigh-Level Trigger, Data Acquisition and Controls 30 June 2003
13 Physics selection and HLT performance 259
full simulation. Excellent agreement was obtained between these simulation methods. Detailsof the simulation can be found elsewhere [13-66].
The ETmiss + jet trigger-rate calculation has been revisited using the latest ATHENA object-ori-
ented reconstruction software framework. In addition, the following improvements were in-cluded in the analysis: an updated version of the PYTHIA event generator; an updated modelfor minimum-bias interactions; a new algorithm for ET
miss calculation utilizing the H1 calibra-tion approach as well as tuned cell cuts. Initially the low-luminosity scenario has been consid-ered without pile-up but with electronic noise added to the simulation. The preliminary resultsat 2 × 1033 cm−2 s−1 give an ET
miss + jet trigger rate of 50 ± 12 Hz for(ET
jet, ETmiss) > (60, 60) GeV, and 40 ± 12 Hz for (ET
jet, ETmiss) > (70, 70) GeV. These rates are
consistent with earlier results [13-1] and can be reduced further by applying topological cuts asin the past. A plot of the trigger rate versus the ET
miss threshold is shown in Figure 13-20 forboth jet threshold settings.
Recently estimates of the tau + ETmiss HLT rate have been made using the ATHENA reconstruc-
tion software. In this case the HLT rate was estimated by assuming that the existing offline tauand ET
miss code simulates the performance of the tau + ETmiss HLT. The effects of electronic
noise in the calorimetry were included in the simulation. This preliminary analysis of the low-luminosity trigger rates did not include the effects of pile-up. The same offline tau-identificationcriteria bulleted in Section 13.4.3.1.3 were used. Also, a cut of ~2σ in the electronic noise was ap-plied to all calorimeter cells immediately after reconstruction and before any further analysis. Inthis case an improvement was made to the standard offline analysis by making the tau-identifi-cation criteria dependent on the ET range [13-67]. In this way the cuts could be optimized for thehighest rejection for a given efficiency. It was seen that the jet rejection came mainly from theET
miss cuts and after that from the tau-identification criteria. This preliminary analysis had onlylimited statistics and thus only a rough estimate of the trigger rate is possible. However, fixingour cuts to give a tau efficiency of 55%, and taking the tau ET > 100 GeV, the estimatedtau + ET
miss rate is ~5 Hz.
Figure 13-20 The ETmiss + jet trigger rate, for two ET (jet) thresholds, as a function of the ET
miss threshold. Theplots are for a luminosity of 2 × 1033 cm−2 s−1 but without pile-up included. Electronic noise has been added.
10 2
10 3
10 4
0 20 40 60 80 100Ptmiss (GeV)
Inte
gral
rat
e (H
z)
Pt(J1) G 60 GeV
Noise, no pile-up
ckin(3) G 35 GeV
10 2
10 3
10 4
0 20 40 60 80 100Ptmiss (GeV)
Inte
gral
rat
e (H
z)
Pt(J1) G 70 GeV
Noise, no pile-up
ckin(3) G 35 GeV
ATLAS Technical Design ReportHigh-Level Trigger, Data Acquisition and Controls 30 June 2003
260 13 Physics selection and HLT performance
13.4.3.3 Triggering on jets
The purpose of the high-level jet trigger is to reduce the rate of events containing jets, comparedto the LVL1 one, by exploiting the improved ET measurement. This improvement is achieved byapplying a more refined energy calibration and jet definition, and using the fine-granularityand high-precision readout data. As jets are the dominant high-pT process, rate reduction can-not be expected by removing fake jet objects. In contrast to e.m. clusters, jets cannot be flaggedas background (unless they are due to instrumental effects). Jets are searched for in the region of|η| < 3.2 in the e.m. and hadronic calorimeters. Hereafter, preliminary results will be presentedusing the following threshold values and luminosity scenarios: j180, j75x3, and j55x4 at1 × 1033 cm−2 s−1 and j290, j130x3, and j90x4 at 1 × 1034 cm−2 s−1. Work is in progress to betteradapt the studies to the present start-up scenario.
The LVL2 jet finding is guided by the LVL1 jet regions of interest (RoIs) — jets are sought in a re-gion around these RoIs. In the current view the EF performs jet finding across the whole pseud-orapidity region with the improved jet calibration and inter-jet calibration allowed at this level.The performance of the high-level jet trigger is described in detail elsewhere [13-68]. The jetrates in this report were obtained using fully simulated QCD di-jet events.
The ATLAS fast-simulation program ATLFAST (version 00-02-22) was used to generate 13 mil-lion di-jet events that were utilized to provide an estimate of the HLT (LVL2+EF) jet-triggerrates for one, two, three and four-jet final states [13-69]. In this case the jet-finding algorithm re-quired a jet-initiator ET of 5 GeV, a jet-cone radius R = 0.4 and a jet ET threshold of 10 GeV. Thetrigger rates were normalized, using a single scaling factor, to the rates predicted, for low andhigh-luminosity running, in a previous analysis based on fully-simulated QCD di-jets [13-68].The one, two, three, and four-jet trigger rates are reported in Table 13-7 for the thresholds givenin reference [13-68] and obtained using the ATLFAST simulation.
13.4.4 b-tagging
The selection of b-jets at trigger level can improve the flexibility of the HLT scheme and possiblyextend its physics performance. In particular, for topologies containing several b-jets, the ability
Table 13-7 The top portion of the table shows HLT rates, obtained using fully simulated events, for different trig-ger-menu items [13-68]. The middle portion of the table shows the estimated rates using a fast simulation [13-69]. The bottom portion of the table shows the jet-trigger rates for the two menu values indicated.
Item1 × 1033 cm−2 s−1
LVL2+EF (Hz) Item 1 × 1034 cm−2 s−1
LVL2+EF (Hz)
j180 253 ± 26 j290 275 ± 87
3j75 286 ± 28 3j130 440 ± 110
4j55 127 ± 15 4j90 165 ± 67
j180 228 ± 8 j290 270 ± 33
3j75 314 ± 10 3j130 270 ± 33
4j55 153 ± 7 4j90 149 ± 25
2j180 101 ± 6 2j290 109 ± 21
2j130 377 ± 11 2j230 358 ± 38

ATLAS Technical Design ReportHigh-Level Trigger, Data Acquisition and Controls 30 June 2003
13 Physics selection and HLT performance 261
to separate b-jets from light-quark and gluon jets could increase the acceptance for signal events(if the use of jet-ET thresholds lower than those discussed in Section 13.5 is feasible) or reducethe background (and hence the rate) for events containing b-jets that have already been selectedby other triggers.
The study presented in this section defines and characterizes, in the low-luminosity case, a b-jetselection for LVL2 [13-70] based on Inner Detector information. The extension of the selection tothe EF and the definition of an overall strategy for the b-tagging will be addressed in futurestudies.
13.4.4.1 LVL2 track reconstruction for b-tagging selection
The track reconstruction and the precise determination of the track parameters (in particular theimpact parameter (d0) in the transverse plane) are crucial ingredients of the b-jet trigger.
Several tracking algorithms based on the silicon detectors have been presented in Section 13.3.This study is based on SiTrack [13-71], a LVL2 algorithm that selects and builds track candidatesusing triplets of space points, because of its good impact-parameter resolution. An early versionof SiTrack, PixTrig (based solely on the pixel detector), was used to perform a similar study forthe Technical Proposal [13-1].
The recent change in the pixel detector geometry (increased B-layer radius) caused a significantdegradation in the impact-parameter resolution for tracks built using the pixel detector alone.The impact-parameter resolution has been recovered, and slightly improved at high-pT (seeFigure 13-21), using the capability of SiTrack to use any layer of the inner detector — the com-paratively large lever arm granted by an SCT layer ensures a better resolution of the track pa-rameters in the transverse plane.
Figure 13-21 Comparison of d0 resolution as a func-tion of pT for different configuration of the LVL2 track-ing algorithm SiTrack. The label ‘Old Geometry’ refersto the results obtained in Ref. [13-1] with an earliergeometry of the pixel detector (the so-called PhysicsTDR layout).
Figure 13-22 The u-jet rejection as a function of theb-jet efficiency for jets from the decay of Higgs bosonswith mH = 120 GeV for trigger and offline algorithms.The bias of the LVL2 selection on the offline selectionis shown.
0
0.005
0.01
0.015
0 10 20 30
pT(GeV)
σ d0(µ
m)
Pixel+SCT
Pixel only
Pixel only (Old Geometry)
1
10
10 2
10 3
0 0.2 0.4 0.6 0.8 1
Offline algorithm
LVL2 algorithm
Offline algorithmon a preselected sample
εb
Ru
ATLAS Technical Design ReportHigh-Level Trigger, Data Acquisition and Controls 30 June 2003
262 13 Physics selection and HLT performance
13.4.4.2 b-tagging algorithm
The b-tagging selection starts with track reconstruction performed by SiTrack within the LVL1jet RoI. For each reconstructed track the significance of the transverse impact parameter S = d0/σ(d0) is computed; the error on the impact parameter σ(d0) is parametrized, using simulatedevents, as a function of pT.
The b-jet discriminator variable is then built using the likelihood-ratio method; for each track (i)in the jet, the ratio of the probability densities for the track to come from a b-jet or a u-jet, fb(Si)/fu(Si), is calculated; the product W = Π fb(Si)/fu(Si) of these ratios over all tracks in the jet is com-puted; finally the tagging variable X = W/(1+W) is defined. Jets are tagged as b-jets if X ~ 1 andu-jets if X ~ 0. The selection efficiency for b-jets and the rejection of light-flavour jets can betuned by varying the cut on the X variable.
The processing time of the b-tagging selection algorithm is dominated by the track-reconstruc-tion phase and today is less than 8 ms per jet on a 2 GHz processor for dijet events. Note that thefigure of 8 ms does not include the data-preparation time that remains to be assessed in the newHLT software framework.
13.4.4.3 Results on single b-jet tagging
The b-tagging algorithm has been characterized on single b-jets coming from H → bb decays(mH = 120 GeV) produced in association with a W-boson at low luminosity, and correspondingu-jets (taken as representative of the light-flavour jets) obtained by artificially replacing the b-quarks from the Higgs decay with u-quarks; the LVL1 jet RoI was simulated by selecting a re-gion ∆φ × ∆η = 0.4 × 0.4 centred around the direction of the quarks coming from the decay of theHiggs boson.
The efficiencies for b-jets (εb) and rejection factors (Ru) against u-jets (defined as the inverse ofthe efficiency for u-jets) are given in Table 13-8. The modest rejections obtained do not spoil theinterest of applying a b-tagging selection at LVL2: in events with multiple b-jets, loose selections(necessary to minimize the bias on the selected sample) applied to several jets can still producesignificant rejections.
Table 13-8 Rejection of the LVL2 b-tagging algorithm against u-jets for three different values of the b-jet effi-ciency: 60% (top), 70% (middle), and 80% (bottom) at low luminosity. The results are shown for different inter-vals of ET and η of the jet.
40 GeV < ET < 70 GeV 70 GeV < ET < 100 GeV ET > 100 GeV
5.9 ± 0.4 5.1 ± 0.6 4.8 ± 0.7
|η| < 1.5 3.6 ± .0.2 3.9 ± 0.4 3.1 ± 0.4
2.3 ± 0.1 2.8 ± 0.3 2.4 ± 0.3
3.7 ± 0.4 4.9 ± 1.0 3.0 ± 0.8
|η| > 1.5 2.6 ± 0.2 2.9 ± 0.5 2.6 ± 0.6
1.5 ± 0.1 1.6 ± 0.2 1.7 ± 0.4

ATLAS Technical Design ReportHigh-Level Trigger, Data Acquisition and Controls 30 June 2003
13 Physics selection and HLT performance 263
13.4.4.4 Comparison with offline b-tagging
The performance of the LVL2 b-jet tagging algorithm has been compared with that of an offlinealgorithm based on impact parameter measurements in the transverse plane. This choice pro-vides a coherent comparison of online and offline algorithms; more exhaustive comparisonstudies will be performed on specific physics selections in due course.
Figure 13-22 demonstrates that the LVL2 and offline selection are well correlated and that, withan appropriate tuning of the LVL2 selection, it is possible to provide subsequent analyses withan unbiased sample.
Different combinations of working points for the LVL2 trigger selection and offline analysiscould be chosen depending on the topology of the events and on the required offline b-taggingefficiency. Additional flexibility can be added to the b-tagging selection by integrating the LVL2selection with a selection at EF, where tracking with offline quality will be available.
13.4.5 B-physics
About one collision in every hundred will produce a bb quark pair. Therefore, in addition to re-jecting non-bb events, the B-trigger must have the ability to identify and select those events con-taining B-decay channels of specific interest. Important areas of study include CP-violationmeasurements with the channels Bd → J/ψKs (with both J/ψ → e+e− and J/ψ → µ+µ−) andBd → π+π− (and more generally Bd,s → h+h-, where h denotes a pion or kaon); measurements ofBs oscillations using Bs → Dsπ and Bs → Dsa1 decays with Ds → φπ; analysis of Bs → J/ψφ andB → J/ψη final states, including the search for CP-violation in Bs → J/ψφ decays where newphysics could enhance the effect significantly beyond Standard Model expectations; rare decaysof the type Bd,s → µ+µ−(X); and B-hadron production measurements. High statistics are re-quired for the precision measurements. As documented in Ref. [13-48], ATLAS is well placed tomake significant and competitive contributions in many of these areas.
Since the HLT/DAQ/DCS Technical Proposal [13-48] the B-trigger has been re-assessed in thelight of a number of developments, including the likelihood of a reduced inner-detector layoutat the start of running, a factor of two increase in the target start-up luminosity, and various trig-ger scenarios for deferring spending on the HLT/DAQ system. The aim is to retain the maxi-mum possible coverage of key B-physics channels within the available resources.
It is important to study a range of scenarios since the actual LHC machine start-up conditionsare uncertain, the luminosity is expected to vary from fill to fill, and there are large uncertaintiesin the physics cross-sections and in the calculation of required resources. A flexible trigger strat-egy has, therefore, been developed based on a di-muon trigger (with pT thresholds, which maybe η dependent, of about 3 – 6 GeV) at luminosities of ~2 × 1033 cm−2 s−1 or above, and intro-ducing other triggers at lower luminosities. Lower luminosities will occur since some LHC fillswill have lower luminosities than others, and the luminosity will fall during each beam-coast(over the period of a beam-coast the luminosity is expected to fall by about a factor of two).
Two strategies have been investigated for these additional triggers, as follows:
• The preferred strategy is to require at least one LVL1 jet or EM RoI in addition to a single-muon trigger (e.g. pT > 8 GeV). After validating the LVL1 muon at LVL2, and in the EF,track reconstruction is performed within the RoIs using pixel, SCT and, optionally, TRTinformation. The reconstructed tracks form the basis of selections for, e.g., J/ψ(e+e-),
ATLAS Technical Design ReportHigh-Level Trigger, Data Acquisition and Controls 30 June 2003
264 13 Physics selection and HLT performance
B(h+h-), and Ds(φπ). Since track reconstruction is performed only inside the RoIs, the re-sources required are modest. More details are given in Ref. [13-72].
• If the LVL1 RoI multiplicity proves too high (or the efficiency too low) for the above ap-proach, a fall-back solution is to perform track reconstruction within the full acceptance ofthe SCT and pixel detectors (so-called full-scan) for events with a LVL1 single-muon trig-ger (e.g. pT >8 GeV), after confirmation of the muon at LVL2. In order to minimize execu-tion time, the TRT is not presently included and so the J/ψ(e+e-) trigger is not possible.The reconstructed tracks form the basis of selections for, e.g., B(h+h-) and Ds(φπ). This re-quires somewhat greater resources than the method described above, in order to performthe full-scan, but promises better efficiency. This strategy is described in detail in Ref. [13-73].
In all cases, at least one LVL1 trigger muon is required to initiate the B-trigger. Since the inclu-sive cross-section for muon production from decays in flight of pions and kaons falls more rap-idly with pT than that for prompt muon production from B-hadron decays, see Figure 13-23, anappropriate choice of pT threshold gives a powerful reduction of the trigger rate due to back-ground processes. For example, a pT threshold of 8 GeV gives a single-muon trigger rate of10 kHz at LVL1 for a luminosity of 1 × 1033 cm−2 s−1. Most of this rate is due to muons with truepT below threshold, originating from pion and kaon decays in flight, a large proportion ofwhich can be rejected at LVL2 on the basis of more precise measurements in the muon spec-trometer and inner detector. After the LVL2 selection the single-muon trigger rate is about2 kHz at a luminosity of 1 × 1033 cm−2 s−1; about one-third of this rate is due to b → µ decays. Itis important not to set the muon pT threshold too high as this would significantly reduce the sta-tistics in the signal channels of interest and render the measurements uncompetitive. The rate isfurther reduced at LVL2 and in the EF by requiring other triggers in addition to the muon, asdescribed in the following sections.

ATLAS Technical Design ReportHigh-Level Trigger, Data Acquisition and Controls 30 June 2003
13 Physics selection and HLT performance 265
13.4.5.1 Di-muon triggers
A di-muon trigger provides a very effectiveselection for several important B-physicschannels, e.g. Bd → J/ψ(µ+µ−)Ks and rare de-cays of the type B → µ+µ−(X). The LVL1 muontrigger is efficient down to a pT of about 5 GeVin the barrel region and about 3 GeV in theend-caps. However, the actual thresholdsused for the di-muon trigger will be deter-mined by rate limitations. For example, a pTthreshold of 6 GeV would give a di-muon trig-ger rate of about 200 Hz after LVL1 at a lumi-nosity of 2 × 1033 cm−2 s−1. These triggers aremostly due to muons from heavy-flavour de-cays, see Figure 13-23, plus some singlemuons that are doubly counted when theytraverse more than one pivot plane in themuon trigger chambers (in most cases suchdouble counting is already resolved at LVL1).Doubly counted single muons are removed atLVL2 which also sharpens the pT threshold,reducing the rate to about 200 Hz. In the EF,the tracks are reconstructed using offline-qual-ity algorithms and specific selections are madeon the basis of mass and decay-length cuts.These consist of semi-inclusive selections, forexample to select J/ψ(µ+µ−) decays with a dis-placed vertex, and in some cases exclusive se-lections such as for Bd,s →µ +µ−. Estimatedtrigger rates are shown in Table 13-9.
13.4.5.2 Hadronic final states
For events with a muon trigger, two strategies have been studied for selecting hadronic finalstates based on either an ID full-scan or an RoI-based method. The ID full-scan consists of trackreconstruction at LVL2 within the entire volume of the SCT and pixel detectors and, optionally,the TRT. The alternative, preferred, strategy uses low-ET LVL1 jet clusters to define RoIs fortrack reconstruction in the ID. By limiting track reconstruction to the part of the ID lying withinthe RoI, only about 10% of the detector on average, there is potential for a significant saving indata movement and processing time compared to the full-scan (up to a factor of ten, dependingon the RoI multiplicity per event).
Preliminary studies of efficiency and jet-cluster multiplicity at LVL1 have been made using afast simulation program. This uses a rather detailed model of the calorimeter that includes aparametrization of longitudinal and transverse shower profiles, and takes into account the ef-fects of pulse history, digitization, and Bunch Crossing IDentification (BCID). These studies in-dicate that a cut ET > 5 GeV on the transverse energy reconstructed in the LVL1 jet windowgives a reasonable mean jet-cluster multiplicity of about two RoIs per event for events contain-ing a muon with pT > 6 GeV6, see Figure 13-24.
Figure 13-23 Single-muon and di-muon cross-sec-tions. Curves are shown for muons from K and πdecays in flight (labelled ‘h’), b and c decays, and forthe sum of these sources (‘all’). Muons are consideredfor |η| < 2.5. For di-muons, the horizontal axis showsthe pT of the lower pT muon. At least one muon musthave pT > 6 GeV and |η| < 2.4 corresponding to LVL1trigger conditions.
1
10
10 2
10 3
10 4
10 5
5 7.5 10 12.5 15pT(µ), GeV/c
Cro
ss s
ectio
n , n
b
ATLAS Technical Design ReportHigh-Level Trigger, Data Acquisition and Controls 30 June 2003
266 13 Physics selection and HLT performance
These studies have been repeated using a full GEANT-based detector simulation followed by asimulation of the LVL1 calorimeter trigger. All sources of electronic noise are simulated, both forthe LAr and Tile calorimeters, as well as for the trigger towers. The effect of the BCID systemwas not simulated, however, and as a result there is a significant contribution to the RoI multi-plicity from small signals from other bunch crossings. The mean number of jet RoIs found per
6. These studies used a muon-pT threshold of 6 GeV. The LVL1 jet and EM RoI multiplicities can be as-sumed to be similar for events selected with an 8 GeV muon threshold, within the accuracy of these es-timates.
Table 13-9 Estimated trigger rates for various B-physics trigger selections at luminosities of 2 × 1033 cm−2 s−1
and 1 × 1033 cm−2 s−1. In these examples the di-muon selection at LVL2 consists only of confirming the muons.The division of selections between LVL2 and the EF remains to be optimized.
Trigger
2 × 1033 cm−2 s−1 1 × 1033 cm−2 s−1
LVL2 EF LVL2 EF
Bd,s → µ+µ−(X)200 Hz
small100 Hz
small
J/ψ(µ+µ−) 10 Hz 5 Hz
Ds(φπ) − − 60 Hz 9 Hz
B(ππ) − − 20 Hz 3 Hz
J/ψ(ee) − − 10 Hz 2 Hz
Total 200 Hz 10 Hz 190 Hz 20 Hz
Figure 13-24 The mean number of jet RoIs per eventshown as a function of the ET cut. Results are shownfor bb → µX events with a muon of pT > 6 GeV.Results are shown for both the fast simulation (dottedcurve) and full simulation (solid line). The mean multi-plicity is also shown for Bs → Dsπ+ signal events withfull simulation.
Figure 13-25 The mean number of EM RoIs perevent shown as a function of the LVL1 ET cut. Resultsare shown from the fast simulation for bb → µX eventswith muon pT > 6 GeV.
0
5
10
15
0 5 10 15
Jet R
OI m
ultip
licity
ET [GeV]
bb–
→ µ6X
Bs → Ds π
Fast simul.
0
0.5
1
1.5
2
2.5
0 2 4 6 8
EM
RO
I mul
tiplic
ity
ET [GeV]
bb–
→ µ6X

ATLAS Technical Design ReportHigh-Level Trigger, Data Acquisition and Controls 30 June 2003
13 Physics selection and HLT performance 267
event is shown in Figure 13-24 as a function of the LVL1 ET threshold. The mean multiplicitiesare significantly higher than those obtained with the fast simulation — this is most probably ex-plained by the lack of BCID in the simulation. Once BCID is included, the measured multiplici-ties are expected to be much closer to the results of the fast simulation, although this remains tobe verified. The full-simulation results, therefore, represent an upper limit, with the anticipatedmultiplicity lying closer to the fast-simulation results. The full simulation shows that a LVL1 jettrigger requiring ET > 6 GeV would give 80% efficiency for finding the RoI for Bs → Dsπ+ eventscontaining a Bs meson with pT > 16 GeV.
Based on the ID tracks reconstructed by one of the above methods (either full-scan or RoI-based) further selections are made for specific channels of interest. These are kept as inclusive aspossible at LVL2, with some more exclusive selections at the EF. For example, samples ofBs → Dsπ and Bs → Dsa1 events can both be triggered by selecting events containing a Ds(φπ)candidate.
Tracks are reconstructed in the EF inside RoIs defined from the results of LVL2. Using LVL2 toguide the EF reconstruction reduces the amount of data to be processed. For example, a regionencompassing all LVL2 tracks forming Ds(φπ) or B(π+π−) candidates corresponds to about 10%of the ID acceptance, on average. Tighter mass cuts can be applied in the EF than at LVL2 sincethere is time available for a more refined track reconstruction which yields better track-parame-ter resolutions. In addition, EF selections may include precise decay-vertex reconstruction, al-lowing further cuts on vertex-fit quality and decay length.
Studies using a full-detector simulation have shown that an overall HLT efficiency of about60%7 can be obtained for Bs → Dsπ signal events where all final-state particles havepT > 1.5 GeV. The corresponding trigger rates are shown in Table 13-9; further details are givenin Ref. [13-74]. It has been shown that, with appropriate tuning of selection cuts, there is very lit-tle degradation of trigger performance if the pixel layout is changed from three barrel layers tothe two layers expected at the start of LHC running. For example, studies based on the LVL2 ID-SCAN algorithm show that reducing the cut on the number of SCT and pixel space-points to aminimum of four for the initial layout (compared to a minimum of five for the full layout)yields the same efficiency as for the full layout with only a 10% increase in trigger rate. Otherstudies have shown that the trigger is insensitive to the anticipated levels of misalignment inthe ID [13-75].
13.4.5.3 Muon–electron final states
A muon–electron trigger is used to select channels such as Bd → J/ψ(e+e−)Ks with an opposite-side muon tag, or Bd → J/ψ(µ+µ−)Ks
with an opposite-side electron tag. The LVL1 trigger isused to find low-ET electron/photon clusters which define RoIs to be investigated at LVL2. Pre-liminary studies, using a fast simulation, show that a reasonable compromise between RoI mul-tiplicity and electron efficiency might be obtained requiring ET > 2 GeV for the LVL1 cluster.This gives a mean RoI multiplicity of about one for events containing a muon with pT > 6 GeV,see Figure 13-25. These studies give an efficiency of about 80% to find an RoI for both the e+ andthe e− from J/ψ(e+e−) in events where both final-state particles have pT > 3 GeV. At LVL2, theelectron/photon RoIs are confirmed in the calorimeter, using full-granularity information andincluding the pre-sampler. Inside the RoI, a search is then made for tracks in the SCT, pixels,
7. These studies were based on a full-scan of the SCT and pixels at LVL2 with a pT threshold for recon-structed tracks of 1.5 GeV. The efficiency for an RoI-based trigger has yet to be measured.
ATLAS Technical Design ReportHigh-Level Trigger, Data Acquisition and Controls 30 June 2003
268 13 Physics selection and HLT performance
and, optionally, the TRT. The RoI about each electron candidate can be quite small, about∆η × ∆φ = 0.2 × 0.2. This gives a large saving in reconstruction time, compared to a full-scan, butrequires a higher pT threshold than is possible with the ID full-scan. The tracks are reconstruct-ed again in the EF, including a vertex fit, and cuts are applied to the decay length and fit quality.The estimated trigger rates are shown in Table 13-9.
13.4.5.4 Resource estimates
In order to estimate the computing resources required for the B-trigger, measurements of algo-rithm execution times have been combined with estimates of trigger rates at each step of the se-lection. Various reconstruction algorithms have been timed on several different platforms inorder to determine the mean execution time at a given luminosity, the scaling of execution timewith the number of hits in an event, and hence the scaling with luminosity. These timing meas-urements have been combined with the estimates of trigger rates and RoI multiplicities to givean estimate of the computing resources required for the B-physics trigger [13-76].
It is estimated that ~15 additional 2 GHz processors are required for the B-physics LVL2 trigger,using the preferred RoI-guided strategy. The corresponding number is about 50 processors forthe fall-back full-scan strategy. These estimates are based on algorithm execution times meas-ured in a previous software framework, CTrig. Preliminary measurements in the new ATHENAframework give algorithm execution times (excluding data access overheads) that are a factor2 – 3 higher than the CTrig measurements. It is anticipated that with further optimization, algo-rithm speeds will approach those obtained in the CTrig framework.
In summary, the use of low-ET LVL1 RoIs to guide reconstruction at LVL2 promises a full pro-gramme of B-physics for very modest resources. However, RoI multiplicities and efficienciesneed to be verified in studies using a full-detector simulation and including a detailed simula-tion of the LVL1 trigger, with BCID. This will be followed up in further studies.
13.5 HLT output rates to offline
After the submission of the HLT/DAQ Technical Proposal [13-1], the baseline scenario for thestart-up of the LHC was changed to a target initial peak luminosity of 2 × 1033 cm−2 s−1. The in-formation already available from the detailed HLT performance studies, as documented in theTP, was used to derive the ATLAS HLT trigger menu for this new scenario; the work concentrat-ed on the parts of the menu contributing most of the rate, consisting mainly of inclusive high-pTobject selections. In addition, the impact of constraints coming from delayed availability of fi-nancial resources was taken into account by restricting the B-physics trigger selection at peakluminosity to di-muon signatures only (see Section 13.4.5). The resulting trigger menus forLVL1 and for the HLT are presented in Table 13-10 and Table 13-11 respectively. The notationused in these tables is explained in Chapter 4.
The signatures shown in the trigger menus are needed to guarantee complete coverage of theATLAS physics programme for observations of new physics and precision measurements. Asdiscussed in Chapter 4, the aim is to be as open as possible to (perhaps unpredicted) signaturesof new physics; to avoid as much as possible any bias introduced in the trigger selection; and toallow refined selection criteria to be used in the offline analyses. It should be noted that thesemenus assume stable operation of the LHC machine and the ATLAS detector, and thus do not

ATLAS Technical Design ReportHigh-Level Trigger, Data Acquisition and Controls 30 June 2003
13 Physics selection and HLT performance 269
apply to the initial start-up phase of ATLAS and the LHC, which is addressed in more details inthe following section.
Table 13-10 lists the main LVL1 selection signatures together with the rates expected for an ini-tial peak luminosity of 2 × 1033 cm−2 s−1. For most of the signatures, the nominal threshold giv-en is defined to give an efficiency of about 95% for a physics object (µ, e/γ, etc.) with ET equal tothe threshold value. This is achieved by an appropriate tuning of the selection cuts at LVL1. Theselection signatures at LVL1 include single- and di-object isolated electromagnetic-calorimeterclusters (which provide candidates for electron and photon object reconstruction at the HLT),single- and di-muon candidates, and the combination of an isolated electromagnetic cluster anda low-pT muon. In addition, hadronic jets are selected for various multiplicity requirements andET thresholds. It is expected to also include a di-jet trigger (with a threshold lower by severaltens of GeV than the one of the inclusive single-jet trigger), which is not shown in the table. Fi-nally, signatures requiring large missing transverse energy, in association with either a jet or atau8 candidate are present. About 20% of the total rate of 25 kHz is allocated for pre-scaled, ex-clusive, calibration, monitor and other triggers, examples of which are described in Chapter 4.
It should be noted that the LVL1 trigger rate estimates are obtained using a physics event MonteCarlo generator and a detailed simulation of the ATLAS detector response. They do not containany safety factor against uncertainties on the rates, for which possible sources are discussed de-tail later. For the design value of the maximum LVL1 accept rate of 100 kHz, this trigger menuthus gives an effective safety factor of four against possible uncertainties affecting the LVL1 trig-ger rate.
Table 13-10 LVL1 trigger menu with rates for a luminosity of 2 × 1033 cm−2 s−1
LVL1 signature Rate (kHz)
EM25I 12.0
2EM15I 4.0
MU20 0.8
2MU6 0.2
J200 0.2
3J90 0.2
4J65 0.2
J60+XE60 0.4
TAU25I+XE30 2.0
MU10+EM15I 0.1
Others (pre-scaled, exclusive, monitor, calibration) 5.0
Total ~25.0
8. In previous documents [13-48], [13-3], [13-1] the LVL1 tau trigger always implicitly required isolationcriteria to identify narrow hadronic jets from tau decays, which was not signalled by the letter 'i' in thephysics object shown in trigger menus. In this document, the notation has been updated to indicatemore correctly the selection conditions.
ATLAS Technical Design ReportHigh-Level Trigger, Data Acquisition and Controls 30 June 2003
270 13 Physics selection and HLT performance
Table 13-11 shows the HLT output rate corresponding to the above LVL1 trigger menu; as forbefore, it does not include any safety factor against uncertainties on the rates. The rates shownwere obtained using the selection algorithm steps at LVL2 and in the EF for the various objects,as described in detail in the previous sections of this chapter. The LVL1 electromagnetic selec-tions separate at the HLT into single-/di-electron and single-/di-photon signatures, which to-gether account for about one-third of the HLT output rate. About 25% of the HLT output rate isfrom the single- and di-muon triggers, whereas single- and multi-jet triggers constitute about15% of the total rate. Selections involving missing transverse energy contribute about 15% of therate. Only 5% of the HLT rate at peak luminosity is allocated to B-physics-related triggers (thelow-pT di-muon signature with additional mass cuts to select J/ψ, ψ’ and rare B-meson decays).About 10% of the total rate is allocated for pre-scaled and other triggers.
As already mentioned for the LVL1 trigger menu, it is important to note that the rate estimatesare the result of simulations, which start with a physics event generator (mostly PYTHIA) andthen involve a detailed GEANT-based simulation of the ATLAS detector response. The rate esti-mates are thus subject to several sources of uncertainties:
• Knowledge of cross-sections: some of the cross-sections (e.g. the ones for multi-jet pro-duction) have big uncertainties (factors of two or more), which directly affect the corre-sponding contributions to the trigger rates.
• Realistic detector behaviour and performance: the results presented in this documentare obtained using the simulated detector behaviour, thus they apply only for stable run-ning conditions with a commissioned and well-understood detector.
• Background conditions: unforeseen beam-related background conditions could have animpact on the trigger rates; such backgrounds could lead to increased rates (possibly onlyfrom certain regions of the detector).
Table 13-11 HLT trigger menu with rates for a luminosity of 2 × 1033 cm−2 s−1
HLT signature Rate (Hz)
e25i 40
2e15i < 1
γ60i 25
2γ20i 2
µ20i 40
2µ10 10
j400 10
3j165 10
4j110 10
j70+xE70 20
τ35i+xE45 5
2µ6 with vertex, decay-length and mass cuts (J/ψ, ψ’, B) 10
Others (pre-scaled, exclusive, monitor, calibration) 20
Total ~200

ATLAS Technical Design ReportHigh-Level Trigger, Data Acquisition and Controls 30 June 2003
13 Physics selection and HLT performance 271
• Resources constraints and software performance: the timing performance of the selec-tion software when faced with real data might limit the rate capabilities of the HLT (or in-termediate stages of it) given constraints from the availability of computing resources —the choice of LVL1 thresholds for the physics objects used in the online selection mighthave to be adjusted as a result, with implications also for the HLT thresholds.
As mentioned already, the menus discussed above are shown for the target initial peak luminos-ity of 2 × 1033 cm−2 s−1. It is expected that during a beam coast, as the luminosity drops by a fac-tor of about two or more, or for machine fills that do not reach the target peak luminosity, theselection will be enlarged by assigning a larger fraction of the available rate to pre-scaled trig-gers (and/or to include additional exclusive or topological selections, which are not activated atthe target luminosity). This would result in the writing of events at a constant rate to mass stor-age, making full use of the online data-movement and computing resources.
13.6 Start-up scenario
The TDAQ system will have to cope with an evolving data-taking environment, in particularduring the start-up phase of the detector operation. It will have to accommodate:
• quickly-evolving luminosity;
• variable beam-related background conditions;
• variable electronic-noise conditions;
• changing configuration of sub-detector electronics, subject to final adjustment iterations;
• limited data-handling capacity of the initial HLT/DAQ system imposed by financial limi-tations and the need to add computing and data-movement capacity as new resources be-come available;
• learning stages of the detector operation.
The TDAQ system commissioning thus has to be considered as a self-adjusting process, opti-mized to use efficiently the data available at each stage of the detector operation — at first datacollected in sub-detector standalone runs, then data collected in the cosmic-ray muon runs, sub-sequently data collected in single-beam operation of LHC, and finally beam–beam collision da-ta.
13.6.1 LVL2 trigger and EF commissioning
The commissioning phase of the HLT/DAQ system will follow that of the sub-detectors and ofthe LVL1 trigger. Many issues will need to be addressed at that stage, to achieve proper syn-chronization of LVL1 signals from trigger detectors (calorimeters, RPC, TGC) and of the CTP.This relates as well to the operations of Data Collection, Data Flow, and Event Builder compo-nents, which feed the algorithms at the LVL2 and EF levels with the proper data fragments orfully-assembled events. Also data consistency from all ATLAS sub-detectors will need to be es-tablished, and pre-processing and formatting will need to be studied since they directly impactthe behaviour of the data-preparation step of the HLT algorithms.
Once the sub-detector data have been understood sufficiently (e.g. in terms of calibration andalignment), it will be necessary to debug and tune the selection of events at LVL2 and in the EF.
ATLAS Technical Design ReportHigh-Level Trigger, Data Acquisition and Controls 30 June 2003
272 13 Physics selection and HLT performance
The commissioning of LVL2 and the EF can be facilitated by splitting it into several phases. Ini-tially the HLT systems will probably be used only to flag events, allowing offline debuggingand testing of the selection before it is used actively in the online environment.
Needless to say, as many preparations as possible will made before the first beam–beam colli-sions occur, starting with test data, followed by an extended period of cosmic-ray running. Itmay be possible to carry out further commissioning during running with a single proton beam,e.g. using beam–gas interactions in the ATLAS detector.
Once the HLT is operational, there will be a period in which the selection criteria at all triggerlevels are adapted, perhaps radically, in the light of experience from the first running. Accountwill have to be taken of any limitations in the performance of the initial HLT/DAQ system (e.g.any bottlenecks in the Dataflow or HLT systems), and also any problems with the detectors orthe LVL1 system (e.g. ‘hot channels’). The trigger menus will have to be tuned, taking into ac-count the measured rates for different LVL1 signatures, to optimize the physics coverage withinthe available HLT/DAQ capacity. Account will also have to be taken of triggers due to beam-re-lated backgrounds that might be particularly significant in the early running.
13.7 References
13-1 ATLAS Collaboration, ATLAS High-Level Triggers, DAQ and DCS Technical Proposal,CERN/LHCC/2000-17 (2000)
13-2 ATLAS Data Challenge 1, http://atlas.web.cern.ch/Atlas/GROUPS/SOFTWARE/DC/DC1/DC1-Report-V1.0-211002.pdf
13-3 ATLAS Collaboration, ATLAS Level-1 Trigger Technical Design Report,CERN/LHCC/98-014 (1998)
13-4 T. Schörner-Sadenius and T. Wengler, Formats and Interfaces in the Simulation of the ATLAS First Level Trigger, ATL-DA-ES-0029 (2002)http://edms.cern.ch/document/345463/
13-5 M. Abolins et al., Specification of the LVL1 / LVL2 trigger interface, ATL-D-ES-0003 (2002)http://edms.cern.ch/document/107485/
13-6 T. Schöerner-Sadenius, The ATLAS Level-1 Trigger offline Simulation: Overview, Core Parts, and Use, ATLAS Internal Note, ATL-COM-DAQ-2003-008 (2003)
13-7 Xerces C++ Parser (XML),http://xml.apache.org/xerces-c/
13-8 E. Eisenhandler and P. Hanke, ATLAS Level-1 Calorimeter Trigger User Requirements Document, ATL-DA-ES-0001 (1998)http://edms.cern.ch/document/ATL-DA-ES-0001/
13-9 A.T. Watson, Updates to the Level-1 e/gamma and tau/hadron Algorithms, ATLAS Internal Note, ATL-DAQ-2000-046 (2000)
13-10 E.J.W. Moyse and A.T. Watson, Performance and Validation of TrigT1Calo, the offline Level-1 Calorimeter Trigger Simulation, ATLAS Internal Note, ATL-COM-DAQ-2003-010 (2003)
13-11 ATLAS Collaboration, ATLAS Muon Spectrometer Technical Design Report,CERN/LHCC/97-022 (1997)

ATLAS Technical Design ReportHigh-Level Trigger, Data Acquisition and Controls 30 June 2003
13 Physics selection and HLT performance 273
13-12 A. Di Mattia and L. Luminari, Performances of the Level-1 Trigger System in the ATLAS Muon Spectrometer Barrel, ATLAS Internal Note, ATL-DAQ-2002-008 (2002)http://atlas.web.cern.ch/Atlas/GROUPS/MUON/layout/muon_layout_P.html
13-13 A. Di Mattia et al., A muon trigger algorithm for Level-2 feature extraction, ATLAS Internal Note, ATL-DAQ-2000-036 (2000)
13-14 A. Di Mattia et al., RPC Trigger Robustness: Status Report, ATLAS Internal Note, ATL-DAQ-2002-015 (2002)
13-15 S. Veneziano, Preliminary Design Report of the MUCTPI Electronics, ATC-RD-ER-0001 (2001)http://edms.cern.ch/document/310152/
13-16 N. Ellis, Central Trigger Processor User Requirement Document, ATL-DA-ES-0003 (1999)http://edms.cern.ch/document/ATL-DA-ES-0003/
13-17 P. Farthouat et al., CTP Technical Specification, ATL-DA-ES-0006 (1999)http://edms.cern.ch/document/107447
13-18 G. Schuler et al., Central Trigger Processor Demonstrator (CTPD), ATL-DA-ER-0005 (2000)http://edms.cern.ch/document/115660/
13-19 I. Brawn et al., A Demonstrator for the ATLAS Level-1 Central Trigger Processor,ATL-DA-ER-0008 (2000)http://edms.cern.ch/document/249113/
13-20 R. Blair et al., ATLAS Second Level Trigger Prototype RoI Builder, ATL-D-ES-0011 (2003)http://edms.cern.ch/document/367638/
13-21 A.G. Mello et al., Region-of-Interest Selection for ATLAS High Level Trigger and offline Software Environments, ATLAS Internal Note, ATL-COM-DAQ-2003-005, ATL-SOFT-2003-005 (2003)
13-22 S. Armstrong et al., Requirements for an Inner Detector Event Data Model, ATLAS Internal Note, ATL-DAQ-2002-011 (2002)
13-23 PESA Core Algorithms Group, S. Armstrong (editor), Algorithms for the ATLAS High Level Trigger, ATLAS Internal Note, ATL-COM-DAQ-2003-013 (2003)
13-24 C. Leggett, IOV Service, and A. Schaffer, IOV Database Service, presentations at the ATLAS EDM-DD Workshop, CERN, January 2003
13-25 K. Assamagan et al., Definition of “Raw Data Objects” for the MDT Chambers of the Muon Spectrometer, ATLAS Internal Note, ATL-COM-MUON-2003-020 (2003)
13-26 T.A.M. Wijnen, The MROD Data Format and the towering partioning of the MDT chambers,ATLAS Internal Note, ATL-COM-MUON-2003-011 (2003)
13-27 P. Bagnaia et al., On-line versus off-line identifiers for the MDT chambers of the Muon Spectrometer, ATLAS Internal Note, ATL-COM-MUON-2003-017 (2003)
13-28 K. Assamagan et al., Raw Data Object Definition for the RPC chambers of the ATLAS Muon Spectrometer, ATLAS Internal Note, ATL-COM-MUON-2003-19 (2003)
13-29 G. Aielli et al., Data Format of the RPC Detector of the Muon System, ATLAS Internal Note, ATLAS-COM-MUON-2003-018 (2003)
13-30 H. Drevermann and N. Konstantinidis, Determination of the z position of primary interactions in ATLAS, ATLAS Internal Note, ATL-DAQ-2002-014 (2002)
13-31 H. Drevermann and N. Konstantinidis, Hit Filtering and Grouping for Track Reconstruction,ATLAS Internal Note, ATL-DAQ-2003-XXX (2003), document in preparation
ATLAS Technical Design ReportHigh-Level Trigger, Data Acquisition and Controls 30 June 2003
274 13 Physics selection and HLT performance
13-32 I. Gaines, S. Gonzalez and S. Qian, Implementation of an Object Oriented Track Reconstruction Model into Multiple LHC Experiments, Computing in High Energy and Nuclear Physics Conference, Padova, 2000
13-33 D. Candlin, R. Candlin and S. Qian, Update of an Object Oriented Track Reconstruction Model for LHC Experiments, Computing in High Energy and Nuclear Physics Conference, Beijing, 2001
13-34 J. Baines et al., B-Physics Event Selection for the ATLAS High Level Trigger, ATLAS Internal Note, ATL-DAQ-2000-031 (2000)
13-35 J. Baines et al., Global Pattern Recognition in the TRT for B-Physics in the ATLAS Trigger,ATLAS Internal Note, ATL-DAQ-99-012 (1999)
13-36 M. Sessler and M. Smizanska, Global Pattern Recognition in the TRT for the ATLAS LVL2 Trigger, ATLAS Internal Note, ATL-DAQ-98-120 (1998)
13-37 S. Sivoklokov, presentations made in PESA Core Algorithms Group meetings, December 2002 and January 2003
13-38 S. Sivoklokov, High pT Level-2 Trigger Algortihm for the TRT Detector in ATRIG, ATLAS Internal Note, ATL-DAQ-2000-043 (2000)
13-39 M.P. Casado, S. González, and T. Shears, TrigT2Calo package,http://atlas-sw.cern.ch/cgi-bin/cvsweb.cgi/offline/Trigger/TrigAlgorithms/TrigT2Calo/
13-40 S. González, T. Hansl-Kozanecka and M. Wielers, Selection of high-pT electromagnetic clusters by the second level trigger of ATLAS, ATLAS Internal Note, ATL-DAQ-2000-002 (2000)
13-41 S. González, B. González Pineiro and T. Shears, First implementation of calorimeter FEX algorithms in the LVL2 reference software, ATLAS Internal Note, ATL-DAQ-2000-020 (2000)
13-42 S. González and T. Shears, Further studies and optimization of the Level-2 trigger electron/photon FEX algorithm, ATLAS Internal Note, ATL-DAQ-2000-042 (2000)
13-43 A. Di Mattia et al., The implementation of the MuFast algorithm in the new PESA framework,ATLAS Internal Note, ATL-COM-DAQ-2003-024 (2003)
13-44 I. Gavrilenko, Description of Global Pattern Recognition Program (xKalman), ATLAS Internal Note, ATLAS-INDET-97-165 (1997)http://maupiti.lbl.gov/atlas/xkal/xkalmanpp/index.en.html.
13-45 R. Clifft and A. Poppleton, IPATREC: Inner Detector Pattern-Recognition and Track Fitting,ATLAS Internal Note, ATLAS-SOFT-94-009 (1994)
13-46 D. Adams et al., Track Reconstruction in the ATLAS Muon Spectrometer with MOORE,ATLAS Internal Note, ATL-COM-MUON-2003-012, ATL-COM-SOFT-2003-008 (2003)
13-47 D. Adams et al., MOORE as Event Filter in the ATLAS High Level Trigger, ATLAS Internal Note, ATL-COM-MUON-2003-013, ATL-COM-SOFT-2003-009, ATL-COM-DAQ-2003-012 (2003)
13-48 ATLAS Detector and Physics Performance Technical Design Report, CERN/LHCC/99-014 and CERN/LHCC/99-015 (1999)
13-49 R.K. Mommsen, A. Radu, M. Wielers, Performance studies for electron and photon selection at the event filter, ATLAS Internal Note, ATL-DAQ-2000-007 (2000)
13-50 R.K. Mommsen, Electron trigger performance studies for the event filter, ATLAS Internal Note, ATL-DAQ-2001-004 (2001)

ATLAS Technical Design ReportHigh-Level Trigger, Data Acquisition and Controls 30 June 2003
13 Physics selection and HLT performance 275
13-51 J. Baines et al., Performance Studies of the High Level Electron Trigger, ATLAS Internal Note, ATL-COM-DAQ-2003-0020 (2003)
13-52 J. Baines et al., First study of the LVL2-EF boundary in the high-pT e/gamma high-level-trigger,ATLAS Internal Note, ATL-DAQ-2000-045 (2000)
13-53 T. Sjostrand, Comput. Phys. Commun. 82 (1994) 74
13-54 T. Sjostrand et al., Comput. Phys. Commun. 135 (2001) 238
13-55 E. Richter-Was, Samples from the DC1 production: dataset 2000, dataset 2001, dataset 2003; few items from physics content evaluation, ATLAS Internal Note, ATL-COM-PHYS-2003-026 (2003)
13-56 S. Tapprogge, ATLAS trigger rates and associated physics performances, Presentation at LHCC Meeting, May 2002,http://agenda.cern.ch/askArchive.php?base=agenda&categ=a02443&id=a02443s1t2/transparencies
13-57 M. Virchaux et al., MUONBOX: a full 3D Tracking Programme for Muon Reconstruction in the ATLAS Spectrometer, ATLAS Internal Note, ATL-MUON-1997-198 (1997)
13-58 GCALOR Package, http://wswww.physik.uni-mainz.de/zeitnitz/gcalor/gcalor.html
13-59 B. Caron et al., A Study of the ATLAS Tau/hadron Trigger, ATLAS Internal Note, ATL-COM-DAQ-2003-030 (2003)
13-60 ATLAS Collaboration, ATLAS Trigger Performance Status Report, CERN/LHCC/98-15 (1998)
13-61 B. Gonzalez-Piniero, Tau Identification in the Second Level Trigger, ATLAS Internal Note, ATL-DAQ-98-127 (1998)
13-62 D. Cavalli and S. Resconi, Combined Analysis of A→ττ Events from Direct and Associated bbA Production, ATLAS Internal Note, ATL-PHYS-2000-005 (2000)
13-63 D. Cavalli et al., Search for A/H→ττ Decays, ATLAS Internal Note, ATL-PHYS-94-051 (1994)
13-64 D. Cavalli and S. Resconi, Tau Jet Separation in the ATLAS Detector, ATLAS Internal Note, ATL-PHYS-98-118 (1998)
13-65 D. Cavalli, Missing Transverse Momentum Reconstruction in ATLAS, ATLAS Internal Note, ATL-PHYS-96-080 (1996)
13-66 B. Caron et al., Event Filter Rates for the ET-miss + jetTrigger at Low Luminosity, ATLAS Internal Note, ATL-DAQ-2000-016 (2000)
13-67 D. Cavalli et al., Status Report on the τ-Identification Performance, ATLAS Physics Workshop, Athens, 2003
13-68 M. Wielers, Performance Studies of Jets in the High Level Trigger, ATLAS Internal Note, ATL-DAQ-2000-015 (2000)
13-69 J. de Jong and J. L. Pinfold, Estimating the ATLAS Multi-jet Trigger Rate Using ATLFAST,ATLAS Internal Note, ATL-COM-DAQ-2003-029 (2003)
13-70 M. Cervetto et al., b-tagging Event Selection for the ATLAS High Level Trigger: an update,ATLAS Internal Note, ATL-COM-DAQ-2003-034 (2003)
13-71 M. Cervetto et al., SiTrack: a LVL2 track reconstruction algorithm based on Silicon detectors,ATLAS Internal Note, ATL-COM-DAQ-2003-25 (2003)
ATLAS Technical Design ReportHigh-Level Trigger, Data Acquisition and Controls 30 June 2003
276 13 Physics selection and HLT performance
13-72 B. Epp et al., A study of the use of Low ET calorimeter RoI in the ATLAS B-Trigger, ATLAS Internal Note, ATL-COM-DAQ-2003-36 (2003)
13-73 J. Baines et al., B-Physics Event Selection for the ATLAS High Level Trigger, ATLAS Internal Note, ATL-DAQ-2000-031 (2000)
13-74 B. Epp, et al., Event Filter Rate for the Ds Trigger, ATLAS Internal Note, ATL-DAQ-2001-003 (2001)
13-75 J. Baines et al., Effects of Inner Detector Misalignment and Inefficiency on the ATLAS B-physics Trigger, ATLAS Internal Note, ATL-DAQ-2001-006 (2001)
13-76 J. Baines et al., Resource Estimates for the ATLAS B-physics Trigger, ATLAS Internal Note, ATL-COM-DAQ-2002-001 (2002)

ATLAS Technical Design ReportHigh-Level Trigger, Data Acquisition and Controls 30 June 2003
14 Overall system performance and validation 277
14 Overall system performance and validation
14.1 Introduction
In this chapter the system performance of the design presented in this TDR in terms of rate ca-pability and functionality is considered. Results of tests and of modelling, aimed at validatingthe various aspects of the design, are presented and discussed. The tests concern the perform-ance of event selection, tests of the rate capability of the DataFlow system in an environmentrepresenting about 10% of the final system (the ‘10% testbed’). Specialized functionality tests ofthe whole DAQ chain as well as the experience gained from using it for real data-taking in theH8 test beam1 are also presented. Computer models have been used for analysing measurementresults from the 10% testbed, and then to validate the models of components which were cali-brated using measurement results from small test set-ups. Full system models have providedinsight into and strategies for avoiding potential problem areas with respect to rate capability ofthe full system. The chapter is concluded by an outlook with respect to anticipated technologydevelopments relevant for the HLT/DAQ system in the near future.
14.2 High-Level Trigger prototypes
The High-Level Trigger (HLT) will select and classify events based on software largely devel-oped in the offline environment. This approach minimizes duplication of development effort,eases software maintenance, and ensures consistency between the offline and the online eventselections. However, given the strict performance requirements of a real-time online environ-ment, it is essential to evaluate the performance of the HLT event selection software (ESS) in arealistic trigger prototype.
The resource utilization characteristics of the HLT software are an important input to the mod-els that predict overall system size and cost. For this reason, a prototyping program was devel-oped to perform dedicated system performance measurements of the event selection softwarein a testbed environment.
14.2.1 Scope of measurement and validation studies
The scope of the work reported here is limited to a system with full event selection and minimalDataFlow capability, providing full trigger functionality with limited performance. Such a dedi-cated ‘vertical slice test’ is sufficient to test the performance of the HLT event selection in a real-istic environment. Nevertheless, even in such a limited system, tests and measurements of thedata flow aspects relevant to event selection can be performed.
An important aspect of this prototyping work is component integration. Although single com-ponents may perform very well in isolated tests, it is possible that only integration with other
1. Large-scale performance tests of the Online Software are discussed in Chapter 10. The aim of these testswas to verify the overall functionality of the Online Software system on a scale similar to that of the finalATLAS installation and to study the system performance aspects in detail.
ATLAS Technical Design ReportHigh-Level Trigger, Data Acquisition and Controls 30 June 2003
278 14 Overall system performance and validation
system elements will reveal weakness not foreseen in the original design. The integration andtesting work described here followed the steps outlined below:
1. individual component testing and validation (addressed in Chapter 8 for RoI collectionand event building and Chapter 13 for the ESS);
2. functional integration of relevant components (Online Software, DataFlow Software, ESS)in a small testbed, providing feedback to developers;
3. measurement program, including event throughput and network latencies.
The last two steps were carried out for a LVL2 testbed, an EF testbed, and a combined HLT test-bed in the context of validating the HLT/DAQ architecture.
In addition to the testbed measurements, a complementary set of validation tests and measure-ments can be performed in the offline environment. Although these offline measurements can-not address the full system aspects of the trigger, they help in isolating and understanding thepure algorithmic processing times of the ESS. This is especially relevant for the EF, where eventsare processed only after all fragments have been assembled, and thus the data flow latencies arecompletely decoupled from the ESS latencies.
The following sections summarize the outcome of this integration and measurement program.
14.2.2 Event selection in a LVL2 prototype
14.2.2.1 Prototype and software configuration
All elements necessary to transport and process event data inside the L2PU were assembled in aLVL2 vertical slice prototype. As shown in Figure 14-1(left), the prototype included the follow-ing components:
• L2PU (Described in Section 9.2.4),
• ROS or ROS emulator (ROSE, described in Section 8.1.3),
• LVL2 Supervisor (L2SV, described in Section 9.2.3).
The above applications, all controlled by the Online Software (see Chapter 10), ran on a five-node testbed at CERN. Figure 14-1(right) shows the configuration of the testbed, which wasconnected to the CERN network through a Fast/Gigabit Ethernet switch. The host machines forthe applications were typically Dual-processor Xeons (2.2 GHz), Athlon machines (1.8 GHz) orsingle-processor Xeons (2.4 GHz). A detailed description of the set-up can be found in [14-1].
The L2PU application hosts both the DataFlow and the HLT software. In building the verticalslice prototype, the major challenge was achieving the integration of both software frameworks,including the offline components that form part of the ESS. As described in Section 9.2.4.2, thePSC interfaces the control aspect of the DataFlow and the ESS. The selection software used inthe testbed comprised most elements described in Chapter 9, including the detector softwarenecessary to assemble and decode the raw data fragments delivered by the ROS. A detailed de-scription of the software integration within the L2PU, including difficulties and unresolved is-sues, can also be found in [14-2].

ATLAS Technical Design ReportHigh-Level Trigger, Data Acquisition and Controls 30 June 2003
14 Overall system performance and validation 279
The prototype ran on fully simulated event data. The input data was generated in the offline en-vironment and written in byte-stream format, a serialized version of the raw data format thatincludes the LVL1 electromagnetic trigger simulation (see Chapter 13). Before starting a run, thedetector data fragments were preloaded into the ROS (or ROSE) while the LVL1 fragments, cor-responding to the RoIs assembled by the RoI Builder, were preloaded into the L2SV. Files con-taining di-jet events at a luminosity of 2 × 1033 cm−2 s−1 were used (see Chapter 13) for themeasurements. The events in the file were pre-selected to contain events that pass the LVL1 trig-ger. Each event contains an average of 1.06 electromagnetic RoIs. A suite of trigger algorithmsdesigned to select electromagnetic clusters ran within the L2PU, together with the appropriatedetector software to decode the raw data.
The LVL2 calorimeter trigger is the first step after a LVL1 accept of an electromagnetic cluster.Since the calorimeter algorithm executes at the LVL1 accept rate, it is the most critical compo-nent when selecting photons or electrons in the LVL2 trigger. For this reason, the LVL2 electro-magnetic selection algorithm (T2Calo, described in Chapter 13) was the first algorithm to beintegrated in the LVL2 testbed. Unless otherwise noted, all LVL2 trigger prototype measure-ments shown here are limited to the LAr calorimeter trigger. However, since all data convertersand algorithms share the same offline infrastructure, any problems identified in the testbed forthe calorimeter (e.g. issues related to the common data flow aspects of the testbed) would mostlikely arise with other detectors. In addition, by using the calorimeter as a test case for data flowissues, many performance measurements for the other detectors can be first carried out in theoffline environment.
14.2.2.2 Measurements
After a first cycle of design (see Chapter 9), the HLT event selection software was implementedusing mostly offline software components. These components, many of which were in the earlystages of development at the time of these tests, had not yet been optimized for performance.Nevertheless, after achieving the integration, it was important to obtain performance measure-ments with this early software so that any incompatibilities with the LVL2 trigger could be iden-tified. By quantifying the behaviour of the ESS in a realistic trigger environment and identifyingany bottlenecks [14-3], a feedback cycle could be established with the original developers of thesoftware.
Figure 14-1 The set-up for the LVL2 vertical slice testbed. The left figure shows the components in a typicalthree-node configuration. The figure on the right shows the hardware configuration of the five-node LVL2 test-bed.
master
Switch: 8 FE + 2 GE
pcuwtr0.cern.ch
pcuwtr1.cern.ch
pcuwtr2.cern.ch
pcuwtr3.cern.ch
pcuwtr4.cern.ch
CERN network
2 X 2.2 GHz Xeon
2 X 1.8 GHz Athlon
1 X 2.2 GHz Xeon
1 X 2.2 GHz Xeon
1 X 2.2 GHz Xeon
GE
GE
FE
FE
FE
L2SVSwitchROS(E)
L2PU
Supervision
CERN network
"Bldg. 32"
ATLAS Technical Design ReportHigh-Level Trigger, Data Acquisition and Controls 30 June 2003
280 14 Overall system performance and validation
14.2.2.2.1 Measurement methodology
In order to measure the performance of the LVL2 prototype, various key components of the ESSand DataFlow were instrumented with time stamps [14-1]. The time stamps allowed detailedevent-by-event profiling of the system behaviour of the prototype. The event throughput, interms of the mean rate at the L2PU, provided another measure of global performance. All ESSperformance measurements quoted here were carried out on an L2PU application running in adual-CPU 2.2 GHz Xeon machine with 1 Gbyte of memory. Unless otherwise noted, the L2PUwas configured to run with one worker thread (see Section 9.2.4.1).
14.2.2.2.2 Initial performance of the ESS in the LVL2 prototype
Initial measurements revealed that the LVL2 calorimeter ESS alone required considerably moreprocessing time than the ~10 ms per event average budget for the LVL2 trigger. Almost all ofthe processing time was consumed in the data conversion and preparation steps. This softwareconverts the byte-stream data into objects that the downstream algorithms can process and ap-plies calibration constants. It had only recently been made available and had not yet been opti-mized.
These first measurements also used the initial form of the ‘London scheme’ for data access (de-scribed in Chapter 9), where ROB data fragments are requested on demand across the networkin a sequential fashion. In this case the total network latencies incurred by the data requestswere 3.7 ms. Given that a typical electromagnetic RoI spans 13–18 ROBs, this latency measure-ment agrees with the measurements presented in Chapter 8, where each ROB request with com-parable payload introduces a latency of ~220 µs.
The LVL2 calorimeter algorithm mean execution time is 1.5 ms per event, with an additional~1 ms consumed by framework and service overheads. The physics performance of the LVL2calorimeter algorithm itself has already been documented elsewhere [14-4].
14.2.2.2.3 First performance improvements
After the above measurements were completed, an initial optimization of the ESS was made fora few critical components. Because the above measurements identified that data transfer andconversion dominated the processing time, work was performed to reduce these contributions.These studies are the first to investigate in detail data access performance.
The initial network latency was reduced by implementing the optimization described inSection 9.5.5.2, whereby all of the data fragments of each RoI are pre-fetched across the networkin a single operation. After this change, the network access latency was reduced from 3.7 ms to650 µs per event for the system configuration shown in Figure 14-1, where one ROS delivers allROB fragments.
In order to provide a baseline measurement of the minimum time the data converter functionwould require using no offline-inherited code, a new LAr converter prototype was developed.This converter satisfies the time-critical needs of LVL2 but avoids offline dependencies, and wasdeveloped based on a lookup table method for region selection and an optimized raw data con-version scheme. In this prototype converter, the event data is passed directly to the requestingalgorithm instead of publishing in a Transient Event Store. In addition, a scheme with calibra-tion after zero-suppression was introduced (details can be found in [14-1]). This optimized con-

ATLAS Technical Design ReportHigh-Level Trigger, Data Acquisition and Controls 30 June 2003
14 Overall system performance and validation 281
verter prototype demonstrated that a data conversion processing time of 1.3 ms per event for anRoI size of ∆η × ∆φ = 0.3 × 0.3 and no zero-suppression was possible.
Applying all of the above improvements gives a total execution time per RoI in the prototype of3.4 ms and 5.9 ms for RoI sizes of ∆η × ∆φ = 0.3 × 0.3 and 0.5 × 0.5, respectively.
Figure 14-2 (left) shows the total latency distribution for di-jet events at low luminosity for a∆η × ∆φ = 0.3 × 0.3 RoI. As can be seen from the figure, over 95% of the events are processedwithin 5 ms. Figure 14-2 (right) shows the main contributions to the total latency. Pure featureextraction in the calorimeter is completed within 500 µs, while data access is typically complet-ed within 1.8 ms for 95% of the events.
The use of zero-suppression in the calorimeter [14-4] has been shown to be very effective in re-ducing algorithm execution time. Applying a 20 MeV energy threshold cut in the L2PU duringthe data conversion step reduced the mean algorithm execution time by 310 µs and 1.4 ms perevent for RoI sizes of ∆η × ∆φ = 0.3 × 0.3 and 0.5 × 0.5, respectively. The bulk of this reduction isdue to the reduced number of calorimeter cells that the feature extraction algorithm has to proc-ess. The data conversion time could also be reduced if zero-suppression could be applied up-stream of the L2PU (e.g. in the RODs). More details on these measurements can be found in[14-1] and [14-5].
These results demonstrate that the system performance required can be achieved with currentsoftware, but that some of the offline components need optimization to provide a better matchto the LVL2 trigger. The optimizations described above are now being studied for implementa-tion in the LAr data conversion software (for use in both the trigger ESS and the LAr offline it-self), and substantial improvements have already been achieved there. Thus, feedback from there-use of offline software in the LVL2 trigger is mutually beneficial. These LVL2-motivated opti-mizations will benefit not only the LVL2, but the EF and the offline software itself, reducing theoverall computing resource needs of ATLAS.
Figure 14-2 Total latency for RoI processing (shown at left) in the LVL2 LAr trigger for di-jet events at low lumi-nosity. The dotted curve is the integral of the distribution, showing that 95% of the events are processed within5 ms. The four main contributions to the latency are shown (right) as curves of integrals. The contributions are(in order of decreasing importance): data access and conversion, framework overheads, network access time,and algorithmic processing.
Time [ms]0 1 2 3 4 5 6 7 8
En
trie
s / 0
.04
0
20
40
60
80
100
120
140
160
Fra
cti
on
of
co
mp
lete
d R
oIs
0
0.2
0.4
0.6
0.8
1
Time [ms] 0 0.5 1 1.5 2 2.5 3
Fra
cti
on
of
co
mp
lete
d R
oIs
/ 0
.01
5
0
0.2
0.4
0.6
0.8
1
T2Calo FEXNetwork latencySteering, historyData conversion
ATLAS Technical Design ReportHigh-Level Trigger, Data Acquisition and Controls 30 June 2003
282 14 Overall system performance and validation
14.2.2.2.4 Other measurements
Since the L2PU will run multiple worker threads hosting the ESS, it is important to test theLVL2 event selection software in a multi-threaded configuration. After applying the changesnecessary to make the ESS thread-safe [14-2], the prototype ran with two worker threads in theL2PU. The event throughput increased from 266 Hz to 323 Hz, although the CPU utilizationwas only ~50% per CPU. The non-scaling effect is due to an inefficient use of memory allocationlocks [14-1] in the Standard Template Library (STL). By partially repairing the inefficient partsof the software, an increase in the event throughput has been observed. This will be improvedin the next round of software optimization.
The LVL2 trigger can be configured to run multiple L2PU applications in a single host machine.In this configuration, each L2PU runs different instances of the ESS, each processing events inparallel. This scheme increases the resource requirements on the host machine since memory isnot shared between the L2PUs and since the number of external connections increases. Thethree-node testbed was configured to run with two L2PUs in a dual-CPU host. The eventthroughput rate was measured to be 470 Hz. In order to draw any conclusions from this study, acareful analysis of the resource implications of using multi-process versus multi-threaded appli-cations must be made. This study will be performed when the multi-threading issues outlinedabove are resolved.
All LVL2 testbed measurements quoted above have been done for the LAr calorimeter. At thetime of writing, the initial implementation of the SCT/Pixel converters based on the Chapter 9design was only just becoming available and had not been optimized for LVL2. In previous ref-erence measurements for the SCT/Pixel data conversion process, an early SCT and pixel proto-type of the trigger software, implemented before the design described in Chapter 9 wasavailable, was developed and tested in the LVL2 testbed [14-5]. This prototype included all soft-ware components necessary to map ROBs to an (η,φ) region, request the data [14-6], and decodethe SCT/Pixel byte-stream data and the LVL1 information. In addition, a LVL2 tracking algo-rithm, SiTree [14-5], reconstructed high-pT tracks within each RoI. The prototype yielded a meantotal processing time of 2.5 ms per event for track reconstruction of single electrons with no pile-up. This result is significantly less than the ~30 ms required by the first implementation of thenew SCT and Pixel converters. However, by implementing improvements similar to those ap-plied to the LAr converter, the SCT and Pixel decoding software can be expected to achieve asimilar level of performance to that of the early prototype.
Because it is executed at the LVL1 muon rate, the processing time of the LVL2 muon trigger, likethe LVL2 calorimeter trigger, is also critical. Measurements [14-7] of LVL2 muon trigger per-formance were carried out in the HLT offline environment (i.e. running the ESS in the offline en-vironment rather than in the testbed). Running a full selection chain for pT = 100 GeV muons inthe barrel at high luminosity yielded a mean total processing time of ~10 ms on a 2.4 GHz ma-chine. This processing time has been calculated taking into account the cavern background sim-ulation in the muon spectrometer for high luminosity (L = 1 × 1034 cm−2 s−1) with a safety factorof two (see Section 13.4.2). It is dominated by data preparation – 1 ms per RoI for the RPCs [14-8] and 7.9 ms per RoI for the MDTs [14-9]. The cavern background increases the MDT occupan-cy and the data preparation time scales linearly with the occupancy. The remaining 1.1 ms isconsumed by the muFast pattern recognition and tracking algorithm itself (algorithm descrip-tion can be found in Chapter 13). Although at this time the LVL2 muon trigger software has notbeen integrated in a testbed environment, these measurements indicate that the processingtimes, including data access, are well understood. Assuming that data flow and network over-heads for the muon trigger are similar to those for the LAr trigger, the overall latency for theLVL2 muon trigger is well under control.

ATLAS Technical Design ReportHigh-Level Trigger, Data Acquisition and Controls 30 June 2003
14 Overall system performance and validation 283
14.2.2.3 Conclusions and outlook
As seen in the previous section, detailed studies and first measurements with the HLT event se-lection software show that there is great potential for optimization of the present initial imple-mentation. Some components of the ESS already perform well, e.g., the selection algorithms.Other components, in particular the detector data converters, need further optimization. Dedi-cated test prototypes have shown that this optimization is possible. In addition, the muon trig-ger software already performs in the offline HLT environment at a level that is compatible withthe LVL2 processing budget. Extrapolating the present performance figures of these prototypesto 8 GHz CPUs, which are expected to be available at LHC turn-on, gives total processing timesthat are compatible with the 10 ms average event processing time budget of LVL2. In all cases,the data preparation is proving to be the major fraction [14-3] of the LVL2 processing time. Thusdetailed studies of the data preparation process have been made, and will continue.
There are a few open issues that need to be addressed for the LVL2 trigger. The multi-threadinginefficiencies encountered with the STL need to be resolved, and the implications on the currentworking model need to be fully understood.
The data access mechanism of the ESS needs to be optimized for the LVL2 trigger. First, the im-plementation of the internal data access including conversion, calibration and data organizationneeds to be optimally designed for execution speed. Secondly, the ‘on-demand’ nature of manyof the offline configuration and data access services, particularly at initialization time, should beadapted to a deterministic model, more suitable for a trigger environment. Thirdly, fragmentsrequired for a given RoI must be requested in parallel. Implementing these optimizations bringsvery substantial performance improvements as was demonstrated above.
The ESS will be processing events in the LVL2 environment at the LVL1 output rate. Conse-quently, any offline components used in the trigger will be executed nearly 103 times more fre-quently in LVL2 than in offline, imposing severe constraints on stability and robustness of thesoftware. Increasing the modularity of the software so that the components needed to build theLVL2 form a restricted highly-robust software ‘core’ would help to address these constraints.This core would still form the basis for the offline reconstruction.
In conclusion, running the ESS in a LVL2 vertical slice prototype serves two purposes: it pro-vides performance measurements for estimating resource requirements, and it provides a plat-form for validating the ESS and the trigger architectural choices. Building the event selectioncode with offline components not only reduces the development and maintenance costs in theLVL2, but it helps in optimizing the performance of these offline components. However, in or-der for this model to work, the LVL2 constraints must be taken into account in the core offlinesoftware. The LVL2 tests shown here demonstrate that this is not only possible, but desirableand mutually beneficial for both the trigger and offline software systems.
14.2.3 Event selection in an Event Filter prototype
In the EF, the event selection process is carried out by the Processing Task (PT), described inSection 9.3. The PT hosts the HLT selection software, which is fully implemented using ATHE-NA (the ATLAS offline software framework [14-10]) and offline reconstruction components. Inorder to validate the event selection in the EF, a prototype was developed that brings togetherthe DAQ DataFlow sub-system (SFI and SFO), the EF data flow (EFD) and the PT running theESS in a single system (see Section 9.3.2.3 and [14-11]).
ATLAS Technical Design ReportHigh-Level Trigger, Data Acquisition and Controls 30 June 2003
284 14 Overall system performance and validation
The performance of the EFD running with dummy PTs is described in Section 9.3.2.4. Here weconcentrate on the performance involving real events processed by the ESS.
14.2.3.1 Integration of EFD with ATHENA data access services
The PTs are independent processes running on each EF node. In order to access event data, theESS running in the PTs are interfaced to the EFD which supplies them with complete eventsfrom the Event Builder. This interface has been implemented by adapting the ATHENA conver-sion services that carry out the conversion between different data types.
The integration of the ESS in the EF consisted then of developing dedicated implementations ofsome of these data conversion services. These EF-specific implementations read, handle, andexchange event data with the EFD using a shared memory mechanism. When a PT requests anevent from the EFD, a pointer to the event in this shared memory is returned to the PT (seeSection 9.3.2). After the processing is completed, a trigger decision is sent to the EFD. If theevent is accepted, the EFD appends to the original event, data generated during the EF process-ing.
14.2.3.2 Prototype and software configuration
Tests were performed by running the EF with simulated events. The data set used was a sampleof di-jet events that was pre-selected to pass the LVL1 electromagnetic trigger. The data sampleis the same as that used for the LVL2 tests and is described in Section 14.2.2. The event size inthis sample was ~3 Mbyte. The data were pre-loaded in an SFI emulator. At the time these testswere made, the EF algorithms were not yet available and so a LVL2 calorimeter algorithm wasused. Tests using more sophisticated algorithms are planned in the next three months.
For the purposes of these tests, the EF result (data generated during processing) contained a sin-gle data fragment produced by a converter dedicated to serializing the results of EF reconstruc-tion, which are in object form. No additional reconstructed objects were serialized in theprototype however, the same mechanism will be used for multiple object serialization in the fu-ture when more complete EF algorithms are available for use in the testbed. For acceptedevents, this serialized fragment was written into the shared memory from where it was append-ed to the original event by the EFD and then sent to the SFO.
Three different hardware configurations were used to carry out the measurements:
1. A single-host dual-processor: one Intel Xeon 2.2 GHz processor with 1 Gbyte of RAM.
2. A multiple host set-up: two Intel Xeon 2.2 GHz processors with 1 Gbyte of RAM intercon-nected by Fast Ethernet.
3. A multiple host set-up: two Intel Xeon 2.2 GHz processors with 1 Gbyte of RAM intercon-nected by Gigabit Ethernet.
14.2.3.3 Measurements
A series of tests was performed on each of the testbed configurations described above:
• validation of the exchange of data between the EFD and the ATHENA PT hosting the ESS;
• throughput measurements.

ATLAS Technical Design ReportHigh-Level Trigger, Data Acquisition and Controls 30 June 2003
14 Overall system performance and validation 285
Validating the event input procedure consisted of checking the integrity of the data after pass-ing it from the EFD to ATHENA, by checking that the ESS produced the same results as whenrunning offline. In order to validate the output procedure, accepted events were sent by the EFDto the SFO and from there to a local disk file. The integrity of these data was then verified byreading, unpacking, and re-processing them offline. The throughput was measured as the aver-age processing time per event (i.e. the inverse of the event rate).
Measurements were conducted with a dual-processor machine hosting all processes, SFI, SFO,EFD, and PTs, (configuration 1 above), and also on a multiple-host set-up with the SFI and SFOrunning on one host and the EFD and PTs running on the other (configurations 2 and 3 above).
The ATHENA PT ran the calorimeter algorithm. The EF selection was configured so that allevents were accepted. The total user time per event was on average 180 ms for the di-jet eventsample described above, and the virtual memory size was typically 260 Mbyte. Table 14-1 sum-marizes the results.
In the first configuration, adding a second PT benefits from the dual-CPU and increases thethroughput significantly, though not by a factor of two as the other resident processes (SFI, SFO,and EFD) require some fraction of the CPU. Adding a third PT saturates the memory; conse-quently, swapping slows down the process considerably. Under these conditions, the PTs wereblocked by the timeout mechanism of the EFD. In the second configuration, with multiple hostsinterconnected by Fast Ethernet, the throughput was limited by the network bandwidth evenwith only one PT (in normal EF running conditions, with an event size of the order of 1 Mbyteand a latency of the order of 1 s, Fast Ethernet bandwidth should be adequate). In the third con-figuration (multiple hosts interconnected by Gigabit Ethernet), there was no bandwidth limita-tion and a single PT used close to 100% of a CPU. Adding a second PT increased thethroughput. Here, each PT used about 80% of a CPU, the remainder being used by the EFD.
14.2.3.4 Conclusions
The ATHENA-based event selection software was successfully integrated with the EFD, dem-onstrating that the EF selection can be built using offline components. As in the case of theLVL2, this approach minimizes development and maintenance costs, while providing a unifiedevent selection chain.
Table 14-1 Results of throughput measurements obtained with the various test configurations (see text fordetails)
ConfigurationNumber of
ATHENA PTs Time per
event (ms)Data throughput
(Mbyte/s) Remark
1
1 190 16
2 110 27
3 timeout limited by memory swap
2 1 380 8 limited by network
31 190 16
2 120 25
ATLAS Technical Design ReportHigh-Level Trigger, Data Acquisition and Controls 30 June 2003
286 14 Overall system performance and validation
Although the tests described here were not conducted with a full EF selection suite, the meas-urements already highlight some of the key performance issues. The behaviour of the ATHENAPT running the selection software in terms of processing time, memory usage and event sizeswill be further evaluated in order to define an optimal EF hardware configuration. These testsdemonstrate the correlation of these parameters.
14.2.4 The HLT vertical slice
The LVL2 trigger and the Event Filter were integrated in a single testbed as shown in Figure 14-3. The LVL2 slice (described in Section 14.2.2) and the EF slice (described in Section 14.2.3) wereconnected to form an ‘HLT vertical slice’ using the CERN network infrastructure. The DFM andthe Event Building were located geographically close to the event fragment sources. In order topass the LVL2 result to the EF, one of the ROSes was configured as a pROS (described inSection 8.1.3.4). The entire system, consisting of 11 nodes, was configured and controlled by theOnline Software through the CERN network.
For accepted events, the L2PU sent a LVL2 Result to the pROS which was readout by the EB.The LVL2 Result became thus available to the ESS running in the Event Filter PTs. An EF Resultwas produced which was appended to events that were passed on to the SFO. During the tests,one ROSe was pre-loaded with 120 LVL1-preselected di-jet events with electronic noise as usedin the LVL2 slice tests; the LVL2 Supervisor was pre-loaded with the corresponding RoI infor-mation (normally received from the RoIB). The energy threshold cut for the LVL2 calorimeter al-gorithm was set to 20 GeV in order to accept approximately two thirds of the events. The LVL2used the T2calo algorithm with optimised data conversion for the LAr Calorimeter (as de-scribed in Section 14.2.2). The LVL2 system was configured to execute the ESS in two L2PUsrunning in parallel. Events accepted by LVL2 were assembled by the EB (2–3 Mbyte per event)and passed on to the Athena-based ESS running in the EF. The latter ran in a sub-farm withthree nodes, each with one EFD and two PTs. In a first test, the EF also used a LVL2 calorimeteralgorithm in offline mode (as described in Section 14.2.3) and including the Tile Calorimeter. Ina second test, the EF decoded the LVL2 Result and ran offline Calorimeter reconstruction codeproducing an EF Result which was appended to the data. Finally, accepted events were record-
Figure 14-3 Set-up for the combined LVL2 and EF vertical slice testbeds.
L2SV
Switch
DFM
ROS(E)
L2PU SFI
Supervision
Switch
EFD
PT
SFO
CERN network
Bldg. 32 Bldg. 513
PT
pROS

ATLAS Technical Design ReportHigh-Level Trigger, Data Acquisition and Controls 30 June 2003
14 Overall system performance and validation 287
ed in byte-stream format by the SFO. The integration was validated by verifying the events re-corded by the SFO.
14.3 HLT CPU requirements
The HLT/DAQ architecture has been designed to handle a maximum LVL1 trigger rate of100 kHz. The estimated CPU requirement of the HLT system to handle this LVL1 rate is summa-rized in this section.
For LVL2, there are several ingredients to this estimate.
• Examples of the feature extraction and reconstruction algorithm performance are present-ed in Chapter 13 and its associated references, and in Section 14.2.2. Typical timing num-bers on a 2 GHz CPU are as follows.
• Calorimeter: ~2 ms.
• Muon: ~1 ms.
• SCT/Pixel: ~3 ms.
• TRT: ~9 ms.
• The frequency of use of each of the algorithms — calculated from the trigger rates and ac-ceptance factors (see Chapter 13 and Appendix A) and the number of RoIs per event foreach RoI type.
• The CPU requirement for the preparation of the data to be used by the algorithms.
Initial measurements have indicated that this will be a significant fraction of the total re-quired CPU time. However, as discussed in Section 14.2.2.2, the measured data-prepara-tion times are preliminary and significant improvements can be expected in most cases.
• The time to access data from the ROBs using the RoI mechanism in the LVL2 trigger.
This has been studied in detail and results are presented in Section 8.3.2.2. The data-ac-cess time is very small compared both to the algorithm and data-preparation times.
• The CPU overhead of the overall software framework in which the selection algorithmsrun.
This is estimated to be a few per cent of the overall processing time per event.
• Additional, currently ill-defined CPU requirements, such as access to calibration data re-siding in the conditions databases and monitoring.
It is not foreseen for the LVL2 trigger to access the conditions databases during a run.However, the EF will need this ability. As the conditions database is currently in its designphase, we do not attempt any estimate of data-access times at this stage. This will be ad-dressed further in the Computing TDR. System and local trigger monitoring procedureswill certainly increase the overall CPU requirements of the HLT.
The above considerations and the sequential data processing steps (see Chapter 2 andAppendix A) have been used as input parameters to detailed modelling of the LVL2 system. Inthe model, typical timing numbers have been scaled to 8 GHz CPUs, the speed expected to beavailable in 2007. The result of the model is that for a LVL1 rate of 25 kHz, ~250 CPUs at 8 GHz
ATLAS Technical Design ReportHigh-Level Trigger, Data Acquisition and Controls 30 June 2003
288 14 Overall system performance and validation
will be required for LVL2. Scaling this number to the maximum LVL1 rate of 100 kHz gives a to-tal LVL2 CPU requirement of 500 dual-processor machines.
For the EF, performance and timing studies are still in progress therefore, a target figure of 1 sper event for the average global EF processing time, assuming 8 GHz CPUs, is used. Assumingan event-building rate of 3.2 kHz (corresponding to a LVL1 rate of 100 kHz) this gives an esti-mate for the EF of 1600 (8 GHz) dual-CPUs. These estimates for LVL2 and the EF are used in theoverall HLT/DAQ-system costing presented in Chapter 16.
The resource estimates clearly are subject to large uncertainties coming from various sources.
• At the start-up luminosity of 2 × 1033 cm−2 s−1, for the physics selections presented inChapters 4 and 13, simulations give a LVL1 trigger rate of ~25 kHz without any safetyfactor and with a limited physics menu. Clearly, many possible selection channels havenot been simulated which would add to the LVL1 rate. There are also very large uncer-tainties in the underlying cross-sections and the background conditions which will affectthis estimate. Designing the system for 100 kHz gives an effective ‘safety factor’ of fourcompared to the above LVL1 rate.
• In extrapolating the LVL1 rate to 100 kHz, we have made the assumption that the mixtureof trigger types remains constant.
• We have made extensive studies of trigger-algorithm data preparation as discussed inChapter 13 and in Section 14.2.2. These results are still preliminary for several reasonssince the detector data formats themselves are preliminary, and studies of data convertersin the ESS have been done only with initial prototype-software not yet fully optimized forthe trigger.
However we can already conclude that the data-preparation CPU requirement will besignificant, and in some cases possibly dominant, compared to the algorithm executiontime.
• The ESS is a first implementation of the design presented in this TDR. Work both on thetrigger testbeds and in offline studies of the trigger algorithms shows that there are manyimprovements and optimizations which can be made.
• The ATLAS offline software, upon which much of the ESS is based, has undergone a com-plete re-design and implementation in the last three years and this process will continue,culminating in the Computing TDR in two years time. Many improvements and optimi-zations are expected in the offline software, which will be directly transferred to the asso-ciated HLT components. The estimates presented above reflect the present performanceof the ESS and the offline.
14.4 The 10% testbed
To study the combined performance of the components and sub-systems of the ATLAS Data-Flow system, a testbed with full DataFlow functionality and a size of approximately 10% of thefinal system has been assembled. Although the testbed is necessarily a scaled down version ofthe final system, individual components are operated at rates similar to those expected in the fi-nal system.
The primary aim of the 10% testbed is to demonstrate the full and concurrent execution of theRoI data collection and event-building functionality to check for possible interference between

ATLAS Technical Design ReportHigh-Level Trigger, Data Acquisition and Controls 30 June 2003
14 Overall system performance and validation 289
them, for instance in the form of reduced performance. Measurements will also be performedon the testbed to study outstanding design and implementation issues, for example bus-basedand switch-based readout and the number of central switches. In addition, measurements per-formed on the testbed are being used to validate and calibrate computer models of the system.The subsequent reproduction of the performance and scaling behaviour of the 10% testbed bymodelling will strengthen conclusions drawn from modelling studies of the full-size HLT/DAQsystem.
14.4.1 Description of the 10% testbed
The 10% testbed presently consists of a set of PCs and custom hardware devices, used to emu-late ROSs, inter-connected via a Gigabit Ethernet network. The testbed, shown in Figure 14-4,reflects the architecture of the final system. It implements two separate central switches for RoIdata collection and event building and allows for additional central switches for the studies ofscalability, e.g. two RoI collection switches and two event building switches. In addition, thetestbed is such that two methods of accessing data buffered in ROBs may be studied: the bus-based ROS and switch-based ROS, see Section 5.5.4.
14.4.1.1 Readout sub-systems
In the testbed the bus-based ROS, as described in Section 8.1.3.3, has been implemented on PCs(numbers 108, 114–116 in Figure 14-4). Each PC is equipped with two Gigabit Ethernet NICsconnecting the ROS to each of the central switches. As described in Section 8.1.3.3, this version
Figure 14-4 Organization of the 10% testbed
T6 #1T6 #2
48 T5C GF
FPGA #4 82
31
48 T5C GF
FPGA #1 83
32
48 T5C GF
FPGA #2 80
32
48 T5C GF
FPGA #3 81
32
111
AL
T1
AL
T2
AL
T3
AL
T4
AL
T5
AL
T6
AL
T7
AL
T8
8484
AL
T9
AL
T 1
0
AL
T 6
AL
T 1
0
AL
T 7
AL
T 8
AL
T 9
AL
T 1
1
87
121 122 123
F 2
131 132 133126 127 128 129 130
134 135 136
121
112
139138137 146145
L2SVs DFM PROS
F 1
120
115 116114108
113112111110 117 140 141 142 143 144
SFIs
SFO
4U1UCTRLFE UTP switch port
GE OF switch port
GE UTP switch port
LVL2+EB VLANs
LVL2 VLAN: 192.168.1.xxx
EB VLAN: 192.168.2.xxx
BackEnd: 192.168.3.xxx
PCs
124
ROSes
L2PUs147
125
ATLAS Technical Design ReportHigh-Level Trigger, Data Acquisition and Controls 30 June 2003
290 14 Overall system performance and validation
of the bus-based ROS emulates the interactions with the ROBINs as the prototype ROBIN (seeSection 8.1.3.2) is at the time of submission not installed. Additional bus-based ROSs are emu-lated in the testbed by sixteen programmable Alteon Gigabit Ethernet NICs (see labels ALTx inFigure 14-4), Ref. [14-12] and [14-13]. The Alteon NICs have only a single Gigabit Ethernet port,i.e. it cannot be simultaneously connected to both central switches. To overcome this limitation,in the testbed, a bus-based ROS is emulated by two Alteons: one connected to the LVL2 centralswitch and the other to the event building central switch, allowing the emulation of eight bus-based ROSs. Together the PCs and the Alteons provide twelve bus-based ROSs, which is 10% ofthe number foreseen in the final system.
In the switch-based ROS scenario, each ROBIN has its own connection to the central switchesvia a concentrating switch. For this scenario the Alteon NICs are agin employed together withthe FPGA ROBIN emulator, see Ref. [14-12]. The latter (FPGA #1 – FPGA #4 in Figure 14-4) hasa single Fast Ethernet link to a concentrating switch (labelled T5C-GF in Figure 14-4). Thirty-two FPGA emulators are connected to a concentrating switch and each concentrating switch hastwo Gigabit Ethernet links, one to each of the central switches. There are 128 FPGA ROBIN em-ulators. The Alteon NICs are as described above.
The maximum message size each FPGA emulator can send is a single Ethernet frame, i.e. theycan only emulate a ROBIN with a single ROB. However, they will respond to any number of re-quests for data and used in this way in the testbed they can emulate 1600 ROBINs. As the Alte-on NIC is programmable, they too can respond to any number of requests for data.
For some system performance measurements, the performance of the Alteon NICs limited theperformance of the system, particularly, when these devices were used to emulate a ROBINwith more than one ROB or a ROS with more than one ROBIN. In the case of the FPGA ROBINemulators, the output bandwidth of the concentrating switch (~105 Mbyte/s) limits the obtain-able rates particularly when they are used to emulate 1600 ROBINs.
14.4.1.2 RoI data collection
Referring to Figure 14-4, the LVL2 trigger consists of a central switch (T6#1), fourteen L2Ps,three L2SVs and a pROS. The central switch is a 32-port Gigabit Ethernet switch with sixteenoptical ports and sixteen electrical (UTP) ports. The fibre ports are used to connect the ROBINemulators and a grouping switch (described below). The UTP ports are used to connect the PCsused for the bus-based ROS and eleven L2Ps (PCs 126–136 in Figure 14-4). The remaining L2Ps(PCs 121–123) connect to the LVL2 central switch via the grouping switch (F2 in Figure 14-4).The grouping switch is a Gigabit Ethernet switch with ten UTP ports and two optical ports. Thismixture of direct and indirect connections has been used in the testbed to understand possibleeffects of the grouping switches, however, the baseline architecture has all L2Ps connected tothe central switch via a grouping switches. The fourteen L2Ps (1U rack-mounted 2.2 GHz and2.4 GHz dual-processor Xeon machines) in the testbed are less than 10% of the final system butfor these tests they were not executing algorithms and issue RoI requests at much higher rates,thus the fourteen L2Ps effectively emulate more than 10% of those in the final system.
14.4.1.3 Event building
The event building consists of a central switch, twelve SFIs and a DFM. The central switch (T6#2 in Figure 14-4) is a 32-port Gigabit Ethernet switch identical to the LVL2 central switch.Twelve of its sixteen optical ports are used to connect the ROBIN emulators. Twelve of its six-

ATLAS Technical Design ReportHigh-Level Trigger, Data Acquisition and Controls 30 June 2003
14 Overall system performance and validation 291
teen UTP ports are used to connect SFIs (PCs 110–113, 117, 140–144 and 124–125 in Figure 14-4).Other UTP ports are used to connect the four PCs used for the bus-based ROS and to connectthe DFM and pROS via a grouping switch (F1 in Figure 14-4). The nine SFIs in the testbed corre-spond to 10% of the number foreseen in the final system.
14.4.1.4 Simultaneous RoI collection and event building
The L2SVs on the testbed emulate the LVL1 trigger and send event requests to the L2PU appli-cations on the L2Ps at rates as high as allowed by the back pressure. For the measurements withconcurrent RoI data collection and event building the back pressure is exerted in two ways. Firstthe L2SV limits the number of outstanding events sent to each L2PU, when this limit is reachedno more events are sent to that L2PU until the L2PU returns the decision from an outstandingevent. Secondly the DFM maintains a queue of events accepted by LVL2 and awaiting assign-ment to an SFI. When this queue is full, a message is sent to the L2SV to discontinue sending re-quests to L2PUs. When the occupancy of the queue drops below 80%, the DFM sends anothermessage to the L2SVs signalling that sending requests can be resumed.
The network topology of the final system has Ethernet loops between the two central switchesand the ROBIN concentrating switches (see Section 8.3.1.2.2) and the Spanning Tree algorithm(STP) or VLANs will be used to ensure a loop-free topology. However, the switches used in thetestbed do not allow STP to be applied on a VLAN basis and the Message Passing layer does notsupport VLAN tags. To avoid network loops the DFM and pROS (which communicate acrossVLANs) are equipped with two network interface cards, one for connecting to the LVL2 VLANand the other to the EB VLAN.
14.4.2 Preliminary results
This section presents preliminary results of initial measurements performed on the fully func-tional testbed, i.e. concurrent RoI data collection and event building. The results of the systemperformance using a bus-based readout are shown in Figure 14-5 and Figure 14-6, while the sys-tem results using a switch-based readout are shown Figure 14-7.
In Figure 14-5, the sustained event-building rate is plotted versus the number of L2PUs used fordifferent LVL2 accept fractions. In this set of measurements there were eight SFIs and four bus-based ROSs each emulating the support of 12 ROLs. Each L2PU had two worker threads re-questing 1.5 kbyte of RoI data from a single ROL per event. Each built event is 48 kbyte. Despitethe small number of SFIs (eight instead of ~110) the event-building rate is higher than it wouldbe in the full system because of the smaller number of ROSs.
For a LVL2 accept fraction of 1% the sustained event-building rate increases almost linearlywith the number of L2PUs and an event-building rate of 0.5 kHz is achieved. For this acceptfraction the rate is limited by the number of L2PUs in the testbed. As the LVL2 accept fractionincreases so does the event-building rate, but increasingly non-linearly with the number ofL2PUs. The sustained event-building rate reaches a maximum of 5.7 kHz corresponding to eachROS driving its link to the event building at ~68 Mbyte/s. Note that in the final system, LVL2accept rates of approximately 3% are expected.
The results of similar measurements are shown in Figure 14-6; however, for this set of measure-ments twelve bus-based ROSs were used, four based on the PCs and eight based on the Alteonemulators. The data show that for LVL2 accept fractions of at least 10% the sustained event-
ATLAS Technical Design ReportHigh-Level Trigger, Data Acquisition and Controls 30 June 2003
292 14 Overall system performance and validation
building rate reaches a 3 kHz limit with only four L2PUs. Similar measurements performed onthe testbed but only for event building show that the limit of 3 kHz is due to the limited numberof SFIs used and that with ten SFIs a limit of 4 kHz would be reached which is imposed by thelimitations of the Alteon emulators. Note that for these measurements, the number of ROSs andSFIs is 10% of that expected in the final system for a LVL2 accept rate of ~3% and the sustainedevent-building rate achieves the design value of 3 kHz for this accept rate.
In Figure 14-7 the preliminary results of initial measurements performed on the testbed with aswitch-based ROS were shown. The measurements were performed with both types of ROBINemulator (FPGA based and the Alteon). In one set of measurements the 125 FPGA ROBIN emu-lators were used to emulate 1600 ROBs, in a second set the Alteon NICs were used to emulate1600 ROBs. In the third set of measurements the 1000 ROBINs are emulated by the 125 FPGAROBIN emulators and the Alteon NICs emulate 600 ROBINs.
The figure shows the sustained event-building rate versus the number of L2PUs, for a LVL2 ac-cept fraction of 3% and eight SFIs performing event building. Ethernet flow control was on. Inthe measurements where a single type of ROBIN emulator was used the event-building rate islimited, in the case of the FPGA emulator, by the link bandwidth connecting the ROS concen-trating switches to the event building central switch. In the case of the measurements per-formed with the Alteons, the achieved event-building rate is limited by the performance of theAlteon NIC. The set of measurements obtained by the joint use of the FPGA and Alteon ROBINemulators reaches the limit imposed by the use of only eight SFIs. These results are discussed inSection 14.6.2.1
The measurements presented here represent only the results from an initial set of studies. Anal-ysis of the measurements presented above, along with modelling of the testbed configurationsused for the measurements, are still in progress at the time of submission of this report. Furtherstudies of the 10% testbed will continue, and it is expected to replace the emulators used for the
Figure 14-5 The event-building rate for simultaneous RoI handling and event building in the 10% testbed. FourROS units, each servicing 12 ROLs, were emulated with four PCs. Per event the L2PUs requested data corre-sponding to one of the ROLs from one of the emulated ROS units. Eight SFIs requested data from all 12 emu-lated ROLs of each ROS for the accept fractions indicated.
0
1000
2000
3000
4000
5000
6000
0 2 4 6 8 10 12
Number of L2PUs (1ROB/RoI, 2threads)
Even
t b
uild
ing
rate
(H
z)
1% accept fraction
3% accept fraction
5% accept fraction
10% accept fraction
20% accept fraction
40% accept fraction
80% accept fraction
100% accept fraction

ATLAS Technical Design ReportHigh-Level Trigger, Data Acquisition and Controls 30 June 2003
14 Overall system performance and validation 293
initial set of measurements by the prototype ROBIN, thus eliminating some of the limitations ofthe current testbed.
Figure 14-6 event-building rate for simultaneous RoI handling and event building in the 10% testbed. 12 ROSeach servicing 12 ROLs, were emulated with four PCs and 16 Alteon NICs (two per ROS unit, one supplyingLVL2 data, the other EB data). Per event the L2PUs requested data corrsponding to one ROLs from one of theemulated ROSs. Eight SFIs requested data from all 12 emulated ROLs of each ROS for the accept fractionsindicated
Figure 14-7 event-building rate for simultaneous RoI handling and event building in the 10% testbed for threedifferent ways of emulating 1600 ROBs, as explained in the text. 8 SFIs were requesting the data from all ROBsfor an accept fraction of 3%. Ethernet flow control was switched on
0
500
1000
1500
2000
2500
3000
3500
0 5 10 15
Number of L2PUs
Ev
en
t b
uil
din
g r
ate
(H
z)
1% accept fraction
5% accept fraction
10% accept fraction
20% accept fraction
40% accept fraction
80% accept fraction
100% accept fraction
0
50
100
150
200
250
0 2 4 6 8 10
Number of L2PUs
Ev
en
t b
uil
din
g r
ate
(H
z)
1000FPGA+600Alteon
FPGA(125)
Alteon(8)
ATLAS Technical Design ReportHigh-Level Trigger, Data Acquisition and Controls 30 June 2003
294 14 Overall system performance and validation
14.5 Functional tests and test beam
Often, during prototyping, more weight is put on the performance of a system than on its stabil-ity and maintainability. Functional user requirements tend to have a lower priority than theachievement of the performance requirements during this phase of development. This is tosome extent true also for the ATLAS HLT/DAQ system. Nevertheless, by carrying out a seriesof functional tests and exposing the system to non-expert users at the ATLAS test beam sites,these issues have been addressed.
Four different aspects of the global functionality have been covered: system configuration, sta-bility in cycling through the control states of the system, monitoring and fault tolerance. Theseaspects were first tested in dedicated laboratory set-ups and then verified in a ‘real’ environ-ment, during test beam data-taking.
14.5.1 System configuration
A data acquisition system must be easily reconfigurable in order to accommodate the substitu-tion of hardware, the change of trigger conditions, etc. Tools for storing/retrieving the configu-ration parameters into/from a database must be available, and Run Control, DataFlow, andTrigger software must be designed to be dynamically reconfigurable.
In test beams, data-taking configurations tend to change very often, because of the addition ofnew components and sub-systems that need stand-alone as well as integrated debugging in theread-out chain. In order to ease integration of detector read-out chains in the DataFlow system,nested partitions were introduced. Nested partitions allow different groups to develop their da-tabases independently and then to link them together under a common top partition. The suc-cess of this technique was recently proven, especially during beam tests of the Muon detectors.For these tests, five different ROD or ROD emulator crates were independently set-up and test-ed, before being connected for further debugging to their corresponding ROS units and finallyalso to the event building system.
Although the configuration of the HLT/DAQ hardware and of the software applications arespecified at the beginning of a data-taking session, a number of configuration parameters forvarious applications can be changed dynamically, e.g. amount of memory to be reserved for thedata, length of queues, etc. Some very dynamic parameters which change for every run, e.g. therun number and calibration variables, are not kept in the configuration database and are distrib-uted via the Information Service provided by the Online Software (see Chapter 10) at the start ofthe run. Mechanisms for dynamic database changes, with corresponding mechanisms to notifythe affected applications, are being studied.
14.5.2 Finite state machine transitions
When performing a series of measurements with different configuration options, the HLT/DAQ system must be capable of cycling through a finite set of states in a stable fashion. This ca-pability has been checked with the help of automated scripts cycling repeatedly through the fi-nite state machine associated with the states. The absence of problems has been verified duringall test beam periods.

ATLAS Technical Design ReportHigh-Level Trigger, Data Acquisition and Controls 30 June 2003
14 Overall system performance and validation 295
14.5.3 Monitoring
In a distributed system such as the HLT/DAQ system it is important to monitor the operationof the system continuously. All applications regularly publish statistics on their performance, aswell as on the occurrence of errors, via the Information Service. Furthermore, the ROS and theSFI are capable of providing event data for physics monitoring. Operational monitoring hasbeen intensively used to conduct all the performance measurements described in the previouschapters. All aspects of the monitoring facilities have been regularly used by the people on shiftduring test beam data-taking.
14.5.4 Fault tolerance
The HLT/DAQ system needs to be fault tolerant. Additional work is needed in this area, there-fore it was not considered to be appropriate yet to conduct a series of systematic tests in order toassess the performance of the system in case of errors. In general, an error that is classified asWARNING does not cause any disruption in the system, except for the possible loss of someevent data. Examples of such errors have been observed in the test beam set-up, for instancewhen a ROD does not send consecutive LVL1 event identifiers (L1IDs) to the ROS, or when anSFI does not receive the requested data of an event in a time-out period. However, a FATAL er-ror in one application, which prevents it from continuing to take data, has a potentially seriouseffect on the overall HLT/DAQ system. An instance of this is if the system is unable recoverfrom failure of a component that is unique and necessary for data-taking, such as the DFM orthe RoI Builder. By design, the system can recover from the failure of one or more L2PUs orSFIs, because the L2SV or DFM, respectively, can dynamically mask the failing component. Thefailure of a ROS, in contrast, requires dynamic re-configuration of the downstream data-takingchain which is not possible at the time of submission of this report. Similarly the mechanism todynamically mask a single ROL in a ROS is not in place.
14.5.5 Conclusions and outlook
The functional performance of the HLT/DAQ system has been tested during the developmentof the system and during its exploitation in a testbeds and test beams. The functionality today isalready adequate for successful application of the present prototype implementation in testbeam set-ups and for carrying out performance measurements. Further development is neces-sary with respect to the dynamic re-configuration of the system during data-taking, in particu-lar in the case where re-configuration is required because of changes in the run conditions whenerrors occur. It is essential that components that are not unique can be dynamically excludedfrom the running system if required. Re-insertion of such components without stopping data-taking may be because of synchronization issues, but the possibility will be studied further.
14.6 Modelling results
14.6.1 Paper model
Estimates of average message frequencies, data volumes and the amount of processing powerrequired for the HLT/DAQ system have been made with the help of a ‘paper model’. The most
ATLAS Technical Design ReportHigh-Level Trigger, Data Acquisition and Controls 30 June 2003
296 14 Overall system performance and validation
important results are presented in Chapter 2. A description of this model and its results can befound in Appendix A.
14.6.2 Computer model
The availability of network connections and switches with sufficient bandwidth and of a suffi-cient amount of computing resources in the DAQ and HLT systems cannot alone guarantee thatthe performance requirements are met. Also necessary are.
• an even distribution of the computing load over the available computing resources;
• minimal congestion and large enough data buffers in switches;
• sufficient spare processor capacity and network bandwidth to cope with fluctuations.
To verify that these conditions are met, the dynamic behaviour of the full system needs to bestudied with the help of simulation with a ‘computer model’, as the construction of a full-scaletestbed is not feasible. Computer models therefore have been developed to obtain informationon basic and fundamental properties such as the achievable throughput, distributions of theLVL2 decision time and of the event-building time, queue development in various places in thesystem (switches and end-nodes), and to study the impact of various traffic-shaping and load-balancing schemes.
The type of simulation used for the computer models is known as ‘discrete event simulation’.The simulation program maintains a time-ordered list of ‘events’, i.e. points in time at which thesimulated system changes state in a way implied by the type of ‘event’ which has occurred.Only at the time of occurrence of an event is the modelled system allowed to change its state. Inmost cases only a small part of the state of the simulated system needs to be updated. The statechange can result in the generation of new events at a later time, which are entered at the correctposition in the time-ordered list. The simulation program executes a loop in which the earliestevent is fetched from the event list and subsequently handled.
The model of the HLT/DAQ system implemented in the simulation programs is an object-ori-ented model, in which most objects represent hardware (e.g. switches, computer links, process-ing nodes), software (e.g. the operating system, DataFlow applications), or data items. Twosimulation programs have been used, the at2sim program [14-14] and the Simdaq program [14-15]. The at2sim program makes use of the general purpose simulation environment of the Ptole-my system [14-16]. Ptolemy offers support for discrete event simulation and allows the imple-mentation of object-oriented models. The Simdaq program is a dedicated C++ program, withthe discrete event simulation mechanism being a part of the program.
The component models used in the at2sim program are models of the testbed components de-scribed in Section 14.4. They were kept as simple as possible, but sufficiently detailed to repro-duce the aspects of their behaviour relevant for the issues studied. Models of all DataFlowapplications [14-17] and Ethernet switches [14-18] have been developed. Computer models ofsmall test set-ups have been developed and have been used for characterizing the behaviour ofsystem components. Also models of testbeds and of the full system have been developed. Forthe calibration of the models of the DataFlow applications, time stamps were obtained with thehelp of code added to the DataFlow software (for this purpose a library based on access to theCPU registers was developed). The time stamps provided estimates on the time spent in variousparts of the applications. The calibration obtained in this way was cross-checked with resultsfrom measurements performed in specialized set-ups with the application tested running at

ATLAS Technical Design ReportHigh-Level Trigger, Data Acquisition and Controls 30 June 2003
14 Overall system performance and validation 297
maximum rate. Models of the switches were obtained with the help of dedicated set-ups. Inthese set-ups use was made of hardware traffic generators. The aim was to find possible limita-tions in the switches which may affect the performance required for the full HLT/DAQ system.The process of identification of appropriate models and a corresponding set of parameters andof collection of the parameter values with the help of dedicated set-ups was iterative and inter-leaved with validation phases. In the validation phases larger set-ups were modelled. Discrep-ancies between results from modelling and from measurements usually gave rise to amodification in the model(s) and associated parameters and another calibration phase.
The component models in the Simdaq program are less specific than the models used in at2sim.The current version of the program can be seen as a dynamic version of the paper model. Theprogram makes use of the same information concerning LVL1 trigger menus, mapping of thedetector onto the ROLs, sizes of fragments associated with ROLs, execution times of LVL2processing steps and associated reduction factors, etc. as the paper model. The eta and phi coor-dinates of the RoIs generated according to the LVL1 trigger menu are chosen at random fromthe possible RoI positions as defined by the LVL1 trigger (the probability of choosing a certainposition is determined by the size of the area in η-φ space associated with the position). Resultsfor average rates should be the same (within the statistical errors) for both models, while com-puter model results for the computing resources actually used, taking into account their utiliza-tion, should be equal to the paper model results for the computing resource requirements. Goodagreement between results from the paper model and Simdaq has been achieved, and the re-sults of both models have been checked for consistency.
14.6.2.1 Results of testbed models
The results of the measurements focusing on the scalability of the EB have been compared tocomputer model predictions. Three different set-ups with homo- or heterogeneous sets of ROBemulators have been modelled. In Figure 14-8 a comparison between results frommeasurements and model predictions for the event-building rates as a function of the numberof SFIs collecting data is presented. Three set-ups were investigated: 125 FPGA ROB emulators(13 ROBs per FPGA), 8 Alteon ROB emulators (200 ROBs per Alteon), a mixture of the twotypes of emulator: 1000 ROBs were emulated by 125 FPGA emulators (8 ROBs per FPGA) andthe remaining 600 ROBs were emulated by 8 Alteons (75 ROBs per Alteon). A set of modellingresults is associated to each set of testbed measurement results. The three set-ups showed differ-ent saturation rates due to either the performance of the emulators or to the arrangement of theset-up. For a small number of SFIs, the event-building rate increases by 30 Hz each time a newSFI is added to the system (this is the maximal building rate of a single SFI). The lowest maxi-mum event-building rate is observed for the set-up with 8 Alteons emulating 200 ROBs each.The internal processing time of the Alteon NICs for the incoming messages is 40 ms and as eachemulator has to process 200 requests for an event, the upper limit for the rate is 125 Hz. In theset-up with the FPGA emulators, the rate limitation is caused by the throughput of the GigabitEthernet up-links connecting the concentrating switches to the EB central switch. With2.2 Mbyte of event data spread uniformly over the FPGA emulators connected via four concen-trating switches, each up-link has to deliver 0.55 Mbyte of data. Assuming the maximum pay-load which can be transferred in 1300 byte packets over the Gigabit Ethernet to be 105 Mbyte/s,the event-building rate is limited to 191 Hz. The highest rate can be observed in the set-up usinga mixture of FPGA and Alteon emulators. The rate limit is determined again by the throughputof the Gigabit up-links between the concentrating switches to which the FPGA emulators con-nect and the EB central switch. In this set-up 1000 out of 1600 ROBs are emulated by the FPGAdevices producing 1.375 Mbyte of event data. This data is spread over the FPGA emulators at-
ATLAS Technical Design ReportHigh-Level Trigger, Data Acquisition and Controls 30 June 2003
298 14 Overall system performance and validation
tached to four concentrating switches and requires that 0.344 Mbyte be sent per event over theup-link. This limits the rate to 305 Hz. In this set-up the limit due to the Alteon NICs is higher,as each emulates 75 ROBs and with 40 ms of processing time for each request the limit would be333 Hz. In the set-up with a mixture of ROB emulators, the rate does not scale linearly with thenumber of SFIs if this number is larger than four and below saturation of the event-buildingrate. This is due to queuing of packets heading for the up-link in the concentrating switch,which is very sensitive to the traffic shaping (or lack of it). Figure 14-8 shows very good agree-ment between the results from measurements and predictions from modelling. These resultsvalidate the calibration of the model components (switches, SFIs, emulators).
In Figure 14-9 a comparison is made between measurement results obtained with the testbedfor simultaneous RoI handling and event building and modelling results. The same three set-ups were used as for obtaining the results presented in Figure 14-8. The EB sub-system was re-ceiving 3% of the processed events accepted by the L2PUs and for those events 8 SFIs were usedto collect data from the ROBs and to build events. Very good agreement has been obtained forthe set-ups with either Alteons or FPGAs ROB emulators. In both cases, the event-building ratesaturates at the same level as for the EB scalability tests. Less good agreement, however stillwithin 10% tolerance, has been reached for the set-up with a heterogeneous set of ROB emula-tors. For this set-up the value at which the event-building rate saturates is determined by theperformance of the 8 SFIs.
14.6.2.2 Results of extrapolation of the at2sim testbed model
The full system model chosen to be implemented in at2sim has 1654 ROBINs, each servicing asingle ROL and each having an individual network connection [14-19]. The LVL2 sub-systemhas been assumed to be composed of 180 L2Ps connected to two Gigabit Ethernet LVL2 centralswitches in two groups of 90. The L2Ps are connected to the central switches via Gigabit Ether-
Figure 14-8 Comparison of measurement results and computer model results for event building only. Ethernetflow control was switched on
1600 sources, Flow Control on
0
50
100
150
200
250
300
350
400
450
0 2 4 6 8 10 12 14 16
Number of SFIs
Even
t b
uild
ing
rate
(H
z)
125 FPGAs (1600 ROLs)
8 ALTEONs (1600 ROLs)
125FPGAs + 8 ALTEONs (1000+600 ROLs)
linear 29 Hz
model result for 125 FPGAs
model result for 8 ALTEONs
model result for 125 FPGAs + 8 ALTEONs

ATLAS Technical Design ReportHigh-Level Trigger, Data Acquisition and Controls 30 June 2003
14 Overall system performance and validation 299
net L2P grouping switches with seven L2Ps attached to the same switch. The EB sub-system iscomposed of 80 SFIs connected in two groups of 40 to two Gigabit Ethernet EB central switches.The SFIs are connected directly to the EB central switches. The L2SV DFM, and pROS are con-nected via a dedicated small Gigabit Ethernet switch to the four central switches. The ROBINsare connected in groups to concentrating switches, each having four up-links to the centralswitches. The number of concentrating switches per sub-detector depends on the average sizeof the event fragments from a given sub-detector (for results of calculations see Ref. [14-19]). Intotal there were 46 concentrating switches. Results were obtained for the following configura-tions.
• Individual ROBIN Fast Ethernet: each ROBIN has a single Fast Ethernet connection to aconcentrating switch. This reflects the configuration in the 10% testbed with the BATMT5Compact switch.
• Individual ROBIN Gigabit Ethernet: each ROBIN has a single Gigabit Ethernet connec-tion to a concentrating switch (thus the concentrating switch becomes an all-Gigabitswitch).
• Two, four or six ROBINs aggregate: two, four or six ROBINs are assumed to share a sin-gle network connection; a single request produces a response with a size two, four or sixtimes larger than the response of a single ROBIN, the number of ROBINs connected to aconcentrating switch is a factor of two, four or six smaller than for individually connectedROBINs.
The traffic generated in the model resembles the traffic in the 75 kHz system: the LVL2 sub-sys-tem was running at an event rate of 75 kHz and the EB sub-system at a rate of ~3 kHz. TheL2PUs were making only one processing step — for each event, data from ten randomly chosen
Figure 14-9 Comparison of measurement and modelling results for the event-building rate for simultaneous RoIhandling and event building in the 10% testbed for three different ways of emulating 1600 ROBs. Ethernet flowcontrol was switched on
1600 ROBs, 8 SFIs, 3% accept, Flow Control on
0
50
100
150
200
250
0 2 4 6 8 10
Number of L2PUs
Even
t b
uild
ing
rate
(H
z)
1000FPGA+600Alteon
Model1000+600
FPGA(125)
ModelFPGA(125)
Alteon(8)
ModelAlteon(8)
ATLAS Technical Design ReportHigh-Level Trigger, Data Acquisition and Controls 30 June 2003
300 14 Overall system performance and validation
ECAL ROBINs were requested and a decision was produced and sent to the L2SV. The L2PUswere not calibrated — they were used only to generate the LVL2 traffic in order to obtain a morerealistic environment. The SFIs were requesting data in random order from all ROBINs or ‘ROB-IN aggregates’.
The effect of a credit-based event-building traffic shaping on the event-building latency andqueue build-up has been investigated with the model. The left plot in Figure 14-10 shows thatincreasing the number of credits per SFI above ten does not improve the latency for event build-ing except for the ‘individual ROBIN Fast Ethernet’ configuration. In the latter configuration,the latency is still related to the transfer speed of the Fast Ethernet links (12.5 Mbyte/s). There-fore queuing of fragments during their transfer to the SFIs is unlikely and the time needed forbuilding a complete event will depend on the time needed to transfer an event fragment via aFast Ethernet link. The shorter latency for set-ups with ‘ROBIN aggregates’ with respect tothose with individually accessed ROBINs is due to the smaller number of requests to be gener-ated per event. The CPU time for receiving replies scales with the number of frames received.The latter scales approximately with the number of ROBINs. The CPU time spent on generatingrequests however scales with the number of ROBINs aggregated. As the EB rate is limited bythe SFI performance (the network provides sufficient bandwidth), the smaller amount of timeneeded for generating requests allows an SFI to process events faster. More quantitatively: theSFI rate when sending requests to the individual ROBINs is 30 Hz, i.e. per event 33 ms is spent(the SFIs run at 99% CPU utilization). The 33 ms is spent on the generation of 1600 requests andthe reception of 1600 replies. It has been measured that for the reception of a packet 14 µs ofCPU time is needed. The reception of 1600 packets will take more than 22 ms. The remaining 11ms is used to produce 1600 requests. In case of an aggregation factor of 2, 5 ms will be saved; foran aggregation factor of 4 or 6 this will be 8 or 9 ms. Interrupt coalescence, for which the defaulttime-out is 65 µs, also plays a role in the speed-up. During 65 µs only a few requests can be gen-erated and consequently, only a few replies will arrive. Thus the gain in processing time due tothe use of interrupt coalescence is limited — one interrupt is generated for a few packets re-ceived. In the case of aggregation a single request will produce 2–6 replies, depending on theaggregation factor. Therefore considerably more packets can be handled per interrupt and thetime spent per packet received is smaller. This in turn leads to a reduction of the time needed forevent building.
A possible consequence of the aggregation of ROBINs consists of overflow of the queues in theswitches. The right plot in Figure 14-10 shows the maximum length of the queues associatedwith the ports in the EB central switches connecting to the SFIs. In case of aggregation, up to sixpackets of replies (in the six ROBIN aggregate scenario) can be returned for a single request, sothe maximum queue length (measured in number of packets queued) can be expected to be
Figure 14-10 Average event-building latency and maximum queue length in the EB central switches for differ-ent ROBIN configurations obtained with the at2sim full system model. Flow control was switched off.
number of credits per SFI0 5 10 15 20 25 30 35
nu
mb
er o
f p
acke
ts
0
20
40
60
80
100
120
140
160
180
200
Maximum queue length in the EB central switch
6 ROBIns aggregate
4 ROBIns aggregate
2 ROBIns aggregate
individual ROBIn GE
individual ROBIn FE
number of credits per SFI0 5 10 15 20 25 30 35
late
ncy
[m
s]
50
100
150
200
250
EB average latency
6 ROBIns aggregate
4 ROBIns aggregate
2 ROBIns aggregate
individual ROBIn GE
individual ROBIn FE

ATLAS Technical Design ReportHigh-Level Trigger, Data Acquisition and Controls 30 June 2003
14 Overall system performance and validation 301
equal to six times the number of credits. Therefore the number of credits may have to be re-duced with respect to the scenarios where each ROBIN has an individual network connection,otherwise the queue length may reach a switch buffer limit and give rise to packet loss.
In Figure 14-11 a prediction is shown for the event-building capability of the full HLT/DAQsystem as a function of the number of SFIs of the type used in the testbed. The maximumnumber of credits was set to 30. The buffer size for the output ports in the central switches wasset to 160 packet slots, the flow control was not (and should not have been) activated in the cen-tral switches. It can be seen that the maximum event-building rate scales linearly with thenumber of SFIs to a rate of 3 kHz for 110 SFIs.
14.6.2.3 Results of the full system Simdaq model
The results presented in this report for the full system model obtained with Simdaq are all fordesign luminosity and a LVL1 accept rate of 100 kHz. Although the distributions for decisiontimes and queue sizes are sensitive to the details of the models the general trends are not. Theeffect of various strategies for minimization of decision times and of queue lengths thereforecan be studied with the model implemented in Simdaq, and also apply for low luminosity andlower LVL1 accept rates.
Two different configurations (see Section 5.5.4) have been studied: a ‘bus-based system’, i.e. asystem with a bus-based ROS, see Figure 14-12; and a ‘switch-based system’, i.e. a system with aswitch-based ROS, see Figure 14-13. In the bus-based system, ROBINs are grouped together ingroups of three (four ROLs each – 12 ROBs in total) in ROS units, each with two Gigabit Ether-net connections, one to a central LVL2 switch and one to a central EB switch. In the switch-based system ROBINs are assumed each to service four ROLs and to be connected via a GigabitEthernet connection to a ‘concentrating switch’. In the bus-based system the L2PUs and SFIscan request data from several or all ROLs of a ROS unit, respectively, with a single request. Theresponse consists of a single, usually multi-frame, message. The addition of a header by theROS has not been taken into account in the results presented. A ROB is associated with eachROL in the model of the ROS unit, the maximum numbers of fragments that need to be buffered
Figure 14-11 Model prediction for the EB capability using the calibrated models of the testbed components.The LVL2 accept fraction is 3%.
0
500
1000
1500
2000
2500
3000
3500
10 20 30 40 50 60 70 80 90 100 110
Number of SFIs
Even
t B
uild
ing
rate
[H
z]
33.53
33.535
33.54
33.545
33.55
33.555
33.56
33.565
33.57
33.575
Even
t B
uild
ing
late
ncy
[ms]
EB rate
latency
ATLAS Technical Design ReportHigh-Level Trigger, Data Acquisition and Controls 30 June 2003
302 14 Overall system performance and validation
are output by the simulation program. A single processor in the ROS unit takes care of distribut-ing requests to the ROBINs and of collecting and concatenating the responses. In the switch-based system event fragment data associated with different ROLs have to be requested sepa-rately. For example, the SFIs have to send four request messages per event to each ROB, andeach will respond with four separate response messages (one per request). Again the maximumnumbers of fragments that need to be buffered are output by the simulation program.
The L2Ps are dual-CPU machines, each running four processing threads. The model for theL2PU is built around an object managing the scheduling and de-scheduling of the threads onthe two CPUs and objects representing the threads. The model allows an arbitrary choice for thenumber of threads and the number of CPUs. Four L2SV processors each manage a group of 125L2PUs and four DFM processors each manage a group of 16 SFIs. Each L2PU receives RoI infor-mation from and sends decisions to the L2SV controlling the group to which the L2PU belongs.The L2PUs also send LVL2 trigger result data to the pROS (not shown in the figures). One of theDFM processors is associated with each L2SV, the L2SV sends blocks of decisions to it. The DFMprocessors collect LVL2 rejects and multi-cast them in blocks of 300 clears to the ROS units orROBINs via the central Event Builder switches (and concentrating switches in case of theswitch-based system). The DFM translates LVL2 accepts into build requests for the SFIs, in thecurrent model these requests are sent to the SFIs according to a round-robin scheme. Each SFIsends an ‘End-of-Event’ message to the DFM controlling the group to which the SFI belongs, af-ter building an event. This is converted to a clear and sent as part of a block of 300 clears to theROBINs or ROS units. The SFIs in this model are single-processor machines. Transfer of com-plete events to the processors of the EF has not been modelled, the events built are discarded bythe SFIs.
An even distribution of the computing load can be achieved by means of a suitable strategy forassigning events to the L2PUs or SFIs. For example a simple and effective strategy can be imple-mented with the help of a record of how many events are being handled by each L2PU or SFI.As the supervisor and DFM are notified when processing is finished such a record can be main-
Figure 14-12 Schematic representation of the bus-based system. Possible ‘hot spots’ are indicated
Bus-based ROS unit with
ROBins connecting to 12 ROLs
Central LVL2 Central EB
64 SFIs
DFM
4 processors
LVL2
subfarm
switch
LVL2
subfarm
switch100 subfarm
switches,
5 L2PUs per
switch
L2SV
I II

ATLAS Technical Design ReportHigh-Level Trigger, Data Acquisition and Controls 30 June 2003
14 Overall system performance and validation 303
tained without an additional exchange of messages. A new event can then be assigned to theL2PU or SFI with the smallest number of events to process (‘least-queued assignment’). This isan effective strategy, which makes high average loads of the L2PUs possible. In Figure , resultsfor the LVL2 decision time (the interval between the time of occurrence of a LVL1 accept and thearrival of the LVL2 decision in the L2SV) are presented for this type of event assignment. Re-sults are also presented for round-robin assignment in combination with assignment of a maxi-mum of four events to the same processor, as well as for a round-robin-only assignmentscheme. The peaks in the distribution for least-queued assignment are caused by the various se-quential processing steps. For each step a fixed processing time has been assumed. In reality al-gorithm processing times will depend on the properties of the input data, which will result inless pronounced peaks than found with the model. The average utilization of the L2PUs is here77%. The tail of the distribution for round-robin assignment does become much longer for asmaller number of L2PUs, i.e. for higher average utilization. Above a utilization of 85–90% sta-ble operation of the system is no longer possible, as the amount of processing resources request-ed is not evenly distributed over the L2PUs. With least-queued assignment stable operation isstill possible at this level of utilization.
After each new assignment by the L2SV of an event to one of the L2PUs, the number of eventsassigned to that L2PU is entered in a histogram. Distributions obtained in this way are present-ed in Figure 14-15, again for least-queued assignment, round-robin assignment with a maxi-mum of four events assigned to the same L2PU and round-robin assignment only. The least-queued strategy clearly results in a minimum number of events assigned simultaneously to thesame L2PU. From the distributions it can be inferred that the choice of four threads per L2PU is
Figure 14-13 A Schematic representation of the switch-based ROS. Due to the bandwidth requirements thenumber of ROBINs connected to a single concentrating switch has been set to eight for the ROBINs receivingdata from the Pixel and SCT sub-detectors and to 10 for the ROBINs receiving data from the TRT and from theLVL1 RODs. For all other sub-detectors 12 ROBINs are connected to a single concentrating switch. Possible‘hot spots’ are indicated.
ROBIns, each
connecting
to 4 ROLs
Concentrating switch, 8-12 ROBins connected
Central
LVL2 0Central
LVL2 1
Central
EB 0
Central
EB 1
64 SFIs, 32 per switch
DFM
4 processors
LVL2
subfarm
switch
LVL2
subfarm
switch
LVL2
subfarm
switch
LVL2
subfarm
switch
50 subfarm switches per central switch,
5 L2PUs per subfarm switch
L2SV
I II
BA
ATLAS Technical Design ReportHigh-Level Trigger, Data Acquisition and Controls 30 June 2003
304 14 Overall system performance and validation
appropriate for the system modelled; two threads probably would not be enough, in particularfor round-robin assignment.
With the model, the building up of queues can be studied. It is important that the predictedqueue lengths do not exceed the available buffer capacity in the switches, as otherwise in realityeither packet loss will occur unless flow control is active. The latter prevents packet loss, butmay also cause temporary blocking of other data transfers. Therefore, with or without flow con-trol active, it is preferable to keep the queues short and to prevent long tails in the queue lengthdistributions by using simple, but effective measures. These can consist of requiring the numberof outstanding requests in the L2PUs and the SFIs to be smaller than a certain maximum and,for the switch-based system, of choosing a suitable pattern for requesting data by the SFIs, aswill be illustrated with a few model results. Less important is the assignment pattern (not to beconfused with the assignment strategy) of events to the L2PUs. It should be noted that the re-sults presented in this section are for the case of flow control switched off.
In both the bus-based and switch-based systems, queues tend to form in the output ports of thecentral switches connecting to the LVL2 subfarm switches (‘point I’) and to the SFIs (‘point II’).Figure 14-16 shows distributions for the queue sizes in point I for four different scenarios for as-signing events to the L2PUs for the bus-based system. In Figure 14-17 the same results are pre-sented for the switch-based system. The size of a queue is equal to the number of Ethernetframes stored in the queue. For each message the number of frames in the queue is entered in ahistogram at the time of arrival of the last frame of that message in the queue. These histogramsare displayed in the figures. The distributions have shorter tails for the switch-based system.
Figure 14-14 The LVL2 decision time for the bus-based system, for round-robin assignment (rr), round-robinassignment of at most four events to the same L2PU (rr4) and least-queued assignment (lq). The results forswitch-based read-out are almost identical. The average decision times are 11.9 ms (rr), 10.7 ms (rr4) and8.8 ms (lq). The maximum numbers of fragments to be buffered per ROL are about 3100 (rr), 3000 (rr4) and2600 (lq), taking into account that deletion of events accepted by the LV2 trigger requires clears from the eventbuilding system.
0
50
100
150
200
lq
rr4
rr
1
100
10000
1000000
Num
ber
of
even
ts
LVL2 decision time (ms)

ATLAS Technical Design ReportHigh-Level Trigger, Data Acquisition and Controls 30 June 2003
14 Overall system performance and validation 305
This is due because one concentrating switch deals with the data from 32–48 ROLs, while in thebus-based system one ROS unit deals with the data from 12 ROLs. On average therefore rathermore data are flowing for the switch-based system via a single port into the central LVL2 switchthan for the bus-based system. This leads to less queuing in point I as the incoming frames ar-rive one after the other with the same speed as that with which they can be output again. Thefigures also show that for the bus-based system the tail of the distribution for least-queued as-signment becomes somewhat smaller if consecutive events are assigned as much as possible toL2Ps connected to different LVL2 subfarm switches. However, the tail can only effectively besuppressed by limiting the number of outstanding requests in the L2PUs. Again the distributionfor the bus-based system has a longer tail than for the switch-based system. This is now mainlybecause in the first case there is a maximum to the outstanding number of (in most cases) multi-frame messages requested, while for the bus-based system in most cases single frame messagesare requested. The distribution for the LVL2 decision time is for both cases almost identical tothe distribution for least-queued assignment presented in Figure .
The lengths of the queues associated with point II (output ports of the central EB switches con-necting to the SFIs) can be controlled with the maximum number of credits, i.e. outstanding re-quests, in the SFIs, as already discussed in Section 14.6.2.2. For bus-based read-out again multi-frame messages are requested, so for the same maximum number of credits the queues will be-come longer, see also Section 14.6.2.2.
Queues associated with point B (output ports of concentrating switches connecting to the cen-tral EB switches) in the switch-based system are sensitive to how the SFIs send event fragmentrequests. For round-robin requesting the requests arrive in all ROBINs connected to a singleconcentrating switch almost at the same time, the responses may then cause contention for ac-cess to one of the up-links. It is not excluded that requests from different SFIs follow closely af-
Figure 14-15 L2SV queues for the bus-based system with round-robin assignment (rr), round-robin assignmentof at most four events to the same L2PU (rr4) and least-queued assignment (lq). The results for switch-basedreadout are almost identical. The averages of the distributions are 1.8 (lq), 2.4 (rr4) and 2.8 (rr).
010
20
lq
rr4
rr
1
100
10000
1000000
Num
ber
of
even
ts
Queue size
ATLAS Technical Design ReportHigh-Level Trigger, Data Acquisition and Controls 30 June 2003
306 14 Overall system performance and validation
ter each other, resulting in more contention. This contention will be alleviated if each SFIrequests data from the ROBINs in a way which avoids sending subsequent requests to the sameconcentrating switch, e.g. by selecting the ROBINs at random, as done in the testbed measure-ments and in the at2sim computer model. In the Simdaq model first data are requested fromonly one of the ROBINs associated with each concentrating switch. Only one request message issent to each ROBIN, so the data associated with only a single ROL are requested. This proce-dure is repeated for the remaining ROLs until all data are requested. In Figure 14-18 the effect ofthis procedure is shown for the concentrating switches connected to the ROBINs receiving datafrom the Pixel detector. The procedure also has a favourable effect on the queue sizes in point A(output ports of the concentrating switches connecting to the central LVL2 switches) for thesame detector (see Figure 14-19). However, these queues tend to be short and are less likely togive rise to problems. The maximum number of credits per SFI in the model has been set to 80.This number directly controls the maximum queue size at point II, but queuing at points B andA is less sensitive to this number.
14.6.2.4 Conclusion
Three models, a paper model and two computer models, have been developed to help guide thedesign of the HLT/DAQ system. Input to the paper model includes details such as average de-tector data fragment size on each ROL, trigger menus, and average event selection processingtimes. The model incorporates the LVL2 RoI based sequential processing strategy. Its output in-cludes average access rates and bandwidths for data from each ROL. It is a considerable aid toestablishing the topology of the HLT/DAQ implementation, e.g. the grouping of ROBs and thenumber of L2P and SFI processors. The two computer models, at2sim and Simdaq, provide dis-
Figure 14-16 Queue sizes at point I, bus-based read-out for round-robin assignment of events to L2PUs (rr);least-queued assignment (lq); least-queued assignment of subsequent events to L2PUs connected to differentsubfarm switches (lq4j); and for this last, with as additional requirement that the number of outstanding requestsis smaller than four (lq44j).
0 20 40 60 80 100 120 140 160
lq44j
lq4j
lq
rr
1
100
10000
1000000
Num
ber
of
even
ts
Queue size

ATLAS Technical Design ReportHigh-Level Trigger, Data Acquisition and Controls 30 June 2003
14 Overall system performance and validation 307
Figure 14-17 Queue sizes at point I, switch-based read-out for round-robin assignment of events to L2PUs (rr);least-queued assignment (lq); least-queued assignment of subsequent events to L2PUs connected to differentsubfarm switches (lq4j); and for this last strategy, with as additional requirement that the number of outstandingrequests is smaller than four (lq44j).
Figure 14-18 Queue sizes at point B for the Pixel detector. The distribution with the long tail occurs for round-robin requesting of data by the SFIs; the tail disappears if nearly simultaneous requesting via the same switch isavoided with the help of a suitable request pattern. See the text for further explanation.
0 20 40 60 80 100 120 140 160
lq44j
lq4j
lq
rr
1
100
10000
1000000
Num
ber
of
even
ts
Queue size
0 50 100 150 200 250 300 350 400 450
1
100
10000
1000000
Num
ber
of
events
Queue size
ATLAS Technical Design ReportHigh-Level Trigger, Data Acquisition and Controls 30 June 2003
308 14 Overall system performance and validation
crete event simulation of the HLT/DAQ implementation, allowing the study of the effect of rateand bandwidth fluctuations. Each program models the HLT/DAQ system to the componentlevel, although at2sim has more detailed models of many components, such as network switch-es and DataFlow applications.
The computer models incorporate a good understanding of current technology, both hardwareand ATLAS software, via models of system components. These component models are calibrat-ed using performance measurements made of testbeds. The computer models are validated bytesting that they predict the correct behaviour of system testbeds over a range of input parame-ters. Validation of the present at2sim model on simulation of combined RoI collection and eventbuilding has been done on the 10% testbed.
The computer models allow extrapolation from validated simulations of testbeds to predictionsof the performance of the final system. Amongst the results of at2sim modeling of the full sys-tem, size predictions of its event building capability and predictions of the effects of differenttraffic shaping and ROB aggregation schemes on queue lengths in the central switches. It showsthat the specified event building rate of 3 kHz can be achieved for the specified LVL2 acceptfraction of 3% with a system of 110 SFIs. These results indicate that it is justified to assume thata system based on Gigabit Ethernet and with components of present technology can provide thelevel of performance required.
The computer models can also be used to refine system implementation. For instance, detailedstudies of processor utilization and of queue lengths at switch ports, with full consideration offluctuations, can be used to optimize the degree of parallelism to be implemented. Such studies
Figure 14-19 Queue sizes at point A for the Pixel detector, for round-robin requesting of event fragments by theSFIs in combination with least-queued assignment of events to L2PUs and a maximum number of outstandingrequests of four per L2PU (lq-eb-rr), and for a request pattern avoiding nearly simultaneous requesting by theSFIs via the same switch for the same type of assignment of events to the L2PUs as for lq-eb-rr, for least-queued assignment of events to the L2PUs without further conditions (lq) and for round-robin assignment (rr).
020
40
rr
lq
lq'
lq'-eb-rr
1
100
10000
1000000
Num
ber
of
even
ts
Queue size

ATLAS Technical Design ReportHigh-Level Trigger, Data Acquisition and Controls 30 June 2003
14 Overall system performance and validation 309
can ensure adequate capacity and avoid overcapacity. Results of Simdaq modeling of the fullsystem include effects on queue lengths of different algorithms for the L2SV and DFM assign-ment of events to L2Ps, and SFIs and of different algorithms for L2PU and SFI requests of ROBdata. These studies show that improved, but simple, algorithms can significantly reduce thelengths of queues, and hence the probability of buffer overflow. Studies with both at2sim andSimdaq provide an understanding of how hot spots can be avoided in the full system and howan even distribution of computing load over the L2Ps and SFIs can be obtained.
All three models, paper model, at2sim, and Simdaq, have provided invaluable input to the de-sign of the full HLT/DAQ system, for instance in guiding the choice of connectivity and of op-erating conditions. The ability to check the consistency of the predictions of the paper model,increases confidence in the model. The models will continue to be used to develop a systemwith even distribution of computing load over available processors, with minimal congestionand buffer overflow in switches, and with sufficient processor capacity and network bandwidthto handle fluctuations reliably.
14.7 Technology tracking
14.7.1 Status and prospects
The ATLAS HLT/DAQ system almost exclusively comprises off-the-shelf commodity equip-ment: PCs, and Ethernet links and switches. The technical evolution of commodity computing,and communications equipment, as well as pricing, is therefore an important consideration inthe performance, costing and life cycle of the HLT/DAQ system.
Impressive price and performance improvements have occurred over the last two decades. Inthis section the prospects for the next decade, a period which covers the run up to the commis-sioning of ATLAS and the first years of running, are considered.
14.7.1.1 The personal computer market
Moore’s law, the doubling of the number of transistors on a chip every 1.5 years, has been re-spected over the last three decades, and the trend is expected to continue at least through to theend of this decade. In practice, Moore’s law has resulted in a doubling of PC performance aboutevery two years, where performance can be quantified in terms of the clock speed of high-endmicroprocessor chips. The computer industry has offered increasing performance at a more orless constant unit price.
For the future it seems that technically, on the time scale of ATLAS, Moore’s law will continue tohold. The downturn in the world economy and a reduced willingness to invest the large sumsof money required to deliver new generations of microprocessors may however change this ex-pectation.
The current performance of PC based components and systems in the ATLAS TDAQ are basedon ~2 GHz PCs. In estimating the performance of the system we have assumed the use of 8 GHzPCs. This is a conservative estimate. In practice the processing power needed for the LVL2 andEF farms will be purchased in stages and will therefore be able to benefit from ever higher proc-essor clock speeds. This will be particularly true for the EF farms where the processing time will
ATLAS Technical Design ReportHigh-Level Trigger, Data Acquisition and Controls 30 June 2003
310 14 Overall system performance and validation
be long compared to the I/O time. System components with high I/O requirements will bemore bounded by link speed, but will also benefit from improvements in processor perform-ance, as illustrated by the performance of the DFM as a function of processor clock speed shownin Figure 14-20.
14.7.1.2 Operating systems
The Linux operating system has evolved rapidly in the last few years. Many commercial com-panies have invested heavily in improving the operating system (IBM, HP, Sun). Currently themain developments are in the areas of user interfaces and high-performance computing. AT-LAS can clearly benefit from the Linux developments in the high-performance computing area.Such improvements include better support for multiple processors, better multi-threading andimproved networking support. Practically all the new developments toward high-throughputtransmission protocols over long-haul links were first implemented under Linux. In the long-term, the optimization of the operating system will continue, fuelled by strong support from theacademic and commercial worlds. The wide spread usage in universities means that ATLASwill have access to qualified Linux professionals throughout the life of the experiment.
14.7.1.3 Networking
The ATLAS HLT/DAQ system uses Ethernet network technology for RoI collection and eventbuilding, as well as data distribution to the EF. It is also used in other networks associated withcontrol and monitoring. Ethernet is, throughout the world, the dominant LAN technology. Ithas evolved from the original IEEE standard, based on a 10 Mbit/s shared medium, to point-to-point links running at speeds of up to 10 Gbit/s.
The price of Ethernet technology has followed a strong downward trend driven by high levelsof competition in a mass market. Figure 14-21 shows the price of 100 Mbit/s and 1 Gbit/s Ether-net network interface cards and switch ports as a function of time. Most PCs are now deliveredwith a Gigabit Ethernet controller integrated on the motherboard, making the connection essen-tially free. Further price drops will certainly occur for Gigabit Ethernet switch ports, in line with
Figure 14-20 The performance of the DFM as a function of processor clock speed.

ATLAS Technical Design ReportHigh-Level Trigger, Data Acquisition and Controls 30 June 2003
14 Overall system performance and validation 311
what has happened with Fast Ethernet. This trend is linked to the increasing provision of a Gi-gabit Ethernet connection in all PCs.
The HLT/DAQ system described in this TDR can be built using Ethernet switches available to-day. Even the most demanding components in the system, the large central switches, are com-fortably within today’s norm. The prognosis for using Ethernet is therefore excellent. It is a verywidely supported international standard, which meets and even exceeds our foreseeable needand will certainly have a lifetime surpassing that of ATLAS.
Consideration is being given to the use of off-site computing capacity to process ATLAS eventsin real time. Tests made recently have shown the technical feasibility of error-free gigabit-per-second transmission between CERN and NBI, Copenhagen over the GEANT pan-European
Figure 14-21 The cost evolution for Fast and Gigabit Ethernet switch ports and network interface cards
Figure 14-22 The network infrastructure between CERN and NBI (Copenhagen) over which gigabit-per-second(Gbps) tests have been performed
R8
StockholmS−GW
GPS
R12
1Gbps1Gbps
1Gbps
R1
R2
R3
CH
Geneva
10Gbps 10Gbps 10Gbps
R5
UK
London
R4
FR
Paris
R6
SE
pcatb56−ge
GPS2.5Gbps
R7
SW−GW
StockholmStockholm
CERNH7
R05GVA
CERN
SWITZERLAND
130.225.245.42Copenhagen
R10DK−GW
R9DK−GW2
Copenhagen
R11LYNGBY−1
1Gbps
2.5Gbps
2.5Gbps2.5Gbps
FORSKNIN−GSNETTET
NORDUnetGEANT NBI
COPENHAGEN
2.5Gbps
2.5Gbps
����
����
10
10
10
10
ATLAS Technical Design ReportHigh-Level Trigger, Data Acquisition and Controls 30 June 2003
312 14 Overall system performance and validation
backbone network [14-20]. Figures 14-22 and 14-23 show the set-up used and some of the resultsobtained.
For the future, it appears technically feasible to export events at high rates from CERN to cen-tres in Member States, for processing in real time. It is within this context that 10-Gigabit Ether-net may have an important role to play. However, the use of such a scheme will ultimatelydepend on the economics of long-haul telecommunications. This factor, as well as technical con-siderations and practical testing, are part of our ongoing programme of work.
14.8 References
14-1 J.T.M. Baines et al., Tests of the ATLAS LVL2 Trigger with PESA Selection Algorithms,ATL-DH-TR-0002 (2003)http://edms.cern.ch/document/390976/
14-2 S. González et al., Use of Gaudi in the LVL2 Trigger: The Steering Controller, ATLAS Internal Note,ATL-DAQ-2002-012 (2002)
14-3 C. Bee et al., HLT Validation of ATHENA, ATLAS Internal Note, ATL-DAQ-2002-005 (2002)
14-4 S. González and T. Shears, Further Studies and Optimization of the Level-2 Trigger electron/photon FEX algorithm, ATLAS Internal Note, ATL-DAQ-2000-042 (2000)
14-5 J.T.M. Baines et al., Initial LVL2 Tests with the Si Tree Algorithm, ATL-DH-TN-0001 (2003)http://edms.cern.ch/document/375305/
Figure 14-23 Packet latency measured between CERN and NBI (Copenhagen) at a 1 Gbps transmission rate

ATLAS Technical Design ReportHigh-Level Trigger, Data Acquisition and Controls 30 June 2003
14 Overall system performance and validation 313
14-6 J.T.M. Baines and W. Li, A Data Manager for the ATLAS High Level Trigger, ATLAS Internal Note, ATL-DAQ-COM-2003-021 (2003)
14-7 A. Di Mattia et al., The implementation of the MuFast algorithm in the new PESA framework,ATLAS Internal Note, ATL-COM-DAQ-2003-024 (2003)
14-8 K. Assamagan et al., Definition of “Raw Data Objects” for the MDT chambers of the Muon Spectrometer, ATLAS Internal Note, ATL-COM-MUON-2003-020 (2003)
14-9 K.Assamagan et al., Raw Data Object Definition for the RPC chambers of the ATLAS Muon Spectrometer, ATLAS Internal Note, ATL-COM-MUON-2003-019 (2003)
14-10 ATLAS ATHENA web site,http://atlas.web.cern.ch/Atlas/GROUPS/SOFTWARE/OO/architecture/General/index.html
14-11 C.Bee et al., Event Filter infrastructure validation tests, ATL-DH-TR-0004 (2002)http://edms.cern.ch/document/391248/
14-12 Tigon/PCI Ethernet Controller, Revision 1.04, Alteon Networks (1997)
14-13 F. Barnes et al., Ethernet Networks for the ATLAS Data Collection System: Emulation and Testing, 12th IEEE-NPSS Real Time Conference (RT2001), Valencia (2001)http://cern.ch/ATLAS-TDAQtalks/RT01/meirosu.pdf
14-14 R. Cranfield et al., Computer modelling of the ATLAS Trigger/DAQ system performance, 13th IEEE-NPSS Real Time Conference (RT2003), Montreal (2003)submitted to IEEE Trans. Nucl. Sci.
14-15 J.C. Vermeulen et al., Discrete Event Simulation of the ATLAS Second Level Trigger,IEEE Trans. Nucl. Sci. 45, 1989–1993 (1998)
14-16 Ptolemy project, http://ptolemy.eecs.berkeley.edu/
14-17 P. Golonka and K. Korcyl, Calibration of the ATLAS Data Collection component models,ATL-DQ-TP-0001 (2003)http://edms.cern.ch/document/391590/
14-18 P. Golonka et al., Modeling large Ethernet networks for the ATLAS High-Level Trigger system using parameterized models of switches and nodes, CERN-OPEN-2001-061 (2001), poster presented on RT 2001 Conference, Valencia (2001)
14-19 H.P. Beck et al., ATLAS TDAQ: A Network-based Architecture, ATL-DQ-EN-0014 (2003)https://edms.cern.ch/document/391592/
14-20 K. Korcyl et al., Network performance measurements as part of feasibility studies on moving part of the ATLAS Event Filter to off-site Institutes, 1st European Across Grids Conference, February 13th–14th, 2003, Universidad de Santiago de Compostela, Spain
ATLAS Technical Design ReportHigh-Level Trigger, Data Acquisition and Controls 30 June 2003
314 14 Overall system performance and validation

Part 4
Organisation and Plan

ATLAS Technical Design ReportHigh-Level Trigger, Data Acquisition and Controls 30 June 2003
15 Quality assurance and development process 317
15 Quality assurance and development process
15.1 Quality assurance in TDAQ
Quality assurance during the production of hardware and software systems is provided by theadoption of a development framework for TDAQ components. The development frameworkconsists of distinct development phases. At the end of each phase a set of deliverables is provid-ed. For hardware, the design and specification of each element will be subject to reviews whichwill cover all aspects of the system design including integration issues, logistics, quality, andsafety. These reviews will also provide an opportunity for QA aspects of the design to be thor-oughly examined. For software, the framework is complemented by guidelines, checklists andstandards, internal reviews, templates, development and testing tools, and coding standards.These are being adopted as common working practices and help with error removal and errorprevention in the system.
The system is divided into many, essentially independent, sub-systems. Proper functional defi-nition of each sub-system and specifications for interconnections between them are essential tobuild, commission, and maintain a quality system. These definitions and specifications are de-scribed in User Requirements Documents and Interface Definitions that also specify proceduresof control, testing, and maintenance as well as outlining in detail the physics performance goalsof the system.
A TDAQ-wide body, the Connect Forum [15-1] assists in coordinating development process ac-tivities and quality assurance methodologies across ATLAS TDAQ/DCS. It also provides ad-vice, especially via the recommendations and information made available through Web pageswhich reflect the dynamic nature of the activity. A common approach to the development viathe use of rules, in-house standards, and document templates helps in building a project cul-ture. Those rules as well as the development phases themselves are not enforced but rather aimto help developers. Emphasis on the various phases will vary and evolve with the life of theproject. During event production for example, the emphasis will be put on maintenance andregular automated validation testing.
15.2 Hardware development and procurement
15.2.1 Reviews
As noted above, hardware will be subject to a review process: the Preliminary Design Review(PDR), the Final Design Review (FDR), and the Production Readiness Review (PRR) [15-2]. ThePDR will be used to examine and assess the full requirements and specifications for the sub-sys-tem element, to identify any missing functionality, to ensure full compatibility with all connect-ing sub-systems, and to determine overall feasibility. For custom hardware this is a veryimportant part of the review procedure, as it will determine the direction of subsequent engi-neering effort.
For custom hardware the FDR will be held before the design is sent for manufacture, and is in-tended to catch any design or engineering errors before budgetary commitment. This review
ATLAS Technical Design ReportHigh-Level Trigger, Data Acquisition and Controls 30 June 2003
318 15 Quality assurance and development process
will necessarily be of a more technical nature than the initial review, but there should be fewproblems to detect by this stage. It will be merged with the PRR which aims to address produc-tion organization, version control, and the organization of quality control.
For components with commercial hardware to be bought in significant numbers the FDR will beheld after a prototype of the component has been assembled and tested. Examples of such com-ponents are HLT sub-farm racks with a mixture of commercial items, and ROS Units with acombination of commercial and custom hardware. The role of the FDR is to check that the com-ponent fully meets the required specification.
Subsequent purchases of the component, which are likely to be in several batches, will then bepreceded by a tendering exercise. This will start with a market survey to check current perform-ances and prices, then a proposal for the precise configuration for the purchase which is re-viewed by a PRR, followed by formal tendering. This process should ensure uniformconfigurations of PCs and local network switches within each round of purchasing, even if con-straints of the different funding agencies require them to be purchased from different sources.Note, however, that in the case of HLT sub-farms where batches are purchased at intervals oftypically one year, identical configurations would not be expected between batches.
15.2.2 Testing
The following tests and procedures on the TDAQ hardware components will be performed toguarantee their performance to the standards required:
• Evaluate the probable frequency of repair to meet the physics goal on each sub-system.
• Evaluate the effect of failure on system components for various types of failure and de-sign the system so that the more probable failures will cause least problems to the overallsystem.
• Select components for the resulting level of required reliability.
• Burn-in all essential custom boards and units to reduce initial failures to a minimum.
• Ensure that the communities possess sufficient spares for repair purposes for the entire 10year running cycle. This will include a study of alternative components to replace thosethat may not be produced throughout the experiment’s lifetime due to a termination ofpresent production processes.
• Establish repair routines for the more routine failures; commercial items should havestandard warranties with conditions checked at the PRR.
• Give each element a serial number; a record will be kept to store the information relativeto each board: origin of the components which populate the board, date of production, re-sults of tests, date of installation, name of the sub-detector using the board, history of fail-ure, and actions taken.
• Test commercial items; initial test by the supplier, acceptance test by the responsibleTDAQ institute.
The networking components are one type of commercial item which will be given special atten-tion. These play a critical role within the ATLAS TDAQ system and the Data Flow network hasvery high performance demands specific to this application. A network tester system is beingdeveloped for the evaluation and testing of network switches. For the concentrating switches, tobe purchased in large numbers, the tests of prototypes will include the use of this system. For

ATLAS Technical Design ReportHigh-Level Trigger, Data Acquisition and Controls 30 June 2003
15 Quality assurance and development process 319
the central switches only very few will be purchased and a modified procedure will be required.Experience obtained from extensive tests on switches allows precise specifications to be givenfor these switches. These will be used to select one or more candidates which will then be eval-uated with the tester to ensure that they fully meet the requirements. Once a switch is integrat-ed into the TDAQ system, it will be managed using a commercial monitoring tool (seeChapter 7). Tests will also be made on the connecting cables to be used within the networks, inparticular for possible problems with electromagnetic interference when large numbers of Un-shielded Twisted Pair (UTP) cables are used.
15.3 The Software Development Process
The Software Development Process (SDP) in ATLAS TDAQ [15-3] provides the structure andthe sequence of activities required for development. A basic framework is provided to guide de-velopers through the steps needed during the development of a component or a system. Con-tinual review and modification of the SDP provides it with the flexibility to adapt to theevolution of the components and systems.
Many of the recommended approaches in the SDP are also applicable to the development ofhardware components or sub-systems involving both software and hardware. The SDP consistsof the following phases as shown in Figure 15-1: Brainstorming, Requirements, Architectureand Design, Implementation, Testing, Maintenance, complemented by reviews. Emphasis onthe different phases will evolve with time.
15.3.1 Inspection and Review
Written material including documents and code is subjected to a process of inspection and re-view at each step from Requirements to Implementation, in the SDP. Inspection is essentially aquality improvement process used to detect defects. The inspection process in the ATLAS
Figure 15-1 Phases and flow of the Software Development Process
C o m p o n en tC o m p o n en tS o f tw a re S o f tw a re D ev e lo p m en t D ev e lo p m en t P ro cess F lo w P ro cess F lo w
R e v ie w
R e v ie w
D e s ig n
Im p le m e n tT e s ts
T e s t P la n
Im p le m e n ta t io n
C o m p o n e n t T e s t
D e p lo y m e n t
In te g ra tio n T e s t
F e e d b a c k
o th e r c o m p o n e n ts
R e q u ir e m e n ts
T e s t R e p o rt
B ra in s to rm in g
R e v ie w
ATLAS Technical Design ReportHigh-Level Trigger, Data Acquisition and Controls 30 June 2003
320 15 Quality assurance and development process
TDAQ project is based on Gilb and Graham’s Software Inspection method [15-4]. An importantfeature of the inspection procedure is its flexibility, allowing it to evolve as needs change duringthe lifetime of the project [15-5].
Overall responsibility for an inspection is taken by an inspection leader who appoints an in-spection team consisting of the document author and three to five inspectors. The core of the in-spection process is the checking phase where the inspectors read the document in detail,comparing it against source documents and lists of rules and standards. Defects are logged in atable, where a defect is defined as a violation of any of the standards. Emphasis is placed onfinding major defects which could seriously compromise the final product. The defects are dis-cussed at a logging meeting and their acceptance or rejection is recorded in an inspection issuelog. The document author edits the document according to the log making an explanatory noteif an issue is rejected. Feedback is also obtained on how the inspection procedure itself may beimproved.
The principal aim of inspection is to detect and correct major defects in a product. An additionalbenefit is the possibility to prevent defects in future products by learning from the defects foundduring inspection procedures. Inspection also provides on-the-job education to people new to aproject and generally improves the project’s working culture.
A number of Web pages have been produced which provide supporting material for inspec-tions such as instructions for inspectors and log file templates [15-1].
15.3.2 Experience
The SDP provides a disciplined approach to producing, testing, and maintaining the varioussystems required by the ATLAS TDAQ project. It helps to ensure the production of high-qualitysoftware and hardware which meet the requirements within a predictable schedule.
However, one of the key differences in adopting the SDP in an HEP — as opposed to an indus-trial — environment is that its application cannot be enforced. Furthermore, the use of such aprocess may appear too rigid to physicists not accustomed to working in a strong managementframework. Nonetheless, the working culture can be changed by increasing awareness of thebenefits of the SDP through training, for example involving new group members in inspections,and ensuring that the SDP itself is sufficiently flexible to evolve with the changing needs of anHEP experiment. This approach is working. The SDP as outlined in this section has alreadybeen adopted by a number of the sub-systems in the ATLAS TDAQ project with positive out-comes.
15.3.3 The development phases
15.3.3.1 Requirements
The Requirements phase [15-6] for a particular sub-system or component consists of gatheringthe requirements and then documenting them. Several documents have been produced to aidand control these activities, based on the early experience of some of the sub-systems. Thewhole process of working group set-up, requirements collection, feedback and review is de-scribed in [15-6]. Another document sets out the principles governing the requirements gather-ing and documentation processes, stressing the importance of, for example, documentation,

ATLAS Technical Design ReportHigh-Level Trigger, Data Acquisition and Controls 30 June 2003
15 Quality assurance and development process 321
evolutionary development, communication, and collective ownership of the requirements spec-ification.
The actual process of establishing the requirements for a sub-system or component is aided by acollection of ‘hints’, and reinforced by a set of rules for the requirements document itself, forwhich a template has been provided in each of the supported documentation formats.
15.3.3.2 Architecture and Design
The Architectural Analysis and Design Phase of the SDP [15-7] follows the Requirements phaseand takes as its starting points the User Requirements and Use Cases together with accompany-ing documents. This phase has sometimes been referred to as ‘high-level system design’. A sys-tem’s architecture is the highest level concept of that system in its environment. It refers to theorganization or structure of significant components interacting through interfaces, those com-ponents being composed of successively smaller components and interfaces. A design presentsa model which is an abstraction of the system to be designed. The step from a real world systemto abstraction is analysis. A ‘How to’ note has been produced describing the overall process.
For this phase, the approach of the Rational Unified Process (RUP) is largely followed. This ap-proach contains descriptions of concepts, artefacts, guidelines, examples, and templates. Itemsof the RUP have been highlighted, in particular, the descriptions of architectural analysis anddesign concepts, and the guidelines for producing software architecture and design documents.
The RUP template for architecture and design documents has been adapted by including expla-nations and making it available in supported formats. The recommended notation is the Uni-fied Modelling Language (UML), and the design is presented in the template as a set of UML-style views. Recipes for producing appropriate diagrams and incorporating them into docu-ments have also been prepared.
15.3.3.3 Implementation
The Implementation Phase of the SDP is largely concerned with writing and checking code, andproducing and debugging hardware components. At the end of the implementation phase anInspection is performed.
ATLAS C++ coding conventions [15-8] are being applied to newly written code and being intro-duced for existing code still in evolution. In the case of Java, the outcome of the ATLAS investi-gation of coding conventions is awaited. DCS will follow the coding standards provided by theJCOP Framework for PVSS [15-9].
Guidelines [15-10] have been provided for multi-user, multi-platform scripting, as well as manyexplanations and examples in UNIX-scripting.
Experience has been gathered with a number of software tools and recommendations have beenmade in the areas of design and documentation [15-11], code checking, and source code man-agement.
ATLAS Technical Design ReportHigh-Level Trigger, Data Acquisition and Controls 30 June 2003
322 15 Quality assurance and development process
15.3.3.4 Component and integration testing
Testing occurs during the entire life-time of a component, group of components, or entire sys-tem. Referring to Figure 15-1, the initial test plan is written during the requirements and designphases of the component, so as not to be biased by the implementation. Since testing is likely tobe an iterative process the test plan is written with re-use in mind. Once implementation is com-plete and passes relevant checking tools the component undergoes unit testing to verify itsfunctionality. Compatibility with other components is verified with integration tests. Severaltypes of tests can be envisaged for both individual components and groups of components.These include functionality, scalability, performance, fault tolerance, and regression tests.
A test report is written once each test is complete. To aid the testing procedure, templates [15-13] are provided for both the test plan and test report in each of the supported documentationformats. More detailed descriptions of the types of test, hints on testing and recommended test-ing tools are also provided. Testing is repeated at many points during the lifetime of a compo-nent, for example at each new release of the component software or after a period of inactivity(system shutdown). Automatic testing and diagnostic procedures to verify the component be-fore use greatly improve efficiency.
15.3.3.5 Maintenance
As with testing, maintenance occurs during the entire lifetime of a component. Several types ofmaintenance can be envisaged. Corrective maintenance involves the fixing of bugs. Adaptivemaintenance involves alterations to support changes in the technical environment. Preventivemaintenance entails the restructuring and rewriting of code, or modification of hardware for fu-ture ease of maintenance. Maintenance is closely coupled to regression testing which should oc-cur each time a maintenance action has been completed to verify that the detected problemshave been solved and new defects have not been introduced. Significant changes to the func-tionality of the component such as the addition of large numbers of new requirements shouldinvolve a full re-iteration of the SDP cycle.
15.3.4 The Development Environment
Regular releases of the sub-system software to be used in test-beam operation, system integra-tion, and large-scale tests is being complemented by nightly builds and automated tests to en-sure early problem finding of newly developed or enhanced products. The use of a source codemanagement system and of the standard release building tool CMT [15-14] allows for the build-ing of common releases of the TDAQ system. These releases are available for the platforms usedin ATLAS TDAQ which are currently a number of Linux versions and for some sub-systemsLynxOS and SunOS. Build policies of different sub-systems like the use of compiler versionsand platforms are coordinated.
Development tools like design tools, memory leak checking tools, automatic document produc-tion tools, and code checking tools are vital elements of the development environment.

ATLAS Technical Design ReportHigh-Level Trigger, Data Acquisition and Controls 30 June 2003
15 Quality assurance and development process 323
15.4 Quality Assurance during deployment
15.4.1 Quality Assurance from early deployment
Deployment of the TDAQ system in test beam and during commissioning gives early feedbackon the suitability of the design and the implementation of the system. It constitutes an integra-tion test under realistic conditions in terms of functionality, reliability, and usability. Experienceand findings are directed to the developers so that improvements can be made to the softwareand hardware concerned. A bug tracking system is in use for the reporting of software prob-lems, their recording, and their follow-up. Complex integration aspects can be better under-stood and lead to adjustments in the design of components, interfaces, and strategies. The earlyuse of the system allows the TDAQ user to become familiar with its operations and usage.
15.4.2 Quality Assurance of operations during data taking
The quality of the TDAQ system must be assured when it is in use during the set-up and instal-lation phase of the ATLAS data acquisition together with the detectors. Correct and smoothdata taking will be aimed for during calibration and physics event production.
Quality assurance is achieved by prevention, monitoring, and fault tolerance.
• Prevention — this includes training, appropriate documentation, a well-defined develop-ment process, proper management of computing infrastructure (computer farms, readoutelectronics, and networks), tracing of hardware and software changes, and regular testingof components.
• Monitoring — special tasks to monitor proper functioning of equipment and data integri-ty. These may run as special processes or be part of the TDAQ applications. Anomaliesare reported, analysed by human/artificial intelligence, and appropriate recovery actionis initiated. This may include running special diagnostic code, replacement of faultyequipment, rebooting of processors, restarting of applications, re-establishing networkconnections, and reconfiguration to continue with a possibly reduced system. Incompleteor corrupted data should be marked in the event data stream and possibly recorded in theconditions database. Physics monitoring may lead to a change of run with different trig-ger conditions and event selection algorithms.
• Fault tolerance — built into the system from the start using an efficient error reporting,analysis, and recovery system as explained in Chapter 6, "Fault tolerance and error han-dling". Some redundancy to reduce possible single points of failure is foreseen where af-fordable.
During the life of the experiment small or major pieces of hardware or software will need to bereplaced with more modern items, possibly using new technologies. The component structurewith the well-defined functionality of each component and well-defined interfaces allowing forblack-box testing according to those functionality specifications will allow the smooth incorpo-ration of new parts into a running system, and in particular when staging of the system is re-quired.
ATLAS Technical Design ReportHigh-Level Trigger, Data Acquisition and Controls 30 June 2003
324 15 Quality assurance and development process
15.5 References
15-1 ATLAS TDAQ & DCS Connect Forum,http://cern.ch/Atlas-connect-forum/
15-2 P. Farthouat and B. Williams, Guidelines for Electronics Design and Production Readiness Reviews,http://cern.ch/Atlas/GROUPS/FRONTEND/WWW/designreview.pdf
15-3 Software Development Process,http://cern.ch/Atlas-connect-forum/under SDP
15-4 T. Gilb and D. Graham, Software Inspection, Addison-Wesley (1993)
15-5 I. Alexandrov et al., Impact of Software Review and Inspection, Computing in High Energy and Nuclear Physics Conference, Padova, 2000
15-6 SDP Requirements documents,http://cern.ch/Atlas-connect-forum/ - SDP - Requirements
15-7 Architecture and Design documents,http://cern.ch/Atlas-connect-forum/ - SDP - Architecture & Design
15-8 ATLAS Quality Assurance Group, ATLAS C++ Coding Standard Specification, ATLAS Internal Note, ATL-SOFT-2002-001 (2002)http://cern.ch/Atlas/GROUPS/SOFTWARE/OO/Development/qa/General/index.html
15-9 Joint Controls Project,http://cern.ch/itco/Projects-Services/JCOP/
15-10 SDP Implementation,http://cern.ch/Atlas-connect-forum/ - SDP - Implementation: Multi-user multi-platform scripting guidelines
15-11 SDP Tools,http://cern.ch/Atlas-connect-forum/ - Tools
15-12 SDP Templates,http://cern.ch/Atlas-connect-forum/ - Templates
15-13 SDP Testing phase,http://cern.ch/Atlas-connect-forum/ - SDP - Testing
15-14 Configuration Management Tool,http://www.cmtsite.org/

ATLAS Technical Design ReportHigh-Level Trigger, Data Acquisition and Controls 30 June 2003
16 Costing 325
16 Costing
The cost estimate of the ATLAS HLT/DAQ system is based on a detailed model of its size (i.e.number of components) as a function of the input LVL1 trigger rate. The model is parametrizedby the assumptions described in Tables 5-3 and 5-4; conservatism and safety factors are appliedin particular for the performance (processing time per event and rejection power) of the HLTand the estimated unit cost of both custom (e.g. the ROBIN) and commercial components (e.g.processors). In the following are described the HLT/DAQ system evolution from commission-ing to its expected final performance, the rationale behind the costing of individual compo-nents, the subdivision of the system cost in terms of functional categories, and a summary of theexpenditure profile.
16.1 System evolution and staging
The ATLAS HLT/DAQ system has been designed to be staged, with the size and performanceof the system evolving as resources become available. The final performance corresponds to aLVL1 rate of 100 kHz. Table 16-1 indicates, for the period 2004 to 2009, the performance capabil-ity (second column) and the functional capability (third column) of the installed system. Thedates of 2008 for the nominal 75 kHz system, and 2009 for the final HLT/DAQ performance, areindicative, in so far as they depend on the availability of resources, the luminosity performanceof the LHC and experience from initial running.
Chapter 5 discusses how the baseline architecture supports the staging of the HLT/DAQ sys-tem. The detector readout procured and installed in 2005–2006 is just for the non-staged part ofthe detector (which represents ~75% of the ROLs). For the purpose of uniformity, custom com-ponents, in particular the ROBIN modules, are fully procured in 2005, although some of themwill be physically installed later (probably in the year 2008) with the staged parts of the ATLAS
Table 16-1 HLT/DAQ performance profile
YearSustained LVL1 rate
(kHz) Notes
2004 N/A Pre-series only
2005 N/A Detector & HLT/DAQ commissioning.75% of detector readoutUse pre-series HLT farms
2006 N/A ATLAS cosmic-ray runUse pre-series HLT farms
2007 37.5 LHC startup 37% HLT farms
2008a
a. Indicative date.
75 Nominal LHC luminosity100% of detector readout75% HLT farms
2009a 100 Final HLT/DAQ performance100% HLT farms
ATLAS Technical Design ReportHigh-Level Trigger, Data Acquisition and Controls 30 June 2003
326 16 Costing
detector. The other parts of the ROS system are, however, procured following the staging of thedetector (i.e. 75% in 2005–2006 and the remaining 25% in 2008). The strategy for staging of theHLT/DAQ system is based on the staging of the LVL2 and EF farms and, as a consequence, ofthe Event Builder (in particular the SFIs) and the central networks.
16.2 Costing of components
The majority of the ATLAS HLT/DAQ system is based on Commercial Off The Shelf (COTS)components: commodity computer and communications hardware (e.g. PCs and Gigabit Ether-net) and related equipment. The estimated unit cost of these components is based on a conserv-ative extrapolation of today’s costs. In addition, for the HLT farms, a 30% overall safety factor isadded to allow for the large uncertainties discussed in Section 14.3.
The unit cost of custom components, i.e. the ROBIN and RoIB, has been established on the basisof R&D prototypes.
16.3 Categories of expenditures
For the purpose of describing the cost and its evolution in time, the HLT/DAQ system has beenorganized in terms of categories of expenditure, closely related to the HLT/DAQ baseline archi-tecture:
• DCS: includes the components needed for the operation of the detector and for the super-vision of the infrastructure of the experiment: operator workstations, servers, detectormaster stations, custom modules, DSS, sniffer, and UPS systems.
• Detector readout: this category includes the ROBINs, the ROSs, and the related infrastruc-ture.
• LVL2 RoI: includes the RoIB, the LVL2 Supervisor, the LVL2 central network, and the in-frastructure.
• LVL2 processors: includes the LVL2 processor farm and the infrastructure.
• Event Builder: includes the DFMs, the SFIs, the Event Builder network, the SFO (with thelocal data storage), and the related infrastructure.
• Event Filter: includes the Event Filter processor farm, the network internal to the EventFilter, and the infrastructure.
• Online: includes processor farms for running the online software, HLT/DAQ operationsand monitoring, the central online network, and the related infrastructure.
• Other: includes items such as contributions to high speed data links in and out of the ex-perimental area, and the acquisition of software products such as farm and network man-agement tools.
• Pre-Series: includes a small-scale version of the system for the purpose of validating theHLT/DAQ implementation.

ATLAS Technical Design ReportHigh-Level Trigger, Data Acquisition and Controls 30 June 2003
16 Costing 327
16.4 Expenditure profile and system cost
The expenditure profile is summarized in Table 16-2 and Figure 16-1. The former indicates thecost for the ATLAS HLT/DAQ system in each year. Figure 16-1 shows the expenditure profileincluding its split on the basis of the categories of expenditure.
The sharing of the cost (for the final system capable of sustaining a 100 kHz LVL1 rate) betweenthe categories of expenditure, is shown in Figure 16-2.
Table 16-2 HLT/DAQ system cost profile (unit is kCHF)
Up to 2003 2004 2005 2006 2007 2008 2009 Total
DCS 296 1624 489 294 422 0 0 3125
Pre-series 0 1048 0 0 0 0 0 1048
Detector R/O 0 0 3049 606 0 405 0 4060
LVL2 RoI 0 400 230 238 868 16 1752
LVL2 Proc 0 0 0 450 899 1348 899 3596
Event Builder 0 0 100 526 274 910 274 2084
Event Filter 0 0 0 1375 2863 4351 2862 11 451
Online 0 0 208 622 0 0 0 830
Infrastructure 0 0 0 508 508 508 508 2032
Total 296 2672 4246 4611 5204 8390 4559 29 978
Figure 16-1 Expenditure profile
0
1000
2000
3000
4000
5000
6000
7000
8000
9000
up to 2003 2004 2005 2006 2007 2008 2009
Year
kC
HF
DCS
Level-2 RoI
Pre-series
Infrastructure
Online
Event Filter
Event Builder
Level-2 Proc
Detector R/O
ATLAS Technical Design ReportHigh-Level Trigger, Data Acquisition and Controls 30 June 2003
328 16 Costing
The total HLT/DAQ system cost, as a function of the LVL1 rate and not including pre-series, isshown in Figure 16-3.
Figure 16-2 Relative cost per category of expenditure (for the final system capable of sustaining a 100 kHzLVL1 rate)
Figure 16-3 HLT/DAQ cost (excluding pre-series) versus LVL1 rate achievable
Det R/O
14%Level-2 RoI
6%
Level-2 Proc
12%
Event Builder
7%Event Filter
38%
Online
3%
Infrastructure
7%
DCS
10%
Pre-series
3%
Det R/O
Level-2 RoI
Level-2 Proc
Event Builder
Event Filter
Online
Infrastructure
DCS
Pre-series
10 775
15 980
24 371
28 930
0
5 000
10 000
15 000
20 000
25 000
30 000
35 000
0 20 40 60 80 100 120
LVL1 rate (kHz)
kC
HF

ATLAS Technical Design ReportHigh-Level Trigger, Data Acquisition and Controls 30 June 2003
17 Organization and resources 329
17 Organization and resources
17.1 Project organization
The ATLAS Trigger/DAQ Project is organised in three main sub-projects: the Level-1 Trigger(N. Ellis), the High Level Trigger (C. Bee) and the Data Acquisition (L. Mapelli). The manage-ment of the overall project is organised in three levels:
1. The TDAQ Management Team (TDMT), whose members are the leaders of the three sub-projects with the close involvement of the chairperson of the Trigger/DAQ InstituteBoard (TDIB, see Section 17.2). One of the three sub-project leaders acts as overall ProjectLeader on a yearly rotational basis, with the particular role of representing the project to-wards outside bodies.
2. The Trigger/DAQ Steering Group (TDSG), composed of the coordinators of the mainsub-systems of each sub-project, the coordinators of cross-system activities and a numberof ex-officio members, including the ATLAS Management and the TDIB Chair (seeFigure 17-1).
3. Each sub-project has its own internal organization and management, tailored to the spe-cific features and needs of the system. The organisation of the HLT and DAQ sub-projectsis illustrated in Figure 17-2 and Figure 17-3. Both the HLT and the DAQ are organised inthree sub-systems each and a number of cross-sub-system activities. The organization ofthe LVL1 trigger sub-project is described elsewhere [17-1].
The progress of the TDAQ project also requires significant interactions with other parts ofATLAS, and for this formal links have been established in several areas. First the Detector Inter-face Group (DIG) provides a forum to coordinate the work of TDAQ and the detector communi-ties, particularly for test beam work and detector commissioning. The DIG coordinator is an ex-
Figure 17-1 The Trigger/DAQ Steering Group (HLT DS stands for HLT Detector Slices, and PSS stands forPhysics Selection Strategy)
Calorimetry
E Eisenhandler
Muons
S Veneziano
CTP
R Spiwoks
Level-1 Trigger
N Ellis
PESA
V Vercesi
HLT Infrastructure
F Wickens
HLT DS
S Falciano
High Level Trigger
C Bee
Dataflow
D Francis
Online Software
M Caprini
DCS
H Burckhart
Data Acquisition
L Mapelli
TDAQ Architecture WG
G Mornacchi
Modelling WG
J Vermeulen
Connect Forum
D Burckhart
PSS WG
S Tapprogge
Liaison with Offline
S George
V Vercesi
Cross-System Activities
TDAQL Mapelli
ATLAS Technical Design ReportHigh-Level Trigger, Data Acquisition and Controls 30 June 2003
330 17 Organization and resources
officio member of the TDSG and several members of TDAQ are members of the DIG Coordina-tion Team. For interactions with ATLAS Technical Coordination, particularly in issues relatingto the infra-structure requirements of TDAQ, the TDMT has been assisted by members of thecommunity undertaking specific responsibilities. For the future it is foreseen that there will be aTDAQ Planning Officer who would take responsibilities in this area. There are particularlystrong links with the ATLAS offline group and in addition to frequent meetings at the level of
Figure 17-2 The High Level Trigger Steering Group (‘Activities’ are working groups cutting across the sub-sys-tems)
Figure 17-3 The DAQ Steering Group (‘Activities’ are working groups across the sub-systems, extendable toHLT and LVL1 as well)
PSS WG
S Tapprogge
Muon slice Inner Detector slice
Calorimetry slice
Detector Slices
S Falciano
Activities
HLTSSW
S George
Algorithms
S Armstrong
Software Releases
C Padilla
PESA
V Vercesi
LVL2 Integration
S Gonzalez
LVL2 Supervision
H Zobernig
L2PU
A Bogaerts
LVL2 Infrastructure
F Wickens
Integration & Testing
M Bosman
EF Supervision
S Wheeler
EFD
A Negri
EF Infrastructure
F Touchard
High Level TriggerC Bee
Architecture
G Mornacchi
Integration & Testing
M Dobson-G Lehmann
Connect
D Burckhart
DIG
B DiGirolamo
ROD Crate DAQ
R Spiwoks
Planning Officer
L Tremblet
Activities
ROS
B Gorini
Data Collection
HP Beck
Network Technologies
R Dobinson
RoI Builder
R Blair
Modelling
J Vermeulen
Integration & Testing
G Lehmann
Dataflow
D Francis
Configuration
I Soloviev
Control
D Liko
Monitoring
S Kolos
Ancillary
R Hart
Integration & Testing
D Burckhart-M Dobson
Online Software
M Caprini
DDC
S Khomoutnikov
DCS
H Burckhart
Data AcquisitionL Mapelli

ATLAS Technical Design ReportHigh-Level Trigger, Data Acquisition and Controls 30 June 2003
17 Organization and resources 331
the management teams two members of the TDSG are also members of the Computing manage-ment. In resource matters the TDMT is assisted by the Chair of the TDIB (see below) and theTDAQ Resource Coordinator (F. Wickens), the latter also acts as the contact between TDAQ andthe ATLAS Resource Coordinator.
The submission and approval process of this TDR marks the completion of most elements of theR&D phase of the TDAQ project. The project organization will be adjusted in late 2003 in orderto reflect the change of phase of the project, as it moves from design and prototyping to produc-tion.
17.2 Resources
The overall ATLAS Trigger/DAQ Collaboration consists of 51 Institutes from 22 countries. Eachinstitute is represented in the TDAQ Institute Board (TDIB) [17-2], the policy and decision mak-ing body of the TDAQ project, presently chaired by A. Nisati. Typical tasks of the TDIB includediscussion and decisions on financial and human resource as well as policy making.
The TDIB is assisted by two committees, the Resource Committee and the Speakers Committee.
• TDAQ Resource Committee (TDRC): The TDIB is advised on finance and resource mat-ters by the TDRC, comprising the TDMT, one member per major Funding Agency andtwo additional members representing collectively the other Funding Agencies. The TDRCis chaired by the TDIB chair, assisted by the TDAQ Resource Coordinator.
• TDAQ Speakers Committee: This is a three member body, presently chaired byL. Levinson, mandated to recommend policy regarding conference speakers, to maintaina complete archive of conference presentations and to ensure a fair distribution of confer-ence talks across the TDAQ Collaboration.
The HLT/DAQ part of the Collaboration comprises 41 Institutes from 21 countries for a total of~230 members.
17.3 References
17-1 ATLAS Collaboration, ATLAS Level-1 Trigger Technical Design Report,CERN/LHCC/98-014 (1998)
17-2 Trigger/DAQ Institute Board,http://cern.ch/Atlas/GROUPS/DAQTRIG/IB/ib.html
ATLAS Technical Design ReportHigh-Level Trigger, Data Acquisition and Controls 30 June 2003
332 17 Organization and resources

ATLAS Technical Design ReportHigh-Level Trigger, Data Acquisition and Controls 30 June 2003
18 Workplan and schedule 333
18 Workplan and schedule
This chapter outlines the short-term (6–12 months) post-TDR workplan for the major activitiesin the HLT and DAQ systems (including DCS). The global HLT/DAQ development schedule ispresented in Section 18.1 as the basis for the definition and context of the workplan. The de-tailed workplan, which is still in preparation, is introduced and a number of issues that willhave to be addressed are indicated (Section 18.2). The strategy that has been developed for thedetector integration and commissioning is described in Section 18.3.
18.1 Schedule
This section presents the overall schedule for the HLT/DAQ system up to LHC turn-on in 2007.The development and deployment of the HLT/DAQ system, both hardware and software, hasbeen mapped onto the ATLAS detectors installation plan [18-1].
18.1.1 System hardware
For the system hardware, the planning is driven by the production schedule for the two customreadout components:
• the S-LINK Link Source Card (LSC), to be installed on the RODs;
• the ROBIN, the receiver part of the ROS (S_LINK receiver and ROL multiplexer).
An analysis of the detector installation schedules points to the first quarter of 2004 as the mo-ment for the Final Design Review of the LSC and the ROBIN. The review of the ROBIN requiresthe I/O optimization studies (see Section 18.2.1) to have been completed beforehand. (The thirdcustom component of the HLT/DAQ, the RoI Builder, is not on the critical path for the detectorinstallation schedule.)
The global HLT/DAQ production schedule is shown in Figure 18-1. It identifies the principalmilestones concerning the detector needs for TDAQ installation, the TDAQ component produc-tion (in the case of custom components), the component purchasing and associated tendering(in the case of commercial components), as well as testing and commissioning.
18.1.2 System software
Six major releases of the system software have been identified (dates are indicative at this stageand will be adapted if necessary). The release strategy is driven by detector operations (e.g. testbeams and cosmic-ray run) and commissioning (see Section 18.3).
1. Current DAQ release, integrating Online Software and DataFlow. It is targeted at theneeds of the ATLAS H8 test-beam operations in 2003 and to the I/O optimization andsystem-performance measurements. This release has been operational since May 2003.
2. ‘Combined test-beam’ release for the combined run in 2004.
3. ‘Sub-detector readout’ release for initial detector commissioning with single ROD CrateDAQ (RCD) for single crates.
ATLAS Technical Design ReportHigh-Level Trigger, Data Acquisition and Controls 30 June 2003
334 18 Workplan and schedule
4. ‘HLT/DAQ installation’ release for commissioning of the HLT/DAQ components andglobal detector commissioning in autumn 2005.
5. ‘Cosmic-ray run’ release for global HLT/DAQ and global detector commissioning, aswell as for the ATLAS cosmic-ray run in autumn 2006.
6. ‘LHC start-up’ release for the start of LHC operation in April 2007.
An overview of the software-development schedule is shown in Table 18-1 for the software ofthe three sub-systems, Online Software, DataFlow, and High-Level Trigger. For the HLT, onlythe LVL2 and EF infrastructure part of the software (the latter is required for detector monitor-ing during detector commissioning phases) is considered here. The development schedule ofthe event selection software and the selection algorithms, is not linked to the DAQ releases andis not reported in the table. This schedule will be defined later this year.
18.2 Post-TDR workplan
The detailed workplan to meet the objectives described in the schedule of the previous sectionis in preparation and will be finalized soon after the TDR publication. Its description goes be-yond the scope of this document, which specifically addresses the workplan of the short-termpost-TDR phase, characterized by the completion of the studies for the optimization of theHLT/DAQ baseline, both in the DataFlow (Section 18.2.1) and in the HLT (Section 18.2.3). The
Figure 18-1 Schedule of the overall HLT/DAQ project
Task Name
Performance milestones
O(kHz) Cosmic run
37 kHz
75 kHz
100 kHz
Software releases
Test beam 2003
DCS JCOP software Framework
Combined test beam
Sub-detector readout
HLT/DAQ installation & ommissioning
Cosmic run
LHC start-up
Custom hardware
Completion of ELMB production
ROL LSC
Prototype available
FDR
PRR
Ready for Installation (i.e. available to detectors)
RoBIn
Prototype available
FDR
PRR
Installation (In ROS)
RoI Builder
Prototype available
FDR
PRR
Ready for installation
Ordering of Commercial Hardware
ROS Industrial PCs
ROS concentrator Switches
PCs for Level 2 supervisors, SFIs & DFMs
Central Switches
HLT sub-farms
Installation
DCS control of infrastructure
DCS Supervisor system installation
Installation of ROSs in USA15
RoI Builder in USA15
SDX
L2SVs, DFMs, SFIs, & Central switches
HLT sub-farms
Integration & commissioning
DCS for sub-detector standalone control
DCS Supervisor commissioning
ReadOut system
ROS - Detector integration & commissioning
RoI Builder & Level 1
DCS communication with external systems
RoI Collection
Event Building
HLT sub-farms
Magnet testing
3/10
2/4
1/4
1/4
5/5
28/11
1/3
7/6
3/6
4/9
5/3
1/1
1/4
9/12
3/8
12/4
1/7
16/3
14/9
6/10
27/9
25/10
29/8
17/1
23/5
19/12
19/12
Q2 Q3 Q4 Q1 Q2 Q3 Q4 Q1 Q2 Q3 Q4 Q1 Q2 Q3 Q4 Q1 Q2 Q3 Q4 Q1 Q2 Q3 Q4 Q1 Q2
03 2H03 1H04 2H04 1H05 2H05 1H06 2H06 1H07 2H07 1H08 2H08 1H09

ATLAS Technical Design ReportHigh-Level Trigger, Data Acquisition and Controls 30 June 2003
18 Workplan and schedule 335
Detector Control System workplan is outlined in Section 18.2.4, while Section 18.2.5 lists someof the other issues that will be addressed.
18.2.1 Online Software workplan
18.2.1.1 Technology evaluation
Taking into account the proposed architecture and the results of the prototypes presented inChapter 10, the Online Software group started a technology evaluation in order to prepare thefinal implementation. In the inter-process communication domain, the evaluation considersnew CORBA implementations and the possibility of using Web Services for information shar-ing. For configuration data storage and access, some other database technologies are beingstudied, including relational databases with possible object extensions and POOL, the persist-ency framework developed in the LHC Computing Grid project. A third direction of evaluationinvestigates the possibility to extend the usage of the expert systems and related products forcontrol and supervision.
18.2.1.2 New features
In parallel with the technology evaluation, in the second part of 2003 new features will be stud-ied in order to be added to future Online Software releases. For Configuration Databases, thenew features include the implementation of the data access library generator and of a notifica-tion mechanism to allow dynamic changes in the configuration. In the Control area, the effortswill be focused in the development of a distributed functionality for initialization, shut-
Table 18-1 Software development schedule for the software of Online Software, DF and HLT
RELEASE Online Software DataFlow High Level Trigger
TDR release(Jun 03)
As described in TDR - Mar 03
As described in TDR, first full DataFlow - May 03
Current EF release - Summer 03
Combined test beam(Summer 04)
Prototype versions of con-trol, configuration, and monitoring services - Feb 04
Consolidation of TDR release, evolution of ROD Crate DAQ - Apr 04
EF infrastructure (version from PDR) - May 04(LVL2 infrastructure - late summer 04)
Sub-detectorreadout(Autumn 04)
Full support of final ROD Crate DAQ - Jun 04
First release of final Data-flow, including ROD Crate DAQ - Aug 04
HLT/DAQ instal-lation(Autumn 05)
Full functionality of con-trol, configuration, and monitoring services, including I/F to condi-tions DB - Apr 05
Consolidation of previous release, completion of DataFlow functionality - Jun 05
Completion of HLT func-tionality for cosmic-ray run - Summer 05
Cosmic-ray run(Autumn 06)
Final large-scale perform-ance and support for par-titioning - Mar 06
Final large-scale release - Jun 06
Ready for cosmic-ray run - Summer 06
LHC start-up(Apr 07)
Final implementation ready for tuning - Dec 06
Consolidation of previous release - Dec 06
Ready for initial physics run - Dec 06
ATLAS Technical Design ReportHigh-Level Trigger, Data Acquisition and Controls 30 June 2003
336 18 Workplan and schedule
downand error handling, combined with more flexibility in the state machine implementation.A common configuration and control development is related to a better partition, segment andresource management. For the Information Sharing services, the performance and scalability is-sues will be addressed, especially for the Event Monitoring Service.
18.2.2 DataFlow workplan
In the baseline design, the flow of data and of control messages between the ROS and the HLTcan be implemented using bus-based or switch-based data collection, for the aggregation ofdata from a number of Read Out Links into each port of the main DataFlow network. Work upto the Final Design Review (FDR) of the custom hardware in the DataFlow (first quarter of 2004)will address, with high priority, the optimization of the data flow at the ROS level.
As described in Chapter 8, a full-system prototype has been developed supporting simultane-ously the two data-aggregation techniques, by means of a ROBIN prototype with two Read OutLinks at the input, and output to both PCI-bus and gigabit Ethernet (see Section 8.1.3.2). Per-formance measurements done on a prototype of the full HLT/DAQ architecture with a size oforder 10% of the final system, as reported in Chapter 8 and Chapter 14, demonstrate the overallviability of the baseline architecture. The measurement programme is continuing with the de-ployment of a number of ROBIN modules in the 10% prototype system, allowing a direct com-parison of functional and performance aspects. This will lead to the choice of the optimalInput/Output path before the FDR of the ROBIN, currently planned for the first quarter of 2004.
The results of the measurements will continue to be used in the discrete event modelling aimedat providing a description of the behaviour of the system scaled to the final size.
18.2.3 High-Level Trigger workplan
The work on the HLT system up to the end of 2003 will be focused on several principal areaswhich are discussed below.
The LVL2 and EF testbeds, discussed in Section 14.2, will be exploitated during the summer pe-riod in order to arrive at a complete set of measurements concerning the functionality and per-formance of the HLT event-selection software. This information, together with the initial resultsof physics-performance studies using the selection algorithms running in the selection-softwareframework, will be analysed in an internal review currently planned for late October 2003. Thereview will identify areas in the software which may require optimization, partial re-implemen-tation, or re-design. The review will define the end of the initial cycle — requirements analysis,design, implementation, testing, and exploitation — which characterizes modern softwareprojects. The second, shorter, cycle will be launched immediately following the review with aview to completing it a year later. During this time, the system-exploitation phase will includeits use in the combined ATLAS test-beam during the summer of 2004.
In parallel with the testbed exploitation, further optimization studies of the selection-softwaredesign and implementation will be done, as discussed in Section 14.2.1. The results of thesestudies will provide important input to the review.
Data are available from the production of large samples of simulated physics channels withnoise and pile-up included. Exploitation of these data using the LVL2 and EF algorithms is nowunder way in order to optimize the implementation and tune the performance of the selection

ATLAS Technical Design ReportHigh-Level Trigger, Data Acquisition and Controls 30 June 2003
18 Workplan and schedule 337
algorithms in terms of signal efficiency, background-rate reduction, and execution time. Thiswill lead to an update of the numbers presented in Refs. [18-2], [18-3] and [18-4]. Initial resultsare presented in this TDR. This work will continue for the rest of this year and beyond.
The HLT system software (used to control the flow of data to and from the HLT algorithms, andfor the control and supervision of the HLT) is being tested in the testbeds and also, currently (inthe case of the EF), in test beam. The design and implementation of these software systems willalso be reviewed towards the end of 2003 with a view to having an updated design and imple-mentation by the middle of 2004.
The purchase of the bulk of the HLT computing and network hardware will take place at as latea date as possible compatible with ATLAS installation and commissioning requirements as wellas the LHC start-up schedule. This is done to benefit from the best possible price/performanceratio of the equipment. The standard sub-farm racks, discussed in Section 5.5.11, will need to beprototyped. This work will begin later this year with a view to having a first rack prototype in2004.
As mentioned notably in Sections 1.5 and 5.2.3.1.4, aspects of access to and use of the conditionsdatabase, and connection of the TDAQ system to the offline prompt reconstruction and toCERN mass storage system are not yet sufficiently defined. These issues have already begun tobe addressed with the offline computing group, and this will continue into next year.
18.2.4 Detector Control System workplan
The DCS schedule is summarized in Figure 18-1.
18.2.4.1 Front-End
The process of producing the ELMBs has started. At the beginning of the third quarter of 2003the radiation qualification of the components will be done, and fully-tested modules should beready at the end of the last quarter of 2003. The software for the ELMB is being finalized andwill be tested in the third quarter of 2003 before being loaded into the ELMB as part of the pro-duction process.
18.2.4.2 Back-End
The Framework Software that is built on top of the SCADA software PVSS is being reviewedand the implementation of a re-designed version will start at the beginning of the third quarterof 2003 in the framework of the JCOP project. The core libraries and tools are expected by theend of November 2003. This final software will be used for the test-beam operation in 2004, atthe ATLAS pit for controlling the sub-detectors, and the experimental infrastructure from mid-2004 onwards. In the beginning, each system will operate in standalone mode. Integrated oper-ation will be needed from the end of 2005 onwards. On this timescale, the overall supervisorysystem for coherent operation of the whole ATLAS experiment from the main control room willbe set up. Communication with external systems will be needed in 2006 in order to allow globalcommissioning of ATLAS, and for the cosmic-ray run in the third quarter of 2006.
ATLAS Technical Design ReportHigh-Level Trigger, Data Acquisition and Controls 30 June 2003
338 18 Workplan and schedule
18.2.5 Other issues to be addressed
During the deployment of the full-system HLT/DAQ prototypes for measurements and optimi-zation of performance, a number of other issues will be addressed that are important for thesystem functionality and the definition of certain services. Amongst these issues, the followinghave so far been identified:
• processor and process management in the HLT farms;
• flow of data in databases (for production, conditions, configuration);
• fault tolerance;
• TDAQ output and computing model viz., offline prompt reconstruction and mass stor-age;
• use of remote EF sub-farms;
• system scalability and robustness against variation of parameters, eg LVL2 rejection pow-er.
As an illustration, the last of the these points is developed briefly here. The feasibility of the ar-chitecture depends on a number of assumptions regarding both external conditions (such as thedata volume of a region of interest) and extrapolations of measurements performed today. Fur-ther study of the robustness of the baseline architecture with respect to reasonable, and maybeforeseeable, variations of these assumptions will be an item for the short-term post-TDR workp-lan.
Table 18-2 lists some of the key parameters for the architecture. For each parameter, the current-ly assumed value is given, and consequences of the variations are discussed.
Table 18-2 Variations of baseline parameters
Parameter Current value Remarks
RoI data volume ~2% Implications on ROL–ROB aggregation factor, ROB–ROS aggre-gation factor, and LVL2 switch size.
RoI request rate/ROB
Uniform distri-bution
This will not be the case. Non-uniform distributions have been studied extensively in Paper Models. Their implications on the traffic pattern through the LVL2 network need further studies.
LVL2 acceptance 30:1 A more pessimistic figure implies a higher rate into the EB or a reduction in the maximum LVL1 rate that can be accepted, hence an effect on the ROL and ROB aggregation factors and the number of SFIs. Thus a large EB network, as well as a related impact (higher EB rate) on the EF farm size.
HLT Decision time/event
10 ms @ LVL21 s @ EF
Variations of O(10%) have a corresponding effect on the size of the farms and the related central (LVL2 or EB) networks.
SFI Input/Out-put capability
60 Mbyte/s In60 Mbyte/s Out
Impact the size of the EB network (because of additional SFIs) Impact the organization of the EF farm. Fewer events output by the SFI will mean smaller sub-farms (or more SFIs per sub-farm)

ATLAS Technical Design ReportHigh-Level Trigger, Data Acquisition and Controls 30 June 2003
18 Workplan and schedule 339
18.3 Commissioning
During detector installation, the corresponding detector readout elements will need to be testedand commissioned. This section presents the strategy developed so that detector commission-ing requirements can be met in parallel with the commissioning of the HLT/DAQ elementsthemselves.
A more detailed description of the commissioning plan can be found in the relevant documen-tation of the ATLAS Technical Coordination [18-5].
18.3.1 Detector commissioning
Detector commissioning will be performed in three phases, namely the readout of a single RODcrate, the readout of multiple ROD crates, and the readout of multiple sub-detectors. The neces-sary tools for the implementation of such a strategy are briefly described here. Some of thesetools are already available today and used at the test beam, in testbeds, and at test sites.
18.3.1.1 Tools for detector commissioning
18.3.1.1.1 ROD-Crate DAQ
The first need of a sub-detector will be to check the functionality of the front-end electronics viathe readout FELs into ROD modules. For this first functionality check, the ROD-Crate DAQ(RCD) will be used. The RCD software is being completed now and its exploitation on test beamoperations is starting. For the initial phase of detector commissioning, it will be a mature andstable product.
The RCD is the minimal infrastructure neededto read out the sub-detectors’ RODs. The read-out will be done initially via VMEbus, by theROD Crate Controller (RCC), as shown inFigure 18-2. Data processing can be done atthe level of the RCC or in an external worksta-tion (connected via Ethernet to the RCC) run-ning the ROS application. Data in theworkstation can then be stored to disk. Thenecessary infrastructure will be in place in theunderground counting room, including theDCS, the TTC, the Local Trigger Processors,and the Conditions Database for the storage ofcalibration data.
Figure 18-2 Readout of ROD modules via VMEbusby the ROD Crate Controller
ATLAS Technical Design ReportHigh-Level Trigger, Data Acquisition and Controls 30 June 2003
340 18 Workplan and schedule
The second step will implement the ROD rea-dout via the standard Read Out Link (ROL)into a standalone ROS, as in Figure 18-3. Thisset-up will enable the data integrity over theROLs to be checked simultaneously for anumber of RODs and is the first major step inthe detector–DAQ integration. This set-up isvery similar to the one already in use and welltested at the H8 ATLAS test beam.
18.3.1.1.2 Readout of multiple ROD crates
In the second phase, data taking from multipleROD crates will be implemented. This will al-low the complete readout of one or more TTC partitions, requiring multiple ROS units and aminimal Event Builder. In all cases the storage of the data to disk or to the Conditions Databasewill be allowed (Figure 18-4).
18.3.1.1.3 Readout of multiple sub-detectors
In preparation for the cosmic-ray run and during the final phase of the ATLAS Commissioning,simultaneous readout from several sub-detectors will be necessary. The timescale for these op-erations matches the timescale for the completion of installation of the final TDAQ elements. Apossible configuration for the readout of more than one sub-detector is very similar to the onepresented in Figure 18-4. The number of hardware elements involved may vary significantly;however, the major change will be the addition of Event Filter sub-farms (only needing minimalprocessing power) to complete the dataflow chain. In the case of multiple sub-detector readout,the CTP infrastructure and the DCS supervisor will also be needed.
Figure 18-4 Readout of multiple ROD crates via ROLs with a minimal Event Building infra-structure
Figure 18-3 Readout of ROD Modules via ROLs con-nected to a minimal ROS system

ATLAS Technical Design ReportHigh-Level Trigger, Data Acquisition and Controls 30 June 2003
18 Workplan and schedule 341
18.3.2 HLT/DAQ Commissioning
HLT/DAQ commissioning will be performed in parallel with detector commissioning. As por-tions of the HLT/DAQ systems are commissioned, they will provide resources for detectorcommissioning.
The HLT/DAQ commissioning will start with the installation and commissioning of a verticalslice of the system, followed by the expansion of the parallelism of the system as needed to sup-port detector installation, commissioning, and HLT processing requirements for commission-ing.
The strategy for commissioning the HLT selection software is being developed as part of the de-velopment of the ATLAS plan for detector commissioning with physics data. Development ofthis plan has recently started in concert with the ATLAS detector and physics groups.
18.3.2.1 Tools for HLT/DAQ commissioning
HLT/DAQ commissioning will require an appropriate set of diagnostic tools. The diagnostictools used for commissioning will generally be the same as those used routinely to test and totroubleshoot the system during future operations. They will include end-to-end tests of the rea-dout chain, as well as the diagnostics necessary to localize failures of the replaceable compo-nent. The diagnostic tests fall into three categories: connectivity or communications tests,functionality tests, and performance or stress tests. In order to provide test data for diagnosticand commissioning tests, components will implement test buffers at their inputs and at theiroutputs. The suites of diagnostic tests that will be required for commissioning are being devel-oped now for testing and evaluation of HLT/DAQ testbeds, for data acquisition, and for detec-tor beam tests.
18.3.2.2 Preparations for HLT/DAQ commissioning
Smooth commissioning of the ATLAS HLT/DAQ systems will be greatly facilitated by properpreparation. In addition to development of an appropriate set of diagnostic tools, as describedabove, preparations for commissioning will include rigorous testing of all hardware and soft-ware before installation in the system. All hardware and software designs will be integratedinto sub-systems and into complete systems, and will be validated on testbeds prior to installa-tion. Every hardware component will undergo rigorous production acceptance testing in thelaboratory before installation. These preparations will minimize the number of failed compo-nents and unforeseen problems experienced during the commissioning process.
18.3.2.3 Sequence of HLT/DAQ commissioning
The first phase of HLT/DAQ commissioning will consist of sequentially installing sub-systemsnecessary to build up a vertical slice of the complete system. Following completion of the verti-cal slice, the HLT/DAQ system will be expanded to provide the online software and dataflowservices necessary to support the growing needs of detector commissioning. The HLT process-ing capabilities will also be expanded in preparation for ATLAS cosmic-ray running in autumn2006 and LHC start-up in spring 2007. The HLT/DAQ commissioning sequence ties in with therequirements for detector commissioning at several points.
ATLAS Technical Design ReportHigh-Level Trigger, Data Acquisition and Controls 30 June 2003
342 18 Workplan and schedule
18.3.2.3.1 Establishing an HLT/DAQ vertical slice
The first step in building up an HLT/DAQ vertical slice will be to install and commission theminimal complete set of Online Software functionality. This step will provide the configuration,control, and monitoring functionality that will be used for subsequent steps of HLT/DAQ com-missioning. It will also provide the functionality required for detector commissioning withROD-Crate DAQ (see Section 18.3.1.1), including connection to the Conditions Database andthe DAQ–DCS Connection (DDC).
The second step in HLT/DAQ commissioning will be to install and commission a minimaldataflow system. This system will first be commissioned without connection to detector front-end electronics. Subsequently, ROSs for the first sub-detector system will be connected (as de-picted in Figure 18-3), and the detector–DAQ interface commissioned. Detector commissioningwith readout of multiple ROD crates (as depicted in Figure 18-4) can then proceed, includingthe ability to log data to disk via an SFI. Detectors can also commission independently of, and inparallel with, other detectors using the partitioning feature of HLT/DAQ.
After commissioning the detector–DAQ interface, components of the LVL1 Trigger will be con-nected to a ROS and to the RoI Builder, the CTP will be connected to the TTC, and the LVL1–HLT/DAQ interface will be commissioned. Following this step, readout of multiple sub-detec-tors, coordinated by the LVL1 trigger, can proceed (as described in Section 18.3.1.1.3). Detectorscan also continue to commission independently of one another using the partitioning feature ofHLT/DAQ. Integration of an Event Filter subfarm will complete the commissioning of theHLT/DAQ vertical slice.
18.3.2.3.2 Building out the HLT/DAQ system
During the second phase of HLT/DAQ commissioning, the vertical slice will be expanded bycommissioning additional parallelism, that is, incorporating additional components, e.g. ROSs,SFIs, etc. The additional parallelism will be added as and when sub-detectors are installed andready for testing. By Summer 2006, the HLT/DAQ system will have reached the scale requiredfor testing ATLAS with cosmic rays. At each step in the expansion of the system, additionalcomponents will be commissioned, and the functionality of the expanded system tested.
Once the vertical slice is complete, performance and stress testing will be initiated. Performancetests will confirm that the required system performance is achieved as the size of the system isincreased. Stress tests will be conducted by operating the system at high levels of performancefor sustained periods of time. Such tests will have previously been performed on testbeds, buton a limited scale. Behaviour on scales larger than the largest testbed will be encountered for thefirst time during the commissioning phase. Any unforeseen performance behaviour will needto be rapidly understood and remedied.
18.3.2.3.3 Final steps in HLT/DAQ commissioning
Commissioning of the HLT/DAQ system will include validation of the timing of all detectorelectronics systems with respect to the DataFlow system. The procedure for establishing thetiming of individual detector electronics systems via the TTC system is described in the TDR forthe LVL1 Trigger. During commissioning, it must be established that event fragments from atriggered event are coherently labelled, i.e. with the same bunch crossing and LVL1 identifiers,by all parts of all detectors. This validation will use built events triggered by cosmic rays that

ATLAS Technical Design ReportHigh-Level Trigger, Data Acquisition and Controls 30 June 2003
18 Workplan and schedule 343
traverse a pair or group of sub-detectors. The data contained in event fragments from each de-tector will be matched with the data in fragments from other detectors. Final validation of co-herent timing will occur by reconstructing events triggered during colliding beams.
A recent ATLAS workshop was dedicated to analysing the detector performance and physicscommissioning needs of the experiment. More info can be found at [18-6].
18.4 References
18-1 ATLAS Installation,http://cern.ch/Atlas/TCOORD/Activities/TcOffice/Scheduling/Installation/ATLASinstallation.html
18-2 ATLAS Collaboration, ATLAS High-Level Triggers, DAQ and DCS Technical Proposal,CERN/LHCC/2000-017 (2000)
18-3 S. Tapprogge, ATLAS trigger rates and associated physics performance, Presentation to LHCC Meeting, March 2002,http://agenda.cern.ch/askArchive.php?base=agenda&categ=a02381&id=a02381s1t2/transparencies
18-4 S. Tapprogge, ATLAS trigger rates and associated physics performance, Presentation to LHCC Meeting, May 2002,http://agenda.cern.ch/askArchive.php?base=agenda&categ=a02443&id=a02443s1t2/transparencies
18-5 ATLAS Technical Co-ordination, ATLAS Commissioning - Sub-Detectors needs of TDAQ for readout, ATC-TD-IN-0002 (2003)http://edms.cern.ch/file/375183/
18-6 Detector performance and physics commissioning with physics data,http://cern.ch/gianotti/commissioning.html
ATLAS Technical Design ReportHigh-Level Trigger, Data Acquisition and Controls 30 June 2003
344 18 Workplan and schedule

Appendices

ATLAS Technical Design ReportHigh-Level Trigger, Data Acquisition and Controls 30 June 2003
A Paper model results 347
A Paper model results
The ‘paper model’ is a static model of the HLT/DAQ system used for estimating rates andprocessing requirements. On account of the RoI-driven nature of the LVL2 trigger and the dif-ferent processing sequences and associated data request patterns, a simple calculation of thequantities of interest on the basis of the LVL1 and LVL2 accept rates and average event fragmentsizes is not feasible. In previous studies a spreadsheet was used. Because it was difficult to mod-ify parameters such as trigger menus and processing sequences, to extract the results, and tocheck the correctness of the computing procedures implemented, the spreadsheet has been re-placed by a program written in C++. All parameters are now specified in separate input filesand are therefore easy to modify. The results to be output by the program (an array of tables inASCII format) are selected by configuration parameters in an input file, and the program sourceprovides a clear overview of the computing procedures involved in the modelling process itself.
A.1 Input
The LVL1 trigger defines a finite number of possible RoI locations. A small region in eta-phispace corresponds to each location. For each location the rate of hits satisfying appropriateLVL1 trigger criteria is assumed to be proportional to the area of the region associated with thelocation and not to depend on its coordinates in eta-phi space. The sum of the rates for all possi-ble locations is equal to the LVL1 menu RoI rate, so that the RoI rate per location can be deter-mined. Along with information on the sizes of the regions-of-interest (see Table A-1), and themapping of the detector on the ROLs, the RoI rate for each ROL can be obtained.
The detailed breakdown of the exclusive ‘nominal’ rates for the different LVL1 trigger menuitems for start-up luminosity are presented in detail in Section 13.5. The total rates are ~25 kHzat start-up luminosity and ~40 kHz at design luminosity [A-1]. These rates include a contribu-tion of ~5 kHz for pre-scaled and calibration triggers which are not considered further in themodel1. Estimates of the fragment sizes are presented in Table A-2. To calculate the bandwidthrequirements, the fragment sizes have been increased to include headers and trailers.
The LVL2 processing consists of several steps, and after each step a decision is taken on whetherdata from other sub-detectors within the RoI should be requested for further analysis. For the
Table A-1 LVL2 RoI sizes
Type of RoI Size in η Size in φ
EM 0.2 0.2
Jet 0.8 0.8
Tau 0.2 0.2
Muon ~0.3–0.4 (depends on detector)
~0.1–0.4 (smallest in muon and in inner detector)
1. The number of 5 kHz is an estimate. The effect of these triggers on the ROB access rates and the event-building rates will be studied when a better understanding of their composition is available from thedetectors. Only a small percentage will be passed through the event-building stage.
ATLAS Technical Design ReportHigh-Level Trigger, Data Acquisition and Controls 30 June 2003
348 A Paper model results
four different types of RoIs, the sub-detectors from which data are needed as input for the dif-ferent processing steps are specified in Table A-3. The acceptance factors associated with theprocessing steps are also specified in the table. In combination with the RoI rates per ROL, therates of requests for RoI data sent by the LVL2 trigger to the buffers receiving data from theROLs, can be calculated. The trigger acceptance factors in Table A-3 determine the overall LVL2accept rate and therefore the event building rate of ~600 Hz at the nominal LVL1 accept rate forstart-up luminosity. A reliable estimate for the final LVL2 accept rate for design luminosity isnot yet available, but for modelling purposes, 1.2 kHz at nominal LVL1 rate (and therefore3.5 kHz at a 100 kHz LVL1 accept rate) has been chosen as a working hypothesis for these stud-ies. However, what is more relevant here are the modelling estimates for processing resourcesrequired for the initial ATLAS data-taking at start-up luminosity, where the modelling input isbetter understood.
In order to estimate the processing resources needed for the LVL2 trigger, the algorithm execu-tion times and the overheads for sending requests to, and receiving data from the ROS, areneeded. The following typical numbers, assuming execution on 8 GHz dual-CPU machines,have been used in the model for each of the detectors: Muons — 6.5 ms, Calorimeters — 3.0 ms,TRT — 7.2 ms (15.3 ms for design luminosity), and SCT/Pixels — 6.7 ms (7.9 ms for design lu-minosity). The numbers specified include an initial estimate for data preparation for each sub-detector and RoI (see Section 14.2.2). Furthermore, for each message sent or received an over-head of 10 µs is included. The processing step resulting in a decision is assumed to take 50 µs.
Table A-2 Estimate of data fragment sizes per ROL for the various sub-detectors. These are given withthe number of ROLs for each of the sub-detectors, for low and design luminosity. These numbers areused as input for modelling.
Fragments size per ROL(byte)
Sub-detectorNumber of
ROLsLow luminosity
(2 × 1033 cm−2 s−1)Design luminosity(1 × 1034 cm−2 s−1)
Pixels 120 200 500
SCT 92 300 1100
TRT 232 300 1200
E.m. calorimeter (LAr Barreland EMEC)
724 752 752
FCAL 16 752 752
Hadron calorimeter64 (Tilecal) 752 752
24 (HEC) 752 752
Muon precision 192 800 800
Muon trigger (RPCs and TGCs) 48 380 380
CSC 32 200 200
LVL1 56 1200 (average) 1200 (average)
Total event size, raw (Mbyte) 1.0 1.3
Total event size, with headers (Mbyte) 1.2 1.5

ATLAS Technical Design ReportHigh-Level Trigger, Data Acquisition and Controls 30 June 2003
A Paper model results 349
Merging of event fragments into a larger fragment suitable for input to the algorithms is as-sumed to proceed at 160 Mbyte/s. TRT data is assumed not to be analysed for muon RoIs.
A.2 Results
The LVL2 system and the Event Builder both send requests for data to the ROS. The rate of re-quests from the Event Builder for data from a single ROL, buffered in the ROS, is equal to theevent-building rate. The LVL2 request rate for data from a single ROL for a given sub-detector isnot the same for all ROLs, as the rate depends on the mapping of the detector onto the ROLs,the possible RoI locations defined by LVL1, and on the RoI sizes. The average request rate fordata from a single ROL and the largest individual request rate, calculated as outlined in the pre-vious section, are presented in Table A-4 (for 100 kHz LVL1 accept rate). The average and larg-est individual volume of data requested per ROL by the LVL2 trigger and by the Event Builderfor a given sub-detector are presented in Table A-5. Similar results are given in Table A-6 andTable A-7 for bus-based ROS units (see Section 5.5.4) handling data from 12 ROLs2. Fragmentsof the same event input via different ROLs can be requested by a single message from a bus-based unit (see Chapter 5), and are concatenated and output as a single message. Data Collec-tion and Raw Ethernet wrappers have been taken into account in the data volumes output bythe ROS units.
Results for the processing resources required for the LVL2 trigger, for the number of SFIs, andfor the rates per L2PU and SFI are presented in Table A-8 for a 100 kHz LVL1 rate. The numberof SFIs has been obtained by requiring that the input data volume be no larger than 60 Mbyte/s.As shown in Chapter 8, this data volume can be accommodated with Gigabit Ethernet. Theprocessing resources required for the LVL2 trigger have been calculated using the rates,
Table A-3 Sub-detector data requested by different processing steps of the LVL2 trigger for the different typesof RoIs and associated acceptance factors. The acceptance factors are relative to the LVL1 RoI rate.
Type of RoI First stepAcceptance
factor Second stepAcceptance
factor Third stepAcceptance
factor
EM E.m. calorim-eter
0.19 (design lum.: 0.16)
Hadron calo-rimeter
0.11 (design lum.: 0.16)
TRT /SCT/PixelsHigher & sharper threshold
0.012 (elec-tron)0.006 (pho-tons)
Jet E.m. and hadron calo-rimeters
1.0 Higher & sharper threshold
0.05
Tau E.m. and hadron calo-rimeters
0.20 TRT /SCT/Pixels
0.10 Higher & sharper threshold
0.033
Muon Muon preci-sion and trig-ger detectors
0.39 SCT/Pixels 0.18 E.m. and hadron calo-rimeters
0.10
2. For each sub-detector, groups of 12 ROLs have been formed, without regard for the partitioning of thesub-detector; for cases where the number of ROLs is not a multiple of 12, the ROS unit with less than 12ROLs connected has not been included in the calculation of the averages.
ATLAS Technical Design ReportHigh-Level Trigger, Data Acquisition and Controls 30 June 2003
350 A Paper model results
processing times, and acceptance factors presented in the previous section. The number of LVL2processors obtained also assumes a 77% CPU utilization. It should be emphasized that the relia-bility of these numbers is determined by the quality of the input parameters used. The model-ling gives similar results, based on current hypotheses for input parameters, at designluminosity, for the LVL2 processing requirements and rates per L2PU. At design luminosity thenumber of SFIs increases to 87 due to the increase in event size.
Table A-4 LVL2 request rate (in kHz) for data from a single ROL for a 100 kHz LVL1 accept rate
Luminosity / rateMuon
precisionMuon trigger
E.m. ca-lorimeter
Hadr. ca-lorimeter TRT SCT Pixels
Low / average 0.10 0.22 2.03 1.36 0.19 0.53 0.67
Low / maximum 0.20 0.30 7.42 1.99 0.22 0.74 0.98
Design / average 0.29 0.62 1.74 0.89 0.04 0.79 0.99
Design / maximum 0.57 0.86 6.34 1.30 0.05 1.08 1.42
Table A-5 Data volume (in Mbyte/s) requested per ROL (LVL2 data and data sent to the Event Builder) for a100 kHz LVL1 accept rate
Luminosity / rateMuon
precisionMuon trigger
E.m. ca-lorimeter
Hadr. ca-lorimeter TRT SCT Pixels
Low / average 2.79 1.55 4.29 3.72 1.28 1.42 1.11
Low / maximum 2.88 1.59 8.90 4.26 1.29 1.50 1.20
Design / average 3.40 1.99 4.46 3.74 4.59 5.13 2.70
Design / maximum 3.66 2.10 8.40 4.09 4.60 5.49 2.96
Table A-6 LVL2 request rate (in kHz) per ROS unit (12 ROLs) for a 100 kHz LVL1 accept rate
Luminosity / rateMuon
precisionMuon trigger
E.m. ca-lorimeter
Hadr. ca-lorimeter TRT SCT Pixels
Low / average 0.9 1.9 12.0 9.4 1.0 3.9 5.1
Low / maximum 1.4 2.5 21.5 10.5 1.3 4.3 7.6
Design / average 2.5 5.5 10.4 6.2 0.2 5.7 7.5
Design / maximum 4.1 7.1 18.6 6.9 0.3 6.3 11.2
Table A-7 Output data volume (in Mbyte/s) per ROS unit (12 ROLs) (LVL2 data and data sent to the EventBuilder) for a 100 kHz LVL1 accept rate
Luminosity / rateMuon
precisionMuon trigger
E.m. ca-lorimeter
Hadr. ca-lorimeter TRT SCT Pixels
Low / average 34.6 19.4 54.0 46.9 16.1 18.2 14.5
Low / maximum 35.2 19.8 70.1 50.3 16.2 18.9 15.5
Design / average 42.3 25.2 56.0 46.8 56.5 64.3 34.1
Design / maximum 44.1 26.1 69.7 49.0 56.6 66.9 36.7

ATLAS Technical Design ReportHigh-Level Trigger, Data Acquisition and Controls 30 June 2003
A Paper model results 351
A.3 References
A-1 S. Tapprogge, ATLAS trigger rates and associated physics performance, Presentation to LHCC Meeting, March 2002,http://agenda.cern.ch/askArchive.php?base=agenda&categ=a02381&id=a02381s1t2/transparencies
Table A-8 Overview of paper model results concerning L2PUs and SFIs for a 100 kHz LVL1 trigger rate at lowluminosity
LVL2 farm size (8 GHz dual-CPUs) 495
Fragment rate in = request rate out per L2PU (kHz) 1.8
Event data volume in per L2PU (Mbyte/s) 3.2
Decision rate per L2PU (kHz) 0.20
Number of SFIs required for 60 Mbyte/s input per SFI 59
Event building rate per SFI (Hz) 51
ATLAS Technical Design ReportHigh-Level Trigger, Data Acquisition and Controls 30 June 2003
352 A Paper model results

ATLAS Technical Design ReportHigh-Level Trigger, Data Acquisition and Controls 30 June 2003
B Glossary 353
B Glossary
The glossary has been split into two sections, one with acronyms and their meaning, and anoth-er with actual definitions of some terms.
B.1 Acronyms
API Application Program Interface
ASIC Application Specific Integrated Circuit
ATLAS A Toroidal LHC ApparatuS
BC Bunch Crossing
BCID Bunch Crossing Identifier
BCR Bunch Counter Reset
BE Back-End
CAN Controller Area Network
CBR Constant Bit Rate
CBQ Class Base Queuing
CERN European Laboratory for Particle Physics
CF Connect Forum
CIC Common Infrastructure Controls
CMA Coincidence Matrix
CMC Common Mezzanine Card
CMT Configuration Management Tool
CondDB Conditions Database
ConfDB Configuration Database
CORBA Common Object Request Broker Architecture
COTS Commodity/Commercial Off-The-Shelf
CP Cluster Processor
CSC Cathode Strip Chamber
CTP Central Trigger Processor
DAL Data Access Library
DAQ Data Acquisition System
DBMS Database Management System
DC Data Collection
DCS Detector Control System
DDC DAQ-DCS Communication
ATLAS Technical Design ReportHigh-Level Trigger, Data Acquisition and Controls 30 June 2003
354 B Glossary
DDC-CT DDC Control Transfer
DDC-DT DDC Data Transfer
DDC-MT DDC Message Transfer
DF DataFlow System
DFM Data Flow Manager
DID Destination Identifier
DIG Detector Interface Group
DMA Direct Memory Access
DSP Digital Signal Processor
DSS Detector Safety System
DVS Diagnostics and Verification System
EB Event Builder
EBN EB Network
ECAL Electromagnetic Calorimeter
ECR Event Counter Reset
ED Event Dump
EDM Event Data Model
EF Event Filter
EFD Event Filter Data flow
EFL Event Format Library
EFN EF Network
EFP EF Processor
EH Event Handler
EL1ID Extended Level-1 ID
ELMB Embedded Local Monitor Board
EMB Electromagnetic Barrel
EMEC Electromagnetic Endcap
EMS Event Monitoring Service
ERS Error Reporting Service
ESA European Space Agency
ESS Event Selection Software
FCAL Forward Calorimeter
FDR Final Design Review
FE Front-End
FEC Front-End Controller

ATLAS Technical Design ReportHigh-Level Trigger, Data Acquisition and Controls 30 June 2003
B Glossary 355
FEL Front-End Link
FPGA Field Programmable Gate Array
FSM Finite State Machine
GCS Global Control Station
GID Global event Identifier
HEC Hadronic Endcap Calorimeter
HLT High Level Trigger
HMI Human Machine Interface
HOLA High-speed Optical Link for ATLAS
ID Inner Detector
IDC Identifiable Container
IGUI Integrated Graphical User Interface
ILU Inter-Language Unification system
IOV Interval Of Validity
IP Interaction Point
IPC Inter-Process Communication
IPC_REF_FILE IPC Reference File
IS Information Service
JCOP Joint Controls Project
JDBC Java Database Connectivity
JEP Jet Energy Processor
L1A LVL1 Accept
L1ID LVL1 Accept Identifier
L2N LVL2 Network
L2P LVL2 Processor
L2PU Level-2 Processing Unit (application)
L2SV Level-2 Supervisor
LAr Liquid Argon
LAN Local Area Network
LBSF Local Buffering and Storage Facility
LCG LHC Computing Grid
LCS Local Control Station
LDC Link Destination Card
LHC Large Hadron Collider
LVL1 Level-1 trigger system
ATLAS Technical Design ReportHigh-Level Trigger, Data Acquisition and Controls 30 June 2003
356 B Glossary
LVL2 Level-2 trigger system
LSC Link Source Card
LTP Local Trigger Processor
LUT Look-Up Table
MAC Media Access Control
MDT Monitored Drift Tube
MRS Message Reporting System
MSSM Minimal SuperSymetric Model
MTTF Mean Time To Failure
NIC Network Interface Card
OBK Online Book Keeper
OHS Online Histogramming Service
OKS Object Kernel Support
OLE Object Linking and Embedding
OMG Object Management Group
OPC OLE for Process Control
OSF Online Software Farm
OSN Online Software Network
PCI Peripheral Component Interconnect
PDR Preliminary Design Review
PESA Physics and Event Selection Architecture
PLC Programmable Logic Controller
PMG Process Manager
PP Pre-Processor
pROS pseudo-ROS
PRR Production Readiness Review
PSC PESA Steering Controller
PT Processing Task
QoS Quality of Service
RC Run Control System
RCC ROD Crate Controller
RCM ROD Crate Module
RCP ROD Crate Processor
RCW ROD Crate Workstation
RDO Raw Data Object

ATLAS Technical Design ReportHigh-Level Trigger, Data Acquisition and Controls 30 June 2003
B Glossary 357
RIO Reconstruction Input Object
ROB Read-Out Buffer
ROBIN Read-Out Buffer Input
ROD Read-Out Driver
RoI Region of Interest
RoIB Region of Interest Builder
ROL Read-Out Link
ROS Read-Out Sub-system
RPC Resistive Plate Chamber
RRM ROB to ROS Merging
RT Real Time
RUP Rational Unified Process
SCADA Supervisory Control and DAQ
SCS Sub-system Control Station
SCT Silicon Tracker
SCX Surface control room
SDP Software Development Process
SDX Surface counting room
SERDES SERial DESerialiser
SFI Sub-Farm Input
SFO Sub-Farm Output
SID Source Identifier
S-LINK Simple Link Interface
STL Standard Template Library
STP Spanning Tree Protocol
TBF Token Bucket Filter
TCP/IP Transmission Control Protocol/Internet Protocol
TDAQ ATLAS Trigger and DAQ (including DCS)
TDR Technical Design Report
TES Transient Event Store
TGC Thin Gap Chamber
TOF Time Of Flight
TRT Transition Radiation Tracker
TTC Timing, Trigger and Control (TTC)
TTCrx TTC Receiver
ATLAS Technical Design ReportHigh-Level Trigger, Data Acquisition and Controls 30 June 2003
358 B Glossary
TTCvi TTC VME Interface
UDP/IP User Datagram Protocol/Internet Protocol
URD User Requirements Document
US15 Underground service area
USA15 Underground counting room
UX15 Experimental cavern
VLAN Virtual Local Area Network
XML Extensible Markup Language
B.2 Definitions
ATHENA The ATLAS offline software framework.
Back-End (BE)The part of the DCS system furthest from the detector.
Bunch Counter Reset (BCR)Signal broadcast by the TTC system once per LHC orbit to control thephase of local bunch counters.
Bunch Crossing Identifier (BCID)Number that defines the bunch crossing at which an event occurred.Potential bunch crossings are numbered 0 to 3563 per LHC orbit, startingwith the first following the LHC extractor gap.
Central Trigger Processor (CTP)The part of LVL1 which generates the LVL1 accept.
Conditions database (CondDB)The conditions database contains the record of the detector conditionsrequired for data analysis, e.g. calibration and geometry constants.
Configuration databases (ConfDB)The configuration databases store the parameters necessary to configurethe TDAQ system's hardware and software components, and runningmodes.
Connect Forum (CF)The group within TDAQ coordinating development process activities andQA methodologies across TDAQ, see Section 15.1 for details.
Data Acquisition System (DAQ)The system comprising the DataFlow, Online and Detector Control Sys-tems.
DAQ-DCS Communication (DDC)The component which provides communications between the Online andDCS systems.

ATLAS Technical Design ReportHigh-Level Trigger, Data Acquisition and Controls 30 June 2003
B Glossary 359
DataCollection (DC)A sub-system of the TDAQ DataFlow responsible for the movement ofevent data from the ROS to the HLT. This includes data from RoIs for LVL2Processing, building complete events for the Event Filter and finally trans-ferring accepted events to Mass Storage. It also handles passing the LVL1RoI pointers and the allocation of LVL2 processors and load balancing ofEvent Building. See Section 8.3.2 for details.
DataCollection FrameworkA set of services used by all LVL2 and EB applications, which provides aunified program structure and common interfaces to Configuration Data-base, Run Control and other Online Software services. See Section 8.3.2 fordetails.
Data Flow Manager (DFM)The DFM orchestrates the correct flow of data fragments between ROSsand SFIs. It is triggered by the L2SV and balances the load of event build-ing tasks on the SFIs. See Section 8.3.2 for details.
Data Flow system (DF)TDAQ system comprising the ROS and DC sub-systems.
Detector Control System (DCS)TDAQ system comprising the control of the sub-detectors and of the com-mon infrastructure of the experiment and the communication with theservices of CERN (cooling, ventilation, electricity distribution, safety etc.)and the LHC accelerator. See Chapter 11 for details.
Detector Interface Group (DIG)The group within Technical Coordination which provides coordinationand a forum for communication between TDAQ and the ATLAS detectors.
Diagnostic package (DVS)This element uses the test manager to diagnose problems with the TDAQsystem and confirm its functionality.
EF Processor (EFP)A processor within the EF farm.
Embedded Local Monitor Board (ELMB)A component of the Front-End DCS system, see Section 11.3.1 for details.
Error Reporting Service (ERS)A component of the Online system, see Section 10.3.3.2 for details.
EventAll ROB fragments from the same bunch crossing. Identified by runnumber and GID after event building.
Event Builder (EB)Part of the DF system, it merges all the fragments belonging to a uniqueEL1ID into a full event at a single destination and assigns a GID.
Event Counter Reset (ECR)Signal broadcast by the TTC system to reset the local event counters.
ATLAS Technical Design ReportHigh-Level Trigger, Data Acquisition and Controls 30 June 2003
360 B Glossary
Event Filter (EF)Sub-system of HLT comprising the hardware and software for the finalstage of the online event selection, data monitoring and calibration usingoffline style algorithms operating on complete events accepted by LVL2.
Event Filter Dataflow (EFD)Part of the EF responsible for the flow of event data within the EF.
Event Filter FarmThe farm of processors in which the EF runs. The same farm may also beused for other purposes, e.g. calibration, by running different software onthe farm.
Event Filter Sub-FarmA sub-set of the Event Filter Farm. Input and output are provided, respec-tively, by the SFI and SFO.
Event Filter supervisorThe hardware and software which controls the EF. It is responsible for theconfiguration, initialisation, and overall error handling of the Event Filter.
Event Format Library (EFL)A software library used across TDAQ to pack and unpack event frag-ments.
Event fragmentA generic term for a sub-set of event data. Specific instances of an eventfragment are ROD, ROB, ROS and sub-detector fragments.
Event Handler (EH)The logical object within the EF consisting of an event distributor, an eventcollector, one or more processing elements, an event handler supervisorand an appropriate communication layer.
Event Monitoring Service (EMS)A component of the Online system, see Section 10.3.3.4 for details.
Event Selection Software (ESS)A software component of the HLT, see Section 9.5 for details.
Extended Level-1 ID (EL1ID)The L1ID extended to 32 bits by concatenating an 8 bit ECR counter in thehigh end bits.
Front-End (FE)The part of various systems closest to the detector. Used for example withthe DCS and the detector specific read-out electronics.
GaudiThe software (from LHCb) providing underlying services for ATHENA.
Global Control Station (GCS)A component of the DCS system, see Section 11.4.1 for details.
Global event Identifier (Gid)For a given run, the unique TDAQ wide identifier of an event added to theevent during event building.

ATLAS Technical Design ReportHigh-Level Trigger, Data Acquisition and Controls 30 June 2003
B Glossary 361
Information Service (IS)A component of the Online system, see Section 10.3.3.1 for details.
High Level Triggers (HLT)TDAQ system, comprised of both the LVL2 and EF, the two ATLAS triggerlevels that are implemented primarily in software.
Level-1 Trigger (LVL1)The ATLAS First Level Trigger system provides a hardware based firsttrigger decision using only a sub-set of an event's data (Calorimeter andMuon only). Normally, only the events accepted by LVL1 are transferredfrom the detectors into the HLT/DAQ system.
Level-1 Trigger TypeAn 8-bit word transmitted with the L1A and giving information about thetype of event.
Level-2 FarmThe farm of processors (L2Ps) in which the LVL2 software runs.
Level-2 Sub-FarmA sub-set of the LVL2 farm.
Level-2 Trigger (LVL2)Sub-system of HLT which provides a software based second stage triggerdecision, to reduce the rate of triggers from LVL1 by about a factor of 100.It uses ‘Regions of Interest’ (RoIs) as given by the LVL1 trigger to selec-tively read out only certain parts of the ATLAS detector hardware andcomputes a LVL2 trigger decision.
Link Destination Card (LDC)An implementation of the electronic card for the destination end of a ROL.
Link Source Card (LSC)An implementation of the electronic card for the source end of a ROL.
Local Buffering and Storage Facility (LBSF)The short term disc buffering between the SFO and the offline mass stor-age.
Local Control Station (LCS)A component of the DCS system, see Section 11.4.1 for details.
Local Trigger Processor (LTP)The trigger local to a TTC partition used to generate LVL1 triggers whenthe associated sub-detector is run independently of the CTP.
LVL1 Accept (L1A)LVL1 trigger Accept signal produced by the Central Trigger Processor(CTP) when an event has met the LVL1 trigger criteria. Also in case of par-titioned running the local triggers generated by LTPs.
LVL1 Accept Identifier (L1ID)A L1ID is built at different levels of the read-out system. The TTCrx pro-vides a 24-bit L1ID with each L1A signal. In conjunction with the BCID, itdefines uniquely an event within a small time frame, of order 1 s.
ATLAS Technical Design ReportHigh-Level Trigger, Data Acquisition and Controls 30 June 2003
362 B Glossary
LVL2 Processing Unit (L2PU)The application running on one of the LVL2 processors, hosting the HLTprocessing algorithms which produce the LVL2 trigger decision.
LVL2 Processor (L2P)A processor within the LVL2 farm.
LVL2 Supervisor (L2SV)The interface to the LVL1 system via the RoI Builder. It is responsible fordistributing events to the LVL2 farm/sub-farms and manages the comput-ing resources by means of load balancing algorithms. The L2SV receivesthe final LVL2 decision from the L2PU. The decision results are communi-cated to the DFM so that accepted events can be further analysed, andrejected events can be flushed from the ROS memory. See Section 9.2.3 fordetails.
LVL2 Trigger TypeAn 8-bit word transmitted with the LVL2 decision.
Message Reporting System (MRS)A facility which allows all software components in the ATLAS TDAQ sys-tem to report error messages to other components.
Object Kernel Support (OKS)This is a package which provides a simple active persistent in-memoryobject manager which is used to implement run-time configuration data-bases.
Online BookKeeper (OBK)A component of the Online system, see Section 10.4.1.2 for details.
Online Histogramming Service (OHS)A component of the Online system, see Section 10.3.3.3 for details.
Online Software SystemAll the software for configuring, controlling and monitoring of the TDAQsystem. It excludes the management, processing and transportation ofphysics data.
PartitionsA subdivision of the TDAQ system which can take data. For normal phys-ics data taking the TDAQ will run as a single partition, for calibration andcommissioning it can be split into a number of parallel partitions. SeeSection 3.4 for details.
PESA Steering Controller (PSC)A software component of LVL2 interfacing the ESS to DataCollection partsof the L2PU, see Section 9.2.4.2 for details.
Physics and Event Selection Architecture (PESA)The group in HLT developing and evaluating the event selection strategyand software.
Process Manager (PMG)This element performs basic job control of software components of theTDAQ (starting, stopping, and monitoring basic status).

ATLAS Technical Design ReportHigh-Level Trigger, Data Acquisition and Controls 30 June 2003
B Glossary 363
Processing Task (PT)The application in an EF processor which runs the event selection code.Several PTs can run concurrently on the same processing node.
pseudo-ROS (pROS)The pROS is the unit which receives the detailed LVL2 result from theLVL2 Processing Units for each event to be passed to event building. Atevent building time the pROS is treated just like a ROS, thus including thedetailed LVL2 result into the full event. See Section 8.1.3.4 for details.
Raw Data Object (RDO)An object representation of the raw data from a sub-detector used in theESS, see Section 9.5.2 for details.
Read-Out Buffer (ROB)The buffer which receives data from one ROL.
Read-Out Driver (ROD)The detector specific Front-End Functional element which gathers datafrom the derandomizers over one or more data streams and builds RODfragments of events to be sent to the ROS or RoIB. Gathers data from FrontEnd Boards (FEBs); Sends fragments to ROB or RoIB.
Read-Out Link (ROL)The physical link between ROD and ROS through which the data are sentat the event rate of the LVL1 trigger accept.
Read-Out Sub-system (ROS)Unit which hosts a number of ROBINs.
Read-Out SystemA system of the ATLAS TDAQ comprising the ROS sub-systems andresponsible for receiving data from the RODs and for supplying eventfragments to the LVL2 and EB sub-systems.
Reconstruction Input Object (RIO)An object containing calibrated and clustered raw data from a sub-detectorused in LVL2, see Section 9.5.2 for details.
Region of Interest (RoI)A region limited in eta and phi, indicated by the LVL1 trigger to containcandidates for objects requiring further computation. Some RoI's may bedefined internally within the LVL2 trigger system.
Region of Interest Builder (RoIB)The element which combines RoI information from different parts of LVL1and forwards it to a LVL2 supervisor.
ROBINThe physical card which contains one or more logical ROBs.
ROD crateThe VME crate which houses the RODs. It also includes a standard proces-sor unit for configuration, control and monitoring. The processor is con-nected to a ROD Crate Workstation to provide standalone data acquisitionat the ROD crate level, see Section 8.1.1 for details.
ATLAS Technical Design ReportHigh-Level Trigger, Data Acquisition and Controls 30 June 2003
364 B Glossary
ROD fragmentData fragment provided by one ROD to the Read-Out System (ROS).
ROS fragmentThe set of ROB fragments, within a ROS, with the same Gid to be sent toHLT.
Sub-system Control Station (SCS)A component of the DCS system, see Section 11.4.1 for details.
Sub-Farm Input (SFI)The DataFlow component where complete events are built and then for-warded to the EF.
Sub-Farm Output (SFO)The DataFlow component which receives accepted events from the EF andforwards them for permanent offline storage.
Simple Link Interface (S-LINK)The specification of the protocol and connector pin-out used for the ROL.
TDAQ Run or RunA continuous period in time of data taking using a given hardware andsoftware configuration and a defined set of run parameters. It is identifiedby a unique run number. The run begins when the TDAQ, detectors andother sub-systems are correctly configured and the machine conditions areacceptable. A run terminates either cleanly when the pre-defined goals ofthe run are met (e.g. a certain number of events have been taken) or abortswhen a serious unexpected problem occurs (e.g. loose the beam or themachine conditions are unacceptable etc.) or when the configurationchanges. See Section 3.3 for details.
Timing, Trigger and Control (TTC)The standard hardware system used across the LHC experiments for thedistribution of fast timing, trigger and control signals.
Transient Event Store (TES)An element of the HLT software used to store the transient objects of anevent during processing.

ATLAS Technical Design ReportHigh-Level Trigger, Data Acquisition and Controls 30 June 2003
C Participating Institutes 365
C Participating Institutes
C.1 Authors from participating institutes
The following is the list of institutes which are participating in the ATLAS High-Level Trigger,Data Acquisition, and Detector Control System Collaboration, together with the names of thephysicists and senior engineers concerned. Short names are given for each institute; for the offi-cial name and location see the opening pages of this document.
AlbertaB. Caron, J. de Jong, J.L. Pinfold, R. Soluk, S. Wheeler
ArgonneR.E. Blair, J. Dawson, J. Schlereth
Barcelona - IFAEM. Bosman, M. Dosil, K. Karr1, G. Merino, A. Pacheco, E. Segura
BernH.P. Beck, G. Comune, S. Gadomski2, C. Haeberli, S. Kabana, V. Perez-Reales, K. Pretzl, A. Radu
BucharestE. Badescu, M. Caprini
CERNS. Armstrong, M. Barczyk, J.A.C. Bogaerts, V. Boisvert, D. Burckhart-Chromek, H. Burckhart,M.P. Casado Lechuga, M. Ciobotaru, J. Da Silva Conceicao, J. Cook, P.J. de Matos Lopes Pinto,B. Di Girolamo, R. Dobinson, M. Dobson, N. Ellis, M. Elsing, J. Flammer, D. Francis, S. Gameiro,P. Golonka, B. Gorini, M. Grothe, M. Gruwe, S. Haas, B.I. Hallgren, R. Jones, M. Joos, E. Knezo,G. Lehmann, D. Liko, R. McLaren, T. Maeno, L. Mapelli, B. Martin, C. Meirosu, G. Mornacchi,E. Moyse, C. Padilla, E. Palencia Cortezon, I. Papadopoulos, J. Petersen, A. Poppleton,D. Prigent, S. Rosati, T. Schoerner-Sadenius, S. Stancu, R. Spiwoks, L. Tremblet, E. van der Bij,F. Varela, T. Wengler, P. Werner
CopenhagenH. Bertelsen, M. Dam, J.R. Hansen, A. Wäänänen
CracowZ. Hajduk, W. Iwanski, A. Kaczmarska, K. Korcyl, J. Olszowska, M. Zurek
GenevaA. Clark, M. Diaz Gomez3, L. Moneta4, I. Riu, A. Straessner
GenoaM. Cervetto, P. Morettini, F. Parodi, C. Schiavi
1. now at Argonne
2. on leave from H. Niewodniczanski Inst. of Nuclear Physics, Cracow
3. now at CERN
4. now at CERN
ATLAS Technical Design ReportHigh-Level Trigger, Data Acquisition and Controls 30 June 2003
366 C Participating Institutes
Hiroshima Institute of TechnologyY. Nagasaka
InnsbruckB. Epp, V.M. Ghete, E. Kneringer, D. Kuhn, A. Nairz5, A. Salzburger, A. Wildauer
JINRI. Alexandrov, S. Korobov, V. Kotov, M. Mineev, V. Tryanin, D. Yanovich
KEKH. Fujii, A. Manabe, K. Nakayoshi, Y. Watase, Y. Yasu
Lancaster UniversityM. Smizanska
LecceG. Cataldi, G. Chiodini, E. Gorini, M. Primavera, S. Spagnolo
Lisbon FCULA. Amorim, N. Barros, D. Klose, J. Lima, C. Oliveira, L. Pedro, J. Villate, H. Wolters
LNF, FrascatiM. Beretta, M.L. Ferrer, W. Liu, I. Sfiligoi
London RHULS. George, B. Green, A. Lowe, A. Misiejuk, J. Strong, P. Teixeira-Dias
London UCLP. Clarke, R. Cranfield, G. Crone, J. Drohan, N. Konstantinidis, M. Muller
MainzL. Koepke
ManchesterR.E. Hughes-Jones
MannheimC. Hinkelbein, A. Khomich, A. Kugel, R. Männer, M. Müller, M. Yu
MarseilleC. Bee, F. Etienne, C. Meessen, Z. Qian, C. Serfon, F. Touchard
Michigan StateM. Abolins, R. Brock, Y. Ermoline, R. Hauser, B.G. Pope
Moscow SUN. Nikitin, S. Sivoklokov, L. Smirnova
NagasakiM. Shimojima, Y. Tanaka
5. now at CERN

ATLAS Technical Design ReportHigh-Level Trigger, Data Acquisition and Controls 30 June 2003
C Participating Institutes 367
NaplesM. Biglietti, G. Carlino, F. Conventi, L. Merola
NIKHEFM. Barisonzi6, H. Boterenbrood, R.G.K. Hart, W.P.J. Heubers, P.P.M. Jansweijer, G.N.M. Kieft,R. Scholte7, J.C. Vermeulen
PaviaR. Ferrari, A. Negri, G. Polesello, D.A. Scannicchio, V. Vercesi
Petersburg NPIV. Filimonov, S. Katunin, A. Kazarov, V. Khomutnikov, S. Kolos, Y. Ryabov, I. Soloviev
Prague AS & CUJ. Chyla, J. Dolejsi
RALJ.T.M. Baines, D.R. Botterill, W. Li, F.J. Wickens
Rio de JaneiroA. dos Anjos, M. Losada Maia, A.G. Mello, J.M. de Seixas
Rome IA. Di Mattia, S. Falciano, C. Luci, L. Luminari, F. Marzano, A. Nisati, E. Pasqualucci
Rome IIIP. Branchini, A. Farilla, C. Stanescu
ShinshuY. Hasegawa, T. Takeshita
Tel AvivH. Abramwicz, Y. Benhammou, E. Etzion
Univ. California IrvineA.J. Lankford, R. Mommsen, S. Pier, M. Schernau
Weizmann Institute of ScienceD. Lellouch, L. Levinson
WisconsinS. Gonzalez, W. Wiedenmann, S.L. Wu, N. Xu, H. Zobernig
6. also University of Twente
7. also University of Twente
ATLAS Technical Design ReportHigh-Level Trigger, Data Acquisition and Controls 30 June 2003
368 C Participating Institutes
C.2 Authors from non-participating institutes
The following is the list of authors belonging to institutes which are not participating in theATLAS High-Level Trigger, Data Acquisition, and Detector Control System Collaboration.
K. Assamagan BrookhavenD. Cavalli INFN MilanoW. Krasny LPNHE, Université Pierre et Marie Curie, ParisM. Le Vine BrookhavenH. Ma BrookhavenS. Rajagopalan BrookhavenG. Stavropoulos Berkeley LBNL & UCS. Tapprogge HelsinkiA. Watson BirminghamM. Wielers Grenoble

ATLAS Technical Design ReportHigh-Level Trigger, Data Acquisition and Controls 30 June 2003
C Participating Institutes 369
ATLAS Technical Design ReportHigh-Level Trigger, Data Acquisition and Controls 30 June 2003
370
This document has been prepared with Release 6.0 of the Adobe FrameMaker® Technical Publishing System using the Technical Design Report template prepared by Mario Ruggier of the Information and Programming Techniques Group, ECP Division, CERN, according to requirements from the ATLAS collaboration.
To facilitate multiple author editing and electronic distribution of documents, only widely available fonts have been used. The principal ones are:
Running text: Palatino 10.5 point on 13 point line spacing Chapter headings: Helvetica Bold 18 point 2nd, 3rd and 4th level headings: Helvetica Bold 14, 12 and 10 point respectively Figure and table captions: Helvetica 9 point