
Conceptualisation of a big data maturity model based on ...
289
Conceptualisation of a big data maturity model based on organisational decision making Suzanne Myburgh Student number: 24128946 A research project submitted to the Gordon Institute of Business Science, University of Pretoria, in partial fulfilment of the requirements for the degree of Master of Business Administration. 9 November 2015
-
Upload
khangminh22 -
Category
Documents
-
view
6 -
download
0
Transcript of Conceptualisation of a big data maturity model based on ...
Conceptualisation of a big data maturity model
based on organisational decision making
Suzanne Myburgh
Student number: 24128946
A research project submitted to the Gordon Institute of Business Science,
University of Pretoria, in partial fulfilment of the requirements for the degree of
Master of Business Administration.
9 November 2015
Conceptualisation of a big data maturity model based on organisational
decision making
2015
i
ABSTRACT
A big data maturity model, based on the usage of big data analytics in organisational
decision making was conceptualised and then tested amongst the executives of South
African listed companies.
Business leaders cannot afford to ignore the potential value of big data. All
organisations haven’t equally mastered big data analytics, and varied scales of maturity
exist regarding how big data is being used in organisational decision making.
Therefore, a clear requirement for an empirically tested big data maturity model has
been identified.
A deductive reasoning approach was used, and several proposed measures of maturity
based on the literature were tested through a cross-sectional qualitative research study
by employing in-depth and expert interviews. Data was analysed through a
combination of content and thematic analysis.
A revised big data maturity model was developed which provides a comprehensive
guide for how big data can be assessed in terms of the decision making and
knowledge management literature. By applying the model managers should identify the
required activities that need to be present at each level of maturity, which will greatly
aid them in identifying necessary improvements to their big data efforts, and therefore
how to unlock the potential value that big data can offer.
KEYWORDS
Big data, maturity model, decision making

Conceptualisation of a big data maturity model based on organisational
decision making
2015
ii
DECLARATION
Conceptualisation of a big data maturity model based on organisational
decision making
2015
iii
TABLE OF CONTENTS
ABSTRACT ................................................................................................................... I
KEYWORDS .................................................................................................................. I
DECLARATION ............................................................................................................ II
LIST OF FIGURES .................................................................................................... VIII
LIST OF TABLES ........................................................................................................ X
CHAPTER 1: INTRODUCTION .............................................................................. 1
1.1 Research Title ..................................................................................................... 1
1.2 Research Problem .............................................................................................. 1
1.3 Research Aim ..................................................................................................... 4
1.4 Research Methodology ....................................................................................... 5
1.5 Research Findings .............................................................................................. 6
1.6 Conclusion to Chapter 1 ...................................................................................... 7
CHAPTER 2: LITERATURE REVIEW .................................................................... 8
2.1 Big Data .............................................................................................................. 8
2.1.1 Big data defined ............................................................................................................. 8
2.1.2 Potential value of big data analytics .............................................................................10
2.1.3 Common challenges related to big data analytics .......................................................13
2.2 Maturity Models Literature Base .........................................................................13
2.2.1 Maturity models overview .............................................................................................14
2.2.2 Big data maturity models ..............................................................................................17
2.2.3 Process, people and object maturity ............................................................................18
2.3 Knowledge Management ....................................................................................20
2.3.1 Data, information and knowledge applied to big data analytics ...................................20
2.3.2 Knowledge and knowledge management ....................................................................20
2.4 Decision Making in Organisations ......................................................................23
2.4.1 Theoretical overview of decision literature ...................................................................23
2.4.2 Decision making defined ..............................................................................................25
2.4.3 Basic model of the decision making process ...............................................................25
2.4.4 Decision context and complexity ..................................................................................25
2.5 South African Context ........................................................................................28
2.5.1 Business environment contextual facts ........................................................................28
Conceptualisation of a big data maturity model based on organisational
decision making
2015
iv
2.5.2 Implications for big data analytics maturity ..................................................................29
2.6 Literature Review Conclusion .............................................................................30
CHAPTER 3: RESEARCH PROPOSITIONS ........................................................ 32
3.1 Proposition 1: Object, Process or People focus as a signal of big data maturity .32
3.2 Proposition 2: Big data, information and knowledge as a signal of big data
maturity .......................................................................................................................33
3.3 Proposition 3: Presence and sophistication of knowledge management activities
as a signal of big data maturity ....................................................................................33
3.4 Proposition 4: Interpretation of the decision context as a signal of big data
maturity .......................................................................................................................33
3.5 Proposition 5: The ability to correctly identify the decision context as a signal of
big data maturity ..........................................................................................................34
3.6 Proposition 6: The ability to correctly identify the information requirements based
on the decision complexity as a signal of big data maturity ..........................................34
3.7 Proposition 7: The ability to present the right information based on the decision
context as a signal of big data maturity ........................................................................35
3.8 Conceptual Big Data Maturity Model ..................................................................36
CHAPTER 4: RESEARCH METHODOLOGY ....................................................... 37
4.1 Research Approach ...........................................................................................37
4.1.1 Research philosophy ....................................................................................................37
4.1.2 Deductive reasoning .....................................................................................................38
4.2 Research Design ................................................................................................39
4.2.1 Cross-sectional study ...................................................................................................39
4.2.2 Qualitative research .....................................................................................................39
4.2.3 Use of in-depth and expert interviews ..........................................................................40
4.3 Universe and Sampling ......................................................................................41
4.3.1 Unit of analysis .............................................................................................................41
4.3.2 Primary universe, sample and sampling methodology ................................................41
4.3.3 Secondary universe, sample and sampling methodology ............................................43
4.4 Measurement Instrument ...................................................................................45
4.4.1 Semi-structured, face-to-face interviews ......................................................................45
4.4.2 Interview guide and researcher’s approach .................................................................46
4.5 Data Collection Process .....................................................................................48
4.6 Data Analysis Approach .....................................................................................49
Conceptualisation of a big data maturity model based on organisational
decision making
2015
v
4.7 Assumptions ......................................................................................................50
4.8 Research Limitations ..........................................................................................50
CHAPTER 5: RESULTS ....................................................................................... 53
5.1 Overview of Sample ...........................................................................................53
5.2 Data Analysis .....................................................................................................59
5.2.1 Data preparation ...........................................................................................................59
5.2.2 Import of documents into analysis software, Atlas.ti ....................................................59
5.2.3 Data analysis approach ................................................................................................59
5.2.4 Tests for saturation .......................................................................................................60
5.2.5 Data verification ............................................................................................................62
5.2.6 Content analysis approach ...........................................................................................63
5.2.7 Threats to reliability and validity ...................................................................................64
5.3 General Findings and Observations ...................................................................64
5.4 Proposition 1: Object, Process or People focus as a signal of big data maturity .67
5.4.1 Object focus definition and coding ...............................................................................67
5.4.2 Process focus definition and coding .............................................................................70
5.4.3 People focus definition and coding ..............................................................................72
5.4.4 Object, process and people focus: Total View .............................................................76
5.4.5 Object, process and people focus: High vs low share price view ................................81
5.4.6 Object, process and people focus – Industry view .......................................................84
5.4.7 Objects, process and people focus: Summary and conclusion ...................................96
5.5 Proposition 2: Big data, information and knowledge as a signal of big data
maturity ..................................................................................................................... 102
5.5.1 Big data definition and coding ....................................................................................102
5.5.2 Information definition and coding ...............................................................................104
5.5.3 Knowledge from big data definition and coding .........................................................105
5.5.4 Big data, information and knowledge: Total view .......................................................107
5.5.5 Big data, information and knowledge: High vs low share price view .........................114
5.5.6 Big data, information and knowledge: Industry view ..................................................115
5.5.7 Big data, information and knowledge: Summary and conclusion ..............................124
5.6 Proposition 3: Presence and sophistication of knowledge management activities
as a signal of big data maturity .................................................................................. 129
5.6.1 Knowledge management definition and coding .........................................................130
5.6.2 Knowledge management activities: Total view ..........................................................132
5.6.3 Knowledge management: High vs low share price view ............................................135
Conceptualisation of a big data maturity model based on organisational
decision making
2015
vi
5.6.4 Knowledge management: Industry view ....................................................................138
5.6.5 Knowledge management: Summary and conclusion .................................................142
5.7 Propositions 4-7: Use of data during decision making ...................................... 146
5.7.1 Use of data during decision making definitions and coding .......................................147
5.7.2 Use of data during decision making: Total view .........................................................153
5.7.3 Use of data during decision making: High vs low share price....................................160
5.7.4 Use of data during decision making: Industry view ....................................................164
5.7.5 Use of data during decision making: Summary and conclusion ................................178
5.8 Conclusion of Results....................................................................................... 183
CHAPTER 6: DISCUSSION OF RESULTS ........................................................ 184
6.1 Proposition 1: Object, Process or People focus as a signal of big data maturity
184
6.2 Proposition 2: Big data, information and knowledge as a signal of big data
maturity ..................................................................................................................... 188
6.3 Proposition 3: Presence and sophistication of knowledge management activities
as a signal of big data maturity .................................................................................. 194
6.4 Proposition 4-7: Use of data during decision making ........................................ 197
6.5 Big Data Maturity Model ................................................................................... 201
6.5.1 Original proposed big data maturity model ................................................................201
6.5.2 Additions and amendments to the original big data maturity model ..........................202
6.5.3 Revised big data maturity model ................................................................................205
6.5.4 Verification of the revised big data maturity model ....................................................206
CHAPTER 7: CONCLUSION .............................................................................. 208
7.1 Key Contributions ............................................................................................. 208
7.2 Implications for Management ........................................................................... 208
7.3 Limitations of the Research .............................................................................. 209
7.4 Suggestions for Future Research ..................................................................... 211
REFERENCES .......................................................................................................... 214
APPENDICES ........................................................................................................... 223
Appendix 1: Ethics Clearance and Consent Statements ............................................ 223
Appendix 2: Interview Guide ...................................................................................... 254
Appendix 3: Industry structure and definitions ........................................................... 256
Appendix 4: FTSE/JSE classification structure .......................................................... 281
Appendix 5: Primary Sampling Frame ....................................................................... 292

Conceptualisation of a big data maturity model based on organisational
decision making
2015
vii
Appendix 6: Sample and respondent profiles ............................................................ 301
Appendix 7: Codebook .............................................................................................. 303
Conceptualisation of a big data maturity model based on organisational
decision making
2015
viii
LIST OF FIGURES
Figure 1: Conceptual big data maturity model .............................................................36
Figure 2: Total industry classification of respondents ..................................................54
Figure 3: High versus low share price across industries of respondents ......................55
Figure 4: Regional classification of respondents ..........................................................56
Figure 5: Respondents' seniority according to job title .................................................57
Figure 6: Respondents’ seniority per industry ..............................................................58
Figure 7: Code creation around pre-defined themes over the course of transcript
analysis (code saturation) ............................................................................61
Figure 8: New codes created outside of predefined themes over the course of transcript
analysis (data saturation) ............................................................................62
Figure 9: Total view of Object, Processes and People .................................................76
Figure 10: Co-occurrence of process codes ................................................................79
Figure 11: Co-occurrences of people codes ................................................................79
Figure 12: High vs Low share price view of Objects, Processes and People ...............81
Figure 16: Industry view of Objects, Processes and People ........................................84
Figure 14: Big data, information and knowledge total view ........................................ 107
Figure 15: Data co-occurrence codes ........................................................................ 110
Figure 16: Information co-occurrence codes.............................................................. 112
Figure 17: Knowledge co-occurrence codes .............................................................. 113
Figure 18: High and low share price view of data, information and knowledge .......... 115
Figure 19: Industry view of data, information and Knowledge .................................... 115
Figure 20: Knowledge management co-occurrences ................................................. 134
Figure 21: Knowledge management high vs low share price groups ......................... 135
Figure 22: Knowledge management industry view .................................................... 138
Figure 23: Data during decision making total view ..................................................... 153
Figure 24: Data during decision making co-occurrences ........................................... 155
Figure 25: Data during decision making high vs low share price view ....................... 160
Figure 26: Data during decision making industry view ............................................... 164
Figure 27: Identify decision context manufacturing, resources and retail ................... 169
Figure 28: Conceptual big data maturity model (original) ........................................... 201

Conceptualisation of a big data maturity model based on organisational
decision making
2015
ix
Figure 29: Revised big data maturity model .............................................................. 205
Conceptualisation of a big data maturity model based on organisational
decision making
2015
x
LIST OF TABLES
Table 1: Transcripts naming convention ......................................................................59
Table 2: Objects Low vs High Share Price word cloud ................................................83
Table 3: Objects Qlickview and information co-occurrence ..........................................83
Table 4: Objects view Communications vs Financial Services .....................................88
Table 5: People view Financial Services, Resources and Retail ..................................92
Table 6: Process view resources versus financial services ..........................................95
Table 7: Raw data review in retail, manufacturing and communications and media... 119
Table 8: Information view in resources and communication ....................................... 122
Table 9: Knowledge in manufacturing and resources ................................................ 124
Table 10: Knowledge management in high and low share price groups .................... 138
Table 11: Knowledge management financial services and manufacturing ................. 142
Table 13: Correct identification of the decision context: Manufacturing, resources and
retail .......................................................................................................... 172
Table 14: Identification of information requirements: Manufacturing, resources and
retail .......................................................................................................... 173
Table 15: Presentation of the right information: Retail and financial services............. 176
Table 16: Business big data maturity model comparison ........................................... 206
Conceptualisation of a big data maturity model based on organisational
decision making
2015
1
CHAPTER 1: INTRODUCTION
1.1 Research Title
Conceptualisation of a big data maturity model based on organisational decision
making.
1.2 Research Problem
Organisations today are drowning in a sea of data that is either too voluminous or too
unstructured to be managed and analysed through traditional means (Davenport,
Harris, De Long, & Jacobson, 2001; Davenport, Barth, & Bean, 2012; World Economic
Forum, 2013). It is vital for organisations to be able to remove the noise from big data
(Qin & Li, 2013) in order to extract the necessary value from it, as business leaders can
no longer afford to ignore the "business and economic possibilities of big data and its
wider implications” (McKinsey Global Institute, 2011:4).
Although big data first appeared in academic literature in 2001, it really only received
much attention after 2007 (Goes, 2014). The majority of the big data literature related
to the fields of science and engineering (Qin, 2014; Wen, Guo-min, Tian-jun, & Xin-ju,
2013; Zhong, Zhang, Xing, Li, & Beili Wan, 2014), market research (Barbu, 2013;
Liebenson, 2012; Terhanian, 2013), healthcare (Chawla & Davis, 2013; Murdoch &
Detsky, 2013), financial services (Bennett, 2013), as well as marketing and advertising
(Bartram, 2013; Kumar, V., Chattaraman, V., Neghina, C., Skiera, B., Aksoy, L., Buoye,
A., & Henseler, J., 2013; Micheaux, 2013 ). The existing literature mostly described the
phenomena of big data, included a few use cases and anecdotal references regarding
the potential value thereof. Practical guidance concerning how to leverage big data or
improve an organisation’s big data efforts is lacking in the literature.
A myriad of opportunities exist for further academic research concerning big data
(Chen, Chiang, & Storey, 2012; Goes, 2014). There is a view that management
scholars needs to discover how ubiquitous data can generate new sources of value, as
Conceptualisation of a big data maturity model based on organisational
decision making
2015
2
well as expound on the routes through which such value is manifested (mechanisms of
value creation) (George, Haas, & Pentland, 2014).
For the past two decades, there has been an increased focus on big data as a source
of competitive advantage in the business and academic literature; for example Glazer
(1991) referred to big data as an asset with significant marketplace value. More
recently, the conceptualisation and opportunity identification of big data has exploded,
as several authors such as Bartram (2013), Davenport et al. (2001), Erickson and
Rothberg (2014), Goes (2014), LaValle, Lesser, Shockley, Hopkins, and Kruschwitz
(2011), and McAfee and Brynjolfsson (2012) all referenced a correlation between a
company’s financial performance and its ability to turn data into actionable insights.
Unfortunately not all organisations are equally adept with regard to big data analytics,
and varied scales of maturity exist regarding how data and insights are being used in
organisational decision making (Kaner and Karni, 2004). Even those organisations that
have succeeded in transforming data into results have only done so in limited areas
(Davenport et al., 2001; McAfee & Brynjolfsson, 2012). Several authors, such as
Bartram (2013), LaValle et al. (2011) and McAfee and Brynjolfsson (2012) strongly
advised that organisations realise the opportunity of big data due to the great
competitive advantage it can provide.
The first port of call for big data maturity models centers in IT and knowledge
management. Despite the hundreds of maturity models that have been published
around IT or knowledge management (Becker, Knackstedt, & Pöppelbuß, 2009;
Lahrmann, Marx, Winter, & Wortmann, 2011; Mettler, Rohner, & Winter, 2010; Rajteric,
2010) none of these models to date have addressed the issue of big data. Such a
perspective is vital to assist organisations in understanding their relative big data
maturity in relation to other organisations, as well as guide organisations around the
required criteria and characteristics that need to be fulfilled to reach a particular
maturity level (Becker et al., 2009).
It is also unclear how relevant the current business intelligence and knowledge
management maturity models such as the works of Kaner and Karni (2004) and
McKenzie, van Winkelen and Grewal (2011) are to the field of big data analytics.
Conceptualisation of a big data maturity model based on organisational
decision making
2015
3
Although the principles of big data analytics are similar to that of traditional data
analytics (McAfee & Brynjolfsson, 2012), organisations struggle to extract the value
from these and adequately manage the information due to increased complexity as a
result of the vast volume, variety and velocity of big data (Bartram, 2013). There is a
clear requirement for new system design and management principles as well as new
methodologies concerning the use of big data (Gosain & Chugh, 2014) as the old
traditional knowledge management approaches no longer suffice (Erickson &
Rothberg, 2014; McAfee & Brynjolfsson, 2012).
Given the relative recentness of big data as a concept, it is not surprising that
academic research on big data analytics in the South African context is sorely lacking,
with the only visible available sources being from industry analysts such as the
McKinsey Report (McKinsey Global Institute, 2011) as well as the World Economic
Forum (World Economic Forum, 2013). Several contextual factors in the South African
business environment pose certain challenges for knowledge and information
management, such as the oversupply of labour, skills shortage, cultural differences and
language barriers combined with a diverse workforce, as well as the limited application
of technology in organisations due to the relatively high broadband costs (Conger,
2014; Ndlela & du Toit, 2001; Plessis & Boon, 2004; World Economic Forum, 2013).
Lastly, although business leaders in South African organisations might understand the
strategic importance of knowledge management, in most cases they are only able to
apply it on an operational level (Ndlela & du Toit, 2001; Plessis & Boon, 2004, World
Economic Forum, 2013). These contextual factors and management challenges
present in the South African environment are typical of other emerging markets.
There is therefore a clear necessity for an empirical big data maturity model, drawing
from literature on knowledge management and decision making, which will aid
organisations in emerging markets such as South Africa to understand how mature
they are in terms of the application of big data analytics during organisational decision
making.
Conceptualisation of a big data maturity model based on organisational
decision making
2015
4
1.3 Research Aim
The aim of this research paper was to conceptualise a big data maturity model for
emerging markets, based on how big data analytics is used in organisational decision
making in South Africa.
As big data maturity models have not yet been specifically covered in the academic
literature, a big data maturity model has been conceptualised in this research paper
based on previous literature concerning big data, maturity models, knowledge
management and decision making. Various big data maturity propositions were
explored during in-depth and expert interviews with C-level executives from South
African organisations in order to verify the maturity dimensions as well as explore any
additional dimensions that might arise from the research.
The research objectives include:
Conceptualise a big data maturity model for emerging markets, based on
previous literature on related topics such as business intelligence, knowledge
management as well as the decision making literature.
Verify the dimensions of maturity as proposed in the maturity model, through in-
depth and expert interviews. Any new dimensions that were not previously
identified in the literature but surfaced during the interviews were added to the
big data maturity model.
Verify findings through data and theory triangulation.
The detailed findings for each industry or specific groups such as companies with both
high and low share prices were included to provide diversity of input and rich insights
around the phenomena of big data analytics. The aims of this research paper did not
include the detailed analysis of the big data maturity in particular organisations or
industries, and therefore the findings did not include the plotting of the various
industries or companies in general in terms of their big data maturity.
Conceptualisation of a big data maturity model based on organisational
decision making
2015
5
1.4 Research Methodology
Interpretivism was adopted as the research philosophy for this research paper, which
relates to the study of phenomena in their natural environment (Saunders & Lewis,
2012) in order to gain an understanding of what is happening in a specific context
(Carson, Gilmore, Perry, & Gronhaug, 2001). In this paper the conceptual big data
maturity model that has been compiled based on the preceding literature, was used as
a guide to study the phenomena of big data maturity in organisations. Deductive
reasoning was used during which a theoretical proposition based on the literature, in
this case the conceptual big data maturity model, was tested through a research
strategy designed to perform this test, in this case, qualitative interviews (Saunders &
Lewis, 2012; Stentoft Arlbjørn & Halldorsson, 2002).
The study was cross-sectional, as the information was collected at a specific point in
time (Saunders & Lewis, 2012). The research was exploratory in nature, during which
qualitative research methods namely in-depth and expert interviews were utilised as
part of the core research strategy.
In terms of the sampling method, a combination of topic experts and non-experts were
interviewed in the form of in-depth discussions with senior executives of various
organisations around the use of big data during decision making. The key informant
technique was used during this research study, during which respondents were
interviewed specifically as a result of their personal skills, or position within the
organisations, and their ability to provide more information and provide a deeper insight
about their environments (Burgess, 1989).
The primary sample, selected through judgment sampling, comprised of companies
that were listed on the Johannesburg Stock Exchange as of January 2015 and these
were classified in one of five industries, namely (1) financial services, (2)
communications and media, (3) manufacturing, (4) resource and (5) retail industries.
The primary sample included two companies from each of these five industries; thus a
minimum of ten companies were selected, one company that had one of the highest
share prices in the industry as of January 2015 and one company that had one of the
lowest share prices in the industry as of January 2015. The secondary sample, also
Conceptualisation of a big data maturity model based on organisational
decision making
2015
6
selected through judgment sampling, included C-level executives who were employed
at the selected companies for at least 6 months, and these executives had the
responsibility of managing strategic decision or at the very least, exposure to strategic
decisions.
The long interview approach by McCracken (1988) was used. The data analysis
approach used was a combination of content and thematic analysis, during which
several categories, derived from the theoretical model, in this case the big data
maturity model, was used to analyse the data, or transcripts (Flick, 2009; Patton,
2002). Main themes, according to the codebook were also identified during the analysis
of the transcripts.
This information was used to extract insights about the relevance of the proposed
conceptual model as well as identify potential new variables for inclusion. A revised big
data maturity model was then presented based on these findings.
1.5 Research Findings
From the results, it was clear that no consensus concerning the definition of big data
exists amongst executives, which in itself signified a lack of maturity amongst
executives. However, there was a sense of urgency and excitement of big data for the
majority of the respondents
It was found that the big data maturity model as presented in this research paper
includes relevant measures of maturity, based on the literature, the results from the
field research, as well as commonalities with some of the big data maturity models that
could be found in the business literature. However the big data maturity model in this
paper is much more comprehensive and more useful as detailed levels of maturity
have been outlined under each of the main measures of maturity.
Conceptualisation of a big data maturity model based on organisational
decision making
2015
7
1.6 Conclusion to Chapter 1
In conclusion, the literature as well as business big data maturity models provided
several cues for the various dimensions of maturity, but these did not contain much
detail about each of these measures, thereby encouraging a check box approach. The
big data maturity model presented in this research paper includes significant detail for
each level of maturity.
The big data maturity model presented in this research paper therefore provides a
comprehensive guide that managers can use to evaluate the maturity of their big data
analytical efforts, as detailed signals of maturity and various layers of maturity are
presented in the model. Through the application of the model managers should then
also be able to identify the required activities that need to be present at each level of
maturity, which will greatly aid them in identifying how to improve their big data efforts,
i.e. how to become more mature, and therefore how to unlock the potential value that
big data can offer.
Conceptualisation of a big data maturity model based on organisational
decision making
2015
8
CHAPTER 2: LITERATURE REVIEW
During the literature review, the main academic sources concerning big data were
reviewed to establish a definition of big data, to determine the potential value that big
data can provide, as well as to ascertain the most prevalent challenges of big data.
A thorough review was then conducted concerning the various maturity models that
have been published in the academic literature, including the most widely cited model,
the capability maturity model published by Paulk, Curtis, Chrissis and Weber (1993).
Other relevant maturity models related to knowledge management, business
intelligence maturity models, and data maturity models were also reviewed to identify
transferrable attributes that can be used to conceptualise a big data maturity model.
The fields of knowledge management and decision making theory were then
investigated to identify potential variables that can be used as a signals of big data
maturity. Lastly, as the study was conducted in South Africa, the South African
business environment and context was reviewed to identify specific nuances as a result
of the geographic location of the study.
2.1 Big Data
2.1.1 Big data defined
Glazer (1991) argued that increased technology adoption and information storing and
processing speed, as well as the emergence of new types of information, has given
rise to the emergence of big data. However in recent years, the data phenomenon has
changed and grown exponentially as the volumes, speed, storage and analytical ability
of Glazer’s time were significantly contrived. For example Strenger (2008) stated that
the massive growth of data volumes has resulted in the term “big data” being coined,
whilst Cohen, Dolan, Dunlap, Hellerstein and Welton (2009) argued that the increased
affordability of data acquisition and storage has played an immense role in the
increased focus on data big data analytics.

Conceptualisation of a big data maturity model based on organisational
decision making
2015
9
Gobble (2013), in contrast, emphasised that the emergence of big data analytics as a
new discipline can be attributed to the proliferation of devices that acquire, process and
generate data; the “Internet of Things”. It can be argued however, that it is not one
single factor but a combination of several advances in both information and
communication technologies that has contributed to the emergence of big data
analytics (Cohen et al., 2009; Glazer, 1991; World Economic Forum, 2013).
Although several definitions for big data have been provided, there does not seem to
be any consensus regarding the attributes of big data that distinguishes it from
traditional analytical disciplines. The majority’s opinion is that big data is unique as a
result of the volume (there is too much of it), velocity (the speed at which it evolves),
variety (it is not structured in a usable way) and veracity (it is challenging to ascertain
the accuracy, credibility or truthfulness) of the data (Aman, Chelmis, & Prasanna, 2014;
Gobble, 2013; Goes, 2014; Lukoianova & Rubin, 2014; McAfee & Brynjolfsson, 2012).
Other authors were of the opinion that it is the “techniques and technologies that make
handling data at extreme scale affordable” that is unique to big data (Hopkins &
Evelson, 2012). Yet another view was that it is the relationality of big data that is
unique, as a result of the “patterns that can be derived by making connections between
pieces of data, about an individual, about individuals in relation to others, about groups
of people, or simply about the structure of information itself” (Boyd & Crawford,
2012:2).
As illustrated, there is no single universal definition for big data. The majority of the
definitions either refer to the volume, variety and veracity of the data, or the new
technologies and techniques that are required to analyse big data, or the unique
insights and patterns that can be derived from the data. It can therefore be argued that
no single definition is correct or incorrect, and a combination of these dimensions can
be applied to differentiate big data from traditional data.
The debate concerning the unique attributes of big data analytics that distinguishes it
from traditional knowledge management or business intelligence disciplines further
confuses business executives about how to approach big data to extract the necessary
value from it (Vriens & Brazell, 2013). In general, most companies struggle with how to
Conceptualisation of a big data maturity model based on organisational
decision making
2015
10
capture and analyse big data; as an example, only half a percent of the big data that
organisations have access to being analysed for insights (Bradley, Barbier, & Handler,
2013). Even in those isolated cases where big data analytics are being employed,
business executives struggle with how to extract the necessary value from the data as
they are unclear about the data’s use (Davenport et al., 2001; Qin & Li, 2013).
An easy solution to overcome these challenges can be to approach big data analytic as
an outcomes-based process, focused on the use and application of big data during
organisational decision making (Erickson & Rothberg, 2014). By utilising insights from
big data as an input into decisions, the information requirements would be defined
upfront (Malakooti, 2012) which would help distinguish between the “noise” and
essential information (Qin, 2014). According to this outcomes-based definition, the
value of big data would be defined according to outcome, which is the quality of the
decision (McKenzie et al., 2011) as well as the impact or result of the decision (Bennet
& Bennet, 2008) and therefore it would be easy for business executives to directly
measure the value and worth of big data for the organisation (Erickson & Rothberg,
2014).
Not all organisations are equally adept at big data analytics, and varied scales of
maturity exist regarding how data and insights are being used in organisational
decision making (Kaner and Karni, 2004). It can therefore be assumed that should
companies become more mature with regard to their big data analytics, specifically
concerning the use of big data during decision making, organisational performance
should improve as a result of improved decision making in the organisation as well as
improved outcomes from the various decisions. The focus of this research paper was
mainly concerned with the conceptualisation of a big data maturity model. The
measurement of improved decisions as a result of the use of big data during decision
making was not addressed in this paper, but can be considered for future research
exploration.
2.1.2 Potential value of big data analytics
Several mentions of data, information and knowledge leading to a competitive
advantage were found in the literature. Various authors anecdotally stated that a
Conceptualisation of a big data maturity model based on organisational
decision making
2015
11
definite link exists between the effective use of information and knowledge
management within an organisation and organisational performance, either through a
direct impact of efficiencies being created, improved organisational performance, or an
indirect impact of improved decisions as a result of utilising data as an input into the
decision process.
For example, Glazer (1991:2) commented that "knowledge or information itself can be
viewed as an asset in its own right, often with significant marketplace value".
Davenport et al. (2001:117) elaborated that value could be extracted as they
mentioned that several companies had “succeeded in turning data into results” and
Bennet and Bennet (2008:405) broadly mentioned more recently that “the knowledge
within an organisation determines organisational performance”. None of the authors,
however, provided empirical knowledge to substantiate these claims of the direct
impact of data on organisational performance; in most cases anecdotal examples of a
few companies who have managed to leverage information to improve performance
were provided in the form of case studies. Case studies themselves are the least
weighty form of evidence.
Contrary to the various case studies or anecdotal references to the value of big data
made by the majority of the authors, McAfee and Brynjolfsson (2012) conducted
research to prove the direct impact of data analytics, and tested the hypothesis that
data-driven companies would be better performers. They found that companies in the
top third of their industry in the use of data-driven decision making were, on average,
5% more productive and 6% more profitable than their competitors. Such research was
based on respondent feedback, which might potentially be biased. Although none of
the detail around the study was disclosed, and therefore the reliability and validity of
the study could not be ascertained, McAfee & Brynjolfsson (2012:64) concluded that
“the more companies characterised themselves as data-driven, the better they
performed on objective measures of financial and operational results”, which alleges
that data analytics can have a direct impact on organisational performance.
Several authors argued that one of the most effective ways for organisations to extract
the potential value from big data is through the increased use of big data as an input
into the organisational decision-making processes (Davenport et al., 2001; McAfee &
Conceptualisation of a big data maturity model based on organisational
decision making
2015
12
Brynjolfsson, 2012; McKenzie et al., 2011). Davenport et al. (2001) initially suggested
that data-based decisions eliminated the possible bias of decisions based on intuition
as it resulted in more consistent decisions which were more cost effective to replicate,
transfer and leverage.
Davenport et al. (2001) also mentioned several examples of companies where
executives had based their judgments on data rather than hunches, and in these cases
they attributed improved organisational performance to this. A decade later McKenzie
et al. (2011) also commented that the application of data in the decision-making
process minimises the risk of ill-informed decisions. McKenzie et al. (2011) and McAfee
and Brynjolfsson (2012) identified the link between the use of data during decision
making and the potential benefits thereof, as they argued that decisions are integral to
daily business practice and that sound and agile decision making based on data can be
viewed as a core strategic capability.
It can therefore be asserted that, as intuition-based decisions are of a poorer quality
than data-based decisions, the extent to which data has been applied as input into the
decision-making process can be an indication of maturity. Therefore intuition-based
decisions can be viewed as an indication of an immature organisation whereas data-
based decisions can be indicative of a mature organisation.
It can be inferred, based on all of the preceding literature, that as an organisation’s big
data maturity and its use of big data analytics during organisational decision making
increases, so will its financial performance. Furthermore, organisations should view big
data analytics maturity as an asset which needs to be managed accordingly.
It can be affirmed that there is a lack of empirical evidence of the causal relationship
between information or knowledge management maturity in an organisation, the use of
data during decision making and organisational financial performance. As such, there
is therefore a clear and urgent requirement to empirically construct a big data maturity
model that addresses the use of data during organisational decision making (which this
research paper addresses), as well as statistically prove the positive causal
relationship between the maturity and impact on financial performance (currently
outside of the scope of this particular research study).
Conceptualisation of a big data maturity model based on organisational
decision making
2015
13
2.1.3 Common challenges related to big data analytics
The most commonly cited challenges of big data analytics include the shortage of
managerial and analytical talent (LaValle et al., 2011; McAfee & Brynjolfsson, 2012;
McKinsey Global Institute, 2011; Vriens & Brazell, 2013). There are also organisational,
cultural and strategic changes necessary to leverage big data investments (Davenport
et al., 2001; LaValle et al., 2011).
Davenport et al. (2001) however, argued that the most pertinent big data analytics
challenge relates to the use of the data itself, as the large volumes of unprocessed or
irrelevant data can confuse and overwhelm the decision maker. Rajteric (2010) and
Strenger (2008) proposed that executives should focus on the “right” information,
defined as reliable, accurate and punctual information, based on the decision that
needs to be made.
This proposed solution concerning the availability of the “right” information can also be
applied to the concept of big data maturity as one of the variables to be included in the
big data maturity model. For example, in cases where the “right” insights from big data
are easily available to user of the data, the organisation can be deemed as mature,
whereas if the “right” insights from big data are not easily available, the organisation
can be viewed as immature.
As the focus of the proposed model in this research paper is specifically around the
use of big data during organisation decision making, the user of the data would be
predominately an individual who needs to make a decision, and the usefulness of the
data, including how reliable, accurate and punctual information it is, will be judged
according to the usefulness of the data as input into the decision. Therefore a “fit”
between the data and the decision needs to be achieved.
2.2 Maturity Models Literature Base
Very few organisations have been able to successfully leverage big data analytics in
their environments, and even those organisations that have succeeded in extracting
value from data have done so in limited areas (Davenport et al., 2001, Kaner and
Conceptualisation of a big data maturity model based on organisational
decision making
2015
14
Karni, 2004, McAfee & Brynjolfsson, 2012). It was therefore proposed that a maturity
model might serve as a possible solution to assist organisations in improving their big
data analytical efforts to extract value from the big data to which they have access. The
basis for any model that deals with how knowledge is managed within an organisation
must consider the available knowledge management literature.
2.2.1 Maturity models overview
The most widely cited maturity model in the academic literature is the capability
maturity model published by Paulk, Curtis, Chrissis and Weber (1993). Other relevant
maturity models are typically classified into one of the following areas (1) knowledge
management frameworks and maturity models (Balasubramanian, Nochur, Henderson
and Kwan (1999); Bennet & Bennet, 2008; Davenport et al., 2001; Desouza, 2006;
Kaner & Karni, 2004; Nochur, Henderson, & Kwan, 1999; Nonaka, 1994), (2) strategy
maturity models (Kenny, 2006), (3) business intelligence maturity models (Cates, Gill,
& Zeituny, 2005; Lahrmann et al., 2011; Williams & Thomann, 2003), and (4) data
maturity models, which appear to be more consultant generated, and appear
predominantly in the business literature as opposed to academic journals (McKinsey
Global Institute, 2011; LaValle et al., 2011; World Economic Forum, 2013). These data
maturity models that are mentioned in business sources does not appear to be
grounded in theory, and seem to be the opinions of the authors that are not empirically
tested. Even in those sources where a literature review and research was briefly
mentioned, such as the article by McKinsey Global Institute (2011), no detail
concerning the literature, nor the research approach and methodology was provided,
making it difficult to ascertain the relevancy and accuracy of the proposed data maturity
model.
Becker et al. (2009:5) defined a maturity model as an “anticipated, desired, or typical
evolution path of discrete stages” of processes. The bottom stage is normally the initial
state in which typically very few capabilities exist, whereas the highest stage
represents total maturity in the majority or all of the capabilities are present. Maturity
models are particularly useful for businesses as they provide a scale on which
organisations can evaluate their current stages on the maturity continuum, as well as
the typical criteria that needs to be fulfilled in order to reach a particular maturity level
Conceptualisation of a big data maturity model based on organisational
decision making
2015
15
(Rajteric, 2010).
Big data analytics is mainly an evolution of traditional data analytics, business
intelligence, information and knowledge management; the same basic principles are
tweaked to cater for the unique attributes of big data, such as the volume, unstructured
form and speed at which it is created (Bartram, 2013; Goes, 2014, McAfee &
Brynjolfsson, 2012). Thus, it can be inferred that the existing business intelligence and
knowledge management maturity models provide a good theoretical foundation on
which to base the big data maturity model on and these need to be adjusted according
to the unique attributes of big data.
Becker et al. (2009), Lahrmann et al., 2011; Mettler et al. (2010), Rajteric (2010) and
Winter and Wortmann (2010) performed an extensive literature review to classify
various existing maturity models. These authors found that in the majority of all of the
maturity models, the term maturity was defined either as (1) process maturity, the
extent to which specific processes are defined, managed, measured, and controlled
(for example Paulk et al., 1993), (2) object maturity, the extent to which particular
objects such as software reaches a predefined level of sophistication (for example
Cates et al., 2005) or (3) people capability, the extent to which the workforce can
enable knowledge creation and enhance proficiency (for example Nonaka, 1994).
Several further commonalities were noted in the various existing maturity models in the
literature. One of the most prevalent resemblances between the models related to the
definition of maturity (Davenport, De Long, & Beers, 1998; Desouza, 2006; Kaner &
Karni, 2004; LaValle et al., 2011). In most cases, maturity was defined according to the
processes of information collection, processing and use. In these models, maturity
ranged from basic and ad hoc information collection, processing and use as the lowest
level of maturity (Davenport et al., 1998; Desouza, 2006; Kaner & Karni, 2004; LaValle
et al., 2011). Reactive and isolated analytics were plotted in the middle of the maturity
continuum and advanced, predictive, organisation wide analytics supported by
sophisticated knowledge management principles could be found at the highest levels of
maturity (Davenport et al., 1998; Desouza, 2006; Kaner & Karni, 2004; LaValle et al.,
2011).
Conceptualisation of a big data maturity model based on organisational
decision making
2015
16
Most models consisted of various levels or stages of maturity in linear and
chronological arrangement, and depicted a typical sequential evolution path, along
which organisations would progress from lower levels of maturity to more advanced
levels (for example as stated in Becker et al., 2009). Many models emphasised the
varied use of knowledge at the different levels of management, which seemed to be
predominantly defined by the roles and responsibilities of the users of the information
(for example Kenny, 2006).
The processes that were outlined in the majority of the maturity models started at ad
hoc, reactive activities as the lowest level of maturity, with varied levels of more
formalised, organisation wide activities towards proactive, organisation wide activities
which were measured, managed and controlled by several principles and policies at
the highest level of maturity. The components of the majority of the models were based
on either process or people capabilities as a measure of maturity, with only some
maturity models focusing on objects as a measure of maturity (Lahrmann, Marx,
Winter, & Wortmann, 2010; Becker et al., 2009; Mettler et al., 2010).
Only a few maturity models addressed dimensions of business intelligence or
information management against decision making as two variables in the one maturity
model. In the majority of the business intelligence maturity models, varied information
requirements were depicted at each level of maturity. For example in the model
proposed by Williams and Thomann (2003) information requirements at the lowest
level of maturity focused on “what” information users required, at the next level of
maturity the information requirements related to “why”, “when” and “where” the
information is required, whereas at the highest level of maturity the information
requirements were determined concerning “how” the data could best be used within the
business.
These business intelligence maturity models can therefore rate an organisation as
mature based on how sophisticated they are in their information collection efforts,
processes, storage and dissemination to business users, but without any consideration
to the relevancy of the information (Williams & Thomann, 2003; Lahrmann et al., 2011;
Cates et al., 2005). As one of the major challenges of big data analytics lies in the vast
volume of the data that is available to business users (Davenport et al., 2012; McAfee
Conceptualisation of a big data maturity model based on organisational
decision making
2015
17
& Brynjolfsson, 2012), these business intelligence maturity models simply ensure that
as much information as possible is being made available to users. Furthermore, these
business intelligence maturity models do not assist business users in evaluating which
data is relevant to them, therefore amplifying the noise of big data as opposed to
filtering it out.
As a possible solution to identifying what data is relevant, Kaner and Karni (2004),
proposed that business users need to evaluate their information requirements in light of
the “action” that the user of the information needs to take or the decision that needs to
be made, and in their proposed model mapped information requirements against the
decision making process. By doing so, the information requirements and presentation
of the information is matched to the decision that needs to be made, and as
organisations progress from lower to higher levels of maturity, there is an increase in
the relevancy of the information with respect to accomplishing objectives, such as a
specific action that needs to be taken or a decision that needs to be made (Kaner &
Karni, 2004). It is therefore proposed that in order for a big data maturity model to be
useful, both variables of information requirements as well as the decision making
process needs to be considered.
The major limitation of existing maturity models in the literature lies in the fact that they
were poorly documented (Becker et al., 2009; Rajteric, 2010), and in most cases the
rationale for the variables was not explained (Rajteric, 2010) nor based on a strong
literature base (Lahrmann et al., 2010). Existing maturity models also seemed to be
positioned as a “one size fits all” solution, with little consideration for the unique
business context or specific user of the model (Rajteric, 2010). The proposed big data
maturity model in this research paper aimed incorporate several elements of the
existing knowledge management and business intelligence maturity models, based on
the feedback from the various propositions.
2.2.2 Big data maturity models
Numerous big data maturity models can be found in the business literature. However,
data published by software vendors or consultancy firms such as IBM (Nott, 2014),
McKinsey (McKinsey Global Institute, 2011), SAP (Getting Value from Big Data: Focus

Conceptualisation of a big data maturity model based on organisational
decision making
2015
18
on the Opportunities, Not the Obstacles, 2014), IDC (IDC Press Releases, 2014) and
SAS (Big Data Meets Big Data Analytics, 2014) seems to have been done primarily for
marketing purposes, as stated by Rajteric (2010). There is therefore a large gap in the
existing literature base concerning big data, specifically regarding a big data maturity
model.
Since the inception of big data as a topic within academic literature (Austin & Mitcham,
2007; Bryant, Katz, & Lazowska, 2008; Cohen et al., 2009; Goes, 2014; Lynch, 2008;
Swaelens, 2007; Wang & Hu, 2007), not a single big data maturity model has been
published in academic journals. Goes (2014) attributed this to the knowledge gap that
currently exists in business, and predicted that academic research concerning big data
should increase as businesses start to expand their knowledge and understanding of
the subject.
2.2.3 Process, people and object maturity
One of the most common attributes of all maturity models relates to their classification
of maturity, as noted earlier, either as process maturity, people maturity, object maturity
or a combination of these (Becker et al., 2009, Mettler et al., 2010, Lahrmann et al.,
2010, Rajteric, 2010). Process maturity can be defined as the extent to which a specific
process is explicitly defined, manager, measured, controlled and effective (Mettler et
al., 2010). People maturity is the extent to which the workforce is proficient in
knowledge creation (Mettler et al., 2010). Object maturity relates to the respective level
of development of a design object, such as the technology, architecture and software
(Lahrmann et al., 2010).
For the purpose of defining dimensions of big data maturity in this research paper, the
various classifications of maturity (processes maturity, object maturity and people
maturity) were synthesised to acquire a signal of maturity. As the focus of the big data
maturity model in this paper was specifically focused on how big data is being used
during organisational decision making, the effective objects (software and tools) as well
as processes and capabilities (people) are required to ensure that sufficient and
appropriate information is presented during the decision making process (objects and
processes), and that the correct managerial and analytical talent is available to
Conceptualisation of a big data maturity model based on organisational
decision making
2015
19
evaluate the information and make the relevant decision.
The general consensus in the literature was that in most cases, the technology,
architecture and software (object maturity) seemed to be the initial focus of big data
efforts in organisations as it was easiest to implement. In most cases object maturity
failed due to the lack of attention on the relevant processes and people implications
(managerial and analytical skills requirements) (McAfee & Brynjolfsson, 2012; Wen et
al., 2013).
As a case in point, Wen et al. (2013:6637) commented that “currently, big data related
technologies can only be seen as a technology demonstration and it is difficult to
address data management and the efficiency of data processing in different
enterprises." LaValle et al. (2011) cited top challenges of big data as the lack of
understanding of how to use analytics to improve the business, constrained
management bandwidth due to competing priorities, the shortage of relevant skills,
insufficient processes in place to acquire the data as well as organisational culture not
being information oriented, which can be attributed to the initial focus on objects such
as technology and software, with the processes and people implications of big data
being ignored initially.
Proposition 1:
The focus of the organisation’s big data efforts, defined either as the object, process or
people is indicative of big data maturity. As is evident in the aforementioned literature, it
can be inferred that an initial focus only on the objects (technology) and disregard of
the people and process implications is indicative of a lower level of big data maturity,
as this is normally the natural starting point of big data analytics for organisations. A
focus on the people and process implications of big data will be indicative of higher
levels of maturity, although there is no consensus concerning the specific order of
these two, as both are viewed as equal indicators of higher levels of big data maturity
(Becker et al., 2009, McAfee & Brynjolfsson, 2012; Mettler et al., 2010, Lahrmann et
al., 2010, Rajteric, 2010; Wen et al., 2013).
Therefore, the focus of an organisation’s big data efforts is indicative of big data
maturity, where a focus on objects and technology is indicative of a lower maturity level
Conceptualisation of a big data maturity model based on organisational
decision making
2015
20
and a focus on the processes or people is indicative of higher levels of maturity (Becker
et al., 2009, McAfee & Brynjolfsson, 2012; Mettler et al., 2010, Lahrmann et al., 2010,
Rajteric, 2010; Wen et al., 2013).
2.3 Knowledge Management
As big data analytics is merely an evolution of traditional data analytics and information
management, the basic definitions of data, information and knowledge (Davenport et
al., 2012; Goes, 2014), as well as the principles of knowledge management was
reviewed in order to identify transferrable attributes that can be used as signals of big
data maturity.
2.3.1 Data, information and knowledge applied to big data analytics
As stated in Section 2.1 (iii) some of the most pertinent challenges of big data relates to
the usefulness of the data due to the “noise” in the data, and therefore the conversion
process from data to information and then knowledge, as outlined in the knowledge
management literature, provided a useful lens through which the big data maturity of
organisations could be determined.
Data includes discrete, objective facts, figures and statistics in its rawest forms, without
any processing being applied (Goes, 2014; Kaner & Karni, 2004). In the context of big
data analytics, the “data” is a combination of structured and unstructured data from a
wide variety of sources that are generated at an increased pace and it is also difficult to
verify the accuracy thereof (Aman, Chelmis, & Prasanna, 2014; Gobble, 2013; Goes,
2014; Lukoianova & Rubin, 2014; McAfee & Brynjolfsson, 2012). Information can be
defined as “data that have been organized or given structure” (Glazer, 1991:2).
2.3.2 Knowledge and knowledge management
As the discipline of big data analytics is merely a natural evolution of knowledge
management, it is important to reflect on knowledge management as this was
historically the primary domain for information management within a business.
Knowledge can be defined as information which has been “combined with experience,
Conceptualisation of a big data maturity model based on organisational
decision making
2015
21
context, interpretation and reflection” which can be applied to decisions and actions
(Davenport et al., 1998:43). Knowledge Management, therefore, is “an organisational
capability that allows people in organisations, working as individuals knowledge
workers, or in teams, projects, or other such communities of interest, to create, capture,
share, and leverage their collective knowledge to improve performance"
(Balasubramanian et al., 1999:145).
It can be argued that “collective knowledge” as used in this definition (Balasubramanian
et al., 1999:145) includes data from both conventional and new sources, quantitative as
well as qualitative data, traditional data as well as big data. Therefore, big data can be
conceptualised as simply an additional new form of data that is being used as input into
knowledge management frameworks. Big data knowledge management is slightly
different from the traditional knowledge management principles (Bartram, 2013;
McAfee & Brynjolfsson, 2012). For example large-volume, complex and unstructured,
growing data sets from multiple, autonomous sources (Wu, Zhu, Wu, & Ding, 2014)
would be typical of “new” big data sets that are incorporated into an organisation’s
knowledge management system.
Therefore the concepts of data, information and knowledge management can be used
to classify the various forms of data, traditional structured data as well big data that
organisations collect, process and disseminate internally. As new sources of data are
required for big data analytics, new and alternative analytical techniques such as text
analytics are also required. However the basic concepts of data, information and
knowledge can still be applied (Chen et al., 2012). This classification of data,
information and knowledge might aid organisations in understanding how mature they
are, as it can be inferred that the more mature organisations have established
knowledge management frameworks in place for both traditional and big data analytics.
One of the most prevalent challenges of big data is the volume and unstructured nature
of the data, which makes it very difficult to use it in its raw form (Gobble, 2013).
Therefore the application of the form of the data, namely the conversion of raw data to
knowledge as an indication of maturity is particularly relevant. This application also
ensures that users of data are focused on the form and the “usefulness” thereof, as it is
very difficult to make decisions based on raw, unusable data.
Conceptualisation of a big data maturity model based on organisational
decision making
2015
22
There are therefore two potential approaches to defining big data maturity in the
context of the various definitions of data and knowledge. One approach would be to
use the “form” of the information as an indication of maturity; organisations that are in
the possession of raw data would be classified as “immature” and organisations that
are in the possession of sophisticated knowledge would be classified as “mature”.
The second approach would be to use the organisation’s knowledge management as
an indication of maturity; the absence of knowledge management in an organisation
would be an indication that the organisation is immature and the presence as well as
the sophistication of knowledge management in the organisation would be an indication
that the organisation is mature.
Another challenge of big data relates to the management of the data, specifically
concerning the collection, sharing, and leveraging of collective knowledge (LaValle et
al., 2011; Qin & Li, 2013), which can be classified as knowledge management
activities. Therefore it is proposed that the presence as well as the sophistication of
knowledge management activities is included in the model as a measure of maturity.
Proposition 2:
One of the dimensions of the big data maturity model in this paper can be defined as
the presence of big data, information and knowledge in the organisation, where the
presence of predominantly big data and information is indicative of an immature
organisation, and the presence of predominantly knowledge is indicative of a mature
organisation (Davenport et al., 1998; Glazer, 1991; Goes, 2014; Kaner & Karni, 2004).
Proposition 3:
One of the dimensions of the big data maturity model in this paper can be defined
according to the presence and sophistication of knowledge management activities in
the organisation. The absence of knowledge management activities in the organisation
(creation, acquisition, sharing and leveraging of collective knowledge) is indicative of
an immature organisation. The presence of knowledge management activities in the
organisation (creation, acquisition, sharing and leveraging of collective knowledge) is
indicative of a higher level of maturity, somewhere in the middle of the maturity
Conceptualisation of a big data maturity model based on organisational
decision making
2015
23
continuum. Should knowledge management activities be present and highly
sophisticated, it is indicative of the highest level of maturity of big data analytics in the
organisation (Balasubramanian et al., 1999).
2.4 Decision Making in Organisations
In order to enable the value realisation of big data, the conceptual big data maturity
model relates specifically to the use of big data during organisational decision making.
As previously illustrated, by focusing on data, information, knowledge and knowledge
management without understanding the purpose for which the data is used might
potentially result in a great deal of effort to produce information that might be irrelevant
and useless to the business user. In order to ensure user relevance, the action arising
from the data or the decision that needs to be made needs to be considered, and the
information requirements determined accordingly (Kaner & Karni, 2004). The next
section therefore focuses on the theory base of decision making literature, as well as
the application thereof in terms of big data being used as an input into the decision-
making process.
2.4.1 Theoretical overview of decision literature
Central to the discussion in Section 2.1 (ii) is the use of the right data to effect the
optimal decisions to increase value. Therefore, no discussion of a model of big data
management could be complete without reviewing decision-making theory to assess
the degree to which this could be incorporated. Decision-making theory first appeared
in the literature in the mid-1900s, when authors such as Black (1948), Edwards (1954),
Cyert, Simon, and Trow (1956), Simon (1959), Cyert and March (1963), Raiffa (1968)
and Barnard (1968) described the phenomena of decision making as a predominantly
rational, linear process during which several alternatives are considered in order to
make a choice. Later, Bellman and Zadeh (1970) brought in the concept of uncertainty,
or “fuzziness”, and reported that the various alternatives’ boundaries are not sharply
defined, which inherently complicates the process. Mintzberg, Raisinghani and Theoret
(1976) concurred with this view, and argued that strategic decision processes are
immensely complex and dynamic, due to the unstructured nature of these decision
Conceptualisation of a big data maturity model based on organisational
decision making
2015
24
situations that have not yet been encountered, and thus no predetermined and explicit
set of ordered responses exist.
Several behavioural theories of decision making emerged, such as the work of Slovic,
Fischhoff and Lichtenstein (1977) as well as the influence that knowledge and
experience has on the decision making process, as is evident in the article by Bettman
and Park (1980). With the birth of information technology and the start of the computer
age in the 1980s, the impact of decision support systems was featured predominantly
as part of the later research on decision theory (Desanctis & Gallupe, 1987; Sprague
Jr, 1980).
For the next few decades the use of technology during decisions was covered
extensively in the academic literature (Desanctis & Gallupe, 1987; Dietterich, 2000; Ho,
1998; Kohavi, 1995; Quinlan, 1986; Saaty, 1996; Sterman, 1989; Turban, 1990). In the
1990s the introduction of the discipline of knowledge and information management in
organisations sparked a new debate concerning how data, information and knowledge
can be utilised as an input into organisational decision making (Alavi & Leidner, 2001;
Courtney, 2001; Kogut & Zander, 1992; Wiig, 1997).
Therefore, as information management and the field of analytics progressed, the use of
such information and data during decision making has also evolved. With the rise of big
data analytics, a natural evolution of the use of information during decision making
occurred, towards the utilisation of big data analytics during organisational decisions,
which is often one of the aspects of big data that most organisations struggle with
(Boyd & Crawford, 2012; Cohen et al., 2009; McAfee & Brynjolfsson, 2012; Rajteric,
2010; Strenger, 2008).
As illustrated previously, the application of big data analytics as an input into the
organisational decision-making process improves the effectiveness of the decisions
and in turn positively impacts the financial performance of the organisation. It is
therefore imperative for business leaders today to understand how the recent
phenomena of big data analytics can be used as an input into decision making.
Conceptualisation of a big data maturity model based on organisational
decision making
2015
25
2.4.2 Decision making defined
In order to comprehensively understand the role that big data analytics can play in
organisational decision making, the various definitions of decision making, as well as
basic frameworks for decision making were thoroughly investigated and discussed.
Although a multitude of definitions of decision making can be found in the literature,
they all broadly detail decision making as a choice (decision) based on a set of
alternatives (options). Some authors, however, had specific opinions concerning the
definition. For example Azuma, Daily and Furmanski (2006) and Mintzberg et al. (1976)
stressed that a decision has to be a specific commitment to action (usually a
commitment of resources), whilst Malakooti (2012) was of the opinion that decision
making is closely related to the art of problem solving.
2.4.3 Basic model of the decision making process
There also seems to be strong consensus amongst the various academics regarding
the basic model of the decision-making process, which is viewed predominantly as a
linear process. In its most simplistic form the process is characterised as information
gathering, identifying and evaluating of various alternatives and options, as well as
making or enacting a decision (Azuma et al., 2006; Bellman & Zadeh, 1970; Cyert et
al., 1956; Mintzberg et al., 1976).
2.4.4 Decision context and complexity
Balasubramanian et al. (1999) and Malakooti (2012) however argued that an extra step
is required at the beginning of the decision-making process, before information
gathering can commence. This addition can be expressed as the step of problem
formulation, during which the context and purpose of the decision are considered
upfront, as this influences the information requirements.
Malakooti (2012) explained the rationale for this additional step, and described the
decision-making process as multi-faceted with various levels of complexity, where at
times the process may occur naturally and spontaneously; whilst at other times, it may
be very complex and needs to be intricately planned with much forethought. It is
Conceptualisation of a big data maturity model based on organisational
decision making
2015
26
therefore important for decision makers to identify the decision context and purpose,
which at the same time illuminates the decision’s complexity, even before decision
makers start gathering the relevant information (Balasubramanian et al., 1999;
Malakooti, 2012).
As one of the main implications of big data is its impact on how decisions are made
(McAfee & Brynjolfsson, 2012) and the massive opportunity that the use of big data
analytics for improved decisions presents (Davenport et al., 2001; McAfee &
Brynjolfsson, 2012; McKenzie et al., 2011), the prerequisite of correctly identifying the
decision context is even more important during the big data era than what it was a few
years ago.
Proposition 4:
The ability of organisations to firstly interpret the decision complexity along the
continuum of simple, routine to complex decisions, before information gathering
commences, can be interpreted as a signal of maturity. An immature organisation
would skip this first step and proceed to gather information without determining the
decision context and complexity, whereas in a mature organisation the decision context
and complexity is investigated and identified along the continuum of routine to complex
decisions upfront before information gathering commences (Balasubramanian et al.,
1999; Malakooti, 2012).
Several other authors also argued that every decision is unique based on the context
(Prusak, 1997), as well as the level (operational, tactical or strategic) at which the
decision is being made (Kaner & Karni, 2004). Bennet & Bennet (2008) also
commented that the length and complexity of the decision process depends on the
specific context, and that the use of data as an input into the decision process also
differs based on the decision and the specific information requirements of the decision
(Bennet & Bennet, 2008). For example, during less complex, routine decisions no
information is required, and the decision is made based on intuition whereas large
volumes of data and insights are required during complex decisions (McKenzie et al.,
2011).
It is therefore imperative for decision makers to correctly interpret the decision context,
Conceptualisation of a big data maturity model based on organisational
decision making
2015
27
as the information requirements of the decision are directly influenced by the decision
context. Should a decision maker incorrectly identify the decision context, they might
also incorrectly identify the information requirements of that decision (Kaner & Karni,
2004; McKenzie et al., 2011; Prusak, 1997).
Proposition 5:
In order to ascertain an organisation’s big data maturity concerning the use of big data
during organisational decision making, not only is the identification of the decision
context important, but also the ability to interpret the decision context and complexity
correctly. It can therefore be inferred that the ability to correctly interpret the decision
context and complexity is indicative of maturity. Thus an organisation can only be
viewed as mature if they have succeeded in correctly interpreting the decision context
and complexity. Should an organisation interpret the decision context and complexity
incorrectly (for example a complex situation would be viewed as a simple, routine
decision situation or vice versa), it will be viewed as immature (thus the presence of
this step is not an indication of maturity alone) (Balasubramanian et al., 1999;
Malakooti, 2012; McKenzie et al., 2011; Prusak, 1997).
Proposition 6:
During the information gathering step of the information process, the ability to correctly
identify the information requirements based on the decision context can also be viewed
as a signal of maturity. The correct required information is identified based on the
context in a mature organisation, for example no information is required for simple,
routine decisions and comprehensive and in depth information is required for complex
decisions. In an immature organisation the required information is incorrectly identified
based on the context, thus there is a mismatch between the decision complexity and
the identified information requirements. For example, during a complex decision it
might be decided that no information is required, or comprehensive information is
deemed to be required during a simple, routine decision, which is incorrect. (Bennet &
Bennet, 2008; Erickson & Rothberg, 2014; George et al., 2014; Malakooti, 2012). This
is the first step of the decision making process and thus would only be mapped against
the first step, and not the subsequent steps of the decision-making process.
Conceptualisation of a big data maturity model based on organisational
decision making
2015
28
Therefore, the ability of an organisation’s ability to correctly identify the information
requirements based on the decision context can be interpreted as a signal of maturity.
It is thus proposed that immature organisations are unable to correctly identify the
information requirements, and in mature organisations the information requirements
are correctly identified based on the decision context.
Proposition 7:
The argument that it is not only the availability of information that is important, but the
ability to effectively manage that information and knowledge (Erickson & Rothberg,
2014) that enables users of big data to extract the possible value from it based on the
insights it can provide (George et al., 2014) can be expanded, to also include the
availability of the “right” relevant information during the consideration of alternative
steps, based on the specific decision context and the complexity of the decision
(Bennet & Bennet, 2008; Malakooti, 2012)
During the consideration of alternative steps in the decision-making process, the
availability of the “right” information based on the decision context can also be used as
a signal of maturity. Therefore, even if an organisation has been able to correctly
identify the information requirements based on the decision context (Proposition 6), the
relevant information is extracted and presented to the decision maker. Failure to do so
results in the organisation being deemed as immature on this specific dimension.
Therefore, a mismatch between the decision context and complexity and the
information that is presented is an indication an immature organisation. The
presentation of relevant and appropriate information based on the decision context is
an indication of a mature organisation.
2.5 South African Context
2.5.1 Business environment contextual facts
Conger (2014), Ndlela and du Toit (2001), Plessis and Boon (2004) as well as the
World Economic Forum all reported general contextual factors in the South African
Conceptualisation of a big data maturity model based on organisational
decision making
2015
29
business environment that are challenges for knowledge and information management.
For example, South Africa faces specific labour challenges such a fiercely competitive
labour market due to the oversupply of blue collar manual labour but simultaneously
has a lack of skilled knowledge management practitioners (Ndlela & du Toit, 2001;
Plessis & Boon, 2004, World Economic Forum, 2013), high unemployment rates (World
Economic Forum, 2013), as well as a culture of knowledge being a source of power
(Ndlela & du Toit, 2001; World Economic Forum, 2013).
As people (or human capital) are an important enabler of knowledge management in
organisations (Ndlela & du Toit, 2001) these labour challenges have a significant
impact on the practice of information management and big data analytics in South
Africa (Plessis & Boon, 2004). This skills shortage might result in South African
organisations potentially struggling with people maturity, defined as the extent to which
the workforce is capable in knowledge creation (Becker et al., 2009, Mettler et al.,
2010, Lahrmann et al., 2010, Rajteric, 2010).
It is expected that South African organisations would therefore be proficient in object
maturity, which is big data technologies and software, or the process maturity, which is
the extent to which big data processes are explicitly defined, manager, measured,
controlled and effective (Mettler et al., 2010) rather than the people maturity. This view
was supported by Venter and Tustin (2009) who found that South African organisations
tend to make significant investments in the technologies and tools that enable them to
collect, store and disseminate information.
Lastly, although business leaders in South African organisations might understand the
strategic importance of knowledge management, in most cases they are only able to
apply it on an operational level (Ndlela & du Toit, 2001; Plessis & Boon, 2004, World
Economic Forum, 2013).
2.5.2 Implications for big data analytics maturity
These environmental factors are typical of other emerging markets. As a result of these
factors, the knowledge management scale and sophistication requirements of
companies in emerging markets such as South Africa could be different than
Conceptualisation of a big data maturity model based on organisational
decision making
2015
30
companies in the rest of the world (Plessis & Boon, 2004).
The skills shortage and lack of skilled knowledge management practitioners in the
South African business environment (which is typical of other emerging markets)
probably pose the most pertinent challenges for the field of big data analytics, and
potentially influence the big data maturity of organisations in emerging markets such as
South Africa.
2.6 Literature Review Conclusion
It is evident from the literature that big data is one of the largest sources of competitive
advantage, and this will increase in the future. But due to the recency of the
phenomena, academic literature expounding the topic is still in its infancy. The existing
literature mostly described the phenomena of big data, included a few use cases and
anecdotal references to the potential value thereof. Practical guidance about how to
leverage big data or improve an organisation’s big data efforts is sorely lacking.
Not all organisations are equally adept with regard to big data analytics, and varied
scales of maturity exist about how data and insights are being used in organisational
decision making. The majority of the existing big data maturity models are published in
the business literature, and currently not a single big data maturity model has been
published thus far in the academic literature. There is therefore a clear requirement for
a big data maturity model which has been grounded in literature and has been
empirically tested.
In order to conceptualise the big data maturity model, the literature about big data,
maturity models, knowledge management and decision making theory was examined
to identify potential variables that can be used as a signals of big data maturity. Lastly,
as the study was conducted in South Africa, the South African business environment
and context was reviewed to identify specific nuances as a result of the geographic
location of the study.
Based on the literature that was reviewed, several signals of big data maturity were
identified and drafted into several research propositions that were empirically tested in

Conceptualisation of a big data maturity model based on organisational
decision making
2015
31
this research study.
Conceptualisation of a big data maturity model based on organisational
decision making
2015
32
CHAPTER 3: RESEARCH PROPOSITIONS
The aim of this research paper was to conceptualise a big data maturity model for
emerging markets, based on how big data analytics is being used in organisational
decision making in South Africa. The various steps of the decision-making process
were selected as one of the dimensions of the maturity model, in line with the views of
Balasubramanian et al. (1999) and Prusak (1997), who argued that information is a
prevalent input into each specific step of the decision process.
The steps in the decision-making process have been identified as (1) Determining the
decision complexity and context (2) Information gathering (3) Evaluation of alternatives
(4) Decision enactment. It can therefore be inferred that the ability to effectively use big
data during each step of the decision-making process is a key dimension to measuring
big data maturity (Balasubramanian et al., 1999; Prusak, 1997).
The other signals of maturity have been defined as follows, based on the proposition
formulation from the review previous literature around big data, maturity models,
knowledge management and decision making:
3.1 Proposition 1: Object, Process or People focus as a
signal of big data maturity
The focus of the organisation’s big data efforts, defined as the object, or the technology
and software, the process, or people is indicative of big data maturity. A focus on the
people and process implications of big data is indicative of higher levels of maturity,
although there is no consensus concerning the specific order of these two implications
(both are equal indicators of higher levels of big data maturity) (Becker et al., 2009,
McAfee & Brynjolfsson, 2012; Mettler et al., 2010, Lahrmann et al., 2010, Rajteric,
2010; Wen et al., 2013). This specific signal of maturity is prevalent in every step of the
decision-making process.
Conceptualisation of a big data maturity model based on organisational
decision making
2015
33
3.2 Proposition 2: Big data, information and knowledge
as a signal of big data maturity
The presence of big data, information and knowledge in the organisation is a signal of
maturity. The presence of predominantly big data and information is indicative of an
immature organisation, and the presence of predominantly knowledge is indicative of a
mature organisation (Davenport et al., 1998; Glazer, 1991; Goes, 2014; Kaner & Karni,
2004). The presence of big data, information and knowledge should be evaluated in
every step of the decision-making process.
3.3 Proposition 3: Presence and sophistication of
knowledge management activities as a signal of big
data maturity
The presence and sophistication of knowledge management activities in the
organisation is a signal of maturity. The absence of knowledge management activities
in the organisation (creation, acquisition, sharing and leveraging of collective
knowledge) is indicative of an immature organisation. The presence of knowledge
management activities in the organisations (creation, acquisition, sharing and
leveraging of collective knowledge) is indicative of a higher level of maturity, situated
somewhere in the middle of the maturity continuum. Should knowledge management
activities be present and highly sophisticated, it is indicative of the highest level of
maturity of big data analytic in the organisation (Balasubramanian et al., 1999). The
presence and sophistication of knowledge management activities should be
investigated at every step of the decision-making process.
3.4 Proposition 4: Interpretation of the decision context
as a signal of big data maturity
The ability of organisations to firstly interpret the decision complexity along the
continuum of simple, routine to complex decisions, before information gathering
Conceptualisation of a big data maturity model based on organisational
decision making
2015
34
commences, can be interpreted as a signal of maturity. An immature organisation
would skip this first step and proceed to gather information without determining the
decision context and complexity, whereas in a mature organisation the decision context
and complexity is investigated and identified along the continuum of routine to complex
decisions upfront before information gathering commences (Balasubramanian et al.,
1999; Malakooti, 2012).
3.5 Proposition 5: The ability to correctly identify the
decision context as a signal of big data maturity
In order to ascertain an organisation’s big data maturity concerning the use of big data
during organisational decision making, not only the identification of the decision context
is important, but also the ability to interpret the decision context and complexity
correctly. It can therefore be inferred that the ability to correctly interpret the decision
context and complexity can be indicative of maturity. Thus an organisation can only be
viewed as mature if they have succeeded in correctly interpreting the decision context
and complexity. Should an organisation interpret the decision context and complexity
incorrectly (for example a complex situation would be viewed as a simple, routine
decision situation or a vice versa), it is considered to be immature (thus the presence of
this step is not an indication of maturity alone) (Balasubramanian et al., 1999;
Malakooti, 2012; McKenzie et al., 2011; Prusak, 1997).
3.6 Proposition 6: The ability to correctly identify the
information requirements based on the decision
complexity as a signal of big data maturity
During the information gathering step of the information process, the ability to correctly
identify the information requirements based on the decision context can also be viewed
as a signal of maturity. The correct required information is identified based on the
context in a mature organisation, for example no information is required for simple,
routine decisions and comprehensive and in depth information is required for complex
Conceptualisation of a big data maturity model based on organisational
decision making
2015
35
decisions. In an immature organisation the required information is incorrectly identified
based on the context, thus there is a mismatch between the decision complexity and
the identified information requirements. For example, during a complex decision it
might be decided that no information is required, or comprehensive information is
deemed to be required during a simple, routine decision, which is incorrect (Bennet &
Bennet, 2008; Erickson & Rothberg, 2014; George et al., 2014; Malakooti, 2012). This
is first step of the decision-making process and thus would only be mapped against the
first step, and not the subsequent steps of the decision-making process.
Therefore, the ability of an organisation to correctly identify the information
requirements based on the decision context can be interpreted as a signal of maturity.
It is thus proposed that immature organisations are unable to correctly identify the
information requirements, and in mature organisations the information requirements
are correctly identified based on the decision context.
3.7 Proposition 7: The ability to present the right
information based on the decision context as a
signal of big data maturity
The argument that it is not only the availability of information that is important, but the
ability to effectively manage that information and knowledge (Erickson & Rothberg,
2014) that enables users of big data to extract the possible value from it based on the
insights it can provide (George et al., 2014) can be expanded, to also include the
availability of the “right” relevant information during the consideration of alternatives
step, based on the specific decision context and the complexity of the decision (Bennet
& Bennet, 2008; Malakooti, 2012).
During the consideration of alternatives step in the decision-making process, the
availability of the “right” information based on the decision context can also be used as
a single of maturity.
During the consideration of alternatives step in the decision-making process, the
availability of the “right” information based on the decision context can also be used as
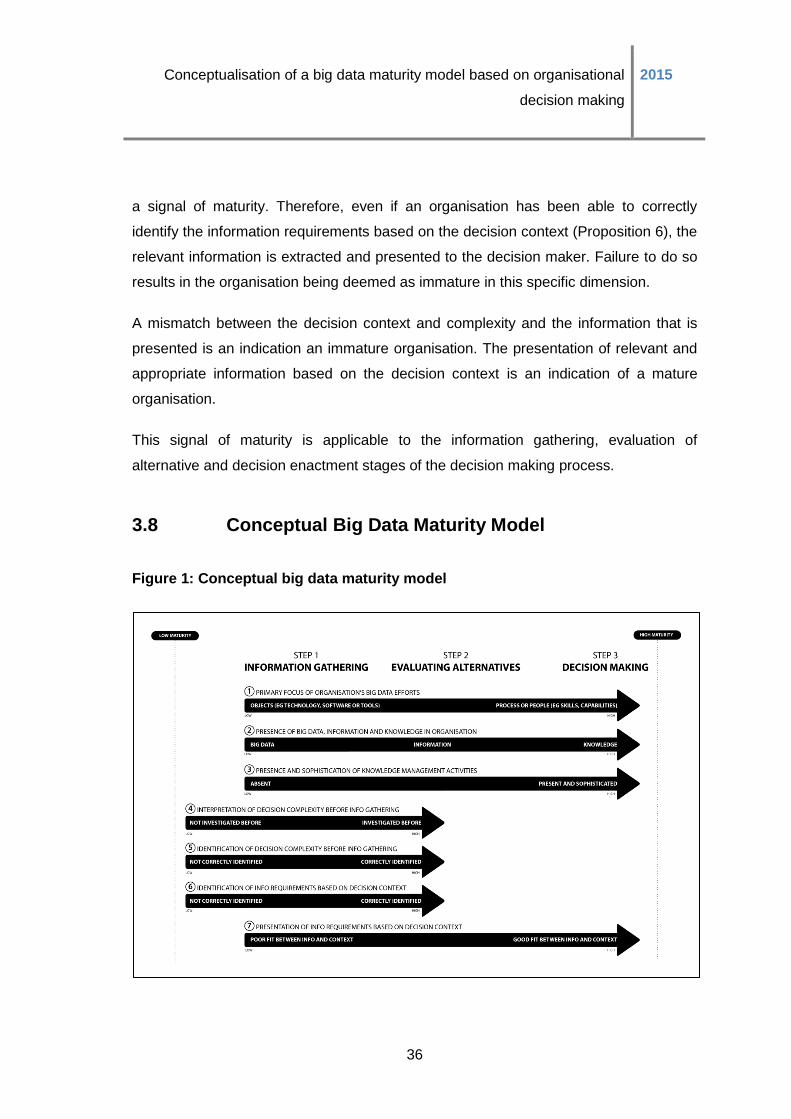
Conceptualisation of a big data maturity model based on organisational
decision making
2015
36
a signal of maturity. Therefore, even if an organisation has been able to correctly
identify the information requirements based on the decision context (Proposition 6), the
relevant information is extracted and presented to the decision maker. Failure to do so
results in the organisation being deemed as immature in this specific dimension.
A mismatch between the decision context and complexity and the information that is
presented is an indication an immature organisation. The presentation of relevant and
appropriate information based on the decision context is an indication of a mature
organisation.
This signal of maturity is applicable to the information gathering, evaluation of
alternative and decision enactment stages of the decision making process.
3.8 Conceptual Big Data Maturity Model
Figure 1: Conceptual big data maturity model
Conceptualisation of a big data maturity model based on organisational
decision making
2015
37
CHAPTER 4: RESEARCH METHODOLOGY
4.1 Research Approach
4.1.1 Research philosophy
Interpretivism was adopted as the research philosophy for this research paper, which
relates to the study of phenomena in their natural environment (Saunders & Lewis,
2012) in order to gain an understanding of what is happening in a specific context
(Carson et al., 2001). Interpretivism is particularly suitable for this paper, as it is
focused on understanding and interpreting phenomenon, in this case, big data maturity,
which has been synthesised in the literature reviewed in Chapter 2 (Carson et al.,
2001). The conceptual big data maturity model that was compiled based on the
preceding literature, and was used as a guide to study the phenomena of big data
maturity in organisations.
Interpretivism is also best suited with qualitative research, as the knowledge acquired
is socially constructed rather than objectively determined, and thus more personal and
flexible research structures were employed (Carson et al., 2001). In this research study
the combination of interpretivism and qualitative research was applied, as the
phenomenon, big data maturity was studied through the analysis of unstructured, in-
depth and rich insights of the application of big data analytics during organisational
decision making, which is a subjective phenomenon based on the specific
organisational environment.
One of the limitations of the interpretive approach relates to the research legitimisation,
specifically the validity, reliability and generalisability of the research (Kelliher, 2011).
Extensive verification and validation has thus been conducted post the data collection
phase to ensure the reliability and transferability of the research.
Conceptualisation of a big data maturity model based on organisational
decision making
2015
38
4.1.2 Deductive reasoning
Deductive reasoning was used during which a theoretical proposition based on the
literature, in this case the conceptual big data maturity model, was tested through a
research strategy designed to perform this test, in this case, qualitative interviews
(Saunders & Lewis, 2012; Stentoft Arlbjørn & Halldorsson, 2002).
Deductive reasoning was selected for this research study as the concept of big data
maturity had not yet been adequately addressed in the academic literature, and thus
there is no existing theoretical knowledge of prior research which can be drawn upon to
make generalisations, as would have been the case if inductive reasoning had been
used (Saunders & Lewis, 2012). In this research study, the relevant theories
concerning information and knowledge management, maturity models as well as
decision-making frameworks were synthesised a priori into a proposed conceptual big
data maturity model, which was tested through qualitative interviews.
The a priori specification of the construct, the conceptual big data maturity model
helped shape the initial design of this theory-building research, and permitted the
researcher to use a firm empirical ground for the emergent theory, without any
subjective insights from the data collection interfering with the initial propositions
(Huberman & Miles, 2002). The advantages of the deductive reasoning approach
relates to the fact that the answer is already known; in this case the maturity model had
already been conceptualised, and this ensured that relevant and structured results
were obtained (Saunders & Lewis, 2012).
The potential disadvantage lies in unknown results being presented (that which falls
outside the original theory). In the case of this research study, any “new” or
unanticipated signals of maturity that were identified during the analysis of the results,
were reported on and suggested as a potential direction for future research.
These “new” signals of maturity in some instances replaced some of the existing
dimensions in the conceptual model due to their relevance exceeding that of the
existing dimensions based on the analysis of the results. In these cases the
replacement of variables aimed to increase the relevancy of the model. Alternatively
additional dimensions were added to the existing conceptual model to increase the

Conceptualisation of a big data maturity model based on organisational
decision making
2015
39
scope of the assortment of big data maturity variables and signals. Any additions or
amendments to the conceptual big data maturity model were then verified through data
and theory triangulation.
4.2 Research Design
4.2.1 Cross-sectional study
The study was cross-sectional, as the information was collected at a specific point in
time (Saunders & Lewis, 2012). The cross-sectional approach was selected for the
research study, as the intention of the study was only to validate the big data maturity
model, and not necessarily to understand how organisations perform when measured
against this model over a period of time.
4.2.2 Qualitative research
The research design was qualitative in nature. Qualitative research is particularly useful
as is enables the researcher to extract rich insights and key contextual factors during
the interviews (Carson et al., 2001). Through the application of qualitative research,
greater comprehension was possible during the interpretation of the results, as the
main themes, rich insights and in-depth information and knowledge around the
phenomena (big data maturity) were analysed.
Qualitative research is widely used when theories need to be applied or interpreted in
diverse organisational contexts based on human behaviour and interpretation (Guba &
Lincoln, 1994). Conversely, quantitative research is focused solely on a limited set of
variables, and thus other contextual factors or subjective meanings, key to
understanding human behaviour such as for example decision making, are disregarded
(Guba & Lincoln, 1994). However, human and organisational behaviour phenomena
such as decision making cannot be fully understood without reference to the meanings
and purposes attached by human actors to their activities (Guba & Lincoln, 1994).
In the case of this research study, the proposed conceptual big data maturity model,
the theory theory was applied in various organisational contexts across several
Conceptualisation of a big data maturity model based on organisational
decision making
2015
40
industries through the interpretation of the use of big data during organisational
decision making, as relayed by the research subjects during the interviews. As the
study of big data analytics is also a new and under-researched field as demonstrated
above, qualitative research was particularly well suited.
4.2.3 Use of in-depth and expert interviews
The research was conducted through as exploratory study, during which qualitative
research methods such as in-depth and expert interviews were used as part of the core
research strategy. The data collection method was a combination of in-depth and
expert interviews; as the sample was a combination of topic experts and non-experts
who were interviewed in the form of in-depth discussions. The opinions of these senior
executives of various organisations concerning the topic of how their organisations
currently utilise big data analytics during decision making yielded significant results. In-
depth interviews are particularly useful when new issues need to be explored in depth
with a respondent (Boyce & Neale, 2006) as was the case during this research study,
where the new emerging issue of big data analytics was explored with the various
respondents.
Dorussen, Lenz and Blavoukos (2005) argued that expert interviews are extremely
powerful due to the ability to extract deep insights from credible sources with “inside”
information that would have not been available through any other data collection
method. The experts interviewed in this research study provided specific insights as
directly relayed by the respondents (who were, in most cases, direct users of big data)
concenring how they specifically use big data analytics during the various decisions
that are made in the specific organisation, either based on the respondents’ own
personal experiences or from their exposure to broader organisational decisions.
The key informant technique was used during this research study, during which
respondents were interviewed specifically as a result of their personal skills, or position
within the organisations. Their ability to provide more information and provide a more
profound insight about their environment was valuable (Burgess, 1989).
Conceptualisation of a big data maturity model based on organisational
decision making
2015
41
4.3 Universe and Sampling
4.3.1 Unit of analysis
The unit of analysis was the organisation, as the proposed big data maturity model was
not based on individual but rather on organisation-wide decision making, as it is the
use of big data analytics during organisational decision making, and not as an input
into individual decision making that was the core focus of this research paper.
Individuals across various departments and divisions in organisations were interviewed
to compile a holistic view of big data maturity across the entire organisation.
4.3.2 Primary universe, sample and sampling methodology
The primary universe that has been identified for the proposed research paper can be
described as all organisations that have access to sufficient volumes of big data that
can be captured and processed. These organisations can be classified either according
to their level of intangible assets (Erickson & Rothberg, 2014) or by implication
according to the large volumes of data they would have access to large volumes of
data based on their organisational size, customer base or industry (McKinsey Global
Institute, 2011). Thus JSE listed companies were viewed as a base.
The primary sampling frame that was selected for this research paper were all of the
South African companies that are listed on the Johannesburg Stock Exchange, as it is
often the larger companies that have access to big data, sufficient systems and
architectures in place to process and analyse big data (McKinsey Global Institute,
2011). Thus small and medium enterprises were excluded from the research.
The primary sample was selected through judgment sampling, as the sampling units
were deliberately selected by the researcher according to certain criteria as established
by the researcher (Burgess, 1989) as well as the principle that the organisations can be
representative of the universe (Kothari, 2004). Judgmental sampling is also frequently
used in qualitative research where the objective of the research is to develop or test
hypotheses or propositions (Kothari, 2004), as was the case with this research study.
Conceptualisation of a big data maturity model based on organisational
decision making
2015
42
The criteria used to select organisations as part of the sample related predominantly to
their industry classification, according to the Industry Classification Benchmark (ICB),
which is a definitive system used to categorise over 70,000 and 75,000 securities
worldwide (ICB, n.d.), as well as the FTSE/JSE classification structure which was
available for download on the Johannesburg Stock Exchange’s website (“FTSE/JSE
Classification Structure,” 2002). As Erickson and Rothberg (2014) and McKinsey
Global Institute (2011) found that the industries that stand to benefit the most from big
data analytics include the financial services, communications and media,
manufacturing, resource and retail industries, the primary sampling frame therefore
included companies that were listed on the Johannesburg Stock Exchange as of
January 2015, and classified in one of these five industries.
Thus, as a first step, the researcher obtained a list of all of the companies that were
listed on the Johannesburg Stock Exchange and classified them in these five
categories. The classification was based on the “industry structure and definitions”
document, attached in Appendix 3, as issued by the Industry Classification Benchmark
(ICB), as well as the FTSE/JSE classification structure (“FTSE/JSE Classification
Structure”, 2002), attached in Appendix 4, which was used as a guideline for industry
classifications.
As the Johannesburg Stock Exchange did not provide a publicly available
comprehensive list of companies under each classification, the classification of the
companies was completed based on information sourced from an online information
aggregation site, ShareData, which provides up-to-date information on JSE listed
companies, such as share prices, fact sheets, annual reports and financial and trends
analyses, as well as comparative information (“ShareData Online Sector Index,” 2015).
This website was selected for use primarily based on the comprehensiveness of the
information on the website, as well as the ability for the user of the site to view
companies based on their industry classification, which is aligned to the Industry
Classification Benchmark (ICB) and the FTSE/JSE classification structure (“FTSE/JSE
Classification Structure”, 2002). No other website offered the user the ability to search
for companies according to industry. In order to verify the classification methodology of
the website, several comparisons were made to selected company websites to verify
Conceptualisation of a big data maturity model based on organisational
decision making
2015
43
that the industry classification was done correctly based on the organisations’ core
business and products or solutions.
The primary sampling frame comprised of companies that were listed on the
Johannesburg Stock Exchange as of January 2015 and were classified in one of five
industries, namely (1) financial services, (2) communications and media, (3)
manufacturing, (4) resources and (5) retail industries is included in Appendice 5.
The primary sample included two companies from each of these five industries; thus a
minimum of ten companies were selected. Included in this sample, one company had
one of the highest share prices in the industry as of January 2015 and one company
had one of the lowest share prices in the industry as of January 2015. The share prices
as of January 2015 were primarily sourced from the ShareData website
(http://www.sharedata.co.za/). The share prices were verified through data
triangulation; by comparing the share prices with other sources of share price
performance, such as Google Finance and the company websites to ensure that the
share prices were correct.
By selecting a top performing and low performing company the range of the model was
also tested, as it is predicted that the top performing company of each industry would
be more mature than the low performing company. This supported Patton (2002), who
argued that by integrating only a few cases, but those which are as different as
possible, the range of variation and differentiation in the field is disclosed, as the
maximal variation in the sample would have been achieved. Therefore, the companies
in the sampling frame in Appendice 5 were categorised according to their share price,
and the top 50% versus the lower 50% were classified according to their share price as
of January 2015, and these were colour coded as green (top) and yellow (bottom).
4.3.3 Secondary universe, sample and sampling methodology
The secondary sample was selected through judgement sampling, where individuals
who were deemed to be relevant to the universe were selected based on certain
criteria (Burgess, 1989, Kothari, 2004). Judgement sampling is frequently used in
qualitative research where the objective of the research is to develop or test
Conceptualisation of a big data maturity model based on organisational
decision making
2015
44
hypotheses or propositions (Kothari, 2004); in this research study the seven
propositions presented in Chapter 3 were tested.
The criteria used by the researcher included seniority (C-level), tenure at company (at
least six months), and responsibility for or exposure to strategic decisions, which
according to Kaner and Karni (2004:228) included decisions which are “concerned with
setting business goals and determining policies and functional strategies to achieve
them.” The rationale for the selected criteria related to the ability of the respondent to
fulfill their roles as key informants (Burgess, 1989) as outlined in Section 4.2 (iii), as it
was assumed that, as these respondents were responsible for strategic decisions and
were relatively senior in the organisations, they would be able to indicate how and
when big data was being used during organisational decision making. A minimum
tenure of at least six months at the company was included in the criteria as it was
assumed that respondents who have been at the company for less than six months
would not have been sufficiently exposed to the organisation context, culture, and
decision making and therefore would not have been able to serve as key informants
concerning the use of big data in the organisation. The World Economic Forum (2013)
stated that several departments across the organisation stand to benefit from big data,
and that the potential value opportunity is not limited to one department or role,
therefore a specific role or department was not included in the selection criteria for
respondents of this research paper.
The secondary universe therefore consisted of C-level executives in any department,
who had been employed in the organisations for a period of at least six months and
who were responsible for making strategic decisions. C-level executives who had not
been employed at the company for at least six months were deemed not to have
enough context or experience with using data for decision making in their current roles
due to the short tenure.
As access to C-level executives in some cases was difficult to obtain; convenience
sampling was also used, based on access to certain individuals as well as the
respondent’s availability to meet the researcher for an interview. Where respondents
were unable to avail themselves, alternative respondents were selected from the same
company, or another company in the same industry. After the initial interviews,
Conceptualisation of a big data maturity model based on organisational
decision making
2015
45
snowball sampling was also applied to gain further access to other C-level executives
in the same company or industry. Due to time constraints as well as difficulty
experienced in gaining access to C-level executives, in some cases executives or
middle managers were selected, as long as they met the other selection criteria, being
that they had been employed at the company for six months or longer and that they
had involvement in, or exposure to, strategic decisions.
A target sample size of 30 was identified, with an average of six C-level executives that
were included for each industry, and at least one executive per company that was
interviewed, so that the targeted 10 companies could be included. According to Patton
(2002), the size of the sample is determined by what needs to be studied, and that the
sample size and composition should be judged based on the context of the study. In
this case, the sample size of 30 respondents was decided upon to achieve a balance
between the breadth, or the range of responses as well as the depth, or the in-depth
insights that are required (Patton, 2002) across the five industries. In order to ensure
that the selected same size was sufficient, during the analysis of results, theoretical
saturation was determined, which is when “all of the main variations of the
phenomenon have been identified and incorporated into the emerging theory” (Guest,
Bunce, & Johnson, 2006:65).
4.4 Measurement Instrument
4.4.1 Semi-structured, face-to-face interviews
The measurement instrument used was semi-structured, face-to-face interviews, during
which each of the propositions and research questions were covered in exploratory
questions and a wide variety of probing methods were employed as necessary during
the interviews. This allowed for a level of consistency during interviews whilst allowing
flexibility for a level of customisation based on the specific organisational context.
The long interview approach by McCracken (1988) was adopted for this research
study. The long interview is a systematic and practical qualitative method, during which
a combination of exploratory (grand gesture) questions as well as planned and
Conceptualisation of a big data maturity model based on organisational
decision making
2015
46
unplanned prompts are used during the interview. Through the application of the long
interview methodology the interviewer was able to collect abundant, relevant and
manageable qualitative data. The method also ensures that the “richness” of the data is
captured, but that detractions are limited (McCracken, 1988). The long interview
method was particularly useful for this research study, as the scope of the interviews
was focused on the proposed conceptual big data maturity model and certain topics
addressed, but at the same time it was not limited to only the topics and variables
included in the model.
4.4.2 Interview guide and researcher’s approach
An interview guide was compiled to ensure that the same terrain is covered with each
respondent, that prompts are managed correctly, that the direction and scope of the
conversations are established prior to the interviews and to also ensure that sufficient
attention was given to each respondent’s responses (McCracken, 1988).
Several question areas were covered as detailed in the interview guide, each of which
were initiated with a grand question, which aimed to entice the respondent to talk,
without over specifying the substance or the perspective of the talk (McCracken, 1988).
The interview guide followed the line of questioning presented below:
- Each interview commenced with a set of background and biographical questions,
which allowed the interviewer to ascertain simple descriptive details of the
respondent’s life as well as establish rapport between the interviewee and
respondent.
- The interview then progressed into questions relating to the company background
and culture, to gather information about the organisational context and the
environment in which the decisions were made, as it would have directly influenced
the decision making approach in the organisation.
- The first two grand questions therefore aimed to establish rapport as well as gain a
comprehensive view about the environment, which served as background
information to the organisational context in which the individual worked.
Conceptualisation of a big data maturity model based on organisational
decision making
2015
47
- The interviewer then asked the respondent to share their own views about big data
analytics, in order to provide further context about the individual’s own perceptions,
opinions and assumptions about the phenomena. The question was included to
provide further background information and context to the researcher, as there is no
widely accepted universal definition of big data analytics and the concept and
definition of big data is in most instances a subjective one.
- The next question aimed to establish whether the organisation had an object, people
or process perspective when it came to their big data analytical efforts. This related
to Proposition 1 as outlined in Section 3.1, which stated that the focus of the
organisation’s big data efforts, defined as the object, or the technology and software,
the process, or people is indicative of big data maturity. A grand question “can you
tell me about how your organisation approaches data analytics?” was first applied,
and then prompts were used concerning the specific focus areas if necessary.
- The researcher then attempted to learn more about the presence of big data,
information and knowledge in the organisation, which, according to Proposition 2 as
outlined in Section 3.2, can be indicative of big data maturity. The question was
either raised as a prompt, or a new grand question, depending on the individual
interviews and the flow of conversation.
- The interviewer then raised a grand open-ended question about how decision
making is typically done in the organisation, and attempted to ascertain whether the
respondent mentioned anything concerning the interpretation of the decision
context. This related to Proposition 4 in Section 3.4, which stated that the
interpretation of the decision context is indicative of big data maturity, and to
Proposition 5 in Section 3.5, which stated that the ability to then also correctly
identify the decision context is indicative of maturity.
- The researcher also tried to establish whether the respondent mentioned anything
relating to information requirements based on the decision complexity, which relates
to Proposition 6 in Section 3.6, which states that the ability to correctly identify the
information requirements based on the decision complexity is indicative of big data
maturity.
- Lastly, the researcher paid attention to any mention of a fit between the information
that was used and the decision context, which related to Proposition 7 in Section
Conceptualisation of a big data maturity model based on organisational
decision making
2015
48
3.7, which states that the ability to present the right information based on the
decision context is indicative of big data maturity.
A series of prompts were used during each interview. Floating prompts, which are
exploitations of everyday speech such as repeating a key term of the respondent’s last
remark in an interrogative tone, was used to sustain answers to grand questions or
encourage elaboration on other comments. Planned prompts were also used at the
very end of each question category to encourage conversation on a topic, should it not
have arisen naturally (McCracken, 1988). The various planned prompts are presented
in the interview guide in Appendice 2.
Other prompting techniques were also applied during the interviews, for example the
category question, which ensured that all of the formal characteristics of the topic under
discussion were accounted for, as well as the contrast prompt and the recall of
exceptional incidents prompt. Auto-driving as a prompt was disregarded for this
research paper, due its obtrusive nature and the reliance on a visual stimulus, as it is
not be applicable to such an abstract term such as big data analytics or decision
making (McCracken, 1988).
During the interviews the interviewer tried to identify and cultivate data on categories
and relationships that were not anticipated, if raised by the respondent during the
interview, therefore keeping an open mind about any possible new areas of discussion.
This technique was based on McCracken's (1988) long interview approach.
4.5 Data Collection Process
Data was collected through a series of face-to-face, semi-structured interviews as
described above. Skype or telephonic interviews were set up for the respondents who
were not located in the Gauteng region. During the interviews the researcher made
short notes concerning vital points or topics that could be explored further, in line with
the various prompts outlined in Section 4.4.
The interviews were then recorded and transcribed for analysis. The transcriptions
were compared with the recorded copies of the interviews, and the required corrections
Conceptualisation of a big data maturity model based on organisational
decision making
2015
49
were applied. For example, if the transcriber could not hear a specific sentence and
therefore was unable to include it in the transcription, the researcher added in the
relevant content were required, after listening to the recording of the interview to verify
the sentence. In some instances, where necessary, respondents were contacted after
the interviews for further questions or validations of facts where required.
4.6 Data Analysis Approach
The data analysis approach used was a combination of content and thematic analysis.
During content analysis, several categories, derived from the theoretical model, in this
case the big data maturity model, were used to analyse the data, or transcripts (Flick,
2009; Patton, 2002). Content analysis is also widely used during deductive research,
as is the case with this research paper (Ezzy, 2013), during which the various
propositions that were compiled based on grounded theory were first reviewed, and
codes and code families were set up accordingly in a codebook, before the coding of
the transcripts commenced.
As is typical of thematic analysis, the researcher searched for common themes in the
data (Cassell & Symon, 2004). In the case of this research study, main themes
according to the codebook were then identified during the analysis of the transcripts.
This information was used to extract insights around the relevance of the proposed
conceptual model as well as identify potential new variables for inclusion.
Further findings for each industry or specific groups such as high and low share price
companies were included to provide rich insights around the phenomena of big data
analytics in these various environments. However, the aim of this research paper did
not include the detailed analysis of the big data maturity in these organisations; the
findings did not include the plotting of the various industries or the companies in
general on the big data maturity model.
The various maturities according to each dimension of maturity were then compiled for
each industry. The conceptual model was then amended to include the new variables,
and findings were verified through triangulation.
Conceptualisation of a big data maturity model based on organisational
decision making
2015
50
4.7 Assumptions
The respondents that participated in the survey were selected from judgement
sampling, and therefore one of the main assumptions during sample selection related
to their ability to act as key informants concerning big data analytics and decision
making in their organisations. It was therefore assumed that the respondents had
enough context and exposure to the field of big data analytics, as well as the various
big data analytical activities in their organisations to comment on big data during the
interviews.
It was also assumed that the respondents correctly interpreted the questions, and
therefore did not misunderstand what the interviewer was asking. Therefore it was
assumed that the respondents provided an honest and accurate answer based on the
question.
The respondents’ answers and comments during the interviews were taken at face
value, as it was assumed that the respondents were open and forthcoming with the
required information, and did not try to disguise or misconstrue the relevant facts.
4.8 Research Limitations
The researcher of this study was, at the time of the study, employed at a major
financial institution in South Africa, and therefore her interpretation of the results could
have potentially been influenced by her current organisational and situational context
and interpretation of respondents’ comments. Therefore, researcher bias could have
occurred during both the data collection process during the interviews as well as the
analysis of results.
The primary sample included only South African companies that are listed on the
Johannesburg Stock Exchange. Although it can be assumed that the results are
relevant to all large organisations in South Africa, even for example organisations that
are listed on other stock exchanges, the transferability of the study was not empirically
tested to ascertain its relevance to other similar larger organisations in South Africa
Conceptualisation of a big data maturity model based on organisational
decision making
2015
51
listed on other stock exchanges. The proposed big data maturity model is aimed
towards large organisations, and thus the applicability of the model for smaller
organisations such as small and medium enterprises is unclear.
As outlined in Chapter 5, Section 5.1, 10 out of the 29 respondents were from the
manufacturing industry, and therefore the results might have been influenced more by
the respondents from the manufacturing industry than the other industries. This might
have caused skewed results being reported. The majority of the respondents were also
from high share price companies, and therefore an equal reflection of high and low
share price was not achieved, so the results might be skewed towards the majority
opinion of these respondents from the high share price groups.
The geographical distribution of the sample was also heavily skewed towards Gauteng,
with 25 of the 29 respondents residing in Gauteng. This might potentially impact the
transferability of the study as the strong presence in the economic hub of South Africa
might skew the results towards greater maturity than is in fact the case.
As the interviews were conducted only in South Africa and with employees of South
African organisations, the proposed big data maturity model is particularly relevant for
South Africa businesses. Although it can be assumed that the proposed model is
relevant to other emerging markets with similar business contexts, the relevance was
not empirically tested in this research study.
The secondary sample included C-level executives, and therefore the views of lower
level employees have been excluded. This might result in biased results as a balanced
view from all levels in the organisation was not obtained.
As the definition of big data is in most cases subjective, and from the interviews it was
clear that no common definition existed amongst the participants, some of the answers
from respondents might have been influenced by their personal views and the
subjective perception of big data.
The relevance and usefulness of the proposed model was established during the
qualitative interviews with South African executives. The interview feedback might have
be subjective (based on the respondent’s own experience and perceptions) which

Conceptualisation of a big data maturity model based on organisational
decision making
2015
52
might result in response bias. By not quantitatively testing the model the extent of the
relevance and usefulness of the proposed model cannot be quantified, for example that
it is 50% useful.
The research did not address the measurement of improved decisions as a result of
the use of big data during organisational decision making. The research also did not
aim to understand how organisations perform when measured against this model over
a period of time. Therefore, the research paper does not draw any correlation or prove
any causal relationship between big data maturity and the potential benefits thereof to
the organisation in the form of improved financial performance or increased revenues.
The research study focused on the relationships between the variables of the big data
model in terms of correlation or causation, and therefore the interrelationship and
dependencies of the variables could not be ascertained.
The conceptual model did not take into account the company culture, which can
potentially influence and impact the company’s approach to knowledge management
and decision making.
Conceptualisation of a big data maturity model based on organisational
decision making
2015
53
CHAPTER 5: RESULTS
During the analysis of results a combination of content and thematic analysis, during
which the findings from the interviews were used to validate the proposed conceptual
model as well as identify potential new variables for inclusion.
A total of 29 interviews were conducted during the period between 6 July 2015 and 11
August 2015. The respondents spanned across 18 companies and five industries. A
total of 11 hours and 25 minutes of recordings of the interviews were collected, which
was then transcribed into 179 pages.
5.1 Overview of Sample
The data collection garnered information from 29 respondents who were interviewed
across the five industries, namely (1) financial services, (2) communications and
media, (3) manufacturing, (4) resources and (5) retail. The last respondent, who was
due to be interview #30, cancelled the interview at the last minute and was unable to
reschedule. Due to time constraints the researcher was unable to find another suitable
research subject, and therefore the final sample consisted of 29 respondents.

Conceptualisation of a big data maturity model based on organisational
decision making
2015
54
Figure 2: Total industry classification of respondents
The majority of the respondents was from the manufacturing industry (10 respondents);
followed by financial services (six respondents) communications and media (five
respondents), resources (four respondents) and retail (six respondents). Therefore,
respondents from the manufacturing industry had the main voice, and the results might
have been influenced more by the respondents from the manufacturing industry than
the other industries.
Financial services, 6
Communications and Media,
5
Manufacturing, 10
Resource, 4
Retail, 4
Total industry breakdown of respondents
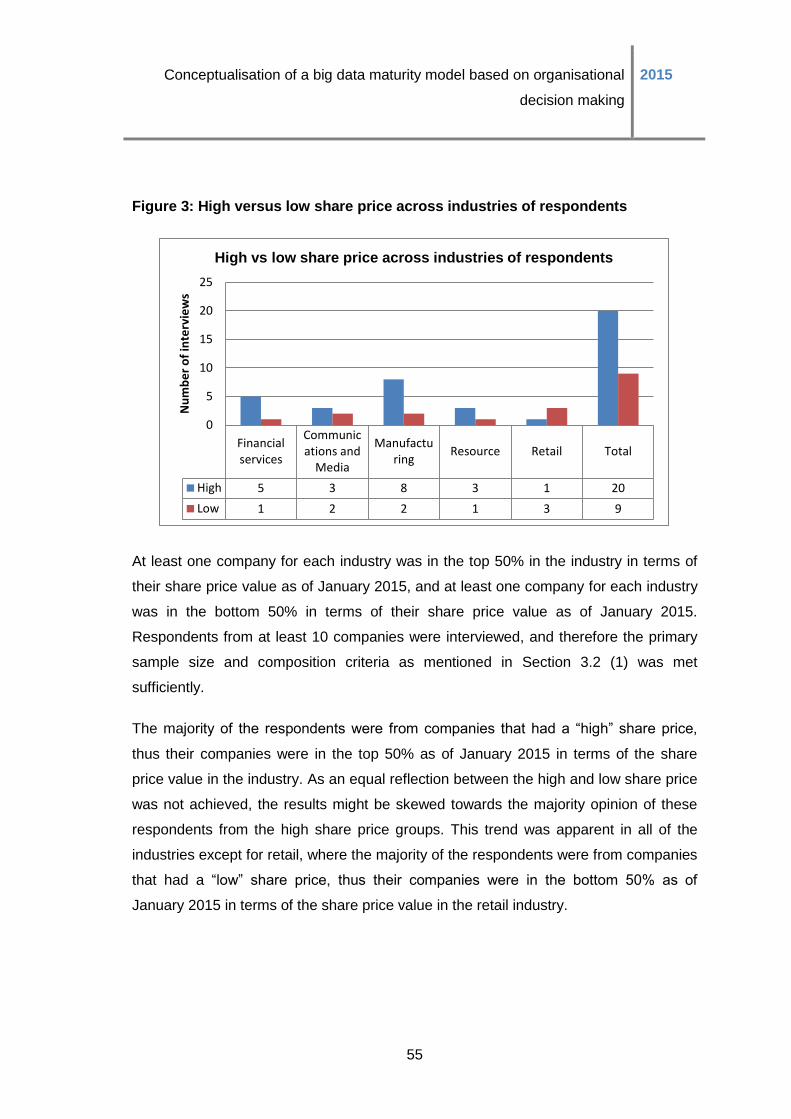
Conceptualisation of a big data maturity model based on organisational
decision making
2015
55
Figure 3: High versus low share price across industries of respondents
At least one company for each industry was in the top 50% in the industry in terms of
their share price value as of January 2015, and at least one company for each industry
was in the bottom 50% in terms of their share price value as of January 2015.
Respondents from at least 10 companies were interviewed, and therefore the primary
sample size and composition criteria as mentioned in Section 3.2 (1) was met
sufficiently.
The majority of the respondents were from companies that had a “high” share price,
thus their companies were in the top 50% as of January 2015 in terms of the share
price value in the industry. As an equal reflection between the high and low share price
was not achieved, the results might be skewed towards the majority opinion of these
respondents from the high share price groups. This trend was apparent in all of the
industries except for retail, where the majority of the respondents were from companies
that had a “low” share price, thus their companies were in the bottom 50% as of
January 2015 in terms of the share price value in the retail industry.
Financialservices
Communications and
Media
Manufacturing
Resource Retail Total
High 5 3 8 3 1 20
Low 1 2 2 1 3 9
0
5
10
15
20
25
Nu
mb
er
of
inte
rvie
ws
High vs low share price across industries of respondents
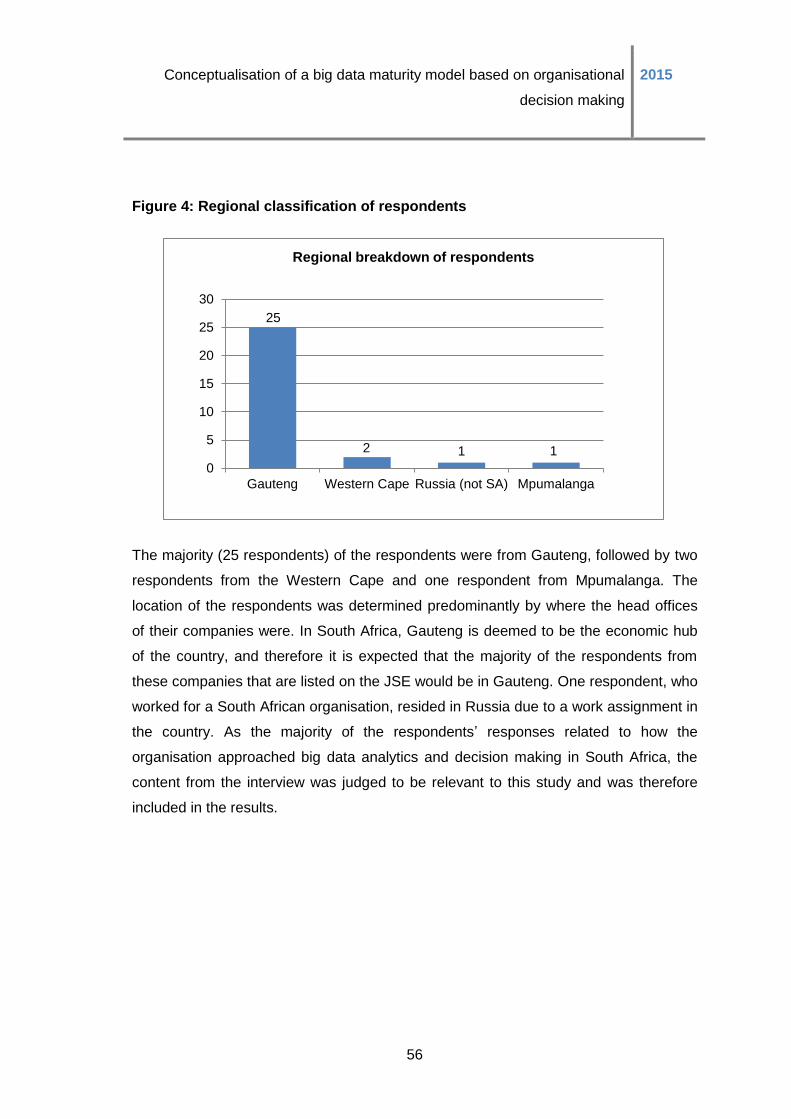
Conceptualisation of a big data maturity model based on organisational
decision making
2015
56
Figure 4: Regional classification of respondents
The majority (25 respondents) of the respondents were from Gauteng, followed by two
respondents from the Western Cape and one respondent from Mpumalanga. The
location of the respondents was determined predominantly by where the head offices
of their companies were. In South Africa, Gauteng is deemed to be the economic hub
of the country, and therefore it is expected that the majority of the respondents from
these companies that are listed on the JSE would be in Gauteng. One respondent, who
worked for a South African organisation, resided in Russia due to a work assignment in
the country. As the majority of the respondents’ responses related to how the
organisation approached big data analytics and decision making in South Africa, the
content from the interview was judged to be relevant to this study and was therefore
included in the results.
25
2 1 1
0
5
10
15
20
25
30
Gauteng Western Cape Russia (not SA) Mpumalanga
Regional breakdown of respondents
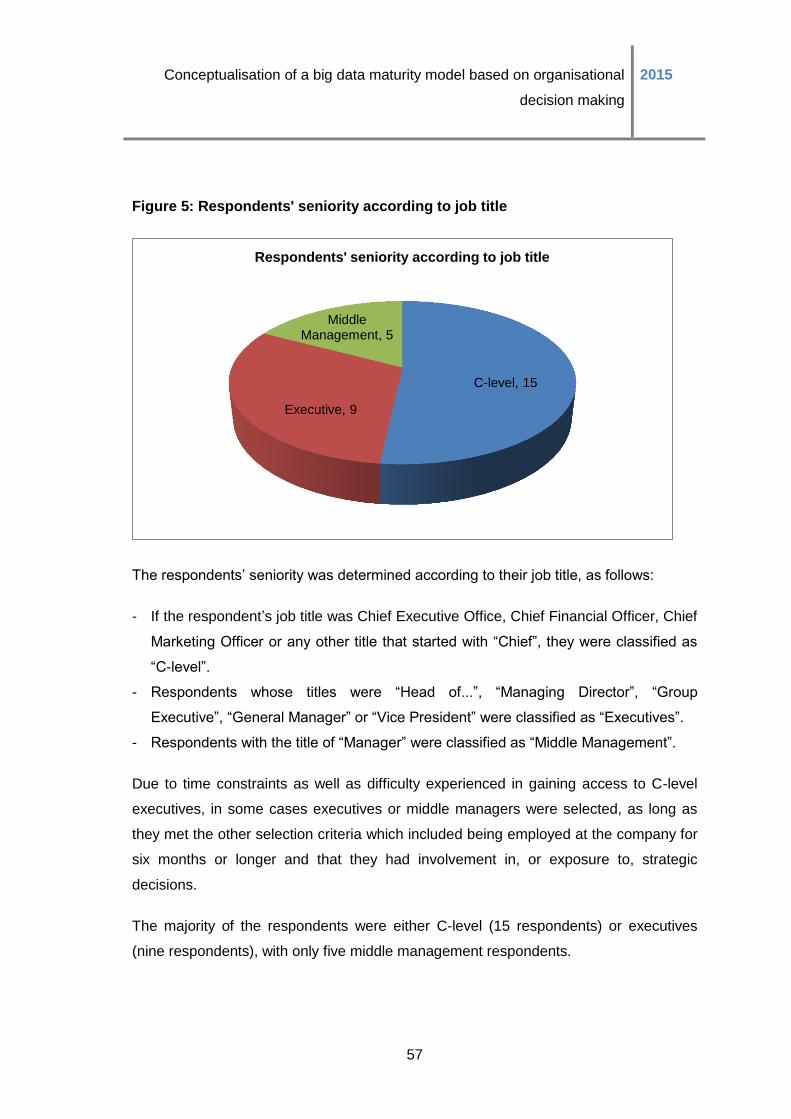
Conceptualisation of a big data maturity model based on organisational
decision making
2015
57
Figure 5: Respondents' seniority according to job title
The respondents’ seniority was determined according to their job title, as follows:
- If the respondent’s job title was Chief Executive Office, Chief Financial Officer, Chief
Marketing Officer or any other title that started with “Chief”, they were classified as
“C-level”.
- Respondents whose titles were “Head of...”, “Managing Director”, “Group
Executive”, “General Manager” or “Vice President” were classified as “Executives”.
- Respondents with the title of “Manager” were classified as “Middle Management”.
Due to time constraints as well as difficulty experienced in gaining access to C-level
executives, in some cases executives or middle managers were selected, as long as
they met the other selection criteria which included being employed at the company for
six months or longer and that they had involvement in, or exposure to, strategic
decisions.
The majority of the respondents were either C-level (15 respondents) or executives
(nine respondents), with only five middle management respondents.
C-level, 15
Executive, 9
Middle Management, 5
Respondents' seniority according to job title
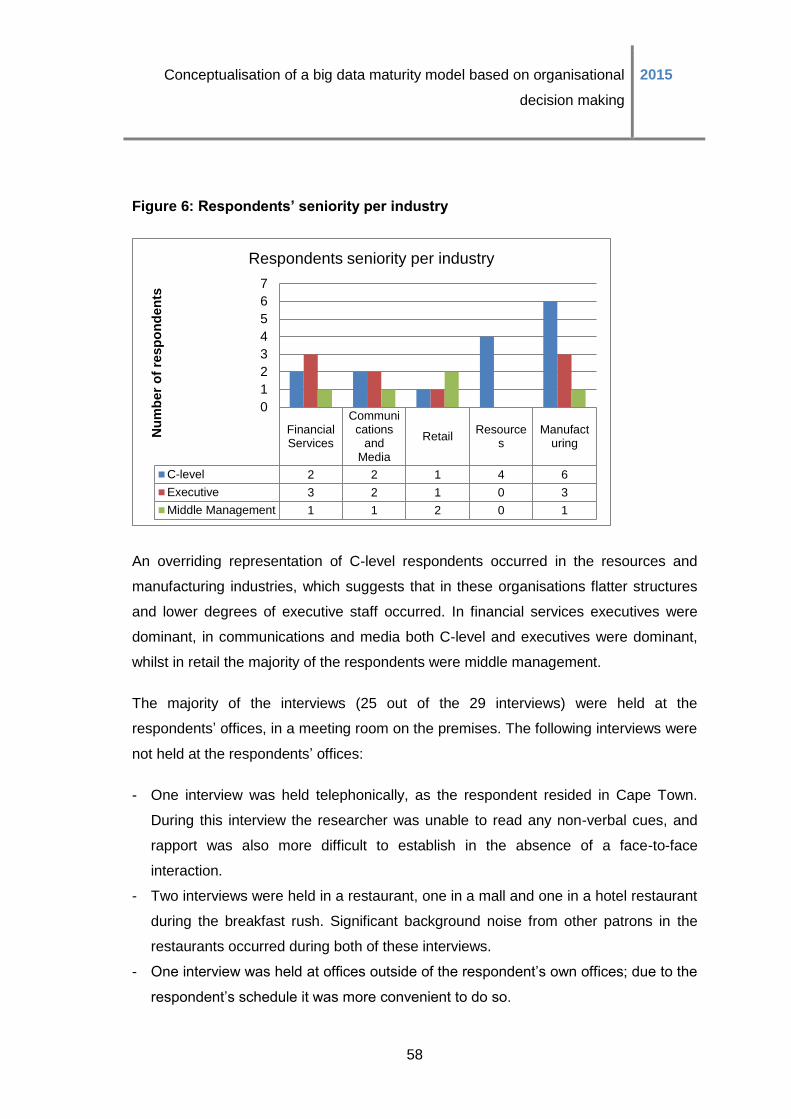
Conceptualisation of a big data maturity model based on organisational
decision making
2015
58
Figure 6: Respondents’ seniority per industry
An overriding representation of C-level respondents occurred in the resources and
manufacturing industries, which suggests that in these organisations flatter structures
and lower degrees of executive staff occurred. In financial services executives were
dominant, in communications and media both C-level and executives were dominant,
whilst in retail the majority of the respondents were middle management.
The majority of the interviews (25 out of the 29 interviews) were held at the
respondents’ offices, in a meeting room on the premises. The following interviews were
not held at the respondents’ offices:
- One interview was held telephonically, as the respondent resided in Cape Town.
During this interview the researcher was unable to read any non-verbal cues, and
rapport was also more difficult to establish in the absence of a face-to-face
interaction.
- Two interviews were held in a restaurant, one in a mall and one in a hotel restaurant
during the breakfast rush. Significant background noise from other patrons in the
restaurants occurred during both of these interviews.
- One interview was held at offices outside of the respondent’s own offices; due to the
respondent’s schedule it was more convenient to do so.
FinancialServices
Communications
andMedia
RetailResource
sManufact
uring
C-level 2 2 1 4 6
Executive 3 2 1 0 3
Middle Management 1 1 2 0 1
0
1
2
3
4
5
6
7
Nu
mb
er
of
resp
on
den
ts
Respondents seniority per industry
Conceptualisation of a big data maturity model based on organisational
decision making
2015
59
5.2 Data Analysis
5.2.1 Data preparation
After the interviews, the recordings were transformed into written transcriptions. The
researcher compared the transcriptions with the recorded copies of the interviews, and
corrections where required were applied. The researcher found that the majority of the
transcriptions were an accurate and concise replication of the interviews, and only
minor amendments were required. Atlas.ti. software was used for analysis.
5.2.2 Import of documents into analysis software, Atlas.ti
As a first step, the interviews were then renamed into the following naming convention,
for import into Atlas.ti.
Table 1: Transcripts naming convention
Industry Share price Company (first few letters)
Seniority of the individual
Initials of the respondent
FIN (used for Financial services)
H (used for High share price in
industry)
CL (used for C-level)
RET (used for Retail) L (used for Low share price in
industry)
EX (used for Executive)
RES (used for Resources) MM (used for Middle Management)
MAN (used for Manufacturing)
COM (used for Telecommunications &
Media)
5.2.3 Data analysis approach
The data analysis utilised a content analysis and thematic approach, during which
several categories, derived from the theoretical model, in this case the big data
maturity model, were used to analyse the data, or transcripts (Flick, 2009; Patton,
2002). Content analysis is also widely used during deductive research, as is the case
with this research study (Ezzy, 2013). The various propositions that were compiled
Conceptualisation of a big data maturity model based on organisational
decision making
2015
60
based on grounded theory were first reviewed, and codes and code families were set
up accordingly in a codebook, before the coding of the transcripts commenced.
Before the analysis of the transcripts, various themes and categories were compiled
based on the various research propositions and these were used to compile the codes
and code families in the codebook. A review of each transcript was then done, with the
various codes being applied. The data from the respondents was taken at face value,
and the interviewees were perceived as a fixed subject of study, any additional or
personal ideas or biases were excluded as far as possible from the analysis (Atkinson
& Delamont, 2010). After each transcript was imported and the codes were applied, the
full list of codes was reviewed and similar codes were merged in order to avoid the
duplication of codes. This process was done twice, as after the completion of the first
round of coding the codes were found to be too vague, and thus the coding process
was done a second time. The full set of codes is available in the codebook in
Appendice 7.
5.2.4 Tests for saturation
To test for code saturation, the progression of newly created codes that still fall within
the predefined “themes” of the propositions based on the conceptual big data maturity
model was documented. Record was made of the creation of these codes. Coding
saturation was achieved, as illustrated in the below figure, as the rate at which new
codes were created declined as the analysis progressed (Guest et al., 2006).
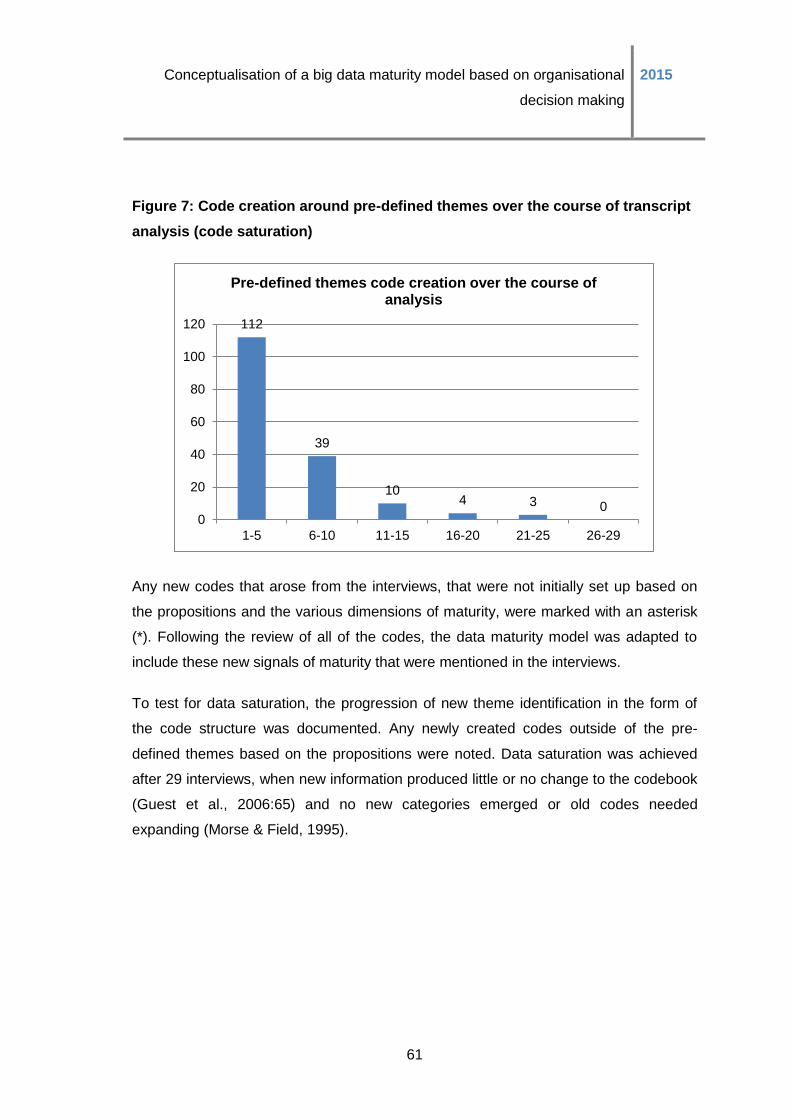
Conceptualisation of a big data maturity model based on organisational
decision making
2015
61
Figure 7: Code creation around pre-defined themes over the course of transcript
analysis (code saturation)
Any new codes that arose from the interviews, that were not initially set up based on
the propositions and the various dimensions of maturity, were marked with an asterisk
(*). Following the review of all of the codes, the data maturity model was adapted to
include these new signals of maturity that were mentioned in the interviews.
To test for data saturation, the progression of new theme identification in the form of
the code structure was documented. Any newly created codes outside of the pre-
defined themes based on the propositions were noted. Data saturation was achieved
after 29 interviews, when new information produced little or no change to the codebook
(Guest et al., 2006:65) and no new categories emerged or old codes needed
expanding (Morse & Field, 1995).
112
39
10 4 3 0
0
20
40
60
80
100
120
1-5 6-10 11-15 16-20 21-25 26-29
Pre-defined themes code creation over the course of analysis
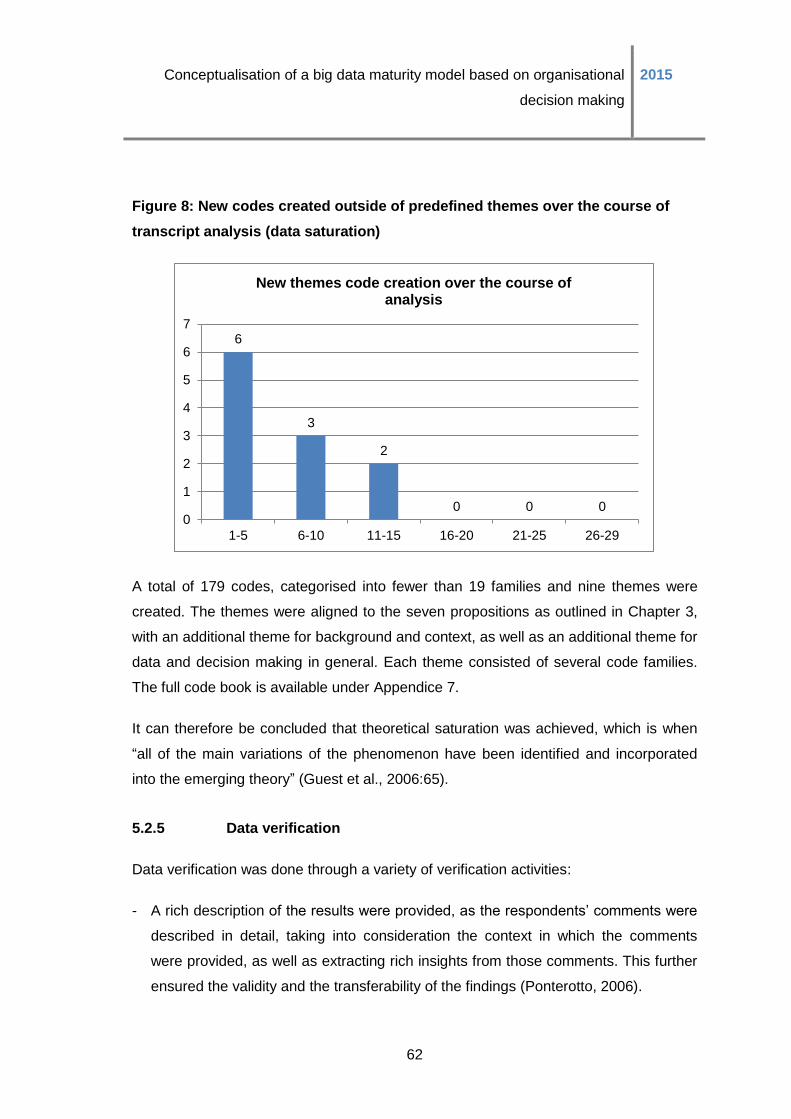
Conceptualisation of a big data maturity model based on organisational
decision making
2015
62
Figure 8: New codes created outside of predefined themes over the course of
transcript analysis (data saturation)
A total of 179 codes, categorised into fewer than 19 families and nine themes were
created. The themes were aligned to the seven propositions as outlined in Chapter 3,
with an additional theme for background and context, as well as an additional theme for
data and decision making in general. Each theme consisted of several code families.
The full code book is available under Appendice 7.
It can therefore be concluded that theoretical saturation was achieved, which is when
“all of the main variations of the phenomenon have been identified and incorporated
into the emerging theory” (Guest et al., 2006:65).
5.2.5 Data verification
Data verification was done through a variety of verification activities:
- A rich description of the results were provided, as the respondents’ comments were
described in detail, taking into consideration the context in which the comments
were provided, as well as extracting rich insights from those comments. This further
ensured the validity and the transferability of the findings (Ponterotto, 2006).
6
3
2
0 0 0 0
1
2
3
4
5
6
7
1-5 6-10 11-15 16-20 21-25 26-29
New themes code creation over the course of analysis
Conceptualisation of a big data maturity model based on organisational
decision making
2015
63
- In order to ascertain the credibility and validity of the results, triangulation was done
where the findings were compared with other data, for e.g.: similar big data maturity
models that are available in the business literature.
- In order to determine the dependability and reliability of the results, the methodology
as outlined in Chapter 4 was thoroughly and rigorously compiled and interrogated
based on the research objectives.
- Internal transferability was attained as several quotes from other sections of the
interviews, as well as cross-industry and respondent comments were considered.
- Confirmability and objectivity was achieved, as the researcher included data that
contradicted the analysis, and the results were also verified with both the supervisor
of the research as well as a consultant who frequently works with the various
industries.
5.2.6 Content analysis approach
The content analysis approach that was followed has been outlined below.
During the data analysis, each proposition, which was translated into code themes,
was analysed first holistically in terms of the main themes that emerged for each
proposition.
The detailed findings were then analysed based on the respondents comments, first on
a holistic level, and then for each share price group and industry sector. One of the
lenses that were used for the analysis was the percentage of time spent speaking
about the specific measure, which was calculated on the enumerative method, where
word count was used as a proxy for importance/focus/emphasis.
The results for each proposition were analysed in order to reach a conclusion, both
concerning the proposed dimension of maturity as well how mature organisations were
if measured against that dimension of maturity. Lastly, a holistic summarised view of
industry performance regarding big data maturity was compiled.
Conceptualisation of a big data maturity model based on organisational
decision making
2015
64
5.2.7 Threats to reliability and validity
The researcher was, at the time of the study, employed at a major financial institution in
South Africa, and therefore her interpretation of the results could have potentially been
influenced by her current organisational and situational context and interpretation of
respondents’ comments.
One of the major threats to reliability and validity related to the confidential nature of an
organisation’s decision-making process as well as their data and analytics approach,
which in some cases might be a potential competitive advantage. As a result, some
respondents might have been reluctant to share the full details of how they approach
big data analytics in their organisation, for fear of this becoming public knowledge and
therefore losing their competitive edge.
As the definition of big data is in most cases subjective, and from the interviews it was
clear that no common definition existed amongst the participants, and therefore some
of the answers from respondents might have been influenced as a result of their
personal views and perception around big data. The majority of the respondents were
also very interested in and open to a conversation about big data, as the general
feeling was that they cannot wait to start implementing big data analytics in their
organisations.
The sample did not include an equal number of high and low share price companies for
each industry, and as outlined in Section 5.1 companies from the manufacturing sector
exceeded all other sectors (10 out of the 29 companies in the sample were from the
manufacturing sector). This might have potentially skewed the results as the
manufacturing companies were represented more than the other industries, and
therefore had more opportunity to share their views than other industries.
5.3 General Findings and Observations
It is clear that there was no consensus amongst the respondents concerning the
definition of big data. Some respondents were unable to provide a definitive description
of big data, such as Respondent P4 who stated “I don’t understand what big data is to
Conceptualisation of a big data maturity model based on organisational
decision making
2015
65
be honest and its relevance”. Other respondents provided various definitions for big
data, such as Respondent P17 who described it as being “unstructured… and fast
changing data”, Respondent P16 who referred to big data as “the immense amount of
data“, Respondent P8 who stated “a large number of databases [interlinked] to get to a
solution” and Respondent P31 who shared that “it means different things to different
people”.
The logical conclusion is that this finding in itself signifies a lack of maturity amongst
executives, specifically concerning the understanding of big data analytics and the
context in which it can be used in organisations. Therefore, at the basic level data
users need to first form an understanding and definition of big data, else the foundation
is not in place to proceed with further big data activities.
Another interesting observation was that the majority of the respondents self-classified
their organisations as relatively immature and stated that that they still have a long
journey ahead of them. For example, Respondent P16 commented that “we are quite
immature when it comes to big data” and Respondent P9 stated “the opportunities of
big data within the (company) is still very, very big”. The phenomenon itself is relatively
new, hence organisations may still be grappling with how to best realise its potential.
Lastly, the majority of the respondents were also very interested in and open to a
conversation about big data, as they could not wait to start implementing big data
analytics in their organisations. The absolute focus and determination of really
harnessing big data analytics was evident, as Respondent P15 explained:
“I think the key opportunity is in making people understand how to use it.
Everyone knows that they have data but where on earth do you start in using
data.”
This finding clearly indicates urgency and excitement amongst executives to start
better understanding big data analytics and explore the various opportunities that it
presents. However it was also clear that although excitement exists, some level of
“stuck-ness” was also evident as big data was clearly something that executives had
not yet mastered. This finding also relates to the technical focus present currently
amongst the users of big data as well as a strong focus on the potential
Conceptualisation of a big data maturity model based on organisational
decision making
2015
66
commercialisation opportunities thereof. Additionally, the majority of the organisations
in the sample are relatively large, the relative opportunities of big data in those
environments are massive as well and therefore where respondents recognised the
potential value it is indicative of the context in which they operate.
It can be inferred that perhaps self-classification is also a signal of big data maturity in
itself, as executives require some level of engagement with and familiarity of big data in
their environments in order to acknowledge their relative maturity. Therefore, it can be
interpreted that executives first need to understand the scope and definition of big data,
at the most basic level, and thereafter self-classify their big data maturity according to
this definition. It is therefore concluded that self-classification be indicative of higher
levels of maturity than simply the recognition of the definition of big data.
It can be concluded that the “appetite” for big data also be considered as a signal of
maturity, and that it be indicative of higher levels of maturity, as once individuals have
self-classified themselves according to the definition of big data, they recognise the
potential value thereof and seem to be ardent to explore the various opportunities it
presents. A further logical conclusion would be that organisations who have managed
to tap into these opportunities, in order to commercialise big data in their environments,
are indicative of the highest levels of maturity.
Reflecting on the above, it is suggested that an additional measure of big data maturity,
“Big data awareness, appetite and commercialisation” be added to the conceptual big
data maturity model. According to this measure, the various maturity levels include:
- L1: Thorough understanding of the scope and definition of big data, but no further
awareness about how mature the organisation’s big data efforts are.
- L2: Understanding of the definition of big data, as well as self-classification of the
organisation’s big data efforts.
- L3: Appetite for and excitement about the potential value that big data analytics can
offer the organisation, but the full value has not yet been realised through
commercialisation.
- L4: Big data systems and plans in place; degree of planning to extract value;
placement of teams.

Conceptualisation of a big data maturity model based on organisational
decision making
2015
67
- L5: Full value of big data has been extracted through the commercialisation of big
data in the organisation.
In terms of the other a priori identified big data maturity dimensions as outlined in
Propositions 1-7, on the surface there did not seem to be major differences from the
model itself. Upon further examination clear nuances emerged, which have been
detailed under each dimension of maturity. The following sections in Chapter 5 are laid
out in the same manner and format as Chapter 3, where each proposition is discussed
in detail and the findings are presented accordingly.
5.4 Proposition 1: Object, Process or People focus as a
signal of big data maturity
Proposition 1 suggested that the focus of the organisation’s big data efforts, defined
either as object, process or people focus, is indicative of big data maturity. A focus on
objects was suggested as being indicative of lower levels of maturity, whilst a focus on
people and processes was proposed to be indicative of higher levels of maturity.
During the formulation of the proposition in Section 3.1 the order of people and process
focus in terms on big data maturity was not yet determined, and it was uncertain if, for
example, processes are indicative of higher levels of maturity than people, or vice
versa.
5.4.1 Object focus definition and coding
As described in Section 2.2 (iii) object focus can be defined as the technology,
architecture, software and solutions that an organisation uses during big data analytics.
Therefore, during the analysis the respondents’ answers to questions of how their
organisation approaches big data analytics, as well as how big data analytics is
enabled in their organisation was reviewed and relevant mentions were coded
accordingly.
Conceptualisation of a big data maturity model based on organisational
decision making
2015
68
Three main themes emerged under the “objects” code family:
(1) Where respondents were aware of several solutions being used, but could not
name them specifically, or made general comments, their relevant remarks
were coded under the “architecture, warehouse, infrastructure”, “aware of
solutions but not involved” and “various reporting solutions” codes. One
example of a comment that would be coded under these codes is the statement
from Respondent P9:
“It would probably be a combination of open source and other tools that are
available in the market”.
And so it seems that some respondents were not that engaged with big data in
their organisations, as they were not really that close to or aware of the various big
data solutions therein.
(2) The second theme that emerged related to specific solutions or software packages.
Every time a respondent mentioned “SAP”, “MS Access”, “SQL”, “SAS”, “Hadoop”,
“GIS software”, “QlikView”, “Excel”, “CSS”, “Oracle”, “PowerBI”, “Buildsmart”, it
would be coded under one of these codes.
“Credit basically creates its own data warehouse and its own then SAS
infrastructure then to run that.” (Respondent P6)
The above quote is an example of one of the quotes that were coded under one of
these codes. This second theme indicates that some of the respondents were
somewhat more engaged with big data in their organisations, as they were more
familiar with the specific solutions used, but that they have not formed an opinion
about whether the big data solutions were sufficient or not.
(3) The third theme related to negative comments, and the codes “technology lagging”,
“reliability of systems an issue”, “no formal solution”.
“It is quite often very difficult to get the latest and greatest software installed
here because the business case for it isn’t always that clear.” (Respondent
P24)
Conceptualisation of a big data maturity model based on organisational
decision making
2015
69
Statements such as the one above were coded under one of these codes.
Respondents therefore were sufficiently engaged and familiar with big data analytics in
their organisations if they were able to offer an opinion of whether the various big data
solutions in their environments were sufficient or not. They were also aware of the
effectiveness and internal obstacles to the implementation suggesting larger and longer
engagement with the tools.
Reflecting on the “objects” code family, it is clear that specific nuances exist around
how engaged the respondents were with the various big data software and solutions in
their environments. Thus, it can be concluded that a focus on the objects, defined as
the technology, architecture, software and solutions that an organisation uses during
big data analytics, in itself it not indicative of big data maturity, but that the depth of
engagement that executives have with these objects can be used as a more accurate
measure of big data maturity. Larger and longer engagement demonstrates a more
complex picture.
Based on the above, three distinct themes of object-related codes that emerged during
analysis, three distinct levels of maturity can be identified and related to the big data
object focus of organisations:
- L1: The lowest levels of maturity would be where individuals in the organisation
were not engaged with the big data objects in their environment at all. At this level,
executives would be vaguely aware of the various big data solutions, but would not
be able to name specific solutions.
- L2: At the middle level of maturity individuals would be somewhat engaged with the
big data solutions in their organisations, but not to the extent where they have
developed a deeper understanding around the effectiveness of these solutions.
Individuals would thus be able to name specific solutions, but not have further
opinions on these solutions or their effectiveness and usefulness.
- L3: At the highest level of maturity individuals would be deeply engaged with the big
data solutions in their organisations, and they would not only be fully aware of the
specific solutions used, but would also be able to provide judgements around the
effectiveness of those solutions.
Conceptualisation of a big data maturity model based on organisational
decision making
2015
70
5.4.2 Process focus definition and coding
As described in Section 2.2 (iii) the process view includes the extent to which a specific
process is explicitly defined, manager, measured, controlled and effective.
Respondents’ comments about how data is created, acquired, and used in their
organisation, or any references to any big data analytical processes were coded under
the “process” code family.
Three main themes and codes that emerged during coding:
(1) Some respondents referred generally to big data processes in their organisations,
which were then coded under the “data collection and cleaning”, “predictive
analytics”, “data cleaning”, “data collection”, “analysis of the data”, “reactive
analytics” and “data integration” codes.
The comment from Respondent P13 was one example of a quote coded under one
of these codes:
“The major source of key data is in our core systems so that is all mainframe
driven, those are based on IMS tables within there that are effectively dragged
into a data lake, data dump and at the moment we are moving from a
[Sybase] environment into a dumping environment and that forms the basis of
the data lake” [emphasis added]
When this specific finding around data lakes was triangulated with the Forbes blog
posts written by Kumar (2014), it became apparent that data lakes are becoming
an increasingly popular way to start with big data analytics, but when left
unchecked, these become toxic, where it becomes impossible to extract useful
insights and derive value from these lakes. This first theme of process-related
codes indicates that these respondents were somewhat aware of the various big
data processes that were underway in their organisations, but as they were not
engaged enough with the various big data analytical processes there was no real
evidence of an opinion of or the management and control of the quality thereof.
(2) References to specific big data collection and user processes unique to a dataset or
Conceptualisation of a big data maturity model based on organisational
decision making
2015
71
the environment were coded under the “data collection social media”, “data
dissemination project data”, “data collection marketing data”, “analysis project
calculation” and the “data collection project data” codes. The quote from
Respondent P8 is a typical example of one of the quotes that were coded under
one of these codes:
“Somebody would say I can’t afford the school fees I need compassion, my
husband died or whatever. A quick glance on Facebook shows her drinking
champagne and driving her Ferrari so obviously we can’t extend the
compassion. So we do use non-traditional ways.”
. Here, the respondents seemed more engaged with the various big data analytical
processes, to an extent where they could pinpoint specific processes that were
underway in their specific environments. Although these respondents were aware
of the organisational context and how this then determined which specific big data
analytical processes were in place, they were still not engaged with these
processes to the extent of where they developed a deeper understanding of the
processes, in order to make a judgement concerning the quality and effectiveness
of these processes.
(3) Negative comments were coded under the “data not integrated or disseminated”,
“gap in data collection”, “fragmented approach”, “no real data mining”, “access to
data problematic”, “big data analytics being inconsistent in the organisation”, “can’t
extract insights from the data”, “over analyse the data” and the “integrity of data an
issue” codes. For example the statement from Respondent P2 that “there is still a
lot of junk in the system” was coded under these codes. In these cases,
respondents seemed sufficiently engaged with the various big data analytical
processes to form an understanding of the various process problems that exist.
The full codebook is available for review in Appendice 7.
Reflecting on the above “process” codes, it is clear that specific nuances exist
concerning the levels of engagement from the respondents with the various big data
processes in their environments. Using their responses as a proxy for organisational
engagement, thus, it can be concluded that a focus on the big data processes in itself
Conceptualisation of a big data maturity model based on organisational
decision making
2015
72
is not indicative of big data maturity, but that the depth of engagement executives with
these processes can be used as a more accurate measure.
Based on the above distinctive three themes of big data processes-related codes that
emerged during analysis, three distinct levels of maturity can be identified related the
big data process focus of organisations:
- L1: The lowest levels of maturity would be where individuals in the organisation
were not engaged with the big data processes in their environment at all. At this
level, executives would be vaguely aware of the various big data processes, but are
not involved enough to be aware of the specific processes in place.
- L2: At the middle level of maturity individuals would be somewhat engaged with the
big data processes in their organisations, but not to the extent where they have
developed a deeper understanding about the effectiveness thereof. Individuals
would thus be able to name specific processes, but not have further opinions on the
effectiveness of these processes.
- L3: At the highest level of maturity individuals would be deeply engaged with the big
data processes in their organisations, and they would not only be fully aware of the
specific processes, but would also be able to provide judgements concerning the
effectiveness of those solutions, through the identification of the process related
problems.
5.4.3 People focus definition and coding
As described in Section 2.2 (iii) people include the workforce that is responsible for and
proficient in analytics. During analysis, any specific mention to the teams or individuals
who are responsible for big data analytics in the organisation was coded under the
“people” code family. In cases where the respondents did not immediately mention the
analytical teams during one of their answers, a floating prompt was used to specifically
ask them about it.
During analysis, the following main themes were identified under the “people” code
family:
(1) Lack of teams or resource allocation to big data analytics, which has been coded
Conceptualisation of a big data maturity model based on organisational
decision making
2015
73
under the “new team”, “no formal team”, “capacity issues” and the “not trusted by
the business” codes. For example the statement by Respondent P6 “I've inherited
a team, which was only set up about a year ago so it's a new team” has been
coded under one of these codes. In these cases it is evident that the businesses
have not readied themselves at all for big data, as they do not have the required
resources to execute on big data. Or where teams exist, these are new and
capacity or trust issues that might occur. It was also apparent that low levels of
trust exist in the big data capabilities in the organisations, either through the lack of
investment or through the negative references to the teams themselves.
(2) The second theme related to comments around specific teams where big data
analytics occur, or examples of specialists in those environments, which were
coded under the “finance team”, “insights team”, “sales teams”, “sales or marketing
teams”, “actuaries”, “business analysts”, “geologists”, “data scientists”,
“mathematicians”, “statisticians” and “engineers” codes. For example the following
comments would be coded under one of these codes:
“I would get [reports] from one of [the teams] or we have a financial manager for
our department and if I need something I can go to her and she can also
request it.” (Respondent P3)
“Most of the better ones have a degree in geology to begin with. Because you
have to actually understand from a contextual perspective what you're doing.
And most of them would have post graduate qualifications in statistics or the
like.” (Respondent P11)
The business readiness for big data in these cases seemed to be better than the
first theme of codes, as there is evidence of big data capabilities being present,
and as a result of the “experts” being involved in big data analytics and their clear
proficiency trust is easier to achieve. The experts themselves were from technical
backgrounds rather than trained specifically for big data analytics. There was no
sense that big data focused training was planned.
(3) The third theme relates to comments about increased development of the existing
skillsets in the organisation, which were coded under the “importance of technical
Conceptualisation of a big data maturity model based on organisational
decision making
2015
74
skills”, “not balanced skills”, “balanced skills”, “quality analytical teams” and
“opportunity for more developers” codes. For example, the following quote would
be coded under one of these codes:
“I think that our next opportunity is bringing in more developer type mind-sets
into this role.” (Respondent P5)
These respondents seemed aware of the value that the big data analytical teams
provide, and seem to trust them enough to invest further in better teams. Improved
business readiness for big data analytics is also achieved due to the increased
investment in the required skill sets. The key additional skill set here was that of
software development more than anything else.
(4) Specific mandates or responsibilities given to these teams were coded under the
“mandate to solve business problems”, “responsible for predictive analytics” and
“market research” codes. For example the comment by respondent P6 “there’s a
team called insights…that solve business problems” was coded under one of these
codes. In these cases the respondents seemed to trust the analytical teams
enough to empower them to solve business problems using big data analytics.
Therefore the business has sufficiently readied itself for big data analytics, as the
relevant teams are in place and empowered to extract the necessary value from
big data. Thus the teams have moved far beyond current technical skills or
software development skills and data lakes towards business contribution.
The full code book is available under Appendice 7 for review.
Reflecting on the above “people” codes, it is apparent that a focus on the people
aspect of big data analytics alone is not indicative of big data maturity, as that the
people focus determines the readiness of the business around big data analytics,
based on the trust, or lack of trust in the big data analytical teams in the organisation.
Within all three, the final aim is towards knowledge management and decision making,
highlighting that the three stage model is not sufficient.
Conceptualisation of a big data maturity model based on organisational
decision making
2015
75
Four people-related levels of big data maturity have therefore been constructed from
the four distinct people related code themes, based on the level of trust in the big data
analytical teams which then also influences the business readiness:
- L1: The lowest level of maturity would be where the business has not readied
themselves at all for big data, as they do not have the required resources to execute
on big data. At this level, there is no formal team, or the team is experiencing major
capacity issues. Low levels of trust exist in the big data capabilities in the
organisations, either through the lack of investment in those teams or due to
negative references to the teams.
- L2: The business readiness for big data is better than L1, as there is evidence that
there are big data capabilities present, and as a result of the “experts” being
involved in big data analytics and their clear proficiency, trust is easier to achieve.
Therefore, at this level, there is a team consisting of big data specialists or experts
and moderate levels of trust in that team. Experts are proficient in existing technical
skills rather than being big data focused in nature.
- L3: Improved business readiness for big data analytics is achieved due to the
increased investment in the required skill sets, as a result of higher trust levels in
these teams. At this level, there is evidence of increased investment into big data
analytical skills in the organisation and higher levels of trust.
- L4: At the highest level of maturity, high levels of trust exist, and the analytical teams
are mandated and empowered to solve business problems through big data
analytics. Therefore the business has sufficiently readied itself for big data analytics,
as at this level the specific big data teams are highly trusted, mandated and
empowered to extract the necessary value from big data.
Finding 1: Usefulness of this dimension as a signal of big data maturity:
In summary, it seems as if a focus on objects, people and processes in itself is not a
signal of big data maturity, and that the specific nuances concerning the depth of
engagement with and trust in the objects, people and processes provide a more
accurate indication of big data maturity:
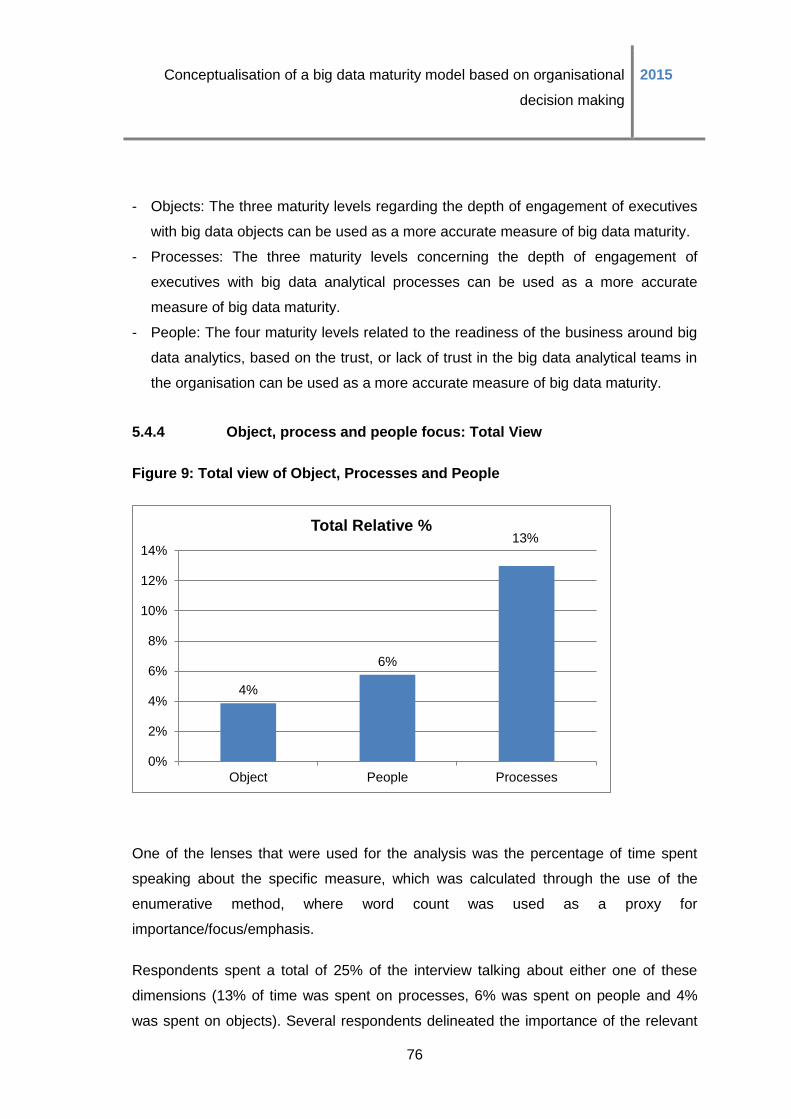
Conceptualisation of a big data maturity model based on organisational
decision making
2015
76
- Objects: The three maturity levels regarding the depth of engagement of executives
with big data objects can be used as a more accurate measure of big data maturity.
- Processes: The three maturity levels concerning the depth of engagement of
executives with big data analytical processes can be used as a more accurate
measure of big data maturity.
- People: The four maturity levels related to the readiness of the business around big
data analytics, based on the trust, or lack of trust in the big data analytical teams in
the organisation can be used as a more accurate measure of big data maturity.
5.4.4 Object, process and people focus: Total View
Figure 9: Total view of Object, Processes and People
One of the lenses that were used for the analysis was the percentage of time spent
speaking about the specific measure, which was calculated through the use of the
enumerative method, where word count was used as a proxy for
importance/focus/emphasis.
Respondents spent a total of 25% of the interview talking about either one of these
dimensions (13% of time was spent on processes, 6% was spent on people and 4%
was spent on objects). Several respondents delineated the importance of the relevant
4%
6%
13%
0%
2%
4%
6%
8%
10%
12%
14%
Object People Processes
Total Relative %
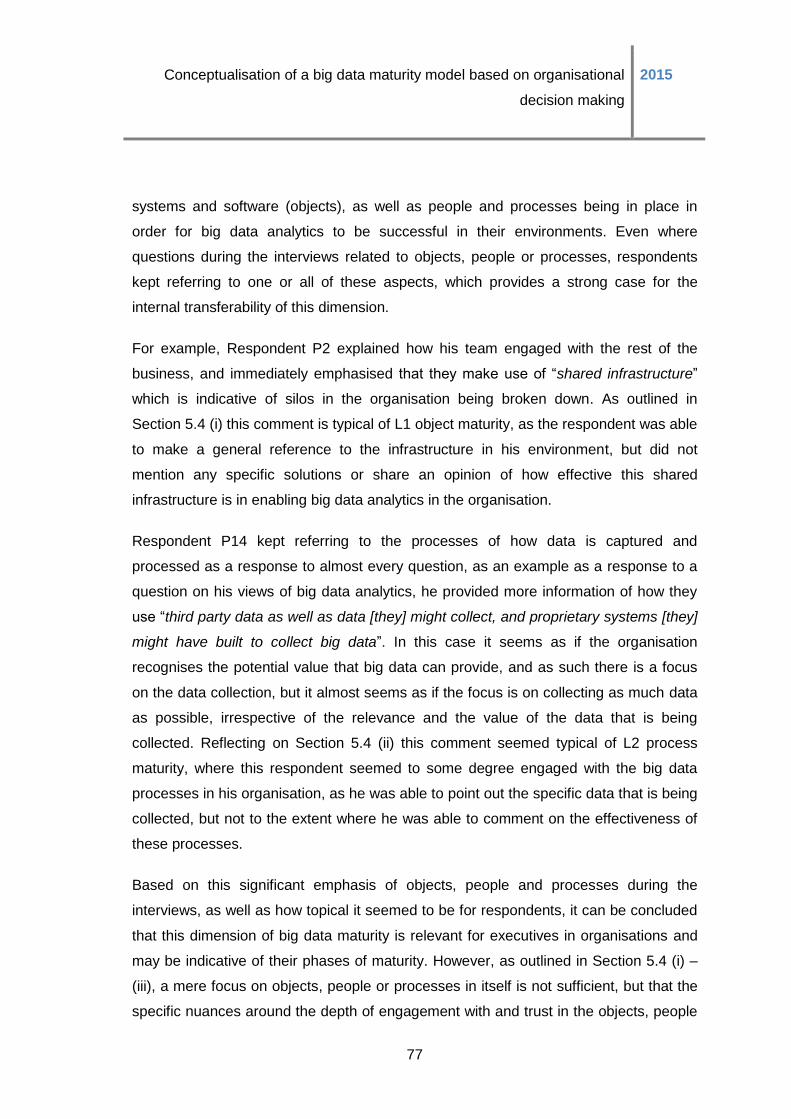
Conceptualisation of a big data maturity model based on organisational
decision making
2015
77
systems and software (objects), as well as people and processes being in place in
order for big data analytics to be successful in their environments. Even where
questions during the interviews related to objects, people or processes, respondents
kept referring to one or all of these aspects, which provides a strong case for the
internal transferability of this dimension.
For example, Respondent P2 explained how his team engaged with the rest of the
business, and immediately emphasised that they make use of “shared infrastructure”
which is indicative of silos in the organisation being broken down. As outlined in
Section 5.4 (i) this comment is typical of L1 object maturity, as the respondent was able
to make a general reference to the infrastructure in his environment, but did not
mention any specific solutions or share an opinion of how effective this shared
infrastructure is in enabling big data analytics in the organisation.
Respondent P14 kept referring to the processes of how data is captured and
processed as a response to almost every question, as an example as a response to a
question on his views of big data analytics, he provided more information of how they
use “third party data as well as data [they] might collect, and proprietary systems [they]
might have built to collect big data”. In this case it seems as if the organisation
recognises the potential value that big data can provide, and as such there is a focus
on the data collection, but it almost seems as if the focus is on collecting as much data
as possible, irrespective of the relevance and the value of the data that is being
collected. Reflecting on Section 5.4 (ii) this comment seemed typical of L2 process
maturity, where this respondent seemed to some degree engaged with the big data
processes in his organisation, as he was able to point out the specific data that is being
collected, but not to the extent where he was able to comment on the effectiveness of
these processes.
Based on this significant emphasis of objects, people and processes during the
interviews, as well as how topical it seemed to be for respondents, it can be concluded
that this dimension of big data maturity is relevant for executives in organisations and
may be indicative of their phases of maturity. However, as outlined in Section 5.4 (i) –
(iii), a mere focus on objects, people or processes in itself is not sufficient, but that the
specific nuances around the depth of engagement with and trust in the objects, people
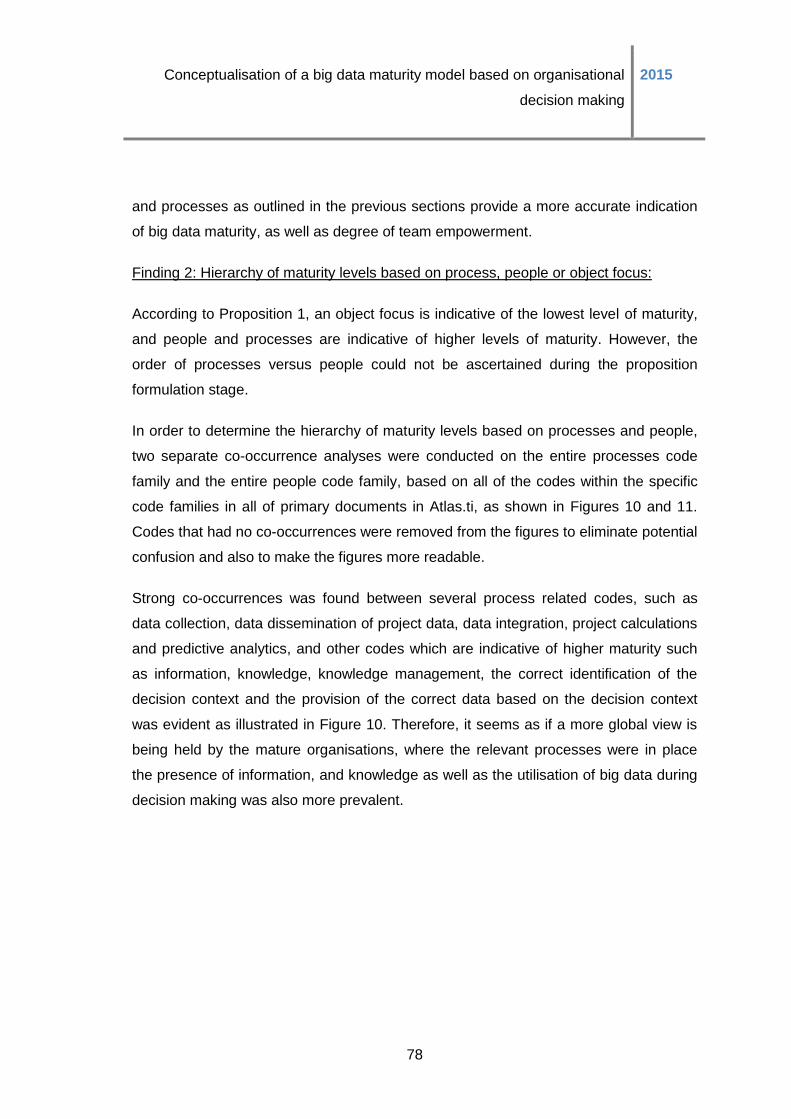
Conceptualisation of a big data maturity model based on organisational
decision making
2015
78
and processes as outlined in the previous sections provide a more accurate indication
of big data maturity, as well as degree of team empowerment.
Finding 2: Hierarchy of maturity levels based on process, people or object focus:
According to Proposition 1, an object focus is indicative of the lowest level of maturity,
and people and processes are indicative of higher levels of maturity. However, the
order of processes versus people could not be ascertained during the proposition
formulation stage.
In order to determine the hierarchy of maturity levels based on processes and people,
two separate co-occurrence analyses were conducted on the entire processes code
family and the entire people code family, based on all of the codes within the specific
code families in all of primary documents in Atlas.ti, as shown in Figures 10 and 11.
Codes that had no co-occurrences were removed from the figures to eliminate potential
confusion and also to make the figures more readable.
Strong co-occurrences was found between several process related codes, such as
data collection, data dissemination of project data, data integration, project calculations
and predictive analytics, and other codes which are indicative of higher maturity such
as information, knowledge, knowledge management, the correct identification of the
decision context and the provision of the correct data based on the decision context
was evident as illustrated in Figure 10. Therefore, it seems as if a more global view is
being held by the mature organisations, where the relevant processes were in place
the presence of information, and knowledge as well as the utilisation of big data during
decision making was also more prevalent.
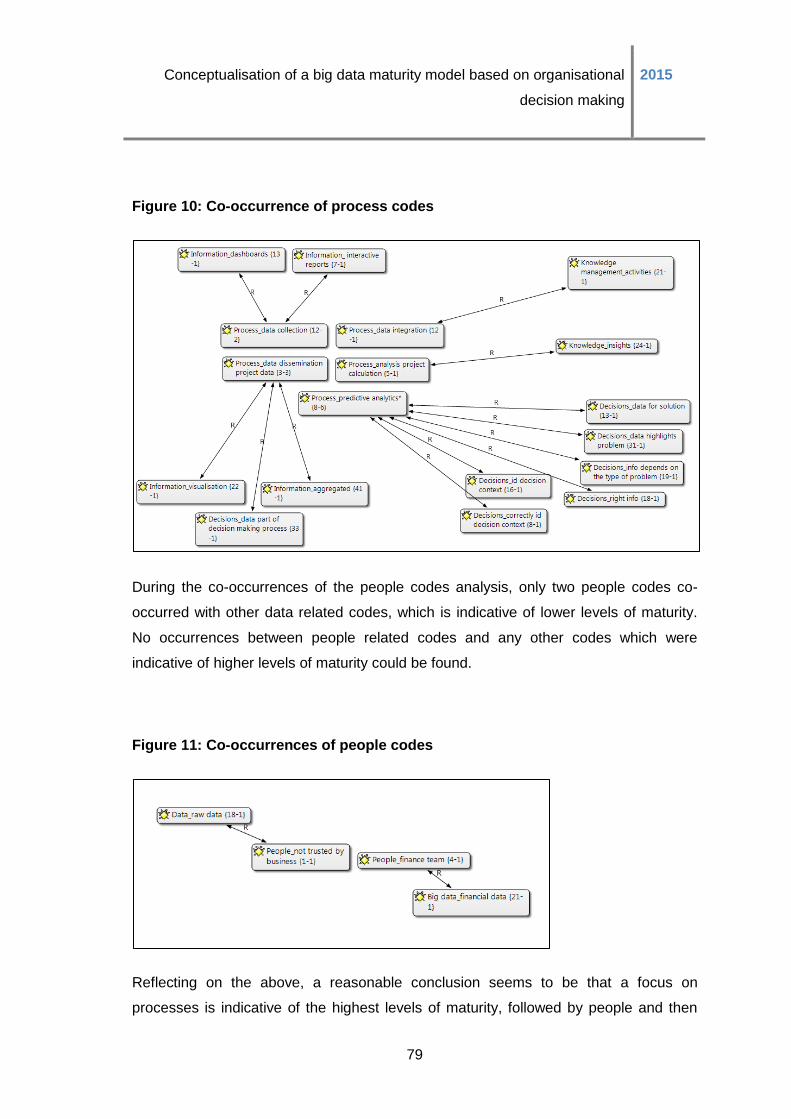
Conceptualisation of a big data maturity model based on organisational
decision making
2015
79
Figure 10: Co-occurrence of process codes
During the co-occurrences of the people codes analysis, only two people codes co-
occurred with other data related codes, which is indicative of lower levels of maturity.
No occurrences between people related codes and any other codes which were
indicative of higher levels of maturity could be found.
Figure 11: Co-occurrences of people codes
Reflecting on the above, a reasonable conclusion seems to be that a focus on
processes is indicative of the highest levels of maturity, followed by people and then
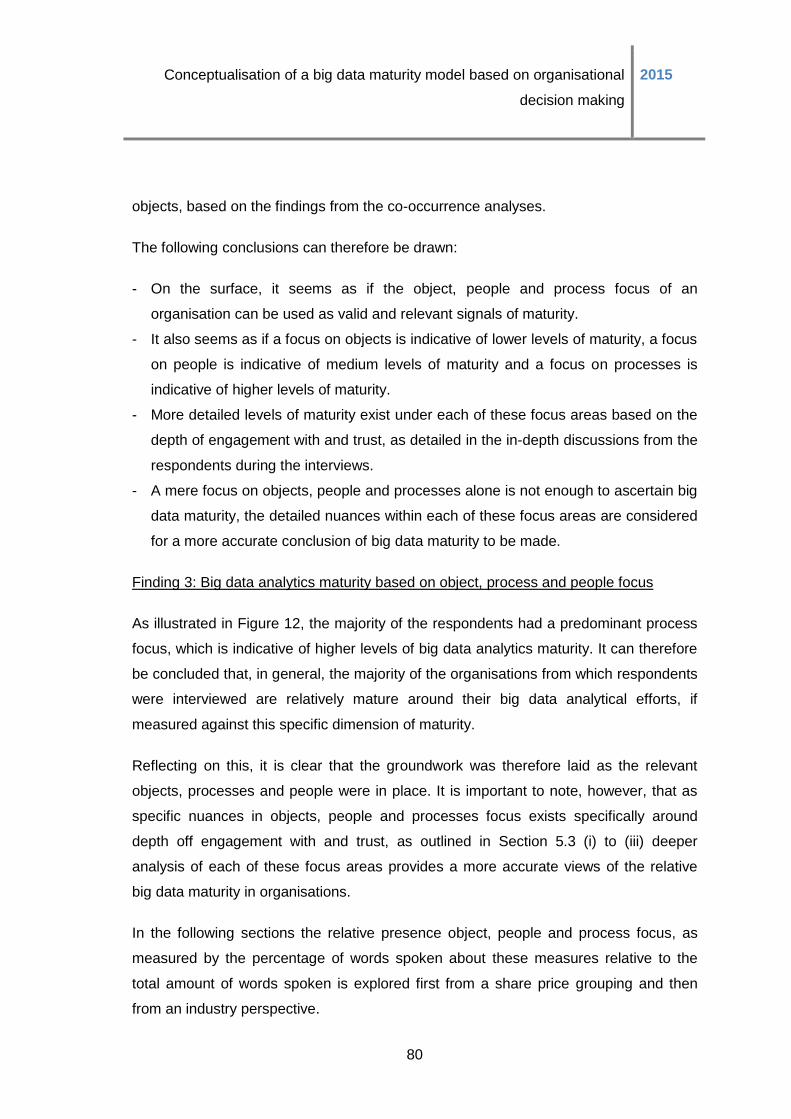
Conceptualisation of a big data maturity model based on organisational
decision making
2015
80
objects, based on the findings from the co-occurrence analyses.
The following conclusions can therefore be drawn:
- On the surface, it seems as if the object, people and process focus of an
organisation can be used as valid and relevant signals of maturity.
- It also seems as if a focus on objects is indicative of lower levels of maturity, a focus
on people is indicative of medium levels of maturity and a focus on processes is
indicative of higher levels of maturity.
- More detailed levels of maturity exist under each of these focus areas based on the
depth of engagement with and trust, as detailed in the in-depth discussions from the
respondents during the interviews.
- A mere focus on objects, people and processes alone is not enough to ascertain big
data maturity, the detailed nuances within each of these focus areas are considered
for a more accurate conclusion of big data maturity to be made.
Finding 3: Big data analytics maturity based on object, process and people focus
As illustrated in Figure 12, the majority of the respondents had a predominant process
focus, which is indicative of higher levels of big data analytics maturity. It can therefore
be concluded that, in general, the majority of the organisations from which respondents
were interviewed are relatively mature around their big data analytical efforts, if
measured against this specific dimension of maturity.
Reflecting on this, it is clear that the groundwork was therefore laid as the relevant
objects, processes and people were in place. It is important to note, however, that as
specific nuances in objects, people and processes focus exists specifically around
depth off engagement with and trust, as outlined in Section 5.3 (i) to (iii) deeper
analysis of each of these focus areas provides a more accurate views of the relative
big data maturity in organisations.
In the following sections the relative presence object, people and process focus, as
measured by the percentage of words spoken about these measures relative to the
total amount of words spoken is explored first from a share price grouping and then
from an industry perspective.
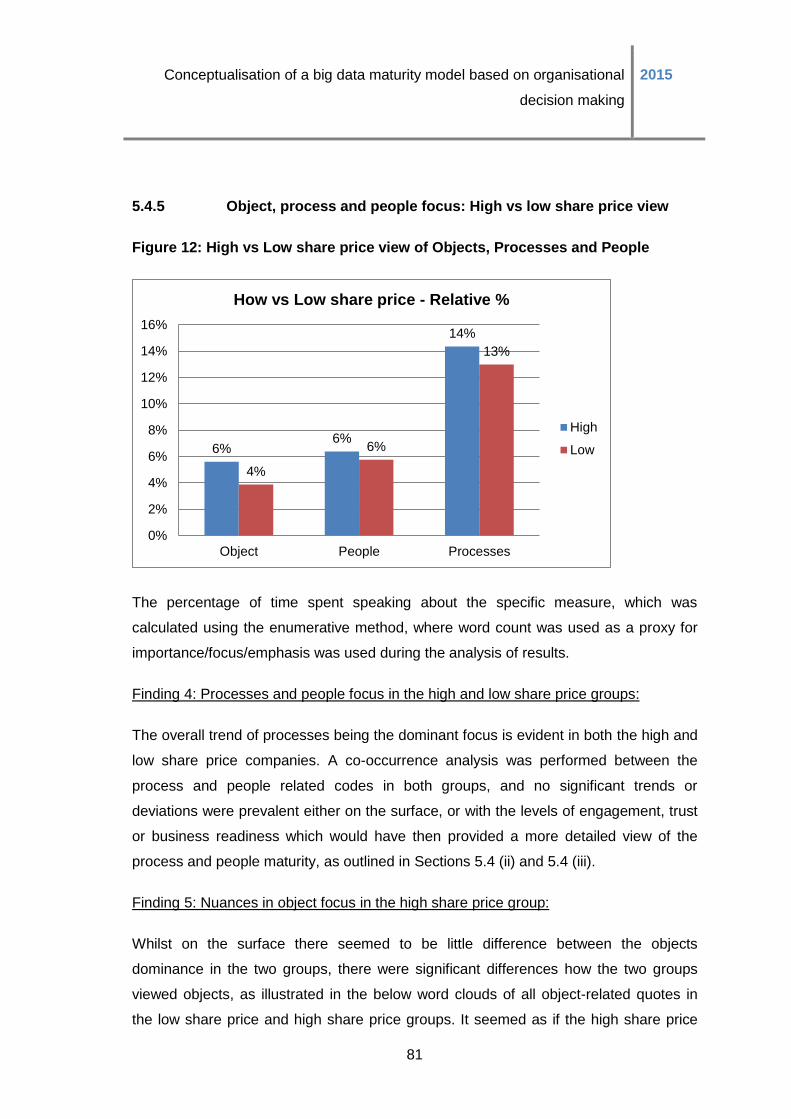
Conceptualisation of a big data maturity model based on organisational
decision making
2015
81
5.4.5 Object, process and people focus: High vs low share price view
Figure 12: High vs Low share price view of Objects, Processes and People
The percentage of time spent speaking about the specific measure, which was
calculated using the enumerative method, where word count was used as a proxy for
importance/focus/emphasis was used during the analysis of results.
Finding 4: Processes and people focus in the high and low share price groups:
The overall trend of processes being the dominant focus is evident in both the high and
low share price companies. A co-occurrence analysis was performed between the
process and people related codes in both groups, and no significant trends or
deviations were prevalent either on the surface, or with the levels of engagement, trust
or business readiness which would have then provided a more detailed view of the
process and people maturity, as outlined in Sections 5.4 (ii) and 5.4 (iii).
Finding 5: Nuances in object focus in the high share price group:
Whilst on the surface there seemed to be little difference between the objects
dominance in the two groups, there were significant differences how the two groups
viewed objects, as illustrated in the below word clouds of all object-related quotes in
the low share price and high share price groups. It seemed as if the high share price
6% 6%
14%
4%
6%
13%
0%
2%
4%
6%
8%
10%
12%
14%
16%
Object People Processes
How vs Low share price - Relative %
High
Low
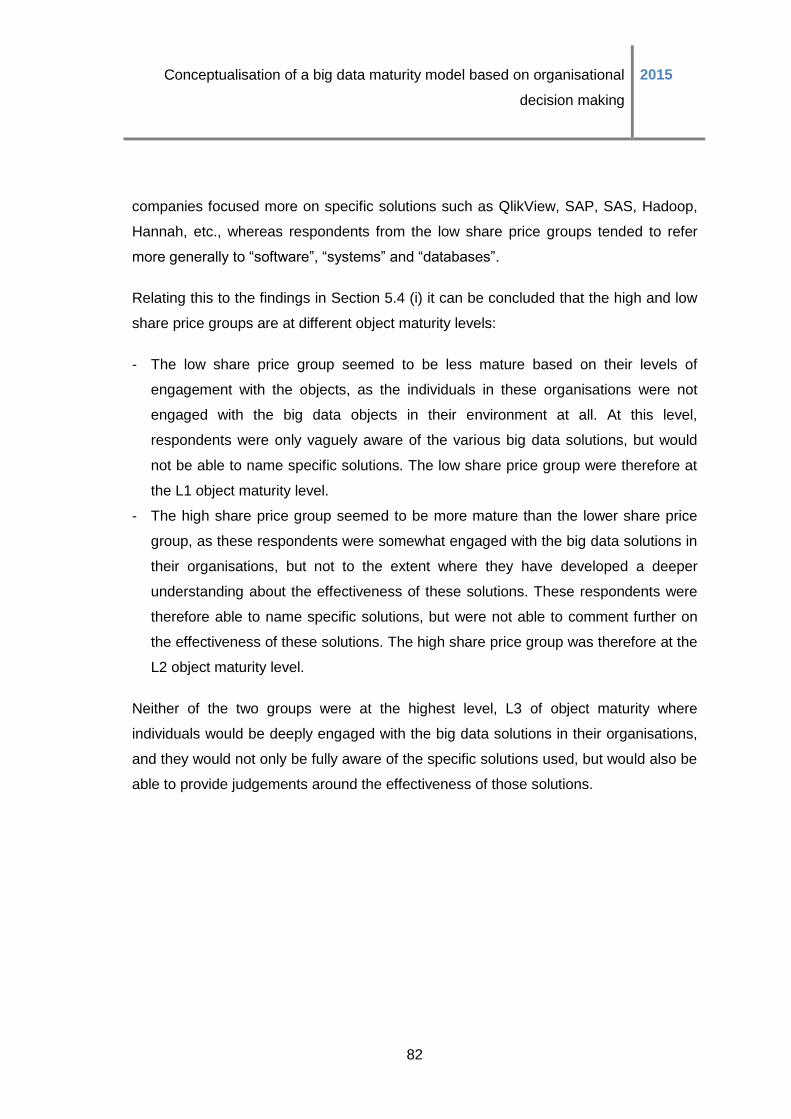
Conceptualisation of a big data maturity model based on organisational
decision making
2015
82
companies focused more on specific solutions such as QlikView, SAP, SAS, Hadoop,
Hannah, etc., whereas respondents from the low share price groups tended to refer
more generally to “software”, “systems” and “databases”.
Relating this to the findings in Section 5.4 (i) it can be concluded that the high and low
share price groups are at different object maturity levels:
- The low share price group seemed to be less mature based on their levels of
engagement with the objects, as the individuals in these organisations were not
engaged with the big data objects in their environment at all. At this level,
respondents were only vaguely aware of the various big data solutions, but would
not be able to name specific solutions. The low share price group were therefore at
the L1 object maturity level.
- The high share price group seemed to be more mature than the lower share price
group, as these respondents were somewhat engaged with the big data solutions in
their organisations, but not to the extent where they have developed a deeper
understanding about the effectiveness of these solutions. These respondents were
therefore able to name specific solutions, but were not able to comment further on
the effectiveness of these solutions. The high share price group was therefore at the
L2 object maturity level.
Neither of the two groups were at the highest level, L3 of object maturity where
individuals would be deeply engaged with the big data solutions in their organisations,
and they would not only be fully aware of the specific solutions used, but would also be
able to provide judgements around the effectiveness of those solutions.
Conceptualisation of a big data maturity model based on organisational
decision making
2015
83
Table 2: Objects Low vs High Share Price word cloud
Objects Low Share Price Objects High Share Price
In order to clarify this finding in more detail, a co-occurrence analysis was performed in
the high share price group, between all of the object-related codes and all of the other
codes. Significant co-occurrences were found between QlikView and interactive
reports, dashboards and visualisation as shown in Table 3 below. QlikView is an easy
to use, self-service business intelligence solution that allows non-technical users to
engage with an interactive dashboard to compile specific graphs or to access the raw
data, all by clicking on specific sections of the QlikView dashboard (Seddon, 2013).
Respondent P6 explained:
“QlikView basically is an interactive dashboard sitting on top of data, which allows
you to create reports where people can change filters on reports” whilst respondent
P7 concurred, and commented: “we have got quite a lot that is available through
QlikView dashboards.”
Table 3: Objects QlickView and information co-occurrence
A potential explanation for the strong emphasis on QlikView as well as dashboards and
interactive visualisation in the high share price group, could be that respondents from
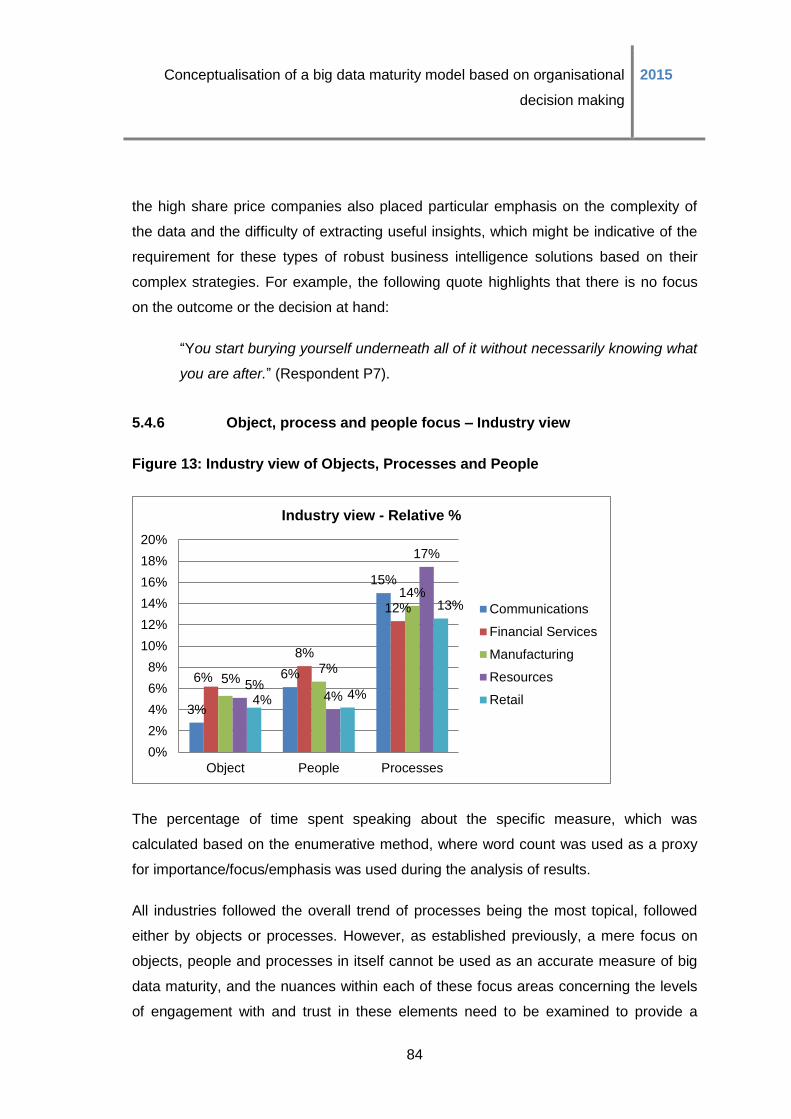
Conceptualisation of a big data maturity model based on organisational
decision making
2015
84
the high share price companies also placed particular emphasis on the complexity of
the data and the difficulty of extracting useful insights, which might be indicative of the
requirement for these types of robust business intelligence solutions based on their
complex strategies. For example, the following quote highlights that there is no focus
on the outcome or the decision at hand:
“You start burying yourself underneath all of it without necessarily knowing what
you are after.” (Respondent P7).
5.4.6 Object, process and people focus – Industry view
Figure 13: Industry view of Objects, Processes and People
The percentage of time spent speaking about the specific measure, which was
calculated based on the enumerative method, where word count was used as a proxy
for importance/focus/emphasis was used during the analysis of results.
All industries followed the overall trend of processes being the most topical, followed
either by objects or processes. However, as established previously, a mere focus on
objects, people and processes in itself cannot be used as an accurate measure of big
data maturity, and the nuances within each of these focus areas concerning the levels
of engagement with and trust in these elements need to be examined to provide a
3%
6%
15%
6%
8%
12%
5% 7%
14%
5% 4%
17%
4% 4%
13%
0%
2%
4%
6%
8%
10%
12%
14%
16%
18%
20%
Object People Processes
Industry view - Relative %
Communications
Financial Services
Manufacturing
Resources
Retail

Conceptualisation of a big data maturity model based on organisational
decision making
2015
85
more accurate and detailed view of big data maturity.
Several nuances in the object, people or processes focus were apparent in certain
industries:
- Financial services seemed to have a larger focus on objects and people relative to
the other industries, whilst resources had a larger focus on the processes.
Respondents from retail companies, although they seemed to follow the general
trend of a predominant focus on processes, spent less time speaking about all of
these focus areas relative to the other respondents from other industries.
- Respondents from financial services spoke the most about objects where
respondents in communications spoke the least about objects.
- Respondents from financial services spoke the most about the people that were
responsible for big data and respondents from the resources and retail sector spoke
the least about the people that were responsible for big data.
- Respondents from resources companies spoke the most about big data analytical
processes, and respondents from financial services spoke the least about big data
analytical processes.
The differing mix of people/processes with objects could be due to industry demands,
as one sector is more process focused and another is more labour intensive. These
specific industry-related nuances are discussed in the following sections, and related to
the detailed maturity levels within each of the object, people and processes views.
Finding 6: Differences in object focus in financial services and communications:
Six percent of the financial services interviews were spent talking about technology
(objects), whereas only 3% were spent talking about the technology in the
communications industry. A word cloud was constructed for the object-related quote in
both industries to ascertain the key differences.
Financial services object focus findings:
- As presented in Table 4, respondents from financial services placed a larger
emphasis the infrastructure whilst respondents from communications companies
Conceptualisation of a big data maturity model based on organisational
decision making
2015
86
placed a larger emphasis on the “tools” in their organisations. The degree to which
each sector faces governance issues may play a role; as well as the demand on
immediate measureable outcomes (marketing) may have also influenced these
companies’ approach to information technology infrastructure.
- One possible reason for the potential emphasis on infrastructure in financial services
might be the prevalence older infrastructures being present and the focus on
modernising the various systems, as Respondent P7 explained: “The core
infrastructure is not designed for advanced analytics”, adding “over time you know
we’ve added a lot more modern and newer solutions”.
- Respondents from financial services also placed significant emphasis on specific big
data software and solutions such as SAS, QlikView, Hadoop, IBM Watson etc. For
example, Respondent P13 shared “the credit community uses SAS and a lot of the
outputs from SAS as sort of their reporting tool”.
- When these two findings are related to the object maturity levels as outlined in
Section 5.4 (i) it can be concluded that financial services is at L3 of object maturity,
where the respondents were deeply engaged with the various big data objects in
their environments, as they were aware of the specific big data solutions, but were
also able to comment on the effectiveness of these solutions. Instances of these
levels of maturity are emphasised in the quotes below:
“That is most probably been our weaknesses at the time as we haven’t
necessarily invested from a system side to be able to really crunch through
the amount of information we have to.” (Respondent P5)
“[QlikView] is quiet expensive for what it is and you need a dedicated
developer to actually develop those, so it is time consuming to develop a
report, once it is there it is set and quiet stabilised.” (Respondent P13)
Communications sector objects focus findings:
- “Tools” were frequently emphasised by respondents from the communications
sector. As an example respondent P9 stated “It would probably be a combination of
open source and other tools that are available in the market” whilst Respondent P14
commented “we have a number of different tools”.
Conceptualisation of a big data maturity model based on organisational
decision making
2015
87
- One possible reason for the prominence of “tools” and absence of mentions to
infrastructure and warehousing solutions might be because in the
telecommunications and media industry, the big data sets might be smaller and less
complex than in the financial services industry, for example. Respondent P9
confirmed this by sharing:
“Because it is only a twenty year old industry [company] have had first mover
advantage for a very long time. So we haven’t had to be clever about things like
segmentation and targeting and developing those types of relationships or even
just really using data from a targeting point of view. It was very much about
getting people connected. There was a massive population to bring them on
board and looking at system and network efficiency”.
- It seems that in this context, the immaturity of this organisation was determined by
the industry context and the fact that the telecommunications and media industry in
South Africa is relatively young. Respondent P14 concurred, stating “I’m amazed at
how few formal data points we use”. This emphasises the relatively low level data
use in that environment, which is indicative of lower levels of maturity.
- When these findings from the communications and media sector are related to the
object maturity levels as outlined in Section 5.4 (i) it can be concluded that
companies in the communications sector are approximately between L1 and L2 of
object maturity. Individuals in these companies ranged from not being engaged to
being somewhat engaged with the various big data software and solutions in their
environments, where they were aware of several big data solutions, and in some
cases were able to name specific solutions. These respondents were however not
able to provide opinions around the effectiveness of these solutions.
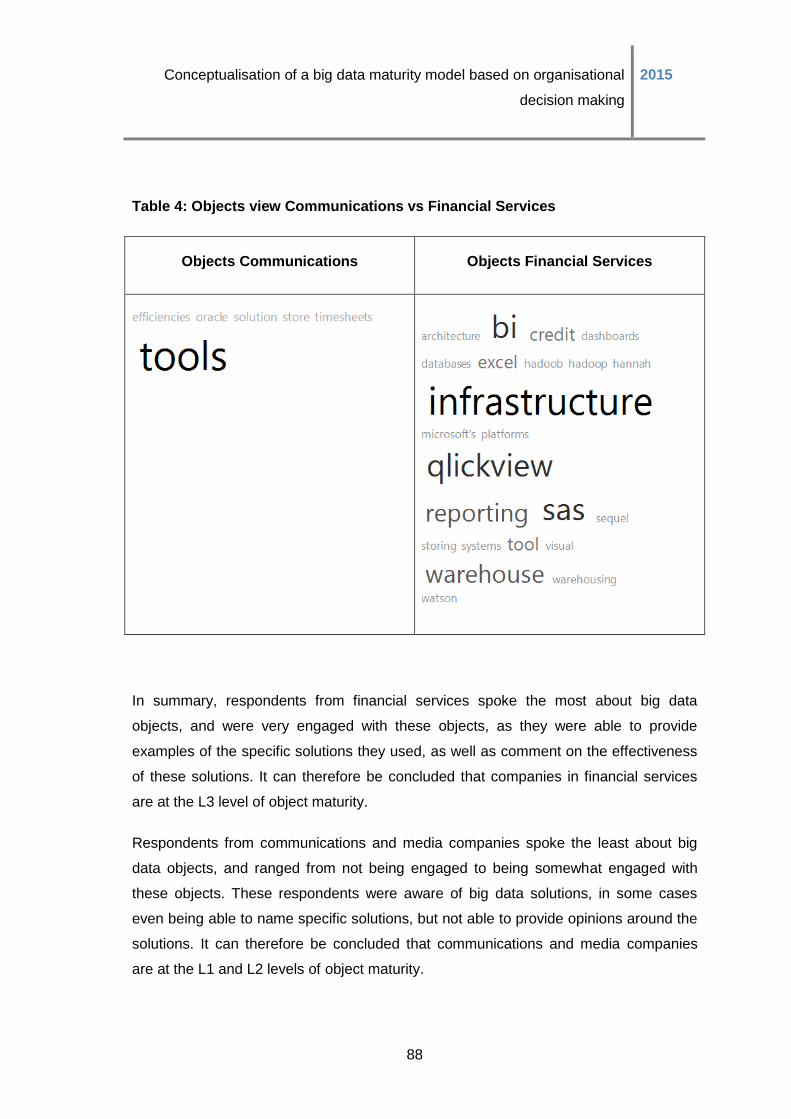
Conceptualisation of a big data maturity model based on organisational
decision making
2015
88
Table 4: Objects view Communications vs Financial Services
Objects Communications Objects Financial Services
In summary, respondents from financial services spoke the most about big data
objects, and were very engaged with these objects, as they were able to provide
examples of the specific solutions they used, as well as comment on the effectiveness
of these solutions. It can therefore be concluded that companies in financial services
are at the L3 level of object maturity.
Respondents from communications and media companies spoke the least about big
data objects, and ranged from not being engaged to being somewhat engaged with
these objects. These respondents were aware of big data solutions, in some cases
even being able to name specific solutions, but not able to provide opinions around the
solutions. It can therefore be concluded that communications and media companies
are at the L1 and L2 levels of object maturity.
Conceptualisation of a big data maturity model based on organisational
decision making
2015
89
Finding 7: Differences in people focus in financial services, resources and retail:
On the “people” dimension, financial services once again led with 8% of the words of
the interview being dedicated on the people, whereas only 4% of the interview were
spent on people by the respondents from the resources and retail industries. In order to
ascertain where the potential differences in industries around the people dimension
might occur, a word cloud was compiled for the most frequently used words in the
phrases coded under the people code family.
Financial services people focus findings:
- In financial services, “team” was emphasised quite prominently by respondents, as
shown in the word cloud in Table 5.
- Although the term “data scientists” did not appear in the below word cloud for
financial services, it was mentioned twice, and financial services was the only
industry where data scientists were specifically referenced. The skill set mentioned
by respondents from financial services seemed to be more varied and included
actuaries, analysts, developers, economists, engineers, mathematicians,
technologists and statisticians.
- One possible reason for this might be the prevalence of actuaries traditionally in the
financial services sector, and therefore a strong baseline of good quality analytical
teams exists. For example, respondents from financial services were quick to
proudly mention their analytical teams early on in the interview, as is evident from
the recurring words such as “brilliant”, “brightest” in the interviews, as well as this
quote from Respondent P2: “we have very highly skilled mathematicians and
statisticians”. It should be noted though that these technical skills have historically
dominated the industry, suggesting that they have drawn on resources already
present rather than developing big data specific skills.
- Relating these findings to the detailed people maturity levels as outlined in Section
5.4 (iii), it can be concluded that financial services are at L4 of people maturity, as
the high levels of trust in the analytical teams are apparent from the interviews. It is
also evident that the analytical teams are empowered to use big data analytics to
extract the relevant value from the data, and therefore that financial services have
sufficiently readied themselves for big data. For example respondent P2 stated:
Conceptualisation of a big data maturity model based on organisational
decision making
2015
90
“In my personal opinion then is I think we are very very rich with resources”,
adding “that is their job description- literally to go and think about data,
understand it; really get to grips with the details.”
Resources industry people focus findings:
- As illustrated below, respondents from the resources industry merely made mention
to engineers, graduates, sales staff or scientists. One of the possible reasons for the
high dominance of these skill sets might relate to the fact that these teams were
already present in these organisations, pre-big data, and therefore it seems as if
these organisations simply default to the skills they currently have, as opposed to
thinking about what additional skills sets are required for big data analytics. They are
therefore similar to the financial sector.
- Respondent P24 highlighted the variety of engineers in his environment as “process
engineers to a large extent….chemical engineers”. The prevalence of these skills
sets might also relate to the types of datasets that resource companies work in,
which the majority of the respondents from resources companies explained in depth.
For example Respondent P24 stated:
“There is a lot of effort we do put into analysing the data we do have that gets
generated on site. I think roughly we have about 250000/300000 tags on site and
what that means is it is a data point that 24/7 transmits data. Now whether it is
temperature or flow or whatever there is, the data point that transmits that…..You
can very easily as an engineer get sucked up into what we call normal production
data. What is the plant doing now; how much is that pump pumping; what is the
temperature of that exchanger or whatever? You can get loads of data like that.”
- Reflecting on this quote it is clear that this respondent defined big data according to
the “volume” dimension, and also that operational data is dominant in his
environment. It is also structured and internal data rather than internal and external
datasets (no variety).
- It can be concluded that resources companies are therefore defined as level L2
regarding people maturity, when comparing these findings to the detailed people
maturity levels as outlined in Section 5.4 (iii). At this level the business readiness for
big data is be better than L1, as there is evidence of big data capabilities being
Conceptualisation of a big data maturity model based on organisational
decision making
2015
91
present, and as a result of the “experts” being involved in big data analytics and their
clear proficiency, trust is easier to achieve. Therefore, at this level, there is a team
consisting of big data specialists or experts and moderate levels of trust in that
team. For example Respondent P11 explained:
“Most of the better ones have a degree in geology to begin with…. most
of them would have post graduate qualifications in statistics or the like.”
Retail sector people focus findings:
- In the retail sector the majority of the respondents placed a strong emphasis on
marketing. For example Respondent P3 stated:
“Then we also have in our collaborative marketing department a lady that
specifically deals with data and research and comparing of whatever we
need the comparison of.”
- The possible reason for the dominance of marketing might be a result of how
important sales and marketing is in the retail environment, as an example from
Respondent P16 illustrates:
“We pay an extra certain percentage point in turnover and (the retailers)
would actually supply you with the data of the sales at the till which
really helps you start indicating. So if I put in this TV promotion over this
weekend I can immediately see does it have any match and we started
to use this data now.”
- Reflecting on the above quote, it seems as if this specific retail company
experimented with cause and effect studies, which might signify that they had an
appetite for big data analytics due to the evidence of limited experimentation.
- Based on these findings it can also be concurred that retail companies are at level
L2 of people maturity, when comparing these findings to the detailed people maturity
levels as outlined in Section 5.4 (iii). Clear evidence of big data capabilities could be
found, and some level of trust is apparent due to the activities and experimentation
being present. The business is therefore readying itself somewhat for big data. For
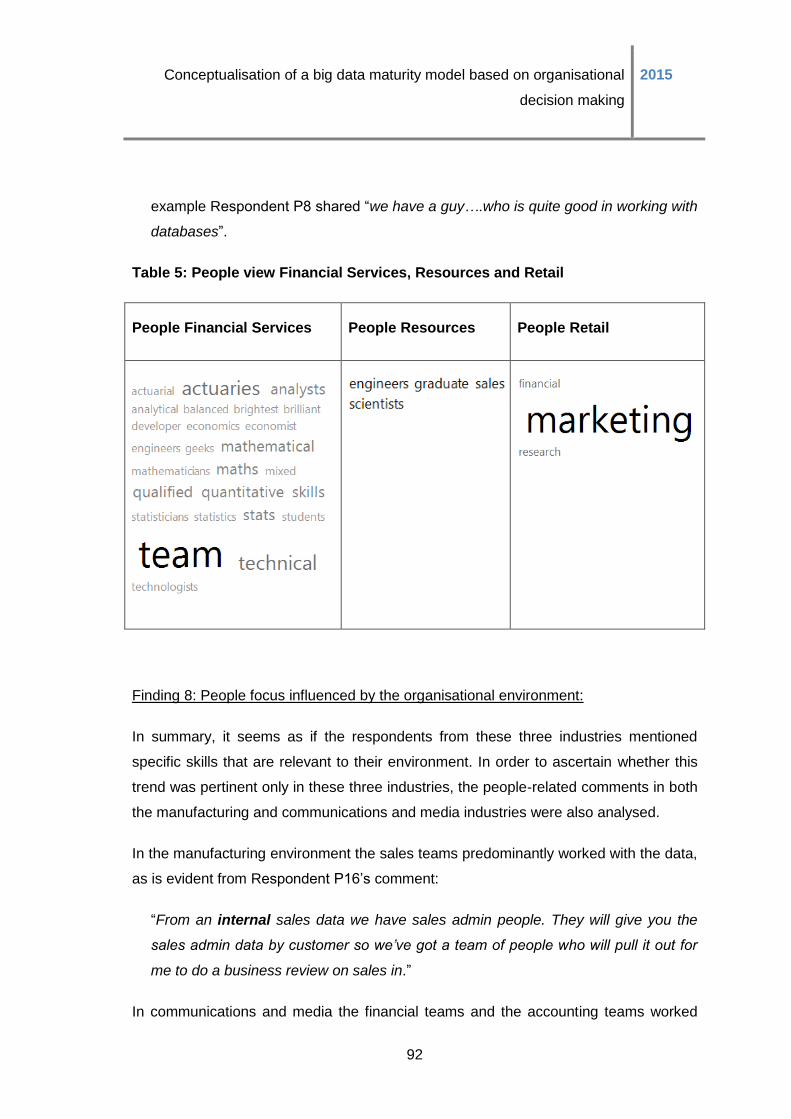
Conceptualisation of a big data maturity model based on organisational
decision making
2015
92
example Respondent P8 shared “we have a guy….who is quite good in working with
databases”.
Table 5: People view Financial Services, Resources and Retail
People Financial Services People Resources People Retail
Finding 8: People focus influenced by the organisational environment:
In summary, it seems as if the respondents from these three industries mentioned
specific skills that are relevant to their environment. In order to ascertain whether this
trend was pertinent only in these three industries, the people-related comments in both
the manufacturing and communications and media industries were also analysed.
In the manufacturing environment the sales teams predominantly worked with the data,
as is evident from Respondent P16’s comment:
“From an internal sales data we have sales admin people. They will give you the
sales admin data by customer so we’ve got a team of people who will pull it out for
me to do a business review on sales in.”
In communications and media the financial teams and the accounting teams worked
Conceptualisation of a big data maturity model based on organisational
decision making
2015
93
most with the data, Respondent P22 stated: “We have a finance team that will prepare
and pull reports.” This suggests current processes which often look backwards to what
has happened (descriptive analytics) rather than employing prescriptive and predictive
analytics.
It can therefore be concluded that the types of skill sets prevalent in organisations’ big
data analytical teams are heavily influenced by the organisational environment and the
type of datasets present in the organisation, which seems to currently be narrow in
focus for all. This is a common trend across all the industries.
It also seemed that all of the industries had some skills internally that focused on big
data analytics. However, as a mere focus on people in itself is not sufficient in order to
make a conclusion of the big data maturity of these industries, the specific nuances in
these skills sets should be analysed in detail for all of the industries, to ascertain the
detailed people maturity levels as outlined in Section 5.4 (iii). All skills bases reviewed
were generated from existing skill sets within the organisation rather than developing or
employing big data specific skills from outside. Detailed review of the data scientist falls
out of the scope of this research study and should be considered for future research
activities.
Finding 9: Differences in processes focus in resources and financial services:
Respondents from the resources industry mentioned processes the most, as 17% of
the interviews were spent talking about the various big data analytical processes. In
financial services, only 12% of the time was spent talking about the processes. In order
to further investigate the different big data analytical processes in these two industries,
word clouds were constructed around the process related mentions.
Resources sector processes focus findings:
- Respondents from resource companies emphasised reports as well as the
reporting function, which is an output which is used during decision making.
Therefore, it is interesting to observe that even without any direct reference being
made to the decision making process, these respondents naturally referred to the
Conceptualisation of a big data maturity model based on organisational
decision making
2015
94
outputs, or the reports that they use during decision making. For example,
Respondent P11 shared:
“We have a weekly EXCO meeting and before that EXCO meeting every
single department head has to produce a weekly report. So it'll be a
cash flow report, a safety report, an HR report with overtime in it, it'll be
a geological report with an assessment of grade against budget.”
- One possible reason for this might be due to the organisational cultures in
resources being committee driven, with a strong focus on project performance
being reported at the various internal committees in the organisations.
Respondent P24 provided further information around this:
“I will, in my business meeting every month, sit with all of them and go
through (their reports). If there are questions I will ask or in the work
discussions I have once a month with them then I will sit and go what is
going on.”
- These all relate to descriptive analytics and long-standing reporting structures rather
than actualising big data.
- When these findings are compared to the detailed processes maturity levels as
outlined in Section 5.4 (ii), it can be concluded that companies in the resources
sector are at level L2 of process maturity. Respondents from resources
companies were moderately engaged with the processes in their environments,
as they were able to refer to specific big data collection or analysis processes, as
well as specific reports that were used, but they were not able to comment on the
usefulness of these processes in presenting relevant information to decision
makers. Respondent P30 provided a further example of the reporting process in
his environment:
“The way this report happens is as soon as the figures are out then
people at my level actually sit down… so my equivalent on the finance
side, my equivalent on the safety side, they go into the reports… So
once those are extracted and the numbers are there they then go… If
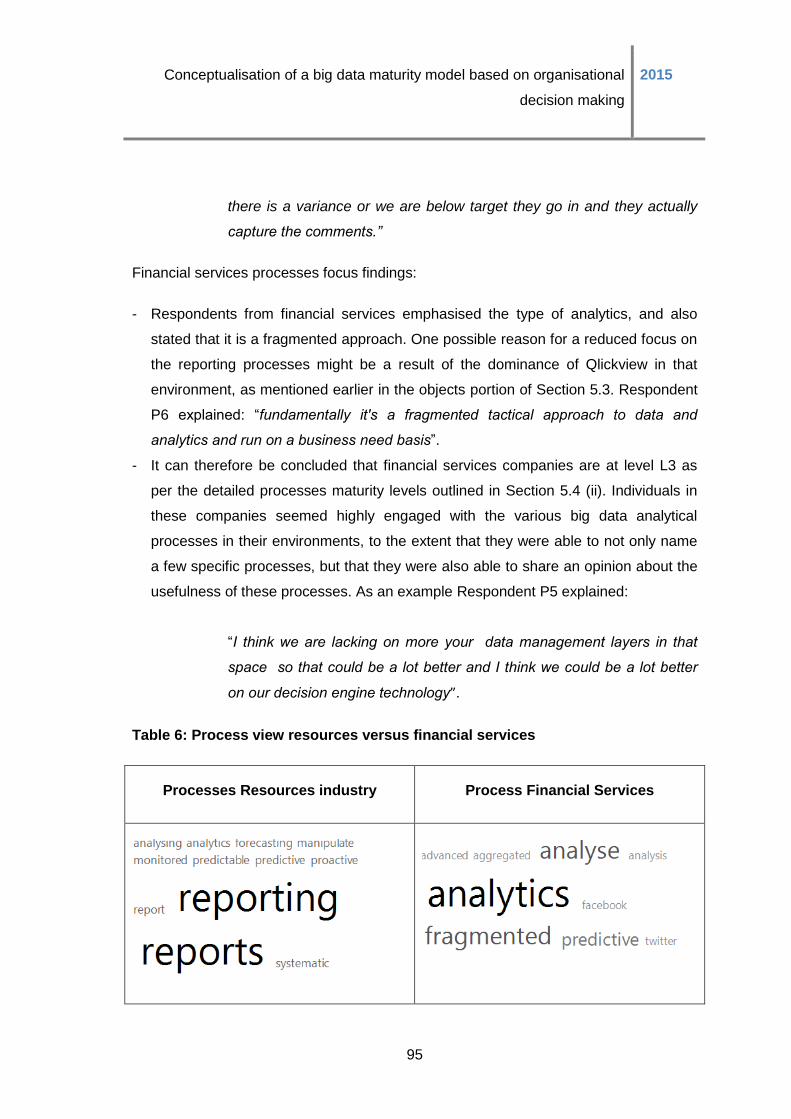
Conceptualisation of a big data maturity model based on organisational
decision making
2015
95
there is a variance or we are below target they go in and they actually
capture the comments.”
Financial services processes focus findings:
- Respondents from financial services emphasised the type of analytics, and also
stated that it is a fragmented approach. One possible reason for a reduced focus on
the reporting processes might be a result of the dominance of Qlickview in that
environment, as mentioned earlier in the objects portion of Section 5.3. Respondent
P6 explained: “fundamentally it's a fragmented tactical approach to data and
analytics and run on a business need basis”.
- It can therefore be concluded that financial services companies are at level L3 as
per the detailed processes maturity levels outlined in Section 5.4 (ii). Individuals in
these companies seemed highly engaged with the various big data analytical
processes in their environments, to the extent that they were able to not only name
a few specific processes, but that they were also able to share an opinion about the
usefulness of these processes. As an example Respondent P5 explained:
“I think we are lacking on more your data management layers in that
space so that could be a lot better and I think we could be a lot better
on our decision engine technology”.
Table 6: Process view resources versus financial services
Processes Resources industry Process Financial Services
Conceptualisation of a big data maturity model based on organisational
decision making
2015
96
5.4.7 Objects, process and people focus: Summary and conclusion
As outlined in Section 3.1, Proposition 1 suggested that the focus of the organisation’s
big data efforts, defined either as object, process or people focus, is indicative of big
data maturity. As per the finding in Section 5.3 (iv), it can be concluded that these
dimensions of big data maturity are topical and relevant for executives in organisations.
This finding is also consistent when triangulated against the IDC’s Big Data Maturity
model (“New IDC Maturity Model Examines Big Data and Analytics in Financial
Services,” 2014) which has included all three of these focus areas, namely object,
people and processes as dimensions of maturity.
However, as outlined in Section 5.4 (i) – (iii), a mere focus on objects, people or
processes in itself is not indicative of big data maturity, and the specific nuances
concerning the depth of engagement with and trust in the objects, people and
processes will provide a more accurate indication of big data maturity. There appears
to be a relationship between industry type and people or processes, although
processes dominate overall.
It is therefore recommended that the various levels of maturity in each of the object,
people and process views be considered:
- Objects: Three maturity levels regarding the depth of engagement executives with
big data objects can be used as a more accurate measure of big data maturity.
- Processes: Three maturity levels around the depth of engagement executives with
big data analytical processes can be used as a more accurate measure of big data
maturity.
- People: Four maturity levels related to the readiness of the business around big data
analytics, based on the trust or lack of trust in the big data analytical teams in the
organisation can be used as a more accurate measure of big data maturity.
The various maturity levels in the object, people and processes views are detailed
below.
Conceptualisation of a big data maturity model based on organisational
decision making
2015
97
Big data object focus maturity levels:
- L1: The lowest levels of maturity would be where individuals in the organisation
were not engaged with the big data objects in their environment at all. At this level,
executives would be vaguely aware of the various big data solutions, but would not
be able to name specific solutions.
- L2: At the middle level of maturity individuals would be somewhat engaged with the
big data solutions in their organisations, but not to the extent where they have
developed a deeper understanding around the effectiveness of these solutions.
Individuals would thus be able to name specific solutions, but not have further
opinions on these solutions.
- L3: At the highest level of maturity individuals would be deeply engaged with the big
data solutions in their organisations, and they would not only be fully aware of the
specific solutions used, but would also be able to provide judgements about the
effectiveness of those solutions.
Big data processes focus maturity levels:
- L1: The lowest levels of maturity would be where individuals in the organisation
were not engaged with the big data processes in their environment at all. At this
level, executives would be vaguely aware of the various big data processes, but
were not involved enough to be aware of the specific processes in place.
- L2: At the middle level of maturity individuals would be somewhat engaged with the
big data processes in their organisations, but not to the extent where they have
developed a deeper understanding around the effectiveness of these processes.
Individuals would thus be able to name specific processes, but not have further
opinions on the effectiveness of these processes.
- L3: At the highest level of maturity individuals would be deeply engaged with the big
data processes in their organisations, and they would not only be fully aware of the
specific processes, but would also be able to provide judgements about the
effectiveness of those solutions, through the identification of the process related
problems.
Conceptualisation of a big data maturity model based on organisational
decision making
2015
98
Big data people/analytical teams focus maturity levels:
- L1: The lowest level of maturity would be where the business has not readied
themselves at all for big data, as they do not have the required resources to execute
on big data. At this level, there is no formal team, or the team is experiencing major
capacity issues. Low levels of trust exist in the big data capabilities in the
organisations, either due to the lack of investment in those teams or due to negative
references to the teams.
- L2: The business readiness for big data is be better than L1, as there is evidence
big data capabilities being present, and as a result of the “experts” being involved in
big data analytics and their clear proficiency, trust is easier to achieve. Therefore, at
this level, there is a team consisting of big data specialists or experts and moderate
levels of trust in that team.
- L3: Improved business readiness for big data analytics is achieved due to the
increased investment in the required skill sets, as a result of higher trust levels in
these teams. At this level, there is evidence of increased investment into big data
analytical skills in the organisation and higher levels of trust.
- L4: At the highest level of maturity, high levels of trust exist, and the analytical teams
are mandated and empowered to solve business problems through big data
analytics. Therefore the business has sufficiently readied itself for big data analytics,
as at this level the specific big data teams are highly trusted, mandated and
empowered to extract the necessary value from big data.
Proposition 1 also suggested that a focus on objects was suggested as being indicative
of lower levels of maturity, and that people and processes were proposed to be
indicative of higher levels of maturity, but without clarification of which one of the
people or process focuses would be indicative of the highest level of maturity. Through
analysis of the various co-occurrences of people and processes with other codes which
are indicative of high levels of maturity, it was found that processes are indicative of the
highest levels of maturity, followed by people and then objects.
Conceptualisation of a big data maturity model based on organisational
decision making
2015
99
The following conclusions where therefore drawn:
- On the surface, it seems as if the object, people and process focus of an
organisation can be used as valid and relevant signals of maturity.
- It also seems as if a focus on objects is indicative of lower levels of maturity, a focus
on people is indicative of medium levels of maturity and a focus on processes is
indicative of higher levels of maturity.
- More detailed levels of maturity exists under each of these focus areas based on the
depth of engagement with and trust, as detailed in the in-depth discussions from the
respondents during the interviews.
- A mere focus on objects, people and processes alone is not enough to ascertain big
data maturity, the detailed nuances within each of these focus areas need to be
considered for a more accurate conclusion of big data maturity to be made.
Based on the significant emphasis of objects, people and processes during the
interviews, as well as how topical it seemed to be for respondents, it was concluded
that this dimension of big data maturity is relevant for executives in organisations.
However, as stated above, a mere focus on objects, people or processes in itself is not
indicative of big data maturity, and thus the specific nuances around the depth of
engagement with and trust in the objects, people and processes as outlined in the
previous sections provide a more accurate indication of big data maturity. However it is
important to note that the combination varies and skill sets seldom vary outside of their
industries.
The following nuances were found between the high and low share price group’s
object, people and process focus:
- The high and low share price groups are at different object maturity levels:
o The low share price group seemed to be less mature based on their levels of
engagement with the objects, as the individuals in these organisations were
not engaged with the big data objects in their environment at all. At this level,
respondents were only vaguely aware of the various big data solutions, but
would not be able to name specific solutions. The low share price group were
therefore at the L1 object maturity level.
Conceptualisation of a big data maturity model based on organisational
decision making
2015
100
o The high share price group seemed to be more mature than the lower share
price group, as these respondents were somewhat engaged with the big data
solutions in their organisations, but not to the extent where they have
developed a deeper understanding about the effectiveness of these solutions.
These respondents were therefore able to name specific solutions, but were
not able to comment further on the effectiveness of these solutions. The high
share price group was therefore at the L2 object maturity level.
- No significant trends or deviations were prevalent concerning the people focus
either on the surface, or around the levels of trust and business readiness which
would have provided a more detailed view of the process and people maturity, as
outlined in Section 5.4 (iii).
- A process focus was dominant in both the high and low share price groups. No
significant trends or deviations were prevalent either on the surface, or around levels
of engagement which would have provided a more detailed view of the process and
people maturity, as outlined in Section 5.4 (ii).
The following nuances were found between the object, people and process focus in the
various industries:
- Object focus:
o Respondents from financial services spoke the most about objects, especially
the infrastructure and specific big data software and solutions such as SAS,
Qlickview, Hadoop, IBM Watson. They were therefore found to be at the L3 of
object maturity, as they were deeply engaged with the various big data objects
in their environments, aware of the specific big data solutions, and also able to
comment on the effectiveness of these solutions.
o Respondents in communications spoke the least about objects, frequently
mentioning the “tools” they use. These companies were found to be somewhat
between L1 and L2 of object maturity, as the individuals ranged from not being
engaged to being somewhat engaged with the various big data software and
solutions in their environments, where they were aware of several big data
solutions, and in some cases were able to name specific solutions, but unable
to provide opinions around the effectiveness of these solutions.
Conceptualisation of a big data maturity model based on organisational
decision making
2015
101
- People focus:
o Respondents from financial services spoke the most about the people that
were responsible for big data, specifically the teams, the data scientists and
the actuaries. It was found that these companies were at level L4 of people
maturity, as high levels of trust in and empowerment of the analytical teams
were apparent and business readiness for big data regarding the talent in the
organisation was evident.
o Respondents from the resources and retail sector spoke the least about the
people that were responsible for big data, specifically the marketing teams. It
was concluded that these companies were at level L2 of people maturity, due
to the clear evidence of big data capabilities, and some level of trust and
business readiness due to the activities and experimentation being present.
It was also observed, that, across industries, the types of skill sets prevalent in
organisations’ big data analytical teams were heavily influenced by the organisational
environment and the type of datasets present in the organisation, which seemed to
currently be narrow in focus for all the companies.
- Processes focus:
o Respondents from resources companies spoke the most about big data
analytical processes, specifically the various reports and reporting rhythms.
These companies were found to be at level L2 of process maturity, as the
respondents from were moderately engaged with the processes in their
environments, as they were able to refer to specific big data collection or
analysis processes, as well as specific reports that were used, but they were
not able to comment on the usefulness of these processes in presenting
relevant information to decision makers.
o Respondents from financial services spoke the least about big data analytical
processes and commented that it is a predominantly fragmented approach.
These companies were found to be at level L3 of process maturity, as the
individuals seemed highly engaged with the various big data analytical
processes in their environments; to the extent that they were able to not only
name a few specific processes, but that they were also able to share an
opinion around the usefulness of these processes.
Conceptualisation of a big data maturity model based on organisational
decision making
2015
102
In conclusion, in order to answer Proposition 1, the object, people and processes view
seemed to be a valid measure of big data maturity, and objects was indicative of lower
levels of maturity, people indicative of medium levels of maturity, and processes
indicative of higher levels of maturity. However, the results also strongly suggested that
a mere focus on one or all of these dimensions could not be taken at face value as a
signal of maturity, and that the detailed nuances under each of these dimensions be
investigated to provide a more detailed and accurate view of big data maturity.
5.5 Proposition 2: Big data, information and knowledge
as a signal of big data maturity
Proposition 2 suggested that the presence of big data, information and knowledge in
the organisation can be used as a signal of big data maturity. The proposition also
stated that the presence of predominantly big data and information is indicative of an
immature organisation, and the presence of predominantly knowledge would be
indicative of a mature organisation.
5.5.1 Big data definition and coding
Big data has been defined in Section 2.3 (i) as a combination of structured and
unstructured data from a wide variety of sources that is being generated at an
increased pace, and present in the organisation as objective facts, figures and statistics
in its rawest forms, without any processing being applied.
During coding, the following main themes were identified:
(1) General mentions of raw data, which was coded as “raw data”. For example this
statement from respondent P3 “very raw, it is Excel spreadsheets with headings and
then from there I filter out, make my own graphs, compare year on year. Ja, it is very
raw” was coded under this code.
(2) Specific mention to numerous variables being present in the organisation, which
was coded as “1000 variables”. The statement from Respondent P4 was coded in
this code: (3)
Conceptualisation of a big data maturity model based on organisational
decision making
2015
103
“In construction always you have a 1000 variables that have to come together,
and it is quite unique” was coded under this code.
(3) Mentions of traditional raw data being present, which was coded as “traditional
data”. For example the comment from respondent P30 was coded under this code:
“98% is traditional at the moment. I don’t even think there is the 2% I am
probably going to lie to you. I would say it is very close to 100% traditional.”
The full codebook is available in Appendice 7.
Reflecting on the above, it is clear that specific nuances exist about how engaged the
respondents were with the various big datasets in their environments. Thus, it can be
concluded that the presence of for example the data, defined as the raw structured or
unstructured data from a wide variety of sources, in itself is not indicative of big data
maturity, but that the depth of engagement of executives with these datasets is used as
a more accurate measure of big data maturity.
Based on the above distinctive three themes of big data related codes that emerged
during analysis; three distinct levels of maturity can be identified related the presence
of big data in organisations:
- L1: Individuals have very little engagement with the datasets in their organisations,
and therefore were able to only refer broadly to raw data being present. Individuals
in L1 organisations would not be able to describe specific details of the datasets
such as the number of variables, nor make a judgement if these raw datasets are
predominantly traditional datasets.
- L2: Individuals are more engaged with the raw datasets in their environments, to the
extent that they could make reference to details of these datasets, such as the
number of variables present in the data. However, individuals are not sufficiently
engaged with the raw datasets to make a judgement about whether the raw
datasets are traditional or not.
- L3: Individuals are extremely engaged with the raw datasets in their environments,
to the extent where they are able to ascertain if the datasets are traditional or not.
Conceptualisation of a big data maturity model based on organisational
decision making
2015
104
One of the important considerations of the above finding is that the definition of
“traditional data”, as with the definition of big data, is subjective, and therefore
dependent on the ability of the respondent to formulate the scope and definition of big
data. However, the correlation between the prevalence of “traditional data” and the
ability of the respondents to formulate a definition of big data was not analysed as it fell
outside of the scope of this research.
5.5.2 Information definition and coding
Information has been defined as data that has been organised or given structure in
Section 2.3 (i) and therefore any mention to processed information has been coded
within the information code family.
As outlined in the codebook in Appendice 7, the following codes and themes were
identified:
(1) General mentions of aggregated information, which was coded under the
“aggregated” code. For example, the statement from Respondent P2, “we are looking
at aggregated data” was coded under this code.
(2) Mention of specific processed information, such as the “visualisation”, “trend
analysis”, “interactive reports” and “dashboards” codes. For example the statement by
Respondent P7 was coded under this code:
“We put quite a lot of time and effort into the visualisation of it, which we use a
front end tool for, and the front end tool that we have selected we are trying to
allow the users to do a fair bit of investigative stuff themselves within that tool.”
Reflecting on the above, it is clear that specific nuances exist about how engaged the
respondents were with the various sets of information in their environments. Thus, it
can be concluded that the presence of information, defined as the data that has been
organised or given structure, in itself is not indicative of big data maturity, but that the
depth of engagement of executives with information can be used as a more accurate
measure of big data maturity.
Conceptualisation of a big data maturity model based on organisational
decision making
2015
105
Based on the above distinctive two themes of information-related codes that emerged
during analysis, two distinct levels of maturity can be identified related to the presence
of information in organisations:
- L1: Individuals have very little engagement with the information in their
organisations, and they can only refer vaguely to the aggregated information in their
environments. Individuals would not be able to reference specific examples of
information.
- L2: Individuals are more engaged with the information in their environments, and
can cite examples of specific information sets that are present in their organisations.
5.5.3 Knowledge from big data definition and coding
Knowledge was defined in Section 2.3 (ii) as information which has been combined
with experience, context, interpretation and reflection which can be applied to decisions
and actions.
The following main themes and codes were identified:
(1) General reference to a lack of insights, such as the statement from Respondent P6,
“to management it's mainly the processed, so I would say to business it's probably 80%
processed, and 20% with insight” was coded under the “lack of insights” code.
(1) General reference to insights was coded under the “insights” codes, such as this
comment from Respondent P17: I think most of [the insights and recommendations] will
happen at a tactical level, from that level up and down.”
(2) Specific mentions to business intelligence being present, which were coded under
the “business intelligence” code. The reference to “business intelligence networks” from
respondent P4 was coded under this code.
The full codebook is available in Appendice 7.
Reflecting on the above, it is clear that specific nuances exist about how engaged the
respondents were with the various sets of knowledge in their environments. Thus, it
can be concluded that the presence of knowledge, defined as the information which
Conceptualisation of a big data maturity model based on organisational
decision making
2015
106
has been combined with experience, context, interpretation and reflection which can be
applied to decisions and actions, in itself is not indicative of big data maturity, but that
the depth of engagement of executives with knowledge can be used as a more
accurate measure.
Based on the above, three distinct themes of knowledge-related codes emerged during
analysis; three distinct levels of maturity can be identified related the presence of
knowledge in organisations:
- L1: Individuals would not be engaged enough with the knowledge in their
organisations to cite specific examples of knowledge, for example business
intelligence. At this level, individuals would generally acknowledge that there is a
lack of insights in their environments.
- L2: Individuals are still not engaged enough with the knowledge in their
organisations to cite specific examples of knowledge, for example business
intelligence, and they will provide general statements of insights being added to the
information in their organisations.
- L3: Individuals are more engaged with the knowledge in their environment, to the
extent that they can provide examples of knowledge activities or artefacts such as
business intelligence being present.
Finding 1: Usefulness of this dimension as a signal of big data maturity:
In summary, it seems as if the mere presence of big data, information or knowledge in
itself is not a signal of big data maturity, and that the specific nuances concerning the
depth of engagement with the big data, information and knowledge provides more
accurate indication of big data maturity:
- Data: The three maturity levels describing the depth of engagement of executives
with big data can be used as a more accurate measure of big data maturity.
- Information: The two maturity levels denoting the depth of engagement of
executives with information can be used as a more accurate measure of big data
maturity.
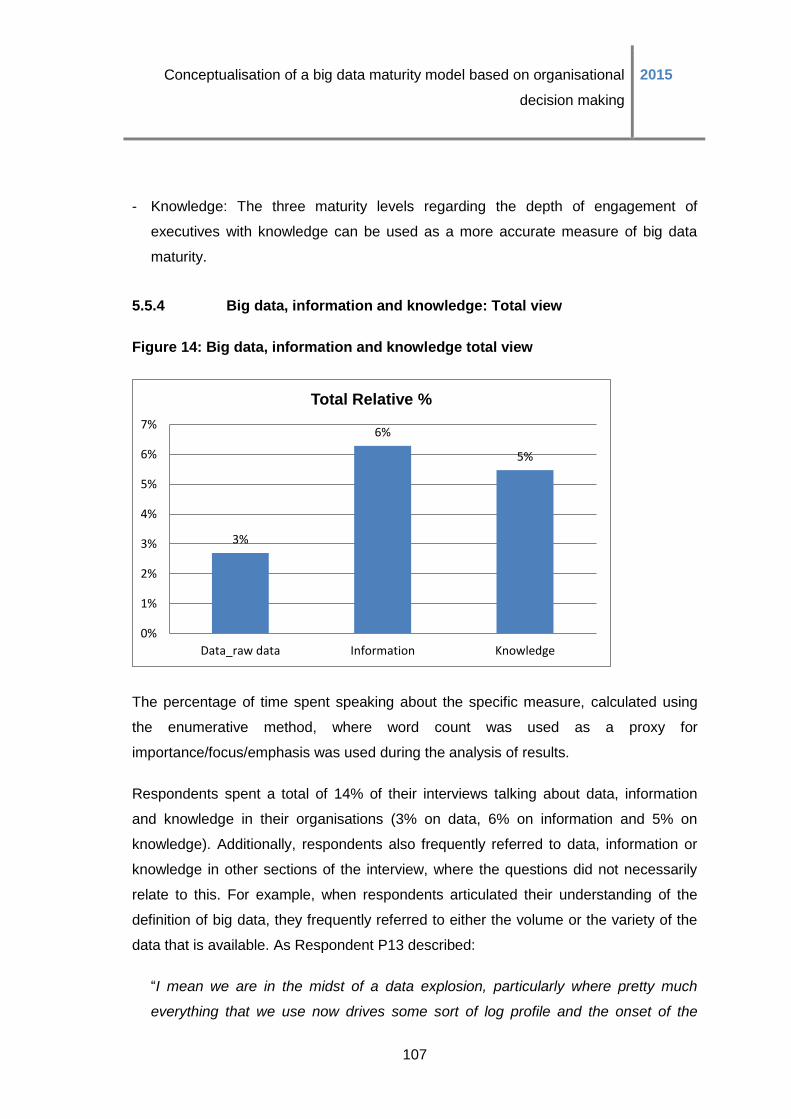
Conceptualisation of a big data maturity model based on organisational
decision making
2015
107
- Knowledge: The three maturity levels regarding the depth of engagement of
executives with knowledge can be used as a more accurate measure of big data
maturity.
5.5.4 Big data, information and knowledge: Total view
Figure 14: Big data, information and knowledge total view
The percentage of time spent speaking about the specific measure, calculated using
the enumerative method, where word count was used as a proxy for
importance/focus/emphasis was used during the analysis of results.
Respondents spent a total of 14% of their interviews talking about data, information
and knowledge in their organisations (3% on data, 6% on information and 5% on
knowledge). Additionally, respondents also frequently referred to data, information or
knowledge in other sections of the interview, where the questions did not necessarily
relate to this. For example, when respondents articulated their understanding of the
definition of big data, they frequently referred to either the volume or the variety of the
data that is available. As Respondent P13 described:
“I mean we are in the midst of a data explosion, particularly where pretty much
everything that we use now drives some sort of log profile and the onset of the
3%
6%
5%
0%
1%
2%
3%
4%
5%
6%
7%
Data_raw data Information Knowledge
Total Relative %
Conceptualisation of a big data maturity model based on organisational
decision making
2015
108
internet of things is starting to pick up on a lot of things, so a lot of the information
we get now is from smartphones and applications etcetera, they drive a lot of the
information as well as a lot of our more traditional data.”
In order to verify the relevance and usefulness of this signal of maturity, three separate
co-occurrence tables were set up for data, information and knowledge as shown in
Figures 15, 16 and 17. There were distinct differences in co-occurrences of each set as
outlined below.
A strong co-occurrence seemed to occur between raw data and specific datasets such
as operational data or sales reports. Additionally, when respondents defined big data
they mentioned the volume and velocity, which revealed a strong co-occurrence with
the “1000 variables” code. This provides compelling evidence of respondents’
understanding that the datasets in their environments are complex due to the
numerous variables, which supports the conclusion in Section 5.5 (i), where, in maturity
level L2 companies according to data maturity individuals are more engaged with the
raw datasets in their environments, to the extent where they could make reference to
details of these datasets such as the number of variables present in the data. However,
individuals are not sufficiently engaged with the raw datasets in order to make a
judgement about whether the raw datasets are traditional or not. As a case in point,
Respondent P4 stated “In construction always you have a 1000 variables that have to
come together”.
It also seemed that where traditional data was mentioned, the big data analytics were
still in infancy in the organisation, and that the approach was predominantly fragmented
and inconsistent in the organisation. Respondent P12 explained:
“It’s predominantly traditional because it has worked for so long and it has been
perfected so why change. However technology has made available real time
information, so you get the earlier adopters that are pushing for technology that
allows you to make decisions quicker; that element of gratification is a lot more
visible. But you do get the two pockets, it will take time, it will take generations
to get that real-time decision making.”
The above statement is typical of an organisation at level L3 of big data maturity as
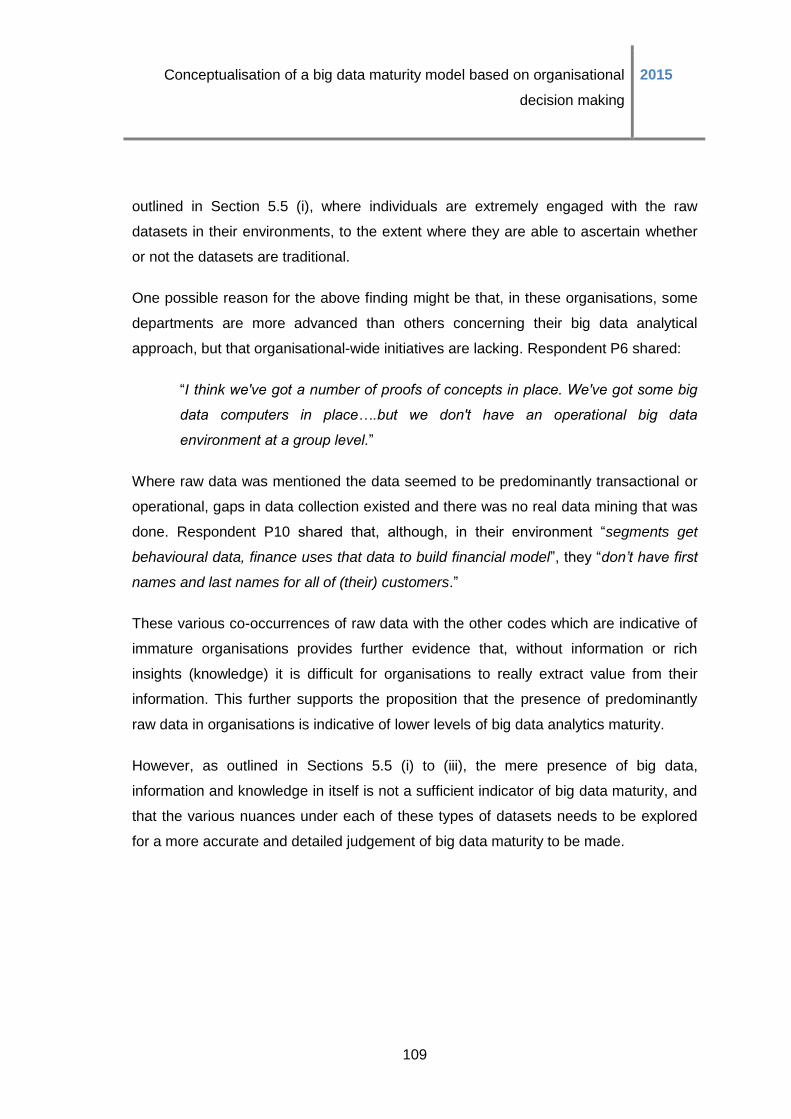
Conceptualisation of a big data maturity model based on organisational
decision making
2015
109
outlined in Section 5.5 (i), where individuals are extremely engaged with the raw
datasets in their environments, to the extent where they are able to ascertain whether
or not the datasets are traditional.
One possible reason for the above finding might be that, in these organisations, some
departments are more advanced than others concerning their big data analytical
approach, but that organisational-wide initiatives are lacking. Respondent P6 shared:
“I think we've got a number of proofs of concepts in place. We've got some big
data computers in place….but we don't have an operational big data
environment at a group level.”
Where raw data was mentioned the data seemed to be predominantly transactional or
operational, gaps in data collection existed and there was no real data mining that was
done. Respondent P10 shared that, although, in their environment “segments get
behavioural data, finance uses that data to build financial model”, they “don’t have first
names and last names for all of (their) customers.”
These various co-occurrences of raw data with the other codes which are indicative of
immature organisations provides further evidence that, without information or rich
insights (knowledge) it is difficult for organisations to really extract value from their
information. This further supports the proposition that the presence of predominantly
raw data in organisations is indicative of lower levels of big data analytics maturity.
However, as outlined in Sections 5.5 (i) to (iii), the mere presence of big data,
information and knowledge in itself is not a sufficient indicator of big data maturity, and
that the various nuances under each of these types of datasets needs to be explored
for a more accurate and detailed judgement of big data maturity to be made.
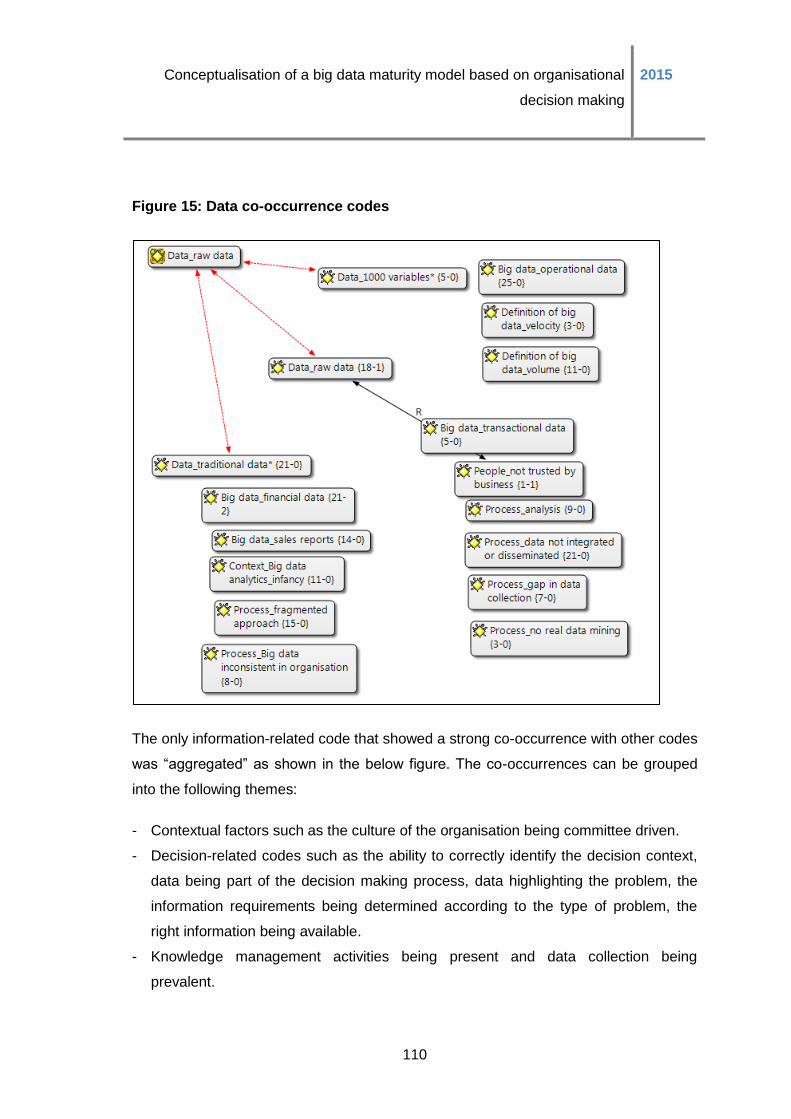
Conceptualisation of a big data maturity model based on organisational
decision making
2015
110
Figure 15: Data co-occurrence codes
The only information-related code that showed a strong co-occurrence with other codes
was “aggregated” as shown in the below figure. The co-occurrences can be grouped
into the following themes:
- Contextual factors such as the culture of the organisation being committee driven.
- Decision-related codes such as the ability to correctly identify the decision context,
data being part of the decision making process, data highlighting the problem, the
information requirements being determined according to the type of problem, the
right information being available.
- Knowledge management activities being present and data collection being
prevalent.
Conceptualisation of a big data maturity model based on organisational
decision making
2015
111
- “Noise” being evident in the data, such as information being used irrespective of the
decision, users not being able to extract insights from the data. For example,
respondent P24 stated “one can sit there for days and days and days analysing stuff
and not getting anything from it”.
The possible implication of these co-occurrences might be that, companies where
information is readily available can start using the data during decision making, but will
still struggle with the relevancy and applicability of the data as, although some
knowledge management activities are being applied, there is a gap regarding the
insights being extracted from the data. These are all typical of organisations that are
relatively mature, but not yet at the highest maturity levels, as there is still much
improvement to be made. As respondent P2 stated:
“There is a lot of noise and information aggregated….at any given time you can
probably get about 400 reports, but there are very good actionable dashboards. I will
use the anti-money laundering one as a good example… there is a real time
dashboard that the entire organization can see that breaks down every single
account in this bank daily, into an action bucket which gets fed real time to an
operations team through some sort of web tool and they can deal with it. So it has
really gone from a view that says ‘hm, that’s interesting’ to an actionable dashboard
that you can see daily how your numbers move. So you will see five thousand
bucket a day, work out tomorrow four will be there and you can see how it goes. So I
think there is some good progress, but overall there is still a lot of junk in the
system.”
Conceptualisation of a big data maturity model based on organisational
decision making
2015
112
Figure 16: Information co-occurrence codes
Interestingly, the only two knowledge-related codes that showed strong co-occurrences
were the “insights” and “lack of insights” codes, as presented below. Where a lack of
insights was mentioned there was also a strong intent to improve knowledge
management activities as well as to create specific initiatives such as central reporting
hubs. This finding is also particularly encouraging when considered in light of the
strong occurrence of insights and analytical teams in those environments, which might
suggest that these organisations have the relevant teams to deploy the correct insights
to the business. As Respondent P29 stated:
“So I think we have started to try and look at how we do that….the journey has
already started. So for harnessing insights, I don’t think we are at that stage yet; I
think we are still at the beginning of the journey towards understanding what big dig
data is and how we use it- how to create a platform to use it.”
The insights mentions co-occurred with business analysts, statisticians, analytics being
quite reactive as well as decisions being intuition based. This is contradictory to what
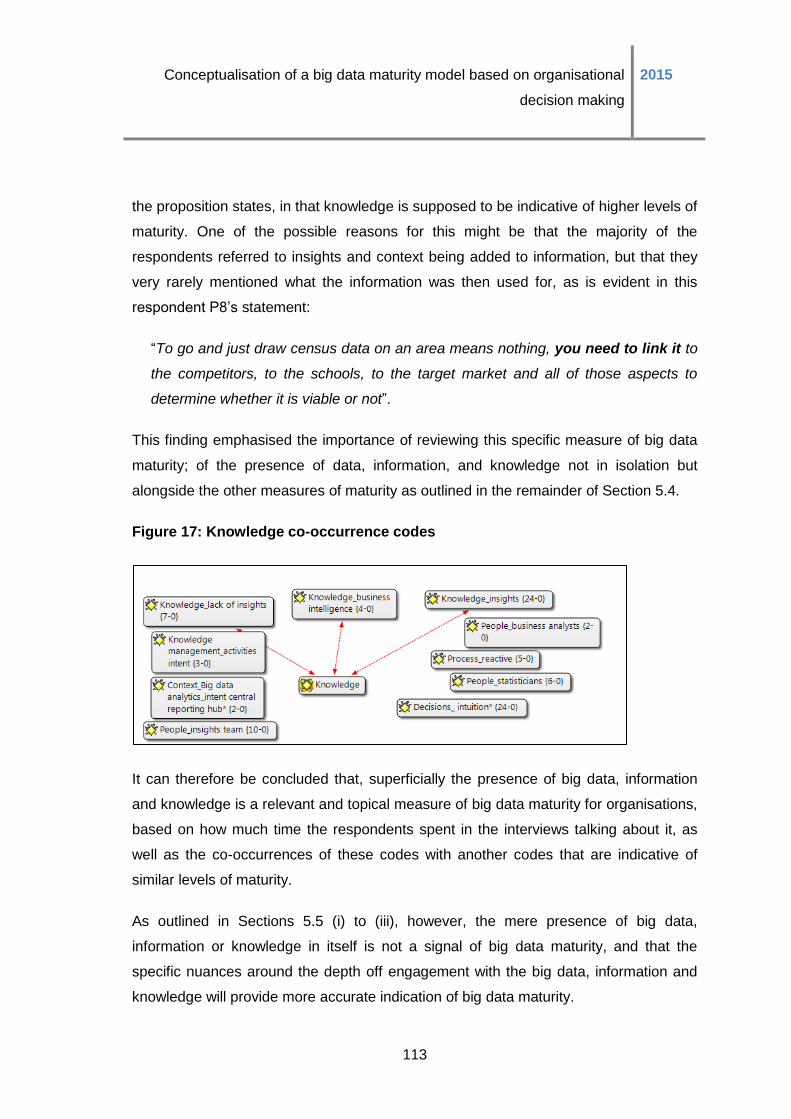
Conceptualisation of a big data maturity model based on organisational
decision making
2015
113
the proposition states, in that knowledge is supposed to be indicative of higher levels of
maturity. One of the possible reasons for this might be that the majority of the
respondents referred to insights and context being added to information, but that they
very rarely mentioned what the information was then used for, as is evident in this
respondent P8’s statement:
“To go and just draw census data on an area means nothing, you need to link it to
the competitors, to the schools, to the target market and all of those aspects to
determine whether it is viable or not”.
This finding emphasised the importance of reviewing this specific measure of big data
maturity; of the presence of data, information, and knowledge not in isolation but
alongside the other measures of maturity as outlined in the remainder of Section 5.4.
Figure 17: Knowledge co-occurrence codes
It can therefore be concluded that, superficially the presence of big data, information
and knowledge is a relevant and topical measure of big data maturity for organisations,
based on how much time the respondents spent in the interviews talking about it, as
well as the co-occurrences of these codes with another codes that are indicative of
similar levels of maturity.
As outlined in Sections 5.5 (i) to (iii), however, the mere presence of big data,
information or knowledge in itself is not a signal of big data maturity, and that the
specific nuances around the depth off engagement with the big data, information and
knowledge will provide more accurate indication of big data maturity.
Conceptualisation of a big data maturity model based on organisational
decision making
2015
114
Finding 2: Big data maturity based on the prevalence of data, information and
knowledge:
Overall the respondents seemed to speak the most about information in their
organisations, and thus it can be inferred that their big data analytics maturity is
average based on this. Knowledge was the second most talked about topic, which
indicates that organisations tend to be placed between “average” and “very mature”.
The various co-occurrence analysis and insights as outlined under the first finding in
this proposition provides deep insights concerning the exact state of maturity and
where the possible gaps lie.
Reflecting on the above, it is clear that the groundwork was therefore laid as the
relevant big datasets, information and knowledge were in place, which is suggestive of
a history of knowledge management. It is important to note, however, that as specific
nuances in big data, information and knowledge exists specifically around the depth of
engagement as outlined in Section 5.5 (i) to (iii) deeper analysis into each of these
focus areas will provide a more accurate views of the relative big data maturity in
organisations.
5.5.5 Big data, information and knowledge: High vs low share price view
Finding 3: Differences in big data, information and knowledge between the high and
low share price groups:
The percentage of time spent speaking about the specific measure, which was
calculated on the enumerative method, where word count was used as an indication of
importance, was used during the analysis of results.
As outlined in Figure 18, it seems as if respondents from the high share price groups
spoke more about each of the measures of data, information and knowledge than what
the lower share price groups did. One of the possible reasons for this is that the high
share price companies tended to engage more with the data in their environments. This
is also consistent with the finding in Section 5.3 (v) where the high share group had a
slightly larger focus on “objects” than low share price.

Conceptualisation of a big data maturity model based on organisational
decision making
2015
115
Figure 18: High and low share price view of data, information and knowledge
5.5.6 Big data, information and knowledge: Industry view
Figure 19: Industry view of data, information and Knowledge
Several variances existed between the various industries concerning the prevalence of
data, information and knowledge in their environments. However, as established
previously, the mere presence of big data, information and knowledge in itself is not a
3%
7%
6%
2%
6%
5%
0%
1%
2%
3%
4%
5%
6%
7%
Data_raw data Information Knowledge
High vs Low share price - Relative %
HighSharePrice
LowSharePrice
3%
5%
6%
3%
8%
3%
5%
6%
4%
2%
7% 7%
2%
5% 4%
0%
1%
2%
3%
4%
5%
6%
7%
8%
9%
Data_raw data Information Knowledge
Industry view - Relative %
FinServices
Resources
Retail
Manufacturing
Comms
Conceptualisation of a big data maturity model based on organisational
decision making
2015
116
sufficient indicator of big data maturity, and the various nuances under each of these
types of datasets need to be explored in order for a more accurate and detailed
judgement of big data maturity to be made.
The nuances of the presence of big data, information and knowledge that were
apparent in certain industries include:
- Retail lags with a focus on predominantly raw data and information, resources
companies seems to be placed in the middle, and manufacturing and financial
services surge ahead with a predominant focus on knowledge and information.
- Respondents from retail seemed to speak the most about raw big data, and
respondents from communications spoke the least about raw big data.
- Respondents from the resources sector spoke the most about information and
respondents from the manufacturing and communications sector spoke the least
about information.
- Respondents from manufacturing companies spoke the most about knowledge,
whilst respondents from resources spoke the least about knowledge.
In the subsequent sections, the main differences of the industries where respondents
spoke the most and the least about the big data, information and knowledge in their
organisations are outlined, as measured in the percentage of words spent on those
aspects relative to the total amount of words spoken in the interviews.
Finding 4: Differences in raw data between retail and manufacturing and
communications
As outlined in Figure 19, respondents from the retail sector spent 5% of their time
talking about raw data, whereas respondents from manufacturing companies as well as
communications and media companies only spent 2% of their time talking about raw
data (measured as a percentage of the total words spoken). In order to ascertain the
key differences, word clouds were constructed on the words around the raw data codes
for these three industries.
It seems clear that the retail, manufacturing and communications and media
companies still focus predominantly on traditional data, and where some traces of big
Conceptualisation of a big data maturity model based on organisational
decision making
2015
117
data analytics occur, the datasets seem relatively small. However, when the big data
maturity levels as outlined in Section 5.5 (i) are applied to these findings, there are
massive differences in the engagement with the data in these industries, and therefore
varying levels of maturity is found.
Big data in the retail sector findings:
- Respondents from the retail sector emphasised raw data as well as statistics, and
spoke about specific datasets such as enrolments numbers. One interesting finding
was their emphasis on graphics and pictures.
- A possible reason for this could be that, as the data is so raw in the retail
environment, users of the data had to almost always visualise into a usable format,
which in most cases would be a graph or a graphic. As respondent P8 explained:
“Everything is basically raw and then we need to filter that through to what we
need and then analyse it to make sure whether it will help us or not. Most of the
info is raw and then we have to convert it into a final product where we can
draw our stats and our ratios and our graphs to make sure whether it is viable or
not.”
- Reflecting on the above, it seems as if the data in the retail environments was still
very structured, and not that large, and that the main focus was on the analysis of
the data as opposed to adding insights to it. This finding is further supported by the
low focus of information and knowledge in retail. Respondent P3 provided more
context:
“There is a monthly divisional report that reflects typically the region, the growth
for that specific region. Ultimately I don’t really deal with that level, I will look at
the business overall and we are constantly reminded of sales going up or down
and where we are during a specific month”
- Based on the above finding, it seems as if retail companies were at level L1 of big
data maturity, as the respondents had very little engagement with the datasets in
their organisations, and therefore were able to only refer broadly to raw data being
present. These respondents were also unable to describe specific details about the
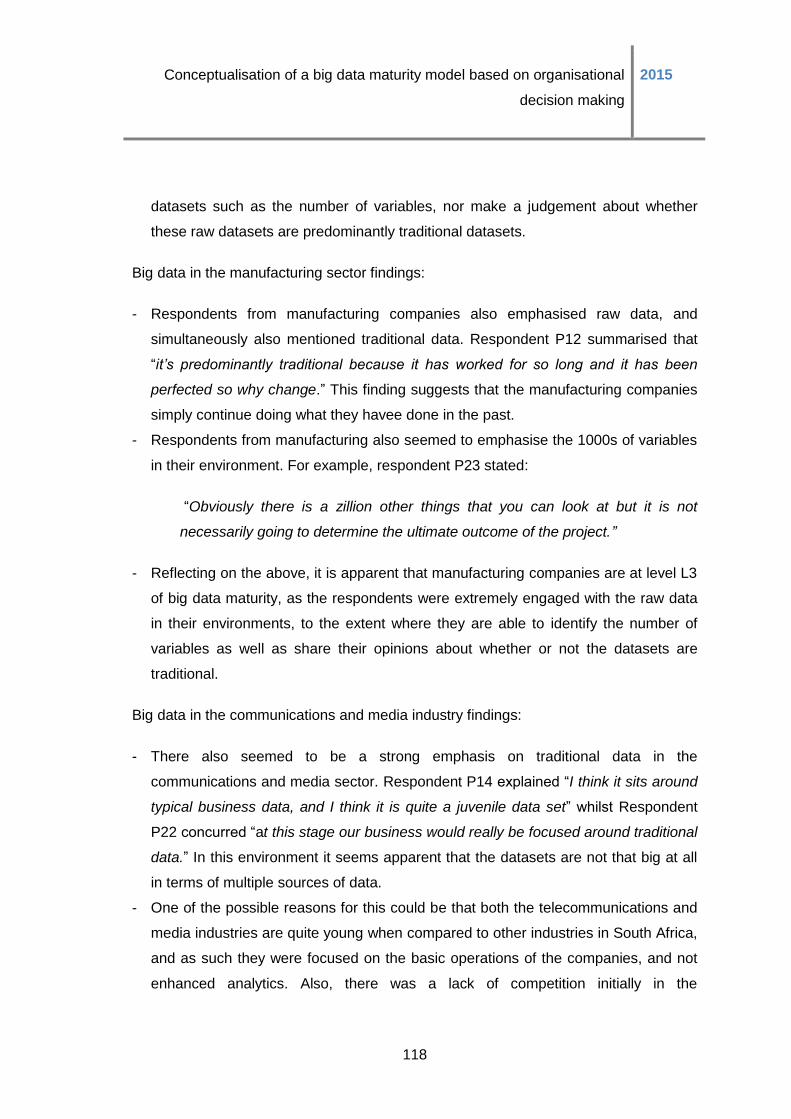
Conceptualisation of a big data maturity model based on organisational
decision making
2015
118
datasets such as the number of variables, nor make a judgement about whether
these raw datasets are predominantly traditional datasets.
Big data in the manufacturing sector findings:
- Respondents from manufacturing companies also emphasised raw data, and
simultaneously also mentioned traditional data. Respondent P12 summarised that
“it’s predominantly traditional because it has worked for so long and it has been
perfected so why change.” This finding suggests that the manufacturing companies
simply continue doing what they havee done in the past.
- Respondents from manufacturing also seemed to emphasise the 1000s of variables
in their environment. For example, respondent P23 stated:
“Obviously there is a zillion other things that you can look at but it is not
necessarily going to determine the ultimate outcome of the project.”
- Reflecting on the above, it is apparent that manufacturing companies are at level L3
of big data maturity, as the respondents were extremely engaged with the raw data
in their environments, to the extent where they are able to identify the number of
variables as well as share their opinions about whether or not the datasets are
traditional.
Big data in the communications and media industry findings:
- There also seemed to be a strong emphasis on traditional data in the
communications and media sector. Respondent P14 explained “I think it sits around
typical business data, and I think it is quite a juvenile data set” whilst Respondent
P22 concurred “at this stage our business would really be focused around traditional
data.” In this environment it seems apparent that the datasets are not that big at all
in terms of multiple sources of data.
- One of the possible reasons for this could be that both the telecommunications and
media industries are quite young when compared to other industries in South Africa,
and as such they were focused on the basic operations of the companies, and not
enhanced analytics. Also, there was a lack of competition initially in the
Conceptualisation of a big data maturity model based on organisational
decision making
2015
119
telecommunications industry due to the high barriers of entry. As Respondent P9
explained:
“(Company) is very similar to many telco’s. Telco’s are slightly unique in the
market. I have been in banking before and I’ve been in FMCG before so they are
not as evolved as those organisations and there is a very good reason for that.
Because it is only a twenty year old industry they have had first-mover advantage
for a very long time. So we haven’t had to be clever about things like segmentation
and targeting and developing those types of relationships or even just really using
data from a targeting point of view. It was very much about getting people
connected.”
- It therefore seems apparent that communications and media companies are also at
level L3 of big data maturity, as the respondents were extremely engaged with the
raw data in their environments, to the extent where they were able to provide
commentary on the datasets being traditional or not. There also seemed to be a
very high level of self-awareness specifically in the communications and media
sector, which might be driven by the increased competitive pressures due to market
saturation and industry regulation concerning lower mobile termination rates, which
puts strain of profitability, as reported by Mochiko (2015).
Table 7: Raw data review in retail, manufacturing and communications and
media
Retail raw data Manufacturing raw data Communications raw
data
Conceptualisation of a big data maturity model based on organisational
decision making
2015
120
Finding 5: Differences in information between resources and communications
There was also major differences in how much time the interview respondents from
resources companies spent talking about information (8% of the time) compared to
how much time respondents from communications and media companies spent talking
about information (5%). The different views from both groups were clarified using word
cloud analyses of their comments around the “information” codes as outlined in Table 8
below.
Information in the resources industry findings:
- Respondents from resources companies emphasised reports as well as some of the
daily, weekly and monthly reporting rhythms that seem to exist in their
environments. Visualisation and trend analysis was also topical during the
interviews. Respondent P11 explained:
“We have a weekly EXCO meeting and before that EXCO meeting every single
department head has to produce a weekly report. So it'll be a cash flow report, a
safety report, an HR report with overtime in it, it'll be a geological report with an
assessment of grade against budget” whilst another respondent from a resources
company stated “You learn the lesson once in terms of how to take a certain bunch
of data, convert it, visualise it in a way that for management it is easy to spot and
see where focus needs to be given.”
- Reflecting on this finding, it seems that the focus is still on small data, and that
traditional business intelligence activities are still prevalent.
- When this finding is interpreted using the information maturity levels as outlined in
Section 5.5 (ii), it is apparent that manufacturing companies are at level L2 of
information maturity, as the respondents are more engaged with the information in
their environments, and can cite examples of specific information sets that are
present in their organisations.
Conceptualisation of a big data maturity model based on organisational
decision making
2015
121
Information in the communications and media industry findings:
- Respondents from the communications sector also emphasised the visualisation of
their reports, and stated that reporting is predominantly static at the moment. Some
of the collective comments from Respondent P9: “you will find your static reports
tend to work a lot better” and Respondent P10 “they are just static graphs mostly,
line graphs, bar graphs.”
- Communication and media companies are also be deemed as being at level L1 of
information maturity, as the respondents seems to have very little engagement with
the information in their organisations, and they were only able to refer vaguely to the
aggregated information in their environments. These respondents were also unable
to reference specific examples of information.
- This finding is in line with the object related maturity of communications and media
companies that was outlined as between L1 and L2 in Section 5.4 (vi), but in
contradiction to the preceding finding in the above section concerning their big data
maturity, which was deemed to be at L3. One of the reasons for this might be the
clear focus on small data, and the strong acknowledgement of traditional datasets
still being prevalent in their environments. If all these findings are reviewed
holistically, it provides evidence that the telecommunications industry is still
relatively immature in their big data efforts.
It is interesting to note that no specific visualisation solutions were specifically
mentioned during the interview process by respondents in the resources and
communication sectors during the “object” focus analysis in Section 5.3 (vi). This might
stress an immediate opportunity for these companies to invest in visualisation and
dashboard solutions which seems to be a much sought after presentation of
information in their environments.
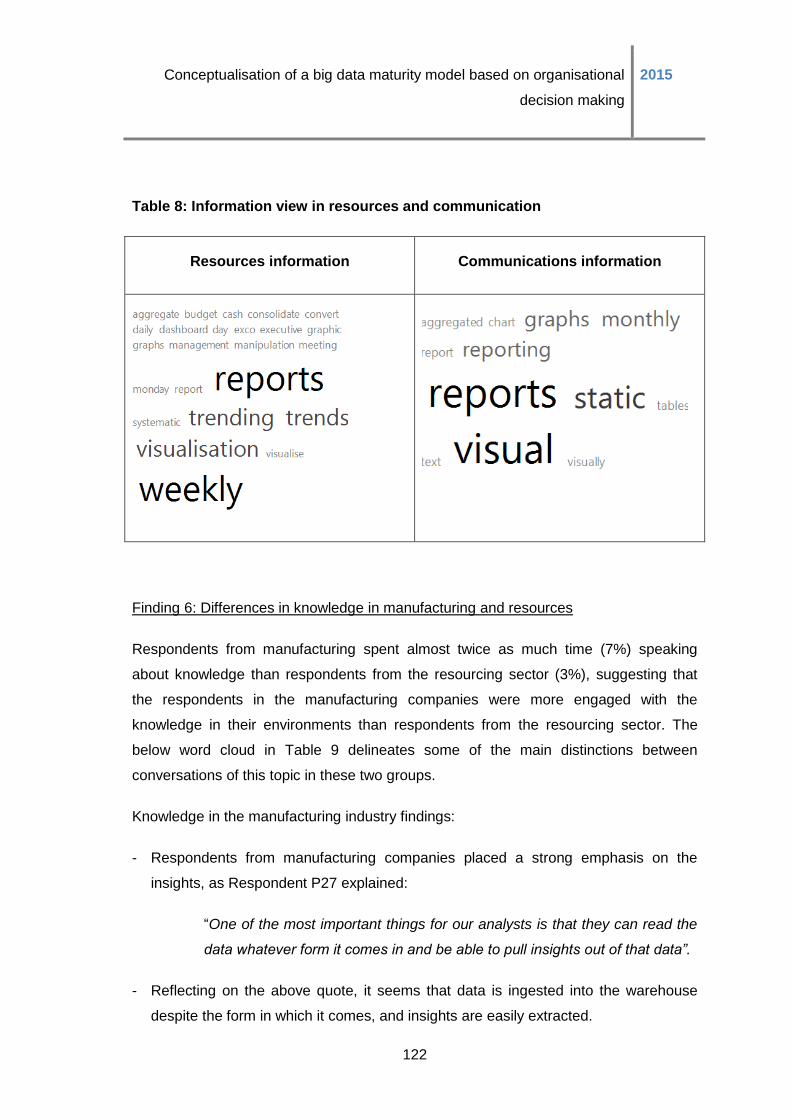
Conceptualisation of a big data maturity model based on organisational
decision making
2015
122
Table 8: Information view in resources and communication
Resources information Communications information
Finding 6: Differences in knowledge in manufacturing and resources
Respondents from manufacturing spent almost twice as much time (7%) speaking
about knowledge than respondents from the resourcing sector (3%), suggesting that
the respondents in the manufacturing companies were more engaged with the
knowledge in their environments than respondents from the resourcing sector. The
below word cloud in Table 9 delineates some of the main distinctions between
conversations of this topic in these two groups.
Knowledge in the manufacturing industry findings:
- Respondents from manufacturing companies placed a strong emphasis on the
insights, as Respondent P27 explained:
“One of the most important things for our analysts is that they can read the
data whatever form it comes in and be able to pull insights out of that data”.
- Reflecting on the above quote, it seems that data is ingested into the warehouse
despite the form in which it comes, and insights are easily extracted.
Conceptualisation of a big data maturity model based on organisational
decision making
2015
123
- As highlighted in the “raw data” word cloud, several respondents mentioned the
thousands, millions, gazillions variables and data points that are available and
therefore due to the volume of data in that environment the extraction of insights is
particularly important. Respondent P4 stated:
“I get a report once a week and there are 100s of things in it. My focus is to
migrate that to a level of quality.”
- Based on these findings it seems as if companies in the manufacturing industry are
at level L3 of knowledge maturity, as the respondents were engaged enough with
the knowledge in their organisations to cite specific examples of knowledge activities
such as business intelligence; they were also able to provide several examples of
insights being added to the information in their organisations.
Knowledge in the resources sector findings:
- In the interviews with the respondents from the resources sector, the capture of
comments, which are insights and context around the various statistics in the report,
was emphasised extensively. Respondent P30 shared:
“The way this report happens is as soon as the figures are out then people at my
level actually sit down… so my equivalent on the finance side, my equivalent on
the safety side, they go into the reports… so once those are extracted and the
numbers are there they then go… if there is a variance or we are below target they
go in and they actually capture the comments.”
- One possible explanation of this is that resource companies are extremely focused
on operational and project data as mentioned earlier in the “processes” analysis in
Section 5.3 (vi), and therefore the performance of the various processes is
extremely important and needs to be measured extensively.
- Additionally, as mentioned earlier due to the organisational cultures in resources
being committee driven, a strong focus on project performance is reported at the
various internal committees in the organisations. Any variances from the target
therefore needs to be explained as outlined in the abovementioned quote from one
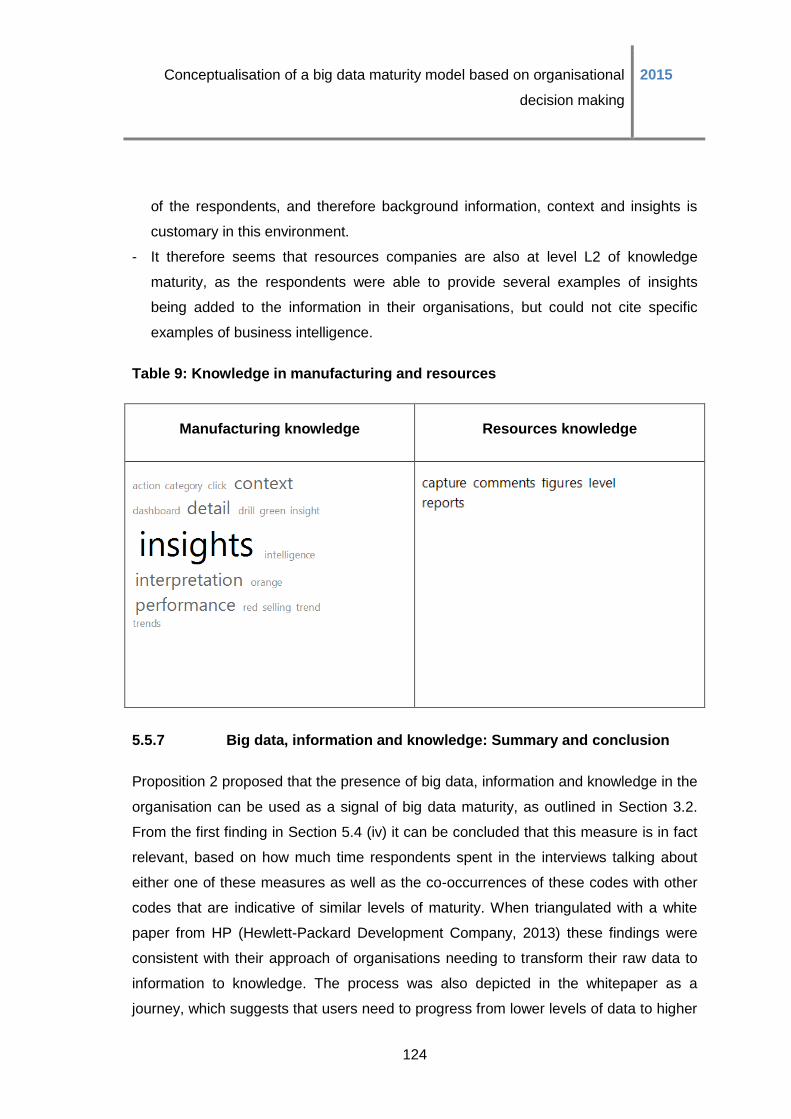
Conceptualisation of a big data maturity model based on organisational
decision making
2015
124
of the respondents, and therefore background information, context and insights is
customary in this environment.
- It therefore seems that resources companies are also at level L2 of knowledge
maturity, as the respondents were able to provide several examples of insights
being added to the information in their organisations, but could not cite specific
examples of business intelligence.
Table 9: Knowledge in manufacturing and resources
Manufacturing knowledge Resources knowledge
5.5.7 Big data, information and knowledge: Summary and conclusion
Proposition 2 proposed that the presence of big data, information and knowledge in the
organisation can be used as a signal of big data maturity, as outlined in Section 3.2.
From the first finding in Section 5.4 (iv) it can be concluded that this measure is in fact
relevant, based on how much time respondents spent in the interviews talking about
either one of these measures as well as the co-occurrences of these codes with other
codes that are indicative of similar levels of maturity. When triangulated with a white
paper from HP (Hewlett-Packard Development Company, 2013) these findings were
consistent with their approach of organisations needing to transform their raw data to
information to knowledge. The process was also depicted in the whitepaper as a
journey, which suggests that users need to progress from lower levels of data to higher

Conceptualisation of a big data maturity model based on organisational
decision making
2015
125
levels of information and then knowledge, in the same way as upwards movement
occurs through maturity levels as depicted in the conceptual model in this research
study.
It is important to note, however, that, as per the finding in Section 5.5 (iii), the mere
presence of big data, information or knowledge in itself is not a signal of big data
maturity, and that the specific nuances of the depth of engagement with the big data,
information and knowledge will provide more accurate indication of big data maturity
It is therefore recommended that the various levels of maturity in each of the big data,
information and knowledge measures be considered:
- Data: The three maturity levels concerning the depth of engagement of executives
with big data can be used as a more accurate measure of big data maturity.
- Information: The two maturity levels regarding the depth of engagement of
executives with information can be used as a more accurate measure of big data
maturity.
- Knowledge: The three maturity levels depicting the depth of engagement of
executives with knowledge can be used as a more accurate measure of big data
maturity.
The various maturity levels in the big data, information and knowledge measures are
detailed below.
Big data maturity levels:
- L1: Individuals have very little engagement with the datasets in their organisations,
and therefore were able to only refer broadly to raw data being present. Individuals
in L1 organisations would not be able to describe specific details about the datasets
such as the number of variables, nor make a judgement if these raw datasets are
predominantly traditional datasets.
- L2: Individuals are more engaged with the raw datasets in their environments, to the
extent where they could make reference to details of these datasets, for example
the number of variables present in the data. However, individuals are not sufficiently
Conceptualisation of a big data maturity model based on organisational
decision making
2015
126
engaged with the raw datasets in order to make a judgement about whether or not
the raw datasets are traditional.
- L3: Individuals are extremely engaged with the raw datasets in their environments,
to the extent where they are able to ascertain whether the datasets are traditional or
not.
Information maturity levels:
- L1: Individuals have very little engagement with the information in their
organisations, and they can only refer vaguely to the aggregated information in their
environments. Individuals would not be able to reference specific examples of
information.
- L2: Individuals are more engaged with the information in their environments, and
can cite examples of specific information sets that are present in their organisations.
Knowledge maturity levels:
- L1: Individuals would not be engaged enough with the knowledge in their
organisations to cite specific examples of knowledge such as business intelligence.
At this level, individuals would generally acknowledge that there is a lack of insights
in their environments.
- L2: Individuals are still not engaged enough with the knowledge in their
organisations to cite specific examples of knowledge such as business intelligence,
and they will provide general statements of insights being added to the information
in their organisations.
- L3: Individuals are more engaged with the knowledge in their environment, to the
extent that they can provide examples of knowledge activities or artefacts such as
business intelligence being present.
Proposition 2 also proposed that the presence of predominantly big data and
information is indicative of an immature organisation, and the presence of
predominantly knowledge is indicative of a mature organisation. As respondents
generally seemed to speak the most about information in their organisations, it can be
inferred that their big data analytics maturity is average based on this specific measure
of maturity. Knowledge was the second most talked about topic, which indicates that
Conceptualisation of a big data maturity model based on organisational
decision making
2015
127
organisations tend to be placed between “average” and “very mature”. It has been
found, however, that the mere presence of big data, information or knowledge in itself
is not a signal of big data maturity, and that the specific nuances of the depth of
engagement with the big data, information and knowledge will provide more accurate
indication of big data maturity.
Therefore, the specific nuances of the depth of engagement with big data, information
and knowledge as outlined in the previous sections will provide a more accurate
indication of big data maturity.
The following nuances of the presence of big data, information and knowledge were
found between the high and low share price groups:
- Respondents from the high share price groups spoke more about each of the
measures of data, information and knowledge when compared to the lower share
price groups.
- One of the possible reasons for this is that the high share price companies tended to
engage more with the data in their environments. This is also consistent with the
finding in Section 5.3 (v) where the high share group had a slightly larger focus on
“objects” than low share price.
The following nuances of the presence of big data, information and knowledge were
found between companies from the various industries:
- Big data:
o Respondents from retail seemed to speak the most about raw big data,
emphasising specific stats and datasets. They were therefore found to be at
level L1 of big data maturity, as the respondents had very little engagement
with the datasets in their organisations, and therefore were able to only refer
broadly to raw data being present. These respondents were also unable to
describe specific details concerning the datasets such as the number of
variables, nor make a judgement about whether these raw datasets are
predominantly traditional datasets.
o Respondents from manufacturing and communications spoke the least about
raw big data, but emphasised the traditional datasets in their environment. It is
Conceptualisation of a big data maturity model based on organisational
decision making
2015
128
apparent that these companies are at level L3 of big data maturity, as the
respondents were extremely engaged with the raw in their environments, to
the extent where they were able to identify the number of variables as well as
share their opinions about whether or not the datasets are traditional.
o In most cases, the data tends to be internal and structured.
- Information:
o Respondents from the resources sector spoke the most about information,
emphasising reports, visualisation and trend analysis. These companies are at
level L2 of information maturity, as the respondents were more engaged with
the information in their environments, and could cite examples of specific
information present in their organisations.
o Respondents from the communications sector spoke the least about
information, highlighted visualisation of their reports, and stated that reporting
is predominantly static. These companies were regarded as being at level L1
of information maturity, as the respondents seems to have very little
engagement with the information in their organisations, and they were only
able to refer vaguely to the aggregated information in their environments.
These respondents were also unable to reference specific examples of
information. This finding is in line with the object-related maturity of
communications and media companies which was outlined being placed
between L1 and L2 in Section 5.4 (vi), but in contradiction to the preceding
finding in the above section concerning their big data maturity, which was
positioned at L3. One of the reasons for this might be the clear focus on small
data, and the strong acknowledgement of traditional datasets still being
prevalent in their environments. If all these findings are reviewed holistically, it
provides evidence that the telecommunications industry is still relatively
immature in their big data efforts and the big data analytics seemed limited in
those environments.
- Knowledge:
o Respondents from manufacturing companies spoke the most about
knowledge, and placed a strong emphasis on insights. These companies were
at level L3 of knowledge maturity, as the respondents were engaged enough
with the knowledge in their organisations to cite specific examples of
Conceptualisation of a big data maturity model based on organisational
decision making
2015
129
knowledge activities such as for example business intelligence; they were also
able to provide several examples of insights being added to the information in
their organisations.
o Respondents from resources spoke the least about knowledge, and the
capture of comments, which are insights and context about the various
statistics in the report, were highlighted extensively. Resources companies
were also pegged at level L2 of knowledge maturity, as the respondents were
able to provide several examples of insights being added to the information in
their organisations, but could not cite specific examples of business
intelligence.
In conclusion, in order to answer Proposition 2, the presence of big data, information
and knowledge seemed to be a valid measure of big data maturity. However, the
results also strongly suggested that a mere focus on one or all of these dimensions
could not be taken at face value as a signal of maturity, and that the detailed nuances
within each of these dimensions must be investigated in order to provide a more
detailed and accurate view of big data maturity.
Another interesting observation was that, in cases where “knowledge” was prevalent,
other signals of immature big data efforts was apparent. The conclusion therefore is
that the mere presence of data, information and knowledge in organisations alone
cannot guarantee that the organisation’s big data analytical efforts are mature, as it is
the use of the data, information, and knowledge during decision making that really
impacts the derived value from it. This provides further evidence that this specific
measure of maturity (data, information, knowledge) should be viewed alongside all of
the other measures of maturity.
5.6 Proposition 3: Presence and sophistication of
knowledge management activities as a signal of big
data maturity
Proposition 3 suggested that the presence and sophistication of knowledge
management activities in the organisation is indicative of big data maturity. Therefore,
Conceptualisation of a big data maturity model based on organisational
decision making
2015
130
according to this proposition, the absence of such activities is indicative of an immature
organisation, and the presence of such activities is indicative of a higher level of
maturity, somewhere in the middle of the maturity continuum. Should knowledge
management activities be present and highly sophisticated, it will be indicative of the
highest level of maturity of big data analytic in the organisation.
5.6.1 Knowledge management definition and coding
According to Section 2.3 (ii), knowledge management was defined as an organisational
capability that allows people in the organisation to create, capture, share and leverage
their collective knowledge to improve organisational performance. During the analysis,
respondents’ answers to the question about whether data is being created, acquired,
and used in their organisations was therefore investigated to reveal evidence of the
presence of knowledge management activities in their organisations.
The following main themes were identified during analysis:
(1) Knowledge management systems, where comments about knowledge management
activities being present in the respondent’s organisation were coded under the
“knowledge management_activities” code. For example, the statement from
Respondent P18 was included in this code:
“Well now there is lots of integration. Previously we would just kind of see maybe
volumes in area, and come up with a theory of those volumes. But now we have
got to tie up these volumes with load shedding, economy, cut it and slice it – it
allows us to be a little more granular and focus our investments into it.
(2) Intent to start doing more knowledge management activities, in cases where
respondents acknowledged that, although knowledge management activities are not
currently present in their organisation, they intend to implement such activities in
future. These comments were coded within the “knowledge management intent”
code, such as the response from Respondent P9: “to be able to integrate at a
product level from a customer point of view and then we’ll start integrating the other
customer sources.”
Conceptualisation of a big data maturity model based on organisational
decision making
2015
131
These two codes were grouped under the “KMS”, Knowledge Management System
code family. The full code book is available for review in Appendice 7.
Reflecting on the above knowledge management coding, it is clear that specific
nuances exist regarding the respondents’ engagement with the various knowledge
management activities in their organisations. These nuances can be used as the
indication of the sophistication of knowledge management activities. Thus, it can be
concluded that knowledge management activities, defined as an organisational
capability that allows people in the organisation to create, capture, share and leverage
their collective knowledge to improve organisational performance, in itself is not
indicative of big data maturity, but that the depth of engagement of executives with
knowledge management activities can be used as a more accurate measure of big
data maturity.
This conclusion is also consistent with the findings in Section 5.5 (iii) where similar
nuances concerning various levels of engagement with knowledge were apparent.
There is also an interesting similarity to the “appetite” for big data that was mentioned
in Section 5.3, and therefore it seems that potential linkages between knowledge
management intent and self-classification, appetite and commercialisation can occur;
where once individuals have self-classified themselves according to the definition of big
data, they recognise the potential value thereof and seem to be interested in exploring
the various opportunities it presents. This can also potentially hold true for knowledge
management activities and the intent to improve on these activities.
Based on the above distinctive two themes of knowledge-management-related codes
that emerged during analysis, three distinct levels of maturity can be identified related
to the presence of knowledge management activities in organisations:
- L1: Low levels of engagement with knowledge management activities in the
organisation, as individuals were able to mention knowledge management activities,
but not expressly comment on what the future plans or intentions are for knowledge
management.
Conceptualisation of a big data maturity model based on organisational
decision making
2015
132
- L2: Individuals are very engaged with the knowledge management activities in their
organisations, as they were able to share future plans and intentions about the
knowledge management activities.
5.6.2 Knowledge management activities: Total view
Finding 1: Usefulness of this dimension as a signal of big data maturity:
Based on the findings in Section 5.5 (iv), strong evidence has already been provided of
the presence of knowledge being indicative of higher levels of big data maturity.
Therefore the presence of knowledge management activities by implication is also
indicative of higher levels of maturity than situations where no knowledge management
activities are present.
In order to better understand the knowledge management codes, a co-occurrence view
has been compiled, with the aim of exploring which other codes occurred when
knowledge management was mentioned.
There was a strong co-occurrence between knowledge management and information,
knowledge as well as strong processes being in place. Additionally, it seemed that
where knowledge management activities were mentioned, some of the “people” related
themes such as business analysts, statisticians as well as insights teams were also
mentioned. For example Respondent P9 mentioned the “combination of open source
and other tools” in conjunction with a project where they plan to “integrate at a product
level from a customer point of view and then…start integrating the other customer
sources”, which seems indicative of both structured and unstructured data The
respondent also referred to the teams who are working on this project:
“Guys in Cape Town who look more at the call centres.........a BI division that
sits up here and they very much look at traditional BI... [and the] Customer
Value Management Team [who] look [at] propensity modelling, probability
modelling.” (Respondent P9)
It can therefore be concluded that it is impossible to separate knowledge management
from the human capital in the organisation.
Conceptualisation of a big data maturity model based on organisational
decision making
2015
133
For example, respondents’ referrals to Excel and Qlickview also featured heavily in the
interviews where knowledge management activities were mentioned, which indicate
that there is a strong reliance on the various tools and software as enablers of standard
business intelligence rather than tools of big data. For example Respondent P4 shared
that at his/her organisations they utilise “on a project level use Excel a lot”, but then in
the same breath he/she provided this example of knowledge management activities:
“Two things that drive market research – one is business intelligence networks, both
externally subscribed to and then internal. So a business development executive will
come back and say ‘I have seen a project’ and we use MS Dynamics to capture the
data and the data migrates, it starts off as a lead and our sales cycle goes through
market intelligence actively, selected target, qualification, tender, negotiation, in/out at
the end. And what we do as a management team, especially my team is we manage
the flow of that data”.
It was evident that when knowledge management activities were mentioned, there was
very little mention of raw data being present in the organisation. Therefore it can be
concluded that in most cases the presence of knowledge management activities occurs
in conjunction with other hints of big data maturity in the organisation.
A lack of insights, as well as acknowledgement that big data was still in infancy by
respondents also resulted in them expressing the intent to put knowledge management
activities or specific solutions such as a central reporting hub in place. For example
Respondent P29 stated “I think we’re at the start of the journey around big data and
merging big data sets” and then continued to comment on some of their planned
knowledge management activities in future:
“I think we have started to do try and look at how we do that; so merging –
merging all our databases, because all our brands have separate databases, so
merging that into one database. So I think the journey has already started. So
for harnessing insights, I don’t think we are at that stage yet; I think we are still
at the beginning of the journey towards understanding what big dig data is and
how we use it- how to create a platform to use it.” (Respondent P29)
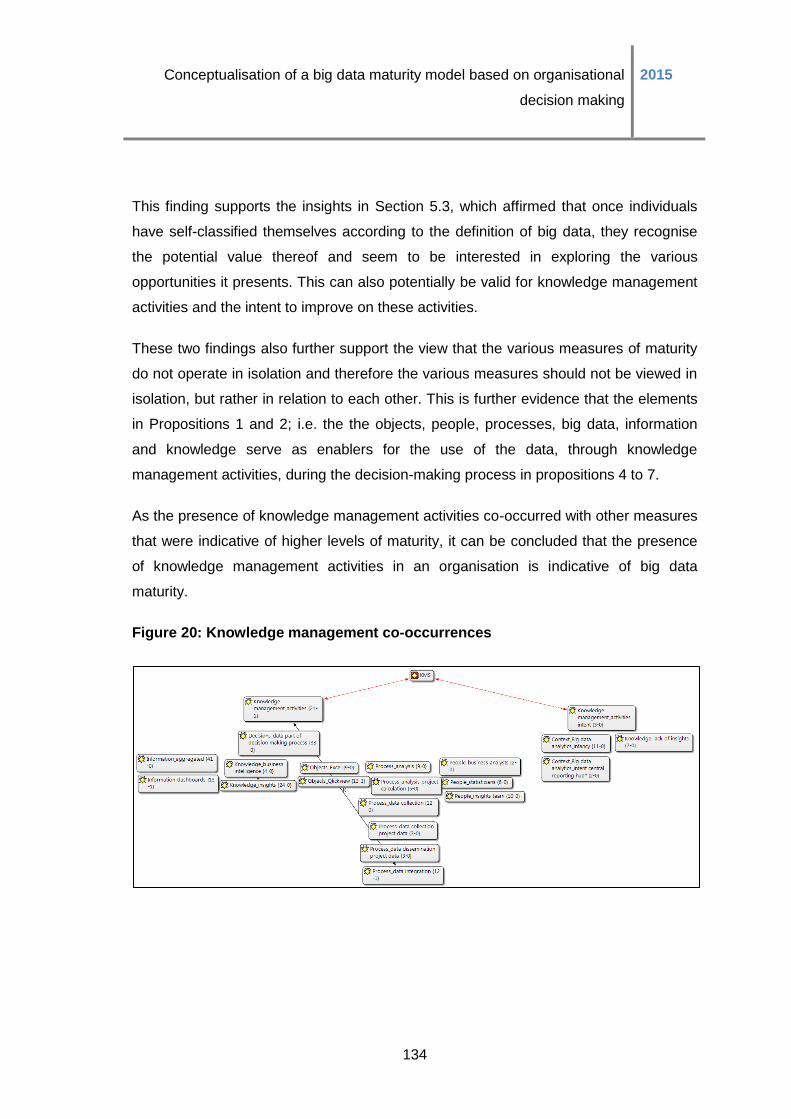
Conceptualisation of a big data maturity model based on organisational
decision making
2015
134
This finding supports the insights in Section 5.3, which affirmed that once individuals
have self-classified themselves according to the definition of big data, they recognise
the potential value thereof and seem to be interested in exploring the various
opportunities it presents. This can also potentially be valid for knowledge management
activities and the intent to improve on these activities.
These two findings also further support the view that the various measures of maturity
do not operate in isolation and therefore the various measures should not be viewed in
isolation, but rather in relation to each other. This is further evidence that the elements
in Propositions 1 and 2; i.e. the the objects, people, processes, big data, information
and knowledge serve as enablers for the use of the data, through knowledge
management activities, during the decision-making process in propositions 4 to 7.
As the presence of knowledge management activities co-occurred with other measures
that were indicative of higher levels of maturity, it can be concluded that the presence
of knowledge management activities in an organisation is indicative of big data
maturity.
Figure 20: Knowledge management co-occurrences
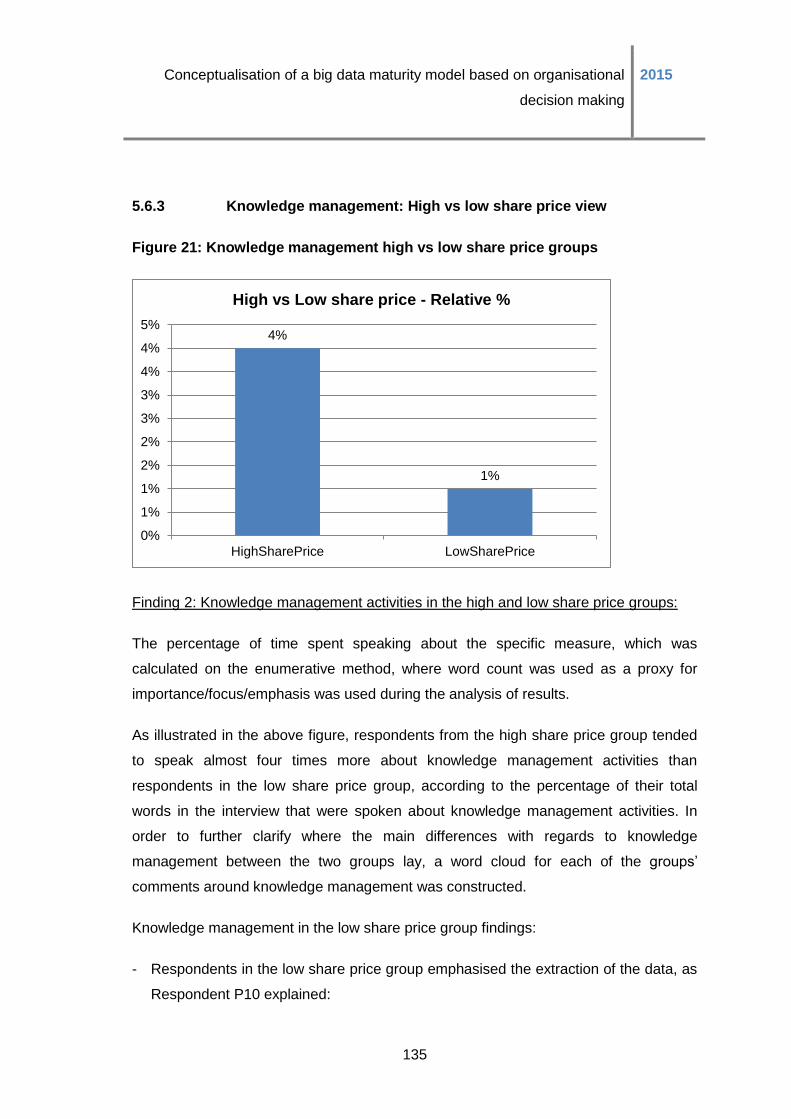
Conceptualisation of a big data maturity model based on organisational
decision making
2015
135
5.6.3 Knowledge management: High vs low share price view
Figure 21: Knowledge management high vs low share price groups
Finding 2: Knowledge management activities in the high and low share price groups:
The percentage of time spent speaking about the specific measure, which was
calculated on the enumerative method, where word count was used as a proxy for
importance/focus/emphasis was used during the analysis of results.
As illustrated in the above figure, respondents from the high share price group tended
to speak almost four times more about knowledge management activities than
respondents in the low share price group, according to the percentage of their total
words in the interview that were spoken about knowledge management activities. In
order to further clarify where the main differences with regards to knowledge
management between the two groups lay, a word cloud for each of the groups’
comments around knowledge management was constructed.
Knowledge management in the low share price group findings:
- Respondents in the low share price group emphasised the extraction of the data, as
Respondent P10 explained:
4%
1%
0%
1%
1%
2%
2%
3%
3%
4%
4%
5%
HighSharePrice LowSharePrice
High vs Low share price - Relative %
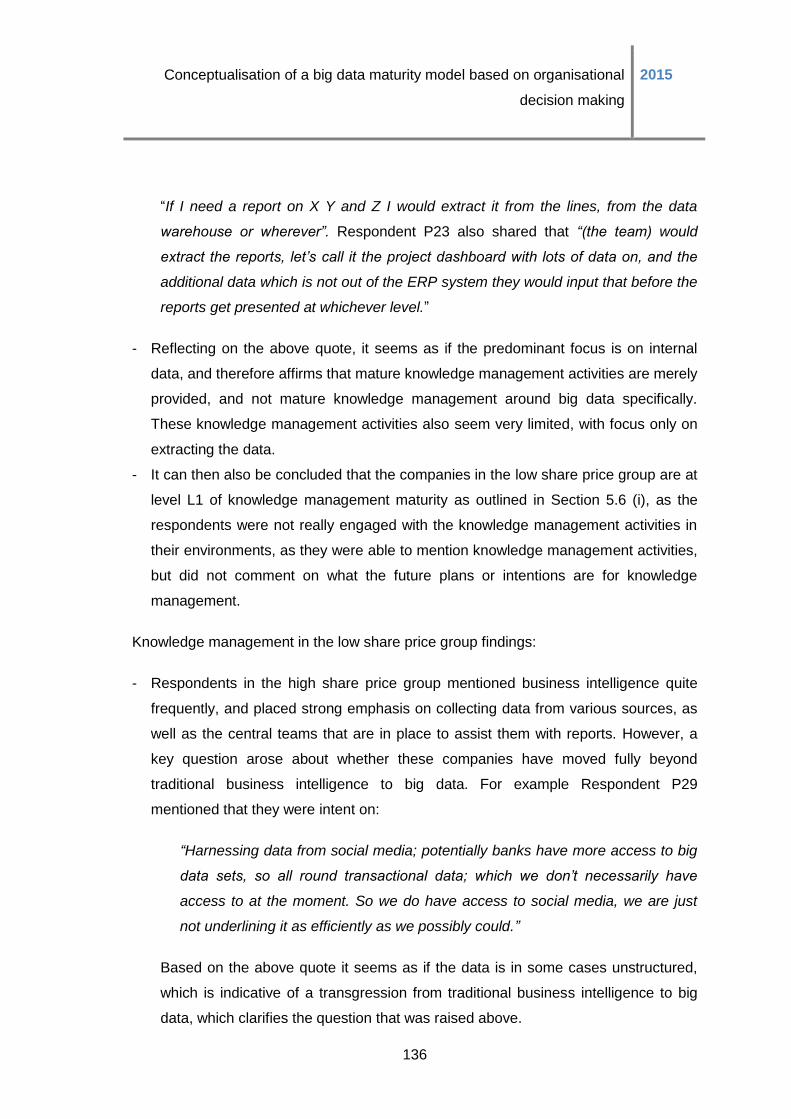
Conceptualisation of a big data maturity model based on organisational
decision making
2015
136
“If I need a report on X Y and Z I would extract it from the lines, from the data
warehouse or wherever”. Respondent P23 also shared that “(the team) would
extract the reports, let’s call it the project dashboard with lots of data on, and the
additional data which is not out of the ERP system they would input that before the
reports get presented at whichever level.”
- Reflecting on the above quote, it seems as if the predominant focus is on internal
data, and therefore affirms that mature knowledge management activities are merely
provided, and not mature knowledge management around big data specifically.
These knowledge management activities also seem very limited, with focus only on
extracting the data.
- It can then also be concluded that the companies in the low share price group are at
level L1 of knowledge management maturity as outlined in Section 5.6 (i), as the
respondents were not really engaged with the knowledge management activities in
their environments, as they were able to mention knowledge management activities,
but did not comment on what the future plans or intentions are for knowledge
management.
Knowledge management in the low share price group findings:
- Respondents in the high share price group mentioned business intelligence quite
frequently, and placed strong emphasis on collecting data from various sources, as
well as the central teams that are in place to assist them with reports. However, a
key question arose about whether these companies have moved fully beyond
traditional business intelligence to big data. For example Respondent P29
mentioned that they were intent on:
“Harnessing data from social media; potentially banks have more access to big
data sets, so all round transactional data; which we don’t necessarily have
access to at the moment. So we do have access to social media, we are just
not underlining it as efficiently as we possibly could.”
Based on the above quote it seems as if the data is in some cases unstructured,
which is indicative of a transgression from traditional business intelligence to big
data, which clarifies the question that was raised above.
Conceptualisation of a big data maturity model based on organisational
decision making
2015
137
- One of the possible reasons can be that these organisations already have the
required systems and processes in place, and therefore knowledge management
systems are easier for them compared to the low share price group, who are still
focused on basic data extraction. Respondent P4 referred to “business intelligence
networks, both externally subscribed to and then internal” being present in his
environment, whilst another respondent in the banking explained that “pulling
together of data sources is a lot easier in (their) environment.”
- These comments correlate strongly with those made by the same respondents when
the objects, people and processes focusses in their environments were examined,
and therefore it seems as if all of these needs to be in place in order for knowledge
management activities to be enabled in those environments.
- Based on these findings, it seems as if the companies in the high share price groups
are at level L2 of knowledge management maturity as outlined in Section 5.6 (i), as
the respondents were vey engaged with the knowledge management activities in
their environments, to the extent that they were able to share future intentions
around these activities.
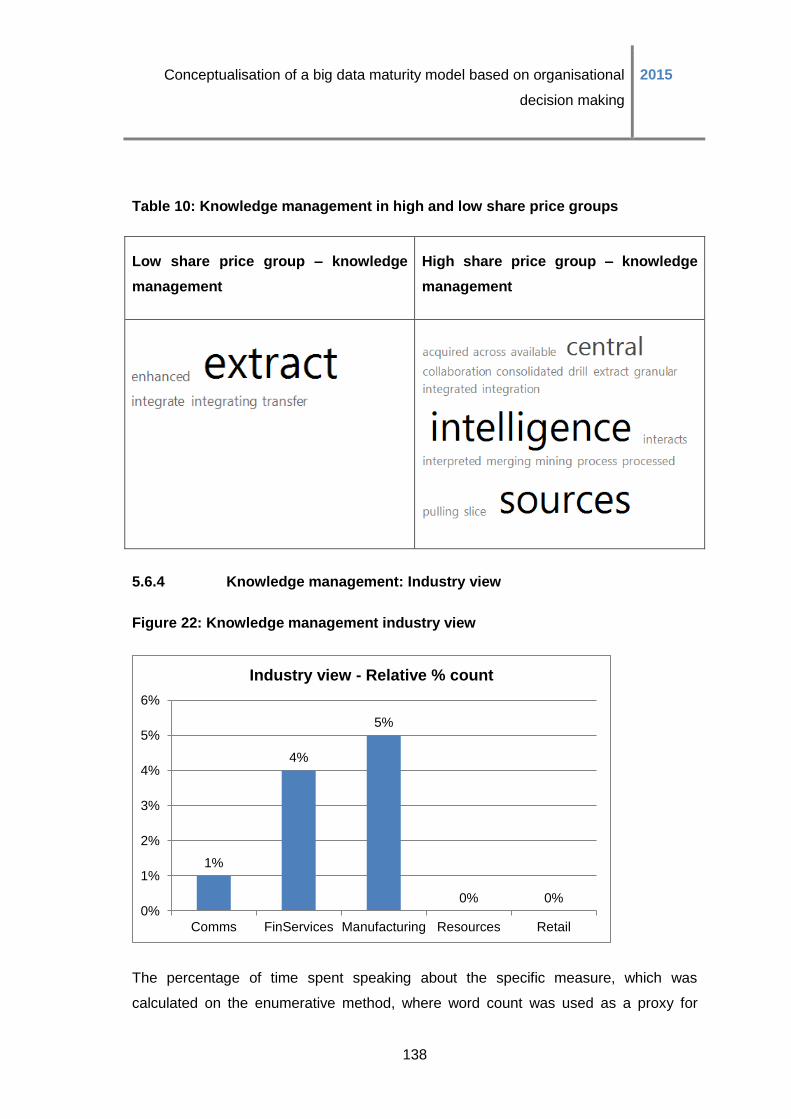
Conceptualisation of a big data maturity model based on organisational
decision making
2015
138
Table 10: Knowledge management in high and low share price groups
Low share price group – knowledge
management
High share price group – knowledge
management
5.6.4 Knowledge management: Industry view
Figure 22: Knowledge management industry view
The percentage of time spent speaking about the specific measure, which was
calculated on the enumerative method, where word count was used as a proxy for
1%
4%
5%
0% 0% 0%
1%
2%
3%
4%
5%
6%
Comms FinServices Manufacturing Resources Retail
Industry view - Relative % count

Conceptualisation of a big data maturity model based on organisational
decision making
2015
139
importance/focus/emphasis was used during the analysis of results.
Finding 3: Differences knowledge management activities in the various industries:
Several nuances concerning knowledge management activities were apparent in
certain industries:
- Massive differences in the amount of time respondents from the various industries
spent talking about knowledge management activities were evident. In general, only
financial services companies seemed to use unstructured data and all appeared to
make use of predominantly descriptive analytics.
- Resources and retail companies seemed to be lagging, as respondents from the
resources and retail sectors did not mention knowledge management activities at all,
and if compared to their objects, people and processes focus they seem to be the
industries that had the least focus on all of them, as outlined in Section 5.3 (vi). This
is therefore indicative of lower levels of maturity and engagement with the
knowledge management initiatives in those environments.
- Respondents from communications and media spent very little time; i.e. only 1% of
the time, talking about knowledge management activities, and then only to share
their intent of improving at it. For example Respondent P9 shared that they aim to
start “integrating the other customer sources” more in the future.
- Manufacturing seemed to be leading, followed closely be financial services.
Respondents from both manufacturing and financial services mentioned knowledge
management activities frequently, as 5% of the total words spoken by respondents
from manufacturing and 4% of the total words spoken by respondents from financial
services referred to knowledge management activities in their environments.
As outlined in Section 5.6 (i), it is not only the mere presence of knowledge
management activities in itself that is indicative of big data maturity, but that the
specific nuances of the various levels of engagement with the knowledge management
activities that provides a more detailed view of the big data maturity according to this
measure. In order to better understand the nuances of the depth of engagement with
knowledge management activities in both manufacturing and financial services, word
clouds of these knowledge management mentions were constructed for both industries.
Conceptualisation of a big data maturity model based on organisational
decision making
2015
140
Knowledge management in financial services findings:
- Respondents from financial services mentioned the central data warehouse quite
frequently, and also emphasised the important role that the various channels play in
data collection.
- The extensive channel and branch network footprint, as well as its massive
contribution to data collection is unique to the banking environment, which enables
knowledge management activities in financial services. As Respondent P6
explained:
“So the data basically goes from channel effectively, branch or something
similar through to a data warehouse, and that central data warehouse then
pushes the data to where ever it needs to go.”
- These findings are also consistent with the strong focus on data warehouses and
infrastructures as outlined in Section 5.3 (vi) and therefore the central warehouses
greatly facilitates the knowledge management system internally in these financial
services organisations.
- Further evidence was then also provided by several of the respondents from
financial services that these knowledge management activities are specific to big
data and not merely traditional business intelligence and knowledge management.
For example Respondent P2 commented:
“Big data sits in [company] purely in the data science team. They have the
mandate to do that and at the moment it is really driven purely as a social
media analytics.”
Respondent P7 shared that the company has “got a foot in the water” in terms of big
data analytics. Based on these quotes it seems relatively apparent that the
knowledge management activities in these environments would be focused on big
data, based on the evidence provided of the strong focus on big data analytics in
these companies. One possible reason for this could be the strong focus on
innovation in the financial services sector in South Africa; however it is important to
note that these companies have a long way to go before they could be said to be
mature.
Conceptualisation of a big data maturity model based on organisational
decision making
2015
141
- When the above findings are interpreted using the detailed knowledge management
maturity levels as outlined in Section 5.6 (i), it can be concluded that the companies
in financial services are at level L1 of knowledge management maturity, as these
respondents were not that engaged with the knowledge management activities in
their organisations, as they were able to mention a few activities but did not share
any future plans or intentions around these activities.
Knowledge management manufacturing findings:
- During the interviews with respondents from manufacturing companies, insights,
intelligence, projects and systems seemed to be quite topical as these various
elements seemed to have created the perfect environment in which knowledge
management activities are enabled.
- For example Respondent P27 explained:
“One of the most important things for our analysts is that they can read the data
whatever from it comes in and be able to pull insights out of that data.”
Whilst respondent P29 shared that they have a “central team, that I once was part of
called retail intelligence”. Respondent P23 also shared that:
“[The teams] would extract the reports; let’s call it the project dashboard with lots of
data on, and the additional data which is not out of the ERP system they would
input that before the reports get presented at whichever level”.
- Reflecting on the above, it seems as if manufacturing companies are at level L1 of
knowledge management maturity, as the respondents were able to mention a few
knowledge management activities but not really comment on their future plans
around these activities, which suggests low levels of engagement with the
knowledge management activities.
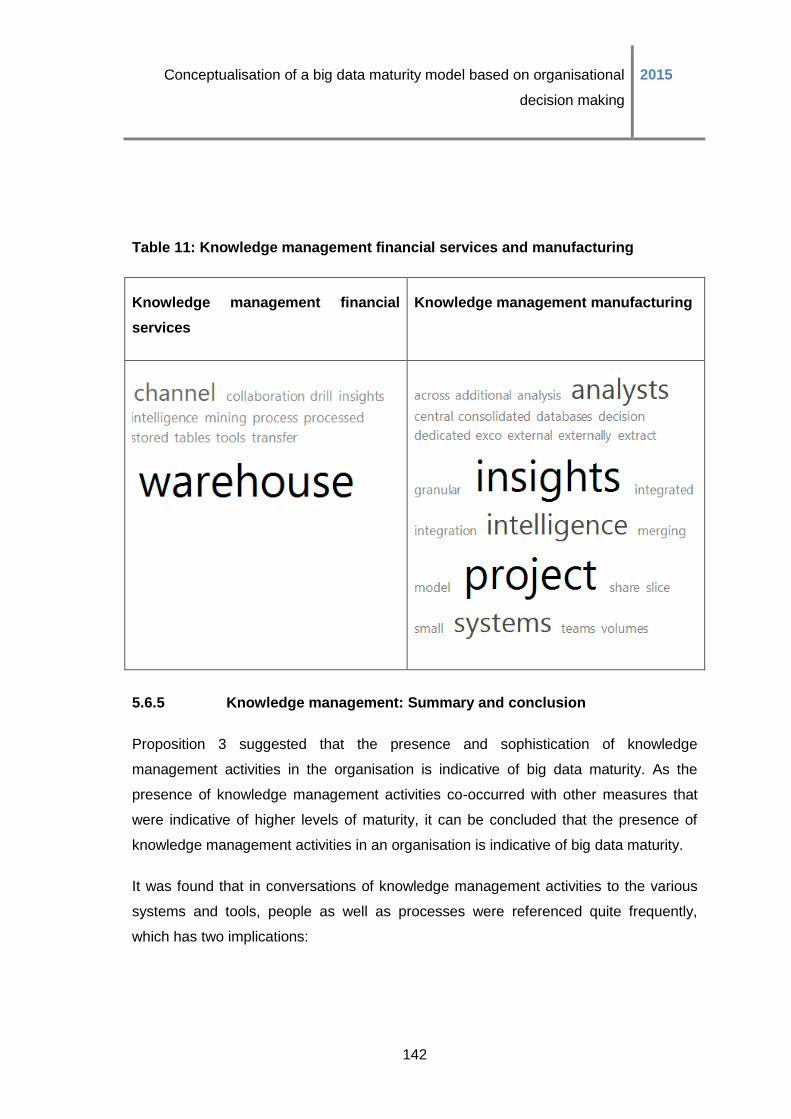
Conceptualisation of a big data maturity model based on organisational
decision making
2015
142
Table 11: Knowledge management financial services and manufacturing
Knowledge management financial
services
Knowledge management manufacturing
5.6.5 Knowledge management: Summary and conclusion
Proposition 3 suggested that the presence and sophistication of knowledge
management activities in the organisation is indicative of big data maturity. As the
presence of knowledge management activities co-occurred with other measures that
were indicative of higher levels of maturity, it can be concluded that the presence of
knowledge management activities in an organisation is indicative of big data maturity.
It was found that in conversations of knowledge management activities to the various
systems and tools, people as well as processes were referenced quite frequently,
which has two implications:
Conceptualisation of a big data maturity model based on organisational
decision making
2015
143
- It seemed that objects, people and processes acted as an enabler for knowledge
management activities. This view is also further supported by strong co-occurrences
of these measures.
- The various measures of maturity do not operate independently, and therefore the
various measures should not be viewed in isolation, but in relation to each other.
Additionally, based on the findings in Section 5.6 (i), it is clear that specific nuances
exist of the respondents’ engagement with the various knowledge management
activities in their organisations. These nuances can be used as the indication for the
sophistication of knowledge management activities. Thus, it can be concluded that
knowledge management activities in itself is not indicative of big data maturity, but that
the depth of engagement of executives with knowledge management activities can be
used as a more accurate measure of big data maturity.
It is therefore recommended that the various levels of maturity concerning the
engagement with knowledge management activities be considered:
- L1: Low levels of engagement with knowledge management activities in the
organisation, as individuals were able to mention knowledge management activities,
but did not really comment on the future plans or intentions regarding knowledge
management.
- L2: Individuals are very engaged with the knowledge management activities in their
organisations, as they were able to share future plans and intentions concerning the
knowledge management activities.
Proposition 3 also proposed that the absence of such activities is indicative of an
immature organisation, and the presence of such activities is indicative of a higher level
of maturity, placed somewhere in the middle of the maturity continuum. Should
knowledge management activities be present and highly sophisticated, it is indicative of
the highest level of maturity of big data analytics in the organisation. Based on the
findings, it is suggested that the level of engagement outlined as above, be used as an
indicator of the level of sophistication of the various knowledge management activities.
Therefore, the specific nuances concerning the depth of engagement knowledge
management activities as outlined above provides a more accurate indication of big
Conceptualisation of a big data maturity model based on organisational
decision making
2015
144
data maturity.
The following nuances of the depth of engagement with knowledge management
activities were found between the high and low share price groups:
- Respondents from the high share price group tended to speak almost four times
more about knowledge management activities than respondents in the low share
price group, and mentioned business intelligence, the collection of data from various
sources, as well as the central teams that are in place to assist them with reports.
One of the possible reasons can be that the organisations from the high share price
groups already have the required systems and processes in place, and therefore
knowledge management systems are easier for them compared to the low share
price group, who are still focused on basic data extraction. These comments
correlate strongly with those made by the same respondents when the objects,
people and processes focusses in their environments were examined, and therefore
it seems as if all of these needs to be in place in order for knowledge management
activities to be enabled in those environments. It was therefore concluded that the
companies in the high share price groups are at level L2 of knowledge management
maturity as outlined in Section 5.6 (i), as the respondents were very engaged with
the knowledge management activities in their environments, to the extent that they
were able to share future intentions around these activities.
- Respondents in the low share price group spoke much less about knowledge
management activities, and where they did, they mentioned only the extraction of
the data. It seemed as if the predominant focus is on internal data, and therefore
evidence of mature knowledge management activities are merely provided, and this
does not denote mature knowledge management around big data specifically.
These knowledge management activities also seem very limited, with focus only on
extracting the data. It was then also concluded that the companies in the low share
price group are at level L1 of knowledge management maturity, as the respondents
were not really engaged with the knowledge management activities in their
environments, as they were able to mention knowledge management activities, but
did not comment on the future plans or intentions of knowledge management.
Conceptualisation of a big data maturity model based on organisational
decision making
2015
145
An interesting observation was that, in cases where “knowledge” was prevalent, other
signals of mature big data efforts were apparent. The conclusion therefore is that the
mere presence of data, information and knowledge in organisations alone cannot
guarantee that the organisation’s big data analytical efforts are mature, as it is the use
of the data, information, and knowledge during decision making that really impacts the
derived value from it. This provides further evidence that this specific measure of
maturity (data, information, knowledge) should be viewed alongside all the other
measures of maturity.
It was also found that the different levels of engagement with knowledge management
seemed to be consistent with the various levels of engagement with knowledge as
identified in Section 5.5 (iii). There was also an interesting similarity to the “appetite” for
big data as mentioned in Section 5.3, and therefore it seems that potential linkages
between knowledge management intent and self-classification, appetite and
commercialisation can occur; where once individuals have self-classified themselves
according to the definition of big data, they recognise the potential value thereof and
seem to be interested in exploring the various opportunities it presents. This can also
potentially hold true for knowledge management activities and the intent to improve on
these activities.
In conclusion, in order to answer Proposition 3, it seemed as if the presence and
sophistication of knowledge management activities can be used as be a valid measure
of big data maturity. However, the results also strongly suggested that the mere
presence of knowledge management activities could not be taken at face value as a
signal of maturity, and that the detailed nuances in terms of the engagement with the
knowledge management activities, which can be used as an indication of the
sophistication of these activities, must be investigated to provide a more detailed and
accurate view of big data maturity. It was also found that knowledge management as a
dimension is closely related to the object, people, processes, data, information and
knowledge and that knowledge management intent seemed to be related to self-
classification, appetite and commercialisation. Therefore, it is concluded that this
dimension of maturity should not be viewed in isolation, but in relation to the other
measures of maturity.
Conceptualisation of a big data maturity model based on organisational
decision making
2015
146
5.7 Propositions 4-7: Use of data during decision
making
In this section, Propositions 4 to 7 have been packaged together, as they all relate to
the use of big data during the various steps in the decision-making process, which,
during the interviews, respondents referred to as one process and not necessarily the
distinct steps. As an example Respondent P12 explained:
“The data is pretty factual and when it is factual then you are able to make decisive
decisions. In our environment you are talking dimensions – height, width, length,
weight – and with all of those elements if the spec sheet says this machine is 70
tons and all of a sudden when you offload it, it is actually 80 tons, you have ordered
a vehicle for 70 so the decision is pretty simple: you only have a permit to move 70.
Change permit, change vehicle, and there is a time delay until that is available.”
Reflecting on the above quote, it seems as if the focus is predominantly on regular
data, and not necessarily big data. This further provides evidence that not all
organisations are equally mature when it comes to their big data efforts.
Propositions 4 to 7 are stated below for clarity:
- Proposition 4 relates to the identification of the decision context, irrespective of
whether the context has been correctly or incorrectly interpreted.
- Proposition 5 relates to the correct interpretation of the decision context.
- Proposition 6 relates to the identification of information requirements based on the
decision context.
- Proposition 7 relates to the ability to present the correct information to the decision
maker based on the decision context.
In the following sections the coding rationale for each of the propositions is discussed,
where after the detailed findings are presented.
Conceptualisation of a big data maturity model based on organisational
decision making
2015
147
5.7.1 Use of data during decision making definitions and coding
Proposition 4: Identification of the decision context coding
Proposition 4 proposed that the ability of decision makers within an organisation to
initially interpret the decision complexity, before information gathering commences, can
be interpreted as a signal of maturity. An immature organisation would skip this first
step and proceed to gather information without determining the decision context and
complexity, whereas in a mature organisation the decision context and complexity is
investigated and identified along the continuum of routine to complex decisions upfront,
before information gathering commences.
The relevant code that has been identified for Proposition 4 is “id decision context”, and
any reference that respondents made to the decision context was coded accordingly.
One example of a comment from a respondent that was coded under this code would
be this statement from Respondent P17 from a resourcing company:
“The complexity…gets a lot higher when you go down so at the top you will basically
see a dashboard with maybe one or two variables, but if you go to operational or
tactical you will have dashboards with 16 variables on there or whatever the case
might be but it is way more specific to that thing, to that specific environment.”
Reflecting on the above quote, the varying complexity at various levels in the
organisation suggests that lower down more data exists that needs to be managed.
The full code book is available in Appendice 7.
Proposition 5: Correct interpretation of the decision context coding
Proposition 5 proposed that, in order to ascertain an organisation’s big data maturity
concerning the use of big data during organisational decision making, not only the
identification of the decision context is important, but also the ability to interpret the
decision context and complexity correctly. It can therefore be inferred that the ability to
correctly interpret the decision context and complexity can be indicative of maturity.
Thus an organisation can only be viewed as mature if they have succeeded in correctly
interpreting the decision context and complexity. Should an organisation interpret the
Conceptualisation of a big data maturity model based on organisational
decision making
2015
148
decision context and complexity incorrectly (for example a complex situation would be
viewed as a simple, routine decision situation or a vice versa), it will be viewed as
immature (thus the presence of this step alone is not an indication of maturity).
The code “correctly id decision context” has been created for Proposition 5, and
included any mention of the decision context being correctly identified coded
accordingly. For example a comment such as the one made by Respondent P20, from
the retail sector, was coded accordingly:
“With the board you’ve got to draw a line. You can’t give too much information
and you can’t give too little information. So there is a middle ground there.”
Proposition 6: Identification of information requirements based on the decision context
coding
Proposition 6 proposed that the ability of an organisation to correctly identify the
information requirements based on the decision context can be interpreted as a signal
of maturity. It is thus proposed that immature organisations are unable to correctly
identify the information requirements, and in mature organisations the information
requirements are correctly identified based on the decision context.
The following themes were identified and codes created for Proposition 6:
(1) Where respondents provided examples of simply analysing the information for
the sake of it, without even having a decision in mind would be coded under the
“info irrespective of problem or context” code. For example the statement by
Respondent P8 from a retail company was categorised in this code:
“We always spread the net as wide as possible, get the info, analyse it
and then come up with the decision.”
Remarks about the data being interrogated but without any mention being made
of the problem at hand were coded under the “focus on explaining the data”
code. These remarks provided evidence that respondents were unable to
identify the information requirements based on the decision context, as no
mention was made of the decision context. Conversely, they rather seemed to
focus on explaining the data that they do have, with total disregard for the
Conceptualisation of a big data maturity model based on organisational
decision making
2015
149
context of the decision at hand. For example, the comment by Respondent P28
from financial services relates to this code:
“So we will have a look at [the reports] on a monthly basis. Understand the
demographics, the profile, the segmentation of those clients; look at it per product
range; per bank; per age group- all of that sort of stuff. So we dissect that to quite a
granular level. And then obviously the interventions will be then to have a look at
that data set and see why it is out of sync with history- increased or decreased, that
sort of thing”
(2) Some respondents referred to decision makers spending significant time on
explaining the data, and then specifically mentioned that the opportunity cost of this is
that the problems do not necessarily get solved. These comments would be coded
under the “focus on explaining the data not solving the problem” code. This remark
from Respondent P4 from a manufacturing company was therefore categorised under
this code:
“You spend all your time managing and presenting and explaining data and
variances and discrepancies, and not as much time as you really should sorting
the problem out.”
Based on this quote it appears that the majority of the time is spent on managing the
data instead of focuses on the problem, which relates to the decision context
identification in Propositions 4 and 5.
(3) In some cases the information requirements seemed to be based on the decision
maker’s experience and not necessarily on the decision context. For example, during
one interview Respondent P24 from a resources company commented “a lot of it has
to do with engineering expertise” when explaining how the information requirements
are determined in his environment. These mentions were coded under the “info
requirements based on experience” code.
(4) Specific mentions or acknowledgements that specific problems exist and that the
information requirements depend on the problem were coded under the “info depends
on the type of problem” code. One example of such a mention that was categorised
Conceptualisation of a big data maturity model based on organisational
decision making
2015
150
under this code is the comment from Respondent P3 from retail, who stated “it
depends on the type of problem”.
The full code book is available for review in Appendice 7.
Proposition 7: The ability to present the correct information based on the decision
context coding
Proposition 7 proposed that, during the consideration of alternatives step in the
decision making process, the availability of the “right” information based on the
decision context can also be used as a signal of maturity. Therefore, even if an
organisation was able to correctly identify the information requirements based on the
decision context (Proposition 6), the relevant information would need to be extracted
and presented to the decision maker. Failure to do so would result in the organisation
being deemed as immature on this specific dimension.
The following themes and codes have been identified for Proposition 7:
(1) Mentions of data not being available when required and therefore being
reactively collected were coded under the “reactive data analytics” code. For
example the comment from respondent P7 from financial services was
categorised under this code:
“We have very often put data and measurement and analytics at the end
of a project and we try and lob it on after the engine is built, which is too
late.”
(2) Some respondents also acknowledged that they do not necessarily always
have the right information available, and these comments would be coded
under “the right info not always present” code. As an example, the comment
from Respondent P13 from financial services was categorised under this code:
“There is always something that falls through the cracks in terms of we didn’t
think to measure it.”
(3) References to the solution of problems being based on intuition would be
coded under the “resolution intuition” code. As an example, Respondent P6
from financial services’ comment was classified under this code:
Conceptualisation of a big data maturity model based on organisational
decision making
2015
151
“I think data plays quite a big role, in that the business is driven by
management reporting. This is driven by data, so data plays a big role in
the identification and prioritisation of issues. And the resolving of issues,
historically, I’d say it was driven more by management.”
(4) Some respondents referred to the use of data during the prioritisation of issues,
which would then be coded under the “priority based on data” code. One such
example of a remark came from Respondent P9 in financial services:
“A lot of activities are now being prioritised under that programme….
[Prioritisation] is based on a couple of things. It is based on churn risk. It is
based on number of customers that have potentially impacted. It is also
based on ease to rectify as well as cost to rectify. It is a fairly complex thing
that you will look at in terms of what are your different variables versus
what gets prioritised.”
(5) In some cases respondents shared that, after the solution was implemented,
there was no feedback loop. These comments, like the statement from
Respondent P9 from a telecommunications company were codedunder the “no
feedback loop after solutions” code:
“We are very good at identifying the problem and all the ins and outs of the
problem to come up with the solution, but often the close loop has been
missing. We will put the solution in place or the fix in place and then we just
leave it and move onto the next problem.”
(6) General comments about the right information being presented were coded as
“present right info”. For example Respondent P3 from a retail company shared
an example which was coded under this code:
“Let’s say it is a meat-related issue, then it will go to our meat markets
manager, our national meat markets manager; if it is a point of sale issue or
something to do with our systems it will be channelled to the right
department to handle that query. If it is a product issue, buyers would be
alerted; if it is about stock availability also buyers would be alerted to that.”
Conceptualisation of a big data maturity model based on organisational
decision making
2015
152
Mentions around data being proactively collected, such as this comment from
Respondent P18 from manufacturing: “we get to be proactive with the data as well”
were coded under the “proactive data analytics” code. These mentions almost
suggest that respondents were able to proactively anticipate what the “right”
information was for future decisions, and thus a move from reactive and descriptive to
predictive and prescriptive analytics is evident.
The full codebook is available in Appendice 7.
Reflecting on the above code groups as identified under Propositions 4 to 7, it is
evident that superficial evidence of the decision context being analysed, information
requirements identified based on the context and the right information being presented
based on the context in itself is not indicative of maturity, and the specific nuances of
each of these steps must be clarified for a more accurate and detailed view of big data
maturity to be formed. These nuances seem to indicate a clear continuum from sorting
the data, management of the data and then the use of data during problem solving.
The various code groups were therefore synthesised into four distinct maturity levels
based on the use of big data during organisational decision making, which provides a
more detailed and accurate view of maturity based on these dimensions:
- L1: At this level, individuals are focused on gathering as much information as
possible irrespective of the context, or they would be focused on explaining the data
that they do have, with total disregard for the context of the decision at hand. There
is very little sorting of data that occurs at this level, and where sorting of data is
evident; it is predominantly done reactively.
- L2: Individuals to a limited extent understand the decision context, and therefore
some sorting and management the data happens, in most cases the information that
is being presented is based on experience or intuition.
- L3: Individuals have fully engaged with the decision context, to the extent that the
information that is being presented is entirely determined by the specific problem or
decision at hand, and decision makers use the data accordingly as input into the
decision. However, there is no feedback loop after the decision has been made.
- L4: The information requirements are entirely determined by the specific problem or
decision at hand, and decision makers use the data accordingly as input into the
decision. A full feedback loop using data to assess the outcome of the decision is
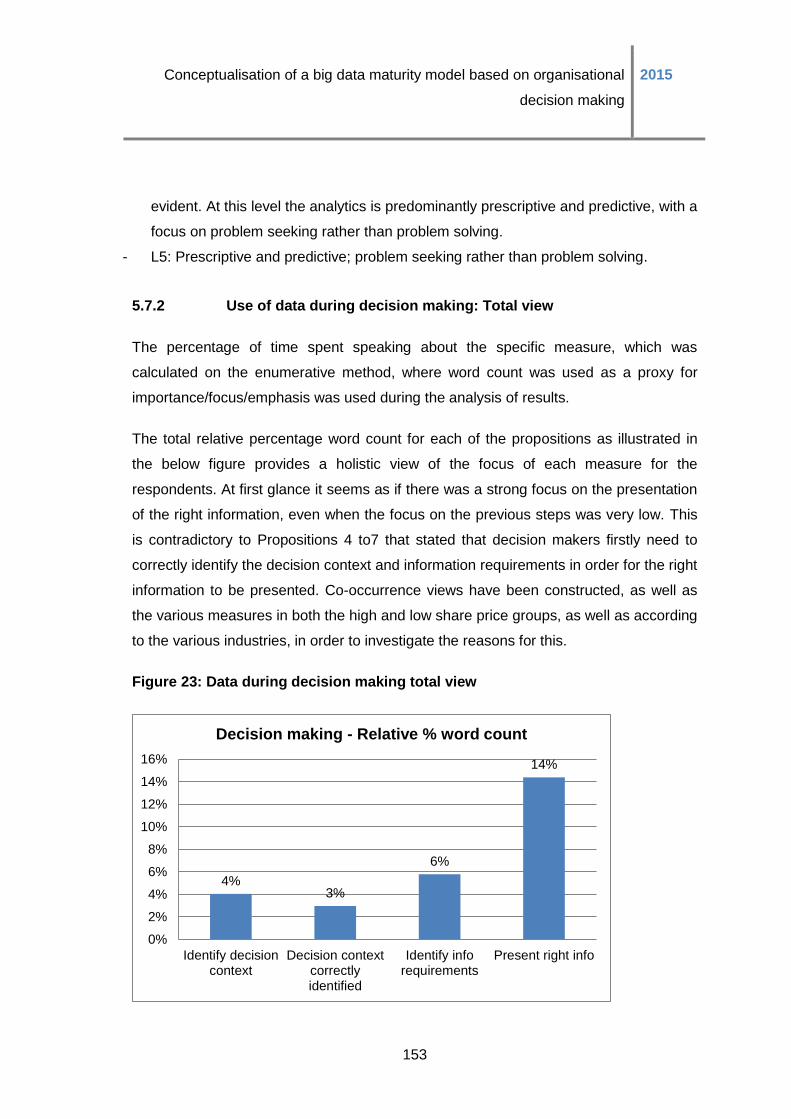
Conceptualisation of a big data maturity model based on organisational
decision making
2015
153
evident. At this level the analytics is predominantly prescriptive and predictive, with a
focus on problem seeking rather than problem solving.
- L5: Prescriptive and predictive; problem seeking rather than problem solving.
5.7.2 Use of data during decision making: Total view
The percentage of time spent speaking about the specific measure, which was
calculated on the enumerative method, where word count was used as a proxy for
importance/focus/emphasis was used during the analysis of results.
The total relative percentage word count for each of the propositions as illustrated in
the below figure provides a holistic view of the focus of each measure for the
respondents. At first glance it seems as if there was a strong focus on the presentation
of the right information, even when the focus on the previous steps was very low. This
is contradictory to Propositions 4 to7 that stated that decision makers firstly need to
correctly identify the decision context and information requirements in order for the right
information to be presented. Co-occurrence views have been constructed, as well as
the various measures in both the high and low share price groups, as well as according
to the various industries, in order to investigate the reasons for this.
Figure 23: Data during decision making total view
4% 3%
6%
14%
0%
2%
4%
6%
8%
10%
12%
14%
16%
Identify decisioncontext
Decision contextcorrectlyidentified
Identify inforequirements
Present right info
Decision making - Relative % word count
Conceptualisation of a big data maturity model based on organisational
decision making
2015
154
In order to further unpack each of these measures of maturity, co-occurrence views
were constructed for each of the codes related to Propositions 4 to 7, as illustrated in
Figure 24:
- (A) Proposition 4: Identification of the decision context
- (B) Proposition 5: Correct identification of the decision context
- (C) Proposition 6: Identification of the information requirements
- (D) Proposition 7: Presentation of the right information.
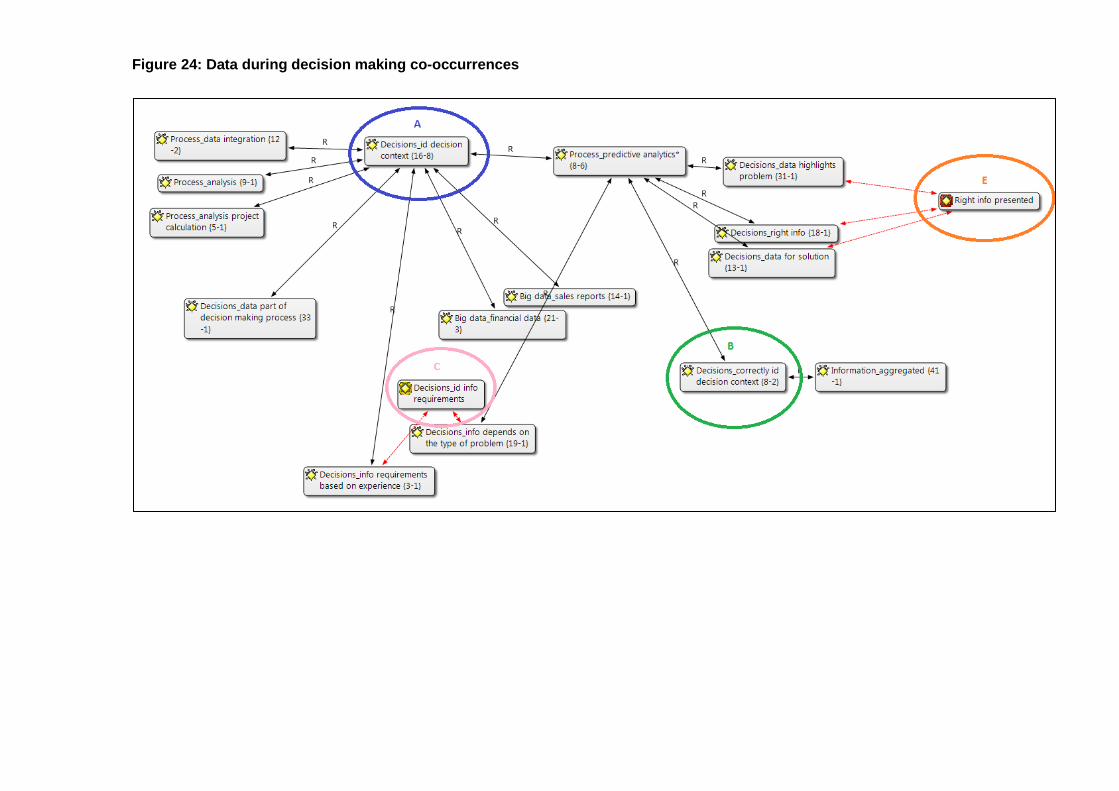
Figure 24: Data during decision making co-occurrences
Co-occurrence of codes with identification of decision context code:
Four distinct co-occurrence themes emerged from the identification of the decision
context (highlighted in blue with “A” on Figure 24):
- Co-occurrence with process-related codes such as analysis and data integration.
- Co-occurrence with other decision-related codes such as data being part of the
decision making process, but information requirements being based on experience.
- Co-occurrence with predictive analytics, which then co-occurred with other decision-
making-related codes such as the correct identification of the decision context, data
highlighting the problem, information depending on the type of problem, the right
information being presented as well as data being used for the solution.
Co-occurrence of codes with the correct identification of decision context code:
The “correct identification of decision context code” only co-occurred with aggregated
information as well as the predictive analytics code (highlighted in green with “B” on
Figure 24).
Co-occurrence of codes with identification of information requirements code:
The identification of information requirements, highlighted in pink with “C” on Figure 24
co-occurred with information depending on the type of problem, as well as information
requirements being based on experience. The information requirements based on
experience code then co-occurred again with the identification of the decision context.
Co-occurrence of codes with the presentation of the right information code:
The right information codes co-occurred with predictive analytics, as (highlighted in
orange with “E” on Figure 24).
In summary, it seems as if when predictive analytics occurs, the decision context is
identified, and when correctly identified, information requirements are determined and
the right information is presented. A possible reason for this might be that, when
predictive analytics occur, the decision makers have an adequate understanding of the
context, information requirements and almost “pre-empted” the right information to be
presented at the time of need. Respondent P9 from telecommunications provides an
example of this:
“Proactively we are very good on the network side in terms of constantly testing
the network, finding where the issues are before customers even experience it.”
The implication of this finding is that perhaps predictive analytics is the most advanced
and therefore it is affirmed as the highest level of maturity in terms of the use of big
Conceptualisation of a big data maturity model based on organisational
decision making
2015
157
data during decision making.
Reflecting on the above, it seems evident that predictive analytics needs to be added
as an additional level of maturity to the maturity levels of the use of big data during
organisational decision making as outlined in Section 5.7 (i). A fifth level has therefore
been added, where predictive analytics is therefore indicative of the highest level of
maturity.
- L1: At this level, individuals are focused on gathering as much information as
possible irrespective of the context, or they would be focused on explaining the data
that they do have, with total disregard for the context of the decision at hand. There
is very little sorting of data that occurs at this level, and where sorting of data is
evident; it is predominantly done reactively.
- L2: Individuals to a limited extent understand the decision context, and therefore
some sorting and management the data happens, in most cases the information that
is being presented is based on experience or intuition.
- L3: Individuals have fully engaged with the decision context, to the extent that the
information that is being presented is entirely determined by the specific problem or
by the decision at hand, and decision makers use the data accordingly as input into
the decision. However, there is no feedback loop after the decision has been made.
- L4: The information requirements are entirely determined by the specific problem or
decision at hand, and decision makers use the data accordingly as input into the
decision. A full feedback loop using data to assess the outcome of the decision is
evident.
- L5: At the highest level of maturity predictive analytics is prevalent, as a full
understanding of the decision context occurs. The right information has been
identified, sorted and is proactively presented, and the outcome of the decision has
also been predicted based on previous decision history. At this level the focus is
also predominantly on problem seeking rather than just solving.
Finding 1: Usefulness of these dimensions as a signal of big data maturity:
On the surface, respondents spent a total of 27% of the interview talking about the use
of data during decision making, of which 4% of the time was spent on identifying the
decision context, and 3% of the time was spent on the decision context being correctly
Conceptualisation of a big data maturity model based on organisational
decision making
2015
158
identified, while 6% was spent on information requirements and 14% was spent on the
importance of presenting the right information. Therefore, it can be tentatively
concluded that the majority of the organisations were relatively mature as there
seemed to be a strong focus on the importance of presenting the right information
during the decision-making process.
However, as outlined previously it is clear that superficial evidence of the decision
context being analysed, information requirements identified based on the context and
the right information being presented based on the context in itself is not indicative of
maturity. The specific nuances of each of these steps need to be clarified to indicate a
clear continuum from sorting the data, management of the data and then the use of
data during problem solving. Some of the nuances concerning the holistic findings are
highlighted below.
Several respondents also acknowledged that one of the most prevalent issues
currently with big data is the use thereof, as Respondent P12 explained:
“So big data analytics, we use a couple of sources for that and for us it is
getting more and more important. Not so much to have data. We have got
tonnes of data in this business. The biggest problem with all this data is nobody
mines the insights. So insights management to me is the biggest advantage
that anyone would have, but then again converting those insights into action.”
This finding relates to the conclusion drawn in Section 5.3, where it was concluded that
the “appetite” for big data was also considered as a signal of maturity, and that it was
indicative of higher levels of maturity, as once individuals have self-classified
themselves according to the definition of big data, they recognise the potential value
thereof and seem to be interested in exploring the various opportunities it presents. A
further logical conclusion would be that organisations who have managed to tap into
these opportunities, in order to commercialise big data in their environments, are
indicative of the highest levels of maturity. The above quote from Respondent P12
seems to provide further evidence of this measure of maturity.
These statements from the respondents further support the view, that, unless big data
is being actively used, it will be difficult to extract the potential value out of it, and that
Conceptualisation of a big data maturity model based on organisational
decision making
2015
159
one of the easiest ways to do so is to use big data during organisational decision
making. It does however seem that general organisations struggle with the use of big
data, as is evident from this statement from Respondent P25:
“Not so much to have data. We have got tons of data in this business. The
biggest problem with all this data is nobody mines the insights. So insights
management to me is the biggest advantage that anyone would have, but then
again converting those insights into action.”
It can therefore be concluded that the use of big data during decision making, as
outlined in Propositions 4 to 7, is a valid and relevant measure of big data maturity,
based on the amount of time respondents spent talking about it, as well as the strong
emphasis they placed on the importance of using big data during decision making in
order to extract value from it. It is important to emphasise though that superficial
evidence of the decision context being analysed, information requirements identified
based on the context and the right information being presented based on the context in
itself are not indicative of maturity. The specific nuances under each of these steps
need to be clarified to indicate a clear continuum from sorting the data, management of
the data and then the use of data during problem solving.
It was found that a strong focus on the presentation of the right information occurred,
even when the focus on the previous steps was very low, and this was contradictory to
the Propositions 4 to 7, which stated that decision makers firstly need to correctly
identify the decision context and information requirements in order for the right
information to be presented. One of the possible reasons for this disparity can be that
several organisations made use of predictive analytics, where the decision context and
information requirements are fairly predictable based on past experiences, and
therefore the right information can easily be presented, without the decision context or
information requirements being considered. Respondent P12 explained:
“An operations entity, it doesn’t matter how big or how complex can, if you do it
right, become very boring and that is actually what you want to get to. Is to say I
want to take the correct data, manipulate it in the correct way, get it monitored
in a certain way that it gets flagged or notifications get sent out when I have to
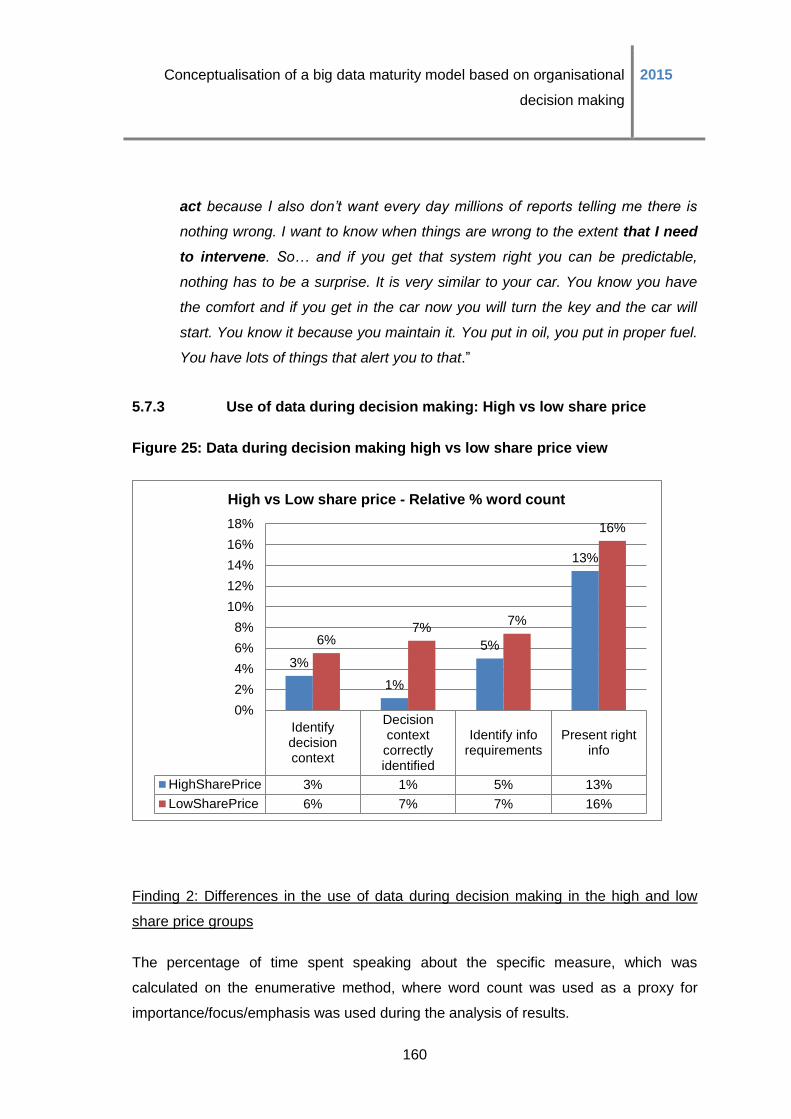
Conceptualisation of a big data maturity model based on organisational
decision making
2015
160
act because I also don’t want every day millions of reports telling me there is
nothing wrong. I want to know when things are wrong to the extent that I need
to intervene. So… and if you get that system right you can be predictable,
nothing has to be a surprise. It is very similar to your car. You know you have
the comfort and if you get in the car now you will turn the key and the car will
start. You know it because you maintain it. You put in oil, you put in proper fuel.
You have lots of things that alert you to that.”
5.7.3 Use of data during decision making: High vs low share price
Figure 25: Data during decision making high vs low share price view
Finding 2: Differences in the use of data during decision making in the high and low
share price groups
The percentage of time spent speaking about the specific measure, which was
calculated on the enumerative method, where word count was used as a proxy for
importance/focus/emphasis was used during the analysis of results.
Identifydecisioncontext
Decisioncontextcorrectlyidentified
Identify inforequirements
Present rightinfo
HighSharePrice 3% 1% 5% 13%
LowSharePrice 6% 7% 7% 16%
3%
1%
5%
13%
6% 7%
7%
16%
0%
2%
4%
6%
8%
10%
12%
14%
16%
18%
High vs Low share price - Relative % word count

Conceptualisation of a big data maturity model based on organisational
decision making
2015
161
Respondents from the low share price group seemed to talk more about each of these
measures, in terms of the relative percentage word count. This finding is contradictory
to previous findings concerning the other measures of maturity where the high share
price group respondents always seemed to dominate the low share price group
respondents’ in terms of the time spent talking about each of the measures. In order to
ascertain the specific nuances in each group, word clouds were constructed for each of
the dimensions, as illustrated in Table 12. A detailed overview of each group has been
provided below to explain the main themes from the respective word clouds.
Table 12: Data in decision making: High vs Low share price cloud words
High share price Low share price
Identify
decision
context
Decision
context
correctly
identified
Identify
information
requirement
s
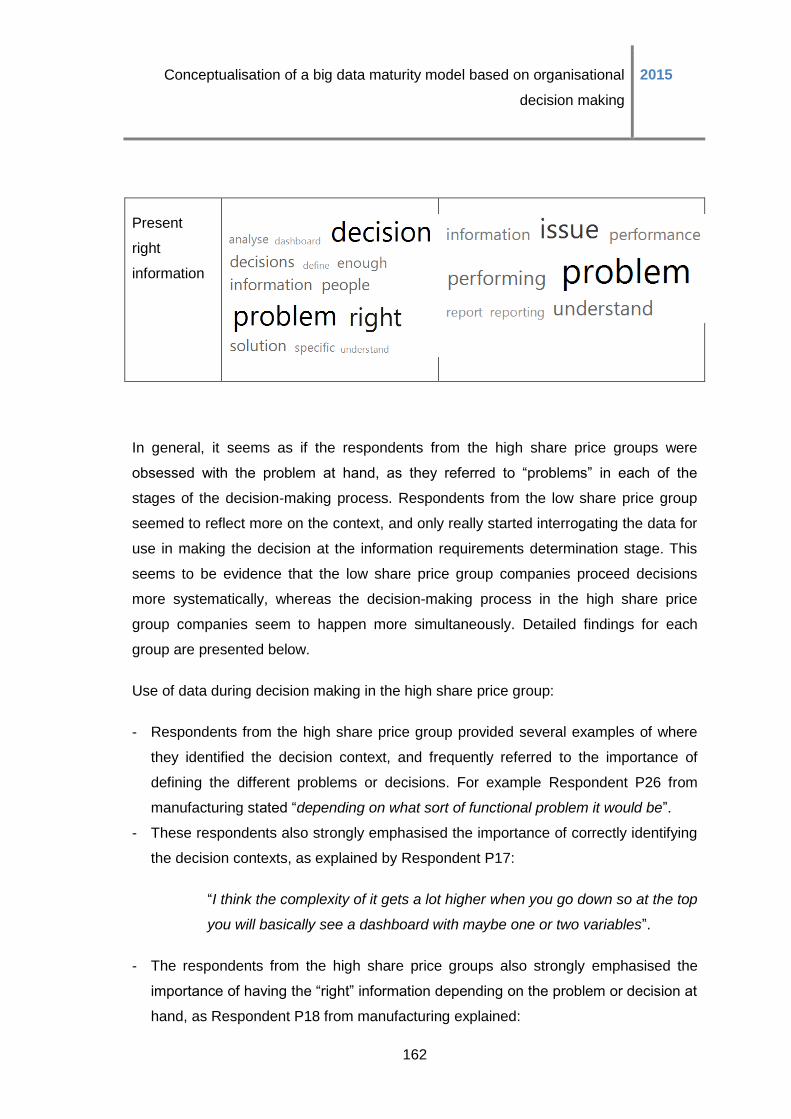
Conceptualisation of a big data maturity model based on organisational
decision making
2015
162
Present
right
information
In general, it seems as if the respondents from the high share price groups were
obsessed with the problem at hand, as they referred to “problems” in each of the
stages of the decision-making process. Respondents from the low share price group
seemed to reflect more on the context, and only really started interrogating the data for
use in making the decision at the information requirements determination stage. This
seems to be evidence that the low share price group companies proceed decisions
more systematically, whereas the decision-making process in the high share price
group companies seem to happen more simultaneously. Detailed findings for each
group are presented below.
Use of data during decision making in the high share price group:
- Respondents from the high share price group provided several examples of where
they identified the decision context, and frequently referred to the importance of
defining the different problems or decisions. For example Respondent P26 from
manufacturing stated “depending on what sort of functional problem it would be”.
- These respondents also strongly emphasised the importance of correctly identifying
the decision contexts, as explained by Respondent P17:
“I think the complexity of it gets a lot higher when you go down so at the top
you will basically see a dashboard with maybe one or two variables”.
- The respondents from the high share price groups also strongly emphasised the
importance of having the “right” information depending on the problem or decision at
hand, as Respondent P18 from manufacturing explained:
Conceptualisation of a big data maturity model based on organisational
decision making
2015
163
“So basically we understand how our volumes are made and what drives
them and availability, - pricing and promotion – and we understand there
are certain levers that we can pull to actually drive those things. So once
we find out from our score card what actually is the issue, we know what
can affect it and what levers we can apply to actually fix it.”
- Reflecting on the above, it seems that companies from the high share price group
are at level L3 of maturity according to the use of data during the decision process,
as the individuals have fully engaged with the decision context, to the extent that the
information that is being presented is entirely determined by the specific problem or
decision at hand, and decision makers use the data accordingly as input into the
decision. However, there is no feedback loop after the decision has been made.
Use of data during decision making in the low share price group:
- Respondents from the low share price group placed an emphasis on “when” a
problem arises it is important to understand “where” exactly it lies. For example
Respondent P16 from retail shared:
“Either the Area Manager himself will go out to see what is happening or
the Rep that is responsible for that store, will go out there and try and see
what the issue is.”
- Respondents from this group also then emphasised the importance of thinking about
the types of information, as well as the importance of the right information to be
presented. Respondent P20 explained:
“With the board you’ve got to draw a line. You can’t give too much
information and you can’t give too little information. So there is a middle
ground there.”
- It therefore seems as if the respondents from the low share price group seemed to
spend more time thinking about the context, and the right information based on the
context, in a very systematic manner.
- When these findings were interpreted according to the levels of maturity as outlined
in Section 5.7 (ii), it was found that companies in the low share price group are also
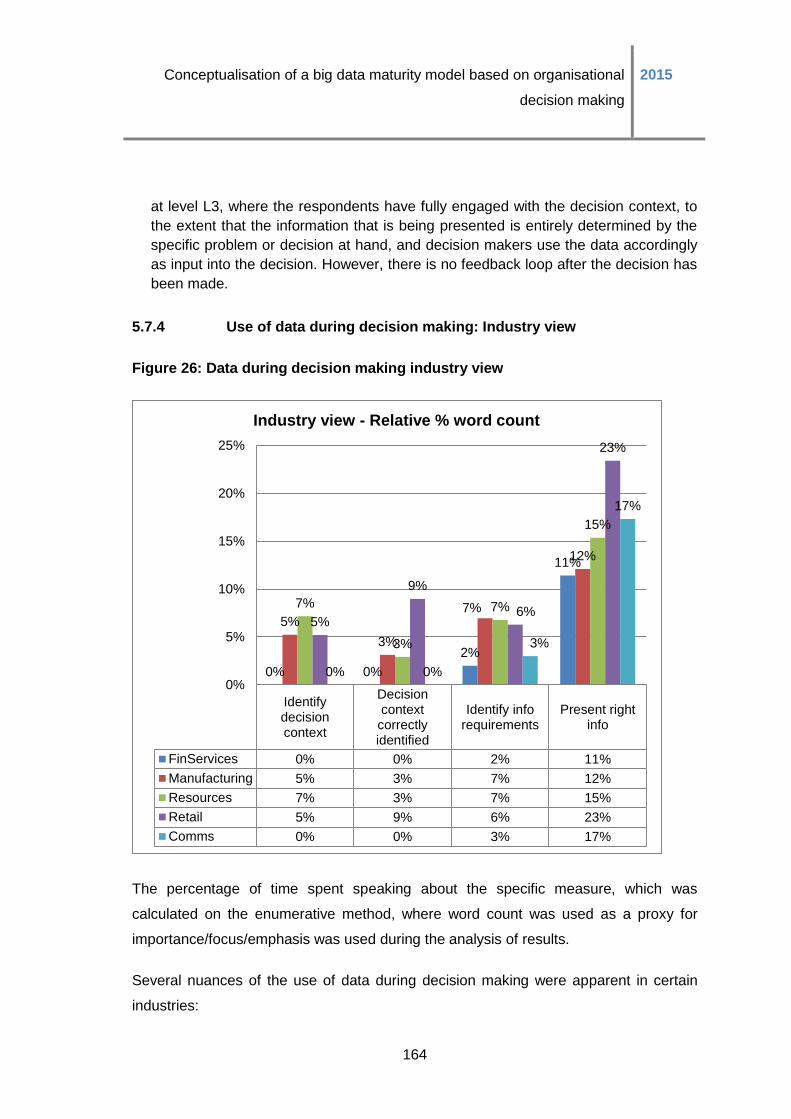
Conceptualisation of a big data maturity model based on organisational
decision making
2015
164
at level L3, where the respondents have fully engaged with the decision context, to
the extent that the information that is being presented is entirely determined by the
specific problem or decision at hand, and decision makers use the data accordingly
as input into the decision. However, there is no feedback loop after the decision has
been made.
5.7.4 Use of data during decision making: Industry view
Figure 26: Data during decision making industry view
The percentage of time spent speaking about the specific measure, which was
calculated on the enumerative method, where word count was used as a proxy for
importance/focus/emphasis was used during the analysis of results.
Several nuances of the use of data during decision making were apparent in certain
industries:
Identifydecisioncontext
Decisioncontextcorrectlyidentified
Identify inforequirements
Present rightinfo
FinServices 0% 0% 2% 11%
Manufacturing 5% 3% 7% 12%
Resources 7% 3% 7% 15%
Retail 5% 9% 6% 23%
Comms 0% 0% 3% 17%
0% 0%
2%
11%
5%
3%
7%
12%
7%
3%
7%
15%
5%
9%
6%
23%
0% 0%
3%
17%
0%
5%
10%
15%
20%
25%
Industry view - Relative % word count
Conceptualisation of a big data maturity model based on organisational
decision making
2015
165
- In general, no single industry excelled in all of the measures, and during each step
of the decision-making process different industries excelled or lagged visibly behind
the others.
- Respondents from the resources sector seemed to place the most emphasis on the
identification of the decision context, followed by respondents from manufacturing
and retail.
- Respondents from retail spoke much more about examples where the decision
context was correctly identified, than respondents from manufacturing and
resources only made limited mention to it. Respondents from financial services and
communication failed to give any examples of the decision context being correctly
identified, which is not unexpected as these respondents did not mention the
decision context at all.
- Respondents from both the manufacturing and resources spent the most time
talking about the identification of information requirements, whereas respondents
from financial services spent very limited time talking about it. These findings are
consistent with the amount of time these respondents spoke about the decision
context, as respondents from both manufacturing and resource companies
mentioned the decision context, whereas respondents from the financial services
sector did not mention the decision context at all.
- Respondents from the retail sector spent a relatively high amount of their time
talking about the right information being presented, compared to respondents from
financial services, who spent much less of their time talking about the right
information being presented.
The detailed findings are presented in the below sections.
Finding 3: Differences in the identification of the decision context between resources,
manufacturing and retail
Respondents from the resources sector placed the most emphasis on the identification
of the decision context, followed by respondents from manufacturing and retail.
Conceptualisation of a big data maturity model based on organisational
decision making
2015
166
Identification of the decision context in resources companies:
- Respondents from resources companies frequently referred to the various reports,
and emphasised the importance of the decision context being clear at the time of
reporting. For example Respondent P24 shared:
“The senior managers that report to me, they need to add [context and
insights]. I will, in my business meeting every month, sit with all of them and
go through it.”
- It seems that the rigorous reporting rhythm of companies in the resources sector in
this case serves as an enabler for the identification of the decision context. This is
also consistent with the findings in previous sections where the decision rhythms in
the resources sector played a considerable role in their approach to big data
analytics.
- Based on these findings it can be concluded that the resource companies are at
level L2 of maturity according to the use of data during decision making maturity
levels as outlined in Section 5.7 (ii). These individuals understand the decision
context to a limited extent, and therefore some sorting and management the data
happens. However it is not clear if in all cases the information that is being
presented is based entirely on the decision context.
Identification of the decision context in financial services and communications and
media:
- Respondents from financial services and communication and media did not speak
about the identification of the context at all, but were able to identify the information
requirements and present the right information (although weaker than the rest).
- This contradicted the proposition that, in order to identify the information
requirements and present the right information, the decision context needs to be
identified. A possible reason for this could be the strong focus of proactive and
predictive analytics as outlined in Section 5.6 (ii) which is prevalent in the financial
services and communications and media sector. For example Respondent P9 from
a telecommunications company shared:
Conceptualisation of a big data maturity model based on organisational
decision making
2015
167
“Proactively we are very good on the network side in terms of constantly
testing the network, finding where the issues are before customers even
experience it.”
- However it does seem that the focus was more on monitoring in these
environments, as opposed to truly understanding the decision context and
identifying information requirements based on the context.
- It can therefore be concluded that the financial services, as well as communication
and media companies are placed somewhere between levels L4 and L5 of maturity
according to the use of data during decision making as outlined in Section 5.7 (ii).
Information requirements seem to be based on the decision context in most cases,
and in some cases of predictive analytics is evident, where a full understanding of
the decision context occurred, the right information has been identified, sorted and is
proactively presented, and the outcome of the decision has also been predicted
based on previous decision history.
Identification of the decision context in manufacturing companies:
- Respondents from manufacturing emphasised the importance of determining the
problem before analysis commenced, as is evident from the high usage of words
such as “look” and “understand”, as illustrated in the below figure. They therefore
seem to be one of the most advanced groups.
- For example Respondent P26 from manufacturing stated:
“So you have got data, what are we going to define, let’s define the
problem, let’s look at the solution options, what they cost, which ones are
going to be the right ones to give the right return. And make that decision
on that basis as a team.”
It therefore seems that these companies were already strongly focused on the
solution focused.
- It can therefore be deduced that the manufacturing companies are at level L3 of
maturity according to Section 5.7 (ii), as the respondents in these companies fully
engaged with the decision context, to the extent that the information that is being
Conceptualisation of a big data maturity model based on organisational
decision making
2015
168
presented is entirely determined by the specific problem or decision at hand, and
decision makers use the data accordingly as input into the decision. However, there
is no feedback loop after the decision has been made.
Identification of the decision context in retail companies:
- The respondents from retail seemed to be fixated on their stores, which is expected
from the retail environment, and they provided several examples of how issues at
store levels are investigated in order to ascertain the complexity of the problem. For
example Respondent P16 stated:
“It’s those stores – that one didn’t sell well. Let me take off the product and
say is it the whole store not performing or is it the product just not
performing in the store? You need to think differently, because people
previously only looked at how the product is doing, you know what I am
saying. Already you jumped a decision ahead saying, but hang on
….maybe there is a problem with that store, with the location because all
my products are not performing. Is it a red issue, is it my salesman in the
store, is it a bad relationship with the [company] store manager.”
- These companies seemed very fixated on merely monitoring, and were placed at
level L2 of maturity according to Section 5.7 (ii), as these individuals has a limited
understanding of the decision context, and while some sorting and management
the data happens, in most cases the information that is being presented is based
on experience or intuition.
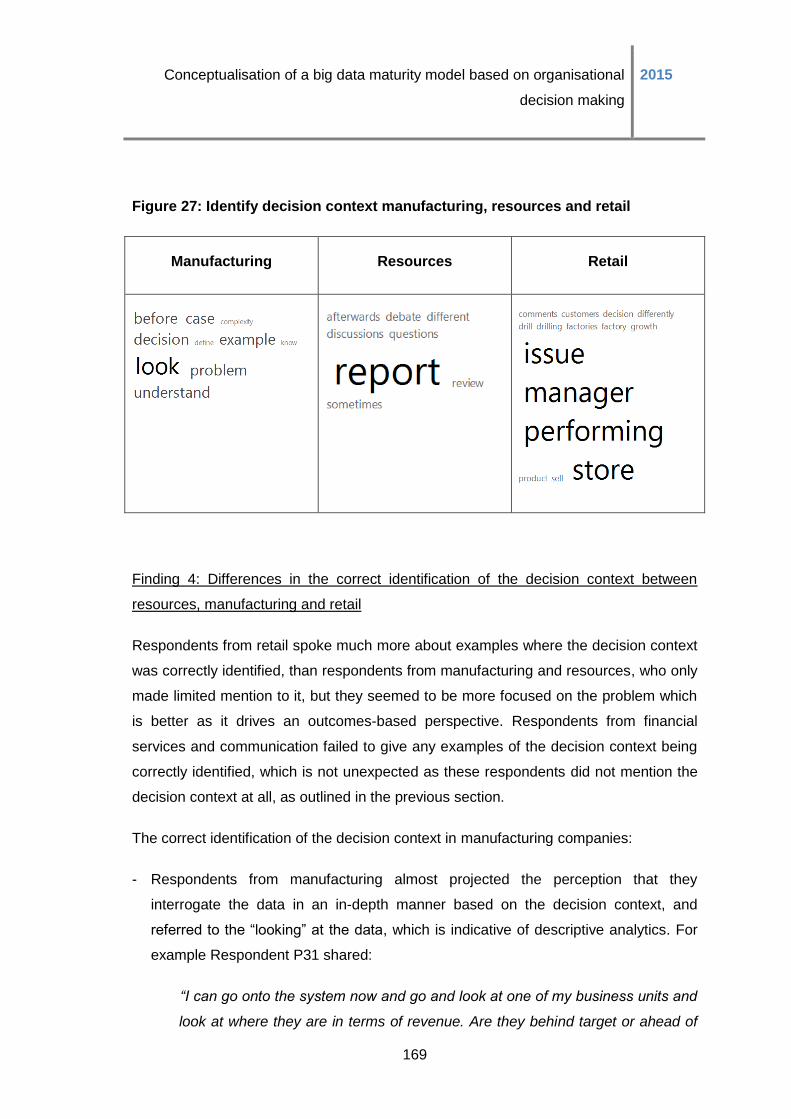
Conceptualisation of a big data maturity model based on organisational
decision making
2015
169
Figure 27: Identify decision context manufacturing, resources and retail
Manufacturing Resources Retail
Finding 4: Differences in the correct identification of the decision context between
resources, manufacturing and retail
Respondents from retail spoke much more about examples where the decision context
was correctly identified, than respondents from manufacturing and resources, who only
made limited mention to it, but they seemed to be more focused on the problem which
is better as it drives an outcomes-based perspective. Respondents from financial
services and communication failed to give any examples of the decision context being
correctly identified, which is not unexpected as these respondents did not mention the
decision context at all, as outlined in the previous section.
The correct identification of the decision context in manufacturing companies:
- Respondents from manufacturing almost projected the perception that they
interrogate the data in an in-depth manner based on the decision context, and
referred to the “looking” at the data, which is indicative of descriptive analytics. For
example Respondent P31 shared:
“I can go onto the system now and go and look at one of my business units and
look at where they are in terms of revenue. Are they behind target or ahead of
Conceptualisation of a big data maturity model based on organisational
decision making
2015
170
target? When I set their KPIs I know exactly where we are because it is real
time. We have incentives now that used to be done annually. So if you meet
your budget that is what you get your cost to company for. If you exceed your
budget then there is a variable incentive.”
- This is consistent with the findings from the “identify decision context” section which
also strongly emphasised ongoing monitoring, and further evidence of their level L3
of maturity according to Section 5.7 (ii), as the respondents in these companies
have fully engaged with the decision context, to the extent that the information that
is being presented is entirely determined by the specific problem or decision at
hand, and decision makers use the data accordingly as input into the decision.
However, there is no feedback loop after the decision has been made. Nor is there
seeking of opportunities outside of discovered problems.
The correct identification of the decision context in resource companies:
- Respondents from the resources sector seemed confident that the engineers in their
environment were able to correctly interpret the decision context, based on their
expertise; they “know” what is “right”. Respondent P24 shared:
“A lot of it has to do with engineering expertise. It is quite simply a fact that we
have guys that know the site. We have very good engineers in some areas
and… or sometimes it is just a case of we get caught out, a piece of equipment
will fail and afterwards we’ll do a root cause analysis and discover this failed
because of, for example, corrosion. The metallurgist will tell us it was because
pH was too low for too long.”
- This serves as further evidence of the level L2 of maturity according to the use of
data during decision making maturity levels as outlined in Section 5.7 (ii). These
individuals understand the decision context to a limited extent, and therefore some
sorting and management the data happens. However in most cases the information
that is being presented is based on experience or intuition.
Conceptualisation of a big data maturity model based on organisational
decision making
2015
171
The correct identification of the decision context in retail companies:
- Respondents from the retail sector spoke about how they identify various problems,
and they provided intricate details where required. As an example Respondent P20
commented:
“Look right now when the business is doing as well as it is it is quite easy. You
know… I mean we had our trading statement out yesterday and all the directors
are very happy. We tend to give more detail on the focus areas. So we driving
something called business optimisation at the moment. It is around stock
holdings, working capital management. Where we have issues then we’d say,
right this is the problem, this is the trend we’re seeing, this is what we plan to do
but we will never go into too much of a granular level.”
- Reflecting on the above it seems apparent that the information requirements are
determined by the decision at hand, but it also seemed that some intuition is
involved, where the data is calculated for the business model and the results need
to be “proved” as opposed to truly clarifying the decision context and
understanding the problem in depth.
- Therefore, companies in the retail sector were placed at level L2 of maturity
according to Section 5.7 (ii), as these individuals have a limited understanding of
the decision context, and some sorting and management of the data happens, but
in most cases the information that is being presented is based on experience or
intuition. These companies are also predominantly reactive when solving
problems, as well as focused on descriptive analytics.
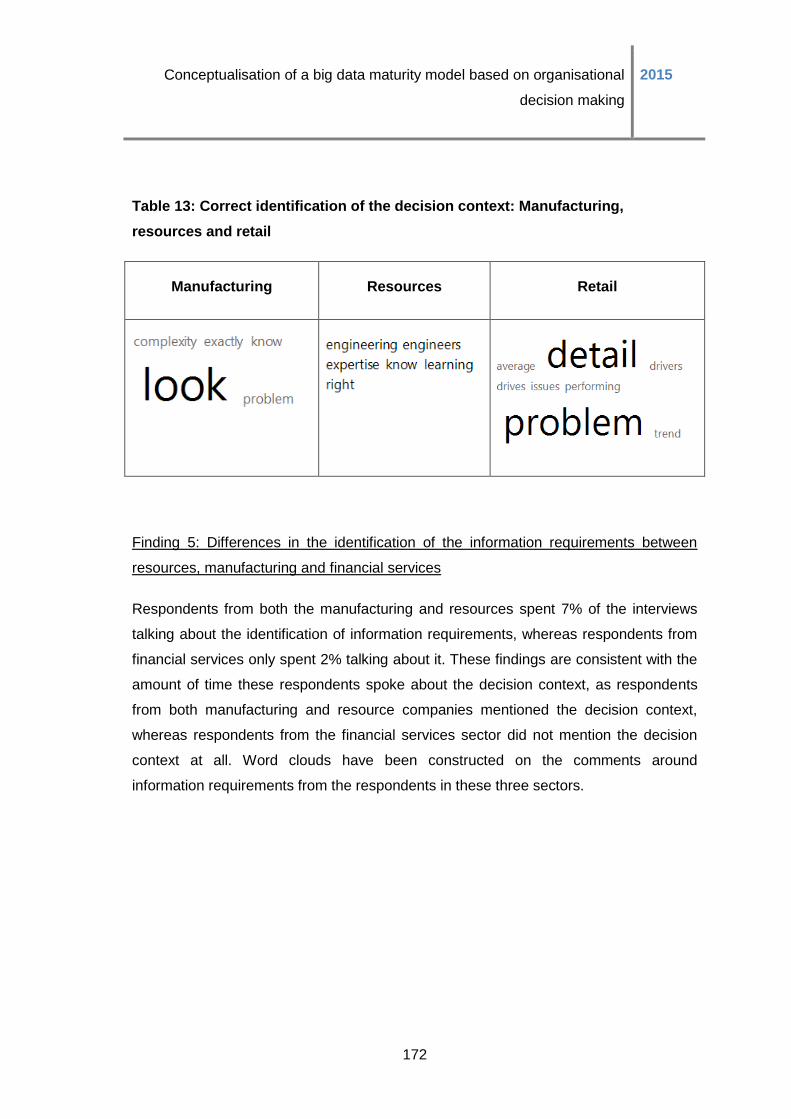
Conceptualisation of a big data maturity model based on organisational
decision making
2015
172
Table 13: Correct identification of the decision context: Manufacturing,
resources and retail
Manufacturing Resources Retail
Finding 5: Differences in the identification of the information requirements between
resources, manufacturing and financial services
Respondents from both the manufacturing and resources spent 7% of the interviews
talking about the identification of information requirements, whereas respondents from
financial services only spent 2% talking about it. These findings are consistent with the
amount of time these respondents spoke about the decision context, as respondents
from both manufacturing and resource companies mentioned the decision context,
whereas respondents from the financial services sector did not mention the decision
context at all. Word clouds have been constructed on the comments around
information requirements from the respondents in these three sectors.
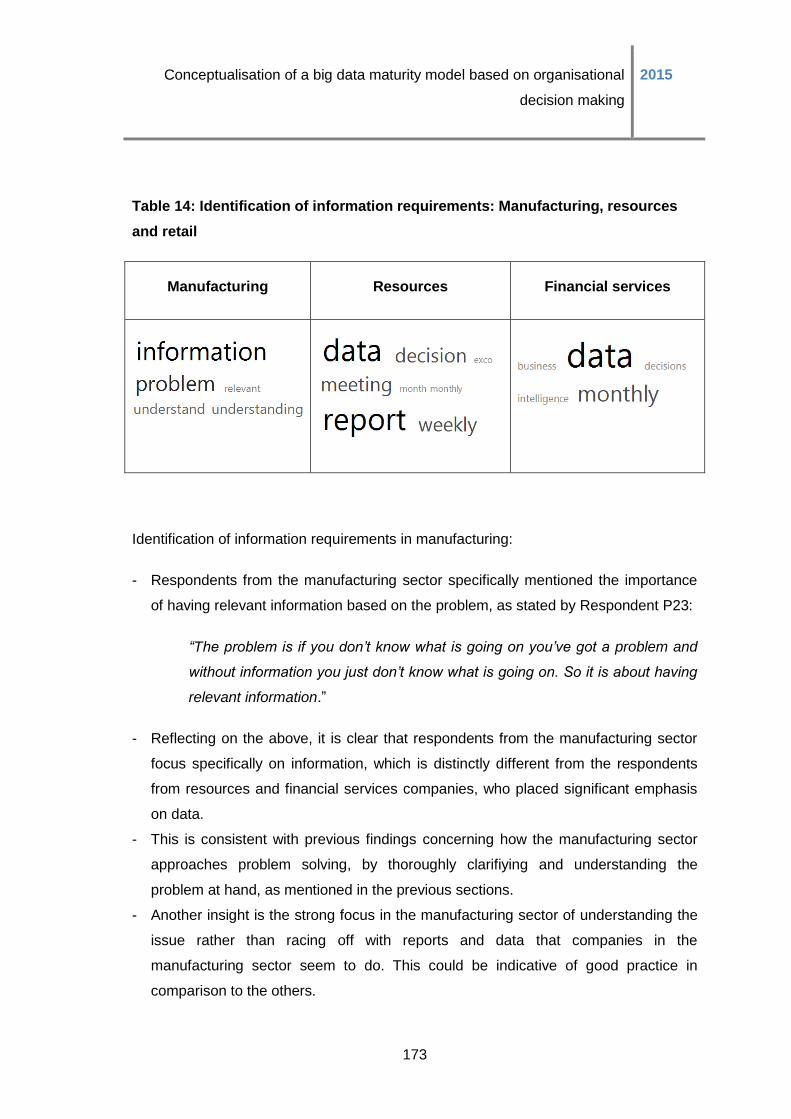
Conceptualisation of a big data maturity model based on organisational
decision making
2015
173
Table 14: Identification of information requirements: Manufacturing, resources
and retail
Manufacturing Resources Financial services
Identification of information requirements in manufacturing:
- Respondents from the manufacturing sector specifically mentioned the importance
of having relevant information based on the problem, as stated by Respondent P23:
“The problem is if you don’t know what is going on you’ve got a problem and
without information you just don’t know what is going on. So it is about having
relevant information.”
- Reflecting on the above, it is clear that respondents from the manufacturing sector
focus specifically on information, which is distinctly different from the respondents
from resources and financial services companies, who placed significant emphasis
on data.
- This is consistent with previous findings concerning how the manufacturing sector
approaches problem solving, by thoroughly clarifiying and understanding the
problem at hand, as mentioned in the previous sections.
- Another insight is the strong focus in the manufacturing sector of understanding the
issue rather than racing off with reports and data that companies in the
manufacturing sector seem to do. This could be indicative of good practice in
comparison to the others.
Conceptualisation of a big data maturity model based on organisational
decision making
2015
174
- Based on the above, it can be concluded that companies from the manufacturing
sector are at level L3 of maturity according to Section 5.7 (ii), as the respondents in
these companies have fully engaged with the decision context, to the extent that the
information that is being presented is entirely determined by the specific problem or
decision at hand, and decision makers use the data accordingly as input into the
decision. However, there is no feedback loop after the decision has been made.
Identification of information requirements in resources:
- Respondents from resources companies shared similar feedback to that found in
previous sections concerning data and decision making, and emphasised the
various management and reporting rhythms, during which data is interrogated in
order to make decisions, which seems indicative of traditional business intelligence.
For example Respondent P24 shared:
“No, the senior managers that report to me, they need to add that. I will, in my
business meeting every month, sit with all of them and go through it. If there are
questions I will ask or in the work discussions I have once a month with them
then I will sit and go what is going on here or something like that. If there are
emergencies it is different. You do get things that go horribly wrong on sites.
Then we deal with it very differently. Then there are almost no reports. Then it is
very much a fire fighting mode where people get together in meetings and stuff
gets thrown on a board and you try and figure out immediately what is going on
and what did go wrong and how to rectify it so it is a whole different procedure
in that case.”
- It seems as if these companies focus more on monitoring the environment, and are
therefore more reactive. These companies also seem to focus predominantly on
structured data.
- Based on these findings it can be concluded that the resource companies are at
level L2 of maturity according to the use of data during decision making maturity
levels as outlined in Section 5.7 (ii). These individuals understand the decision
context to a limited extent, and therefore some sorting and management the data
happens. However it is not clear if in all cases the information that is being
Conceptualisation of a big data maturity model based on organisational
decision making
2015
175
presented is based entirely on the decision context, as there seems to be a heavy
reliance on intuition to determine the information requirements.
Identification of information requirements in financial services:
- Respondents in financial services emphasised how they use data from business
intelligence reports during their various meetings to make decisions. No real
mention of the decision context was made, for example Respondent P28 stated:
“So for example: we would sit in a monthly update session where we would
look at that data and then based on the data, either tweak or change a
process, tweak or change a marketing plan, a sales intervention- that kind of
thing. But a lot of decisions are made on the data that is presented.”
- However it seems as if the focus is still predominantly on small data, and traditional
business intelligence and structured data as opposed to big data.
- Based on the above, it can be concluded that the financial services are at level L4 of
maturity according to the use of data during decision making as outlined in Section
5.7 (ii), as the information requirements are entirely determined by the specific
problem or decision at hand, and decision makers use the data accordingly as input
into the decision. A full feedback loop using data to assess the outcome of the
decision is evident. In this specific case no evidence of predictive analytics, which
would be indicative of level L5 maturity, could be found.
Finding 6: Differences in the presentation of the right information between retail and
financial services
Respondents from the retail sector spent 23% of their time talking about the right
information being presented, compared to respondents from financial services, who
only spent 11% of their time talking about the right information being presented. The
specific differences are illustrated in the word clouds in Table 15. However this still
seems to be conventional knowledge management and therefore the transition to big
data does not seem to have been fully made.
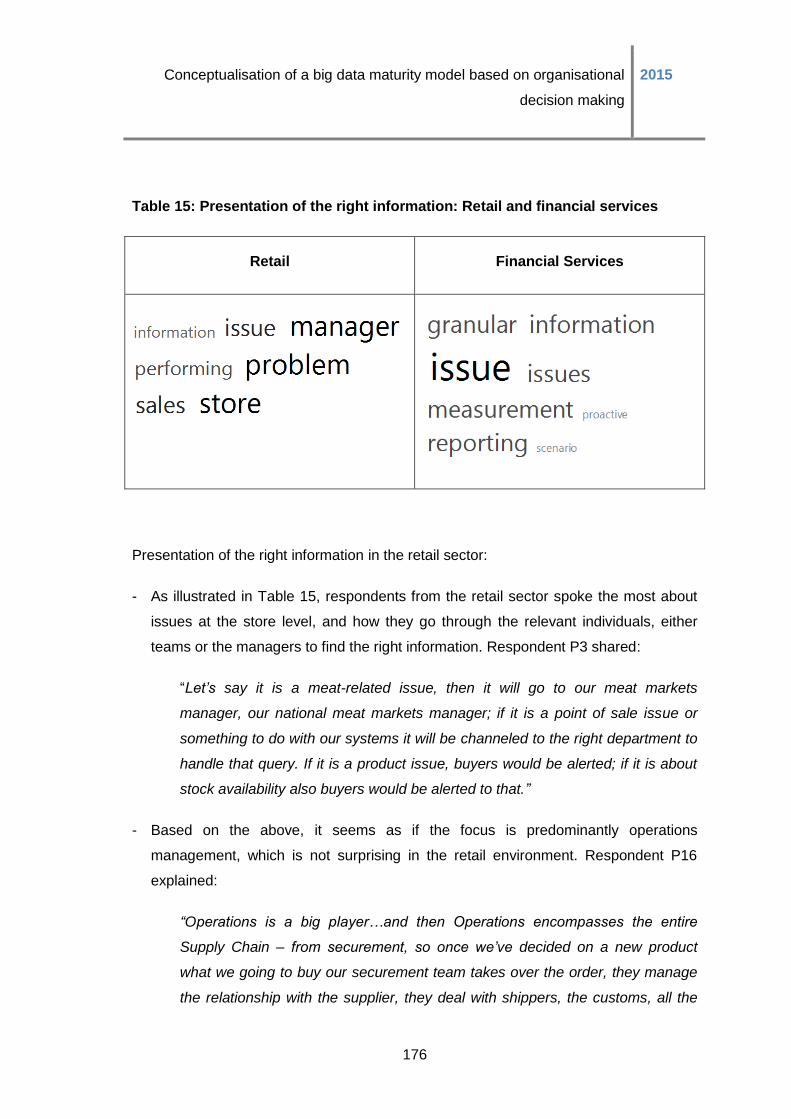
Conceptualisation of a big data maturity model based on organisational
decision making
2015
176
Table 15: Presentation of the right information: Retail and financial services
Retail Financial Services
Presentation of the right information in the retail sector:
- As illustrated in Table 15, respondents from the retail sector spoke the most about
issues at the store level, and how they go through the relevant individuals, either
teams or the managers to find the right information. Respondent P3 shared:
“Let’s say it is a meat-related issue, then it will go to our meat markets
manager, our national meat markets manager; if it is a point of sale issue or
something to do with our systems it will be channeled to the right department to
handle that query. If it is a product issue, buyers would be alerted; if it is about
stock availability also buyers would be alerted to that.”
- Based on the above, it seems as if the focus is predominantly operations
management, which is not surprising in the retail environment. Respondent P16
explained:
“Operations is a big player…and then Operations encompasses the entire
Supply Chain – from securement, so once we’ve decided on a new product
what we going to buy our securement team takes over the order, they manage
the relationship with the supplier, they deal with shippers, the customs, all the
Conceptualisation of a big data maturity model based on organisational
decision making
2015
177
way through to into this warehouse and them from basically “techpack” - to
basically sending it out again to the Customers. And not necessarily to
consumers, the customers as obviously our customers are Pick & Pay, Spar
and then consumer will purchase on that. So essentially the chain from inbound
to outbound that covers in my area. It is quite a large portfolio, it’s exciting, it’s
nice, it’s different, it keeps change.”
- It can therefore be concluded that these companies are at level L2 of maturity
according to Section 5.7 (ii); these individuals to a limited extent understand the
decision context, and some sorting and management the data happens, but in
most cases the information that is being presented is based on experience or
intuition.
Presentation of the right information in financial services:
- Respondents from financial services shared various examples of how issues surface
from the reports, and then also how they explored the information in order to identify
the exact problem as well as find a solution. As an example, Respondent P28
shared:
“So we will have a look at that on a monthly basis. Understand the
demographics, the profile, the segmentation of those clients; look at it per
product range; per bank; per age group- all of that sort of stuff. So we dissect
that to quite a granular level. And then obviously the interventions will be then to
have a look at that data set and see why it is out of sync with history- increased
or decreased, that sort of thing.”
- Reflecting on the above, it can be concluded that these companies were at level L3
of maturity according to Section 5.7 (ii), as they have fully engaged with the decision
context, to the extent that the information that is being presented is entirely
determined by the specific problem or decision at hand, and decision makers use
the data accordingly as input into the decision. However, there is no feedback loop
after the decision has been made.
Conceptualisation of a big data maturity model based on organisational
decision making
2015
178
5.7.5 Use of data during decision making: Summary and conclusion
Propositions 4 to 7 related to various steps in the decision making process, which were
signals of big data maturity:
- Proposition 4 proposed that the ability of decision makers within an organisation to
firstly interpret the decision complexity, before information gathering commences,
can be interpreted as a signal of maturity. An immature organisation would skip this
first step and proceed to gather information without determining the decision context
and complexity, whereas in a mature organisation the decision context and
complexity is investigated and identified along the continuum of routine to complex
decisions upfront before information gathering commences.
- Proposition 5 proposed that, in order to ascertain an organisation’s big data maturity
around the use of big data during organisational decision making, not only the
identification of the decision context is important, but also the ability to interpret the
decision context and complexity correctly. It can therefore be inferred that the ability
to correctly interpret the decision context and complexity can be indicative of
maturity. Thus an organisation can only be viewed as mature if they have
succeeded in correctly interpreting the decision context and complexity. Should an
organisation interpret the decision context and complexity incorrectly (for example a
complex situation would be viewed as a simple, routine decision situation or vice
versa), it is viewed as immature (thus the presence of this step alone is not an
indication of maturity).
- Proposition 6 proposed that the ability of an organisation to correctly identify the
information requirements based on the decision context can be interpreted as a
signal of maturity. It is thus proposed that immature organisations are unable to
correctly identify the information requirements, and in mature organisations the
information requirements are correctly identified based on the decision context.
- Proposition 7 proposed that, during the consideration of alternatives step in the
decision making process, the availability of the “right” information based on the
decision context can also be used as a signal of maturity. Therefore, even if an
organisation has been able to correctly identify the information requirements based
on the decision context (Proposition 6), the relevant information needs to be

Conceptualisation of a big data maturity model based on organisational
decision making
2015
179
extracted and presented to the decision maker. Failure to do so will result in the
organisation being categorised as immature in this specific dimension.
The first finding related to the usefulness of the variables, the use of big data during
decision making, as outlined in Propositions 4 to 7 as measures of maturity. It was
found that that the use of big data during decision making, as outlined in Propositions 4
to 7, is a valid and relevant measure of big data maturity, based on the amount of time
respondents spent talking about it, as well as due to the strong emphasis they placed
on the importance of using big data during decision making in order to extract value
from it.
However, as outlined in Section 5.7 (i) and (ii), it was clear that superficial evidence of
the decision context being analysed, information requirements identified based on the
context and the right information being presented based on the context in itself are not
indicative of maturity, and the specific nuances under each of these steps need to be
clarified in order for a more accurate and detailed view of big data maturity to be
formed. These nuances seemed to indicate a clear continuum from sorting the data,
management of the data, the use of data during problem solving and predictive
analytics, which was then grouped into five distinct maturity levels based on the use of
big data during organisational decision making, which provides a more detailed and
accurate view of maturity based on these dimensions.
The following nuances of the use of big data during decision making were found
between the high and low share price groups:
- Respondents from the low share price group seemed to talk more about each of
these measures, in terms of the relative percentage word count. This finding is
contradictory to previous findings about the other measures of maturity where the
high share price group respondents always seemed to dominate the low share price
group respondents’ in terms of the time spent talking about each of the measures.
These respondents also seemed to reflect more on the context, and only really
started interrogating the data for use in making the decision at the information
requirements determination stage.
Conceptualisation of a big data maturity model based on organisational
decision making
2015
180
- This seems to affirm that the low share price group companies proceed in making
decisions more systematically, whereas the decision-making process in the high
share price group companies seem to happen more simultaneously.
- The respondents from the high share price groups were obsessed with the problem
at hand, as they referred to “problems” in each of the stages of the decision-making
process.
- The companies in both the high and low share price groups were placed at level L3
of maturity according to the use of data during the decision process, as the
individuals have fully engaged with the decision context, to the extent that the
information that is being presented is entirely determined by the specific problem or
decision at hand, and decision makers use the data accordingly as input into the
decision. However, there is no feedback loop after the decision has been made.
The following nuances of the use of big data during decision making were found in the
various industries:
- In general, no single industry excelled in all of the measures, and during each step
of the decision-making process different industries excelled or lagged visibly behind
the others.
- The identification of the decision context:
o Respondents from the resources sector seemed to place the most emphasis
on the identification of the decision context, which seemed to be a result of the
various reports and reporting rhythms in those companies which almost force
the decision makers to frequently consider the context. It was found that the
resource companies were placed at level L2 of maturity according to the use
of data during decision making maturity levels as outlined in Section 5.7 (ii).
These individuals understand the decision context to a limited extent, and
therefore some sorting and management the data happens. However it is not
clear if in all cases the information that is being presented is based entirely on
the decision context.
o Respondents from manufacturing retail and spoke the second most about the
identification of the decision context, which emphasised the importance of
clarifying the problem before analysis commenced. It was found that these
companies were at level L3 of maturity according to Section 5.7 (ii), as the
Conceptualisation of a big data maturity model based on organisational
decision making
2015
181
respondents in these companies fully engaged with the decision context, to
the extent that the information that is presented is entirely determined by the
specific problem or decision at hand, and decision makers use the data
accordingly as input into the decision. However, there is no feedback loop
after the decision has been made.
o Respondents from retail companies also spoke the second most about this
measure, and seemed to be fixated on their stores, which is an expected
factor from the retail environment. They provided several examples of how
issues at store levels are investigated in order to ascertain the complexity of
the problem. It was found that these companies were at level L2 of maturity
according to Section 5.7 (ii); these individuals to a limited extent understand
the decision context, and some sorting and management the data happens,
but in most cases the information that is being presented is based on
experience or intuition.
o The respondents from financial services as well as communications and
media companies did not speak about the identification of the decision context
at all.
- The correct identification of the decision context:
o Respondents from retail spoke much more about examples where the
decision context was correctly identified than any of the other industries, and
explained that they would intricately discuss the details where required. It was
apparent that the information requirements are determined by the decision at
hand, but it also seemed that some intuition is involved, where the data is
calculated for the business model and the results need to be “proved” as
opposed to truly clarifying the decision context and understanding the problem
in depth. This served as further evidence of the level L2 of maturity according
to Section 5.7 (ii) for retail companies.
o Respondents from manufacturing only made limited mention to this measure,
and almost projected the perception that they perform in-depth interrogations
of the data based on the decision context. This was consistent with the
findings from the “identify decision context” section which also strongly
emphasised ongoing monitoring, and further evidence of their level L3 maturity
according to Section 5.7 (ii).
Conceptualisation of a big data maturity model based on organisational
decision making
2015
182
o Respondents from resources companies also only made limited mention to
this measure, and seemed confident that the engineers in their environment
were able to correctly interpret the decision context, based on their expertise.
This served as further evidence of the level L2 of maturity.
o Respondents from financial services and communication failed to provide any
examples of the decision context being correctly identified, which is not
unexpected as these respondents did not mention the decision context at all.
- The identification of the information requirements:
o Respondents from both the manufacturing and resources spent the most time
talking about the identification of information requirements.
o Respondents from manufacturing companies specifically mentioned the
importance of having relevant information based on the problem, which is
distinctly different from the respondents from resources and financial services
companies, who placed significant emphasis on data. This finding was
consistent with previous findings concsidering how the manufacturing sector
approaches problem solving, by thoroughly determining and clarifying the
problem at hand, as mentioned in the previous sections and is another
indication of their level L3 maturity according to Section 5.7 (ii).
o Respondents from resources companies shared similar feedback to that
provided in previous sections concerning data and decision making, and
emphasised the various management and reporting rhythms, during which
data is interrogated in order to make decisions. It also seemed as if these
companies focus more on monitoring the environment, and are therefore more
reactive, which was indicative of their level L2 of maturity according to the use
of data during decision making maturity levels as outlined in Section 5.7 (ii).
o Respondents from financial services spent very limited time talking about the
identification of information requirements, which was not surprising
considering that these respondents also did not mention the decision context
at all.
- The presentation of the right information
o Respondents from the retail sector spent a relatively high amount of their time
talking about the right information being presented, compared to respondents
Conceptualisation of a big data maturity model based on organisational
decision making
2015
183
from financial services, who spent much less of their time talking about the
right information being presented.
o Respondents in retail companies frequently referred to their retail channel, and
how they would access the relevant individuals, either teams or the managers,
to find the right information. It therefore seemed as if the focus was
predominantly operations management, which is not surprising in the retail
environment. These companies were still categorised at level L2 of maturity
according to Section 5.7 (ii).
o Respondents from financial services shared various examples of how issues
surface from the reports, and then also how they explore the information in
order to identify the exact problem as well as attain a solution. It was found
that these companies were at level L3 of maturity according to Section 5.7 (ii),
as they fully engaged with the decision context, to the extent that the
information that is presented is entirely determined by the specific problem or
decision at hand, and decision makers use the data accordingly as input into
the decision. However, there is no feedback loop after the decision has been
made.
5.8 Conclusion of Results
Based on the above findings as outlined in Sections 5.1 – 5.7 about Propositions 1 to
7, it was found that the measures of big data maturity as outlined in the propositions
are all valid and relevant measures of big data maturity. The data however has
emphasised several nuances within each of the measures, which suggested a case for
including these detailed levels within each of the main measures.
In the following section these findings are interpreted by referring to the literature
reviewed in Chapter 2, after which the original conceptual big data maturity model is
revised based on the findings, and an updated big data maturity model is presented.
Conceptualisation of a big data maturity model based on organisational
decision making
2015
184
CHAPTER 6: DISCUSSION OF RESULTS
In this chapter the results as presented in Chapter 5 for each proposition, has been
discussed with reference back to the literature in Chapter 2. The various measures of
maturity were either validated, expanded on or contradicted based on the findings.
After all of the propositions have been covered, any new dimensions of maturity that
arose during analysis have been conversed. Lastly a revised big data maturity model
is presented based on the findings.
6.1 Proposition 1: Object, Process or People focus as a
signal of big data maturity
The first proposition proposed that the first dimension of big data maturity can be
measured according to the focus of the organisation’s big data efforts, defined either as
object, process or people focus (Becker et al., 2009, Mettler et al., 2010, Lahrmann et
al., 2010, Rajteric, 2010).
The literature proposed that objects included the technology, architecture and software
of organisations (Lahrmann et al., 2010). During the analysis of results, 18 distinct
object-related codes were identified, and therefore it seems as if a one-dimensional
shallow definition of objects does not apply, as more in-depth insights about the
respondents’ engagement with the big technologies, architecture and software in their
environments strongly emerged from the results through these codes. The findings
from the research delineated that three distinct levels of depth of engagement with the
objects occur. At the first level, individuals did not engage with the objects in their
environments at all, as they were only vaguely aware of the various big data solutions
but not sufficiently engaged so that they could name specific solutions. At the highest
level, full engagement with the objects occurred, as the respondents were so involved
in the big data solutions that they could pinpoint the exact solutions in their
environments, as well as provide opinions about the effectiveness and usefulness of
those solutions. The implication of this finding was that a mere focus on the objects; i.e.
the breadth of the objects, alone is not a sufficient measure of maturity, but that the
Conceptualisation of a big data maturity model based on organisational
decision making
2015
185
engagement, i.e. the depth of objects should be evaluated to provide a more detailed
view of big data maturity.
The literature defined processes as the extent to which a specific process is explicitly
defined, managed, measured, controlled and effective (Mettler et al., 2010). During the
analysis of results this definition too was found to be lacking, as it was not sufficient to
describe all of the complex processes that the respondents explained during the
interviews. It was also evident from the findings that three distinct engagement levels
with the various processes in the organisations also occurred, similarly to the
engagement with objects; from low engagement where respondents were very vaguely
aware of big data analytical processes but not engaged enough to pinpoint specific
processes, to the highest level of engagement where respondents were aware of the
exact processes that occurred in their organisations, and were also able to provide
their opinions on the usefulness of these processes. The implication of this finding was
that a simple focus on processes, i.e. the breadth of processes, is not a sufficient
measure for big data maturity, and that the engagement with the processes, i.e. the
depth of processes be analysed for a more detailed and accurate view of big data
maturity to be provided.
The literature also defined the people focus as that extent to which the workforce is
proficient in knowledge creation (Mettler et al., 2010). The findings from the results
clearly emphasised that the relationship of the various big data analytical teams is
more complex than this superficial definition, as during analysis a total of 23 people-
related codes emerged, which were then grouped into several themes. From these
themes, it was apparent that various levels of trust exist between the analytical teams
and the complements of the businesses, which directly impact the business readiness
for big data. Four different trust and business readiness levels surfaced during the
analysis, from situations where no analytical teams where present, or where
capabilities were lacking, to where full trust, empowerment and business mandates
were given to the analytical teams to extract the value from big data, which resulted in
high business readiness for big data. Additionally, significant differences were found by
industry, suggesting that the reason people versus processes challenge was not
resolved is based on industry structure rather than anything else.
Conceptualisation of a big data maturity model based on organisational
decision making
2015
186
Through the synthetisation of the various measures of maturity in the literature, i.e.
object, people and processes, it was proposed that a focus on objects was suggested
as being indicative of lower levels of maturity, whilst a focus on people and processes
was proposed to be indicative of higher levels of maturity (Becker et al., 2009, Mettler
et al., 2010, Lahrmann et al., 2010, Rajteric, 2010). During the formulation of the
proposition in Section 3.1 the order of people and process focus in terms on big data
maturity was not yet determined, and it was uncertain whether processes are indicative
of higher levels of maturity than people, or vice versa (Becker et al., 2009; Mettler et
al., 2010; Lahrmann et al., 2010; Rajteric, 2010).
The findings from Section 5.3 (iv) supported the proposal from the literature that an
object focus is indicative of the lowest level of maturity. It was also concluded from the
findings that a process focus is indicative of the highest levels of maturity, followed by
people and then objects, based on the strong co-occurrence of the processes-related
codes with other codes which are indicative of higher maturity such as information,
knowledge, knowledge management, the correct identification of the decision context
and the provision of the correct data based on the decision context.
Based on these conclusions, three pivotal questions arose:
- Do the more detailed maturity levels within the object, people or processes views
replace the proposition that a focus on objects is indicative of low levels of maturity,
and that a focus on people or processes is indicative of higher levels of maturity?
- Or, do the detailed levels of maturity within the object, people and processes
dimensions fall under each of these dimensions, therefore resulting in multiple
layers of maturity based on (a) the focus area and (b) the detail under that focus
area?
- Or, are these large organisations at a level at which they have the basics but their
engagement in these is what matters?
No definitive and empirically tested conclusion could be drawn for the above three
questions. However, due to the in-depth insights as well as the level of detail the
respondents provided during the interviews concerning the various levels of
engagement with and trust of the objects, people and processes in their environments,
Conceptualisation of a big data maturity model based on organisational
decision making
2015
187
it seemed to be a very important dimension to consider for each of the focus areas. It
was therefore concluded preliminarily that the detailed maturity levels within each of the
object, people and process focus areas as detailed in Sections 5.4 (i) – (iii) need to be
included in the object, people and process focus areas as signals of maturity.
Additionally, due to the significant differences in the objects, processes and people
focus areas it seems as if the industry structure also had an impact on the maturities
within each of these measures.
In summary, the following conclusions were therefore drawn: On the surface, it seems
as if the object, people and process focus of an organisation can be used as valid and
relevant signals of maturity. More detailed levels of maturity exist within each of these
focus areas based on the depth of engagement with and trust. Therefore, a mere focus
on objects, people and processes alone is not enough to ascertain big data maturity, as
the complexities included in the various engagement levels with each of these focus
areas need to be considered in order for a more accurate conclusion of big data
maturity to be made, according to these detailed levels of maturity within each of the
object, people and process views.
One of the implications of these conclusions are that the first measure of big data
maturity, defined as an object, people and processes focus according to the literature
(Becker et al., 2009, Mettler et al., 2010, Lahrmann et al., 2010, Rajteric, 2010) has
been extended as follows according to the findings of this research:
- A focus on objects, processes and people does not serve as a sufficient signal of
maturity. Therefore, a mere focus on one or all of these measures alone is
irrelevant, and no assessments of big data maturity can be made by superficially
considering the mere focus on each of these due to the superficial nature of
considering these dimensions without considering the nuances in each of these
dimensions.
- Although it was found that object focus is indicative of the lowest level of maturity,
and was also concluded from the findings that a process focus is indicative of the
highest levels of maturity, followed by people and then objects, the nuances under
each of these focus areas need to be considered in order for a more detailed and
accurate assessment of big data maturity to be made.
Conceptualisation of a big data maturity model based on organisational
decision making
2015
188
- There are various maturity levels under each of these focus areas, i.e. objects,
processes and people as outlined in Sections 5.4 (i) to (iii).
- This specific proposition in the big data maturity model as suggested by the
literature (Becker et al., 2009, McAfee & Brynjolfsson, 2012; Mettler et al., 2010,
Lahrmann et al., 2010, Rajteric, 2010; Wen et al., 2013) would therefore need to be
updated to include these levels of maturity within each of the objects, people and
processes focus areas as outlined in Sections 5.4 (i) to (iii):
o Objects focus: Three maturity levels for the depth of engagement of
executives with big data objects.
o Processes focus: Three maturity levels for the depth of engagement of
executives with big data analytical processes.
o People focus: Four maturity levels related to the readiness of the business for
big data analytics, based on the trust, or lack of trust in the big data analytical
teams in the organisation.
o A review of industry characteristics, whether consumer, machine facing;
people/labour dense and degree of digitisation.
o Greater levels of maturity associated with higher performance as evidenced by
share price findings.
6.2 Proposition 2: Big data, information and knowledge
as a signal of big data maturity
The second proposition recommended that the presence of big data, information and
knowledge in the organisation can be used as a signal of big data maturity (Davenport
et al., 1998; Glazer, 1991; Goes, 2014; Kaner & Karni, 2004).
The definition of big data, as provided in the literature, related to discrete, objective
facts, figures and statistics in its rawest forms, without any processing being applied
(Goes, 2014; Kaner & Karni, 2004). In the context of big data analytics, the “data” was
also proposed to be a combination of structured and unstructured data from a wide
variety of sources that are generated at an increased pace and the accuracy thereof is
also difficult to verify (Aman, Chelmis, & Prasanna, 2014; Gobble, 2013; Goes, 2014;
Conceptualisation of a big data maturity model based on organisational
decision making
2015
189
Lukoianova & Rubin, 2014; McAfee & Brynjolfsson, 2012). During the analysis of
results specific nuances were found concerning how engaged the respondents were
with the various big datasets in their environments, from no engagement where
respondents were broadly aware of big data in their environments, but could not name
specific solutions or comment further on the datasets; to very engaged, to the extent
where individuals were able to delineate specific datasets and ascertain whether these
datasets were traditional or not. Much data was internal and structured; backward
looking rather than focused on real-time. Thus, it can be concluded that the presence
of the data in itself is not indicative of big data maturity, but that the depth of
engagement of executives with these datasets can be used is a more accurate
measure of big data maturity. Moreover many organisations appeared to be rooted in
conventional reporting and business intelligence processes. The predominant analytics
were descriptive rather than predictive or prescriptive. It was also apparent that the
types big data sets would need to be considered in order to make an accurate
assessment of big data maturity according to this dimension of maturity.
The literature defined information as “data that have been organized or given
structure”, (Glazer, 1991:2). During the analysis of results it was found that this simple
definition of information is not sufficient, as it does not take into account the differences
that clearly surfaced in the data of the various levels of engagement with information in
organisations. These engagement levels range from little engagement where
individuals could only refer vaguely to the aggregated information, but not comment
further, to very engaged where organisations could name specific information sets that
are present in their organisations. Thus, it can be concluded that the presence of
information in itself is not indicative of big data maturity, but that the depth of
engagement of executives with information can be used as a more accurate measure
of big data maturity. However, from the results it appeared that the datasets in these
environments were predominantly structured and traditional.
Knowledge was defined in the literature as information which has been “combined with
experience, context, interpretation and reflection” which can be applied to decisions
and actions (Davenport et al., 1998:43). During the analysis of the results it was clear
that the mere presence of information combined with experience, context, interpretation
and reflection is too simplistic a definition of knowledge, as it not only includes the
Conceptualisation of a big data maturity model based on organisational
decision making
2015
190
information that has been enriched with context that is important, but that the various
engagement levels with knowledge in the organisation need to be considered as well.
Thus, it can be concluded that the presence of knowledge in itself is not indicative of
big data maturity, but that the depth of engagement of executives with knowledge can
be used as a more accurate measure of big data maturity.
Proposition 2 also stated the presence of predominantly big data and information is
indicative of an immature organisation, and the presence of predominantly knowledge
is indicative of a mature organisation (Davenport et al., 1998; Glazer, 1991; Goes,
2014; Kaner & Karni, 2004). According to the first finding in Section 5.4 (iv) it can be
concluded that the presence of big data, information and knowledge, superficially
seems to be a relevant measure of maturity based on how much time respondents
spent in the interviews talking about either one of these measures as well as the co-
occurrences of these codes with another codes which are indicative of similar levels of
maturity. It is important to note, however, that, in line with the above findings, the mere
presence of big data, information or knowledge in itself is not a signal of big data
maturity, and that the specific nuances concerning the depth of engagement with the
big data, information and knowledge provides more accurate indications of big data
maturity.
Therefore, although the findings seem to support Proposition 2 on the surface, it is also
clear that the findings extend the proposition with clear indications of more detailed and
accurate signals of maturity within each of these main measures. It can thus be
concluded that more detailed levels of maturity exists within each of these focus areas
based on the depth of engagement with each of these measures.
The literature emphasising big data, information, and knowledge did not consider any
of the other dimensions of maturity (Davenport et al., 1998; Glazer, 1991; Goes, 2014;
Kaner & Karni, 2004). During the analysis of results strong co-occurrences existed
between the big data information, and knowledge codes and other dimensions of
maturity in the other propositions. Thus, from the results it became apparent that big
data, information and knowledge cannot be considered in isolation, but should be
reviewed with the objects, people, processes, knowledge management and use of data
during decision making as outlined in propositions 1, 3,4,5,6 and 7.
Conceptualisation of a big data maturity model based on organisational
decision making
2015
191
Based on these conclusions, two pivotal questions arose:
- Do the more detailed maturity levels within the big data, information and knowledge
measures replace the proposition that the presence big data is indicative of low
levels of maturity, the presence of information is indicative of higher level of maturity
and the presence of knowledge is indicative of the highest level of maturity?
- Or, do the detailed levels of maturity within the big data, information and knowledge
dimensions fall under each of these dimensions, therefore resulting in multiple
layers of maturity based on (a) the presence of the types of datasets which are big
data, information or knowledge and (b) the detailed maturity under each measure
based on the depth of engagement with those datasets?
As a result of the strong evidence presented for the co-occurrences of other measures
of maturity, it seems likely that the proposition that the presence of big data is indicative
of low levels of maturity, the presence of information is indicative of higher level of
maturity and the presence of knowledge is indicative of the highest level of maturity is
valid. But it is as important to also consider the various nuances raised about the depth
of engagement with these various datasets, which was apparent during the interviews.
It cannot be ignored, and therefore seemed to be a very important dimension to
consider under each of the focus areas.
Based on the results in Section 5.5 (iv), it was is clear that the groundwork was laid in
the organisations studied as the relevant big datasets, information and knowledge were
in place, which is suggestive of a history of knowledge management. It is important to
note, however, that as specific nuances in big data, information and knowledge exists
specifically concerning the depth of engagement as outlined in Section 5.5 (i) to (iii)
deeper analysis into each of these focus areas provides a more accurate view of the
relative big data maturity in organisations.
- It was therefore concluded preliminarily that the detailed maturity levels under
each of the big data, information and knowledge measures as detailed in
Section 5.5 (i) – (iii) need to be included within the big data, information and
knowledge dimensions as more detailed signals of maturity based on the
various levels of engagement with the big data, information and knowledge in

Conceptualisation of a big data maturity model based on organisational
decision making
2015
192
these organisations. A further complexity arose from the results concerning the
mix of structured versus unstructured data, information and knowledge, and
traditional versus big data business intelligence. These complexities were not
mentioned by Davenport et al. (1998), Glazer (1991), Goes (2014) and Kaner
and Karni (2004) at all.
In summary, the following conclusions were therefore drawn: On the surface, it seems
as if the presence of big data, information and knowledge in organisation can be used
as valid and relevant signals of maturity. More detailed levels of maturity exist within
each of these dimensions based on the depth of engagement with various datasets.
Therefore, the mere presence of big data, information and knowledge alone are not
enough to ascertain big data maturity, as the detailed nuances within each of these
dimensions need to be considered in order for a more accurate conclusion of big data
maturity to be made, according to these detailed levels of maturity under each of the
big data, information and knowledge dimensions. Strong evidence was also provided
that this measure of big data maturity cannot be considered in isolation, but should be
reviewed alongside the other measures of maturity as outlined in propositions 1,
3,4,5,6 and 7.
One of the implications of these conclusions are that the second measure of big data
maturity, defined presence of big data, information and knowledge in the organisation
can be used as a signal of big data maturity (Davenport et al., 1998; Glazer, 1991;
Goes, 2014; Kaner & Karni, 2004) and this has been extended as follows according to
the findings of this research:
- The mere presence of big data, information or knowledge in itself is not signals of
big data maturity. The specific nuances of the depth of engagement with the big
data, information and knowledge should be analysed in order for a more accurate
assessment of big data maturity to be made.
- Although it was found that the presence of big data is indicative of the lowest level of
maturity, the presence of information is indicative of higher levels of maturity and the
presence of knowledge is indicative of the highest level of maturity, the nuances
within each of these dimensions need to be considered in order for a more detailed
and accurate assessment of big data maturity to be made.
Conceptualisation of a big data maturity model based on organisational
decision making
2015
193
- There are various maturity levels under each of measures, i.e. the presence of big
data, information and knowledge as outlined in Sections 5.5 (i) to (iii).
- The big data maturity model therefore needs to be updated to include these levels of
maturity within each of the big data, information and knowledge measures as
outlined in Sections 5.5 (i) to (iii):
o Big Data: Three maturity levels for the depth of engagement of executives with
big data.
o Information: Two maturity levels for the depth of engagement of executives
with information.
o Knowledge: Three maturity levels the depth of engagement of executives with
knowledge.
It therefore is apparent that the results concur with the theory published by Davenport
et al. (1998), Glazer (1991), Goes (2014) and Kaner and Karni (2004), however none
of these authors synthesised these various data forms into a signal of maturity, nor
considered the complexities within each of the datasets. These authors also failed to
make any distinction between traditional, structured data and big data which is more
unstructured, as well as traditional business intelligence and business intelligence
based on big data.
Also, none of the knowledge-management-related maturity models by
Balasubramanian et al., (1999), Bennet & Bennet, (2008) Davenport et al. (2001),
Kaner and Karni (2004), and Desouza (2006) and Nonaka (1994) discussed the level
of depth of the engagement with the data, information and knowledge as found in the
results and outlined in the big data maturity model in this paper.
As outlined in Section 5.5 (v) it seemed as if respondents from the high share price
groups spoke more about each of the measures of data, information and knowledge
than what the lower share price groups did. One of the possible reasons for this is that
the high share price companies tended to engage more with the data in their
environments, which suggests that the link of improved big data efforts on
organisational performance as suggested by Bartram (2013), Davenport et al. (2001),
Bennet and Bennet (2008), Erickson and Rothberg (2014), Glazer (1991), McAfee and
Brynjolfsson (2012) and McKenzie et al. (2011) is valid for this study.
Conceptualisation of a big data maturity model based on organisational
decision making
2015
194
6.3 Proposition 3: Presence and sophistication of
knowledge management activities as a signal of big
data maturity
The third proposition suggested that the presence and sophistication of knowledge
management activities in the organisation can be used as a signal of big data maturity
(Balasubramanian et al., 1999).
Knowledge management was defined in the literature as “an organisational capability
that allows people in organisations, working as individual knowledge workers, or in
teams, projects, or other such communities of interest, to create, capture, share, and
leverage their collective knowledge to improve performance" (Balasubramanian et al.,
1999:145). The literature also suggested that the “collective knowledge” as used in this
definition (Balasubramanian et al., 1999:145) includes data from both conventional and
new sources, quantitative as well as qualitative data, traditional data as well as big
data, and that big data is simply an additional new form of data that is being used as
input into knowledge management frameworks, but that big data knowledge
management is also slightly different from the traditional knowledge management
principles (Bartram, 2013; McAfee & Brynjolfsson, 2012).
During the analysis of results it became clear that knowledge management activities
occur in various shapes and forms in organisations, and that the definition of
knowledge management might not be as straightforward as the literature suggested.
Based on the findings in Section 5.6 (i), it is clear that specific nuances exist for how
engaged the respondents were with the various knowledge management activities in
their organisations, such as individuals not being engaged with the knowledge
management activities at all, to being fully engaged with these activities. These
nuances can be used as an indication for the sophistication of knowledge management
activities. Thus, it can be concluded that knowledge management activities in itself is
not indicative of big data maturity, but that the depth of engagement of executives with
knowledge management activities can be used as a more accurate measure of big
data maturity.
Conceptualisation of a big data maturity model based on organisational
decision making
2015
195
Proposition 3 also stated that the absence of knowledge management activities in the
organisation is indicative of an immature organisation, and that the presence of
knowledge management activities in the organisations is indicative of a higher level of
maturity, somewhere in the middle of the maturity continuum. It was also proposed that
where knowledge management activities are present and highly sophisticated, it is
indicative of the highest level of maturity of big data analytic in the organisation
(Balasubramanian et al., 1999). According to the finding in Section 5.6 (ii), it was found
that knowledge management activities co-occurred with other measures that were
indicative of higher levels of maturity, and therefore it was concluded that the presence
of knowledge management activities in an organisation is indicative of big data
maturity. It was then also found that the various levels of depth of engagement with
knowledge management activities could be used as an indication of the sophistication
of the knowledge management activities.
Thus, it seemed as if the results supported Proposition 3, and also provided evidence
of how the sophistication of knowledge management activities could be measured. It
can therefore be concluded that the two sub-levels of maturity based on the depth of
engagement with knowledge management activities be ingested into this proposition,
so that three levels of maturity around knowledge management exist:
- Immature: No presence of knowledge management activities.
- Moderately mature: Knowledge management activities are evident, but low levels of
engagement with knowledge management activities in the organisation exist.
Individuals are aware of knowledge management activities, but cannot comment on
what the future plans or intentions are for knowledge management.
- Highest level of maturity: Knowledge management activities are evident, and
individuals are very engaged with the knowledge management activities in their
organisations, as they are able to share future plans and intentions of the knowledge
management activities.
The authors in the literature also proposed that knowledge management activities
should be investigated at every step of the decision-making process (Balasubramanian
et al., 1999). However there were no empirical findings to support their claims.
According to the findings in Section 5.6 (ii), it was concluded that the elements in
Conceptualisation of a big data maturity model based on organisational
decision making
2015
196
Propositions 1 and 2; i.e. the objects, people, processes, big data, information and
knowledge serve as enablers for the use of the data, through knowledge management
activities, during the decision-making process in Propositions 4 to 7. The results
therefore support the literature’s view that knowledge management activities occur
during the various steps of the decision-making process, and also provided strong
evidence that knowledge management should be considered alongside the pre-focus
of objects, people and processes in organisations, as well as the presence of big data,
information and knowledge in the organisation.
It was also found that the different levels of engagement with knowledge management
seemed to be consistent with the various levels of engagement with knowledge as
identified in Section 5.5 (iii). There was also an interesting similarity to the “appetite” for
big data as mentioned in Section 5.3, and therefore it seems that potential linkages
between knowledge management intent and self-classification, appetite and
commercialisation can occur. In most cases, once individuals have understood big
data, they were able to self-classify their organisation’s big data efforts as mature or
immature, and then they are able to identify the potential value of big data and seem to
be interested in exploring the various opportunities it presents through
commercialisation. This can also potentially be valid for knowledge management
activities and the intent to improve on these activities. The literature did not provide any
suggestions of these potential co-occurrences, and further empirical research is
recommended to determine the relationships between these measures better.
In summary, the following conclusions were therefore drawn: On the surface, it seems
as if the presence of knowledge management activities in organisation can be used as
a valid and relevant signal of maturity, but that the simple definition of knowledge
management as described by Balasubramanian et al. (1999) was limited. Strong
evidence was also presented that the depth of engagement with the knowledge
management activities be used as an indicator for the sophistication of knowledge
management activities. The results also strongly suggested that, instead of taking the
mere presence of knowledge management activities as indicative of big data maturity,
as suggested by Balasubramanian et al. (1999) and almost prescribes to a “ticking of
the box” manner of measurement, the depth of engagement with these knowledge
Conceptualisation of a big data maturity model based on organisational
decision making
2015
197
management activities must be considered in order for a more accurate assessment of
big data maturity to be obtained.
It was also found that knowledge management does not occur in isolation, but should
be reviewed alongside the other measures of maturity as outlined in Propositions 1, 3,
4, 5, 6 and 7 as well as the big data maturity self-classification, appetite and
commercialisation dimension. These interrelationships between the various dimensions
of maturity were totally ignored by the Balasubramanian et al. (1999).
Reflecting on the above, Proposition 3 needs to be updated as follows:
- The mere presence of knowledge management activities in itself is not a signal of
big data maturity. The specific nuances concerning the depth of engagement with
the various knowledge management activities should be analysed in order for a
more accurate assessment of big data maturity to be made based on the
sophistication of the knowledge management activities.
- The big data maturity model therefore needs to be updated to include these different
levels of engagement with knowledge management activities:
o Immature: No presence of knowledge management activities.
o Moderately mature: Knowledge management activities are evident, but low
levels of engagement with knowledge management activities in the
organisation exist. Individuals are aware of knowledge management activities,
but cannot comment on what the future plans or intentions are for knowledge
management.
o Highest level of maturity: Knowledge management activities are evident, and
individuals are very engaged with the knowledge management activities in
their organisations, as they are able to share future plans and intentions
around the knowledge management activities.
6.4 Proposition 4-7: Use of data during decision making
Propositions 4-7 related to the use of big data during decision making, and from the
literature the various steps of the decision-making process were outlined and the
Conceptualisation of a big data maturity model based on organisational
decision making
2015
198
appropriate use of data during each step was suggested.
Proposition 4 offered that the ability of decision makers within an organisation to firstly
interpret the decision complexity, before information gathering commences, can be
interpreted as a signal of maturity. An immature organisation would skip this first step
and proceed to gather information without determining the decision context and
complexity, whereas in a mature organisation the decision context and complexity
would be investigated and identified along the continuum of routine to complex
decisions upfront before information gathering commences (Balasubramanian et al.,
1999; Malakooti, 2012). During the analysis of results cues of interpreting the decision
context were found and coded accordingly. During the analysis of results evidence was
found of the interpretation of the decision context, but strong co-occurrences between
this step and the subsequent steps as outlined in Propositions 5 to 7 suggested that
the step of identifying the decision context does not occur in isolation, and should be
considered with the rest of the steps in Propositions 5 to 7. Balasubramanian et al.
(1999) suggested that in some cases, specifically based on the context, the decision
process might be longer or shorter, and in some cases some of the steps would
happen simultaneously. The findings from this research therefore supported this view
from the literature, and also delineated the types of decisions that occur with varying
use of data, from reactive to proactive and predictive decisions.
Proposition 5 recommended that, in order to ascertain an organisation’s big data
maturity about the use of big data during organisational decision making, not only the
identification of the decision context is important, but also the ability to interpret the
decision context and complexity correctly. It can therefore be inferred that the ability to
correctly interpret the decision context and complexity can be indicative of maturity.
Thus an organisation can only be viewed as mature if they have succeeded in correctly
interpreting the decision context and complexity. Should an organisation interpret the
decision context and complexity incorrectly (for example a complex situation would be
viewed as a simple, routine decision situation or a vice versa), it would be viewed as
immature (thus the presence of this step alone is not an indication of maturity)
(Balasubramanian et al., 1999; Malakooti, 2012; McKenzie et al., 2011; Prusak, 1997).
As was the case with Proposition 4, during the analysis of results evidence was found
Conceptualisation of a big data maturity model based on organisational
decision making
2015
199
of the correct interpretation of the decision context, but strong co-occurrences between
this step and the other decision-making steps as outlined in Propositions 4, 6 and 7
suggested that the step correctly identifying the decision context does not occur in
isolation, and should be considered with the rest of the steps in propositions 5 to 7.
Balasubramanian et al. (1999) suggested in the literature that in some cases,
specifically based on the context, the decision process might be longer or shorter, and
in some cases some of the steps would happen simultaneously. The findings from this
research therefore supported this view from the literature.
Proposition 6 stated that, during the information gathering step of the information
process, the ability to correctly identify the information requirements based on the
decision context can also be viewed as a signal of maturity. The correct required
information is identified based on the context in a mature organisation, for example no
information is required for simple, routine decisions and comprehensive and in-depth
information is required for complex decisions. In an immature organisation the required
information is incorrectly identified based on the context, thus there is a mismatch
between the decision complexity and the identified information requirements. For
example, during a complex decision it might be decided that no information is required,
or comprehensive information is deemed to be required during a simple, routine
decision, which is incorrect (Bennet & Bennet, 2008; Erickson & Rothberg, 2014;
George et al., 2014; Malakooti, 2012)
Similar to Propositions 4 and 5, during the analysis of results cues about the
information requirements determination based on the decision context was found and
coded accordingly and therefore empirical evidence for this was found in this research.
It was also was clear from the results that various nuances exist for how organisations
determine the information requirements, from simply gathering as much information as
possible to determining the information requirements based on the decision maker’s
intuition and lastly the information requirements being fully determined by the decision
context. These findings seem to add significant depth to this step, as originally outlined
by Balasubramanian et al. (1999), and therefore it seems as if the results from this
research seemed to not only support the literature, but then also extend the thinking
through these nuances concerning the identification of the information requirements.
Conceptualisation of a big data maturity model based on organisational
decision making
2015
200
The implication of this finding was that a mere identification of the information
requirements alone is not a sufficient measure of maturity, and that the various
nuances should be investigated to provide a more accurate and detailed view of big
data maturity.
As was also the case with Propositions 4 and 5, the strong co-occurrences between
this step and the other decision-making steps as outlined in Propositions 4, 5 and 7
suggested that the step of identifying the information requirements do not occur in
isolation, and should be considered with the rest of the steps in Propositions 5 to 7.
Balasubramanian et al. (1999) and Kaner and Karni (2004) also suggested that in
some cases, specifically based on the context, the decision-making process might be
longer or shorter, and in some cases some of the steps would happen simultaneously.
The findings from this research therefore supported this view from the literature and
also provided an additional lens through which the types of decisions can be
interpreted; namely reactive, proactive and predictive decisions.
Proposition 7 suggested that it is not only the availability of information that is
important, but the ability to effectively manage that information and knowledge
(Erickson & Rothberg, 2014) that enables users of big data to extract the possible
value from it based on the insights it can provide. This complied with George et al.'s
(2014) proposition, but the findings confirmed that this position can be expanded, to
also include the availability of the “right” relevant information during the consideration of
alternatives step, based on the specific decision context and the complexity of the
decision (Bennet & Bennet, 2008; Malakooti, 2012). During the analysis of results
several nuances were evident concerning the presentation of the right information, from
reactive analytics to absolute obsession with the “right” information being presented for
every decision.
As found in Sections 5.7 (i) and (ii), superficial evidence of the decision context being
analysed, information requirements identified based on the context and the right
information being presented based on the context in itself are not indicative of maturity,
as there are very specific nuances within some of the steps that need to be clarified in
order for a more accurate and detailed view of big data maturity to be attained. These
nuances seem to indicate a clear continuum from sorting the data, management of the
Conceptualisation of a big data maturity model based on organisational
decision making
2015
201
data and then the use of data during problem solving. When comparing this finding to
what was presented initially in the literature, it was interesting to note that although
some authors such as Balasubramanian et al. (1999) and Kaner and Karni (2004)
hinted towards a continuum in the literature, none of the authors presented a clear view
of what such a continuum will look like. This research, therefore, attempts to present
such a continuum. The various code groups were therefore synthesised into four
distinct maturity levels based on the use of big data during organisational decision
making, in order to make available a more detailed and accurate view of maturity
based on these dimensions.
In summary, the following conclusions were therefore drawn: On the surface, it seems
as if the use of big data during decision making as outlined in Propositions 4 to 7 can
be used as valid and relevant signals of maturity as initially proposed by
Balasubramanian et al. (1999) in the literature. More detailed levels of maturity exist
within each most of these steps, and therefore, evidence of the decision context being
analysed, information requirements identified based on the context and the right
information being presented based on the context in itself are not indicative of maturity,
and the nuances within some of the steps need to be clarified for a more accurate and
detailed view of big data maturity to be formed.
As a result of the abovementioned conclusion, the various measures of maturity as
stated in Propositions 4 to 7 should therefore be replaced with the five levels of
maturity according to the use of big data in decision making as outlined in Section 5.7
(ii).
6.5 Big Data Maturity Model
6.5.1 Original proposed big data maturity model
The original conceptual big data maturity model as outlined in Section 3.8 has been
included below.
Figure 28: Conceptual big data maturity model (original)
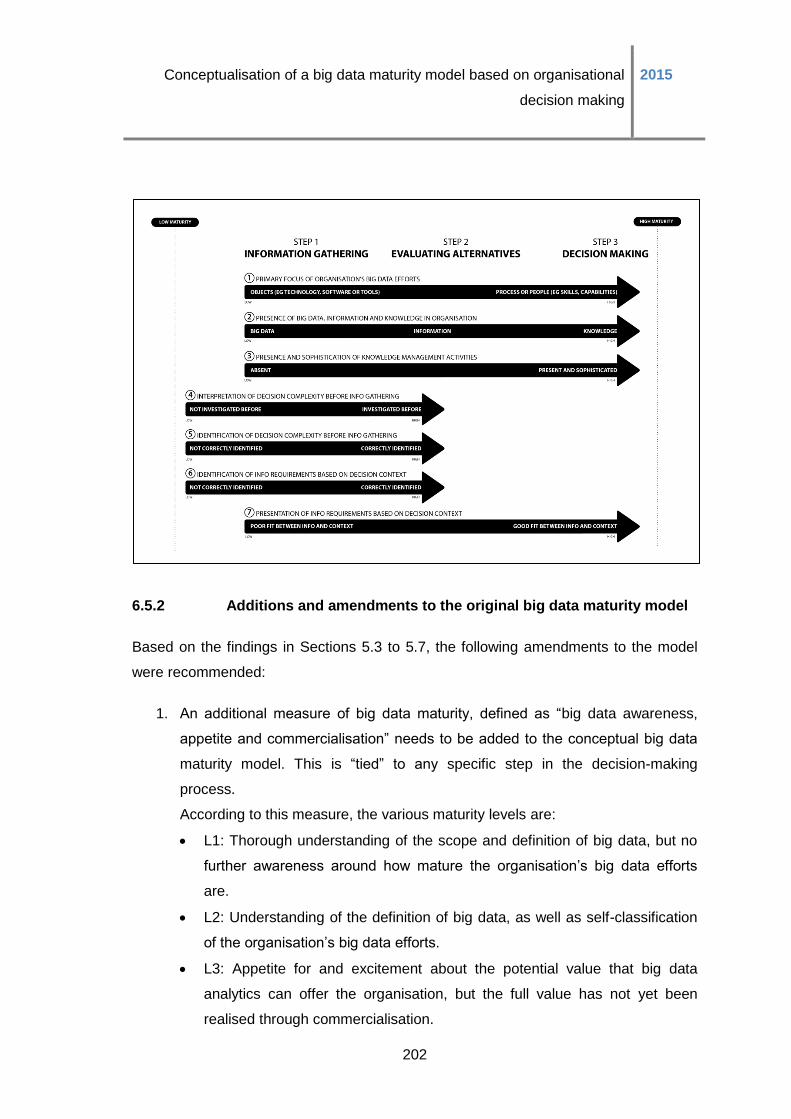
Conceptualisation of a big data maturity model based on organisational
decision making
2015
202
6.5.2 Additions and amendments to the original big data maturity model
Based on the findings in Sections 5.3 to 5.7, the following amendments to the model
were recommended:
1. An additional measure of big data maturity, defined as “big data awareness,
appetite and commercialisation” needs to be added to the conceptual big data
maturity model. This is “tied” to any specific step in the decision-making
process.
According to this measure, the various maturity levels are:
L1: Thorough understanding of the scope and definition of big data, but no
further awareness around how mature the organisation’s big data efforts
are.
L2: Understanding of the definition of big data, as well as self-classification
of the organisation’s big data efforts.
L3: Appetite for and excitement about the potential value that big data
analytics can offer the organisation, but the full value has not yet been
realised through commercialisation.
Conceptualisation of a big data maturity model based on organisational
decision making
2015
203
L4: Full value of big data has been extracted through the commercialisation
of big data in the organisation.
2. The continuum of object, people and processes has changed slightly, and more
detailed levels of maturity under each of object, people and processes have
emerged:
L1: Object focus: Lowest level of maturity.
o L1.1: No engagement
o L1.2: Some engagement
o L1.3: Deeply engaged
L2: People focus: Medium level of maturity.
o L2.1: No business readiness, no team/capacity issues, no trust
o L2.2: Some capabilities, some trust
o L2.3: Increased investment in skills
o L2.4: Teams mandate and empowerment, highest level of trust
L3: Process focus: Highest level of maturity.
o L3.1: No engagement
o L3.2: Some engagement
o L3.3: Deeply engaged
3. More detailed levels of maturity within each of big data, information and
knowledge are defined:
L1: Big data: Lowest level of maturity.
o L1.1: No engagement
o L1.2: Some engagement
o L1.3: Deeply engaged
L2: Information: Medium level of maturity.
o L2.1: No engagement
o L2.2: Engaged
L3: Knowledge: Highest level of maturity.
o L3.1: No engagement
o L3.2: Some engagement
o L3.3: Deeply engaged
Conceptualisation of a big data maturity model based on organisational
decision making
2015
204
4. More detailed levels of maturity within knowledge management activities:
L1: No engagement
L2: Engaged
Therefore the above recommended amendments to the big data conceptual model acts
as “ENABLERS”, which also needs to be illustrated on this model.
5. Propositions 5 to 7 which related to the decision making process, have been
synthesised into one continuum. Therefore the old headings of “step…” now
falls way, and these section should be renamed: “OUTPUT: USE OF DATA
DURING DECISIONS”
L1: Very little sorting of data
L2: Some sorting and management of data happens, but influenced by
experience or intuition
L3: Sorting and management of data determined by the decision context
L4: Sorting and management of data determined by the decision context
and feedback loop
L5: Predictive analytics
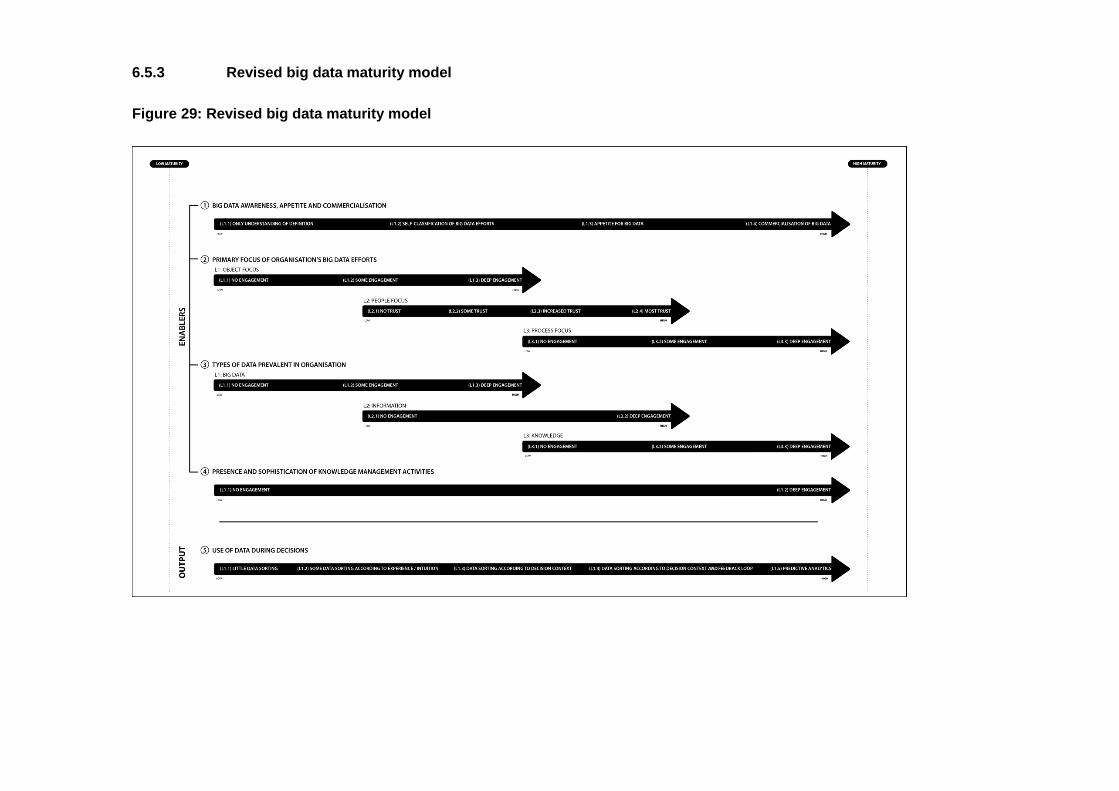
6.5.3 Revised big data maturity model
Figure 29: Revised big data maturity model
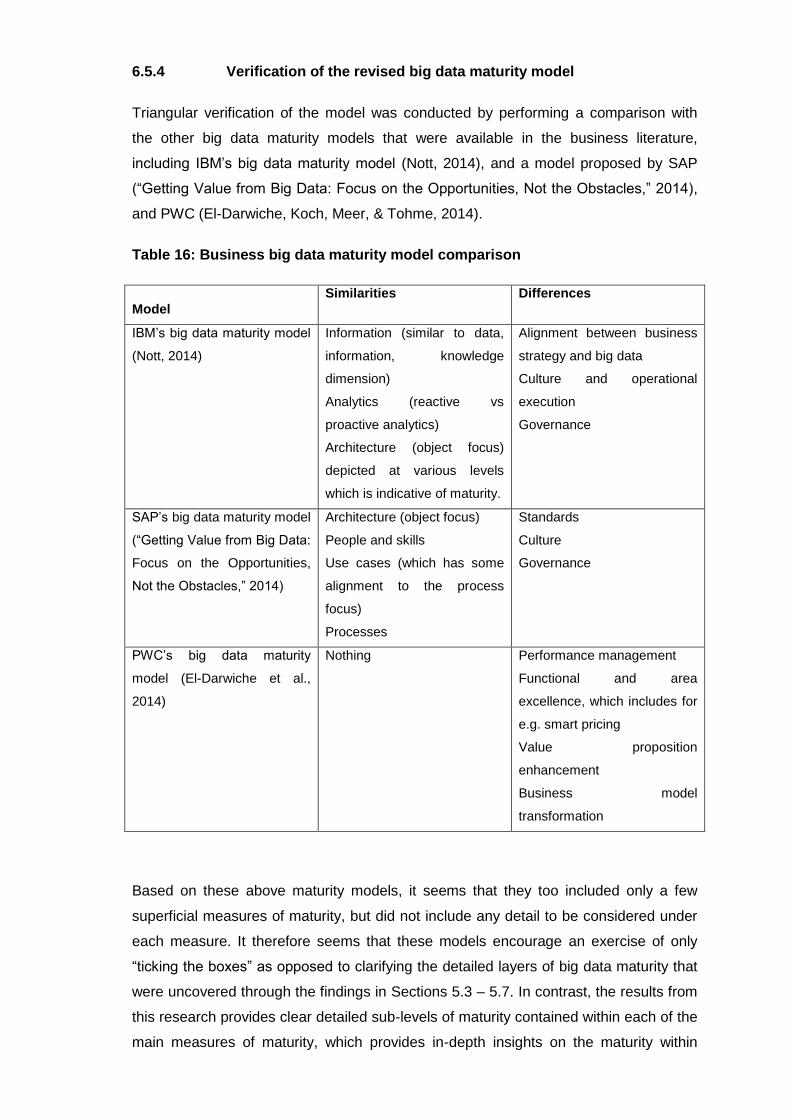
6.5.4 Verification of the revised big data maturity model
Triangular verification of the model was conducted by performing a comparison with
the other big data maturity models that were available in the business literature,
including IBM’s big data maturity model (Nott, 2014), and a model proposed by SAP
(“Getting Value from Big Data: Focus on the Opportunities, Not the Obstacles,” 2014),
and PWC (El-Darwiche, Koch, Meer, & Tohme, 2014).
Table 16: Business big data maturity model comparison
Model
Similarities Differences
IBM’s big data maturity model
(Nott, 2014)
Information (similar to data,
information, knowledge
dimension)
Analytics (reactive vs
proactive analytics)
Architecture (object focus)
depicted at various levels
which is indicative of maturity.
Alignment between business
strategy and big data
Culture and operational
execution
Governance
SAP’s big data maturity model
(“Getting Value from Big Data:
Focus on the Opportunities,
Not the Obstacles,” 2014)
Architecture (object focus)
People and skills
Use cases (which has some
alignment to the process
focus)
Processes
Standards
Culture
Governance
PWC’s big data maturity
model (El-Darwiche et al.,
2014)
Nothing Performance management
Functional and area
excellence, which includes for
e.g. smart pricing
Value proposition
enhancement
Business model
transformation
Based on these above maturity models, it seems that they too included only a few
superficial measures of maturity, but did not include any detail to be considered under
each measure. It therefore seems that these models encourage an exercise of only
“ticking the boxes” as opposed to clarifying the detailed layers of big data maturity that
were uncovered through the findings in Sections 5.3 – 5.7. In contrast, the results from
this research provides clear detailed sub-levels of maturity contained within each of the
main measures of maturity, which provides in-depth insights on the maturity within

Conceptualisation of a big data maturity model based on organisational
decision making
2015
207
each of the measures.
Conceptualisation of a big data maturity model based on organisational
decision making
2015
208
CHAPTER 7: CONCLUSION
7.1 Key Contributions
It is clear from the literature that big data analytics will be one of the biggest sources of
competitive advantage in the near future. Not all companies are equally adept at their
big data efforts, and only a few companies have been able to demonstrate examples of
how they have extracted value from their big data efforts. Therefore, the big data
maturity model presented in this research paper is the first big data maturity model
which has been grounded in theory and has been empirically tested.
It was found that the big data maturity model in Section 6.5 (iii) includes relevant
measures of maturity, based on the literature and the results from the field research as
well as commonalities with some of the big data maturity models that could be found in
the business literature. However the big data maturity model in Section 5.8 (iii) is more
comprehensive and more useful as detailed levels of maturity have been outlined
under each of the main measures of maturity.
Based on the results of this study, there is clear no consensus about the definition of
big data that exists amongst executives, which might signify a lack of maturity amongst
executives, specifically concerning the understanding of big data analytics and the
context in which it can be used in organisations. However, as the majority of the
respondents were also very interested in and open to a conversation to big data, they
exuded high levels of excitement with regard to commencing the implementation of big
data analytics in their organisations. The respondents’ reactions denote urgency and
excitement amongst executives to start better understanding big data analytics and
explore the various opportunities that it presents.
7.2 Implications for Management
The big data maturity model presented in this research paper provides a
comprehensive guide that managers can use to evaluate the maturity of their big data
Conceptualisation of a big data maturity model based on organisational
decision making
2015
209
analytical efforts, as detailed signals of maturity and various layers of maturity are
presented in the model. Through the application of the model, managers should then
also be able to identify the required activities that need to be present at each level of
maturity, which will greatly aid them in identifying how to improve their big data efforts,
i.e.: how to become more mature, and therefore how to unlock the potential value that
big data can offer.
7.3 Limitations of the Research
The researcher of this study was, at the time of the study, employed at a major
financial institution in South Africa, and therefore her interpretation of the results could
have potentially been influenced by her current organisational and situational context
and interpretation of respondents’ comments. Therefore, researcher bias could have
occurred during both the data collection process during the interviews as well as the
analysis of results.
The primary sample included only South African companies that are listed on the
Johannesburg Stock Exchange. Although it can be assumed that the results are
relevant to all large organisations in South Africa, even organisations that are listed on
other stock exchanges, the transferability of the study was not empirically tested to
ascertain its relevance to other similar larger organisations in South Africa listed on
other stock exchanges. The proposed big data maturity model was aimed towards
large organisations, and thus applicability of the model for smaller organisations such
as small and medium enterprises is unclear.
As outlined in Section 5.1 below, 10 out of the 29 respondents were from the
manufacturing industry, and therefore the results might have been influenced more by
the respondents from the manufacturing industry than the other industries. This might
have resulted in skewed results that were reported. The majority of the respondents
were also from high share price companies, and therefore as an equivalent
representation between the high and low share price were not achieved, the results
might be skewed towards the majority opinion of these respondents from the high
share price groups.
Conceptualisation of a big data maturity model based on organisational
decision making
2015
210
The geographical distribution of the sample was also heavily skewed towards Gauteng,
with 25 of the 29 respondents residing in Gauteng. This might potentially impact the
transferability of the study as the strong presence in the economic hub of South Africa
might skew the results towards greater maturity than is in fact the case.
As the interviews were conducted only in South Africa and with employees of South
African organisations, the proposed big data maturity model is particularly relevant for
South Africa businesses. Although it can be assumed that the proposed model is
relevant to other emerging markets with similar business contexts, the relevance has
not been empirically tested in this paper.
The secondary sample included C-level executives, and therefore the views or lower
level employees have been excluded. This might result in biased results as a balanced
view at all levels in the organisation was not obtained.
The definition of big data was in most cases subjective. From the interviews it was
clear that no common definition existed amongst the participants, and therefore some
of the answers from respondents might have been influenced by their personal views
and subjective perceptions of big data.
The relevance and usefulness of the proposed model was established during
qualitative interviews with South African executives. The interview feedback might have
be subjective (based on the respondents’ own experience and perceptions) which
might have resulted in response bias. By not quantitatively testing the model the extent
of the relevance and usefulness of the proposed model cannot be quantified, for
example that it is 50% useful.
The research did not address the measurement of improved decisions as a result of
the use of big data during decision making. The research also did not aim to
understand how organisations perform when measured against this model over a
period of time. Therefore, the research study did not draw any correlation or prove any
causal relationship between big data maturity and the potential benefits thereof to the
organisation in the form of improved financial performance or increased revenues.

Conceptualisation of a big data maturity model based on organisational
decision making
2015
211
The research study focused on the relationships between the variables of the big data
model in terms of correlation or causation, and therefore the interrelationship and
dependencies of the variables could not be ascertained.
The conceptual model did not consider the company culture, which can potentially
influence and impact the company’s approach to knowledge management and decision
making.
7.4 Suggestions for Future Research
As the research was conducted in South Africa, which is an emerging market, there is
an opportunity of testing the model in developed countries and identifying whether it
needs to be revised to be relevant to those markets as well.
The primary sample of this research study included only South African companies that
are listed on the Johannesburg Stock Exchange. Although it can be assumed that the
results will be relevant to all large organisations in South Africa, even organisations that
are listed on other stock exchanges, the transferability of the study was not be
empirically tested to ascertain its relevance to other similar larger organisations in
South Africa listed on other stock exchanges. The proposed big data maturity model is
aimed towards large organisations, and thus applicability of the model for smaller
organisations is unclear. Future research can test the model against small and medium
enterprises to ascertain if it will need to be modified to be relevant to small and medium
companies as well.
The secondary sample of this paper included C-level executives, and therefore the
views or lower level employees have been excluded. A strong opportunity for future
research exists for exploring how the views of lower level employees compare with the
findings from the C-level executives interviews established in this research study.
The measurement of improved decisions as a result of the use of big data during
decision making has not been addressed in this paper, and therefore there is an
opportunity to extend the findings by establishing whether a correlation exists between
big data maturity and a company’s financial performance. This will also establish
Conceptualisation of a big data maturity model based on organisational
decision making
2015
212
whether the high share price companies were deemed to be more mature in terms of
their big data efforts as a result of these companies having access to more capital that
they can use to invest in data analytics, or whether the high share price companies’
superior financial performance can be attributed to their mature big data efforts.
Further research can also be conducted to determine how organisations perform when
measured against this model over a period of time, as this research modestly proposes
that higher levels of maturity should result in improved organisational performance.
Research can also be performed to empirically determine how organisations can move
from the lower levels of maturity to higher maturity levels.
One of the new possible variables that was raised during this research related to the
ratio of old traditional data as well as big data. The possible implications would be that,
should an organisation be in possession of data (as opposed to information and
knowledge), but the data is big data and not traditional data; it can potentially influence
the maturity level ascribed to the organisation. However as the definition of big data is
very subjective and abstract, and due to the difficulties in obtaining all of the data in an
organisation to calculate the ratio between old and new datasets, this new variable has
not been included in the big data maturity model in this research study, but can be
explored further during potential future research.
The inclusion of sub-levels of maturity within each of the main levels can be empirically
tested in future research.
Although this research study provided preliminary industry findings concerning each of
the measures of maturity, a full and detailed analysis according to each of the maturity
measures can be conducted in order to map the maturity of each industry against each
dimension.
This research paper provided preliminary evidence that the various measures of
maturity do not operate in isolation but in relation to each other. The relationships
between the various measures, i.e. correlation, causation etc. can be explored in future
research.
Conceptualisation of a big data maturity model based on organisational
decision making
2015
213
In-depth research can also be conducted to explore how the commercialisation of big
data potentially influences and accelerates organisations’ big data maturity.
A detailed review of the data scientist falls out of the scope of this research and should
be considered for future research activities.
Conceptualisation of a big data maturity model based on organisational
decision making
2015
214
REFERENCES
Alavi, M., & Leidner, D. E. (2001). Review: Knowledge management and knowledge
management systems: Conceptual foundations and research issues. MIS
Quarterly, 107–136.
Atkinson, P., & Delamont, S. (2010). SAGE Qualitative Research Methods. SAGE
Publications. Retrieved from
https://books.google.co.za/books?id=L00K8q4OMA4C.
Austin, T., & Mitcham, J. (2007). Preservation and Management Strategies for
Exceptionally Large Data Formats:’Big Data’. Archaeology Data Service and
English Heritage.
Azuma, R., Daily, M., & Furmanski, C. (2006). A review of time critical decision making
models and human cognitive processes (p. 9–pp). Presented at the Aerospace
Conference, 2006 IEEE, IEEE.
Balasubramanian, P., Nochur, K., Henderson, J. C., & Kwan, M. M. (1999). Managing
process knowledge for decision support. Decision Support Systems, 27(1),
145–162.
Barbu, A. (2013). Eight Contemporary Trends in the Market Research Industry.
Management & Marketing, 8(3), 429–450.
Barnard, C. I. (1968). The functions of the executive (Vol. 11). Harvard university press.
Bartram, P. (2013). The value of data. Financial Management, 42(2), 26–31.
Becker, J., Knackstedt, R., & Pöppelbuß, D.-W. I. J. (2009). Developing maturity
models for IT management. Business & Information Systems Engineering, 1(3),
213–222.
Bellman, R. E., & Zadeh, L. A. (1970). Decision-making in a fuzzy environment.
Management Science, 17(4), B–141.
Bennett, M. (2013). The financial industry business ontology: Best practice for big data.
Journal of Banking Regulation, 14(3-4), 255–268.
http://doi.org/10.1057/jbr.2013.13
Bennet, D. & Bennet, A. (2008). The depth of knowledge: surface, shallow or deep?
VINE, 38(4), 405–420. http://doi.org/10.1108/03055720810917679.

Conceptualisation of a big data maturity model based on organisational
decision making
2015
215
Bettman, J. R., & Park, C. W. (1980). Effects of prior knowledge and experience and
phase of the choice process on consumer decision processes: A protocol
analysis. Journal of Consumer Research, 234–248.
Bilbao-Osorio, B., Dutta, S., & Lanvin, B. (2013). The Global Information Technology
Report 2014. Geneva: World Economic Forum and INSEAD. Retrieved from
http://www3.weforum.org/docs/WEF_GlobalInformationTechnology_Report_201
4.pdf.
Black, D. (1948). On the rationale of group decision-making. The Journal of Political
Economy, 23–34.
Boyce, C., & Neale, P. (2006). Conducting in-depth interviews: A guide for designing
and conducting in-depth interviews for evaluation input. Pathfinder International
Watertown, MA.
Boyd, D., & Crawford, K. (2012). Six Provocations for Big Data. SSRN Working Paper
Series. http://doi.org/10.2139/ssrn.1926431.
Bradley, J., Barbier, J., & Handler, D. (2013). Embracing the Internet of Everything to
Capture Your Share of $14.4 Trillion. (Cisco White Paper). Ciscso. Retrieved
from
http://www.cisco.com/web/about/ac79/docs/innov/IoE_Economy_Insights.pdf.
Bryant, R., Katz, R. H., & Lazowska, E. D. (2008). Big-data computing: Creating
revolutionary breakthroughs in commerce, science and society.
Burgess, R. (1989). Field Research: A Sourcebook and Field Manual (First). London
and New York: routledge.
Carson, D., Gilmore, A., Perry, C., & Gronhaug, K. (2001). Qualitative marketing
research. Sage.
Cassell, C., & Symon, G. (2004). Essential guide to qualitative methods in
organizational research. Sage.
Cates, J. E., Gill, S. S., & Zeituny, N. (2005). The Ladder of Business Intelligence
(LOBI): a framework for enterprise IT planning and architecture. International
Journal of Business Information Systems, 1(1), 220–238.
Chawla, N. V., & Davis, D. A. (2013). Bringing big data to personalized healthcare: a
patient-centered framework. Journal of General Internal Medicine, 28(3), 660–
665.
Cohen, J., Dolan, B., Dunlap, M., Hellerstein, J. M., & Welton, C. (2009). MAD skills:
Conceptualisation of a big data maturity model based on organisational
decision making
2015
216
new analysis practices for big data. Proceedings of the VLDB Endowment, 2(2),
1481–1492.
Conger, S. (2014). Knowledge Management for Information and Communications
Technologies for Development Programs in South Africa. Information
Technology for Development, 21(1), 113–134.
http://doi.org/10.1080/02681102.2014.899960.
Courtney, J. F. (2001). Decision making and knowledge management in inquiring
organizations: toward a new decision-making paradigm for DSS. Decision
Support Systems, 31(1), 17–38.
Cyert, R. M., & March, J. G. (1963). A behavioral theory of the firm. Englewood Cliffs,
NJ, 2.
Cyert, R. M., Simon, H. A., & Trow, D. B. (1956). Observation of a business decision.
The Journal of Business, 29(4), 237–248.
Davenport, T. H., Barth, P., & Bean, R. (2012). How Big Data Is Different. MIT Sloan
Management Review, 54(1), 43–46.
Davenport, T. H., De Long, D. W., & Beers, M. C. (1998). Successful knowledge
management projects. Sloan Management Review, 39(2), 43–57.
Davenport, T. H., Harris, J. G., De Long, D. W., & Jacobson, A. L. (2001). Data to
knowledge to results: Building an analytic capability. California Management
Review, 43(2), 117–138.
Desanctis, G., & Gallupe, R. B. (1987). A foundation for the study of group decision
support systems. Management Science, 33(5), 589–609.
Desouza, K. C. (2006). Knowledge Management Maturity Model: Theoretical
development and preliminary empirical testing (Ph.D.). University of Illinois at
Chicago, Ann Arbor. Retrieved from ProQuest Business Collection; ProQuest
Dissertations & Theses Global. (304948328).
Dietterich, T. G. (2000). An experimental comparison of three methods for constructing
ensembles of decision trees: Bagging, boosting, and randomization. Machine
Learning, 40(2), 139–157.
Dorussen, H., Lenz, H., & Blavoukos, S. (2005). Assessing the reliability and validity of
expert interviews. European Union Politics, 6(3), 315–337.
Edwards, W. (1954). The theory of decision making. Psychological Bulletin, 51(4), 380.
El-Darwiche, B., Koch, V., Meer, D., & Tohme, W. (2014). Big data maturity An action
Conceptualisation of a big data maturity model based on organisational
decision making
2015
217
plan for policymakers and executives. Retrieved from
http://www.strategyand.pwc.com/media/file/Strategyand_Big-data-maturity.pdf.
Erickson, S., & Rothberg, H. (2014). Big Data and Knowledge Management:
Establishing a Conceptual Foundation. Electronic Journal of Knowledge
Management, 12(2), 101–109.
Ezzy, D. (2013). Qualitative Analysis. Taylor & Francis. Retrieved from
https://books.google.co.za/books?id=CROOAQAAQBAJ.
Flick, U. (2009). An Introduction to Qualitative Research. SAGE Publications. Retrieved
from https://books.google.co.za/books?id=sFv1oWX2DoEC
FTSE/JSE Classification Structure. (2002). Retrieved from
https://www.jse.co.za/content/JSEIndexClassificationandCodesItems/FTSE-
JSE%20detailed%20sector%20schematic.pdf.
George, G., Haas, M. R., & Pentland, A. (2014, April). BIG DATA AND
MANAGEMENT. Academy of Management Journal, pp. 321–326.
Glazer, R. (1991). Marketing in an information-intensive environment: strategic
implications of knowledge as an asset. The Journal of Marketing, 1–19.
Gobble, M. (2013). Big Data: The Next Big Thing in Innovation. Research Technology
Management, 56(1), 64–66.
Goes, P. B. (2014). Big Data and IS Research. MIS Quarterly, 38(3), iii–viii.
Gosain, A., & Chugh, N. (2014). New Design Principles for Effective Knowledge
Discovery from Big Data. International Journal of Computer Applications,
96(17). http://doi.org/10.5120/16886-6904.
Guba, E. G., & Lincoln, Y. S. (1994). Competing paradigms in qualitative research.
Handbook of Qualitative Research, 2(163-194).
Guest, G., Bunce, A., & Johnson, L. (2006). How many interviews are enough? An
experiment with data saturation and variability. Field Methods, 18(1), 59–82.
Hewlett-Packard Development Company. (2013). From big data to knowledge.
Retrieved from http://www.vertica.com/wp-content/uploads/2013/03/From-big-
data-to-knowledge_interactive-4AA4-4914ENW.pdf.
Hopkins, B., & Evelson, B. (2012, February). Forrester: Big data – start small, but scale
quickly. Retrieved from http://www.computerweekly.com/opinion/Forrester-Big-
Data-Start-Small-But-Scale-Quickly.
Ho, T. K. (1998). The random subspace method for constructing decision forests.
Conceptualisation of a big data maturity model based on organisational
decision making
2015
218
Pattern Analysis and Machine Intelligence, IEEE Transactions on, 20(8), 832–
844.
Chen, H., Chiang, R. H. L., & Storey, V. C. (2012). BUSINESS INTELLIGENCE AND
ANALYTICS: FROM BIG DATA TO BIG IMPACT. MIS Quarterly, 36(4), 1165–
1188.
Huberman, A. M., & Miles, B. M. (2002). The Qualitative Researcher’s Companion.
California: Sage Publications, Inc.
ICB. (n.d.). Industry Classification Benchmark (ICB), a Single Standard Defining the
Market. Retrieved from http://www.icbenchmark.com/.
IDC Press Releases. (2014, April 17). Retrieved from
https://www.idc.com/getdoc.jsp?containerId=prUS24808014.
Kaner, M., & Karni, R. (2004). A Capability Maturity Model for Knowledge-Based
Decisionmaking. Information Knowledge Systems Management, 4(4), 225–252.
Kelliher, F. (2011). Interpretivism and the pursuit of research legitimisation: an
integrated approach to single case design. Leading Issues in Business
Research Methods, 1, 45.
Kenny, J. (2006). Strategy and the learning organization: a maturity model for the
formation of strategy. The Learning Organization, 13(4), 353–368.
http://doi.org/10.1108/09696470610667733.
Kogut, B., & Zander, U. (1992). Knowledge of the firm, combinative capabilities, and
the replication of technology. Organization Science, 3(3), 383–397.
Kohavi, R. (1995). The power of decision tables. In Machine Learning: ECML-95 (pp.
174–189). Springer.
Kothari, C. (2004). Research methodology: Methods and techniques. New Age
International.
Kumar, S. (2014, November 25). Four Common Mistakes That Can Make For A Toxic
Data Lake. Retrieved from
http://www.forbes.com/sites/ciocentral/2014/11/25/four-common-mistakes-that-
make-for-toxic-data-lakes/.
Kumar, V., Chattaraman, V., Neghina, C., Skiera, B., Aksoy, L., Buoye, A., & Henseler,
J. (2013). Data-driven services marketing in a connected world. Journal of
Service Management, 24(3), 330–352.
http://doi.org/10.1108/09564231311327021.
Conceptualisation of a big data maturity model based on organisational
decision making
2015
219
Lahrmann, G., Marx, F., Winter, R., & Wortmann, F. (2010). Business intelligence
maturity models: an overview. Presented at the VII conference of the Italian
chapter of AIS (itAIS 2010). Italian chapter of AIS, Naples.
Lahrmann, G., Marx, F., Winter, R., & Wortmann, F. (2011). Business intelligence
maturity: Development and evaluation of a theoretical model (pp. 1–10).
Presented at the System Sciences (HICSS), 2011 44th Hawaii International
Conference on, IEEE.
LaValle, S., Lesser, E., Shockley, R., Hopkins, M. S., & Kruschwitz, N. (2011). Big
Data, Analytics and the Path From Insights to Value. MIT Sloan Management
Review, 52(2), 21–32.
Liebenson, D. (2012, March 21). Big Data: Opportunity or Threat for Market Research?
Retrieved from http://www.greenbookblog.org/2012/03/21/big-data-opportunity-
or-threat-for-market-research/.
Lynch, C. (2008). Big data: How do your data grow? Nature, 455(7209), 28–29.
Malakooti, B. (2012). Decision making process: typology, intelligence, and optimization.
Journal of Intelligent Manufacturing, 23(3), 733–746.
http://doi.org/10.1007/s10845-010-0424-1.
Manyika, J., Chui, M., Brown, B., Bughin, J., Dobbs, R., Roxburgh, C., & Byers, A. H.
(2011). Big data: The next frontier for innovation, competition, and productivity.
McKinsey Global Institute. Retrieved from
http://www.mckinsey.com/Insights/MGI/Research/Technology_and_Innovation/
Big_data_The_next_frontier_for_innovation.
McAfee, A., & Brynjolfsson, E. (2012). Big Data: The Management Revolution. (cover
story). Harvard Business Review, 90(10), 60–68.
McCracken, G. (1988). The Long Interview. Newbury Park, Calif: Sage.
McKenzie, J., Christine van Winkelen, & Grewal, S. (2011). Developing organisational
decision-making capability: a knowledge manager’s guide. Journal of
Knowledge Management, 15(3), 403–421.
http://doi.org/10.1108/13673271111137402.
Mettler, T., Rohner, P., & Winter, R. (2010). Towards a classification of maturity models
in information systems. In Management of the interconnected world (pp. 333–
340). Springer.
Micheaux, A. L. (2013). Getting to the bottom of Pandora’s Box. Journal of Direct, Data
Conceptualisation of a big data maturity model based on organisational
decision making
2015
220
and Digital Marketing Practice, 14(3), 187–200.
http://doi.org/10.1057/dddmp.2012.38
Mintzberg, H., Raisinghani, D., & Theoret, A. (1976). The structure of“ unstructured”
decision processes. Administrative Science Quarterly, 246–275.
Morse, J. M., & Field, P.-A. (1995). Nursing research: The application of qualitative
approaches. Nelson Thornes.
Mochiko, T. (2015, March 5). Telecom Industry: The big squeeze. Retrieved from
http://www.financialmail.co.za/coverstory/2015/03/05/telecom-industry-the-big-
squeeze.
Murdoch T. B, & Detsky A. S. (2013). THe inevitable application of big data to health
care. JAMA, 309(13), 1351–1352. http://doi.org/10.1001/jama.2013.393.
Ndlela, L. T., & du Toit, A. S. A. (2001). Establishing a knowledge management
programme for competitive advantage in an enterprise. International Journal of
Information Management, 21(2), 151–165. http://doi.org/10.1016/S0268-
4012(01)00007-X.
New IDC Maturity Model Examines Big Data and Analytics in Financial Services.
(2014, April 17). Retrieved from
https://www.idc.com/getdoc.jsp?containerId=prUS24808014.
Nonaka, I. (1994). A dynamic theory of organizational knowledge creation.
Organization Science, 5(1), 14–37.
Nott, C. (2014, August 15). IBM Blog. Retrieved from
http://www.ibmbigdatahub.com/blog/big-data-analytics-maturity-model.
Patton, M. Q. (2002). Qualitative Research and Evaluation Methods (3rd ed.). London:
SAGE.
Plessis, M. D., & Boon, J. A. (2004). Knowledge management in eBusiness and
customer relationship management: South African case study findings.
International Journal of Information Management, 24(1), 73–86.
http://doi.org/10.1016/j.ijinfomgt.2003.10.002.
Ponterotto, J. G. (2006). Brief Note on the Origins, Evolution, and Meaning of the
Qualitative Research Concept Thick Description. The Qualitative Report, 11(3),
538–549.
Prusak, L. (1997). Knowledge in organizations. Elsevier.
Qin, H. F., & Li, Z. H. (2013). Research on the Method of Big Data Analysis.
Conceptualisation of a big data maturity model based on organisational
decision making
2015
221
Information Technology Journal, 12(10), 1974–1980.
Qin, S. J. (2014). Process Data Analytics in the Era of Big Data. AICHE JOURNAL,
60(9), 3092–3100. http://doi.org/10.1002/aic.14523.
Quinlan, J. R. (1986). Induction of decision trees. Machine Learning, 1(1), 81–106.
Raiffa, H. (1968). Decision analysis: introductory lectures on choices under uncertainty.
Rajteric, I. H. (2010). Overview of Business Intelligence Maturity Models.
Management : Journal of Contemporary Management Issues, 15(1), 47–67.
Saaty, T. L. (1996). Decision making with dependence and feedback: The analytic
network process (Vol. 4922). RWS publications Pittsburgh.
SAP Whitepaper. (2014). SAP. Retrieved from
http://www.sap.com/bin/sapcom/da_dk/downloadasset.2014-04-apr-30-
12.getting-value-from-big-data-focus-on-the-opportunities-not-the-obstacles-
pdf.html.
SAS Whitepaper. (2014). SAS Institute. Retrieved from
http://www.sas.com/content/dam/SAS/en_us/doc/whitepaper1/big-data-meets-
big-data-analytics-105777.pdf.
Saunders, M., & Lewis, P. (2012). Doing Research in Business & Management. An
Essential Guide to Planning your Project. England: Pearson Education Limited.
Seddon, H. (2013, March). What is QlikView and What makes it Unique. Presented at
the Business Discovery World Tour, Mumbai. Retrieved from
http://www.slideshare.net/QlikView-India/what-is-qlik-view-and-what-makes-it-
unique.
ShareData Online Sector Index. (2015). Retrieved from
http://www.sharedata.co.za/index/i_sector.htm.
Simon, H. A. (1959). Theories of decision-making in economics and behavioral
science. The American Economic Review, 253–283.
Slovic, P., Fischhoff, B., & Lichtenstein, S. (1977). Behavioral decision theory. Annual
Review of Psychology, 28(1), 1–39.
Sprague Jr, R. H. (1980). A framework for the development of decision support
systems. MIS Quarterly, 1–26.
Sterman, J. D. (1989). Modeling managerial behavior: Misperceptions of feedback in a
dynamic decision making experiment. Management Science, 35(3), 321–339.
Strenger, L. (2008). Coping with“ Big Data” Growing Pains. Business Intelligence
Conceptualisation of a big data maturity model based on organisational
decision making
2015
222
Journal, 13(4), 45–52.
Swaelens, B. (2007). Hybrid data structures for graphics programs.
Terhanian, G. (2013). Hiring the researchers of Tomorrow. Marketing Insights, 25(1),
42–47.
Turban, E. (1990). Decision support and expert systems: management support
systems. Prentice Hall PTR.
Venter, P., & Tustin, D. (2009). The availability and use of competitive and business
intelligence in South African business organisations. Southern African Business
Review, 13(2).
Vriens, M., & Brazell, J. D. (2013). The Competitive Advantage. Marketing Insights,
25(3), 32–38.
Wang, G., & Hu, F. (2007). Quick knowledge reduction based on divide and conquer
method in huge data sets (pp. 312–315). Presented at the Proceedings of the
2nd international conference on pattern recognition and machine intelligence,
Springer-Verlag.
Wen, D., Guo-min, G., Tian-jun, W., & Xin-ju, Y. (2013). Organization and Management
of Meteorological Sensor Network Collected Big Data. Information Technology
Journal, 12(22), 6636–6640.
Wiig, K. M. (1997). Knowledge management: where did it come from and where will it
go? Expert Systems with Applications, 13(1), 1–14.
Williams, N., & Thomann, J. (2003). BI Maturity and ROI: How Does Your Organization
Measure Up? Decision Path.
Wu, X., Zhu, X., Wu, G.-Q., & Ding, W. (2014). Data mining with big data. Knowledge
and Data Engineering, IEEE Transactions on, 26(1), 97–107.
Zhong, Y., Zhang, L., Xing, S., Li, F., & Beili Wan. (2014). The Big Data Processing
Algorithm for Water Environment Monitoring of the Three Gorges Reservoir
Area. Abstract and Applied Analysis. http://doi.org/10.1155/2014/698632.
Conceptualisation of a big data maturity model based on organisational
decision making
2015
254
Appendix 2: Interview Guide
Biographical and background questions:
Grand tour question: Tell me about your role at <company>
Planned prompt: What are some of your key roles at responsibilities?
Planned prompt: What is your title and in which department do you report into?
Company background and company culture:
Grand tour question: Tell me about how things work at <company> in terms of the day
to day operations?
Planned prompt: What are some of the organisational values?
Planned prompt: How will you describe <organisations>’s culture?
General big data:
Grand tour question: What are your views on big data analytics?
Object, People and Process Focus (Proposition 1):
Grand tour question: Can you tell me about how <organisation>’s approaches data
analytics?
Planned prompt: How is data analytics enabled in <organisation>?
Planned prompt: How do you use systems and tools to enable data analytics?
Planned prompt: Can you tell me about any data analytical processes that are in
place?
Planned prompt: How about the people that work with big data analytics?
Conceptualisation of a big data maturity model based on organisational
decision making
2015
255
Planned prompt: Tell me about the types of reports that normally pass your and the
types of information they contain? (Trying to ascertain data, information, and
knowledge)
Data, Information and Knowledge Management (Proposition 2 and 3):
Grand tour question: Can you tell me about how data is being creation, acquired, and
used in <organisation>?
Planned prompt: Do you mostly use raw data?
Planned prompt: How about graphs and tables?
Planned prompt: Does any of the reports includes insights and recommendations?
Use of data during decision making (Proposition 4-7):
Grand tour question: Can you tell me about decision making is typically done in
<organisation>?
Planned prompt: How are problems being identified?
Planned prompt: How are the problems being solved?
Planned prompt: Do you have any other comments around how data is being used
during the decision making process?
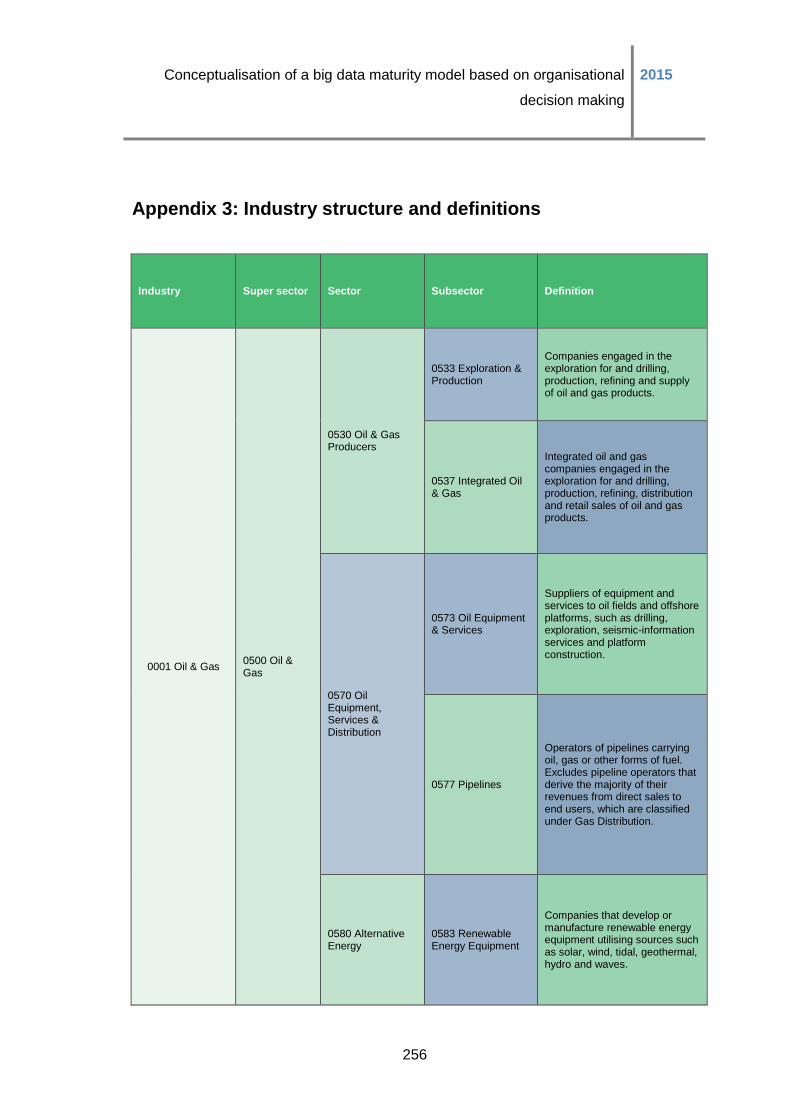
Conceptualisation of a big data maturity model based on organisational
decision making
2015
256
Appendix 3: Industry structure and definitions
Industry Super sector Sector Subsector Definition
0001 Oil & Gas 0500 Oil & Gas
0530 Oil & Gas Producers
0533 Exploration & Production
Companies engaged in the exploration for and drilling, production, refining and supply of oil and gas products.
0537 Integrated Oil & Gas
Integrated oil and gas companies engaged in the exploration for and drilling, production, refining, distribution and retail sales of oil and gas products.
0570 Oil Equipment, Services & Distribution
0573 Oil Equipment & Services
Suppliers of equipment and services to oil fields and offshore platforms, such as drilling, exploration, seismic-information services and platform construction.
0577 Pipelines
Operators of pipelines carrying oil, gas or other forms of fuel. Excludes pipeline operators that derive the majority of their revenues from direct sales to end users, which are classified under Gas Distribution.
0580 Alternative Energy
0583 Renewable Energy Equipment
Companies that develop or manufacture renewable energy equipment utilising sources such as solar, wind, tidal, geothermal, hydro and waves.
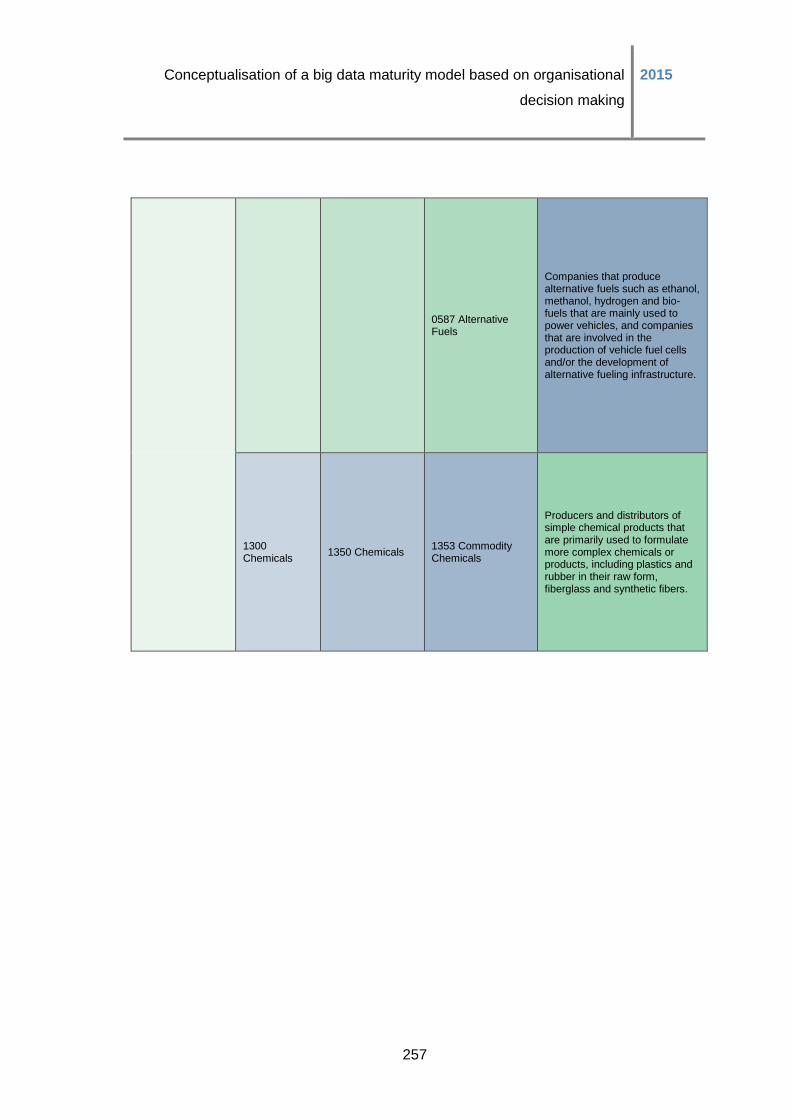
Conceptualisation of a big data maturity model based on organisational
decision making
2015
257
0587 Alternative Fuels
Companies that produce alternative fuels such as ethanol, methanol, hydrogen and bio-fuels that are mainly used to power vehicles, and companies that are involved in the production of vehicle fuel cells and/or the development of alternative fueling infrastructure.
1300 Chemicals
1350 Chemicals 1353 Commodity Chemicals
Producers and distributors of simple chemical products that are primarily used to formulate more complex chemicals or products, including plastics and rubber in their raw form, fiberglass and synthetic fibers.
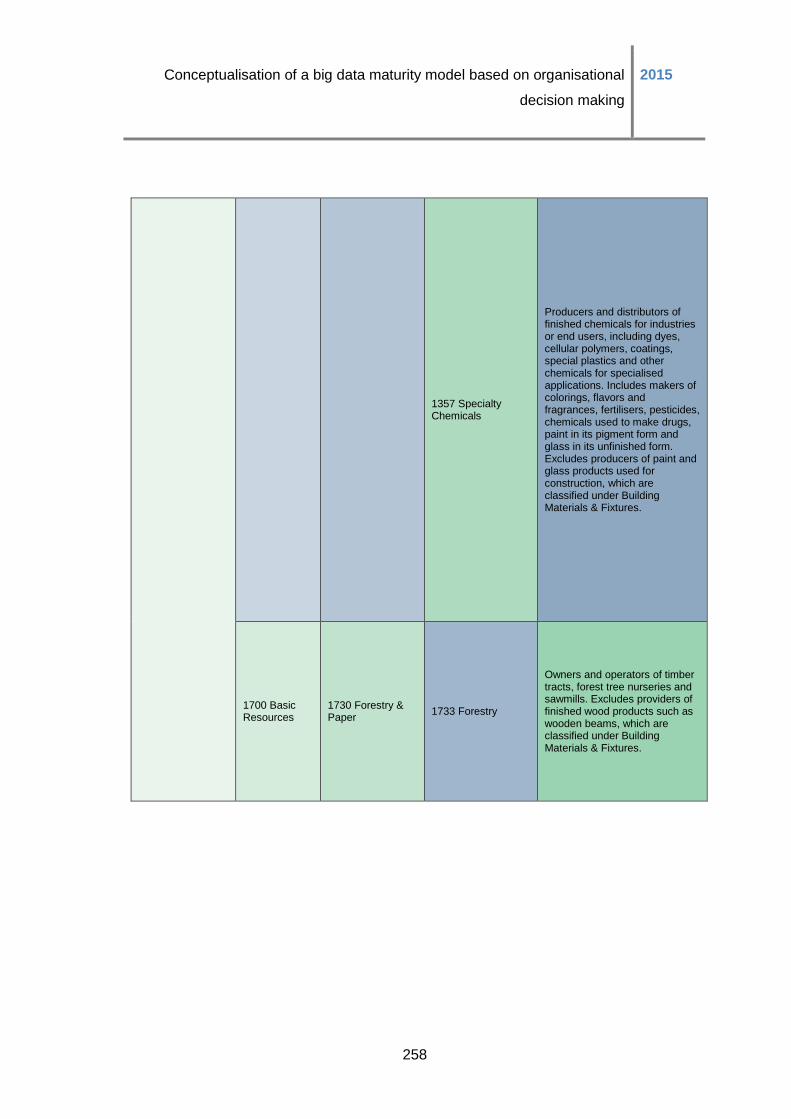
Conceptualisation of a big data maturity model based on organisational
decision making
2015
258
1357 Specialty Chemicals
Producers and distributors of finished chemicals for industries or end users, including dyes, cellular polymers, coatings, special plastics and other chemicals for specialised applications. Includes makers of colorings, flavors and fragrances, fertilisers, pesticides, chemicals used to make drugs, paint in its pigment form and glass in its unfinished form. Excludes producers of paint and glass products used for construction, which are classified under Building Materials & Fixtures.
1700 Basic Resources
1730 Forestry & Paper
1733 Forestry
Owners and operators of timber tracts, forest tree nurseries and sawmills. Excludes providers of finished wood products such as wooden beams, which are classified under Building Materials & Fixtures.
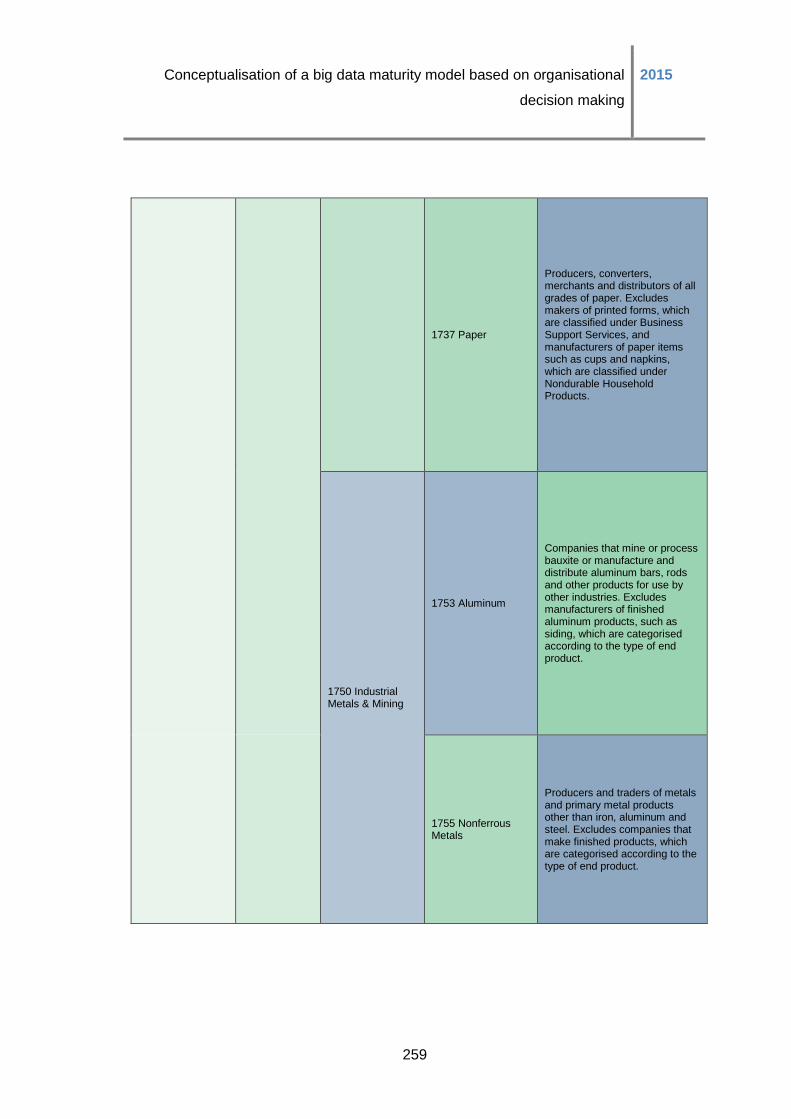
Conceptualisation of a big data maturity model based on organisational
decision making
2015
259
1737 Paper
Producers, converters, merchants and distributors of all grades of paper. Excludes makers of printed forms, which are classified under Business Support Services, and manufacturers of paper items such as cups and napkins, which are classified under Nondurable Household Products.
1750 Industrial Metals & Mining
1753 Aluminum
Companies that mine or process bauxite or manufacture and distribute aluminum bars, rods and other products for use by other industries. Excludes manufacturers of finished aluminum products, such as siding, which are categorised according to the type of end product.
1755 Nonferrous Metals
Producers and traders of metals and primary metal products other than iron, aluminum and steel. Excludes companies that make finished products, which are categorised according to the type of end product.
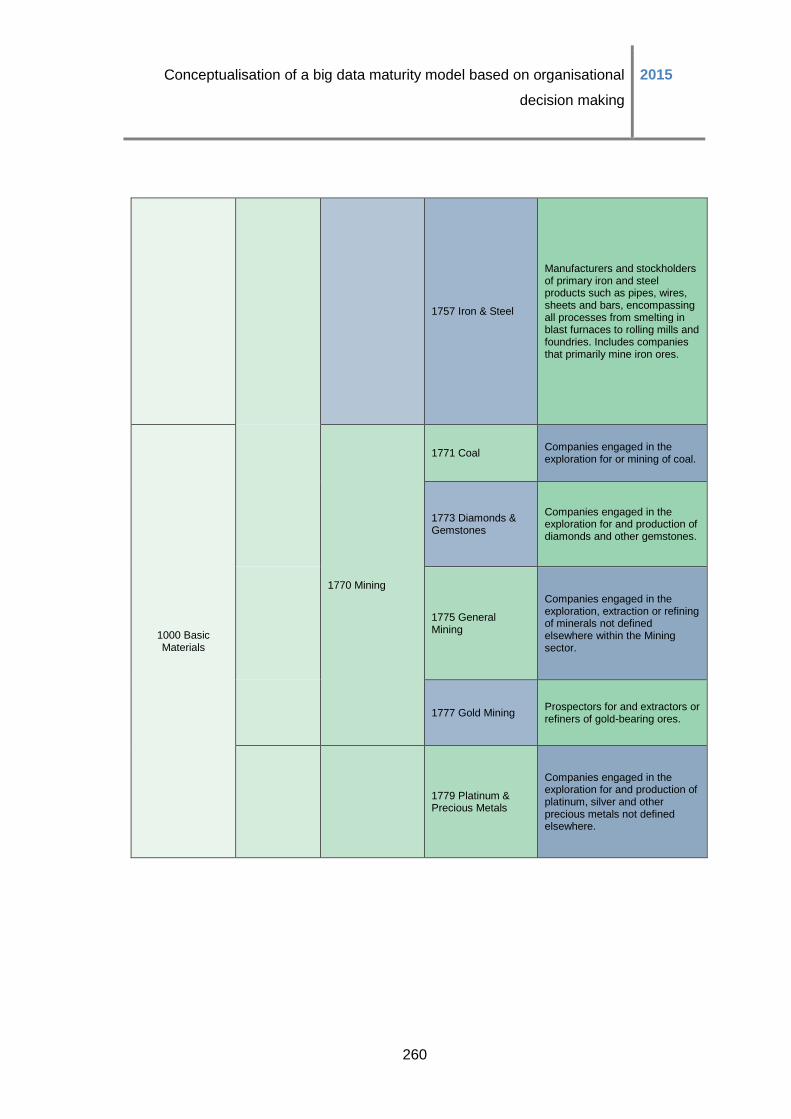
Conceptualisation of a big data maturity model based on organisational
decision making
2015
260
1757 Iron & Steel
Manufacturers and stockholders of primary iron and steel products such as pipes, wires, sheets and bars, encompassing all processes from smelting in blast furnaces to rolling mills and foundries. Includes companies that primarily mine iron ores.
1000 Basic Materials
1770 Mining
1771 Coal Companies engaged in the exploration for or mining of coal.
1773 Diamonds & Gemstones
Companies engaged in the exploration for and production of diamonds and other gemstones.
1775 General Mining
Companies engaged in the exploration, extraction or refining of minerals not defined elsewhere within the Mining sector.
1777 Gold Mining Prospectors for and extractors or refiners of gold-bearing ores.
1779 Platinum & Precious Metals
Companies engaged in the exploration for and production of platinum, silver and other precious metals not defined elsewhere.
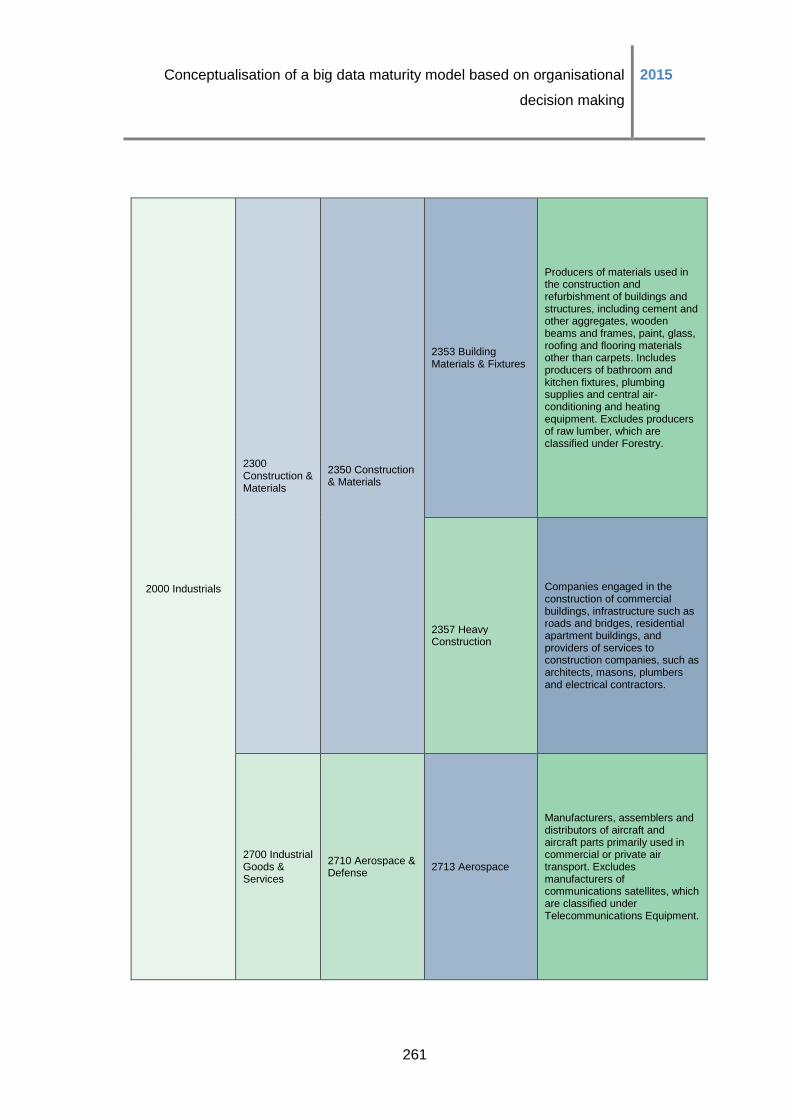
Conceptualisation of a big data maturity model based on organisational
decision making
2015
261
2000 Industrials
2300 Construction & Materials
2350 Construction & Materials
2353 Building Materials & Fixtures
Producers of materials used in the construction and refurbishment of buildings and structures, including cement and other aggregates, wooden beams and frames, paint, glass, roofing and flooring materials other than carpets. Includes producers of bathroom and kitchen fixtures, plumbing supplies and central air-conditioning and heating equipment. Excludes producers of raw lumber, which are classified under Forestry.
2357 Heavy Construction
Companies engaged in the construction of commercial buildings, infrastructure such as roads and bridges, residential apartment buildings, and providers of services to construction companies, such as architects, masons, plumbers and electrical contractors.
2700 Industrial Goods & Services
2710 Aerospace & Defense
2713 Aerospace
Manufacturers, assemblers and distributors of aircraft and aircraft parts primarily used in commercial or private air transport. Excludes manufacturers of communications satellites, which are classified under Telecommunications Equipment.
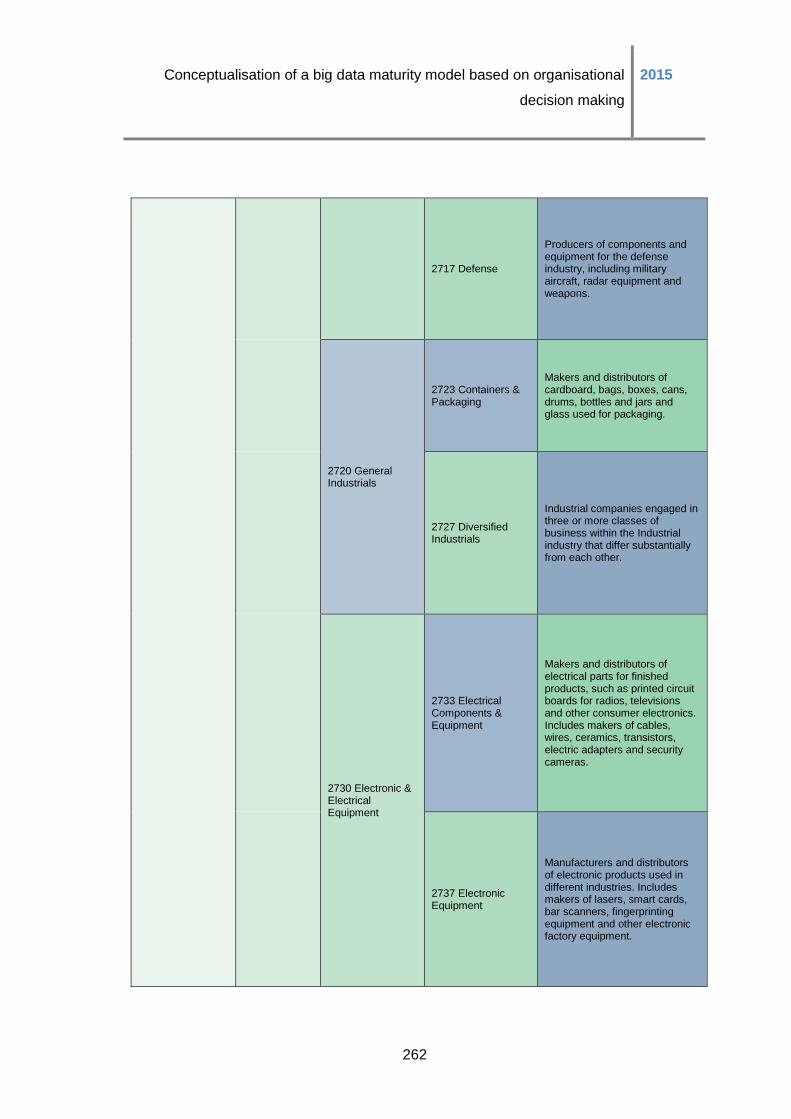
Conceptualisation of a big data maturity model based on organisational
decision making
2015
262
2717 Defense
Producers of components and equipment for the defense industry, including military aircraft, radar equipment and weapons.
2720 General Industrials
2723 Containers & Packaging
Makers and distributors of cardboard, bags, boxes, cans, drums, bottles and jars and glass used for packaging.
2727 Diversified Industrials
Industrial companies engaged in three or more classes of business within the Industrial industry that differ substantially from each other.
2730 Electronic & Electrical Equipment
2733 Electrical Components & Equipment
Makers and distributors of electrical parts for finished products, such as printed circuit boards for radios, televisions and other consumer electronics. Includes makers of cables, wires, ceramics, transistors, electric adapters and security cameras.
2737 Electronic Equipment
Manufacturers and distributors of electronic products used in different industries. Includes makers of lasers, smart cards, bar scanners, fingerprinting equipment and other electronic factory equipment.
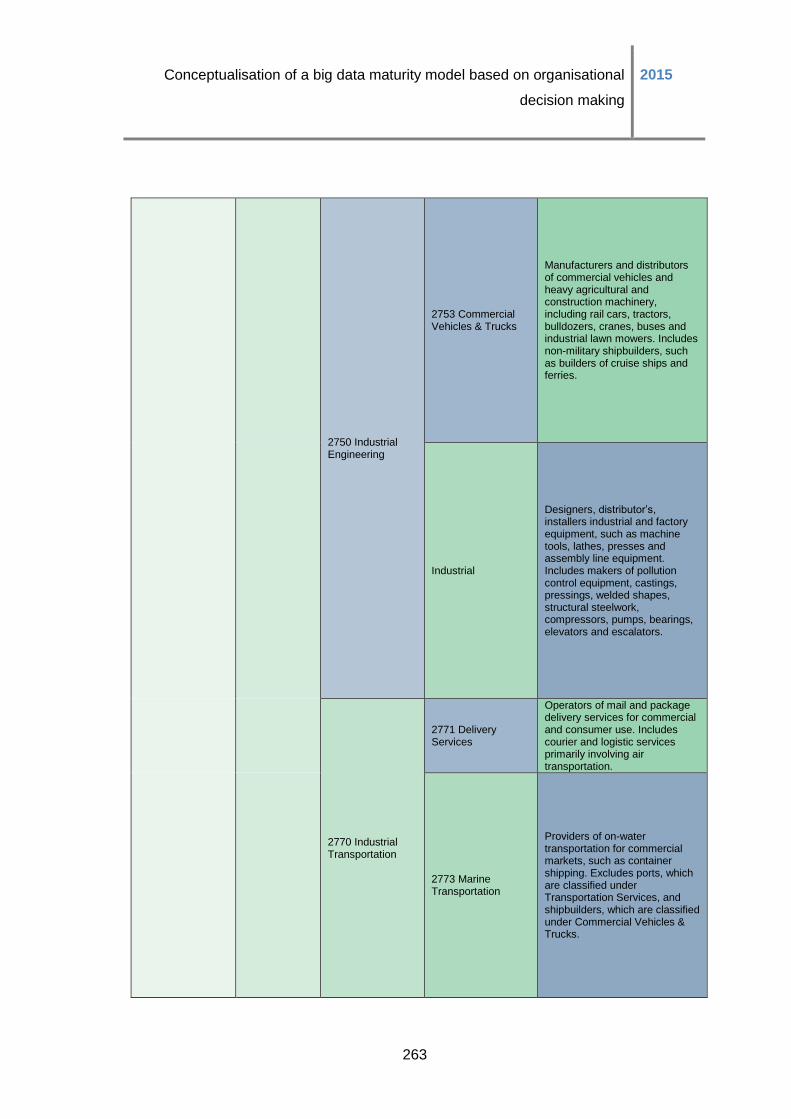
Conceptualisation of a big data maturity model based on organisational
decision making
2015
263
2750 Industrial Engineering
2753 Commercial Vehicles & Trucks
Manufacturers and distributors of commercial vehicles and heavy agricultural and construction machinery, including rail cars, tractors, bulldozers, cranes, buses and industrial lawn mowers. Includes non-military shipbuilders, such as builders of cruise ships and ferries.
Industrial
Designers, distributor’s, installers industrial and factory equipment, such as machine tools, lathes, presses and assembly line equipment. Includes makers of pollution control equipment, castings, pressings, welded shapes, structural steelwork, compressors, pumps, bearings, elevators and escalators.
2770 Industrial Transportation
2771 Delivery Services
Operators of mail and package delivery services for commercial and consumer use. Includes courier and logistic services primarily involving air transportation.
2773 Marine Transportation
Providers of on-water transportation for commercial markets, such as container shipping. Excludes ports, which are classified under Transportation Services, and shipbuilders, which are classified under Commercial Vehicles & Trucks.
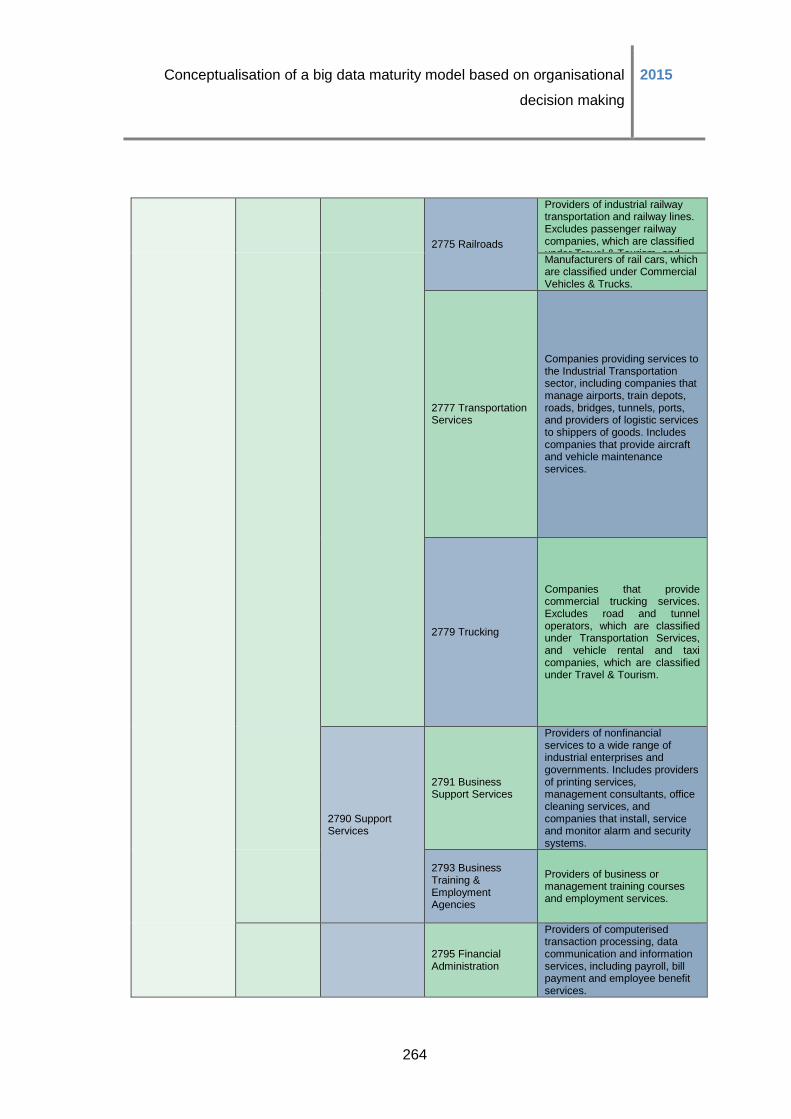
Conceptualisation of a big data maturity model based on organisational
decision making
2015
264
2775 Railroads
Providers of industrial railway transportation and railway lines. Excludes passenger railway companies, which are classified under Travel & Tourism, and Manufacturers of rail cars, which are classified under Commercial Vehicles & Trucks.
2777 Transportation Services
Companies providing services to the Industrial Transportation sector, including companies that manage airports, train depots, roads, bridges, tunnels, ports, and providers of logistic services to shippers of goods. Includes companies that provide aircraft and vehicle maintenance services.
2779 Trucking
Companies that provide commercial trucking services. Excludes road and tunnel operators, which are classified under Transportation Services, and vehicle rental and taxi companies, which are classified under Travel & Tourism.
2790 Support Services
2791 Business Support Services
Providers of nonfinancial services to a wide range of industrial enterprises and governments. Includes providers of printing services, management consultants, office cleaning services, and companies that install, service and monitor alarm and security systems.
2793 Business Training & Employment Agencies
Providers of business or management training courses and employment services.
2795 Financial Administration
Providers of computerised transaction processing, data communication and information services, including payroll, bill payment and employee benefit services.
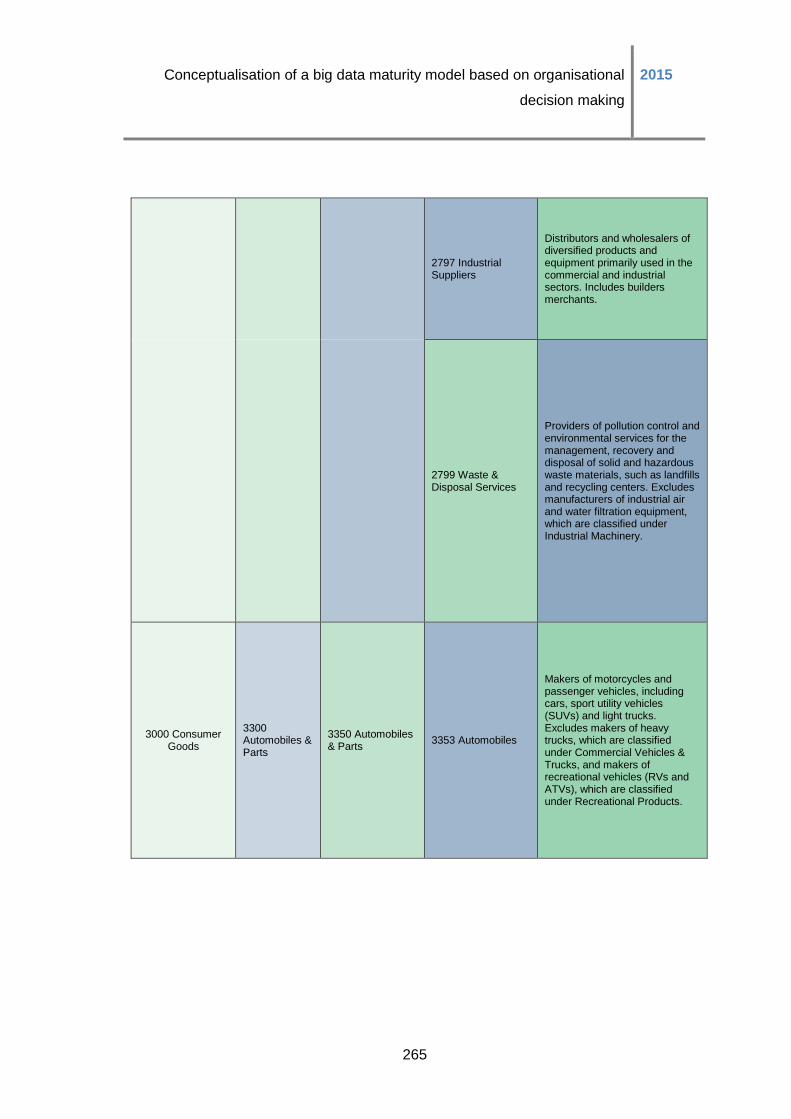
Conceptualisation of a big data maturity model based on organisational
decision making
2015
265
2797 Industrial Suppliers
Distributors and wholesalers of diversified products and equipment primarily used in the commercial and industrial sectors. Includes builders merchants.
2799 Waste & Disposal Services
Providers of pollution control and environmental services for the management, recovery and disposal of solid and hazardous waste materials, such as landfills and recycling centers. Excludes manufacturers of industrial air and water filtration equipment, which are classified under Industrial Machinery.
3000 Consumer Goods
3300 Automobiles & Parts
3350 Automobiles & Parts
3353 Automobiles
Makers of motorcycles and passenger vehicles, including cars, sport utility vehicles (SUVs) and light trucks. Excludes makers of heavy trucks, which are classified under Commercial Vehicles & Trucks, and makers of recreational vehicles (RVs and ATVs), which are classified under Recreational Products.
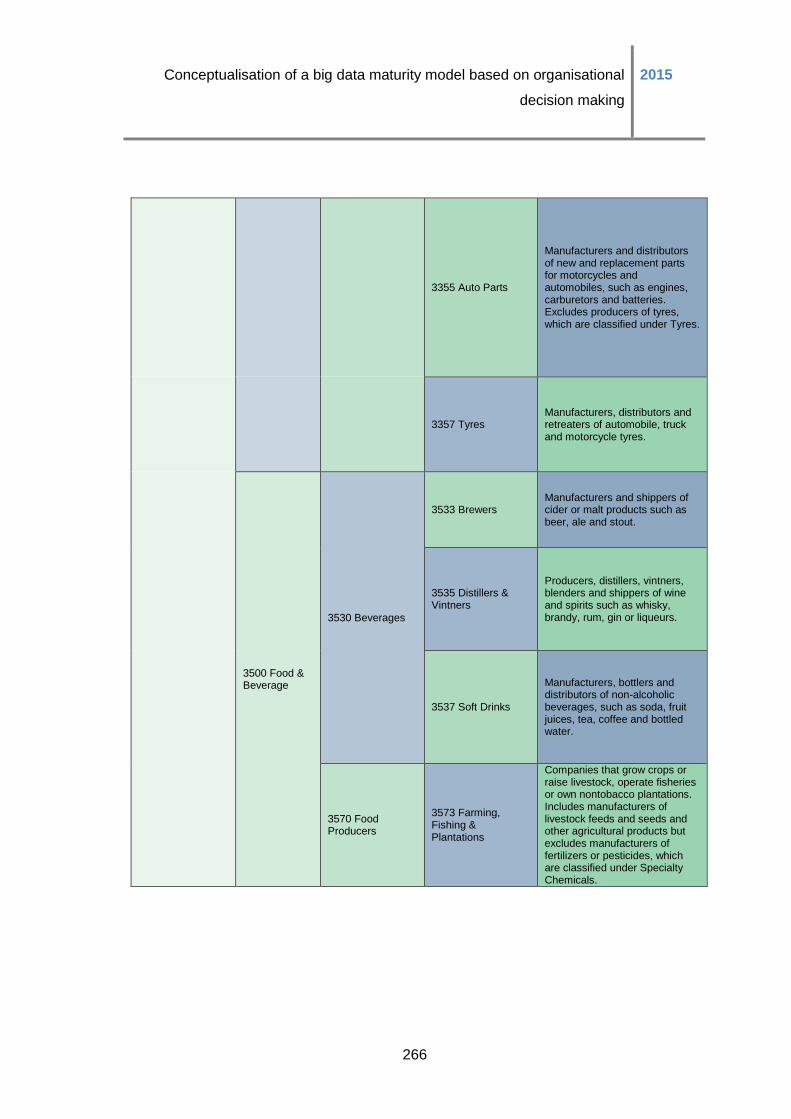
Conceptualisation of a big data maturity model based on organisational
decision making
2015
266
3355 Auto Parts
Manufacturers and distributors of new and replacement parts for motorcycles and automobiles, such as engines, carburetors and batteries. Excludes producers of tyres, which are classified under Tyres.
3357 Tyres Manufacturers, distributors and retreaters of automobile, truck and motorcycle tyres.
3500 Food & Beverage
3530 Beverages
3533 Brewers Manufacturers and shippers of cider or malt products such as beer, ale and stout.
3535 Distillers & Vintners
Producers, distillers, vintners, blenders and shippers of wine and spirits such as whisky, brandy, rum, gin or liqueurs.
3537 Soft Drinks
Manufacturers, bottlers and distributors of non-alcoholic beverages, such as soda, fruit juices, tea, coffee and bottled water.
3570 Food Producers
3573 Farming, Fishing & Plantations
Companies that grow crops or raise livestock, operate fisheries or own nontobacco plantations. Includes manufacturers of livestock feeds and seeds and other agricultural products but excludes manufacturers of fertilizers or pesticides, which are classified under Specialty Chemicals.
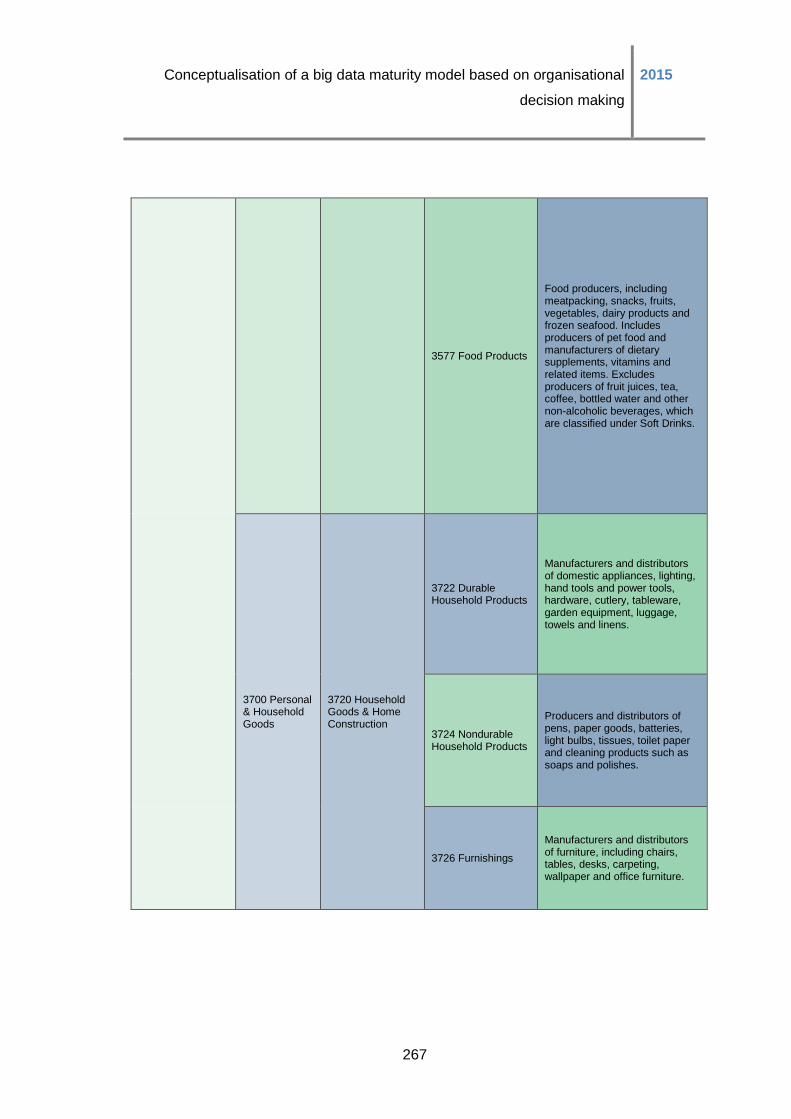
Conceptualisation of a big data maturity model based on organisational
decision making
2015
267
3577 Food Products
Food producers, including meatpacking, snacks, fruits, vegetables, dairy products and frozen seafood. Includes producers of pet food and manufacturers of dietary supplements, vitamins and related items. Excludes producers of fruit juices, tea, coffee, bottled water and other non-alcoholic beverages, which are classified under Soft Drinks.
3700 Personal & Household Goods
3720 Household Goods & Home Construction
3722 Durable Household Products
Manufacturers and distributors of domestic appliances, lighting, hand tools and power tools, hardware, cutlery, tableware, garden equipment, luggage, towels and linens.
3724 Nondurable Household Products
Producers and distributors of pens, paper goods, batteries, light bulbs, tissues, toilet paper and cleaning products such as soaps and polishes.
3726 Furnishings
Manufacturers and distributors of furniture, including chairs, tables, desks, carpeting, wallpaper and office furniture.

Conceptualisation of a big data maturity model based on organisational
decision making
2015
268
3728 Home Construction
Constructors of residential homes, including manufacturers of mobile and prefabricated homes intended for use in one place.
3740 Leisure Goods
3743 Consumer Electronics
Manufacturers and distributors of consumer electronics, such as TVs, VCRs, DVD players, audio equipment, cable boxes, calculators and camcorders.
3745 Recreational Products
Manufacturers and distributors of recreational equipment. Includes musical instruments, photographic equipment and supplies, RVs, ATVs and marine recreational vehicles such as yachts, dinghies and speedboats.
3747 Toys
Manufacturers and distributors of toys and video/computer games, including such toys and games as playing cards, board games, stuffed animals and dolls.
3760 Personal Goods
3763 Clothing & Accessories
Manufacturers and distributors of all types of clothing, jewelry, watches or textiles. Includes sportswear, sunglasses, eyeglass frames, leather clothing and goods, and processors of hides and skins.
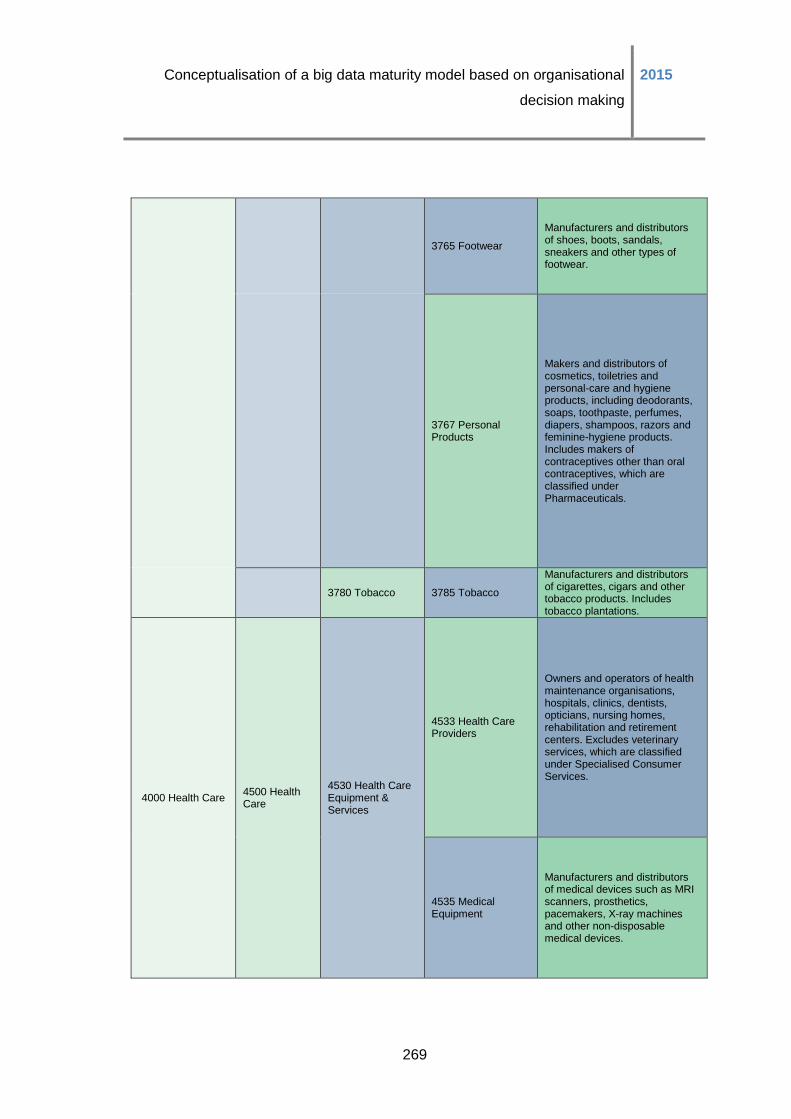
Conceptualisation of a big data maturity model based on organisational
decision making
2015
269
3765 Footwear
Manufacturers and distributors of shoes, boots, sandals, sneakers and other types of footwear.
3767 Personal Products
Makers and distributors of cosmetics, toiletries and personal-care and hygiene products, including deodorants, soaps, toothpaste, perfumes, diapers, shampoos, razors and feminine-hygiene products. Includes makers of contraceptives other than oral contraceptives, which are classified under Pharmaceuticals.
3780 Tobacco 3785 Tobacco
Manufacturers and distributors of cigarettes, cigars and other tobacco products. Includes tobacco plantations.
4000 Health Care 4500 Health Care
4530 Health Care Equipment & Services
4533 Health Care Providers
Owners and operators of health maintenance organisations, hospitals, clinics, dentists, opticians, nursing homes, rehabilitation and retirement centers. Excludes veterinary services, which are classified under Specialised Consumer Services.
4535 Medical Equipment
Manufacturers and distributors of medical devices such as MRI scanners, prosthetics, pacemakers, X-ray machines and other non-disposable medical devices.
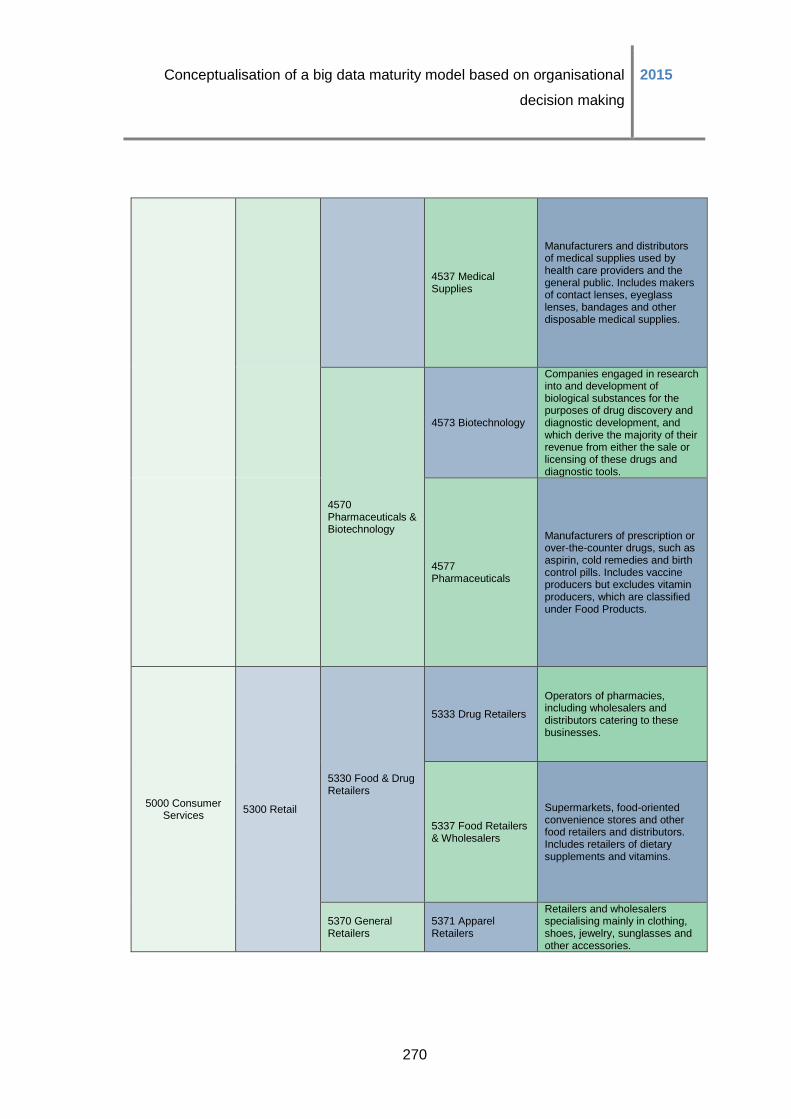
Conceptualisation of a big data maturity model based on organisational
decision making
2015
270
4537 Medical Supplies
Manufacturers and distributors of medical supplies used by health care providers and the general public. Includes makers of contact lenses, eyeglass lenses, bandages and other disposable medical supplies.
4570 Pharmaceuticals & Biotechnology
4573 Biotechnology
Companies engaged in research into and development of biological substances for the purposes of drug discovery and diagnostic development, and which derive the majority of their revenue from either the sale or licensing of these drugs and diagnostic tools.
4577 Pharmaceuticals
Manufacturers of prescription or over-the-counter drugs, such as aspirin, cold remedies and birth control pills. Includes vaccine producers but excludes vitamin producers, which are classified under Food Products.
5000 Consumer Services
5300 Retail
5330 Food & Drug Retailers
5333 Drug Retailers
Operators of pharmacies, including wholesalers and distributors catering to these businesses.
5337 Food Retailers & Wholesalers
Supermarkets, food-oriented convenience stores and other food retailers and distributors. Includes retailers of dietary supplements and vitamins.
5370 General Retailers
5371 Apparel Retailers
Retailers and wholesalers specialising mainly in clothing, shoes, jewelry, sunglasses and other accessories.
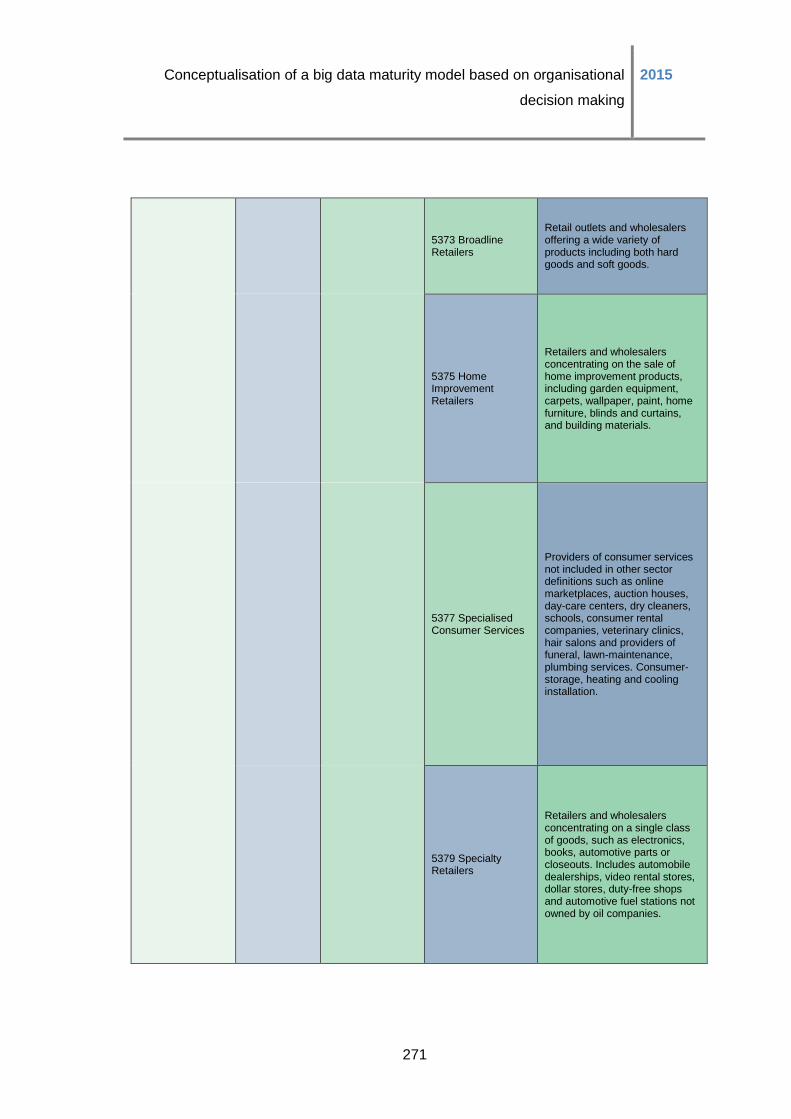
Conceptualisation of a big data maturity model based on organisational
decision making
2015
271
5373 Broadline Retailers
Retail outlets and wholesalers offering a wide variety of products including both hard goods and soft goods.
5375 Home Improvement Retailers
Retailers and wholesalers concentrating on the sale of home improvement products, including garden equipment, carpets, wallpaper, paint, home furniture, blinds and curtains, and building materials.
5377 Specialised Consumer Services
Providers of consumer services not included in other sector definitions such as online marketplaces, auction houses, day-care centers, dry cleaners, schools, consumer rental companies, veterinary clinics, hair salons and providers of funeral, lawn-maintenance, plumbing services. Consumer-storage, heating and cooling installation.
5379 Specialty Retailers
Retailers and wholesalers concentrating on a single class of goods, such as electronics, books, automotive parts or closeouts. Includes automobile dealerships, video rental stores, dollar stores, duty-free shops and automotive fuel stations not owned by oil companies.
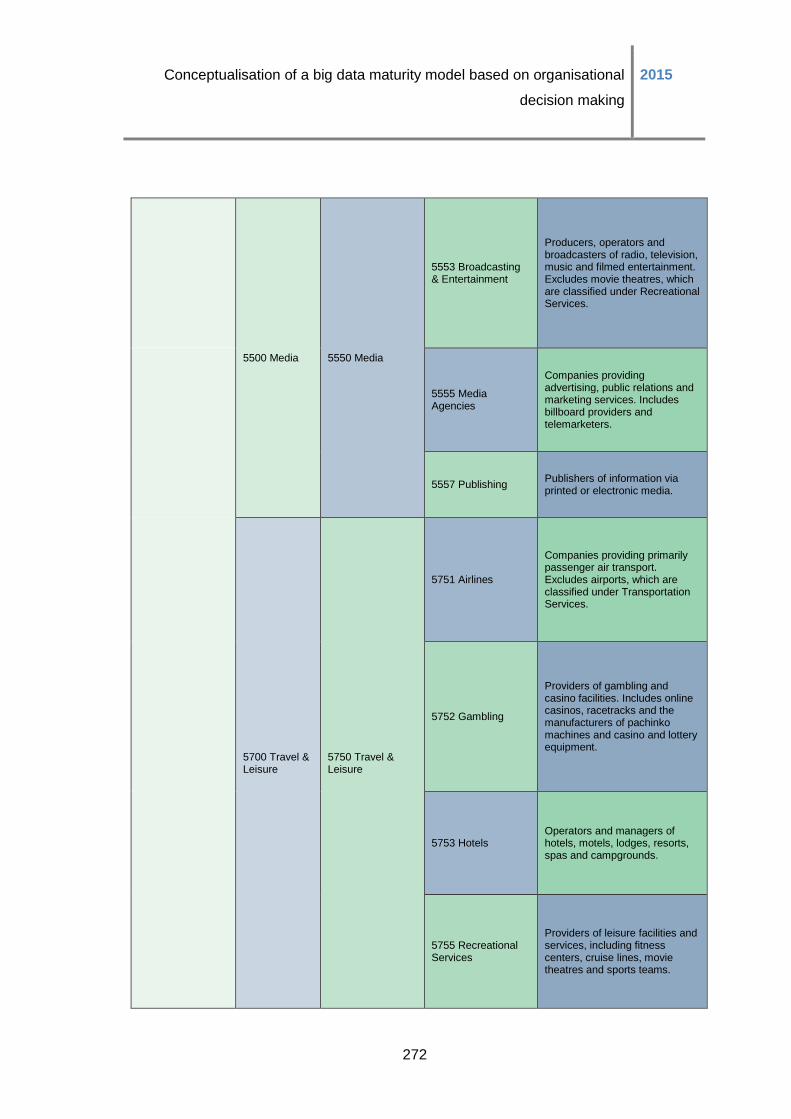
Conceptualisation of a big data maturity model based on organisational
decision making
2015
272
5500 Media 5550 Media
5553 Broadcasting & Entertainment
Producers, operators and broadcasters of radio, television, music and filmed entertainment. Excludes movie theatres, which are classified under Recreational Services.
5555 Media Agencies
Companies providing advertising, public relations and marketing services. Includes billboard providers and telemarketers.
5557 Publishing Publishers of information via printed or electronic media.
5700 Travel & Leisure
5750 Travel & Leisure
5751 Airlines
Companies providing primarily passenger air transport. Excludes airports, which are classified under Transportation Services.
5752 Gambling
Providers of gambling and casino facilities. Includes online casinos, racetracks and the manufacturers of pachinko machines and casino and lottery equipment.
5753 Hotels Operators and managers of hotels, motels, lodges, resorts, spas and campgrounds.
5755 Recreational Services
Providers of leisure facilities and services, including fitness centers, cruise lines, movie theatres and sports teams.
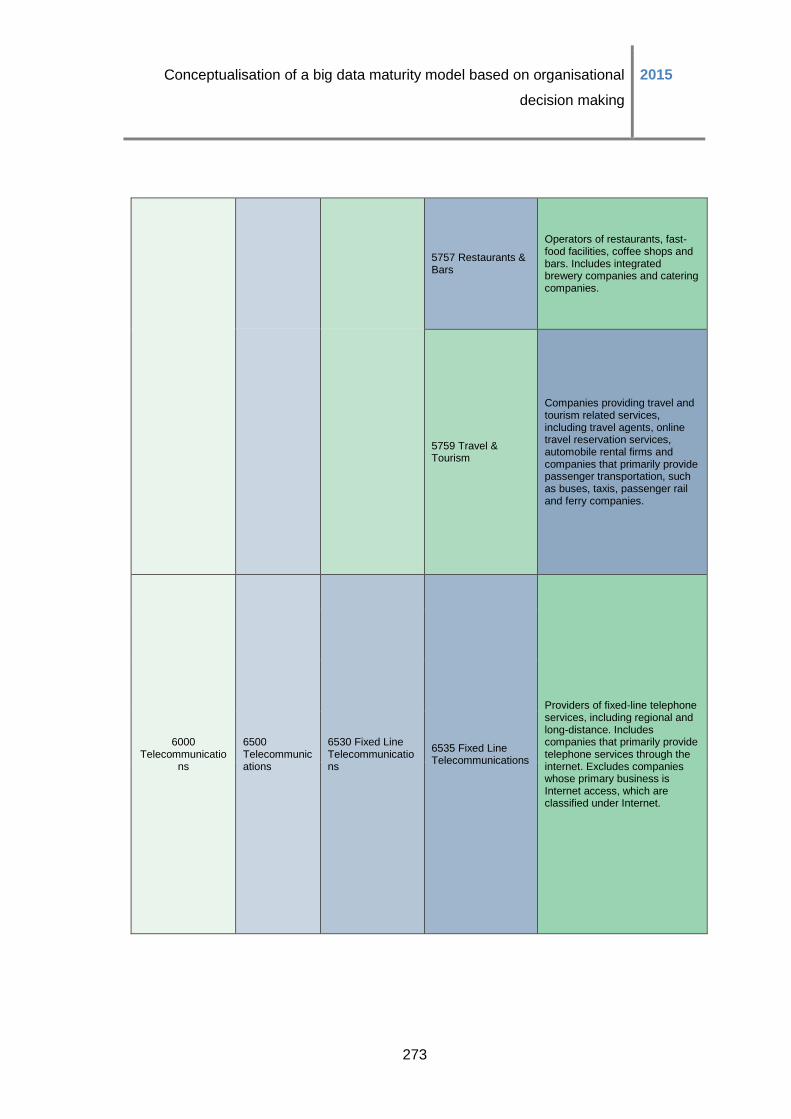
Conceptualisation of a big data maturity model based on organisational
decision making
2015
273
5757 Restaurants & Bars
Operators of restaurants, fast-food facilities, coffee shops and bars. Includes integrated brewery companies and catering companies.
5759 Travel & Tourism
Companies providing travel and tourism related services, including travel agents, online travel reservation services, automobile rental firms and companies that primarily provide passenger transportation, such as buses, taxis, passenger rail and ferry companies.
6000 Telecommunicatio
ns
6500 Telecommunications
6530 Fixed Line Telecommunications
6535 Fixed Line Telecommunications
Providers of fixed-line telephone services, including regional and long-distance. Includes companies that primarily provide telephone services through the internet. Excludes companies whose primary business is Internet access, which are classified under Internet.
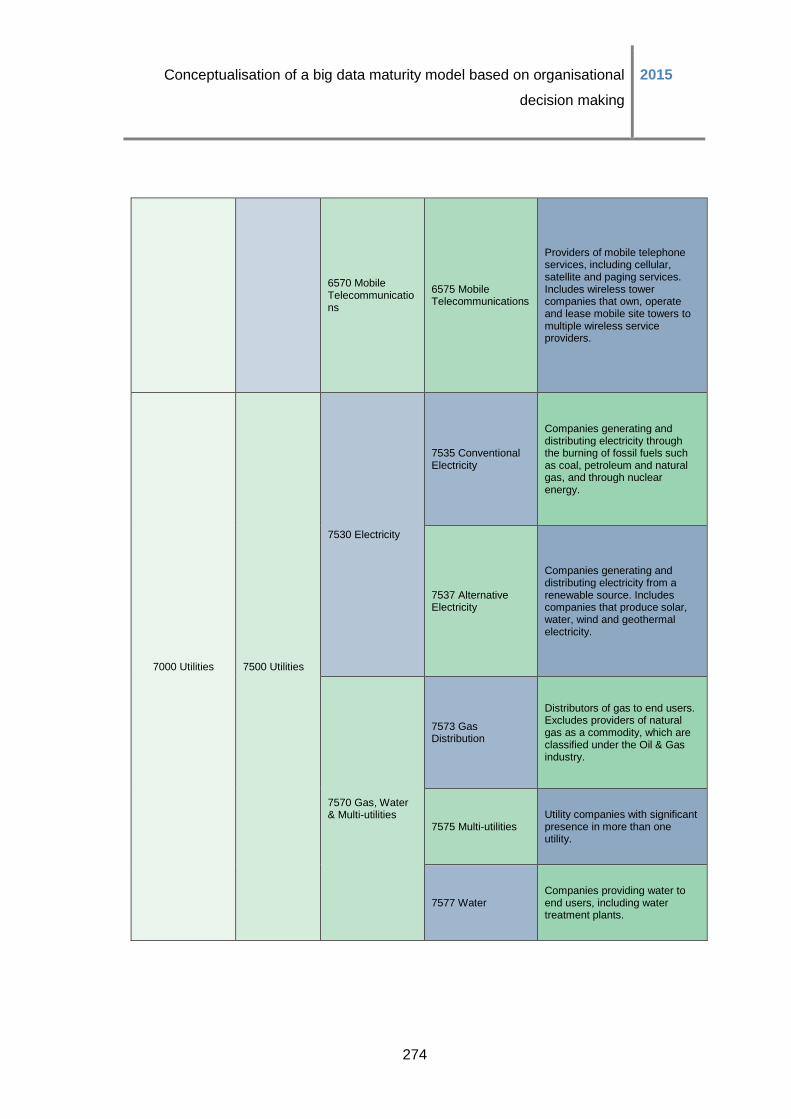
Conceptualisation of a big data maturity model based on organisational
decision making
2015
274
6570 Mobile Telecommunications
6575 Mobile Telecommunications
Providers of mobile telephone services, including cellular, satellite and paging services. Includes wireless tower companies that own, operate and lease mobile site towers to multiple wireless service providers.
7000 Utilities 7500 Utilities
7530 Electricity
7535 Conventional Electricity
Companies generating and distributing electricity through the burning of fossil fuels such as coal, petroleum and natural gas, and through nuclear energy.
7537 Alternative Electricity
Companies generating and distributing electricity from a renewable source. Includes companies that produce solar, water, wind and geothermal electricity.
7570 Gas, Water & Multi-utilities
7573 Gas Distribution
Distributors of gas to end users. Excludes providers of natural gas as a commodity, which are classified under the Oil & Gas industry.
7575 Multi-utilities Utility companies with significant presence in more than one utility.
7577 Water Companies providing water to end users, including water treatment plants.
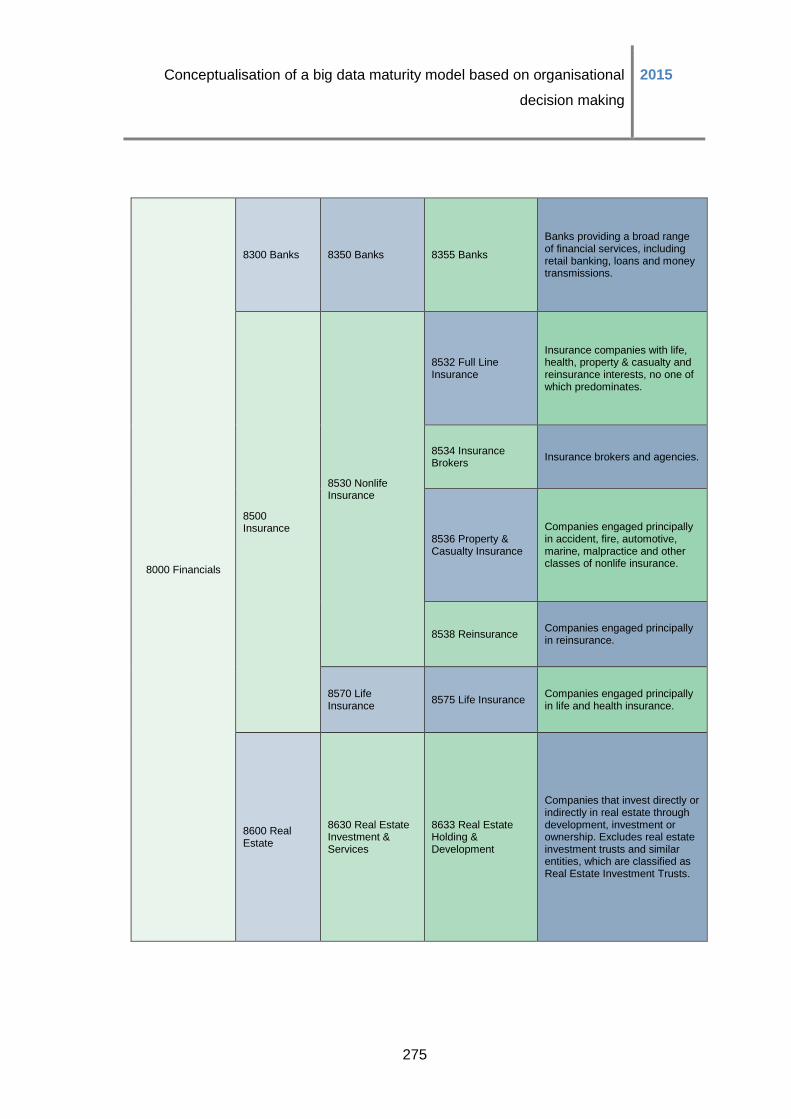
Conceptualisation of a big data maturity model based on organisational
decision making
2015
275
8000 Financials
8300 Banks 8350 Banks 8355 Banks
Banks providing a broad range of financial services, including retail banking, loans and money transmissions.
8500 Insurance
8530 Nonlife Insurance
8532 Full Line Insurance
Insurance companies with life, health, property & casualty and reinsurance interests, no one of which predominates.
8534 Insurance Brokers
Insurance brokers and agencies.
8536 Property & Casualty Insurance
Companies engaged principally in accident, fire, automotive, marine, malpractice and other classes of nonlife insurance.
8538 Reinsurance Companies engaged principally in reinsurance.
8570 Life Insurance
8575 Life Insurance Companies engaged principally in life and health insurance.
8600 Real Estate
8630 Real Estate Investment & Services
8633 Real Estate Holding & Development
Companies that invest directly or indirectly in real estate through development, investment or ownership. Excludes real estate investment trusts and similar entities, which are classified as Real Estate Investment Trusts.
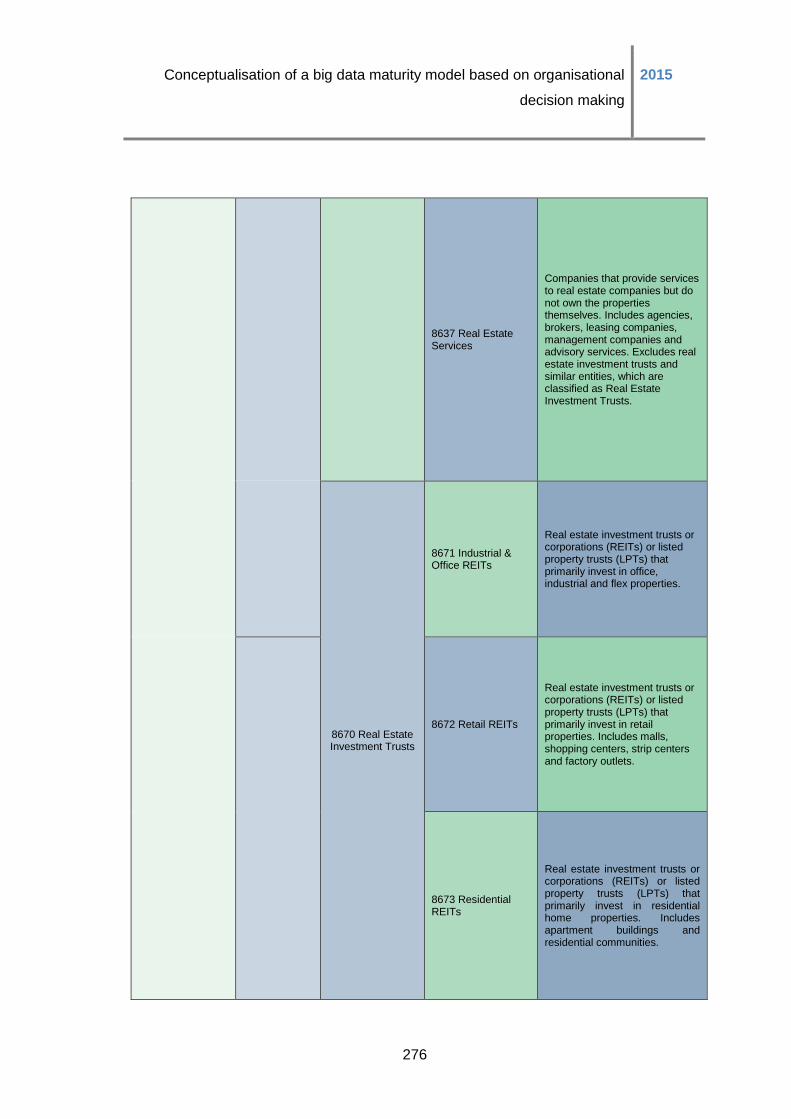
Conceptualisation of a big data maturity model based on organisational
decision making
2015
276
8637 Real Estate Services
Companies that provide services to real estate companies but do not own the properties themselves. Includes agencies, brokers, leasing companies, management companies and advisory services. Excludes real estate investment trusts and similar entities, which are classified as Real Estate Investment Trusts.
8670 Real Estate Investment Trusts
8671 Industrial & Office REITs
Real estate investment trusts or corporations (REITs) or listed property trusts (LPTs) that primarily invest in office, industrial and flex properties.
8672 Retail REITs
Real estate investment trusts or corporations (REITs) or listed property trusts (LPTs) that primarily invest in retail properties. Includes malls, shopping centers, strip centers and factory outlets.
8673 Residential REITs
Real estate investment trusts or corporations (REITs) or listed property trusts (LPTs) that primarily invest in residential home properties. Includes apartment buildings and residential communities.
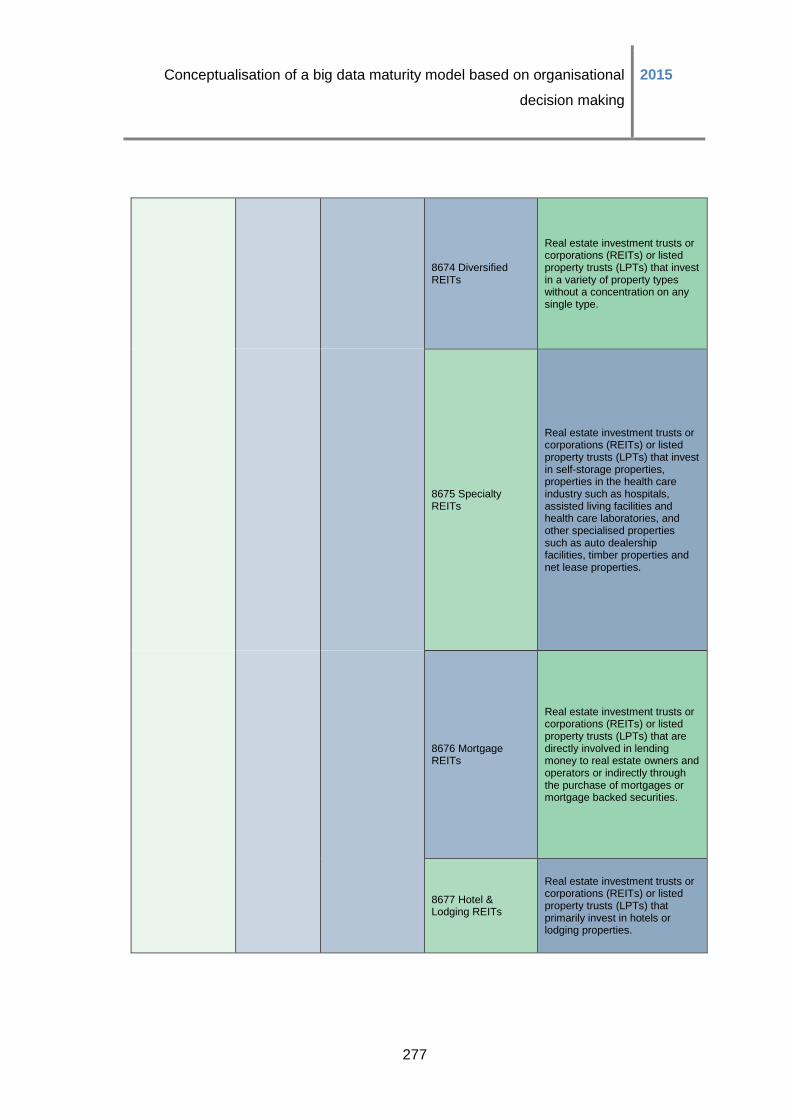
Conceptualisation of a big data maturity model based on organisational
decision making
2015
277
8674 Diversified REITs
Real estate investment trusts or corporations (REITs) or listed property trusts (LPTs) that invest in a variety of property types without a concentration on any single type.
8675 Specialty REITs
Real estate investment trusts or corporations (REITs) or listed property trusts (LPTs) that invest in self-storage properties, properties in the health care industry such as hospitals, assisted living facilities and health care laboratories, and other specialised properties such as auto dealership facilities, timber properties and net lease properties.
8676 Mortgage REITs
Real estate investment trusts or corporations (REITs) or listed property trusts (LPTs) that are directly involved in lending money to real estate owners and operators or indirectly through the purchase of mortgages or mortgage backed securities.
8677 Hotel & Lodging REITs
Real estate investment trusts or corporations (REITs) or listed property trusts (LPTs) that primarily invest in hotels or lodging properties.
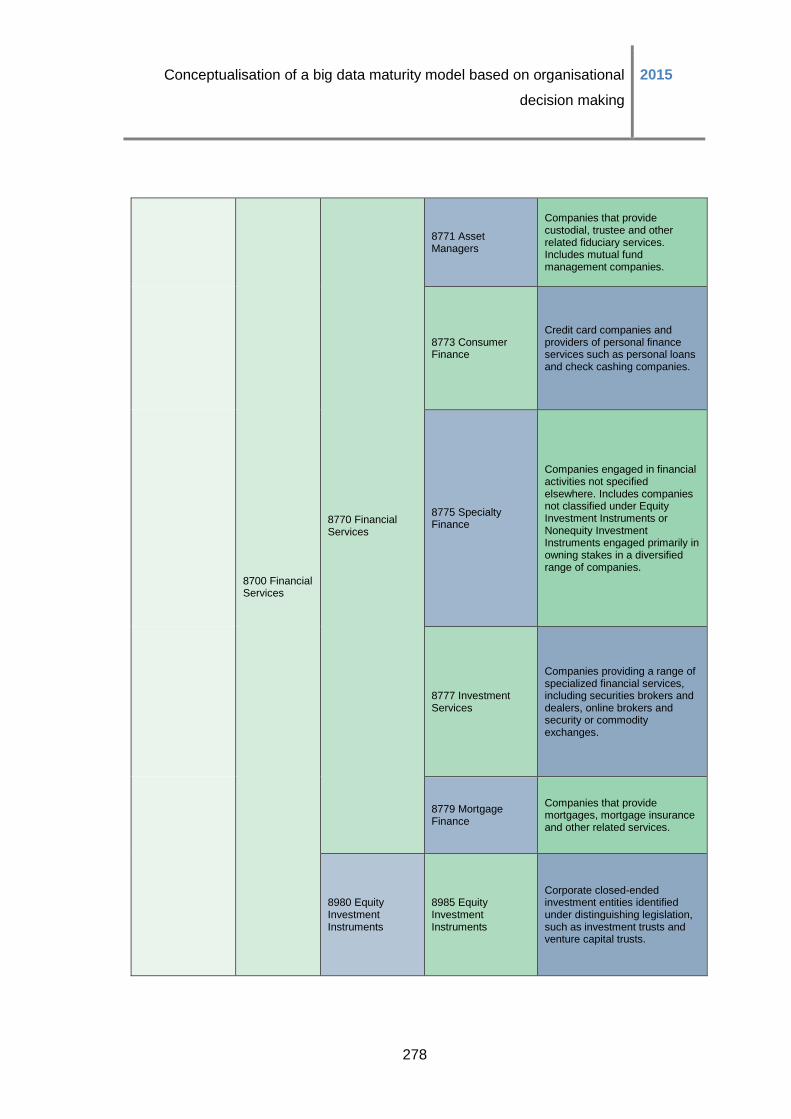
Conceptualisation of a big data maturity model based on organisational
decision making
2015
278
8700 Financial Services
8770 Financial Services
8771 Asset Managers
Companies that provide custodial, trustee and other related fiduciary services. Includes mutual fund management companies.
8773 Consumer Finance
Credit card companies and providers of personal finance services such as personal loans and check cashing companies.
8775 Specialty Finance
Companies engaged in financial activities not specified elsewhere. Includes companies not classified under Equity Investment Instruments or Nonequity Investment Instruments engaged primarily in owning stakes in a diversified range of companies.
8777 Investment Services
Companies providing a range of specialized financial services, including securities brokers and dealers, online brokers and security or commodity exchanges.
8779 Mortgage Finance
Companies that provide mortgages, mortgage insurance and other related services.
8980 Equity Investment Instruments
8985 Equity Investment Instruments
Corporate closed-ended investment entities identified under distinguishing legislation, such as investment trusts and venture capital trusts.
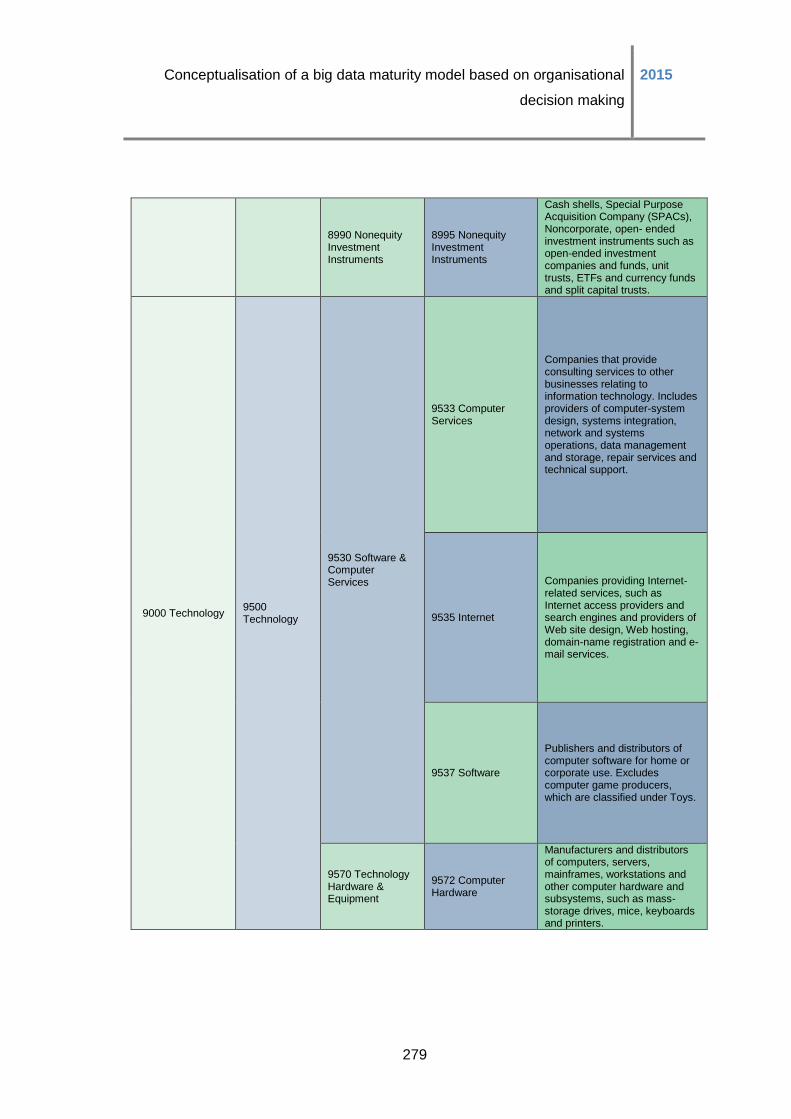
Conceptualisation of a big data maturity model based on organisational
decision making
2015
279
8990 Nonequity Investment Instruments
8995 Nonequity Investment Instruments
Cash shells, Special Purpose Acquisition Company (SPACs), Noncorporate, open- ended investment instruments such as open-ended investment companies and funds, unit trusts, ETFs and currency funds and split capital trusts.
9000 Technology 9500 Technology
9530 Software & Computer Services
9533 Computer Services
Companies that provide consulting services to other businesses relating to information technology. Includes providers of computer-system design, systems integration, network and systems operations, data management and storage, repair services and technical support.
9535 Internet
Companies providing Internet-related services, such as Internet access providers and search engines and providers of Web site design, Web hosting, domain-name registration and e-mail services.
9537 Software
Publishers and distributors of computer software for home or corporate use. Excludes computer game producers, which are classified under Toys.
9570 Technology Hardware & Equipment
9572 Computer Hardware
Manufacturers and distributors of computers, servers, mainframes, workstations and other computer hardware and subsystems, such as mass-storage drives, mice, keyboards and printers.

Conceptualisation of a big data maturity model based on organisational
decision making
2015
280
9574 Electronic Office Equipment
Manufacturers and distributors of electronic office equipment, including photocopiers and fax machines.
9576 Semiconductors
Producers and distributors of semiconductors and other integrated chips, including other products related to the semiconductor industry, such as semiconductor capital equipment and motherboards. Excludes makers of printed circuit boards, which are classified under Electrical Components & Equipment.
9578 Telecommunications Equipment
Makers and distributors of high-technology communication products, including satellites, mobile telephones, fibers optics, switching devices, local and wide-area networks, teleconferencing equipment and connectivity devices for computers, including hubs and routers.
(ICB, n.d.).
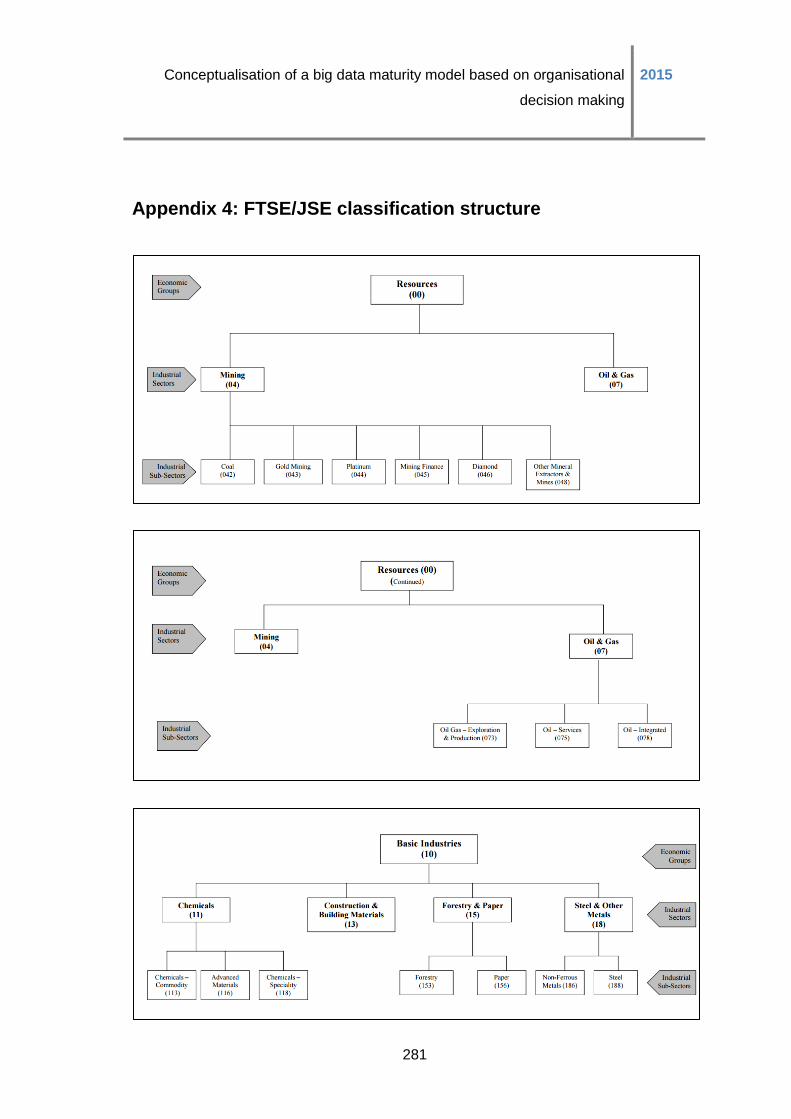
Conceptualisation of a big data maturity model based on organisational
decision making
2015
281
Appendix 4: FTSE/JSE classification structure
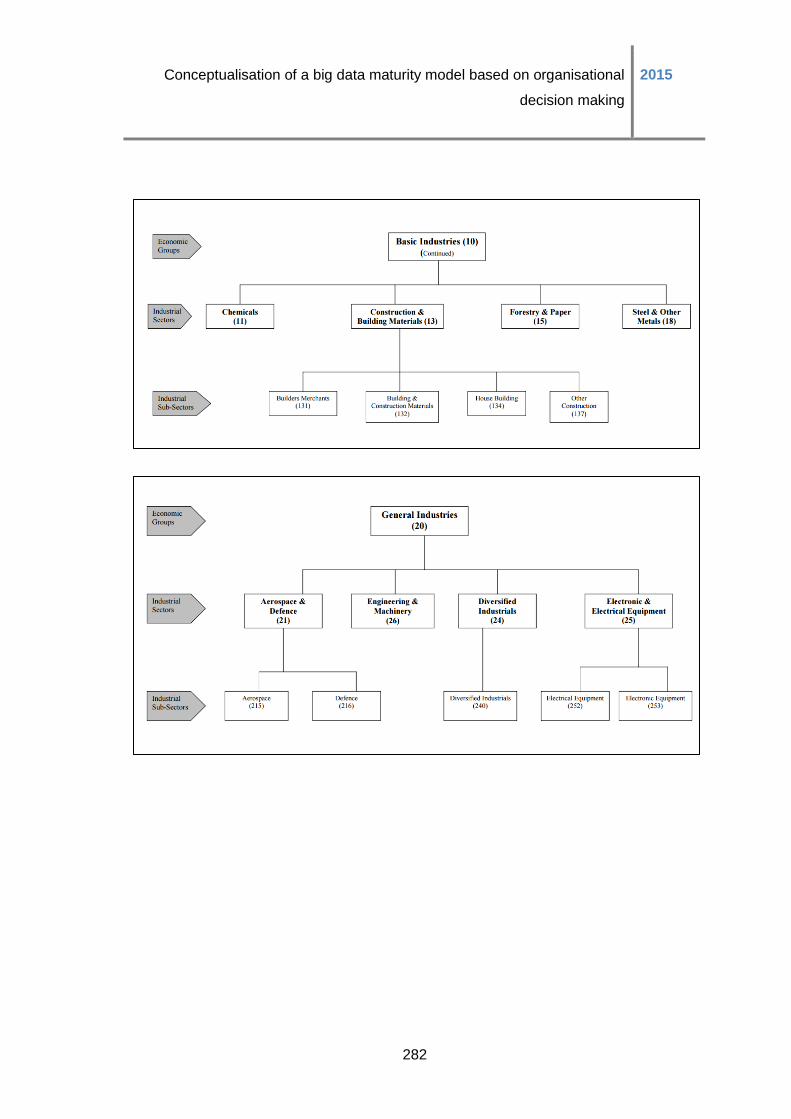
Conceptualisation of a big data maturity model based on organisational
decision making
2015
282
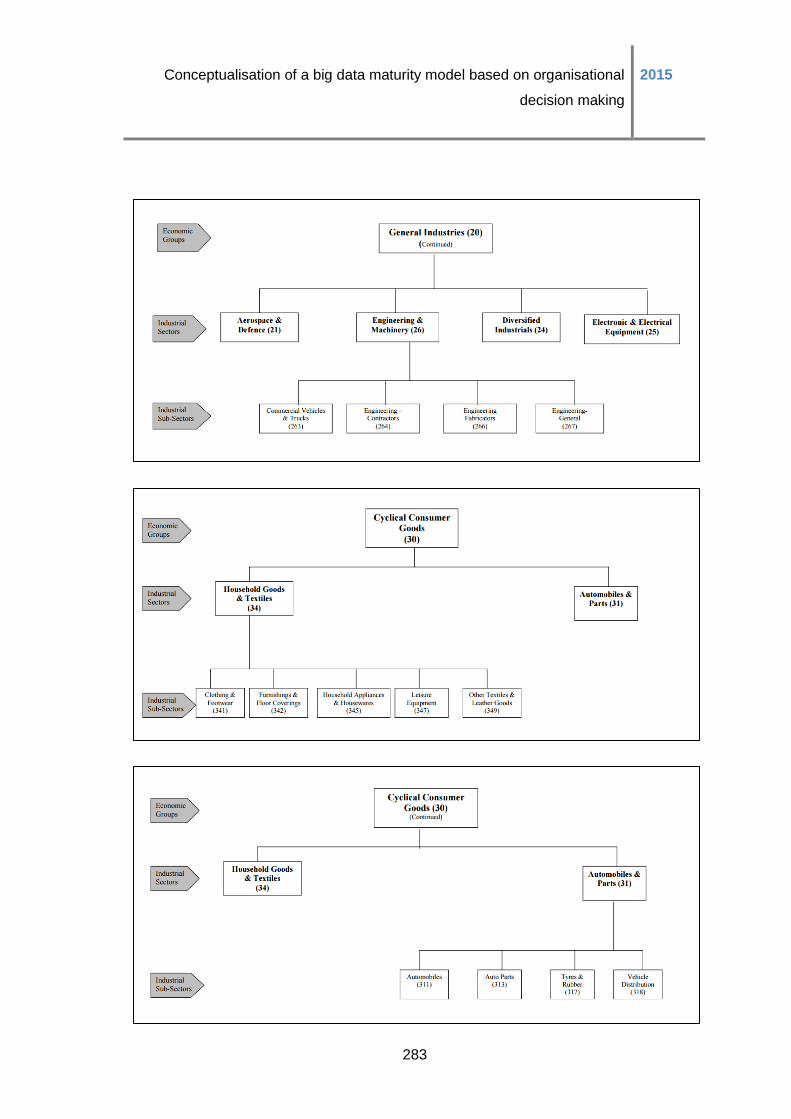
Conceptualisation of a big data maturity model based on organisational
decision making
2015
283
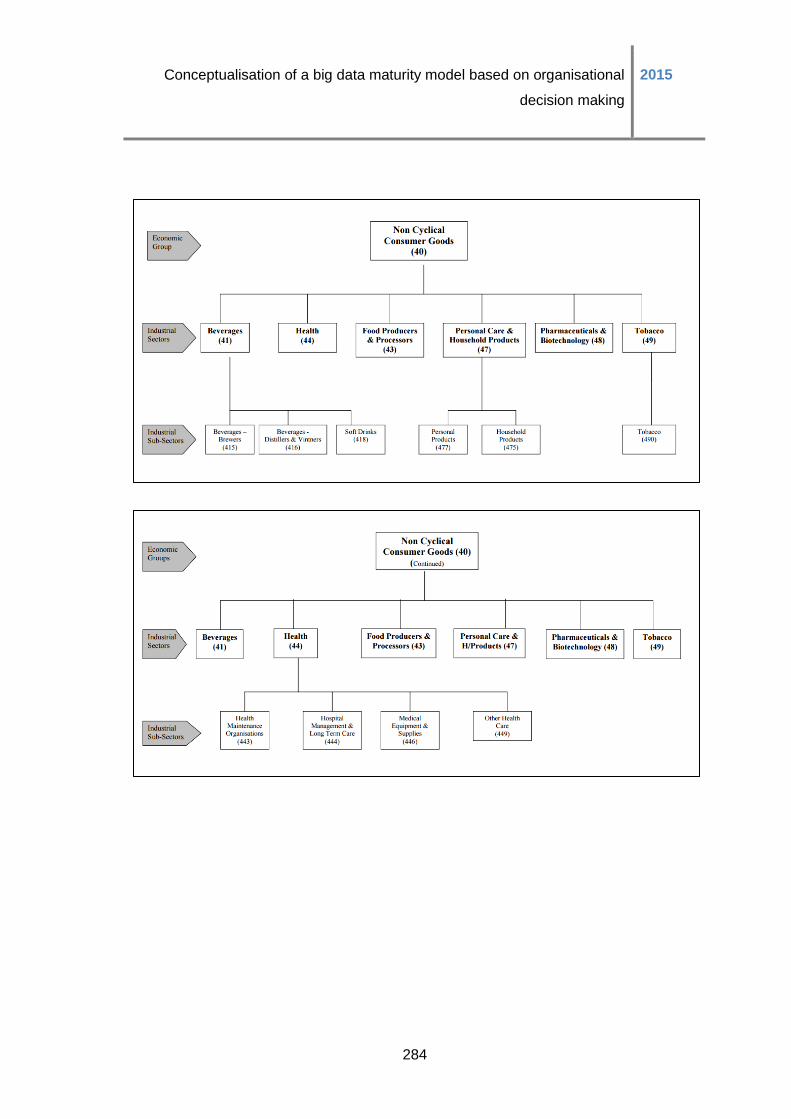
Conceptualisation of a big data maturity model based on organisational
decision making
2015
284
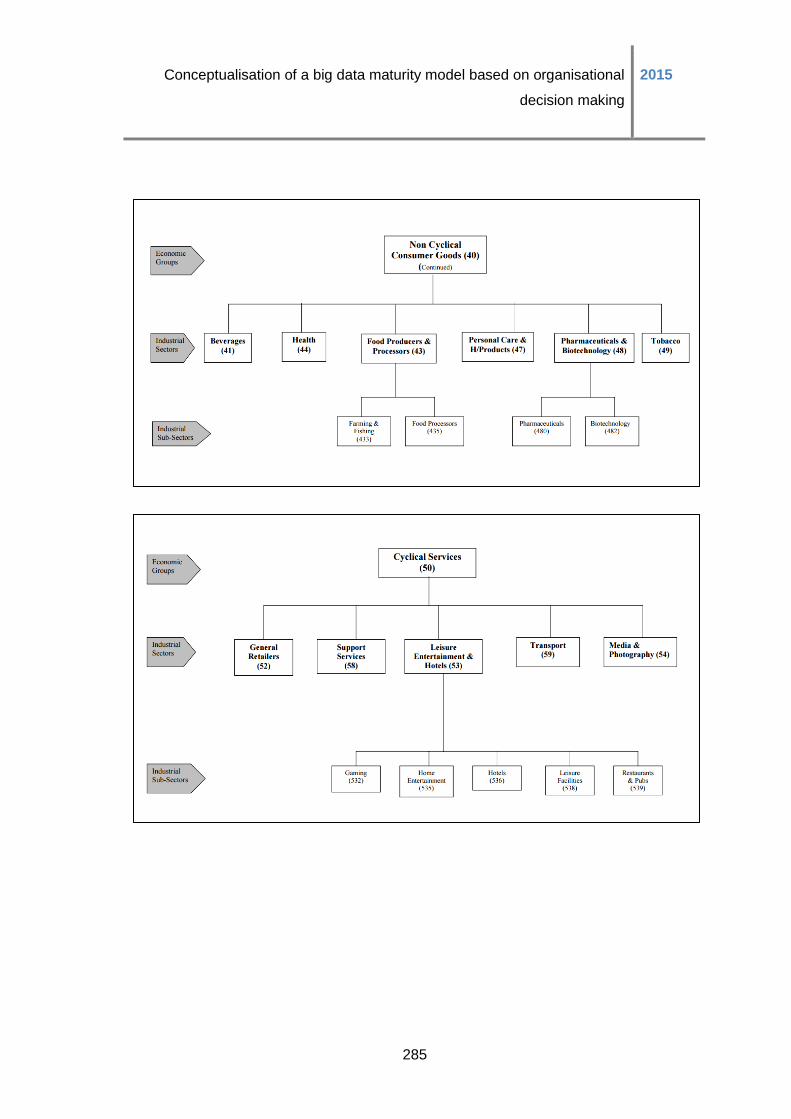
Conceptualisation of a big data maturity model based on organisational
decision making
2015
285
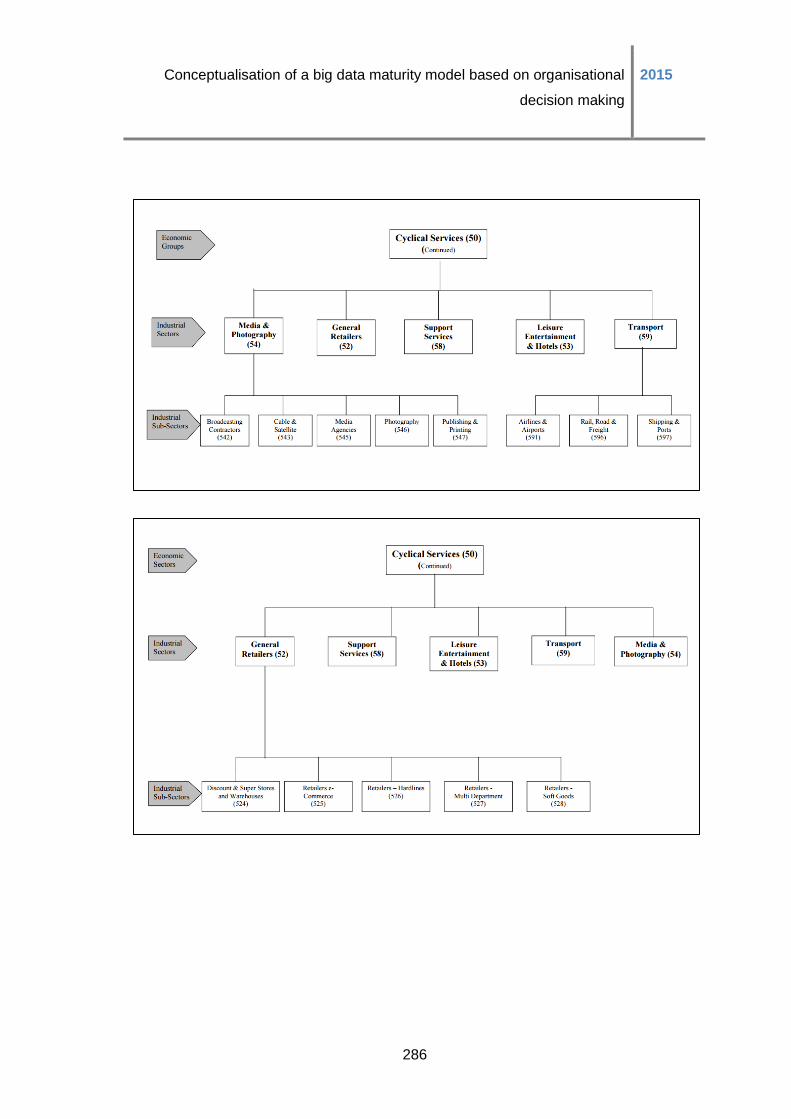
Conceptualisation of a big data maturity model based on organisational
decision making
2015
286
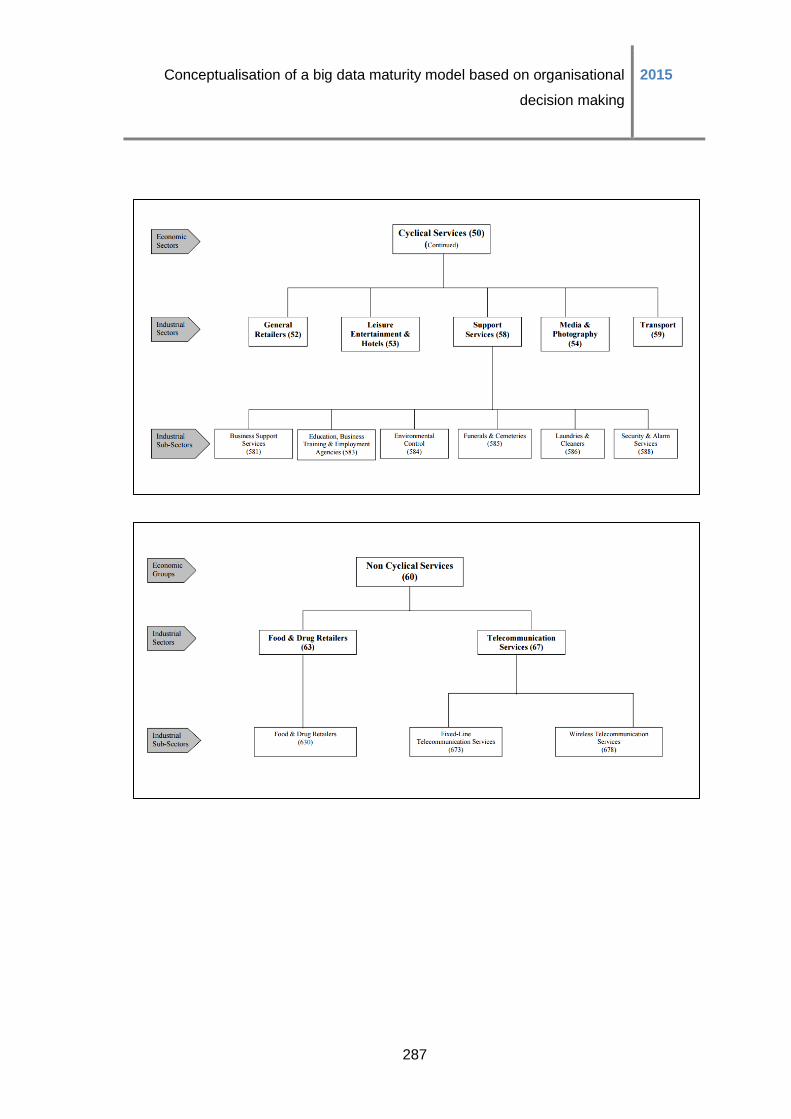
Conceptualisation of a big data maturity model based on organisational
decision making
2015
287
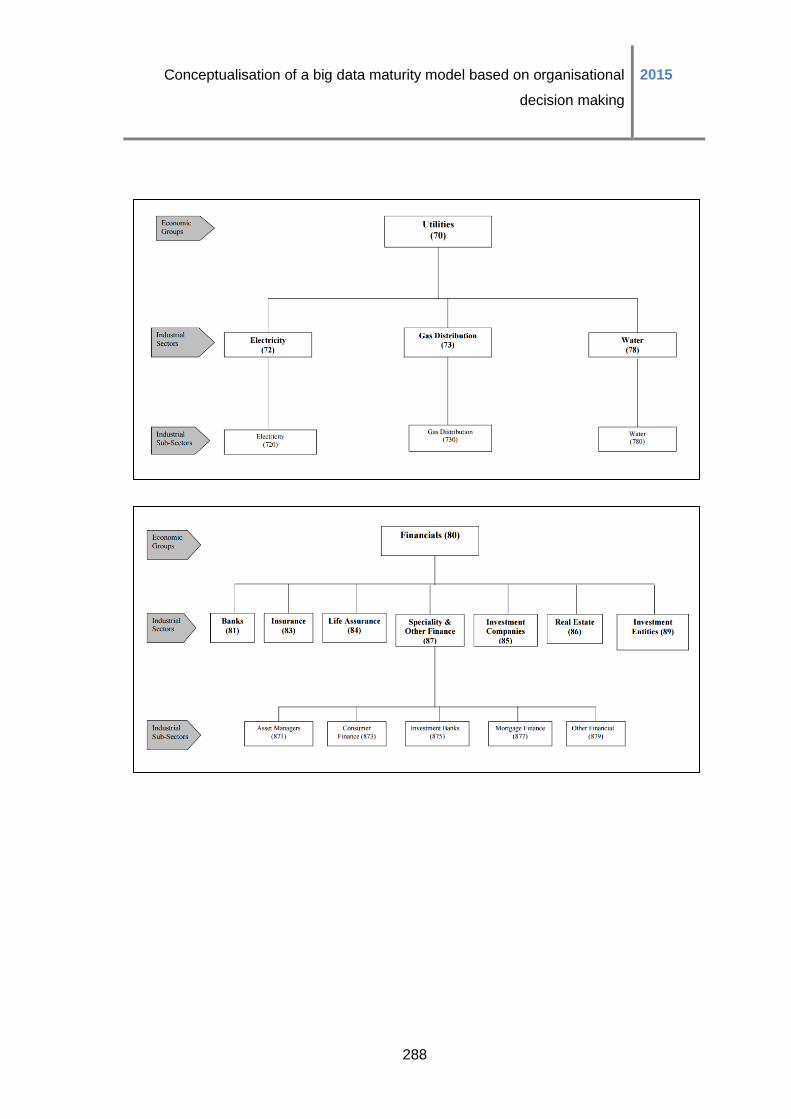
Conceptualisation of a big data maturity model based on organisational
decision making
2015
288
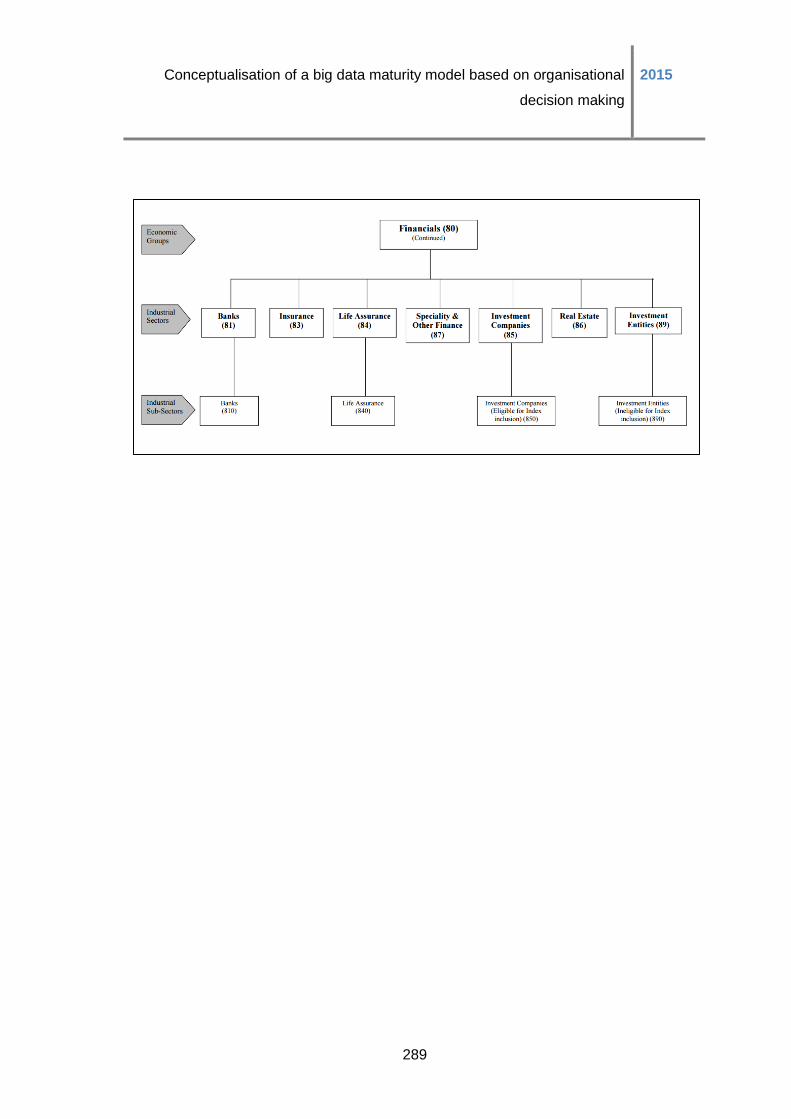
Conceptualisation of a big data maturity model based on organisational
decision making
2015
289
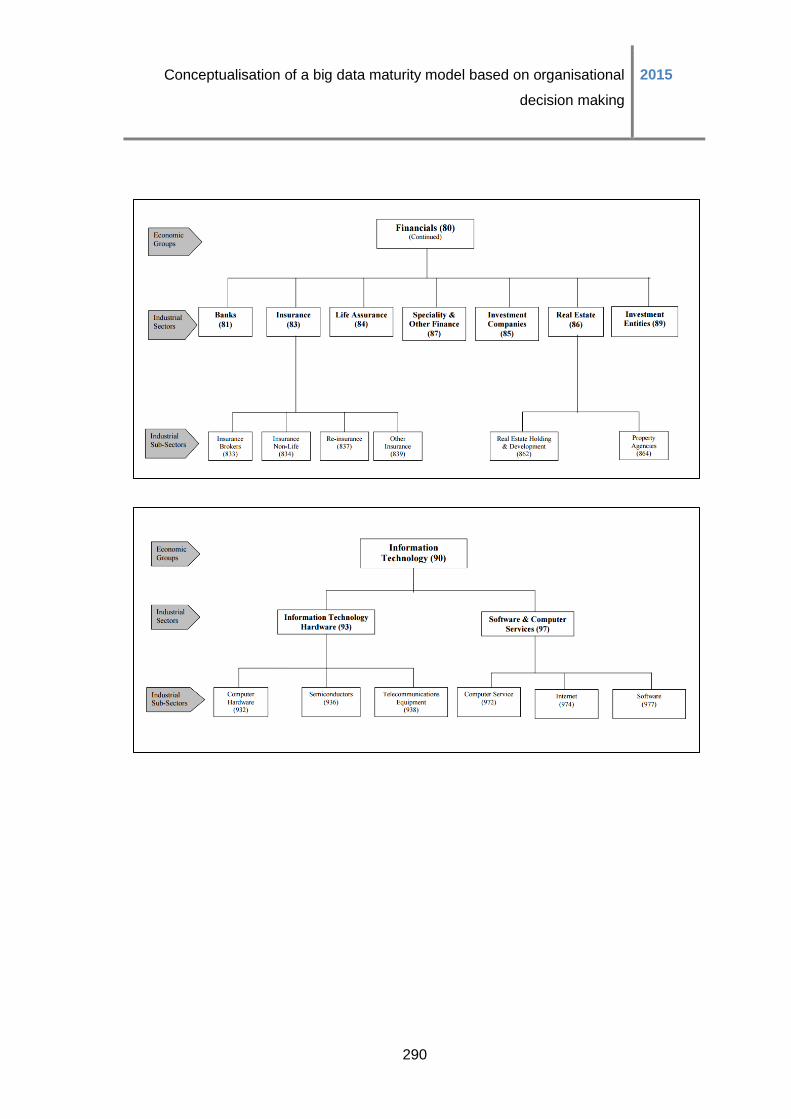
Conceptualisation of a big data maturity model based on organisational
decision making
2015
290
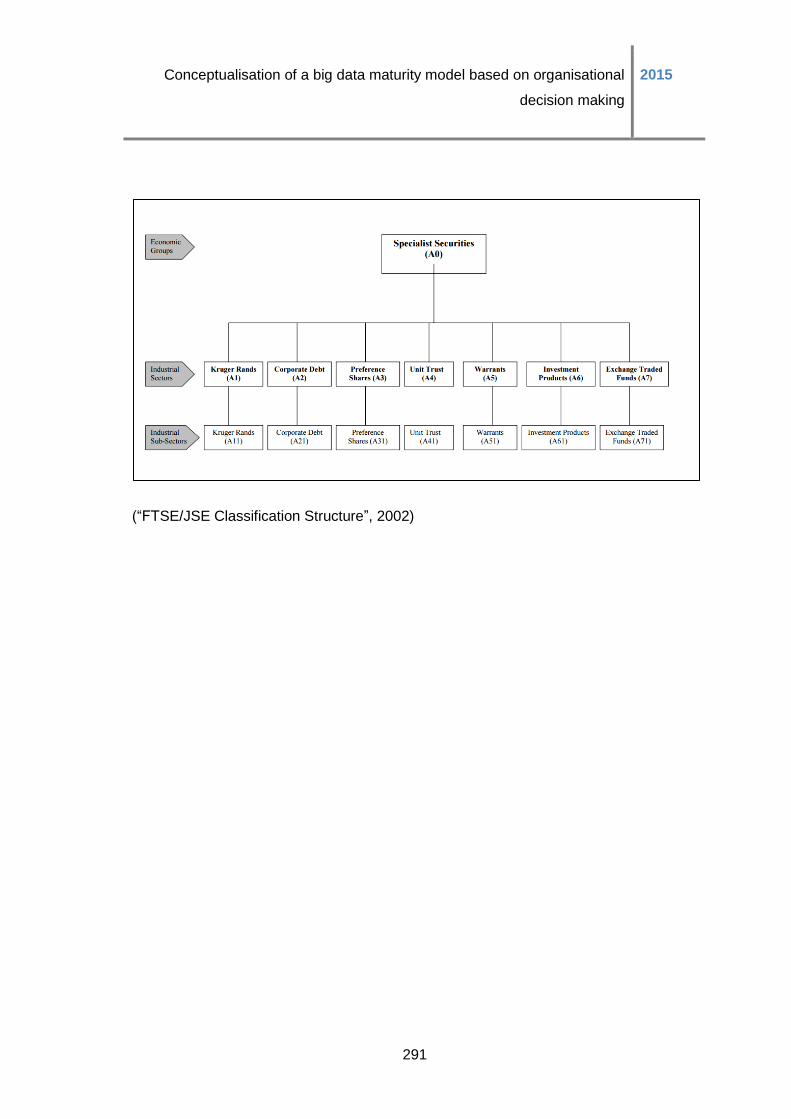
Conceptualisation of a big data maturity model based on organisational
decision making
2015
291
(“FTSE/JSE Classification Structure”, 2002)
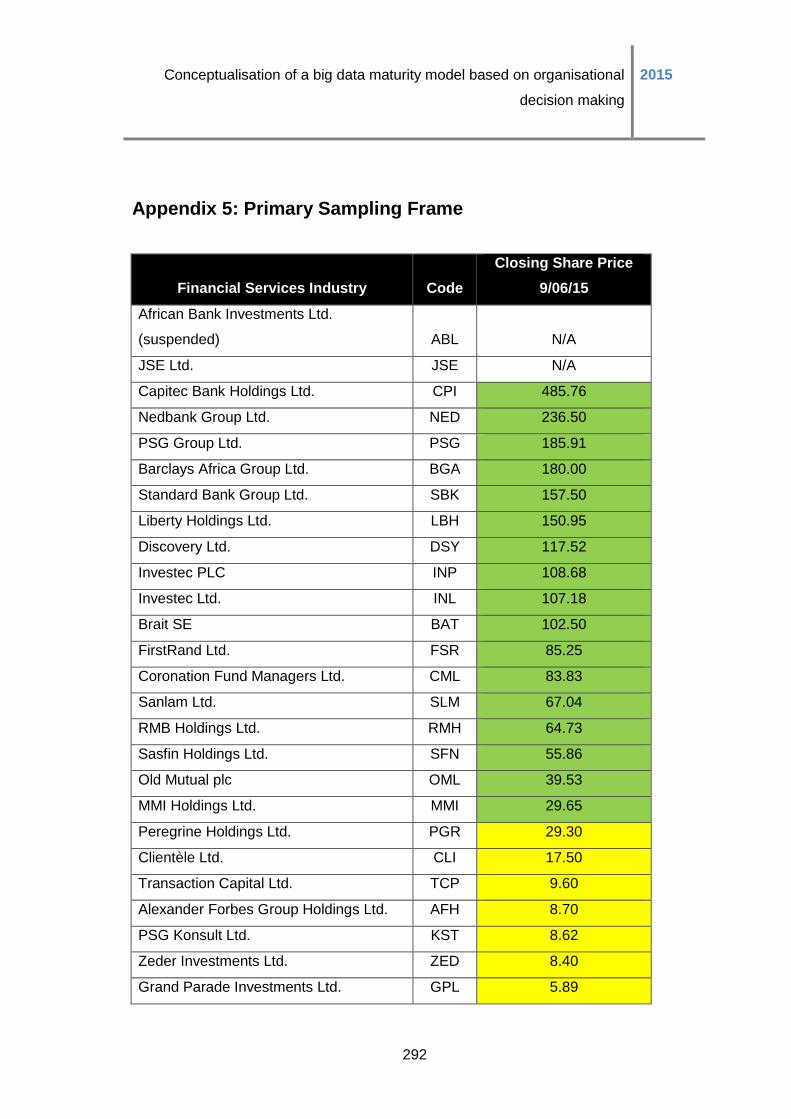
Conceptualisation of a big data maturity model based on organisational
decision making
2015
292
Appendix 5: Primary Sampling Frame
Financial Services Industry Code
Closing Share Price
9/06/15
African Bank Investments Ltd.
(suspended) ABL N/A
JSE Ltd. JSE N/A
Capitec Bank Holdings Ltd. CPI 485.76
Nedbank Group Ltd. NED 236.50
PSG Group Ltd. PSG 185.91
Barclays Africa Group Ltd. BGA 180.00
Standard Bank Group Ltd. SBK 157.50
Liberty Holdings Ltd. LBH 150.95
Discovery Ltd. DSY 117.52
Investec PLC INP 108.68
Investec Ltd. INL 107.18
Brait SE BAT 102.50
FirstRand Ltd. FSR 85.25
Coronation Fund Managers Ltd. CML 83.83
Sanlam Ltd. SLM 67.04
RMB Holdings Ltd. RMH 64.73
Sasfin Holdings Ltd. SFN 55.86
Old Mutual plc OML 39.53
MMI Holdings Ltd. MMI 29.65
Peregrine Holdings Ltd. PGR 29.30
Clientèle Ltd. CLI 17.50
Transaction Capital Ltd. TCP 9.60
Alexander Forbes Group Holdings Ltd. AFH 8.70
PSG Konsult Ltd. KST 8.62
Zeder Investments Ltd. ZED 8.40
Grand Parade Investments Ltd. GPL 5.89
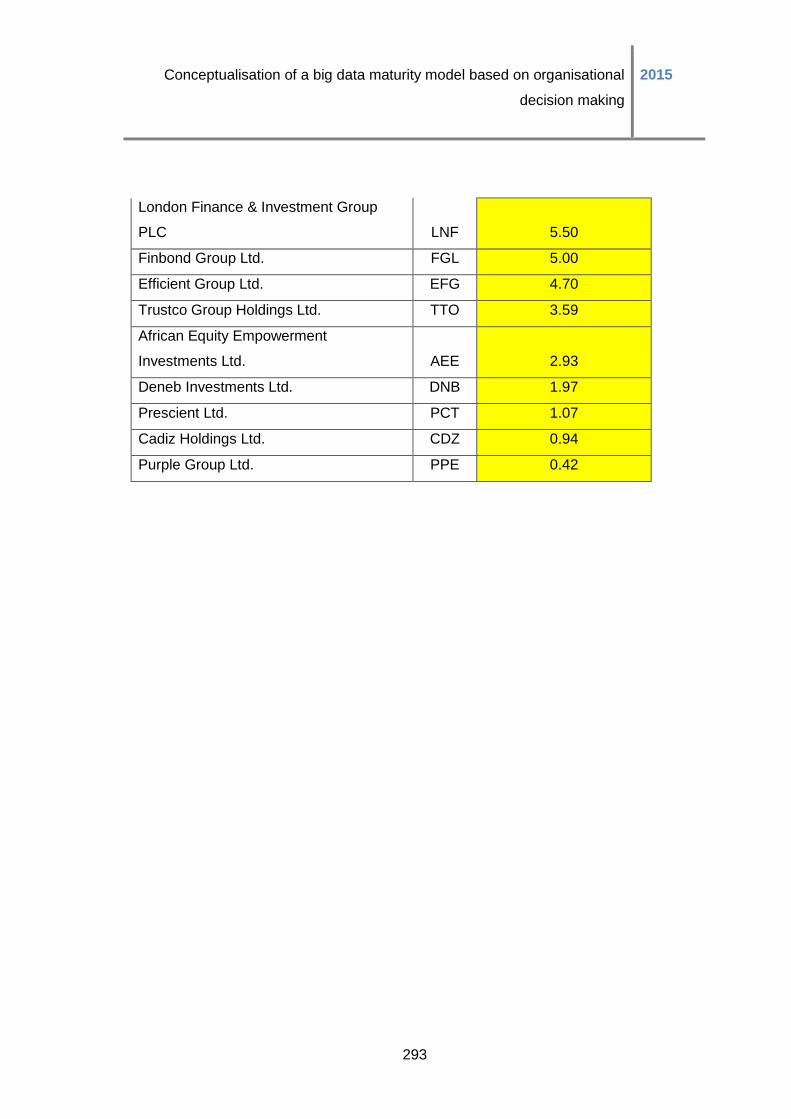
Conceptualisation of a big data maturity model based on organisational
decision making
2015
293
London Finance & Investment Group
PLC LNF 5.50
Finbond Group Ltd. FGL 5.00
Efficient Group Ltd. EFG 4.70
Trustco Group Holdings Ltd. TTO 3.59
African Equity Empowerment
Investments Ltd. AEE 2.93
Deneb Investments Ltd. DNB 1.97
Prescient Ltd. PCT 1.07
Cadiz Holdings Ltd. CDZ 0.94
Purple Group Ltd. PPE 0.42
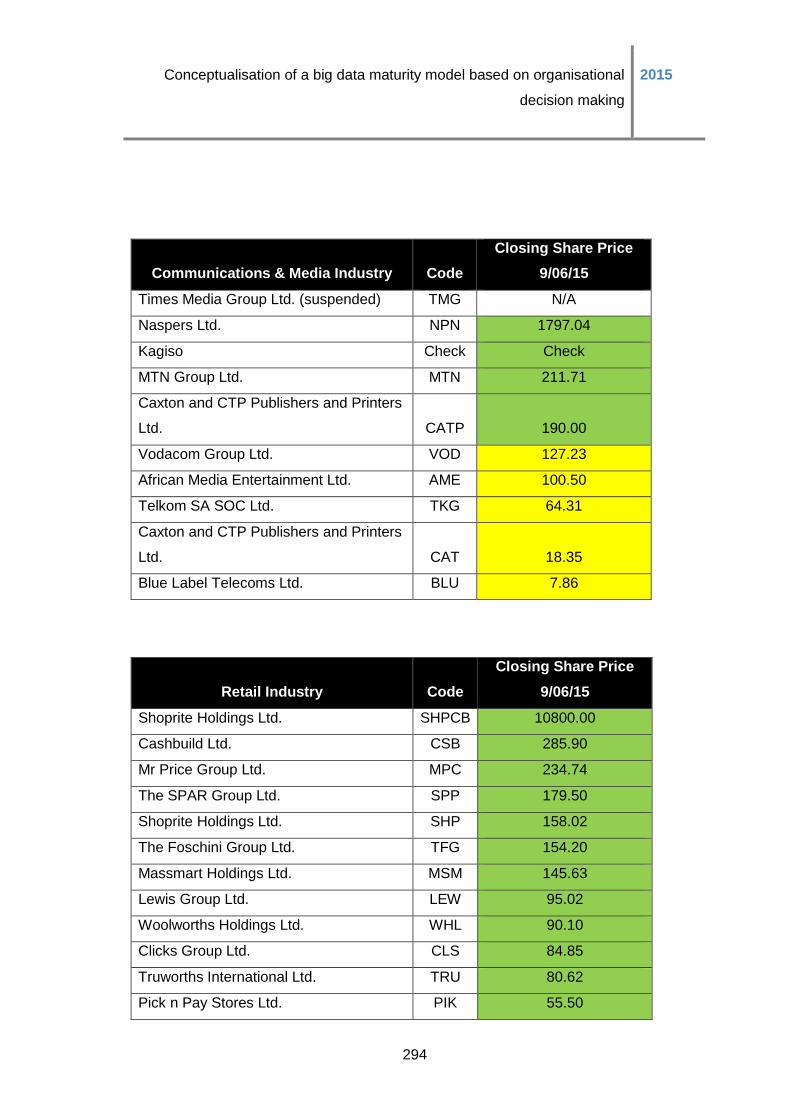
Conceptualisation of a big data maturity model based on organisational
decision making
2015
294
Communications & Media Industry Code
Closing Share Price
9/06/15
Times Media Group Ltd. (suspended) TMG N/A
Naspers Ltd. NPN 1797.04
Kagiso Check Check
MTN Group Ltd. MTN 211.71
Caxton and CTP Publishers and Printers
Ltd. CATP 190.00
Vodacom Group Ltd. VOD 127.23
African Media Entertainment Ltd. AME 100.50
Telkom SA SOC Ltd. TKG 64.31
Caxton and CTP Publishers and Printers
Ltd. CAT 18.35
Blue Label Telecoms Ltd. BLU 7.86
Retail Industry Code
Closing Share Price
9/06/15
Shoprite Holdings Ltd. SHPCB 10800.00
Cashbuild Ltd. CSB 285.90
Mr Price Group Ltd. MPC 234.74
The SPAR Group Ltd. SPP 179.50
Shoprite Holdings Ltd. SHP 158.02
The Foschini Group Ltd. TFG 154.20
Massmart Holdings Ltd. MSM 145.63
Lewis Group Ltd. LEW 95.02
Woolworths Holdings Ltd. WHL 90.10
Clicks Group Ltd. CLS 84.85
Truworths International Ltd. TRU 80.62
Pick n Pay Stores Ltd. PIK 55.50
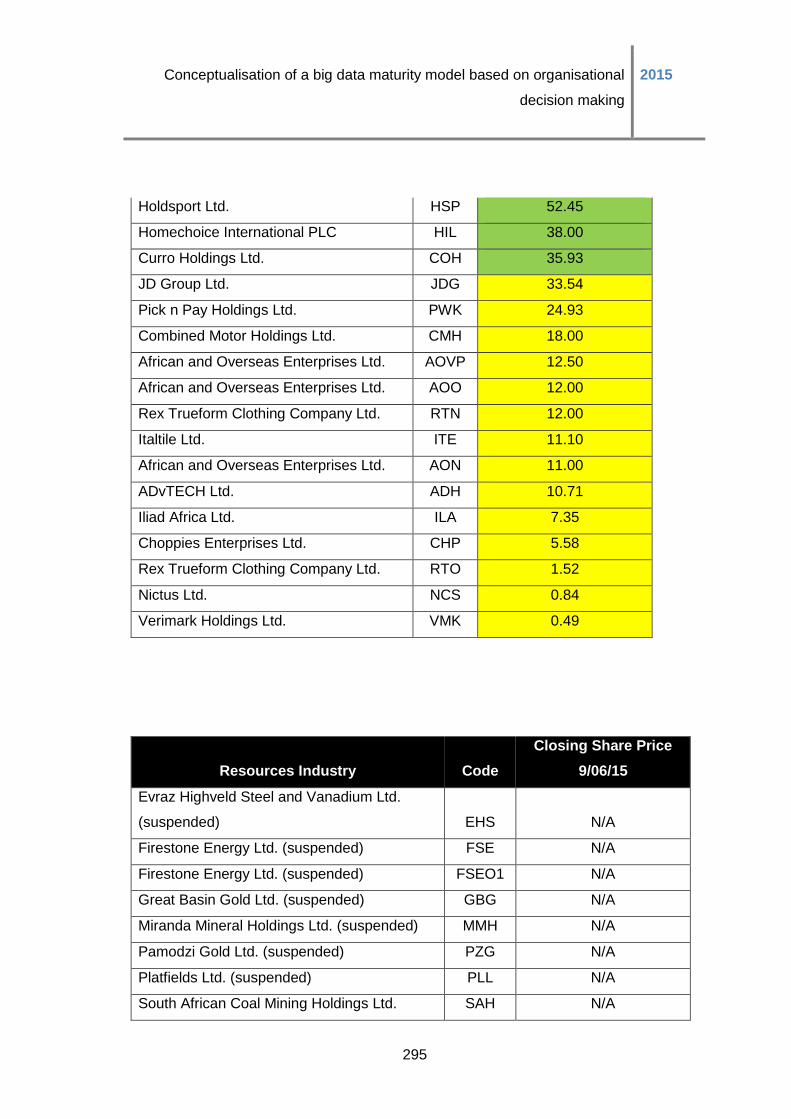
Conceptualisation of a big data maturity model based on organisational
decision making
2015
295
Holdsport Ltd. HSP 52.45
Homechoice International PLC HIL 38.00
Curro Holdings Ltd. COH 35.93
JD Group Ltd. JDG 33.54
Pick n Pay Holdings Ltd. PWK 24.93
Combined Motor Holdings Ltd. CMH 18.00
African and Overseas Enterprises Ltd. AOVP 12.50
African and Overseas Enterprises Ltd. AOO 12.00
Rex Trueform Clothing Company Ltd. RTN 12.00
Italtile Ltd. ITE 11.10
African and Overseas Enterprises Ltd. AON 11.00
ADvTECH Ltd. ADH 10.71
Iliad Africa Ltd. ILA 7.35
Choppies Enterprises Ltd. CHP 5.58
Rex Trueform Clothing Company Ltd. RTO 1.52
Nictus Ltd. NCS 0.84
Verimark Holdings Ltd. VMK 0.49
Resources Industry Code
Closing Share Price
9/06/15
Evraz Highveld Steel and Vanadium Ltd.
(suspended) EHS N/A
Firestone Energy Ltd. (suspended) FSE N/A
Firestone Energy Ltd. (suspended) FSEO1 N/A
Great Basin Gold Ltd. (suspended) GBG N/A
Miranda Mineral Holdings Ltd. (suspended) MMH N/A
Pamodzi Gold Ltd. (suspended) PZG N/A
Platfields Ltd. (suspended) PLL N/A
South African Coal Mining Holdings Ltd. SAH N/A
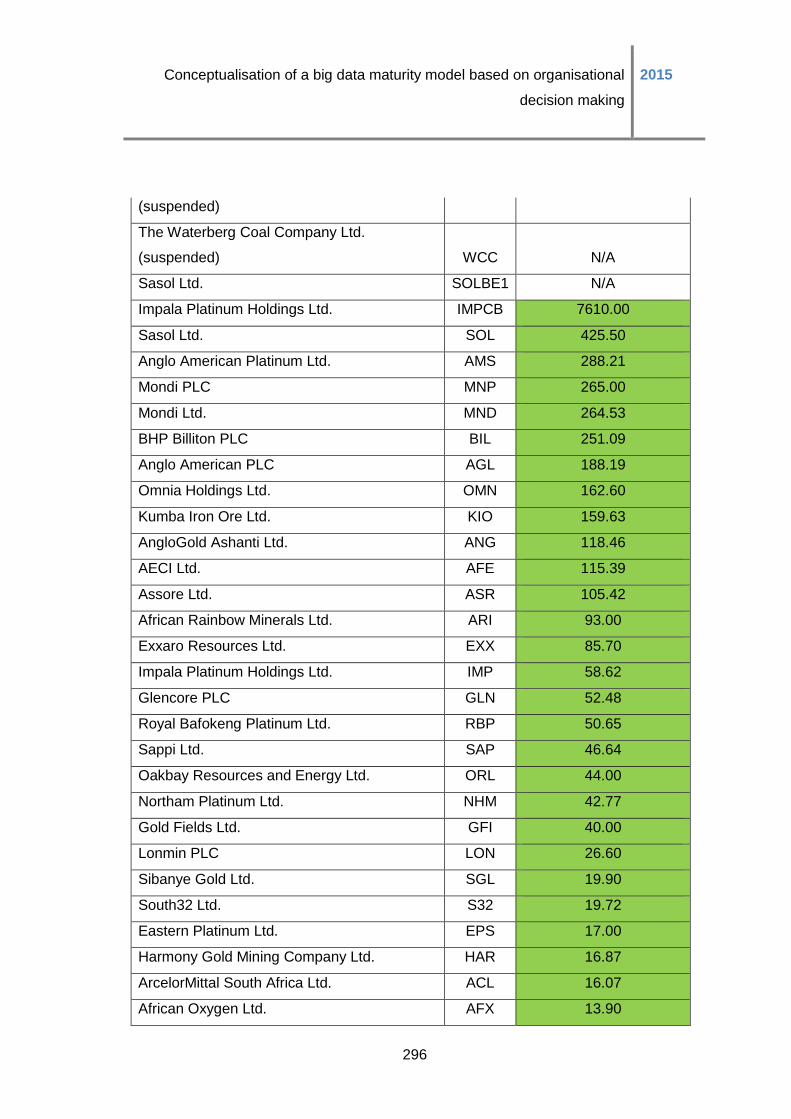
Conceptualisation of a big data maturity model based on organisational
decision making
2015
296
(suspended)
The Waterberg Coal Company Ltd.
(suspended) WCC N/A
Sasol Ltd. SOLBE1 N/A
Impala Platinum Holdings Ltd. IMPCB 7610.00
Sasol Ltd. SOL 425.50
Anglo American Platinum Ltd. AMS 288.21
Mondi PLC MNP 265.00
Mondi Ltd. MND 264.53
BHP Billiton PLC BIL 251.09
Anglo American PLC AGL 188.19
Omnia Holdings Ltd. OMN 162.60
Kumba Iron Ore Ltd. KIO 159.63
AngloGold Ashanti Ltd. ANG 118.46
AECI Ltd. AFE 115.39
Assore Ltd. ASR 105.42
African Rainbow Minerals Ltd. ARI 93.00
Exxaro Resources Ltd. EXX 85.70
Impala Platinum Holdings Ltd. IMP 58.62
Glencore PLC GLN 52.48
Royal Bafokeng Platinum Ltd. RBP 50.65
Sappi Ltd. SAP 46.64
Oakbay Resources and Energy Ltd. ORL 44.00
Northam Platinum Ltd. NHM 42.77
Gold Fields Ltd. GFI 40.00
Lonmin PLC LON 26.60
Sibanye Gold Ltd. SGL 19.90
South32 Ltd. S32 19.72
Eastern Platinum Ltd. EPS 17.00
Harmony Gold Mining Company Ltd. HAR 16.87
ArcelorMittal South Africa Ltd. ACL 16.07
African Oxygen Ltd. AFX 13.90
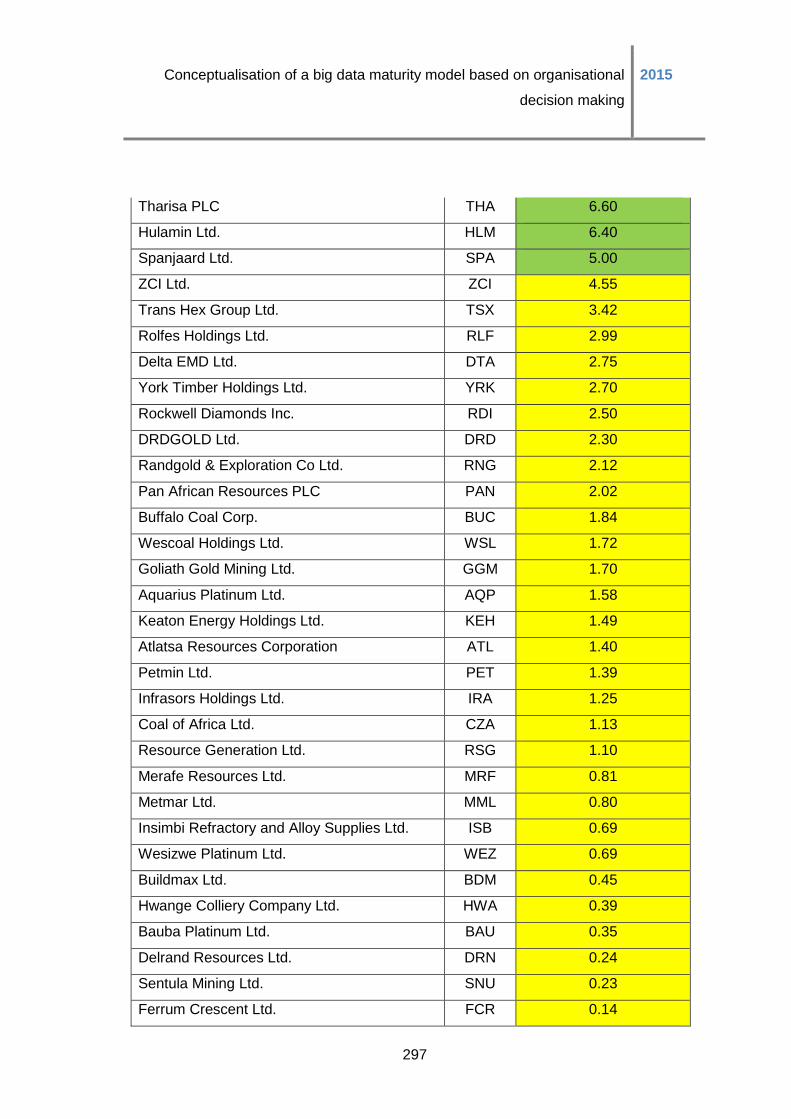
Conceptualisation of a big data maturity model based on organisational
decision making
2015
297
Tharisa PLC THA 6.60
Hulamin Ltd. HLM 6.40
Spanjaard Ltd. SPA 5.00
ZCI Ltd. ZCI 4.55
Trans Hex Group Ltd. TSX 3.42
Rolfes Holdings Ltd. RLF 2.99
Delta EMD Ltd. DTA 2.75
York Timber Holdings Ltd. YRK 2.70
Rockwell Diamonds Inc. RDI 2.50
DRDGOLD Ltd. DRD 2.30
Randgold & Exploration Co Ltd. RNG 2.12
Pan African Resources PLC PAN 2.02
Buffalo Coal Corp. BUC 1.84
Wescoal Holdings Ltd. WSL 1.72
Goliath Gold Mining Ltd. GGM 1.70
Aquarius Platinum Ltd. AQP 1.58
Keaton Energy Holdings Ltd. KEH 1.49
Atlatsa Resources Corporation ATL 1.40
Petmin Ltd. PET 1.39
Infrasors Holdings Ltd. IRA 1.25
Coal of Africa Ltd. CZA 1.13
Resource Generation Ltd. RSG 1.10
Merafe Resources Ltd. MRF 0.81
Metmar Ltd. MML 0.80
Insimbi Refractory and Alloy Supplies Ltd. ISB 0.69
Wesizwe Platinum Ltd. WEZ 0.69
Buildmax Ltd. BDM 0.45
Hwange Colliery Company Ltd. HWA 0.39
Bauba Platinum Ltd. BAU 0.35
Delrand Resources Ltd. DRN 0.24
Sentula Mining Ltd. SNU 0.23
Ferrum Crescent Ltd. FCR 0.14
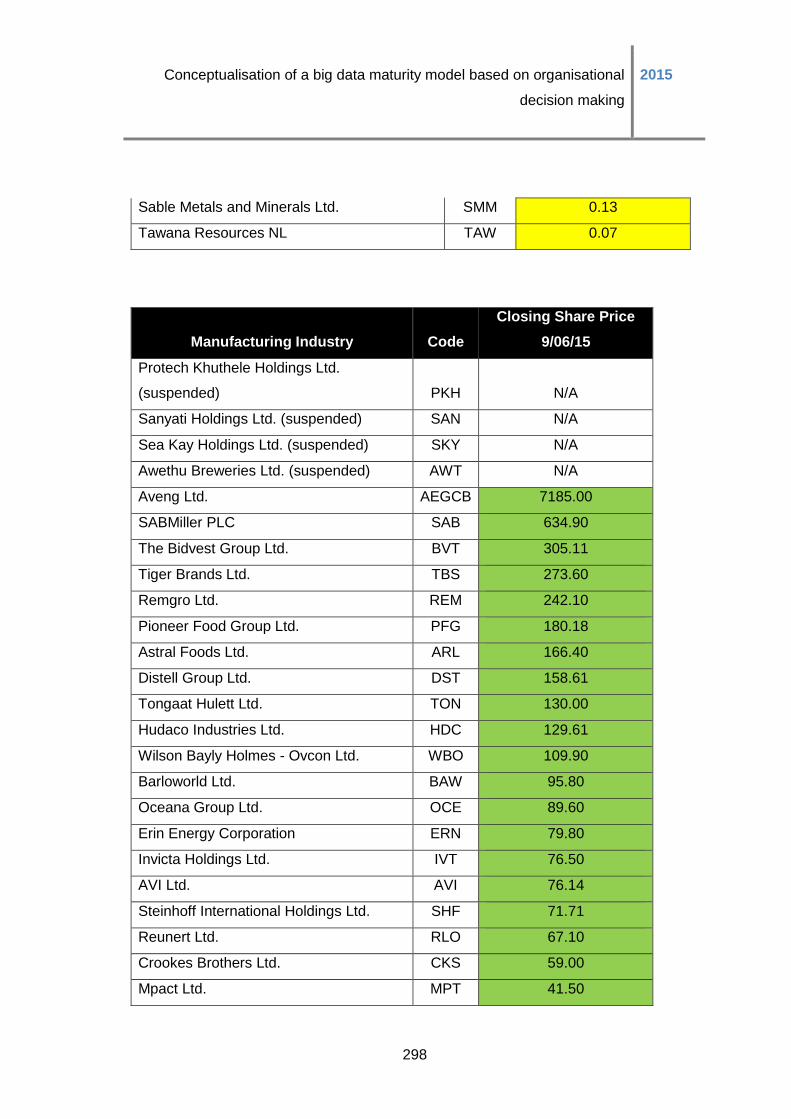
Conceptualisation of a big data maturity model based on organisational
decision making
2015
298
Sable Metals and Minerals Ltd. SMM 0.13
Tawana Resources NL TAW 0.07
Manufacturing Industry Code
Closing Share Price
9/06/15
Protech Khuthele Holdings Ltd.
(suspended) PKH N/A
Sanyati Holdings Ltd. (suspended) SAN N/A
Sea Kay Holdings Ltd. (suspended) SKY N/A
Awethu Breweries Ltd. (suspended) AWT N/A
Aveng Ltd. AEGCB 7185.00
SABMiller PLC SAB 634.90
The Bidvest Group Ltd. BVT 305.11
Tiger Brands Ltd. TBS 273.60
Remgro Ltd. REM 242.10
Pioneer Food Group Ltd. PFG 180.18
Astral Foods Ltd. ARL 166.40
Distell Group Ltd. DST 158.61
Tongaat Hulett Ltd. TON 130.00
Hudaco Industries Ltd. HDC 129.61
Wilson Bayly Holmes - Ovcon Ltd. WBO 109.90
Barloworld Ltd. BAW 95.80
Oceana Group Ltd. OCE 89.60
Erin Energy Corporation ERN 79.80
Invicta Holdings Ltd. IVT 76.50
AVI Ltd. AVI 76.14
Steinhoff International Holdings Ltd. SHF 71.71
Reunert Ltd. RLO 67.10
Crookes Brothers Ltd. CKS 59.00
Mpact Ltd. MPT 41.50

Conceptualisation of a big data maturity model based on organisational
decision making
2015
299
Metair Investments Ltd MTA 35.25
Masonite (Africa) Ltd. MAS 34.00
Nampak Ltd. NPK 33.35
Super Group Ltd. SPG 32.50
Consolidated Infrastructure Group Ltd. CIL 30.25
Howden Africa Holdings Ltd. HWN 30.00
Imperial Holdings Ltd. IPL 27.77
Trencor Ltd. TRE 27.77
Grindrod Ltd. GND 27.73
Group Five Ltd. GRF 26.95
Raubex Group Ltd. RBX 20.00
PPC Ltd. PPC 19.02
Afrimat Ltd. AFT 18.90
Transpaco Ltd. TP 18.50
Clover Industries Ltd. CLR 18.00
RCL Foods Ltd. RCL 17.46
Calgro M3 Holdings Ltd. CGR 16.90
Rhodes Food Group Holdings Ltd. RFG 16.80
Illovo Sugar Ltd. ILV 16.00
Cargo Carriers Ltd. CRG 16.00
Master Drilling Group Ltd. MDI 15.05
Murray & Roberts Holdings Ltd. MUR 13.63
Allied Electronics Corporation Ltd. AEN 13.25
Allied Electronics Corporation Ltd. AEL 13.06
Bell Equipment Ltd. BEL 10.00
Capevin Holdings Ltd. CVH 9.47
Montauk Holdings Ltd. MNK 9.24
Sephaku Holdings Ltd. SEP 8.50
Aveng Ltd. AEG 8.28
Sovereign Food Investments Ltd. SOV 8.00
Bowler Metcalf Ltd. BCF 7.95
Stefanutti Stocks Holdings Ltd. SSK 7.00
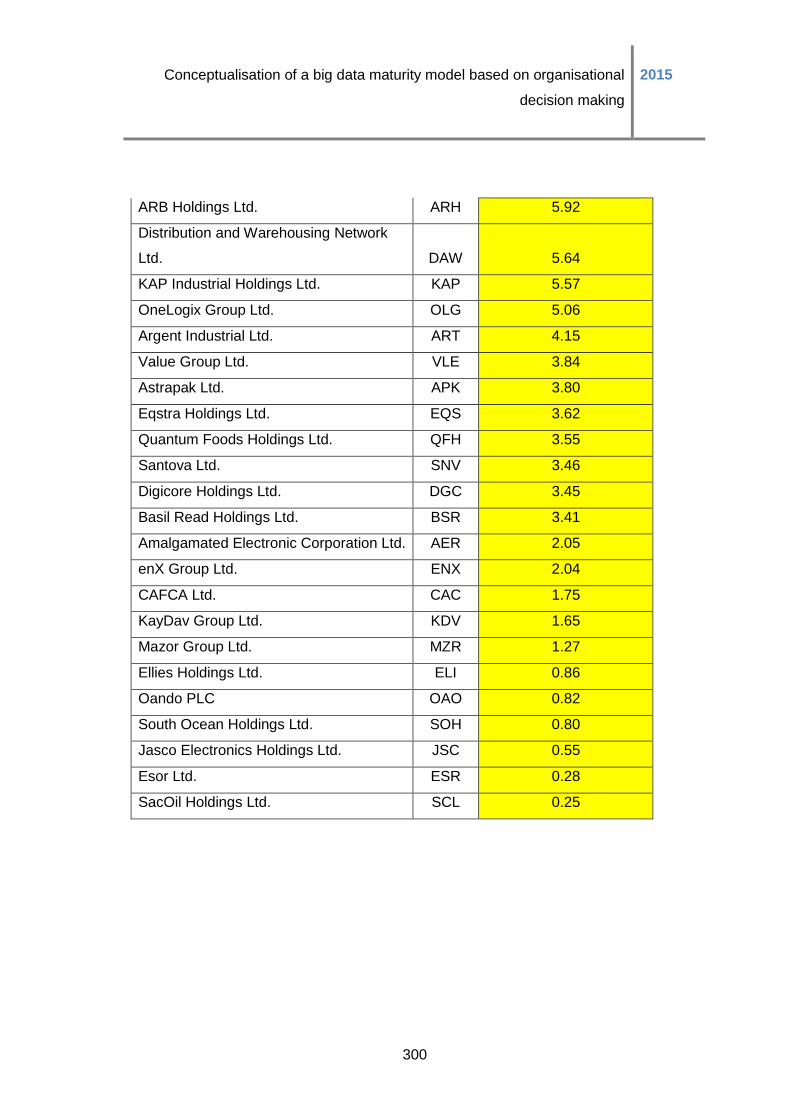
Conceptualisation of a big data maturity model based on organisational
decision making
2015
300
ARB Holdings Ltd. ARH 5.92
Distribution and Warehousing Network
Ltd. DAW 5.64
KAP Industrial Holdings Ltd. KAP 5.57
OneLogix Group Ltd. OLG 5.06
Argent Industrial Ltd. ART 4.15
Value Group Ltd. VLE 3.84
Astrapak Ltd. APK 3.80
Eqstra Holdings Ltd. EQS 3.62
Quantum Foods Holdings Ltd. QFH 3.55
Santova Ltd. SNV 3.46
Digicore Holdings Ltd. DGC 3.45
Basil Read Holdings Ltd. BSR 3.41
Amalgamated Electronic Corporation Ltd. AER 2.05
enX Group Ltd. ENX 2.04
CAFCA Ltd. CAC 1.75
KayDav Group Ltd. KDV 1.65
Mazor Group Ltd. MZR 1.27
Ellies Holdings Ltd. ELI 0.86
Oando PLC OAO 0.82
South Ocean Holdings Ltd. SOH 0.80
Jasco Electronics Holdings Ltd. JSC 0.55
Esor Ltd. ESR 0.28
SacOil Holdings Ltd. SCL 0.25
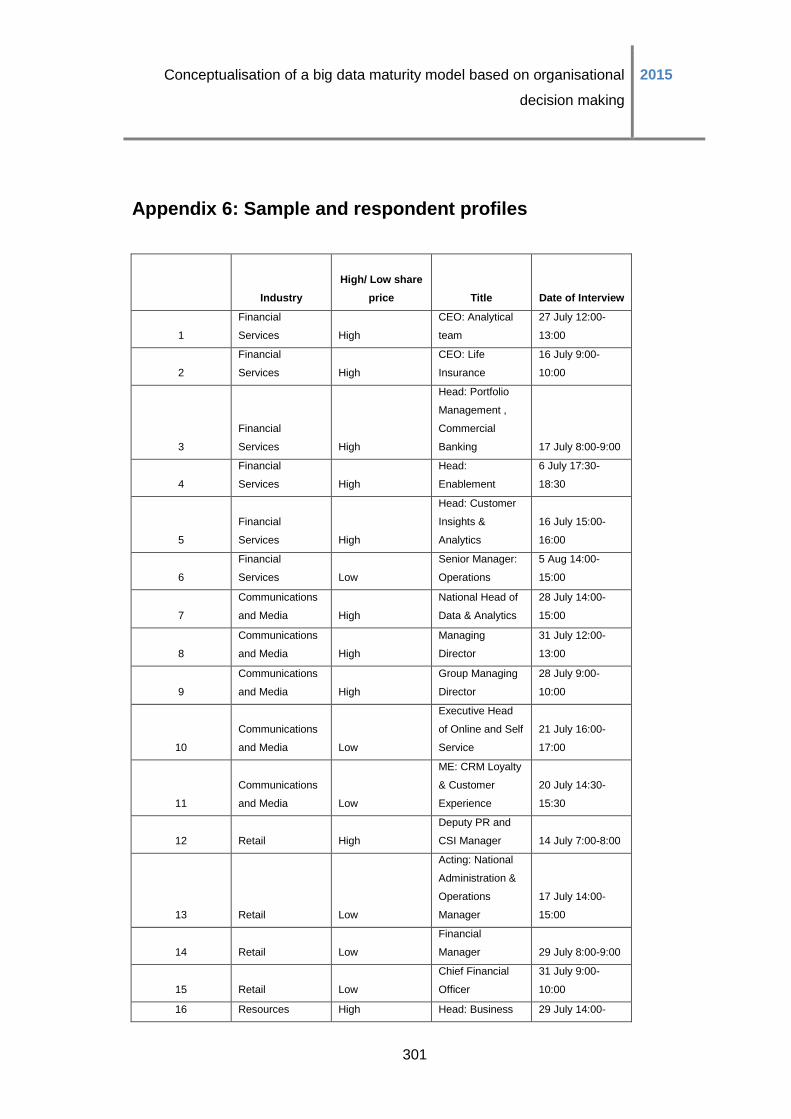
Conceptualisation of a big data maturity model based on organisational
decision making
2015
301
Appendix 6: Sample and respondent profiles
Industry
High/ Low share
price Title Date of Interview
1
Financial
Services High
CEO: Analytical
team
27 July 12:00-
13:00
2
Financial
Services High
CEO: Life
Insurance
16 July 9:00-
10:00
3
Financial
Services High
Head: Portfolio
Management ,
Commercial
Banking 17 July 8:00-9:00
4
Financial
Services High
Head:
Enablement
6 July 17:30-
18:30
5
Financial
Services High
Head: Customer
Insights &
Analytics
16 July 15:00-
16:00
6
Financial
Services Low
Senior Manager:
Operations
5 Aug 14:00-
15:00
7
Communications
and Media High
National Head of
Data & Analytics
28 July 14:00-
15:00
8
Communications
and Media High
Managing
Director
31 July 12:00-
13:00
9
Communications
and Media High
Group Managing
Director
28 July 9:00-
10:00
10
Communications
and Media Low
Executive Head
of Online and Self
Service
21 July 16:00-
17:00
11
Communications
and Media Low
ME: CRM Loyalty
& Customer
Experience
20 July 14:30-
15:30
12 Retail High
Deputy PR and
CSI Manager 14 July 7:00-8:00
13 Retail Low
Acting: National
Administration &
Operations
Manager
17 July 14:00-
15:00
14 Retail Low
Financial
Manager 29 July 8:00-9:00
15 Retail Low
Chief Financial
Officer
31 July 9:00-
10:00
16 Resources High Head: Business 29 July 14:00-
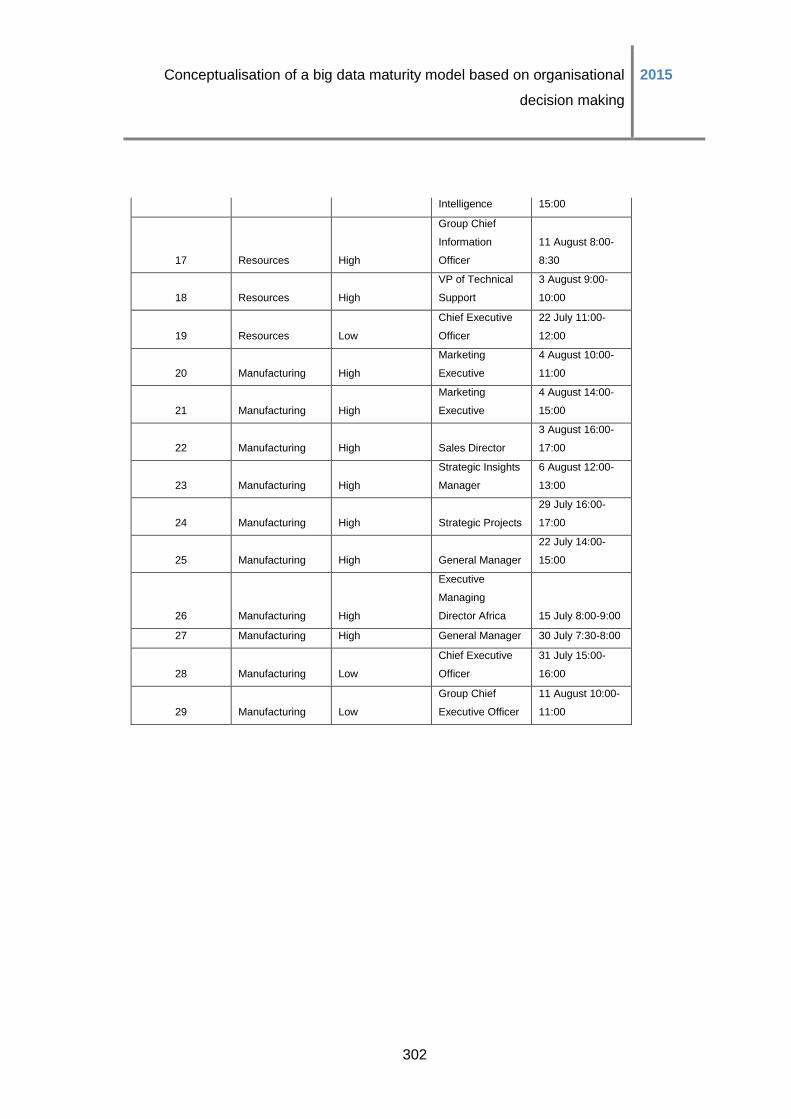
Conceptualisation of a big data maturity model based on organisational
decision making
2015
302
Intelligence 15:00
17 Resources High
Group Chief
Information
Officer
11 August 8:00-
8:30
18 Resources High
VP of Technical
Support
3 August 9:00-
10:00
19 Resources Low
Chief Executive
Officer
22 July 11:00-
12:00
20 Manufacturing High
Marketing
Executive
4 August 10:00-
11:00
21 Manufacturing High
Marketing
Executive
4 August 14:00-
15:00
22 Manufacturing High Sales Director
3 August 16:00-
17:00
23 Manufacturing High
Strategic Insights
Manager
6 August 12:00-
13:00
24 Manufacturing High Strategic Projects
29 July 16:00-
17:00
25 Manufacturing High General Manager
22 July 14:00-
15:00
26 Manufacturing High
Executive
Managing
Director Africa 15 July 8:00-9:00
27 Manufacturing High General Manager 30 July 7:30-8:00
28 Manufacturing Low
Chief Executive
Officer
31 July 15:00-
16:00
29 Manufacturing Low
Group Chief
Executive Officer
11 August 10:00-
11:00
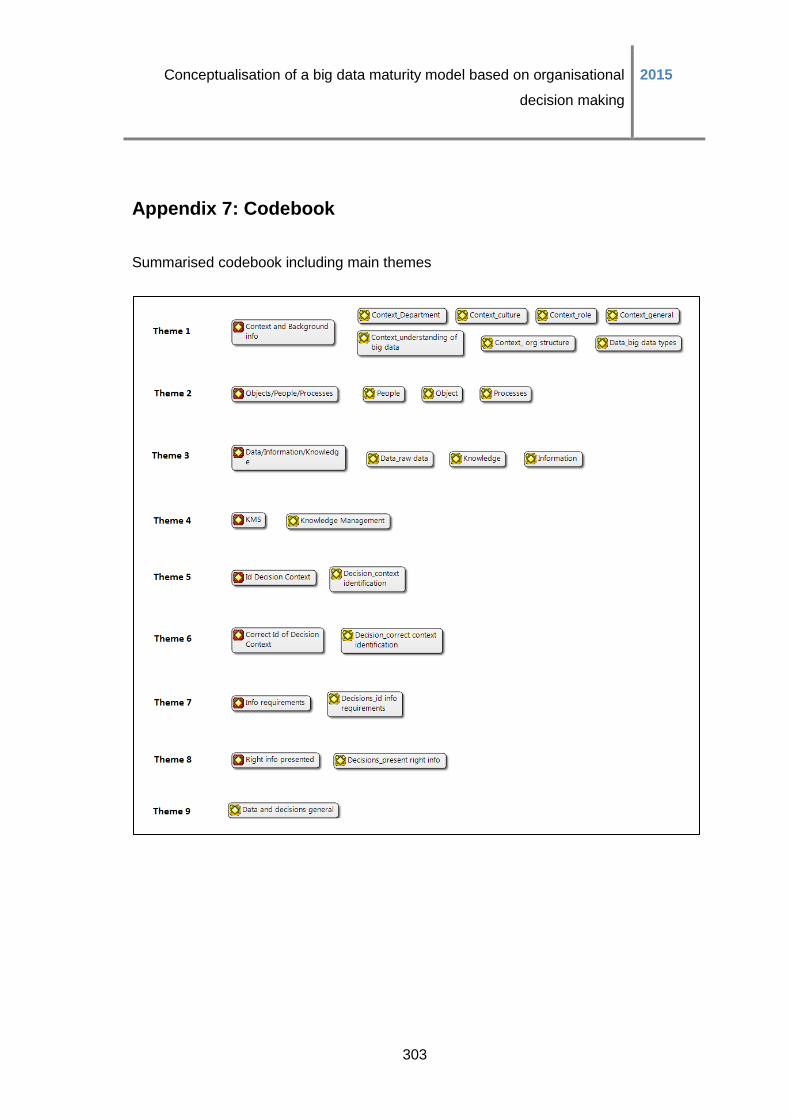
Conceptualisation of a big data maturity model based on organisational
decision making
2015
303
Appendix 7: Codebook
Summarised codebook including main themes
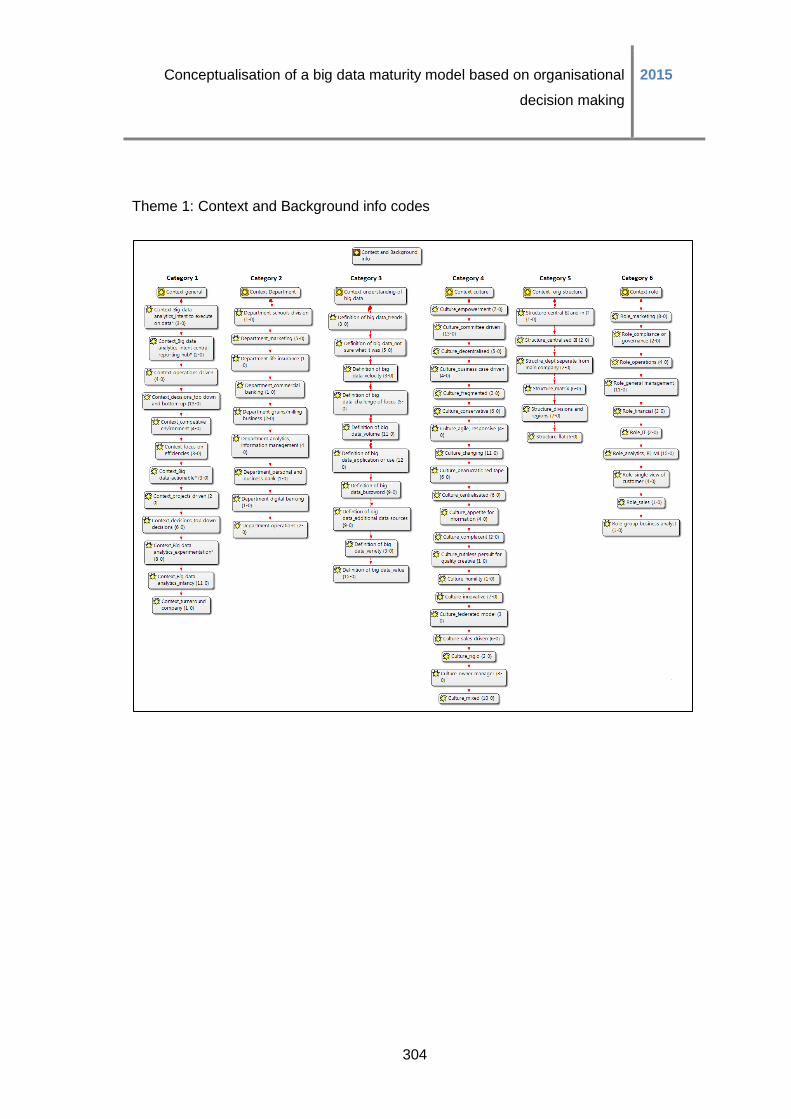
Conceptualisation of a big data maturity model based on organisational
decision making
2015
304
Theme 1: Context and Background info codes
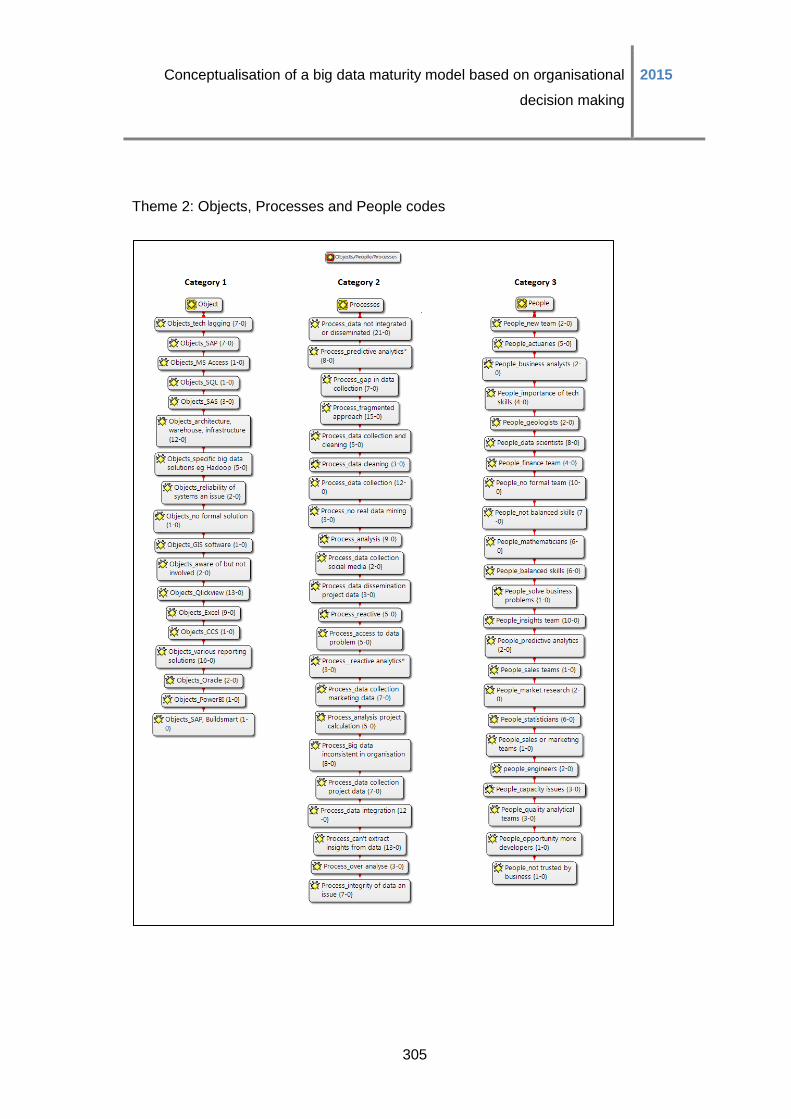
Conceptualisation of a big data maturity model based on organisational
decision making
2015
305
Theme 2: Objects, Processes and People codes
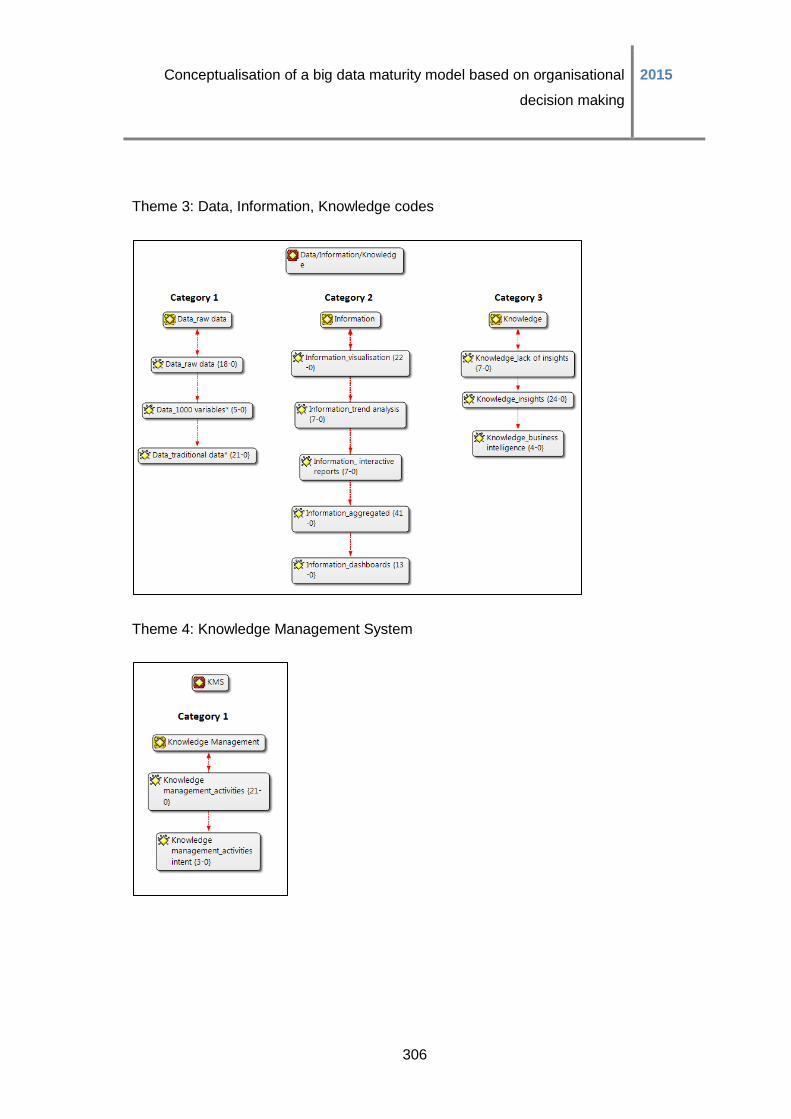
Conceptualisation of a big data maturity model based on organisational
decision making
2015
306
Theme 3: Data, Information, Knowledge codes
Theme 4: Knowledge Management System
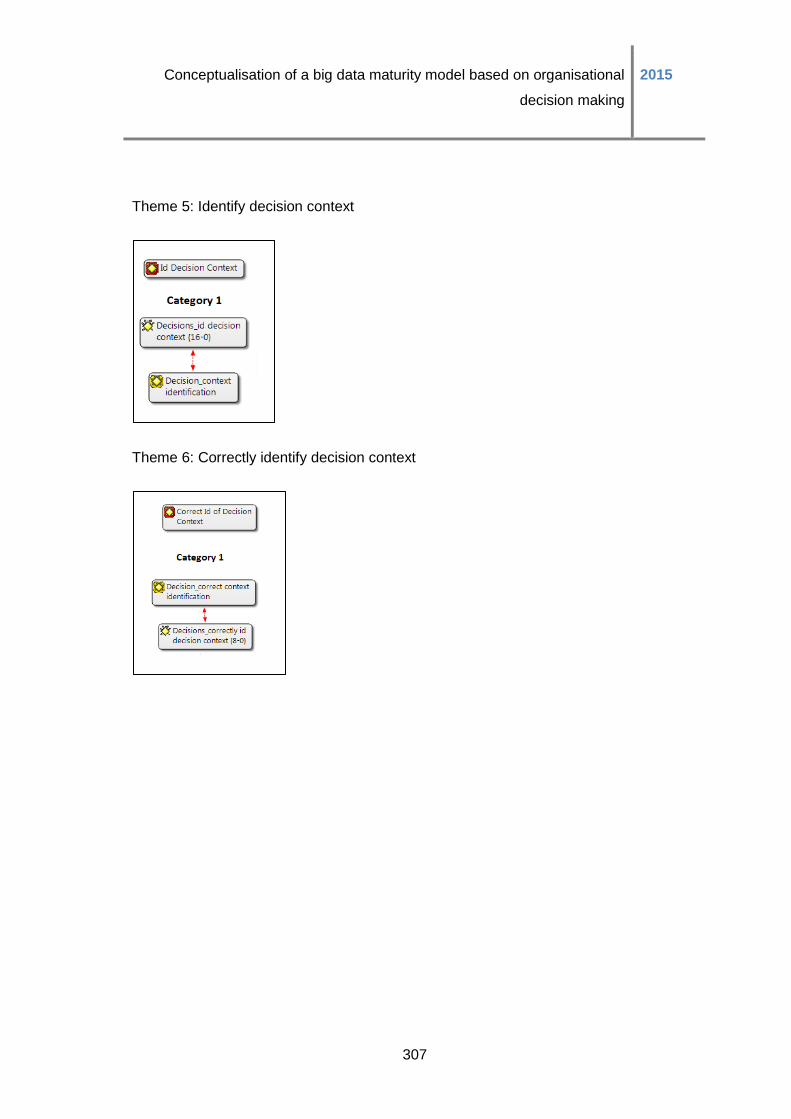
Conceptualisation of a big data maturity model based on organisational
decision making
2015
307
Theme 5: Identify decision context
Theme 6: Correctly identify decision context
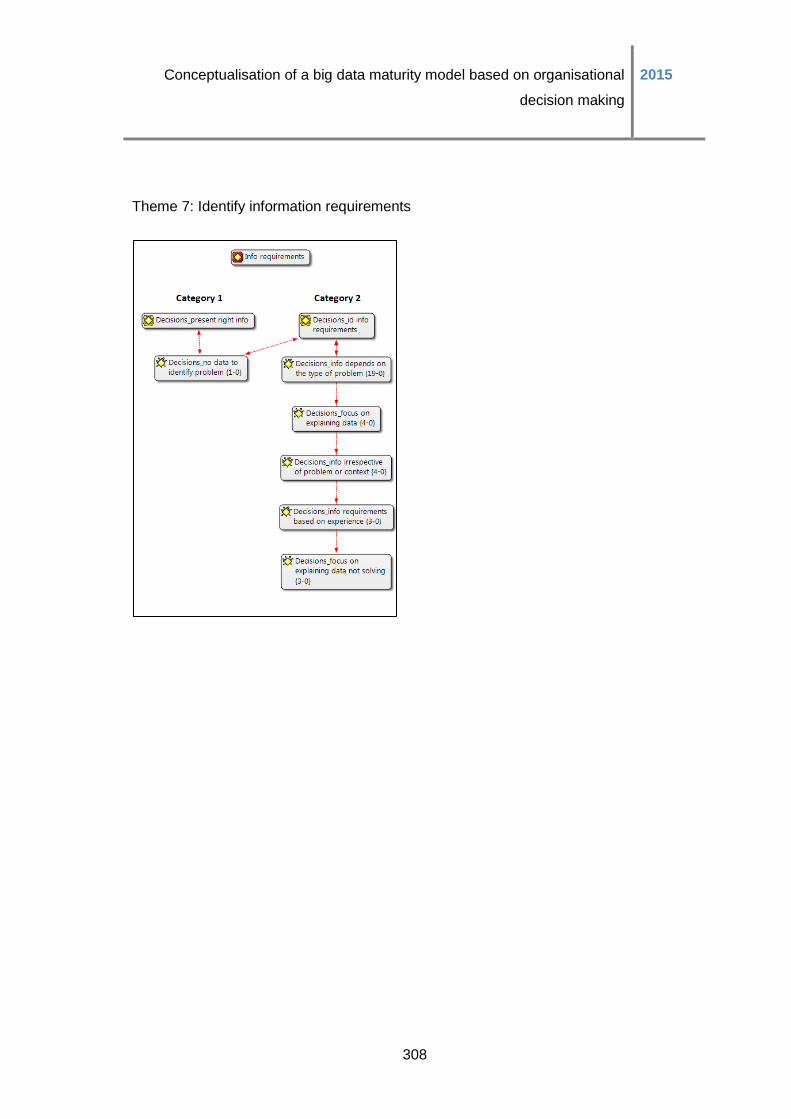
Conceptualisation of a big data maturity model based on organisational
decision making
2015
308
Theme 7: Identify information requirements
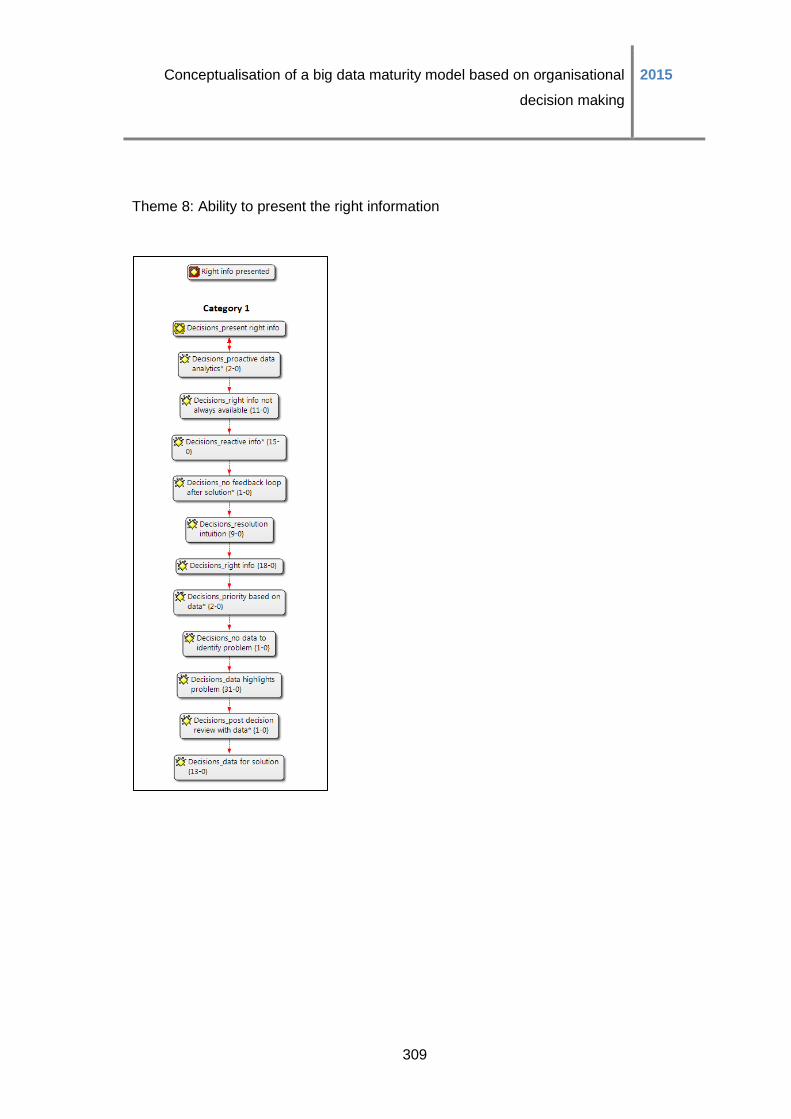
Conceptualisation of a big data maturity model based on organisational
decision making
2015
309
Theme 8: Ability to present the right information