CIP module 1_draft 5_23May.indd - Parliament of South Africa
This article was downloaded by: [Ismael Coronado]On: 25 July 2014, At: 10:15Publisher: Taylor & FrancisInforma Ltd Registered in England and Wales Registered Number: 1072954 Registered office: Mortimer House,37-41 Mortimer Street, London W1T 3JH, UK
Historical Biology: An International Journal ofPaleobiologyPublication details, including instructions for authors and subscription information:http://www.tandfonline.com/loi/ghbi20
Computer-integrated polarisation (CIP) in the analysisof fossils: a case of study in a Palaeozoic coral(Sinopora, Syringoporicae, Carboniferous)Ismael Coronadoa, Alberto Pérez-Huertab & Sergio Rodríguezac
a Departamento de Paleontología, Universidad Complutense de Madrid, C/José AntonioNováis 2, Ciudad Universitaria, E-28040 Madrid, Spainb Department of Geological Sciences, University of Alabama, Tuscaloosa, AL 35487, USAc Instituto de Geociencias (IGEO, CSIC-UCM), C/José Antonio Nováis 2, Ciudad Universitaria,E-28040 Madrid, SpainPublished online: 23 Jul 2014.
To cite this article: Ismael Coronado, Alberto Pérez-Huerta & Sergio Rodríguez (2014): Computer-integrated polarisation(CIP) in the analysis of fossils: a case of study in a Palaeozoic coral (Sinopora, Syringoporicae, Carboniferous), HistoricalBiology: An International Journal of Paleobiology, DOI: 10.1080/08912963.2014.938236
To link to this article: http://dx.doi.org/10.1080/08912963.2014.938236
PLEASE SCROLL DOWN FOR ARTICLE
Taylor & Francis makes every effort to ensure the accuracy of all the information (the “Content”) containedin the publications on our platform. However, Taylor & Francis, our agents, and our licensors make norepresentations or warranties whatsoever as to the accuracy, completeness, or suitability for any purpose of theContent. Any opinions and views expressed in this publication are the opinions and views of the authors, andare not the views of or endorsed by Taylor & Francis. The accuracy of the Content should not be relied upon andshould be independently verified with primary sources of information. Taylor and Francis shall not be liable forany losses, actions, claims, proceedings, demands, costs, expenses, damages, and other liabilities whatsoeveror howsoever caused arising directly or indirectly in connection with, in relation to or arising out of the use ofthe Content.
This article may be used for research, teaching, and private study purposes. Any substantial or systematicreproduction, redistribution, reselling, loan, sub-licensing, systematic supply, or distribution in anyform to anyone is expressly forbidden. Terms & Conditions of access and use can be found at http://www.tandfonline.com/page/terms-and-conditions
Computer-integrated polarisation (CIP) in the analysis of fossils: a case of study in a Palaeozoiccoral (Sinopora, Syringoporicae, Carboniferous)
Ismael Coronadoa*, Alberto Perez-Huertab and Sergio Rodrıgueza,c
aDepartamento de Paleontologıa, Universidad Complutense de Madrid, C/Jose Antonio Novais 2, Ciudad Universitaria, E-28040Madrid, Spain; bDepartment of Geological Sciences, University of Alabama, Tuscaloosa, AL 35487, USA; cInstituto de Geociencias(IGEO, CSIC-UCM), C/Jose Antonio Novais 2, Ciudad Universitaria, E-28040 Madrid, Spain
(Received 6 May 2014; accepted 21 June 2014)
Computer-integrated polarisation (CIP) method has been applied satisfactorily in the study of fossils skeletons of Sinopora(tabulate coral, Auloporida and Carboniferous). A previous characterisation of sample by scanning electron microscopy,atomic force microscopy and cathodoluminescence (CL) with the purpose of distinguishing the diagenetical alteration wasdone. Subsequently, a crystallographic comparison between CIP and electron-backscattering diffraction has been madegetting a very good correlation between both methods. The CIP method allows obtaining c-axis orientation images, polefigures, and measure and mapping the misorientation of uniaxial biominerals in recent and fossil skeletons. This techniquecan only be used in uniaxial biominerals (calcite, quartz and hydroxylapatite), limiting its use for biaxial or bimineralic andpolimineralic biominerals. CIP method has good spatial resolution (limited by camera); in our example 90 nm. The mainadvantage of this technique, versus other with similar properties, is the fast acquisition of data in low and highmagnifications. This method does not require special treatment of samples and can be very useful for the analysis ofmicrostructures in thin and ultra-thin sections. CIP method detects diagenetic alterations in fossil skeletons by modificationsin the inner arrangement of biominerals, which combined with CL offers valuable geochemical and crystallographicinformation.
Keywords: computer-integrated polarisation; electron-backscattering diffraction; biomineralisation; palaeontology;tabulate corals; Sinopora
Introduction
Matrix-mediated controlled biominerals are hierarchical
structures, with a significant arrangement from nano to
macroscales, to form robust skeletons. This structuring
develops some singular properties at mechanical level,
establishing a research focus for current cutting-edge
biomaterial research (Burdick and Mauck 2011; DiMasi
and Gower 2014). Likewise, these super-structures high-
light the natural evolutionary processes of biomineralisa-
tion that is of interest in palaeontology, particularly the
control exerted by organisms in the formation of skeletons
throughout past environmental and climatic changes.
Calcium carbonate biominerals are an example of such
hierarchical structures with the controlled formation of
crystalline microstructures (Griesshaber et al. 2007;
Beniash 2011). These microstructures have singular
crystallographic properties due to their ordered structure,
representing an evolutionary advantage to organisms for
better adaptation to environments, protection, and improve-
ment of ecological interactions, and overall functional
morphology (Feng et al. 2000; Mann 2001; Schmahl et al.
2004; Currey 2005).
The analysis of the evolution of biomineral properties
can be achieved by the study of fossils (Dauphin 2002;
Stolarski et al. 2007; Cuif et al. 2011; Perez-Huerta et al.
2012). The study of mechanisms responsible for the
development of skeletons in palaeontology is very useful to
understand the common crystallisation pathways in some
groups and their evolution through the time (Stolarski and
Mazur 2005; Cuif et al. 2011). Also, biomineral properties,
such as preferred crystallographic orientations and
geochemical signatures, can help us to distinguish the
systematic affinity of uncertain taxa and to observe the
preservation state of fossils. This last fact is very helpful in
geochemical studies with focus on palaeoclimatic and
palaeoenvironmental interpretations, in which good fossil
preservation may reflect primary chemical signals of
skeletons and shells (Grossman et al. 1996; Mii et al. 2001;
Rosales et al. 2004). Techniques routinely used in the study
of biomineralisation can also be used to inform about the
preservation state of fossils (Perez-Huerta et al. 2007;
Stolarski et al. 2007; Fryda et al. 2009; Grellet-Tinner et al.
2011; Lee et al. 2012; Moreno-Azanza et al. 2013; Torney
et al., 2013).
Classically, the studies of microstructure in palaeozoic
corals have been focused to identify and classify
evolutionary patterns of biocalcification and their
applications as taxonomy criteria. However, this fact has
q 2014 Taylor & Francis
*Corresponding author. Email: [email protected]
Historical Biology, 2014
http://dx.doi.org/10.1080/08912963.2014.938236
Dow
nloa
ded
by [
Ism
ael C
oron
ado]
at 1
0:15
25
July
201
4
been charged of controversy during more than 70 years,
because some authors have considered some or all
microstructures present in palaeozoic corals as a product
of diagenetical alteration (more details in Rodrıguez 1989;
Coronado et al. 2013). By the use of routine techniques
used in biomineralisation, Coronado et al. (2013) have
demonstrated the presence of primary skeletal structures in
a skeleton of a Syringoporicae from Carboniferous of
Spain. The importance of control about crystallographic
orientations exerted by organisms is crucial to understand
the production and formation of biominerals and the
processes of diagenesis that change the original crystal-
lographic information (Perez-Huerta et al. 2007). In this
regard, several techniques have been systematically used
including polarised microscopy (Schmidt 1924; Burdick
and Mauck 2011), X-ray diffraction (Checa and
Rodrıguez-Navarro 2005; Rodrıguez-Navarro 2006),
transmission electron microscopy (Griesshaber et al.
2009; Lee et al. 2012), electron-backscattering diffraction
(EBSD) (Perez-Huerta et al. 2007; Coronado et al. 2013)
and polarisation-dependent imaging contrast (PIC) map-
ping done using X-ray photoelectron emission spectro-
microscopy with synchrotron radiation (Gilbert et al.
2011; Gilbert 2012).
The scope of this study was the introduction of a new
technique, computer-integrated polarisation (CIP)
microscopy, for the crystallographic analysis of biominer-
alised structures in fossils, and its application in the
detection of diagenetic alteration. CIP has been described
as a method for texture analysis and optical orientation
imaging (Heilbronner and Pauli 1993; Heilbronner 2000;
Heilbronner and Barret 2014). This technique determines
the c-axis orientations of uniaxial minerals from optical
micrographs and displays the results in the form of pole
figures and c-axis orientation images (COIs), using a
colour-code scheme [colour look-up table (CLUT)], which
represents each orientation in two elements (azimuth and
inclination). CIP has beenmainly used in structural geology
for the analysis of quartz and calcite with good results (van
Daalen et al. 1999; Trullenque et al. 2006), but without
application to recent and fossil biominerals.We present this
tool as an alternative to conventional crystallographic
methods used in biomineralisation, showing their advan-
tages and disadvantages in relation to other techniques and
their applications in palaeontology. For this purpose, a
structural and crystallographic case study of skeletons of
Sinopora sp. is presented, including a comparison of
crystallographic data obtained by CIP and EBSD.
Materials
Colonies and colony branches of Sinopora sp. Sokolov,
1955 come from Cantabric Zone (Figure S1(A)), north part
of Iberian Massif (Lotze 1945), and more specifically in
the Vergano Fm., Pisuerga-Carrion Unit, Palencia, Spain
(Figure S1(B)). Samples from Celada de Roblecedo Sur
section were collected (van der Graff 1971), which is
located in the Celada de Roblecedo Anticline between the
Redondo Syncline and the Castillerıa Syncline. It is Late
Moscovian (Myachkovian horizon) in age. Details about
the locality and palaeoecology of taxa are contained in
Coronado and Rodrıguez (2014).
Sinopora Sokolov, 1955 is a tabulate coral that belongs
to the Order Auloporida and Family ?Sinoporidae
Sokolov, 1995. We include provisionally this genus in
the superfamily Syringoporicae because of its similarities
with Multithecopora (Hill 1981). Sinopora shows a small
bushy colonial morphology with cylindrical corallites,
slender, elongated and curved, but with deeper calices with
sharp edges (Figure 1(A)–(C)). Lateral increase, hola-
canth septal spines and tabulae are rare (Figure S1).
Methods
To characterise and evaluate the original preservation of
coral skeleton, a combination of different structural and
crystallographic techniques was used, including petro-
graphic microscopy, scanning electron microscopy (SEM),
atomic force microscopy (AFM) and cold cathodolumi-
nescence (CL). In addition, selected samples were prepared
for their study by EBSD and their observation by
petrographic microscopy and analysed by CIP.
Structural characterisation
SEM and petrographic microscopy were used for
visualisation and characterisation of the microstructures
in the corals. The samples were cut, polished and etched
with formic acid 2% solution for 7 s for SEM. Images were
obtained with a JEOL JSM-820 scanning electron
microscope operated at 20 kV, equipped with an EDX
system, located in the Geological Techniques Research
Assistance Centre (Universidad Complutense de Madrid,
Spain). Thirty-one thin sections of six coral colonies and
two ultra-thin sections were prepared to study by
petrographic microscope and CIP analysis.
The rock counterpart of thin sections that presented
better preservation characteristics were selected to study
the samples with AFM. The different rock pieces were
polished and cut by a circular diamond cutter forming thin
slides of rock. The thin slides were cut and etched with a
Milli-Q water solution for 7 h and observed with an Atomic
Force Microscope [model Digital Instruments Nanoscope
IIIA (Veeco), located at the National Centre of Electron
Microscopy, Universidad Complutense de Madrid, Spain].
The images were obtained at room temperature and in air
using a tapping mode with a silica tip. The images were
processed with the Nanoscope software v5.30 r3 sr3 of
2 I. Coronado et al.
Dow
nloa
ded
by [
Ism
ael C
oron
ado]
at 1
0:15
25
July
201
4
Veeco Instruments Inc. and the WSxM v5.0 Develop 5.0
software of Nanotec (Horcas et al. 2007). Two main types
of images can be obtained with AFM: height and phase.
Height images enable topographical reconstruction of the
crystal surface, while phase images provide information
regarding the variations inmaterial properties.More details
concerning the properties of each image is presented in
Coronado et al. (2013).
The CL study was carried out with a cold CL probe CL
8200 MK 4 system made by Cambridge Image
Technology Ltd (Cambridge, UK), working at 16 kV and
a current of 0.5mA, fitted to a petrographic microscope
Nikon Eclipse E400 POL with camera, located in the
Geological Storage Division, Hidrogeochemical Group,
Ciemat (Madrid, Spain). CL microscopy has been applied
in the past with the aim to prove the diagenetic or biogenic
origin of coral microstructures (e.g. Mas and Rodrıguez
1990; Fedorowski 2003; Stolarski et al. 2007).
Crystallographic characterisation
For EBSD analyses, samples were prepared using a thin
slide of rock that contains a colony in transversal and
longitudinal sections. The slides were polished with
alumina of 1 and 0.3mm and finally polished with colloidal
silica (0.06mm). Before analysis, sampleswere coatedwith
a thin layer (1.5 nm) of Au/Pt (Perez-Huerta and Cusack
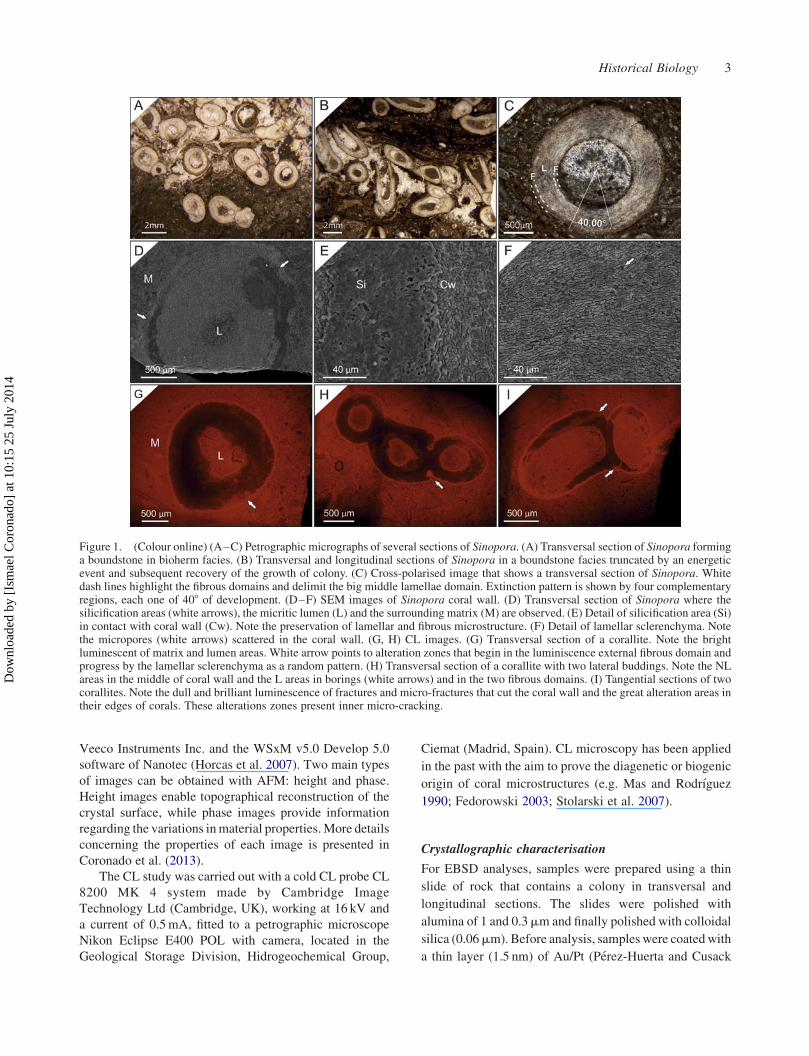
Figure 1. (Colour online) (A–C) Petrographic micrographs of several sections of Sinopora. (A) Transversal section of Sinopora forminga boundstone in bioherm facies. (B) Transversal and longitudinal sections of Sinopora in a boundstone facies truncated by an energeticevent and subsequent recovery of the growth of colony. (C) Cross-polarised image that shows a transversal section of Sinopora. Whitedash lines highlight the fibrous domains and delimit the big middle lamellae domain. Extinction pattern is shown by four complementaryregions, each one of 408 of development. (D–F) SEM images of Sinopora coral wall. (D) Transversal section of Sinopora where thesilicification areas (white arrows), the micritic lumen (L) and the surrounding matrix (M) are observed. (E) Detail of silicification area (Si)in contact with coral wall (Cw). Note the preservation of lamellar and fibrous microstructure. (F) Detail of lamellar sclerenchyma. Notethe micropores (white arrows) scattered in the coral wall. (G, H) CL images. (G) Transversal section of a corallite. Note the brightluminescent of matrix and lumen areas. White arrow points to alteration zones that begin in the luminiscence external fibrous domain andprogress by the lamellar sclerenchyma as a random pattern. (H) Transversal section of a corallite with two lateral buddings. Note the NLareas in the middle of coral wall and the L areas in borings (white arrows) and in the two fibrous domains. (I) Tangential sections of twocorallites. Note the dull and brilliant luminescence of fractures and micro-fractures that cut the coral wall and the great alteration areas intheir edges of corals. These alterations zones present inner micro-cracking.
Historical Biology 3
Dow
nloa
ded
by [
Ism
ael C
oron
ado]
at 1
0:15
25
July
201
4
2009). The EBSD study was carried out with an Oxford
Nordlys camera mounted on a Field Emission Scanning
Electron Microscope JEOL 7000 located in the Central
Analytical Facility (CAF) of the University of Alabama.
EBSD data were collected with the Oxford Aztec 2.0
software at high vacuum, 30 kV, large probe current and a
resolution of 0.3mm step size for crystallographic maps.
Finally, data were analysed using OIM 5.3 from EDAX-
TSL. In this study, EBSD data are represented by
crystallographic maps and pole figures, which represent
the stereographic projection of crystallographic planes in
reference to the {0001}, f10�10} and f01�10} calcite planesin a transversal section of Sinopora sp.MATLABe toolbox
MTEX (Bachmann et al. 2011) has been used with the
purpose to plot misorientations.
For CIP analysis, two ultra-thin sections, representing
transverse and longitudinal sections, of Sinopora sp. were
used. For the analysis of thin sections, it is necessary to use
ultra-thin sections due to the size of crystals, with better
results obtained when the first grey order of interference
colour is reached during polishing. In some cases, the
ultra-thin sections in the limit with second order of
interference colour (blues and yellows colourations) can
also be used. The method of preparation of ultra-thin
sections was described by Lafuste (1970) and the samples
should be between 2 and 10mm in thickness. This
thickness induces some alterations in the CIP analysis, due
to impurities in the glass (dust, scratches or particles), and
it requires careful cleaning of the surfaces before analysis.
Six CIP analyses in different corallites were performed
with a petrographic Zeiss microscope with a reflex camera
attached and a Kodak Wratten filter no. 25, at 20 £ and
40 £ magnifications, to determine the crystallographic
correlation of coral wall microstructure and were
processed with the Image SXM software (Barret 1997).
The resolution is 3072 £ 2048 pixel and the ratio pixel–
mm is 1:1.14.
Misorientation images were analysed to characterise
the potential diagenetical alteration of these coral samples.
These images show the misorientation, which is the
number of degrees required to bring these two crystals into
crystallographic alignment on a common axis, for each
pixel measurement in north–south and east–west direc-
tions. In addition, circular polarisation images (details in
Heilbronner and Barret 2014) were obtained to distinguish
some regions affected by recrystallisation. Finally, with
the purpose of measuring the misorientations among
crystals and establishing a comparison with EBSD data, it
was necessary to make a transect of misorientations using
the SXM Image, measuring the difference of orientation
between two correlated crystals. This analysis was carried
out using a random process of measure during 200 contacts
of crystals, helped by the azimuthal image of COI and
plotting the results in a histogram.
Results
Structure of Sinopora
Microstructural characterisation
Sinopora skeletons are formed by alternating domains of
calcite crystals, with two morphologies: lamellae and
fibres. The microstructure is composed of three domains,
an external fibrous domain, a middle lamellar domain and
an inner fibrous domain (Figure 1(C)), with fibres located
within the external and inner domains. Occasionally, the
preservation of coral does not clearly permit to observe the
fibrous domains, with some corals showing signs of
abrasion at their external edges, resulting in the removal of
the fibrous domain.
Fibres (Figures 4(A), 6(A) and 8(A)) are elongate
crystals, with length from 12 to 30mm (x ¼ 19mm) and
width between 2 and 5mm (x ¼ 3mm), with irregular
morphology and indentations to their edges. The morpho-
logical axis is permanently oriented towards the lumen,
perpendicular to growth direction. A gradual transit between
fibres and lamellae is produced, as it is characteristic in the
Palaeozoic corals (Semenoff-Tian-Chansky 1974; Lafuste
1978, 1983; Rodrıguez 1989; Falces and Rodrıguez 1999).
Sometimes, it can be recognised in Sinopora skeleton, a
branch-off in the transition point where two or more fibres
form a lamellae (Figure 6(A)) or lamellae which turn 908their morphological axis (L-shaped) and point to the lumen
in the transit to fibrous domain (Figures 6(A) and 8(A)).
Lamellae, sensu Lafuste (1983), are the second
morphological element that make the microstructure in
Sinopora and are the most abundant. Lamellae are straight
to slightly wavy, with indentations at their edges, and are
completely imbricated with each other showing a compact
packaging (Figure 1(F)), being the most characteristic
morphology the ‘scutellate’ lamellae (Lafuste 1983).
These structures having a lateral development in two
dimensions, with lengths from 5 to 30mm (x ¼ 16mm)
and width from 2 to 4mm (x ¼ 3mm), are microlamellae,
sensu Rodrıguez (1989). The morphological axis is
permanently oriented perpendicular to the lumen, parallel
to growth direction. The concave part of lamellae always
points out to the lumen, showing a concentrically aspect of
the lamellae domain (Figure 1(C),(F)). Petrographic
microscopy shows an undulate extinction, around the
coral wall, which is characteristic of Syringoporicae. The
extinction in a transversal section shows a cross with four
extinct regions at 408 (Figure 1(C)).
Nanostructural characterisation
AFM is a powerful technique to observe the original
nanostructures of fossil skeletons and their preservation
state. This method have been applied in tabulate (Coronado
et al. 2013) and scleractinian (Stolarski and Mazur 2005)
corals with remarkable results. AFM images of the coral
4 I. Coronado et al.
Dow
nloa
ded
by [
Ism
ael C
oron
ado]
at 1
0:15
25
July
201
4
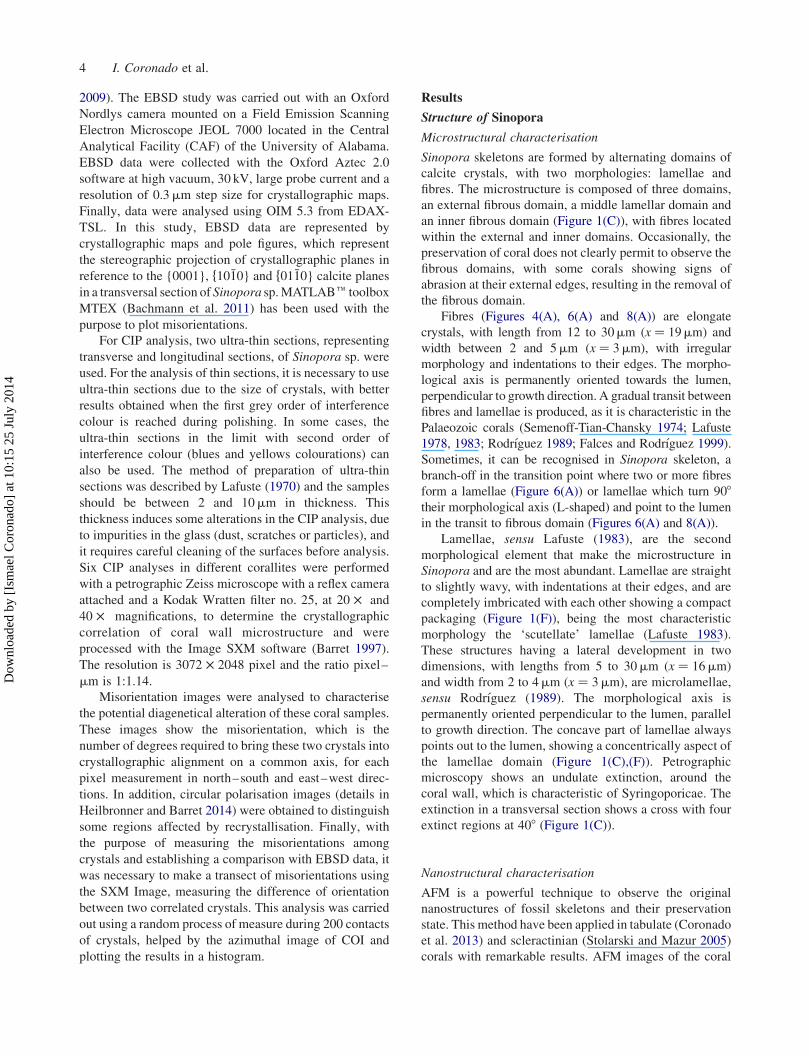
wall (Figure 3(B)–(D)) show an intricate nanostructure
formed by nanogranules in both lamellae and fibres
(Figure 4). The nanogranules are mainly rounded and very
well rounded, with irregular morphologies. The sizes are
more variable, 31–74 nm (x ¼ 46 nm), but the distribution
is random (Figure 4), in contrast to other Syringoporicae
where the nanotexture is co-oriented (Coronado et al.
2013). The edges of the nanogranules exhibit a dark colour
in phase images, indicating that they have a different
composition (Figure 2(D),(E)). In topography image, some
nanogranules present a rim around them, with other
topography indicating that the compositional variation is
part of other phase or a mixing of phases. Several authors
(Dauphin 2002; Cuif et al. 2008; Gorzelak et al. 2013) have
studied these envelopes in recent and fossil organisms and
proposed that they could be organic coatings from the
original organic matrix.
Coral wall preservation
There are some signs of diagenetical alteration observable
by CL, SEM and AFM. Skeletons of Sinopora show some
good preservation of their original morphology and
structure, but some corallites show patterns of alteration.
Corals by CL exhibit in the majority of them null or low
luminescence, showing a distribution of the luminescence
mainly in the fibrous domains of the external and inner
edges. The luminescence of the matrix is very bright
(Figure 1(G)). Bright luminescence is common in fractures
of the rock (Figure 1(I)) and micro-cracking of the
skeletons in borings (Figure 1(G),(H)). Dull luminescence
is common in coral wall from the external part as a
migration of fluids, and later, recrystallisation in these
areas is observable in a scattered pattern of luminescence.
On the other hand, there are some corals that present bright
luminescence in regions of the coral wall, associated to
micro-cracking (Figure 1(I)) and later alteration from
these points.
SEM also show alteration signs in the coral walls,
with a minimum number of corals altered by silicification
on their edges. This pattern of alteration is produced by
the migration of fluids from the external part of coral to
the inner one, but without reaching the lumen. Sometimes,
it is observable in little gulf around the silicification areas,
the microstructure preserved or partially preserved around
of them (Figure 1(E)). In these last areas, a degrading
neomorphism pattern is observable around the original
microstructure. Likewise, it is common that some corals
presenting an alteration pattern by dissolution in the form
Figure 2. (Colour online) (A–F) AFM images of a coral wall of Sinopora. (A) Height image of the longitudinal section of a lamella. (B)Phase image of A where granular-shaped nanocrystals are observed. Note the thickness of the dark coating around crystals. (C) Heightimage of the longitudinal section of a lamella. (D) Phase image of C where granular-shaped nanocrystals and the partial merging betweennanocrystals by recrystallisation are observed. (E) Height image of the longitudinal section of a lamella. (F) Phase image of E. Note theflattening of the topography in the height image and the loss of nanotexture in the phase image by recrystallisation.
Historical Biology 5
Dow
nloa
ded
by [
Ism
ael C
oron
ado]
at 1
0:15
25
July
201
4
of isolated pores scattered by the wall (Figure 1(F),
white arrow).
AFM data exhibit some regions in the external part
of coral in which nanogranules are melted, losing the
original morphology and increasing their size (Figure 4
(B),(C),(E),(F)). In these areas, the dark-coloured coating
observable in the coral wall is lost or partially lost by
this nano-recrystallisation, in correspondence with the
luminescence by CL.
Crystallography of Sinopora
Electron-backscattering diffraction
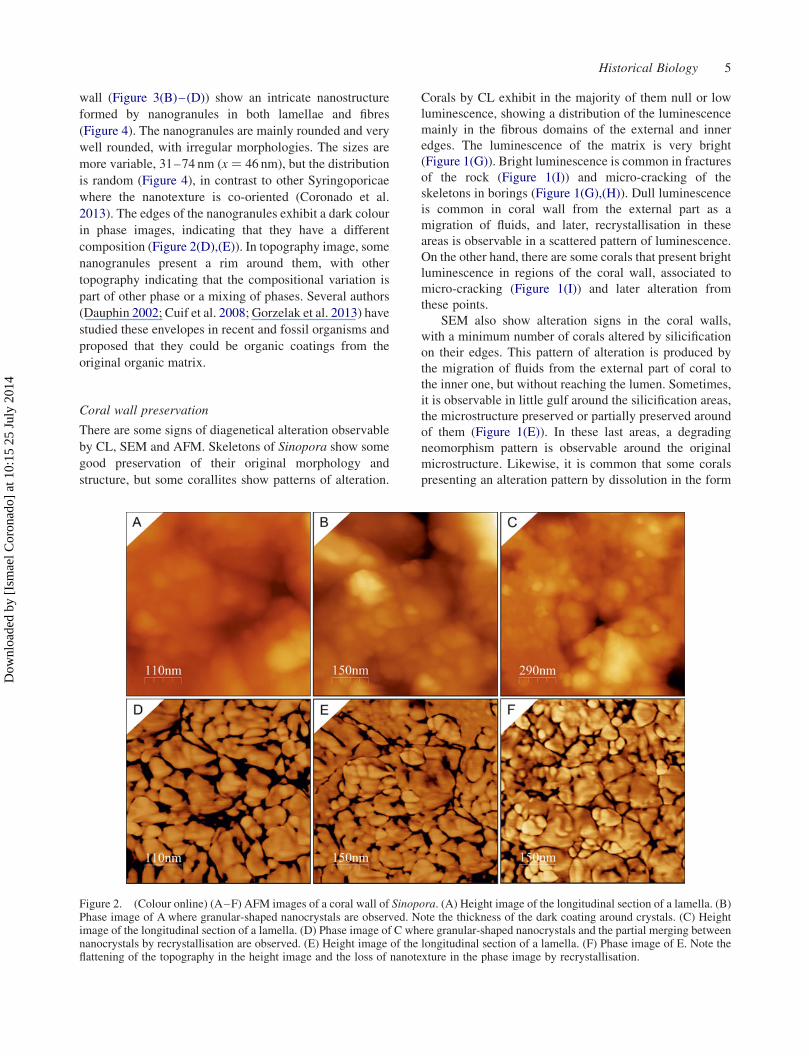
EBSD data confirm observations of microstructure by
petrographic microscopy and SEM, in addition, to provide
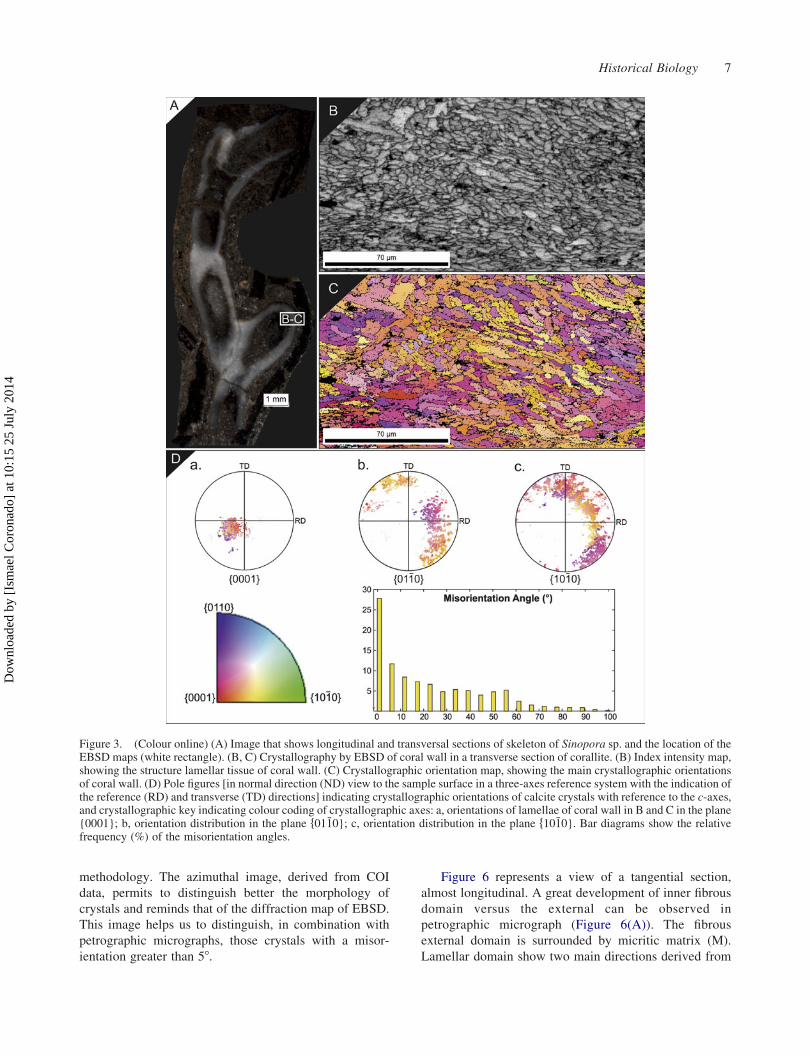
crystallographic information (Figure 3). Diffraction maps
of transversal section in the middle zone show well-
defined crystals with microlamellae morphology (Figure 3
(B)), as well as reflects that ‘scutellate’ microlamellae can
be imbricated composing a frame (Figure 3(B)).
Crystallographic maps indicate that each structure
(lamellae in this case) behaves like a single crystal (Figure 3
(C)). The lamellae present a c-axis of calcite perpendicular
to their elongation, with an inclination respect to the
morphological axis of ca. 308. It is characteristic that the
distribution of colours derived by preferred crystal-
lographic orientations show packages of lamellae with the
same orientation, cut by other packages with a different
orientation. Pole figures of three plane of calcite f10�10},f01�10} and {0001} are represented, with the purpose of
obtaining the distribution of orientation of lamellae in each
plane. The plane {0001} shows a unique pole maxima with
all the orientations located in the same direction of c-axis,
with an inner variation of 608. In contrast, the f10�10} and
f01�10} planes show a gradual rotation of a and b axes
around c-axis, with the last one fixed.
The misorientation has been analysed with the MTEX
tool, which measures the different crystallographic
orientation between two grains (crystals) which are in
contact. A grain map, of EBSD crystallographic map, was
done using a threshold of 28, in order to reduce the noise inthe inner variation of each crystal. Subsequently, a
misorientation histogram was generated to indicate that
the main order of misorientation is less than 58, with a
mode of ca. 2.58 and the second most common is ca. 158.The next maxima of misorientation are ca. 358, 408 and 558(Figure 3(D)).
Computer-integrated-polarisation
Six COIs and their corresponding pole figures were
obtained using the CIP method from different corallites of
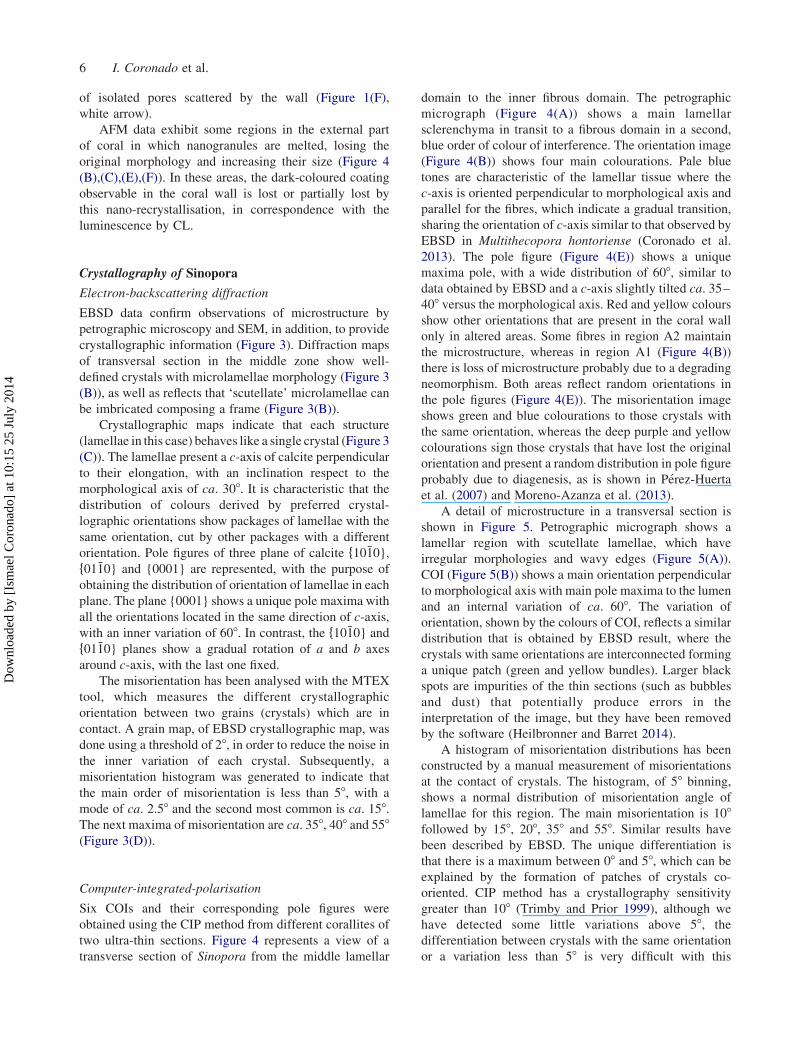
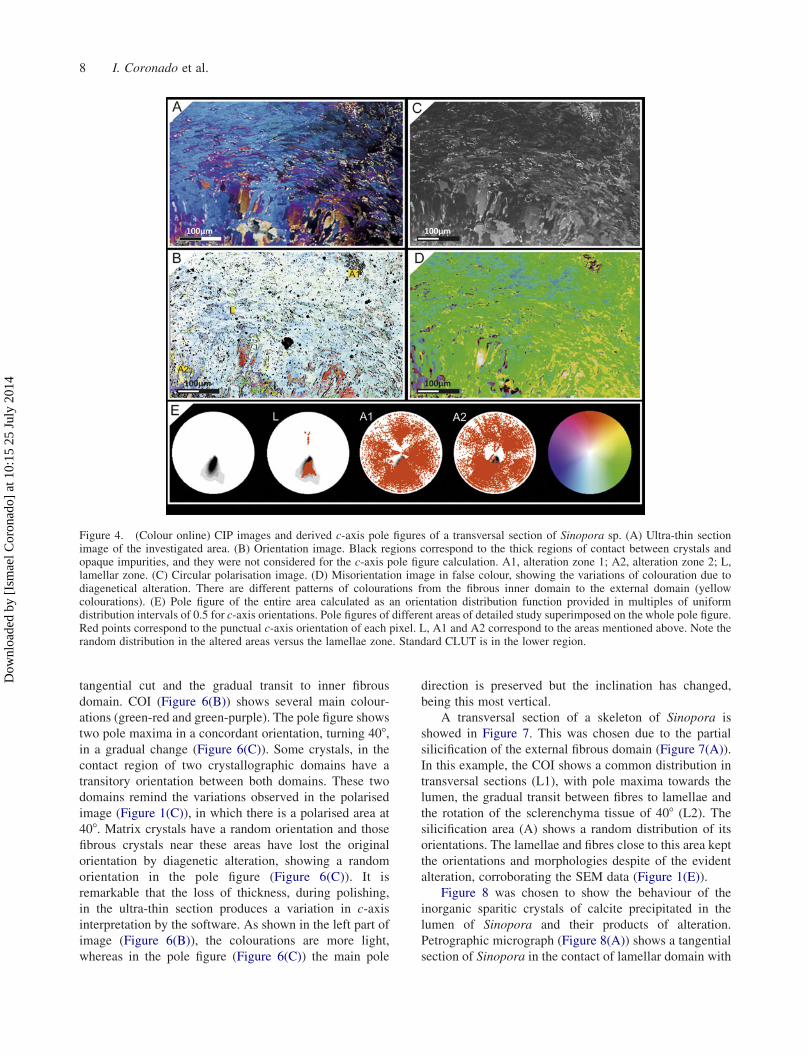
two ultra-thin sections. Figure 4 represents a view of a
transverse section of Sinopora from the middle lamellar
domain to the inner fibrous domain. The petrographic
micrograph (Figure 4(A)) shows a main lamellar
sclerenchyma in transit to a fibrous domain in a second,
blue order of colour of interference. The orientation image
(Figure 4(B)) shows four main colourations. Pale blue
tones are characteristic of the lamellar tissue where the
c-axis is oriented perpendicular to morphological axis and
parallel for the fibres, which indicate a gradual transition,
sharing the orientation of c-axis similar to that observed by
EBSD in Multithecopora hontoriense (Coronado et al.
2013). The pole figure (Figure 4(E)) shows a unique
maxima pole, with a wide distribution of 608, similar to
data obtained by EBSD and a c-axis slightly tilted ca. 35–
408 versus the morphological axis. Red and yellow colours
show other orientations that are present in the coral wall
only in altered areas. Some fibres in region A2 maintain
the microstructure, whereas in region A1 (Figure 4(B))
there is loss of microstructure probably due to a degrading
neomorphism. Both areas reflect random orientations in
the pole figures (Figure 4(E)). The misorientation image
shows green and blue colourations to those crystals with
the same orientation, whereas the deep purple and yellow
colourations sign those crystals that have lost the original
orientation and present a random distribution in pole figure
probably due to diagenesis, as is shown in Perez-Huerta
et al. (2007) and Moreno-Azanza et al. (2013).
A detail of microstructure in a transversal section is
shown in Figure 5. Petrographic micrograph shows a
lamellar region with scutellate lamellae, which have
irregular morphologies and wavy edges (Figure 5(A)).
COI (Figure 5(B)) shows a main orientation perpendicular
to morphological axis with main pole maxima to the lumen
and an internal variation of ca. 608. The variation of
orientation, shown by the colours of COI, reflects a similar
distribution that is obtained by EBSD result, where the
crystals with same orientations are interconnected forming
a unique patch (green and yellow bundles). Larger black
spots are impurities of the thin sections (such as bubbles
and dust) that potentially produce errors in the
interpretation of the image, but they have been removed
by the software (Heilbronner and Barret 2014).
A histogram of misorientation distributions has been
constructed by a manual measurement of misorientations
at the contact of crystals. The histogram, of 58 binning,shows a normal distribution of misorientation angle of
lamellae for this region. The main misorientation is 108followed by 158, 208, 358 and 558. Similar results have
been described by EBSD. The unique differentiation is
that there is a maximum between 08 and 58, which can be
explained by the formation of patches of crystals co-
oriented. CIP method has a crystallography sensitivity
greater than 108 (Trimby and Prior 1999), although we
have detected some little variations above 58, the
differentiation between crystals with the same orientation
or a variation less than 58 is very difficult with this
6 I. Coronado et al.
Dow
nloa
ded
by [
Ism
ael C
oron
ado]
at 1
0:15
25
July
201
4
methodology. The azimuthal image, derived from COI
data, permits to distinguish better the morphology of
crystals and reminds that of the diffraction map of EBSD.
This image helps us to distinguish, in combination with
petrographic micrographs, those crystals with a misor-
ientation greater than 58.
Figure 6 represents a view of a tangential section,
almost longitudinal. A great development of inner fibrous
domain versus the external can be observed in
petrographic micrograph (Figure 6(A)). The fibrous
external domain is surrounded by micritic matrix (M).
Lamellar domain show two main directions derived from
Figure 3. (Colour online) (A) Image that shows longitudinal and transversal sections of skeleton of Sinopora sp. and the location of theEBSD maps (white rectangle). (B, C) Crystallography by EBSD of coral wall in a transverse section of corallite. (B) Index intensity map,showing the structure lamellar tissue of coral wall. (C) Crystallographic orientation map, showing the main crystallographic orientationsof coral wall. (D) Pole figures [in normal direction (ND) view to the sample surface in a three-axes reference system with the indication ofthe reference (RD) and transverse (TD) directions] indicating crystallographic orientations of calcite crystals with reference to the c-axes,and crystallographic key indicating colour coding of crystallographic axes: a, orientations of lamellae of coral wall in B and C in the plane{0001}; b, orientation distribution in the plane f01�10}; c, orientation distribution in the plane f10�10}. Bar diagrams show the relativefrequency (%) of the misorientation angles.
Historical Biology 7
Dow
nloa
ded
by [
Ism
ael C
oron
ado]
at 1
0:15
25
July
201
4
tangential cut and the gradual transit to inner fibrous
domain. COI (Figure 6(B)) shows several main colour-
ations (green-red and green-purple). The pole figure shows
two pole maxima in a concordant orientation, turning 408,in a gradual change (Figure 6(C)). Some crystals, in the
contact region of two crystallographic domains have a
transitory orientation between both domains. These two
domains remind the variations observed in the polarised
image (Figure 1(C)), in which there is a polarised area at
408. Matrix crystals have a random orientation and those
fibrous crystals near these areas have lost the original
orientation by diagenetic alteration, showing a random
orientation in the pole figure (Figure 6(C)). It is
remarkable that the loss of thickness, during polishing,
in the ultra-thin section produces a variation in c-axis
interpretation by the software. As shown in the left part of
image (Figure 6(B)), the colourations are more light,
whereas in the pole figure (Figure 6(C)) the main pole
direction is preserved but the inclination has changed,
being this most vertical.
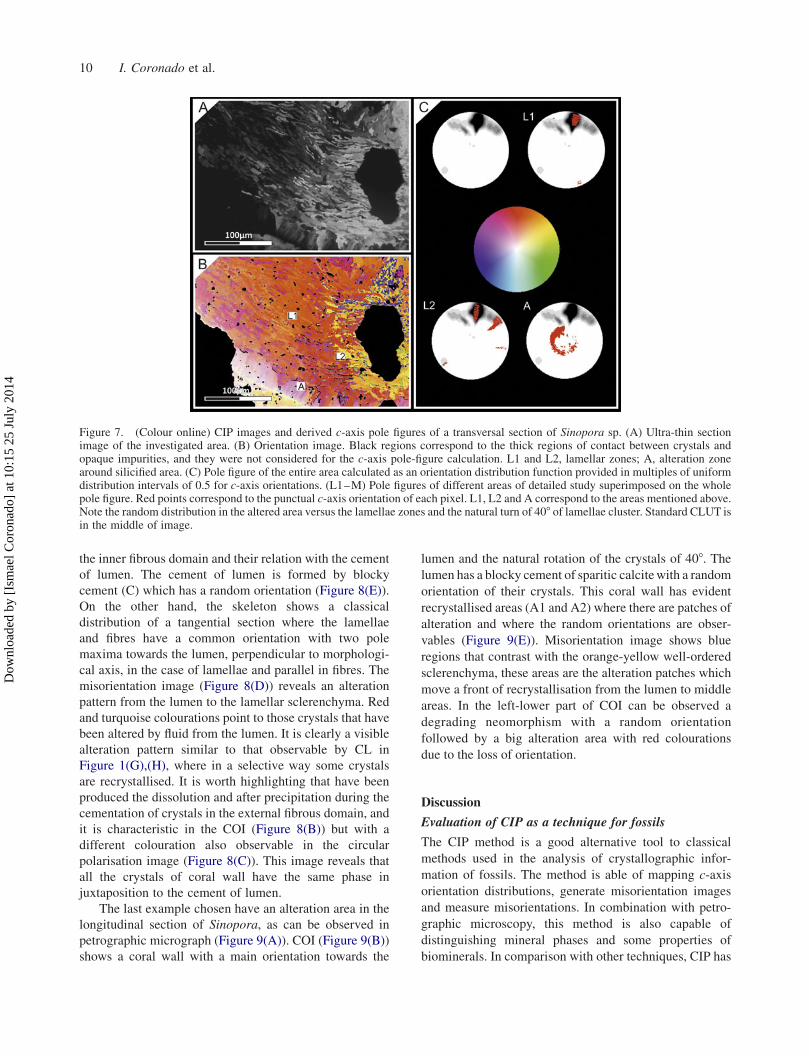
A transversal section of a skeleton of Sinopora is
showed in Figure 7. This was chosen due to the partial
silicification of the external fibrous domain (Figure 7(A)).
In this example, the COI shows a common distribution in
transversal sections (L1), with pole maxima towards the
lumen, the gradual transit between fibres to lamellae and
the rotation of the sclerenchyma tissue of 408 (L2). Thesilicification area (A) shows a random distribution of its
orientations. The lamellae and fibres close to this area kept
the orientations and morphologies despite of the evident
alteration, corroborating the SEM data (Figure 1(E)).
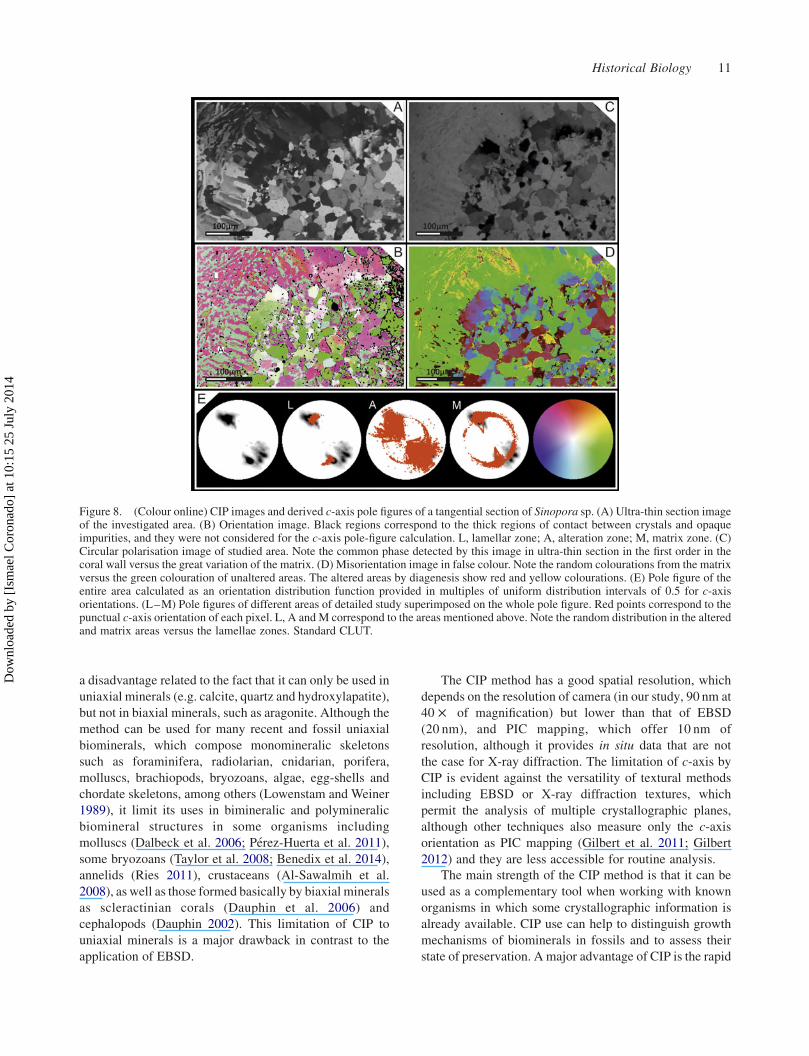
Figure 8 was chosen to show the behaviour of the
inorganic sparitic crystals of calcite precipitated in the
lumen of Sinopora and their products of alteration.
Petrographic micrograph (Figure 8(A)) shows a tangential
section of Sinopora in the contact of lamellar domain with
Figure 4. (Colour online) CIP images and derived c-axis pole figures of a transversal section of Sinopora sp. (A) Ultra-thin sectionimage of the investigated area. (B) Orientation image. Black regions correspond to the thick regions of contact between crystals andopaque impurities, and they were not considered for the c-axis pole figure calculation. A1, alteration zone 1; A2, alteration zone 2; L,lamellar zone. (C) Circular polarisation image. (D) Misorientation image in false colour, showing the variations of colouration due todiagenetical alteration. There are different patterns of colourations from the fibrous inner domain to the external domain (yellowcolourations). (E) Pole figure of the entire area calculated as an orientation distribution function provided in multiples of uniformdistribution intervals of 0.5 for c-axis orientations. Pole figures of different areas of detailed study superimposed on the whole pole figure.Red points correspond to the punctual c-axis orientation of each pixel. L, A1 and A2 correspond to the areas mentioned above. Note therandom distribution in the altered areas versus the lamellae zone. Standard CLUT is in the lower region.
8 I. Coronado et al.
Dow
nloa
ded
by [
Ism
ael C
oron
ado]
at 1
0:15
25
July
201
4
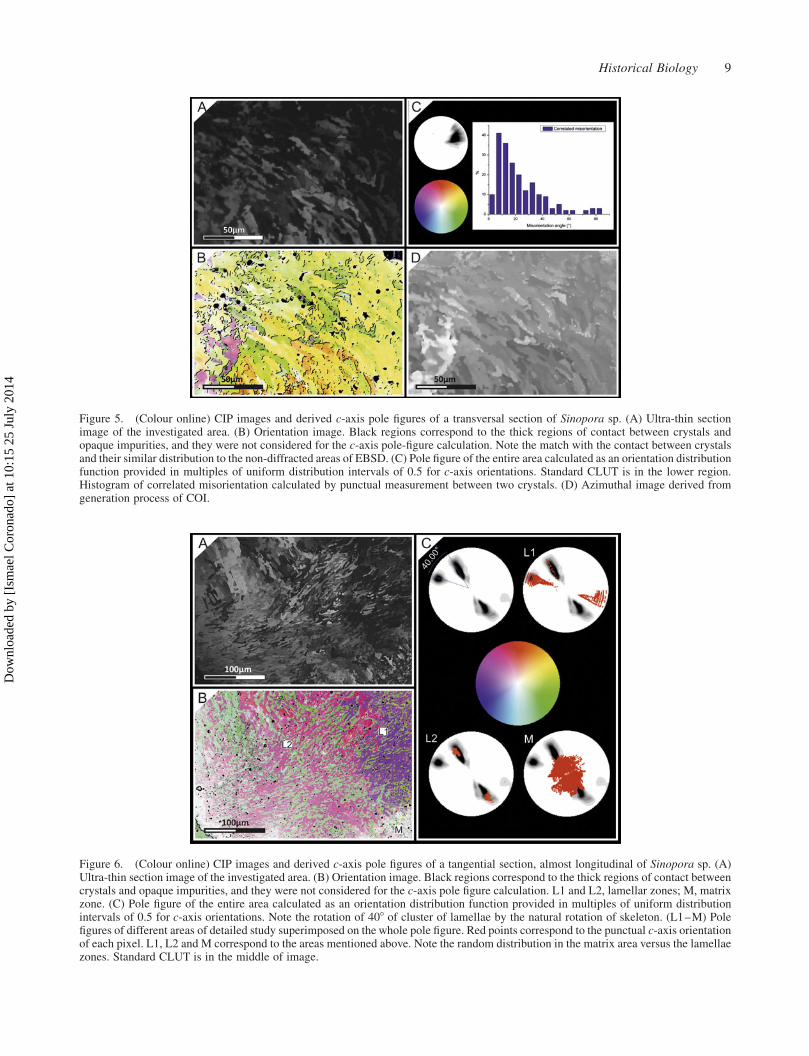
Figure 6. (Colour online) CIP images and derived c-axis pole figures of a tangential section, almost longitudinal of Sinopora sp. (A)Ultra-thin section image of the investigated area. (B) Orientation image. Black regions correspond to the thick regions of contact betweencrystals and opaque impurities, and they were not considered for the c-axis pole figure calculation. L1 and L2, lamellar zones; M, matrixzone. (C) Pole figure of the entire area calculated as an orientation distribution function provided in multiples of uniform distributionintervals of 0.5 for c-axis orientations. Note the rotation of 408 of cluster of lamellae by the natural rotation of skeleton. (L1–M) Polefigures of different areas of detailed study superimposed on the whole pole figure. Red points correspond to the punctual c-axis orientationof each pixel. L1, L2 and M correspond to the areas mentioned above. Note the random distribution in the matrix area versus the lamellaezones. Standard CLUT is in the middle of image.
Figure 5. (Colour online) CIP images and derived c-axis pole figures of a transversal section of Sinopora sp. (A) Ultra-thin sectionimage of the investigated area. (B) Orientation image. Black regions correspond to the thick regions of contact between crystals andopaque impurities, and they were not considered for the c-axis pole-figure calculation. Note the match with the contact between crystalsand their similar distribution to the non-diffracted areas of EBSD. (C) Pole figure of the entire area calculated as an orientation distributionfunction provided in multiples of uniform distribution intervals of 0.5 for c-axis orientations. Standard CLUT is in the lower region.Histogram of correlated misorientation calculated by punctual measurement between two crystals. (D) Azimuthal image derived fromgeneration process of COI.
Historical Biology 9
Dow
nloa
ded
by [
Ism
ael C
oron
ado]
at 1
0:15
25
July
201
4
the inner fibrous domain and their relation with the cement
of lumen. The cement of lumen is formed by blocky
cement (C) which has a random orientation (Figure 8(E)).
On the other hand, the skeleton shows a classical
distribution of a tangential section where the lamellae
and fibres have a common orientation with two pole
maxima towards the lumen, perpendicular to morphologi-
cal axis, in the case of lamellae and parallel in fibres. The
misorientation image (Figure 8(D)) reveals an alteration
pattern from the lumen to the lamellar sclerenchyma. Red
and turquoise colourations point to those crystals that have
been altered by fluid from the lumen. It is clearly a visible
alteration pattern similar to that observable by CL in
Figure 1(G),(H), where in a selective way some crystals
are recrystallised. It is worth highlighting that have been
produced the dissolution and after precipitation during the
cementation of crystals in the external fibrous domain, and
it is characteristic in the COI (Figure 8(B)) but with a
different colouration also observable in the circular
polarisation image (Figure 8(C)). This image reveals that
all the crystals of coral wall have the same phase in
juxtaposition to the cement of lumen.
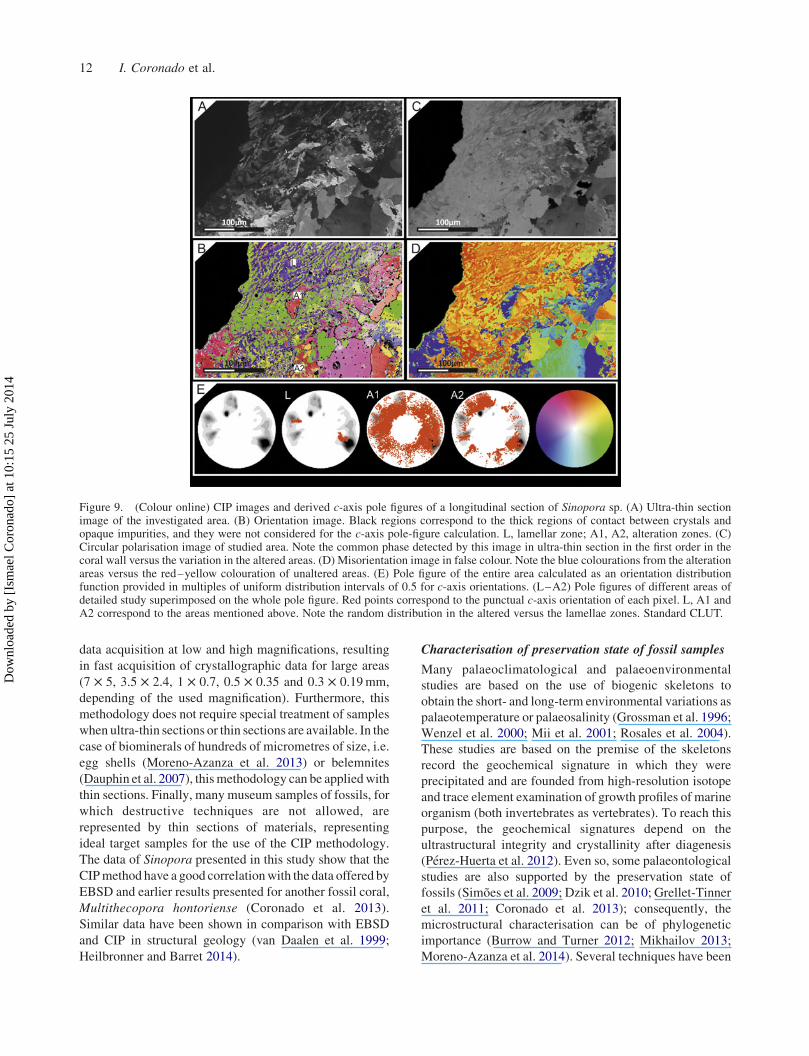
The last example chosen have an alteration area in the
longitudinal section of Sinopora, as can be observed in
petrographic micrograph (Figure 9(A)). COI (Figure 9(B))
shows a coral wall with a main orientation towards the
lumen and the natural rotation of the crystals of 408. The
lumen has a blocky cement of sparitic calcitewith a random
orientation of their crystals. This coral wall has evident
recrystallised areas (A1 and A2) where there are patches of
alteration and where the random orientations are obser-
vables (Figure 9(E)). Misorientation image shows blue
regions that contrast with the orange-yellow well-ordered
sclerenchyma, these areas are the alteration patches which
move a front of recrystallisation from the lumen to middle
areas. In the left-lower part of COI can be observed a
degrading neomorphism with a random orientation
followed by a big alteration area with red colourations
due to the loss of orientation.
Discussion
Evaluation of CIP as a technique for fossils
The CIP method is a good alternative tool to classical
methods used in the analysis of crystallographic infor-
mation of fossils. The method is able of mapping c-axis
orientation distributions, generate misorientation images
and measure misorientations. In combination with petro-
graphic microscopy, this method is also capable of
distinguishing mineral phases and some properties of
biominerals. In comparison with other techniques, CIP has
Figure 7. (Colour online) CIP images and derived c-axis pole figures of a transversal section of Sinopora sp. (A) Ultra-thin sectionimage of the investigated area. (B) Orientation image. Black regions correspond to the thick regions of contact between crystals andopaque impurities, and they were not considered for the c-axis pole-figure calculation. L1 and L2, lamellar zones; A, alteration zonearound silicified area. (C) Pole figure of the entire area calculated as an orientation distribution function provided in multiples of uniformdistribution intervals of 0.5 for c-axis orientations. (L1–M) Pole figures of different areas of detailed study superimposed on the wholepole figure. Red points correspond to the punctual c-axis orientation of each pixel. L1, L2 and A correspond to the areas mentioned above.Note the random distribution in the altered area versus the lamellae zones and the natural turn of 408 of lamellae cluster. Standard CLUT isin the middle of image.
10 I. Coronado et al.
Dow
nloa
ded
by [
Ism
ael C
oron
ado]
at 1
0:15
25
July
201
4
a disadvantage related to the fact that it can only be used in
uniaxial minerals (e.g. calcite, quartz and hydroxylapatite),
but not in biaxial minerals, such as aragonite. Although the
method can be used for many recent and fossil uniaxial
biominerals, which compose monomineralic skeletons
such as foraminifera, radiolarian, cnidarian, porifera,
molluscs, brachiopods, bryozoans, algae, egg-shells and
chordate skeletons, among others (Lowenstam and Weiner
1989), it limit its uses in bimineralic and polymineralic
biomineral structures in some organisms including
molluscs (Dalbeck et al. 2006; Perez-Huerta et al. 2011),
some bryozoans (Taylor et al. 2008; Benedix et al. 2014),
annelids (Ries 2011), crustaceans (Al-Sawalmih et al.
2008), as well as those formed basically by biaxial minerals
as scleractinian corals (Dauphin et al. 2006) and
cephalopods (Dauphin 2002). This limitation of CIP to
uniaxial minerals is a major drawback in contrast to the
application of EBSD.
The CIP method has a good spatial resolution, which
depends on the resolution of camera (in our study, 90 nm at
40 £ of magnification) but lower than that of EBSD
(20 nm), and PIC mapping, which offer 10 nm of
resolution, although it provides in situ data that are not
the case for X-ray diffraction. The limitation of c-axis by
CIP is evident against the versatility of textural methods
including EBSD or X-ray diffraction textures, which
permit the analysis of multiple crystallographic planes,
although other techniques also measure only the c-axis
orientation as PIC mapping (Gilbert et al. 2011; Gilbert
2012) and they are less accessible for routine analysis.
The main strength of the CIP method is that it can be
used as a complementary tool when working with known
organisms in which some crystallographic information is
already available. CIP use can help to distinguish growth
mechanisms of biominerals in fossils and to assess their
state of preservation. A major advantage of CIP is the rapid
Figure 8. (Colour online) CIP images and derived c-axis pole figures of a tangential section of Sinopora sp. (A) Ultra-thin section imageof the investigated area. (B) Orientation image. Black regions correspond to the thick regions of contact between crystals and opaqueimpurities, and they were not considered for the c-axis pole-figure calculation. L, lamellar zone; A, alteration zone; M, matrix zone. (C)Circular polarisation image of studied area. Note the common phase detected by this image in ultra-thin section in the first order in thecoral wall versus the great variation of the matrix. (D) Misorientation image in false colour. Note the random colourations from the matrixversus the green colouration of unaltered areas. The altered areas by diagenesis show red and yellow colourations. (E) Pole figure of theentire area calculated as an orientation distribution function provided in multiples of uniform distribution intervals of 0.5 for c-axisorientations. (L–M) Pole figures of different areas of detailed study superimposed on the whole pole figure. Red points correspond to thepunctual c-axis orientation of each pixel. L, A and M correspond to the areas mentioned above. Note the random distribution in the alteredand matrix areas versus the lamellae zones. Standard CLUT.
Historical Biology 11
Dow
nloa
ded
by [
Ism
ael C
oron
ado]
at 1
0:15
25
July
201
4
data acquisition at low and high magnifications, resulting
in fast acquisition of crystallographic data for large areas
(7 £ 5, 3.5 £ 2.4, 1 £ 0.7, 0.5 £ 0.35 and 0.3 £ 0.19mm,
depending of the used magnification). Furthermore, this
methodology does not require special treatment of samples
when ultra-thin sections or thin sections are available. In the
case of biominerals of hundreds of micrometres of size, i.e.
egg shells (Moreno-Azanza et al. 2013) or belemnites
(Dauphin et al. 2007), thismethodology can be appliedwith
thin sections. Finally, many museum samples of fossils, for
which destructive techniques are not allowed, are
represented by thin sections of materials, representing
ideal target samples for the use of the CIP methodology.
The data of Sinopora presented in this study show that the
CIPmethod have a good correlationwith the data offered by
EBSD and earlier results presented for another fossil coral,
Multithecopora hontoriense (Coronado et al. 2013).
Similar data have been shown in comparison with EBSD
and CIP in structural geology (van Daalen et al. 1999;
Heilbronner and Barret 2014).
Characterisation of preservation state of fossil samples
Many palaeoclimatological and palaeoenvironmental
studies are based on the use of biogenic skeletons to
obtain the short- and long-term environmental variations as
palaeotemperature or palaeosalinity (Grossman et al. 1996;
Wenzel et al. 2000; Mii et al. 2001; Rosales et al. 2004).
These studies are based on the premise of the skeletons
record the geochemical signature in which they were
precipitated and are founded from high-resolution isotope
and trace element examination of growth profiles of marine
organism (both invertebrates as vertebrates). To reach this
purpose, the geochemical signatures depend on the
ultrastructural integrity and crystallinity after diagenesis
(Perez-Huerta et al. 2012). Even so, some palaeontological
studies are also supported by the preservation state of
fossils (Simoes et al. 2009; Dzik et al. 2010; Grellet-Tinner
et al. 2011; Coronado et al. 2013); consequently, the
microstructural characterisation can be of phylogenetic
importance (Burrow and Turner 2012; Mikhailov 2013;
Moreno-Azanza et al. 2014). Several techniques have been
Figure 9. (Colour online) CIP images and derived c-axis pole figures of a longitudinal section of Sinopora sp. (A) Ultra-thin sectionimage of the investigated area. (B) Orientation image. Black regions correspond to the thick regions of contact between crystals andopaque impurities, and they were not considered for the c-axis pole-figure calculation. L, lamellar zone; A1, A2, alteration zones. (C)Circular polarisation image of studied area. Note the common phase detected by this image in ultra-thin section in the first order in thecoral wall versus the variation in the altered areas. (D) Misorientation image in false colour. Note the blue colourations from the alterationareas versus the red–yellow colouration of unaltered areas. (E) Pole figure of the entire area calculated as an orientation distributionfunction provided in multiples of uniform distribution intervals of 0.5 for c-axis orientations. (L–A2) Pole figures of different areas ofdetailed study superimposed on the whole pole figure. Red points correspond to the punctual c-axis orientation of each pixel. L, A1 andA2 correspond to the areas mentioned above. Note the random distribution in the altered versus the lamellae zones. Standard CLUT.
12 I. Coronado et al.
Dow
nloa
ded
by [
Ism
ael C
oron
ado]
at 1
0:15
25
July
201
4
used to help characterise the preservation state of fossils
skeleton, such as scanning microscopy, CL, X-ray
diffraction, transmission electron microscopy coupled
and ultimately geochemical analysis, which help to
discriminate those analyses that are ‘outlaws’ in the
variation searched (Armendariz et al. 2008; Lee et al.
2012). Presumably with this focus on mind, some research
groups began to improve the techniques used to
characterise the state of preservation of fossil, implement-
ing techniques such as EBSD, which offer a new
perspective in this field, characterising the crystallography
of skeletons and offering a new perspective of diagenetical
alteration (Perez-Huerta et al. 2007; Stolarski et al. 2007;
Coronado et al. 2013).
One of most used techniques in the characterisation of
preservation state is CL, which is particularly valuable in
the sedimentary petrology area (Richter et al. 2003; Boggs
and Krinsley 2006). The behaviour of marine carbonates
under CL is usually a good indicator of diagenetic alteration
by burial, and it is applied to identify recrystallisation
processes. In calcium carbonate material, the variation of
CL is generally attributed to the concentration ratio of
the activator, which is incorporated in the skeletons
during digenesis (Rosales et al. 2004). Pb2þ, Mn2þ and
trivalent rare-earth elements ions are regarded as the main
activators to luminescence in calcites, whereas Fe2þ is the
main inhibitor (Richter et al. 2003; Flugel 2004; Barbin
2013). As a result, non-luminescent (NL) calcites are
considered unaffected by diagenesis. A geochemical
analysis of these elements in the samples can help to test
the existence of diagenetic alteration. However, the
previous premise is questionable in biogenic carbonates
due to the incorporation of little amounts of Mn2þ or Fe2þ
by metabolic activity or/and by physicochemical pattern of
the surrounding environment during their growth and
ontogeny (Barbin et al. 1991; Barbin and Gaspard 1995;
Barbin 2000; Barbin 2013), and also some of biogenic
carbonates can be diagenetically affected and NL, because
they have no scavenged activators in the new crystals,
considering that, for example, some silicification areas are
NL and their surrounding alteration is alsoNL (unpublished
results). With these reasons derived, CL is usually
complemented with geochemical data (Grossman et al.
1996; Rosales et al. 2004). As shown by the results
presented in this study, the crystallographic methods can
complement this characterisation, and the CIP method
permits to have a combination of both techniques
(Heilbronner and Barret 2014), which offer a double vision
giving crystallographic information together with geo-
chemical by CL. The combination of both or more
techniques permits to get a better characterisation of
preservation state of biogenic skeletons.
Within the current study, SEM, CL and AFM images
reveal the presence of some altered areas by diagenesis.
The CL images of whole corals show a visible preference
of alteration of fibrous domains and random pattern of
alteration on lamellar domain. These patterns of alteration
are similar to that observed by COI, where the alteration
front advances form the external and internal areas,
modifying isolated crystals or cluster of crystals of tens of
microns. These patterns have a very good correlation with
the AFM data, where some isolated regions of hundreds of
nanometres show signs of alteration (merging nanogra-
nules and loss of dark coatings), but this alteration is
non-continuous on the contrary as was described in
Multithecopora hontoriense (Coronado et al. 2013). SEM
images expose some alteration arrays as are dissolution
pores, and silicification. The surrounding region micro-
crystals of silicified areas occasionally show degrading
neomorphism and in some cases kept the biogenic
morphology. The COI images show that these last areas,
where the microstructure is also kept, saved the crystal-
lographic orientation in most regions.
Conclusions
CIP method has been applied satisfactorily in the study of
fossils skeletons of Sinopora. The study includes a
previous characterisation of sample by SEM, AFM and
CL with the purpose of distinguishing the diagenetical
alteration. Later, a crystallographic comparison between
CIP and EBSD has been made getting a very good
correlation between the two methods. The CIP method
allows obtaining COIs, pole figures, and measure and
mapping the misorientation. CIP have some advantages
and disadvantages that limit and promote their use, with
respect to the other crystallographic techniques applied in
palaeontological studies.
. This technique can only be used in uniaxial
biominerals (calcite, quartz and hydroxylapatite),
limiting its use for biaxial or bimineralic and
polimineralic biominerals.. CIP method has good spatial resolution (limited by
camera); in our example, 90 nm versus 20 nm of
EBSD.. CIP method can only analyse a unique crystallo-
graphic plane, which is the one containing the c-axis.. It does fast acquisition of data in low and high
magnifications.. This method does not require special treatment of
samples and can be very useful for the analysis of thin
and ultra-thin sections.. It is a technique very affordable for any research
centre.. It is very useful in museum samples where only non-
destructive techniques are allowed.. CIP method detects very fast diagenetic alterations,
which combined with CL offers geochemical and
crystallographic information.
Historical Biology 13
Dow
nloa
ded
by [
Ism
ael C
oron
ado]
at 1
0:15
25
July
201
4
Acknowledgements
This article is a contribution to the Spanish Working Group IGCP596 Climate change and biodiversity patterns in the Mid-Palaeozoic (UNESCO). The authors thank the staff of ResearchAssistance Centre of Geological Techniques and National Centreof Electron Microscopy (Universidad Complutense of Madrid,Spain) and Marıa Jesus Turrero for allowing them to use thecathodoluminescence (CIEMAT). A.P-H. thanks the College ofArts & Sciences (The University of Alabama) for support andJohnny Goodwing (CAF) for help with SEM. The authors thankthe anonymous reviewer and the editor Gareth Dyke for theirhelp and constructive comments on the text.
Funding
This work was supported by the Spanish Ministerio de Economıay Competitividad [research project CGL2012-30922BTE];Complutense University Research Group [910231]; FPI-UCMgrant [Ismael Coronado].
References
Al-Sawalmih A, Li C, Siegel S, Fabritius H, Yi S, Raabe D, Fratzl P, ParisO. 2008. Microtexture and chitin/calcite orientation relationship inthe mineralized exoskeleton of the American Lobster. Adv FunctMater. 18:3307–3314.
Armendariz M, Rosales I, Quesada C. 2008. Oxygen isotope and Mg/Cacomposition of Late Visean (Mississippian) brachiopod shells fromSW Iberia: palaeoclimatic and palaeogeographic implications innorthern Gondwana. Palaeogeogr Palaeoclimatol Palaeoecol.268:65–79.
Bachmann F, Hielscher R, Schaeben H. 2011. Grain detection from 2dand 3d EBSD data – specification of the MTEX algorithm.Ultramicroscopy. 111:1720–1733.
Barbin V. 2000. Cathodoluminescence of carbonate shells: biochemicalvs diagenetic process. In: Cathodoluminescence in geosciences.Berlin, Heidelberg: Springer; p. 303–329.
Barbin V. 2013. Application of cathodoluminescence microscopy torecent and past biological materials: a decade of progress. MinerPetrol. 107:353–362.
Barbin V, Gaspard D. 1995. Cathodoluminescence of recentarticulatebrachiopod shells. Implications for growth stages and diagenesisevaluation. Geobios. 28(Suppl. 1):39–45.
Barbin V, Ramseyer K, Debenay JP, Schein E, Roux M, Decrouez D.1991. Cathodoluminescence of recent biogenic carbonates: environ-mental and ontogenetic fingerprint. Geol Mag. 128:19–26.
Barret S. 1997. Image analysis and the internet. Sci Data Manag.1:18–25.
Benedix G, Jacob DE, Taylor PD. 2014. Bimineralic bryozoan skeletons:a comparison of three modern genera. Facies. 60:389–403.
Beniash E. 2011. Biominerals – hierarchical nanocomposites: theexample of bone. Wiley Interdiscip Rev Nanomed Nanobiotechnol.3:47–69. Epub 2010/09/10.
Boggs JS, Krinsley D. 2006. Application of cathodoluminescenceimaging to the study of sedimentary rocks. Cambridge, UK:Cambridge University Press.
Burdick JA, Mauck RL. 2011. Biomaterials for tissue engineeringapplications a review of the past and future trends. Wien: Springer.
Burrow CJ, Turner S. 2012. Scale structure of putative chondrichthyanGladbachus adentatus Heidtke & Kratschmer, 2001 from the MiddleDevonian Rheinisches Schiefergebirge, Germany. Hist Biol.25:385–390.
Coronado I, Perez-Huerta A, Rodrıguez S. 2013. Primary biogenicskeletal structures in Multithecopora (Tabulata, Pennsylvanian).Palaeogeogr Palaeoclimatol Palaeoecol. 386:286–299.
Coronado I, Rodrıguez S. 2014. Carboniferous auloporids from theIberian Peninsula: palaeocology, diversity, and spatio-temporaldistribution. J Iber Geol. 40:61–85.
Cuif JP, Ball AD, Dauphin Y, Farre B, Nouet J, Perez-Huerta A, SalomeM, Williams CT. 2008. Structural, mineralogical, and bichemicaldiversity in the lower part of the pearl layer of cultivated seawaterpearls from Polynesia. Microsc Microanal. 14:405–417.
Cuif J-P, Dauphin Y, Sorauf JE. 2011. Biominerals and fossils throughtime. Cambridge: Cambridge University Press.
Currey JD. 2005. Hierarchies in biomineral structures. Science.309:253–254.
Checa AG, Rodrıguez-Navarro AB. 2005. Self-organisation of nacre inthe shells of Pterioida (Bivalvia: Mollusca). Biomaterials.26:1071–1079.
Dalbeck P, England J, Cusack M, Lee MR, Fallick AE. 2006.Crystallography and chemistry of the calcium carbonate polymorphswitch in M. edulis shells. Eur J Miner. 18:601–609.
Dauphin Y. 2002. Fossil organic matrices of the Callovian aragoniticammonites from Lukow (Poland): location and composition. IntJ Earth Sci. 91:1071–1080.
Dauphin Y, Cuif J-P, Massard P. 2006. Persistent organic components inheated coral aragonitic skeletons – implications for palaeoenviron-mental reconstructions. Chem Geol. 231:26–37.
Dauphin Y, Williams CT, Barskov IS. 2007. Aragonitic rostra of theTuronian belemnitid Goniocamax: arguments from diagenesis. ActaPalaeontol Pol. 52:85–97.
DiMasi E, Gower LB. 2014. Biomineralization sourcebook: character-ization of biominerals and biomimetic materials. Boca Raton, FL:CRC Press.
Dzik J, Sulej T, Niedzwiedzki G. 2010. Possible link connecting reptilianscales with avian feathers from the early Late Jurassic of Kazakstan.Hist Biol. 22:394–402.
Falces S, Rodrıguez S. 1999. Observations on the skeletogenesis ofrugose corals. Proceedings of the abstracts of the 8th InternationalSymposium on Fossil Cnidaria and Porifera, Sendai, Japan. p. 50.
Fedorowski J. 2003. Some remarks on diagenesis of rugose coralskeletons. Geologos. 6:89–109.
Feng QL, Li HB, Pu G, Zhang DM, Cui FZ, Li HD, Kim TN. 2000.Crystallographic alignment of calcite prisms in the oblique prismaticlayer of Mytilus edulis shell. J Mater Sci. 35:3337–3340.
Flugel E. 2004. Microfacies of carbonate rocks: analysis, interpretationand application. Berlin: Springer.
Fryda J, Bandel K, Frydova B. 2009. Crystallographic texture ofLateTriassic gastropod nacre: evidence of long-term stablility of themechanism controlling its formation. Bull Geosci. 84:745–754.
Gilbert P. 2012. Polarization-dependent Imaging Contrast (PIC) mappingreveals nanocrystal orientation patterns in carbonate biominerals.J Electron Spectrosc Rel Phenom. 185:395–405.
Gilbert P, Young A, Coppersmith SN. 2011. Measurement of c-axisangular orientation in calcite (CaCO3) nanocrystals using X-rayabsorption spectroscopy. Proc Natl Acad Sci. 108:11350–11355.
Gorzelak P, Stolarski J, Mazur M, Meibom A. 2013. Micro- tonanostructure and geochemistry of extant crinoidal echinodermskeletons. Geobiology. 11:29–43.
Grellet-Tinner G, Sim CM, Kim DH, Trimby P, Higa A, An SL, Oh HS,Kim TJ, Kardjilov N. 2011. Description of the first lithostrotiantitanosaur embryo in ovo with Neutron characterization andimplications for lithostrotian Aptian migration and dispersion.Gondwana Res. 20:621–629.
Griesshaber E, Kelm K, Sehrbrock A, Mader W, Mutterlose J, Brand U,Schmahl WW. 2009. Amorphous calcium carbonate in the shellmaterial of the brachiopod Megerlia truncata. Eur J Miner.21:715–723.
Griesshaber E, Schmahl WW, Neuser R, Pettke T, Blum M, Mutterlose J,Brand U. 2007. Crystallographic texture and microstructure ofterebratulide brachiopod shell calcite: an optimized materials designwith hierarchical architecture. Am Miner. :722–734.
Grossman EL, Mii H-S, Zhang C, Yancey TE. 1996. Chemical variationin Pennsylvanian brachiopod shells; diagenetic, taxonomic, micro-structural, and seasonal effects. J Sediment Res. 66:1011–1022.
Heilbronner R. 2000. Automatic grain boundary detection and grain sizeanalysis using polarization micrographs or orientation images.J Struct Geol. 22:969–981.
Heilbronner R, Barret S. 2014. Image analysis in Earth Sciences –microstructures and textures of Earth materials. London: Springer.
14 I. Coronado et al.
Dow
nloa
ded
by [
Ism
ael C
oron
ado]
at 1
0:15
25
July
201
4
Heilbronner RP, Pauli C. 1993. Integrated spatial and orientation analysisof quartz c-axes by computer-aided microscopy. J Struct Geol.15:369–382.
Hill D. 1981. Rugosa and Tabulata. In: Teichert C, editor. Treatise oninvertebrate paleontology, Part F [Coelenterata] Suppl 1. Boulderand Lawrence: Geological Society of America.
Horcas I, Fernandez R, Gomez-Rodrıguez JM, Colchero J, Gomez-Herrero J, Baro A. 2007. WSXM: a software for scanning probemicroscopy and a tool for nanotechnology. Rev Sci Instrum. 78:8.Available from: http://scitation.aip.org/content/aip/journal/rsi/78/1/10.1063/1.2432410.
Lafuste J. 1970. Lames ultra-minces a faces polies. Procede etapplicationa la microstructure des Madreporaires fossiles. CompRend Hebdom Seanc Acad Sci Paris. 270:679–681.
Lafuste J. 1978. Modalites de passage des lamelles aux fibres dans lamuraillede Tabules (Micheliniidae) du Devonien et du Permien.Geobios. 11:405–408.
Lafuste J. 1983. Passage des microlamelles aux fibres dans le squeletted’un Tabule ‘michelinimorphe’ du Viseen du Sahara algerien.Geobios. 16:755–761.
Lee MR, Torney C, Owen AW. 2012. Biomineralisation in the Palaeozoicoceans: evidence for simultaneous crystallisation of high andlow magnesium calcite by phacopine trilobites. Chem Geol.314–317:33–44.
Lotze F. 1945. Zur Gliederung der Varisziden der Iberischen Meseta.Geotekton Forsch. 6:78–92.
Lowenstam H, Weiner S. 1989. On biomineralization. New York, NY:Oxford University Press.
Mann S. 2001. Biomineralization: principles and concepts in bioinorganicmaterials chemistry. Oxford: Oxford University Press.
Mas R, Rodrıguez S. 1990. Cathodoluminiscence as a tool infosildiagenetic analyses of Late Paleozoic Corals. In: Lopez SF,editor. Proceedings of the Comunicaciones de la Reunion deTafonomıa y Fosilizacion. Madrid.
Mii HS, Grossman EL, Yancey TE, Chuvashov B, Egorov A. 2001.Isotopic records of brachiopod shells from the Russian Platform –evidence for the onset of mid-Carboniferous glaciation. Chem Geol.175:133–147.
Mikhailov KE. 2013. Eggshell structure, parataxonomy and phylogeneticanalysis: some notes on articles published from 2002 to 2011. HistBiol. 26:144–154.
Moreno-Azanza M, Bauluz B, Canudo JI, Puertolas-Pascual E, SellesAG. 2014. A re-evaluation of aff. Megaloolithidae eggshellfragments from the uppermost Cretaceous of the Pyrenees andimplications for crocodylomorph eggshell structure. Hist Biol.26:195–205.
Moreno-Azanza M, Mariani E, Bauluz B, Canudo JI. 2013. Growthmechanisms in dinosaur eggshells: an insight from electronbackscatter diffraction. J Vertebr Paleontol. 33:121–130.
Perez-Huerta A, Cusack M. 2009. Optimizing electron backscatterdiffraction of carbonate biominerals-resin type and carbon coating.Microsc Microanal. 15:197–203.
Perez-Huerta A, Cusack M, England J. 2007. Crystallography anddiagenesis in fossil Craniid brachiopods. Palaeontology.50:757–763.
Perez-Huerta A, Cusack M,Mendez CA. 2012. Preliminary assessment ofthe use of electron backscatter diffraction (EBSD) in conodonts.Lethaia. 45:253–258.
Perez-Huerta A, Dauphin Y, Cuif JP, Cusack M. 2011. High resolutionelectron backscatter diffraction (EBSD) data from calcite biomin-erals in recent gastropod shells. Micron. 42:246–251.
Richter DK, Gotze T, Gotze J, Neuser RD. 2003. Progress in applicationof cathodoluminescence (CL) in sedimentary petrology. MinerPetrol. 79:127–166.
Ries JB. 2011. Skeletal mineralogy in a high-CO2 world. J Exp Mar BiolEcol. 403:54–64.
Rodrıguez-Navarro A. 2006. XRD2DScan: new software for polycrystal-line materials characterization using two-dimensional X-raydiffraction. J Appl Crystallogr. 39:905–909.
Rodrıguez S. 1989. Lamellar microstructure in Palaeozoic corals: originand use in taxonomy. Mem Ass Australas Palaentol. 8:157–168.
Rosales I, Quesada S, Robles S. 2004. Paleotemperature variations ofEarly Jurassic seawater recorded in geochemical trends of belemnitesfrom the Basque-Cantabrian basin, northern Spain. PalaeogeogrPalaeoclimatol Palaeoecol. 203:253–275.
Schmahl WW, Griesshaber E, Neuser R, Lenze A, Job R, Brand U. 2004.The microstructure of the fibrous layer of terebratulide brachiopodshell calcite. Eur J Mineral. 16:693–697.
Schmidt WJ. 1924. Die bausteine des tierkorpers in polarisiertem lichte.Bonn: F. Cohen.
Semenoff-Tian-Chansky P. 1974. Donnees nouvelles sur la microstruc-ture de certains Tetracoralliaires. Trudy Instituta Geologii i GeofizikiMosco. 1:132–144.
Simoes MG, Rodrigues SC, Kowalewski M. 2009. Bouchardia rosea, avanishing brachiopod species of the Brazilian platform: taphonomy,historical ecology and conservation paleobiology. Hist Biol.21:123–137.
Stolarski J, Mazur M. 2005. Nanostructure of biogenic versus abiogeniccalcium carbonate crystals. Acta Palaeontol Pol. 50:847–865.
Stolarski J, Meibom A, Przenioslo R, Mazur M. 2007. A Cretaceousscleractinian coral with a calcitic skeleton. Science. 318:92–94.
Taylor PD, Kudryavtsev AB, Schopf JW. 2008. Calcite and aragonitedistributions in the skeletons of bimineralic bryozoans as revealed byRaman spectroscopy. Invertebr Biol. 127:87–97.
Torney C, Lee MR, Owen AW. 2013. Microstructure and growth of thelenses of schizochroal trilobite eyes. Palaeontology. [Online 21 Nov2013]. doi:10.1111/pala.12088.
Trimby PW, Prior DJ. 1999. Microstructural imaging techniques: acomparison between light and scanning electron microscopy.Tectonophysics. 303:71–81.
Trullenque G, Kunze K, Heilbronner R, Stunitz H, Schmid SM. 2006.Microfabrics of calcite ultramylonites as records of coaxial and non-coaxial deformation kinematics: examples from the Rocher de l’Yretshear zone (Western Alps). Tectonophysics. 424:69–97.
van Daalen M, Heilbronner R, Kunze K. 1999. Orientation analysis oflocalized shear deformation in quartz fibres at the brittle-ductiletransition. Tectonophysics. 303:83–107.
van der Graff WJE. 1971. Three Upper Carboniferous, limestone-rich,high-destructive delta systems with submarine fan deposits,Cantabrian Mountains, Spain. Leidse Geol Mededel. 46:157–235.
Wenzel B, Lecuyer C, Joachimski MM. 2000. Comparing oxygen isotoperecords of silurian calcite and phosphate-d18O compositions ofbrachiopods and conodonts. Geochim Cosmochim Acta.64:1859–1872.
Historical Biology 15
Dow
nloa
ded
by [
Ism
ael C
oron
ado]
at 1
0:15
25
July
201
4
Copyright © 2022 FDOKUMEN