
Computational Ecology and Software, 2015, Vol. 5, Iss. 2
107
Computational Ecology and Software Vol. 5, No. 2, 1 June 2015 International Academy of Ecology and Environmental Sciences
Transcript of Computational Ecology and Software, 2015, Vol. 5, Iss. 2

Computational Ecology and Software
Vol. 5, No. 2, 1 June 2015
International Academy of Ecology and Environmental Sciences

Computational Ecology and Software ISSN 2220-721X Volume 5, Number 2, 1 June 2015 Editor-in-Chief WenJun Zhang
Sun Yat-sen University, China
International Academy of Ecology and Environmental Sciences, Hong Kong
E-mail: [email protected], [email protected]
Editorial Board Ronaldo Angelini (The Federal University of Rio Grande do Norte, Brazil)
Andre Bianconi (Sao Paulo State University (Unesp), Brazil)
Bin Chen (Beijing Normal University, China)
Daniela Cianelli (University of Naples Parthenope, Italy)
Alessandro Ferrarini (University of Parma, Italy)
Yanbo Huang (USDA-ARS Crop Production Systems Research Unit, USA)
Istvan Karsai (East Tennessee State University, USA)
Vladimir Krivtsov (Heriot-Watt University, UK)
Lev V. Nedorezov (University of Nova Gorica, Slovenia)
Fivos Papadimitriou (Environmental and Land Use Consultancies, Greece)
George P. Petropoulos (Institute of Applied and Computational Mathematics, Greece)
Vikas Rai (Jazan University, Saudi Arabia)
Santanu Ray (Visva Bharati University, India)
Kalle Remm (University of Tartu, Estonia)
Rick Stafford (University of Bedfordshire, UK)
Luciano Telesca (Institute of Methodologies for Environmental Analysis, Italy)
Bulent Tutmez (Inonu University, Turkey)
Ranjit Kumar Upadhyay (Indian School of Mines, India)
Ezio Venturino (Universita’ di Torino, Italy)
Michael John Watts (The University of Adelaide, Australia)
Peter A. Whigham (University of Otago, New Zealand)
ZhiGuo Zhang (Sun Yat-sen University, China)
Editorial Office: [email protected]
Publisher: International Academy of Ecology and Environmental Sciences
Address: Unit 3, 6/F., Kam Hon Industrial Building, 8 Wang Kwun Road, Kowloon Bay, Hong Kong
Tel: 00852-2138 6086; Fax: 00852-3069 1955
Website: http://www.iaees.org/
E-mail: [email protected]

Computational Ecology and Software, 2015, 5(2): 119-129
IAEES www.iaees.org
Article
Fluctuating asymmetry and developmental instability in Protoreaster
nodosus (Chocolate Chip Sea Star) as a biomarker for environmental
stress
D.J. V. Trono, R. Dacar, L. Quinones, S. R. M. Tabugo
Department of Biological Sciences, College of Science and Mathematics, Mindanao State University-Iligan Institute of
Technology, Philippines
E-mail: [email protected]
Received 12 December 2014; Accepted 20 January 2015; Published online 1 June 2015
Abstract
Fluctuating asymmetry (FA), pertains to small and random departures from perfect symmetry of an organism’s
bilateral traits and has been used as a measurement of developmental instability and as a potential indicator of
stress in populations. It measures the variations from symmetry of a symmetrical structure whose sides are said
to be genetically identical, with similar history of gene activity and experiencing the same environment.
Symmetries are potentially the basis for studies on FA. Hence, this study assessed the potential of FA as a
reliable developmental instability and environmental stress indicator in five-fold dihedral symmetrical
Protoreaster nodosus (Chocolate chip sea fish) from three (3) different sites (Linamon, Lanao del Norte; Initao,
Misamis Oriental and Jasaan, Misamis Oriental). FA for each population from every site was measured for
comparison. In this study, anatomical landmarks were subjected to Procrustes superimposition and Principal
Component Analysis (PCA) using “Symmetry and Asymmetry in Geometric Data” (SAGE) program. Results
showed highly significant FA and significant DA for population from Jasaan and Linamon where habitat
disturbance due to anthropogenic activities were prevalent. Thus, experienced more stress compared to the
other populations, suggesting that significant variation in size or left-right side of each individual could be a
product of genotype-environment interaction. Moreover, insignificant FA and high DA was obtained from
Initao (protected seascape area) which indicated that variation among individual genotypes and asymmetry in
phenotypes is mostly induced by genetics under less stressful environment. Significant FA and increase FA
present inability of species to buffer stress in its developmental pathways and have implications on species
fitness. Hypothesis assumes that fluctuating asymmetry has costs, reflects the quality of individuals and the
level of genetic and environmental stress experienced by individuals or populations during development. Here,
FA proved to be efficient when applied to five-fold dihedral symmetrical organisms.
Keywords fluctuating asymmetry; developmental instability; biomarker; Protoreaster nodosus; environmental
stress.
Computational Ecology and Software ISSN 2220721X URL: http://www.iaees.org/publications/journals/ces/onlineversion.asp RSS: http://www.iaees.org/publications/journals/ces/rss.xml Email: [email protected] EditorinChief: WenJun Zhang Publisher: International Academy of Ecology and Environmental Sciences

Computational Ecology and Software, 2015, 5(2): 119-129
IAEES www.iaees.org
1 Introduction
Monitoring the impacts of a wide range of environmental stressors on ecosystem health is of interest to
conservation biology and sustainability (Beasley et al., 2013). Stressors of interest include pollutants, changes
in natural environmental parameters such as temperature, humidity, density, and shifts in resource use induced
by global warming, habitat defragmentation and habitat loss, that often leads to detrimental consequences or
loss of inhabitant organisms (Whiteman and Loganathan, 2001). Thus, there is a need to find reliable and
suitable early-warning biological indicators of such stress for conservation programmes.
Along this line, in marine environment sea stars play an ecological role as keystone species (Paine et al.,
1985). Wherein, they are not necessarily abundant in the marine community however, they exert strong control
on community structure not by numerical might but according to their pivotal ecological roles or niches.
Ecological data can be utilized from ecologically important species of sea stars (e.g. Protoreaster nodosus and
Pisaster ochraceus) because they have a long life span, with a maximum of 34 years (Menge, 1975; Bos et al.,
2008). Hence, are suitable for long term monitoring. With this, is the incessant search for easily measured
biomarkers which resulted in the investigation of asymmetry of morphological characters as a possible
biomarker for stress and the most widely used measure of asymmetry is Fluctuating Asymmetry (FA).
Symmetry is a major trait of life and it has been suggested that more symmetrical individuals have higher
developmental stability (DS), reproductive success and survival rate. Developmental stability is defined as the
ability of an organism to moderate its development against genetic or environmental conditions and produce
the genetically determined phenotype (Daloso, 2014; Galbo and Tabugo, 2014; Carpentero and Tabugo, 2014
and Trotta et al., 2005). DS has been used to monitor the effects of anthropogenic and natural factors of stress
on living organisms (Albarra´n-Lara, 2010). Under normal conditions, development follows a genetically
determined pathway, and minor perturbations are controlled by developmental stability mechanisms. Under
stressful conditions (e.g., increased toxicants) and tolerance limits have exceeded, the stress leads to
developmental instability such that development cannot be restored to the original pathway causing increase
phenotypic variations of the organism, reduce the homeostasis of a biological system, or generate symmetry
deviations in an organ or an organism’s relative symmetry. In this context, stress identified at morphological
level generally means that the physiological and molecular plasticity were unable to buffer the stress
(Whiteman and Loganathan, 2001). The most common tool for measuring DS is FA. Generally, FA is defined
as fine and random deviations from perfect symmetry of organism’s morphology. Also, considered a reliable
factor for measuring developmental stability because it reflects both genetic and environmental stress and this
has been an important theory in evolutionary biology for decades (Palmer, 1994). In this respect, it is perceived
that FA measures the capacity of the organism to buffer its developmental pathways against any
environmentally derived and genetic stressors. It is believed that the presence of either of the said stressors
during ontogeny may impair the effectiveness of these buffering mechanisms. This may affect normal
developmental process and could be manifested as increase levels of FA of an otherwise bilaterally
symmetrical character on organisms (Mpho et al., 2000). In this context, it is perceived that there is a direct
relationship between FA and developmental instability (Graham et al., 2010).
In this regard, this study was done to investigate the potential of FA as a biomarker of environmental
stress and determine developmental instability in the sea star (Protoreaster nodosus). It assessed the difference
in the FA indexes of Protoreaster nodosus from three (3) different sites (Linamon, Lanao del Norte; Initao,
Misamis Oriental and Jasaan, Misamis Oriental) portraying different environmental conditions and determine
the possibility of FA as a tool to determine ecological stress and its efficiency when applied to five-fold
dihedral symmetrical organisms. Fluctuating asymmetry is also a useful potential indicator of an organism’s
health and welfare.
120

Computational Ecology and Software, 2015, 5(2): 119-129
IAEES www.iaees.org
2 Materials and Methods
2.1 Study sites and specimen collection
Three study sites were surveyed within the coast of Northern Mindanao region: Bobotan, Initao; Linamon, and
Aplaya, Jasaan. The sites chosen differ with their proximity to human settlements and predicted to differ in
terms of environmental conditions. Bobotan, Initao is a protected seascape under Initao-Libertad Protected
Landscape and Seascape declared last 2002. There were more less 15 households residing near the area which
take part of the local government unit (LGU) activities in protecting and preserving the area. Linamon and
Aplaya were chosen as sites which differ in anthropogenic disturbance. Survey and sampling procedures were
done during low tide. Samples were collected in a 30 meter by 2 meter line transect (10 m by 2 m line transect
per sampling replicate) running parallel with the shore and placed randomly at each site within the low
intertidal zone (see Fig. 1).
2.2 Physico-chemical parameters
Measurement of ecological variables could serve as indicator for pollution or water disturbance in a particular
community. The following variables were recorded at each site: water and air temperature, hydrogen ion
concentration (pH) and salinity. These parameters were measured in situ conducted by triplicate in the 30
meter by 2 meter line transect.
2.3 Digital imaging preparation and measurement of Fluctuating Asymmetry (FA)
Thirty (30) individuals of P. nodosus were photographed for each site using a standard procedure. Samples
were carefully removed from the water, photographed and then returned to their original nest such that no
animal was harmed during the process. The digital images of the sea stars were processed and landmarked
assignment was done using tpsUti1 and tpsDig2 softwares. Landmarking was done in triplicates to quantify
and minimize measurement error. For morphometric analysis, forty-one (41) landmark points were assigned
for each individual. Arm opposite to the madreporite was designated as Arm 1, and the others follow
clockwise successively in aboral view (see Fig. 2) based on Ji et al., (2012) study. Fig. 3 shows the location of
the landmarks used in the sea star. Descriptions of identified landmarks are presented in Table 1.
Fig. 1 Transect line used for the collection of P. nodosus.
121

Computational Ecology and Software, 2015, 5(2): 119-129
IAEES www.iaees.org
Fig. 2 Aboral view of P. nodosus showing the anterior arm, opposite to the madreporite, which serves as Arm 1 and other arms follow clockwise successively.
Fig. 3 Location of forty-one (41) landmarks in P. nodosus sea star used for fluctuating asymmetry (FA) analysis.
122

Computational Ecology and Software, 2015, 5(2): 119-129
IAEES www.iaees.org
Table 1 Description of assigned landmarks on P. nodosus sea star.
Landmark
points Anatomical Description
Landmark
points Anatomical Description
1 Eyespot of anterior arm
(Arm 1) 30, 34 Distal end of Arm 3
2,3 Distal end of anterior arm 32 Eyespot of Arm 3
4,5 Middle of anterior arm 40 Interambulacrum between bivium Arms
6,7 Proximal end of anterior arm 27, 39 Proximal end of Arm 4
8 Interambulacrum between Arm 1
and Arm 2 29, 37 Middle of Arm 4
9 Interambulacrum between Arm 1
and Arm 5 31, 35 Distal end of Arm 4
10, 22 Proximal end of Arm 2 33 Eyespot of Arm 4
12, 20 Middle of Arm 2 25 Interambulacrum between Arm 4 and 5
14, 18 Distal end of Arm 2 11, 23 Promixal end of Arm 5
16 Topmost/ eyespot of Arm 2 13, 21 Middle region of Arm 5
24 Interambulacrum between Arm 2
and 3 15, 19 Distal end of Arm 5
26, 38 Proximal end of Arm 3 17 Eyespot of Arm 5
28, 36 Middle of Arm 3 41 Center of central disk
Individual levels of FA were obtained using the SAGE (Symmetry and Asymmetry in Geometric Data)
program. This software analysed the x- and y-coordinates, using a configuration protocol that divided both
sides of the sea star body. Object symmetry was applied in this case as sea stars have five-fold dihedral
symmetry. The FA theory has mostly been applied to bilaterally symmetrical organisms with only a few
published studies on organisms having five-fold dihedral symmetry (most echinoderms including starfish).
Herewith, breaking dihedral symmetry produces a bilaterally symmetrical object having just one reflective axis
of symmetry.
Procrustes methods were used to analyze shape by superimposing configurations of landmarks into two
or more specimens to achieve an overall best fit (see Fig. 4). The squared average of Procrustes distances for
all specimens is the individual contribution to the FA component of variation within a sample. To detect the
components of variances and deviations, a two-way, mixed model ANOVA with three replicates was used.
(Marquez, 2006; Klingenberg et al., 1998).
123

Computational Ecology and Software, 2015, 5(2): 119-129
IAEES www.iaees.org
The effect called ‘sides’ is the variation between the two sides; it is a measure of directional asymmetry.
The effect called ‘individuals’ is the variation among individual genotypes (size and shape variation). The
individual’s mean square is a measure of total phenotypic variation and it is random. The ‘individual by sides’
interaction is the failure of the effect of individuals to be the same from side to side; it is a measure of
fluctuating asymmetry and anti-symmetry; variations could be dependent to both environmental and genetic
conditions (Graham et al., 2010).
3 Results and Discussion
There were many assumptions behind fluctuating asymmetry (FA) and developmental stability (DS) and the
nature of the factors behind developmentally unstable phenotypes is not yet well understood. However, it is
noted that developmental stability is the situation wherein an organism has adequately buffered itself against
epigenetic disturbances hence, displaying its developmentally programmed phenotype. At the instance, that an
organism fails to buffer such disturbances, it may display signs of developmental instability. The origin of the
disturbance is assumed to be genetic, environmental or the product of genotype-environment interaction
(Markow, 1995). Fluctuating asymmetry (FA), pertains to small and random departures from perfect symmetry
of an organism’s bilateral traits and has been used as a measurement of developmental instability and as a
potential indicator of stress in populations. Thus, investigating the link between FA and DS in ecologically
important natural populations of sea stars shed light on the quest for morphological characters as a possible
biomarker for stress and knowledge on gene-environment interaction (Daloso, 2014; Galbo and Tabugo, 2014;
Trotta et al., 2005).
Herewith, Table 2 shows the Procrustes two-way, mixed model ANOVA table with expected mean
squares. The effect called “individuals” is the variation among individual animals and can be interpreted as a
size/shape variation; the “individuals” mean square is a measure of total phenotypic variation and is random.
The effect called “sides” is the variation between the two sides; it is a measure of directional asymmetry (DA).
The “individual by side interaction” is the failure of the effect of individuals to be the same from side to side; it
is a measure of FA and antisymmetry. It is a mixed effect. The error term is the “measurement error”; it is a
random effect (Parés-Casanova and Kucherova, 2013).
Fig. 4 Procrustes fitted image of P. nodosus done by SAGE software.
124

Computational Ecology and Software, 2015, 5(2): 119-129
IAEES www.iaees.org
Results show not significant FA value for Initao site (protected seascape) yet highly significant DA value,
which indicated that variation among individual genotypes and asymmetry in phenotypes is mostly induced by
genetics under less stressful environment. Meanwhile, the F values of “individual x sides” suggested highly
significant FA for the other two sites, Linamon and Aplaya, Jasaan as indicated by low mean square value of
measurement error compared to the individual by sides mean square values. Chocolate chip sea star
populations in Linamon and Aplaya, Jasaan have also shown significant scores on “individual” and “side”
effects. The effect called “sides” which refer to the variation between the two sides, a measure of directional
asymmetry (DA) were significant for both populations and were of the same level. A high FA and significant
DA leads to generation of phenotypes interacting with the perturbed ambient. Thus, may indicate interplay of
genotype and environment under more stressful environment. Noteworthy, was that Linamon and Aplaya,
Jasaan sampling sites displayed some level of environmental disturbance based on the ocular site inspection.
Anthropogenic disturbance were prevalent in Linamon sampling site due to human settlements along the shore
such that sewage and canal run offs go directly to the bay and various litters (e.g. plastics, diapers) were often
found scattered in the shoreline. While, Jasaan sampling area was situated near two industrial plants,
Philippine Sinter Corporation (PSC) and Pilipinas Kao, Inc., that produce sintered ore and biodegradable
chemicals, respectively. Yet, there were no official report on heavy metals or toxic contamination in the site.
Results coincide with the study of Utayopas (2001) on Trichopsi vittatus (croaking gourami) with highest
mean asymmetries were detected from the most polluted site in almost all characters. This suggests that
significant variation in size or left-right side of each individual could be a product of genotype-environment
interaction. Thus, P. nodosus individuals in these areas may have developmental instability during ontogeny
which could be due to exposure to environmental or genetic stressors. The individual’s inability to buffer the
stress leads to deviation in its relative symmetry. In this context, it is perceived that there is a direct
relationship between FA and developmental instability (Graham et al., 2010).
Table 2 Procrustes two-way, mixed model anova results of body symmetry of p. Nodosus.
*Significant, P< 0.05.
Effect/Site SS dF MS P F
Linamon
Individuals 0.13662 1131 0.0001208 0 2.4497******
Sides 0.030035 39 0.00077013 0 15.6182******
Individuals x sides 0.055769 1131 4.9309e-005 0.0020071 1.1418***
Measurement error 0.20211 4680 4.3186e-005 --
Initao
Individuals 0.14522 1131 0.0001284 0 2.4965******
Sides 0.049487 39 0.0012689 0 24.6727******
Individuals x sides 0.058167 1131 5.143e-005 0.76773 0.96575
Measurement error 0.2492 4680 5.3253e-005 --
Jasaan
Individuals 0.18584 1131 0.00016432 8.6159e-009 1.3995******
Sides 0.069279 39 0.0017764 0 15.1301******
Individuals x sides 0.13279 1131 0.00011741 0 2.285******
Measurement error 0.24046 4680 5.1381e-005
125

Computational Ecology and Software, 2015, 5(2): 119-129
IAEES www.iaees.org
In addition, principal component analysis from Procustes analysis may serve as reliable tool in
visualization of variations in landmarks (Galbo and Tabugo, 2014). The percentage values of PCA represent
the total variation in FA (see Table 3 and Fig. 5). Based on the results exhibited by PC 1 and PC2, population
from Initao express less variation compared to Linamon and Aplaya, Jasaan. Reversely, higher FA was
exhibited by the individuals in Linamon and Aplaya, Jasaan compared to Initao. Generally, PC 1 accounts for
most of the variation. Highest variation (PC 1= 70%) is exhibited in Jasaan followed by Linamon (PC 1= 37%).
Thus, explaining the symmetry deviation observed. This could have been attributed by both genetic and,
largely, of environmental stressors.
Table 3 Variance explained by first two principal components of Protoreaster nodosus in three sites.
Moreover, using Canonical Correspondence Analysis (CCA) physico-chemical parameters of each
sampling sites were correlated with PC values. Results revealed that individual variation in each samples were
more likely related to pH stress in P. nodosus (Fig. 6). Study of Dupont et al. (2008) show that at low pH
larvae of the ecological keystone brittlestar, Ophiothrix fragilis, either were abnormal, had altered skeletal
proportions and asymmetry during skeletogenesis and there was a delay in development. The exposure of
larvae to elevated CO2 (high pH) treatment takes longer to reach the same developmental stage. Herewith, FA
has costs and reflects the degree of environmental stress, health and quality of individuals.
Sites PC 1 (%) PC2 (%) Overall (%)
Linamon 37.19 19.81 57
Initao 34.14 19.28 53.42
Jasaan 69.66 11.35 81.01
126

Computational Ecology and Software, 2015, 5(2): 119-129
IAEES www.iaees.org
(a) Linamon PC1 (37.19%) Linamon PC2 (19.81%)
(b) Initao PC1 (34.14%) Initao PC2 (19.28%)
(c) Jasaan PC1 (69.66%) Jasaan PC2 (11.35%) Fig. 5 Deformation grid of fluctuating asymmetry for PC1 and PC2 of (a) Linamon, (b) Initao, and (c) Jasaan P. nodosus
populations.
127

Computational Ecology and Software, 2015, 5(2): 119-129
IAEES www.iaees.org
4 Conclusion
Under stressful conditions, the genotypes may show some deviations in their perfect bilateral symmetry, which
can be identified through the analysis of fluctuating asymmetry (FA). Results show that sampling areas which
are environmentally disturbed (Linamon and Jasaan) due to various anthropogenic activities such as industrial
or residential pollutants exhibited high FA and significant DS. This suggests that significant variation in size or
left-right side of each individual could be a product of genotype-environment interaction. Meanwhile, Initao
(protected seascape) population have exhibited insignificant FA level and high DS, such that variation among
individual genotypes and asymmetry in phenotypes is mostly induced by genetics under less stressful
environment. Hence, P. nodosus found in Linamon and Aplaya, Jasaan could be considered as
developmentally unstable and its inability to buffer the environmental and genetic stressors above tolerance
limit have led to deviation of its relative symmetry. It is perceived that there is a direct relationship between
FA and developmental instability. Thus, the study demonstrates the potential of FA as a biomarker for
environmental stress in five-fold dihedral symmetry of sea stars and a tool in detecting developmental
instability. Moreover, this tool should be applied to other similar organisms and wide range of physico-
chemical parameter should be included to fully assess the health of a certain habitat.
Acknowledgment
The authors would like to thank their families and DOST.
References
Albarrán-Lara AL, Mendoza-Cuenca L, Valencia-Ávalos S, González-Rodríguez A, Oyama K. 2010. Leaf
fluctuating asymmetry increases with hybridization and introgression between Quercus magnoliifolia and
Quercus resinosa (Fagaceae) along an altitudinal gradient in Mexico. International Journal of Plant
Fig. 6 Canonical Correspondence Analysis (CCA) of PCA scores and physico-chemical parameters.
128

Computational Ecology and Software, 2015, 5(2): 119-129
IAEES www.iaees.org
Sciences, 171(3): 310-322
Beasley DA, Bonisoli-Alquati A, Mousseau T. 2013. The use of fluctuating asymmetry as a measure of
environmentally induced developmental instability: A meta-analysis. Ecological Indicators, 30: 218-226
Bos AR, Gumanao GS, Alipoyo JCE, Cardona LT. 2008. Population dynamics, reproduction and growth of the
Indo-Pacific horned sea star, Protoreaster nodosus (Echinodermata; Asteroidea). Marine Biology, 156:55-
63
Carpentero ER, Tabugo SRM. 2014. Determining developmental instability via fluctuating asymmetry in the
shell shape of Arctica islandica Linn. 1767 (ocean quahog). European Journal of Zoological Research,
3(3): 1-7
Daloso DM. 2014. The ecological context of bilateral symmetry of organ and organisms. Natural Science, 6(4):
184-190
Dupont S, Havenhand J, Thorndyke W, Peck L, Thorndyke M. 2008. Near-future level of CO2-driven ocean
acidification radically affects larval survival and development in the brittlestar Ophiothrix fragilis. Marine
Ecology Progress Series, 373: 285-294
Galbo K, Tabugo SRM. 2014. Fluctuating asymmetry in the wings of Culex quinquefasciatus (Say) (Diptera:
Culicidae) from selected barangays in Iligan City, Philippines. AACL Bioflux, 7(5): 357-264
Graham JH, Raz S, Hel-Or H, Nevo E. 2010. Fluctuating asymmetry: Methods, theory, and applications.
Symmetry, 2(2): 466-540
Ji C, Wu L, Zhao W, Wang S, Lv J. 2012. Echinoderms have bilateral tendencies. PLoS ONE 7(1): e28978
Klingenberg CP, McIntyre GS, Zaklan SD. 1998. Left-right asymmetry of fly wings and the evolution of body
axes. Proceedings of the Royal Society of London B, Biological Sciences, 265: 1255-1259
Markow T. 1995. Evolutionary ecology and developmental instability. Annual Review of Entomology, 40:
105-120
Marquez E. 2006. Sage: symmetry and asymmetry in geometric data. Ver 1.0.
http://www.personal.umich.edu/~emarquez/morph/
Menge BA. 1975. Brood or broadcast? The adaptive significance of different reproductive strategies in the two
intertidal sea stars Leptasterias hexactis and Pisaster ochraceus. Marine Biology, 31: 87-100
Mpho M, Holloway GJ, Callaghan A. 2000. The effect of larval density on life history and wing asymmetry in
the mosquito Culex pipiens. Bulletin of Entomological Research, 90: 279-283
Paine RT, Castillo JC, Cancino J. 1985. Perturbation and recovery patterns of starfish-dominated intertidal
assemblages in Chile, New Zealand and Washington State. American Naturalist, 125: 679-691
Palmer AR. 1994. Fluctuating asymmetry analysis: a primer. In: Developmental Instability: Its Origins and
Evolutionary Implications (Markow TA, ed). Kluwer Academic, London, UK
Parés-Casanova PM, Kucherova I. 2013. Horn asymmetry in a local goat population. International Journal of
Research in Agriculture and Food Sciences, 1(2): 12-17
Trotta V, Corrado F, Calboli F, Garoia F, et al. 2005. Fluctuating asymmetry as a measure of ecological stress
in Drosophila melanogaster (Diptera: Drosophilidae). European Journal of Entomology, 102: 195-200
Utayopas P, 2001. Fluctuating Asymmetry in Fishes Inhabiting Potluted and Unpolluted Bodies of Water in
Thailand. Thammasat International Journal of Science and Technology, 6(2): 10-20
Vishalakshi C, Singh BN. 2008. Effect of environmental stress on fluctuating asymmetry in certain
morphological traits in Drosophila ananassae: nutrition and larval crowding Canadian Journal of
Zoology, 86(5): 427-437
Whiteman HH, Loganathan BG. 2001. Developmental stability in amphibians as a biological indicator of
chemical contamination and other environmental stressors. Kentucky EPA/EPSCoR, USA
129

Computational Ecology and Software, 2015, 5(2): 130-138
IAEES www.iaees.org
Article
Distinguishing niche and neutral processes: Issues in variation
partitioning statistical methods and further perspectives
Youhua Chen Department of Renewable Resources, University of Alberta, Edmonton, T6G 2H1, Canada
E-mail: [email protected]
Received 30 September 2014; Accepted 6 November 2014; Published online 1 June 2015
Abstract
Variance partitioning methods, which are built upon multivariate statistics, have been widely applied in
different taxa and habitats in community ecology. Here, I performed a literature review on the development
and application of the methods, and then discussed the limitation of available methods and the difficulties
involved in sampling schemes. The central goal of the work is then to propose some potential practical
methods that might help to overcome different issues of traditional least-square-based regression modeling. A
variety of regression models has been considered for comparison. In initial simulations, I identified that
generalized additive model (GAM) has the highest accuracy to predict variation components. Therefore, I
argued that other advanced regression techniques, including the GAM and related models, could be utilized in
variation partitioning for better quantifying the aggregation scenarios of species distribution.
Keywords multivariate ordination; regression models; general additive models; dispersal limitation;
environmental filtering.
1 Introduction
1.1 Variation decomposition in community ecology
It is quite often not only one process regulating and determining community structure. Typically, the
combination of multiple processes and their interactions will have profound impacts on resultant community
structure. So, it is natural to ask which kinds of processes are dominant, while others are auxiliary. Thus, the
variance in response variables can be separated into several parts, and by employing statistical methods, we
can identify the contribution and relative importance of different ecological mechanisms.
Fig. 1 depicts the methods for performing variation decomposition at different data levels. The methods
range from simple linear regression, to multiple regression models, to multivariate regression model, and other
multivariate statistical methods.
Computational Ecology and Software ISSN 2220721X URL: http://www.iaees.org/publications/journals/ces/onlineversion.asp RSS: http://www.iaees.org/publications/journals/ces/rss.xml Email: [email protected] EditorinChief: WenJun Zhang Publisher: International Academy of Ecology and Environmental Sciences

Computational Ecology and Software, 2015, 5(2): 130-138
IAEES www.iaees.org
Fig. 1 Different methods, ranging from a simple regression to multivariate statistics, have been used for variation partitioning to distinguish environmental and spatial filtering. Solid arrow denotes that the method can be used for performing variation partitioning tests, while dashed arrow denotes that that method (pointed by the head of arrow) can be generalized or deduced from another method.
1.2 How is variation partitioning related to the debate between niche and neutral processes?
Two mechanisms significantly affect species diversity patterns: neutral and deterministic factors.
Environmental descriptors, defining the niche of species, are deterministic; while spatial descriptors, defining
the dispersal ability of species, are neutral.
Since Hubbell’s neutral theory (Hubbell, 2001), a great amount of works tried to predict the power of
neutral theory in empirical data. However, most of them failed to support neutral theory (McGill, 2003; Gotelli
and McGill, 2006). There are several ways to test neutral theory. One is to generate individual predictions and
test them by regression based on neutral theory. For example, the distance decay of species composition
(Gilbert and Lechowicz, 2004); the priority effect of juvenile co-occurrence reduction (Gilbert et al., 2008).
Since the repellence of pure neutral theory in empirical test, the mainstream nowadays is to combine both
niche and neutrality to explain community structure, and test the relative importance of each component.
Therefore, variation partitioning is introduced (Borcard et al., 1992) to detect the contribution from each part
of variations. In a work of Tuomisto and Ruokolainen (Tuomisto and Ruokolainen, 2006), they suggested that
dispersal limitation derived from neutral process can only be tested by using distance-based methods.
1.3 How to perform variation partitioning?
To character species composition and environmental variables is a major topic in current ecological research.
Redundancy analysis (suited for linear relationships between species composition and environmental variables)
and Canonical correspondence analysis (handling nonlinear species-environment relationship) are the two
widely used methods to investigate the relationship of environmental variables and species diversity
information (Fig. 1). Variation partitioning can be used to test and determine the possibilities of individual
predictors in influencing species distribution and abundance (Peres-Neto et al., 2006).
131

Computational Ecology and Software, 2015, 5(2): 130-138
IAEES www.iaees.org
Variation partitioning can be divided into four parts: pure environmental variation, pure space variation,
mixed environmental and space variation, and unexplained variation (Borcard et al., 1992). Fig. 2 showed the
schematic map of the variation components which were often complied in previous literature.
Fig. 2 Schematic map showing different components and fractions that are related to variation partitioning. a-pure environmental variation; b-mixed environmental and space variation; c-pure space variation; d-unexplained variation. a+b+c+d=total variance involved in the community data.
In principle, I use the spatial coordinates as the basic spatial descriptors. I can use the eigenvectors derived
from the principal components of spatial coordinates, which has been used in some previous works (Dray et al.,
2006). Or, I can get the Moran’s eigenvector maps (Dray et al., 2006; Sattler et al., 2010), which is a general
form of principal coordinates of neighbour matrices (Borcard and Legendre, 2002). Both methods use the
eigenfunctions of spatial connectivity matrices, thus they are scale-independent.
When setting spatial descriptors as covariables, I can know the proportion of pure environmental variation.
In contrast, when setting environmental variables as covariables, I can deduce the proportion of pure space
variation. The mixed environmental and spatial variation can be derived from the subtraction of total known
variation-pure environmental variation-pure spatial variation.
It is quite simple to perform comparative studies in ecological data by implementing variation partitioning
in regression results. Basically, all kinds of statistical software and tools can implement variation partitioning,
as long as they can perform multiple regression analysis. As I stated above, it needs only three times of
running regressions, each of which should comprise environmental variables only, spatial variables only and
both spatial and environmental variables together. From a convenience perspective, there is a commercial
statistical software called Canoco (ter Braak, 1986), which is designed for constrained community ordination
analysis. Variation partitioning can be implemented using partial CCA method in the package. Besides that, I
can perform variation partitioning by using some open-source packages in R software. For example, the
command “varpart” can be recalled to perform variation partitioning using “vegan” package (Oksanen et al.,
2012).
132

Computational Ecology and Software, 2015, 5(2): 130-138
IAEES www.iaees.org
1.4 Literature searching and study classification
To search the available publications relevant to separate the effects of niche processes and neutrality, I used the
following databases: Google Scholar, Web of Science, Springlink, Wiley-Blackwell, and Elsevier publishers.
The keywords used for query include “variation partition”, “redundancy analysis”, “niche and neutral
processes”, “dispersal limitation and habitat filtering”, “spatial and environmental descriptors”.
Based on the query results, I summarized two basic categories for the subject, which are 1) theoretical and
methodological development; and 2) applications on different taxa and habitats. Table 1 summarized all the
relevant work on the subject.
Table 1 A literature review on the methodology and applications of variation partitioning in community ecology.
Sub-discipline Description Literature
1,
Methodological
background and
development
Advocating or
criticizing the
variance
partitioning and
developing
relevant tools
1, the original paper describing variation partitioning:
Borcard et al. (Borcard et al., 1992)
2, comparison of different methods on performing
variation partitioning. For example, Mantel test, multiple
regression model, canonical correspondence analysis and
so on (Legendre et al., 2005, 2008)
3, ecological questions that can be addressed by variation
partitioning: beta diversity (Legendre et al., 2005, 2009);
neutrality versus niche (Smith and Lundholm, 2010;
Tuomisto et al., 2012);
4, rebuttal to variation partitioning methods and relevant
technical aspects:
Tuomisto and Ruokolainen (Tuomisto and Ruokolainen,
2006) suggested that distance method (like Mantel test)
should be the only choice to test neutral hypothesis.
Gilbert and Bennett (Gilbert and Bennett, 2010) found that
traditional variation partitioning methods have a very
restricted power to correctly quantify each part of
variances involved in the simulated data.
Diniz-Filho et al. (Diniz-Filho et al., 2012) suggested that
spatial autocorrelation test (Moran’s I index) can be linked
to niche and neutrality partitioning.
2, Applications
on various
taxonomic
hierarchy and
spatial scales
Applying
variation
partitioning to
different
community
assemblages
across different
ecosystems,
areas and taxa.
1, terrestrial ecosystems:
Oribatid mites (Borcard and Legendre, 1994; Lindo and
Winchester, 2009);
Forest birds (Cushman and McGarigal, 2002; Pearman,
2002);
Pteridophyte plants (Jones et al., 2008)
2, marine and aquatic ecosystems:
Stream fish community (Steward-Koster et al., 2007);
Pelagic fish assemblages (Peltonen et al., 2007)
133

Computational Ecology and Software, 2015, 5(2): 130-138
IAEES www.iaees.org
From the table, it seemed that most of applications of variation partitioning are on terrestrial ecosystems,
and the studied taxa varied from birds to plants. Interestingly, there are only a few relevant works on marine
and aquatic ecosystems, with only focus on fish assemblages.
1.5 A review of current methods and possible problems
There are many possible methods by applying nonlinear regression techniques to reveal the correlation of
environmental and spatial variables against species distribution-composition matrix. The possibilities of
introducing advanced nonlinear regression model, including local regression methods, general additive models
and least partial square methods, can be beneficial to overcome the challenges.
Gilbert and Bennett (Gilbert and Bennett, 2010) performed a simulation comparison for analyzing the
powers and differences among a variety of variation partitioning methods, most of which are widely used.
Typically, the most prevailing methods are the regression on distance matrices (e.g., Mantel test), canonical
correspondence analysis and redundancy analysis. Moreover, it is suggested to better retain spatial information
by using some kinds of transformation called principal components of neighbour matrices (or Moran’s
eigenvector maps).
Despite their wide applications, Gilbert and Bennett (Gilbert and Bennett, 2010) found out that all kinds of
tools have greatly underestimated each part of variances. For example, they found out that canonical ordination
under-fitted the environmental variation, which was simulated in a high amount.
1.6 Potential methods
As found, the under-fit problem of different variation components by traditional ordination methods is largely
due to the disability of traditional regression models. This is because all the available methods are built on the
basis of least-square estimation of regression coefficients. All the conventional methods have the implicit
assumption of homoscedasticity involved in the dataset more or less. Thus, as long as the data were composed
of inherent heteroscedasticity, the power of least-square regression was questioned. Simple linear or nonlinear
(e.g., polynomial regression and general linear models) fitting will be not possible to remove the impact of
shifting data variance in the data set.
Fig. 3 showed the impacts of heteroscedasticity are hard to remove when plotting fitted residuals after
conventional regression models. Thus, it sounds that a promising method to overcome the under-fit problem
identified by Gilbert and Bennett (Gilbert and Bennett, 2010) is to adopt advanced regression models. Hence,
in the following section of our synthesis is to propose advanced regression tools.
1.7 General additive model (GAM) and relevant nonlinear smoothing methods
The regression models in this category are of course nonlinear, however, another important feature is that they
employed completely different ways aiming to solve the problem of heteroscedasticity. General additive model
(GAM) typically has the power to remove the problem of variance heterogeneity, with the cost of difficult
ecological explanation.
Here I generated a simple relationship between species abundance and one environmental variable with
increasing variance across the landscape. Then, I applied different regression models to fit this heterogeneous
variance case. The resultant residuals after fitting were as showed in Fig. 3, the simple linear model have only
R2-adjusted=0.4171, in contrast, GAM returned an R2-adjusted= 0.542. Polynomial regression model is no
more than a simple linear model, with R2-adjusted=0.417. Moreover, when checking the regression residuals, I
can find out that resultant residuals have no heterogeneity. In contrast, residuals from linear models (the same
applied to quadratic nonlinear models, but not showed here) still have variance heterogeneity, and the case
becomes worse at both lateral sides of the points.
134

Computational Ecology and Software, 2015, 5(2): 130-138
IAEES www.iaees.org
0 20 40 60 80 100
-20
-10
01
02
0
Linear model
Re
sid
ual
s
0 20 40 60 80 100
-10
01
02
0
Additive model
Re
sid
ual
s
Fig. 3 The problem of variance heterogeneity and the effectiveness of additive models compared to linear models to remove variance heterogeneity (left figure is the residuals fitted by simple linear model, while the residuals derived from general additive fitting with Gaussian family is showed in the right figure). It is clear a humped pattern (non-homogenous residuals) still occurs in the left graph.
2 Implications and Further Perspectives
2.1 Spatial heterogeneity and distributional aggregation may reduce the power
Typically geographic coordinates are our only choices to measure spatial patterns and drivers of the
community structure. However, sometimes it is hard to extract enough spatial information from simple
geographic coordinates. In the case of multi-dimensional folding and transformation, Euclidean distances of
geographic locations might not be sufficient to capture the variation caused by spatial distances. For example,
species distributions typically show the aggregated, rather than random, patterns across different taxa. The
driving reasons are usually dispersal-limited colonization and the constraint of habitat heterogeneity, and also
biotic interactions, e.g., inter- and intra- specific competition.
2.2 Moran’s spatial scales and edge effects
Sampling of different variables at different locations and scales might typically encounter the scale problem.
The inconsistence of scales for different variables may lead to bias prediction on disentangling niche and
neutrality processes. In such a case, the relative contribution of neutrality and niche processes driving the
community structure may be misleading. Fig. 4 (upper graph) illustrated the scale issue when doing sampling
in fields. Insufficient sampling across the region can give us a rough estimation of spatial gradient, but which
is largely departed from the true gradient caused by middle-degree Moran’s process. In this case, spatial
variation should be overestimated. This issue can happen of course for environmental variables as well.
Edge effects may also inflate the possible separation of environmental filtering and spatial limitation. As
showed in the same Fig. 4 (lower graph), if the sampling effect is focused on the transitional boundary areas of
an environmental variable, the resultant explanation can be that the signaling of environmental filtering is not
strong. It is easy to avoid the edge problem for one environmental variable. However, for the case of multiple
variables, as it should be hard to predict their transitional boundaries, the sampling scheme can be always
coupled with edge effects.
135

Computational Ecology and Software, 2015, 5(2): 130-138
IAEES www.iaees.org
Fig. 4 Sampling biases caused by Moran’s spatial scales and edge effects. Two rectangular areas indicate two distinct levels of an environmental variable (e.g., precipitation, elevation, temperature and so on). Square and triangle points with red and blue colors indicated two species. Ellipse circles represent density of species population. Transparent gray squares represent sampling plots across the region. In principle, the community bounded by the large square is structured by environmental filtering. The upper graph illustrates the insufficient sampling case, which make the wrong conclusion that environmental filtering is not important to capture the beta-diversity. The lower graph illustrate the edge sampling case, which make the wrong conclusion that spatial filtering is much more important than environmental filtering to structure the community.
At another side, as known that, both processes can have similar predictions on many facets of community
structures. For example, niche process can generate the same distance-decaying pattern as that of neutrality
process. In the case like that, typically the resultant community structure is co-dominated by both mechanisms
and hard to separate without additional information about the community. Thus, it might be not effective to use
partial regression techniques to separate niche and neutrality processes.
136

Computational Ecology and Software, 2015, 5(2): 130-138
IAEES www.iaees.org
2.3 Variable selection process
Maybe variable selection is an improved way to better capture the most correlated variation information for
spatial and environmental drivers. In tradition, backward or forward variable selection procedure is applied to
choose the optimal subsets of variables. In the case of variation partitioning, I can do the variable selection
separately, then obtain the most correlated spatial and environmental predictors to perform variation
decomposition. This method did provide the most significant variables, but a small change of variable subset
will lead to a great amount of changes in the resulting variation. Thus, the discrete process may reduce the
prediction accuracy when new variables are included (Tibshirani, 1996). Fortunately, I have other advanced
model selection methods, for example, Lasso and ridge regressions can be good alternatives for choosing good
candidates in variation partitioning.
2.4 An integrative way to partition and understand ecological communities
The explanation is the most challenging thing for general additive models, although it has a higher appealing
prediction power than linear models. The comprising manner is to use simple linear or nonlinear regression to
fit the data when obtaining the possible curve pattern inspired by GAM models. Then, combining the fitted
adjusted R2 from GAM and fitted line from either linear or simple nonlinear regression models, I can clearly
and easily explain the possible relationships and mechanisms that might dominate the community data.
References
Borcard D, Legendre P. 2002. All-scale spatial analysis of ecological data by means of principal coordinates of
neighbor matrices. Ecological Modelling, 153: 51-68
Borcard D, Legendre P. 1994. Environmental control and spatial structure in ecological communities: an
example using oribatid mites (Acari, Oribatei). Environmental and Ecological Statistics, 1: 37-61
Borcard D, Legendre P, Drapeau P. 1992. Partialling out the Spatial Component of Ecological Variation.
Ecology, 73: 1045
Ter Braak, CJF. 1986. Canonical correspondence analysis : a new eigenvector technique for multivariate direct
gradient analysis. Ecology, 67: 1167-1179
Cushman S, McGarigal K. 2002. Hierarchical, multi-scale decomposition ofspecies-environment relationships.
Landscape Ecology, 17: 637-646
Diniz-Filho J, Siqueira T, Padial A, Rangel T, Landeiro V, Bini L. 2012. Spatial atucorrelation analysis allows
disentangling the balance between neutral and niche processes in metacommunities. Oikos, 121: 201-210.
Dray S, Legendre P, Peres-Neto PR. 2006. Spatial modelling: a comprehensive framework for principal
coordinate analysis of neighbour matrices (PCNM). Ecological Modelling, 196: 483-493
Gilbert B, Bennett JR. 2010. Partitioning variation in ecological communities: do the numbers add up? Journal
of Applied Ecology, 47: 1071-1082
Gilbert B, Lechowicz M. 2004. Neutrality, niches, and dispersal in a temperate forest understory. Proceedings
of the National Academy of Sciences, 101: 7651-7656
Gilbert B, Srivastava DS, Kirby KR. 2008. Niche partitioning at multiple scales facilitates coexistence among
mosquito larvae. Oikos, 117: 944-950
Gotelli N, McGill B. 2006. Null versus neutral models: what’s the difference? Ecography, 29: 793-800
Hubbell SP. 2001. The Unified Neutral Theory of Biodiversity and Biogeography (MPB-32) (Monographs in
Population Biology). Princeton University Press, USA
Jones M, Tuomisto H, Borcard D, Legendre P, Clark D, Olivas P. 2008. Explaining variation in tropical plant
community composition: influence of environmental and spatial data quality. Oecologica, 155: 593-604
137

Computational Ecology and Software, 2015, 5(2): 130-138
IAEES www.iaees.org
Legendre P, Borcard D, Peres-Neto P. 2005. Analyzing beta diversity: Partitioning the spatial variation of
community composition data. Ecological Monographs, 75: 435-450
Legendre P, Borcard D, Peres-Neto P. 2008. Analyzing or explaining beta diversity : Comment. Ecology, 89:
3238-3244
Legendre P, Mi X, Ren H, Ma K, Yu M, Sun IF, He F. 2009. Partitioning beta diversity in a subtropical broad-
leaved forest of China. Ecology, 90: 663-674
Lindo Z, Winchester NN. 2009. Spatial and environmental factors contributing to patterns in arboreal and
terrestrial oribatid mite diversity across spatial scales. Oecologia, 160: 817-825
McGill B. 2003. A test of the unified neutral theory of biodiversity. Nature, 422: 881-885
Oksanen J, Blanchet F, Kindt R, Legendre P, Minchin P, O’Hara R, Simpson G, Solymos P, Stevens M,
Wagner H. 2012. vegan: Community Ecology Package. R package version 2.0-4. http://CRAN.R-
project.org/package=vegan.
Pearman P. 2002. The scale of community structure: habitat variation and avian guids in tropical forest
understory. Ecological Monographs, 72: 19-39
Peltonen H, Luoto M, Pakkonen J, Karjalainen M, Tuomaala A, Poni J, Viitasalo M. 2007. Pelagic fish
abundance in relation to regional environmental variation in the Gulf of Finland, northern Baltic Sea.
ICES Journal of Marine Science, 64: 487-495
Peres-Neto P, Legendre P, Dray S, Borcard D. 2006. Variation partitioning of species data matrices: estimation
and comparison of fractions. Ecology, 87: 2614-2625
Sattler T, Borcard D, Arlettaz R, Bontadina F, Legendre P, Obrist MK, Moretti M. 2010. Spider, bee, and bird
communities in cities are shaped by environmental control and high stochasticity. Ecology, 91: 3343-
3353
Smith TW, Lundholm JT. 2010. Variation partitioning as a tool to distinguish between niche and neutral
processes. Ecography, 33: 648-655
Steward-Koster B, Kennard M, Harch B, Sheldon F, Arthington A, Pusey B. 2007. Partitioning the variation in
stream fish assemblages within a spatio-temporal hierarchy. Marine and Freshwater Research, 58: 675-
686
Tibshirani R. 1996. Regression shrinkage and selection via the Lasso. Journal of Royal Statistics Society B, 58:
267-288
Tuomisto H, Ruokolainen K. 2006. Analyzing or explaining beta diversity? Understanding the targets of
different methods of analysis. Ecology, 87: 2697-708
Tuomisto H, Ruokolainen L, Ruokolainen K. 2012. Modelling niche and neutral dynamics: on the ecological
interpretation of variation partitioning results. Ecography, 35: 961-971
138

Computational Ecology and Software, 2015, 5(2): 139-151
IAEES www.iaees.org
Article
Application of homotopy perturbation method to the Navier-Stokes
equations in cylindrical coordinates
H. A. Wahab1, Anwar Jamal1, Saira Bhatti2, Muhammad Naeem3, Muhammad Shahzad1, Sajjad
Hussain1
1Department of Mathematics, Hazara University, Manshera, Pakistan 2Department of Mathematics, COMSATS Institute of Information Technology, Abbottabad, Pakistan 3Department of Information Technology, Hazara University, Manshera, Pakistan
E-mail: [email protected], [email protected]
Received 30 September 2014; Accepted 8 February 2015; Published online 1 June 2015
Abstract
This paper deals with the approximate analytical solution of the Navier-Stokes equations in cylindrical
coordinates. The homotopy perturbation method is used to get the analytical approximation. Depending upon
different available choices for the linear operator, we also have the advantage to choose different initial
approximations to start our analysis. The analysis is done without calculating the Adomian’s polynomials.
Keywords Navier-Stokes equations; homotopy perturbation method; iterative approximation; infinite series
solution.
1 Introduction
The Navier-Stokes equations describe the motion of fluids that is a substance which can be flow and it arises
from Newton 2nd law applying to the fluid motion (Square, 1952). The Navier-Stokes equations are widely
used in physics, they are used for modeling of weather and seas currents, designing of aircrafts and cars, for
motions of stars, they are used in video games, flow of water in a pipe, blood circulations, analysis of power
stations, and study of populations (Thorpe, 1997).
In fluids mechanics, the dynamics of a flowing fluid is governed and represented by the Navier- Stokes
equations which are nonlinear partial differential equations. Here our case of interest is to approximate the
governing equations of the flow field in a tube, since it is nonlinear in character and it is impossible to solve
these equations analytically to get the exact solution. To solve these equations, we are led to adopt some
restrictive assumptions and some simplifications, which involve the suppositions of weak non linearity to
apply traditional perturbation methods, small parameter assumptions which restrict the wide applications of the
Computational Ecology and Software ISSN 2220721X URL: http://www.iaees.org/publications/journals/ces/onlineversion.asp RSS: http://www.iaees.org/publications/journals/ces/rss.xml Email: [email protected] EditorinChief: WenJun Zhang Publisher: International Academy of Ecology and Environmental Sciences

Computational Ecology and Software, 2015, 5(2): 139-151
IAEES www.iaees.org
perturbation techniques, linearization which is certainly a handy task, discretization to apply numerical
techniques etc. In using the traditional numerical methods for the numerical solution of the Navier- Stokes
equations are very difficult and it is due to mixing of different length scales involving in the fluid flow which
results in massive out prints.
Our objective here is to find the continuous analytical solution to the governing equation in cylindrical
coordinates without massive outsprints and restrictive suppositions as discussed above, which change physical
problem into a mathematical problem. K. Haldar (Haldar, 1995) used Adomian’s decomposition method
(Adomian, 1996; Adomian, 1989) for the analytical approximation of the problem which is most transparent
method for the solutions of the Navier-Stokes equation in cylindrical coordinates. However the limitations of
this method involve a handy task of the calculations of the Adomian polynomials, which proved to be too
difficult and cause to slow down the application. To overcome this shortcoming, we make use of the homotopy
perturbation method to get analytical approximations for different choices of linear operators and the initial
guesses available. Recently, the homotopy perturbation method being a powerful technique was developed by
He (He, 1999, 2005) .The main advantage of this technique is to overcome the difficulties arising in the
process of calculations for the nonlinear terms arising in the problem. This gives analytical approximation to
the different classes of the nonlinear differential equations, system of differential equations, integral and
integro-differential equation and systems of such equations. Haldar applied the Adomian’s decomposition
method to the Navier- stokes equations in cylindrical coordinates for two dimensional irrotational fluid flow in
a tube (Hardar, 1997). Our present analysis gives the application of homotopy perturbation method without
any restrictive assumptions and handy calculations of the Adomian polynomials to the Navier Stoke Equations
in cylindrical coordinates, in which the steady two dimensional irrotational flow of fluid in a tube of non-
uniform circular cross section can be studied.
2 The Governing Equations
Consider the governing equations of motion for the two dimensional flow field for a viscous fluid in a tube
which are described by the cylindrical coordinate transformation of the Navier-Stokes equations read as;
2 2
2 2
1 1,
u u u u u Pu v
z r r r zr z
(1)
2 2 2
2 2 2
1 1.
v v v v v v Pu v
z r r r rr r z
(2)
It is suggested that the rotational motion of the fluid is negligible. Then the equation of continuity reads is
10
urv
r r z
(3)
Where ,u is fluid velocity components in the axial x coordinate and v is in the radial coordinate r , and
the fluid pressure is described by P , the fluid density by , and the kinematic viscosity by for the fluid.
Introducing and labeling the stream function as , then we may have,
1,u
r r
and 1
vr z
, (4)
The equation of continuity is satisfied identically. The dynamical equation of motion in term of the stream
function are obtained by eliminating P between (2) and (3), and making us of the relation (4), it is read as;
140

Computational Ecology and Software, 2015, 5(2): 139-151
IAEES www.iaees.org
22
,1 2
, zr r r
(5)
Introducing as a linear operator which is defined as;
2 2
2 2
1,
r rr z
(6)
and the Jacobean defined as
, ( ) ( )
., z
L r rr r z r z
z z
(7)
Now, we here mainly discuss to forms of the linear operator defined by equation (5). We will split the
linear operator in two parts and discuss the two cases. It is to note that in the homotopy perturbation
method we are free to choose the linear operator. This mainly depends upon the given form of the initial or
boundary condition and the problem under investigation. Therefore, depending upon our choices and the
possibilities for the appearance of the auxiliary linear form of operator in the problem we consider two cases
here.
Case 1:
The first form of the linear operator extracted from equation (5) for the possible form of the linear operator is
supposed to be;
2
1 2
1.
r rr
(8)
Then the operator becomes 2
1 2z
, which implies that
22 2 2
1 1 122
z
then
22 2 2
1 1 122 .
z
(9)
Using (9) in (5), the equation (5) takes the following form
2 2 42 21 12 2 4
1 ( , ) 22 ( ) ,
(r, z)r zr z z
Taking 1 both sides
2 42 111 2 4 2
( ) 1 ( , ) 22 .
(r, z)r zz z r
In order to apply the proposed homotopy perturbation method to the given problem, we need to define the
nonlinear term appearing in the governing equations. Therefore, we define the nonlinear term as N in the
above equation which is given as;
2
1 ( , ) 2.
(r, z)N
r zr
Then we get the following nonlinear form of equation for our analysis,
141

Computational Ecology and Software, 2015, 5(2): 139-151
IAEES www.iaees.org
2 42 1 1
1 2 2 4
( )1 ( , ) 22
(r, z)r r z z z
Operating 11
on both sides of the above equation,
2 41 1 1
1 1 2 2 4
1 ( , ) 22 ,
(r, z)r zr z z
(10)
Using homotopy perturbation method (HPM) proposed by J. H. He (He, 2006), we construct a homotopy for
equation (10) as; (r, z; ) : [0,1] This satisfies
0, 1 0,H v v u A v f r and here 0,1 is designed to be an
embedding parameter,
41 1 1 11
1 1 0 1 1 12 2 4
,1 21 , 2 0.
,
w w w
r r z zr z z
(11)
Suppose the solution of (11) is of the form of
20 1 2, ; ,r z (12)
Using (12) in (11) we get
0 1 0 11 1 11 0 1 1 0 1 1
1 2 40 1 1 0 1 0 11 1 1
1 0 1 12 2 4
, ,1, +
r, z
, , ,2, 2 0.
owr
zr z z
(13)
Now we simplify the quantities enclosed in brackets,
0 1 0 1
0 1 0 1
0 1 0 1
, , ,
r, zr r
z z
1
2 2 2 20 2 0 1 2 0 1 2 0 1 2
r z z r
2 30 0 0 02 2 2 2 1 1 1 1( ) ( ) ( ),r z z r r z z r r z z r
0, 10 0 1 0 2 0 0 2 1 11 2, , , , ,
, , , , , ,o
r z r z r z r z r z r z
(14)
The calculations made in (14) is according to the definition of the Jacobean, and
142

Computational Ecology and Software, 2015, 5(2): 139-151
IAEES www.iaees.org
1
0 1 1 0 10 0 10 1 0 1 0
2 0 1 22 1 0 ,
z z z z
z z z
(15)
Combining the terms containing the equal powers of in equation (14) and (15)
0 00 1 01 1 02
,1 2,
,C
r r z zr
(15a)
1 0 0 11 0 12 1 02 2
, , 2 2,
, ,C
r z r z z zr r
(15b)
2 0 0 2 1 12 0 1 23 2 1 22 2 2
, , , 2 2 2,
, , ,C
r z r z r z z z zr r r
(15c)
and so on. Now
2 2 2 2 20 1 2 0 1 20 1 2
2 2 2 2z z z z
(16)
4 0 1 2 4 4 40 1 2 0 1 20 1 2
4 4 4 4z z z z
(17)
Now combining the terms containing the equal powers of in equations (16) and (17)
2 41 0 0
1 2 42 ,D
z z
(17a)
2 41 1 1
2 2 42 ,D
z z
(17b)
2 41 2 2
3 2 42 ,D
z z
(17c)
and so on. Using equations (15a), (15b), (15c), (17a), (17b), (17c) in equation (13). We get from equation (13),
0 1 11 0 1 1 1 0 1 0
1 1 0 1 2 0 1 21 1 2 3 1 2 3 0.C C C D D D
(18)
Equating the coefficients of equal powers of we have the zeroth order problem as:
Zeroth Order problem: 1 0 1 0 0, which implies 0 0 ,r z
(19)
Here 0 is defined as the solution of homogenous equation 21 0 0, (20)
subject to the pre-prescribed boundary conditions. Now to find the approximation for 1 for which we first
143

Computational Ecology and Software, 2015, 5(2): 139-151
IAEES www.iaees.org
find the inverse operator 21 and for it we consider equation (3), 1 0 (21)
We now define 2
2& ,rr r rr
then operator 1 takes the following form as
1
1,rr rr
1
1.rr rr
Using equation (21) we get 10rr rr
Solving for rr and r that is for
linear terms
1,rr rr
(22)
,r rrr (23)
Operating 1r on (24) and 1
rr on (24) we get
11
1,rr rr
(24)
12 ,r rrr (25)
1 and 2 are the solutions of two homogenous equations 0,rr and 0,r respectively. The
inverse linear operators 1rr and 1
r are defined as
1
1
,
.
rr
r
drdr
dr
(26)
Adding (25) and (26) we get 1 11 2
12 ,rr r r rrr
r
and dividing both
sides by 2, to get 1 11 2 1,
2 rr r r rrrr
(27)
1 1
0
1 1,
2 rr r r rrrr
(28)
where 1 20 2
, then
1 11 0
1 12 1
1 11
1 1,
2
1 1,
2
1 1.
2
rr r r rr
rr r r rr
n rr r r rr n
rr
rr
rr
(29)
144

Computational Ecology and Software, 2015, 5(2): 139-151
IAEES www.iaees.org
Let the quantity in brackets is denoted by
1 0
22 1 0 02
11 01
1
21 1 1 1
,2 2 2 2
1
2n
n n
(30)
1 1
0 00 0
1 1 1
2 2
n
nrr r r rrn n
n n
rr
(31)
Now the inverse of the linear operator is defined 2
21
1rr rr
as
2 1 11
0
1 1
2
n
rr r r rrnn
rr
(32)
Now we come to equation (19) and define the zeroth order problem as, 0 0. And the 1st order problem
as 1 11 1 1 0 1 1 1 .C D
Substituting values from equation (15a) (17a) we get,
2 40 01 1 0 1 0 0
1 1 1 0 1 0 2 2 4
,1 22 .
,r r z zr z z
Operating 1 on both sides of the above equation yields,
2 40 02 2 1 0 1 0 0
1 1 1 0 0 2 2 4
,1 22 .
,r r z zr z z
Making use of 0 0 , for the initial guess of HPM methodology, 21 0 0,
2 40 02 1 0 1 0 0
1 1 0 2 2 4
,1 22 .
,r r z zr z z
Operating with 21 on both sides of the above expression,
2 40 01 2 2 20 1 0 0
1 1 0 1 12 2 4
,1 22 ,
,r r z zr z z
(33)
where 21 is given in equation (32). The 2nd order problem is given as, 1 1
1 2 1 2 2 .C D Using
the values of 2C and 2D from equations (15b) and (17b), we get
145

Computational Ecology and Software, 2015, 5(2): 139-151
IAEES www.iaees.org
2 41 0 0 11 1 0 1 1 1 1
1 2 1 1 02 2 2 4
, ,1 2 22 .
, ,r r z r z z zr r z z
Operating with 11 both sides of the above equation to get,
1 0 0 11 2 0 12 1 1 02 2
2 42 21 1 1
1 12 4
, ,1 2 1 2
, ,
2 ,
r r z z r r z zr r
z z
(34)
Now since in the methodology of HPM, we suppose the following expression for the approximate solution of
the problem,
0 1 2 31
lim ,
(35)
where the components of the series solution are defined to be as; 0 0 ,
2 40 01 2 2 20 1 0 0
1 1 0 1 12 2 4
,1 22 ,
,r r z zr z z
1 0 0 11 2 0 12 1 1 02 2
2 42 21 1 1
1 12 4
, ,1 2 1 2
, ,
2 ,
r r z z r r z zr r
z z
and so on. If once 0 is obtained, which can be easily obtained by constructing the homotopy for the given
problem and equating the coefficients for the zeroth order problem, then we can find 1 in terms of 0 and
in the similar fashion 2 can be evaluated in terms of 1 and 0 .The other higher order components can
be easily obtained having the all other lower order values. Thus all the components of can be calculated.
The series solution 0
,nn
thus can be given the following form,
2 40 01 2 2 20 1 0 0
0 1 0 1 12 2 4
1 0 0 11 2 0 11 1 02 2
2 42 21 1 1
1 12 4
,1 22
,
, ,1 2 1 2
, ,
2
r r z zr z z
r r z z r r z zr r
z z
(36)
146

Computational Ecology and Software, 2015, 5(2): 139-151
IAEES www.iaees.org
Case 2:
We may have the other available or chosen form of the linear operator as;
1.rr r zzr
Whereas ,r r
2
2rr r
and
2
2,zz z
then from equation (5) we have,
22
,1 2.
, zr r r
Taking 1 both sides of the above expression,
2 12
,1 2.
, zr r zr
2 12
,1 20.
, zr r zr
(37)
Using the methodology of HPM, we may construct a homotopy for equation (37) as;
, ;q : 0,1r z
1 10 2
,1 2, 1
,zH q q q
r r zr
(38)
Suppose the solution for equation (38) is of the following form
0 1 20 1 2( , ; ) ( , ) ( , ) ( , )r z q q r z q r z q r z (39)
Where as
0 1 0 1
0 1 0 1
0 1 0 10 1 0 1
0 0 1 0 0 11
, ,,
, z , ,
, ,( , ) ( , )
, , ,
, , ,
q q
r rr q q
z z
q qq q
r z r z
qr z r z r z
2 0 0 2 1 12 , , , , (40)
, , ,q
r z r z r z
1
0 1 1 0 10 0 10 1 0 0
2 0 1 22 1 0
,,
,
q qz z z z
qz z z
(41)
Using (40) and (41) in (38) we get
147

Computational Ecology and Software, 2015, 5(2): 139-151
IAEES www.iaees.org
0 0 1 0 0 11 10 0
2 0 0 2 1 12
, , ,
, , ,
, , ,
, , ,
q qr z r z r z
qr z r z r z
0 10 0 10 1 02 2 2
2 2 2 , 0q q
z z zr r r
We first define the inverse linear operator 2 , consider equation (3), 0. Then
1,rr r zzr
10,rr r zzr
1,rr zz rr
Multiplying both sides of the above equation by r , we get
.r rr zzr r (42)
In similar way, we get 1
,zz r rrr (43)
1.rr r zzr
(44)
11
12
13
1
1
r rr zz
zz r rr
rr r zz
r r
r
r
(45)
1 1 11 2 3 1 1 1,
3 3 r rr zz zz r rr rr r zzr rr r
(46)
where 1 2 30 3
, and 1 , 2 and 3 are the solutions of homogenous equations 0r ,
0r r and 0,zz then
1 1 10
1 1 1.
3 r rr zz zz r rr rr r zzr rr r
(47)
The inverse linear operators 1r , 1
zz , and 1
rr are defined by
1 1 1, , r zz rrdr dzdz drdr (48)
Then we have,
148

Computational Ecology and Software, 2015, 5(2): 139-151
IAEES www.iaees.org
1 1 11 0
1 1 12 1
1 1 11
1 1 1,
3
1 1 1,
3
1 1 1
3
r rr zz zz r rr rr r zz
r rr zz zz r rr rr r zz
n r rr zz zz r rr rr r zz
r rr r
r rr r
r rr r
.n
(49)
Let us denote the quantity within the brackets by , then the following expression is obtained,
1 0
22 1 0 02
33 2 03
11 01
1,
31 1 1 1
,3 3 3 31 1
,3 3
1,
3n
n n
(50)
1 1 10
0 0
1 1 1 1.
3 3
n
nr rr zz zz r rr rr r zz nn n
n n
r rr r
Thus the inverse linear operator can be easily identified as;
2
2 1 1 1
0
1 1 1 1 (51)
3
n
rr r zz r rr zz zz r rr rr r zznn
r rr r r
Now the zeroth order problem is 0 0 , 0 0 .
(52)
The 1st order problem is:
0 01 1 01 0 02
,1 2.
,r r z zr
Operating with both sides of the above equations;
0 02 2 1 01 0 02
,1 2
,r r z r z
In order to find the initial guess of HPM, we make use of the zeroth order problem as: 20 0.
0 02 1 01 02
,1 2,
,r r z zr
Operating 2 on both sides to get,
0 01 2 01 02
,1 2,
,r r z zr
(53)
149

Computational Ecology and Software, 2015, 5(2): 139-151
IAEES www.iaees.org
The 2nd order problem is:
1 0 0 11 2 0 12 1 02 2
, ,2 2,
, ,r z z r z zr r
and so on. The series solution form of the problem reads as,
0 2 31lim , ;q ,r z
Where the following quantities are defined, 1 2 30 3
0 01 2 01 02
,1 2,
,r r z zr
1 0 0 11 2 0 12 1 02 2
, ,2 2,
, ,r z z r z zr r
(54)
and so on. The series form of the solution can be written as; 0
,nn
2 40 01 2 2 20 1 0 0
0 1 0 1 12 2 4
1 0 0 11 2 0 11 1 02 2
2 42 21 1 1
1 12 4
,1 22
,
, ,1 2 1 2
, ,
2
r r z zr z z
r r z z r r z zr r
z z
3 Conclusion
We have considered two cases for the available linear operators and obtained the approximation for our
problem. Of course, the selection of the linear operators mainly depends upon the given initial or boundary
conditions. We can see that for the first case, the available linear operator was split in two parts and for the
second case, we considered the full linear form of the operator without splitting it into parts. Thus, on the basis
on methodology of the Adomian decomposition and the homotopy perturbation method (Haldar, 1995), the
present analysis can be applied to a wide range of the physical and engineering problems (Shakil et al., 2013;
Wahab et al., 2013; Wahab et al., 2014; Siddiqui et al., 2014).
As compared to the Adomian decomposition method for the analysis of the problem (Haldar, 1995), we
have the great advantage of the selection of the initial guess which can be chosen on the basis of the previous
knowledge, and most importantly, the initial approximation should satisfy the given initial or boundary
conditions, which leads us to the uniformly valid approximately series solution. While, the Adomian
decomposition method does not have such advantage, because we have to select the initial guess based on the
recursive relation produced by the method. But this initial approximations sometimes, may lead to non-
uniformly valid series solution which also may contain the secular terms in the series. In homotopy
perturbation method, the initial guess satisfying the given conditions may give a uniformly valid series
solution.
On the other hand, the calculation of the Adomian polynomials is not an easy task for the nonlinear terms
150

Computational Ecology and Software, 2015, 5(2): 139-151
IAEES www.iaees.org
appearing in the problems. However, there are some computer programs which can calculate the Adomian
polynomials, but they are for some specific cases. In our analysis, we avoid such handy calculation because
homotopy perturbation method transforms a non-linear problem into a small number or sub-linear problems
with prescribed conditions. No matter of concern with the existence of the parameter small or large. This is
again a dominating advantage of the method over Adomian decomposition method (Shakil et al., 2013; Wahab
et al., 2013; Wahab et al., 2014; Siddiqui et al., 2014).
References
Adomian G. 1986. Application of the decomposition method to the Navier-Stokes equations. Journal of
Mathematical Analysis and Applications, 119: 340-360
Adomian G. 1989. Nonlinear Stochastic Systems: Theory and Applications to Physics. Kluwer Academic
Publishers, USA
Adomian G. 1993. Nonlinear transport in moving fluids. Applied Mathematics Letters, 6(5): 35-38
Afzal M, Wahab HA, Bhatti S., and Naeem, Qureshi MT. 2014. A Mathematical Model for the Rods with Heat
Generation and Convective Cooling. Journal of Basic and Applied Scientific, 4(6): 68-76
Haldar K. 1995. Application of adomian approximations to the Navier-Stokes equation in cylindrical
coordinates. Applied Mathematics Letters, 9(4): 109-113
He JH. 1999. Homotopy perturbation technique. Computer Methods in Applied Mechanics and Engineering,
178(3/4): 257-262
He JH. 2000. A coupling method of homotopy techniques and perturbation technique for nonlinear problems.
International Journal of Non-Linear Mechanics, 35(1): 37-43
He JH. 2006. Some asymptotic methods for strongly nonlinear equations. International Journal of Modern
Physics B, 1141-1199
Shakil M, Khan T, Wahab HA, Bhatti S. 2013. A Comparison of Adomian Decomposition Method (ADM)
and Homotopy Perturbation Method (HPM) for Nonlinear Problems. International Journal of Research
in Applied, Natural and Social Sciences, 1(3): 37-48
Siddiqui AM, Wahab HA, Bhatti S, Naeem M. 2014. Comparison of HPM and PEM for the flow of non-
newtonian fluid between heater parallel plates. Research Journal of Applied Sciences, Engineering
and Technology, 7(10): 4226-4234
Squire HB. 1952. Some viscous fluid flow problems. Philosophical Magazine, 43: 942-945
Thorpe JF. 1997. Development in theoretical and applied mechanics. Shaw, WA. Pergamon Press, Oxford, UK.
Wahab HA, Shakil M, Khan T, Bhatti S, Naeem M. 2013. A comparative study of a system of Lotka-Voltera
type of PDEs through perturbation methods. Computational Ecology and Software. 3(4): 110-125
Wahab HA, Khan T, Shakil M, Bhatti S, Naeem M. 2014. Analytical approximate solutions of the systems of
non linear partial differential equations by Homotopy Perturbation Method (HPM) and Homotopy
Analysis Method (HAM). Journal of Applied Sciences and Agriculture, 9(4): 1855-1864
151

Computational Ecology and Software, 2015, 5(2): 152-174
IAEES www.iaees.org
Modeling the effect of pollution on biological species: A socio-
ecological problem
B. Dubey1, J. Hussain2, S. N. Raw3, Ranjit Kumar Upadhyay4 1Department of Mathematics, Birla Institute of Technology and Science, Pilani – 333031, India 2Department of Mathematics and Computer Science, Mizoram University, Aizwal – 796009, India 3Department of Mathematics, National Institute of Technology, Raipur – 492010, India 4Department of Applied Mathematics, Indian School of Mines, Dhanbad – 826004, India
E-mail: [email protected]
Received 13 December 2014; Accepted 20 January 2015; Published 1 June 2015
Abstract
In this paper, a nonlinear spatial model is proposed and analyzed to study the effect of pollution on biological
population. It is assumed that the pollutants enter into the environment not directly by the population but by a
precursor produced by the population itself. It is further assumed that larger the population, faster the precursor
is produced, and larger the precursor, faster the pollutant is produced. Criteria for nonlinear stability and
instability for both spatial and non-spatial models are obtained. The various parameter ranges for stable
homogeneous solutions are identified. By the simulation experiments, it is observed that by applying an
appropriate effort F , the population density P can be maintained at a higher equilibrium level. It is also
shown that the equilibrium level of the concentration of precursor pollutant, concentration of pollutant in the
environment and in the population decrease due to the effort F.
Keywords precursor; pollutant; biological species; stability; conservation efforts.
Computational Ecology and Software ISSN 2220721X URL: http://www.iaees.org/publications/journals/ces/onlineversion.asp RSS: http://www.iaees.org/publications/journals/ces/rss.xml Email: [email protected] EditorinChief: WenJun Zhang Publisher: International Academy of Ecology and Environmental Sciences
1 Introduction
Our environment is getting polluted day by day due to rapid pace of urbanization, industrialization and
deforestation, and we face one of the most important present day socio-ecological problems closely related to
physiological and bio-spherical changes in the population. We do have several examples where the pollution
is responsible for increase in death rate, decrease in birth rate and migration of population (Shukla and Dubey,
1996). The effects of pollution caused by various human factors on structure and functions of ecosystems have
been studied by several researchers (Woodwell, 1970; Smith, 1981; McLaughli, 1985; Hari et al., 1986;
Article

Computational Ecology and Software, 2015, 5(2): 152-174
IAEES www.iaees.org
Woodman and Cowling, 1987; Schulze, 1989; Ghosh, 2000; Srinivasu, 2002; Ghosh et al., 2002, 2006; Naresh
et al. 2006a, 2006b; Sundar, 2013; Sundar et al., 2014). In recent decades, some investigations have been
made to study the effect of pollution on a single or two biological species (Hallam et al., 1983a, 1983b, Hallam
and Luna, 1984; Hallam and Ma, 1986; Luna and Hallam, 1987; Freedman and Shukla, 1991; Huaping and Ma,
1991; Shukla and Dubey, 1996, 1997; Dubey, 1997; Dubey and Das, 1999; Dubey and Hussain, 2000a, 2000b,
2006; Shukla et al., 2001, 2003, 2009; Dubey et al., 2003, 2009; Naresh et al, 2006a, 2006b; Dubey and
Naranayan, 2010; Sundar et al., 2014). In particular, Hallam et al. (1983b) studied the effect of a toxicant in
the environment on a single-species population by assuming that its growth rate density decreases linearly with
the uptake concentration of toxicant. Huaping and Ma (1991) proposed and analysed a mathematical model to
study the effect of toxicant on naturally stable two-species communities. In these investigations, it has been
assumed that carrying capacity does not depend on the concentration of toxicant present in the environment.
However, in real situations the effect of toxicant is to decrease both the growth rate of species and the carrying
capacity of the environment. Taking this aspect into account, Freedman and Shukla (1991) investigated the
effect of a toxicant on a single-species and predator-prey system by considering the exogeneous introduction
of toxicant into the environment.
Shukla and Dubey (1996) studied the simultaneous effects of two toxicants on a biological species, one
being more toxic than the other. Dubey (1997) propose a mathematical model to study the depletion and
conservation of forestry resources in a polluted environment. Shukla et al. (2001) studied the effect of a
toxicant emitted into the environment from external sources on two competing biological species. They found
that the four usual outcomes of competition between two species may be altered under certain conditions
which are mainly dependent on emission rate of toxicant into the environment, uptake concentration of
toxicant by the two species and their growth rates and carrying capacities. Dubey et al. (2003) studied the
behaviour of a resource biomass in the presence of industrialization and pollution. They showed that in the
case of small periodic influx of toxicant into the environment, the resource biomass has a periodic behaviour if
the depletion rate coefficient of environmental pollution is small. However, if this coefficient increases beyond
a threshold value, then the resource biomass converges towards its equilibrium. Naresh et al. (2006a)
investigated the effect of an intermediate toxic product formed by uptake of a toxicant on a plant biomass.
Shukla et al. (2003) proposed and analysed a mathematical model and studied effects of primary and
secondary toxicants on the biomass of resources such as forestry, agricultural crops. Dubey and Hussain (2006)
investigated the survival of a biological species which is dependent on a resource in a polluted environment
and they showed that the diffusion plays a general role in stabilising the system.
In the above investigations, it is assumed that the pollutant enters into the environment by some manmade
projects which may be population (industrialization) dependent, constant, zero or periodic. In this regard,
Rescigno (1977) studied the effect of a precursor pollutant on a single species, but he did not consider the rate
of uptake concentration of the pollutant on the growth of the species. Further, in the above works the effects of
diffusion has not been considered. Keeping the above in view, in this paper we propose and analyse a
nonlinear model to study the effect of a precursor pollutant, which is formed by various human activities in the
atmosphere, on population where the effect of uptake concentration, diffusion and conservation are considered.
The paper is organized as follows. In Section 2, we discuss the model system. Under Section 3, we analyse
the model system without diffusion. In Section 4, we analyze the model system with diffusion. Section 5
describes the conservation model system. In Section 6 and 7, we analyse the conversion model system without
153

Computational Ecology and Software, 2015, 5(2): 152-174
IAEES www.iaees.org
and with diffusion, respectively. Section 8 depicts the numerical results. Finally, we summarize the results in
the last Section.
2 The Proposed Mathematical Model
Let us consider a polluted environment where a biological population is growing logistically in a closed region
D with smooth boundary D . We assume that the environment is polluted by various population activities. It
is further assumed that the population is affected by the pollutant formed in the atmosphere by its precursor.
Let ),,( tyxP be the population density, ),,( tyxQ the concentration of the precursor pollutant emitted by
various activities of the population, ( , , )T x y t the concentration of pollutant formed by Q in the atmosphere
and ),,( tyxU uptake concentration of pollutant by the population at coordinates Dyx ),( and time .0t
It is also assumed that the larger the population, the faster the precursor is produced. It is further assumed that
the larger the precursor, the faster the pollutant is produced. Then, system may be governed by the following
set of differential equations:
.1,0
,
,
,
,)(
)(
10
001
22110
0
21
20
PTThUt
U
TDPTUThhQt
T
QPt
Q
PDTK
PrPUr
t
P
(1)
We analyse the system (1) with the following initial and boundary conditions:
,0),()0,,( ,0),()0,,( ,0),()0,,( yxyxTyxyxQyxyxP
,0 ,),( ,0 ;),( ,0),()0,,(
tDyxn
T
n
PDyxyxyxU (2)
where n is the unit outward normal to .D We assume that the functions P, Q, T, U belong to the class
)(2 DC .
In model (1), 2
2
2
22
yx
is the Laplacian diffusion operator. 1D and 2D are the diffusion rate coefficients of ),,( tyxP and
),,( tyxT respectively in D . is the growth rate of Q due to population P , 0 the natural depletion rate
coefficient of .Q h can be interpreted as the growth rate coefficient of T due to .Q 0h can be interpreted as
the natural depletion rate coefficient of T , a fraction 0 of which goes inside the body of the population. is
the depletion rate coefficient of T due to .P 1 is the natural depletion rate coefficient of U , a fraction 1 of
which re-enters into the environment.
In model (1), the function )(Ur is the specific growth rate of the population which decreases as
U increases, i.e.
154

Computational Ecology and Software, 2015, 5(2): 152-174
IAEES www.iaees.org
0)0( rr and 0)( Ur for .0U (3)
The function )(TK is the carrying capacity of the population in the presence of pollutant and it decreases
as T increases. Hence we assume that
0)0( KK and 0)( TK for ,0T and a aTT such that .0)( aTK (4)
The model is analysed with and without diffusion.
3 Model Without Diffusion
In this section we take 021 DD in model (1). Then model (1) reduces to
.0)0( ,0)0( ,0)0( ,0)0(
,
,
,
,)(
)(
001
110
0
20
UTQP
PTThUdt
dU
PTUThhQdt
dT
QPdt
dQ
TK
PrPUr
dt
dP
(5)
It can be checked that there exists two non-negative equilibria (which belong to the first orthant), namely,
)0,0,0,0(0E and ),,,( UTQPE , where TQP , , and U are the positive solutions of the following
algebraic equations:
0
0
0 0 1 1
0 01
( ) ( ),
,
( ), (say),(1 ) (1 )
1{ ( ) ( )} ( ), (say).
r P r U K T
Q P
hQT f P
h P
U h f P Pf P g P
It can be verified that the equilibrium E exists if the following inequality holds at :E
.0)()())(())(()()(0 PfTKPgrPfKPgUrr (6)
By computing the variational matrix corresponding to the equilibrium 0E , it can be checked that 0E is a
saddle point with unstable manifold locally in the P direction and with stable manifold locally in the
UTQ space.
155

Computational Ecology and Software, 2015, 5(2): 152-174
IAEES www.iaees.org
In the following theorem, it is shown that E is locally asymptotically stable.
Theorem 3.1 Let the following inequalities hold:
),()(9
4)(
)(0
0
2
2
0 PhTK
rTTK
TK
Pr
(7)
),(3
2)}({ 012
200211 PhcPhc (8)
),(3
2001
2 Phch (9)
where
)(3
12
001
TK
rc
and .)(
2T
Urc
(10)
Then the equilibrium E is locally asymptotically stable.
Proof By taking the transformations
, , , , uUUTTqQQpPP
we first linearize model (5). Then we consider the following positive definite function in the linearized form of
model (5): 2
2 2 21 2
1( , , , } { }
2
pV p q u c q c u
P (11)
where 1c and 2c are positive constants given by (10). It can be checked that the derivative of V with respect
to t is negative definite under conditions (7)-(9), proving the theorem.
In the following theorem it is shown that the equilibrium E is globally asymptotically stable. To prove this theorem, we need the following lemma which establishes a region of attraction for system (5). The proof
of this lemma is easy and hence is omitted.
Lemma 3.1 The set }0 ,0:),,,{( 001
KUTQKPUTQP is a region of attraction for
all solutions initiating in the interior of the positive orthant, where
h0 and )}.1(),1(,min{ 11000 hh
Theorem 3.2 In addition to the assumptions (3) and (4), let )(Ur and )(TK satisfy in 1 ,
0)( ,)(0 KTKKUr m and kTK )(0 , (12)
for some positive constants mK, and .k Let the following inequalities hold:
156

Computational Ecology and Software, 2015, 5(2): 152-174
IAEES www.iaees.org
2
0200
KK
kKr
m
< )()(9
40
0 PhTK
r , (13)
)(3
2 01
2
0
TK
rK
, (14)
),(3
2001
2 Phch (15)
)(3
2)( 01
20011 PhPh , (16)
where 1c is same as defined in Eq. (10).
Then, E is globally asymptotically stable with respect to all solutions initiating in the interior of the positive
orthant 1 .
Proof Consider the following positive definite function around E ,
22211 )(
2
1)(
2
1)(
2ln),,,( UUTTQQ
c
P
PPPPUTQPV . (17)
Now differentiating 1V with respect to t along the solutions of (5), we get
21
20
201
201 )())(()()()(
UUTTPhQQcPPTK
r
dt
dV
))()()(())()()(())(( 01 UUPPTUTTPPTTPrQQPPc
+ ),)()(())(( 0011 UUTTPhTTQQh (18)
where
.
,)(
)(
),/()(
1
)(
1
)(
,
),(
,)()(
)(
2
TTTK
TK
TTTTTKTK
T
UUUr
UUUU
UrUrU
From (12) and the mean value theorem, we note that
)(U and 2
( ) .m
kT
K
157

Computational Ecology and Software, 2015, 5(2): 152-174
IAEES www.iaees.org
Now Eq. (18) can be rewritten as the sum of the quadratics:
22212
211
1 )(2
1))(()(
2
1QQaQQPPaPPa
dt
dV
23313
211 )(
2
1))(()(
2
1TTaTTPPaPPa
24414
211 )(
2
1))(()(
2
1UUaUUPPaPPa
23323
222 )(
2
1))(()(
2
1TTaTTQQaQQa
,)(2
1))(()(
2
1 24434
233 UUaUUTTaTTa
where
, ),(3
2 , ,
)(3
21440330122
011 aPhaca
TK
ra ,112 ca ),)(( 013 TTPra
,)(14 TUa ,23 ha .001134 Pha
Sufficient conditions for dt
dV1 to be negative definite are that the following conditions hold:
,2211212 aaa (19)
,3311213 aaa (20)
,4411214 aaa (21)
,3322223 aaa (22)
.4433234 aaa (23)
We note that inequality (19) is satisfied automatically for the chosen value of 1c in the theorem. We also
note that that ),20()13( ),21()14( )22()15( and ).23()16( Hence 1V is a Liapunov
function with respect to E whose domain contains the region of attraction 1 , proving the theorem.
The above theorem implies that the population living in a polluted environment attains an equilibrium
level under certain conditions. The equilibrium level of the precursor pollutant is crucial in affecting the
equilibrium level of population which decreases as the equilibrium level of precursor pollutant increases. We
also note that if and h are kept at small level, then possibility of satisfying conditions (13)-(15) increases.
This implies that the stability of the system can be maintained by lowering the rate of formations of precursor
and environmental pollutants.
158

Computational Ecology and Software, 2015, 5(2): 152-174
IAEES www.iaees.org
4 Model With Diffusion
In this section, we consider the complete model (1)-(2) and state the main results in the form of the following
theorem.
Theorem 4.1 (i) If the equilibrium E of model (5) is globally asymptotically stable, then the corresponding uniform steady state of the initial-boundary value problems (1)-(2) is also globally asymptotically stable.
(ii) If the equilibrium E of model (5) is unstable even then the uniform steady state of the initial-boundary value problems (1)-(2) can be made stable by increasing diffusion coefficients to sufficiently large values.
Proof Let us consider the following positive definite function
D
dAUTQPVtUtTtQtPV ),,,())(),(),(),(( 12
where 1V is given by Eq. (17).
We assume that 1V is differentiable and the functions P, Q, T, U belong to the class )(2 DC .
Then we have,
D
dAt
U
U
V
t
T
T
V
t
Q
Q
V
t
P
P
V
dt
dV 11112
1 2 ,I I (24)
where
D
dAdt
dVI 1
1 and .212
2112 dAT
T
VDP
P
VDI
D
(25)
We note the following properties of ,1V namely,
011
DD T
V
P
V,
and for all points of ,D
,012
12
12
12
12
12
UT
V
UQ
V
TQ
V
UP
V
TP
V
QP
V
0 ,0 ,021
2
21
2
21
2
T
V
Q
V
P
Vand .0
21
2
U
V
Now we consider 2I and determine the sign of each term. We utilize the following formula known as
Green’s first identity in the plane:
159
Computational Ecology and Software, 2015, 5(2): 152-174
IAEES www.iaees.org
D D D
dAGFdsn
GFdAGF ,).( 2
where n
G
is the directional derivative in the direction of the unit outward normal to D and s is the arc
length.
Then with P
VF
1 and PG we obtain
D DD
dAPP
Vds
n
P
P
VdAP
P
V.1121
,.1
D
dAPP
V since .0
n
P
Now .ˆˆ21
2
21
21 j
y
P
P
Vi
x
P
P
V
P
V
Hence
dAPP
V
D
21 ,022
21
2
dAy
P
x
P
P
VD
Similarly .0 21
D dATT
V
i.e., .02 I (26)
Thus we note that if ,01 I then .0211 II
dt
dV This shows that if E is globally asymptotically
stable in the absence of diffusion, then the uniform steady state of the initial-boundary value problems (1)-(2)
also must be globally asymptotically stable. This proves the first part of Theorem 4.1.
We further note that if ,01 dt
dVi.e., if ,01 I then E may become unstable in the absence of diffusion.
But, Eqs. (24) and (26) show that by increasing diffusion coefficients 1D and 2D to sufficiently large values,
dt
dV2 can be made negative even if .01 I This proves the second part of Theorem 4.1.
The above theorem implies that diffusion with reservoir boundary conditions may stabilize a system which
is otherwise unstable.
We shall explain the above theorem for a rectangular habitat D defined by
}0 ,0:),{( byaxyxD (27)
in the form of the following theorem.
160
Computational Ecology and Software, 2015, 5(2): 152-174
IAEES www.iaees.org
Theorem 4.2 In addition to assumptions (3) and (4), let )(),( TKUr satisfy the inequalities in (12). Let the
following inequalities hold:
2 2 2 2 2 2 20 0 0 0 1 2
02 2 2 2 2 20
( ) ( )4
9 ( )m
r K k K r D P a b D a bh P
K K a b a bK T
(28)
,)(
)(3
2222
0
22210
1
2
0
baK
baPD
TK
rK
(29)
22
2222
0032 )(
3
2
ba
baDPhch
, (30)
,)(
3
2}{
22
2222
012
1100
ba
baDPhPh
(31)
where
.)(
)(3 2220
22210
20
3
baK
baPD
TK
rc
(32)
Then the uniform steady state of the initial-boundary value problems (1)-(2) is globally asymptotically stable
with respect to all solutions initiating in the interior of the positive orthant.
Proof Let us consider the rectangular region D given by equation (27). In this case 2I , which is defined in
Theorem (4.1), can be written as
}.)()){((})(){()( 2221
2
222
21
2
12 y
T
x
T
T
VDdA
y
P
x
P
P
VDI
DD
(33)
From Eq. (17), we obtain
221
2
P
P
P
V
and .121
2
T
V
Hence
dAy
T
x
TDdA
y
P
x
P
K
PDI
DD
22
2
22
20
12 .
Now
dAx
PD
2
DdA
x
PP2
)(
b a
dxdyx
PP
0 0
2)(
.
161

Computational Ecology and Software, 2015, 5(2): 152-174
IAEES www.iaees.org
Let ,a
xz then
b
Ddzdy
z
PP
adA
x
P
0
1
0
22)(1
.
Now using the inequality (Denn, 1972),
,1
0
21
0
22
dxPdxx
P
we obtain
b
DdzdyPP
adA
x
P
0
1
0
222
)(
b a
dxdyPPa 0 0
22
)(
.)( 22
2
D
dAPPa
Similarly, .)()( 22
22
DDdAPP
bdA
y
P
Thus, .)()(
)()( 2
22
22222
2220
2221
2
DD
dATTba
baDdAPP
baK
baPDI
Now from (18) and (24), we obtain
D
QQcPPbaK
baPD
TK
r
dt
dV 201
2
2220
222102 )()}(
)(
)({[
21
222
2222
0 )()}()(
{ UUTTba
baDPh
))(}()({))(( 03 TTPPTTPrQQPPc
))(}()({ UUPPTU
,)])(}({ 1100 dAUUTTPh (34)
where )(T and )(U are defined in Eq. (18).
Now Eq. (34) can be written as the sum of the quadratics
D
QQbQQPPbPPbdt
dV 22212
211
2 )(2
1))(()(
2
1{
162

Computational Ecology and Software, 2015, 5(2): 152-174
IAEES www.iaees.org
23313
211 )(
2
1))(()(
2
1TTbTTPPbPPb
24414
211 )(
2
1))(()(
2
1UUbUUPPbPPb
23323
222 )(
2
1))(()(
2
1TTbTTQQbQQb
,})(2
1))(()(
2
1 24434
233 dAUUbUUTTbTTb
where
,b },)(
{3
2 , },
)(
)({
3
214422
2222
03301222220
22210
11
ba
baDPhbcb
baK
baPD
TK
rb
,312 cb ),)(( 013 TTPrb ,)(14 TUb ,23 hb .001134 Phb
Sufficient conditions for dt
dV2 to be negative definite are that the following conditions hold:
,22112
12 bbb (35)
,33112
13 bbb (36)
,44112
14 bbb (37)
,3322223 bbb (38)
.4433234 bbb (39)
We note that inequality (35) is automatically satisfied for the value of 3c given in (32). We further note
(28) (36), (29) (37), (30) (38) and (31) (39). Hence 2V is a Liapunov function with respect to E
whose domain contains the region of attraction ,1 proving the theorem.
From the above theorem we note that inequalities (28)-(31) may be satisfied by increasing 1D and 2D to
sufficiently large values. This implies that in the case of diffusion stability is more plausible than the case of
no diffusion. Thus, in the case of diffusion the population converges towards its carrying capacity faster than
the case of no diffusion, and hence the survival of the population may be ensured.
5 Conservation Model
In the previous section, it has been noted that uncontrolled human activities that are polluting the environment
may harm itself considerably. Therefore, some kind of efforts must be adopted to stop further deterioration of
the environment. In this section a mathematical model is proposed and analysed to control the undesired level
of precursor pollutant by some mechanisms. It is assumed that the effort applied to control the precursor
pollutant is proportional to the undesired level of the precursor pollutant. Then the dynamics of the system is
assumed to be governed by the system of differential equations given below:
163

Computational Ecology and Software, 2015, 5(2): 152-174
IAEES www.iaees.org
2
201
0 1
20 1 1 2
1 0 0
1 1
0 1
( ) ,( )
,
,
,
( ) ( ) ,
0 , 1.
c c
r PPr U P D P
t K T
QP Q r F
tT
hQ h T U PT D TtU
U h T PTt
FQ Q H Q Q F
t
(40)
The above model (40) is to be analysed with following initial and boundary conditions:
,0),()0,,( ,0),()0,,( ,0),()0,,( yxyxTyxyxQyxyxP
;),( ,0),()0,,( ,0),()0,,( 1 DyxyxyxFyxyxU
,0 ,),( ,0
tDyxn
T
n
P (41)
where n is the unit outward normal to .D Again we assume that the functions P, Q, T, U, F belong to the
class )(2 DC .
In model (40), ),,( tyxF is the density of effort applied to control the undesired level of precursor
pollutant formed by the population. 01 r is depletion rate coefficient of ),,( tyxQ due to the effort .F 1
is the growth rate coefficient of F and 1 its natural depreciation rate coefficient. cQ is the critical level of
precursor pollutant which is assumed to be harmless to the population. In the last equation of system (40),
)(tH denotes the unit step function which takes into account the case for which .cQQ
6 Conservation Model Without Diffusion
In this section we take 021 DD in model (40). Then model (40) has only one interior equilibrium,
namely, ),,,,,( FUTQPE where UTQP ,,, and F are the positive solutions of the system
of algebraic equations given below:
(say) ),()1()1(
)(
(say) ),(
),()(
21100
1
11101
111
0
PfPh
PhfT
Pfr
QrPQ
TKUrPr
c
164

Computational Ecology and Software, 2015, 5(2): 152-174
IAEES www.iaees.org
. ),(
,0
(say) ),()()(1
1
1
32001
cc
c
QQQQ
F
PfPfPhU
As earlier, it is easy to check that E exists if the following inequality holds at E :
.0))(()()())(()()( 32230 PfrPfTKPfKPfUrr (42)
In the following theorem, it is shown that E is locally asymptotically stable. The proof is similar to
Theorem 3.1 and hence is omitted.
Theorem 6.1 Let the following inequalities hold:
2
0 002
4( ) ( ),
( ) 9 ( )
r P rK T T h P
K T K T
(43)
),(9
4001
2 Phch (44)
),(3
2)}({ 012
200211
PhcPhc (45)
where
)(3 200
1 TK
rc
and .)(
2
T
Urc
Then E is locally asymptotically stable.
In the following lemma a region of attraction for system (40) without diffusion is established. The proof of
this lemma is easy and hence is omitted.
Lemma 6.1 The set }0,0 ,0:),,,,{(1
01002
K
FK
UTQKPFUTQP is a
region of attraction for all solutions initiating in the interior of the positive orthant, where
h0 and )}.1(),1(),min{( 11000 hh
The following theorem gives criteria for global stability of E , whose proof is similar to Theorem 3.2 and
hence is omitted.
Theorem 6.2 In addition to the assumptions (3) and (4), let )(Ur and )(TK satisfy in 2 ,
0)( ,)(0 KTKKUr m and 0 ( )K T k ,
165

Computational Ecology and Software, 2015, 5(2): 152-174
IAEES www.iaees.org
for some positive constants mK, and .k Let the following inequalities hold:
),()(9
40
0
2
200
PhTK
rK
K
kKr
m
(46)
,)(3
2 01
2
0
TK
rK
(47)
),(9
4001
2 Phch (48)
),(3
2)( 01
20011
PhPh (49)
where .)(3 2
001
TK
rc
Then E is globally asymptotically stable with respect to all solutions initiating in the positive orthant.
Theorems (6.1) and (6.2) show that if suitable efforts are made to control the undesired level of precursor
pollutant formed by the activities of populations in the environment, the population density may be maintained
at a desired level under certain conditions.
7 Conservation Model With Diffusion
We now consider the case when )2,1( 0 iDi in model (40). Under an analysis similar to Section 4, it can
be established that if the interior equilibrium E of model (40) with no diffusion is globally asymptotically
stable, then the corresponding uniform steady state of system (40)-(41) is also globally asymptotically stable
with respect to solutions such that
,0),( ,0),( ,0),( ,0),( ,0),( 1 yxyxyxyxyx .),( Dyx
Further, it should be noted that if system (40) with no diffusion is unstable even then the corresponding
uniform steady state of system (40)-(41) can be made stable by increasing diffusion coefficients to sufficiently
large values.
Thus, we conclude that diffusion in our model plays the general role of stabilizing the system.
8 Numerical Simulations
In this section, numerical simulation results are presented to illustrate the results of previous sections. Matlab
7.5 is used for numerical simulation to study the dynamical behaviour of the model system (5). Model (5) is
integrated numerically using the fourth order Runge-Kutta method. We consider the following particular form
of the function in model (5):
0 10
0 1
( ) ,
( ) .
r U r r U
K T K K T
(50)
166

Computational Ecology and Software, 2015, 5(2): 152-174
IAEES www.iaees.org
The model system (5) displays stable focus for the following set of parameter values given in Eq. (51):
).5,5,5,5(),,,( conditions initialwith
,06.0,02.0,01.0,0.7,20.0,30.0
,04.0,05.0,0.50,08.0,0.60,07.0,0.20
0000
1010
010100
UTQP
hh
KKKrr m
(51)
With above values of parameters, it is found that condition (6) for the existence of interior equilibrium E
is satisfied and it is given by
( , , , ) (58.8821,73.5844, 6.0276, 3.0440).P Q T U (52)
We also note that for the values of parameters given above, all conditions of Theorem (3.1) and (3.2) are
satisfied. This shows that E is locally as well as globally asymptotically stable. The time series analysis of
model system (5) is presented in Fig.1 which shows that the positive equilibrium E is a stable focus.
Fig. 1 Time-series corresponding to the individuals of the model system (5) with parameter values given in Eq. (51).
To study the dynamical behaviour of the model system (5), the temporal evolution of T and U are
observed for different values of control parameters. We observe the temporal dynamics of the concentration of
pollutant T in the atmosphere formed by Q for different control parameters and found that it increases for the
increasing value of the growth rate parameter of Q due to P (i.e., ) but it is of decline nature as we increase
the value of the parameter 0 , the natural depletion rate coefficient of Q. We have presented the increasing and
decreasing nature of T in Fig. 2.
167

Computational Ecology and Software, 2015, 5(2): 152-174
IAEES www.iaees.org
(a) (b) Fig. 2 Temporal evolution (t vs. T) for the model system (5) with variation of parameters (a) , (b) 0 , and other parameters are given in Eq. (51).
We have also studied the temporal dynamics of uptake concentration of pollutant by the population due to
the variation of parameters , 0 and 1 . It is found that the uptake concentration of pollutant by population
increases if we increase the growth rate coefficient of Q due to P (i.e. ), and it decreases if we increase the
values of natural depletion rate coefficient of Q and U respectively (see Fig. 3).
(a) (b)
168

Computational Ecology and Software, 2015, 5(2): 152-174
IAEES www.iaees.org
(c) Fig. 3 Temporal evolution (t vs. U) for the model system (5) with variation of parameters (a) , (b) 0 , (c) 1 , and other parameters are given in Eq. (51).
Now if we compare the nature of Fig. 2 with Figs.3(a)-(b), it is found that the growth rate and the natural
depletion rate of Q have almost same impact on the dynamics of the pollutant formed by Q in the atmosphere
and on the uptake concentration of pollutant by the population.
To study the dynamical behaviour of model system (40) without diffusion, we select the same particular
form of the function as given in Eq. (50) and values of parameters are given below in Eq. (53):
0 10 0 1 0
0 1 0 1
1 1 1
20.0, 0.07, 60.0, 0.08, 0.05, 0.04,
0.30, 0.20, 7.0, 0.01, 0.02, 0.06,
0.09, 12.0, 0.9, 0.14,c
r r K K
h h
r Q
(53)
0 0 0 0 0with initial conditions ( , , , , ) (5.0, 5.0, 5.0, 5.0, 5.0).P Q T U F
With above values of parameters, it is found that condition (42) for the existence of interior equilibrium *E is satisfied and is given by
)9893.31,1229.0,2390.0,9680.2,9511.59(),,,,( FUTQP . (54)
By choosing 50.0mK , we note that all conditions of Theorem (6.1) and (6.2) are satisfied. This shows
that equilibrium *E is locally as well as globally asymptotically stable. The time series of model (40) without
diffusion is presented in Fig.4 which shows that the positive equilibrium *E is a stable focus.
169

Computational Ecology and Software, 2015, 5(2): 152-174
IAEES www.iaees.org
Fig. 4 Time-series corresponding to the individuals of the model system (40) without diffusion with parameter values given in eq. (53).
By comparing Figs.1 and 4, we note that due to effort F, the equilibrium level of the population has
increased whereas equilibrium level of the concentration of precursor pollutant, concentration of pollutant in
the environment and population have decreased.
Fig. 5 Graph of F versus Q for the different initial starts for the set of parameter value given in Eq. (53).
The phase plane analysis of the model system (40) without diffusion in the (Q, F) plane is shown in Fig. 5
which also shows that the positive equilibrium is a stable focus.
The time series analysis of F, the effort applied to control the undesired level of precursor pollutant
formed by the population is shown in Fig.6. It shows the positive and negative impact as we increase the value
of growth rate of Q due to P (i.e., ) and the depletion rate of Q due to F (i.e., 1r ) respectively.
170

Computational Ecology and Software, 2015, 5(2): 152-174
IAEES www.iaees.org
(a) (b) Fig. 6 Temporal evolution (t vs. F) for the model system (40) without diffusion with variation of parameters (a) , (b) 1r , and other parameters are given in Eq. (53).
The effect of different control parameters on the dynamical behaviour of the conservation model is
presented in Table 1. After varying one of the control parameter in its range, while keeping all others constant,
we monitor the changes in the dynamical behaviour of the model system, thereby fixing the regimes in which
the system exhibit either stable focus or stable limit cycle solution. We have varied the control parameters in
the following ranges:
0 10 0 115 53 26 49 57 149 0 01 0 34 3 6 12 5r , r , K , . h . , . μ . .
From Table 1, it is found that for the parameters 0r in the ranges [22.0, 53.0], 10r in the range [26.0, 27.0],
0K in the range [57.0, 92.0], h in the range [0.01, 0.28] and 1 in the range [3.6, 8.5], the system dynamics
converging to the stable equilibrium and for other ranges it exhibits limit cycle solution. For the lower values
of all the control parameters except for 0r , the intrinsic growth rate of population, the dynamics settled on
equilibrium position and for higher values it shows the periodic nature.
9 Discussions and Conclusions
The proposed nonlinear model is analysed to study the effect of pollution on a population, which is living in an
environment polluted by its own activities. The model has been studied with and without diffusion. In the case
of no diffusion, it has been shown that population density settles down to its equilibrium level, the magnitude
of which depends upon the equilibrium levels of emission and washout rates of pollutant as well as on the rate
of precursor formation and its depletion. It has been noted that the rate of precursor formation is critical in
effecting the population. It has further been noted that if the concentration of pollutant increases unabatedly,
the survival of the population would be threatened.
In case of a model with diffusion, it has been shown that the uniform steady state of the system is
globally asymptotically stable if the corresponding steady state is globally asymptotically stable in case of
without diffusion. It has further been noted that if the positive equilibrium of the system with no diffusion is
171

Computational Ecology and Software, 2015, 5(2): 152-174
IAEES www.iaees.org
unstable, then the corresponding uniform steady state of the system with diffusion can be made stable by
increasing diffusion coefficients appropriately. Thus, it has been concluded that the global stability is more
plausible in the case of diffusion than the case of no diffusion. It is found that the uptake concentration of
pollutant by population increases if we increase the growth rate coefficient of Q due to P, and it decreases, if
we increase the values of natural depletion rate coefficient of Q, T and U respectively.
Table 1 Simulation experiment of model (40) without diffusion with parameter values 1 40,K 1,
0 0.01, 1 0.3,r 0 0.2,h 1 0.02, 0 0.01, 1 7.0, 0.06, 1 0.4, and 0.14cQ with
initial condition 0 0 0 0 0( , , , , ) (5.0,5.0,5.0,5.0,5.0)P Q T U F and SF: Stable Focus; SLC: Stable Limit Cycle.
Parameter varied
Range in which parameter varied
Dynamical outcome
(P,Q)
(P,T)
(P,U)
(P,F)
(Q,T)
(Q,U)
(Q,F)
(T,U)
(T,F)
(U,F)
0
015 53
r
r
15-21 22-53
SLC SF
SLC SF
SLC SF
SLC SF
SLC SF
SLC SF
SLC SF
SLC SF
SLC SF
SLC SF
10
1026 49
r
r
26-27 28-49
SF SLC
SF SLC
SF SLC
SF SLC
SF SLC
SF SLC
SF SLC
SF SLC
SF SLC
SF SLC
0
057 149
K
K
57-92 93-149
SF SLC
SF SLC
SF SLC
SF SLC
SF SLC
SF SLC
SF SLC
SF SLC
SF SLC
SF SLC
0.01 0.34
h
h
0.01-0.28 0.29-0.34
SF SLC
SF SLC
SF SLC
SF SLC
SF SLC
SF SLC
SF SLC
SF SLC
SF SLC
SF SLC
1
13.6 12.5
3.6-8.5 9.0-12.5
SF SLC
SF SLC
SF SLC
SF SLC
SF SLC
SF SLC
SF SLC
SF SLC
SF SLC
SF SLC
In case of conservation model, it has been shown that if the rate of formation of the precursor pollutant is
controlled by some external means, its effect on the population can be minimised. All the above results in the
absence of diffusion are well supported by computer simulations as explained in Section 8. It is also found that
the system dynamics converging to the stable equilibrium for lower values of all the control parameters except
for the intrinsic growth rate parameter 0r of the population and for the higher values it exhibit the limit cycle
solution.
From this study, it can be concluded that the uncontrolled human activities that polluting the environment
may be harmful to itself. Therefore some kind of efforts must be adopted to control the further deterioration of
172

Computational Ecology and Software, 2015, 5(2): 152-174
IAEES www.iaees.org
the environment. This study also gives some idea about how to prevent the biological species living in an
environment polluted by its own activity and to develop the model related to socio-ecological problems and
about its solution.
Acknowledgements
The first author (BD) gratefully acknowledges the support received by UGC, New Delhi, Grant No.
F.510/2/DRS/2010 (SAP-I).
References
Denn MM. 1972. Stability of Reaction and Transport Processes. Prentice-Hall, Englewood, Cliffs, NJ, USA
Dubey B. 1997. Modelling the effect of toxicant on forestry resources. Indian Journal of Pure and Applied
Mathematics, 28: 1-12
Dubey B, Das B. 1999. Models for the survival of species dependent on resource in industrial environments.
Journal of Mathematical Analysis and Applications, 231: 374-396
Dubey B, Hussain J. 2000a. A model for the allelopathic effect on two competing species. Ecological
Modelling, 129: 195-207
Dubey B, Hussain J. 2000b. Modelling the interaction of two biological species in a polluted environment.
Journal of Mathematical Analysis and Applications, 246: 58-79
Dubey B, Hussain J. 2006. Modelling the survival of species dependent on a resource in a polluted
environment. Nonlinear Analysis: Real World Applications, 7: 187-210
Dubey B, Narayanan AS. 2010. Modelling effects of industrialization, population and pollution on a renewable
resource. Nonlinear Analysis: Real World Applications, 11: 2853-2848
Dubey B, Sharma S, Sinha P, Shukla JB. 2009. Modelling the depletion of forestry resources by population
and population pressure augmented industrialization. Applied Mathematical Modelling, 33: 3002-3014
Dubey B, Upadhyay RK, Hussain J. 2003. Effects of industrialization and pollution on resource biomass: a
mathematical model. Ecological Modelling, 167: 83-95
Freedman HI, Shukla JB. 1991. Models for the effect of toxicant in single-species and predator-prey systems.
Journal of Mathematical Biology, 30: 15-30
Ghosh M. 2000. Industrial pollution and asthma: a mathematical model. Journal of Biological Systems, 8(4):
347-371
Ghosh M, Chandra P, Sinha P. 2002. A mathematical model to study the effect of toxic chemicals on a prey-
predator type fishery. Journal of Biological Systems, 10(2): 97-105
Ghosh M, Chandra P, Sinha P, Shukla, JB. 2006. Modelling the spread of bacterial infectious disease with
environmental effect in a logistically growing human population. Nonlinear Analysis: Real World
Applications, 7(3): 341 – 363
Hallam TG, Clark CE, Jordan GS. 1983a. Effects of toxicants on populations: a qualitative approach II. First
order kinetics. Journal of Mathematical Biology, 18: 25-37
Hallam TG, Clark CE, Lassiter RR. 1983b. Effects of toxicants on populations: a qualitative approach I.
Equilibrium environmental exposure. Ecological Modelling, 18: 291-304
173

Computational Ecology and Software, 2015, 5(2): 152-174
IAEES www.iaees.org
Hallam TG, Luna De JT. 1984. Effects of toxicants on populations: a qualitative approach III. Environmental
and food chain pathways. Journal of Theoretical Biology, 109: 411-429
Hallam TG, Ma Z. 1986. Persistence in population models with demographic fluctuations. Journal of
Mathematical Biology, 24: 327-339
Hari P, Raunemaa T, Hautojarvi A. 1986. The effect on forest growth of air pollution from energy production.
Atmospheric Environment, 20(1): 129-137
Huaping L, Ma Z. 1991. The threshold of survival for system of two species in a polluted environment. Journal
of Mathematical Biology, 30: 49-61
Luna De JT, Hallam TG. 1987. Effects of toxicants on populations: a qualitative approach IV. Resource-
Consumer-Toxicant models. Ecological Modelling, 35: 249-273
McLaughlin SB. 1985. Effects of air pollution on forests. Journal of Air Pollution and Control Association, 35:
512-534
Naresh R, Sundar S, Shukla JB. 2006a. Modelling the effect of an intermediate toxic product formed by uptake
of a toxicant on plant biomass. Applied Mathematics and Computation, 182: 151-160
Naresh R, Sundar S, Upadhyay RK. 2006b. Modelling the removal of primary and secondary air pollutants by
precipitation. International Journal of Nonlinear Sciences and Numerical Simulation, 7(3): 285-294
Rescigno A. 1977. The struggle for life-V. One species living in a limited environment. Bulletin of
Mathematical Biology, 39: 479-485
Schulze ED. 1989. Air pollution and forest decline in a Spruce (Picea abies) forest. Science, 224: 776-783
Shukla JB, Agrawal AK, Dubey B, Sinha P. 2001. Existence and survival of two competing species in a
polluted environment: a mathematical model. Journal of Biological Systems, 2: 89-103
Shukla JB, Agrawal AK, Sinha P, Dubey B. 2003. Modelling effects of primary and secondary toxicants on
renewable resources. Natural Resource Modelling, 16: 99-120
Shukla JB, Dubey B. 1996. Simultaneous effect of two toxicants on biological species: a mathematical model.
Journal of Biological Systems, 4(1): 109-130
Shukla JB, Dubey B. 1997. Modelling the depletion and conservation of forestry resources: effects of
population and pollution. Journal of Mathematical Biology, 36: 71-94
Shukla JB, Sharma S, Dubey B, Sinha P. 2009. Modeling the survival of a resource dependent population:
effects of toxicants (pollutants) emitted from external sources as well as formed by its precursors.
Nonlinear Analysis: Real World Applications, 10: 54-70
Smith WH. 1981. Air Pollution and Forests. Springer-Verlag, New York, USA
Srinivasu PDN. 2002. Control of environmental pollution to conserve a population. Nonlinear Analysis: Real
World Applications, 3: 397-411
Sundar S. 2013. An ecological type nonlinear model for the removal of carbon dioxide from the atmosphere by
introducing liquid species. Computational Ecology and Software, 3(2): 33-43
Sundar S, Naresh R, Mishra, AK, Tripathi A. 2014. Modelling the dynamics of carbon dioxide removal in the
atmosphere. Computational Ecology and Software, 4(4): 248-268
Woodman JN, Cowling EB. 1987. Airborne chemical and forest health. Environmental Science and
Technology 21: 120-126
Woodwell GM. 1970. Effects of pollution on the structure and physiology of ecosystems. Science, 168: 429-
431
174

Computational Ecology and Software, 2015, 5(2): 175-186
IAEES www.iaees.org
Article
Hopf bifurcation and stability analysis for a delayed logistic equation
with additive Allee effect
E.M. Elabbasy, Waleed A.I. Elmorsi University of Mansoura, Mansoura, Egypt
E-mail: [email protected], [email protected]
Received 19 November 2014; Accepted 25 December 2014; Published online 1 June 2015
Abstract
In this paper the linear stability of the delayed logistic equation with additive Allee effect is investigated. We
also analyze the associated characteristic transcendental equation, to show the occurrence of Hopf bifurcation
at the positive equilibrium. To determine the direction of Hopf bifurcation and the stability of bifurcating
periodic solution, we use the normal form approach and a center manifold theorem. Finally, a numerical
example is given to demonstrate the effectiveness of the theoretical analysis.
Keywords time delay; logistic equation; stability; Hopf bifurcation; additive Allee effect.
1 Introduction
Considering the fact that the environment has limited resources, the Belgium mathematician Pierre-Francois
Verhulst (Verhulst, 1838) proposed one of the most famous equation that used to model a lot of applications in
ecology and biology. The logistic equation - also known as Verhulst model- is a model of population growth
first proposed by Verhulst (1845, 1847). Verhulst (Agarwal et al., 2014) argued that the unlimited growth in
the exponential growth model must be restricted by the Malthusian “struggle for existence”
and he proposed the model
(1)
Equation (1) is called logistic growth in a population where is the intrinsic growth rate and
is the carrying capacity (the maximum number of individuals that the environment can support). We can see
that is globally stable steady state for equation (1) with any initial condition. If the initial condition
is more than (less than) then the population decreases (increase) approaching as tends to ∞ .
The logistic equation has a lot of applications in many fields like economy (Shone, 2002), ecology (Pastor,
2008), biology (Murray, 2002), medicine (Forys and Marciniak-Czochra, 2003) and neurosciences
(Gershenfeld, 1999). To know more about the history of the logistic equation see Kingsland (1982).
Computational Ecology and Software ISSN 2220721X URL: http://www.iaees.org/publications/journals/ces/onlineversion.asp RSS: http://www.iaees.org/publications/journals/ces/rss.xml Email: [email protected] EditorinChief: WenJun Zhang Publisher: International Academy of Ecology and Environmental Sciences

Computational Ecology and Software, 2015, 5(2): 175-186
IAEES www.iaees.org
In the last few years the importance of embedding the time delay into dynamical systems was increased,
especially in ecological and biological systems because in these systems the reproduction is not instantaneous.
Incorporating the time delay into system allow the system rate of change to depend on his own past history.
Also by using time delay in equations that model eco-systems or bio-systems, phenomena as feeding time,
reaction time, maturation periods, etc., can be represented.
Time delays have been incorporated into biological and ecological models to fix the deficiencies of
ordinary differential equation that ignored important phenomena. Furthermore, so many of the processes, both
natural and man-made, in medicine, diseases, physics, chemistry, bio-systems, eco-systems, economics, etc.,
involve time delays. In general, delay differential equations exhibit much more complicated dynamics than
ordinary differential equations. For these reasons, the researchers in many fields pay great attention for
studying delayed systems (Agarwal et al., 2014; Ding et al., 2013; Engelborghs et al., 2002; Ruan, 2006;
Kuang, 1993; Braddock, 1983; Bi and Xiao, 2014; Hu and Li, 2012).
To make the logistic equation more realistic, Hutchinson [Hutchinson, 1948] proposed incorporating the
effect of delay and he introduced the delayed logistic equation
(2)
where is time delay. For other formula of delayed logistic equation see (Arino et al., 2006).
Hutchinson suggested that the equation (2) can be used to model the dynamics of a single species
population growing towards a saturation level with a constant reproduction rate (Kuang, 1993;
Gobalsamy, 1992; Cuching, 1977).
More interesting topological changes in the population size as limit cycles, chaos and damped oscillations
are produced in the existence of delay (Storgaz, 1994).
Noticing the behavior of species one can see that some species often help each other in their search for
food or habitat and to escape from their predators. For example, some social species such as ants, bees, etc.,
have developed complex cooperative behavior involving division of labor, altruism, etc. Such cooperative
processes have a positive feedback influence since individuals have been provided a greater chance to survive
and reproduce as density increase.
The ecologist Warder Clyde Allee (Allee, 1931) paid a lot of attention to aggregation and associated
cooperative and social characteristics among members of a species in animal populations, and his work has
been among the most influential for animal behavioral research.
In numerous writings (Allee, 1931; Allee, 1941; Allee et al., 1949) Allee shows that for a variety of
biological reasons positive (negative) feedback effects can happen at low (high) population density. The
positive feedback is called Allee effects (Dennis, 1989; Stephens et al., 1999). In population dynamics, the
Allee effect refers to a process that reduces the growth rate for small population densities.
The so-called Allee effect (Elabbasy et al., 2007) refers to a population that has a maximal per capita
growth rate at intermediate density. This occurs when the per capita growth rate increases as density increases
and decreases after the density passes a certain value.
Modelling Allee effects in population dynamics and fields that related to it as a multi-species interactions
in eco-systems, disease dynamics and the spread of epidemics, etc., has great interest in mathematical literature.
(Dennis, 1989; Elaydi and Sacker, 2010; Courchamp et al., 2008; Schreiber, 2003; Cushing and Hudsona,
2012; Lewis and Kareiva, 1993)
The equation
(3)
176

Computational Ecology and Software, 2015, 5(2): 175-186
IAEES www.iaees.org
is the prototypical model for a multiplicative Allee effect where is the intrinsic growth rate and is the
carrying capacity. If it shows the weak Allee effect, while if , it shows the
strong Allee effect.
The strong Allee effect introduces a population threshold (the minimal size of the population required to
survive), and the population must surpass this threshold to grow. In contrast, a population with a weak Allee
effect does not have a threshold [Wang et al, 2011; Wang and Kot, 2001].
Dennis (Dennis, 1989) who first introduced the equation that modeled the additive Allee effect in the
form
, (4)
and then it used in [Aguirre et al, 2009].
The term is called the additive Allee effect where and are called Allee
constants with . If then the equation (4) exhibits a weak Allee effect and if then it
exhibits a strong Allee effect (Wang and Kot, 2001).
In our paper, we study the delayed logistic equation with additive Allee effect in the form
(5)
2 Local Stability and Existence of Hopf Bifurcation
The model – at - has a trivial equilibrium , and positive equilibrium
. And at the model (5) has a trivial equilibrium and two positive
equilibrium
and .
For convenience, we indicate to the next lemma which consolidates our stability analysis.
Lemma 1 (Hale and Lunel, 1993)
All roots of the characteristic equation , where are real, have negative real
parts if and only if
,
and
where is the root of , if and if .
Theorem 1
(I) At
1. The equilibrium of equation (5) is unstable.
2. The equilibrium of Eq. (5) is stable if and is unstable if .
(II) At 0
1. The equilibrium 0 of equation (5) is stable.
177

Computational Ecology and Software, 2015, 5(2): 175-186
IAEES www.iaees.org
2. The two equilibrium and of equation
5 are stable if and are unstable if .
Proof.
I Linearizing equation about equilibrium using , it becomes
6
It is easy to show that equation has the characteristic equation in the form
(7)
Since 0 then 0
Then the model is unstable.
Again, by linearizing about equation 5 will be
1 (8)
Or
(9)
Where 1 and
Equation (9) has the characteristic equation
0 (10)
Let be the root of equation 10 ; then:
cos sin 0
cos sin 0 (11)
Then, by separating and equating real parts and imaginary parts
cos 0 (12.a)
sin 0 (12.b)
Then (13)
From 13 and using 12. , 12.
tan (14)
By the same way, we can prove part (II).
Theorem 2
If τ α τ i τ denote a root of Eq. (10) near τ τ , such that τ and
α τ 0 then
dα τ
dτ0
Proof.
By differentiating the characteristic equation (10) with respect to we get
178

Computational Ecology and Software, 2015, 5(2): 175-186
IAEES www.iaees.org
1
This gives
Then
Sign sign sign
sign sign1
0
Theorem 2 stated the last condition for the occurrence of Hopf bifurcations and the results can be introduced as
follows.
Theorem 3.
(I) in the case if 0 , When the parameter τ passes through the critical value τ , there
are Hopf bifurcations at the equilibrium
to a periodic orbit.
(II) In the case if 0 , when the parameter τ passes through the critical
value τ , there are Hopf bifurcations at the equilibriums
and to a periodic orbit.
3 Stability and Direction of the Hopf Bifurcation
Let , then the equation 5 written as
1
1 (15)
In 1, 0 , equation 15 written as
, (16)
Where
0 1
, 0 1
0 (17)
Using the Riesz representation theorem, there exists a function , of bounded variation for 1,0
such that
, 0 for (18)
We can choose
, 1 (19)
where is the Dirac delta function.
For 1,0 , ; define
1,0
, θ 0 (20)
179

Computational Ecology and Software, 2015, 5(2): 175-186
IAEES www.iaees.org
and
0 1,0
, 0 21
Then the system 16 can be written as operation equation
22
where
1,0
The equation 22 is more mathematically pleased because this equation involves a single unknown variable
.
For ψ 0, 1 , the adjoint operator of is defined as
ψ
ψ 1,0
, ψ s 0 23
For 1,0 and ψ 0, 1 , the bilinear inner product defined as
ψ , ψ 0 0 ψ 24
To determine the Poincare normal form of the operator we need to calculate the eigenvector and
of and that corresponding to the eigenvalues and respectively.
It is easy to be verified that and .
In order to assure that , 1, we need to determine the value. From 24
, 0 0
, 1 1
1
1 25
Hassard et al. (1981) introduced a method to compute the co-ordinates that describe the center manifold
at 0 .
Tracking Hassard method, for , a solution of 22 at 0 , we define:
, and , 2 26
On the center manifold we have:
, , , , Where
, , 27
where are local co-ordinates for center manifold in in the direction of and . Note that ,
is real if is real. We shall deal with real solution only.
180

Computational Ecology and Software, 2015, 5(2): 175-186
IAEES www.iaees.org
Now, for solution of equation 22
, , ,
Then since 0
, ,
0 , 28
Equation (28) can be written in abbreviated form as
, 29
Where
, 0 ,
,2 2
30
Since from 26
Then
2 0 , 1,0
2 0 , , 0 31
This can be written as
, , 32
where
, , 2 2
33
Since
, 0 ,
0 0,
0 1 0 (34)
Using equations 26 in 34 and comparing coefficient with 30 , we find
2 35.
(35.b
2 35.
0 0 1 1 2 0
0 35.d
Since , 36
Using 32 and substitution by the expansions of previous functions and comparing coefficients we find that
2 – 37
181
Computational Ecology and Software, 2015, 5(2): 175-186
IAEES www.iaees.org
38
2 – 39
Since from 31 , 32 and 33 we find
40
41
42
From 37 and 40
2
2 43
This equation has the solution
3
44
By the same way
45
Where and are constants and they are evaluated from the formulas
2
2 46
2
/ 47
We can also compute
0 2
2| || |3 2
0
2 0
48
Theorem (Hassard et al., 1981): In (48), the directions of Hopf bifurcation are determined by the sign of
and the stability of bifurcating periodic solutions by the sign of . In this case, if 0 0 , then the
Hopf bifurcation is supercritical (subcritical) and if 0 0 the bifurcating periodic solutions are
orbitally stable (unstable).
4 Numerical Example
In this section, we give some numerical simulations supporting our theoretical analysis. In the first case
( 0), by choosing r 3 , 4 , 0.5 ; 0.75 and 0.5 for , 0 , fig. 1
at 0.6 shows the existence of Hopf bifurcation and limit cycle behavior for model (5).
182

Computational Ecology and Software, 2015, 5(2): 175-186
IAEES www.iaees.org
(a) ( b)
Fig. 1 Wave form plot (a) and phase plot (b) at 0.6 for the case 0 for model (5).
The wave form plot and the phase plot in Fig. 2 show the periodicity of the solution and existence of an
attractor for model (5) at 1.
(a) (b)
Fig. 2 Wave form plot (a) and phase plot (b) at 1 for the case ( 0 ) for model (5).
In the second case ( 0 ) - we will choose 1 , 4, 0.9 ; 0.6 and
0.5 for , , 0 -Fig. 3 shows that the equilibrium point for the model (5) is asymptotically stable at
=1.5.
183

Computational Ecology and Software, 2015, 5(2): 175-186
IAEES www.iaees.org
(a) (b)
Fig. 3 Wave form plot (a) and phase plot (b) at 1.5for the case ( 0 ) for model (5).
In Fig. 4, wave form plot and phase plot at =2 show the existence of Hopf bifurcation and limit cycle
behavior for model (5).
(a) (b)
Fig. 4 Wave form plot (a) and phase plot (b) at =2 for the case ( 0 ) for model (5).
5 Conclusions
In this paper, we have investigated the stability and Hopf bifurcation of a delayed logistic equation with
additive Allee effect. Also we have obtained stability conditions and we showed that a Hopf Bifurcation will
occur when the time delay parameter pass through critical values; that is, a family of periodic orbits bifurcates
from the equilibrium. The direction of Hopf bifurcation and the stability of the bifurcating periodic orbits are
184

Computational Ecology and Software, 2015, 5(2): 175-186
IAEES www.iaees.org
discussed by applying the normal form approach and the center manifold theorem. Numerical simulations have
shown that the analytical results are correct.
References
Agarwal RP, O’Regan D, Saker S. 2014. Oscillation and Stability of Delay Models in Biology. Springer,
Netherlands
Aguirre P, Gonzalez-Olivares E, Saez E. 2009. Two limit cycles in a Leslie–Gower predator–prey model with
additive Allee effect. Nonlinear Analysis: Real World Applications, 10: 1401-1416
Aguirre P, Gonzalez-Olivares E, Saez E. 2009. Three limit cycles in a Leslie–Gower predator–prey model with
additive Allee effect. SIAM Journal of Applied Mathematics, 69: 1244-1269
Allee WC. 1931. Animal Aggregation: A study In General Sociology. The University of Chicago Press, USA
Allee WC. 1941. The Social Life of Animals (Third edition). William Heineman, London and Toronto, UK
Allee WC, Park O, Park T, et al. 1949. Principles of Animal Ecology. WB Saunders, Philadelphia, USA
Arino J, Wang L, Wolkowicz GSK. 2006. An alternative formulation for a delayed logistic equation. Journal
of Theoretical Biology, 241: 109-119
Bi P, Xiao H. 2014. Bifurcations of tumor-immune competition systems with delay. Abstract and Applied
Analysis, (10.1155/2014/723159)
Braddock RD, Driessche PV. 1983. On a two lag differential equation. Journal of the Australian Mathematical
Society Series B, 24: 292-317
Courchamp F, Berec L, Gascoigne J.2008. Allee Effects in Ecology and Conservation. Oxford University
Press, UK
Cushing JM. 1977. Integro-differential Equations and Delay Models in Population Dynamics. Lecture Notes in
Biomathematics, Springer, Berlin, Germany
Cushing JM, Hudsona JT. 2012. Evolutionary dynamics and strong Allee effects. Journal of Biological
Dynamics, 6: 941-958
Dennis B. 1989. Allee effects: Population growth, critical density, and the chance of extinction. Natural
Resource Model, 3: 481-538
Ding Y, Jiang W, Yu P. 2013. Bifurcation analysis in a recurrent neural network model with delays.
Communications in Nonlinear Science and Numerical Simulation, 18: 351-372
Elabbasy EM, Saker SH, EL-Metwally H. 2007. Oscillation and stability of nonlinear discrete models
exhibiting the Allee effect, Mathematica Versita Slovaca, 57: 243-258
Elaydi SN, Sacker RJ. 2010. Population models with Allee effect: A new model. Journal of Biological
Dynamics, 4: 397-408
Engelborghs K, Luzyanina T, Roose D. 2002. Numerical bifurcation analysis of delay differential equations
using dde-biftool. ACM Transactions on Mathematical Software, 28: 1-21
Forys U, Marciniak-Czochra A. 2003. Logistic equation in tumor growth modelling. International Journal of
Applied Mathematics and Computer Science, 13: 317-325
Gershenfeld NA.1999. The Nature of Mathematical Modeling. Cambridge University Press, Cambridge, USA
Gopalsamy K. 1992. Stability and Oscillations in Delay Differential Equations of Population Dynamics,
Kluwer Academic Press, London, UK
Hale J, Lunel MV.1993. Introduction to Functional Differential Equations. Springer, New York, USA
Hassard BD, Kazarinoff ND, Wan YH. 1981. Theory and Applications of Hopf Bifurcation. Cambridge
University Press, Cambridge, USA
185

Computational Ecology and Software, 2015, 5(2): 175-186
IAEES www.iaees.org
Hu GP, Li XL. 2012. Stability and Hopf bifurcation for a delayed predator–prey model with disease in the prey,
Chaos, Solitons and Fractals, 45: 229-237
Hutchinson GE. 1948. Circular casual systems in ecology. Annals of New York Academy of Sciences, 50:
221-246
Kingsland S. 1982.The refractory model: The logistic curve and the history of population of ecology. The
Quarterly Review of Biology.57: 29-52
Kuang Y. 1993. Delay Differential Equations with Applications in Population Dynamics. Academic Press
Incorporation, USA
Lewis MA, Kareiva P. 1993. Allee dynamics and the spread of invading organisms. Theoretical Population
Biology, 43: 141-158
Murray JD. 2002. Mathematical Biology I. An Introduction (Third edition). Springer, Netherlands
Pastor J. 2008. Mathematical Ecology of Populations and Ecosystems. Wiley-Blackwell, USA
Ruan S. 2006. Delay differential equations in single species dynamics. In: Delay Differential Equations and
Applications (Arino O, Hbid ML, eds). 477-517, Springer, Berlin, Germany
Schreiber SJ. 2003. Allee effects, extinctions, and chaotic transients in simple population models. Theoretical
Population Biology, 64: 201-209
Shone R. 2002. Economic Dynamics: Phase Diagrams and Their Economic Application. Second edition.
Cambridge University Press, USA
Stephens PA, Sutherland WJ, Freckleton RP. 1999. What is the Allee effect? Oikos, 87: 185-190
Storgaz SH. 1994. Nonlinear dynamics and Chaos. Perseus Books Publishing, USA
Verhulst PF. 1838. Notice sur la loique la population suit dans son accroissement. Corresp. Math. et Phys., 10:
113-121
Wang J, Shi J, Wei J. 2011. Predator–prey system with strong Allee effect in prey. Journal of Mathematical
Biology, 62: 291-331
Wang MH, Kot M. 2001. Speeds of invasion in a model with strong or weak Allee effects. Mathematical
Bioscience, 171: 83-97
186

Computational Ecology and Software, 2015, 5(2): 187-200
IAEES www.iaees.org
Article
Bifurcation and complex dynamics of a discrete-time predator–prey
system
S. M. Sohel Rana Department of Mathematics, University of Dhaka, Dhaka-1000, Bangladesh
E-mail: [email protected]
Received 22 December 2014; Accepted 10 February 2015; Published online 1 June 2015
Abstract
In this paper, we investigate the dynamics of a discrete-time predator-prey system of Holling-I type in the
closed first quadrant 2R . The existence and local stability of positive fixed point of the discrete dynamical
system is analyzed algebraically. It is shown that the system undergoes a flip bifurcation and a Neimark-
Sacker bifurcation in the interior of 2R by using bifurcation theory. It has been found that the dynamical
behavior of the model is very sensitive to the parameter values and the initial conditions. Numerical simulation
results not only show the consistence with the theoretical analysis but also display the new and interesting
dynamic behaviors, including phase portraits, period-9, 10, 20-orbits, attracting invariant circle, cascade of
period-doubling bifurcation from period-20 leading to chaos, quasi-periodic orbits, and sudden disappearance
of the chaotic dynamics and attracting chaotic set. In particular, we observe that when the prey is in chaotic
dynamic, the predator can tend to extinction or to a stable equilibrium. The Lyapunov exponents are
numerically computed to characterize the complexity of the dynamical behaviors. The analysis and results in
this paper are interesting in mathematics and biology.
Keywords discrete-time predator-prey system; chaos; flip and Neimark-Sacker bifurcations; Lyapunov
exponents.
1 Introduction
The dynamics of predator-prey interaction is the starting point for many variations that yield more realistic
biological and mathematical problems in population ecology. Predation is a direct interaction which occurs
when individuals from one population derive their nourishment by capturing and ingesting individuals from
another population. There are many articles devoted to the study of predator-prey interaction both from the
experimental and the modeling point of view. It is well known the Lotka-Voltera predator-prey model is one of
the fundamental population models; a predator-prey interaction has been described firstly by two pioneers
Lotka (1924) and Voltera (1926) in two independent works. After them, more realistic prey-predator model
Computational Ecology and Software ISSN 2220721X URL: http://www.iaees.org/publications/journals/ces/onlineversion.asp RSS: http://www.iaees.org/publications/journals/ces/rss.xml Email: [email protected] EditorinChief: WenJun Zhang Publisher: International Academy of Ecology and Environmental Sciences

Computational Ecology and Software, 2015, 5(2): 187-200
IAEES www.iaees.org
were introduced by Holling suggesting three types of functional responses for different species to model the
phenomena of predation (Holling, 1965).
Qualitative analyses of prey-predator models describe by set of differential equations were studied by
many authors (Brauer and Castillo, 2001; Hastings and Powell, 1991; Klebanoff and Hastings, 1994; May,
1974; Murray, 1998; Zhu et al., 2002). Another possible way to understand a prey-predator interaction is by
using discrete-time models. These models are more reasonable than the continuous time models when
populations have non-overlapping generations (Brauer and Castillo, 2001; Murray, 1998) and lead to
unpredictable dynamic behaviors from a biological point of view. This suggests the possibility that the
governing laws of ecological systems may be relatively simple and therefore discoverable. The author (May,
1975, 1976) had clearly documented the rich array of dynamic behavior possible in simple discrete-time
models. Recently, there is a growing evidence showing that the dynamics of the discrete-time prey-predator
models can present a much richer set of patterns than those observed in continuous-time models (Agiza et al.,
2009; Danca et al., 1997; Elsadany et al., 2012; Hasan et al., 2012; He and Lai, 2011; Jing and Yang, 2006; Li,
1975; Liu, 2007; Hu et al., 2011; He and Li, 2014). However, there are few articles discussing the dynamical
behaviors of predator-prey models, which include bifurcations and chaos phenomena for the discrete-time
models. The authors (He and Lai, 2011; Jing, 2006; Liu, 2007; Hu et al., 2011) obtained the flip bifurcation by
using the center manifold theorem and bifurcation theory. But in (Agiza et al., 2009; Danca et al., 1997;
Elsadany et al., 2012), the authors only showed the flip bifurcation and Hopf bifurcation by using numerical
simulations. In this work, we confine our interest to present, by using both analytic and numerical methods, the
domains of the values of the parameters under which the system predicts that the populations will be able to
persist at a steady state, the conditions for flip and/or Neimark-Sacker bifurcations by using the normal form
theory of the discrete system (see section 4, Kuznetsov, 1998) and the domain for the presence of chaos in the
system by measuring the maximum Lyapunov exponents.
In ecology, many species have no overlap between successive generations, and thus their population
evolves in discrete-time steps (Murray, 1998). Such a population dynamics is described by difference equation.
Let nx denotes the number of prey population and ny the number of predator population in the n th
generation. Our model is described by the following system of nonlinear difference equations in non-
dimensional form:
nnnn
nnnnn
dyybxy
yaxxrxxH
1
1 )1(: (1)
In the system (1), the prey grows logistically with intrinsic growth rate r and carrying capacity one in
the absence of predation. The predator consumes the prey with functional response Holling type I. All
parameters dbar ,,, have positive values that stand for prey intrinsic growth rate, per capita searching
efficiency of the predator, conversion rate, and the death rate of the predator, respectively. From mathematical
and biological point of view, we will pay attention on the dynamical behaviors of (1) in the closed first
quadrant 2R . Starting with initial population size 00 , yx , the iteration of system (1) is uniquely
determined a trajectory of the states of population output in the following form
00 ,, yxHyx nnn , where ,2,1,0n .
188

Computational Ecology and Software, 2015, 5(2): 187-200
IAEES www.iaees.org
Our results in this paper are extension to those in (Danca et al., 1997; Elsadany et al., 2012). This paper is
organized as follows. In Section 2, we discuss the existence and local stability of positive fixed point for
system (1) in 2R . In Section 3, we show that there exist some values of the parameters such that (1)
undergoes the flip bifurcation and the Neimark-Sacker bifurcation in the interior of 2R . In section 4, we
present the numerical simulations which not only illustrate our results with theoretical analysis but also exhibit
complex dynamical behaviors such as the cascade periodic-doubling bifurcation in periods 2, 4, 8, 9, 10, 20-
orbits, quasi-periodic orbits and chaotic sets. Finally a short discussion is given in Section 5.
2 Existence and Local Stability of Fixed Points
In this section, we shall first discuss the existence of fixed points for (1), then study the stability of the fixed
point by the eigenvalues for the Jacobian matrix of (1) at the fixed point.It is clear that the system (1) has the
following fixed points in the ),( yx -plane:
0,00E ,
0,1
1 r
rE and **
2 , yxE , whereb
dx
1* and ab
d
a
ry
111*
.
To discuss the existence of fixed points, we say that fixed points will not exist if any one of its
components is negative. The fixed point 0E always exists. The existence condition for 1E is 1r . Finally,
the feasibility condition for the positive fixed point 2E is
db
br
1 (or 1,
1
)1(
rr
drb ).
Now we study the stability of the positive fixed point (we left the others) only. Note that the local stability
of the fixed point ),( yx is determined by the modules of eigenvalues of the characteristic equation at the
fixed point.
The Jacobian matrix due to the linearization of (1) evaluated at 2E is given by
1
)1()1(
)1()1(1
, **
a
rdrbb
da
b
rd
yxJ
and the characteristic equation of the Jacobian matrix J can be written as
0212 (2)
whereb
rdtrJ
)1(21
and d
b
drdJ
21)1(det2 .
Therefore, the eigenvalues of J are
b
rd
2
)1(1
21
2,1
(3)
where db
drd
b
rd
1)1(
2
)1(1
2
2
2
2
1 .
189

Computational Ecology and Software, 2015, 5(2): 187-200
IAEES www.iaees.org
Using Jury’s criterion (Elaydi, 1996), we have necessary and sufficient condition for local stability of the
fixed point 2E which are given in the following proposition.
Proposition 1. Whendb
br
1, then system (1) has a positive fixed point 2E and
(i) it is a sink if one of the following conditions holds:
(i.1) 0 and 1
)2(
)1(3
)3)(1(
r
rdb
rdd
rdd;
(i.2) 0 and 1
)2(
r
rdb .
(ii) it is a source if one of the following conditions holds:
(ii.1) 0 and
1
)2(,
)1(3
)3)(1(max
r
rd
rdd
rddb ;
(ii.2) 0 and 1
)2(
r
rdb .
(iii) it is non-hyperbolic if one of the following conditions holds:
(iii.1) 0 and rdd
rddb
)1(3
)3)(1(
;
(iii.2) 0 and 1
)2(
r
rdb .
(iv) it is a saddle for the other values of parameters except those values in (i)–(iii).
Following Jury’s criterion, we can see that one of the eigenvalues of 2EJ is 1 and the others are
neither 1 nor 1 if the term (iii.1) of Proposition 1 holds. Therefore, there may be flip bifurcation of the
fixed point 2E if r varies in the small neighborhood of 2EFB where
0,,,1,0,
)3)(1(
)3(:,,,
2dbar
dbd
dbrdbarFBE .
Also when the term (iii.2) of Proposition 1 holds, we can obtain that the eigenvalues of 2EJ are a pair
of conjugate complex numbers with module one. The conditions in the term (iii.2) of Proposition 1 can be
written as the following set:
0,,,1,0,
2:,,,
2dbar
db
brdbarNSE
and if the parameter r varies in the small neighborhood of 2ENS ; then the Neimark-Sacker bifurcation will
appear.
190

Computational Ecology and Software, 2015, 5(2): 187-200
IAEES www.iaees.org
3 Flip Bifurcation and Neimark-Sacker Bifurcation
In this section, we choose the parameter r as a bifurcation parameter to study the flip bifurcation and the
Neimark-Sacker bifurcation of 2E by using bifurcation theory in (see Section 4 in Kuznetsov, 1998; see also
Guckenheimer and Holmes, 1983; Robinson, 1999; Wiggins, 2003).
We first discuss the flip bifurcation of (1) at 2E . Suppose that 0 , i.e.,
01)1(2
)1(1
2
d
b
drd
b
rd. (4)
Let )3)(1(
)3(1 dbd
dbr
, then the eigenvalues of J are
1)( 11 r , and db
dbr
3
436)( 12 .
The condition 1)( 12 r leads to
13
436
db
db. (5)
Let *~ xxx , *~ yyy and **, yxJrA , we transform the fixed point **, yx of system
(1) into the origin, then system (1) becomes
ryxF
ryxF
y
xrA
y
x
,~,~,~,~
~
~
~
~
2
1 (6)
where
,~~,~,~
,~~~,~,~4
2
421
XyxbryxF
XyxaxrryxF
(7)
and TyxX ~,~ . It follows that
,2),(
, 122111
2
1,0
12
1 yaxyaxyrxyxrF
yxBkj
kjkj
,),(
, 1221
2
1,0
22
2 ybxybxyxrF
yxBkj
kjkj
,0),(
,,2
1,,0
13
1
lkjlkj
lkj
uyxrF
uyxC
,0),(
,,2
1,,0
23
2
lkjlkj
lkj
uyxrF
uyxC
and 1rr .
191
Computational Ecology and Software, 2015, 5(2): 187-200
IAEES www.iaees.org
Therefore,
yxB
yxByxB
,
,,
2
1 and
uyxC
uyxCuyxC
,,
,,,,
2
1 are symmetric multilinear vector
functions of uyx ,, R2.
We know that A has simple eigenvalue 1)( 11 r , and the corresponding eigenspace cE is one-
dimensional and spanned by an eigenvector q R2 such that qqrA )( 1 . Let p R2 be the adjoint
eigenvector, that is, pprAT )( 1 . By direct calculation we obtain
Tbybxdq ** ,1~ ,
Taybxdp ** ,1~ .
In order to normalize p with respect to q , we denote
Taybxdp **1 ,1
where
**2*11
1
yabxbxd .
It is easy to see 1, qp , where , means the standard scalar product in R2:
2211, qpqpqp .
Following the algorithms given in (Kuznetsov, 1998), the sign of the critical normal form coefficient
11 r , which determines the direction of the flip bifurcation, is given by the following formula:
qqBIAqBpqqqCpr ,)(,,2
1,,,
6
1 111
(8)
From the above analysis and the theorem in (Kuznetsov, 1998; Guckenheimer and Holmes, 1983; Robinson,
1999; Wiggins, 2003), we have the following result.
Theorem 1. Suppose that **, yx is the positive fixed point. If the conditions (4), (5) hold and 011 r ,
then system (1) undergoes a flip bifurcation at the fixed point **, yx when the parameter r varies in a
small neighborhood of 1r . Moreover, if 011 r (respectively, 011 r ), then the period-2 orbits that
bifurcate from **, yx are stable (respectively, unstable).
In Section 4, we will give some values of the parameters such that 011 r , thus the flip bifurcation
occurs as r varies (see Figure 1).
We next discuss the existence of a Neimark-Sacker bifurcation by using the Neimark-Sacker theorem in
(Kuznetsov, 1998; Guckenheimer and Holmes, 1983; Robinson, 1999; Wiggins, 2003).
It is clear that the eigenvalues 2,1 given by (3) are complex for 0det42 JtrJ , which leads to
0 , i.e.,
192

Computational Ecology and Software, 2015, 5(2): 187-200
IAEES www.iaees.org
01)1(2
)1(1
2
d
b
drd
b
rd (9)
Let db
br
22 ,
then we have 1)(det 2 rJ .
For 2rr , the eigenvalues of the matrix associated with the linearization of the map (6) at
0,0, ** yx are conjugate with modulus 1, and they are written as
)()(422
)(2
2122
212,1 rr
ir (10)
and 1)( 2 ri , 02
)1)(2()(
2
b
ddb
dr
rd
rr
i, 2,1i . Note that 12 .
In addition, if 1,0)( 2 rtrJ , which leads to
3,2)1( 2
b
rd,
then we have 1)( 2 rki for .4,3,2,1k
Let q C2 be an eigenvector of )( 2rA corresponding to the eigenvalue )( 21 r such that
qrqrA )()( 212 , qrqrA )()( 212 .
Also let p C2 be an eigenvector of the transposed matrix )( 2rAT corresponding to its eigenvalue,
that is, )()( 2221 rr ,
prprAT )()( 222 , prprAT )()( 222 .
By direct calculation we obtain
Tbybxdq **1 ,~ ,
Taybxdp **2 ,~ .
In order to normalize p with respect to q , we denote
193

Computational Ecology and Software, 2015, 5(2): 187-200
IAEES www.iaees.org
Taybxdp **22 ,
where
**2*2
2
1
yabxbxd
.
It is easy to see 1, qp , where , means the standard scalar product in C2:
2211, qpqpqp .
Any vector X R2 can be represented for r near 2r as qzqzX ,for some complex z . Indeed,
the explicit formula to determine z is Xpz , . Thus, system (6) can be transformed for sufficiently
small r (near 2r ) into the following form:
),,()(1 rzzgzrz ,
where )(1 r can be written as )(1 )(1)( rierr (where )(r is a smooth function with
0)( 2 r ) and g is a complex-valued smooth function of rzz and,, , whose Taylor expression with
respect to ),( zz contains quadratic and higher-order terms:
2
)(!!
1),,(
lk
lkkl zzrg
lkrzzg , with klg , ,1,0, lk .
By symmetric multilinear vector functions, the Taylor coefficients klg can be expressed by the formulas
qqBprg ,,220 , qqBprg ,,211 ,
qqBprg ,,202 , qqqCprg ,,,221 ,
and the coefficient 22 r , which determines the direction of the appearance of the invariant curve in a
generic system exhibiting the Neimark-Sacker bifurcation, can be computed via
2
02
2
111120)(
)(2)(21
)(
22 4
1
2
1
12
21Re
2Re
2
222
gggge
eeger
ri
ririri
,
where )( 21)( 2 re ri .
For the above argument and the theorem in (Kuznetsov, 1998; Guckenheimer and Holmes, 1983;
Robinson, 1999; Wiggins, 2003), we have the following result.
Theorem 2. Suppose that **, yx is the positive fixed point. If 022 r (respectively, 0 ) the
Neimark-Sacker bifurcation of system (1) at 2rr is supercritical (respectively, subcritical) and there exists
a unique closed invariant curve bifurcation from **, yx for 2rr , which is asymptotically stable
(respectively, unstable).
In Section 4 we will choose some values of the parameters so as to show the process of a Neimark-Sacker
194

Computational Ecology and Software, 2015, 5(2): 187-200
IAEES www.iaees.org
bifurcation for system (1) in Figure 2 by numerical simulation.
4 Numerical Simulations
In this section, our aim is to present numerical simulations to explain the above theoretical analysis, especially
the bifurcation diagrams, phase portraits and Maximum Lyapunov exponents for system (1) around the
positive fixed point 2E and show the new interesting complex dynamical behaviors. It is known that
Maximum Lyapunov exponents quantify the exponential divergence of initially close state-space trajectories
and frequently employ to identify a chaotic behaviour. We choose the growth rate of prey, r as the real
bifurcation parameter (varied parameter) and other model parameters are as fixed parameters, otherwise stated.
For showing the dynamics of the system (1) change, the bifurcation parameters are considered in the following
cases:
Case (i): varying r in range 43 r , and 25.0,95.1,3 dba fixing.
Case (ii): varying r in range 97.21 r , and 25.0,5.4,5.3 dba fixing.
Fig. 1 Bifurcation diagrams and maximum Lyapunov exponent for system (1) around 2E . (a) Flip bifurcation diagram of system
(1) in ( yxr ) space, the initial value is 061.0,641.0, 00 yx (b) Flip bifurcation diagram in ( xr ) plane (c)
Maximum Lyapunov exponents corresponding to (b) and (d) Maximum Lyapunov exponents are superimposed on Flip
bifurcation diagram.
195

Computational Ecology and Software, 2015, 5(2): 187-200
IAEES www.iaees.org
For case (i). The bifurcation diagrams of system (1) in ( yxr ) space and in ( xr ) pane are given
in Fig. 1(a-b). After calculation for the fixed point 2E of map (1), the flip bifurcation emerges from the fixed
point 062.0,641.0 at 3.31 rr and 2
,, EFBdba . It shows the correctness of proposition 1. At
1rr , we have 167.1411 r , which determines the direction of the flip bifurcation and shows the
correctness of Theorem1.From Fig. 1(b), we see that the fixed point 2E is stable for 3.3r and loses its
stability at the flip bifurcation parameter value 3.3r , we also observe that there is a cascade of period
doubling bifurcations for 3.3r . The maximum Lyapunov exponents corresponding to Fig. 1(b) are
computed and plotted in Fig. 1(c), confirming the existence of the chaotic regions and period orbits in the
parametric space.
For case (ii). The bifurcation diagrams of system (1) in the ( yxr ) space, the ( xr ) plane and the
( yr ) plane are given in Fig. 2(a-b-c). After calculation for the fixed point 2E of map (1), the Neimark-
Sacker bifurcation emerges from the fixed point 127.0,2778.0 at 22 rr and 2
,, ENSdba . It
shows the correctness of proposition 1. For 2rr , we have ,691661.0722222.02,1 i 12,1 ,
,03125.0)(
2
rr
i
dr
rd ,65106.188889.020 ig ,57389.461111.102 ig
,30523.125.111 ig ,021 g and 625.522 r . Therefore, the Neimark-Sacker bifurcation is
supercritical and it shows the correctness of Theorem 2.
From Fig. 2(b-c), we observe that the fixed point 2E of map (1) is stable for 2r and loses its
stability at 2r and an invariant circle appears when the parameter r exceeds 2 , we also observe that
there are period-doubling phenomenons. The maximum Lyapunov exponents corresponding to Fig. 2(b-c) are
computed and plotted in Fig. 2(d), confirming the existence of the chaotic regions and period orbits in the
parametric space. From Fig. 2(d), we observe that some Lyapunov exponents are bigger than 0, some are
smaller than 0, so there exist stable fixed points or stable period windows in the chaotic region. In general the
positive Lyapunov exponent is considered to be one of the characteristics implying the existence of chaos. The
bifurcation diagrams for x and y together with maximum Lyapunov exponents is presented in Fig. 2(e).
Fig. 2(f) is the local amplification corresponding to Fig. 2(b) for ]948.2,7.2[r .
The phase portraits which are associated with Fig. 2(a) are disposed in Fig. 3, which clearly depicts the
process of how a smooth invariant circle bifurcates from the stable fixed point 127.0,2778.0 . When r
exceeds 2 there appears a circular curve enclosing the fixed point 2E , and its radius becomes larger with
respect to the growth of r . When r increases at certain values, for example, at 745.2r , the circle
disappears and a period-9 orbits appears, and some cascades of period doubling bifurcations lead to chaos.
From Fig. 3, we observe that as r increases there are period-9, 10, 20-orbits, quasi-periodic orbits and
attracting chaotic sets. See that for 97.2&95.2r , where the system is chaotic, is the value of maximal
Lyapunov exponent positive that confirm the existence of the chaotic sets.
196

IAEES
Fig. 2 Bi
diagram o
Lyapunov
Local amp
furcation diagr
of system (1) in
exponents cor
plification corre
Com
rams and maxi
n ( yxr ) s
rresponding to (
esponding to (a)
mputational Ecol
imum Lyapuno
space (b-c) H
(b-c) (e) Maxim
) for 2,7.2[r
logy and Softw
ov exponent fo
Hopf bifurcation
mum Lyapunov
]948.2 . The init
ware, 2015, 5(2)
or system (1) a
n diagrams in
v exponents are
tial value is 0x
: 187-200
around 2E . (a)
( xr ) and ( r
e superimposed
0,25.0, 00 y
w
) Neimark-Sack
yr ) planes (
d on bifurcatio
11. .
www.iaees.org
ker bifurcation
(d) Maximum
on diagrams (f)
n
m
)
197

IAEES
In o
values of
on initial
of these L
(1) for p
Fig. 4(a)
negative
which ch
order to obse
f Lyapunov e
l conditions,
Lyapunov ex
parameters r. In Fig. 4(b)
Lyapunov ex
hoice of para
Com
Fig. 3 Phase
erve the comp
exponents qua
so we compu
xponents on tw
97.2,0.1) is plotted th
xponent and
ameters the s
mputational Ecol
e portraits for va
plex dynamic
antify the cha
ute maximum
wo real param
and 2bhe sign of the
red color rep
system (1) is
logy and Softw
arious values of
cs, we can v
aotic behavior
m Lyapunov
meters r and
5.4,5.2 and
maximal Ly
presents posit
showing cha
ware, 2015, 5(2)
f r correspon
ary one more
r of discrete s
exponents of
d b . The max
fixing other
apunov expo
tive Lyapuno
aotic motion,
: 187-200
nding to Fig. 3(a
e parameters
system or at l
f system (1) a
ximum Lyapu
parameters a
onent of map
ov exponent.
, and for whi
w
a).
of system (
least sensitive
and study the
unov exponen
as in case (ii
(1). Blue col
Here it is ea
ich one is th
www.iaees.org
1). Since the
e dependence
e dependence
nts of system
i) is given in
lor represents
asy to see for
he system (1)
e
e
e
m
n
s
r
)
198

IAEES
exhibitin
97.2rwhich ar
Fig. 4 Sig
covering
blue‘o’ = n
5 Discus
In this pa
Holling t
As certa
bifurcatio
interestin
quasi-per
period-n
space, th
Referenc
Agiza HN
with
Brauer F
Verla
Danca M
Biolo
Elaydi SN
Elsadany
ng periodic or
5.4&7 bre consistent w
gn of maximum
97.2,0.1r a
negative). The i
ssion
aper, We perf
type I functio
ain parameter
on and a Ne
ng dynamical
riodic orbits
orbits and in
he model (1) h
ces
N, Elabbasy
Holling type
F, Castillo-Ch
ag, New York
M, Codreanu
ogical Physic
N. 1996. An
y AA, EL-Me
Com
r quasi period
5 and the n
with signs in
m Lyapunov ex
and .4,5.2b
initial value is
formed a deta
onal response
rs increase o
imark-Sacker
l behaviors, in
and the chao
nvariant cycle
had a great se
EM, EL-Me
II. Nonlinear
havez C. 2001
k, USA
S, Bako B.
s, 23: 11-20
Introduction
etwally HA, E
mputational Ecol
dic movement
non-chaotic s
Fig. 4(b).
xponent for sy
5 (b) Sign of
25.0, 00 yx
ailed comput
and showed
or decrease f
r bifurcation
ncluding peri
otic sets, whi
e. Finally, sim
ensitivity to th
etwally H, et
r Analysis: R
1. Mathemati
. 1997. Deta
to Difference
Elabbasy EM
logy and Softw
t. E.g., the ch
situation is f
ystem (1) aroun
Maximum Lya
11.0,5 .
tational analy
that it has a c
further away,
in the interi
iod-9, 10, 20-
ich imply tha
mulation wor
he choice of i
al. 2009. Ch
Real World Ap
ical Models in
ailed analysis
e Equations. S
M, Agiza HN.
ware, 2015, 5(2)
haotic situatio
for values o
nd 2E . (a) Ma
apunov expone
ysis of the dis
complex dyna
, we showed
ior of 2R . M
-orbits, invari
at the predato
rks showed th
initial conditi
haotic dynam
pplications, 1
n Population
s of a nonlin
Springer-Ver
2012. Chaos
: 187-200
on is on Fig. 3
f parameters
aximum Lyapun
ents correspond
screte-time pr
amics in the c
d that system
Moreover, sy
iant cycle, ca
ors and prey
hat in certain
ions and para
mics of a disc
10: 116-129
Biology and
near prey-pre
rlag, USA
and bifurcati
w
3 for values o
s 745.2r
nov exponents
ding to (a) (red
redator-prey s
closed first qu
m (1) can un
ystem (1) disp
ascade of peri
can coexist
n regions of th
ameter values
crete prey-pre
d Epidemiolog
edator model
ion of a nonli
www.iaees.org
of parameters
5.4& b
of system (1)
d‘*’ = positive,
system (1) of
uadrant 2R .
ndergo a flip
played much
iod-doubling,
in the stable
he parameter
.
edator model
gy. Springer-
l. Journal of
inear discrete
s
)
,
f
.
p
h
,
e
r
l
-
f
e
199

Computational Ecology and Software, 2015, 5(2): 187-200
IAEES www.iaees.org
prey-predator system. Computational Ecology and Software, 2(3): 169-180
Guckenheimer J, Holmes P. 1983. Nonlinear Oscillations, Dynamical Systems, and Bifurcations of Vector
Fields. Springer, New York, USA
Hasan KA, Hama, M. F. 2012. Complex Dynamics Behaviors of a Discrete Prey-Predator Model with
Beddington-DeAngelis Functional Response. International Journal of Contemporary Mathematical
Sciences, 7(45): 2179-2195
Hastings A, Powell T. 1991.Chaos in three-species food chain. Ecology, 72: 896-903
He ZM, Lai X. 2011.Bifurcations and chaotic behavior of a discrete-time predator-prey system. Nonlinear
Analysis: Real World Applications, 12: 403-417
He ZM, Li Bo. 2014.Complex dynamic behavior of a discrete-time predator-prey system of Holling-III type.
Advances in Difference Equations, 180
Hu ZY, Teng Z, Zhang L. 2011. Stability and bifurcation analysis of a discrete predator-prey model with
nonmonotonic functional response. Nonlinear Analysis, 12: 2356-2377
Holling CS. 1965. The functional response of predator to prey density and its role in mimicry and population
regulation. Memoirs of the Entomological Society of Canada, 45: 1-60
Jing ZJ, Yang J. 2006. Bifurcation and chaos discrete-time predator-prey system. Chaos, Solutions and
Fractals, 27: 259-277
Klebanoff A, Hastings A. 1994. Chaos in three species food-chain. Journal of Mathematical Biology, 32: 427-
245
Kuznetsov YK. 1998. Elements of Applied Bifurcation Theory (3rd edn). Springer, New York, USA
Li TY, Yorke JA. 1975. Period three implies chaos. American Mathematical Monthly, 82: 985-992
Liu X, Xiao DM. 2007. Complex dynamic behaviors of a discrete-time predator prey system. Chaos, Solutions
and Fractals, 32: 80-94
Lotka AJ. 1925. Elements of Mathematical Biology, Williams and Wilkins, Baltimore, USA
May RM. 1974.Stability and Complexity in Model Ecosystems. Princeton University Press, NJ, USA
May RM. 1975. Biological populations obeying difference equations: stable points, stable cycles and chaos.
Journal of Theoretical Biology, 51(2): 511-524
May RM. 1976. Simple mathematical models with very complicated dynamics. Nature; 261:459-467
Murray JD. 1998. Mathematical Biology. Springer-Verlag, Berlin, Germany
Robinson C. 1999. Dynamical Systems, Stability, Symbolic Dynamics and Chaos (2nd edn). CRC Press, Boca
Raton, USA
Volterra V. 1926.Variazioni e fluttuazionidelnumerod’individui in specie animaliconviventi, Mem. R. Accad.
Naz. Dei Lincei, Ser. VI, vol. 2
Wiggins S. 2003. Introduction to Applied Nonlinear Dynamical Systems and Chaos (2nd edn). Springer, New
York, USA
Zhu H, Campbell SA, Wolkowicz G. 2002. Bifurcation analysis of a predator-prey system with nonmonotonic
functional response. SIAM Journal on Applied Mathematics, 63: 636-682
200

Computational Ecology and Software, 2015, 5(2): 201-221
IAEES www.iaees.org
Article
Modeling and analysis of the survival of a biological species in a
polluted environment: Effect of environmental tax
Shyam Sundar1, Ram Naresh2
1Department of Mathematics, P. S. Institute of Technology, Kanpur-208020, India 2Department of Mathematics, H. B. Technological Institute, Kanpur-208002, India
E-mail: [email protected]
Received 30 December 2014; Accepted 10 February 2015; Published online 1 June 2015
Abstract
In this paper, a nonlinear dynamical model is proposed and analyzed to study the survival of biological species
in a polluted environment considering the effect of environmental tax which can be used further to improve
environmental quality. The environmental tax is imposed to control the emission of pollutants/toxicants only
when the equilibrium concentration of pollutants go beyond its threshold level causing harm to the biological
species and its ecosystem under consideration. Local and nonlinear stability conditions are obtained by
considering suitable Liapunov function. Numerical simulation of the dynamical system is performed in order
to illustrate the analytical findings. It is shown that the density of biological species decreases as the
concentration of pollutants increases and may even become extinct if the concentration is very high. It has also
been shown that the environmental tax plays an important role to control the concentration of pollutants in the
atmosphere and maintaining the density of biological species at a desired level.
Keywords modeling; biological species; polluted environment; environmental tax; stability.
1 Introduction
It has been observed during last several years that various kinds of toxicants (pollutants) such as toxic gases,
smoke, particulate matters, cement dust, chemicals, etc. discharged from various industries and other sources
have made considerable change in the both terrestrial and aquatic environment in the form of deforestation, air
pollution, water pollution, etc. The survival of biological species is threatened instantly due to polluted air,
water, soil, land and vegetation, etc. caused by toxicants. Therefore, it is crucial to investigate the effect of
toxicants on biological species and the reduction in concentration in the atmosphere by imposing
environmental tax on emitters which may in turn reduce environmental damage and minimizing harm to
economic growth.
Some investigations have been made to study the effect of toxicants released to the water bodies, gaseous
pollutants and particulate matters on the environment and ecology as well as on biological species (Lovett and
Kinsman, 1990; Hopke, 2009; Woo, 2009; Cambra-Lopez, 2010; Pertsev and Tsaregorodtseva, 2011). For
example, Cambra-Lopez (2010) have reviewed the effect of airborne particulate matters from the livestock
production systems and have shown that high concentration of particulate matters can deteriorate the
environment as well as the health of human and animals.

Computational Ecology and Software, 2015, 5(2): 201-221
IAEES www.iaees.org
In recent years, several studies have been conducted to comprehend the effect of toxicants on biological
species living in a polluted environment (Hallam and Clark, 1981; Freedman and Shukla, 1991; Liu and Ma,
1991; Chattopadhyaya, 1996; Shukla and Dubey, 1996, 1997; Shukla et al., 2001, 2009, 2013; Mukherjee,
2002; Liu et al., 2003; Samanta and Matti, 2004; Dubey and Hussain, 2006; Naresh et al., 2006; Dubey, 2010;
Samanta, 2010; Misra and Kalra, 2012; Naresh et al., 2014). In this regard, Samanta and Matti (2004) have
proposed and analyzed a nonlinear mathematical model to study the effect of toxicant on a single species
living in a polluted environment by considering three cases; instantaneous input of toxicant, constant input of
toxicant and fluctuating emission rate of toxicant into the environment. In the analysis, it has been shown that
instantaneous emission of toxicants has no significant effect on population but the population settles down to a
steady state if the toxicants are emitted incessantly. Dubey and Hussain (2006) proposed a mathematical model
for the survival of species dependent on a resource in polluted environment considering the effect of diffusion
on the system. They have shown that the equilibrium level of the density of population decreases as the
environmental concentration of the pollutant increases. Naresh et al. (2006) have studied the dynamics of the
plant biomass in a polluted environment by considering the effect of intermediate toxic product formed by
uptake of a toxicant on plant biomass. It has been shown that intermediate toxic product is mainly responsible
for the decrease in the intrinsic growth of plant biomass and the equilibrium label of the density of plant
biomass depends upon the rate of emission of toxicant into the atmosphere. Shukla et al. (2009) have studied
the effect of toxicants on population emitted from extraneous sources as well as formed by its precursors by
developing a nonlinear mathematical model and have shown that the densities of population and its resource
decrease due to increase in the concentration of toxicants in the environment.
At present, deterioration in environmental quality due to discharge of toxicants in the atmosphere is a
burning issue in India and elsewhere. Rapid growth of industries, fast population growth, increasing demand of
resources and deforestation are all exacerbating problems that need to be comprehended. In this regard, some
mitigation options are to be required to improve environmental quality. Environmental tax policy may be one
of the most potent mitigation strategies that must be imposed to the emitters keeping in mind that it is imposed
neither to enhance net additional tax revenue nor to reduce the overall energy consumptions but is
implemented to get clean environment. During previous years, effect of implementation of environmental tax
has been discussed by policy makers to reduce environmental damages and to get a clean environment
(Symons et al., 1994; Bovenberg et al., 1996; Stern, 2006; Sterner, 2007; Braathen and Greene, 2011; Liu,
2012). Environmental tax, to be imposed to the emitters, is generally based on the following factors,
1. The quantity of the pollutants/toxicants discharged into the environment
2. The use of resources
3. The products responsible for environmental degradation
4. The vehicle excise duty
In India, about 64% policy makers have considered environmental tax as a most important significant
factor making a clean environment (Kanabar, 2011). It is mentioned here that the tax is levied to the emitters
only when the concentration of pollutants in the atmosphere crosses a threshold limit. Threshold means the
concentration of pollutants below which there is no harm to the population and its environment. The tax is
imposed on the basis of per unit emission of pollutants (beyond its threshold limit) in the environment. The
study of implementation of environmental tax to reduce the concentration of pollutants in the atmosphere has
less understood and received little attention using nonlinear mathematical models. In this regard, Agarwal and
Devi (2010) have studied the effect of environmental tax on the survival of biological species in a polluted
environment using a mathematical model but they have not considered the formation of intermediate toxic
product inside the biomass.
202

Computational Ecology and Software, 2015, 5(2): 201-221
IAEES www.iaees.org
In view of the above, in this paper, we have proposed and analyzed a nonlinear mathematical model to
study the effect of environmental tax to reduce the concentration of toxicants in the atmosphere forming
intermediate toxic product inside the biomass due to interaction of toxicants with sap (biomass fluid).
2 Mathematical Model
Consider a biological species living in a polluted environment affected by toxicants emitted into the
atmosphere from different sources. To model the phenomenon, we have made the following assumptions,
1. The cumulative rate of emission of toxicants is constant (say Q ) though it may be a function of time.
2. The growth rate of biological species is affected by an intermediate toxic product (formed inside the
biomass due to the interaction of uptaken toxicants and the liquid present in the biomass).
3. The carrying capacity of biological species is affected by the concentration of toxicants emitted into the
environment and it decreases with increase in the concentration of toxicants emitted into the environment.
4. Environmental tax is assumed to be imposed only when the toxicant concentration crosses a threshold and as
such, it is taken to be directly proportional to the difference of toxicants concentration and its threshold level.
Threshold concentration implies the level up to which there is no harmful effect on biological species.
Let )(tN be the density of biological species, )(),( tUtT and )(1 tU be the concentrations of
toxicants emitted into the environment, the toxicants uptaken by biological species and the intermediate toxic
product formed, respectively. Let )(tI be the environmental tax imposed on the emitters. It is assumed that the
depletion of toxicants is directly proportional to the concentration of toxicants as well as the density of
biological species i.e. )()( tTtN , being the interaction rate coefficient of toxicants with biological
species, is the uptake rate coefficient of toxicants due to biological species and )1( is the rate by
which biological species are directly affected by toxicants. The uptake concentration of toxicants is assumed to
be depleted naturally by a rate 0 and 1 is the interaction rate coefficient of toxicants uptaken by the
biological species. When toxicants uptaken interact with the fluid (sap) inside biological species, intermediate
toxic product is formed which is mainly responsible for deterioration of biological species. Let be the rate
of formation of intermediate toxic product and the constants 0 and 1 are the depletion rate coefficients of
intermediate toxic product due to excretion and depuration of toxicants. To control the emission of toxicants
into the atmosphere, environmental tax is assumed to be imposed on the emitters when toxicant concentration
crosses a threshold level and it is assumed to be proportional to the difference of toxicants concentration and
its threshold value i.e. )( 0TT , 0T being the threshold concentration of toxicants and is the tax rate
coefficient. If 0TT , no tax will be imposed on the emitters. Since it is difficult to implement and maintain a
foolproof tax system due to some practical problems like pilferages, natural and administrative problems, it is,
203

Computational Ecology and Software, 2015, 5(2): 201-221
IAEES www.iaees.org
therefore, obvious to consider a term E0 as a depletion of environmental tax due to these factors. The
constant μ is the tax repulsion rate coefficient.
)()()1()())((
)())((
)( 01 tTtNtN
tTK
tNrtUr
dt
tdN
(1)
)()()()()()(
0 tEtTtNtTtQdt
tdT (2)
)()()()()()(
10 tNtUtUtTtNdt
tdU (3)
)()()()()(
11101 tNtUtUtU
dt
tdU (4)
)())(()(
00 tETtTdt
tdE (5)
0)0(,0)0(,0)0(,0)0(,0)0( 10 EUUTTN
In the model, the function )( 1Ur denotes the intrinsic growth rate of biological species in the presence of
intermediate toxic product formed inside it, as discussed above, and 0r is the maximum intrinsic growth rate
of biological species in the absence of intrinsic toxic product. The intrinsic growth rate )( 1Ur decreases as the
concentration of intermediate toxic product 1U increases and hence, we assume that,
0)0( 0 rr , 0)( 1 Ur for 01 U
The function )(TK denotes the carrying capacity of species in presence of toxicants in the environment
and 0K is the maximum carrying capacity in the absence of toxicants. The carrying capacity )(TK decreases
as the concentration of toxicants T increases and hence,
0)0( 0 KK , 0)( TK for 0T
Remarks
1. As discussed above, the rate of discharge of toxicants (Q ) into the atmosphere is assumed to be constant
which is controlled by introducing a term E (environmental tax), given in equation (2). From (2), we note
that as (the tax repulsion coefficient) increases, the concentration of toxicant into the atmosphere decreases.
204

Computational Ecology and Software, 2015, 5(2): 201-221
IAEES www.iaees.org
2. It is further remarked here that the cumulative concentration of toxicants/pollutants must be greater than its
threshold concentration (i.e. 0TT ) for the physical significance of the model system and in this situation the
tax will be imposed on the industrialists and would continue till 0TT . If 0TT , then dt
dE will be negative
and no tax will be imposed to the concerned industrialists. Further, if 0 i.e. no tax is imposed to the
industrialists, the toxicants concentration would cross its harmful limit (threshold concentration) and the
survival of biological species will be threatened and it might become extinct.
It is, therefore, desirable that environmental tax must be levied to keep the toxicants emission under control.
Lemma If 00
TQ
, then the set
mmm EEUUUUQ
TKNEUUTN 0,0,0,0,0:),,,,( 110
01
is the region of attraction for all solutions of the model system (1) – (5) initiating in the interior of positive
octant, where 00
0
QK
U m , mm UU0
1
,
000
TQ
Em
.
Since 0
Q is the maximum concentration of toxicants and therefore it is remarked here that the condition
00
QT for the existence of region of attraction implies that the environmental tax can be imposed to the
industrialists only when the concentration of toxicants crosses its threshold value.
3 Equilibrium Analysis
The model under consideration has following two nonnegative equilibria,
(i) ),0,0,,0(0 ETE
where
00
00
TQ
T and
00
00
0
TQE
(ii) ),,,,( **1
**** EUUTNE
The positive solution of *E is given by the following system of algebraic equations,
0)1()(
)( 01 T
TK
NrUr (6)
00 ETNTQ (7)
205

Computational Ecology and Software, 2015, 5(2): 201-221
IAEES www.iaees.org
010 UNUTN (8)
01110 NUUU (9)
0)( 00 ETT (10)
From equations (7) and (10), we have
0)( 00
0 TTTNTQ (11)
Equation (11), (8) and (9) can also be respectively written as,
)(
00
00 Nf
N
TQ
T
(12)
)()(
10
NgN
NfNU
(13)
)()(
101 Nh
N
NgU
(14)
Now, from (6), we have
0)1()(
))(( 0 TTK
NrNhr (15)
To show the existence of nontrivial equilibrium *E , we plot the isoclines given by equations (11) and (15) in TN plane as follows,
From equation (11) we note the following,
(i) 0N 0
00
00
TQ
T
(ii) 000
T
N
dT
dN
in first quadrant.
(iii)
00
N and 0T are the asymptotes.
From equation (15), we also note the following,
(i) 0T 0KN
206

Computational Ecology and Software, 2015, 5(2): 201-221
IAEES www.iaees.org
(ii) 0N 0)1(
0
rT
(iii) 0
)()())((
)1()()(
0
20
TK
rNgNgr
TKTK
Nr
dT
dN
in first quadrant, provided 11
002
N
In view of the above, it is shown in figure 1 that the isoclines given by (11) and (15) intersect at a unique point
),( ** TN in the interior of first quadrant in TN plane showing that the steady-state values of *N and
*T are within the invariant region.
Knowing the values of *N and *T , we can find the values of *
1* ,UU and *E from the equations (13), (14)
and (10) respectively.
It is noted that,
N
TNU
10
0
TN
mUQK
00
0
This shows that the steady-state value of *U is within the invariant region.
We also note that,
N
UU
101
0
U
0
mU mU1
This shows that the steady-state value of *
1U is within the invariant region.
Further,
0
0 )(
TT
E
207
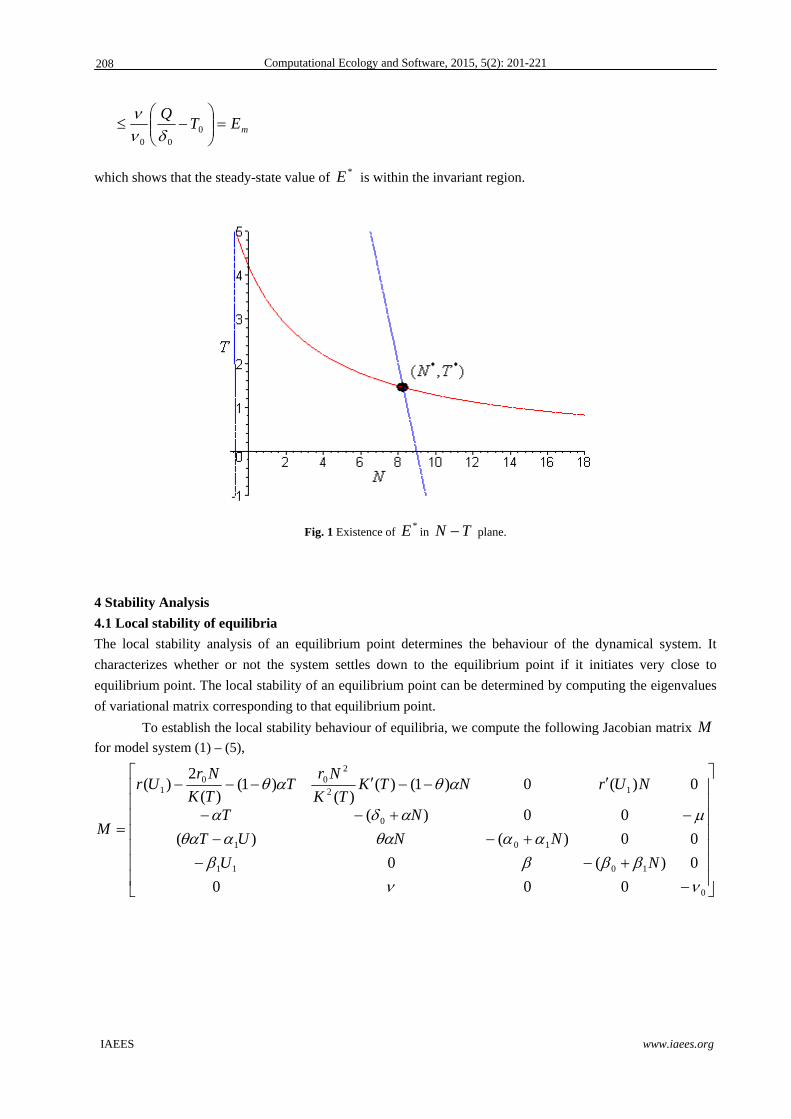
Computational Ecology and Software, 2015, 5(2): 201-221
IAEES www.iaees.org
0
00
TQ
mE
which shows that the steady-state value of *E is within the invariant region.
Fig. 1 Existence of *E in TN plane.
4 Stability Analysis
4.1 Local stability of equilibria
The local stability analysis of an equilibrium point determines the behaviour of the dynamical system. It
characterizes whether or not the system settles down to the equilibrium point if it initiates very close to
equilibrium point. The local stability of an equilibrium point can be determined by computing the eigenvalues
of variational matrix corresponding to that equilibrium point.
To establish the local stability behaviour of equilibria, we compute the following Jacobian matrix M
for model system (1) – (5),
0
1011
101
0
12
200
1
000
0)(0
00)()(
00)(
0)(0)1()()(
)1()(
2)(
NU
NNUT
NT
NUrNTKTK
NrT
TK
NrUr
M
208

Computational Ecology and Software, 2015, 5(2): 201-221
IAEES www.iaees.org
It can easily be checked that the equilibrium ),0,0,,0(0 ETE is stable or unstable according as
)1(0
rT or
)1(0
rT (necessary condition for the existence of *E ) respectively. This implies that
0E is saddle point if *E exist otherwise it is locally asymptotically stable.
To study the local stability behaviour of the model system about ),,,,( **1
**** EUUTNE , we define
following positive definite function *E ,
25
214
23
22
21 2
1
2
1
2
1
2
1
2
1ekukukknkV (16)
where 1,,, uun and e are small perturbations about *E and )5...,,2,1( iki are positive constants to be
chosen appropriately.
Differentiating (16) with respect to ''t and using linearized system of (1) – (5), we get,
2*103
2*02
2*
*0
1 )()()(
uNkNknTK
Nrk
dt
dV
205
21
*104 )( ekuNk
nuUTknTkNTKTK
Nrk )()1()(
)(*
1*
3*
2**
*2
2*0
1
uNknuUkNUrk )())(( *31
*114
**11
1452 )()( uukekk
Now, dt
dV will be negative definite under the following conditions,
)()(9
4)1()(
)(*
0*
*0
21
2
*2
***2
2*0
1 NTK
NrkkTkNTK
TK
Nrk
)()(9
4)( *
10*
*0
12*
1*
3 NTK
NrkUTk
)()(3
2))(( *
10*
*0
412*
114**
11 NTK
NrkkUkNUrk
))((9
4)( *
10*
022*
3 NNkNk
0*
0522
52 )(3
4)( Nkkkk
209

Computational Ecology and Software, 2015, 5(2): 201-221
IAEES www.iaees.org
))((3
2 *10
*103
24 NNkk
Choosing 121 kk ,
2*
*0
2*1
**
*0*
103 )(
)(,
)(
1
)(min)(
9
4
N
N
UTTK
NrNk
,
32
*10
*10
4
))((
3
2k
NNk
and
5k , dt
dV will be negative definite provided the conditions
(17) and (18) are satisfied implying that ),,,,( **1
**** EUUTNE is locally asymptotically stable.
Theorem 4.1 The interior equilibrium ),,,,( **1
**** EUUTNE is locally asymptotically stable if the
following conditions hold,
)()(9
4)1()(
)(*
0*
*0
2
****2
2*0 N
TK
NrTNTK
TK
Nr
(17)
)()(3
2))(( *
10*
*0
42*
114**
1 NTK
NrkUkNUr (18)
This theorem implies that if the interaction rate coefficient of toxicants with biological species (i.e. ) and
)( *1Ur are large then the conditions (17) and (18) may not be satisfied. This implies that these parameters
destabilize the system.
4.2 Nonlinear stability of equilibrium ),,,,( **1
**** EUUTNE
In this section we discuss the nonlinear stability character of an interior equilibrium
),,,,( **1
**** EUUTNE inside the region of attraction by using Liapunov second method.
To establish the nonlinear stability behaviour of ),,,,( **1
**** EUUTNE , we consider the following
positive definite function,
2*52*11
42*32*2*
**1 )(
2)(
2)(
2)(
2log EE
mUU
mUU
mTT
m
N
NNNNmW
where )5...,2,1( imi are positive constants to be chosen appropriately.
Differentiating it, we get
dt
dUUUm
dt
dTTTm
dt
dN
NNNm
dt
dW)()(
1)( *
3*
2*
1
dt
dEEEm
dt
dUUUm )()( *
51*
114
2*13
2*2 )()( UUNmTTNm
210

Computational Ecology and Software, 2015, 5(2): 201-221
IAEES www.iaees.org
2*03
2*02
2**
01 )()()(
)(UUmTTmNN
TK
rm
2*05
2*11104 )())(( EEmUUNm
))(](})()1[{( ***210 TTNNTmmTNr
))(}()({))()(( *11
**11411
***1
*3 UUNNUmUmUUNNUTm
))(())(}({))(( *11
*4
**52
**3 UUUUmEETTmmUUTTNm
where
*
11*
1
*11*
11
*11
1
)(
,)()(
)(
UUUr
UUUU
UrUrU and
*
*2
**
*
)(
)(
,)(
1
)(
1
)(
TTTK
TK
TTTT
TKTKT
Now dt
dW will be negative definite provided the following conditions are satisfied,
0*0
212*
210 )(9
4]})()1[{(
TK
rmmTmmTNr
0*0
12*
1*
3 )(9
4)(
TK
rmUTm
0*0
12*
11411 )(3
2})({
TK
rmUmUm
0022
3 9
4)( mNm
00522
52 3
4)( mmmm
0032
4 3
2 mm
Let )( 1Ur and )(TK satisfying in such that 0)( KTKK m , pUr )(0 1 , qTK )(0 ,
where qpKm ,, are some positive constants.
Using mean value theorem, we get pU )( 1 and qT )( .
Now maximizing LHS and choosing 121 mm ,
211

Computational Ecology and Software, 2015, 5(2): 201-221
IAEES www.iaees.org
20
02*
1**
003 )(
,)(
1
)(min
9
4
KUTTK
rm
,
5m , 3200
4 3
2mm
, dt
dV will be
negative definite inside the region of attraction , provided the conditions (19) and (20) are satisfied
implying that ),,,,( **1
**** EUUTNE is nonlinearly asymptotically stable.
Theorem 4.2 Let )( 1Ur and )(TK satisfying in such that 0)( KTKK m , pUr )(0 1 ,
qTK )(0 , where qpKm ,, are some positive constants then equilibrium
),,,,( **1
**** EUUTNE will be nonlinearly asymptotically stable provided the inequalities are satisfied,
)(9
4)1(
*00
2
*200 TK
rT
K
qKr
m
(19)
)(3
2)(
*00
12*
114 TK
rmpUm
(20)
where
20
02*
1**
003 )(
,)(
1
)(min
9
4
KUTTK
rm
and 32
004 3
2mm
This theorem implies that if the interaction rate coefficient of toxicants with biological species (i.e. )
and p are large then the conditions (19) and (20) may not be satisfied. This implies that these parameters have
destabilizing effect on the model system.
5 Permanence of Solution
From a biological point of view, permanence (persistence) is defined as the long-term survival of all
interacting populations in an ecosystem. It also deals with the growth of biological species as well as other
components of the system. It is noted that the steady state level of all species settles asymptotically above a
certain threshold. Mathematically, persistence is defined as,
Let )(tN be the population density at any time ‘ t ’ then it is said to be persistent (Freedman and Waltman,
1984), if
0)(inflim
tNt
provided 0)0( N . If there exists 0 such that
)(inflim tNt
then the population is said to be uniformly persistent in an ecological system. Thus, the population is said to be
permanent, if it is uniformly persistent and if the bound of population size does not depend on initial
conditions as t .
Theorem 5
212

Computational Ecology and Software, 2015, 5(2): 201-221
IAEES www.iaees.org
If 00
)1(
QQr
then the system (1)-(5) is uniformly persistent.
Proof
From equation (1), we have
0
01 )1(
))((
)())(()(
)(
Q
tTK
tNrtUrtN
dt
tdN
00
0
0
)1()(
)(
Q
K
tNrQrtN
)()1(
)(
000
0
0
0 tNQQ
rr
K
K
tNr
This implies that
inf000
0 )1()(inflim NQQ
rr
KtN
t
(let)
From equation (2), we have
0
0000 )()()(
)(T
QtTKtTtQ
dt
tdT
)()( 00000
tTKTQ
Q
This implies that
inf00
000
)()(inflim T
K
TQ
Q
tTt
(let)
From equation (3), we have
)()()(
01011 tUKTNdt
tdU
This implies that
inf010
infinf
)()(inflim U
K
TNtU
t
(let)
From equation (4), we have
)()()()(
1010inf1 tUKtU
dt
tdU
This implies that
)()(inflim
010
inf1 K
UtU
t
213

Computational Ecology and Software, 2015, 5(2): 201-221
IAEES www.iaees.org
Similarly, we can find from equation (5), that
0
0inf )()(inflim
TT
tEt
Thus, we have,
0000
0 )(suplim)(inflim)1( KtNtNQQ
rr
Ktt
000
000 )(suplim)(inflim
)(
Q
tTtTK
TQ
Q
tt
0010
infinf )(suplim)(inflim)(
QtUtU
K
TNtt
011
010
inf )(suplim)(inflim)(
QtUtU
K
Utt
0
000
0inf )(suplim)(inflim)(
TQ
tEtETT
tt
Hence the theorem.
6 Numerical Simulations
In this section, we have performed some numerical simulations using software Maple7 in the presence and
absence of environmental tax considering the effect of intermediate toxic product on biological species. For
this, we have assumed the following set of parameters,
3.0,2.0,1.0,3.0,5.0,9,4,01.0,01.0,5 010 KrbaQ
6.0,2.0,4.0,4.0,03.0,02.0,2.0 0010 T
The equilibrium values corresponding to ),,,,( **1
**** EUUTNE are given by,
695243.1,049509.1,781606.0,447621.1,285064.8 **1
*** EUUTN
Eigenvalues corresponding to ),,,,( **1
**** EUUTNE are given by,
0.0073i0.2656 0.0073i,0.2656 1.0300, 2.3388,4.2706, . Since all the eigenvalues are
either negative or have negative real parts and therefore equilibrium ),,,,( **1
**** EUUTNE is locally
asymptotically stable.
214

Computational Ecology and Software, 2015, 5(2): 201-221
IAEES www.iaees.org
The existence of ),,,,( **1
**** EUUTNE in TN plane is shown in figure 1. The nonlinear
stability behavior of ),,,,( **1
**** EUUTNE is shown in figure 2 where the trajectories with different
initial starts have been plotted. It is noted that all the trajectories with different initial starts approach to the
equilibrium point *E . The variation of density of biological species, concentration of toxicants, uptaken concentration, concentration of intermediate toxic product and the amount of environmental tax with time ''t
for different values of rate of emission of toxicants is shown in figures 3 – 7 respectively. From these figures, it
can easily be observed that the density of biological species decreases while the concentrations of toxicants,
uptaken toxicants and intermediate toxic product increase as the rate of emission of toxicants increases. Further,
it has also been shown in figure 7 that the environmental tax increases as the rate of emission of toxicants in
the environment increases beyond its threshold level.
Fig. 2 Nonlinear stability in 1UU plane.
Fig. 3 Variation of N with time ''t for different values of Q
215

Computational Ecology and Software, 2015, 5(2): 201-221
IAEES www.iaees.org
Fig. 4 Variation of T with time ''t for different values of Q
Fig. 5 Variation of U with time ''t for different values of Q
The effect of intermediate toxic product on biological species with time ''t has been shown in figure 8. It
can be seen from figure 8 that as the rate of formation of intermediate toxic product inside the biological
species increases the density of biomass decreases. The variation of density of biological species )(N and the
concentration of toxicants )(T with time ''t in the presence and absence of environmental tax has been shown
in figures 9 and 10 respectively. From these figures, it is noted that in the absence of environmental tax,
density of biological species decreases as a result of increase in the concentration of toxicants while in the
presence of environmental tax, density of biological species increases due to decrease in the concentration of
toxicants. The variation of density of biological species )(N and the concentration of toxicants )(T with time
''t for different values of tax rate coefficient is shown in figures 11 and 12 respectively. It is shown that as the
tax rate coefficient increases, the equilibrium level of density of biological species increases and the
concentration of toxicants decreases.
216

Computational Ecology and Software, 2015, 5(2): 201-221
IAEES www.iaees.org
Fig. 6 Variation of 1U with time ''t for different values of Q
Fig. 7 Variation of E with time ''t for different values of Q
Fig. 8 Variation of N with time ''t for different values of
217

Computational Ecology and Software, 2015, 5(2): 201-221
IAEES www.iaees.org
Fig. 9 Variation of N with time ''t in the presence )4.0( and absence )0( of environmental tax.
Fig. 10 Variation of T with time ''t in the presence )4.0( and absence )0( of environmental tax
Fig. 11 Variation of N with time ''t for the different values of tax rate coefficient
218

Computational Ecology and Software, 2015, 5(2): 201-221
IAEES www.iaees.org
Fig. 12 Variation of T with time ''t for the different values of tax rate coefficient
7 Conclusions
In this paper, our main aim is to study the survival of biological species living in a polluted environment and to
reduce the concentration of toxicants into the atmosphere by imposing environmental tax on emitters. The
concentration of toxicants into the atmosphere can only be reduced by reducing the cumulative emission rate
of toxicants. It is assumed that the environmental tax is levied on emitters only when the concentration of
pollutants goes beyond a threshold level, as discussed earlier. Existence of equilibria and their stability
behavior has been obtained. It is shown that the first equilibrium (i.e. E ) corresponding to the extinction of
biological species is unstable. The nontrivial equilibrium (i.e. *E ) is locally and globally stable under certain conditions within the region of attraction. It is shown that the equilibrium density of biological population
decreases while the concentration of toxicants, uptaken concentration and the concentration of intermediate
toxic product increase as the emission rate of toxicants increases. It is further shown that as the rate of
emission of toxicants increases, the environmental tax to be imposed on emitters, also increases. This implies
that it is advantageous to levy tax to reduce the discharge of toxicants and to improve the environmental
quality. It is also noted here that the tax revenue, thus generated, can be used for environmental protection so
that we have a clean environment and the biological species may survive potentially.
References
Agarwal M, Devi S. 2010. The effect of environmental tax on the survival of biological species in a polluted
environment: a mathematical model. Nonlinear Analysis: Modelling and Control, 15(3): 271-286
Bovenberg AL, Lawrence HG. 1996. Optimal environmental taxation in the presence of other taxes: General
equilibrium analyses. The American Economic Review, 86(4): 985-1000
Braathen NA, Greene J. Taxation, Innovation and the Environment. OECD, 2011
www.oecd.org/env/taxes/innovation
Cambra-Lopez M, Aarnink AJ, Zhao Y, Calvet S, Torres AG. 2010. Airborne particulate matter from livestock
production systems: A review of an air pollution problem. Environmental Pollution, 158: 1-17
Chattopadhyaya J. 1996. Effect of toxic substance on a two species competitive system. Ecological Modelling,
84(1-3): 287-289
Dubey B. 2010. A model for the effect of pollutant on human population dependent on a resource with
environmental and health policy. Journal of Biological Systems, 18(3): 571-592
219

Computational Ecology and Software, 2015, 5(2): 201-221
IAEES www.iaees.org
Dubey B, Hussain J. 2006. Modelling the survival of species dependent on a resource in a polluted
environment. Nonlinear Analysis: Real World Applications, 7: 187-210
Freedman HI, Shukla JB. 1991. Models for the effect of toxicant in single-species and predator–prey systems.
Journal of Mathematical Biology, 30: 15-30
Freedman HI, Waltman P. 1984. Persistence in models of three interacting predator prey populations.
Mathematical Bioscences, 68: 213-231
Hallam TG, Clark CE. 1981. Non-autonomous logistic equations as models of populations in a deteriorating
environment. Journal of Theoretical Biology, 93: 303-311
Hopke PK. 2009. Contemporary threats and air pollution. Atmospheric Environment, 43: 87-93
Kanabar D. 2011. Tax trends in emerging India: A survey. KPMG, kpmg.com/in
Liu H, Ma Z. 1991. The threshold of survival for system of two species in a polluted environment. Journal of
Mathematical Biology, 30: 49-61
Liu B, Chen L, Zhang Y. 2003. The effects of impulsive toxicant input on a population in a polluted
environment. Journal of Biological Systems, 11(3): 265-274
Liu AA. 2012. Tax Evasion and Optimal Environmental Taxes, Resources for the Future. Washington DC,
USA
Lovett GM, Kinsman JD. 1990. Atmospheric pollutant deposition to high-elevation ecosystem. Atmospheric
Environment, 11: 2767-2786
Misra OP, Kalra P. 2012. Modelling effect of toxic metal on the individual plant growth: A two
compartment model. American Journal of Computational and Applied Mathematics, 2(6): 276-289
Mukherjee D. 2002. Persistence and global stability of a population in a polluted environment with delay.
Journal of Biological Systems, 10: 225-232
Naresh R, Sundar S, Shukla JB. 2006. Modelling the effect of an intermediate toxic product formedby uptake
of a toxicant on plant biomass. Applied Mathematics and Computation, 182(1): 51-160
Naresh R, Sharma D, Shyam Sundar S. 2014. Modeling the effect of toxicant on plant biomass with time
delay. International Journal of Nonlinear Science, 17(3): 254-267
Pertsev NV, Tsaregorodtseva GE. 2011. A mathematical model of the dynamics of a population affected by
harmful substances. Journal of Applied and Industrial Mathematics, 5(1): 94-103
Samanta GP, Matti A.2004. Dynamical model of a single species system in a polluted environment. Journal of
Applied Mathematics and Computing, 16(1-2): 231-242
Samanta GP. 2010. A two-species competitive system under the influence of toxic substances. Applied
Mathematics and Computation, 216(1): 291-299
Shukla JB, Dubey B. 1996. Simultaneous effect of two toxicants on biological species: a mathematical model.
Journal of Biological Systems, 4(1): 109-130
Shukla JB, Dubey B. 1997. Modelling the depletion and conservation of forestry resources: effects of
population and pollution. Journal of Mathematical Biology, 36: 71-94
Shukla JB, Agarwal A, Dubey B, Sinha P. 2001. Existence and survival of two competing species in a polluted
environment: A mathematical model. Journal of Biological Systems, 9(2): 89-103
Shukla JB, Sharma S, Dubey B, Sinha P. 2009. Modeling the survival of resource-dependent population:
Effects of toxicants (pollutants) emitted from external sources as well as formed by its precursors.
Nonlinear Analysis: Real World Applications, 10: 54-70
Shukla JB, Sundar S, Shivangi, Naresh R. 2013. Modeling and analysis of the acid rain formation due to
precipitation and its effect on plant species. Natural Resource Modeling, 26(1): 53-65
Stern N. 2006. Stern’s Review on Economics of Climate Change. Cambridge University Press, USA
220

Computational Ecology and Software, 2015, 5(2): 201-221
IAEES www.iaees.org
Sterner T. 2007. Gasoline Taxes: A useful instrument for climate policy. Energy Policy, 35: 3194-3202
Symons E, Proops J, Gay P. 1994. Carbon Taxes, consumer demand and carbon dioxide emissions: A
simulation analysis for the UK. Fiscal Studies, 15(2): 19-43
Woo SU. 2009. Forest decline of the world: A linkage with air pollution and global warming. African Journal
of Biotechnology, 8(25): 7409-7414
221

Computational Ecology and Software
The Computational Ecology and Software (CES) is an open access, peer/open reviewed online journal that
considers scientific articles in all different areas of computational ecology. It is the transactions of the
International Society of Computational Ecology. The journal is concerned with the ecological researches,
constructions and applications of theories and methods of computational sciences including computational
mathematics, computational statistics and computer science. It features the simulation, approximation,
prediction, recognition, and classification of ecological issues. Intensive computation is one of the major
stresses of the journal. The journal welcomes research articles, short communications, review articles,
perspectives, and book reviews. The journal also supports the activities of the International Society of
Computational Ecology. The topics to be covered by CES include, but are not limited to:
Computation intensive methods, numerical and optimization methods, differential and difference
equation modeling and simulation, prediction, recognition, classification, statistical computation
(Bayesian computing, randomization, bootstrapping, Monte Carlo techniques, stochastic process, etc.),
agent-based modeling, individual-based modeling, artificial neural networks, knowledge based systems,
machine learning, genetic algorithms, data exploration, network analysis and computation, databases,
ecological modeling and computation using Geographical Information Systems, satellite imagery, and
other computation intensive theories and methods.
Artificial ecosystems, artificial life, complexity of ecosystems and virtual reality.
The development, evaluation and validation of software and algorithms for computational ecology. The
development and evaluation of apparatus, instruments and machines for ecological and environmental
analysis, investigation and monitoring based on the software of computational ecology.
Methodological applications of computational ecology in the researches of ecology and environmental
sciences.
Authors can submit their works to the email box of this journal, [email protected] and (or) [email protected]. All
manuscripts submitted to CES must be previously unpublished and may not be considered for publication
elsewhere at any time during review period of this journal.
In addition to free submissions from authors around the world, special issues are also accepted. The organizer of
a special issue can collect submissions (yielded from a research project, a research group, etc.) on a specific
topic, or submissions of a conference for publication of special issue.
Editorial Office: [email protected]
Publisher: International Academy of Ecology and Environmental Sciences
Address: Unit 3, 6/F., Kam Hon Industrial Building, 8 Wang Kwun Road, Kowloon Bay, Hong Kong
Tel: 00852-2138 6086
Fax: 00852-3069 1955
E-mail: [email protected]

Computational Ecology and Software ISSN 2220-721X
Volume 5, Number 2, 1 June 2015 Articles Fluctuating asymmetry and developmental instability in Protoreaster nodosus (Chocolate Chip Sea Star) as a biomarker for environmental stress D.J. V. Trono, R. Dacar, L. Quinones, S. R. M. Tabugo 119-129 Distinguishing niche and neutral processes: Issues in variation partitioning statistical methods and further perspectives YouHua Chen 130-138 Application of homotopy perturbation method to the Navier-Stokes equations in cylindrical coordinates H. A. Wahab, Anwar Jamal, Saira Bhatti, et al. 139-151 Modeling the effect of pollution on biological species: A socio-ecological problem B. Dubey, J. Hussain, S. N. Raw, Ranjit Kumar Upadhyay 152-174 Hopf bifurcation and stability analysis for a delayed logistic equation with additive Allee effect E.M. Elabbasy, Waleed A.I. Elmorsi 175-186 Bifurcation and complex dynamics of a discrete-time predator–prey system S. M. Sohel Rana 187-200 Modeling and analysis of the survival of a biological species in a polluted environment: Effect of environmental tax Shyam Sundar, Ram Naresh 201-221
IAEES http://www.iaees.org/